potato diseases surveillance in kenya - wur
TRANSCRIPT
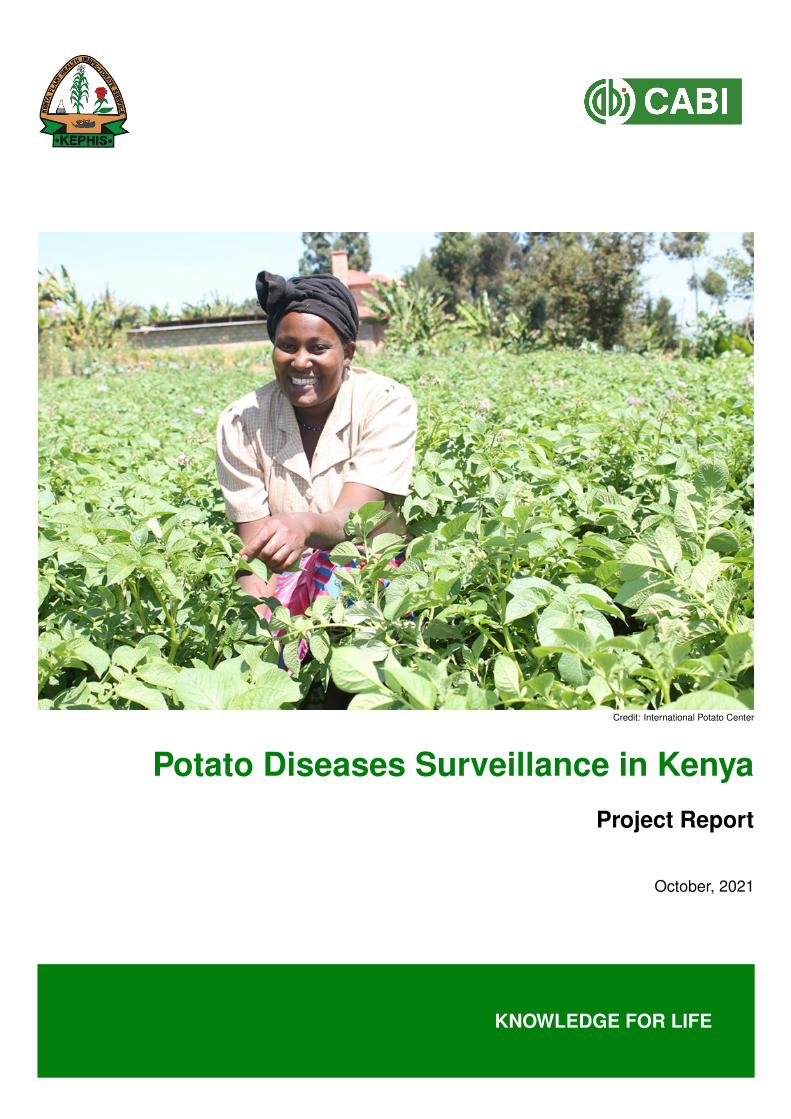
Credit: International Potato Center
Potato Diseases Surveillance in KenyaProject Report
October, 2021
KNOWLEDGE FOR LIFE

Implementing Institutions
CAB International (CABI)Joseph Mulema; Lucy Karanja; Washington Otieno; Daniel Karanja; Idah Mugambi;and Willis Ochilo
Kenya Plant Health Inspectorate Services (KEPHIS)Isaac Macharia; Ivan Obare; Jane Wanjiku; Florence Munguti; and George Ngundo
Correct citation
Mulema J., Karanja, L., Otieno W., Karanja D., Macharia I., Obare I., Chepng’eno M.,Chemutai C., Mugambi I., Nyaundi O., Wanjiku J., Kagondu M., Munguti F., NgundoG., and Ochilo W. (2021), Potato Diseases Surveillance in Kenya, Final Project Report.CAB International (CABI) and Kenya Plant Health Inspectorate Services (KEPHIS),Nairobi, Kenya, 156 Pages.
Potato Diseases Surveillance in Kenya© CABI and KEPHIS, 2021
Typeset using PDFLATEX as implemented in MIKTEX.
i| Page
Acknowledgements
We extend our sincere appreciation to the Kenya-Netherlands Seed Potato Project forthe grant extended to CABI through the Wageningen Centre for Development Innovation(WCDI) for implementing this work and CABI’s Action on Invasives Programme foradditional funding (https://www.cabi.org/projects/action-on-invasives)
We appreciate the support from all institutions involved directly or indirectly, particularly;Dr. Esther Kimani, Mr. Simeon Kibet, Dr. Isaac Macharia, George Ngundo and IvanObare all of KEPHIS; Dr. Moses Nyongesa (Kenya Agricultural and Livestock ResearchOrganization (KALRO)), Tigoni; Dr. Sharma Kalpana (International Potato Center(CIP)); Mr. Wachira Kaguongo (National Potato Council of Kenya (NPCK)); Prof. JohnKimenju (University of Nairobi (UoN)) and Julie Kariuki (TechnoServe) and the Ministryof Agriculture Livestock and Fisheries (MoALF).
We acknowledge the support offered by the County Director of Agriculture (CDA),Sub-county Agricultural Officer (SCAO) and Ward Agricultural Officer (WAO) of thecounties of Elegeyo Marakwet, Meru, Nakuru, Narok, Nyandarua and Trans Nzoia.
We recognise the effort of the team that worked tirelessly in the midst of verychallenging situations to collect the samples which made this project possible. Thiswas a multi-institution effort which was reflected in the teams that comprised of stafffrom CABI: Duncan Chacha, Fernadis Makale and Winnie Nunda; KEPHIS: GeorgeNgundo, Lucy Thungu and Jane Wanjiku; KALRO: Faith Imari Apwoka, Jackson Kilonziand Patrick Pwaipwai) and UoN: Loise Mumbi, Hilda Odongo and Miriam Mbiyu.
We thank the team of interns at KEPHIS; Boniface Ogwoka, Chebon Kagongo, ClifftonEnzoveri, Dennis Maritim, Diana Aluoch, Harriet Nanyanga, John Mwanu, Koima Kari,Leornard Kiprotich, Oliver Kwach, Moses Kobia and Victor Obure who particpated inprocessing the samples. We extent special appreciation to Caren Chemutai, OliviahNyaundi, Mercy Chepng’eno and Kelvin Kagondu for their dedication to the projectboth during processing of samples, isolation of the target pathogens, and moleculardiagnostic tests.
Lastly, the farmers from the six sub-counties who provided valuable social-economicinformation and the potato samples that formed the basis of this surveillance.
ii| Page

Project Partners
iii| Page
Table of Contents
Acknowledgements ii
Project Partners iii
List of Tables vii
List of Figures ix
Acronyms and Abbreviations xi
Executive Summary xiv
1 Introduction 1
1.1 Background . . . . . . . . . . . . . . . . . . . . . . . . . . . . . . . . . . . 11.2 Production . . . . . . . . . . . . . . . . . . . . . . . . . . . . . . . . . . . . 21.3 Production Challenges . . . . . . . . . . . . . . . . . . . . . . . . . . . . . 4
1.3.1 Low Availability of Certified Seed . . . . . . . . . . . . . . . . . . 41.3.2 Low Usage of Certified Seed . . . . . . . . . . . . . . . . . . . . 41.3.3 High Pest Incidence . . . . . . . . . . . . . . . . . . . . . . . . . 41.3.4 Additional Factors . . . . . . . . . . . . . . . . . . . . . . . . . . 7
1.4 Potato Diseases Surveillance . . . . . . . . . . . . . . . . . . . . . . . . . 7
2 Target Species 10
2.1 Clavibacter sepedonicus . . . . . . . . . . . . . . . . . . . . . . . . . . . . 102.2 Pectobacterium and Dickeya species . . . . . . . . . . . . . . . . . . . . . 12
2.2.1 Pectobacterium species . . . . . . . . . . . . . . . . . . . . . . . 122.2.2 Dickeya species . . . . . . . . . . . . . . . . . . . . . . . . . . . 132.2.3 Symptoms of Soft Rot Pectobacteriaceae . . . . . . . . . . . . . 14
3 Fact-finding Mission 16
3.1 Background . . . . . . . . . . . . . . . . . . . . . . . . . . . . . . . . . . . 163.2 Elgeyo Marakwet County . . . . . . . . . . . . . . . . . . . . . . . . . . . . 163.3 Meru County . . . . . . . . . . . . . . . . . . . . . . . . . . . . . . . . . . 173.4 Nakuru County . . . . . . . . . . . . . . . . . . . . . . . . . . . . . . . . . 173.5 Narok County . . . . . . . . . . . . . . . . . . . . . . . . . . . . . . . . . . 183.6 Nyandarua County . . . . . . . . . . . . . . . . . . . . . . . . . . . . . . . 183.7 Trans Nzoia County . . . . . . . . . . . . . . . . . . . . . . . . . . . . . . . 19
iv| Page
4 Materials and Methods 20
4.1 Sample Collection . . . . . . . . . . . . . . . . . . . . . . . . . . . . . . . 204.2 Sample Processing . . . . . . . . . . . . . . . . . . . . . . . . . . . . . . . 234.3 Sample Supporting Data . . . . . . . . . . . . . . . . . . . . . . . . . . . . 234.4 Isolation of Target Pathogens . . . . . . . . . . . . . . . . . . . . . . . . . 24
4.4.1 Clavibacter sepedonicus . . . . . . . . . . . . . . . . . . . . . . 244.4.2 Dickeya spp. and Pectobacterium spp. . . . . . . . . . . . . . . . 24
4.5 DNA Extraction . . . . . . . . . . . . . . . . . . . . . . . . . . . . . . . . . 254.6 PCR Assay . . . . . . . . . . . . . . . . . . . . . . . . . . . . . . . . . . . 25
5 Field surveillance 28
5.1 Background . . . . . . . . . . . . . . . . . . . . . . . . . . . . . . . . . . . 285.2 General Survey Results . . . . . . . . . . . . . . . . . . . . . . . . . . . . 295.3 Elgeyo Marakwet County . . . . . . . . . . . . . . . . . . . . . . . . . . . . 395.4 Meru County . . . . . . . . . . . . . . . . . . . . . . . . . . . . . . . . . . 485.5 Nakuru County . . . . . . . . . . . . . . . . . . . . . . . . . . . . . . . . . 565.6 Narok County . . . . . . . . . . . . . . . . . . . . . . . . . . . . . . . . . . 665.7 Nyandarua County . . . . . . . . . . . . . . . . . . . . . . . . . . . . . . . 735.8 Trans Nzoia County . . . . . . . . . . . . . . . . . . . . . . . . . . . . . . . 83
6 Molecular Diagnostics 91
6.1 Background . . . . . . . . . . . . . . . . . . . . . . . . . . . . . . . . . . . 916.2 Clavibacter sepedonicus . . . . . . . . . . . . . . . . . . . . . . . . . . . . 916.3 Dickeya and Pectobacterium Species . . . . . . . . . . . . . . . . . . . . . 92
6.3.1 Dickeya Species . . . . . . . . . . . . . . . . . . . . . . . . . . . 946.3.2 Pectobacterium Species . . . . . . . . . . . . . . . . . . . . . . . 95
7 Discussion, Conclusion and Recommendations 108
7.1 Purpose of the surveillance . . . . . . . . . . . . . . . . . . . . . . . . . . 1087.2 Discussion . . . . . . . . . . . . . . . . . . . . . . . . . . . . . . . . . . . . 1097.3 Conclusion . . . . . . . . . . . . . . . . . . . . . . . . . . . . . . . . . . . 1117.4 Recommendations . . . . . . . . . . . . . . . . . . . . . . . . . . . . . . . 111
Bibliography 115
Appendices 127
A Questionnaire 128
B Buffer and Stock Solutions 132
B.1 EDTA . . . . . . . . . . . . . . . . . . . . . . . . . . . . . . . . . . . . . . 132B.2 Dithiothreitol . . . . . . . . . . . . . . . . . . . . . . . . . . . . . . . . . . . 132B.3 Sodium Acetate . . . . . . . . . . . . . . . . . . . . . . . . . . . . . . . . . 132B.4 Sodium Chloride . . . . . . . . . . . . . . . . . . . . . . . . . . . . . . . . 133B.5 Sodium Hydroxide . . . . . . . . . . . . . . . . . . . . . . . . . . . . . . . 133B.6 Proteinase . . . . . . . . . . . . . . . . . . . . . . . . . . . . . . . . . . . . 133
v| Page
B.7 Tris . . . . . . . . . . . . . . . . . . . . . . . . . . . . . . . . . . . . . . . . 133B.8 CTAB Buffer . . . . . . . . . . . . . . . . . . . . . . . . . . . . . . . . . . . 133B.9 CTAB Extraction Buffer . . . . . . . . . . . . . . . . . . . . . . . . . . . . . 133B.10 Phosphate Buffer - 10 mM . . . . . . . . . . . . . . . . . . . . . . . . . . . 134B.11 Phosphate Buffer - 50 mM . . . . . . . . . . . . . . . . . . . . . . . . . . . 134B.12 Ringer’s Buffer . . . . . . . . . . . . . . . . . . . . . . . . . . . . . . . . . 134B.13 Freezing Medium . . . . . . . . . . . . . . . . . . . . . . . . . . . . . . . . 134B.14 D-PEM . . . . . . . . . . . . . . . . . . . . . . . . . . . . . . . . . . . . . . 135B.15 S-PEM . . . . . . . . . . . . . . . . . . . . . . . . . . . . . . . . . . . . . . 135B.16 TE Buffer . . . . . . . . . . . . . . . . . . . . . . . . . . . . . . . . . . . . 135B.17 TAE Electrophoresis Buffer . . . . . . . . . . . . . . . . . . . . . . . . . . 135
C Media 136
C.1 DL-CVP Medium . . . . . . . . . . . . . . . . . . . . . . . . . . . . . . . . 136C.2 SL-CVP Medium . . . . . . . . . . . . . . . . . . . . . . . . . . . . . . . . 137C.3 Luria Bertani Agar . . . . . . . . . . . . . . . . . . . . . . . . . . . . . . . 137C.4 Luria Broth . . . . . . . . . . . . . . . . . . . . . . . . . . . . . . . . . . . 137C.5 MTNA Medium . . . . . . . . . . . . . . . . . . . . . . . . . . . . . . . . . 138C.6 NCP-88 Medium . . . . . . . . . . . . . . . . . . . . . . . . . . . . . . . . 138C.7 Nutrient Agar . . . . . . . . . . . . . . . . . . . . . . . . . . . . . . . . . . 139C.8 Nutrient Broth . . . . . . . . . . . . . . . . . . . . . . . . . . . . . . . . . . 139C.9 YGM . . . . . . . . . . . . . . . . . . . . . . . . . . . . . . . . . . . . . . . 139C.10 YGM-modified Medium . . . . . . . . . . . . . . . . . . . . . . . . . . . . . 139C.11 NBY Medium . . . . . . . . . . . . . . . . . . . . . . . . . . . . . . . . . . 140
D Sample collection and processing 141
D.1 Symptomatic Samples . . . . . . . . . . . . . . . . . . . . . . . . . . . . . 141D.2 Asymptomatic Samples . . . . . . . . . . . . . . . . . . . . . . . . . . . . 141
E Isolation of Clavibacter sepedonicus 142
E.1 Symptomatic Materials . . . . . . . . . . . . . . . . . . . . . . . . . . . . . 142E.2 Asymptomatic Materials and Screening for Latent Infections . . . . . . . . 142
F Isolation of Soft Rot Pectobacteriaceae 143
F.1 Background . . . . . . . . . . . . . . . . . . . . . . . . . . . . . . . . . . . 143F.2 Symptomatic Materials . . . . . . . . . . . . . . . . . . . . . . . . . . . . . 143F.3 Asymptomatic Materials . . . . . . . . . . . . . . . . . . . . . . . . . . . . 144
G Extraction of Genomic DNA 147
H All samples positive for Soft Rot Pectobacteriaceae (SRP) 148
I Addendum 155
J Addendum 156
Contact us
vi| Page
List of Tables
4.1 Surveyed locations . . . . . . . . . . . . . . . . . . . . . . . . . . . . . . . 214.2 Positive control strains . . . . . . . . . . . . . . . . . . . . . . . . . . . . . 264.3 Primer sets for conventional PCR . . . . . . . . . . . . . . . . . . . . . . . 264.4 Conventional PCR cycling conditions . . . . . . . . . . . . . . . . . . . . . 27
5.1 Field assessment personnel teams . . . . . . . . . . . . . . . . . . . . . . 285.2 Farmers interviewed in all six counties . . . . . . . . . . . . . . . . . . . . 295.3 Crops grown in the six counties . . . . . . . . . . . . . . . . . . . . . . . . 315.4 Use of crops grown in the six counties . . . . . . . . . . . . . . . . . . . . 325.5 Potato varieties grown in the six counties . . . . . . . . . . . . . . . . . . . 335.6 Source of potato planting materials in the six counties . . . . . . . . . . . 345.7 Crops used in rotations . . . . . . . . . . . . . . . . . . . . . . . . . . . . . 355.8 Methods of irrigation . . . . . . . . . . . . . . . . . . . . . . . . . . . . . . 355.9 Pests managed by agronomic practices in the six counties . . . . . . . . . 365.10 Presence of bacterial ring rot across the six counties . . . . . . . . . . . . 375.11 Presence of SRP-associated across the six counties . . . . . . . . . . . . 385.12 Disaggregation of farmers in Elgeyo Marakwet county . . . . . . . . . . . 405.13 Crops grown in Elgeyo Marakwet county . . . . . . . . . . . . . . . . . . . 425.14 Use of crops grown in Elgeyo Marakwet county . . . . . . . . . . . . . . . 425.15 Potato varieties grown in Elgeyo Marakwet county . . . . . . . . . . . . . . 435.16 Source of potato planting materials in Elgeyo Marakwet county . . . . . . 435.17 Crops used in rotations in Elgeyo Marakwet county . . . . . . . . . . . . . 445.18 Pathogenic organisms managed by agronomic practices in Elgeyo
Marakwet county . . . . . . . . . . . . . . . . . . . . . . . . . . . . . . . . 455.19 Insects managed by agronomic practices in Elgeyo Marakwet county . . . 455.20 Disaggregation of farmers in Meru county . . . . . . . . . . . . . . . . . . 495.21 Crops grown in Meru county . . . . . . . . . . . . . . . . . . . . . . . . . . 515.22 Use of crops grown in Meru county . . . . . . . . . . . . . . . . . . . . . . 515.23 Potato varieties grown in Meru county . . . . . . . . . . . . . . . . . . . . 525.24 Source of potato planting materials in Meru county . . . . . . . . . . . . . 525.25 Crops used in rotations in Meru county . . . . . . . . . . . . . . . . . . . . 535.26 Pathogenic organisms managed by agronomic practices in Meru county . 545.27 Insects managed by agronomic practices in Meru county . . . . . . . . . . 545.28 Disaggregation of farmers in Nakuru county . . . . . . . . . . . . . . . . . 57
vii| Page
5.29 Crops grown in Nakuru county . . . . . . . . . . . . . . . . . . . . . . . . 595.30 Use of crops grown Nakuru county . . . . . . . . . . . . . . . . . . . . . . 595.31 Potato varieties grown in Nakuru county . . . . . . . . . . . . . . . . . . . 605.32 Source of potato planting materials in Nakuru county . . . . . . . . . . . . 605.33 Crops used in rotations in Nakuru county . . . . . . . . . . . . . . . . . . . 615.34 Pathogenic organisms managed by agronomic practices in Nakuru county 635.35 Insects managed by agronomic practices in Nakuru county . . . . . . . . 635.36 Presence of SRP-associated diseases in Nakuru county . . . . . . . . . . 645.37 Disaggregation of farmers in Narok county . . . . . . . . . . . . . . . . . . 675.38 Crops grown in Narok county . . . . . . . . . . . . . . . . . . . . . . . . . 685.39 Use of crops grown Narok county . . . . . . . . . . . . . . . . . . . . . . . 685.40 Potato varieties grown in Narok county . . . . . . . . . . . . . . . . . . . . 695.41 Source of potato planting materials in Narok county . . . . . . . . . . . . . 695.42 Crops used in rotations in Narok county . . . . . . . . . . . . . . . . . . . 705.43 Pathogenic organisms managed by agronomic practices in Narok county . 705.44 Insects managed by agronomic practices in Narok county . . . . . . . . . 715.45 Disaggregation of farmers in Nyandarua county . . . . . . . . . . . . . . . 745.46 Crops grown in Nyandarua county . . . . . . . . . . . . . . . . . . . . . . 765.47 Use of crops grown in Nyandarua county . . . . . . . . . . . . . . . . . . . 765.48 Potato varieties grown in Nyandarua county . . . . . . . . . . . . . . . . . 775.49 Source of potato planting materials in Nyandarua county . . . . . . . . . . 775.50 Crops used in rotations in Nyandarua county . . . . . . . . . . . . . . . . 795.51 Pathogenic organisms managed by agronomic practices in Nyandarua county 805.52 Insects managed by agronomic practices in Nyandarua county . . . . . . 805.53 Presence of SRP-associated diseases in Nyandarua county . . . . . . . . 815.54 Disaggregation of farmers in Trans Nzoia county . . . . . . . . . . . . . . 845.55 Crops grown in Trans Nzoia county . . . . . . . . . . . . . . . . . . . . . . 855.56 Usage of crops grown Trans Nzoia county . . . . . . . . . . . . . . . . . . 865.57 Potato varieties grown in Trans Nzoia county . . . . . . . . . . . . . . . . . 875.58 Source of potato planting materials in Trans Nzoia county . . . . . . . . . 875.59 Crops used in rotations in Trans Nzoia county . . . . . . . . . . . . . . . . 885.60 Pathogenic organisms managed by agronomic practices in Trans Nzoia
county . . . . . . . . . . . . . . . . . . . . . . . . . . . . . . . . . . . . . . 885.61 Insects managed by agronomic practices in Trans Nzoia county . . . . . . 88
6.1 Positive samples for Dickeya species . . . . . . . . . . . . . . . . . . . . . 946.2 Samples confirmed with P. atrosepticum . . . . . . . . . . . . . . . . . . . 986.3 Samples confirmed with P. brasiliense . . . . . . . . . . . . . . . . . . . . 996.4 Samples confirmed with P. carotovorum . . . . . . . . . . . . . . . . . . . 1016.5 Samples confirmed with P. parmentieri . . . . . . . . . . . . . . . . . . . . 1036.6 Samples confirmed with multiple Pectobacterium species . . . . . . . . . 105
H.1 All samples confirmed with Dickeya and Pectobacterium species . . . . . 149
I.1 Result from additional surveillance . . . . . . . . . . . . . . . . . . . . . . 155
viii| Page
List of Figures
1.1 Potato production regions in Kenya . . . . . . . . . . . . . . . . . . . . . . 21.2 Africa potato production for 2018 . . . . . . . . . . . . . . . . . . . . . . . 31.3 Average potato yields for East Africa . . . . . . . . . . . . . . . . . . . . . 31.4 Factors affecting potato production in Kenya . . . . . . . . . . . . . . . . . 61.5 Counties selected for the disease surveillance exercise . . . . . . . . . . . 8
2.1 Bacterial ringrot symptoms . . . . . . . . . . . . . . . . . . . . . . . . . . . 112.2 Blackleg and soft rot symptoms . . . . . . . . . . . . . . . . . . . . . . . . 15
4.1 Cross section of a potato tuber . . . . . . . . . . . . . . . . . . . . . . . . 23
5.1 Disaggregation by gender from the six counties . . . . . . . . . . . . . . . 295.2 Disaggregation by age from the six across counties . . . . . . . . . . . . . 305.3 Proportion of age categories from the six counties . . . . . . . . . . . . . 305.4 Agronomic practices across the six counties . . . . . . . . . . . . . . . . . 345.5 Sources of information across the six counties . . . . . . . . . . . . . . . . 375.6 Information dissemination across the six counties . . . . . . . . . . . . . . 385.7 Sample collection in Elgeyo Marakwet county . . . . . . . . . . . . . . . . 395.8 Disaggregation by gender in Elgeyo Marakwet county . . . . . . . . . . . 405.9 Disaggregation by age in Elgeyo Marakwet county . . . . . . . . . . . . . 415.10 Proportion of age categories in Elgeyo Marakwet county . . . . . . . . . . 415.11 Agronomic practices in Elgeyo Marakwet county . . . . . . . . . . . . . . 445.12 Sources of information in Elgeyo Marakwet county . . . . . . . . . . . . . 465.13 Information dissemination in Elgeyo Marakwet county . . . . . . . . . . . 465.14 Sample collection in Meru county . . . . . . . . . . . . . . . . . . . . . . . 485.15 Disaggregation by gender in Meru county . . . . . . . . . . . . . . . . . . 495.16 Disaggregation by age in Meru county . . . . . . . . . . . . . . . . . . . . 505.17 Proportion of the age categories in Meru county . . . . . . . . . . . . . . . 505.18 Agronomic practices in Meru county . . . . . . . . . . . . . . . . . . . . . 535.19 Sources of information in Meru county . . . . . . . . . . . . . . . . . . . . 555.20 Information dissemination in Meru Marakwet county . . . . . . . . . . . . 555.21 Sample collection in Nakuru county . . . . . . . . . . . . . . . . . . . . . . 565.22 Disaggregation by gender in Nakuru county . . . . . . . . . . . . . . . . . 575.23 Disaggregation by age in Nakuru county . . . . . . . . . . . . . . . . . . . 585.24 Proportion of the age categories in Nakuru county . . . . . . . . . . . . . 58
ix| Page
5.25 Agronomic practices in Nakuru county . . . . . . . . . . . . . . . . . . . . 625.26 Sources of information in Nakuru county . . . . . . . . . . . . . . . . . . . 645.27 Information dissemination in Nakuru county . . . . . . . . . . . . . . . . . 655.28 Sample collection in Narok county . . . . . . . . . . . . . . . . . . . . . . 665.29 Disaggregation by gender in Narok county . . . . . . . . . . . . . . . . . . 675.30 Disaggregation by age in Narok county . . . . . . . . . . . . . . . . . . . . 675.31 Proportion of the age categories in Narok county . . . . . . . . . . . . . . 685.32 Agronomic practices in Narok county . . . . . . . . . . . . . . . . . . . . . 705.33 Sources of information in Narok county . . . . . . . . . . . . . . . . . . . . 715.34 Information dissemination in Narok county . . . . . . . . . . . . . . . . . . 725.35 Sample collection in Nyandarua county . . . . . . . . . . . . . . . . . . . . 735.36 Disaggregation by gender in Nyandarua county . . . . . . . . . . . . . . . 745.37 Disaggregation by age in Nyandarua county . . . . . . . . . . . . . . . . . 755.38 Proportion of the age categories in Nyandarua county . . . . . . . . . . . 755.39 Agronomic practices in Nyandarua county . . . . . . . . . . . . . . . . . . 785.40 Sources of information in Nyandarua county . . . . . . . . . . . . . . . . . 815.41 Information dissemination in Nyandarua county . . . . . . . . . . . . . . . 825.42 Sample collection in Trans Nzoia county . . . . . . . . . . . . . . . . . . . 835.43 Disaggregation by gender in Trans Nzoia county . . . . . . . . . . . . . . 845.44 Disaggregation by age in Trans Nzoia county . . . . . . . . . . . . . . . . 845.45 Proportion of the age categories in Trans Nzoia county . . . . . . . . . . . 855.46 Agronomic practices in Trans Nzoia county . . . . . . . . . . . . . . . . . . 865.47 Sources of information in Trans Nzoia county . . . . . . . . . . . . . . . . 895.48 Information dissemination in Trans Nzoia county . . . . . . . . . . . . . . . 90
6.1 Samples tested for presence of C. sepedonicus . . . . . . . . . . . . . . . 926.2 Samples tested for presence of SRP . . . . . . . . . . . . . . . . . . . . . 936.3 Samples positive for Dickeya species . . . . . . . . . . . . . . . . . . . . . 946.4 Samples positive for P. atrosepticum . . . . . . . . . . . . . . . . . . . . . 956.5 Samples positive for P. brasiliense . . . . . . . . . . . . . . . . . . . . . . 966.6 Samples positive for P. carotovorum . . . . . . . . . . . . . . . . . . . . . 976.7 Samples positive for P. parmentieri . . . . . . . . . . . . . . . . . . . . . . 976.8 Distribution of target pathogens . . . . . . . . . . . . . . . . . . . . . . . . 107
x| Page
Acronyms and Abbreviations
ADC Agricultural Development CorporationANI average nucleotide identityapprox. ApproximatelyASTGS Agricultural Sector Transformation and Growth Strategybp base pairBRR Bacterial Ring RotCABI CAB InternationalCCO County Crops OfficerCDA County Director of AgricultureCFU Colony-forming unitsCHCO County Horticultural Crops OfficerCIP International Potato CenterCO Chief OfficerCOPE Centre of Phytosanitary ExcellenceCSV Comma Separated ValuesCTAB Cetyl Trimethyl Ammonium BromideCVP Crystal Violet PectateDCDA Deputy County Director of AgricultureDDH DNA-DNA hybridizationDL-CVP Double-layer Crystal Violet Pectate (CVP)DMSO Dimethyl sulfoxideDNA Deoxyribonucleic aciddNTP Deoxyribonucleotide triphosphateDO Data OfficerDoA Department of AgricultureD-PEM Double Strength Pectate Enrichment MediumEDTA Ethylenediaminetetraacetic acidFAP Field Assessment PersonnelFFSs Farmer Field Schoolsg Gram
xi| Page
GDP Gross Domestic Producth Hourha HectaresIPPC International Plant Protection ConventionIPTG Isopropyl β-D-1-thiogalactopyranosideISC Invasive Species CompendiumISPM International Standard for Phytosanitary MeasuresKALRO Kenya Agricultural and Livestock Research OrganizationKEPHIS Kenya Plant Health Inspectorate ServicesKES Kenya ShillingsLAMP Loop-Mediated Isothermal AmplificationLB Luria BrothLBA Luria Bertani AgarLtd Limitedmasl meters above sea levelMECs Mass Extension Campaignsmg Milligrammin MinutemL MillilitreMLSA multilocus sequence analysismM MllimolarMoALF Ministry of Agriculture Livestock and FisheriesMt. MountainNA Nutrient AgarNARL National Agricultural Research LaboratoriesNB Nutrient BrothNBY Yeast extract Glucose Mineral MediumNCPPB National Collection of Plant Pathogenic BacteriaNGM Nutrient Glycerol ManganeseNGOs Non-governmental OrganisationNo. NumberNPCK National Potato Council of KenyaODK Open Data KitPCN Potato cyst nematodePCR Polymerase chain reactionPFAs Pest Free AreasPLRV Potato Leaf Roll VirusPMDG Pest Management Decision GuidesPRA Pest Risk Analysis
xii| Page
PTN Potato tuber nematodePVA Potato Virus APVM Potato Virus MPVP PolyvinylpyrrolidonePVS Potato Virus SPVX Potato Virus XPVY Potato Virus Yrpm Revolutions per minuteSCADO Sub-county Agricultural Development OfficerSCAO Sub-county Agricultural OfficerSCAPMO Sub-county Agricultural Production and Marketing OfficerSCCDO Sub-county Crops Development OfficerSCCO Sub-county Crops OfficerSDS Sodium Dodecyl Sulfatesec SecondsSL-CVP Single-layer CVPSMS Short Message ServiceS-PEM Single Strength Pectate Enrichment MediumSRE Soft Rot EnterobacteriaceaeSRP Soft Rot PectobacteriaceaeSSA Sub-Saharan AfricaSWC Soil and Water Conservationt TonneTAE Tris-Acetate-EDTATaq Thermus aquaticusTE Tris-EDTATris Tris(hydroxymethyl)aminomethaneUoN University of NairobiUSD United States DollarsV VoltsVC Value ChainWAO Ward Agricultural OfficerWCDI Wageningen Centre for Development InnovationYGM Yeast extract Glucose Mineral Medium
xiii| Page
Executive Summary
The agriculture sector contributes 33% of the Gross Domestic Product (GDP) toKenya’s economy and adds another 27% through linkages to other sectors such asmanufacturing, distribution and services. It is the main source of direct income andlivelihoods for about 70% and 40% of the rural and Kenya’s total population respectively.The Agricultural Sector Transformation and Growth Strategy (ASTGS) prioritized 13Value Chain (VC) including potato with potential to raise smallholder farmer incomesand offer dietary diversity. This is in line with the “Big Four” agenda which includesfood security in addition to affordable housing, manufacturing and affordable healthcarefor all. Potato (Solanum tuberosum L.), one of the prioritized VCs, is only second tomaize in importance, contributing more than USD 300 million annually to the economyand employing about 3.3 million people directly and indirectly as; producers (growers),brokers, market agents, transporters, processors, vendors, retailers and exporters.Potato farmers are estimated at 800,000 and spread across a number of countieswhich include, Bomet, Bungoma, Elgeyo Marakwet, Kericho, Kiambu, Kirinyaga, Meru,Muranga, Nakuru, Narok, Nyandarua, Nyeri, Trans Nzoia, Uasin Gishu and West Pokot.
Kenya is the 4th leading producer of potato in Africa after Egypt, Algeria and SouthAfrica producing potato on an acreage of 217,315 ha which is only second to Nigeriaaccording to 2018 figures from FAOSTAT. Total production in the same period resultedin a total tonnage of 1,870,375 t giving an average yield of 8.6 t/ha. This yield is farbelow the Africa and global averages and most countries in Africa including East Africaexcept Uganda. Kenya’s potato yield has progressively decreased from 21.2 t/ha in2008 to 8.6 t/ha in 2018. This is attributed to a number of factors which include but arenot limited to low availability of certified seed potato, low usage of certified seed potato,limited or no crop rotation, declining soil fertility, low usage of agro-inputs, inability totake advantage of irrigation to enable year-round production but as a major factor, highpest incidence. A number of pests especially Alternaria solani, Phytophthora infestans,Ralstonia solanacearum and viruses (especially potato viruses X, Y and potato leaf rollvirus) have been widely reported in Kenya. Other pests affecting potato productioninclude Clavibacter sepedonicus, the cause of bacterial ring rot; Dickeya species, thecause of soft rots; and Pectobacterium species, the cause of blackleg and soft rots.Species in the genus Dickeya and Pectobacterium colectively belong to the Soft rotPectobacteriaceae (SRP). Pectobacterium species identified in Kenya in previousstudies include P. brasiliense, P. carotovorum, and P. parmentieri.
xiv| Page
C. sepedonicus, species in the genus Dickeya and some in the genus Pectobacteriumare listed as quarantine pests in Kenya. A horizon scanning assessment conducted in2018 by CABI with other stakeholders in the plant health system including KEPHIShighlighted C. sepedonicus and some Soft rot Pectobacteriaceae (D. dadantii, D.dianthicola, D. solani, D. zeae, P. atrosepticum, and P. parmentieri) as high risk toKenya’s agricultural sector. A surveillance exercise was conducted to determine thepresence of bacteria that incite blackleg and soft rots (Dickeya sp. and Pectobacterium.sp.) and bacterial ring rot (C. sepedonicus). The exercise was conducted in the sixmajor potato producing counties of Kenya selected through a consultative processby stakeholders. The counties included; Elgeyo Marakwet, Meru, Nakuru, Narok,Nyandarua and Trans Nzoia. A fact-finding mission that brought together key countyofficials was conducted in each of the counties. The objective of this mission werefive-fold, i) explain the rationale of the potato disease surveillance exercise; ii) share thesurveillance protocol with the county officials; iii) ascertain facts about potato productionand associated pests (especially the target pests) in the county; iv) identify areas withinthe county (potato growing areas) to undertake the surveillance work; and v) agree onthe timelines and involvement of county personnel in the surveillance work. Apart fromcollecting samples from which the pathogens were isolated, a structured questionnairewas also administered to all the farmers from whose fields the samples were collected.Prior to the surveillance exercise, all Field Assessment Personnel (FAP) under wenttraining at the National Agricultural Research Laboratories (NARL), Kabete, Nairobi,Kenya. The objective was to ensure that the whole team understood the protocol, thesymptoms and signs of the target pathogens, the procedure for sample collection, andhow the integrity of the samples was supposed to be protected.
The surveillance exercise was conducted during the second (short rains) seasonof 2019 commencing on 1st December and ending on 20th December 2019. TheFAP interviewed and collected samples from 1,002 farms across the six counties.All samples were delivered to KEPHIS within 24 hours of collection. Of the 1,002farmers, female accounted for 42% (421) and male, 58% (581). The majority camefrom Nyandarua county (317, 32%), followed by Nakuru (268, 27%), Meru (122, 12%),Trans Nzoia (110, 11%), Narok (94, 9%) and lastly Elgeyo Marakwet (91, 9%). Inaddition to disaggregation by gender, the farmers were also disaggregated by age. Fiveage categories were considered which included <30 years, 31-35, 36-45, 46-55 and>55 years. The least category interviewed was the <30 year (85, 8%); followed by31-35 year (127, 14.5%); then 36-45 years (248, 24.8%); >55 years (254, 25.3%) andlastly, the 46-55 year (288, 28.7 %). The majority of farmers (830, 83%) selected potatoas the first-choice crop followed by maize (112, 11%) in the distant second. However,maize was preferred by most farmers (437, 43.6%) as the second-choice crop afterpotato. Potato also accounted for the biggest acreage followed by maize but camethird after maize and cabbage when selected as second choice. A similar trend wasobserved across counties.
In total, 28 varieties were grown across all counties with 16 selected as their first-choice.Shangi was selected by the majority (899, 89.7%) followed in the distant second byDutch Robijn (33, 3.3%). Four other varieties were selected at least by more than 10
xv| Page
farmers which included Asante (16, 1.6%), Tigoni (11, 1.1%), Kabale (10, 1.0%) andSherekea (10, 1.0%). The majority of farmers obtained their potato planting materialsfrom informal sources. A proportion of 34.1% (342) obtained from fellow farmers,32.1% (322) used own-saved materials and 19.9% (199) sourced from both categoriesresulting in totals of 521 (51.2%) and 541 (54%) who sourced from fellow farmersand used own-saved planting materials respectively. A small proportion of 5.1% (51)sourced potato planting materials from the market. Only 17.2% (172) of the farmerssourced seed from seed producers. Other sources indicated by 1.4% (14) of thefarmers included the county governments and and Non-governmental Organisation(NGOs). The majority of farmers claimed to have used appropriate agronomic practicesthat improve crop productivity such as recommended spacing (911, 90.9%), fertilizerapplication (987, 98.5%), scouting for pests (896, 89.4%), crop rotation (753, 75.1%),pest management (987, 97.1%) and weeding (973, 97.1%). Only 9.3% (94) irrigatedtheir crops and 33.1% (332) used improved seed. Although 98.2% (984) did not mulchtheir crop, it is not an essential practice in potato production. A similar trend wasobserved across counties.
Crop rotation was used across counties by 75% (753) of the farmers with maize (546,54.5%) being the most rotated crop with potato followed by cabbage (226, 22.6%). Asimilar trend was observed across all counties. Maize was also the second-choicecrop after potato with cabbage coming in a distant third probably explaining thechoice of these crops in rotations. Although it was a small fraction (5, 0.5%), somefarmers rotated potato with tomato for which they share the same pests. This is not agood agronomic practice and needs to be addressed through awareness and farmertraining. Irrigation was only reported by 8.9% of the total (1,002) number of the farmers.Sprinkler irrigation was the most used and mostly in Meru (66 of the 89; 74.1%)followed by Nyandarua (20 of 89; 22.5%) confirming reports of low usage and mostlyaround the Mt. Kenya region. The majority (more than 50%) of farmers claimed todeploy various agronomic practices to manage pests such as A. solani, P. infestans,R. solanacearum, white flies, cutworms, aphids. SRP-associated diseases especiallyblackleg were mentioned by approximately 2% of the farmers (20 of 1,002) whilebacterial ring rot was not mentioned at all. The majority (964, 96.2%) of farmers usedtheir own experience for crop management however, 56.5% (566) obtained informationfrom friends, 56.5% (566) from radio, 54.8% (548) from government extension whiledemonstration and agro-dealer were selected by more than a third of the farmers.
Seven farmers (equivalent to 7 in 1,000) indicated to have observed bacterial ring rotwhile 17% (170) indicated to have observed presence of SRP-associated diseases(blackleg in plants and soft rots in tubers). Nakuru and Nyandarua recorded thehighest and comparable observations of SRP-associated diseases followed by ElgeyoMarakwet and Narok whose observation were also comparable but significantly lesswith Trans Nzoia recording the least. It should also be noted that Nyandarua andNakuru had the highest number of samples collected from the farmers. Bacterial ringrot perceived observations could have been confused with other plant health problemshowever, the low perceived observations of blackleg and soft rots does not indicateabsence of the disease but probably a confusion of symptoms, lack of knowledge of the
xvi| Page
disease or latent infections. The action taken by the majority of farmers to managedSRP-associated diseases was to do “doing nothing” (56%, 96 of 170) followed byuprooting (42%, 73 of 170) especially for blackleg. Interestingly, 15.3% (26 of 170)farmers used chemicals to manage blackleg while only 5 (approx. 3%), reported thecases to extension officers. Use of chemicals to manage diseases caused by bacteriais not a cost-effective and effective management strategy. The preferred choice ofinformation dissemination selected by the majority of farmers was mobile messagingfollowed by extension. The two choices in the same order were echoed across the sixcounties.
Selective or targeted sampling (mentioned in ISPM 6 and described in ISPM 31) wasemployed to obtain samples. This is because the surveillance exercise focused on ahost and pathogenic organisms that were deliberately targeted with the objective ofdetecting presence. This surveillance exercise was not aimed at providing informationabout levels of infestation or distribution of the pathogen. The farmers from whomthe samples were obtained, were selectively identified by the WAO and CDA. Theselection was based on two criteria, the farm should have had a long history of potatoproduction (at least three previous seasons) and had at least observed suspectedcases of the target pathogens. The two criteria gave a higher chance of obtaining thetarget pathogens because of the perceived disease presence. Samples were collectedfrom plants showing symptoms associated with the target pathogens. In addition, soilwas collected because blackleg and soft rot bacteria survive in soil for between 1week to 6 months, depending on environmental conditions such as soil temperature,moisture and pH although survival can be longer if there are volunteer plants. In casesymptomatic plants were not observable, then simple random sampling (also describedin ISPM 31) was employed to give equal probability in selecting samples. Randomnesswas achieved either by walking and examining hosts in a large zigzag pattern acrossthe field. In this case, more than one plant sample was collected per farmer field visited.To avoid transfer of pests from farmer to farmer and plant to plant, disposable gloveswere used and changed between farmers and plants in the field. In addition, the FAPalso sterilized their shoes with 5% Sodium hypochlorite in between farmers’ fields toavoid transmission of soil-borne pests. All samples were packaged in Khaki paper bagsand given unique codes (identifiers) derived from the county, sub-county and wardnames and initials of farmers’ names and sent immediately by courier to Bacteriologyunit of the plant health laboratory at KEPHIS headquarters with in 24 hour of collection.The unique identifiers were also linked to the detailed information collected about thefarmer through a structured questionnaire administered using tablets using the OpenData Kit (ODK) platform.
All samples were kept at 4oC in the cold room on arrival at KEPHIS Laboratoriesand processed within 24 h. Using sterlised implements, whole plant samples wereseparated into pieces of leaves, stems, roots and tubers and kept at -20oC untilneeded for isolation. Soil samples were measured in approx. 40 g portions andalso kept at -20oC. All the samples obtained were asymptomatic for bacterial ringrot while the majority were asymptomatic for blackleg and soft rots. C. sepedonicus,and the genera Dickeya and Pectobacterium were isolated following established
xvii| Page
procedures. An enrichment step was included in the isolation procedure for Dickeyaand Pectobacterium genera to enrich the bacteria to detection levels since mostsamples were asymptomatic. The total number of samples from which the bacteriawere isolated were 2,834 samples comprising of 1,334 stem and 696 tuber and 804soil samples (only for blackleg and soft rots). Following isolations, molecular diagnostictools especially end point PCR using published primer sequences for respective targetpathogenic species was conducted. C. sepedonicus was not identified in any of thesamples obtained correlating with the few observations by the farmers which wasattributed probably to confusion of symptoms with other plant health problems.
The genera Dickeya and Pectobacterium were identified in 291 samples of which 63%(183) were stems, 32% (92), soil and 5% (16) were tubers. The varieties from whichthey were isolated comprised of Shangi (177, 89%), Dutch Robijn (18, 9%), Asante (2,1%), Destiny (1, 1%) and Kabale (1, 1%). The majority of isolations were from samplesobtained from Nyandarua, 65% (190 of 291) followed by Narok (16.5%, 48 of 291)then Nakuru (7.9%, 23 of 291), Meru (4.8%, 14 of 29), Elgeyo Marakwet (3.4%, 10of 291), and Trans Nzoia (2%, 6 of 291). Dickeya spp. was identified in two samples(tubers) obtained from two farms, one in Elgeyo Marakwet and the other in Narok. Thesample from Narok also tested positive for a species of Pectobacterium. Additionalsurveillance in Elgeyo Marakwet and Narok through contact tracing confirmed thegenus Dickeya on 5 of the 12 farms of which one tested positive for D. solani. Alsosurveillance by a team from KALRO confirmed presence of D. solani and D. dianthicolain Taita Taveta. The genus Pectobacterium was identified in 290 samples which isequivalent to one in every ten samples. Using species-specific primers, P. atrosepticumwas confirmed in 29 samples, 9 of which were soil and 20, stems distributed acrossall the six counties. P. brasiliense was identified in 46 samples comprising of 16 soilsamples, 28 stem sample and 2 tuber samples. P. carotovorum was identified in 39samples comprising of 27 stem samples, 11 soil samples, and 1 tuber samples. P.parmentieri was confirmed in 39 samples which comprised 34 stem samples, 13 soilsamples, and 4 tuber samples. As indicated, many other samples tested positive for thegenus Pectobacterium. In addition to identifying two species from the same sample asindicated above, multiple species were also identified in the same field as well as samesample. In some fields, same Pectobacterium subspecies were identified in the soil andthe plant (stem or tuber). This could probably be a case of seed- and soil-borne transferwhich underscores the role of using potato planting materials from the informal sectorin spreading blackleg and soft rots and probably other pests such as reported with R.solanacearum, nematodes and viruses. The identification of the genus Pectobacteriumin soil as well as the genera Dickeya and Pectobacterium from a majority asymptomaticsamples demonstrates that this is a plant health problem that has to be addressed.
Although low yields have been observed in Kenya (average 8.6t/ha), these low yieldscannot only be attributed to management practices used by potato farmers. Someof these practices were aimed at managing some pest which did not include C.sepedonicus and the genera Dickeya and Pectobacterium. This demonstrated a poorunderstanding of these problems especially blackleg and soft rots. The low yieldscould partly be attributed to the poor quality of potato planting materials where there
xviii| Page
is over-dependence on the informal sector. This has resulted in planting materialsinfested with pests resulting in soil contaminating with soil-borne pests. If available, pestfree areas can be delineated especially for production of potato seed. There is needto address the issue of over-dependence on seed from the informal sector probablythrough supporting interventions that increase availability of certified seed or clean seedwhere farmers use home-saved seed. Some of these interventions include positive seedselection and seed plot technique both of which improve the quality of farmer-savedseed. Although C. sepedonicus was not identified in the samples tested, it is essentialto conduct routine surveillance to update its status of this pest in the country. Mostfarmers were not conversant with blackleg and soft rots which was compounded with alack of knowledge on actionable management options. It is important that fit-for-purposeinformation and communication materials are developed and used in raising awarenessamongst various stakeholders especially farmers, extension and agro-input suppliers.Evaluation of potato varieties against SRP-associated diseases will improve extensionadvisory. The confirmation of presence of Soft rot Pectobacteriaceae necessities areview of the quarantine status of some of the Pectobacterium species and the genusDickeya. Pest-initiated pests risk analysis (PRA) need to conducted for P. atrosepticum,D. solani, and D. dianticola to assist in deciding the most appropriate actions that willreduce the risk of damage these pests may have on plants and plant products.
xix| Page
1
Introduction
1.1 Background
Three in four Kenyans live in rural areas and derive their livelihood from production,processing, and marketing of crop, livestock, fish, and forest products (1). Agriculture iscentral to Kenya’s economy contributing 33% of the GDP, adding another 27% throughlinkages to manufacturing, distribution and services. This sector is the main source ofincome and livelihoods for about 70 and 40% of the rural and Kenya’s total populationrespectively. The ASTGS prioritized 13 VC with potential to raise smallholder farmerincomes and offer dietary diversity (1). Potato was included amongst the 13 VCs
Potato (Solanum tuberosum L.) is the second most important crop in Kenya after maize,contributing approx. USD 300-400 million annually to the economy. The potato VCemploys about 3.3 million people directly and indirectly as producers (growers), brokers,market agents, transporters, processors, vendors, retailers and exporters. Growerswho are predominantly smallholders are estimated at 800,000 and grow the crop onaverage land areas of approx. 0.47 ha. Potato is also key to food and nutritional securityand has been demonstrated to be rich in vitamins, minerals, proteins, antioxidants,essential amino acids as well as carbohydrates (2). The prospects for growth of themarket for fresh potato makes potato a good alternative for addressing food priceswhich opens up opportunities for rural development in Kenya (3).
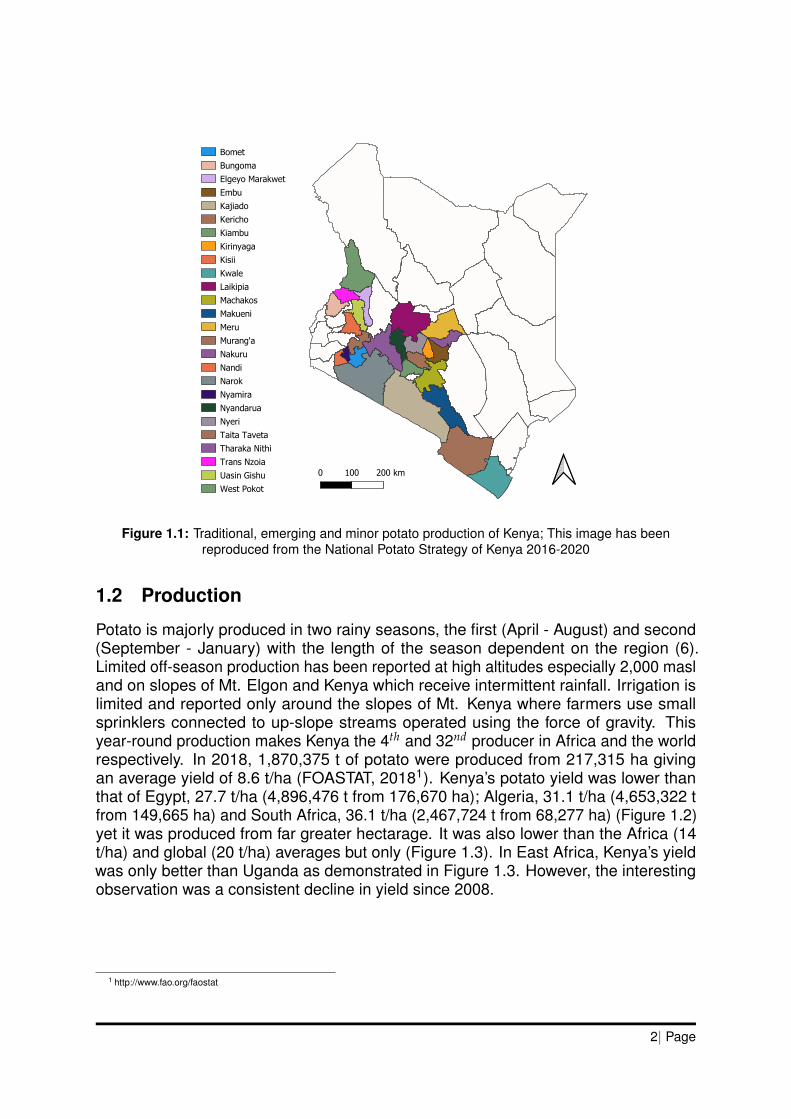
Globally, the crop is grown in a wide range of altitudes, latitudes and climatic conditionsboth in the tropics and sub-tropics during cool and dry seasons (although underirrigation) (4). In Kenya, it is predominantly grown in high altitude areas between 1,500and 3,000 masl and annual rainfall of between 1,050 and 1,900 mm. Traditionally,the crop is produced in the counties of Bomet, Bungoma, Elgeyo Marakwet, Kericho,Kiambu, Kirinyaga, Meru, Muranga, Nakuru, Narok, Nyandarua, Nyeri, Trans Nzoia,Uasin Gishu and West Pokot however, increased demand has shifted production tonon-tranditional counties such of Embu, Kajiado, Kwale, Machakos, Makueni, Samburuand Tharaka Nithi with counties such as Baringo, Kisii, Laikipia, Nandi and Nyamiraconsidered potential growing areas (Figure: 1.1) (5).
1| Page
Bomet
Bungoma
Elgeyo Marakwet
Embu
Kajiado
Kericho
Kiambu
Kirinyaga
Kisii
Kwale
Laikipia
Machakos
Makueni
Meru
Murang'a
Nakuru
Nandi
Narok
Nyamira
Nyandarua
Nyeri
Taita Taveta
Tharaka Nithi
Trans Nzoia
Uasin Gishu
West Pokot
Figure 1.1: Traditional, emerging and minor potato production of Kenya; This image has beenreproduced from the National Potato Strategy of Kenya 2016-2020
1.2 Production
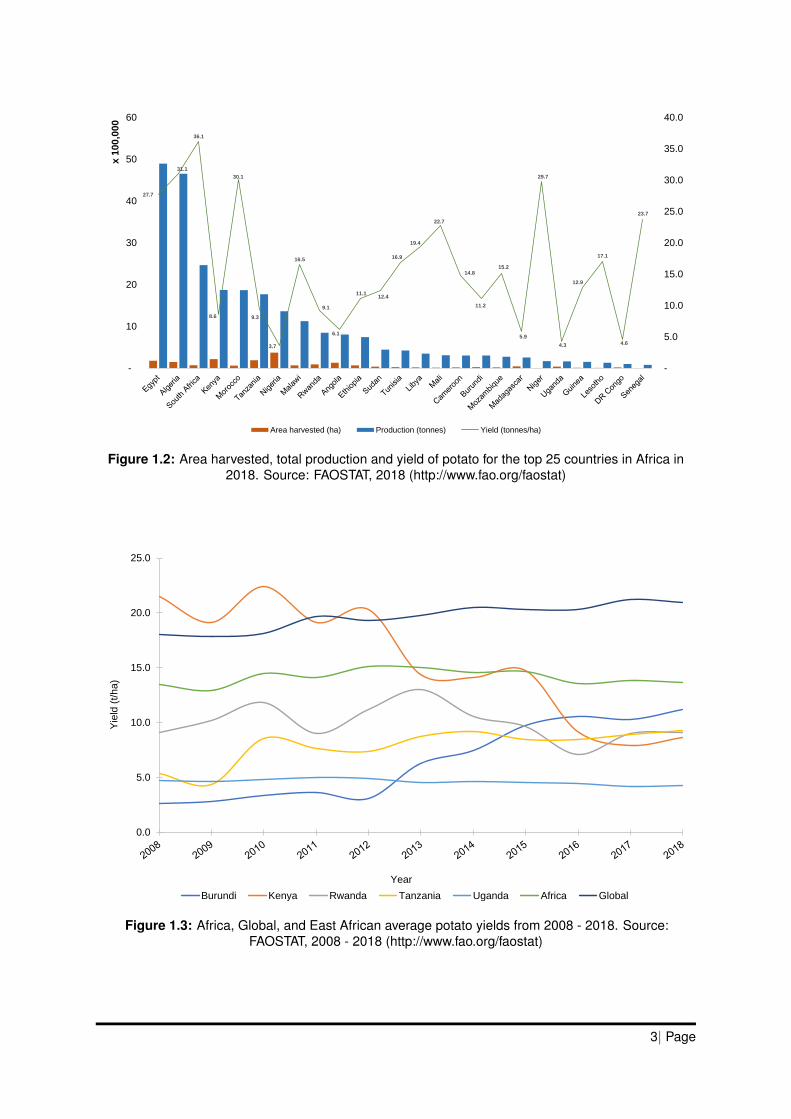
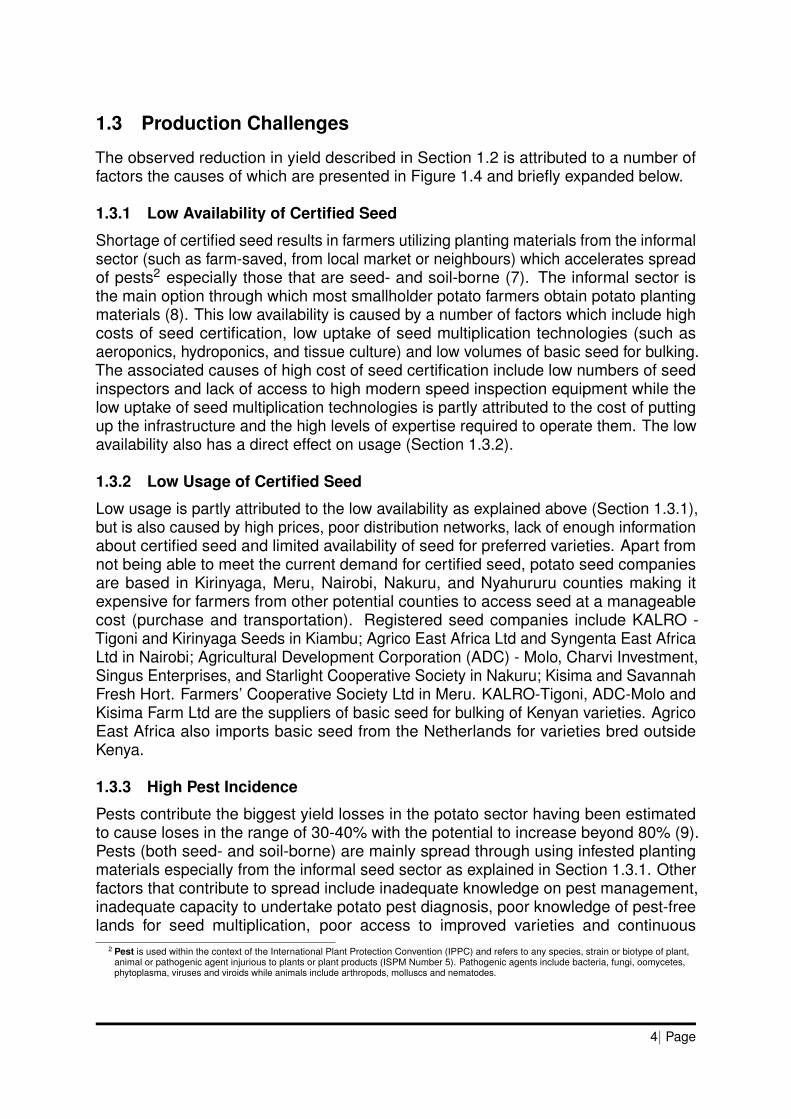
Potato is majorly produced in two rainy seasons, the first (April - August) and second(September - January) with the length of the season dependent on the region (6).Limited off-season production has been reported at high altitudes especially 2,000 masland on slopes of Mt. Elgon and Kenya which receive intermittent rainfall. Irrigation islimited and reported only around the slopes of Mt. Kenya where farmers use smallsprinklers connected to up-slope streams operated using the force of gravity. Thisyear-round production makes Kenya the 4th and 32nd producer in Africa and the worldrespectively. In 2018, 1,870,375 t of potato were produced from 217,315 ha givingan average yield of 8.6 t/ha (FOASTAT, 20181). Kenya’s potato yield was lower thanthat of Egypt, 27.7 t/ha (4,896,476 t from 176,670 ha); Algeria, 31.1 t/ha (4,653,322 tfrom 149,665 ha) and South Africa, 36.1 t/ha (2,467,724 t from 68,277 ha) (Figure 1.2)yet it was produced from far greater hectarage. It was also lower than the Africa (14t/ha) and global (20 t/ha) averages but only (Figure 1.3). In East Africa, Kenya’s yieldwas only better than Uganda as demonstrated in Figure 1.3. However, the interestingobservation was a consistent decline in yield since 2008.
1 http://www.fao.org/faostat
2| Page
27.7
31.1
36.1
8.6
30.1
9.3
3.7
16.5
9.1
6.1
11.1 12.4
16.9
19.4
22.7
14.8
11.2
15.2
5.9
29.7
4.3
12.9
17.1
4.6
23.7
-
5.0
10.0
15.0
20.0
25.0
30.0
35.0
40.0
-
10
20
30
40
50
60x 1
00,0
00
Area harvested (ha) Production (tonnes) Yield (tonnes/ha)
Figure 1.2: Area harvested, total production and yield of potato for the top 25 countries in Africa in2018. Source: FAOSTAT, 2018 (http://www.fao.org/faostat)
0.0
5.0
10.0
15.0
20.0
25.0
Yie
ld (
t/ha)
Year
Burundi Kenya Rwanda Tanzania Uganda Africa Global
Figure 1.3: Africa, Global, and East African average potato yields from 2008 - 2018. Source:FAOSTAT, 2008 - 2018 (http://www.fao.org/faostat)
3| Page
1.3 Production Challenges
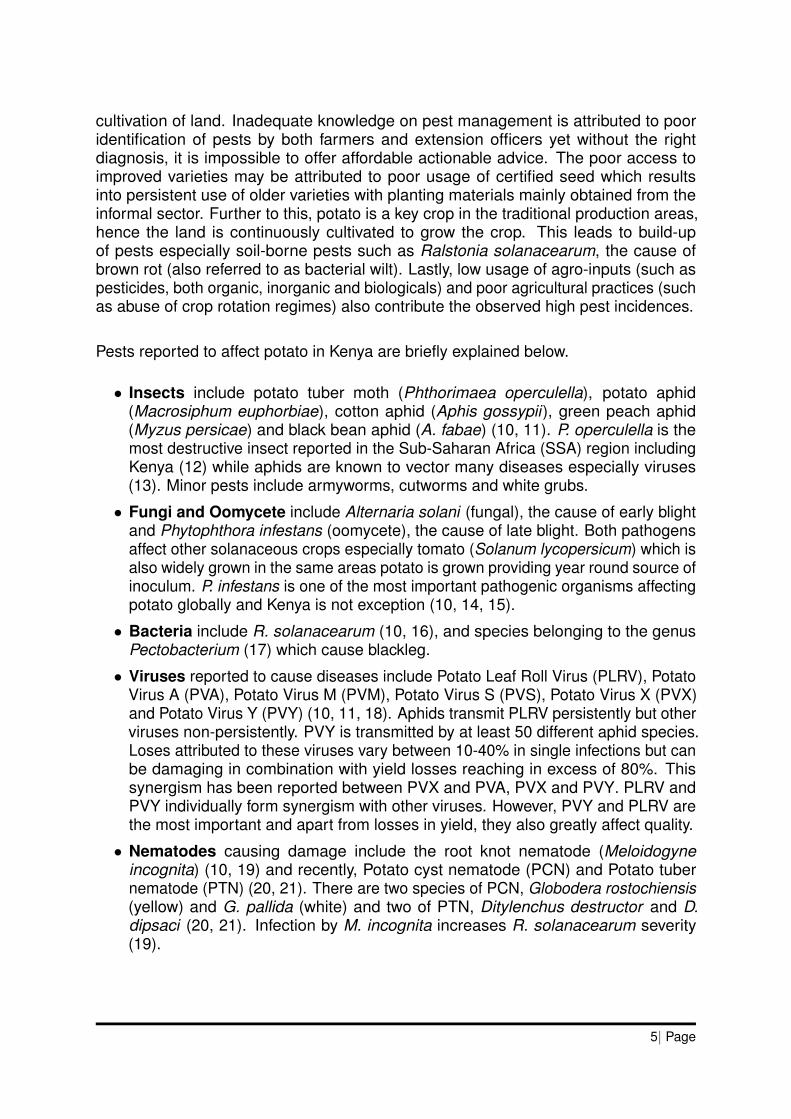
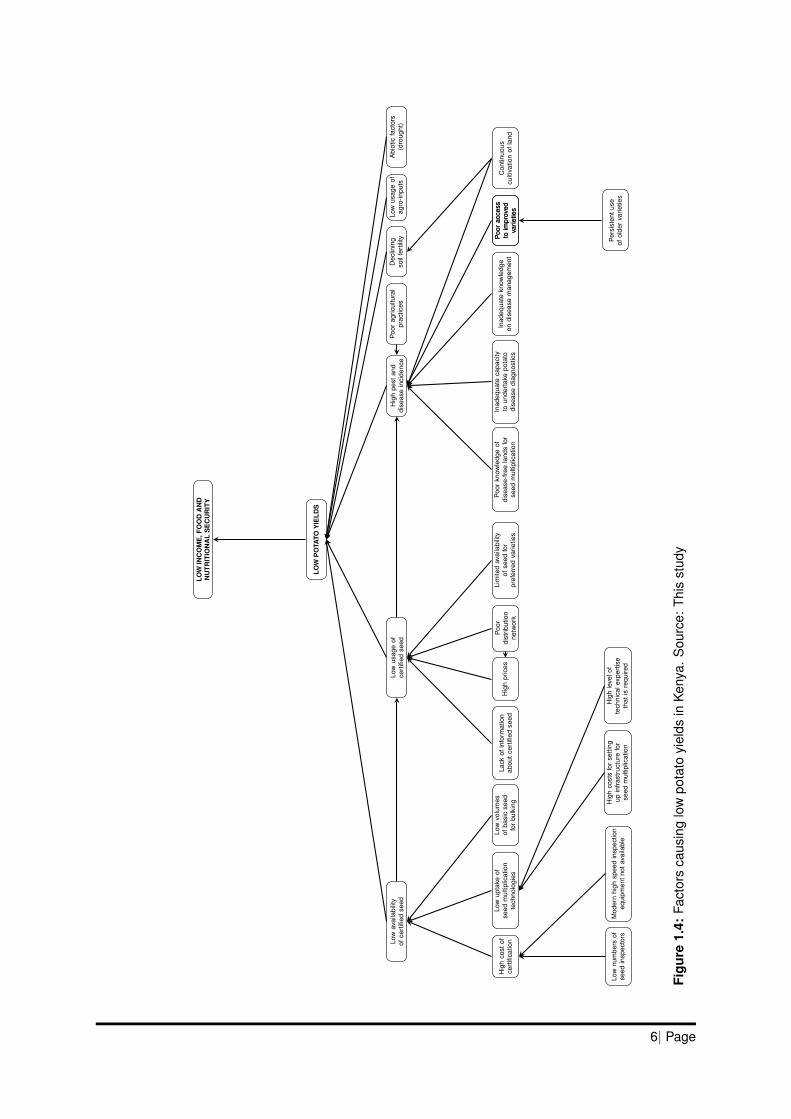
The observed reduction in yield described in Section 1.2 is attributed to a number offactors the causes of which are presented in Figure 1.4 and briefly expanded below.
1.3.1 Low Availability of Certified Seed
Shortage of certified seed results in farmers utilizing planting materials from the informalsector (such as farm-saved, from local market or neighbours) which accelerates spreadof pests2 especially those that are seed- and soil-borne (7). The informal sector isthe main option through which most smallholder potato farmers obtain potato plantingmaterials (8). This low availability is caused by a number of factors which include highcosts of seed certification, low uptake of seed multiplication technologies (such asaeroponics, hydroponics, and tissue culture) and low volumes of basic seed for bulking.The associated causes of high cost of seed certification include low numbers of seedinspectors and lack of access to high modern speed inspection equipment while thelow uptake of seed multiplication technologies is partly attributed to the cost of puttingup the infrastructure and the high levels of expertise required to operate them. The lowavailability also has a direct effect on usage (Section 1.3.2).
1.3.2 Low Usage of Certified Seed
Low usage is partly attributed to the low availability as explained above (Section 1.3.1),but is also caused by high prices, poor distribution networks, lack of enough informationabout certified seed and limited availability of seed for preferred varieties. Apart fromnot being able to meet the current demand for certified seed, potato seed companiesare based in Kirinyaga, Meru, Nairobi, Nakuru, and Nyahururu counties making itexpensive for farmers from other potential counties to access seed at a manageablecost (purchase and transportation). Registered seed companies include KALRO -Tigoni and Kirinyaga Seeds in Kiambu; Agrico East Africa Ltd and Syngenta East AfricaLtd in Nairobi; Agricultural Development Corporation (ADC) - Molo, Charvi Investment,Singus Enterprises, and Starlight Cooperative Society in Nakuru; Kisima and SavannahFresh Hort. Farmers’ Cooperative Society Ltd in Meru. KALRO-Tigoni, ADC-Molo andKisima Farm Ltd are the suppliers of basic seed for bulking of Kenyan varieties. AgricoEast Africa also imports basic seed from the Netherlands for varieties bred outsideKenya.
1.3.3 High Pest Incidence
Pests contribute the biggest yield losses in the potato sector having been estimatedto cause loses in the range of 30-40% with the potential to increase beyond 80% (9).Pests (both seed- and soil-borne) are mainly spread through using infested plantingmaterials especially from the informal seed sector as explained in Section 1.3.1. Otherfactors that contribute to spread include inadequate knowledge on pest management,inadequate capacity to undertake potato pest diagnosis, poor knowledge of pest-freelands for seed multiplication, poor access to improved varieties and continuous
2 Pest is used within the context of the International Plant Protection Convention (IPPC) and refers to any species, strain or biotype of plant,animal or pathogenic agent injurious to plants or plant products (ISPM Number 5). Pathogenic agents include bacteria, fungi, oomycetes,phytoplasma, viruses and viroids while animals include arthropods, molluscs and nematodes.
4| Page
cultivation of land. Inadequate knowledge on pest management is attributed to pooridentification of pests by both farmers and extension officers yet without the rightdiagnosis, it is impossible to offer affordable actionable advice. The poor access toimproved varieties may be attributed to poor usage of certified seed which resultsinto persistent use of older varieties with planting materials mainly obtained from theinformal sector. Further to this, potato is a key crop in the traditional production areas,hence the land is continuously cultivated to grow the crop. This leads to build-upof pests especially soil-borne pests such as Ralstonia solanacearum, the cause ofbrown rot (also referred to as bacterial wilt). Lastly, low usage of agro-inputs (such aspesticides, both organic, inorganic and biologicals) and poor agricultural practices (suchas abuse of crop rotation regimes) also contribute the observed high pest incidences.
Pests reported to affect potato in Kenya are briefly explained below.
• Insects include potato tuber moth (Phthorimaea operculella), potato aphid(Macrosiphum euphorbiae), cotton aphid (Aphis gossypii), green peach aphid(Myzus persicae) and black bean aphid (A. fabae) (10, 11). P. operculella is themost destructive insect reported in the Sub-Saharan Africa (SSA) region includingKenya (12) while aphids are known to vector many diseases especially viruses(13). Minor pests include armyworms, cutworms and white grubs.
• Fungi and Oomycete include Alternaria solani (fungal), the cause of early blightand Phytophthora infestans (oomycete), the cause of late blight. Both pathogensaffect other solanaceous crops especially tomato (Solanum lycopersicum) which isalso widely grown in the same areas potato is grown providing year round source ofinoculum. P. infestans is one of the most important pathogenic organisms affectingpotato globally and Kenya is not exception (10, 14, 15).
• Bacteria include R. solanacearum (10, 16), and species belonging to the genusPectobacterium (17) which cause blackleg.
• Viruses reported to cause diseases include Potato Leaf Roll Virus (PLRV), PotatoVirus A (PVA), Potato Virus M (PVM), Potato Virus S (PVS), Potato Virus X (PVX)and Potato Virus Y (PVY) (10, 11, 18). Aphids transmit PLRV persistently but otherviruses non-persistently. PVY is transmitted by at least 50 different aphid species.Loses attributed to these viruses vary between 10-40% in single infections but canbe damaging in combination with yield losses reaching in excess of 80%. Thissynergism has been reported between PVX and PVA, PVX and PVY. PLRV andPVY individually form synergism with other viruses. However, PVY and PLRV arethe most important and apart from losses in yield, they also greatly affect quality.
• Nematodes causing damage include the root knot nematode (Meloidogyneincognita) (10, 19) and recently, Potato cyst nematode (PCN) and Potato tubernematode (PTN) (20, 21). There are two species of PCN, Globodera rostochiensis(yellow) and G. pallida (white) and two of PTN, Ditylenchus destructor and D.dipsaci (20, 21). Infection by M. incognita increases R. solanacearum severity(19).
5| Page
LOW
INC
OM
E,F
OO
DA
ND
NU
TRIT
ION
AL
SE
CU
RIT
Y
LOW
PO
TATO
YIE
LDS
Low
avai
labi
lity
ofce
rtifi
edse
edLo
wus
age
ofce
rtifi
edse
edH
igh
pest
and
dise
ase
inci
denc
eP
oor
agric
ultu
ral
prac
tices
Dec
linin
gso
ilfe
rtili
tyLo
wus
age
ofag
ro-in
puts
Abi
otic
fact
ors
(dro
ught
)
Low
upta
keof
seed
mul
tiplic
atio
nte
chno
logi
es
Hig
hco
stof
cert
ifica
tion
Low
volu
mes
ofba
sic
seed
for
bulk
ing
Poo
rdi
strib
utio
nne
twor
k
Lim
ited
avai
labi
lity
ofse
edfo
rpr
efer
red
varie
ties
Hig
hpr
ices
Lack
ofin
form
atio
nab
outc
ertifi
edse
edIn
adeq
uate
know
ledg
eon
dise
ase
man
agem
ent
Inad
equa
teca
paci
tyto
unde
rtak
epo
tato
dise
ase
diag
nost
ics
Poo
rkn
owle
dge
ofdi
seas
e-fr
eela
nds
for
seed
mul
tiplic
atio
n
Poo
rac
cess
toim
prov
edva
rietie
s
Con
tinuo
uscu
ltiva
tion
ofla
nd
Low
num
bers
ofse
edin
spec
tors
Mod
ern
high
spee
din
spec
tion
equi
pmen
tnot
avai
labl
e
Poo
rac
cess
toim
prov
edva
rietie
s
Hig
hco
sts
for
setti
ngup
infra
stru
ctur
efo
rse
edm
ultip
licat
ion
Hig
hle
velo
fte
chni
cale
xper
tise
that
isre
quire
d
Per
sist
entu
seof
olde
rva
rietie
s
Figu
re1.
4:Fa
ctor
sca
usin
glo
wpo
tato
yiel
dsin
Ken
ya.
Sou
rce:
This
stud
y
6| Page
1.3.4 Additional Factors
Apart from resulting in high pest and disease incidences, continuous cultivation of landcauses decline in soil fertility and the inability to afford agro-inputs (fertilizers) makescorrection of this impossible. Lastly, potato production is widely rain-fed with minimalirrigation mostly reported in the Mt. Kenya region (22, 23). This affects year roundproduction but also drought decimates potential yields.
1.4 Potato Diseases Surveillance
A series of meetings focusing on pest challenges decimating potato production inKenya were conducted in 2019. These meetings brought together various actors in thepotato value chain under the auspices of KEPHIS. A disease surveillance programmein the potato value chain whose main aim is to help the regulatory authorities inKenya in disease monitoring was suggested. This will ensure that pests and diseasesare detected early before spreading and seed regulatory practices are aligned withemerging risk factors. This will lead to increased awareness of the country’s peststatus, better pest prioritization and increased investments in critical pest risks. Thiswill potentially improve pest management practices of authorities and market actors,drive increased availability of quality seed hence improving potato productivity, foodsecurity and incomes.
Therefore, in June 2019, a potato diseases surveillance planning meeting that broughttogether a number of actors in the potato value chain was held at KEPHIS headquartersfollowing a series of meetings. Objectives of this meeting were;
i. Tap on technical knowledge of the invited stakeholders and evaluate technicalissues in the context of Kenya’s potato sub-sector.
ii. Examine ways of availing to farmers, as much as possible, disease free potatoplanting material to help increase productivity.
iii. Explore modalities of how item (ii) above can be achieved; considering prevalenceof major disease threats and development of survey protocols the for some of them
iv. Agree on the roles of different institutions in the whole surveillance process, thescope of surveillance activities and time frames for surveillance work especiallyroles of KEPHIS and CABI, costing of activities, prioritizing organisms to target inthe surveys.
KEPHIS presented a list of priority organisms identified as regulated pests in seedpotato, from both the quarantine and the regulated non-quarantine perspectives.The organism included; the bacterial pathogens, Clavibacter sepedonicus; Dickeyaand Pectobacteria species; the oomycete, Rhizoctonia solani); viruses (All strainsof potato virus Y); and the nematodes, G. rostochiensis, Ditylenchus disaci and D.destructor. The nematode, G. pallida was ruled out as it has only been found in onesample in one field and upon repeated sampling, presence could not be confirmed.Although, the ultimate and long-term aim would be to have all organisms covered in thesurveillance programme; constraints related to funding necessitated conducting theexercise in phases. Therefore, C. sepedonicus; Dickeya and Pectobacteria species
7| Page

were considered for Phase 1 while the rest for Phase 2. Surveillance to be conductedin selected major potato growing counties and a few other counties with potential toproduce disease free planting material and expand potato production.
Counties to include in the surveillance exercise were selected based on three criteriadescribed below.
• The county should be among those leading in potato production.• The county should have a high potential to produce disease free planting material
as well as high potential to expand production of ware potato.• The county should have representative agro-ecological zones and hence enabling
pest expression needed for collection of suitable samples.
Based on the above guidelines; Elgeyo Marakwet, Meru, Nakuru, Narok, Nyandaruaand Trans Nzoia counties were selected (Figure 1.5). The selected counties havebeen host to a number of studies regarding potato pest status. For instance, studies byKamau et al. (17) and Onkendi et al. (24) in the counties of Elgeyo Marakwet, Nakuru,Narok and Nyandarua established the presence of P. carotovorum, P. brasiliense andP. wasabiae (now P. parmentieri). The viruses PLRV, PVA, PVM, PVS, PVX andPVY were confirmed to be present in the counties of Meru, Nakuru, Narok, Nyeri andNyandarua through studies conducted by Muthomi et al. (11, 18) and Were et. al.(10). Recently, presence of the G. rostochiensis (yellow) and G. pallida (white) wereconfirmed in Kenya through surveys conducted in Nyandarua (20, 25).
Elgeyo Marakwet
Meru
Nakuru
Narok
Nyandarua
Trans Nzoia
Figure 1.5: Counties where the disease surveillance exercise was conducted
8| Page
The key objectives of the surveillance exercise included;
• Develop the surveillance protocol in line with international standards.
• Develop a survey plan in collaboration with key stakeholders such as KEPHIS andKALRO to maximise ownership of methodology and results.
• Determine the presence and distribution of bacteria that incite blackleg and softrots (Dickeya sp. and Pectobacterium sp) and bacterial ring rot (C. sepedonicus).
• Enable prioritization of regulatory actions needed in interventions as part of officialcontrols in seed multiplication and supply systems for Kenya.
• Support objective analysis of the current regulatory framework for certification ofseed potato and develop / apply control/prevention measures necessary for qualityassurance elements of seed health management strategy.
• Generate data and develop information that spell out risks and mitigation measuresin seed supply systems (production, multiplication and distribution) for industryactors and farmers.
A horizon scanning assessment conducted in 2018 by CABI with other stakeholders inthe plant health system including KEPHIS based on an adapted procedure of Sutherlandet al. (26) and Roy et al. (27) highlighted C. sepedonicus and some of the Soft rotPectobacteriaceae which included D. dadantii, D. dianthicola, D. solani, D. zeae, P.atrosepticum, and P. parmentieri as a high risk to Kenya’s agricultural sector. Otherpathogenic organisms important to the potato value chain that were highlighted includepotato spindle tuber viroid, potato mop-top virus.
9| Page
2
Target Species
2.1 Clavibacter sepedonicus
Clavibacter sepedonicus (28) (formally C. michiganensis subsp. sepedonicus (29, 30))is the major cause of the vascular disease commonly referred to as Bacterial RingRot (BRR). It is a gram-positive rod-shaped, aerobic non-sporulating plant-pathogenicbacterium which affects both aerial stems and tubers (31). C. sepedonicus is largelyrestricted to an endophytic lifestyle, proliferating within plant tissues and incapableof persisting in the absence of plant material (32). It can however survive on drymaterials such as walls, packaging materials and machines. It may remain latent insymptomless foliage, stems and tubers. All potato cultivars can serve as latent carriers,some cultivars however, are more likely to remain symptomless upon infection (33).The disease has a quarantine status and a zero tolerance in the seed potato industryin most countries including Kenya (34). C. sepedonicus has not yet been reported inKenya. Field symptoms as presented in Figure 2.1 become visible only from mid to lateseason and include;
• Wilting is a key but not very specific symptom and in symptomatic plants, it occursin lower leaves. It is usually slow, initially limited to the leaf margins which often curlupwards. Interveinal areas become pale green to yellowish and develop necroticareas.• Young infected leaves often continue to expand, though less so in the infected
zones creating odd-shaped leaves.• Symptoms may occur on a few stems and proceed upwards from the lower leaves
until the entire stem is wilted resulting in severely infected plants dying prematurely.• Heavily infected tubers may yield plants that develop rosette-like symptoms
characterised by short internodes and reduced size of tuber. Such plants areoccasionally stunted.• Cutting a cross-section of lower stems, results in some cases exudation of a white
ooze.• Symptoms may be obscured by or confused with other wilts and foliage diseases,
natural senescence and mechanical damage making them easily missed duringfield inspections.• Pathogens for which symptoms may be confused include R. solanacearum, Phoma
10| Page

exigua var. foveata, and some saprophytic bacteria. Also Dickeya spp. andPectobacterium spp. may cause similar leaf and wilt symptoms but usually withbrowning or blackening of the stems.• Tuber symptoms may be confused with but differ from those caused by R.
solanacearum.• In the early stages, the rotted tissues usually remain cream-colored and by pressing
the vascular tissue cream-colored slime with a cheese-like consistency appears,as opposed to the appearance, without pressing of a slimier ooze observed inbrown rot. The rots however, does become discoloured as secondary invadersestablish.• External tuber symptoms, in severe cases may appear as reddish to brown blotches
and/or surface cracks.
BACTERIAL RING ROT DISEASE OF POTATO
Early season dwarf rosette symptomCredit: Credit: Ontario CropIPM
Yellowing of interveinal areasCredit: Ontario CropIPM
Transverse cut of a bacterial ring rot infected tuberCredit: Solke H. De Boer
A creamy or cheesy exudate forced from the vasculartissue when the tuber is squeezed
Credit: Neil Gudmestad
Figure 2.1: Symptoms displayed in leaves and tubers of potato plants affected by C. sepedonicus
11| Page
2.2 Pectobacterium and Dickeya species
Species of bacteria reported in the genera Dickeya and Pectobacterium are knownto cause soft rots in many plant hosts including S. tuberosum (35–38) but have alsobeen isolated from aquatic environments (39–41). In S. tuberosum, they cause blacklegin plants (field) and soft rots in tubers (in field, during storage and transport) (42, 43).The two genera were originally classified under the genus Erwinia with the species E.carotovora subsp. atroseptica, E. carotovora subsp. betavasculorum, E. carotovorasubsp. carotovora, E. carotovora subsp. odorifera, E. carotovora subsp. wasabiae,E. cacticida and E. chrysanthemi but Hauben et al. (44) proposed transfer of allthese species to the genus Pectobacterium resulting in the species, P. carotovorumsubsp. atrosepticum, P. carotovorum subsp. betavasculorum, P. carotovorum subsp.carotovorum, P. carotovorum subsp. odoriferum, P. carotovorum subsp. wasabiae,P. cacticidum and P. chrysanthemi (later elevated to Dickeya (45)). Dickeya andPectobacterium were originally classified under the Family Enterobacteriaceae but havesince been moved to the Family Pectobacteriaceae and are now collectively groupedunder the Soft rot Pectobacteriaceae (SRP) instead of Soft Rot Enterobacteriaceae(SRE) (46). Plants may be infected and tubers contaminated by more than onebacterial species (47). The main virulence determinants of SRP are pectolytic enzymessecreted through the type II secretion system however, the cfa gene cluster, typeIII and IV secretion systems have also been shown to contribute to pathogenicity(48, 49). The genus Pectobacterium is comprised of 18 species while Dickeya, 12species (50) which are concisely explained in Sections 2.2.1 and 2.2.2. Speciesdelineation of SRP has been conducted through 16S rRNA sequence analysis(51–53), DNA-DNA hybridization (DDH) (wet-lab or digital3) (51, 55, 56), averagenucleotide identity (ANI) values (56), multilocus sequence analysis (MLSA) usingvarious housekeeping genes (37, 38, 52, 53, 55, 57) and analysis of utilization ofvarious carbon sources (55, 56, 58, 59). Housekeeping genes used include acnA, atpD,carA, icd, gapA, mdh, mtlD, pgi, recA, and rpoS. Some of the carbon sources analysedinclude, 1-O-methyl-β-D-glucopyranoside, 1-O-methyl-α-d-glucopyranoside, l-alanine,cellobiose, d-galactose, gluconic acid, inulin, lactose, maltose, d-mannose, melibiose,palatinose, raffinose, and trehalose.
2.2.1 Pectobacterium species
P. actinidiae (formerly P. carotovorum subsp. actinidiae (56) was isolated from Actinidiachinensis (yellow kiwifruit) (37). P. aquaticum is a separate species of strains isolatedfrom waterways (53). P. oderiferum (56) (formerly P. carotovorum subsp. odoriferum(36)) has been isolated from Abelmoschus esculentus (okra), Allium ampeloprasum(leek), Apium graveolens (celery), Beta vulgaris (sugar beet), Brassica rapa (Chinesecabbage), Cichorium intybus (chicory), Cynara scolymus (artichoke), Hyacinthusorientalis (hyacinth), S. tuberosum (36, 60). P. aroidearum is a species elevated fromP. oderiferum (38) and has previously been isolated from Ornithogalum dubium (sunstar), S. tuberosum, Saccharum officinarum (sugarcane), and Zantedeschia aethiopica(calla lily). (38). P. atrosepticum (51) (formerly P. carotovorum subsp. atrosepticum(58) is reported almost exclusively on S. tuberosum (61). P. betavasculorum (51)
3 Digital DDH is an in silico method to replicate the wet-lab DDH as closely as possible (54)
12| Page
(formerly P. carotovorum subsp. betavasculorum (62) is hosted on B. vulgaris (63, 64).P. brasiliense (56) (formerly P. carotovorum subsp. brasiliense) is a highly aggressivespecies causing severe infections on S. tuberosum in tropical and subtropical regions.P. cacticidum (formerly P. cacticida) affects various species of cactus and has beenisolated from Stenocereus gummosus (sour pitaya), Acanthocereus pentagonus(triangle cactus), Carnegiea gigantea (Saguaro), Cylindropuntia fulgida (jumpingcholla), Ferocactus wislezenii (fish hook barrel), Opuntia ficus-indica (barbary fig),Opuntia stricta (prickly pear), Opuntia phaeacantha (desert prickly pear), Stenocereusthurberi (organ pipe cactus) but has also been observed to cause soft rots in S.tuberosum slices (35).
P. carotovorum (56) (formerly P. carotovorum subsp. carotovorum (51)) affects a widerange of hosts worldwide including S. tuberosum (65, 66). P. fontis was elevated from P.carotovorum and strains in this species were isolated from waterfalls (67). P. parmentieriwas elevated from P. carotovorum and strains from this species are known to causesoft rots and blackleg in S. tuberosum (68). P. wasabiae (formerly p. carotovora subsp.wasabiae), first isolated from diseased rhizomes of Japanese horseradish (Eutremawasabi) (69) and later from S. tuberosum plants and tubers (70–74) was amended andincorporated into P. parmentieri (75). It was originally a separate recognised speciesin the genus Pectobacterium (50). P. parvum isolated from S. tuberosum stems, wasoriginally classified as P. carotovorum subsp. carotovorum but recently elevated toa new species that has a Salmonella SPI-1-like type III secretion system and lowvirulence (76). P. peruviense isolated from S. tuberosum tubers cultivated at highaltitudes was originally classified as P. carotovorum subsp. carotovorum but reclassifiedinto a new species (77). P. polaris isolated from S. tuberosum was originally classifiedas P. carotovorum subsp. carotovorum but reclassified into a new species due todistinctiveness from other Pectobacterium species (78). P. polonicum is a new speciesisolated from groundwater sampled from a vegetable field. This species is distinct fromthe other Pectobacterium species but closely related to P. punjabense and P. parmentieri(79). P. punjabense isolated from S. tuberosum, is a new species which is closely relatedto P. parmentieri (59). P. versatile is a new species (56) that includes isolates originallyclassified as Candidatus Pectobacterium maceratum (80). This species was beenisolated from water obtained from rivers, Allium porrum (wild leek), Brassica oleracea,C. intybus, C. scolymus, Daucus carota (carrot), H. orientalis, Lactuca sativa (lettuce),S. tuberosum (stems and tubers) and flowering plants (chrysanthemum, cyclamen, andprimula) (56). P. zantedeschiae is a new species assigned to isolates recovered from Z.aethiopica (79) which were originally designated to P. atrosepticum (81, 82). All speciesexcept for P. brasiliense, P. carotovorum, P. parmentieri (17) have not been reported inKenya. However, although P. atrosepticum has not yet been reported, CABI’s InvasiveSpecies Compendium (ISC) indicates its presence in neighbouring Tanzania (83).
2.2.2 Dickeya species
As previously indicated, all Dickeya originally belonged to the species Erwiniachrysanthemi (84) and were divided into six pathovars; chrysanthemi, dianthicola,dieffenbachiae, parthenii, zeae, and paradisiaca (85). Hauben et al. (62) proposedthe transfer of E. chrysanthemi and its associated pathovars except paradisiaca to
13| Page
the genus Pectobacterium becoming P. chrysanthemi while the pathovar paradisiacawas renamed Brenneria paradisiaca. Samson et al. (45), proposed elevation of thespecies P. chrysanthemi and B. paradisiaca to the genus Dickeya based on 16S rDNAsequence phylogeny and delineation of six species based on DNA-DNA hybridizationstudies as D. chrysanthemi, D. dadantii, D. diffenbachiae, D. dianthicola, D. zeae and D.paradisiaca. The species D. dadantii was later divided into two subspecies, dadantii anddieffenbachiae. The subspecies diffenbachiae was a reclassification of D. diffenbachiaebased on DNA-DNA hybridization and MLSA (55). All the six species comprise strainsisolated from various plant hosts, including both dicots and monocots but do not appearto harbour real host specificity (50). Studies by Pendron et al. (86) demonstrateddiversity among D. zeae strains resulting in two distinct clades, one of which waslater elevated to D. oryzae (87). The species D. solani (88), D. fangzhongdai (89), D.poaceiphila (90) for pectinolytic bacteria isolated from potato, Pyrus pyrifolia (pear)and S. officinarum respectively. The species D. aquatica (39), D. lacustris (40), andD. undicola (41) were proposed for Dickeya strains isolated from water. All Dickeyaspecies have not been reported in Kenya however, CABI’s ISC (83) indicates presenceof D. chrysanthemi in Kenya although a substantive reference is not available.
2.2.3 Symptoms of Soft Rot Pectobacteriaceae
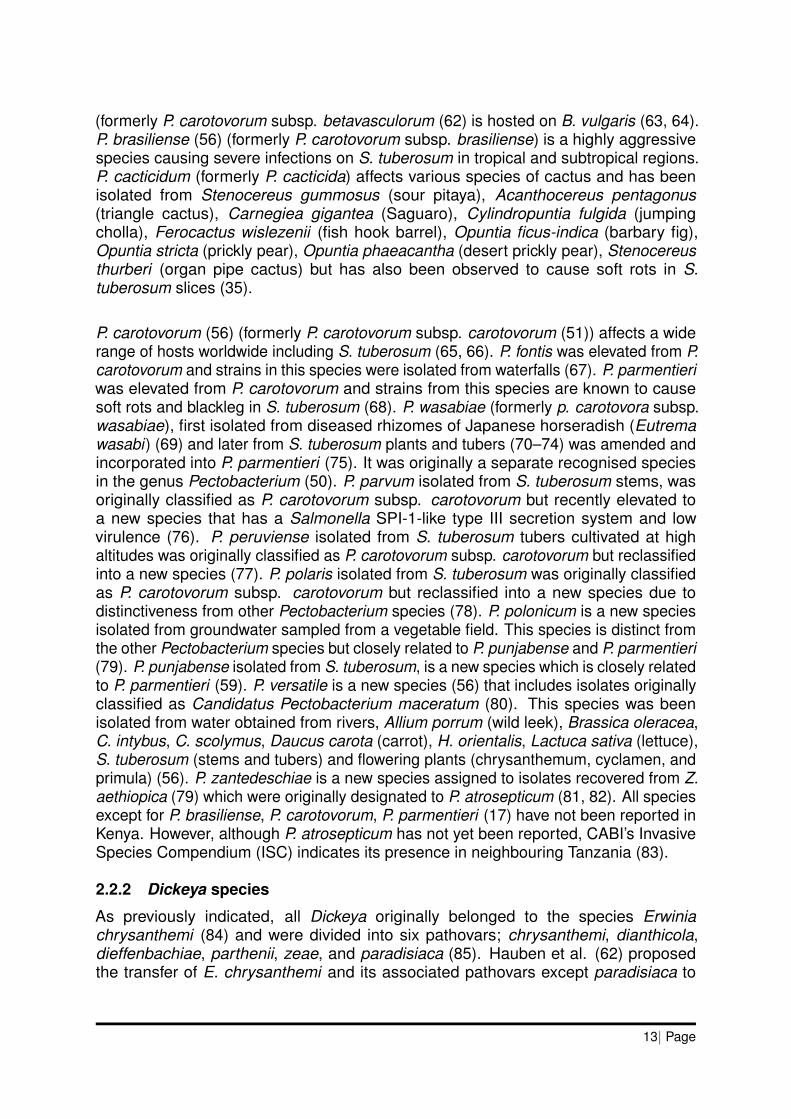
Field symptoms as presented in Figure 2.2 include;
• Blackleg may develop early (early blackleg) in the season after plants emerge andis characterised by stunted plants with yellowish foliage.• The lower part of the below-ground stem of such plants is dark brown to black in
colour and extensively decayed.• The pith region is susceptible to decay and in infected plants, this decay may
extend upward in the stem far beyond the tissue with externally visible symptoms.• Blackleg may also develop late in the season and appears as a black discoloration
of previously healthy stems, accompanied by rapid wilting and yellowing of theleaves. When the entire stem is affected, it decays and becomes desiccatedleading to premature senescence.• Black or brown discoloration of the stems always starts below ground and moves
up the stem until the entire stem is black or brown and wilted.• Tubers get infected via the stolon (which attaches the tuber to the plant) or via the
soil by bacterium in the root zone spread from infected tissue or infested water.• Tubers begin decaying at the stolon attachment site where the tissue becomes
blackened and soft. The entire tuber may decay or the rot may remain partiallyrestricted to the tissue inside the vascular ring (inner perimedullar).• Potatoes stored under environments, with poor aeration such as in conditions of
high humidity get a condition known as “hard rot” where lesions caused by thebacterium found around lenticels or mechanical damage becomes arrested onimproving conditions.• Once blackleg bacterium incites decay, growth of secondary bacteria often
contributes to the decay process modifying symptomatology of the disease.
14| Page
BLACKLEG AND SOFT ROT DISEASES OF POTATO
Black leg symptoms on the potato stemsCredit: OSU Extension Plant Pathology
Black leg symptoms on potato stemsCredit: APS Biocontrol
Soft rot symptoms on outer skin of potato tubersCredit: PlantVillage
Soft rot symptoms on outer side of potato tubersCredit: American Phytopathological Society
Internal soft rot symptoms in potato tubersCredit: AgroAtlas
Internal soft rot symptoms in potato tubersCredit: www.spudman.com
Figure 2.2: Symptoms displayed in leaves, stems and tubers of potato plants affected byPectobacterium and Dickeya species
15| Page
3
Fact-finding Mission
3.1 Background
In November 2019, the project team, comprising four scientists; Joseph Mulema, WillisOchilo and Duncan Chacha all from CABI and George Ngundo from KEPHIS undertooka fact-finding mission in the six counties (Elgeyo Marakwet, Meru, Nakuru, Narok,Nyandarua, and Trans Nzoia) selected for the surveillance exercise. The objectives ofthe fact-finding mission were four-fold;
• Explain the rationale of the potato disease surveillance exercise and share thesurveillance protocol with the county officials• Ascertain facts about potato production and associated pests and diseases
(especially the target diseases) in the county• Identify areas within the county (potato growing areas) to undertake the
surveillance work• Agree on the timelines and involvement of county personnel in the surveillance
work.
The five day activity commenced from Meru county on the 11th November 2019,proceeded to Nyandarua and Nakuru counties on the 12nd November 2019, TransNzoia county on the 13th November 2019, Elgeyo Marakwet county on the 14th
November ending in Narok on 15th November county. The attendees of meetingswere majorly from County governments’ Department of Agriculture (DoA) who includedCDA, County Horticultural Crops Officer (CHCO), County Crops Officer (CCO),Chief Officer (CO), Deputy County Director of Agriculture (DCDA), Data Officer(DO), Sub-county Agricultural Development Officer (SCADO), SCAO, Sub-countyCrops Development Officer (SCCDO), Sub-county Crops Officer (SCCO), Sub-countyAgricultural Production and Marketing Officer (SCAPMO), Soil and Water Conservation(SWC), and WAO.
3.2 Elgeyo Marakwet County
Potato is the leading cash crop in the county with a considerable segment of thepopulation dependent on the crop as the main source of income. The crop is producedin 14 out of 20 wards in the county. Area under cultivation is estimated at 20,000 ha with
16| Page
the annual production also estimated at 250,000 metric tonnes. The preferred variety bymost farmers is Shangi since it matures after a short period and produces higher yields.The attendees of the meeting included; Rael Kipyego (CDA), Von Murgor (SCAO),Elizabeth Cheruto (SCAPMO), Charity Kosgei (SCCO) and Willy Rotich (SWC). Thechallenges mentioned included lack of clean seed; pests (especially P. infestans and R.solanacearum); continued use of extended bags; lack of proper storage facilities anddrought because the production is mainly rain-fed. To address the challenge of lackof clean seed, the County government, annually sets aside funds for procurement ofpotato seed which is sourced mostly from the ADC farm in Nakuru. However, the countyalso seeks to establish a potato seed multiplication centre. They are also consideringirrigation to reduce dependency on rain-fed production. All sub-counties (Keiyo North,Keiyo South, Marakwet East, and Marakwet West) were selected for the surveillanceexercise. In Keiyo North, two wards (Kamariny and Kapchemutwa) were selected; KeiyoSouth, two wards (Kabiemit and Kaptarakwa); Marakwet East, one ward (Kapyego);and Marakwet West, two wards (Kapsowar and Lelan).
3.3 Meru County
Potato is one of the main food crops produced in the county, second only to maize.It is produced in eight out of the ten sub-counties with the area under productionestimated at 6,600 ha. The county has only one company involved in seed production(Kisima Farm) hence unable to meet the demand in the region. The attendees ofthe meeting included Paul Mugwika (SCCO), Richard Muriithi (CHCO), Charity Kiritu(SCAO), Peninah Muthamia (SCAO), Peter Nguru (SCAO), Cornelius Miriti, (WAO),John Gathogo (WAO), Joseph M’tetu (WAO) and Godfrey Musyoka (WAO). Someof the potato production challenges mentioned included lack of clean seed; lack ofproper storage facilities; degraded and over-used soils; pests (especially P. infestans,R. solanacearum, PCN and viruses); poor marketing; and continued use of extendedbags. To address the challenge of lack of clean seed, the county supplies farmerswith certified seed and also trains them on potato production best practices. Aboutmarketing, the county has formed seven potato cooperatives and one union to assistwith marketing and processing. Lastly, on the issue of pests, the county desires toestablish a baseline of all pests.Three sub-counties (Buuri, Imenti Central and ImentiSouth) which lead in potato production were selected for the surveillance exercise. InBuuri, four wards (Kiirua/Naari, Kibirichia, Kisima and Timau); Imenti Central, one ward(Abothuguchi West); and Imenti South, two wards (Nkuene and Abongeta West) wereselected.
3.4 Nakuru County
Potato is one of the main food crops produced in the county, second only to maize.Nakuru is also one of the leading counties when it comes to seed production. Amongthe companies involved in seed production that are based in Nakuru is ADC, andAgrico East Africa Ltd. Annual potato production in the county is estimated at 541,000metric tonnes produced on an estimated 95,000 ha by 20,000 smallholder farmers.The estimated value of the produce is KES 9.4 billion. Potato is produced throughoutthe year however, most of it is exported to other counties. The variety preferred by
17| Page
most farmers is Shangi since it matures after a short period and produces higheryields. The attendees of the meeting included Stephen Mwangi (CCO), HannahOduor (CDA), Joseph Gaturuku (CHCO), Lynette Echesa (DO) and Alfred Waithaka(SCAO). The challenges mentioned included pests (especially A. solani, P. infestans, R.solanacearum, and PCN); lack of certified potato seed; lack of proper storage facilitiesresulting in post-harvest losses; erratic weather pattern; high cost of agro-inputs; poormarketing structures; fluctuating market prices; and continued use of extended bags. Toaddress the issue of the lack of proper storage facilities, the county intends to promoteadoption of post-harvest management technologies. On the issue of erratic weatherpatterns, the county intends to promote irrigation so as to reduce the dependency onrain-fed potato production. Seven sub-counties (Bahati, Gilgil, Kuresoi North, KuresoiSouth, Molo, Njoro, and Sirikwa) were selected for the surveillance exercise. Bahati,one ward (Ndundori); Gilgil, two wards (Eburru and Elementaita); Kuresoi North, threewards (Kamara, Kiptororo, and Nyota); Kuresoi South, four wards (Amalo, Keringet,Kiptagich, and Tinet); Molo, four wards (Elburgon, Marioshoni, Molo and Turi); Njoro,three wards (Mauche, Mau Narok and Nessuit); and Sirikwa, two wards (Biashara andNaivasha) were selected.
3.5 Narok County
Narok targets to be a leading county when it comes to seed production. The attendeesof the meeting included Benard Kimeto (CDA), Grace Mugo (CO) - Agriculture, andJohn Maina (WAO). The challenges mentioned included poor agronomic practices forboth seed and ware potato; pests; limited supply of certified seed potato and continueduse of extended bags. Three sub-counties (Narok East, Narok North, and Narok South)were selected for the surveillance exercise. In Narok East, two wards (Keekonyokie andIldamat); Narok North (Melili and Oloropil); and Narok South, two wards (Sogoo andSagamian) were selected.
3.6 Nyandarua County
Potato is the key enterprise contributing to food security, employment and incomegeneration in county. Nyandarua contributes approximately 33% of the country’s totalproduce. Area under production is estimated at 37,000 ha resulting in an estimatedannual production of 550,000 metric tonnes. The most common varieties grown includeShangi, Rudolph, Caruso, Connect, Markies and Wanjiku. The county seeks toposition itself as a leading producer of seed potato in the country. The attendeesof the meeting included Joseph Wathinja (CDA), Daniel Muchiri (DCDA), Agnes Mburu(SCADO), Joseph Kimotho (SCCDO), John Macharia (SCCO), Mary Muigai (glsscco)and Robert Mwaniu (SCCO). The challenges mentioned that decimate productionincluded pests (especially P. infestans, R. solanacearum, PCN, spider mites, andviruses); waterlogging; limited supply of certified seed; lack of markets and storagefacilities; and poor agronomic practices for both seed and ware potato production. Toaddress the issue limited certified seed, some farmers have ventured into apical cuttingswhile the county is also building a tissue culture laboratory. They also envisage that thePotato Regulation 2019 will address lots of the challenges in the entire value chain. Allsub-counties (Kinangop, Kipipiri, Ndaragwa, Ol Joro Orok and Ol Kalou) were selected
18| Page
for the surveillance exercise. In Kinangop, four wards (Magumu, Murungaru, NorthKinangop and Nyakio); Kipipiri, three wards (Geta, Kipipiri and Wanjohi); Ndaragwa,three wards (Central, Kiriita and Shamata); Ol Joro Orok, three wards (Charagita,Gathanje and Weru); and Ol Kalou, three wards (Kanjuiri Ridge, Mirangine and Rurii)were selected.
3.7 Trans Nzoia County
Potato is produced under an estimated at 1,400 ha resulting in an estimated annualproduction estimated at 13,500 metric tonnes. The attendees of the meeting includedKenneth Kagai (CCO), Edward Osanya (CDA), Jacinta Waliaula (DCDA), Benard Owuori(SCADO), Namoi Mukusa (SCADO), Elizabeth Kariuki (SCAO), Francis Ng’ang’a(SCAO) and Stella Kimutai (SCAO). The challenges metioned included pests; erraticweather pattern; limited supply of certified seed. The county intends to venture intoirrigation farming to reduce over dependency on rain-fed potato production. Threesub-counties (Cherangani, Endebess, and Saboti) were selected for the surveillanceexercise. In Cherangani, two wards (Cherangani/Suwerwa and Makutano); Endebess,three wards (Chepchoina, Endebess, and Matumbei); and Saboti, two wards (Kinyoroand Saboti) were selected.
19| Page
4
Materials and Methods
4.1 Sample Collection
Prior to the surveillance exercise, a list of farmers per ward in the respectivesub-counties per target county, was received from the CDAs as had been agreed uponduring the fact-finding mission (Section 3). The farmers were selected by the WAOsbased on two criteria; the farm should have had a long history of potato production(at least three previous seasons) and had at least observed suspected cases of thetarget pathogens. We employed selective or targeted sampling (mentioned in ISPM 6and described in ISPM 31) because the surveillance exercise focused on a host andpathogens deliberately targeted with the objective of detecting presence but not provideinformation about levels of infestation.
Therefore, samples were collected from plants showing symptoms associated withthe target pathogens. Whole plant (includes leaves, stems and tubers) samples werecollected and put in Khaki paper bags to protect them from direct sunlight. The collectedsamples were then placed in insulated containers (polystyrene boxes) which containedice blocks to protect them from temperature extremes and shipped to KEPHIS within 24h of collection. Soil samples were also collected and placed in plastic bags which wereplaced within Khaki paper bags. This was because blackleg and soft rot bacteria maysurvive in soil for between 1 week to 6 months, depending on environmental conditionssuch as soil temperature, moisture and pH, although survival can be longer if there areplant materials such as volunteers (42, 91). Soil was collected from all farm even wherewhole plants had been obtained. For farmers who met the criteria but had alreadyharvested the crop, soil was a key sample in addition to plant debris, volunteer plants,and tubers if they were available. For tubers, up to 25 were randomly collected whetherthey displayed soft rot symptoms or not.
In case symptomatic plants were not observable, then simple random sampling (alsodescribed in ISPM 31) was employed to give equal probability in selecting samples.Randomness was achieved either by walking and examining hosts in a large zigzagpattern across the field. To avoid transfer of pests from farmer to farmer and plantto plant, disposable gloves were used between visiting different farms and sampling
20| Page
different plants in the field. This was important especially were only asymptomaticplants were observable which prevented transmission of pests especially pathogenicorganisms between plants during examination. In addition, the FAP also sterilized theirshoes in a solution of 5% Sodium hypochlorite in between farmers’ fields. This waskey to avoid transmission of soil-borne pests especially R. solanacearum. To increasethe chances of detection, three samples were collected per farm especially were nosymptomatic plants were observed.
All samples were given unique codes (identifiers) derived from the county, sub-countyand ward names and initials of farmers’ names. The identifier consisted of a two-lettercode for the county, three-letter codes for the sub-county and ward and two or threeletter initials for the farmers’ names (Table 4.1). The codes were set by selecting acombination of the first two or three consonants to ensure uniqueness unless theywere few in which case a vowel was added either at the beginning or the end. Wheresub-county and ward codes were similar, a second consonant that would createuniqueness in one was selected. Numbers were added to the farmers’ initials if theywere similar for farmers from the same county, sub-county and ward. For instance,sample MR-IMS-AGB-CM was from Meru county, Imenti South sub-county, AbogetaWest ward and came from Chris Marete while sample MR-IMC-ABT-SM3 was from thesame county, sub-county and ward but there were three farmers with the same initials.
The unique identifiers were also linked to detailed information collected about thefarmer from whom the sample was collected as indicated in Section 4.3 and AppendixA. Prior to the exercise, all FAP received training at the NARL, Kabete in Nairobi. Theobjective was to ensure that the whole team understood the protocol, the symptomsand signs of the target pathogens, the procedure for sample collection, includinghygienic measures, and how the integrity of the samples was supposed to be protected.
Table 4.1: Surveyed counties, sub counties and wards with their respective codes
County Sub county WardElgeyo Marakwet (EM) Keiyo North (KYN) Kamariny (KMN)
Kapchemutwa (KPC)Keiyo South (KYS) Kabiemit (KBM)
Kaptarakwa (KPT)Marakwet East (MRE) Kapyego (KPY)Marakwet West (MRW) Kapsowar (KPS)
Lelan (LLN)Meru (MR) Buuri (BRI) Kibirichia (KBR)
Kiirua/Naari (KNA)Kisima (KSM)Timau (TMA)
Imenti Central (IMC) Abothuguchi West (ABT)Imenti South (IMS) Abogeta West ABG)
Nkuene (NKU)Nakuru (NK) Bahati (BHT) Ndundori (NDN)
Gilgil (GLG) Eburu (EBR)Elementaita (EML)
Kuresoi North (KRN) Kamara (KMR)Continued on next page. . .
21| Page
County Sub county WardKiptororo (KPR)Nyota (NYT)Sirikwa (SRK)
Kuresoi South (KRS) Amalo (AML)Keringet (KRN)Kiptagich (KPG)Tinet (TNT)
Molo (MLO) Elburgon (ELB)Marioshoni (MRS)Molo (MLO)Turi (TRI)
Naivasha (NVS) Biashara (BSH)Njoro (NJR) Mau Narok (MNR)
Mauche (MCH)Nessuit (NSS)
Narok (NR) Narok East (NRE) Keekonyokie (KKN)Ildamat (ILD)
Narok North (NRN) Melili (MLL)Olokurto (OLK)Oloropil (OLR)
Narok South (NRS) Sagamian (SGM)Sogoo (SGO)
Nyandarua Kinangop (KNG) Magumu (MGM)Murungaru (MRG)North Kinangop (NKG)Nyakio (NYK)
Kipipiri (KPP) Geta (GTA)Kipipiri (KPR)Wanjohi (WNJ)
Ndaragwa (NDR) Central (CNT)Kiriita (KRT)Shamata (SHM)
Ol Joro Orok (OLJ) Charagita (CHR)Gathanje (GTH)Weru (WRU)
Ol Kalou (OLK) Kanjuiri Ridge (KNJ)Mirangine (MRN)Rurii (RRI)
Trans Nzoia (TN) Cherangany (CHR) Cherangani/Suwerwa (CHS)Makutano (MKT)
Endebess (END) Chepchoina (CHP)Endebess (END)Matumbei (MTM)
Saboti (SBT) Kinyoro (KYN)Saboti (SBT)
Although the wards were an indication by the county teams were the surveillanceexercise could be conducted in the respective counties, 87.3% (55) of the total number(63) of wards were surveyed. The RED indicates the wards that were not surveyed andaccount for 12.7% (8) of the total number of wards.
22| Page
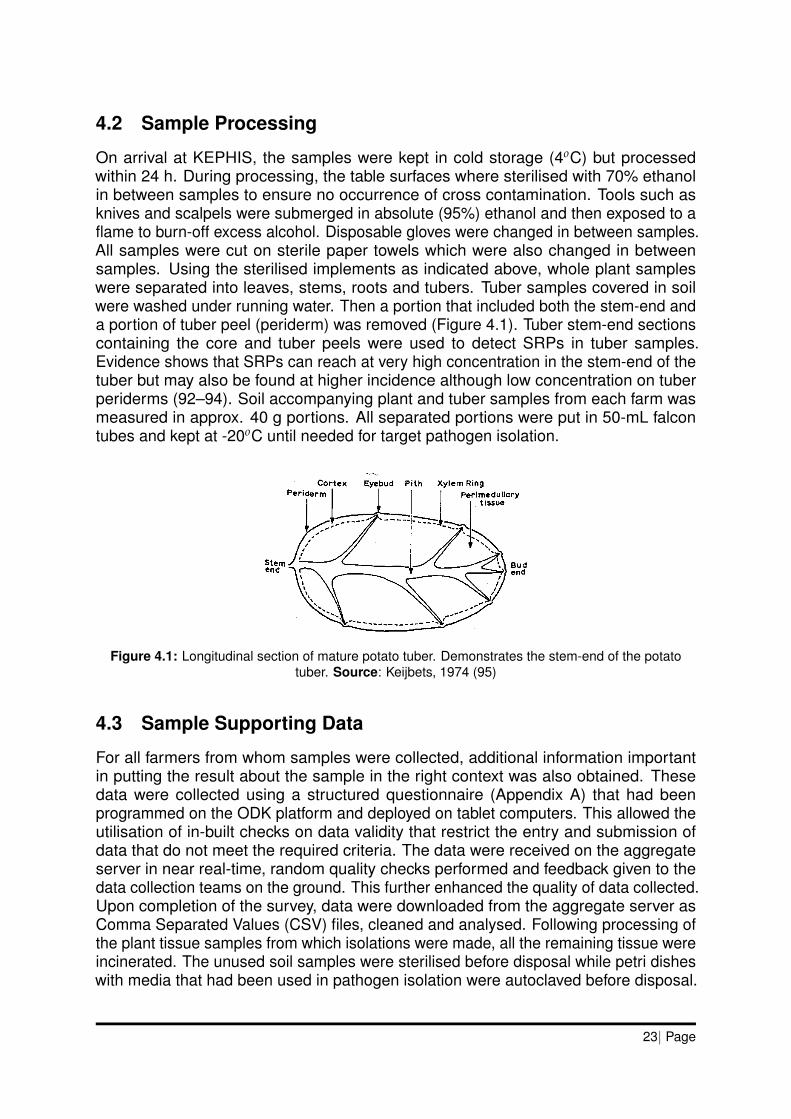
4.2 Sample Processing
On arrival at KEPHIS, the samples were kept in cold storage (4oC) but processedwithin 24 h. During processing, the table surfaces where sterilised with 70% ethanolin between samples to ensure no occurrence of cross contamination. Tools such asknives and scalpels were submerged in absolute (95%) ethanol and then exposed to aflame to burn-off excess alcohol. Disposable gloves were changed in between samples.All samples were cut on sterile paper towels which were also changed in betweensamples. Using the sterilised implements as indicated above, whole plant sampleswere separated into leaves, stems, roots and tubers. Tuber samples covered in soilwere washed under running water. Then a portion that included both the stem-end anda portion of tuber peel (periderm) was removed (Figure 4.1). Tuber stem-end sectionscontaining the core and tuber peels were used to detect SRPs in tuber samples.Evidence shows that SRPs can reach at very high concentration in the stem-end of thetuber but may also be found at higher incidence although low concentration on tuberperiderms (92–94). Soil accompanying plant and tuber samples from each farm wasmeasured in approx. 40 g portions. All separated portions were put in 50-mL falcontubes and kept at -20oC until needed for target pathogen isolation.
Figure 4.1: Longitudinal section of mature potato tuber. Demonstrates the stem-end of the potatotuber. Source: Keijbets, 1974 (95)
4.3 Sample Supporting Data
For all farmers from whom samples were collected, additional information importantin putting the result about the sample in the right context was also obtained. Thesedata were collected using a structured questionnaire (Appendix A) that had beenprogrammed on the ODK platform and deployed on tablet computers. This allowed theutilisation of in-built checks on data validity that restrict the entry and submission ofdata that do not meet the required criteria. The data were received on the aggregateserver in near real-time, random quality checks performed and feedback given to thedata collection teams on the ground. This further enhanced the quality of data collected.Upon completion of the survey, data were downloaded from the aggregate server asComma Separated Values (CSV) files, cleaned and analysed. Following processing ofthe plant tissue samples from which isolations were made, all the remaining tissue wereincinerated. The unused soil samples were sterilised before disposal while petri disheswith media that had been used in pathogen isolation were autoclaved before disposal.
23| Page
4.4 Isolation of Target Pathogens
4.4.1 Clavibacter sepedonicus
The samples (tubers or stems) were washed in running water to remove excess soilfollowed by surface sterilization in 5% Sodium hypochlorite solution for 5 min. The tissuewere then macerated in a small volume (approx. 5-8 mL) of 50 mM phosphate bufferand left for 5-10 min for bacteria to ooze out into the solution. 100 µL of the supernatantwas spread on to MTNA medium (Appendix C.5) and incubated at 23oC. The plateswere examined from 3 days and presumptive colonies transferred to NBY (AppendixC.11) or YGM (Appendix C.9) medium. Detailed protocol presented in Appendix E.
4.4.2 Dickeya spp. and Pectobacterium spp.
The test samples (tubers and stem) were washed under running tap water to removeexcess soil but avoided breaking the skin. This was followed by surface sterilizationwith 0.5% Sodium hypochlorite for 5 min. The samples were then washed three timesin sterile distilled water and finally air-dried. For symptomatic samples, the skin (stems)was cut open while for tubers, small portions were extracted to remove small amountsof tissue (approx. 0.1 g). This was done at the intersection of the diseased and healthytissue (edge of lesion) using a sterile scalpel. Samples were cut on sterile papertowels, which where disposed of between samples as was the gloves. Some studieshave shown that Dickeya sp. and Pectobacterium sp. can be found in the same fieldhence processing samples individually provides information on which pathogen is moreprevalent. Therefore, even duplicate, triplicate or quadruplicate asymptomatic sampleswhere processed and isolations made separately. The tissues were macerated inapprox. 5-8 mL of sterile distilled water in a plastic petri dish and left for about 5 min toallow the bacteria diffuse out.
The extract from the homogenized sample was pippetted off. A 1 mL aliquot of thesupernatant was removed and stored at -20oC as a back-up stock. Another 100 µLof the supernatant was innoculated in D-PEM (Appendix B.14) and incubated underanaerobic conditions at 28oC for 24 h. Isolations were made on selective diagnosticCVP medium (Appendix C.1 and C.2). For soil, all stones where removed and allaggregates broken up in small pieces. Approx. 20 g of soil were added to D-PEMin ratio of 1:3 (w/v) and incubated under anaerobic conditions as explained earlier.100-200 µL of the supernatant of the enriched sample was then spread on to CVPplates which were incubated upside down at 28oC for about 5-7 days. Because of theenormity of the samples that were processed, separate colonies or cavities were notpicked instead approx. 1.5 mL of sterile water was added to each plate and washedto recover all surface growth. Around 1.3 mL was added to a 1.5-mL eppendorf andkept at -20oC for further use while the remaining, approx. 500 µL added to anothereppendorf and used in Section 4.6 for molecular diagnostic tests.
Following PCR confirmation, 100 µL from samples that were positive was spreadon to Nutrient Agar (NA) (Appendix C.7) plates and incubated at 28oC for 3 days.Well-spaced colonies were selected and streaked on to fresh NA plates. However, for
24| Page
all crowded plates or those that carried characteristic saprophytic growth, a dilutionseries from 100 to 10−3 was made from the original sample. This ensured that colonieswere well separated out and where there was saprophytic growth, saprohytes werediluted out leaving only the SRP. 100 µL of each dilution for each sample was thenspread on to fresh NA plates and incubated as originally indicated. Alternatively, 100µL from samples that tested positive were spread on to CVP plates and incubated asindicated. Colonies forming cavities were then selected and streaked on to fresh NAplates. Detailed protocol presented in Appendix F. However, for some samples
4.5 DNA Extraction
Pure bacterial colonies from a 24-h old culture grown on NA or YGM medium for C.sepedonicus; or for Dickeya and Pectobacterium species were picked with a sterile loopand suspended in 500 µL of sterile distilled water. 40 µL of Sodium Dodecyl Sulfate(SDS) (10%) and 8 µL Proteinase K (2 mg/mL) were added, mixed well and incubatedfor 1 h at 56oC. 100 µL of 5 M Sodium chloride and 100 µL of CTAB were then added,mixed and incubated at 65oC for 10 min. 500 µL of Chloroform:Isoamyl alcohol (24:1)were added, vortexed and centrifuged at 13,226 x g for 10 min to separate the phases.The aqueous phase was removed and transferred to a clean 1.5 or 2.0 mL microfugetube. The Chloroform:Isoamyl alcohol extraction step was repeated if there were anycarry over organic phase. The salt concentration was adjusted by adding 1/10 volumeof Sodium acetate (0.5 M, pH 5.2). 2.5 volumes of ice cold ethanol (100%) was thenadded and incubated overnight at -20oC. The mixture was centrifuged at 13,226 x gfor 10 min at 4oC and the supernatant carefully decanted. 500 µL of ice-cold ethanol(70%) were added, centrifuged at 13,226 x g for 10 min at 4oC to wash the pellet.The supernatant was decanted and the pellet air dried for 60 min in a Lamina flow.The pellet of extracted DNA was resuspended in 100 µL Tris-EDTA (TE) buffer. Theextracted DNA was stored at -20oC until need for use. The purity and concentrationof DNA was determined on a NanoDrop spectrophotometer (NanoDrop Technologies,Wilmington, Delaware). The detailed protocol is included in Appendix G. Preparation ofbuffers and solutions available in Appendix B.
4.6 PCR Assay
The PCR template used was either DNA that was isolated as explained above(Section 4.5) or directly from bacterial cells (colony). For bacterial colonies, bacterialcells were killed by heating at 92 oC for 15 min (? ). PCR reactions were carriedout in a total volume of 20 µL containing 1X PCR buffer (New England Biolabs,Ipswich, MA, USA), 0.8 µM of each primer (Table 4.3), 0.2 mM of each of the fourdNTP (New England Biolabs, Ipswich, MA, USA), 1.25 unit of Taq DNA polymerase(New England Biolabs, Ipswich, MA, USA), and 2 µL (approx. 100 ng) of templategenomic DNA or 3 µL of heat-killed bacterial cells. In each PCR reaction, negativeand positive controls were included. The negative control comprised of sterilewater used in the preparation of the PCR master mix while the positive controlused depended on the pathogen species being diagnosed and consisted of DNAextracted from species obtained from the official culture collection at NCPPB (Table 4.2).
25| Page
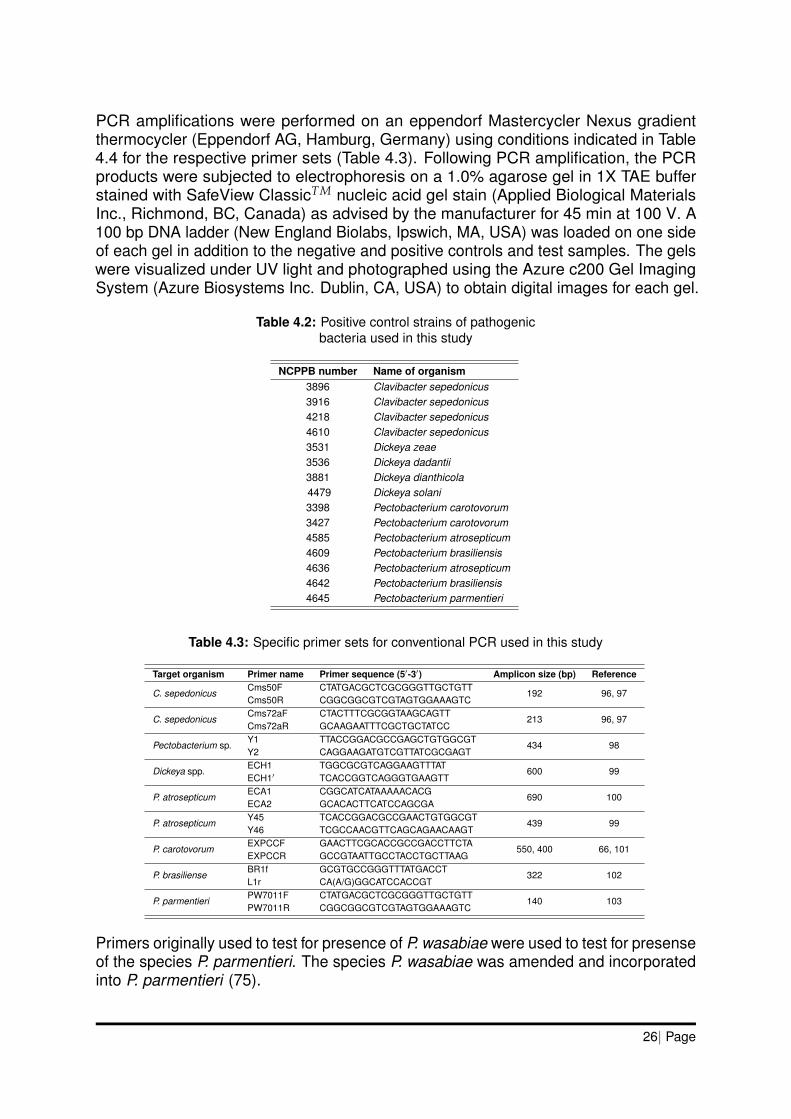
PCR amplifications were performed on an eppendorf Mastercycler Nexus gradientthermocycler (Eppendorf AG, Hamburg, Germany) using conditions indicated in Table4.4 for the respective primer sets (Table 4.3). Following PCR amplification, the PCRproducts were subjected to electrophoresis on a 1.0% agarose gel in 1X TAE bufferstained with SafeView ClassicTM nucleic acid gel stain (Applied Biological MaterialsInc., Richmond, BC, Canada) as advised by the manufacturer for 45 min at 100 V. A100 bp DNA ladder (New England Biolabs, Ipswich, MA, USA) was loaded on one sideof each gel in addition to the negative and positive controls and test samples. The gelswere visualized under UV light and photographed using the Azure c200 Gel ImagingSystem (Azure Biosystems Inc. Dublin, CA, USA) to obtain digital images for each gel.
Table 4.2: Positive control strains of pathogenicbacteria used in this study
NCPPB number Name of organism3896 Clavibacter sepedonicus3916 Clavibacter sepedonicus4218 Clavibacter sepedonicus4610 Clavibacter sepedonicus3531 Dickeya zeae3536 Dickeya dadantii3881 Dickeya dianthicola4479 Dickeya solani3398 Pectobacterium carotovorum3427 Pectobacterium carotovorum4585 Pectobacterium atrosepticum4609 Pectobacterium brasiliensis4636 Pectobacterium atrosepticum4642 Pectobacterium brasiliensis4645 Pectobacterium parmentieri
Table 4.3: Specific primer sets for conventional PCR used in this study
Target organism Primer name Primer sequence (5′-3′) Amplicon size (bp) Reference
C. sepedonicusCms50F CTATGACGCTCGCGGGTTGCTGTT
192 96, 97Cms50R CGGCGGCGTCGTAGTGGAAAGTC
C. sepedonicusCms72aF CTACTTTCGCGGTAAGCAGTT
213 96, 97Cms72aR GCAAGAATTTCGCTGCTATCC
Pectobacterium sp.Y1 TTACCGGACGCCGAGCTGTGGCGT
434 98Y2 CAGGAAGATGTCGTTATCGCGAGT
Dickeya spp.ECH1 TGGCGCGTCAGGAAGTTTAT
600 99ECH1′ TCACCGGTCAGGGTGAAGTT
P. atrosepticumECA1 CGGCATCATAAAAACACG
690 100ECA2 GCACACTTCATCCAGCGA
P. atrosepticumY45 TCACCGGACGCCGAACTGTGGCGT
439 99Y46 TCGCCAACGTTCAGCAGAACAAGT
P. carotovorumEXPCCF GAACTTCGCACCGCCGACCTTCTA
550, 400 66, 101EXPCCR GCCGTAATTGCCTACCTGCTTAAG
P. brasilienseBR1f GCGTGCCGGGTTTATGACCT
322 102L1r CA(A/G)GGCATCCACCGT
P. parmentieriPW7011F CTATGACGCTCGCGGGTTGCTGTT
140 103PW7011R CGGCGGCGTCGTAGTGGAAAGTC
Primers originally used to test for presence of P. wasabiae were used to test for presenseof the species P. parmentieri. The species P. wasabiae was amended and incorporatedinto P. parmentieri (75).
26| Page
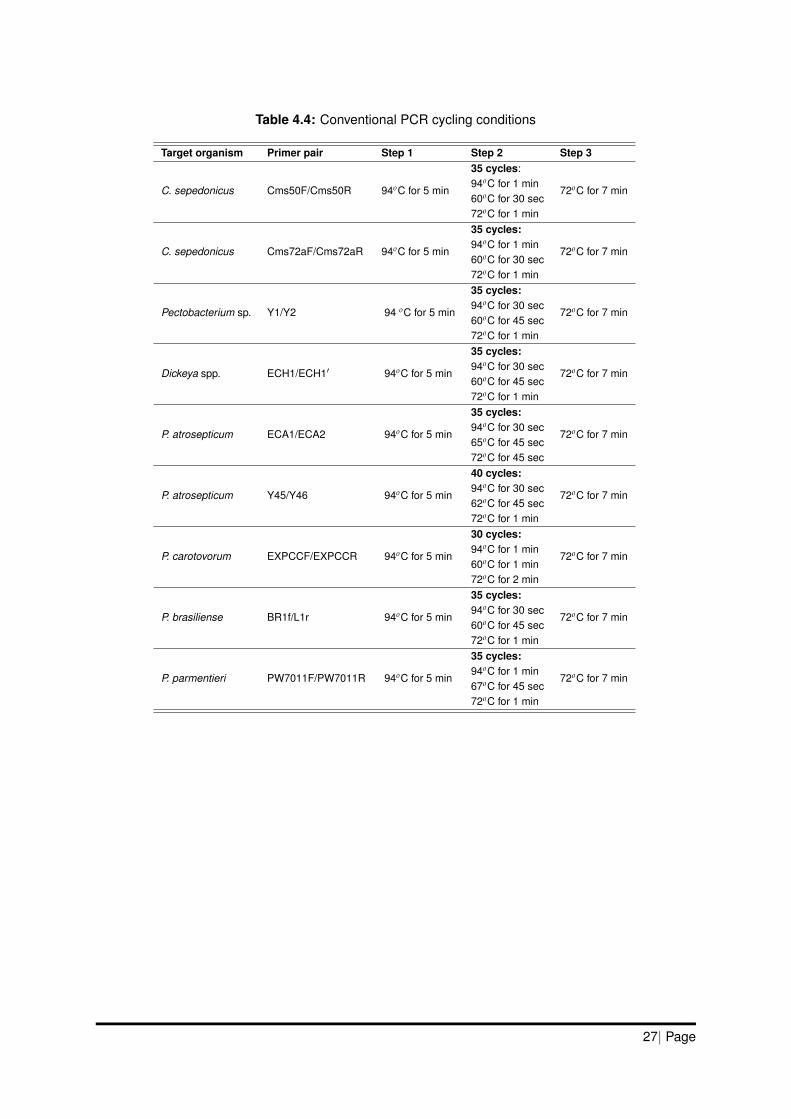
Table 4.4: Conventional PCR cycling conditions
Target organism Primer pair Step 1 Step 2 Step 3
C. sepedonicus Cms50F/Cms50R 94oC for 5 min
35 cycles:
72oC for 7 min94oC for 1 min60oC for 30 sec72oC for 1 min
C. sepedonicus Cms72aF/Cms72aR 94oC for 5 min
35 cycles:
72oC for 7 min94oC for 1 min60oC for 30 sec72oC for 1 min
Pectobacterium sp. Y1/Y2 94 oC for 5 min
35 cycles:
72oC for 7 min94oC for 30 sec60oC for 45 sec72oC for 1 min
Dickeya spp. ECH1/ECH1′ 94oC for 5 min
35 cycles:
72oC for 7 min94oC for 30 sec60oC for 45 sec72oC for 1 min
P. atrosepticum ECA1/ECA2 94oC for 5 min
35 cycles:
72oC for 7 min94oC for 30 sec65oC for 45 sec72oC for 45 sec
P. atrosepticum Y45/Y46 94oC for 5 min
40 cycles:
72oC for 7 min94oC for 30 sec62oC for 45 sec72oC for 1 min
P. carotovorum EXPCCF/EXPCCR 94oC for 5 min
30 cycles:
72oC for 7 min94oC for 1 min60oC for 1 min72oC for 2 min
P. brasiliense BR1f/L1r 94oC for 5 min
35 cycles:
72oC for 7 min94oC for 30 sec60oC for 45 sec72oC for 1 min
P. parmentieri PW7011F/PW7011R 94oC for 5 min
35 cycles:
72oC for 7 min94oC for 1 min67oC for 45 sec72oC for 1 min
27| Page
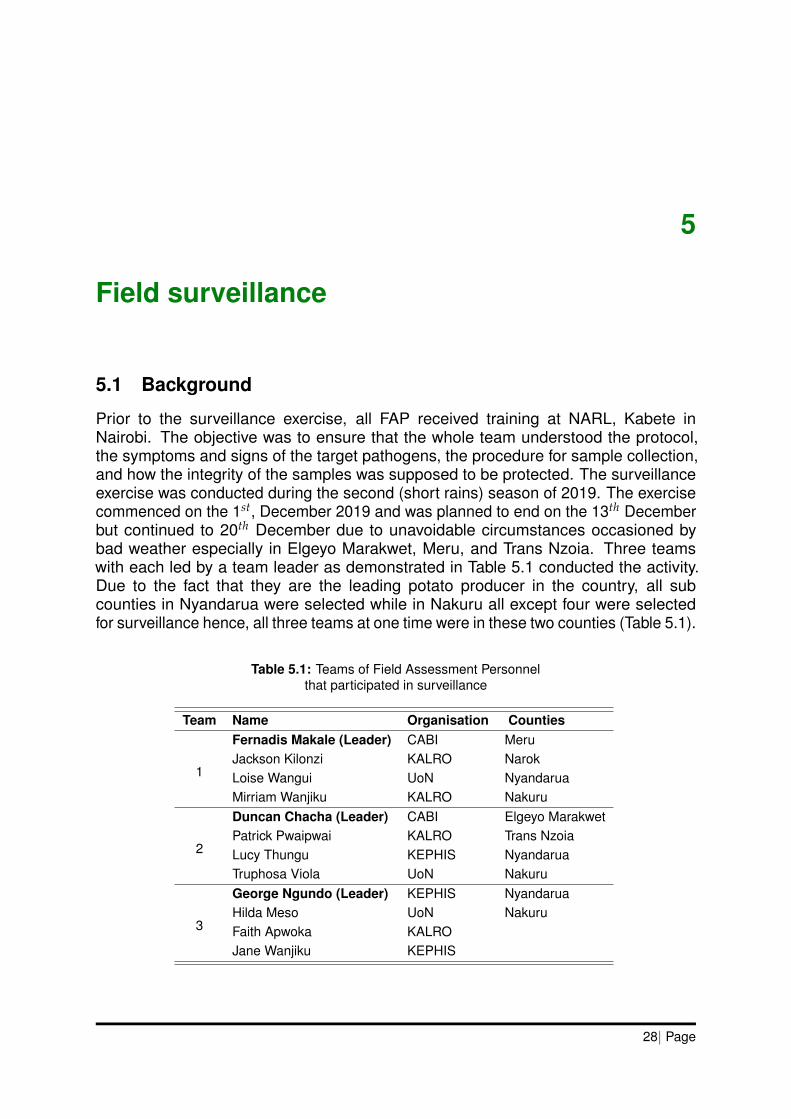
5
Field surveillance
5.1 Background
Prior to the surveillance exercise, all FAP received training at NARL, Kabete inNairobi. The objective was to ensure that the whole team understood the protocol,the symptoms and signs of the target pathogens, the procedure for sample collection,and how the integrity of the samples was supposed to be protected. The surveillanceexercise was conducted during the second (short rains) season of 2019. The exercisecommenced on the 1st, December 2019 and was planned to end on the 13th Decemberbut continued to 20th December due to unavoidable circumstances occasioned bybad weather especially in Elgeyo Marakwet, Meru, and Trans Nzoia. Three teamswith each led by a team leader as demonstrated in Table 5.1 conducted the activity.Due to the fact that they are the leading potato producer in the country, all subcounties in Nyandarua were selected while in Nakuru all except four were selectedfor surveillance hence, all three teams at one time were in these two counties (Table 5.1).
Table 5.1: Teams of Field Assessment Personnelthat participated in surveillance
Team Name Organisation Counties
1
Fernadis Makale (Leader) CABI MeruJackson Kilonzi KALRO NarokLoise Wangui UoN NyandaruaMirriam Wanjiku KALRO Nakuru
2
Duncan Chacha (Leader) CABI Elgeyo MarakwetPatrick Pwaipwai KALRO Trans NzoiaLucy Thungu KEPHIS NyandaruaTruphosa Viola UoN Nakuru
3
George Ngundo (Leader) KEPHIS NyandaruaHilda Meso UoN NakuruFaith Apwoka KALROJane Wanjiku KEPHIS
28| Page
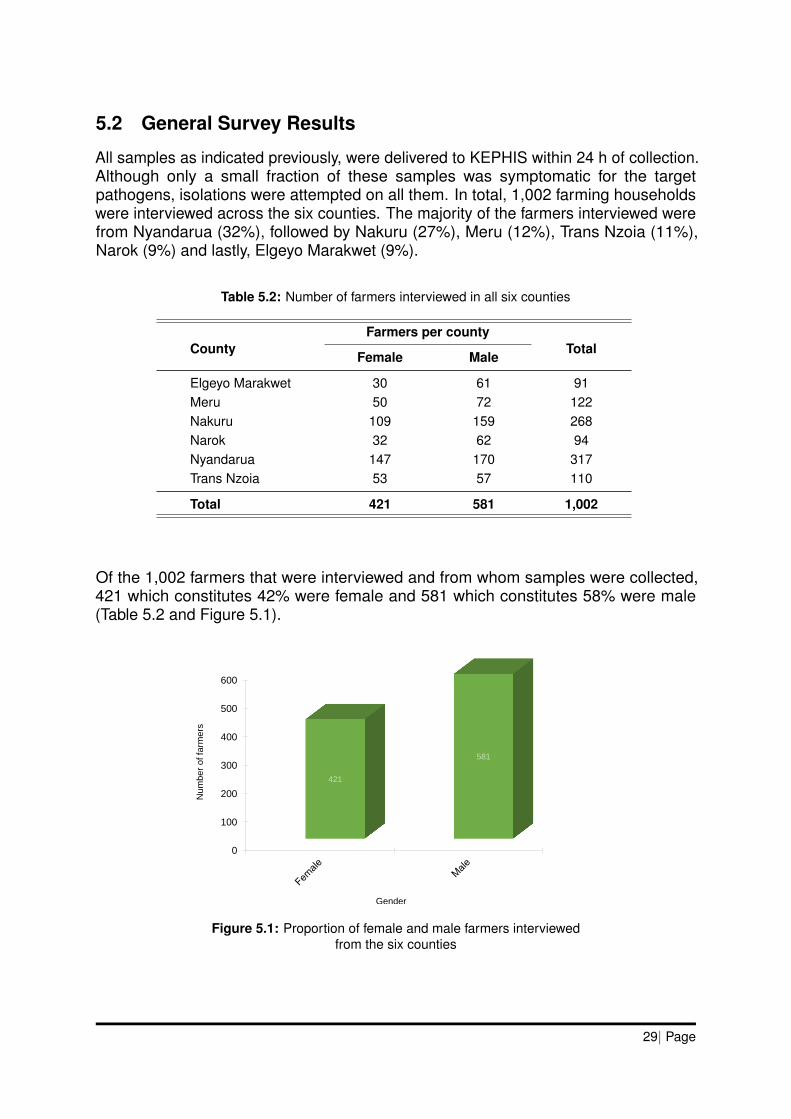
5.2 General Survey Results
All samples as indicated previously, were delivered to KEPHIS within 24 h of collection.Although only a small fraction of these samples was symptomatic for the targetpathogens, isolations were attempted on all them. In total, 1,002 farming householdswere interviewed across the six counties. The majority of the farmers interviewed werefrom Nyandarua (32%), followed by Nakuru (27%), Meru (12%), Trans Nzoia (11%),Narok (9%) and lastly, Elgeyo Marakwet (9%).
Table 5.2: Number of farmers interviewed in all six counties
CountyFarmers per county
TotalFemale Male
Elgeyo Marakwet 30 61 91Meru 50 72 122Nakuru 109 159 268Narok 32 62 94Nyandarua 147 170 317Trans Nzoia 53 57 110
Total 421 581 1,002
Of the 1,002 farmers that were interviewed and from whom samples were collected,421 which constitutes 42% were female and 581 which constitutes 58% were male(Table 5.2 and Figure 5.1).
0
100
200
300
400
500
600
421
581
Nu
mb
er
of fa
rme
rs
Gender
Figure 5.1: Proportion of female and male farmers interviewedfrom the six counties
29| Page
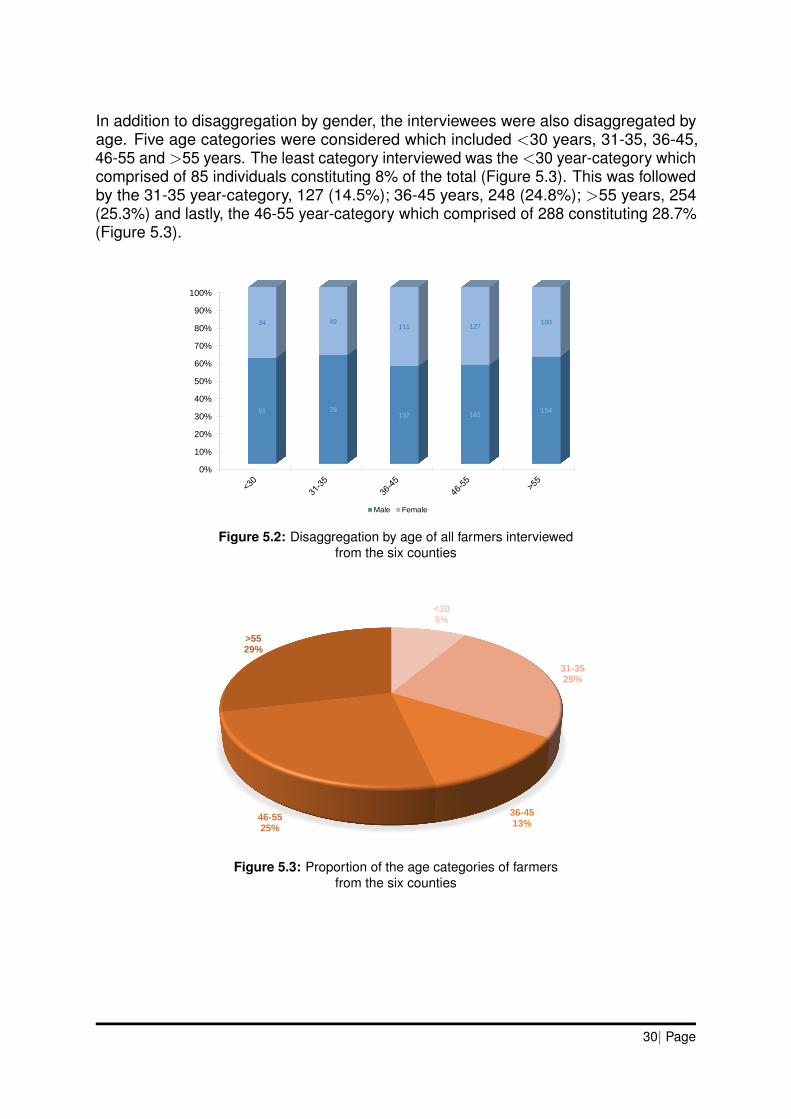
In addition to disaggregation by gender, the interviewees were also disaggregated byage. Five age categories were considered which included <30 years, 31-35, 36-45,46-55 and >55 years. The least category interviewed was the <30 year-category whichcomprised of 85 individuals constituting 8% of the total (Figure 5.3). This was followedby the 31-35 year-category, 127 (14.5%); 36-45 years, 248 (24.8%); >55 years, 254(25.3%) and lastly, the 46-55 year-category which comprised of 288 constituting 28.7%(Figure 5.3).
0%
10%
20%
30%
40%
50%
60%
70%
80%
90%
100%
51 78137 161
154
34 49111 127
100
Male Female
Figure 5.2: Disaggregation by age of all farmers interviewedfrom the six counties
<308%
31-3525%
36-4513%
46-5525%
>5529%
Figure 5.3: Proportion of the age categories of farmersfrom the six counties
30| Page
Table 5.3: Crops grown by interviewed farmers in the six counties
CropCrop 1 Crop 2 Crop 3
Number Acreage Number Acreage Number Acreage
Avocado 1 1.00Bananas 2 2.00Beans 11 15.95 64 99.78 142 142.00Beet root 2 2.00Black nightshade 1 2.00 1 1.00Boma Rhodes 2 5.50 1Broccoli 1 0.25 1.00Butternut 1 1.00Cabbages 15 12.25 132 139.91 100 100.00Capsicum 1 1.00Carrots 5 2.75 33 56.98 58 58.00Coffee 1 0.25Cowpeas 4 2.50 1 1.00Flowers 1 1.00 2 2.00French beans 2 2.50 6 3.50 10 10.00Garden peas 6 9.50 72 71.98 89 89.00Groundnuts 2 1.50 2 2.00Kales 4 2.10 9 2.55 18 18.00Maize 112 577.00 437 697.26 117 117.00Millet 1 1.00Napier grass 1 0.10 2 2.00Oats 1 1.00 4 6.00 4 4.00Onions 6 6.06 8 8.00Passion fruit 1 0.60 1 0.25 1 1.00Pearl millet 1 0.25 1 0.25 1 1.00Pigeon pea 1 2.00 1 1.00Plums 1 1.00Potatoes 830 1,557.76 119 105.36 35 35.00Pyrethrum 1 2.00Snow peas 5 5.75 3 3.00Sorghum 1 0.50 1 20.00Spider plant 1 0.13Spinach 1 1.00Sugarcane 2 1.00Sweet potatoes 1 0.50 2 1.75 1 1.00Tea 1 0.80 1 1.50 1 1.00Tomatoes 1 0.50 7 5.70 8 8.00Tree Tomato 3 1.13 2 2.00Wheat 4 36.00 13 199.63 11 11.00None 72 375
Total 1,002 2,230.71 1,002 1,434.80 1,002 627.00
Potato was selected by the majority of farmers (830, 83%) as the first-choice crop grownfollowed by maize (112, 11%) in the distant second however, maize was preferred bymost farmers (437, 43.6%) as the second-choice crop after potato (Table 5.3). As afirst-choice crop, potato also accounted for the biggest acreage followed by maize butcame third after maize and cabbage when selected as second-choice.
31| Page
Table 5.4: Use of crops selected by the interviewed farmers in the six counties
CropCrop 1 Crop 2 Crop 3
Food Income Both Food Income Both Food Income Both
Avocado 1Bananas 2Beans 3 2 6 8 12 44 41 22 79Beet root 1Black nightshade 1Boma Rhodes 2 1Broccoli 1 1Butternut 1Cabbages 7 8 7 72 53 16 41 43Capsicum 1Carrots 3 2 1 19 13 3 19 36Coffee 1Cowpeas 4 1Flowers 1 2French beans 2 6 9 1Garden peas 4 2 5 32 35 12 37 40Groundnuts 2 1 1Kales 4 2 1 6 8 3 7Maize 33 15 64 147 50 240 64 13 40Millet 1Napier grass 1 1 1Oats 1 1 1 2 2 1 1Onions 1 5 3 2 3Passion fruit 1 1 1Pearl millet 1 1 1Pigeon pea 1 1Plums 1Potatoes 44 330 456 21 32 66 6 4 25Pyrethrum 1Snow peas 5 3Sorghum 1 1Spider plant 1Spinach 1Sugarcane 2Sweet potatoes 1 1 1 1Tea 1 1 1Tomatoes 1 5 2 3 5Tree Tomato 3 2Wheat 4 1 10 2 6
Total 81 372 549 198 252 480 158 169 294
Whether selected as the first or second-choice crop, the majority of farmers in eithercategory indicated they grew potato to cater for income and food followed by onlyincome while the least (44) grew the crop solely for food.
32| Page
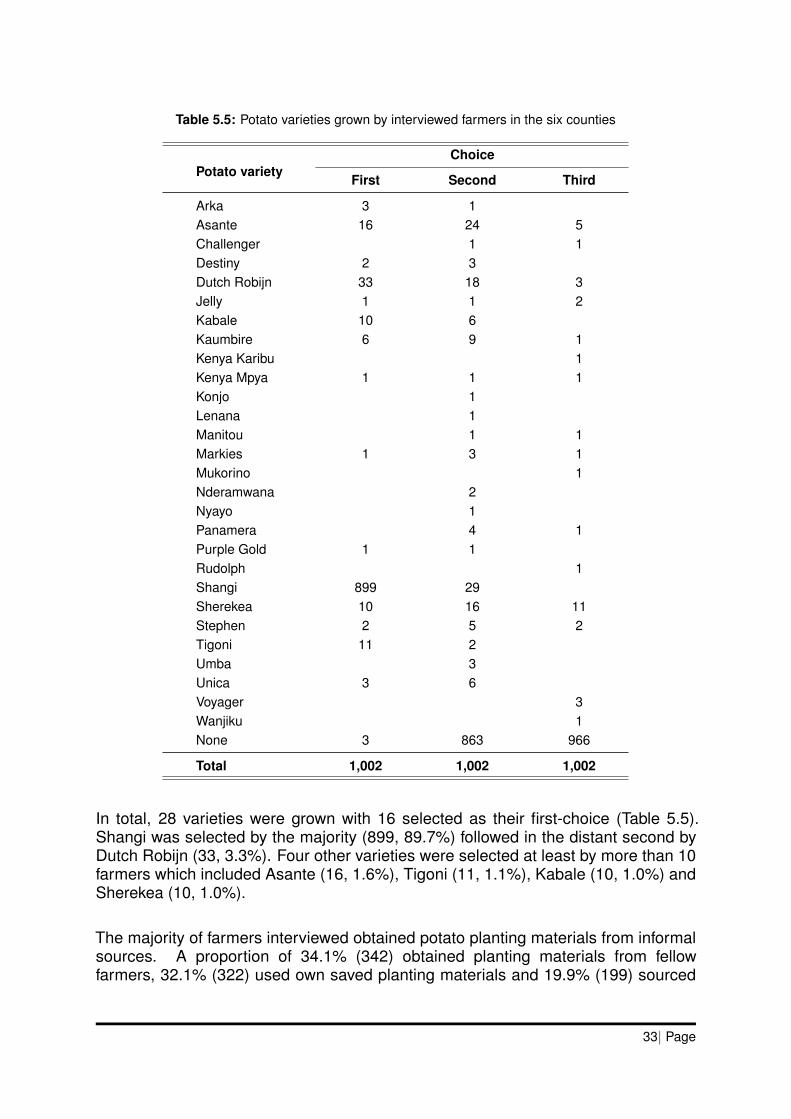
Table 5.5: Potato varieties grown by interviewed farmers in the six counties
Potato varietyChoice
First Second Third
Arka 3 1Asante 16 24 5Challenger 1 1Destiny 2 3Dutch Robijn 33 18 3Jelly 1 1 2Kabale 10 6Kaumbire 6 9 1Kenya Karibu 1Kenya Mpya 1 1 1Konjo 1Lenana 1Manitou 1 1Markies 1 3 1Mukorino 1Nderamwana 2Nyayo 1Panamera 4 1Purple Gold 1 1Rudolph 1Shangi 899 29Sherekea 10 16 11Stephen 2 5 2Tigoni 11 2Umba 3Unica 3 6Voyager 3Wanjiku 1None 3 863 966
Total 1,002 1,002 1,002
In total, 28 varieties were grown with 16 selected as their first-choice (Table 5.5).Shangi was selected by the majority (899, 89.7%) followed in the distant second byDutch Robijn (33, 3.3%). Four other varieties were selected at least by more than 10farmers which included Asante (16, 1.6%), Tigoni (11, 1.1%), Kabale (10, 1.0%) andSherekea (10, 1.0%).
The majority of farmers interviewed obtained potato planting materials from informalsources. A proportion of 34.1% (342) obtained planting materials from fellowfarmers, 32.1% (322) used own saved planting materials and 19.9% (199) sourced
33| Page

planting materials from both categories resulting in totals of 521 (51.2%) and 541(54%) who sourced from fellow farmers and used own saved seed respectively. Asmall proportion of 5.1% (51) sourced planting materials from the market. Two ofthe farmers sourced planting materials from markets, fellow farmer or used theirown saved materials (data not shown). Only 17.2% (172) of the farmers sourcedseed from seed producers. Others sources indicated by 1.4% (14) of the farmersincluded the county government and NGOs. Note that some of the farmers selectedmultiple sources of planting materials resulting in the total figures not adding up to 1,002.
Table 5.6: Source of potato planting materials for farmers in the six counties
countySource
Own-saved Fellow farmers Market Seed distributors Others
Elgeyo Marakwet 16 67 2 6 1Meru 45 44 10 64 2Nakuru 170 161 2 36 6Narok 48 58 5 26Nyandarua 233 147 6 28 5Trans Nzoia 9 64 26 12
Total 521 541 51 172 14
The majority of farmers claimed using appropriate agronomic practices that improvecrop productivity like recommended spacing (911, 90.9%), fertilizer application (987,98.5%), scouting for pests (896, 89.4%), crop rotation (753, 75.1%), pest management(987, 97.1) and weeding (973, 97.1%). However, only 9.3% (94) irrigated their cropsand 33.1% (332) used improved seed. Although 98.2% (984) did not mulch their crop,it is not an essential practice in potato production.
0%
10%
20%
30%
40%
50%
60%
70%
80%
90%
100%
332
911987
896
753
987 973
1894
670
9115
106
249
15 29
984908
Yes No
Figure 5.4: Agronomic practices implemented in potato productionin the six counties
34| Page
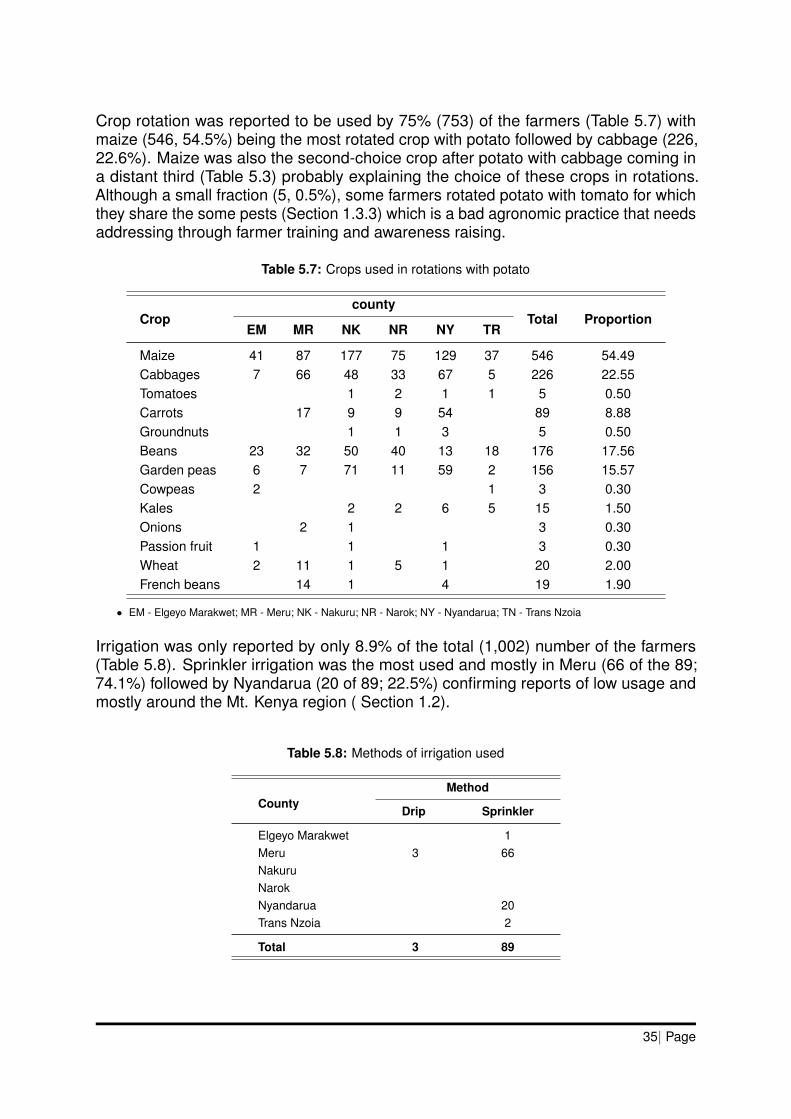
Crop rotation was reported to be used by 75% (753) of the farmers (Table 5.7) withmaize (546, 54.5%) being the most rotated crop with potato followed by cabbage (226,22.6%). Maize was also the second-choice crop after potato with cabbage coming ina distant third (Table 5.3) probably explaining the choice of these crops in rotations.Although a small fraction (5, 0.5%), some farmers rotated potato with tomato for whichthey share the some pests (Section 1.3.3) which is a bad agronomic practice that needsaddressing through farmer training and awareness raising.
Table 5.7: Crops used in rotations with potato
Cropcounty
Total ProportionEM MR NK NR NY TR
Maize 41 87 177 75 129 37 546 54.49Cabbages 7 66 48 33 67 5 226 22.55Tomatoes 1 2 1 1 5 0.50Carrots 17 9 9 54 89 8.88Groundnuts 1 1 3 5 0.50Beans 23 32 50 40 13 18 176 17.56Garden peas 6 7 71 11 59 2 156 15.57Cowpeas 2 1 3 0.30Kales 2 2 6 5 15 1.50Onions 2 1 3 0.30Passion fruit 1 1 1 3 0.30Wheat 2 11 1 5 1 20 2.00French beans 14 1 4 19 1.90
• EM - Elgeyo Marakwet; MR - Meru; NK - Nakuru; NR - Narok; NY - Nyandarua; TN - Trans Nzoia
Irrigation was only reported by only 8.9% of the total (1,002) number of the farmers(Table 5.8). Sprinkler irrigation was the most used and mostly in Meru (66 of the 89;74.1%) followed by Nyandarua (20 of 89; 22.5%) confirming reports of low usage andmostly around the Mt. Kenya region ( Section 1.2).
Table 5.8: Methods of irrigation used
CountyMethod
Drip Sprinkler
Elgeyo Marakwet 1Meru 3 66NakuruNarokNyandarua 20Trans Nzoia 2
Total 3 89
35| Page
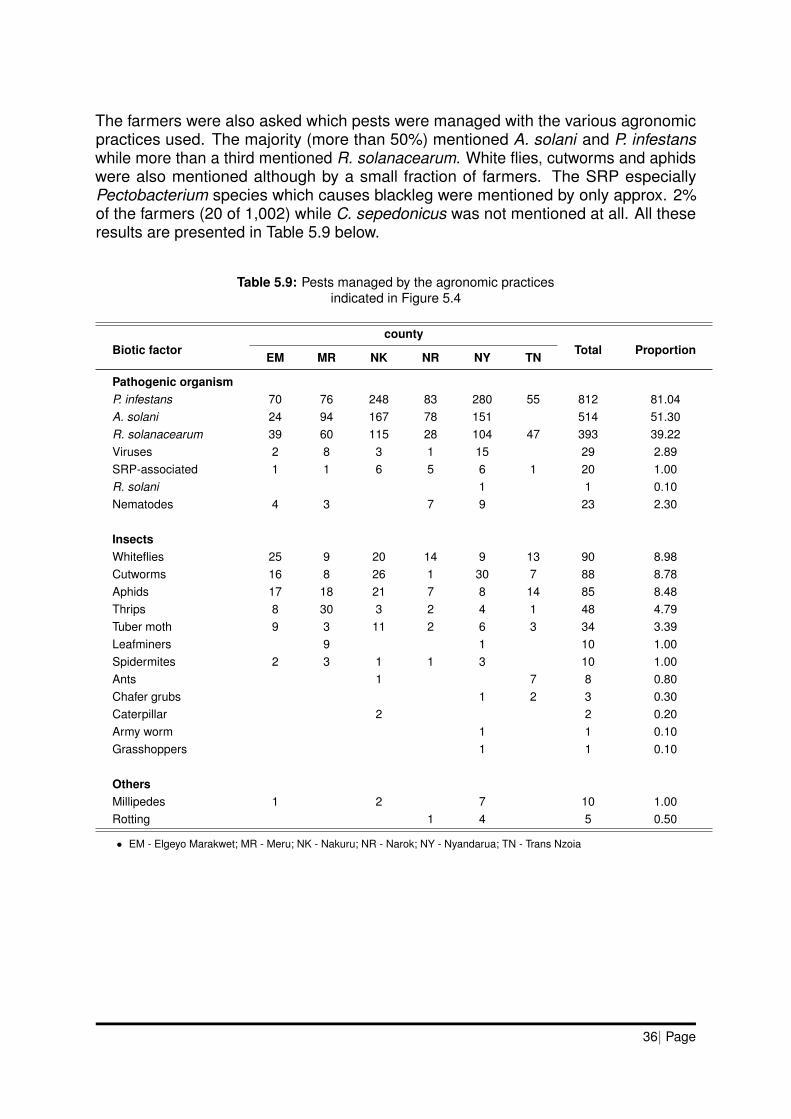
The farmers were also asked which pests were managed with the various agronomicpractices used. The majority (more than 50%) mentioned A. solani and P. infestanswhile more than a third mentioned R. solanacearum. White flies, cutworms and aphidswere also mentioned although by a small fraction of farmers. The SRP especiallyPectobacterium species which causes blackleg were mentioned by only approx. 2%of the farmers (20 of 1,002) while C. sepedonicus was not mentioned at all. All theseresults are presented in Table 5.9 below.
Table 5.9: Pests managed by the agronomic practicesindicated in Figure 5.4
Biotic factorcounty
Total ProportionEM MR NK NR NY TN
Pathogenic organismP. infestans 70 76 248 83 280 55 812 81.04A. solani 24 94 167 78 151 514 51.30R. solanacearum 39 60 115 28 104 47 393 39.22Viruses 2 8 3 1 15 29 2.89SRP-associated 1 1 6 5 6 1 20 1.00R. solani 1 1 0.10Nematodes 4 3 7 9 23 2.30
InsectsWhiteflies 25 9 20 14 9 13 90 8.98Cutworms 16 8 26 1 30 7 88 8.78Aphids 17 18 21 7 8 14 85 8.48Thrips 8 30 3 2 4 1 48 4.79Tuber moth 9 3 11 2 6 3 34 3.39Leafminers 9 1 10 1.00Spidermites 2 3 1 1 3 10 1.00Ants 1 7 8 0.80Chafer grubs 1 2 3 0.30Caterpillar 2 2 0.20Army worm 1 1 0.10Grasshoppers 1 1 0.10
OthersMillipedes 1 2 7 10 1.00Rotting 1 4 5 0.50
• EM - Elgeyo Marakwet; MR - Meru; NK - Nakuru; NR - Narok; NY - Nyandarua; TN - Trans Nzoia
36| Page
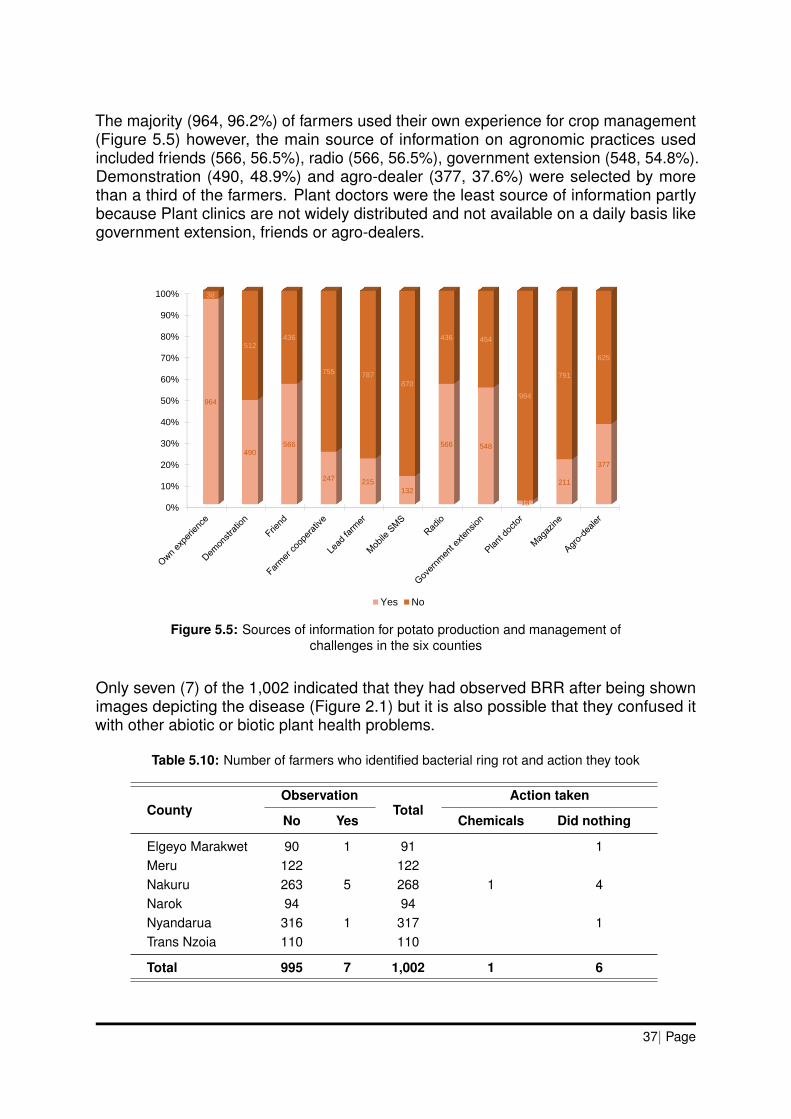
The majority (964, 96.2%) of farmers used their own experience for crop management(Figure 5.5) however, the main source of information on agronomic practices usedincluded friends (566, 56.5%), radio (566, 56.5%), government extension (548, 54.8%).Demonstration (490, 48.9%) and agro-dealer (377, 37.6%) were selected by morethan a third of the farmers. Plant doctors were the least source of information partlybecause Plant clinics are not widely distributed and not available on a daily basis likegovernment extension, friends or agro-dealers.
0%
10%
20%
30%
40%
50%
60%
70%
80%
90%
100% 38
512436
755 787
870
436 454
984
791
625
964
490566
247 215
132
566 548
18
211
377
Yes No
Figure 5.5: Sources of information for potato production and management ofchallenges in the six counties
Only seven (7) of the 1,002 indicated that they had observed BRR after being shownimages depicting the disease (Figure 2.1) but it is also possible that they confused itwith other abiotic or biotic plant health problems.
Table 5.10: Number of farmers who identified bacterial ring rot and action they took
CountyObservation
TotalAction taken
No Yes Chemicals Did nothing
Elgeyo Marakwet 90 1 91 1Meru 122 122Nakuru 263 5 268 1 4Narok 94 94Nyandarua 316 1 317 1Trans Nzoia 110 110
Total 995 7 1,002 1 6
37| Page
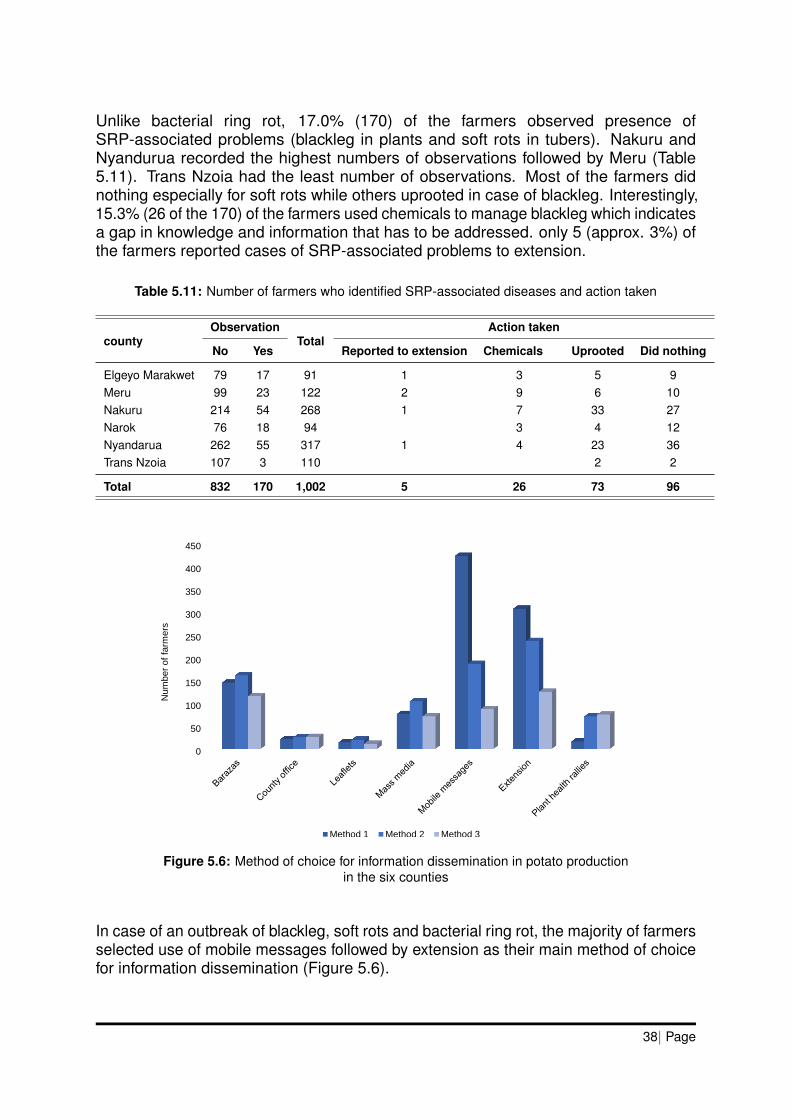
Unlike bacterial ring rot, 17.0% (170) of the farmers observed presence ofSRP-associated problems (blackleg in plants and soft rots in tubers). Nakuru andNyandurua recorded the highest numbers of observations followed by Meru (Table5.11). Trans Nzoia had the least number of observations. Most of the farmers didnothing especially for soft rots while others uprooted in case of blackleg. Interestingly,15.3% (26 of the 170) of the farmers used chemicals to manage blackleg which indicatesa gap in knowledge and information that has to be addressed. only 5 (approx. 3%) ofthe farmers reported cases of SRP-associated problems to extension.
Table 5.11: Number of farmers who identified SRP-associated diseases and action taken
countyObservation
TotalAction taken
No Yes Reported to extension Chemicals Uprooted Did nothing
Elgeyo Marakwet 79 17 91 1 3 5 9Meru 99 23 122 2 9 6 10Nakuru 214 54 268 1 7 33 27Narok 76 18 94 3 4 12Nyandarua 262 55 317 1 4 23 36Trans Nzoia 107 3 110 2 2
Total 832 170 1,002 5 26 73 96
0
50
100
150
200
250
300
350
400
450
Nu
mb
er
of
farm
ers
Method 1 Method 2 Method 3
Figure 5.6: Method of choice for information dissemination in potato productionin the six counties
In case of an outbreak of blackleg, soft rots and bacterial ring rot, the majority of farmersselected use of mobile messages followed by extension as their main method of choicefor information dissemination (Figure 5.6).
38| Page
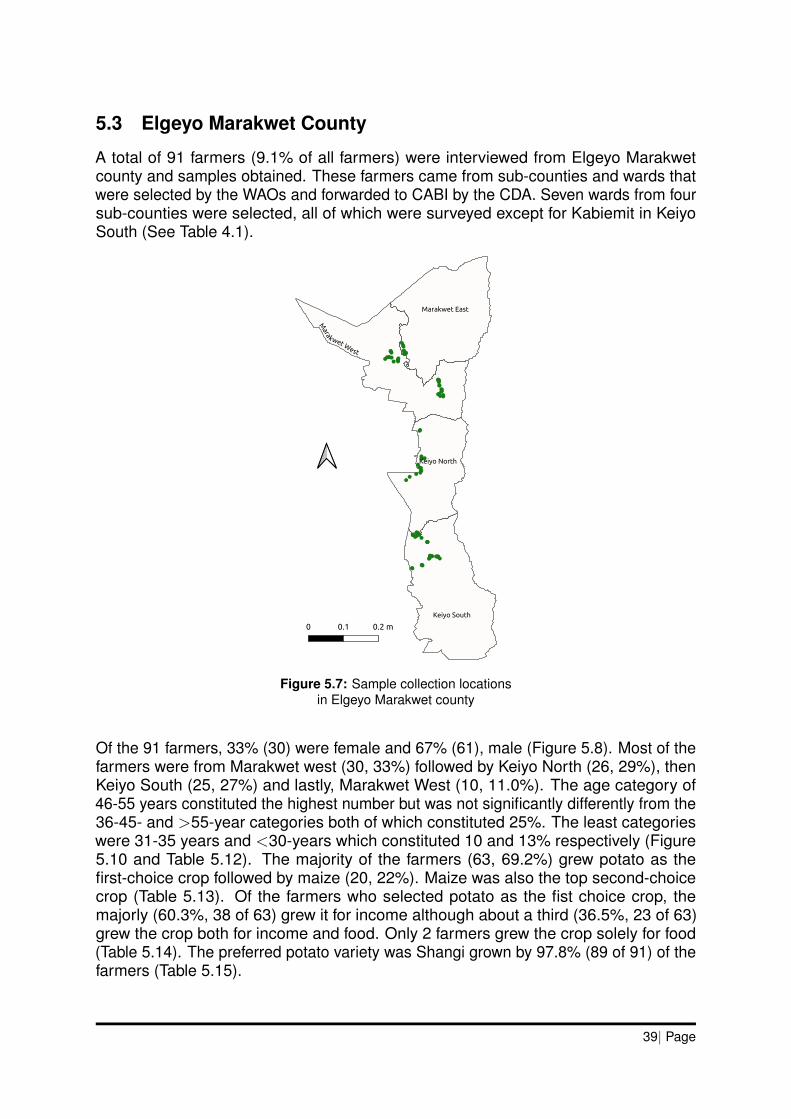
5.3 Elgeyo Marakwet County
A total of 91 farmers (9.1% of all farmers) were interviewed from Elgeyo Marakwetcounty and samples obtained. These farmers came from sub-counties and wards thatwere selected by the WAOs and forwarded to CABI by the CDA. Seven wards from foursub-counties were selected, all of which were surveyed except for Kabiemit in KeiyoSouth (See Table 4.1).
Figure 5.7: Sample collection locationsin Elgeyo Marakwet county
Of the 91 farmers, 33% (30) were female and 67% (61), male (Figure 5.8). Most of thefarmers were from Marakwet west (30, 33%) followed by Keiyo North (26, 29%), thenKeiyo South (25, 27%) and lastly, Marakwet West (10, 11.0%). The age category of46-55 years constituted the highest number but was not significantly differently from the36-45- and >55-year categories both of which constituted 25%. The least categorieswere 31-35 years and <30-years which constituted 10 and 13% respectively (Figure5.10 and Table 5.12). The majority of the farmers (63, 69.2%) grew potato as thefirst-choice crop followed by maize (20, 22%). Maize was also the top second-choicecrop (Table 5.13). Of the farmers who selected potato as the fist choice crop, themajorly (60.3%, 38 of 63) grew it for income although about a third (36.5%, 23 of 63)grew the crop both for income and food. Only 2 farmers grew the crop solely for food(Table 5.14). The preferred potato variety was Shangi grown by 97.8% (89 of 91) of thefarmers (Table 5.15).
39| Page
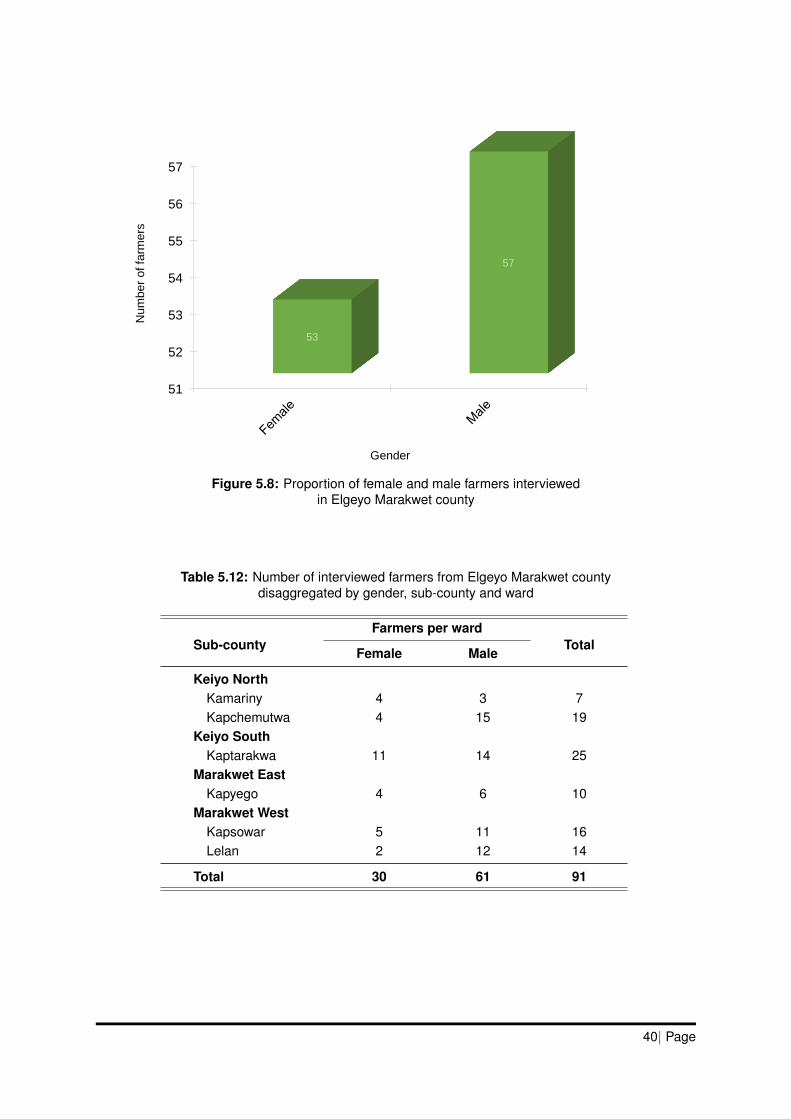
51
52
53
54
55
56
57
53
57
Num
ber
of fa
rmers
Gender
Figure 5.8: Proportion of female and male farmers interviewedin Elgeyo Marakwet county
Table 5.12: Number of interviewed farmers from Elgeyo Marakwet countydisaggregated by gender, sub-county and ward
Sub-countyFarmers per ward
TotalFemale Male
Keiyo NorthKamariny 4 3 7Kapchemutwa 4 15 19
Keiyo SouthKaptarakwa 11 14 25
Marakwet EastKapyego 4 6 10
Marakwet WestKapsowar 5 11 16Lelan 2 12 14
Total 30 61 91
40| Page
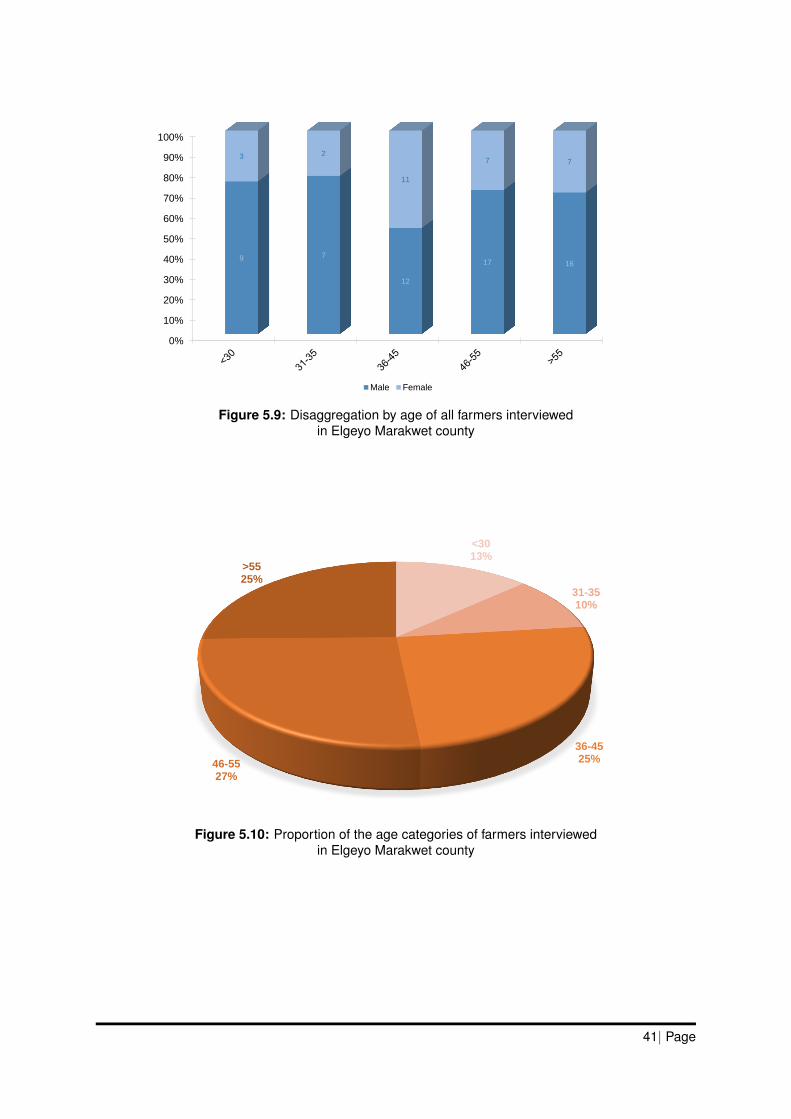
0%
10%
20%
30%
40%
50%
60%
70%
80%
90%
100%
9 7
12
17 16
3 2
11
7 7
Male Female
Figure 5.9: Disaggregation by age of all farmers interviewedin Elgeyo Marakwet county
<3013%
31-3510%
36-4525%46-55
27%
>5525%
Figure 5.10: Proportion of the age categories of farmers interviewedin Elgeyo Marakwet county
41| Page
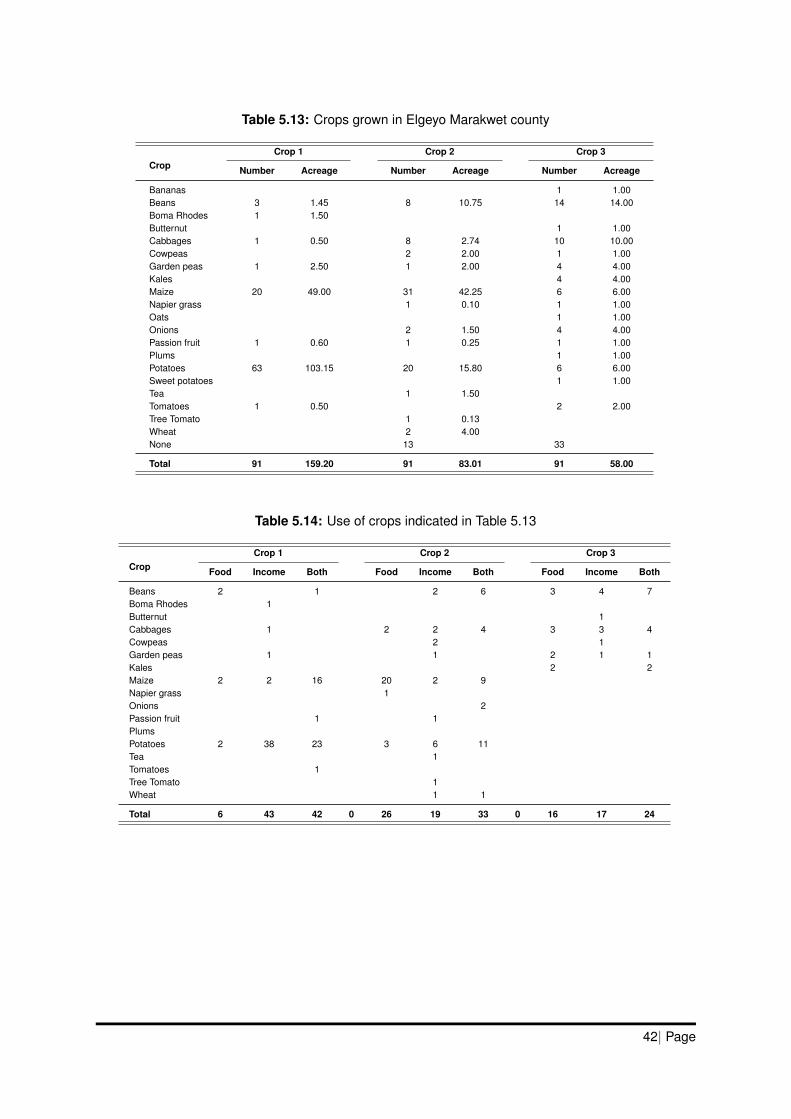
Table 5.13: Crops grown in Elgeyo Marakwet county
CropCrop 1 Crop 2 Crop 3
Number Acreage Number Acreage Number Acreage
Bananas 1 1.00Beans 3 1.45 8 10.75 14 14.00Boma Rhodes 1 1.50Butternut 1 1.00Cabbages 1 0.50 8 2.74 10 10.00Cowpeas 2 2.00 1 1.00Garden peas 1 2.50 1 2.00 4 4.00Kales 4 4.00Maize 20 49.00 31 42.25 6 6.00Napier grass 1 0.10 1 1.00Oats 1 1.00Onions 2 1.50 4 4.00Passion fruit 1 0.60 1 0.25 1 1.00Plums 1 1.00Potatoes 63 103.15 20 15.80 6 6.00Sweet potatoes 1 1.00Tea 1 1.50Tomatoes 1 0.50 2 2.00Tree Tomato 1 0.13Wheat 2 4.00None 13 33
Total 91 159.20 91 83.01 91 58.00
Table 5.14: Use of crops indicated in Table 5.13
CropCrop 1 Crop 2 Crop 3
Food Income Both Food Income Both Food Income Both
Beans 2 1 2 6 3 4 7Boma Rhodes 1Butternut 1Cabbages 1 2 2 4 3 3 4Cowpeas 2 1Garden peas 1 1 2 1 1Kales 2 2Maize 2 2 16 20 2 9Napier grass 1Onions 2Passion fruit 1 1PlumsPotatoes 2 38 23 3 6 11Tea 1Tomatoes 1Tree Tomato 1Wheat 1 1
Total 6 43 42 0 26 19 33 0 16 17 24
42| Page
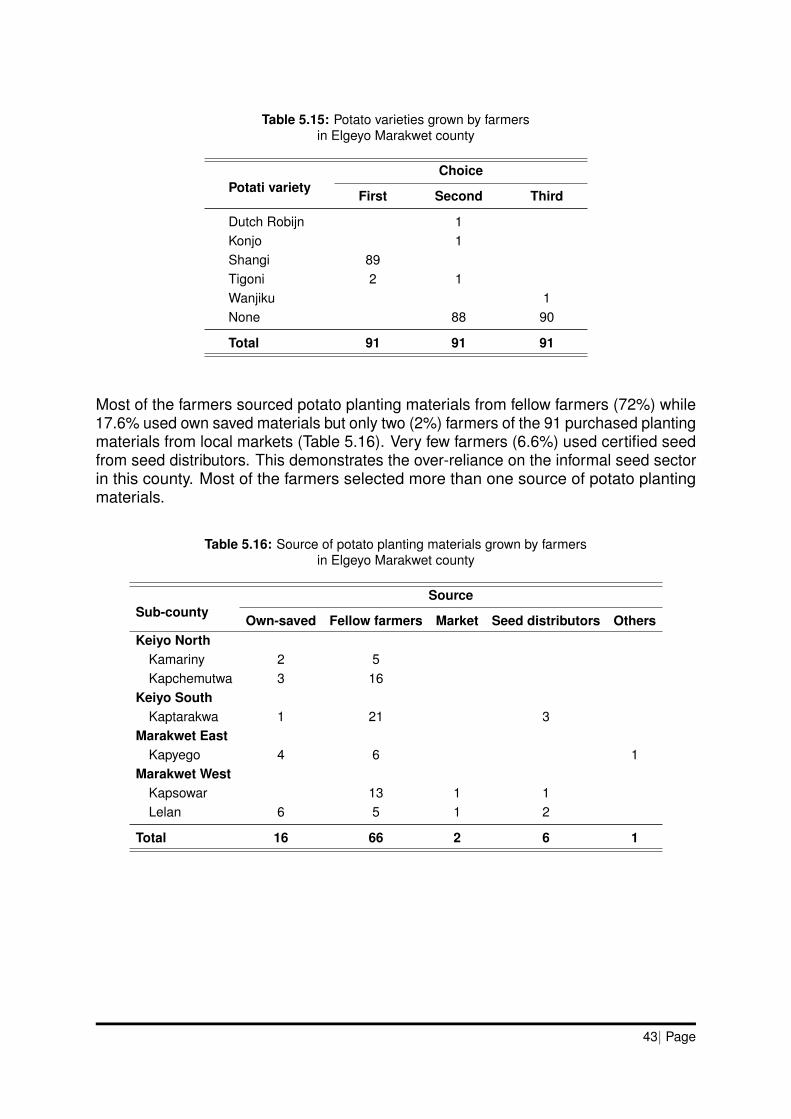
Table 5.15: Potato varieties grown by farmersin Elgeyo Marakwet county
Potati varietyChoice
First Second Third
Dutch Robijn 1Konjo 1Shangi 89Tigoni 2 1Wanjiku 1None 88 90
Total 91 91 91
Most of the farmers sourced potato planting materials from fellow farmers (72%) while17.6% used own saved materials but only two (2%) farmers of the 91 purchased plantingmaterials from local markets (Table 5.16). Very few farmers (6.6%) used certified seedfrom seed distributors. This demonstrates the over-reliance on the informal seed sectorin this county. Most of the farmers selected more than one source of potato plantingmaterials.
Table 5.16: Source of potato planting materials grown by farmersin Elgeyo Marakwet county
Sub-countySource
Own-saved Fellow farmers Market Seed distributors OthersKeiyo North
Kamariny 2 5Kapchemutwa 3 16
Keiyo SouthKaptarakwa 1 21 3
Marakwet EastKapyego 4 6 1
Marakwet WestKapsowar 13 1 1Lelan 6 5 1 2
Total 16 66 2 6 1
43| Page
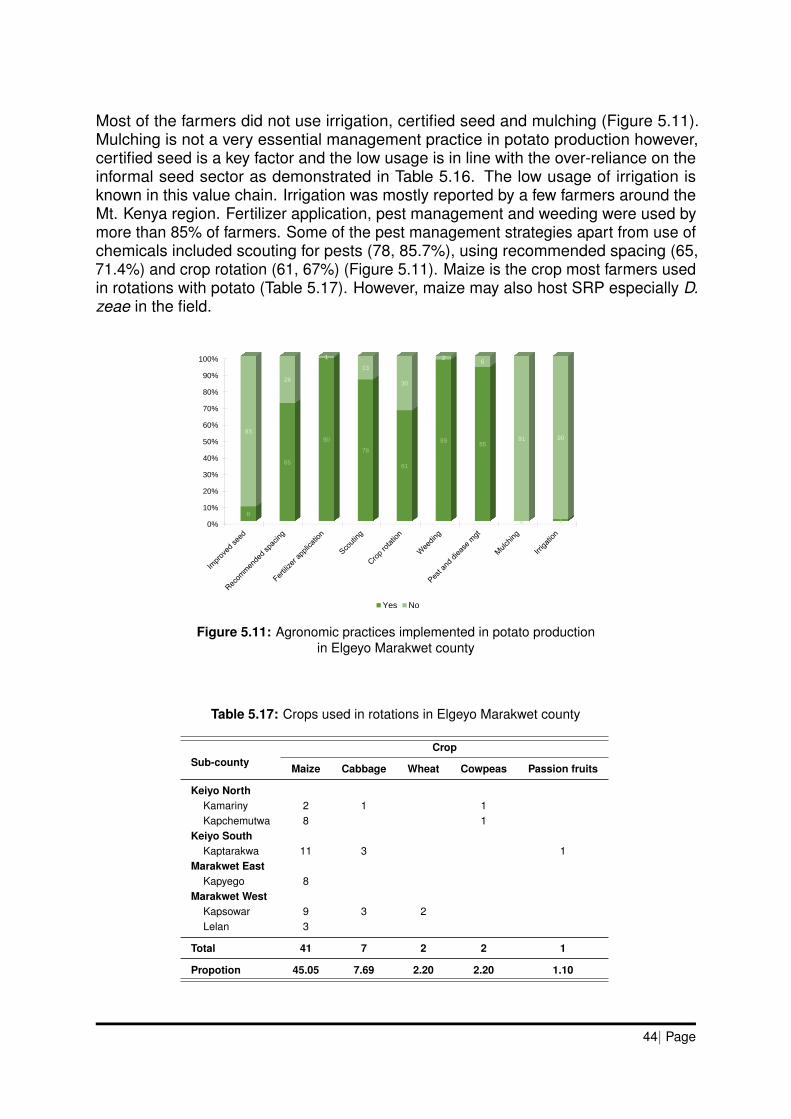
Most of the farmers did not use irrigation, certified seed and mulching (Figure 5.11).Mulching is not a very essential management practice in potato production however,certified seed is a key factor and the low usage is in line with the over-reliance on theinformal seed sector as demonstrated in Table 5.16. The low usage of irrigation isknown in this value chain. Irrigation was mostly reported by a few farmers around theMt. Kenya region. Fertilizer application, pest management and weeding were used bymore than 85% of farmers. Some of the pest management strategies apart from use ofchemicals included scouting for pests (78, 85.7%), using recommended spacing (65,71.4%) and crop rotation (61, 67%) (Figure 5.11). Maize is the crop most farmers usedin rotations with potato (Table 5.17). However, maize may also host SRP especially D.zeae in the field.
0%
10%
20%
30%
40%
50%
60%
70%
80%
90%
100%
8
65
90
78
61
8985
0 1
83
26
1
13
30
26
91 90
Yes No
Figure 5.11: Agronomic practices implemented in potato productionin Elgeyo Marakwet county
Table 5.17: Crops used in rotations in Elgeyo Marakwet county
Sub-countyCrop
Maize Cabbage Wheat Cowpeas Passion fruits
Keiyo NorthKamariny 2 1 1Kapchemutwa 8 1
Keiyo SouthKaptarakwa 11 3 1
Marakwet EastKapyego 8
Marakwet WestKapsowar 9 3 2Lelan 3
Total 41 7 2 2 1
Propotion 45.05 7.69 2.20 2.20 1.10
44| Page
Agronomic practices such as crop rotation, scouting for pests, weeding and otherpest management strategies were used to mainly manage A. solani, P. infestans andR. solanacearum, whiteflies, aphids, and cutworms (Table 5.18 and 5.19). The SRPobserved as blackleg was reported by only one farmer (Table 5.18) while there was nomention of bacterial ring rot.
Table 5.18: Pathogenic organisms managed by the agronomic practicesindicated in Figure 5.11
Sub-countyPathogenic organism
P. infestans R. solanacearum A. solani Nematodes Viruses Blackleg
Keiyo NorthKamariny 7 9 6 1Kapchemutwa 10 11 1
Keiyo South 1Kaptarakwa 23 10 4
Marakwet East 1Kapyego 4 1
Marakwet WestKapsowar 13 10 3 1Lelan 11 1 1
Total 64 34 24 4 2 1
Proportion (%) 70.33 37.36 26.37 4.40 2.20 1.10
Table 5.19: Insects managed by the agronomic practicesindicated in Figure 5.11
Sub-countyPest
Whiteflies Aphids Cutworms Tuber moth Thrips Spider mite Millipedes
Keiyo NorthKamariny 2 2 1Kapchemutwa 15 9 4 6 8 2
Keiyo SouthKaptarakwa 2 3 1 1 1
Marakwet EastKapyego 1
Marakwet WestKapsowar 5 3 3 2Lelan 1 7
Total 25 17 17 9 8 2 1
Proportion (%) 27.47 18.68 18.68 9.89 8.79 2.20 1.10
45| Page
0%
10%
20%
30%
40%
50%
60%
70%
80%
90%
100% 1
46
35
63
7670
41
33
91
49
37
90
45
56
28
1521
50
58
0
42
54
Yes No
Figure 5.12: Sources of information for potato production and management of challengesin Elgeyo Marakwet county
0
5
10
15
20
25
30
35
40
Num
ber
of
farm
ers
Method 1 Method 2 Method 3
Figure 5.13: Method of choice for information dissemination in potato productionin Elgeyo Marakwet county
46| Page
Most of the farmers depended on own experience (selected by 99%) in potato productionand management followed by friends (56, 61.5%), government extension (58, 63.7%);radio (50, 55.0%) and agro-dealer (54, 59.3%) which were selected in roughly equalproportions by the farmers with lead farmer and mobile SMS the least (Figure 5.12).Plant doctors did not future in Elgeyo Marakwet county because plant clinics are yetto be launched in this county. Of the 91 farmers, only 1 indicated to have observedbacterial ring rot (Table 5.10) while only 23 farmers observed SRP-associated diseases(Table 5.11. The observation of bacterial ring rot could have been confused with othersymptoms but the low observations of SRP-associated diseases does not indicateabsence of the pathogenic organism but probably a confusion of symptoms, lack ofknowledge of the disease symptoms or presence of latent infections. In case of anoutbreak of blackleg, soft rots and bacterial ring rot, the majority of farmers selecteduse of mobile messages followed by extension which was statistically similar to Barazasas their method of choice for information dissemination (Figure 5.13).
47| Page
5.4 Meru County
A total of 122 farmers (12.2% of all farmers) from whom samples were also obtainedwere interviewed from Meru county. These farmers came from sub-counties and wardsthat were selected by the WAOs and forwarded to CABI by the CDA (Table 4.1). Thefarmers came from seven wards selected from three of the nine sub-counties, all ofwhich were surveyed (Figure 5.14).
Figure 5.14: Sample collection locations in Meru county
Of the 122 farmers, 41% (50) were female and 59% (72), male (Figure 5.15 and Table5.20). Most of the farmers were from Buuri (30, 33%) followed by Imenti South (26,29%) and lastly, Central Imenti (10, 11%). The age categories of 46-55 and 36-45years both constituted 30% of the total farmers interviewed followed by >55 years (26,21%), then 31-35 years (20, 16%) and lastly <30 years (3, 3%) (Figures 5.16 and 5.17).The majority of farmers (105, 86%) grew potato as the first-choice crop. A number ofcrops were grown as second-choice with the list being topped by cabbage (43, 35.2%)and maize (41, 33.6%). Maize was the preferred third-choice crop followed by beans.Results available in Table 5.21. Farmers who grew potato as a first-choice crop, themajorly grew it for income (55, 45.1%). The second category which constituted 36.1%(44) grew the crop for both income and food. Only 6 farmers (about 5%) of the 122grew potato solely for food. Results on usage of the crop available in Table 5.22. Morethan half of the farmers (64, 52.5%) sourced their seed from seed distributors (Table5.24). The informal potato seed sector was very strong in Meru because the numberof farmers who indicated using own saved planting materials closely matched thosewho accessed it from fellow farmers (45 vs 44 which constitutes approximately 36%)
48| Page

with those who got it from the market constituting 8% (10). Another source of potatoplanting materials was free provision through the county government.
0
10
20
30
40
50
60
70
80
50
72
Nu
mb
er
of fa
rme
rs
Gender
Figure 5.15: Proportion of female and male farmers interviewedin Meru county
Table 5.20: Number of interviewed farmers from Meru countydisaggregated by gender, sub-county and ward
Sub-countyFarmers per ward
TotalFemale Male
BuuriKibirichia 7 7 14Kiirua/Naari 7 10 17Kisima 6 13 19Timau 11 11 22
Imenti CentralAbothuguchi West 7 14 21
Imenti SouthAbogeta West 8 9 17Nkuene 4 8 12
Total 50 72 122
49| Page
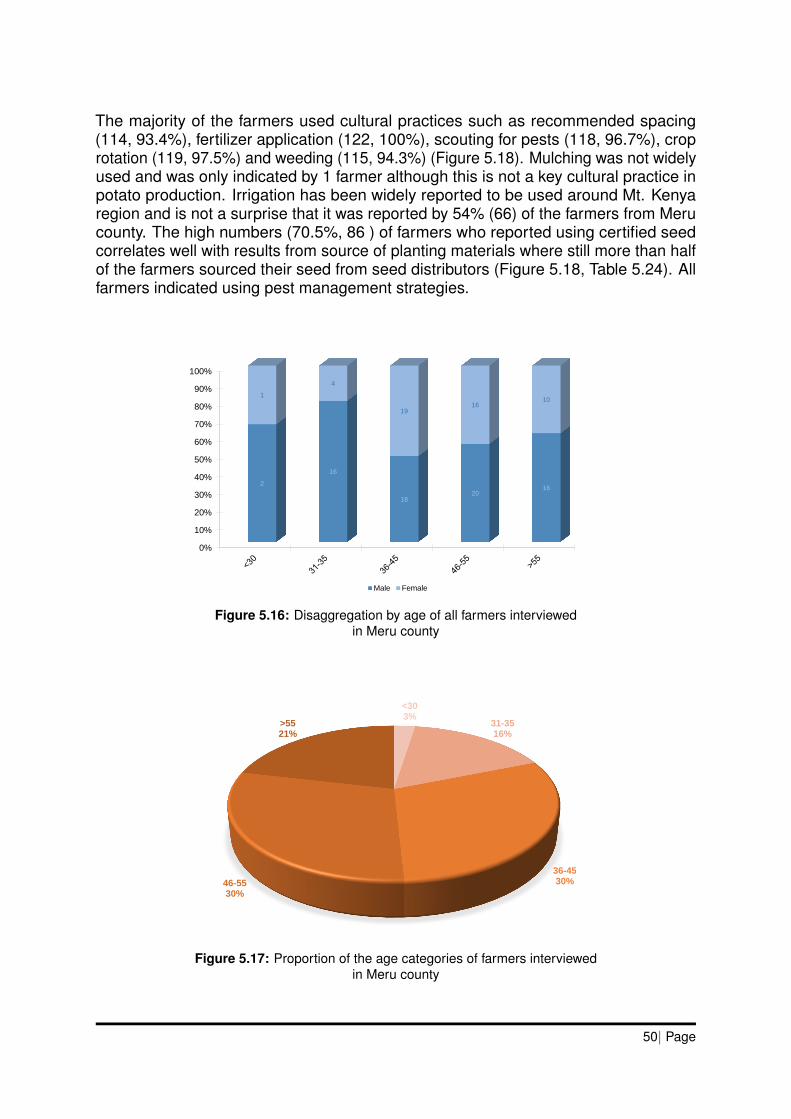
The majority of the farmers used cultural practices such as recommended spacing(114, 93.4%), fertilizer application (122, 100%), scouting for pests (118, 96.7%), croprotation (119, 97.5%) and weeding (115, 94.3%) (Figure 5.18). Mulching was not widelyused and was only indicated by 1 farmer although this is not a key cultural practice inpotato production. Irrigation has been widely reported to be used around Mt. Kenyaregion and is not a surprise that it was reported by 54% (66) of the farmers from Merucounty. The high numbers (70.5%, 86 ) of farmers who reported using certified seedcorrelates well with results from source of planting materials where still more than halfof the farmers sourced their seed from seed distributors (Figure 5.18, Table 5.24). Allfarmers indicated using pest management strategies.
0%
10%
20%
30%
40%
50%
60%
70%
80%
90%
100%
2
16
1820
16
1
4
1916
10
Male Female
Figure 5.16: Disaggregation by age of all farmers interviewedin Meru county
<303%
31-3516%
36-4530%46-55
30%
>5521%
Figure 5.17: Proportion of the age categories of farmers interviewedin Meru county
50| Page
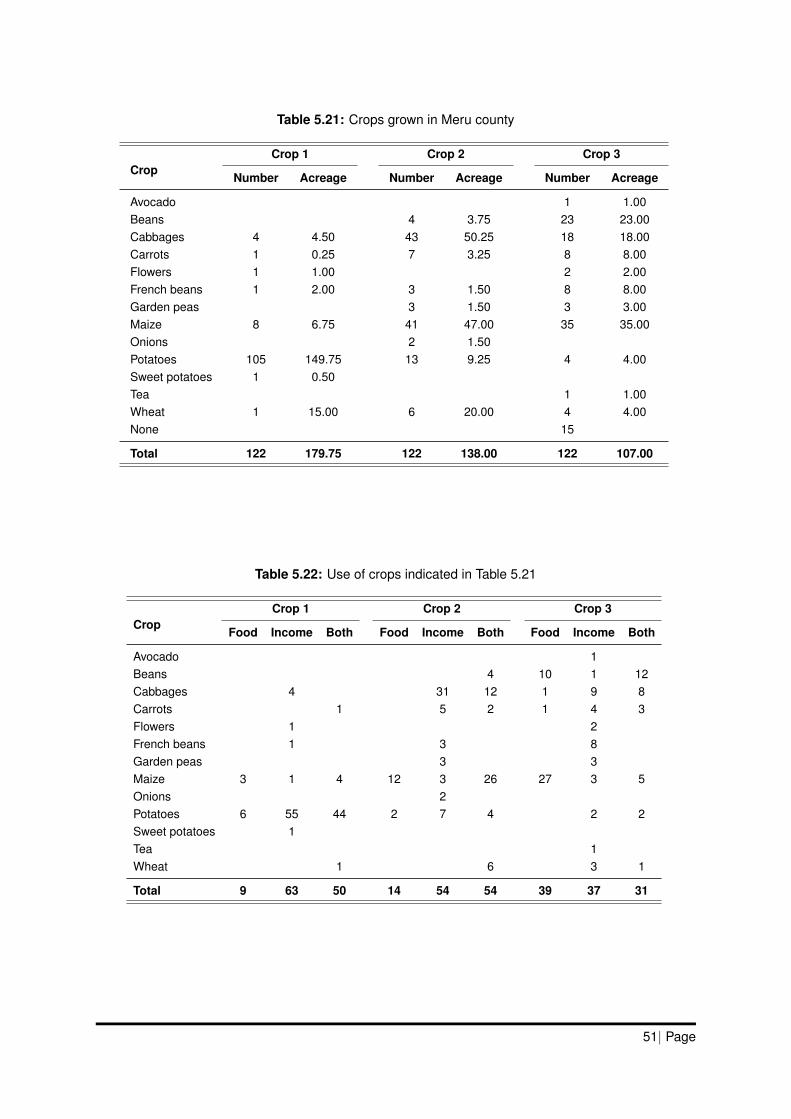
Table 5.21: Crops grown in Meru county
CropCrop 1 Crop 2 Crop 3
Number Acreage Number Acreage Number Acreage
Avocado 1 1.00Beans 4 3.75 23 23.00Cabbages 4 4.50 43 50.25 18 18.00Carrots 1 0.25 7 3.25 8 8.00Flowers 1 1.00 2 2.00French beans 1 2.00 3 1.50 8 8.00Garden peas 3 1.50 3 3.00Maize 8 6.75 41 47.00 35 35.00Onions 2 1.50Potatoes 105 149.75 13 9.25 4 4.00Sweet potatoes 1 0.50Tea 1 1.00Wheat 1 15.00 6 20.00 4 4.00None 15
Total 122 179.75 122 138.00 122 107.00
Table 5.22: Use of crops indicated in Table 5.21
CropCrop 1 Crop 2 Crop 3
Food Income Both Food Income Both Food Income Both
Avocado 1Beans 4 10 1 12Cabbages 4 31 12 1 9 8Carrots 1 5 2 1 4 3Flowers 1 2French beans 1 3 8Garden peas 3 3Maize 3 1 4 12 3 26 27 3 5Onions 2Potatoes 6 55 44 2 7 4 2 2Sweet potatoes 1Tea 1Wheat 1 6 3 1
Total 9 63 50 14 54 54 39 37 31
51| Page
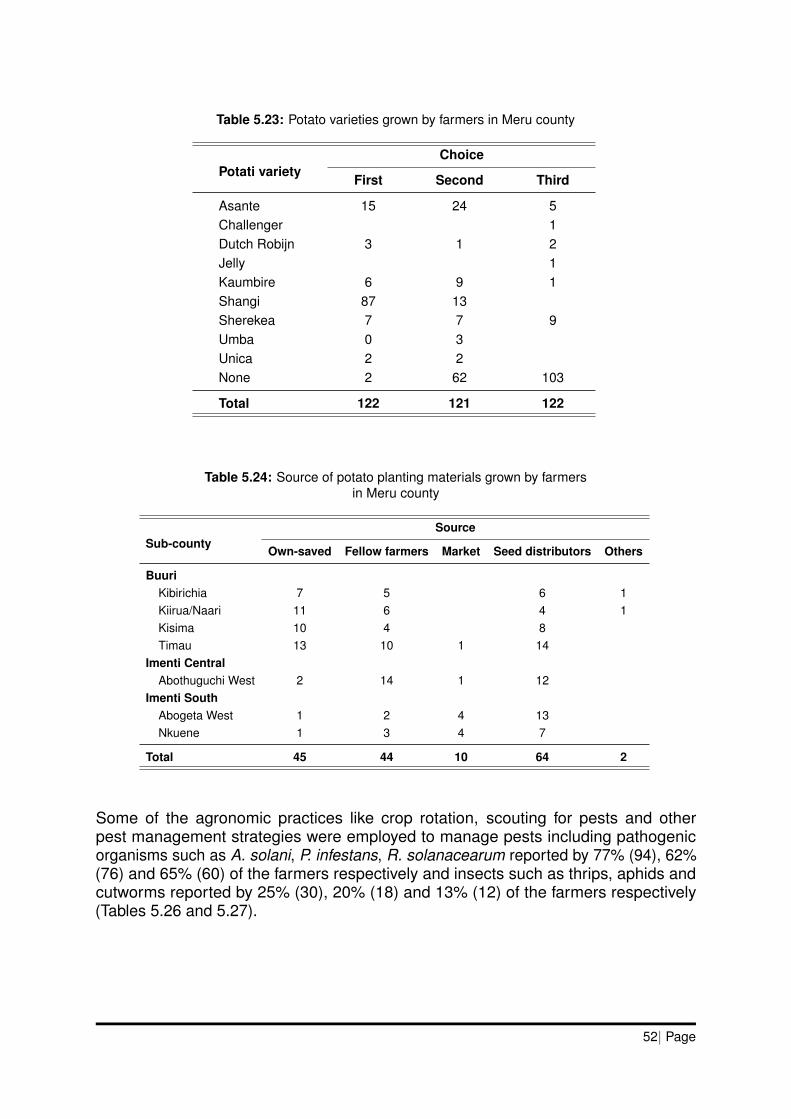
Table 5.23: Potato varieties grown by farmers in Meru county
Potati varietyChoice
First Second Third
Asante 15 24 5Challenger 1Dutch Robijn 3 1 2Jelly 1Kaumbire 6 9 1Shangi 87 13Sherekea 7 7 9Umba 0 3Unica 2 2None 2 62 103
Total 122 121 122
Table 5.24: Source of potato planting materials grown by farmersin Meru county
Sub-countySource
Own-saved Fellow farmers Market Seed distributors Others
BuuriKibirichia 7 5 6 1Kiirua/Naari 11 6 4 1Kisima 10 4 8Timau 13 10 1 14
Imenti CentralAbothuguchi West 2 14 1 12
Imenti SouthAbogeta West 1 2 4 13Nkuene 1 3 4 7
Total 45 44 10 64 2
Some of the agronomic practices like crop rotation, scouting for pests and otherpest management strategies were employed to manage pests including pathogenicorganisms such as A. solani, P. infestans, R. solanacearum reported by 77% (94), 62%(76) and 65% (60) of the farmers respectively and insects such as thrips, aphids andcutworms reported by 25% (30), 20% (18) and 13% (12) of the farmers respectively(Tables 5.26 and 5.27).
52| Page
0%
10%
20%
30%
40%
50%
60%
70%
80%
90%
100%
86
114122 118 119 115
122
1
66
36
80 4 3 7
0
121
56
Yes No
Figure 5.18: Agronomic practices implemented in potato productionin Meru county
Table 5.25: Crops used in rotations in Meru county
Sub-countyCrop
Maize Cabbage Beans Carrots French beans Wheat Garden peas Onions
BuuriKibirichia 8 5 3 2 2 1 1Kiirua/Naari 16 1 15 1Kisima 6 9 3 9 4 6 1 1Timau 18 3 8 5 3 2
Imenti CentralAbothuguchi West 15 21 1 6
Imenti SouthAbogeta West 15 17 2 2Nkuene 9 10 2 3
Total 87 66 32 17 14 11 7 2
Propotion 71.3 54.1 26.3 13.9 11.5 9.0 5.7 1.6
53| Page
Table 5.26: Pathogenic organisms managed by the agronomic practicesindicated in Figure 5.18
Sub-countyPathogenic organism
A. solani P. infestans R. solanacearum Viruses Nematodes SRP-associated Rust
BuuriKibirichia 12 12 4 1 1Kiirua/Naari 17 13 4 4Kisima 18 10 6 1Timau 17 17 15 3 1
Imenti CentralAbothuguchi West 14 9 14 1
Imenti SouthAbogeta West 9 8 13Nkuene 7 7 4 1
Total 94 76 60 8 3 1 1
Proportion (%) 77.05 83.52 65.93 8.79 3.30 1.10 1.10
Table 5.27: Insects managed by the agronomic practicesindicated in Figure 5.18
Sub-countyInsect
Thrips Aphids Cutworms Leafminers Whiteflies Spider mite Tuber moth
BuuriKibirichia 4Kiirua/Naari 2 1 2 2 1 1Kisima 6 6 1 1Timau 3 2 2 1 3
Imenti CentralAbothuguchi West 7 6 2 5 4 1
Imenti SouthAbogeta West 4 1 1 1 1Nkuene 4 2 4 2 1
Total 30 18 12 9 9 3 3
Proportion (%) 24.59 19.78 13.19 9.89 9.89 3.30 3.30
Most the farmers depended on own experience (selected by 90%) in potato productionand management. More than 45% indicated demonstration (45%, 55), friends (46%, 56)and government extension (48.4%, 59) as the preferred source of information (Figure5.19). Mobile SMS and magazines were the least preferred. SRP-associated diseaseswere reported by 23 (18.9%) farmers which demonstrates either a lack of knowledgeabout the diseases, presence of latent infections or confusion of symptoms. In eithercase, some of the farmers uprooted blackleg-infected plants but did nothing for soft rotand some blackleg cases. Chemicals were used to manage the problem but is not aneffective management strategy for diseases incited by bacteria (Table 5.11).
54| Page
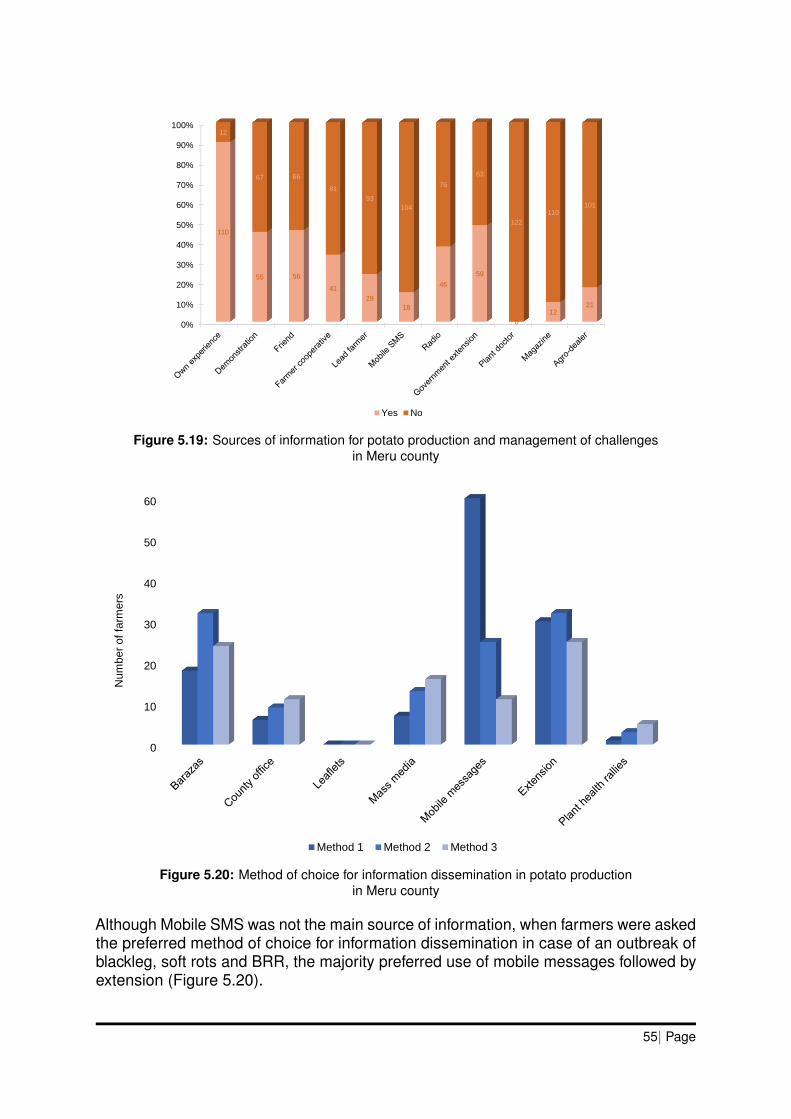
0%
10%
20%
30%
40%
50%
60%
70%
80%
90%
100%12
67 66
81
93
104
76
63
122
110101
110
55 56
41
29
18
46
59
0
1221
Yes No
Figure 5.19: Sources of information for potato production and management of challengesin Meru county
0
10
20
30
40
50
60
Num
ber
of
farm
ers
Method 1 Method 2 Method 3
Figure 5.20: Method of choice for information dissemination in potato productionin Meru county
Although Mobile SMS was not the main source of information, when farmers were askedthe preferred method of choice for information dissemination in case of an outbreak ofblackleg, soft rots and BRR, the majority preferred use of mobile messages followed byextension (Figure 5.20).
55| Page
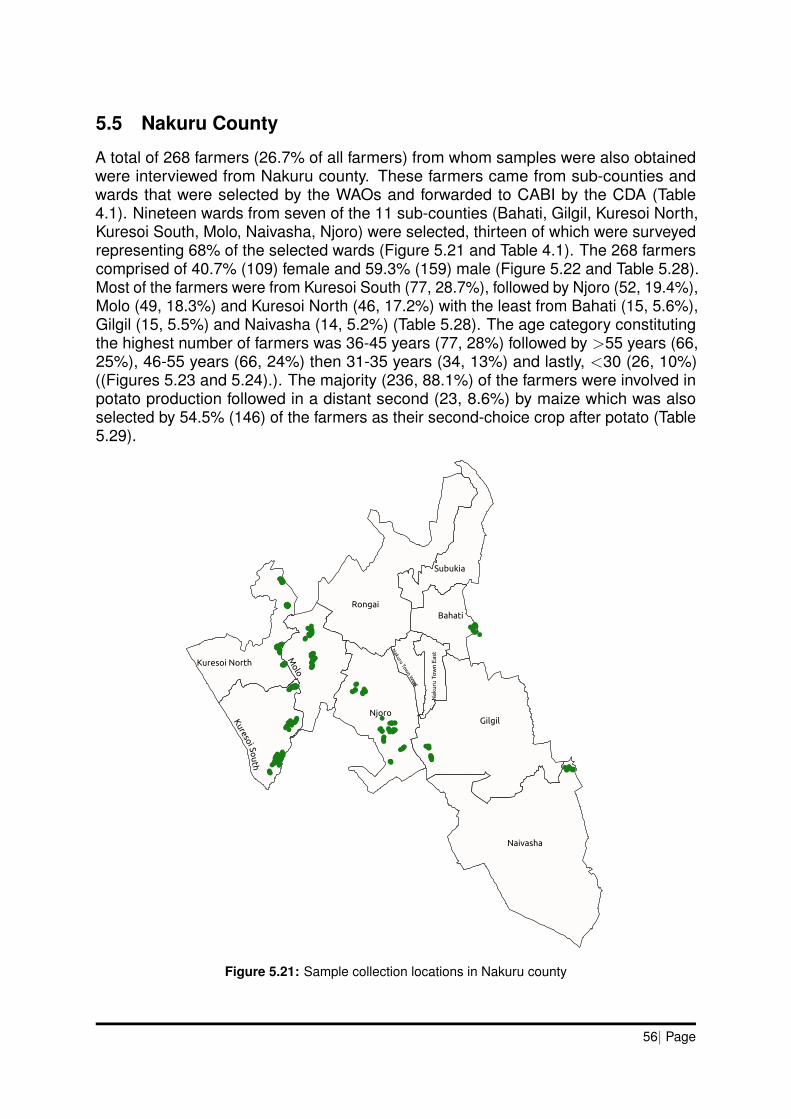
5.5 Nakuru County
A total of 268 farmers (26.7% of all farmers) from whom samples were also obtainedwere interviewed from Nakuru county. These farmers came from sub-counties andwards that were selected by the WAOs and forwarded to CABI by the CDA (Table4.1). Nineteen wards from seven of the 11 sub-counties (Bahati, Gilgil, Kuresoi North,Kuresoi South, Molo, Naivasha, Njoro) were selected, thirteen of which were surveyedrepresenting 68% of the selected wards (Figure 5.21 and Table 4.1). The 268 farmerscomprised of 40.7% (109) female and 59.3% (159) male (Figure 5.22 and Table 5.28).Most of the farmers were from Kuresoi South (77, 28.7%), followed by Njoro (52, 19.4%),Molo (49, 18.3%) and Kuresoi North (46, 17.2%) with the least from Bahati (15, 5.6%),Gilgil (15, 5.5%) and Naivasha (14, 5.2%) (Table 5.28). The age category constitutingthe highest number of farmers was 36-45 years (77, 28%) followed by >55 years (66,25%), 46-55 years (66, 24%) then 31-35 years (34, 13%) and lastly, <30 (26, 10%)((Figures 5.23 and 5.24).). The majority (236, 88.1%) of the farmers were involved inpotato production followed in a distant second (23, 8.6%) by maize which was alsoselected by 54.5% (146) of the farmers as their second-choice crop after potato (Table5.29).
Figure 5.21: Sample collection locations in Nakuru county
56| Page
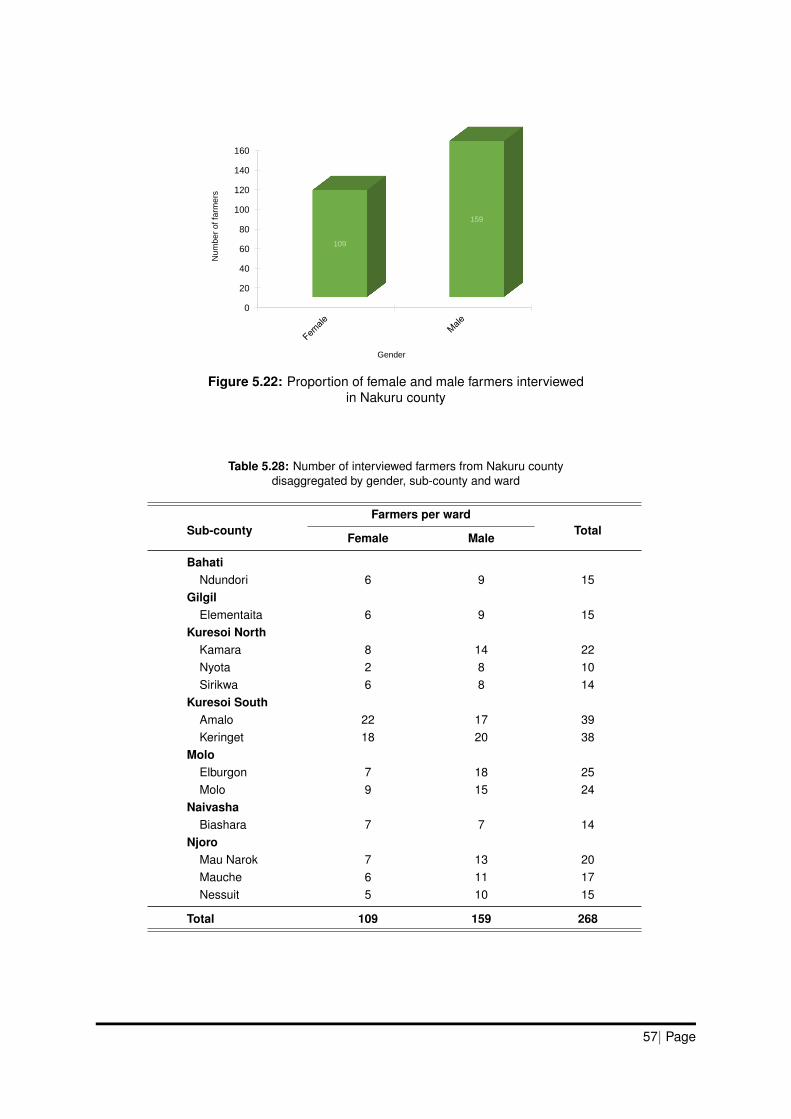
0
20
40
60
80
100
120
140
160
109
159N
um
ber
of fa
rmers
Gender
Figure 5.22: Proportion of female and male farmers interviewedin Nakuru county
Table 5.28: Number of interviewed farmers from Nakuru countydisaggregated by gender, sub-county and ward
Sub-countyFarmers per ward
TotalFemale Male
BahatiNdundori 6 9 15
GilgilElementaita 6 9 15
Kuresoi NorthKamara 8 14 22Nyota 2 8 10Sirikwa 6 8 14
Kuresoi SouthAmalo 22 17 39Keringet 18 20 38
MoloElburgon 7 18 25Molo 9 15 24
NaivashaBiashara 7 7 14
NjoroMau Narok 7 13 20Mauche 6 11 17Nessuit 5 10 15
Total 109 159 268
57| Page
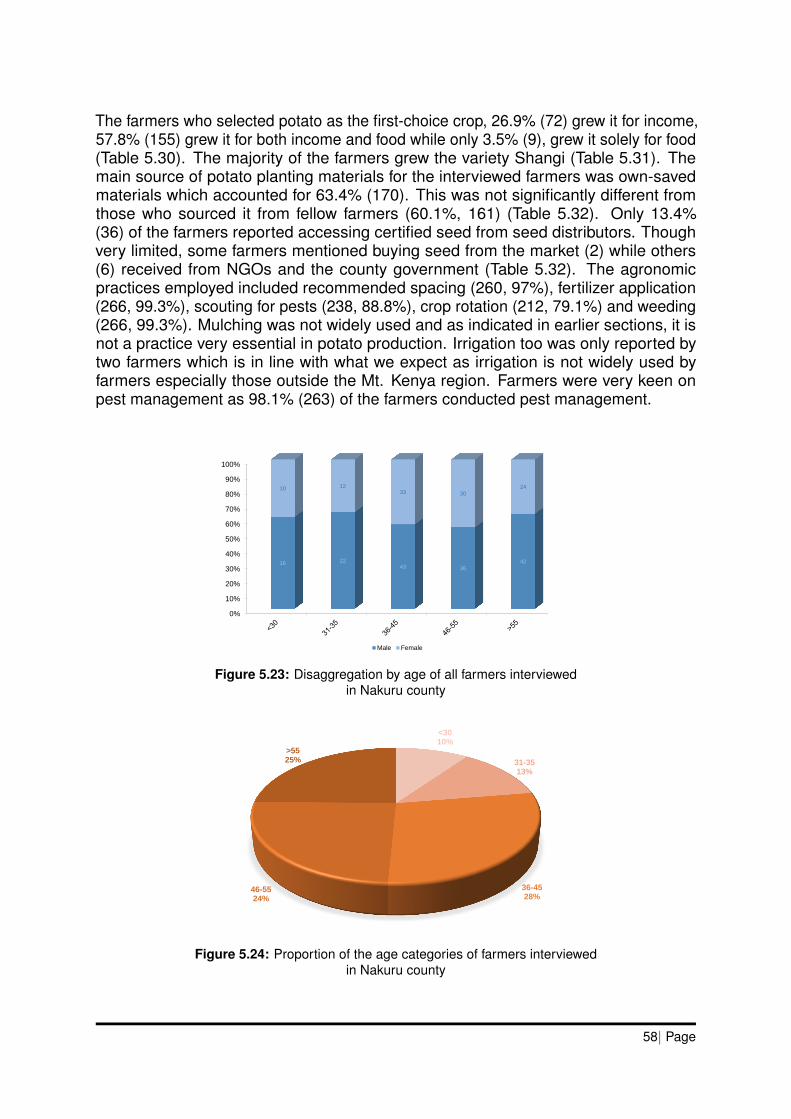
The farmers who selected potato as the first-choice crop, 26.9% (72) grew it for income,57.8% (155) grew it for both income and food while only 3.5% (9), grew it solely for food(Table 5.30). The majority of the farmers grew the variety Shangi (Table 5.31). Themain source of potato planting materials for the interviewed farmers was own-savedmaterials which accounted for 63.4% (170). This was not significantly different fromthose who sourced it from fellow farmers (60.1%, 161) (Table 5.32). Only 13.4%(36) of the farmers reported accessing certified seed from seed distributors. Thoughvery limited, some farmers mentioned buying seed from the market (2) while others(6) received from NGOs and the county government (Table 5.32). The agronomicpractices employed included recommended spacing (260, 97%), fertilizer application(266, 99.3%), scouting for pests (238, 88.8%), crop rotation (212, 79.1%) and weeding(266, 99.3%). Mulching was not widely used and as indicated in earlier sections, it isnot a practice very essential in potato production. Irrigation too was only reported bytwo farmers which is in line with what we expect as irrigation is not widely used byfarmers especially those outside the Mt. Kenya region. Farmers were very keen onpest management as 98.1% (263) of the farmers conducted pest management.
0%
10%
20%
30%
40%
50%
60%
70%
80%
90%
100%
16 2243 36
42
10 1233 30
24
Male Female
Figure 5.23: Disaggregation by age of all farmers interviewedin Nakuru county
<3010%
31-3513%
36-4528%
46-5524%
>5525%
Figure 5.24: Proportion of the age categories of farmers interviewedin Nakuru county
58| Page
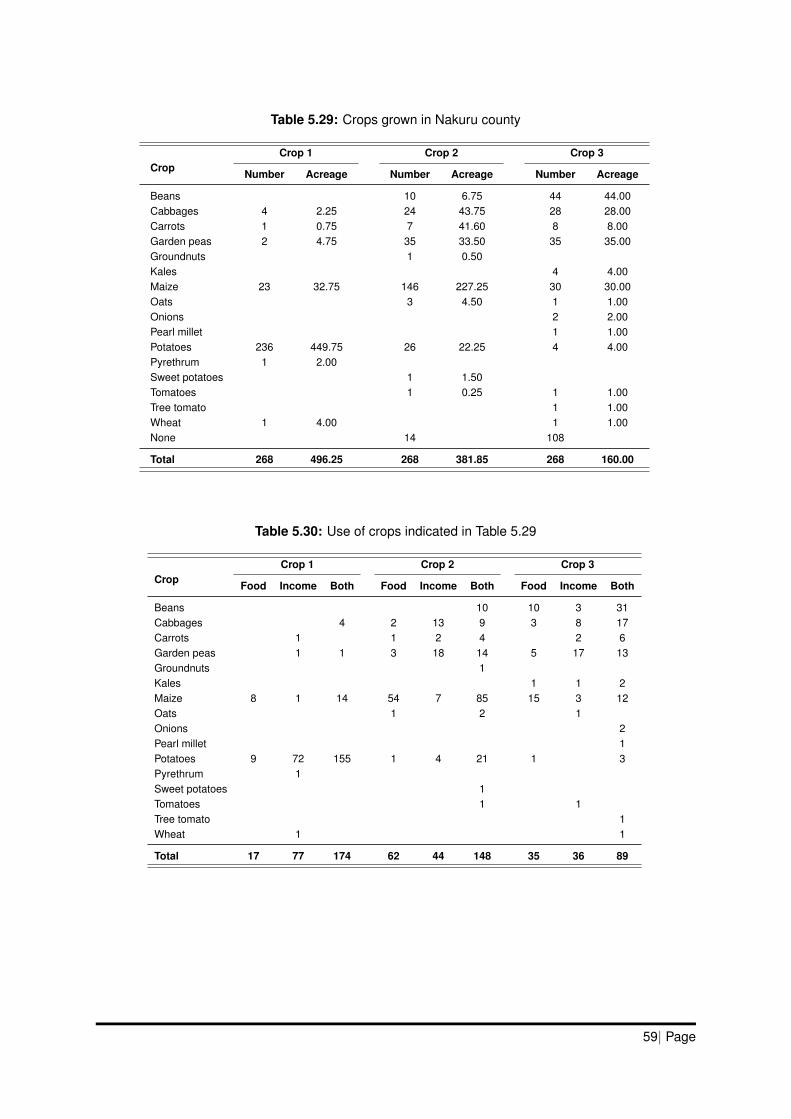
Table 5.29: Crops grown in Nakuru county
CropCrop 1 Crop 2 Crop 3
Number Acreage Number Acreage Number Acreage
Beans 10 6.75 44 44.00Cabbages 4 2.25 24 43.75 28 28.00Carrots 1 0.75 7 41.60 8 8.00Garden peas 2 4.75 35 33.50 35 35.00Groundnuts 1 0.50Kales 4 4.00Maize 23 32.75 146 227.25 30 30.00Oats 3 4.50 1 1.00Onions 2 2.00Pearl millet 1 1.00Potatoes 236 449.75 26 22.25 4 4.00Pyrethrum 1 2.00Sweet potatoes 1 1.50Tomatoes 1 0.25 1 1.00Tree tomato 1 1.00Wheat 1 4.00 1 1.00None 14 108
Total 268 496.25 268 381.85 268 160.00
Table 5.30: Use of crops indicated in Table 5.29
CropCrop 1 Crop 2 Crop 3
Food Income Both Food Income Both Food Income Both
Beans 10 10 3 31Cabbages 4 2 13 9 3 8 17Carrots 1 1 2 4 2 6Garden peas 1 1 3 18 14 5 17 13Groundnuts 1Kales 1 1 2Maize 8 1 14 54 7 85 15 3 12Oats 1 2 1Onions 2Pearl millet 1Potatoes 9 72 155 1 4 21 1 3Pyrethrum 1Sweet potatoes 1Tomatoes 1 1Tree tomato 1Wheat 1 1
Total 17 77 174 62 44 148 35 36 89
59| Page
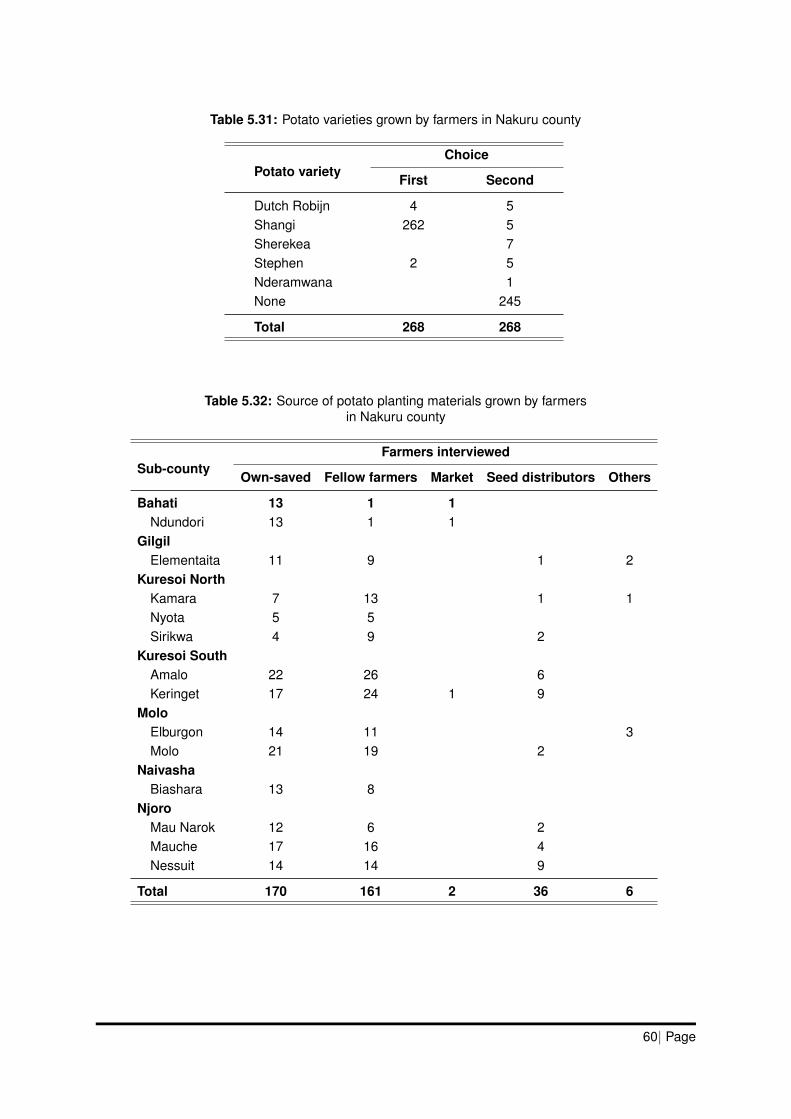
Table 5.31: Potato varieties grown by farmers in Nakuru county
Potato varietyChoice
First Second
Dutch Robijn 4 5Shangi 262 5Sherekea 7Stephen 2 5Nderamwana 1None 245
Total 268 268
Table 5.32: Source of potato planting materials grown by farmersin Nakuru county
Sub-countyFarmers interviewed
Own-saved Fellow farmers Market Seed distributors Others
Bahati 13 1 1Ndundori 13 1 1
GilgilElementaita 11 9 1 2
Kuresoi NorthKamara 7 13 1 1Nyota 5 5Sirikwa 4 9 2
Kuresoi SouthAmalo 22 26 6Keringet 17 24 1 9
MoloElburgon 14 11 3Molo 21 19 2
NaivashaBiashara 13 8
NjoroMau Narok 12 6 2Mauche 17 16 4Nessuit 14 14 9
Total 170 161 2 36 6
60| Page
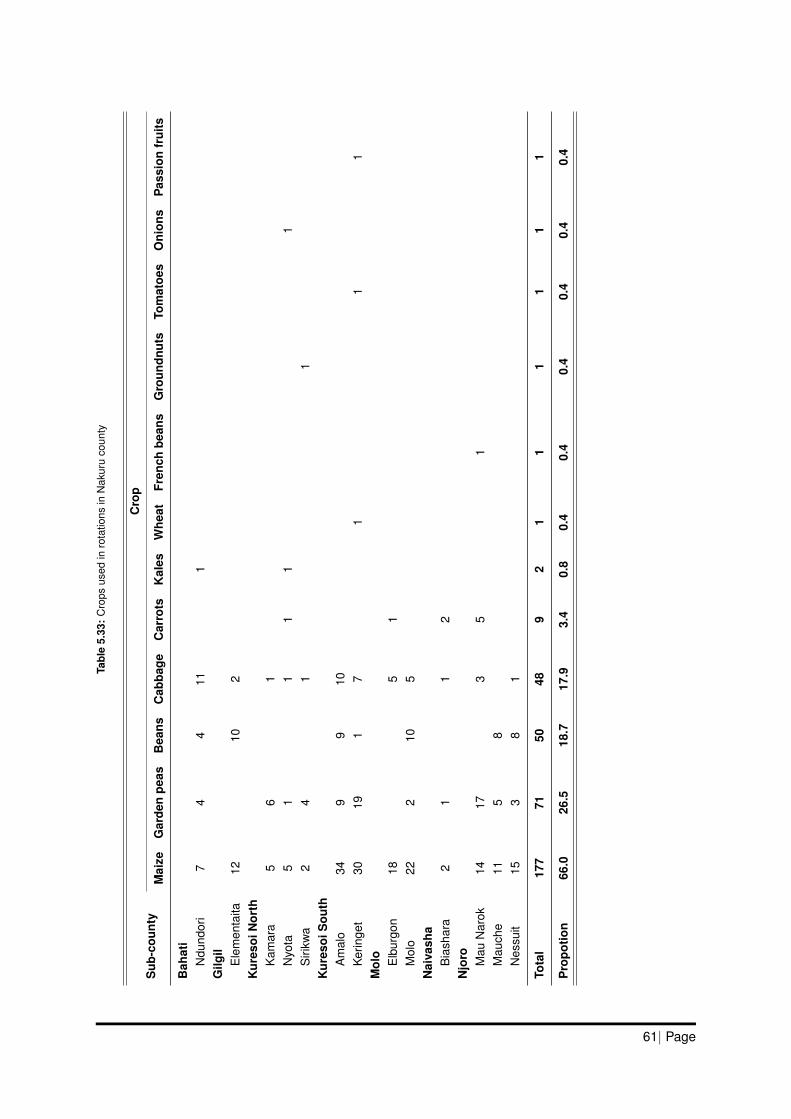
Tabl
e5.
33:
Cro
psus
edin
rota
tions
inN
akur
uco
unty
Sub
-cou
nty
Cro
p
Mai
zeG
arde
npe
asB
eans
Cab
bage
Car
rots
Kal
esW
heat
Fren
chbe
ans
Gro
undn
uts
Tom
atoe
sO
nion
sP
assi
onfr
uits
Bah
ati
Ndu
ndor
i7
44
111
Gilg
ilE
lem
enta
ita12
102
Kur
esoi
Nor
thK
amar
a5
61
Nyo
ta5
11
11
1S
irikw
a2
41
1K
ures
oiS
outh
Am
alo
349
910
Ker
inge
t30
191
71
11
Mol
oE
lbur
gon
185
1M
olo
222
105
Nai
vash
aB
iash
ara
21
12
Njo
ro Mau
Nar
ok14
173
51
Mau
che
115
8N
essu
it15
38
1
Tota
l17
771
5048
92
11
11
11
Pro
potio
n66
.026
.518
.717
.93.
40.
80.
40.
40.
40.
40.
40.
4
61| Page
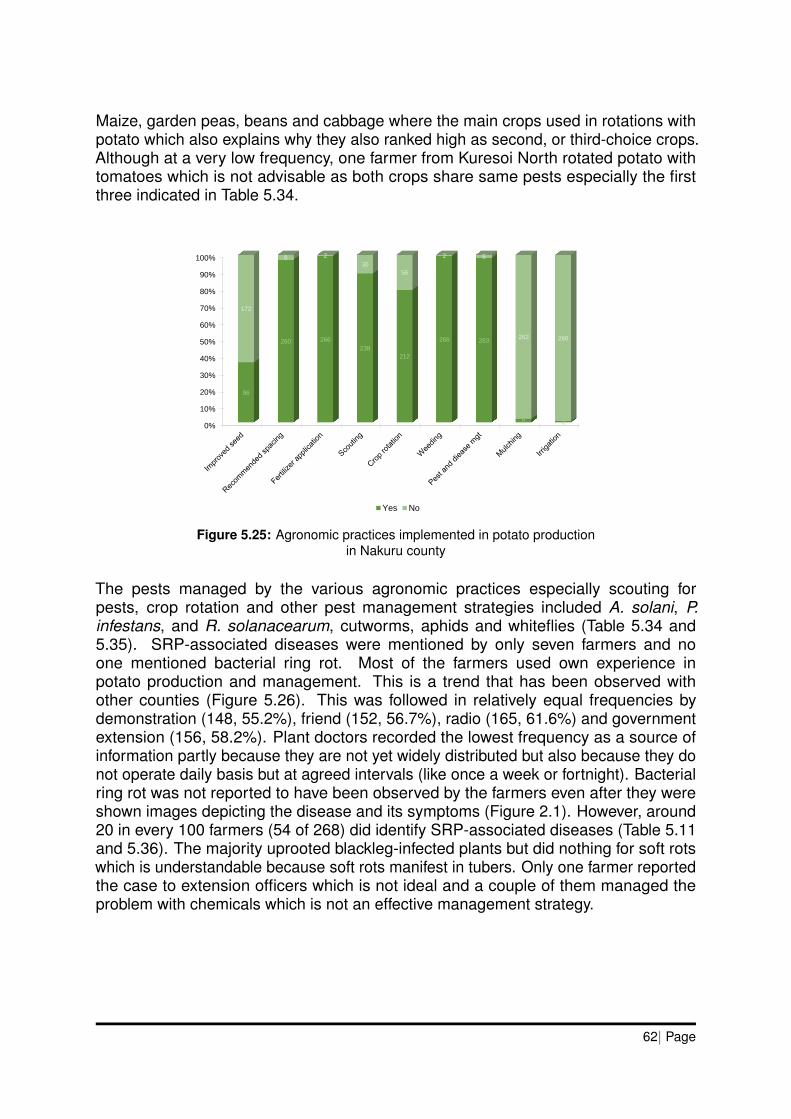
Maize, garden peas, beans and cabbage where the main crops used in rotations withpotato which also explains why they also ranked high as second, or third-choice crops.Although at a very low frequency, one farmer from Kuresoi North rotated potato withtomatoes which is not advisable as both crops share same pests especially the firstthree indicated in Table 5.34.
0%
10%
20%
30%
40%
50%
60%
70%
80%
90%
100%
96
260 266
238
212
266 263
6 2
172
8 2
30
56
2 5
262 266
Yes No
Figure 5.25: Agronomic practices implemented in potato productionin Nakuru county
The pests managed by the various agronomic practices especially scouting forpests, crop rotation and other pest management strategies included A. solani, P.infestans, and R. solanacearum, cutworms, aphids and whiteflies (Table 5.34 and5.35). SRP-associated diseases were mentioned by only seven farmers and noone mentioned bacterial ring rot. Most of the farmers used own experience inpotato production and management. This is a trend that has been observed withother counties (Figure 5.26). This was followed in relatively equal frequencies bydemonstration (148, 55.2%), friend (152, 56.7%), radio (165, 61.6%) and governmentextension (156, 58.2%). Plant doctors recorded the lowest frequency as a source ofinformation partly because they are not yet widely distributed but also because they donot operate daily basis but at agreed intervals (like once a week or fortnight). Bacterialring rot was not reported to have been observed by the farmers even after they wereshown images depicting the disease and its symptoms (Figure 2.1). However, around20 in every 100 farmers (54 of 268) did identify SRP-associated diseases (Table 5.11and 5.36). The majority uprooted blackleg-infected plants but did nothing for soft rotswhich is understandable because soft rots manifest in tubers. Only one farmer reportedthe case to extension officers which is not ideal and a couple of them managed theproblem with chemicals which is not an effective management strategy.
62| Page

Table 5.34: Pathogenic organisms managed by the agronomic practicesindicated in Figure 5.25
Sub-countyPathogenic organisms
P. infestans A. solani R. solanacearum SRP-associated Viruses
BahatiNdundori 15 15
GilgilElementaita 15 9 6
Kuresoi NorthKamara 18 2 7Nyota 6 2Sirikwa 12 2 3
Kuresoi SouthAmalo 37 38 29Keringet 38 38 12 1
MoloElburgon 21 12 6 1Molo 22 22 21
NaivashaBiashara 12 5 7 2
NjoroMau Narok 20 20 1Mauche 17 15 4Nessuit 15 8 2
Total 248 165 115 7 3
Proportion (%) 92.5 61.6 42.9 2.6 1.1
Table 5.35: Insects managed by the agronomic practicesindicated in Figure 5.25
Sub-countyInsects
Cutworms Aphids Whiteflies Tuber moth Thrips Spider mites
BahatiNdundori 2 2
GilgilElementaita 1
Kuresoi NorthKamara 7 4 1Nyota 3 1 1Sirikwa 3 4 1
Kuresoi SouthAmaloKeringet 2 3 4
MoloElburgon 4 5 10 1 1Molo 1 1 4 1
NaivashaBiashara 1
NjoroMau Narok 2 3 3 1Mauche 1Nessuit 1 2 1
Total 26 21 20 11 3 1
Proportion (%) 21.31 17.21 16.39 9.02 2.46 0.82
63| Page
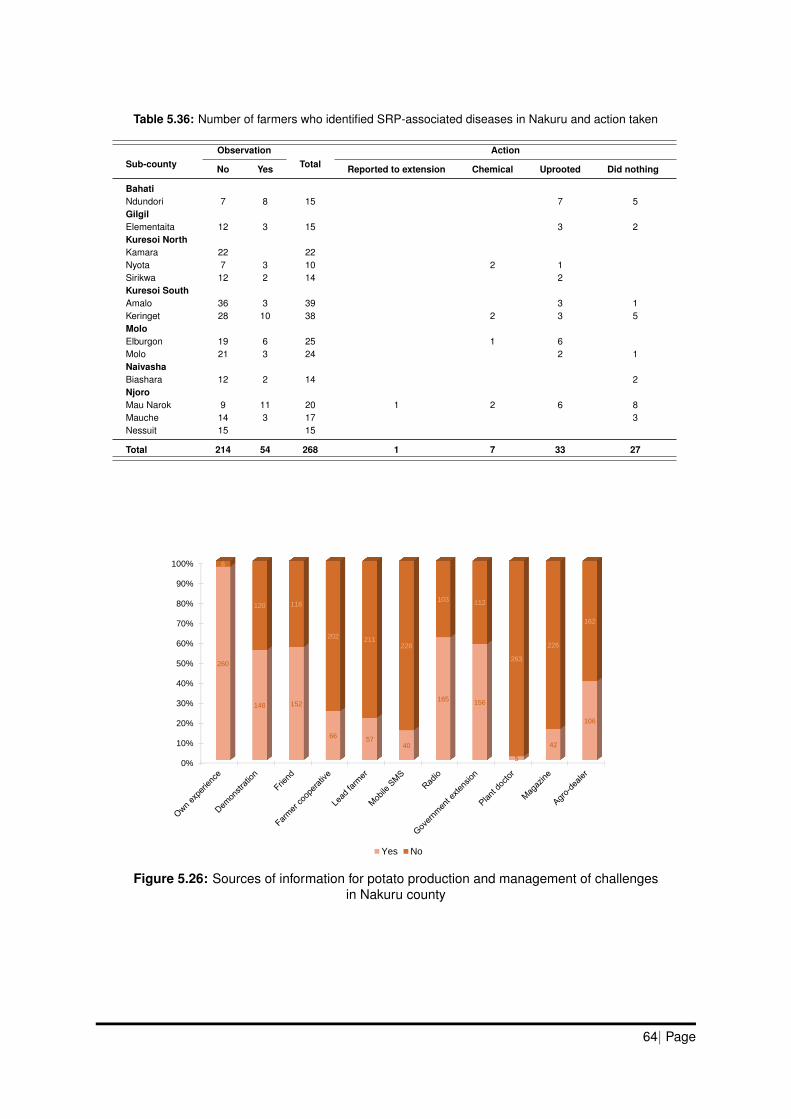
Table 5.36: Number of farmers who identified SRP-associated diseases in Nakuru and action taken
Sub-countyObservation
TotalAction
No Yes Reported to extension Chemical Uprooted Did nothing
BahatiNdundori 7 8 15 7 5GilgilElementaita 12 3 15 3 2Kuresoi NorthKamara 22 22Nyota 7 3 10 2 1Sirikwa 12 2 14 2Kuresoi SouthAmalo 36 3 39 3 1Keringet 28 10 38 2 3 5MoloElburgon 19 6 25 1 6Molo 21 3 24 2 1NaivashaBiashara 12 2 14 2NjoroMau Narok 9 11 20 1 2 6 8Mauche 14 3 17 3Nessuit 15 15
Total 214 54 268 1 7 33 27
0%
10%
20%
30%
40%
50%
60%
70%
80%
90%
100% 8
120 116
202211
228
103112
263
226
162
260
148 152
6657
40
165156
5
42
106
Yes No
Figure 5.26: Sources of information for potato production and management of challengesin Nakuru county
64| Page
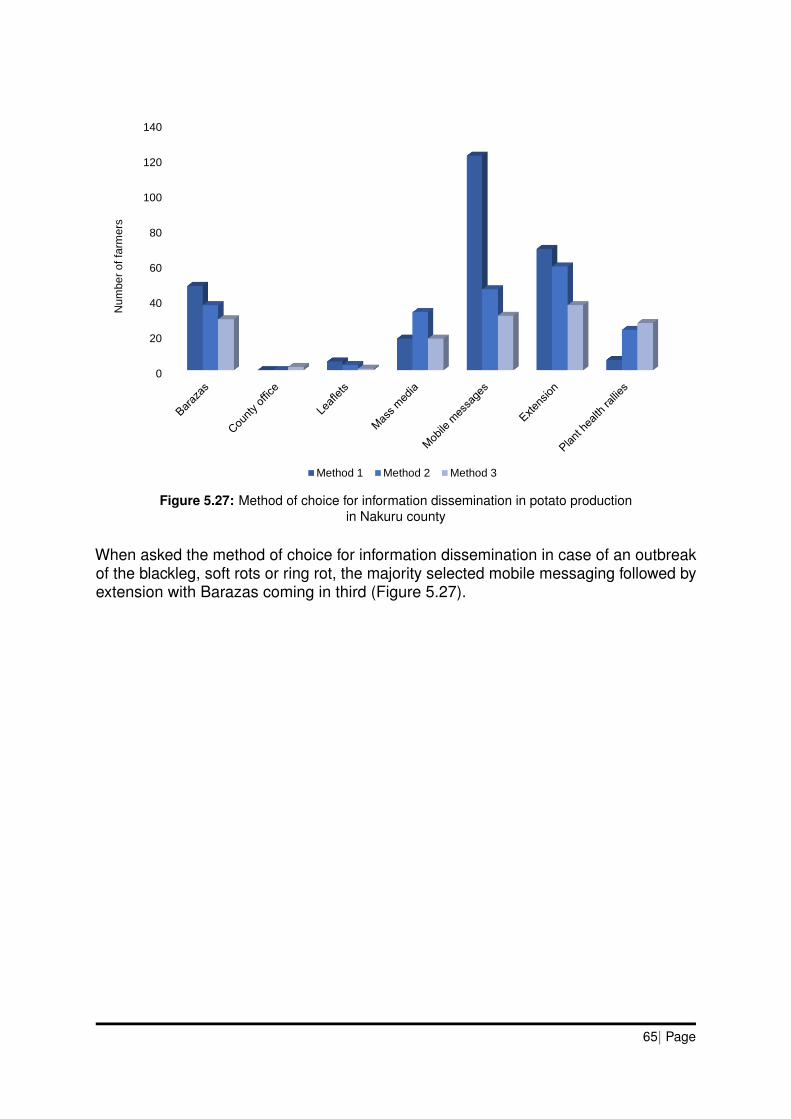
0
20
40
60
80
100
120
140N
um
ber
of
farm
ers
Method 1 Method 2 Method 3
Figure 5.27: Method of choice for information dissemination in potato productionin Nakuru county
When asked the method of choice for information dissemination in case of an outbreakof the blackleg, soft rots or ring rot, the majority selected mobile messaging followed byextension with Barazas coming in third (Figure 5.27).
65| Page
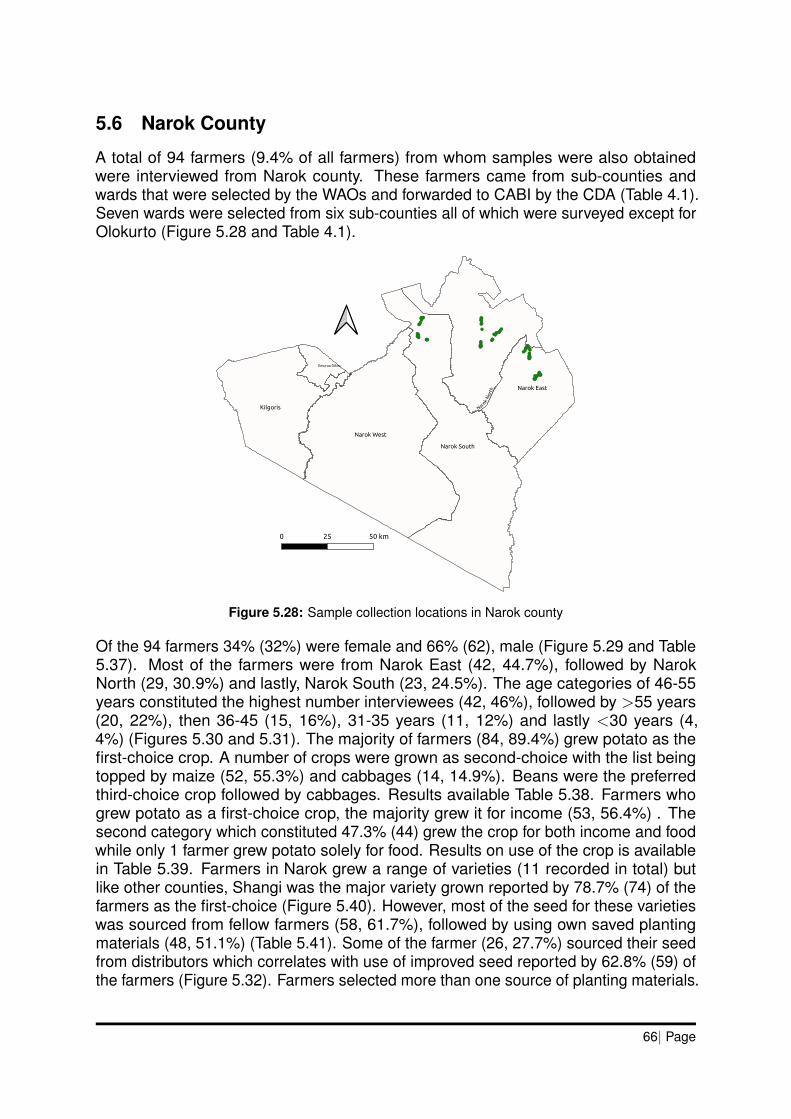
5.6 Narok County
A total of 94 farmers (9.4% of all farmers) from whom samples were also obtainedwere interviewed from Narok county. These farmers came from sub-counties andwards that were selected by the WAOs and forwarded to CABI by the CDA (Table 4.1).Seven wards were selected from six sub-counties all of which were surveyed except forOlokurto (Figure 5.28 and Table 4.1).
Figure 5.28: Sample collection locations in Narok county
Of the 94 farmers 34% (32%) were female and 66% (62), male (Figure 5.29 and Table5.37). Most of the farmers were from Narok East (42, 44.7%), followed by NarokNorth (29, 30.9%) and lastly, Narok South (23, 24.5%). The age categories of 46-55years constituted the highest number interviewees (42, 46%), followed by >55 years(20, 22%), then 36-45 (15, 16%), 31-35 years (11, 12%) and lastly <30 years (4,4%) (Figures 5.30 and 5.31). The majority of farmers (84, 89.4%) grew potato as thefirst-choice crop. A number of crops were grown as second-choice with the list beingtopped by maize (52, 55.3%) and cabbages (14, 14.9%). Beans were the preferredthird-choice crop followed by cabbages. Results available Table 5.38. Farmers whogrew potato as a first-choice crop, the majority grew it for income (53, 56.4%) . Thesecond category which constituted 47.3% (44) grew the crop for both income and foodwhile only 1 farmer grew potato solely for food. Results on use of the crop is availablein Table 5.39. Farmers in Narok grew a range of varieties (11 recorded in total) butlike other counties, Shangi was the major variety grown reported by 78.7% (74) of thefarmers as the first-choice (Figure 5.40). However, most of the seed for these varietieswas sourced from fellow farmers (58, 61.7%), followed by using own saved plantingmaterials (48, 51.1%) (Table 5.41). Some of the farmer (26, 27.7%) sourced their seedfrom distributors which correlates with use of improved seed reported by 62.8% (59) ofthe farmers (Figure 5.32). Farmers selected more than one source of planting materials.
66| Page

0
10
20
30
40
50
60
70
32
62
Nu
mb
er
of fa
rme
rs
Gender
Figure 5.29: Proportion of female and male farmers interviewedin Narok county
Table 5.37: Number of interviewed farmers from Narok countydisaggregated by gender, sub-county and ward
Sub-countyFarmers per ward
TotalFemale Male
Narok EastIidamat 10 11 21Keekonyokie 7 14 21
Narok NorthMelili 1 12 13Oloropil 6 10 16
Narok SouthSagamian 5 6 11Sogoo 3 9 12
Total 32 62 94
0%
10%
20%
30%
40%
50%
60%
70%
80%
90%
100%
2
7
8
29 14
2
4
7
13 6
Male Female
Figure 5.30: Disaggregation by age of all farmers interviewedin Narok county
67| Page
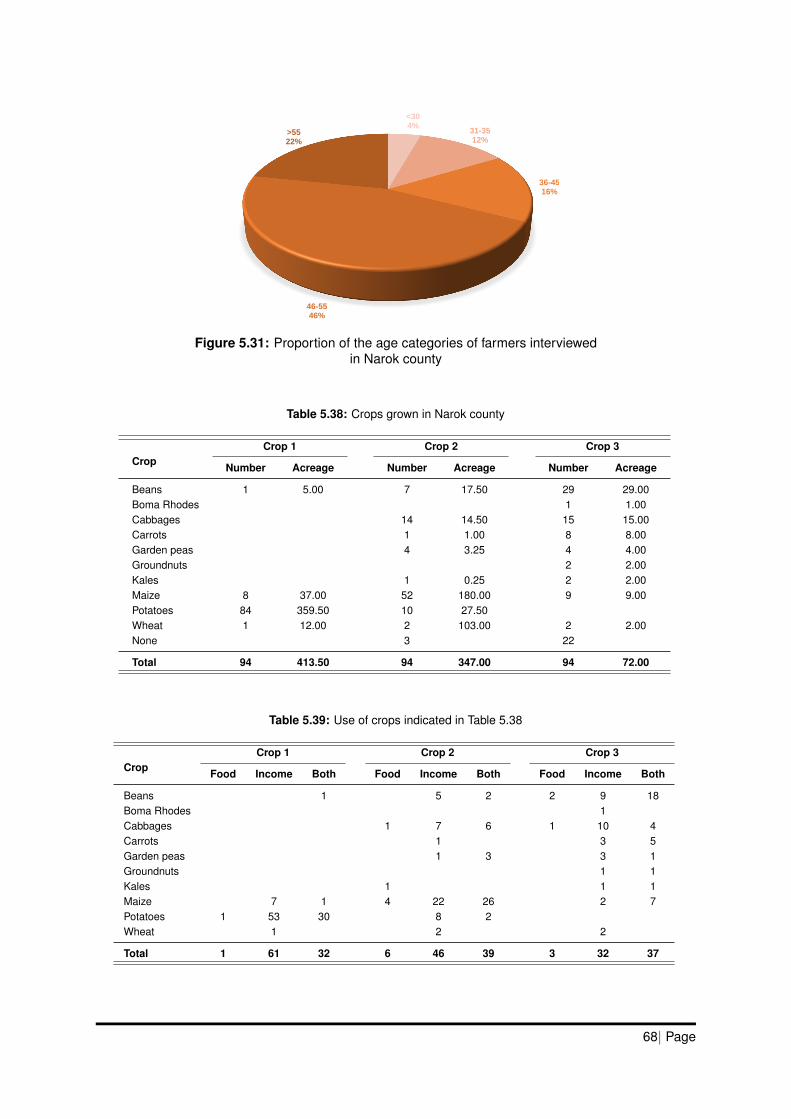
<304%
31-3512%
36-4516%
46-5546%
>5522%
Figure 5.31: Proportion of the age categories of farmers interviewedin Narok county
Table 5.38: Crops grown in Narok county
CropCrop 1 Crop 2 Crop 3
Number Acreage Number Acreage Number Acreage
Beans 1 5.00 7 17.50 29 29.00Boma Rhodes 1 1.00Cabbages 14 14.50 15 15.00Carrots 1 1.00 8 8.00Garden peas 4 3.25 4 4.00Groundnuts 2 2.00Kales 1 0.25 2 2.00Maize 8 37.00 52 180.00 9 9.00Potatoes 84 359.50 10 27.50Wheat 1 12.00 2 103.00 2 2.00None 3 22
Total 94 413.50 94 347.00 94 72.00
Table 5.39: Use of crops indicated in Table 5.38
CropCrop 1 Crop 2 Crop 3
Food Income Both Food Income Both Food Income Both
Beans 1 5 2 2 9 18Boma Rhodes 1Cabbages 1 7 6 1 10 4Carrots 1 3 5Garden peas 1 3 3 1Groundnuts 1 1Kales 1 1 1Maize 7 1 4 22 26 2 7Potatoes 1 53 30 8 2Wheat 1 2 2
Total 1 61 32 6 46 39 3 32 37
68| Page

Table 5.40: Potato varieties grown by farmers in Narok county
Potato varietyChoice
First Second Third
Destiny 1 3Dutch Robijn 18 3Jelly 1 1Manitou 1 1Markies 1 3 1Nyayo 1Panamera 2 1Rudolph 1Shangi 74 5Sherekea 2Voyager 3None 73 86
Total 94 94 94
Table 5.41: Source of potato planting materials grown by farmers in Narok county
Sub-countySource
Own saved Fellow farmers Market Seed distributors
Narok EastIidamat 17 12 3Keekonyokie 12 11 2 9
Narok NorthMelili 8 11 4Oloropil 9 9 4
Narok SouthSagamian 9 3 2Sogoo 2 6 4
Total 48 58 5 26
69| Page
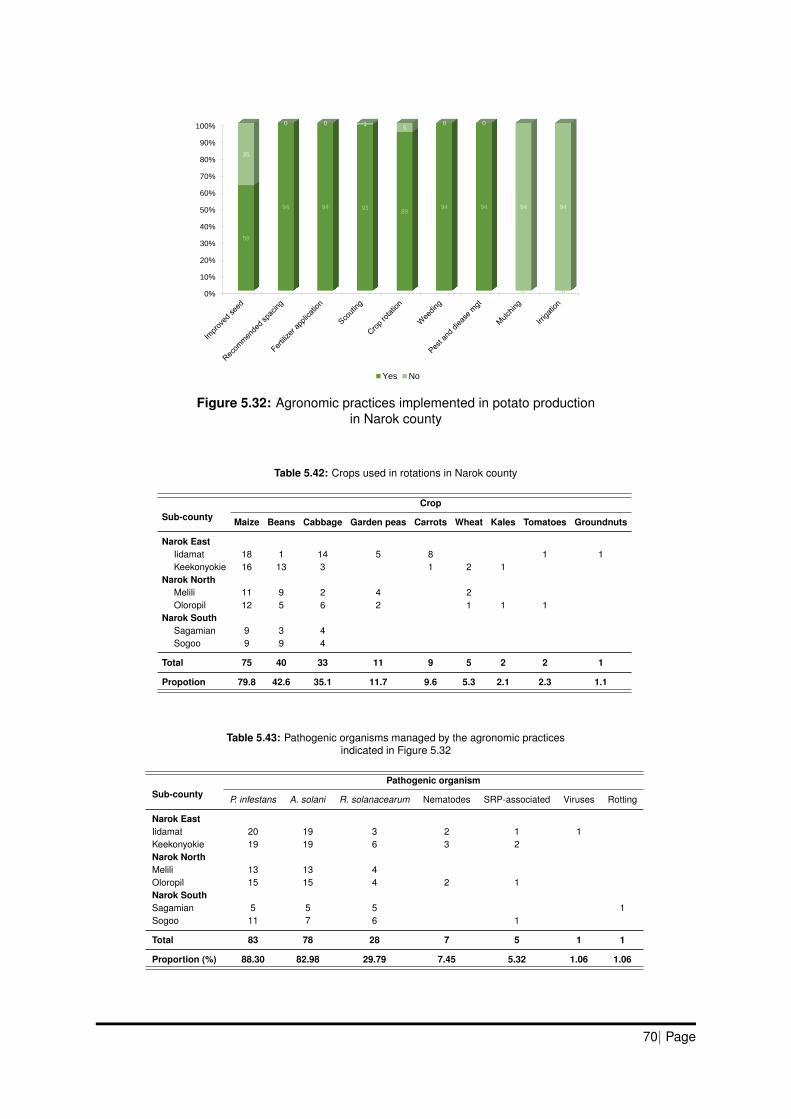
0%
10%
20%
30%
40%
50%
60%
70%
80%
90%
100%
59
94 94 9389
94 94
0 0
35
0 0 15
0 0
94 94
Yes No
Figure 5.32: Agronomic practices implemented in potato productionin Narok county
Table 5.42: Crops used in rotations in Narok county
Sub-countyCrop
Maize Beans Cabbage Garden peas Carrots Wheat Kales Tomatoes Groundnuts
Narok EastIidamat 18 1 14 5 8 1 1Keekonyokie 16 13 3 1 2 1
Narok NorthMelili 11 9 2 4 2Oloropil 12 5 6 2 1 1 1
Narok SouthSagamian 9 3 4Sogoo 9 9 4
Total 75 40 33 11 9 5 2 2 1
Propotion 79.8 42.6 35.1 11.7 9.6 5.3 2.1 2.3 1.1
Table 5.43: Pathogenic organisms managed by the agronomic practicesindicated in Figure 5.32
Sub-countyPathogenic organism
P. infestans A. solani R. solanacearum Nematodes SRP-associated Viruses Rotting
Narok EastIidamat 20 19 3 2 1 1Keekonyokie 19 19 6 3 2Narok NorthMelili 13 13 4Oloropil 15 15 4 2 1Narok SouthSagamian 5 5 5 1Sogoo 11 7 6 1
Total 83 78 28 7 5 1 1
Proportion (%) 88.30 82.98 29.79 7.45 5.32 1.06 1.06
70| Page
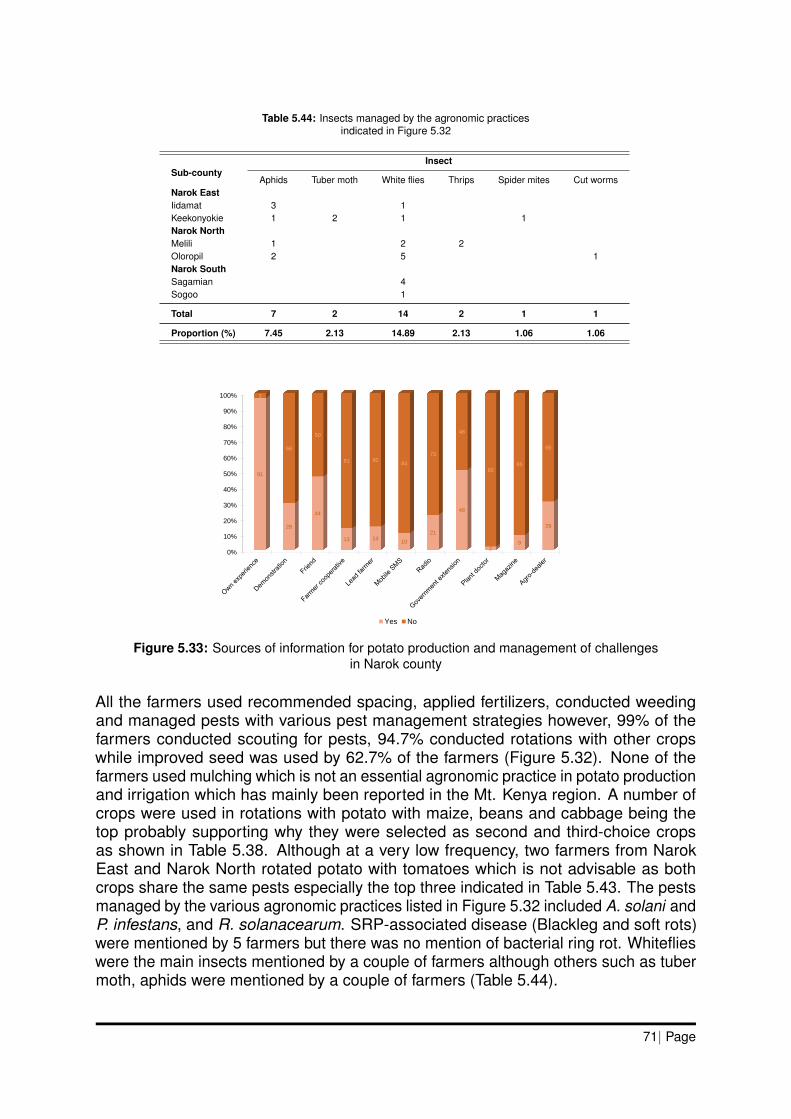
Table 5.44: Insects managed by the agronomic practicesindicated in Figure 5.32
Sub-countyInsect
Aphids Tuber moth White flies Thrips Spider mites Cut wormsNarok EastIidamat 3 1Keekonyokie 1 2 1 1Narok NorthMelili 1 2 2Oloropil 2 5 1Narok SouthSagamian 4Sogoo 1
Total 7 2 14 2 1 1
Proportion (%) 7.45 2.13 14.89 2.13 1.06 1.06
0%
10%
20%
30%
40%
50%
60%
70%
80%
90%
100% 3
66
50
81 8084
73
46
9285
65
91
28
44
13 1410
21
48
29
29
Yes No
Figure 5.33: Sources of information for potato production and management of challengesin Narok county
All the farmers used recommended spacing, applied fertilizers, conducted weedingand managed pests with various pest management strategies however, 99% of thefarmers conducted scouting for pests, 94.7% conducted rotations with other cropswhile improved seed was used by 62.7% of the farmers (Figure 5.32). None of thefarmers used mulching which is not an essential agronomic practice in potato productionand irrigation which has mainly been reported in the Mt. Kenya region. A number ofcrops were used in rotations with potato with maize, beans and cabbage being thetop probably supporting why they were selected as second and third-choice cropsas shown in Table 5.38. Although at a very low frequency, two farmers from NarokEast and Narok North rotated potato with tomatoes which is not advisable as bothcrops share the same pests especially the top three indicated in Table 5.43. The pestsmanaged by the various agronomic practices listed in Figure 5.32 included A. solani andP. infestans, and R. solanacearum. SRP-associated disease (Blackleg and soft rots)were mentioned by 5 farmers but there was no mention of bacterial ring rot. Whiteflieswere the main insects mentioned by a couple of farmers although others such as tubermoth, aphids were mentioned by a couple of farmers (Table 5.44).
71| Page
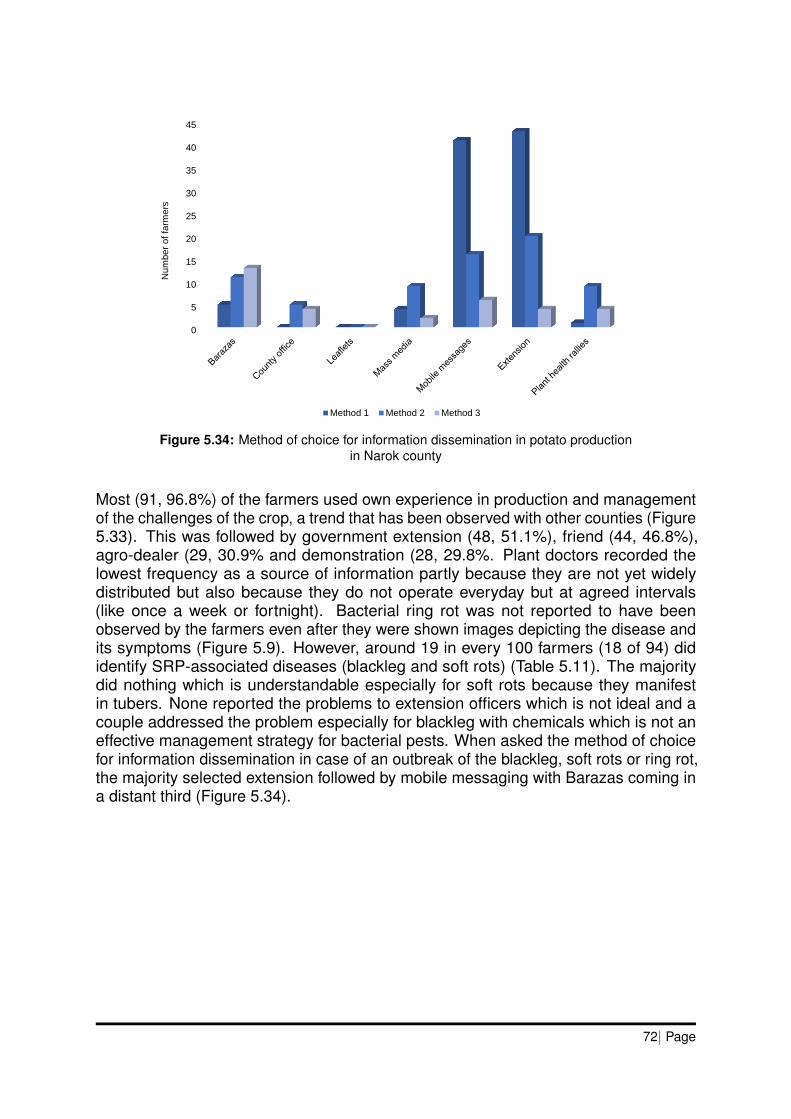
0
5
10
15
20
25
30
35
40
45
Nu
mb
er
of
farm
ers
Method 1 Method 2 Method 3
Figure 5.34: Method of choice for information dissemination in potato productionin Narok county
Most (91, 96.8%) of the farmers used own experience in production and managementof the challenges of the crop, a trend that has been observed with other counties (Figure5.33). This was followed by government extension (48, 51.1%), friend (44, 46.8%),agro-dealer (29, 30.9% and demonstration (28, 29.8%. Plant doctors recorded thelowest frequency as a source of information partly because they are not yet widelydistributed but also because they do not operate everyday but at agreed intervals(like once a week or fortnight). Bacterial ring rot was not reported to have beenobserved by the farmers even after they were shown images depicting the disease andits symptoms (Figure 5.9). However, around 19 in every 100 farmers (18 of 94) dididentify SRP-associated diseases (blackleg and soft rots) (Table 5.11). The majoritydid nothing which is understandable especially for soft rots because they manifestin tubers. None reported the problems to extension officers which is not ideal and acouple addressed the problem especially for blackleg with chemicals which is not aneffective management strategy for bacterial pests. When asked the method of choicefor information dissemination in case of an outbreak of the blackleg, soft rots or ring rot,the majority selected extension followed by mobile messaging with Barazas coming ina distant third (Figure 5.34).
72| Page
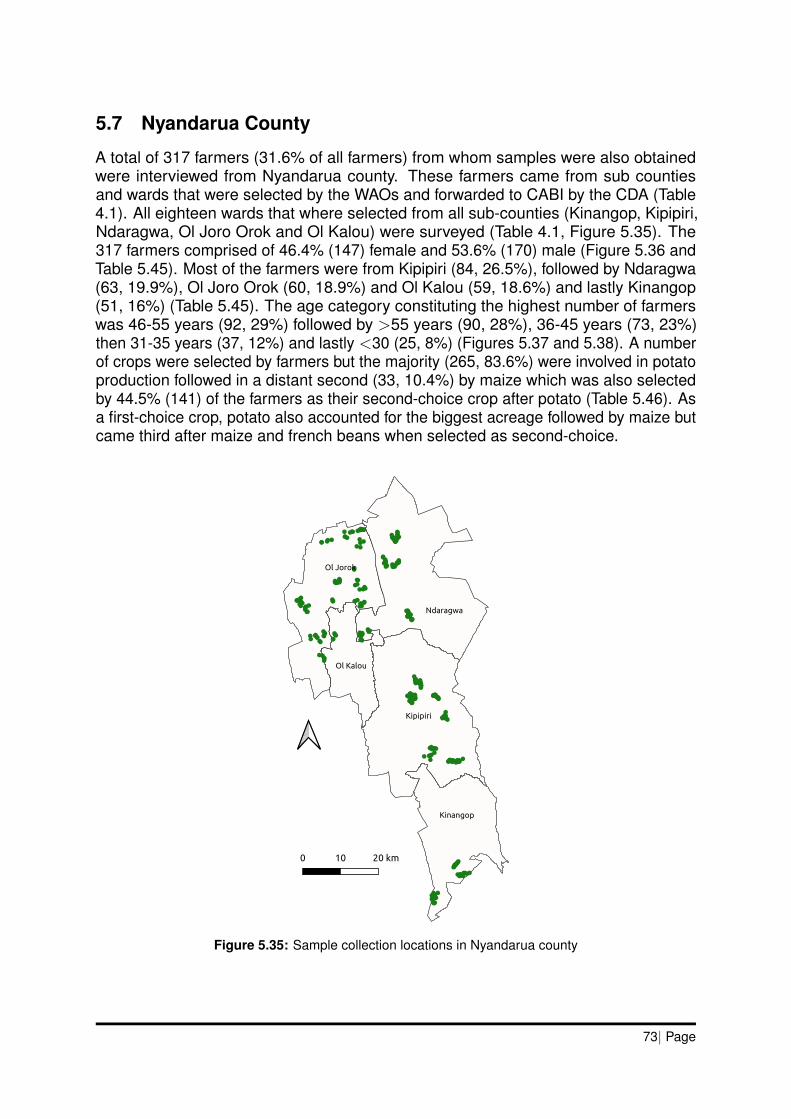
5.7 Nyandarua County
A total of 317 farmers (31.6% of all farmers) from whom samples were also obtainedwere interviewed from Nyandarua county. These farmers came from sub countiesand wards that were selected by the WAOs and forwarded to CABI by the CDA (Table4.1). All eighteen wards that where selected from all sub-counties (Kinangop, Kipipiri,Ndaragwa, Ol Joro Orok and Ol Kalou) were surveyed (Table 4.1, Figure 5.35). The317 farmers comprised of 46.4% (147) female and 53.6% (170) male (Figure 5.36 andTable 5.45). Most of the farmers were from Kipipiri (84, 26.5%), followed by Ndaragwa(63, 19.9%), Ol Joro Orok (60, 18.9%) and Ol Kalou (59, 18.6%) and lastly Kinangop(51, 16%) (Table 5.45). The age category constituting the highest number of farmerswas 46-55 years (92, 29%) followed by >55 years (90, 28%), 36-45 years (73, 23%)then 31-35 years (37, 12%) and lastly <30 (25, 8%) (Figures 5.37 and 5.38). A numberof crops were selected by farmers but the majority (265, 83.6%) were involved in potatoproduction followed in a distant second (33, 10.4%) by maize which was also selectedby 44.5% (141) of the farmers as their second-choice crop after potato (Table 5.46). Asa first-choice crop, potato also accounted for the biggest acreage followed by maize butcame third after maize and french beans when selected as second-choice.
Figure 5.35: Sample collection locations in Nyandarua county
73| Page
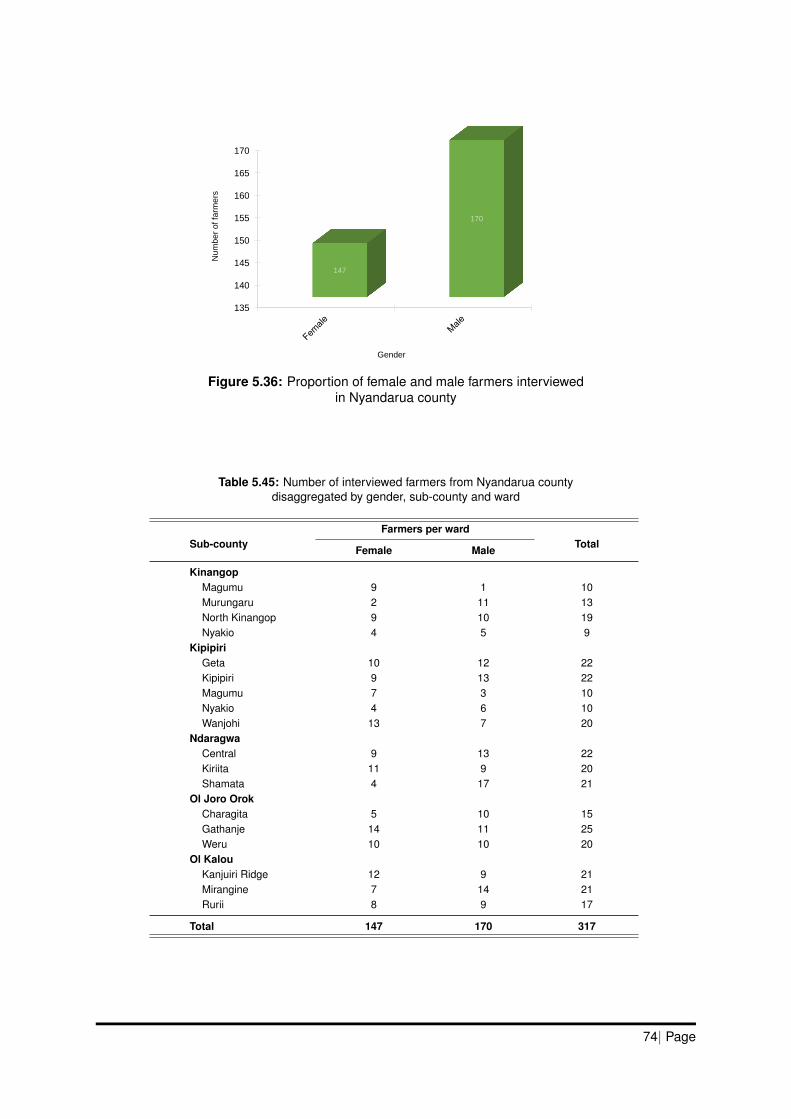
135
140
145
150
155
160
165
170
147
170N
um
ber
of fa
rmers
Gender
Figure 5.36: Proportion of female and male farmers interviewedin Nyandarua county
Table 5.45: Number of interviewed farmers from Nyandarua countydisaggregated by gender, sub-county and ward
Sub-countyFarmers per ward
TotalFemale Male
KinangopMagumu 9 1 10Murungaru 2 11 13North Kinangop 9 10 19Nyakio 4 5 9
KipipiriGeta 10 12 22Kipipiri 9 13 22Magumu 7 3 10Nyakio 4 6 10Wanjohi 13 7 20
NdaragwaCentral 9 13 22Kiriita 11 9 20Shamata 4 17 21
Ol Joro OrokCharagita 5 10 15Gathanje 14 11 25Weru 10 10 20
Ol KalouKanjuiri Ridge 12 9 21Mirangine 7 14 21Rurii 8 9 17
Total 147 170 317
74| Page
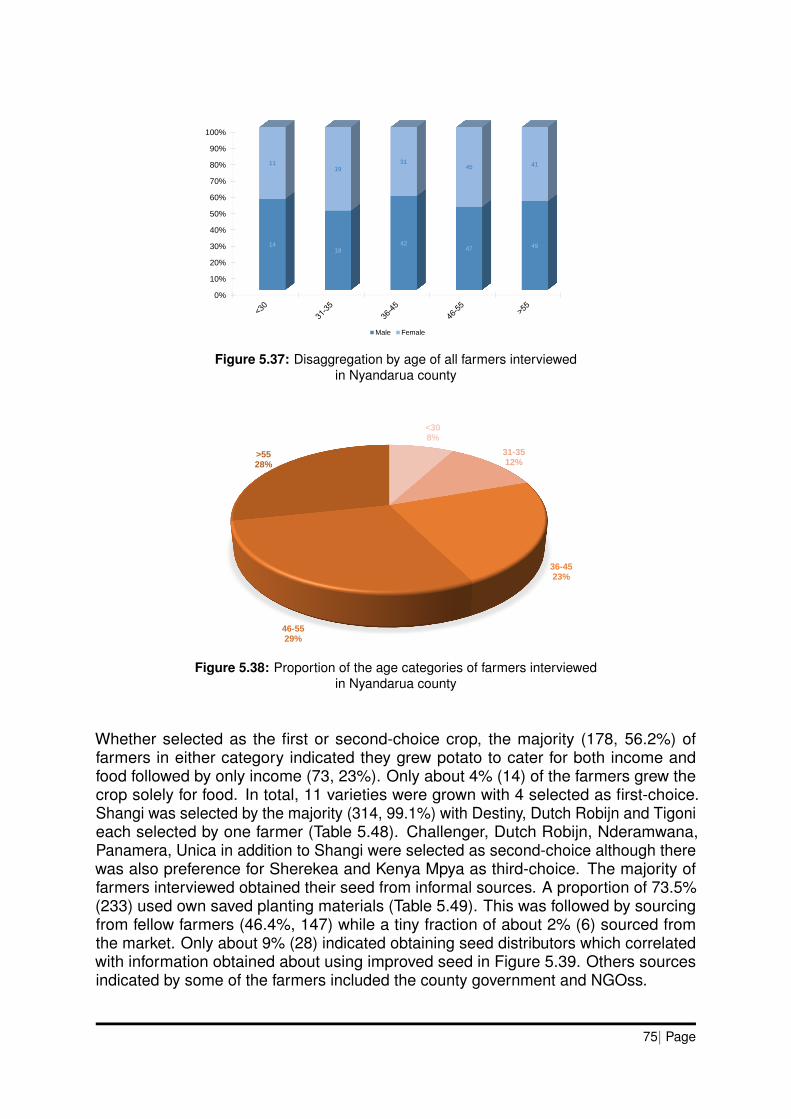
0%
10%
20%
30%
40%
50%
60%
70%
80%
90%
100%
1418
4247 49
1119
3145 41
Male Female
Figure 5.37: Disaggregation by age of all farmers interviewedin Nyandarua county
<308%
31-3512%
36-4523%
46-5529%
>5528%
Figure 5.38: Proportion of the age categories of farmers interviewedin Nyandarua county
Whether selected as the first or second-choice crop, the majority (178, 56.2%) offarmers in either category indicated they grew potato to cater for both income andfood followed by only income (73, 23%). Only about 4% (14) of the farmers grew thecrop solely for food. In total, 11 varieties were grown with 4 selected as first-choice.Shangi was selected by the majority (314, 99.1%) with Destiny, Dutch Robijn and Tigonieach selected by one farmer (Table 5.48). Challenger, Dutch Robijn, Nderamwana,Panamera, Unica in addition to Shangi were selected as second-choice although therewas also preference for Sherekea and Kenya Mpya as third-choice. The majority offarmers interviewed obtained their seed from informal sources. A proportion of 73.5%(233) used own saved planting materials (Table 5.49). This was followed by sourcingfrom fellow farmers (46.4%, 147) while a tiny fraction of about 2% (6) sourced fromthe market. Only about 9% (28) indicated obtaining seed distributors which correlatedwith information obtained about using improved seed in Figure 5.39. Others sourcesindicated by some of the farmers included the county government and NGOss.
75| Page
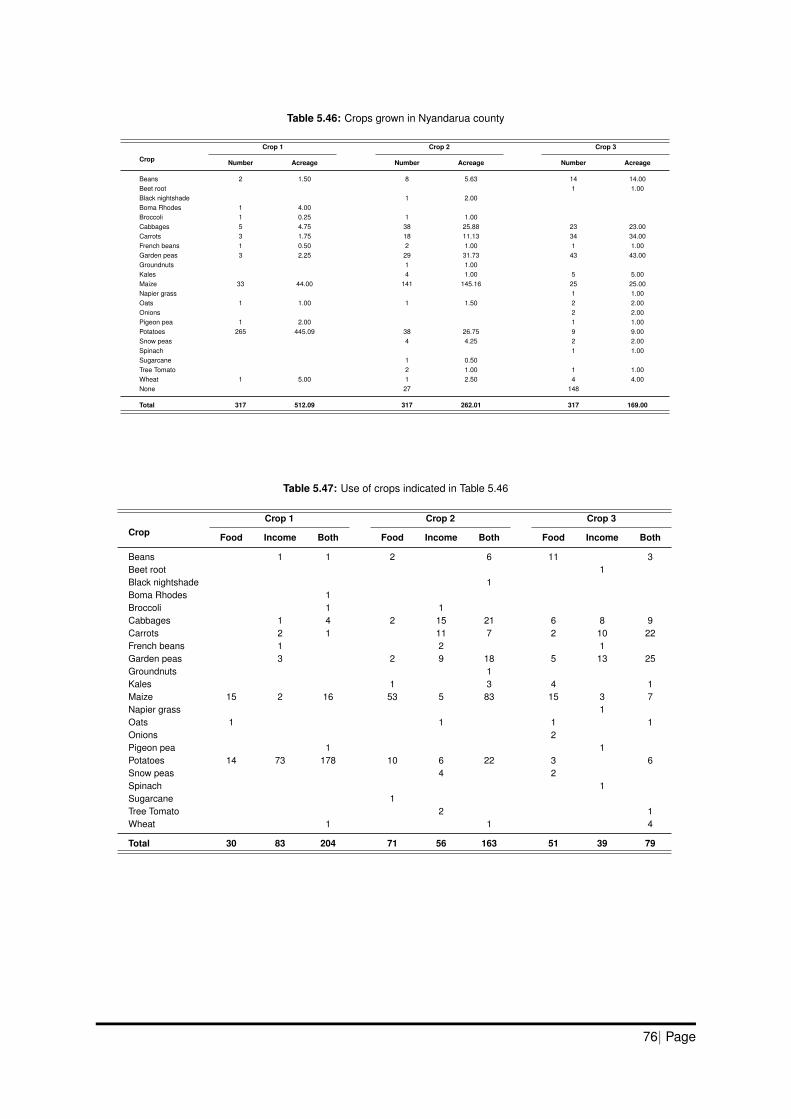
Table 5.46: Crops grown in Nyandarua county
Crop
Crop 1 Crop 2 Crop 3
Number Acreage Number Acreage Number Acreage
Beans 2 1.50 8 5.63 14 14.00Beet root 1 1.00Black nightshade 1 2.00Boma Rhodes 1 4.00Broccoli 1 0.25 1 1.00Cabbages 5 4.75 38 25.88 23 23.00Carrots 3 1.75 18 11.13 34 34.00French beans 1 0.50 2 1.00 1 1.00Garden peas 3 2.25 29 31.73 43 43.00Groundnuts 1 1.00Kales 4 1.00 5 5.00Maize 33 44.00 141 145.16 25 25.00Napier grass 1 1.00Oats 1 1.00 1 1.50 2 2.00Onions 2 2.00Pigeon pea 1 2.00 1 1.00Potatoes 265 445.09 38 26.75 9 9.00Snow peas 4 4.25 2 2.00Spinach 1 1.00Sugarcane 1 0.50Tree Tomato 2 1.00 1 1.00Wheat 1 5.00 1 2.50 4 4.00None 27 148
Total 317 512.09 317 262.01 317 169.00
Table 5.47: Use of crops indicated in Table 5.46
CropCrop 1 Crop 2 Crop 3
Food Income Both Food Income Both Food Income Both
Beans 1 1 2 6 11 3Beet root 1Black nightshade 1Boma Rhodes 1Broccoli 1 1Cabbages 1 4 2 15 21 6 8 9Carrots 2 1 11 7 2 10 22French beans 1 2 1Garden peas 3 2 9 18 5 13 25Groundnuts 1Kales 1 3 4 1Maize 15 2 16 53 5 83 15 3 7Napier grass 1Oats 1 1 1 1Onions 2Pigeon pea 1 1Potatoes 14 73 178 10 6 22 3 6Snow peas 4 2Spinach 1Sugarcane 1Tree Tomato 2 1Wheat 1 1 4
Total 30 83 204 71 56 163 51 39 79
76| Page
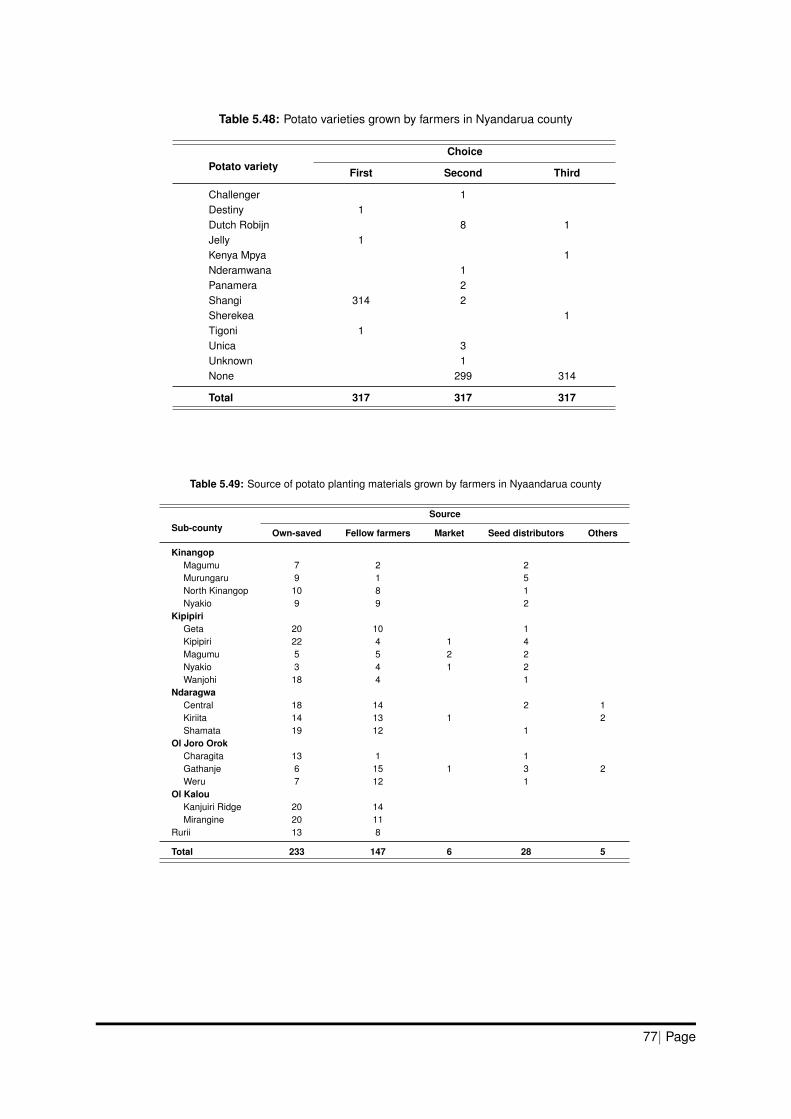
Table 5.48: Potato varieties grown by farmers in Nyandarua county
Potato varietyChoice
First Second Third
Challenger 1Destiny 1Dutch Robijn 8 1Jelly 1Kenya Mpya 1Nderamwana 1Panamera 2Shangi 314 2Sherekea 1Tigoni 1Unica 3Unknown 1None 299 314
Total 317 317 317
Table 5.49: Source of potato planting materials grown by farmers in Nyaandarua county
Sub-countySource
Own-saved Fellow farmers Market Seed distributors Others
KinangopMagumu 7 2 2Murungaru 9 1 5North Kinangop 10 8 1Nyakio 9 9 2
KipipiriGeta 20 10 1Kipipiri 22 4 1 4Magumu 5 5 2 2Nyakio 3 4 1 2Wanjohi 18 4 1
NdaragwaCentral 18 14 2 1Kiriita 14 13 1 2Shamata 19 12 1
Ol Joro OrokCharagita 13 1 1Gathanje 6 15 1 3 2Weru 7 12 1
Ol KalouKanjuiri Ridge 20 14Mirangine 20 11
Rurii 13 8
Total 233 147 6 28 5
77| Page

0%
10%
20%
30%
40%
50%
60%
70%
80%
90%
100%
72
300 310
277
207
316 309
1023
245
17 7
40
110
1 8
307294
Yes No
Figure 5.39: Agronomic practices implemented in potato productionin Nyandarua county
The majority of farmers used key agronomic practices such as recommended spacing,fertilizer application, weeding in potato production and management (Figure 5.39).Mulching was not widely used and as indicated previously, it is not a key and essentialpractice in potato production. Irrigation too was reported by a few farmers (23, 7%) andas reported previously, it is not widely used in this value chain and only reported by afew farmers in the Mt. Kenya region. Use of improved seed was reported by less thana quarter (72, 22.7% ) of farmers and the low usage is in line with the over-relianceon the informal seed sector as demonstrated in Table 5.49. Rotations with other cropswere conducted by at least seven in ten of the farmers interviewed (207, 65%). Maizewas the most rotated crop (129, 40.7%) followed by cabbage (67, 21.1%) while gardenpeas and carrots were mentioned in relatively equal proportions, 56 (17.7%) and 54(17.0%) respectively (Table 5.50). Scouting for pests and use of other pest managementstrategies were reported by more than 70% of the farmers. Some of the pests managedand reported by more than quarter of the farmers included A. solani, P. infestans, andR. solanacearum (Table 5.51). Cutworms were the most observed insects and wereindicated by at least one in ten farmers (Table 5.52). Most of the farmers depended onown experience (selected by 99%) in potato production and management (Figure 5.40).Radio came in second as the main source of information (221, 69.7%) followed byfriend (178, 56.2%), government extension (152, 47.9%), demonstration (148, 46.7%)and agro-dealer (131, 41.3%). Mobile SMS were the least while plant doctors werenot recorded. Plant doctors did not feature much because plant clinics are yet to belaunched. Of the 317 farmers, only 1 indicated to have observed ring rot (Table 5.10)while 17% (55 of 317) observed SRP-associated diseases (blackleg and soft rots)(Table 5.11 and 5.53). The majority of farmers did nothing especially for soft rots whilefor blackleg, the plants were uprooted. None of the farmers reported the cases toextension and one used chemicals to manage blackleg.
78| Page
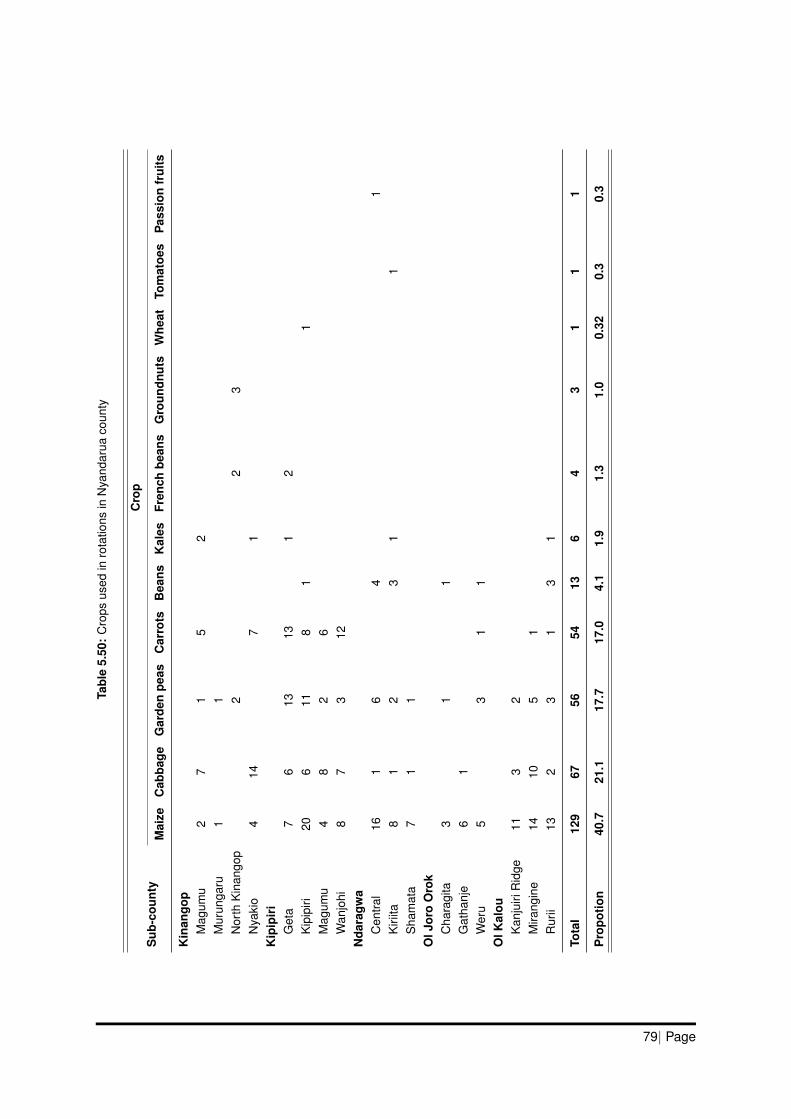
Tabl
e5.
50:
Cro
psus
edin
rota
tions
inN
yand
arua
coun
ty
Sub
-cou
nty
Cro
p
Mai
zeC
abba
geG
arde
npe
asC
arro
tsB
eans
Kal
esFr
ench
bean
sG
roun
dnut
sW
heat
Tom
atoe
sP
assi
onfr
uits
Kin
ango
pM
agum
u2
71
52
Mur
unga
ru1
1N
orth
Kin
ango
p2
23
Nya
kio
414
71
Kip
ipir
iG
eta
76
1313
12
Kip
ipiri
206
118
11
Mag
umu
48
26
Wan
johi
87
312
Nda
ragw
aC
entra
l16
16
41
Kiri
ita8
12
31
1S
ham
ata
71
1O
lJor
oO
rok
Cha
ragi
ta3
11
Gat
hanj
e6
1W
eru
53
11
OlK
alou
Kan
juiri
Rid
ge11
32
Mira
ngin
e14
105
1R
urii
132
31
31
Tota
l12
967
5654
136
43
11
1
Pro
potio
n40
.721
.117
.717
.04.
11.
91.
31.
00.
320.
30.
3
79| Page
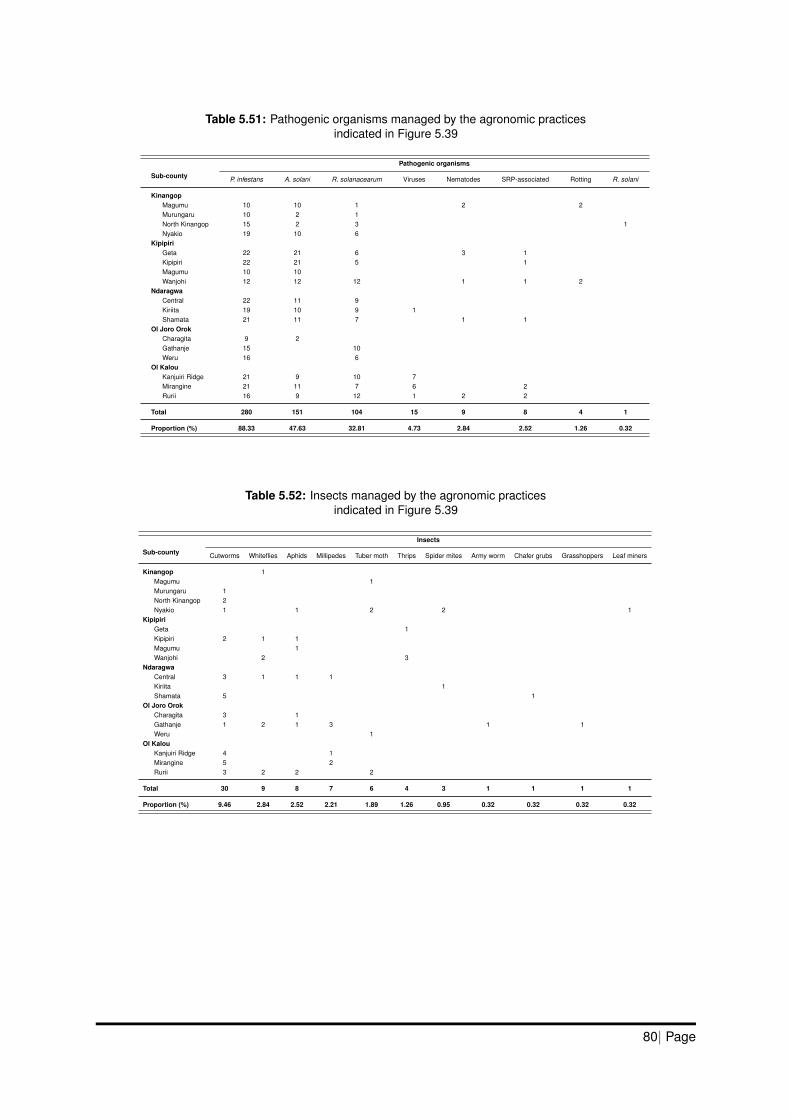
Table 5.51: Pathogenic organisms managed by the agronomic practicesindicated in Figure 5.39
Sub-county
Pathogenic organisms
P. infestans A. solani R. solanacearum Viruses Nematodes SRP-associated Rotting R. solani
KinangopMagumu 10 10 1 2 2Murungaru 10 2 1North Kinangop 15 2 3 1Nyakio 19 10 6
KipipiriGeta 22 21 6 3 1Kipipiri 22 21 5 1Magumu 10 10Wanjohi 12 12 12 1 1 2
NdaragwaCentral 22 11 9Kiriita 19 10 9 1Shamata 21 11 7 1 1
Ol Joro OrokCharagita 9 2Gathanje 15 10Weru 16 6
Ol KalouKanjuiri Ridge 21 9 10 7Mirangine 21 11 7 6 2Rurii 16 9 12 1 2 2
Total 280 151 104 15 9 8 4 1
Proportion (%) 88.33 47.63 32.81 4.73 2.84 2.52 1.26 0.32
Table 5.52: Insects managed by the agronomic practicesindicated in Figure 5.39
Sub-county
Insects
Cutworms Whiteflies Aphids Millipedes Tuber moth Thrips Spider mites Army worm Chafer grubs Grasshoppers Leaf miners
Kinangop 1Magumu 1Murungaru 1North Kinangop 2Nyakio 1 1 2 2 1
KipipiriGeta 1Kipipiri 2 1 1Magumu 1Wanjohi 2 3
NdaragwaCentral 3 1 1 1Kiriita 1Shamata 5 1
Ol Joro OrokCharagita 3 1Gathanje 1 2 1 3 1 1Weru 1
Ol KalouKanjuiri Ridge 4 1Mirangine 5 2Rurii 3 2 2 2
Total 30 9 8 7 6 4 3 1 1 1 1
Proportion (%) 9.46 2.84 2.52 2.21 1.89 1.26 0.95 0.32 0.32 0.32 0.32
80| Page

Table 5.53: Number of farmers who identified SRP-associated diseases in Nyandarua county and action taken
Sub-countyObservation
TotalAction
No Yes Report to extension Chemical Uprooted Did nothing
KinangopMagumu 9 1 10 1Murungaru 13 13North Kinangop 19 19Nyakio 9 9
KipipiriGeta 16 6 22 3 4Kipipiri 21 1 22 1Magumu 10 10Nyakio 7 3 10 3 2Wanjohi 12 8 20 1 1 4 2
NdaragwaCentral 18 4 22 2 3Kiriita 17 3 20 3Shamata 19 2 21 1 1
Ol Joro OrokCharagita 15 15Gathanje 23 2 25 1 1Weru 20 20
Ol KalouKanjuiri Ridge 15 6 21 2 5Mirangine 12 9 21 1 2 8Rurii 7 10 17 5 7
Total 262 55 317 1 4 23 36
0%
10%
20%
30%
40%
50%
60%
70%
80%
90%
100% 4
169
139
239 240
288
96
165
317
256
186
313
148
178
78 77
29
221
152
0
61
131
Yes No
Figure 5.40: Sources of information for potato production and management of challengesin Nyandarua county
81| Page
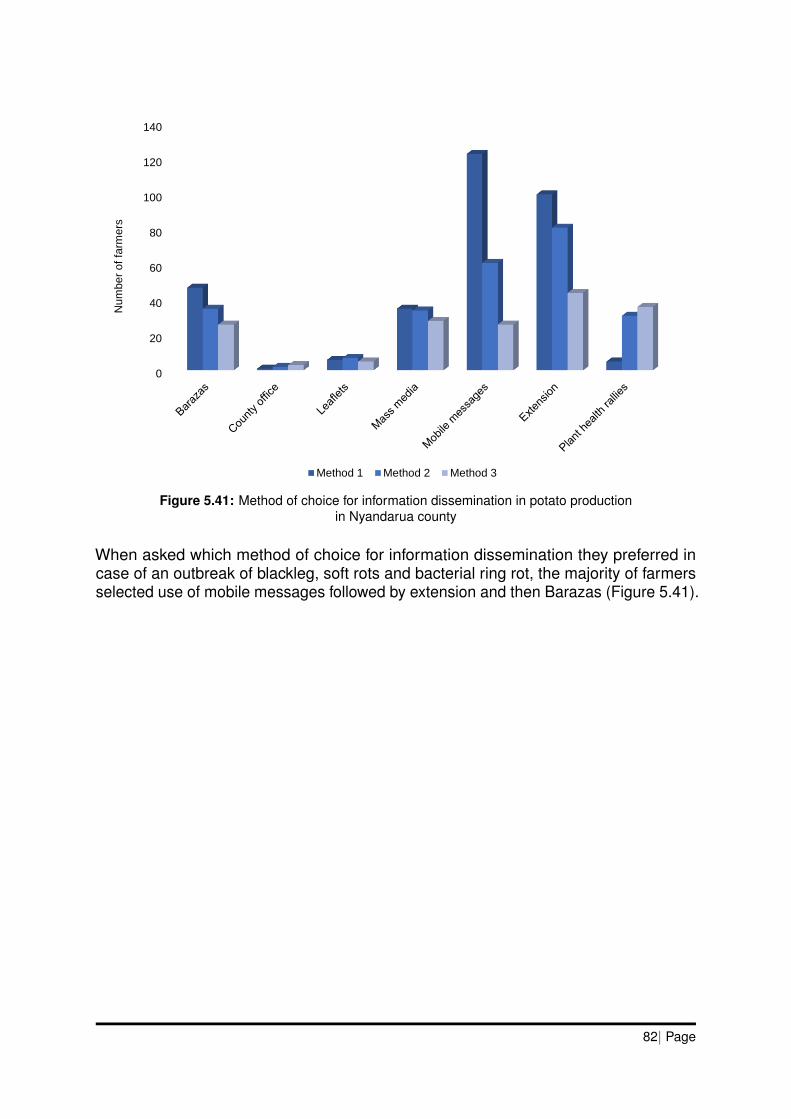
0
20
40
60
80
100
120
140N
um
ber
of
farm
ers
Method 1 Method 2 Method 3
Figure 5.41: Method of choice for information dissemination in potato productionin Nyandarua county
When asked which method of choice for information dissemination they preferred incase of an outbreak of blackleg, soft rots and bacterial ring rot, the majority of farmersselected use of mobile messages followed by extension and then Barazas (Figure 5.41).
82| Page

5.8 Trans Nzoia County
A total of 110 farmers (11.0% of all farmers) from whom samples were also obtainedwere interviewed from Trans Nzoia county. These farmers came from sub-counties andwards that were selected by the WAOs and forwarded to CABI by the CDA (Table 4.1).All seven wards that where selected from all sub-counties (Cherangany, Endebess andSaboti) were surveyed (Table 4.1, Figure 5.42). The 110 farmers comprised of 48.0%(53) female and 52.0% (57) male (Figure 5.43 and Table 5.54). Most of the farmerswere from Sabot (56, 50.9%), followed by Cherangany (28, 25.5%), and Endebess (26,23.6%) (Table 5.54). The age category constituting the highest number was >55 years(29, 26.4%) followed by 46-55 years (28, 25.5%), then 36-45 years, (24, 21.8%), 31-35years (16, 14.6%) and lastly <30 years (13, 11.8%).
Figure 5.42: Sample collection locations in Trans Nzoia county.
Up to 22 crops were grown as the first, second- or third-choice crops, however, themajority (77, 70%) grew potato as their first-choice while 12 (10.9%) grew the crop asthe second- and third-choice crop (Table 5.55). Potato also accounted for the highestacreage as the first-choice crop. Bananas were selected as the second-choice cropfollowed by maize, a trend that was observed for the third-choice crop as well (Table5.55). The majority (39, 35.5%) of the farmers grew potato for income, 23.6% (26) grewthe crop for both income and food while 10.9% (12) grew the crop solely fro food. Thefarmers mentioned up to 11 varieties that were grown with Shangi being the most widelygrown as indicated by 66.4% (73) of the farmers (Table 5.57). This was a trend observedin all other counties. Interestingly Kabale is a Ugandan variety and was the second mostgrown in Trans Nzoia. Most of the farmers (64, 58.2%) sourced planting materials fromfellow farmers (Table 5.58). This was followed by sourcing from the market (26, 23.6%)with the least being using own planting materials (9, 8.2%). However, 10.9% (12) of thefarmers sourced their planting materials from seed distributors which correlates withfigures of farmers who indicated that they used improved seed (Figure 5.46). Note;most of the farmers selected multiple sources of planting materials.
83| Page
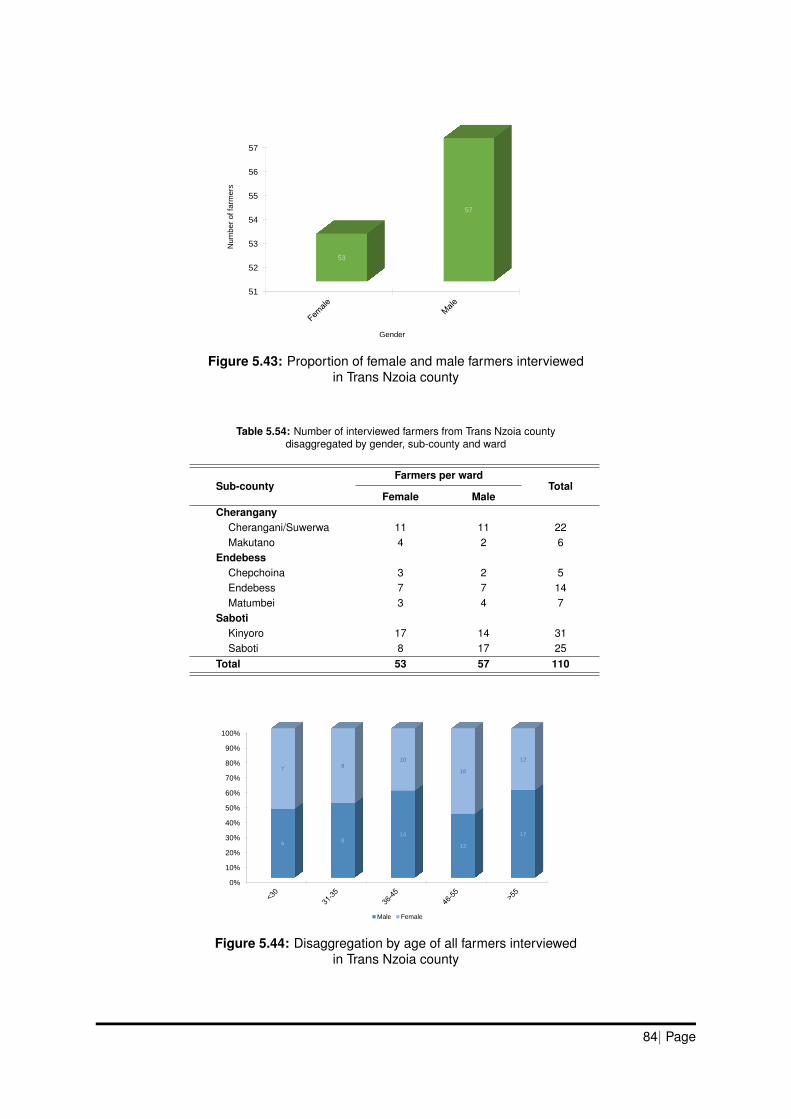
51
52
53
54
55
56
57
53
57
Nu
mb
er
of fa
rme
rs
Gender
Figure 5.43: Proportion of female and male farmers interviewedin Trans Nzoia county
Table 5.54: Number of interviewed farmers from Trans Nzoia countydisaggregated by gender, sub-county and ward
Sub-countyFarmers per ward
TotalFemale Male
CheranganyCherangani/Suwerwa 11 11 22Makutano 4 2 6
EndebessChepchoina 3 2 5Endebess 7 7 14Matumbei 3 4 7
SabotiKinyoro 17 14 31Saboti 8 17 25
Total 53 57 110
0%
10%
20%
30%
40%
50%
60%
70%
80%
90%
100%
68
14
12
17
78
10
16
12
Male Female
Figure 5.44: Disaggregation by age of all farmers interviewedin Trans Nzoia county
84| Page
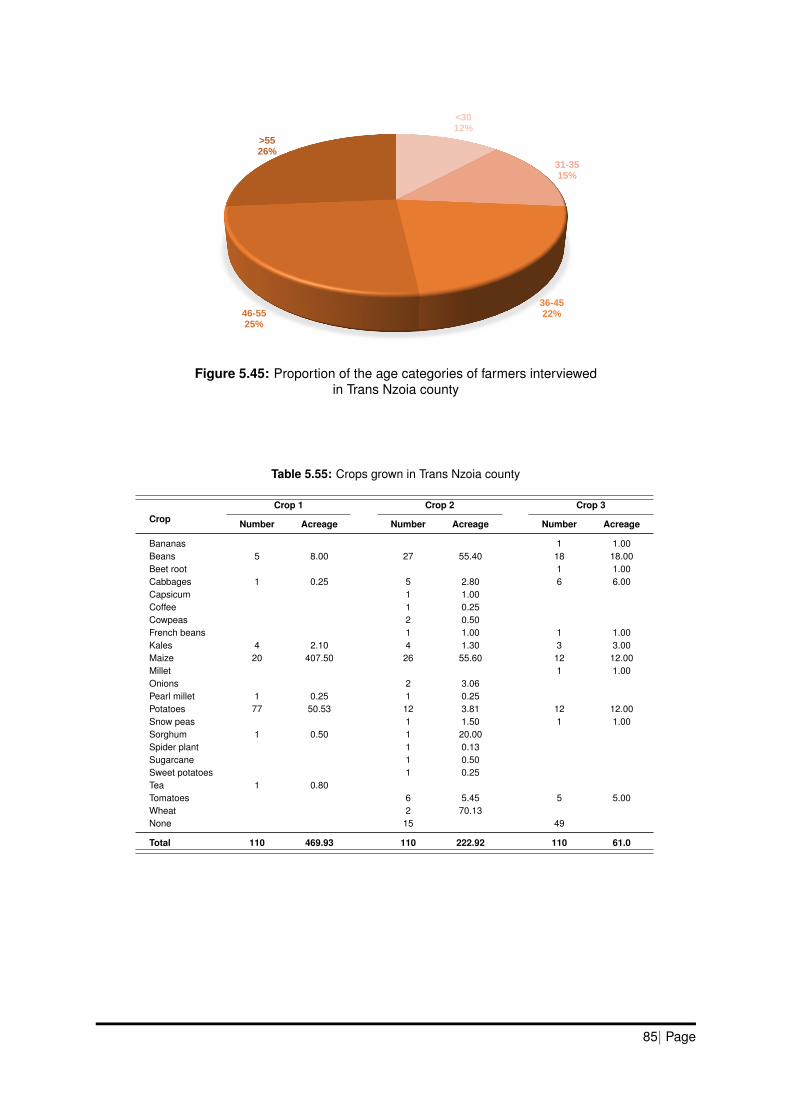
<3012%
31-3515%
36-4522%46-55
25%
>5526%
Figure 5.45: Proportion of the age categories of farmers interviewedin Trans Nzoia county
Table 5.55: Crops grown in Trans Nzoia county
CropCrop 1 Crop 2 Crop 3
Number Acreage Number Acreage Number Acreage
Bananas 1 1.00Beans 5 8.00 27 55.40 18 18.00Beet root 1 1.00Cabbages 1 0.25 5 2.80 6 6.00Capsicum 1 1.00Coffee 1 0.25Cowpeas 2 0.50French beans 1 1.00 1 1.00Kales 4 2.10 4 1.30 3 3.00Maize 20 407.50 26 55.60 12 12.00Millet 1 1.00Onions 2 3.06Pearl millet 1 0.25 1 0.25Potatoes 77 50.53 12 3.81 12 12.00Snow peas 1 1.50 1 1.00Sorghum 1 0.50 1 20.00Spider plant 1 0.13Sugarcane 1 0.50Sweet potatoes 1 0.25Tea 1 0.80Tomatoes 6 5.45 5 5.00Wheat 2 70.13None 15 49
Total 110 469.93 110 222.92 110 61.0
85| Page

Table 5.56: Usage of crops indicated in Table 5.55
CropCrop 1 Crop 2 Crop 3
Food Income Both Food Income Both Food Income Both
Bananas 1Beans 1 4 6 5 16 5 5 8Beet root 1Cabbages 1 4 1 2 3 1Capsicum 1Coffee 1Cowpeas 2French beans 1 1Kales 4 1 3 1 1 1Maize 5 2 13 4 11 11 3 2 7Millet 1Onions 1 1Pearl millet 1 1Potatoes 12 39 26 5 1 6 2 1 9Snow peas 1 1Sorghum 1 1Spider plant 1Sugarcane 1Sweet potatoes 1Tea 1Tomatoes 5 1 2 3Wheat 1 1
Total 18 42 50 19 37 39 14 16 31
0%
10%
20%
30%
40%
50%
60%
70%
80%
90%
100%
11
78
105
92
65
107100
1 2
99
32
5
18
45
310
109 108
Yes No
Figure 5.46: Agronomic practices implemented in potato productionin Trans Nzoia county
86| Page
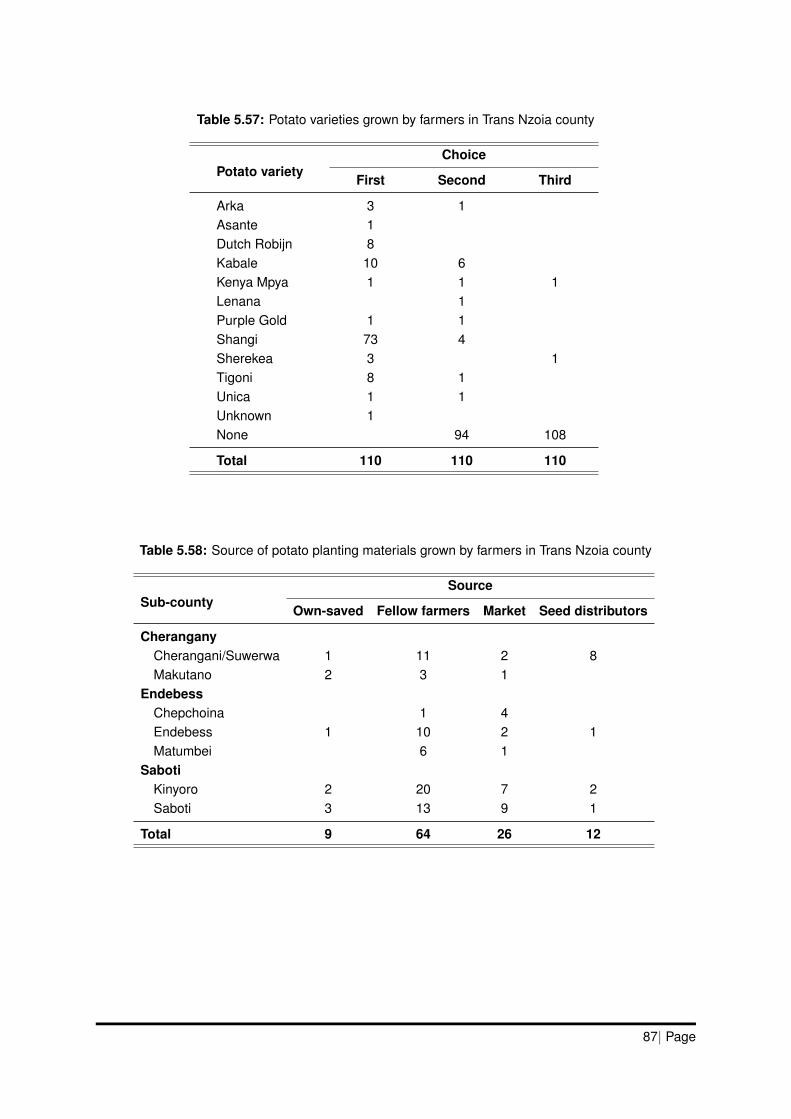
Table 5.57: Potato varieties grown by farmers in Trans Nzoia county
Potato varietyChoice
First Second Third
Arka 3 1Asante 1Dutch Robijn 8Kabale 10 6Kenya Mpya 1 1 1Lenana 1Purple Gold 1 1Shangi 73 4Sherekea 3 1Tigoni 8 1Unica 1 1Unknown 1None 94 108
Total 110 110 110
Table 5.58: Source of potato planting materials grown by farmers in Trans Nzoia county
Sub-countySource
Own-saved Fellow farmers Market Seed distributors
CheranganyCherangani/Suwerwa 1 11 2 8Makutano 2 3 1
EndebessChepchoina 1 4Endebess 1 10 2 1Matumbei 6 1
SabotiKinyoro 2 20 7 2Saboti 3 13 9 1
Total 9 64 26 12
87| Page
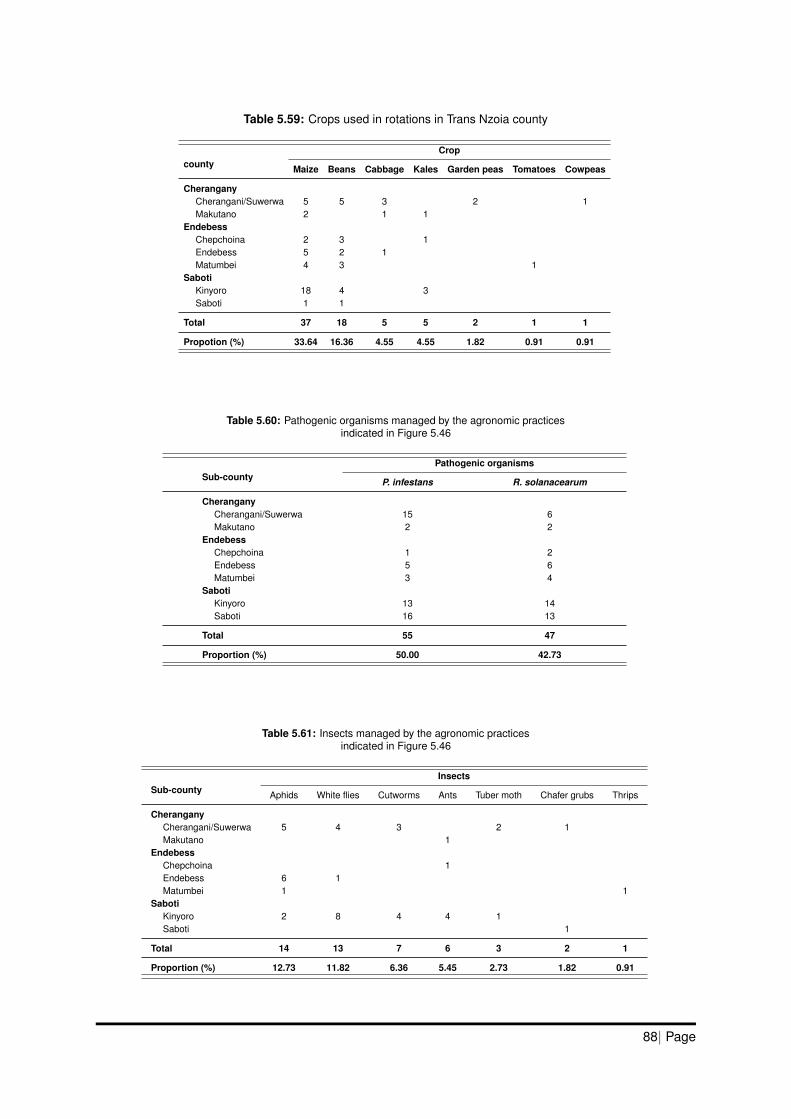
Table 5.59: Crops used in rotations in Trans Nzoia county
countyCrop
Maize Beans Cabbage Kales Garden peas Tomatoes Cowpeas
CheranganyCherangani/Suwerwa 5 5 3 2 1Makutano 2 1 1
EndebessChepchoina 2 3 1Endebess 5 2 1Matumbei 4 3 1
SabotiKinyoro 18 4 3Saboti 1 1
Total 37 18 5 5 2 1 1
Propotion (%) 33.64 16.36 4.55 4.55 1.82 0.91 0.91
Table 5.60: Pathogenic organisms managed by the agronomic practicesindicated in Figure 5.46
Sub-countyPathogenic organisms
P. infestans R. solanacearum
CheranganyCherangani/Suwerwa 15 6Makutano 2 2
EndebessChepchoina 1 2Endebess 5 6Matumbei 3 4
SabotiKinyoro 13 14Saboti 16 13
Total 55 47
Proportion (%) 50.00 42.73
Table 5.61: Insects managed by the agronomic practicesindicated in Figure 5.46
Sub-countyInsects
Aphids White flies Cutworms Ants Tuber moth Chafer grubs Thrips
CheranganyCherangani/Suwerwa 5 4 3 2 1Makutano 1
EndebessChepchoina 1Endebess 6 1Matumbei 1 1
SabotiKinyoro 2 8 4 4 1Saboti 1
Total 14 13 7 6 3 2 1
Proportion (%) 12.73 11.82 6.36 5.45 2.73 1.82 0.91
88| Page
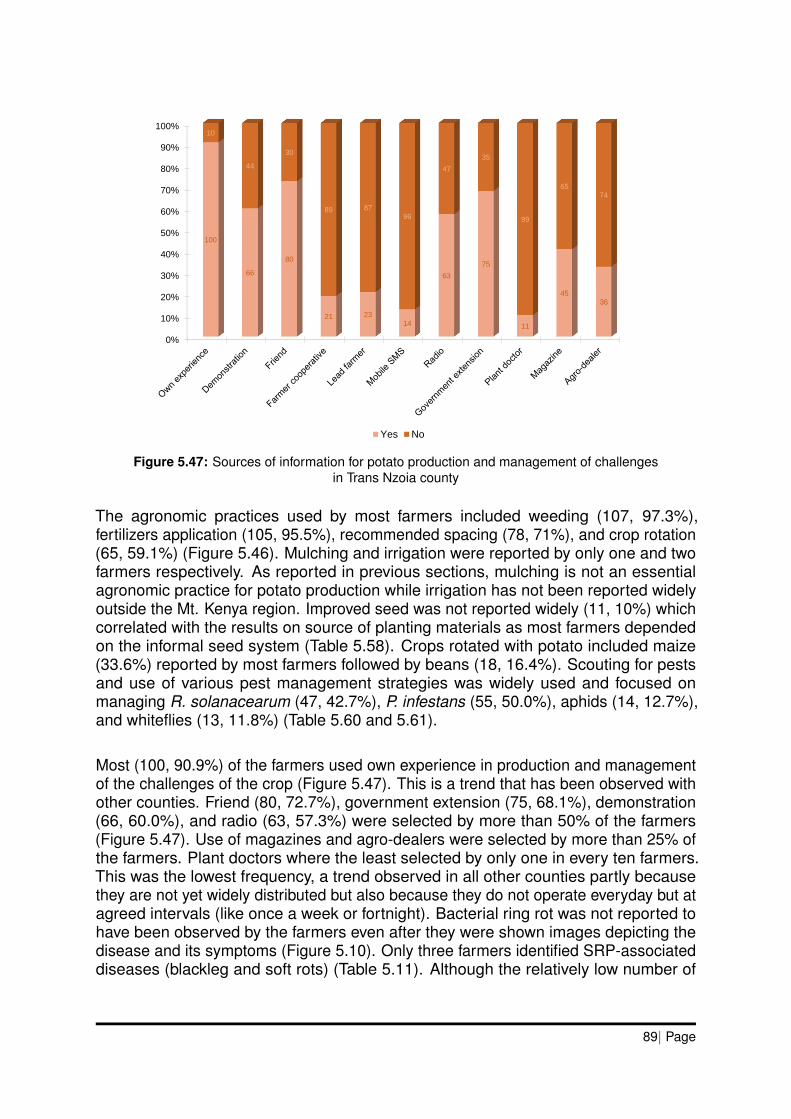
0%
10%
20%
30%
40%
50%
60%
70%
80%
90%
100%10
44
30
89 87
96
47
35
99
65
74
100
66
80
21 23
14
63
75
11
45
36
Yes No
Figure 5.47: Sources of information for potato production and management of challengesin Trans Nzoia county
The agronomic practices used by most farmers included weeding (107, 97.3%),fertilizers application (105, 95.5%), recommended spacing (78, 71%), and crop rotation(65, 59.1%) (Figure 5.46). Mulching and irrigation were reported by only one and twofarmers respectively. As reported in previous sections, mulching is not an essentialagronomic practice for potato production while irrigation has not been reported widelyoutside the Mt. Kenya region. Improved seed was not reported widely (11, 10%) whichcorrelated with the results on source of planting materials as most farmers dependedon the informal seed system (Table 5.58). Crops rotated with potato included maize(33.6%) reported by most farmers followed by beans (18, 16.4%). Scouting for pestsand use of various pest management strategies was widely used and focused onmanaging R. solanacearum (47, 42.7%), P. infestans (55, 50.0%), aphids (14, 12.7%),and whiteflies (13, 11.8%) (Table 5.60 and 5.61).
Most (100, 90.9%) of the farmers used own experience in production and managementof the challenges of the crop (Figure 5.47). This is a trend that has been observed withother counties. Friend (80, 72.7%), government extension (75, 68.1%), demonstration(66, 60.0%), and radio (63, 57.3%) were selected by more than 50% of the farmers(Figure 5.47). Use of magazines and agro-dealers were selected by more than 25% ofthe farmers. Plant doctors where the least selected by only one in every ten farmers.This was the lowest frequency, a trend observed in all other counties partly becausethey are not yet widely distributed but also because they do not operate everyday but atagreed intervals (like once a week or fortnight). Bacterial ring rot was not reported tohave been observed by the farmers even after they were shown images depicting thedisease and its symptoms (Figure 5.10). Only three farmers identified SRP-associateddiseases (blackleg and soft rots) (Table 5.11). Although the relatively low number of
89| Page
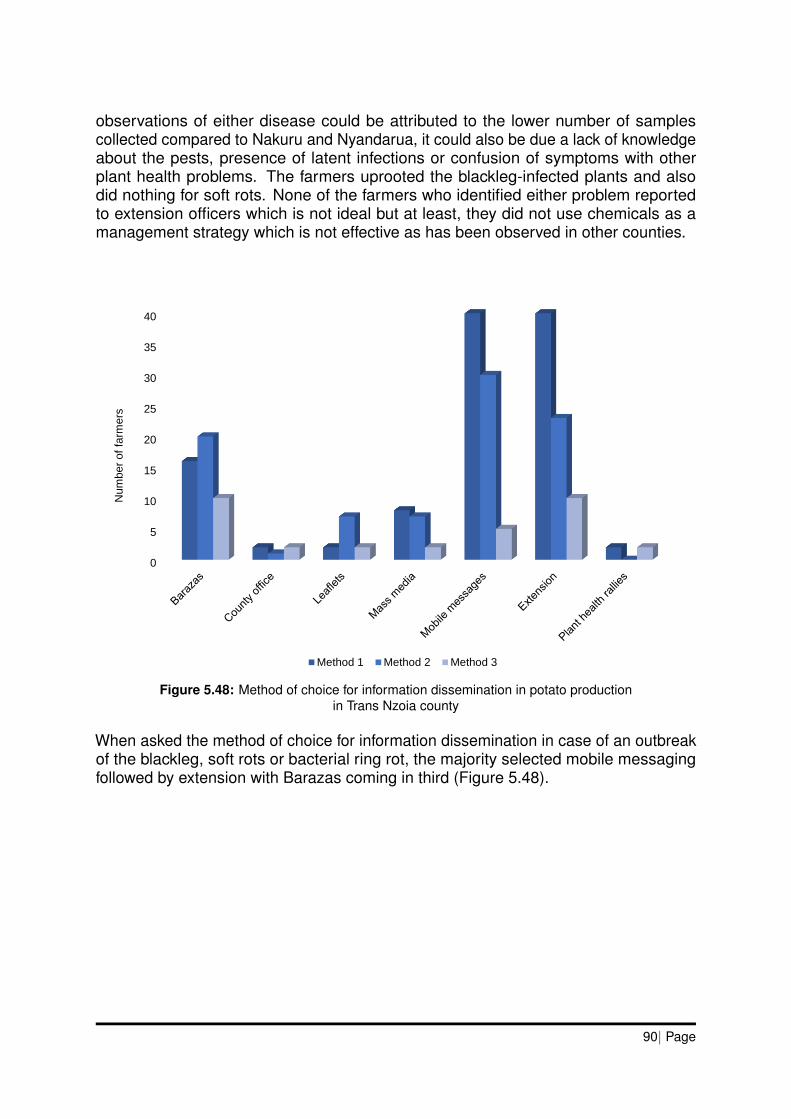
observations of either disease could be attributed to the lower number of samplescollected compared to Nakuru and Nyandarua, it could also be due a lack of knowledgeabout the pests, presence of latent infections or confusion of symptoms with otherplant health problems. The farmers uprooted the blackleg-infected plants and alsodid nothing for soft rots. None of the farmers who identified either problem reportedto extension officers which is not ideal but at least, they did not use chemicals as amanagement strategy which is not effective as has been observed in other counties.
0
5
10
15
20
25
30
35
40
Num
ber
of
farm
ers
Method 1 Method 2 Method 3
Figure 5.48: Method of choice for information dissemination in potato productionin Trans Nzoia county
When asked the method of choice for information dissemination in case of an outbreakof the blackleg, soft rots or bacterial ring rot, the majority selected mobile messagingfollowed by extension with Barazas coming in third (Figure 5.48).
90| Page
6
Molecular Diagnostics
6.1 Background
Samples were collected from 1,002 farming households in six counties (Figure 1.5).Samples included whole plants directly from the field (comprised leaves, stems andtubers); tubers (where the crop had been harvested or previous season’s crop wasavailable in storage) and soil. Soil was included because it has been reported to harbourSRP for 1 week to 6 months depending on the prevailing environmental conditions (soiltemperature, moisture and pH) although they can survive much longer if volunteers arepresent (42). All the samples were asymptomatic for Clavibacter sepedonicus whilethe majority were asymptomatic for the SRP species. As a result, some of the sampleswere collected in duplicate, triplicate or quadruplicate as described in Section 4.1 tomaximise chances of isolating either pathogen. On arrival at KEPHIS laboratories, allsamples were processed and a total of 2,834 samples was obtained which comprisedof 1,334 stem samples, 696 tuber samples and 804 soil samples. Some of the sampleswere discarded especially if their integrity was questionable. For instance, S. tuberosumbeing a very perishable crop, some of the samples were so rotten especially the tubersfor any pathogenic isolations to be made. For soil, some samples were discardedbecause they were secured directly in paper bags ending up being mixed in polystyreneboxes with other soil samples when the paper bags gave way due the immense wetnessin the soil. The higher number of stem samples processed in comparison to the numberof households (1,002) is because some samples were obtained in duplicate, triplicateor quadruplicate as previously indicated. In addition, more stem samples were retainedbecause their integrity was intact unlike soil and tubers. All processed samples werekept at -20oC until needed for isolations.
6.2 Clavibacter sepedonicus
All the samples from which isolation of C. sepedonicus was attempted, wereasymptomatic as indicated above. Isolations were done only from stem and tubersamples on MTNA medium (Appendix C.5) after which, clean colonies were transferredto YGM medium (Appendix C.9). Isolation were made from 2,030 samples comprisingof 1,334 stem and 696 tuber samples resulting in 1,362 purified colonies. DNA wasisolated from 1,005 of the 1,362 colonies as indicated in Chapter 4 but detailed in
91| Page
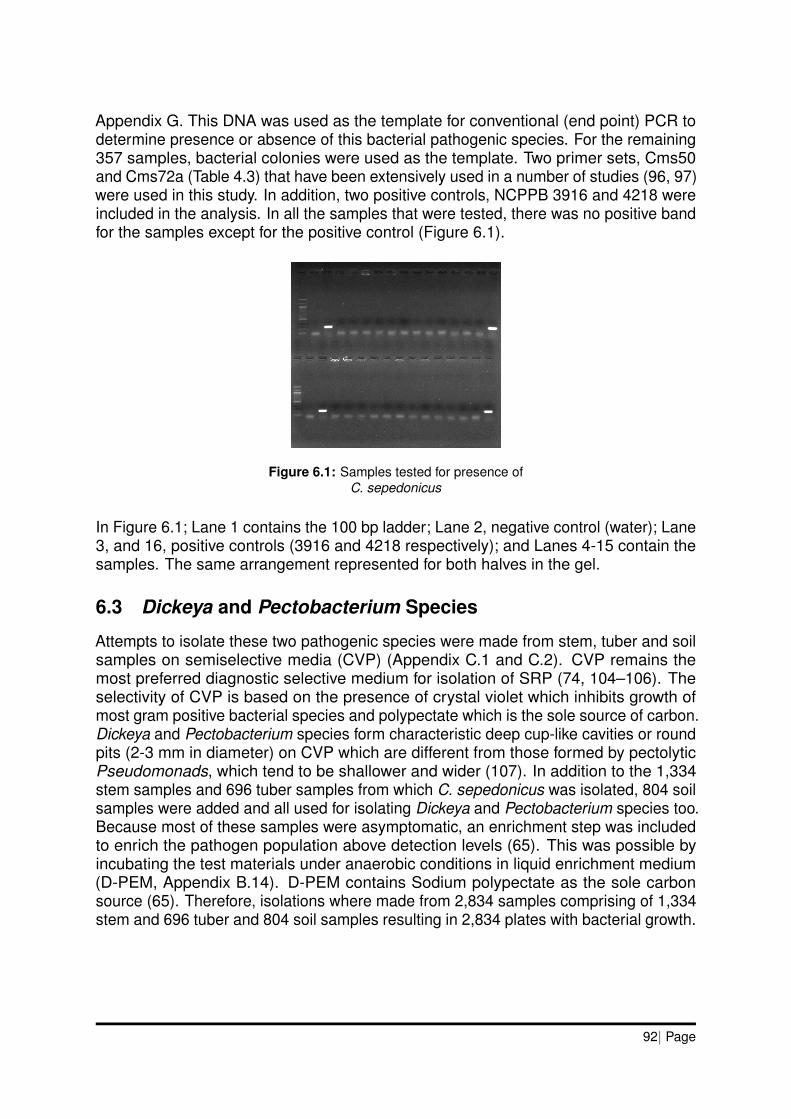
Appendix G. This DNA was used as the template for conventional (end point) PCR todetermine presence or absence of this bacterial pathogenic species. For the remaining357 samples, bacterial colonies were used as the template. Two primer sets, Cms50and Cms72a (Table 4.3) that have been extensively used in a number of studies (96, 97)were used in this study. In addition, two positive controls, NCPPB 3916 and 4218 wereincluded in the analysis. In all the samples that were tested, there was no positive bandfor the samples except for the positive control (Figure 6.1).
Figure 6.1: Samples tested for presence ofC. sepedonicus
In Figure 6.1; Lane 1 contains the 100 bp ladder; Lane 2, negative control (water); Lane3, and 16, positive controls (3916 and 4218 respectively); and Lanes 4-15 contain thesamples. The same arrangement represented for both halves in the gel.
6.3 Dickeya and Pectobacterium Species
Attempts to isolate these two pathogenic species were made from stem, tuber and soilsamples on semiselective media (CVP) (Appendix C.1 and C.2). CVP remains themost preferred diagnostic selective medium for isolation of SRP (74, 104–106). Theselectivity of CVP is based on the presence of crystal violet which inhibits growth ofmost gram positive bacterial species and polypectate which is the sole source of carbon.Dickeya and Pectobacterium species form characteristic deep cup-like cavities or roundpits (2-3 mm in diameter) on CVP which are different from those formed by pectolyticPseudomonads, which tend to be shallower and wider (107). In addition to the 1,334stem samples and 696 tuber samples from which C. sepedonicus was isolated, 804 soilsamples were added and all used for isolating Dickeya and Pectobacterium species too.Because most of these samples were asymptomatic, an enrichment step was includedto enrich the pathogen population above detection levels (65). This was possible byincubating the test materials under anaerobic conditions in liquid enrichment medium(D-PEM, Appendix B.14). D-PEM contains Sodium polypectate as the sole carbonsource (65). Therefore, isolations where made from 2,834 samples comprising of 1,334stem and 696 tuber and 804 soil samples resulting in 2,834 plates with bacterial growth.
92| Page
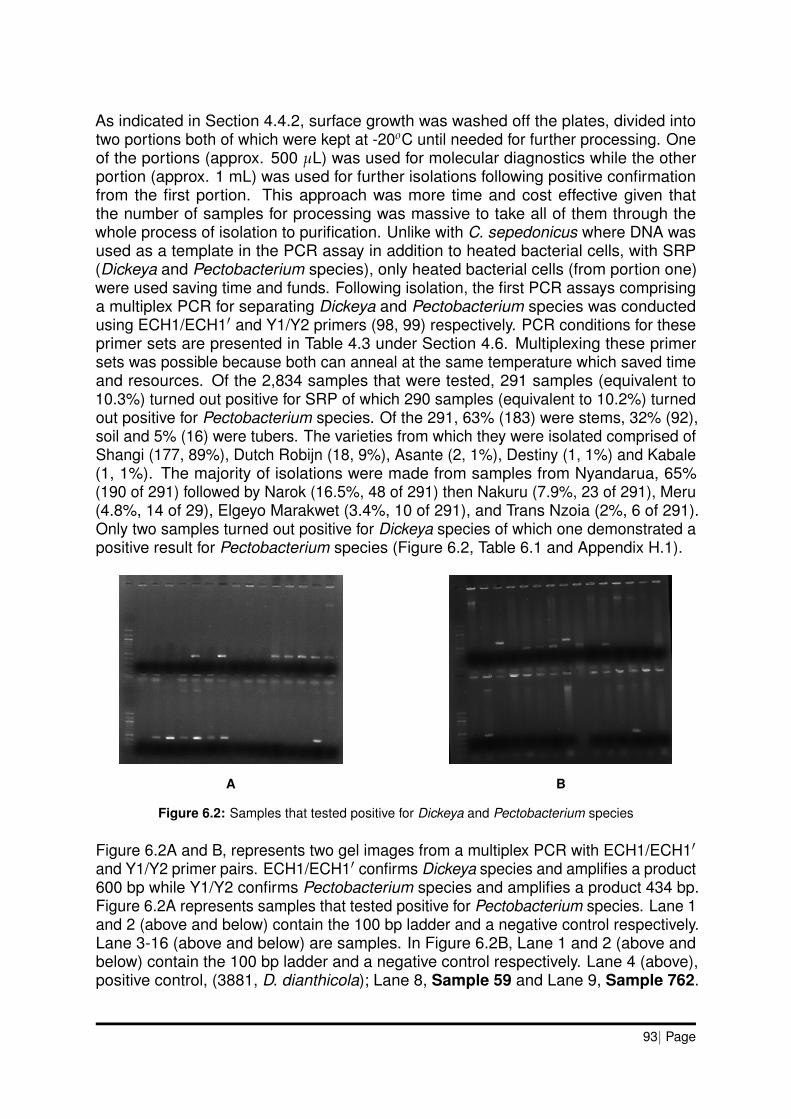
As indicated in Section 4.4.2, surface growth was washed off the plates, divided intotwo portions both of which were kept at -20oC until needed for further processing. Oneof the portions (approx. 500 µL) was used for molecular diagnostics while the otherportion (approx. 1 mL) was used for further isolations following positive confirmationfrom the first portion. This approach was more time and cost effective given thatthe number of samples for processing was massive to take all of them through thewhole process of isolation to purification. Unlike with C. sepedonicus where DNA wasused as a template in the PCR assay in addition to heated bacterial cells, with SRP(Dickeya and Pectobacterium species), only heated bacterial cells (from portion one)were used saving time and funds. Following isolation, the first PCR assays comprisinga multiplex PCR for separating Dickeya and Pectobacterium species was conductedusing ECH1/ECH1′ and Y1/Y2 primers (98, 99) respectively. PCR conditions for theseprimer sets are presented in Table 4.3 under Section 4.6. Multiplexing these primersets was possible because both can anneal at the same temperature which saved timeand resources. Of the 2,834 samples that were tested, 291 samples (equivalent to10.3%) turned out positive for SRP of which 290 samples (equivalent to 10.2%) turnedout positive for Pectobacterium species. Of the 291, 63% (183) were stems, 32% (92),soil and 5% (16) were tubers. The varieties from which they were isolated comprised ofShangi (177, 89%), Dutch Robijn (18, 9%), Asante (2, 1%), Destiny (1, 1%) and Kabale(1, 1%). The majority of isolations were made from samples from Nyandarua, 65%(190 of 291) followed by Narok (16.5%, 48 of 291) then Nakuru (7.9%, 23 of 291), Meru(4.8%, 14 of 29), Elgeyo Marakwet (3.4%, 10 of 291), and Trans Nzoia (2%, 6 of 291).Only two samples turned out positive for Dickeya species of which one demonstrated apositive result for Pectobacterium species (Figure 6.2, Table 6.1 and Appendix H.1).
A B
Figure 6.2: Samples that tested positive for Dickeya and Pectobacterium species
Figure 6.2A and B, represents two gel images from a multiplex PCR with ECH1/ECH1′and Y1/Y2 primer pairs. ECH1/ECH1′ confirms Dickeya species and amplifies a product600 bp while Y1/Y2 confirms Pectobacterium species and amplifies a product 434 bp.Figure 6.2A represents samples that tested positive for Pectobacterium species. Lane 1and 2 (above and below) contain the 100 bp ladder and a negative control respectively.Lane 3-16 (above and below) are samples. In Figure 6.2B, Lane 1 and 2 (above andbelow) contain the 100 bp ladder and a negative control respectively. Lane 4 (above),positive control, (3881, D. dianthicola); Lane 8, Sample 59 and Lane 9, Sample 762.
93| Page
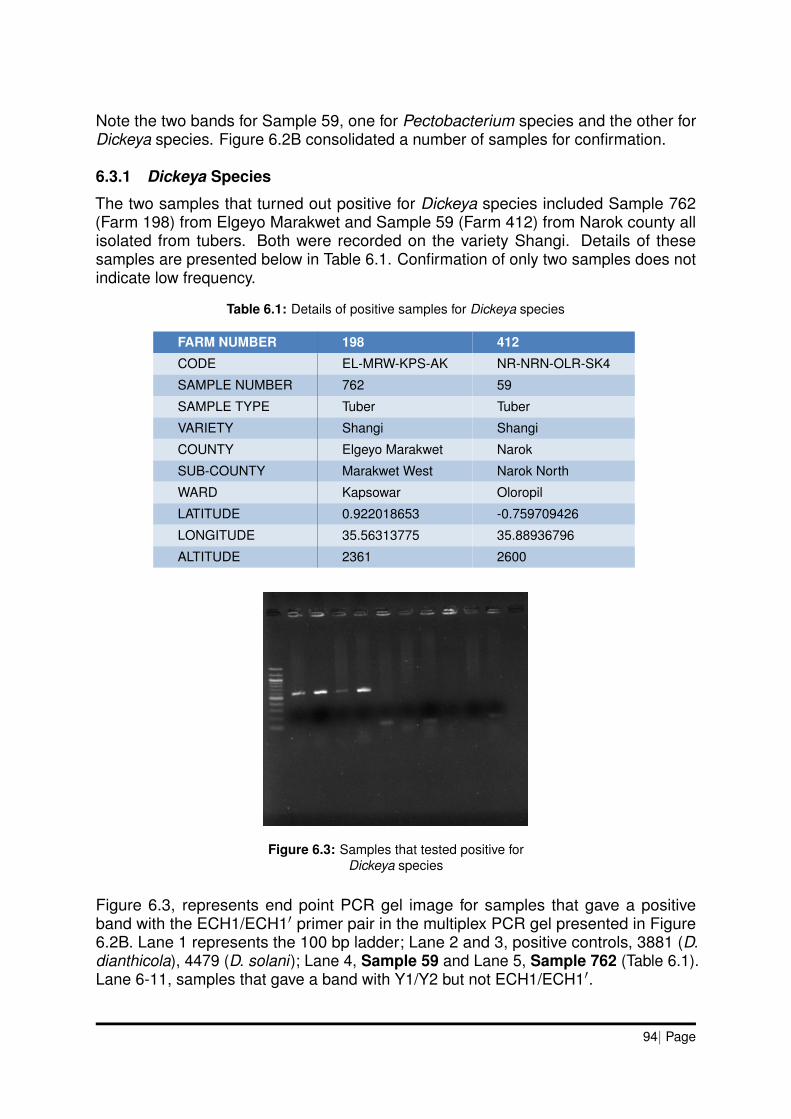
Note the two bands for Sample 59, one for Pectobacterium species and the other forDickeya species. Figure 6.2B consolidated a number of samples for confirmation.
6.3.1 Dickeya Species
The two samples that turned out positive for Dickeya species included Sample 762(Farm 198) from Elgeyo Marakwet and Sample 59 (Farm 412) from Narok county allisolated from tubers. Both were recorded on the variety Shangi. Details of thesesamples are presented below in Table 6.1. Confirmation of only two samples does notindicate low frequency.
Table 6.1: Details of positive samples for Dickeya species
FARM NUMBER 198 412
CODE EL-MRW-KPS-AK NR-NRN-OLR-SK4
SAMPLE NUMBER 762 59
SAMPLE TYPE Tuber Tuber
VARIETY Shangi Shangi
COUNTY Elgeyo Marakwet Narok
SUB-COUNTY Marakwet West Narok North
WARD Kapsowar Oloropil
LATITUDE 0.922018653 -0.759709426
LONGITUDE 35.56313775 35.88936796
ALTITUDE 2361 2600
Figure 6.3: Samples that tested positive forDickeya species
Figure 6.3, represents end point PCR gel image for samples that gave a positiveband with the ECH1/ECH1′ primer pair in the multiplex PCR gel presented in Figure6.2B. Lane 1 represents the 100 bp ladder; Lane 2 and 3, positive controls, 3881 (D.dianthicola), 4479 (D. solani); Lane 4, Sample 59 and Lane 5, Sample 762 (Table 6.1).Lane 6-11, samples that gave a band with Y1/Y2 but not ECH1/ECH1′.
94| Page
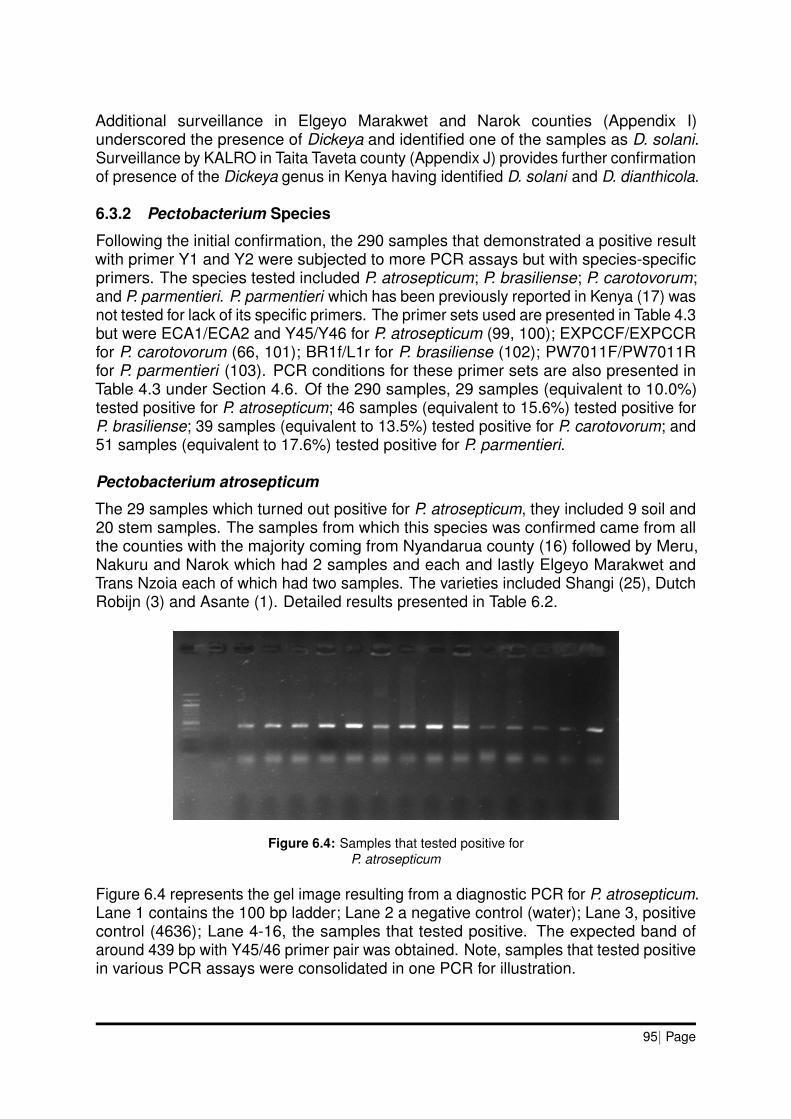
Additional surveillance in Elgeyo Marakwet and Narok counties (Appendix I)underscored the presence of Dickeya and identified one of the samples as D. solani.Surveillance by KALRO in Taita Taveta county (Appendix J) provides further confirmationof presence of the Dickeya genus in Kenya having identified D. solani and D. dianthicola.
6.3.2 Pectobacterium Species
Following the initial confirmation, the 290 samples that demonstrated a positive resultwith primer Y1 and Y2 were subjected to more PCR assays but with species-specificprimers. The species tested included P. atrosepticum; P. brasiliense; P. carotovorum;and P. parmentieri. P. parmentieri which has been previously reported in Kenya (17) wasnot tested for lack of its specific primers. The primer sets used are presented in Table 4.3but were ECA1/ECA2 and Y45/Y46 for P. atrosepticum (99, 100); EXPCCF/EXPCCRfor P. carotovorum (66, 101); BR1f/L1r for P. brasiliense (102); PW7011F/PW7011Rfor P. parmentieri (103). PCR conditions for these primer sets are also presented inTable 4.3 under Section 4.6. Of the 290 samples, 29 samples (equivalent to 10.0%)tested positive for P. atrosepticum; 46 samples (equivalent to 15.6%) tested positive forP. brasiliense; 39 samples (equivalent to 13.5%) tested positive for P. carotovorum; and51 samples (equivalent to 17.6%) tested positive for P. parmentieri.
Pectobacterium atrosepticum
The 29 samples which turned out positive for P. atrosepticum, they included 9 soil and20 stem samples. The samples from which this species was confirmed came from allthe counties with the majority coming from Nyandarua county (16) followed by Meru,Nakuru and Narok which had 2 samples and each and lastly Elgeyo Marakwet andTrans Nzoia each of which had two samples. The varieties included Shangi (25), DutchRobijn (3) and Asante (1). Detailed results presented in Table 6.2.
Figure 6.4: Samples that tested positive forP. atrosepticum
Figure 6.4 represents the gel image resulting from a diagnostic PCR for P. atrosepticum.Lane 1 contains the 100 bp ladder; Lane 2 a negative control (water); Lane 3, positivecontrol (4636); Lane 4-16, the samples that tested positive. The expected band ofaround 439 bp with Y45/46 primer pair was obtained. Note, samples that tested positivein various PCR assays were consolidated in one PCR for illustration.
95| Page
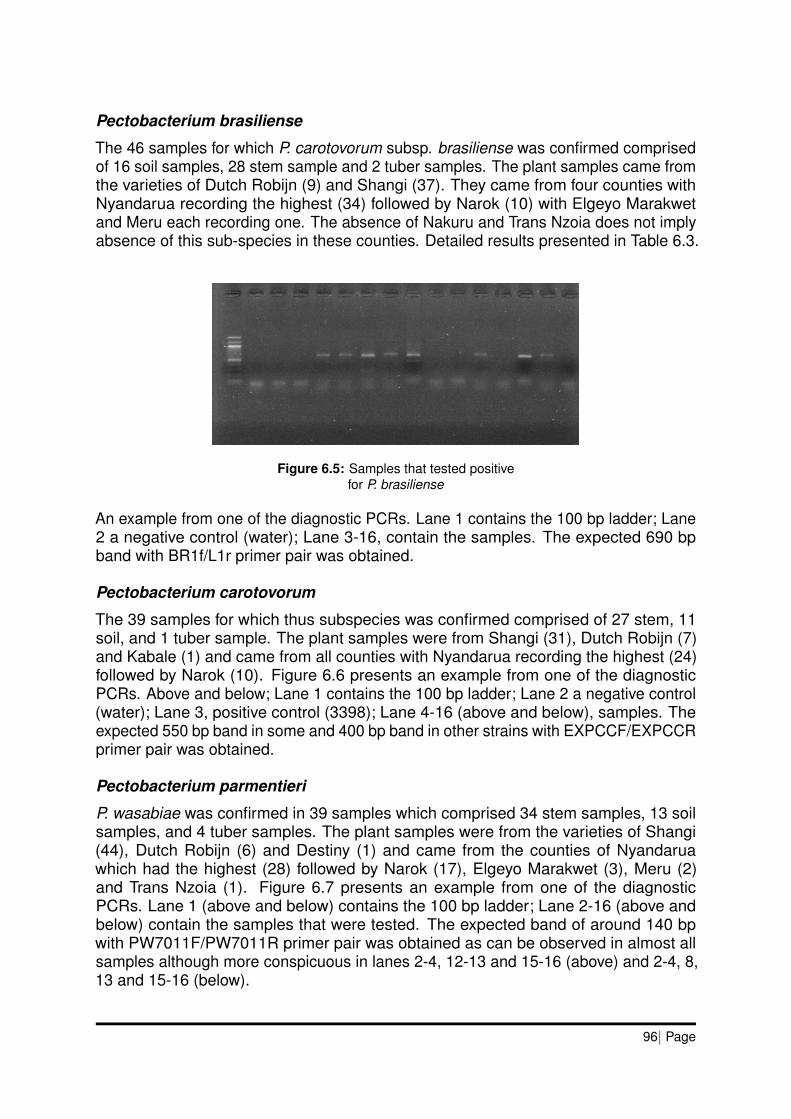
Pectobacterium brasiliense
The 46 samples for which P. carotovorum subsp. brasiliense was confirmed comprisedof 16 soil samples, 28 stem sample and 2 tuber samples. The plant samples came fromthe varieties of Dutch Robijn (9) and Shangi (37). They came from four counties withNyandarua recording the highest (34) followed by Narok (10) with Elgeyo Marakwetand Meru each recording one. The absence of Nakuru and Trans Nzoia does not implyabsence of this sub-species in these counties. Detailed results presented in Table 6.3.
Figure 6.5: Samples that tested positivefor P. brasiliense
An example from one of the diagnostic PCRs. Lane 1 contains the 100 bp ladder; Lane2 a negative control (water); Lane 3-16, contain the samples. The expected 690 bpband with BR1f/L1r primer pair was obtained.
Pectobacterium carotovorum
The 39 samples for which thus subspecies was confirmed comprised of 27 stem, 11soil, and 1 tuber sample. The plant samples were from Shangi (31), Dutch Robijn (7)and Kabale (1) and came from all counties with Nyandarua recording the highest (24)followed by Narok (10). Figure 6.6 presents an example from one of the diagnosticPCRs. Above and below; Lane 1 contains the 100 bp ladder; Lane 2 a negative control(water); Lane 3, positive control (3398); Lane 4-16 (above and below), samples. Theexpected 550 bp band in some and 400 bp band in other strains with EXPCCF/EXPCCRprimer pair was obtained.
Pectobacterium parmentieri
P. wasabiae was confirmed in 39 samples which comprised 34 stem samples, 13 soilsamples, and 4 tuber samples. The plant samples were from the varieties of Shangi(44), Dutch Robijn (6) and Destiny (1) and came from the counties of Nyandaruawhich had the highest (28) followed by Narok (17), Elgeyo Marakwet (3), Meru (2)and Trans Nzoia (1). Figure 6.7 presents an example from one of the diagnosticPCRs. Lane 1 (above and below) contains the 100 bp ladder; Lane 2-16 (above andbelow) contain the samples that were tested. The expected band of around 140 bpwith PW7011F/PW7011R primer pair was obtained as can be observed in almost allsamples although more conspicuous in lanes 2-4, 12-13 and 15-16 (above) and 2-4, 8,13 and 15-16 (below).
96| Page
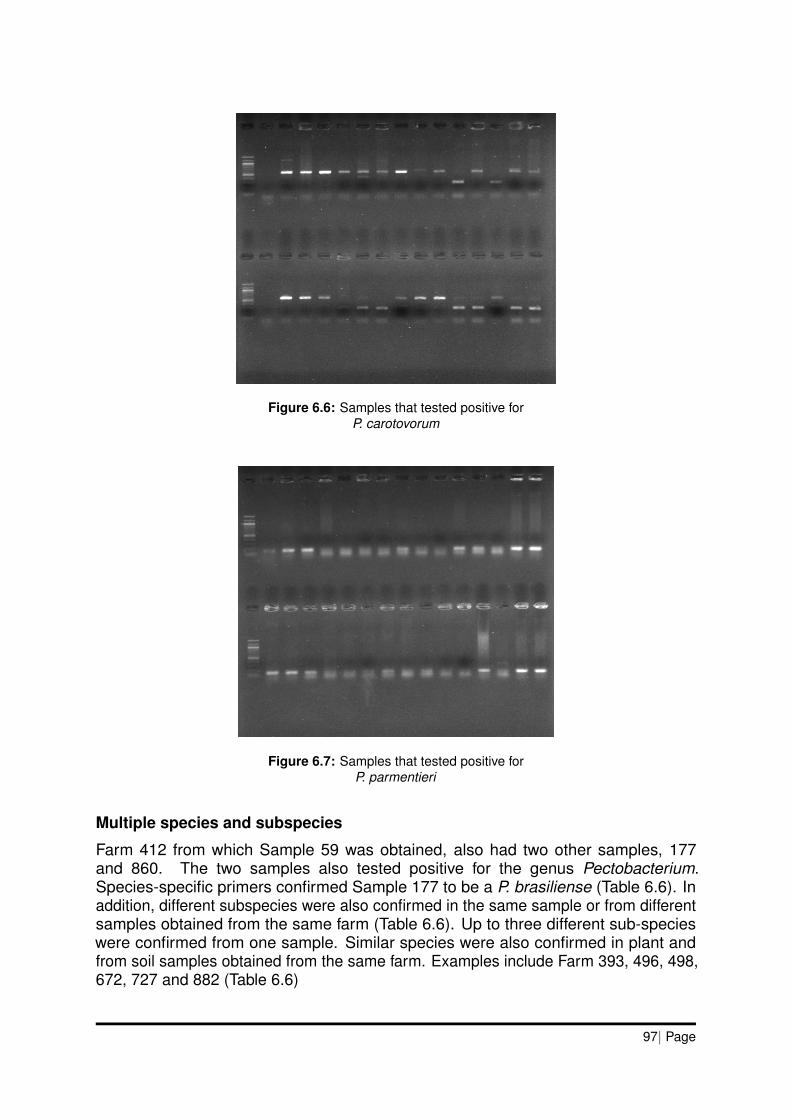
Figure 6.6: Samples that tested positive forP. carotovorum
Figure 6.7: Samples that tested positive forP. parmentieri
Multiple species and subspecies
Farm 412 from which Sample 59 was obtained, also had two other samples, 177and 860. The two samples also tested positive for the genus Pectobacterium.Species-specific primers confirmed Sample 177 to be a P. brasiliense (Table 6.6). Inaddition, different subspecies were also confirmed in the same sample or from differentsamples obtained from the same farm (Table 6.6). Up to three different sub-specieswere confirmed from one sample. Similar species were also confirmed in plant andfrom soil samples obtained from the same farm. Examples include Farm 393, 496, 498,672, 727 and 882 (Table 6.6)
97| Page
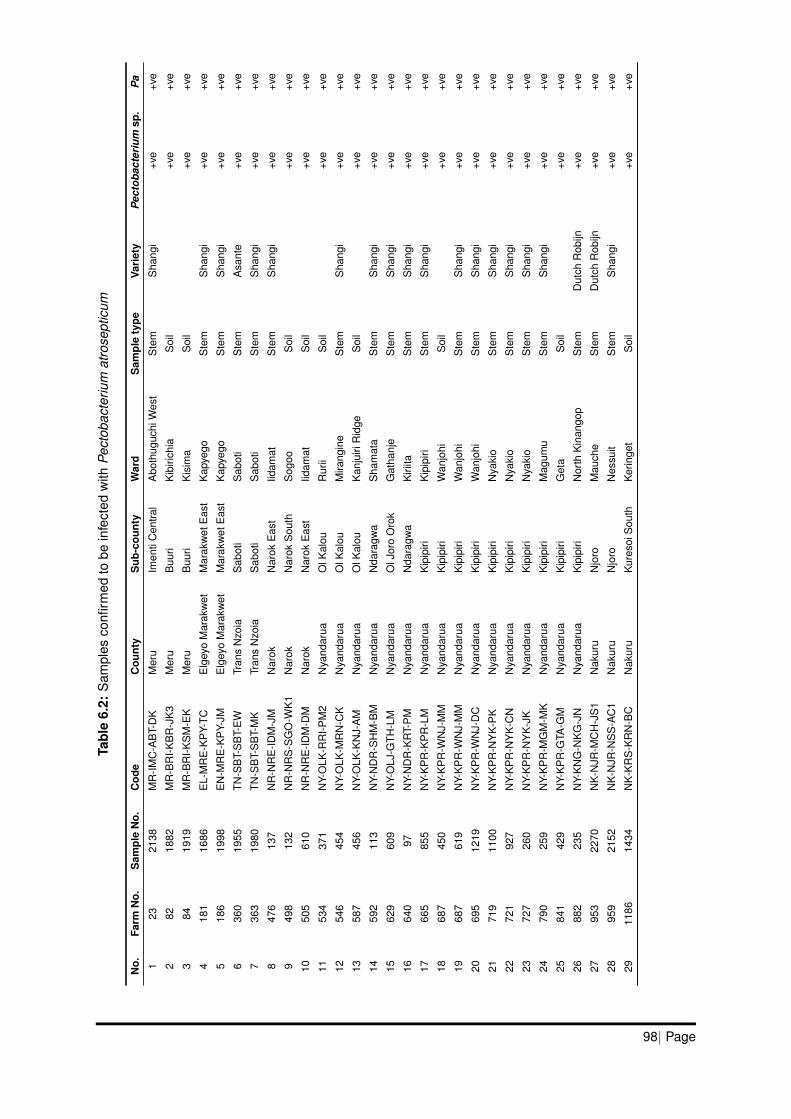
Tabl
e6.
2:S
ampl
esco
nfirm
edto
bein
fect
edw
ithPe
ctob
acte
rium
atro
sept
icum
No.
Farm
No.
Sam
ple
No.
Cod
eC
ount
yS
ub-c
ount
yW
ard
Sam
ple
type
Vari
ety
Pec
toba
cter
ium
sp.
Pa
123
2138
MR
-IMC
-AB
T-D
KM
eru
Imen
tiC
entra
lA
both
uguc
hiW
est
Ste
mS
hang
i+v
e+v
e
282
1882
MR
-BR
I-KB
R-J
K3
Mer
uB
uuri
Kib
irich
iaS
oil
+ve
+ve
384
1919
MR
-BR
I-KS
M-E
KM
eru
Buu
riK
isim
aS
oil
+ve
+ve
418
116
86E
L-M
RE
-KP
Y-TC
Elg
eyo
Mar
akw
etM
arak
wet
Eas
tK
apye
goS
tem
Sha
ngi
+ve
+ve
518
619
98E
N-M
RE
-KP
Y-JM
Elg
eyo
Mar
akw
etM
arak
wet
Eas
tK
apye
goS
tem
Sha
ngi
+ve
+ve
636
019
55TN
-SB
T-S
BT-
EW
Tran
sN
zoia
Sab
oti
Sab
oti
Ste
mA
sant
e+v
e+v
e
736
319
80TN
-SB
T-S
BT-
MK
Tran
sN
zoia
Sab
oti
Sab
oti
Ste
mS
hang
i+v
e+v
e
847
613
7N
R-N
RE
-IDM
-JM
Nar
okN
arok
Eas
tIid
amat
Ste
mS
hang
i+v
e+v
e
949
813
2N
R-N
RS
-SG
O-W
K1
Nar
okN
arok
Sou
thS
ogoo
Soi
l+v
e+v
e
1050
561
0N
R-N
RE
-IDM
-DM
Nar
okN
arok
Eas
tIid
amat
Soi
l+v
e+v
e
1153
437
1N
Y-O
LK-R
RI-P
M2
Nya
ndar
uaO
lKal
ouR
urii
Soi
l+v
e+v
e
1254
645
4N
Y-O
LK-M
RN
-CK
Nya
ndar
uaO
lKal
ouM
irang
ine
Ste
mS
hang
i+v
e+v
e
1358
745
6N
Y-O
LK-K
NJ-
AM
Nya
ndar
uaO
lKal
ouK
anju
iriR
idge
Soi
l+v
e+v
e
1459
211
3N
Y-N
DR
-SH
M-B
MN
yand
arua
Nda
ragw
aS
ham
ata
Ste
mS
hang
i+v
e+v
e
1562
960
9N
Y-O
LJ-G
TH-L
MN
yand
arua
OlJ
oro
Oro
kG
atha
nje
Ste
mS
hang
i+v
e+v
e
1664
097
NY-
ND
R-K
RT-
PM
Nya
ndar
uaN
dara
gwa
Kiri
itaS
tem
Sha
ngi
+ve
+ve
1766
585
5N
Y-K
PR
-KP
R-L
MN
yand
arua
Kip
ipiri
Kip
ipiri
Ste
mS
hang
i+v
e+v
e
1868
745
0N
Y-K
PR
-WN
J-M
MN
yand
arua
Kip
ipiri
Wan
johi
Soi
l+v
e+v
e
1968
761
9N
Y-K
PR
-WN
J-M
MN
yand
arua
Kip
ipiri
Wan
johi
Ste
mS
hang
i+v
e+v
e
2069
512
19N
Y-K
PR
-WN
J-D
CN
yand
arua
Kip
ipiri
Wan
johi
Ste
mS
hang
i+v
e+v
e
2171
911
00N
Y-K
PR
-NY
K-P
KN
yand
arua
Kip
ipiri
Nya
kio
Ste
mS
hang
i+v
e+v
e
2272
192
7N
Y-K
PR
-NY
K-C
NN
yand
arua
Kip
ipiri
Nya
kio
Ste
mS
hang
i+v
e+v
e
2372
726
0N
Y-K
PR
-NY
K-J
KN
yand
arua
Kip
ipiri
Nya
kio
Ste
mS
hang
i+v
e+v
e
2479
025
9N
Y-K
PR
-MG
M-M
KN
yand
arua
Kip
ipiri
Mag
umu
Ste
mS
hang
i+v
e+v
e
2584
142
9N
Y-K
PR
-GTA
-GM
Nya
ndar
uaK
ipip
iriG
eta
Soi
l+v
e+v
e
2688
223
5N
Y-K
NG
-NK
G-J
NN
yand
arua
Kip
ipiri
Nor
thK
inan
gop
Ste
mD
utch
Rob
ijn+v
e+v
e
2795
322
70N
K-N
JR-M
CH
-JS
1N
akur
uN
joro
Mau
che
Ste
mD
utch
Rob
ijn+v
e+v
e
2895
921
52N
K-N
JR-N
SS
-AC
1N
akur
uN
joro
Nes
suit
Ste
mS
hang
i+v
e+v
e
2911
8614
34N
K-K
RS
-KR
N-B
CN
akur
uK
ures
oiS
outh
Ker
inge
tS
oil
+ve
+ve
98| Page
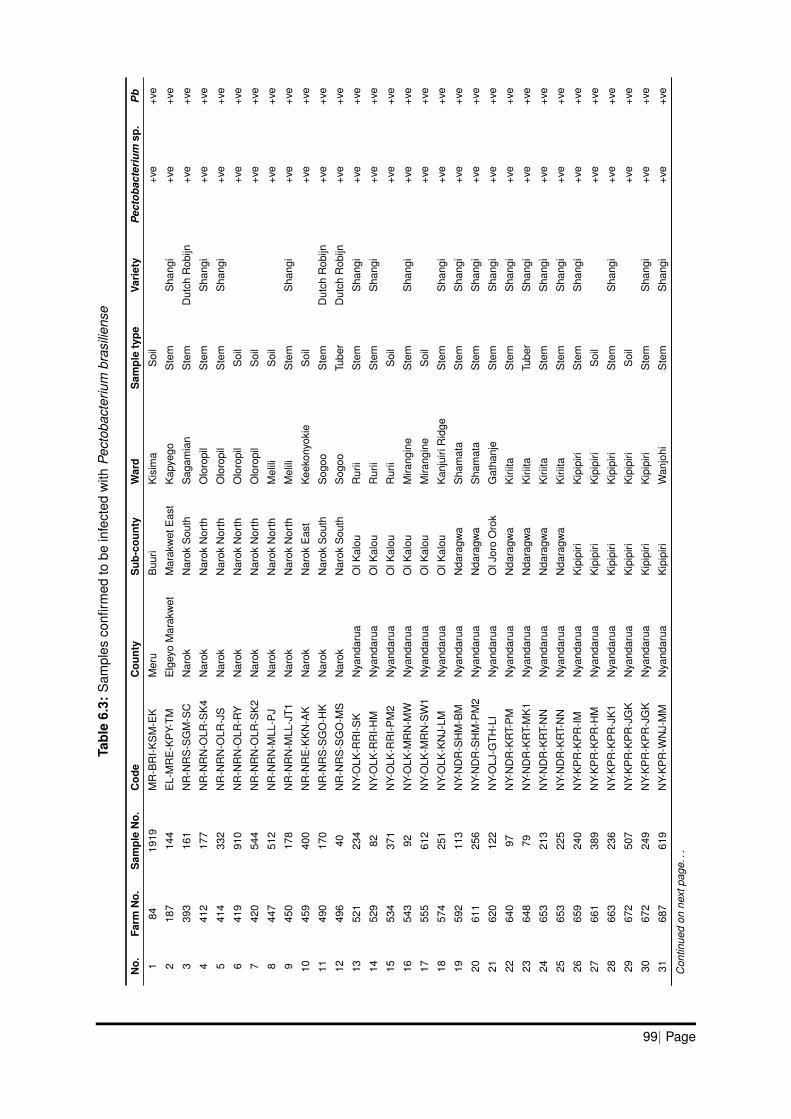
Tabl
e6.
3:S
ampl
esco
nfirm
edto
bein
fect
edw
ithPe
ctob
acte
rium
bras
ilien
se
No.
Farm
No.
Sam
ple
No.
Cod
eC
ount
yS
ub-c
ount
yW
ard
Sam
ple
type
Vari
ety
Pec
toba
cter
ium
sp.
Pb
184
1919
MR
-BR
I-KS
M-E
KM
eru
Buu
riK
isim
aS
oil
+ve
+ve
218
714
4E
L-M
RE
-KP
Y-TM
Elg
eyo
Mar
akw
etM
arak
wet
Eas
tK
apye
goS
tem
Sha
ngi
+ve
+ve
339
316
1N
R-N
RS
-SG
M-S
CN
arok
Nar
okS
outh
Sag
amia
nS
tem
Dut
chR
obijn
+ve
+ve
441
217
7N
R-N
RN
-OLR
-SK
4N
arok
Nar
okN
orth
Olo
ropi
lS
tem
Sha
ngi
+ve
+ve
541
433
2N
R-N
RN
-OLR
-JS
Nar
okN
arok
Nor
thO
loro
pil
Ste
mS
hang
i+v
e+v
e
641
991
0N
R-N
RN
-OLR
-RY
Nar
okN
arok
Nor
thO
loro
pil
Soi
l+v
e+v
e
742
054
4N
R-N
RN
-OLR
-SK
2N
arok
Nar
okN
orth
Olo
ropi
lS
oil
+ve
+ve
844
751
2N
R-N
RN
-MLL
-PJ
Nar
okN
arok
Nor
thM
elili
Soi
l+v
e+v
e
945
017
8N
R-N
RN
-MLL
-JT1
Nar
okN
arok
Nor
thM
elili
Ste
mS
hang
i+v
e+v
e
1045
940
0N
R-N
RE
-KK
N-A
KN
arok
Nar
okE
ast
Kee
kony
okie
Soi
l+v
e+v
e
1149
017
0N
R-N
RS
-SG
O-H
KN
arok
Nar
okS
outh
Sog
ooS
tem
Dut
chR
obijn
+ve
+ve
1249
640
NR
-NR
S-S
GO
-MS
Nar
okN
arok
Sou
thS
ogoo
Tube
rD
utch
Rob
ijn+v
e+v
e
1352
123
4N
Y-O
LK-R
RI-S
KN
yand
arua
OlK
alou
Rur
iiS
tem
Sha
ngi
+ve
+ve
1452
982
NY-
OLK
-RR
I-HM
Nya
ndar
uaO
lKal
ouR
urii
Ste
mS
hang
i+v
e+v
e
1553
437
1N
Y-O
LK-R
RI-P
M2
Nya
ndar
uaO
lKal
ouR
urii
Soi
l+v
e+v
e
1654
392
NY-
OLK
-MR
N-M
WN
yand
arua
OlK
alou
Mira
ngin
eS
tem
Sha
ngi
+ve
+ve
1755
561
2N
Y-O
LK-M
RN
-SW
1N
yand
arua
OlK
alou
Mira
ngin
eS
oil
+ve
+ve
1857
425
1N
Y-O
LK-K
NJ-
LMN
yand
arua
OlK
alou
Kan
juiri
Rid
geS
tem
Sha
ngi
+ve
+ve
1959
211
3N
Y-N
DR
-SH
M-B
MN
yand
arua
Nda
ragw
aS
ham
ata
Ste
mS
hang
i+v
e+v
e
2061
125
6N
Y-N
DR
-SH
M-P
M2
Nya
ndar
uaN
dara
gwa
Sha
mat
aS
tem
Sha
ngi
+ve
+ve
2162
012
2N
Y-O
LJ-G
TH-L
IN
yand
arua
OlJ
oro
Oro
kG
atha
nje
Ste
mS
hang
i+v
e+v
e
2264
097
NY-
ND
R-K
RT-
PM
Nya
ndar
uaN
dara
gwa
Kiri
itaS
tem
Sha
ngi
+ve
+ve
2364
879
NY-
ND
R-K
RT-
MK
1N
yand
arua
Nda
ragw
aK
iriita
Tube
rS
hang
i+v
e+v
e
2465
321
3N
Y-N
DR
-KR
T-N
NN
yand
arua
Nda
ragw
aK
iriita
Ste
mS
hang
i+v
e+v
e
2565
322
5N
Y-N
DR
-KR
T-N
NN
yand
arua
Nda
ragw
aK
iriita
Ste
mS
hang
i+v
e+v
e
2665
924
0N
Y-K
PR
-KP
R-IM
Nya
ndar
uaK
ipip
iriK
ipip
iriS
tem
Sha
ngi
+ve
+ve
2766
138
9N
Y-K
PR
-KP
R-H
MN
yand
arua
Kip
ipiri
Kip
ipiri
Soi
l+v
e+v
e
2866
323
6N
Y-K
PR
-KP
R-J
K1
Nya
ndar
uaK
ipip
iriK
ipip
iriS
tem
Sha
ngi
+ve
+ve
2967
250
7N
Y-K
PR
-KP
R-J
GK
Nya
ndar
uaK
ipip
iriK
ipip
iriS
oil
+ve
+ve
3067
224
9N
Y-K
PR
-KP
R-J
GK
Nya
ndar
uaK
ipip
iriK
ipip
iriS
tem
Sha
ngi
+ve
+ve
3168
761
9N
Y-K
PR
-WN
J-M
MN
yand
arua
Kip
ipiri
Wan
johi
Ste
mS
hang
i+v
e+v
e
Con
tinue
don
next
page
...
99| Page
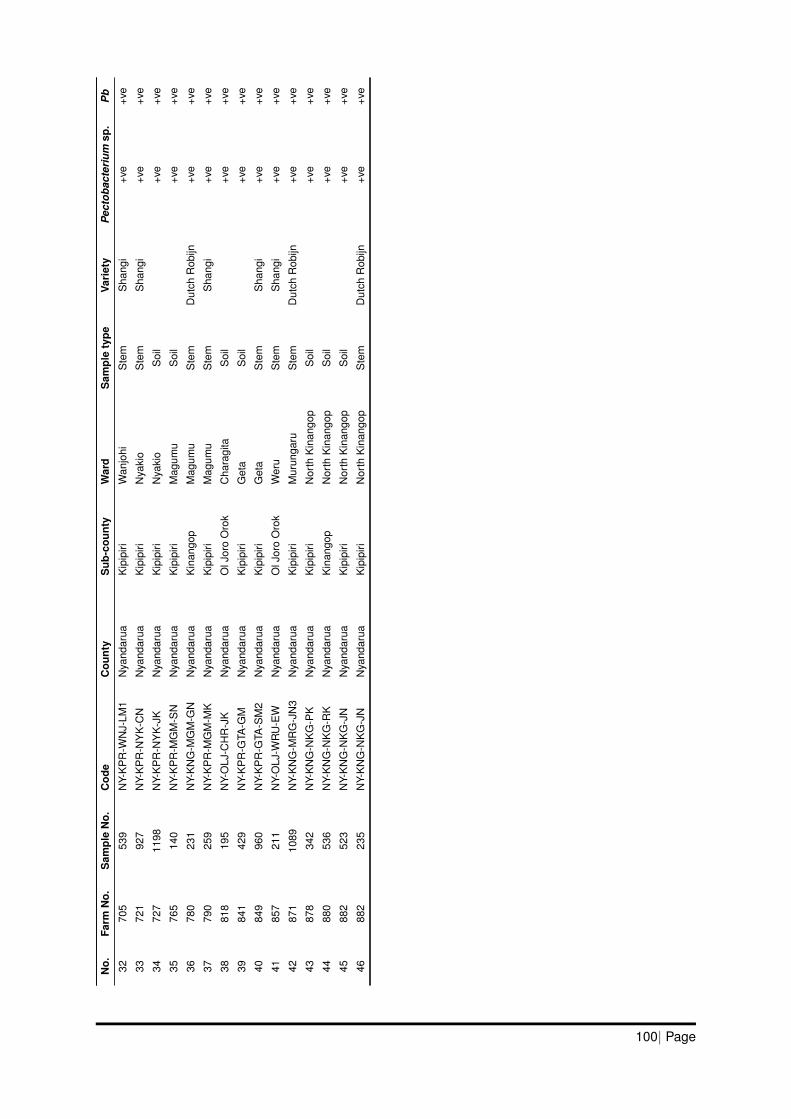
No.
Farm
No.
Sam
ple
No.
Cod
eC
ount
yS
ub-c
ount
yW
ard
Sam
ple
type
Vari
ety
Pec
toba
cter
ium
sp.
Pb
3270
553
9N
Y-K
PR
-WN
J-LM
1N
yand
arua
Kip
ipiri
Wan
johi
Ste
mS
hang
i+v
e+v
e
3372
192
7N
Y-K
PR
-NY
K-C
NN
yand
arua
Kip
ipiri
Nya
kio
Ste
mS
hang
i+v
e+v
e
3472
711
98N
Y-K
PR
-NY
K-J
KN
yand
arua
Kip
ipiri
Nya
kio
Soi
l+v
e+v
e
3576
514
0N
Y-K
PR
-MG
M-S
NN
yand
arua
Kip
ipiri
Mag
umu
Soi
l+v
e+v
e
3678
023
1N
Y-K
NG
-MG
M-G
NN
yand
arua
Kin
ango
pM
agum
uS
tem
Dut
chR
obijn
+ve
+ve
3779
025
9N
Y-K
PR
-MG
M-M
KN
yand
arua
Kip
ipiri
Mag
umu
Ste
mS
hang
i+v
e+v
e
3881
819
5N
Y-O
LJ-C
HR
-JK
Nya
ndar
uaO
lJor
oO
rok
Cha
ragi
taS
oil
+ve
+ve
3984
142
9N
Y-K
PR
-GTA
-GM
Nya
ndar
uaK
ipip
iriG
eta
Soi
l+v
e+v
e
4084
996
0N
Y-K
PR
-GTA
-SM
2N
yand
arua
Kip
ipiri
Get
aS
tem
Sha
ngi
+ve
+ve
4185
721
1N
Y-O
LJ-W
RU
-EW
Nya
ndar
uaO
lJor
oO
rok
Wer
uS
tem
Sha
ngi
+ve
+ve
4287
110
89N
Y-K
NG
-MR
G-J
N3
Nya
ndar
uaK
ipip
iriM
urun
garu
Ste
mD
utch
Rob
ijn+v
e+v
e
4387
834
2N
Y-K
NG
-NK
G-P
KN
yand
arua
Kip
ipiri
Nor
thK
inan
gop
Soi
l+v
e+v
e
4488
053
6N
Y-K
NG
-NK
G-R
KN
yand
arua
Kin
ango
pN
orth
Kin
ango
pS
oil
+ve
+ve
4588
252
3N
Y-K
NG
-NK
G-J
NN
yand
arua
Kip
ipiri
Nor
thK
inan
gop
Soi
l+v
e+v
e
4688
223
5N
Y-K
NG
-NK
G-J
NN
yand
arua
Kip
ipiri
Nor
thK
inan
gop
Ste
mD
utch
Rob
ijn+v
e+v
e
100| Page
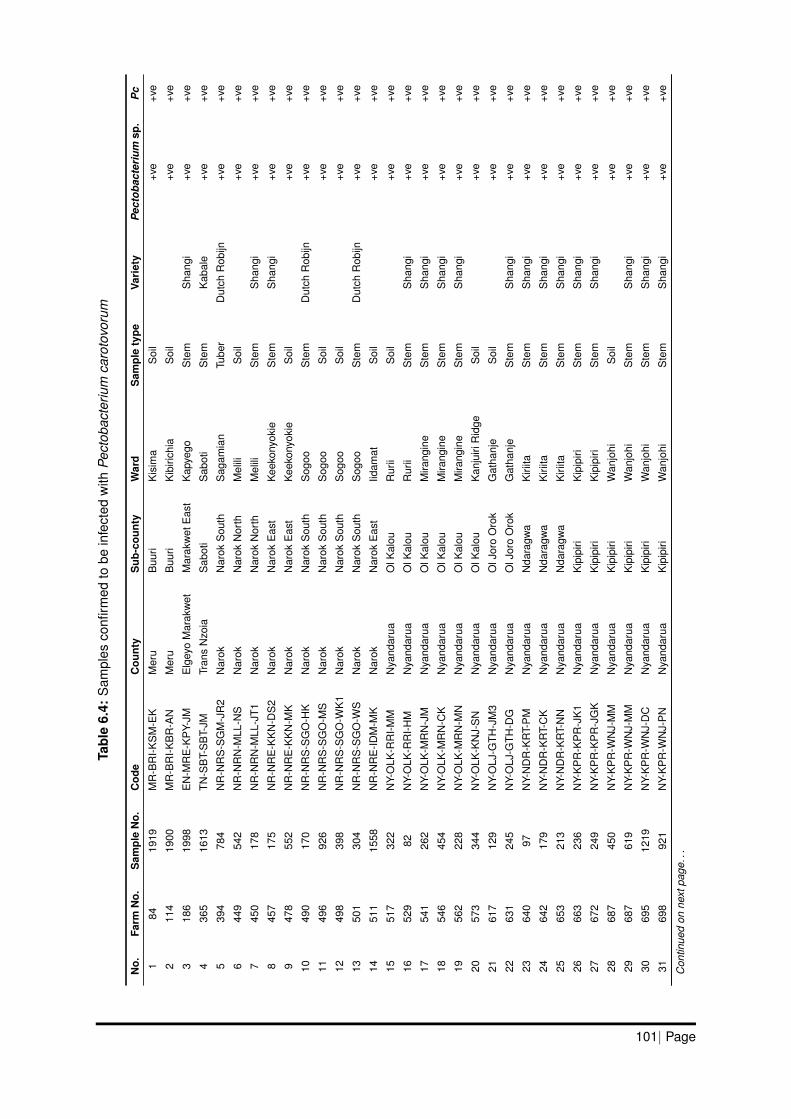
Tabl
e6.
4:S
ampl
esco
nfirm
edto
bein
fect
edw
ithPe
ctob
acte
rium
caro
tovo
rum
No.
Farm
No.
Sam
ple
No.
Cod
eC
ount
yS
ub-c
ount
yW
ard
Sam
ple
type
Vari
ety
Pec
toba
cter
ium
sp.
Pc
184
1919
MR
-BR
I-KS
M-E
KM
eru
Buu
riK
isim
aS
oil
+ve
+ve
211
419
00M
R-B
RI-K
BR
-AN
Mer
uB
uuri
Kib
irich
iaS
oil
+ve
+ve
318
619
98E
N-M
RE
-KP
Y-JM
Elg
eyo
Mar
akw
etM
arak
wet
Eas
tK
apye
goS
tem
Sha
ngi
+ve
+ve
436
516
13TN
-SB
T-S
BT-
JMTr
ans
Nzo
iaS
abot
iS
abot
iS
tem
Kab
ale
+ve
+ve
539
478
4N
R-N
RS
-SG
M-J
R2
Nar
okN
arok
Sou
thS
agam
ian
Tube
rD
utch
Rob
ijn+v
e+v
e
644
954
2N
R-N
RN
-MLL
-NS
Nar
okN
arok
Nor
thM
elili
Soi
l+v
e+v
e
745
017
8N
R-N
RN
-MLL
-JT1
Nar
okN
arok
Nor
thM
elili
Ste
mS
hang
i+v
e+v
e
845
717
5N
R-N
RE
-KK
N-D
S2
Nar
okN
arok
Eas
tK
eeko
nyok
ieS
tem
Sha
ngi
+ve
+ve
947
855
2N
R-N
RE
-KK
N-M
KN
arok
Nar
okE
ast
Kee
kony
okie
Soi
l+v
e+v
e
1049
017
0N
R-N
RS
-SG
O-H
KN
arok
Nar
okS
outh
Sog
ooS
tem
Dut
chR
obijn
+ve
+ve
1149
692
6N
R-N
RS
-SG
O-M
SN
arok
Nar
okS
outh
Sog
ooS
oil
+ve
+ve
1249
839
8N
R-N
RS
-SG
O-W
K1
Nar
okN
arok
Sou
thS
ogoo
Soi
l+v
e+v
e
1350
130
4N
R-N
RS
-SG
O-W
SN
arok
Nar
okS
outh
Sog
ooS
tem
Dut
chR
obijn
+ve
+ve
1451
115
58N
R-N
RE
-IDM
-MK
Nar
okN
arok
Eas
tIid
amat
Soi
l+v
e+v
e
1551
732
2N
Y-O
LK-R
RI-M
MN
yand
arua
OlK
alou
Rur
iiS
oil
+ve
+ve
1652
982
NY-
OLK
-RR
I-HM
Nya
ndar
uaO
lKal
ouR
urii
Ste
mS
hang
i+v
e+v
e
1754
126
2N
Y-O
LK-M
RN
-JM
Nya
ndar
uaO
lKal
ouM
irang
ine
Ste
mS
hang
i+v
e+v
e
1854
645
4N
Y-O
LK-M
RN
-CK
Nya
ndar
uaO
lKal
ouM
irang
ine
Ste
mS
hang
i+v
e+v
e
1956
222
8N
Y-O
LK-M
RN
-MN
Nya
ndar
uaO
lKal
ouM
irang
ine
Ste
mS
hang
i+v
e+v
e
2057
334
4N
Y-O
LK-K
NJ-
SN
Nya
ndar
uaO
lKal
ouK
anju
iriR
idge
Soi
l+v
e+v
e
2161
712
9N
Y-O
LJ-G
TH-J
M3
Nya
ndar
uaO
lJor
oO
rok
Gat
hanj
eS
oil
+ve
+ve
2263
124
5N
Y-O
LJ-G
TH-D
GN
yand
arua
OlJ
oro
Oro
kG
atha
nje
Ste
mS
hang
i+v
e+v
e
2364
097
NY-
ND
R-K
RT-
PM
Nya
ndar
uaN
dara
gwa
Kiri
itaS
tem
Sha
ngi
+ve
+ve
2464
217
9N
Y-N
DR
-KR
T-C
KN
yand
arua
Nda
ragw
aK
iriita
Ste
mS
hang
i+v
e+v
e
2565
321
3N
Y-N
DR
-KR
T-N
NN
yand
arua
Nda
ragw
aK
iriita
Ste
mS
hang
i+v
e+v
e
2666
323
6N
Y-K
PR
-KP
R-J
K1
Nya
ndar
uaK
ipip
iriK
ipip
iriS
tem
Sha
ngi
+ve
+ve
2767
224
9N
Y-K
PR
-KP
R-J
GK
Nya
ndar
uaK
ipip
iriK
ipip
iriS
tem
Sha
ngi
+ve
+ve
2868
745
0N
Y-K
PR
-WN
J-M
MN
yand
arua
Kip
ipiri
Wan
johi
Soi
l+v
e+v
e
2968
761
9N
Y-K
PR
-WN
J-M
MN
yand
arua
Kip
ipiri
Wan
johi
Ste
mS
hang
i+v
e+v
e
3069
512
19N
Y-K
PR
-WN
J-D
CN
yand
arua
Kip
ipiri
Wan
johi
Ste
mS
hang
i+v
e+v
e
3169
892
1N
Y-K
PR
-WN
J-P
NN
yand
arua
Kip
ipiri
Wan
johi
Ste
mS
hang
i+v
e+v
e
Con
tinue
don
next
page
...
101| Page
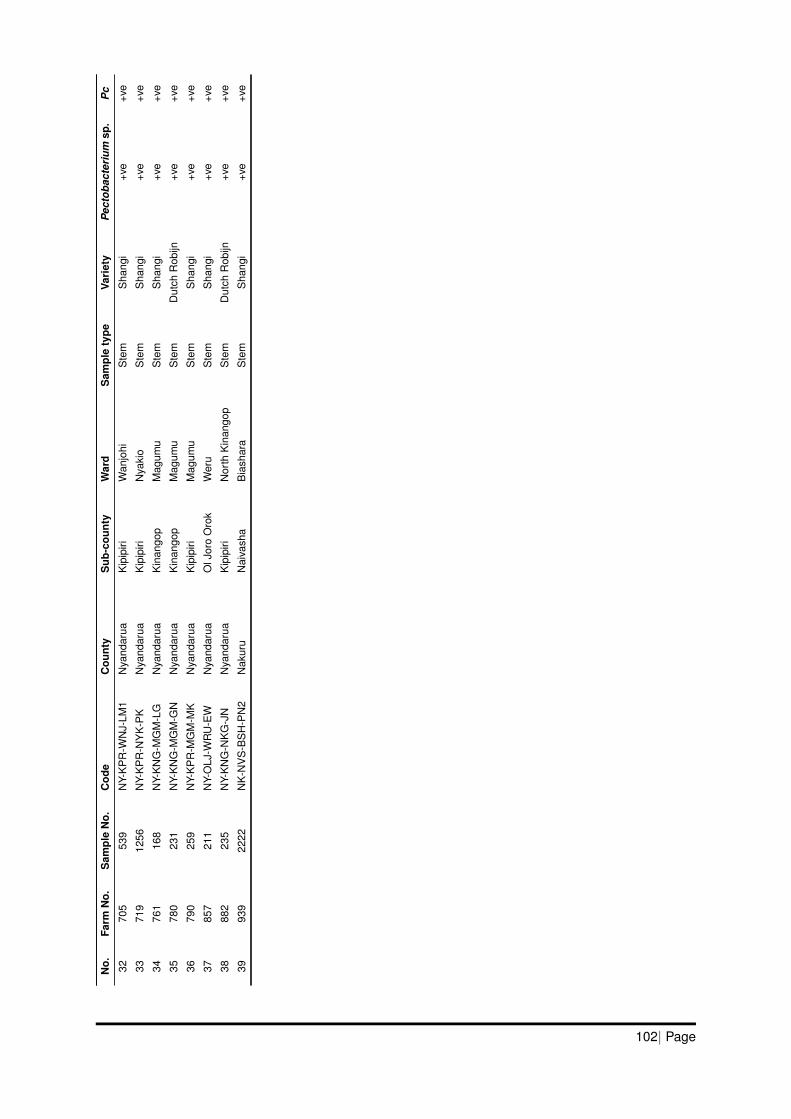
No.
Farm
No.
Sam
ple
No.
Cod
eC
ount
yS
ub-c
ount
yW
ard
Sam
ple
type
Vari
ety
Pec
toba
cter
ium
sp.
Pc
3270
553
9N
Y-K
PR
-WN
J-LM
1N
yand
arua
Kip
ipiri
Wan
johi
Ste
mS
hang
i+v
e+v
e
3371
912
56N
Y-K
PR
-NY
K-P
KN
yand
arua
Kip
ipiri
Nya
kio
Ste
mS
hang
i+v
e+v
e
3476
116
8N
Y-K
NG
-MG
M-L
GN
yand
arua
Kin
ango
pM
agum
uS
tem
Sha
ngi
+ve
+ve
3578
023
1N
Y-K
NG
-MG
M-G
NN
yand
arua
Kin
ango
pM
agum
uS
tem
Dut
chR
obijn
+ve
+ve
3679
025
9N
Y-K
PR
-MG
M-M
KN
yand
arua
Kip
ipiri
Mag
umu
Ste
mS
hang
i+v
e+v
e
3785
721
1N
Y-O
LJ-W
RU
-EW
Nya
ndar
uaO
lJor
oO
rok
Wer
uS
tem
Sha
ngi
+ve
+ve
3888
223
5N
Y-K
NG
-NK
G-J
NN
yand
arua
Kip
ipiri
Nor
thK
inan
gop
Ste
mD
utch
Rob
ijn+v
e+v
e
3993
922
22N
K-N
VS
-BS
H-P
N2
Nak
uru
Nai
vash
aB
iash
ara
Ste
mS
hang
i+v
e+v
e
102| Page
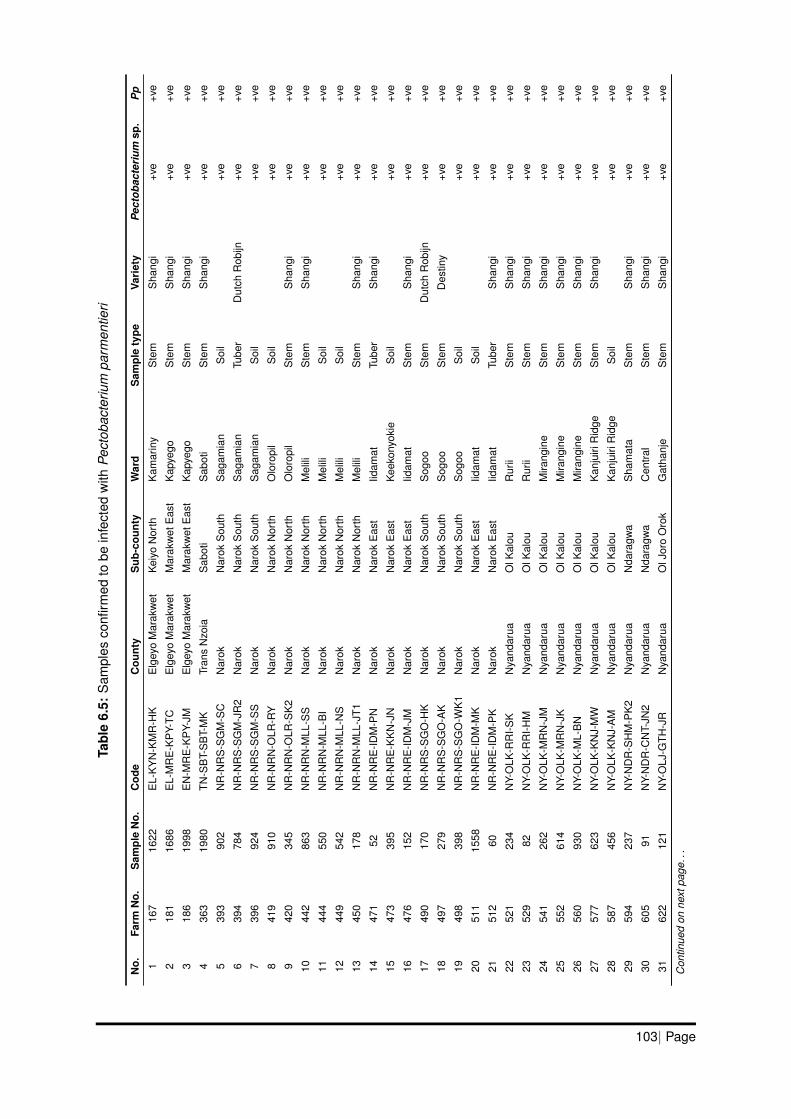
Tabl
e6.
5:S
ampl
esco
nfirm
edto
bein
fect
edw
ithPe
ctob
acte
rium
parm
entie
ri
No.
Farm
No.
Sam
ple
No.
Cod
eC
ount
yS
ub-c
ount
yW
ard
Sam
ple
type
Vari
ety
Pec
toba
cter
ium
sp.
Pp
116
716
22E
L-K
YN
-KM
R-H
KE
lgey
oM
arak
wet
Kei
yoN
orth
Kam
arin
yS
tem
Sha
ngi
+ve
+ve
218
116
86E
L-M
RE
-KP
Y-TC
Elg
eyo
Mar
akw
etM
arak
wet
Eas
tK
apye
goS
tem
Sha
ngi
+ve
+ve
318
619
98E
N-M
RE
-KP
Y-JM
Elg
eyo
Mar
akw
etM
arak
wet
Eas
tK
apye
goS
tem
Sha
ngi
+ve
+ve
436
319
80TN
-SB
T-S
BT-
MK
Tran
sN
zoia
Sab
oti
Sab
oti
Ste
mS
hang
i+v
e+v
e
539
390
2N
R-N
RS
-SG
M-S
CN
arok
Nar
okS
outh
Sag
amia
nS
oil
+ve
+ve
639
478
4N
R-N
RS
-SG
M-J
R2
Nar
okN
arok
Sou
thS
agam
ian
Tube
rD
utch
Rob
ijn+v
e+v
e
739
692
4N
R-N
RS
-SG
M-S
SN
arok
Nar
okS
outh
Sag
amia
nS
oil
+ve
+ve
841
991
0N
R-N
RN
-OLR
-RY
Nar
okN
arok
Nor
thO
loro
pil
Soi
l+v
e+v
e
942
034
5N
R-N
RN
-OLR
-SK
2N
arok
Nar
okN
orth
Olo
ropi
lS
tem
Sha
ngi
+ve
+ve
1044
286
3N
R-N
RN
-MLL
-SS
Nar
okN
arok
Nor
thM
elili
Ste
mS
hang
i+v
e+v
e
1144
455
0N
R-N
RN
-MLL
-BI
Nar
okN
arok
Nor
thM
elili
Soi
l+v
e+v
e
1244
954
2N
R-N
RN
-MLL
-NS
Nar
okN
arok
Nor
thM
elili
Soi
l+v
e+v
e
1345
017
8N
R-N
RN
-MLL
-JT1
Nar
okN
arok
Nor
thM
elili
Ste
mS
hang
i+v
e+v
e
1447
152
NR
-NR
E-ID
M-P
NN
arok
Nar
okE
ast
Iidam
atTu
ber
Sha
ngi
+ve
+ve
1547
339
5N
R-N
RE
-KK
N-J
NN
arok
Nar
okE
ast
Kee
kony
okie
Soi
l+v
e+v
e
1647
615
2N
R-N
RE
-IDM
-JM
Nar
okN
arok
Eas
tIid
amat
Ste
mS
hang
i+v
e+v
e
1749
017
0N
R-N
RS
-SG
O-H
KN
arok
Nar
okS
outh
Sog
ooS
tem
Dut
chR
obijn
+ve
+ve
1849
727
9N
R-N
RS
-SG
O-A
KN
arok
Nar
okS
outh
Sog
ooS
tem
Des
tiny
+ve
+ve
1949
839
8N
R-N
RS
-SG
O-W
K1
Nar
okN
arok
Sou
thS
ogoo
Soi
l+v
e+v
e
2051
115
58N
R-N
RE
-IDM
-MK
Nar
okN
arok
Eas
tIid
amat
Soi
l+v
e+v
e
2151
260
NR
-NR
E-ID
M-P
KN
arok
Nar
okE
ast
Iidam
atTu
ber
Sha
ngi
+ve
+ve
2252
123
4N
Y-O
LK-R
RI-S
KN
yand
arua
OlK
alou
Rur
iiS
tem
Sha
ngi
+ve
+ve
2352
982
NY-
OLK
-RR
I-HM
Nya
ndar
uaO
lKal
ouR
urii
Ste
mS
hang
i+v
e+v
e
2454
126
2N
Y-O
LK-M
RN
-JM
Nya
ndar
uaO
lKal
ouM
irang
ine
Ste
mS
hang
i+v
e+v
e
2555
261
4N
Y-O
LK-M
RN
-JK
Nya
ndar
uaO
lKal
ouM
irang
ine
Ste
mS
hang
i+v
e+v
e
2656
093
0N
Y-O
LK-M
L-B
NN
yand
arua
OlK
alou
Mira
ngin
eS
tem
Sha
ngi
+ve
+ve
2757
762
3N
Y-O
LK-K
NJ-
MW
Nya
ndar
uaO
lKal
ouK
anju
iriR
idge
Ste
mS
hang
i+v
e+v
e
2858
745
6N
Y-O
LK-K
NJ-
AM
Nya
ndar
uaO
lKal
ouK
anju
iriR
idge
Soi
l+v
e+v
e
2959
423
7N
Y-N
DR
-SH
M-P
K2
Nya
ndar
uaN
dara
gwa
Sha
mat
aS
tem
Sha
ngi
+ve
+ve
3060
591
NY-
ND
R-C
NT-
JN2
Nya
ndar
uaN
dara
gwa
Cen
tral
Ste
mS
hang
i+v
e+v
e
3162
212
1N
Y-O
LJ-G
TH-J
RN
yand
arua
OlJ
oro
Oro
kG
atha
nje
Ste
mS
hang
i+v
e+v
e
Con
tinue
don
next
page
...
103| Page
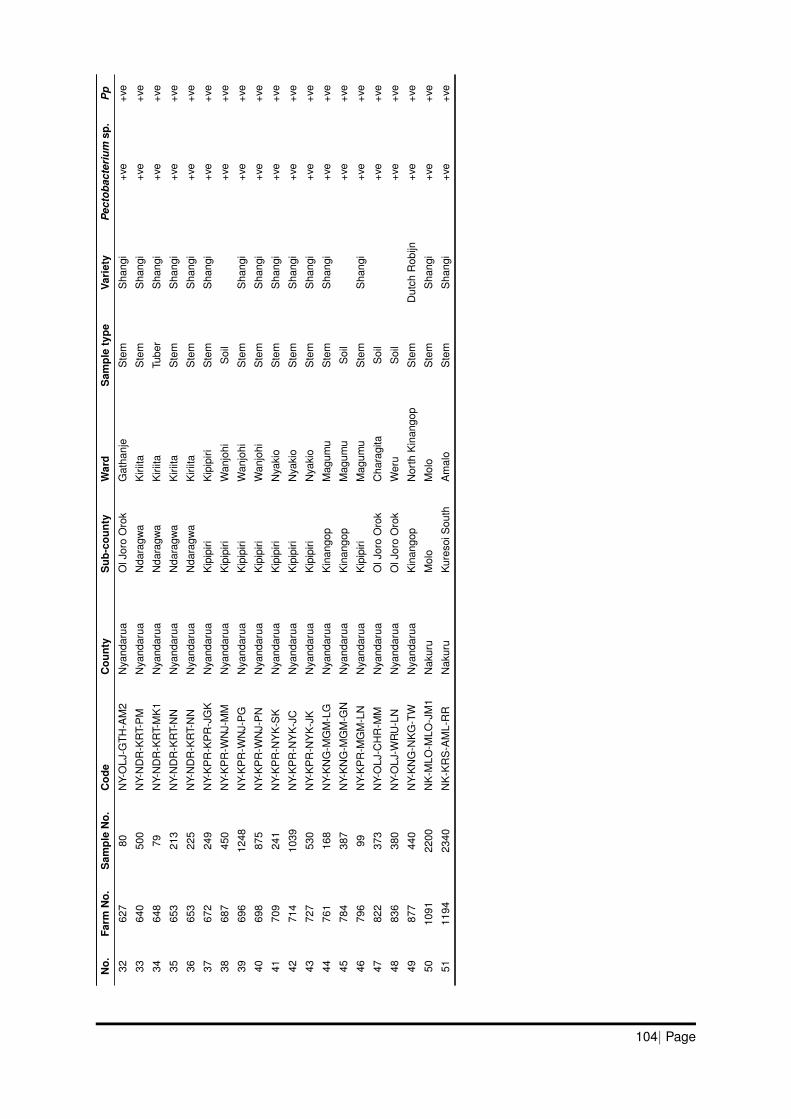
No.
Farm
No.
Sam
ple
No.
Cod
eC
ount
yS
ub-c
ount
yW
ard
Sam
ple
type
Vari
ety
Pec
toba
cter
ium
sp.
Pp
3262
780
NY-
OLJ
-GTH
-AM
2N
yand
arua
OlJ
oro
Oro
kG
atha
nje
Ste
mS
hang
i+v
e+v
e
3364
050
0N
Y-N
DR
-KR
T-P
MN
yand
arua
Nda
ragw
aK
iriita
Ste
mS
hang
i+v
e+v
e
3464
879
NY-
ND
R-K
RT-
MK
1N
yand
arua
Nda
ragw
aK
iriita
Tube
rS
hang
i+v
e+v
e
3565
321
3N
Y-N
DR
-KR
T-N
NN
yand
arua
Nda
ragw
aK
iriita
Ste
mS
hang
i+v
e+v
e
3665
322
5N
Y-N
DR
-KR
T-N
NN
yand
arua
Nda
ragw
aK
iriita
Ste
mS
hang
i+v
e+v
e
3767
224
9N
Y-K
PR
-KP
R-J
GK
Nya
ndar
uaK
ipip
iriK
ipip
iriS
tem
Sha
ngi
+ve
+ve
3868
745
0N
Y-K
PR
-WN
J-M
MN
yand
arua
Kip
ipiri
Wan
johi
Soi
l+v
e+v
e
3969
612
48N
Y-K
PR
-WN
J-P
GN
yand
arua
Kip
ipiri
Wan
johi
Ste
mS
hang
i+v
e+v
e
4069
887
5N
Y-K
PR
-WN
J-P
NN
yand
arua
Kip
ipiri
Wan
johi
Ste
mS
hang
i+v
e+v
e
4170
924
1N
Y-K
PR
-NY
K-S
KN
yand
arua
Kip
ipiri
Nya
kio
Ste
mS
hang
i+v
e+v
e
4271
410
39N
Y-K
PR
-NY
K-J
CN
yand
arua
Kip
ipiri
Nya
kio
Ste
mS
hang
i+v
e+v
e
4372
753
0N
Y-K
PR
-NY
K-J
KN
yand
arua
Kip
ipiri
Nya
kio
Ste
mS
hang
i+v
e+v
e
4476
116
8N
Y-K
NG
-MG
M-L
GN
yand
arua
Kin
ango
pM
agum
uS
tem
Sha
ngi
+ve
+ve
4578
438
7N
Y-K
NG
-MG
M-G
NN
yand
arua
Kin
ango
pM
agum
uS
oil
+ve
+ve
4679
699
NY-
KP
R-M
GM
-LN
Nya
ndar
uaK
ipip
iriM
agum
uS
tem
Sha
ngi
+ve
+ve
4782
237
3N
Y-O
LJ-C
HR
-MM
Nya
ndar
uaO
lJor
oO
rok
Cha
ragi
taS
oil
+ve
+ve
4883
638
0N
Y-O
LJ-W
RU
-LN
Nya
ndar
uaO
lJor
oO
rok
Wer
uS
oil
+ve
+ve
4987
744
0N
Y-K
NG
-NK
G-T
WN
yand
arua
Kin
ango
pN
orth
Kin
ango
pS
tem
Dut
chR
obijn
+ve
+ve
5010
9122
00N
K-M
LO-M
LO-J
M1
Nak
uru
Mol
oM
olo
Ste
mS
hang
i+v
e+v
e
5111
9423
40N
K-K
RS
-AM
L-R
RN
akur
uK
ures
oiS
outh
Am
alo
Ste
mS
hang
i+v
e+v
e
104| Page

Tabl
e6.
6:S
ampl
esco
nfirm
edto
bein
fect
edw
ithm
ultip
lePe
ctob
acte
rium
subs
peci
es
No.
Farm
No.
Sam
ple
No.
Cod
eC
ount
yS
ub-c
ount
yW
ard
Sam
ple
type
Vari
ety
SR
PS
ubsp
ecie
s
Pec
toba
cter
ium
spp.
Dic
keya
spp.
Pa
Pb
Pc
Pp
184
1919
MR
-BR
I-KS
M-E
KM
eru
Buu
riK
isim
aS
oil
+ve
+ve
+ve
+ve
218
116
86E
L-M
RE
-KP
Y-TC
Elg
eyo
Mar
akw
etM
arak
wet
Eas
tK
apye
goS
tem
Sha
ngi
+ve
+ve
+ve
318
619
98E
N-M
RE
-KP
Y-JM
Elg
eyo
Mar
akw
etM
arak
wet
Eas
tK
apye
goS
tem
Sha
ngi
+ve
+ve
+ve
+ve
436
319
80TN
-SB
T-S
BT-
MK
Tran
sN
zoia
Sab
oti
Sab
oti
Ste
mS
hang
i+v
e+v
e+v
e5
393
161
NR
-NR
S-S
GM
-SC
Nar
okN
arok
Sou
thS
agam
ian
Ste
mD
utch
Rob
ijn+v
e+v
e6
393
902
NR
-NR
S-S
GM
-SC
Nar
okN
arok
Sou
thS
agam
ian
Soi
l+v
e+v
e7
394
784
NR
-NR
S-S
GM
-JR
2N
arok
Nar
okS
outh
Sag
amia
nTu
ber
Dut
chR
obijn
+ve
+ve
+ve
841
259
NR
-NR
N-O
LR-S
K4
Nar
okN
arok
Nor
thO
loro
pil
Tube
rS
hang
i+v
e+v
e9
412
177
NR
-NR
N-O
LR-S
K4
Nar
okN
arok
Nor
thO
loro
pil
Ste
mS
hang
i+v
e+v
e10
412
860
NR
-NR
N-O
LR-S
K4
Nar
okN
arok
Nor
thO
loro
pil
Ste
mS
hang
i+v
e11
419
910
NR
-NR
N-O
LR-R
YN
arok
Nar
okN
orth
Olo
ropi
lS
oil
+ve
+ve
+ve
1244
954
2N
R-N
RN
-MLL
-NS
Nar
okN
arok
Nor
thM
elili
Soi
l+v
e+v
e+v
e13
450
178
NR
-NR
N-M
LL-J
T1N
arok
Nar
okN
orth
Mel
iliS
tem
Sha
ngi
+ve
+ve
+ve
+ve
1447
613
7N
R-N
RE
-IDM
-JM
Nar
okN
arok
Eas
tIid
amat
Ste
mS
hang
i+v
e+v
e15
476
152
NR
-NR
E-ID
M-J
MN
arok
Nar
okE
ast
Iidam
atS
tem
Sha
ngi
+ve
+ve
1649
017
0N
R-N
RS
-SG
O-H
KN
arok
Nar
okS
outh
Sog
ooS
tem
Dut
chR
obijn
+ve
+ve
+ve
+ve
1749
640
NR
-NR
S-S
GO
-MS
Nar
okN
arok
Sou
thS
ogoo
Tube
rD
utch
Rob
ijn+v
e+v
e18
496
926
NR
-NR
S-S
GO
-MS
Nar
okN
arok
Sou
thS
ogoo
Soi
l+v
e+v
e19
498
132
NR
-NR
S-S
GO
-WK
1N
arok
Nar
okS
outh
Sog
ooS
oil
+ve
+ve
2049
839
8N
R-N
RS
-SG
O-W
K1
Nar
okN
arok
Sou
thS
ogoo
Soi
l+v
e+v
e+v
e21
511
382
NR
-NR
E-ID
M-M
KN
arok
Nar
okE
ast
Iidam
atS
oil
+ve
2251
115
58N
R-N
RE
-IDM
-MK
Nar
okN
arok
Eas
tIid
amat
Soi
l+v
e+v
e+v
e23
521
234
NY-
OLK
-RR
I-SK
Nya
ndar
uaO
lKal
ouR
urii
Ste
mS
hang
i+v
e+v
e+v
e24
529
82N
Y-O
LK-R
RI-H
MN
yand
arua
OlK
alou
Rur
iiS
tem
Sha
ngi
+ve
+ve
+ve
+ve
2552
912
16N
Y-O
LK-R
RI-H
MN
yand
arua
OlK
alou
Rur
iiS
tem
Sha
ngi
+ve
2653
437
1N
Y-O
LK-R
RI-P
M2
Nya
ndar
uaO
lKal
ouR
urii
Soi
l+v
e+v
e+v
e27
541
262
NY-
OLK
-MR
N-J
MN
yand
arua
OlK
alou
Mira
ngin
eS
tem
Sha
ngi
+ve
+ve
+ve
2854
645
4N
Y-O
LK-M
RN
-CK
Nya
ndar
uaO
lKal
ouM
irang
ine
Ste
mS
hang
i+v
e+v
e+v
e29
587
340
NY-
OLK
-KN
J-A
MN
yand
arua
OlK
alou
Kan
juiri
Rid
geS
oil
+ve
3058
734
1N
Y-O
LK-K
NJ-
AM
Nya
ndar
uaO
lKal
ouK
anju
iriR
idge
Soi
l+v
e31
587
456
NY-
OLK
-KN
J-A
MN
yand
arua
OlK
alou
Kan
juiri
Rid
geS
oil
+ve
+ve
+ve
3258
756
7N
Y-O
LK-K
NJ-
AM
Nya
ndar
uaO
lKal
ouK
anju
iriR
idge
Ste
mS
hang
i+v
e33
592
96N
Y-N
DR
-SH
M-B
MN
yand
arua
Nda
ragw
aS
ham
ata
Ste
mS
hang
i+v
e34
592
113
NY-
ND
R-S
HM
-BM
Nya
ndar
uaN
dara
gwa
Sha
mat
aS
tem
Sha
ngi
+ve
+ve
+ve
3564
097
NY-
ND
R-K
RT-
PM
Nya
ndar
uaN
dara
gwa
Kiri
itaS
tem
Sha
ngi
+ve
+ve
+ve
+ve
3664
050
0N
Y-N
DR
-KR
T-P
MN
yand
arua
Nda
ragw
aK
iriita
Ste
mS
hang
i+v
e+v
e
Con
tinue
don
next
page
...
105| Page
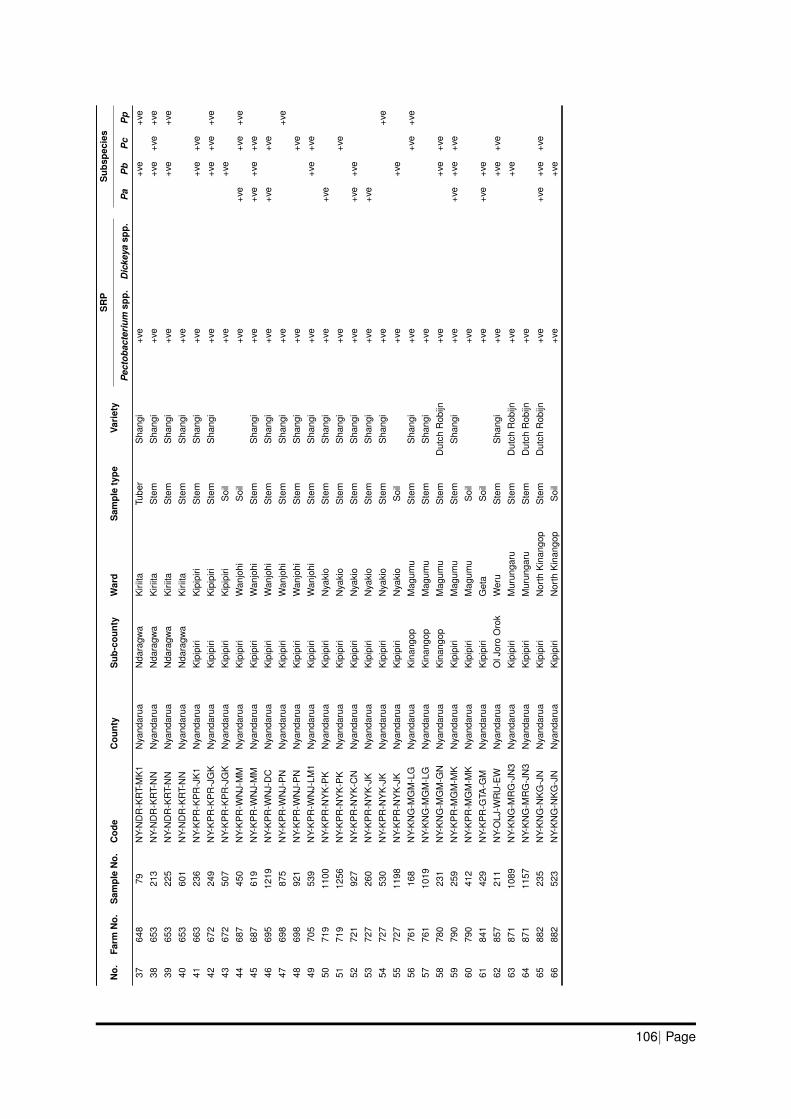
No.
Farm
No.
Sam
ple
No.
Cod
eC
ount
yS
ub-c
ount
yW
ard
Sam
ple
type
Vari
ety
SR
PS
ubsp
ecie
s
Pec
toba
cter
ium
spp.
Dic
keya
spp.
Pa
Pb
Pc
Pp
3764
879
NY-
ND
R-K
RT-
MK
1N
yand
arua
Nda
ragw
aK
iriita
Tube
rS
hang
i+v
e+v
e+v
e38
653
213
NY-
ND
R-K
RT-
NN
Nya
ndar
uaN
dara
gwa
Kiri
itaS
tem
Sha
ngi
+ve
+ve
+ve
+ve
3965
322
5N
Y-N
DR
-KR
T-N
NN
yand
arua
Nda
ragw
aK
iriita
Ste
mS
hang
i+v
e+v
e+v
e40
653
601
NY-
ND
R-K
RT-
NN
Nya
ndar
uaN
dara
gwa
Kiri
itaS
tem
Sha
ngi
+ve
4166
323
6N
Y-K
PR
-KP
R-J
K1
Nya
ndar
uaK
ipip
iriK
ipip
iriS
tem
Sha
ngi
+ve
+ve
+ve
4267
224
9N
Y-K
PR
-KP
R-J
GK
Nya
ndar
uaK
ipip
iriK
ipip
iriS
tem
Sha
ngi
+ve
+ve
+ve
+ve
4367
250
7N
Y-K
PR
-KP
R-J
GK
Nya
ndar
uaK
ipip
iriK
ipip
iriS
oil
+ve
+ve
4468
745
0N
Y-K
PR
-WN
J-M
MN
yand
arua
Kip
ipiri
Wan
johi
Soi
l+v
e+v
e+v
e+v
e45
687
619
NY-
KP
R-W
NJ-
MM
Nya
ndar
uaK
ipip
iriW
anjo
hiS
tem
Sha
ngi
+ve
+ve
+ve
+ve
4669
512
19N
Y-K
PR
-WN
J-D
CN
yand
arua
Kip
ipiri
Wan
johi
Ste
mS
hang
i+v
e+v
e+v
e47
698
875
NY-
KP
R-W
NJ-
PN
Nya
ndar
uaK
ipip
iriW
anjo
hiS
tem
Sha
ngi
+ve
+ve
4869
892
1N
Y-K
PR
-WN
J-P
NN
yand
arua
Kip
ipiri
Wan
johi
Ste
mS
hang
i+v
e+v
e49
705
539
NY-
KP
R-W
NJ-
LM1
Nya
ndar
uaK
ipip
iriW
anjo
hiS
tem
Sha
ngi
+ve
+ve
+ve
5071
911
00N
Y-K
PR
-NY
K-P
KN
yand
arua
Kip
ipiri
Nya
kio
Ste
mS
hang
i+v
e+v
e51
719
1256
NY-
KP
R-N
YK
-PK
Nya
ndar
uaK
ipip
iriN
yaki
oS
tem
Sha
ngi
+ve
+ve
5272
192
7N
Y-K
PR
-NY
K-C
NN
yand
arua
Kip
ipiri
Nya
kio
Ste
mS
hang
i+v
e+v
e+v
e53
727
260
NY-
KP
R-N
YK
-JK
Nya
ndar
uaK
ipip
iriN
yaki
oS
tem
Sha
ngi
+ve
+ve
5472
753
0N
Y-K
PR
-NY
K-J
KN
yand
arua
Kip
ipiri
Nya
kio
Ste
mS
hang
i+v
e+v
e55
727
1198
NY-
KP
R-N
YK
-JK
Nya
ndar
uaK
ipip
iriN
yaki
oS
oil
+ve
+ve
5676
116
8N
Y-K
NG
-MG
M-L
GN
yand
arua
Kin
ango
pM
agum
uS
tem
Sha
ngi
+ve
+ve
+ve
5776
110
19N
Y-K
NG
-MG
M-L
GN
yand
arua
Kin
ango
pM
agum
uS
tem
Sha
ngi
+ve
5878
023
1N
Y-K
NG
-MG
M-G
NN
yand
arua
Kin
ango
pM
agum
uS
tem
Dut
chR
obijn
+ve
+ve
+ve
5979
025
9N
Y-K
PR
-MG
M-M
KN
yand
arua
Kip
ipiri
Mag
umu
Ste
mS
hang
i+v
e+v
e+v
e+v
e60
790
412
NY-
KP
R-M
GM
-MK
Nya
ndar
uaK
ipip
iriM
agum
uS
oil
+ve
6184
142
9N
Y-K
PR
-GTA
-GM
Nya
ndar
uaK
ipip
iriG
eta
Soi
l+v
e+v
e+v
e62
857
211
NY-
OLJ
-WR
U-E
WN
yand
arua
OlJ
oro
Oro
kW
eru
Ste
mS
hang
i+v
e+v
e+v
e63
871
1089
NY-
KN
G-M
RG
-JN
3N
yand
arua
Kip
ipiri
Mur
unga
ruS
tem
Dut
chR
obijn
+ve
+ve
6487
111
57N
Y-K
NG
-MR
G-J
N3
Nya
ndar
uaK
ipip
iriM
urun
garu
Ste
mD
utch
Rob
ijn+v
e65
882
235
NY-
KN
G-N
KG
-JN
Nya
ndar
uaK
ipip
iriN
orth
Kin
ango
pS
tem
Dut
chR
obijn
+ve
+ve
+ve
+ve
6688
252
3N
Y-K
NG
-NK
G-J
NN
yand
arua
Kip
ipiri
Nor
thK
inan
gop
Soi
l+v
e+v
e
106| Page
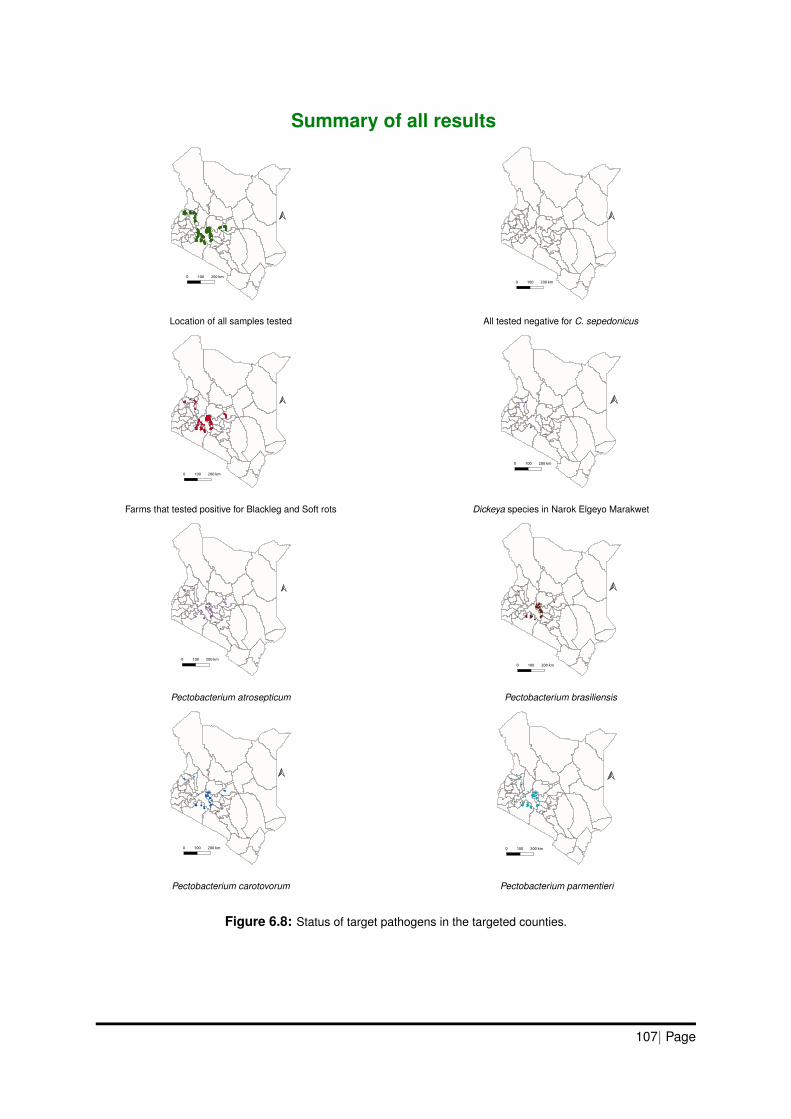
Summary of all results
Location of all samples tested All tested negative for C. sepedonicus
Farms that tested positive for Blackleg and Soft rots Dickeya species in Narok Elgeyo Marakwet
Pectobacterium atrosepticum Pectobacterium brasiliensis
Pectobacterium carotovorum Pectobacterium parmentieri
Figure 6.8: Status of target pathogens in the targeted counties.
107| Page
7
Discussion, Conclusion andRecommendations
7.1 Purpose of the surveillance
The purpose of this extensive surveillance exercise was to assist the phytosanitaryand seed regulatory authorities in Kenya in early detection of pests that are ofquarantine significance; and to ensure that seed certification practices are alignedwith emerging risk factors. This will contribute towards increased awareness of thecountry’s pest status, better pest prioritization and increased investments in critical pestrisks. Ultimately, this will potentially improve pest management practices of authoritiesand market actors, drive increased availability of quality seed hence improving potatoproductivity, incomes and therefore food security. To reiterate, the specific objectives ofthe surveillance were;
(i) Determine the presence and distribution of bacteria that cause blackleg and softrots (Dickeya sp. and Pectobacterium spp.) and bacterial ring rot (C. sepedonicus).
(ii) Generate data and develop information that define risks and mitigation measuresin seed supply systems (production, multiplication and distribution) for industryactors and farmers.
(iii) Enable prioritization of risk-based regulatory actions as part of official controls inseed multiplication and supply systems for Kenya.
(iv) Support objective analysis of the current regulatory framework for certification ofseed potato and develop/apply control/prevention measures necessary for qualityassurance elements of a potato seed health management strategy.
The work focused on key pests known to affect the potato value chain: ring rot,blackleg and soft rot. Ring rot is caused by the gram-positive rod-shaped, aerobicnon-sporulating plant-pathogenic bacterium, C. sepedonicus, whereas blackleg andsoft rots are caused by gram-negative bacteria that belong to the genera Dickeya andPectobacterium. While C. sepedonicus has a postulated possible effect on the qualityand quantity of seed, the genera Dickeya and Pectobacterium have an effect on theyield for all types of potato. The surveillance was aimed at determining the presenceof these pathogens in the country. For Dickeya and Pectobacterium, the work also
108| Page
focused on identifying the subspecies/pathovars that are present. The surveillancewas conducted in six counties which included Elgeyo Marakwet, Meru, Nakuru, Narok,Nyandarua and Trans Nzoia. Meru, Nakuru and Nyandarua are considered the leadingproducers of potato in the country. These counties were selected through a consultativeprocess led by KEPHIS. The six counties were selected based on criteria which includedprominence in potato production, and suspected high pest pressure increasing thechance of finding the target pathogens. In addition to collection of samples, a structuredquestionnaire was distributed among farmers selected by the County authorities, tobetter understand the farming systems potentially affected by the target pathogens.
7.2 Discussion
The farmers who participated in the surveillance exercise were mainly small-scalepotato growers which was expected as they were specifically selected by the WAOsand CDAs as explained in Chapters 3 and 4. Although almost equal proportions of thefemale and male respondents were observed, this does not indicate that there wereequal proportions of female and male who headed households that grew the crop. Itwas due to the person who was present at the time to answer the questions. However,it gave us good insights in the views either sex had on this value chain. In total, 28varieties were grown across all counties with 16 selected as their first choice. Shangiwas grown by the majority of farmers followed in the distant second by Dutch Robijn.Mumia et al. (108) also reported Shangi being the most grown variety in Nyandaruaand Kiambu counties. According to the Potato Catalogue 2019, Shangi is an earlymaturing variety grown for chips in a wide range of areas4 probably explaining thewise adoption. Dutch Robijn was found to do well in a couple counties5 although wasbetter suited for Bomet. The majority of farmers obtained seed through informal meansespecially from fellow farmers, using own saved seed and from the market. Use ofseed from the informal sector is not new as it has previously been reported by Mumiaet al. (108) in Nyandarua and Kiambu; Muthoni et al. (8) and Kinyua et al. (7). Only 17in 100 farmers sourced seed from seed producers. In Section 1.3, the main causes ofpoor usage of certified seed that need addressing such as low availability of certifiedseed, high prices, poor distribution networks, lack of information about the advantagesof certified seed and limited availability of seed for preferred varieties were explained indetail.
All farmers interviewed claimed to use appropriate agronomic practices such asmaintaining recommended spacing, use of fertilizers, weeding, and rotations whichis contrary to earlier reports as presented in Section 1.3.3. A number of previousreports have reported limited usage of irrigation which is mainly concentrated aroundMt. Kenya. This was too observed in this study where irrigation was only reportedby a couple of farmers in Meru. Most of the farmers relied on own experience inpotato production which is understandable because these are traditional potatogrowing regions and these farmers receive support from many actors in the valuechain on potato production. The farmers also indicated scouting for pests and also
4 Bomet, Elgeyo Marakwet, Kericho, Kiambu, Kisii, Kwale, Laikipia, Meru, Nakuru, Nandi, Narok, Nyandarua, Nyeri, Taita-Taveta, Trans-Nzoia,Uasin Gishu, and West Pokot
5 Bomet, Kiambu, Meru, Nakuru, Nyandarua, Nyeri, Cherangani hills, Taita-Taveta, Trans-Nzoia, Uasin Gishu, and West Pokot
109| Page
applied appropriate pest management strategies to manage A. solani, P. infestans,R. solanacearum, aphids, cutworms, whiteflies. However, very few of the farmersidentified either of the target diseases even after being shown images depicting thesymptoms of the pest organisms. In addition, very few farmers indicated either ofthe diseases (blackleg, soft rots and ring rot) as targets for management with thevarious agronomic practices. The low observations of blackleg and soft rots donot indicate absence of the disease but most probably a confusion of symptoms,lack of knowledge about the pest or the frequent occurrence of latent infections.Some of those who observed the diseases, did nothing to control them, which isnot advisable as it results in spread of these causal pests. Some farmers uprooteddiseased plants while others used chemical management which is not an effectivemanagement strategy for bacterial pathogens. The lack of action by the farmers whoobserved the disease is bad but when farmers do not dispose uprooted plants well andsafely, it is not much better. There is need for a concerted effort to raise awarenessabout these diseases and also promote efficient and actionable managementstrategies. This could be possible with mobile SMS and through extension whichwere overwhelmingly selected as the most preferred information dissemination methods.
With the exception of C. sepedonicus, SRP species were identified both in plants andsoils. Dickeya species were identified in tubers collected from two farm in ElgeyoMarakwet and Narok counties. This was the first record of this species in Kenya.Pectobacterium species such as P. brasiliense, P. carotovorum and P. parmentierioriginally reported by Kamau et. al. (17) in Kenya were also detected. P. parmentieriwas also reported in Kenya by Kamua and asscoaiates (17) but was not tested inthis study. In addition, P. atrosepticum was detected in samples collected from all sixcounties. Like Dickeya species, this was the first detection of this species in Kenya.Multiple species (Dickeya and Pectobacterium) were reported from the same fieldas well as the same sample. This has been reported before in tubers which havebeen shown to be contaminated with more than one bacterial pathogens (47). Thisobservation and reports by Perombelon (47) supported the decision of processing andisolating from samples especially stems received in duplicate, triplicate or quadruplicatefrom the same farm. The isolation of similar subspecies from soil and plants obtainedfrom the same farm also underscores a possible soil-borne transmission. Transmissionof bacterial pathogens from soil to plants has been documented in many plant/pathogeninteractions, R. solanacearum which also affects potato, being the best example(109–111). One in every 10 samples tested positive for SRP, an indication of a highprevalence of the blackleg and soft rots in the smallholder potato production systems inKenya. The over-reliance on the informal sector for potato seed could be blamed forpoor quality potato as reported by processing companies and the low yields observedacross the value chain. Muthoni et al. (8) and Kinyua et al. (7) have reported this beforeand blamed it for the spread of seed-borne pathogens especially R. solanacearum andprobably now Dickeya and Pectobacterium species (112). From some of the farms,Pectobacterium species were detected in the soil and in the plants possibly pointing tospread from soil to plants.
110| Page
7.3 Conclusion
A number of conclusion can be drawn from this study;
(i) The majority of farmers relied mainly on the informal seed sector for potato seed.
(ii) Interviewed farmers claimed to have a good understanding of potato productionand management. This contracts earlier studies.
(iii) Irrigation is not widely used.
(iv) Contrary to earlier studies, there is a good understanding of management of keypotato pests (especially A. solani, P. infestans, R. solanacearum, aphids, cutworms,whiteflies) amongst smallholder potato farmers.
(v) There is less knowledge about the target pests (C. sepedonicus, Dickeya andPectobacterium species) amongst smallholder potato farmers.
(vi) C. sepedonicus, the cause of bacterial ring rot disease in potato was not identifiedin any of the samples tested.
(vii) Soft rot Pectobacteriacea were found to be widespread and they were identified inone of every ten samples tested;
• Dickeya and Pectobacterium species can occur in the same field and plantand were therefore also found in the same sample in a number of cases.Dickeya species was identified for the first time in Kenya on two farms, each ina different county.• P. brasiliense, P. carotovorum, and P. parmentieri which have been reported in
Kenya previously, were again frequently detected.• P. atrosepticum which has not been reported before in Kenya was identified in
samples tested across all counties surveyed and therefore, found to be alsomore established than expected.• The genus Dickeya has not been reported in Kenya before however, it was
identified in samples collected in Elgeyo Marakwet and Narok counties andone of the samples identified as D, solani and in Taita Taveta county by KALROand identified as D. solani and D. dianthicola.
7.4 Recommendations
The project has demonstrated a few issues that need to be addressed. For instance;there is high dependence on the informal seed system for potato seed supply; andblackleg and soft rot causing bacteria are present in both tubers and soil. The followingis suggested;
(i) Develop fit-for-purpose information and communication materials in the form ofPest Management Decision Guides (PMDG)s, illustrative factsheets and photoguides suited to different stakeholders (farmers, extension, research, academia,and agro-input suppliers) to support awareness raising.
(ii) Raise awareness on prevention and control measures regarding bacterial pestproblems (brown rot, blackleg and soft rots). It is recommended to compare
111| Page
awareness options and develop and roll out the most effective awareness strategy.This could be achieved through Mass Extension Campaigns (MECs) using radio,plant health rallies and mobile SMS. The messages may include amongst others,the following;
• Applying a minimum of a 1 to 3 rotation;• Removing volunteer plants and wild hosts as much as possible by proper weed
control; Not to cut seed to be planted for seed production;• Discouraging cutting seed for ware potato production, and if done, disinfecting
the implement in Sodium Hypoclorite (5%) (house bleach); Taking hygienicmeasures, like disinfection of implements/boots with household bleach;• Rogueing and proper destruction of pest-infested plants as from early in the
season (starting as early as you can see symptoms); Controling insects whenappropriate;• Careful harvesting under dry conditions and storage where possible under
cooled conditions;• Not to use pesticides to combat the target pathogens as they are ineffective
against bacterial pathogens.
(iii) Train extension officers on field identification of blackleg and soft rots as well assampling and hygiene, and appropriate actionable management strategies.
(iv) Develop, adapt or repurpose protocol for detection of Dickeya and Pectobacteriumspecies in tubers, minitubers, and micro-propagated plants.
(v) Extend sampling and testing during active growth to facilitate seed certification toinclude Dickeya and Pectobacterium species.
(vi) Routine surveillance of C. sepedonicus to update its status in the country may beconsidered.
(vii) Discuss in a multi-stakeholder setting the feasibility, advantages and disadvantagesof delineating Pest Free Areas (PFAs) for the production of certified seed or atleast for the production of the early generations of seed multiplication. Explore thepotential of production and multiplication of pest-free potato seed in non-traditionalpotato growing areas.
(viii) Support interventions that increase availability of certified seed potato.
This surveillance demonstrated that lack of certified seed potato is one of thecauses of the widespread occurrence of the target pathogens. This is in line withprevious reports from many studies conducted in Kenya. One of the key issuesthat was identified through problem analysis as indicated in Figure 1.4 was thepoor distribution network. This has two effects; i) high prices; and 2) low usage ofcertified seed potato. Any intervention that is aimed at improving the distributionnetwork and also make certified seed affordable, will increase usage of certifiedseed especially under smallholder potato production systems. However, this willonly be possible if the causes of low availability of certified seed potato as indicatedin Figure 1.4 are also addressed. There is need to support and subsidise certifiedseed growers to increase distribution and also lower the prices. This could bethrough incentives for producing certified seed such as differential pricing or policy.
112| Page
(ix) Support smallholder potato farmers to produce better quality planting materialson-farm
The social-economic study demonstrated that smallholder potato farmers heavilydepend on seed from the informal sector especially own seed (home-saved), obtainseed from fellow farmers or seed bought from the market. This has resulted intransmission of seed-borne pests. The causal pathogens such as R. solanacearumand PCN have ended-up infesting the soils too. It is therefore important thatKEPHIS works with extension and other development partners to support farmerswith methods that can enable them maintain pest-free potato seed for own-use.The common methods promoted are;
(a) Positive Selection
Train farmers in positive selection. In positive selection, farmers select andmark healthy-looking plants as mother plants to produce better quality seedpotato. This method that has been previously promoted for use by smallholderpotato farmers in East Africa (113).
(b) Seed Plot Technique
Train farmers in the seed plot technique. In the seed plot technique, farmersuse seed plots to improve the quality of their saved seed. Initial tubers haveto be of exceptional quality, preferably certified. This technique providesa platform for obtaining seed free from tuber-borne pathogens such asR. solanacearum which has always been the target but also Dickeya andPectobacterium species. This method has also been promoted previouslyamong smallholder potato farmers in East Africa (114).
(x) Screening for tolerant varieties
According to the Potato Variety Catalogue for 2019, there over 60 potato varietiesin Kenya. Pests to which this varieties have been reported to display toleranceinclude A. solani, P. infestans, R. solanacearum, Rhizoctonia solani (cause ofblack scurf), Streptomyces scabies (cause of common scab) and Spongosporasubterranea (cause of powdery scab), Synchytrium endobioticum (cause of potatowart disease), G. rostochiensis, PVY (strains N and NTN), and PVX. Only Destinyand Jelly have been reported to display tolerance to SRP and are presented asErwinia spp. (Destiny) and blackleg (Jelly). Efforts should be made to evaluatetolerance of all varieties to SRP. This is better achieved through a multi-stakeholderinitiative of key value chain actors.
(xi) Review quarantine status of Soft Rot Pectobacteriaceae (SRP)
This project including the additional surveillance conducted in Elgeyo Marakwetand Narok (Appendix I) and the surveillance conducted in Taita Taveta by KALRO(Appendix J) presents evidence of presence of additional SRP in addition to thoseoriginally reported by Kamau et al. (17) which have also been reported in thisstudy. Therefore, it is necessary to review the quarantine status of SRP whosepresence has been reported. Pectobacterium is made up of 18 species (Section2.2.1) of which 4 are present in Kenya while Dickeya is made up of 12 (Section2.2.2) of which 2 could be present D. solani and D. dianthicola (Appendix I and J).
113| Page
Funds permitting, it will be important to determine the status of other SRP speciesin country.
(xii) Seed certification
KEPHIS has a clear seed certification process which may need reviewing toaddress the current state of some SRP in the country.
(xiii) Pest Risk Analysis (PRA)
It is important pest-initiated PRAs are conducted for P. atrosepticum, D. solani, andD. dianticola. This is will help decide the most appropriate actions that will reducethe risk of damage these pests may have on plants and plant products. The PRAsmay be extended to other species of SRP that may be deemed high risk to thepotato and other value chains.
114| Page
Bibliography
1 MoALF, Agricultural Sector Transformation and Growth Strategy, 2019-2029.Technical report, Ministry of Agriculture, Livestock, Fisheries and Irrigation (MoALF)(2019).
2 Andre, C., Ghislain, M., Bertin, P., Oufir, M., del Rosario, H. M., Hoffmann, L.,Hausman, J.-F., Larondelle, Y., and Evers, D. (2007) Andean Potato Cultivars(Solanum Tuberosum L.) as a Source of Antioxidant and Mineral Micronutrients.Journal of Agricultural and Food Chemistry, 55(2), 366–378.
3 Scott, G. J., Rosegrant, M. W., and Ringler, C. (2000) Global Projections for Rootand Tuber Crops to the Year 2020. Food Policy, 25, 561–597.
4 Ganie, S. A., Ghani, M. Y., Nissar, Q., Jabeen, N., Anjum, Q., Ahanger, F. A., andAyaz, A. (2013) Status and Symptomatology of Early Blight (Alternaria Solani) ofPotato (Solanum Tuberosum L.) in Kashmir Valley.. African Journal of AgriculturalResearch, 8, 5104–5115.
5 MoALF, The National Potato Council Strategy 2016-2020. Technical report, Ministryof Agriculture, Livestock and Fisheries (MoALF) (2016).
6 Gildemacher, P. R., Kaguongo, W., Ortiz, O., Tesfaye, A., Woldegiorgis, G., Wagoire,W. W., Kakuhenzire, R., Kinyae, P. M., Nyongesa, M., Struik, P. C., and Leeuwis,C. (May, 2009) Improving Potato Production in Kenya, Uganda and Ethiopia: ASystem Diagnosis. Potato Research, 52(2), 173–205.
7 Kinyua, Z. M., Smith, J. J., Lung’aho, C., Olanya, M., and Priou, S. (2001) On-FarmSuccess and Challenges of Producing Bacterial Wilt Free Tubers in Seed Plots inKenya. African Crop Science Journal, 9, 279–285.
8 Muthoni, J., Mbiyu, M. W., and Nyamongo, D. O. (April, 2010) A Review of PotatoSeed Systems and Germplasm Conservation in Kenya. Journal of Agricultural andFood Information, 11(2), 157–167.
9 Savary, S., Ficke, A., Aubertot, J.-N., and Hollier, C. (December, 2012) Crop LossesDue to Diseases and Their Implications for Global Food Production Losses andFood Security. Food Security, 4(4), 519–537.
10 Were, H. K., Kabira, J. N., Kinyua, Z. M., Olubayo, F. M., Karinga, J. K., Aura, J.,Lees, A. K., Cowan, G. H., and Torrance, L. (2013) Occurrence and Distribution ofPotato Pests and Diseases in Kenya. Potato Research, 56, 325–342.
115| Page
11 Muthomi, J. W., Kinyungu, T. N., Nderitu, J. H., and Olubayo, F. M. (2011) Incidenceof Aphid-Transmitted Viruses in Farmer-Produced Seed Potato Tubers in Kenya.African Journal of Horticultural Science, 5, 18–25.
12 Bruce, L. P. and George, L. T. H. (1989) Phthorimaea Operculella (Zell.), the PotatoTuber Moth: New Locality Records for East Africa.. American Journal of PotatoResearch, 66, 583–586.
13 Leonard, M. D., Walker, H. G., and Enari, L. (1970) Host Plants of MyzusPersicae at the Los Angeles State and County Arboretum. In Proceedings ofthe Entomological Society of Washington Arcadia, California: Vol. 72, pp. 294–312.
14 Njuguna, J. G. M., Oduor, G. I., and Njenga, D. N. (1998) Rate of Adoption ofNew Late Blight Resistant Potato Cultivars by Farmers in Kiambu District. In 2ndBiennial Crop Protection Conference.
15 Olanya, O. M., Adipala, E., Hakiza, J. J., Ojiambo, P., Mukalazi, J. M., Forbes, G.,and Nelson, R. (2001) Epidemiology and Population Dynamics of PhytophthoraInfestans in Sub-Saharan Africa: Progress and Constraints.. African Crop ScienceJournal, 9(1), 185–193.
16 Michieka, A. O. (1993) Screening CIP Potato Germplasm for Resistance toPseudomonas Solanacearum. In Smith, E. F., (ed.), Workshop on Bacterial Wilt ofPotato Caused by Pseudomonas Solanacearum, .
17 Kamau, J. W., Ngaira, J., Kinyua, J., Gachamba, S., Ngundo, G., Janse, J., andMacharia, I. (August, 2019) Occurence of Pectinolytic Bacteria Causing Blacklegand Soft Rot of Potato in Kenya. Journal of Plant Pathology, 101(3), 689–694.
18 Muthomi, J. W., Nyaga, J. N., Olubayo, F. N., Nderitu, J. H., Kabira, J. N., Kiretai,S. M., Aura, J. A., and Wakahiu, M. (2009) Incidence of Aphid Transmitted Virusesin Farmer-Based Seed Potato Production in Kenya. Asian Journal of Plant Sciences,8, 166–171.
19 Ateka, E. M., Mwang’ombe, A. W., and Kimenju, J. W. (2001) Studies on theInteraction between Ralstonia Solanacearum (Smith) and Meloidogyne Spp. inPotato.. African Crop Science Journal, 9(3), 527–535.
20 Mwangi, J. M., Kariuki, G. M., Waceke, J. W., and Grundler, F. M. (2015) FirstReport of Globodera Rostochiensis Infesting Potatoes in Kenya. New DiseaseReports, 31, 18.
21 Mwaura, P., Niere, B., and Vidal, S. (December, 2017) Application of anEntomopathogenic Fungus (Beauveria Bassiana) Increases Potato NematodesReproduction and Potato Tubers Damage Caused by Ditylenchus Destructor andD. Dipsaci . Biological Control, 115, 23–29.
22 Gildemacher, P. R., Demo, P., Barker, I., Kaguongo, W., Woldegiorgis, G., Wagoire,W. W., Wakahiu, M., Leeuwis, C., and Struik, P. C. (October, 2009) A Description ofSeed Potato Systems in Kenya, Uganda and Ethiopia. American Journal of PotatoResearch, 86(5), 373–382.
116| Page
23 Muthoni, J. and Nyamongo, D. O. (September, 2009) A Review of Constraints toWare Irish Potatoes Production in Kenya. Journal of Horticulture and Forestry, 1(7),98–102.
24 Onkendi, E. M., Maluleke, L. N., and Moleleki, L. N. (2014) First Report ofPectobacterium Carotovorum Subsp. Brasiliense Causing Soft Rot and Blacklegof Potatoes in Kenya. Plant Disease, 98(5), 684–684.
25 Mburu, H., Cortada, L., Haukeland, S., Ronno, W., Nyongesa, M., Kinyua, Z.,Bargul, J. L., and Coyne, D. (May, 2020) Potato Cyst Nematodes: A New Threat toPotato Production in East Africa. Frontiers in Plant Science, 11(670), 1–13.
26 Sutherland, W. J., Fleishman, E., Mascia, M. B., Pretty, J., and Rudd, M. A. (2011)Methods for Collaboratively Identifying Research Priorities and Emerging Issues inScience and Policy. Methods in Ecology and Evolution, 2(3), 238–247.
27 Roy, H. E., Peyton, J., Aldridge, D. C., Bantock, T., Blackburn, T. M., Britton, R.,Clark, P., Cook, E., Dehnen-Schmutz, K., Dines, T., Dobson, M., Edwards, F.,Harrower, C., Harvey, M. C., Minchin, D., Noble, D. G., Parrott, D., Pocock, M.J. O., Preston, C. D., Roy, S., Salisbury, A., Schonrogge, K., Sewell, J., Shaw,R. H., Stebbing, P., Stewart, A. J. A., and Walker, K. J. (2014) Horizon Scanning forInvasive Alien Species with the Potential to Threaten Biodiversity in Great Britain.Global Change Biology, 20(12), 3859–3871.
28 EFSA Panel on Plant Health, Bragard, C., Dehnen-Schmutz, K., Di Serio, F.,Gonthier, P., Jaques Miret, J. A., Justesen, A. F., MacLeod, A., Magnusson, C. S.,Milonas, P., Navas-Cortes, J. A., Parnell, S., Potting, R., Reignault, P. L., Thulke,H.-H., Van der Werf, W., Vicent Civera, A., Yuen, J., Zappala, L., Van der Wolf, J.,Kaluski, T., Pautasso, M., and Jacques, M.-A. (April, 2019) Pest Categorisation ofClavibacter Sepedonicus. EFSA Journal, 17(4), e05670.
29 Bentley, S. D., Corton, C., Brown, S. E., Barron, A., Clark, L., Doggett, J., Harris,B., Ormond, D., Quail, M. A., May, G., Francis, D., Knudson, D., Parkhill, J., andIshimaru, C. A. (2008) Genome of the Actinomycete Plant Pathogen ClavibacterMichiganensis Subsp. Sepedonicus Suggests Recent Niche Adaptation. Journalof Bacteriology, 190(2150-2160).
30 Li, X., Tambong, J., Yuan, K. X., Chen, W., Xu, H., Levesque, C. A., and De Boer,S. H. (January, 2018) Re-Classification of Clavibacter Michiganensis Subspecieson the Basis of Whole-Genome and Multi-Locus Sequence Analyses. Int J SystEvol Microbiol, 68(1), 234–240.
31 EPPO (2006) Clavibacter Michiganensis Subsp. Sepedonicus: Diagnostics.OEPP/EPPO Bulletin, 36, 99–109.
32 Bentley, D., Balasubramanian, S., Swerdlow, H., Smith, G., Milton, J., Brown,C., Hall, K., Evers, D., Barnes, C., Bignell, H., Boutell, J., Bry-ant, J., Carter, R.,Keira Cheetham, R., Cox, A., Ellis, D., Flatbush, M., Gormley, N., Humphray, S.,Irving, L., Karbelashvili, M., Kirk, S., Li, H., Liu, X., Maisinger, K., Murray, L.,Obradovic, B., Ost, T., Parkinson, M., and Pratt, M. (2008) Accurate Whole HumanGenome Sequencing Using Reversible Terminator Chemistry. Nature, 456(7218),53–59.
117| Page
33 Franc, G. D. (1999) Persistence and Latency of Clavibacter Michiganensis Subsp.Sepedonicus in Field-Grown Seed Potatoes. Plant Disease, 83, 247–250.
34 Pankova, I., Krejzari, V., and Cepl, J. (2007) Detection of Clavibacter MichiganensisSubsp. Sepedonicus in Daughter Tubers of Volunteer Potato Plants. PlantProtection Science, 43, 127–134.
35 Alcorn, S. M., Orum, T. V., Steigerwalt, A. G., Foster, J. L. M., Fogleman, J. C.,and Brenner, D. J. (1991) Taxonomy and Pathogenicity of Erwinia Cacticida Sp.Nov.†. International Journal of Systematic and Evolutionary Microbiology,, 41(2),197–212.
36 Gallois, A., Samson, R., Ageron, E., and Grimont, P. A. D. (1992) ErwiniaCarotovora Subsp. Odorifera Subsp. Nov., Associated with Odorous Soft Rotof Chicory (Cichorium Intybus L.). International Journal of Systematic andEvolutionary Microbiology,, 42(4), 582–588.
37 Koh, Y., Kim, G., Lee, Y., Sohn, S., Koh, H., Kwon, S., Heu, S., and Jung, J.(December, 2012) Pectobacterium Carotovorum Subsp. Actinidiae Subsp. Nov.,a New Bacterial Pathogen Causing Canker-like Symptoms in Yellow Kiwifruit,Actinidia Chinensis. null, 40(4), 269–279.
38 Nabhan, S., De Boer, S. H., Maiss, E., and Wydra, K. (2013) PectobacteriumAroidearum Sp. Nov., a Soft Rot Pathogen with Preference for MonocotyledonousPlants. International Journal of Systematic and Evolutionary Microbiology,, 63(Pt 7),2520–2525.
39 Parkinson, N., DeVos, P., Pirhonen, M., and Elphinstone, J. (2014) DickeyaAquatica Sp. Nov., Isolated from Waterways. International Journal of Systematicand Evolutionary Microbiology,, 64(Pt 7), 2264–2266.
40 Hugouvieux-Cotte-Pattat, N., Jacot-des-Combes, C., and Briolay, J. (2019) DickeyaLacustris Sp. Nov., a Water-Living Pectinolytic Bacterium Isolated from Lakes inFrance. International Journal of Systematic and Evolutionary Microbiology,, 69(3),721–726.
41 Oulghazi, S., Cigna, J., Lau, Y. Y., Moumni, M., Chan, K. G., and Faure, D.(2019) Transfer of the Waterfall Source Isolate Pectobacterium Carotovorum M022to Pectobacterium Fontis Sp. Nov., a Deep-Branching Species within the GenusPectobacterium. International Journal of Systematic and Evolutionary Microbiology,,69(2), 470–475.
42 Czajkowski, R., Perombelon, M. C. M., van Veen, J. A., and van der Wolf, J. M.(2011) Control of Blackleg and Tuber Soft Rot of Potato Caused by Pectobacteriumand Dickeya Species: A Review. Plant Pathology, 60(6), 999–1013.
43 Czajkowski, R., Perombelon, M., Jafra, S., Lojkowska, E., Potrykus, M., vander Wolf, J., and Sledz, W. (2015) Detection, Identification and Differentiation ofPectobacterium and Dickeya Species Causing Potato Blackleg and Tuber Soft Rot:A Review. Ann Appl Biol, 166(1), 18–38.
118| Page
44 Hauben, L., Moore, E. R., Vauterin, L., Steenackers, M., Mergaert, J., Verdonck,L., and Swings, J. (August, 1998) Phylogenetic Position of Phytopathogens withinthe Enterobacteriaceae. Systematic and Applied Microbiology, 21(3), 384–397.
45 Samson, R., Legendre, J. B., Christen, R., Saux, M. F.-L., Achouak, W., andGardan, L. (2005) Transfer of Pectobacterium Chrysanthemi (Burkholder et al.1953) Brenner et al. 1973 and Brenneria Paradisiaca to the Genus Dickeya Gen.Nov. as Dickeya Chrysanthemi Comb. Nov. and Dickeya Paradisiaca Comb. Nov.and Delineation of Four Novel Species, Dickeya Dadantii Sp. Nov., DickeyaDianthicola Sp. Nov., Dickeya Dieffenbachiae Sp. Nov. and Dickeya Zeae Sp.Nov. International Journal of Systematic and Evolutionary Microbiology, 55(4),1415–1427.
46 Adeolu, M., Alnajar, S., Naushad, S., and S Gupta, R. (December, 2016)Genome-Based Phylogeny and Taxonomy of the ’Enterobacteriales’: Proposalfor Enterobacterales Ord. Nov. Divided into the Families Enterobacteriaceae,Erwiniaceae Fam. Nov., Pectobacteriaceae Fam. Nov., Yersiniaceae Fam. Nov.,Hafniaceae Fam. Nov., Morganellaceae Fam. Nov., and Budviciaceae Fam. Nov..Int J Syst Evol Microbiol, 66(12), 5575–5599.
47 Perombelon, M. C. M. (2000) Blackleg Risk Potential of Seed Potatoes Determinedby Quantification of Tuber Contamination by the Causal Agent and ErwiniaCarotovora Subsp. Atroseptica: A Critical Review. EPPO Bulletin, 30, 413–420.
48 Pirhonen, M., Flego, D., Heikinheimo, R., and Palva, E. (1993) A Small DiffusibleSignal Molecule Is Responsible for the Global Control of Virulence and ExoenzymeProduction in the Plant Pathogen Erwinia Carotovora. The EMBO Journal, 12(6),2467–2476.
49 Lehtimaki, S., Rantakari, A., Routtu, J., Tuikkala, A., Li, J., Virtaharju, O., Palva,E. T., Romantschuk, M., and Saarilahti, H. T. (November, 2003) Characterization ofthe Hrp Pathogenicity Cluster of Erwinia Carotovora Subsp. Carotovora: High BasalLevel Expression in a Mutant Is Associated with Reduced Virulence. MolecularGenetics and Genomics, 270(3), 263–272.
50 Toth, I. K., Barny, M.-a., Czajkowski, R., Elphinstone, J. G., Li, X. S., Pedron, J.,Pirhonen, M., and Van Gijsegem, F. (2021) Pectobacterium and Dickeya: Taxonomyand Evolution. In Van Gijsegem, F., van der Wolf, J. M., and Toth, I. K., (eds.), PlantDiseases Caused by Dickeya and Pectobacterium Species, pp. 13–37 SpringerInternational Publishing Cham.
51 Gardan, L., Gouy, C., Christen, R., and Samson, R. (2003) Elevationof Three Subspecies of Pectobacterium Carotovorum to Species Level:Pectobacterium Atrosepticum Sp. Nov., Pectobacterium Betavasculorum Sp. Nov.and Pectobacterium Wasabiae Sp. Nov.. International Journal of Systematic andEvolutionary Microbiology,, 53(2), 381–391.
52 Ozturk, M., Aksoy, H. M., Potrykus, M., and Lojkowska, E. (September, 2018)Genotypic and Phenotypic Variability of Pectobacterium Strains Causing Blacklegand Soft Rot on Potato in Turkey. European Journal of Plant Pathology, 152(1),143–155.
119| Page
53 Pedron, J. and Van Gijsegem, F. (2019) Diversity in the Bacterial Genus DickeyaGrouping Plant Pathogens and Waterways Isolates. OBM Genetics, 3(4), 22.
54 Meier-Kolthoff, J. P., Auch, A. F., Klenk, H.-P., and Goker, M. (February, 2013)Genome Sequence-Based Species Delimitation with Confidence Intervals andImproved Distance Functions. BMC Bioinformatics, 14(1), 60.
55 Brady, C. L., Cleenwerck, I., Denman, S., Venter, S. N., Rodrıguez-Palenzuela, P.,Coutinho, T. A., and De Vos, P. (2012) Proposal to Reclassify Brenneria Quercina(Hildebrand and Schroth 1967) Hauben et al. 1999 into a New Genus, LonsdaleaGen. Nov., as Lonsdalea Quercina Comb. Nov., Descriptions of LonsdaleaQuercina Subsp. Quercina Comb. Nov., Lonsdalea Quercina Subsp. Iberica Subsp.Nov. and Lonsdalea Quercina Subsp. Britannica Subsp. Nov., Emendation of theDescription of the Genus Brenneria, Reclassification of Dickeya Dieffenbachiaeas Dickeya Dadantii Subsp. Dieffenbachiae Comb. Nov., and Emendation ofthe Description of Dickeya Dadantii . International Journal of Systematic andEvolutionary Microbiology,, 62(Pt 7), 1592–1602.
56 Portier, P., Pedron, J., Taghouti, G., Fischer-Le Saux, M., Caullireau, E., Bertrand,C., Laurent, A., Chawki, K., Oulgazi, S., Moumni, M., Andrivon, D., Dutrieux,C., Faure, D., Helias, V., and Barny, M.-A. (2019) Elevation of PectobacteriumCarotovorum Subsp. Odoriferum to Species Level as Pectobacterium OdoriferumSp. Nov., Proposal of Pectobacterium Brasiliense Sp. Nov. and PectobacteriumActinidiae Sp. Nov., Emended Description of Pectobacterium Carotovorum andDescription of Pectobacterium Versatile Sp. Nov., Isolated from Streams andSymptoms on Diverse Plants. International Journal of Systematic and EvolutionaryMicrobiology,, 69(10), 3207–3216.
57 Young, J. and Park, D.-C. (July, 2007) Relationships of Plant PathogenicEnterobacteria Based on Partial atpD, carA, and recA as Individual andConcatenated Nucleotide and Peptide Sequences. Systematic and AppliedMicrobiology, 30(5), 343–354.
58 Perombelon, M. C. M. (2002) Methods for the Detection and Quantification ofErwinia Carotovora Subsp. Atroseptica on Potatoes Suitable for Commercial Use:A Laboratory Manual, Scottish Crop Research Institute, Invergowrie, Dundee,Scotland.
59 Sarfraz, S., Riaz, K., Oulghazi, S., Cigna, J., Sahi, S. T., Khan, S. H., and Faure, D.(2018) Pectobacterium Punjabense Sp. Nov., Isolated from Blackleg Symptomsof Potato Plants in Pakistan. International Journal of Systematic and EvolutionaryMicrobiology,, 68(11), 3551–3556.
60 Waleron, M., Waleron, K., and Lojkowska, E. (July, 2014) Characterization ofPectobacterium Carotovorum Subsp. Odoriferum Causing Soft Rot of StoredVegetables. European Journal of Plant Pathology, 139(3), 457–469.
61 van der Wolf, J. M. and De Boer, S. H. (January, 2007) Chapter 27 - BacterialPathogens of Potato. In Vreugdenhil, D., Bradshaw, J., Gebhardt, C., Govers,F., Mackerron, D. K., Taylor, M. A., and Ross, H. A., (eds.), Potato Biology andBiotechnology, pp. 595–617 Elsevier Science B.V. Amsterdam.
120| Page

62 Hauben, L., Van Gijsegem, F., and Swings, J. (1998) Genus XXIV. PectobacteriumWaldee 1945, 469. In Bergey’s Manual of Systematic Bacteriology Vol. 2, pp.721–730.
63 Thomson, S. V., Hildebrand, D. C., and Schroth, M. N. (1981) Identification andNutritional Differentiation of the Erwinia Sugarbeet Pathogen from Members ofErwinia Carotovora and Erwinia Chrysanthemi . Phytopathology, 71, 1037–1042.
64 Zidack, N. K. and Jacobsen, B. J. (January, 2001) First Report and VirulenceEvaluation of Erwinia Carotovora Subsp. Betavasculorum on Sugarbeet in Montana.Plant Health Progress, 2(1), 6.
65 Perombelon, M. C. M. (2002) Potato Diseases Caused by Soft Rot Erwinias: AnOverview of Pathogenesis. Plant Pathology, 51, 1–12.
66 de Haan, E. G., Dekker-Nooren, T. C. E. M., van den Bovenkamp, G. W.,Speksnijder, A. G. C. L., van der Zouwen, P. S., and van der Wolf, J. M. (2008)Pectobacterium Carotovorum Subsp. Carotovorum Can Cause Potato Blackleg inTemperate Climates. European Journal of Plant Pathology, 122, 561–569.
67 Oulghazi, S., Pedron, J., Cigna, J., Lau, Y. Y., Moumni, M., Van Gijsegem, F.,Chan, K.-G., and Faure, D. (2019) Dickeya Undicola Sp. Nov., a Novel Species forPectinolytic Isolates from Surface Waters in Europe and Asia. International Journalof Systematic and Evolutionary Microbiology,, 69(8), 2440–2444.
68 Zoledowska, S., Motyka, A., Zukowska, D., Sledz, W., and Lojkowska, E. (January,2018) Population Structure and Biodiversity of Pectobacterium Parmentieri Isolatedfrom Potato Fields in Temperate Climate. Plant Disease, 102(1), 154–164.
69 Goto, M. and Matsumoto, K. (1987) Erwinia Carotovora Subsp. Wasabiae Subsp.Nov. Isolated from Diseased Rhizomes and Fibrous Roots of Japanese Horseradish(Eutrema Wasabi Maxim.). International Journal of Systematic and EvolutionaryMicrobiology,, 37(2), 130–135.
70 Ma, B., Hibbing, M. E., Kim, H.-S., Reedy, R. M., Yedidia, I., Breuer, J., Breuer, J.,Glasner, J. D., Perna, N. T., Kelman, A., and Charkowski, A. O. (September, 2007)Host Range and Molecular Phylogenies of the Soft Rot Enterobacterial GeneraPectobacterium and Dickeya. Phytopathology, 97(9), 1150–1163.
71 Pitman, A. R., Harrow, S. A., and Visnovsky, S. B. (March, 2010) GeneticCharacterisation of Pectobacterium Wasabiae Causing Soft Rot Disease of Potatoin New Zealand. European Journal of Plant Pathology, 126(3), 423–435.
72 Baghaee-Ravari, S., Rahimian, H., Shams-Bakhsh, M., Lopez-Solanilla, E.,Antunez-Lamas, M., and Rodrıguez-Palenzuela, P. (March, 2011) Characterizationof Pectobacterium Species from Iran Using Biochemical and Molecular Methods.European Journal of Plant Pathology, 129(3), 413–425.
73 De Boer, S. H., Li, X., and Ward, L. J. (October, 2012) Pectobacterium Spp.Associated with Bacterial Stem Rot Syndrome of Potato in Canada. Phytopathology,102(10), 937–947.
121| Page
74 Pasanen, M., Laurila, J., Brader, G., Palva, E. T., Ahola, V., van der Wolf, J.,Hannukkala, A., and Pirhonen, M. (2013) Characterisation of PectobacteriumWasabiae and Pectobacterium Carotovorum Subsp. Carotovorum Isolates fromDiseased Potato Plants in Finland. Annals of Applied Biology, 163, 403–419.
75 Khayi, S., Cigna, J., Chong, T. M., Quetu-Laurent, A., Chan, K.-G., Helias, V., andFaure, D. (2016) Transfer of the Potato Plant Isolates of Pectobacterium Wasabiaeto Pectobacterium Parmentieri Sp. Nov.. International Journal of Systematic andEvolutionary Microbiology,, 66(12), 5379–5383.
76 Pasanen, M., Waleron, M., Schott, T., Cleenwerck, I., Misztak, A., Waleron, K.,Pritchard, L., Bakr, R., Degefu, Y., van der Wolf, J., Vandamme, P., and Pirhonen,M. (2020) Pectobacterium Parvum Sp. Nov., Having a Salmonella SPI-1-like TypeIII Secretion System and Low Virulence. International Journal of Systematic andEvolutionary Microbiology,, 70(4), 2440–2448.
77 Waleron, M., Misztak, A., Waleron, M., Franczuk, M., Wielgomas, B., and Waleron,K. (March, 2018) Transfer of Pectobacterium Carotovorum Subsp. CarotovorumStrains Isolated from Potatoes Grown at High Altitudes to PectobacteriumPeruviense Sp. Nov.. Systematic and Applied Microbiology, 41(2), 85–93.
78 Dees, M. W., Lebecka, R., Perminow, J. I. S., Czajkowski, R., Grupa, A., Motyka,A., Zoledowska, S., Sliwka, J., Lojkowska, E., and Brurberg, M. B. (August, 2017)Characterization of Dickeya and Pectobacterium Strains Obtained from DiseasedPotato Plants in Different Climatic Conditions of Norway and Poland. EuropeanJournal of Plant Pathology, 148(4), 839–851.
79 Waleron, M., Misztak, A., Waleron, M., Franczuk, M., Jonca, J., Wielgomas,B., Mikicinski, A., Popovic, T., and Waleron, K. (May, 2019) PectobacteriumZantedeschiae Sp. Nov. a New Species of a Soft Rot Pathogen Isolated from CallaLily (Zantedeschia Spp.). Systematic and Applied Microbiology, 42(3), 275–283.
80 Shirshikov Fedor V., Korzhenkov Aleksei A., Miroshnikov Kirill K., KabanovaAnastasia P., Barannik Alla P., Ignatov Alexander N., and Miroshnikov KonstantinA. (April, 2018) Draft Genome Sequences of New Genomospecies “CandidatusPectobacterium Maceratum” Strains, Which Cause Soft Rot in Plants. GenomeAnnouncements, 6(15), e00260–18.
81 Mikicinski, A., Sobiczewski, P., Sulikowska, M., Puławska, J., and Treder, J. (April,2010) Pectolytic Bacteria Associated with Soft Rot of Calla Lily (ZantedeschiaSpp.) Tubers. Journal of Phytopathology, 158(4), 201–209.
82 Popovic, T., Jelusic, A., Milovanovic, P., Janjatovic, S., Budnar, M., Dimkic, I., andStankovic, S. (December, 2017) First Report of Pectobacterium Atrosepticum,Causing Bacterial Soft Rot on Calla Lily in Serbia. Plant Disease, 101(12), 2145.
83 CABI Invasive Species Compendium. www.cabi.org/isc (2021).
84 Burkholder, W. R., Mcfadden, L. A., and Dimock, E. W. (1953) A Bacterial Blight ofChrysanthemums. Phytopathology, 43(9).
122| Page
85 Young, J. M., Dye, D. W., Bradbury, J. F., Panagopoulos, C. G., and Robbs, C. F.(February, 1978) A Proposed Nomenclature and Classification for Plant PathogenicBacteria. null, 21(1), 153–177.
86 Pedron, J., Bertrand, C., Taghouti, G., Portier, P., and Barny, M.-A. (2019)Pectobacterium Aquaticum Sp. Nov., Isolated from Waterways. InternationalJournal of Systematic and Evolutionary Microbiology, 69(3), 745–751.
87 Wang, Y.-P., Wu, M.-F., Lin, P.-J., Wang, Y., Chen, A.-D., Jiang, Y.-Y., Zhai, B.-P.,Chapman, J. W., and Hu, G. (September, 2020) Plagues of Desert Locusts: VeryLow Invasion Risk to China. Insects, 11(9), 628.
88 van der Wolf, J. M., Nijhuis, E. H., Kowalewska, M. J., Saddler, G. S., Parkinson,N., Elphinstone, J. G., Pritchard, L., Toth, I. K., Lojkowska, E., Potrykus, M.,Waleron, M., de Vos, P., Cleenwerck, I., Pirhonen, M., Garlant, L., Helias, V.,Pothier, J. F., Pfluger, V., Duffy, B., Tsror, L., and Manulis, S. (2014) Dickeya SolaniSp. Nov., a Pectinolytic Plant-Pathogenic Bacterium Isolated from Potato (SolanumTuberosum). International Journal of Systematic and Evolutionary Microbiology,64, 768–774.
89 Tian, Y., Zhao, Y., Yuan, X., Yi, J., Fan, J., Xu, Z., Hu, B., De Boer, S. H., andLi, X. (2016) Dickeya Fangzhongdai Sp. Nov., a Plant-Pathogenic BacteriumIsolated from Pear Trees (Pyrus Pyrifolia). International Journal of Systematic andEvolutionary Microbiology,, 66(8), 2831–2835.
90 Hugouvieux-Cotte-Pattat, N., Brochier-Armanet, C., Flandrois, J.-P., andReverchon, S. (2020) Dickeya Poaceiphila Sp. Nov., a Plant-Pathogenic BacteriumIsolated from Sugar Cane (Saccharum Officinarum). International Journal ofSystematic and Evolutionary Microbiology,, 70(8), 4508–4514.
91 Toth, I. K., van der Wolf, J. M., Saddler, G., Lojkowska, E., Helias, V., Pirhonen, M.,Tsror, L., and Elphinstone, J. G. (2011) Dickeya Species: An Emerging Problemfor Potato Production in Europe. Plant Pathology, 60(3), 385–399.
92 Czajkowski, R., Grabe, G. J., and van der Wolf, J. M. (October, 2009) Distribution ofDickeya Spp. and Pectobacterium Carotovorum Subsp. Carotovorum in NaturallyInfected Seed Potatoes. European Journal of Plant Pathology, 125(2), 263–275.
93 Degefu, Y., Virtanen, E., and Vayrynen, T. (2009) Pre-PCR Processes in theMolecular Detection of Blackleg and Soft Rot Erwiniae in Seed Potatoes. Journalof Phytopathology, 157(6), 370–378.
94 Tsror, L., Erlich, O., Hazanovsky, M., Ben Daniel, B., Zig, U., and Lebiush, S.(2012) Detection of Dickeya Spp. Latent Infection in Potato Seed Tubers UsingPCR or ELISA and Correlation with Disease Incidence in Commercial Field Cropsunder Hot-Climate Conditions. Plant Pathology, 61(1), 161–168.
95 Keijbets, M. Pectic Substances in the Cell Wall and the Intercellular Cohesion ofPotato Tuber Tissue during Cooking PhD thesis Pudoc Wageningen, Netherlands(1974).
123| Page
96 Gudmestad, N. C., Mallik, I., Pasche, J. S., Anderson, N. R., and Kinzer, K.(2009) A Real-Time PCR Assay for the Detection of Clavibacter MichiganensisSubsp. Sepedonicus Based on the Cellulase A Gene Sequence. Plant Disease,93, 649–659.
97 Cho, M. S., Park, D. H., Namgung, M., Ahn, T.-Y., and Park, D. S. (2015) Validationand Application of a Real-Time PCR Protocol for the Specific Detection andQuantification of Clavibacter Michiganensis Subsp. Sepedonicus in Potato. PlantPathology, 31, 123–131.
98 Darrasse, A., Priou, S., Kotoujansky, A., and Bertheau, Y. (1994) PCR andRestriction Fragment Length Polymorphism of a Pel Gene as a Tool to IdentifyErwinia Carotovora in Relation to Potato Diseases. Applied and EnvironmentalMicrobiology, 60(5), 1437.
99 Frechon, D., Exbrayat, P., Helias, V., Hyman, L. J., Jouan, B., Llop, P., Lopez,M. M., Payet, N., Perombelon, M. C. M., Toth, I. K., van Beckhoven, J. R. C. M.,van der Wolf, J. M., and Bertheau, Y. (June, 1998) Evaluation of a PCR Kit forthe Detection of Erwinia Carotovora Subsp. Atroseptica on Potato Tubers. PotatoResearch, 41(2), 163–173.
100 De Boer, S. H. and Ward, L. J. (1995) PCR Detection of Erwinia CarotovororaSubsp. Atroseptica Associated with Potato Tissue. Phytopathology, 85, 854–858.
101 Kang, H. W., Kwon, S. W., and Go, S. J. (2003) PCR-Based Specific andSensitive Detection of Pectobacterium Carotovorum Ssp. Carotovorum by PrimersGenerated from a URP-PCR Fingerprinting-Derived Polymorphic Band. PlantPathology, 52(2), 127–133.
102 Duarte, V., De Boer, S. H., Ward, L. J., and de Oliveira, A. M. R. (2004)Characterization of Atypical Erwinia Carotovora Strains Causing Blackleg of Potatoin Brazil. Journal of Applied Microbiology, 96, 535–545.
103 Kim, M. H., Cho, M. S., Kim, B. K., Choi, H. J., Hahn, J. H., Kim, C., Kang, M. J.,Kim, S. H., and Park, D. S. (2012) Quantitative Real-Time Polymerase ChainReaction Assay for Detection of Pectobacterium Wasabiae Using YD RepeatProtein Gene-Based Primers. Plant Disease, 96, 253–257.
104 Laurila, J., Ahola, V., Lehtinen, A., Joutsjoki, T., Hannukkala, A., Rahkonen, A.,and Pirhonen, M. (2008) Characterization of Dickeya Strains Isolated from Potatoand River Water Samples in Finland. European Journal of Plant Pathology, 122,213–225.
105 Tsror, L., Erlich, O., Lebiush, S., Hazanovsky, M., Zig, U., Slawiak, M., Grabe,G., van der Wolf, J. M., and van de Haar, J. J. (September, 2008) Assessment ofRecent Outbreaks of Dickeya Sp. (Syn. Erwinia Chrysanthemi) Slow Wilt in PotatoCrops in Israel. European Journal of Plant Pathology, 123(3), 311.
106 Helias, V., Hamon, P., Huchet, E., Wolf, J. V. D., and Andrivon, D. (2012) Two NewEffective Semiselective Crystal Violet Pectate Media for Isolation of Pectobacteriumand Dickeya. Plant Pathology, 61, 339–345.
124| Page

107 van der Wolf, J. M., Cahill, G., Van Gijsegem, F., Helias, V., Humphris, S., Li, X. S.,Lojkowska, E., and Pritchard, L. (2021) Isolation, Detection and Characterizationof Pectobacterium and Dickeya Species. In Van Gijsegem, F., van der Wolf, J. M.,and Toth, I. K., (eds.), Plant Diseases Caused by Dickeya and PectobacteriumSpecies, pp. 149–173 Springer International Publishing Cham.
108 Mumia, B. I., Muthomi, J. W., Narla, R. D., Nyongesa, M. W., and Olubayo, F. M.(2018) Seed Potato Production Practices and Quality of Farm Saved Seed Potato inKiambu and Nyandarua Counties in Kenya. World Journal of Agricultural Research,6(1), 20–30.
109 Powelson, M. L. and Apple, J. D. (1984) Soil and Seed Tubers as Sources ofInoculum of Erwinia Carotovora Pv. Carotovora for Stem Soft Rot of Potatoes.Phytopathology, 74, 429–432.
110 Dung, J. K. S., Johnson, D. A., and Schroeder, B. K. (2014) Role of Co-Infectionby Pectobacterium and Verticillium Dahliae in the Development of Early Dying andAerial Stem Rot of Russet Burbank Potato. Plant Pathology, 63(2), 299–307.
111 Elsayed, T. R., Jacquiod, S., Nour, E. H., Sørensen, S. J., and Smalla, K.(2020) Biocontrol of Bacterial Wilt Disease through Complex Interaction betweenTomato Plant, Antagonists, the Indigenous Rhizosphere Microbiota, and RalstoniaSolanacearum. Frontiers in Microbiology, 10, 2835–2835.
112 Ansermet, M., Schaerer, S., Kellenberger, I., Tallant, M., and Dupuis, B. (2016)Influence of Seed-Borne and Soil-Carried Inocula of Dickeya Spp. on Potato PlantTranspiration and Symptom Expression. European Journal of Plant Pathology, 145,459–467.
113 Kakuhenzire, R., Lemaga, B., Tibanyendera, D., Borus, D., Kashaija, I., Namugga,P., and Schulte-Geldermann, E. (September, 2013) Positive Selection: A SimpleTechnique for Improving Seed Potato Quality and Potato Productivity amongSmallholder Farmers. Acta Horticulturae, 1007, 225–233.
114 Kinyua, Z. M., Schulte-Geldermann, E., Namugga, P., Ochieng-Obura, B.,Tindimubona, S., Bararyenya, A., Kashaija, I. N., Rwomushana, I., and Opio,F. (2015) Adaption and Improvement of the Seed-Plot Technique in SmallholderPotato Production. In Low, J., Nyongesa, M., Quinn, S., and Parker, M., (eds.),Potato and Sweet Potato in Africa: Transforming the Value Chains for Food andNutrition Security, pp. 218–225 CAB International Nairobi, Kenya.
115 Humphris, S. N., Cahill, G., Elphinstone, J. G., Kelly, R., Parkinson, N. M., Pritchard,L., Toth, I. K., and Saddler, G. S. (2009) Detection of the Bacterial Potato PathogensPectobacterium and Dickeya Spp. Using Conventional and Real-Time PCR. InLacomme, C., (ed.), Plant Pathology: Techniques and Protocols, pp. 1–16 HumanaPress New York, USA second edition.
116 Wilson, I. W., Schiff, C. L., Hughes, D. E., and Somerville, S. C. (2001) QuantitativeTrait Loci Analysis of Powdery Mildew Disease Resistance in the ArabidopsisThaliana Accession Kashmir-1. Genetics, 158, 1301–1309.
125| Page
117 Pritchard, L., Humphris, S., Saddler, G. S., Parkinson, N. M., Bertrand, V.,Elphinstone, J. G., and Toth, I. K. (2012) Detection of Phytopathogens of theGenus Dickeya Using a PCR Primer Prediction Pipeline for Draft Bacterial GenomeSequences. Plant Pathology, 62(3), 587–596.
126| Page
Appendices
127| Page
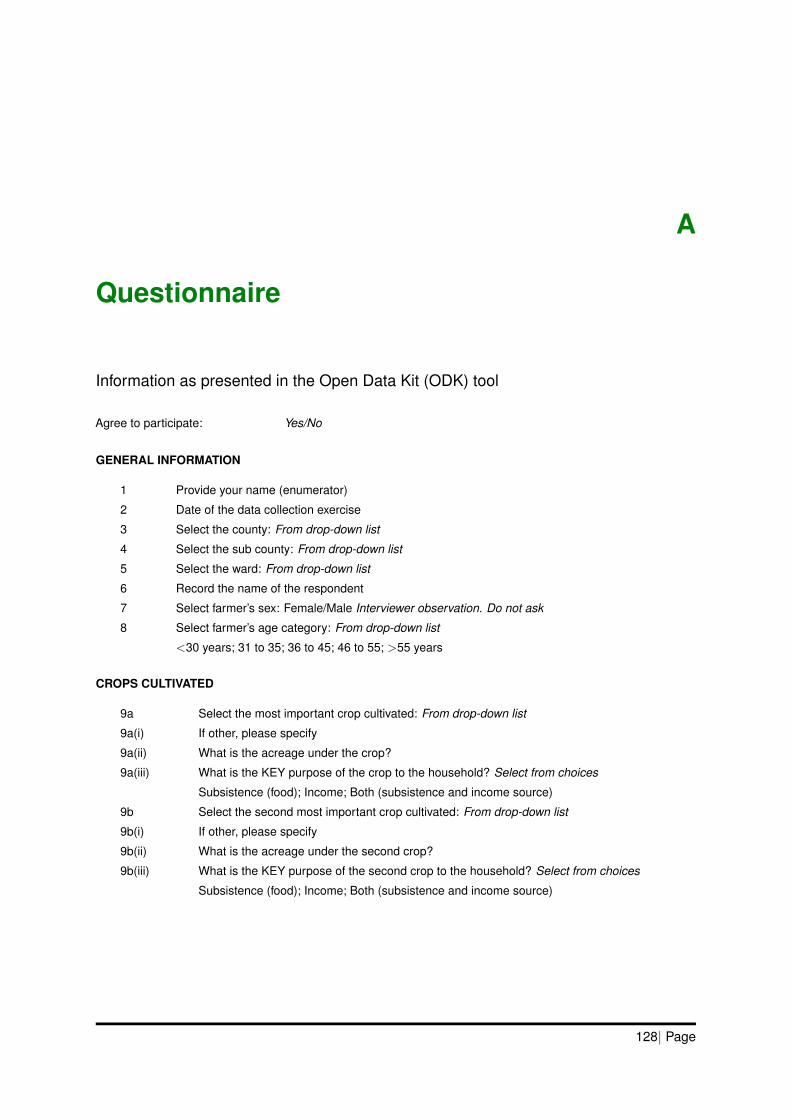
A
Questionnaire
Information as presented in the Open Data Kit (ODK) tool
Agree to participate: Yes/No
GENERAL INFORMATION
1 Provide your name (enumerator)
2 Date of the data collection exercise
3 Select the county: From drop-down list
4 Select the sub county: From drop-down list
5 Select the ward: From drop-down list
6 Record the name of the respondent
7 Select farmer’s sex: Female/Male Interviewer observation. Do not ask
8 Select farmer’s age category: From drop-down list
<30 years; 31 to 35; 36 to 45; 46 to 55; >55 years
CROPS CULTIVATED
9a Select the most important crop cultivated: From drop-down list
9a(i) If other, please specify
9a(ii) What is the acreage under the crop?
9a(iii) What is the KEY purpose of the crop to the household? Select from choices
Subsistence (food); Income; Both (subsistence and income source)
9b Select the second most important crop cultivated: From drop-down list
9b(i) If other, please specify
9b(ii) What is the acreage under the second crop?
9b(iii) What is the KEY purpose of the second crop to the household? Select from choices
Subsistence (food); Income; Both (subsistence and income source)
128| Page
9c Select the third most important crop cultivated: From drop-down list
9c(i) If other, please specify
9c(ii) What is the acreage under the third crop?
9c(iii) What is the KEY purpose of the third crop to the household? Select from choices
Subsistence (food); Income; Both (subsistence and income source)
10a Select the first potato variety cultivated: From drop-down list
10a(i) If other, please specify
10a(ii) What is the acreage under the first variety?
10b Select the second potato variety cultivated: From drop-down list
10b(i) If other, please specify
10b(ii) What is the acreage under the second variety?
10c Select the third potato variety cultivated: From drop-down list
10c(i) If other, please specify
10c(ii) What is the acreage under the third variety?
11 Where did you obtain the seed you planted in the potato field?
11(i) If other, please specify
12 Briefly describe your cropping history
AGRONOMIC PRACTICES
13 Did you apply any of the following agronomic practices on your potato crop? Yes/No
13a Planted improved seed
13b Used recommended spacing
13c Fertilizer application
13d Scouting for pest and diseases
13e Crop rotation
13f Weeding
13g Pest and disease control
13h Mulching
13i Irrigation
13j Intercropping
14a Which crops did you rotate your potato crop with? From drop-down list
14a(i) If other, please specify
14b Which pests and diseases did you control? From drop-down list
14b(i) If other, please specify
14c Which method of irrigation did you use? From drop-down list
14c(i) If other, please specify
129| Page
INFORMATION SOURCES
15 Did you utilise any of the following sources of information on the agronomic practices put in place toimprove potato production in your farm?
15a Own experience
15b Demonstration plots/ field days/Farmer Field Schools (FFSs)
15c Neighbours, family and friends
15d Farmer cooperative
15e Lead farmer or village-based advisor
15f Mobile SMS
15g Agricultural program on radio/TV
15h Government extension officer
15i Magazine, newspaper, leaflets
15j Agro-dealer
15k CABI Plant doctor
BLACKLEG DISEASE
16a Have you ever seen this disease on your or the neighbour’s farm?
Enumerator displays photos showing blackleg disease
16b What did you do when you saw the disease?
16c Select the potato varieties affected by blackleg and from which samples have been collected:From drop-down list
16c(i) If other, please specify.
16d What is the development stage of the potato varieties affected by blackleg, from whichsamples have been collected?
17 Select the unit used to measure area affected by the disease.
18 How much area of the farm are affected by the disease?
19 Record the percentage of plants affected by the disease.
20 What is the spatial pattern of plants damaged by the disease?
SOFTROT DISEASE
21a Have you ever seen this disease on your or the neighbour’s farm?
Enumerator displays photos showing softrot damage
21b What did you do when you saw this disease?
21c Select the potato varieties affected by soft rot disease and from which samples have been collected.
21c(i) If other, please specify.
21d What is the development stage of the potato varieties affected by soft rot, from which samples havebeen collected?
22 Select the unit used to measure area affected by the disease.
23 How much area of the farm are affected by the disease?
24 Record the percentage of plants affected by the disease.
25 What is the spatial pattern of plants damaged by the disease?
130| Page
RING ROT DISEASE
21a Have you ever seen this disease on your or the neighbour’s farm?
Enumerator displays photos showing ringrot disease
21b What did you do when you saw this disease?
21c Select the potato varieties affected by this disease and from which samples have they beencollected.
21c(i) If other, please specify.
21d What is the development stage of the potato varieties affected by ringrot, from which samples havebeen collected?
22 Select the unit used to measure the area affected by the disease.
23 How much area of the farm are affected by the disease?
24 Record the percentage of plants affected by the disease.
25 What is the spatial pattern of plants damaged by the disease?
INFORMATION DISSEMINATION
26a In case there is an outbreak of these diseases, name the first method you like the information to bedisseminated to farmers in your county
26b In case there is an outbreak of these diseases, name the second method you like the information tobe disseminated to farmers in your county?
26c In case there is an outbreak of these diseases, name the third method you like the information to bedisseminated to farmers in your county?
27 If I needed to contact you for clarification or information, what is the phone number I could use?
28 Take GPS coordinates of the farm
29 Record the sample number
131| Page
B
Buffer and Stock Solutions
Buffers and stock solutions adopted from Humphris et al. (115)6; Perombelon and van Der Wolf, (58)7 and Protocolfor detection of Dickeya and Pectobacterium in potato tubers, stems, or irrigation Water8
B.1 0.5 M EDTA pH 8.0
• Weigh EDTA (C10H16N2O8) (Sigma-Aldrich) 186.12 g• Dissolve in 800 mL sterile distilled water• Add about 20 g of Sodium hydroxide (NaOH) pellets (Sigma-Aldrich)9
• Bring volume up to 1000 mL with distilled water.• Sterilize by autoclaving at 121 oC for 15 min.
B.2 Dithiothreitol (1 M)
• Weigh Dithiothreitol (DTT) (Sigma-Aldrich) 1.54 g• Dissolve in 10 mL sterile distilled water.• Prewet a 0.22 µm syringe filter by drawing through 10 mL of sterile water.• Discard water• Sterilize DTT stock through the prepared 0.22 µm syringe filter.• Aliquot into 2 mL tubes and store at -20oC.• Keep stocks for up to one year.
B.3 Sodium Acetate (3 M)
• Weigh Sodium acetate (CH3COONa) (Sigma-Aldrich) 204.05 g• Dissolve in 800 mL water.• Adjust pH to 5.2 with Glacial acetic acid (CH3COOH) (Sigma-Aldrich)• Bring volume up to 1000 mL with distilled water.• Sterilize by autoclaving at 121oC for 15 min.
6 Humphris, S. N.; Cahill, G.; Elphinstone, J. G.; Kelly, R.; Parkinson, N. M.; Pritchard, L.; Toth, I. K. & Saddler, G. S. Detection of the bacterialpotato pathogens Pectobacterium and Dickeya spp. using conventional and real-time PCR. In: Plant Pathology: Techniques and Protocols.Lacomme, C. (Ed.). Humana Press, 2009, Pages 1-16
7 Perombelon, M. C. M. & van der Wolf, J. M. (Eds.) Methods for the detection and quantification of Erwinia carotovora subsp. atropsetica onpotatoes. Laboratory Manual. Scottish Crop Research Institute, 2002
8 https://www.aphis.usda.gov/plant health/plant pest info/potato/downloads/dickeya/npc-dickeya-protocol.pdf9 EDTA will not dissolve until the pH is near 8.0. Therefore, slowly add more Sodium hydroxide until pH is 8.0.
132| Page
B.4 Sodium Chloride (5 M)
• Weigh Sodium chloride (NaCl) (Sigma-Aldrich) 292.2 g• Dissolve in 800 mL distilled water.• Bring volume up to 1000 mL with distilled water.• Sterilize by autoclaving at 121oC for 15 min.
B.5 Sodium Hydroxide (10 M)
• Weigh Sodium hydroxide (NaOH) (Sigma-Aldrich) 40.0 g• Dissolve in 50 mL distilled water.• Bring volume up to 100 mL with distilled water.• Sterilize by autoclaving at 121oC for 15 min.
B.6 Proteinase K (2 mg/mL)
• Weigh Proteinase K (Sigma-Aldrich) 20.0 mg• Dissolve in mL sterile distilled water and store at -20oC.
B.7 1 M Tris, pH 8.0
• Weigh Tris base (C4H11NO3) (Sigma-Aldrich) 121.1 g• Dissolve 800 mL sterile distilled water.• Adjust pH to 8.0 with concentrated Hydrochloric acid (HCl) (Sigma-Aldrich).• Bring volume up to 1000 mL with distilled water.• Sterilize by autoclaving at 121oC for 15 min.
B.8 CTAB Buffer
• Tris base (Sigma-Aldrich) (1 M, pH 8.0) 100 mL• Sodium chloride (Sigma-Aldrich) (5 M) 280 mL• EDTA (Sigma-Aldrich) (0.5 M, pH 8.0) 40 mL• CTAB (Sigma-Aldrich) 20.0 g• Bring volume up to 1000 mL with sterile distilled water
B.9 CTAB Extraction Buffer
• CTAB buffer 20 mL• PVP ((C6H9NO)n) (Sigma-Aldrich) 0.8 g• β-Mercaptoethanol (C2H6OS)10 (Sigma-Aldrich) 100 µL• Put the solution in the water bath for 10-20 min to dissolve the PVP.• Avoid shaking the solution to stop the detergent from bubbling.• Add β-Mercaptoethanol just before use
10 Use fume cabinet - fumes of β-Mercaptoethanol are poisonous!
133| Page
B.10 10 mM Phosphate Buffer
• For resuspension and dilution of potato tuber heel-end core extracts following concentration to a pellet bycentrifugation6,7.
• Dissolve the following components in 800 mL distilled water;◦ Sodium phosphate dibasic dodecahydrate (Na2HPO4·12H2O) (Sigma-Aldrich) 2.7 g◦ Sodium phosphate monobasic dihydrate (NaH2PO4·2H2O) (Sigma-Aldrich) 0.4 g◦ Adjust pH to 7.2◦ Bring volume up to 1000 mL with distilled water.◦ Sterilize by autoclaving at 121oC for 15 min.
B.11 50 mM Phosphate Buffer
• For extraction of the bacteria from plant tissues by homogenization or shaking6,7.• Dissolve the following components in 800 mL distilled water;
◦ Di-sodium hydrogen phosphate (Na2HPO4) (Sigma-Aldrich) 4.26 g◦ Potassium dihydrogen phosphate (Sigma-Aldrich) 2.72 g◦ Adjust pH to 7.0◦ Bring volume up to 1000 mL with distilled water.◦ Sterilize by autoclaving at 121oC for 15 min.
B.12 Ringer’s Buffer
Adopted from the Protocol for detection of Dickeya and Pectobacterium in potato tubers, stems, or irrigation Water8
• Sodium chloride (Sigma-Aldrich) 2.25 g• Potassium chloride (KCl) (Sigma-Aldrich) 0.12 g• Sodium bicarbornate (NaHCO3) (Sigma-Aldrich) 0.05 g• Calcium chloride hexahydrate (CaCl2.6H2O) (Sigma-Aldrich) 0.12 g• Adjust pH to 7.0• Sterilize by autoclaving at 121oC for 15 min.
B.13 Freezing Medium
Adopted from Perombelon and van Der Wolf, (58)7.
• In 800 mL distilled water, dissolve the following components;◦ Di-potassium phosphate (Sigma-Aldrich) 12.6 g◦ Potassium dihydrogen phosphate (KH2PO4) (Sigma-Aldrich) 3.6 g◦ Sodium citrate (Na3C6H5O7) (Sigma-Aldrich) 0.9 g◦ Magnesium sulphate (MgSO4) (Sigma-Aldrich) 0.18 g◦ Ammonium sulphate (Sigma-Aldrich) 0.18 g◦ Glycerol (Sigma-Aldrich) 88.0 g
• Bring volume up to 1000 mL with Sterile distilled water.• Sterilize by autoclaving at 121oC for 15 min.
134| Page

B.14 Double Strength Pectate Enrichment Medium (D-PEM)
Adopted from Humphris et al. (115)6, Perombelon and van Der Wolf, (58)7 and the Protocol for detection of Dickeyaand Pectobacterium in potato tubers, stems, or irrigation Water8.
• Dissolve the following components in order of the recipe in 300 mL distilled water and heat if necessary;◦ Magnesium sulphate (MgSO4) (Sigma-Aldrich) 0.64 g◦ Ammonium sulphate ((NH4)2SO4) (Sigma-Aldrich) 2.16 g◦ Di-potassium phosphate (K2HPO4) (Sigma-Aldrich) 2.16 g
• Bring volume up to 1000 mL with distilled water.• Suspend 3.4 g of the Sodium polypectate (C18H23NaO19
−2) (Sigma-Aldrich) in 5 mL of absolute Ethanol andadd to the salts solution, mixing well using a magnetic stirrer.
• Steam until the polypectate is completely dissolved.• Adjust pH to 7.2, if necessary.• Prepare small aliquots (e.g. 50 mL)• Sterilise by autoclaving at 121oC for 15 min.• Store and store at 4oC.• Once open, do not re-use to avoid contamination.
B.15 Single Strength Pectate Enrichment Medium (D-PEM)
Adopted from Humphris et al. (115)6, Perombelon and van Der Wolf, (58)7 and the Protocol for detection of Dickeyaand Pectobacterium in potato tubers, stems, or irrigation Water8.
• Similar procedure as for D-PEM except that the concentrations are halved.
B.16 TE Buffer
• Tris (1 M, pH 8.0) (Sigma-Aldrich) 10.0 mL• EDTA (0.5 M, pH 8.0) 2.0 mL• Bring volume up to 1000 mL with sterile distilled water• Sterilize by autoclaving at 121oC for 15 min.
B.17 10X TAE Electrophoresis Buffer
• Tris (1 M, pH 8.0) (Sigma-Aldrich) 48.4 g• Glacial Acetic acid (Sigma-Aldrich) 11.4 mL• EDTA (0.5 M, pH 8.0) (Sigma-Aldrich) 20.0 mL• Bring volume up to 1000 mL with sterile distilled water• Store at room temperature• Dilute stock solution 10:1 to make a 1X working solution11
11 1X buffer contains 40 mM Tris, 20 mM Glacial acetic acid and 1 mM EDTA
135| Page
C
Media
C.1 Double-layer CVP (DL-CVP) Medium
Adopted from Humphris et al. (115)6, Perombelon and van Der Wolf, (58)7 and the Protocol for detection of Dickeyaand Pectobacterium in potato tubers, stems, or irrigation Water8.
• Add each ingredient in the order listed and dissolve each ingredient slowly before adding the subsequent oneon the list.
• Dissolved the following components in 800 mL of distilled water (Basal layer);◦ Calcium chloride dihydrate (CaCl2.2H2O) (Sigma-Aldrich) 5.5 g◦ Tryptone (Sigma-Aldrich) 1.0 g◦ Sodium nitrate (NaNO3) (Sigma-Aldrich) 1.6 g◦ Crystal Violet (0.1% Aqueous solution) (Sigma-Aldrich) 1.5 mL◦ Agar (Oxoid) 15.0 g◦ Bring volume up to 1000 mL with distilled water
• Dissolved the following components in 600 mL of distilled water (Top layer);◦ EDTA (5.5%, pH 8.0) (Sigma-Aldrich) 2.0 mL◦ Sodium hydroxide (5 M) (Sigma-Aldrich) 4.8 mL◦ Sodium polypectate (Sigma-Aldrich) 20.0 g◦ Add the polypectate slowly and heat the solution to 80-100oC while stirring with a magnetic stirrer to
near full speed to avoid lump formation.◦ Adjust pH to 7.0.◦ Bring volume up to 800 mL with distilled water
• Autoclave the two solutions for 15 min at 120oC.• Restore pressure slowly to avoid bubble formation within the medium.• Cool the media for basal layer to 45-50oC and pour into Petri dishes (approximately 15 mL per dish in 9-cm
petri dishes).• Allow the basal layer to set in a laminar flow hood to remove excess surface moisture.• Then pour the top layer (approximately 7 mL per dish in 9 cm petri dishes).• Place plates with lids ajar for 1 h in a biosafety hood or laminar flow at room temperature for 1-4 h to eliminate
all surface condensation.• If CVP medium is to be used straight away, chill plates for at least 2 h at 4oC after pouring.• Store plates at 4oC for up 2 months in a sealed polythene bag.• CVP medium will be grey when properly prepared.• Double layer is more time consuming and difficult to make, but can be more suited to samples with large
numbers of bacteria due to its slower cavity development.
136| Page
C.2 Single-layer CVP (SL-CVP) Medium
Adopted from Humphris et al. (115)6, Perombelon and van Der Wolf, (58)7 and the Protocol for detection of Dickeyaand Pectobacterium in potato tubers, stems, or irrigation Water8.
• Add each ingredient in the order listed and dissolve each ingredient slowly before adding the subsequent oneon the list.
• Dissolved the following components in 400 mL of distilled water (Mix A)◦ Calcium chloride dihydrate (Sigma-Aldrich) 1.02 g◦ Tryptone (Sigma-Aldrich) 1.0 g◦ Sodium citrate (Na3C6H5O7)12 (Sigma-Aldrich) 5.0 g◦ Sodium nitrate (Sigma-Aldrich) 2.0 g◦ Crystal Violet (0.1% Aqueous solution)13 (Sigma-Aldrich) 1.5 mL◦ Agar (Oxoid) 4.0 g◦ Dissolve Mix A ingredients in water using a magnetic stirrer.◦ Adjust pH to 7.0.◦ Bring volume up to 500 mL with distilled water
• Dissolved the following components in 400 mL of distilled water (Mix B)◦ Sodium hydroxide (5 M) (Sigma-Aldrich) 2.8 mL◦ Sodium polypectate (Sigma-Aldrich) 18.0 g◦ Add Sodium hydroxide (Sigma-Aldrich) first to 500 mL of distilled water followed by polypectate.◦ Add the polypectate slowly and heat the solution to 80-100oC while stirring with a magnetic stirrer to
near full speed to avoid lump formation.◦ Adjust pH to 7.0◦ Bring volume up to 500 mL with distilled water
• Autoclave both Mix A and Mix B separately for 15 min at 120oC.• Restore pressure slowly to avoid bubble formation within the medium.• Carefully pour Mix A into Mix B while the solutions are still hot.• Swirl to mix the solutions together.• Pour immediately about 18 mL per 9-cm petri dish as the medium cannot be readily re-melted.• Place plates with lids ajar in a biosafety hood or laminar flow at room temperature for 1-4 h to eliminate all
surface condensation.• If CVP medium is to be used straight away, chill plates for at least 2 h at 4oC after pouring.• Store plates at 4oC for up 2 months in a sealed polythene bag.• CVP14 medium will be grey when properly prepared.
C.3 Luria Bertani Agar (LBA)
Adopted from Perombelon and van Der Wolf, (58)7.
• Dissolved the following components in 800 mL of distilled water;◦ Bacto peptone (Oxoid) 10.0 g◦ Yeast extract (Oxoid) 5.0 g◦ Sodium chloride (Sigma-Aldrich) 10.0 g◦ Agar (Oxoid) 15.0 g
• Adjust pH to 7.5.• Bring volume up to 1000 mL with distilled water.• Sterilize by autoclaving at 121oC for 20 min.
C.4 Luria Broth (LB)
Adopted from Perombelon and van Der Wolf, (58)7.
• As LBA but without the agar
12 Sodium citrate reduces growth and pit formation by pectolytic Pseudomonas species.13 Store Crystal violet stock solutions at 4oC14 The final pH of CVP should be 6.9-7.2. If necessary, adjust by adding Sodium hydroxide before pouring. It is easier to raise than to lower the
pH in this medium.
137| Page
C.5 MTNA Medium
Adopted from EPPO (31)15
• Dissolved the following components in 800 mL of distilled water;◦ Yeast extract (Oxoid) 2.00 g◦ D-Mannitol (Sigma-Aldrich) 2.50 g◦ Di-potassium phosphate (K2HPO4) (Sigma-Aldrich) 0.25 g◦ Potassium dihydrogen phosphate (KH2PO4) (Sigma-Aldrich) 0.25 g◦ Sodium chloride 0.05 g◦ Magnesium sulphate heptahydrate (MgSO4·7H2O) (Sigma-Aldrich) 0.10 g◦ Manganese sulphate monohydrate (MnSO4·H2O) (Sigma-Aldrich) 0.015 g◦ Ferrous sulphate heptahydrate (FeSO4·7H2O) (Sigma-Aldrich) 0.005 g◦ Agar (Oxoid) 16.00 g
• Adjust pH to 7.2 with Concentrated Hydrochloric acid (HCl).• Bring volume up to 1000 mL with distilled water.• Sterilize by autoclaving at 121oC for 15 min.• Add the following antibiotics after filter-sterilizing;
◦ Trimethoprim 0.060 g◦ Nalidixic acid 0.002 g◦ Amphotericin B 0.010 g.
• All antibiotics where from Sigma-Aldrich• Antibiotic stock solutions should be kept in 96% Ethanol (Trimethoprim and Nalidixic acid) and DMSO
((CH3)2SO) for Amphotericin B1. Stock solutions should be filter-sterilized.• Durability of basal medium is 3 months. After antibiotics are added durability is 1 month when media is stored
at 4oC.
C.6 NCP-88 Medium
Adopted from EPPO (31)15.
• Dissolved the following components in 800 mL of distilled water;◦ Nutrient agar (Oxoid) 23.0 g◦ Yeast extract (Oxoid) 2.0 g◦ D-Mannitol (Sigma-Aldrich) 5.0 g◦ Di-potassium phosphate (Sigma-Aldrich) 2.0 g◦ Potassium dihydrogen phosphate (Sigma-Aldrich) 0.5 g◦ Magnesium sulphate heptahydrate (Sigma-Aldrich) 0.25 g
• Adjust pH to 7.2.• Bring volume up to 1000 mL with distilled water.• Sterilize by autoclaving at 121oC for 15 min and cool down to 50oC.• Add the following antibiotics after filter-sterilizing;
◦ Polymyxin B sulphate 0.003 g◦ Nalidixic acid 0.008 g◦ Cycloheximide 0.200 g.
• All antibiotics where from Sigma-Aldrich• Antibiotic stock solutions should be kept in 50% Ethanol (Cycloheximide) and sterile distilled water (Polymyxin
B). Stock solutions should be filter-sterilized.• Durability of basal medium is 3 months. After antibiotics are added durability is 1 month when media is stored
at 4oC.
15 EPPO, 2006, Clavibacter michiganensis subsp. sepedonicus: Diagnostics, Bulletin OEPP/EPPO Bulletin 36, Pages 99–109. https://gd.eppo.int/download/standard/183/pm7-059-1-en.pdf
138| Page
C.7 Nutrient Agar (NA)
Adopted from Perombelon and van Der Wolf, (58)7.
• Dissolved the following components in 800 mL of distilled water;◦ Lab Lemco (Oxoid) 1.0 g◦ Yeast extract (Oxoid) 2.0 g◦ Bacto peptone (Oxoid) 5.0 g◦ Sodium chloride (Sigma-Aldrich) 5.0 g◦ Agar (Oxoid) 15.0 g
• Adjust pH to 7.0.• Bring volume up to 1000 mL with distilled water.• Sterilize by autoclaving at 121oC for 20 min.
C.8 Nutrient Broth (NB)
Adopted from Perombelon and van Der Wolf, (58)7.
• As NA but without the agar.
C.9 Yeast extract Glucose Mineral (YGM) Medium
Adopted from EPPO (31)15.
• Dissolved the following components in 800 mL of distilled water;◦ Bacto Yeast extract (Oxoid) 2.00 g◦ D(+) Glucose (monohydrate) (Sigma-Aldrich) 2.50 g◦ Di-potassium phosphate (Sigma-Aldrich) 0.25 g◦ Potassium dihydrogen phosphate (Sigma-Aldrich) 0.25 g◦ Sodium chloride (Sigma-Aldrich) 0.050 g◦ Magnesium sulphate heptahydrate (Sigma-Aldrich) 0.10 g◦ Manganese sulphate monohydrate (Sigma-Aldrich) 0.015 g◦ Ferrous sulphate heptahydrate (Sigma-Aldrich) 0.005 g◦ Agar (Oxoid) 18.00 g
• Bring volume up to 1000 mL with distilled water.• Sterilize by autoclaving 0.5 L volumes of medium at 121oC for 20 min and cool down to 50oC.
C.10 YGM-modified Medium
Adopted from EPPO (31)15.
• Dissolved the following components in 800 mL of distilled water;◦ Yeast extract (Oxoid) 2.00 g◦ Di-potassium phosphate (Sigma-Aldrich) 0.25 g◦ Potassium dihydrogen phosphate (Sigma-Aldrich) 0.25 g◦ Magnesium sulphate heptahydrate (Sigma-Aldrich) 0.10 g◦ Manganese sulphate monohydrate (Sigma-Aldrich) 0.15 g◦ Sodium chloride (Sigma-Aldrich) 0.05 g◦ Ferrous sulphate heptahydrate (Sigma-Aldrich) 0.005 g◦ Bromothymol blue (Sigma-Aldrich) 0.05 g◦ Agar (Oxoid) 18.00 g
• Bring volume up to 1000 mL with distilled water.• Sterilize by autoclaving 0.5 L volumes of medium at 121oC for 20 min and cool down to 50oC.
139| Page
C.11 Nutrient Broth Yeast extract (NBY) Medium
Adopted from EPPO (31)15.
• Dissolved the following components in 800 mL of distilled water;◦ Nutrient agar (Oxoid) 23.00 g◦ Yeast extract (Oxoid) 2.00 g◦ Potassium dihydrogen phosphate (Sigma-Aldrich) 0.50 g◦ Di-potassium phosphate (Sigma-Aldrich) 2.00 g◦ Magnesium sulphate heptahydrate (Sigma-Aldrich) 0.25 g◦ D-Mannitol (Sigma-Aldrich) 5.00 g◦ Agar (Sigma-Aldrich) 18.00 g
• Bring volume up to 1000 mL with distilled water.• Sterilize by autoclaving 0.5 L volumes of medium at 121oC for 20 min, cooling to 50oC.
140| Page
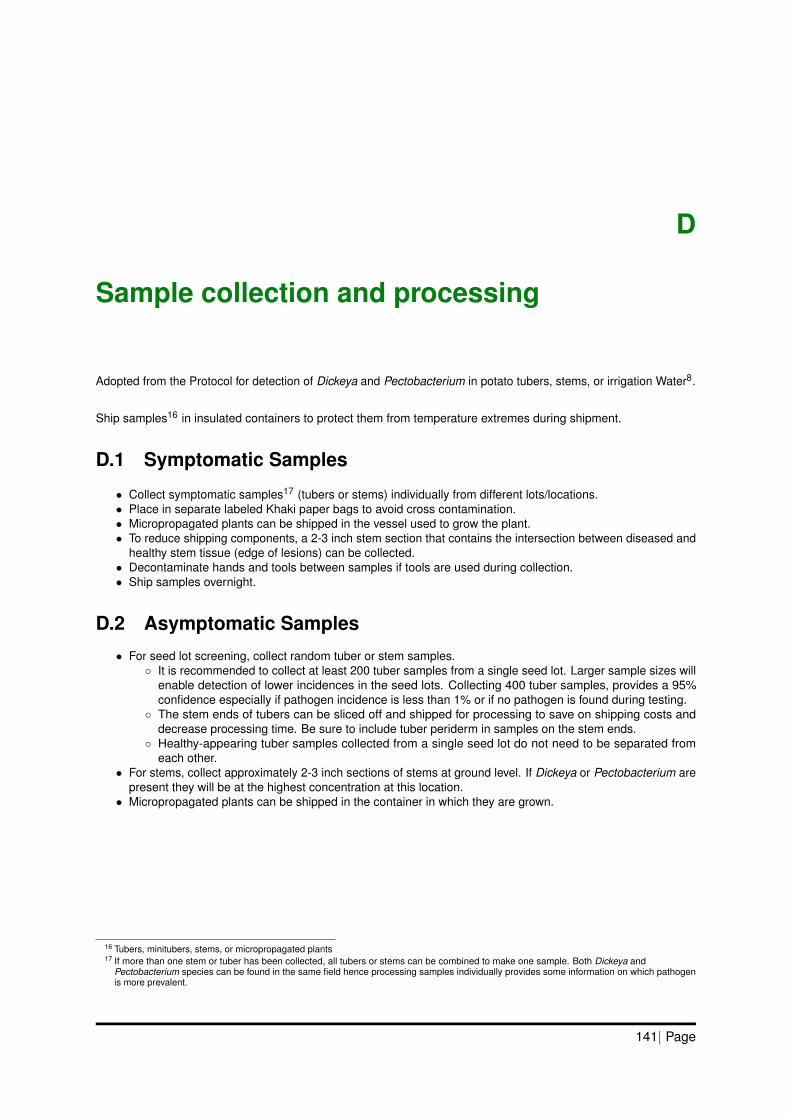
D
Sample collection and processing
Adopted from the Protocol for detection of Dickeya and Pectobacterium in potato tubers, stems, or irrigation Water8.
Ship samples16 in insulated containers to protect them from temperature extremes during shipment.
D.1 Symptomatic Samples
• Collect symptomatic samples17 (tubers or stems) individually from different lots/locations.• Place in separate labeled Khaki paper bags to avoid cross contamination.• Micropropagated plants can be shipped in the vessel used to grow the plant.• To reduce shipping components, a 2-3 inch stem section that contains the intersection between diseased and
healthy stem tissue (edge of lesions) can be collected.• Decontaminate hands and tools between samples if tools are used during collection.• Ship samples overnight.
D.2 Asymptomatic Samples
• For seed lot screening, collect random tuber or stem samples.◦ It is recommended to collect at least 200 tuber samples from a single seed lot. Larger sample sizes will
enable detection of lower incidences in the seed lots. Collecting 400 tuber samples, provides a 95%confidence especially if pathogen incidence is less than 1% or if no pathogen is found during testing.
◦ The stem ends of tubers can be sliced off and shipped for processing to save on shipping costs anddecrease processing time. Be sure to include tuber periderm in samples on the stem ends.
◦ Healthy-appearing tuber samples collected from a single seed lot do not need to be separated fromeach other.
• For stems, collect approximately 2-3 inch sections of stems at ground level. If Dickeya or Pectobacterium arepresent they will be at the highest concentration at this location.
• Micropropagated plants can be shipped in the container in which they are grown.
16 Tubers, minitubers, stems, or micropropagated plants17 If more than one stem or tuber has been collected, all tubers or stems can be combined to make one sample. Both Dickeya and
Pectobacterium species can be found in the same field hence processing samples individually provides some information on which pathogenis more prevalent.
141| Page
E
Isolation of Clavibacter sepedonicus
Excepts of the protocol adopted from EPPO (31)15.
E.1 Symptomatic materials
• Wash the test (tubers, stems or leaves) samples in running water to remove excess soil.• Sterilize the surface with 0.5 % Sodium hypochlorite or 70 % Ethanol for 5 min.• Remove ooze or sections of discoloured tissue from the vascular ring in tubers or from the vascular strands of
stems or leaves.• Crush the material in a small volume of sterile distilled water or 50 mM Phosphate buffer and leave for 5-10
min.• Prepare a series of decimal dilutions of the suspension in 10 mM Phosphate buffer. This is important because
the bacterium is usually present in high populations in infected tissues; the saprophytes are diluted out remainwith the pathogen.
• Spread 100 µL from each sample at 1 in 100 up to 1 in 10000 dilutions, onto MTNA or NCP-88 medium withspreaders.
• Alternatively, spread out the initial 100 µL potato aliquot onto first agar plate with a spreader. The spreaderis then used on a second agar plate, streaking out any left residue and lastly on a third plate. This gives adilution plating effect via the spreader.
• Incubate the plates in the dark at 21-23 oC.• After 3 days, examine the plates by comparing with positive controls. Repeat this after 5, 7 and possibly 10
days.• Purify presumptive colonies on YGM preferably after 3-5 days before the plates become too overgrown.• Use purified cultures for identification.
E.2 Asymptomatic Materials and Screening for Latent Infections
• Use a sample of at least 200 tubers.• Larger number of tubers in the sample will lead to inhibition or generate difficult results to interpret.• The procedure can also be conveniently applied for samples with less than 200 tubers.
142| Page
F
Isolation of Soft Rot Pectobacteriaceae
F.1 Background
Isolation of the SRP, Pectobacterium and Dickeya species is made on selective diagnostic CVP medium18. Theycan be isolated from the leaves and stems of potato plants or the peel and stolon end of tubers. In the tubers, thebacteria are normally present in the lenticels, the periderm19, around the eyes, and in the stem end. They reach avery high concentration in the stem end of the tuber. They may be found at higher incidence but low concentrationon tuber periderm. Sampling and processing the peel and stem (stolon) end cores separately indicates whetherthe bacterial infection is systemic (found in the vascular tissue of the stolon or stem end) or is found externally aslenticel infection in tuber peel. These bacteria form characteristic deep cup-like cavities or round pits (2-3 mm indiameter) on CVP medium which are different from those formed by other pectolytic Pseudomonads, which tend tobe shallower and wider. Preparation of the test material depends on whether infection is active, then isolation can bemade directly, or if latent, then an enrichment20 step is included prior to isolation. The procedure described belowhas been adopted from Humphris et al. (115)6, Perombelon and van Der Wolf, (58)7 and the Protocol for detectionof Dickeya and Pectobacterium in potato tubers, stems, or irrigation Water8.
F.2 Symptomatic Materials
a. Wash the test samples (tubers, stem or leaves) under running tap water to remove excess soil or debris butavoid breaking the skin.
b. Surface sterilize with 0.5% Sodium hypochlorite or 70% Ethanol for 5 min. Then wash with sterile deionizedwater or sterilized distilled water three times and finally air-dry.
c. Break or cut open the skin (stem) or extract small portions of tuber to remove a small amount of tissue (approx.0.1 g). This is done at the intersection of the diseased and healthy tissue (edge of lesion) using a sterilescalpel.
d. Change gloves between samples. Samples can also be cut on paper towels, which should be disposed ofbetween samples.
e. If more than one stem or tuber sample has been collected or submitted, all tubers or stems can be combinedto make one sample. However, both Dickeya and Pectobacterium can be found in the same field henceprocessing samples individually provides some information on which pathogen is more prevalent.
f. Place diseased tissue pieces in a 2 mL centrifuge tube and store at -80oC if DNA isolation will be conductedfor direct PCR diagnosis21.
g. Otherwise, tease or pulverise the tissue in sterile distilled water (approx. 0.2 mL) in a plastic petri dish. Addantioxidants22 such as Tetrasodium pyrophosphate (C5H11NS2) (0.1% final concentration) or Dithiothreitol
18 CVP remains the most preferred diagnostic selective medium for isolation of SRP (74, 106). The selectivity of CVP medium is based on thepresence of crystal violet which inhibits growth of most gram-positive bacterial species and polypectate (pectin) as the sole carbon source.
19 Collect periderm and stem end samples separately from each tuber or sliced off stem end and process with the periderm intact20 If pathogen populations are very low, they may need to be enriched above detection levels. Therefore, the test materials are incubated under
anaerobic conditions in liquid enrichment containing Sodium polypectate as the sole carbon source (65).21 Note, even if multiple species are detected with PCR assays, it may be difficult to isolate multiple species from a sample because the different
species may be present in very disparate ratios.22 Adding an antioxidant delays bacterial cell death by toxic substances present in extracts
143| Page

(C4H10O2S2) (0.75% final concentration) or Diethyldithiocarbamic acid (C5H11NS2) (5% volume:volume) towater. Leave for about 5 min to allow the bacteria to diffuse out of the tissue 23.
h. Alternatively, put the diseased tissue into a sterile mortar and homogenize in sterile water. Leave to stand for20 min.
i. Pipette off the extract from the homogenized sample and prepare a dilution series from 100 to 10−3 or mayincrease up to 10−6 in sterile distilled water. This ensures that background saprophytes are diluted out andonly isolated Pectobacterium and Dickeya colonies are obtained.
j. Spread 100 µL of each dilution for each sample onto duplicate CVP plates previously dried to remove excesssurface moisture.
k. Alternatively, streak, with a sterile inoculating needle with a loop at the end, a loop ful of the liquid from Step i.on to a CVP plate previously dried to remove excess surface moisture to obtain isolated colonies. Streaksshould be made in four right angle directions, flaming and cooling the loop after each directional streak.
l. You may also inoculate the 100 µL of homogenate in D-PEM and incubate under anaerobic conditions at23-28oC for 24 h prior to plating onto CVP.
m. Incubate the CVP plates upside down with one plate at 27oC and the other plate at 37oC for 48 h. AlthoughPectobacterium and Dickeya spp are both plated onto CVP, they should be incubated at 27oC and 37oCrespectively for colony formation. Pectobacterium and Dickeya spp form characteristic deep cavities in themedium, due to their ability to break down and metabolize pectin. Dickeya grows more slowly and has moresmaller colonies than Pectobacterium, so plates should be evaluated daily and any new pitting colonies shouldbe removed to a new plate. Some Pectobacterium strains produce copious amounts of plant cell walldegrading enzymes and can liquefy CVP plates. If this occurs, other media, such as NA plus Isopropylβ-D-1-thiogalactopyranoside (IPTG) (C14H15BrClNO6) plus Isopropyl β-D-1-thiogalactopyranoside (C9H18O5S)or Nutrient Glycerol Manganese (NGM) can be used to attempt another (repeated) isolation.
n. For use as a back-up stock, a 1 mL aliquot of the homogenate can be removed and added to 200 µL of 100 %sterile glycerol and stored at -20oC or -80oC for longer-term storage.
o. A dilution series of approximately 10−1 to 10−4 Colony-forming units (CFU) mL−1 of a positive control forPectobacterium and Dickeya spp. should also be prepared.
p. Select well-spaced colonies or cavities per CVP plate and re-streak on to fresh CVP plate.q. Incubate plates at respective temperatures, 27oC or 37oC.r. Select colonies (cavities) from Step p., streak each on NA or LBA (See Appendix C) plate on previously dried
(free of excess surface moisture) petri dishes.24
s. Incubate at 27oC or 37oC for about one week to grow only Dickeya and Pectobacterium colonies. SRP formround convex creamy-translucent colonies on NA or LBA25.
t. You may also subculture bacterial colonies from Step r. onto NA medium slants and store at room temperatureuntil use.
F.3 Asymptomatic Materials and Screening for Latent Infections
These typically require a culture-based enrichment step to detect Dickeya or Pectobacterium spp.
1. Isolation from Stemsa. If present26, SRP will be in high concentrations at the base of the stem. Use a sterile blade to extract
approx. 5-8 cm (2-3 inches) section of plant tissue from the base of each stem or just above the groundlevel.
b. Sterilize tools (submerge in 95% alcohol and flame excess alcohol) and work surface (wipe down with70% alcohol between samples). Sterilization could be also be done between batches of tubers but notnecessarily in a single batch.
c. Change gloves between samples. Samples can also be cut on paper towels, which should be disposedof between samples.
23 We did not add the antioxidant as we could not have them shipped in time. However, added as explained in the Protocol for detection ofDickeya and Pectobacterium in potato tubers, stems, or irrigation Water8 for the benefit of others
24 You may not pick colonies but instead add approx. 1.5 mL of sterile water to each plate and wash to recover all surface growth. Add approx.1.3 mL to a 1.5-mL eppendorf and keep at -20oC for further use (recover bacteria). Add the remaining approx. 500 µL to another eppendorffor use in molecular diagnostic tests. Also keep at -20oC.
25 Dickeya does not survive well on some agar medium, such as LBA, and it survives poorly on media stored at cool temperatures (4-10oC). OnLBA or at cool temperatures, cells die or become non-culturable within a few days. Therefore, isolates should be stored as soon as a pureculture is obtained. Isolates may be stored indefinitely at -80oC by suspending cells in cryovials filled with filter-sterilized 20% vol:vol glycerolor in cryovials containing ceramic beads. It is crucial that vigorous cells are stored, so cells from freshly streaked plates that are incubated forno more than one day should be used for stored cultures.
26 Present whether in the field, greenhouse grown stems or in micropropagated plants
144| Page
d. Wash the samples under running tap water to remove excess soil or debris but avoid breaking the skin.e. Place samples either into separate universal extraction bags, 12 mL sterile tubes or flasks.f. Add 15 mL of 0.25 (quarter) strength Ringer’s buffer containing Tetrasodium pyrophosphate (0.1%
final concentration) or Dithiothreitol (0.75% final concentration) or Diethyldithiocarbamic acid (5%volume:volume) antioxidants to each sample23.
g. Pulverise to give an oatmeal consistency.h. Leave to stand for 20 min or soak samples overnight at room temperature to allow the bacteria to
stream out of the samples.i. Samples may also be placed on a shaker to aid in recovery of bacteria from the samples.j. Remove the supernatant (approx. 1.5 mL) and dispense into 2 separate sterile 1.5 mL tubes.
k. Remove 100 µL and continue with Step 5 if interested in obtaining Dickeya or Pectobacterium isolates.l. Otherwise, spin both 1.5 mL tubes in a centrifuge at 14,000 rpm for 2-5 min until a pellet forms.
m. Remove the supernatant from both tubes. Not all supernatant needs to be removed as the pellet isdelicate.
n. Designate one tube as “Use for PCR” reaction. Note the pellet can be frozen at -80oC and retrieved at alater date for processing.
o. Add 500 µL of filter-sterilized 20% glycerol (vol:vol) to the second tube, resuspend the pellet and store at-80oC as backup. Cells from this suspension can either be plated onto CVP medium or used for PCR ata later date.
2. Isolation from Tubersa. Tuber sample may be processed in groups 25-200 tubers/sample. Smaller batches, such as 25 tubers,
allow for estimates of incidence, while larger tuber batches aid in determining pathogen presence.b. The stem ends of tubers can be sliced off and shipped for processing to save on shipping costs and
decrease processing time. Be sure to include tuber periderm in samples on the stem ends.c. Wash tuber samples in tap water to remove soil prior to processing.d. Separate rotten from unrotten tubers during washing to avoid cross-contamination.e. Sterilize tools (submerge in 95% alcohol and flame excess alcohol) and work surface (wipe down with
70% alcohol) between samples.f. Change gloves between samples. Samples can also be cut on paper towels, which should be disposed
of between samples.g. Using a clean and disinfected hand-held potato peeler27 to remove one peel strip from each tuber that
includes both the stem/heel end (stolon attachment) and rose ends28.h. Rinse the tubers again and use a separate hand-held peeler or disposable scalpel to remove a small
plug of tissue from the stolon end of each tuber in the sample (approximately 5-10 mm deep and wide)making sure not to take any peel.
i. Place samples either into separate universal extraction bags, 12 mL sterile tubes or flasks.j. Add 15 mL 0.25 (quarter) strength Ringer’s buffer containing Tetrasodium pyrophosphate (0.1%
final concentration) or Dithiothreitol (0.75% final concentration) or Diethyldithiocarbamic acid (5%volume:volume) antioxidants29 to each sample23.
k. Pulverise to give and oatmeal consistency.l. Shake samples 100 rpm for at least 2 h to allow for bacteria to stream out of samples.
m. Remove 5 mL of solution and place in 15 mL sterile centrifuge tube.n. Add 5 mL of D-PEM30 to select for growth of Dickeya and Pectobacterium species.o. Loosen lids of the 12 mL centrifuge tubes a quarter of a turn to allow for gas exchange and place in
disposable anaerobic chambers with indicator.p. Place samples at 36-37oC for 48 h under anaerobic (low oxygen) conditions to promote growth of
Dickeya and Pectobacterium sp. Incubation temperatures above 33oC kill or inhibit growth of many otherplant-associated bacteria.
q. Remove 100 µL and continue with Step 5 if interested in obtaining Dickeya or Pectobacterium isolates.
27 Clean and disinfect peeler between each sample by rising with 0.2 M Sodium hydroxide and then with 96% Ethanol and finally rising well withdistilled (or tap) water. Allow to drain before peeling next sample
28 Both tuber stem end sections containing the core and peel (92, 94) and tuber peels (93) have been used to detect soft rot bacteria on tubersamples and both have been shown to correlate with field incidence.
29 Adding an antioxidant delays bacterial cell death by toxic substances present in extracts30 The amount of test material and PEM used may vary but the ratio to aim for is approx. 1:3 to 1:5 (w/v) tissue in S-PEM, and 1:1 (v/v) liquid
sample in D-PEM.
145| Page
3. Isolation from Watera. Collect 250 mL water samples in sterile containers. If possible collect the sample approximately 10-12
inches under the surface of water.b. Pack samples in shipping box with ice packets surrounding containers to keep samples cool.c. Ship to the laboratory and process within 24 h of collection.d. Subdivide into aliquots of 40 mL and clarify by centrifugation at a low speed (180 ×g) for 10 min.e. Remove 20 mL of supernatant and mix with an equal volume of D-PEM in 50 mL centrifuge tube. See
Appendix B.14 on reconstituting D-PEM.f. Incubate in an anaerobically at 36-37 oC for 48 h.
g. Centrifuge at 10,000 ×g to concentrate the bacterial fraction.h. Resuspend the pellet 1 mL sterile water.i. Make serial dilution and plate onto CVP medium to isolate single colonies.j. Alternatively, extract DNA from the resuspended pellet.
4. Isolation from Soila. For soil/debris, remove stones, break up aggregates and cut plant tissues into small pieces.
5. Platinga. Spread 100 µL of each dilution for each sample onto duplicate CVP plates previously dried to remove
excess surface moisture.b. You may also inoculate the 100 µL of homogenate in D-PEM and incubate under anaerobic conditions
at 23-28oC for 24 h prior to plating onto CVP.c. Incubate the CVP plates upside down with one plate at 27oC and the other plate at 37oC for 48 h to grow
Pectobacterium and Dickeya species respectively.d. A dilution series of approximately 10−1 to 10−4 CFU mL−1 of a positive control for Pectobacterium and
Dickeya spp. should also be prepared.e. Select well-spaced colonies or cavities per CVP plate and re-streak on to fresh CVP plate.f. Incubate plates at respective temperatures, 27oC or 37oC.
g. Select colonies (cavities) from Step e., streak each on NA or LBA (See Appendix C.7 and C.3 respectively)plate previously dried to remove excess surface moisture.
h. Incubate at 27oC or 37oC for about one weeks to ensure that only Pectobacterium and Dickeya coloniesare present. SRP form round convex creamy-translucent colonies on either medium.
i. You may also subculture bacterial colonies from Step g. onto NA medium slants until they are needed.
146| Page

G
Extraction of Genomic DNA from Bacteria
The procedure has been adapted from a number of publications (such as Wilson (116)) and laboratories.
1. Inoculate 10-15 mL of NB or LB from a single colony of a pure fresh (<72 h) culture growing on NA or LBA.2. Incubate while shaking at 27oC for 18 h.3. Harvest cells from this suspension by centrifugation for 10 min at 9,447 x g.4. Resuspend the pellet in 500 µL of sterile distilled water and transfer to a clean 1.5 mL Eppendorf.5. Alternatively, scrap bacterial growth off the surface of a freshly grown plate (NA or LBA) and suspended in 500
µL of sterile distilled water.6. Add 20 µL lysozyme (Conc. 100 mg/mL) and mix well. This is step is necessary for hard to lyse gram (+) and
some gram (-) bacteria.7. Incubate for 30 min at 37oC.8. Add 40 µL of 10% SDS (NaC12H25SO4) and mix well.9. Add 8 µL Proteinase K (2 mg/mL). Mix well.
10. Incubate for 1-3 h at 56oC. If cells are not lysed (as seen by cleared solution with increased viscosity),incubation can proceed overnight (16 h).
11. Add 100 µL of 5 M NaCl and mix well.12. Add 100 µL of CTAB/NaCl (heated to 65oC) and mix well.13. Incubate at 65oC for 10 min. 31
14. Add 500 µL of Chloroform:Isoamyl alcohol (24:1), mix well and vortex.15. Spin at 13,000 rpm for 10 min preferably at 4oC to separate the phases.16. Transfer the aqueous phase to a clean microfuge tube (should not be viscous)32
17. Repeat the Chloroform:Isoamyl alcohol extraction (Step 14) until no protein remains at the interphase otherwiseproceed to Step 18.
18. Adjust the salt concentration by adding 1/10 volume of Sodium acetate, pH 5.2 and mix well. Total volumeshould approximately be 550 µL.
19. Add 2 volumes (1100 µL) of cold 100% Ethanol (calculated after salt addition).20. Incubate overnight at -20oC.21. Spin at 13,000 rpm in a microfuge for 10 min at 4oC.22. Carefully decant supernatant. (change orientation of tube so that pellet is on opposite side).23. Add 500 µL 70% ice-cold Ethanol to wash the pellet.24. Spin at 13,000 rpm in a microfuge for 10 min at 4oC.25. Carefully decant supernatant.26. Air dry the pellet for 60 min in a lamina fume hood or briefly vacuum to dry pellet.27. Resuspend pellet in 100 µL TE buffer.28. Measure purity and concentration on a Spectrophotometer.29. Store at -20oC for immediate use otherwise keep DNA at -80oC for longer-term storage.
31 Step 11 is very important since CTAB-nucleic acid precipitate will form if the salt concentration drops below 0.5 M at room temperature. Theaim here is to remove cell wall debris, denatured protein, and polysaccharides complexed to CTAB (a cationic detergent), while retaining thenucleic acids in solution.
32 This extraction removes CTAB-protein/polysaccharide complexes. A white interface should be visible after centrifugation. If interface isn’tcompact - remove with a sterile toothpick, re-centrifuge and collect the supernatant.
147| Page

H
All samples positive for SRP
148| Page
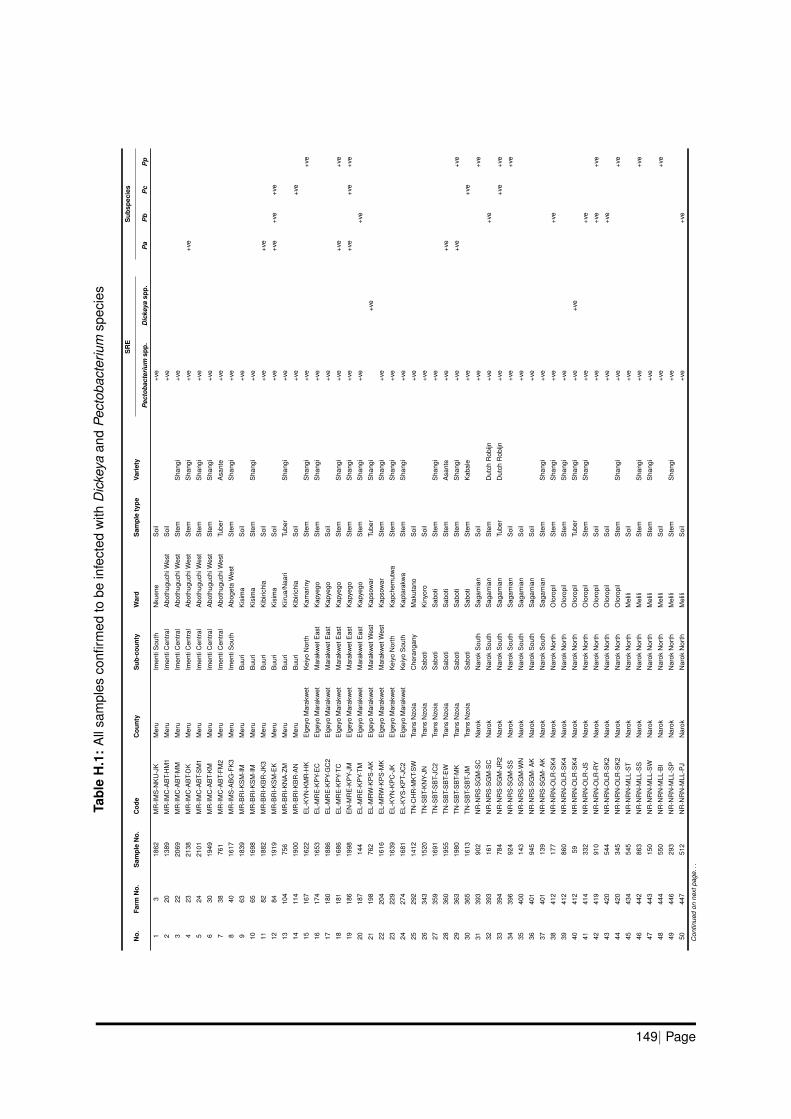
Tabl
eH
.1:
All
sam
ples
confi
rmed
tobe
infe
cted
with
Dic
keya
and
Pect
obac
teriu
msp
ecie
s
No.
Farm
No.
Sam
ple
No.
Cod
eC
ount
yS
ub-c
ount
yW
ard
Sam
ple
type
Vari
ety
SR
ES
ubsp
ecie
s
Pec
toba
cter
ium
spp.
Dic
keya
spp.
Pa
Pb
Pc
Pp
13
1862
MR
-IMS
-NK
U-J
KM
eru
Imen
tiS
outh
Nku
ene
Soi
l+v
e
220
1389
MR
-IMC
-AB
T-H
M1
Mer
uIm
enti
Cen
tral
Abo
thug
uchi
Wes
tS
oil
+ve
322
2069
MR
-IMC
-AB
T-M
MM
eru
Imen
tiC
entra
lA
both
uguc
hiW
est
Ste
mS
hang
i+v
e
423
2138
MR
-IMC
-AB
T-D
KM
eru
Imen
tiC
entra
lA
both
uguc
hiW
est
Ste
mS
hang
i+v
e+v
e
524
2101
MR
-IMC
-AB
T-S
M1
Mer
uIm
enti
Cen
tral
Abo
thug
uchi
Wes
tS
tem
Sha
ngi
+ve
630
1949
MR
-IMC
-AB
T-K
MM
eru
Imen
tiC
entra
lA
both
uguc
hiW
est
Ste
mS
hang
i+v
e
738
761
MR
-IMC
-AB
T-FM
2M
eru
Imen
tiC
entra
lA
both
uguc
hiW
est
Tube
rA
sant
e+v
e
840
1617
MR
-IMS
-AB
G-F
K3
Mer
uIm
enti
Sou
thA
boge
taW
est
Ste
mS
hang
i+v
e
963
1839
MR
-BR
I-KS
M-IM
Mer
uB
uuri
Kis
ima
Soi
l+v
e
1065
1698
MR
-BR
I-KS
M-IM
Mer
uB
uuri
Kis
ima
Ste
mS
hang
i+v
e
1182
1882
MR
-BR
I-KB
R-J
K3
Mer
uB
uuri
Kib
irich
iaS
oil
+ve
+ve
1284
1919
MR
-BR
I-KS
M-E
KM
eru
Buu
riK
isim
aS
oil
+ve
+ve
+ve
+ve
1310
475
6M
R-B
RI-K
NA
-ZM
Mer
uB
uuri
Kiir
ua/N
aari
Tube
rS
hang
i+v
e
1411
419
00M
R-B
RI-K
BR
-AN
Mer
uB
uuri
Kib
irich
iaS
oil
+ve
+ve
1516
716
22E
L-K
YN
-KM
R-H
KE
lgey
oM
arak
wet
Kei
yoN
orth
Kam
arin
yS
tem
Sha
ngi
+ve
+ve
1617
416
53E
L-M
RE
-KP
Y-E
CE
lgey
oM
arak
wet
Mar
akw
etE
ast
Kap
yego
Ste
mS
hang
i+v
e
1718
018
86E
L-M
RE
-KP
Y-G
C2
Elg
eyo
Mar
akw
etM
arak
wet
Eas
tK
apye
goS
oil
+ve
1818
116
86E
L-M
RE
-KP
Y-TC
Elg
eyo
Mar
akw
etM
arak
wet
Eas
tK
apye
goS
tem
Sha
ngi
+ve
+ve
+ve
1918
619
98E
N-M
RE
-KP
Y-JM
Elg
eyo
Mar
akw
etM
arak
wet
Eas
tK
apye
goS
tem
Sha
ngi
+ve
+ve
+ve
+ve
2018
714
4E
L-M
RE
-KP
Y-TM
Elg
eyo
Mar
akw
etM
arak
wet
Eas
tK
apye
goS
tem
Sha
ngi
+ve
+ve
2119
876
2E
L-M
RW
-KP
S-A
KE
lgey
oM
arak
wet
Mar
akw
etW
est
Kap
sow
arTu
ber
Sha
ngi
+ve
2220
416
16E
L-M
RW
-KP
S-M
KE
lgey
oM
arak
wet
Mar
akw
etW
est
Kap
sow
arS
tem
Sha
ngi
+ve
2322
916
39E
L-K
YN
-KP
C-J
KE
lgey
oM
arak
wet
Kei
yoN
orth
Kap
chem
utw
aS
tem
Sha
ngi
+ve
2427
416
81E
L-K
YS
-KP
T-JC
2E
lgey
oM
arak
wet
Kei
yoS
outh
Kap
tara
kwa
Ste
mS
hang
i+v
e
2529
214
12TN
-CH
R-M
KT-
SW
Tran
sN
zoia
Che
rang
any
Mak
utan
oS
oil
+ve
2634
315
20TN
-SB
T-K
NY-
JNTr
ans
Nzo
iaS
abot
iK
inyo
roS
oil
+ve
2735
916
91TN
-SB
T-S
BT-
JC2
Tran
sN
zoia
Sab
oti
Sab
oti
Ste
mS
hang
i+v
e
2836
019
55TN
-SB
T-S
BT-
EW
Tran
sN
zoia
Sab
oti
Sab
oti
Ste
mA
sant
e+v
e+v
e
2936
319
80TN
-SB
T-S
BT-
MK
Tran
sN
zoia
Sab
oti
Sab
oti
Ste
mS
hang
i+v
e+v
e+v
e
3036
516
13TN
-SB
T-S
BT-
JMTr
ans
Nzo
iaS
abot
iS
abot
iS
tem
Kab
ale
+ve
+ve
3139
390
2N
R-N
RS
-SG
M-S
CN
arok
Nar
okS
outh
Sag
amia
nS
oil
+ve
+ve
3239
316
1N
R-N
RS
-SG
M-S
CN
arok
Nar
okS
outh
Sag
amia
nS
tem
Dut
chR
obijn
+ve
+ve
3339
478
4N
R-N
RS
-SG
M-J
R2
Nar
okN
arok
Sou
thS
agam
ian
Tube
rD
utch
Rob
ijn+v
e+v
e+v
e
3439
692
4N
R-N
RS
-SG
M-S
SN
arok
Nar
okS
outh
Sag
amia
nS
oil
+ve
+ve
3540
014
3N
R-N
RS
-SG
M-W
NN
arok
Nar
okS
outh
Sag
amia
nS
oil
+ve
3640
194
5N
R-N
RS
-SG
M-A
KN
arok
Nar
okS
outh
Sag
amia
nS
oil
+ve
3740
113
9N
R-N
RS
-SG
M-A
KN
arok
Nar
okS
outh
Sag
amia
nS
tem
Sha
ngi
+ve
3841
217
7N
R-N
RN
-OLR
-SK
4N
arok
Nar
okN
orth
Olo
ropi
lS
tem
Sha
ngi
+ve
+ve
3941
286
0N
R-N
RN
-OLR
-SK
4N
arok
Nar
okN
orth
Olo
ropi
lS
tem
Sha
ngi
+ve
4041
259
NR
-NR
N-O
LR-S
K4
Nar
okN
arok
Nor
thO
loro
pil
Tube
rS
hang
i+v
e+v
e
4141
433
2N
R-N
RN
-OLR
-JS
Nar
okN
arok
Nor
thO
loro
pil
Ste
mS
hang
i+v
e+v
e
4241
991
0N
R-N
RN
-OLR
-RY
Nar
okN
arok
Nor
thO
loro
pil
Soi
l+v
e+v
e+v
e
4342
054
4N
R-N
RN
-OLR
-SK
2N
arok
Nar
okN
orth
Olo
ropi
lS
oil
+ve
+ve
4442
034
5N
R-N
RN
-OLR
-SK
2N
arok
Nar
okN
orth
Olo
ropi
lS
tem
Sha
ngi
+ve
+ve
4543
454
5N
R-N
RN
-MLL
-ST
Nar
okN
arok
Nor
thM
elili
Soi
l+v
e
4644
286
3N
R-N
RN
-MLL
-SS
Nar
okN
arok
Nor
thM
elili
Ste
mS
hang
i+v
e+v
e
4744
315
0N
R-N
RN
-MLL
-SW
Nar
okN
arok
Nor
thM
elili
Ste
mS
hang
i+v
e
4844
455
0N
R-N
RN
-MLL
-BI
Nar
okN
arok
Nor
thM
elili
Soi
l+v
e+v
e
4944
629
3N
R-N
RN
-MLL
-SP
Nar
okN
arok
Nor
thM
elili
Ste
mS
hang
i+v
e
5044
751
2N
R-N
RN
-MLL
-PJ
Nar
okN
arok
Nor
thM
elili
Soi
l+v
e+v
e
Con
tinue
don
next
page
...
149| Page
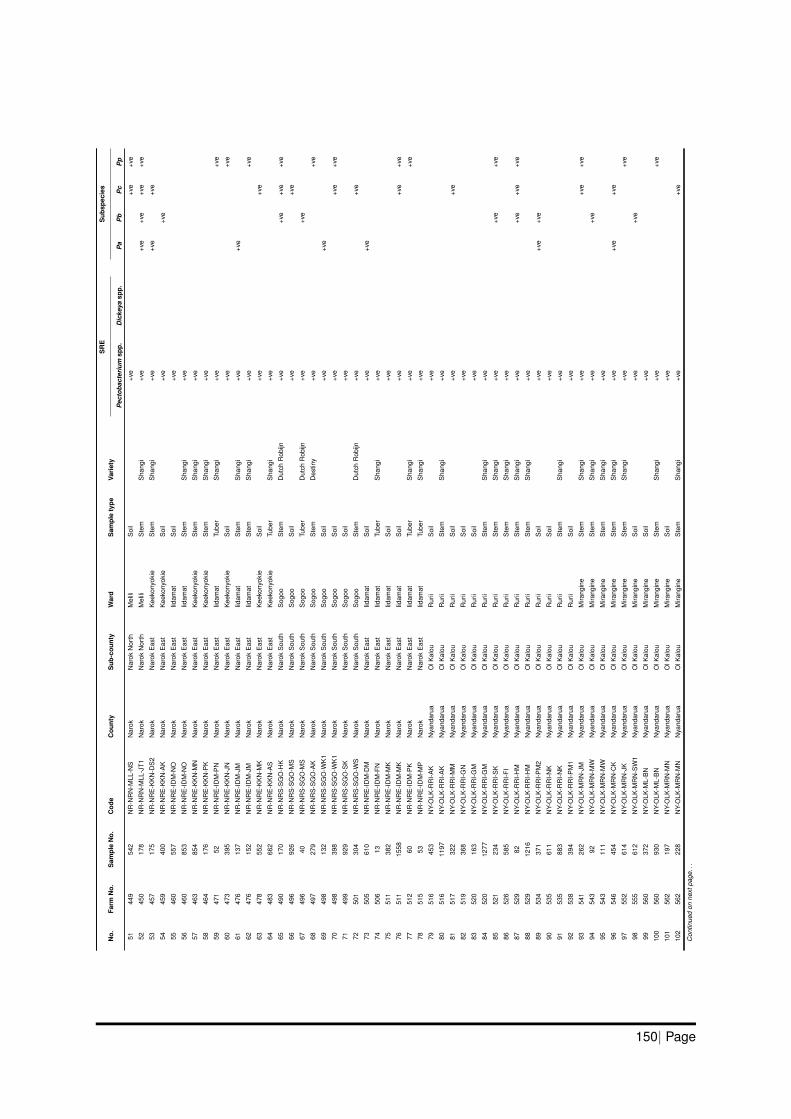
No.
Farm
No.
Sam
ple
No.
Cod
eC
ount
yS
ub-c
ount
yW
ard
Sam
ple
type
Vari
ety
SR
ES
ubsp
ecie
s
Pec
toba
cter
ium
spp.
Dic
keya
spp.
Pa
Pb
Pc
Pp
5144
954
2N
R-N
RN
-MLL
-NS
Nar
okN
arok
Nor
thM
elili
Soi
l+v
e+v
e+v
e
5245
017
8N
R-N
RN
-MLL
-JT1
Nar
okN
arok
Nor
thM
elili
Ste
mS
hang
i+v
e+v
e+v
e+v
e+v
e
5345
717
5N
R-N
RE
-KK
N-D
S2
Nar
okN
arok
Eas
tK
eeko
nyok
ieS
tem
Sha
ngi
+ve
+ve
+ve
5445
940
0N
R-N
RE
-KK
N-A
KN
arok
Nar
okE
ast
Kee
kony
okie
Soi
l+v
e+v
e
5546
055
7N
R-N
RE
-IDM
-NO
Nar
okN
arok
Eas
tIid
amat
Soi
l+v
e
5646
085
3N
R-N
RE
-IDM
-NO
Nar
okN
arok
Eas
tIid
amat
Ste
mS
hang
i+v
e
5746
385
4N
R-N
RE
-KK
N-M
NN
arok
Nar
okE
ast
Kee
kony
okie
Ste
mS
hang
i+v
e
5846
417
6N
R-N
RE
-KK
N-P
KN
arok
Nar
okE
ast
Kee
kony
okie
Ste
mS
hang
i+v
e
5947
152
NR
-NR
E-ID
M-P
NN
arok
Nar
okE
ast
Iidam
atTu
ber
Sha
ngi
+ve
+ve
6047
339
5N
R-N
RE
-KK
N-J
NN
arok
Nar
okE
ast
Kee
kony
okie
Soi
l+v
e+v
e
6147
613
7N
R-N
RE
-IDM
-JM
Nar
okN
arok
Eas
tIid
amat
Ste
mS
hang
i+v
e+v
e
6247
615
2N
R-N
RE
-IDM
-JM
Nar
okN
arok
Eas
tIid
amat
Ste
mS
hang
i+v
e+v
e
6347
855
2N
R-N
RE
-KK
N-M
KN
arok
Nar
okE
ast
Kee
kony
okie
Soi
l+v
e+v
e
6448
366
2N
R-N
RE
-KK
N-A
SN
arok
Nar
okE
ast
Kee
kony
okie
Tube
rS
hang
i+v
e
6549
017
0N
R-N
RS
-SG
O-H
KN
arok
Nar
okS
outh
Sog
ooS
tem
Dut
chR
obijn
+ve
+ve
+ve
+ve
6649
692
6N
R-N
RS
-SG
O-M
SN
arok
Nar
okS
outh
Sog
ooS
oil
+ve
+ve
6749
640
NR
-NR
S-S
GO
-MS
Nar
okN
arok
Sou
thS
ogoo
Tube
rD
utch
Rob
ijn+v
e+v
e
6849
727
9N
R-N
RS
-SG
O-A
KN
arok
Nar
okS
outh
Sog
ooS
tem
Des
tiny
+ve
+ve
6949
813
2N
R-N
RS
-SG
O-W
K1
Nar
okN
arok
Sou
thS
ogoo
Soi
l+v
e+v
e
7049
839
8N
R-N
RS
-SG
O-W
K1
Nar
okN
arok
Sou
thS
ogoo
Soi
l+v
e+v
e+v
e
7149
992
9N
R-N
RS
-SG
O-S
KN
arok
Nar
okS
outh
Sog
ooS
oil
+ve
7250
130
4N
R-N
RS
-SG
O-W
SN
arok
Nar
okS
outh
Sog
ooS
tem
Dut
chR
obijn
+ve
+ve
7350
561
0N
R-N
RE
-IDM
-DM
Nar
okN
arok
Eas
tIid
amat
Soi
l+v
e+v
e
7450
613
NR
-NR
E-ID
M-F
NN
arok
Nar
okE
ast
Iidam
atTu
ber
Sha
ngi
+ve
7551
138
2N
R-N
RE
-IDM
-MK
Nar
okN
arok
Eas
tIid
amat
Soi
l+v
e
7651
115
58N
R-N
RE
-IDM
-MK
Nar
okN
arok
Eas
tIid
amat
Soi
l+v
e+v
e+v
e
7751
260
NR
-NR
E-ID
M-P
KN
arok
Nar
okE
ast
Iidam
atTu
ber
Sha
ngi
+ve
+ve
7851
553
NR
-NR
E-ID
M-M
PN
arok
Nar
okE
ast
Iidam
atTu
ber
Sha
ngi
+ve
7951
645
3N
Y-O
LK-R
RI-A
KN
yand
arua
OlK
alou
Rur
iiS
oil
+ve
8051
611
97N
Y-O
LK-R
RI-A
KN
yand
arua
OlK
alou
Rur
iiS
tem
Sha
ngi
+ve
8151
732
2N
Y-O
LK-R
RI-M
MN
yand
arua
OlK
alou
Rur
iiS
oil
+ve
+ve
8251
936
8N
Y-O
LK-R
RI-G
NN
yand
arua
OlK
alou
Rur
iiS
oil
+ve
8352
016
3N
Y-O
LK-R
RI-G
MN
yand
arua
OlK
alou
Rur
iiS
oil
+ve
8452
012
77N
Y-O
LK-R
RI-G
MN
yand
arua
OlK
alou
Rur
iiS
tem
Sha
ngi
+ve
8552
123
4N
Y-O
LK-R
RI-S
KN
yand
arua
OlK
alou
Rur
iiS
tem
Sha
ngi
+ve
+ve
+ve
8652
658
5N
Y-O
LK-R
RI-F
IN
yand
arua
OlK
alou
Rur
iiS
tem
Sha
ngi
+ve
8752
982
NY-
OLK
-RR
I-HM
Nya
ndar
uaO
lKal
ouR
urii
Ste
mS
hang
i+v
e+v
e+v
e+v
e
8852
912
16N
Y-O
LK-R
RI-H
MN
yand
arua
OlK
alou
Rur
iiS
tem
Sha
ngi
+ve
8953
437
1N
Y-O
LK-R
RI-P
M2
Nya
ndar
uaO
lKal
ouR
urii
Soi
l+v
e+v
e+v
e
9053
561
1N
Y-O
LK-R
RI-N
KN
yand
arua
OlK
alou
Rur
iiS
oil
+ve
9153
588
3N
Y-O
LK-R
RI-N
KN
yand
arua
OlK
alou
Rur
iiS
tem
Sha
ngi
+ve
9253
839
4N
Y-O
LK-R
RI-P
M1
Nya
ndar
uaO
lKal
ouR
urii
Soi
l+v
e
9354
126
2N
Y-O
LK-M
RN
-JM
Nya
ndar
uaO
lKal
ouM
irang
ine
Ste
mS
hang
i+v
e+v
e+v
e
9454
392
NY-
OLK
-MR
N-M
WN
yand
arua
OlK
alou
Mira
ngin
eS
tem
Sha
ngi
+ve
+ve
9554
311
1N
Y-O
LK-M
RN
-MW
Nya
ndar
uaO
lKal
ouM
irang
ine
Ste
mS
hang
i+v
e
9654
645
4N
Y-O
LK-M
RN
-CK
Nya
ndar
uaO
lKal
ouM
irang
ine
Ste
mS
hang
i+v
e+v
e+v
e
9755
261
4N
Y-O
LK-M
RN
-JK
Nya
ndar
uaO
lKal
ouM
irang
ine
Ste
mS
hang
i+v
e+v
e
9855
561
2N
Y-O
LK-M
RN
-SW
1N
yand
arua
OlK
alou
Mira
ngin
eS
oil
+ve
+ve
9956
037
2N
Y-O
LK-M
L-B
NN
yand
arua
OlK
alou
Mira
ngin
eS
oil
+ve
100
560
930
NY-
OLK
-ML-
BN
Nya
ndar
uaO
lKal
ouM
irang
ine
Ste
mS
hang
i+v
e+v
e
101
562
197
NY-
OLK
-MR
N-M
NN
yand
arua
OlK
alou
Mira
ngin
eS
oil
+ve
102
562
228
NY-
OLK
-MR
N-M
NN
yand
arua
OlK
alou
Mira
ngin
eS
tem
Sha
ngi
+ve
+ve
Con
tinue
don
next
page
...
150| Page
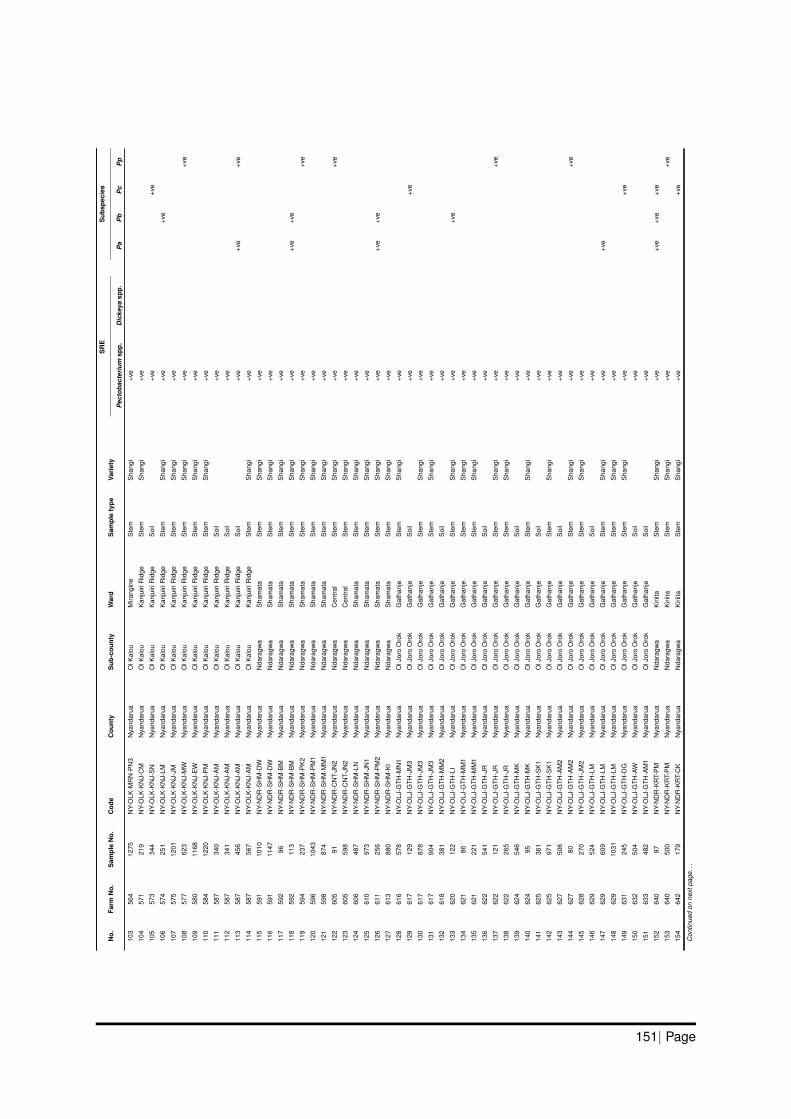
No.
Farm
No.
Sam
ple
No.
Cod
eC
ount
yS
ub-c
ount
yW
ard
Sam
ple
type
Vari
ety
SR
ES
ubsp
ecie
s
Pec
toba
cter
ium
spp.
Dic
keya
spp.
Pa
Pb
Pc
Pp
103
564
1275
NY-
OLK
-MR
N-P
N3
Nya
ndar
uaO
lKal
ouM
irang
ine
Ste
mS
hang
i+v
e
104
571
219
NY-
OLK
-KN
J-C
MN
yand
arua
OlK
alou
Kan
juiri
Rid
geS
tem
Sha
ngi
+ve
105
573
344
NY-
OLK
-KN
J-S
NN
yand
arua
OlK
alou
Kan
juiri
Rid
geS
oil
+ve
+ve
106
574
251
NY-
OLK
-KN
J-LM
Nya
ndar
uaO
lKal
ouK
anju
iriR
idge
Ste
mS
hang
i+v
e+v
e
107
575
1201
NY-
OLK
-KN
J-JM
Nya
ndar
uaO
lKal
ouK
anju
iriR
idge
Ste
mS
hang
i+v
e
108
577
623
NY-
OLK
-KN
J-M
WN
yand
arua
OlK
alou
Kan
juiri
Rid
geS
tem
Sha
ngi
+ve
+ve
109
580
1168
NY-
OLK
-KN
J-E
WN
yand
arua
OlK
alou
Kan
juiri
Rid
geS
tem
Sha
ngi
+ve
110
584
1220
NY-
OLK
-KN
J-P
MN
yand
arua
OlK
alou
Kan
juiri
Rid
geS
tem
Sha
ngi
+ve
111
587
340
NY-
OLK
-KN
J-A
MN
yand
arua
OlK
alou
Kan
juiri
Rid
geS
oil
+ve
112
587
341
NY-
OLK
-KN
J-A
MN
yand
arua
OlK
alou
Kan
juiri
Rid
geS
oil
+ve
113
587
456
NY-
OLK
-KN
J-A
MN
yand
arua
OlK
alou
Kan
juiri
Rid
geS
oil
+ve
+ve
+ve
114
587
567
NY-
OLK
-KN
J-A
MN
yand
arua
OlK
alou
Kan
juiri
Rid
geS
tem
Sha
ngi
+ve
115
591
1010
NY-
ND
R-S
HM
-DW
Nya
ndar
uaN
dara
gwa
Sha
mat
aS
tem
Sha
ngi
+ve
116
591
1147
NY-
ND
R-S
HM
-DW
Nya
ndar
uaN
dara
gwa
Sha
mat
aS
tem
Sha
ngi
+ve
117
592
96N
Y-N
DR
-SH
M-B
MN
yand
arua
Nda
ragw
aS
ham
ata
Ste
mS
hang
i+v
e
118
592
113
NY-
ND
R-S
HM
-BM
Nya
ndar
uaN
dara
gwa
Sha
mat
aS
tem
Sha
ngi
+ve
+ve
+ve
119
594
237
NY-
ND
R-S
HM
-PK
2N
yand
arua
Nda
ragw
aS
ham
ata
Ste
mS
hang
i+v
e+v
e
120
596
1043
NY-
ND
R-S
HM
-PM
1N
yand
arua
Nda
ragw
aS
ham
ata
Ste
mS
hang
i+v
e
121
598
874
NY-
ND
R-S
HM
-MM
1N
yand
arua
Nda
ragw
aS
ham
ata
Ste
mS
hang
i+v
e
122
605
91N
Y-N
DR
-CN
T-JN
2N
yand
arua
Nda
ragw
aC
entra
lS
tem
Sha
ngi
+ve
+ve
123
605
598
NY-
ND
R-C
NT-
JN2
Nya
ndar
uaN
dara
gwa
Cen
tral
Ste
mS
hang
i+v
e
124
606
487
NY-
ND
R-S
HM
-LN
Nya
ndar
uaN
dara
gwa
Sha
mat
aS
tem
Sha
ngi
+ve
125
610
973
NY-
ND
R-S
HM
-JN
1N
yand
arua
Nda
ragw
aS
ham
ata
Ste
mS
hang
i+v
e
126
611
256
NY-
ND
R-S
HM
-PM
2N
yand
arua
Nda
ragw
aS
ham
ata
Ste
mS
hang
i+v
e+v
e+v
e
127
613
880
NY-
ND
R-S
HM
-KI
Nya
ndar
uaN
dara
gwa
Sha
mat
aS
tem
Sha
ngi
+ve
128
616
578
NY-
OLJ
-GTH
-MN
1N
yand
arua
OlJ
oro
Oro
kG
atha
nje
Ste
mS
hang
i+v
e
129
617
129
NY-
OLJ
-GTH
-JM
3N
yand
arua
OlJ
oro
Oro
kG
atha
nje
Soi
l+v
e+v
e
130
617
878
NY-
OLJ
-GTH
-JM
3N
yand
arua
OlJ
oro
Oro
kG
atha
nje
Ste
mS
hang
i+v
e
131
617
904
NY-
OLJ
-GTH
-JM
3N
yand
arua
OlJ
oro
Oro
kG
atha
nje
Ste
mS
hang
i+v
e
132
618
381
NY-
OLJ
-GTH
-MM
2N
yand
arua
OlJ
oro
Oro
kG
atha
nje
Soi
l+v
e
133
620
122
NY-
OLJ
-GTH
-LI
Nya
ndar
uaO
lJor
oO
rok
Gat
hanj
eS
tem
Sha
ngi
+ve
+ve
134
621
86N
Y-O
LJ-G
TH-M
M1
Nya
ndar
uaO
lJor
oO
rok
Gat
hanj
eS
tem
Sha
ngi
+ve
135
621
221
NY-
OLJ
-GTH
-MM
1N
yand
arua
OlJ
oro
Oro
kG
atha
nje
Ste
mS
hang
i+v
e
136
622
541
NY-
OLJ
-GTH
-JR
Nya
ndar
uaO
lJor
oO
rok
Gat
hanj
eS
oil
+ve
137
622
121
NY-
OLJ
-GTH
-JR
Nya
ndar
uaO
lJor
oO
rok
Gat
hanj
eS
tem
Sha
ngi
+ve
+ve
138
622
265
NY-
OLJ
-GTH
-JR
Nya
ndar
uaO
lJor
oO
rok
Gat
hanj
eS
tem
Sha
ngi
+ve
139
624
546
NY-
OLJ
-GTH
-MK
Nya
ndar
uaO
lJor
oO
rok
Gat
hanj
eS
oil
+ve
140
624
95N
Y-O
LJ-G
TH-M
KN
yand
arua
OlJ
oro
Oro
kG
atha
nje
Ste
mS
hang
i+v
e
141
625
361
NY-
OLJ
-GTH
-SK
1N
yand
arua
OlJ
oro
Oro
kG
atha
nje
Soi
l+v
e
142
625
971
NY-
OLJ
-GTH
-SK
1N
yand
arua
OlJ
oro
Oro
kG
atha
nje
Ste
mS
hang
i+v
e
143
627
506
NY-
OLJ
-GTH
-AM
2N
yand
arua
OlJ
oro
Oro
kG
atha
nje
Soi
l+v
e
144
627
80N
Y-O
LJ-G
TH-A
M2
Nya
ndar
uaO
lJor
oO
rok
Gat
hanj
eS
tem
Sha
ngi
+ve
+ve
145
628
270
NY-
OLJ
-GTH
-JM
2N
yand
arua
OlJ
oro
Oro
kG
atha
nje
Ste
mS
hang
i+v
e
146
629
524
NY-
OLJ
-GTH
-LM
Nya
ndar
uaO
lJor
oO
rok
Gat
hanj
eS
oil
+ve
147
629
609
NY-
OLJ
-GTH
-LM
Nya
ndar
uaO
lJor
oO
rok
Gat
hanj
eS
tem
Sha
ngi
+ve
+ve
148
629
1031
NY-
OLJ
-GTH
-LM
Nya
ndar
uaO
lJor
oO
rok
Gat
hanj
eS
tem
Sha
ngi
+ve
149
631
245
NY-
OLJ
-GTH
-DG
Nya
ndar
uaO
lJor
oO
rok
Gat
hanj
eS
tem
Sha
ngi
+ve
+ve
150
632
504
NY-
OLJ
-GTH
-AW
Nya
ndar
uaO
lJor
oO
rok
Gat
hanj
eS
oil
+ve
151
633
482
NY-
OLJ
-GTH
-AM
1N
yand
arua
OlJ
oro
Oro
kG
atha
nje
Soi
l+v
e
152
640
97N
Y-N
DR
-KR
T-P
MN
yand
arua
Nda
ragw
aK
iriita
Ste
mS
hang
i+v
e+v
e+v
e+v
e
153
640
500
NY-
ND
R-K
RT-
PM
Nya
ndar
uaN
dara
gwa
Kiri
itaS
tem
Sha
ngi
+ve
+ve
154
642
179
NY-
ND
R-K
RT-
CK
Nya
ndar
uaN
dara
gwa
Kiri
itaS
tem
Sha
ngi
+ve
+ve
Con
tinue
don
next
page
...
151| Page

No.
Farm
No.
Sam
ple
No.
Cod
eC
ount
yS
ub-c
ount
yW
ard
Sam
ple
type
Vari
ety
SR
ES
ubsp
ecie
s
Pec
toba
cter
ium
spp.
Dic
keya
spp.
Pa
Pb
Pc
Pp
155
643
308
NY-
ND
R-K
RT-
RW
Nya
ndar
uaN
dara
gwa
Kiri
itaS
tem
Sha
ngi
+ve
156
643
900
NY-
ND
R-K
RT-
RW
Nya
ndar
uaN
dara
gwa
Kiri
itaS
tem
Sha
ngi
+ve
157
646
568
NY-
ND
R-K
RT-
SM
Nya
ndar
uaN
dara
gwa
Kiri
itaS
tem
Sha
ngi
+ve
158
648
79N
Y-N
DR
-KR
T-M
K1
Nya
ndar
uaN
dara
gwa
Kiri
itaTu
ber
Sha
ngi
+ve
+ve
+ve
159
653
213
NY-
ND
R-K
RT-
NN
Nya
ndar
uaN
dara
gwa
Kiri
itaS
tem
Sha
ngi
+ve
+ve
+ve
+ve
160
653
225
NY-
ND
R-K
RT-
NN
Nya
ndar
uaN
dara
gwa
Kiri
itaS
tem
Sha
ngi
+ve
+ve
+ve
161
653
601
NY-
ND
R-K
RT-
NN
Nya
ndar
uaN
dara
gwa
Kiri
itaS
tem
Sha
ngi
+ve
162
657
114
NY-
KP
R-W
NJ-
HN
Nya
ndar
uaK
ipip
iriW
anjo
hiS
tem
Sha
ngi
+ve
163
658
2062
NY-
KP
R-K
PR
-SK
2N
yand
arua
Kip
ipiri
Kip
ipiri
Ste
mS
hang
i+v
e
164
659
314
NY-
KP
R-K
PR
-IMN
yand
arua
Kip
ipiri
Kip
ipiri
Soi
l+v
e
165
659
240
NY-
KP
R-K
PR
-IMN
yand
arua
Kip
ipiri
Kip
ipiri
Ste
mS
hang
i+v
e+v
e
166
661
389
NY-
KP
R-K
PR
-HM
Nya
ndar
uaK
ipip
iriK
ipip
iriS
oil
+ve
+ve
167
663
236
NY-
KP
R-K
PR
-JK
1N
yand
arua
Kip
ipiri
Kip
ipiri
Ste
mS
hang
i+v
e+v
e+v
e
168
664
307
NY-
KP
R-K
PR
-JN
2N
yand
arua
Kip
ipiri
Kip
ipiri
Soi
l+v
e
169
664
1203
NY-
KP
R-K
PR
-JN
2N
yand
arua
Kip
ipiri
Kip
ipiri
Ste
mS
hang
i+v
e
170
665
855
NY-
KP
R-K
PR
-LM
Nya
ndar
uaK
ipip
iriK
ipip
iriS
tem
Sha
ngi
+ve
+ve
171
672
507
NY-
KP
R-K
PR
-JG
KN
yand
arua
Kip
ipiri
Kip
ipiri
Soi
l+v
e+v
e
172
672
249
NY-
KP
R-K
PR
-JG
KN
yand
arua
Kip
ipiri
Kip
ipiri
Ste
mS
hang
i+v
e+v
e+v
e+v
e+v
e
173
673
2723
NY-
KP
R-K
PR
-JN
1N
yand
arua
Kip
ipiri
Kip
ipiri
Tube
rS
hang
i+v
e
174
676
1060
NY-
KP
R-K
PR
-AM
1N
yand
arua
Kip
ipiri
Kip
ipiri
Ste
mS
hang
i+v
e
175
676
1070
NY-
KP
R-K
PR
-AM
1N
yand
arua
Kip
ipiri
Kip
ipiri
Ste
mS
hang
i+v
e
176
677
1072
NY-
KP
R-K
PR
-PM
2N
yand
arua
Kip
ipiri
Kip
ipiri
Ste
mS
hang
i+v
e
177
687
450
NY-
KP
R-W
NJ-
MM
Nya
ndar
uaK
ipip
iriW
anjo
hiS
oil
+ve
+ve
+ve
+ve
178
687
619
NY-
KP
R-W
NJ-
MM
Nya
ndar
uaK
ipip
iriW
anjo
hiS
tem
Sha
ngi
+ve
+ve
+ve
+ve
179
694
254
NY-
KP
R-W
NJ-
JM1
Nya
ndar
uaK
ipip
iriW
anjo
hiS
tem
Sha
ngi
+ve
+ve
180
694
577
NY-
KP
R-W
NJ-
JM1
Nya
ndar
uaK
ipip
iriW
anjo
hiS
tem
Sha
ngi
+ve
181
695
1219
NY-
KP
R-W
NJ-
DC
Nya
ndar
uaK
ipip
iriW
anjo
hiS
tem
Sha
ngi
+ve
+ve
+ve
182
696
206
NY-
KP
R-W
NJ-
PG
Nya
ndar
uaK
ipip
iriW
anjo
hiS
tem
Sha
ngi
+ve
183
696
1248
NY-
KP
R-W
NJ-
PG
Nya
ndar
uaK
ipip
iriW
anjo
hiS
tem
Sha
ngi
+ve
+ve
184
698
875
NY-
KP
R-W
NJ-
PN
Nya
ndar
uaK
ipip
iriW
anjo
hiS
tem
Sha
ngi
+ve
+ve
185
698
921
NY-
KP
R-W
NJ-
PN
Nya
ndar
uaK
ipip
iriW
anjo
hiS
tem
Sha
ngi
+ve
+ve
186
702
621
NY-
KP
R-W
NJ-
SM
Nya
ndar
uaK
ipip
iriW
anjo
hiS
tem
Sha
ngi
+ve
187
705
539
NY-
KP
R-W
NJ-
LM1
Nya
ndar
uaK
ipip
iriW
anjo
hiS
tem
Sha
ngi
+ve
+ve
+ve
188
709
241
NY-
KP
R-N
YK
-SK
Nya
ndar
uaK
ipip
iriN
yaki
oS
tem
Sha
ngi
+ve
+ve
189
709
273
NY-
KP
R-N
YK
-SK
Nya
ndar
uaK
ipip
iriN
yaki
oS
tem
Sha
ngi
+ve
190
714
1000
NY-
KP
R-N
YK
-JC
Nya
ndar
uaK
ipip
iriN
yaki
oS
tem
Sha
ngi
+ve
191
714
1039
NY-
KP
R-N
YK
-JC
Nya
ndar
uaK
ipip
iriN
yaki
oS
tem
Sha
ngi
+ve
+ve
192
714
1195
NY-
KP
R-N
YK
-JC
Nya
ndar
uaK
ipip
iriN
yaki
oS
tem
Sha
ngi
+ve
193
719
1100
NY-
KP
R-N
YK
-PK
Nya
ndar
uaK
ipip
iriN
yaki
oS
tem
Sha
ngi
+ve
+ve
194
719
1256
NY-
KP
R-N
YK
-PK
Nya
ndar
uaK
ipip
iriN
yaki
oS
tem
Sha
ngi
+ve
+ve
195
721
927
NY-
KP
R-N
YK
-CN
Nya
ndar
uaK
ipip
iriN
yaki
oS
tem
Sha
ngi
+ve
+ve
+ve
196
722
1150
NY-
KP
R-N
YK
-FM
Nya
ndar
uaK
ipip
iriN
yaki
oS
tem
Sha
ngi
+ve
197
727
1198
NY-
KP
R-N
YK
-JK
Nya
ndar
uaK
ipip
iriN
yaki
oS
oil
+ve
+ve
198
727
260
NY-
KP
R-N
YK
-JK
Nya
ndar
uaK
ipip
iriN
yaki
oS
tem
Sha
ngi
+ve
+ve
199
727
530
NY-
KP
R-N
YK
-JK
Nya
ndar
uaK
ipip
iriN
yaki
oS
tem
Sha
ngi
+ve
+ve
200
730
976
NY-
KN
G-N
YK
-DK
Nya
ndar
uaK
inan
gop
Nya
kio
Ste
mS
hang
i+v
e
201
730
1176
NY-
KN
G-N
YK
-DK
Nya
ndar
uaK
inan
gop
Nya
kio
Ste
mS
hang
i+v
e
202
735
1190
NY-
ND
R-C
NT-
MK
2N
yand
arua
Nda
ragw
aC
entra
lS
tem
Sha
ngi
+ve
203
740
2469
NY-
ND
R-C
NT-
DM
2N
yand
arua
Nda
ragw
aC
entra
lTu
ber
Sha
ngi
+ve
204
745
1069
NY-
ND
R-C
NT-
JN1
Nya
ndar
uaN
dara
gwa
Cen
tral
Ste
mS
hang
i+v
e
205
750
160
NY-
ND
R-C
NT-
JMN
yand
arua
Nda
ragw
aC
entra
lS
tem
Sha
ngi
+ve
206
753
1272
NY-
ND
R-C
NT-
KK
Nya
ndar
uaN
dara
gwa
Cen
tral
Ste
mS
hang
i+v
e
Con
tinue
don
next
page
...
152| Page
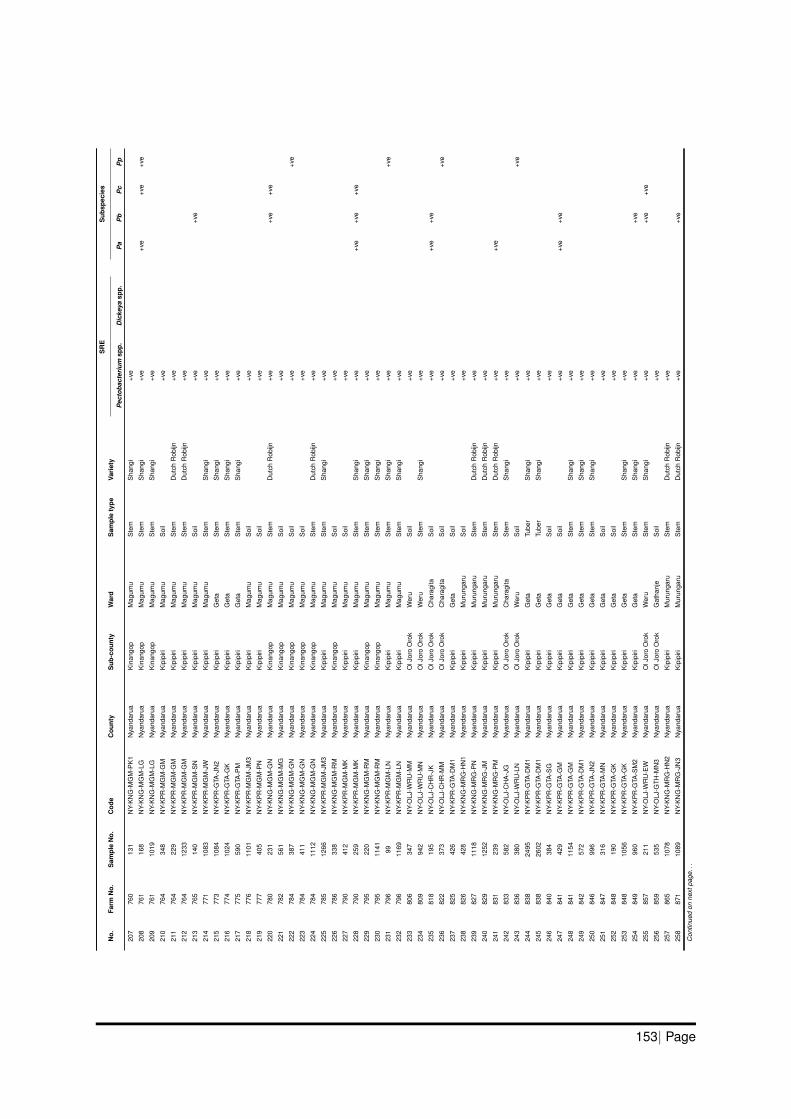
No.
Farm
No.
Sam
ple
No.
Cod
eC
ount
yS
ub-c
ount
yW
ard
Sam
ple
type
Vari
ety
SR
ES
ubsp
ecie
s
Pec
toba
cter
ium
spp.
Dic
keya
spp.
Pa
Pb
Pc
Pp
207
760
131
NY-
KN
G-M
GM
-PK
1N
yand
arua
Kin
ango
pM
agum
uS
tem
Sha
ngi
+ve
208
761
168
NY-
KN
G-M
GM
-LG
Nya
ndar
uaK
inan
gop
Mag
umu
Ste
mS
hang
i+v
e+v
e+v
e+v
e
209
761
1019
NY-
KN
G-M
GM
-LG
Nya
ndar
uaK
inan
gop
Mag
umu
Ste
mS
hang
i+v
e
210
764
348
NY-
KP
R-M
GM
-GM
Nya
ndar
uaK
ipip
iriM
agum
uS
oil
+ve
211
764
229
NY-
KP
R-M
GM
-GM
Nya
ndar
uaK
ipip
iriM
agum
uS
tem
Dut
chR
obijn
+ve
212
764
1233
NY-
KP
R-M
GM
-GM
Nya
ndar
uaK
ipip
iriM
agum
uS
tem
Dut
chR
obijn
+ve
213
765
140
NY-
KP
R-M
GM
-SN
Nya
ndar
uaK
ipip
iriM
agum
uS
oil
+ve
+ve
214
771
1083
NY-
KP
R-M
GM
-JW
Nya
ndar
uaK
ipip
iriM
agum
uS
tem
Sha
ngi
+ve
215
773
1084
NY-
KP
R-G
TA-J
N2
Nya
ndar
uaK
ipip
iriG
eta
Ste
mS
hang
i+v
e
216
774
1024
NY-
KP
R-G
TA-G
KN
yand
arua
Kip
ipiri
Get
aS
tem
Sha
ngi
+ve
217
775
590
NY-
KP
R-G
TA-P
MN
yand
arua
Kip
ipiri
Get
aS
tem
Sha
ngi
+ve
218
776
1101
NY-
KP
R-M
GM
-JM
3N
yand
arua
Kip
ipiri
Mag
umu
Soi
l+v
e
219
777
405
NY-
KP
R-M
GM
-PN
Nya
ndar
uaK
ipip
iriM
agum
uS
oil
+ve
220
780
231
NY-
KN
G-M
GM
-GN
Nya
ndar
uaK
inan
gop
Mag
umu
Ste
mD
utch
Rob
ijn+v
e+v
e+v
e
221
782
561
NY-
KN
G-M
GM
-MG
Nya
ndar
uaK
inan
gop
Mag
umu
Soi
l+v
e
222
784
387
NY-
KN
G-M
GM
-GN
Nya
ndar
uaK
inan
gop
Mag
umu
Soi
l+v
e+v
e
223
784
411
NY-
KN
G-M
GM
-GN
Nya
ndar
uaK
inan
gop
Mag
umu
Soi
l+v
e
224
784
1112
NY-
KN
G-M
GM
-GN
Nya
ndar
uaK
inan
gop
Mag
umu
Ste
mD
utch
Rob
ijn+v
e
225
785
1266
NY-
KP
R-M
GM
-JM
3N
yand
arua
Kip
ipiri
Mag
umu
Ste
mS
hang
i+v
e
226
786
338
NY-
KN
G-M
GM
-RM
Nya
ndar
uaK
inan
gop
Mag
umu
Soi
l+v
e
227
790
412
NY-
KP
R-M
GM
-MK
Nya
ndar
uaK
ipip
iriM
agum
uS
oil
+ve
228
790
259
NY-
KP
R-M
GM
-MK
Nya
ndar
uaK
ipip
iriM
agum
uS
tem
Sha
ngi
+ve
+ve
+ve
+ve
229
795
220
NY-
KN
G-M
GM
-RM
Nya
ndar
uaK
inan
gop
Mag
umu
Ste
mS
hang
i+v
e
230
795
1141
NY-
KN
G-M
GM
-RM
Nya
ndar
uaK
inan
gop
Mag
umu
Ste
mS
hang
i+v
e
231
796
99N
Y-K
PR
-MG
M-L
NN
yand
arua
Kip
ipiri
Mag
umu
Ste
mS
hang
i+v
e+v
e
232
796
1169
NY-
KP
R-M
GM
-LN
Nya
ndar
uaK
ipip
iriM
agum
uS
tem
Sha
ngi
+ve
233
806
347
NY-
OLJ
-WR
U-M
MN
yand
arua
OlJ
oro
Oro
kW
eru
Soi
l+v
e
234
809
942
NY-
OLJ
-WR
U-M
NN
yand
arua
OlJ
oro
Oro
kW
eru
Ste
mS
hang
i+v
e
235
818
195
NY-
OLJ
-CH
R-J
KN
yand
arua
OlJ
oro
Oro
kC
hara
gita
Soi
l+v
e+v
e+v
e
236
822
373
NY-
OLJ
-CH
R-M
MN
yand
arua
OlJ
oro
Oro
kC
hara
gita
Soi
l+v
e+v
e
237
825
426
NY-
KP
R-G
TA-D
M1
Nya
ndar
uaK
ipip
iriG
eta
Soi
l+v
e
238
826
428
NY-
KN
G-M
RG
-HN
1N
yand
arua
Kip
ipiri
Mur
unga
ruS
oil
+ve
239
827
1118
NY-
KN
G-M
RG
-PN
Nya
ndar
uaK
ipip
iriM
urun
garu
Ste
mD
utch
Rob
ijn+v
e
240
829
1252
NY-
KN
G-M
RG
-JM
Nya
ndar
uaK
ipip
iriM
urun
garu
Ste
mD
utch
Rob
ijn+v
e
241
831
239
NY-
KN
G-M
RG
-PM
Nya
ndar
uaK
ipip
iriM
urun
garu
Ste
mD
utch
Rob
ijn+v
e+v
e
242
833
582
NY-
OLJ
-CH
A-J
GN
yand
arua
OlJ
oro
Oro
kC
hara
gita
Ste
mS
hang
i+v
e
243
836
380
NY-
OLJ
-WR
U-L
NN
yand
arua
OlJ
oro
Oro
kW
eru
Soi
l+v
e+v
e
244
838
2495
NY-
KP
R-G
TA-D
M1
Nya
ndar
uaK
ipip
iriG
eta
Tube
rS
hang
i+v
e
245
838
2602
NY-
KP
R-G
TA-D
M1
Nya
ndar
uaK
ipip
iriG
eta
Tube
rS
hang
i+v
e
246
840
384
NY-
KP
R-G
TA-S
GN
yand
arua
Kip
ipiri
Get
aS
oil
+ve
247
841
429
NY-
KP
R-G
TA-G
MN
yand
arua
Kip
ipiri
Get
aS
oil
+ve
+ve
+ve
248
841
1154
NY-
KP
R-G
TA-G
MN
yand
arua
Kip
ipiri
Get
aS
tem
Sha
ngi
+ve
249
842
572
NY-
KP
R-G
TA-D
M1
Nya
ndar
uaK
ipip
iriG
eta
Ste
mS
hang
i+v
e
250
846
996
NY-
KP
R-G
TA-J
N2
Nya
ndar
uaK
ipip
iriG
eta
Ste
mS
hang
i+v
e
251
847
316
NY-
KP
R-G
TA-M
NN
yand
arua
Kip
ipiri
Get
aS
oil
+ve
252
848
190
NY-
KP
R-G
TA-G
KN
yand
arua
Kip
ipiri
Get
aS
oil
+ve
253
848
1056
NY-
KP
R-G
TA-G
KN
yand
arua
Kip
ipiri
Get
aS
tem
Sha
ngi
+ve
254
849
960
NY-
KP
R-G
TA-S
M2
Nya
ndar
uaK
ipip
iriG
eta
Ste
mS
hang
i+v
e+v
e
255
857
211
NY-
OLJ
-WR
U-E
WN
yand
arua
OlJ
oro
Oro
kW
eru
Ste
mS
hang
i+v
e+v
e+v
e
256
859
535
NY-
OLJ
-GTH
-MN
3N
yand
arua
OlJ
oro
Oro
kG
atha
nje
Soi
l+v
e
257
865
1078
NY-
KN
G-M
RG
-HN
2N
yand
arua
Kip
ipiri
Mur
unga
ruS
tem
Dut
chR
obijn
+ve
258
871
1089
NY-
KN
G-M
RG
-JN
3N
yand
arua
Kip
ipiri
Mur
unga
ruS
tem
Dut
chR
obijn
+ve
+ve
Con
tinue
don
next
page
...
153| Page
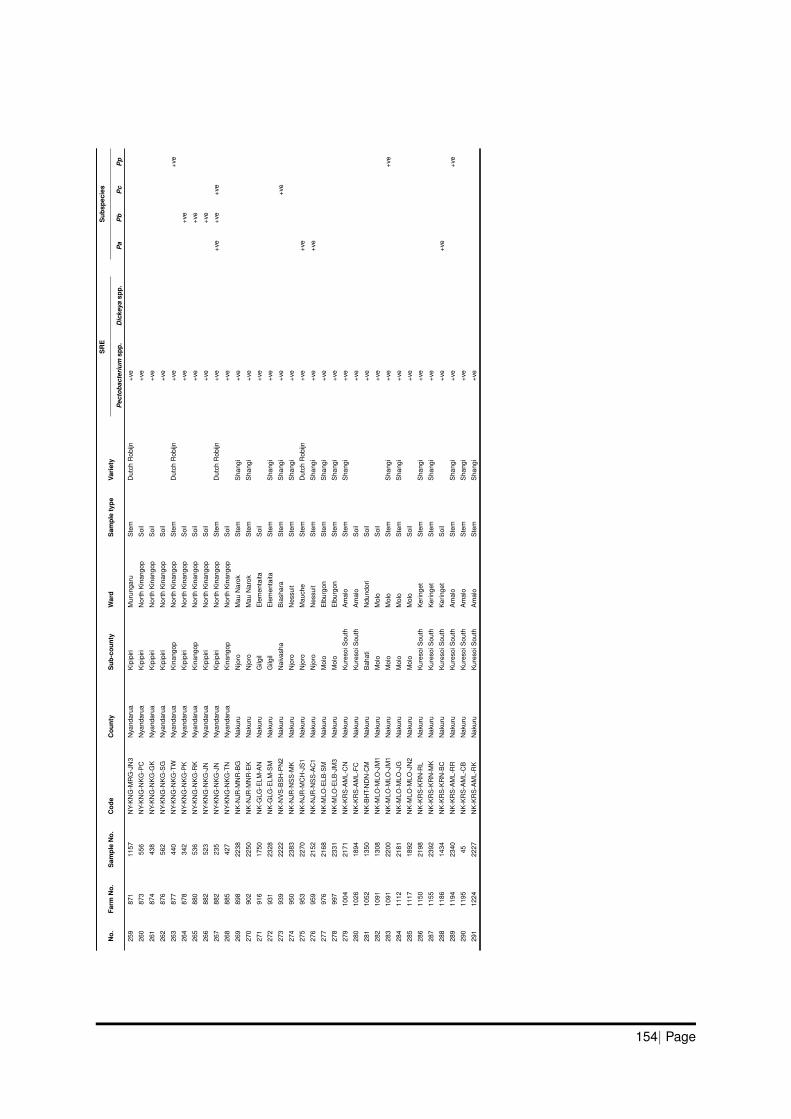
No.
Farm
No.
Sam
ple
No.
Cod
eC
ount
yS
ub-c
ount
yW
ard
Sam
ple
type
Vari
ety
SR
ES
ubsp
ecie
s
Pec
toba
cter
ium
spp.
Dic
keya
spp.
Pa
Pb
Pc
Pp
259
871
1157
NY-
KN
G-M
RG
-JN
3N
yand
arua
Kip
ipiri
Mur
unga
ruS
tem
Dut
chR
obijn
+ve
260
873
556
NY-
KN
G-N
KG
-PC
Nya
ndar
uaK
ipip
iriN
orth
Kin
ango
pS
oil
+ve
261
874
438
NY-
KN
G-N
KG
-GK
Nya
ndar
uaK
ipip
iriN
orth
Kin
ango
pS
oil
+ve
262
876
562
NY-
KN
G-N
KG
-SG
Nya
ndar
uaK
ipip
iriN
orth
Kin
ango
pS
oil
+ve
263
877
440
NY-
KN
G-N
KG
-TW
Nya
ndar
uaK
inan
gop
Nor
thK
inan
gop
Ste
mD
utch
Rob
ijn+v
e+v
e
264
878
342
NY-
KN
G-N
KG
-PK
Nya
ndar
uaK
ipip
iriN
orth
Kin
ango
pS
oil
+ve
+ve
265
880
536
NY-
KN
G-N
KG
-RK
Nya
ndar
uaK
inan
gop
Nor
thK
inan
gop
Soi
l+v
e+v
e
266
882
523
NY-
KN
G-N
KG
-JN
Nya
ndar
uaK
ipip
iriN
orth
Kin
ango
pS
oil
+ve
+ve
267
882
235
NY-
KN
G-N
KG
-JN
Nya
ndar
uaK
ipip
iriN
orth
Kin
ango
pS
tem
Dut
chR
obijn
+ve
+ve
+ve
+ve
268
885
427
NY-
KN
G-N
KG
-TN
Nya
ndar
uaK
inan
gop
Nor
thK
inan
gop
Soi
l+v
e
269
898
2238
NK
-NJR
-MN
R-B
GN
akur
uN
joro
Mau
Nar
okS
tem
Sha
ngi
+ve
270
902
2250
NK
-NJR
-MN
R-E
KN
akur
uN
joro
Mau
Nar
okS
tem
Sha
ngi
+ve
271
916
1750
NK
-GLG
-ELM
-AN
Nak
uru
Gilg
ilE
lem
enta
itaS
oil
+ve
272
931
2328
NK
-GLG
-ELM
-SM
Nak
uru
Gilg
ilE
lem
enta
itaS
tem
Sha
ngi
+ve
273
939
2222
NK
-NV
S-B
SH
-PN
2N
akur
uN
aiva
sha
Bia
shar
aS
tem
Sha
ngi
+ve
+ve
274
950
2383
NK
-NJR
-NS
S-M
KN
akur
uN
joro
Nes
suit
Ste
mS
hang
i+v
e
275
953
2270
NK
-NJR
-MC
H-J
S1
Nak
uru
Njo
roM
auch
eS
tem
Dut
chR
obijn
+ve
+ve
276
959
2152
NK
-NJR
-NS
S-A
C1
Nak
uru
Njo
roN
essu
itS
tem
Sha
ngi
+ve
+ve
277
976
2168
NK
-MLO
-ELB
-SM
Nak
uru
Mol
oE
lbur
gon
Ste
mS
hang
i+v
e
278
997
2331
NK
-MLO
-ELB
-JM
3N
akur
uM
olo
Elb
urgo
nS
tem
Sha
ngi
+ve
279
1004
2171
NK
-KR
S-A
ML-
CN
Nak
uru
Kur
esoi
Sou
thA
mal
oS
tem
Sha
ngi
+ve
280
1026
1894
NK
-KR
S-A
ML-
FCN
akur
uK
ures
oiS
outh
Am
alo
Soi
l+v
e
281
1052
1350
NK
-BH
T-N
DN
-CM
Nak
uru
Bah
ati
Ndu
ndor
iS
oil
+ve
282
1091
1308
NK
-MLO
-MLO
-JM
1N
akur
uM
olo
Mol
oS
oil
+ve
283
1091
2200
NK
-MLO
-MLO
-JM
1N
akur
uM
olo
Mol
oS
tem
Sha
ngi
+ve
+ve
284
1112
2181
NK
-MLO
-MLO
-JG
Nak
uru
Mol
oM
olo
Ste
mS
hang
i+v
e
285
1117
1892
NK
-MLO
-MLO
-JN
2N
akur
uM
olo
Mol
oS
oil
+ve
286
1150
2198
NK
-KR
S-K
RN
-RL
Nak
uru
Kur
esoi
Sou
thK
erin
get
Ste
mS
hang
i+v
e
287
1155
2392
NK
-KR
S-K
RN
-MK
Nak
uru
Kur
esoi
Sou
thK
erin
get
Ste
mS
hang
i+v
e
288
1186
1434
NK
-KR
S-K
RN
-BC
Nak
uru
Kur
esoi
Sou
thK
erin
get
Soi
l+v
e+v
e
289
1194
2340
NK
-KR
S-A
ML-
RR
Nak
uru
Kur
esoi
Sou
thA
mal
oS
tem
Sha
ngi
+ve
+ve
290
1195
45N
K-K
RS
-AM
L-C
BN
akur
uK
ures
oiS
outh
Am
alo
Ste
mS
hang
i+v
e
291
1224
2227
NK
-KR
S-A
ML-
RK
Nak
uru
Kur
esoi
Sou
thA
mal
oS
tem
Sha
ngi
+ve
154| Page

I
Addendum
Surveillance to establish extent of Dickeya species
Dickeya spp. was identified on two farms, Elgeyo Marakwet (Farm 198) and Narok (Farm 412) (Table 6.1). The twofarms were identified and a team from KEPHIS conducted a contact tracing exercise from the 3rd to 7th November2020. Contact tracing was supported by the rationale that most farmers depend on the informal seed systemand either save own planting materials or share planting materials amongst themselves. The two farmers wereinterviewed to gain an understanding of how they obtain planting materials and with whom they share the materials.Farmer of Farm 198 is the main supplier of potato planting materials in Marakwet West and supports every grower inthe region with planting materials, agro-inputs, agronomic advice and market information. Although the farmers in thesub-county understand the importance of planting certified seed potato, there is no registered certified seed supplierand farmer of Farm 198 is the main seed merchant. Tuber samples were collected from three farmers who hadobtained potato planting materials from Farm 198 and additional tuber samples from Farm 198. Farmer of Farm 412sourced initial potato planting materials from the main market in Narok town. The farmer sells and also exchangespotato planting materials with neighbours and friends but also obtains materials from other farmers. Subsequently,tuber samples were obtained from eight farmers from whom Farmer of Farm 412 exchanged or obtained tubersand additional tuber samples obtained from Farm 412. Isolation of Dickeya species were conducted as previouslyexplained (Section 4.4.2). Molecular confirmation was conducted as detailed in Section 4.6. Dickeya species wasconfirmed in samples collected from 5 of the 12 farms representing a proportion of 42%. One of the samples wasidentified as D. solani using the SOL-A primer set published by Pritchard et al. (117).
Table I.1: Result from additional surveillance conducted in Elgeyo Marakwet and Narok counties
Farmer County Sub-county Ward Latitude Longitude Result
412 Narok Norok North Oloropil -0.75971 35.8894 +ve
1244 Narok Norok North Oloropil -0.75875 35.8877 -ve
1245 Narok Norok North Oloropil -0.71347 35.8989 -ve
1246 Narok Norok North Oloropil -0.72314 38.8986 -ve
1247 Narok Norok North Oloropil -0.72314 38.8986 +ve
1248 Narok Norok North Eneneleetia -0.69237 35.9061 -ve
1249 Narok Norok North Eneneleetia -0.71047 35.9012 -ve
1250 Narok Norok North Eneneleetia -0.71404 35.9050 -ve
1251 Narok Norok North Eneneleetia -0.69855 35.9030 +ve
198 Elgeyo Marakwet Marakwet West Kapsowar -0.92202 35.5631 +ve
1252 Elgeyo Marakwet Marakwet West Kapsowar -0.92273 35.5636 +ve
1253 Elgeyo Marakwet Marakwet West Kapsowar -0.92230 35.5603 -ve
1254 Elgeyo Marakwet Marakwet West Kapsowar -0.92911 35.5619 -ve
This additional surveillance exercise was funded by CABI’s Action on Invasives Programme.
155| Page
J
Addendum
Surveillance by KALRO in Taita Taveta County
A surveillance was conducted by a team from KALRO in Taita Taveta county. Using Loop-Mediated IsothermalAmplification (LAMP) assays, they detected Dickeya sp. specifically D. solani and D. dianthicola. This work waspresented at the 3rd Phytosanitary Conference that took place from 13th to 16th September 2021 in Nairobi, Kenya.The conference was organised by KEPHIS and the Centre of Phytosanitary Excellence (COPE) and supportedfinancially by CABI.
THE 3RD INTERNATIONAL PHYTOSANITARY CONFERENCEPROGRAMME AND BOOK OF ABSTRACTS
THEME: Enhancing Phytosanitary Systems for Healthy Plants, Safe and Sustainable Trade
50
Surveillance of Papaya Mealybug (Paracoccus marginatus) (Hemiptera: Pseudococidae) in the Coastal Counties of Kenya
Ombuya A., Kosiom T., Marangu J., Kemei F., Mbae C. and Macharia I.Kenya Plant Health Inspectorate Service (KEPHIS) Mombasa regional office, P.O Box 80126-80100, Mombasa
Papaya mealybug, Surveillance, Incidence, Intensity, management practices, Kenya
Following the first report in 2016, KEPHIS has continued to carry out surveillances to determine occurrence and distribution of Papaya mealybug (PMB) in Kenya. Surveillance was conducted in November and December 2020 covering six coastal counties of Kenya. The surveillance was aimed at determining the incidence and severity of infestations of PMB in the farmers’ fields, the host range in the coastal region of Kenya, and to create awareness to farmers on management of PMB. A total of 67 farms were randomly sampled across the six counties. An open data kit (ODK) mobile tool generated questionnaire was administered in collecting data. PMB was confirmed to occur in the six counties of the coast region with incidences of 10-100%. The overall intensity of infestation in the six counties ranged from very low to medium. The intensity of infestation was highest on fruits as compared to the other parts of papaya plant. Besides the host range earlier reported, PMB attacked additional hosts including citrus, sugarcane, okra and custard apple. Majority of the farmers (65%) surveyed were knowledgeable on PMB. The lowest population of PMB occurred in fields where farmers combined chemical and cultural approaches for management.
Corresponding Author: [email protected]
Corresponding Author [email protected]
On-Field Detection of the Genus Pectobacterium and Dickeya Causing Black Leg in Taita Taveta County, Kenya
Micheni, C*., Wanjala, B.W., Owiro, N., Apwoka, F. and Amata, R.
Kenya Agricultural and Livestock Research Organization (KALRO) – Kabete, P.O. Box 14733-00800
Potato (Solanum tuberosum) is the second most important crop after maize in Kenya and plays a major role in addressing the government’s development agenda on food and nutrition security. However its production is constrained by several factors including diseases of phytosanitary and economic importance. Blackleg disease, is a major disease of potato caused by plant pathogenic bacteria in the genera Pectobacterium and Dickeya. These bacteria cause stem wilts and rots and tuber soft rots causing production losses and rejection of stocks during certification process globally. Rapid, cost effective, accurate and efficient detection of plant pathogens is crucial for disease management. Loop-mediated isothermal amplification (LAMP) is a robust nucleic acid amplification method that works under isothermal conditions making it suitable for field testing. Blackleg causing bacteria was recently reported in Taita Taveta County and the study aimed at evaluating the operability of field detection for genus Pectobacterium and Dickeya using LAMP. The assay detected both Pectobacterium and Dickeya using generic primers from crude extracts of potato stem and tuber tissues within 30 minutes. The earliest time to positivity for the genus Dickeya was 4.30 and 6.30 minutes for stem and tuber respectively while for genus
Key words
156| Page
Contact us
AfricaGhanaCABI, CSIR CampusNo.6 Agostino Neto RoadAirport Residential AreaP.O. Box CT 8630, CantonmentsAccra, GhanaT: +233 (0)302 797 202E: [email protected]
KenyaCABI, Canary Bird673 Limuru Road,MuthaigaP.O. Box 633-00621Nairobi, KenyaT: +254 (0)20 2271000/20E: [email protected]
ZambiaCABI, Southern Africa Centre5834 Mwange CloseKalundu, P.O. Box 37589Lusaka, ZambiaT: +260967619665E: [email protected]
AmericasBrazilCABI, UNESP-Fazenda ExperimentalLageado,FEPAF (Escritorio da CABI)Rua Dr. Jose Barbosa De Barros1780Fazenda Experimental LageadoCEP: 18.610-307Botucatu, San Paulo, BrazilT: +55 (14) 3880 7670E: [email protected]
Trinidad & TobagoCABI, Gordon Street, CurepeTrinidad & TobagoT: +1 868 6457628E: [email protected]
USACABI, 745 Atlantic Avenue
8th FloorBoston, MA 02111T: +1 (617) 682-9015/T: +1 (617) 682-9016E: [email protected]
AsiaChinaCABI, BeijingRepresentativeOfficeInternal Post Box 85Chinese Academy ofAgricultural Sciences12 Zhongguancun NandajieBeijing 100081, ChinaT: +86 (0)10 82105692E: [email protected]
IndiaCABI, 2nd Floor, CG Block,NASC Complex, DPShastri MargOpp. Todapur Village,PUSANew Dehli – 110012, IndiaT: +91 (0)11 25841906E: [email protected]
MalaysiaCABI, PO Box 21043400 UPM SerdangSelangor, MalaysiaT: +60(0)3 894329321E: [email protected]
PakistanCABI, Opposite 1-A,Data Gunj Baksh RoadSatellite Town, PO Box 8Rawalpindi-PakistanT: +92 51 929 2064/ 2063 / 2062E: [email protected]
EuropeSwitzerlandCABI, Rue des Grillons 1CH-2800 DelemontSwitzerlandT: +41 (0)32 4214870E: [email protected]
Head OfficeCABI, Nosworthy WayWallingford, OxfordshireOX10 8DE, UKT: +44 (0)1491 832111E: [email protected]
UK (Egham)CABI, Bakeham LaneEgham, SurreyTW20 9TY, UKT: +44 (0)1491 829080E: [email protected]: [email protected]