cover small - wur edepot
TRANSCRIPT
January–June 2011 Number 49
Journal of the African Elephant, African Rhinoand Asian Rhino Specialist Groups
January–June 2011 No. 49
ISSN 1026 2881
S p e c i e sS u r v i v a l
C o m m i s s i o n
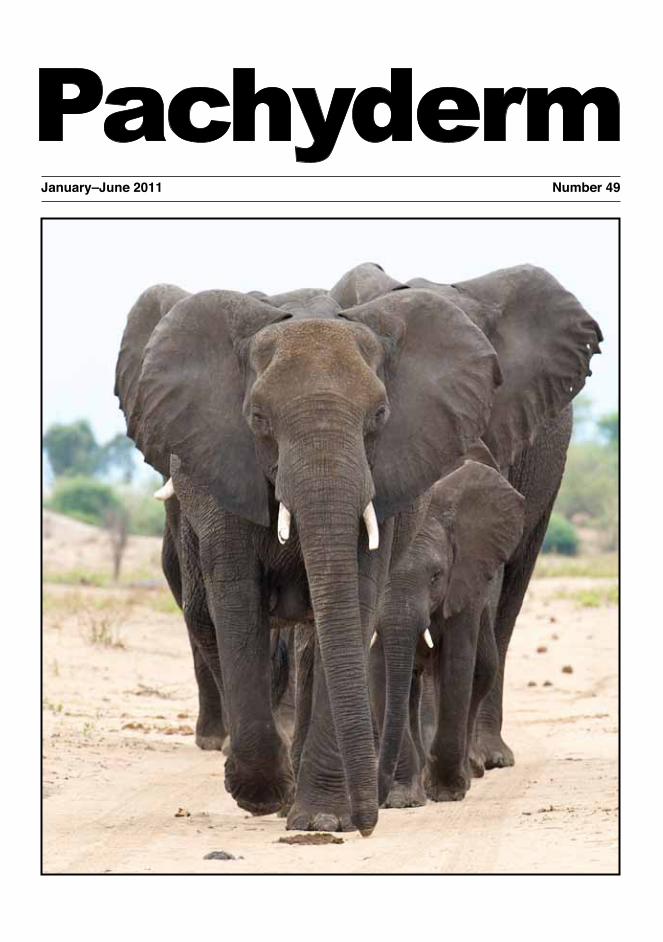
Cover: Elephants in Chobe National Park, Botswana.
Photo: M.W. Atkinson
1 Chair reports/Rapports des Présidents
1 African Elephant Specialist Group report/Rapport du Groupe Spécialiste des Eléphants d’Afrique
Holly T. Dublin
6 African Rhino Specialist Group report/Rapport du Groupe Spécialiste des Rhinos d’Afrique
Mike Knight
16 Asian Rhino Specialist Group report/Rapport du Groupe Spécialiste du Rhinocéros d’Asie
Bibhab Kumar Talukdar
20 Research20 Matriarchal associations and reproduction in a
remnant subpopulation of desert-dwelling elephants in Namibia
Keith E.A. Leggett, Laura MacAlister Brown and Rob Roy Ramey II
33 Invasive species in grassland habitat: an ecological threat to the greater one-horned rhino (Rhinoceros unicornis)
Bibhuti P. Lahkar, Bibhab Kumar Talukdar and Pranjit Sarma
EditorBridget McGraw
Section EditorsDeborah Gibson—African elephantsKees Rookmaaker—African and Asian rhinos
Editorial BoardJulian BlancHolly T. DublinRichard EmslieMike KnightEsmond MartinRobert OlivierDiane SkinnerBibhab K. TalukdarLucy Vigne
Design and layoutAksent Ltd
Address all correspondence, including enquiries about subscription, to:
The Editor, PachydermPO Box 68200–00200Nairobi, KenyaTel: +254 20 249 3561/65Cell:+254 724 256 804/734 768 770email: [email protected]: http://pachydermjournal.org
Reproduction of this publicaton for educational or other non-commercial purposes is authorized without written permission from the copyright holder provided the source is fully acknowledged.
Reproduction of this publication for resale or other commercial purposes is prohibited without written permission of the copyright holder.
January–June 2011 No. 49
Journal of the African Elephant,
African Rhino and
Asian Rhino Specialist Groups
40 The relic population of forest elephants near Lake Tumba, Democratic Republic of Congo: abundance, dung lifespan, food items and movements
Bila-Isia Inogwabini, Longwango Mbende and Abokome Mbenzo
48 Biophysical and human factors determine the distribution of poached elephants in Tsavo East National Park, Kenya
Daniel Muteti Kyale, Shadrack Ngene and John Maingi
61 Census and ear-notching of black rhinos (Diceros bicornis michaeli) in Tsavo East National Park, Kenya
Shadrack Ngene, Elephus Bitok, Joseph Mukeka, Francis Gakuya, Patrick Omondi, Kennedy Kimitei, Yusuf Watol, Linus Kariuki and Benson Ouma Okita
70 Elephant corridor use and threats in the eastern range of Amboseli elephants, Kenya
John M. Kioko and Simon Ole Seno
79 Consumption of elephant and mammoth ivory increases in southern China
Lucy Vigne and Esmond Martin
90 Notes90 Estimating the population structure of Javan rhinos (Rhinoceros sondaicus) in
Ujung Kulon National Park using the mark-recapture method based on video and camera trap identification
Adhi Rachmat Sudrajat Hariyadi, Agus Priambudi, Ridwan Setiawan, Daryan Daryan, Asep Yayus and Hendra Purnama
Views expressed in Pachyderm are those of the individual authors and do not necessarily reflect those of IUCN, the Species Survival Commission or any of the three Specialist Groups responsible for producing Pachyderm (the African Elephant Specialist Group, the African Rhino Specialist Group and the Asian Rhino Specialist Group).
100 Obituary Nandjui Awo
Richard Barnes
101 MIKE–ETIS updates101 Update on the implementation of the MIKE programme in Africa / Mise
à jour sur la mise en oeuvre du Programme de MIKE en Afrique
Tom De Meulenaer
109 ETIS update number five: Progress in the implementation of the Elephant Trade Information System (ETIS) / Mise à jour d’ETIS numéro cinq: Progrès dans la mise en oeuvre du Système d’Information sur le Trafic d’Eléphant (ETIS)
Tom Milliken and Louisa Sangalakula
113 Guidelines for contributors
January–June 2011 No. 49
Journal of the African Elephant,
African Rhino and
Asian Rhino Specialist Groups
AcknowledgementsThe production of this issue of Pachyderm was only possible through contributions from a number of organizations and individuals. In particular, we would like to thank the following:


Pachyderm No. 49 January–June 2011 1
In this, the 49th issue of Pachyderm, we bid farewell to Dr Martin Brooks, who has stepped down as Chair of the African Rhino Specialist Group. I personally want to recognize Martin for his longstanding service on behalf of the SSC and African rhinos. I have worked with Martin for many years and in different capacities. As the Chair of the AfRSG, Martin’s steady and objective style of leadership and his ability to secure sup-port, especially for regular and highly-productive gatherings of the African rhino conservation com-munity, will always be remembered.
It has been a busy six months, with a lot of time spent on fundraising, providing support to the CITES–MIKE programme as it moves into a transition phase, making progress on updating the African and Asian Elephant Database (AAED) and moving forward with the Ivory Flows Initiative. We continue to have real concern about the illegal killing of elephants in Central Africa, with recent disturbing reports from Salonga and Dzanga Sangha, and even recently in Samburu and Laikipia in East Africa. I hope that the conservation community can draw together to HQVXUH�WKDW�LQIRUPDWLRQ�LV�ÀRZLQJ�WR�WKH�UHOHYDQW�authorities to ensure that action can be taken to halt this, where possible.
PachydermDr Simon Stuart, Chair of the IUCN Species Survival Commission, has appointed Dr Mike
African Elephant Specialist Group reportRapport du Groupe de Spécialiste de l’Eléphant d’Afrique
Holly T. Dublin, Chair/Président
IUCN/SSC African Elephant Specialist Group, PO Box 68200–00200, Nairobi, Kenya; e-mail: [email protected]
Dans ce 49ème numéro de Pachyderme, nous disons au revoir au Dr Martin Brooks, qui a quitté ses fonctions de Président du Groupe de Spécialistes des Rhinocéros d’Afrique. Au nom de la CSE et des rhinocéros d’Afrique je tiens personnellement à reconnaître Martin pour son service de longue date. J’ai travaillé avec Martin pendant de nombreuses années et dans différentes capacités. On se souviendra toujours de son style de leadership régulier et objectif en tant que président du GSRAf et de sa capacité à obtenir du soutien, surtout pour des rencontres régulières et très fructueuses de la communauté de conservation des rhinocéros en Afrique.
Cela a été six mois chargés, avec beaucoup de temps consacré à la collecte de fonds, à l’appui au programme CITES-MIKE qui entre dans une phase de transition, à la mise à jour de la Base de Données sur l’Eléphant d’Afrique et d’Asie (BDEAA) et la poursuite GH�O¶,QLWLDWLYH�GX�ÀX[�G¶LYRLUH��1RXV�FRQWLQXRQV�j�rWUH�réellement préoccupés par l’abattage illicite des éléphants en Afrique centrale, étant donné les récents rapports troublants en provenance de Salonga et Dzanga Sangha, et PrPH�UpFHPPHQW�GH�6DPEXUX�j�/DLNLSLD��-¶HVSqUH�TXH�OD�communauté de la conservation pourra s’unir pour veiller à ce que ces informations soient diffusées aux autorités compétentes pour que des mesures soient prises pour y remédier si possible.
PachydermeLe Dr Simon Stuart, Président de la Commission de la Survie des Espèces de l’UICN, a nommé le Dr Mike Knight pour reprendre le travail de Président du Groupe
CHAIR REPORTSRAPPORTS DES PRESIDENTS

2 Pachyderm No. 49 January–June 2011
Dublin
Knight to take on the job of chairing the African Rhino Specialist Group. We welcome Mike to the Editorial Board, and thank Martin for his many years of service to Pachyderm.
As we prepare for the next issue of Pachyderm, which will be the 50th, there is certainly a great GHDO�WR�UHÀHFW�RQ���'HVSLWH�WKH�PDQ\�µFORVH�FDOOV¶�we have had in trying to ensure that Pachyderm goes on, that is a lot of issues and an amazing history for a publication produced from a group of voluntary experts and something remarkable of which we can all be proud.
The African and Asian Elephant DatabaseWe now have nearly 70 survey reports, collected since 2007, and we are working on getting these into the AAED. As always, there is a demand from many quarters for understanding trends over time; while we are able to provide these for some sites in East and southern Africa, it is more challenging in the historically data-poor regions of West and Central Africa. However, we hope WR� HPEDUN� RQ� VRPH�PRGHOOLQJ� H[HUFLVHV� WR�¿OO�these gaps, utilizing the expertise of a number of colleagues who have offered help. It could be an exciting next step for the AAED but progress remains funding dependent.
In the years since we have been unable to ¿QDQFH� XSGDWLQJ� RI� WKH�$IULFDQ� HOHSKDQW� GDWD�there is an increasing validation of the need to collect and collate data as we have done for many years through the African Elephant Database and publication of the African Elephant Status Reports. The CITES community and others have repeatedly reiterated the need for updated continent-level data to underpin both CITES–MIKE and ETIS analyses, therefore we will continue to make the database a priority for fundraising.
Illegal killing and ivory tradeUpdate on the CITES-MIKE and ETIS programmes
As MIKE Phase 2 nears its end in December 2011, we are working closely with the CITES Secretariat to assist with the preparation for the third phase of MIKE. I facilitated a workshop in
de Spécialistes des Rhinocéros d’Afrique. Nous nous félicitons de la venue de Mike au comité de rédaction, et nous remercions Martin pour ses nombreuses années de service au Pachyderme.
La préparation du prochain numéro de Pachyderme, qui sera le 50ème��QRXV�IDLW�FHUWDLQHPHQW�UpÀpFKLU��0rPH�VL�souvent nous avons failli échouer dans nos efforts de voir que Pachyderme continue, cela fait beaucoup de numéros et une histoire étonnante pour une publication produite par un groupe d’experts bénévoles ; voilà quelque chose GH�UHPDUTXDEOH�GRQW�QRXV�SRXYRQV�WRXV�rWUH�¿HUV�
La Base de Données sur l’Eléphant d’Afrique et d’AsieNous avons maintenant près de 70 rapports d’étude, re-cueillis depuis 2007, et nous travaillons à les mettre dans la BDEAA. Comme toujours, beaucoup de personnes veulent comprendre les tendances temporelles. Alors que nous sommes en mesure d’en fournir pour certains sites HQ�$IULTXH�GH�O¶HVW�HW�DXVWUDOH��F¶HVW�SOXV�GLI¿FLOH�SRXU�OHV�régions d’Afrique de l’Ouest et centrale historiquement pauvres en données. Cependant, nous espérons faire des exercices de modélisation pour combler ces lacunes, en utilisant l’expertise des collègues qui ont offert leur aide. &HOD�SRXUUDLW�rWUH�XQH�QRXYHOOH�pWDSH�SDVVLRQQDQWH�SRXU�OD�%'($$�PDLV�OHV�SURJUqV�GpSHQGHQW�GX�¿QDQFHPHQW�
Depuis le temps que nous n’avons pas été en mesure GH�¿QDQFHU� OD�PLVH� j� MRXU� GHV� GRQQpHV� VXU� O¶pOpSKDQW�d’Afrique, l’on constate de plus en plus la nécessité de collecter les données et les compiler comme nous l’avons fait pendant de nombreuses années à travers la Base de Données sur l’Eléphant d’Afrique et la publication des rapports de situation de l’Eléphant d’Afrique. La communauté de la CITES et d’autres ont réitéré à maintes reprises la nécessité d’avoir des données à jour au niveau continental pour soutenir les analyses de CITES-MIKE et d’ETIS. Par conséquent, nous allons continuer à faire de la base de données une priorité pour la collecte de fonds.
Abattage illicite et commerce de l’ivoireMise à jour sur les programmes de CITES-MIKE et d’ETIS
3XLVTXH�OD�SKDVH���GH�0,.(�WRXFKH�j�VD�¿Q�HQ�GpFHPEUH�2011, nous travaillons en étroite collaboration avec le Secrétariat de la CITES sur la préparation de la troisième phase de MIKE. J’ai animé un atelier au mois de mai qui devait examiner les systèmes de surveillance existants des éléphants et le commerce des spécimens d’éléphants
Pachyderm No. 49 January–June 2011 3
African Elephant Specialist Group report
May to review existing monitoring systems for el-ephants and the trade in elephant specimens and to recommend a way towards achieving an integrated analytical and reporting framework. This work-shop, hosted by the MIKE Central Co-ordination 8QLW�� EURXJKW� WRJHWKHU�¿HOG�� DQDO\WLFDO� DQG� ODZ�enforcement experts, as well as members of the MIKE–ETIS sub-group of the Standing Commit-tee and representation from the CITES Secretariat. An intensive three days of work resulted in a clear way forward for the further integration of CITES, UNEP–WCMC, MIKE, ETIS and the IUCN/SSC monitoring systems for African and Asian elephants, as well as a number of practical sug-JHVWLRQV� WKDW�ZLOO� HQKDQFH� IXUWKHU� UH¿QHPHQW� RI�all the systems, both in terms of their operations and their analytical structures.
This workshop was followed up, two weeks later, by the 10th meeting of the MIKE Technical Advisory Group (TAG). I could not attend, but was ably represented by Diane Skinner, who presented the results of the workshop. She has reported to me that it was a very successful TAG meeting, with a great deal of energy and effort put into the work. The TAG expressed concerns that momentum on data collection, as well as the movement towards integration with other systems, should be maintained, even in the face of a potential funding hiatus between the end of MIKE Phase 2 and the beginning of Phase 3. The TAG again discussed the necessity for an early warning system, to alert managers and policy-makers to emerging poaching crises. It was agreed that this is an urgent need and a small group of TAG members has been assigned the job of establishing whether such a system is possible with the current set of monitoring and reporting tools available.
As mandated in CITES Decision 14.78, the AfESG will be providing a brief update on the status of the African elephant, in a joint submission from the AfESG, the Asian Elephant Specialist Group, UNEP–WCMC, MIKE and ETIS, to the 61st meeting of the Standing Committee of &,7(6�WKLV�FRPLQJ�$XJXVW��7KLV�ZLOO�EH�WKH�¿UVW�time that all these systems have reported together to the CITES community. While this report will be an aggregation of information, rather than an LQWHJUDWLRQ�� LW� LV� D�¿UVW� VWHS� WRZDUGV�EULQJ�PRUH�in-depth, timely and useful information to policy-makers.
et voir comment l’on pourrait réaliser un cadre intégré d’analyse et de rapport. Cet atelier, organisé par l’Unité Centrale de Coordination (UCC) de MIKE, a réuni les experts de terrain, les experts en matière d’analyse et d’application de la loi, ainsi que les membres des sous-groupes MIKE-ETIS du Comité Permanent et des représentants du Secrétariat de la CITES. Trois jours de travail intensif ont abouti à une voie claire à suivre pour l’intégration des systèmes de surveillance de la CITES, du PNUE-WCMC, de MIKE, d’ETIS et de la CSE/UICN en faveur des éléphants d’Afrique et d’Asie, ainsi que des suggestions pratiques qui permettront d’améliorer tous les systèmes en termes de leurs opérations et leurs structures d’analyse.
Cet atelier a été suivi, quinze jours plus tard, par la 10ème réunion du Groupe Consultatif Technique de MIKE (GCT). Je ne pouvais pas y assister, mais j’étais bien représentée par Diane Skinner, qui a présenté les résultats de l’atelier. Elle m’a signalé que c’était une réunion très réussie du GTC, avec beaucoup d’énergie et d’efforts investis dans le travail. Le GCT a exprimé l’avis que la dynamique de collecte des données et le mouvement vers l’intégration avec d’autres systèmes GHYUDLHQW� rWUH�PDLQWHQXV��PrPH� HQ� IDFH� GX�GpFDODJH�SRWHQWLHO�GH�¿QDQFHPHQW�HQWUH�OD�¿Q�GH�OD�SKDVH�0,.(�2 et le début de la phase 3. Le GCT a encore discuté de la nécessité d’un système d’alerte précoce, pour alerter les gestionnaires et les décideurs politiques des crises émergeantes de braconnage. On s’est convenu que c’était un besoin urgent et on a assigné à un petit groupe de membres du GCT la tâche de déterminer si un tel système serait possible avec les outils de surveillance et de rapport actuellement disponibles.
Conformément à la décision 14.78 de la CITES, le GSEAf va fournir une brève mise à jour sur l’état de l’éléphant d’Afrique, dans une présentation conjointe du GSEAf, de la PNUE-WCMC, et de MIKE et d’ETIS, à la 61ème réunion du Comité Permanent de la CITES en août prochain. Ce sera la première fois que tous ces systèmes auront fait un rapport conjoint à la communauté de la CITES. Alors que ce rapport sera une agrégation d’informations plutôt qu’une intégration, c’est un premier pas vers la diffusion d’informations approfondies, opportunes et utiles aux décideurs.
En préparation pour la phase 3 de MIKE, pour laquelle on espère que la Commission européenne continuera à soutenir MIKE, le GSEAf a organisé une réunion pour rassembler l’équipe du Bureau Régional d’Afrique de l’Est et Australe de l’UICN avec l’UCC de 0,.(�HW�VHV�DJHQWV�G¶DSSXL�VRXV�UpJLRQDX[��D¿Q�GH�YRLU�
4 Pachyderm No. 49 January–June 2011
In preparation for MIKE Phase 3, in which it is hoped the European Commission will continue to support MIKE, the AfESG organized a meeting to bring the IUCN ESARO team together with the MIKE CCU and MIKE sub-regional support RI¿FHUV�� WR� GLVFXVV�ZD\V� WR� HQVXUH� WKDW� ,8&1�and MIKE have a greater programmatic linkage going forward, a desire that has been expressed by both the Director-General of IUCN and the Secretary-General of CITES. Unfortunately, no RQH�IURP�,8&1�3$&2²RXU�RI¿FH�IRU�:HVW�DQG�Central Africa—was able to join the meeting, but we will be reporting to them and others in IUCN with overlapping interests and mandates in order to take their comments forward in the continued negotiation over IUCN’s role in MIKE Phase 3.
Finally, our elephant meat study in Central Africa has been completed and the case studies and summary study are now being prepared for publication in the next couple of months. The summary study will be published as an IUCN Occasional Publication, while the case studies will be available online. Both Dan Stiles, the consultant on this project, and Diane Skinner attended the joint meeting of the CBD Bushmeat Liaison Working Group and the CITES Central Africa Bushmeat Working Group held in Nairobi in June. We will be looking for next steps in what has been a very interesting new contribution to our understanding of elephant conservation challenges in Central Africa.
Ivory flows initiative
Following on from the successful meeting in Hangzhou, China, last year, which brought together producing, transiting and consuming countries to discuss ways to build awareness for reduction of the illegal ivory trade, the AfESG has worked with the U.S.A. and China Management Authorities, co-sponsors of our efforts to date, to submit a report to the 61st meeting of the CITES Standing Committee on the meeting and the initiative. This document outlines a number of agreed activities that have been undertaken since the meeting. In particular, the AfESG has developed an initiative with Ke-nya Airways to raise their passengers’ awareness, SDUWLFXODUO\�WKRVH�WUDYHOOLQJ�RQ�WKHLU�UHJXODU�ÀLJKWV�between locations within sub-Saharan Africa, Thailand and China about the legal and conserva-
comment l’UICN et MIKE pourraient avoir un lien plus programmatique à l’avenir, un vœu déjà exprimé tant par le Directeur général de l’UICN et par le Secrétaire général de la CITES. Malheureusement, aucun membre de notre bureau d’Afrique de l’Ouest et centrale n’a été en mesure de participer à la réunion, mais nous allons OHXU�IDLUH�UDSSRUW�HW�j�G¶DXWUHV�j�O¶8,&1�D\DQW�OHV�PrPHV�LQWpUrWV� D¿Q�GH�SUHQGUH� HQ� FRPSWH� OHXUV� REVHUYDWLRQV�dans la poursuite des négociations sur le rôle de l’UICN dans la phase 3 de MIKE.
(Q¿Q��QRWUH�pWXGH�VXU�OD�YLDQGH�G¶pOpSKDQW�HQ�$IULTXH�centrale a été achevée et les études de cas et l’étude de synthèse sont en cours de préparation pour la publication dans les prochains mois. L’étude de synthèse sera publiée en tant que publication de l’UICN, tandis que les études de cas seront disponibles en ligne. Dan Stiles, consultant sur ce projet, et Diane Skinner ont participé à la réunion conjointe du Groupe de Liaison sur la viande de brousse de la Convention sur la Diversité Biologique et le Groupe de travail sur la viande de brousse en Afrique centrale de la CITES tenue à Nairobi en juin. Nous cherchons la voie à suivre dans cette nouvelle contribution très intéressante j�QRWUH�FRPSUpKHQVLRQ�GHV�Gp¿V�GH�OD�FRQVHUYDWLRQ�GHV�éléphants en Afrique centrale.
Initiative du flux d’Ivoire
L’année passée, suite à la réunion fructueuse à Hangzhou en Chine qui avait réuni les pays producteurs, de transit et consommateurs dans le but de discuter des moyens d’accroître la sensibilisation à la réduction du commerce illicite d’ivoire, le GSEAf a travaillé avec les organes de gestion des Etats-Unis et de la Chine, les co-sponsors de nos efforts à ce jour, pour présenter un rapport à la 61ème réunion du Comité permanent de la CITES sur la réunion et l’initiative. Ce document décrit un certain nombre d’activités convenues qui ont été entreprises depuis la réunion. Le GSEAf a surtout élaboré une initiative avec Kenya Airways pour sensibiliser leurs passagers, surtout ceux qui voyagent sur des vols réguliers entre l’Afrique subsaharienne, la Thaïlande et la Chine sur les conséquences légales et sur la conservation du commerce illicite de l’ivoire. On prévoit de lancer cette campagne plus tard cette année.
Conflits homme-éléphantLeo Niskanen, coordinateur technique de l’UICN ESARO pour les aires de conservation et la diversité des espèces est en train d’élaborer un programme de travail
Dublin

Pachyderm No. 49 January–June 2011 5
tion consequences of the illegal ivory trade. This campaign is planned to be launched later this year.
Human-elephant conflictLeo Niskanen, the IUCN ESARO Technical Co-ordinator for Conservation Areas and Species Diversity, is developing a programme of work LQ�7DQ]DQLD�IRU�KXPDQ�ZLOGOLIH�FRQÀLFW�DQG�WKH�AfESG is supporting this work closely.
Updates on conservation and management strategies and action plansDiane Skinner visited Burkina Faso and Niger in January this year for meetings with IUCN and CITES–MIKE colleagues to determine ways to continue our support for the implementation of the West African Elephant Conservation Strategy. She will also be attending the second meeting of the focal points for the CMS MOU concerning the conservation of West African elephants, which the AfESG helped to bring to life in 2005. CMS is also considering a possible mechanism to support elephant conservation in Central Africa, and the AfESG will provide information and expertise for this process.
Fundraising has been an important focus for us in the past six months, as we look to the future. We are soliciting funds from a variety of donors, and I am hopeful that Diane Skinner and Cecily Nyaga will be here next year to support the members and the various projects in which we are engaged.
Finally, I am thrilled to report that there is progress towards building a programmatic collaboration with IUCN, something that I think will enhance our ability to catalyse real conservation action on behalf of African elephants.
HQ�7DQ]DQLH�SRXU�OHV�FRQÀLWV�KRPPH�IDXQH�HW�OH�*6($I�soutient ces travaux.
Mises à jour sur les stratégies et les plans d’action de conservation et de gestion Diane Skinner a visité le Burkina Faso et le Niger en MDQYLHU�GH�FHWWH�DQQpH�D¿Q�GH� UHQFRQWUHU� OHV�FROOqJXHV�de l’UICN et de la CITES-MIKE pour déterminer les moyens de poursuivre notre appui à la mise en œuvre de la Stratégie de conservation des éléphants de l’Afrique de l’Ouest. Elle participera également à la deuxième réunion des points focaux pour le protocole d’entente de la CMS (Convention sur la conservation des espèces migratrices appartenant à la faune sauvage) concernant la conserva-tion des éléphants d’Afrique de l’Ouest, que le GSEAf a aidé à concrétiser en 2005. La CMS envisage également un mécanisme possible pour soutenir la conservation des éléphants en Afrique centrale, et le GSEAf fournira des informations et une expertise à ce processus.
La collecte de fonds nous a été un élément important au cours des six derniers mois pendant que nous nous tournons vers l’avenir. Nous sollicitons des fonds auprès de divers bailleurs, et j’espère que Diane Skinner et Cecily Nyaga seront ici l’année prochaine pour soutenir les membres et les différents projets dans lesquels nous sommes engagés.
(Q¿Q�� MH� VXLV� WUqV� KHXUHXVH� G¶DQQRQFHU� TX¶LO� \� D�des progrès vers le renforcement d’une collaboration programmatique avec l’UICN, qui à mon sens va améliorer notre capacité à catalyser l’action réelle de la conservation pour le compte des éléphants d’Afrique.
African Elephant Specialist Group report
6 Pachyderm No. 49 January–June 2011
10th Meeting of the IUCN/SSC African Rhino Specialist GroupThe 10th meeting of the AfRSG was held at Mokala National Park (NP), South Africa, from ��WR����0DUFK��������7KH�PHHWLQJ�ZDV�RI¿FLDOO\�opened by Mr Fundisile Mketeni, who heads up the South African delegation at CITES COP 15, and is the Deputy Director-General, Biodiversity and Conservation in South Africa’s Department of Environmental Affairs.
$V�ZLWK�SUHYLRXV�PHHWLQJV��PXFK�RI�WKH�¿UVW�day was taken up with African range State reports. The information presented was then collated and reviewed during the meeting and used to update the continental African Rhino statistics. The country reports indicated that well-equipped, sophisticated organized crime syndicates have killed more than 800 African rhinos in the past three years. However on a positive note, despite the marked increase in rhino poaching, overall numbers of both black and white rhinos in Africa have continued to increase since 31 December 2007. As of the end of 2010, there were 4,840 black rhinos (Diceros bicornis), XS�IURP�������DW�WKH�HQG�RI��������7KLV�UHÀHFWV�an almost doubling of overall numbers of this species in the wild since 1992–95 when numbers bottomed out at 2,400–2,500. Numbers of the more numerous white rhino (Ceratotherium simum) also increased at a continental level up to 20,150 by 31 December 2010 (up from 17,500 at the end of 2007). While these continued increases are good news, the increasing involvement of organized criminal poaching networks is of great concern. Unless the rapid escalation in poaching in recent years can be halted, continental rhino numbers could once again start to decline (as they recently did in Zimbabwe for a period).
$V�ZLWK� SUHYLRXV� DVVHVVPHQWV�� WKH� µ%LJ� �¶�range States of South Africa, Namibia, Kenya
African Rhino Specialist Group report Rapport du Groupe Spécialiste des Rhinos d’Afrique
Mike Knight, Chair/Président
Park Planning & Development, South African National Parks, PO Box 76693, Nelson Mandela Metropolitan University, Port Elizabeth, South Africa 6013; email: [email protected]
10ème réunion du Groupe de Spécialistes des Rhinocéros d’Afrique de la CSE/UICNLa 10ème session du GSRAf s’est tenue au Parc National de Mokala en Afrique du Sud du 5 au 10 mars 2011. La UpXQLRQ� D� pWp� RI¿FLHOOHPHQW� RXYHUWH� SDU�0��)XQGLVLOH�Mketeni, qui dirige la délégation sud-africaine à la CdP 15 de la CITES, et qui est Directeur Général Adjoint de la biodiversité et la conservation au Ministère sud-africain des Affaires Environnementales.
Comme lors des réunions précédentes, une grande partie de la première journée a été consacrée aux rapports des Etats de l’aire de répartition d’Afrique. Les informations présentées étaient ensuite rassemblées et examinées et utilisées pour mettre à jour les statistiques du Rhinocéros d’Afrique sur le continent. Les rapports des pays ont indiqué que des syndicats du crime organisé bien équipés et sophistiqués avaient tué plus de 800 rhinocéros d’Afrique au cours des trois dernières années. Cependant, sur une note positive, malgré l’augmentation marquée du braconnage, le nombre global des rhinocéros noirs et blancs en Afrique continue à augmenter depuis OH����'pFHPEUH�������$�OD�¿Q�GH�������LO�\�DYDLW�������UKLQRFpURV�QRLUV��'LFHURV�ELFRUQLV���FRQWUH�������j�OD�¿Q�de 2007. Cela correspond à un quasi redoublement du nombre global de cette espèce dans la nature depuis la période 1992-1995 lorsque le nombre avait atteint son point bas de 2.400 - 2.500. Le nombre de rhinocéros blancs (Ceratotherium simum) au niveau continental, plus nombreux, s’élevait à 20.150 jusqu’au 31 Décembre ����� �FRQWUH� ������� j� OD� ¿Q� GH� �������%LHQ� TXH� FHV�augmentations continues constituent de bonnes nouvelles, l’implication croissante des organizations criminelles des réseaux de braconnage est très préoccupante. A moins que O¶RQ�SXLVVH�DUUrWHU�O¶HVFDODGH�UDSLGH�GX�EUDFRQQDJH�GHV�dernières années, le nombre continental de rhinocéros pourrait à nouveau commencer à diminuer (comme cela a été le cas récemment au Zimbabwe pour une période).
Comme pour les évaluations précédentes, les « 4 Grands » Etats de l’aire de répartition, à savoir l’Afrique
Pachyderm No. 49 January–June 2011 7
and Zimbabwe continue to conserve the bulk of Africa’s rhino with 98.8% of the white rhino and 96.1% of the black rhino. Of these countries, only Zimbabwe showed a decline over the last three years, but encouragingly due to continued increases in the Lowveld, overall numbers showed a slight increase over the last year. Botswana, Tanzania and Swaziland are the only other range States with over 100 rhinos, with smaller but increasing numbers in Zambia, Malawi and Uganda.
Following a report entitled African Rhinos in Captivity the AsRSG Chair Dr Bibhab Talukdar gave an overview of the status of Asian rhinos and key conservation measures.
7KH�¿UVW� GD\� FRQFOXGHG�ZLWK� D� QXPEHU� RI�presentations on rhino support programmes, including the WWF/Ezemvelo KZNWildlife Black Rhino Range Expansion Project, WWF’s African Rhino Programme, International Rhino Foundation, Save the Rhino International, U.S. Fish and Wildlife’s Rhino and Tiger Conservation Fund, and the Lead SA initiative.
With the marked increase in rhino poaching and illegal trade, rhino protection, security and trade issues were the focus of attention on the second day. The first session dealt with CITES and trade issues. The joint IUCN/TRAFFIC report presented to CITES CoP15 was summarized giving most attention to the key trade issues it highlighted and the related CITES decisions to emerge from this and the report’s recommendations. Members were then informed about the amendments to the CITES rhino resolution Conf. 9.14 (rev. CoP14). This includes new reporting requirements for the next CITES CoP for states whose citizens have been implicated in rhino crimes (and in particular Viet Nam). Members were then informed about the subsequent visit to Viet Nam of a delegation from South Africa that had held bilateral discussions relating to rhino security and trade. The next session reviewed Post-CITES Responses to the poaching upsurge focusing on the four major rhino range States: South Africa, Zimbabwe, Kenya and Namibia. The afternoon session reviewed rhino security mechanisms and techniques starting with a report back from SADC Rhino and Elephant Security Group/Interpol Environmental Crime Working Group,
du Sud, la Namibie, le Kenya et le Zimbabwe, continuent à conserver la majeure partie des rhinocéros d’Afrique avec 98,8% de rhinocéros blancs et 96,1% de rhinocéros noirs. Parmi ces pays, seul le Zimbabwe a montré un déclin au cours des trois dernières années, mais ce qui est encourageant c’est que l’augmentation continue dans le Lowveld dont les chiffres globaux montrent une légère augmentation au cours de l’année passée. Le Botswana, la Tanzanie et le Swaziland sont les autres Etats de l’aire de répartition ayant plus de 100 rhinocéros, avec des populations plus petites mais croissantes en Zambie, au Malawi et en Ouganda.
Suite à un rapport intitulé « Rhinocéros d’Afrique en captivité », le président du GSRAs, le Dr Bibhab Talukdar, a donné un aperçu de l’état des rhinocéros d’Asie et les mesures clés de conservation.
La première journée s’est terminée par plusieurs exposés sur les programmes de soutien aux rhinocéros, GRQW� OH� 3URMHW� GµH[WHQVLRQ� GH� O¶DLUH� GH� UpSDUWLWLRQ� GX�rhinocéros noir de WWF/Ezemvelo KwaZulu-Natal, le Programme de WWF pour le Rhinocéros d’Afrique, la Fondation Internationale pour le Rhinocéros, Save WKH�5KLQR�,QWHUQDWLRQDO��OH�6HUYLFH�GH�OD�3rFKH�HW�GH�OD�Faune des Etats-Unis et le Fonds pour la Conservation du Rhinocéros et du Tigre, et l’initiative Lead SA.
Etant donné l’augmentation marquée du braconnage de rhinocéros et du commerce illicite, la protection des rhinocéros, les questions de sécurité et le commerce ont fait l’objet des discussions de la deuxième journée. La première session a été consacrée à la CITES et aux questions du commerce. Le rapport conjoint de l’UICN/TRAFFIC présenté à la CdP15 de la CITES a été résumé en soulignant les questions clés du commerce et les décisions connexes de la CITES qui en résultent et les recommandations du rapport. Les membres ont pWp� HQVXLWH� LQIRUPpV� GHV�PRGL¿FDWLRQV� DSSRUWpHV� j� OD�résolution Conf. CITES. 9.14 (Rev. CdP14) de la CITES sur les rhinocéros. Cela inclut les nouvelles exigences pour la rédaction du rapport pour la prochaine CdP de la CITES concernant les Etats dont les citoyens ont été impliqués dans des crimes de rhinocéros (et en particulier le Viet Nam). Les membres ont été ensuite informés de la visite au Viet Nam d’une délégation d’Afrique du Sud qui avait tenu des discussions bilatérales relatives à la sécurité et le commerce du rhinocéros. La session suivante a examiné les réponses après la CITES sur la recrudescence du braconnage en se concentrant sur les quatre grands États de l’aire de répartition du rhinocéros: l’Afrique du Sud, le Zimbabwe, le Kenya et la Namibie. La session de l’après-midi a examiné les mécanismes et les techniques
African Rhino Specialist Group report
8 Pachyderm No. 49 January–June 2011
and then a review of the components needed in an effective rhino security strategy. Presentations focused on the drivers affecting poaching and how to reduce their influence, intelligence management systems, advances in rhino DNA analyses, scene of the crime training, investigation techniques, managing transponder data and the use of statements in aggravation of sentences. Members urged greater co-operation between wildlife investigators, police and prosecutors, the sensitization of magistrates and judges, and sought assistance in the development of new tools and technologies to detect and intercept UKLQR� SRDFKHUV� DQG� KRUQ� WUDI¿FNHUV��:KLOH� WKH�number of arrests of rhino poachers/horn dealers has increased (with the handing down of long jail terms in some countries), the meeting noted that there was an urgent need to improve the rate of convictions in a number of the range States that were unacceptably low. Increased penalties for rhino related crimes were also needed in some countries. The meeting commended recent initiatives to combat poaching, including the establishment of the National Wildlife Crime Reaction Unit in South Africa, the increasing protection throughout the rhino’s range and the development of new methods for analysing the DNA of rhino horn. Regional information sharing and the bilateral engagement between South Africa and the authorities in Viet Nam were also ZHOFRPHG��9LHW�1DP�KDV�EHHQ�LGHQWL¿HG�DV�WKH�initial destination for much of the current illegal rhino horn leaving southern Africa; while there is clearly internal horn use within Viet Nam, at this stage it is unclear how much of the horn moves on to other destinations.
In South Africa, a large number (about 24%) of rhinos live on private land, and it was clear that rhino management, including security, control of rhino horn stockpiles and reporting on their numbers and movements needed to be improved and co-ordinated among rhino holders. It was for this reason that a greater participation by the private owners at the meeting was welcomed and is to be expanded upon. The urgent need to improve the allocation of hunting permit applications in some South African provinces and especially North West Province was also noted with concern.
de sécurité du rhinocéros en commençant par un rapport du Groupe de Sécurité de la SADC sur le rhinocéros et l’éléphant/le Groupe de Travail d’Interpol sur le Crime environnemental, puis un examen des composantes QpFHVVDLUHV�G¶XQH�VWUDWpJLH�GH�VpFXULWp�HI¿FDFH�SRXU�OH�rhinocéros. Les présentations ont porté sur les facteurs qui affectent le braconnage et la façon de réduire leur LQÀXHQFH�� OHV� V\VWqPHV� GH� JHVWLRQ� GX� UHQVHLJQHPHQW��les progrès dans les analyses d’ADN de rhinocéros, la IRUPDWLRQ�VXU�VFqQH�GX�FULPH��OHV�WHFKQLTXHV�G¶HQTXrWH��la gestion des données du transpondeur et l’utilisation des dépositions dans l’alourdissement des peines.
Les membres ont demandé une plus grande FRRSpUDWLRQ�HQWUH� OHV�HQTXrWHXUV�GH� OD� IDXQH�� OD�SROLFH�et les procureurs, la sensibilisation des magistrats et des MXJHV�HW�RQW�GHPDQGp�XQH�DVVLVWDQFH�D¿Q�GH�GpYHORSSHU�de nouveaux outils et de technologies pour détecter et LQWHUFHSWHU�OHV�EUDFRQQLHUV�GH�UKLQRFpURV�HW�OHV�WUD¿TXDQWV�de corne. Alors que les arrestations de braconniers et de revendeurs de corne ont augmenté (et de longues peines de prison dans certains pays), la réunion a noté qu’il y avait un besoin urgent d’améliorer le taux de condamnations qui était trop faible dans plusieurs états de l’aire de répartition. Il fallait aussi des sanctions plus lourdes pour les crimes relatifs aux rhinocéros dans certains pays. La réunion a salué les initiatives récentes de lutte contre le braconnage, notamment la création de l’Unité Nationale de réaction au Crime contre la Faune en Afrique du Sud, l’amélioration de la protection dans toute l’aire de répartition des rhinocéros et le développement de nouvelles méthodes pour l’analyse d’ADN de la corne de rhinocéros. L’on a accueilli l’échange d’informations régionales et l’engagement bilatéral entre l’Afrique du Sud et les autorités du Viet Nam. Le Viet Nam a été LGHQWL¿p�FRPPH�OD�GHVWLQDWLRQ�LQLWLDOH�SRXU�XQH�JUDQGH�partie des cornes de rhinocéros illégales provenant d’Afrique australe. Alors qu’il y a une utilisation interne de la corne au Viet Nam, à ce stade on ne connaît pas la quantité de cornes qui est acheminée vers d’autres destinations.
En Afrique du Sud, beaucoup de rhinocéros (environ 24%) vivent sur des terres privées, et c’était clair que la gestion de rhinocéros, y compris la sécurité, le contrôle des stocks de cornes de rhinocéros et les rapports sur leur QRPEUH�HW�OHXUV�PRXYHPHQWV�GHYDLHQW�rWUH�DPpOLRUpV�HW�coordonnés parmi les détenteurs de rhinocéros. Pour cette raison, la réunion a bien accueilli une plus grande participation des propriétaires privés ce qui sera renforcé. On a noté le besoin urgent d’améliorer l’allocation des demandes de permis de chasse dans certaines provinces
Knight
Pachyderm No. 49 January–June 2011 9
Day three began with a session on focal rhino populations, including the northern white rhino project at Ol Pejeta in Kenya, and updates on black rhino repatriation and re-establishment in both the Serengeti NP in Tanzania and North Luangwa NP in Zambia. Following an overview of challenges and approaches to managing a free ranging black rhino population in Kenya, environmental education programmes and lessons learned in selected areas were discussed. A proposed black rhino re-establishment programme in Gona-rhe-Zhou, Zimbabwe was outlined and the setting up of a new black rhino intensive protective zone in Tsavo West NP, Kenya was described. Key ELRORJLFDO�¿QGLQJV�IURP����\HDUV�RI�EODFN�UKLQR�monitoring by the SADC Rhino Management Group (RMG) in South Africa and Namibia were also presented. This study drew upon information collected from up to 80 individual populations, making it some of the best population data for an endangered species.
The following session, called Management Techniques, included conservation implications of a black rhino genetic study in Kenya, the probable effects of alien plants on the black rhino population in Ol Jogi, Kenya, helicopter block counting in Kruger and Etosha NPs, social considerations relating to black rhino translocations in Zimbabwe, key factors affecting black rhino diet, nutrition and population density and performance in different habitats in South Africa and Namibia, and vegetation assessments as indicators of carrying capacity changes in a key EODFN�UKLQR�SRSXODWLRQ��7KH�GD\�¿QLVKHG�ZLWK�DQ�overview of the potential role of intensive assisted reproduction techniques and challenges facing ex-situ reproduction.
On the morning of the fourth day, the Mokala Park Manager informed delegates on the development of the Park and its rhino conservation programmes. This was followed by a presentation on the rhino monitoring in Mokala and a number of other SANParks black Rhino areas by specialist black rhino monitors. These background presentations were then followed E\�D�¿HOG�YLVLW�OHG�E\�WKH�3DUN�0DQDJHU�DQG�WKH�specialist black rhino monitors that work in the 13��7KH�RI¿FLDO�$I56*�0HPEHUV¶�0HHWLQJ�DQG�D�plenary session to discuss the upcoming revision of WWF’s African Rhino programme’s Strategic Action Plan completed the day.
d’Afrique du Sud et en particulier dans la Province du Nord-ouest.
La troisième journée a débuté par une session sur les populations de rhinocéros ciblées, y compris le projet de rhinocéros blancs du nord à Ol Pejeta au Kenya, et les mises à jour sur le rapatriement de rhinocéros noirs et leur rétablissement au Parc National de Serengeti en Tanzanie et au Parc National de Luangwa Nord en Zambie. Après XQH�YXH�G¶HQVHPEOH�GHV�Gp¿V�HW�GHV�DSSURFKHV�j�OD�JHVWLRQ�d’une population libre de rhinocéros noirs au Kenya, on a discuté les programmes d’éducation environnementale et les leçons apprises dans certaines aires. Un programme proposé pour le rétablissement du rhinocéros noir à Gona-rhe-Zhou au Zimbabwe a été expliqué et la mise en place d’une nouvelle zone de protection intensive de rhinocéros noirs au Parc National de Tsavo Ouest au Kenya a été décrite. Les principaux résultats biologiques de 18 années de suivi du rhinocéros noir par le Groupe de Gestion du rhinocéros de la SADC (RMG) en Afrique du Sud et en Namibie ont également été présentés. Cette étude, s’étant appuyé sur des informations recueillies auprès de 80 populations individuelles, dispose de quelques-unes des meilleures séries de données de population pour une espèce en voie de disparition.
La session suivante, appelée techniques de gestion, comprenait les implications de conservation d’une étude génétique de rhinocéros noirs au Kenya, les effets probables des plantes exotiques sur la population de rhinocéros noirs dans Ol Jogi au Kenya, le comptage de bloc en hélicoptère dans les parcs nationaux de Kruger et Etosha, les considérations sociales relatives aux translocations de rhinocéros noirs au Zimbabwe, les facteurs clés affectant le régime alimentaire, la nutrition, la densité de population et la performance du rhinocéros noir dans les différents habitats en Afrique du Sud et en Namibie, et les évaluations de la végétation en tant qu’indicateurs des changements de la capacité de charge chez une population clé de rhinocéros noirs. La journée s’est terminée par une vue d’ensemble du rôle potentiel des techniques intensives de reproduction assistée et les Gp¿V�DX[TXHOV�OD�UHSURGXFWLRQ�H[�VLWX�HVW�FRQIURQWpH�
Le matin du quatrième jour, le directeur du parc Mokala a parlé aux délégués au sujet du développement du parc et ses programmes de conservation de rhinocéros. Cela a été suivi par un exposé sur le suivi de rhinocéros dans Mokala et d’autres habitats de rhinocéros noirs des parcs nationaux sud-africains par des moniteurs spécialisés. Ces présentations ont été suivies par une visite de terrain conduite par le directeur du parc et les moniteurs spécialisés du rhinocéros noir qui travaillent
African Rhino Specialist Group report
10 Pachyderm No. 49 January–June 2011
A number of working groups were held over the next two days. One working group met to try to develop a more sustainable funding model for the AfRSG Secretariat. Following an informative background presentation, the main working group examined rhinos in a land use/economics context with a particular focus on possible measures which might prevent rhinos from being illegally killed and reduce the drivers/incentives to trade illegally in rhino horn. This group also looked at options and institutional DUUDQJHPHQWV�IRU�FR�PDQDJHPHQW�DQG�FRVW�EHQH¿W�sharing. Discussion centred on how to increase the perceived value of a live rhino relative to the value of a dead rhino to the people that matter. A plenary session was then held to discuss priority initiatives/projects/resources needed to improve the security of Africa’s rhinos with the focus of identifying potential funding needs and allocation of responsibilities. It was hoped that by putting forward co-ordinated consolidated proposals, it may be possible to secure additional resources to help protect and secure Africa’s remaining rhinos.
As usual, many of the benefits of these meetings came from the social interaction, networking and discussions among members RXWVLGH�RI� WKH�RI¿FLDO� VHVVLRQV�� �0RNDOD�HQGHG�up being an excellent venue to facilitate such interactions.
The AfRSG would like to thank U.S. Fish and Wildlife’s Rhino and Tiger Conservation Fund, WWF’s African Rhino Programme, the International Rhino Foundation, Save the Rhino ,QWHUQDWLRQDO�DQG�6$13DUNV�IRU�¿QDQFLDO�VXSSRUW�and/or support in kind that enabled the successful meeting to take place.
Change of AfRSG ChairAfter his introduction and welcome at the 10th AfRSG meeting, Dr Martin Brooks announced to the AfRSG membership that he would be step-ping down as Chair once a successor had been named. In a letter to members at the meeting, the head of the SSC, Dr Simon Stuart expressed his thanks and appreciation for the sterling work Martin Brooks has done as Chair over the last two decades— one of the longest serving SG Chairs. Dr Stuart was able to attend some of the meeting, and took advantage of the opportunity to canvas
GDQV�OH�31��/D�UpXQLRQ�RI¿FLHOOH�GHV�PHPEUHV�GX�*65$I�et une séance plénière pour discuter la révision prochaine du plan d’action stratégique du programme de rhinocéros de WWF pour l’Afrique ont complété la journée.
Les réunions des groupes de travail ont eu lieu au cours des deux jours suivants. Un groupe de travail s’est UpXQL�SRXU�WHQWHU�G¶pODERUHU�XQ�PRGqOH�GH�¿QDQFHPHQW�plus durable pour le Secrétariat du GSRAf. Après une présentation informative, le principal groupe de travail a examiné les rhinocéros dans un contexte d’utilisation des terres/économie foncière avec un accent particulier sur OHV�PHVXUHV�SRVVLEOHV�TXL�SRXUUDLHQW�HPSrFKHU�O¶DEDWWDJH�illégal des rhinocéros et réduire les moteurs/incitations au commerce illicite des cornes de rhinocéros. Ce groupe a également examiné les options et les dispositions institutionnelles pour la cogestion et le partage des coûts-avantages. La discussion a porté sur la façon d’augmenter la valeur perçue des rhinocéros vivants par rapport à la valeur de rhinocéros morts pour les intéressés. La session plénière a ensuite discuté des initiatives/projets prioritaires et les ressources nécessaires pour améliorer la sécurité GHV�UKLQRFpURV�G¶$IULTXH�DYHF�O¶REMHFWLI�G¶LGHQWL¿HU�OHV�EHVRLQV�SRWHQWLHOV�GH�¿QDQFHPHQW� HW� OD� UpSDUWLWLRQ�GHV�responsabilités. On espérait qu’en mettant en avant des propositions coordonnées consolidées, il serait possible d’obtenir des ressources supplémentaires pour protéger et sécuriser les rhinocéros restants d’Afrique.
Comme d’habitude, la plupart des avantages de ces réunions proviennent de l’interaction sociale, le réseautage et les discussions entre les membres en dehors GHV�VpDQFHV�RI¿FLHOOHV��0RNDOD�D�¿QL�SDU�rWUH�XQ�H[FHOOHQW�lieu pour faciliter de telles interactions.
Le GSRAf voudrait remercier le Service de la Pêche et de la Faune des Etats-Unis, le Fonds pour la Conservation du Rhinocéros et du Tigre et le Programme de WWF pour le rhinocéros d’Afrique, la Fondation Internationale pour le Rhinocéros, Save the Rhino International et les Parcs Nationaux d’Afrique du Sud SRXU�OH�VRXWLHQ�¿QDQFLHU�HW�RX�HQ�QDWXUH�TXL�D�SHUPLV�OD�réussite de la réunion.
Changement du président du GSRAfAprès son introduction et son mot de bienvenue à la 10ème réunion du GSRAf, le Dr Martin Brooks a annoncé aux membres du GSRAf qu’il quitterait son poste de président une fois un successeur nommé. Dans une lettre adressée aux membres à la réunion, le chef de la CSE, le Dr Simon Stuart, a exprimé ses remerciements pour le travail remarquable que Martin Brooks avait fait en tant
Knight

Pachyderm No. 49 January–June 2011 11
PHPEHUV�WR�¿QG�RXW�ZKR�WKH\�IHOW�ZRXOG�EH�PRVW�suitable and appropriate as the new Chair. Soon after the meeting, Dr Stuart announced his deci-VLRQ�WR�DSSRLQW�'U�0LNH�.QLJKW��FXUUHQW�2I¿FLDO�South African Country Representative on the AfRSG, and Chair of the SADC Rhino Manage-ment Group) as the new AfRSG Chair. The cur-UHQW�2I¿FLDO�.HQ\DQ�&RXQWU\�5HSUHVHQWDWLYH�RQ�the AfRSG, Benson Okita-Ouma MBS was also appointed AfRSG Deputy-Chair with Dr Richard (PVOLH�FRQWLQXLQJ�DV�SDUW�WLPH�6FLHQWL¿F�2I¿FHU��
Signs the rate of poaching in South Africa and Kenya may be levelling off In the last edition of Pachyderm, the Chair re-ported on the 333 rhinos that had been killed in South Africa during 2010. As of 14 May 2011 a further 156 (1.16 rhinos/day) have been poached in 2011. This represents a 27.6% increase over the 2010 average of 0.91/day. At this rate as many as 425 could be poached in South Africa this year. However, in 2010 rhino poaching increased throughout the year. Average poaching levels for Jan–April 2010 were 0.58 rhinos/day, 0.93/day for May–August, reaching a high of 1.21/day over the last four months of the year. Thus OHYHOV�RI�SRDFKLQJ�LQ�WKH�¿UVW��ò�PRQWKV�RI������are at a marginally lower level than at the end of ODVW�\HDU���7KLV�LV�SRVVLEO\�WKH�¿UVW�HYLGHQFH�WKDW�the rate of poaching may be slowing down and possibly stabilizing in South Africa since the rapid escalation in poaching started in 2007. Although totally undesirable, the current populations can still grow, albeit at a reduced rate, at the current 2% loss to poaching.
Kenya lost a total 41 rhinos to poaching in 2009 and 2010—also about 2% of the national SRSXODWLRQ��7KLV�ZDV� WKH� ¿UVW� WLPH� VXFK� KLJK�levels of poaching were recorded in the 25–year history of Kenya’s rhino conservation programme. The overall growth rate has been UHGXFHG� VLJQL¿FDQWO\�� � ,Q� UHVSRQVH� WKH�.HQ\DQ�Government has introduced newer strategies to reverse the poaching trend. By May 2011, a total of 6 animals had been illegally killed, a possible indication that the new initiatives were working and that the loss to poaching could be reduced to less than 1% by year end.
que président au cours des deux dernières décennies, l’un des présidents qui a servi le Groupe de Spécialistes le plus longtemps. Le Dr Stuart a pu participer à plusieurs VpDQFHV�GH�OD�UpXQLRQ��HW�LO�HQ�D�SUR¿Wp�SRXU�VRQGHU�OHV�membres pour savoir qui, selon eux, serait le président le plus convenable. Peu de temps après, il a annoncé sa déci-sion de nommer le Dr Mike Knight (représentant actuel d’Afrique du Sud au GSRAf, et président du Groupe de Gestion du rhinocéros de la SADC) comme le nouveau SUpVLGHQW�GX�*65$I��/H�UHSUpVHQWDQW�RI¿FLHO�GX�.HQ\D�DX�GSRAf, Benson Okita-Ouma, a été nommé vice-président du Groupe alors que le Dr Richard Emslie continuera à rWUH�OH�FKDUJp�G¶pWXGHV�VFLHQWL¿TXHV�j�WHPSV�SDUWLHO�
Signes que le taux de braconnage en Afrique du Sud et au Kenya pourrait être en train de se stabiliser
Dans le dernier numéro du Pachyderme, le Président a fait un rapport sur 333 rhinocéros qui avaient été tués en Afrique du Sud en 2010. Jusqu’au 14 mai, 156 rhinocéros de plus (1,16 rhinocéros/jour) ont été braconnés en 2011. Cela représente une augmentation de 27,6% par rapport à la moyenne de 0.91/jour en 2010. A ce rythme, pas moins GH�����UKLQRFpURV�SRXUUDLHQW�rWUH�EUDFRQQpV�HQ�$IULTXH�du Sud cette année. Cependant, en 2010 le braconnage de rhinocéros a augmenté toute l’année. Les niveaux moyens de braconnage de janvier à avril 2010 étaient de 0,58 rhinocéros/jour, 0,93/jour de mai à août, atteignant un maximum de 1,21/jour au cours des quatre derniers mois de l’année. Ainsi, les niveaux de braconnage dans les 4 premiers mois et demi de 2011 sont à un niveau OpJqUHPHQW�LQIpULHXU�j�FHOXL�GH�OD�¿Q�GH�O¶DQQpH�GHUQLqUH��C’est probablement la première preuve que le taux de EUDFRQQDJH�SRXUUDLW�rWUH�HQ�WUDLQ�GH�UDOHQWLU�HW�VH�VWDELOLVHU�en Afrique du Sud depuis son escalade rapide qui avait débuté en 2007. Bien que totalement indésirable, les populations actuelles peuvent encore augmenter, quoique de façon réduite, au taux actuel de 2% de pertes dues au braconnage.
Le Kenya a perdu un total de 41 rhinocéros au braconnage en 2009 et 2010, ce qui est aussi environ 2% de la population nationale. C’est la première fois qu’on a enregistré ce niveau élevé de braconnage dans 25 ans de l’histoire du programme de conservation des rhinocéros au Kenya. Le taux de croissance global a pWp� UpGXLW�GH�PDQLqUH� VLJQL¿FDWLYH��(Q� UpSRQVH�j� FHOD��le gouvernement du Kenya a mis en place de nouvelles stratégies pour renverser la tendance du braconnage. Jusqu’en mai 2011, 6 animaux avaient été abattus
African Rhino Specialist Group report
12 Pachyderm No. 49 January–June 2011
Any positive signs here should under no circumstances deter authorities from continuing to improve the protection of their rhino populations and law enforcement efforts.
EWT workshop Just prior to the AfRSG meeting, in early March 2011, the Endangered Wildlife Trust organized a meeting to discuss the pros and cons of the possibility of starting a legal trade in horn and dehorning as a conservation measure to increase incentives for rhino owners and custodians and to reduce poaching and the illegal demand for horn. The meeting was attended by delegates from South Africa, Namibia, Zimbabwe and Swaziland. The meeting recognized that a necessary and ur-gent precursor before any trading proposal could be seriously considered by CITES was for South Africa’s private sector to get its house in order and improve reporting on rhino numbers, stockpiles and rhino movements. A working group at the meeting with representation from government, international NGOs and private rhino owner UHSUHVHQWDWLYHV�VSHFL¿FDOO\�DGGUHVVHG�WKLV�LVVXH��The meeting also thoroughly reviewed the utility of dehorning as an occasional management tool, building upon preliminary discussions held at the SADC RMG meeting in Namibia late last year. In addition to this meeting, the SADC RMG has initiated a close relationship with the Wildlife Ranchers South Africa (WRSA) to increase the private rhinos owners awareness and responsibil-ity with regards managing this important national asset.
National rhino plans & strategies The work on the revision and development of rhino plans as previously reported has continued. At the AfRSG meeting, Mr Mketeni informed members that the South African black rhino plan was nearing the end of the process of getting RI¿FLDO�DSSURYDO�� �7KH�UHYLVHG�7DQ]DQLDQ�EODFN�rhino conservation plan has also been formally approved. In March a series of workshops were held in Harare as part of the process of review-ing and revising Zimbabwe’s national rhino plan,which is is in the process of being drafted. A draft of the revised Botswana National Rhino
illégalement, une indication possible que les nouvelles initiatives réussissent et que la perte due au braconnage SRXUUDLW� rWUH� UDPHQpH� j�PRLQV� GH� ���HQ�¿Q� G¶DQQpH� Tout signe positif ici ne doit en aucun cas dissuader les autorités de continuer à améliorer la protection de leurs populations de rhinocéros et leurs efforts d’application de la loi. L’atelier du Fonds pour les Espèces Menacées (EWT) Juste avant la réunion du GSRAf, au début du mois de mars 2011, le Fonds pour les Espèces Menacées a organisé une réunion pour discuter des avantages et des inconvénients de l’idée du commerce licite de corne et l’écornage comme des mesures de conservation et d’incitations aux propriétaires et détenteurs de rhinocéros D¿Q�GH�UpGXLUH� OH�EUDFRQQDJH�HW� OD�GHPDQGH�LOOLFLWH�GH�corne. La réunion rassemblait les délégués d’Afrique du Sud, de Namibie, du Zimbabwe et du Swaziland. La réunion a reconnu que la condition nécessaire et urgente avant que la CITES puisse envisager sérieusement toute proposition de négociation était que le secteur privé en Afrique du Sud remette de l’ordre en améliorant les rapports sur le nombre de rhinocéros, les stocks et les mouvements de rhinocéros. Un groupe de travail comprenant des représentants du gouvernement, des ONG internationales et des propriétaires privés de rhinocéros VH� VRQW� SHQFKpV� VSpFL¿TXHPHQW� VXU� FHWWH� TXHVWLRQ��/D�réunion a également examiné l’utilité de l’écornage en tant qu’outil ponctuel de gestion, en s’appuyant sur les discussions préliminaires lors de la réunion du Groupe de Gestion du Rhinocéros de la SADC (SADC RMG) en Namibie l’année dernière. En plus de cette réunion, le SADC RMG a entrepris une collaboration étroite avec les Eleveurs de la Faune d’Afrique du Sud (WRSA) pour sensibiliser et responsabiliser les propriétaires de rhinocéros en ce qui concerne la gestion de cette importante ressource nationale. Plans et stratégies nationaux pour le Rhinocéros Comme signalé précédemment, le travail sur la révision et le développement des plans de rhinocéros a continué. Lors de la réunion du GSRAf, M. Mketeni a informé les membres que le plan pour le rhinocéros noir d’Afrique GX�6XG�pWDLW�VXU�OH�SRLQW�G¶REWHQLU�O¶DSSUREDWLRQ�RI¿FLHOOH��La version révisée du plan pour la conservation du UKLQRFpURV�QRLU�GH�7DQ]DQLH�D�pJDOHPHQW�pWp�RI¿FLHOOHPHQW�approuvée. Au mois de mars une série d’ateliers ont eu lieu à Harare dans le cadre de l’examen et la révision du plan national pour le rhinocéros du Zimbabwe, qui HVW�HQ�WUDLQ�G¶rWUH�UpGLJp��8QH�YHUVLRQ�GX�3ODQ�QDWLRQDO�
Knight
Pachyderm No. 49 January–June 2011 13
Plan has also been completed and has been sent out for comment within the country.
Indications are that Uganda still wishes to develop a rhino policy and national plan. Zambia has also indicated that it wishes to revise its policy. South Africa also intends to revise its white rhino strategy and develop a national white rhino policy with assistance from the SADC RMG and key stakeholders. Kenya will be reviewing its strategic plan in June 2011, with a possible launch of the new plan before the end of 2011. The East African Rhino Management Group (EARMG) that includes the countries of Burundi, Ethiopia, Kenya, Rwanda, Tanzania and Uganda was inaugurated in 2009. A common strategic plan for the rhinos in this region will be developed in the near future.
Northern White Rhino update The young female northern white rhino (NWR) has been cycling repeatedly and has been mated at least twice. Unfortunately bureaucratic problems within the EU are currently stopping/delaying the import of dung samples. It has therefore not been possible to assess the recent hormonal status of NWR and southern white rhino (SWR) females WR�FRQ¿UP�LI�DQ\�DUH�SUHJQDQW���(QFRXUDJLQJO\�WKH�other older NWR bull who was originally wary of, and avoided the unfamiliar SWR cows in his pad-dock, has since mated with at least two of them.
The NWR subspecies/species issue was discussed at some length by Brooks in Pachyderm ����&ROOHHQ�2¶5\DQ�KDV�UHFHQWO\�FRQ¿UPHG�VKH�and co-workers are working on a rebuttal paper for publication. As Chair of AfRSG, I await their response to the original paper by Groves et al. (2010) with interest. Brooks (2010) indicated that there are a number of alternative ways to classify species, and for this reason there is unlikely to be universal agreement on the issue. Further correspondence from Colin Groves and Jan Robovský has emphasized their preference for the Phylogenetic Species Concept over the biological species/mate recognition concept. These letters have been forwarded to Colleen O’Ryan and Eric Harley for their consideration. However, their view is not universally shared and others are critical of the excessive splitting that can follow from using the phylogenetic
révisé du Botswana pour le rhinocéros a également été terminée et envoyée pour commentaires dans le pays. Il semble que l’Ouganda souhaite développer une politique et un plan national pour le rhinocéros et la Zambie souhaite aussi revoir sa politique. L’Afrique du Sud a l’intention de revoir sa stratégie pour le rhinocéros blanc et d’élaborer une politique nationale en la matière avec l’aide du SADC RMG et les principaux intervenants. Le Kenya révisera son plan stratégique en juin 2011, avec XQ�ODQFHPHQW�SRVVLEOH�GX�QRXYHDX�SODQ�DYDQW�OD�¿Q�GH�2011. Le Groupe de Gestion du Rhinocéros d’Afrique de l’Est (EARMG) qui rassemble le Burundi, l’Ethiopie, le Kenya, le Rwanda, la Tanzanie et l’Ouganda a été inauguré en 2009. Un plan stratégique commun pour les rhinocéros dans cette région sera élaboré dans un proche avenir.
Mise à jour sur le Rhinocéros blanc du nord La jeune rhinocéros femelle blanche du nord a eu des menstruations à plusieurs reprises et s’est accouplée au moins deux fois. Malheureusement des problèmes EXUHDXFUDWLTXHV� DX� VHLQ� GH� O¶8(� DUUrWHQW� RX� UHWDUGHQW�l’importation des échantillons de crottes. Il n’a donc pas été possible d’évaluer le statut hormonal récent de la femelle rhinocéros blanche du nord et celle du sud pour FRQ¿UPHU�VL�HOOHV�VRQW�JHVWDQWHV��&¶HVW�HQFRXUDJHDQW�TXH�le rhinocéros mâle blanc du nord plus âgé, qui à l’origine VH�Pp¿DLW�GHV�UKLQRFpURV�IHPHOOHV�EODQFKHV�GX�VXG�LQFRQ-nues dans son paddock s’est depuis accouplé avec au moins deux d’entre elles.
La question de la sous-espèce/espèce du rhinocéros blanc du nord a été discutée en détail par Brooks dans le n0 48 du Pachyderme. Colleen O’Ryan a récemment FRQ¿UPp� TX¶HOOH� HW� VHV� FROOqJXHV� WUDYDLOODLHQW� VXU� XQ�document de réfutation pour la publication. En tant que SUpVLGHQW�GX�*65$I��M¶DWWHQGV�DYHF�LQWpUrW�OHXU�UpSRQVH�à l’article original de Groves et al. (2010). Brooks (2010) indique que puisqu’il y a différentes façons de classer les espèces, il est peu probable qu’il y ait un accord universel sur la question. D’autres lettres de Colin Groves et Jan Robovský soulignent leur préférence pour le concept d’espèce phylogénétique sur le concept des espèces biologiques/reconnaissance sexuelle. Ces lettres ont été transmises à Colleen O’Ryan et Eric Harley pour examen. Cependant, leur avis n’est pas universellement partagé et d’autres critiques de la division excessive qui peut découler de l’usage du concept phylogénétique
African Rhino Specialist Group report

14 Pachyderm No. 49 January–June 2011
species concept, favouring instead the use of the Biological Species/Mate Recognition species concept, which currently regards the NWR as a subspecies. However, I would like to reiterate the point made by Brooks (2010), that the debate as to whether or not the NWR is a subspecies or separate species is somewhat academic and practically largely irrelevant (in the absence of WKH� FRQ¿UPDWLRQ� WKDW� RWKHU� SRWHQWLDO� XQUHODWHG�founder NWR still occur in the wild). This primarily arises from the current extremely small founder genome equivalent of only 1.71 NWR rhinos, high degree of inter-relatedness between WKH�IRXU�H[��'YĤU�.UiORYp�=RR�1:5�DW�2O�3HMHWD�(which do not form a viable founder population), and the old age of the two males and hence the limited time available for them to breed and pass on their adaptive NWR genes. As Brooks (2010) explained, to meet the overall conservation goal and successfully conserve as many adaptive NWR genes as possible for eventual reintroduction into former range (or close by), and to prevent excessive inbreeding, intercrossing with SWR will need to be part of any strategy. Of course, there can be no guarantee that this last-ditch attempt to conserve adaptive NWR genes will succeed, but we can hope that the observed matings at Ol Pejeta will translate into successful pregnancies.
AfRSG member wins Goldman awardIt is with pleasure that I can report on the recent award of the Goldman Environmental Prize to Zimbabwe Lowveld Trust Director and long-standing AfRSG member Raoul du Toit for his sterling rhino conservation work, and his work in the Zimbabwe Lowveld in particular. Raoul has also indicated he will be ploughing the prize money back into supporting the important work being undertaken by the Lowveld Trust. An indi-cation of the success of this work over the years is that numbers once more are slightly increasing in the Lowveld, and the area now has more rhinos than it has in the recent historical past.
des espèces, favorisent plutôt l’utilisation de l’espèce biologique/reconnaissance sexuelle, ce qui considère actuellement le rhinocéros blanc du nord comme une sous-espèce. Toutefois, je tiens à réitérer la remarque faite par Brooks (2010), que le débat quant à savoir si oui ou non le rhinocéros blanc du nord est une sous-espèce ou une espèces séparée est quelque peu théorique et hors GH�SURSRV�HQ�O¶DEVHQFH�GH�OD�FRQ¿UPDWLRQ�TXH�G¶DXWUHV�fondateurs potentiels indépendants se trouvent dans la nature. Cela découle principalement de l’équivalent actuel du génome fondateur très petit de seulement 1,71 rhinocéros blancs du nord, le degré élevé de consanguinité entre les quatre rhinocéros blancs du nord à Ol Pejeta, SUpFpGHPPHQW�GX�]RR�GH�'YĤU�.UiORYp��TXL�QH�IRUPHQW�pas une population fondatrice viable), et la vieillesse des deux mâles et, donc le temps limité disponible pour eux de se reproduire et transmettre leurs gènes adaptatifs de rhinocéros blancs du nord. Comme Brooks (2010) l’a expliqué, pour atteindre l’objectif global de conservation et conserver avec succès autant de gènes adaptatifs du rhinocéros blanc du nord que possible pour la réintroduction éventuelle dans l’ancien habitat (ou à proximité), et pour éviter la consanguinité excessive, le croisement avec le rhinocéros blanc du sud doit faire partie de la stratégie. Bien sûr, il ne peut y avoir aucune garantie que cette dernière tentative de conserver les gènes adaptatifs du rhinocéros blanc du nord va réussir, mais nous pouvons espérer que les accouplements observés à Ol Pejeta se traduiront par des gestations réussies.
Un membre du GSRAf gagne le prix Goldman C’est avec plaisir que je rapporte l’attribution récente du prix Goldman pour l’environnement au Directeur de la Fiducie du Lowveld du Zimbabwe et membre de longue date du GSRAf, Raoul du Toit, pour son travail remarquable de conservation des rhinocéros en général et sur le Lowveld du Zimbabwe en particulier. Raoul a également déclaré qu’il réinvestira l’argent du prix dans le travail important de la Fiducie du Lowveld. Une LQGLFDWLRQ�GH�OD�UpXVVLWH�GH�FH�WUDYDLO�DX�¿O�GHV�DQQpHV�c’est qu’encore une fois la population est en légère augmentation dans le Lowveld, et la région a maintenant plus de rhinocéros que dans le passé récent.
Knight

Pachyderm No. 49 January–June 2011 15
References%URRNV��3�0����������µ$IULFDQ�5KLQR�6SHFLDOLVW�*URXS�
report’. Pachyderm 48:8–15.
Groves, C.P., Fernando, P. and Robovský, J. (2010). µ7KH�6L[WK�5KLQR��$�7D[RQRPLF�5H�DVVHVVPHQW�of the Critically Endangered Northern White Rhinoceros’. PLoS ONE 5(4):e9703.
Acknowledgements In addition to the sponsors of the AfRSG meeting listed above, the AfRSG would like to thank WWF African Rhino Programme (with funding from WWF Netherlands) and International Rhino Foundation IRU�WKHLU�SDUWLDO�VXSSRUW�RI�WKH�6FLHQWL¿F�2I¿FHU���$V�the new Chair I would also like to acknowledge and thank Dr Martin Brooks for all his dedication, work and leadership of the group for over two decades and IRU�RQFH�DJDLQ��WRJHWKHU�ZLWK�WKH�6FLHQWL¿F�2I¿FHU��organizing another successful AfRSG meeting.
RéférencesBrooks PM. 2010. Rapport du Groupe de Spécialistes
du Rhinocéros d’Afrique. Pachyderme 48: 8-15.
Groves C.P., P. Fernando & Robovský. 2010. Le 6ème Rhinocéros: Une réévaluation taxonomique du rhinocéros blanc du nord en danger critique d’extinction. PLoS ONE 5 (4): e9703.
RemerciementsEn plus des sponsors de la réunion du GSRAf énumérés ci-dessus, le GSRAf tient à remercier le Programme de WWW pour les rhinocéros d’Afrique �DYHF�XQ�¿QDQFHPHQW�GH�::)�3D\V�%DV��HW�OD�)RQ-dation Internationale pour le Rhinocéros pour leur VRXWLHQ� SDUWLHO� GX� FKDUJp� GHV� pWXGHV� VFLHQWL¿TXHV��En tant que nouveau président, je tiens également à remercier le Dr Martin Brooks pour tout son dévoue-ment, son travail et son leadership du groupe depuis plus de deux décennies et pour avoir organisé une fois de plus (en collaboration avec le chargé des études VFLHQWL¿TXHV��HQFRUH�XQH�UpXQLRQ�UpXVVLH�GX�*65$I�
African Rhino Specialist Group report
16 Pachyderm No. 49 January–June 2011
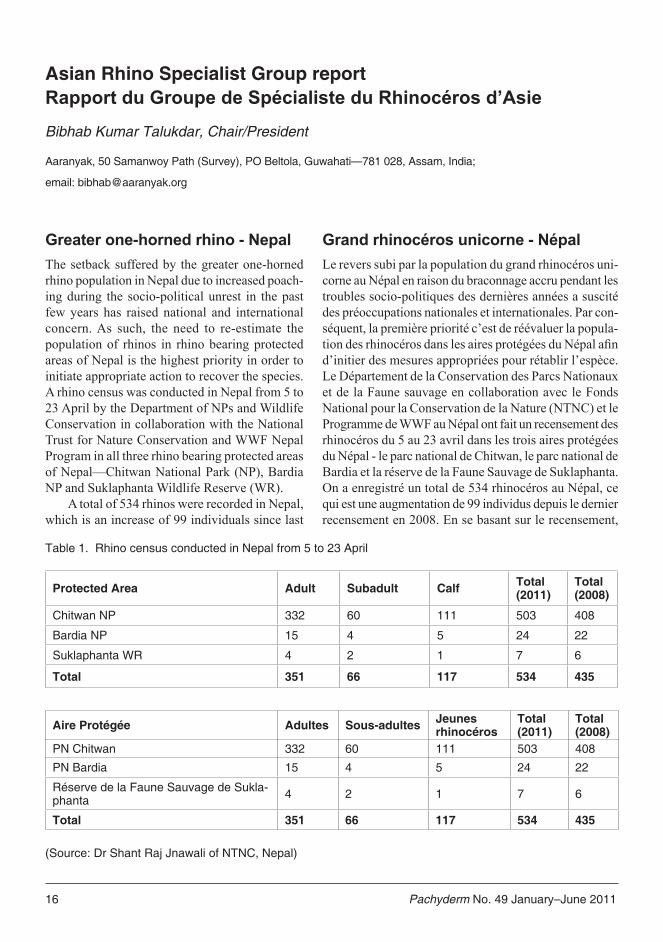
Greater one-horned rhino - NepalThe setback suffered by the greater one-horned rhino population in Nepal due to increased poach-ing during the socio-political unrest in the past few years has raised national and international concern. As such, the need to re-estimate the population of rhinos in rhino bearing protected areas of Nepal is the highest priority in order to initiate appropriate action to recover the species. A rhino census was conducted in Nepal from 5 to 23 April by the Department of NPs and Wildlife Conservation in collaboration with the National Trust for Nature Conservation and WWF Nepal Program in all three rhino bearing protected areas of Nepal—Chitwan National Park (NP), Bardia NP and Suklaphanta Wildlife Reserve (WR).
A total of 534 rhinos were recorded in Nepal, which is an increase of 99 individuals since last
Grand rhinocéros unicorne - NépalLe revers subi par la population du grand rhinocéros uni-corne au Népal en raison du braconnage accru pendant les troubles socio-politiques des dernières années a suscité des préoccupations nationales et internationales. Par con-séquent, la première priorité c’est de réévaluer la popula-WLRQ�GHV�UKLQRFpURV�GDQV�OHV�DLUHV�SURWpJpHV�GX�1pSDO�D¿Q�d’initier des mesures appropriées pour rétablir l’espèce. Le Département de la Conservation des Parcs Nationaux et de la Faune sauvage en collaboration avec le Fonds National pour la Conservation de la Nature (NTNC) et le Programme de WWF au Népal ont fait un recensement des rhinocéros du 5 au 23 avril dans les trois aires protégées du Népal - le parc national de Chitwan, le parc national de Bardia et la réserve de la Faune Sauvage de Suklaphanta. On a enregistré un total de 534 rhinocéros au Népal, ce qui est une augmentation de 99 individus depuis le dernier recensement en 2008. En se basant sur le recensement,
Asian Rhino Specialist Group reportRapport du Groupe de Spécialiste du Rhinocéros d’Asie
Bibhab Kumar Talukdar, Chair/President
Aaranyak, 50 Samanwoy Path (Survey), PO Beltola, Guwahati—781 028, Assam, India;
email: [email protected]
Table 1. Rhino census conducted in Nepal from 5 to 23 April
Protected Area Adult Subadult Calf Total (2011)
Total (2008)
Chitwan NP 332 60 111 503 408
Bardia NP 15 4 5 24 22
Suklaphanta WR 4 2 1 7 6
Total 351 66 117 534 435
Aire Protégée Adultes Sous-adultes Jeunes rhinocéros
Total (2011)
Total (2008)
PN Chitwan 332 60 111 503 408
PN Bardia 15 4 5 24 22
Réserve de la Faune Sauvage de Sukla-phanta 4 2 1 7 6
Total 351 66 117 534 435
(Source: Dr Shant Raj Jnawali of NTNC, Nepal)
Pachyderm No. 49 January–June 2011 17
le tableau suivant indique le nombre de rhinocéros dans les aires protégées.
Depuis janvier 2011, on a enregistré un total de sept décès de rhinocéros dans le PN de Chitwan, dont cinq étaient des morts naturelles et deux étaient le résultat du braconnage. Aucun décès de rhinocéros n’a été enregistré au PN de Bardia, ni à la Réserve de la Faune Sauvage de Suklaphanta pendant la période.
Le Département des PN et de la Faune Sauvage du 1pSDO�D�LQWHQVL¿p�OHV�SDWURXLOOHV�HW�O¶DSSOLFDWLRQ�GH�OD�ORL���DX�PRLQV����EUDFRQQLHUV�GH�UKLQRFpURV�RQW�pWp�DUUrWpV�et emprisonnés durant cette période.
L’IndeEn Inde, dans les sept aires connues de rhinocéros, à savoir les PN de Kaziranga, d’Orang, de Manas et le sanctuaire de la Faune sauvage de Pabitora dans l’Assam, le PN de Gorumara et le Sanctuaire de la Faune Sauvage de Jaldapara au Bengale occidental et le PN de Dudhwa dans l’Uttar Pradesh, les populations de rhinocéros sont stables et ont une tendance croissante, malgré quelques incidences de braconnage qui ont eu lieu pendant les six premiers mois de 2011. Au PN de Gorumara et au Sanctuaire de la Faune Sauvage de Jaldapara du Bengale occidental, un suivi génétique non-invasif de populations du grand rhinocéros unicorne est initié par le Programme Génétique de la Faune Sauvage d’Aaranyak, en col-ODERUDWLRQ�DYHF�OH�'pSDUWHPHQW�GHV�)RUrWV�GX�%HQJDOH�occidental en utilisant la crotte comme la source d’ADN provenant de l’espèce ciblée.
Le projet de suivi génétique du grand rhinocéros unicorne dans les aires protégées du Bengale occidental est important pour les raisons suivantes:�� Les aires protégées telles que le Sanctuaire de la
Faune Sauvage de Jaldapara comportent le plus grand nombre d’individus (108) après le PN de Kaziranga (2048). Cela nécessite l’évaluation des niveaux con-temporains de la diversité génétique de cette popula-WLRQ�D¿Q�G¶pYDOXHU�OH�QLYHDX�GH�FRQVDQJXLQLWp�GXH�j�la probabilité d’isolement génétique.
�� Bien que les populations au Bengale occidental soient apparemment isolées géographiquement, on doit évaluer des niveaux contemporains d’échange démographique et génétique avec d’autres aires.
�� On peut comparer les données génétiques obtenues à partir de la population du Bengale occidental à celles de la population de l’Assam et éventuellement DYHF�FHOOHV�GX�1pSDO��D¿Q�GH�FRPSUHQGUH�OD�VWUXFWXUH�méta-génétique des populations de cette espèce au
census in 2008. Based on the census, the following table indicates the number of rhinos in protected areas.
Since January 2011, a total of seven rhino deaths have been recorded from Chitwan NP, of ZKLFK�¿YH�ZHUH�QDWXUDO�DQG�WZR�ZHUH�WKH�UHVXOW�of poaching. No rhino deaths have been recorded from Bardia NP or Suklaphanta WR during the period.
The Department of NPs and Wildlife &RQVHUYDWLRQ�RI�1HSDO�KDV�LQWHQVL¿HG�WKH�SDWUROV�and law enforcement—at least 12 rhino poachers have been arrested and sent to jail during this period.
IndiaIn India the seven known rhino bearing areas—Kaziranga NP, Orang NP, Manas NP and Pabitora Wildlife Sanctuary (WLS) in Assam; and India’s Gorumara NP and Jaldapara WLS in West Bengal and Dudhwa NP in Uttar Pradesh—the popula-tions of rhinos are stable and on an increasing trend, despite a few poaching incidents that took SODFH�LQ�¿UVW�VL[�PRQWKV�RI�������,Q�*RUXPDUD�13�and Jaldapara WLS of West Bengal, non-invasive population genetic monitoring of greater one-horned rhinos is being initiated by the Wildlife Genetics Programme of Aaranyak, in collabora-tion with the West Bengal Forest Department, using dung as a source of DNA from the target species.
Proposed population genetic monitoring of greater one-horned rhinos in the protected areas RI�:HVW�%HQJDO� LV� VLJQL¿FDQW� IRU� WKH� IROORZLQJ�reasons:
�� Protected areas such as Jaldapara WLS car-ries the highest number of individual (108) after Kaziranga NP (2048). This necessitates the assessment of the contemporary levels of genetic diversity in this population in order to evaluate the level of inbreeding due to past bottlenecking and likely genetic isolation.
�� Although the populations in West Bengal are apparently isolated geographically, evaluation of the contemporary levels of demographic and genetic exchange with other areas needs to be investigated.
�� The genetic data obtained from the West Ben-gal population can be compared with that from
Asian Rhino Specialist Group report
18 Pachyderm No. 49 January–June 2011
niveau du paysage. Finalement, ces informations VHURQW� LPSRUWDQWHV� GDQV� O¶LGHQWL¿FDWLRQ�GHV�8QLWpV�(YROXWLRQQDLUHV�6LJQL¿FDWLYHV�GX�JUDQG� UKLQRFpURV�unicorne dans toute l’aire de sa distribution.
Sous les auspices du projet de la Vision 2020 du rhi-nocéros d’Inde, quatre rhinocéros ont été capturés au Sanctuaire de la Faune Sauvage de Pabitora le 17 janvier 2011, puis transportés et relâchés dans le PN de Manas. Jusqu’à présent dans ce projet, huit rhinocéros ont été capturés à Pabitora depuis 2008 et relâchés dans le PN de Manas. Il y a encore trois rhinocéros orphelins secourus auparavant lors des inondations au PN de Kaziranga, qui ont ensuite été réhabilités au PN de Manas. Actuellement la population totale de rhinocéros à Manas s’élève à 11. Pendant l’hiver prochain, 12 rhinocéros de plus seront transférés à partir de Pabitora et du PN de Kaziranga.
Le rhinocéros de JavaLe dernier bastion du rhinocéros de Java est désormais limité au PN d’Ujung Kulon et les aires adjacentes des IRUrWV� GH�*XQXQJ�+RQMH��PDLV�PDOKHXUHXVHPHQW�� OD�région est exposée aux catastrophes naturelles comme les tsunamis, les tremblements de terre, les maladies etc. Les efforts de piégeage photographique dans le PN d’Ujung Kulon par WWF et les autorités du parc ont trouvé au moins 30 rhinocéros de Java différents. On avait précédemment estimé que la population de rhi-nocéros de Java se situait entre 35 et 44 individus. Pour des motifs de la gestion biologique et stratégiques, il y a un besoin urgent de créer une deuxième population de cette sous-espèce du rhinocéros de Java dès que possible. Il faut également agir pour améliorer la performance de reproduction des rhinocéros restants dans Ujung Kulon.
Pour améliorer la conservation des rhinocéros de Java, en association avec Yayasan Badak Indonésie, WWF et le Fonds International pour le Rhinocéros, le 0LQLVWqUH� ,QGRQpVLHQ�GHV�)RUrWV� D� ODQFp�XQH�QRXYHOOH�initiative appelée Etude du Rhinocéros de Java et de O¶$LUH�GH�&RQVHUYDWLRQ�GDQV�OHV��IRUrWV�GH�*XQXQJ�+RQMH�adjacentes au PN d’Ujung Kulon avec les objectifs suivants:1. Créer une clôture pour protéger l’habitat du rhi-
nocéros et faciliter une étude plus approfondie de l’écologie et du comportement du rhinocéros de Java tout en le protégeant du bétail des villages environ-nants.
2. Fournir un emplacement convenable et de la sécurité D¿Q�GH�GpYHORSSHU�XQ�GHX[LqPH�KDELWDW�SRXU�OH�UKL-nocéros de Java grâce à la gestion de l’habitat.
the Assam population—and possibly in future with that of Nepal—in order to understand the meta-population genetic structure of this species at a landscape level. Eventually, this information will be important in identifying WKH�(YROXWLRQDU\�6LJQL¿FDQW�8QLWV��(68V��RI�greater one-horned rhinos in the entire area of its range distribution.
Under auspices of the Indian Rhino Vision 2020 project, four rhinos were captured in Pabitora WLS on 17 January 2011 and translocated and released in Manas NP. So far under this project, eight rhinos have been captured in Pabitora WLS since 2008 and released in Manas NP. There are three more orphaned rhinos earlier rescued dur-LQJ�ÀRRGLQJ�LQ�.D]LUDQJD�13��ZKLFK�ZHUH�ODWHU�rehabilitated in Manas NP. Currently the total rhino population in Manas stands at 11. In the forthcoming winter, 12 more rhinos will be shifted to Manas from Pabitora WLS and Kaziranga NP.
Javan rhinoThe last remaining stronghold of Javan rhinos is now restricted to Ujung Kulon NP and the adjoin-ing areas of Gunung Honje forests; unfortunately, the area is prone to natural catastrophes like tsunamis, earthquakes, disease etc. The camera trapping efforts in Ujung Kulon NP by WWF and the park authorities has found at least 30 Javan rhinos in the NP. It was earlier estimated that the population of Javan rhinos ranges between 35 and 44. On biological management and strategic grounds there is an urgent need to establish a second population of this Javan rhino subspe-cies as soon as possible. Action to improve the reproductive performance of rhinos remaining in Ujung Kulon is also needed.
To enhance the conservation of Javan rhinos, Indonesia’s Ministry of Forests, in association with Yayasan Badak Indonesia, WWF and IRF, has launched a new initiative called the Javan Rhino Study and Conservation Area (JaRhiSCA) in Gunung Honje forests adjacent to Ujung Kulon NP with the following objectives:
1. To establish an enclosure in order to safeguard rhino habitat, facilitate closer study of Javan rhino ecology and behaviour while protecting it from cattle from surrounding villages.
Talukdar
Pachyderm No. 49 January–June 2011 19
Asian Rhino Specialist Group report
2. To provide good location and safety to develop a second habitat for Javan rhinos through habi-tat management.
3. To gain knowledge of carrying capacity and living space needed for Javan rhinos in order to plan for further reintroduction.
4. To build common understanding of the im-portance of Javan rhino conservation through a parallel socialization process with local communities, NGOs, local governments and other stakeholders toward the conservation of Javan rhinos.
Sumatran rhinoThe current estimates of Sumatran rhinos, also a critically endangered mammal, stands between 150–250, of which about 120–180 are estimated to be found within Indonesia and about 30–60 within Malaysia (both Peninsular Maylasia and Sabah).
Indonesia could play a leading role in ensuring the long-term survival of Sumatran rhinos. The potential sites for Sumatran rhinos in Indonesia include Bukit Barisan Selatan NP in Southern Sumatra, the Gunung Leuser NP in Central Sumatra in Aceh province and Way Kambas NP in Lampung province of Sumatra.
3. Approfondir des connaissances sur la capacité de charge et l’espace vital nécessaire au rhinocéros de -DYD��D¿Q�GH�SODQL¿HU�GH�QRXYHOOHV�UpLQWURGXFWLRQV�
4. Créer une compréhension commune de l’importance de la conservation du rhinocéros de Java à travers un processus de socialisation parallèle avec les collec-tivités locales, les ONG, les gouvernements locaux et les autres intervenants en faveur de la conservation des rhinocéros de Java.
Le rhinocéros de SumatraLes estimations actuelles des rhinocéros de Sumatra, un mammifère en danger critique, se situent entre 150 à 250 individus, dont on estime qu’entre 120 et 180 se trouvent en Indonésie et entre 30 et 60 en Malaisie (sur les péninsules de Malaisie et Sabah).
L’Indonésie pourrait jouer un rôle de premier plan pour assurer la survie à long terme du rhinocéros de Sumatra. Les sites potentiels pour les rhinocéros de Sumatra en Indonésie comprennent le PN Bukit Barisan Selatan au sud de Sumatra, le PN de Gunung Leuser au centre de Sumatra dans la province d’Aceh et le PN de Kambas Way dans la province de Lampung à Sumatra.

20 Pachyderm No. 49 January–June 2011
Matriarchal associations and reproduction in a remnant subpopulation of desert-dwelling elephants in Namibia
Keith E.A. Leggett1, Laura MacAlister Brown2 and Rob Roy Ramey II3
1 University of New South Wales, Arid Zone Research Station, Fowlers Gap, Via Broken Hill, NSW 2880, Australia; email: [email protected] Wildlife Science International, Inc., and Namibian Elephant and Giraffe Trust, P.O. Box 386, Nederland, CO 80466 USA; email: [email protected] Wildlife Science International, Inc., Namibian Elephant and Giraffe Trust, P.O. Box 386, Nederland, CO 80466 USA; email: [email protected]
AbstractThis study focused on a subpopulation of desert-dwelling elephants in the Kunene region of north-western Namibia, where rainfall and resources are scarce, and the rate of reproduction and recruitment is low. This subpopulation can be considered a remnant; its oldest members are survivors of the war-related poaching that occurred in the region during the 1970s and 1980s, and its numbers have still not recovered to pre-war levels. Unlike less disturbed elephant populations with strong, multi-tiered matrilineal associations, previous UHVHDUFK�VXJJHVWHG�WKDW�WKH�DVVRFLDWLRQV�LQ�WKH�.XQHQH�VXESRSXODWLRQ�LQYROYHG�RQO\�ORRVH�DI¿OLDWLRQV�ODFNLQJ�strong social bonds. Taking that study a step further, this manuscript examines the social structure of all adult females (n=14) in the subpopulation, based on observational data combined with mitochondrial DNA (mtDNA) sequence data. A network analysis was generated from nearly eight years of association data. It was found WKDW�IHPDOH�GHVHUW�GZHOOLQJ�HOHSKDQWV�OLYH�LQ�¿UVW�WLHU�IDPLO\�XQLWV�RU�VPDOO�VHFRQG�WLHU�IDPLO\�JURXSV��DQG�LQ�at least two cases these include unrelated adult females. Associations at the level of third-tier/bond groups are rare and transitory, and there was no evidence of these being dominated by a single female or matriarch. The matrilineal social structure in this subpopulation is consistent with reports from other poached or culled elephant populations in Africa. Collectively, the results of these studies are inconsistent with the classic model of elephant social structure—stable, strictly matrilineal societies—especially in cases where poaching or cull-ing has occurred, even if it transpired decades previously.
Key words: matriarchal associations, desert-dwelling elephants, Namibia
Résumé Cette étude a porté sur une sous-population d’éléphants du désert dans la région de Kunene au nord-ouest de la Namibie, où la pluviométrie et les ressources sont rares, et où le taux de reproduction et de recrutement est faible. On peut considérer cette sous-population comme un vestige; ses membres les plus âgés sont des survivants du braconnage lié à la guerre qui s’est produite dans la région durant les années 1970 et 1980 et ses effectifs n’ont toujours pas atteint les niveaux d’avant-guerre. Contrairement aux populations d’éléphants moins perturbés ayant des associations matrilinéaires fortes à plusieurs niveaux, des recherches antérieures ont suggéré
RESEARCH

Pachyderm No. 49 January–June 2011 21
que les associations de la sous-population de Kunene QH�FRPSUHQQHQW�TXH�GHV�DI¿OLDWLRQV�IDLEOHV�Q¶D\DQW�pas de liens sociaux forts. En poursuivant cette étude plus loin, ce manuscrit examine la structure sociale de toutes les femelles adultes (n=14) de la sous-population, en se basant sur les données d’observation combinées avec les données de séquences d’ADN mitochondrial. Une analyse du réseau a été générée à partir des données d’association couvrant près de huit ans. On a constaté que les éléphants femelles du désert vivaient dans des unités familiales à un seul niveau ou dans de petits groupes familiaux à deux niveaux, et dans au moins deux cas, ces unités comprenaient des femelles adultes non apparentées. Des associations ayant des groupes avec des liens au troisième niveau sont rares et transitoires, et il n’y avait aucune preuve que celles-ci étaient dominées par une seule femelle ou une matriarche. La structure sociale matrilinéaire de cette sous-population est semblable aux rapports d’autres populations d’éléphants braconnés ou abat-tus sélectivement en Afrique. Collectivement, les résultats de ces études ne ressemblent pas au modèle classique de la structure sociale de l’éléphant - de sociétés stables, strictement matrilinéaires - surtout dans des cas où le braconnage ou l’abattage sélectif RQW�HX�OLHX��PrPH�VL�FHOD�V¶pWDLW�SURGXLW�GHV�GpFHQ-nies auparavant.
IntroductionSocial structure in African elephants
Sociality in African elephants is organized around groups of related females and their dependent off-spring, usually led by the eldest female (matriarch) (Buss, 1961; Buss & Smith, 1966; Moss, 1982).0RVV�DQG�3RROH��������DQG�3RROH��������GH¿QHG�D�µIDPLO\� XQLW¶� DV� WKH� EDVLF� XQLW� RI� HOHSKDQW� VRFLHW\��which consists of an individual female and her de-SHQGHQW�RIIVSULQJ��µ)DPLO\�JURXSV¶�DUH�UHODWHG�DGXOW�females with dependent offspring, who associate. Family groups form defensive units and kin-based al-legiances, which in turn may have a positive effect on calf survival rate (McComb et al., 2001; Archie et al.,�������µ%RQG�JURXSV¶�RU�µNLQVKLS�JURXSV¶�DUH�PDGH�XS�of several closely related family groups. Bond groups form when family groups become too large and split along family lines. When bond groups meet, elaborate greeting behaviours are often exhibited (Douglas-Hamilton, 1972, 1975; Moss, 1982). Families and bond groups that have the same seasonal ranges are
FODVVL¿HG�DV�µFODQV¶��&ODQV�DUH�XVHG�WR�GH¿QH�D�OHYHO�of association around habitat use and it is unclear whether it is a functioning elephant social unit (Poole, 1996).
:LWWHP\HU� HW� DO�� ������� ������ UHFHQWO\� UH¿QHG�WKH�GHVFULSWLRQ�DQG�TXDQWLWDWLYH�EDVLV�RI�WKLV�¿VVLRQ±�fusion social organization in terms of a four-tiered system: a breeding female and her sexually immature RIIVSULQJ�DUH�WKH�EDVH�VRFLDO�XQLW��WHUPHG�¿UVW�WLHU�XQLW�0XOWLSOH�¿UVW�WLHU��PRWKHU±FDOI��XQLWV�LQ�DVVRFLDWLRQ�are termed second-tier groups, also referred to as family or core groups.
Second-tier groups coalesce to form third-tier social groups corresponding to bond or kinship groups. These in turn are nested within fourth-tier groups corresponding to clans.
Early studies of elephant populations such as those in Amboseli found that female associations were strictly matrilineal, and that second-tier/family groups were comprised of related adult females (Moss & Poole, 1983). More recent studies of elephant populations, including those in Amboseli, have combined data on home range size, association indices and genetic relatedness in order to provide new insights into elephant population structure and sociality (Nyakaana & Arctander, 1999; Nyakaana et al., 2001; Charif et al., 2004; Archie et al., 2006a,b; Okello et al., 2008; Pinter-Wollman et al., 2008, 2009; Gobush et al., 2009; and Wittemyer et al., 2007, 2009).
Several of these studies found that, in populations that had undergone severe social disruption (from poaching or culling), second-tier/family groups were often comprised of females who were unrelated (i.e. did not share mtDNA). These groups were SUHVXPDEO\�WKH�UHVXOW�RI�IXVLRQ�RI�XQUHODWHG�¿UVW�WLHU��family units, or the adoption of orphaned individuals or sole survivors. Results of extensive genetic analyses (mtDNA and microsatellites) in Amboseli (Archie et al., 2006a) and in the Samburu and Buffalo Springs National Reserves (Wittemyer et al., 2001, 2009), made it clear that elephant associations are not strictly matrilineal, but follow a gradient from KLJK� JHQHWLF� UHODWHGQHVV� DW� ¿UVW� DQG� VHFRQG� WLHUV��WR�QRW�VLJQL¿FDQWO\�GLIIHUHQW�IURP�UDQGRP�DW�IRXUWK�tiers. Poaching and/or large-scale social disruption due to severe drought could have led to this shift in relationship, with more unrelated individuals being found in second-tier/family groups, such as in the more heavily poached Samburu and Buffalo Springs National Reserves.
Matriarchal associations of elephants in Namibia
22 Pachyderm No. 49 January–June 2011
Leggett et al.
The strongest genetic effects of poaching in an East African elephant population were reported by Gobush et al. (2009) from Mikumi National Park, Tanzania. The Mikumi population experienced heavy poaching—a 75% reduction in the population—prior to CITES’s listing of African elephants as an Appendix I species in 1989. Although some poaching still occurs, it has dramatically diminished in intensity as a result of the ivory ban. Gobush et al. (2009) reported that the majority of groups (n=77) were found to contain only 2 to 3 adult females, and 45% RI�WKHVH�ZHUH�FODVVL¿HG�DV�JHQHWLFDOO\�GLVUXSWHG��H�J��either matrilineally unrelated with different mtDNA haplotypes or having the same mtDNA haplotype but unrelated at nuclear loci). In addition, the relatedness of individuals was substantially lower for a given level of association as compared to populations that did not experience poaching. Similar results were reported from another heavily poached population in northern Zambia; Owens and Owens (2009) found that age structure and sex ratio were skewed, the mean second-tier/family group size was reduced and that 37% of second-tier/family groups contained no females older than 15 years. Collectively, the results of these studies shake up the classic model of elephant social structure—stable, strictly matrilineal societies—especially in cases where poaching or culling have occurred, even if that poaching or culling occurred decades previously.
Desert-dwelling elephants of the Kunene region, Namibia
The history of elephants in the Kunene region is largely unknown due to the remoteness and rugged-QHVV�RI�WKH�DUHD��7KH�¿UVW�JRYHUQPHQW�RYHUODQG�YHKLFOH�to the western Kunene (Hoarusib and Hoanib Rivers) was a rescue expedition to the Skeleton Coast in 1945 �0DUVK���������2QH�RI�WKH�¿UVW�V\VWHPDWLF�VXUYH\V�RI�elephants in the region was made by G.L. Owen-Smith �DQ�DJULFXOWXUDO�RI¿FLDO�IRU�WKH�.DRNRYHOG�7HUULWRU\��1968-1970) who estimated there were 70 elephants occupying the Hoarusib River in 1968-1970, from the upper Hoarusib Gorge to the coast (Owen-Smith, 1970, and pers. comm.) Subsequently, aerial surveys during the wars, the period from 1975–1989 (Desert Research Foundation, undated) suggested large-scale displacement of elephants in the western Kunene, including the loss and subsequent re-colonization of elephants in the lower Hoarusib River. Additionally, a
subpopulation in the western end of the Kunene River, which was known to make annual migrations south to the Hoarusib River, was also lost to poaching by 1980 (Viljoen, 1988).
Three previous studies have reported on the social structure of desert-dwelling elephants in Namibia (Viljoen, 1988; Lindeque & Lindeque, 1991; Leggett et al., 2003.) Viljoen’s study (1988) was conducted during the period 1980–1983 in the western Kunene, a period of severe drought and heavy poaching at the time of the Namibian War of Independence (1966–1989) and the Angolan War (1975–2002). Part of his study focused on a subpopulation of desert-dwelling elephants in the north-western Kunene region. In this subpopulation Viljoen observed a social structure similar to that reported by Douglas-Hamilton (1972), Martin (1978) and Moss and Poole (1983), except that the age structures of several family groups suggested the loss of older adult females (matriarchs) due to poaching. Viljoen had to presume the relatedness of individuals within family groups because genetic tools were not available at that time, and the limited duration of the study did not allow for deciphering relatedness in such a long-lived species. He found an increase in average group size during the wet season as a result of feeding aggregations.
Lindeque and Lindeque (1991) suggested that WKLV�VXESRSXODWLRQ�UHÀHFWHG�D�UHPQDQW�FRUH�HOHSKDQW�society, presumably as a result of the wars and concomitant poaching. Their study, however, focused on the range and movement of a limited number of radio-collared elephants and did not examine elephant socio-ecology.
Based on preliminary observational data, Leggett et al. (2003) suggested that the associations between ¿UVW�WLHU�IDPLO\�XQLWV�LQ�WKLV�VXESRSXODWLRQ�LQYROYHG�RQO\� ORRVH� DI¿OLDWLRQV� ODFNLQJ� VWURQJ� VRFLDO� ERQGV. Taking the preliminary observations of Leggett et al. (2003) a step further, this paper examines the social structure of all adult female elephants in this subpopulation, based on eight years of observational data combined with mitochondrial DNA sequence data.
MethodsStudy area
The study area is located in the Kunene province of north-western Namibia (Fig. 1) in an extremely arid

Pachyderm No. 49 January–June 2011 23
Figure 1. Map of the study area in Namibia showing the four primary river catchments used by desert-dwelling elephants. This study focused on the permanent family groups inhabiting the Hoarusib and Hoanib catchments, west of the 100 mm isohyet.
Matriarchal associations in elephants in Namibia
24 Pachyderm No. 49 January–June 2011
area where rainfall is spatially and temporally variable and averages less than 100 mm annually (Viljoen, 1988). Distant rainfall in the upper reaches (over 60 km to the east) of the Hoarusib and Hoanib River catchment areas typically produce brief seasonal ÀRRGLQJ�GXULQJ�WKH�ZHW�VHDVRQ��)HEUXDU\±0D\��DIWHU�Viljoen, 1988), even if no rain falls in the immediate DUHD��7KHVH�ZHVWHUQ�ÀRZLQJ�HSKHPHUDO�ULYHUV�FDUU\�little surface water except in canyons where bedrock forces it to the surface, and for most of the year the ZDWHU�ÀRZV�XQGHUJURXQG��-DFREVRQ�HW�DO����������,Q�this desert environment the ribbons of vegetation DORQJ� WKH� HSKHPHUDO� ULYHUV� UHSUHVHQW� µOLQHDU� RDVHV¶�ZKHUH�HOHSKDQWV�DQG�RWKHU�ZLOGOLIH�¿QG�IRUDJH�DQG�water during the dry season. Elephants occupy these ephemeral rivers most of the year in predictable home ranges (Viljoen, 1988; Leggett et al., 2003; Leggett, 2006). Female elephants move up and down these riverbeds and tributaries, sometimes to the ocean, and make periodic 70 km migrations between the two rivers. Migration often occurs in response to the abundant ripening of Faidherbia albida pods, a protein source that is highly sought after by elephants and other herbivores. During the wet season, elephants range beyond these river drainages, initially on forag-ing expeditions in search of Commiphora spp. bushes, and later for other forage as rainfall brings a green-up of vegetation (Viljoen, 1987, 1988, 1989a, 1989b; Viljoen & Bothma, 1990; Leggett, 2006).
Human habitation in the region is concentrated in and upstream of the town of Purros along the ephemeral Hoarusib River and in, and upstream of Sesfontein along the Hoanib River, but also includes a handful of tourist camps between the towns and the Skeleton Coast National Park (SCNP). Self-drive and guided tourists move up and down the rivers during the dry season; however, most are restricted from entering SCNP, which extends from the coast approximately 30 km inland.
Identification of individuals in the Hoarusib/Hoanib subpopulation
All elephants in the subpopulation have been individu-DOO\�LGHQWL¿HG�XVLQJ�D�FRPELQDWLRQ�RI�SKRWRJUDSKV�DQG�LGHQWL¿FDWLRQ� VKHHWV��7KH� SKRWRJUDSKLF� WHFKQLTXHV�used were similar to those already described by Altmann (1974), Douglas-Hamilton and Douglas-Hamilton (1975), Moss (1982) and Sukumar (1989), and elephants were aged by size (Laws, 1966). Each elephant is assigned a number beginning with WKF
or WKM (western Kunene female or western Kunene male), and offspring of an individual female are labelled a1, a2, a3 etc., according to birth sequence. When offspring reach sexual maturity (for females, DW�ELUWK�RI�¿UVW�RIIVSULQJ��IRU�PDOHV��DW�GHSDUWXUH�IURP�the family unit) they are assigned an adult number. *URXSV�DUH�FODVVL¿HG�DFFRUGLQJ�WR�WKH�ROGHVW�IHPDOH��for example, a second-tier/family group that contains four adult females (WKF-3, WKF-11, WKF-14 and WKF-15) is referred to as WKF-14’s group, as she is the oldest female in the group.
Quantification of observed associations among adult females
The observations reported here were made between 2002 and 2009 (n=397). Monthly surveys were con-GXFWHG�LQ�WKH�VWXG\�DUHD��ZHDWKHU�DQG�ÀRRGV�SHUPLW-WLQJ��DQG�REVHUYDWLRQV�RI�LQGLYLGXDO�LGHQWL¿FDWLRQV��location, numbers, and behaviour were recorded. Elephants were considered to associate if they were observed within 500 m of each other (Wittemyer et al., 2005; Pinter-Wollman et al., 2008). However, the majority of the observations of association involved obvious social interactions and were made at distances much closer than 500 m. Only one observation of association was recorded for any pair of individuals each day.
Association indices (AI) for all pair-wise combinations of adult females were calculated using the methods of Ginsberg and Young (1992). The program Cytoscape 2.6.3 (Shannon et al., 2003) was used to plot pair-wise AI among adult female elephants. To cluster these into a network we used the stochastic spring-embedded algorithm, as implemented in Cytoscape (Ley et al., 2008). The strength of the social bond or AI between elephants is indicated by line thickness.
Mitochondrial DNA genotyping
Genetic material was obtained from fresh faecal samples of known individuals in the subpopulation. Approximately 5 g of the surface material of fresh faeces were collected using a new pair of sterile gloves for each collection. Samples were air dried and stored in paper bags prior to DNA extraction. After drying, D�ÀDPH�VWHULOL]HG�UD]RU�EODGH�ZDV�XVHG�WR�VFUDSH�WKH�surface of dried faeces to obtain sloughed intestinal cells. Strict contamination control procedures were observed during the scraping and extraction process
Leggett et al.
Pachyderm No. 49 January–June 2011 25
(Ramey et al., 2000). DNA was then extracted using a 4,$*(1�6WRRO�'1$�NLW�DQG�PRGL¿FDWLRQV�GHVFULEHG�by Wehausen et al. (2004).
A fragment of the control region was PCR-amplified using primers LafCr1 and LafCr2, as described in Nyakaana and Arctander (1999) with WKH�IROORZLQJ�PRGL¿FDWLRQV�WR�3&5�FRQGLWLRQV�����&�GHQDWXUH�IRU���PLQ���IROORZHG�E\����F\FOHV�RI����&�IRU����VHF������&�IRU����VHF���DQG����&�IRU����VHF���Cycle sequencing was performed on both strands DW� DQ� DQQHDOLQJ� WHPSHUDWXUH� RI� ���&�ZLWK� SULPHUV�LafCr1, LafCr2, and an internal primer BETH (ATGGCCCTGAAGAAAGAACC) that was designed IRU�WKH�¿UVW�FRQVHUYHG�VHTXHQFH�EORFN�RI�WKH�FRQWURO�region (Charif et al., 2004). A second PCR was used to obtain additional control region sequence, utilizing the reverse compliment of BETH and a new primer PreRPT-r (GTCCTCCGAGCATTGACTGAA) with WKH�IROORZLQJ�3&5�FRQGLWLRQV�����&�GHQDWXUH�IRU���PLQ���IROORZHG�E\����F\FOHV�RI����&�IRU����VHF������&�IRU����VHF���DQG����&�IRU����VHF��&\FOH�VHTXHQFLQJ�ZDV�performed on both strands at an annealing temperature RI� ���&�� 8QLQFRUSRUDWHG� G\H� WHUPLQDWRUV� ZHUH�removed with DyeEx spin columns (QIAGEN), and the reactions run on an ABI373XL automated DNA sequencer. Chromatograms were compiled and edited using the program Sequencher 4.0 (GeneCodes). The combined mtDNA sequences were 829 bp in length.
ResultsPopulation size and reproduction
As of 2009, there remain only 14 adult female elephants in the Kunene subpopulation that spans the Hoarusib and Hoanib Rivers. These 14 females assort URXJKO\� LQWR�¿YH� VHFRQG�WLHU�IDPLO\� JURXSV�RI� �±��adult females and their offspring. The total number of subadults, juveniles, and calves in the subpopulation is presently 19, bringing the number of females and off-spring to 33. When adult males (n=17) who frequent the area are added in, the total number of elephants in the subpopulation may exceed 50 (although fewer are typically present). There are six remaining adult males over the age of 25 who frequent the Hoanib and Hoarusib. The mean calving interval (e.g. years of observation x number of adult females/calves born) of this subpopulation was 9.1 years, although three females have produced two calves during the study (e.g. every 4–5 years). Calf survival to one year of age was 67% (8 out of 12 observed calves), although WKLV�¿JXUH�FDQQRW�DFFRXQW�IRU�QHZERUQV�WKDW�PD\�KDYH�died before they were observed, and whose carcasses were never found.
Over the eight years of the study, the number of adult females has remained fairly constant, at around 14 (Table 2). Two adult females in the subpopulation died—WKF-10 in 2002, of natural causes and WKF-17 in 2006, of gunshot wounds (orphaning her calf). One adult female, WKF-19, joined the subpopulation, presumably from another subpopulation to the south.
Oldest adult female in each family group Associated adult females Number of subadults, juveniles, and calves
WKF-1 WKF-2 3
WKF-4 WKF-19 3
WKF-7 2
WKF-8 WKF-13 0
WKF-14 WKF-15, WKF-3, (WKF-10*), WKF-11 7
WKF-16 1
WKF-18 (WKF-17**), WKF-12 2
*Died in 2002 **Died in 2006
Table 1. Composition of elephant groups in Hoarusib and Hoanib Rivers, showing the oldest female in each family group and associated adult females during the course of this study. The number of subadults and juveniles observed during the 2009 hot-dry season are shown in the third column.
Matriarchal associations in elephants in Namibia
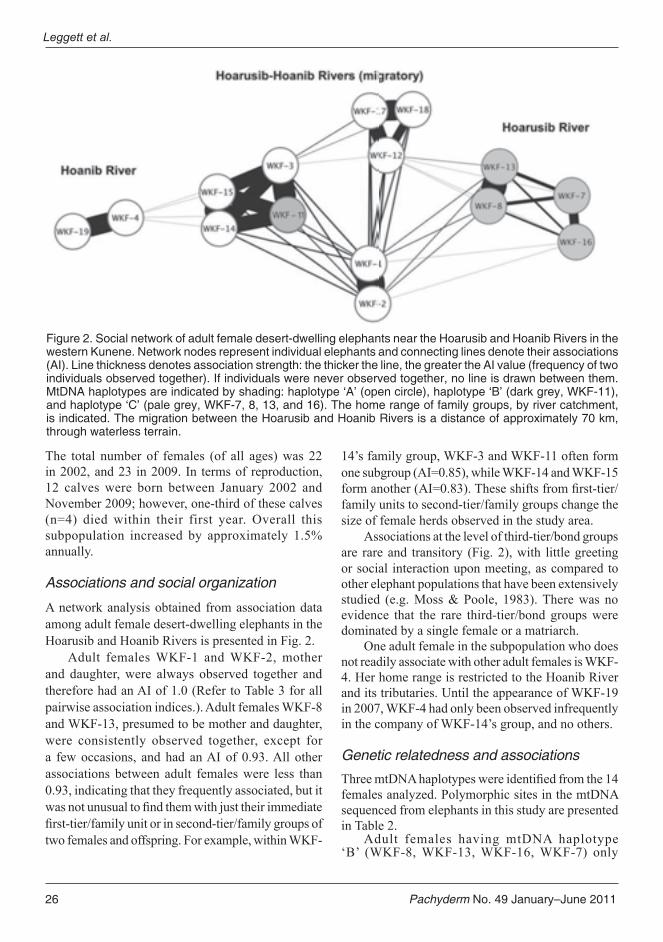
26 Pachyderm No. 49 January–June 2011
Leggett et al.
The total number of females (of all ages) was 22 in 2002, and 23 in 2009. In terms of reproduction, 12 calves were born between January 2002 and November 2009; however, one-third of these calves (n=4) died within their first year. Overall this subpopulation increased by approximately 1.5% annually.
Associations and social organization
A network analysis obtained from association data among adult female desert-dwelling elephants in the Hoarusib and Hoanib Rivers is presented in Fig. 2.
Adult females WKF-1 and WKF-2, mother and daughter, were always observed together and therefore had an AI of 1.0 (Refer to Table 3 for all pairwise association indices.). Adult females WKF-8 and WKF-13, presumed to be mother and daughter, were consistently observed together, except for a few occasions, and had an AI of 0.93. All other associations between adult females were less than 0.93, indicating that they frequently associated, but it ZDV�QRW�XQXVXDO�WR�¿QG�WKHP�ZLWK�MXVW�WKHLU�LPPHGLDWH�¿UVW�WLHU�IDPLO\�XQLW�RU�LQ�VHFRQG�WLHU�IDPLO\�JURXSV�RI�two females and offspring. For example, within WKF-
14’s family group, WKF-3 and WKF-11 often form one subgroup (AI=0.85), while WKF-14 and WKF-15 IRUP�DQRWKHU��$, �������7KHVH�VKLIWV�IURP�¿UVW�WLHU�family units to second-tier/family groups change the size of female herds observed in the study area.
Associations at the level of third-tier/bond groups are rare and transitory (Fig. 2), with little greeting or social interaction upon meeting, as compared to other elephant populations that have been extensively studied (e.g. Moss & Poole, 1983). There was no evidence that the rare third-tier/bond groups were dominated by a single female or a matriarch.
One adult female in the subpopulation who does not readily associate with other adult females is WKF-4. Her home range is restricted to the Hoanib River and its tributaries. Until the appearance of WKF-19 in 2007, WKF-4 had only been observed infrequently in the company of WKF-14’s group, and no others.
Genetic relatedness and associations
7KUHH�PW'1$�KDSORW\SHV�ZHUH�LGHQWL¿HG�IURP�WKH����females analyzed. Polymorphic sites in the mtDNA sequenced from elephants in this study are presented in Table 2.
Adult females having mtDNA haplotype µ%¶� �:.)����:.)�����:.)�����:.)���� RQO\�
Figure 2. Social network of adult female desert-dwelling elephants near the Hoarusib and Hoanib Rivers in the western Kunene. Network nodes represent individual elephants and connecting lines denote their associations (AI). Line thickness denotes association strength: the thicker the line, the greater the AI value (frequency of two individuals observed together). If individuals were never observed together, no line is drawn between them. MtDNA haplotypes are indicated by shading: haplotype ‘A’ (open circle), haplotype ‘B’ (dark grey, WKF-11), and haplotype ‘C’ (pale grey, WKF-7, 8, 13, and 16). The home range of family groups, by river catchment, is indicated. The migration between the Hoarusib and Hoanib Rivers is a distance of approximately 70 km, through waterless terrain.
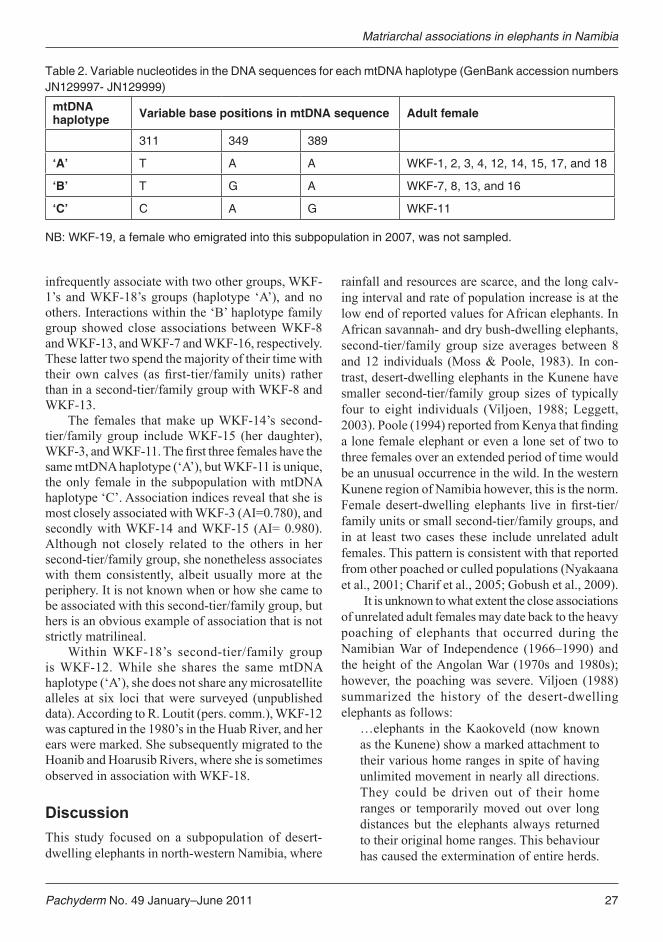
Pachyderm No. 49 January–June 2011 27
infrequently associate with two other groups, WKF-�¶V� DQG�:.)���¶V� JURXSV� �KDSORW\SH� µ$¶��� DQG�QR�RWKHUV��,QWHUDFWLRQV�ZLWKLQ�WKH�µ%¶�KDSORW\SH�IDPLO\�group showed close associations between WKF-8 and WKF-13, and WKF-7 and WKF-16, respectively. These latter two spend the majority of their time with WKHLU� RZQ� FDOYHV� �DV� ¿UVW�WLHU�IDPLO\� XQLWV�� UDWKHU�than in a second-tier/family group with WKF-8 and WKF-13.
The females that make up WKF-14’s second-tier/family group include WKF-15 (her daughter), :.)����DQG�:.)�����7KH�¿UVW�WKUHH�IHPDOHV�KDYH�WKH�VDPH�PW'1$�KDSORW\SH��µ$¶���EXW�:.)����LV�XQLTXH��the only female in the subpopulation with mtDNA KDSORW\SH�µ&¶��$VVRFLDWLRQ�LQGLFHV�UHYHDO�WKDW�VKH�LV�most closely associated with WKF-3 (AI=0.780), and secondly with WKF-14 and WKF-15 (AI= 0.980). Although not closely related to the others in her second-tier/family group, she nonetheless associates with them consistently, albeit usually more at the periphery. It is not known when or how she came to be associated with this second-tier/family group, but hers is an obvious example of association that is not strictly matrilineal.
Within WKF-18’s second-tier/family group is WKF-12. While she shares the same mtDNA KDSORW\SH��µ$¶���VKH�GRHV�QRW�VKDUH�DQ\�PLFURVDWHOOLWH�alleles at six loci that were surveyed (unpublished data). According to R. Loutit (pers. comm.), WKF-12 was captured in the 1980’s in the Huab River, and her ears were marked. She subsequently migrated to the Hoanib and Hoarusib Rivers, where she is sometimes observed in association with WKF-18.
DiscussionThis study focused on a subpopulation of desert-dwelling elephants in north-western Namibia, where
rainfall and resources are scarce, and the long calv-ing interval and rate of population increase is at the low end of reported values for African elephants. In African savannah- and dry bush-dwelling elephants, second-tier/family group size averages between 8 and 12 individuals (Moss & Poole, 1983). In con-trast, desert-dwelling elephants in the Kunene have smaller second-tier/family group sizes of typically four to eight individuals (Viljoen, 1988; Leggett, �������3RROH��������UHSRUWHG�IURP�.HQ\D�WKDW�¿QGLQJ�a lone female elephant or even a lone set of two to three females over an extended period of time would be an unusual occurrence in the wild. In the western Kunene region of Namibia however, this is the norm. )HPDOH� GHVHUW�GZHOOLQJ� HOHSKDQWV� OLYH� LQ�¿UVW�WLHU�family units or small second-tier/family groups, and in at least two cases these include unrelated adult females. This pattern is consistent with that reported from other poached or culled populations (Nyakaana et al., 2001; Charif et al., 2005; Gobush et al., 2009).
It is unknown to what extent the close associations of unrelated adult females may date back to the heavy poaching of elephants that occurred during the Namibian War of Independence (1966–1990) and the height of the Angolan War (1970s and 1980s); however, the poaching was severe. Viljoen (1988) summarized the history of the desert-dwelling elephants as follows:
…elephants in the Kaokoveld (now known as the Kunene) show a marked attachment to their various home ranges in spite of having unlimited movement in nearly all directions. They could be driven out of their home ranges or temporarily moved out over long distances but the elephants always returned to their original home ranges. This behaviour has caused the extermination of entire herds.
Table 2. Variable nucleotides in the DNA sequences for each mtDNA haplotype (GenBank accession numbers JN129997- JN129999)
mtDNA haplotype Variable base positions in mtDNA sequence Adult female
311 349 389
‘A’ T A A WKF-1, 2, 3, 4, 12, 14, 15, 17, and 18
‘B’ T G A WKF-7, 8, 13, and 16
‘C’ C A G WKF-11
NB: WKF-19, a female who emigrated into this subpopulation in 2007, was not sampled.
Matriarchal associations in elephants in Namibia
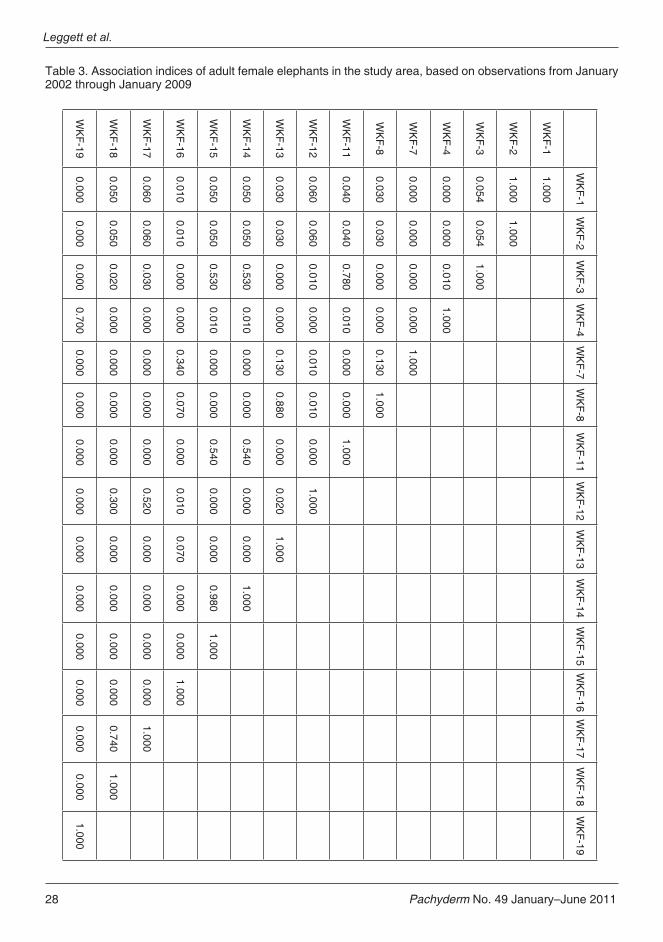
28 Pachyderm No. 49 January–June 2011
Leggett et al.
Table 3. Association indices of adult female elephants in the study area, based on observations from January 2002 through January 2009
WK
F-19
WK
F-18
WK
F-17
WK
F-16
WK
F-15
WK
F-14
WK
F-13
WK
F-12
WK
F-11
WK
F-8
WK
F-7
WK
F-4
WK
F-3
WK
F-2
WK
F-1
0.000
0.050
0.060
0.010
0.050
0.050
0.030
0.060
0.040
0.030
0.000
0.000
0.054
1.000
1.000
WK
F-1
0.000
0.050
0.060
0.010
0.050
0.050
0.030
0.060
0.040
0.030
0.000
0.000
0.054
1.000
WK
F-2
0.000
0.020
0.030
0.000
0.530
0.530
0.000
0.010
0.780
0.000
0.000
0.010
1.000
WK
F-3
0.700
0.000
0.000
0.000
0.010
0.010
0.000
0.000
0.010
0.000
0.000
1.000
WK
F-4
0.000
0.000
0.000
0.340
0.000
0.000
0.130
0.010
0.000
0.130
1.000
WK
F-7
0.000
0.000
0.000
0.070
0.000
0.000
0.880
0.010
0.000
1.000
WK
F-8
0.000
0.000
0.000
0.000
0.540
0.540
0.000
0.000
1.000
WK
F-11
0.000
0.300
0.520
0.010
0.000
0.000
0.020
1.000
WK
F-12
0.000
0.000
0.000
0.070
0.000
0.000
1.000
WK
F-13
0.000
0.000
0.000
0.000
0.980
1.000
WK
F-14
0.000
0.000
0.000
0.000
1.000
WK
F-15
0.000
0.000
0.000
1.000
WK
F-16
0.000
0.740
1.000
WK
F-17
0.000
1.000
WK
F-18
1.000
WK
F-19
Pachyderm No. 49 January–June 2011 29
Examples of this are the northern elephant population, which numbered 160 in 1970 (Owen-Smith, 1970), only to be shot out except for eight cows by 1977. These cows were almost continuously hunted until they too were killed in 1980 in the same area. Another example is the elephant herds of the middle Hoarusib River where Woods counted 100 elephants in 1951 (in: Green, 1952) but by 1977 this group had dwindled to 14 (Viljoen, 1988). In 1980 there were only four cows left who were continuously harassed and shot at by the resident people. Although these cows temporarily joined other herds for short peri-ods they repeatedly returned to the original home range until they too were killed in April 1981. Similarly, elephants that frequented the Hartman Valley - Kunene River region num-bered 40 in 1970 (Owen-Smith, 1970), eight in 1977 (Viljoen, 1988) and at present consist of only six cows and no bulls. Although these cows had on two occasions joined elephants in the western Hoarusib River, they returned over a distance of 195 km to their original home range along the Kunene River [and were subsequently shot and killed].
Viljoen (1988) also reported that, by 1980, the western subpopulation (Hoarusib, Hoanib and Uniab Rivers) consisted of 86 individuals, and by 1983 there were only 70 individuals left. The maximum number found in this region in 2009 was approximately 74 (50 in the Hoarusib and Hoanib Rivers, and potentially another 15–24 in the Uniab River and its tributaries (unpub-lished data from P. Stander, pers. comm.; J. Nott and R. Ramey, pers. comm.).
Because of heavy poaching in the past, and a low reproductive rate (i.e. long calving interval) due to the desert environment, it would appear that the traditional herd structure described by Douglas-Hamilton (1972) and Moss and Poole (1983) does not currently apply to desert-dwelling elephants of northwest Namibia. This combination of factors constrains the possible VL]H�RI�¿UVW�WLHU�IDPLO\�XQLWV�DQG�VHFRQG�WLHU�IDPLO\�groups, and therefore the potential emergence of a third-tier/bond group or fourth-tier/clan hierarchy. The majority (~12) of adult females in the subpopulation are old enough (30–50 years) to have witnessed (and possibly been orphaned by) the poaching that severely depleted the western Kunene during the late 1970s and
1980s (Viljoen, 1987). Poaching may have disrupted otherwise stable matriarchal groups and the surviving females re-formed loose associations.
Compared to savannah-dwelling elephants, desert-dwelling elephants living in this marginal environment have a lower rate of reproduction, reduced rate of defecation, longer movements and much larger home ranges (Leggett et al., 2003; Leggett, 2006; Leggett, 2008). While males come and go from this subpopulation, females are very philopatric and make only infrequent movements greater than 20 km outside these rivers. The only VXEVWDQWLDO�LQÀX[�RI�IHPDOH�HOHSKDQWV�LQWR�WKH�VWXG\�area was temporary: an unknown group of females and young (n=9) that was not known from the Hoarusib RU�+RDQLE�5LYHUV�EULHÀ\�RFFXSLHG�WKH�UHPRWH�+RDQLE�ÀRRGSODLQ� IRU� VHYHUDO�PRQWKV� LQ� ����� �SHUV�� REV����This group, however, has not been seen since (P. Stander, pers. comm.).
If this subpopulation experiences no female immigration, emigration, or unexpected mortality, then the number of reproductive females (e.g. the population structure) may be expected to remain approximately the same: seven subadult females (13 years or older) will be of reproductive age by 2014, an equal or greater number of adult females will be older than 40 years, and three will be more than 50 years. In eight years, the Hoarusib/Hoanib subpopulation has had a net loss of one adult female (and a net gain of only one female, all ages included). With only 14 adult females present and a net population reduction since the 1980s (Viljoen, 1988), it is apparent that the loss of any adult females could have negative consequences for this small subpopulation.
From a conservation perspective, at the current size and rate of increase (1.5% annually), it is doubtful that this desert subpopulation will soon recover to what it was in the 1960s, prior to extensive poaching. The combination of past poaching and a severe desert environment underscore the need to reduce female PRUWDOLW\��ZKHWKHU�LW�LV�IURP�KXPDQ�HOHSKDQW�FRQÀLFW��poaching or disease.
AcknowledgementsThe communities and conservancies of north-western Namibia, and the Ministry of Environment and Tour-ism are thanked for their permission and support dur-ing the study. We thank the following organizations for their support: Earthwatch Institute, Denver Zoo, U.S. Fish and Wildlife Service, Wilderness Trust,
Matriarchal associations in elephants in Namibia
30 Pachyderm No. 49 January–June 2011
Leggett et al.
Wildlife Conservation Society, Okahirongo Elephant Lodge and Wilderness Safaris. We also thank Garth Owen-Smith and Dr Philip Stander for discussions on the history of elephants in the Kunene.
References$OWPDQQ��-����������µ2EVHUYDWLRQDO�VWXG\�RI�EHKDYLRXU��
Sampling methods’. Behaviour 49:277–67.
Archie, E.A., Moss, C.J. and Alberts, S.C. (2006a). µ7KH�WLHV�WKDW�ELQG��JHQHWLF�UHODWHGQHVV�SUHGLFWV�WKH�¿VVLRQ�DQG�IXVLRQ�RI�VRFLDO�JURXSV�LQ�ZLOG�$IULFDQ�elephants’. Proceedings of the Royal Society B. 273:513–522.
Archie, E.A., Morrison, T.A., Foley, C.A.H., Moss, &�-�� DQG�$OEHUWV�� 6�&�� �����E��� µ'RPLQDQFH�rank relationships among wild female African elephants, Loxodonta Africana’. Animal Behaviour 71:117–127.
%XVV�� ,�2�� �������� µ6RPH�REVHUYDWLRQV�RQ� WKH�IRRG�habits and behaviour of the African elephant’. Journal of Wildlife Management 25:131–148.
%XVV�� ,�2�� DQG�6PLWK��1�6�� �������� µ2EVHUYDWLRQV�on reproduction and breeding behaviour of the African elephant’. Journal of Wildlife Management 30:375–388.
Charif, R.A., Ramey, R.R., Langbauer, W.R., Payne, K.B., Martin, R.B. and Brown, L.M. (2005). µ6SDWLDO�UHODWLRQVKLSV�DQG�PDWULOLQHDO�NLQVKLS�LQ�African savannah elephant (Loxodonta africana) clans’. Behavioural Ecology and Sociobiology 57:327–338.
Desert Research Foundation (Undated). Elephant Monitoring. Appendix 2, Project No. 3884 (NA 0002), Huab Catchment Area, Conservation Project.
'RXJODV�+DPLOWRQ�� ,�� �������� µ2Q� WKH� HFRORJ\� DQG�behaviour of the African elephant’. PhD Thesis, Oxford, UK: University of Oxford.
Douglas-Hamilton, I. and Douglas-Hamilton, O. (1975). Among the Elephants. London: Collins and Harvill Press.
*LQVEHUJ��-�5��DQG�<RXQJ��7�3�� �������� µ0HDVXULQJ�association between individuals or groups in behavioural studies’. Animal Behaviour. 44:377–379.
*REXVK��.���.HUU��%��DQG�:DVVHU��6����������µ*HQHWLF�relatedness and disrupted social structure in a poached population of African elephants’. Molecular Ecology 18:722–734.
Green, L. (1952). Lords of the Last Frontier. Cape Town: Howard B. Timmins.
Jacobson, P.J., Jacobson, K.M. and Seely, M.K. (1995). Ephemeral rivers and their catchments: sustaining people and development in western Namibia. Windhoek: Desert Research Foundation of Namibia.
/DZV��5�0�� �������� µ$JH� FULWHULD� IRU� WKH�$IULFDQ�elephant’. African Journal of Ecology 4(1):1–37.
Leggett, K.E.A., Fennessy, J.T. and Schneider, 6�� �������� µ6HDVRQDO� GLVWULEXWLRQV� DQG� VRFLDO�dynamics of elephants in the Hoanib River catchment, northwestern Namibia’. African Zoology 38:305–316.
/HJJHWW��.�(�$�� �������� µ&RSURSKDJ\� DQG�XQXVXDO�thermoregulatory behaviour in desert-dwelling elephants of north-western Namibia’. Pachyderm 36:113–115.
/HJJHWW��.�(�$����������µ+RPH�UDQJH�DQG�VHDVRQDO�movement of elephants in the Kunene Region, Northwest Namibia’. African Zoology. 41(1):17–36.
/HJJHWW��.�(�$�� �������� µ'LXUQDO� DFWLYLWLHV� RI� WKH�desert-dwelling elephants in northwestern Namibia’. Pachyderm 45:20–33.
Ley, R.E., Hamady, M., Lozupone, C., Turnbaugh, P., Ramey, R.R., Bircher, S., Schlegel, M.L., Tucker, T.A., Schrenzel, M.D., Knight, R. and Gordon, -�,����������µ(YROXWLRQ�RI�PDPPDOV�DQG�WKHLU�JXW�microbes’. Science 320:1,647–1,651.
/LQGHTXH��0��DQG�/LQGHTXH��3�0����������µ6DWHOOLWH�tracking of elephants in northwest Namibia;. African Journal of Ecology 29:196–206.
Marsh, J.H. (2008). Skeleton Coast. 2nd edition. 1DPLELDQ�6FLHQWL¿F�6RFLHW\�
0DUWLQ��5�%�� �������� µ$VSHFWV� RI� HOHSKDQW� VRFLDO�organization’. Rhodesian Science News 12:184–187.

Pachyderm No. 49 January–June 2011 31
McComb, K., Moss, C.J., Durant, S.M., Baker, L. and 6D\LDOHO��6����������µ0DWULDUFKV�DV�UHSRVLWRULHV�RI�social knowledge in African elephants’. Science 292:491–494.
Moss, C.J. (1982). Portraits in the Wild: Animal Behaviour in East Africa. Chicago, USA: University of Chicago Press.
Moss, C.J. (1988) Elephant Memories. New York, NY: William Morrow.
0RVV��&�-��DQG�3RROH��-�+����������µ5HODWLRQVKLSV�DQG�social structure in African elephants.’ In: Primate Social Relationships: An Integrated Approach. 5�$��+LQGH��HG���2[IRUG��8.��%ODFNZHOO�6FLHQWL¿F�Publications.
1\DNDDQD��6��DQG�$UFWDQGHU��3����������µ3RSXODWLRQ�genetic structure of the African elephant in Uganda based on variation at mitochondrial and QXFOHDU�ORFL��HYLGHQFH�IRU�PDOH�ELDVHG�JHQH�ÀRZ¶��Molecular Ecology 8:1,105–1,115.
Nyakaana S., Abe, E.L., Arctander, P. and Siegismund, +�5����������µ'1$�HYLGHQFH�IRU�HOHSKDQW�VRFLDO�behaviour breakdown in Queen Elizabeth National Park, Uganda’. Animal Conservation 4:231–237.
Okello, J.B.A., Masembe, C., Rasmussen, H.B., Wittemyer, G., Omondi, P., Kahindi, O., Muwanika, V.B., and Arctander, P., Douglas-Hamilton, I., Nyakaana, S. and Siegismund, +�5�� �������� µ3RSXODWLRQ� JHQHWLF� VWUXFWXUH� RI�savannah elephants in Kenya: conservation and management implications’. Journal of Heredity 99:443–452.
Owen-Smith, G.L. (1970). The Kaokoveld: An Ecological Base for Future Development Planning. Unpublished report.
2ZHQV��0�-�� DQG�2ZHQV��'�� �������� µ(DUO\� DJH�reproduction in female savannah elephants (Loxodonta africana) after severe poaching’. African Journal of Ecology 47:214–222.
Pinter-Wollman, N., Isbell, L.A. and Hart, L.A. ��������µ7KH�UHODWLRQVKLS�EHWZHHQ�VRFLDO�EHKDYLRXU�and habitat familiarity in African elephants (Loxodonta africana)’. Proceedings of the Royal Society B doi:10.1098/rspb.2008.1538. Published online.
Pinter-Wollman, N., Isbell, L.A. and Hart, L.A. �������� µ$VVHVVLQJ� WUDQVORFDWLRQ� RXWFRPH��Comparing behavioural and physiological aspects of translocated and resident African elephants (Loxodonta africana)’. Biological Conservation 142:1,116–1,124.
3RROH��-�+����������µ6H[�GLIIHUHQFHV�LQ�WKH�EHKDYLRXU�of African elephants’. In: R.V. Hort and F. Balaban (eds.) The differences between the sexes, pp. 331-347. New York, USA: Cambridge University Press.
3RROH�� -�+�� �������� µ7KH�$IULFDQ� HOHSKDQW¶�� ,Q��.��Kangwana (ed.) Studying Elephants, Nairobi, Kenya: AWF Technical Handbook Series No. 7, African Wildlife Foundation.
Ramey, R.R., Boyce, W.M., Farrell, B. and Kelley, 6�� �������� µ3K\ORJHQ\� DQG� KRVW� VSHFL¿FLW\� RI�psoroptic mange mites as indicated by ITS sequence data’. Journal of Medical Entomology 37(6):791–796.
Shannon, P., Markiel, A., Ozier, O., Baliga, N.S., Wang, J.T., Ramage, D., Amin, N., Schwikowski, %�� DQG� ,GHNHU�� 7�� �������� µ&\WRVFDSH�� $�Software Environment for Integrated Models of Biomolecular Interaction Networks’. Genome Research 13:2,498–2,504.
Sukumar, R. (1989). The Asian Elephant: Ecology and Management. Cambridge, UK: Cambridge University Press.
9LOMRHQ�� 3�-�� �������� µ6WDWXV� DQG� SDVW� DQG� SUHVHQW�distribution of elephants in Kaokoveld, South West Africa/Namibia’. South African Journal of Zoology 22:247–257.
9LOMRHQ�� 3�-�� �������� µ7KH� HFRORJ\� RI� WKH� GHVHUW�dwelling elephants (Loxodonta africana) (Blumenbach, 1797) of western Damaraland and Kaokolan. PhD Thesis. Pretoria, South Africa: University of Pretoria.
9LOMRHQ�� 3�-�� �����D��� µ6SDWLDO� GLVWULEXWLRQ� DQG�movements of elephants (Loxodonta africana) in the northern Namib Desert region of the Kaokoveld, Southwest Africa/Namibia’. South African Journal of Zoology 219:1–19.
Matriarchal associations in elephants in Namibia

32 Pachyderm No. 49 January–June 2011
Leggett et al.
9LOMRHQ��3�-�������E���µ+DELWDW�VHOHFWLRQ�DQG�SUHIHUUHG�food plants of a desert-dwelling elephant population in the Northern Namib Desert, South West Africa/Namibia’. African Journal of Ecology 27:227–240.
9LOMRHQ�� 3�-�� DQG� %RWKPD�� -�'�� �������� µ'DLO\�movements of desert-dwelling elephants in the northern Namib Desert’. South African Journal of Wildlife Research 20:69–72.
Wehausen, J.D., Ramey, R.R. and Epps, C. (2004). µ([SHULPHQWV� LQ� '1$� H[WUDFWLRQ� DQG� 3&5�amplification from bighorn sheep faeces: the importance of DNA extraction method’. Journal of Heredity 95(6):503–509.
:LWWHP\HU��*�� �������� µ7KH�HOHSKDQW�SRSXODWLRQ�RI�Samburu and Buffalo Springs National Reserves, Kenya’. African Journal of Ecology 39:357–365.
Wittemyer, G., Douglas-Hamilton, I. and Getz, W.M. ��������µ7KH�VRFLRHFRORJ\�RI�HOHSKDQWV��DQDO\VLV�of the processes creating multi-tiered social structures’. Animal Behaviour 69:1,357–1,371.
Wittemyer, G., Getz, W.M., Vollrath, F. and Douglas-+DPLOWRQ��,����������µ6RFLDO�GRPLQDQFH��VHDVRQDO�movements, and spatial segregation in African elephants: a contribution to conservation behaviour’. Behavioural Ecology and Sociobiology 61:1,919–1,931.
Wittemyer, G., Okello, J.B.A., Rasmussen, H.B., Arctander, P., Nyakaana, S., Douglas-Hamilton, ,��DQG�6LHJLVPXQG��+�5����������µ:KHUH�VRFLDOLW\�and relatedness diverge: the genetic basis for hierarchical social organization in African elephants’. Proceedings of the Royal Society B. doi:10.1098/rspb.2009.0941. Published online.
Pachyderm No. 49 January–June 2011 33
Invasive species in grassland habitat: an ecological threat to the greater one-horned rhino (Rhinoceros unicornis)
Bibhuti P. Lahkar, Bibhab Kumar Talukdar and Pranjit Sarma
Aaranyak, 50 Samanwoy Path (Survey), PO Beltola, Guwahati - 781 028, Assam, India;
email: [email protected]
AbstractThe successes achieved in Assam towards conservation and management of greater one-horned rhinos (Rhi-noceros unicornis) are often overshadowed by a few poaching incidences. Rhino conservation efforts made by the Assam Forest Department, assisted by communities and civil society organizations, have made it possible to downgrade the status of greater one-horned rhinos from Endangered to Vulnerable on IUCN’s 2008 Red Lists of Threatened Species. One of the major threats besides poaching is the slow and steady intrusion of LQYDVLYH�VSHFLHV�LQ�JUDVVODQG�KDELWDWV��ZKLFK�GLUHFWO\�UHGXFHV�VXLWDEOH�ÀRUD�IRU�UKLQRV�DQG�RWKHU�KHUELYRUHV���This matter has not yet been highlighted to attract conservation intervention and support. The increasing inva-VLRQ�RI�ZHHGV�WKDW�KDV�EHHQ�REVHUYHG�LQ�1HSDO�DQG�,QGLD¶V�JUDVVODQG�KDELWDWV�LQ�WKH�SDVW�GHFDGH�QHHGV�VFLHQWL¿F�intervention to ensure the long-term conservation of rhino habitats. Based on available information, we portray the threats posed by invasive species towards the survival of greater one-horned rhinos in India and Nepal.
Key words: greater one-horned rhino, invasive species, management, threats, grassland
Résumé
Les succès obtenus dans l’Assam dans la conservation et la gestion du grand rhinocéros unicorne (Rhinoceros unicornis) sont souvent obscurcis par quelques incidences de braconnage. Les efforts faits par le Département GHV�)RUrWV�GH�O¶$VVDP�SRXU�FRQVHUYHU�OH�UKLQRFpURV��DVVLVWp�SDU�OHV�FRPPXQDXWpV�HW�OHV�RUJDQL]DWLRQV�GH�OD�société civile, ont permis de déclasser l’inscription du grand rhinocéros unicorne d’une Espèce menacée de disparition à une Espèce vulnérable sur les Listes rouges de l’UICN de 2008. L’une des principales menaces qui pèsent sur ces animaux à part le braconnage c’est l’intrusion lente et régulière des espèces envahissantes dans les habitats des herbages, ce qui réduit directement les essences adaptées aux rhinocéros et aux autres herbivores. Cette question n’a pas encore été mise en exergue pour attirer l’intervention et le soutien à la conservation. L’invasion croissante des mauvaises herbes qu’on a observée dans les habitats des herbages GX�1pSDO�HW�HQ�,QGH�DX�FRXUV�GH�OD�GHUQLqUH�GpFHQQLH�QpFHVVLWH�XQH�LQWHUYHQWLRQ�VFLHQWL¿TXH�SRXU�YHLOOHU�j�OD�conservation à long terme des habitats de rhinocéros. Selon les informations disponibles, nous décrivons les menaces posées par les espèces envahissantes à la survie des grands rhinocéros unicornes en Inde et au Népal.
34 Pachyderm No. 49 January–June 2011
Lahkar et al.
IntroductionThe critical issue facing the managers of protected areas and conservationists is how to maintain biodiversity in the face of naturally ocurring and man-made perturbations in the habitat (Love et al., 2009). Biological invasions are among the anthropo-genically-mediated perturbations threatening native biodiversity, preventing natural ecological succession and changing the community structure and composi-tion; additionally, ecosystem services are impacted (Vitousek et al., 1996; Mack et al., 2000).
All rhino-bearing protected areas of India and Nepal are protected from poachers and encroachers by government decree since its inception under the legal framework of the two countries. Although threats to rhinos from poaching are highlighted more often (Talukdar, 2002, 2003, 2006), the spread of invasive species in the rhino habitats of India and Nepal has become a major concern in recent years.
Although it is a natural process, worldwide biological invasion threatens biodiversity, ecosystem dynamics, resource availability, national economies and human health (Ricciardi et al., 2000). It is a pervasive and costly environmental problem (Larson et al., 2001). Nevertheless, the growing human population and improved worldwide transport have led to a skyrocketing incidence and scale of invasions by non-indigenous species (Ewel et al., 1999).
Distribution of invasive plants may have relationships with human disturbances, which can be HDVLO\�LGHQWL¿HG�LQ�IRUHVW�IULQJH�DUHDV��+RRSHU�HW�DO���2005). In general, increasing the frequency, intensity, spatial patterns or scale of disturbances will likely lead to faster replacement of native by exotic species (Yan et al., 2001).
All of the invasive plant species are from South America and were introduced to the Indian subcontinent as fodder crops or ornamentals in the early part of the last century (Lowe et al., 2000). The principal invasive species in rhino habitats are Mikania micrantha, Mimosa spp., Ipomea spp. and Chromolaena odorata, which have the potential to destroy prime animal habitats including that of rhinos.
This paper provides the foundation for developing urgently needed management components such as VWUHDPOLQHG�SODQQLQJ�RI�µSULRULW\�DUHDV¶�IRU�FRQWUROOLQJ�the invasive species and integration of control activities with existing park management strategies and activities.
Alien species in rhino habitatsMimosa diplotricha is a fast growing, abundantly thorny, biennial or perennial shrub with angular branching stems that become woody with age. Its leaves are alternate, bipinnate and compound. Once established, Mimosa spp. is difficult to control. Mimosa seeds are typically dispersed in two ways: FDUULHG�GRZQVWUHDP�GXULQJ�ÀRRGV�RU�WUDQVSRUWHG�E\�animals or machinery. Moreover, it is reported to be poisonous to herbivores and considered to be one of the most serious alien invasive species (IUCN/ISSG database). The invasion of Mimosa has emerged a major threat in Kaziranga National Park (NP) (Vat-takkavan et al., 2002).
Chromolaena odorata is a perennial shrub species native to neotropical America stretching from southern Florida to the upper drainage basin of the Amazon in Southern Bolivia. IUCN’s Invasive 6SHFLHV�6SHFLDOLVW�*URXS�KDV�LGHQWL¿HG�Chromolaena as one of the hundred worst invaders. Until recently, LW�ZDV�WD[RQRPLFDOO\�FODVVL¿HG�DV�(XSDWRULXP��7KH�genus Chromolaena belongs to the family Asteraceae, one of the largest and most evolved of plant families.
Mikania micrantha is a perennial creeping climber known for its vigorous and rampant growth. It grows best where fertility, organic matter, soil moisture and humidity are high. It damages or kills other plants by cutting out the light and smothering them and competing for water and nutrients. A native of Central and South America, Mikania micrantha was LQWURGXFHG�WR�,QGLD�DIWHU�:RUOG�:DU�,,�WR�FDPRXÀDJH�airfields. Once established, Mikania micrantha spreads at an alarming rate, readily climbing and twining on any vertical support, including crops, EXVKHV�� WUHHV��ZDOOV� DQG� IHQFHV�� 6LJQL¿FDQWO\�� LW� LV�believed that the plant releases substances that inhibit the growth of other plants (IUCN/ISSG database).
Ipomoea carnea, the Pink Morning Glory, is RI�$PHULFDQ�RULJLQ��7KLV�ÀRZHULQJ�SODQW�KDV�KHDUW�shaped leaves that are a rich green and 6–9 inches long. It can be easily grown from seeds which are toxic and it can be hazardous to herbivores (USDA database).
Lantana camara is a low erect or subscandent, vigorous shrub with stout recurved prickles and a strong odour of black currents. It grows to 1.2–2.4 metres or more. The diverse and broad geographic GLVWULEXWLRQ� RI� ODQWDQD� LV� D� UHÀHFWLRQ� RI� LWV�ZLGH�ecological tolerances. It occurs in diverse habitats
Pachyderm No. 49 January–June 2011 35
Invasive species in greater one-horned rhino habitat
and on a variety of soil types. Lantana is now a major weed in many regions of the world where it invades natural and agricultural ecosystems. Lantana has been implicated in the poisoning of a number of herbivores including cattle, buffalos, sheep and goats (IUCN/SSG database).
Mode of invasionThe dispersal of plant species through natural dispersal agents like air and water has been slow process. However, with globalization there has been a phenomenal increase in trade, tourism, travel and other human activities, which have caused both the intentional and unintentional introduction of species from one country to another at an unprecedented pace.
A classic example of the intentional introduction of an invasive plant in Assam is Mimosa, which was brought by tea garden owners as nutrients (for their nitrogen containing property) for economic development. Unfortunately, Mimosa penetrated into
rhino habitats of Kaziranga NP (Vattakkavan et al., 2002) and Orang NP (pers. comm. and observations) from tea gardens through water and subsequently established itself in the grasslands of both of these rhino bearing parks.
Some of the most invasive and widespread unintentional introductions include Mikania micrantha, Ipomea, Lantana camara and Chromolaena odorata. The unintentional introduction modes include aircraft, road vehicles, boats, water, commercial goods and packaging materials. Wind, insects and birds also help in spreading invasive plant species.
Impact of invasive species on rhino habitatGrasslands of the Indian subcontinent have suffered a rapid decline, mainly due to human-induced modi-¿FDWLRQV�WKDW�LQFOXGH�KXPDQ�VHWWOHPHQW��DJULFXOWXUH��XUEDQL]DWLRQ�� XQV\VWHPDWLF� ¿UH�� OLYHVWRFN� JUD]LQJ��irrigation and dams. All the extended grasslands both
Table 1. Some alien species that have detrimental impacts on grassland ecosystems, as recorded in rhino habitats in India and Nepal
Sites Invasive species Current Impact Rate of spread Management by Forest Department
Kaziranga NP Mimosa Severe Increasing rapidly /CPWCN�TGOQXCN��ſTG
Mikania Moderate Increased moderately None
Orang NP Mimosa Severe Increasing rapidly Fire
Mikania High Increasing rapidly None
Chromolaena Moderate Increasing slowly None
Manas NP Chromolaena Severe Increasing rapidly Fire
Mikania High Increasing rapidly None
Pabitora WLS Ipomoea High Increasing rapidly None
Mikania Moderate Increasing slowly None
Jaldapara WLS
Mikania High Increasing rapidly
Garumara NP Mikania High Increasing rapidly
Chromolaena High Increasing rapidly
Chitwan NP Mikania Severe Increasing rapidly Cut & burnt, Herbi-cides
Chromolaena High Increasing rapidly 7RTQQV���ſTG
Lantana High Increasing slowly Cut & uprootBardia NP Mikania Severe Increasing rapidly
Lantana High Increasing rapidly Cut & uproot
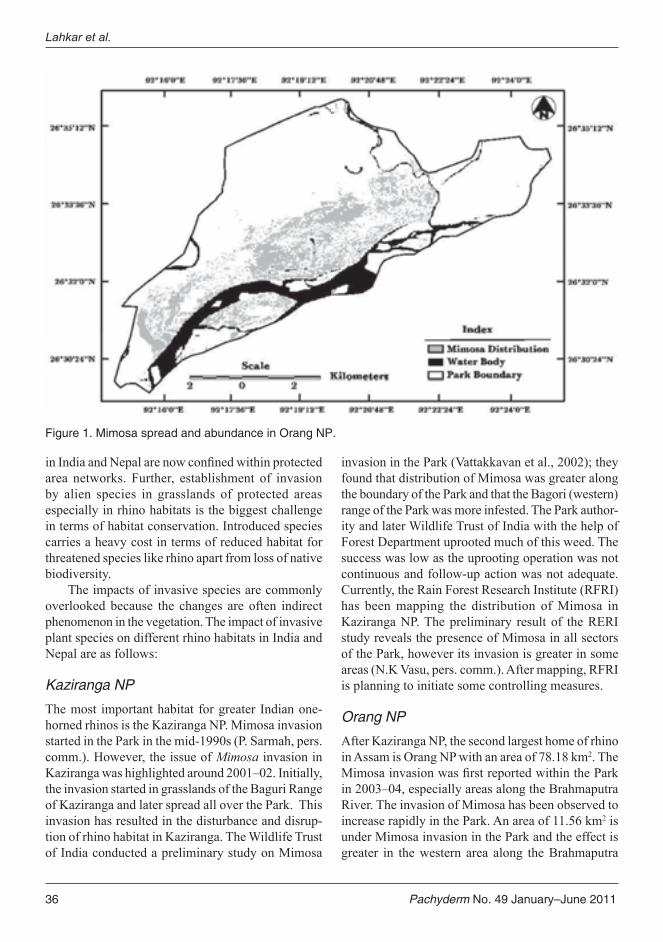
36 Pachyderm No. 49 January–June 2011
Lahkar et al.
LQ�,QGLD�DQG�1HSDO�DUH�QRZ�FRQ¿QHG�ZLWKLQ�SURWHFWHG�area networks. Further, establishment of invasion by alien species in grasslands of protected areas especially in rhino habitats is the biggest challenge in terms of habitat conservation. Introduced species carries a heavy cost in terms of reduced habitat for threatened species like rhino apart from loss of native biodiversity.
The impacts of invasive species are commonly overlooked because the changes are often indirect phenomenon in the vegetation. The impact of invasive plant species on different rhino habitats in India and Nepal are as follows:
Kaziranga NP
The most important habitat for greater Indian one-horned rhinos is the Kaziranga NP. Mimosa invasion started in the Park in the mid-1990s (P. Sarmah, pers. comm.). However, the issue of Mimosa invasion in Kaziranga was highlighted around 2001–02. Initially, the invasion started in grasslands of the Baguri Range of Kaziranga and later spread all over the Park. This invasion has resulted in the disturbance and disrup-tion of rhino habitat in Kaziranga. The Wildlife Trust of India conducted a preliminary study on Mimosa
invasion in the Park (Vattakkavan et al., 2002); they found that distribution of Mimosa was greater along the boundary of the Park and that the Bagori (western) range of the Park was more infested. The Park author-ity and later Wildlife Trust of India with the help of Forest Department uprooted much of this weed. The success was low as the uprooting operation was not continuous and follow-up action was not adequate. Currently, the Rain Forest Research Institute (RFRI) has been mapping the distribution of Mimosa in Kaziranga NP. The preliminary result of the RERI study reveals the presence of Mimosa in all sectors of the Park, however its invasion is greater in some areas (N.K Vasu, pers. comm.). After mapping, RFRI is planning to initiate some controlling measures.
Orang NP
After Kaziranga NP, the second largest home of rhino in Assam is Orang NP with an area of 78.18 km2. The 0LPRVD�LQYDVLRQ�ZDV�¿UVW�UHSRUWHG�ZLWKLQ�WKH�3DUN�in 2003–04, especially areas along the Brahmaputra River. The invasion of Mimosa has been observed to increase rapidly in the Park. An area of 11.56 km2 is under Mimosa invasion in the Park and the effect is greater in the western area along the Brahmaputra
Figure 1. Mimosa spread and abundance in Orang NP.
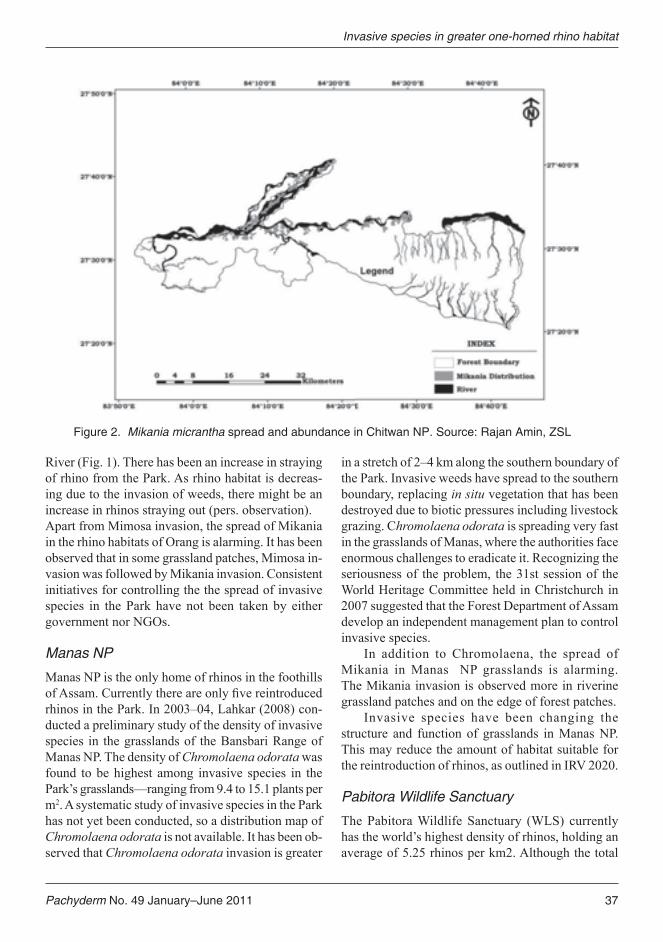
Pachyderm No. 49 January–June 2011 37
Invasive species in greater one-horned rhino habitat
River (Fig. 1). There has been an increase in straying of rhino from the Park. As rhino habitat is decreas-ing due to the invasion of weeds, there might be an increase in rhinos straying out (pers. observation). Apart from Mimosa invasion, the spread of Mikania in the rhino habitats of Orang is alarming. It has been observed that in some grassland patches, Mimosa in-vasion was followed by Mikania invasion. Consistent initiatives for controlling the the spread of invasive species in the Park have not been taken by either government nor NGOs.
Manas NP
Manas NP is the only home of rhinos in the foothills RI�$VVDP��&XUUHQWO\�WKHUH�DUH�RQO\�¿YH�UHLQWURGXFHG�rhinos in the Park. In 2003–04, Lahkar (2008) con-ducted a preliminary study of the density of invasive species in the grasslands of the Bansbari Range of Manas NP. The density of Chromolaena odorata was found to be highest among invasive species in the Park’s grasslands—ranging from 9.4 to 15.1 plants per m2. A systematic study of invasive species in the Park has not yet been conducted, so a distribution map of Chromolaena odorata is not available. It has been ob-served that Chromolaena odorata invasion is greater
in a stretch of 2–4 km along the southern boundary of the Park. Invasive weeds have spread to the southern boundary, replacing in situ vegetation that has been destroyed due to biotic pressures including livestock grazing. Chromolaena odorata is spreading very fast in the grasslands of Manas, where the authorities face enormous challenges to eradicate it. Recognizing the seriousness of the problem, the 31st session of the World Heritage Committee held in Christchurch in 2007 suggested that the Forest Department of Assam develop an independent management plan to control invasive species.
In addition to Chromolaena, the spread of Mikania in Manas NP grasslands is alarming. The Mikania invasion is observed more in riverine grassland patches and on the edge of forest patches.
Invasive species have been changing the structure and function of grasslands in Manas NP. This may reduce the amount of habitat suitable for the reintroduction of rhinos, as outlined in IRV 2020.
Pabitora Wildlife Sanctuary
The Pabitora Wildlife Sanctuary (WLS) currently has the world’s highest density of rhinos, holding an average of 5.25 rhinos per km2. Although the total
Figure 2. Mikania micrantha spread and abundance in Chitwan NP. Source: Rajan Amin, ZSL
38 Pachyderm No. 49 January–June 2011
area of the Sanctuary is only 38.81 km2, 16 km2 are inhabited by rhinos. The invasion of Ipomoea in grassland is the biggest threat to the rhino habitat in Pabitora. It has sparked competition among grasses and Ipomoea for space and nutrients. Sarma et al. (2009) highlighted the number of rhinos straying from the Sanctuary due to changes in grassland dynamics. Unregulated livestock grazing has also affected the quality of grassland in Pabitora.
So far no robust initiative has been taken by government nor NGOs for controlling the invasive species in the Sanctuary, which seems to be essential for improving the condition of rhino habitat.
Jaldapara WLS
Jaldapara WLS represents the remnant patches of grasslands in duars of North Bengal. Biswas and Mathur (2003) highlighted the Mikania invasion in grassland patches, which was found to be more wide-spread in grasslands in the old river bed with primary woodland succession, grasslands along the current riverbed and generated grassland patches. Not much information is available about the impact of invasive species in the Sanctuary. Although the Forest Depart-ment has been regularly clearing weeds, systematic initiative has not been taken by them or by NGOs for controlling the invasive species in the Sanctuary.
Garumara NP
All the grassland patches in the Park have been planted by the forest department to create grassland habitats suitable for rhinos. Not much information is known about the impact of invasive species in the Park, although the Forest Department has regularly cleared weeds; unfortunately, a systematic initiative has not been taken by concerned conservation and research agencies for controlling the invasive spe-cies in the NP.Chitwan NP
The Zoological Society of London, the National Trust for Nature Conservation in Nepal and CABI have been working in the Park to understand the impact of invasive species and further prevent the spread-ing invasion through short- and long-term planning. They found that there were two main problematic invasives—Mikania in the wetter areas and Chro-molaena in the dryer zones. About 50% of potential rhino areas are now affected by the principal invasive species with primary rhino habitats (Rajan Amin, pers. comm.) (Fig. 2). The initial focus in the short-term
could include improved cultural/mechanical control based on the experience from previous trials. Long-term measures could address developing biological control, looking at successful campaigns in India and elsewhere.
Bardia NP
Not much information is available on the impact of invasive species on rhino habitat. Again, the Zoologi-cal Society of London, the National Trust for Nature Conservation in Nepal and CABI have been working in the Park to understand the impact of invasive spe-cies and undertake mitigating measures through both short- and long-term planning.
ConclusionIt is now widely accepted that the control of alien invasive species is not a short-term or isolated effort. It requires the long-term application of efforts aided by constant monitoring and investigation. Concerted effort is needed to control invasive species and a better understanding of the causes of their spread can help to implement pre-emptive measures.
The potential of these invasive alien plants to destroy prime rhino habitat is enormous and should be investigated properly and immediately. The cost and GLI¿FXOW\�RI�HUDGLFDWLRQ�LQFUHDVH�H[SRQHQWLDOO\�ZLWK�each season of delay. It cannot be over-emphasized; experience elsewhere has shown that if left too long the problem will become so immense that infestations cannot be practically or economically dealt with. Thus important habitats for the rhino would be destroyed.
Government agencies, institutions and individuals in rhino bearing areas lack adequate knowledge of the ecological and environmental consequences caused by invasive alien species and how to address it. Hence emphasis should be given to apprise policy makers, managers, conservationists, media and the academic community about this genuine threat to Asian rhinos.
References%LVZDV�7��DQG�0DWKXU��9�%����������µ7KH�JUDVVODQGV�
of Jaldapara Wildlife Sanctuary-composition, VWUXFWXUH� DQG� WKHLU� FRQVHUYDWLRQ� VLJQL¿FDQFH¶��ENVIS Bulletin on Grassland Ecosystems and Agroforestry 1(1):29–47.
Lahkar et al.
Pachyderm No. 49 January–June 2011 39
Invasive species in greater one-horned rhino habitat
Ewel, J.J., O’Dowd, D.J., Bergelsen, J., Daehler, C.C., D’Antonio, C.M., Gomez, L.D. (1999). µ'HOLEHUDWH� LQWURGXFWLRQV� RI� VSHFLHV��5HVHDUFK�needs’. Bioscience 49:619–30.
Hooper, D.U., Chapin, F.S. III, Ewel, J. J., Hector, A., Inchausti, P., Lavorel, S., Lawton, J. H., Lodge, D. M., Loreau, M., Naeem, S., Schmid, B., Setälä, H., Symstad, A. J., Vandermeer, J., :DUGOH��'�$����������µ(IIHFWV�RI�%LRGLYHUVLW\�RQ�Ecosystem Functioning: A Consensus of Current Knowledge’. Ecological Monographs 75(1):3–35.
/DKNDU��%�3�� �������� µ(FRORJ\�DQG�0DQDJHPHQW�RI�Grassland with special reference to Grass and Bird Communities in Manas National Park’. Ph.D. Thesis Assam: Gauhati University, Guwahati.
Larson, D.L., Anderson P.J., and Newton, W. (2001). µ$OLHQ�LQYDVLRQ�LQ�PL[HG�JUDVV�SUDLULH��(IIHFWV�RI�vegetation type and anthropogenic disturbance’. Ecol Appl 11:128–41.
Love, A., Babu, S., and Babu, C.R. (2009). µ0DQDJHPHQW�RI�Lantana, an invasive alien weed, in forest ecosystems of India’. Current Science 97(10):1421-1429
Lowe S., Browne, M., Boudjelas, S. and De Poorter, M. (2000). 100 of the World’s Worst Invasive Alien Species. A selection from the Global Invasive Species Database. Published by the Invasive Species Specialist Group (ISSG) a specialist group of the Species Survival Commission (SSC) of the World Conservation Union (IUCN), 12pp. First published as special lift-out in Aliens 12, December 2000.
Mack, R.N., Simberloff, D., Londsdale, W.M., Evans, H., Clout M. and Bazzaz, F. (2000). µ%LRWLF� LQYDVLRQV�� FDXVHV�� HSLGHPLRORJ\�� JOREDO�consequences, and control’. Ecol. Appl. 10:689–710.
Ricciardi A., Steiner, W.W.M., Mack R.N. and 6LPHUORII�� '�� �������� µ7RZDUGV� D� JOREDO�information system for invasive species’. Bioscience 50(3):239–44.
Sarma, P.K., Talukdar, B.K., Sarma, K. and Barua, 0�� �������� µ$VVHVVPHQW� RI� KDELWDW� FKDQJH� DQG�threats to the great one-horned rhino (Rhinoceros unicornis) in Pabitora Wildlife Sanctuary, Assam, using multi-temporal satellite data.’ Pachyderm 46:18–24.
7DOXNGDU��%�.����������µ'HGLFDWLRQ�OHDGV�WR�UHGXFHG�rhino poaching in Assam in recent years’. Pachyderm 33:58–63.
7DOXNGDU��%�.����������µ,PSRUWDQFH�RI�DQWL�SRDFKLQJ�measures towards successful conservation and protection of rhinos and elephants, north-eastern India’. Pachyderm, 34:59–65.
Talukdar, B.K. (2006). Assam Leads in conserving the greater one-horned Rhinoceros in the new millennium. Pachyderm 41:85–89.
Vattakkavan, J., Vasu, N.K., Varma, S., Gureja N. DQG�$L\DGXUDL��$�� �������� µ6LOHQW� 6WUDQJOHUV��Eradication of Mimosa in Kaziranga National Park, Assam’. Wildlife Trust of India, New Delhi, 55 pp.
Vitousek, P. M., Dantonio, C.M., Loope, L.L. and :HVWEURRNV��5�� � �������� µ%LRORJLFDO� LQYDVLRQV�as global environmental change’. Am. Sci., 84:468–478.
Yan, X, L Zhenyu, Gregg, W.P. and Dianmo, L. ��������µ,QYDVLYH�VSHFLHV�LQ�&KLQD²DQ�RYHUYLHZ��Biodiversity and conservation 10:1317–1341.

40 Pachyderm No. 49 January–June 2011
The relic population of forest elephants near Lake Tumba, Democratic Republic of Congo: abundance, dung lifespan, food items and movements
Bila-Isia Inogwabini1, 2 *, Longwango Mbende2 and Abokome Mbenzo2
1 Durrell Institute for Conservation and Ecology2 World Wide Fund for Nature, DRC Programme* Corresponding author: email: [email protected]
Abstract A survey of forest elephant was conducted in the southern Lake Tumba region, using both transect and for-est reconnaissance methods. Three focal areas of elephants were discovered in the region stretching from 1JRPEH�GRZQ�WR�WKH�UHJLRQ�RI�0DOHER��'XH�WR�LQVXI¿FLHQW�GDWD��RQO\�UHODWLYH�DEXQGDQFHV�ZHUH�FDOFXODWHG�and varied among these three different locations: 0.03 dung-piles/km (Ngombe–Lake Tumba), 0.04 dung-piles/km (Mbanzi–Malebo) and 0.33 dung-piles/km (Lukolela). Elephant trails in the Malebo–Mbanzi area were traversed 0.52 passages/day, within the range [0.50–3.0], indicating a permanent presence of elephants LQ�WKH�]RQH��'XQJ�SLOHV�LQ�WKH�GU\�DQG�UDLQ\�VHDVRQV�\LHOGHG�DQ�RYHUDOO�PHDQ�GXQJ�OLIHVSDQ�RI�ȝ� �����GD\V�ZLWKLQ�WKH�UDQJH�>��±���@�DQG�VHDVRQDO�PHDQ�OLIHVSDQ�ȝ� �������GD\V�ZLWKLQ�>��±���@�DQG�ȝ� �������GD\V�within [42–126] respectively. Dung-pile heights decreased following the equations y = -4.8818lnx + 16.278 and y = 26.025e -0.3734+x respectively. Seed counts on elephant dung-piles indicated that Dysplasia dewevrei, Klainedoxa gabonensis, Treculia africana and Anonidium mannii constituted ca 70% of seeds found in el-HSKDQW�GXQJ�SLOHV��(OHSKDQW�PRYHPHQWV�ZHUH�VXVSHFWHG�E\�WKH�OD\RXW�RI�WUDLOV�EXW�WKHLU�FRQ¿UPDWLRQ�ZRXOG�need a more detailed study.
Key words: forest elephant, Lake Tumba, food items, elephant movements
Résumé 8QH�pWXGH�GH�O¶pOpSKDQW�GH�IRUrW�D�pWp�PHQpH�GDQV�OD�UpJLRQ�VXG�GX�/DF�7XPED��HQ�XWLOLVDQW�OHV�GHX[�PpWKRGHV�GH�WUDQVHFW�HW�GH�UHFRQQDLVVDQFH�GH�IRUrW��2Q�D�GpFRXYHUW�WURLV�GRPDLQHV�GH�FRQFHQWUDWLRQ�G¶pOpSKDQWV�GDQV�OD�UpJLRQ�V¶pWHQGDQW�GH�1JRPEH�YHUV�OD�UpJLRQ�GH�0DOHER��(Q�UDLVRQ�GHV�GRQQpHV�LQVXI¿VDQWHV��RQ�D�FDOFXOp�VHXOHPHQW�OHV�abondances relatives et elles variaient entre ces trois endroits différents: 0,03 tas de crottes/km (Ngombe-Lac Tumba), 0,04 tas de crottes/km (Mbanzi-Malebo) et 0,33 tas de crottes/km (Lukolela). Les pistes d’éléphants dans la zone de Malebo-Mbanzi ont été parcourues avec 0,52 passages/jour, dans l’intervalle [0,50 à 3,0], indiquant une présence permanente des éléphants dans la zone. Les tas de crottes pendant les saisons sèches et SOXYLHXVHV�RQW�GRQQp�XQH�GXUpH�GH�YLH�PR\HQQH�JOREDOH�GH�FURWWH�ȝ� �����MRXUV�GDQV�O¶LQWHUYDOOH�>������@�HW�XQH�GXUpH�GH�YLH�PR\HQQH�VDLVRQQLqUH�ȝ� �������MRXUV�GDQV�O¶LQWHUYDOOH�>������@�HW�ȝ� �������MRXUV�GDQV�O¶LQWHUYDOOH�[42 - 126] respectivement. Les hauteurs des tas de crottes ont diminué d’après les équations y =-4.8818lnx + 16.278 et y = 26.025e-0.3734 + x respectivement. Le nombre de graines sur les tas de crottes d’éléphants indiquaient que le Dysplatsia dewevrei, le Klainodoxa gabonensis, le Treculia Africana et le Manii Annonaduim constituaient environ 70% de celles trouvées dans les tas de crottes d’éléphants. On a eu le sentiment que la disposition des SLVWHV�FRUUHVSRQGDLW�DX[�GpSODFHPHQWV�GHV�pOpSKDQWV��PDLV�LO�IDXGUD�XQH�pWXGH�SOXV�GpWDLOOpH�SRXU�OD�FRQ¿UPDWLRQ���

Pachyderm No. 49 January–June 2011 41
IntroductionBetween the 1970s and late 1980s, elephant poach-ing—supported by the ivory trade—dating back to historical times (Pekenham, 1992), increased and swept Central African forests to fuel the ivory market (Blake et al., 2007). This trade took heavy tolls on elephant populations across the species range and led to some local extinctions. In addition to poaching, KDELWDW� IUDJPHQWDWLRQ� OHG� WR� FRQÀLFW� DQG� SHUVHFX-tion, complicating any action plan for the species conservation (Blake, 2002; Douglas-Hamilton, 1989; Douglas-Hamilton, 1988a; Douglas-Hamilton & Douglas-Hamilton, 1982). Direct consequences of the ivory trade and habitat fragmentation were felt not only in areas with herds of elephants but also and more severely in areas adjacent to and near major towns. In these areas, elephant numbers dramatically declined as poaching within the vicinity of major towns was facilitated by communication networks—principally roads—that made large markets accessible for both elephant meat and ivory. However, while poaching and local extinctions increased, the basics of the ecol-ogy of forest of elephant was not well understood; knowledge was lacking about simple yet important information for management such as abundance and distribution. Even today, elephant abundance and distribution are still either poorly or partially known within the range States (Blake & Hedges, 2004). Equally, very few concrete measures to curb declining trends in elephant populations were taken in many countries across Central Africa to the point that even now, the conservation status of forest elephants, as opposed to the situation with savannah elephants (Bossen, 1998) remains less documented and the species’ taxonomic status in Africa continues to be OHVV�FODUL¿HG��9RJHO��������5RFD�HW�DO����������$YDLO-able knowledge is scanty and variabile in accuracy (Blake & Hedges, 2004). Historically, the Democratic Republic of Congo (DRC) counted as one stronghold of forest elephants in Central Africa (Alers et al., 1992). However, most of what is known about DRC’s elephant populations is, at best, informed guesses (Alers et al., 1992). Within a few exceptional areas of the country where elephants occur in large numbers (e.g. Garamba and Salonga), the lawlessness severely affects elephants and their habitats; otherwise, little nationwide knowledge of the species exists. There is still a need to document the species distribution, its abundance and to understand its ecology in many
DRC forests. This paper presents a relic population of forest elephants that resides in the region of Malebo where elephants were thought to be extinct. It focuses on elephant abundance and distribution whilst also SURYLGLQJ�¿QGLQJV�RQ�GXQJ�OLIHVSDQ��GH¿QHG�DV�WKH�time it takes a dung-pile to disappear) and preliminary plant species consumed by elephants in the zone.
Study siteThe Malebo region (Fig. 1) is in the Lake Tumba–Lake Maindombe hinterland (Inogwabini et al., 2007a, b), straddling the provinces of Bandundu and Equateur in their administrative territories of Bolobo, Yumbi and Lukolela. This area covers ~ 40,000 km2, of which three blocks of ~ 12,000 km2 (represent-ing 30%) of the total were surveyed. At its southern edge, the region is located on the Bateke Plateau and descends toward the Congo Central Basin, known as the Cuvette Centrale (Inogwabini et al., 2006). Malebo is located in an ecosystem that divides the northern swampy forests and the southern savannahs. Swampy forests, which cover most of the territory of Lukolela, are essentially composed of mixed mature forest with open understorey whose main emergent trees are Uapaca guineensis, Uapaca heuloditii and Guibourtia demeusei etc. (Inogwabini et al., 2006). 7KH�UHJLRQ�LV�DOVR�FKDUDFWHUL]HG�E\�HSLVRGHV�RI�ÀRRG-ing, during which water covers approximately 65% of the forest. Some portions of this region are within the newly created Tumba–Lediima Natural Reserve. In the complex of forest-savannah mosaic, forest gal-OHULHV�DUH�FRPSRVHG�RI�WHUUD�¿UPD�PL[HG�PDWXUH�IRU-est, with species such as Gilbertiodendron dewevrei and Entandrophragma spp. etc. The understorey is comprised of 45–50% of the Marantaceae family and species such as Humania liebrechtsiana and Mega-phrynium macrostachyum. Some of these areas were logged in the last 25–30 years to extract the wenge (Millettia laurentii), a high-priced black hardwood. The savannahs of the region are woody, dominated by Hymenocardia acida and Annona senegalensis. The southern limit of the study’s region is about 45 km from the southern edge of the Tumba–Lediima Natural Reserve.
Demographically, at the edges of the Lake Tumba, north of the region, people are essentially agriculturalists. They are also known to practice LQWHQVLYH�¿VKLQJ� GXULQJ� WKH� GU\� VHDVRQV��ZKLFK� LV�deeply rooted in their culture. Not only is traditional
The relic population of elephants near Lake Tumba, DRC

42 Pachyderm No. 49 January–June 2011
hunting commonly practiced throughout the year, but also the intrusion of modern weapons and ammunition has become a prevalent characteristic of the entire region. In the south, traditional agriculture and pastoral activities include raising cattle, which was introduced in this region by the Belgians in the 1950s. It became the only employment possibility and has entrenched itself deeply in the local culture to the point that the practice has now dispersed across the region and symbolizes wealth. This paper provides results of the surveys that were conducted in each of the three blocks in Fig. 1, which are part of the overall ecosystem, and social and cultural scenes described above.
Materials and methods
Research methods varied according to the sub-objec-tives of the study. Distribution and abundance data were collected using the conventional reconnaissance and transects with variable lengths (Buckland et al., 1993; Hall et al., 1997) methods. Reconnaissance con-sisted of comprehensive (Walsh et al., 2001; Blake, 2002) and forest exploration (White & Edwards, 2002, Van Krunkelsven et al., 2000; Hall et al., 1997). Comprehensive reconnaissance and forest exploration differ in that comprehensive reconnaissance restricts observers to follow a compass direction with deviation > 45o from the main orientation (White & Edwards,
Inogwabini et al.
Figure 1. Elephant survey region in the southern Lake Tumba landscape, Democratic Republic of Congo.

Pachyderm No. 49 January–June 2011 43
The relic population of elephants near Lake Tumba, DRC
2000; White et al., 2001). Direct sighting and/or indirect signs of elephants were recorded. Indirect signs consisted of dung-piles, footprints, evidence of rubbings and feeding remains. Recorded information consisted of geo-referenced position of any sign of an elephant, recorded using the hand-held Garmin GPS units (Waters & Shockley, 2000). These positions were mapped post hoc to provide the distribution of elephants. Field survey data on elephant distribution were complemented by information gathered from local hunters hired to serve as trackers. Perpendicular distances from each dung-pile to each transect were measured with a tape measure but the sample was too small to estimate elephant density. However, the total number of dung-piles was divided by the effort mea-VXUHG�DV�GLVWDQFH��NP��WR�SURYLGH�HQFRXQWHU�UDWHV�IJ��DV�it was the case of data collected from reconnaissance.
In the southern part of the study area, elephant trails were screened on a weekly basis for the dung lifespan study. Over a period of 179 days, new elephant dung-piles and/or other signs were counted and the rates/frequency of usage of permanent trails were calculated to provide an indication of the permanency of elephants in the zone. The permanency was thought to be a good surrogate for both relative abundance and reduced poaching.
Elephant trails in the Malebo region (Fig. 1) were located and used for the dung lifespan study and the LGHQWL¿FDWLRQ�SODQW�VSHFLHV�HDWHQ�E\�HOHSKDQWV�LQ�WKH�region. Fresh dung-piles (+��GD\�ROG��RQ�WHUUD�¿UPD�ZHUH�LGHQWL¿HG�DQG�VFUHHQHG�WKURXJK�WKHLU�FRPSOHWH�GLVDSSHDUDQFH��$W� WKH�¿UVW� VLJKWLQJ�� WKH� KHLJKWV� RI�each dung-pile were measured using a 1 mm-error tape measure. Then the team visited the dung-piles on a weekly basis and measured subsequent heights. Apart from heights, data also included habitat types, dung exposure to the sun, and rainfall data that were FROOHFWHG�IURP�WKH�¿HOG�EDVH�VLWXDWHG�DSSUR[LPDWHO\�at a 15 km straight line distance south of the trail. The
PHDQ�GXQJ�OLIHVSDQ��ȝ��ZDV�FDOFXODWHG�DV�WKH�QXPEHU�of days it took all the dung samples to completely disappear. Then individual measures of dung heights ZHUH�SORWWHG�DQG�¿WWHG�WR�DQ�H[SRQHQWLDO�PRGHO�¦�[���where x = a function of time. Dung heights were also plotted against the rainfall in the region in order to VHH�ZKHWKHU�SDWWHUQV�RI�UDLQIDOO�LQÀXHQFHG�WKH�GHFD\�rate, as suggested by Barnes et al. (1997).
Plant species that elephants consumed were LGHQWL¿HG�WKURXJK�WKUHH�PHWKRGV��GLUHFW�REVHUYDWLRQV�of feeding elephants, feeding remains and examination RI�GXQJ�SLOHV��6SHFLHV�WKDW�ZHUH�UHDGLO\�LGHQWL¿HG�LQ�WKH�¿HOG�ZHUH�QRWHG�ZKLOH��ZKHQ�XQVXUH��SODQW�LWHPV�ZHUH�EURXJKW�WR�WKH�¿HOG�EDVH�IRU�SURSHU�LGHQWL¿FDWLRQ�E\�WKH�¿HOG�WHDP�ERWDQLVWV�
ResultsElephants were present in the three surveyed blocks (Fig. 1). However, relative abundance varied among WKH� WKUHH� ORFDWLRQV� �7DEOH�����7KH�KLJKHVW� IJ� ������dung-piles/km was that of Lukolela (= 2 in Fig. 1). Although, the mean trail usage in the Mbanzi–Malebo � ���LQ�)LJ�����ZDV�IJ� ������SDVVDJH�GD\��7DEOH�����there was variation among seven monitored perma-nent elephant trails (Fig. 2).
7KH�RYHUDOO�PHDQ�GXQJ� OLIHVSDQ�ȝ� �����GD\V��within the range of 42–182 days, with variations between dry and rainy seasons (Table 2 and Fig. 4). Over their lifespan, elephant dung-pile heights decreased following the equations y = -4.8818lnx+16.278 and y = 26.025e-0.3734x for dry and rainy seasons respectively (Fig. 4).
Elephants principally consumed nine plant species (Fig. 3), with Dysplasia dewevrei being the most commonly counted species in dung-piles followed in decreasing order by Klainedoxa gabonensis, Treculia africana and Anonidium mannii. The four constitute ca 70% of seeds found in elephant dung-piles in the region.
Table 1. Relative abundance of elephants in the southern Lake Tumba
Zone Effort N IJ Methods 1 2 3 1 2 3 1 2 3
Ngombe–Lake Tumba 46 124 - 2 5 - 0.04 0.02 -
Mbanzi-Malebo - 148 179 - 6 96 0.04 - 0.5
Lukolela - 107 35 0.33
1 = Transect, effort expressed in km and IJ expressed in dung-piles km-1
2 = Reconnaissance, effort express in km and IJ expressed in dung-piles km-1
3 = Trails, effort expressed in days and IJ expressed in passage day-1
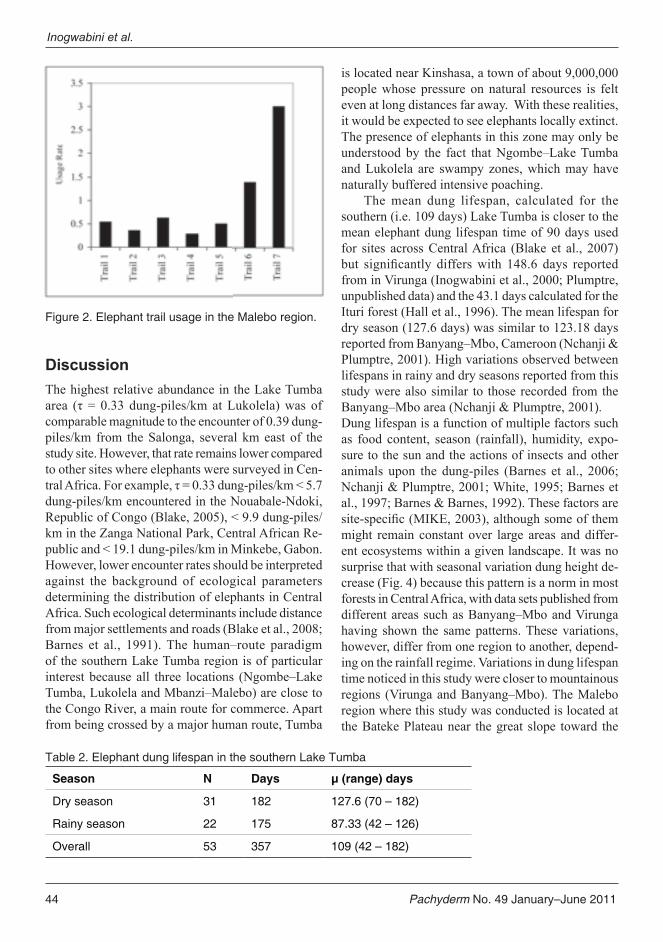
44 Pachyderm No. 49 January–June 2011
DiscussionThe highest relative abundance in the Lake Tumba DUHD� �IJ� � ����� GXQJ�SLOHV�NP� DW�/XNROHOD��ZDV� RI�comparable magnitude to the encounter of 0.39 dung-piles/km from the Salonga, several km east of the study site. However, that rate remains lower compared to other sites where elephants were surveyed in Cen-WUDO�$IULFD��)RU�H[DPSOH��IJ� ������GXQJ�SLOHV�NP�������dung-piles/km encountered in the Nouabale-Ndoki, 5HSXEOLF�RI�&RQJR��%ODNH���������������GXQJ�SLOHV�km in the Zanga National Park, Central African Re-SXEOLF�DQG��������GXQJ�SLOHV�NP�LQ�0LQNHEH��*DERQ��However, lower encounter rates should be interpreted against the background of ecological parameters determining the distribution of elephants in Central Africa. Such ecological determinants include distance from major settlements and roads (Blake et al., 2008; Barnes et al., 1991). The human–route paradigm of the southern Lake Tumba region is of particular interest because all three locations (Ngombe–Lake Tumba, Lukolela and Mbanzi–Malebo) are close to the Congo River, a main route for commerce. Apart from being crossed by a major human route, Tumba
is located near Kinshasa, a town of about 9,000,000 people whose pressure on natural resources is felt even at long distances far away. With these realities, it would be expected to see elephants locally extinct. The presence of elephants in this zone may only be understood by the fact that Ngombe–Lake Tumba and Lukolela are swampy zones, which may have naturally buffered intensive poaching.
The mean dung lifespan, calculated for the southern (i.e. 109 days) Lake Tumba is closer to the mean elephant dung lifespan time of 90 days used for sites across Central Africa (Blake et al., 2007) EXW� VLJQL¿FDQWO\� GLIIHUV�ZLWK� ������ GD\V� UHSRUWHG�from in Virunga (Inogwabini et al., 2000; Plumptre, unpublished data) and the 43.1 days calculated for the Ituri forest (Hall et al., 1996). The mean lifespan for dry season (127.6 days) was similar to 123.18 days reported from Banyang–Mbo, Cameroon (Nchanji & Plumptre, 2001). High variations observed between lifespans in rainy and dry seasons reported from this study were also similar to those recorded from the Banyang–Mbo area (Nchanji & Plumptre, 2001).Dung lifespan is a function of multiple factors such as food content, season (rainfall), humidity, expo-sure to the sun and the actions of insects and other animals upon the dung-piles (Barnes et al., 2006; Nchanji & Plumptre, 2001; White, 1995; Barnes et al., 1997; Barnes & Barnes, 1992). These factors are VLWH�VSHFL¿F��0,.(���������DOWKRXJK�VRPH�RI�WKHP�might remain constant over large areas and differ-ent ecosystems within a given landscape. It was no surprise that with seasonal variation dung height de-crease (Fig. 4) because this pattern is a norm in most forests in Central Africa, with data sets published from different areas such as Banyang–Mbo and Virunga having shown the same patterns. These variations, however, differ from one region to another, depend-ing on the rainfall regime. Variations in dung lifespan time noticed in this study were closer to mountainous regions (Virunga and Banyang–Mbo). The Malebo region where this study was conducted is located at the Bateke Plateau near the great slope toward the
Inogwabini et al.
Figure 2. Elephant trail usage in the Malebo region.
Table 2. Elephant dung lifespan in the southern Lake Tumba
Season N Days μ (range) days
Dry season 31 182 127.6 (70 – 182)
Rainy season 22 175 87.33 (42 – 126)
Overall 53 357 109 (42 – 182)

Pachyderm No. 49 January–June 2011 45
ÀDW� UHJLRQ� RI� WKH�&HQWUDO�&RQJR�%DVLQ�� NQRZQ� DV�the cuvette centrale. Weather patterns in this higher elevation zone are different from those of the lowland forest and are closer to those in highlands. Further-more, the region is a forest–savannah mosaic, with most dung-piles recorded being exposed to the sun. Sun-baking has been documented to lengthen how long a dung-pile can survive in other sites, including Banyang–Mbo (Nchanji & Plumptre, 2001), Virunga (Plumptre, unpublished data) and Lopé (White, 1995). Dung height decrease equations presented for both dry and rainy seasons are similar to those published by Barnes et al. (2007) on dung decay rates. They indicate that a decrease in dung heights is related to dung decay and that rainfall, as in other areas, was among the key determinants of dung lifespan.
A comparison of food items between the Malebo region (Fig. 3) and Odzala-Kokoua (Republic of Congo), an area with an analogous environment of savannah forest mosaic suggest similar types of diet, with species such as Anonidium mannii and Klainedoxa gabonensis being also among the most consumed fruit plants (Maisels, 1996; Dowsett-Lemaire 1995a, b). Desplasia dewevri is a big fruit and cannot easily be swallowed by small mammals; the species may, therefore depend on elephants for its dispersal. Anonidium mannii has fruits preferred by many large mammals—including humans, elephants and great apes. Anonidium mannii has been
suggested to be a key fruit species because it has been documented to occur more frequently in elephant dung in previous studies (Blake, 2002). However, the tree of the Annodium manii is always left standing QHDU�¿HOGV�ZKHQ�SHRSOH�FOHDU�IRUHVWV�IRU�DJULFXOWXUH�because humans also prefer the species’ fruits. These two facts may lead to exacerbated human–elephant FRQÀLFW��6HYHUDO�LQFLGHQWV�RI�HOHSKDQWV�FURS�UDLGLQJ�LQ�¿HOGV� QHDU� YLOODJHV� KDYH� RFFXUUHG� RYHU� WKH� ODVW�few years. Among these incidents, about 50% (n=21) were near Mbanzi (Fig. 1, Inogwabini & Mbende, in prep.) a village where Anonidium mannii trees are FRQVSLFXRXVO\�OHIW�QHDU�¿HOGV�DQG�KXPDQ�KRXVHV��7KH�presence of the Anonidium mannii may explain these incidents, although a more systematic and thorough study is needed to draw sound inferences. Human-HOHSKDQW�FRQÀLFW�KDV�EHHQ�H[SODLQHG�DV�¿JKWLQJ�RYHU�resources, including fruits, in several other areas across the species range (Hoare, 2000, 1999; Lahm, 1996; Kangwana, 1995)
The systematic monitoring of elephant trails has provided indications of the presence of elephants and D�PHDQ�IRU�D�VLPSOL¿HG�PRQLWRULQJ�WRRO��2YHU�WLPH��we have been counting the accumulated presence and absence of dung-piles on various trails in order to monitor the elephant’s relative abundance in the region. Trail frequentation as a monitoring scheme has been used in the Nouabale–Ndoki area (Blake, pers. comm.), with relatively viable results. It is suggested here that relative permanent frequentation of trails by elephants may provide a sensible and inexpensive method for the monitoring of the elephant populations.
The relic population of elephants near Lake Tumba, DRC
Figure 3. The most common plant species consumed by elephants as numbered from dung-piles in the Lake Tumba area of this study.
Figure 4. Dung lifespan and dung height decrease equations (rainy and dry seasons), Malebo region.

46 Pachyderm No. 49 January–June 2011
Furthermore, all trails in the Mbanzi–Malebo area (Fig. 1) lead to the north. We hypothesize that that direction may indicate a long ranging movement among the three blocks (Fig. 1) though this would require a firm confirmation from proper studies supported by such techniques as GPS Telemetry.
AcknowledgementsThis work has been partially funded by USAID’s programme, The Central Africa Regional Program for the Environment. However views expressed by WKH�DXWKRUV�GR�QRW� UHÀHFW� WKRVH�RI�86$,'��:H�DUH�most thankful to WWF US for permission to use the data, and WWF DRC for helping with the necessary RI¿FLDO�GRFXPHQWV�WR�FDUU\�RXW�¿HOG�UHVHDUFK�LQ�/DNH�Tumba landscape.
References Alers, M.P., Blom, A., Sikubwabo, K.C., Masunda,
7�� DQG� %DUQHV�� 5�)�:�� �������� µ3UHOLPLQDU\�assessment of the status of the forest elephants in Zaire’. African Journal of Ecology 30:279–291.
Barnes, R.F.W., Majam, J.N., Asamoah-Boatang, B. DQG�$J\HL�2KHPHQJ��-�����������µ7KH�VXUYLYDO�RI�elephant dung piles in relation to forest canopy and slope in southern Ghana’. Pachyderm 41:37–43.
Barnes, R.F.W., Asamoah-Boateng, B., Naada-0DMDP��-��DQG�$J\HLR�+HPQJ��-����������µ5DLQIDOO�and population dynamics of elephant dung-piles in the forests of southern Ghana’. African Journal of Ecology 35:39–52.
%DUQHV��5�)�:��DQG�%DUQHV��.�/����������µ(VWLPDWLQJ�decay rates of elephant dung-piles in forest’. African Journal of Ecology 30:316–321.
Barnes, R.F.W., Barnes K.L., Alers M.P.T. and Blom, $�� �������� µ0DQ�GHWHUPLQHV� WKH� GLVWULEXWLRQ�RI�elephants in the rain forests of northern Gabon’. African Journal of Ecology 29:54–63.
%ODNH��6�� �������� µ7KH�(FRORJ\�RI�)RUHVW�(OHSKDQW�Distribution and its Implications for Conservation’. Ph.D. Thesis. Edinburgh: University of Edinburgh.
Blake. S. and Hedges, S. (2004). 6LQNLQJ�ÀDJVKLSV��the case of forest elephants in Asia and Africa. Conservation Biology (18)5:1191–1202.
Blake, S., Strindberg, S., Boudjan, P., Makombo, C., Inogwabini, B.I., Omari, I., Grossmann, F., Bene-Bene, L., de Semboli, B., Mbenzo, V., S’hwa, D., Bayogo, R., Williamson, E.A., Fay, M. and 0DLVHOV��)����������µ)RUHVW�HOHSKDQW�FULVLV�LQ�WKH�Congo Basin’. PloS Biology 5(4):1–9.
%RVVHQ��%�� �������� µ5HVHDUFK� RQ�$IULFDQ� HOHSKDQW�(Loxodonta Africana) (Blumenbach 1797): a biography’. African Journal of Ecology 36:371–376.
Douglas-Hamilton, I., Karesh, W.B. and Kock, M.D. (2008). Roadless Wilderness Area Determines Forest Elephant Movements in the Congo Basin. PLoS ONE.
'RXJODV�+DPLOWRQ��,����������µ2YHUYLHZ�RI�VWDWXV�DQG�trends of the African elephant’. In: S. Cobb (ed.) The Ivory Trade and the Future of the African Elephant. Oxford: Ivory Trade Review Group.
'RXJODV�+DPLOWRQ��,�������D���µ7KH�JUHDWHDVW�$IULFDQ�elephant disaster’. Swara 11:8–11.
'RXJODV�+DPLOWRQ�� ,�� �����E��� µ7UDFNLQJ�$IULFDQ�elephants with a Global Positioning System GPS) Radio Collar’. Pachyderm 25:81–92.
Douglas-Hamilton, I. & Douglas-Hamilton. O. 1982. Battle for the Elephants. New York, USA: Viking.
Dowsett-Lemaire, F. (1995a). Contribution à l’étude de la végétation forestière du Parc National d’Odzala (Congo). Groupement AGRECO-CTFT. Unpublished Report.
Dowsett-Lemaire, F. (1995b). Etude de la végétation des mosaïques foret-savane au Parc National d’Odzala (Congo) et essai de cartographie. Groupement AGRECO-CTFT.
Hall, J.S., Inogwabini, B.I., Williamson, E.A., Omari, ,���6LNXEZDER��&�� DQG�:KLWH��/�-�7�� �������� µ$�survey of Elephants (Loxodonta africana) in the Kahuzi-Biega National Park lowland sector and adjacent forest in eastern Zaire’. African Journal of Ecology 35:213–223.
+RDUH�� 5�(�� �������� µ'HWHUPLQDQWV� RI� KXPDQ±HOHSKDQW�FRQÀLFW�LQ�D�ODQG�XVH�PRVDLF¶��Journal of Applied Ecology 36:689–700.
+RDUH�� 5�(�� �������� µ3URMHFW� RI� WKH� +XPDQ±(OHSKDQW�&RQÀLFW�7DVN�)RUFH��+(7)���UHVXOWV�DQG�recommendations’. Pachyderm 28:73–77.
Inogwabini et al.
Pachyderm No. 49 January–June 2011 47
The relic population of elephants near Lake Tumba, DRC
Inogwabini, B.I., Hall, J.S., Vedder, A., Curran, B., Yamagiwa, J. and Basabose, K. (2000). µ&RQVHUYDWLRQ�6WDWXV� RI� ODUJH�PDPPDOV� LQ� WKH�mountain sector of Kahuzi-Biega National Park, Democratic Republic of Congo in 1996’. African Journal of Ecology 38:269–276.
.DQJZDQD��.�)����������µ+XPDQ±HOHSKDQW�FRQÀLFW��the challenge ahead’. Pachyderm 19:11–14.
/DKP��6�$�� �������� µ$�QDWLRQZLGH� VXUYH\� RI� FURS�raiding by elephants and other species in Gabon’. Pachyderm 21:69–77.
0DLVHOV�� )�*�� �������� µ6\QWKHVLV� RI� LQIRUPDWLRQ�concerning the Parc National d’Odzala, Republic of Congo’. Groupement AGRECO-CTFT. Unpublished report.
Nchanji, A.C. and Plumptre, A.J. (2001). ‘Seasonality in elephant dung decay and implications for censusing and population monitoring in south-western Cameroon’. African Journal of Ecology 391:24.
Pakenham, A. (1992). Scramble for Africa – White man’s conquest of Dark Continent from 1876 to 1912. Perennial/Time Warner Books.
:KLWH��/�-�7����������µ)DFWRUV�DIIHFWLQJ�WKH�GXUDWLRQ�of elephant dung piles in rain forest in the Lope Reserve, Gabon’. African Journal of Ecology 33:142–150.

48 Pachyderm No. 49 January–June 2011
Biophysical and human factors determine the distribution of poached elephants in Tsavo East National Park, Kenya
Daniel Muteti Kyale1, Shadrack Ngene2* and John Maingi3
1Kenya Wildlife Service, PO Box 40241, Nairobi 00100, Kenya 2International Institute for Geo-Information Science and Earth Observation (ITC), Hengelosestraat 99, PO Box 48, 7500 AA, Enschede, The Netherlands; email: [email protected] or [email protected] 3Miami University, Geography Department, 33A Shideler Hall, 501 East High Street, Oxford, Ohio, USA
*Corresponding author
Abstract
This study investigates the distribution of poached elephants as well as the biophysical and anthropogenic factors that determine the distribution of the poached elephants in Tsavo East National Park (TENP), Kenya. Data on the distribution of poached elephants, from 1990 to 2005, were acquired from elephant mortality database of the Kenya Wildlife Service (KWS). The distribution of poached elephants was not random but exhibited a clustered pattern. Poaching of elephants was higher in the central and northern areas of TENP. Poaching hotspots occurred along the main rivers (i.e. Tiva, Galana and Voi Rivers). During the wet season, a high density of poached elephants was recorded within the grassland, bushland and open bushland. In the dry season, the density of poached elephants was highest in the woodland, bushland, open bushland and JUDVVODQG�HQYLURQPHQWV��7KH�GLVWULEXWLRQ�RI�SRDFKHG�HOHSKDQWV�ZDV�VLJQL¿FDQWO\�FRUUHODWHG�ZLWK�ODQG�FRYHU��proximity to main rivers, surface water, ranger patrol bases, park gates, roads and park boundaries. Priority security patrols should be performed along the Galana, Tiva and Voi Rivers.
Key words: Elephant distribution, physical and human factors, mortality, poaching
RésuméCette étude examine la répartition des éléphants braconnés, ainsi que les facteurs biophysiques et anthropiques qui déterminent la répartition des éléphants braconnés dans le Parc National de Tsavo Est, au Kenya. Les données sur la répartition des éléphants braconnés, de 1990 à 2005, ont été acquises à partir de la base de données du Service Kenyan de la Faune (KWS) sur la mortalité des éléphants. La répartition des éléphants EUDFRQQpV�Q¶pWDLW�SDV�DOpDWRLUH��PDLV�SUpVHQWDLW�XQH�FRQ¿JXUDWLRQ�UHJURXSpH��/H�EUDFRQQDJH�GHV�pOpSKDQWV�était plus élevé dans les zones centrales et septentrionales du parc. Les points névralgiques de braconnage se trouvaient le long des rivières principales (c.-à-d. Tiva, Galana, et Voi). Au cours de la saison pluvieuse, on a enregistré une forte densité d’éléphants braconnés dans les herbages, la brousse et la brousse ouverte. 3HQGDQW�OD�VDLVRQ�VqFKH��OD�GHQVLWp�GHV�pOpSKDQWV�EUDFRQQpV�pWDLW�OD�SOXV�pOHYpH�GDQV�OD�IRUrW�FODLUH��OD�EURXVVH��OD�EURXVVH�RXYHUWH�HW�OHV�KHUEDJHV��/D�UpSDUWLWLRQ�GHV�pOpSKDQWV�EUDFRQQpV�DYDLW�XQH�FRUUpODWLRQ�VLJQL¿FDWLYH�avec la couverture du sol, la proximité des principaux cours d’eau, les eaux de surface, les bases de patrouilles des écogardes, les entrées du parc, les routes et les limites du parc. Les patrouilles prioritaires de sécurité GHYUDLHQW�V¶HIIHFWXHU�OH�ORQJ�GHV�ÀHXYHV�*DODQD��7LYD�HW�9RL�
Pachyderm No. 49 January–June 2011 49
IntroductionPoaching of elephants for ivory is the main issue af-fecting the African elephant population (Blanc et al., 2007; Thouless et al., 2008; AFESG, 1997; WWF, 1997). African countries that have elephants invest PDVVLYH�¿QDQFLDO�UHVRXUFHV�DQG�SHUVRQQHO�WR�SURWHFW�the species (Thouless et al., 2008). The minimum recurrent expenditure that wildlife agencies in Africa need to protect elephants in their natural ranges is about USD 50–200 per km2 annually (Cumming et al., 1990; Jachmann & Billiouw, 1997). While these sug-gested expenditures are likely to be out of date, it may be useful to note that apart from South Africa (USD 4,350), Tsavo East in Kenya (USD 1,450), Burkina Faso (USD 132), Luangwa Valley in Zambia (USD 82.2), which operated above or within this minimum range of expenditure, other African countries operated well below (e.g. Zaire, USD 2; Tanzania, USD 18; Sudan, USD 12; Cameroon, USD 5; Malawi, USD 49), with most other African countries operating below a tenth of the suggested minimum (Cumming et al., 1990; Jachmann & Billiouw, 1997). However, under different circumstances, for example where a protected area is close to an international border like TENP, budgetary needs to protect elephants effec-tively may be higher (Jachmann & Billiouw, 1997).
In terms of personnel, Jachmann and Billiouw (1997) recommended a minimum of one park ranger for every 24 km2 of protected area if effective patrolling and policing is to be realized. KWS, like most wildlife departments in other African countries, is understaffed with about one ranger per 100 km2 of protected area. Furthermore, Kenya is unable to meet WKLV�¿QDQFLDO�REOLJDWLRQ�DQG�LV�WKXV�XQOLNHO\�WR�EH�DEOH�to allocate more funds towards wildlife conservation. It is therefore important to explore strategies that LQYROYH�PRUH� HI¿FLHQW� XVH� RI� WKH� OLPLWHG� DYDLODEOH�resources. By assessing spatial and temporal patterns of elephant mortality, important insights about the characteristics of particular areas of TENP where elephants are more vulnerable to human-induced death can be generated, which in turn can help guide effective deployment of policing resources.
TENP was chosen for the current study because it is the largest park in the country (KWS, 2003), and has both the highest concentration of elephants and highest incidences of elephant poaching (Economist, 2002; Hammer, 1993; Robinson, 2000). TENP is a predominantly semi-arid bushland with only a small
area of the Park developed and open for tourism. Unfavourably hot climate, poor accessibility and the ODUJH�VL]H�RI�WKH�SDUN��PDNH�SDWUROOLQJ�GLI¿FXOW�DQG�more challenging with currently available resources (Kioko, 2002).
In this study, we used GIS to describe spatial patterns of elephant mortality attributed to poaching. We identify areas within the TENP and its environs that are at greater risk to elephant poaching. Lastly, we investigate the biophysical and human factors that determine the distribution of poached elephants in the park. Such information would be useful in guiding the deployment of policing resources in the park and its immediate vicinity.
Materials and methodsStudy area
The TENP was gazetted in 1948 and is among the old-est parks in Kenya (Smith & Kasiki, 2000). It covers approximately 12,000 km2, accounting for about 40% of the total area covered by parks in Kenya (KWS, 2003). Elevation within the park increases westwards from 150 m at the eastern park boundary to 1,200 m on the western boundary (Tolvanen, 2004). Rainfall is bimodal with the long rains occurring between March and May, and the short rains occurring be-tween October and December. January–February and June–September are considered to be the dry season.
Like elevation, rainfall in the park increases from about 250 mm in the eastern part to about 450 mm in the western part (KWS, 2003). The main source of permanent water in the park is the Galana River, which is formed by the union of Athi and Tsavo rivers. Seasonal sources of water include the Tiva and Voi Rivers, the Aruba Dam and a few scattered ponds and swamps (Fig. 1).
Vegetation within TENP is mainly bushland/grassland savannah and semi-arid Acacia and Commiphora woodlands with Premna, Bauhinia and Sericocomorpsis scrub scattered with Delonix elata and Melia volkensii trees and interspersed with open plains (McKnight, 2000). Riverine vegetation dominated by Acacia elatior, Hyphaene compressa, and Suaeda monoica occurs along the rivers. The vegetation is generally denser in the western part of the park and lighter in the eastern part, corresponding to a decreasing rainfall gradient (KWS, 2003).
Factors in the distribution of poached elephants in Tsavo East
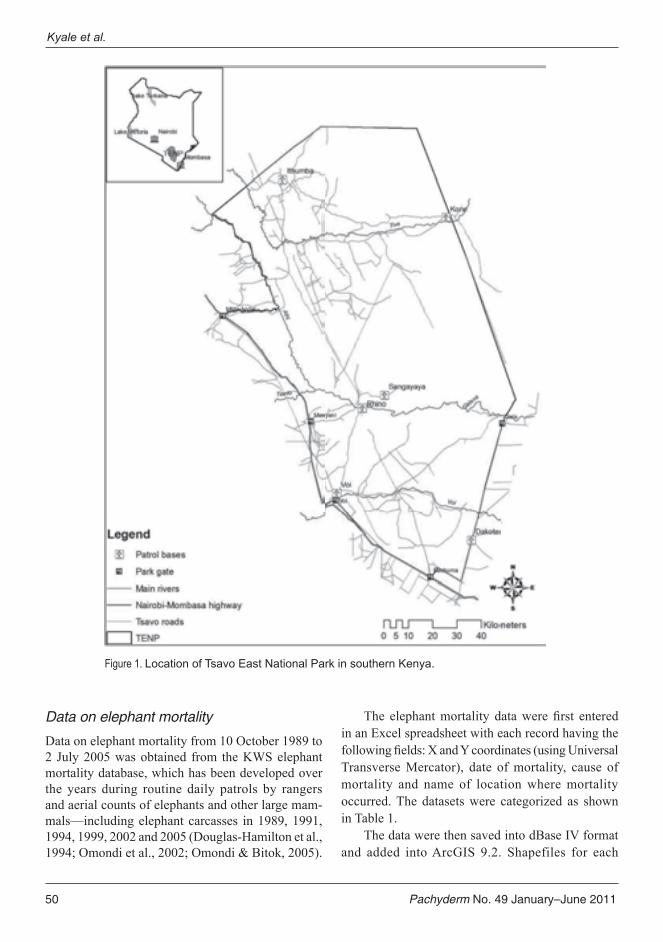
50 Pachyderm No. 49 January–June 2011
Kyale et al.
Figure 1. Location of Tsavo East National Park in southern Kenya.
Data on elephant mortality
Data on elephant mortality from 10 October 1989 to 2 July 2005 was obtained from the KWS elephant mortality database, which has been developed over the years during routine daily patrols by rangers and aerial counts of elephants and other large mam-mals—including elephant carcasses in 1989, 1991, 1994, 1999, 2002 and 2005 (Douglas-Hamilton et al., 1994; Omondi et al., 2002; Omondi & Bitok, 2005).
7KH� HOHSKDQW�PRUWDOLW\� GDWD�ZHUH�¿UVW� HQWHUHG�in an Excel spreadsheet with each record having the IROORZLQJ�¿HOGV��;�DQG�<�FRRUGLQDWHV��XVLQJ�8QLYHUVDO�Transverse Mercator), date of mortality, cause of mortality and name of location where mortality occurred. The datasets were categorized as shown in Table 1.
The data were then saved into dBase IV format and added into ArcGIS 9.2. Shapefiles for each
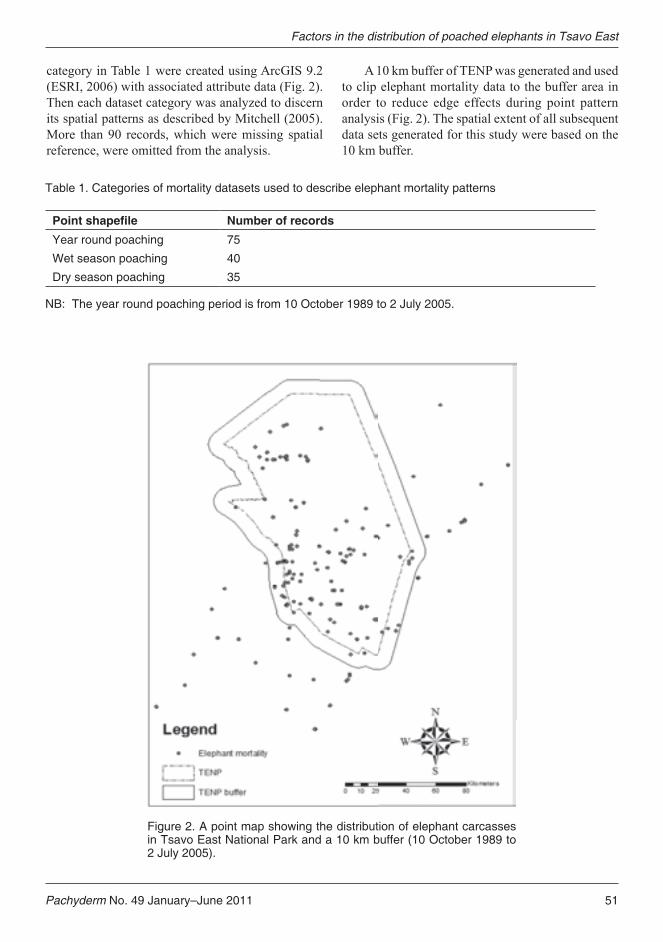
Pachyderm No. 49 January–June 2011 51
Factors in the distribution of poached elephants in Tsavo East
category in Table 1 were created using ArcGIS 9.2 (ESRI, 2006) with associated attribute data (Fig. 2). Then each dataset category was analyzed to discern its spatial patterns as described by Mitchell (2005). More than 90 records, which were missing spatial reference, were omitted from the analysis.
A 10 km buffer of TENP was generated and used to clip elephant mortality data to the buffer area in order to reduce edge effects during point pattern analysis (Fig. 2). The spatial extent of all subsequent data sets generated for this study were based on the 10 km buffer.
Table 1. Categories of mortality datasets used to describe elephant mortality patterns
2QKPV�UJCRGſNG Number of recordsYear round poaching 75
Wet season poaching 40
Dry season poaching 35
NB: The year round poaching period is from 10 October 1989 to 2 July 2005.
Figure 2. A point map showing the distribution of elephant carcasses in Tsavo East National Park and a 10 km buffer (10 October 1989 to 2 July 2005).
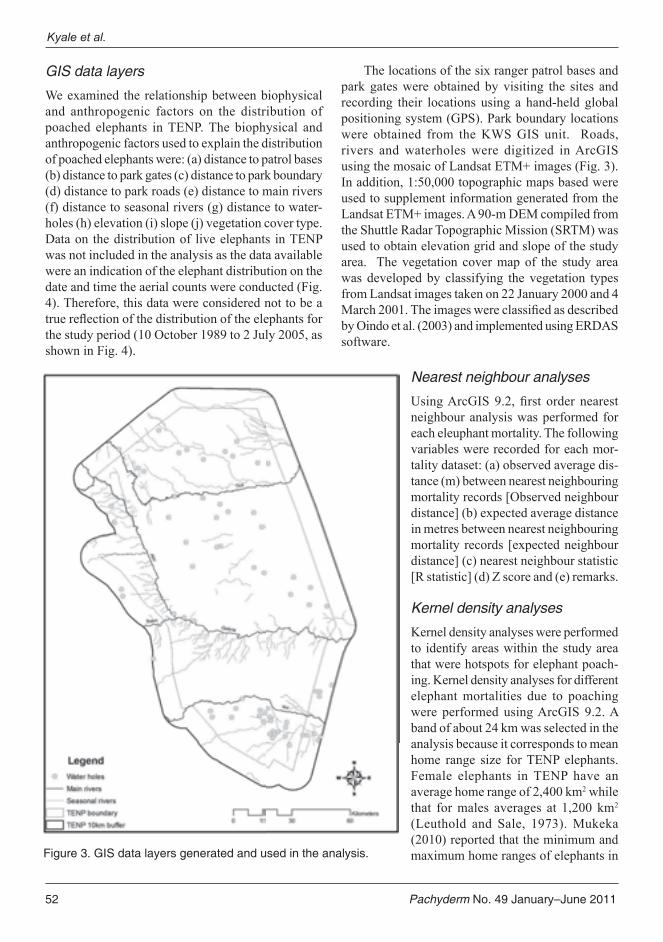
52 Pachyderm No. 49 January–June 2011
GIS data layers
We examined the relationship between biophysical and anthropogenic factors on the distribution of poached elephants in TENP. The biophysical and anthropogenic factors used to explain the distribution of poached elephants were: (a) distance to patrol bases (b) distance to park gates (c) distance to park boundary (d) distance to park roads (e) distance to main rivers (f) distance to seasonal rivers (g) distance to water-holes (h) elevation (i) slope (j) vegetation cover type. Data on the distribution of live elephants in TENP was not included in the analysis as the data available were an indication of the elephant distribution on the date and time the aerial counts were conducted (Fig. 4). Therefore, this data were considered not to be a WUXH�UHÀHFWLRQ�RI�WKH�GLVWULEXWLRQ�RI�WKH�HOHSKDQWV�IRU�the study period (10 October 1989 to 2 July 2005, as shown in Fig. 4).
The locations of the six ranger patrol bases and park gates were obtained by visiting the sites and recording their locations using a hand-held global positioning system (GPS). Park boundary locations were obtained from the KWS GIS unit. Roads, rivers and waterholes were digitized in ArcGIS using the mosaic of Landsat ETM+ images (Fig. 3). In addition, 1:50,000 topographic maps based were used to supplement information generated from the Landsat ETM+ images. A 90-m DEM compiled from the Shuttle Radar Topographic Mission (SRTM) was used to obtain elevation grid and slope of the study area. The vegetation cover map of the study area was developed by classifying the vegetation types from Landsat images taken on 22 January 2000 and 4 0DUFK�������7KH�LPDJHV�ZHUH�FODVVL¿HG�DV�GHVFULEHG�by Oindo et al. (2003) and implemented using ERDAS software.
Nearest neighbour analyses
8VLQJ�$UF*,6� ����� ¿UVW� RUGHU� QHDUHVW�neighbour analysis was performed for each eleuphant mortality. The following variables were recorded for each mor-tality dataset: (a) observed average dis-tance (m) between nearest neighbouring mortality records [Observed neighbour distance] (b) expected average distance in metres between nearest neighbouring mortality records [expected neighbour distance] (c) nearest neighbour statistic [R statistic] (d) Z score and (e) remarks.
Kernel density analyses
Kernel density analyses were performed to identify areas within the study area that were hotspots for elephant poach-ing. Kernel density analyses for different elephant mortalities due to poaching were performed using ArcGIS 9.2. A band of about 24 km was selected in the analysis because it corresponds to mean home range size for TENP elephants. Female elephants in TENP have an average home range of 2,400 km2 while that for males averages at 1,200 km2 (Leuthold and Sale, 1973). Mukeka (2010) reported that the minimum and maximum home ranges of elephants in Figure 3. GIS data layers generated and used in the analysis.
Kyale et al.

Pachyderm No. 49 January–June 2011 53
Tsavo East and West National Parks were about 400 km2 and 1,900 km2 respectively. The maximum radius within which an elephant moved in the Tsavos was about 24.7 km, which is a value close to the width of band (24 km) used in this analysis (Mukeka, 2010). During the dry season, however, the size of an el-ephant home range increases (Leuthold & Sale, 1973; Mukeka, 2010), and as such, a wider band width (31.5 km) was used for the analysis of dry season poaching.
Exploring relationships between elephant mortality patterns and the biophysical and anthropogenic variables
The ArcGIS 9.2 Spatial Analyst tool was used to create distance surfaces from the buffer zone to ranger patrol bases, park gates, park roads, park boundaries, permanent rivers, seasonal rivers and waterholes (ESRI, 2006). 6KDSH�¿OHV�RI�WKH�HOHSKDQW�PRU-tality point data were added onto the created distance surfaces. Next, the value of distance of the poached elephants to each re-spective variable were extracted as described by Mitchell (2005) using ArcGIS 9.2 extraction of value to point tool in spatial analyst (ESRI, 2006). This produced an attribute table with distances values on all elephant poaching mortality locations in of the aforementioned at-tributes. Additionally, elevation and slope, and land cover types at every elephant mortality lo-cation were extracted from the DEM and the TENP vegetation cover map for each poaching category (ESRI, 2006; Mitchell, 2005).
Vegetation cover types were categorical rather than
quantitative and therefore, their relationships with the various poaching categories needed to be assessed differently. The land cover types were extracted at each mortality location for all elephant poaching categories examined in this analysis. The number of times (frequency) elephant mortality occurred in each land cover type was tabulated for every elephant poaching category and its respective percentage calculated for comparison with percentage size of corresponding land cover.
All extracted elephant mortality density values in each poaching category were correlated with corresponding distance (or elevation and slope) values extracted for each biophysical and human factor under
Figure 4. The distribution of elephants in Tsavo National Park in late January 2005. (Source: KWS Database, Elephant Programme)
Factors in the distribution of poached elephants in Tsavo East
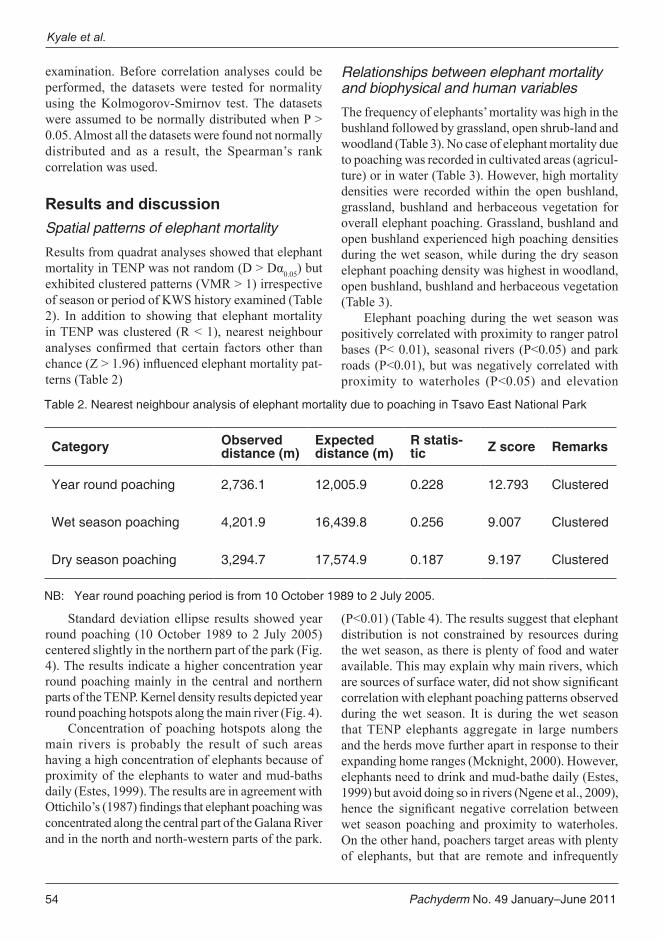
54 Pachyderm No. 49 January–June 2011
examination. Before correlation analyses could be performed, the datasets were tested for normality using the Kolmogorov-Smirnov test. The datasets were assumed to be normally distributed when P > 0.05. Almost all the datasets were found not normally distributed and as a result, the Spearman’s rank correlation was used.
Results and discussionSpatial patterns of elephant mortality
Results from quadrat analyses showed that elephant PRUWDOLW\�LQ�7(13�ZDV�QRW�UDQGRP��'�!�'Į0.05) but exhibited clustered patterns (VMR > 1) irrespective of season or period of KWS history examined (Table 2). In addition to showing that elephant mortality LQ�7(13�ZDV�FOXVWHUHG� �5�������QHDUHVW�QHLJKERXU�DQDO\VHV� FRQ¿UPHG� WKDW� FHUWDLQ� IDFWRUV� RWKHU� WKDQ�FKDQFH��=�!�������LQÀXHQFHG�HOHSKDQW�PRUWDOLW\�SDW-terns (Table 2)
Standard deviation ellipse results showed year round poaching (10 October 1989 to 2 July 2005) centered slightly in the northern part of the park (Fig. 4). The results indicate a higher concentration year round poaching mainly in the central and northern parts of the TENP. Kernel density results depicted year round poaching hotspots along the main river (Fig. 4).
Concentration of poaching hotspots along the main rivers is probably the result of such areas having a high concentration of elephants because of proximity of the elephants to water and mud-baths daily (Estes, 1999). The results are in agreement with 2WWLFKLOR¶V��������¿QGLQJV�WKDW�HOHSKDQW�SRDFKLQJ�ZDV�concentrated along the central part of the Galana River and in the north and north-western parts of the park.
Relationships between elephant mortality and biophysical and human variables
The frequency of elephants’ mortality was high in the bushland followed by grassland, open shrub-land and woodland (Table 3). No case of elephant mortality due to poaching was recorded in cultivated areas (agricul-ture) or in water (Table 3). However, high mortality densities were recorded within the open bushland, grassland, bushland and herbaceous vegetation for overall elephant poaching. Grassland, bushland and open bushland experienced high poaching densities during the wet season, while during the dry season elephant poaching density was highest in woodland, open bushland, bushland and herbaceous vegetation (Table 3).
Elephant poaching during the wet season was positively correlated with proximity to ranger patrol EDVHV� �3��������� VHDVRQDO� ULYHUV� �3�������DQG�SDUN�URDGV� �3��������EXW�ZDV�QHJDWLYHO\�FRUUHODWHG�ZLWK�SUR[LPLW\� WR�ZDWHUKROHV� �3������� DQG� HOHYDWLRQ�
�3��������7DEOH�����7KH�UHVXOWV�VXJJHVW�WKDW�HOHSKDQW�distribution is not constrained by resources during the wet season, as there is plenty of food and water available. This may explain why main rivers, which DUH�VRXUFHV�RI�VXUIDFH�ZDWHU��GLG�QRW�VKRZ�VLJQL¿FDQW�correlation with elephant poaching patterns observed during the wet season. It is during the wet season that TENP elephants aggregate in large numbers and the herds move further apart in response to their expanding home ranges (Mcknight, 2000). However, elephants need to drink and mud-bathe daily (Estes, 1999) but avoid doing so in rivers (Ngene et al., 2009), KHQFH� WKH� VLJQL¿FDQW� QHJDWLYH� FRUUHODWLRQ� EHWZHHQ�wet season poaching and proximity to waterholes. On the other hand, poachers target areas with plenty of elephants, but that are remote and infrequently
Table 2. Nearest neighbour analysis of elephant mortality due to poaching in Tsavo East National Park
Category Observed distance (m)
Expected distance (m)
R statis-tic Z score Remarks
Year round poaching 2,736.1 12,005.9 0.228 12.793 Clustered
Wet season poaching 4,201.9 16,439.8 0.256 9.007 Clustered
Dry season poaching 3,294.7 17,574.9 0.187 9.197 Clustered
NB: Year round poaching period is from 10 October 1989 to 2 July 2005.
Kyale et al.
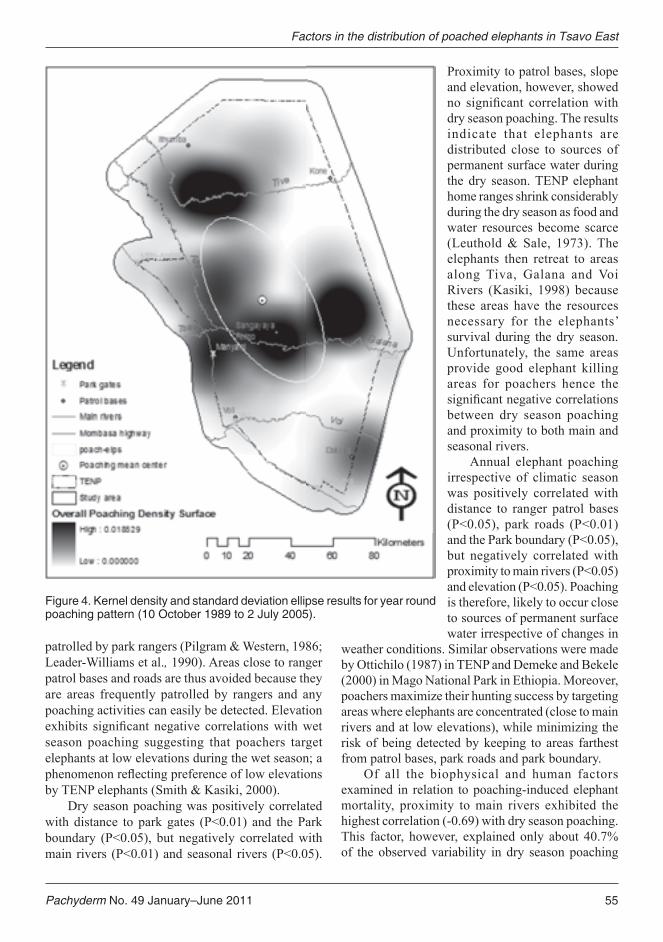
Pachyderm No. 49 January–June 2011 55
patrolled by park rangers (Pilgram & Western, 1986; Leader-Williams et al., 1990). Areas close to ranger patrol bases and roads are thus avoided because they are areas frequently patrolled by rangers and any poaching activities can easily be detected. Elevation H[KLELWV� VLJQL¿FDQW� QHJDWLYH� FRUUHODWLRQV�ZLWK�ZHW�season poaching suggesting that poachers target elephants at low elevations during the wet season; a SKHQRPHQRQ�UHÀHFWLQJ�SUHIHUHQFH�RI�ORZ�HOHYDWLRQV�by TENP elephants (Smith & Kasiki, 2000).
Dry season poaching was positively correlated ZLWK� GLVWDQFH� WR� SDUN� JDWHV� �3������� DQG� WKH�3DUN�ERXQGDU\� �3�������� EXW� QHJDWLYHO\� FRUUHODWHG�ZLWK�PDLQ� ULYHUV� �3�������DQG�VHDVRQDO� ULYHUV� �3��������
Proximity to patrol bases, slope and elevation, however, showed QR� VLJQL¿FDQW� FRUUHODWLRQ�ZLWK�dry season poaching. The results indicate that elephants are distributed close to sources of permanent surface water during the dry season. TENP elephant home ranges shrink considerably during the dry season as food and water resources become scarce (Leuthold & Sale, 1973). The elephants then retreat to areas along Tiva, Galana and Voi Rivers (Kasiki, 1998) because these areas have the resources necessary for the elephants’ survival during the dry season. Unfortunately, the same areas provide good elephant killing areas for poachers hence the VLJQL¿FDQW�QHJDWLYH�FRUUHODWLRQV�between dry season poaching and proximity to both main and seasonal rivers.
Annual elephant poaching irrespective of climatic season was positively correlated with distance to ranger patrol bases �3�������� SDUN� URDGV� �3�������DQG�WKH�3DUN�ERXQGDU\��3��������but negatively correlated with SUR[LPLW\�WR�PDLQ�ULYHUV��3�������DQG�HOHYDWLRQ��3��������3RDFKLQJ�is therefore, likely to occur close to sources of permanent surface water irrespective of changes in
weather conditions. Similar observations were made by Ottichilo (1987) in TENP and Demeke and Bekele (2000) in Mago National Park in Ethiopia. Moreover, poachers maximize their hunting success by targeting areas where elephants are concentrated (close to main rivers and at low elevations), while minimizing the risk of being detected by keeping to areas farthest from patrol bases, park roads and park boundary.
Of all the biophysical and human factors examined in relation to poaching-induced elephant mortality, proximity to main rivers exhibited the highest correlation (-0.69) with dry season poaching. This factor, however, explained only about 40.7% of the observed variability in dry season poaching
Figure 4. Kernel density and standard deviation ellipse results for year round poaching pattern (10 October 1989 to 2 July 2005).
Factors in the distribution of poached elephants in Tsavo East

56 Pachyderm No. 49 January–June 2011
Table 3. Relationship between elephant mortality and land cover types in Tsavo East National Park
Land cover
Elephant mortality
Year round poaching
Wet season poaching Dry season poaching
Name Area (Km2) Freq Density Freq Density Freq Density
Forest 840 3 0.0036 1 0.0012 0 0.0000
Woodland 3,063 9 0.0029 2 0.0007 9 0.0039
Grassland 3,511 18 0.0051 14 0.0040 3 0.0008
Bushland 7,926 27 0.0035 17 0.0021 14 0.0018
Open bushland 2,664 14 0.0053 5 0.0019 8 0.0030Herbaceous vegeta-tion 489 3 0.0061 0 0.0000 1 0.0020
Agriculture 106 0 0.0000 0 0.0000 0 0.0000
Water 32 0 0.0000 0 0.0000 0 0.0000
Barren land 683 1 0.0015 1 0.0015 0 0.0000
Total 193,138 75 0.0004 40 0.0002 35 0.0002
Table 4. Spearman’s Rank correlates for elephant mortality in Tsavo East National Park
Factors Annual poaching Wet season poaching Dry season poaching
Distance to patrol bases 0.247* 0.422** -0.148
Distance to park gates 0.065 0.022 0.444**
Distance to main rivers -0.238* 0.139 -0.686**Distance to seasonal rivers 0.073 0.338* -0.409*
Distance to waterholes -0.216 -0.317* -0.022
Distance to park roads 0.408** 0.466** 0.147Distance to park boundary 0.229* 0.200 0.378*
Elevation (m) -0.258* -0.424** -0.169
Slope (degrees) 0.015 0.039 -0.046
.GXGNU�QH�UKIPKſECPEG��* = p < 0.05; ** = p < 0.01
(Fig.5). This finding indicates that there were other important factors influencing poaching-induced elephant mortality that were not measured in the current study. Some of these factors may include rainfall distribution, locations of lodges and campsites, park ranger observation posts and political and socio-economic factors that may influence elephant poaching.
Studies on social organization of elephants have shown that elephants of the TENP exhibit aggregation
all-year-round (McKnight, 2000). The aggregations constitute large groups that are not family units but those formed in response to stress, harassment and lack of matriarchs to lead family units as a result of previous heavy poaching (Lewis, 1986; Ruggiero, 1990). The aggregating behaviour of previously heavily poached elephant populations may therefore, explain why elephant mortality exhibited clustered patterns in TENP irrespective of season or the KWS historical period analyzed. It would therefore be
Kyale et al.
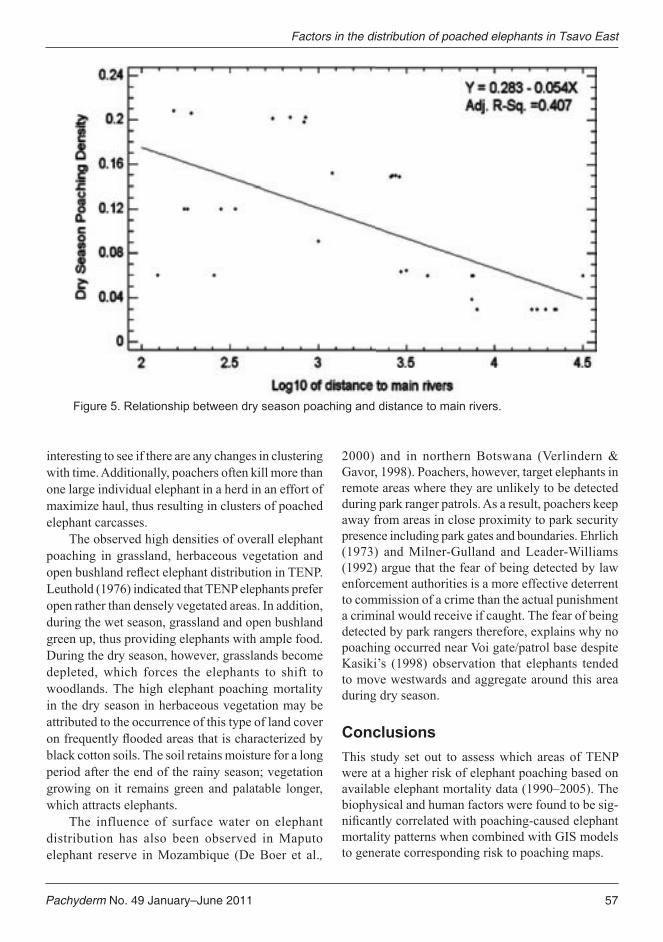
Pachyderm No. 49 January–June 2011 57
interesting to see if there are any changes in clustering with time. Additionally, poachers often kill more than one large individual elephant in a herd in an effort of maximize haul, thus resulting in clusters of poached elephant carcasses.
The observed high densities of overall elephant poaching in grassland, herbaceous vegetation and RSHQ�EXVKODQG�UHÀHFW�HOHSKDQW�GLVWULEXWLRQ�LQ�7(13��Leuthold (1976) indicated that TENP elephants prefer open rather than densely vegetated areas. In addition, during the wet season, grassland and open bushland green up, thus providing elephants with ample food. During the dry season, however, grasslands become depleted, which forces the elephants to shift to woodlands. The high elephant poaching mortality in the dry season in herbaceous vegetation may be attributed to the occurrence of this type of land cover RQ�IUHTXHQWO\�ÀRRGHG�DUHDV�WKDW�LV�FKDUDFWHUL]HG�E\�black cotton soils. The soil retains moisture for a long period after the end of the rainy season; vegetation growing on it remains green and palatable longer, which attracts elephants.
The influence of surface water on elephant distribution has also been observed in Maputo elephant reserve in Mozambique (De Boer et al.,
2000) and in northern Botswana (Verlindern & Gavor, 1998). Poachers, however, target elephants in remote areas where they are unlikely to be detected during park ranger patrols. As a result, poachers keep away from areas in close proximity to park security presence including park gates and boundaries. Ehrlich (1973) and Milner-Gulland and Leader-Williams (1992) argue that the fear of being detected by law enforcement authorities is a more effective deterrent to commission of a crime than the actual punishment a criminal would receive if caught. The fear of being detected by park rangers therefore, explains why no poaching occurred near Voi gate/patrol base despite Kasiki’s (1998) observation that elephants tended to move westwards and aggregate around this area during dry season.
Conclusions This study set out to assess which areas of TENP were at a higher risk of elephant poaching based on available elephant mortality data (1990–2005). The biophysical and human factors were found to be sig-QL¿FDQWO\�FRUUHODWHG�ZLWK�SRDFKLQJ�FDXVHG�HOHSKDQW�mortality patterns when combined with GIS models to generate corresponding risk to poaching maps.
Figure 5. Relationship between dry season poaching and distance to main rivers.
Factors in the distribution of poached elephants in Tsavo East

58 Pachyderm No. 49 January–June 2011
Results obtained from nearest neighbour and kernel density analyses indicated that elephant poaching was not a random event in TENP, and instead exhibited clustered patterns irrespective of season for which poaching-induced elephant mortality was examined in the pre- and post-CITES ban on ivory trade. In addition, nearest neighbour analysis indicated that the clustering of poaching-induced elephant mortality did not occur by chance. Various point pattern analysis techniques, including kernel density and nearest neighbour analysis, revealed a similar distribution of poaching hotspots. The nearest neighbour analysis and kernel density analysis techniques provide the best combination for analysing elephant mortality patterns because of the former’s DELOLW\� WR� VWDWLVWLFDOO\� WHVW� WKH� VLJQL¿FDQFH� RI� WKH�elephant mortality patterns and the latter’s ability to visualize hotspots.
Different biophysical and human factors were correlated with observed patterns of poaching-induced elephant mortality. Land cover type, availability of surface water and elevation were the most important biophysical factors limiting poached elephant distribution, while proximity to park roads, JDWHV��SDUN�ERXQGDU\�DQG�SDWURO�EDVHV�ZHUH�VLJQL¿FDQW�GHWHUUHQWV� WR�SRDFKLQJ��6ORSH�ZDV�QRW� VLJQL¿FDQWO\�correlated with poaching-induced elephant mortality.
AcknowledgementsWe feel indebted to the Department of Geography IRU�¿QDQFLDOO\�VXSSRUWLQJ�WKH�¿UVW�DXWKRU�GXULQJ�KLV�studies at Miami University, and to KWS for granting KLP�VWXG\�OHDYH�GXULQJ�WKLV�SHULRG��7KH�¿UVW�DXWKRU�is sincerely thankful to his M.S. thesis committee members including Dr John Maingi, Dr Kimberly Medley and Dr Mary Henry, for their constructive input into the M.S. upon which this paper is based. We are also indebted to the KWS staff for assisting in RQH�ZD\�RU�DQRWKHU�GXULQJ�WKH�¿UVW�DXWKRU¶V�¿HOGZRUN�LQ�.HQ\D��)LQDOO\��WKH�¿UVW�DXWKRU�H[WHQGV�KLV�WKDQNV�to the Miami University’s Departments of Geography DQG�=RRORJ\� IRU� WKHLU�¿QDQFLDO� VXSSRUW� GXULQJ� WKH�¿HOGZRUN�SKDVH�LQ�.HQ\D�
References$)(6*� �������� µ5HYLHZ� RI�$IULFDQ� (OHSKDQW�
Conservation Priorities’. In: C. R. Thouless, (ed.) Working document of the IUCN/SSC African Specialist Group. Nairobi, Kenya: AFESG. (Unpublished)
$QRQ\PRXV���������µ&ORVLQJ�LQ�IRU�WKH�.LOO"�$IWHU�D�decade of quiet, ivory poaching has started again in Kenya’. Economist 363(8273):76–77.
Blanc, J.J., Barnes, R.F.W. Craig, G.C., Dublin, H.T., Thouless, C.R., Douglas-Hamilton, I. and Hart, J.A. (2007). African Elephant Status Report 2007: an update from the African Elephant Database. Occasional Paper Series of the IUCN Species Survival Commission No. 33. I. S. A. E. S. Group. Gland, Switzerland: IUCN. (Unpublished)
Born Free Foundation (2000). “Stop the Clock” Report 4th April 2000. Executive Summary. West Sussex: Born Free Foundation. (Unpublished)
%XUWRQ��0�� �������� µ$Q�$VVHVVPHQW� RI�$OWHUQDWLYH�Methods of Estimating the Effects of Ivory Trade Ban on Poaching Effort’. Ecological Economics 30:93–106.
Cobb, S. (1976). The abundance and distribution of large herbivores in Tsavo National Park, Kenya. Unpublished PhD dissertation, Oxford University.
Cumming, D.H.M, du Toit, R.F. and Stuart S.N. (1990). African Elephants and Rhinos: Status Survey and Conservation Action Plan. Gland, Switzerland: IUCN. (Unpublished)
De Boer, W.F., Ntumi, C.P., Correia, A.U. and Mafuca, -�0����������µ'LHW�DQG�'LVWULEXWLRQ�LQ�WKH�0DSXWR�Elephant Reserve, Mozambique’. African Journal of Ecology 38:188–201.
'HPHNH��<�� DQG�%HNHOH��$�� �������� µ6WXG\� RQ� WKH�Elephants of Mago National Park, Ethiopia’. Pachyderm 28:32–43.
Douglas-Hamilton I., Gachago S., Litoroh M. and Mirangi J. 1994. Tsavo elephant count 1994. Nairobi: Kenya Wildlife Service. (Unpublished)
Dublin, H.T., McShane, T.O. and Newby, J. (eds). (1997). Conserving Africa’s Elephants: current issues and priorities for action WWF International, 1196 Gland, Switzerland.
Kyale et al.

Pachyderm No. 49 January–June 2011 59
(KUOLFK�� ,�� �������� µ3DUWLFLSDWLRQ� LQ� ,OOHJLWLPDWH�Activities: A Theoretical and Empirical Investigation’. Journal of Political Economy 81 (3):521–566.
ESRI (Environmental Systems Research Institute) (2006). ArcGIS: Arc Map Version 9.2. California, USA: ESRI.
Estes, R. (1999). The Safari Companion: Guide to watching African mammals including hoofed mammals, carnivores, and primates. White River Junction: Chelsea Green Publishing Company.
+DNDQVVRQ��1��7�� �������� µ7KH� KXPDQ� HFRORJ\� RI�world systems in East Africa: The impact of ivory trade.’ Human Ecology 32(5):569–591.
+DPPHU�� -�� �������� µ7KH�ZDU� WR� VDYH� WKH�7VDYR�Reserve’. Newsweek 121(15):3–4.
+HUWEHUJ��5����������µ,PSDFWV�RI�WKH�,YRU\�7UDGH�%DQ�on Poaching Incentives: A Numerical example’. Ecological Economics 36:189–195.
IUCN (2000). Red list of Endangered Species. Gland, Switzerland: IUCN.
-DFKPDQQ��+�� DQG�%LOOLRXZ��0�� �������� µ(OHSKDQW�Poaching and Law Enforcement in the Central Luangwa Valley, Zambia’. Journal of Applied Ecology 34(1):233–244.
-\RWL� �.�� DQG�+DUIRUG�� -�� �������� µ7KH� LYRU\� WUDGH�EDQ�� ,V� LW� HIIHFWLYH"¶�Ecological Economics 19(2):147–155.
.DVLNL�� 6��0�� �������� µ+XPDQ�HOHSKDQW� FRQIOLFW�in areas adjacent to the Tsavo National Parks, Kenya’. PhD dissertation, University of Kent.
Kenya Wildlife Service 2003. Tsavo East National Park. http://www.kws.org/tsavoeast.htm
Kioko, J. M. (2002). Family of ten Elephants Gunned Down in Tsavo East, one Poacher killed, three still on the run. Nairobi, Kenya: Kenya Wildlife Press Release.
Leader-Williams, N. Albon, S. D. and Berry, P.S.M. ��������µ,OOHJDO�([SORLWDWLRQ�RI�%ODFN�5KLQRFHURV�and Elephant Populations: Patterns of Decline, Law Enforcement and Patrol Efforts in Luangwa Valley, Zambia’. Journal of Applied Ecology 27(3):1,055–1,087.
/HXWKROG��:����������µ*URXS�VL]H�LQ�HOHSKDQWV�RI�7VDYR�1DWLRQDO�3DUN�DQG�SRVVLEOH�IDFWRUV�LQÀXHQFLQJ�LW¶��Journal of Animal Ecology,45(2):425–439.
/HXWKROG��:�� �������� µ6SDWLDO� RUJDQL]DWLRQ� DQG�strategy of habitat utilization of elephants in Tsavo National Park, Kenya’. Zeitschrift fur Saugetierkunde, 42:358–379.
/HXWKROG��:��DQG�6DOH��-��%����������µ0RYHPHQWV�DQG�patterns of habitat utilization of elephants in Tsavo National Park, Kenya’. East African Wildlife Journal 11:369–384.
/HZLV��'��0����������µ'LVWXUEDQFH�HIIHFWV�RQ�HOHSKDQW�feeding: evidence for compression in Luangwa Valley, Zambia’. African Journal of Ecology, 24: 227–241.
0F.QLJKW�� %�� �������� µ&KDQJHV� LQ� (OHSKDQW�Demography, Reproduction and Group Structure in Tsavo East National Park (1966 - 1994)’. Pachyderm 29:15–24.
Milner-Gulland, E. J. and Leader-Williams, N. (1992). µ$�0RGHO�RI�,QFHQWLYHV�WR�,OOHJDO�([SORLWDWLRQ�RI�Black Rhinos and Elephants: Poaching Pays in Luangwa Valley, Zambia’. Journal of Applied Ecology 29(2):388–401.
Mitchell, A. (2005). The ESRI guide to GIS analysis: Volume 2, spatial measurements and statistics. ESRI Press, Ridland, California, USA.
0XNHND��-����������µ$QDO\]LQJ�WKH�GLVWULEXWLRQ�RI�WKH�African elephant (Loxodonta africana) in Tsavo, Kenya’. M.Sc thesis, Miami University, Oxford, Ohio, USA.
Ngene, S.M., Skidmore, A.K., Gils, H., Douglas-Hamilton, I. and Omondi, P. (2009). ‘Elephant distribution around a volcanic shield dominated by a mosaic of forest-savannah (Marsabit, Kenya)’. Afr. J. Ecol. 47:234–245.
Oindo, B.O., Skidmore, A.K. and de Salvo, 3����������µ0DSSLQJ�KDELWDW�DQG�ELRORJLFDO�GLYHUVLW\�in the Maasai Mara ecosystem’. International Journal of Remote Sensing 24(5):1053–1069.
Omondi, P.O., King, J., Bitok, E. and Geddes, C. ��������µ7RWDO�DHULDO�FRXQW�RI�HOHSKDQWV�DQG�EXIIDOR�in the Tsavo/Mkomazi ecosystem’. Nairobi, Kenya: Kenya Wildlife Service. (Unpublished)
Factors in the distribution of poached elephants in Tsavo East
60 Pachyderm No. 49 January–June 2011
Omondi, P. and Bitok, E. (2005). Total Aerial Count of Elephants, Buffalo & other species in the Tsavo/Mkomazi Ecosystem. Nairobi, Kenya: Kenya Wildlife Service. (Unpublished)
2WWLFKLOR��:��.����������µ7KH�FDXVH�RI�WKH�UHFHQW�KHDY\�elephant mortality in the Tsavo ecosystem, Kenya, 1975–80’. Biological Conservation 41:279–289.
3HDUFH��)����������µ,YRU\�VDOH�IXHOV�LOOHJDO�WUDGH�IHDUV¶��New Scientist 181:2439.
3LOJUDP�� 7�� DQG�:HVWHUQ�� '�� �������� µ,QIHUULQJ�Hunting Patterns on African Elephant from Tusks in the International Ivory Trade’. Journal of Applied Ecology 23(2):503–514.
5RELQVRQ��6����������µ'\LQJ�IRU�,YRU\��(YHQ�$IULFDQ�conservationists cannot agree on how best to protect elephant populations from the threat of poachers’. Time Europe 155(15):44–45.
Ruggiero, R. (1990). The effects of poaching disturbance on elephant behaviour. Pachyderm 13:42–44.
Smith, R. J. and Kasiki, S. (2000). A Spatial Analysis of Human-Elephant Conflict in the Tsavo Ecosystem, Kenya. AfESG Report. Gland, Switzerland: IUCN.
Thouless, C.R., King, J., Omondi, P., Kahumbu, P. and Douglas-Hamilton, I. (2008). The status of Kenya’s elephants. Nairobi, Kenya: Save the Elephant.
Tolvanen, R. (2004). Nature Conservation Areas in Kenya – Tsavo East and West National Parks. In: Pellikka, P. J., Ylhaisi and Clark, B. (eds). Taita Hills and Kenya - Seminar, Reports and Journal of a Field Excursion to Kenya. Helsinki, Finland: Expedition Reports of the Department of Geography, University of Helsinki 40:59–63.
9HUOLQGHQ��$�� DQG�*DYRU�� ,�.�1�� �������� µ6DWHOOLWH�Tracking of Elephants in Northern Botswana’. African Journal of Ecology 36:105–116.
Wijgaarden, W. (1985). Elephants – trees-grazers: Relationship between climate, soil, vegetation and large herbivores in a semi-arid ecosystem (Tsavo, Kenya). ITC Publication #4.
Kyale et al.
Pachyderm No. 49 January–June 2011 61
Census and ear-notching of black rhinos (Diceros bicornis michaeli) in Tsavo East National Park, Kenya
Shadrack Ngene1*, Elephus Bitok2, Joseph Mukeka3, Francis Gakuya4, Patrick Omondi5, Kennedy Kimitei6, Yusuf Watol7, Linus Kariuki8 and Benson Ouma Okita9
1,2,6,7Kenya Wildlife Service, Tsavo Conservation Area, P.O. Box 14, Voi, Kenya
3,5,8,9Kenya Wildlife Service, Langata Road, P.O. Box 40241, 00200 Nairobi
*Corresponding author: Shadrack Ngene; email: [email protected]
AbstractThis paper updates the status of the black rhino population in Tsavo East National Park (NP). Data were ac-TXLUHG�WKURXJK�DHULDO�FRXQWV�RI�WKH�EODFN�UKLQR�EHWZHHQ���DQG���2FWREHU������XVLQJ�WKUHH�¿[HG�ZLQJ�KXVN\�aircrafts and a Bell 206L helicopter in an area of about 3,300 km2. Based on previous sightings of rhinos, the DUHD�ZDV�GLYLGHG�LQWR����EORFNV��ZLWK�HDFK�EORFN�VXEGLYLGHG�LQWR�����P�WUDQVHFWV��$Q�DLUFUDIW�À\LQJ�DW�DERXW�500 m above the ground was assigned to carry out the aerial survey following these transects within each EORFN��2EVHUYHUV�VFDQQHG�IRU�UKLQRV�DERXW�����P�RQ�HLWKHU�VLGHV�RI�WKH�ÀLJKW�SDWKV��,QWHQVLYH�VHDUFKHV�LQ�areas with dense vegetation, especially along the Galana and Voi Rivers and other known rhino range areas was also carried out by both the huskies and the helicopter. The count resulted in sighting of 11 black rhinos. 6HYHQ�RI�WKHVH�LQGLYLGXDOV�ZHUH�HDU�QRWFKHG�DQG�¿WWHG�ZLWK�UDGLR�WUDQVPLWWHUV�DQG�WKH�KRUQV�ZHUH�WLSSHG�RII�to discourage poaching. Three of the seven captured rhinos were among the 49 animals translocated to Tsavo East between 1993 and 1999. The other four animals were born in Tsavo East. Two female rhinos and their FDOYHV�ZHUH�QRW�HDU�QRWFKHG�RU�¿WWHG�ZLWK�WUDQVPLWWHUV��,W�LV�UHFRPPHQGHG�WKDW�DQRWKHU�FRXQW�EH�FDUULHG�RXW�immediately after the wet season as the rhinos spend more time in the open areas while the vegetation is still green. The repeat aerail count is to include blocks north of River Galana.
Key words: Aerial count, black rhino, population size, Tsavo East National Park
Résumé Ce document met à jour l’état de la population de rhinocéros noirs dans le Parc national de Tsavo Est. Les données ont été obtenues par des comptages aériens de rhinocéros noirs entre le 3 et le 9 octobre 2010 en XWLOLVDQW�WURLV�DYLRQV�+XVN\�j�DLOHV�¿[HV�HW�XQ�KpOLFRSWqUH�%HOO����/�GDQV�XQH�]RQH�G¶HQYLURQ������NP2. En se basant sur les observations précédentes de rhinocéros, on a divisé la région en 14 blocs, chaque bloc étant subdivisé en transects de 400 m. Un avion volant à environ 500 m au-dessus du sol était affecté à la réalisa-tion des relevés aériens suivant ces transects dans chaque bloc. Les observateurs scrutaient les rhinocéros à environ 200 m de chaque côté de la trajectoire de vol. Des recherches intensives dans les zones ayant une végétation dense, surtout le long des rivières Galana et Voi et d’autres zones connues comme des habitats de rhinocéros ont également été effectuées par les avions et l’hélicoptère. Le comptage a permis l’observation de 11 rhinocéros noirs. Sept de ces rhinocéros ont été entaillés à l’oreille et munis d’émetteurs radio et leurs cornes ont été taillées pour décourager le braconnage. Trois des sept rhinocéros capturés étaient parmi les 49 animaux transférés à Tsavo Est entre 1993 et 1999. Les quatre autres animaux sont nés à Tsavo Est. Deux rhinocéros femelles et leurs veaux n’ont pas été entaillés à l’oreille ou équipés d’émetteurs. On recommande qu’un autre comptage soit réalisé immédiatement après la saison des pluies car le rhinocéros passe plus de WHPSV�GDQV�OHV�]RQHV�RXYHUWHV�ORUVTXH�OD�YpJpWDWLRQ�HVW�HQFRUH�YHUWH��/H�FRPSWDJH�DpULHQ�GRLW�rWUH��UpSpWp�SRXU�inclure des blocs se trouvant au nord de la rivière Galana.
62 Pachyderm No. 49 January–June 2011
IntroductionThe black rhino (Diceros bicornis) suffered a rapid decline across Africa in the 1970s and 1980s, both in population size and range (Okita-Ouma et al., 2007; Milledge, 2007). The population size declined from about 65,000 animals in 1970 to fewer than 2,500 by 1992 (Milliken et al., 2009; Emslie et al., 2007; Milledge, 2007). Between the 1960s and 1992, the decline was less than half in large national parks like Tsavo East and West (Western, 1982; Gakahu, 1993). In Kenya, black rhino numbers dropped from an estimated 20,000 in 1970 to fewer than 400 animals by the 1990s (KWS, 2008; Okita-Ouma et al., 2007; Milledge, 2007). Tsavo East was one of the most severely im-pacted areas with the population declining from over 5,000 in the late 1960s to about ten animals in 1988 (Okita-Ouma et al., 2007), and only two individuals by 1991 (KWS, 2008).
Earlier in the 20th century, clearing of land for crop farming and settlement was the main cause for the decline of rhinos (WWF, 2004). However, during the last quarter of the 20th century, the drastic decline of black rhino numbers was largely due to the increased demand for rhino horn in the international markets (Vigne et al., 2007; WWF, 2004), resulting in an upsurge in poaching (Milledge, 2007). Other causes of decline have been poor security coverage of the rhino range due to inadequate resources such as finances, vehicles, personnel and equipment (Milledge, 2007).
Overall numbers of African black rhinos in the wild have continued to increase up to 4,200 as at 31 December 2007 (Emslie et al., 2007). Since 1995, the number of black rhinos in Kenya has increased by 55% with an annual growth rate of 4.5% (Emslie et al., 2007). However, populations in the intensive protection zones, especially in Tsavo East NP declined (KWS, 2008).
The intensive protection zone population in Tsavo East was established in 1993 (Brett, 1993). 7KH�¿UVW�JURXS�RI�IRXU�EODFN�UKLQRV�ZHUH�WUDQVORFDWHG�from Nairobi NP in 1993 (KWS, 2008; KWS, 2010). Sixteen more rhinos were translocated into the park from Solio in 1994 (KWS, 2008; KWS, 2010) and in 1996 12 were moved from Solio ranch (11) and Ngulia (1) to the Tsavo East free release area. More rhinos were translocated to the park in 1997 (1 from Oljogi), 1998 (1 from Lewa), and 1999 (15; 11 from Nairobi NP and 4 Oljogi) (KWS, 2010). By 1999, 49 black
rhinos had been translocated into the park (KWS, 2010). Vigne et al. (2007) reported an estimated 56 black rhinos in Tsavo East NP. These estimates were revised to about 28 animals in 2009 (KWS, 2010). Twenty-seven black rhino carcasses have been sighted in Tsavo East between 1993 and 2010 (KWS, 2010). Most of the carcasses were reported between 2000 and 2006, most of them being because of poaching (KWS, 2010; Okita-Ouma et al., 2007; Milledge, 2007). The high rate of poaching resulted in the need to establish the current status of black rhinos in Tsavo East National Park. This clearly indicates the lack of routine monitoring and location of the Tsavo East rhinos in the period preceding this census, which is a prerequisite for securing and ensuring growth in any rhino population.
This paper outlines the present status of the black UKLQR�LQ�7VDYR�(DVW�13��FRPSDUHV�RXU�¿QGLQJV�ZLWK�those of Mulama and Okita (2002) and provides recommendations for the future long-term security management of these animals.
Materials and methodsStudy site
The census was carried out in Tsavo East NP, South of the Galana River and North of the Voi River, in an area of about 3,300 km2 (Fig. 1). The park has been described in detail by many researchers (Tolvanen, 2004; Smith & Kasiki, 2000; McKnight, 2000; Cobb, 1976). It was gazetted in 1948 and covers about 12,000 km2 (Smith & Kasiki, 2000). It contains a high number of endangered and other species, making it an important biodiversity area (Smith & Kasiki, 2000). More than 324 species of birds and 32 species of large mammals occur in the park (Cobb, 1976), including elephants, giraffes, common zebras, Maasai giraffes and black rhinos (Leuthold, 1977; Wijgaarden, 1985).
Most of the southern part of the park is relatively ÀDW�ZLWK�RFFDVLRQDO�LQVHOEHUJV�GRWWLQJ�WKH�ODQGVFDSH��The lowest plains in the eastern part of the park rise to 150 masl and increase westwards to as high as 1200 masl in the Yatta Plateau (Tolvanen, 2004). The climate of the park has two distinct rainy seasons—the long rains experienced between March and May and the short rains between October and December. The driest months are January and February and June through September. Annual mean rainfall in the park varies according to altitude with the eastern part
Ngene et al.
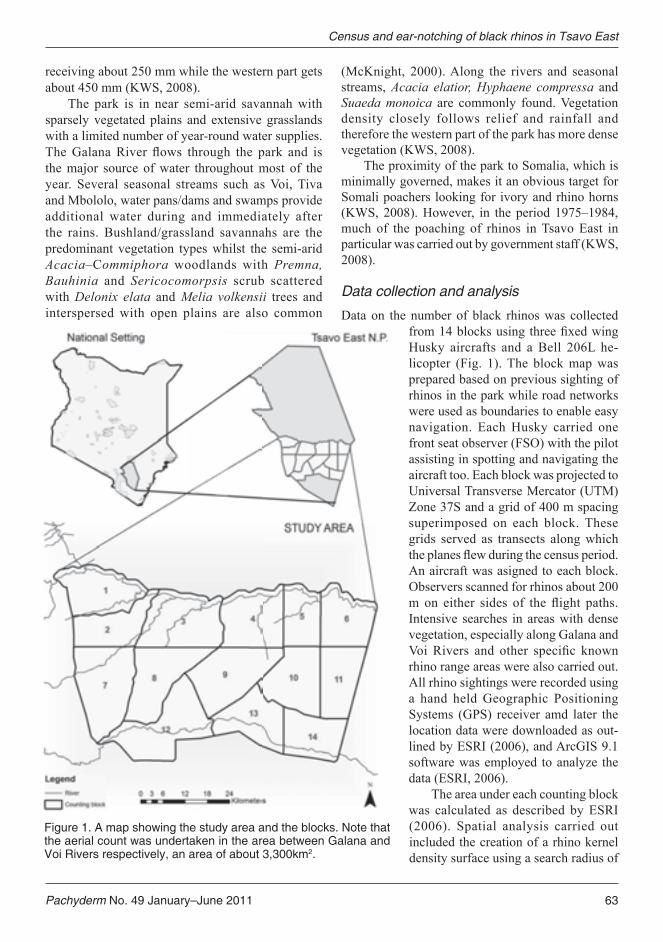
Pachyderm No. 49 January–June 2011 63
receiving about 250 mm while the western part gets about 450 mm (KWS, 2008).
The park is in near semi-arid savannah with sparsely vegetated plains and extensive grasslands with a limited number of year-round water supplies. 7KH�*DODQD�5LYHU� ÀRZV� WKURXJK� WKH� SDUN� DQG� LV�the major source of water throughout most of the year. Several seasonal streams such as Voi, Tiva and Mbololo, water pans/dams and swamps provide additional water during and immediately after the rains. Bushland/grassland savannahs are the predominant vegetation types whilst the semi-arid Acacia–Commiphora woodlands with Premna, Bauhinia and Sericocomorpsis scrub scattered with Delonix elata and Melia volkensii trees and interspersed with open plains are also common
(McKnight, 2000). Along the rivers and seasonal streams, Acacia elatior, Hyphaene compressa and Suaeda monoica are commonly found. Vegetation density closely follows relief and rainfall and therefore the western part of the park has more dense vegetation (KWS, 2008).
The proximity of the park to Somalia, which is minimally governed, makes it an obvious target for Somali poachers looking for ivory and rhino horns (KWS, 2008). However, in the period 1975–1984, much of the poaching of rhinos in Tsavo East in particular was carried out by government staff (KWS, 2008).
Data collection and analysis
Data on the number of black rhinos was collected IURP����EORFNV�XVLQJ�WKUHH�¿[HG�ZLQJ�Husky aircrafts and a Bell 206L he-licopter (Fig. 1). The block map was prepared based on previous sighting of rhinos in the park while road networks were used as boundaries to enable easy navigation. Each Husky carried one front seat observer (FSO) with the pilot assisting in spotting and navigating the aircraft too. Each block was projected to Universal Transverse Mercator (UTM) Zone 37S and a grid of 400 m spacing superimposed on each block. These grids served as transects along which WKH�SODQHV�ÀHZ�GXULQJ�WKH�FHQVXV�SHULRG��An aircraft was asigned to each block. Observers scanned for rhinos about 200 P�RQ� HLWKHU� VLGHV� RI� WKH� ÀLJKW� SDWKV��Intensive searches in areas with dense vegetation, especially along Galana and 9RL�5LYHUV� DQG� RWKHU� VSHFL¿F� NQRZQ�rhino range areas were also carried out. All rhino sightings were recorded using a hand held Geographic Positioning Systems (GPS) receiver amd later the location data were downloaded as out-lined by ESRI (2006), and ArcGIS 9.1 software was employed to analyze the data (ESRI, 2006).
The area under each counting block was calculated as described by ESRI (2006). Spatial analysis carried out included the creation of a rhino kernel density surface using a search radius of
Figure 1. A map showing the study area and the blocks. Note that the aerial count was undertaken in the area between Galana and Voi Rivers respectively, an area of about 3,300km2.
Census and ear-notching of black rhinos in Tsavo East
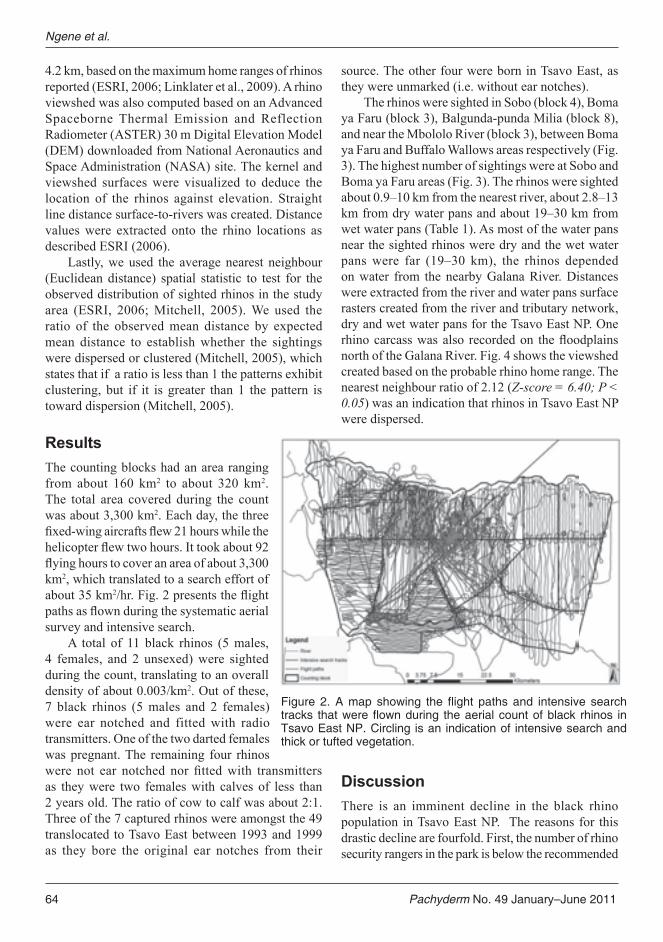
64 Pachyderm No. 49 January–June 2011
4.2 km, based on the maximum home ranges of rhinos reported (ESRI, 2006; Linklater et al., 2009). A rhino viewshed was also computed based on an Advanced Spaceborne Thermal Emission and Reflection Radiometer (ASTER) 30 m Digital Elevation Model (DEM) downloaded from National Aeronautics and Space Administration (NASA) site. The kernel and viewshed surfaces were visualized to deduce the location of the rhinos against elevation. Straight line distance surface-to-rivers was created. Distance values were extracted onto the rhino locations as described ESRI (2006).
Lastly, we used the average nearest neighbour (Euclidean distance) spatial statistic to test for the observed distribution of sighted rhinos in the study area (ESRI, 2006; Mitchell, 2005). We used the ratio of the observed mean distance by expected mean distance to establish whether the sightings were dispersed or clustered (Mitchell, 2005), which states that if a ratio is less than 1 the patterns exhibit clustering, but if it is greater than 1 the pattern is toward dispersion (Mitchell, 2005).
Results The counting blocks had an area ranging from about 160 km2 to about 320 km2. The total area covered during the count was about 3,300 km2. Each day, the three ¿[HG�ZLQJ�DLUFUDIWV�ÀHZ����KRXUV�ZKLOH�WKH�KHOLFRSWHU�ÀHZ�WZR�KRXUV��,W�WRRN�DERXW����À\LQJ�KRXUV�WR�FRYHU�DQ�DUHD�RI�DERXW�������km2, which translated to a search effort of about 35 km2�KU��)LJ����SUHVHQWV�WKH�ÀLJKW�SDWKV�DV�ÀRZQ�GXULQJ�WKH�V\VWHPDWLF�DHULDO�survey and intensive search.
A total of 11 black rhinos (5 males, 4 females, and 2 unsexed) were sighted during the count, translating to an overall density of about 0.003/km2. Out of these, 7 black rhinos (5 males and 2 females) were ear notched and fitted with radio transmitters. One of the two darted females was pregnant. The remaining four rhinos ZHUH� QRW� HDU� QRWFKHG� QRU� ¿WWHG�ZLWK� WUDQVPLWWHUV�as they were two females with calves of less than 2 years old. The ratio of cow to calf was about 2:1. Three of the 7 captured rhinos were amongst the 49 translocated to Tsavo East between 1993 and 1999 as they bore the original ear notches from their
source. The other four were born in Tsavo East, as they were unmarked (i.e. without ear notches).
The rhinos were sighted in Sobo (block 4), Boma ya Faru (block 3), Balgunda-punda Milia (block 8), and near the Mbololo River (block 3), between Boma ya Faru and Buffalo Wallows areas respectively (Fig. 3). The highest number of sightings were at Sobo and Boma ya Faru areas (Fig. 3). The rhinos were sighted about 0.9–10 km from the nearest river, about 2.8–13 km from dry water pans and about 19–30 km from wet water pans (Table 1). As most of the water pans near the sighted rhinos were dry and the wet water pans were far (19–30 km), the rhinos depended on water from the nearby Galana River. Distances were extracted from the river and water pans surface rasters created from the river and tributary network, dry and wet water pans for the Tsavo East NP. One UKLQR�FDUFDVV�ZDV�DOVR� UHFRUGHG�RQ� WKH�ÀRRGSODLQV�north of the Galana River. Fig. 4 shows the viewshed created based on the probable rhino home range. The nearest neighbour ratio of 2.12 (Z-score = 6.40; P < 0.05) was an indication that rhinos in Tsavo East NP were dispersed.
DiscussionThere is an imminent decline in the black rhino population in Tsavo East NP. The reasons for this drastic decline are fourfold. First, the number of rhino security rangers in the park is below the recommended
(KIWTG� ���#�OCR� UJQYKPI� VJG� ƀKIJV� RCVJU� CPF� KPVGPUKXG� UGCTEJ�VTCEMU� VJCV�YGTG�ƀQYP�FWTKPI� VJG�CGTKCN�EQWPV�QH�DNCEM� TJKPQU� KP�Tsavo East NP. Circling is an indication of intensive search and thick or tufted vegetation.
Ngene et al.
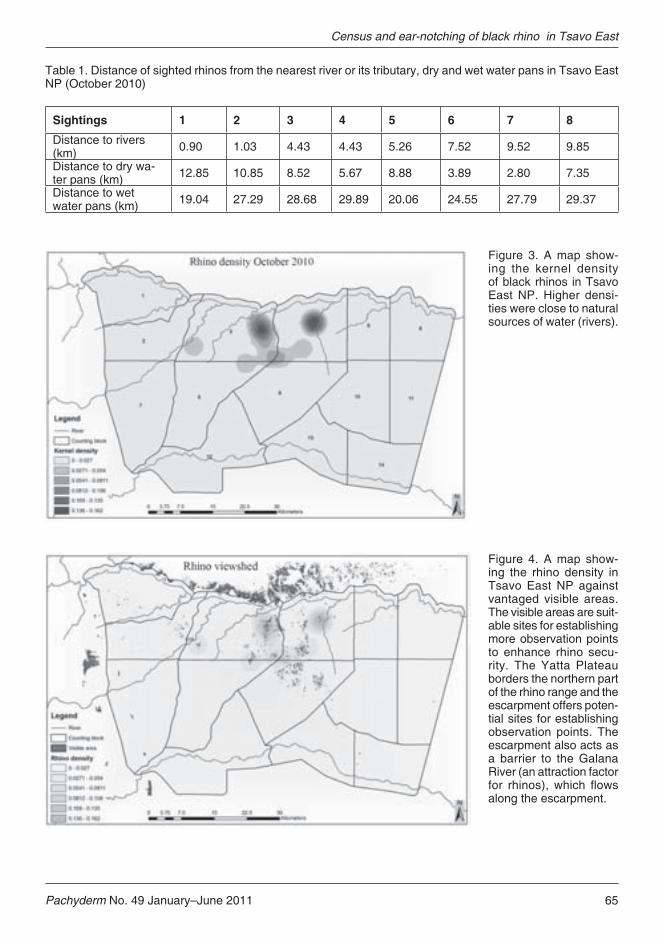
Pachyderm No. 49 January–June 2011 65
Table 1. Distance of sighted rhinos from the nearest river or its tributary, dry and wet water pans in Tsavo East NP (October 2010)
Sightings 1 2 3 4 5 6 7 8
Distance to rivers (km) 0.90 1.03 4.43 4.43 5.26 7.52 9.52 9.85
Distance to dry wa-ter pans (km) 12.85 10.85 8.52 5.67 8.88 3.89 2.80 7.35
Distance to wet water pans (km) 19.04 27.29 28.68 29.89 20.06 24.55 27.79 29.37
Figure 3. A map show-ing the kernel density of black rhinos in Tsavo East NP. Higher densi-ties were close to natural sources of water (rivers).
Figure 4. A map show-ing the rhino density in Tsavo East NP against vantaged visible areas. The visible areas are suit-able sites for establishing more observation points to enhance rhino secu-rity. The Yatta Plateau borders the northern part of the rhino range and the escarpment offers poten-tial sites for establishing observation points. The escarpment also acts as a barrier to the Galana River (an attraction factor HQT� TJKPQU���YJKEJ� ƀQYU�along the escarpment.
Census and ear-notching of black rhino in Tsavo East

66 Pachyderm No. 49 January–June 2011
level. The minimum manpower density that should be in place for rhino protection is one active, trained and adequately equipped ranger per 20 km² (du Toit et al., 2006). This would have to be increased to one man per 10 km² where poaching pressures are high (du Toit et al., 2006). The 3,300 km2 range of black rhinos in the park is expansive. This area requires about 170 rangers as recommended by du Toit et al. (2006). If the area of rhino concentration were to be narrowed down to about 1,100 km2, about 55 rang-ers would be required to effectively provide security for the rhinos. Secondly, the proximity of Tsavo East to Somalia (KWS, 2008) coupled with the low ranger force has made the rhinos therein an obvious target by the Somali poachers (Okita-Ouma et al., 2007; Milledge, 2007). Thirdly, other rhino moni-toring resources allocated to the rhino unit are not adequate (KWS, 2008; Okita-Ouma, Amin & Kock, 2007; Milledge, 2007), which limits coverage of the expansive rhino range. Fourth, during the wet season most roads in the park become impassable, further exposing the rhinos to danger.
The nearest neighbour ratio (~2) indicated a dispersed distribution pattern of rhinos in the southern part of Tsavo East NP. This wide dispersion makes the monitoring of these rhinos challenging. The reasons for the observed distribution pattern could be attributed to lack of habitat heterogeneity and/or the territorial nature of black rhinos (Estes, 1991). The dispersed distribution pattern poses a challenge to the understaffed security team entrusted with monitoring this population.
There are four reasons that there could be more black rhinos in the park than were counted. First, WZR�EODFN� UKLQRV� DUH� NQRZQ� WR� GH¿QLWHO\� UDQJH� LQ�some areas, but were not sighted during the count (Oyugi pers. comm.; Lelesit pers. comm.). Some of these areas are swamps with mixed habitat with over 50% cover (Mukeka, 2010), which makes it GLI¿FXOW�WR�VSRW�EODFN�UKLQRV�IURP�WKH�DLU��$FFRUGLQJ�to Hillman-Smith & Groves (1994), in mixed habitats 60% of daytime locations of black rhinos are in areas with lateral cover of over 50%. Second, it is possible that more black rhinos could have been occupying the riverine vegetation, which has 50% coverage and ridges (Hillman-Smith & Gloves, 1994). These areas have greener shrubs, making an ideal habitat for black rhinos, especially during the dry season. The dense vegetation cover and presence of ridges could have prevented sighting of rhinos from the air.
7KLV�LV�VXSSRUWHG�E\�¿QGLQJV�E\�+LWFKLQV��������DQG�Thompson (1971), who reported a direct relationship between density of black rhino and density of habitat. 'HQVLWLHV� RI� �� ����NP2 were reported in thicket habitats in Hluluwe Reserve, which supported about 26% more black rhinos than the open savannah habitat (Hitchins, 1969). Goddard (1967) established that local densities varied from 0.03/km2 to 1.3/km2 in Tsavo, depending on habitat, and 0.2/km2 in Olduvai, with 0.3/km2 in the mixed habitat of Ngorongoro. In Serengeti NP, which is more open, lower densities ranging from 0.02/km2 to 0.05/km2 have been recorded by Frame (1980). Third, the rhinos could have established their home range in the northern part of the park, which this survey did not cover. Assuming that rhinos occur in this area, this population was not counted, which could have contributed to the low numbers recorded. Fourth, the validity of counting black rhinos from the air has been questioned in the past (Goddard, 1967). For example, an aerial counts of black rhinos in Olduvai Gorge in Tanzania—where the population was already known—where 85% of the study area consisted of open plains studded with acacia scrub and Acacia tortilis, the results recorded sightings of only 50% of the known rhino population (Goddard, 1967). Therefore, results from aerial count of black rhinos should be treated with extreme caution (Goddard, 1967). It is also important to note that the number of rhinos detected from the air depends on the time of day the survey is conducted, activity and distribution patterns of the rhinos, characteristics of the rhinos, visibility conditions and the aircraft’s altitude as discussed in detail by Goddard (1967). Based on the above, it is possible that the number of rhinos counted in Tsavo East could be only 50% of the actual number inhabiting the southern part of the park.
The population has been breeding, which is indicated by the fact that some of the captured rhinos were born in Tsavo East, two calves were sighted and one darted rhino was pregnant. The population is still small and its long term survival is questionable, as small populations are vulnerable to stochastic problems that can endanger their survival (Lacy, 1987). In the short term, environmental and demographic problems are likely to be more serious for small populations of rhinos (Lacy, 1987). Over the ORQJ�WHUP��JHQHWLF�SUREOHPV�ZLOO�EHFRPH�VLJQL¿FDQW�if the rhino population remains small. Preliminary analyses suggest that for black rhinos at least 20–30 effective founders in a conservation unit are
Ngene et al.
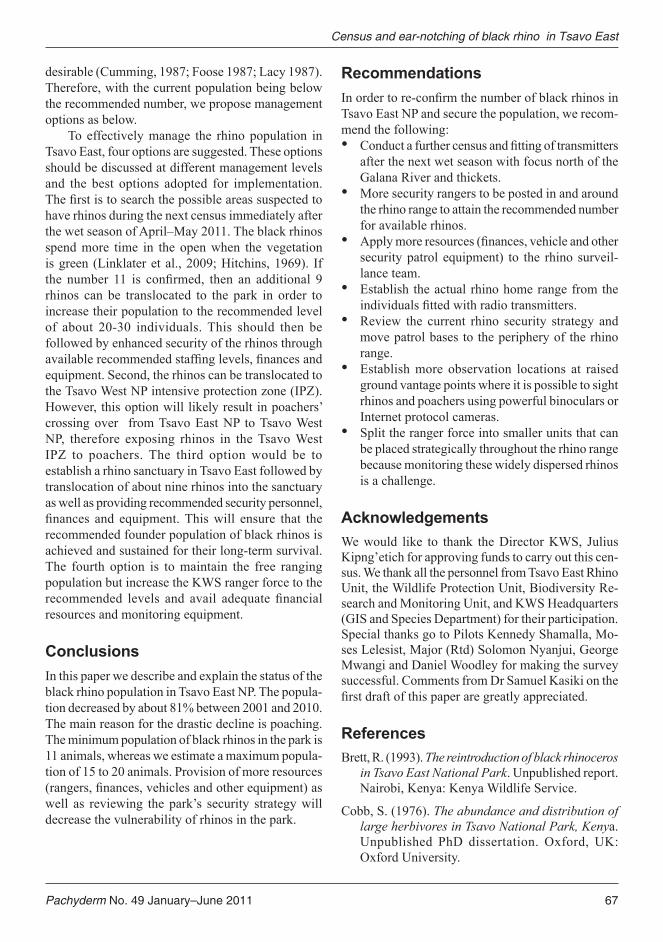
Pachyderm No. 49 January–June 2011 67
desirable (Cumming, 1987; Foose 1987; Lacy 1987). Therefore, with the current population being below the recommended number, we propose management options as below.
To effectively manage the rhino population in Tsavo East, four options are suggested. These options should be discussed at different management levels and the best options adopted for implementation. 7KH�¿UVW�LV�WR�VHDUFK�WKH�SRVVLEOH�DUHDV�VXVSHFWHG�WR�have rhinos during the next census immediately after the wet season of April–May 2011. The black rhinos spend more time in the open when the vegetation is green (Linklater et al., 2009; Hitchins, 1969). If WKH� QXPEHU� ��� LV� FRQ¿UPHG�� WKHQ� DQ� DGGLWLRQDO� ��rhinos can be translocated to the park in order to increase their population to the recommended level of about 20-30 individuals. This should then be followed by enhanced security of the rhinos through DYDLODEOH�UHFRPPHQGHG�VWDI¿QJ�OHYHOV��¿QDQFHV�DQG�equipment. Second, the rhinos can be translocated to the Tsavo West NP intensive protection zone (IPZ). However, this option will likely result in poachers’ crossing over from Tsavo East NP to Tsavo West NP, therefore exposing rhinos in the Tsavo West IPZ to poachers. The third option would be to establish a rhino sanctuary in Tsavo East followed by translocation of about nine rhinos into the sanctuary as well as providing recommended security personnel, ¿QDQFHV� DQG� HTXLSPHQW��7KLV�ZLOO� HQVXUH� WKDW� WKH�recommended founder population of black rhinos is achieved and sustained for their long-term survival. The fourth option is to maintain the free ranging population but increase the KWS ranger force to the UHFRPPHQGHG� OHYHOV� DQG� DYDLO� DGHTXDWH� ¿QDQFLDO�resources and monitoring equipment.
ConclusionsIn this paper we describe and explain the status of the black rhino population in Tsavo East NP. The popula-tion decreased by about 81% between 2001 and 2010. The main reason for the drastic decline is poaching. The minimum population of black rhinos in the park is 11 animals, whereas we estimate a maximum popula-tion of 15 to 20 animals. Provision of more resources �UDQJHUV��¿QDQFHV��YHKLFOHV�DQG�RWKHU�HTXLSPHQW��DV�well as reviewing the park’s security strategy will decrease the vulnerability of rhinos in the park.
Recommendations,Q�RUGHU�WR�UH�FRQ¿UP�WKH�QXPEHU�RI�EODFN�UKLQRV�LQ�Tsavo East NP and secure the population, we recom-mend the following:�� &RQGXFW�D�IXUWKHU�FHQVXV�DQG�¿WWLQJ�RI�WUDQVPLWWHUV�
after the next wet season with focus north of the Galana River and thickets.
�� More security rangers to be posted in and around the rhino range to attain the recommended number for available rhinos.
�� $SSO\�PRUH�UHVRXUFHV��¿QDQFHV��YHKLFOH�DQG�RWKHU�security patrol equipment) to the rhino surveil-lance team.
�� Establish the actual rhino home range from the LQGLYLGXDOV�¿WWHG�ZLWK�UDGLR�WUDQVPLWWHUV�
�� Review the current rhino security strategy and move patrol bases to the periphery of the rhino range.
�� Establish more observation locations at raised ground vantage points where it is possible to sight rhinos and poachers using powerful binoculars or Internet protocol cameras.
�� Split the ranger force into smaller units that can be placed strategically throughout the rhino range because monitoring these widely dispersed rhinos is a challenge.
AcknowledgementsWe would like to thank the Director KWS, Julius Kipng’etich for approving funds to carry out this cen-sus. We thank all the personnel from Tsavo East Rhino Unit, the Wildlife Protection Unit, Biodiversity Re-search and Monitoring Unit, and KWS Headquarters (GIS and Species Department) for their participation. Special thanks go to Pilots Kennedy Shamalla, Mo-ses Lelesist, Major (Rtd) Solomon Nyanjui, George Mwangi and Daniel Woodley for making the survey successful. Comments from Dr Samuel Kasiki on the ¿UVW�GUDIW�RI�WKLV�SDSHU�DUH�JUHDWO\�DSSUHFLDWHG��
ReferencesBrett, R. (1993). The reintroduction of black rhinoceros
in Tsavo East National Park. Unpublished report. Nairobi, Kenya: Kenya Wildlife Service.
Cobb, S. (1976). The abundance and distribution of large herbivores in Tsavo National Park, Kenya. Unpublished PhD dissertation. Oxford, UK: Oxford University.
Census and ear-notching of black rhino in Tsavo East
68 Pachyderm No. 49 January–June 2011
&XPPLQJ��'����������µ6PDOO�SRSXODWLRQ�PDQDJHPHQW�of black rhinoceros’. Pachyderm 9:12–20.
du Toit, R., Mungwashu, L. and Emslie, R. H. �������� µ6XPPDU\� RI� JXLGHOLQHV� IRU� HQVXULQJ�the security of rhino populations. Guidelines for implementing SADC rhino conservation strategies’. Harare, SADC Regional Programme for Rhino Conservation. (Downloadable from AfRSG or Rhino Resource Center site).
Emslie, R.H,, Milledge, S., Brooks, M., van Strien, N.J. and Dublin, H.T. (2007) African and Asian Rhinoceroses – Status, Conservation and Trade. CoP14, Doc. 54. Geneva, Switzerland: CITES Secretariat.
ESRI [Environmental Systems Research Institute] (2006). ArcGIS: ArcMap Version 9.2. California, USA: ESRI.
Estes, R.D. (1991). The behavioural guide to African mammals: including hoofed mammals, carnivores, primates. Berkeley and Los Angeles, California, USA: University of California Press.
)RRVH��7�-����������µ6PDOO�3RSXODWLRQ�0DQDJHPHQW�of Black Rhino. Proceedings of African Rhino Workshop’. Pachyderm 9:31–34.
)UDPH�� *�:�� �������� µ%ODFN� UKLQRFHURV� VXE�population in the Serengeti Plains, Tanzania’. African Journal of Ecology 18:155–166.
*DNDKX�� &�*�� �������� µ$IULFDQ� UKLQRV�� FXUUHQW�numbers and distribution’. In: A.O. Ryder (ed.) Rhinoceros biology and conservation: Proceedings of an international conference. San Diego, USA: San Diego, Zoological Society.
*RGGDUG�� -�� �������� µ+RPH� UDQJH�� EHKDYLRU� DQG�recruitment rates of two black rhinoceros populations’. East African wildlife Journal 5:133–150.
Hillman-Smith, A.K.A. and Groves, C.P. (1994). µ7KH� %ODFN� 5KLQRFHURV� �Diceros bicornis)’. Mammalian Species 455:1–8.
+LWFKLQV��3�0����������µ,QÀXHQFH�RI�YHJHWDWLRQ�W\SHV�on sizes of home ranges of black rhinoceros in Hluhluwe Game Reserve, Zululand’. Lammergeyer 10:81–86.
KWS (2008). The Tsavo Conservation Area Management Plan (2008-2018). Unpublished report. Nairobi, Kenya: Kenya Wildlife Service.
KWS (2010). Unpublished rhinoceros database. Nairobi, Kenya: Kenya Wildlife Service.
/DF\��5�&����������µ$QDO\VLV�RI�IRXQGHU�UHSUHVHQWDWLRQ�in pedigrees: founder equivalents and founder genome equivalents’. Zoo Biology 8:111–124.
/HXWKROG�:�� �������� µ6SDWLDO� RUJDQL]DWLRQ� DQG�strategy of habitat utilization of elephants in Tsavo National Park, Kenya’. Zeitschrift fur Saugetierkunde 42:358–379.
Linklater, W.L., Plotz, R.D., Kerley, G.I.H., Brashares, J.S., Lent, P.C., Cameron, E.Z., Law, P.R. and +LWFKLQV�� 3�0�� �������� µ'LVVLPLODU� KRPH� UDQJH�estimates for black rhinoceros Diceros bicornis cannot be used to infer habitat change’. Oryx 44(1):16–19.
0F.QLJKW�� %�� �������� µ&KDQJHV� LQ� (OHSKDQW�Demography, Reproduction and Group Structure in Tsavo East National Park (1966 - 1994)’. Pachyderm 29:15–24.
Mitchell, A. (2005). The ESRI guide to GIS analysis: Volume 2, spatial measurements and statistics. California, USA: ESRI Press.
Milliken, T., Emslie, R.H. and Talukda, B. (2009). African and Asian Rhinoceroses – Status, Conservation and Trade. CoP15, Doc. 45.1 (Rev. 1). Geneva, Switzerland: CITES Secretariat.
Mukeka, J. (2010). Analysing the distribution of elephants in Tsavo, Kenya. MSc Thesis, Ohio, USA: Miami University.
0XODPD��0�� DQG�2NLWD�2XPD��%�� �������� µ7VDYR�East and Ngulia rhino populations counted’. Pachyderm 32:88–89.
0LOOHGJH��6�$�+����������µ,OOHJDO�NLOOLQJ�RI�$IULFDQ�rhinos and horn trade, 2000–2005: the era of resurgent markets and emerging organized crime’. Pachyderm 43:96–107.
Okita-Ouma, B., Amin, R. and Kock, R. (2007). Conservation status of black rhino and management rhino in Kenya. Nairobi, Kenya: Kenya Wildlife Service, Species Conservation and Management, Rhino Section.
Ngene et al.
Pachyderm No. 49 January–June 2011 69
Smith R. J. and Kasiki S. (2000). A Spatial Analysis of +XPDQ�(OHSKDQW�&RQÀLFW�LQ�WKH�7VDYR�(FRV\VWHP��Kenya. Gland, Switzerland: IUCN/SSC.
Thompson, P.R. (1971). Factors affecting the distribution and survival of black rhinoceros in Rhodesia��7KHVLV�IRU�&HUWL¿FDWH�RI�)LHOG�(FRORJ\��Rhodisia: University of Rhodesia.
7ROYDQHQ��5�� �������� µ1DWXUH�&RQVHUYDWLRQ�$UHDV�in Kenya- Tsavo East and West National Parks’. In: P. J. Pellikka, Ylhaisi and B. Clark (eds). Tait Hills and Kenya- Seminar, Reports and Journal of a Field Excursion to Kenya. Expedition Reports of the Department of Geography, University of Helsinki 40:59–63.
Vigne L., Martin E. and Okita-Ouma, B. (2007). µ,QFUHDVHG� GHPDQG� IRU� UKLQR� KRUQ� LQ�<HPHQ�threatens eastern Africa’s rhinos.’ Pachyderm 43:73–86.
:HVWHUQ� '�� �������� µ3DWWHUQV� RI� GHSOHWLRQ� LQ�Kenya rhino population and the conservation implications’. Biological Conservation 24:147–156.
:LMJDDUGHQ��:���������µ(OHSKDQWV�±� WUHHV��JUD]HUV��Relationship between climate, soil, vegetation and large herbivores in a semi-arid ecosystem (Tsavo, Kenya)’. ITC Publication #4.
WWF (2004). Black Rhinoceros (Diceros bicornis). WWF facts sheet. 13th meeting of the conference of the parties to cites (2-14 October 2004), Bangkok, Thailand.
Census and ear-notching of black rhino in Tsavo East

70 Pachyderm No. 49 January–June 2011
Elephant corridor use and threats in the eastern range of Amboseli elephants, Kenya
John M. Kioko1* and Simon Ole Seno2
1The School for Field Studies, Center for Wildlife Management Studies, PO Box 27743 – 00506, Nairobi, Kenya2School of Natural Resources Management, Narok University College, PO Box 861 – 20500, Narok, Kenya
* Corresponding author: [email protected]
AbstractElephant corridors are critical in safeguarding wildlife dispersal areas. Understanding the level of corridor use by elephants and the threats they face is important for prioritizing their conservation. Following cessation of heavy elephant poaching in 1970s and 1980s in the Amboseli area, elephants associated with Amboseli National Park (NP) began to reoccupy their eastern range. However, emerging changes in land use and ownership may be hindering elephant movements and range utilization. The status of three corridors and their use by elephants and other wildlife in the eastern range of Amboseli elephants was assessed. The intensity of daily corridor use by elephants differed among three corridors that were observed in this study. There was a strong relationship EHWZHHQ�HOHSKDQW�DQG�RWKHU�ZLOGOLIH�XVH�RI�WKH�FRUULGRUV��(OHSKDQW�FRUULGRUV�ZHUH�VLJQL¿FDQWO\�WKUHDWHQHG�due to constriction by human settlement, agriculture, land subdivision and existence of non-negotiated land tenure. Primarily, these threats have been occasioned by individualization of land. Potential solutions to pre-serve critical elephant corridors include the initiation of community-based conservation programmes such as conservancies and land lease agreements.
Key words: Amboseli Ecosystem, corridor threat factors, elephant movement
RésuméLes corridors des éléphants sont essentiels à la sauvegarde de zones de dispersion de la faune. Comprendre le niveau d’utilisation des corridors par les éléphants et les menaces auxquels ils font face est un fait important SRXU�HQ�IDLUH�OHXU�FRQVHUYDWLRQ�XQH��SULRULWp��$SUqV�O¶DUUrW�GH�O¶LQWHQVH�EUDFRQQDJH�GHV�pOpSKDQWV�GHV�DQQpHV�1970 et 1980 dans la région d’Amboseli, les éléphants associés au Parc national d’Amboseli ont commencé à réintégrer leur habitat oriental. Toutefois, les changements émergents dans l’utilisation et la propriété foncière peuvent entraver les déplacements des éléphants et l’utilisation de l’habitat. On a évalué l’état de trois cor-ridors et leur utilisation par les éléphants et les autres animaux sauvages dans l’habitat oriental d’Amboseli. L’intensité de l’utilisation quotidienne du corridor par les éléphants diffère entre les trois corridors qu’on a observés dans cette étude. Il y avait une corrélation forte entre l’utilisation des corridors par les éléphants HW�OHV�DXWUHV�DQLPDX[�VDXYDJHV��/HV�FRUULGRUV�GHV�pOpSKDQWV�pWDLHQW�VLJQL¿FDWLYHPHQW�PHQDFpV�j�FDXVH�GH�OD�réduction par le peuplement humain, l’agriculture, le lotissement et l’existence de la propriété foncière non négociée. Principalement, ces menaces étaient occasionnées par l’individualisation de la terre. Des solutions potentielles pour préserver les corridors essentiels aux éléphants comprennent l’initiation de programmes de conservation communautaire tels que les conservations et les contrats de location des terres.
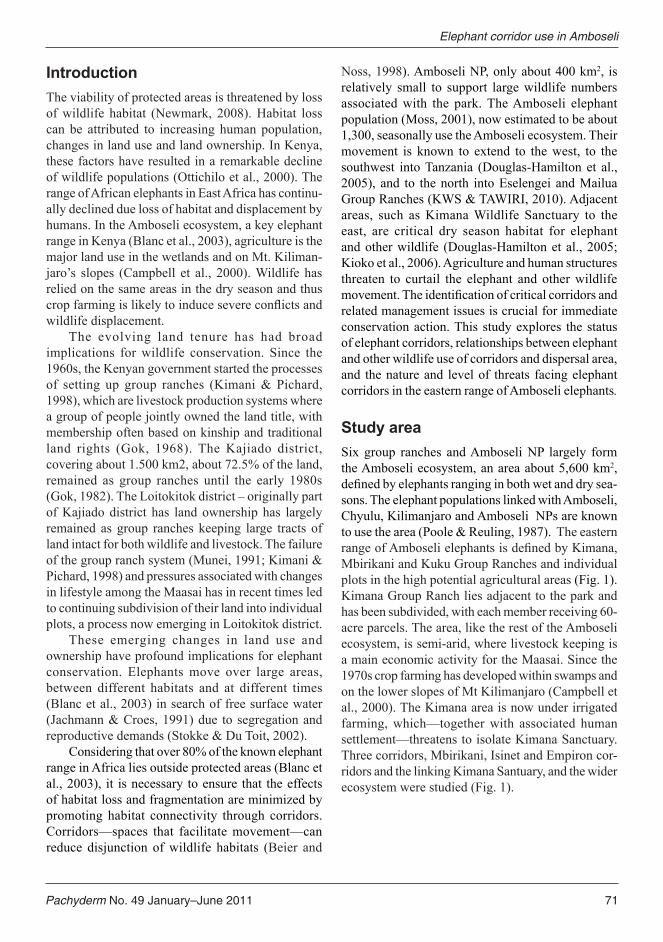
Pachyderm No. 49 January–June 2011 71
IntroductionThe viability of protected areas is threatened by loss of wildlife habitat (Newmark, 2008). Habitat loss can be attributed to increasing human population, changes in land use and land ownership. In Kenya, these factors have resulted in a remarkable decline of wildlife populations (Ottichilo et al., 2000). The range of African elephants in East Africa has continu-ally declined due loss of habitat and displacement by humans. In the Amboseli ecosystem, a key elephant range in Kenya (Blanc et al., 2003), agriculture is the major land use in the wetlands and on Mt. Kiliman-jaro’s slopes (Campbell et al., 2000). Wildlife has relied on the same areas in the dry season and thus FURS�IDUPLQJ�LV�OLNHO\�WR�LQGXFH�VHYHUH�FRQÀLFWV�DQG�wildlife displacement.
The evolving land tenure has had broad implications for wildlife conservation. Since the 1960s, the Kenyan government started the processes of setting up group ranches (Kimani & Pichard, 1998), which are livestock production systems where a group of people jointly owned the land title, with membership often based on kinship and traditional land rights (Gok, 1968). The Kajiado district, covering about 1.500 km2, about 72.5% of the land, remained as group ranches until the early 1980s (Gok, 1982). The Loitokitok district – originally part of Kajiado district has land ownership has largely remained as group ranches keeping large tracts of land intact for both wildlife and livestock. The failure of the group ranch system (Munei, 1991; Kimani & Pichard, 1998) and pressures associated with changes in lifestyle among the Maasai has in recent times led to continuing subdivision of their land into individual plots, a process now emerging in Loitokitok district.
These emerging changes in land use and ownership have profound implications for elephant conservation. Elephants move over large areas, between different habitats and at different times (Blanc et al., 2003) in search of free surface water (Jachmann & Croes, 1991) due to segregation and reproductive demands (Stokke & Du Toit, 2002).
Considering that over 80% of the known elephant range in Africa lies outside protected areas (Blanc et al., 2003), it is necessary to ensure that the effects of habitat loss and fragmentation are minimized by promoting habitat connectivity through corridors. Corridors—spaces that facilitate movement—can reduce disjunction of wildlife habitats (Beier and
Noss, 1998). Amboseli NP, only about 400 km2, is relatively small to support large wildlife numbers associated with the park. The Amboseli elephant population (Moss, 2001), now estimated to be about 1,300, seasonally use the Amboseli ecosystem. Their movement is known to extend to the west, to the southwest into Tanzania (Douglas-Hamilton et al., 2005), and to the north into Eselengei and Mailua Group Ranches (KWS & TAWIRI, 2010). Adjacent areas, such as Kimana Wildlife Sanctuary to the east, are critical dry season habitat for elephant and other wildlife (Douglas-Hamilton et al., 2005; Kioko et al., 2006). Agriculture and human structures threaten to curtail the elephant and other wildlife PRYHPHQW��7KH�LGHQWL¿FDWLRQ�RI�FULWLFDO�FRUULGRUV�DQG�related management issues is crucial for immediate conservation action. This study explores the status of elephant corridors, relationships between elephant and other wildlife use of corridors and dispersal area, and the nature and level of threats facing elephant corridors in the eastern range of Amboseli elephants.
Study areaSix group ranches and Amboseli NP largely form the Amboseli ecosystem, an area about 5,600 km2, GH¿QHG�E\�HOHSKDQWV�UDQJLQJ�LQ�ERWK�ZHW�DQG�GU\�VHD-sons. The elephant populations linked with Amboseli, Chyulu, Kilimanjaro and Amboseli NPs are known to use the area (Poole & Reuling, 1987). The eastern UDQJH�RI�$PERVHOL�HOHSKDQWV�LV�GH¿QHG�E\�.LPDQD��Mbirikani and Kuku Group Ranches and individual plots in the high potential agricultural areas (Fig. 1). Kimana Group Ranch lies adjacent to the park and has been subdivided, with each member receiving 60-acre parcels. The area, like the rest of the Amboseli ecosystem, is semi-arid, where livestock keeping is a main economic activity for the Maasai. Since the 1970s crop farming has developed within swamps and on the lower slopes of Mt Kilimanjaro (Campbell et al., 2000). The Kimana area is now under irrigated farming, which—together with associated human settlement—threatens to isolate Kimana Sanctuary. Three corridors, Mbirikani, Isinet and Empiron cor-ridors and the linking Kimana Santuary, and the wider ecosystem were studied (Fig. 1).
Elephant corridor use in Amboseli
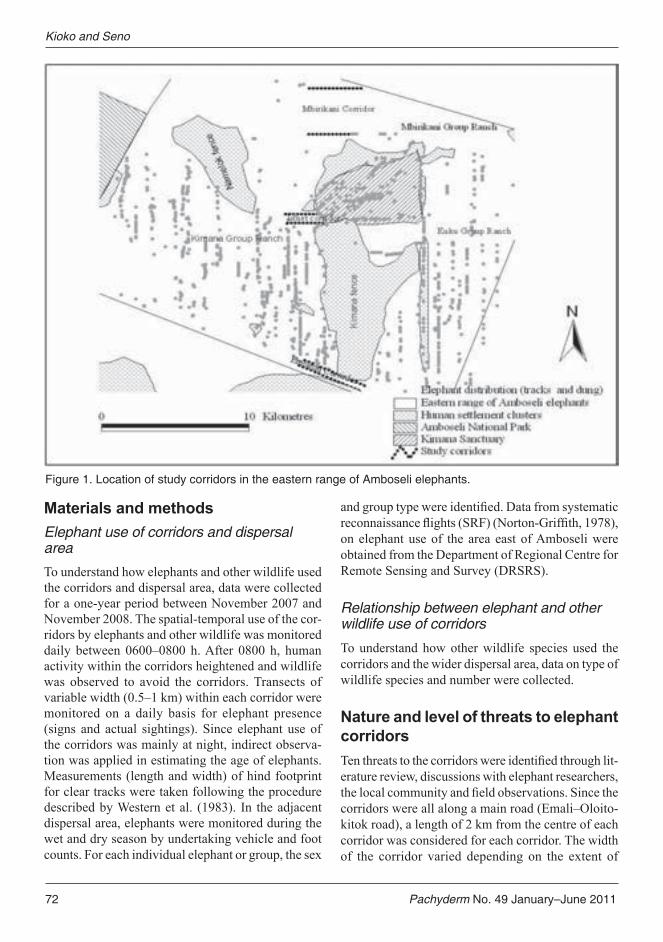
72 Pachyderm No. 49 January–June 2011
Materials and methodsElephant use of corridors and dispersal area
To understand how elephants and other wildlife used the corridors and dispersal area, data were collected for a one-year period between November 2007 and November 2008. The spatial-temporal use of the cor-ridors by elephants and other wildlife was monitored daily between 0600–0800 h. After 0800 h, human activity within the corridors heightened and wildlife was observed to avoid the corridors. Transects of variable width (0.5–1 km) within each corridor were monitored on a daily basis for elephant presence (signs and actual sightings). Since elephant use of the corridors was mainly at night, indirect observa-tion was applied in estimating the age of elephants. Measurements (length and width) of hind footprint for clear tracks were taken following the procedure described by Western et al. (1983). In the adjacent dispersal area, elephants were monitored during the wet and dry season by undertaking vehicle and foot counts. For each individual elephant or group, the sex
DQG�JURXS�W\SH�ZHUH�LGHQWL¿HG��'DWD�IURP�V\VWHPDWLF�UHFRQQDLVVDQFH�ÀLJKWV��65)���1RUWRQ�*ULI¿WK���������on elephant use of the area east of Amboseli were obtained from the Department of Regional Centre for Remote Sensing and Survey (DRSRS).
Relationship between elephant and other wildlife use of corridors
To understand how other wildlife species used the corridors and the wider dispersal area, data on type of wildlife species and number were collected.
Nature and level of threats to elephant corridors7HQ�WKUHDWV�WR�WKH�FRUULGRUV�ZHUH�LGHQWL¿HG�WKURXJK�OLW-erature review, discussions with elephant researchers, WKH�ORFDO�FRPPXQLW\�DQG�¿HOG�REVHUYDWLRQV��6LQFH�WKH�corridors were all along a main road (Emali–Oloito-kitok road), a length of 2 km from the centre of each corridor was considered for each corridor. The width of the corridor varied depending on the extent of
Figure 1. Location of study corridors in the eastern range of Amboseli elephants.
Kioko and Seno
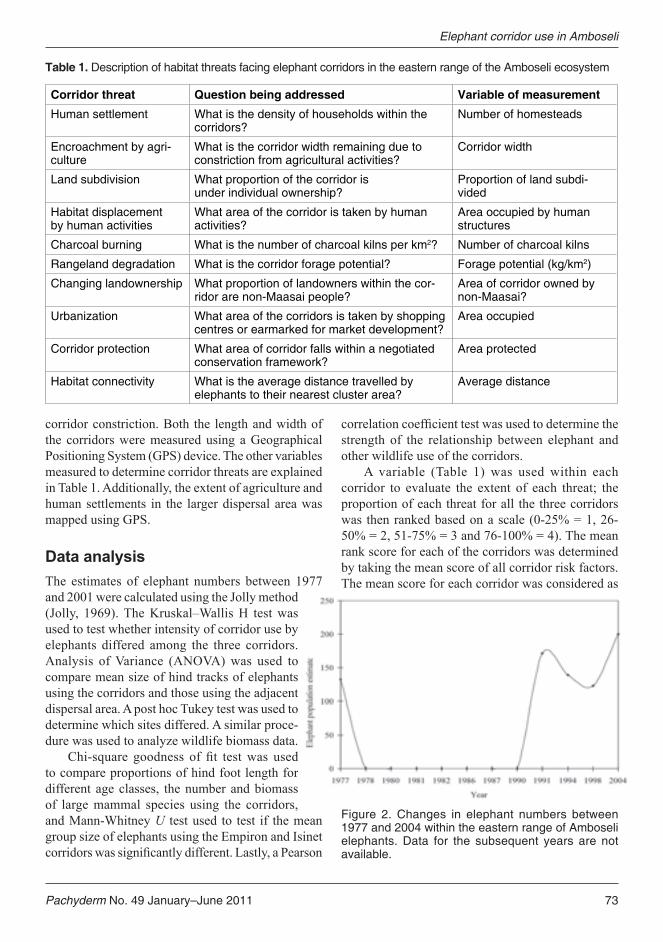
Pachyderm No. 49 January–June 2011 73
corridor constriction. Both the length and width of the corridors were measured using a Geographical Positioning System (GPS) device. The other variables measured to determine corridor threats are explained in Table 1. Additionally, the extent of agriculture and human settlements in the larger dispersal area was mapped using GPS.
Data analysisThe estimates of elephant numbers between 1977 and 2001 were calculated using the Jolly method (Jolly, 1969). The Kruskal–Wallis H test was used to test whether intensity of corridor use by elephants differed among the three corridors. Analysis of Variance (ANOVA) was used to compare mean size of hind tracks of elephants using the corridors and those using the adjacent dispersal area. A post hoc Tukey test was used to determine which sites differed. A similar proce-dure was used to analyze wildlife biomass data.
&KL�VTXDUH� JRRGQHVV� RI� ¿W� WHVW�ZDV� XVHG�to compare proportions of hind foot length for different age classes, the number and biomass of large mammal species using the corridors, and Mann-Whitney U test used to test if the mean group size of elephants using the Empiron and Isinet FRUULGRUV�ZDV�VLJQL¿FDQWO\�GLIIHUHQW��/DVWO\��D�3HDUVRQ�
FRUUHODWLRQ�FRHI¿FLHQW�WHVW�ZDV�XVHG�WR�GHWHUPLQH�WKH�strength of the relationship between elephant and other wildlife use of the corridors.
A variable (Table 1) was used within each corridor to evaluate the extent of each threat; the proportion of each threat for all the three corridors was then ranked based on a scale (0-25% = 1, 26-50% = 2, 51-75% = 3 and 76-100% = 4). The mean rank score for each of the corridors was determined by taking the mean score of all corridor risk factors. The mean score for each corridor was considered as
Table 1. Description of habitat threats facing elephant corridors in the eastern range of the Amboseli ecosystem
Corridor threat Question being addressed Variable of measurementHuman settlement What is the density of households within the
corridors?Number of homesteads
Encroachment by agri-culture
What is the corridor width remaining due to constriction from agricultural activities?
Corridor width
Land subdivision What proportion of the corridor is under individual ownership?
Proportion of land subdi-vided
Habitat displacement by human activities
What area of the corridor is taken by human activities?
Area occupied by human structures
Charcoal burning What is the number of charcoal kilns per km2? Number of charcoal kilns
Rangeland degradation What is the corridor forage potential? Forage potential (kg/km2)
Changing landownership What proportion of landowners within the cor-ridor are non-Maasai people?
Area of corridor owned by non-Maasai?
Urbanization What area of the corridors is taken by shopping centres or earmarked for market development?
Area occupied
Corridor protection What area of corridor falls within a negotiated conservation framework?
Area protected
Habitat connectivity What is the average distance travelled by elephants to their nearest cluster area?
Average distance
and 2001 were calculated using the Jolly method (Jolly, 1969). The Kruskal–Wallis H test was used to test whether intensity of corridor use by elephants differed among the three corridors. Analysis of Variance (ANOVA) was used to compare mean size of hind tracks of elephants using the corridors and those using the adjacent
&KL�VTXDUH� JRRGQHVV� RI� ¿W� WHVW�ZDV� XVHG�to compare proportions of hind foot length for
Elephant corridor use in Amboseli
Figure 2. Changes in elephant numbers between 1977 and 2004 within the eastern range of Amboseli elephants. Data for the subsequent years are not available.
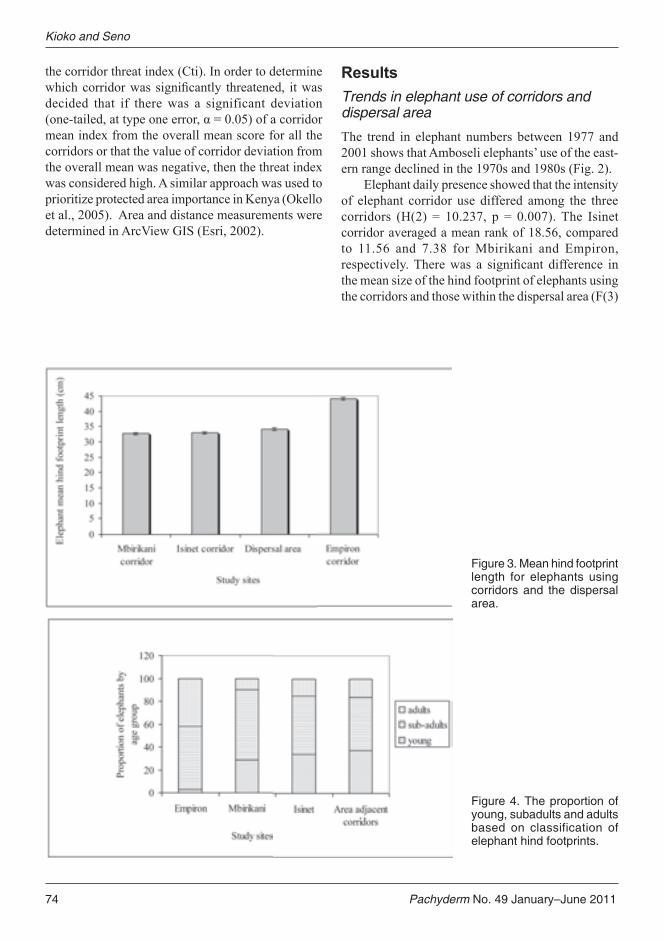
74 Pachyderm No. 49 January–June 2011
the corridor threat index (Cti). In order to determine ZKLFK�FRUULGRU�ZDV�VLJQL¿FDQWO\� WKUHDWHQHG�� LW�ZDV�decided that if there was a significant deviation �RQH�WDLOHG��DW�W\SH�RQH�HUURU��Į� �������RI�D�FRUULGRU�mean index from the overall mean score for all the corridors or that the value of corridor deviation from the overall mean was negative, then the threat index was considered high. A similar approach was used to prioritize protected area importance in Kenya (Okello et al., 2005). Area and distance measurements were determined in ArcView GIS (Esri, 2002).
ResultsTrends in elephant use of corridors and dispersal area
The trend in elephant numbers between 1977 and 2001 shows that Amboseli elephants’ use of the east-ern range declined in the 1970s and 1980s (Fig. 2).
Elephant daily presence showed that the intensity of elephant corridor use differed among the three corridors (H(2) = 10.237, p = 0.007). The Isinet corridor averaged a mean rank of 18.56, compared to 11.56 and 7.38 for Mbirikani and Empiron, UHVSHFWLYHO\��7KHUH�ZDV� D� VLJQL¿FDQW� GLIIHUHQFH� LQ�the mean size of the hind footprint of elephants using the corridors and those within the dispersal area (F(3)
Figure 3. Mean hind footprint length for elephants using corridors and the dispersal area.
Figure 4. The proportion of young, subadults and adults based on classification of elephant hind footprints.
Kioko and Seno

Pachyderm No. 49 January–June 2011 75
����� ���������3���������)LJ�������$�SRVW�KRF�7XNH\�test showed that elephants using Empiron corridor had a higher mean hind footprint size (44.096±.38) compared to elephants using larger dispersal area, and those using Mbirikani (32.68±0.35) and Isinet (32.99±0.34) corridors. The aggregate mean hind footprint length of elephants using the dispersal area �������������ZDV�QRW�VLJQL¿FDQWO\�GLIIHUHQW�IURP�WKH�ones using the Isinet corridor (32.99±0.34).
There were significant differences in the proportions of the young (F2 ���������GI� ���S��������and the old (F2 ��������GI� ����S���������EXW�QRW�WKH�proportion of the subadult elephant population (F2
= 2, df = 3, p = 0.572) across the corridors (Fig. 4). The mean group size of elephants in Empiron and ,VLQHW�FRUULGRUV�GLG�QRW�GLIIHU�VLJQL¿FDQWO\��8� ������S� ���������DQG�VLPLODUO\� WKHUH�ZHUH�QR�VLJQL¿FDQW�differences in the mean among the group of elephants using the dispersal areas and those that used the corridors in the wet and dry seasons (H (4) = 5.04, P = 0.282).
Large mammal use of corridors and dispersal area
The variety of large mammal species that used the GLIIHUHQW�FRUULGRUV�GLG�QRW�GLIIHU�VLJQL¿FDQWO\��F2 = 27.52, df = 2, P = 4.83). Many species however used Isinet corridor, while Empiron corridor was used by a lesser number of species. The number of species that used the corridors did not differ from that for species
that used the wider dispersal area (F2 = 6.02, df = 3, p = 0.11). Eleven of the 17 species observed within the study area avoided Empiron corridor, while only 2 species avoided Isinet corridor (Table 2).
One-way ANOVA comparing large mammal biomass (excluding elephants) in the three corridors VKRZV�VLJQL¿FDQW�GLIIHUHQFHV��)�������� ��������S��0.01. Tukey’s HSD comparison of large mammal biomass indicates that the mean biomass was significantly different between two of the three corridors. The highest percent of wildlife biomass 58.00% (5,251 kg) was associated with Isinet corridor (F2� ��������GI� ����S���������&RQVLVWHQW�ZLWK�RYHUDOO�monthly wildlife use of the three corridors (Fig. 5),
6CDNG����%JK�USWCTG�IQQFPGUU�QH�ſV�VGUV�HQT�XCTKCVKQP�KP�NCTIG�OCOOCN�KPENWFKPI�/CCUCK�QUVTKEJ��WUG�QH�+UKPGV��Mbirikani and Empiron corridors in January – December 2008
Species Isinet corridor
Mbirikani corridor
Empiron corridor
Total x2 - value P-value
Elephant 71 5 28 (104) 64.750 P<0.05
Grant’s gazelle 779 363 35 1177 708.731 P<0.05
Maasai giraffe 532 404 34 970 413.699 P<0.05
Impala 567 42 385 994 428.972 P<0.05
Maasai ostrich 12 69 0 81 40.11 _
Thomson’s gazelle 886 757 0 1643 10.128 _
Burchell’s zebra 1089 0 712 1801 78.917 _
Common wildebeest
1250 788 0 2038 104.732 _
Common waterbuck
2 0 0 2 _
Warthog 42 0 0 42 _
Vervet monkey 21 0 0 21 _
Gerenuk 0 453 0 453 _
Lion 0 * 0 0 _
Spotted hyena * 1 * 1 _
NB: Only signs cited (*), Test not done (-) as one of the corridor had zero values.
Elephant corridor use in Amboseli
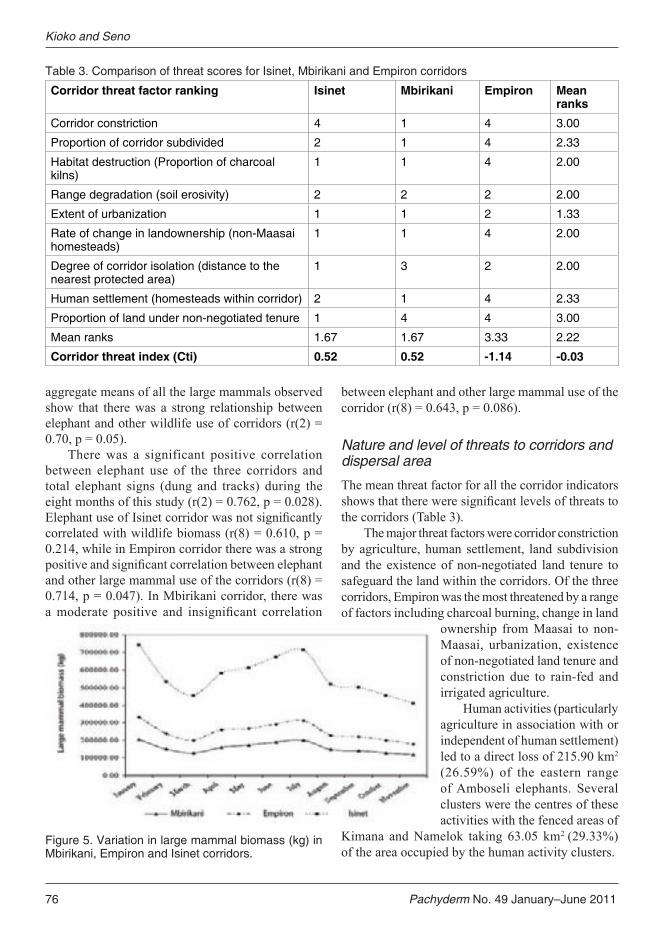
76 Pachyderm No. 49 January–June 2011
aggregate means of all the large mammals observed show that there was a strong relationship between elephant and other wildlife use of corridors (r(2) = 0.70, p = 0.05).
There was a significant positive correlation between elephant use of the three corridors and total elephant signs (dung and tracks) during the eight months of this study (r(2) = 0.762, p = 0.028). (OHSKDQW�XVH�RI�,VLQHW�FRUULGRU�ZDV�QRW�VLJQL¿FDQWO\�correlated with wildlife biomass (r(8) = 0.610, p = 0.214, while in Empiron corridor there was a strong SRVLWLYH�DQG�VLJQL¿FDQW�FRUUHODWLRQ�EHWZHHQ�HOHSKDQW�and other large mammal use of the corridors (r(8) = 0.714, p = 0.047). In Mbirikani corridor, there was D�PRGHUDWH� SRVLWLYH� DQG� LQVLJQL¿FDQW� FRUUHODWLRQ�
between elephant and other large mammal use of the corridor (r(8) = 0.643, p = 0.086).
Nature and level of threats to corridors and dispersal area
The mean threat factor for all the corridor indicators VKRZV�WKDW�WKHUH�ZHUH�VLJQL¿FDQW�OHYHOV�RI�WKUHDWV�WR�the corridors (Table 3).
The major threat factors were corridor constriction by agriculture, human settlement, land subdivision and the existence of non-negotiated land tenure to safeguard the land within the corridors. Of the three corridors, Empiron was the most threatened by a range of factors including charcoal burning, change in land
ownership from Maasai to non-Maasai, urbanization, existence of non-negotiated land tenure and constriction due to rain-fed and irrigated agriculture.
Human activities (particularly agriculture in association with or independent of human settlement) led to a direct loss of 215.90 km2 (26.59%) of the eastern range of Amboseli elephants. Several clusters were the centres of these activities with the fenced areas of
Kimana and Namelok taking 63.05 km2 (29.33%) of the area occupied by the human activity clusters.
Table 3. Comparison of threat scores for Isinet, Mbirikani and Empiron corridors Corridor threat factor ranking Isinet Mbirikani Empiron Mean
ranksCorridor constriction 4 1 4 3.00
Proportion of corridor subdivided 2 1 4 2.33
Habitat destruction (Proportion of charcoal kilns)
1 1 4 2.00
Range degradation (soil erosivity) 2 2 2 2.00
Extent of urbanization 1 1 2 1.33
Rate of change in landownership (non-Maasai homesteads)
1 1 4 2.00
Degree of corridor isolation (distance to the nearest protected area)
1 3 2 2.00
Human settlement (homesteads within corridor) 2 1 4 2.33
Proportion of land under non-negotiated tenure 1 4 4 3.00
Mean ranks 1.67 1.67 3.33 2.22
Corridor threat index (Cti) 0.52 0.52 -1.14 -0.03
Kioko and Seno
Figure 5. Variation in large mammal biomass (kg) in Mbirikani, Empiron and Isinet corridors.
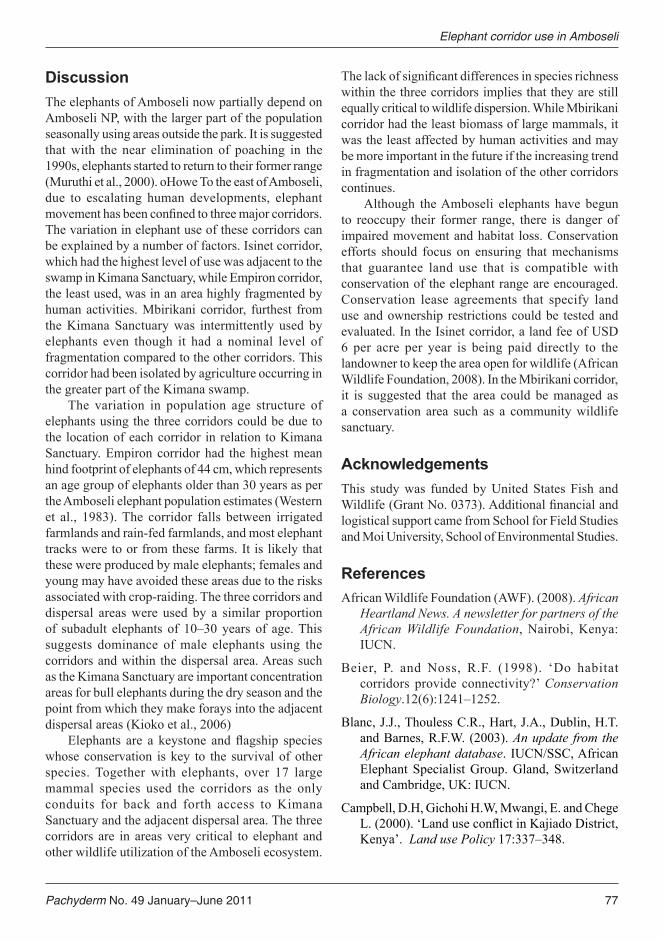
Pachyderm No. 49 January–June 2011 77
DiscussionThe elephants of Amboseli now partially depend on Amboseli NP, with the larger part of the population seasonally using areas outside the park. It is suggested that with the near elimination of poaching in the 1990s, elephants started to return to their former range (Muruthi et al., 2000). oHowe To the east of Amboseli, due to escalating human developments, elephant PRYHPHQW�KDV�EHHQ�FRQ¿QHG�WR�WKUHH�PDMRU�FRUULGRUV��The variation in elephant use of these corridors can be explained by a number of factors. Isinet corridor, which had the highest level of use was adjacent to the swamp in Kimana Sanctuary, while Empiron corridor, the least used, was in an area highly fragmented by human activities. Mbirikani corridor, furthest from the Kimana Sanctuary was intermittently used by elephants even though it had a nominal level of fragmentation compared to the other corridors. This corridor had been isolated by agriculture occurring in the greater part of the Kimana swamp.
The variation in population age structure of elephants using the three corridors could be due to the location of each corridor in relation to Kimana Sanctuary. Empiron corridor had the highest mean hind footprint of elephants of 44 cm, which represents an age group of elephants older than 30 years as per the Amboseli elephant population estimates (Western et al., 1983). The corridor falls between irrigated farmlands and rain-fed farmlands, and most elephant tracks were to or from these farms. It is likely that these were produced by male elephants; females and young may have avoided these areas due to the risks associated with crop-raiding. The three corridors and dispersal areas were used by a similar proportion of subadult elephants of 10–30 years of age. This suggests dominance of male elephants using the corridors and within the dispersal area. Areas such as the Kimana Sanctuary are important concentration areas for bull elephants during the dry season and the point from which they make forays into the adjacent dispersal areas (Kioko et al., 2006)
(OHSKDQWV� DUH� D� NH\VWRQH� DQG�ÀDJVKLS� VSHFLHV�whose conservation is key to the survival of other species. Together with elephants, over 17 large mammal species used the corridors as the only conduits for back and forth access to Kimana Sanctuary and the adjacent dispersal area. The three corridors are in areas very critical to elephant and other wildlife utilization of the Amboseli ecosystem.
7KH�ODFN�RI�VLJQL¿FDQW�GLIIHUHQFHV�LQ�VSHFLHV�ULFKQHVV�within the three corridors implies that they are still equally critical to wildlife dispersion. While Mbirikani corridor had the least biomass of large mammals, it was the least affected by human activities and may be more important in the future if the increasing trend in fragmentation and isolation of the other corridors continues.
Although the Amboseli elephants have begun to reoccupy their former range, there is danger of impaired movement and habitat loss. Conservation efforts should focus on ensuring that mechanisms that guarantee land use that is compatible with conservation of the elephant range are encouraged. Conservation lease agreements that specify land use and ownership restrictions could be tested and evaluated. In the Isinet corridor, a land fee of USD 6 per acre per year is being paid directly to the landowner to keep the area open for wildlife (African Wildlife Foundation, 2008). In the Mbirikani corridor, it is suggested that the area could be managed as a conservation area such as a community wildlife sanctuary.
AcknowledgementsThis study was funded by United States Fish and :LOGOLIH��*UDQW�1R���������$GGLWLRQDO�¿QDQFLDO�DQG�logistical support came from School for Field Studies and Moi University, School of Environmental Studies.
ReferencesAfrican Wildlife Foundation (AWF). (2008). African
Heartland News. A newsletter for partners of the African Wildlife Foundation, Nairobi, Kenya: IUCN.
%HLHU�� 3�� DQG� 1RVV�� 5�)�� �������� µ'R� KDELWDW�FRUULGRUV� SURYLGH� FRQQHFWLYLW\"¶�Conservation Biology.12(6):1241–1252.
Blanc, J.J., Thouless C.R., Hart, J.A., Dublin, H.T. and Barnes, R.F.W. (2003). An update from the African elephant database. IUCN/SSC, African Elephant Specialist Group. Gland, Switzerland and Cambridge, UK: IUCN.
Campbell, D.H, Gichohi H.W, Mwangi, E. and Chege /����������µ/DQG�XVH�FRQÀLFW�LQ�.DMLDGR�'LVWULFW��Kenya’. Land use Policy 17:337–348.
Elephant corridor use in Amboseli
78 Pachyderm No. 49 January–June 2011
Douglas-Hamilton, I., Krink T. and Vollrath, F. (2005). µ0RYHPHQWV�DQG�FRUULGRUV�RI�$IULFDQ�HOHSKDQWV�LQ�relation to protected areas’. Naturwissenschaften 92:158-163.
ESRI. (2002). Using ArcView GIS. Redlands, CA, USA: Environmental Systems Research Institute.
Government of Kenya (GOK). (1968). Group (Land) Representatives Act. Government Printers, Nairobi, Kenya.
Government of Kenya (GOK). (1982). Minutes on Poka Group Ranch meeting on Subdivision, 21/8/91. File KAJ/POKA Group Ranch (1)65, Kajiado, Kenya.
-DFKPDQQ��+�� DQG�&URHV��7�� �������� µ(IIHFWV� RI�browsing by elephants on the Combretum/Terminalia woodland at the Nazinga Game Ranch, Burkina Faso, West Africa’. Biological Conservation 57:13–24.
-ROO\��*�0�� �������� µ6DPSOLQJ�PHWKRGV� IRU� DHULDO�census of wildlife populations’. East African Agricultural Journal 34:46–49.
.LPDQL��.��DQG�3LFKDUG��-�� �������� µ5HFHQW�7UHQGV�and Implications of Group Ranch Subdivision and Fragmentation in Kajiado District, Kenya’. The Geographic Journal 164:202–213.
Kioko, J., Muruthi, P., Omondi, P and Chiyo, P.I. �������� µ7KH�SHUIRUPDQFH�RI� HOHFWULF� IHQFHV� DV�elephant barriers in Amboseli, Kenya’. South African Journal of Wildlife Research 38(1):52–58.
Kioko, J., Okello, M. and Muruthi, P. (2006). µ(OHSKDQW�QXPEHUV�DQG�GLVWULEXWLRQ�LQ�WKH�7VDYR�Amboseli ecosystem, southwestern Kenya’. Pachyderm 40:61-68.
Kenya Wildlife Service (KWS) and Tanzania Wildlife Research Institute (TAWIRI). (2010). Aerial Total Count: Amboseli-West Kilimanjaro Ecosystem, Wet season, March 2010 Kenya: KWS.
0RVV��&�-����������µ7KH�GHPRJUDSK\�RI�DQ�$IULFDQ�Elephant (Loxodonta Africana) population in Amboseli’. Journal of Zoology 255:145–156.
Munei, K. (1991). Study on the subdivision of group ranches in Kajiado District. Department of Livestock production Kajiado District, Kenya.
Muruthi, P., Stanley, P.M., Soorae P., Moss, C.J. and /DQMRXZ����������µ&RQVHUYDWLRQ�RI�ODUJH�PDPPDOV�in Africa. What lessons and challenges for the IXWXUH"¶� ,Q��$��(QWZLVWOH�DQG�1��'XVWRQH� �HGV���Priorities for the conservation of mammalian biodiversity: has the pada had its day"�8�.���Cambridge University Press.
1HZPDUN��:�'�� �������� µ,VRODWLRQ� RI�$IULFDQ�Protected Areas’. Frontiers in Ecology and the Environment 6:1–9.
1RUWRQ±*ULI¿WKV��0�� �������� �Counting Animals. Handbooks on techniques currently used in African wildlife ecology. 2nd Edition. Nairobi, Kenya: African Wildlife Leadership Foundation.
Okello, M.M., Wishitemi, B.E.I. and Lagat, B. (2005). µ7RXULVP�SRWHQWLDO�DQG�DFKLHYHPHQW�RI�SURWHFWHG�areas in Kenya: Criteria and prioritization’. Tourism Analysis 10:1,083–5,423.
Ottichilo, W.K., Grunblatt J., Said, M.Y. and Wargute, 3�:���������� µ:LOGOLIH�DQG�OLYHVWRFN�SRSXODWLRQ�trends in the Kenya rangeland’. In: TT. Dolan (ed.) Wildlife Conservation by Sustainable Use. pp. 203–219. Boston, USA: Kluwer Academic Publishing.
Poole, J.H. and Reuling, M. (1997). A survey of elephant and other wildlife of the West Kilimanjaro basin Tanzania. Unpublished report. African Elephant Specialist Group. Nairobi, Kenya.
6WRNNH��6��DQG�GX�7RLW��-�7����������µ6H[XDO�VHJUHJDWLRQ�in habitat use by elephants in Chobe National Park, Botswana’. African Journal of Ecology 40:360–371.
Western, D., Moss, C.J. and Georgiadis, N. (1983). µ$JH�HVWLPDWLRQ�DQG�SRSXODWLRQ�DJH�VWUXFWXUH�RI�elephants from footprint dimensions’. Journal of Wildlife Management 47:1,192–1,197.
Kioko and Seno

Pachyderm No. 49 January–June 2011 79
Consumption of elephant and mammoth ivory increases in southern China
Lucy Vigne and Esmond Martin
PO Box 15510, Nairobi—00503, Kenya; email: [email protected]
AbstractChina is the largest importer by weight of illegal ivory in the world (Milliken et al., 2009). In 2004, in order WR�UHGXFH�WKLV�LOOHJDO�LYRU\�WUDGH�LQ�&KLQD��WKH�JRYHUQPHQW�WRRN�VWHSV�IRU�LYRU\�WR�EH�VROG�ZLWK�DQ�RI¿FLDO�LGHQWL¿FDWLRQ�FDUG�IRU�HDFK�LWHP�LQ�WKH�UHJLVWHUHG�VKRSV��&KLQD�ZDV�WKHQ�DSSURYHG�E\�&,7(6�WR�EX\�WXVNV�IURP�the southern African ivory auctions in 2008; Chinese traders bought approximately 62 tonnes.
In January 2011 we surveyed ivory factories and retail outlets in Guangzhou, the largest city in southern China and an important ivory centre, and in Fuzhou, a city famous for carving. According to a factory owner in Fuzhou, in 2010 he paid USD 455/kg for government-owned 1-5 kg tusks. Similar privately owned ivory in 2010 cost USD 750/kg, according to various sources. High quality Siberian mammoth tusks were approximately USD 400/kg (wholesale) in 2010 in China.
In Guangzhou we counted 6,437 ivory objects (88% newer items) on display for retail sale, of which ������ZHUH�EHLQJ�VROG�ZLWKRXW�LGHQWL¿FDWLRQ��,'��FDUGV��ZKLFK�LV�LOOHJDO���7KHUH�ZHUH����RXWOHWV�VHOOLQJ�LYRU\�in Guangzhou, of which only eight displayed the compulsory ID cards. Since 2004 there has been a 50% increase in the number of ivory items for sale in Guangzhou. There were also 6,541 mammoth ivory items counted, mostly in specialty shops. Since 2004 there has been a 100% increase in the number of mammoth ivory items in Guangzhou. This is mainly due to an increasingly wealthy Chinese population, and favourable publicity about mammoth tusks. In Fuzhou, ivory demand is much lower; we counted only 282 ivory items (66% older pieces) in 39 outlets and none had ID cards. Mammoth ivory items numbered 100, mostly in one outlet.
Of all the elephant ivory items we counted in Guangzhou and Fuzhou, 63% did not have ID cards and were thus illegally on display. Recommendations to cut down illegal trade are given in this report.
Key words: Elephant, mammoth, ivory, China
Résumé /D�&KLQH�HVW�OH�SOXV�JUDQG�LPSRUWDWHXU�G¶LYRLUH�LOOLFLWH�GDQV�OH�PRQGH��0LOOLNHQ�HW�DO����������(Q�������D¿Q�de réduire ce commerce illicite d’ivoire en Chine, le gouvernement a pris des mesures pour que l’ivoire soit YHQGX�DYHF�XQH�FDUWH�G¶LGHQWL¿FDWLRQ�RI¿FLHOOH�SRXU�FKDTXH�DUWLFOH�GDQV�OHV�PDJDVLQV�HQUHJLVWUpV��/D�&KLQH�a ensuite reçu l’approbation de la CITES pour acheter les défenses des ventes aux enchères de l’ivoire sud-africain en 2008; les commerçants chinois en ont acheté environ 62 tonnes.
(Q�MDQYLHU�������QRXV�DYRQV�HQTXrWp�DXSUqV�GHV�XVLQHV�HW�GHV�SRLQWV�GH�YHQWH�G¶LYRLUH�j�*XDQJ]KRX��OD�plus grande ville dans le sud de la Chine et un centre d’ivoire important et à Fuzhou, une ville célèbre pour la sculpture. Selon un propriétaire d’usine à Fuzhou, il avait payé USD 455/kg en 2010 pour les défenses d’entre 1et 5 kg appartenant au gouvernement. De l’ivoire similaire appartenant aux privés coûtait USD 750/kg en 2010, selon diverses sources. En 2010, les défenses des mammouths de Sibérie de haute qualité coûtaient environ USD 400/kg (en gros) en Chine.
A Guangzhou, nous avons compté 6.437 objets en ivoire (88% d’articles nouveaux) en vente en détail, GRQW�������pWDLHQW�YHQGXV�VDQV�FDUWHV�G¶LGHQWL¿FDWLRQ��FH�TXL�HVW�LOOpJDO��,O�\�DYDLW����SRLQWV�GH�YHQWH�G¶LYRLUH�j�*XDQJ]KRX��GRQW�VHXOV�KXLW�DI¿FKDLHQW�OHV�FDUWHV�G¶LGHQWL¿FDWLRQ�REOLJDWRLUH��'HSXLV������LO�\�D�HX�XQH�

80 Pachyderm No. 49 January–June 2011
augmentation de 50% dans le nombre d’articles en ivoire en vente à Guangzhou. Il y avait aussi 6.541 articles en ivoire de mammouth comptés, surtout dans les magasins spécialisés. Depuis 2004 il y a eu une augmentation de 100% dans le nombre d’articles en ivoire de mammouth à Guangzhou. Ceci est principalement dû à une population chinoise de plus en plus riche, et une publicité favorable sur les défenses de mammouth. A Fuzhou, la demande d’ivoire est beaucoup plus faible, nous n’avons compté que 282 articles en ivoire (66% des pièces anciennes) dans 39 points de vente et aucun n’avait GH� FDUWH� G¶LGHQWL¿FDWLRQ��/HV� DUWLFOHV� HQ� LYRLUH� GH�mammouth se chiffraient à 100 pour la plupart en un point de vente.
Parmi tous les articles en ivoire d’éléphant que nous avons comptés à Guangzhou et à Fuzhou, 63% Q¶DYDLHQW�SDV�GH�FDUWHV�G¶LGHQWL¿FDWLRQ�HW�GRQF�pWDLHQW�illégalement en vente. Dans ce rapport nous donnons des recommandations pour réduire le commerce illicite.
IntroductionThe economic boom in China has sparked growing concern about illegal ivory consumption. China has a long history in ivory (Martin & Stiles, 2003), and ivory factories still produce an array of elaborate carvings and smaller items. Guangzhou and Fuzhou in south and south-east China are famous for ivory carving.
After the 1990 CITES ban on ivory imports and exports, Chinese craftsmen increasingly turned to bone carving and recently increased their carving of mammoth ivory (Mammuthus primigenius). The mammoth, being extinct, is exempt from CITES, and tusks from Siberia are imported mostly via Hong Kong. In November 2008, Chinese ivory traders bought 62 tonnes of elephant tusks, along with traders from Japan (Vigne & Martin, 2010) during one-off auctions in Botswana, Namibia and South Africa. CITES allowed this trade as the Chinese government had introduced new legislative measures to control their ivory trade.
What has been the effect of this new injection RI� OHJDO� HOHSKDQW� WXVNV� RQWR� WKH�&KLQHVH�PDUNHW"�+RZ�ZHOO�LV�ODZ�HQIRUFHPHQW�ZRUNLQJ"�:KDW�LV�WKH�HYLGHQFH�RI�LOOHJDO�LYRU\�IRU�VDOH"�:KDW�DUH�WKH�YLHZV�of the traders and consumers about elephant ivory
DQG�PDPPRWK�LYRU\"�$UH�WKH�WZR�LYRULHV�EHLQJ�VROG�VHSDUDWHO\�RU�EHLQJ�PL[HG"�$QG�KRZ�KDV�GHPDQG�IRU�elephant and mammoth ivory changed in recent years �0DUWLQ�������"��
Methodology:H�FDUULHG�RXW�¿HOGZRUN�LQ�WKH�WZR�PDLQ�LYRU\�PDQX-facturing centres of southern China: Guangzhou (also important for retail sales) from 10 to 17 January and
Fuzhou from 18 to 23 January 2011. Factories and shops that were last surveyed in 2004 by Esmond Martin were re-visited where possible (Martin, 2006). Information on new locations was collected from the Internet, taxi drivers, ivory factory managers and vendors. Most ivory retail outlets were surveyed. Ivory pieces on display for sale were counted, cat-egorized by type, priced, checked for ID cards and photographed. Mammoth and hippo ivory items were similarly recorded. Vendors were interviewed about their sales and turnover. Three factories in Guangzhou and three in Fuzhou that were crafting items from elephant ivory, mammoth ivory and bone
Vigne and Martin
Figure 1. This ivory carver in Guangzhou was working at a government ivory factory.
© Lucy V
igne
Pachyderm No. 49 January–June 2011 81
Consumption of elephant and mammoth ivory increases in southern China
were visited. Data were collected on the numbers of craftsmen, tusk prices, items produced and amounts of materials used to compare with earlier surveys. )RU�WKLV�UHSRUW�ZKHQ�WKH�ZRUG�µLYRU\¶�RU�µWXVN¶�LV�XVHG�DORQH��LW�UHIHUV�WR�HOHSKDQW�LYRU\��7KH�SKUDVH�µROG�LYRU\�LWHPV¶�UHIHUV�WR�WKRVH�PDGH�XS�WR�������LGHQWL¿DEOH�E\�VW\OH�DQG�FRQGLWLRQ��DQG�µQHZ�LYRU\�LWHPV¶�PHDQV�those made after 1990.
Ivory legislation in ChinaSeizures
There are four main sources of elephant tusks in China: old privately-owned stocks, government sup-plies, the legal 62 tonnes imported in 2008 and illegal tusks smuggled into China after 1990. The last source greatly concerns wildlife conservationists and law HQIRUFHPHQW�RI¿FLDOV��$FFRUGLQJ�WR�(OHSKDQW�7UDGH�Information System (ETIS) analysis, from 1990 to 2008, seizures of tusks and worked ivory en route to China and reaching the country were the highest in the world by weight and third by number of pieces (Mil-OLNHQ�HW�DO����������(7,6�FRQFOXGHG��µ&KLQD�UHPDLQV�the most important contemporary player in the illicit trade in ivory’ (Milliken et al., 2009).
Legislation on retail sales
In order to reduce the selling of illegal ivory, the Chi-QHVH�JRYHUQPHQW�RQO\�DOORZV�LYRU\�LWHPV�LQ�VSHFL¿F�registered shops, and the shop owner must provide information to the government on how much is sold and to whom. According to Wan Ziming at Beijing’s &,7(6�RI¿FH��LQ������WKHUH�ZHUH����GHVLJQDWHG�LYRU\�manufacturers and 137 designated ivory retailers in China. The list of designated ivory dealers for 2011 was expected to be similar. In 2010, there were 12 ivory factories and 25 designated retail outlets in Guangdong and Fujian provinces. The shops are re-TXLUHG�E\�ODZ�WR�GLVSOD\�IUDPHG�FHUWL¿FDWHV�WKDW�VWDWH�that they are permitted to trade in elephant ivory. In addition, since May 2004, all elephant ivory items must have an ID card beside the object on display for sale (unlike mammoth ivory items). Small items, such as pendants, may have their ID cards in a drawer if there is no space with the item. If an item weighs over 50 g, a photo of the item must be shown on the ID card as well as the serial number, name of factory, size, weight and other descriptions of the item. If an LYRU\�LWHP�LV� OHVV�WKDQ����J�� WKH�,'�FDUG�FHUWL¿FDWH�
does not require a picture of the item (Wan Ziming, pers. comm. February and March 2011).
The State Forestry Administration provides OHDÀHWV� LQ� WKH�LYRU\�VKRSV��ZULWWHQ�LQ�&KLQHVH�� WKDW�request customers to buy ivory only in designated LYRU\�VKRSV�DQG�WR�DVN�IRU� WKH�,'�FDUG��7KH� OHDÀHW�explains how to identify an array of complicated VHFXULW\�PHDVXUHV�RQ�HDFK�,'�FDUG��KDQG�SDLQWHG�ÀRUDO�patterns and shading lines, laser anti-counterfeit labels IRU�VHFXULW\��µGULS�GLVDSSHDUHG¶�SULQWLQJ�WHFKQRORJ\��VHFXULW\� OLQHV�� UHOLHI� VKDGLQJ�� GRXEOH� µV¶� DQWL�OLIW�LQFLVLRQV�� FRORXUOHVV� ÀXRUHVFHQW� VHFXULW\� LQN� DQG�PLFUR¿OP�WH[W���7KH�OHDÀHW�GHVFULEHV�WKH�JRYHUQPHQW¶V�µVWDQGDUGL]DWLRQ� RI� GRPHVWLF� LYRU\�PDQDJHPHQW�measures’ and states that an ivory item cannot be separated from its ID card, which guarantees its legal status. It states that if an item is less than 50 g and is a unique artistic piece of high value, then it is recommended that its photo is also on the ID card, but it is not mandatory. Most small items (less than 50 g) are mass-produced with no independent features or patterns, such as necklaces, bracelets, rings, chopsticks and stamps, so these items require only D�QXPEHUHG�,'�FDUG�ZLWK�QR�SKRWRJUDSK��7KH�OHDÀHW�further notes for foreign tourists and expatriates that µZLWKRXW�SHUPLVVLRQ�WR�LPSRUW�HOHSKDQW�LYRU\�DQG�LWV�products [it] is illegal. Similarly [for] PRC citizens without permission to carry ivory and its products from abroad [it] is illegal [at] immigration also’. It DOVR�VWDWHV�WKDW�µ&LWL]HQV�IURP�DEURDG��WR�FDUU\�LYRU\�and ivory products [through] immigration, need to get permission from relevant departments of the H[SRUWLQJ�FRXQWU\�DQG�LVVXH�H[SRUW�FHUWL¿FDWHV��ZKLOH�government departments need to get the consent of the appropriate department for an import licence [for] customs before release’.
7KH�OHDÀHW�IXUWKHU�H[SODLQV�WKDW�RQO\�%RWVZDQD��Namibia, Zimbabwe and South Africa have their elephants on Appendix II of CITES which allows under certain circumstances controlled and OLPLWHG�WUDGH�LQ�WXVNV��7KH�OHDÀHW�WKHQ�VD\V�WKDW�WKH�management, maintenance and development of this ivory tag information system, commissioned by the Chinese State Forestry Administration, was praised by WKH�LQWHUQDWLRQDO�&,7(6�FRPPXQLW\��7KH�OHDÀHW�DOVR�describes how to distinguish elephant and mammoth tusk cross-sections, showing the typical crossed lines, and explaining that elephant ivory has an angle of 115 degrees while for mammoth tusks it is less than a 90 degree angle. In reality these lines are often hard to see and distinguish.
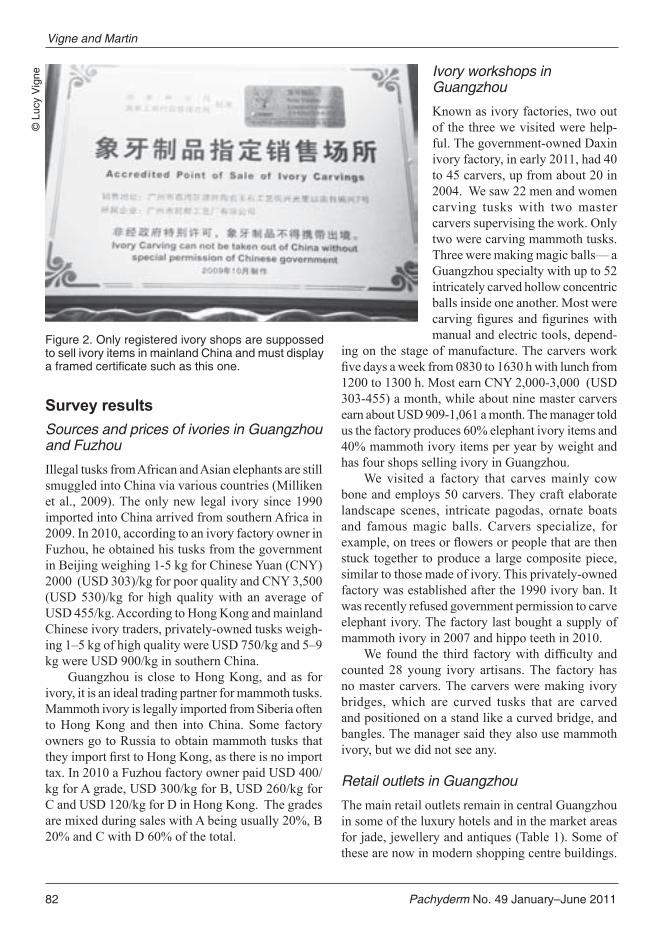
82 Pachyderm No. 49 January–June 2011
Survey resultsSources and prices of ivories in Guangzhou and Fuzhou
Illegal tusks from African and Asian elephants are still smuggled into China via various countries (Milliken et al., 2009). The only new legal ivory since 1990 imported into China arrived from southern Africa in 2009. In 2010, according to an ivory factory owner in Fuzhou, he obtained his tusks from the government in Beijing weighing 1-5 kg for Chinese Yuan (CNY) 2000 (USD 303)/kg for poor quality and CNY 3,500 (USD 530)/kg for high quality with an average of USD 455/kg. According to Hong Kong and mainland Chinese ivory traders, privately-owned tusks weigh-ing 1–5 kg of high quality were USD 750/kg and 5–9 kg were USD 900/kg in southern China.
Guangzhou is close to Hong Kong, and as for ivory, it is an ideal trading partner for mammoth tusks. Mammoth ivory is legally imported from Siberia often to Hong Kong and then into China. Some factory owners go to Russia to obtain mammoth tusks that WKH\�LPSRUW�¿UVW�WR�+RQJ�.RQJ��DV�WKHUH�LV�QR�LPSRUW�tax. In 2010 a Fuzhou factory owner paid USD 400/kg for A grade, USD 300/kg for B, USD 260/kg for C and USD 120/kg for D in Hong Kong. The grades are mixed during sales with A being usually 20%, B 20% and C with D 60% of the total.
Ivory workshops in Guangzhou
Known as ivory factories, two out of the three we visited were help-ful. The government-owned Daxin ivory factory, in early 2011, had 40 to 45 carvers, up from about 20 in 2004. We saw 22 men and women carving tusks with two master carvers supervising the work. Only two were carving mammoth tusks. Three were making magic balls— a Guangzhou specialty with up to 52 intricately carved hollow concentric balls inside one another. Most were FDUYLQJ�¿JXUHV�DQG�¿JXULQHV�ZLWK�manual and electric tools, depend-
ing on the stage of manufacture. The carvers work ¿YH�GD\V�D�ZHHN�IURP������WR������K�ZLWK�OXQFK�IURP�1200 to 1300 h. Most earn CNY 2,000-3,000 (USD 303-455) a month, while about nine master carvers earn about USD 909-1,061 a month. The manager told us the factory produces 60% elephant ivory items and 40% mammoth ivory items per year by weight and has four shops selling ivory in Guangzhou.
We visited a factory that carves mainly cow bone and employs 50 carvers. They craft elaborate landscape scenes, intricate pagodas, ornate boats and famous magic balls. Carvers specialize, for H[DPSOH��RQ�WUHHV�RU�ÀRZHUV�RU�SHRSOH�WKDW�DUH�WKHQ�stuck together to produce a large composite piece, similar to those made of ivory. This privately-owned factory was established after the 1990 ivory ban. It was recently refused government permission to carve elephant ivory. The factory last bought a supply of mammoth ivory in 2007 and hippo teeth in 2010.
:H�IRXQG� WKH� WKLUG� IDFWRU\�ZLWK�GLI¿FXOW\� DQG�counted 28 young ivory artisans. The factory has no master carvers. The carvers were making ivory bridges, which are curved tusks that are carved and positioned on a stand like a curved bridge, and bangles. The manager said they also use mammoth ivory, but we did not see any.
Retail outlets in Guangzhou
The main retail outlets remain in central Guangzhou in some of the luxury hotels and in the market areas for jade, jewellery and antiques (Table 1). Some of these are now in modern shopping centre buildings.
Vigne and Martin©
Luc
y V
igne
Figure 2. Only registered ivory shops are suppossed to sell ivory items in mainland China and must display C�HTCOGF�EGTVKſECVG�UWEJ�CU�VJKU�QPG�

Pachyderm No. 49 January–June 2011 83
Mammoth ivory specialty shops had posters in the windows describing mammoths to customers, and with increased publicity, mammoth ivory has become an accepted substitute for elephant ivory. Some shops also displayed signs to say mammoth ivory items can be taken out of China but that the trade and use of elephant ivory are permitted in China only. Larger carvings were usually displayed in wall cabinets behind glass and small items under glass table-tops, including at the pay-desk.
There were 80 outlets seen selling elephant ivory (Table 2). These also sold jade, jewellery, antiques, souvenirs/gifts, mammoth ivory or were registered ivory specialty shops. Of these outlets, eight were selling ivory with ID cards and 72 outlets had no ID cards (25 selling new ivory and 52 selling old ivory with 5 selling both). We counted 6,437 ivory items on display: 3,206 newer items with no ID cards, 2,490 newer items with ID cards, and 741 old items with no ID cards. Thus 3,947 items (over half) had no ID cards and were thus illegal. Nearly all the items were carved in China. The most common were pendants, beads, ¿JXULQHV��EDQJOHV�EUDFHOHWV�DQG�FKDUPV��LQ�WKDW�RUGHU���Many of the old items for sale are rarely produced today, such as belt ornaments, hair brushes, containers for opium and incense, and games such as cribbage or mahjong. Vendors told us that their ivory sales were presently slow. Vendors sometimes told us their elephant ivory was mammoth, which does not require an ID card and that foreigners can export. When we asked for an ID card, vendors sometimes directed us WR�D�YHUL¿FDWLRQ�RI¿FH��PRVWO\�IRU�JHPVWRQHV��WR�SURYH�WKH�LWHP¶V�DXWKHQWLFLW\��7KH�RI¿FH�KDG�QRWKLQJ�WR�GR�ZLWK�FRQ¿UPLQJ�LWV�OHJDO�VWDWXV��*HQHUDOO\��YHQGRUV�tolerated our questions and photographs. There are many unregistered outlets with ivory that have not EHHQ�RI¿FLDOO\� LQVSHFWHG� DQG� VRPH�YHQGRUV� IUHHO\�admitted that their ivory was illegal; we were told WKDW�QR�FRQ¿VFDWLRQV�KDG�WDNHQ�SODFH���
Most of the newest illegal ivory items were bangles and necklaces. In three antique shops in the jade shopping area we were shown 21 hidden new LOOHJDO� LYRU\�¿JXUHV��PRVWO\�DERXW����FP�� VRPH� LQ�YHOYHW�OLQHG�ER[HV���2QH�YHQGRU�VDLG�KLV�¿JXUHV�ZHUH�new, and another claimed hers were old, but they had been stained to look old. (These were not counted in our survey, as they were not on display). One hotel gift shop had two bangles and a pendant on display with authenticity cards but not ID cards. The vendor explained they were expensive as the ivory was from
the rarer elephants of Thailand, not from African elephants. The vendor demonstrated this with torch-light on the ivory showing a pinkish glow. He was not concerned that the ivory was illegal. One Chinese man bought several large new illegal ivory objects, which the owner incorrectly told us were mammoth, from a jade shop and two Chinese women bought legal ivory pendants in an ivory specialty shop when we were there.
Prices varied considerably for similar items (Table 3). In small outlets, ivory items did not have price labels and bargaining was required. Pendants averaged at USD 66, cigarette holders were about USD 296, and name seals about USD 214. Figurines DQG�¿JXUHV�UDQJHG�ZLGHO\�LQ�SULFH�DFFRUGLQJ�WR�WKH�outlet, workmanship and artistic value.
There were 30 outlets selling mammoth ivory (17 also selling elephant ivory items and 13 only mammoth). There were 6,541 mammoth ivory items (Table 2). Virtually all the objects were carved in China since 2004. Because of the brown outer layer, large cracks and stains, they are often uniquely shaped VFXOSWXUHV��QRW�PDVV�SURGXFHG�¿JXUHV�DV�LV�SRVVLEOH�with elephant ivory. Only grade A mammoth tusks produce white blemish-free items that resemble elephant ivory. Elephant ivory, being whiter, is more popular than mammoth in China. Prices of mammoth ivory items were thus slightly lower to encourage sales. We saw no mammoth ivory items being purchased.
Workshops in Fuzhou
In Fuzhou we interviewed ivory factory owners and PDQDJHUV�ZKR�WROHUDWHG�RXU�µPDUNHW�VXUYH\¶�EHFDXVH�we were foreigners, they said. Fuzhou is famous for carving, especially the coloured Shoushan stone from the surrounding mountains. Wood and ivory carvers from all over China come to Fuzhou for employment. ,Q�WKH�¿UVW�RI�WKUHH�IDFWRULHV�ZH�YLVLWHG��WKHUH�ZHUH����carvers, half from Fuzhou and the rest from elsewhere in China. They live in the factory buildings with their families. Both men and women carve. The work is intense, requiring very good eye sight and a steady hand, and people retire from this factory in their 40s to carve ivory trinkets from home. The factory produces carvings from mammoth tusks (50% by weight of total factory production), cow bone (35%) and ivory (15%). Chinese, we were told, like full mammoth carved tusks and the carvers had about 40
Consumption of elephant and mammoth ivory increases in southern China

84 Pachyderm No. 49 January–June 2011
pairs to carve, the heaviest being 70 kg. We saw 28 carvers mostly working elephant ivory. They receive a salary of 1,500 to 5,000 CNY (USD 227 to 758) a month. About 10 carvers had recently left to carve ZRRG��ZKLFK�LV�PRUH�SUR¿WDEOH��
Factory sales were poor in 2009 due to the world recession, but improved in 2010 with an increase in Chinese buyers. After the 1990 CITES ban on ivory the government had removed the factory’s elephant tusks (600 kg, compensating them only 200,000 CNY—about USD 24,000 or USD 40/kg at the time). The factory owner disputed the low price but to no avail. He has only managed recently to buy more tusks from the government. First he needed a permit to carve ivory. Then he needed permission
to buy tusks so he wrote to the government in May 2010. He had to wait until permission was granted in November 2010 to buy 1,500 kg of ivory. The delivery was scheduled in early 2011. The factory must process a limited supply: 120 kg from January to June, and 60 kg from July to December, but would like more. The factory must also submit designs to the government and afterwards a photograph of each item for its compulsory ID card. The items are sold to shops and private customers in China. About 90% of the factory’s mammoth ivory sales are wholesale within China, the rest is mainly exported to USA and Europe. In 2009, a factory representative went to Italy
to sell mammoth tusks for 10,000 CNY a kg (USD 1,470) but the Italians would only offer less than half this amount so the sale did not occur.
We visited a second factory with 20 ivory craftsmen, 10 of whom were carving both elephant and mammoth ivory. The approaching 2011 Chinese New Year meant some had gone on holiday. If the craftsmen are not from Fuzhou, they are given accommodation in new housing blocks around the city; the factory provides lunch and supper. The IDFWRU\�RI¿FH�KDG� WZR�ZDOO�JODVV�FDELQHWV� WR�VKRZ�the items they make—one for mammoth and the other for elephant ivory carvings—and a glass-topped table for trinkets. In 2008 the factory owner went to southern Africa and bought tusks with the Chinese RI¿FLDOV��7KH�&KLQHVH�JRYHUQPHQW�RQO\�DOORZV� WKH�factory to utilize 120 kg a year, although the owner ZRXOG�OLNH�WR�FDUYH�PRUH��&KLQHVH�UHOLJLRXV�¿JXULQHV�of Kwan Yin and the Buddha made from both ivories are particularly popular. In 2010 the company, which also has an enterprise in Hong Kong, brought 3,000 kg of mammoth tusks from Hong Kong to use in this factory, having sold 1,000 kg of these tusks in Hong Kong. In 2009 and 2010 60% of the sales of mammoth ivory items were sold in China and 40% exported, mainly to France and the USA.
The third factory we visited in Guangzhou employed 50 to 60 mammoth ivory and bone carvers, having stopped utilizing ivory in 1990. The bones come mostly from buffaloes and cows in Sichuan province and cost 6 CNY (USD .92) per kg. The owner uses a few camel bones that cost 7–8 CNY a kg but he prefers buffalo and cow bone saying the quality is better. The owner had trained as an ivory carver, EXW�GXH�WR�WKH������&,7(6�EDQ�KH�KDG�GLYHUVL¿HG�LQWR�substitute materials and has no intention of returning to ivory. He said some factories were closing as it is hard to employ skilled carvers nowadays with increased pressure for a family’s one child to go to university rather than become an artisan. This factory SURGXFHV�ODUJH�¿JXUHV�DQG�IXUQLWXUH�FRYHUHG�LQ�WKLQ�bone rectangles. The main market for these is the USA where hand-made products are appreciated. There is no shortage of bones, but the factory needs more sales, and being luxury products his exports have been affected by the recent international recession. The factory also produces plain, polished mammoth tusks DQG�PDPPRWK�LYRU\�KXPDQ�DQG�DQLPDO�¿JXUHV�RI�D�very high standard. There was a large display priced for sale. All were recognizably carved from mammoth
Vigne and Martin
Figure 3. A carver in Fuzhou works with an electric drill on a whole mammoth tusk.
© L
ucy
Vig
ne
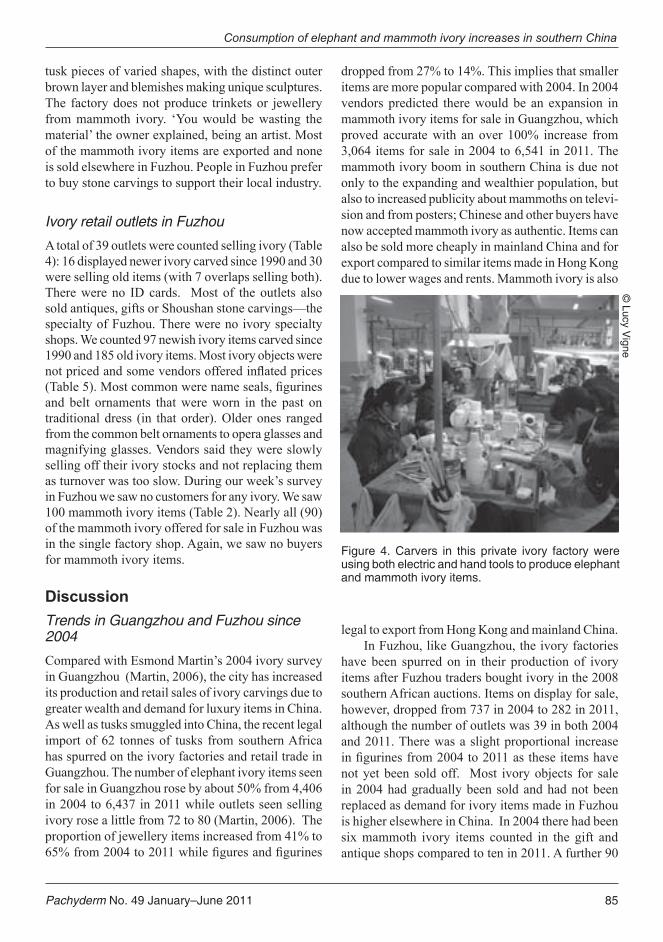
Pachyderm No. 49 January–June 2011 85
tusk pieces of varied shapes, with the distinct outer brown layer and blemishes making unique sculptures. The factory does not produce trinkets or jewellery IURP�PDPPRWK� LYRU\�� µ<RX�ZRXOG� EH�ZDVWLQJ� WKH�material’ the owner explained, being an artist. Most of the mammoth ivory items are exported and none is sold elsewhere in Fuzhou. People in Fuzhou prefer to buy stone carvings to support their local industry.
Ivory retail outlets in Fuzhou
A total of 39 outlets were counted selling ivory (Table 4): 16 displayed newer ivory carved since 1990 and 30 were selling old items (with 7 overlaps selling both). There were no ID cards. Most of the outlets also sold antiques, gifts or Shoushan stone carvings—the specialty of Fuzhou. There were no ivory specialty shops. We counted 97 newish ivory items carved since 1990 and 185 old ivory items. Most ivory objects were QRW�SULFHG�DQG�VRPH�YHQGRUV�RIIHUHG�LQÀDWHG�SULFHV��7DEOH�����0RVW�FRPPRQ�ZHUH�QDPH�VHDOV��¿JXULQHV�and belt ornaments that were worn in the past on traditional dress (in that order). Older ones ranged from the common belt ornaments to opera glasses and magnifying glasses. Vendors said they were slowly selling off their ivory stocks and not replacing them as turnover was too slow. During our week’s survey in Fuzhou we saw no customers for any ivory. We saw 100 mammoth ivory items (Table 2). Nearly all (90) of the mammoth ivory offered for sale in Fuzhou was in the single factory shop. Again, we saw no buyers for mammoth ivory items.
DiscussionTrends in Guangzhou and Fuzhou since 2004
Compared with Esmond Martin’s 2004 ivory survey in Guangzhou (Martin, 2006), the city has increased its production and retail sales of ivory carvings due to greater wealth and demand for luxury items in China. As well as tusks smuggled into China, the recent legal import of 62 tonnes of tusks from southern Africa has spurred on the ivory factories and retail trade in Guangzhou. The number of elephant ivory items seen for sale in Guangzhou rose by about 50% from 4,406 in 2004 to 6,437 in 2011 while outlets seen selling ivory rose a little from 72 to 80 (Martin, 2006). The proportion of jewellery items increased from 41% to ����IURP������WR������ZKLOH�¿JXUHV�DQG�¿JXULQHV�
dropped from 27% to 14%. This implies that smaller items are more popular compared with 2004. In 2004 vendors predicted there would be an expansion in mammoth ivory items for sale in Guangzhou, which proved accurate with an over 100% increase from 3,064 items for sale in 2004 to 6,541 in 2011. The mammoth ivory boom in southern China is due not only to the expanding and wealthier population, but also to increased publicity about mammoths on televi-sion and from posters; Chinese and other buyers have now accepted mammoth ivory as authentic. Items can also be sold more cheaply in mainland China and for export compared to similar items made in Hong Kong due to lower wages and rents. Mammoth ivory is also
legal to export from Hong Kong and mainland China. In Fuzhou, like Guangzhou, the ivory factories
have been spurred on in their production of ivory items after Fuzhou traders bought ivory in the 2008 southern African auctions. Items on display for sale, however, dropped from 737 in 2004 to 282 in 2011, although the number of outlets was 39 in both 2004 and 2011. There was a slight proportional increase LQ�¿JXULQHV�IURP������WR������DV�WKHVH�LWHPV�KDYH�not yet been sold off. Most ivory objects for sale in 2004 had gradually been sold and had not been replaced as demand for ivory items made in Fuzhou is higher elsewhere in China. In 2004 there had been six mammoth ivory items counted in the gift and antique shops compared to ten in 2011. A further 90
Consumption of elephant and mammoth ivory increases in southern China
Figure 4. Carvers in this private ivory factory were using both electric and hand tools to produce elephant and mammoth ivory items.
© Lucy V
igne
86 Pachyderm No. 49 January–June 2011
items were seen in a mammoth ivory factory shop in 2011 that was not visited in 2004, although the owner started production in 1992. Mammoth ivory items made in Fuzhou have always been mostly exported or sold elsewhere in China.
Legal and illegal sales in retail outlets
While ID cards are usually seen in the larger registered shops in Guangzhou, especially the government-owned ivory shops called Daxin, there are loopholes. Some items were displayed illegally with no ID cards— supposedly the cards had not been made yet. More commonly mammoth and ivory items were mixed. In a registered shop with separate cabinets for ivory and mammoth ivory, 15-cm Buddha carvings of both ivories that looked identical were together. Furthermore, some of these Buddhas had ID cards beside them, and others were in a drawer. It would be easy to re-use these IDs if not taken by a customer or if the buyer was mistakenly told his item was mammoth ivory. Another vendor in a registered shop claimed she did not know which items were which; most items looked like ivory but had no ID cards. For small items weighing less than 50 g, cards are usually stacked in a drawer, but again the customer may leave with his purchased item without the card, as we saw happen with a pendant sale in a registered shop. This would enable illegal ivory items again to be mixed in with legal items. Most of the outlets with ivory we visited were not registered to sell ivory and were selling items, both old and new, all illegally (with no ID cards) in Guangzhou and Fuzhou. Several vendors openly said their ivory was new and illegal and occasionally pretended new items were old; this VXJJHVWV�RI¿FLDO�LQVSHFWLRQV�DQG�FRQ¿VFDWLRQV�KDYH�not taken place in most shops.
The increased production of ivory substitutes
Within China consumer demand for mammoth ivory is increasing as grade A makes an acceptable alternative to elephant ivory and other grades can produce unique sculptures of artistic merit. Only some objects, such as the many layered magic ball and chopsticks, cannot be carved from the more brittle mammoth tusks. Un-fortunately, this look-alike material can be confused with elephant ivory and even experienced carvers admit they often need a magnifying glass to tell the
difference, especially for small items. Although some registered ivory shops have separate display cabinets for mammoth ivory and elephant ivory, others do not, and the two ivories can be mixed by mistake or pur-posefully. Some mammoth ivory specialty shops also sell ivory. Only mammoth ivory carvings that retain some bark-like exterior or have more acute angled FURVV�KDWFKLQJ�YLVLEOH�RQ�WKH�EDVH�DUH�LGHQWL¿DEOH���
Hippo teeth from Africa (on CITES Appendix II, which allows controlled trade) in 2010 were USD 120-150/kg wholesale, but few factories are buying them these days. In Guangzhou 10 outlets offered 114 hippo ivory items down from 457 in 12 outlets in 2004. Hippo teeth have become a less common substitute with the growth in mammoth ivory supplies. Being small in size, being on CITES Appendix II and having a tendency to crack makes them less popular compared with mammoth ivory. The most common KLSSR�WHHWK�LWHPV�IRU�VDOH�LQ������ZHUH�¿JXULQHV�������and bridges (29%). Some items are very expensive: a 20-cm landscape carving cost USD 3,000, and a 27-cm carved bridge was USD 3.787 in Guangzhou. In Fuzhou only one item, a hippo tusk, was seen for sale in one outlet.
There are several stores in the jewellery and jade markets of Guangzhou that sell quantities of inexpensive fake ivory beads, bracelets, necklaces, EDQJOHV��¿JXULQHV�DQG�RWKHU�FRPPRQ�LWHPV��9HQGRUV�called the unknown material resin, plastic, elephant bone, camel bone, reconstituted ivory powder and sometimes ivory. Unlike plastic, this material can ZLWKVWDQG�D�ÀDPH��KDV�QR�VPHOO� OLNH�ERQH��DQG�KDV�curving lines (like map contours) running through it that partly resembles ivory. The temperature, texture and weight resemble ivory. Some vendors confuse this material with ivory—accidentally and/or purposefully—and we did see synthetic beads with ivory pendants selling as ivory necklaces.
Conclusion and recommendationsThere is a large illegal trade in retail ivory items without ID cards in Guangzhou. Of the 6,437 ivory items counted for sale, 61% were illegal and 39% le-gal. Fuzhou’s retail ivory items were fewer (282), but none had the compulsory ID cards. The government attempts to control the illegal trade. For Guangzhou and Fuzhou and their provinces only 25 designated retail outlets are permited to sell ivory, but we found ivory items in 119 outlets in the two cities alone. The
Vigne and Martin

Pachyderm No. 49 January–June 2011 87
Chinese government introduced an ID card system to allow the sale of legal ivory items. Many ivory items being sold, perhaps 63% of the items we counted in Guangzhou and Fuzhou, did not have an ID card in the shop. Furthermore, some vendors were selling elephant ivory as mammoth ivory.
The number of mammoth ivory items counted in Guangzhou was almost the same as ivory seen for sale. Mammoth ivory items for sale in Fuzhou were very few, less than half of those of ivory. Since 2004, in Guangzhou there has been about 100% increase in the number of mammoth ivory items seen which some say may have helped elephants as more customers are buying mammoth ivory items in place of elephant ivory. Both, however, are in increasing demand with the rising wealth and population in China. The number of ivory items surveyed in Guangzhou has risen by 50% since 2004.
What is needed is further enforcement of the laws in place. The small shops and stalls, especially in the jewellery/jade market area of central Guangzhou, which sell some of the newest illegal ivory, need regular inspections to stop their illicit trade. Old items QHHG�WR�EH�JLYHQ�,'�FDUGV�DV�LV�WKH�ODZ��2I¿FLDOV�QHHG�also to check frequently the registered ivory shops for ID cards. It would help if mammoth ivory items were required to have similar ID cards to reduce ivory being sold as mammoth; some shops display them but they are optional. It would also help prevent illegal ivory trade if the traders worked towards an effective association to help manage their ivory industry. One improvement would be for ivory and mammoth specialty shops to sell only one type of ivory, or at least a shop selling both to be clearly divided in order
to reduce mixing. As grade A mammoth and elephant ivory items are so similar, traders may wish to sell only mammoth ivory sculptures with some outer layer visible to reduce confusion with ivory, thus preventing the entry of illegal items that jeopardize WKHLU�EXVLQHVV�� �,I�&KLQHVH�RI¿FLDOV�DQG�WUDGHUV�FDQ�tighten their controls and law enforcement, they can reduce the illegal ivory trade in China.
AcknowledgementsWe would like to thank Columbus Zoo and the Aquarium Conservation Fund, Elephant Family and The Aspinall Foundation.
ReferencesMilliken T., Burn R., Sangalakula L. 2009. The
Elephant Trade Information System (ETIS) and the Illicit Trade in Ivory: a report to the 15th meeting of the Conference of the Parties to CITES. Report for CITES CoP15 Doc.44.1 Annex (unpublished).
Martin E., Stiles D. 2003. The Ivory Markets of East Asia. Save the Elephants, Nairobi and London.
0DUWLQ�(��������µ$UH�ZH�ZLQQLQJ�WKH�FDVH�IRU�LYRU\�VXEVWLWXWHV�LQ�&KLQD"¶�Pachyderm 40:88-100.
9LJQH�/���0DUWLQ�(�� ������ µ&RQVXPHU� GHPDQG� IRU�ivory in Japan declines’. Pachyderm 47:45-54.
Table 1. Types of retail outlets and number of ivory and mammoth ivory items surveyed in Guangzhou in January 2011
IVORY MAMMOTH IVORY Type No. No. of items No. No. of items
Antique outlet 49 1,116 0 0Department store 1 559 1 27Gift outlet 4 23 1 2Specialty outlet 17 4,500 28 6,512Jewellery outlet incl. jade 6 232 0 0Other 3 7 0 0TOTAL 80 6,437 30 6,541
Consumption of elephant and mammoth ivory increases in southern China

88 Pachyderm No. 49 January–June 2011
Table 2. Number of retail outlets seen with ivory, and mammoth ivory and number of items counted in January 2011
City No. of outlets seen No. of items No. of outlets seen No. of items with ivory with mammoth ivory Guangzhou 80 6,437 30 6,541 Fuzhou 39 282 3 100
Table 3. Retail prices for recently-made ivory items seen in Guangzhou in January 2011
Item Size in cm Range in USD Av. USD price
JEWELLERYBangle 1 58-600 418 Bangle 2-2.5 430-1,150 845 Necklace, small beads 43-2,461 441 Necklace, large beads 170-2,462 731 Pendant 3-4 35-151 66 Ring, plain 0.25 3-18 10
FIGURINESAnimal 5 258-554 414 10 505-2,585 1,349 20 - 10,769
Human 5 192-2,077 684 10 563-2,277 1,145 20 3,077-13,538 7,990 40 - 13,846 60 33,076-38,461 35,769
TUSKSCarved 20 - 32,307 40 - 15,153 60 25,538-30,769 28,154 Polished 40 12,308-19,692 16,000 60 24,615-35,077 29,846
MISC.Chopsticks, pair 20 131-825 455 Cigarette holder 10-15 151-831 296 Name seal 2 x 6 92-554 214
NB: USD 1 = CNY 6.5
Vigne and Martin
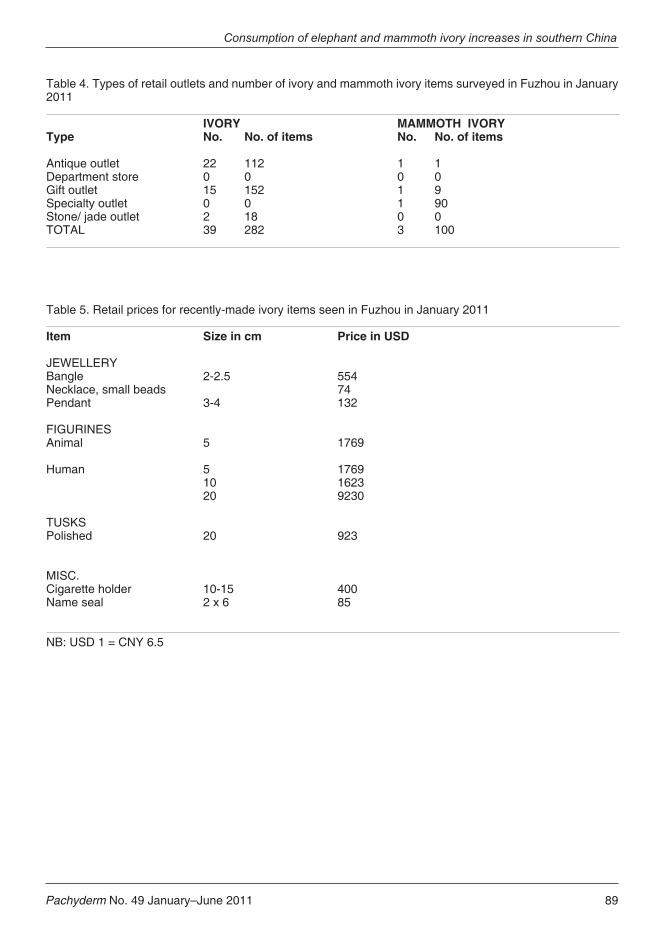
Pachyderm No. 49 January–June 2011 89
Table 4. Types of retail outlets and number of ivory and mammoth ivory items surveyed in Fuzhou in January 2011
IVORY MAMMOTH IVORYType No. No. of items No. No. of items
Antique outlet 22 112 1 1Department store 0 0 0 0Gift outlet 15 152 1 9Specialty outlet 0 0 1 90 Stone/ jade outlet 2 18 0 0TOTAL 39 282 3 100
Table 5. Retail prices for recently-made ivory items seen in Fuzhou in January 2011
Item Size in cm Price in USD
JEWELLERY Bangle 2-2.5 554Necklace, small beads 74Pendant 3-4 132
FIGURINESAnimal 5 1769 Human 5 1769 10 1623 20 9230 TUSKSPolished 20 923
MISC.Cigarette holder 10-15 400Name seal 2 x 6 85
NB: USD 1 = CNY 6.5
Consumption of elephant and mammoth ivory increases in southern China

90 Pachyderm No. 49 January–June 2011
Estimating the population structure of Javan rhinos (Rhinoceros sondaicus) in Ujung Kulon National Park using the mark-recapture method based on video and camera trap identification
Adhi Rachmat Sudrajat Hariyadi1*, Agus Priambudi2, Ridwan Setiawan3, Daryan Daryan4, Asep Yayus5 and Hendra Purnama6
1,3WWF Indonesia, Jl Halmahera No. 9 Villa Admiral Lippo Carita km 8, Labuan-Pandeglang 42264, Banten, Indonesia2,4,5,6Ujung Kulon NP Authority, Jl Perintis Kemerdekaan No. 51 Labuan – Pandeglang Banten Indonesia 42264
*Corresponding author: [email protected]
AbstractThe population structure of the Javan rhino (Rhinoceros sondaicus) in Ujung Kulon National Park (NP) in %DQWHQ��,QGRQHVLD�ZDV�DVVHVVHG�XVLQJ�YLVXDO�LGHQWL¿FDWLRQ�DQG�PDUN�UHFDSWXUH�HVWLPDWLRQ��7KH�VRIWZDUH�SUR-JUDP�&$3785(�ZDV�XVHG�IRU�VHOHFWLQJ�WKH�EHVW�¿W�HVWLPDWRU�IRU�WKH�PDUN�UHFDSWXUH�FDOFXODWLRQ�DQG�\LHOGV�M(th) as the best model. The software results delivered a mean estimation of 32 rhinos (a minimum of 29 DQG�PD[LPXP�RI����UKLQRV��ZLWK�D�����FRQ¿GHQFH�OHYHO�EDVHG�RQ�WKH�GDWDVHW�REWDLQHG�IURP�$SULO������WR�6HSWHPEHU�������7KH�YLVXDO�LGHQWL¿FDWLRQ�VXJJHVWV�WKDW�WKH�FXUUHQW�SRSXODWLRQ�LQ�8MXQJ�.XORQ�13�LV�PDOH�biased by a 3:2 sex ratio of males versus females. The demography shows that the population consists of mainly adult individuals that have a tendency of 1% population growth per year.
Key words: Javan rhino, population, mark-recapture, population estimation, camera trap
RésuméLa structure de la population du rhinocéros de Java (Rhinoceros sondaicus) dans le parc national d’Ujung .XORQ�j�%DQWHQ�HQ�,QGRQpVLH�D�pWp�pYDOXpH�HQ�XWLOLVDQW�O¶LGHQWL¿FDWLRQ�YLVXHOOH�HW�XQH�HVWLPDWLRQ�GH�FDSWXUH�marquage-recapture. Le logiciel CAPTURE a été utilisé comme le meilleur modèle pour sélectionner le meilleur estimateur propre au calcul et aux rendements M (th) de capture-marquage-recapture. Les résultats du logiciel ont donné une estimation moyenne de 32 rhinocéros (un minimum de 29 et un maximum de 47 UKLQRFpURV��DYHF�XQ�QLYHDX�GH�FRQ¿DQFH�GH�����G¶DSUqV�OD�VpULH�GH�GRQQpHV�REWHQXHV�G¶DYULO������j�VHSWHP-EUH�������/¶LGHQWL¿FDWLRQ�YLVXHOOH�VXJJqUH�TXH�OD�SRSXODWLRQ�DFWXHOOH�GDQV�OH�SDUF�QDWLRQDO�G¶8MXQJ�.XORQ�est biaisée en faveur des mâles avec un rapport de 3 mâles contre 2 femelles. La démographie montre que la population se compose principalement d’individus adultes qui ont une tendance de croissance de 1% par an.
NOTES
Pachyderm No. 49 January–June 2011 91
IntroductionThe main indicators of success in conserving an en-dangered wildlife species are the population size and the net population growth. The Indonesian govern-ment set the growth of the Javan rhino population at a rate of 3% annually in order to achieve the conserva-tion goal set in the Indonesian Rhino Conservation Strategy (PHKA, 2007). Unfortunately, the existing condition of the habitat (dense forest) and the scarce distribution Javan rhinos do not allow the application of census methods to obtain exact counts such as those like direct counts, which can be implemented for deer and pheasants (Lewis, 1970), or using aerial counts as done for wildlife in the Serengeti-Mara region (Talbot & Stewart, 1964). Fortunately, the distribu-tion of Javan rhinos has been extensively studied (Hoogerwerf, 1970; Muntasib, 2002), so there is no immediate need for conducting a patch occupancy survey, which would tend to have a bias due to the inability of this method to accurately detect the pres-ence of an animal in a given survey area if not done repeatedly (Mackenzie & Royle, 2005). Due to the GLI¿FXOWLHV� LQ� DSSO\LQJ� D� GLUHFW� FRXQW�H[DFW� FRXQW��the existing conditions for Javan rhinos should only rely on a relatively accurate estimation of population structure, instead of on exact counts.
One method that offers relatively accurate population estimates of wildlife species is the mark-UHFDSWXUH�FDOFXODWLRQ�EDVHG�RQ�YLVXDO�LGHQWL¿FDWLRQ��DV�done on tiger populations in India (Karanth & Nichols, �������7KH�XVH�RI�FDPHUD�WUDSV�IRU�YLVXDO�LGHQWL¿FDWLRQ�RI�UKLQRV�LQ�8MXQJ�.XORQ�13�ZDV�LQLWLDWHG�E\�*ULI¿WK�(1993), and was followed by Yahya (2002) to study the distribution and by Hariyadi et al. (2010) to study the behaviour of the Javan rhinos directly in their habitat.
The Javan rhino is known to have frequent wallowing behaviour because moisture/water is required to ensure the integrity of their epidermis (Shadwick et al., 1992), as well as for thermoregulation (Schenkel & Schenkel-Hullinger, 1969). Failure to wallow will lead to dryness that could eventually lead to pathological conditions and pain in the epidermal tissue (Munson et al., 1998). The need to wallow for both male and female Javan rhinos in Ujung Kulon NP is indicated by the daily wallowing behaviour recorded in previous observations (Schenkel et al., 1969; Hoogerwerf, 1970; Sajudin, 1984). There is no known sexual dimorphism in the epidermal tissue, and no differences in wallow frequencies between male and female Javan rhinos have been reported.
The differences of wallow frequencies between males and females are assumed to be very little based on ¿QGLQJV� IURP�<DK\D� �������� VR� WKH\� VKRXOG� VKRZ�similar wallowing frequencies and probabilities. If this is true, there will not be a sex bias to take into account with the survey design.
In using mark-recapture estimation of the population size, it is important to determine the population closure during the survey period. 3RSXODWLRQ�FORVXUH�LV�GH¿QHG�XVLQJ�WZR�FDWHJRULHV²the demographic closure and the geographic closure (White et al., 1982). Since the movement trends of Javan rhinos have been previously recorded in Yahya (2002) and Setiawan and Yahya (2002), the geographic closure for the Javan rhino population FDQ�EH�GH¿QHG��+RZHYHU��GXH� WR� WKH�RFFXUUHQFH�RI�births and mortality during the survey period, the GHPRJUDSKLF�FORVXUH�SULQFLSOHV�PD\�QRW�EH�IXO¿OOHG�LQ�this study (White et al., 1982), so the analysis must be carefully designed to ensure that demographic closure is accounted for in order to select the appropriate model for mark-recapture estimation.
Material and methodsEstimation of Javan rhino population size using PDUN�UHFDSWXUH�FDOFXODWLRQ�UHTXLUHV�LGHQWL¿FDWLRQ�RI�HDFK�LQGLYLGXDO�UKLQR��&RQVLGHULQJ�WKH�GLI¿FXOWLHV�RI�physically capturing and marking each rhino, it is agreed that the less invasive method to calculate is WKURXJK�LQGLYLGXDO�LGHQWL¿FDWLRQ�DQG�GLIIHUHQWLDWLQJ�Javan rhinos from photos and/or video. The use of automatic video recording devices (video traps) is an approved method for estimating the population size of the elusive species (Karanth & Nichols, 2002) such as Javan rhino. Therefore, 34 DVREye automatic record-ing devices were used for this purpose in the peninsula of the Ujung Kulon NP from April 2008 to September 2009. Rhino habitat in Ujung Kulon NP consists of a peninsula of 30,000 ha that is dominated mainly by lowland rainforest, coastal and mangrove forest.
These 34 cameras were systematically placed in the study area and 1 camera was placed in the vicinity of holes at the height of 1.5 to 2.5 metres above ground. These cameras were secured onto a tree with 10 to 20 degree downward angles to record any activity in the wallow hole. Wallow holes were selected using several criteria such as: type of wallow holes (temporary or permanent), the numbers of rhinos known to use a particular hole and the size of the wallow (area in m2 and the depth of water
Estimating Javan rhino population in Ujung Kulon National Park
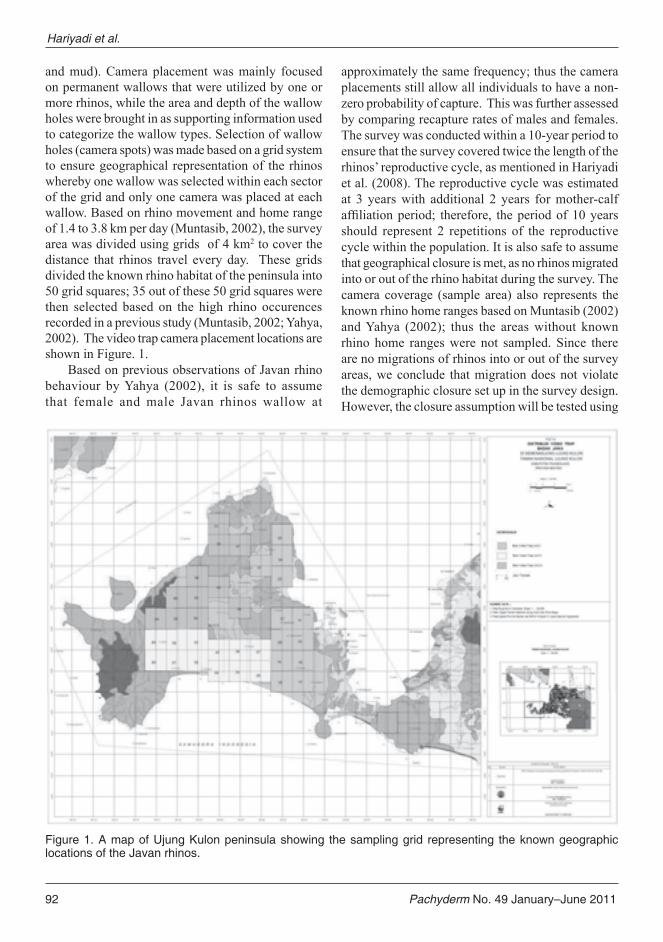
92 Pachyderm No. 49 January–June 2011
and mud). Camera placement was mainly focused on permanent wallows that were utilized by one or more rhinos, while the area and depth of the wallow holes were brought in as supporting information used to categorize the wallow types. Selection of wallow holes (camera spots) was made based on a grid system to ensure geographical representation of the rhinos whereby one wallow was selected within each sector of the grid and only one camera was placed at each wallow. Based on rhino movement and home range of 1.4 to 3.8 km per day (Muntasib, 2002), the survey area was divided using grids of 4 km2 to cover the distance that rhinos travel every day. These grids divided the known rhino habitat of the peninsula into 50 grid squares; 35 out of these 50 grid squares were then selected based on the high rhino occurences recorded in a previous study (Muntasib, 2002; Yahya, 2002). The video trap camera placement locations are shown in Figure. 1.
Based on previous observations of Javan rhino behaviour by Yahya (2002), it is safe to assume that female and male Javan rhinos wallow at
approximately the same frequency; thus the camera placements still allow all individuals to have a non-zero probability of capture. This was further assessed by comparing recapture rates of males and females. The survey was conducted within a 10-year period to ensure that the survey covered twice the length of the rhinos’ reproductive cycle, as mentioned in Hariyadi et al. (2008). The reproductive cycle was estimated at 3 years with additional 2 years for mother-calf DI¿OLDWLRQ�SHULRG�� WKHUHIRUH�� WKH�SHULRG�RI����\HDUV�should represent 2 repetitions of the reproductive cycle within the population. It is also safe to assume that geographical closure is met, as no rhinos migrated into or out of the rhino habitat during the survey. The camera coverage (sample area) also represents the known rhino home ranges based on Muntasib (2002) and Yahya (2002); thus the areas without known rhino home ranges were not sampled. Since there are no migrations of rhinos into or out of the survey areas, we conclude that migration does not violate the demographic closure set up in the survey design. However, the closure assumption will be tested using
Figure 1. A map of Ujung Kulon peninsula showing the sampling grid representing the known geographic locations of the Javan rhinos.
Hariyadi et al.
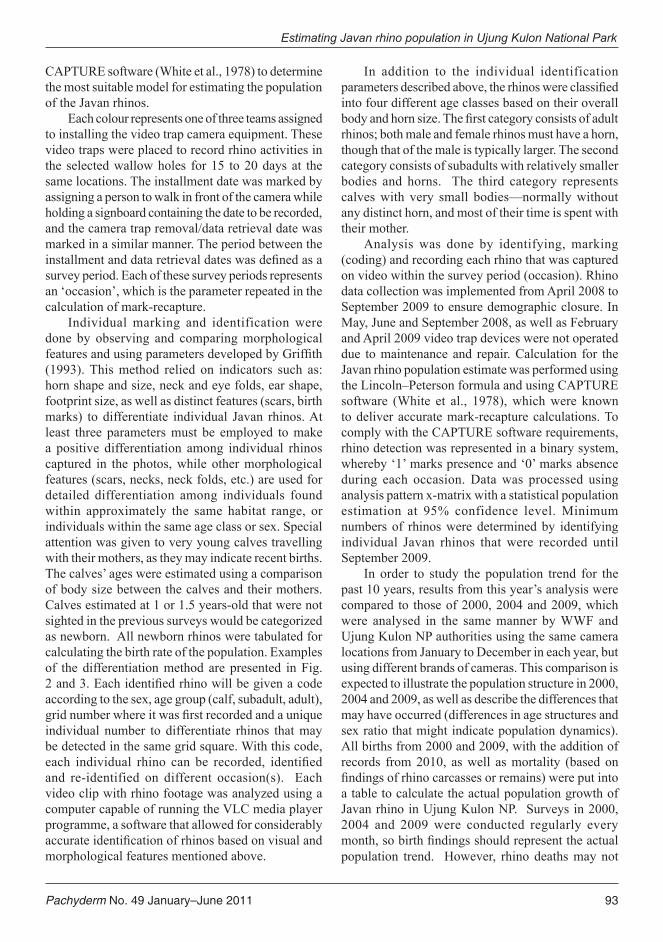
Pachyderm No. 49 January–June 2011 93
CAPTURE software (White et al., 1978) to determine the most suitable model for estimating the population of the Javan rhinos.
Each colour represents one of three teams assigned to installing the video trap camera equipment. These video traps were placed to record rhino activities in the selected wallow holes for 15 to 20 days at the same locations. The installment date was marked by assigning a person to walk in front of the camera while holding a signboard containing the date to be recorded, and the camera trap removal/data retrieval date was marked in a similar manner. The period between the LQVWDOOPHQW�DQG�GDWD�UHWULHYDO�GDWHV�ZDV�GH¿QHG�DV�D�survey period. Each of these survey periods represents DQ�µRFFDVLRQ¶��ZKLFK�LV�WKH�SDUDPHWHU�UHSHDWHG�LQ�WKH�calculation of mark-recapture.
Individual marking and identification were done by observing and comparing morphological IHDWXUHV�DQG�XVLQJ�SDUDPHWHUV�GHYHORSHG�E\�*ULI¿WK�(1993). This method relied on indicators such as: horn shape and size, neck and eye folds, ear shape, footprint size, as well as distinct features (scars, birth marks) to differentiate individual Javan rhinos. At least three parameters must be employed to make a positive differentiation among individual rhinos captured in the photos, while other morphological features (scars, necks, neck folds, etc.) are used for detailed differentiation among individuals found within approximately the same habitat range, or individuals within the same age class or sex. Special attention was given to very young calves travelling with their mothers, as they may indicate recent births. The calves’ ages were estimated using a comparison of body size between the calves and their mothers. Calves estimated at 1 or 1.5 years-old that were not sighted in the previous surveys would be categorized as newborn. All newborn rhinos were tabulated for calculating the birth rate of the population. Examples of the differentiation method are presented in Fig. ��DQG����(DFK�LGHQWL¿HG�UKLQR�ZLOO�EH�JLYHQ�D�FRGH�according to the sex, age group (calf, subadult, adult), JULG�QXPEHU�ZKHUH�LW�ZDV�¿UVW�UHFRUGHG�DQG�D�XQLTXH�individual number to differentiate rhinos that may be detected in the same grid square. With this code, HDFK� LQGLYLGXDO� UKLQR� FDQ� EH� UHFRUGHG�� LGHQWL¿HG�and re-identified on different occasion(s). Each video clip with rhino footage was analyzed using a computer capable of running the VLC media player programme, a software that allowed for considerably DFFXUDWH�LGHQWL¿FDWLRQ�RI�UKLQRV�EDVHG�RQ�YLVXDO�DQG�morphological features mentioned above.
In addition to the individual identification SDUDPHWHUV�GHVFULEHG�DERYH��WKH�UKLQRV�ZHUH�FODVVL¿HG�into four different age classes based on their overall ERG\�DQG�KRUQ�VL]H��7KH�¿UVW�FDWHJRU\�FRQVLVWV�RI�DGXOW�rhinos; both male and female rhinos must have a horn, though that of the male is typically larger. The second category consists of subadults with relatively smaller bodies and horns. The third category represents calves with very small bodies—normally without any distinct horn, and most of their time is spent with their mother.
Analysis was done by identifying, marking (coding) and recording each rhino that was captured on video within the survey period (occasion). Rhino data collection was implemented from April 2008 to September 2009 to ensure demographic closure. In May, June and September 2008, as well as February and April 2009 video trap devices were not operated due to maintenance and repair. Calculation for the Javan rhino population estimate was performed using the Lincoln–Peterson formula and using CAPTURE software (White et al., 1978), which were known to deliver accurate mark-recapture calculations. To comply with the CAPTURE software requirements, rhino detection was represented in a binary system, ZKHUHE\�µ�¶�PDUNV�SUHVHQFH�DQG�µ�¶�PDUNV�DEVHQFH�during each occasion. Data was processed using analysis pattern x-matrix with a statistical population estimation at 95% confidence level. Minimum numbers of rhinos were determined by identifying individual Javan rhinos that were recorded until September 2009.
In order to study the population trend for the past 10 years, results from this year’s analysis were compared to those of 2000, 2004 and 2009, which were analysed in the same manner by WWF and Ujung Kulon NP authorities using the same camera locations from January to December in each year, but using different brands of cameras. This comparison is expected to illustrate the population structure in 2000, 2004 and 2009, as well as describe the differences that may have occurred (differences in age structures and sex ratio that might indicate population dynamics). All births from 2000 and 2009, with the addition of records from 2010, as well as mortality (based on ¿QGLQJV�RI�UKLQR�FDUFDVVHV�RU�UHPDLQV��ZHUH�SXW�LQWR�a table to calculate the actual population growth of Javan rhino in Ujung Kulon NP. Surveys in 2000, 2004 and 2009 were conducted regularly every PRQWK��VR�ELUWK�¿QGLQJV�VKRXOG�UHSUHVHQW�WKH�DFWXDO�population trend. However, rhino deaths may not
Estimating Javan rhino population in Ujung Kulon National Park
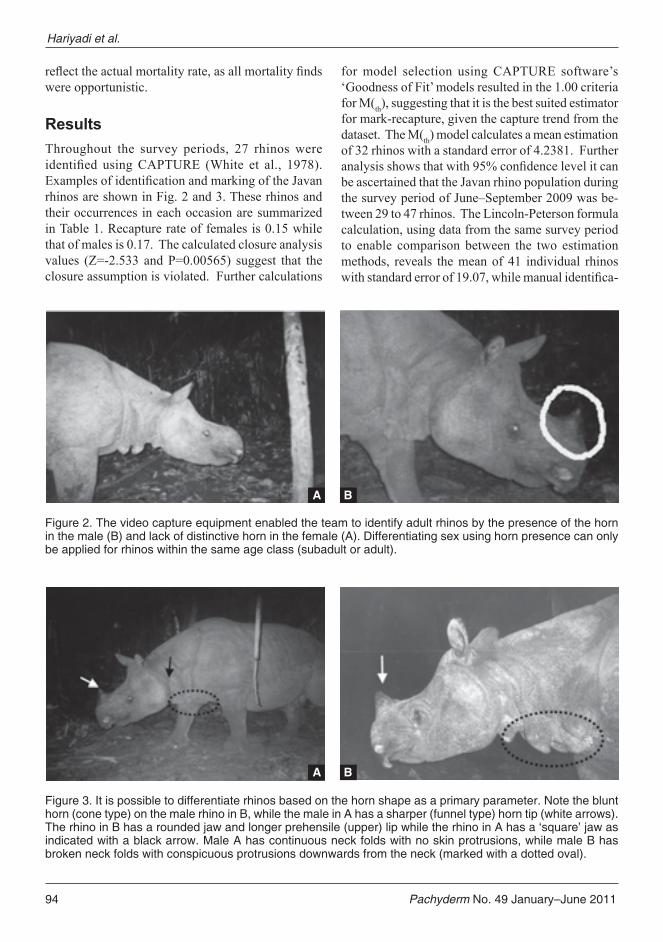
94 Pachyderm No. 49 January–June 2011
UHÀHFW�WKH�DFWXDO�PRUWDOLW\�UDWH��DV�DOO�PRUWDOLW\�¿QGV�were opportunistic.
ResultsThroughout the survey periods, 27 rhinos were LGHQWL¿HG� XVLQJ�&$3785(� �:KLWH� HW� DO��� ��������([DPSOHV�RI�LGHQWL¿FDWLRQ�DQG�PDUNLQJ�RI�WKH�-DYDQ�rhinos are shown in Fig. 2 and 3. These rhinos and their occurrences in each occasion are summarized in Table 1. Recapture rate of females is 0.15 while that of males is 0.17. The calculated closure analysis values (Z=-2.533 and P=0.00565) suggest that the closure assumption is violated. Further calculations
for model selection using CAPTURE software’s µ*RRGQHVV�RI�)LW¶�PRGHOV�UHVXOWHG�LQ�WKH������FULWHULD�for M(th), suggesting that it is the best suited estimator for mark-recapture, given the capture trend from the dataset. The M(th) model calculates a mean estimation of 32 rhinos with a standard error of 4.2381. Further DQDO\VLV�VKRZV�WKDW�ZLWK�����FRQ¿GHQFH�OHYHO�LW�FDQ�be ascertained that the Javan rhino population during the survey period of June–September 2009 was be-tween 29 to 47 rhinos. The Lincoln-Peterson formula calculation, using data from the same survey period to enable comparison between the two estimation methods, reveals the mean of 41 individual rhinos ZLWK�VWDQGDUG�HUURU�RI��������ZKLOH�PDQXDO�LGHQWL¿FD-
Figure 2. The video capture equipment enabled the team to identify adult rhinos by the presence of the horn in the male (B) and lack of distinctive horn in the female (A). Differentiating sex using horn presence can only be applied for rhinos within the same age class (subadult or adult).
Figure 3. It is possible to differentiate rhinos based on the horn shape as a primary parameter. Note the blunt horn (cone type) on the male rhino in B, while the male in A has a sharper (funnel type) horn tip (white arrows). The rhino in B has a rounded jaw and longer prehensile (upper) lip while the rhino in A has a ‘square’ jaw as indicated with a black arrow. Male A has continuous neck folds with no skin protrusions, while male B has broken neck folds with conspicuous protrusions downwards from the neck (marked with a dotted oval).
A
A
B
B
Hariyadi et al.
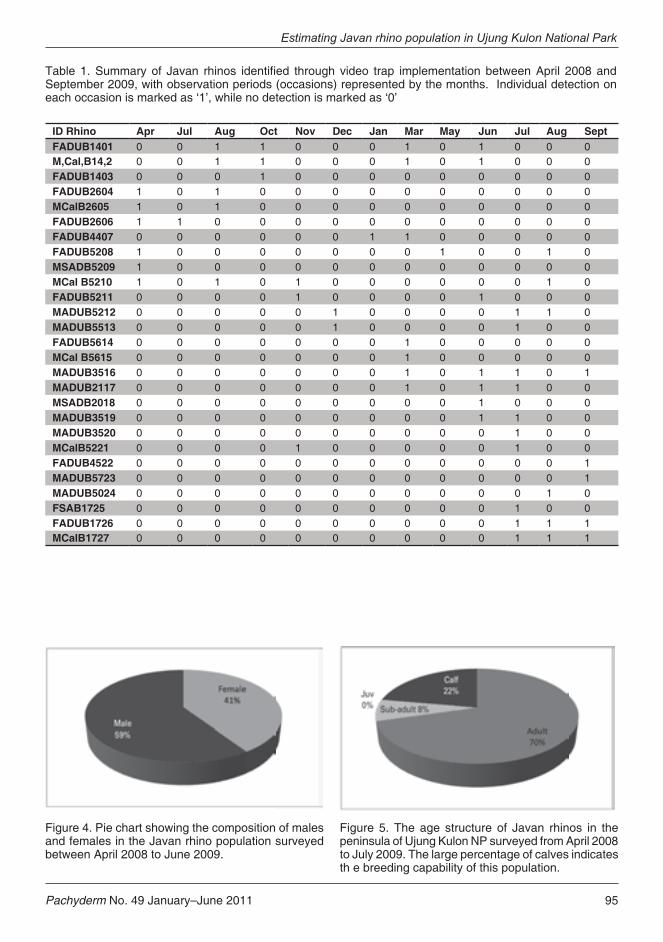
Pachyderm No. 49 January–June 2011 95
Figure 4. Pie chart showing the composition of males and females in the Javan rhino population surveyed between April 2008 to June 2009.
Figure 5. The age structure of Javan rhinos in the peninsula of Ujung Kulon NP surveyed from April 2008 to July 2009. The large percentage of calves indicates th e breeding capability of this population.
Estimating Javan rhino population in Ujung Kulon National Park
6CDNG� ���5WOOCT[�QH� ,CXCP� TJKPQU� KFGPVKſGF� VJTQWIJ� XKFGQ� VTCR� KORNGOGPVCVKQP�DGVYGGP�#RTKN� �����CPF�September 2009, with observation periods (occasions) represented by the months. Individual detection on each occasion is marked as ‘1’, while no detection is marked as ‘0’
ID Rhino Apr Jul Aug Oct Nov Dec Jan Mar May Jun Jul Aug SeptFADUB1401 0 0 1 1 0 0 0 1 0 1 0 0 0M,Cal,B14,2 0 0 1 1 0 0 0 1 0 1 0 0 0FADUB1403 0 0 0 1 0 0 0 0 0 0 0 0 0FADUB2604 1 0 1 0 0 0 0 0 0 0 0 0 0MCalB2605 1 0 1 0 0 0 0 0 0 0 0 0 0FADUB2606 1 1 0 0 0 0 0 0 0 0 0 0 0FADUB4407 0 0 0 0 0 0 1 1 0 0 0 0 0FADUB5208 1 0 0 0 0 0 0 0 1 0 0 1 0MSADB5209 1 0 0 0 0 0 0 0 0 0 0 0 0MCal B5210 1 0 1 0 1 0 0 0 0 0 0 1 0FADUB5211 0 0 0 0 1 0 0 0 0 1 0 0 0MADUB5212 0 0 0 0 0 1 0 0 0 0 1 1 0MADUB5513 0 0 0 0 0 1 0 0 0 0 1 0 0FADUB5614 0 0 0 0 0 0 0 1 0 0 0 0 0MCal B5615 0 0 0 0 0 0 0 1 0 0 0 0 0MADUB3516 0 0 0 0 0 0 0 1 0 1 1 0 1MADUB2117 0 0 0 0 0 0 0 1 0 1 1 0 0MSADB2018 0 0 0 0 0 0 0 0 0 1 0 0 0MADUB3519 0 0 0 0 0 0 0 0 0 1 1 0 0MADUB3520 0 0 0 0 0 0 0 0 0 0 1 0 0MCalB5221 0 0 0 0 1 0 0 0 0 0 1 0 0FADUB4522 0 0 0 0 0 0 0 0 0 0 0 0 1MADUB5723 0 0 0 0 0 0 0 0 0 0 0 0 1MADUB5024 0 0 0 0 0 0 0 0 0 0 0 1 0FSAB1725 0 0 0 0 0 0 0 0 0 0 1 0 0FADUB1726 0 0 0 0 0 0 0 0 0 0 1 1 1MCalB1727 0 0 0 0 0 0 0 0 0 0 1 1 1
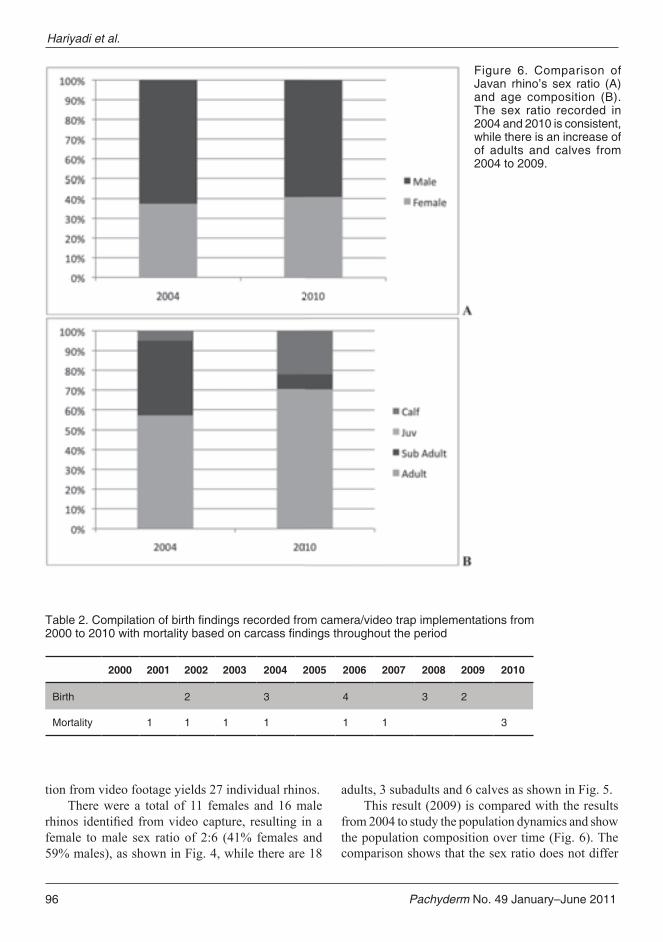
96 Pachyderm No. 49 January–June 2011
tion from video footage yields 27 individual rhinos.There were a total of 11 females and 16 male
UKLQRV� LGHQWL¿HG� IURP�YLGHR�FDSWXUH�� UHVXOWLQJ� LQ�D�female to male sex ratio of 2:6 (41% females and 59% males), as shown in Fig. 4, while there are 18
adults, 3 subadults and 6 calves as shown in Fig. 5. This result (2009) is compared with the results
from 2004 to study the population dynamics and show the population composition over time (Fig. 6). The comparison shows that the sex ratio does not differ
Figure 6. Comparison of Javan rhino’s sex ratio (A) and age composition (B). The sex ratio recorded in 2004 and 2010 is consistent, while there is an increase of of adults and calves from 2004 to 2009.
6CDNG����%QORKNCVKQP�QH�DKTVJ�ſPFKPIU�TGEQTFGF�HTQO�ECOGTC�XKFGQ�VTCR�KORNGOGPVCVKQPU�HTQO������VQ������YKVJ�OQTVCNKV[�DCUGF�QP�ECTECUU�ſPFKPIU�VJTQWIJQWV�VJG�RGTKQF
2000 2001 2002 2003 2004 2005 2006 2007 2008 2009 2010
Birth 2 3 4 3 2
Mortality 1 1 1 1 1 1 3
Hariyadi et al.
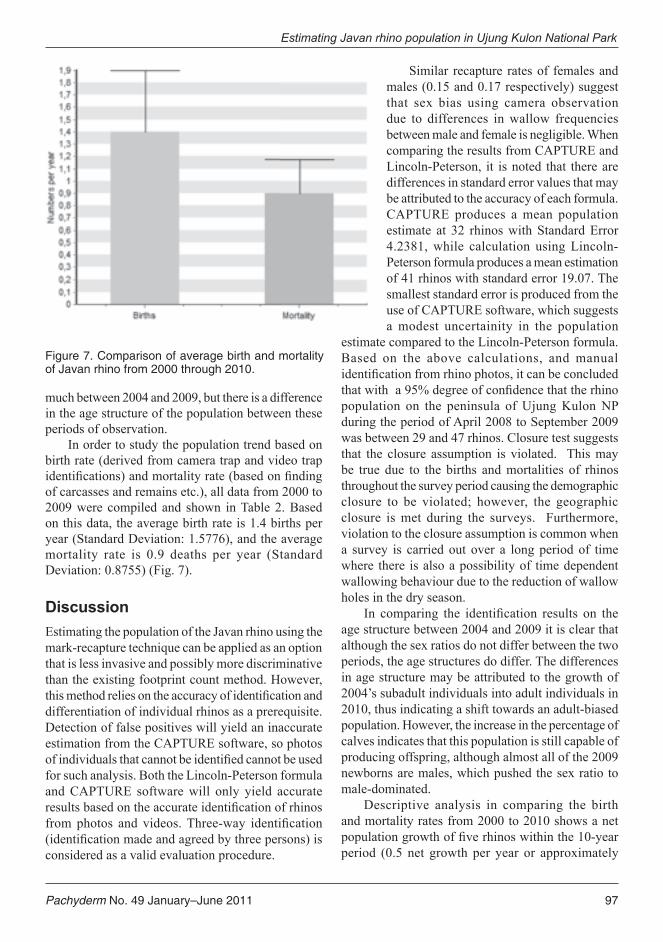
Pachyderm No. 49 January–June 2011 97
much between 2004 and 2009, but there is a difference in the age structure of the population between these periods of observation.
In order to study the population trend based on birth rate (derived from camera trap and video trap LGHQWL¿FDWLRQV��DQG�PRUWDOLW\�UDWH��EDVHG�RQ�¿QGLQJ�of carcasses and remains etc.), all data from 2000 to 2009 were compiled and shown in Table 2. Based on this data, the average birth rate is 1.4 births per year (Standard Deviation: 1.5776), and the average mortality rate is 0.9 deaths per year (Standard Deviation: 0.8755) (Fig. 7).
DiscussionEstimating the population of the Javan rhino using the mark-recapture technique can be applied as an option that is less invasive and possibly more discriminative than the existing footprint count method. However, WKLV�PHWKRG�UHOLHV�RQ�WKH�DFFXUDF\�RI�LGHQWL¿FDWLRQ�DQG�differentiation of individual rhinos as a prerequisite. Detection of false positives will yield an inaccurate estimation from the CAPTURE software, so photos RI�LQGLYLGXDOV�WKDW�FDQQRW�EH�LGHQWL¿HG�FDQQRW�EH�XVHG�for such analysis. Both the Lincoln-Peterson formula and CAPTURE software will only yield accurate UHVXOWV�EDVHG�RQ�WKH�DFFXUDWH�LGHQWL¿FDWLRQ�RI�UKLQRV�IURP�SKRWRV� DQG� YLGHRV��7KUHH�ZD\� LGHQWL¿FDWLRQ��LGHQWL¿FDWLRQ�PDGH�DQG�DJUHHG�E\�WKUHH�SHUVRQV��LV�considered as a valid evaluation procedure.
Similar recapture rates of females and males (0.15 and 0.17 respectively) suggest that sex bias using camera observation due to differences in wallow frequencies between male and female is negligible. When comparing the results from CAPTURE and Lincoln-Peterson, it is noted that there are differences in standard error values that may be attributed to the accuracy of each formula. CAPTURE produces a mean population estimate at 32 rhinos with Standard Error 4.2381, while calculation using Lincoln-Peterson formula produces a mean estimation of 41 rhinos with standard error 19.07. The smallest standard error is produced from the use of CAPTURE software, which suggests a modest uncertainity in the population
estimate compared to the Lincoln-Peterson formula. Based on the above calculations, and manual LGHQWL¿FDWLRQ�IURP�UKLQR�SKRWRV��LW�FDQ�EH�FRQFOXGHG�WKDW�ZLWK��D�����GHJUHH�RI�FRQ¿GHQFH�WKDW�WKH�UKLQR�population on the peninsula of Ujung Kulon NP during the period of April 2008 to September 2009 was between 29 and 47 rhinos. Closure test suggests that the closure assumption is violated. This may be true due to the births and mortalities of rhinos throughout the survey period causing the demographic closure to be violated; however, the geographic closure is met during the surveys. Furthermore, violation to the closure assumption is common when a survey is carried out over a long period of time where there is also a possibility of time dependent wallowing behaviour due to the reduction of wallow holes in the dry season.
,Q� FRPSDULQJ� WKH� LGHQWL¿FDWLRQ� UHVXOWV� RQ� WKH�age structure between 2004 and 2009 it is clear that although the sex ratios do not differ between the two periods, the age structures do differ. The differences in age structure may be attributed to the growth of 2004’s subadult individuals into adult individuals in 2010, thus indicating a shift towards an adult-biased population. However, the increase in the percentage of calves indicates that this population is still capable of producing offspring, although almost all of the 2009 newborns are males, which pushed the sex ratio to male-dominated.
Descriptive analysis in comparing the birth and mortality rates from 2000 to 2010 shows a net SRSXODWLRQ�JURZWK�RI�¿YH�UKLQRV�ZLWKLQ�WKH����\HDU�period (0.5 net growth per year or approximately
Figure 7. Comparison of average birth and mortality of Javan rhino from 2000 through 2010.
Estimating Javan rhino population in Ujung Kulon National Park
98 Pachyderm No. 49 January–June 2011
���SRSXODWLRQ� JURZWK���$OWKRXJK� QRW� VLJQL¿FDQW��and still much lower than the targeted 3% annual population growth (PHKA, 2007), the population might potentially be growing. However, the mortality recorded in 2010 (three deaths) is relatively higher than average, so further investigation on the cause of death in 2010 is necessary. Since poaching has been stopped, other causes of death of adult rhinos will need to be carefully examined. The possibility of disease must not be overlooked. This should enable population managers to prevent an increase of the mortality rate within these populations in the future. In addition to studying the cause of mortality, such as diseases and other abnormalities, the stagnant population for the past 10 years suggests that the carrying capacity of the Ujung Kulon peninsula may have been reached. Therefore, future efforts to save the Javan rhino must include: improving the existing habitat quality (increasing food plant quality and abundance), locating sites outside the current geographical distribution to be designated as a second habitat, and the translocation of individual rhinos to the second habitat to start a new population. Having another population of Javan rhinos outside their current distribution in Ujung Kulon NP will greatly increase the chance of survival of this species.
ConclusionsImplementation of camera/video trap surveys ap-pear to be a good method for monitoring Javan rhino SRSXODWLRQ�LQ�8MXQJ�.XORQ�13��DV�LW�HQDEOHV�LGHQWL¿FD-WLRQ�RI�LQGLYLGXDO�UKLQRV��$FFXUDWH�LGHQWL¿FDWLRQ�LV�D�prerequisite in using mark-recapture analysis, as the LGHQWL¿FDWLRQ�VHUYHV�PDUNLQJ�RI�LQGLYLGXDO�VSHFLPHQV��Judging from the standard error produced from using CAPTURE program and Lincoln-Peterson estimation for mark-recapture it can be concluded that the former yields lower uncertainity in the estimation, as it pro-duces a much smaller standard error than the latter. Based on this long-term study to monitor the popula-tion of Javan rhinos (Rhinoceros sondaicus) in Ujung Kulon NP, the rhino population size is estimated at a minimum of 29 and a maximum of 47 individuals. Despite the male-biased sex ratio the population is capable of reproduction, but due to the the mortality rate the net population growth is only 0.5 individual per year (which corresponds to 1% population growth per year between the years 2000 and 2010). In order to achieve the target of 3% net growth of the Javan
rhino population, the birth rate needs to increase and, importantly, the mortality rate needs to be reduced.
AcknowledgementsThe research is made possible in co-operation with Ujung Kulon NP Authority, Indonesian Ministry of Forestry, WWF, International Rhino Foundation (IRF), Asian Rhino Project (ARP), and WWF-AREAS (Asian Rhino and Elephant Action Strategy). Also thanks to Abishek, Stephan Wulfraat and Arnaud Lyet for the valuable input on the statistical and editorial aspects of mark-recapture estimation.
References*ULI¿WKV��0����������The Javan Rhino of Ujung Kulon
An Investigation Of Its Population And Ecology Through Camera Trapping. Indonesia: WWF.
Hariyadi, A.R.S., Santoso, A., Setiawan, R. and 3ULDPEXGL��$�� �������� � µ$XWRPDWLF� &DPHUD�Survey for Monitoring Reproductive Pattern and Behaviour of Javan Rhinoceros (Rhinoceros sondaicus) in Ujung Kulon National Park, Indonesia’. Proceeding of the 3rd International Meeting on Asian Zoo/Wildlife Medicine and Conservation (AZWMC).
Hariyadi, A.R.S., Setiawan, R., Daryan, Y.A. and 3XUQDPD��+�� �������� µ3UHOLPLQDU\� EHKDYLRXU�observation of the Javan Rhinoceros (Rhinoceros sondaicus) Based on Camera Trap Surveys in Ujung Kulon National Park’. Pachyderm 47:93–99.
Hoogerwerf, A. (1970). Udjung Kulon the land of the last Rhinoceros. Leiden: EJ Brill.
Karanth, K.U. and Nichols, J.D. (2002). Monitoring Tigers and Their Prey: A Manual for Researchers, Managers, and Conservationists in Tropical Asia. Bangalore, India: Centre for Wildlife Studies.
/HZLV�� -�&�� �������� µ:LOGOLIH�&HQVXV�0HWKRG��$�résumé’. Journal of Wildlife Diseases. 6:356–364.
0DFNHQ]LH��'�,��DQG�5R\OH��-�$�����������µ'HVLJQLQJ�occupancy studies: general advice and allocating survey efforts’. Journal of Applied Ecology 42:1105–114.
Hariyadi et al.
Pachyderm No. 49 January–June 2011 99
Munson, L., Koehler, J.W., Wilkinson, J.E. and 0LOOHU��5�(�� �������� µ9HVLFXODU� DQG�8OFHUDWLYH�'HUPDWRSDWK\� UHVHPEOLQJ�6XSHU¿FLDO�1HFURWLF�Dermatitis in Captive Black Rhinoceroses (Diceros bicornis)’. Vet Pathol 35:31–42.
Muntasib, E.K.S.H. (2002). Penggunaan Ruang Habitat Oleh Badak Jawa (Rhinoceros sondaicus, Desm 1822) Di Taman Nasional Ujung Kulon. Disertasi Fakultas Kehutanan Institut Pertanian Bogor (IPB).
PHKA (2007). Strategy and Action Plan for the Conservaion of Rhinos in Indonesia 2007-2017. Republic of Indonesia: Ministry of Forestry,
Sajudin, H.R. (1984). Studi Perilaku dan Populasi Badak Jawa (Rhinoceros sondaicus Desmarest 1822) di Ujung Kulon. Tesis Fakultas Biologi Universitas Nasional.
Schenkel, R., Schenkel-Hullinger, L. and Ramono, :�6�� �������� µ$UHD�PDQDJHPHQW� IRU� WKH� -DYDQ�rhinoceros (Rhinoceros sondaicus Desm.), A Pilot study’. The Malayan Nat. J. 31:253–275.
Schenkel, R. and Schenkel-Hullinger, L. (1969). The Javan rhinoceros in Ujung Kulon Nature Reserve: its ecology and behavior. Acta Tropica 26:98–135.
Shadwick, R.E., Russel, A.P. and Lauff, R.F. (1992). µ7KH� 6WUXFWXUH� DQG�0HFKDQLFDO� 'HVLJQV� RI�Rhinoceros’. Dermal Armor. Phil. Trans. R.Soc. London 337:419–428.
Setiawan, R. and Yahya, A. (2002). Studi Populasi dan Distribusi Badak Jawa (Rhinoceros sondaicus, Demarest, 1822) Melalui Perhitungan Koleksi Feses dan Tapak di Taman Nasional Ujung Kulon. Balai Taman Nasional Ujung Kulon & WWF Indonesia Project ID0091.07.
7DOERW�� /�0�� DQG� 6WHZDUW��'�5�0�� �������� µ)LUVW�Wildlife Census of the Entire Serengeti-Mara region, East Africa’. The Journal of Wildlife Management 28(4):815–827.
White, G.C., Anderson, D.R., Burnham, K.P. and Otis, D.L. (1978). User’s Manual for Program Capture. Logan Utah: Utah State University Press.
White, G.C., Anderson, D.R., Burnham, K.P. and Otis, D.L. (1982). Capture-Recapture and Removal Methods for Sampling Closed Population. Los Alamos New Mexico: Los Alamos National Laboratory.
Yahya, A. (2002). Studi Populasi Badak Jawa (Rhinoceros sondaicus) Melalui Kamera Penjebak Infra Merah Di Taman Nasional Ujung Kulon. Indonesia: WWF.
Estimating Javan rhino population in Ujung Kulon National Park
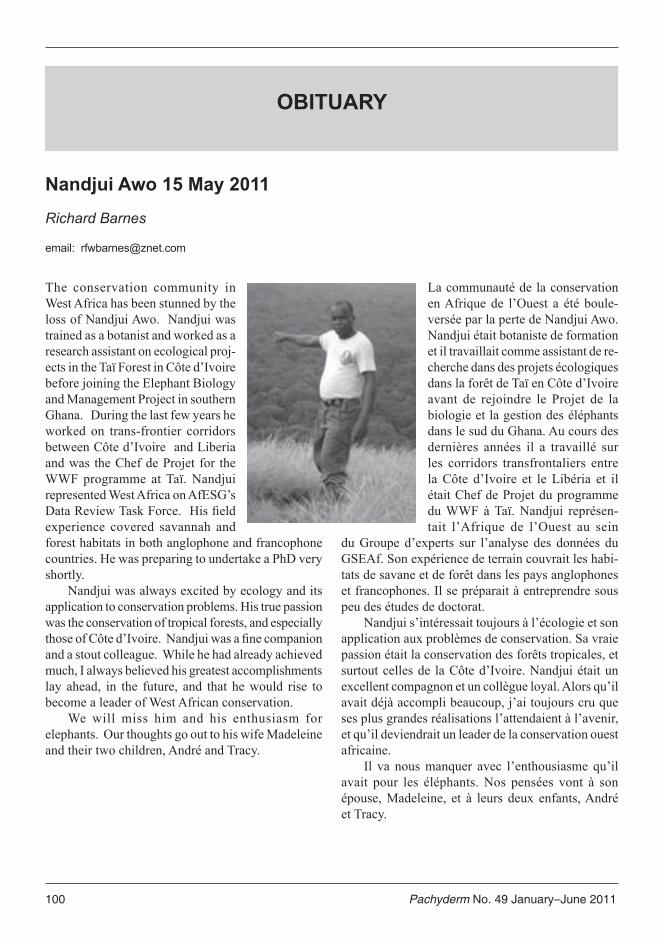
100 Pachyderm No. 49 January–June 2011
Nandjui Awo 15 May 2011
Richard Barnes
email: [email protected]
The conservation community in West Africa has been stunned by the loss of Nandjui Awo. Nandjui was trained as a botanist and worked as a research assistant on ecological proj-ects in the Taï Forest in Côte d’Ivoire before joining the Elephant Biology and Management Project in southern Ghana. During the last few years he worked on trans-frontier corridors between Côte d’Ivoire and Liberia and was the Chef de Projet for the WWF programme at Taï. Nandjui represented West Africa on AfESG’s 'DWD�5HYLHZ�7DVN�)RUFH���+LV�¿HOG�experience covered savannah and forest habitats in both anglophone and francophone countries. He was preparing to undertake a PhD very shortly.
Nandjui was always excited by ecology and its application to conservation problems. His true passion was the conservation of tropical forests, and especially WKRVH�RI�&{WH�G¶,YRLUH���1DQGMXL�ZDV�D�¿QH�FRPSDQLRQ�and a stout colleague. While he had already achieved much, I always believed his greatest accomplishments lay ahead, in the future, and that he would rise to become a leader of West African conservation.
We will miss him and his enthusiasm for elephants. Our thoughts go out to his wife Madeleine and their two children, André and Tracy.
La communauté de la conservation en Afrique de l’Ouest a été boule-versée par la perte de Nandjui Awo. Nandjui était botaniste de formation et il travaillait comme assistant de re-cherche dans des projets écologiques GDQV�OD�IRUrW�GH�7Dw�HQ�&{WH�G¶,YRLUH�avant de rejoindre le Projet de la biologie et la gestion des éléphants dans le sud du Ghana. Au cours des dernières années il a travaillé sur les corridors transfrontaliers entre la Côte d’Ivoire et le Libéria et il était Chef de Projet du programme du WWF à Taï. Nandjui représen-tait l’Afrique de l’Ouest au sein
du Groupe d’experts sur l’analyse des données du GSEAf. Son expérience de terrain couvrait les habi-WDWV�GH�VDYDQH�HW�GH�IRUrW�GDQV�OHV�SD\V�DQJORSKRQHV�et francophones. Il se préparait à entreprendre sous peu des études de doctorat.
Nandjui s’intéressait toujours à l’écologie et son application aux problèmes de conservation. Sa vraie SDVVLRQ�pWDLW�OD�FRQVHUYDWLRQ�GHV�IRUrWV�WURSLFDOHV��HW�surtout celles de la Côte d’Ivoire. Nandjui était un excellent compagnon et un collègue loyal. Alors qu’il avait déjà accompli beaucoup, j’ai toujours cru que ses plus grandes réalisations l’attendaient à l’avenir, et qu’il deviendrait un leader de la conservation ouest africaine.
Il va nous manquer avec l’enthousiasme qu’il avait pour les éléphants. Nos pensées vont à son épouse, Madeleine, et à leurs deux enfants, André et Tracy.
OBITUARy
Pachyderm No. 49 January–June 2011 101
Update on the implementation of the MIKE programme in Africa
La mise en œuvre du Programme de MIKE en Afrique
Tom De Meulenaer, MIKE Co-ordinatoremail: [email protected]
The MIKE programme maintained a high level of training and capacity building activities in Africa WKURXJKRXW�WKH�¿UVW�VL[�PRQWK�RI�������$�QXPEHU�RI�VSHFL¿F�DFWLYLWLHV�DQG�RXWSXWV�DUH�KLJKOLJKWHG�DQG�EULHÀ\�FRPPHQWHG�XSRQ�EHORZ�
TAG10The MIKE Technical Advisory Group met for the tenth time on 30–31 May 2011 in Naivasha, Kenya (TAG10). Important items on the agenda included the evaluation of the MIKE Phase II project for Africa and its recommendations pertaining to the TAG and its work, the outcomes of two technical workshops on improved collaboration between MIKE and ETIS, the updated analysis of MIKE data for the 61st meeting of the Standing Com-mittee Geneva (Switzerland), 15-19 August 2011 (SC61) and the results of a study on elephant meat trade in Central Africa.
Workshop on MIKE and ETIS analytical and reporting frameworksIn the context of the ongoing implementation of the MIKE programme in Africa and in support of recommendations emanating from the TAG, a workshop was convened in Nairobi, Kenya on 9–11 May 2011 to review the existing analytical and reporting systems for elephants and trade in elephant specimens, basically MIKE and ETIS, and to provide recommendations for improvements and adjustments to these systems. Additionally, linkages were explored between them as well as
MIKE–ETIS UPDATES
Le programme MIKE a maintenu un niveau élevé d’activités de formation et de renforcement de capacités en Afrique pendant les six premiers mois de 2011. Plu-VLHXUV�DFWLYLWpV�VSpFL¿TXHV�HW�GHV�UpVXOWDWV�VRQW�PLV�HQ�évidence et brièvement commentés ci-dessous.
GCT10 Le Groupe Consultatif Technique de MIKE s’est réuni pour la dixième fois du 30 au 31 mai 2011 à Naivasha, au Kenya (GCT10). Les points importants à l’ordre du jour comprenaient l’évaluation de la Phase II du projet MIKE pour l’Afrique et ses recommandations relatives au GCT et ses travaux, les résultats de deux ateliers techniques axés sur une meilleure collaboration entre MIKE et ETIS, l’analyse actualisée des données de MIKE pour la 61ème réunion du Comité Permanent de Genève (Suisse), du 15 au 19 août 2011 (CP61) et les résultats d’une étude VXU�OH�WUD¿F�GH�OD�YLDQGH�G¶pOpSKDQW�HQ�$IULTXH�&HQWUDOH�
Atelier sur les cadres analytiques et de rapport de MIKE et d’ETISDans le contexte de la mise en œuvre en cours du programme de MIKE en Afrique et l’appui des recom-mandations émanant du GCT, un atelier a été organisé à Nairobi, au Kenya, du 9 au 11 mai 2011 pour examiner les systèmes existants d’analyse et de rapport sur les pOpSKDQWV�HW�OH�WUD¿F�GHV�VSpFLPHQV�G¶pOpSKDQWV��HVVHQWLHO-lement MIKE et ETIS, et fournir des recommandations pour améliorer et ajuster ces systèmes. En outre, les liens entre eux ont été explorés ainsi qu’avec les informations de la CSE/UICN sur les populations d’éléphants, et des RSWLRQV� LGHQWL¿pHV� SRXU� OH� GpYHORSSHPHQW� GHV� FDGUHV�

102 Pachyderm No. 49 January–June 2011
De Meulenaer
with the IUCN/SSC’s information on elephant populations, and on identifying options for the development of compatible analytical and report-ing frameworks. The workshop was facilitated by the IUCN/SSC African Elephant Specialist Group (AfESG) and its results discussed at TAG10. The workshop report will become available for publica-tion on the CITES website.
Evaluation of the MIKE programme in AfricaThe MIKE Phase II project in Africa (2007-2011) was subject of an independent progress evalu-ation, conducted in February–March 2011. The overall evaluation was positive, stating that Phase II displayed real progress towards implementing the MIKE system and producing important ana-lytical results. While the MIKE system was not perfect, information emerged that was appreci-ated at national and international levels. Several African elephant range States wanted to join the monitoring programme; participating range States were interested in having more MIKE sites; PRQLWRULQJ�KDG�PRYHG�IURP�VSHFL¿F�VLWHV�DQG�D�single species to wider ecosystems, with increas-ing cross-border co-operation; and the uptake of MIST as a preferred method for data collection and storage was very encouraging. The review noted, however, that many sites were still totally dependent on donor funding, and a number of long-standing concerns, stemming back from MIKE’s initial years, remained unresolved such DV�LQWHU�GHSDUWPHQWDO�FRQÀLFWV�LQ�FHUWDLQ�HOHSKDQW�range States that prevent the normal functioning of MIKE, and the high rate of turnover of MIKE’s 1DWLRQDO�DQG�6LWH�2I¿FHUV��$GGLWLRQDOO\��LQ�PDQ\�elephant range States, law enforcement monitor-ing was still seen as an additional burden and had not been institutionalized as a central activity for Protected Area management.
Recommendations included: support the continuation and expansion of MIKE, including a new Phase III, review the Terms of Reference IRU�6XEUHJLRQDO�6XSSRUW�2I¿FHUV�DQG�IRU�1DWLRQDO�DQG�6LWH�0,.(�2I¿FHUV�� UHYLHZ�HOHSKDQW� UDQJH�State commitments towards the implementation of MIKE and protocols to implement MIKE at the site level (with criteria that should be met for sites and elephant range States to remain in or join
d’analyse et de rapport compatibles. L’atelier était animé par le Groupe de Spécialistes de l’Eléphant d’Afrique (GSEAf) de la CSE/UICN et ses résultats discutés lors du GCT10. Le rapport de l’atelier sera disponible pour publication sur le site web de la CITES.
Evaluation du programme MIKE en AfriqueLa phase II du projet MIKE en Afrique (2007-2011) a fait l’objet d’une évaluation indépendante, réalisée en février-mars 2011. L’évaluation globale était positive, indiquant TXH�OD�SKDVH�,,�DYDLW�DI¿FKp�GH�UpHOV�SURJUqV�YHUV�OD�PLVH�en œuvre du système MIKE et produisait d’importants résultats analytiques. Bien que le système MIKE ne soit SDV�SDUIDLW��LO�VHPEOH�rWUH�DSSUpFLp�DX�QLYHDX�QDWLRQDO�HW�international. Plusieurs états de l’aire de répartition de l’éléphant voulaient rejoindre le programme de surveil-lance; les états de l’aire de répartition participants étaient intéressés à avoir plus de sites MIKE; la surveillance V¶pWDLW�pWHQGXH�GHV�VLWHV�VSpFL¿TXHV�HW�XQH�VHXOH�HVSqFH�à de larges écosystèmes; avec l’augmentation de la coo-pération transfrontalière et l’adoption de MIST en tant que la méthode préférée pour la collecte et le stockage des données ; tout cela était très encourageant. L’évaluation a toutefois noté que de nombreux sites étaient encore totale-PHQW�GpSHQGDQWV�GX�¿QDQFHPHQW�GHV�EDLOOHXUV��XQ�FHUWDLQ�nombre de préoccupations qui remontent aux premières années de MIKE étaient restées en suspens comme les FRQÀLWV�LQWHUGpSDUWHPHQWDX[�GDQV�FHUWDLQV�pWDWV�GH�O¶DLUH�GH�GLVWULEXWLRQ�FH�TXL�HPSrFKH�OH�IRQFWLRQQHPHQW�QRUPDO�de MIKE, et le renouvellement fréquent du personnel national et les agents du site MIKE. De plus, dans de nombreux états de l’aire de répartition de l’éléphant, le suivi de l’application de la loi était encore considéré un fardeau supplémentaire et n’avait pas été institution-nalisé comme une activité centrale pour la gestion des aires protégées.
Les recommandations comprenaient: le soutien de la poursuite et l’expansion du programme MIKE, y compris une nouvelle phase III, l’examen des cahiers des charges pour les agents d’appui sous-régionaux et nationaux et les agents du site MIKE, l’examen des engagements des états de l’aire de répartition des éléphants vers la mise en œuvre de MIKE et les protocoles pour le niveau des VLWHV��\�FRPSULV�GHV�FULWqUHV�TXL�GHYUDLHQW�rWUH�UHPSOLV�pour que les sites et les états de l’aire de répartition restent ou à adhèrent au système); la préparation pour l’entrée d’autres sites et d’états africains de l’aire de répartition des éléphants dans le programme MIKE, la
Pachyderm No. 49 January–June 2011 103
Update on the implementation of the MIKE programme in Africa
the system); prepare for bringing additional sites and African elephant range States into the MIKE programme; continue promoting MIST; develop new standardized ranger curricula in training institutions across the range of African elephants; and make use of the subregional economic groupings in Africa to enhance political interest. Other recommendations concerned the TAG (inter alia encouraging renewal of its membership), the need to update MIKE’s elephant survey standards, the location of the MIKE Central Co-ordination Unit within UNEP, the need to peer-review methodologies and outputs of MIKE, exploration RI�WKH�IHDVLELOLW\�IRU�0,.(�WR�RSHUDWH�DV�DQ�µHDUO\�warning system’, and making the entire MIKE data set, along with its analysis protocols, publically available to allow external scientists to undertake additional and possibly better analyses.
The outcomes of the evaluation will be brought to the attention of and discussed with the relevant MIKE institutions and bodies, and will be taken into consideration for the development of MIKE Phase III.
Preparations for SC61The MIKE Central Co-ordination Unit was in-volved in the preparation of documents SC61 Doc. 44.2 (Elephant management and conserva-tion), SC61 Doc. 44.3 (MIKE-ETIS Subgroup) and SC61 Doc. 44.5 [Review of Resolution Conf. 10.10 (Rev. CoP15)], which are to be discussed at the 61st meeting of the Standing Committee (SC61, Geneva, 15–19 August 2011). These documents are available from the CITES website.
Document SC61 Doc. 44.2, produced in compliance with Decision 14.78 (Rev. CoP15), integrates information from CITES–MIKE (an updated analysis of MIKE data), TRAFFIC (an update on ETIS), UNEP–WCMC (recent trade in elephant specimens) and the IUCN/SSC African and Asian Elephant Specialist Groups (on the conservation status of elephants and pertinent conservation actions and management strategies).
The MIKE analysis was conducted in April 2011 and duly reviewed at TAG10. The data set used for analysis consists of 7,378 carcasses of elephants that died between 2002 and 2010 in 46 MIKE sites in 25 range States in Africa and 11 sites in 4 range States in Asia. The data contain a considerable number of gaps across several years
promotion de MIST; le développement de nouveaux programmes normalisés pour les écogardes dans les institutions de formation à travers l’habitat des éléphants d’Afrique et l’utilisation des groupements économiques VRXV�UpJLRQDX[� DIULFDLQV� SRXU� SURPRXYRLU� O¶LQWpUrW�politique. D’autres recommandations concernaient le GCT (notamment le renouvellement de ses membres), la nécessité d’actualiser les normes d’étude MIKE sur les éléphants, la localisation de l’Unité Centrale de Coordination MIKE au sein du PNUE, la nécessité de révision par les pairs des méthodologies et des résultats de MIKE, l’exploration de faisabilité pour que MIKE fonctionne comme un «système d’alerte précoce», et la mise à disposition de toute la série de données MIKE, DYHF� VHV� SURWRFROHV� G¶DQDO\VH�� D¿Q� GH� SHUPHWWUH� DX[�scientifiques externes d’entreprendre des analyses VXSSOpPHQWDLUHV�HW�SHXW�rWUH�GH�PHLOOHXUHV�DQDO\VHV�
Les résultats de l’évaluation seront portés à l’attention des institutions et des organismes MIKE concernés et seront discutés avec eux et pris en considération pour développer la phase III MIKE.
Préparatifs pour le CP61L’Unité Centrale de Coordination de MIKE participait à la préparation des documents du CP 61 Doc. 44.2 (ges-tion et conservation des éléphants), CP 61 Doc. 44.3 (sous-groupe MIKE-ETIS) et CP 61 Doc. 44.5 [examen de la résolution Conf. 10.10 (Rev. CdP15)], qu’on doit discuter lors de la 61ème réunion du Comité permanent (CP 61, Genève, 15-19 août 2011). Ces documents sont disponibles sur le site web de la CITES.
Le document CP 61 Doc. 44.2, produit en conformité avec la décision 14.78 (Rev. CdP15), intègre les informations de la CITES-MIKE (une analyse actualisée des données de MIKE), TRAFFIC (une mise à jour sur ETIS), PNUE-WCMC (trafic récent des spécimens d’éléphants) et les Groupes de Spécialistes de l’Eléphant d’Afrique et d’Asie de la CSE/UICN (sur l’état de la conservation des éléphants, les actions et les stratégies pertinentes de gestion de la conservation).
L’analyse de MIKE a été faite en avril 2011 et passée en revue à la réunion du GCT 10. La série de données utilisée pour l’analyse se compose de 7.378 carcasses d’éléphants qui sont morts entre 2002 et 2010 dans les 46 sites MIKE dans 25 Etats de l’aire de répartition en Afrique et 11 sites dans 4 Etats de l’aire de répartition d’Asie. Les données contiennent un nombre considérable de lacunes sur plusieurs années causées par la non-déclaration de la part de plusieurs sites, en particulier les sites MIKE d’Afrique de l’Ouest et d’Asie. Cela
104 Pachyderm No. 49 January–June 2011
caused by non-reporting on the part of several sites, particularly in West African and Asian MIKE sites. This may be partly due to the fact that these regions harbour the smallest elephant populations, but nevertheless there remains ample room for improvement in reporting and carcass detection rates in both. The potential effects of these data gaps were, however, not found to have D� VLJQL¿FDQW� LPSDFW� RQ� WKH� RYHUDOO� UHVXOWV��7KH�MIKE programme evaluates relative poaching levels based on the Proportion of Illegally Killed Elephants (PIKE), which is calculated as the number of illegally killed elephants found divided by the total number of elephant carcasses encountered by patrols (or other means), aggregated by year for each site.
Trends and levels of illegal killing from 2002 to 2010 for Africa suggested a mild overall increase, punctuated by declines in 2005–2006 and 2009. Most of the overall variation in PIKE, however, is explained by spatial factors (sites and the countries and subregions in which they are located) rather than temporal (yearly) factors. Central Africa consistently displays the highest levels of poaching, followed by West Africa, while poaching levels are generally lower in East Africa and lowest of all in southern Africa and Asia.
The recent MIKE analysis evaluated the relationships between poaching levels and a wide range of factors at local, national and global OHYHOV�� 6RPH�RI� WKHVH� FRPSRXQGHG�¿QGLQJV� RI�previous analyses, but some new features were DOVR�LGHQWL¿HG��
At the local level, sites suffering from higher levels of poverty (as indicated by the level of infant mortality) showed more land use heterogeneity (which is linked to human density and activity) and experienced higher levels of elephant poaching. Poaching levels tended to be lower where cattle densities are higher, which might be a proxy for relative wealth). Areas with denser vegetation cover faced higher levels of poaching, while larger sites experienced lower levels of poaching.
As in previous MIKE analyses, governance emerged as the most important national-level predictor of elephant poaching. The consequences of bad governance are likely to manifest themselves throughout the ivory trade chain, facilitating the movement of illegal ivory from the site of poaching all the way to the point of export. The
De Meulenaer
SHXW�rWUH�G��HQ�SDUWLH�DX�IDLW�TXH�FHV�UpJLRQV�DEULWHQW�OHV�SRSXODWLRQV�G¶pOpSKDQWV�OHV�SOXV�SHWLWHV���TXDQG�PrPH�des rapports et les taux de détection des carcasses dans FHV� GHX[� UpJLRQV� GHYUDLHQW� rWUH� DPpOLRUpV��7RXWHIRLV��les effets potentiels de ces lacunes ne semblent pas DYRLU� XQ� LPSDFW� VLJQL¿FDWLI� VXU� OHV� UpVXOWDWV� JOREDX[��Le programme MIKE évalue les niveaux relatifs de braconnage en se basant sur la Proportion des éléphants abattus illégalement (PIKE), qui est calculée comme le nombre d’éléphants tués illégalement qu’on divise par le nombre total de carcasses trouvé par les patrouilles (ou par d’autres moyens), regroupé par année pour chaque site.
Les tendances et les niveaux de l’abattage illégal de 2002 à 2010 pour l’Afrique ont suggéré une légère augmentation globale, ponctuée par des baisses en 2005-2006 et 2009. La plupart de la variation globale de PIKE, cependant, s’explique par les facteurs spatiaux (les sites et les pays ou sous-régions dans lesquels ils se situent) plutôt que par des facteurs temporels (par an). L’Afrique &HQWUDOH�DI¿FKH�FRQVWDPPHQW�OHV�SOXV�KDXWV�QLYHDX[�GH�braconnage, suivie par l’Afrique occidentale, tandis que le niveau de braconnage est généralement plus faible en Afrique de l’Est et le plus bas de tous en Afrique australe et en Asie.
L’analyse récente MIKE a évalué les relations entre les niveaux de braconnage et une large gamme de facteurs au niveau local, national et mondial. Certains de ces DQDO\VHV�RQW�UHÀpWp�OHV�UpVXOWDWV�GHV�DQDO\VHV�SUpFpGHQWHV��mais quelques nouvelles caractéristiques ont également pWp�LGHQWL¿pHV�
Au niveau local, les sites qui souffrent d’un niveau élevé de pauvreté (indiqué par le niveau de mortalité infantile) montrent plus d’hétérogénéité d’utilisation des terres (ce qui est lié à la densité et à l’activité humaine) et connaissent des niveaux plus élevés de braconnage GHV�pOpSKDQWV��/HV�QLYHDX[�GH�EUDFRQQDJH�WHQGHQW�j�rWUH�plus faibles là où les densités du bétail sont plus élevées �SHXW��rWUH�XQ�LQGLFDWHXU�GH�ULFKHVVH�UHODWLYH���/HV�]RQHV�ayant une couverture végétale plus dense éprouvent des niveaux plus élevés de braconnage, alors que les plus grands sites connaissent des niveaux plus faibles de braconnage.
Comme dans les analyses précédentes MIKE, la gouvernance ressort comme le prédicteur le plus important du braconnage des éléphants au niveau national. Les conséquences de la mauvaise gouvernance risquent de se manifester tout au long de la chaîne du WUD¿F�GH�O¶LYRLUH��HQ�IDFLOLWDQW�OD�FLUFXODWLRQ�GH�O¶LYRLUH�illicite à partir du site du braconnage jusqu’au point

Pachyderm No. 49 January–June 2011 105
level of human development was also an important predictor for poaching levels in the analysis. It would seem that poor governance prevents the improvement of the human condition, driving the rural poor to poaching for sustenance, which in turn might provide incentives for underpaid and GH�PRWLYDWHG� RI¿FLDOV� WR� IDFLOLWDWH�� DQG� EHQH¿W�from, the movement of illegal ivory. Levels of governance were generally lowest in the Central African subregion, where poaching levels were highest.
At the global level, the importance of the demand for (illegal) ivory as a key factor driving the illegal killing of elephants was recognized. Therefore, a measure of general consumer demand for goods and services in ivory-consuming nations, namely the annual per cent change in household consumption expenditure (i.e. consumer spending), was used as a proxy for ivory demand. Changes in consumer spending in China were indeed found to be strongly and positively related to PIKE, whereas this was not the case for countries such as Japan, Thailand, Vietnam, the Philippines and Malaysia. It is worth noting that levels of private consumption expenditure in China are continuing to increase in 2011. Thus, if demand in China is indeed a reliable predictor of levels of elephant poaching, PIKE could be expected to increase accordingly in the course of the current year. Preliminary evidence from the Samburu-Laikipia MIKE site, where record levels of poaching for ivory are being measured in 2011, seems to support this assessment (Wittemyer and Douglas-Hamilton, pers. comm.). There appears to be no time lag (within the annual time framework in which both MIKE and ETIS operate) between demand and poaching trends. This suggests that poaching levels may quickly respond to perceived levels of current demand, but the role of illegally stockpiled ivory, which could KDYH�D�VWURQJ�LQÀXHQFH�RQ�WKLV�G\QDPLF��LV�QRW�ZHOO�understood at present. Data on the age and source of ivory are needed to explore this dimension of the ivory trade chain. Isotope- and DNA-based techniques hold great promise in this respect, but their reliability needs to be independently assessed.
Update on the Implementation of the MIKE Programme in Africa
d’exportation. Le niveau de développement humain était aussi un prédicteur important des niveaux de braconnage dans l’analyse. Il semblerait que la mauvaise JRXYHUQDQFH� HPSrFKH� O¶DPpOLRUDWLRQ� GH� OD� FRQGLWLRQ�humaine, conduisant les pauvres en milieu rural au braconnage pour survivre, ce qui à son tour inciterait les fonctionnaires mal-payés et démotivés de faciliter et EpQp¿FLHU�GX�PRXYHPHQW�GH�O¶LYRLUH�LOOpJDO��/HV�QLYHDX[�de la gouvernance étaient les plus faibles généralement en Afrique centrale, où les niveaux de braconnage étaient les plus élevés.
Au niveau mondial, on a reconnu l’importance de la demande d’ivoire (illégal) comme un facteur clé de l’abattage illicite des éléphants. Par conséquent, une mesure de la demande générale des consommateurs pour les biens et les services dans les pays consommateurs d’ivoire, à savoir le changement du pourcentage annuel des dépenses des ménages (ex. les dépenses des consommateurs), a été utilisée comme un indicateur de la demande d’ivoire. On a effectivement trouvé que les changements des dépenses de consommation en Chine étaient fortement et positivement liés à PIKE, alors que ce n’était pas le cas pour les pays comme le Japon, la Thaïlande, le Vietnam, les Philippines et la Malaisie. Il est à noter que les niveaux de dépenses de consommation privée en Chine continuent d’augmenter en 2011. Ainsi, si OD�GHPDQGH�HQ�&KLQH�HVW�HQ�HIIHW�XQ�IDFWHXU�SUpGLFWLI�¿DEOH�des niveaux du braconnage des éléphants, l’on pourrait s’attendre à ce que PIKE augmente en conséquence au cours de l’année en cours. Les données préliminaires sur le site MIKE de Samburu-Laikipia, où les niveaux record de braconnage pour l’ivoire ont été enregistrés en 2011, semblent appuyer cette évaluation (Wittemyer et Douglas-Hamilton, comm. pers.). Il semble n’y avoir aucun décalage temporel (dans le cadre annuel dans lequel MIKE et ETIS travaillent) entre la demande et les tendances du braconnage. Cela suggère que les niveaux de braconnage peuvent répondre rapidement aux niveaux perçus de demande actuelle, mais le rôle de l’ivoire LOOpJDO�VWRFNp��TXL�SRXUUDLW�DYRLU�XQH�IRUWH�LQÀXHQFH�VXU�cette dynamique, n’est pas bien comprise à présent. Il faut des données sur l’âge et la source de l’ivoire pour H[SORUHU�FHWWH�GLPHQVLRQ�GH�OD�FKDvQH�GX�WUD¿F�GH�O¶LYRLUH��Les techniques isotopiques basées sur l’ADN sont très SURPHWWHXVHV� j� FHW� pJDUG��PDLV� OHXU�¿DELOLWp� GRLW� rWUH�évaluée de manière indépendante.
106 Pachyderm No. 49 January–June 2011
Evolving the MIKE data collection toolsIn order to meet its objectives of monitoring trends in the illegal killing of elephants, establishing an information base to assist in elephant manage-ment decisions, and building capacity in elephant range States, the MIKE programme has, since 2007, been deploying a conservation area manage-ment information system across most of its sites. The software in question, known as MIST, was developed in the late 1990s for Uganda Wildlife Authority with funding from German Technical Co-operation (GTZ, now GIZ). MIST was de-signed for the standardized capture, management DQG�TXHU\LQJ�RI�¿HOG�GDWD�RQ� ODZ�HQIRUFHPHQW��illegal activities and other observations by park rangers. Apart from Uganda, for whom it was originally produced, MIST has been adopted by a number of elephant range States in Africa and Asia, such as Rwanda, Ghana, Democratic Republic of the Congo and Cambodia, and also by a number of international conservation NGOs, including the Wildlife Conservation Society (WCS). The promo-tion of MIST by the MIKE programme has further boosted its expansion in Africa in recent years.
While MIST has been meeting the immediate needs of its users, WCS and other organizations LQYROYHG�LQ�¿HOG�GDWD�FROOHFWLRQ�KDYH�IHOW�WKH�QHHG�to replace MIST with a new and more up-to-date software product. The new software would be developed under a collaborative, open source approach. At the same time, work has started on an upgraded version of MIST. The MIKE Central Co-ordinating Unit has been following both these developments, and provided technical advice as QHFHVVDU\��/RRNLQJ�DW�WKH�VRIWZDUH�VSHFL¿FDWLRQV��both could potentially meet the requirements of MIKE, which include: a) free and open source b) ÀH[LEOH�DQG�FXVWRPL]DEOH��DOORZLQJ�IRU�FXVWRPL]HG�forms and reports to be created c) mapping and spatial analysis capabilities and d) ability to import data from legacy systems. It will in any case remain important for each of the elephant range States to have the ability to choose the data collection system that suits them best.
De Meulenaer
L’évolution récente des outils MIKE de collecte de données$¿Q�G¶DWWHLQGUH� VHV� REMHFWLIV� GH� VXUYHLOODQFH� GHV� WHQ-dances de l’abattage illégal des éléphants, de création d’une base d’informations pour faciliter la gestion des éléphants et de renforcement des capacités des Etats de l’aire de répartition des éléphants, le programme MIKE déploie depuis 2007 un système d’informations de gestion des aires de conservation dans la plupart de ses sites. Le logiciel en question, connu comme MIST, a été développé dans les années 1990 pour le Service de OD�)DXQH�G¶2XJDQGD�JUkFH�DX�¿QDQFHPHQW�GH� OD�&RR-pération technique allemande (GTZ, maintenant GIZ). MIST a été conçu pour la saisie standardisée, la gestion et l’interrogation des données de terrain sur l’application des lois, les activités illégales et d’autres observations par les écogardes des parcs. A part l’Ouganda, pour lequel il avait été initialement produit, MIST a été adopté par plus-ieurs états de l’aire de répartition des éléphants en Afrique et en Asie, tels que le Rwanda, le Ghana, la République Démocratique du Congo et le Cambodge, et aussi par des ONG internationales de conservation, comme la Société pour la Conservation de la Faune (WCS). La promotion de MIST par le programme MIKE a encore renforcé son expansion en Afrique ces dernières années.
Alors que MIST répond aux besoins immédiats de ses utilisateurs, la WCS et d’autres organisations impliquées dans la collecte des données sur terrain ressentent le besoin de remplacer MIST par un nouveau logiciel plus actualisé. Le nouveau logiciel serait développé sous une DSSURFKH�FRQFHUWpH�HW�GH�VRXUFH�RXYHUWH��(Q�PrPH�WHPSV��les travaux ont commencé sur une version améliorée de MIST. L’Unité Centrale de Coordination de MIKE fait le suivi de ces deux évolutions, et fournit les conseils WHFKQLTXHV� QpFHVVDLUHV��4XDQW� j� OHXUV� VSpFL¿FDWLRQV��les deux logiciels pourraient répondre aux exigences du programme MIKE, qui comprennent: a) une source gratuite et ouverte ; b) flexible et personnalisable, permettant de créer des formulaires et des rapports personnalisés ; c) les possibilités de cartographie et d’analyse spatiale ; et d) la capacité d’importer des données des systèmes existants. Dans tous les cas ce sera important que chaque Etats de l’aire de répartition des éléphants choisisse le système de collecte de données qui lui convient le mieux.
Pachyderm No. 49 January–June 2011 107
MIKE Phase IIIIn close collaboration with IUCN, preparations continued for the next Phase of MIKE, which is expected to take the programme well beyond the 16th meeting of the Conference of the Parties (CoP16, Thailand, March 2013). The next phase should allow MIKE to evolve towards being as simple, sustainable and—above all—useful as possible to participating African elephant range States, the CITES community and all partner or-ganizations involved in MIKE. A project concept has been developed that groups the main areas RI�ZRUN�IRU�WKLV�QHZ�SKDVH�LQWR�¿YH�ZHOO�GH¿QHG�areas: capacity building; research, analysis and dis-semination of information; supporting governance and implementation structures; evolving the MIKE system; and ensuring future sustainability. The goals of the new phase are expected to: �� Evolve and expand the MIKE monitoring
system as a simple, sustainable and useful tool for African elephant range States, CITES and SDUWQHU�RUJDQL]DWLRQV�WKURXJK�ZKLFK�¿HOG�GDWD�is collected and analyzed that contributes to the management and protection of all biodiversity (not just elephants) both in situ and nationally, and that examines impacts of national conser-vation and development policies, enhances law enforcement effectiveness and advances the sustainable management of natural resources.
�� Undertake capacity building activities to strengthen the ability of elephant range States to collect and utilize MIKE data to better conserve protected areas and their keystone species.
�� Provide scientifically robust outputs for elephant range States, Governments and CITES to make well informed decisions on elephant conservation and management, and on trade in elephant products.
�� Ensure that MIKE structures are well co-RUGLQDWHG��PXWXDOO\�VXSSRUWLYH�DQG�HI¿FLHQW�
�� Foster cross-border and international co-operation and decision-making with regard to the conservation and management of elephants and elephant habitats.
�� Assist African elephant range States in meeting international monitoring and reporting require-ments concerning elephants.
Update on the implementation of the MIKE programme in Africa
Phase III MIKE En étroite collaboration avec l’UICN, l’on continue les préparatifs pour la prochaine phase MIKE, qui devrait faire avancer le programme au-delà de la 16ème réunion de la Conférence des Parties (CdP16, en Thaïlande en mars 2013). La phase suivante devrait permettre à MIKE G¶pYROXHU�SRXU�rWUH�DXVVL�VLPSOH��GXUDEOH�HW�SDU�GHVVXV�tout utile que possible pour les états participants de l’aire de répartition de l’éléphant, la communauté de la CITES et les organisations partenaires de MIKE. L’on a développé un projet regroupant les cinq domaines de travail principaux pour cette nouvelle phase c’est-à-dire: le renforcement de capacité ; la recherche, l’analyse et la diffusion des informations; le soutien des structures de la gouvernance et l’exécution; l’évolution du système MIKE et la viabilité future. On s’attend à ce que les objectifs de la nouvelle phase soient de:�� Faire évoluer et étendre le système de surveillance
MIKE comme un outil simple, durable et utile pour les Etats de l’aire de répartition des éléphants, la CITES et les organisations partenaires grâce au-quel les données de terrain recueillies et analysées contribuent à la gestion et à la protection de toute la biodiversité (et pas seulement les éléphants), in situ et à l’échelle nationale, et qui examine les impacts de la conservation et des politiques nationales de développement, renforce l’application de la loi et fait avancer la gestion durable des ressources naturelles.
�� Entreprendre des activités de renforcement de ca-pacité pour aider les Etats de l’aire de répartition des éléphants à collecter et utiliser les données de MIKE pour mieux conserver les aires protégées et leurs espèces clé.
�� )RXUQLU� GHV� UpVXOWDWV� VFLHQWL¿TXHPHQW� ¿DEOHV� DX[�Etats de l’aire de répartition des éléphants, aux gou-vernements et à la CITES pour la prise de décisions bien informées sur la conservation et la gestion des pOpSKDQWV��HW�VXU�OH�WUD¿F�GHV�SURGXLWV�G¶pOpSKDQWV�
�� S’assurer que les structures de MIKE sont bien coordonnées, se soutiennent mutuellement et sont HI¿FDFHV�
�� Favoriser la coopération transfrontalière et internatio-nale et la prise de décision à l’égard de la conservation et la gestion des éléphants et leurs habitats.
�� Aider les Etats de l’aire de répartition des éléphants à satisfaire aux exigences de la surveillance et des rapports internationaux concernant les éléphants.

108 Pachyderm No. 49 January–June 2011
�� Develop strong programmatic and institutional partnerships with IUCN and with regional orga-nizations and local, national and international stakeholders to ensure sustainability and uptake of the MIKE programme and to fully imple-ment MIKE Phase III.
�� Enhance the collaboration between IUCN/SSC AfESG and ETIS to provide streamlined analyses of the entire ivory supply chain.
�� Développer des partenariats programmatiques et institutionnels solides avec l’UICN, les organisa-tions régionales et locales, et les acteurs nationaux et internationaux pour assurer la viabilité et l’adoption du programme MIKE et la mise en œuvre de la phase III MIKE.
�� Améliorer la collaboration entre le GSEAf de la CSE/8,&1�HW�(7,6�SRXU� IRXUQLU� GHV� DQDO\VHV� HI¿FDFHV�de toute la chaîne d’approvisionnement de l’ivoire.
Pachyderm No. 49 January–June 2011 109
ETIS update number five: Progress in the implementation of the Elephant Trade Information System (ETIS)
Mise à jour d’ETIS numéro cinq: Progrès dans la mise en oeuvre du Système d’Information sur le Trafic d’Eléphant (ETIS)
Tom Milliken* and Louisa Sangalakula TRAFFIC East/Southern Africa
*Corresponding author: [email protected]
ETIS is going through significant—and wel-come—changes, thanks to the Darwin Initiative grant with the University of Reading’s Dr Fiona M. Underwood. First designed in 1997, and put into operation a year later, it is certainly time for a major overhaul of ETIS. Indeed, 2011 commenced with the redesign and development of phase two of the ETIS software, which resulted in the deliv-ery of an alpha testing version of the new system by the software developers, the American-based company Solertium, in March. This milestone was followed by a rigorous review and testing period by TRAFFIC staff and the lead consultant on the project, Robert W. Burn. The plan is to have the beta version produced by June 2011.
Technically speaking, the new system is being GHYHORSHG�LQ�D�µ5XE\�RQ�5DLOV¶��5R5��IUDPHZRUN��which drives a remotely hosted PostgreSQL database. The database will be moved to a remote server to be determined by TRAFFIC, rather than EHLQJ�KHOG�RQ�D�FRPSXWHU�LQ�WKH�+DUDUH�RI¿FH�RI�TRAFFIC East/Southern Africa (T-ESA). Under a strictly regulated system of access control, ETIS will effectively enter the Internet age and become available online to a restricted group of users and stakeholders. The envisaged users will mainly be CITES Management Authorities who will be able to access the database for the purpose of providing elephant product seizure records to ETIS, reviewing their own records or downloading their ETIS data or other reports and information that may be available. Commencing in 2012, the CITES Parties should have round-the-clock access
(7,6�WUDYHUVH�XQH�SpULRGH�GH�FKDQJHPHQWV�VLJQL¿FDWLIV�et bienvenus, grâce à la subvention de l’Initiative de Darwin et le Dr. Fiona M. Underwood de l’Université de Reading. D’abord conçu en 1997, et mis en service un an plus tard, il est certainement temps pour une révision majeure d’ETIS. En effet, 2011 a débuté par la refonte et le développement du logiciel de la phase deux d’ETIS ce qui a abouti à la livraison en mars de la version du test alpha du nouveau système par les développeurs de logiciels, l’entreprise américaine Solertium. Cette étape a été suivie par une révision rigoureuse et des tests de la version alpha par le personnel de TRAFFIC et le consultant principal du projet, Robert W. Burn. Le plan HVW�G¶DYRLU�OD�YHUVLRQ�GX�WHVW�ErWD�UpDOLVpH�HQ�MXLQ�������
Techniquement parlant, le nouveau système est développé dans un cadre de « Rubis sur les Rails», qui fait fonctionner une base de données PostgreSQL se trouvant sur un server hôte à distance. La base de données sera déplacée vers un serveur à distance qui sera déterminé SDU�75$)),&��DX�OLHX�G¶rWUH�WHQX�VXU�XQ�RUGLQDWHXU�GDQV�le bureau de TRAFFIC d’Afrique orientale/australe (T-ESA) à Harare. Dans un système de contrôle d’accès strictement réglementé, ETIS entrera effectivement dans l’ère de l’Internet et sera disponible en ligne à un groupe restreint d’utilisateurs et d’intervenants. Les utilisateurs envisagés seront principalement les Services de gestion de la CITES qui pourront accéder à la base de données dans le but de fournir à ETIS les dossiers de saisie des produits issus des éléphants, revoir leurs propres dossiers ou télécharger les données d’ETIS ou d’autres rapports HW�LQIRUPDWLRQV�TXL�SHXYHQW�rWUH�GLVSRQLEOHV��$�SDUWLU�GH�2012, les Parties à la CITES devraient avoir un accès aux données d’ETIS les concernant vingt-quatre heures
110 Pachyderm No. 49 January–June 2011
to the ETIS data that relates to them. This exciting development will take ETIS to a new level in its role of monitoring the illegal trade in elephant products worldwide.
Moving ETIS to an Internet-based platform entails a range of technological challenges. As in many parts of Africa, Internet connections in the T-ESA office are sometimes slow and unpredictable. To deal with this problem, a small server dedicated to the ETIS database has been purchased and will be installed in the T-ESA RI¿FH��,W�ZLOO�VHUYH�DV�D�EXIIHU�EHWZHHQ�WKH�RQOLQH�database, which will reside on a remote server, and ZRUN�LQ�WKH�7�(6$�RI¿FH��VR�WKDW�ZRUN�FDQ�FRQWLQXH�in the event of Internet failure. There will be a facility allowing the periodic synchronization the local and online versions of the database.
Other changes are afoot in terms of the database VWUXFWXUH��1HZ�¿HOGV�IRU�GDWD�KDYH�EHHQ�LGHQWL¿HG�DQG�FOHDUO\�GH¿QHG��ZKLOVW�VRPH�LPSRUWDQW�FKDQJHV�WR� H[LVWLQJ�¿HOGV�KDYH�DOVR�EHHQ�PDGH��0RVW�RI�WKHVH�FKDQJHV�PRGL¿FDWLRQV�ZLOO�DOORZ�PRUH� LQ��depth analysis of trade routes in the future as it LV�EHOLHYHG� WKDW� WUDGH�ÀRZV� IRU� UDZ�DQG�ZRUNHG�ivory have some distinctive differences. Further, in order to relate the ETIS data to the CITES– MIKE (Monitoring the Illegal Killing of Elephants) database and other information held in the African and Asian elephant databases administered by the IUCN/SSC African and Asian Elephant Specialist *URXSV��WKH�GH¿QLWLRQ�RI�µ&RXQWU\�RI�2ULJLQ¶�IRU�raw ivory transactions has been changed so that it can only be an elephant range State. In the past, XVLQJ�D�&,7(6�WUDGH�GH¿QLWLRQ��µFRXQWU\�RI�RULJLQ¶�could be any country in the world. This change has necessitated a systematic review of all data currently held by TRAFFIC in ETIS so that all records have been adjusted as appropriate. In cases ZKHUH�WKH�µ&RXQWU\�RI�2ULJLQ¶�LV�QRW�D�UDQJH�6WDWH��LW� KDV� EHHQ� VKLIWHG� WR� EH� D� µ&RXQWU\� RI�([SRUW�5H�H[SRUW¶�� D�¿HOG� WKDW� QRZ�DOORZV� WKH� HQWU\�RI�multiple countries. Fields for transit countries have also been expanded.
New database input mechanisms are also being constructed. On-screen data entry forms are in development both for online data providers and the ETIS System Administrator. These forms are currently being extensively tested. The System Administrator version of the interface will also have extensive facilities for querying the database
sur vingt-quatre. Grâce à ce développement passionnant, ETIS va atteindre un nouveau niveau dans son rôle de VXUYHLOODQFH�GX�WUD¿F�LOOpJDO�GH�SURGXLWV�G¶pOpSKDQWV�GDQV�le monde entier.
Le déplacement d’ETIS sur une plate-forme de O¶,QWHUQHW� LPSOLTXH� XQH� VpULH� GH� Gp¿V� WHFKQRORJLTXHV��Comme dans de nombreuses régions d’Afrique, des connexions d’Internet dans le bureau de T-ESA sont parfois lentes et imprévisibles. Pour faire face à ce problème, on a acheté un petit serveur consacré à la base de données d’ETIS et on l’installera dans le bureau de T-ESA. Il servira de tampon entre la base de données en ligne sur le serveur à distance, et le travail dans le EXUHDX�GH�7�(6$��D¿Q�TXH�OH�WUDYDLO�SXLVVH�FRQWLQXHU�HQ�cas de défaillance de l’Internet. Il y aura une installation permettant la synchronisation périodique de la version locale de la base et celle en ligne.
D’autres changements sont en cours en termes de structure de la base de données. De nouveaux champs SRXU�OHV�GRQQpHV�RQW�pWp�LGHQWL¿pV�HW�FODLUHPHQW�Gp¿QLV��tandis qu’on a aussi fait des changements importants dans les champs existants. La plupart de ces changements permettront une analyse plus approfondie des routes commerciales à l’avenir car on croit que les flux commerciaux d’ivoire brut ou travaillé ont quelques différences distinctives. En outre, afin de relier les données d’ETIS à la base de données de CITES-MIKE (Suivi de l’abattage illégal des éléphants) et d’autres informations détenues dans les bases de données de l’éléphant d’Afrique et d’Asie administrées par les Groupes de Spécialistes de l’Eléphant d’Afrique et d’Asie GH�OD�&6(�8,&1��OD�Gp¿QLWLRQ�GH�©SD\V�G¶RULJLQHª�SRXU�OHV�WUDQVDFWLRQV�G¶LYRLUH�EUXW�D�pWp�PRGL¿pH�SRXU�QH�SOXV�rWUH�TX¶XQ�(WDW�GH�O¶DLUH�GH�UpSDUWLWLRQ�GHV�pOpSKDQWV��'DQV�OH�SDVVp��O¶XWLOLVDWLRQ�GH�OD�Gp¿QLWLRQ�FRPPHUFLDOH�GH�OD�&,7(6�� ©SD\V� G¶RULJLQHª� SRXYDLW� rWUH� Q¶LPSRUWH� TXHO�pays du monde. Ce changement a nécessité une révision systématique de toutes les données actuellement détenues par TRAFFIC dans ETIS pour que tous les dossiers soient ajustés comme il fallait. Dans les cas où le «pays d’origine» n’est pas un état de l’aire de répartition, cela a FKDQJp�SRXU�rWUH�XQ�©SD\V�G¶H[SRUWDWLRQ��UpH[SRUWDWLRQª��un champ qui permet maintenant l’entrée de plusieurs pays. Les champs pour les pays de transit ont également été élargis.
De nouveaux mécanismes de saisie de bases de données sont également créés. Les formulaires de saisie de données sur l’écran sont en cours d’élaboration, tant pour les fournisseurs de données en ligne que pour l’administrateur du système ETIS. Ces formulaires
ETIS update number five
Pachyderm No. 49 January–June 2011 111
Milliken and Sangalakula
and a preliminary version of the query generator is currently being tested. Once the new ETIS database structure has been completed and fully assessed, online data entry features will be tested by a selected group of CITES Parties. The plan is to roll out the new system to the CITES Parties at the commencement of 2012.
The development of the analytical framework is also on-going as another component of the Darwin Initiative project. Whilst major progress on this activity was overshadowed by the current focus on software development, some issues relating to the general framework were explored, including the identification of drivers of the trade, the estimation of weights in seizure cases where only a number of pieces are given, and the development of automated procedures for summaries and analysis. Statistical analyses will be carried out in the open VRXUFH�5� VWDWLVWLFDO� VRIWZDUH�� DQG�HI¿FLHQW�ZD\V�of interfacing the software with the database are currently under trial.
In terms of the management and operation of ETIS, data entry functions have been overshadowed by the focus on the testing and review of the alpha version of the database and other activities relating to the development of the new system. Regardless, during this period 620 new cases were added to ETIS, one record was deleted due to duplication and 719 cases are pending data entry. ETIS currently comprises 16,492 elephant product seizure records, representing law enforcement action in 88 countries or territories since 1989.
In the context of understanding and further developing linkages between ETIS, MIKE and the African and Asian Elephant Databases, a workshop was convened by the MIKE CCU and facilitated by the IUCN/SSC African Elephant Specialist Group (AfESG) from 9–11 May 2011 called µ(OHSKDQWV�DQG�WKH�WUDGH�LQ�HOHSKDQW�VSHFLPHQV��D�review of existing analytical and reporting systems and recommendations for a way forward’. The workshop resulted in recommendations to enhance practical linkages and joint analysis and reporting by IUCN/SSC, MIKE and ETIS.
Finally, TRAFFIC participated in the 10th
meeting of the MIKE Technical Advisory Group (TAG) held on 30 and 31 May 2011, in Naivasha, Kenya. A decision not to hold the Fifth meeting of the ETIS MIKE TAG in conjunction with the
subissent actuellement des tests approfondis. La version administrateur du système de l’interface aura également de nombreux équipements pour l’interrogation de la base de données et une version préliminaire du générateur de UHTXrWH�HVW�HQ�WUDLQ�G¶rWUH�WHVWpH��8QH�IRLV�TXH�OD�QRXYHOOH�structure de la base de données d’ETIS aura été achevée et pleinement évaluée, les fonctionnalités de la saisie des données en ligne seront testées par un groupe sélectionné des Parties à la CITES. Le plan consiste à déployer le nouveau système pour les Parties à la CITES au début de 2012.
Le développement du cadre d’analyse est également en cours en tant qu’une autre composante du projet de l’Initiative Darwin. Alors que des progrès majeurs sur cette activité ont été éclipsés par l’accent mis actuellement sur le développement de logiciels, certaines questions relatives au cadre général ont été H[SORUpHV�� \� FRPSULV� O¶LGHQWL¿FDWLRQ� GHV�PRWHXUV� GX�WUD¿F��O¶HVWLPDWLRQ�GX�SRLGV�GDQV�OHV�FDV�GH�VDLVLH�R��VHXO�un nombre limité de pièces est donné et l’élaboration des procédures automatisées pour des résumés et des analyses. Les analyses statistiques seront effectuées utilisant le logiciel statistique R de source ouverte, et les PR\HQV�HI¿FDFHV�G¶LQWHUIDFHU�OH�ORJLFLHO�DYHF�OD�EDVH�GH�données sont actuellement à l’essai.
En termes de gestion et de fonctionnement d’ETIS, les fonctions de saisie de données ont été éclipsées par l’accent sur les essais et la révision de la version alpha de la base de données et d’autres activités relatives à l’élaboration du nouveau système. Quoiqu’il en soit, durant cette période, 620 cas nouveaux ont été ajoutés à ETIS, un enregistrement a été supprimé en raison de la duplication et 719 cas attendent la saisie de données. ETIS comprend actuellement 16 492 dossiers de saisies de produits issus des éléphants, ce qui représente une action de l’application de la loi dans 88 pays ou territoires depuis 1989.
Dans le contexte de la compréhension et du développement des liens entre ETIS, MIKE et les bases de données de l’éléphant d’Afrique et d’Asie, l’UCC de MIKE a organisé un atelier sur le sujet «Les éléphants HW� OH� WUD¿F� GHV� VSpFLPHQV� G¶pOpSKDQWV�� XQH� UpYLVLRQ�des systèmes existants d’analyse et de rapport et des recommandations pour la voie à suivre» facilité par le Groupe de Spécialistes de l’Eléphant d’Afrique (GSEAf) de la CSE/UICN du 9 au 11 mai 2011. L’atelier a abouti à des recommandations concrètes pour renforcer les liens et l’analyse conjointe et les rapports de la CSE/UICN, MIKE et ETIS.
112 Pachyderm No. 49 January–June 2011
ETIS update number five
(Q¿Q��75$)),&�D�SDUWLFLSp�j� OD���ème réunion du Groupe Consultatif Technique de MIKE (GCT), tenue du 30 au 31 mai 2011, à Naivasha au Kenya. Une décision de ne pas tenir la cinquième réunion du GCT d’ETIS-MIKE en conjonction avec la réunion de MIKE a été prise en raison du fait que la plupart des membres du GCT d’ETIS n’auraient pas pu y assister. Cependant on a fait de grands pas pour relier les programmes de MIKE et d’ETIS au GCT de MIKE. C’est une période passionnante de croissance et de réalignement pour ETIS.
MIKE meeting was made due to the fact that most of the ETIS TAG members were unable to attend. Further strides were made, however, to link the MIKE and ETIS programmes at the MIKE TAG. It is an exciting period of growth and re-alignment for ETIS.
Pachyderm No. 49 January–June 2011 113
Aim and scopePachyderm publishes papers and notes concerning all aspects of the African elephant, the African rhino and the Asian rhino with a focus on the conservation and management of these species in the wild. At the same time, the journal is a platform for disseminating information concerning the activities of the African Elephant, the African Rhino, and the Asian Rhino Specialist Groups of the IUCN Species Survival Com-mission and about rhinos and elephants.
Submission of manuscriptsAll manuscripts should be submitted online at http://pachydermjournal.org.
If there are any questions or concerns regarding the submission process, please send an email to: [email protected] or otherwise contact by post/telephone:The Editor, PachydermIUCN/SSC AfESGPO Box 68200–00200Nairobi, Kenyatelephone: +254 20 249 3561/65fax: +254 20 2493570
Preparation of manuscriptsManuscripts are accepted in both the English and French languages. Where possible, the abstract should be provided in both languages.
Images, figures and maps3UHIHUDEO\�SURYLGH�¿JXUHV�DQG�PDSV�LQ�WKHLU�RULJLQDO�IRUP��IRU�H[DPSOH��FKDUWV�DQG�GDWD�LQ�([FHO�¿OHV��PDSV�as EPS and images in the highest quality possible, such as TIF (600 dpi). Indicate clearly the author or VRXUFH�RI�¿JXUHV��PDSV�DQG�SKRWRJUDSKV�
Title and authorsThe title should contain as many of the key words as possible but should not be more than 25 words long. Follow with the name(s) of the author(s) with LQVWLWXWLRQDO�DI¿OLDWLRQ�DQG�IXOO�SRVWDO�DQG�HPDLO�DG-dress of the corresponding author, to whom proofs and editorial comments will be sent.
Research and management papersThese should be not more than 5,000 words and be structured as follows: 1) Title 2) Abstract of not more than 250 words (informative type, outlining informa-tion from the Introduction, Materials and methods, Results, Discussion, but not detailed results) 3) ad-ditional key words (if any), not appearing in the title 4) Introduction 5) Materials and methods 6) Results 7) Discussion 8) Conclusions, if appropriate 9) Ac-knowledgements (optional, brief) 10) References (no more than 25) 11) Tables 12) Figure and photo captions 13) Figures and photos.
Papers may be reports of original biology research or they may focus more on the socio-economic aspects of conservation, including market surveys.
Field notes7KH�MRXUQDO�ZHOFRPHV�QRWHV�IURP�WKH�¿HOG��7KH\�PD\�FRQWDLQ�¿JXUHV�DQG�WDEOHV�EXW�VKRXOG�EH��������ZRUGV�
Review papersReview papers, which are unbiased reviews of all the H[LVWLQJ�NQRZOHGJH�RQ�D�VSHFL¿F�WRSLF��DUH�ZHOFRPHG��/HQJWK�VKRXOG�EH��������ZRUGV�
GUIDELINES FOR CONTRIBUTORS
114 Pachyderm No. 49 January–June 2011
Guidelines
Book reviewsPachyderm invites reviews of newly published books, ZKLFK�VKRXOG�EH��������ZRUGV�
Letters to the ChairLetters should be addressed to the relevant Special-LVW�*URXS�&KDLU��DQG�VKRXOG�EH�������ZRUGV��/HWWHUV�are welcome that comment on articles published in Pachyderm or on any other issue relating to elephant and rhino conservation in the wild.
Journal conventionsNomenclatureUse common names of animals and plants, giving VFLHQWL¿F�QDPHV� LQ� LWDOLFV� RQ�¿UVW�PHQWLRQ��*HQHU-ally refer to animals in the plural form (i.e. rhinos, elephants).
SpellingUse British spelling, following the latest edition of the Concise Oxford Dictionary or the Oxford English Dictionary��XVLQJ�µ]¶�LQVWHDG�RI�µV¶�LQ�ZRUGV�OLNH�µUHF-RJQL]H¶��µRUJDQL]DWLRQ¶��µLPPRELOL]HG¶��EXW�µDQDO\VH¶��µSDUDO\VH¶��7KH�GLFWLRQDU\�LV�DYDLODEOH�RQOLQH�DW�KWWS���oed.com.
NumbersUse International System of Units for measurement (m, km, g, ha, h) with a space between the numeral and the unit of measurement. Give measurements in ¿JXUHV��IRU�H[DPSOH����PP����NP����KD��H[FHSW�DW�WKH�beginning of a sentence.
Spell out numbers under 10 if not a unit of measurement unless the number is part of a series containing numbers 10 or over, for example: 14 adult males, 23 adult females and 3 juveniles.
In the text, write 4-digit numbers without a FRPPD��XVH�D�FRPPD�DV�WKH�VHSDUDWRU�IRU�¿JXUHV�IRXU�digits or more: 1,750 and 11,750. The separator will be a full stop in French papers.
References
Use the Harvard method of citing and listing refer-ences.
,Q�WKH�WH[W��FLWH�WZR�DXWKRUV��µ�;��<�������¶�RU�µ;�DQG�<�������¶��FLWH�PRUH�WKDQ�WZR�DXWKRUV�µ�;�HW�DO��������¶�RU� µ;�HW�DO�� ������¶��1RWH� WKDW� WKHUH� LV�D�comma between the author(s) and the year.
If multiple works are being cited, separate them by a semi-colon: (X et al., 2002; Y, 2002; Z, 2002).
Please see the IUCN Style Manual, for a detailed description and examples of reference citation. The manual is available to download at http://cmsdata.iucn.org/downloads/iucn_style_manual1209.pdf.