sensible aging - wur edepot
TRANSCRIPT
Sensible Aging
Nutrient dense foods and physical exercise for the vulnerable elderly
Nynke de Jong
0000 0820 1895
Promotoren: dr. W.A. van Staveren Hoogleraar in de voeding van de oudere mens
dr. ir. F.J. Kok Hoogleraar in de voeding en epidemiologie
Co-promotor: dr. ir. C.P.G.M. de Groot Universitair docent,
Afdeling Humane Voeding en Epidemiologie Wageningen Universiteit
/OfJ olio\. 2 ^
Sensible Aging
Nutrient dense foods and physical exercise for the vulnerable elderly
Nynke de Jong
Proefschrift
ter verkrijging van de graad van doctor op gezag van de rector magnificus van de Wageningen Universiteit,
dr. CM. Karssen, in het openbaar te verdedigen op dinsdag 19 oktober 1999
des namiddags te 15.45 uur in de Aula van de Wageningen Universiteit.
\*» 3 M>o5>!
The studies described in this thesis were funded by the Dutch Dairy Foundation on Nutrition and Health, Maarssen, The Netherlands. The intervention study (Chapters 3 - 6) was, additionally, supported by the Health Research Council, The Hague, The Netherlands (grant number 28-2748). The studies were part of the research program of the Graduate School VLAG.
Financial support for the publication of this thesis by the Wageningen University, the Dutch Dairy Foundation on Nutrition and Health, Maarssen and the Netherlands Society of Gerontology, Utrecht is gratefully acknowledged.
de Jong, Nynke
Sensible Aging - Nutrient dense foods and physical exercise for the vulnerable elderly Thesis Wageningen University - With ref. - With summary in Dutch ISBN 90-5808-124-9
Cover: Henk de Jong front page 'De vergankelijkheid' (Transience')
back page 'Nederlandsezuivel...' ('Dutch dairy...")
Printing: Grafisch bedrijf Ponsen & Looijen B.V., Wageningen, The Netherlands
© de Jong.

In herinnering aan de pakes Voor beide beppes

Stellingen
1. Verrijkte voedingsmiddelen en lichamelijke activiteit lijken een complementair, gunstig, effect op de lichaamssamenstelling van ouderen te hebben. Het belang hiervan, ter verlichting van osteoporose en sarcopenie, wordt thans waarschijnlijk onderschat. O.a. dit proefschrift.
2. Voedingsmiddelen, verrijkt met een fysiologische dosis aan vitaminen en mineralen, zijn potentieel simpele, gebruiksvriendelijke en goedkope middelen om de voedingstoestand van fragiele ouderen te verbeteren. Dit proefschrift.
3. Zolang er geen duidelijke, uniforme criteria zijn voor fragiliteit, is onderlinge vergelijking van interventiestudies, uitgevoerd bij fragiele ouderen, moeilijk. O.a. dit proefschrift.
4. De opvatting van veel ouderen dat er vroeger meer smaak aan voedingsmiddelen zat dan tegenwoordig, kan verklaard worden uit een achteruitgang in geur- en smaakwaameming met de leeftijd.
5. Beoordeling van de 'aangenaamheid' van gratis verstrekte voedingsmiddelen, door een generatie die de Tweede Wereldoorlog nog heeft meegemaakt, levert geen betrouwbare resultaten.
6. Onderzoek doen bij ouderen is dubbel investeren in de eigen toekomst.
7. Vervoer op tijd is beter dan vervoer op maat.
8. Voor onze kennisintensieve samenleving is vergrijzing een zegen.
9. De efficientie van een non-profit instelling is negatief gecorreleerd aan de gelaagdheid van haar organisatiestructuur.
10. Het vierjarige keurslijf van een promotie-onderzoek is achterhaald in een tijd van flexibiliteit.
11,'Morgen zal alles anders zijn'. Dit is niet juist. Bart Johannes Beers in 'De teste stellingen zijn van hout' - uitspraken van Delftse promovendi.
12. Minima verdienen evenveel aandacht als Maxima. Ingeborg Brouwer en Nynke de Jong.
Stellingen behorend bij het proefschrift
Sensible Aging - Nutrient dense foods and physical exercise for the vulnerable elderly
Nynke de Jong Wageningen, 19 oktober 1999
CONTENTS
1. General Introduction 9
2. Impaired sensory functioning in elders: the relation with its potential 29
determinants and nutritional intake
3. Effect of dietary supplements and physical exercise on sensory 53
perception, appetite, intake and body weight in frail elderly?
4. Functional biochemical and nutrient indices in frail elderly people 75
partly affected by dietary supplements but not by exercise
5. Physiologically dosed nutrient dense foods and exercise in frail 99
elderly: effect on B-vitamins, homocysteine and neuropsychological
functioning
6. Dietary supplements and physical exercise affecting bone and 117
body composition in frail elderly
7. Appraisal of 4-months consumption of nutrient dense foods 135
within the daily feeding pattern of frail elderly
8. General Discussion 149
Summary 171 Samenvatting 176 Appendix 183 Dankwoord / Acknowledgments 185 About the author 189 List of publications 190

General Introduction

Chapter 1
The aging of the populations of developed as well as developing countries is well
recognized. Demographic statistics show frequently increasing numbers of elderly
over 65 years of age in the Netherlands (2.1 million to day) compared to numbers
calculated in the seventies or eighties (1.6 million in 1980)12. Life expectancy has
increased as well, but how much of this is 'disability free life expectancy' is a topic
of much interest. Dutch men of 55 years of age have on average still 22.6 years to
live of which 14 years should be healthy. For Dutch women this constitutes 16
healthy years of an expected total of 27.6 years3.
As a consequence of present western health politics, the development of
institutional care has been curtailed to limit governmental expenditure on health
care. Less commonly mentioned is, for instance, the decreasing number of Dutch
elderly homes and their inhabitants. In ten years time, approximately 175 homes
have been closed, which was associated with a decline in the total number of
residents from 0.14 to 0.11 million12. Consequently, an increasing number of
elderly sustain an independent living in the community. Home-care services, social
services and meals-on-wheels programs are of increasing value in assisting older
people. Approximately, 90% of senior citizens visiting a general practitioner are
experiencing minor or major functional disabilities4. The Dutch home-care
registered 0.5 million clients in 1996 of which 75% were aged 65 years or older. A
yearly increase of 3% in this age category was met. Similar statistics were found
among the clientele of the meals-on-wheels services56. Hence, it is not surprising
with clients and total costs rising, that a considerable burden and stress is placed
upon these civil institutions and perhaps in the near future upon the total health
care system7. The increase in societal costs and magnitude of elderly services,
gives rise to discussions among politicians, administrators, researchers, care
givers and insurers. Elderly health promotion, ailment and disability prevention,
meant to improve functional independence and quality of life, are given a high
priority. In this respect nutritional research is acknowledged as an affirmative
action.
The demographic statistics described above are based on classifications of
elderly in order of chronological age. The aging population, however, is very
heterogeneous within an individual (as organs and systems age differently), as well
as between individuals due to different genetics, environment, social and economic
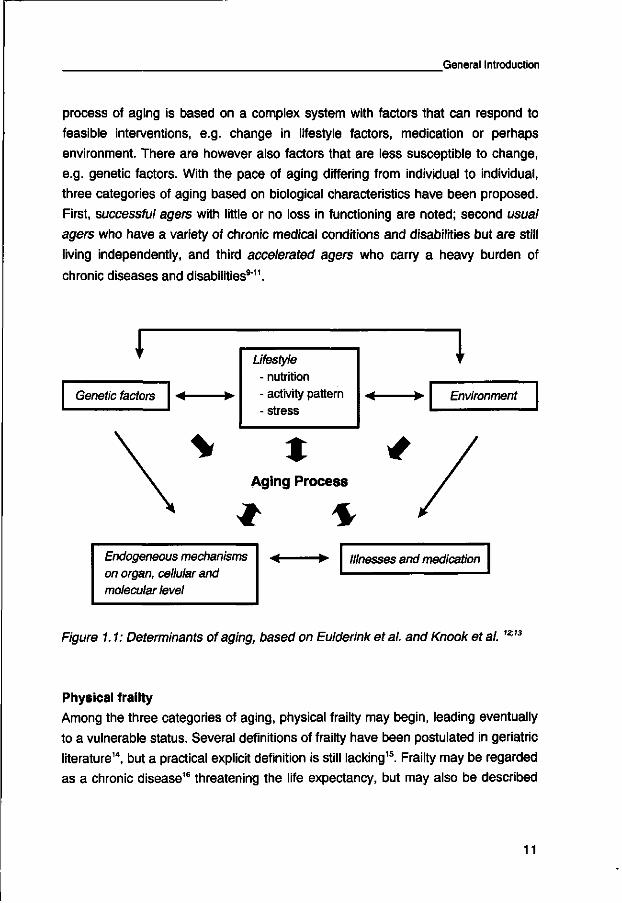
circumstances8. In Figure 1.1 important determinants of aging are presented. The
10
General Introduction
process of aging is based on a complex system with factors that can respond to
feasible interventions, e.g. change in lifestyle factors, medication or perhaps
environment. There are however also factors that are less susceptible to change,
e.g. genetic factors. With the pace of aging differing from individual to individual,
three categories of aging based on biological characteristics have been proposed.
First, successful agers with little or no loss in functioning are noted; second usual
agers who have a variety of chronic medical conditions and disabilities but are still
living independently, and third accelerated agers who carry a heavy burden of
chronic diseases and disabilities911.
\
Genetic factors
Lifestyle - nutrition - activity pattern - stress
» I * I
1 I
Environment
Endogeneous mechanisms on organ, cellular and molecular level
Illnesses and medication
Figure 1.1: Determinants of aging, based on Eulderink et al. and Knook et al. '2:13
Physical frailty
Among the three categories of aging, physical frailty may begin, leading eventually
to a vulnerable status. Several definitions of frailty have been postulated in geriatric
literature14, but a practical explicit definition is still lacking15. Frailty may be regarded
as a chronic disease16 threatening the life expectancy, but may also be described
11
Chapter 1
as just part of the aging process15. An example supporting the latter statement is
the broad definition of 'those elders who are neither too well, nor too disabled'17.
Chronological age indications or living conditions are sometimes taken into
account: 'frail elderly are individuals of more than 65 years of age who depend on
others for the activities of daily living and who are often under institutional care'18.
Finally, Buchner and Wagner (1992) tried a more physical approach in defining
frailty as 'a state of reduced physiologic reserve, associated with an increased
susceptibility of disability'19. The practical operation of the latter definition is,
however, still indefinite. Propositions, directing to inactivity, medicine use,
depression, feeding patterns, weight loss, low body weight or other low bodily
measures like arm circumference and muscle strength have been made19"22, but not
thoroughly or appropriately tested in well-controlled intervention studies.
The assessment of functional status is an important decisive factor in defining
physical frailty. Several domains of functioning have been proposed: i.e. physical,
cognitive, emotional, sensory and/or social functioning23. Physical and cognitive
dysfunction have the greatest impact on the overall burden, but emotional
problems like depression, and sensory aspects like visual and hearing problems or
even a declining taste and smell perception are known to contribute24. Widowhood
is a good example of a mediating factor in social functioning. Consensus has been
reached regarding frail elderly finding themselves in a precarious balance of assets
and deficits. With passing time a continuous downward process will be established,
leading to loss of physiologic reserves and finally to unfavorable institutionalization.
Yet, physical frailty may be treatable or even preventable1415, thereby improving the
quality of elderly life.
This latter belief was the starting point for the intervention trial in frail elderly
described in this thesis. As shown in Figure 1.1, two important contributors to the
process of aging, which may be susceptible to change, are nutrition and activity
pattern. Since physiological reserves in the frail are reduced19, we should aim on
replenishment through improved food intake (with, for example, nutrient dense
foods) and higher activity level. In assisting the frail elderly to remain autonomous
and to enjoy a better life25 minimizing the risk on (developing) nutritional
deficiencies is emphasized26;27.
12
General Introduction
Causes of the complex state of frailty
The adaptation of a sedentary lifestyle influences hunger, appetite, and
consequently dietary intake. This is mainly induced by a lowering of the total daily
energy expenditure. In sedentary individuals an important determinant of energy
expenditure is the absolute amount of active metabolic tissue, i.e. fat-free mass
and it is estimated that this tissue declines by about 15% between the third and
eight decade of life28"30. The decline in fat-free mass and energy expenditure in the
older individual will, at first, lead to excess storage of fat since energy intake is not
reduced concomitantly. Energy intake exceeds requirements and results in an
increased prevalence of obesity in middle-aged and younger-old individuals.
However, in the oldest-old the amount of reduced physical activity, fat-free mass,
and energy expenditure affects appetite and total dietary intake so that it becomes
increasingly difficult to meet micronutrient requirements.
In addition, age-related decline in sensory perception, influencing the taste and
smell of food, may limit food enjoyment243132. Dietary intake may decline and the
risk of developing nutrient deficiencies may be further increased. Along with this, a
reduced absorption and utilization of several nutrients may escalate in the elderly.
Adverse drug-nutrient interactions and altered drug metabolism in the frail may
interfere as well33"35, but controversy still exists with respect to the eventual
influence of drugs on the nutritional status36'39. Synergistic actions of all modifiers
may finally lead to detrimental blood nutrient levels and, perhaps, to adverse
functional biochemical health indicator levels.
Another consequence of the disuse and wasting of muscle mass, by virtue of
inactivity, is the related decline in bone mass and bone density40"42. The decrease
in muscle mass is eventually responsible for a reduction in aerobic capacity,
physical fitness and functioning43"47. A fear of falling may be developed and a
further sequential deterioration in activity may result. Hereby a vicious circle is
inevitably set. With the introduction of feasible exercises (to improve physical
activity level) plus the preparation of enjoyable nutrient dense foods in small
portions (to overcome the risk of nutritional deficiencies) an upward tendency,
reversing the deteriorating process, may be introduced.
13
Chapter 1
Aim of the study
A lot of research, performed on elderly until now, has focused on either apparently
healthy elderly or institutional residents. The frail elderly, defined here as those
who are trying to uphold their lives within their private homes in the community,
have not been given much attention up to date. This is partly due to the fact that
they do not easily respond to advertisements or calls to participate in trials, in
contrast to healthy elderly. Research on the frail, is in the first place important
because their nutritional and health status is likely to be different from healthy
elderly. Many recommendations are based on research in the latter group and it is
important to supplement our knowledge with data about the frail (less healthy)
ones. The possibility of keeping them healthy and strong in their own surroundings
and thus improving their quality of life, through relatively simple means seems a
rather realistic and worthwhile goal. Supply of customary nutritious food and
effective but moderate intense exercise programs may be examples of feasible
interventions. Aiming for optimization of their quality of life while simultaneously
reducing governmental expenses and stress placed upon the health care system
should be key factors in current policy. Furthermore, valuable new data are needed
to add to the current debate about the sense or nonsense of functional (enriched)
foods for the elderly.
Research on the potential benefits of these types of interventions is important.
However, a good appraisal of the newly developed interventions is a pre-requisite
for future implementation. This point has been under-emphasized in most studies
focusing on effectiveness.
Summarizing, the research questions addressed in this thesis are:
a. What is the nutritional status of Dutch frail elderly people?
b. What is the effect of specially developed nutrient dense foods and physical
exercise on the nutritional and health status of the Dutch frail elderly?
c. What is the appraisal of nutrient dense foods by frail elderly?
Proposed interventions
nutrient dense foods
The risk of the frail elderly developing a suboptimal or deficient nutritional state is
substantial. Underlying causes are diverse, as has already been outlined. Many
14
General Introduction
intervention trials in elderly have focused on the effectiveness of a single nutrient
on a single outcome parameter or have studied the application of highly dosed
supplements. However, a suboptimal nutritional and health status which is caused
by long term inactivity, low energy expenditure and, as it progresses, a deprived
appetite and overall nutritional intake should be improved by a multiple nutrients
approach. These elderly are most probably in need of a whole range of nutrients
instead of a single isolated nutrient48. In addition the action of many nutrients may
be complementary and, therefore, several balanced foods containing a range of
vitamins and minerals, frequently characterized as deficient in elderly people,
should be designed. Those with a poor appetite and low activity level may benefit
most from an increase in the density of the diet instead of volume. Subsequently,
small portions, palatable throughout the day and easy to include in all daily meals
are needed. Inactive persons may achieve a new energy balance on a lower level,
therefore, extra energy provided by the macronutrients fat or carbohydrate is
questionable.
In addition to the information on isolated nutrients, research on pharmaceutical
dosed supplements and lack of information on the distinction between sufficient
and excessive use35 should be noted. In our opinion, supply of physiological doses
of nutrients, based on recommended daily allowances should be sufficient in order
to overcome present deficiencies. The development of food products thereby is
preferred above the use of tablets, since foods still contain other important
nutrients as well as non-nutritive ingredients (e.g. dietary fiber). Furthermore,
another tablet in addition to most probably frequently used prescribed medicines is
unattractive. Details about the types of products used in our intervention trial, the
exact amount of nutrients added to the products and the acceptance of the
products by the subjects, can be found in Chapters 3 to 7, and the appendix of this
thesis, moreover in our supplementary article describing the variability of the
micronutrient content of the foods during the whole intervention period (de Jong et
al., submitted).
physical exercise
Another important contributor to the downward process of frailty, which might be
manipulated, is physical inactivity. A higher activity level might introduce a better
appetite and nutritional intake and thus cause a beneficial effect on the nutritional
15
Chapter 1
and health status49. In this way synergy between both programs may even be
established50. As skeletal muscle atrophy due to disuse is common, our exercise
program aimed at altering muscle structure and mass. These alterations are likely
to influence the functioning of essential and less important muscle groups. Physical
activity will improve gait, postural control and functional mobility50"52. Maintenance
or improvement of the performance of present daily activities by regular applicative
exercise may prolong independent physical functioning in the elderly284553. Until
now several exercise programs have been developed and investigated on their
effectiveness on health indicators4215152154, however, they mostly focus on resistance
training.
In our all-round exercise program, emphasis has been placed on skill training,
such as walking, stooping, lifting, and (chair) standing. Indirectly it, thereby, aimed
at improving muscle strength, co-ordination, flexibility, speed and endurance. The
program intended to be moderate intense and was gradually increasing. The all-
round aspect due to a diversity of types of exercises and materials applied, instead
of frequently repeated types of exercises was assumed to be appealing to frail
elderly. Improvement of compliance but also testing of the feasibility of any of such
program in daily elderly life were important goals of this diverse approach. Details
about the design of the program can be found in the complementary thesis of
Marijke Chin A Paw55. In the following section indicators of the nutritional and
health status investigated in this thesis are briefly introduced.
Sensory factors and appetite
One of the domains influencing frailty is sensory aspects. Visual and hearing
problems are essential elements but with respect to the nutrition intervention, taste
and smell perception are also key factors. It is well established that sensory
perception declines with age3256'58. This decline is more evident in the sense of
smell than the sense of taste and is often more distinct in men than in women58.
Along with neurological changes during aging explanations such as diminished
release of flavors due to impaired saliva flow combined with difficulties in chewing
(bad fitting dentures) and swallowing, medications (causing a dry mouth or off-
flavors) and smoking behavior have been investigated with mixed outcomes355659"63.
Reduced taste and smell perception may have a negative impact on appetite and
hunger feelings, thereby reducing food enjoyment and finally total dietary intake24.
16
General Introduction
However, while chronologic age-related decline has been well documented, the
relation between a) sensory factors and other (age-related) contributors and b)
sensory factors and food intake, through appetite and hunger feelings is less clear.
In Chapter 2 this topic is presented. Since food enjoyment is one of the stimuli
which remains important until the very last end of life64, a lot of work still needs to
be carried out, gaining more insight into the declining sensory system, its impact on
the quality of life and the way of dealing with it. The effectiveness of nutritional
supplementation and physical exercise on sensory factors related to appetite,
feelings of hunger and dietary intake in frail elderly has not been thoroughly
investigated so far. Chapter 3 deals with this topic.
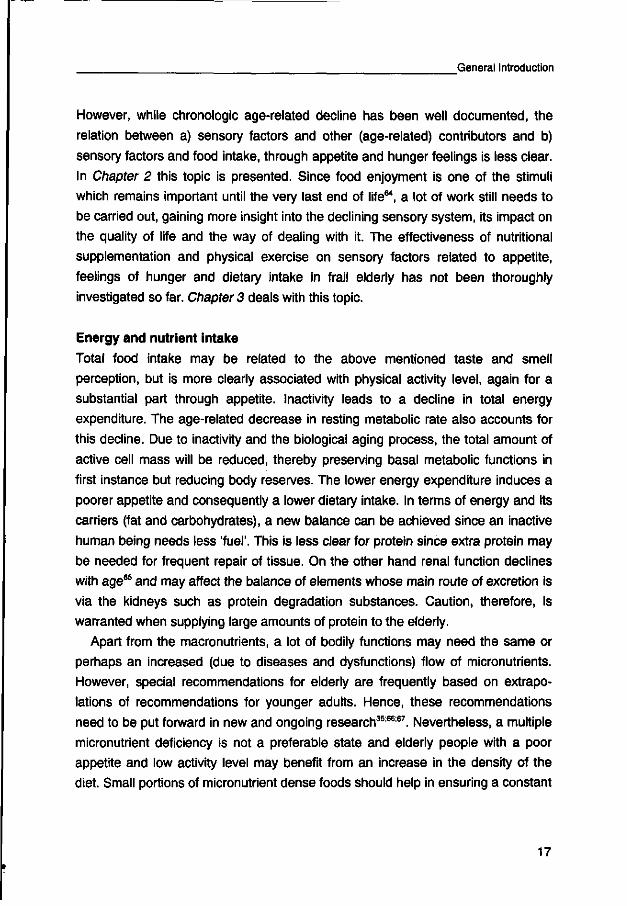
Energy and nutrient intake
Total food intake may be related to the above mentioned taste and smell
perception, but is more clearly associated with physical activity level, again for a
substantial part through appetite. Inactivity leads to a decline in total energy
expenditure. The age-related decrease in resting metabolic rate also accounts for
this decline. Due to inactivity and the biological aging process, the total amount of
active cell mass will be reduced, thereby preserving basal metabolic functions in
first instance but reducing body reserves. The lower energy expenditure induces a
poorer appetite and consequently a lower dietary intake. In terms of energy and its
carriers (fat and carbohydrates), a new balance can be achieved since an inactive
human being needs less 'fuel'. This is less clear for protein since extra protein may
be needed for frequent repair of tissue. On the other hand renal function declines
with age65 and may affect the balance of elements whose main route of excretion is
via the kidneys such as protein degradation substances. Caution, therefore, is
warranted when supplying large amounts of protein to the elderly.
Apart from the macronutrients, a lot of bodily functions may need the same or
perhaps an increased (due to diseases and dysfunctions) flow of micronutrients.
However, special recommendations for elderly are frequently based on extrapo
lations of recommendations for younger adults. Hence, these recommendations
need to be put forward in new and ongoing research3566*7. Nevertheless, a multiple
micronutrient deficiency is not a preferable state and elderly people with a poor
appetite and low activity level may benefit from an increase in the density of the
diet. Small portions of micronutrient dense foods should help in ensuring a constant
17

Chapter 1
micronutrient intake. Increasing the physical activity level, energy expenditure and
indirectly dietary intake is another important opportunity, but is perhaps more
difficult to achieve. A description of the intake of our frail elderly at baseline
compared to healthy elderly and the effectiveness of our interventions in raising
dietary intake are illustrated in Chapters 3 and 4.
Biochemical parameters of nutritional and health status
Dietary intake is not always predictive of the actual nutritional status. Other factors
like diseases present and medicines may act as underlying causes for a different
outcome of the nutritional status. Several studies on the elderly show correlation
coefficients between intake data and biochemical indices of nutrients that vary
between 0.0 to 0.6, depending on the type of nutrient, but also on the method of
measuring6869. Numerous biochemical indicators can be selected to define
nutritional and health state but none is the absolute key descriptor on its own. It is
important to select several indicators since they all vary in estimated half life, body
pools and responsiveness to conditions related to malnutrition4870.
Until now, very few well-controlled trials investigating effects of both
interventions have focused on biochemical evidence. It is expected, however, that
especially frail elderly might suffer from suboptimal states and benefit from
supplementation or exercise. Several direct measures of vitamins or derived
functional tests indicative of vitamin status in blood have been performed to
describe baseline vitamin state and change after intervention (Chapter 4).
Checking compliance regarding the consumption of nutrient dense foods was an
additional aim. Likewise, several other biochemical markers of malnutrition and/or
illnesses have been measured to define nutritional and health status at baseline
and after intervention. Emphasis has been placed on circulating proteins like
albumin, pre-albumin, transferrin, ferritin and C-reactive protein. Hematological
indicators such as hemoglobin, hematocrit, percentage lymphocytes and blood cell
count have been described as well.
Homocysteine
An example of a functional measure of nutrition and health state is plasma
homocysteine level. Interest in homocysteine level, as an independent risk factor
for cardiovascular disease has grown eminently during the last decade. Deficiency
18
General Introduction
in vitamins B6, B12 and/or folate, all serving as co-enzymes in the metabolism of
homocysteine, cause unfavorable elevated levels of this metabolite71"74. Frail elderly
are at high risk for suboptimal or deficiency states and therefore have a serious
elevated risk for high homocysteine levels. Another reason for outlining these B-
vitamins is that deficiency in vitamin B12 and folate have been associated with
neurological abnormalities75'77. Chapter 5 describes the homocysteine state, the
performance on two tests indicating neurological functioning, the vitamins involved,
and the effectiveness of our interventions on these parameters.
Body and bone composition
Advancing age is associated with changes in body and bone composition. This is
partly due to the direct effect of biological aging but is also due to diseases,
inactivity and inadequate dietary intake. Changes in body composition have been
differentiated in three categories: wasting (i.e. unintentional loss of total weight,
including fat and fat-free mass), cachexia (i.e. loss of fat-free mass but little total
weight loss) and sarcopenia (i.e. loss of skeletal muscle mass)78. Wasting may only
develop at the far end of the 'life spectrum', but sarcopenia and cachexia may be
pre-existing. Sarcopenia accounts for age-associated decreases in resting
metabolic rate due to a decline in active cells and in activity levels, both, in turn, the
cause of decreased energy requirements. Substantial additional effects of
sarcopenia, due to disuse of muscles, on muscle strength, bone density (because
of lack of regular substantial mechanical load) and functional capacity have been
documented284345467981. Although the effects of sarcopenia seem to be enormous,
the public health significance of this process is still not fully appreciated.
Osteoporosis, on the contrary, has been recognized as one of the most
important disorders associated with aging. It is characterized by a reduction in
bone mass and an alteration of bone architecture leading to an increased
susceptibility to fracture82. Causes should be sought in age-related factors and
nutritional factors, with emphasis on vitamin D and calcium8384. More recently,
vitamin K85 and cobalamin86 have been mentioned. Controversy exists regarding
the effect of dietary protein on bone. Extra protein may induce a higher urinary
excretion of calcium, and may reflect a higher bone resorption, although not all
studies support these findings87.
19
Chapter 1
The potential of osteoporosis to cause suffering is acknowledged. Maximizing the
peak bone mass, its maintenance as long as possible and prevention of bone loss
in old age are (therapeutic) objectives for the restoration of bone and prevention of
osteoporotic-related fractures88. In our study we have investigated body
composition (e.g. fat-free and fat mass) as well as bone mass and density. The
changes due to the interventions are described in Chapter 6.
Design of the study
Subjects were recruited in Wageningen and surrounding municipalities. Several
approaches were used: a) co-workers of home-care institutions were asked to
encourage their clients to participate, b) letters, via meals-on-wheels services, were
sent to ask customers to participate, c) letters, were distributed in elderly homes,
as in d) social services centers for elderly, e) there was recruitment via general
practitioners, and f) articles in local newspapers. After sending of the written
information brochure, meetings with all initially interested were organized in order
to explain the purpose of the study. Furthermore, the opportunity was provided to
meet the investigators involved. During the meeting, it was emphasized that
everything (including all transportation) would be arranged and that both
intervention programs were especially designed for all elderly (even those not
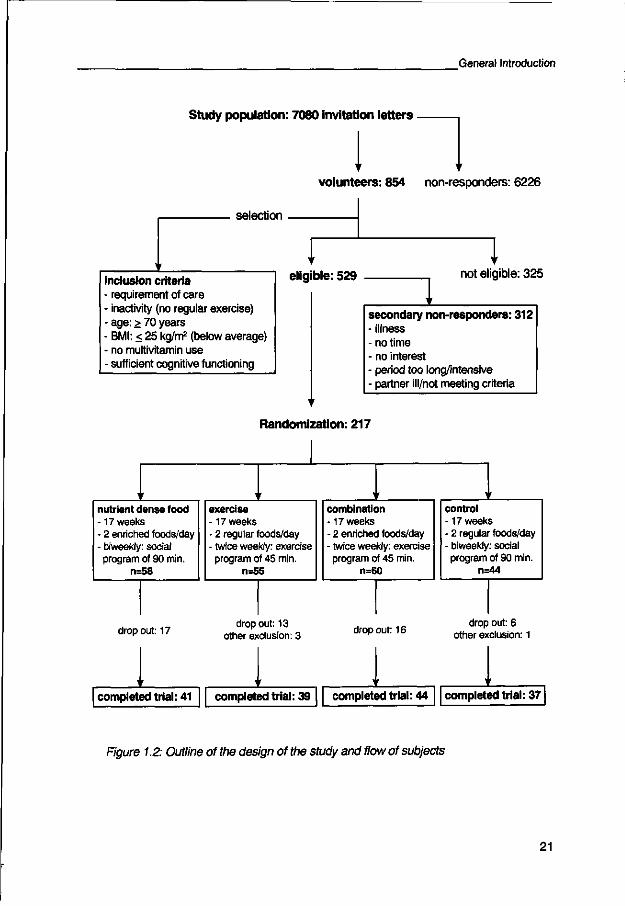
feeling too well). The design, selection criteria and subjects flow are presented in
Figure 1.2. After assuring eligibility, subjects were randomized into one of four
groups. Figure 1.2 shows that the study followed a 2x2 factorial design, which
permitted us to investigate possible interaction between nutrient dense foods and
exercise. In case of no interaction, we would be able to separate between both
main effects.
20
General Introduction
Study population: 7080 invitation letters •
volunteers: 854 non-responders: 6226
selection
inclusion criteria - requirement of care - inactivity (no regular exercise) - age: > 70 years - BMI: < 25 kg/m2 (below average) - no multivitamin use - sufficient cognitive functioning
eligible: 529 not eligible: 325
secondary non-responders: 312 - illness - no time - no interest - period too long/intensive - partner ill/not meeting criteria
Randomization: 217
u w v w
nutrient dense food -17 weeks - 2 enriched foods/day - biweekly: social program of 90 min.
n=58
exercise -17 weeks - 2 regular foods/day - twice weekly: exercise program of 45 min.
n=55
combination -17 weeks - 2 enriched foods/day - twice weekly: exercise program of 45 min.
n=60
control -17 weeks - 2 regular foods/day - biweekly: social program of 90 min.
n=44
drop out: 17 dropout: 13
other exclusion: 3 dropout: 16 drop out: 6
other exclusion: 1
completed trial: 41 completed trial: 39 completed trial: 44 completed trial: 37
Figure 1.2: Outline of the design of the study and flow of subjects
21
Chapter 1
Randomization is important for comparability of all factors (known or unknown to
the investigator) that may affect the final results. A control group was added to
investigate a possible placebo effect, i.e. the effect of just consuming regular foods
and attention on the health and nutritional status. The purpose was to recruit 50
participants in all groups, because a substantial drop-out was expected. Before the
actual start of the study all participants signed consent forms. Moreover, the
subjects' general practitioners signed an agreement in which they agreed to their
patients' participation.
The study period was 4 months (17 weeks). This period was based on evidence
from earlier studies5189 which had demonstrated partial effects from exercise or
nutrition on nutritional and health status indicators after only 10 or 12 weeks of
intervention. Mann et al.90 showed effects on the blood vitamin state after 4
months. In addition, red blood cells have a complete turnover period of
approximately 16 weeks and the maximum possible biochemical effect should have
been established by that time.
A longer intervention period would probably have negatively affected compliance
and would have caused more problems with recruitment and logistics. At baseline
(week 0) and after 17 weeks of intervention (week 18) data were collected.
Exceptions were the collection of the energy and nutrient intake data, which were
obtained in the last week of intervention. Information about the appraisal of the
nutrient dense foods was gathered at the beginning (weeks 1 and 2) and during the
last two weeks of intervention (weeks 16 and 17).
Outline of the thesis
In this thesis, the effectiveness of consuming multiple nutrient dense foods,
containing a physiological dose of several micronutrients and an all-round
moderate intense exercise program, both specifically designed for frail elderly, is
described. Emphasis is placed on the following outcome parameters: sensory
functioning, appetite, food intake, biochemical nutritional/health indicators and
bone and body composition. The complementary thesis of Marijke Chin A Paw55
focuses on several other health aspects: physical fitness and functioning, immune
response and subjective well-being.
In Chapter 2 a preliminary study is described. Two different elderly populations,
i.e. free-living versus institutionalized are compared with respect to their taste and
22

General Introduction
smell perception, possible determinants, appetite and food intake. By this, a
reference with respect to sensory perception and appetite was created for our
intervention population. Chapters 3 to 6 focus on the effect of both interventions in
a Dutch frail elderly population. Chapter 3 mainly describes the effect on sensory
perception, appetite, energy and macronutrient intake. Since (change in) intake is
not always predictive for the (change in) nutrient and health status as indicated by
biochemical parameters a separate Chapter (4) discusses this issue. An example
of a functional biochemical indicator of health state is homocysteine, this is covered
in Chapter 5. Interest in this indicator has grown markedly, since it is regarded as
an important risk factor in cardiovascular disease. The vitamins involved in the
metabolic process of homocysteine are also thought to be related to neurologic
functioning. In Chapter 6 we address the effect of our intervention programs on
body composition (total body weight but also divided in fat and fat free mass), total
bone mass and density. Following on from the effectiveness of the interventions,
long-term feasibility is of major importance for future implementation. The appraisal
of our nutrient dense foods is analyzed in Chapter 7, whereas the exercise
program is described in Marijke Chin A Paw's thesis55. In Chapter 8 the main
results of the study are summarized and put into perspective and public health
implications are considered.
References
1. Centraal Bureau voor de Statistiek: Statistisch Jaarboek 1999, 's Gravenhage, SDU-uitgeverij; 1999. 2. Centraal Bureau voor de Statistiek: Statistisch jaarboek 1990, 's Gravenhage, SDU-uitgeverij; 1990. 3. Centraal Bureau voor de Statistiek: Overlevingstafels, 1995 en 1991 -1995, Maandstatistiek van de bevolking 1997.1997:72-74. 4. Meyboom-de Jong B: Bejaarde patienten. Een onderzoek in twaalf huisartspraktijken. 1989. Rijksuniversiteit Groningen. 5. Baars JA and Spaan JM: Jaarboek Thuiszorg 1996. 1-86. 1996. Bunnik, The Netherlands, De Landelijke Vereniging voor Thuiszorg and NZi: Onderzoek, Informatie en Opleidingen in de Zorg. 6. Nagel KP and de Schutter M: Maaltijddiensten. 1997. Den Haag, the Netherlands, Consumentenbond. 7. Gloth FM, Walston J, Meyer J, Pearson J: Reliability and validity of the Frail Elderly Functional Assessment questionnaire. Am J Phys Med Rehabil 1995;74:45-53. 8. Pendergast DR, Fisher NM, Calkins E: Cardiovascular, neuromuscular, and metabolic alterations with age leading to frailty. J Gerontol 1993 ;48 Spec No:61-67. 9. Rowe JW, Kahn RL: Human aging: usual and successful. Science 1987;237:143-149.
23
Chapter 1
10. Harris TB, Feldman J J: Implications of health status in analysis of risk in older persons. J of Aging and Health 1991 ;3:262-284. 11. van der Wielen, RPJ. Vitamin intake and status in elderly Europeans. 1-167. 1995. Department of Human Nutrition, Wageningen Agricultural University, the Netherlands. 12. Eulderink F, Heeren TJ, Knook DL, Ligthart GJ: Inleiding Gerontologie en Geriatrie, Houten/Diegem, the Netherlands, Bohn Stafleu Van Loghum; 1999. 13. Knook DL, Brouwer A: Voeding van Ouderen, Alphen aan den Rijn, Stichting Voeding Nederland, Samsom Stafleu; 1989. 14. Rockwood K, Fox RA, Stolee P, Robertson D, Beattie BL: Frailty in elderly people: an evolving concept. CMAJ. 1994;150:489-495. 15. Bortz WM: The physics of frailty. J Am GeriatrSoc 1993;41:1004-1008. 16. MacAdam M, Capitman J, Yee D, Prottas J, Leutz W, Westwater D: Case management for frail elders: the Robert Wood Johnson Foundation's Program for Hospital Initiatives in Long-Term Care. The Gerontologist. 1989;29:737-744. 17. dayman A: Determinants of frailty. The Gerontologist 1990;30:105A(Abstract) 18. Woodhouse KW, Wynne H, Baillie S, James OF, Rawlins MD: Who are the frail elderly? Q J Med 1988;68:505-506. 19. Buchner DM, Wagner EH: Preventing frail health. Clin Geriatr.Med. 1992;8:1-17. 20. Chin A Paw JMM, Dekker JM, Feskens EJM, Schouten EG, Kromhout D: How to select a frail elderly population? A comparison of three working definitions. J Clin Epidem 1999; in press. 21. Faisant C, Lauque S, Guigoz Y, Ghisolfi-Marque A, Vellas BJ, Albarede JL: Nutrition Assessment and MNA (mini nutritional assessment), in Vellas BJ, Sachet P, Baumgartner RN (eds): Facts and Research in Gerontology: Nutritional Intervention and the Elderly. Paris, France, Serdi Publisher; 1995:157-161. 22. Speechley M, Tinetti M: Falls and injuries in frail and vigorous community elderly persons. J Am GeriatrSoc 1991;39:46-52. 23. Guralnik JM, Simonsick EM: Physical disability in older Americans. J Gerontol 1993;48 SpecNo:3-10. 24. Morley JE: Anorexia of aging: physiologic and pathologic. Am J Clin Nutr 1997;66:760-773. 25. Butler RN: Quality of life: can it be an endpoint? How can it be measured? Am J Clin Nutr 1992;55:1267S-1270S. 26. Commissie Voedingsnormen Voedingsraad: Nederlandse voedingsnormen 1989, Den Haag, Voedingsraad; 1989. 27. Commissie Voeding van de Oudere Mens Voedingsraad: Voeding van de oudere mens, Den Haag, Voedingsraad; 1995. 28. Evans WJ: Exercise, Nutrition and Aging. ClinGeriatr Med 1995;11:725-734. 29. Cohn SH, Vartsky D, Yasumura S, et al: Compartmental body composition based on total-body nitrogen, potassium, and calcium. Am J Physiol 1980;239:E524-E530 30. McGandy RB, Barrows-CH J, Spanias A, Meredith A, Stone JL, Norris AH: Nutrient intakes and energy expenditure in men of different ages. J Gerontol 1966;21:581 -587. 31. Schiffman SS, Warwick ZS: Flavor enhancement of foods for the elderly can reverse anorexia. Neurobiol Aging 1988;9:24-26. 32. Schiffman SS: Taste and smell losses in normal aging and disease. JAMA 1997;278:1357-1362. 33.0'Mahony MS, Woodhouse KW: Age, environmental factors and drug metabolism. Pharmacol Ther 1994;61:279-287. 34. Roe DA: Drug-nutrient interactions in the elderly. Geriatrics 1986;41:57-74. 35. Morley JE, Mooradian AD, Silver AJ, Heber D, Alfin SR: Nutrition in the elderly [clinical conference]. Ann Intern Med 1988;109:890-904.
24

General Introduction
36. Saltzman JR, Russell RM: The aging gut. Nutritional issues. Gastroenterol Clin North Am 1998;27:309-324. 37. Russell RM: Changes in gastrointestinal function attributed to aging. Am J Clin Nutr 1992;55:1203S-1207S. 38. Tucker K: Micronutrient status and aging. Nutr Rev 1995;53:S9-15. 39. Ahmed FE: Effect of nutrition on the health of the elderly. J Am Diet Assoc 1992;92:1102-1108. 40. Evans WJ: Exercise, Nutrition and Aging. J Nutr 1992;122:796-801. 41. Ferretti JL, Capozza RF, Cointry GR, et al: Gender-related differences in the relationship between densitometric values of whole-body bone mineral content and lean body mass in humans between 2 and 87 years of age. Bone 1998:22:683-690. 42. Nelson ME, Fiatarone MA, Morganti CM, Trice I, Greenberg RA, Evans WJ: Effects of high-intensity strength training on multiple risk factors for osteoporotic fractures. A randomized controlled trial. JAMA 1994;272:1909-1914. 43. Evans WJ, Campbell WW: Sarcopenia and age-related changes in body composition and functional capacity. J Nutr 1993;123:465-468. 44. Evans WJ: Functional and metabolic consequences of sarcopenia. J Nutr 1997;127:998S-1003S. 45. Fielding RA: Effects of exercise training in the elderly: impact of progressive- resistance training on skeletal muscle and whole-body protein metabolism. Proc Nutr Soc 1995;54:665-675. 46. Roubenoff R, Harris TB: Failure to thrive, sacropenia and functional decline in the elderly. Clin GeriatrMed 1997;13:613-622. 47. Harris T: Muscle mass and strength: relation to function in population studies. J Nutr 1997;127:1004S-1006S. 48. Bunker VW, Stansfield MF, Marszal RA, Hounslow A, Clayton BA: An evaluation of the benefits of a nutritional supplement in improving the nutrition and wellbeing of housebound elderly people, in: Targeting health promotion: reaching those in need, proceedings of a symposium. Cambridge, The Health Promotion Research Trust; 1993:122-151. 49. Evans WJ, Meredith CN: Exercise and nutrition in the elderly, in Munro HN, Danford DE (eds): Nutrition, aging and the elderly. New York, Plenum Press; 1989:89-126. 50. Fiatarone MA, O'Neill EF, Doyle N, et al: The Boston FICSIT study: the effects of resistance training and nutritional supplementation on physical frailty in the oldest old. J Am Geriatr Soc 1993;41:333-337. 51. Fiatarone MA, O'Neill EF, Ryan ND, et al: Exercise training and nutritional supplementation for physical frailty in very elderly people. N EnglJ Med 1994;330:1769-1775. 52. Fiatarone MA, Marks EC, Ryan ND, Meredith CN, Lipsitz LA, Evans WJ: High-intensity strength training in nonagenarians. Effects on skeletal muscle. JAMA 1990;263:3029-3034. 53. Evans WJ, Cyr-Campbell D: Nutrition, exercise, and healthy aging. J Am Diet Assoc 1997;97:632-638. 54. Nelson ME, Fisher EC, Dilmanian FA, Dallal GE, Evans WJ: A 1-y walking program and increased dietary calcium in postmenopausal women: effects on bone. Am J Clin Nutr 1991;53:1304-1311. 55. Chin A Paw JMM: Aging in Balance - Physical exercise and nutrient dense foods for the vulnerable elderly. 1999. Wageningen Agricultural University. 56. Schiffman SS: Perception of taste and smell in elderly persons. Critical Reviews in Food Science and Nutrition 1993;33:17-26. 57. Doty RL, Shaman P, Applebaum SL, Giberson R, Siksorski L, Rosenberg L: Smell identification ability: changes with age. Science 1984;226:1441-1443. 58. Ship JA, Weiffenbach JM: Age, gender, medical treatment, and medication effects on smell identification. J Gerontol 1993;48:M26-M32
25

Chapter 1
59. Schiffman SS: Taste and smell in disease (second of two parts). N Engl J Med 1983;308:1337-1343. 60. Schiffman SS: Taste and smell in disease (first of two parts). N Engl J Med 1983;308:1275-1279. 61. Chauncey HH, Muench ME, Kapur KK, Wayler AH: The effect of the loss of teeth on diet and nutrition. Int Dent J1984;34:98-104. 62. Kaplan AR, Glanville EV, Fischer R: Cumulative Effect of Age and Smoking on Taste Sensitivity in Males and Females. J of Gerontol 1965;20:334-337. 63. Percival RS, Challacombe SJ, Marsh PD: Flow rates of resting whole and stimulated parotid saliva in relation to age and gender. J Dent Res 1994;73:1416-1420. 64. Schlettwein GD: Nutrition and the quality of life: a measure for the outcome of nutritional intervention.? Am J Clin Nutr 1992;55:1263S-1266S. 65. Sourander LB: The aging kidney, in Brocklehurst JC (ed): Tekstbook of geriatric medicine and gerontology. London, Churchill Livingstone; 1978:291-305. 66. Ludman EK, Newman JM: Frail elderly: assessment of nutrition needs. The Gerontologist. 1986;26:198-202. 67. Munro HN: The challenges of research into nutrition and aging: Introduction to a multifaceted problem, in Munro HN, Danford DE (eds): Nutrition, aging and the elderly. New York, Plenum Press; 1989:1-21. 68. Bailey AL, Maisey S, Southon S, Wright AJ, Finglas PM, Fulcher RA: Relationships between micronutrient intake and biochemical indicators of nutrient adequacy in a "free-living' elderly UK population. Br J Nutr 1997;77:225-242. 69. Jacques PF, Sulsky SI, Sadowski JA, Phillips JC, Rush D, Willett WC: Comparison of micronutrient intake measured by a dietary questionnaire and biochemical indicators of micronutrient status. Am J Clin Nutr 1993;57:182-189. 70. Gibson RS: Principles of nutritional assessment, New York, Oxford University Press; 1990. 71. Joosten E, van den Brandt A, Riezler R, et al: Metabolic evidence that deficiencies of vitamin B-12 (cobalamin), folate, and vitamin B-6 occur commonly in elderly people. Am J Clin Nutr 1993;58:468-476. 72. Allen RH, Stabler SP, Lindenbaum J: Relevance of vitamins, homocysteine and other metabolites in neuropsychiatric disorders. EurJPediatr 1998;157 Suppl 2:S122-S126 73. Buchman AL: Vitamin supplementation in the elderly: a critical evaluation. Gastroenterologist. 1996;4:262-275. 74. Naurath HJ, Joosten E, Riezler R, Stabler SP, Allen RH, Lindenbaum J: Effects of vitamin B12, folate, and vitamin B6 supplements in elderly people with normal serum vitamin concentrations. Lancet 1995;346:85-89. 75. Reynolds EH, Rothfeld P, Pincus JH: Neurological disease associated with folate deficiency. Br Med J 1973;2:398-400. 76. Goodwin JS, Goodwin JM, Garry PJ: Association between nutritional status and cognitive functioning in a healthy elderly population. JAMA 1983;249:2917-2921. 77. Matthews JH: Cobalamin and folate deficiency in the elderly. Baillieres Clin Haematol 1995;8:679-697. 78. Roubenoff R: The pathophysiology of wasting in the elderly. J Nutr 1999;129:256S-259S. 79. Chumlea WC, Guo SS, Glaser RM, Vellas BJ: Sarcopenia, function and health. Nutr Health and Aging 1997;1:7-12. 80. Payette H, Hanusaik N, Boutier V, Morais JA, Gray Donald K: Muscle strength and functional mobility in relation to lean body mass in free-living frail elderly women. Eur J Clin Nutr 1998;52:45-53. 81. Evans WJ: What is sarcopenia? J Gerontol A Biol Sci Med Sci 1995;50 Spec No:5-8. 82. Tohme J, Cosman F, Lindsay R: Osteoporosis, in Becker KL (ed): Principles and Practice of Endocrinology and Metabolism. Philadelphia, J.B. Lipincott; 1995:567-584.
26
General Introduction
83. Meunier P: Prevention of hip fractures by correcting calcium and vitamin D insufficiencies in elderly people. Scand J Rheumatol Suppl 1996;103:75-78. 84. Holick MF: Vitamin D and Bone Health. J Nutr 1996; 126:1159S-1164S. 85. Vermeer C, Gijsbers BL, Craciun AM, van Groenen DM, Knapen MH: Effects of vitamin K on bone mass and bone metabolism. J Nutr 1996; 126:1187S-1191S. 86. Melton ME, Kochman ML: Reversal of severe osteoporosis with vitamin B12 and etidronate therapy in a patient with pernicious anemia. Metabolism 1994;43:468-469. 87. Kersterter JE, O'Brien KO, Insogna KL: Dietary protein affects intestinal calcium absorption. Am J Clin Nutr 1998;68:859-865. 88. Masi L, Bilezikian JP: Osteoporosis: new hope for the future. Int J Fertil 1997;42:245-254. 89. Gray-Donald K, Payette H, Boutier V, Page S: Evaluation of the dietary intake of homebound elderly and the feasibility of dietary supplementation. J Am Coll Nutr 1994;13:277-284. 90. Mann BA, Garry PJ, Hunt WC, Owen GM, Goodwin JS: Daily multivitamin supplementation and vitamin blood levels in the elderly: a randomized, double-blind, placebo-controlled trial. J Am GeriatrSoc 1987;35:302-306.
27
Impaired sensory functioning in elders: the
relation with its potential determinants and
nutritional intake Journal of Gerontology: Biological Sciences 1999; 54A, in press
Nynke de Jong
Ina Mulder
Cees de Graaf
Wija A. van Staveren
Chapter 2
This study assessed the relation of an impaired taste and smell perception with a) potential determinants and b) nutritional intake and status in elderly people. Determinants examined were age, gender, functional category (institutionalized vs independently living), dental state, illnesses, smoking behavior, drug usage, and saliva excretion and composition. Nutritional intake and status were measured by an 'appetite and hunger' questionnaire, a food frequency questionnaire and body mass index. In order to have access to a large heterogeneous group, two different categories of elderly people were studied. We enrolled independently living elders (n=89) assumed to have a relatively good taste and smell perception, and institutionalized elders (n=67) with a potential poorer taste and smell perception. Scores at the smell identification (range: 0-10) and taste perception (range: 0-4) test were, respectively, 5.7 (independently living) vs 3.5 (institutionalized); p<0.0001 and 3.3 vs 3.0; p<0.05. Correlation between smell test scores and outcomes of the 'appetite and hunger' questionnaire ranged from r: 0.19 to 0.50; p-values<0.05. There was, however, no clear correlation of any sensory outcome with energy and food intake, nor with BMI. Regression analyses revealed that age and the functional category were the most important determinants of the scores on the taste perception and smell identification tests.
It is concluded that a poor performance on sensory tests is related to a poor appetite but not necessarily to low energy intake or low BMI. Age-related factors and smoking are important determinants of impaired sensory functioning.
INTRODUCTION
The process of aging may be accompanied by an increasingly poor nutritional and
health status. A poor appetite and, consequently, a low food intake contribute to
this phenomenon. One of the most important factors influencing food intake is
enjoyment of food (e.g. because of its pleasant taste12). It is commonly known that
a large part of our taste (in the general sense of the word) is determined by our
sense of smell and that this smell perception is more affected by age than our taste
perception3"5. It is estimated that half of the elderly population experience olfactory
dysfunction6. Previous lab research has also shown that elderly people prefer a
higher concentration of some specific food flavors37"12.
30
. Impact of poor sensory perception
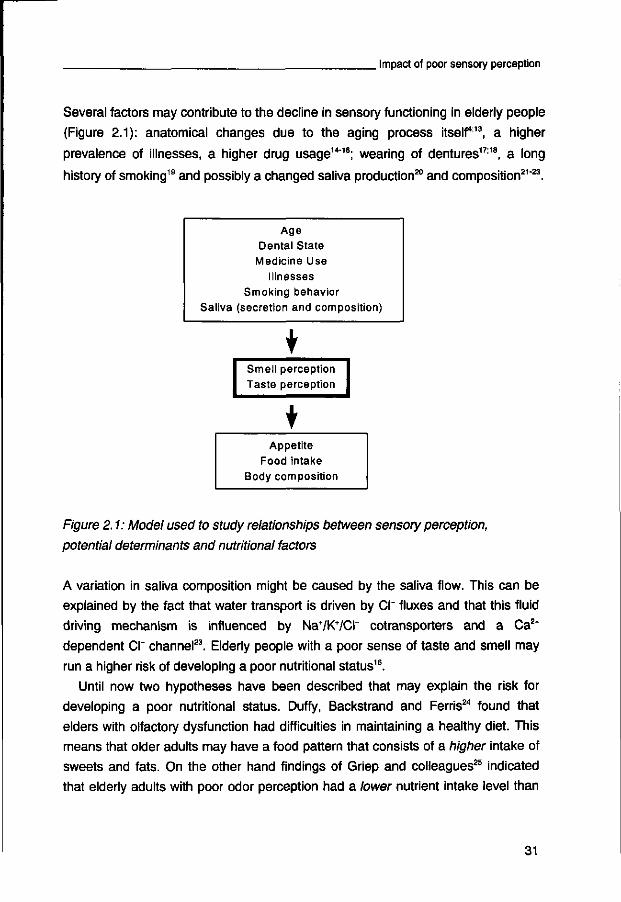
Several factors may contribute to the decline in sensory functioning in elderly people
(Figure 2.1): anatomical changes due to the aging process itself13, a higher
prevalence of illnesses, a higher drug usage14'16; wearing of dentures17118, a long
history of smoking19 and possibly a changed saliva production20 and composition21'23.
Age Dental State
Medicine Use Illnesses
Smoking behavior Saliva (secretion and composition)
I Smell perception
Taste perception
Appetite
Food intake Body composition
Figure 2.1: Model used to study relationships between sensory perception,
potential determinants and nutritional factors
A variation in saliva composition might be caused by the saliva flow. This can be
explained by the fact that water transport is driven by CI" fluxes and that this fluid
driving mechanism is influenced by NaVKVCI" cotransporters and a Ca2+
dependent CI" channel23. Elderly people with a poor sense of taste and smell may
run a higher risk of developing a poor nutritional status16.
Until now two hypotheses have been described that may explain the risk for
developing a poor nutritional status. Duffy, Backstrand and Ferris24 found that
elders with olfactory dysfunction had difficulties in maintaining a healthy diet. This
means that older adults may have a food pattern that consists of a higher intake of
sweets and fats. On the other hand findings of Griep and colleagues25 indicated
that elderly adults with poor odor perception had a lower nutrient intake level than
31
Chapter 2
those with good odor perception. Both studies, however, were carried out in very
special groups of community-living elders: Duffy and associates24 performed her
study in elders with known olfactory dysfunctioning, and Griep and colleagues25
focused on extremely healthy elders.
The purpose of our trial was to investigate the relation between sensory
dysfunctioning and nutritional intake in order to solve the apparent controversy
raised in the literature. We studied those factors that might influence the taste and
smell perception of elderly adults. In order to have access to a heterogeneous
study population, we examined two groups of elders cross-sectionally: one
independently living group and one institutionalized group.
METHODS
Subjects
A sample of 89 independently-living elders and 67 elders living in senior homes
was recruited in the area of Wageningen, The Netherlands, through letters or by
direct contact. The subjects had to be 70 years or older. Elderly adults with
diabetes were excluded because of their inability to take the flavor test and their
possible different food consumption pattern, fat distribution and possibly changed
saliva composition. The study protocol was approved by the Medical Ethical
Committee of the Division of Human Nutrition and Epidemiology of the
Wageningen Agricultural University. Subjects received a study description, after
which they signed a consent form.
Design of the study
Data were collected during two home visits in the period of December 1995 to
January 1996. One hour before the start of the first home visit, subjects were asked
not to eat, drink (with the exception of water), smoke, or brush their teeth (with
respect to the collection of saliva and the taste and smell tests). After the collection
of saliva, the assessment of the general questionnaire as well as the questionnaire
concerning appetite, hunger feelings, and subjective feelings of taste and smell
performance took place. The smell identification test and taste perception test were
performed and, anthropometric measurements were conducted. The food
frequency questionnaire was filled out during the second home visit.
32
. Impact of poor sensory perception
Smell identification test
The smell identification test was based on the Connecticut Chemosensory Clinical
Research Center (CCCRC) test26. The test comprised ten 40 ml plastic jars with 2
mm holes in their lids, containing the following stimuli: baby powder, chocolate,
cinnamon, coffee, mothballs, peanut butter, soap, ammonia, onion (instead of the
original item wintergreen, which is not familiar in the Netherlands), Vicks Vapo-
Steam. Concentrations of the stimuli were set after pretesting with a group of 12
students, aged: 20-25 years; 73% of these students scored a 8 items right. This
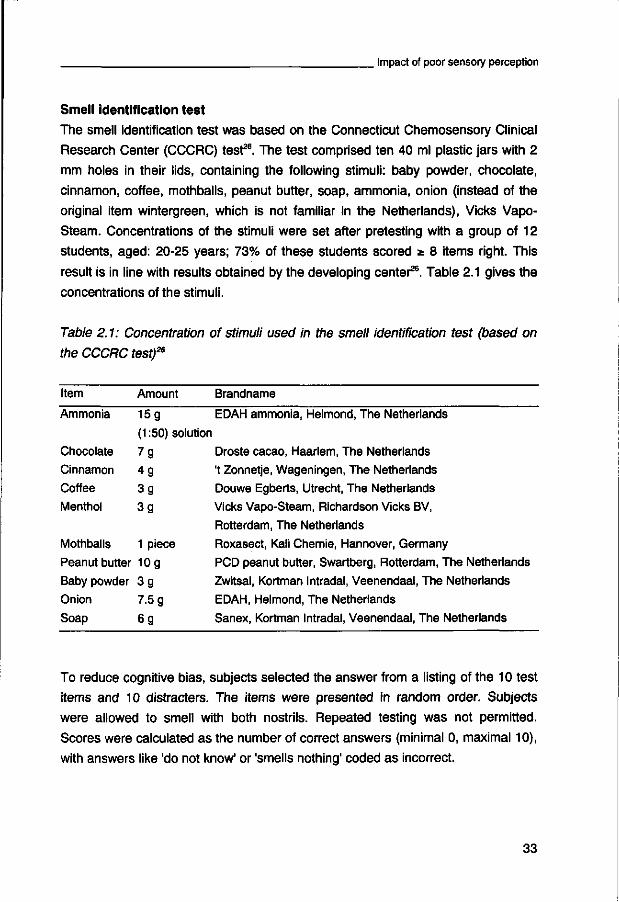
result is in line with results obtained by the developing center26. Table 2.1 gives the
concentrations of the stimuli.
Table 2.1: Concentration of stimuli used in the smell identification test (based on
the CCCRC test)26
Item Amount Brandname
EDAH ammonia, Helmond, The Netherlands
Droste cacao, Haarlem, The Netherlands
't Zonnetje, Wageningen, The Netherlands
Douwe Egberts, Utrecht, The Netherlands
Vicks Vapo-Steam, Richardson Vicks BV,
Rotterdam, The Netherlands
Roxasect, Kali Chemie, Hannover, Germany
PCD peanut butter, Swartberg, Rotterdam, The Netherlands
Zwitsal, Kortman Intradal, Veenendaal, The Netherlands
EDAH, Helmond, The Netherlands
Sanex, Kortman Intradal, Veenendaal, The Netherlands
Ammonia
Chocolate
Cinnamon
Coffee
Menthol
Mothballs
Peanut butter
Baby powder
Onion
Soap
15g
(1:50) solution
7g
4g
3g
3g
1 piece
10g
3g 7.5 g
6g
To reduce cognitive bias, subjects selected the answer from a listing of the 10 test
items and 10 distracters. The items were presented in random order. Subjects
were allowed to smell with both nostrils. Repeated testing was not permitted.
Scores were calculated as the number of correct answers (minimal 0, maximal 10),
with answers like 'do not know' or 'smells nothing' coded as incorrect.
33
Chapter 2
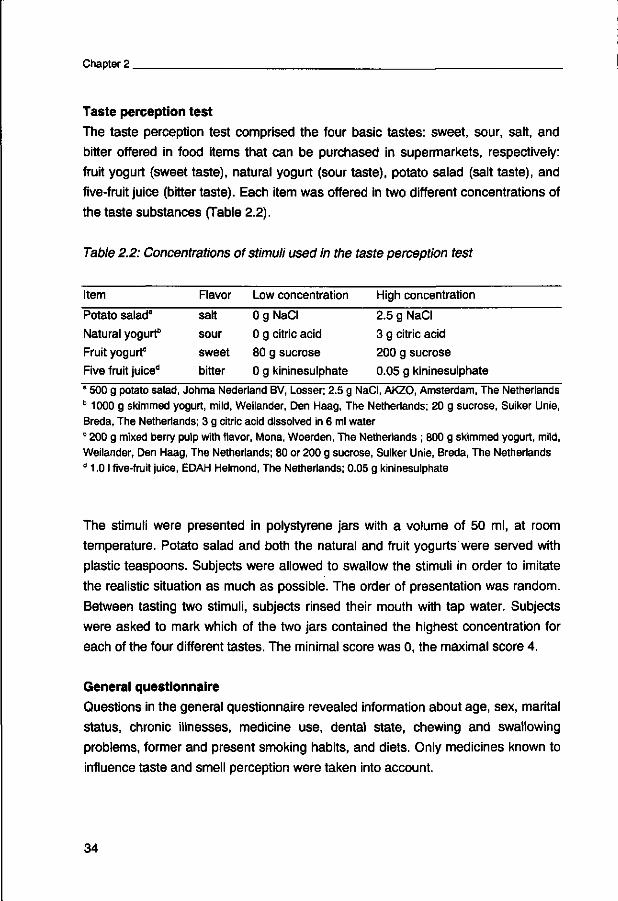
Taste perception test
The taste perception test comprised the four basic tastes: sweet, sour, salt, and
bitter offered in food items that can be purchased in supermarkets, respectively:
fruit yogurt (sweet taste), natural yogurt (sour taste), potato salad (salt taste), and
five-fruit juice (bitter taste). Each item was offered in two different concentrations of
the taste substances (Table 2.2).
Table 2.2: Concentrations of stimuli used in the taste perception test
Item Flavor Low concentration High concentration
Potato salad"
Natural yogurt6
Fruit yogurt0
Five fruit juice"
salt 0 g NaCI
sour 0 g citric acid
sweet 80 g sucrose
bitter 0 g kininesulphate
2.5 g NaCI
3 g citric acid
200 g sucrose
0.05 g kininesulphate
" 500 g potato salad, Johma Nederland BV, Losser; 2.5 g NaCI, AKZO, Amsterdam, The Netherlands b 1000 g skimmed yogurt, mild, Weilander, Den Haag, The Netherlands; 20 g sucrose, Suiker Unie, Breda, The Netherlands; 3 g citric acid dissolved in 6 ml water c 200 g mixed berry pulp with flavor, Mona, Woerden, The Netherlands ; 800 g skimmed yogurt, mild, Weilander, Den Haag, The Netherlands; 80 or 200 g sucrose, Suiker Unie, Breda, The Netherlands d 1.0 I five-fruit juice, EDAH Helmond, The Netherlands; 0.05 g kininesulphate
The stimuli were presented in polystyrene jars with a volume of 50 ml, at room
temperature. Potato salad and both the natural and fruit yogurts were served with
plastic teaspoons. Subjects were allowed to swallow the stimuli in order to imitate
the realistic situation as much as possible. The order of presentation was random.
Between tasting two stimuli, subjects rinsed their mouth with tap water. Subjects
were asked to mark which of the two jars contained the highest concentration for
each of the four different tastes. The minimal score was 0, the maximal score 4.
General questionnaire
Questions in the general questionnaire revealed information about age, sex, marital
status, chronic illnesses, medicine use, dental state, chewing and swallowing
problems, former and present smoking habits, and diets. Only medicines known to
influence taste and smell perception were taken into account.
34

. Impact of poor sensory perception
Saliva excretion and composition
Saliva was first collected in an unstimulated way to determine the spontaneous
flow rate: subjects were asked to spit into a small plastic jar during exactly 5
minutes. Second, the saliva production was stimulated in order to get enough
sample to determine the concentration of the minerals and protein. Production was
stimulated with a piece of laboratory Parafilm of 5x5 cm. Subjects were asked to
chew on this piece and spit the produced saliva in another plastic jar until a volume
of 10 ml was reached. Both jars were kept on ice until further processing.
Weight of the unstimulated saliva was determined, after which the excretion rate
in ml/min could be calculated with the assumption that 1 g of saliva should be equal
to 1 ml. The pH was measured with a pH-electrode. The buffer capacity was
determined with the measurement of the HC03~ content, through titration with acid.
The stimulated saliva samples were kept at -20 °C until further analysis. The
chloride content was determined with a chlorocounter type 77 (Marius, Utrecht, The
Netherlands). Potassium, sodium, calcium, and magnesium contents were
determined with the AAS (atomic absorption spectrometry) method (type 2380,
Perkin Elmer, Norwalk, CT, USA). The total protein content was measured
according to the method of Lowry and colleagues27 with the standard protein:
mucin type I from the bovine submandibular/ glands (Sigma M4503).
Appetite, hunger, subjective taste, and smell questionnaire
The aim of this questionnaire was to provide descriptive data about the
participants' own sensory impressions and their feelings of appetite and hunger.
Subjects were asked to answer a total of 29 questions about their feelings of their
present taste perception (8 questions), their present smell perception (3 questions),
their present smell perception compared to their past perception (3 questions),
their hunger feelings (9 questions) and appetite (6 questions). After reading the
question the subjects had to score their answer on 5-point Likert scales with
verbally labeled answering categories. An example of a 'question' is the following
statement: 'In former days the taste of food was: 1. much better than nowadays, 2.
better than nowadays, 3. the same as nowadays, 4. worse than nowadays, 5.
much worse than nowadays'. Every answer was coded from 1 to 5. A higher score
corresponded to a more positive feeling about their taste and smell perception,
appetite, and hunger. Five variables could be constructed:
35

Chapter 2
1. subjective feelings of present taste perception (range: 8-40);
2. subjective feelings of present smell perception (range: 3-15);
3. appetite (range: 6-30);
4. daily feelings of hunger (range: 9-45);
5. present smell perception compared to the past (range 3-15).
Food and energy intake
A validated semi-quantitative food frequency questionnaire of 104 items28 was
carried out to estimate the intake of energy and the foods that contributed most to
the intake of energy. The questionnaire was administered by trained interviewers.
In a personal interview subjects were asked to recall the consumption of 104 items
during the past month. The responses were coded as frequency per week, and
energy, nutrient, and food intake was assessed with use of data from the 'Dutch
Nutrient Data Base 1986/87'2*.
Anthropometry
Subjects were weighed on a mechanical weighing scale (Seca; Hamburg,
Germany) to the nearest 0.5 kg. Height was measured to the nearest 0.001 m
using a portable stadiometer. Body mass index (BMI) was calculated as weight in
kilograms divided by height in meters squared. Body circumferences were
measured to the nearest 0.001 m with the subject standing upright in light clothing.
The waist circumference was measured midway between the lower rib margin and
the iliac crest around the abdomen at the level of the umbilicus. The hip
circumference was measured at the level of the point yielding the maximum
circumference over the buttocks. The waist-hip circumference ratio was calculated
as waist circumference divided by hip circumference and was used as an index of
body fat distribution30.
Statistical analysis
Data analysis was conducted using the Statistical Analysis System (version 6;
Cary, NC: SAS Institute Inc., 1990). To test whether the group was heterogeneous,
differences between the two groups of elderly adults were tested with an unpaired
t-test, a Pearson chi-squared test, or with the general linear model procedure. A
Wilcoxon two-way rank order test was used when the response variables were not
36

. Impact of poor sensory perception
normally distributed. In order to test whether or not the group (independent vs
institutionalized) differences were greater for smell than for taste, a repeated
measures analysis was performed. For this, the taste score was multiplied by 2.5 to
make both ranges more similar. Out of the taste and smell scores, one general
sensory variable was constructed as repeated dependent measure; group and kind
of test (smell or taste) were regarded as the independent variables. The interaction
between the latter two indicated whether or not the group differences for smell
were greater than the group differences for taste. Pearson correlation coefficients
were used to test a) relationships between taste and smell perception and their
possible mediating factors and b) taste and smell perception with energy intake,
BMI, and fat distribution (see Figure 2.1). Pearson correlation coefficients were
also used for quantifying the association between subjective feelings about taste
and smell perception, appetite and hunger feelings and objective measurements of
taste and smell perception. The internal validity of our appetite, hunger, subjective
taste, and smell questionnaire was tested through the use of Cronbach's a. The
level of p<0.05 was considered as statistically significant. In order to find out
whether elderly subjects with a good sensory performance differed in food intake
from those with a poor performance, we categorized elderly subjects into two
groups: one distinct group of good smellers (high score on the smell test: 8-10)
and one of poor smellers (score: 0-7 on smell test); cut off points were in line with
boundary of normosmia of Cain and colleagues.26. Stepwise forward multiple
regression technique was used to model which independent variables accounted
most for the variation in the scores of the taste and smell tests (dependent
variables). To compare the regression coefficients for the taste test and the smell
variables directly, we constructed standardized coefficients within the regression
procedure. Dummy variables were made for gender (men: 1, women: 2) and
functional category (independently living: 1, institutionalized: 2).
RESULTS
Scores on taste and smell test
The mean scores (±sd) on the taste and smell tests are presented in Table 2.3.
Differences between groups were obvious, with the institutionalized elders scoring
lower on both tests. This difference held when men and women were studied
37
Chapter 2
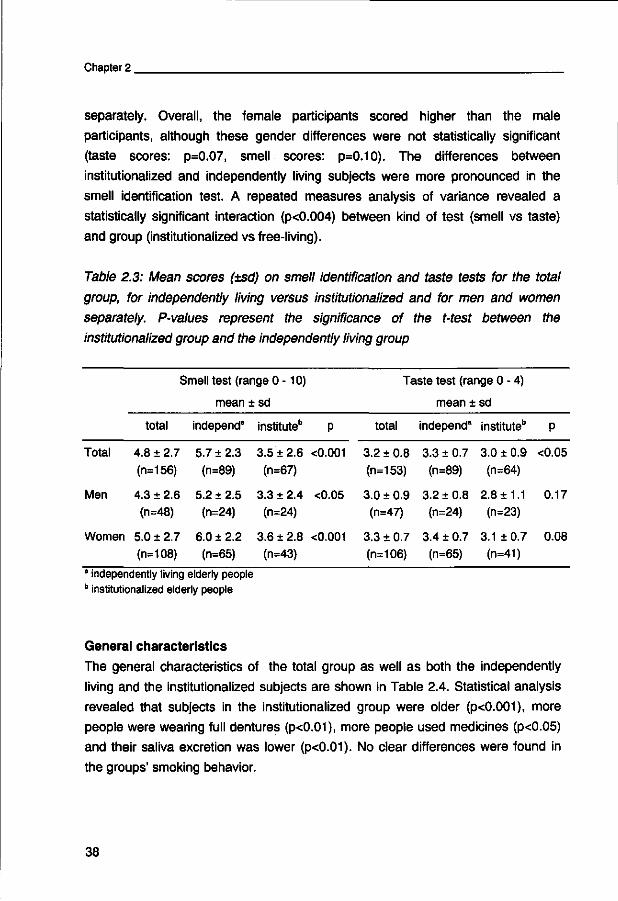
separately. Overall, the female participants scored higher than the male
participants, although these gender differences were not statistically significant
(taste scores: p=0.07, smell scores: p=0.10). The differences between
institutionalized and independently living subjects were more pronounced in the
smell identification test. A repeated measures analysis of variance revealed a
statistically significant interaction (p<0.004) between kind of test (smell vs taste)
and group (institutionalized vs free-living).
Table 2.3: Mean scores (±sd) on smell identification and taste tests for the total
group, for independently living versus institutionalized and for men and women
separately. P-values represent the significance of the t-test between the
institutionalized group and the independently living group
Total
Men
Women
Smell test (range 0 -10)
total
4.8 ± 2.7 (n=156)
4.3 ± 2.6 (n=48)
5.0 ± 2.7 (n=108)
mean
independ"
5.7 ±2.3
(n=89)
5.2 ± 2.5 (n=24)
6.0 ± 2.2 (n=65)
±sd
institute" p
3.5 ±2.6 <0.001 (n=67)
3.3 ±2.4 <0.05 (n=24)
3.6 ±2.8 <0.001 (n=43)
Taste test (range 0 - 4)
total
3.2 ±0.8 (n=153)
3.0 ±0.9 (n=47)
3.3 ± 0.7 (n=106)
mean ± sd
independ* institute"
3.3 ±0.7 3.0 + 0.9 (n=89) (n=64)
3.2 ±0.8 2.8 ±1.1 (n=24) (n=23)
3.4 ±0.7 3.1 ±0.7 (n=65) (n=41)
P
<0.05
0.17
0.08
* independently living elderly people b institutionalized elderly people
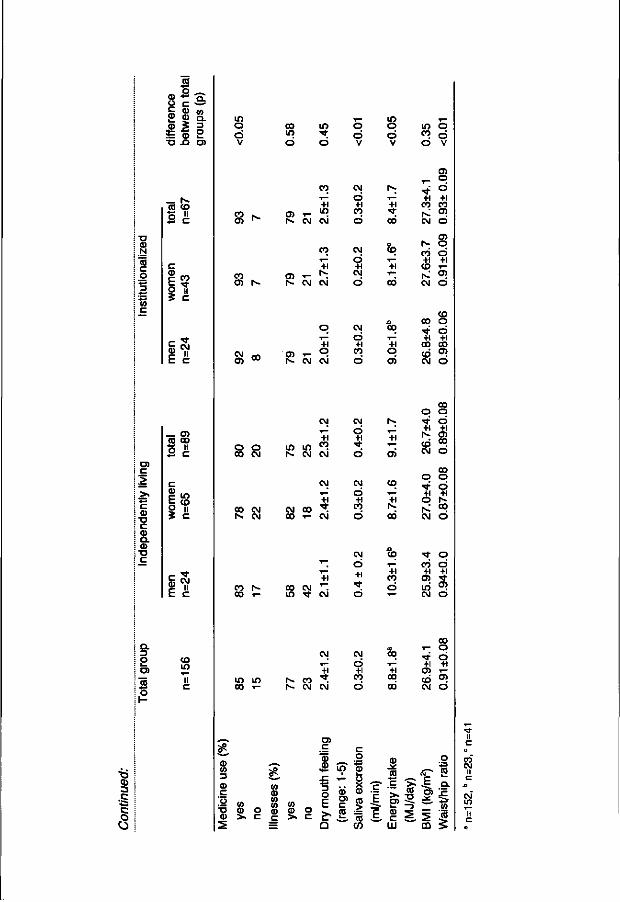
General characteristics
The general characteristics of the total group as well as both the independently
living and the institutionalized subjects are shown in Table 2.4. Statistical analysis
revealed that subjects in the institutionalized group were older (p<0.001), more
people were wearing full dentures (p<0.01), more people used medicines (p<0.05)
and their saliva excretion was lower (p<0.01). No clear differences were found in
the groups' smoking behavior.
38

T3 C co
c
c CD t .c
o C to
& 8 Co a s
o
co
S> •S c § co
co
co c ca Q)
E CO
TO •o a) to
I I .8 .CO
c
a to en
5 C CD
5 TO & CO
o CD f to
t> - 9>
CD ^ to c .o cvi
.2 I
CO
o _ <D *- "S o c •= S <" to a) 3 3 •a u o)
T3 CD N
o *••-»
3
co _c
« o
c CD
E o
c CD
E
r-co
II c
CO * j " II c
CM II c
CO +1 CM CO
CO +1 CM CO
in +1
CM CO
• *
h-
• * CO
CO lO
CO CM
CO i —
• * f
o 05
CO CO
to O)
c >
c CD T3 C CD a. CD •a c
_ o> CO CO
c CD
IS
2 II t C
a. 3
lO o d v
o d v
o CO
co • *
t>- r-»
CO T - 7 -
w co t-
CO » CM
S O U ) i - m CM
in to
CM r -CO C D
CO CO CO CO T - •>-
oi CM ai CO 7- T -
CO I"-lO CO
CM O h- CM CO
• *
+1 CO h~ CO
i - CO co r-- h~ CO i - i -
C0 CO i - 00
o en CO
•4—'
CO in II c
CO +1 o> h-
co r-CO CO
CO O CM h- 1 - 1 -
r»- w m co
to CD
CO CD
^ CD to C to o CD tO
& U> ,, c » ro > >, < - i
W T3 •£ CD J ID 1 1 3 iS 13 "o |
- i 'I -C P tO
o CO CD
CD <-> Q
Q. C
CD O
-° E o> (0 C i_ 2 CD
i I CO
c
i g" CO 2
o = 03 03
CO
o c _ £ l!
;T3
N w c o
CO c
(0 <x>
c
2 ii E c
c CD Q.
. <B •"D c
D ) C
> >. ** c (1)
• n
_ 0> CO 00
4-* C
c CD
t co
§£
£ II E c
CL 3 O
«
CO LO
II c
c
o d v
CO
2
CM
0 0 m d
O) h -
o> r*-
05 i ^
,_ CM
T -
CM
,_ CM
W t
d
CO T^
+1 LO c\i
CO 1 —
+i h -
cvi
q T —
+1 o CM
T —
o d V
CM
d +i
CO
d
CO
d +i
CM
d
CM
d +1
CO
d
in o d V
r-: T - ^
+1 * •
CO
CO
^ +1 1_ co
CO
^ +1 o 0 )
LO cr> d
^ +i CO r-; CM
co +i
CO
r CM
CO
•* +i 0 0
CO CM
y—
o d V
CO
o d +i
CO 0 )
d
en o d +i
i—
O i
d
CO
o d +i
0 0 0 )
d
o o 0 0 CM
0 0 CM K CM
1 ^ CM CM
CO T - CM
CM
d + 1
d
CM
d +i
CO
d
h»
+i oi
CO
^ +i i ^
0 0
o • *
+ 1
CO CM
O
• *
+1
q | s ^
CM
CO O
d +1
CO CO
d
00 o d +i ^ 0 0
d
co r» 0 0 i -
• ^
T —
+i CO CM T lO • * CM
CM
d +1 t
d
CO
^ +i CO d T —
•<*• o co d +i +i
03 • * in °? CM O
W LO CO •>-
t^ CO r«- CM
CM 1 —
+1 t CM
CM
d +1
CO
d
<0
0 0 1 —
+1 CO
CO
CO i - o •* d +1 +1
CO i -co °>. CM O
£ CD CO 3
CD
c o
T3 V
5
(0 CD o
c
CO CD CO CO CD
c =
CO CD o
c
CD
.c o E
Q
in T —
CD CD
c CO
c g CD
U X CD
.1 CO
CO
c ;E 1
CD
>. k_ CD
c LLI
CO
2
«r .E
i co
o
'« Q.
§ CO
CO
II c u
co" CM II
c
CM" m
II c «
. Impact of poor sensory perception
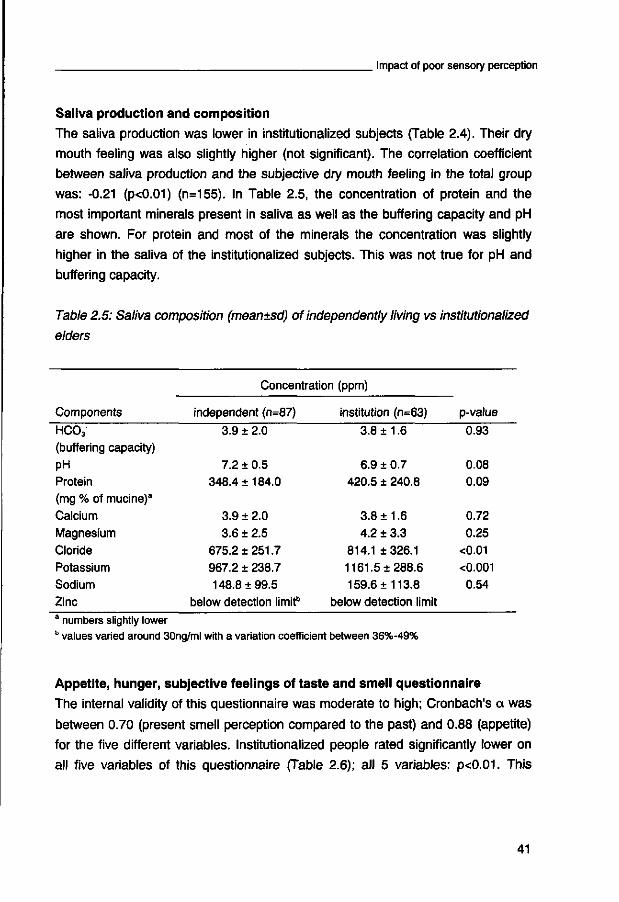
Saliva production and composition
The saliva production was lower in institutionalized subjects (Table 2.4). Their dry
mouth feeling was also slightly higher (not significant). The correlation coefficient
between saliva production and the subjective dry mouth feeling in the total group
was: -0.21 (p<0.01) (n=155). In Table 2.5, the concentration of protein and the
most important minerals present in saliva as well as the buffering capacity and pH
are shown. For protein and most of the minerals the concentration was slightly
higher in the saliva of the institutionalized subjects. This was not true for pH and
buffering capacity.
Table 2.5: Saliva composition (mean±sd) of independently living vs institutionalized
elders
Components
HC03
(buffering capacity)
PH Protein (mg % of mucine)3
Calcium Magnesium Cloride Potassium Sodium
Zinc
Concentration (ppm)
independent (n=87)
3.9 ± 2.0
7.2 ± 0.5 348.4 ±184.0
3.9 + 2.0 3.6 ±2.5
675.2 ± 251.7 967.2 ± 238.7 148.8 ±99.5
below detection limit"
institution (n=63)
3.8 ±1.6
6.9 ±0.7
420.5 ± 240.8
3.8 ±1.6 4.2 ± 3.3
814.1 ±326.1
1161.5 ±288.6 159.6 ±113.8
below detection limit
p-value
0.93
0.08 0.09
0.72
0.25 <0.01 <0.001 0.54
numbers slightly lower b values varied around 30ng/ml with a variation coefficient between 36%-49%
Appetite, hunger, subjective feelings of taste and smell questionnaire
The internal validity of this questionnaire was moderate to high; Cronbach's a was
between 0.70 (present smell perception compared to the past) and 0.88 (appetite)
for the five different variables. Institutionalized people rated significantly lower on
all five variables of this questionnaire (Table 2.6); all 5 variables: p<0.01. This
41
Chapter 2
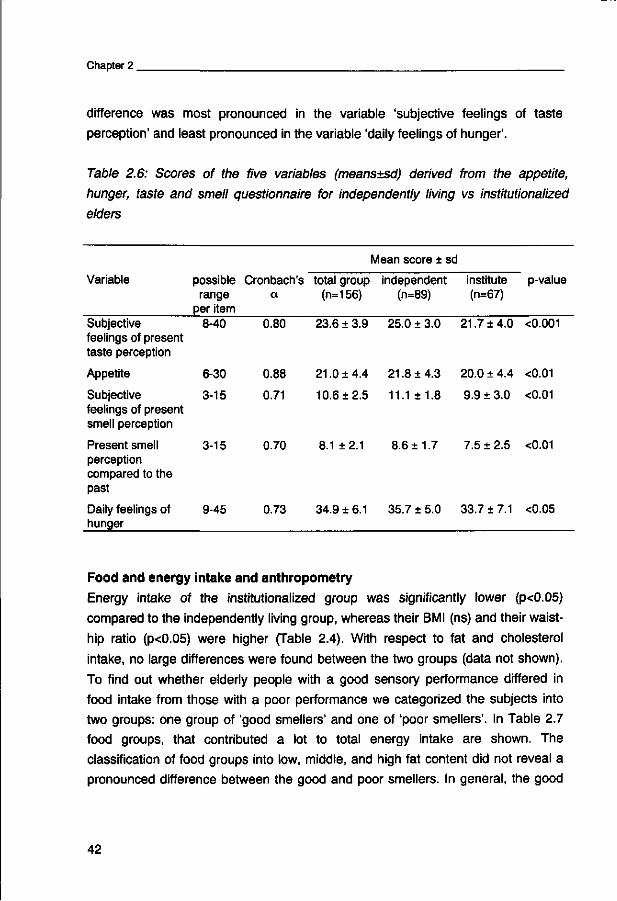
difference was most pronounced in the variable 'subjective feelings of taste
perception' and least pronounced in the variable 'daily feelings of hunger'.
Table 2.6: Scores of the five variables (means±sd) derived from the appetite,
hunger, taste and smell questionnaire for independently living vs institutionalized
elders
Mean score ± sd
Variable possible Cronbach's total group independent institute p-value range a (n=156) (n=89) (n=67)
per item Subjective 8-40 feelings of present taste perception
Appetite 6-30
Subjective 3-15 feelings of present smell perception
Present smell 3-15 perception compared to the past
Daily feelings of 9-45 hunger
0.80 23.6 ±3.9 25.0 ±3.0 21.7 ±4.0 <0.001
0.88 21.0 ±4.4 21.8 ±4.3 20.0 ± 4.4 <0.01
0.71 10.6 ±2.5 11.1 ±1.8 9.9 ±3.0 <0.01
0.70 8.1 ±2.1 8.6 ±1.7 7.5 ± 2.5 <0.01
0.73 34.9 ±6.1 35.7 ±5.0 33.7 ±7.1 <0.05
Food and energy intake and anthropometry
Energy intake of the institutionalized group was significantly lower (p<0.05)
compared to the independently living group, whereas their BMI (ns) and their waist-
hip ratio (p<0.05) were higher (Table 2.4). With respect to fat and cholesterol
intake, no large differences were found between the two groups (data not shown).
To find out whether elderly people with a good sensory performance differed in
food intake from those with a poor performance we categorized the subjects into
two groups: one group of 'good smellers' and one of 'poor smellers'. In Table 2.7
food groups, that contributed a lot to total energy intake are shown. The
classification of food groups into low, middle, and high fat content did not reveal a
pronounced difference between the good and poor smellers. In general, the good
42
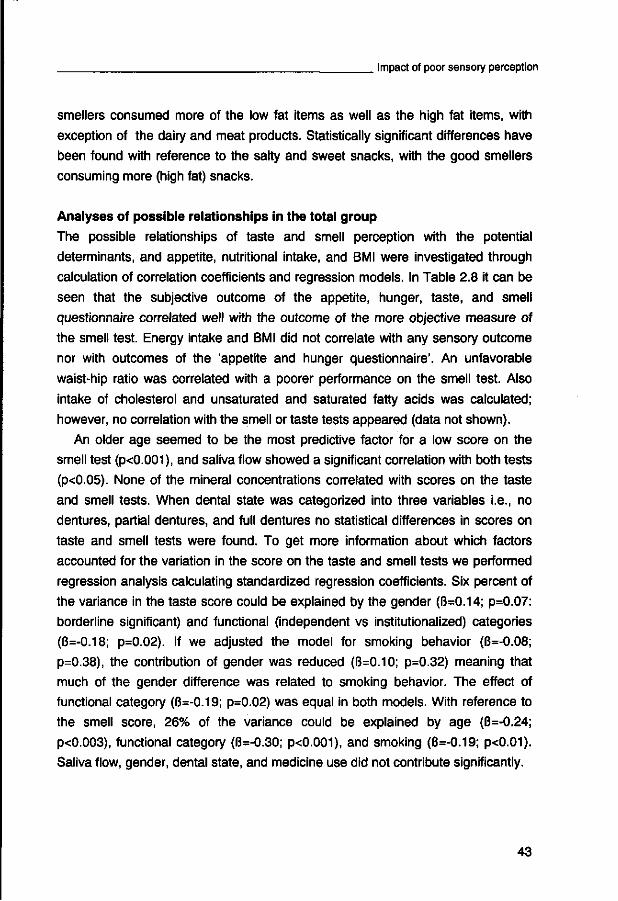
Impact of poor sensory perception
smellers consumed more of the low fat items as well as the high fat items, with
exception of the dairy and meat products. Statistically significant differences have
been found with reference to the salty and sweet snacks, with the good smellers
consuming more (high fat) snacks.
Analyses of possible relationships in the total group
The possible relationships of taste and smell perception with the potential
determinants, and appetite, nutritional intake, and BMI were investigated through
calculation of correlation coefficients and regression models. In Table 2.8 it can be
seen that the subjective outcome of the appetite, hunger, taste, and smell
questionnaire correlated well with the outcome of the more objective measure of
the smell test. Energy intake and BMI did not correlate with any sensory outcome
nor with outcomes of the 'appetite and hunger questionnaire'. An unfavorable
waist-hip ratio was correlated with a poorer performance on the smell test. Also
intake of cholesterol and unsaturated and saturated fatty acids was calculated;
however, no correlation with the smell or taste tests appeared (data not shown).
An older age seemed to be the most predictive factor for a low score on the
smell test (p<0.001), and saliva flow showed a significant correlation with both tests
(p<0.05). None of the mineral concentrations correlated with scores on the taste
and smell tests. When dental state was categorized into three variables i.e., no
dentures, partial dentures, and full dentures no statistical differences in scores on
taste and smell tests were found. To get more information about which factors
accounted for the variation in the score on the taste and smell tests we performed
regression analysis calculating standardized regression coefficients. Six percent of
the variance in the taste score could be explained by the gender (13=0.14; p=0.07:
borderline significant) and functional (independent vs institutionalized) categories
(I3=-0.18; p=0.02). If we adjusted the model for smoking behavior (B=-0.08;
p=0.38), the contribution of gender was reduced (13=0.10; p=0.32) meaning that
much of the gender difference was related to smoking behavior. The effect of
functional category (I3=-0.19; p=0.02) was equal in both models. With reference to
the smell score, 26% of the variance could be explained by age (6=-0.24;
p<0.003), functional category ((3=-0.30; p<0.001), and smoking (6=-0.19; p<0.01).
Saliva flow, gender, dental state, and medicine use did not contribute significantly.
43
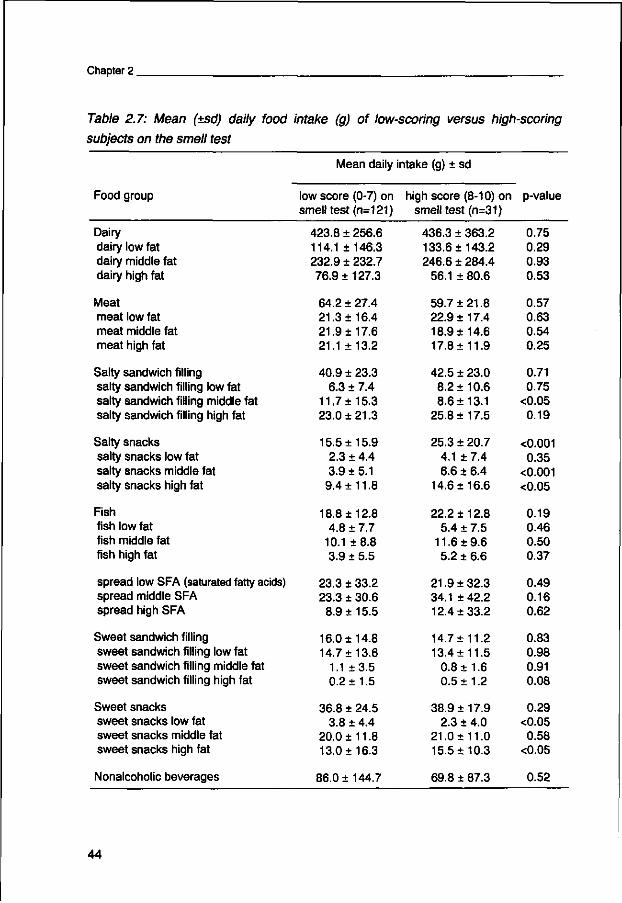
Chapter 2
Table 2.7: Mean (±sd) daily food intake (g) of low-scoring versus high-scoring
subjects on the smell test
Food group
Dairy dairy low fat dairy middle fat dairy high fat
Meat meat low fat meat middle fat meat high fat
Salty sandwich filling salty sandwich filling low fat salty sandwich filling middle fat salty sandwich filling high fat
Salty snacks salty snacks low fat salty snacks middle fat salty snacks high fat
Fish fish low fat fish middle fat fish high fat
spread low SFA (saturated fatty acids) spread middle SFA spread high SFA
Sweet sandwich filling sweet sandwich filling low fat sweet sandwich filling middle fat sweet sandwich filling high fat
Sweet snacks sweet snacks low fat sweet snacks middle fat sweet snacks high fat
Nonalcoholic beverages
Mean daily intake (g) ± sd
low score (0-7) on smell test (n=121)
423.8 ± 256.6 114.1 ±146.3 232.9 ± 232.7 76.9 ±127.3
64.2 ± 27.4 21.3 ±16.4 21.9 ±17.6 21.1 ±13.2
40.9 ± 23.3 6.3 ± 7.4
11.7 ±15.3 23.0 ±21.3
15.5 ±15.9 2.3 ± 4.4 3.9 ±5.1 9.4 ±11.8
18.8 ±12.8 4.8 ± 7.7
10.1 ±8.8 3.9 ±5.5
23.3 ± 33.2 23.3 ± 30.6 8.9 ±15.5
16.0 ±14.8 14.7 ±13.6
1.1 ±3.5 0.2 ±1.5
36.8 ± 24.5 3.8 ± 4.4
20.0 ±11.8 13.0 ±16.3
86.0 ±144.7
high score (8-10) on smell test (n=31)
436.3 ± 363.2 133.6 ±143.2 246.6 ± 284.4
56.1 ± 80.6
59.7 + 21.8 22.9 ±17.4 18.9 ±14.6 17.8+11.9
42.5 ± 23.0 8.2 ±10.6 8.6 ±13.1
25.8 ±17.5
25.3 ± 20.7 4.1 +7.4 6.6 + 6.4
14.6 ±16.6
22.2 ±12.8 5.4 + 7.5
11.6 + 9.6 5.2 ± 6.6
21.9 ±32.3 34.1 ± 42.2 12.4 ±33.2
14.7 ± 11.2 13.4± 11.5
0.8+1.6 0.5 + 1.2
38.9 ±17.9 2.3 + 4.0
21.0 ±11.0 15.5 ±10.3
69.8 + 87.3
p-value
0.75 0.29 0.93 0.53
0.57 0.63 0.54 0.25
0.71 0.75
<0.05 0.19
<0.001 0.35
<0.001 <0.05
0.19 0.46 0.50 0.37
0.49 0.16 0.62
0.83 0.98 0.91 0.08
0.29 <0.05 0.58
<0.05
0.52
44
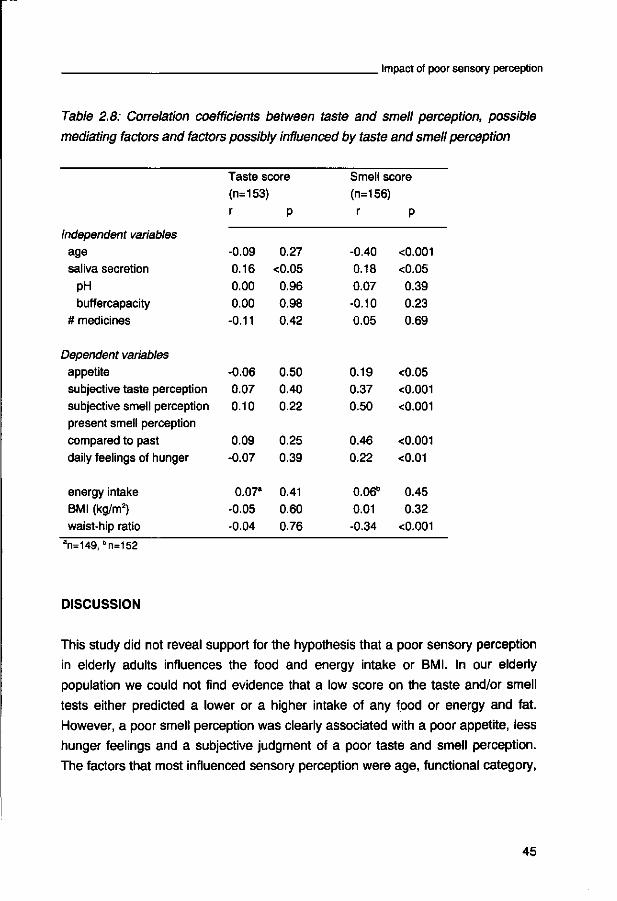
Impact of poor sensory perception
Table 2.8: Correlation coefficients between taste and smell perception, possible
mediating factors and factors possibly influenced by taste and smell perception
Independent variables age saliva secretion
pH
buffercapacity # medicines
Dependent variables appetite subjective taste perception subjective smell perception present smell perception compared to past daily feelings of hunger
energy intake BMI (kg/m2) waist-hip ratio
Taste score
(n=153) r
-0.09 0.16 0.00 0.00
-0.11
-0.06 0.07 0.10
0.09 -0.07
0.07a
-0.05 -0.04
P
0.27
<0.05 0.96 0.98 0.42
0.50 0.40 0.22
0.25 0.39
0.41 0.60 0.76
Smell score (n=156) r
-0.40 0.18 0.07 -0.10 0.05
0.19 0.37 0.50
0.46 0.22
0.06" 0.01 -0.34
P
<0.001 <0.05 0.39 0.23 0.69
<0.05 <0.001 <0.001
<0.001 <0.01
0.45 0.32
<0.001 an=149, bn=152
DISCUSSION
This study did not reveal support for the hypothesis that a poor sensory perception
in elderly adults influences the food and energy intake or BMI. In our elderly
population we could not find evidence that a low score on the taste and/or smell
tests either predicted a lower or a higher intake of any food or energy and fat.
However, a poor smell perception was clearly associated with a poor appetite, less
hunger feelings and a subjective judgment of a poor taste and smell perception.
The factors that most influenced sensory perception were age, functional category,
45
Chapter 2
and smoking. Medicine use, dental state, and saliva composition were of less
importance. Any gender effects were related to differences in smoking behavior.
Although it is widely assumed that smell and/or taste dysfunctions adversely
influence dietary intake and nutritional status, fundamental relationships between
chemosensory dysfunctioning and dietary behavior are lacking31. In Mattes and
colleagues' studies3132, patients with chemosensory disorders were not
automatically at substantial nutritional risk. However, the contrary also has been
shown: studies of Schiffman (and Warwick121415) revealed that especially sick
elders with losses in taste and olfactory acuity showed a reduced intake of foods.
Duffy and associates24 found that olfactory dysfunction indicated a nutrient intake
profile with a higher risk for cardiac disease, that is, higher intake of sweets and
less intake of low-fat milk products and a lower preference for foods with a
predominant sour/bitter taste or pungency. Griep et al.25 indicated that lower serum
levels of some parameters of nutritional status correlated with a poorer sense of
smell.
Adding the results of our study to the present literature, we might now conclude
that an impaired taste and smell perception in elderly adults probably influences
the quality of life due to the loss of appetite, less hunger feelings, and the
perception of a more bland taste of most foods. It does not automatically influence
the nutritional intake or status. The group of sick elderly patients might be
considered an exception.
In our study we used a food frequency questionnaire with a reference period of
one month to measure food intake. This questionnaire, which focuses especially on
energy, fats, fatty acids, cholesterol, and special food groups, has among others
been validated in elderly subjects against a dietary history2833. It was shown that
this questionnaire only showed very small errors contributing to the total error and
that individual means only differed between 0-10% of the reference means.
Therefore, we think that this list is an appropriate tool in classifying elderly people
according to their food intake.
We found a consistent distinction between the scores at the smell test and the
taste test of the independently living subjects versus the institutionalized elders.
This was expected, because the latter group is not only chronologically older but
also seems to be biologically older. From literature we already know that a decline
in taste and smell perception occurs as a part of the normal physiological aging
46

Impact of poor sensory perception
process4, partly due to degeneration of taste buds and nerves16. The influence of
age and functional category on sensory perception reflected in the regression
coefficients is more pronounced in the scores on the smell test. This finding is in
line with findings in literature where smell deficits were mentioned as a more
serious problem than taste deficits with increasing age53435. In general, gender
comparisons reveal that from childhood on, women score higher on sensory tests
than men6. The mean outcomes of our smell and taste tests reveal differences
between the two sexes, but the regression models show that gender differences in
this study population are related to differences in smoking behavior between men
and women.
Saliva composition, dental state, illnesses, and medicine use seemed to be of
less influence on the smell and taste scores. Although evidence exists that
medicines and illnesses can account for the loss in taste and smell perception16, we
did not find a clear relation. We especially coded the medicines known to influence
taste and smell perception, and through this coding we even found a considerable
number of people using these medicines. An explanation for no relation between
medicine use and taste and smell perception could be the fact that we did not deal
with (very) sick people and that therefore the dosages used were too low to
influence sensory perception in a considerable way.
The influence of the dental state was also not proven, although the prevalence
of people with full dentures was high in our study. Having full dentures does not of
course automatically imply that dental problems exist. There is, however, abundant
evidence that dentition state and chewing and swallowing ability are correlated in
the sense that persons with full dentures are having more problems with chewing
and swallowing. Moreover elderly people with these problems shift to dietary
restrictions with respect to 'hard to chew' food items173637. Reports in literature
suggest that dentition influences taste perception34. In this study the number of
elders with no dentures being so low, may create an analysis problem. The role of
the dental state in chewing and swallowing abilities combined with the release of
flavors should be investigated more extensively.
A correlation was found between the unstimulated saliva flow and both the
subjective feeling of a dry mouth and the scores on the sensory tests. Also in
literature it is stated that a reduced salivary flow goes together with a feeling of
dryness, alterations in taste, and difficulty with chewing and swallowing38.
47
Chapter 2
Weiffenbach et al.39 however question the search for a salivary factor responsible
for the maintenance of taste. In the present study, no correlation was found
between the scores on the sensory tests and the composition of saliva, although
there seemed to be a trend for the institutionalized subjects to have a higher
concentration of certain components. An explanation might be that, next to
unstimulated saliva flow, the stimulated flow also is lower in institutionalized elders.
This means a lower production of water and therefore a higher concentration of the
components. Thorselius and colleagues40 did not find any age-related alterations in
the stimulated flow. Furthermore, mixed results have been found regarding a
possible influence of the saliva composition on sensory aspects212341.
Next to the taste and smell scores institutionalized elders also scored lower on
the questionnaire about appetite, hunger feelings and subjective judgment of taste
and smell perception. Apart from the age-related factors involved, less physical
activity and functioning could be an explanation. Physical functioning could be
partially reflected by our division of subjects into two categories independently
living and institutionalized. We unfortunately do not have any data on physical
activity, but this will be investigated in our next study in a group of frail elders.
As far as we know, this is the first time that such an extended questionnaire
assessing appetite, hunger, and subjective feelings about sensory perception has
been used. A correlation of these items with smell perception was evident in the
total group. The internal validity of the questionnaire was moderate to high, which
supports the expectation that this questionnaire is a promising new measure in
nutrition sciences. External validation of this questionnaire should take place in a
future study.
In our study we used a slightly modified and translated identification part of the
CCCRC test26. The other part of this test (threshold part) does have limitations in
the reliability; the identification part may test some cognitive functioning. With
respect to the latter we tried to overcome this with special answer forms that
included all the answers next to some 'distracters'. From studies of Cain et al.2642 it
was revealed that the identification part of this test had a slightly better resolution
than the threshold part, meaning that identification may have a higher sensitivity.
They furthermore argued that the identification part would generally be the choice
on grounds of ease of use, speed of administration and resolution between
patients. Since both threshold and identification may at least have equal limitations
48
Impact of poor sensory perception
in reliability, we think that use of the identification test was sufficient. We adapted
the test with respect to the smell 'wintergreen' which is not familiar in The
Netherlands, and used onion instead. The original test correlated highly with the
extensively validated UPSIT test42. We do not have evidence that the transition of
wintergreen to onion (both prickling odorous) next to the translation to the Dutch
language might have changed the test considerably.
Unfortunately, a validated simple taste test meeting our demands was not
available. We therefore developed our own taste test and incorporated this test in
the study after extensive pilot testing. With this test we did not aim to cover the
whole spectrum of the taste perception field; we only aimed at distinguishing
between elders with a good taste perception and elderly subjects with a poorer
performance.
In order to study the determinants of sensory functioning and its impact on the
nutritional intake in an apparently healthy elderly population we needed a
heterogeneous group of elders with variation in the scores on the sensory tests,
and with variation in the possible mediating factors and in nutritional and health
status. The results show that our group of independently living elderly differed in
quite some aspects of our group of institutionalized elders, despite the fact that an
extremity of the distribution (sick people) was missing. Differences in taste and
smell perception could be explained by age-related factors and smoking. A poor
performance on the sensory tests was related to a poor appetite and less hunger
feelings but not to a low energy intake or low BMI. The two latter variables might be
more influenced by physical activity.
In future research, physical activity should be taken into account. Another next
step should be a longitudinal study in which the direct consequences of a decline in
taste and smell perception are investigated. Moreover, sources should be used on
how to deal with a poor taste and smell perception and a (consequently) poor
appetite, with the aim of improving the quality of elderly life, as the impact on the
nutritional intake and nutritional state may not be alarming in apparently healthy
elderly people.
ACKNOWLEDGMENTS
We thank Mr. Jaap van Aarst of the Foundation for Social Welfare for Elderly People and the directors of the institutes Heidestein, Het Beekdal, De Klinkenberg, Beringhem,
49

Chapter 2.
Bethanie, and De Nudehof for helping to recruit our elderly subjects. We also thank
Desiree Heerstrass, Anneke Nales, Vera de Groof, and Francesca Erdelmann for their
assistance in the data collection; Saskia Meyboom for guidance on the food intake
measurements; Annette Stafleu for developing the base of the appetite questionnaire,
and Jan Burema for his statistical advice. This research was supported by the Dutch
Dairy Foundation on Nutrition and Health, Maarssen, The Netherlands.
References
1. Stafleu A: Family resemblance in fat intake, nutrition attitudes and beliefs: a study among three generations of women. 1-189.1994. Wageningen Agricultural University. 2. Krondl M, Lau D, Yurkiw MA, Coleman PH: Food use and perceived food meanings of the elderly. J Am Diet Assoc. 1982;80:523-529. 3. Murphy C: Nutrition and chemosensory perception in the elderly. Crit Rev Food Sci Nutr 1993;33:3-15. 4. Ship JA, Weiffenbach JM: Age, gender, medical treatment, and medication effects on smell identification. J Gerontol 1993;48:M26-M32. 5. Stevens JC, Bartoshuk LM, Cain WS: Chemical senses and aging: taste versus smell. Chem Senses; 1984. 1984;9:167-179. 6. Doty RL, Shaman P, Kimmelman CP, Dann MS: University of Pennsylvania Smell Identification Test: a rapid quantitative olfactory function test for the clinic. Laryngoscope 1984;94:176-178. 7. de Graaf C, van Staveren WA, Burema J: Psychophysical and psychohedonic functions of four common food flavours in elderly subjects. Chem Senses 1996;21:293-302. 8. de Graaf C, Polet P, van Staveren W.A.: Sensory perception and pleasantness of food flavors in elderly subjects. J Gerontol 1994;49:93-99. 9. de Jong N, de Graaf C, van Staveren WA: Effect of sucrose in breakfast items on pleasantness and food intake in the elderly. Physiol Behav 1996;60:1453-1462. 10. Murphy C: Age-Associated changes in taste and odor sensation, perception, and preference. Nutr of the Elderly 1992;29:79-87. 11. Murphy C, Withee J: Age-related differences in the pleasantness of chemosensory stimuli. Psychol Aging 1986;1:312-318. 12. Schiffman SS, Warwick ZS: Effect of flavor enhancement of foods for the elderly on nutritional status: food intake, biochemical indices, and anthropometric measures. Physiol Behav 1993;53:395-402. 13. Weiffenbach JM, Cowart BJ, Baum BJ: Taste intensity perception in aging. J Gerontol 1986;41:460-468. 14. Schiffman SS: Taste and smell in disease (2nd of two parts) N Engl J Med 1983;308:1337-43. 15. Schiffman SS: Taste and smell in disease (1st of two parts) N Engl J Med 1983;308:1275-79. 16. Schiffman SS: Perception of taste and smell in elderly persons. Crit Rev Food Sci Nutr 1993;33:17-26. 17. Chauncey HH, Muench ME, Kapur KK, Wayler AH: The effect of the loss of teeth on diet and nutrition. IntDentJ 1984;34:98-104. 18. de Braat C: De relatie tussen (slechte) orale gezondheid en voeding, in Stasse-Wolthuis M, Geerts ACW (eds): Voeding van ouderen. Alphen aan den Rijn/Brussel, Samsom Stafleu; 1989:62-72.
50

Impact of poor sensory perception
19. Kaplan AR, Glanville EV, Fischer R: Cumulative effect of age and smoking on taste sensitivity in males and females. J Gerontol 1965;20:334-337. 20. Percival RS, Challacombe SJ, Marsh PD: Flow rates of resting whole and stimulated parotid saliva in relation to age and gender. J Dent Res 1994;73:1416-1420. 21. Zoumas-Morse C, Guinard JX: Effect of saliva flow and composition on perception of food taste and texture. Appetite 1995;24:202-202. (Abstract) 22. Laurin D, Brodeur JM, Leduc N, Bourdages J, Lachapelle D, Vallee R: Nutritional deficiencies and gastrointestinal disorders in the edentulous elderly: a literature review. J Can Dent Assoc 1992;58:738-740. 23. Baum BJ: Saliva secretion and composition. Front Oral Physiol 1987;6:126-134. 24. Duffy VB, Backstrand JR, Ferris AM: Olfactory dysfunction and related nutritional risk in free-living, elderly women. J Am Diet Assoc 1995;95:879-884. 25. Griep Ml, Verleye G, Franck AH, Collys K, Mets TF, Massart DL: Variation in nutrient intake with dental status, age and odour perception. Eur J Clin Nutr 1996;50:816-825. 26. Cain WS, Gent JF, Goodspeed RB, Leonard G: Evaluation of olfactory dysfunction in the Connecticut Chemosensory Clinical Research Center. Laryngoscope 1988;98:83-88. 27. Lowry DH, Rozebrough NJ, Farr AL, Randall RJ: Protein measurement with the folin phenol reagent. J Biol Chem 1951 ;193:265-275. 28. Feunekes GIJ, van Staveren WA, de Vries JHM, Burema J, Hautvast JGAJ: Relative and biomarker-based validity of a food-frequency questionnaire estimating intake of fats and cholesterol. Am J Clin Nutr 1993;58:489-496. 29. Stichting Nederlands Voedingsstoffenbestand. Dutch Nutrient Data Base. 1987. The Hague, the Netherlands, Voorlichtingsbureau voor de Voeding. 30. Fidanza F: Nutritional status assessment: a manual for population studies, New York, Chapman and Hall; 1991. 31. Mattes RD, Cowart BJ, Schiavo MA, et al: Dietary evaluation of patients with smell and/or taste disorders. Am J Clin Nutr 1990;51:233-240. 32. Mattes RD, Cowart BJ: Dietary assessment of patients with chemosensory disorders. J Am Diet Assoc 1994;94:50-56. 33. van Staveren WA, Feunekes Gl, Elburg L, Erdelman F: Validity of dietary questionnaires in studies on nutrition and heart disease, in Somogyi JC, Biro G, Hotzel D (eds): Nutrition and cardiovascular risks, critical evaluation of survey methods. Basel, Bibl Nutr Dieta; 1992:47-58. 34. Chauhan J, Hawrysh ZJ, Gee M, Donald EA, Basu TK: Age-related olfactory and taste changes and interrelationships between taste and nutrition. J Am Diet Assoc 1987;87:1543-1550. 35. Bartoshuk LM, Weiffenbach JM: Chemical senses and aging, in Schneider EL, Rowe JW (eds): Handbook of the biology of aging. San Diego, Academic Press; 1990:429-443. 36. Demers M, Brodeur JM, Simard P, Vallee R: Problems associated with edentulism among the elderly. J Can Dent Assoc 1986;52:1019-1022. 37. Brodeur JM, Laurin D, Vallee R, Lachapelle D: Nutrient intake and gastrointestinal disorders related to masticatory performance in the edentulous elderly. J Prosthet Dent 1993;70:468-473. 38. Kaplan MD, Baum BJ: The functions of saliva. Dysphagia. 1993;8:225-229. 39. Weiffenbach JM, Fox PC, Baum BJ: Taste and salivary function. Proc Natl Acad Sci USA 1986;83:6103-6106. 40. Thorselius I, Emilson CG, Osterberg T: Salivary conditions and drug consumption in older age groups of elderly Swedish individuals. Gerodontics. 1988;4:66-70. 41. Baum BJ: Evaluation of stimulated parotid saliva flow rate in different age groups. J Dent Res 1981;60:1292-1296. 42. Cain WS, Rabin MD: Comparability of two tests of olfactory functioning. Chem Senses 1989;14:479-485.
51

Effect of dietary supplements and physical
exercise on sensory perception, appetite, intake
and body weight in frail elderly? Submitted
Nynke de Jong
Marijke J.M. Chin A Paw
Cees de Graaf
Wija A. van Staveren
Chapter 3
This study investigated the effect of a 17-weeks intervention program with nutrient dense foods (enriched with vitamins and minerals at 25-100% of the Dutch RDA) and/or physical exercise in 159 frail elderly (46 men, 113 women, mean age: 78.7±5.6 years). Subjects were randomized over 4 groups: a) nutrition, b) exercise, c) both and d) control. Main outcome parameters were sensory perception (smell test and questionnaire), appetite (questionnaire), energy intake (3-day food record) and body weight (scale and DXA).
At baseline, moderate but significant correlations were found between appetite and energy intake (r=0.30, p<0.0001), between smell test and smell perception assessed by questionnaire (r=0.40, p<0.0001) and between lean body weight and energy intake (r=0.50, p<0.0001). Results after 17-weeks intervention revealed neither change in smell test scores (p=0.19) nor in appetite (p=0.17). A minimal positive effect of exercise compared to non-exercising groups on energy intake (difference: 0.5 MJ, p=0.05) was shown next to a preserving effect of exercise on lean body mass (+0.08 kg) compared to a decrease (-0.4 kg) in non-exercisers (p<0.02). Correlation between change in lean body mass and change in energy intake was 0.18 (p=0.05). It is concluded that the preserving effect on lean body mass in frail elderly due to 17-weeks of exercise is related to changes in energy intake. Changes are however small. The effect on energy intake is not influenced by a change in reported appetite or sensory perception. Nutrient dense foods were not able to improve any of the outcome parameters in this study.
INTRODUCTION
Aging is often associated with an impairment of health and nutritional status. The
onset and intensity of this process is not only determined by chronological age but
also by biological factors. These factors differ for each individual and therefore lead
to heterogeneity in the elderly population1. Researchers have made a distinction
between successful, normal and accelerated aging23. Within all these categories
the process of frailty may commence. Buchner and Wagner4 define frailty as a
state of reduced physiologic reserve associated with increased susceptibility to
disability. However, other more extensive or more confined definitions have also
been used5. Frailty is in most cases related to a diminished physical, cognitive,
emotional, sensory and/or social functioning6.
54
Sensory perception, appetite, intake, and body weight
An impairment in sensory functioning, like a reduced taste and smell perception
may have a negative impact on appetite and feelings of hunger, and thereby cause
a decrease in energy intake. Clear evidence, however, for the relationship between
an impaired taste and smell perception, a decreased appetite and food and energy
intake has not been found so far. A few studies confirmed this relationship,
especially in sick7"9 but also in healthy elderly10. Others failed to detect associations
between taste and smell perception, food acceptability and a substantial reduced
energy or nutrient intake in apparently healthy elderly1113. We were also not able to
demonstrate a clear association between appetite and food intake in apparently
healthy elderly people (Chapter 2).
Still, a good appetite is generally regarded as a sign of good health and a
decreasing willingness or acceptance of food could be an early sign of the process
of worsening health14. Since this process might be one of the indicators of frailty,
attendance to this problem is, especially in the frail, of major importance. To
improve or maintain the quality of 'the frail elderly life' it is important to maintain a
sufficient appetite, and nutritional and health status or if necessary improve it.
Adaptation of physical exercise, thereby increasing energy expenditure and hence
appetite and total dietary intake, moreover assurance of a high nutritional quality of
the diet of elderly people in order to combat any potential deficiencies are believed
to be key factors in interfering in the process of frailty15"17. Changes in the taste and
smell system with age may be interrelated to nutrient intake18. Only a few studies in
frail elderly have been performed to investigate the effects of either physical
exercise and/or nutritional supplements on several indicators of nutritional and
health status1511619"21. However, none of these studies has focused on the effects of
these interventions on sensory factors (in relation to), appetite, energy intake and
(lean) body weight.
We hypothesized that frailty is (partially) mediated by an impaired sensory
functioning, decreased appetite and hunger feelings and, therefore, a marginal
nutritional intake. This in the end may result in a decreasing body weight. The
current study is part of a large scale intervention trial in frail elderly and was
designed to investigate the effect of the consumption of micronutrient dense
products, a physical exercise program or a combination of the factors, mentioned.
Emphasis is placed on the measurement of appetite and taste and smell
perception as predictors for energy intake.
55
Chapter 3
SUBJECTS AND METHODS
Subjects
A total of 7080 letters were sent to elderly living in the neighborhood of
Wageningen, The Netherlands, resulting in a study population of 217 free-living
frail elderly, who were interested and met the selection criteria. Figure 1.2
summarizes the process of subject selection for the trial. To fulfill the criteria 'frail'
subjects should require a kind of health care, such as home care or meals-on-
wheels. The main other selection criteria were: age (70 years or older), inactivity
(not regularly participating in physical activities of moderate to high intensity), body
mass index: BMIs25 kg/m2 (based on self-reported weight and length) or recent
involuntary weight loss, no use of multivitamin supplements and ability to
understand the study procedures.
Before the start of the baseline measurements subjects gave their written
informed consent. The study protocol was approved by the external Medical Ethical
Committee of the Division of Human Nutrition and Epidemiology of the
Wageningen Agricultural University. Pre- and postmeasurement(s) were available
of 165 subjects. Reasons for drop out (n=52, 24%) were mainly health problems,
including (terminal) disease, hospital stay, recent falling and/or fracturing. Another
four subjects were excluded because time between pre- and postmeasurement
was less than 17 weeks due to hospitalization. Two subjects were hospitalized in
the week of postmeasurements (sudden heart attack) and ended up with
incomplete figures. This resulted in a population of 159 subjects.
Design
Enrollment took place between January (first starting group) and June 1997 (sixth
starting group), depending on the area of residence. Within each starting group
subjects were randomly assigned to one of the four intervention groups:
a. nutrition: nutrient dense products + social program;
b. exercise: regular products + exercise program;
c. combination: nutrient dense products + exercise program;
d. control: regular products + social program.
The intervention period was 17 weeks. The data were collected at baseline (week
0) and after 17 weeks (week 18).
56
. Sensory perception, appetite, intake, and body weight
Nutrient dense foods
The nutrient dense products as well as the regular products comprised of two
categories: a fruit based category and a dairy category. All subjects were asked to
consume daily one product out of each category (one dairy product and one fruit-
based product per day). Within the two categories several products were
developed. Availability of a variety of products was intended to help to prevent
boredom and to increase acceptability of the enriched products. Since these foods
had a limited shelf-life, each participant got weekly a new cooled container with
fresh stock, containing the following:
fruit based category - 4 portions of apple/berry/grape juice (portion size: 100 grams);
- 4 portions orange/peach juice (100 grams);
- 2 portions of apple compote (100 grams);
- 2 portions of apple/peach compote (100 grams).
dairy category - 4 portions of vanilla custard (100 grams);
- 4 portions of strawberry yogurt (100 grams);
- 4 portions of vanilla/apple yogurt (100 grams);
- 4 portions of vanilla/mixed fruit quark (75 grams due to the 'satiating'
effect of quark).
Due to daily consumption of two nutrient dense products, subjects in the nutrition
group and combination group got -100% of the Dutch RDA 22;23 of the vitamins D,
E, B,, B2, B6, folic acid, B12, C and ~ 25-100% of the Dutch RDA of the following
minerals: calcium (25%), magnesium (25%), zinc (50%), iron (50%), iodine (100%)
on top of their normal intake (see also appendix). Subjects in the control group and
the exercise group got the natural amount of the regular products on top of their
normal intake (amount of vitamins and minerals in regular products negligible
compared to the nutrient dense products). The energy content of the nutrient
dense products was the same as the regular products. Consumption of two
products a day delivered a mean energy intake of -0.48 MJ/day.
Exercise program
The main objective of the exercise program was maintenance/improvement of
mobility and performance of daily activities essential for independent functioning
by maintenance of versatility in movement. Emphasis was placed on skill training;
muscle strength, co-ordination, flexibility, speed and endurance were trained by
exercises such as walking, stooping and chair stands thereby improving
57
Chapter 3 .
performance of daily activities. Different materials were used, for example balls,
ropes, weights, dynabands. Group sessions were organized twice a week for 45
minutes and were of moderate, gradually increasing intensity. The sessions were
co-ordinated by skilled teachers and supervised by one of the project leaders
(MCAP). In order to guarantee uniformity all sessions were extensively rehearsed
with all teachers together, moreover an instruction video and manual was made in
advance. A social program was organized as a control for the exercise program, in
order to check for possible effects of attention. Sessions of 90 minutes were
organized once every two weeks by a skilled creative therapist. This program
focused on creative activities, social activities and lectures about topics of interest
for elderly. Transport to and from all the sessions was arranged.
General and activity questionnaires
Questions in the general questionnaire revealed information about age, sex, marital
status, education, social activities, living conditions, illness, medicine use, dental
state, chewing and swallowing problems and former and present smoking habits.
Physical activity was assessed using a validated questionnaire based on the
Physical Activity Scale for Elderly (PASE)2425.
Dietary intake
At baseline and in the last week of intervention a three day (two weekdays and one
weekend day; non-consecutive) estimated dietary record was collected by three
trained dietitians. Subjects having difficulties with writing could make use of a voice
tape recorder. In home face-to-face interviews were organized before in order to
explain and afterwards to revise and correct the diaries. Portion sizes were
recorded in household measures, whereby frequently used household measures
were weighed afterwards. Food consumption data were coded (with a frequent
cross checking by all three dietitians) after which energy and nutrients were
calculated with the computerized Dutch Food Composition Table of 199726. The
energy and macronutrient content of the intervention food products were included
in the food consumption data.
58

. Sensory perception, appetite, intake, and body weight
Appetite, hunger, subjective taste and smell questionnaire
Subjects were asked to respond to a total of 29 questions about their feelings of
appetite and hunger and about their taste and smell perception27. After reading the
question subjects had to score on a 5 point Likert scale with verbally labeled
answering categories. An example of a 'question' is the following statement: 'In
former days my appetite was: 1. much better than nowadays, 2. better than
nowadays, 3. the same as nowadays, 4. worse than nowadays, 5. much worse
than nowadays'. A higher score corresponded to a more positive feeling about their
taste and smell perception, a better appetite and more feelings of hunger. Initially
five variables were calculated:
1. present taste perception (8 items; range: 8-40);
2. present smell perception (3 items; range: 3-15);
3. appetite (6 items; range: 6 - 30);
4. daily feelings of hunger (9 items; range: 9-45);
5. present smell perception compared to the past (3 items; range: 3-15).
Smell identification test
The smell identification test, was based on the Connecticut Chemosensory Clinical
Research Center (CCCRC) test2829. The test comprised ten 40 ml plastic jars with 2
mm holes in their lids, containing the following stimuli: baby powder, chocolate,
cinnamon, coffee, mothballs, peanut butter, soap, ammonia, onion (instead of the
original item wintergreen, which is not familiar in the Netherlands), Vicks Vapo-
Steam. To reduce cognitive bias, subjects selected the answer from a list which
consisted of the 10 test items and 10 distracters. The items were presented in
random order. Scores were calculated as the number of correct answers (minimal
0; maximal 10), with answers like 'do not know' or 'smells nothing' coded as
incorrect.
Body weight and height
All anthropometric measurements were performed in the morning with subjects
wearing underwear. Body weight was measured to the nearest 0.01 kg using a
digital scale (ED-6-T; Berkel, Rotterdam, The Netherlands). Height was measured
to the nearest 0.001 m using a wall-mounted stadiometer. Lean body mass data
59
Chapter 3
were obtained with DXA measurements (see also chapter 6). Body mass index
was calculated as weight in kilograms divided by height in meters squared30.
Statistical analysis
Data were analyzed using the statistical program SAS (Statistical Analysis
Program, version 6, Cary, NC: SAS Institute Inc., 1990). Means ± standard
deviations (sd) of baseline values were calculated per intervention group for the
primary outcome variables. Absolute changes ± sd per intervention group were
calculated and compared with each other by ANOVA (analysis of variance).
Differences were tested with Tukey's procedure. A multiple regression model was
used to determine the effect of both interventions and a possible interaction on the
change in outcome variables. Since no interaction occurred between nutrition and
exercise only these two independent variables were included in the model.
Pearson correlation coefficients were used to calculate relationships in the baseline
data between scores on the smell test, energy intake, body weight and outcomes
of the questionnaire on appetite, hunger and sensory perception. The internal
validity of this latter questionnaire was tested by calculating Cronbach's a. In order
to investigate interrelationships among the questions on this list a principal
components analysis with varimax rotation was used. Two-tailed p-values were
considered statistically significant at p<0.05.
RESULTS
Baseline characteristics
In Table 3.1 baseline characteristics of the four intervention groups are presented.
Approximately, 70% of the participants were women. Mean age of the study
population was 79 years and mean BMI was 24.5 kg/m2. One or more chronic
diseases were present in at least 91% of the population. The majority was living
alone. Only one quarter of the participants reported chewing problems, while at
least three quarter complained of a dry mouth. Complete or partial dentures were
found in 85% of the participants.
60
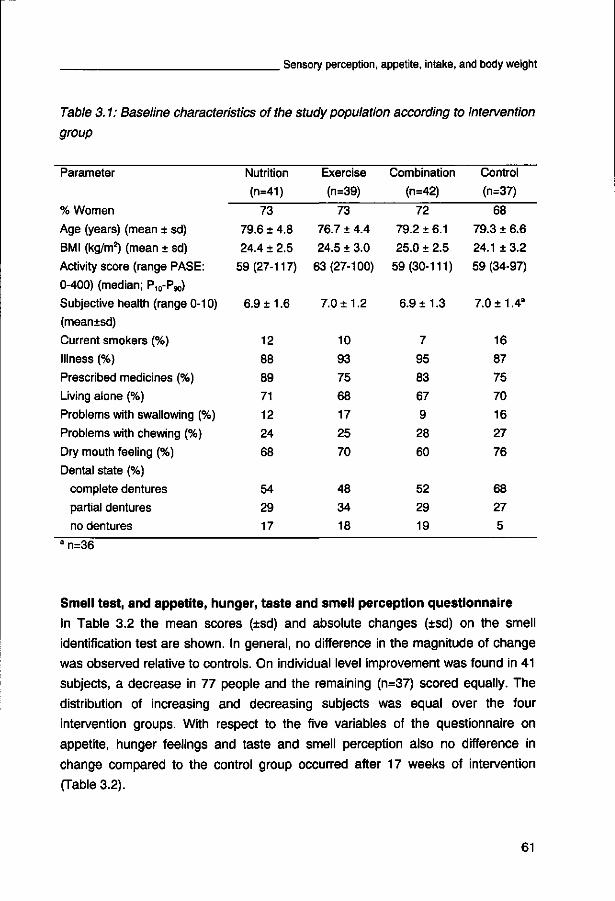
Sensory perception, appetite, intake, and body weight
Table 3.1: Baseline characteristics of the study population according to intervention
group
Parameter
% Women
Age (years) (mean + sd)
BMI (kg/m2) (mean ± sd)
Activity score (range PASE:
0-400) (median; P -Pgo)
Subjective health (range 0-10)
(mean±sd)
Current smokers (%)
Illness (%)
Prescribed medicines (%)
Living alone (%)
Problems with swallowing (%)
Problems with chewing (%)
Dry mouth feeling (%)
Dental state (%)
complete dentures
partial dentures
no dentures
Nutrition
(n=41)
73
79.6 ± 4.8
24.4 ± 2.5
59(27-117)
6.9 ±1.6
12
88
89
71
12
24
68
54
29
17
Exercise
(n=39)
73
76.7 ± 4.4
24.5 ± 3.0
63(27-100)
7.0 ±1.2
10
93
75
68
17
25
70
48
34
18
Combination
(n=42)
72
79.2 ± 6.1
25.0 ± 2.5
59(30-111)
6.9 ±1.3
7
95
83
67
9
28
60
52
29
19
Control
(n=37)
68
79.3 ± 6.6
24.1 ± 3.2
59 (34-97)
7.0 ± 1 .4"
16
87
75
70
16
27
76
68
27
5
n=36
Smell test, and appetite, hunger, taste and smell perception questionnaire
In Table 3.2 the mean scores (±sd) and absolute changes (±sd) on the smell
identification test are shown. In general, no difference in the magnitude of change
was observed relative to controls. On individual level improvement was found in 41
subjects, a decrease in 77 people and the remaining (n=37) scored equally. The
distribution of increasing and decreasing subjects was equal over the four
intervention groups. With respect to the five variables of the questionnaire on
appetite, hunger feelings and taste and smell perception also no difference in
change compared to the control group occurred after 17 weeks of intervention
(Table 3.2).
61
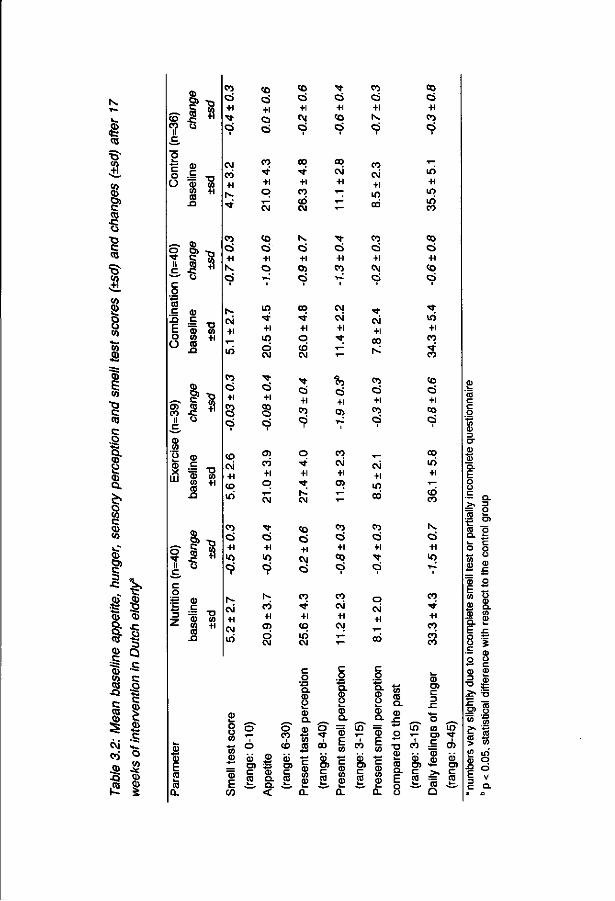
I TO
jfi
8 TO "g C TO
3 2 o o (0
co •*-•
^ CD
S « • Q C
TO C
.o & a CO
C> O co c co to
c
CO
C? 3 -C
.a* • A
o. TO Co
. C
0> to TO • Q
C TO CO
§ c\i co
•32 •Q .TO K
CO
t3 3
Q .c c .o A
c
1 .c s ~
o 3 co 9? k
to c J3 E o O
ST CO
ii
c
CO CJ
CD
H I
o" n c c o
z
CD 4—' CD
E CO k_ CO
a.
CD c "55 CO CO
03
1? CO
• c u
CD
_c "55 co CO
JD
to
CD
"55 CO CO
J3
CO +1
•Q
8
• a (0 +i
T3 CO +1
| a u
c « o .£
O "CD CO CO
? ! S —' o c o
to C» +i o ci
C O
+i o
to o +1 o
lO
+1 LO
o
C M
M -
ci + 1
C O
+1
o
o +1
o
CO
+ 1
C D
O CM
O CJ CO
® CD
to ci + 1
CM
C)
CO
+ 1
C O to C M
d +1 o> ci
co •<t
+i o CO CM
Ci +1
CO
o
o + 1
C M
to ci +i
C M Ci
C O
+ 1
C O
l O CM
c o a. CD o i_ CD Q .
O C O
<D O
to "T CO C O
CD O) &
CD £ £ S : CO Q . E - i ^ Q .
C O <
C> +1
to o*
C O
c\i +i
ci +i co
CM
CM
+ 1
Ci +1
C O
CM
+ 1
CO ci +i
C O
Ci
C O
CM
+ 1
CM
C
o Q . CD U k_ CD Q .
"53 E co
CD
c CO
CD O ) c CO
CD • J c CO
CO C5
+1
ci
CO CM
+1 LO CO
CO ci +i
CM ci
•<fr
CM
+ 1
C O
co ci +i
C O Ci
C M
+1 Ifl C O
CO Ci +1
Ci
O C M + 1
C
o
!i & | "55 o E ~*
CD c CO CD Q . CO c CD C 0. cj
C O
o" + 1
C O
ci
C O
+ 1
C O
l O
C O o' +1 to Ci
in +1
C O
C O
to ci + 1
C O
Ci
C O
l O
+1
CO
K
Ci +1
C O
+ 1
C O
C O
co
CD t3) c 3
^^ o C O CO T - C3)
co £ CD
CD CD
CO = i> co
Q
CD 3 CT
S Q. E o u c
t 8 D) •c
CO o Q . ^
O o 4 - U
CO o
«i s S. (1) (A •5. £ E JZ
8 1 CD
B g CD CD
" 5 3
i> 1
• • « in CD a) o
g | d CO § v
c a.
. Sensory perception, appetite, intake, and body weight
In Table 3.3 the baseline score of the smell identification test is compared with the
outcomes of the 'appetite, hunger and smell' questionnaire at baseline. The smell
test score correlated (p<0.0001) with the answers on our smell perception
variables. Furthermore, the answers on appetite and daily feelings of hunger were
positively correlated (p<0.0002) with reported energy intake. No correlation
appeared between smell test score and energy intake (r=0.03, p=0.65).
At baseline, appetite was negatively correlated with a dry mouth feeling (r=-0.35,
p<0.0001) and problems with swallowing (r=-0.19, p=0.007). Problems with
chewing were not directly related to appetite (r=0.07, p=0.36), however, correlation
of appetite with number of teeth bordered on significance (r=0.25, p=0.06).
Table 3.3: Pearson correlation coefficients of baseline scores on appetite, hunger
and sensory perception versus energy intake and smell test in Dutch elderly
subjects
Parameter
Appetite
Perception of present taste
Perception of present smell
Present smell perception
compared to the past
Daily feelings of hunger
n
158
158
154
156
156
Energy intake
r
0.30
0.13
0.08
0.09
0.27
P
0.0001
0.07
0.27
0.23
0.0002
n
155
155
151
154
153
Smell score
r
0.06
0.11
0.40
0.32
0.08
P
0.44
0.15
0.0000
0.0001
0.26
Dietary intake
In Table 3.4 the mean baseline energy and macronutrient intakes (±sd) and their
17-wk changes (±sd) are presented per intervention group. No statistically
significant differences in baseline values nor in changes between the intervention
groups compared to the control group were found. At baseline 66% (n=104) of the
subjects had an energy intake below the Dutch Recommended Dietary Intakes22;23.
Concerning micronutrients on average 58% had intakes below these recommen
dations.
63
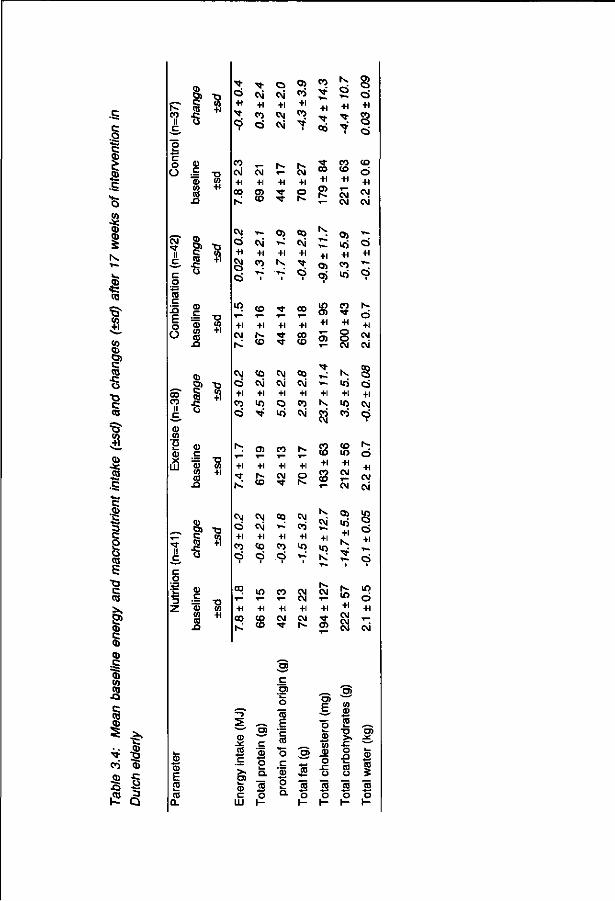
c .o c
I o
J2
i
I to
3 CO
O) c co •c 0
c to
:& CO Q P •ie to +3 .£ +-• c
.<D C
•*»• 3
s Q co 5
T3 C co >
8> 0) c OJ CD C
Q) CO co
•Q c co 0) §
• ^
cri 0)
3 .CO K
CD
3 <D
-c .CO 3 Q
CO CO
II _c_
CD CO
"0 k_
CD X
LU
5 II c c g
' k .
13 z
0 E CO CO Q.
I !
CD , C "CO CO CO
CO
•s
CD _ c "CD CO CO
J3
CD
1 0)
,C "55 CO CO
. 0 .
I 1 CD
"CD CO CO
. O
• o CO + 1
X I (0 +1
•a (0 +1
•a (O +1
c\i +1
CO
co , _ c\i CM +1 +1
co q> co
co
co
ci +1 CO O
cvi +1 10
•
+1
co
CM +1
CO O '
+1 CO CO
+1 CM
CM CVJ CO
0> co +1 co
r«-+1
• *
• *
CM +1 O 1^
o> CO *~ CM +1 +1
+1 +1 00 CO
CM CM + 1 + 1 o co 1 0 cvj
05 CO !•»•
CM CO +1
CO CM 1 - CM
+1 +1
CM CM
CO
+1
00
00 +1 a>
10
CM co CM 00 ^
co co
co co
CM »*• +1 10
CM
O' >-+1
05
+ 1 CO 10
+1 +1 1 - o O) o T- CM
+ 1 If)
CO CO CM
CO 1 0 + 1
CM 1 - CM
0 1 l O + 1
K
w + 1
CM CM CM
o +1
8
CO 0 + 1
CM CM
O + 1
1 ^ O + 1
CM CM
o' + 1
CM
0
+ 1 CM c\i
+1
IO 0 +1
—> ^ CD
&
CD C
HI
^ CO c B 0 k_
a. CO 0 H
c .2> 0
CO F c CO 0 c CD O a.
TO
5 (0 0 H
"55 F •5 a)
CD O O
CO 0 I -
(0 CD CO
-u .c 0 .0. k_ CO 0 CO 0
1-
^
as
to 0 H

. Sensory perception, appetite, intake, and body weight
Compared with two-thirds of the recommendations still 30% of the participants had
energy intakes below 6.3 MJ. With respect to macro- and micronutrients intake
percentages below two-third of the reference were varying from 3% for protein till
93% for vitamin D (in women; see also Chapter 4).
Since we found no evidence of an interaction between the two types of
interventions we could analyze the effect of each intervention separately: exercise
vs no-exercise and nutrient dense foods vs regular foods. In Table 3.5 the crude
regression coefficients are presented with their p-values.
Table 3.5: Estimates of the mean difference in change between the group
receiving nutrient dense products versus regular products, and the group receiving
exercise versus no exercise
Parameter
Change in energy intake (MJ) Change in protein intake (g) Change in carbohydrate intake (g) Change in fat intake (g) Change in score on smell test (range:0-l0) Change in hunger feelings (range:9-45) Change in appetite (range:6-30) Change in present taste perception (range:8-40) Change in present smell perception (range:3-15)
Nutrient dense foods
vs regular products
difference
-0.09
-3.40
-4.17
0.00
-0.39
-0.48
-0.72
-0.13
0.20
P 0.72
0.15
0.56
0.99
0.19
0.51
0.17
0.83
0.52
Exercise
vs no exercise
difference
0.48
1.61
14.23
3.73
0.06
0.24
-0.27
-0.63
-0.83
P 0.05
0.49
0.05
0.24
0.84
0.75
0.61
0.27
0.009
Exercise increased borderline significant energy intake and carbohydrate intake
(p=0.05) towards the non-exercisers, although no clear effect is shown on the
intake of the other macronutrients. When we corrected for baseline energy intake
and age the regression coefficient for energy declined slightly to 0.4 MJ. The
nutrient dense products compared to the group receiving regular products did not
reveal significant differences on the intake variables. Furthermore no clear effect of
the nutrition intervention nor of the exercise intervention was found on the changes
65
Chapter 3
in smell test score or items from the appetite, hunger and sensory perception
questionnaire.
Body weight
At baseline the correlation between body weight and energy intake (n=156) was
rather low 0.26 (p=0.0008), but this correlation coefficient was increased when only
lean body weight as measure of metabolic tissue was taken into account: r=0.50,
p=0.0001 (n=141). With respect to change in total body weight (measured by
scale) due to the interventions a mean decline was found in the non-exercising
groups of -0.3 kg, whereas a small increase of 0.2 kg was found in the exercising
groups (estimate of the difference between exercisers and non-exercisers: 0.5 kg,
p=0.041). Lean body mass (measured by DXA) declined even more in the non
exercising group (-0.4 kg) compared to a preserving effect of +0.08 kg in the
exercisers (estimate of the difference between the two groups 0.5 kg; p=0.014),
leaving room for a shift in lean body mass towards fat mass in the non-exercisers.
Correlation between change in energy intake and change in both total body weight
and lean body weight was moderate (r=0.18;p=0.02, respectively r=0.16; p=0.05).
DISCUSSION
This study revealed no relevant effect of the nutrition and exercise interventions on
appetite and sensory perception, but a small effect of exercise was found on
energy intake and lean body weight. A moderate but significant correlation between
change in energy intake and change in (lean) body weight indicated that effects of
interventions on these parameters may be related to each other. The small benefits
of exercise on energy intake and body weight could not be attributed to an increase
in reported appetite. The 17-weeks consumption of nutrient dense products did not
result in an increment in energy and macronutrient intake or body weight.
Calculations of the sample size with a power of 80% and a two-sided
significance level of 5% revealed that for detecting a mean change of 0.5±0.6MJ,
23 subjects per group were needed. This was certainly achieved in our study.
66
. Sensory perception, appetite, intake, and body weight
Effect of interventions on energy/food intake
In order to improve compliance the products were especially designed in small
portions, moreover they should easily be included in the daily meals and palatable
throughout the day. Consumption of two products revealed an extra 0.48 MJ per
day, but we observed that total energy intake did not increase due to the nutritional
intervention. The participants probably replaced their normal dessert or soft drink
for a dairy product respectively a fruit juice supplied during the study, despite the
possibility of consuming the products on top of their normal intake. This indicates
that our supplements fitted remarkably well in the daily eating pattern of elderly and
that they maintained their dietary pattern and regulated their food intake in this
way.
With respect to subjects participating in the exercise program they might have
been in need of extra energy or nutrients to maintain in energy balance. We found
a small, borderline significant increase in energy intake of the exercising group
towards a small decrease in the non-exercising group. Intake of macronutrients
increased in the exercising vs the non-exercising group, although not very
convincingly. We measured a preserving effect in (lean) body mass of the exercise
compared to a decline in the non-exercising group, and we found a correlation
between change in body mass and change in energy intake. In a supplementation
study of Gray-Donald et al.16, in which free-living frail elderly increased their total
intake although not statistically significant, the observed weight gain was also
compatible with the extra energy consumed.
The effect of adopting an exercise program on diet was only investigated in a
few studies which showed inconsistent results (review)3132. Figures on components
of energy balance due to exercise in (frail) elderly have also not been intensively
described in literature. Campbell et al.33 studied the effect of a progressive
resistance training program in healthy older adults and concluded that their
program was effective in increasing energy requirements with 15%. Since their
relatively intensive resistance training program is not comparable with our all-round
exercise program designed for frail elderly we might perhaps expect an increase in
the energy requirement of half of it, e.g. 7.5% = 0.5 MJ on a mean total of 7.4 MJ.
In our exercising group the increase in energy intake was smaller: 0.2 MJ.
Butterworth et al.34 confirms the small effect of moderate amounts of exercise on
enhanced dietary intake in elderly women. In the frail study population of Fiatarone
67
Chapter 3
et al.15 total energy intake declined after the trial in the exercise and control group.
In both the supplementation and combination group total energy intake increased
but this was fully attributed to the energy dense supplement supplied. The same
results have been found by Meredith et al.20. Their study clearly showed that the
unsupplemented group tended to reduce their energy and macronutrient intake
after training, the supplemented group increased their intake mainly due to the
supplement itself.
Despite both environmental changes (nutrient dense foods supplied, exercise
program) we observed that the elderly did not easily alter their food habits or
intake. Whether this is an example of perfect regulation or that our intervention
programs did not have enough power and intensity to establish a change or that
this is a problem of (physiological) impairment of elderly to react on external
changes is difficult to answer. Median attention rate at the exercise sessions was
90%, at the social sessions this was 80% thereby confirming the high compliance
rate. Not many trials investigated long-term control of energy intake in elderly35.
Results from Rolls et al.36 and Roberts et al.37 confirm that elderly are less capable
of regulating energy intake despite changes in diet or activity level. Blundell et al.38
point out that the human body may try as long as possible to deal with the higher
physical activity levels with the same amount of nutrients. This is also stated by
Rolls39. Schlettwein-Gsell40 argues from a psychological and social point of view
that a rapid change in food intake or altering familiar dietary habits might not be
expected in elderly: 'they might notice their physical drawbacks, they however live
in such strong regular life pattern that change might be threatening and
consequently the will to change food intake might not be evident enough'.
Appetite, hunger feelings and sensory perception
With respect to the 'appetite, hunger and smell' questionnaire the internal validity
was satisfactory (range: 0.69 till 0.89), moreover a poor appetite based on
questionnaire predicted a lower energy intake. An explanation for the lack of effect
on outcomes of our appetite, hunger and sensory perception questionnaire may be
the intensity or duration of our intervention programs. Furthermore an interesting
theory of De Castro41 may apply: while aging, the ability of ingested nutrients to
affect the subjective state of hunger in the individual is decreasing. In other words
the internal state becomes less able to influence the subjective state as aging
68
. Sensory perception, appetite, intake, and body weight
progresses. Because of this it may be extremely difficult to find a change on these
subjective parameters.
Supplementation did not show an improvement on smell perception. This might
also be extremely difficult to achieve since impairment of sensory perception may
be mainly caused by age-related factors and smoking42"44. This is in agreement with
conclusions from Schiffman's review45 that the prognosis for recovery of smell and
taste sensations is poor. On the other hand it has been postulated that several
micronutrient deficiencies might influence taste and smell perception18. Especially
zinc is mentioned within this respect, but also vitamin A, B„ B6, B12 and folic acid.
Since all of these nutrients, with exception of vitamin A were added to the foods up
to 50-100% of the Dutch RDA, it should have been possible to improve an impaired
taste and smell perception caused by nutritional deficiencies with micronutrient
supplementation. The fact that we did not find any change in smell perception may
be explained by a) our participants did have a relatively low dietary intake when
compared to healthy Dutch elderly and Dutch recommendations, but not low
enough to establish effect (de Jong et al., manuscript submitted or Chapter 4) or b)
subtle micronutrient deficiency is of minor importance compared to the (possibly
irreversible) degenerative process in taste buds and nerves while ageing46.
Type and duration of intervention
The difference between other supplementation/exercise studies15;16;19;20;34 and our
study is among others the type of the exercise program (an all-round program
instead of only resistance training) and the supplement used. We strictly added
only micronutrients, known to be frequently low in elderly, and no extra energy or
macronutrients to the product since we had special interest in spontaneous
changes in appetite and energy and macronutrient intake. Our time frame of 17
weeks might have been too short to measure effects of both the nutritional and
exercise intervention on appetite, sensory perception or intake. These kind of
intervention studies are however quite aggravating for frail elderly and it is
therefore, difficult to implement interventions of longer duration.
69
Chapter 3
Population
The question arising, is whether the population was really frail. One of the main
criteria was BMI s 25 kg/m2 or recent uncontrolled weight loss. For practical
reasons we had to rely on self-reported height and weight. Since elderly often
overestimate their current height, their BMI turned out to be somewhat higher than
initially calculated. However, comparing our population with healthy Dutch elderly
our participants were less active (PASE score: 64 in our population vs 85 in the
population of Schuit25, the mean BMI of 24.5 kg/m2 was lower compared with data
from the European Seneca study (men: 26, women: 28 kg/m2)47 as well as the
subjective rating of health on a 10-point scale: 7 in our population vs 8 in the
healthy elderly population of Schuit48. The majority of our participants used
medication and suffered from more than one disease. Furthermore, the mean
energy intake is considerably lower compared to the intake of a representative
group of Dutch apparently healthy elderly49. Summarizing this, means that our
study group on average had a worse health profile compared to apparently healthy
elderly.
Measurement methods
The internal validity of the questionnaire was moderate to high and since energy
intake was clearly varying between groups scoring low or high on the appetite
questions (data not shown) the questionnaire seems to be reliable. Furthermore,
statistically significant correlation coefficients were found between the smell
identification test and the measurement of smell perception with the questionnaire.
The same was found between the 'gold standard' of appetite, namely total energy
intake and the subjective measurements of appetite and feelings of hunger.
Additional factor analysis revealed out of the 29 questions two factors: one for
appetite in general and one for smell. We observed that the questions about taste
were incorporated in the factor appetite. These two factors showed exactly the
same statistical significant correlation coefficients with energy intake and score on
the smell identification test respectively. And again also no absolute change with
respect to the control group was observed in these two factors. This reinforces the
results we initially found with the separate five constructed variables of the
questionnaire. This questionnaire is a newly developed instrument which was
tested in a population of institutionalized and free-living elderly27. Up till now a
70

. Sensory perception, appetite, intake, and body weight
reliable extensive questionnaire with respect to appetite parameters is lacking. And
although, the internal validity of this questionnaire is satisfying it would be very
interesting to investigate whether or not ratings on the appetite scale could be
related to physiological parameters.
We decided to use a 3-day dietary report instead of a food frequency
questionnaire, 24-hour recalls or dietary history because short term memory in
elderly may be impaired50, and the burden on the participants was already quite
high. We used a smell test as objective measurement of sensory perception since
smell sensitivity declines more in elderly and is easier to measure compared to
taste51. The smell identification test we used in this study was based on the
validated CCCRC test2829 and we only adopted slight modifications.
Because appetite may be viewed as a sign of good health in the frail, it is important
to focus on this topic, and not only through the difficult and intensive to measure
'gold standard' energy intake. Moreover, energy intake does not always reflect
appetite because elderly may eat because they are used eating, although they do
not feel like it. We were not able to improve either appetite, hunger feelings and
sensory perception, and due to exercise we found only small effects on energy and
nutrient intake. Changes in energy intake were neither convincingly correlated with
appetite but slightly with body weight. This once more confirms the complexity of
the whole system and the extremely difficult task to improve nutritional and health
status of the frail elderly through increasing appetite by providing nutrient dense
foods and exercise.
ACKNOWLEDGEMENTS
We thank Saskia Meyboom, Els Siebelink and Karin Roosemalen for their contributions in the data collection with respect to dietary intake and in helping to organize the distribution of the foods. We furthermore thank Carolien Terink and Liselotte van Asten for their assistance in the collection of the other data. All sport teachers (Joke Seinen, Isabella Borburgh, Rita Wubbels, Tineke Zwijnen) and the creative therapist (Nelly van Amersfoort) are gratefully acknowledged for their great effort in leading the programs and loyalty to the study. Last but not least we would like to thank Wiebe Visser of the Dutch Dairy Foundation on Nutrition and Health, Maarssen, The Netherlands for the financial support moreover for establishing and co-ordinating the contacts with the following (food) companies and their co-workers: Roche Nederland B.V. (Allita van
71
Chapter 3
Daatselaar), Friesland Coberco Dairy Foods B.V. (Hette Bouma, Henk van der Hoek, Rudi Fransen, Martine Alles), Campina Melkunie - Mona Division (Frank Elbers), Bekina Lebensmittel GmbH (Anneliese Mahrow), subsidiary of Royal Numico NV. Their effort in the development and production of the food products is gratefully acknowledged.
References
1. Feldman EB: Aspects of the interrelations of nutrition and aging--1993. Am J Clin Nutr 1993;58:1-3. 2. Harris TB, Feldman JJ: Implications of Health Status in Analysis of Risk in Older Persons. J of Aging and Health 1991 ;3:262-284. 3. Rowe JW, Kahn RL: Human aging: usual and successful. Science 1987;237:143-149. 4. Buchner DM, Wagner EH: Preventing frail health. Clin GeriatrMed 1992;8:1-17. 5. Strawbridge WJ, Shema SJ, Balfour JL, Higby HR, Kaplan GA: Antecedents of frailty over three decades in an older cohort. J Gerontol B Psychol Sci Soc Sci 1998;53:S9-16. 6. Guralnik JM, Simonsick EM: Physical disability in older Americans. J Gerontol 1993;48 SpecNo:3-10. 7. Schiffman SS, Warwick ZS: Effect of flavor enhancement of foods for the elderly on nutritional status: food intake, biochemical indices, and anthropometric measures. Physiol Behav 1993;53:395-402. 8. Schiffman SS: Taste and smell in disease (2nd of two parts). N Engl J Med 1983;308:1337-1343. 9. Schiffman SS: Taste and smell in disease (1st of two parts). N Engl J Med 1983;308:1275-1279. 10. Griep Ml, Verleye G, Franck AH, Collys K, Mets TF, Massart DL: Variation in nutrient intake with dental status, age and odour perception. Eur J Clin Nutr 1996;50:816-825. 11. Ferris AM, Duffy VB: Effect of olfactory deficits on nutritional status. Does age predict persons at risk? Ann NY Acad Sci 1989;561:113-123. 12. Mattes RD, Cowart BJ, Schiavo MA, et al: Dietary evaluation of patients with smell and/or taste disorders. Am J Clin Nutr 1990;51:233-240. 13. Mattes RD, Cowart BJ: Dietary assessment of patients with chemosensory disorders. J Am Diet Assoc 1994;94:50-56. 14. Frisoni GB, Franzoni S, Rozzini R, Ferrucci L, Boffelli S, Trabucchi M: Food intake and mortality in the frail elderly. J Gerontol A Biol Sci Med Sci 1995;50:M203-M210 15. Fiatarone MA, O'Neill EF, Ryan ND, et al: Exercise training and nutritional supplementation for physical frailty in very elderly people. N Engl J Med 1994;330:1769-1775. 16. Gray-Donald K, Payette H, Boutier V: Randomized clinical trial of nutritional supplementation shows little effect on functional status among free-living frail elderly. J Nutr 1995;125:2965-2971. 17. Gray-Donald K: The frail elderly: meeting the nutritional challenges. J Am Diet Assoc 1995;95:538-540. 18. Chauhan J, Hawrysh ZJ, Gee M, Donald EA, Basu TK: Age-related olfactory and taste changes and interrelationships between taste and nutrition. J Am Diet Assoc 1987;87:1543-1550.
72
. Sensory perception, appetite, intake, and body weight
19. Lipschitz DA, Mitchell CO, Steele RW, Milton KY: Nutritional evaluation and supplementation of elderly subjects participating in a "meals on wheels" program. JPEN 1985;9:343-347. 20. Meredith CN, Frontera WR, O'Reilly KP, Evans WJ: Body composition in elderly men: effect of dietary modification during strength training. J Am GeriatrSoc 1992;40:155-162. 21. Nelson ME, Fiatarone MA, Morganti CM, Trice I, Greenberg RA, Evans WJ: Effects of high-intensity strength training on multiple risk factors for osteoporotic fractures. A randomized controlled trial. JAMA 1994;272:1909-1914. 22. Commissie Voedingsnormen Voedingsraad: Nederlandse voedingsnormen 1989, Den Haag, Voedingsraad; 1989. 23. Commissie Voeding van de Oudere Mens Voedingsraad: Voeding van de oudere mens, Den Haag, Voedingsraad; 1995. 24. Washburn RA, Smith KW, Jette AM, Janney CA: The Physical Activity Scale for the Elderly (PASE): development and evaluation. J Clin Epidemiol 1993;46:153-162. 25. Schuit AJ, Schouten EG, Westerterp KR, Saris WH: Validity of the Physical Activity Scale for the Elderly (PASE): according to energy expenditure assessed by the doubly labeled water method. J Clin Epidemiol 1997;50:541 -546. 26. Stichting Nederlands Voedingsstoffenbestand. Dutch Nutrient Data Base/Nederlandse Voedingsmiddelentabel 1997. The Hague, Voorlichtingsbureau voor de Voeding. 27. de Jong N, Mulder I, de Graaf C, van Staveren WA: Impaired sensory functioning in elderly: the relation with its potential determinants and nutritional intake. J Gerontol A Biol Sci 1999; 54A in press. 28. Cain WS, Gent JF, Goodspeed RB, Leonard G: Evaluation of olfactory dysfunction in the Connecticut Chemosensory Clinical Research Center. Laryngoscope 1988;98:83-88. 29. Cain WS, Rabin MD: Comparability of two tests of olfactory functioning. Chem Senses 1989;14:479-485. 30. Fidanza F: Nutritional status assessment: a manual for population studies, New York, Chapman and Hall; 1991. 31. Titchenal CA: Exercise and food intake. What is the relationship? Sports Med 1988;6:135-145. 32. Kris-Etherton PM, Durrwachter J, Datillo AM, DeWolfe JA, Trenkner LL: The interactive effects of health behavior changes: diet, exercise and smoking. Top Clin Nutr 1991 ;6:1 -21. 33. Campbell WW, Crim MC, Young VR, Evans WJ: Increased energy requirements and changes in body composition with resistance training in older adults. Am J Clin Nutr 1994;60:167-175. 34. Butterworth DE, Nieman DC, Perkins R, Warren BJ, Dotson RG: Exercise training and nutrient intake in elderly women. J Am Diet Assoc 1993;93:653-657. 35. Stubbs RJ: Appetite, feeding behaviour and energy balance in human subjects. Proc Nutr Soc 1998;57:341-356. 36. Rolls BJ, Dimeo KA, Shide DJ: Age-related impairments in the regulation of food intake. Am J Clin Nutr 1995;62:923-931. 37. Roberts SB, Fuss P, Heyman MB, et al: Control of food intake in older men. JAMA 1994;272:1601-1606. 38. Blundell JE, Lawton CJ, King NJ: Problems of eating and appetite control in the elderly. Aging Milano 1997;9:42 39. Rolls BJ: Aging and appetite. Nutr Rev 1992;50:422-426. 40. Schlettwein GD: Nutrition and the quality of life: a measure for the outcome of nutritional intervention? Am J Clin Nutr 1992;55:1263S-1266S. 41. De Castro JM: Age-related changes in spontaneous food intake and hunger in humans. Appetite 1993;21:255-272.
73

Chapter 3.
42. Doty RL, Shaman P, Kimmelman CP, Dann MS: University of Pennsylvania Smell Identification Test: a rapid quantitative olfactory function test for the clinic. Laryngoscope 1984;94:176-178. 43. Kaplan AR, Glanville EV, Fischer R: Cumulative effect of age and smoking on taste sensitivity in males and females. J Gerontol 1965;20:334-337. 44. Ship JA, Weiffenbach JM: Age, gender, medical treatment, and medication effects on smell identification. J Gerontol 1993;48:M26-M32 45. Schiffman SS: Taste and smell losses in normal aging and disease. JAMA 1997;278:1357-1362. 46. Schiffman SS: Perception of taste and smell in elderly persons. Crit Rev Food Sci Nutr 1993;33:17-26. 47. de Groot CPGM, Perdigao AL, Deurenberg P: Longitudinal changes in anthropometric characteristics of elderly Europeans. SENECA Investigators. Eur J Clin Nutr 1996;50 Suppl 2:S9-15. 48. Schuit.AJ: Regular physical activity in old age, effect on coronary heart disease risk factors and well-being. 1-163.1997. Wageningen Agricultural University. 49. Moreiras 0, van Staveren WA, Amorim Cruz J, et al: Longitudinal changes in the intake of energy and macronutrients of elderly Europeans. SENECA Investigators. Eur J Clin Nutr 1996;50 Suppl 2:S67-S76. 50. Samet JM: Surrogate measures of dietary intake. Am J Clin Nutr 1989;50:1139-1144. 51. Stevens JC, Bartoshuk LM, Cain WS: Chemical senses and aging: taste versus smell. Chem Senses; 1984. 1984;-79.
74

Functional biochemical and nutrient indices in
frail elderly people partly affected by dietary
supplements but not by exercise Journal of Nutrition 1999; 129, in press
Nynke de Jong
Marijke J.M. Chin A Paw
Lisette C.P.G.M. de Groot
Cees de Graaf
Frans J. Kok
Wija A. van Staveren
Chapter 4.
Decline in dietary intake due to inactivity and hence development of a suboptimal nutritional status is a major problem in frail elderly people. However, benefits of micronutrient supplementation, all-round physical exercise, or a combination of both on functional biochemical and hematological indicators of nutritional and health status in frail elderly subjects have not been tested thoroughly.
A 17-wk randomized controlled trial was performed in 145 free-living frail elderly people (43 men, 102 women, mean age: 78±5.7 years). Based on a 2x2 factorial design, subjects were assigned to: a) nutrient dense foods, or b) exercise, or c) both, or d) control. Foods were enriched with micronutrients, frequently characterized as deficient in elderly people (25-100% of the RDA). Exercises focused on skill training including strength, endurance, coordination, flexibility. Dietary intake, blood vitamin levels and nutritional and health indicators, including (pre)albumin, ferritin, transferrin, C-reactive protein, hemoglobin and lymphocytes were measured.
At baseline, 28% of the total population had an energy intake below 6.3 MJ, up to a maximum of 93% having vitamin intakes below 2/3 of the Dutch RDA. Individual (blood)vitamin deficiencies, at baseline ranging from 3% for erythrocyte glutathione reductase-a to 39% for 25-hydroxy vitamin D and 42% for vitamin B12, were corrected after 17-wks in the groups receiving the nutrient dense foods (groups a and c), whereas no significant changes were observed in the control or exercise group (b and d). Biochemical and hematological indicators at baseline were within the reference ranges (mean albumin: 46g/l, pre-albumin: 0.25g/l, hemoglobin: 8.6mmol/l) and not affected by any intervention. Long term protective effects of nutrient supplementation and exercise by maintaining optimal nutrient levels and thereby reducing the initial chance of developing critical biochemical values needs further investigation. Other indicative functional variables for suboptimal nutritional state, next to exploration of the ones currently selected, should also be explored.
INTRODUCTION
Older adults are a heterogeneous group. Individuals differ with respect to the
progress of aging due to several biological factors. Within this process of aging,
physical frailty may commence. A more sedentary lifestyle, a reduction in metabolic
cell mass and consequently a lower energy expenditure and dietary intake are
76
. Functional biochemical parameters and nutrient indices
important contributors to the downward process of frailty. A decline in intake is in
turn associated with the risk of developing a suboptimal nutritional state or multiple
micronutrient deficiencies. Although the small intestine, pancreas and liver are
believed to undergo only few clinically relevant changes with normal aging due to
their large reserve capacity12, alterations in absorption and metabolism of several
nutrients (including dietary vitamin B6, vitamin B12, folate, calcium, iron, zinc)
accompany the frailty process. Various disease states, for example atrophic
gastritis, and relatively high levels of medication also contribute to alterations in
absorption and metabolism2"4.
Blood concentrations of water-soluble vitamins often show the fastest decline in
elderly people with inadequate dietary intake, since body reserves are limited5, but
marginal states of vitamin D and minerals like iron, magnesium and zinc are
reported as well36"9.
Until now, only a few studies have investigated the influence of nutrient
supplementation and/or exercise on multiple indicators of nutritional status in
elderly people, classified as frail or 'at risk'10"13. Physical exercise is reported to
increase energy expenditure1415, resulting in a possible increment of total dietary
intake16. Additionally, a slowing down or reversal of the overall age-related decline
in physiological functioning may occur17. This may be reflected in the enhancement
of a multitude of bodily processes including nutrient metabolism18, organ system
functioning19, hormone secretion2021 and perhaps gastrointestinal nutrient
absorption22. In an early study by Mann et al.23, it was shown that multivitamin
supplementation increased blood levels of the water soluble vitamins. This was not
observed for fat soluble vitamins, thereby confirming the theory that greater storage
pools of the fat soluble vitamins are present in the liver and fat tissue.
So far, well-controlled trials investigating possible benefits of all-round physical
exercise and/or physiologically dosed micronutrient dense foods on functional
biochemical indicators of nutritional status in frail elderly people, have not been
published. Previous studies either investigated effects of nutritional supplements
only, had access to just small samples, or focused on other outcomes.
For our present trial, we hypothesized that either supplementation of a
physiological dose of micronutrients (due to a beneficial increase in nutrient status)
or a progressive all-round exercise program (mainly by an increase in daily energy
expenditure and dietary intake) would affect selected biochemical and
77

Chapter 4
hematological indicators of nutritional and health status in a group of community
dwelling frail elderly people. As exercise might additionally result in a more efficient
nutrient absorption and overall metabolism, a combination of both interventions
may be even more beneficial. Nutrient intake, blood nutrient levels as indicators of
available body pools24, and functional biochemical indicators of overall nutritional
and health status will be addressed.
MATERIAL AND METHODS
Subjects
The study population consisted of 217 free-living frail elderly Dutch people. Frailty
was defined according to the following criteria: requirement of health care, such as
home care or meals-on-wheels service; age (a 70 y); no regular exercise; body
mass index below average (BMI a 25 kg/m2, based on self reported weight and
height) or recent weight loss; no use of multivitamin supplements and ability to
understand the study procedures.
All subjects gave their written informed consent. The study protocol was
approved by the Medical Ethical Committee of the Division of Human Nutrition and
Epidemiology of the Wageningen Agricultural University. Pre- and post-intervention
measurement(s) were available for 165 subjects. Reasons for drop out (n=52,
24%) were mainly health problems, including (terminal) disease, hospital
admittance, recent falling and/or fracturing. Valid (pre- and post) biochemical
variables were available for 145 subjects. Four subjects were excluded because
the time between pre- and post-intevention measurement was less than 13 wks
due to hospitalization, three subjects were not able to visit our research center after
intervention due to illness and therefore ended the trial with incomplete blood
samples. Venipuncture did not succeed in one subject and 12 subjects were
excluded from analyses because of multivitamin usage.
Design
Enrollment took place between January and June 1997. Subjects were randomly
assigned to one of four intervention groups. The first group (nutrition) received
nutrient dense products and a social program, the second group (exercise)
received regular products and an exercise program, the third group (combination)
78

. Functional biochemical parameters and nutrient indices
received nutrient dense products with an exercise program and the fourth group,
control (or placebo), received regular products and a social program. The
intervention period was 17 wks and data were collected at baseline (week 0) and
after 17 wks (in week 18). Dietary intake data were collected at baseline and during
the last week of intervention (week 17).
Nutrient dense foods
Subjects were asked to consume two products a day: one from a series of fruit
products and one from a series of dairy products. Availability of a variety of
products was intended to avoid monotony and to increase acceptability of the
products. Fresh 100 g servings of fruit based products (two types of both fruit juice
and compote) and 100 g servings of dairy products (vanilla custard, two types of
fruit yogurt and 75 g of cheese curd with fruits) were provided weekly. Daily
consumption of two enriched products delivered -100% of the Dutch RDA9;25 of
vitamins: D, E, B,, B2, B6, folic acid, B12 and C and ~ 25-100% of the Dutch RDA of
the minerals: calcium (25%), magnesium (25%), zinc (50%), iron (50%), iodine
(100%). Subjects in the control and exercise group received the natural amount of
the regular products (amount of vitamins and minerals in regular products at the
highest 15% of the concentration in enriched products). Both the enriched and
regular products had an energy content of -0.48 MJ per two products.
Exercise program
The main objective of the exercise program was to maintain and/or improve
mobility and performance of daily activities essential for independent functioning by
maintaining versatility in movement. Perhaps via a more efficient nutrient
absorption and metabolism, nutritional status could also be improved18"20*2.
Emphasis was placed on skill training: muscle strength, coordination, flexibility,
speed and endurance were trained by exercises such as walking, stooping and
chair stands. Different materials were used, for example balls, ropes, weights and
elastic bands. The second objective was to improve nutrient status, through
increasing the daily activity level, overall energy expenditure and consequently
dietary intake.
Group sessions were organized twice a week for 45 min and were of moderate,
gradually increasing intensity. Since participants were assumed to be fairly inactive
79
Chapter 4
at baseline, sessions twice a week were considered the maximum amount in order
to achieve sufficient compliance. From earlier studies we knew that with a twice-
weekly-program beneficial effects could be determined on functional capacity and
muscle strength2627. Sessions were supervised by skilled teachers to improve
safety and prevent wrong and harmful movements. In order to guarantee uniformity
sessions were extensively rehearsed with all teachers together, and an instruction
video and manual were made in advance. A social program served as a control (for
attention) program for the exercise program. Sessions of 90 min were organized
once every two weeks by a skilled creative therapist. This program focused on
creative activities, social activities and lectures on interesting topics for elderly
people. Transport to and from all sessions was arranged.
Questionnaires
A general questionnaire asked for information on age, sex, marital status,
education, living conditions, illness, medicine and supplement use, and smoking
habits. Physical activity was assessed using the validated Physical Activity Scale
for Elderly (PASE)2829.
Anthropometry
All anthropometric measurements were performed with subjects wearing under
clothes. Body weight was measured to the nearest 0.01 kg using a digital scale
(ED-6-T; Berkel, Rotterdam, The Netherlands) and height was measured to the
nearest 0.001 m using a wall-mounted stadiometer. Body mass index was
calculated as weight in kilograms divided by height in meters squared30.
Dietary intake
A three day (two weekdays and one weekend day; non-consecutive) estimated
dietary record was obtained by three trained dietitians at baseline (week 0) and in
the last week of intervention (week 17). During a home visit prior to the
intervention, dietitians provided subjects with a clear explanation on how to record
and estimate portion sizes in household measures. During a second visit, they
checked the diary and weighed the portion sizes of the most frequently used foods
in household measures. Subjects having difficulties with writing could use a voice
tape recorder. In case of problems occurring during the three days of recording,
80
. Functional biochemical parameters and nutrient indices
subjects could telephone the dietitians at daytime and in the evening. Food
consumption data were coded (with frequent cross checking by all three dietitians)
after which energy and nutrients were calculated with the computerized Dutch
Food Composition Table of 1997 and a supplement of 1995 for folate and vitamin
B 31;32 12
Biochemistry
Pre- and post-intervention blood samples were collected from fasting subjects
between 07.00 and 09.00 for all indicators, except samples for complete blood
count and vitamin C which for practical reasons were collected in our research
center at noon and immediately put on ice before further processing. Within 1 h of
collecting samples for vitamin C analysis 0.5 ml EDTA plasma was mixed with 2.0
mL metaphosphoric acid (50g/l, JT Baker Bakergrade) to deproteinize the vitamin
C sample (analyzed with HPLC-fluorimetry, coefficient of variation between runs: 5-
10%)3033. A fresh 3 ml EDTA sample was used for complete blood count (Coulter
Counter type T-860, Coulter Corporation, Miami, FL).
With respect to the fasting blood samples, 3 ml serum was used for analyses of
the serum proteins: albumin (bromocresol-green), pre-albumin, C-reactive protein,
transferrin, ferritin, thyroxine (T4) (immunoturbidimetric principle). A Hitachi-911
automatic analyzer, Hitachi Instrument Division, Japan and a AIA-600 Enzyme
Immunoassay Analyzer, Tosoh Corporation, Japan were used with a CV between
runs of 1-8%. For vitamins B, and B2, erythrocyte transketolase activity (ETK) and
erythrocyte glutathione reductase activity (EGR) were determined respectively
(kinetic spectrophotometric enzyme determination), between-run-CV 7-9%3033.
Samples (3 ml) were hemolyzed after slow centrifugation and washed with an
equal amount of 9 g/l NaCI. After three washing procedures the erythrocytes were
diluted with an equal volume of Nonidet P40 (Boom, Meppel, The Netherlands).
For vitamin B6, serum pyridoxal-5'-phosphate (1 ml) was determined by HPLC-
fluorimetry with a between-run-CV of 5-10%3033, for vitamin B12 a 0.5 ml plasma
sample was analyzed with the IMx automated immunoassay system34, and 25-
hydroxy vitamin D values were analyzed in a 0.5 ml serum sample for vitamin D
(CPB) with a between-run-CV of 5-10%35. All samples were stored at -80°C until
analysis. Pre- and post-intervention samples were analyzed in the same batch.
Analyses were performed by the TNO Nutrition and Food Research Institute, Zeist,
81

Chapter 4
The Netherlands, the Department of Clinical Chemistry, University Hospital
Nijmegen, The Netherlands (B12), and the Division of Human Nutrition and
Epidemiology, Wageningen Agricultural University, The Netherlands (Coulter
counter).
Statistical analysis
Data were analyzed using the statistical program SAS (Statistical Analysis
Program, version 6, NC: SAS Institute Inc., 1990). Means ± sd, medians (10th- 90th
percentiles) or percentages of (baseline) values were calculated for all intervention
groups. The prevalence of subjects deviating from the reference were calculated as
frequencies. Absolute changes ± sd per intervention group were calculated and
compared with changes in the control group using an unpaired t-test. Since many
subjects had a lower CRP level than the detection limit of 0.30 mg/l, we set those
values at 0.15 mg/l in order to calculate changes on a continuous scale for the
whole population. Multiple regression was used to determine the effect of both
interventions and a possible interaction on the change in biochemical variables.
Since no evidence of an interaction was observed between interventions a
comparison was made between the supplemented group versus the non-
supplemented group and the exercising group versus the non-exercising group
respectively. For all the changes in the variables studied, confounding by baseline
age, supplement use and corresponding baseline biochemical value was checked
(e.g. for change in albumin the model was adjusted for baseline albumin and so
forth). In the adjusted regression model only the corresponding baseline
biochemical value was added as a confounder, since age and supplement use did
not contribute significantly to the model. A p-value sO.05 was considered
significant.
RESULTS
On average, 70% of the participants (mean age: 78 y) were women (Table 4.1). In
general, none of the baseline variables differed considerably among the four
intervention groups except age (exercise group slightly younger, p=0.20) and
percentage of subjects using single nutrient supplements (combination group
slightly higher, p=0.36).
82
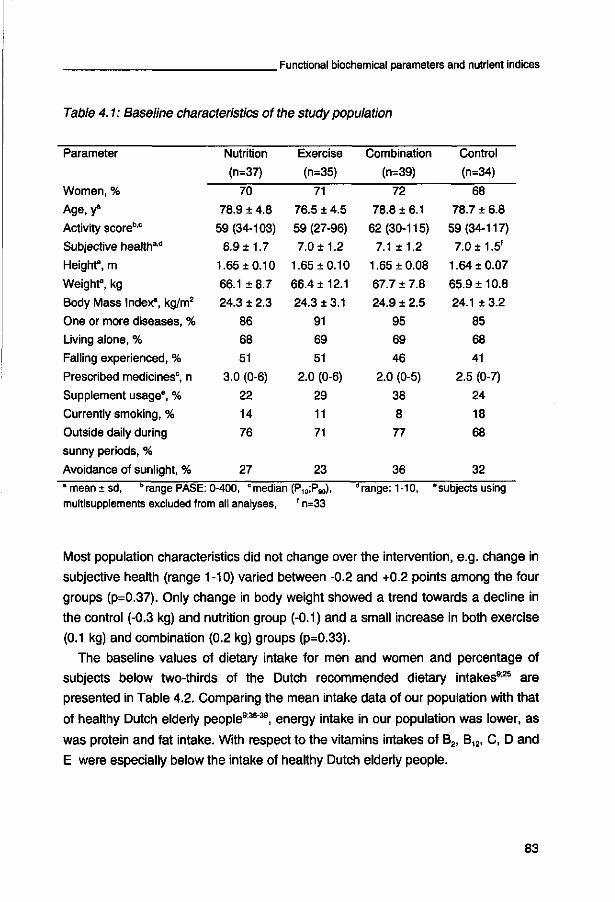
. Functional biochemical parameters and nutrient indices
Table 4.1: Baseline characteristics of the study population
Parameter
Women, %
Age, y3
Activity scorebc
Subjective health3"
Height3, m
Weight3, kg
Body Mass Index3, kg/m2
One or more diseases, %
Living alone, %
Falling experienced, %
Prescribed medicines0, n
Supplement usage8, %
Currently smoking, %
Outside daily during
sunny periods, %
Avoidance of sunlight, %
Nutrition
(n=37)
70
78.9 ± 4.8
59(34-103)
6.9 ±1.7
1.65 ±0.10
66.1 ± 8.7
24.3 ± 2.3
86
68
51
3.0 (0-6)
22
14
76
27
Exercise
(n=35)
71
76.5 ± 4.5
59 (27-96)
7.0 ±1.2
1.65 ±0.10
66.4 ±12.1
24.3 ± 3.1
91
69
51
2.0 (0-6)
29
11
71
23
Combination
(n=39)
72
78.8 ± 6.1
62(30-115)
7.1 ±1.2
1.65 ±0.08
67.7 ± 7.8
24.9 ± 2.5
95
69
46
2.0 (0-5)
38
8
77
36
Control
(n=34)
68
78.7 ± 6.8
59(34-117)
7.0 ±1.5'
1.64 ± 0.07
65.9 + 10.8
24.1 ± 3.2
85
68
41
2.5 (0-7)
24
18
68
32
• mean + sd, " range PASE: 0-400, c median | multisupplements excluded from all analyses,
' range: 1-10, * subjects using 'n=33
Most population characteristics did not change over the intervention, e.g. change in
subjective health (range 1-10) varied between -0.2 and +0.2 points among the four
groups (p=0.37). Only change in body weight showed a trend towards a decline in
the control (-0.3 kg) and nutrition group (-0.1) and a small increase in both exercise
(0.1 kg) and combination (0.2 kg) groups (p=0.33).
The baseline values of dietary intake for men and women and percentage of
subjects below two-thirds of the Dutch recommended dietary intakes925 are
presented in Table 4.2. Comparing the mean intake data of our population with that
of healthy Dutch elderly people936"39, energy intake in our population was lower, as
was protein and fat intake. With respect to the vitamins intakes of B2, B12, C, D and
E were especially below the intake of healthy Dutch elderly people.
83
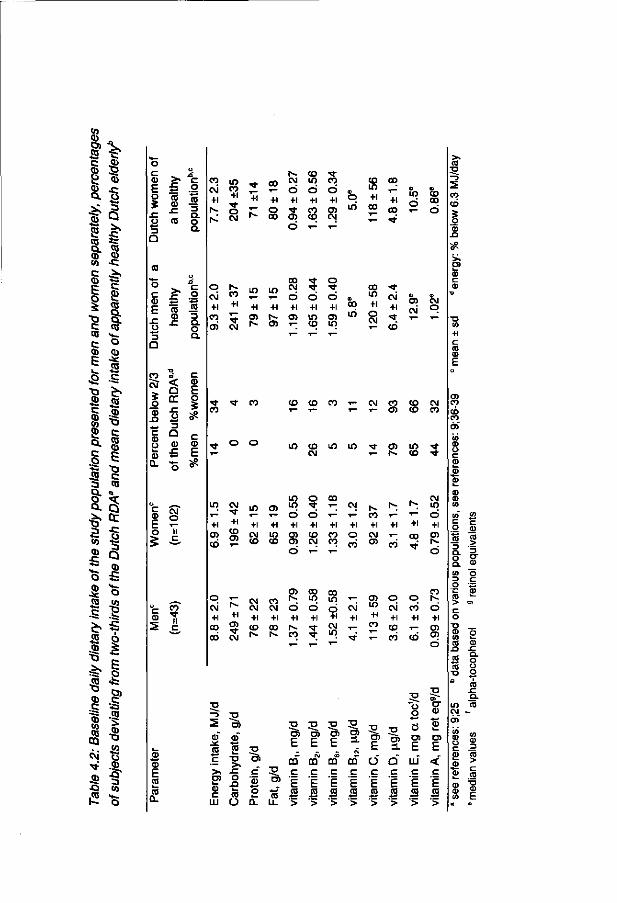
c
CO Q .
q> to c <b
6
i C to c n> E
CO
Q
£ to CB
•C
c
I CD s~ O
.TO
a • o C S3
co
E C TO
c 0) to
c o
•S 3
Q
£ O
3
I 1
to co £
o
to
3 tu . c "53 to
CO
c\i
•32 -Q
i2
E
.TO
« o .co •5" 3 to **~ o
c CO
E o
.c o
Q
c CD E j = o
*-» Q
CO CM
S o CD
C CB
o I -d> Q .
c CO
E o
5
c CD
5
£ .2 tO jS
to o Q.
tM O
CO
II
3 Q. O Q.
C CO
E o 5
E to to
Q .
CO 10 CM CO
O c\i +1
05 CM
r-. co +1
CO
CO
+1 a> r--
o o
N (D t CM m co
d +1
o +1
CO CM
d +1
o +1
O Tf CO 05 CO 05 CO CM
O T^ T^
d +1
o
d +1
05 m o> i - co m
C5 CO CO
r-. +i
CM CO CM CM
CD CO
d +1
CO
+1 CM l O
t o CO W • g>
b +1 « «» « » CO 2
1 - • *
CO
to
t o t o CO 1 -
m ID ID in CM
CO i n +1 o CM
LO T -
+1 o> CO
CM
+1 CO O )
LO T -
+1 CM CO
O) T -
+1 in to
m in o +i CJ5 O) o
o • *
o +1 to CM 1 —
CO
*": T -
+1 CO CO Y —
CM l —
+1 o CO
r>-co +i CM OS
m m o d
CO V to tz
>. m w 01 r LU
tl)
to T3 JZ
o n k _
to O
3J 5 5 5
c co
E E E
0. u.
m co c c E to
CM +1
co
CD i n
OS
CM
CM CO tO i - 05 CD
T CT> m i - N CD
CM i n
i - ••- o
CO
o o CM CO
+ ' +1 +1
J2 to 1 -^ CO t o
o o
1° -o B
Eli1
O Q w c c c E £ E ( 0 CO CO
• > • > • >
IT CO
C3)
E
< c E
>
to
—}
co to 5 CD
+1 05
o
CO r-~. o +i m CD
c o to
Q. CO
-> a k_
CO
c: o
T3
(0 n CO
m T3
C CD
CO
> J CJ CD
O
CD
*—
o CD c-Q . O O O
CO sz a. co
C M -en
CD 3
CO
> c CO
CD
e

.Functional biochemical parameters and nutrient indices
When two-thirds of the Dutch RDA is taken as cut-off value, macronutrient intake
was adequate in our population, whereas vitamin D, E and A in particular were
below this cut-off value. With respect to energy intake 14% of the men and 34% of
women had intakes below 6.3 MJ, the level at which several micronutrient
deficiencies can be expected.
Mean intake data of each of the three intervention groups (i.e. nutrition, exercise
and combination group) were compared with the control group (Table 4.3). Both
the exercise and the combination group had a slightly lower energy (p=0.051) and
carbohydrate intake (p<0.05) than the control group at baseline. At the end of
intervention the combination and nutrition group significantly increased their intakes
of those micronutrients which were added to the nutrient dense foods. No
significant increases were found in the exercise group compared to the control
group.
Table 4.3: Dietary intake, changes after 17-wksa and percentage of subjects below
2/3 of the Dutch RDA" presented for the all intervention groups separately0
Parameter
Energy intake, MJ/d
baseline
change
pre/post-intervention < ref, %
Carbohydrate, g/d
baseline
change
pre/post-intervention < ref, %
Protein, g/d
baseline
change
pre/post-intervention < ref, %
Fat, g/d
baseline
change
pre/post-intervention < ref, %
Nutrition
(n=37)
7.8±1.8
-0.4+1.4
22/30
222±59
-16±39
0/3
66+15
-0.7±15
0/0
72±22
-2±21
-
Exercise
(n=34)
7.2±1.8d
0.2±1.2
32/21
209+60*
2+34
0/0
65±20
4±17
0/0
68±18
2±18
-
Combination
(n=38)
7.1±1.4d
0.1±1.3
34/34
196+43*
9±38
3/0
67±16
-0.8+14
3/0
67±17
0.9±18
-
Control
(n=34)
7.7±2.2
-0.4±2.1
21/38
223±65
-7+66
6/9
68±22
0.8±14
3/6
69+27
-3±23
-
85
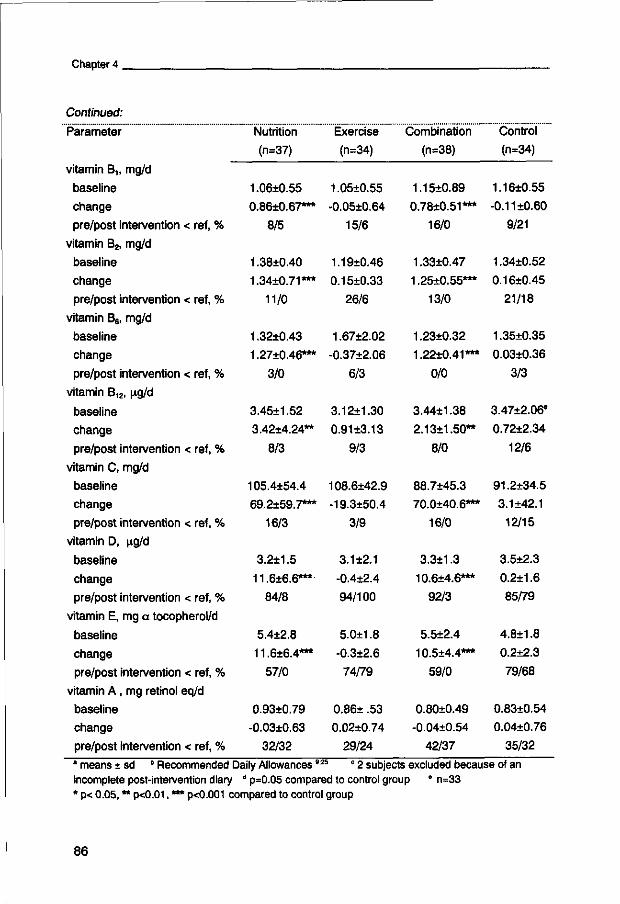
Chapter 4
Continued:
Parameter
vitamin B„ mg/d
baseline
change
pre/post intervention < ref, %
vitamin B2> mg/d
baseline
change
pre/post intervention < ref, %
vitamin B6, mg/d
baseline
change
pre/post intervention < ref, %
vitamin B12, u,g/d
baseline
change
pre/post intervention < ref, %
vitamin C, mg/d
baseline
change
pre/post intervention < ref, %
vitamin D, ng/d
baseline
change
pre/post intervention < ref, %
vitamin E, mg a tocopherol/d
baseline
change
pre/post intervention < ref, %
vitamin A , mg retinol eq/d
baseline
change
pre/post intervention < ref, %
Nutrition
(n=37)
1.06±0.55
0.86±0.67***
8/5
1.38±0.40
1.34±0.71***
11/0
1.32±0.43
1.27±0.46***
3/0
3.45±1.52
3.42±4.24**
8/3
105.4±54.4
69,2±59.7***
16/3
3.2±1.5
11.6±6.6***
84/8
5.4±2.8
11.6±6.4***
57/0
0.93+0.79
-0.03±0.63
32/32
Exercise
(n=34)
1.05±0.55
-0.05±0.64
15/6
1.19+0.46
0.15±0.33
26/6
1.67±2.02
-0.37±2.06
6/3
3.12+1.30
0.91 ±3.13
9/3
108.6±42.9
-19.3±50.4
3/9
3.1±2.1
-0.4±2.4
94/100
5.0±1.8
-0.3±2.6
74/79
0.86± .53
0.02+0.74
29/24
Combination
(n=38)
1.15±0.89
0.78+0.51***
16/0
1.33±0.47
1.25+0.55***
13/0
1.23±0.32
1.22±0.41***
0/0
3.44±1.38
2.13±1.50**
8/0
88.7±45.3
70.0±40.6***
16/0
3.3±1.3
10.6+4.6***
92/3
5.5+2.4
10.5±4.4***
59/0
0.80±0.49
-0.04+0.54
42/37
Control
(n=34)
1.16±0.55
-0.11 ±0.60
9/21
1.34±0.52
0.16±0.45
21/18
1.35±0.35
0.03±0.36
3/3
3.47±2.06e
0.72±2.34
12/6
91.2±34.5
3.1 ±42.1
12/15
3.5±2.3
0.2±1.6
85/79
4.8±1.8
0.2±2.3
79/68
0.83+0.54
0.04±0.76
35/32
" means ± sd b Recommended Daily Allowances9:25 ° 2 subjects excluded because of an incomplete post-intervention diary d p=0.05 compared to control group e n=33 * p< 0.05, ** p<0.01, *** p<0.001 compared to control group
86
.Functional biochemical parameters and nutrient indices
With respect to blood levels of several selected vitamins and their 17-week
changes (±sd), significant increases were detected in 25-hydroxyvitamin D, vitamin
B12, ascorbic acid and pyridoxal-5-phosphate in both the nutrition and combination
group compared to the control group (Table 4.4). Erythrocyte transketolase factor a
(as a measure for vitamin B,) and glutathione factor a (as a measure for B2) both
decreased in the direction of 1.0. The change in ETK-a was borderline significant in
the nutrition group (p=0.07) and the change in EGR-a was significant (p<0.05) in
the combination group. Since values above 1.25 are unfavorable8, this is
considered a beneficial decrease. The beneficial effects of supplementation are
also reflected in the percentages of subjects outside the reference values pre- and
post-intervention (Table 4.4).
Overall, very few subjects in the supplemented groups (between 0% and 15%)
were classified as deficient after intervention. No significant differences in change
were found between the exercise group and the control group. Since no evidence
of interaction was found we could focus on the main effects (i.e. the supplemented
group vs the non-supplemented group and exercise vs non-exercise). For all
micronutrients under study, we adjusted the models for the corresponding baseline
values. Significant increases were calculated in micronutrient levels in the
supplemented group compared to the non-supplemented group (all p<0.003),
whereas no significant difference in change occurred in the exercisers vs non-
exercisers (all p>0.15, data not shown).
In general, at baseline all mean values of the other selected biochemical and
hematological indicators fell within or above the range of the reference values,
meaning that no clinical deficiencies of any indices on group level were observed
(Table 4.5). No statistically significant increases in the intervention groups
compared to the control group were found. Only with respect to albumin, pre
albumin and thyroxine (T4) was a slight improvement in the nutrition compared to
the control group noted. With respect to mean values of hemoglobin, hematocrit
and number of red blood cells there was a tendency of decline in all groups,
whereas the mean number of white blood cells and lymphocytes slightly increased.
87
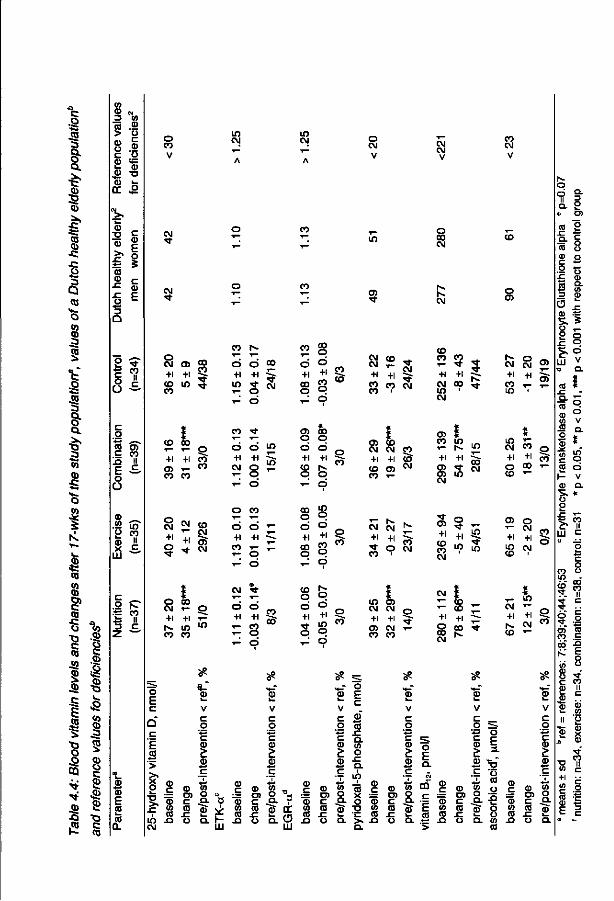
c .o •A •S
&
1 I S3
•c
3 Q cc o 03
C
.o •S
&
to
CD
o
i co to n> §> to
S T3 O
CO
•92 •Q
1?
E c3
I
c 9)
C CO
to 2 M 3 co
« .2 > o 8 .1 c o CO cp E: CO
£> TJ
co n co
CO CD
. C
o 3
O
t_ CO
E § c CD
E
•p CO
O ~
c o CO 05 C CO
o O
co .<2 I n O CO ™ II
c £
c .2 P .•£ co J= ii 3 C
O CO V
CM
CM
O CM
O
CM CO • > - CM
+i 3J • * CM
W CM
CO h»
o CM
+1 co CO
CD
+1 i n
CO CO
T«. o
+i W
^
" O
+1
-o
CO
CM
IV
+i O ) CO
CO
+1
.,_ CO
o CO CO
d +i
CM
^
CO • *
d +i
o +i
CO
o £ o
O CO
o '-+1 ^ o '" d
CM • *
o CM +1
1 ^ CO
CO T -
+1 m CO
o
m
d +i *— ^
d +i CO
<_>
CO
CO
l O CM
CO
CO g
o d m
+1 +l s CO g <°
• o
OJ co o o o o +1 +1 co r«-o o T ^ d
co g
o ° ,-, +' +l § c o g n
,_: o
° ° o
o °. ,_: O
o CM
lO
O)
CM CM
+1 CO CO
CM
+1 • < * •
CO
CO T -
+1
CO
CM
• * •
CM
i CM CO
+1 CO
OJ CM
+ ' CO O CM
w en CM
+1
o>
CM
+1 CM
O
• * •
o E c
Q
c E CO
±Z
> S? o
• a
• i n CM
CO c "55 CO CO
.a
CO
c CO
o
«-CO k _
V
c o *-» c CO
ct CO •«-» _c
CO o a.
Q .
"e
1 -LU
CO c
"CO CO CO
J3
CO
c CO
o
M-^" CO h -
V
c o
V J
c CO
£ CO 4—'
.c * • *
co o a. ai" Q .
8 1
DC O H I
CO c "55 co co n
CO C3) c CO
o
• • -^ CO k _
V
c o
c CO
2 0)
** c 4 ^
CO o a .
^ Q .
o E c
co" CO
SI Q. CO o sz Q-i
i n
• CO
o T3
>. Q.
CO c ~w co CO
JD
CM CM V
O CO CM
CM
CO CO CO j— ^
+ 1 + 1
CM 0 0 m ' CM
O) i m " > 1 ^ i - r>- m
+i OJ a) in CM
+' +1 £ % "? s CM
5! i • ^ CO , _ , _ +1
o a i CM
CO
+i CO N-
*" ^ • *
CO CM
CO
O O)
1^-CM
C
o
S a.
.£ ^ co 1o of I c Q- ~ CO co 7» E <o
J : J: to co o o. S -Q >
8 92 +i +i
CO , -in •
O )
in co +i +i o co CO T -
O)
+1
i n CO
CM
+i
CO
+i CM
h +i
CM
c _ O i r •5 O
CO OJ c CO r u
c CIJ
£: CO
£ to o a.
k _
Q .
E i
T) U CO
O
o (J CO CO
c "5 to IU
A
03
c CO
r o
c CO
£ CO
c CO o a.
^IJ &_ a.
A
• a CO
+i
c CO
E a
l-~ o d §•
e O)
to 9 p CD o © o
I s £ co
1 S to . « 2 o ^ q ^° ii] v •a a .
CB *
S | CO ° CO V
•S °-CO *
I 8" CO o
I - V
ai a. 5. * u o
£• M Ml C
8 I * 1 CO " CO
CO I I
• tU CD
S: to II o
CO X CD
C O
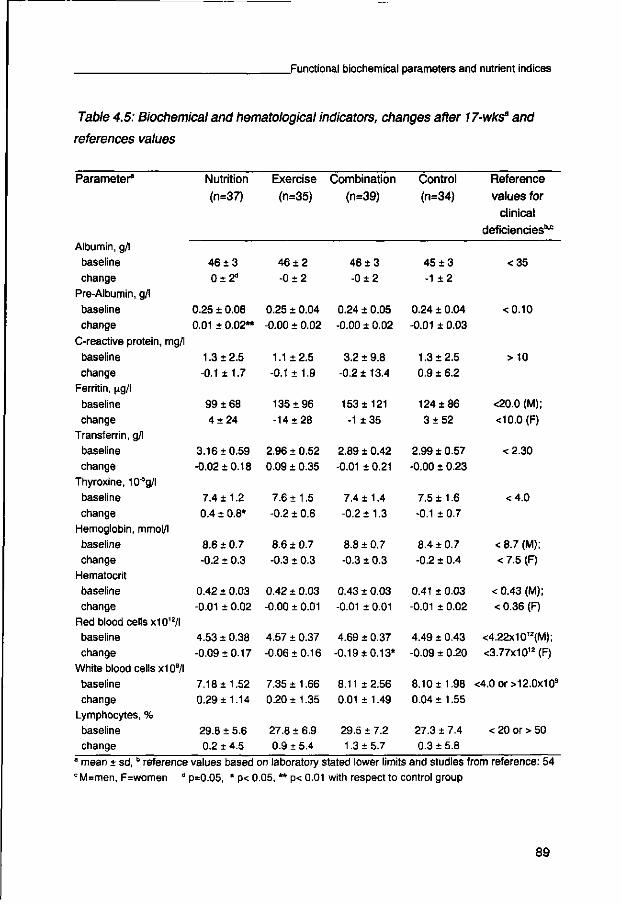
.Functional biochemical parameters and nutrient indices
Table 4.5: Biochemical and hematological indicators, changes after 17-wks* and
references values
Parameter*
Albumin, g/l
baseline
change
Pre-Albumin, g/l
baseline change
C-reactive protein, mg/l
baseline
change Ferritin, |xg/l
baseline change
Transferrin, g/l
baseline
change
Thyroxine, 10 5g/l
baseline
change Hemoglobin, mmol/l
baseline change
Hematocrit baseline
change
Red blood cells x10,2/l baseline
change
White blood cells x109/l
baseline
change Lymphocytes, %
baseline change
Nutrition (n=37)
46 ±3
0 ± 2 d
0.25 ± 0.06
0.01 ± 0.02**
1.3 ± 2.5
-0.1 ±1.7
99 ±68
4 ±24
3.16 ±0.59
-0.02 ±0.18
7.4 ±1.2
0.4 ± 0.8*
8.6 + 0.7
-0.2 ± 0.3
0.42 ± 0.03
-0.01 ± 0.02
4.53 ± 0.38 -0.09 ±0.17
7.18 ±1.52 0.29 ±1.14
29.8 ± 5.6 0.2 ± 4.5
Exercise (n=35)
46 ±2
- 0±2
0.25 ± 0.04
-0.00 ± 0.02
1.1 ±2.5 -0.1 ±1.9
135 ±96
-14 + 28
2.96 ± 0.52
0.09 ± 0.35
7.6 ± 1.5
-0.2 ± 0.6
8.6 ±0.7
-0.3 ± 0.3
0.42 ± 0.03
-0.00 ± 0.01
4.57 ± 0.37
-0.06 ±0.16
7.35 ± 1.66
0.20 ±1.35
27.8 ±6.9 0.9 ± 5.4
Combination (n=39)
46 ±3
- 0±2
0.24 ± 0.05
-0.00 ± 0.02
3.2 ± 9.8
-0.2 ±13.4
153 ±121
-1 ±35
2.89 ± 0.42
-0.01 ± 0.21
7.4 ±1.4
-0.2 ±1.3
8.8 ±0.7
-0.3 ± 0.3
0.43 ± 0.03 -0.01 ± 0.01
4.69 + 0.37
-0.19 + 0.13*
8.11 ±2.56 0.01 + 1.49
29.5 ± 7.2 1.3 ±5.7
Control (n=34)
45 ±3
-1 ± 2
0.24 ± 0.04
-0.01 ± 0.03
1.3 ±2.5
0.9 ± 6.2
124 ±86
3 ±52
2.99 ± 0.57
-0.00 ± 0.23
7.5 ±1.6
-0.1 ± 0.7
8.4 ±0.7
-0.2 ± 0.4
0.41 ± 0.03
-0.01 + 0.02
4.49 ± 0.43
-0.09 ± 0.20
8.10 ±1.98 0.04 ± 1.55
27.3 ± 7.4 0.3 ± 5.8
Reference values for
clinical deficiencies"0
<35
<0.10
>10
<20.0 (M);
<10.0(F)
<2.30
<4.0
< 8.7 (M);
< 7.5 (F)
<0.43(M);
< 0.36 (F)
<4.22x10¹²(M);
<3.77x10¹²(F)
<4.0 or >12.0x10⁹
< 20 or > 50
a mean ± sd,b reference values based on laboratory stated lower limits and studies from reference: 54 cM=men, F=women d p=0.05, * p< 0.05, ** p< 0.01 with respect to control group
89
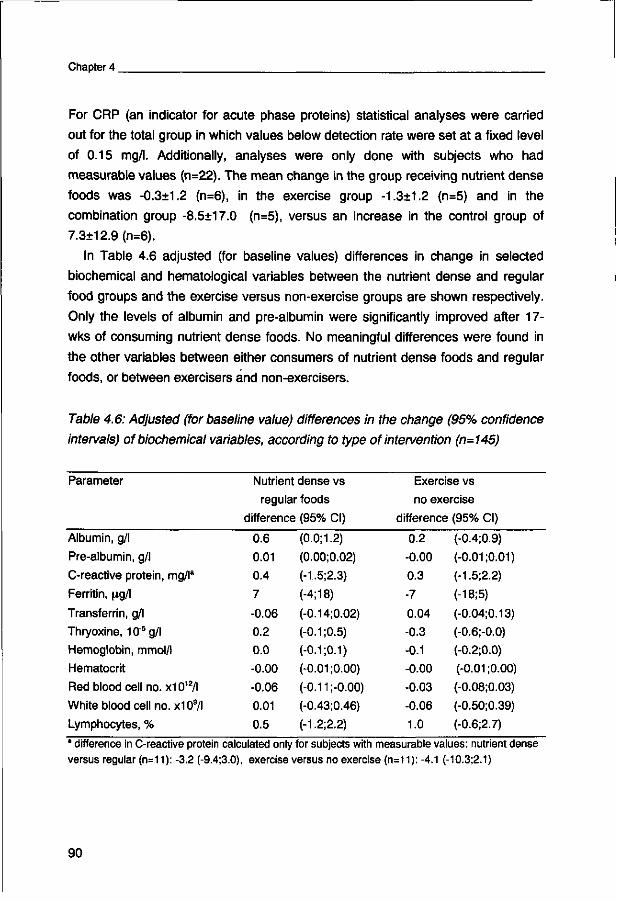
Chapter 4
For CRP (an indicator for acute phase proteins) statistical analyses were carried
out for the total group in which values below detection rate were set at a fixed level
of 0.15 mg/l. Additionally, analyses were only done with subjects who had
measurable values (n=22). The mean change in the group receiving nutrient dense
foods was -0.3±1.2 (n=6), in the exercise group -1.3±1.2 (n=5) and in the
combination group -8.5±17.0 (n=5), versus an increase in the control group of
7.3±12.9(n=6).
In Table 4.6 adjusted (for baseline values) differences in change in selected
biochemical and hematological variables between the nutrient dense and regular
food groups and the exercise versus non-exercise groups are shown respectively.
Only the levels of albumin and pre-albumin were significantly improved after 17-
wks of consuming nutrient dense foods. No meaningful differences were found in
the other variables between either consumers of nutrient dense foods and regular
foods, or between exercisers and non-exercisers.
Table 4.6: Adjusted (for baseline value) differences in the change (95% confidence
intervals) of biochemical variables, according to type of intervention (n=145)
Parameter
Albumin, g/l
Pre-albumin, g/l
C-reactive protein, mg/la
Ferritin, jxg/l
Transferrin, g/l
Thryoxine, 10"5 g/l
Hemoglobin, mmol/l
Hematocrit
Red blood cell no. x1012/l
White blood cell no. x109/l
Lymphocytes, %
Nutrient dense vs
regular foods
difference (95% CI)
0.6
0.01
0.4
7
-0.06
0.2
0.0
-0.00
-0.06
0.01
0.5
(0.0;1.2)
(0.00;0.02)
(-1.5;2.3)
(-4;18)
(-0.14;0.02)
(-0.1;0.5)
(-0.1;0.1)
(-o.oi;0.oo) (-0.11;-0.00)
(-0.43:0.46)
(-1.2;2.2)
Exercise vs
no exercise
difference (95% CI)
0.2
-0.00
0.3
-7
0.04
-0.3
-0.1
-0.00
-0.03
-0.06
1.0
(-0.4;0.9)
(-o.oi;o.oi) (-1.5:2.2)
(-18:5)
(-0.04;0.13)
(-0.6;-0.0)
(-o.2;o.o) (-o.oi;o.oo) (-0.08:0.03)
(-0.50:0.39)
(-0.6:2.7)
• difference in C-reactive protein versus regular (n=11): -3.2 (-9.4;
calculated only for subjects with measurable values: nutrient dense 3.0), exercise versus no exercise (n=11):-4.1 (-10.3:2.1)
90
.Functional biochemical parameters and nutrient indices
DISCUSSION
Nutrient dense foods containing a physiological dose of those micronutrients
frequently characterized as deficient in frail elderly significantly improved blood
vitamin levels and corrected present individual deficiencies. However, despite
these individual vitamin deficiencies at baseline, mean values of selected
biochemical and hematological indicators, were not found below reference values.
Therefore, in our frail elders none of the selected indicators seemed to be
considerably affected by either nutritional supplementation or the specifically
designed all-round exercise program.
In affluent societies nutritional deficiencies are not common in healthy elderly
people40, but low dietary intakes and clinically relevant deficiencies are evident in
institutionalized elderly people. This latter group is physically inactive, may have
reduced energy needs and is deteriorating in health41. Our population of
community-dwelling frail elderly people is, to a lesser extent, regarded as such a
group. From several selected indicators it appeared that we studied an elderly
group with indeed a worse health profile than apparently healthy Dutch elderly
people. Their mean BMI was lower compared to Dutch elderly in the European
Seneca study (24 kg/m2 vs 26 kg/m2 in men and 28 kg/m2 in women)42 and self
rated health was lower (7.0 vs 7.7) as was their activity level (PASE score 64 vs
85)29;43. Mean scores on physical fitness tests were below average as well (Chin A
Paw et al., submitted). In addition, we found that 34% of our female subjects had a
substantially low energy intake (< 6.3 MJ) moreover relatively low intakes of
several vitamins were calculated as well. Blood vitamin deficiency rates of the total
group varied between 42% for vitamin B12 and 39% for serum 25-hydroxy vitamin D
to 3% for EGR-a (a functional measure of vitamin B2). For most vitamins mean
blood values in our study population were lower compared to mean values in
healthy Dutch elderly people78394044"46.
On the mean group level, however, no clinically relevant deficiencies of
functional variables were noted. Indicators of poor protein status or chronic or
acute illnesses like low albumin, pre-albumin and transferrin levels, low lymphocyte
count or high CRP levels were not notably prevalent in our frail population. This
observation may act as the main explanation for the fact that despite the observed
significant improvement in blood vitamin levels in the supplemented groups (which
91
Chapter 4
is a confirmation that indeed our nutrient dense foods had been consumed and that
indeed the provided vitamins were circulating in blood) we did not detect many
clinically relevant beneficial changes in the selected indicators. Only albumin and
pre-albumin significantly improved after the 17 wks nutritional intervention,
although levels were regarded as adequate at baseline. However, the relevance of
these increases is equivocal: the change in (pre-) albumin, might only be attributed
to chance. In a subgroup with measurable values of CRP, supplementation and
exercise seemed to be beneficial, but due to a small sample size this finding should
also be interpreted with caution.
In an early study by Mann et al.23 it was observed that 4 months of daily
multivitamin supplementation with tablets improved blood levels of the water
soluble vitamins in elderly people. For the fat soluble vitamins this was not proven.
In our supplemented groups the water soluble vitamins increased significantly.
Since we only measured vitamin D, a fat soluble vitamin known to be frequently low
in elderly, we cannot comment on improvement of fat soluble vitamins in general.
Until now clinical significance of improved vitamin levels as such have not been
evaluated in well controlled intervention trials. Only very few studies have focused
on the effects of both exercise and nutrition on several nutritional and health
indicators in frail elderly people10, and only very limited information is available
about improvements in functional (biochemical and hematological) indicators by
either intervention1213. Also, as far as we know studies with an all-round
progressive exercise program combined with provision of a physiological dose of
micronutrients have not been performed in community-dwelling frail elderly people.
It was hypothesized that the physical exercise program would improve activity
level, energy expenditure and hence dietary intake. In addition, other beneficial
effects on a multitude of bodily processes may be attributed to exercise as well.
Gastrointestinal dysmotility, for example, may be caused by hypothyroidism and
may be enhanced by physical exercise22. Others have postulated that thyroid
hormone levels2147 but also growth hormone20, insulin/glucose dynamics and
lipoprotein metabolism18 can be affected by certain types of programmed exercise.
Serum albumin has been positively associated with skeletal muscle mass48, and
may therefore be influenced by physical activity. Perhaps several other (still
unknown) beneficial effects on the metabolism and organ functioning in aging
persons may be induced by regular exercise. Our program may unintentionally
92

.Functional biochemical parameters and nutrient indices
have been of a too low intensity or short duration to induce any change in energy
expenditure and dietary intake, or gastrointestinal absorption and metabolism.
Hence, individual deficient nutrient blood levels were not corrected in the exercising
group during the intervention period. Yet, the expected beneficial effects of
exercise might be expressed in the long term as maintenance of bodily tissues,
organ systems and biochemical variables. Additionally, significant favorable effects
on biochemical indicators could only have been induced in more frail, bedridden,
elderly people.
Our findings are in agreement with observations of Lipschitz et al.13 who studied
supplementation in a 'meals-on-wheels elderly population'. They observed no
change in serum ferritin levels, hemoglobin levels (not even in persons with
anemia) or lymphocyte count but found a modest rise in serum albumin and in
several selected nutrient concentrations. Additionally, Meredith et al.12 found
normal nutritional biochemical values at baseline and no change in these variables
after a refeeding program during physical rehabilitation in elderly men.
It has been suggested that the failure of most functional indicators to improve
with nutritional support implies that abnormalities are age or disease related rather
than nutrition related13. Other explanations may also be raised, such as possible
slight alterations in (micro)nutrient metabolism due to organ dysfunctioning, thereby
not profiting from the corrected blood nutrient levels. Another possibility is the
occurrence of renewed blood plasma or red cell balances, due to resorption of
other tissues in chronically deficient people. Regarding activity coefficients of ETK
and EGR, long term deficiency may be masked by decreased synthesis or kinetic
functions of the apoenzyme involved, thereby establishing a new balance49'52.
Perhaps the reference values for clinically relevant deficiencies need some re-
evaluation against recently postulated 'optimal nutrient levels'. A relatively short
intervention period should also be mentioned within this respect. Long term
protective effects of nutrient supplementation on biochemical and hematological
variables may occur, due to maintenance of the optimal nutrient levels. But benefits
from this maintenance may only be measurable after many years.
Alternatively, since no multiple clinically relevant deficiencies at baseline were
found, no relevant improvements might be expected after 17 weeks of intervention.
The fact that our variables did not change after intervention is consistent with
earlier studies1213. It suggests that improving these currently selected biochemical
93
Chapter 4
and hematological indicators in these specific community-dwelling frail elderly
populations may not necessarily be the first aim. On the other hand, the risk of
developing a 'delayed' suboptimal nutritional state in the long term due to
exhausted body reserves may be present in these frail groups. This may not be
determined immediately because a renewed but unfavorable balance through
tissue resorption may be initiated in the first place. Long term effects of
supplementation and also exercise should therefore be investigated, as well as the
mechanisms settled within once deficient subjects. Additionally, the relationships
between and effects on other functional indicators, for example incidence of
(infectious) diseases, osteoporosis and physical fitness and functioning should be
the topic of further research in this frail elderly community-dwelling population.
ACKNOWLEDGMENTS
We would like to thank Marga van der Steen for her endless effort in drawing blood from the participants and in preparing the samples afterwards. All sport teachers and the creative therapist are acknowledged for leading the programs. We are furthermore grateful to the dietitians Saskia Meyboom, Els Siebelink and Karin Roosemalen for organizing and distributing the foods and obtaining the dietary records. Last but not least we would like to thank Wiebe Visser of the Dutch Dairy Foundation on Nutrition and Health, Maarssen, the Netherlands for establishing and coordinating the contacts with the following (food) companies: Roche Nederland B.V., Friesland Coberco Dairy Foods B.V., Campina Melkunie - Mona Division, Bekina Lebensmittel GmbH, subsidiary of Royal Numico NV.
References
I.Russell RM: Changes in gastrointestinal function attributed to aging. Am J Clin Nutr 1992;55:1203S-1207S. 2. Saltzman JR, Russell RM: The aging gut. Nutritional issues. Gastroenterol Clin North Am 1998;27:309-324. 3. Tucker K: Micronutrient status and aging. Nutr Rev 1995;53:S9-15. 4. Ahmed FE: Effect of nutrition on the health of the elderly. J Am Diet Assoc 1992;92:1102-1108. 5. Machlin U: Handbook of vitamins - nutritional, biochemical and clinical aspects, New York, Marcel Dekker Inc.; 1984. 6. Payette H, Gray Donald K: Dietary intake and biochemical indices of nutritional status in an elderly population, with estimates of the precision of the 7-d food record. Am J Clin Nutr 1991;54:478-488.
94
.Functional biochemical parameters and nutrient indices
7. van der Wielen RPJ, Lowik MR, van den Berg H, et al: Serum vitamin D concentrations among elderly people in Europe. Lancet 1995;346:207-210. 8. Schrijver J, van Veelen BWC, Schreurs WHP: Biochemical evaluation of the vitamin and iron status of an apparently healthy Dutch free-living elderly population. Comparison with younger adults. Int J Vitam Nutr Res 1985;55:337-349. 9. Commissie Voeding van de Oudere Mens Voedingsraad: Voeding van de oudere mens, Den Haag, Voedingsraad; 1995. 10. Fiatarone MA, O'Neill EF, Ryan ND, et al: Exercise training and nutritional supplementation for physical frailty in very elderly people. N Engl J Med 1994;330:1769-1775. 11. Gray-Donald K, Payette H, Boutier V: Randomized clinical trial of nutritional supplementation shows little effect on functional status among free-living frail elderly. J Nutr 1995;125:2965-2971. 12. Meredith CN, Frontera WR, O'Reilly KP, Evans WJ: Body composition in elderly men: effect of dietary modification during strength training. J Am Geriatr Soc 1992;40:155-162. 13. Lipschitz DA, Mitchell CO, Steele RW, Milton KY: Nutritional evaluation and supplementation of elderly subjects participating in a "meals on wheels" program. JPEN 1985;9:343-347. 14. Titchenal CA: Exercise and food intake, what is the relationship? Sports Med 1988;6:135-145. 15. Poehlman ET: Energy expenditure and requirements in aging humans. J Nutr 1992;122:2057-2065. 16. Mensink GB, Arab L: Relationships between nutrient intake, nutritional status and activity levels in an elderly and in a younger population; a comparison of physically more active and more inactive people. Z Gerontol 1989;22:16-25. 17. Fielding RA: Effects of exercise training in the elderly: impact of progressive- resistance training on skeletal muscle and whole-body protein metabolism. Proc Nutr Soc 1995;54:665-675. 18. Morris JN, Hardman AE: Walking to health. Sports Med 1997;23:306-332. 19. Young A: Ageing and physiological functions. Philos Trans R Soc Lond B Biol Sci 1997;352:1837-1843. 20. Martin FC, Yeo AL, Sonksen PH: Growth hormone secretion in the elderly: ageing and the somatopause. Baillieres Clin Endocrinol Metab 1997; 11:223-250. 21. Lee MS, Kang CW, Shin YS, et al: Acute effects of chundosunbup qi-training on blood concentrations of TSH, calcitonin, PTH and thyroid hormones in elderly subjects. Am J Chin Med 1998;26:275-281. 22. Lovat LB: Age related changes in gut physiology and nutritional status. Gut 1996;38:306-309. 23. Mann BA, Garry PJ, Hunt WC, Owen GM, Goodwin JS: Daily multivitamin supplementation and vitamin blood levels in the elderly: a randomized, double-blind, placebo-controlled trial. J Am Geriatr Soc 1987;35:302-306. 24. Garry PJ, Koehler KM: Problems in Interpretation of Dietary and Biochemical Data from Population Studies, in Present Knowledge in Nutrition. 1989:407-414. 25. Commissie Voedingsnormen Voedingsraad: Nederlandse voedingsnormen 1989, Den Haag, Voedingsraad; 1989. 26. Lord SR, Lloyd DG, Nirui M, Raymond J, Williams P, Stewart RA: The effect of exercise on gait patterns in older women: a randomized controlled trial. J Gerontol A Biol Sci Med Sci 1996;51:M64-M70 27. McMurdo ME, Rennie L: A controlled trial of exercise by residents of old people's homes. Age Ageing 1993;22:11-15. 28. Washburn RA, Smith KW, Jette AM, Janney CA: The Physical Activity Scale for the Elderly (PASE): development and evaluation. J Clin Epidemiol 1993;46:153-162.
95
Chapter 4.
29. Schuit AJ, Schouten EG, Westerterp KR, Saris WH: Validity of the Physical Activity Scale for the Elderly (PASE): according to energy expenditure assessed by the doubly labeled water method. J Clin Epidemiol 1997;50:541 -546. 30. Fidanza F: Nutritional status assessment: a manual for population studies, New York, Chapman and Hall; 1991. 31. Stichting Nederlands Voedingsstoffenbestand. Dutch Nutrient Data Base 1997. The Hague, Voorlichtingsbureau voor de Voeding. 32. Stichting Nederlands Voedingsstoffebestand. Dutch Nutrient Data Base 1995. The Hague, Voorlichtingsbureau voor de Voeding. 33. van den Berg H, Heseker H, Lamand M, Sandstrom B, Thurnham D: Flair Concerted Action No 10 Status Papers. Int J Vitam Nutr Res 1993;63:247-316. 34. Kuemmerle SC, Boltinghouse GL, Delby SM, Lane TL, Simondsen RP: Automated assay of vitamin B-12 by the Abbott IMx analyzer. Clin Chem 1992;38:2073-2077. 35. van den Berg H, Schrijver J, Boshuis PG: Vitamin D (25-OHD) in serum by competitive protein-binding assay, in Fidanza F (ed): Nutritional status assessment. A manual for population studies. London, Chapman and Hall; 1991:203-209. 36. Amorim-Cruz JA, Moreiras O, Brzozowska A: Longitudinal changes in the intake of vitamins and minerals of elderly Europeans. SENECA Investigators. Eur J Clin Nutr 1996;50 Suppl 2:S77-S85 37. van der Wielen RPJ, de Wild G, de Groot LCPGM, Hoefnagels WH, Van Staveren WA: Dietary intakes of energy and water-soluble vitamins in different categories of aging. J Gerontol A Biol Sci Med Sci 1996;51 :B100-B107 38. Bergstein I, Van Die I: Vitamine D en de voeding van ouderen. Nederlands Tijdschrift voor dietisten 1988;43:169-172. 39. van Asselt DZB, de Groot LCPGM, Van Staveren WA, et al: Role of cobalamin intake and atrophic gastritis in mild cobalamin deficiency in older Dutch subjects. Am J Clin Nutr 1998;68:328-334. 40. Lowik MR, Schrijver J, Odink J, van den Berg H, Wedel M, Hermus RJ: Nutrition and aging: nutritional status of "apparently healthy" elderly (Dutch nutrition surveillance system). J Am Coll Nutr 1990;9:18-27. 41. Rosenberg IH: Nutrition and aging, in Hazzard WR, Bierman EL, Blass JP, Ettinger WH, Halter JB, Andres R (eds): Principles of geriatric medicine and gerontology. New York, McGraw-Hill, Inc.; 1994:49-59. 42. de Groot CPGM, Perdigao AL, Deurenberg P: Longitudinal changes in anthropometric characteristics of elderly Europeans. SENECA Investigators. Eur J Clin Nutr 1996;50 Suppl 2:S9-15. 43. Schuit AJ: Regular physical activity in old age, effect on coronary heart disease risk factors and well-being. 1-163.1997. Wageningen Agricultural University. 44. Haller J, Weggemans RM, Lammi KC, Ferry M: Changes in the vitamin status of elderly Europeans: plasma vitamins A, E, B-6, B-12, folic acid and carotenoids. SENECA Investigators. Eur J Clin Nutr 1996;50 Suppl 2:S32-S46 45. Lowik MR, Hulshof KF, Schneijder P, Schrijver J, Colen AA, van Houten P: Vitamin C status in elderly women: a comparison between women living in a nursing home and women living independently. J Am Diet Assoc. 1993;93:167-172. 46. Lowik MR, van den Berg H, Schrijver J, Odink J, Wedel M, van Houten P: Marginal nutritional status among institutionalized elderly women as compared to those living more independently (Dutch Nutrition Surveillance System). J Am Coll Nutr 1992;11:673-681. 47. Zerath E, Holy X, Douce P, Guezennec CY, Chatard JC: Effect of endurance training on postexercise parathyroid hormone levels in elderly men. Med Sci Sports Exerc 1997;29:1139-1145. 48. Baumgartner RN, Koehler KM, Romero L, Garry PJ: Serum albumin is associated with skeletal muscle in elderly men and women. Am J Clin Nutr 1996;64:552-558.
96
.Functional biochemical parameters and nutrient indices
49. Buttery JE, Milner CR, Chamberlain BR: The NADH-dependent transketolase assay: a note of caution [letter]. Clin Chem 1982;28:2184-2185. 50. Warnock LG: A new approach to erythrocyte transketolase measurement. J Nutr 1970;100:1957-1962. 51. Glatzle D, Korner WF, Christeller S, Wiss 0: Method for the detection of a biochemical riboflavin deficiency. Stimulation of NADPH2-dependent glutathione reductase from human erythrocytes by FAD in vitro. Investigations on the vitamin B2 status in healthly people and geriatric patients. Int Z Vitaminforsch 1970;40:166-183. 52. Cooperman JM: Riboflavin, in Machlin JL (ed): Handbook of vitamins, nutritional, biochemical and clinical aspects. New York, Marcel Dekker; 1984:299-327. 53. Ooms ME: Vitamin D status and sex hormone binding globulin: determinants of bone turnover and bone mineral density in elderly women. In: Osteoporosis in elderly women. Vitamin D deficiency and other risk factors; 1994: 69-83. 54. van der Wielen RPJ: Vitamin intake and status in elderly Europeans. 1-167. 1995. Department of Human Nutrition, Wageningen Agricultural University.
97

Physiologically dosed nutrient dense foods and
exercise in frail elderly: effect on B-vitamins,
homocysteine and neuropsychological
functioning Submitted
Nynke de Jong
Marijke J.M. Chin A Paw
Lisette C.P.G.M. de Groot
Dorine W. Swinkels
Frans J. Kok
Wija A. van Staveren

Chapter 5.
The objective was to determine the effect of enriched foods and physical exercise on blood vitamin concentrations, homocysteine level and neuropsychologic functioning in frail elderly. A 17-weeks randomized placebo controlled intervention trial, following a 2x2 factorial design was performed: a) group receiving enriched foods + social program, b) group receiving enriched foods + exercise program, c) group receiving regular foods + exercise program, d) group receiving regular foods + social program. Foods were enriched with a physiologically dosed cocktail of vitamins and minerals (25-100% of the Dutch RDA), the all-round exercise program focused on training of strength, coordination, flexibility and endurance. Plasma vitamin levels (cobalamin, folate and pyridoxine-5-phosphate(PLP)), red blood cell folate and homocysteine concentration were analyzed. In addition two neuropsychologic tests, i.e. reaction time and manual dexterity were performed. Of 130 independently living frail elderly (mean age: 78±5 years) data were available. Vitamin levels were significantly (p<0.001) raised in the nutrient dense food groups compared to the non-enriched groups. Plasma cobalamin in the enriched groups was, with respect to baseline levels, raised with 22%, plasma folate with 101%, red cell folate with 87% and PLP with 68%. The non-enriched groups changed their levels with -2%, -6%,1% and -13% respectively. Homocysteine level deviated with -25% in the enriched groups, whereas a small increase of 2% in the non-enriched group was found (p<0.002). Compared to non-enriched subjects a mean (95% CI) decline of 5.0 umol (-6.5;-3.5) was achieved in the nutrient dense group. Exercise did not affect vitamin or homocysteine level. No significant effect of both interventions was observed on the neuropsychologic tests.
In conclusion, the decrease in homocysteine level in frail elderly confirms a subclinical metabolic deficiency state and may reduce their risk of cardiovascular disease. Effects of B-vitamins on mental health have yet to be ascertained.
INTRODUCTION
Prevalence of low plasma cobalamin (vitamin B12), folate and pyridoxal-5-
phosphate (vitamin B6) concentrations have been found with advancing age by
several but not all investigators1"7, thus demonstrating considerable controversy.
Other clinical metabolic tests of functional intracellular vitamin deficiencies like
plasma concentrations of homocysteine (Hey) and methylmalonic acid (MMA)
100
. B-vitamins, homocysteine and neuropsychologic functioning
seem to be more functional78. These indicators suggest a substantially higher
vitamin deficiency prevalence79 and even metabolic evidence of vitamin deficiency
in the presence of normal plasma vitamin levels have been reported10.
Interest in elevated plasma Hey, as a potential risk factor for cardiovascular
disease has recently grown notably. Deficiency of either folate and/or cobalamin,
and to a lesser extent vitamin B6, all cofactors in the Hey metabolizing enzymes,
may cause elevated levels of Hey. Deficiency of cobalamin as well as folate, are
additionally associated with neurologic abnormalities2411"13.
Particularly frail elderly are at risk for suboptimal or deficient micronutrient
states, functional decline and neurologic disorders. Primary or secondary factors
influencing the nutritional and health state are biological aging, chronic diseases
(e.g. atrophic gastritis) and physical inactivity resulting in less energy expenditure
and inadequate dietary intake or uptake14"18. In the past decade research in frail
elderly has demonstrated benefits of nutritional supplementation programs and/or
exercise on some (but not all) indicators of nutritional and health status19"22.
Nevertheless, influence of oral physiologically dosed multiple micronutrients on
homocysteine levels have not been described in frail elderly. Likewise, the
influence of exercise, aiming at a direct improvement of physical and neurologic
functioning, but also aiming at improvement of physical activity, energy expenditure
and hence total dietary intake, has not been taken into account.
For ethical reasons proposed public health programs for lowering homocysteine
levels should not be based on unnecessarily high doses of folic acid or other B-
vitamins23. To overcome any potential risk of over-exposure with adverse effects,
research is needed for determination of optimal dosages for community based
(frail) elderly with perhaps only mildly elevated homocysteine levels. In this
intervention trial, we focus on the effects of multiple physiologically dosed nutrient
dense foods and/or exercise on vitamin status, homocysteine levels and
neuropsychological functioning in frail elderly.
MATERIAL AND METHODS
Subjects
The study population comprised of 217 free-living Dutch (frail) elderly. Frailty was
defined according to the following criteria: requirement of health care (such as
101
Chapter 5
home care or meals-on-wheels service); age & 70 years; no regular exercise; body
mass index below average (BMI s 25 kg/m2, based on self reported weight and
height) or recent weight loss; ability to understand the study procedures and no use
of multivitamin supplements.
All subjects gave a written informed consent. The study protocol was approved
by the external Medical Ethical Committee of the Division of Human Nutrition and
Epidemiology of the Wageningen Agricultural University. Pre- and postintervention
measurement(s) were available for 165 subjects. Reasons for this drop out (n=52,
24%) were mainly health problems, including (terminal) disease, hospital
admittance, recent falling and/or fracturing. Valid (pre- and post) vitamin and
homocysteine measures were available for 130 subjects. Four subjects were
excluded because the time between pre- and postmeasurement was less than 13
weeks due to hospitalization, three subjects were not able to visit our research
center after intervention due to illness. In one subject venipuncture was not
successful and additionally 12 subjects were excluded from analyses, because of
multivitamin usage. Another 14 subjects were excluded because of vitamin B-
complex usage. Finally, one subject in the control group was dropped because of
extremely high Hey values (i.e. pre-intervention: 93.2 p,mol/l, post-intervention: 84.3
nmol/l).
Design
Enrollment took place between January and June 1997. Subjects were randomly
assigned to one of four intervention groups:
a. nutrition: nutrient dense products + social program;
b. exercise: regular products + exercise program;
c. combination: nutrient dense products + exercise program;
d. control (or placebo): regular products + social program.
The intervention period was 17 weeks. At baseline (week 0) and after 17 weeks (in
week 18) data were collected.
Nutrient dense foods
Subjects were asked to consume two products a day: one from a series of fruit
products and one from a series of dairy products. Availability of a variety of
products was intended to avoid boredom and to increase acceptability of the
102
. B-vitamins, homocysteine and neuropsychologic functioning
products. Fresh 100 g servings of fruit based products (two types of both fruit juice
and compote) and 100 g servings of dairy products (vanilla custard, two types of
fruit yogurt and cheese curd with fruits (75 g)) were provided weekly. Daily
consumption of two enriched products delivered -100% of the Dutch RDA 24;2S of
the vitamins: D, E, B„ B2, B6, folic acid, B12, C and ~ 25-100% of the Dutch RDA of
the minerals: calcium (25%), magnesium (25%), zinc (50%), iron (50%), iodine
(100%). Details about the contents of the enriched products are described
elsewhere (manuscript submitted) and in the appendix. Subjects in the control and
exercise group received identical regular products (amount of vitamins and
minerals at the highest 15% of the concentration in enriched products). Both the
enriched and the regular products contained -0.48 MJ of energy per two products.
Exercise program
The main objective of the exercise program was maintenance / improvement of
mobility and performance of daily activities essential for independent functioning
by maintenance of versatility in movement. Emphasis was placed on skill training:
muscle strength, coordination, flexibility, speed and endurance were trained by
exercises such as walking, stooping and chair stands. Different materials were
used, for example balls, ropes, weights, elastic bands. Group sessions were
organized twice a week for 45 minutes and were of moderate, gradually increasing
intensity. The sessions were coordinated by skilled teachers and supervised by
one of the project leaders (MCAP). In order to guarantee uniformity all sessions
were extensively rehearsed with all teachers together, moreover an instruction
video and manual were made in advance. A social program served as a control (for
attention) program for the exercise program. Sessions of 90 minutes were
organized once every two weeks by a skilled creative therapist. This program
focused on creative activities, social activities and lectures about topics of interest
for elderly. Transport to and from all sessions was arranged.
Measures
Questionnaires asked for information on age, sex, marital status, education, living
conditions, illness, medicine and supplement use, and physical activity level.
Anthropometric measurements were performed to determine body weight (to 0.01
kg on a digital scale: ED-6-T; Berkel) and height (to 0.001 m with a wall-mounted
103
Chapter 5
stadiometer). Body mass index was calculated as weight in kilograms divided by
height in meters squared26.
Neuropsychological parameters
Two validated tests were used for measuring the neuropsychological functioning.
First, a block-transfer test was accomplished: the participant was instructed to
replace 40 blocks with the preferred hand from a full board to an empty board as
fast as possible in a prescribed sequence. Second, a reaction time test was
conducted: the subject had to react to the onset of a light by pushing a button as
fast as possible. Details about these two tests can be found elsewhere27.
Biochemistry
Blood samples from fasting subjects were collected between 07.00 and 09.00 for
all indicators except samples for complete blood count and homocysteine. For
practical reasons these latter two samples were collected in our research center at
noon and immediately put on ice, before further processing. For total homocysteine
0.5 ml non-fasting EDTA plasma was used for analysis (HPLC-fluorimetry). All
samples were analyzed within one run, with a variation coefficient of 3.5%. A fresh
3 ml non-fasting EDTA sample was used for complete blood count (Coulter
Counter type T-860).
With respect to the fasting blood samples 1.5 ml EDTA-plasma was preserved
for analyses of vitamin B12 and folate, using ion capture IMx (Abott Labs, Abott
Park, IL, USA)2829. Between run coefficients of variation were <5% and <10%
respectively. For red cell folate hemolysates were prepared out of 100^1 fasting
EDTA plasma and 2 ml 1% ascorbic acid in water. Lysis reagent, containing
guanidine HCI was used to dilute the sample four times and added at the time of
analysis. Determination, using ion capture IMx as well, was followed by calculation
of corrected red blood cell folate concentration with % hematocrit and plasma folate
concentration used in the formula. A regression formula was used to correct for the
delayed dilution with lysis reagent. Coefficient of variation with respect to these red
blood cell folate samples was found <13% between run. For vitamin B6 pyridoxal-
5'-phosphate (PLP) was determined (derivatives separated by reversed-phase
HPLC and detected by fluorescence) in 1.0 ml of plasma26. Between assay CV was
5-10%.
104
. B-vitamins, homocysteine and neuropsychologic functioning
Until analysis all samples were stored at -80°C. Pre- and postintervention samples
were analyzed in the same batch. Analyses were performed by the TNO Nutrition
and Food Research Institute, Zeist, The Netherlands (PLP), the Department of
Clinical Chemistry, University Hospital Nijmegen, St. Radboud, Nijmegen (B12,
plasma and red cell folate) and the division of Human Nutrition and Epidemiology,
Wageningen Agricultural University, The Netherlands (Hey, hemocytometry).
Statistical analysis
Data were analyzed using the statistical program SAS (Statistical Analysis
Program, version 6, NC: SAS Institute Inc., 1990). Means ± standard deviations
(sd), medians (10th- 90th percentiles) or percentages of (baseline) values were
calculated for all intervention groups. Means and mean changes (±sd) per
intervention group were calculated and compared with mean changes in the control
group (ANOVA followed by unpaired t-tests). The prevalence of subjects deviating
from reference deficiency levels before and after intervention were calculated as
frequencies: i.e. vitamin B12 < 221 pmol/l, PLP < 20 nmol/l, plasma folate < 6.3
nmol/l, red blood cell folate < 337 nmol/l and homocysteine > 16.2 u.mol/1 according
to the manufacturer's stated lower limit of normal values and the literature*10*0"33
(with respect to Hey, data and cut-off levels of fasting as well as non-fasting
subjects were described). With respect to the two neuropsychological tests
medians and median changes (10th- 90* percentiles) per intervention group were
calculated and compared with the control group (rank-sum test). Spearman
correlation coefficients were obtained between (baseline) blood vitamin values,
homocysteine levels and the neuropsychologic tests. Multiple regression was used
to determine the effect of both interventions and a possible interaction on the
change in homocysteine level. Since no evidence of interaction was observed
between both interventions a comparison was made between the supplemented
group versus the non-supplemented group and the exercising group versus the
non-exercising group respectively, by linear regression. Baseline homocysteine
and vitamin values were added as covariates to the model to check for
confounding.
105
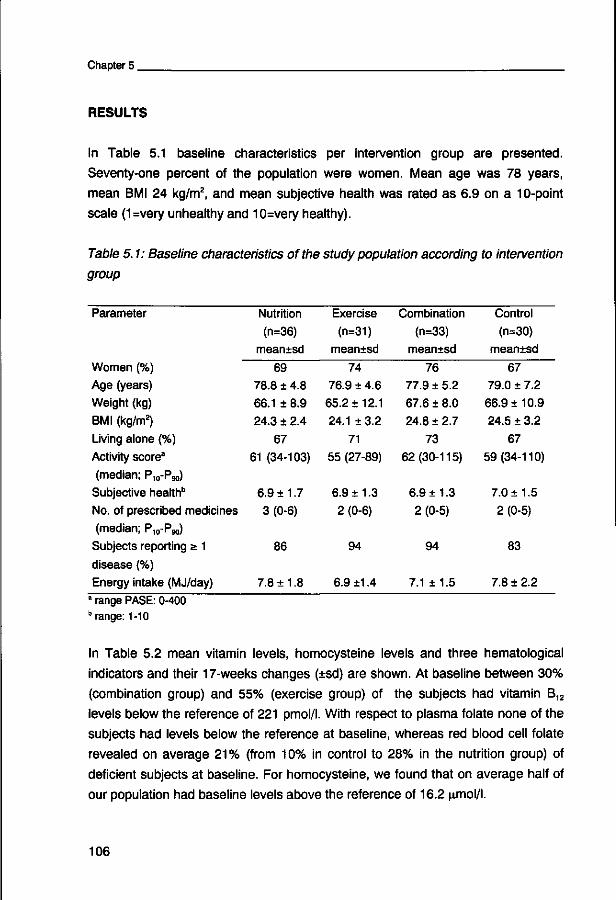
Chapter 5
RESULTS
In Table 5.1 baseline characteristics per intervention group are presented.
Seventy-one percent of the population were women. Mean age was 78 years,
mean BMI 24 kg/m2, and mean subjective health was rated as 6.9 on a 10-point
scale (1=very unhealthy and 10=very healthy).
Table 5.1: Baseline characteristics of the study population according to intervention
group
Parameter
Women (%)
Age (years)
Weight (kg)
BMI (kg/m2)
Living alone (%)
Activity score3
(median; P10-Pgo)
Subjective health"
No. of prescribed medicines
(median; P10-Pgo) Subjects reporting a 1
disease (%)
Energy intake (MJ/day)
Nutrition
(n=36)
meamsd
69
78.8 ± 4.8
66.1 ± 8.9
24.3 ± 2.4
67
61 (34-103)
6.9 ±1.7
3 (0-6)
86
7.8 ±1.8
Exercise
(n=31)
mean±sd
74
76.9 ± 4.6
65.2 ±12.1
24.1 ±3.2
71
55 (27-89)
6.9 ±1.3
2 (0-6)
94
6.9 ±1.4
Combination
(n=33)
mean±sd
76
77.9 ± 5.2
67.6 ± 8.0
24.8 ± 2.7
73
62(30-115)
6.9 ±1.3
2 (0-5)
94
7.1 ±1.5
Control
(n=30)
mean±sd
67
79.0 ± 7.2
66.9 ±10.9
24.5 ± 3.2
67
59(34-110)
7.0 ±1.5
2 (0-5)
83
7.8 ±2.2 a range PASE: 0-400 "range: 1-10
In Table 5.2 mean vitamin levels, homocysteine levels and three hematological
indicators and their 17-weeks changes (±sd) are shown. At baseline between 30%
(combination group) and 55% (exercise group) of the subjects had vitamin B12
levels below the reference of 221 pmol/l. With respect to plasma folate none of the
subjects had levels below the reference at baseline, whereas red blood cell folate
revealed on average 21% (from 10% in control to 28% in the nutrition group) of
deficient subjects at baseline. For homocysteine, we found that on average half of
our population had baseline levels above the reference of 16.2 nmol/l.
106

. B-vitamins, homocysteine and neuropsychologic functioning
Table 5.2: Mean blood vitamin levels (±sd) and 17-week change (±sd) In the frail
elderly study population
Parameter
Vitamin B12 (pmol/l) baseline change % < 221 pmol pre/post intervention
Folate (nmol/l) baseline change
% < 6.3 nmol pre/post intervention
Red cell folate (nmol/l) baseline change
% < 337 nmol pre/post intervention
PLP (nmol/l) baseline change % < 20 nmol pre/post intervention
Homocysteine ((xmol/l)
baseline change
% > 16.2u.mol
pre/post intervention Hemoglobin (mmol/l) baseline change
Hematocrit (l/l) baseline change
Mean corpuscular vol (fl)
baseline change
Nutrition (n=36) Exercise (n=31) Combination (n=33) Control (n=30) mean±sd
281 ±113" 78 ±67* 42/11
19.0 ±7.8
18.0 ± 7.2* 0/0
502.1 ± 227.6
488.0 ± 293.8* 28/0
38.3 ± 25.1 32.6 ±29.4*
14/0
17.3 ±5.7 -4.0 ± 3.9*
53/22
8.6 ± 0.7 -0.2 ± 0.3
0.42 ± 0.03
-0.01 ± 0.02
92 ±4 0.5 ±1.7
meantsd
233 ± 97 -5 ±42 55/52
19.9 ±8.1 -2.1 ± 4.9
0/0
462.9 ±146.9 22.8 ± 121.2
23/13
33.8 ± 22.7 -0.5 ± 28.8
26/19
16.8 ±7.0° 0.5 ± 2.4
45/45
8.7 ± 0.7
-0.3 ± 0.3
0.42 ± 0.03
-0.00 ±0.01
91 ±4 0.2 ± 1.1
mean±sd
299 ±142 51 ±72*
30/18
18.0±7.2b
19.5 ± 6.8*
0/0
491.6 ± 180.2" 376.8 ±177.8*
22/0
35.8 ±31.7 17.7 ±27.0*
30/3
16.3 ±6.1 -4.6 ± 4.8*
48/9
8.9 ± 0.7 -0.3 ± 0.3
0.43 ± 0.03 -0.01 ±0.01
91 ±4
1.0 ± 1.5
mean±sd
229 ± 87.2 -2 ±37 50/47
16.4 ±7.0 -0.15 ±3.2
0/0
540.5 ±134.4
•10.8 ±190.1 10/17
32.3 ± 22.4 -3.9 ± 13.5
23/23
19.5 ±7.8 0.3 ± 5.6
57/63
8.5 ± 0.7 -0.2 ± 0.4
0.41 ±0.03 -0.01 ± 0.02
92 ±4 0.3 ± 1.6
' p < 0.001 compared to the control group," n=35,b n=32,c n=30
107
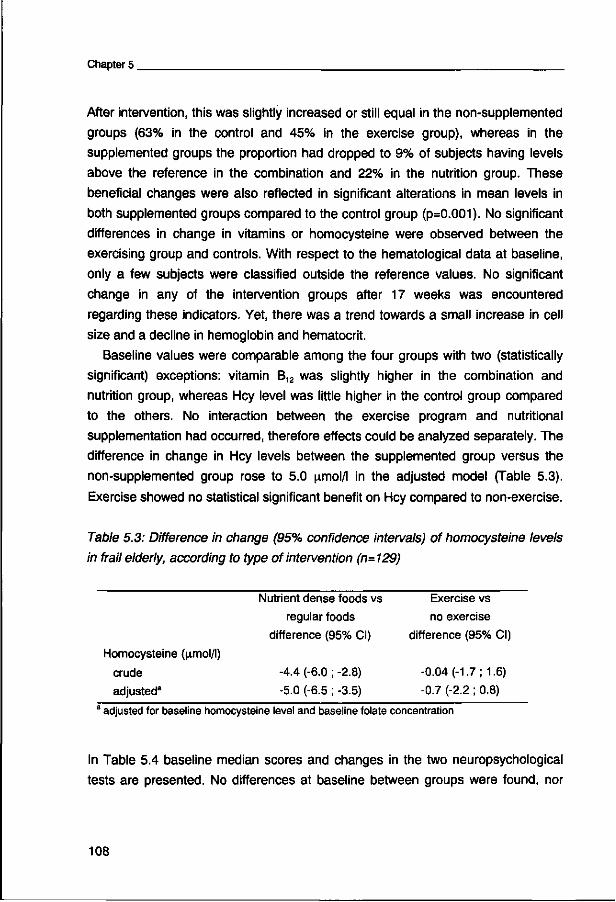
Chapter 5
After intervention, this was slightly increased or still equal in the non-supplemented
groups (63% in the control and 45% in the exercise group), whereas in the
supplemented groups the proportion had dropped to 9% of subjects having levels
above the reference in the combination and 22% in the nutrition group. These
beneficial changes were also reflected in significant alterations in mean levels in
both supplemented groups compared to the control group (p=0.001). No significant
differences in change in vitamins or homocysteine were observed between the
exercising group and controls. With respect to the hematological data at baseline,
only a few subjects were classified outside the reference values. No significant
change in any of the intervention groups after 17 weeks was encountered
regarding these indicators. Yet, there was a trend towards a small increase in cell
size and a decline in hemoglobin and hematocrit.
Baseline values were comparable among the four groups with two (statistically
significant) exceptions: vitamin B12 was slightly higher in the combination and
nutrition group, whereas Hey level was little higher in the control group compared
to the others. No interaction between the exercise program and nutritional
supplementation had occurred, therefore effects could be analyzed separately. The
difference in change in Hey levels between the supplemented group versus the
non-supplemented group rose to 5.0 nmol/l in the adjusted model (Table 5.3).
Exercise showed no statistical significant benefit on Hey compared to non-exercise.
Table 5.3: Difference in change (95% confidence intervals) of homocysteine levels
in frail elderly, according to type of intervention (n=129)
Nutrient dense foods vs Exercise vs
regular foods no exercise
difference (95% CI) difference (95% CI)
Homocysteine (u.mol/1)
crude -4.4 (-6.0; -2.8) -0.04 (-1.7; 1.6)
adjusted3 -5.0 (-6.5; -3.5) -0.7 (-2.2; 0.8) a adjusted for baseline homocysteine level and baseline folate concentration
In Table 5.4 baseline median scores and changes in the two neuropsychological
tests are presented. No differences at baseline between groups were found, nor
108
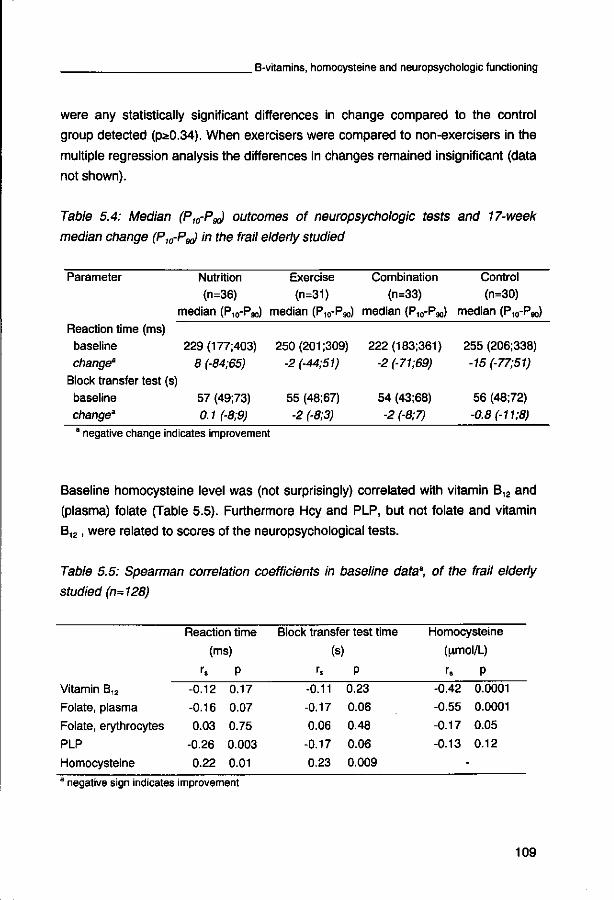
. B-vitamins, homocysteine and neuropsychologic functioning
were any statistically significant differences in change compared to the control
group detected (pa0.34). When exercisers were compared to non-exercisers in the
multiple regression analysis the differences in changes remained insignificant (data
not shown).
Table 5.4: Median (P10-P^ outcomes of neuropsychologic tests and 17-week
median change (Pm-PgJ in the frail elderly studied
Parameter Nutrition (n=36)
median (P10-P9o Reaction time (ms) baseline 229(177;403) change3 8 (-84;65)
Block transfer test (s) baseline 57 (49;73) change3 0.1 (-8;9)
Exercise
(n=31) median (Pi0-P<so)
250 (201 ;309) -2 (-44;51)
55 (48;67)
-2 (-8;3)
Combination (n=33)
median (P10-Pgo)
222(183;361) -2 (-71;69)
54 (43;68)
-2 (-8;7)
Control (n=30)
median (P10-P,K>)
255 (206;338) -15(-77;51)
56 (48;72)
-0.8(-11;8) a negative change indicates improvement
Baseline homocysteine level was (not surprisingly) correlated with vitamin B12 and
(plasma) folate (Table 5.5). Furthermore Hey and PLP, but not folate and vitamin
B12, were related to scores of the neuropsychological tests.
Table 5.5: Spearman correlation coefficients in baseline data", of the frail elderly
studied (n=128)
Vitamin B12
Folate, plasma
Folate, erythrocytes
PLP
Homocysteine
Reaction time
(ms)
h P
-0.12 0.17
-0.16 0.07
0.03 0.75
-0.26 0.003
0.22 0.01
Block transfer test time
(s
rs
-0.11
-0.17
0.06
-0.17
0.23
P
0.23
0.06
0.48
0.06
0.009
Homocysteine
(u,mol/L)
rs P -0.42 0.0001
-0.55 0.0001
-0.17 0.05
-0.13 0.12
-1 negative sign indicates improvement
109
Chapter 5
The 17-weeks change in folate was inversely correlated with change in Hey
(plasma folate: r=-0.67, p<0.001; red blood cell folate: r=-0.52, p<0.001). Change in
vitamin B12 and PLP also showed an inverse significant correlation with Hey level,
but to a lesser extent: r=-0.36, p<0.001 and r=-0.41, p<0.001 respectively.
Changes in blood vitamins nor homocysteine level did correlate with the changes in
the neuropsychologic tests (data not shown).
DISCUSSION
Seventeen weeks consumption of our physiologically dosed micronutrient enriched
foods beneficially affected blood vitamin and homocysteine levels in a group of
Dutch frail elderly. The considerable decrease (-25%) in the latter metabolite
confirms a subclinical metabolic deficiency state in these elderly. There was no
significant effect of the enriched foods on two indicative tests for
neuropsychological functioning. In addition no significant effect of all-round
moderate intense exercise was observed on any of the parameters, nor was an
interaction between the enriched foods and exercise found.
Moderate increased concentrations of homocysteine may be an independent
risk factor for cardiovascular disease34"36. Meta-analyses of observational studies
predict that a 1 nmol/L decrease of homocysteine level, can result in a 10%
reduction in risk of coronary heart disease. This prognosis has been based upon
Hey levels within the range of 10-15 jimol/L35. Our baseline Hey values exceed this
range, but the question arises whether the prediction of this 10% reduction still
counts for a population at such an old age. More data are needed on the
implication of this reduction in the younger-old moreover in elderly, already called
'survivors'. Another perhaps more important implication of high homocysteine and
low B-vitamin levels in this population is the relation with mental health.
A comparison of our homocysteine data with other values of free-living and
hospitalized elderly reveals that levels in our frail population were more
elevated103013738, thus confirming the assumption of a population being classified at
risk of subclinical deficiency. Regarding the plasma concentrations we found lower
baseline cobalamin and folate levels, compared to free-living elderly studied by
several investigators113039. Even similar cobalamin values were found in geriatric
patients diagnosed for deficiencies40. However, compared to others, the opposite
110
. B-vitamins, homocysteine and neuropsychologic functioning
was revealed with our values being equal or even higher2101139"41. This demonstra
tes the striking variability in vitamin concentrations observed by many investigators.
A partly explanation is the use of different methods and consequently different cut
off levels. For evaluation of folate deficiency it has been indicated to use method-
specific reference ranges predominantly42. And only recently, it has been
suggested to raise the screening level of cobalamin deficiency43031.
The focus on the functional parameters instead of sole plasma/serum vitamin
concentrations is currently regarded as more appropriate1043. A few studies have
already mentioned the metabolic evidence of vitamin deficiency in elderly in the
presence of normal plasma vitamin levels710. In our population, relatively high Hey
levels were accompanied with a considerable number of subjects found to be
deficient in plasma cobalamin but not notably in plasma folate. On the other hand
we detected a stronger association between (change in) folate status and (change
in) Hey level than between cobalamin and Hey. The mean decline of approximately
5 (xmol/L in total Hey in the supplemented group compared to the non-
supplemented group confirms once more the need for examining metabolic
deficiency even in the absence of low plasma folate levels. Perhaps the current
cut-off levels for folate deficiency might need a re-evaluation as well. We did not
detect significant beneficial changes in the hematological parameters. It has been
suggested that despite depletion of folate or cobalamin levels, anemia induced by
this depletion is only occurring at the far end of vitamin deficiency spectrum.
Consequently it is extremely difficult to prove beneficial effects on hematological
parameters in only mildly deficient subjects44.
The higher prevalence of cobalamin deficiency instead of folate deficiency is in
agreement with findings of Hanger et al.2 and results of the Framingham study9, but
not with Ortega et al.1145. Review of present studies suggests that cobalamin
deficient elderly develop a wide variety of neurologic abnormalities4346. We have
tested neuropsychologic functioning by two tests but found no relation between
cobalamin status and neuropsychologic functioning at baseline, nor did we find an
improvement in these tests despite significant increases in plasma vitamin levels.
Up till now large scale well-controlled studies on elderly were not able to
demonstrate overall improvements in neuropsychological function following
therapy1. The reliability and validity of the two tests have been judged as sufficient
on group level, according to several criteria on objectivity, stability, consistency and
111
Chapter 5
relative validity with respect to other tests. Test-retest and concurrent validity
correlation coefficients were varying between 0.83 till 0.92 and between 0.46 till
0.75 respectively2747. The question arising in the first place is whether the
neurologic dysfunctioning was severe enough in our population. Despite a
considerable proportion of cobalamin deficient subjects the deficiency might not
have been rigid enough and/or the degenerating process may not have developed
far enough to establish effect. On the other hand a degenerating process as such
might not even be reversible. The 17-weeks consumption of oral physiologically
dosed supplements may also not have been sufficient for improving performance
on these tests. Comparison of baseline values with healthy elderly revealed a
performance below moderate active and even sedentary Dutch healthy subjects48.
Subtle neuropsychologic improvements, may on the other hand, perhaps only be
detected with more sensitive, other types of tests or in more deficient, probably
institutionalized patients. The favorable decline in Hey levels and proportion of
cobalamin deficient individuals is however noteworthy and confirms the prosperity
of our nutritional intervention.
A few studies demonstrated a lowering of plasma Hey by administration of
pharmacological (intramuscular) doses of folic acid, vitamin B12 and/or B61023. The
effect of lower doses in the general population and more specifically in elderly has
not been studied up till now, but has been recognized as highly relevant to the
question of food fortification. Ward et al.23 demonstrated an effective lowering of
Hey levels in apparently healthy volunteers with a daily dose of 200 |j.g of folic acid
but not with 100 \ig. The effectiveness of relatively low doses has been confirmed
by a study of Brouwer et al.49. With respect to the (frail) elderly population with
mildly elevated Hey levels, we have now proven the effectiveness of physiologically
(and thus low) dosed (at the highest 100% of the Dutch RDA) multiple
micronutrients. Low doses are more likely to be reached by food enrichment, which
is a more attractive way of increasing folate status in elderly than tablets or
expanding total food intake. Simultaneous administration of folic acid and vitamin
B12 is preferred above folic acid alone9 since inappropriate mistreatment of clinical
vitamin B12 deficiency signs should be precluded. However since we chose for a
multiple nutrient approach we cannot determine the contribution of each particular
nutrient to the lowering of Hey, but the increase in folate was stronger correlated to
the decrease in homocysteine than cobalamin and PLP.
112

. B-vitamins, homocysteine and neuropsychologic functioning
The exercise program did not have an (additional) effect on blood vitamin
concentrations or on Hey. The effect of exercise was assumed to act through
increased dietary intake. Change in total energy intake indeed differed slightly
between exercisers and non-exercisers however this was mainly attributed to a
decline in the latter group (manuscript submitted). Absolute increase in dietary
intake in order to establish a biochemical change was probably too small. The
limited mechanical load and endurance compartment of our all-round and
moderate intense exercise program may be part of the explanation. The effect of
exercise on the two neuropsychological tests could also have been established
directly as well, through training of these modalities. The small improvement found
in the exercisers on the neuropsychological tests was also found in the control
group and therefore no effect of exercise can be referred to these two tests.
The beneficial effect on Hey established by our oral physiologically dosed
nutrient dense foods is considerable and seems relevant. Physiologically dosed
nutrient dense foods have the potential of being a simple, easy-to-adopt, attractive
and inexpensive intervention to improve the nutritional status in frail elderly. The
beneficial decline in risk on among others cardiovascular diseases, comorbidity
and the relation with mental health in a population at this age should be
investigated in the long term.
ACKNOWLEDGEMENTS
We would like to thank Marga van der Steen for carrying out the huge task of drawing blood of all participants and the preparation of the samples afterwards. All sport teachers and the creative therapist are acknowledged for leading the programs. We are furthermore grateful to the Marianne van Bergen of the department of Clinical Chemistry, University Hospital Nijmegen, St. Radboud, and Jan Harryvan of the laboratory of the department of Human Nutrition and Epidemiology, Wageningen Agricultural University for analyzing all samples. Last but not least we would like to thank Wiebe Visser of the Dutch Dairy Foundation on Nutrition and Health, Maarssen, the Netherlands for establishing and coordinating the contacts with the following (food) companies: Roche Nederland B.V., Friesland Coberco Dairy Foods B.V., Campina Melkunie - Mona Division, Bekina Lebensmittel GmbH, subsidiary of Royal Numico NV.
113

Chapter 5.
References
1. Matthews JH: Cobalamin and folate deficiency in the elderly. Baillieres Clin Haematol 1995;8:679-697. 2. Hanger HC, Sainsbury R, Gilchrist NL, Beard ME, Duncan JM: A community study of vitamin B12 and folate levels in the elderly. J Am Geriatr Soc 1991 ;39:1155-1159. 3. Garry PJ, Goodwin JS, Hunt WC: Folate and vitamin B12 status in a healthy elderly population. J Am Geriatr Soc 1984;32:719-726. 4. van Asselt DZB, de Groot LCPGM, van Staveren WA, et al: Role of cobalamin intake and atrophic gastritis in mild cobalamin deficiency in older Dutch subjects. Am J Clin Nutr 1998;68:328-334. 5. Blundell EL, Matthews JH, Allen SM, Middleton AM, Morris JE, Wickramasinghe SN: Importance of low serum vitamin B12 and red cell folate concentrations in elderly hospital inpatients. J Clin Pathol 1985;38:1179-1184. 6. Nilsson EH, Landahl S, Lindstedt G, et al: Low serum cobalamin levels in a population study of 70- and 75-year-old subjects. Gastrointestinal causes and hematological effects. Dig Dis Sci 1989;34:716-723. 7. Joosten E, van den Brandt A, Riezler R, et al: Metabolic evidence that deficiencies of vitamin B-12 (cobalamin), folate, and vitamin B-6 occur commonly in elderly people Am J Clin Nutr 1993;58:468-476. 8. Allen RH, Stabler SP, Savage DG, Lindenbaum J: Diagnosis of cobalamin deficiency I: usefulness of serum methylmalonic acid and total homocysteine concentrations. Am J Hematol 1990;34:90-98. 9. Lindenbaum J, Rosenberg IH, Wilson PW, Stabler SP, Allen RH: Prevalence of cobalamin deficiency in the Framingham elderly population. Am J Clin Nutr 1994;60:2-11. 10. Naurath HJ, Joosten E, Riezler R, Stabler SP, Allen RH, Lindenbaum J: Effects of vitamin B12, folate, and vitamin B6 supplements in elderly people with normal serum vitamin concentrations. Lancet 1995;346:85-89. 11. Ortega RM, Manas LR, Andres P, et al: Functional and psychic deterioration in elderly people may be aggravated by folate deficiency. J Nutr 1996;126:1992-1999. 12. Buchman AL: Vitamin supplementation in the elderly: a critical evaluation. Gastroenterologist 1996;4:262-275. 13. Reynolds EH, Rothfeld P, Pincus JH: Neurological disease associated with folate deficiency. Br Med J 1973;2:398-400. 14. van der Wielen RPJ: Vitamin intake and status in elderly Europeans. 1-167. 1995. Department of Human Nutrition, Wageningen Agricultural University. 15. McGandy RB, Barrows-CH J, Spanias A, Meredith A, Stone JL, Norris AH: Nutrient intakes and energy expenditure in men of different ages. J Gerontol 1966;21:581 -587. 16. Rosenberg IH: Nutrition and aging, in Hazzard WR, Bierman EL, Blass JP, Ettinger WH, Halter JB, Andres R (eds): Principles of geriatric medicine and gerontology. New York, McGraw-Hill, Inc.; 1994:49-59. 17. Shock NW: Energy metabolism, caloric intake and physical activity of the ageing, in Anonymous: Normal human aging: the Baltimore Longitudinal Study of Aging. Bethesda, US Government Printing Office; 1984:372-381. 18. Vaughan L, Zurlo F, Ravussin E: Aging and energy expenditure. Am J Clin Nutr 1991;53:821-825. 19. Fiatarone MA, O'Neill EF, Ryan ND, et al: Exercise training and nutritional supplementation for physical frailty in very elderly people. N Engl J Med 1994;330:1769-1775. 20. Gray-Donald K, Payette H, Boutier V: Randomized clinical trial of nutritional supplementation shows little effect on functional status among free-living frail elderly. J Nutr 1995;125:2965-2971.
114
. B-vitamins, homocysteine and neuropsychologic functioning
21. Lipschitz DA, Mitchell CO, Steele RW, Milton KY: Nutritional evaluation and supplementation of elderly subjects participating in a "meals on wheels" program. JPEN 1985;9:343-347. 22. Meredith CN, Frontera WR, O'Reilly KP, Evans WJ: Body composition in elderly men: effect of dietary modification during strength training. J Am GeriatrSoc 1992;40:155-162. 23. Ward M, McNulty H, McPartlin J, Strain JJ, Weir DG, Scott JM: Plasma homocysteine, a risk factor for cardiovascular disease, is lowered by physiological doses of folic acid. QJM 1997;90:519-524. 24. Commissie Voedingsnormen Voedingsraad: Nederlandse voedingsnormen 1989, Den Haag, Voedingsraad; 1989. 25. Commissie Voeding van de Oudere Mens Voedingsraad: Voeding van de oudere mens Den Haag, Voedingsraad; 1995. 26. Fidanza F: Nutritional Status Assessment: a manual for population studies, New York, Chapman and Hall; 1991. 27. Lemmink KAPM, van-Heuvelen MJG, Rispens P, Brouwer WH, Bult P: The Groningen Fitness Test For The Elderly: Composition and Application In Large-Scale Fitness Events, in Harris S, Heikkinen E, Harris WS (eds): Physical activity, aging and sports, volume IV: toward healthy aging - international perspectives. Part 2. psychology, motivation and programs. Albany, New York, Center for the Study of Aging of Albany; 1995:221-230. 28. Wilson DH, Herrmann R, Hsu S, et al: Ion capture assay for folate with the Abbott IMx analyzer. Clin Chem 1995;41:1780-1781. 29. Kuemmerle SC, Boltinghouse GL, Delby SM, Lane TL, Simondsen RP: Automated assay of vitamin B-12 by the Abbott IMx analyzer. Clin Chem 1992;38:2073-2077. 30. Koehler KM, Romero U, Stauber PM, et al: Vitamin supplementation and other variables affecting serum homocysteine and methylmalonic acid concentrations in elderly men and women. J Am Coll Nutr 1996;15:364-376. 31. Pennypacker LC, Allen RH, Kelly JP, et al: High prevalence of cobalamin deficiency in elderly outpatients. J Am GeriatrSoc 1992;40:1197-1204. 32. Lowik MR, Schrijver J, Odink J, van den Berg H, Wedel M, Hermus RJ: Nutrition and aging: nutritional status of "apparently healthy" elderly (Dutch nutrition surveillance system). J Am Coll Nutr 1990;9:18-27. 33. Haller J, Weggemans RM, Lammi KC, Ferry M: Changes in the vitamin status of elderly Europeans: plasma vitamins A, E, B-6, B-12, folic acid and carotenoids. SENECA Investigators. Eur J Clin Nutr 1996;50 Suppl 2:S32-S46 34. Clarke R, Woodhouse P, Ulvik A, et al: Variability and determinants of total homocysteine concentrations in plasma in an elderly population. Clin Chem 1998;44:102-107. 35. Boushey CJ, Beresford SA, Omenn GS, Motulsky AG: A quantitative assessment of plasma homocysteine as a risk factor for vascular disease. Probable benefits of increasing folic acid intakes. JAMA 1995;274:1049-1057. 36. Arnesen E, Refsum H, Bonaa KH, Ueland PM, Forde OH, Nordrehaug JE: Serum total homocysteine and coronary heart disease. Int J Epidemiol 1995;24:704-709. 37. Selhub J, Jacques PF, Wilson PW, Rush D, Rosenberg IH: Vitamin status and intake as primary determinants of homocysteinemia in an elderly population. JAMA 1993;270:2693-2698. 38. Tucker KL, Selhub J, Wilson PW, Rosenberg IH: Dietary intake pattern relates to plasma folate and homocysteine concentrations in the Framingham Heart Study. J Nutr 1996;126:3025-3031. 39. Quinn K, Basu TK: Folate and vitamin B12 status of the elderly. Eur J Clin Nutr 1996;50:340-342. 40. Craig GM, Elliot C, Hughes KR: Masked vitamin B12 and folate deficiency in the elderly. Br J Nutr 1985;54:613-619. 41. Sauberlich HE: Folate status of U.S. Population Groups, in Bailey LB (ed): Folate in health
115

Chapter 5.
and disease. New York, Marcel Dekker Inc.; 1995:171-194. 42. Gunter EW, Bowman BA, Caudill SP, Twite DB, Adams MJ, Sampson EJ: Results of an international round robin for serum and whole-blood folate. Clin Chem 1996;42:1689-1694. 43. Nilsson EH: Age-related changes in cobalamin (vitamin B12) handling. Implications for therapy. Drugs Aging 1998;12:277-292. 44. Herbert V: The 1986 Herman Award Lecture. Nutrition science as a continually unfolding story: the folate and vitamin B-12 paradigm. Am J Clin Nutr 1987;46:387-402. 45. Ortega RM, Redondo R, Andres P, Eguileor I: Nutritional assessment of folate and cyanocobalamin status in a Spanish elderly group. Int J Vitam Nutr Res 1993;63:17-21. 46. Allen RH, Stabler SP, Lindenbaum J: Relevance of vitamins, homocysteine and other metabolites in neuropsychiatric disorders. Eur J Pediatr. 1998;157 Suppl 2:S122-S126 47. van Heuvelen MJG, Kempen GUM, Ormel J, Rispens P: Physical fitness related to age and physical acitivity in older persons. Med Sci Sports Exerc 1998;30:434-441. 48. Voorrips LE, Lemmink KA, van Heuvelen MJG, Bult P, van Staveren WA: The physical condition of elderly women differing in habitual physical activity. Med Sci Sports Exerc. 1993;25:1152-1157. 49. Brouwer IA, van Dusseldorp M, Thomas CM, et al: Low-dose folic acid supplementation decreases plasma homocysteine concentrations: a randomized trial. Am J Clin Nutr 1999;69:99-104.
116
Dietary supplements and physical exercise
affecting bone and body composition in frail
elderly Accepted for publication in the American Journal of Public Health
Nynke de Jong
Marijke J.M. Chin A Paw
Lisette C.P.G.M. de Groot
Gerrit J. Hiddink
Wija A. van Staveren
Chapter 6
The objective was to determine the effect of enriched foods and all-round physical exercise on bone and body composition in frail elderly. A 17-weeks randomized controlled intervention trial, following a 2x2 factorial design: a) enriched foods, b) exercise c) both, d) neither (control), was performed in 143 frail elderly (age: 78.6±5.6 years). Foods were enriched with multiple micronutrients (25-100% of the Dutch RDA); exercises focused on skill training: strength, endurance, coordination and flexibility. Main outcome parameters were bone and body composition, measured with DXA (dual energy X-ray absorptiometry).
Exercise preserved lean mass (mean difference between exercisers and non-exercisers: 0.5 kg±1.2 kg; p<0.02). Enriched food groups slightly increased their BMD (bone mineral density) (+0.4%), bone mass (+0.6%) and bone calcium (+0.6%) compared to small decreases of -0.1%, -0.2% and -0.4% resp. in the non-enriched groups. Differences between these two groups were for BMD: 0.006±0.020 g/cm2 (p=0.08), total bone mass: 19±55 g (p=0.04) and bone calcium: 8±21 g (p=0.03). Foods containing a physiological dose of micronutrients slightly increased bone mass, calcium and density in 17 weeks, whereas moderate intensive exercise preserved lean body mass in frail elderly.
INTRODUCTION
Physical frailty in elderly has been defined as a state of reduced physiologic
reserve associated with increased susceptibility to disability1. Cornerstones of the
process of frailty are a more sedentary lifestyle and consequently a lower energy
expenditure. A declining appetite and dietary intake concurrently increases the risk
of developing (micro)nutrient deficiencies. Further deterioration of health and
nutritional status may in turn hamper the physical activity level.
Both inactivity and inadequate dietary intake are important contributors to
sarcopenia. This loss of skeletal muscle mass, together with advancing age is
associated with other changes in body composition, including a reduction in total
lean body mass, total body water and bone density and an increase in body fat2"5.
These alterations are known to affect health, physical functioning and the quality of
life67. Moreover a decreased bone density may lead to fractures after minimal
trauma8.
118

_Body and bone composition
The potential reversibility of especially sarcopenia but also bone loss and
osteoporosis is therefore of great interest279. Up till now only one study examined
the effects of dietary supplements combined with physical exercise on body
composition in frail elderly5. It was shown that low muscle mass was strongly
related to impaired mobility. Resistance training increased muscle size. The
supplement on the other hand did not affect muscle mass. Other trials either
investigated nutritional (energy+nutrients) supplementation1011 or only focused on
strength training9. Supplementation increased body weight (both lean and fat
mass). Strength training protected bone mineral density and muscle mass.
Interactive effects or effectiveness of supplements on bone loss were not studied
thoroughly.
For our intervention we specifically developed micronutrient dense foods with a
physiological amount of only those vitamins (100% of the Dutch RDA) and minerals
(25-100% of the RDA) frequently characterized as deficient in elderly. Furthermore,
an unique progressive all-round exercise program aiming at long term feasibility
was developed. The effect of micronutrient dense products, a physical exercise
program and a combination of both on body composition and bone parameters in
frail elderly were investigated.
MATERIAL AND METHODS
Subjects
The study population comprised of 217 frail elderly living in their private houses in
the neighborhood of Wageningen, The Netherlands. Figure 1.2 (Chapter 1) gives
an outline of the selection of the subjects. The main criterion was requirement of
(health) care, which consisted of a) medical home care, or b) use of meals-on-
wheels service, or c) household assistance through home care or d) through a
social network. Other selection criteria were: age (70 years or older), no regular
exercise, body mass index below average (BMI s 25 kg/m2, based on self reported
weight and height) or recent weight loss, no use of multivitamin supplements and
ability to understand the study procedures.
All subjects gave their written informed consent. The study protocol was
approved by the external Medical Ethical Committee of the Division of Human
Nutrition and Epidemiology.
119
Chapter 6
Design, randomization and follow up
Enrollment took place between January and June 1997. After confirmation of
eligibility, subjects were randomized to one of the four intervention groups, through
selection of sealed envelopes:
a. nutrition: nutrient dense products + social program;
b. exercise: regular products + exercise program;
c. combination: nutrient dense products + exercise program;
d. control: regular products + social program.
Since a higher drop out rate was expected in the intervention groups more subjects
were assigned to these groups. Couples were randomized together. After
randomization, baseline measurements (week 0) were performed at our research
center. The intervention period was 17 weeks, after which (week 18) data were
collected again. Pre- and postintervention measurement(s) were available for 161
subjects. In total 56 (26%) subjects dropped out (Figure 6.1). In 25 cases this
occurred immediately after baseline measurement, mainly because of too much
distress. Other reasons for drop out (n=27) were mainly related to health problems,
including (terminal) disease, hospital admittance, recent falling and/or fracturing. Of
four subjects, who withdrew between week 8 and 17 of intervention, intermediate
measurements were available, but they were not included in the data analysis.
Valid DXA measurements were available for 143 subjects.
Nutrient dense foods
Subjects had to consume two products a day: one from a series of fruit products
and one from a series of dairy products. Availability of a variety of products was
intended to avoid monotony and to increase acceptability of the products. Every
week fresh 100 g servings of fruit based products (two types of both fruit juice and
compote) and dairy products (vanilla custard, two types of fruit yogurt and fruit
quark (75 g)) were provided. Daily consumption of two enriched products delivered
-100% of the Dutch RDA1213 of the vitamins: D, E, B„ B2, B6, folic acid, B12, C and ~
25-100% of the Dutch RDA of the minerals: calcium (25%), magnesium (25%), zinc
(50%), iron (50%), iodine (100%). Subjects in the control and exercise group
received the natural amount present in identical regular products (concentration
vitamins/minerals at the highest 15% of the concentration in enriched products).
120
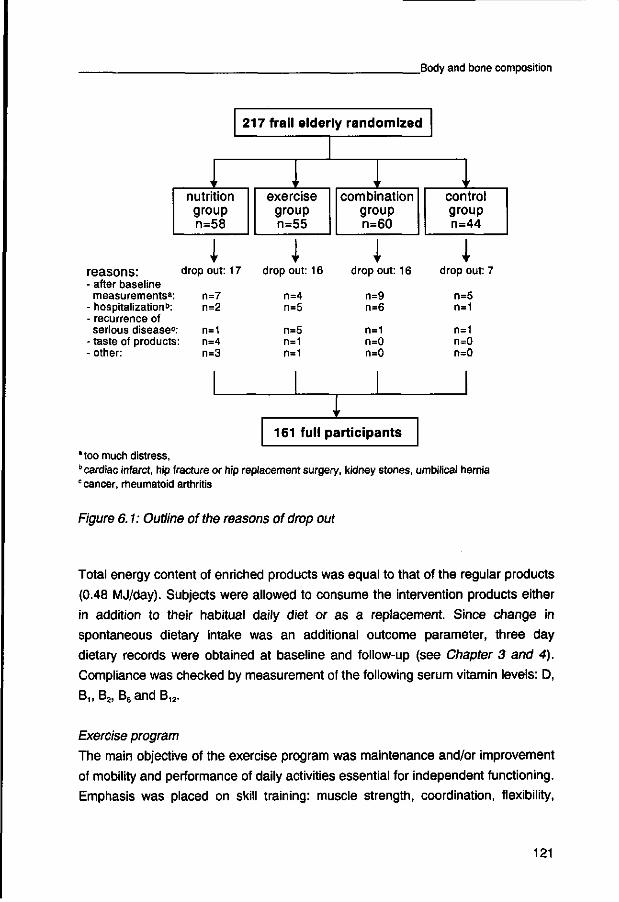
_Body and bone composition
217 frail elderly randomized
" 1 ' 1 ' "
nutrition group n=58
exercise group n=55
combination group n=60
control group n=44
reasons: - after baseline
measurements3: - hospitalization5: - recurrence of serious disease0:
- taste of products - other:
1 drop out:
n=7 n=2
n=1 n=4 n=3
17 1
drop out:
n=4 n=5
n=5 n=1 n=1
16 1
drop out:
n=9 n=6
n=1 n=0 n=0
16 i
drop out: 7
n=5 n=1
n=1 n=0 n=0
161 full participants
"too much distress, b cardiac infarct, hip fracture or hip replacement surgery, kidney stones, umbilical hernia c cancer, rheumatoid arthritis
Figure 6.1: Outline of the reasons of drop out
Total energy content of enriched products was equal to that of the regular products
(0.48 MJ/day). Subjects were allowed to consume the intervention products either
in addition to their habitual daily diet or as a replacement. Since change in
spontaneous dietary intake was an additional outcome parameter, three day
dietary records were obtained at baseline and follow-up (see Chapter 3 and 4).
Compliance was checked by measurement of the following serum vitamin levels: D,
B,, B2, B6and B12.
Exercise program
The main objective of the exercise program was maintenance and/or improvement
of mobility and performance of daily activities essential for independent functioning.
Emphasis was placed on skill training: muscle strength, coordination, flexibility,
121
Chapter 6
speed and endurance were trained with usage of different materials as balls, ropes,
weights and elastic bands. Group sessions were organized twice a week for 45 min
and were of moderate, gradually increasing intensity. In order to guarantee
uniformity, sessions were extensively rehearsed with all skilled teachers and the
supervisor (MCAP). Moreover an instruction video and manual were developed.
Participants and teachers were instructed to train at moderate to high intensity
(value of 7) according to a 10 point RPE scale (rating of perceived exertion)14. A
social program served as a control (for attention) for the exercise program.
Sessions were organized biweekly by a skilled creative therapist. This program
focused on creative activities, social activities and lectures about topics of interest
for elderly people. Transport to and from the sessions was arranged. Compliance
was checked by recording attendance to the sessions.
Questionnaires
The general questionnaire revealed information about age, sex, marital status,
education, living conditions, use of care, illness, medicine use, recent falling and
fracturing. Physical activity was assessed using the validated Physical Activity
Scale for Elderly (PASE)1516.
Anthropometry and body composition
All anthropometric measurements were performed with subjects wearing
underwear. Body weight was measured to the nearest 0.05 kg using a digital scale
(ED-6-T; Berkel, Rotterdam, the Netherlands). Height was measured to the nearest
0.001 m using a wall-mounted stadiometer. Body mass index was calculated as
weight in kg divided by height in m2. Waist and hip circumferences were
determined for calculation of the waist/hip ratio (WHR), as a measure of fat
distribution17.
Body composition of the subjects was determined by a DXA (dual energy X-ray)
measurement (Lunar DPX-L, whole body scanner, Radiation, Madison, Wl). The
system uses a filtered X-ray source providing peak energies at 40 and 70 keV. The
software divides pixels into bone mineral and soft tissue compartments. The soft
tissue is then further separated into fat and fat-free soft tissue. For all subjects the
fast scan mode was used.
122
_Body and bone composition
Statistical analysis
Data were analyzed using the statistical program SAS (Statistical Analysis
Program, version 6, NC: SAS Institute Inc., 1990). Means ± standard deviations
(sd), medians (10th- 90th percentiles) or percentages of baseline values were
calculated per intervention group for the primary outcome variables. Absolute
changes±sd per intervention group were calculated and compared with changes in
the control group (unpaired t-test). A multiple regression model was used to
determine the effect of both interventions and a possible interaction on the change
in body and bone composition variables. For all changes in these variables
confounding by baseline age, weight, BMI, frequency of fracturing, change in
energy intake, and interaction between sex and intervention program was checked.
With respect to the models analyzing the change in bone parameters, change in
body weight has also been taken into account. Since no evidence of interaction
was observed between both interventions, a comparison was made between the
supplemented group versus the non-supplemented group and the exercising group
versus the non-exercising group respectively. Interaction between the exercise
program and sex was evident with respect to change in lean body mass. Stratified
analyses were performed additionally. No interaction between the nutrition program
and sex was found concerning change in bone parameters. Adding all other
covariates to the models did not markedly alter the results.
A rank procedure was carried out in which the population was divided in two: a
relatively high compliant group of exercisers (attendance to the session high) and a
low compliant group (attendance low) next to a relatively high compliant
supplemented group (increase in serum vitamin levels high) vs a low compliant
group (increase in serum vitamin levels low). A p-value s0.05 was considered
statistically significant.
RESULTS
Baseline characteristics
Approximately, 70% of the participants were women (Table 6.1). Mean age of the
study population was 79 years, with the exercise group being slightly younger. One
or more diseases were present in at least 91% of the population. Subjective health
on a 10-point scale (with 1=not healthy and 10=very healthy) was on average rated
123
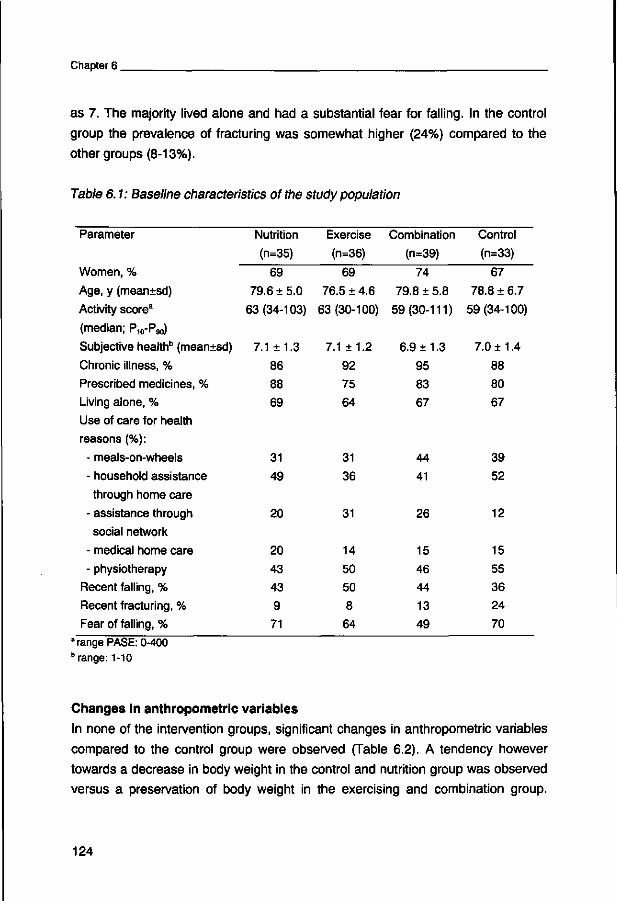
Chapter 6
as 7. The majority lived alone and had a substantial fear for falling. In the control
group the prevalence of fracturing was somewhat higher (24%) compared to the
other groups (8-13%).
Table 6.1: Baseline characteristics of the study population
Parameter
Women, %
Age, y (meantsd)
Activity score3
(median; P -Pgo)
Subjective healthb (mean±sd)
Chronic illness, %
Prescribed medicines, %
Living alone, %
Use of care for health
reasons (%):
- meals-on-wheels
- household assistance
through home care
- assistance through
social network
- medical home care
- physiotherapy
Recent falling, %
Recent fracturing, %
Fear of falling, %
Nutrition
(n=35)
69
79.6 ± 5.0
63(34-103)
7.1 ±1.3
86
88
69
31
49
20
20
43
43
9
71
Exercise
(n=36)
69
76.5 ± 4.6
63(30-100)
7.1 ±1.2
92
75
64
31
36
31
14
50
50
8
64
Combination
(n=39)
74
79.8 ± 5.8
59(30-111)
6.9 ±1.3
95
83
67
44
41
26
15
46
44
13
49
Control
(n=33)
67
78.8 ± 6.7
59(34-100)
7.0 ±1.4
88
80
67
39
52
12
15
55
36
24
70 8 range PASE: 0-400 "range: 1-10
Changes in anthropometric variables
In none of the intervention groups, significant changes in anthropometric variables
compared to the control group were observed (Table 6.2). A tendency however
towards a decrease in body weight in the control and nutrition group was observed
versus a preservation of body weight in the exercising and combination group.
124
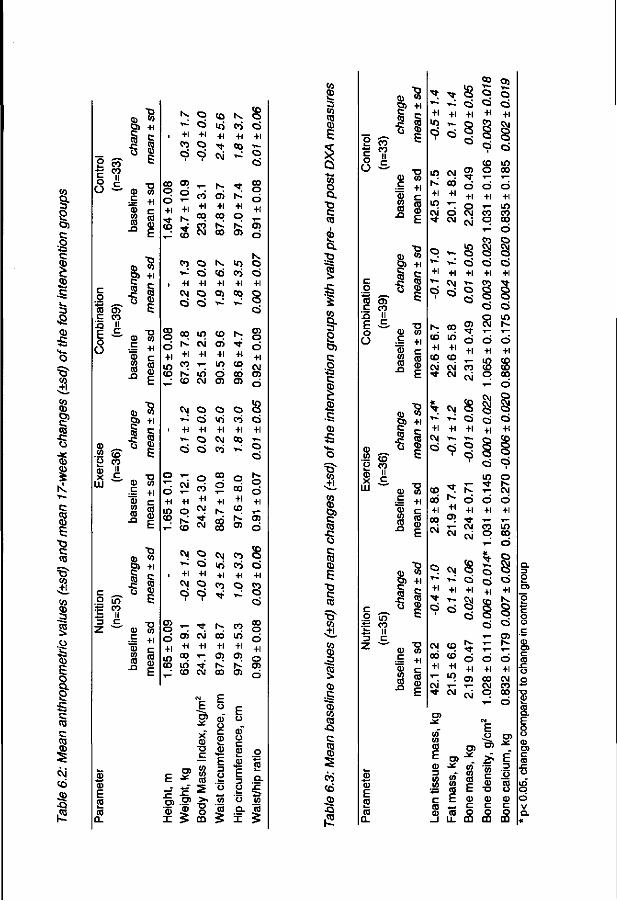
I s .§ C
CD
o
to
CD O) c co •s
I T —
c CD 03
E •o c CO
I CO CD
0) E o
I c co c
CO
I c\i cd CD
• Q .to
CD <0 O ) +1
c
1 O -=- c»
c = +1 c
« CO S CD
CD CO
CD °> D) +1
5 S •8 8 co a>
C CO
IA o ^ 0 1
T3 (D <fl
CD (0 O k_ CD X
111
CO CO
II c
CO
•c 0
CD
£ co S CD
CD «J O ) +1 C p-
S co S CD
CD CO O ) +1
§ s •8 S
(0 E CO
T3 CD (0
! 8 CO
^ O CO K *"• cS io co +1 +1
CO O d ci
+1 +1
CM w
8 +1
0 " m °> +1 +1
I"-
+1 +1 +1
CO CO o
CO t ^ t ^
CO o ^ d +1 +1
CM
d
CO co +1 +1
O l 0 0
(O IO s> s
CM o >-: o +1 +1
d ci
o o 1 0 CO +1 +1 cvi oq co' •**•
O r-
+1 +1 IO CO , - • £ < *
0 0
o
+1
06
<N -^ d +1 +1
CM
d
CM CO
US CO
+1 +1
CO o
§ - * r- co a> c\i co id o
+ , + 1 + 1 + 1 + 1 ^ j CO 1 — 05 05 ! D U ) ^ S N ^J CO CM 0 0 (J>
'. E
E •*
o) .2" CD ®
X 5
03 ^ 5 CM 0 0 OJ o
o d +1
§
o 0 +1
Q h - CM OJ • *
+ l +1 +1 +1 +1
^ co 1 - m co
co i-^ LO d 06 65 , ; ( D N O ! O l Q
§ ci +1
Y—
o d
o d +1
a! d
d +1
8
CO o 0 +1 o CJJ d
X CD
C
(0 (0
2 >. T3 O
CO
CD O C CD i _
E 0 i _
0
OT CO
5
0
CD" 0 c CD
CD H—
E 3 0
0 a.
I
.2
Q .
V) CO
5
CO
1 CO CO CD
E
CO o Q. •o c co
I 1
CO
§•
I c .0 c
s ,c 00
o
& CO 0) o> c co
•g c co CD
T3 c cc
CO
-il CO CD 3 § CD .£ OS CO
co • Q c
CO
CO
cd •Q
T3 CD co O ) +1 C ~
O - ^ CD ( 0
CD c £ CO S CD
c . 0
CO c !a E 0
O ) CO
II c
CD O )
c
1 CD
•O CO
+1 c CD
E
T3 (0
o S co co co
CD <0 O ) +1 C r-
l ™ CO O CO o II x S.
Ill •u <D in
S co co «
CD CO O ) +1
c
I • D
CD CO
•E +1
CD c
5 g
' - t - ; o c > o
+1 +1 +1 +1 +1
•O 1 - Q CO c\|
9 d | 8 8 9 c i
I O CM
r^ cd +1 +1 I O T -
d + 1
o
CM
CM
o ~ § »- -^ c i +1 +1 +1
•*- <M •» -
9 ci 5
CO I O o 0 0
d d +1 +1
1 - m co co o 0 0
CM CM o c i +1
1 o c i +1
i o o O IO
l"~ CO
+1 CO
CM • *
* •<J;
0 0
LO
+1 CO
CM CM
CM
d +1 _ co
CM'
CO CJ
CM
d +1
1 0 CO
q
8
r«
d +1
CO CO CO
d 8 q
o +1
o c>
CO *
06 ^
+1 + l
c o 0 ! * 1 - CM
d +1
o +1
i d LO
o +1
1 ci
• o 1 ^ CM
d +1
CM CM CM CO LO O CO
i ci +1
K O C3 Ci
i - 0 3 CM CO ! J ^ ^
r-. CO
9 CM o • - W ci +1 +1 +1
• * i ~ C\|
d <s 9
0 0 CO
+1 +1 o +1
(0 CO CO
E CD 3 (0 00
c CO CD
C3)
0) CO CO
E +-» CO
o>
CO 00 CO
E CD c 0
0
^ 5
(0
c CD
73 CD C O
CD C
_ .. - - o _i LL m co m
0 0 CM CM CO O CO •r^ d
E" 3 o

Chapter 6
Changes in bone parameters and body composition
Table 6.3 presents mean baseline values and change (±sd) of the body
composition and bone parameters of the DXA measurements. Significant
differences (p<0.05) in change in lean body mass were found between the exercise
group and the control group. With respect to change in bone mineral density a
significant difference between the nutrition group and the control group was
detected. Since no evidence of interaction was observed between the two
interventions, the effect of each intervention was analyzed separately (Table 6.4).
Table 6.4: Estimates of the mean difference in change in body composition
measured by DXA between groups receiving nutrient dense vs regular products
and groups receiving exercise vs no exercise (n=143)
Parameter
change in lean body mass, kg
change in fat mass, kg
change in calcium mass, kg
change in bone mass, kg
change in bone mineral
density, g/cm2
Nutrient dense foods (n=74) vs regular foods (n=69)
difference
-0.1
0.1
0.008
0.019
0.006
P 0.60
0.48
0.03
0.04
0.08
Exercise (n=75) vs no exercise
difference
0.5a
0.0
-0.005
-0.012
-0.000
(n=68)
P 0.02
0.95
0.15
0.19
0.99
" men (n=43): 1.0 kg; p=0.04, women (n=100): 0.3 kg; p=0.20
Supplementation showed a slightly positive, but not statistically significant, effect
on bone mineral density (difference between supplemented and non-supplemented
groups: 0.006 g/cm2, p=0.08). Bone mass and bone calcium improved significantly
in the supplemented group compared to the non-supplemented group (difference:
19 g, p=0.04 and 8 g, p=0.03 respectively). When bone parameters in a high
compliant supplemented group (n=36) were compared with a less compliant
supplemented group (n=36) it appeared that bone mineral density increased with
+0.006 g/cm2 in the first group vs +0.002 g/cm2 in the latter group (ns). The
126
_Body and bone composition
improvement in bone mass (+25 g) and bone calcium (+9 g) was also higher in the
more compliant group compared to the low compliant group (+3 g resp. +1 g)
(p=0.08). Differences were of the same magnitude when high compilers (n=36)
were compared to the controls (n=33): p-values between 0.03 to 0.1.
Exercise showed a positive effect on lean body mass compared to the non
exercising group (difference: 0.5 kg, p =0.02). For men this difference was 1.0 kg
(p=0.04) and for women: 0.3 kg (p=0.20). No effect of exercise on bone parameters
was found. The effect on lean body mass was mainly attributed to preservation in
the exercise group towards a decrease among the non-exercising subjects.
Comparison of the high compliant exercisers (relatively high attendance rate, n=39)
vs low compliant exercisers (n=36) revealed that the lean body mass in the high
compliant group increased +0.1 kg compared to +0.01 kg in the less compliant
exercising group (ns). A significant difference was revealed (p=0.04) when high
compilers (n=39) were compared to the controls (n=33).
DISCUSSION
As far as we know this is the first trial investigating effects of a progressive
moderate intense all-round exercise program combined with special developed
foods containing a physiological dose of micronutrients in frail elderly. This trial
demonstrated a slight increase in bone mineral density, total bone mass and bone
calcium as a result of a 17 weeks intervention with nutrient dense foods. Our
exercise program showed a protective effect on the age-related decline in lean
body mass. No evidence of interaction between both intervention programs was
found.
Population
Since uniform criteria to select frail elderly are still lacking we defined our own and
thereby put emphasis on the need for care, physical inactivity and BMI below
average or involuntary weight loss. For practical reasons we had to rely on
subjects' own reports. Since many elderly suffer from senile kyphosis, moreover
often overestimate height and underestimate weight, the distribution of actual BMI
shifted to the right compared to the initial calculated BMI. We however succeeded
in recruiting a population with a worse health profile compared to Dutch healthy
127
Chapter 6
elderly. Their mean BMI was lower compared to Dutch elderly in the European
Seneca study (24 kg/m2 vs 26 kg/m2 in men and 28 kg/m2 in women)18.
Furthermore, self rated health (7.0 vs 7.7) as well as activity level (PASE score 64
vs 85) were lower compared to healthy Dutch elderly16. Mean energy intake and
scores on physical fitness tests were also below average19 (Chin A Paw et al.,
submitted).
Concerning the drop outs, of 38 subjects additional information was available.
Their mean age (78.9 years) and mean body weight (64.9 kg) was comparable with
the ones who sustained. Their mean subjective health (6.6) was however slightly
lower. Half of the drop outs (Figure 6.1) immediately withdrew before/during/after
the baseline measurements, mainly because of too much distress. This seemed
therefore not to be related to the type of intervention. Concerning the health related
reasons (i.e. hospital admittance and recurrence of serious illnesses), slightly more
subjects dropped out in both the exercise and combination group, which might
point to a slight selective withdrawal. In case, a possibly worse health profile of
drop outs would have caused little selectiveness of drop out, it would only have
caused an underestimation of the effect of exercise.
Type of intervention
Studies with a combination of an all-round progressive exercise program and
supplemented food products enriched with a physiological dose of micronutrients
have not been performed yet in frail elderly. The specific aim of developing such an
exercise program was to investigate effects of exercises which are feasible and
acceptable for frail individuals at the long term, instead of investigating effects of
monotonous resistance and endurance training programs using unfamiliar
equipment.
We strictly added only vitamins and minerals of which intake is known to be
frequently low in elderly. No extra energy or macronutrients were added since we
expected that due to low levels of activity, energy requirements will also be
relatively low. The need for sufficient micronutrients is often not altered in less
active elderly132021, however debate about the latter is still going on2223. Nutrient
dense foods instead of vitamin/mineral pills are attractive and preferred since foods
in general contain also other important nutrients. Additionally these elderly often
use already a lot of medicines and vitamin/mineral pills may be regarded as
128
_Body and bone composition
another 'medicine' and as a consequence taken together and confused with the
regular medicines.
Measurements
DXA is a non-invasive, relatively fast and therefore appealing method for the
assessment of bone mass in elderly. Since the device is also capable of precisely
assessing soft tissue mass it is clearly a promising method of choice24. There are
however also indications of less valid measurements25"27. Moreover DXA, like other
methods, still assumes constancy in constituents of fat free mass.
Our main objective was investigating changes, therefore the absolute validity of
our data towards a reference was of less importance. With respect to repeatability
DXA should allow accurate measurements of small changes in body composition28" 30. Additional data obtained with the D20 dilution technique demonstrated a small
increase in lean body mass in the exercising group vs a small decrease in the non
exercising group although this reached no statistical significance. Calculation of the
ratio between extracellular water and total body water with this method revealed
that in none of the intervention groups changes in this ratio occurred. This means
that effects determined, cannot be attributed to change in hydration state (data
unpublished). These D20 dilution data together with our data on (scale) body
weight point in the same direction as our DXA data.
Effect on lean body mass
To date most studies only focused on the effects of high intensity resistance
training in frail elderly. Progressive resistance training proved to be effective in the
prevention of sarcopenia3132. Several trials5933 clearly demonstrated beneficial
effect of resistance training on muscle size, muscle mass and strength. Meredith et
al." concluded that strength training in elderly men combined with a nutritional
supplement affected body composition, however their findings should be confirmed
in a larger trial with sedentary controls.
We were able to detect a preserving effect of exercise on lean body mass. The
response to exercise differed between men and women. Apparently men benefited
more from exercise and also lost more lean mass with no exercise. Men simply
have more lean mass to train or to lose and may also be more responsive to
exercise. A higher 'trainability' might have been accompanied with more fanaticism.
129

Chapter 6
The comparison of a high compliant with a relatively low compliant exercising group
revealed that the preserving effect on lean body mass was indeed attributable to
the exercise program; in the less compliant group lean body mass did not change
whereas a small increase was found in the high compliant group. The decrease in
the non-exercising groups may be attributed to the ongoing process of sarcopenia
in frail elderly. The positive result of our exercise program is a valuable addition to
all earlier findings, since we expect the long term feasibility of our program to be
higher compared to high intensity strength training with monotonous exercises.
Our nutrient dense products did not have any effect on lean or fat mass in frail
elderly. We hypothesized that extra micronutrients correct existent deficiencies and
due to a better nutritional status subjects might develop a higher activity level, a
better appetite and in turn a higher energy intake. Due to these changes
sarcopenia might be reversed. The lack of effect on lean or fat mass with the
nutrition intervention may be caused by several factors. First, the duration of
intervention may not have been long enough to establish a considerable effect on
the mechanism described. Second, at baseline the process of age-related
sarcopenia may not have been severe enough to establish an improvement with
nutrient dense products. In earlier reports510 an increase in body weight due to
(energy dense) supplements is described. No significant changes in muscle mass
were found and therefore fat mass must have been increased. This effect may be
attributed to the energy dense supplement used, which is not comparable to the
nutrient dense foods we used in our study.
Effect on bone
The small but significant changes in bone parameters due to 17-weeks
consumption of our nutrient dense products are of importance in the debate
whether bone loss and osteoporosis are irreversible and whether changes found
within one year can be ascribed to transient effects34. Several public health
approaches to the problem of osteoporosis are currently recommended: a)
maximization of the peak bone mass in the younger age groups, b) estrogen
replacement therapy in post-menopausal women and c) recommendation of
sufficient or extra calcium and vitamin D intake at older age. Optimal supplies of
both nutrients are essential in the process of restoring bone and should be
effective even at old age3536. Additionally, exercise is often recommended. Since
130

_Body and bone composition
we found a larger increase in bone mass, bone calcium and bone density in the
group with the largest increase in their serum vitamin levels it seems that indeed
the enriched products contribute to the observed changes in bone parameters in
these elderly. The response to the nutrient dense foods with respect to bone
density, bone mass and bone calcium appeared not to be markedly different
between men and women. Our results certainly should be interpreted with caution.
Effects could be attributed to the variability of the DXA machine, although the
magnitude of our effects is in agreement with effects from a 1-year walking
program9. Additionally, several studies reporting effects on bone mass and density
after one or two years of supplementation found already an effect within the first
(half) year37"39, after which effects were leveling off. Chapuy et al.,40 showed effects
on fracture rates even after two months, accompanied with a modest increase in
bone density. Studies about the precision and stability of DXA measurements
report coefficients of variation of total body parameters between 0.6-1.0%3041, so
possibly only because of sufficient power we were able to detect statistical
significant changes. Nevertheless, the change in control and experimental group is
in the direction expected. A longer intervention period as well as biochemical
markers of bone turnover might have given more convincing and more relevant
results. This should be confirmed in future studies.
The exercise program did not have an (additional) effect on bone parameters. A
possible explanation may be again the duration of the program. Controlled trials of
longer duration showed that exercise can positively influence bone density by a few
percent42. Nelson et al.943 detected effects on bone density and bone mass after
one year of resistance or endurance training. Because they did not report an earlier
measurement, the time span requested before effects on bone parameters occur
due to exercise is still unclear. Furthermore, the mechanical load of our exercise
program may not have been large enough to establish an effect on bone. On the
other hand, even a more important effect of exercise may be the decline in risk on
falling solely due to improving balance and co-ordination. This effect may have a
greater impact on prevention of fracturing than modest effects of exercise on bone
density.
In summary, loss of bone, a decline in bone mineral density and the process of
sarcopenia is a serious threat to independently functioning, community dwelling
frail elderly. Investigating potential reversibility of sarcopenia but also bone loss
131

Chapter 6
and osteoporosis is important since a slight improvement in these factors, may
improve physical functioning and quality of life and may subsequently lessen the
need for support services. This trial confirms that supplementing and training frail
elderly is beneficial even beyond the age of 70, since positive effects on both lean
body mass and bone parameters appeared. However, since our interventions are
unique and changes after 17 weeks of intervention only small, results should be
confirmed in future studies.
ACKNOWLEDGEMENTS
We thank Astrid Kruizinga, Gitte Kloek, Michiel van Wolfswinkel, Marleen Manders, Marleen Kamphuis and Mieke Kriege for their assistance in the collection of the data. All sport teachers (Joke Seinen, Isabella Borburgh, Rita Wubbels, Tineke Zwijnen), the creative therapist (Nelly van Amersfoort) are acknowledged for their effort in leading the programs and the dietitians for organizing the distribution of the foods. Last but not least we would like to thank Wiebe Visser of the Dutch Dairy Foundation on Nutrition and Health, Maarssen, The Netherlands for the financial support moreover for establishing and coordinating the contacts with the following (food) companies and their co-workers: Roche Nederland B.V. (Allita van Daatselaar), Friesland Coberco Dairy Foods B.V. (Hette Bouma, Henk van der Hoek, Rudi Fransen, Marline Alles), Campina Melkunie - Mona Division (Frank Elbers), Bekina Lebensmittel GmbH (Anneliese Mahrow), subsidiary of Royal Numico NV. Their effort in the development and production of the food products is gratefully acknowledged.
References
1. Buchner DM, Wagner EH: Preventing frail health. Clin GeriatrMed 1992;8:1-17. 2. Evans WJ, Cyr-Campbell D: Nutrition, exercise, and healthy aging. J Am Diet Assoc 1997;97:632-638. 3. Evans WJ: What is sarcopenia? J Gerontol A Biol Sci Med Sci 1995;50 Spec No:5-8. 4. Evans WJ: Exercise, Nutrition and Aging. JNutr 1992;122:796-801. 5. Fiatarone MA, O'Neill EF, Ryan ND, et al: Exercise training and nutritional supplementation for physical frailty in very elderly people. N Engl J Med 1994;330:1769-1775. 6. Chumlea WC, Guo SS, Glaser RM, Vellas BJ: Sarcopenia, function and health. Nutr Health and Aging 1997;1:7-12. 7. Payette H, Hanusaik N, Boutier V, Morais JA, Gray DK: Muscle strength and functional mobility in relation to lean body mass in free-living frail elderly women. Eur J Clin Nutr 1998;52:45-53. 8. Sowers M: Epidemiology of calcium and vitamin D in bone loss. J Nutr 1993;123:413-417.
132
_Body and bone composition
9. Nelson ME, Fiatarone MA, Morganti CM, Trice I, Greenberg RA, Evans WJ: Effects of high-intensity strength training on multiple risk factors for osteoporotic fractures. A randomized controlled trial. JAMA 1994;272:1909-1914. 10. Gray-Donald K, Payette H, Boutier V: Randomized clinical trial of nutritional supplementation shows little effect on functional status among free-living frail elderly. J Nutr 1995;125:2965-2971. 11. Meredith CN, Frontera WR, O'Reilly KP, Evans WJ: Body composition in elderly men: effect of dietary modification during strength training. J Am GeriatrSoc 1992;40:155-162. 12. Commissie Voedingsnormen Voedingsraad: Nederlandse voedingsnormen 1989, Den Haag, Voedingsraad; 1989. 13. Commissie Voeding van de Oudere Mens Voedingsraad: Voeding van de oudere mens, Den Haag, Voedingsraad; 1995. 14. Feriche B, Chicharro JL, Vaquero AF, Perez M, Lucia A: The use of a fixed value of RPE during a ramp protocol. Comparison with the ventilatory threshold. J Sports Med Phys Fitness 1998;38:35-38. 15. Washburn RA, Smith KW, Jette AM, Janney CA: The Physical Activity Scale for the Elderly (PASE): development and evaluation. J Clin Epidemiol 1993;46:153-162. 16. Schuit AJ, Schouten EG, Westerterp KR, Saris WH: Validity of the Physical Activity Scale for the Elderly (PASE): according to energy expenditure assessed by the doubly labeled water method. J Clin Epidemiol 1997;50:541-546. 17. Fidanza F: Nutritional status assessment: a manual for population studies, New York, Chapman and Hall; 1991. 18.de Groot CPGM, Perdigao AL, Deurenberg P: Longitudinal changes in anthropometric characteristics of elderly Europeans. SENECA Investigators. Eur J Clin Nutr 1996;50 Suppl 2:S9-15. 19.de Jong N, de Groot CPGM, De Graaf C, Chin A Paw JMM, Van Staveren WA: Assessment of dietary intake and appetite in frail elderly. Eur J Clin Nutr 1998;52:S37 20. van der Wielen RPJ: Vitamin intake and status in elderly Europeans. 1-167. 1995. Department of Human Nutrition, Wageningen Agricultural University. 21. Heseker H, Kubler W: Vitamin requirements of the elderly, in Munro H, Schlierf G (eds): Nutrition of the elderly. New York, Nestec Ltd., Vervey; Raven Press, Ltd.; 1992:129-143. 22. Wood RJ, Suter PM, Russell RM: Mineral requirements of elderly people. Am J Clin Nutr 1995;62:493-505. 23. Russell RM: New views on the RDAs for older adults. J Am Diet Assoc 1997;97:515-518. 24. Kohrt WM: Body composition by DXA: tried and true? Med Sci Sports Exerc 1995;27:1349-1353. 25. Bergsma-Kadijk JA, Baumeister B, Deurenberg P: Measurement of body fat in young and elderly women: comparison between a four-compartment model and widely used reference methods. Br J Nutr 1996;75:649-657. 26. Nelson ME, Fiatarone MA, Layne JE, et al: Analysis of body-composition techniques and models for detecting change in soft tissue with strength training. Am J Clin Nutr 1996;63:678-686. 27. Jebb SA, Goldberg GR, Jennings G, Elia M: Dual-energy X-ray absorptiometry measurements of body composition: effects of depth and tissue thickness, including comparisons with direct analysis. Clin Sci Colch 1995;88:319-324. 28. Mazess RB, Barden HS, Bisek JP, Hanson J: Dual-energy x-ray absorptiometry for total-body and regional bone-mineral and soft-tissue composition. Am J Clin Nutr 1990;51:1106-1112. 29. Going SB, Massett MP, Hall MC, et al: Detection of small changes in body composition by dual-energy x-ray absorptiometry. Am J Clin Nutr 1993;57:845-850. 30. Jebb SA: Measurement of soft tissue composition by dual energy X-ray absorptiometry. Br J Nutr 1997;77:151-163.
133

Chapter 6 .
31. Fielding RA: The role of progressive resistance training and nutrition in the preservation of lean body mass in the elderly. J Am Coll Nutr 1995;14:587-594. 32. Campbell WW, Crim MC, Young VR, Evans WJ: Increased energy requirements and changes in body composition with resistance training in older adults. Am J Clin Nutr 1994;60:167-175. 33. Fiatarone MA, Marks EC, Ryan ND, Meredith CN, Lipsitz LA, Evans WJ: High-intensity strength training in nonagenarians. Effects on skeletal muscle. JAMA 1990;263:3029-3034. 34. O'Brien KO: Combined calcium and vitamin D supplementation reduces bone loss and fracture incidence in older men and women. Nutr Rev 1998;56:148-150. 35. Masi L, Bilezikian JP: Osteoporosis: new hope for the future. Int J Fertil 1997;42:245-254. 36. Chapuy MC, Meunier PJ: Physiopathologie et prevention des fractures de I'extremite superieure du femur. Rev Prat. 1995;45:1120-1123. 37. Dawson-Hughes B, Harris SS, Krall EA, Dallal GE, Falconer G, Green CL: Rates of bone loss in postmenopausal women randomly assigned to one of two dosages of vitamin D. Am J Clin Nutr 1995;61:1140-1145. 38. Dawson-Hughes B, Harris SS, Krall EA, Dallal GE: Effect of calcium and vitamin D supplementation on bone density in men and women 65 years of age or older. N Engl J Med 1997;337:670-676. 39. Ooms ME, Roos JC, Bezemer PD, van-der VW, Bouter LM, Lips P: Prevention of bone loss by vitamin D supplementation in elderly women: a randomized double-blind trial. J Clin Endocrinol Metab 1995;80:1052-1058. 40. Chapuy MC, Arlot ME, Duboeuf F, et al: Vitamin D3 and calcium to prevent hip fractures in the elderly women. N EnglJ Med 1992;327:1637-1642. 41. Johnson J, Dawson HB: Precision and stability of dual-energy X-ray absorptiometry measurements. Calcif Tissue Int 1991;49:174-178. 42. Reid IR: Therapy of osteoporosis: calcium, vitamin D, and exercise. Am J Med Sci 1996;312:278-286. 43. Nelson ME, Fisher EC, Dilmanian FA, Dallal GE, Evans WJ: A 1-y walking program and increased dietary calcium in postmenopausal women: effects on bone. Am J Clin Nutr 1991;53:1304-1311.
134

Appraisal of 4-months consumption of nutrient
dense foods within the daily feeding pattern of
frail elderly Submitted
Nynke de Jong
Marijke J.M. Chin A Paw
Cees de Graaf
Gerrit J. Hiddink
Lisette C.P.G.M. de Groot
Wija A. van Staveren
Chapter 7
Feasibility and long-term preference for nutrient dense foods in frail elders have only been addressed laterally in literature, while it is of major importance for a successful implementation. The appraisal and acceptance of 4 dairy and 4 fruit products either enriched with multiple micronutrients (25-100% of the Dutch RDA) or identical regular foods were assessed in 150 frail elders over a 4 months intervention period. Differences between both groups (enriched vs regular) emerged from the overall evaluation score (10-point scale): 6.4±1.6 and 7.7±1.7 respectively (p<0.001). Optimization of the hedonic parameters of nutrient dense foods and major long-term attention for application in the daily elderly feeding pattern is of essential importance.
INTRODUCTION
The public health interest in assisting elderly to remain autonomous, improving
their quality of life and lowering health care costs is growing. Community support
services in affluent societies are becoming more and more available, although
governmental reduction of expenses of those services is inducing problems. Older
populations requiring community support or meals-on-wheels services, have been
studied by several investigators in order to describe the nutritional and health
problems moreover to outline the effectiveness of several intervention programs1"5.
In developing effective nutritional interventions aiming at reversion of a
suboptimal nutritional state, sustainment of independence and limitation of health
care costs, the question whether the program is feasible is often addressed
laterally. Gray-Donald et al.1 were attempting to assess the feasibility of their
supplementation program, however their report is only based on 14 subjects and is
lacking evaluative data other than feelings of general well-being. Little is known
about long-term preference of the foods (in most cases milkshakes) provided. In
fact, in-home judgement of fortified or novel foods by elderly has been scantily
investigated in general6.
Some demands for senior foods have been agreed upon already for years:
easy-to-open and store containers, large readable labels, available at reasonable
cost and sufficient variety78. Since appetite may be decreased in the frail due to
lower activity levels9, products should be served in small portions. In order to meet
the declining sensory perception of elderly flavor, texture and color may need
136
. Appraisal of nutrient dense foods
adaptation7. The foods should be palatable throughout the day, should fit in all
main meals but also as snack between meals.
Debate about what nutrients or which energy density these foods should contain
and in which (safe) concentration is still going on. Up till now some industries have
marketed special 'formulas' with increased energy density and high concentrations
of macro- as well as micronutrients. Target populations for these relatively
expensive and mainly medicin-like products are hospitalized and institutionalized
elderly.
Our goal was developing safe customary nutrient dense foods in several
varieties containing a physiological dose of micronutrients, for the community
dwelling (high-risk) frail elders in order to increase the micronutrient density of their
diet. Due to a decreased activity level and a presumed lower basal metabolic rate,
extension of energy density was not a major topic. The effectiveness of these foods
on the nutritional and health status are described in Chapters 3 - 6 of this thesis.
The present paper focuses on the in-home long-term judgement and acceptance of
the foods, the food choice behavior and the appropriateness of these foods for
widespread implementation in the community.
METHODS
Subjects and Design
In total 217 free-living Dutch frail elderly were recruited through home-care
services, meals-on-wheels organizations, elderly homes, elderly social services
and general practitioners. The subjects were selected based on the following
criteria: age *70 years, requirement of health care (home care, meals-on-wheels),
inactive, body mass index s25 kg/m2 (based on self reported weight and height) or
involuntary weight loss, no usage of multivitamins and ability to understand the
study procedures. A written informed consent was obtained. The study protocol
was approved by the Medical Ethical Committee of the Division of Human Nutrition
and Epidemiology.
Subjects were randomly assigned to the nutrient dense or the regular food group
both combined with either an exercise program or a social program (total of 4
groups, details described in Chapters 3 - 6). The intervention period was 17 weeks.
At baseline (week 0) and in the last week of intervention (week 17) a 3-day dietary
137
Chapter 7
food record was obtained. In week 1 and 2 of the intervention, subjects were asked
to complete a product-diary with specific questions about the products provided.
The same was asked at the end (week 16 and 17). In week 18 a general
evaluation form was filled out.
Pre- and postintervention measurements were available from 165 subjects.
Reasons for drop out (n=52) were mainly health problems. Additionally, 4 subjects
were excluded because time between pre- and postintervention was less than 13
weeks due to hospitalization. Another 2 subjects were hospitalized in week 18.
Seventy-one subjects in the nutrient dense group successfully completed product-
diaries at both the start and the end, whereas 58 subjects in the regular food group
filled out these diaries. Evaluation forms and baseline food records were available
for 78 and 72 subjects and respectively. The remainder of the participants ended
up with incomplete or invalid diaries due to forgetfulness or inaccurateness.
Nutrient dense foods
During the intervention subjects had to consume 2 products a day: one from a
series of fruit based and one from a series of dairy products. The fruit products
consisted of 100 grams servings of orange-peach juice, apple-berry-grape juice,
apple compote and apple-peach compote. Dairy products consisted of 100 grams
portions of vanilla custard, strawberry yoghurt, vanilla-apple yoghurt and a 75
grams portion of vanilla-mixed-fruit quark (quark was regarded as more 'satiating'
compared to others). Of all products 4 fresh servings (with both compotes as
exception: 2 servings) were provided weekly in a cooled container. This means that
subjects received 28 products in total. Consumption of 7 dairy and 7 fruit products
per week, resulted in 14 products as leftovers, which was checked. Availability of a
variety of products (even at the end of the week) was intended to avoid boredom,
to increase acceptability and to imitate daily life in which multiple types of products
are available.
Daily consumption of two enriched products delivered -100% of the Dutch
RDA10" of several vitamins and -25-100% of the RDA of several minerals (see
appendix). Only those vitamins and minerals were chosen of which intake or blood
levels are known to be frequently low in frail elderly. Subjects in the regular group
received identical products in the same portion sizes. The natural amount of
vitamins and minerals of the regular products was at the highest 15% of the
138
. Appraisal of nutrient dense foods
concentration in enriched products. Both the enriched and the regular products
contained -0.48 MJ energy per two products.
Diary and questionnaires
The specific product-diary consisted of 7 pages for each of the fruit and dairy
products in order to cover a week. Information was gathered about type of product
consumed, time of consumption (morning, afternoon, evening) and 'eating/drinking
period' (breakfast, lunch, dinner or in between). On a 10-point scale, with 1=low
and 10=high, the desire to eat the product just before consumption, pleasantness
and attitude to product in general were rated, in addition, stomach or bowel
problems (10-point scale) and the experience with opening the package (1=very
easy, 2=in between, 3=very difficult) were reported.
The general evaluation form included questions about overall judgement of the
supplementation program (10-point scale), argumentation for this judgement, the
obligatory consumption of a total of two supplements (10-point scale), intention to
buy the nutrient dense foods, if available, and in case which ones and for what
reasons.
Energy intake at baseline and at the end of intervention was calculated from a 3-
day (2 weekdays and one weekend day) dietary record. Three trained dietitians
assisted the subjects with the recording. Portion sizes were documented in
household measures, whereby frequently used household measures were weighed
afterwards. Food consumption data were coded after which energy was calculated
with a computerized Dutch Food Composition Table12. The energy content of the
intervention products were included in the data.
Information about age, sex, marital status, living conditions, meal preparation,
illness and medicine use was provided by a general questionnaire.
Statistical analysis
Data were analysed using the statistical program SAS (Statistical Analysis
Program, version 6, NC: SAS Institute Inc., 1990). Means±sd, medians (10*'- 90th
percentiles) or percentages were calculated for both groups separately. Within
each group all 8 types of products were evaluated. In case subjects consumed the
same type of product several times per period; i.e. two weeks at the start (first
139

Chapter 7
period) and two weeks at the end of intervention (last period), a subject mean for
that product was calculated first, before calculating the group mean (weighted
means). Differences between both groups were tested with an unpaired t-test.
Changes over time within the nutrient dense food group were compared with
changes in the regular food group with a t-test. In case two or more dichotomous
variables were compared, a chi-square test was provided. Pearson correlation
coefficients were used for calculation of baseline relationships. A p-value of <0.05
was considered as statistically significant.
RESULTS
In Table 7.1 baseline characteristics of the population according to intervention
group are presented. No relevant differences between both groups were observed.
With respect to energy intake no significant difference in change over the
intervention period was found: in the regular group (n=69) the mean change was
0.0±1.7 MJ/day, in the nutrient dense group (n=77): -0.09±1.4 MJ/day (p=0.69).
Table 7.1: Baseline characteristics of the study population (n=150)
Parameter
Women (%)
Age (years) (meamsd)
Subjective health (range 1-10) (meamsd)
Body Mass Index (kg/m2) (meamsd)
Living alone (%)
No. of prescribed medicines (median;P10-P9o)
No. of chronic diseases (medianiP^-Pgo)
Currently smoking (%)
Preparation of hot meal by (%):
-self
- meals-on-wheels
- partner
Energy intake (MJ/day) (meansisd)
Nutrient dense
food (n=78)
71
79.0±5.4
6.9±1.5
24.7±2.4
67
3 (0-6)
2(1-3)
10
58
27
12
7.6 ±1.7
Regular food
(n=72)
71
77.3+5.7
6.9±1.3
24.4+3.1
68
2 (0-7)
1 (0-3)
11
58
28
13
7.6 ± 2.0
140

. Appraisal of nutrient dense foods
Of 53 subjects who were not included in the analyses (drop-outs or time between
pre- and postintervention measurements too short) additional information was
available: 34 were randomized to the nutrient dense and 19 to the regular group.
Mean age of these subjects was 79 years and subjective health was rated as 6.6.
At baseline, no significant differences with respect to mean (±sd) hedonic ratings
of the products between both groups were observed, although on average regular
foods were rated slightly higher than nutrient dense foods (Table 7.2). Exceptions
were both fruit compote products. Ratings at the end of intervention had slightly
declined (in some cases significantly) or stayed equal. The decline did not differ
between the nutrient dense and the regular food group. The fruit compotes were
the least favourite foods reflected by frequency of consumption and significant
declines in hedonic ratings. All three questions (pleasantness, attitude and desire-
to-eat) were highly correlated: coefficients varied from 0.77 till 0.91 (p<0.0001) at
the start and from 0.85 till 0.95 (p<0.0001) at the end of intervention (based on 723
observations). When baseline ratings of the subjects under study were compared
with those of the drop outs it turned out that these were equal, in the regular as
well as in the nutrient dense group.
The 'eating/drinking period' was for both categories (dairy and fruit) mainly as
snack in the afternoon and in the evening (63% for fruit and 32% for dairy).
Besides, dairy foods were consumed as dessert after a hot lunch (21%) or dinner
(21%). The amount of the foods was on average rated as 'exactly enough'. No
problems with opening of the cans were reported in either group. All mean scores
were between 1 and 2 on a 3-point scale with 1 =very easy and 3=very difficult to
open. Slight but significant changes in both groups (p<0.05) over time were
detected with subjects having more difficulties with opening of the cans at the end
of the study.
Hardly any gastro-intestinal complaints were noted. On a 10-point scale (with 1
regarded as many problems and 10 as no problems at all) average ratings varied
between 8.7±1.8 (apple compote) and 9.4±1.2 (vanilla custard). Overall slightly
more bowel problems were reported by subjects who consumed the nutrient dense
foods, but this was not significant, nor was a significant change over the
intervention period detected (largest change -0.6±0.4 in enriched strawberry
yoghurt).
141
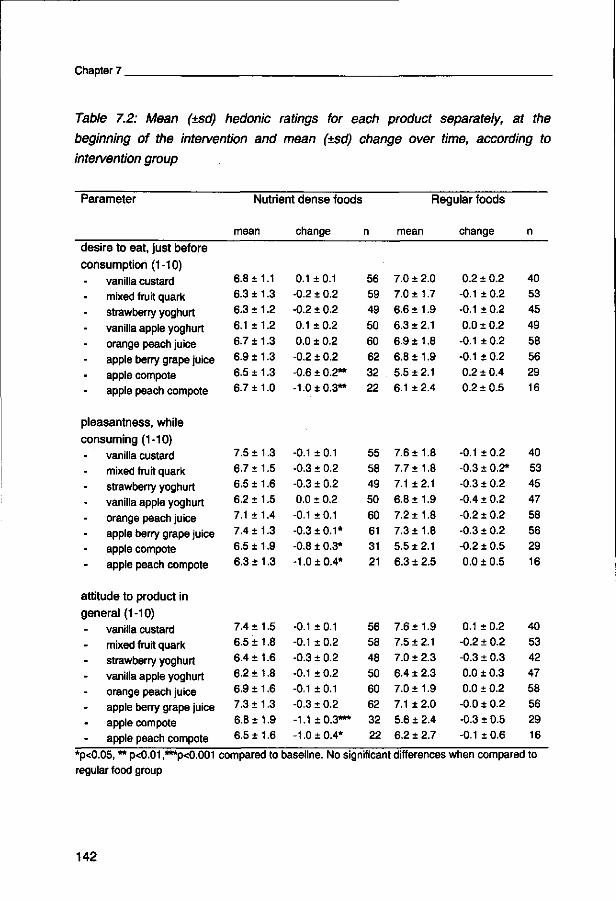
Chapter 7
Table 7.2: Mean (±sd) hedonic ratings for each product separately, at the
beginning of the intervention and mean (±sd) change over time, according to
intervention group
Parameter
desire to eat, just before
consumption (1-10)
vanilla custard mixed fruit quark strawberry yoghurt
vanilla apple yoghurt orange peach juice
apple berry grape juice
apple compote apple peach compote
pleasantness, while
consuming (1-10)
vanilla custard mixed fruit quark
strawberry yoghurt
vanilla apple yoghurt
orange peach juice
apple berry grape juice apple compote
apple peach compote
attitude to product in
general (1 -10)
vanilla custard
mixed fruit quark strawberry yoghurt
vanilla apple yoghurt orange peach juice
apple berry grape juice
apple compote apple peach compote
Nutrient dense foods
mean
6.8 ±1.1
6.3 ± 1.3 6.3 ± 1.2
6.1 ±1.2
6.7 ±1.3
6.9 ± 1.3
6.5 ±1.3 6.7 ±1.0
7.5 ± 1.3
6.7 ±1.5
6.5 ±1.6 6.2 ±1.5
7.1 ±1.4
7.4 ±1.3
6.5 ± 1.9 6.3 ±1.3
7.4 ± 1.5 6.5 ± 1.8
6.4 ±1.6
6.2 ±1.8
6.9 ±1.6
7.3 ±1.3 6.8 ±1.9
6.5 ±1.6
change
0.1 ±0.1 -0.2 ± 0.2 -0.2 ± 0.2
0.1 ±0.2
0.0 ± 0.2 -0.2 ± 0.2
-0.6 ± 0.2** -1.0 ±0.3**
-0.1 ±0.1 -0.3 ± 0.2
-0.3 ± 0.2
0.0 ± 0.2
-0.1 ±0.1
-0.3 ±0 .1*
-0.8 ± 0.3* -1.0 ±0.4*
-0.1 ±0.1
-0.1 ±0.2
-0.3 ± 0.2 -0.1 ± 0.2
-0.1 ±0.1
-0.3 ± 0.2 -1.1 ±0.3***
-1.0 ± 0.4*
n
56
59 49
50
60 62
32 22
55
58 49
50
60 61
31 21
56 58
48
50 60
62 32
22
Regular foods
mean
7.0 ± 2.0 7.0 ±1.7
6.6 ±1.9
6.3 ± 2.1
6.9 ± 1.8
6.8 ±1.9
5.5 ±2.1 6.1 ±2.4
7.6 ±1.8
7.7 ±1.8
7.1 ±2.1 6.8+1.9
7.2 ±1.8
7.3 ±1.8
5.5 ±2.1 6.3 ± 2.5
7.6 ±1.9 7.5 + 2.1
7.0 ± 2.3
6.4 ± 2.3
7.0 ± 1.9
7.1 ±2.0 5.6 ±2.4
6.2 ±2.7
change
0.2 ± 0.2
-0.1 ± 0.2 -0.1 + 0.2
0.0 ± 0.2
-0.1 ± 0.2
-0.1 + 0.2
0.2 ± 0.4 0.2 ± 0.5
-0.1 ±0.2
-0.3 ± 0.2*
-0.3 + 0.2 -0.4 ± 0.2
-0.2 ± 0.2
-0.3 ± 0.2
-0.2 ± 0.5 0.0 ± 0.5
0.1 ± 0.2 -0.2 ± 0.2
-0.3 ± 0.3
0.0 ±0.3
0.0 ±0.2
-0.0 ± 0.2 -0.3 ± 0.5
-0.1 ±0.6
n
40
53 45
49
58
56
29 16
40 53
45 47
58
56
29 16
40 53
42
47
58
56 29
16
*p<0.05,**p<0.0V regular food group
*p<0.001 compared to baseline. No significant differences when compared to
142
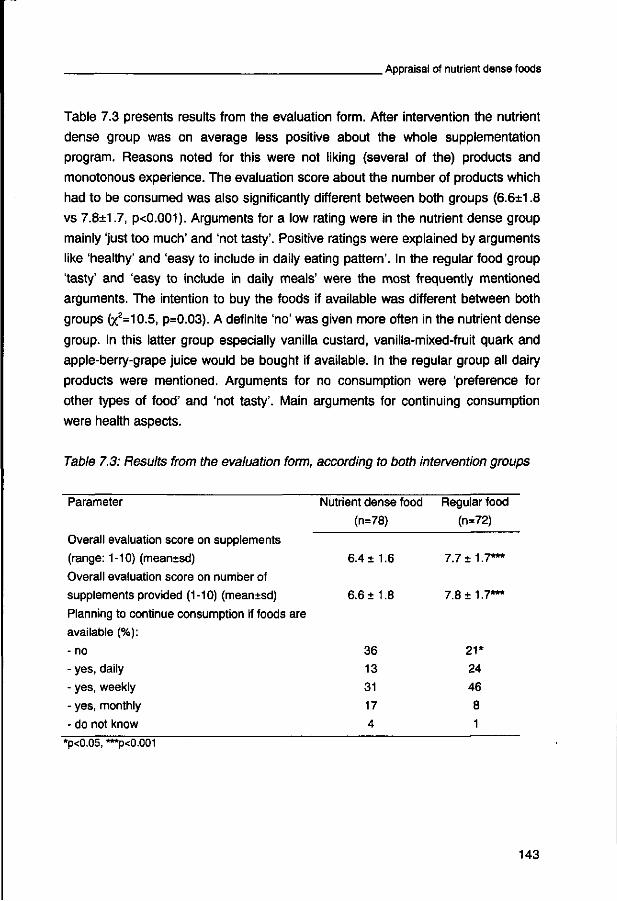
. Appraisal of nutrient dense foods
Table 7.3 presents results from the evaluation form. After intervention the nutrient
dense group was on average less positive about the whole supplementation
program. Reasons noted for this were not liking (several of the) products and
monotonous experience. The evaluation score about the number of products which
had to be consumed was also significantly different between both groups (6.6±1.8
vs 7.8±1.7, p<0.001). Arguments for a low rating were in the nutrient dense group
mainly 'just too much' and 'not tasty'. Positive ratings were explained by arguments
like 'healthy' and 'easy to include in daily eating pattern'. In the regular food group
'tasty' and 'easy to include in daily meals' were the most frequently mentioned
arguments. The intention to buy the foods if available was different between both
groups (x2=10.5, p=0.03). A definite 'no' was given more often in the nutrient dense
group. In this latter group especially vanilla custard, vanilla-mixed-fruit quark and
apple-berry-grape juice would be bought if available. In the regular group all dairy
products were mentioned. Arguments for no consumption were 'preference for
other types of food' and 'not tasty'. Main arguments for continuing consumption
were health aspects.
Table 7.3: Results from the evaluation form, according to both intervention groups
Parameter
Overall evaluation score on supplements
(range: 1-10) (mean±sd)
Overall evaluation score on number of
supplements provided (1-10) (mean±sd)
Planning to continue consumption if foods are
available (%):
- no
- yes, daily
- yes, weekly
- yes, monthly
- do not know
Nutrient dense food
(n=78)
6.4 ±1.6
6.6 ±1.8
36
13
31
17
4
Regular food
(n=72)
7.7 ±1.7***
7.8 ±1.7***
21*
24
46
8
1
*p<0.05, ***p<0.001
143
Chapter 7
DISCUSSION
This placebo controlled in-home appraisal study revealed that several products do
have a 'market potential' as 'healthy' snacks or desserts. Since, already at
baseline, small but consistent differences existed between the nutrient dense and
regular foods, with the latter group scoring more positive on the preference ratings,
it seems of essential importance that nutrient dense foods are developed without
the slightest off-flavours or discolours. Hedonic ratings obtained at the end of
intervention were only slightly lower or stayed equal compared to baseline.
Because of the provision of a variety of foods, boredom was minimized in both
groups.
Foods enriched with multiple micronutrients having the potential of being healthy
and fitting in an elderly feeding pattern, aiming at optimizing the quality of life
should meet the demands of this target population. Governmental health councils
often advice consumption of nutrient dense foods by those at risk, but up till now
not many special senior products have been marketed with respect to this issue.
Perhaps this is an illustrative consequence of the difficulties, manufacturers
experience in the development and long-term evaluation of these special types of
'senior' foods. The foods will have to be marketed next to the already existing
highly dosed pharmaceutical products like multivitamin and -mineral pills.
The ratings observed in our study are not widely distributed. On the one hand
this can be explained by the fact that we used just 'customary' foods which were all
familiar to the elderly so no extremes may be expected. On the other hand it is
evident from earlier studies1314 that elderly are hesitating to rate very positively or
very negatively about food. In addition, they will not complain about food very soon
(which is in experimental settings provided for free!). Therefore, emphasizing the
importance of giving honest answers is essential in this study population.
The nutrient dense foods were at baseline consistently rated less positive than
the regular foods, and this finally resulted in a large difference in the overall
evaluation score. This latter finding indicates that development of optimal hedonic
characteristics of the products is needed. Four subjects in the nutrient dense food
group and one in the regular group specifically dropped out because of the type,
taste and appearance of these foods. On average baseline ratings from drop outs
did not differ from subjects under study.
144
. Appraisal of nutrient dense foods
It appears from our data that boredom was only slightly present after 17 weeks
intervention. The small decline observed in some nutrient dense foods cannot be
explained by the presence of very subtle off-flavours, triggering resistance after
long-term consumption since the decline was equal in both groups. The stronger
decline in ratings of the nutrient dense fruit compotes may be explained by the fact
that instead of a weekly fresh stock, by exception they were produced only once,
just before the start of intervention. Off-flavours could have had more chance to
develop across the time of the study in these compotes. Last but not least, the
obligatory consumption of the foods itself, may induce resistance but on average
the ratings of the elderly were quite stable.
The intervention products were mainly consumed as snack in between meals or
as dessert. No significant difference in change in energy intake appeared when the
nutrient dense food group was compared with the regular group. This is confirming
the fact that subjects replaced their normal desserts or snacks for our foods and
did not alter their habitual dietary patterns considerably. Portion sizes of 100 grams
appeared to be satisfying. The amount of vanilla-mixed-fruit quark was rated the
lowest, so the smaller portion size was not essentially needed. No significant bowel
problems occurred, meaning that the products were physiologically well tolerated,
even at the long-term. Variety needed for prevention of boredom within a person
has already been mentioned. This is, however, also essential with respect to the
physiological heterogeneity in elderly. Due to a relative high prevalence of diabetes
type II in these groups and the mythological fear of elderly diabetic patients of
eating too much sucrose, artificial sweetened products should be available. Dairy
products may sometimes induce problems due to intolerance. We furthermore
observed subjects not liking 'sour' dairy products (opined stomach problems) or too
sweet juices once more confirming the indispensability of diversity in nutrient dense
foods.
Nutritionists should stress that 'medicalization' of elderly with vitamin pills is not
a favourable direction. Next to the possibility of confusing real medicines with
vitamin pills, simultaneous intake may also induce a negative drug-nutrient
interaction. A physiological dose of micronutrients in foods aiming at reversion of a
suboptimal state in community-dwelling elderly may be as effective as
pharmaceutical concentrations at the long-term15. Pleasant and satisfying foods
may be key factors for optimizing the quality of elderly life. External stimuli, like
145
Chapter 7
foods, are elements which will remain important till the very last end in human life16
and thus should not be replaced by pharmaceutical products. Additionally,
micronutrient enriched foods contain other ingredients of high nutritional value as
well. Therefore we emphasized the development and evaluation of customary
natural-like foods in contrast to the milkshake (medicine) type often used as
intervention supplement.
This is the first extended trial which directly investigated hedonic aspects of
enriched foods in a 4-months in-home setting. Long-term sensory studies are
needed to be able to trustworthy evaluate newly developed foods. While part of the
target population may not do their own shopping anymore, caretakers and relatives
should also be made aware of the existence of such new foods. Pleasant, healthy
snacks or desserts, available in a large variety to stimulate long-term eating and
avoid boredom, moreover to guarantee physiological tolerance in a frail group with
multiple widespread complaints and diseases are vital initial conditions.
ACKNOWLEDGEMENTS
We are grateful to the dieticians Saskia Meyboom, Els Siebelink and Karin Roosemalen for the weekly organization and distribution of the foods to all subjects. We furthermore would like to thank Danielle Lamtink, Mariska de Vette and Renate Taalman for the data-entry of the diaries. Chefaro International b.v. is kindly acknowledged for the placed disposal of boxes of vitamins and minerals. Last but not least we would like to thank Wiebe Visser of the Dutch Dairy Foundation on Nutrition and Health, Maarssen, the Netherlands for the financial support moreover for establishing and coordinating the contacts with the following (food) companies: Roche Nederland B.V. (Allita van Daatselaar), Friesland Coberco Dairy Foods B.V. (Hette Bouma, Henk van der Hoek, Rudi Fransen, Martine Alles), Campina Melkunie - Mona Division (Frank Elbers), Bekina Lebensmittel GmbH (Anneliese Mahrow), subsidiary of Royal Numico NV. Their effort in the development and production of the foods is gratefully acknowledged.
146
. Appraisal of nutrient dense foods
References
1. Gray-Donald K, Payette H, Boutier V, Page S: Evaluation of the dietary intake of homebound elderly and the feasibility of dietary supplementation. J Am Coll Nutr 1994; 13:277-284. 2. Coulston AM, Craig L, Voss AC: Meals-on-wheels applicants are a population at risk for poor nutritional status. J Am Diet Assoc 1996;96:570-573. 3. Fiatarone MA, O'Neill EF, Ryan ND, et al: Exercise training and nutritional supplementation for physical frailty in very elderly people. N Engl J Med 1994;330:1769-1775. 4. Lipschitz DA, Mitchell CO, Steele RW, Milton KY: Nutritional evaluation and supplementation of elderly subjects participating in a "meals on wheels" program. JPEN 1985;9:343-347. 5. Meredith CN, Frontera WR, O'Reilly KP, Evans WJ: Body composition in elderly men: effect of dietary modification during strength training. J Am GeriatrSoc 1992;40:155-162. 6. Porcherot C, Issanchou S: Dynamics of liking for flavoured crackers: test of predictive value of a boredom test. Food Oual Pref 1998;9:21 -29. 7. Hautvast JGAJ, de Groot LCPGM, Van Staveren WA: How food-related industries can respond to the nutritional needs of the elderly: an European view. Nutr Rev 1992;50:484-487. 8. Dichter CR: Designing foods for the elderly: an American view. Nutr Rev 1992;50:480-483. 9. Casper RC: Nutrition and its relationship to aging. Exp Gerontol 1995;30:299-314. 10. Commissie Voedingsnormen Voedingsraad: Nederlandse voedingsnormen 1989, Den Haag, Voedingsraad; 1989. 11. Commissie Voeding van de Oudere Mens Voedingsraad: Voeding van de oudere mens, Den Haag, Voedingsraad; 1995. 12. Stichting Nederlands Voedingsstoffenbestand. Dutch Nutrient Data Base 1997. The Hague, Voorlichtingsbureau voor de Voeding. 13.de Jong N, De Graaf C, Van Staveren WA: Effect of sucrose in breakfast items on pleasantness and food intake in the elderly. Physiol Behav. 1996;60:1453-1462. 14. de Graaf C, Polet P, Van Staveren W.A.: Sensory perception and pleasantness of food flavors in elderly subjects. J Gerontol 1994;49:93-99. 15. Morley JE, Mooradian AD, Silver AJ, Heber D, Alfin SR: Nutrition in the elderly [clinical conference]. Ann Intern Med 1988;109:890-904. 16. Schlettwein GD: Nutrition and the quality of life: a measure for the outcome of nutritional intervention? Am J Clin Nutr 1992;55:1263S-1266S.
147

General Discussion
General Discussion
The core of this thesis describes the results of an intervention trial in frail elderly
people in which the effects of nutrient dense foods and physical exercise On
several indicators of nutritional and health status have been investigated (Chapters
3 to 6). Focus on the potential benefits, including quality of life, of relatively simple
applicable and realistic interventions in frail elderly people is important. It may help
to overcome the growing burden and societal costs associated with the provision of
care and services for the elderly. In addition, understanding of dietary, biochemical
and other clinical nutrition data to support our current marginal knowledge with
regard to frail elderly people is essential for the development of adequate
recommendations and public health policy.
The feasibility of both interventions is a prerequisite for future implementation.
An important additional aspect of this thesis, therefore, is the focus on the
acceptance of the newly developed foods and their appraisal within the daily eating
pattern of elderly people (Chapter 7). The feasibility of the exercise program is
described in the thesis of Marijke Chin A Paw1. Additionally, in a preliminary study
(Chapter 2) the relationship between sensory functioning and a) its potential
determinants and b) food intake has been investigated. Since sensory properties
remain important till the very last end of life, it is of great value to investigate the
decline in taste and smell perception and its impact on food enjoyment and total
food intake. Firstly, the main findings with respect to the research questions
formulated in Chapter 1 are briefly summarized and put into perspective below.
Secondly, the feasibility of the nutritional intervention is discussed as well as the
methods used to investigate the outcome measures. Recommendations for future
research are suggested all throughout. Finally, public health implications are
considered. The chapter concludes with general remarks.
Main findings
Preliminary study
In the cross-sectional study described in Chapter 2, two groups of elderly people
(i.e. independently living and institutionalized) have been investigated. The
institutionalized group scored significantly lower on the sensory tests as well as on
the questionnaire on appetite, hunger feelings and their own impressions about
taste and smell functioning. This could be mainly ascribed to chronological age as
well as to biological age factors. The differences between men and women in our
150
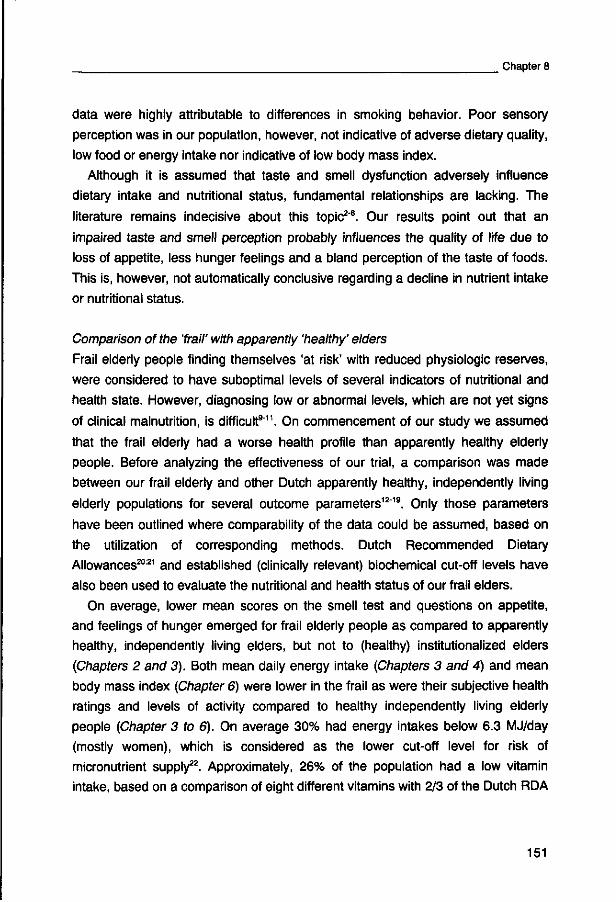
Chapter 8
data were highly attributable to differences in smoking behavior. Poor sensory
perception was in our population, however, not indicative of adverse dietary quality,
low food or energy intake nor indicative of low body mass index.
Although it is assumed that taste and smell dysfunction adversely influence
dietary intake and nutritional status, fundamental relationships are lacking. The
literature remains indecisive about this topic2"8. Our results point out that an
impaired taste and smell perception probably influences the quality of life due to
loss of appetite, less hunger feelings and a bland perception of the taste of foods.
This is, however, not automatically conclusive regarding a decline in nutrient intake
or nutritional status.
Comparison of the 'frail' with apparently 'healthy' elders
Frail elderly people finding themselves 'at risk' with reduced physiologic reserves,
were considered to have suboptimal levels of several indicators of nutritional and
health state. However, diagnosing low or abnormal levels, which are not yet signs
of clinical malnutrition, is difficult9"11. On commencement of our study we assumed
that the frail elderly had a worse health profile than apparently healthy elderly
people. Before analyzing the effectiveness of our trial, a comparison was made
between our frail elderly and other Dutch apparently healthy, independently living
elderly populations for several outcome parameters12"19. Only those parameters
have been outlined where comparability of the data could be assumed, based on
the utilization of corresponding methods. Dutch Recommended Dietary
Allowances2021 and established (clinically relevant) biochemical cut-off levels have
also been used to evaluate the nutritional and health status of our frail elders.
On average, lower mean scores on the smell test and questions on appetite,
and feelings of hunger emerged for frail elderly people as compared to apparently
healthy, independently living elders, but not to (healthy) institutionalized elders
(Chapters 2 and 3). Both mean daily energy intake (Chapters 3 and 4) and mean
body mass index (Chapter 6) were lower in the frail as were their subjective health
ratings and levels of activity compared to healthy independently living elderly
people (Chapter 3 to 6). On average 30% had energy intakes below 6.3 MJ/day
(mostly women), which is considered as the lower cut-off level for risk of
micronutrient supply22. Approximately, 26% of the population had a low vitamin
intake, based on a comparison of eight different vitamins with 2/3 of the Dutch RDA
151
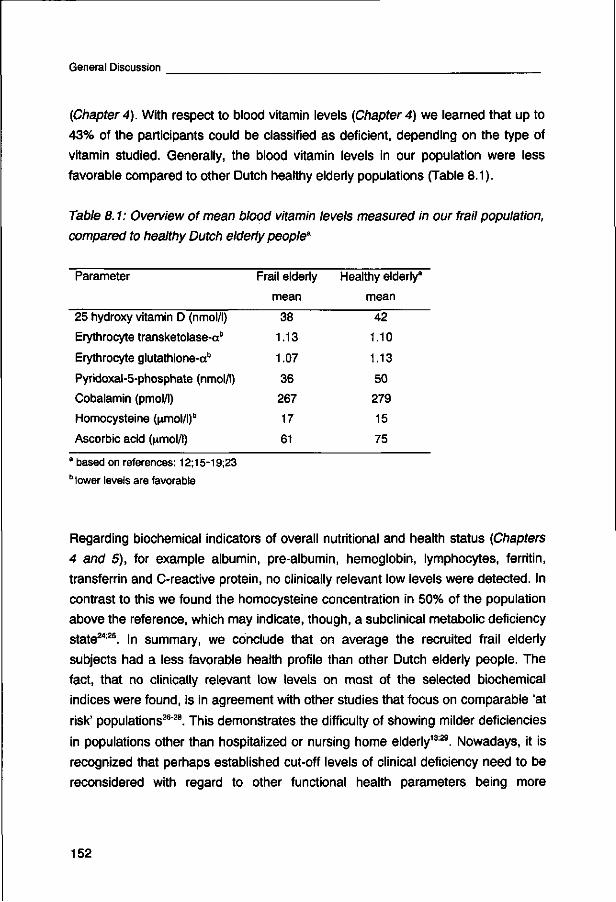
General Discussion
(Chapter 4). With respect to blood vitamin levels (Chapter 4) we learned that up to
43% of the participants could be classified as deficient, depending on the type of
vitamin studied. Generally, the blood vitamin levels in our population were less
favorable compared to other Dutch healthy elderly populations (Table 8.1).
Table 8.1: Overview of mean blood vitamin levels measured in our frail population,
compared to healthy Dutch elderly people*
Parameter
25 hydroxy vitamin D (nmol/l)
Erythrocyte transketolase-ab
Erythrocyte glutathione-ab
Pyridoxal-5-phosphate (nmol/l)
Cobalamin (pmol/l)
Homocysteine ([imol/l)b
Ascorbic acid (nmol/l)
Frail elderly
mean
38
1.13
1.07
36
267
17
61
Healthy elderly3
mean
42
1.10
1.13
50
279
15
75
a based on references: 12;15-19;23 b lower levels are favorable
Regarding biochemical indicators of overall nutritional and health status (Chapters
4 and 5), for example albumin, pre-albumin, hemoglobin, lymphocytes, ferritin,
transferrin and C-reactive protein, no clinically relevant low levels were detected. In
contrast to this we found the homocysteine concentration in 50% of the population
above the reference, which may indicate, though, a subclinical metabolic deficiency
state2425. In summary, we conclude that on average the recruited frail elderly
subjects had a less favorable health profile than other Dutch elderly people. The
fact, that no clinically relevant low levels on most of the selected biochemical
indices were found, is in agreement with other studies that focus on comparable 'at
risk' populations26"28. This demonstrates the difficulty of showing milder deficiencies
in populations other than hospitalized or nursing home elderly13129. Nowadays, it is
recognized that perhaps established cut-off levels of clinical deficiency need to be
reconsidered with regard to other functional health parameters being more
152
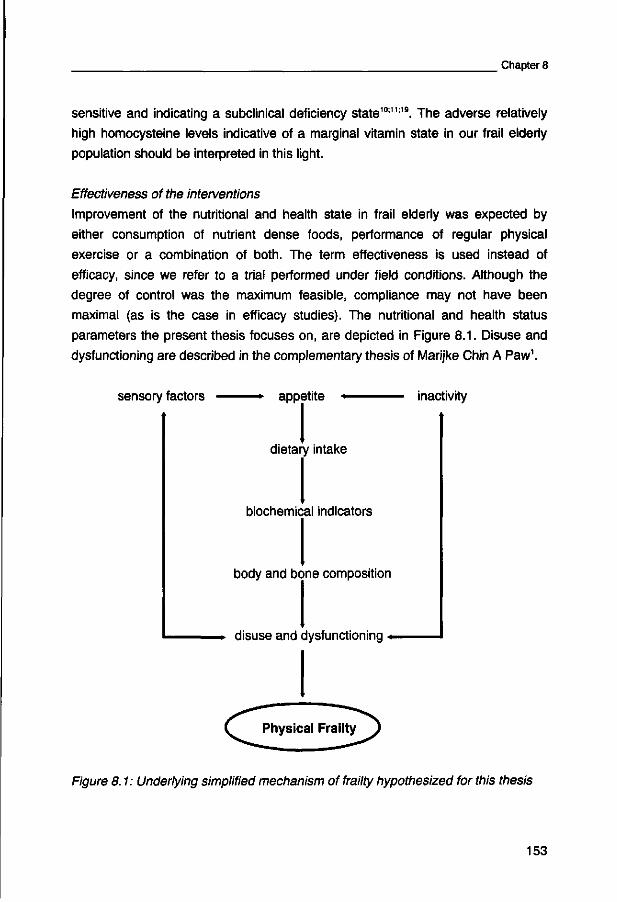
Chapter 8
sensitive and indicating a subclinical deficiency state101119. The adverse relatively
high homocysteine levels indicative of a marginal vitamin state in our frail elderly
population should be interpreted in this light.
Effectiveness of the interventions
Improvement of the nutritional and health state in frail elderly was expected by
either consumption of nutrient dense foods, performance of regular physical
exercise or a combination of both. The term effectiveness is used instead of
efficacy, since we refer to a trial performed under field conditions. Although the
degree of control was the maximum feasible, compliance may not have been
maximal (as is the case in efficacy studies). The nutritional and health status
parameters the present thesis focuses on, are depicted in Figure 8.1. Disuse and
dysfunctioning are described in the complementary thesis of Marijke Chin A Paw1.
sensory factors appetite inactivity
dietary intake
biochemical indicators
body and bone composition
disuse and dysfunctioning
Figure 8.1: Underlying simplified mechanism of frailty hypothesized for this thesis
153

General Discussion
In Table 8.2 an overview of the measured direction of effects is given. Since we
observed no interaction between the nutrition and exercise program, we compared
the nutrient dense food group with the regular food group and the exercise group
with the non-exercise group respectively. A possible interaction cannot be ruled out
completely. As power calculations were based on desired main effects, larger
numbers may have been necessary to find synergy between both programs.
Table 8.2: Overview of the main findings of the intervention study, as described in
this thesis
Parameter Enriched foods vs
regular foodsa
Exercise vs
non-exercisea
| blood vitamin levels
appetite
energy intake
functional biochemical indicators
- homocysteine
hematological parameters
- health related parameters
(e.g. (pre-)albumin, CRP,
ferritine, transferrin)
body composition
lean body mass
- fat mass
- bone parameters
+
0
0
+
0
0
0
0
+
0
0
+
0
0
0
+
0
0
' 0 = no effect, + = positive effect
Nutrient dense foods vs regular foods
After four months of intervention, a significant rise in blood vitamin levels was found
in the group receiving extra nutrients (Chapters 4 and 5). This confirms earlier
findings30, and additionally verifies the assumption that subjects indeed consumed
the supplied foods and that, accordingly, the nutrients had been absorbed and
circulated in their blood. The significant improvements in vitamin levels were
implicative for a beneficial lowering effect of approximately 25% of homocysteine
154

Chapter 8
(Chapter 5), a potential risk factor for cardiovascular disease and impaired mental
health3133.
Also for people who survive into old age, increased life expectancy makes it
important to reduce such risk factors for disablement1434. The younger old may
especially benefit from a decline in homocysteine concentration with only
physiologically dosed supplements. Our findings add substantial support to the
current proposed health programs (for the elderly) in which low dose
supplementation of those vitamins involved in the homocysteine metabolism is
recommended instead of unnecessary and unethical high doses35.
Another beneficial effect found in the nutrient dense food group compared to the
non-supplemented subjects was related to bone mass, bone calcium and bone
density (Chapter 6). The balance between bone formation and deformation can
apparently be influenced positively, although we could not completely rule out
transient effects36. In Figure 8.2 differences in percentage change over the study
period of 17-weeks are presented for lean body mass and bone composition
parameters comparing the nutrient dense food group with the regular food group
and the exercising group with the non-exercising group.
1.2
0.7 4 4)
£ 0.2
-0.3
-0.8
• • exercise vs non-exercise
nutrient dense vs regular foods
B lean body mass • bone mass • bone calcium 0 bone density
Figure 8.2: Differences in 17-weeks change (%) in lean body mass and three bone
parameters between the exercising group vs the non-exercising group and the
nutrient dense food group vs the regular food group respectively (*p<0.05)
155
General Discussion
The results with regard to bone parameters are in line with other trials which
showed a divergence in bone density between controls and supplemented subjects
within the first half-year of intervention37"39. Chapuy et al.40 recorded within 2 months
a reduction in fracture rate. However, this was accompanied by only modest bone
density benefits. In contrast to our supplementation program, these trials
intervened with larger doses of calcium and/or vitamin D (i.e. between 400 and 800
IU vitamin D/day, and between 0.5 and 1.2 g calcium/day). Whether the same
effect can be established with physiological doses, may be confirmed in future
studies. Longer term interventions in the frail should approve the steadiness of this
interference in bone metabolism and should investigate the potential declining risk
of falling and fracturing. Biochemical measures of bone turnover, for example
serum parathyroid hormone or osteocalcin, might also confirm the results, although
less convincing results have been noted with respect to these measurements
compared to bone mineral density measurements3738.
Improvement in vitamin levels did not have any effect on appetite, spontaneous
dietary intake, lean and fat mass or functional biochemical indicators of nutritional
and health status, other than the decrease of homocysteine. Subjective scores on
a questionnaire on appetite, feelings of hunger and sensory perception (Chapter 3)
may not be decisive for the final nutritional state, but they reflect food enjoyment
and quality of life41. A good appetite is generally regarded as a sign of good health.
A decreasing acceptance of food can be an early warning of worsening health4243.
An improvement in appetite and spontaneous dietary intake through supplements
only, may be extremely difficult to achieve. Perhaps only the very sick patients may
benefit from such an intervention. Another explanation may be the fact that in older
individuals the ability of ingested nutrients to affect the subjective state of hunger
and satiety decreases44.
For most healthy elderly, overt vitamin and mineral deficiencies are uncommon16
though, it is possible that milder subclinical vitamin deficiencies play a role in the
declining health of the frail elderly. The difficulty of demonstrating low levels and
furthermore improving functional biochemical indicators (Chapter 4) has led to the
assumption that abnormalities may be age or disease related, rather, than nutrition
related2627. Longer term protective effects of nutrient supplementation, due to
maintenance of optimal levels, may be an important future topic.
156
Chapter 8
In the supplemented group, no effect on fat and lean body mass was achieved
compared to the regular food group. The stability of these body composition
parameters may be partly explained by the subject's regulation of intake on food
product level, i.e. subjects replaced their normal dessert or soft drink with our
intervention products, which did not contain extra energy or macronutrients.
Others, who intervened with both nutrients and energy, demonstrated an effect on
total body weight in frail elderly4546, but not on lean body mass45. Favorable effects
on body composition achieved by micronutrient dense supplements, measurable
within four months, is again perhaps only achievable in frail bedridden elderly
people, suffering from multiple diseases. Again, long term beneficial results through
protection of these body tissues, by consumption of sufficient macro- or
micronutrients should be investigated.
Exercise vs no-exercise
Adopting moderate intense regular exercise seems to stimulate a preserving effect
on lean body mass in our frail elders (Chapter 6). This preservation of lean body
mass correlates slightly to the effects on energy intake. The findings of Fiatarone et
al.45 indicate an improvement in thigh-muscle area in the exercisers compared to a
decline in the non-exercisers. Our results are supportive to their observations. They
furthermore showed, that only those who perform physical exercise were able to
augment their nutritional intake. Reversal of inactivity, and the protection of lean
body mass, may thus influence energy intake, though up till now effects of
moderate intense amounts of exercise have yielded inconsistent results47"49.
Maintenance of metabolic active cell mass may additionally be predictive for
muscle strength, muscle functioning and mobility5051. Preservation of muscle mass
and strength, together with exercise, induced improved balance and coordination.
This may also be meaningful for a decline in falling and fracture rates4552. In Marijke
Chin A Paw's thesis1 beneficial effects of our exercise program, with respect to
physical fitness and functioning (among others balance) have been described.
Improvement in appetite or hunger feelings by exercise was not observed, nor
were any changes in biochemical parameters noted in the exercise group. With
respect to the first issue, we might not have been able to pick up small changes
with our questionnaire, which may only be suitable in classifying elderly in poor and
healthy eaters. Up till now the effect on appetite of physical exercise has not been
157
General Discussion
adequately examined. Our questionnaire was the first attempt to investigate this
more thoroughly. Since changes in parameters like dietary intake and lean body
mass may be ascribed to preservation in the exercising group versus a small
decline in the non-exercisers, biochemical parameters were not expected to have
changed much.
Appraisal of micronutrient dense foods
People, in both nutrient dense and regular food groups, were asked to rate the
taste and pleasantness of the foods, their desire to eat and their attitude towards
the products in general at the start and finish of the intervention (Chapter 7). They
started off rating the food equally. Most of the foods were consumed as desserts or
snacks between meals, usually as a replacement (Chapter 3). At the end of the
intervention, a small decline in the hedonic ratings; presumably a kind of
weariness, had occurred. This was not significantly different from baseline, nor
between groups. Perhaps the obligatory consumption of two products a day was
inducing the decline. The evaluation score, measured at the far end of the study,
revealed, nevertheless, a substantial difference between groups, indicating that the
nutrient dense foods were less accepted than the regular items. The intention to
buy the foods, if commercially available, differed also between both groups.
Immediate assessment of hedonic aspects of foods might not result in absolutely
'honest' answers since elderly people might experience difficulties in complaining
about foods, which were provided for free. Therefore, for a successful future
implementation, we conclude that the newly developed micronutrient dense foods
need considerable adaptation with respect to their hedonic qualities.
Since we observed that the foods were predominantly taken as a replacement,
we think that we succeeded in choosing the right types of nutrient dense foods.
They fitted into the elderly feeding pattern, and the portion sizes seemed
appropriate. We preferred a physiologically dosed multinutrient approach instead of
single nutrients in mega doses since moderate multiple deficiencies due to low
food intake are more likely to occur than a single severe nutrient deficiency28. The
latter is more often the cause of a serious metabolic disease. In addition, possible
effects of only micronutrients can be distinguished from effects of extra energy or
other macronutrients. In line with this, the thesis focuses on spontaneous increases
in energy intake due to, for example, exercise. Intakes in excess of adequate
158
Chapter 8
supply, might not be desirable or might even be counter-productive953. However,
the interdependence between nutrients is not yet fully understood. Arguments for
choosing multiple foods familiar to elders, instead of frequently used milkshake
type supplements are related to compliance and imitation of daily life.
As far as we know, this is the first time that specific foods, developed for an
intervention trial, have been evaluated as extensively as such. Perception of very
subtle off-flavors do sometimes occur after repeated and long-term exposure.
Therefore, it is of importance to focus on these adverse effects not only in
laboratory trials, but also in longer lasting experiments in in-home settings, with
varying examinations before marketing these types of products.
Indicators used to describe nutritional and health status
Sensory factors and appetite
In Chapters 2 and 3 we outlined the use of a newly developed questionnaire on
appetite, feelings of hunger and subject's own impression about taste and smell
perception. A kind of reference was constructed by first investigating the scores of
healthy independently living elderly as well as institutionalized elderly. The internal
validity explored by Cronbach's alpha seemed to be sufficient, whereas the
external validity is still a point of concern since a suitable 'forward biological
measure' is lacking. Dietary intake may act as an absolute measure of appetite,
though not always in the case of elderly. They just may eat because they simply
have to, without necessarily feeling like eating. This might also be an explanation
for our findings that appetite is related to energy intake in frail elderly (Chapter 3),
whereas in healthy independently living and institutionalized elderly (Chapter 2) this
was not observed. Meals are being served in institutions which may induce eating
in the latter group and reduce the variability within this group. At the moment,
several tests with hormone levels as biological markers of hunger and appetite are
being explored. The questionnaire seems to be at least valuable in classification; it
may, however, lack power to measure a small change.
We used a slightly adapted CCCRC smell test (Chapters 2 and 3), which has
been validated against the Pennsylvania UPSIT test54"56. This latter test has been
counted as the 'golden standard' and since both tests are highly correlated we
assume no hampering of our data in this respect. The advantage of the (cheap)
CCCRC smell test is that the smells offered are derived from natural products. The
159

General Discussion
UPSIT test, on the contrary, offers 'new' smells to elderly subjects as pizza and are
constructed artificially to meet the requirements of a 'scratch and sniff' system.
Energy and nutrient intake
Having stated that dietary intake may not always act as a good measure of appetite
in elderly, obtaining data about dietary intake is still important. Dietary intake is one
of the determinants of nutritional status. We deliberately chose for a three day
dietary record (Chapters 3 and 4). This method has shown to be a sufficiently
reliable tool to get information on the regular food consumption pattern57. The
method places some burden on the elderly subject, though three days seem
feasible to handle (which may not be the case for seven days). With a proper
explanation beforehand and a personal interview afterwards reliable data can be
obtained. Some underestimation might have occurred, because of the effort of
writing up. Along with debates on the value of dietary intake data, another
controversial issue is choosing a 2/3 of the RDA as a cut-off level for insufficient
intake. This point has arbitrarily been selected and is not based upon scientific
evidence5859. Minimum requirements are based on many other determinants and,
to date, no absolute figures indicating pronounced undernutrition have been
agreed upon10. Recently, under the supervision of the National Academy of
Sciences in the United States, four different dietary reference intakes instead of
one recommendation (RDA) have been postulated60. Next to the 'established' RDA,
values of adequate intake, estimated average requirement and tolerable upper
intake level have been calculated as well. Prevention of chronic diseases has been
used as an additional criterion. Usage depends on the ultimate purpose of the
study and the type of nutrient. For evaluation of intake on group level, the
estimated average requirement is developed. This defines the intake level at which
the need of 50% of healthy individuals of the population is met. This reference
value is not yet available for all nutrients.
Other methods of investigating nutritional intake include a dietary history, food
frequency questionnaires or 24-hour recalls. A serious disadvantage of the dietary
history is that it is time consuming. The 24-hour recall deals with the short-term
memory of the elderly and often does not give accurate information on an individual
level. Food frequency questionnaires of moderate length may provide useful data
on macronutrient level, but on a micronutrient level results do vary576162.
160

Chapter 8
Biochemical parameters
Biochemical parameters used to judge the nutritional and health status are multiple
and widespread (Chapters 4 and 5). Several parameters are chosen often to define
the nutritional status, since up till now no sole measure has been found to indicate
nutritional and health status adequately, in our study, we have separated the
biochemical parameters into two categories: a) parameters describing the vitamin
status and b) functional biochemical parameters which are likely to be more
indicative of the overall health status. The first category describes the available
body pool of vitamins. This pool is dependent on nutrient intake, but also on
disease state, drug-nutrient interactions and other interfering internal factors like
functioning of the gastro-intestinal tract and the ability of elderly skin to efficiently
synthesize vitamin D13296365. With respect to water soluble vitamins the body pool is
limited and an insufficient intake will be reflected shortly in those vitamin levels.
Replenishment can occur rapidly. Vitamins obtained by excessive intake will be
excreted through urine. With respect to fat soluble vitamins body pools are much
higher (e.g. in fat tissue and liver) and take longer to exhaust30.
The second category, the functional biochemical indicators, are assumed to
reflect health state and endangered homeostasis more specifically than nutrient
levels as they may depend more strongly on non-nutritive factors such as age,
illness, drug use and internal metabolic processes, next to dietary intake1366. Due
to this interdependence, it is often not clear whether diseases cause unfavorable
biochemical indicator levels or whether low biochemical levels cause the disease58.
Another problem is the lack of uniform and clear cut-off levels, induced by different
analyzing techniques. More sensitive parameters, defining suboptimal levels
instead of parameters for clinical deficiency, should be established in the future,
along with more insight into the whole interdependent complex of age-, nutrition-,
disease- and metabolic-related factors.
Body and bone composition
With respect to measurement of body composition, various techniques are
available. Up till now only one 'golden standard' has been appointed: densitometry
(or underwater weighing). Since this method was not feasible for frail elderly, the
dual-energy X-ray absorptiometer represented a promising alternative. Today it is
the most commonly used measurement to determine bone parameters. An
161
General Discussion
important feature of this method is that the procedure is fast, straightforward, non
invasive and convenient for the elderly population especially. Apart from the bone
parameters, measurements of lean and fat mass obtained by DXA are also rather
precise. Accuracy, is influenced by, for example, the thickness of the soft tissue67.
Assumptions, with respect to constancy in fat and fat free mass constitute another
drawback but we think that we have chosen the optimal feasible method for
measuring body composition in frail elderly. We checked the DXA data with
deuterium dilution technique results. Changes derived using this latter method did
not reach statistical significance, as found with DXA, but pointed in the same
direction.
Success of selection of a frail study population
In all epidemiological surveys focusing on the elderly, the problem of refusing
participation especially by those less healthy, more socially isolated and less
educated is noted68. Since nutritional problems are most likely to occur in these
people, the problems in elderly registered so far are prone to underestimation.
Research in frail elderly, therefore, is a challenging and important topic. Selecting
frail elderly for participation in an intervention trial, is an even more difficult and
time consuming process. Next to the 'natural' reluctance of many elderly to co
operate in research, especially the frail elderly deal with limited physical fitness and
health. Besides, they often live on their own, do not have a 'sheltering support from
nurses' as is the case in nursing homes and do not have the opportunity of
discussing their inner thoughts with a close partner. All these factors finally
influence their decisions on unascertained events.
Initially, we had planned to recruit frail elderly through co-workers at home care
institutions in Wageningen and surrounding municipalities, after which the principal
investigators would have invited the elderly for an introductory meeting. Several
selection criteria, outlined in Figure 1.2 in Chapter 1, were defined. One early
criterion, i.e. involuntary weight loss, was left out of our final criteria list. The
outlining of this criterion was based on analyses in pre-existing data-bases (see
Marijke Chin A Paw's thesis1) and indicated frailty or being 'at risk' the most
specific. However, after a pilot test we noticed that weight loss was either unknown
to the potential elderly volunteers or home care co-workers or it indicated and
selected elderly who were too ill to participate. The downward process of frailty
162
Chapter 8
might already have been proceeded too far in this latter group of elderly. Therefore
we chose for the standard of a body mass index below or equal to 25 kg/m2,
assumed to indicate limited body reserves as well.
Agreed co-operation of home care institutions was based on delicate grounds.
Unexpected events prevented them from recruiting. With respect to this, we were
forced to expand our recruitment activities to meals-on-wheels organizations,
elderly social services, local newspapers and elderly homes as has been described
in Chapter 1. With this adaptation of the selection procedure we had to rely solely
on subject's own reports about fulfillment of the criteria, which was prone to bias.
The fulfillment of criteria was investigated telephonically by the principal
investigators. Unfortunately, in several cases the selection criteria were not
completely met. Reported BMI was underestimated quite frequently compared to
observed BMI. Care requirement was sometimes only based on convenience
instead of need and occasionally activity pattern and supplement use turned out
also to be different compared to the first telephonic report.
These issues result in a population being less frail than originally intended. On
the other hand, taking the time and effort put into the whole recruitment procedure
into account, it was the maximum feasible. Comparison of our elderly population
with apparently healthy elders reveals that our elderly had, on average, a worse
health profile. With respect to the feasibility of our programs, we believe now that
interventions as such in a group of not too frail subjects have the most appealing
strength and therefore success. Voluntary participation of the very old and frail is
probably not a realistic aim. The effect of preserving 'health' in populations, as we
dealt with, is perhaps even more relevant than trying to improve nutritional and
health status in 'unwilling' elderly. In addition, we assume that the results found
thus far with our types of interventions have only led to an underestimation rather
than an overestimation of the effects, which at least upholds our conclusions.
Drop-out
In the intervention groups, drop-out rate was higher (27%) compared to the control
group (14%). This is inevitable in intervention trials in the elderly. Reasons for drop
out were mostly related to health problems, including (terminal) disease, hospital
stay, recent falling and/or fracturing. A few subjects (n=4) withdrew because of
holiday or too much distress. Most of the health related problems were not ascribed
163
General Discussion
to the intervention programs themselves because a) drop out (n=25) occurred
before the start of the actual intervention and b) the occurrence of diseases
seemed not likely to be related, i.e. recurrence of cancer, umbilical hernia, kidney
stones or eye-cataract (n=7). Other ailments might have been related to
participation especially in the exercise part of the intervention including: hip
fracture/surgery, cardiac infarction and rheumatoid arthritis (16 persons). In most of
these cases, however, the medical problems were pre-existing. Only five subjects,
of whom one was receiving the regular foods, did not like the foods supplied. In
general, drop-outs were of the same age, but rated their subjective health slightly
lower than those who sustained the intervention. Because of this, a little
underestimation of the results might have taken place. Since only a small number
withdrew because of reasons which may have been related to the type of
intervention, we assume that the outcomes on group level are not altered
dramatically.
Public health implications
It is recognized that people most likely to take action for elderly, classified as 'frail'
or 'in need', are those responsible for the day-to-day care: i.e. partners, family,
friends, neighbors, home-care assistants and social and health workers9.
Interventions, therefore, should be designed firstly towards easy accessibility for
the frail and secondly towards realistic application possibilities for non-medical
personnel. We attempted to meet both conditions and focused on a population for
whom relevant benefits may still be expected.
Given the diminished energy requirements in old age, it is often difficult to
maintain a balanced diet, adequate in micronutrients. Hence, in 'at risk' populations
nutrient dense foods should be considered. Those should have the same
properties as familiar food, be served in small portions and should be easy to
include in all daily meals. One promising way of administration is the replacement
of a normal dessert with a nutrient dense item in the meals-on-wheels provision.
Daily consumption of a physiological dose of nutrients significantly increases blood
levels and, furthermore, lowers the homocysteine concentration, a risk factor for
cardiovascular disease and impaired mental health. Although elderly people are
survivors, they still may benefit from such interventions in order to extend the
healthy or disability free life expectancy. The potential long term protective effects
164
Chapter 8
on health through supplementation, due to maintenance of optimal blood nutrient
levels, have to be emphasized, but also need to be further investigated.
Consumption of nutrient dense foods might have a beneficial effect on bone tissue,
although we would like to stress the fact that our findings are preliminary. To what
extent such an effect on bone tissue influences fracture rates (or in other words
what is the final clinical relevance of the effects on bone tissue?) needs to be
further established.
The physical exercise program, in addition, is feasible (see Marijke Chin A Paw's
thesis1) but only if applied less frequently. Furthermore, it is logistically more
difficult to apply than nutrient dense foods. Re-activation or keeping substantial
activity levels by mobilizing the less healthy elderly and regain or hold an
acceptable performance level is a time-consuming and difficult task. It is easier to
adapt to daily consumption of a dessert than to take-up exercise. However, with
respect to physical fitness and functioning more substantial results can be
achieved (thesis of Marijke Chin A Paw1). In this thesis the preserving effect of our
exercise program on muscle mass and energy intake has been determined. Long
term protective effects of exercise due to maintenance of bodily tissues and
functions are worth considering. A longer and perhaps more intense exercise
program (a higher physical loading) could have had additional effects on bone
tissue. Together with an improved balance, effects on bone tissue and skeleton
stability should lower the rate of falling and fracturing.
In summary, perhaps the most important health implication is the consideration
of preventive interventions. Preservation of optimal biochemical levels, muscle and
bone tissue, as well as other organ systems, would imply establishment of
physiologic reserves at longer term, associated with the maintenance of functional
ability, autonomy and hence quality of life.
General conclusions
The core study described in this thesis contributes to the knowledge on the
nutritional and health status of a group of elderly people 'classified' at risk, which
adds to our current understanding of this status in apparently healthy elderly and
institutionalized seniors. The intervention study shows that the main effects of
nutrient dense foods and physical exercise may be complementary. Nutritional
intervention increases nutrient blood levels effectively, thereby beneficially lowering
165
General Discussion
homocysteine, a potential risk factor for cardiovascular disease or impaired mental
health. Another potential beneficial effect of the nutritional supplementation might
be the slight improvement in several bone parameters (bone density, bone mass
and bone calcium). The physical exercise program complements this result with a
preserving effect on lean body mass and total dietary intake. With these favorable
effects on blood nutrient levels, body and bone composition, a potential
preservation of physical functioning, mobility and independence might be achieved.
Inactivity, and consequently reduced appetite, energy expenditure and dietary
intake and also disuse and dysfunctioning of muscles, is a major contributor to the
downward process of frailty. As energy expenditure and dietary intake decline,
difficulties in maintaining a balanced diet will increase. Improvement of the density
of the diet may in that case be recommended. Sensory factors influence appetite
and hence quality of life, though they do not always affect dietary intake or body
composition to a measurable extent. Therefore, application of nutrient dense foods
could be part of a feasible public health program, with the restriction that the
nutrient dense foods should taste as good as regular, familiar foods even at the
long-term.
Maintenance of enjoyment of life by either appetizing, tasty and 'healthy' nutrient
dense foods or provision of physical exercise on different intensity levels is most
important. Personal attention and guidance, low-threshold, easy accessible and
cheap opportunities should lead to successful implementation of these types of
interventions and should open promising pathways to reduce health care costs and
a better quality of life.
EPILOGUE
(summarizing the findings described in this thesis and the complementary thesis of
Marijke Chin A Paw1)
Both adequate nutrition and physical exercise are recognized as essential and
mutually interacting factors for optimal health. We have tried to develop an exercise
and nutritional intervention program, feasible for widespread implementation
among frail older people. Because of the interacting effects of nutrition and physical
activity we hypothesized that simultaneous intervention with both nutrient dense
166
Chapter 8
foods and training would provide synergy, but in our trial no evidence of interaction
was detected. However, the results do propose the combination of micronutrient
enriched foods and physical exercise for optimal health promotion as both
interventions exert different effects. We conclude that consumption of nutrient
dense foods improves blood vitamin levels, homocysteine concentration, and bone
mass and density. Exercise improves physical functioning and fitness and
preserves muscle mass, energy intake and delayed-type hypersensitivity. Whether
the observed effects on bone parameters, blood vitamins and delayed-type
hypersensitivity are relevant for the prevention of fractures, maintenance of bodily
functions and morbidity respectively, remains to be confirmed in longer-term
interventions. Neither intervention was effective in improving subjective well-being,
appetite and self-rated disabilities. A plausible explanation is that the
questionnaires chosen were not sensitive enough to measure changes in time. As
subjective feelings may reflect explicitly life satisfaction, they are extremely relevant
for future research in this field.
References
1 Chin A Paw JMM: Aging in Balance - Physical exercise and nutrient dense foods for the vulnerable elderly. 1999. Wageningen Agricultural University. 2 Mattes RD, Cowart BJ, Schiavo MA, et al: Dietary evaluation of patients with smell and/or taste disorders. Am J Clin Nutr 1990;51:233-240. 3 Mattes RD, Cowart BJ: Dietary assessment of patients with chemosensory disorders. J Am Diet Assoc 1994;94:50-56. 4 Schiffman SS: Taste and smell in disease (2nd of two parts). N Engl J Med 1983;308:1337-1343. 5 Schiffman SS: Taste and smell in disease (1st of two parts). N Engl J Med 1983;308:1275-1279. 6 Schiffman SS, Warwick ZS: Effect of flavor enhancement of foods for the elderly on nutritional status: food intake, biochemical indices, and anthropometric measures. Physiol Behav 1993;53:395-402. 7 Griep Ml, Verleye G, Franck AH, Collys K, Mets TF, Massart DL: Variation in nutrient intake with dental status, age and odour perception. Eur J Clin Nutr 1996;50:816-825. 8 Duffy VB, Backstrand JR, Ferris AM: Olfactory dysfunction and related nutritional risk in free-living, elderly women. J Am Diet Assoc 1995;95:879-884. 9 Davies L: Nutrition and the elderly: identifying those at risk. Proc NutrSoc 1984;43:295-302. 10 Blumberg J: Nutrient requirements of the healthy elderly-should there be specific RDAs? Nutr Rev 1994;52:S15-S18. 11 Blumberg J: The requirement for vitamins in aging and age-associated degenerative conditions. Bibl Nutr Dieta 1995;108-115. 12 Haller J, Weggemans RM, Lammi KC, Ferry M: Changes in the vitamin status of elderly Europeans: plasma vitamins A, E, B-6, B-12, folic acid and carotenoids. SENECA
167

General Discussion
Investigators. Eur J Clin Nutr 1996;50 Suppl 2:S32-S46 13 van der Wielen RPJ: Vitamin intake and status in elderly Europeans. 1-167. 1995. Department of Human Nutrition, Wageningen Agricultural University. 14 Schuit AJ. Regular physical activity in old age, effect on coronary heart disease risk factors and well-being. 1-163. 1997. Department of Epidemiology and Public Health, Wageningen Agricultural University. 15 0oms ME: Vitamin D status and sex hormone binding globulin: determinants of bone turnover and bone mineral density in elderly women. In: Osteoporosis in elderly women. Vitamin D deficiency and other risk factors. 69-83.1994. 16 Lowik MR, Schrijver J, Odink J, van den Berg H, Wedel M, Hermus RJ: Nutrition and aging: nutritional status of "apparently healthy" elderly (Dutch nutrition surveillance system). J Am Coll Nutr 1990;9:18-27. 17 Schrijver J, van Veelen BWC, Schreurs WHP: Biochemical evaluation of the vitamin and iron status of an apparently healthy Dutch free-living elderly population. Comparison with younger adults. Int J Vitam Nutr Res 1985;55:337-349. 18 Lowik MR, van den Berg H, Schrijver J, Odink J, Wedel M, van Houten P: Marginal nutritional status among institutionalized elderly women as compared to those living more independently (Dutch Nutrition Surveillance System). J Am Coll Nutr 1992;11:673-681. 19 van Asselt DZB, de Groot LCPGM, Van Staveren WA, et al: Role of cobalamin intake and atrophic gastritis in mild cobalamin deficiency in older Dutch subjects. Am J Clin Nutr 1998;68:328-334. 20 Commissie Voedingsnormen Voedingsraad: Nederlandse voedingsnormen 1989, Den Haag, Voedingsraad; 1989. 21 Commissie Voeding van de Oudere Mens Voedingsraad: Voeding van de oudere mens, Den Haag, Voedingsraad; 1995. 22 de Groot CPGM, van den Broek T, van Staveren WA: Energy intake and micronutrient intake in elderly Europeans: seeking the minimum requirement in the SENECA study. Age Ageing 1999;28: in press. 23 van der Wielen RPJ, Lowik MR, van den Berg H, et al: Serum vitamin D concentrations among elderly people in Europe. Lancer 1995;346:207-210. 24 Koehler KM, Romero LJ, Stauber PM, et al: Vitamin supplementation and other variables affecting serum homocysteine and methylmalonic acid concentrations in elderly men and women. J Am Coll Nutr 1996; 15:364-376. 25 Selhub J, Jacques PF, Wilson PW, Rush D, Rosenberg IH: Vitamin status and intake as primary determinants of homocysteinemia in an elderly population. JAMA 1993;270:2693-2698. 26 Lipschitz DA, Mitchell CO, Steele RW, Milton KY: Nutritional evaluation and supplementation of elderly subjects participating in a "meals on wheels" program. JPEN 1985;9:343-347. 27 Meredith CN, Frontera WR, O'Reilly KP, Evans WJ: Body composition in elderly men: effect of dietary modification during strength training. J Am Geriatr Soc 1992;40:155-162. 28 Bunker VW, Stansfield MF, Marszal RA, Hounslow A, Clayton BA: An evaluation of the benefits of a nutritional supplement in improving the nutrition and wellbeing of housebound elderly people, in: Targeting health promotion: reaching those in need, proceedings of a symposium. Cambridge, The Health Promotion Research Trust; 1993:122-151. 29 Buchman AL: Vitamin supplementation in the elderly: a critical evaluation. Gastroenterologist 1996;4:262-275. 30 Mann BA, Garry PJ, Hunt WC, Owen GM, Goodwin JS: Daily multivitamin supplementation and vitamin blood levels in the elderly: a randomized, double-blind, placebo-controlled trial. J Am Geriatr Soc 1987;35:302-306. 31 Miller JW: Homocysteine and Alzheimer's Disease. Nutr Rev 1999;57:126-129. 32 Matthews JH: Cobalamin and folate deficiency in the elderly. Baillieres Clin Haematol
168

Chapter 8
1995;8:679-697. 33 Boushey CJ, Beresford SA, Omenn GS, Motulsky AG: A quantitative assessment of plasma homocysteine as a risk factor for vascular disease. Probable benefits of increasing folic acid intakes. JAMA 1995;274:1049-1057. 34 Castelli WP, Wilson PWF, Levy D, Anderson K: Cardiovascular Risk Factors in the Elderly. Am J Cardiol 1989;63:12H-19H. 35 Ward M, McNulty H, McPartlin J, Strain JJ, Weir DG, Scott JM: Plasma homocysteine, a risk factor for cardiovascular disease, is lowered by physiological doses of folic acid. Q J Med 1997;90:519-524. 36 O'Brien KO: Combined calcium and vitamin D supplementation reduces bone loss and fracture incidence in older men and women. NutrRev 1998;56:148-150. 37 Dawson-Hughes B, Harris SS, Krall EA, Dallal GE, Falconer G, Green CL: Rates of bone loss in postmenopausal women randomly assigned to one of two dosages of vitamin D. Am J Clin Nutr 1995;61:1140-1145. 38 Ooms ME, Roos JC, Bezemer PD, van der Vijgh WJF, Bouter LM, Lips P: Prevention of bone loss by vitamin D supplementation in elderly women: a randomized double-blind trial. J Clin Endocrinol Metab 1995;80:1052-1058. 39 Dawson-Hughes B, Harris SS, Krall EA, Dallal GE: Effect of calcium and vitamin D supplementation on bone density in men and women 65 years of age or older. N Engl J Med 1997;337:670-676. 40 Chapuy MC, Arlot ME, Duboeuf F, et al: Vitamin D3 and calcium to prevent hip fractures in the elderly women. N Engl J Med 1992;327:1637-1642. 41 Marcus EL, Berry EM: Refusal to Eat in the Elderly. NutrRev 1998;56:163-171. 42 Frisoni GB, Franzoni S, Rozzini R, Ferrucci L, Boffelli S, Trabucchi M: Food intake and mortality in the frail elderly. J Gerontol A Biol Sci Med Sci 1995;50:M203-M210 43 Morley JE: Anorexia in Older Persons - Epidemiology and Optimal Treatment. Drugs Aging 1996;8:134-155. 44 De-Castro JM: Age-related changes in spontaneous food intake and hunger in humans. Appetite 1993;21:255-272. 45 Fiatarone MA, O'Neill EF, Ryan ND, et al: Exercise training and nutritional supplementation for physical frailty in very elderly people. N Engl J Med 1994;330:1769-1775. 46 Gray-Donald K, Payette H, Boutier V: Randomized clinical trial of nutritional supplementation shows little effect on functional status among free-living frail elderly. J Nutr 1995;125:2965-2971. 47 Butterworth DE, Nieman DC, Perkins R, Warren BJ, Dotson RG: Exercise training and nutrient intake in elderly women. J Am Diet Assoc 1993;93:653-657. 48 Titchenal CA: Exercise and food intake. What is the relationship? Sports Med 1988;6:135-145. 49 Kris-Etherton PM, Durrwachter J, Datillo AM, DeWolfe JA, Trenkner LL: The interactive effects of health behavior changes: diet, exercise and smoking. Top Clin Nutr 1991 ;6:1 -21. 50 Evans WJ: Functional and metabolic consequences of sarcopenia. J Nutr 1997;127:998S-1003S. 51 Roubenoff R, Harris TB: Failure to thrive, sacropenia and functional decline in the elderly. Clin GeriatrMed 1997;13:613-622. 52 Province MA, Hadley EC, Hornbrook MC, et al: The effects of exercise on falls in elderly patients. JAMA 1995;273:1341-1347. 53 Morley JE, Mooradian AD, Silver AJ, Heber D, Alfin SR: Nutrition in the elderly [clinical conference]. Ann Intern Med 1988;109:890-904. 54 Cain WS, Gent JF, Goodspeed RB, Leonard G: Evaluation of olfactory dysfunction in the Connecticut Chemosensory Clinical Research Center. Laryngoscope 1988;98:83-88. 55 Cain WS, Rabin MD: Comparability of two tests of olfactory functioning. Chem Senses
169
General Discussion
1989;14:479-485. 56 Doty RL, Shaman P, Kimmelman CP, Dann MS: University of Pennsylvania Smell Identification Test: a rapid quantitative olfactory function test for the clinic. Laryngoscope 1984;94:176-178. 57 Cameron ME, van Staveren WA: Manual on methodology for food consumption studies, Oxford, Oxford University Press; 1988. 58 Mowe M, Bohmer T, Kindt E: Reduced nutritional status in an elderly population (> 70 y) is probable before disease and possibly contributes to the development of disease. Am J Clin Nutr 1994;59:317-324. 59 Young VR: Energy requirements in the elderly. Nutr Rev 1992;50:95-101. 60 Yates AA, Schlicker SA, Suitor CW: Dietary Reference Intakes: the new basis for recommendations for calcium and related nutrients, B vitamins, and choline. J Am Diet Assoc. 1998;98:699-706. 61 Ocke MC, Bueno de Mesquita H, Pols MA, Smit HA, Van Staveren WA, Kromhout D: The Dutch EPIC food frequency questionnaire. II. Relative validity and reproducibility for nutrients. Int J Epidemiol 1997;26 Suppl 1 :S49-S58 62 van Staveren WA, Feunekes GIJ, Elburg L, Erdelman F: Validity of dietary questionnaires in studies on nutrition and heart disease, in Somogyi JC, Biro G, Hotzel D (eds): Nutrition and cardiovascular risks, critical evaluation of survey methods. Basel, Karger, Bibl Nutr Dieta; 1992:47-58. 63 O'Mahony MS, Woodhouse KW: Age, environmental factors and drug metabolism. Pharmacol Ther 1994;61:279-287. 64 Young A: Ageing and physiological functions. Philos Trans R Soc Lond B Biol Sci 1997;352:1837-1843. 65 Roe DA: Drug-nutrient interactions in the elderly. Geriatrics 1986;41:57-74. 66 Wilson MMG, Kaiser FE: Nutrition in Women, in Vellas BJ, Sachet P, Baumgartner RN (eds): Nutritional intervention and the elderly - facts and research in gerontology. Paris, Serdi Publisher; 1995:181-204. 67Jebb SA, Goldberg GR, Jennings G, Elia M: Dual-energy X-ray absorptiometry measurements of body composition: effects of depth and tissue thickness, including comparisons with direct analysis. Clin Sci Colch 1995;88:319-324. 68 Van 't Hof MA, Hautvast JGAJ, Schroll M, Vlachonikolis IG: Design, methods and participation. Euronut SENECA investigators. Eur J Clin Nutr 1991 ;45 Suppl 3:5-22.
170

Summary

Summary
The elderly population is very heterogeneous, with individuals differing in
responsiveness to factors involved in the complex process of aging. One of the
more vulnerable groups among the aging elderly are the so-called 'frail elderly'
people. Definitions of frailty vary, but denoting frailty as 'a state of reduced
physiologic reserve, associated with an increased susceptibility to disability' seems
an appropriate approach. As a consequence of present western health policy, an
increasing number of (frail) elderly people are sustaining a living in the community.
As many of these experience minor or major functional disabilities, the burden on,
for example, home-care services and meal-on-wheels organizations is increasing.
Research on the community-dwelling frail elderly is needed, in order to keep them
healthy and strong in their own surroundings, improve their quality of life, and
simultaneously reduce the societal health care costs.
The frail elderly have often been marked as non-responders. Therefore,
information on their nutritional and health status is scarce. The first objective of this
thesis was to address several descriptors of the nutritional and health status of the
frail compared to a healthy elderly population. The second objective was to
investigate whether two types of 'feasible' interventions (nutrition and exercise)
could improve or maintain the nutritional and health status of frail elders. The third
objective was to analyze the appraisal of newly developed foods.
The outcome of a 17-week randomized placebo-controlled intervention trial are
described in Chapters 3 to 6. We operationalized frailty using several criteria, such
as a) requirement of care, b) age above or equal to 70 years, c) no regular exercise
and d) body mass index below average (BMI s 25 kg/m2) or recent weight loss. We
developed a 2x2 factorial design to investigate possible interaction between the
two types of intervention. In case of no evidence of interaction we could focus on
the main effects. Subjects were randomized into one of four groups:
- nutrient dense food group: nutrient dense foods + social program (n=41);
- exercise group: regular foods + exercise program (n=39);
- combination group: nutrient dense foods + exercise program (n=44);
- control (or placebo) group: regular foods + social program (n=37).
The nutrient dense foods consisted of 100 gram portions of customary dairy and
fruit products enriched with -25-100% of the Dutch recommended daily allowances
of the vitamins B„ B2, B6, folic acid, B12, C, D and E and the minerals calcium,
magnesium, zinc, iron and iodine (see appendix). The exercise program focused
172
Summary
on skill training: muscle strength, co-ordination, flexibility, speed, and endurance
were worked on twice weekly in group sessions of 45 minutes. At baseline and
after intervention, data were collected. In this thesis, the following outcome
measures are described: sensory performance (by questionnaire and objective
test), appetite, dietary intake, blood nutrient and functional biochemical health
indices, and body composition. The foods were evaluated on hedonic parameters
in the first two and last two weeks of intervention and by a general evaluation form.
Preceding the intervention study, we performed a descriptive study in
independently living healthy (n=89) vs institutionalized elders (n=67) regarding
sensory performance, appetite, dietary intake and potential determinants of
sensory performance (Chapter 2).
This latter cross-sectional study revealed that healthy elders performed better on
sensory tests than institutionalized seniors. Both groups also differed in appetite,
daily feelings of hunger and subjective feelings of taste and smell perception
(p<0.05). Correlation coefficients between subjective outcomes of the
questionnaire and objective tests ranged from 0.19 to 0.50 (p<0.05). However,
sensory outcome was not correlated with energy and food intake or with BMI. Age
and functional category (i.e. institutionalized or free-living) were important
determinants of sensory performance. Influence of gender may be explained by
differences in smoking habits.
In the subsequent intervention trial {Chapters 3 to 6), a significant correlation
was found at baseline between the smell test and subjective feelings of smell
perception (p<0.0001). Energy intake was significantly correlated with appetite
(r=0.30, p<0.0001). After 17 weeks, no change in smell test scores or in appetite
was revealed. Since no evidence of interaction occurred, the exercising group was
compared with the non-exercising group and the enriched food group with the
regular food group. A difference of 0.5 MJ in energy intake was noted between the
exercisers and non-exercisers, along with a preserving effect of exercise on (lean)
body mass (correlation: r=0.18, p<0.05).
Approximately 30% of the population (mainly women) had energy intakes below
6.3 MJ, the level below which several micronutrient deficiencies can be expected
(Chapter 4). When micronutrient intake was compared with 2/3 of the Dutch RDA,
between 3% (vitamin B6) and 93% of the women (vitamin D) had inadequate
intakes. The individual blood nutrient deficiency percentages ranged from 3% for
173
Summary
erythrocyte glutathione reductase-a (functional measure for vitamin B2) to 39% for
25(hydroxy) vitamin D and to 42% for vitamin B,2. Blood levels in the groups
receiving nutrient dense foods increased after intervention (all p<0.001, with
exception of the functional measures of vitamin B, and B2), whereas no significant
changes were observed in the exercise or control group. Chapter 4 also presents
functional biochemical health indices including (pre-)albumin, ferritin, transferrin, C-
reactive protein, thyroxin and hematological parameters. At baseline, no clinically
relevant low levels of these parameters were detected, and in none of the
intervention groups did a relevant change occur after intervention.
The mean baseline homocysteine level was 17.4 u.mol/1 (Chapter 5). Elevated
levels are regarded as a potential risk factor for cardiovascular disease and
impaired cognitive functioning. A significant decline of about 25% was detected in
the groups receiving nutrient dense foods, which may indicate the existence of
subclinical nutrient deficiency. Homocysteine concentrations changed -5.0 u.mol/1
(p<0.001) in the enriched compared to the non-enriched group.
Another measure of nutritional status is body and bone composition (Chapter 6).
A feasible method of measuring body composition in frail elderly is dual energy X-
ray absorptiometry (DXA). Like other methods measuring body composition, this
technique makes use of estimates of the distribution of body water, the main
component of the body. This implies that the potential to measure small changes in
body composition is reduced. Therefore, our results should be cautiously
interpreted. Exercise, compared to no-exercise, preserved lean body mass (mean
difference both groups was 0.5 kg; p<0.02). Consumption of enriched foods,
compared to regular foods, resulted in beneficial effects on bone density, mass and
calcium content (differences between both groups were: 0.5% (mean: 0.006 g/cm2,
p=0.08), 0.8% (mean: 19 g, p=0.04) and 1.0% (mean: 8 g, p=0.03) respectively).
Results obtained using other techniques measuring body composition (deuterium
dilution technique and body weight measured on scale) pointed in the same
direction.
In Chapter 7 results of the acceptance of nutrient dense foods compared to
identical regular foods are described. At the beginning, small (not significant) but
consistent differences emerged in ratings of 'pleasantness' and 'desire-to-eat'
between the nutrient dense and regular foods. At the end, ratings dropped slightly
or remained equal. It emerged from the evaluation questionnaire, that regular foods
174

Summary
scored significantly higher (7.7) than nutrient dense foods (6.4, p<0.001) on a 10-
point scale.
In conclusion, blood nutrient levels in our population of frail elders significantly
improved after 17 weeks consumption of nutrient dense foods, while homocysteine
concentration significantly decreased. However, the prevalence of clinically
relevant deficiency levels of blood vitamins varied. Results from our body
composition data cautiously suggest that nutrient dense foods may have a
beneficial effect on several bone parameters. Exercise may complement the effects
of nutrient dense foods, as a preserving effect was observed on lean body mass.
Long-term effects of exercise and supplementation with nutrient dense foods on
biochemical health indicators, by maintenance of all bodily functions, as well as
appetite should be investigated in the future. The supply of physiologically dosed
micronutrient enriched foods, improving the density of the diet, may be part of a
feasible, beneficial, and ethical public health program. However, the hedonic
qualities of nutrient dense foods should be optimized in order to be suitable for
such long-term application. The most important goal in implementing elderly health
programs should be maintenance or improvement of enjoyment of life. Healthy and
appetizing foods, as well as pleasant and feasible exercise programs, may help
achieve that goal.
175

Samenvatting

Samenvatting
In deze samenvatting wil ik graag aan mijn familie en vrienden in het kort uitleggen wat ik de afgelopen jaren heb gedaan en vooral wat de uitkomsten zijn van die grote interventiestudie waar ik toch zo druk mee was.
Verouderen In de westerse wereld worden steeds meer mensen steeds ouder: een zogenaamde
dubbele vergrijzing. De snelheid van verouderen verschilt per individu. Er zijn mensen
die op hoge leeftijd nog de Nijmeegse vierdaagse lopen, er zijn er ook die al op
relatief jonge leeftijd verpleegd worden. Dit proces van verouderen is afhankelijk van
veel verschillende factoren die ook elkaar kunnen beTnvloeden. Naast erfelijkheid is
bijvoorbeeld de omgeving waarin iemand leeft, van belang. Ziekten en medicijnen
hebben invloed, alsook factoren die te maken hebben met de zogenaamde 'leefstijl'
(bijv. voedingsgewoonten, hoeveelheid stress en de mate waarin iemand nog actief
is). De wisselwerking van al deze elementen zorgt ervoor dat iemand 'succesvol'
'normaal' of 'versneld' veroudert. Met name deze laatste categorie ouderen is
kwetsbaar en heeft maatschappelijke aandacht nodig.
De Nederlandse overheid richt haar beleid erop dat steeds meer ouderen zo lang
mogelijk thuis, in hun eigen omgeving, blijven wonen. Het is daarbij belangrijk dat de
gezondheid en vooral de kwaliteit van het leven van de thuis-wonende oudere ge-
waarborgd blijven. Verschillende instanties zijn (gedeeltelijk) verantwoordelijk voor
deze zorg, waaronder thuiszorgorganisaties, maaltijdvoorzieningen (tafeltje-dek-je),
dienstencentra voor ouderen, en ook de huisarts en familie.
Kans op negatieve spiraal Wanneer mensen ouder worden, dan wordt er vaak als vanzelf een meer zittende leefstijl aangenomen. Door een minder actief leven kan de eetlust dalen en lijkt een verminderde voedselinname een logisch gevolg. Op zichzelf hoeft dat niet erg te zijn, want er wordt tenslotte ook minder energie verbruikt. Wanneer men echter onder een bepaalde minimumgrens komt bestaat het gevaar voor tekorten aan verscheidene vitaminen en mineralen. Hierdoor kan het lichamelijk functioneren op allerlei niveau's achteruitgaan. Voorbeelden zijn: organen die slechter werken, maar ook het uitvoeren van dagelijkse dingen zoals wassen en aankleden. Er kan gewichtsverlies optreden, men zal zich minder fit gaan voelen en tenslotte zal de activiteit nog verder afnemen. Er is een negatieve spiraal ontstaan.
177

Samenvatting
Strategieen die de gezondheid kunnen beinvloeden Regelmatige lichaamsbeweging en voedingsmiddelen die rijk zijn aan vitaminen en mineralen zijn twee veelbelovende methoden die de kans op een gezonde oude dag kunnen verhogen. Ik heb het effect van deze methoden samen met mijn collega Marijke Chin A Paw dnderzocht. De belangrijkse vragen van mijn onderzoek waren:
1. Verschillen de ouderen, die zich in een negatieve spiraal bevinden, ook daadwerkelijk van de 'op het oog gezonde' ouderen?
2. Wat is nu eigenlijk het effect van een speciaal ontwikkeld bewegings- en voedingsprogramma op de gezondheid van ouderen?
3. Wat vindt men van het voedingsprogramma? (Marijke evalueerde de mening over het bewegingsprogramma).
Vraag 1: Verschillen tussen gezonde ouderen en ouderen 'in negatieve spiraal'?
Voor veel aspecten gold dat beide groepen ouderen inderdaad van elkaar verschillen.
De mensen 'in een negatieve spiraal' kregen minder energie met de voeding binnen
en hadden een lager gewicht (rekening houdend met de lengte). De vitaminegehaltes
in hun bloed waren ook minder gunstig. Het rapportcijfer dat mensen zichzelf voor
hun gezondheid gaven was in die groep eveneens lager.
Vraag 2: Wat is het effect van een speciaal voedings- en bewegingsprogramma? Het effect van een voedings- en bewegingsprogramma op de
gezondheid werd onderzocht in de studie 'Fit op Leeftijd'. Ook
werd bekeken of een combinatie van beide programma's wellicht een groter effect had. Om deelnemers te vinden werden ruim
7000 brieven verstuurd via: thuiszorgorganisaties, maaltijd-leveranciers (tafeltje-dek-je), dienstencentra voor ouderen,
_ _ . _.-._,.. ,~ service-flats en aanleunwoningen. OP LEEFTIJD a
In totaal waren 854 mensen ge'i'nteresseerd. Zij werden via een telefonische enquete door ons geselecteerd. De belangrijkste kenmerken waarop wij selecteerden waren:
- gebruik maken van hulp (bijvoorbeeld thuiszorg of maaltijdvoorziening); - weinig lichaamsbeweging; - ongewenst gewichtsverlies of gewicht lager dan gemiddeld.
Uiteindelijk konden en wilden 217 personen meedoen. Van de deelnemers, die een
178
Samenvatting
gemiddelde leeftijd van 79 jaar hadden, was een kwart man en driekwart vrouw.
Zij werden door loting ingedeeld in een van de volgende vier groepen:
1) voedina: verrijkte voedingsmiddelen + educatief programma (58 personen) 2) beweqinq: normale voedingsmiddelen + bewegingsprogramma (55 personen) 3) combinatie: verrijkte voedingsmiddelen + bewegingsprogramma (60 personen) 4) controle: normale voedingsmiddelen + educatief programma (44 personen)
Om te waken voor een zogenaamd 'placebo'-effect, dus b.v. net effect op de ervaren gezondheid door denken dat men gezonde voedingsmiddelen eet en door meedoen aan een programma of onderzoek op zich, werden ter vergelijk ook normale voedingsmiddelen en een educatief programma aangeboden.
Het voedingsprogramma: Hiervoor werden speciaal produkten door diverse
Nederlandse bedrijven ontwikkeld. We wilden graag kleine porties die gemakkelijk
over de gehele dag te eten waren. De deelnemers kregen 17 weken lang verse
zuivelprodukten (vanillevla, kwark, twee soorten vruchtenyoghurt) en fruitprodukten
(sinaasappel-perziksap, appel-bes-druivensap en twee soorten vruchtenmoes). Aan
de verrijkte produkten werden diverse vitaminen en mineralen toegevoegd: D, E, B,,
B2, B6, foliumzuur, B12, C en calcium, magnesium, ijzer, zink en jodium. Per dag moest
een zuivel- en een fruitprodukt gegeten worden. Dat leverde in totaal 25-100% van de
dagelijks aanbevolen hoeveelheden van deze voedingsstoffen voor ouderen op. Ook
van de normale produkten moesten er twee gegeten worden. Deze waren qua uiterlijk
identiek aan de verrijkte produkten.
Het bewegingsprogramma: Er werd gedurende 17 weken, in 2 lessen per week van elk 45 minuten geoefend met verschillende materialen (b.v. pittenzakken, ballen, gewichten). Groepen van 10 a 15 personen werden getraind door ervaren sport-docenten. Het programma richtte zich op het verbeteren van het lichamelijk functioneren door het trainen van spierkracht, lenigheid, coordinatie, snelheid en uithoudingsvermogen.
Het educatieve programma: Voor dit programma (gecoordineerd door een ervaren activiteitenleider) werden eenmaal per 14 dagen diverse activiteiten georganiseerd zoals lezingen, creatieve activiteiten of een voedingsquiz.
Metingen ter bepaling van gezondheid en voedingstoestand: In de week voor en na de
17 weken durende programma's werden metingen verricht om de voedingstoestand en
de gezondheid te bepalen, bijvoorbeeld:
179
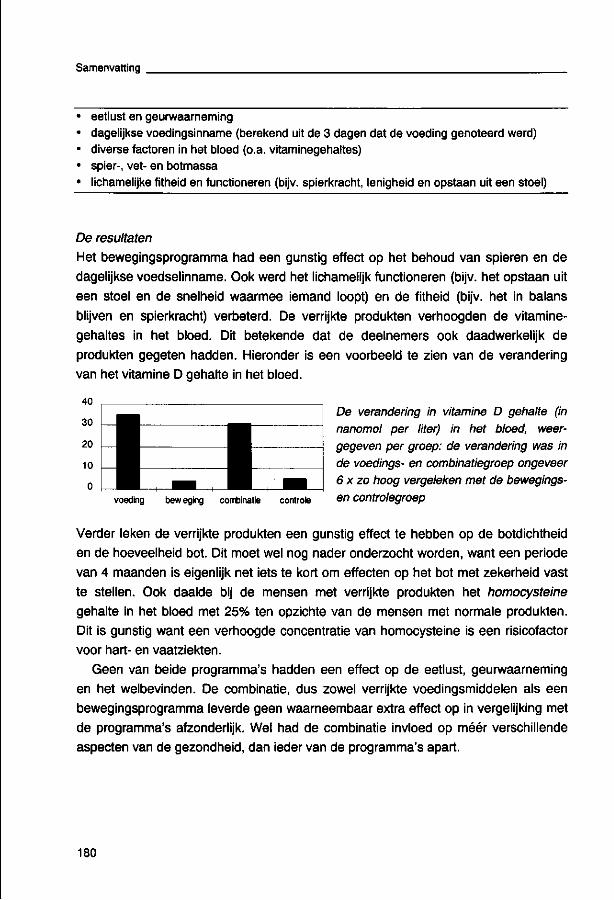
Samenvatting
eetlust en geurwaarneming dagelijkse voedingsinname (berekend uit de 3 dagen dat de voeding genoteerd werd) diverse factoren in het bloed (o.a. vitaminegehaltes) spier-, vet- en botmassa lichamelijke fitheid en functioneren (bijv. spierkracht, lenigheid en opstaan uit een stoel)
De resultaten
Het bewegingsprogramma had een gunstig effect op het behoud van spieren en de
dagelijkse voedselinname. Ook werd het lichamelijk functioneren (bijv. het opstaan uit
een stoel en de snelheid waarmee iemand loopt) en de fitheid (bijv. het in balans
blijven en spierkracht) verbeterd. De verrijkte produkten verhoogden de vitamine
gehaltes in het bloed. Dit betekende dat de deelnemers ook daadwerkelijk de
produkten gegeten hadden. Hieronder is een voorbeeld te zien van de verandering
van het vitamine D gehalte in het bloed.
40
30
20
10 S De verandering in vitamine D gehalte (in nanomol per liter) in het bloed, weer-gegeven per groep: de verandering was in de voedings- en combinatiegroep ongeveer 6 x zo hoog vergeleken met de bewegings-
voeding beweging combinatie controle en COntrolegroep
Verder leken de verrijkte produkten een gunstig effect te hebben op de botdichtheid en de hoeveelheid bot. Dit moet wel nog nader onderzocht worden, want een periode van 4 maanden is eigenlijk net iets te kort om effecten op het bot met zekerheid vast te stellen. Ook daalde bij de mensen met verrijkte produkten het homocysteine gehalte in het bloed met 25% ten opzichte van de mensen met normale produkten. Dit is gunstig want een verhoogde concentratie van homocysteine is een risicofactor voor hart- en vaatziekten.
Geen van beide programma's hadden een effect op de eetlust, geurwaarneming en het welbevinden. De combinatie, dus zowel verrijkte voedingsmiddelen als een bewegingsprogramma leverde geen waarneembaar extra effect op in vergelijking met de programma's afzonderlijk. Wel had de combinatie invloed op meer verschillende aspecten van de gezondheid, dan ieder van de programma's apart.
180
. Samenvatting
Vraag 3: De beoordeling van de produkten?
De beoordeling van de programma's was belangrijk om iets over de praktische
haalbaarheid in de toekomst te kunnen zeggen. De evaluatiescore van de
voedingsmiddelen leverde voor de normale produkten een rapportcijfer op van 8".
Echter voor de verrijkte varianten was dit een 6,5. Ook het percentage mensen wat
na de studie de produkten zelf ook wel wilden kopen was lager binnen de verrijkte
groepen. De vanillevla en beide vruchtensappen waren over het algemeen het meest
populair. Men stond in het algemeen positief ten opzichte van verrijking van
voedingsmiddelen, maar aan de nieuwe produkten moet nog wel gesleuteld worden
voordat ze echt in de winkel verkocht kunnen worden.
Conclusie Ik concludeer dat speciale voedingsmiddelen en ook bewegingsprogramma's de gezondheid van ouderen gunstig kunnen bei'nvloeden. Het verbeteren van de gezondheid is belangrijk, evenals het hebben en houden van plezier in het leven. Smakelijke voedingsmiddelen en prettige maar efficiente bewegingsprogramma's passen daarbij. Omdat beide programma's verschillende effecten laten zien, wil ik een combinatie van beiden aanbevelen.
Vanuit het standpunt van de jeugd bezien is het leven een oneindig lange toekomst;
vanuit het standpunt van de ouderdom een zeer kort verleden. (A. Schopenhauer)
181
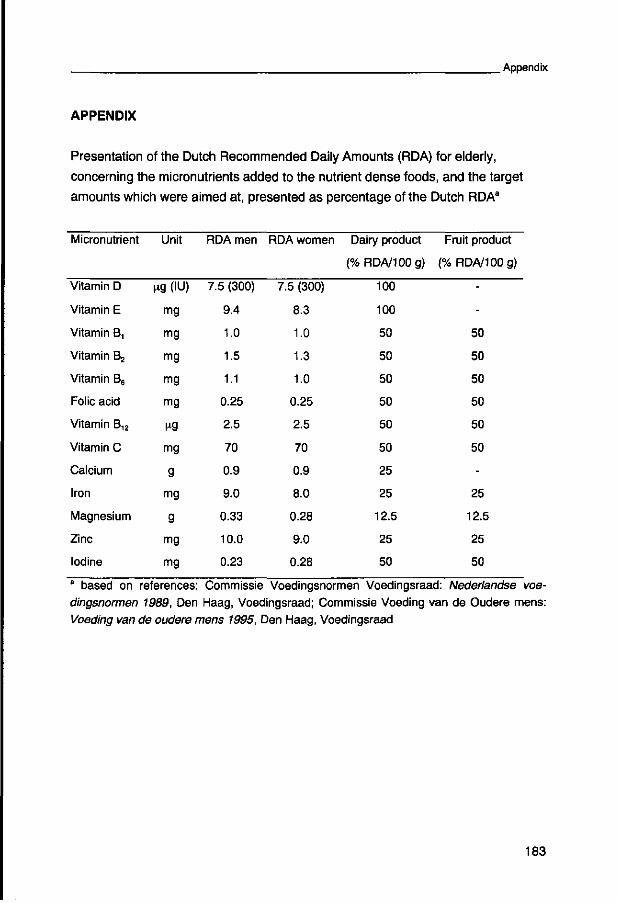
. Appendix
APPENDIX
Presentation of the Dutch Recommended Daily Amounts (RDA) for elderly,
concerning the micronutrients added to the nutrient dense foods, and the target
amounts which were aimed at, presented as percentage of the Dutch RDAa
Micronutrient Unit RDA men RDA women Dairy product Fruit product
(% RDA/100 g) (% RDA/100 g)
100 -
100
50 50
50 50
50 50
50 50
50 50
50 50
25
25 25
12.5 12.5
25 25
50 50 a based on references: Commissie Voedingsnormen Voedingsraad: Nederlandse voe-dingsnormen 1989, Den Haag, Voedingsraad; Commissie Voeding van de Oudere mens: Voeding van de oudere mens 1995, Den Haag, Voedingsraad
Vitamin D
Vitamin E
Vitamin B,
Vitamin B2
Vitamin B6
Folic acid
Vitamin B12
Vitamin C
Calcium
Iron
Magnesium
Zinc
Iodine
M (IU)
mg
mg
mg
mg
mg
ng
mg
g
mg
g
mg
mg
7.5 (300)
9.4
1.0
1.5
1.1
0.25
2.5
70
0.9
9.0
0.33
10.0
0.23
7.5 (300)
8.3
1.0
1.3
1.0
0.25
2.5
70
0.9
8.0
0.28
9.0
0.28
183
Dankwoord
DANKWOORD / ACKNOWLEDGMENTS
Het proefschrift is af , en dus is het tijd om wat 'gas' terug te nemen, tijd om even
op vakantie te gaan, maar vooral tijd om terug te blikken en terug te denken aan al
die mensen die zoveel hebben bijgedragen aan de grote klus.
Marijke Chin A Paw, mijn 'counterpart', jou noem ik als eerste. 'Bijdragen aan' is
voor jou niet het juiste woord. We waren samen het onderzoek. Niemand zal ontken-
nen dat het project toch aardig gecompliceerd was en dat het soms barre (werk)tijden
waren. Voor veel deelnemers waren we Marijke en Nynke, voor anderen slechts 'die
donkere' en die 'blonde'. Niet alleen qua uiterlijk verschillen we van elkaar; maar dat
versterkte het project. Marijk, ik heb veel van je geleerd, hopelijk jij ook veel van mij....
Wija van Staveren, veel heb ik ook van jou geleerd, maar dan op een ander vlak! Ik
ben begonnen bij jou als student; inmiddels bijna opgenomen in jouw 'ouderen-
doctoren-stamboom'. Bedankt dat je er was, ook op het allermoeilijkste moment. De
spiegel die je me toen hebt voorgehouden verlichtte heel wat! Frans Kok, als tweede
promotor en voorzitter van een nieuwe grote vakgroep kon jij steeds de nodige
afstand bewaren. 'Bufferen' is misschien wel het toverwoord. Lisette de Groot, vanaf
het begin van het project was je betrokken; het werd steeds meer! Ik vond het fijn om
met je samen te werken, een 'back-up' tijdens het veldwerk gehad te hebben en
bovenal te merken dat we over veel dingen precies hetzelfde dachten. Kees de Graaf,
jij zag de 'aio'... Je had altijd een groot vertrouwen in mij, ook al was ik dat zelf, af en
toe, wel eens even kwijt. Bedankt voor al die uren dat we samen hebben zitten
discussieren over de proefopzet, de produkten, de resultaten, maar ook over India en
Indonesia Evert Schouten, rust onder alle omstandigheden, bedankt! Gert-Jan
Hiddink, doordat je als sponsor en begeleider betrokken was, hebben we intensief
contact gehad, ook wel eens op onverwachte vlakken! Hartelijk bedankt voor het
gedetailleerde en waardevolle commentaar bij mijn artikelen.
Van begeleiders stap ik over naar degenen die ik (mede)begeleid heb. Er gaan 23
namen volgen, maar beste 'afstudeervakkers' jullie waren allemaal heel hard nodig.
Bergen werk hebben jullie verzet. In mil daarvoor heb ik jullie bergen papier in de
weekenden gelezen. Bedankt, Ina, Desiree, Antoinett, Vera, Anneke, Nancy,
Ingeborg, Saskia, Margriet, Carolien, Liselotte, Gitte, Michiel, Astrid, Nienke, Sigrid,
Marleen M., Marleen K., Mieke, Danielle, Renate, Mariska and Patrick (thanks!).
Dan de mensen van de lange adem: dietisten Saskia Meyboom, Els Siebelink en
Karin Roosemalen, nooit zal ik vergeten wat we hebben meegemaakt met Teun
185
Acknowledgments.
Sticker, Bep en Toos van de receptie, twee (Rotterdamse) 'broodrammen' en 's
avonds een 'bietje middigeten'! De uren in de koeling staan waarschijnlijk ook in jullie
geheugen gegrift. Marga van der Steen, misschien zal ik wel nooit helemaal weten
hoe het was om in je eentje 's ochtends vroeg, in het donker op zoek te moeten naar
onbekende straten en mensen. Duizenden buisjes stonden door jouw inspanning in
de -80! De sportdocenten van het MBvO uit de regio Arnhem: Tineke Zwijnen,
Isabella Borburgh, Joke Seinen, Rita Wubbels, door jullie intensieve band met de
deelnemers hebben jullie misschien ook het meeste 'leed' te verduren gehad als het
vervoer weer eens de helft van jullie les afsnoepte. Gelukkig hebben jullie enthousiast
volgehouden. Nelly van Amersfoort, bovenstaande woorden kunnen ook voor jou
gelden. Het verschil was alleen dat jij, als activiteitenbegeleidster, in je eentje voor
het sociale programma stond. Van lampenkapjes tot vogelkooitjes, maar ook serieuze
gesprekken zijn de revue gepasseerd. Reuze bedankt!
Caroelien Schuurman en Sabine Neppelenbroek, zonder jullie 'wervingscampag-
nes' hadden we het zeer zeker geen 'grote' studie kunnen noemen. De hulp van nog
een zeer groot aantal vrijwilligers was eveneens onontbeerlijk. 'Jongens', mijn ruimte
is beperkt, maar ik ben jullie allemaal zeer dankbaar.
Geen echte voedingsproef, zonder voedingsmiddelen. Al die micronutrienten
moesten in 100 gram produkt en dat moest ook nog prima smaken. Bijna onmoge-
lijk.... Allita van Daatselaar (Roche Nederland B.V.), bedankt dat je de 'mixen-op-maat'
zo snel geleverd kon krijgen. Ook wil ik dhr. van de Wiel (Chefaro International B.V.)
hier bedanken. Sommige vitaminen en mineralen waren inderdaad beter geschikt voor
tabletjes: we hebben een wijze les geleerd. Een andere schier onmogelijke taak was
om wekelijks honderden porties vers af te leveren. Toch is het gelukt, ook al hebben
we spannende momenten beleefd. Fantastisch, die logistieke inspanning van jullie,
Rudi Fransen, Henk van der Hoek (Friesland Coberco Dairy Foods) en Frank Elbers
(Mona, Campina Melkunie)! Frau Anneliese Mahrow (Bekina Lebensmittel GmbH),
weit uber 35.000 Glaser Apfel-(Pfirsich) mus, dass war von einer anderen Ordnung!
Ich werde niemals den blauen Apfelmus vergessen, den wir zuerst entwickelt hatten.
Vielen Dank fur Ihre Gastfreundschaft in Beelitz. Wendy van Koningsbruggen, weet je
nog?
Ook de mensen van diverse labs ben ik erkentelijk. Frans Schouten, Jan Harryvan,
Paul Hulshof, Joke Barendse (Humane Voeding en Epidemiologie), Henk van den
Berg en Jan van Schoonhoven (TNO-Voeding), Dorine Swinkels en Marianne van
Bergen (CKCL-Nijmegen), klasse dat ik jullie zo vaak mocht lastig vallen met analy-
186
Dankwoord
ses en al mijn vragen. Jan Burema, bedankt voor je statistische adviezen. Ben
Scholte en Dirk Jochems, computer-ergenis-verhelpers, net was handig dat jullie ook
op 'John Snow' zaten. Paul Deurenberg, bedankt voor al je DEXA-ondersteuning!
Beste 'aio-mensen in hetzelfde schuitje' en oud aio-collega's, plezier in het werk
houden, af en toe stoom afblazen en leuke dingen doen buiten het werk is hartstikke
belangrijk! Margje en Ingeborg, fijn dat jullie mijn 'nimfen' willen zijn op de dag.
Margje, vanaf de tweede week in Wageningen kennen we elkaar: van eerstejaars
'KSV-klooi' tot laatstejaars aio. Een lieve vriendin met altijd een luisterend en
begrijpend oor... Avonden lang kunnen we filosoferen over de belangrijke dingen in
het leven en wat eigenlijk anders zou moeten. De gezellige klaverjasavondjes houden
we er in, hoor! Volgend jaar in Australie? Ing, dat een fusie ook wel eens een
scheiding betekent hebben wij aan den lijve ondervonden. 'Lief en leed' en uiteindelijk
ook de boedel gedeeld. Je secretaresse-kwaliteiten zal ik onthouden evenals je tas-
rondbreng niveau (Bep-achterklep?). We waren getraind in werken en kletsen
tegelijk, dat maakte de tijd o zo waardevol. Martine Alles and Kevin Murray, thank you
both for your valuable comments on large parts of the manuscript. Martine, bedankt
voor al je bemoediging, ook vanuit die andere functie.
Allerbest zusje, lieve broer. Ook jullie hebben je ingezet tijdens de proef der
proeven. Marijk, je was een zorgzame klusjesvrouw die al aardig in de vakgroep
ingeburgerd raakte. Arjan, jouw tijdelijke werkloosheid kwam goed van pas. Lijntjes
trekken zonder muis, wat een klus! Onze gezellige familie-uurtjes koester ik.
Lieve pap en mam, aan jullie ouders (de trotse wortels, maar ook ons kwetsbare
kwartetje van de familie) is dit proefschrift opgedragen. Toch zijn jullie het, die mij
doorzettingsvermogen hebben gegeven en gestimuleerd hebben om te leren. De
wetenschap dat er een baken in de Beemster staat waar ik altijd, met alles, terecht
kan, samen met jullie nimmer aflatende interesse hebben ertoe geleid dat ik nu toch
zo ver ben gekomen.
En dan eindelijk 'mijn grote lieve appelmoes-logisticus' ben jij aan de beurt.
Tegelijkertijd aan een proefschrift werken, kweekt een enorm begrip Jorg, zonder
jouw relativeringsvermogen, slimme oplossingen voor alle problemen, eindeloos
positieve kijk op de dingen en jouw liefde was mijn leven een stuk minder leuk
geweest. We gaan samen lekker weg, ik wacht op jou
e
187
About the author
Nynke de Jong was born in Amsterdam, The Netherlands, on 2 August 1970. In 1988
she completed secondary school at the Rijksscholengemeenschap in Purmerend. In
the same year she started with her studies on Human Nutrition at the Wageningen
Agricultural University. As a part of her studies she spent 6 months of research at the
Netherlands Institute for Dairy Research (NIZO), Ede. She conducted a practical
training period of 7 months in the rural area of Mpika, Zambia. Subsequently, at the
department of Human Nutrition in Wageningen she studied the growth and nutritional
status of previously macrobiotic fed children and finalized her studies at the Nutrition
Research Department of Nutricia, Zoetermeer. In August 1994, she obtained her MSc
degree with majors in human nutrition, physiology, and food chemistry. From October
1994 to April 1995, she was appointed as a research associate on sensory perception
in elders at the department of Human Nutrition, Wageningen Agricultural University
(now: division of Human Nutrition and Epidemiology, Wageningen University). At the
same department, from April 1995 to October 1999, as PhD-fellow she performed the
research in elderly people described in this thesis. This study was part of a multi-
disciplinary project in which human nutrition and human movement sciences were
combined. During this period she was board member of the Wageningen PhD
Organization (WAIOO), editorial board member of the PhD-newsletter 'Newtrition' and
member of the departmental 'postgraduate education' committee. She attended the
annual international 'Erasmus Epidemiology Summer Program' in Rotterdam, and
participated in international courses like 'Regulation of Food Intake', 'Nutritional and
Lifestyle Epidemiology' and 'Use of Body Composition Techniques in Laboratory and
Field Studies'. In February 2000, she will start a 1-year postdoctoral position at the
Department of Human Nutrition at Otago University in New Zealand.
189
Publications
List of publications
Full papers 1. de Jong N, Visser S, Olieman C. (1993) Determination of milk proteins by capillary
electrophoresis. Journal of Chromatography A 652: 207-213. 2. van Dusseldorp M, Arts ICW, Bergsma JS, de Jong N, Dagnelie PC, van Staveren WA.
(1996) Catch-up growth in children fed a macrobiotic diet in early childhood. Journal of Nutrition 126: 2977-2983.
3. de Jong N, de Graaf C, van Staveren WA. (1996) Effect of sucrose in breakfast items on pleasantness and food intake in the elderly. Physiology and Behaviour 60: 1453-1462.
4. van Dam FSAM, Hilgers FJM, Emsbroek G, Touw Fl, van As CJ, de Jong N. (1999) Deterioration of olfaction and gustation as a consequence of total laryngectomy. The Laryngoscope 109: 1150-1155.
5. de Jong N, Mulder I, de Graaf C, van Staveren WA. (1999) Impaired sensory functioning in elderly: the relation with its potential determinants and nutritional intake. The Journal of Gerontology: Biological Sciences 54A. In press.
6. de Jong N, Chin A Paw JMM, de Groot CPGM, de Graaf C, Kok FJ, van Staveren WA. (1999) Functional biochemical and nutrient indices in frail elderly people partly affected by dietary supplements but not by exercise. Journal of Nutrition 129. In press.
7. de Jong N, Chin A Paw JMM, de Groot CPGM, Hiddink GJ, van Staveren WA. Dietary supplements and physical exercise affecting bone and body composition in frail elderly. Accepted for publication in the American Journal of Public Health.
8. de Jong N, Chin A Paw JMM, de Graaf C, van Staveren WA. Effect of dietary supplements and physical exercise on sensory perception, appetite, intake and body weight in frail elderly. Submitted.
9. de Jong N, Chin A Paw JMM, de Groot CPGM, Swinkels DW, Kok FJ, van Staveren WA. Physiologically dosed nutrient dense foods and exercise in frail elderly: effect on B-vitamins, homocysteine and neuropsychological functioning. Submitted.
10. de Jong N, Chin A Paw JMM, de Graaf C, Hiddink GJ, de Groot CPGM, van Staveren WA. Appraisal of 4-months consumption of nutrient dense foods within the daily feeding pattern of frail elderly. Submitted.
11.de Jong N, Adam SGM, de Groot CPGM, de Graaf C, Executive Group for Development of Nutrient Dense Foods for Frail Elderly. Variability of micronutrient content in enriched dairy and fruit products. Submitted.
Other publications 1. de Jong N, van Dusseldorp M, Bergsma JS, Arts ICW, van Staveren WA. (1996)
Growth and nutritional status of macrobiotically fed children until 10 years of age. Aktuelle Ernahrungsmedizin 21:14-15.
2. Chin A Paw JMM, de Jong N. (1996) Adviezen voor ouderen krijgen test in de praktijk: nutrientdichte voeding en lichaamsbeweging bij fragiele ouderen. Voeding 57: 26-28 (in Dutch).
190
Publications
3. de Jong N, Mathey M-FAM, de Groot CPGM, van Staveren WA. (1999) Conference Report Third International Dietary Assessment Methods Congress': Implications for future policy. Nutrition Today 34: 124-128.
4. de Jong N, de Graaf C. (1999) Author's resonse to commentary on 'Impaired sensory functioning in elderly: the relation with its potential determinants and nutritional intake. The Journal of Gerontology: Biological Sciences 54A. In press.
5. de Jong N, Chin A Paw JMM, de Groot CPGM, Hiddink GJ, van Staveren WA. (1999) Effect of nutrient dense foods and physical exercise on dietary intake and body composition in frail elderly? In Buttriss J and Saltmarsh M (eds): Functional Foods '99: Proceedings of a Conference held in April 1999, Royal Society of Chemistry: Cambridge. In press.
Abstracts 1. de Jong N, Arts ICW, Bergsma JS, van Dusseldorp M, van Staveren WA. (1994)
Invloed van macrobiotische voeding op de groei en voedingstoestand van kinderen in de leeftijd van 7 tot 17 jaar. Tijdschrift voor Sociale Geneeskunde 6: middenkatern (in Dutch).
2. de Jong N, de Graaf C, Chin A Paw JMM, van Staveren WA. (1997) Are nutritional problems related to taste and smell ability? The 2nd European Congress on Nutrition and Health in the Elderly. The Journal of Nutrition, Health and Aging 1: 77.
3. Chin A Paw JMM, Dekker JM, Feskens EJM, de Jong N, Kok FJ, Kromhout D. (1996) How to select frail elderly? The Zutphen elderly study. The 2nd European Congress on Nutrition and Health in the Elderly. The Journal of Nutrition, Health and Aging 1: 73.
4. de Jong N, de Graaf C, de Groot CPGM, Chin A Paw JMM, van Staveren WA. (1997) Nutrient dense foods against frailty in elderly? Cerin Symposium, Nutrition and personnes agees, Abstract book: 309.
5. Chin A Paw JMM, Dekker JM, Feskens EJM, de Jong N, Kok FJ, Kromhout D. (1997) How to select frail elderly? The Zutphen elderly study. Cerin Symposium, Nutrition and personnes agees, Abstract book: 308.
6. de Jong N, de Groot CPGM, Chin A Paw JMM, van Staveren WA. (1998) Nutrientdichte voedingsmiddelen en lichaamsbeweging bij fragiele ouderen...? Nationaal gerontologie congres 'Ouder Worden '98': 29.108 (in Dutch).
7. de Jong N, de Groot CPGM, de Graaf C, Chin A Paw JMM, van Staveren WA. (1998) Assessment of Dietary Intake and Appetite in Frail Elderly. European Journal of Clinical Nutrition 52; Supplement 2: S37.
8. Chin A Paw JMM, de Jong N, Schouten EG. (1998) The effect of exercise and nutrient dense products on physical performance and fitness in frail elderly. Aging and Physical Activity: application to functional capacity and health, Book of abstracts: 24.
9. Chin A Paw JMM, de Jong N, Kloek G, Pallast EGM, Schouten EG. (1998) The effect of exercise and nutrient dense products on immune response in frail elderly. Aging and Physical Activity: application to functional capacity and health, Book of abstracts: 81.
10. de Jong N, Chin A Paw JMM, de Groot CPGM, Hiddink GJ, van Staveren WA. (1999) Effect of nutrient dense foods and physical exercise on dietary intake and body composition in frail elderly? British Nutrition Foundation: Functional Foods '99, Book of abstracts: 38.
191