abebe nigussie - wur edepot
TRANSCRIPT
Closing the nutrient loops in (peri-)urban farming
systems through composting
Abebe Nigussie
ii
Thesis committee
Promotors
Prof. Dr. Thomas W. Kuyper
Personal chair at the Department of Soil Quality
Wageningen University, The Netherlands
Prof. Dr. A. de Neergaard
Professor of Soil Fertility
Department of Plant and Environmental Sciences, University of Copenhagen, Denmark
Co-promotor
Dr. S. Bruun
Associate professor at the Department of Plant and Environmental Sciences
University of Copenhagen, Denmark
Other members of the committee
Prof. Dr. Ir. G. Zeeman, Wageningen University, The Netherlands
Dr. J. Magid, Copenhagen University, Denmark
Dr. M.L. Cayuela, Spanish National Research Council, Murcia, Spain
Dr. Ir. C.L. van Beek, Alterra, Wageningen Environmental Research, The Netherlands
This research was conducted under the auspices of the PhD School of Science of the
University of Copenhagen and the C.T. de Wit Graduate School for Production Ecology
and Resource Conservation of Wageningen University under the Erasmus Mundus Joint
Doctorate Program Agricultural Transformation by Innovation (AgTraIn).
iii
Closing the nutrient loops in (peri-)urban farming
systems through composting
Abebe Nigussie
Thesis
submitted in fulfilment of the requirements for the joint degree of Doctor
at Wageningen University and University of Copenhagen
by the authority of the Rector Magnificus Prof. Dr. A.P.J. Mol,
and Head of Ph.D School of Science, Prof. Dr. M. Pejrup
in the presence of the
Thesis Committee appointed by the Academic Board, Wageningen University, and
the Ph.D School of Science, University of Copenhagen
to be defended in public
on Tuesday 24 January 2017
at 13:30 in the Aula of Wageningen University
iv
Abebe Nigussie
Closing the nutrient loops in (peri-)urban farming systems through composting, 144 pages
PhD Thesis, Wageningen University, The Netherlands
Copenhagen University, Denmark (2017)
With references, summaries in English and Danish
DOI: 10.18174/395151
ISBN: 978-94-6343-005-0

v
To my parents and wife

vi
vii
CONTENTS
Chapter 1 General introduction 1
Chapter 2 Agricultural waste utilisation strategies and demand for urban-
waste compost: Evidences from smallholder farmers in Ethiopia
13
Chapter 3 Vermicomposting as a technology for reducing nitrogen losses and
greenhouse gas emissions from small-scale composting
39
Chapter 4 Delayed addition of nitrogen-rich substrates during composting of
municipal waste: Effects on nitrogen loss, greenhouse gas
emissions and compost stability
63
Chapter 5 Earthworms change the quantity and composition of dissolved
organic carbon and reduce greenhouse gas emissions during
composting
85
Chapter 6 General discussion 105
References 123
Summary 131
Sammenfatning
134

viii
General introduction
1
CHAPTER 1
General introduction
Background
Mineral fertilisers and organic amendments (e.g. crop residues, animal manure and
compost) are used to improve soil fertility and maintain agricultural fields in a
productive state. The addition of organic amendments has been shown to maintain soil
organic matter content and thereby contribute to enhanced fertiliser use efficiency
(Negassa et al., 2005). Despite these benefits, the use of mineral fertiliser is limited in
many developing countries due to its high price (Kassie et al., 2009; Dercon and
Christiaensen, 2011), whereas only a small number of farmers in these countries apply
organic amendments on their croplands (Baudron et al., 2014; Valbuena et al., 2015).
Only small fractions of animal manure and crop residues are retained on croplands due
to the strong competition for agricultural waste for fuel and animal feed (Fig 1.1;
Baudron et al., 2014), the low production of manure (Tittonell et al., 2005) and limited
labour availability (Tittonell et al., 2005; Kassie et al., 2009; Baudron et al., 2014). Other
biodegradable materials such as urban waste should therefore be considered as
alternative sources for soil amendment.
A United Nations report indicates that slightly more than half (54%) of the
world’s population live in cities, with that number expected to rise to 66% by 2050
(United Nations, 2014). The rapid growth of urban populations generates large amounts
of waste. As a result, waste management has become a matter of widespread concern
(Marshall and Farahbakhsh, 2013), especially in developing countries where the current
practices of waste treatment and/or re-use of waste are insufficient (Fig 1.1). Over 80% of
urban waste is disposed of in landfills or local dumpsites due to the high costs associated
with alternative waste management practices (Scarlat et al., 2010). In these countries,
more than half of urban solid waste is biodegradable (Kasozi and von Blottnitz, 2010;
Getahun et al., 2012a), indicating that bioconversion of urban waste into soil
amendments (i.e., composting) is feasible.
Chapter 1
2
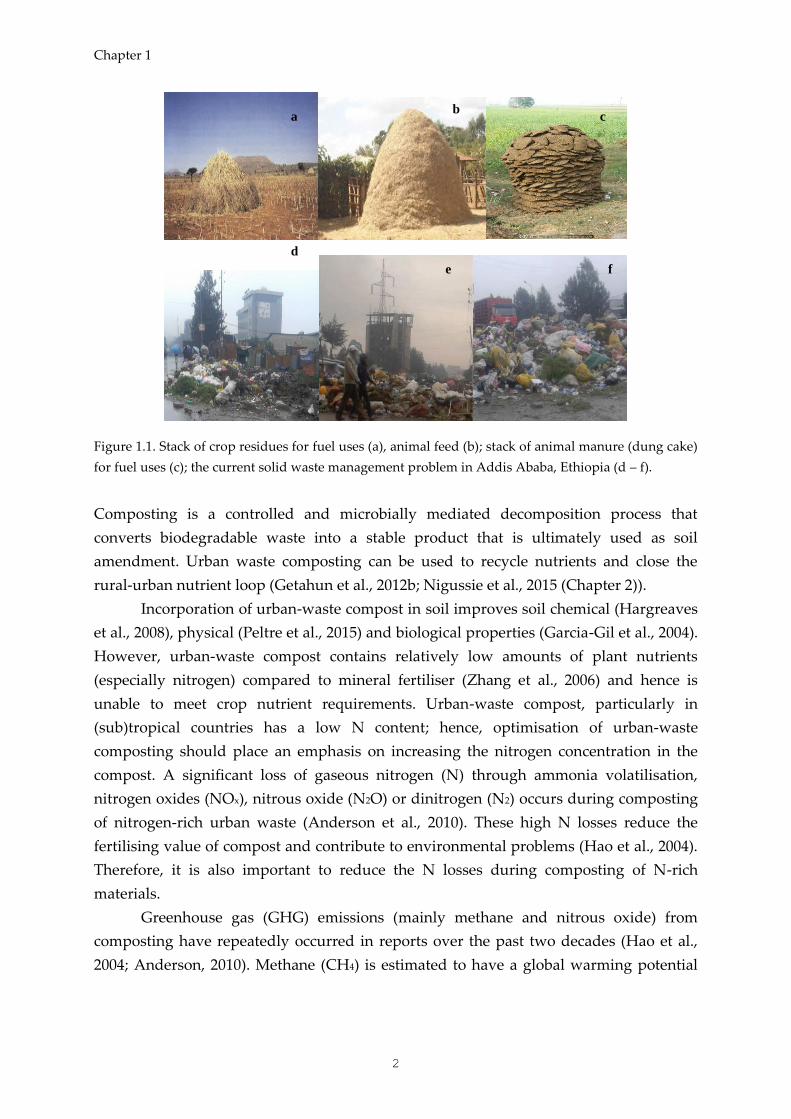
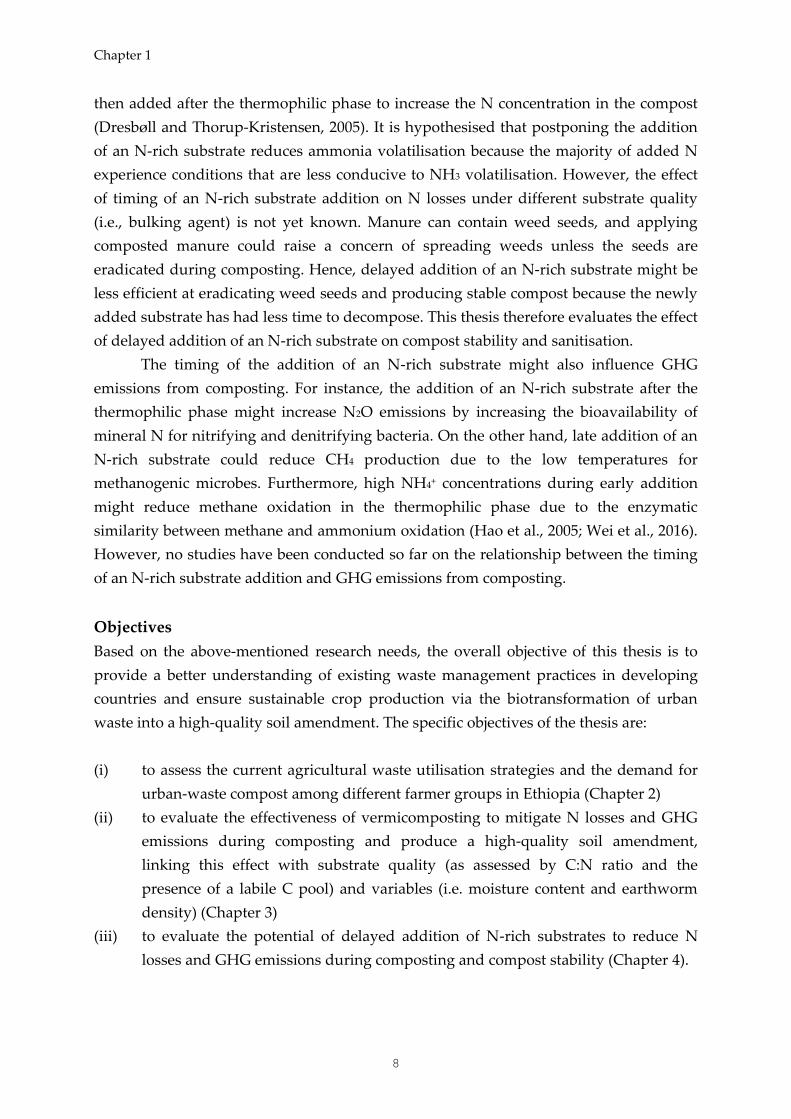
Figure 1.1. Stack of crop residues for fuel uses (a), animal feed (b); stack of animal manure (dung cake)
for fuel uses (c); the current solid waste management problem in Addis Ababa, Ethiopia (d – f).
Composting is a controlled and microbially mediated decomposition process that
converts biodegradable waste into a stable product that is ultimately used as soil
amendment. Urban waste composting can be used to recycle nutrients and close the
rural-urban nutrient loop (Getahun et al., 2012b; Nigussie et al., 2015 (Chapter 2)).
Incorporation of urban-waste compost in soil improves soil chemical (Hargreaves
et al., 2008), physical (Peltre et al., 2015) and biological properties (Garcia-Gil et al., 2004).
However, urban-waste compost contains relatively low amounts of plant nutrients
(especially nitrogen) compared to mineral fertiliser (Zhang et al., 2006) and hence is
unable to meet crop nutrient requirements. Urban-waste compost, particularly in
(sub)tropical countries has a low N content; hence, optimisation of urban-waste
composting should place an emphasis on increasing the nitrogen concentration in the
compost. A significant loss of gaseous nitrogen (N) through ammonia volatilisation,
nitrogen oxides (NOx), nitrous oxide (N2O) or dinitrogen (N2) occurs during composting
of nitrogen-rich urban waste (Anderson et al., 2010). These high N losses reduce the
fertilising value of compost and contribute to environmental problems (Hao et al., 2004).
Therefore, it is also important to reduce the N losses during composting of N-rich
materials.
Greenhouse gas (GHG) emissions (mainly methane and nitrous oxide) from
composting have repeatedly occurred in reports over the past two decades (Hao et al.,
2004; Anderson, 2010). Methane (CH4) is estimated to have a global warming potential
d
e f
a b
c
General introduction
3
(GWP) of 35 times that of CO2 over 100 years; whereas nitrous oxide (N2O) has a GWP of
298 times that of CO2 over 100 years (IPCC, 2013). Compost optimisation should
therefore put emphasis on increasing or maintaining the nitrogen content of compost,
reducing N losses and mitigating GHG emissions.
Several technologies, such as the addition of crop residues (Santos et al., 2016; Vu
et al., 2015), the control of aeration rate (Chowdhury et al., 2014) and the control of pH
(Awasthi et al., 2016) (section 1.2.), are suggested as ways of reducing N losses and GHG
emissions from composting. However, most of these interventions are inadequate to fit
easily within the broader small-scale farming systems in developing countries because
these practices are expensive. There is therefore a need for more research to develop low-
cost methods to mitigate N losses and GHG emissions from composting, while retaining
the beneficial properties (fertilising value) of compost. This thesis aims to address this
research demand.
Composting by earthworms (known as vermicomposting) is proposed in this
thesis as a low-cost strategy for reducing N loss and GHG emissions (Chapter 3 and 4). I
hypothesised that earthworms reduce GHG emissions from composting because they
increase aeration in compost piles and influence N transformations through their
interaction with associated microbes (Lazcano et al., 2008; Velasco-Velasco et al., 2011).
Another low-cost strategy for minimising N losses and GHG emissions from
composting is to delay the addition of N-rich substrates. High temperatures (> 45 0C)
shift the NH4+ = NH3 equilibrium towards ammonia (Pagans et al., 2006). The addition of
N-rich substrate at the beginning of composting increases N losses due to the
combination of labile N and high temperatures during the thermophilic phase, which is a
conducive environment for ammonia volatilisation. The addition of N-rich substrate
after the thermophilic phase is therefore proposed in this thesis (Chapter 5) as a way of
reducing N losses from composting. The aim of this thesis is therefore to provide
mechanistic insight into the effects of vermicomposting and the timing of substrate
addition on N losses and GHG emissions from urban-waste composting.
There is extensive literature about the importance of urban-waste composting for
soil fertility (Garcia-Gil et al., 2004) and crop production (Hargreaves et al., 2008).
However, socio-cultural and economic perspectives of urban-waste compost receive less
attention in developing countries, even though these issues should be studied prior to
scaling up urban-waste composting into large-scale enterprises. This thesis (Chapter 2)
also aims to address farmers’ attitudes towards urban waste compost and to associate
these with their livelihood strategies.
Chapter 1
4
Nitrogen losses and GHG emissions from composting
During composting, microorganisms consume oxygen and decompose organic materials,
thereby generating heat, water vapour and carbon dioxide (CO2). As organic matter
decomposes, mineral nutrients such as nitrogen, phosphorus and sulphur are released. A
significant amount of ammonia (NH3), NOx and potent greenhouse gases (i.e., methane
and nitrous oxide) are produced during composting as well.
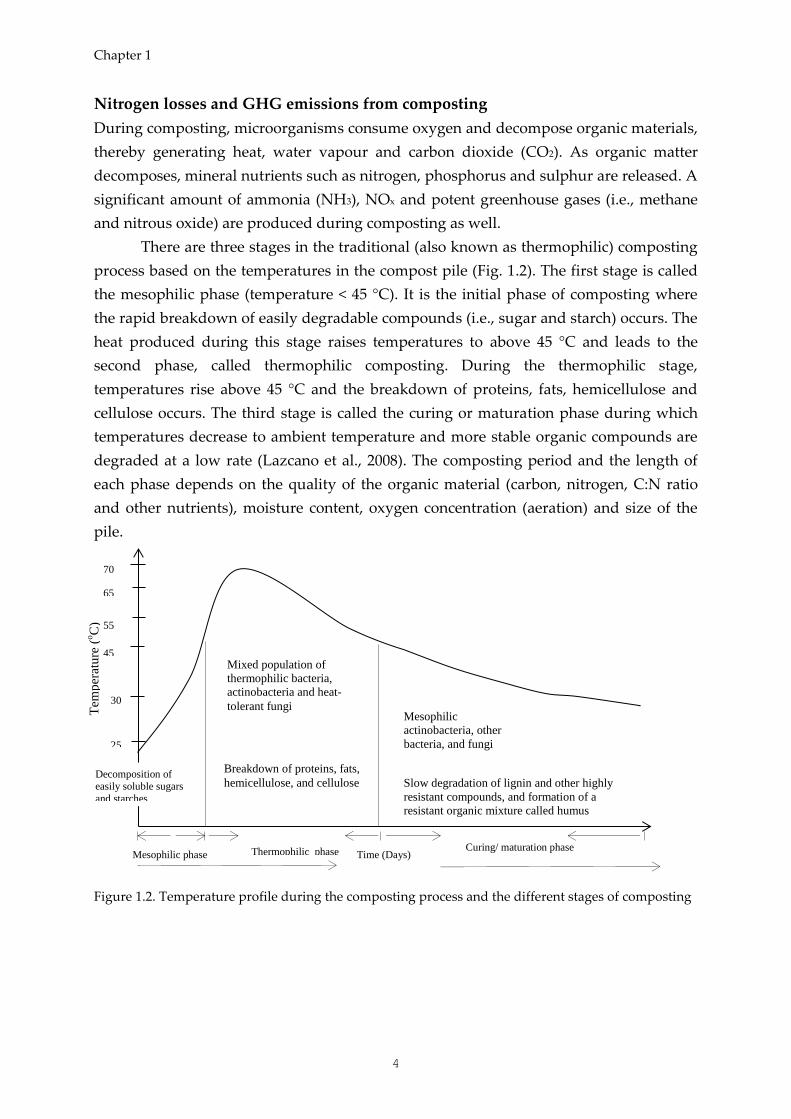
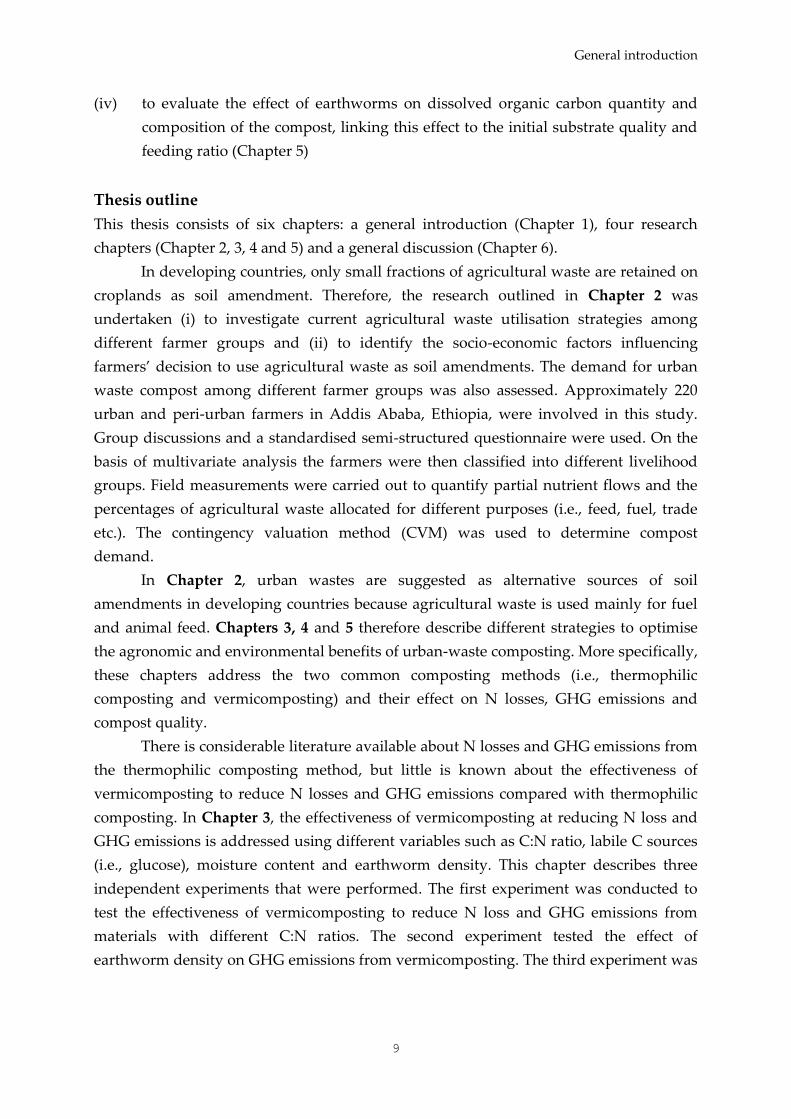
There are three stages in the traditional (also known as thermophilic) composting
process based on the temperatures in the compost pile (Fig. 1.2). The first stage is called
the mesophilic phase (temperature < 45 °C). It is the initial phase of composting where
the rapid breakdown of easily degradable compounds (i.e., sugar and starch) occurs. The
heat produced during this stage raises temperatures to above 45 °C and leads to the
second phase, called thermophilic composting. During the thermophilic stage,
temperatures rise above 45 °C and the breakdown of proteins, fats, hemicellulose and
cellulose occurs. The third stage is called the curing or maturation phase during which
temperatures decrease to ambient temperature and more stable organic compounds are
degraded at a low rate (Lazcano et al., 2008). The composting period and the length of
each phase depends on the quality of the organic material (carbon, nitrogen, C:N ratio
and other nutrients), moisture content, oxygen concentration (aeration) and size of the
pile.
Figure 1.2. Temperature profile during the composting process and the different stages of composting
Thermophilic phase Curing/ maturation phase
Tem
per
atu
re (
oC
)
25
30
45
55
70
65
Time (Days)
Decomposition of easily soluble sugars
and starches
Breakdown of proteins, fats,
hemicellulose, and cellulose
Mixed population of
thermophilic bacteria,
actinobacteria and heat-
tolerant fungi
Slow degradation of lignin and other highly
resistant compounds, and formation of a
resistant organic mixture called humus
Mesophilic
actinobacteria, other
bacteria, and fungi
Mesophilic phase
General introduction
5
Reducing nitrogen losses and GHG emissions are among the main challenges of the
composting process because these losses reduce the fertilising value of compost and
contribute to climate change. Ammonia volatilisation is the major N loss from compost
and accounts for over 60% of total N losses (Dias et al., 2009; Chowdhury et al., 2014).
Ammonia volatilisation occurs mainly during the thermophilic phase of composting
(Chowdhury et al., 2014). Similarly, Eklind et al. (2007) showed that higher temperatures
(i.e., 67 °C) increase ammonia loss by more than 100% compared to lower temperatures
(i.e., 40 °C). Many studies have shown that more than half of total N losses occur during
the thermophilic stage of composting (Pagans et al., 2006; Dias et al., 2009).
Methane is produced in anoxic hotspots by methanogenic microbes while N2O is
produced during nitrification in aerobic microsites and denitrification in anaerobic
microsites (Hao et al., 2004). The total global warming potential (CO2-equivalent) of
composting processes reaches 80-110 kg CO2-eq. Mg-1 fresh weight during garden waste
composting (Anderson et al., 2010). Most CH4 emissions occur during the thermophilic
stage of composting due to the coexistence of labile carbon compounds and anoxic
microsites (Anderson et al., 2010; Chowdhury et al., 2014), and the activity of
methanogens increases at high temperatures (Ermolaev et al., 2014). Chowdhury et al.
(2014) and Vu et al. (2015) showed that more than 70% of CH4 production occurs during
the thermophilic phase. On the other hand, N2O is emitted after the thermophilic stage
because nitrifying and denitrifying bacteria are mesophilic (Hao et al., 2004; Vu et al.,
2015).
Several strategies have been developed to reduce N losses and GHG emissions
from composting. The increase in the C:N ratio of the composting mixture is frequently
used to reduce N losses and GHG emissions (Chowdhury et al., 2014; Wang et al., 2014).
For example, the use of straw decreased total N loss by 33% from vegetable waste
composting (Chapter 2) and by 27-30% from manure composting (Vu et al., 2015; Sun et
al., 2015). Similarly, high C:N materials such as sawdust, straw and biochar reduced CH4
emissions by 70 - 90% and N2O emissions by 37 - 43% from composting, as noted by
Jiang et al. (2011), Vu et al. (2015) and Chowdhury et al. (2014). Different mechanisms
explain the effect of high C:N materials on reducing N losses and GHG emissions from
composting. First, high C:N materials immobilise a significant amount of inorganic
nitrogen and hence prevent ammonia volatilisation. Second, the bulkier nature of
materials such as straw allows air movement through the compost pile, and influence
temperature and moisture in compost pile and consequently affect N losses and GHG
emissions (Bustamante et al., 2013; Chowdhury et al., 2014).
Aeration is another option for mitigating N losses and GHG emissions from
composting because it reduces the presence of anaerobic hotspots in a composting pile.
Chapter 1
6
Excessive aeration, however, increases N loss via ammonia volatilisation (Chowdhury et
al., 2014; Cook et al., 2015). Studies have shown that the total N loss can increase by over
88% during excessive aeration compared to optimal aeration (Chowdhury et al., 2014;
Jiang et al., 2011). Similarly, Cook et al. (2015) observed that frequent turning of the
compost pile (i.e., three times per week) more than doubled the total N losses compared
with less frequent turning (i.e., once a week). Aeration reduces CH4 emissions from
composting (Chowdhury et al., 2014; Jiang et al., 2011), but its effect on N2O emissions
remains controversial. Studies have shown a stimulation effect (Jiang et al., 2011),
inhibition effect (Shen et al., 2011) and no effect (Chowdhury et al., 2014) of aeration on
N2O production. High NO3- production via nitrification – which leads to N2O production
through nitrifier denitrification – explains the high N2O production with increasing
aeration.
Controlling the pH using additives is another option for minimising ammonia
volatilisation from composting because pH > 9 increases the production of ammonia
(Pagans et al., 2006). The use of NH4+ absorbents such as active carbon, biochar and
zeolite has also been recommended to mitigate N losses from composting (Steiner et al.,
2010; Chowdhury et al., 2014). However, these technologies are not included in this
thesis because they are expensive.
Existing technologies to mitigate N losses and GHG emissions are difficult to scale
out to farmer’s conditions, particularly for smallholder farmers in developing countries.
For instance, materials such as crop residues have competitive uses in smallholder
farming systems. Over 85% of crop residues are used for feed and/or fuel in developing
countries like Ethiopia (Baudron et al., 2014), making it difficult for smallholder farmers
to produce high C:N ratio composting materials. Technologies such as controlling pH
and aeration are expensive and require skill. Simple and low-cost strategies should
therefore be investigated for smallholder farmers in developing countries.
Vermicomposting as a low-cost strategy for reducing N losses and GHG emissions
Vermicomposting is a composting process that involves both earthworms and associated
microorganisms to decompose and stabilise organic materials (Munroe, 2007). During
vermicomposting, earthworms fragment organic materials into smaller particles, and
facilitate the further microbial decomposition process. There are an estimated 1800
earthworm species worldwide, but only a few of these species are used for
vermicomposting. Epigeic earthworm species – earthworms that only feed on fresh,
relatively un-decomposed litter – are used for vermicomposting, with Eisenia fetida and
Dendrobaena veneta the most common earthworm species used for this purpose (Munroe,
2007).
General introduction
7
It is plausible that vermicomposting reduces N losses and GHG emissions from
composting. First, earthworms improve air circulation through the continuous turning of
organic materials, thereby maintaining aerobic conditions. Second, earthworms affect N
cycling – mineralisation, immobilisation, nitrification and denitrification – through their
interaction with associated microbes (Lazcano et al., 2008; Velasco-Velasco et al., 2011).
Third, vermicomposting is a mesophilic process (< 30 °C), implying that ammonia
volatilisation is less likely to occur because ammonia emissions rise with increasing
temperature. The effects of earthworms on soil properties and GHG emissions (mainly
N2O emissions) from soils are well documented (Lubbers et al., 2013), but earthworm
effects on N losses and GHG emissions from composting are generally ignored and
therefore need further investigation. In their report, Lubbers et al. (2013) showed that
earthworms increased N2O emissions from soil. The substrate quality, earthworm species
and earthworm density used for vermicomposting, however, differ from those in soil.
Therefore it is impossible to extrapolate the results of soil experiments to
vermicomposting systems.
Currently little is known about N losses and GHG emissions during
vermicomposting (Lleó et al., 2013; Lim et al., 2016), and the literature is contradictory.
These contradictions are probably explained by the different conditions of the
experiments such as mineral N concentration, C quality, moisture content and
earthworm density, all of which could influence N loss and GHG emissions from
vermicomposting. For instance, mineral nitrogen and available C contents influence the
denitrification processes in the earthworm gut of anecic earthworms (Lubbers et al.,
2013). Earthworm density might influence aeration and subsequently influence GHG
emissions. My thesis used a wide range of substrate qualities (i.e., C:N ratio, labile C
sources such as glucose) and other factors (i.e., earthworm density, amount of input, and
moisture) to clarify our understanding of the effects of earthworms on N losses and GHG
emissions from composting.
Timing of substrate addition as a low-cost strategy for reducing N losses
Recently, N-rich substrates such as poultry manure have been applied during
composting to increase the fertilising value of compost (Dias et al., 2009). The addition of
more labile N materials at the beginning of composting results in ammonia volatilisation
(Bryndum, 2014) due to the co-existence of a high concentration of NH4+, easily
mineralisable compounds and a high temperature. Delaying (splitting) the addition of an
N-rich substrate has therefore been studied in this thesis to reduce N losses from
composting. During the split addition of an N-rich substrate, the first part is added at the
beginning of composting to support the turnover of labile carbon. The remaining part is
Chapter 1
8
then added after the thermophilic phase to increase the N concentration in the compost
(Dresbøll and Thorup-Kristensen, 2005). It is hypothesised that postponing the addition
of an N-rich substrate reduces ammonia volatilisation because the majority of added N
experience conditions that are less conducive to NH3 volatilisation. However, the effect
of timing of an N-rich substrate addition on N losses under different substrate quality
(i.e., bulking agent) is not yet known. Manure can contain weed seeds, and applying
composted manure could raise a concern of spreading weeds unless the seeds are
eradicated during composting. Hence, delayed addition of an N-rich substrate might be
less efficient at eradicating weed seeds and producing stable compost because the newly
added substrate has had less time to decompose. This thesis therefore evaluates the effect
of delayed addition of an N-rich substrate on compost stability and sanitisation.
The timing of the addition of an N-rich substrate might also influence GHG
emissions from composting. For instance, the addition of an N-rich substrate after the
thermophilic phase might increase N2O emissions by increasing the bioavailability of
mineral N for nitrifying and denitrifying bacteria. On the other hand, late addition of an
N-rich substrate could reduce CH4 production due to the low temperatures for
methanogenic microbes. Furthermore, high NH4+ concentrations during early addition
might reduce methane oxidation in the thermophilic phase due to the enzymatic
similarity between methane and ammonium oxidation (Hao et al., 2005; Wei et al., 2016).
However, no studies have been conducted so far on the relationship between the timing
of an N-rich substrate addition and GHG emissions from composting.
Objectives
Based on the above-mentioned research needs, the overall objective of this thesis is to
provide a better understanding of existing waste management practices in developing
countries and ensure sustainable crop production via the biotransformation of urban
waste into a high-quality soil amendment. The specific objectives of the thesis are:
(i) to assess the current agricultural waste utilisation strategies and the demand for
urban-waste compost among different farmer groups in Ethiopia (Chapter 2)
(ii) to evaluate the effectiveness of vermicomposting to mitigate N losses and GHG
emissions during composting and produce a high-quality soil amendment,
linking this effect with substrate quality (as assessed by C:N ratio and the
presence of a labile C pool) and variables (i.e. moisture content and earthworm
density) (Chapter 3)
(iii) to evaluate the potential of delayed addition of N-rich substrates to reduce N
losses and GHG emissions during composting and compost stability (Chapter 4).
General introduction
9
(iv) to evaluate the effect of earthworms on dissolved organic carbon quantity and
composition of the compost, linking this effect to the initial substrate quality and
feeding ratio (Chapter 5)
Thesis outline
This thesis consists of six chapters: a general introduction (Chapter 1), four research
chapters (Chapter 2, 3, 4 and 5) and a general discussion (Chapter 6).
In developing countries, only small fractions of agricultural waste are retained on
croplands as soil amendment. Therefore, the research outlined in Chapter 2 was
undertaken (i) to investigate current agricultural waste utilisation strategies among
different farmer groups and (ii) to identify the socio-economic factors influencing
farmers’ decision to use agricultural waste as soil amendments. The demand for urban
waste compost among different farmer groups was also assessed. Approximately 220
urban and peri-urban farmers in Addis Ababa, Ethiopia, were involved in this study.
Group discussions and a standardised semi-structured questionnaire were used. On the
basis of multivariate analysis the farmers were then classified into different livelihood
groups. Field measurements were carried out to quantify partial nutrient flows and the
percentages of agricultural waste allocated for different purposes (i.e., feed, fuel, trade
etc.). The contingency valuation method (CVM) was used to determine compost
demand.
In Chapter 2, urban wastes are suggested as alternative sources of soil
amendments in developing countries because agricultural waste is used mainly for fuel
and animal feed. Chapters 3, 4 and 5 therefore describe different strategies to optimise
the agronomic and environmental benefits of urban-waste composting. More specifically,
these chapters address the two common composting methods (i.e., thermophilic
composting and vermicomposting) and their effect on N losses, GHG emissions and
compost quality.
There is considerable literature available about N losses and GHG emissions from
the thermophilic composting method, but little is known about the effectiveness of
vermicomposting to reduce N losses and GHG emissions compared with thermophilic
composting. In Chapter 3, the effectiveness of vermicomposting at reducing N loss and
GHG emissions is addressed using different variables such as C:N ratio, labile C sources
(i.e., glucose), moisture content and earthworm density. This chapter describes three
independent experiments that were performed. The first experiment was conducted to
test the effectiveness of vermicomposting to reduce N loss and GHG emissions from
materials with different C:N ratios. The second experiment tested the effect of
earthworm density on GHG emissions from vermicomposting. The third experiment was
Chapter 1
10
performed to test the effect of moisture and addition of glucose on GHG emissions from
vermicomposting. To test these objectives, kitchen waste was used as composting
material. All the experiments were conducted in small-scale composting reactors, and the
experiments lasted for 45 days.
Chapter 4 describes the effect of the timing of addition of an N-rich substrate on
N loss and GHG emissions from composting. To test this effect, a medium-scale
experiment was conducted for 90 days in 1 m x 1 m x 1 m boxes made of wood. Poultry
manure (N-rich substrate) was applied in three different ways: (i) all poultry manure was
applied at the beginning of composting, (ii) 80% of poultry manure was applied at the
start of composting and the remaining 20% added after the thermophilic phase, or (iii)
20% of poultry manure was applied at the start of composting and the remaining 80%
was added after the thermophilic phase. Total N loss was estimated using a mass-
balance, and the CO2, N2O and CH4 emissions were measured to quantify the GHG
budgets. To test the effect of split addition of N-rich substrate on sanitation, seeds from
four weed species were put in small nylon mesh bags and added to the compost pile. At
the end of the composting experiment, the nylon bags were retrieved and the seeds
tested for germination. The incubation experiment was conducted for 90 days and
different indices were used to test for the effect of the timing of N-rich substrate addition
on compost stability.
In my previous studies (Chapter 3), I noted that earthworms increased CO2
emissions, and the higher CO2 emissions indicated a higher degree of stabilisation.
Therefore, I initiated Chapter 5 to link the effect of earthworms on CO2 emissions with
dissolved organic carbon (DOC) quantity and its composition (humic acid, fulvic acid,
hydrophobic neutral, and hydrophilic compounds) – which is a recently proposed
indicator of compost stability. Chapter 5 also deals with the effect of feeding ratio on
compost stability and GHG emissions from vermicomposting. To address these
objectives a laboratory-scale vermicomposting was conducted for 60 days using garden
waste.
In Chapter 6, I argue that reliance solely on agricultural waste to increase soil
fertility and sustain crop production is problematic, especially in developing countries. I
therefore suggest that biodegradable urban waste should be considered as alternative
resource for sustainable agricultural production in developing countries. The chapter
contains a synthesis of the merits and demerits of the composting technologies that are
suggested in this thesis to mitigate N losses and GHG emissions and ends with the
conclusions and policy implications of the findings from this thesis. Finally, this chapter
suggests future research directions.
General introduction
11
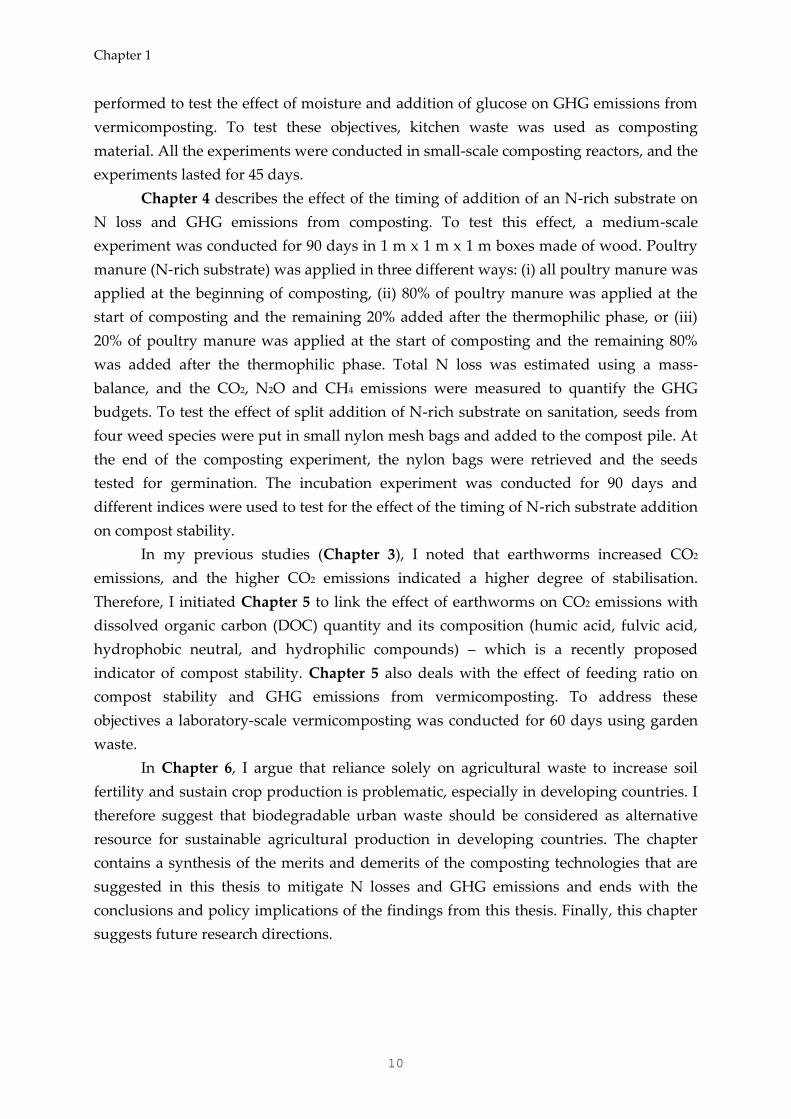
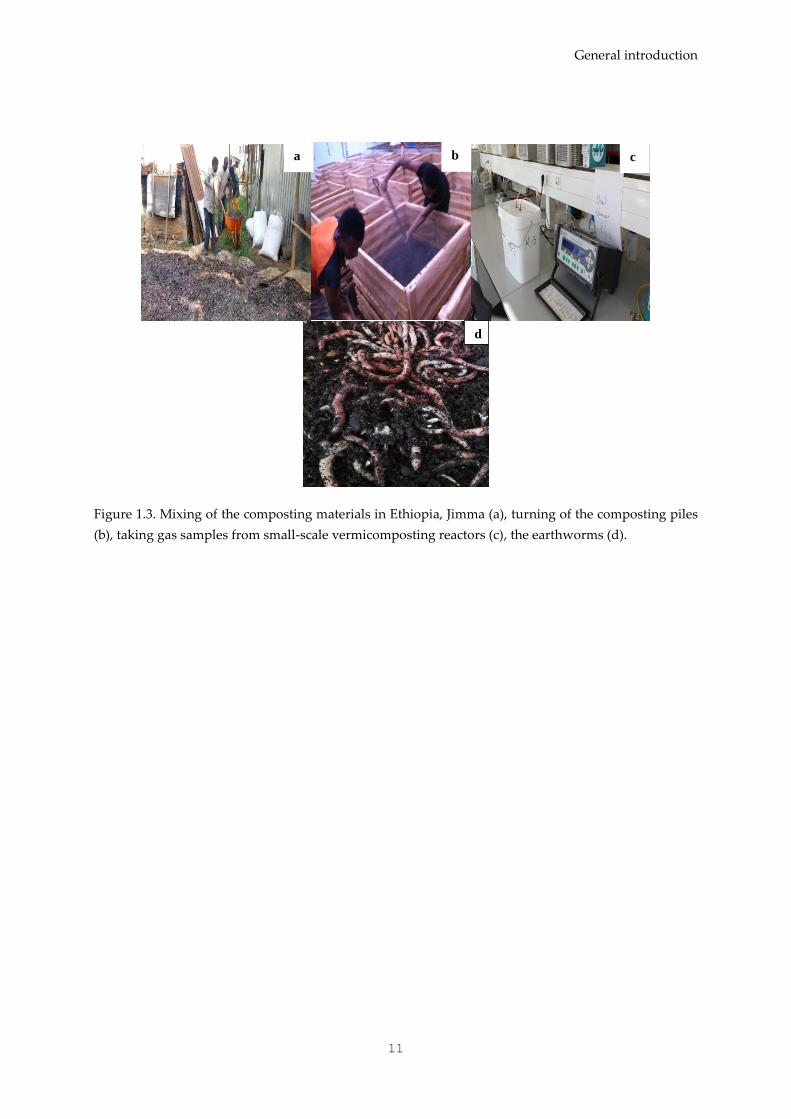
Figure 1.3. Mixing of the composting materials in Ethiopia, Jimma (a), turning of the composting piles
(b), taking gas samples from small-scale vermicomposting reactors (c), the earthworms (d).
a b c
d

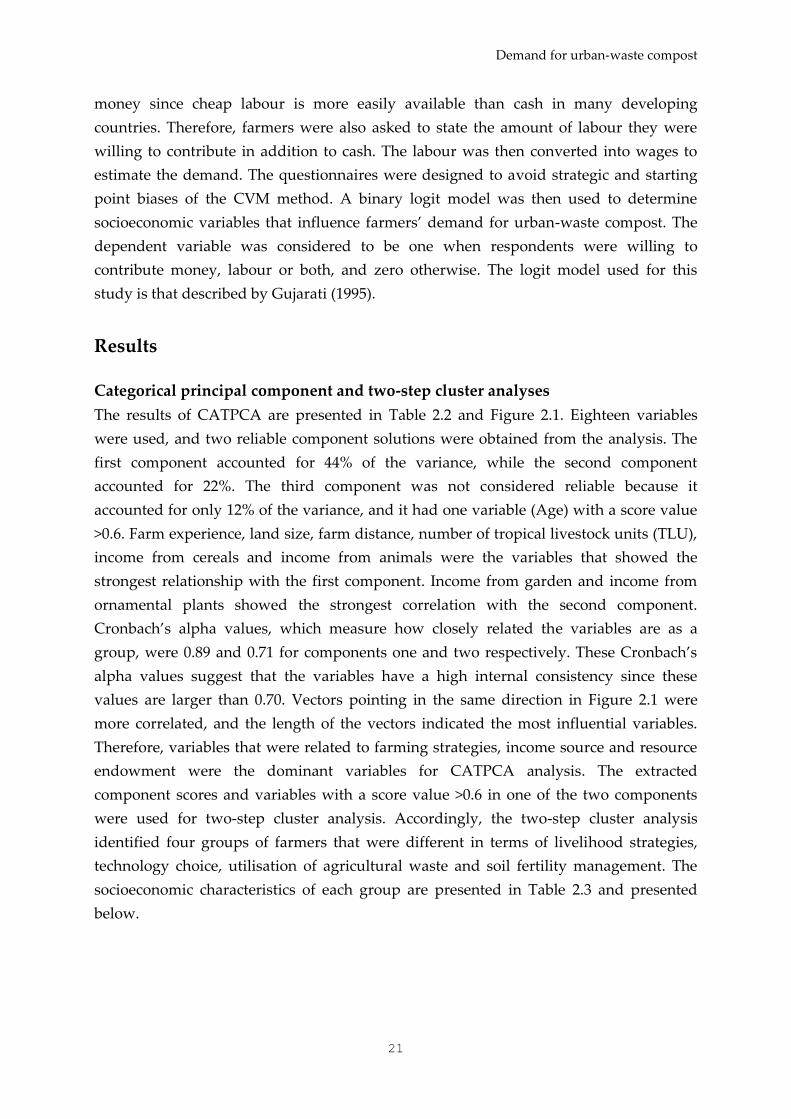
Demand for urban-waste compost
13
CHAPTER 2
Agricultural waste utilisation strategies and demand for
urban-waste compost: Evidences from smallholder farmers in
Ethiopia
This chapter is published as:
Nigussie, A., Kuyper, T.W., de Neergaard, A. (2015). Agricultural waste utilisation
strategies and demand for urban-waste compost: Evidence from smallholder farmers
in Ethiopia. Waste Management 44, 82 – 93.
Chapter 2
14
Agricultural waste utilisation strategies and demand for
urban-waste compost: Evidences from smallholder farmers in
Ethiopia
Abstract
The use of agricultural waste for soil amendment is limited in developing countries.
Competition between fuel and feed is the major cause for the insufficient application of
agricultural waste on cropland. The aims of this study were therefore (i) to investigate
variation in agricultural-waste allocation between groups of farmers with different
livelihood strategies and link this allocation with the nutrient balances of their
production systems, (ii) to identify farm characteristics that influence utilisation of
agricultural waste for soil amendment, and (iii) to assess demand for urban-waste
compost. A total of 220 farmers were selected randomly and interviewed using
standardised semi-structured questionnaires. Four groups of farmers, namely (i) field
crop farmers, (ii) vegetable producers, (iii) ornamental-plant growers, and (iv) farmers
practising mixed farming, were identified using categorical principal component and
two-step cluster analyses. Field crop farmers produced the largest quantity of
agricultural waste, but they allocated 80% of manure to fuel and 85% of crop residues to
feed. Only <10% of manure and crop residues were applied on soils. Farmers also sold
manure and crop residues, and this generated 5-10% of their annual income. Vegetable
and ornamental-plant growers allocated over 40% of manure and crop residues to soil
amendment. Hence, nutrient balances were less negative in vegetable production
systems. Education, farm size, land tenure and access to extension services were the
variables that impeded allocation of agricultural waste to soil amendment. Replacement
of fuel and feed through sustainable means is a viable option for soil fertility
management. Urban-waste compost should also be used as alternative option for soil
amendment. Our results showed variation in compost demand between farmers.
Education, landownership, experience with compost and access to extension services
explained variation in compost demand. We also demonstrated that labour availability
should be used to estimate compost demand beside cash.
Keywords: animal manure, crop residue, compost, livelihood strategy, municipal waste
Demand for urban-waste compost
15
Introduction
Urban and peri-urban agroecosystems are common in many countries, and they are
often characterised by a surplus nutrient balance due to the intensive use of fertilisers
and heavy irrigation with waste water (Khai et al., 2007; Wang et al., 2008; Diogo et al.,
2010; Abdulkadir et al., 2013). In contrast, some studies showed negative nutrient
balances and hence declining soil fertility in urban and peri-urban farming systems
(Tewodros et al., 2007). Mineral fertilisers have been used to improve and maintain soil
fertility and crop production; however, this is a challenge for many smallholder farmers
because mineral fertilisers are expensive (Kassie et al., 2009; Dercon and Christiaensen,
2011). Hence, the integration of mineral fertilisers with organic amendments (e.g. animal
manure and compost) has been recommended to increase crop production (Negassa et
al., 2005). Organic amendments could also increase or maintain soil organic matter
contents and thereby contribute to enhanced fertiliser use efficiency.
The use of organic amendments in cropping systems is the most viable option for
farmers to maintain their field in a productive state. The benefit of organic amendments
is not new for many farmers. However, only small fractions of animal manure and crop
residues are retained on farmlands in many developing countries due to the low
production of manure, the limited availability of labour and the inefficient collection of
manure (Tittonell et al., 2005; Kassie et al., 2009; Baudron et al., 2014). In addition to this,
high competition of agricultural waste with other uses (e.g. feed and fuel) results in
insufficient application of organic amendments in soils, and this competition has become
a major concern. For example, utilisation of agricultural waste for feed and fuel has been
identified as a major cause for the slow adoption of conservation agriculture in sub-
Saharan Africa and South Asia (Mekonen and Kohlin, 2009; Baudron et al., 2014;
Valbuena et al., 2015). Nevertheless, more than 10 t ha-1 of organic amendment are still
recommended for resource poor farmers in many developing counties (Negassa et al.,
2005; Hou et al., 2011) but such recommendations do not consider competition in the
utilisation of agricultural waste.
It is important to identify the current uses of agricultural waste across different
farmers groups and livelihood strategies because it explains the causes for minimum
application of organic amendments for cropping systems. It is also essential to determine
the farm characteristics that impede farmers using agricultural waste for soil
amendment. Baudron et al. (2014); Rimhanen and Kahiluoto (2014); Valbuena et al.
(2015) found that most of the crop residues are fed to livestock in sub-Saharan Africa and
South Asia countries. In contrast, the majority of farmers in Western Kenya, India and
Bangladesh retain over 80% of crop residues on farmland (Baudron et al., 2014; Valbuena
et al., 2015). This variation could be due to the difference in degree of agricultural
intensification and high competition of agricultural waste with other uses such as feed or
Chapter 2
16
fuel (Baudron et al., 2014). Another reason could be differences in terms of farm
characteristics and livelihood strategies. Therefore, we hypothesised that farmers with
different production goals, degree of intensification and socioeconomic status have
different agricultural-waste utilisation strategies. For example, subsistence field crop
farmers may prefer to utilise agricultural waste for feed or fuel. In contrast, vegetable
producers might apply more manure and retain more crop residues on fields than cereal
producers because vegetable production demands a high nutrient input and generates a
rapid economic return (Abdulkadir et al., 2013). Similarly, land entitlement might
encourage farmers to allocate large quantities of agricultural waste to soil amendment.
Availability of labour, farm size and distance could also determine farmers’ decisions to
allocate agricultural waste for soil amendment since investment is required to transport
agricultural waste (Tittonell et al., 2010). However, no studies have been conducted to
explain variation in utilisation of agricultural waste across different livelihood strategies
and production goals.
It is clear that only very small fractions of agricultural waste are allocated to soil
amendment in many developing countries (Baudron et al., 2014; Jaleta et al., 2014;
Rimhanen and Kahiluoto, 2014). Therefore, other organic resources (e.g. urban waste)
should be considered as an alternative option for soil amendment in urban and peri-
urban farming systems in developing countries. Previous studies have suggested the use
of urban waste compost to enhance urban agricultural production (Danso et al., 2006;
Mary et al., 2010). However, there are very few studies on urban-waste compost demand
between different farmers groups and production goals using contingent valuation
method (Danso et al., 2006). Contingent valuation method (CVM) is a widely used
method to estimate the economic values of environmental services (Danso et al., 2006).
Thus, the specific objectives of this study were: (i) to investigate the utilisation of
agricultural waste between different urban farmers and link this use with partial nutrient
balances, (ii) to identify farm characteristics that influence farmers’ decisions to use
agricultural waste as a soil amendment, and (iii) to assess the demand for non-
agricultural waste (i.e. urban waste) compost.
Materials and Methods
Study area
The study was conducted in Addis Ababa, the capital city of Ethiopia. Addis Ababa is
located between 2400 and 3100 m above sea level and has a total land area of 530 km2.
The average low and high temperatures are 10 and 25 °C respectively. Annual
precipitation is 1180 mm. It has a unimodal rainfall regime starting in June and lasting
until September. The dominant soil type is Vertisol, and the parent material is olivine
basalt (Tekalign et al., 1993). Urban farmers who grow crops in the study area are
Demand for urban-waste compost
17
approximately 7,000 (Mengistu, 2013). Teff (Eragrostis tef), wheat (Triticum sp. ) and
chickpea (Cicer arietinum) are the main crops grown in the area. Cabbage (Brassica
oleracea), Ethiopian mustard (Brassica carinata), potato (Solanum tuberosum) and carrot
(Daucus carota) are the main vegetables grown. Cattle, donkeys and sheeps are the main
livestock types kept by farmers. The poor solid-waste management system is one of the
main problems in the city. The current waste generation is about 1,000 tons day-1. The
average daily waste generation is 32 kg person-1 yr-1 (Guerrero et al., 2013). About 76% of
the urban waste is household waste and over 50% of the urban waste consists of organic
materials that can be recycled into compost (Regassa et al., 2011). From the total waste
generated, only 65% is collected, and the remaining 35% is dumped on open sites,
drainage channels, rivers and streets (Guerrero et al., 2013). Currently, less than 5% of
the urban waste is composted (Mengistu, 2013).
Socioeconomic survey
Areas that represent the current agricultural systems and heterogeneities of livelihood
strategies were selected using secondary sources and governmental and non-
governmental organisations. Discussions were held with key informants who worked in
agricultural offices in order to obtain information about the farmers, their locations and
other relevant information. A total of 220 households were randomly selected, and
individual farmers were interviewed using a standardised semi-structured questionnaire
and informal conversation. The sample size was determined according to Israel (1992)
who recommended a minimum of 200 samples for population size between 5,000 and
10,000 at 95% confidence level and 7% precision level. The questionnaire was pre-tested
with 12 respondents and modifications were made on the basis of this pre-test. Field
observations and discussions with key informants, and governmental and non-
governmental organisations (NGOs) were used to supplement the household interviews.
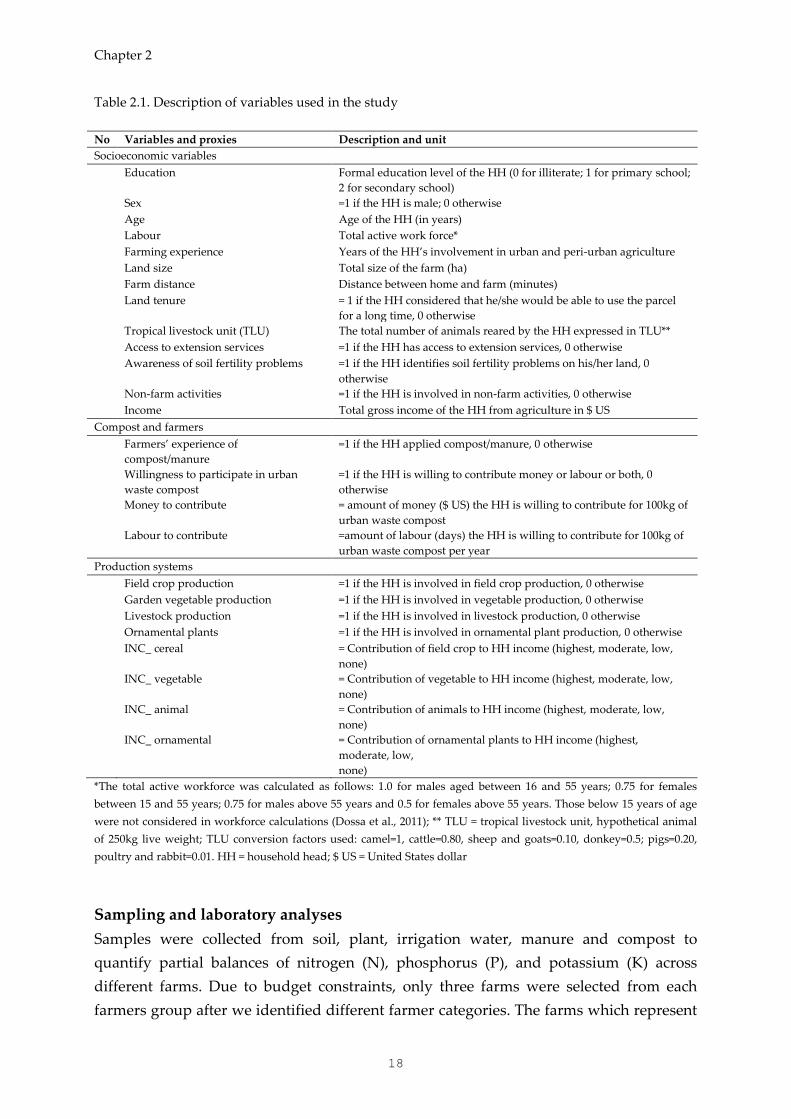
The qualitative and quantitative variables used in the study are given in Table 2.1.
Chapter 2
18
Table 2.1. Description of variables used in the study
No Variables and proxies Description and unit
Socioeconomic variables
Education Formal education level of the HH (0 for illiterate; 1 for primary school;
2 for secondary school)
Sex =1 if the HH is male; 0 otherwise
Age Age of the HH (in years)
Labour Total active work force*
Farming experience Years of the HH’s involvement in urban and peri-urban agriculture
Land size Total size of the farm (ha)
Farm distance Distance between home and farm (minutes)
Land tenure = 1 if the HH considered that he/she would be able to use the parcel
for a long time, 0 otherwise
Tropical livestock unit (TLU) The total number of animals reared by the HH expressed in TLU**
Access to extension services =1 if the HH has access to extension services, 0 otherwise
Awareness of soil fertility problems =1 if the HH identifies soil fertility problems on his/her land, 0
otherwise
Non-farm activities =1 if the HH is involved in non-farm activities, 0 otherwise
Income Total gross income of the HH from agriculture in $ US
Compost and farmers
Farmers’ experience of
compost/manure
=1 if the HH applied compost/manure, 0 otherwise
Willingness to participate in urban
waste compost
=1 if the HH is willing to contribute money or labour or both, 0
otherwise
Money to contribute = amount of money ($ US) the HH is willing to contribute for 100kg of
urban waste compost
Labour to contribute =amount of labour (days) the HH is willing to contribute for 100kg of
urban waste compost per year
Production systems
Field crop production =1 if the HH is involved in field crop production, 0 otherwise
Garden vegetable production =1 if the HH is involved in vegetable production, 0 otherwise
Livestock production =1 if the HH is involved in livestock production, 0 otherwise
Ornamental plants =1 if the HH is involved in ornamental plant production, 0 otherwise
INC_ cereal = Contribution of field crop to HH income (highest, moderate, low,
none)
INC_ vegetable = Contribution of vegetable to HH income (highest, moderate, low,
none)
INC_ animal = Contribution of animals to HH income (highest, moderate, low,
none)
INC_ ornamental = Contribution of ornamental plants to HH income (highest,
moderate, low,
none)
*The total active workforce was calculated as follows: 1.0 for males aged between 16 and 55 years; 0.75 for females
between 15 and 55 years; 0.75 for males above 55 years and 0.5 for females above 55 years. Those below 15 years of age
were not considered in workforce calculations (Dossa et al., 2011); ** TLU = tropical livestock unit, hypothetical animal
of 250kg live weight; TLU conversion factors used: camel=1, cattle=0.80, sheep and goats=0.10, donkey=0.5; pigs=0.20,
poultry and rabbit=0.01. HH = household head; $ US = United States dollar
Sampling and laboratory analyses
Samples were collected from soil, plant, irrigation water, manure and compost to
quantify partial balances of nitrogen (N), phosphorus (P), and potassium (K) across
different farms. Due to budget constraints, only three farms were selected from each
farmers group after we identified different farmer categories. The farms which represent
Demand for urban-waste compost
19
each category were selected through detailed observation, discussion with farmers and
development agents. Three sub-plots (1 m2) were prepared in each farm (Abdulkadir et
al., 2012). Soil and plant samples were collected from these sub-plots. Composite soil
samples were taken from the 0-25 cm layer and air-dried for laboratory analysis. The
hydrometer method was used to determine soil texture, and pH-H2O was measured in a
1:2.5 soil-to-water suspension. Soil carbon was analysed using the Walkley-Black
method, total N using Kjeldahl digestion, available P using Olsen extraction and soil K
using aqua regia digestion (Van Reewijk, 1992). Plant, manure and compost samples
were also collected and weighed immediately after sampling to determine fresh weight.
Plant samples were oven-dried at 60 °C for three days, then ground and sieved for N, P
and K analyses (Van Reewijk, 1992). Nitrogen in plant tissue was analysed using
Kjeldahl digestion, while P and K were measured using vanadomolybdophosphoric acid
extraction and atomic absorption respectively. Nitrogen, phosphorus and potassium in
water, compost and manure were analysed as described earlier. Nitrogen, P and K
concentrations in plant, manure and compost samples were multiplied by their dry mass
to estimate element fluxes (Eq. (1)).
f = ∑ QiCi
n
i=1
… … … … … … … … … … … .. (1)
where ƒ is the input or output flow of N, P or K for one year; n is number of events in a
year (growing season; fertilisation (manure or compost); irrigation); Q is quantity of dry
material; C is concentration of N, P or K.
The element balance equation was then calculated as: 𝐵𝑒 = 𝐼𝑒 − 𝑂𝑒 … … … … … … … … … … … … … .. (2)
where B is the nutrient balance; e is the element (N, P or K); Ie is input of an element
(fertiliser, compost, manure, irrigation) and Oe is output of an element (harvested crop
yield and crop residue).
Data analyses
Categorical principal component analysis (CATPCA) and two-step clustering were used
to classify 220 farmers into different groups (Dossa et al., 2011). Since nominal and metric
variables were included in the study, CATPCA was used instead of principal component
analysis. CATPCA was performed using IBM SPSS Statistics 22.0 to identify
relationships between variables and to reduce a large number of variables into a small
number of orthogonal components. According to Abdulkadir et al., (2012), a component
(a CATPCA axis) is reliable if it contains at least four variables with a loading score > 0.6.
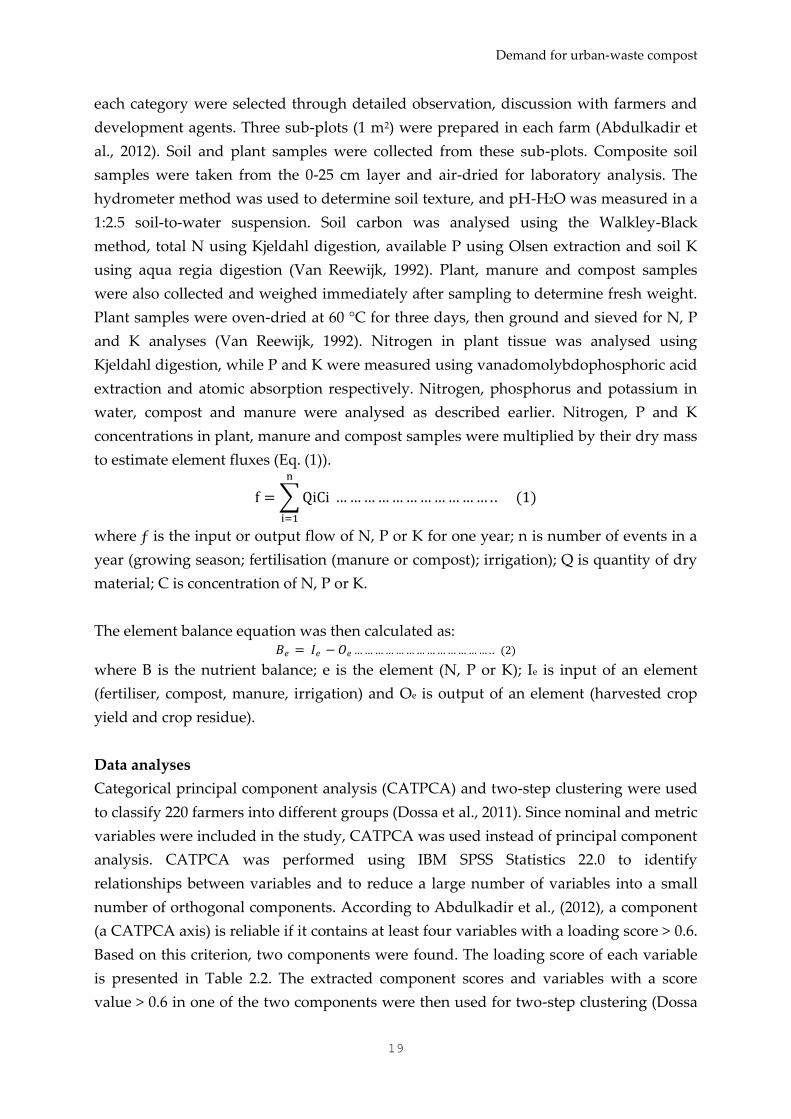
Based on this criterion, two components were found. The loading score of each variable
is presented in Table 2.2. The extracted component scores and variables with a score
value > 0.6 in one of the two components were then used for two-step clustering (Dossa
Chapter 2
20
et al., 2011). Before running the cluster analysis, a visual binning procedure was
performed to convert continuous variables into nominal variables and reduce the higher
weight of categorical variables at the expense of continuous variables (Dossa et al., 2011).
A silhouette measure of cluster cohesion and separation – which was used for measuring
the quality of the clustering solution – showed a good clustering quality because the
value was between 0.6 and 0.7. Analysis of variance (ANOVA) for continuous variables
and chi-square for categorical variables were used to test for significant differences
between the clusters.
Table 2.2. Component loadings of socioeconomic variables used for categorical component analysis
(CATPCA)
Variable Dimension
1 2
Farming experience 0.635 0.081
Age of HH 0.259 0.192
Sex of HH 0.202 -0.339
Education status of HH -0.437 -0.197
Active labour force -0.445 0.123
Area of the farmland 0.722 -0.116
Farm distance 0.782 -0.103
TLU 0.685 0.136
Awareness of soil fertility -0.153 -0.146
HH involved in field crop production 0.900 -0.100
HH involved in vegetable production -0.532 0.785
HH involved in animal rearing 0.823 0.210
HH involved in ornamental plant production -0.424 -0.821
Contribution of field crop to HH income 0.916 -0.148
Contribution of vegetable to HH income -0.583 0.781
Contribution of animals to HH income 0.738 0.190
Contribution of ornamental plants to HH income -0.424 -0.821
Contribution of non-farm activities to HH income -0.205 -0.362
Cronbach’s alpha 0.89 0.71
Total eigenvalue 5.67 2.88
% variance 43.58 22.16
HH= household head; TLU = tropical livestock unit
The contingency valuation method (CVM) using dichotomous choice was implemented
to estimate the demand for urban waste compost via a willingness to contribute money
or labour (Danso et al., 2006). In our study, labour was also used to estimate compost
demand because resource-poor farmers might prefer to contribute labour rather than
Demand for urban-waste compost
21
money since cheap labour is more easily available than cash in many developing
countries. Therefore, farmers were also asked to state the amount of labour they were
willing to contribute in addition to cash. The labour was then converted into wages to
estimate the demand. The questionnaires were designed to avoid strategic and starting
point biases of the CVM method. A binary logit model was then used to determine
socioeconomic variables that influence farmers’ demand for urban-waste compost. The
dependent variable was considered to be one when respondents were willing to
contribute money, labour or both, and zero otherwise. The logit model used for this
study is that described by Gujarati (1995).
Results
Categorical principal component and two-step cluster analyses
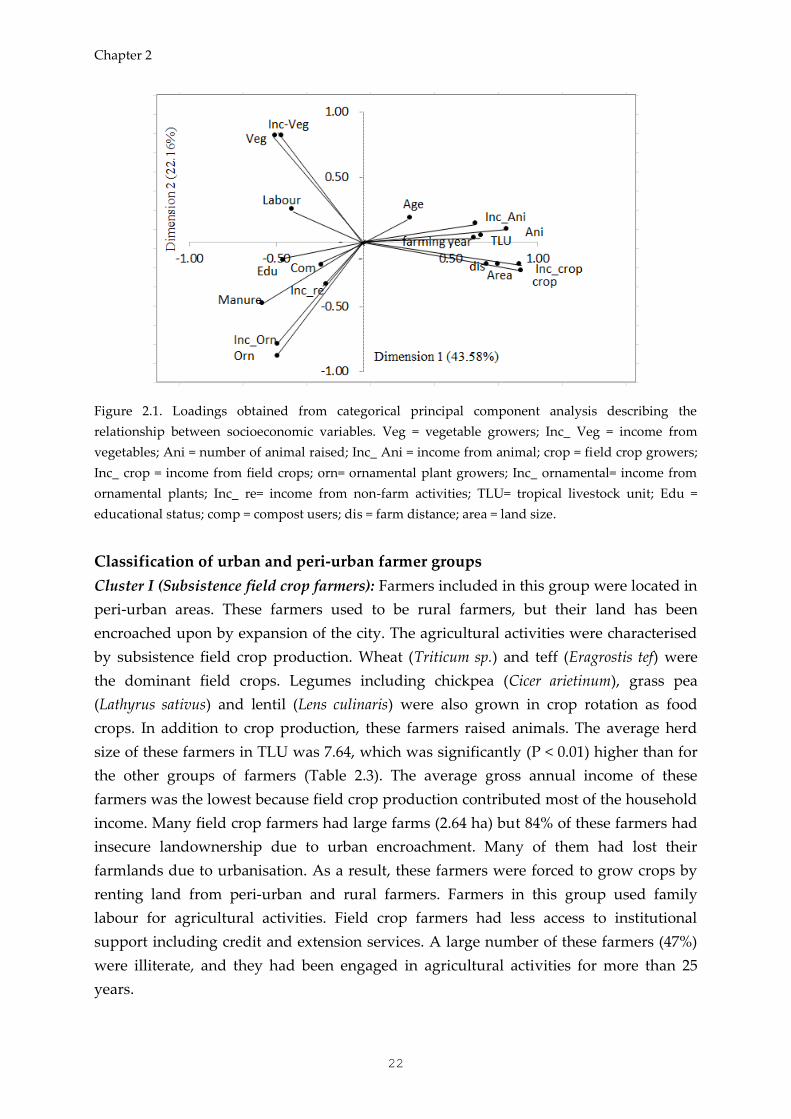
The results of CATPCA are presented in Table 2.2 and Figure 2.1. Eighteen variables
were used, and two reliable component solutions were obtained from the analysis. The
first component accounted for 44% of the variance, while the second component
accounted for 22%. The third component was not considered reliable because it
accounted for only 12% of the variance, and it had one variable (Age) with a score value
>0.6. Farm experience, land size, farm distance, number of tropical livestock units (TLU),
income from cereals and income from animals were the variables that showed the
strongest relationship with the first component. Income from garden and income from
ornamental plants showed the strongest correlation with the second component.
Cronbach’s alpha values, which measure how closely related the variables are as a
group, were 0.89 and 0.71 for components one and two respectively. These Cronbach’s
alpha values suggest that the variables have a high internal consistency since these
values are larger than 0.70. Vectors pointing in the same direction in Figure 2.1 were
more correlated, and the length of the vectors indicated the most influential variables.
Therefore, variables that were related to farming strategies, income source and resource
endowment were the dominant variables for CATPCA analysis. The extracted
component scores and variables with a score value >0.6 in one of the two components
were used for two-step cluster analysis. Accordingly, the two-step cluster analysis
identified four groups of farmers that were different in terms of livelihood strategies,
technology choice, utilisation of agricultural waste and soil fertility management. The
socioeconomic characteristics of each group are presented in Table 2.3 and presented
below.
Chapter 2
22
Figure 2.1. Loadings obtained from categorical principal component analysis describing the
relationship between socioeconomic variables. Veg = vegetable growers; Inc_ Veg = income from
vegetables; Ani = number of animal raised; Inc_ Ani = income from animal; crop = field crop growers;
Inc_ crop = income from field crops; orn= ornamental plant growers; Inc_ ornamental= income from
ornamental plants; Inc_ re= income from non-farm activities; TLU= tropical livestock unit; Edu =
educational status; comp = compost users; dis = farm distance; area = land size.
Classification of urban and peri-urban farmer groups
Cluster I (Subsistence field crop farmers): Farmers included in this group were located in
peri-urban areas. These farmers used to be rural farmers, but their land has been
encroached upon by expansion of the city. The agricultural activities were characterised
by subsistence field crop production. Wheat (Triticum sp.) and teff (Eragrostis tef) were
the dominant field crops. Legumes including chickpea (Cicer arietinum), grass pea
(Lathyrus sativus) and lentil (Lens culinaris) were also grown in crop rotation as food
crops. In addition to crop production, these farmers raised animals. The average herd
size of these farmers in TLU was 7.64, which was significantly (P < 0.01) higher than for
the other groups of farmers (Table 2.3). The average gross annual income of these
farmers was the lowest because field crop production contributed most of the household
income. Many field crop farmers had large farms (2.64 ha) but 84% of these farmers had
insecure landownership due to urban encroachment. Many of them had lost their
farmlands due to urbanisation. As a result, these farmers were forced to grow crops by
renting land from peri-urban and rural farmers. Farmers in this group used family
labour for agricultural activities. Field crop farmers had less access to institutional
support including credit and extension services. A large number of these farmers (47%)
were illiterate, and they had been engaged in agricultural activities for more than 25
years.
Demand for urban-waste compost
23
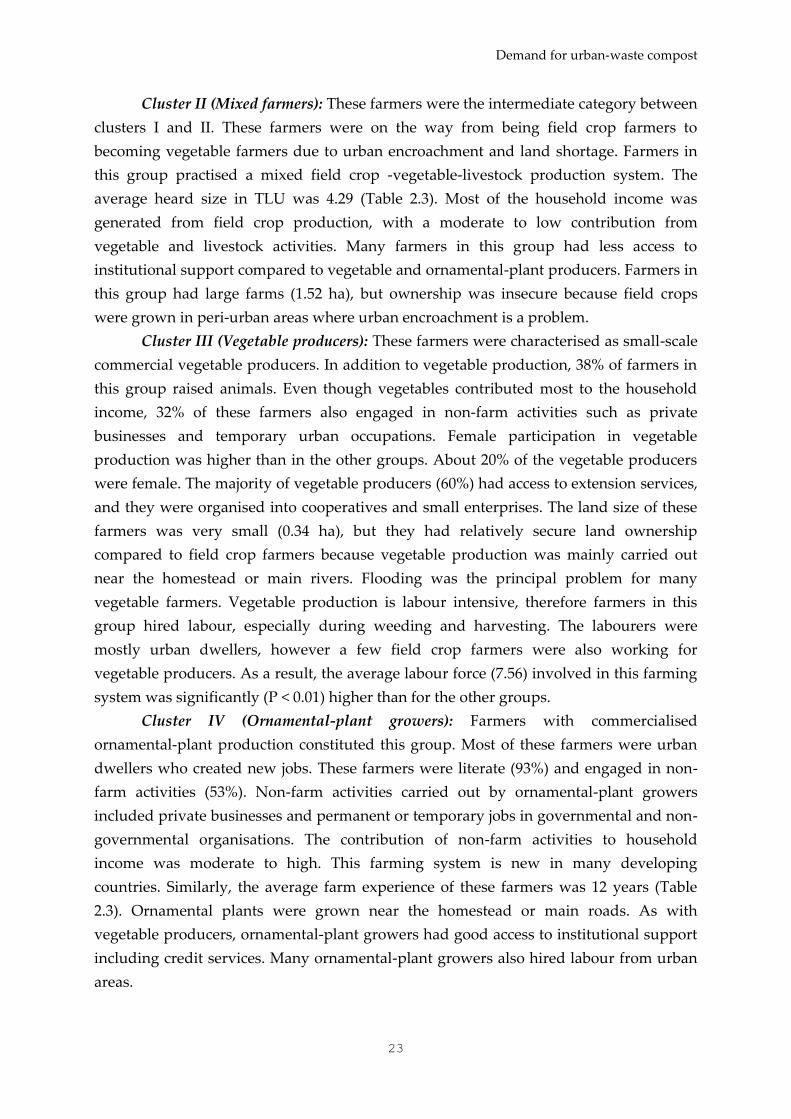
Cluster II (Mixed farmers): These farmers were the intermediate category between
clusters I and II. These farmers were on the way from being field crop farmers to
becoming vegetable farmers due to urban encroachment and land shortage. Farmers in
this group practised a mixed field crop -vegetable-livestock production system. The
average heard size in TLU was 4.29 (Table 2.3). Most of the household income was
generated from field crop production, with a moderate to low contribution from
vegetable and livestock activities. Many farmers in this group had less access to
institutional support compared to vegetable and ornamental-plant producers. Farmers in
this group had large farms (1.52 ha), but ownership was insecure because field crops
were grown in peri-urban areas where urban encroachment is a problem.
Cluster III (Vegetable producers): These farmers were characterised as small-scale
commercial vegetable producers. In addition to vegetable production, 38% of farmers in
this group raised animals. Even though vegetables contributed most to the household
income, 32% of these farmers also engaged in non-farm activities such as private
businesses and temporary urban occupations. Female participation in vegetable
production was higher than in the other groups. About 20% of the vegetable producers
were female. The majority of vegetable producers (60%) had access to extension services,
and they were organised into cooperatives and small enterprises. The land size of these
farmers was very small (0.34 ha), but they had relatively secure land ownership
compared to field crop farmers because vegetable production was mainly carried out
near the homestead or main rivers. Flooding was the principal problem for many
vegetable farmers. Vegetable production is labour intensive, therefore farmers in this
group hired labour, especially during weeding and harvesting. The labourers were
mostly urban dwellers, however a few field crop farmers were also working for
vegetable producers. As a result, the average labour force (7.56) involved in this farming
system was significantly (P < 0.01) higher than for the other groups.
Cluster IV (Ornamental-plant growers): Farmers with commercialised
ornamental-plant production constituted this group. Most of these farmers were urban
dwellers who created new jobs. These farmers were literate (93%) and engaged in non-
farm activities (53%). Non-farm activities carried out by ornamental-plant growers
included private businesses and permanent or temporary jobs in governmental and non-
governmental organisations. The contribution of non-farm activities to household
income was moderate to high. This farming system is new in many developing
countries. Similarly, the average farm experience of these farmers was 12 years (Table
2.3). Ornamental plants were grown near the homestead or main roads. As with
vegetable producers, ornamental-plant growers had good access to institutional support
including credit services. Many ornamental-plant growers also hired labour from urban
areas.
Chapter 2
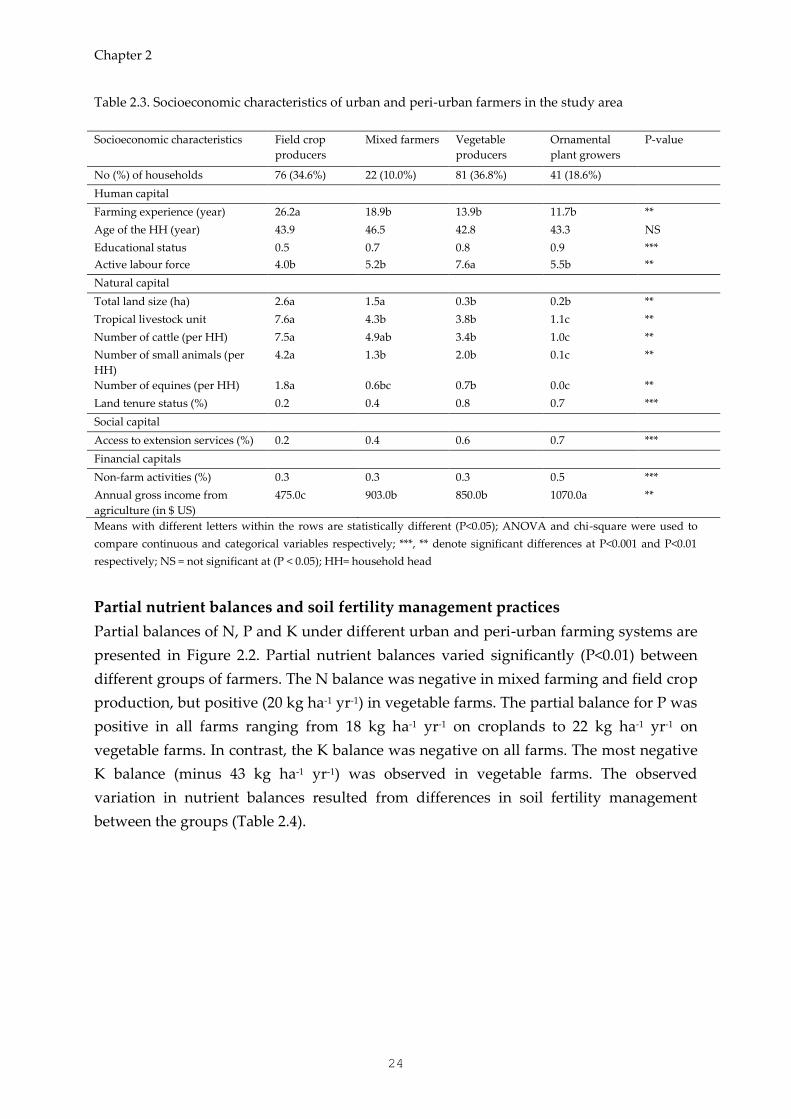
24
Table 2.3. Socioeconomic characteristics of urban and peri-urban farmers in the study area
Socioeconomic characteristics Field crop
producers
Mixed farmers Vegetable
producers
Ornamental
plant growers
P-value
No (%) of households 76 (34.6%) 22 (10.0%) 81 (36.8%) 41 (18.6%)
Human capital
Farming experience (year) 26.2a 18.9b 13.9b 11.7b **
Age of the HH (year) 43.9 46.5 42.8 43.3 NS
Educational status 0.5 0.7 0.8 0.9 ***
Active labour force 4.0b 5.2b 7.6a 5.5b **
Natural capital
Total land size (ha) 2.6a 1.5a 0.3b 0.2b **
Tropical livestock unit 7.6a 4.3b 3.8b 1.1c **
Number of cattle (per HH) 7.5a 4.9ab 3.4b 1.0c **
Number of small animals (per
HH)
4.2a 1.3b 2.0b 0.1c **
Number of equines (per HH) 1.8a 0.6bc 0.7b 0.0c **
Land tenure status (%) 0.2 0.4 0.8 0.7 ***
Social capital
Access to extension services (%) 0.2 0.4 0.6 0.7 ***
Financial capitals
Non-farm activities (%) 0.3 0.3 0.3 0.5 ***
Annual gross income from
agriculture (in $ US)
475.0c 903.0b 850.0b 1070.0a **
Means with different letters within the rows are statistically different (P<0.05); ANOVA and chi-square were used to
compare continuous and categorical variables respectively; ***, ** denote significant differences at P<0.001 and P<0.01
respectively; NS = not significant at (P < 0.05); HH= household head
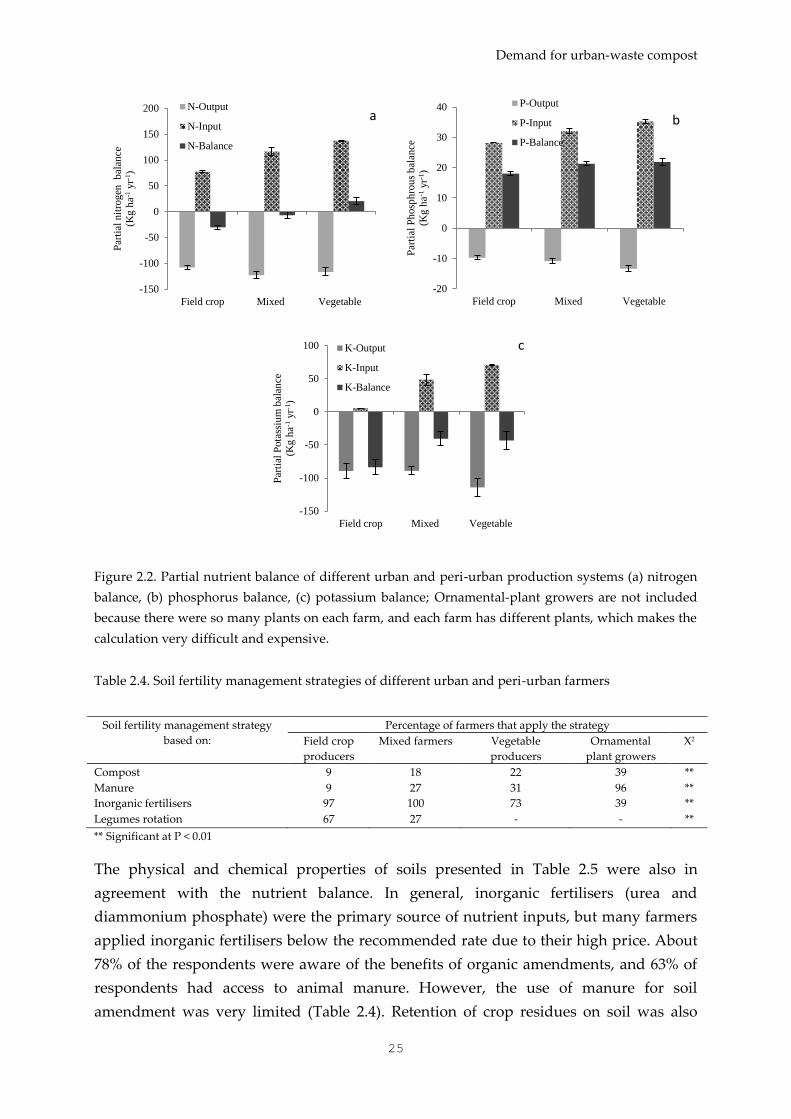
Partial nutrient balances and soil fertility management practices
Partial balances of N, P and K under different urban and peri-urban farming systems are
presented in Figure 2.2. Partial nutrient balances varied significantly (P<0.01) between
different groups of farmers. The N balance was negative in mixed farming and field crop
production, but positive (20 kg ha-1 yr-1) in vegetable farms. The partial balance for P was
positive in all farms ranging from 18 kg ha-1 yr-1 on croplands to 22 kg ha-1 yr-1 on
vegetable farms. In contrast, the K balance was negative on all farms. The most negative
K balance (minus 43 kg ha-1 yr-1) was observed in vegetable farms. The observed
variation in nutrient balances resulted from differences in soil fertility management
between the groups (Table 2.4).
Demand for urban-waste compost
25
Figure 2.2. Partial nutrient balance of different urban and peri-urban production systems (a) nitrogen
balance, (b) phosphorus balance, (c) potassium balance; Ornamental-plant growers are not included
because there were so many plants on each farm, and each farm has different plants, which makes the
calculation very difficult and expensive.
Table 2.4. Soil fertility management strategies of different urban and peri-urban farmers
Soil fertility management strategy
based on:
Percentage of farmers that apply the strategy
Field crop
producers
Mixed farmers Vegetable
producers
Ornamental
plant growers
X2
Compost 9 18 22 39 **
Manure 9 27 31 96 **
Inorganic fertilisers 97 100 73 39 **
Legumes rotation 67 27 - - **
** Significant at P < 0.01
The physical and chemical properties of soils presented in Table 2.5 were also in
agreement with the nutrient balance. In general, inorganic fertilisers (urea and
diammonium phosphate) were the primary source of nutrient inputs, but many farmers
applied inorganic fertilisers below the recommended rate due to their high price. About
78% of the respondents were aware of the benefits of organic amendments, and 63% of
respondents had access to animal manure. However, the use of manure for soil
amendment was very limited (Table 2.4). Retention of crop residues on soil was also
-150
-100
-50
0
50
100
150
200
Field crop Mixed Vegetable
Par
tial
nit
rogen
b
alan
ce
(Kg h
a-1 y
r-1)
N-Output
N-Input
N-Balance
a
-20
-10
0
10
20
30
40
Field crop Mixed Vegetable
Par
tial
Ph
osp
hro
us
bal
ance
(Kg h
a-1 y
r-1)
P-Output
P-Input
P-Balance
b
-150
-100
-50
0
50
100
Field crop Mixed Vegetable
Par
tial
Pota
ssiu
m b
alan
ce
(Kg h
a-1 y
r-1)
K-Output
K-Input
K-Balance
c
Chapter 2
26
limited in the study area. The majority of farmers retained less than 10% of crop residues
on their fields. Ornamental-plant and vegetable growers applied higher amounts of
organic amendments compared to the other two clusters. Most ornamental-plant
growers applied organic amendments at the rate of 6 t ha-1 yr-1 while vegetable producers
applied organic amendments less than 3 t ha-1 yr-1. About 96% of ornamental plant
growers applied manure and 39% applied compost from plant residues. In contrast, 31%
of vegetable growers, 27% of mixed farmers and 9% of field crop producers applied
manure on their farmlands. Similarly, 22% of vegetable growers, 18% of mixed farmers
and 9% of field crop producers used compost as soil amendment (Table 2.4).
Table 2.5. Physical and chemical properties of soils (0-25cm)
Soil properties Field crop farmers
(n=3)
Mixed farmers
(n=3)
Vegetable
farmers
(n=3)
P-Value
Clay (%) 66.2 61.0 43.9 NS
Silt (%) 22.6 26.0 34.7 NS
Sand (%) 11.2b 13.0ab 21.4a *
pH-H2O 7.3 7.4 7.6 NS
Organic carbon (%) 1.2b 1.4b 2.2a **
Total nitrogen (%) 0.1b 0.1b 0.2a **
Olsen-P (mg kg-1) 17.9c 43.4b 89.1a **
CEC (cmol (+)/kg soil) 58.3 61.3 45.2 NS
Exch Ca (cmol (+)/kg soil) 44.2 45.9 31.3 NS
Exch Mg (cmol (+)/kg soil) 10.3 8.1 9.5 NS
Exch K (cmol (+)/kg soil) 1.8b 1.4b 2.1a *
Total P (g kg-1) 0.6b 0.8ab 1.0a **
Total K (g kg-1) 3.0b 4.12a 4.6a **
* Ornamental plant growers are not included because these farmers used pot soils whose properties varied from farm to
farm; CEC = cation exchange capacity; Exch = exchangeable *, ** denote significant difference at P<0.05 and P<0.01
respectively
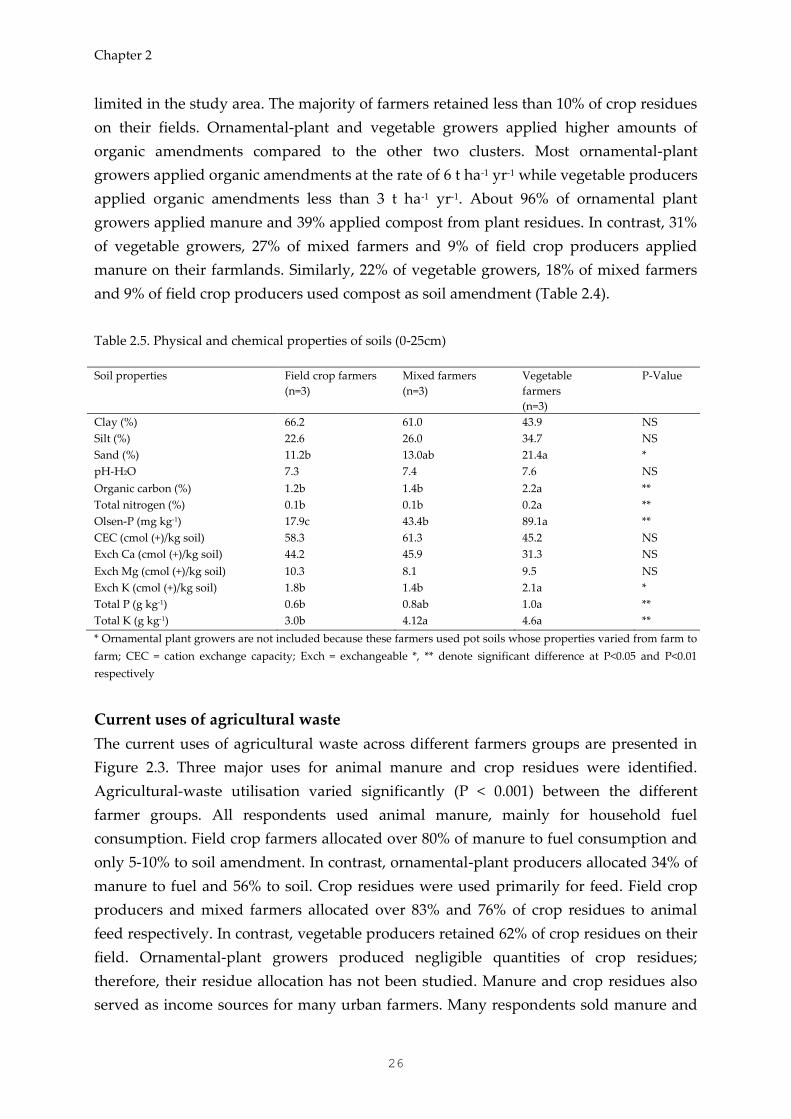
Current uses of agricultural waste
The current uses of agricultural waste across different farmers groups are presented in
Figure 2.3. Three major uses for animal manure and crop residues were identified.
Agricultural-waste utilisation varied significantly (P < 0.001) between the different
farmer groups. All respondents used animal manure, mainly for household fuel
consumption. Field crop farmers allocated over 80% of manure to fuel consumption and
only 5-10% to soil amendment. In contrast, ornamental-plant producers allocated 34% of
manure to fuel and 56% to soil. Crop residues were used primarily for feed. Field crop
producers and mixed farmers allocated over 83% and 76% of crop residues to animal
feed respectively. In contrast, vegetable producers retained 62% of crop residues on their
field. Ornamental-plant growers produced negligible quantities of crop residues;
therefore, their residue allocation has not been studied. Manure and crop residues also
served as income sources for many urban farmers. Many respondents sold manure and
Demand for urban-waste compost
27
crop residues (teff (Eragrostis tef)) and earned more than $50 yr-1. This is equivalent to 5-
10% of their annual income. A very small fraction of crop residues was allocated to fuel.
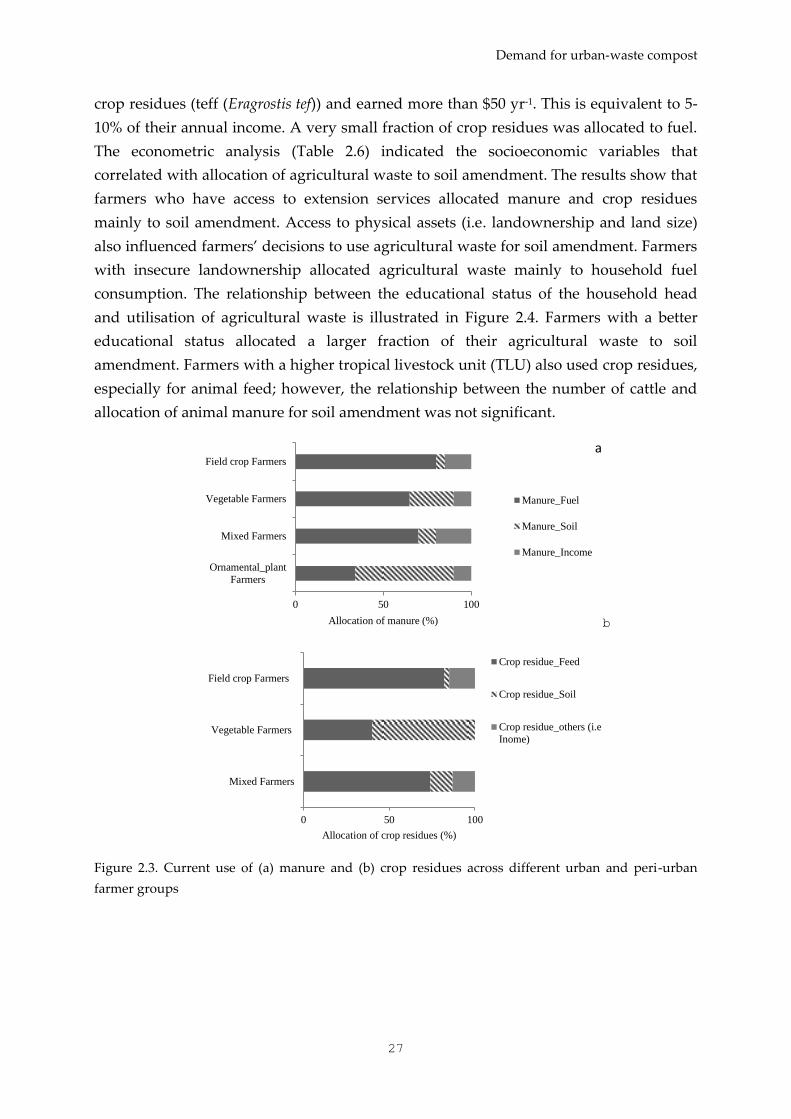
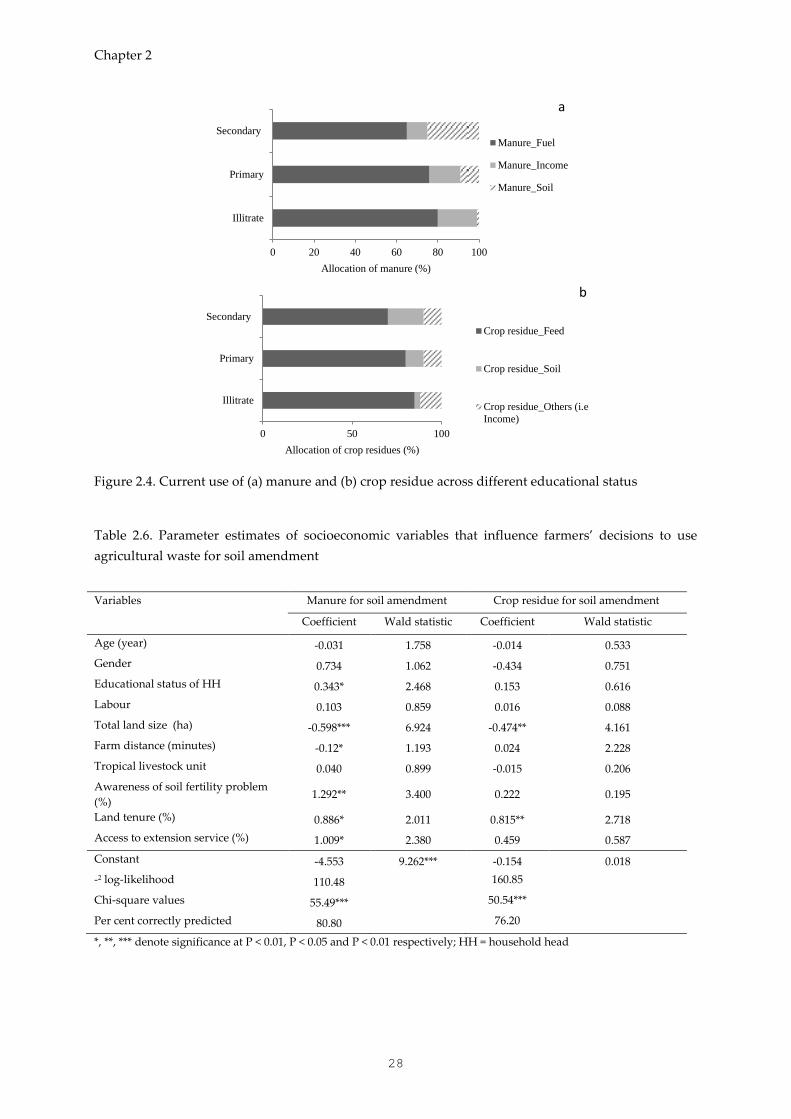
The econometric analysis (Table 2.6) indicated the socioeconomic variables that
correlated with allocation of agricultural waste to soil amendment. The results show that
farmers who have access to extension services allocated manure and crop residues
mainly to soil amendment. Access to physical assets (i.e. landownership and land size)
also influenced farmers’ decisions to use agricultural waste for soil amendment. Farmers
with insecure landownership allocated agricultural waste mainly to household fuel
consumption. The relationship between the educational status of the household head
and utilisation of agricultural waste is illustrated in Figure 2.4. Farmers with a better
educational status allocated a larger fraction of their agricultural waste to soil
amendment. Farmers with a higher tropical livestock unit (TLU) also used crop residues,
especially for animal feed; however, the relationship between the number of cattle and
allocation of animal manure for soil amendment was not significant.
Figure 2.3. Current use of (a) manure and (b) crop residues across different urban and peri-urban
farmer groups
0 50 100
Ornamental_plant
Farmers
Mixed Farmers
Vegetable Farmers
Field crop Farmers
Allocation of manure (%)
Manure_Fuel
Manure_Soil
Manure_Income
a
0 50 100
Mixed Farmers
Vegetable Farmers
Field crop Farmers
Allocation of crop residues (%)
Crop residue_Feed
Crop residue_Soil
Crop residue_others (i.e
Inome)
b
Chapter 2
28
Figure 2.4. Current use of (a) manure and (b) crop residue across different educational status
Table 2.6. Parameter estimates of socioeconomic variables that influence farmers’ decisions to use
agricultural waste for soil amendment
Variables Manure for soil amendment Crop residue for soil amendment
Coefficient Wald statistic Coefficient Wald statistic
Age (year) -0.031 1.758 -0.014 0.533
Gender 0.734 1.062 -0.434 0.751
Educational status of HH 0.343* 2.468 0.153 0.616
Labour 0.103 0.859 0.016 0.088
Total land size (ha) -0.598*** 6.924 -0.474** 4.161
Farm distance (minutes) -0.12* 1.193 0.024 2.228
Tropical livestock unit 0.040 0.899 -0.015 0.206
Awareness of soil fertility problem
(%) 1.292** 3.400 0.222 0.195
Land tenure (%) 0.886* 2.011 0.815** 2.718
Access to extension service (%) 1.009* 2.380 0.459 0.587
Constant -4.553 9.262*** -0.154 0.018
-2 log-likelihood 110.48 160.85
Chi-square values 55.49*** 50.54***
Per cent correctly predicted 80.80 76.20
*, **, *** denote significance at P < 0.01, P < 0.05 and P < 0.01 respectively; HH = household head
0 20 40 60 80 100
Illitrate
Primary
Secondary
Allocation of manure (%)
Manure_Fuel
Manure_Income
Manure_Soil
a
0 50 100
Illitrate
Primary
Secondary
Allocation of crop residues (%)
Crop residue_Feed
Crop residue_Soil
Crop residue_Others (i.e
Income)
b
Demand for urban-waste compost
29
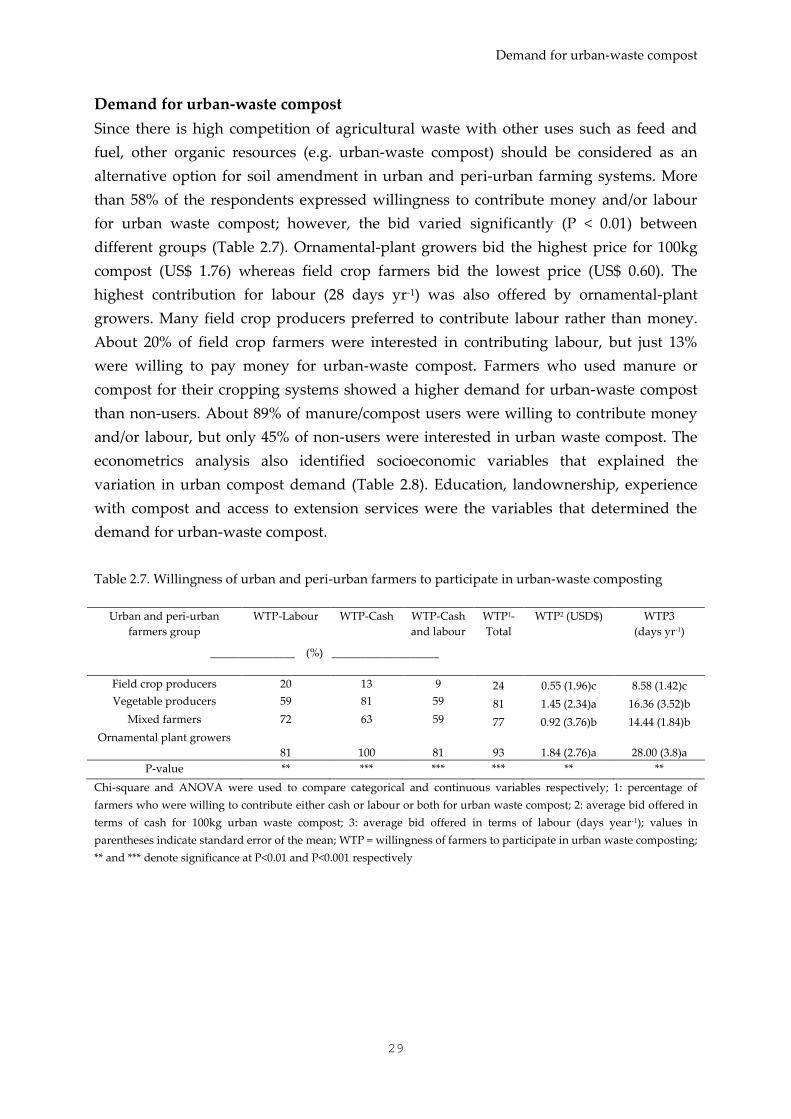
Demand for urban-waste compost
Since there is high competition of agricultural waste with other uses such as feed and
fuel, other organic resources (e.g. urban-waste compost) should be considered as an
alternative option for soil amendment in urban and peri-urban farming systems. More
than 58% of the respondents expressed willingness to contribute money and/or labour
for urban waste compost; however, the bid varied significantly (P < 0.01) between
different groups (Table 2.7). Ornamental-plant growers bid the highest price for 100kg
compost (US$ 1.76) whereas field crop farmers bid the lowest price (US$ 0.60). The
highest contribution for labour (28 days yr-1) was also offered by ornamental-plant
growers. Many field crop producers preferred to contribute labour rather than money.
About 20% of field crop farmers were interested in contributing labour, but just 13%
were willing to pay money for urban-waste compost. Farmers who used manure or
compost for their cropping systems showed a higher demand for urban-waste compost
than non-users. About 89% of manure/compost users were willing to contribute money
and/or labour, but only 45% of non-users were interested in urban waste compost. The
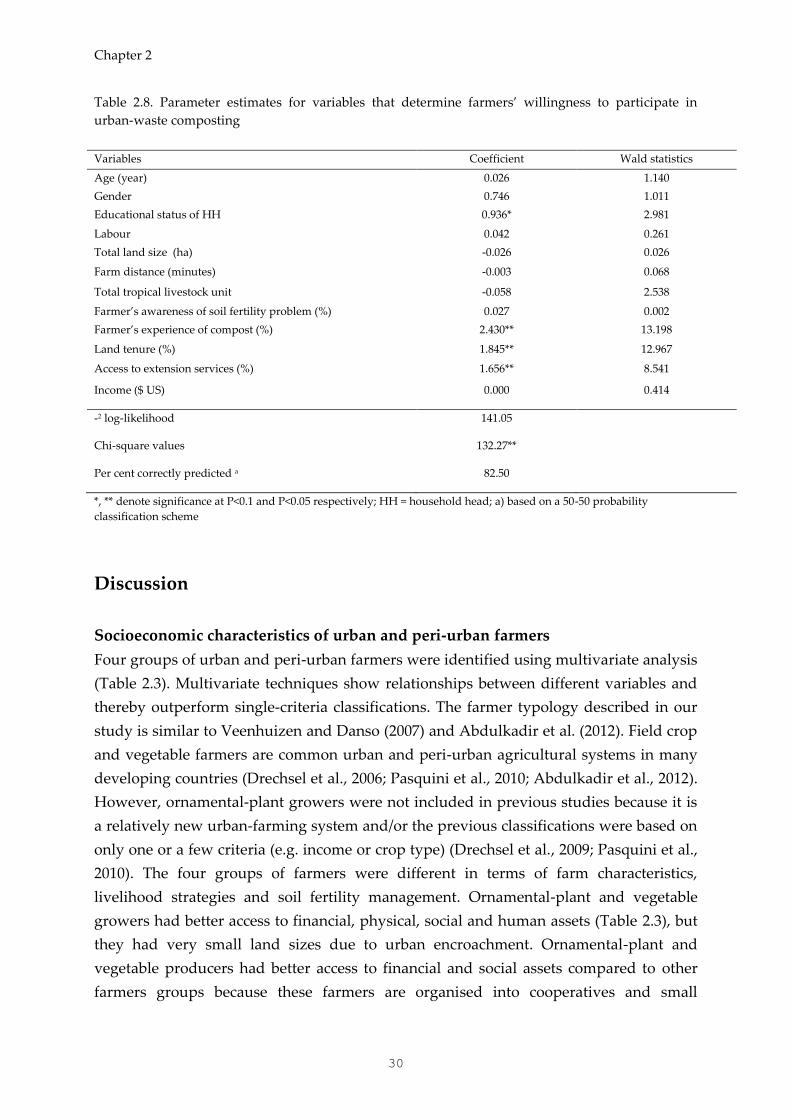
econometrics analysis also identified socioeconomic variables that explained the
variation in urban compost demand (Table 2.8). Education, landownership, experience
with compost and access to extension services were the variables that determined the
demand for urban-waste compost.
Table 2.7. Willingness of urban and peri-urban farmers to participate in urban-waste composting
Urban and peri-urban
farmers group
WTP-Labour WTP-Cash
WTP-Cash
and labour
WTP1-
Total
WTP2 (USD$) WTP3
(days yr-1)
_______________ (%) ___________________
Field crop producers 20 13 9 24 0.55 (1.96)c 8.58 (1.42)c
Vegetable producers 59 81 59 81 1.45 (2.34)a 16.36 (3.52)b
Mixed farmers 72 63 59 77 0.92 (3.76)b 14.44 (1.84)b
Ornamental plant growers
81
100
81 93 1.84 (2.76)a 28.00 (3.8)a
P-value ** *** *** *** ** **
Chi-square and ANOVA were used to compare categorical and continuous variables respectively; 1: percentage of
farmers who were willing to contribute either cash or labour or both for urban waste compost; 2: average bid offered in
terms of cash for 100kg urban waste compost; 3: average bid offered in terms of labour (days year-1); values in
parentheses indicate standard error of the mean; WTP = willingness of farmers to participate in urban waste composting;
** and *** denote significance at P<0.01 and P<0.001 respectively
Chapter 2
30
Table 2.8. Parameter estimates for variables that determine farmers’ willingness to participate in
urban-waste composting
Variables Coefficient Wald statistics
Age (year) 0.026 1.140
Gender 0.746 1.011
Educational status of HH 0.936* 2.981
Labour 0.042 0.261
Total land size (ha) -0.026 0.026
Farm distance (minutes) -0.003 0.068
Total tropical livestock unit -0.058 2.538
Farmer’s awareness of soil fertility problem (%) 0.027 0.002
Farmer’s experience of compost (%) 2.430** 13.198
Land tenure (%) 1.845** 12.967
Access to extension services (%) 1.656** 8.541
Income ($ US) 0.000 0.414
-2 log-likelihood 141.05
Chi-square values 132.27**
Per cent correctly predicted a 82.50
*, ** denote significance at P<0.1 and P<0.05 respectively; HH = household head; a) based on a 50-50 probability
classification scheme
Discussion
Socioeconomic characteristics of urban and peri-urban farmers
Four groups of urban and peri-urban farmers were identified using multivariate analysis
(Table 2.3). Multivariate techniques show relationships between different variables and
thereby outperform single-criteria classifications. The farmer typology described in our
study is similar to Veenhuizen and Danso (2007) and Abdulkadir et al. (2012). Field crop
and vegetable farmers are common urban and peri-urban agricultural systems in many
developing countries (Drechsel et al., 2006; Pasquini et al., 2010; Abdulkadir et al., 2012).
However, ornamental-plant growers were not included in previous studies because it is
a relatively new urban-farming system and/or the previous classifications were based on
only one or a few criteria (e.g. income or crop type) (Drechsel et al., 2009; Pasquini et al.,
2010). The four groups of farmers were different in terms of farm characteristics,
livelihood strategies and soil fertility management. Ornamental-plant and vegetable
growers had better access to financial, physical, social and human assets (Table 2.3), but
they had very small land sizes due to urban encroachment. Ornamental-plant and
vegetable producers had better access to financial and social assets compared to other
farmers groups because these farmers are organised into cooperatives and small
Demand for urban-waste compost
31
enterprises. Ornamental-plant and vegetable producers had also better educational
status that helps them to utilize the available resources (e.g. credit, extension services).
Due to shortage of land, ornamental-plant and vegetable production systems are more
intensive and market-oriented compared to field crop and mixed production. Many field
crop farmers had large land sizes and the farmlands were located far from their
homestead. Hence, it was difficult to use intensive farm management practices due to the
efforts required to transport agricultural inputs (e.g. irrigation water, compost and
manure). Market-oriented and intensified vegetable production on small areas of public
land has been reported in several countries (Drechsel et al., 2009; Pasquini et al., 2010;
Abdulkadir et al., 2012). For example, West African urban farmers produce vegetables on
land ranging from 0.07 to 0.41 ha (Abdulkadir et al., 2012); however, the vegetable
production is more intensive than those identified in our study. Many field crop farmers
used family labour for agricultural activities, while more than 76% of ornamental-plant
and vegetable growers hired additional labour (i.e field crop farmers and unemployed
urban dwellers). The family labour reported in this study was very low compared to
urban and peri-urban farming systems in West African and Asian countries (De Bon,
2001; Abdulkadir et al., 2012). Hence, a shortage of labour could be another reason for
less intensified production in our study. Many urban and peri-urban farmers in the area
even lost their land because the land had been taken over for residential or other urban
uses. Land acquisition is one of the main constraints for many urban farmers and it
impedes the adoption of intensive agricultural practices (Condon et al., 2010, De Bon,
2001). In Ethiopia, land is a public good owned by the state. Therefore, farmers are not
allowed to sell their land or use it as collateral to obtain credit (Gittleman, 2009). This
land tenure system discourages many urban farmers from investing in their farmland
and generating more revenue. We observed that many urban farmers escaped the land
tenure trap through intensified production systems close to their homestead. This
implies that field crop producers could shift to more intensified production systems in
the future because urban encroachment accelerates in the area.
Ornamental-plant and vegetable growers had more formal education than the
other clusters and were more engaged in non-farm activities. Some field crop producers
were also engaged in unskilled non-farm activities, for instance as night watchmen or
labourers. The contribution of non-farm activities to household income was moderate to
high in the area. Low income from agriculture is the main reason for many farmers of the
other groups to be involved in non-farm activities. Furthermore, the high rate of
urbanisation in the study area (> 4% per year) creates job opportunities for many farmers
outside agriculture. In agreement with our findings, De Bon (2001) and Tittonell et al.
(2010) reported a significant contribution of non-farm activities to household income in
East African countries. However, the contribution of non-farm activities to household
income was very low in West African countries (Abdulkadir et al., 2012). The observed
Chapter 2
32
differences between Western African farmers and our respondents suggest the need for
site-specific classification of farmers to understand their livelihood strategies and design
agricultural policies.
Soil fertility management practices
Soil fertility management practices varied significantly between groups of farmers. The
application of manure and compost was very limited in the area. Inorganic fertilisers
were the main sources of plant nutrients. Ornamental-plant and vegetable production
demands a high nutrient input and consequently rapid economic returns, hence the
highest application of organic amendments and irrigation practices were observed in
these production systems. The high soil organic carbon content on vegetable farms
compared to other farms (Table 2.5) also supported relatively high use of organic
amendments in vegetable production. We also observed that only vegetable producers
and few farmers who practised mixed farming used irrigation because many vegetable
farms were located near the farmers’ homesteads or close to rivers or main roads, and for
that reason were suitable for irrigation. Irrigation with wastewater is the main source of
plant nutrients in many urban and peri-urban agricultural systems (Khai et al., 2007;
Abdulkadir et al., 2013). According to Khai et al. (2007), wastewater represents 21 to 61%
and 31 to 66% of total N and K inputs respectively in small-scale peri-urban vegetable
production systems in Southeast Asia. In total 21 kg N ha-1 yr-1, 2.4 kg P ha-1 yr-1 and 55
kg K ha-1 yr-1 respectively were added on vegetable farms from irrigation water in the
area. This is equivalent to 11-15%, 5-8% and 70-85% of total N, P and K inputs
respectively. As a result, partial N and P balances were more positive on vegetable farms
due to high use of organic amendments and irrigation with wastewater. The negative N
balance on field crop and mixed farms could result from the application of inorganic
fertilisers below the recommended rate due to their high price (Kassie et al., 2009) and
insufficient application of organic amendments. Only 9% of field crop farmers applied
manure and/or retained crop residues on farmlands (Table 2.4), and the application rate
of manure and/or crop residues was very low (<1 t ha-1yr-1). In agreement with this,
Baudron et al. (2014) reported a limited application of manure on cropland in sub-
Saharan Africa (423 kg ha-1). Loss of nitrogen through leaching following heavy rainfall
could be another reason for the negative N balance. Urea and di-ammonium phosphate
were the only inorganic fertilisers available to the farmers. Hence, negative K balances
were observed in all urban and peri-urban production systems. Irrigation water and
organic amendments were the main sources of K on vegetable farms. However, even
then the partial balance for K remained negative in these production systems probably
due to large exports of K with the edible parts of vegetables. Comparable negative K
balances were reported by Wang et al. (2008), Diogo et al. (2010) and Abdulkadir et al.
(2013) in urban farming systems. In contrast to our study, Khai et al. (2007), Wang et al.
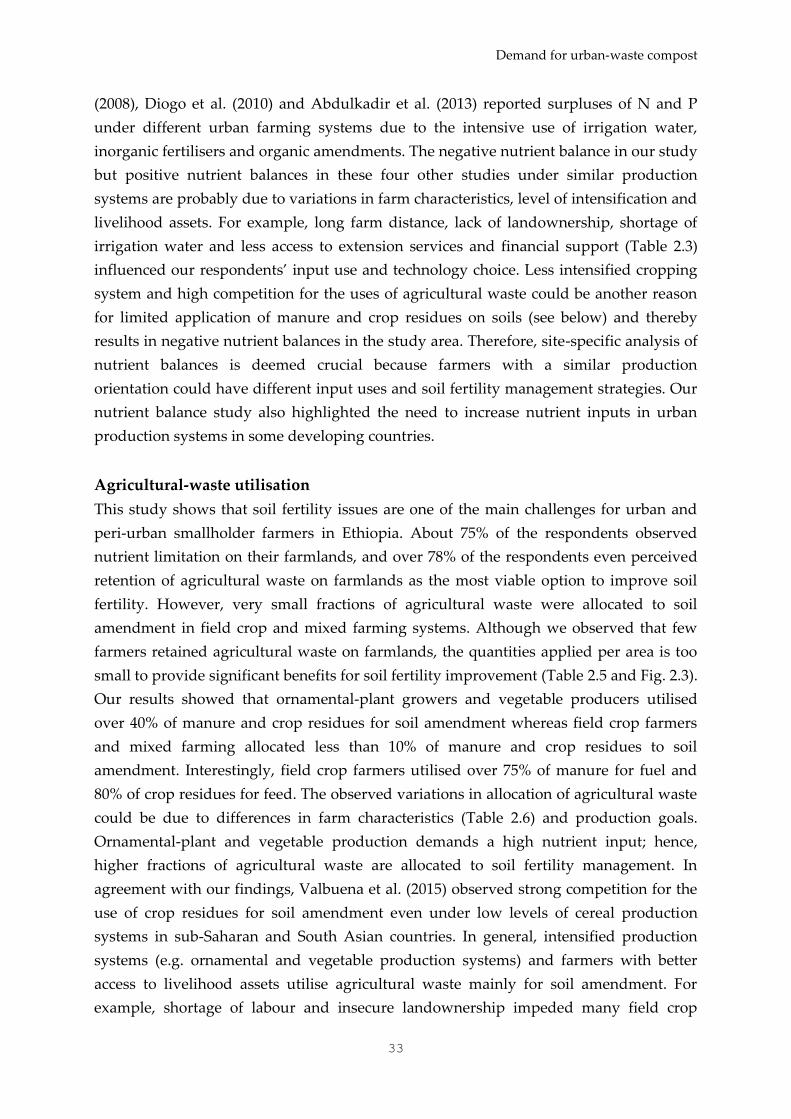
Demand for urban-waste compost
33
(2008), Diogo et al. (2010) and Abdulkadir et al. (2013) reported surpluses of N and P
under different urban farming systems due to the intensive use of irrigation water,
inorganic fertilisers and organic amendments. The negative nutrient balance in our study
but positive nutrient balances in these four other studies under similar production
systems are probably due to variations in farm characteristics, level of intensification and
livelihood assets. For example, long farm distance, lack of landownership, shortage of
irrigation water and less access to extension services and financial support (Table 2.3)
influenced our respondents’ input use and technology choice. Less intensified cropping
system and high competition for the uses of agricultural waste could be another reason
for limited application of manure and crop residues on soils (see below) and thereby
results in negative nutrient balances in the study area. Therefore, site-specific analysis of
nutrient balances is deemed crucial because farmers with a similar production
orientation could have different input uses and soil fertility management strategies. Our
nutrient balance study also highlighted the need to increase nutrient inputs in urban
production systems in some developing countries.
Agricultural-waste utilisation
This study shows that soil fertility issues are one of the main challenges for urban and
peri-urban smallholder farmers in Ethiopia. About 75% of the respondents observed
nutrient limitation on their farmlands, and over 78% of the respondents even perceived
retention of agricultural waste on farmlands as the most viable option to improve soil
fertility. However, very small fractions of agricultural waste were allocated to soil
amendment in field crop and mixed farming systems. Although we observed that few
farmers retained agricultural waste on farmlands, the quantities applied per area is too
small to provide significant benefits for soil fertility improvement (Table 2.5 and Fig. 2.3).
Our results showed that ornamental-plant growers and vegetable producers utilised
over 40% of manure and crop residues for soil amendment whereas field crop farmers
and mixed farming allocated less than 10% of manure and crop residues to soil
amendment. Interestingly, field crop farmers utilised over 75% of manure for fuel and
80% of crop residues for feed. The observed variations in allocation of agricultural waste
could be due to differences in farm characteristics (Table 2.6) and production goals.
Ornamental-plant and vegetable production demands a high nutrient input; hence,
higher fractions of agricultural waste are allocated to soil fertility management. In
agreement with our findings, Valbuena et al. (2015) observed strong competition for the
use of crop residues for soil amendment even under low levels of cereal production
systems in sub-Saharan and South Asian countries. In general, intensified production
systems (e.g. ornamental and vegetable production systems) and farmers with better
access to livelihood assets utilise agricultural waste mainly for soil amendment. For
example, shortage of labour and insecure landownership impeded many field crop
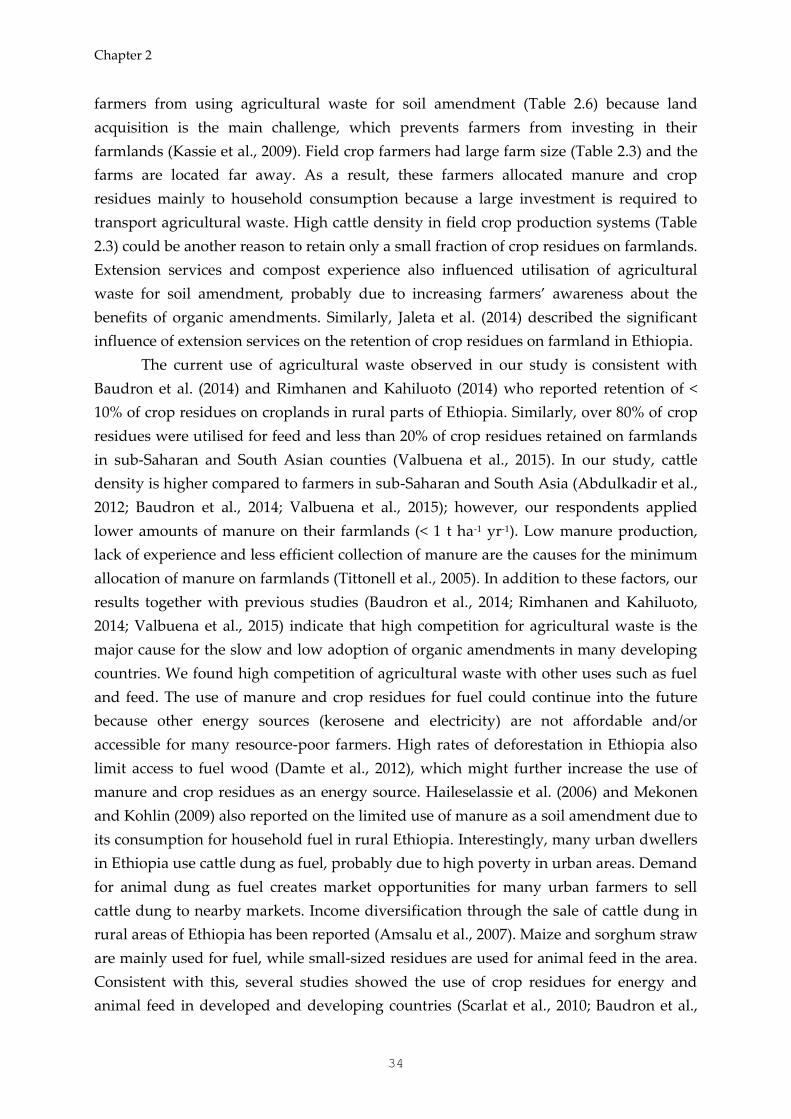
Chapter 2
34
farmers from using agricultural waste for soil amendment (Table 2.6) because land
acquisition is the main challenge, which prevents farmers from investing in their
farmlands (Kassie et al., 2009). Field crop farmers had large farm size (Table 2.3) and the
farms are located far away. As a result, these farmers allocated manure and crop
residues mainly to household consumption because a large investment is required to
transport agricultural waste. High cattle density in field crop production systems (Table
2.3) could be another reason to retain only a small fraction of crop residues on farmlands.
Extension services and compost experience also influenced utilisation of agricultural
waste for soil amendment, probably due to increasing farmers’ awareness about the
benefits of organic amendments. Similarly, Jaleta et al. (2014) described the significant
influence of extension services on the retention of crop residues on farmland in Ethiopia.
The current use of agricultural waste observed in our study is consistent with
Baudron et al. (2014) and Rimhanen and Kahiluoto (2014) who reported retention of <
10% of crop residues on croplands in rural parts of Ethiopia. Similarly, over 80% of crop
residues were utilised for feed and less than 20% of crop residues retained on farmlands
in sub-Saharan and South Asian counties (Valbuena et al., 2015). In our study, cattle
density is higher compared to farmers in sub-Saharan and South Asia (Abdulkadir et al.,
2012; Baudron et al., 2014; Valbuena et al., 2015); however, our respondents applied
lower amounts of manure on their farmlands (< 1 t ha-1 yr-1). Low manure production,
lack of experience and less efficient collection of manure are the causes for the minimum
allocation of manure on farmlands (Tittonell et al., 2005). In addition to these factors, our
results together with previous studies (Baudron et al., 2014; Rimhanen and Kahiluoto,
2014; Valbuena et al., 2015) indicate that high competition for agricultural waste is the
major cause for the slow and low adoption of organic amendments in many developing
countries. We found high competition of agricultural waste with other uses such as fuel
and feed. The use of manure and crop residues for fuel could continue into the future
because other energy sources (kerosene and electricity) are not affordable and/or
accessible for many resource-poor farmers. High rates of deforestation in Ethiopia also
limit access to fuel wood (Damte et al., 2012), which might further increase the use of
manure and crop residues as an energy source. Haileselassie et al. (2006) and Mekonen
and Kohlin (2009) also reported on the limited use of manure as a soil amendment due to
its consumption for household fuel in rural Ethiopia. Interestingly, many urban dwellers
in Ethiopia use cattle dung as fuel, probably due to high poverty in urban areas. Demand
for animal dung as fuel creates market opportunities for many urban farmers to sell
cattle dung to nearby markets. Income diversification through the sale of cattle dung in
rural areas of Ethiopia has been reported (Amsalu et al., 2007). Maize and sorghum straw
are mainly used for fuel, while small-sized residues are used for animal feed in the area.
Consistent with this, several studies showed the use of crop residues for energy and
animal feed in developed and developing countries (Scarlat et al., 2010; Baudron et al.,
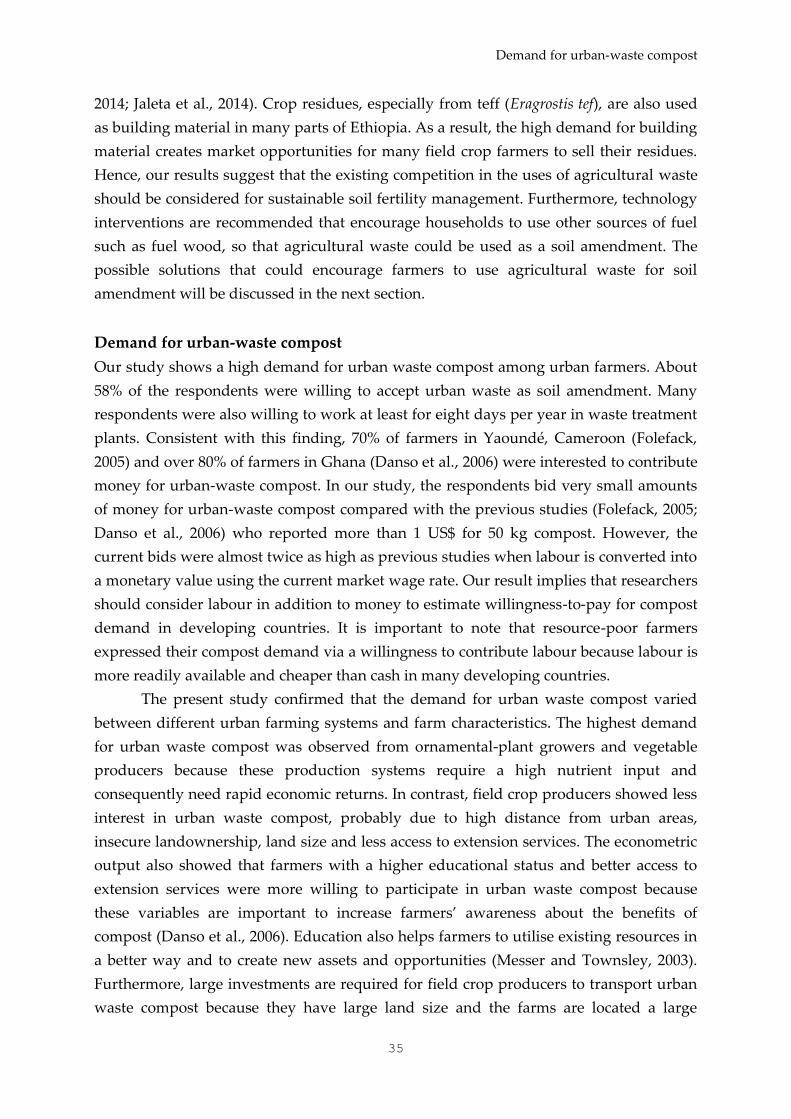
Demand for urban-waste compost
35
2014; Jaleta et al., 2014). Crop residues, especially from teff (Eragrostis tef), are also used
as building material in many parts of Ethiopia. As a result, the high demand for building
material creates market opportunities for many field crop farmers to sell their residues.
Hence, our results suggest that the existing competition in the uses of agricultural waste
should be considered for sustainable soil fertility management. Furthermore, technology
interventions are recommended that encourage households to use other sources of fuel
such as fuel wood, so that agricultural waste could be used as a soil amendment. The
possible solutions that could encourage farmers to use agricultural waste for soil
amendment will be discussed in the next section.
Demand for urban-waste compost
Our study shows a high demand for urban waste compost among urban farmers. About
58% of the respondents were willing to accept urban waste as soil amendment. Many
respondents were also willing to work at least for eight days per year in waste treatment
plants. Consistent with this finding, 70% of farmers in Yaoundé, Cameroon (Folefack,
2005) and over 80% of farmers in Ghana (Danso et al., 2006) were interested to contribute
money for urban-waste compost. In our study, the respondents bid very small amounts
of money for urban-waste compost compared with the previous studies (Folefack, 2005;
Danso et al., 2006) who reported more than 1 US$ for 50 kg compost. However, the
current bids were almost twice as high as previous studies when labour is converted into
a monetary value using the current market wage rate. Our result implies that researchers
should consider labour in addition to money to estimate willingness-to-pay for compost
demand in developing countries. It is important to note that resource-poor farmers
expressed their compost demand via a willingness to contribute labour because labour is
more readily available and cheaper than cash in many developing countries.
The present study confirmed that the demand for urban waste compost varied
between different urban farming systems and farm characteristics. The highest demand
for urban waste compost was observed from ornamental-plant growers and vegetable
producers because these production systems require a high nutrient input and
consequently need rapid economic returns. In contrast, field crop producers showed less
interest in urban waste compost, probably due to high distance from urban areas,
insecure landownership, land size and less access to extension services. The econometric
output also showed that farmers with a higher educational status and better access to
extension services were more willing to participate in urban waste compost because
these variables are important to increase farmers’ awareness about the benefits of
compost (Danso et al., 2006). Education also helps farmers to utilise existing resources in
a better way and to create new assets and opportunities (Messer and Townsley, 2003).
Furthermore, large investments are required for field crop producers to transport urban
waste compost because they have large land size and the farms are located a large
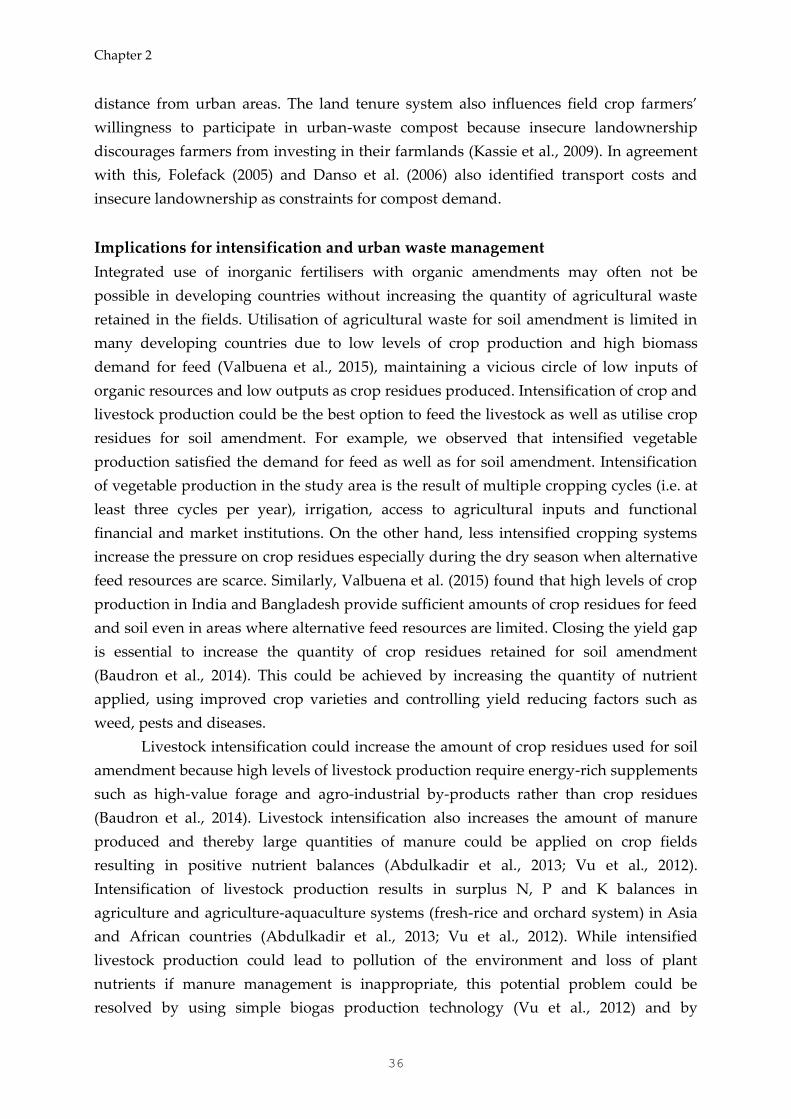
Chapter 2
36
distance from urban areas. The land tenure system also influences field crop farmers’
willingness to participate in urban-waste compost because insecure landownership
discourages farmers from investing in their farmlands (Kassie et al., 2009). In agreement
with this, Folefack (2005) and Danso et al. (2006) also identified transport costs and
insecure landownership as constraints for compost demand.
Implications for intensification and urban waste management
Integrated use of inorganic fertilisers with organic amendments may often not be
possible in developing countries without increasing the quantity of agricultural waste
retained in the fields. Utilisation of agricultural waste for soil amendment is limited in
many developing countries due to low levels of crop production and high biomass
demand for feed (Valbuena et al., 2015), maintaining a vicious circle of low inputs of
organic resources and low outputs as crop residues produced. Intensification of crop and
livestock production could be the best option to feed the livestock as well as utilise crop
residues for soil amendment. For example, we observed that intensified vegetable
production satisfied the demand for feed as well as for soil amendment. Intensification
of vegetable production in the study area is the result of multiple cropping cycles (i.e. at
least three cycles per year), irrigation, access to agricultural inputs and functional
financial and market institutions. On the other hand, less intensified cropping systems
increase the pressure on crop residues especially during the dry season when alternative
feed resources are scarce. Similarly, Valbuena et al. (2015) found that high levels of crop
production in India and Bangladesh provide sufficient amounts of crop residues for feed
and soil even in areas where alternative feed resources are limited. Closing the yield gap
is essential to increase the quantity of crop residues retained for soil amendment
(Baudron et al., 2014). This could be achieved by increasing the quantity of nutrient
applied, using improved crop varieties and controlling yield reducing factors such as
weed, pests and diseases.
Livestock intensification could increase the amount of crop residues used for soil
amendment because high levels of livestock production require energy-rich supplements
such as high-value forage and agro-industrial by-products rather than crop residues
(Baudron et al., 2014). Livestock intensification also increases the amount of manure
produced and thereby large quantities of manure could be applied on crop fields
resulting in positive nutrient balances (Abdulkadir et al., 2013; Vu et al., 2012).
Intensification of livestock production results in surplus N, P and K balances in
agriculture and agriculture-aquaculture systems (fresh-rice and orchard system) in Asia
and African countries (Abdulkadir et al., 2013; Vu et al., 2012). While intensified
livestock production could lead to pollution of the environment and loss of plant
nutrients if manure management is inappropriate, this potential problem could be
resolved by using simple biogas production technology (Vu et al., 2012) and by
Demand for urban-waste compost
37
improving flooring and roofing of the stall. In our study area, we observed that farmers
without cropland but with intensified livestock production have a problem of manure
handling. Therefore, creating linkages between intensified livestock farmers and crop
producers could increase the amount of manure applied on farmlands.
Farm characteristics and socioeconomic conditions impede agricultural
intensification in developing countries (Baudron et al., 2014; Valbuena et al., 2015). We
identified that insecure land ownership, shortage of land, limited access to agricultural
inputs and to functional finance and market institutions and extension services are the
major challenges for crop and livestock intensification in the area. Hence, it is essential to
improve the existing policies, infrastructure, extension services, markets and financial
institutions to encourage intensification of crop and livestock production so that the
pressure on agricultural waste could be reduced in developing countries.
Urban waste composting is another viable option to increase soil fertility in urban
farming systems where utilisation of agricultural waste for soil amendment is limited. A
large amount of urban waste is produced every day; however, the majority of waste is
dumped in landfills in both developed and developing countries (Regassa et al., 2011;
Mengistu, 2013; Guerrero et al., 2013; Bernad - Beltrán et al., 2014). Large proportions of
urban waste in the study area as well as in many countries are organic which could
provide an opportunity to recycle urban waste in to compost (Xiao et al., 2007; Mengistu,
2013; Bernad-Beltrán et al., 2014). However, less than 5% of urban waste is converted to
compost in the study area (Mengistu, 2013), and even in some developed countries (e.g
Beijing, China) (Xiao et al., 2007). We suggest small and decentralized community
composting facilities because large and centralized composting plants require high
operational, maintenance, and transportation costs. Small-scale composting plants create
jobs for the urban poor and empower women. Urban waste composting involves a large
number of different stakeholders. However, many urban waste composting facilities in
the area and developing countries often face problems due to lack of organisation,
infrastructure, involvement of stakeholders and financial resources (Guerrero et al.,
2013).
Conclusions
The integrated use of mineral fertilisers and organic amendments is the most sustainable
option to increase agricultural production and soil organic matter. However, very small
fractions of agricultural waste are allocated for soil amendment. We suggest that
competition for agricultural waste between fuel, feed and soil amendment is a major
cause of nutrient deficits in the urban and peri-urban production systems. Agricultural
waste is mainly used for feed, fuel and income source. Hence, current soil fertility
management strategies should consider that competition for the allocation of agricultural
Chapter 2
38
waste. Furthermore, replacement of fuel and feed through sustainable means other than
farm waste is crucial, as a consequence of which agricultural waste could be used as soil
amendment. Urban-waste compost could also be an alternative soil amendment for
urban and peri-urban agriculture. The re-use of biodegradable urban waste for soil
amendment is an imperative in many developing countries. Hence, education and
creation of awareness about urban-waste compost are required. The involvement and
commitment of stakeholders are also essential because considerable investments are
required to utilise urban waste for soil amendment. Finally, we suggest that both labour
and cash should be considered when estimating willingness-to-pay for compost.
Acknowledgements
This research was funded by the AgTraIn (Agricultural Transformation by Innovation)
Erasmus Mundus Joint Doctoral programme. The authors acknowledge Prof. Lijbert
Brussaard, Dr. Sander Bruun and three anonymous reviewers for their valuable
comments on earlier versions of the manuscript. Our special thanks go to Biruk Abdissa
for his assistance during fieldwork.
Vermicomposting reduces N losses and GHG emissions during composting
39
CHAPTER 3
Vermicomposting as a technology for reducing nitrogen
losses and greenhouse gas emissions from small-scale
composting
This chapter is published as:
Nigussie, A., Kuyper, T.W., Bruun, S., de Neergaard A. (2016). Vermicomposting as a
technology for reducing nitrogen losses and greenhouse gas emissions from small-
scale composting. Journal of Cleaner Production 139, 429-439.
Chapter 3
40
Vermicomposting as a technology for reducing nitrogen
losses and greenhouse gas emissions from small-scale
composting
Abstract
Thermophilic composting produces a significant amount of greenhouse gases. The
objectives of this study were (i) to evaluate the effectiveness of vermicomposting to
reduce nitrogen losses and greenhouse gases emissions compared to thermophilic
composting, and (ii) to determine the effect of different variables (i.e. carbon : nitrogen
ratio, earthworm density, moisture content and carbon quality) on greenhouse gases
emissions and earthworm growth during vermicomposting. The results showed that
vermicomposting significantly reduced nitrogen loss by 10-20% compared to
thermophilic composting. Vermicomposting decreased nitrous oxide emissions by 25-
36% and methane emissions by 22-26%. A higher earthworm density increased carbon
dioxide emissions by 3-14%, but decreased methane emissions by 10-35%. Earthworm
density had a marginal effect on nitrous oxide emissions. Vermicomposting decreased
nitrous oxide emissions by 40% with higher moisture and by 23% with lower moisture.
Vermicomposting also decreased methane emissions by 32% and 16% with higher and
lower moisture respectively. This study showed that the addition of labile carbon sources
increased carbon dioxide and methane emissions and earthworm growth, but did not
affect nitrous oxide emissions. In conclusion, vermicomposting is effective at reducing
nitrogen losses and greenhouse gas emissions from composting. Therefore,
vermicomposting could represent an option for reducing greenhouse gas emissions from
composting, particularly in developing countries where the existing technical solutions
are expensive and difficult to implement.
Keywords: thermophilic composting, vermicomposting, substrate quality, earthworms
Vermicomposting reduces N losses and GHG emissions during composting
41
Introduction
Municipal solid waste management has become a matter of global concern due to rapid
urban population growth and the high costs associated with waste management
(Marshall and Farahbakhsh, 2013). Studies have shown that biodegradable materials
constitute over half of municipal solid waste (Taeporamaysamai and Ratanatamskul,
2016), with their results indicating that bioconversion of municipal solid waste into soil
amendments (compost) is a viable option for sustainable waste management. High
compost demand by urban farmers (Nigussie et al., 2015) also emphasises the need for
municipal waste composting.
Thermophilic composting and vermicomposting are effective techniques
commonly used to convert biodegradable waste into soil amendments. Thermophilic
composting is a composting process at high temperatures (> 45 oC), but vermicomposting
is a mesophilic (< 30 °C) process that involves earthworms and associated
microorganisms in decomposing and stabilising organic materials (Lim et al., 2016).
Major similarities and differences between thermophilic composting and
vermicomposting are summarised by Lim et al. (2016).
Compost, particularly in many (sub-) tropical countries, contains low amounts of
plant nutrients (especially nitrogen) and hence is unable to meet crop nutrient
requirements. Nitrogen (N) is lost during composting through ammonia (NH3), nitrogen
oxides (NOx), nitrous oxide (N2O) or dinitrogen (N2) (Awasthi et al., 2016; Chan et al.,
2016). The total N loss may account for 40-70% of initial N (Vu et al., 2015). These N
losses reduce the fertilising value of compost and contribute to environmental problems.
Furthermore, significant greenhouse gas (GHG) emissions (methane and nitrous oxide)
from thermophilic composting are widely reported (Lim et al., 2016). Anoxic hotspots in
the compost piles produce methane (CH4), while nitrification in aerobic microsites and
denitrification in anaerobic microsites are responsible for N2O production (Chan et al.,
2011).
Moisture, temperature, pH, ammonium concentration and substrate C:N ratio are
the key factors that control N losses and GHG emissions from thermophilic composting
(Chowdhury et al., 2014; Santos et al., 2016). Temperatures above 45 °C increase NH3
volatilisation and a high pH (about 9; pKa = 9.25) shifts the NH4+ = NH3 equilibrium to
ammonia (Chowdhury et al., 2014). High temperatures also inhibit the nitrification
process and thereby increase ammonia volatilisation. About 36-70% of total N losses
have been observed during the active stage of thermophilic composting (Chowdhury et
al., 2014). High oxygen consumption during the active stage leads to anoxic microsites,
which are centres of GHG production. Similarly, high activities of methanogens
(Ermolaev et al., 2014) and subsequent CH4 emissions (Vu et al., 2015) have been
reported during the thermophilic stage. Controlling pH through the use of additives
(Awasthi et al., 2016), lowering mineralisable C and/or increasing the substrate C : N
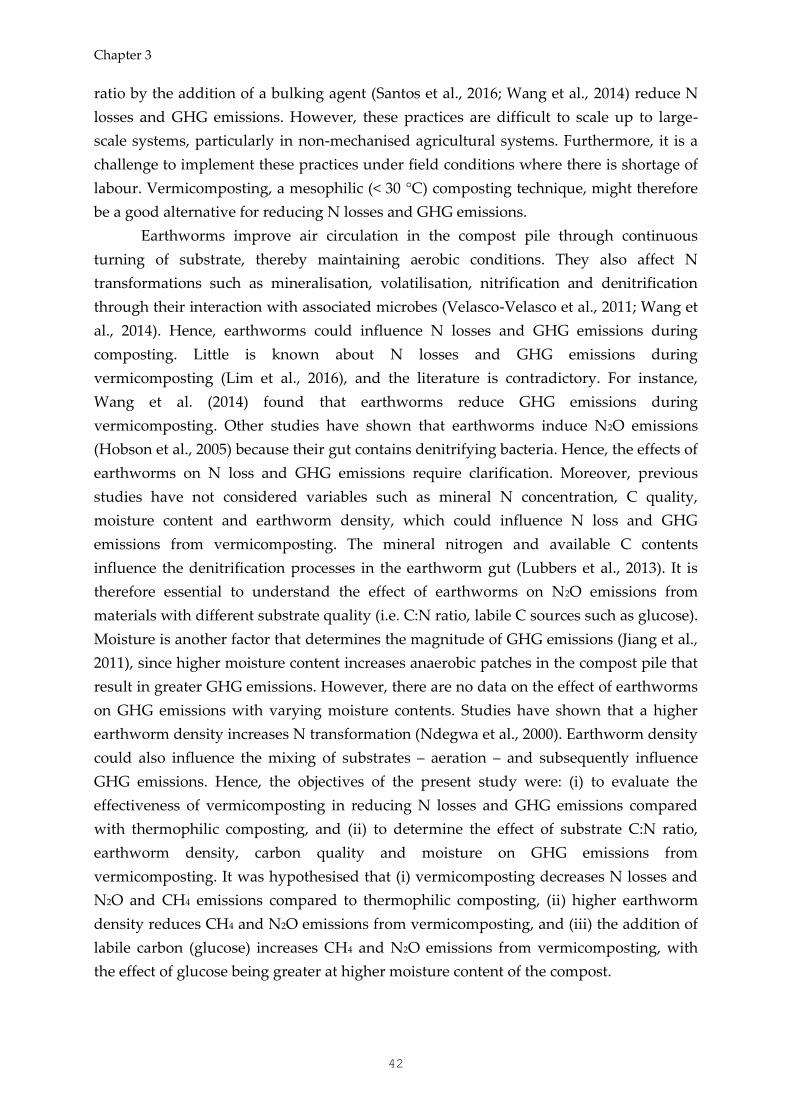
Chapter 3
42
ratio by the addition of a bulking agent (Santos et al., 2016; Wang et al., 2014) reduce N
losses and GHG emissions. However, these practices are difficult to scale up to large-
scale systems, particularly in non-mechanised agricultural systems. Furthermore, it is a
challenge to implement these practices under field conditions where there is shortage of
labour. Vermicomposting, a mesophilic (< 30 °C) composting technique, might therefore
be a good alternative for reducing N losses and GHG emissions.
Earthworms improve air circulation in the compost pile through continuous
turning of substrate, thereby maintaining aerobic conditions. They also affect N
transformations such as mineralisation, volatilisation, nitrification and denitrification
through their interaction with associated microbes (Velasco-Velasco et al., 2011; Wang et
al., 2014). Hence, earthworms could influence N losses and GHG emissions during
composting. Little is known about N losses and GHG emissions during
vermicomposting (Lim et al., 2016), and the literature is contradictory. For instance,
Wang et al. (2014) found that earthworms reduce GHG emissions during
vermicomposting. Other studies have shown that earthworms induce N2O emissions
(Hobson et al., 2005) because their gut contains denitrifying bacteria. Hence, the effects of
earthworms on N loss and GHG emissions require clarification. Moreover, previous
studies have not considered variables such as mineral N concentration, C quality,
moisture content and earthworm density, which could influence N loss and GHG
emissions from vermicomposting. The mineral nitrogen and available C contents
influence the denitrification processes in the earthworm gut (Lubbers et al., 2013). It is
therefore essential to understand the effect of earthworms on N2O emissions from
materials with different substrate quality (i.e. C:N ratio, labile C sources such as glucose).
Moisture is another factor that determines the magnitude of GHG emissions (Jiang et al.,
2011), since higher moisture content increases anaerobic patches in the compost pile that
result in greater GHG emissions. However, there are no data on the effect of earthworms
on GHG emissions with varying moisture contents. Studies have shown that a higher
earthworm density increases N transformation (Ndegwa et al., 2000). Earthworm density
could also influence the mixing of substrates – aeration – and subsequently influence
GHG emissions. Hence, the objectives of the present study were: (i) to evaluate the
effectiveness of vermicomposting in reducing N losses and GHG emissions compared
with thermophilic composting, and (ii) to determine the effect of substrate C:N ratio,
earthworm density, carbon quality and moisture on GHG emissions from
vermicomposting. It was hypothesised that (i) vermicomposting decreases N losses and
N2O and CH4 emissions compared to thermophilic composting, (ii) higher earthworm
density reduces CH4 and N2O emissions from vermicomposting, and (iii) the addition of
labile carbon (glucose) increases CH4 and N2O emissions from vermicomposting, with
the effect of glucose being greater at higher moisture content of the compost.
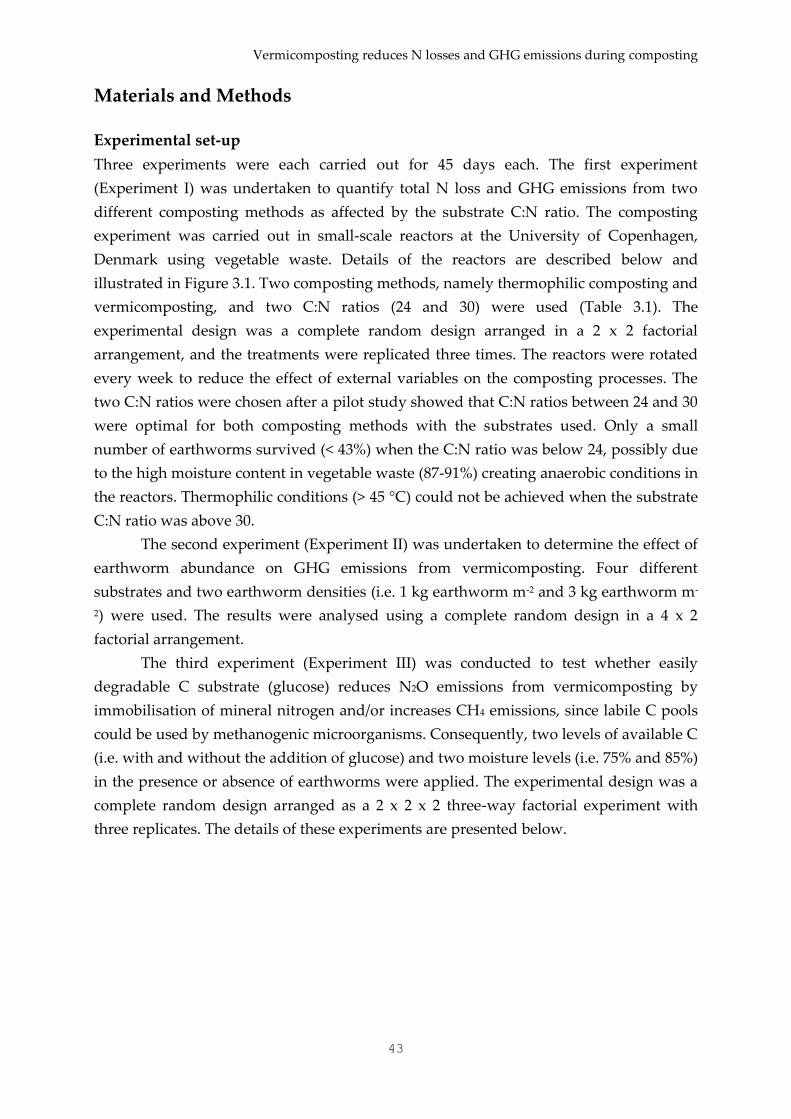
Vermicomposting reduces N losses and GHG emissions during composting
43
Materials and Methods
Experimental set-up
Three experiments were each carried out for 45 days each. The first experiment
(Experiment I) was undertaken to quantify total N loss and GHG emissions from two
different composting methods as affected by the substrate C:N ratio. The composting
experiment was carried out in small-scale reactors at the University of Copenhagen,
Denmark using vegetable waste. Details of the reactors are described below and
illustrated in Figure 3.1. Two composting methods, namely thermophilic composting and
vermicomposting, and two C:N ratios (24 and 30) were used (Table 3.1). The
experimental design was a complete random design arranged in a 2 x 2 factorial
arrangement, and the treatments were replicated three times. The reactors were rotated
every week to reduce the effect of external variables on the composting processes. The
two C:N ratios were chosen after a pilot study showed that C:N ratios between 24 and 30
were optimal for both composting methods with the substrates used. Only a small
number of earthworms survived (< 43%) when the C:N ratio was below 24, possibly due
to the high moisture content in vegetable waste (87-91%) creating anaerobic conditions in
the reactors. Thermophilic conditions (> 45 °C) could not be achieved when the substrate
C:N ratio was above 30.
The second experiment (Experiment II) was undertaken to determine the effect of
earthworm abundance on GHG emissions from vermicomposting. Four different
substrates and two earthworm densities (i.e. 1 kg earthworm m-2 and 3 kg earthworm m-
2) were used. The results were analysed using a complete random design in a 4 x 2
factorial arrangement.
The third experiment (Experiment III) was conducted to test whether easily
degradable C substrate (glucose) reduces N2O emissions from vermicomposting by
immobilisation of mineral nitrogen and/or increases CH4 emissions, since labile C pools
could be used by methanogenic microorganisms. Consequently, two levels of available C
(i.e. with and without the addition of glucose) and two moisture levels (i.e. 75% and 85%)
in the presence or absence of earthworms were applied. The experimental design was a
complete random design arranged as a 2 x 2 x 2 three-way factorial experiment with
three replicates. The details of these experiments are presented below.
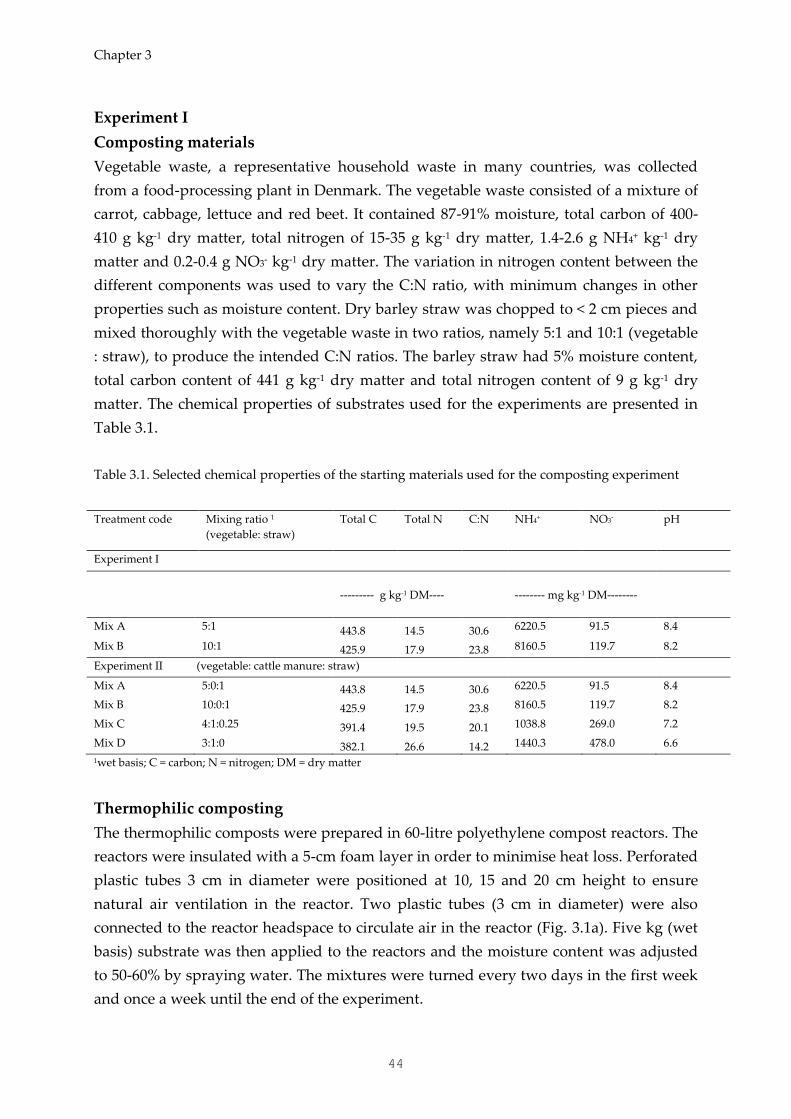
Chapter 3
44
Experiment I
Composting materials
Vegetable waste, a representative household waste in many countries, was collected
from a food-processing plant in Denmark. The vegetable waste consisted of a mixture of
carrot, cabbage, lettuce and red beet. It contained 87-91% moisture, total carbon of 400-
410 g kg-1 dry matter, total nitrogen of 15-35 g kg-1 dry matter, 1.4-2.6 g NH4+ kg-1 dry
matter and 0.2-0.4 g NO3- kg-1 dry matter. The variation in nitrogen content between the
different components was used to vary the C:N ratio, with minimum changes in other
properties such as moisture content. Dry barley straw was chopped to < 2 cm pieces and
mixed thoroughly with the vegetable waste in two ratios, namely 5:1 and 10:1 (vegetable
: straw), to produce the intended C:N ratios. The barley straw had 5% moisture content,
total carbon content of 441 g kg-1 dry matter and total nitrogen content of 9 g kg-1 dry
matter. The chemical properties of substrates used for the experiments are presented in
Table 3.1.
Table 3.1. Selected chemical properties of the starting materials used for the composting experiment
Treatment code Mixing ratio 1
(vegetable: straw)
Total C Total N C:N NH4+ NO3- pH
Experiment I
--------- g kg-1 DM----
-------- mg kg-1 DM--------
Mix A 5:1 443.8 14.5 30.6 6220.5 91.5 8.4
Mix B 10:1 425.9 17.9 23.8 8160.5 119.7 8.2
Experiment II (vegetable: cattle manure: straw)
Mix A 5:0:1 443.8 14.5 30.6 6220.5 91.5 8.4
Mix B 10:0:1 425.9 17.9 23.8 8160.5 119.7 8.2
Mix C 4:1:0.25 391.4 19.5 20.1 1038.8 269.0 7.2
Mix D 3:1:0 382.1 26.6 14.2 1440.3 478.0 6.6
1wet basis; C = carbon; N = nitrogen; DM = dry matter
Thermophilic composting
The thermophilic composts were prepared in 60-litre polyethylene compost reactors. The
reactors were insulated with a 5-cm foam layer in order to minimise heat loss. Perforated
plastic tubes 3 cm in diameter were positioned at 10, 15 and 20 cm height to ensure
natural air ventilation in the reactor. Two plastic tubes (3 cm in diameter) were also
connected to the reactor headspace to circulate air in the reactor (Fig. 3.1a). Five kg (wet
basis) substrate was then applied to the reactors and the moisture content was adjusted
to 50-60% by spraying water. The mixtures were turned every two days in the first week
and once a week until the end of the experiment.
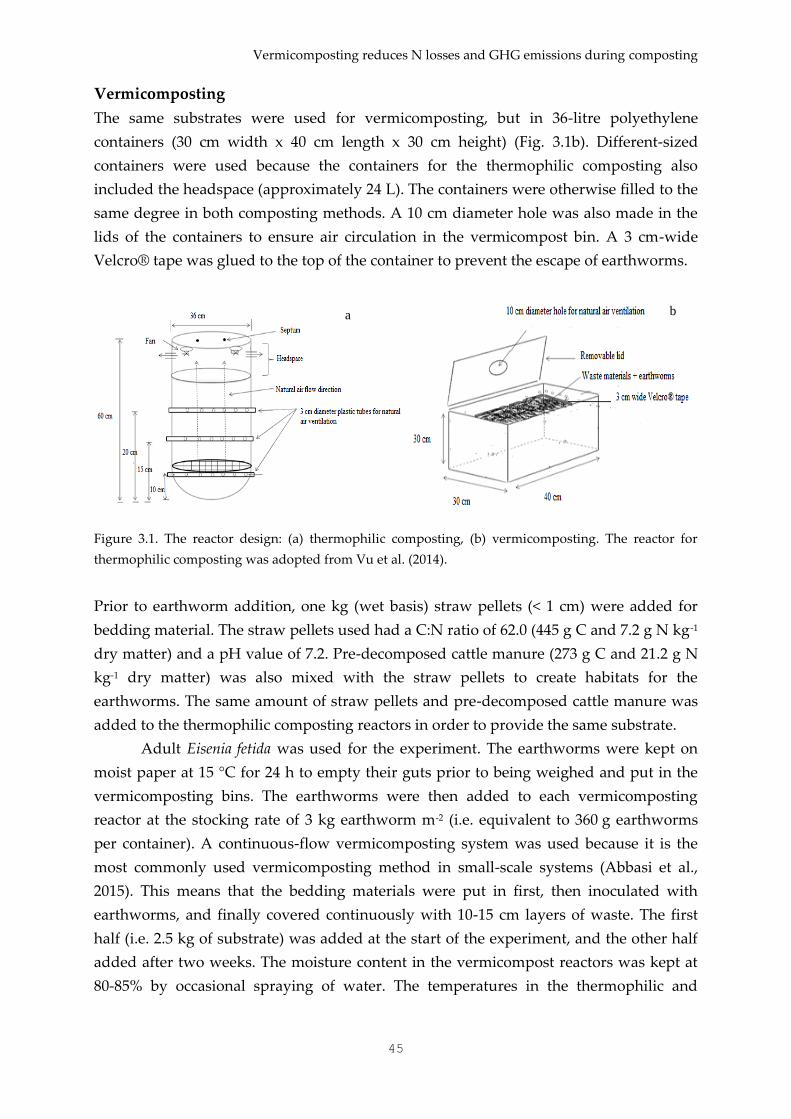
Vermicomposting reduces N losses and GHG emissions during composting
45
Vermicomposting
The same substrates were used for vermicomposting, but in 36-litre polyethylene
containers (30 cm width x 40 cm length x 30 cm height) (Fig. 3.1b). Different-sized
containers were used because the containers for the thermophilic composting also
included the headspace (approximately 24 L). The containers were otherwise filled to the
same degree in both composting methods. A 10 cm diameter hole was also made in the
lids of the containers to ensure air circulation in the vermicompost bin. A 3 cm-wide
Velcro® tape was glued to the top of the container to prevent the escape of earthworms.
Figure 3.1. The reactor design: (a) thermophilic composting, (b) vermicomposting. The reactor for
thermophilic composting was adopted from Vu et al. (2014).
Prior to earthworm addition, one kg (wet basis) straw pellets (< 1 cm) were added for
bedding material. The straw pellets used had a C:N ratio of 62.0 (445 g C and 7.2 g N kg-1
dry matter) and a pH value of 7.2. Pre-decomposed cattle manure (273 g C and 21.2 g N
kg-1 dry matter) was also mixed with the straw pellets to create habitats for the
earthworms. The same amount of straw pellets and pre-decomposed cattle manure was
added to the thermophilic composting reactors in order to provide the same substrate.
Adult Eisenia fetida was used for the experiment. The earthworms were kept on
moist paper at 15 °C for 24 h to empty their guts prior to being weighed and put in the
vermicomposting bins. The earthworms were then added to each vermicomposting
reactor at the stocking rate of 3 kg earthworm m-2 (i.e. equivalent to 360 g earthworms
per container). A continuous-flow vermicomposting system was used because it is the
most commonly used vermicomposting method in small-scale systems (Abbasi et al.,
2015). This means that the bedding materials were put in first, then inoculated with
earthworms, and finally covered continuously with 10-15 cm layers of waste. The first
half (i.e. 2.5 kg of substrate) was added at the start of the experiment, and the other half
added after two weeks. The moisture content in the vermicompost reactors was kept at
80-85% by occasional spraying of water. The temperatures in the thermophilic and
b a
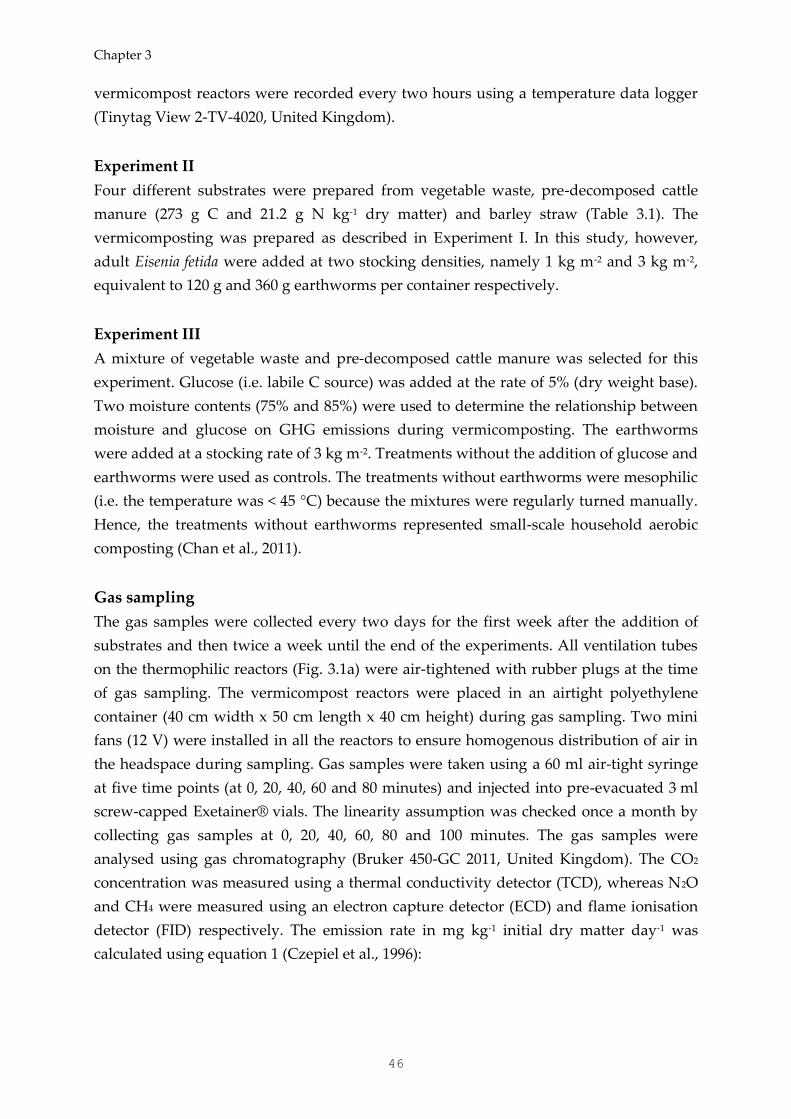
Chapter 3
46
vermicompost reactors were recorded every two hours using a temperature data logger
(Tinytag View 2-TV-4020, United Kingdom).
Experiment II
Four different substrates were prepared from vegetable waste, pre-decomposed cattle
manure (273 g C and 21.2 g N kg-1 dry matter) and barley straw (Table 3.1). The
vermicomposting was prepared as described in Experiment I. In this study, however,
adult Eisenia fetida were added at two stocking densities, namely 1 kg m-2 and 3 kg m-2,
equivalent to 120 g and 360 g earthworms per container respectively.
Experiment III
A mixture of vegetable waste and pre-decomposed cattle manure was selected for this
experiment. Glucose (i.e. labile C source) was added at the rate of 5% (dry weight base).
Two moisture contents (75% and 85%) were used to determine the relationship between
moisture and glucose on GHG emissions during vermicomposting. The earthworms
were added at a stocking rate of 3 kg m-2. Treatments without the addition of glucose and
earthworms were used as controls. The treatments without earthworms were mesophilic
(i.e. the temperature was < 45 °C) because the mixtures were regularly turned manually.
Hence, the treatments without earthworms represented small-scale household aerobic
composting (Chan et al., 2011).
Gas sampling
The gas samples were collected every two days for the first week after the addition of
substrates and then twice a week until the end of the experiments. All ventilation tubes
on the thermophilic reactors (Fig. 3.1a) were air-tightened with rubber plugs at the time
of gas sampling. The vermicompost reactors were placed in an airtight polyethylene
container (40 cm width x 50 cm length x 40 cm height) during gas sampling. Two mini
fans (12 V) were installed in all the reactors to ensure homogenous distribution of air in
the headspace during sampling. Gas samples were taken using a 60 ml air-tight syringe
at five time points (at 0, 20, 40, 60 and 80 minutes) and injected into pre-evacuated 3 ml
screw-capped Exetainer® vials. The linearity assumption was checked once a month by
collecting gas samples at 0, 20, 40, 60, 80 and 100 minutes. The gas samples were
analysed using gas chromatography (Bruker 450-GC 2011, United Kingdom). The CO2
concentration was measured using a thermal conductivity detector (TCD), whereas N2O
and CH4 were measured using an electron capture detector (ECD) and flame ionisation
detector (FID) respectively. The emission rate in mg kg-1 initial dry matter day-1 was
calculated using equation 1 (Czepiel et al., 1996):
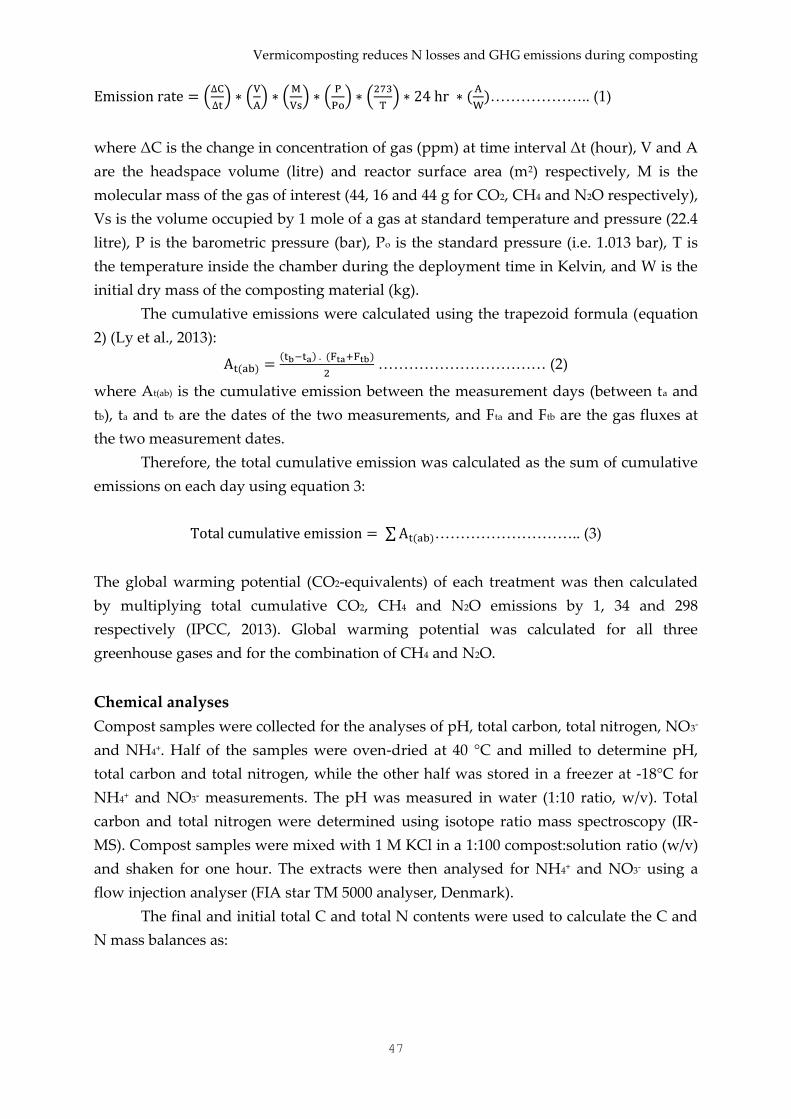
Vermicomposting reduces N losses and GHG emissions during composting
47
Emission rate = (∆C
∆t) ∗ (
V
A) ∗ (
M
Vs) ∗ (
P
Po) ∗ (
273
T) ∗ 24 hr ∗ (
A
W)……………….. (1)
where ΔC is the change in concentration of gas (ppm) at time interval Δt (hour), V and A
are the headspace volume (litre) and reactor surface area (m2) respectively, M is the
molecular mass of the gas of interest (44, 16 and 44 g for CO2, CH4 and N2O respectively),
Vs is the volume occupied by 1 mole of a gas at standard temperature and pressure (22.4
litre), P is the barometric pressure (bar), Po is the standard pressure (i.e. 1.013 bar), T is
the temperature inside the chamber during the deployment time in Kelvin, and W is the
initial dry mass of the composting material (kg).
The cumulative emissions were calculated using the trapezoid formula (equation
2) (Ly et al., 2013):
At(ab) =(tb−ta) . (Fta+Ftb)
2 …………………………… (2)
where At(ab) is the cumulative emission between the measurement days (between ta and
tb), ta and tb are the dates of the two measurements, and Fta and Ftb are the gas fluxes at
the two measurement dates.
Therefore, the total cumulative emission was calculated as the sum of cumulative
emissions on each day using equation 3:
Total cumulative emission = ∑ At(ab)……………………….. (3)
The global warming potential (CO2-equivalents) of each treatment was then calculated
by multiplying total cumulative CO2, CH4 and N2O emissions by 1, 34 and 298
respectively (IPCC, 2013). Global warming potential was calculated for all three
greenhouse gases and for the combination of CH4 and N2O.
Chemical analyses
Compost samples were collected for the analyses of pH, total carbon, total nitrogen, NO3-
and NH4+. Half of the samples were oven-dried at 40 °C and milled to determine pH,
total carbon and total nitrogen, while the other half was stored in a freezer at -18°C for
NH4+ and NO3- measurements. The pH was measured in water (1:10 ratio, w/v). Total
carbon and total nitrogen were determined using isotope ratio mass spectroscopy (IR-
MS). Compost samples were mixed with 1 M KCl in a 1:100 compost:solution ratio (w/v)
and shaken for one hour. The extracts were then analysed for NH4+ and NO3- using a
flow injection analyser (FIA star TM 5000 analyser, Denmark).
The final and initial total C and total N contents were used to calculate the C and
N mass balances as:
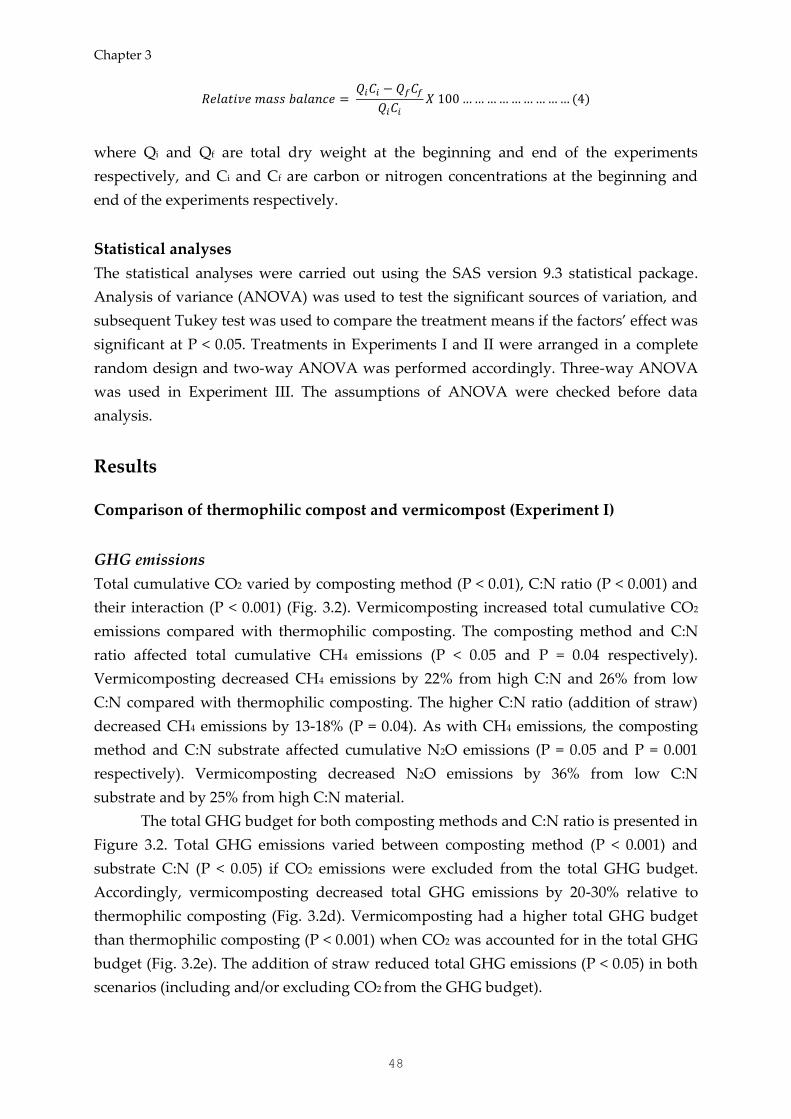
Chapter 3
48
𝑅𝑒𝑙𝑎𝑡𝑖𝑣𝑒 𝑚𝑎𝑠𝑠 𝑏𝑎𝑙𝑎𝑛𝑐𝑒 = 𝑄𝑖𝐶𝑖 − 𝑄𝑓𝐶𝑓
𝑄𝑖𝐶𝑖
𝑋 100 … … … … … … … … … (4)
where Qi and Qf are total dry weight at the beginning and end of the experiments
respectively, and Ci and Cf are carbon or nitrogen concentrations at the beginning and
end of the experiments respectively.
Statistical analyses
The statistical analyses were carried out using the SAS version 9.3 statistical package.
Analysis of variance (ANOVA) was used to test the significant sources of variation, and
subsequent Tukey test was used to compare the treatment means if the factors’ effect was
significant at P < 0.05. Treatments in Experiments I and II were arranged in a complete
random design and two-way ANOVA was performed accordingly. Three-way ANOVA
was used in Experiment III. The assumptions of ANOVA were checked before data
analysis.
Results
Comparison of thermophilic compost and vermicompost (Experiment I)
GHG emissions
Total cumulative CO2 varied by composting method (P < 0.01), C:N ratio (P < 0.001) and
their interaction (P < 0.001) (Fig. 3.2). Vermicomposting increased total cumulative CO2
emissions compared with thermophilic composting. The composting method and C:N
ratio affected total cumulative CH4 emissions (P < 0.05 and P = 0.04 respectively).
Vermicomposting decreased CH4 emissions by 22% from high C:N and 26% from low
C:N compared with thermophilic composting. The higher C:N ratio (addition of straw)
decreased CH4 emissions by 13-18% (P = 0.04). As with CH4 emissions, the composting
method and C:N substrate affected cumulative N2O emissions (P = 0.05 and P = 0.001
respectively). Vermicomposting decreased N2O emissions by 36% from low C:N
substrate and by 25% from high C:N material.
The total GHG budget for both composting methods and C:N ratio is presented in
Figure 3.2. Total GHG emissions varied between composting method (P < 0.001) and
substrate C:N (P < 0.05) if CO2 emissions were excluded from the total GHG budget.
Accordingly, vermicomposting decreased total GHG emissions by 20-30% relative to
thermophilic composting (Fig. 3.2d). Vermicomposting had a higher total GHG budget
than thermophilic composting (P < 0.001) when CO2 was accounted for in the total GHG
budget (Fig. 3.2e). The addition of straw reduced total GHG emissions (P < 0.05) in both
scenarios (including and/or excluding CO2 from the GHG budget).
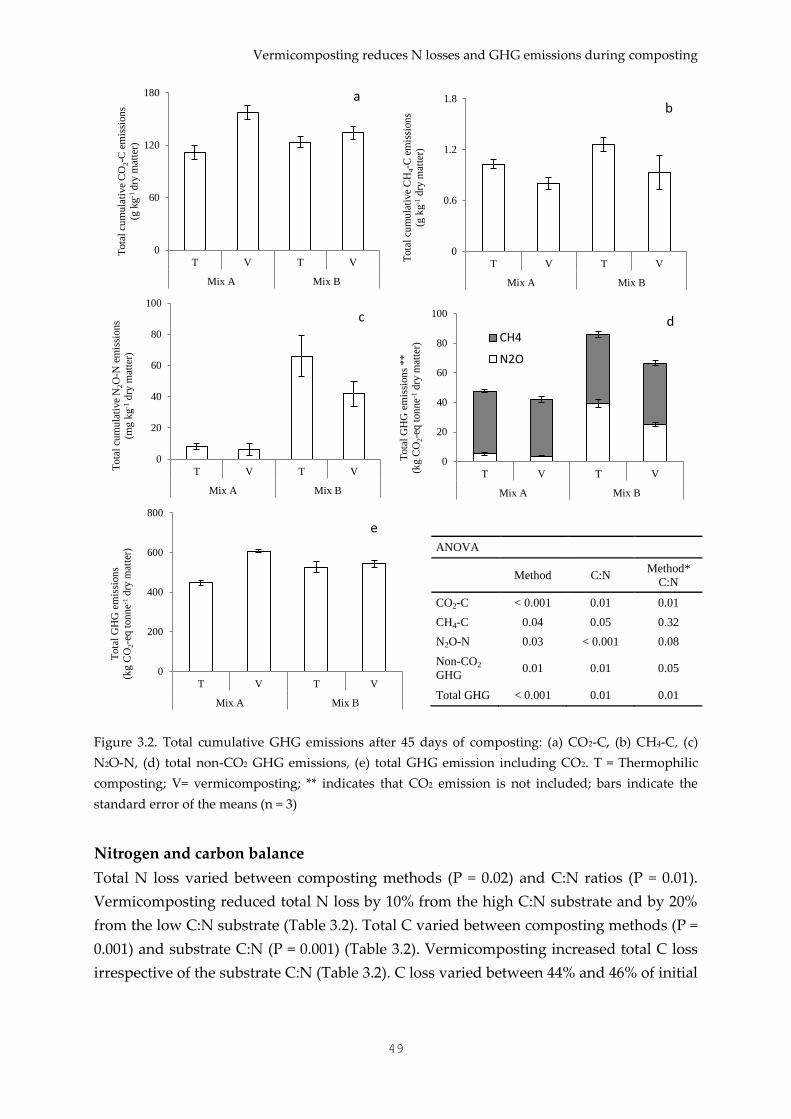
Vermicomposting reduces N losses and GHG emissions during composting
49
Figure 3.2. Total cumulative GHG emissions after 45 days of composting: (a) CO2-C, (b) CH4-C, (c)
N2O-N, (d) total non-CO2 GHG emissions, (e) total GHG emission including CO2. T = Thermophilic
composting; V= vermicomposting; ** indicates that CO2 emission is not included; bars indicate the
standard error of the means (n = 3)
Nitrogen and carbon balance
Total N loss varied between composting methods (P = 0.02) and C:N ratios (P = 0.01).
Vermicomposting reduced total N loss by 10% from the high C:N substrate and by 20%
from the low C:N substrate (Table 3.2). Total C varied between composting methods (P =
0.001) and substrate C:N (P = 0.001) (Table 3.2). Vermicomposting increased total C loss
irrespective of the substrate C:N (Table 3.2). C loss varied between 44% and 46% of initial
0
60
120
180
T V T V
Mix A Mix B
Tota
l cu
mu
lati
ve
CO
2-C
em
issi
on
s
(g k
g-1
dry
mat
ter)
a
0
0.6
1.2
1.8
T V T V
Mix A Mix B
Tota
l cu
mu
lati
ve
CH
4-C
em
issi
on
s
(g k
g-1
dry
mat
ter)
b
0
20
40
60
80
100
T V T V
Mix A Mix B
Tota
l cu
mu
lati
ve
N2O
-N e
mis
sion
s
(mg k
g-1
dry
mat
ter)
c
0
20
40
60
80
100
T V T V
Mix A Mix B
Tota
l G
HG
em
issi
on
s **
(kg C
O2-e
q t
on
ne-1
dry
mat
ter)
CH4
N2O
d
0
200
400
600
800
T V T V
Mix A Mix B
Tota
l G
HG
em
issi
on
s
(kg C
O2-e
q t
on
ne-1
dry
mat
ter)
e
ANOVA
Method C:N Method*
C:N
CO2-C < 0.001 0.01 0.01
CH4-C 0.04 0.05 0.32
N2O-N 0.03 < 0.001 0.08
Non-CO2
GHG 0.01 0.01 0.05
Total GHG < 0.001 0.01 0.01
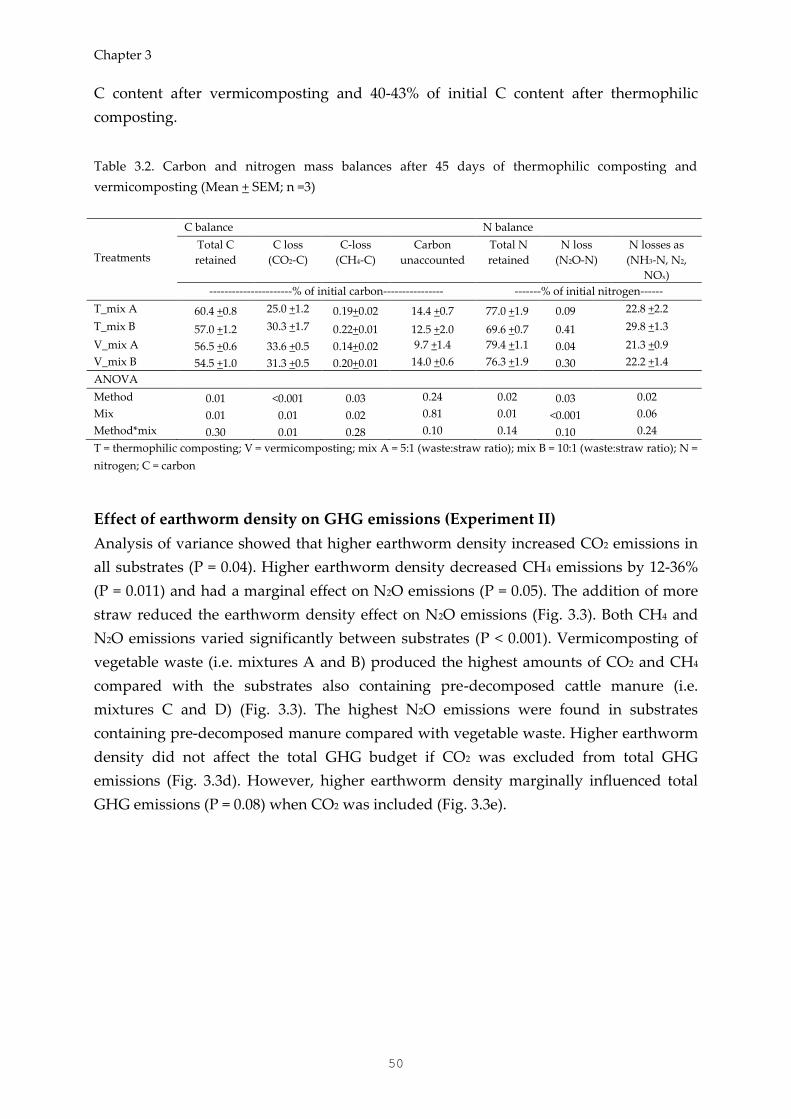
Chapter 3
50
C content after vermicomposting and 40-43% of initial C content after thermophilic
composting.
Table 3.2. Carbon and nitrogen mass balances after 45 days of thermophilic composting and
vermicomposting (Mean + SEM; n =3)
Treatments
C balance N balance
Total C
retained
C loss
(CO2-C)
C-loss
(CH4-C)
Carbon
unaccounted
Total N
retained
N loss
(N2O-N)
N losses as
(NH3-N, N2,
NOx)
----------------------% of initial carbon---------------- -------% of initial nitrogen------
T_mix A 60.4 +0.8 25.0 +1.2 0.19+0.02 14.4 +0.7 77.0 +1.9 0.09 22.8 +2.2
T_mix B 57.0 +1.2 30.3 +1.7 0.22+0.01 12.5 +2.0 69.6 +0.7 0.41 29.8 +1.3
V_mix A 56.5 +0.6 33.6 +0.5 0.14+0.02 9.7 +1.4 79.4 +1.1 0.04 21.3 +0.9
V_mix B 54.5 +1.0 31.3 +0.5 0.20+0.01 14.0 +0.6 76.3 +1.9 0.30 22.2 +1.4
ANOVA
Method 0.01 <0.001 0.03 0.24 0.02 0.03 0.02
Mix 0.01 0.01 0.02 0.81 0.01 <0.001 0.06
Method*mix 0.30 0.01 0.28 0.10 0.14 0.10 0.24
T = thermophilic composting; V = vermicomposting; mix A = 5:1 (waste:straw ratio); mix B = 10:1 (waste:straw ratio); N =
nitrogen; C = carbon
Effect of earthworm density on GHG emissions (Experiment II)
Analysis of variance showed that higher earthworm density increased CO2 emissions in
all substrates (P = 0.04). Higher earthworm density decreased CH4 emissions by 12-36%
(P = 0.011) and had a marginal effect on N2O emissions (P = 0.05). The addition of more
straw reduced the earthworm density effect on N2O emissions (Fig. 3.3). Both CH4 and
N2O emissions varied significantly between substrates (P < 0.001). Vermicomposting of
vegetable waste (i.e. mixtures A and B) produced the highest amounts of CO2 and CH4
compared with the substrates also containing pre-decomposed cattle manure (i.e.
mixtures C and D) (Fig. 3.3). The highest N2O emissions were found in substrates
containing pre-decomposed manure compared with vegetable waste. Higher earthworm
density did not affect the total GHG budget if CO2 was excluded from total GHG
emissions (Fig. 3.3d). However, higher earthworm density marginally influenced total
GHG emissions (P = 0.08) when CO2 was included (Fig. 3.3e).
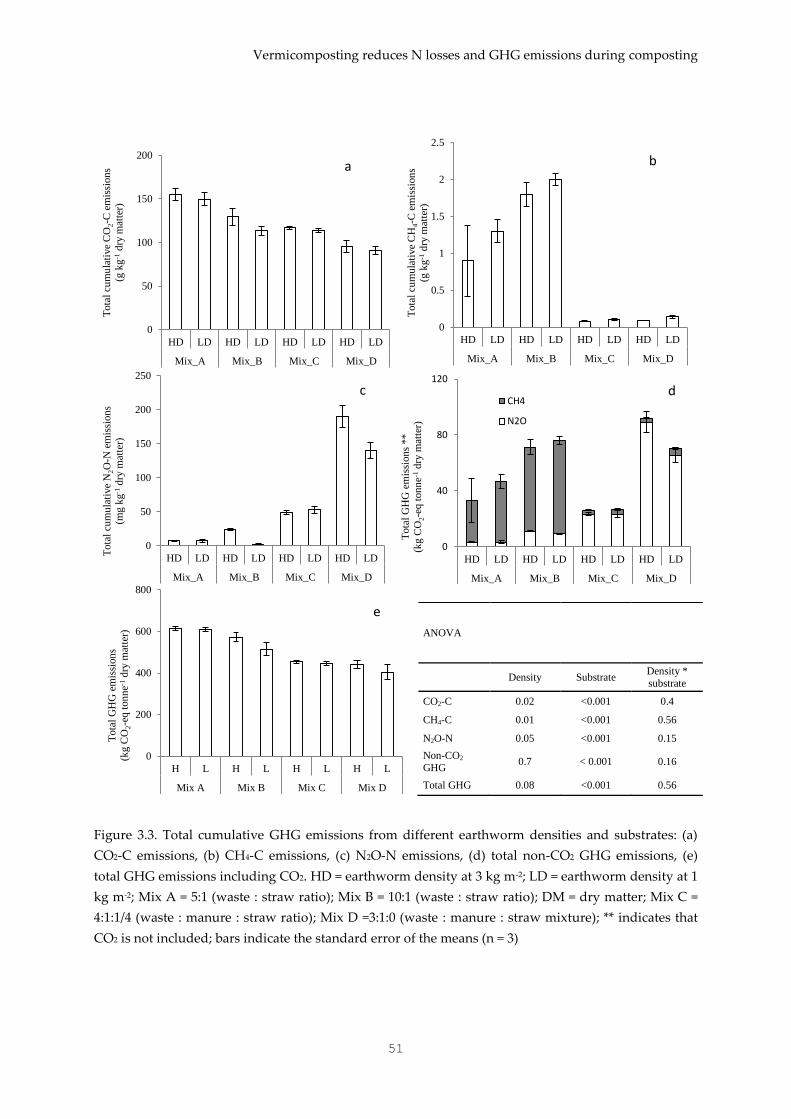
Vermicomposting reduces N losses and GHG emissions during composting
51
Figure 3.3. Total cumulative GHG emissions from different earthworm densities and substrates: (a)
CO2-C emissions, (b) CH4-C emissions, (c) N2O-N emissions, (d) total non-CO2 GHG emissions, (e)
total GHG emissions including CO2. HD = earthworm density at 3 kg m-2; LD = earthworm density at 1
kg m-2; Mix A = 5:1 (waste : straw ratio); Mix B = 10:1 (waste : straw ratio); DM = dry matter; Mix C =
4:1:1/4 (waste : manure : straw ratio); Mix D =3:1:0 (waste : manure : straw mixture); ** indicates that
CO2 is not included; bars indicate the standard error of the means (n = 3)
0
50
100
150
200
HD LD HD LD HD LD HD LD
Mix_A Mix_B Mix_C Mix_D
Tota
l cu
mu
lati
ve
CO
2-C
em
issi
on
s
(g k
g-1
dry
mat
ter)
a
0
0.5
1
1.5
2
2.5
HD LD HD LD HD LD HD LD
Mix_A Mix_B Mix_C Mix_D
Tota
l cu
mu
lati
ve
CH
4-C
em
issi
on
s
(g k
g-1
dry
mat
ter)
b
0
50
100
150
200
250
HD LD HD LD HD LD HD LD
Mix_A Mix_B Mix_C Mix_D
Tota
l cu
mu
lati
ve
N2O
-N e
mis
sion
s
(mg k
g-1
dry
mat
ter)
c
0
40
80
120
HD LD HD LD HD LD HD LD
Mix_A Mix_B Mix_C Mix_D
Tota
l G
HG
em
issi
on
s **
(kg C
O2-e
q t
on
ne-1
dry
mat
ter)
CH4
N2O
d
0
200
400
600
800
H L H L H L H L
Mix A Mix B Mix C Mix D
Tota
l G
HG
em
issi
on
s
(kg C
O2-e
q t
on
ne-1
dry
mat
ter)
e
ANOVA
Density Substrate Density *
substrate
CO2-C 0.02 <0.001 0.4
CH4-C 0.01 <0.001 0.56
N2O-N 0.05 <0.001 0.15
Non-CO2
GHG 0.7 < 0.001 0.16
Total GHG 0.08 <0.001 0.56
Chapter 3
52
Effect of C quality and moisture on GHG emissions (Experiment III)
The addition of glucose increased the total cumulative CO2 and CH4 emissions from
vermicompost (P < 0.001 and P < 0.001 respectively) (Fig. 3.4). The glucose effect on N2O
emissions was non-significant (P = 0.13). The higher moisture content increased total
cumulative CH4 emissions (P < 0.001) and N2O emissions (P = 0.01). The effect of
moisture on CH4 and N2O, however, was only pronounced in the treatments without
earthworms (Fig. 3.4). Earthworm treatments decreased CH4 emissions by 9-53% (P <
0.001) and N2O emissions by 16-59% (P < 0.001) compared with non-earthworm
treatments. Earthworms decreased N2O emissions by 40% with higher moisture and by
23% with lower moisture. Earthworms also decreased CH4 emissions by 32% and 16%
with higher and lower moisture respectively.
Change in chemical properties
The composting method and C:N ratio affected C and N concentration in the end
product (P < 0.01 and P < 0.001 respectively). The C concentration was higher in
thermophilic composting than in vermicomposting (Table 3.3). Vermicomposting
resulted in a higher total nitrogen concentration than thermophilic composting for all
substrates. Total N concentration increased by 26-33% after vermicomposting, but only
by 18-20% after thermophilic composting. The composting method did not affect NH4+
concentration (P = 0.23), however NH4+ concentration varied significantly between
substrates (P < 0.001) (Table 3.3). NO3- concentration varied between the composting
methods (P = 0.03) and C:N ratio (P < 0.001). Vermicomposting increased NO3-
concentration by 14% and 33% with the high and low C:N ratio respectively compared
with thermophilic composting (Table 3.3). During Experiment III, vermicomposting also
increased NO3- concentration by 164-401% (P < 0.0001) compared with non-earthworm
treatments (Supplementary Fig. 3.1). Earthworm density, however, did not affect NH4+
and NO3- concentrations.
Earthworm biomass
The earthworm biomass increased in all vermicomposting experiments (Fig. 3.5). The
relative change in earthworm biomass was significantly affected by substrate C:N ratio
(P < 0.001), but not by the initial earthworm density (P = 0.14). Mixtures containing
decomposed cattle manure (i.e. mixtures C and D) increased the earthworm biomass by
more than 80%, while the mixtures of vegetable waste and straw (i.e. mixtures A and B)
increased the earthworm biomass by just 40%. Higher moisture content increased
earthworm biomass by 50-57% (P < 0.001) compared with the lower moisture content.
The addition of glucose marginally increased the earthworm biomass (Fig. 3.5).
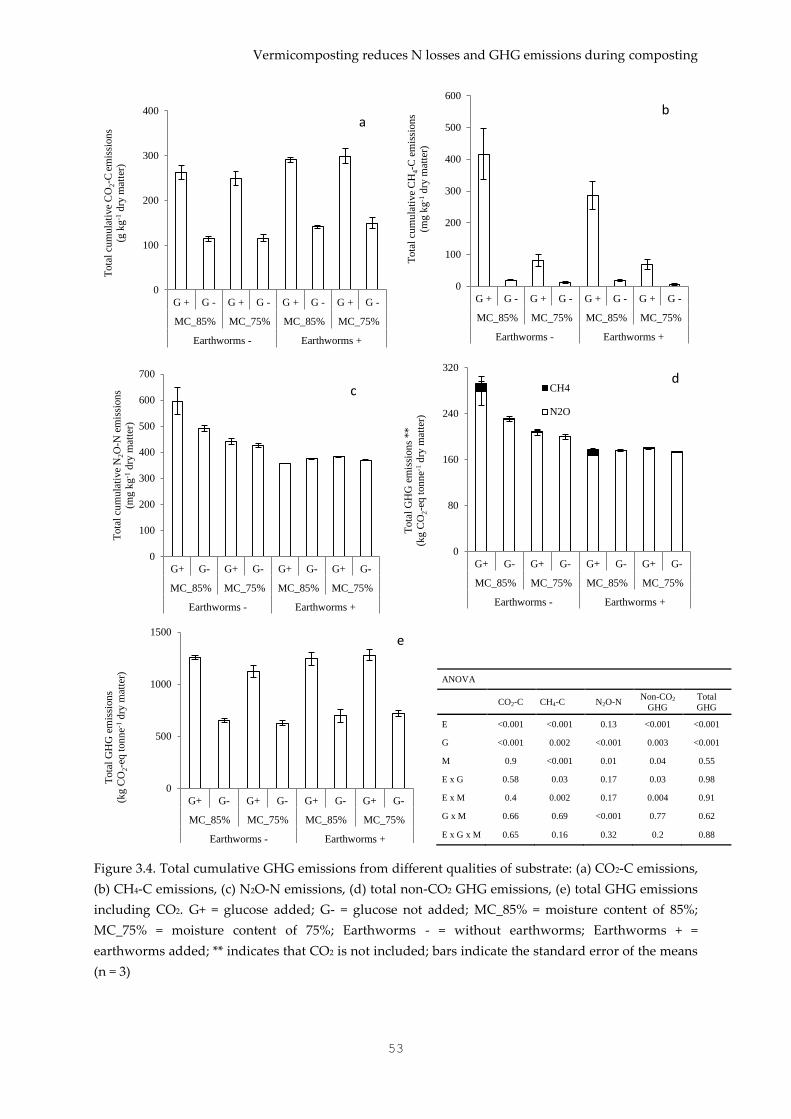
Vermicomposting reduces N losses and GHG emissions during composting
53
Figure 3.4. Total cumulative GHG emissions from different qualities of substrate: (a) CO2-C emissions,
(b) CH4-C emissions, (c) N2O-N emissions, (d) total non-CO2 GHG emissions, (e) total GHG emissions
including CO2. G+ = glucose added; G- = glucose not added; MC_85% = moisture content of 85%;
MC_75% = moisture content of 75%; Earthworms - = without earthworms; Earthworms + =
earthworms added; ** indicates that CO2 is not included; bars indicate the standard error of the means
(n = 3)
0
100
200
300
400
G + G - G + G - G + G - G + G -
MC_85% MC_75% MC_85% MC_75%
Earthworms - Earthworms +
Tota
l cu
mu
lati
ve
CO
2-C
em
issi
on
s
(g k
g-1
dry
mat
ter)
a
0
100
200
300
400
500
600
G + G - G + G - G + G - G + G -
MC_85% MC_75% MC_85% MC_75%
Earthworms - Earthworms +
Tota
l cu
mu
lati
ve
CH
4-C
em
issi
on
s
(mg k
g-1
dry
mat
ter)
b
0
100
200
300
400
500
600
700
G+ G- G+ G- G+ G- G+ G-
MC_85% MC_75% MC_85% MC_75%
Earthworms - Earthworms +
Tota
l cu
mu
lati
ve
N2O
-N e
mis
sion
s
(mg k
g-1
dry
mat
ter)
c
0
80
160
240
320
G+ G- G+ G- G+ G- G+ G-
MC_85% MC_75% MC_85% MC_75%
Earthworms - Earthworms +
Tota
l G
HG
em
issi
on
s **
(kg C
O2-e
q t
on
ne-1
dry
mat
ter)
CH4
N2O
d
0
500
1000
1500
G+ G- G+ G- G+ G- G+ G-
MC_85% MC_75% MC_85% MC_75%
Earthworms - Earthworms +
Tota
l G
HG
em
issi
on
s
(kg C
O2-e
q t
on
ne-1
dry
mat
ter)
e
ANOVA
CO2-C CH4-C N2O-N Non-CO2
GHG
Total
GHG
E <0.001 <0.001 0.13 <0.001 <0.001
G <0.001 0.002 <0.001 0.003 <0.001
M 0.9 <0.001 0.01 0.04 0.55
E x G 0.58 0.03 0.17 0.03 0.98
E x M 0.4 0.002 0.17 0.004 0.91
G x M 0.66 0.69 <0.001 0.77 0.62
E x G x M 0.65 0.16 0.32 0.2 0.88
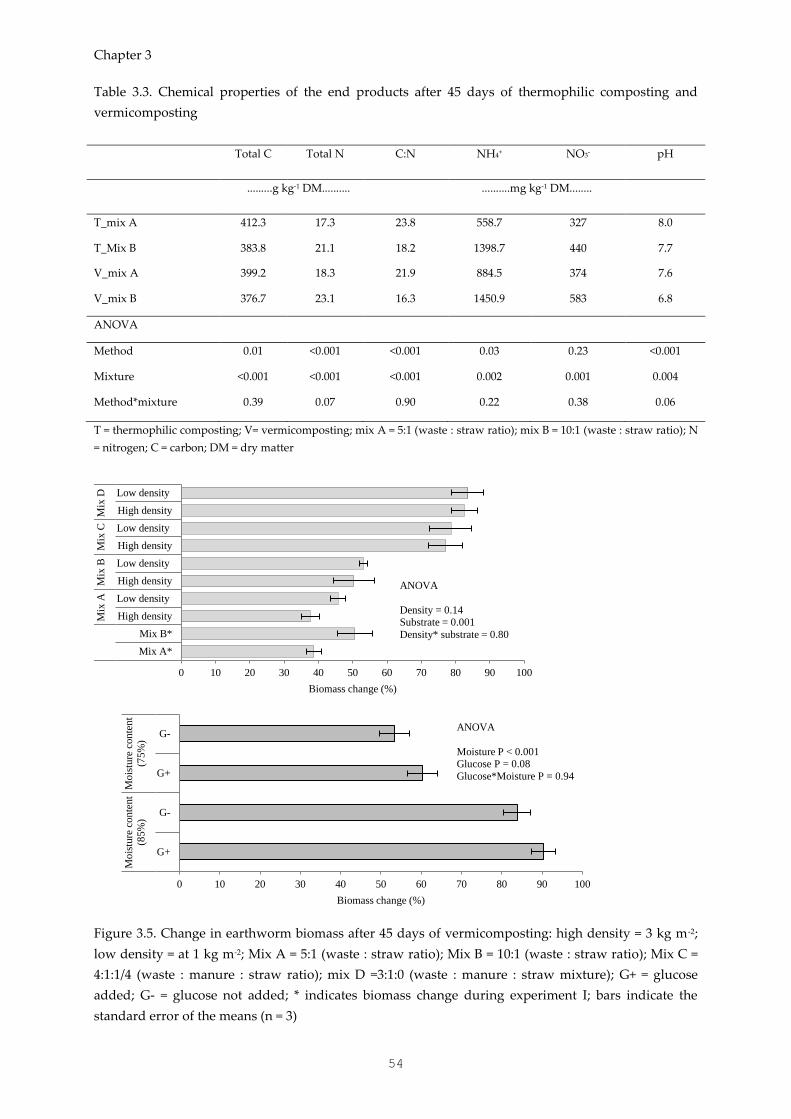
Chapter 3
54
Table 3.3. Chemical properties of the end products after 45 days of thermophilic composting and
vermicomposting
Total C Total N C:N NH4+ NO3- pH
.........g kg-1 DM.......... ..........mg kg-1 DM........
T_mix A 412.3 17.3 23.8 558.7 327 8.0
T_Mix B 383.8 21.1 18.2 1398.7 440 7.7
V_mix A 399.2 18.3 21.9 884.5 374 7.6
V_mix B 376.7 23.1 16.3 1450.9 583 6.8
ANOVA
Method 0.01 <0.001 <0.001 0.03 0.23 <0.001
Mixture <0.001 <0.001 <0.001 0.002 0.001 0.004
Method*mixture 0.39 0.07 0.90 0.22 0.38 0.06
T = thermophilic composting; V= vermicomposting; mix A = 5:1 (waste : straw ratio); mix B = 10:1 (waste : straw ratio); N
= nitrogen; C = carbon; DM = dry matter
Figure 3.5. Change in earthworm biomass after 45 days of vermicomposting: high density = 3 kg m-2;
low density = at 1 kg m-2; Mix A = 5:1 (waste : straw ratio); Mix B = 10:1 (waste : straw ratio); Mix C =
4:1:1/4 (waste : manure : straw ratio); mix D =3:1:0 (waste : manure : straw mixture); G+ = glucose
added; G- = glucose not added; * indicates biomass change during experiment I; bars indicate the
standard error of the means (n = 3)
0 10 20 30 40 50 60 70 80 90 100
Mix A*
Mix B*
High density
Low density
High density
Low density
High density
Low density
High density
Low density
Mix
AM
ix B
Mix
CM
ix D
Biomass change (%)
ANOVA
Density = 0.14 Substrate = 0.001
Density* substrate = 0.80
0 10 20 30 40 50 60 70 80 90 100
G+
G-
G+
G-
Mo
istu
re c
on
tent
(85%
)
Mo
istu
re c
on
tent
(75%
)
Biomass change (%)
ANOVA
Moisture P < 0.001 Glucose P = 0.08
Glucose*Moisture P = 0.94
Vermicomposting reduces N losses and GHG emissions during composting
55
Discussion
Earthworms and GHG emissions from vermicomposting
Methane and nitrous oxide
The hypothesis that vermicomposting decreases CH4 and N2O emissions irrespective of
the substrate quality (C:N ratio and presence of a labile C pool) (Figs. 3.2 and 3.4) was
confirmed. In agreement with these findings, earthworms have been found to decrease
CH4 emissions by > 40% during vermicomposting of manure (Wang et al., 2014) and N2O
emission by > 80% during vermifiltration of pig slurry (Luth et al., 2011). Vermifiltration
is a wastewater treatment using epigeic earthworms, which is a different system from
that used in the present study. Wang et al. (2014) also observed a 6-27% decrease in N2O
emission during vermicomposting of manure. The present study, however, is the first to
evaluate the effectiveness of vermicomposting to reduce GHG emissions using a wide
range of variables (C:N ratio, carbon quality, moisture and earthworm density).
Continuous turning of the substrates by earthworms and subsequent higher air
circulation explained the decrease in CH4 and N2O emissions after vermicomposting,
which is also supported by the lower CH4 emissions with the higher earthworm density,
as hypothesised. The higher temperature (45-56 °C) in the thermophilic phase compared
with vermicomposting (< 27 °C) (Supplementary Fig. 3.2) may also contribute to the
differences in CH4 emissions between the composting methods. High microbial activities
during the active phase of composting increase temperature and oxygen consumption,
and subsequently increase CH4 production (Chowdhury et al., 2014; Vu et al., 2015).
Chowdhury et al. (2014) found a positive correlation between composting temperature
and CH4 emissions. N2O emission occurs during both nitrification and denitrification
processes, implying that excess aeration increases nitrification and consequently results
in high N2O production (Jiang et al., 2011). Surplus air circulation could therefore explain
the slight increase in N2O emission at higher earthworm density. The effect of earthworm
density on N2O was less pronounced in straw-amended substrates, suggesting that initial
nitrogen content, aeration and other composting parameters might influence the effect of
earthworm abundance on N2O emissions.
Increasing the C:N ratio (addition of straw) reduced CH4 and N2O emissions from
both composting methods, as hypothesised (Figs. 3.2 and 3.3). The addition of straw or
bulking agents improves porosity and regulates moisture in a compost pile and thereby
reduces CH4 and N2O emissions (Santos et al., 2016; Vu et al., 2014). The addition of
glucose also increased CH4 emissions as hypothesised. Higher CH4 emissions from the
addition of glucose to substrates (Fig. 3.4) implies that labile C pools could easily be used
by methanogenic microorganisms to produce CH4 (Garcia-Marco et al., 2014). The
Chapter 3
56
addition of labile C sources (glucose) also increased microbial oxygen demand and
thereby caused anaerobic microsites for CH4 and N2O production. Higher CH4 emissions
from vegetable waste than from pre-decomposed manure (Fig. 3.3) confirmed the
hypothesis that a high proportion of easily decomposable materials increase CH4
production. The effect of glucose addition on N2O emissions, however, was inconsistent
with this study’s hypothesis. N2O emissions were mainly affected by NO3- concentration.
Higher N2O emissions from pre-decomposed manure than from vegetable mixtures (Fig.
3.3) could be explained by the higher concentration of NO3- (Table 3.1). A high moisture
content increases anaerobic patches in compost piles and thereby increases CH4 and N2O
emissions. However, this study showed that earthworms reduced the moisture effect on
CH4 and N2O, as hypothesised (Fig. 3.4), because the earthworms mixed the substrates
continuously and thereby counterbalanced the moisture effect. The results are consistent
with the 34% decrease in N2O due to earthworms in the soil with higher moisture (i.e.
97% water-filled pore space) (Chen et al., 2014).
Carbon dioxide
Total cumulative CO2 emissions were higher from vermicomposting than from
thermophilic composting, as hypothesised. Experiment III also confirmed this hypothesis
since vermicomposting increased total cumulative CO2 emissions by 11-26% relative to
non-earthworm treatments. Higher total cumulative CO2 emissions indicate a higher
biodegradation rate and stabilisation (Chan et al., 2011). The results from the present
study therefore suggest that vermicomposting enhances decomposition of waste
materials compared with thermophilic compost. Similarly, the CO2 flux after 45 days was
between 0.15 and 0.5 g CO2-C kg-1 dry matter day-1 in vermicompost and 0.98 – 1.3 g CO2-
C kg-1 dry matter day-1 in thermophilic compost, implying that vermicompost was at a
more advanced stage of decomposition than conventional compost. It is possible to argue
that earthworm respiration could contribute to higher CO2 emissions from
vermicomposting. However, this argument cannot explain the higher CO2 emissions in
the earthworm treatments because the difference observed was greater than the
earthworm respiration. The effect of earthworms on CO2 emissions was less clear in the
low C:N and substrates with glucose (Figs. 3.2 and 3.4) because a higher proportion of
easily decomposable materials (i.e. low C:N and glucose-added substrates) resulted in
much higher decomposition (Chowdhury et al., 2014), which exceeded the earthworms’
effect. The higher CO2 emissions at higher earthworm density implied that
decomposition of vermicompost could be accelerated by increasing the earthworm
population from the optimal earthworm density (1.6 kg earthworms m-2) recommended
by Ndegwa et al. (2000).
Vermicomposting reduces N losses and GHG emissions during composting
57
Total GHG emissions
This study used two different scenarios to assess the GHG budget from the two
composting methods. The first scenario excluded CO2 emissions from the total GHG
budget. Under this scenario, vermicomposting had a lower total GHG budget than
thermophilic composting, as hypothesised. The lower GHG budget from
vermicomposting was explained by the lower N2O and CH4 production (Figs. 3.2 and
3.4). The second scenario included CO2 emissions in the GHG budget, and under this
scenario total GHG emissions were higher from vermicomposting than from
thermophilic composting. This variation was expected because CO2 emissions were
higher during vermicomposting, and CO2 contributed over 75% of the total GHG budget
in all treatments. Similarly, Anderson et al. (2010) and Chan et al. (2011) reported an 80%
contribution of CO2 to total GHG emissions during household waste composting. Higher
CO2 emissions indicate a greater stability of the remaining material (i.e. a higher
decomposition). It is therefore important to exclude CO2 from the total GHG budget of
composting experiments (Schott et al., 2016; Vu et al., 2015), including as biogenic CO2
from short-term pools, as plant litter is usually excluded from greenhouse gas balances
(IPCC, 2013). Substrate quality determined the relative contribution of N2O and CH4 to
the total GHG budget (Figs. 3.2, 3.3 and 3.4). The contribution of CH4 was higher than
N2O in vegetable waste composting due to the high proportion of easily degradable C,
which favours CH4 production. The N2O contribution was higher from cattle manure,
which was explained by the high mineral N concentration in cattle manure.
Nitrogen and carbon balance
Total N loss was lower after vermicomposting than thermophilic composting, as
hypothesised. The N loss as N2O was small (less than 1% of the total N loss) (Table 3.3),
therefore other gaseous losses such as NH3, NOx and N2 explain the variation in N loss
between the two composting methods. No N loss via leaching was observed during the
experimental period. NH3 is the major N loss from composting (Jiang et al., 2011), and
temperatures above 45 °C increase NH3 volatilisation (Chowdhury et al., 2014). Hence,
higher temperatures (45-56 °C) during the active phase (Supplementary Fig. 3.1) explain
the higher N loss during thermophilic composting. The active phase was short (i.e. three
days), typical of small-scale composting systems (Bustamante et al., 2013; Lieo et al.,
2013), however this temperature is sufficient to produce a significant NH3 loss
(Chowdhury et al., 2014; Vu et al., 2015). Total N loss was lower compared with previous
studies on manure composting (Chowdhury et al., 2014; Vu et al., 2015) and this
difference can be explained by the lower N concentration in the substrates (Table 3.1)
relative to manure (25 - 38.6 g kg-1 dry matter) (Chowdhury et al., 2014; Vu et al., 2015).
The NO3- concentration increased during composting and was higher after
Chapter 3
58
vermicomposting, implying higher N mineralisation, nitrification and lower NH3 loss in
the vermicompost than in conventional compost. Moreover, the more rapid decrease in
NH4+ concentration after thermophilic composting suggested high NH3 loss.
Vermicomposting increased total C loss compared with thermophilic composting,
irrespective of substrate quality (Table 3.3). CO2 loss accounted for over 65% of C loss
(Table 3.3), therefore higher C loss after vermicomposting was explained by (i)
earthworms decomposing C (Lubbers et al., 2013) (ii) earthworms mixing the substrate,
thereby increasing the accessibility of the materials for decomposers, and (iii) earthworm
casts increasing decomposition (Sierra et al., 2013). The unaccounted C was between 9-
14%, which is comparable with several studies (Chowdhury et al., 2014; Vu et al., 2015).
The unaccounted C indicates C that was not measured between sampling dates (Vu et
al., 2015) and/or C loss via volatile compounds (Chowdhury et al., 2014). The sampling
frequency might be inadequate for capturing all CO2 emissions, particularly from
vermicomposting where intensive decomposition occurs. The increase in earthworm
biomass (Fig. 3.5) also explains some of the unaccounted carbon during
vermicomposting.
Implications for small-scale farmers
Gaseous N losses and GHG emissions have been reported from thermophilic composting
(Chowdhury et al., 2014), and these emissions reduce the agronomic value of compost
and contribute to climate change and nuisance odour. The addition of bulking agents
such as crop residues (Santos et al., 2016; Vu et al., 2015), the control of aeration rate
(Chowdhury et al., 2014) and the control of pH (Awasthi et al., 2016) have been identified
as means of reducing N losses and GHG emissions from composting. However, it is
difficult to apply these practices in many developing countries, for instance because of
the competing uses of crop residues, mainly for animal feed and fuel in smallholder
farming systems (Nigussie et al., 2015), and the need for labour to turn compost piles,
determining factors in the adoption of composting in developing countries (Nigussie et
al., 2015). Technologies such as forced aeration are expensive and difficult to scale up to
field conditions. It is therefore suggested that vermicomposting is a more practical and
less expensive method than the existing solutions to reduce GHG emissions, enhance the
fertilising value of compost and close the nutrient loop in smallholder farming systems.
Temperatures above 45 °C are essential in order to remove pathogens from compost
(Velasco-Velasco et al., 2011). However, literature shows the effectiveness of
vermicomposting at eradicating pathogens (Edwards et al., 2011; Rodríguez-Canché et
al., 2010). Pre-composting prior to vermicomposting could be the solution to remove
pathogens and weed seeds from vermicomposting (Wang et al., 2014), however N loss
and GHG emissions during pre-composting need further investigation because higher N
Vermicomposting reduces N losses and GHG emissions during composting
59
losses and GHG emissions might occur during the pre-composting stage (Velasco-
Velasco et al., 2011).
The experiments in this study were designed to correspond to the activity of
small-scale farmers in developing countries; therefore care should be taken when
extrapolating the results to large-scale enterprises. For example, temperatures may reach
values above 60°C (Tortosa et al., 2012) during large-scale thermophilic composting.
Hence, N losses and GHG emissions could be greater in large-scale composting systems.
The earthworm effect on GHG budget might be smaller in large-scale vermicomposting
because a high input of fresh material might offset the effect of earthworms on aeration
(Luth et al., 2011).
Studies have shown earthworm-induced N2O emissions from soils (Lubbers et al.,
2013) because denitrifying bacteria in the earthworm gut contribute to measurable N2O
fluxes. However, caution should be exercised when interpreting this fact because
substrate quality, earthworm species and earthworm abundance used for
vermicomposting are different from soil experiments. Vermicomposting uses nitrogen-
rich substrates, higher earthworm density (> 1 kg m-2) and epigeic earthworms,
consequently the earthworms’ effect on aeration exceeds the earthworm gut effect
(denitrification). In contrast, soil usually has < 3% organic carbon, low earthworm
density (< 2.1 g m-2) and anecic earthworms, consequently the earthworm gut effect on
denitrification is greater.
Conclusions
This study showed that vermicomposting reduces total N loss, CH4 and N2O emissions
compared with thermophilic composting methods, irrespective of the substrate quality
(i.e. C:N ratio, moisture content and presence of a labile C pool). Higher earthworm
abundance reduces CH4 emissions and accelerates the decomposition process. The
addition of labile C sources increases CO2 and CH4 emissions during composting.
Vermicomposting increases CO2 emissions, implying that vermicompost is at a more
advanced stage of decomposition than thermophilic compost. Numerous solutions have
been identified for reducing N losses and non-CO2 GHG emissions from composting,
however the existing technologies are harder to apply in developing countries because
they are expensive and difficult to upscale to larger systems. Vermicomposting, on the
other hand, is a low-cost method, making it feasible for many resource-poor farmers to
produce high fertilising value compost. Further studies, however, are needed to
understand the effect of earthworms on N losses and GHG emissions from composting
using different parameters such as substrate quality, earthworm species and feeding
frequency.
Chapter 3
60
Acknowledgements
This work has been conducted as part of a PhD thesis project supported by the
Agricultural Transformation by Innovation (AgTraIn) Erasmus Mundus Joint Doctorate
Programme, funded by the EACEA (Education, Audio-visual and Culture Executive
Agency) of the European Commission. The authors would like to acknowledge the
anonymous reviewers for their constructive comments on the earlier version of the
manuscript.
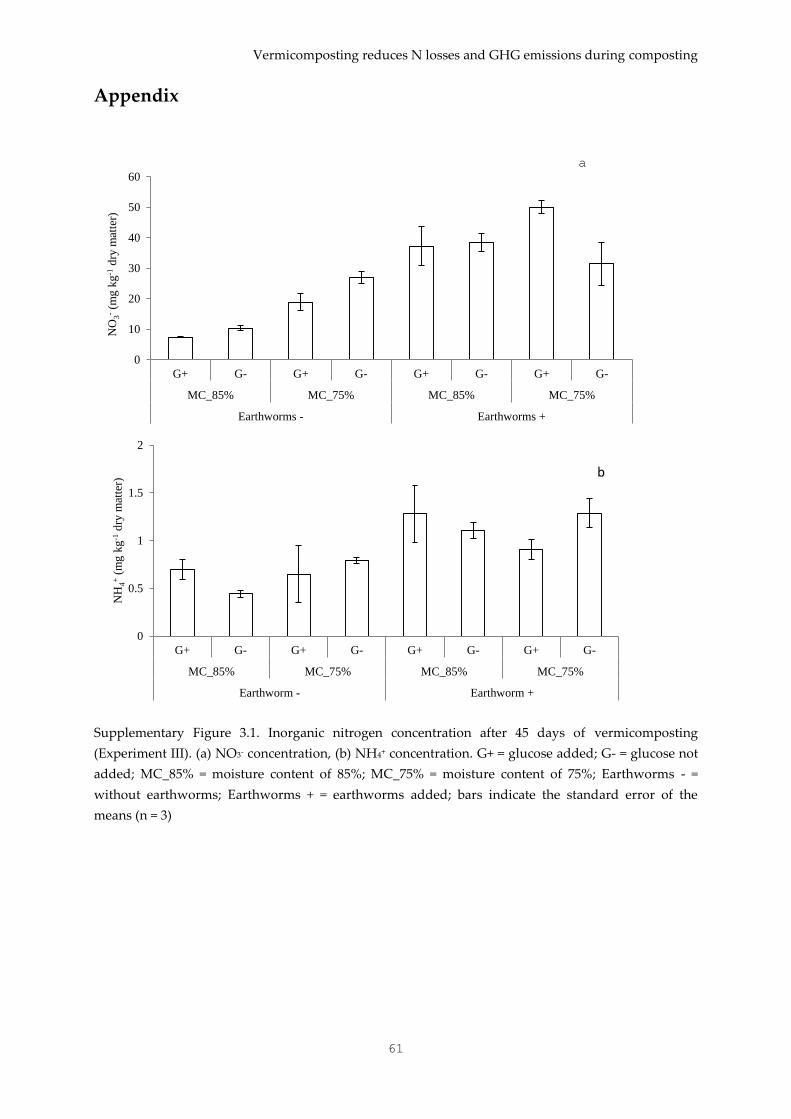
Vermicomposting reduces N losses and GHG emissions during composting
61
Appendix
Supplementary Figure 3.1. Inorganic nitrogen concentration after 45 days of vermicomposting
(Experiment III). (a) NO3- concentration, (b) NH4+ concentration. G+ = glucose added; G- = glucose not
added; MC_85% = moisture content of 85%; MC_75% = moisture content of 75%; Earthworms - =
without earthworms; Earthworms + = earthworms added; bars indicate the standard error of the
means (n = 3)
0
10
20
30
40
50
60
G+ G- G+ G- G+ G- G+ G-
MC_85% MC_75% MC_85% MC_75%
Earthworms - Earthworms +
NO
3- (m
g k
g-1
dry
mat
ter)
0
0.5
1
1.5
2
G+ G- G+ G- G+ G- G+ G-
MC_85% MC_75% MC_85% MC_75%
Earthworm - Earthworm +
NH
4+ (
mg k
g-1
dry
mat
ter)
b
a
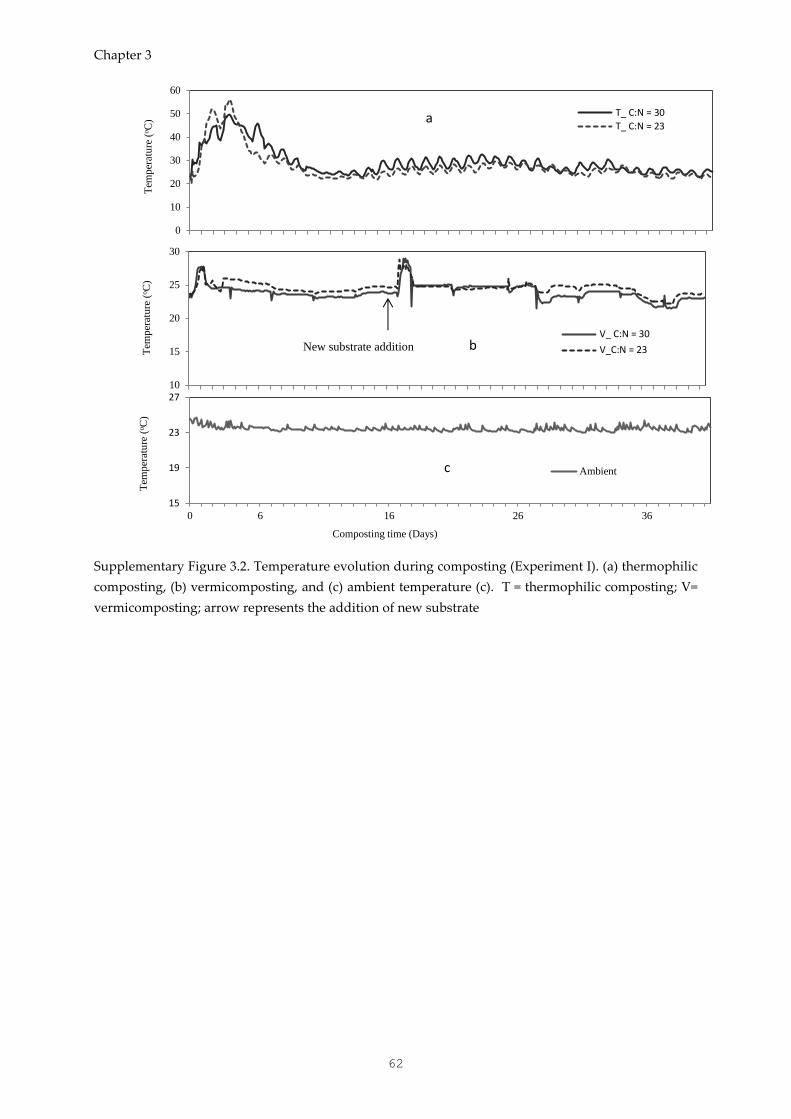
Chapter 3
62
Supplementary Figure 3.2. Temperature evolution during composting (Experiment I). (a) thermophilic
composting, (b) vermicomposting, and (c) ambient temperature (c). T = thermophilic composting; V=
vermicomposting; arrow represents the addition of new substrate
0
10
20
30
40
50
60
Tem
per
atu
re (
oC
)
T_ C:N = 30
T_ C:N = 23a
10
15
20
25
30
Tem
per
atu
re (
oC
)
V_ C:N = 30
V_C:N = 23New substrate addition b
15
19
23
27
0 6 16 26 36
Tem
per
atu
re (
oC
)
Composting time (Days)
Ambientc
63
CHAPTER 4
Delayed addition of nitrogen-rich substrates during
composting of municipal waste: Effects on nitrogen loss,
greenhouse gas emissions and compost stability
This chapter is published at Chemosphere as:
Nigussie, A., Kuyper, T.W., Bruun, S., de Neergaard A. (2016). Delayed addition of
nitrogen-rich substrates during composting of municipal waste: Effects on nitrogen
loss, greenhouse gas emissions and compost stability. Chemosphere 166: 352-362
Chapter 4
64
Delayed addition of nitrogen-rich substrates during
composting of municipal-waste: Effects on nitrogen loss,
greenhouse gas emissions and compost stability
Abstract
Municipal waste is usually composted with an N-rich substrate, such as manure, to
increase the N content of the product. This means that a significant amount of nitrogen
can be lost during composting. The objectives of this study were (i) to investigate the
effect of split addition of a nitrogen-rich substrate (poultry manure) on nitrogen losses
and greenhouse gas emissions during composting and to link this effect to different
bulking agents (coffee husks and sawdust), and (ii) to assess the effect of split addition of
a nitrogen-rich substrate on compost stability and sanitisation. The results showed that
split addition of the nitrogen-rich substrate reduced nitrogen losses by 9% when sawdust
was used and 20% when coffee husks were used as the bulking agent. Depending on the
bulking agent used, split addition increased cumulative N2O emissions by 400-600%
compared to single addition. In contrast, single addition increased methane emissions by
up to 50% compared to split addition of the substrate. Hence, the timing of the addition
of the N-rich substrate had only a marginal effect on total non-CO2 greenhouse gas
emissions. Split addition of the N-rich substrate resulted in compost that was just as
stable and effective at completely eradicating weed seeds as single addition. These
findings therefore show that split addition of a nitrogen-rich substrate could be an option
for increasing the fertilising value of municipal waste compost without having a
significant effect on total greenhouse gas emissions or compost stability.
Keywords: municipal wastes, poultry manure, bulking agent, split application
Delayed addition of N-rich substrate reduces N losses during composting
65
Introduction
A large amount of municipal waste is generated globally due to rapid urban population
growth (Scarlat et al., 2015). In many developing countries, over 80% of municipal waste
ends up in landfills or incineration sites (Scarlat et al., 2015). Studies have shown that
biodegradable materials constitute more than 50% of municipal waste in developing
countries (Getahun et al., 2012a) and therefore composting has been suggested as a
method to reduce the amount of municipal waste in landfill sites. More importantly,
composting of municipal waste can be used to recycle nutrients from urban areas to
agricultural land, thereby closing the rural-urban nutrient loop (Nigussie et al., 2015) and
contributing to a circular economy.
Municipal-waste compost contains a high amount of organic matter, and
incorporation in soil may therefore increase soil aggregate stability, reduce the draught
force for soil tillage (Peltre et al., 2015), promote soil microbial activity and enhance soil
chemical properties (Hargreaves et al., 2008). No adverse effects of the application of
municipal waste compost on croplands have been reported (Poulsen et al., 2013).
However, municipal waste composts, particularly in many (sub)tropical
countries, contain low levels of nitrogen (N), commonly < 1% of dry matter (Getahun et
al., 2012b). In addition, less than 10% of total N is mineralised from municipal waste
compost in the first year after soil application (Zhang et al., 2006). This means that the
compost will also contain relatively little mineralisable nitrogen, therefore relatively
large amounts (40-50 Mg ha-1) of compost have to be applied to satisfy plant
requirements (Hargreaves et al., 2008). However, high input of municipal waste compost
might result in losses of other nutrients and the accumulation of heavy metals in soils
and plant tissues, thus impeding the ecological and environmental benefits of the
compost. The optimisation of municipal waste composting should therefore place an
emphasis on increasing the nitrogen concentration in the compost while reducing losses
of other nutrients.
The composting of municipal waste and N-rich substrates such as poultry manure
generally increases the N concentration in the compost (Lhadi et al., 2006; Rizzo et al.,
2015). Poultry manure has a total N content greater than 3% dry matter, but contains
pathogens such as E. coli and Salmonella and weed seeds, implying that poultry manure
should be treated (composted) prior to soil application. Composting of municipal waste
with poultry manure is therefore a strategy for increasing the N concentration in
compost and sanitising poultry manure.
Temperatures above 45 °C during composting, i.e. the thermophilic phase, are
essential for compost sanitisation. High temperatures (> 45 oC) shift the NH4+ = NH3
equilibrium towards ammonia (Pagans et al., 2006) and inhibit nitrification, both of
which increase ammonia volatilisation. Poultry manure has a high NH4+ concentration,
implying that composting of municipal waste with poultry manure may increase
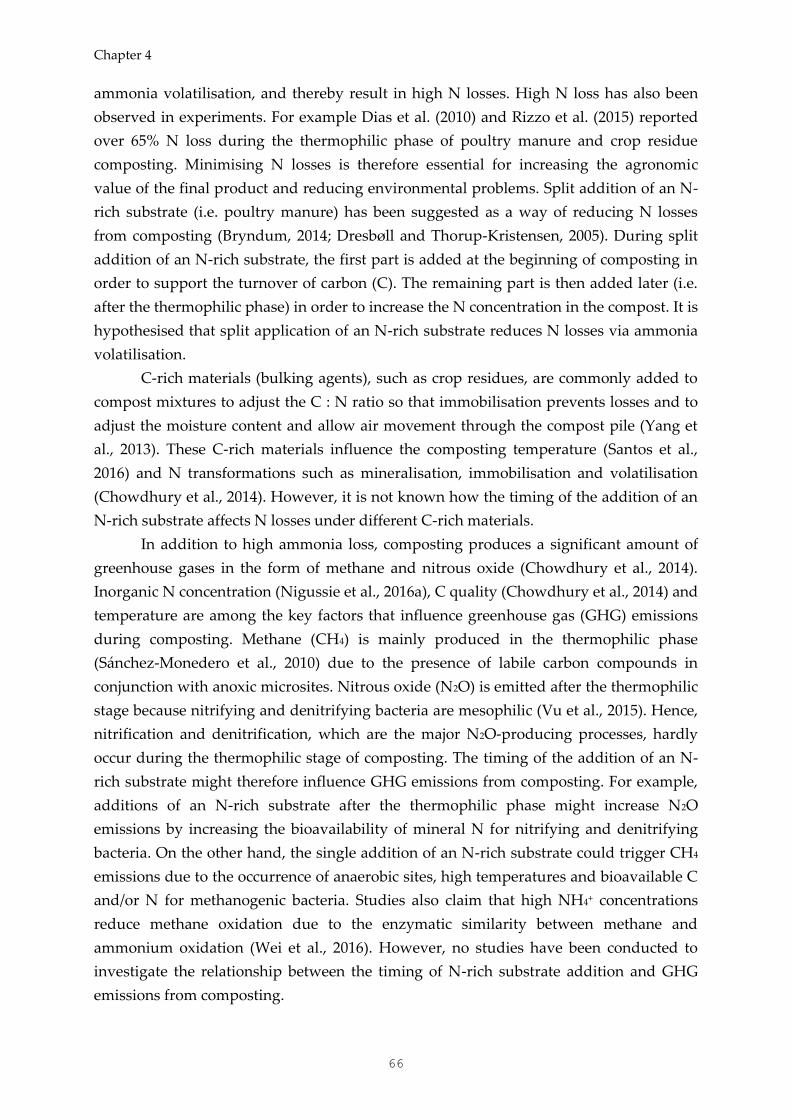
Chapter 4
66
ammonia volatilisation, and thereby result in high N losses. High N loss has also been
observed in experiments. For example Dias et al. (2010) and Rizzo et al. (2015) reported
over 65% N loss during the thermophilic phase of poultry manure and crop residue
composting. Minimising N losses is therefore essential for increasing the agronomic
value of the final product and reducing environmental problems. Split addition of an N-
rich substrate (i.e. poultry manure) has been suggested as a way of reducing N losses
from composting (Bryndum, 2014; Dresbøll and Thorup-Kristensen, 2005). During split
addition of an N-rich substrate, the first part is added at the beginning of composting in
order to support the turnover of carbon (C). The remaining part is then added later (i.e.
after the thermophilic phase) in order to increase the N concentration in the compost. It is
hypothesised that split application of an N-rich substrate reduces N losses via ammonia
volatilisation.
C-rich materials (bulking agents), such as crop residues, are commonly added to
compost mixtures to adjust the C : N ratio so that immobilisation prevents losses and to
adjust the moisture content and allow air movement through the compost pile (Yang et
al., 2013). These C-rich materials influence the composting temperature (Santos et al.,
2016) and N transformations such as mineralisation, immobilisation and volatilisation
(Chowdhury et al., 2014). However, it is not known how the timing of the addition of an
N-rich substrate affects N losses under different C-rich materials.
In addition to high ammonia loss, composting produces a significant amount of
greenhouse gases in the form of methane and nitrous oxide (Chowdhury et al., 2014).
Inorganic N concentration (Nigussie et al., 2016a), C quality (Chowdhury et al., 2014) and
temperature are among the key factors that influence greenhouse gas (GHG) emissions
during composting. Methane (CH4) is mainly produced in the thermophilic phase
(Sánchez-Monedero et al., 2010) due to the presence of labile carbon compounds in
conjunction with anoxic microsites. Nitrous oxide (N2O) is emitted after the thermophilic
stage because nitrifying and denitrifying bacteria are mesophilic (Vu et al., 2015). Hence,
nitrification and denitrification, which are the major N2O-producing processes, hardly
occur during the thermophilic stage of composting. The timing of the addition of an N-
rich substrate might therefore influence GHG emissions from composting. For example,
additions of an N-rich substrate after the thermophilic phase might increase N2O
emissions by increasing the bioavailability of mineral N for nitrifying and denitrifying
bacteria. On the other hand, the single addition of an N-rich substrate could trigger CH4
emissions due to the occurrence of anaerobic sites, high temperatures and bioavailable C
and/or N for methanogenic bacteria. Studies also claim that high NH4+ concentrations
reduce methane oxidation due to the enzymatic similarity between methane and
ammonium oxidation (Wei et al., 2016). However, no studies have been conducted to
investigate the relationship between the timing of N-rich substrate addition and GHG
emissions from composting.
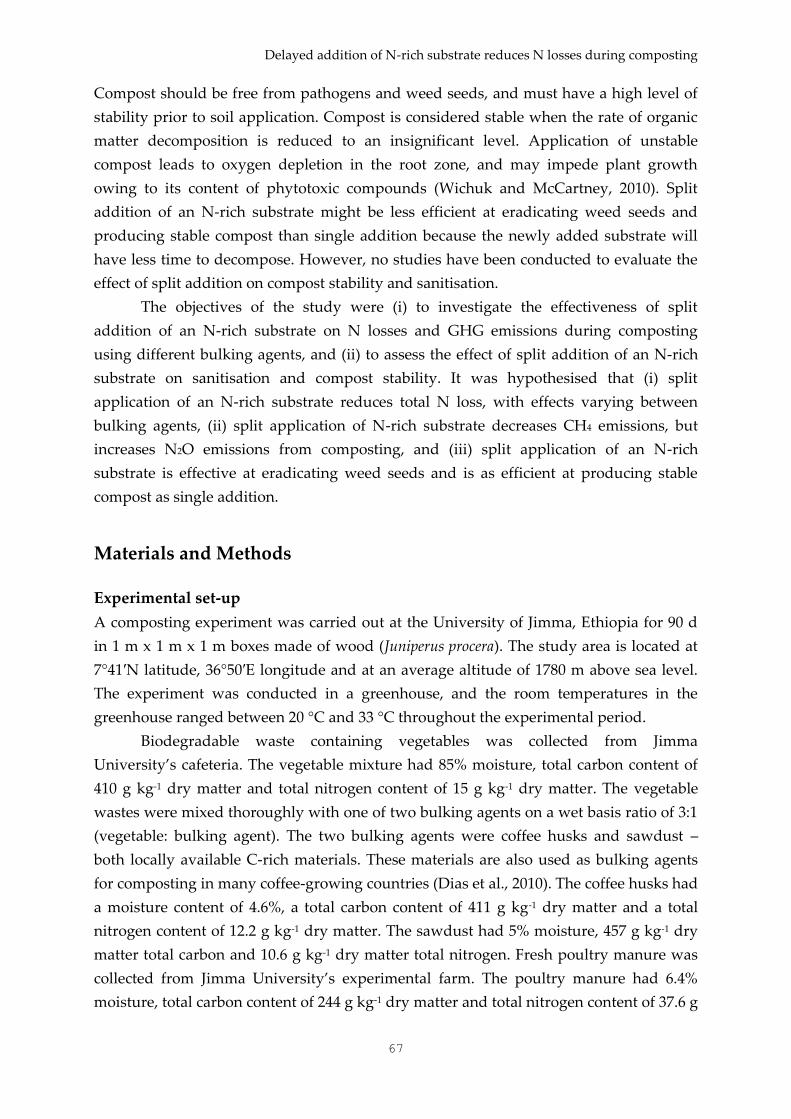
Delayed addition of N-rich substrate reduces N losses during composting
67
Compost should be free from pathogens and weed seeds, and must have a high level of
stability prior to soil application. Compost is considered stable when the rate of organic
matter decomposition is reduced to an insignificant level. Application of unstable
compost leads to oxygen depletion in the root zone, and may impede plant growth
owing to its content of phytotoxic compounds (Wichuk and McCartney, 2010). Split
addition of an N-rich substrate might be less efficient at eradicating weed seeds and
producing stable compost than single addition because the newly added substrate will
have less time to decompose. However, no studies have been conducted to evaluate the
effect of split addition on compost stability and sanitisation.
The objectives of the study were (i) to investigate the effectiveness of split
addition of an N-rich substrate on N losses and GHG emissions during composting
using different bulking agents, and (ii) to assess the effect of split addition of an N-rich
substrate on sanitisation and compost stability. It was hypothesised that (i) split
application of an N-rich substrate reduces total N loss, with effects varying between
bulking agents, (ii) split application of N-rich substrate decreases CH4 emissions, but
increases N2O emissions from composting, and (iii) split application of an N-rich
substrate is effective at eradicating weed seeds and is as efficient at producing stable
compost as single addition.
Materials and Methods
Experimental set-up
A composting experiment was carried out at the University of Jimma, Ethiopia for 90 d
in 1 m x 1 m x 1 m boxes made of wood (Juniperus procera). The study area is located at
7°41′N latitude, 36°50′E longitude and at an average altitude of 1780 m above sea level.
The experiment was conducted in a greenhouse, and the room temperatures in the
greenhouse ranged between 20 °C and 33 °C throughout the experimental period.
Biodegradable waste containing vegetables was collected from Jimma
University’s cafeteria. The vegetable mixture had 85% moisture, total carbon content of
410 g kg-1 dry matter and total nitrogen content of 15 g kg-1 dry matter. The vegetable
wastes were mixed thoroughly with one of two bulking agents on a wet basis ratio of 3:1
(vegetable: bulking agent). The two bulking agents were coffee husks and sawdust –
both locally available C-rich materials. These materials are also used as bulking agents
for composting in many coffee-growing countries (Dias et al., 2010). The coffee husks had
a moisture content of 4.6%, a total carbon content of 411 g kg-1 dry matter and a total
nitrogen content of 12.2 g kg-1 dry matter. The sawdust had 5% moisture, 457 g kg-1 dry
matter total carbon and 10.6 g kg-1 dry matter total nitrogen. Fresh poultry manure was
collected from Jimma University’s experimental farm. The poultry manure had 6.4%
moisture, total carbon content of 244 g kg-1 dry matter and total nitrogen content of 37.6 g
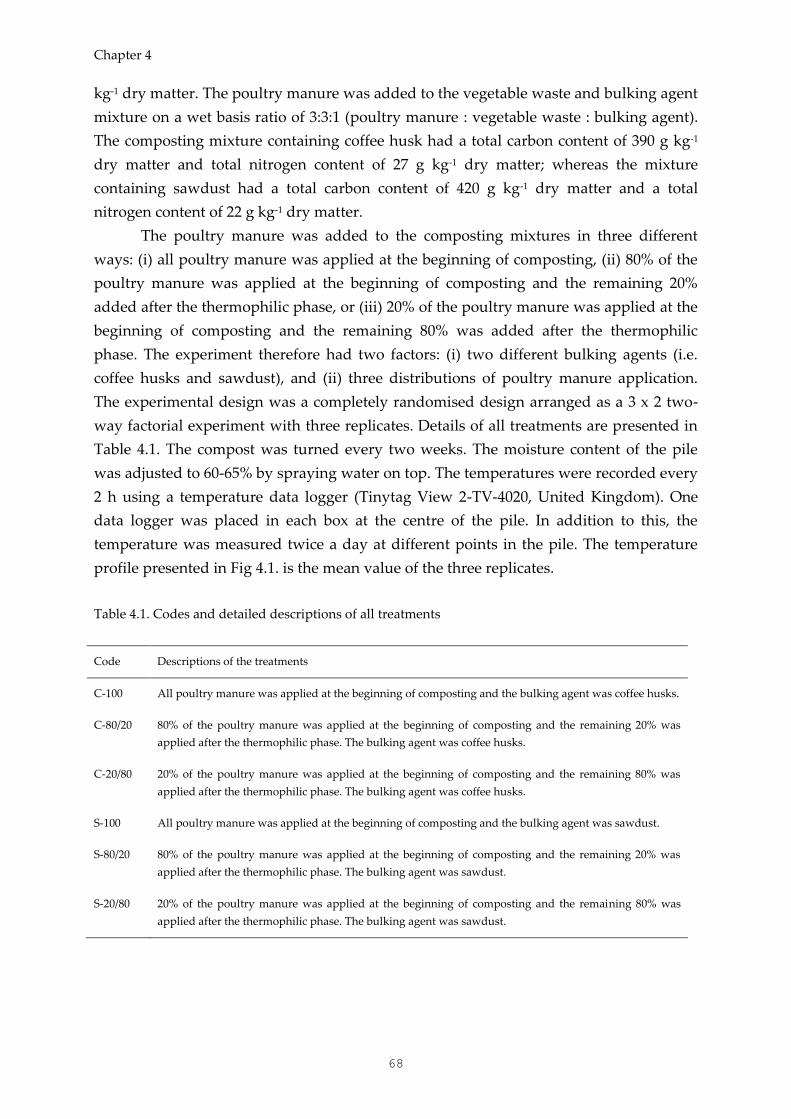
Chapter 4
68
kg-1 dry matter. The poultry manure was added to the vegetable waste and bulking agent
mixture on a wet basis ratio of 3:3:1 (poultry manure : vegetable waste : bulking agent).
The composting mixture containing coffee husk had a total carbon content of 390 g kg-1
dry matter and total nitrogen content of 27 g kg-1 dry matter; whereas the mixture
containing sawdust had a total carbon content of 420 g kg-1 dry matter and a total
nitrogen content of 22 g kg-1 dry matter.
The poultry manure was added to the composting mixtures in three different
ways: (i) all poultry manure was applied at the beginning of composting, (ii) 80% of the
poultry manure was applied at the beginning of composting and the remaining 20%
added after the thermophilic phase, or (iii) 20% of the poultry manure was applied at the
beginning of composting and the remaining 80% was added after the thermophilic
phase. The experiment therefore had two factors: (i) two different bulking agents (i.e.
coffee husks and sawdust), and (ii) three distributions of poultry manure application.
The experimental design was a completely randomised design arranged as a 3 x 2 two-
way factorial experiment with three replicates. Details of all treatments are presented in
Table 4.1. The compost was turned every two weeks. The moisture content of the pile
was adjusted to 60-65% by spraying water on top. The temperatures were recorded every
2 h using a temperature data logger (Tinytag View 2-TV-4020, United Kingdom). One
data logger was placed in each box at the centre of the pile. In addition to this, the
temperature was measured twice a day at different points in the pile. The temperature
profile presented in Fig 4.1. is the mean value of the three replicates.
Table 4.1. Codes and detailed descriptions of all treatments
Code Descriptions of the treatments
C-100 All poultry manure was applied at the beginning of composting and the bulking agent was coffee husks.
C-80/20 80% of the poultry manure was applied at the beginning of composting and the remaining 20% was
applied after the thermophilic phase. The bulking agent was coffee husks.
C-20/80 20% of the poultry manure was applied at the beginning of composting and the remaining 80% was
applied after the thermophilic phase. The bulking agent was coffee husks.
S-100 All poultry manure was applied at the beginning of composting and the bulking agent was sawdust.
S-80/20 80% of the poultry manure was applied at the beginning of composting and the remaining 20% was
applied after the thermophilic phase. The bulking agent was sawdust.
S-20/80 20% of the poultry manure was applied at the beginning of composting and the remaining 80% was
applied after the thermophilic phase. The bulking agent was sawdust.
Delayed addition of N-rich substrate reduces N losses during composting
69
Chemical analyses
Compost samples were collected at the beginning and end of the experiment for analysis
of total carbon, total nitrogen, NO3- and NH4+. The sampling was carried out from five
different locations after turning the pile thoroughly. The pile was turned manually to
ensure representative sampling. The five samples were then mixed to make a composite
sample. Half of the samples were dried (40 °C) and sent to the University of
Copenhagen, Denmark, for analysis of total carbon and total nitrogen. Total carbon and
total nitrogen were determined using an elemental analyser coupled to an isotope ratio
mass spectrometer (PYRO Cube from Elementar, Germany coupled to an Isoprime100
IRMS, UK). The remaining samples were stored at -18 °C for NH4+ and NO3-
measurements. The NH4+ and NO3- concentrations were measured as described by
Bryndum (2014). Briefly, compost samples were mixed with 1 M KCl in a 1:100 compost :
solution ratio (w/v) and shaken for 1 h. The extracts were then analysed for NH4+ and
NO3- concentrations using a flow injection analyser (FIA star TM 5000 analyser,
Denmark). Water-extractable C was determined using ultra-pure water, as described by
Straathof and Comans (2015). Briefly, fresh compost was mixed with ultra-pure milli-Q
water at a 1:10 ratio (w/v), shaken for 1 h on the horizontal shaker and filtered through
0.45 μm (Whatman TM). Due to the heterogeneity of the compost samples, each sample
was replicated four times and the replicates were finally pooled together after the
extracts had been filtered through 0.45 μm. A sub-sample (5 ml) was then taken and
analysed for DOC quantity using San++ channel SFA (SKALAR, The Netherlands). The
final and initial total N concentrations were used to calculate the N loss during
composting as:
𝐹𝑟𝑎𝑐𝑡𝑖𝑜𝑛𝑎𝑙 𝑛𝑖𝑡𝑟𝑜𝑔𝑒𝑛 𝑙𝑜𝑠𝑠 = ( 𝑄𝑖𝐶𝑖 − 𝑄𝑓𝐶𝑓
𝑄𝑖
) 𝑥 100 … … … … … … … … … … . (1)
where Qi and Qf are total dry mass (kg) of the vegetable waste-bulking material-manure
mixture that was added during the experiment and remained at the end of the
experiment respectively, and Ci and Cf are nitrogen concentrations that were added
during the experiment and remained at the end of the experiment respectively.
Gas sampling
The static-chamber method was used to collect gas samples (Chan et al., 2011). For gas
sampling, a 20 L polyethylene gas chamber equipped with a rubber stopper was inserted
2 cm into the composting materials. The rim of the chamber was then covered in the
composting material and water applied around it to provide a good air seal. Two mini
fans (12 V) were installed in the polyethylene chamber to ensure homogeneous
distribution of air in the headspace. Gas samples were collected by syringe every 2 d for
the first week after the addition of substrates, and then once a week until the end of the
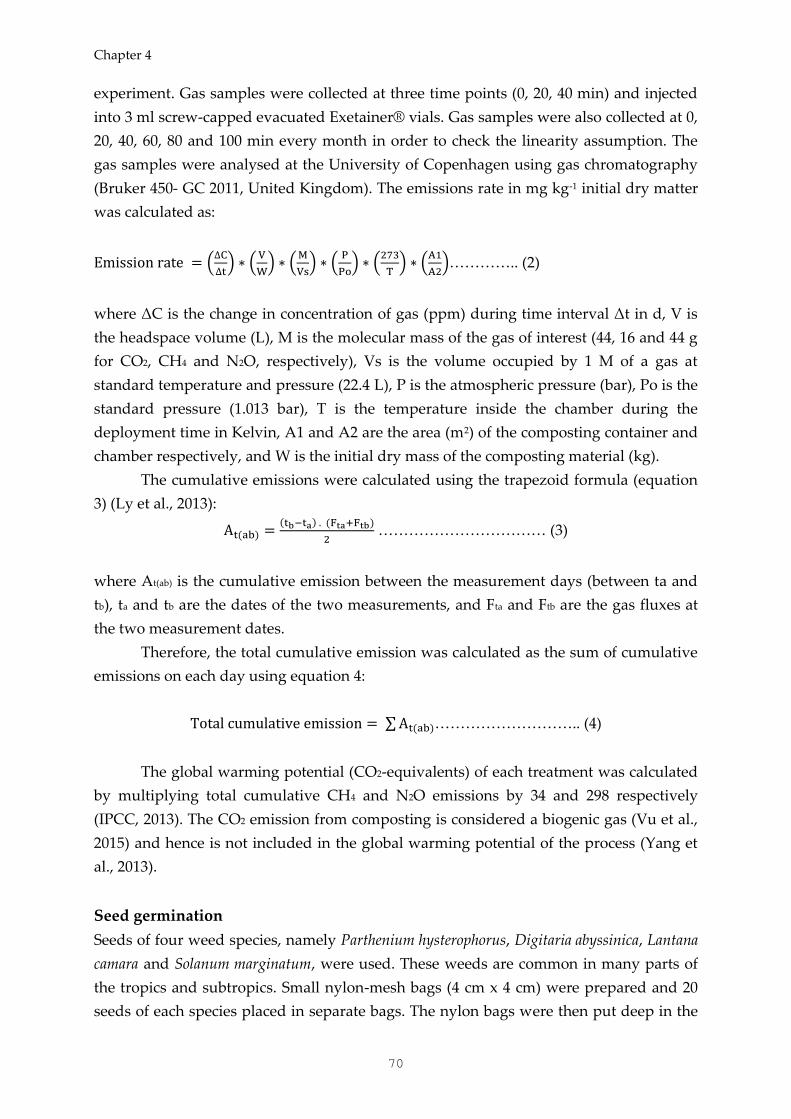
Chapter 4
70
experiment. Gas samples were collected at three time points (0, 20, 40 min) and injected
into 3 ml screw-capped evacuated Exetainer® vials. Gas samples were also collected at 0,
20, 40, 60, 80 and 100 min every month in order to check the linearity assumption. The
gas samples were analysed at the University of Copenhagen using gas chromatography
(Bruker 450- GC 2011, United Kingdom). The emissions rate in mg kg-1 initial dry matter
was calculated as:
Emission rate = (∆C
∆t) ∗ (
V
W) ∗ (
M
Vs) ∗ (
P
Po) ∗ (
273
T) ∗ (
A1
A2)………….. (2)
where ΔC is the change in concentration of gas (ppm) during time interval Δt in d, V is
the headspace volume (L), M is the molecular mass of the gas of interest (44, 16 and 44 g
for CO2, CH4 and N2O, respectively), Vs is the volume occupied by 1 M of a gas at
standard temperature and pressure (22.4 L), P is the atmospheric pressure (bar), Po is the
standard pressure (1.013 bar), T is the temperature inside the chamber during the
deployment time in Kelvin, A1 and A2 are the area (m2) of the composting container and
chamber respectively, and W is the initial dry mass of the composting material (kg).
The cumulative emissions were calculated using the trapezoid formula (equation
3) (Ly et al., 2013):
At(ab) =(tb−ta) . (Fta+Ftb)
2 …………………………… (3)
where At(ab) is the cumulative emission between the measurement days (between ta and
tb), ta and tb are the dates of the two measurements, and Fta and Ftb are the gas fluxes at
the two measurement dates.
Therefore, the total cumulative emission was calculated as the sum of cumulative
emissions on each day using equation 4:
Total cumulative emission = ∑ At(ab)……………………….. (4)
The global warming potential (CO2-equivalents) of each treatment was calculated
by multiplying total cumulative CH4 and N2O emissions by 34 and 298 respectively
(IPCC, 2013). The CO2 emission from composting is considered a biogenic gas (Vu et al.,
2015) and hence is not included in the global warming potential of the process (Yang et
al., 2013).
Seed germination
Seeds of four weed species, namely Parthenium hysterophorus, Digitaria abyssinica, Lantana
camara and Solanum marginatum, were used. These weeds are common in many parts of
the tropics and subtropics. Small nylon-mesh bags (4 cm x 4 cm) were prepared and 20
seeds of each species placed in separate bags. The nylon bags were then put deep in the
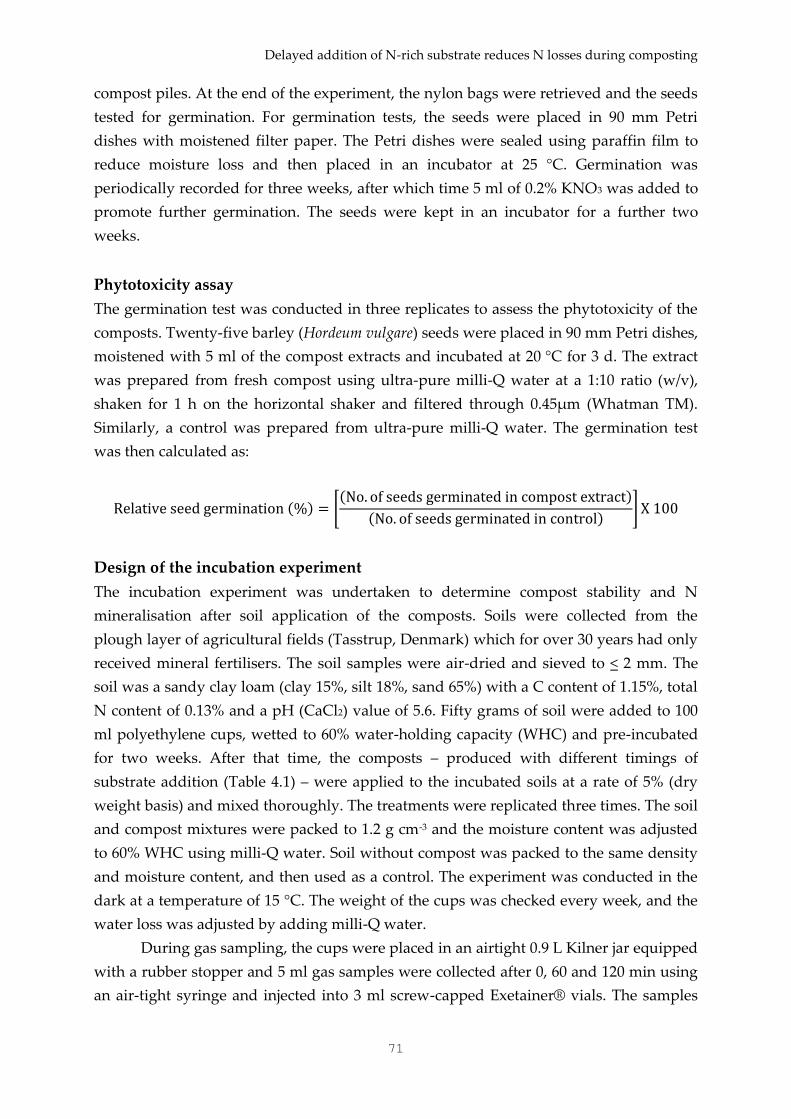
Delayed addition of N-rich substrate reduces N losses during composting
71
compost piles. At the end of the experiment, the nylon bags were retrieved and the seeds
tested for germination. For germination tests, the seeds were placed in 90 mm Petri
dishes with moistened filter paper. The Petri dishes were sealed using paraffin film to
reduce moisture loss and then placed in an incubator at 25 °C. Germination was
periodically recorded for three weeks, after which time 5 ml of 0.2% KNO3 was added to
promote further germination. The seeds were kept in an incubator for a further two
weeks.
Phytotoxicity assay
The germination test was conducted in three replicates to assess the phytotoxicity of the
composts. Twenty-five barley (Hordeum vulgare) seeds were placed in 90 mm Petri dishes,
moistened with 5 ml of the compost extracts and incubated at 20 °C for 3 d. The extract
was prepared from fresh compost using ultra-pure milli-Q water at a 1:10 ratio (w/v),
shaken for 1 h on the horizontal shaker and filtered through 0.45μm (Whatman TM).
Similarly, a control was prepared from ultra-pure milli-Q water. The germination test
was then calculated as:
Relative seed germination (%) = [(No. of seeds germinated in compost extract)
(No. of seeds germinated in control)] X 100
Design of the incubation experiment
The incubation experiment was undertaken to determine compost stability and N
mineralisation after soil application of the composts. Soils were collected from the
plough layer of agricultural fields (Tasstrup, Denmark) which for over 30 years had only
received mineral fertilisers. The soil samples were air-dried and sieved to < 2 mm. The
soil was a sandy clay loam (clay 15%, silt 18%, sand 65%) with a C content of 1.15%, total
N content of 0.13% and a pH (CaCl2) value of 5.6. Fifty grams of soil were added to 100
ml polyethylene cups, wetted to 60% water-holding capacity (WHC) and pre-incubated
for two weeks. After that time, the composts – produced with different timings of
substrate addition (Table 4.1) – were applied to the incubated soils at a rate of 5% (dry
weight basis) and mixed thoroughly. The treatments were replicated three times. The soil
and compost mixtures were packed to 1.2 g cm-3 and the moisture content was adjusted
to 60% WHC using milli-Q water. Soil without compost was packed to the same density
and moisture content, and then used as a control. The experiment was conducted in the
dark at a temperature of 15 °C. The weight of the cups was checked every week, and the
water loss was adjusted by adding milli-Q water.
During gas sampling, the cups were placed in an airtight 0.9 L Kilner jar equipped
with a rubber stopper and 5 ml gas samples were collected after 0, 60 and 120 min using
an air-tight syringe and injected into 3 ml screw-capped Exetainer® vials. The samples
Chapter 4
72
were analysed for CO2 concentration using gas chromatography (Bruker 450-GC 2011,
United Kingdom). The gas samples were collected every 2 d for the first week and then
once a week until the end of the experiment. The CO2 emissions were calculated from the
increase in CO2 concentration inside the Kilner jars, assuming a linear increase in CO2
concentration during sampling. The linearity assumption was checked once a month by
collecting gas samples at 0, 20, 40, 60, 80 and 100 min.
Two destructive soil samples were collected at 21 and 60 d from the sub-set of
each treatment. The NH4+ and NO3- concentrations were extracted using 1 M KCl
solution. Briefly, 20 g of sample (dry matter basis) was mixed with 80 ml of 1 M KCl,
shaken for 1 h, filtered and stored at -18 °C. The NH4+ and NO3- concentrations were
analysed from the extract using flow injection analysis (FIA star TM 5000 analyser,
Denmark).
Statistical analyses
All treatments (i.e. both the composting and incubation experiments) were arranged in a
completely randomised design, and two-way analysis of variance (ANOVA) was
performed. Tukey tests were used to compare the treatment means if the factors’ effect
was significant at P < 0.05. All statistical analyses were carried out using SAS version 9.2
statistical package.
Results
Temperature profile
The temperature throughout the composting period is shown in Figure 4.1. The
thermophilic phase was reached within one week for all treatments and lasted for more
than three weeks. The peak temperatures were between 55 and 63 °C and between 52
and 55 °C respectively when coffee husks and sawdust were used as the bulking agent.
The timing of the addition of the N-rich substrate did not affect the temperature in the
first active phase of the composting, but split addition resulted in a second temperature
peak, which lasted for less than two weeks.
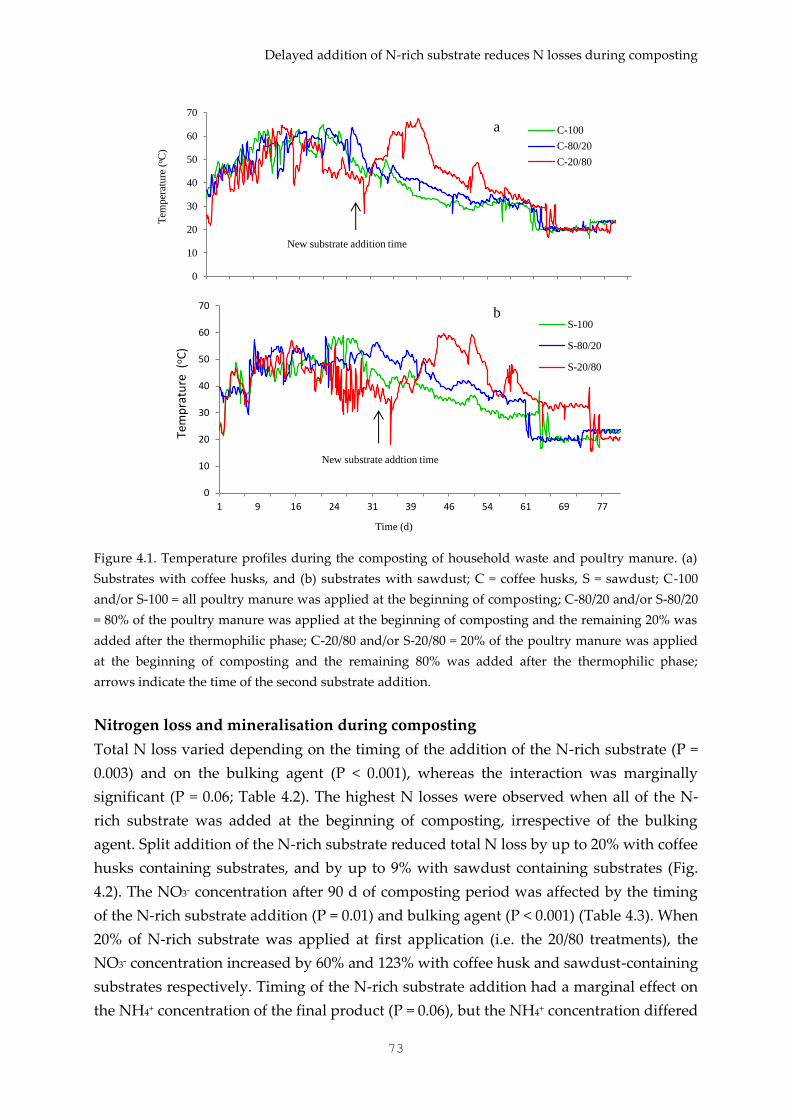
Delayed addition of N-rich substrate reduces N losses during composting
73
Figure 4.1. Temperature profiles during the composting of household waste and poultry manure. (a)
Substrates with coffee husks, and (b) substrates with sawdust; C = coffee husks, S = sawdust; C-100
and/or S-100 = all poultry manure was applied at the beginning of composting; C-80/20 and/or S-80/20
= 80% of the poultry manure was applied at the beginning of composting and the remaining 20% was
added after the thermophilic phase; C-20/80 and/or S-20/80 = 20% of the poultry manure was applied
at the beginning of composting and the remaining 80% was added after the thermophilic phase;
arrows indicate the time of the second substrate addition.
Nitrogen loss and mineralisation during composting
Total N loss varied depending on the timing of the addition of the N-rich substrate (P =
0.003) and on the bulking agent (P < 0.001), whereas the interaction was marginally
significant (P = 0.06; Table 4.2). The highest N losses were observed when all of the N-
rich substrate was added at the beginning of composting, irrespective of the bulking
agent. Split addition of the N-rich substrate reduced total N loss by up to 20% with coffee
husks containing substrates, and by up to 9% with sawdust containing substrates (Fig.
4.2). The NO3- concentration after 90 d of composting period was affected by the timing
of the N-rich substrate addition (P = 0.01) and bulking agent (P < 0.001) (Table 4.3). When
20% of N-rich substrate was applied at first application (i.e. the 20/80 treatments), the
NO3- concentration increased by 60% and 123% with coffee husk and sawdust-containing
substrates respectively. Timing of the N-rich substrate addition had a marginal effect on
the NH4+ concentration of the final product (P = 0.06), but the NH4+ concentration differed
0
10
20
30
40
50
60
70
Tem
per
atu
re (
oC
)
C-100
C-80/20
C-20/80
a
New substrate addition time
0
10
20
30
40
50
60
70
1 9 16 24 31 39 46 54 61 69 77
Tem
pra
ture
(oC
)
Time (d)
S-100
S-80/20
S-20/80
b
New substrate addtion time
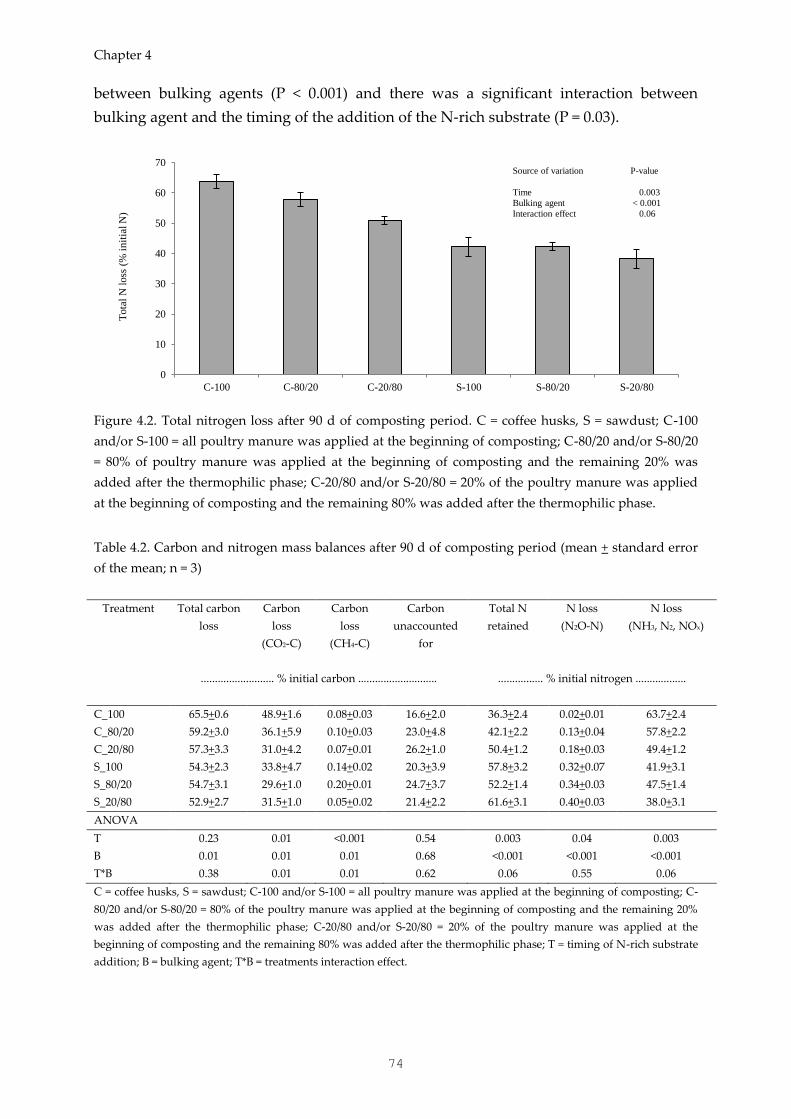
Chapter 4
74
between bulking agents (P < 0.001) and there was a significant interaction between
bulking agent and the timing of the addition of the N-rich substrate (P = 0.03).
Figure 4.2. Total nitrogen loss after 90 d of composting period. C = coffee husks, S = sawdust; C-100
and/or S-100 = all poultry manure was applied at the beginning of composting; C-80/20 and/or S-80/20
= 80% of poultry manure was applied at the beginning of composting and the remaining 20% was
added after the thermophilic phase; C-20/80 and/or S-20/80 = 20% of the poultry manure was applied
at the beginning of composting and the remaining 80% was added after the thermophilic phase.
Table 4.2. Carbon and nitrogen mass balances after 90 d of composting period (mean + standard error
of the mean; n = 3)
Treatment Total carbon
loss
Carbon
loss
(CO2-C)
Carbon
loss
(CH4-C)
Carbon
unaccounted
for
Total N
retained
N loss
(N2O-N)
N loss
(NH3, N2, NOx)
.......................... % initial carbon ............................
................ % initial nitrogen ..................
C_100 65.5+0.6 48.9+1.6 0.08+0.03 16.6+2.0 36.3+2.4 0.02+0.01 63.7+2.4
C_80/20 59.2+3.0 36.1+5.9 0.10+0.03 23.0+4.8 42.1+2.2 0.13+0.04 57.8+2.2
C_20/80 57.3+3.3 31.0+4.2 0.07+0.01 26.2+1.0 50.4+1.2 0.18+0.03 49.4+1.2
S_100 54.3+2.3 33.8+4.7 0.14+0.02 20.3+3.9 57.8+3.2 0.32+0.07 41.9+3.1
S_80/20 54.7+3.1 29.6+1.0 0.20+0.01 24.7+3.7 52.2+1.4 0.34+0.03 47.5+1.4
S_20/80 52.9+2.7 31.5+1.0 0.05+0.02 21.4+2.2 61.6+3.1 0.40+0.03 38.0+3.1
ANOVA
T 0.23 0.01 <0.001 0.54 0.003 0.04 0.003
B 0.01 0.01 0.01 0.68 <0.001 <0.001 <0.001
T*B 0.38 0.01 0.01 0.62 0.06 0.55 0.06
C = coffee husks, S = sawdust; C-100 and/or S-100 = all poultry manure was applied at the beginning of composting; C-
80/20 and/or S-80/20 = 80% of the poultry manure was applied at the beginning of composting and the remaining 20%
was added after the thermophilic phase; C-20/80 and/or S-20/80 = 20% of the poultry manure was applied at the
beginning of composting and the remaining 80% was added after the thermophilic phase; T = timing of N-rich substrate
addition; B = bulking agent; T*B = treatments interaction effect.
0
10
20
30
40
50
60
70
C-100 C-80/20 C-20/80 S-100 S-80/20 S-20/80
Tota
l N
loss
(%
in
itia
l N
)
Source of variation P-value
Time 0.003
Bulking agent < 0.001
Interaction effect 0.06
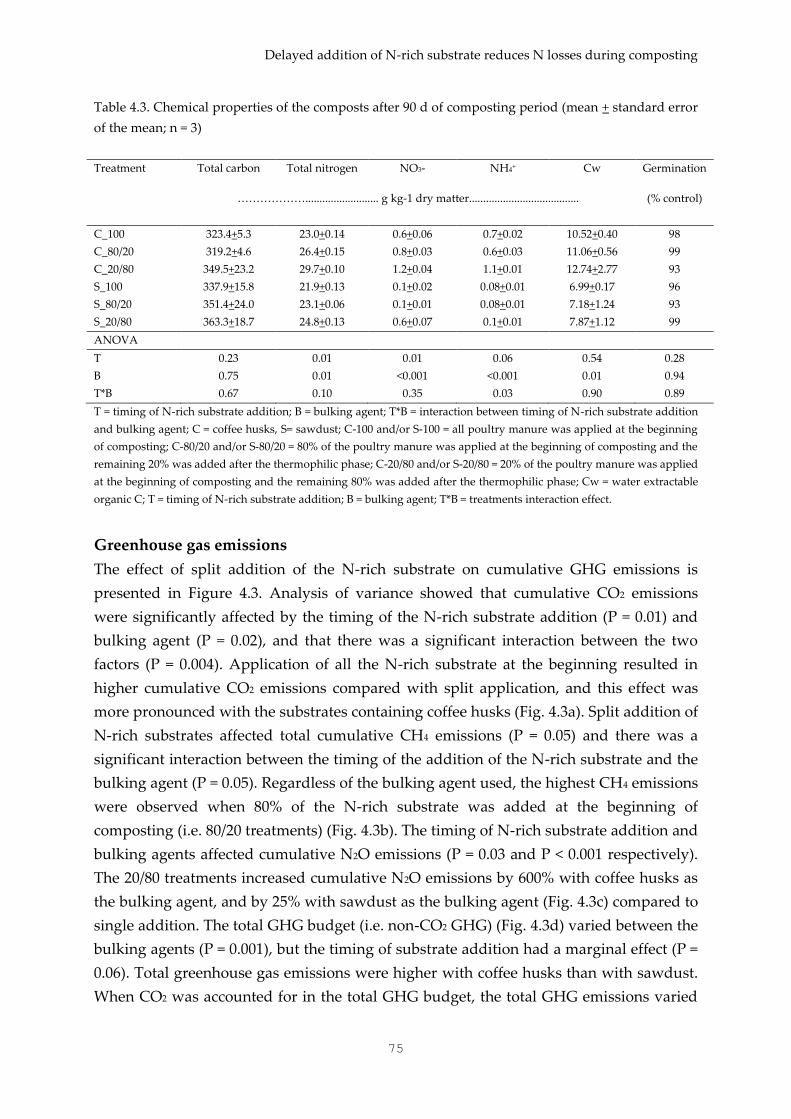
Delayed addition of N-rich substrate reduces N losses during composting
75
Table 4.3. Chemical properties of the composts after 90 d of composting period (mean + standard error
of the mean; n = 3)
Treatment Total carbon Total nitrogen NO3- NH4+ Cw Germination
……………….......................... g kg-1 dry matter.......................................
(% control)
C_100 323.4+5.3 23.0+0.14 0.6+0.06 0.7+0.02 10.52+0.40 98
C_80/20 319.2+4.6 26.4+0.15 0.8+0.03 0.6+0.03 11.06+0.56 99
C_20/80 349.5+23.2 29.7+0.10 1.2+0.04 1.1+0.01 12.74+2.77 93
S_100 337.9+15.8 21.9+0.13 0.1+0.02 0.08+0.01 6.99+0.17 96
S_80/20 351.4+24.0 23.1+0.06 0.1+0.01 0.08+0.01 7.18+1.24 93
S_20/80 363.3+18.7 24.8+0.13 0.6+0.07 0.1+0.01 7.87+1.12 99
ANOVA
T 0.23 0.01 0.01 0.06 0.54 0.28
B 0.75 0.01 <0.001 <0.001 0.01 0.94
T*B 0.67 0.10 0.35 0.03 0.90 0.89
T = timing of N-rich substrate addition; B = bulking agent; T*B = interaction between timing of N-rich substrate addition
and bulking agent; C = coffee husks, S= sawdust; C-100 and/or S-100 = all poultry manure was applied at the beginning
of composting; C-80/20 and/or S-80/20 = 80% of the poultry manure was applied at the beginning of composting and the
remaining 20% was added after the thermophilic phase; C-20/80 and/or S-20/80 = 20% of the poultry manure was applied
at the beginning of composting and the remaining 80% was added after the thermophilic phase; Cw = water extractable
organic C; T = timing of N-rich substrate addition; B = bulking agent; T*B = treatments interaction effect.
Greenhouse gas emissions
The effect of split addition of the N-rich substrate on cumulative GHG emissions is
presented in Figure 4.3. Analysis of variance showed that cumulative CO2 emissions
were significantly affected by the timing of the N-rich substrate addition (P = 0.01) and
bulking agent (P = 0.02), and that there was a significant interaction between the two
factors (P = 0.004). Application of all the N-rich substrate at the beginning resulted in
higher cumulative CO2 emissions compared with split application, and this effect was
more pronounced with the substrates containing coffee husks (Fig. 4.3a). Split addition of
N-rich substrates affected total cumulative CH4 emissions (P = 0.05) and there was a
significant interaction between the timing of the addition of the N-rich substrate and the
bulking agent (P = 0.05). Regardless of the bulking agent used, the highest CH4 emissions
were observed when 80% of the N-rich substrate was added at the beginning of
composting (i.e. 80/20 treatments) (Fig. 4.3b). The timing of N-rich substrate addition and
bulking agents affected cumulative N2O emissions (P = 0.03 and P < 0.001 respectively).
The 20/80 treatments increased cumulative N2O emissions by 600% with coffee husks as
the bulking agent, and by 25% with sawdust as the bulking agent (Fig. 4.3c) compared to
single addition. The total GHG budget (i.e. non-CO2 GHG) (Fig. 4.3d) varied between the
bulking agents (P = 0.001), but the timing of substrate addition had a marginal effect (P =
0.06). Total greenhouse gas emissions were higher with coffee husks than with sawdust.
When CO2 was accounted for in the total GHG budget, the total GHG emissions varied
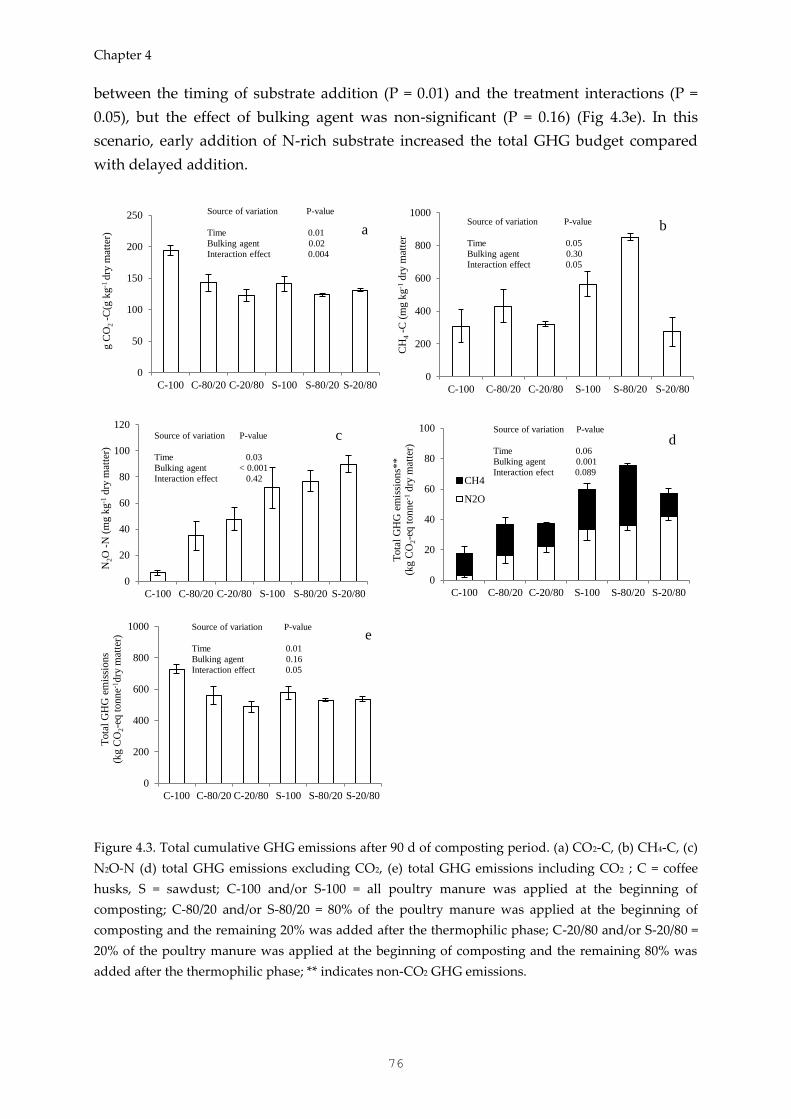
Chapter 4
76
between the timing of substrate addition (P = 0.01) and the treatment interactions (P =
0.05), but the effect of bulking agent was non-significant (P = 0.16) (Fig 4.3e). In this
scenario, early addition of N-rich substrate increased the total GHG budget compared
with delayed addition.
Figure 4.3. Total cumulative GHG emissions after 90 d of composting period. (a) CO2-C, (b) CH4-C, (c)
N2O-N (d) total GHG emissions excluding CO2, (e) total GHG emissions including CO2 ; C = coffee
husks, S = sawdust; C-100 and/or S-100 = all poultry manure was applied at the beginning of
composting; C-80/20 and/or S-80/20 = 80% of the poultry manure was applied at the beginning of
composting and the remaining 20% was added after the thermophilic phase; C-20/80 and/or S-20/80 =
20% of the poultry manure was applied at the beginning of composting and the remaining 80% was
added after the thermophilic phase; ** indicates non-CO2 GHG emissions.
0
50
100
150
200
250
C-100 C-80/20 C-20/80 S-100 S-80/20 S-20/80
g C
O2 -
C(g
kg
-1 d
ry m
atte
r) a
Source of variation P-value
Time 0.01
Bulking agent 0.02
Interaction effect 0.004
0
200
400
600
800
1000
C-100 C-80/20 C-20/80 S-100 S-80/20 S-20/80C
H4 -
C (
mg k
g-1
dry
mat
ter
b Source of variation P-value
Time 0.05
Bulking agent 0.30
Interaction effect 0.05
0
20
40
60
80
100
120
C-100 C-80/20 C-20/80 S-100 S-80/20 S-20/80
N2O
-N
(m
g k
g-1
dry
mat
ter)
c Source of variation P-value
Time 0.03
Bulking agent < 0.001
Interaction effect 0.42
0
20
40
60
80
100
C-100 C-80/20 C-20/80 S-100 S-80/20 S-20/80
Tota
l G
HG
em
issi
on
s**
(kg C
O2-e
q t
on
ne-1
dry
mat
ter)
CH4
N2O
d Source of variation P-value
Time 0.06
Bulking agent 0.001
Interaction efect 0.089
0
200
400
600
800
1000
C-100 C-80/20 C-20/80 S-100 S-80/20 S-20/80
Tota
l G
HG
em
issi
on
s
(kg C
O2-e
q t
on
ne-1
dry
mat
ter)
e Source of variation P-value
Time 0.01
Bulking agent 0.16
Interaction effect 0.05
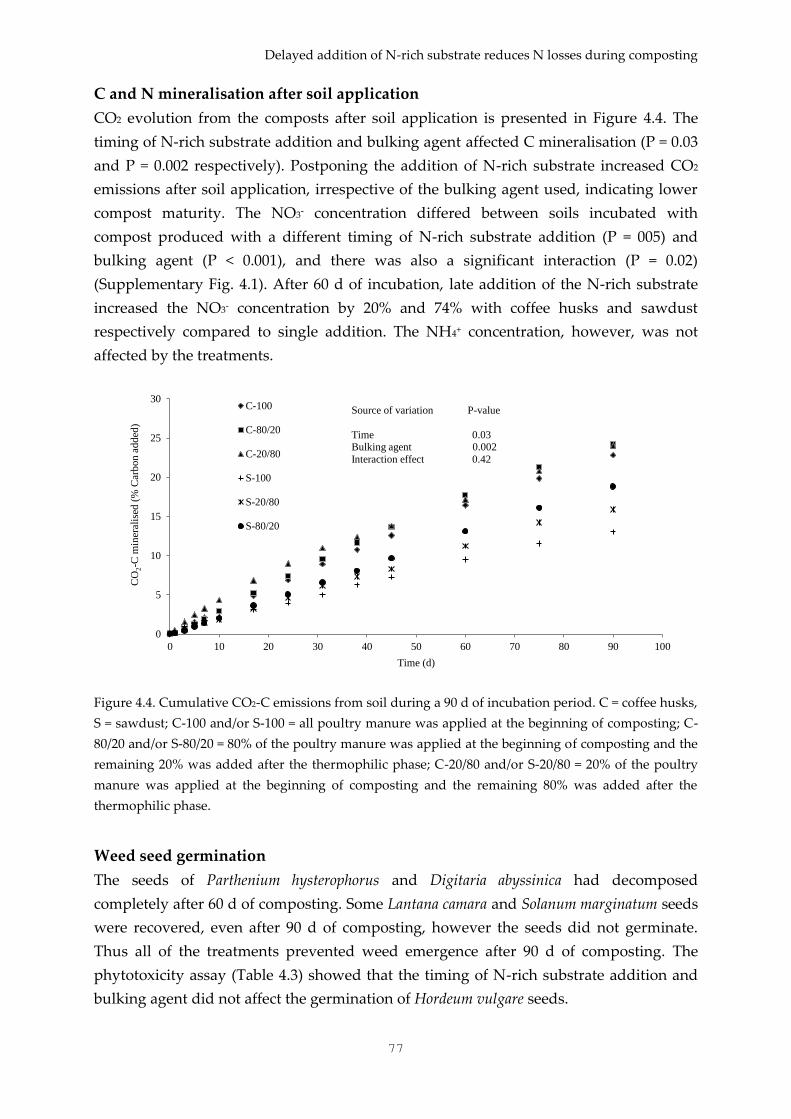
Delayed addition of N-rich substrate reduces N losses during composting
77
C and N mineralisation after soil application
CO2 evolution from the composts after soil application is presented in Figure 4.4. The
timing of N-rich substrate addition and bulking agent affected C mineralisation (P = 0.03
and P = 0.002 respectively). Postponing the addition of N-rich substrate increased CO2
emissions after soil application, irrespective of the bulking agent used, indicating lower
compost maturity. The NO3- concentration differed between soils incubated with
compost produced with a different timing of N-rich substrate addition (P = 005) and
bulking agent (P < 0.001), and there was also a significant interaction (P = 0.02)
(Supplementary Fig. 4.1). After 60 d of incubation, late addition of the N-rich substrate
increased the NO3- concentration by 20% and 74% with coffee husks and sawdust
respectively compared to single addition. The NH4+ concentration, however, was not
affected by the treatments.
Figure 4.4. Cumulative CO2-C emissions from soil during a 90 d of incubation period. C = coffee husks,
S = sawdust; C-100 and/or S-100 = all poultry manure was applied at the beginning of composting; C-
80/20 and/or S-80/20 = 80% of the poultry manure was applied at the beginning of composting and the
remaining 20% was added after the thermophilic phase; C-20/80 and/or S-20/80 = 20% of the poultry
manure was applied at the beginning of composting and the remaining 80% was added after the
thermophilic phase.
Weed seed germination
The seeds of Parthenium hysterophorus and Digitaria abyssinica had decomposed
completely after 60 d of composting. Some Lantana camara and Solanum marginatum seeds
were recovered, even after 90 d of composting, however the seeds did not germinate.
Thus all of the treatments prevented weed emergence after 90 d of composting. The
phytotoxicity assay (Table 4.3) showed that the timing of N-rich substrate addition and
bulking agent did not affect the germination of Hordeum vulgare seeds.
0
5
10
15
20
25
30
0 10 20 30 40 50 60 70 80 90 100
CO
2-C
min
eral
ised
(%
Car
bon
ad
ded
)
Time (d)
C-100
C-80/20
C-20/80
S-100
S-20/80
S-80/20
Source of variation P-value
Time 0.03 Bulking agent 0.002
Interaction effect 0.42
Chapter 4
78
Discussion
Relative nitrogen loss
Postponing the addition of the N-rich substrate reduced total N loss irrespective of the
bulking agent, as hypothesised. The total N loss observed in this study ranged from 40%
to 60% of the initial N content, and was comparable with earlier studies (Bernal et al.,
2009; Steiner et al., 2010), but higher than other studies (Yang et al., 2013). The high N
losses in this study could be explained by the high temperatures, the long duration of the
thermophilic phase (Fig. 4.1), the high NH4+ concentration and C loss (Table 4.2 and 4.3)
and the relatively open design of the composting containers. The N loss as N2O was less
than 1% for all treatments (Table 4.2), and N loss via leaching was minimised by
controlling the moisture content throughout the experimental period. The majority of N
losses could therefore be explained by ammonia emissions and N2 losses (Table 4.2). It is
well known that temperatures above 45 °C increase ammonia volatilisation dramatically
(Pagans et al., 2006). In this experiment, the thermophilic phase (> 45 °C) lasted for more
than three weeks (Fig. 4.1) and the NH4+ concentration was > 1000 mg kg-1 dry matter for
all treatments, implying the presence of optimal conditions for ammonia volatilisation.
The high initial concentration of NH4+ when all the N-rich substrate was added at the
beginning was therefore more prone to NH3 volatilisation than the split treatments. Split
addition of N-rich substrate resulted in a second temperature peak, but this temperature
lasted for less than two weeks. Consequently, when the addition of the N-rich substrate
was postponed, the majority of N added was exposed to a lesser extent to conditions that
are conducive to volatilisation. In agreement with these findings, Bryndum (2014)
reported a 33% reduction in N loss due to the delayed addition of N-rich substrates (i.e.
poultry manure) from composting of sugarcane bagasse and filter cake. Dresbøll and
Thorup-Kristensen (2005), however, did not observe a significant effect of split addition
of clover on N loss from composting of wheat straw and clover. These contradictory
results are probably due to the differences in NH4+ concentration, temperature and
materials used for composting. For instance, there are higher levels of ammonium and
easily mineralisable nitrogen compounds in poultry manure than in clover, which
contains mainly organic nitrogen. The NH4+ concentration was < 400 mg kg-1 dry matter
during the earlier study (Dresbøll and Thorup-Kristensen, 2005). Hence, the effect of split
application is less in clover because nitrogen has to be mineralised before it can volatilise.
Furthermore, the thermophilic phase only lasted for two weeks in the previous study
(Dresbøll and Thorup-Kristensen, 2005), which could have resulted in less ammonia
volatilisation compared to the present experiment. The effect of delayed addition of N-
rich substrate on N loss was not as great as expected and/or reported by Bryndum (2014).
This variation is explained by the second thermophilic phase, which was observed in the
present study, but not by Bryndum (2014). The second thermophilic phase might result
Delayed addition of N-rich substrate reduces N losses during composting
79
in high N losses, but these high temperatures are crucial for compost sanitisation. It is
hypothesised that splitting the N-rich substrate more than twice might further reduce
total N loss, and this hypothesis should be investigated.
The effect of split addition on N loss varied between both bulking materials (P <
0.001). These variations could be explained by the higher temperatures (55-63 °C) when
coffee husks rather than sawdust were used (52-55 °C) (Fig. 4.1), which subsequently led
to higher ammonia volatilisation. High N immobilisation could be another explanation
for the minimum effect of split addition with the substrates containing sawdust because
the higher C : N ratio of this mixture may have efficiently immobilised ammonium. The
total N loss was correlated with organic matter and/or C loss during the composting
process (r2 = 0.78; P < 0.001). The higher C loss with coffee husk substrate compared to
sawdust substrate (Table 4.2) could therefore be an explanation for the observed
differences in total N losses between the two bulking materials. In agreement with these
findings, Dias et al. (2009) observed N loss with substrate containing coffee husks that
was three times higher than with sawdust. To the authors’ knowledge, this is the first
study that has investigated the interactions between the timing of N-rich substrate
addition and bulking agent on N loss. Further studies are needed to investigate the
effectiveness of split substrate addition under different composting conditions, such as
substrate quality, moisture content, aeration and other variables. Split addition of N-rich
substrates also increased mineral N content in the final product after soil application, as
hypothesised. Immobilisation and ammonia loss explained the observed variations
between the treatments in mineral N concentrations. The mineral N concentrations in the
soil after 21 and 60 d of incubation agreed with the inorganic N concentration of the
composts (Table 4.3).
Greenhouse gas emissions
The hypothesis that split addition of an N-rich substrate increases N2O emissions was
confirmed. Both nitrifying and denitrifying bacteria are mesophilic, and high
temperatures effectively reduce N2O production (Vu et al., 2015). In the present
experiments, over 95% of N2O emissions were observed after the thermophilic phase for
all treatments. Postponing the addition of N-rich substrate increases the accessibility of
inorganic N (NH4+ and NO3-) for nitrifying and denitrifying bacteria and consequently
increases N2O production. The cumulative N2O emissions were higher than those in
previous reports on composting (Chowdhury et al., 2014; Vu et al., 2015). High NH4+ and
NO3- concentrations in poultry manure may explain the high N2O emissions in this
experiment.
Early additions of N-rich substrate (i.e. 100/0 and 80/20 treatments) increased the
cumulative CH4 emissions from composting, as hypothesised, and the effect was more
pronounced with the substrates containing sawdust. The high CH4 production during
Chapter 4
80
early additions of the N-rich substrate could be explained by (i) the high load of
materials which results in more anaerobic pockets in the pile, (ii) the presence of high
temperatures in conjunction with high available C and N for the methanogens which
increases CH4 production, and (iii) low methane oxidation due to the similarity between
enzymes involved in methane and ammonium oxidation (Wei et al., 2016).
Methanotrophs can switch substrates from CH4 to NH4+ and result in low CH4 oxidation.
Regardless of the bulking agent used, cumulative CH4 emissions were lower during
single addition of the N-rich substrate than when 80% of the N-rich substrate was added
at the beginning of composting (Fig. 4.3). This observation is attributed to the high NH4+
concentration and ammonia volatilisation during single addition of the N-rich substrate
because methanogenic activity decreases as ammonia volatilisation and NH4+
concentration increase (Hao et al., 2005). The present findings are in agreement with the
results of previous studies reporting on the response of CH4 production from soil to
different nitrogen fertilisers (Wei et al., 2016). To the authors’ knowledge, this is the first
report on the relationship between split addition of an N-rich substrate and GHG
emissions during composting. Further investigations are needed to reveal the
mechanisms of how the timing of substrate addition influences the GHG budget. For
both greenhouse gases (N2O and CH4), the cumulative emissions were higher with the
substrates containing sawdust than those containing coffee husks. The likely explanation
is that the bulkier nature of coffee husks allows more air movement through the compost
pile than sawdust does. We used two different scenarios to assess the GHG budget from
the treatments. The first scenario excludes CO2 from the total GHG budget because
higher CO2 evolution indicates a greater degree of stabilisation of the compost.
Moreover, the less stable composts produce more CO2 during soil application (Fig 4.4);
hence, the total CO2 emissions would eventually converge to the same value for all
composts (Supplementary Fig. 4.2). Under this scenario, the total GHG budget was not
affected by the timing of N-rich substrate addition. Early addition of N-rich substrate,
however, increased the total GHG budget when CO2 was included in the GHG budget.
The obvious explanation is that early addition produce higher CO2 than delay addition
(Fig 4.3a), and CO2 contributed over 85% of the total GHG budget in all treatments.
CO2 evolution and compost stability
The hypothesis that split application of an N-rich substrate increases C mineralisation
after soil application was confirmed. The CO2 evolution from the composts after soil
application correlated with the cumulative CO2 emissions during composting (Fig. 4.3a)
and C loss (Table 4.2). Higher total C loss and CO2 emissions during composting (Fig. 4.3
and Table 4.2) and the subsequent low CO2 emissions after soil application (Fig. 4.4)
indicated that composts produced by early additions were at a more advanced stage of
decomposition compared to split addition. An obvious explanation for this is that the
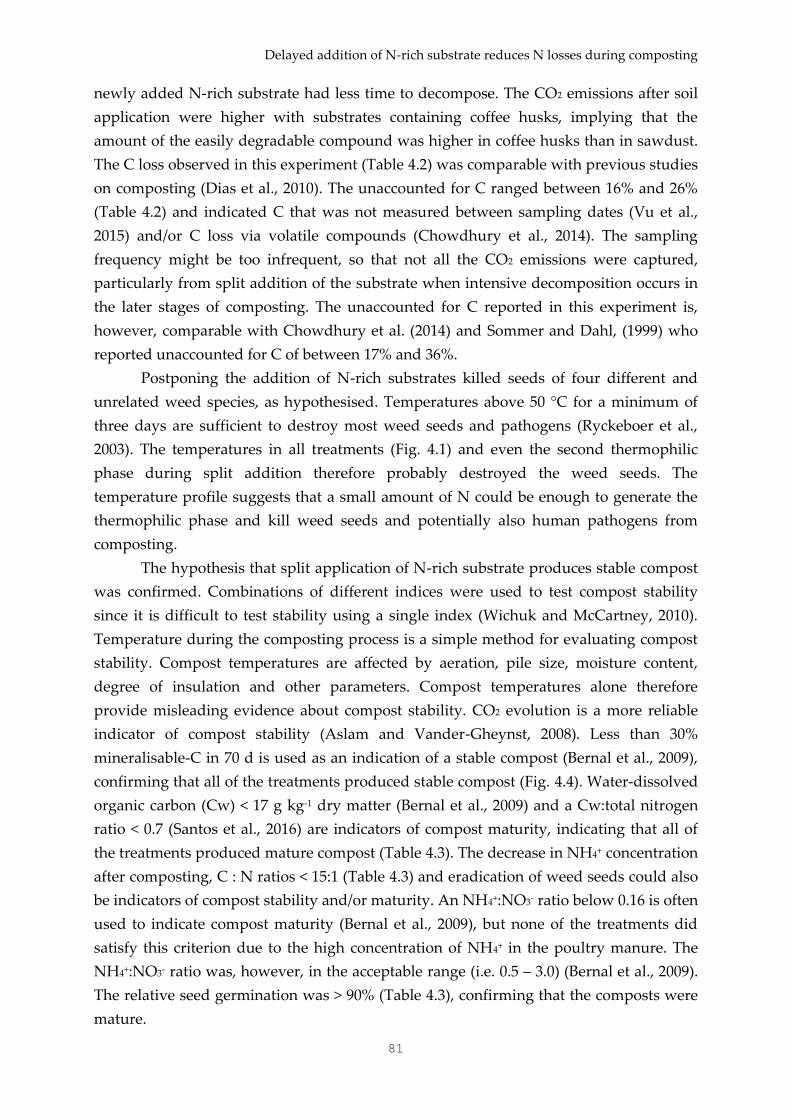
Delayed addition of N-rich substrate reduces N losses during composting
81
newly added N-rich substrate had less time to decompose. The CO2 emissions after soil
application were higher with substrates containing coffee husks, implying that the
amount of the easily degradable compound was higher in coffee husks than in sawdust.
The C loss observed in this experiment (Table 4.2) was comparable with previous studies
on composting (Dias et al., 2010). The unaccounted for C ranged between 16% and 26%
(Table 4.2) and indicated C that was not measured between sampling dates (Vu et al.,
2015) and/or C loss via volatile compounds (Chowdhury et al., 2014). The sampling
frequency might be too infrequent, so that not all the CO2 emissions were captured,
particularly from split addition of the substrate when intensive decomposition occurs in
the later stages of composting. The unaccounted for C reported in this experiment is,
however, comparable with Chowdhury et al. (2014) and Sommer and Dahl, (1999) who
reported unaccounted for C of between 17% and 36%.
Postponing the addition of N-rich substrates killed seeds of four different and
unrelated weed species, as hypothesised. Temperatures above 50 °C for a minimum of
three days are sufficient to destroy most weed seeds and pathogens (Ryckeboer et al.,
2003). The temperatures in all treatments (Fig. 4.1) and even the second thermophilic
phase during split addition therefore probably destroyed the weed seeds. The
temperature profile suggests that a small amount of N could be enough to generate the
thermophilic phase and kill weed seeds and potentially also human pathogens from
composting.
The hypothesis that split application of N-rich substrate produces stable compost
was confirmed. Combinations of different indices were used to test compost stability
since it is difficult to test stability using a single index (Wichuk and McCartney, 2010).
Temperature during the composting process is a simple method for evaluating compost
stability. Compost temperatures are affected by aeration, pile size, moisture content,
degree of insulation and other parameters. Compost temperatures alone therefore
provide misleading evidence about compost stability. CO2 evolution is a more reliable
indicator of compost stability (Aslam and Vander-Gheynst, 2008). Less than 30%
mineralisable-C in 70 d is used as an indication of a stable compost (Bernal et al., 2009),
confirming that all of the treatments produced stable compost (Fig. 4.4). Water-dissolved
organic carbon (Cw) < 17 g kg-1 dry matter (Bernal et al., 2009) and a Cw:total nitrogen
ratio < 0.7 (Santos et al., 2016) are indicators of compost maturity, indicating that all of
the treatments produced mature compost (Table 4.3). The decrease in NH4+ concentration
after composting, C : N ratios < 15:1 (Table 4.3) and eradication of weed seeds could also
be indicators of compost stability and/or maturity. An NH4+:NO3- ratio below 0.16 is often
used to indicate compost maturity (Bernal et al., 2009), but none of the treatments did
satisfy this criterion due to the high concentration of NH4+ in the poultry manure. The
NH4+:NO3- ratio was, however, in the acceptable range (i.e. 0.5 – 3.0) (Bernal et al., 2009).
The relative seed germination was > 90% (Table 4.3), confirming that the composts were
mature.
Chapter 4
82
Implications
Nitrogen loss during composting reduces the agronomic value of compost and
contributes to greenhouse gas emissions and unpleasant odours. Different strategies
have been identified for reducing N losses from composting, but existing technologies
such as controlling the pH (Pagans et al., 2006), controlling the aeration rate
(Chowdhury et al., 2014) and the use of absorbents (i.e. active carbon, biochar and
zeolite) (Kahn et al., 2016; Steiner et al., 2010) are expensive and difficult to scale up to
field-scale conditions. The addition of crop residues to adjust the C:N ratio is another
effective method for reducing N losses (Dias et al., 2010), but there are competing uses of
crop residues for animal feed and fuel in smallholding farming systems in developing
countries (Nigussie et al., 2015). It is therefore suggested that split addition of N-rich
substrate is a less expensive method than the existing solutions for reducing N losses
from composting, which also produces compost with a high fertilising value. Many
smallholder farmers prepare compost by continuously adding organic materials to a
compost pile, implying that the present experiment corresponds to the activity of
smallholder farmers in developing countries. In practice, however, it is not only
nitrogen-rich substrates that are added continuously to a compost pile, but different
qualities of materials as well. Further studies, therefore, are needed to determine the
effect of split application of different quality substrates on the composting process.
Conclusions
Irrespective of the bulking agent used, split addition of the nitrogen-rich substrate
reduced nitrogen loss without having a significant effect on total greenhouse gas
emissions, compost stability and sanitisation. Split addition of the N-rich substrate
increased N mineralisation after soil application, implying an increase in the fertilising
value of the end product. This study demonstrated that the timing of substrate addition
affected CH4 and N2O emissions, but not the total GHG budget. Split addition of N-rich
substrates did not affect the temperature profile during the thermophilic phase and was
effective at eradicating a wide range of weed seeds. This study provides essential
information with regard to the timing of substrate addition to produce compost with a
high fertilising value and avoid emissions of greenhouse gases. However, further studies
are needed to scale up this technique to field conditions. Experiments in the presence of
plants are also recommended in order to test the effect of split addition of an N-rich
substrate on the agronomic value of the compost.
Delayed addition of N-rich substrate reduces N losses during composting
83
Acknowledgements
This work has been conducted as part of a PhD thesis project supported by the
Agricultural Transformation by Innovation (AgTraIn) Erasmus Mundus Joint Doctorate
Programme, funded by the EACEA (Education, Audio-visual and Culture Executive
Agency) of the European Commission. The authors would like to acknowledge the
anonymous reviewers for their constructive comments on the earlier version of the
manuscript.
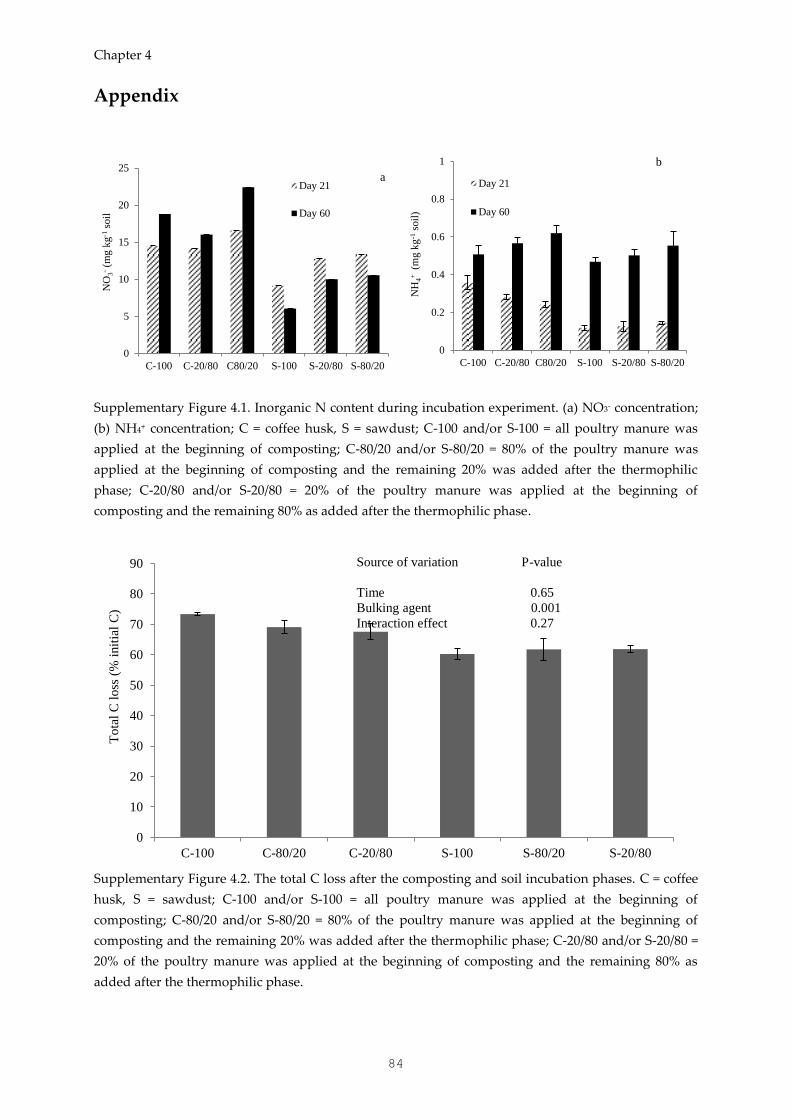
Chapter 4
84
Appendix
Supplementary Figure 4.1. Inorganic N content during incubation experiment. (a) NO3- concentration;
(b) NH4+ concentration; C = coffee husk, S = sawdust; C-100 and/or S-100 = all poultry manure was
applied at the beginning of composting; C-80/20 and/or S-80/20 = 80% of the poultry manure was
applied at the beginning of composting and the remaining 20% was added after the thermophilic
phase; C-20/80 and/or S-20/80 = 20% of the poultry manure was applied at the beginning of
composting and the remaining 80% as added after the thermophilic phase.
Supplementary Figure 4.2. The total C loss after the composting and soil incubation phases. C = coffee
husk, S = sawdust; C-100 and/or S-100 = all poultry manure was applied at the beginning of
composting; C-80/20 and/or S-80/20 = 80% of the poultry manure was applied at the beginning of
composting and the remaining 20% was added after the thermophilic phase; C-20/80 and/or S-20/80 =
20% of the poultry manure was applied at the beginning of composting and the remaining 80% as
added after the thermophilic phase.
0
5
10
15
20
25
C-100 C-20/80 C80/20 S-100 S-20/80 S-80/20
NO
3- (m
g k
g-1
soil
Day 21
Day 60
0
0.2
0.4
0.6
0.8
1
C-100 C-20/80 C80/20 S-100 S-20/80 S-80/20
NH
4+
(m
g k
g-1
soil
)
Day 21
Day 60
b
0
10
20
30
40
50
60
70
80
90
C-100 C-80/20 C-20/80 S-100 S-80/20 S-20/80
To
tal
C l
oss
(%
init
ial
C)
Source of variation P-value
Time 0.65
Bulking agent 0.001
Interaction effect 0.27
a
Earthworms change the quantity and composition of DOC
85
CHAPTER 5
Earthworms change the quantity and composition of
dissolved organic carbon and reduce greenhouse gas
emissions during composting
Submitted to Waste Management as:
Nigussie, A., Bruun, S., de Neergaard, A., Kuyper, TW. Earthworms change the
quantity and composition of dissolved organic carbon and reduce greenhouse gas
emissions during composting
.
Chapter 5
86
Earthworms change the quantity and composition of
dissolved organic carbon and reduce greenhouse gas
emissions during composting
Abstract
Vermicomposting has been suggested as an alternative composting method that is
efficient at stabilising biodegradable waste and reducing greenhouse gas emissions
during composting. The amount of substrate added per earthworm biomass (i.e. feeding
ratio) influences the growth and activity of earthworms and aeration. However, the effect
of earthworms and feeding ratio on the stabilisation process is not known. Dissolved
organic carbon (DOC) has recently been proposed as an indicator of compost stability.
The objective of this study was therefore to assess the earthworms’ effect on DOC
content (quantity) and composition (quality), and on greenhouse gas emissions; and link
this effect to feeding ratio and substrate quality. The results showed that earthworms
reduced total DOC content and NH4+ : NO3- ratio, indicating larger stability of
earthworm compost. The concentrations of humic acid and fulvic acid were also reduced
by earthworms, whereas there was no significant effect on hydrophobic neutrals and
hydrophilics. The humic acid fraction was depleted more quickly than the other
compounds, indicating that humic acids are degraded during composting. The optimum
feeding ratio decreased DOC content, humic acid and fulvic acid, but increased
cumulative CO2 production compared with the high ratio. The lowest cumulative N2O
emissions were observed at the optimum feeding ratio; there was no significant
difference between the high feeding ratio and non-earthworm treatments. These results
suggest that measurement of DOC components provides greater insight into the
stabilisation process. Moreover, feeding ratio should be considered as an essential
parameter when assessing the effect of earthworms on organic-waste stabilisation and
greenhouse gas emissions.
Keywords: vermicomposting, nitrous oxide, feeding ratio, dissolved organic carbon,
stabilisation
Earthworms change the quantity and composition of DOC
87
Introduction
Thermophilic composting and vermicomposting are two composting techniques
commonly used to convert biodegradable waste into compost. Thermophilic composting
is a microbially-mediated, high-temperature (> 45 °C) process, while vermicomposting is
a mesophilic (< 30 °C) process that involves earthworms and associated microorganisms
in the decomposition and stabilisation of organic materials (Munroe, 2007). The
temperature during vermicomposting should remain within the range of 15-30 °C, as
temperatures above 35 °C kill earthworms (Munroe, 2007). The temperatures are kept
low in vermicomposting by gradual addition of the substrate (Nigussie et al., 2016)
and/or pre-composting the material prior to vermicomposting (Lazcano et al., 2008).
Considerable decomposition while retaining higher nutrient concentrations was
observed during vermicomposting compared with thermophilic composting (Nigussie et
al., 2016a; Lazcano et al., 2008). In contrast, high N losses occur during thermophilic
composting because high temperatures (> 45 °C) increase ammonia volatilisation (Pagans
et al., 2006). Temperatures above 45 °C are however considered essential for eradicating
seeds and pathogens from compost (Ryckeboer et al., 2003). Vermicomposting has also
been shown to be effective at eradicating weeds and pathogens (Edwards et al., 2011),
but the mechanisms of how earthworms kill weed seeds and pathogens is not known
and the reports are contradictory. Hence the combination of thermophilic composting
and vermicomposting has most often been proposed to produce compost of high
agronomic value that is at the same time pathogen-free (Lazcano et al., 2008). The first
phase – thermophilic composting – occurs only for a short period of time, mainly to
eradicate pathogens and eliminate toxic compounds, and the subsequent
vermicomposting (i.e. the second phase) is carried out to accelerate the stabilisation
process and improve the agronomic value of compost (Lazcano et al., 2008).
It is important that compost should be sufficiently stable prior to soil application
because unstable compost reduces plant growth. Unstable compost leads to oxygen
depletion in the root zone and osmotic stress and contains phytotoxic compounds
(Wichuk and McCartney, 2010). Compost is considered stable when the organic matter
decomposition rate is reduced to a low level with no heat development. A number of
indices are used to determine compost stability (Bernal et al., 2009; Khan et al., 2014).
Evolution of CO2 is the most commonly used indicator (Bernal et al., 2009; Nigussie et al.,
2016b), but this index is influenced by a number of factors such as substrate quality. Lack
of heat development is another simple method for evaluating compost stability (Boulter-
Bitzer et al., 2006), however it is also affected by aeration, pile size, moisture content,
degree of insulation and other parameters. Therefore the use of one index to determine
compost stability is potentially misleading. Indices such as a C : N ratio < 12 and a NH4+-
N : NO3--N ratio < 0.16 are also recommended as a threshold level for indicating compost
maturity (Khan et al., 2014), however, theses indices also depend on substrate quality.
Chapter 5
88
Numerous researchers have therefore suggested the combined use of multiple indices as
indicator for compost stability (Bernal et al., 2009; Khan et al., 2014).
Dissolved organic carbon (DOC) has recently been proposed as an indicator of
compost stability (Bernal et al., 2009; Santos et al., 2016). A maximum threshold DOC
value of 4 g kg-1 dry matter is used as an indicator of stable compost (Zmora-Nahum et
al., 2005; Kahn et al., 2014). Not only the quantity but also the quality (i.e. chemical
composition) of DOC can be used to assess compost stability. A batch fractionation
procedure (Van Zomeren and Comans, 2007) is currently used to separate DOC into four
fractions, viz., humic acid (HA), fulvic acid (FA), hydrophobic neutral (HON), all
considered as hydrophobic compounds, and hydrophilic (Hi) compounds (Straathof and
Comans, 2015). A recent study has shown that the proportions of these four fractions
vary between composts, irrespective of DOC concentration (Straathof and Comans,
2015). Hi compounds declined during composting likely because they were used as a
substrate for microorganisms, and the hydrophobic compounds (HA, FA and HON)
fractionally increased in stable compost.
It is plausible that earthworms influence the DOC quantity and quality
(composition) of compost because they ingest the substrates and thereby condition the
microbial communities that influence the decomposition process. Previous studies have
found higher stabilisation of compost as a result of vermicomposting compared to
thermophilic composting using indices such as CO2 evolution (Nigussie et al., 2016; Ngo
et al., 2013) and biochemical analysis (Lazcano et al., 2008). However, little is known
about the effect of earthworms on DOC quantity and quality during vermicomposting.
Feeding ratio is defined as the amount of substrate added per weight of
earthworm (Ndegwa et al., 2000) and high feeding ratio decreases the conversion rate of
fresh materials into vermicompost. Previous studies have shown that very high food
supply reduces the biomass and reproduction of earthworms (Luth et al., 2011).
Furthermore, Ndegwa et al. (2000) found that low feeding ratio increases the
mineralisation of nutrients (particularly nitrogen) compared with high feeding ratio.
High feeding ratio increases temperature and impedes air circulation in the pile (Luth et
al., 2011), both of which affect GHG emissions. For instance, if food supply is too high
(supra-optimal feeding ratio) per unit earthworm biomass, the temperature in the pile
increases; high temperatures and anoxic patches not only result in increased earthworm
mortality, but in greater GHG emissions as well. Feeding ratio is therefore an essential
parameter that should be considered when assessing the effect of earthworms on
stabilisation and greenhouse gas emissions. Recent reports have used substrate quality
(Nigussie et al., 2016; Wang et al., 2015) and earthworm density (Nigussie et al., 2016) to
evaluate the effect of earthworms on decomposition and GHG emissions. In addition,
feed type affects the conversion rate of fresh materials into vermicompost (Edwards and
Bohlen, 1996). However, the effect of feeding ratio on stabilisation processes and GHG
emissions during vermicomposting is not known. The objectives of the present study
Earthworms change the quantity and composition of DOC
89
were therefore (i) to evaluate the effect of earthworms on DOC quantity and composition
of the compost, linking this effect to the initial substrate quality and feeding ratio, and (ii)
to assess the effect of feeding ratio on GHG emissions from vermicomposting. We
hypothesised that (i) earthworms reduce the DOC content of compost compared to non-
earthworm composting, with the effect of earthworms being greater at the optimal
feeding ratio; (ii) earthworms reduce DOC content more in substrates that underwent the
shortest pre-composting period, (iii) earthworms reduce the fractional contribution of Hi
and hence increase the fractional contribution made by HA, FA and HON compared to
non-earthworm composting, (iv) high feeding ratio increases GHG emissions from
vermicomposting compared to the optimal feeding ratio, and (v) high feeding ratio
reduces compost stability, as assessed by CO2 fluxes, compared to the optimal feeding
ratio.
Materials and Methods
Experimental setup
Pre-decomposed garden waste was obtained from Unifarm, part of Wageningen
University and Research, and placed in plastic boxes (30 cm width X 40 cm length X 25
cm height). Three substrates with different composition that have undergone different
degrees of decomposition were used as composting materials. The first substrate
(substrate_1) had been through the composting process for three months and the second
substrate (substrate_2) had been through the composting process for nearly 1½ months.
The third substrate (substrate_3) was prepared from substrate_1, substrate_2 and cattle
manure at a ratio of 1:1:1. The cattle manure was added in the third substrate to increase
nitrogen availability in the mixture, whereas pre-decomposed materials were used in this
experiment to avoid the development of high temperatures in the vermicompost bins.
Hence there was no temperature effect in our experiment unlike the previous
composting experiments (Nigussie et al., 2016; Straathof and Comans, 2015).
Mixtures of adult individuals of two epigeic earthworm species, namely Eisenia
fetida and Dendrobaena veneta (approximate 2:1 ratio), were obtained from two earthworm
breeding companies, ‘De Polderworm’ and Star Foods, in The Netherlands. The
earthworms were added at a stocking density of 3 kg earthworms m-2. The substrates
were added to the vermicomposting bin in two doses: (i) 1.5 kg substrate kg earthworms-
1 (recommended by Aira and Domínguez, 2008) – hereafter referred to as optimal ratio
(OR) – and (ii) 3 kg substrate kg earthworms-1 – hereafter referred to as the high ratio
(HR). Treatments without earthworms were used as controls. The experiment had two
factors arranged in a 3 x 3 (earthworm treatments (OR, HR and control) X substrate
quality) complete randomised design with three replicates. The experiment was
conducted for 60 days, and the moisture content in each container was adjusted to 70-
75% by spraying of water on top.
Chapter 5
90
DOC and its fractionation
DOC was extracted using ultra-pure water, as described by Straathof and Comans (2015).
Briefly, fresh compost was mixed with ultra-pure milli-Q water at a 1:10 ratio (w/v),
shaken for one hour on a horizontal shaker and filtered through a 0.45μm filter
(Whatman TM). Due to the heterogeneity of the compost samples, each sample was
replicated four times and the replicates were finally pooled together after the extracts
had been filtered. A sub-sample (5 ml) was then taken and analysed for DOC
concentration using San++ channel SFA (SKALAR, The Netherlands). The remaining
samples were used for DOC fractionation.
The batch fractionation procedure (Van Zomeren and Comans, 2007) was used to
separate the DOC fractions. Briefly, 40 ml of the DOC sample was added in a 50 ml
centrifuge tube, acidified to pH 1.0 with 6 M HCl and allowed to stand overnight. This
step allowed the humic acid (HA) fraction to precipitate and form pellets. The acidified
solution was then centrifuged (20 min, 3500 g) to separate the HA (i.e. the pellets) from
the supernatant containing FA, HON and Hi (FaHyHON). About 25 ml of 0.1 M KOH
(pH 12.0) was added to the pellets and shaken for 20 min to re-suspend the HA fraction.
The supernatant was transferred to another 50 ml centrifuge tube. About 15 ml of the
supernatant was added to a 3 gm DAX-8 resin (Sigma–Aldrich), shaken for one hour and
filtered through 0.45 μm (Whatman TM). This step separated the hydrophilic
compounds (Hi) from the supernatant. Finally, 15 ml 0.1 M KOH was added to the DAX-
8 resin, shaken for one hour, and filtered through 0.45 μm (Whatman TM) to separate the
fulvic acid (FA) fractions. This step was repeated three or more times until the
concentration in the samples was equal to the blank samples. The neutral (HoN)
fractions were estimated from the DOC that was not dissolved under alkaline conditions.
The concentrations of each fraction were measured using San++ channel SFA (SKALAR,
The Netherlands).
Gas sampling
The static chamber method was used to collect gas samples (Chan et al., 2010) every two
days for the first week and then once a week until the end of the experiment, after 60
days. Gas samples were collected three times after closing the chamber (0, 20 and 40
minutes). Gas samples were also collected after 0, 20, 40, 60, 80 and 100 minutes every
month in order to check the linearity assumption. The gas samples were measured using
INNOVA 1412 photoacoustic field gas monitor (LumaSense Technologies, Ballerup,
Denmark). The emissions rate in mg kg-1 initial dry matter day-1 was calculated as:
Earthworms change the quantity and composition of DOC
91
Emission rate = (∆C
∆t) ∗ (
V
W) ∗ (
M
Vs) ∗ (
P
Po) ∗ (
273
T) … … … … … … … … … . (1)
where ΔC is the change in concentration of gas (ppm) during time interval Δt in days, V
is the headspace volume (litres), M is the molecular mass of the gas of interest (44, 16 and
44 g for CO2, CH4 and N2O respectively), Vs is the volume occupied by 1 mole of a gas at
standard temperature and pressure (22.4 litre), P is the atmospheric pressure (bar), Po is
the standard pressure (1.013 bar), T is the temperature inside the chamber during the
deployment time in Kelvin, and W is the initial dry mass of the composting material (kg).
The cumulative emissions were calculated using the trapezoid integration rule (Ly
et al., 2013).
Chemical analyses
Compost samples were collected at the end of the experiment for the analyses of pH,
NO3- and NH4+. The samples were stored at 4 °C prior to laboratory analysis. pH was
measured from a compost : water ratio of 1:10 (w/v), whereas NO3- and NH4+
concentrations were determined using 1 M KCl. The compost samples were mixed with 1
M KCl at a ratio of 1:100 compost:solution (w/v) and shaken for one hour. The extracts
were then analysed for NH4+ and NO3- concentrations using segmented flow analysis
(SFA) (SKALAR analytical, Netherlands).
Statistical analyses
A two-way analysis of variance (ANOVA) was performed to test for significant effects of
earthworm treatments, substrate quality and their interactions. A separate ANOVA was
performed - excluding the control treatment - to test for significant effects of two feeding
ratios on the vermicomposting process. The data were checked for the assumptions of
ANOVA prior to data analysis. Levene and Shapiro-Wilk’s tests were used to test for
homogeneity of variance and normality respectively. Data on the change in earthworm
biomass did not fit with ANOVA assumptions and hence the data were log-transformed.
Tukey test was used to compare the means if the factors’ effect was found significant at P
< 0.05. Linear regression was performed between the CO2 emissions in the last week as
an independent variable and DOC quantity and DOC composition as a dependent
variable. All statistical analyses were undertaken using SAS version 9.2.
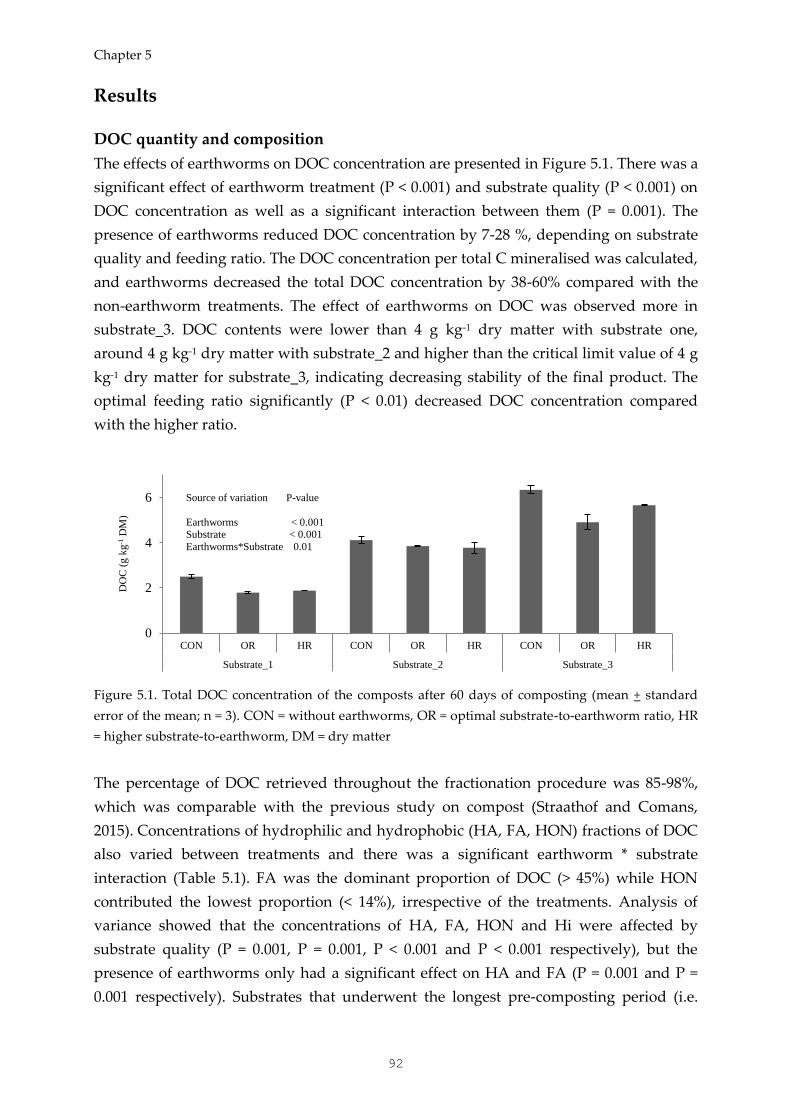
Chapter 5
92
Results
DOC quantity and composition
The effects of earthworms on DOC concentration are presented in Figure 5.1. There was a
significant effect of earthworm treatment (P < 0.001) and substrate quality (P < 0.001) on
DOC concentration as well as a significant interaction between them (P = 0.001). The
presence of earthworms reduced DOC concentration by 7-28 %, depending on substrate
quality and feeding ratio. The DOC concentration per total C mineralised was calculated,
and earthworms decreased the total DOC concentration by 38-60% compared with the
non-earthworm treatments. The effect of earthworms on DOC was observed more in
substrate_3. DOC contents were lower than 4 g kg-1 dry matter with substrate one,
around 4 g kg-1 dry matter with substrate_2 and higher than the critical limit value of 4 g
kg-1 dry matter for substrate_3, indicating decreasing stability of the final product. The
optimal feeding ratio significantly (P < 0.01) decreased DOC concentration compared
with the higher ratio.
Figure 5.1. Total DOC concentration of the composts after 60 days of composting (mean + standard
error of the mean; n = 3). CON = without earthworms, OR = optimal substrate-to-earthworm ratio, HR
= higher substrate-to-earthworm, DM = dry matter
The percentage of DOC retrieved throughout the fractionation procedure was 85-98%,
which was comparable with the previous study on compost (Straathof and Comans,
2015). Concentrations of hydrophilic and hydrophobic (HA, FA, HON) fractions of DOC
also varied between treatments and there was a significant earthworm * substrate
interaction (Table 5.1). FA was the dominant proportion of DOC (> 45%) while HON
contributed the lowest proportion (< 14%), irrespective of the treatments. Analysis of
variance showed that the concentrations of HA, FA, HON and Hi were affected by
substrate quality (P = 0.001, P = 0.001, P < 0.001 and P < 0.001 respectively), but the
presence of earthworms only had a significant effect on HA and FA (P = 0.001 and P =
0.001 respectively). Substrates that underwent the longest pre-composting period (i.e.
0
2
4
6
CON OR HR CON OR HR CON OR HR
Substrate_1 Substrate_2 Substrate_3
DO
C (
g k
g-1
DM
)
Source of variation P-value
Earthworms < 0.001 Substrate < 0.001
Earthworms*Substrate 0.01
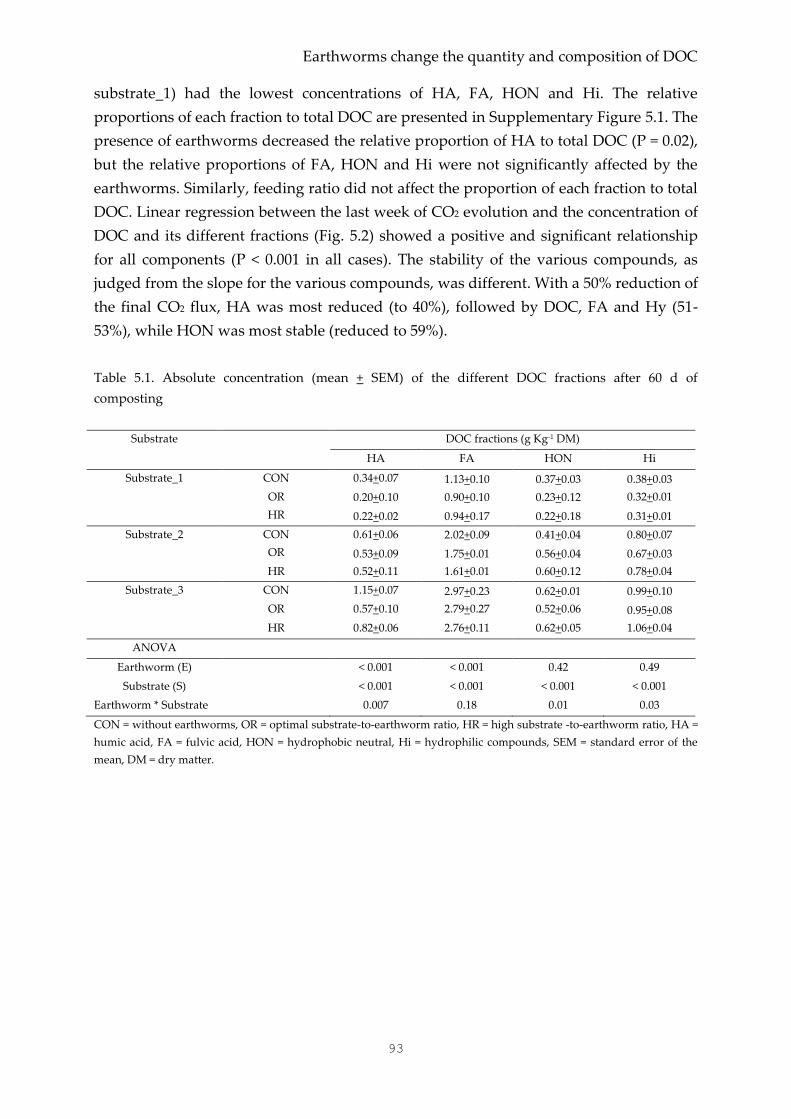
Earthworms change the quantity and composition of DOC
93
substrate_1) had the lowest concentrations of HA, FA, HON and Hi. The relative
proportions of each fraction to total DOC are presented in Supplementary Figure 5.1. The
presence of earthworms decreased the relative proportion of HA to total DOC (P = 0.02),
but the relative proportions of FA, HON and Hi were not significantly affected by the
earthworms. Similarly, feeding ratio did not affect the proportion of each fraction to total
DOC. Linear regression between the last week of CO2 evolution and the concentration of
DOC and its different fractions (Fig. 5.2) showed a positive and significant relationship
for all components (P < 0.001 in all cases). The stability of the various compounds, as
judged from the slope for the various compounds, was different. With a 50% reduction of
the final CO2 flux, HA was most reduced (to 40%), followed by DOC, FA and Hy (51-
53%), while HON was most stable (reduced to 59%).
Table 5.1. Absolute concentration (mean + SEM) of the different DOC fractions after 60 d of
composting
Substrate DOC fractions (g Kg-1 DM)
HA FA HON Hi
Substrate_1 CON 0.34+0.07 1.13+0.10 0.37+0.03 0.38+0.03
OR 0.20+0.10 0.90+0.10 0.23+0.12 0.32+0.01
HR 0.22+0.02 0.94+0.17 0.22+0.18 0.31+0.01
Substrate_2 CON 0.61+0.06 2.02+0.09 0.41+0.04 0.80+0.07
OR 0.53+0.09 1.75+0.01 0.56+0.04 0.67+0.03
HR 0.52+0.11 1.61+0.01 0.60+0.12 0.78+0.04
Substrate_3 CON 1.15+0.07 2.97+0.23 0.62+0.01 0.99+0.10
OR 0.57+0.10 2.79+0.27 0.52+0.06 0.95+0.08
HR 0.82+0.06 2.76+0.11 0.62+0.05 1.06+0.04
ANOVA
Earthworm (E) < 0.001 < 0.001 0.42 0.49
Substrate (S) < 0.001 < 0.001 < 0.001 < 0.001
Earthworm * Substrate 0.007 0.18 0.01 0.03
CON = without earthworms, OR = optimal substrate-to-earthworm ratio, HR = high substrate -to-earthworm ratio, HA =
humic acid, FA = fulvic acid, HON = hydrophobic neutral, Hi = hydrophilic compounds, SEM = standard error of the
mean, DM = dry matter.
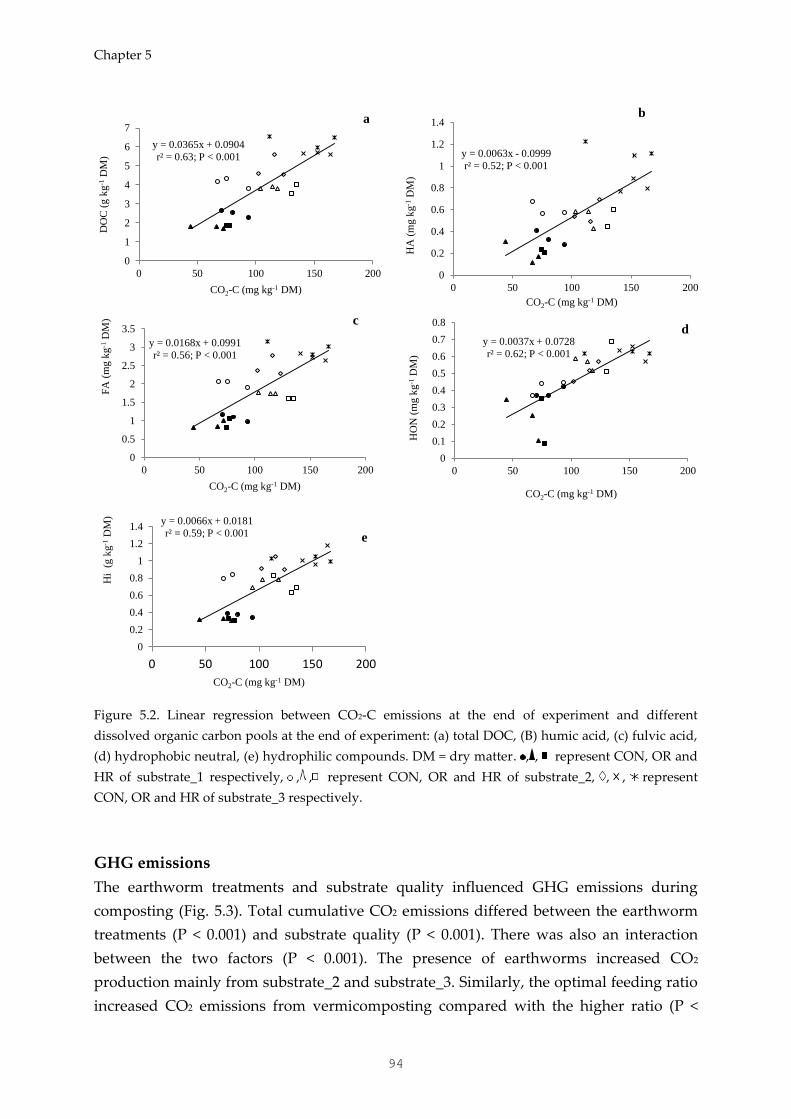
Chapter 5
94
Figure 5.2. Linear regression between CO2-C emissions at the end of experiment and different
dissolved organic carbon pools at the end of experiment: (a) total DOC, (B) humic acid, (c) fulvic acid,
(d) hydrophobic neutral, (e) hydrophilic compounds. DM = dry matter. , , represent CON, OR and
HR of substrate_1 respectively, , , represent CON, OR and HR of substrate_2, , , represent
CON, OR and HR of substrate_3 respectively.
GHG emissions
The earthworm treatments and substrate quality influenced GHG emissions during
composting (Fig. 5.3). Total cumulative CO2 emissions differed between the earthworm
treatments (P < 0.001) and substrate quality (P < 0.001). There was also an interaction
between the two factors (P < 0.001). The presence of earthworms increased CO2
production mainly from substrate_2 and substrate_3. Similarly, the optimal feeding ratio
increased CO2 emissions from vermicomposting compared with the higher ratio (P <
a b
c
e
d
y = 0.0365x + 0.0904
r² = 0.63; P < 0.001
0
1
2
3
4
5
6
7
0 50 100 150 200
DO
C (
g k
g-1
DM
)
CO2-C (mg kg-1 DM)
y = 0.0037x + 0.0728
r² = 0.62; P < 0.001
0
0.1
0.2
0.3
0.4
0.5
0.6
0.7
0.8
0 50 100 150 200
HO
N (
mg k
g-1
DM
)
CO2-C (mg kg-1 DM) y = 0.0066x + 0.0181
r² = 0.59; P < 0.001
0
0.2
0.4
0.6
0.8
1
1.2
1.4
0 50 100 150 200
Hi
(g k
g-1
DM
)
CO2-C (mg kg-1 DM)
y = 0.0063x - 0.0999
r² = 0.52; P < 0.001
0
0.2
0.4
0.6
0.8
1
1.2
1.4
0 50 100 150 200
HA
(m
g k
g-1
DM
)
CO2-C (mg kg-1 DM)
y = 0.0168x + 0.0991
r² = 0.56; P < 0.001
0
0.5
1
1.5
2
2.5
3
3.5
0 50 100 150 200
FA
(m
g k
g-1
DM
)
CO2-C (mg kg-1 DM)
a
c
e
d
b
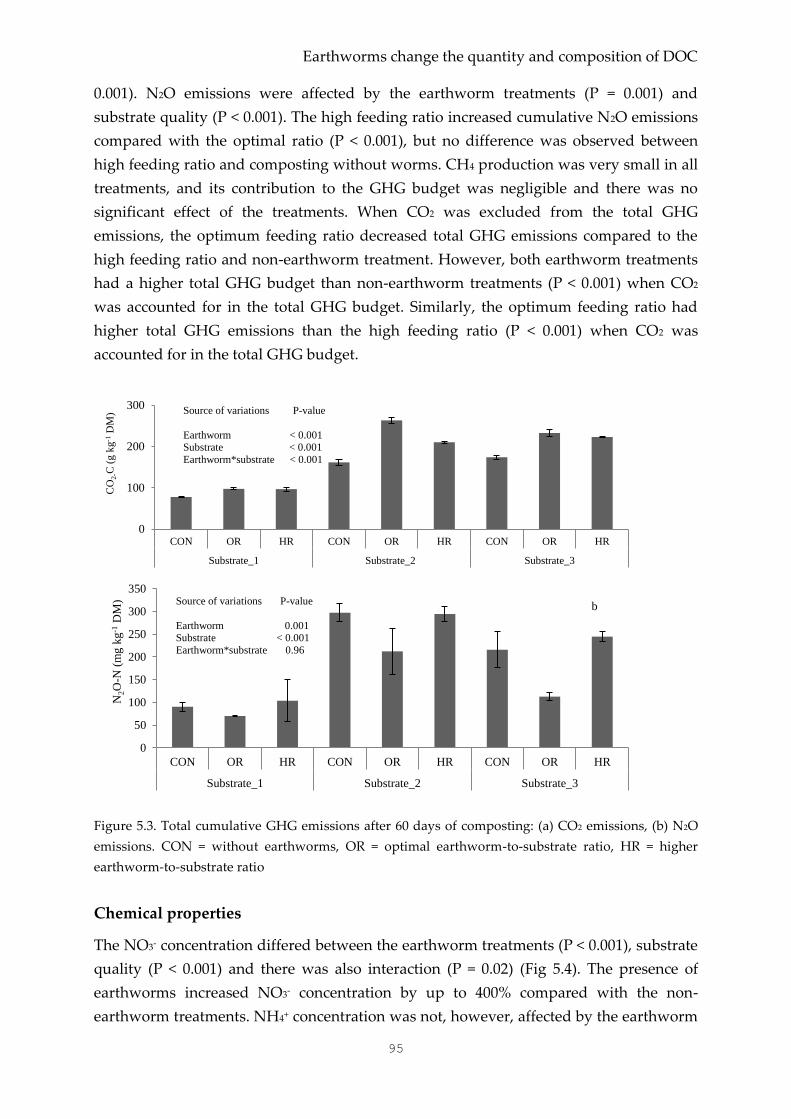
Earthworms change the quantity and composition of DOC
95
0.001). N2O emissions were affected by the earthworm treatments (P = 0.001) and
substrate quality (P < 0.001). The high feeding ratio increased cumulative N2O emissions
compared with the optimal ratio (P < 0.001), but no difference was observed between
high feeding ratio and composting without worms. CH4 production was very small in all
treatments, and its contribution to the GHG budget was negligible and there was no
significant effect of the treatments. When CO2 was excluded from the total GHG
emissions, the optimum feeding ratio decreased total GHG emissions compared to the
high feeding ratio and non-earthworm treatment. However, both earthworm treatments
had a higher total GHG budget than non-earthworm treatments (P < 0.001) when CO2
was accounted for in the total GHG budget. Similarly, the optimum feeding ratio had
higher total GHG emissions than the high feeding ratio (P < 0.001) when CO2 was
accounted for in the total GHG budget.
Figure 5.3. Total cumulative GHG emissions after 60 days of composting: (a) CO2 emissions, (b) N2O
emissions. CON = without earthworms, OR = optimal earthworm-to-substrate ratio, HR = higher
earthworm-to-substrate ratio
Chemical properties
The NO3- concentration differed between the earthworm treatments (P < 0.001), substrate
quality (P < 0.001) and there was also interaction (P = 0.02) (Fig 5.4). The presence of
earthworms increased NO3- concentration by up to 400% compared with the non-
earthworm treatments. NH4+ concentration was not, however, affected by the earthworm
0
100
200
300
CON OR HR CON OR HR CON OR HR
Substrate_1 Substrate_2 Substrate_3
CO
2-C
(g k
g-1
DM
) Source of variations P-value
Earthworm < 0.001
Substrate < 0.001
Earthworm*substrate < 0.001
0
50
100
150
200
250
300
350
CON OR HR CON OR HR CON OR HR
Substrate_1 Substrate_2 Substrate_3
N2O
-N (
mg k
g-1
DM
)
b Source of variations P-value
Earthworm 0.001 Substrate < 0.001
Earthworm*substrate 0.96
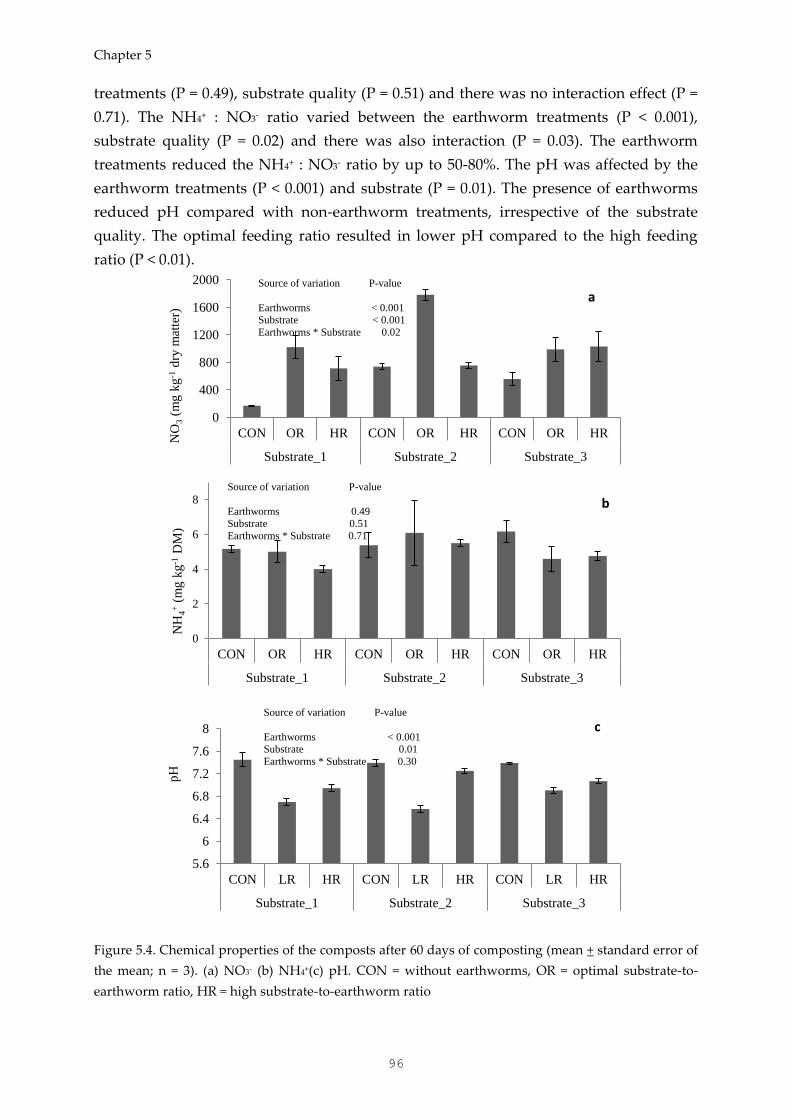
Chapter 5
96
treatments (P = 0.49), substrate quality (P = 0.51) and there was no interaction effect (P =
0.71). The NH4+ : NO3- ratio varied between the earthworm treatments (P < 0.001),
substrate quality (P = 0.02) and there was also interaction (P = 0.03). The earthworm
treatments reduced the NH4+ : NO3- ratio by up to 50-80%. The pH was affected by the
earthworm treatments (P < 0.001) and substrate (P = 0.01). The presence of earthworms
reduced pH compared with non-earthworm treatments, irrespective of the substrate
quality. The optimal feeding ratio resulted in lower pH compared to the high feeding
ratio (P < 0.01).
Figure 5.4. Chemical properties of the composts after 60 days of composting (mean + standard error of
the mean; n = 3). (a) NO3- (b) NH4+(c) pH. CON = without earthworms, OR = optimal substrate-to-
earthworm ratio, HR = high substrate-to-earthworm ratio
0
400
800
1200
1600
2000
CON OR HR CON OR HR CON OR HR
Substrate_1 Substrate_2 Substrate_3
NO
3 (
mg k
g-1
dry
mat
ter)
Source of variation P-value
Earthworms < 0.001 Substrate < 0.001
Earthworms * Substrate 0.02
a
0
2
4
6
8
CON OR HR CON OR HR CON OR HR
Substrate_1 Substrate_2 Substrate_3
NH
4+ (
mg k
g-1
DM
)
Source of variation P-value
Earthworms 0.49 Substrate 0.51
Earthworms * Substrate 0.71
b
5.6
6
6.4
6.8
7.2
7.6
8
CON LR HR CON LR HR CON LR HR
Substrate_1 Substrate_2 Substrate_3
pH
Source of variation P-value
Earthworms < 0.001 Substrate 0.01
Earthworms * Substrate 0.30
c
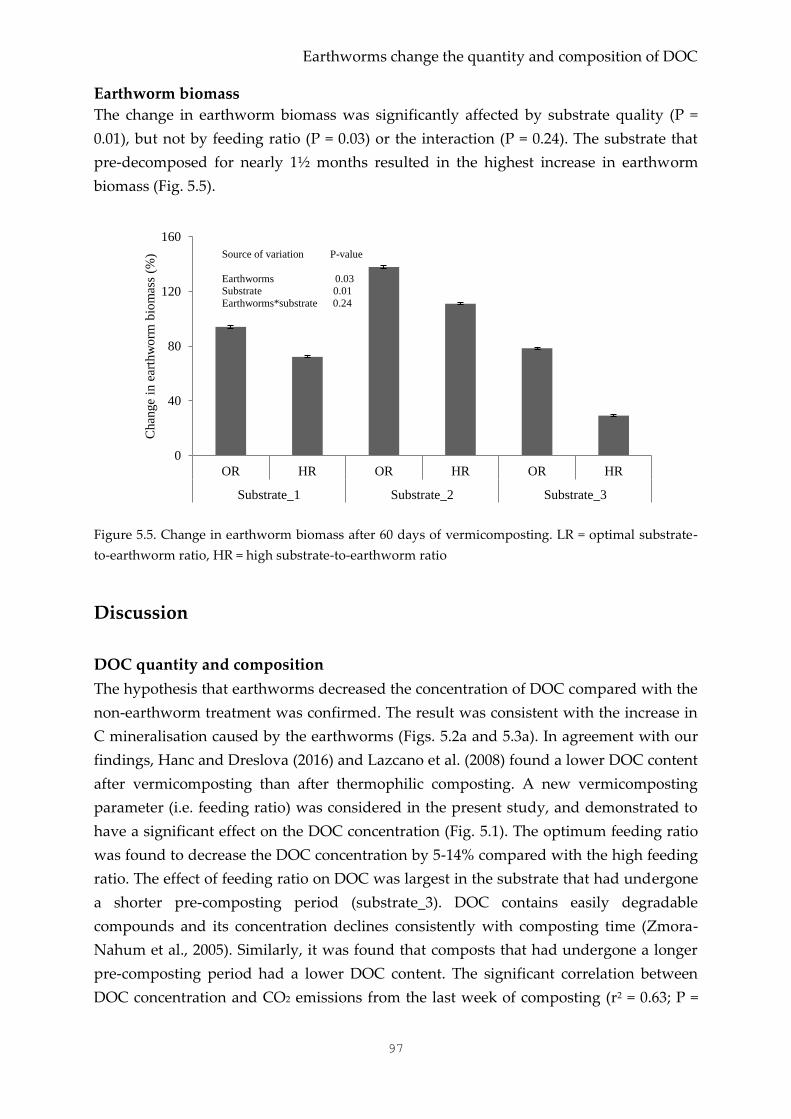
Earthworms change the quantity and composition of DOC
97
Earthworm biomass
The change in earthworm biomass was significantly affected by substrate quality (P =
0.01), but not by feeding ratio (P = 0.03) or the interaction (P = 0.24). The substrate that
pre-decomposed for nearly 1½ months resulted in the highest increase in earthworm
biomass (Fig. 5.5).
Figure 5.5. Change in earthworm biomass after 60 days of vermicomposting. LR = optimal substrate-
to-earthworm ratio, HR = high substrate-to-earthworm ratio
Discussion
DOC quantity and composition
The hypothesis that earthworms decreased the concentration of DOC compared with the
non-earthworm treatment was confirmed. The result was consistent with the increase in
C mineralisation caused by the earthworms (Figs. 5.2a and 5.3a). In agreement with our
findings, Hanc and Dreslova (2016) and Lazcano et al. (2008) found a lower DOC content
after vermicomposting than after thermophilic composting. A new vermicomposting
parameter (i.e. feeding ratio) was considered in the present study, and demonstrated to
have a significant effect on the DOC concentration (Fig. 5.1). The optimum feeding ratio
was found to decrease the DOC concentration by 5-14% compared with the high feeding
ratio. The effect of feeding ratio on DOC was largest in the substrate that had undergone
a shorter pre-composting period (substrate_3). DOC contains easily degradable
compounds and its concentration declines consistently with composting time (Zmora-
Nahum et al., 2005). Similarly, it was found that composts that had undergone a longer
pre-composting period had a lower DOC content. The significant correlation between
DOC concentration and CO2 emissions from the last week of composting (r2 = 0.63; P =
0
40
80
120
160
OR HR OR HR OR HR
Substrate_1 Substrate_2 Substrate_3
Chan
ge
in e
arth
wo
rm b
iom
ass
(%) Source of variation P-value
Earthworms 0.03 Substrate 0.01
Earthworms*substrate 0.24
Chapter 5
98
0.001) (Fig. 5.2a) confirmed that existence of active decomposition process in the
substrates containing a high DOC content. The DOC concentration of compost influences
microbial activities and C mineralisation after soil application (Straathof et al., 2014) and
hence it is used as an indicator of compost stability (Zmora-Nahum et al., 2005).
Composts with a low DOC content (less than 4 g kg-1 dry matter) are considered more
stable (Bernal et al., 2009), implying that the earthworms, especially at optimum feeding
ratios, stabilise compost more quickly than non-earthworm treatments. The possible
explanation for the higher stabilisation caused by earthworms is that they enhance the
decomposition process through their interaction with microorganisms. Substrate_3 was
not fully stable because it had high total DOC content (5-6 g kg-1 dry matter), and it is
mainly due to the presence of manure that went through a pre-decomposition period for
few days. The DOC concentration observed in this study was comparable with the earlier
composting studies (Zmora-Nahum et al., 2005; Hanc and Dreslova, 2016), which
reported a DOC concentration in the range 3-6 g kg-1 dry matter. However, Straathof and
Comans (2015) reported a low DOC content (< 0.5-1.0 g kg-1 dry matter) in some compost,
although their municipal-waste compost also contained high amounts of DOC (5-7 g kg-1
dry matter). However, their values cannot be directly compared with our results, as in
their composts organic materials were mixed with soil prior to composting. After
correcting for non-organic (mineral) soil components, their compost contained between
2-3 g kg-1 dry organic matter (compost with woody material or forest leaf litter) and up to
19 g kg-1 dry matter (for municipal organic waste). Current literature often reports the
DOC concentration per dry matter without considering the mineral fractions of compost
materials (i.e. soils). Hence, we recommend that DOC be expressed per weight of organic
materials after discounting mineral content in order to assess compost stability. In our
study, however, only organic materials were used and hence the DOC values could be
used directly to indicate compost stability.
The concentrations of different DOC compositions (FA, HA, HON and Hi) was
affected by the earthworm treatments, substrate quality and their interaction (Table 5.1).
The presence of earthworms decreased concentrations of FA and HA, whereas the
concentrations of all four components of DOC were lower in vermicompost than in
compost in the absence of worms. The low concentration of the DOC fractions in the
earthworm treatments coincided with the decrease in the total DOC concentration (Fig.
5.1). Therefore, the relative proportion of each fraction to total DOC (Supplementary Fig.
5.1) could provide more reliable information on the earthworms’ effect on DOC
composition and the turnover of the fractions during composting.
Straathof and Comans (2015) reported the DOC composition of composts
produced from different input materials and processing conditions and noted significant
variation in the relative contribution of HA, FA, HON and Hi in the various composts.
Our study showed only small effects of treatments and substrate on the fractional
contribution to total DOC. One major explanation for the discrepancy is that these
Earthworms change the quantity and composition of DOC
99
authors used a larger range of input material (from wood and forest leaf litter to
municipal waste) and there were also large differences between composting practices
(temperature, time).
We hypothesised, in agreement with Straathof and Comans (2015) that during the
composting process, Hi compounds are depleted more quickly than the three
hydrophobic compounds because the hydrophilic fraction consists of low-molecular-
weight sugars and amino acids, which are readily available C sources for
microorganisms. Straathof and Comans (2015) reported a lower Hi proportion, but
higher proportions of HA, FA and HON in composts that had undergone a longer
composting period and high temperature (> 70 °C) compared with composts produced at
a lower temperature with a composting period of < 28 days (i.e. unstable compost). They
suggested that the fractional contribution of Hi to DOC may be a better indicator for the
contribution of compost on microbial activity. However, our data contradict this
hypothesis. In fact, the fractional contribution of HA declined with increasing stability;
and a ranking of the compounds with increasing stability was HA > DOC ≈ FA ≈ Hi >
HON. We suggest two hypotheses to explain why HA turned out to be the least stable
component. First, decline of HA (and FA to a smaller extent) is likely indicative for
ligninolysis, whereas decline of Hi is indicative for cellulolysis. While it has for a long
time been taken for granted that degradation of lignin proceeds at a slower rate than
degradation of cellulose, recent data have actually indicated a faster decomposition of
lignin than cellulose (Klotzbücher et al., 2011). Second, changes in the various pools are
driven both by depletion of the compound during decomposition but also by novel
production during degradation and / or changes in solubility of compounds. Van
Zomeren and Comans (2007) put their study in the framework of a novel perspective on
humic substances as supramolecular associations of compounds with relatively small
mass, and observed that at declining HA concentrations the chances increased that part
of the HA fraction actually showed up in the FA fraction. Further research is needed to
evaluate both potential mechanisms. Considering that the concentrations of HA and FA,
but not those of HON and Hi, were lower in the vermicompost than in the non-worm
compost, independent of the total amounts of DOC, we hypothesise a role of earthworms
and their associated microbes in the breakdown of aromatic polymers like lignin.
Earthworms also secrete mucus, and these compounds may be rich in carbohydrates and
proteins (Pan et al., 2010) that may also preferentially end up in the Hi fraction. Next to
the fractional contribution of individual compounds, the ratio of hydrophilic to
hydrophobic substances (HA+FA+HON) may provide indications of compost stability.
Our compost showed ratios between 0.20 and 0.30, while the study of Straathof and
Coomans (2015) indicated ratios of 0.66-0.79 for unstable composts.
To our knowledge, however, no studies have been conducted to assess the effect
of earthworms on DOC composition. Further studies are therefore recommended to
advance understanding of the effect of earthworms on the DOC pools using different
Chapter 5
100
parameters such as substrate quality (i.e. fresh organic material), earthworm species and
earthworm density.
Greenhouse gas emissions
As hypothesised, earthworms increased CO2 emissions compared with non-earthworm
treatments, and the results were comparable with earlier studies (Chan et al., 2010;
Nigussie et al., 2016). Similarly, the CO2 emissions from vermicomposting were higher at
optimum feeding ratio than at the high ratio, as hypothesised. Higher cumulative CO2
emissions indicated a greater stability of compost and confirmed that the earthworms
resulted in compost which was at a more advanced stage of stabilisation. The CO2 results
were in agreement with the observation on DOC quantity (Fig. 5.1).
The hypothesis that the high feeding ratio increases N2O emissions from
vermicomposting was confirmed. As compared to the non-earthworm treatment,
earthworms decreased N2O emissions by 23-48% at the optimum feeding ratio. At the
higher ratio, however, earthworms had no significant effect on N2O emissions compared
with the non-earthworm treatments. The low N2O production in the earthworm
treatments could be explained by: (i) continuous turning of substrates by earthworms
which subsequently increases aeration (Chan et al., 2010; Nigussie et al., 2016) and (ii)
high substrate stability after it has passed through the earthworms’ gut (Luth et al.,
2011). Hence, the low DOC concentration as evidence for compost stability (Fig. 5.1)
could explain the low N2O emissions in the earthworm treatments. At the higher feeding
ratio, however, the presence of anaerobic patches and the lower degree of stabilisation
(Fig. 5.1) reduced the mitigation effect of earthworms on N2O emissions.
Reports on the effect of earthworms on N2O emissions are contradictory. For
instance, Hobson et al. (2005) and Lubbers et al. (2012) reported earthworm-induced N2O
emissions. In contrast, Chan et al. (2011), Nigussie et al. (2016) and Wang et al. (2015)
found that earthworms decreased N2O emissions during composting. The contrasting
results can be explained by differences in earthworm species (i.e. difference in their
feeding and burrowing behaviours) (Lubbers et al., 2013), substrate quality (i.e. carbon
quality and nitrogen content) (Luth et al., 2011; Nigussie et al., 2016), temperature
(Nigussie et al., 2016) and the scale of the experiment (Chan et al., 2010). In our study the
decreasing effect of earthworms on N2O emissions occurred at optimum feeding ratio,
while at a high feeding ratio earthworms did not decrease N2O emission, implying that
feeding ratio is an important parameter for consideration when assessing the
earthworms’ effect on GHG emissions during composting. Denitrification in the
earthworm gut was the main process contributing to N2O emissions in the case of anecic
earthworms (Lubbers et al., 2013). Composting materials mostly contain high levels of
nitrogen, hence the contribution of denitrification occurring in the earthworm gut to total
N2O emissions was smaller than the contribution from denitrification in the environment
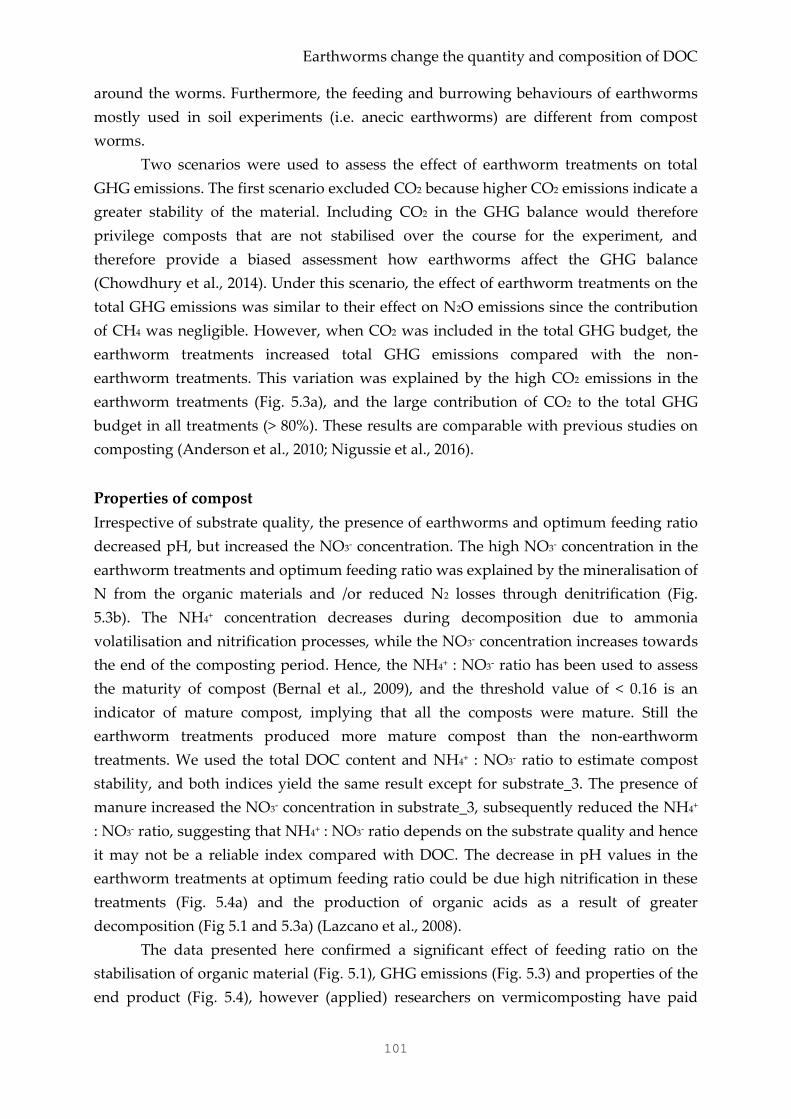
Earthworms change the quantity and composition of DOC
101
around the worms. Furthermore, the feeding and burrowing behaviours of earthworms
mostly used in soil experiments (i.e. anecic earthworms) are different from compost
worms.
Two scenarios were used to assess the effect of earthworm treatments on total
GHG emissions. The first scenario excluded CO2 because higher CO2 emissions indicate a
greater stability of the material. Including CO2 in the GHG balance would therefore
privilege composts that are not stabilised over the course for the experiment, and
therefore provide a biased assessment how earthworms affect the GHG balance
(Chowdhury et al., 2014). Under this scenario, the effect of earthworm treatments on the
total GHG emissions was similar to their effect on N2O emissions since the contribution
of CH4 was negligible. However, when CO2 was included in the total GHG budget, the
earthworm treatments increased total GHG emissions compared with the non-
earthworm treatments. This variation was explained by the high CO2 emissions in the
earthworm treatments (Fig. 5.3a), and the large contribution of CO2 to the total GHG
budget in all treatments (> 80%). These results are comparable with previous studies on
composting (Anderson et al., 2010; Nigussie et al., 2016).
Properties of compost
Irrespective of substrate quality, the presence of earthworms and optimum feeding ratio
decreased pH, but increased the NO3- concentration. The high NO3- concentration in the
earthworm treatments and optimum feeding ratio was explained by the mineralisation of
N from the organic materials and /or reduced N2 losses through denitrification (Fig.
5.3b). The NH4+ concentration decreases during decomposition due to ammonia
volatilisation and nitrification processes, while the NO3- concentration increases towards
the end of the composting period. Hence, the NH4+ : NO3- ratio has been used to assess
the maturity of compost (Bernal et al., 2009), and the threshold value of < 0.16 is an
indicator of mature compost, implying that all the composts were mature. Still the
earthworm treatments produced more mature compost than the non-earthworm
treatments. We used the total DOC content and NH4+ : NO3- ratio to estimate compost
stability, and both indices yield the same result except for substrate_3. The presence of
manure increased the NO3- concentration in substrate_3, subsequently reduced the NH4+
: NO3- ratio, suggesting that NH4+ : NO3- ratio depends on the substrate quality and hence
it may not be a reliable index compared with DOC. The decrease in pH values in the
earthworm treatments at optimum feeding ratio could be due high nitrification in these
treatments (Fig. 5.4a) and the production of organic acids as a result of greater
decomposition (Fig 5.1 and 5.3a) (Lazcano et al., 2008).
The data presented here confirmed a significant effect of feeding ratio on the
stabilisation of organic material (Fig. 5.1), GHG emissions (Fig. 5.3) and properties of the
end product (Fig. 5.4), however (applied) researchers on vermicomposting have paid
Chapter 5
102
little attention to feeding ratio. Feeding ratio influences earthworm growth (Fig. 5.5: Luth
et al., 2011), aeration and temperature, subsequently affecting decomposition,
mineralisation, nutrient losses and GHG emissions. Hence, it is suggested that this ratio
be considered an equally important parameter when evaluating the effectiveness of
earthworms in the stabilisation of organic materials to parameters such as earthworm
species, substrate quality etc.
Conclusions
Earthworms accelerated the stabilisation of organic materials compared with the non-
earthworm treatments, as confirmed by CO2 production, DOC concentration, DOC
composition and NH4+ : NO3- ratio. Earthworms decreased the total DOC concentration,
but they did not affect the relative composition of hydrophilic, fulvic acid and
hydrophobic neutral fractions. The relative contribution by humic acid decreased in the
earthworm treatments, implying that the humic acid fraction was less recalcitrant as
commonly assumed, and was likely used as a substrate by microorganisms. The
hydrophilic-to-hydrophobic ratio was consistent between the different stable composts,
despite differences between input materials and processing conditions, and this ratio
could be used as an additional criterion to assess compost stability. This ratio is much
higher for unstable composts, implying that it can be used as an indicator of compost
stability. Fractionation of DOC is therefore important for understanding the stabilisation
of organic waste. A higher (supra-optimal) feeding ratio reduced the stabilisation process
and increased N2O emissions compared with the optimum feeding ratio. Hence feeding
ratio should be considered as an important parameter when assessing the earthworms’
effect on the stabilisation of organic materials and GHG emissions during composting.
Acknowledgements
This study was conducted as part of a PhD thesis project supported by the Agricultural
Transformation by Innovation (AgTraIn) Erasmus Mundus Joint Doctorate Programme,
funded by the EACEA (Education, Audio-visual and Culture Executive Agency) of the
European Commission. The authors would like to thank Mr Jaap Nelemans for
laboratory assistance, Mr. Lou Derks from De Polderworm for providing the earthworms
and technical advice, and prof. Rob Comans for helpful discussion on DOC fractionation
and the interpretation of the various fractions.
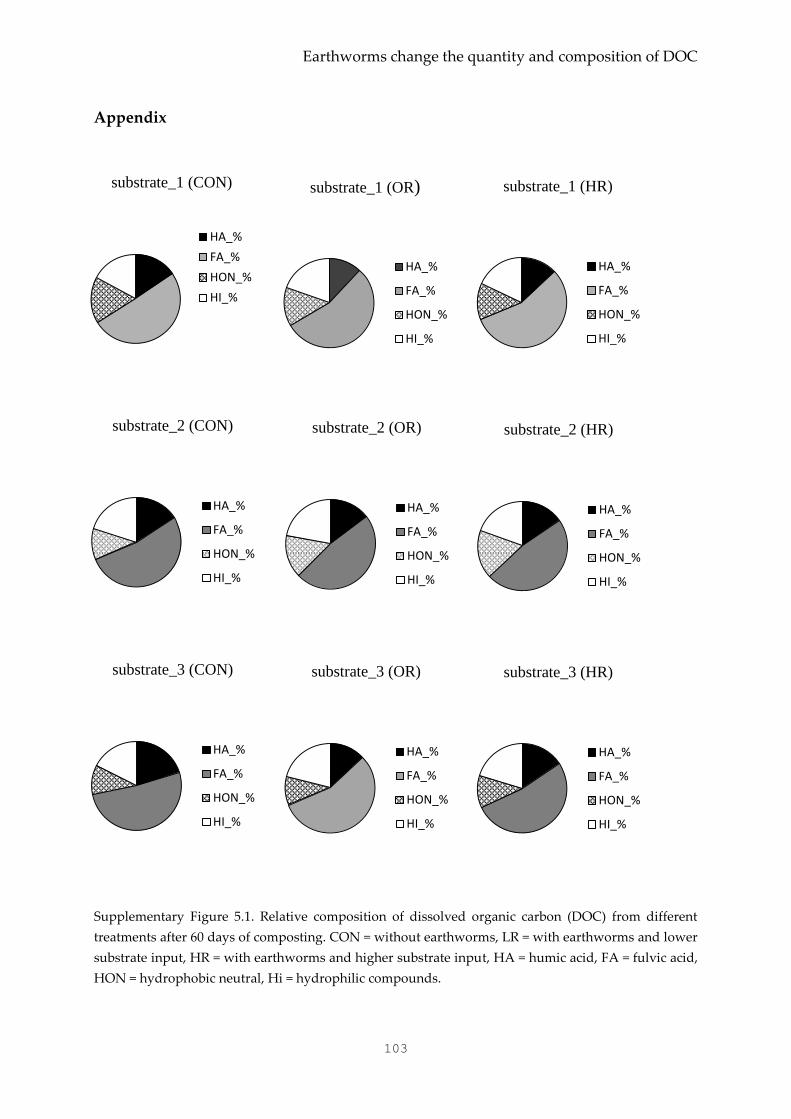
Earthworms change the quantity and composition of DOC
103
Appendix
Supplementary Figure 5.1. Relative composition of dissolved organic carbon (DOC) from different
treatments after 60 days of composting. CON = without earthworms, LR = with earthworms and lower
substrate input, HR = with earthworms and higher substrate input, HA = humic acid, FA = fulvic acid,
HON = hydrophobic neutral, Hi = hydrophilic compounds.
substrate_1 (CON)
HA_%
FA_%
HON_%
HI_%
substrate_1 (OR)
HA_%
FA_%
HON_%
HI_%
substrate_1 (HR)
HA_%
FA_%
HON_%
HI_%
substrate_2 (CON)
HA_%
FA_%
HON_%
HI_%
substrate_2 (OR)
HA_%
FA_%
HON_%
HI_%
substrate_2 (HR)
HA_%
FA_%
HON_%
HI_%
substrate_3 (CON)
HA_%
FA_%
HON_%
HI_%
substrate_3 (OR)
HA_%
FA_%
HON_%
HI_%
substrate_3 (HR)
HA_%
FA_%
HON_%
HI_%

Chapter 5
104
Chapter 6
105
CHAPTER 6
General discussion
General discussion
106
Introduction
Many smallholder farming systems in developing countries are characterised by low
agricultural inputs, such as improved seed varieties, mineral fertilisers and organic
amendments (i.e. crop residues, manure, compost). Numerous efforts have been made to
improve soil fertility and crop yield using mineral fertilisers and/or organic amendments
(Mann and Warner, 2015). Organic amendments maintain or increase soil organic matter
contents and thereby contribute to enhanced fertiliser use efficiency. Despite the benefits
of organic amendments, many smallholder farmers do not retain crop residues or
manure on their farmlands and as a result, a large quantity of nutrients and carbon (C) is
exported from agricultural lands to markets/cities. The use of other sources, such as
urban-waste compost, has been therefore proposed to close nutrient and C cycles (Danso
et al., 2006; Mary et al., 2010).
Many efforts have recently been made to prepare compost from urban-waste. In
developed countries urban-waste compost has been applied to farmlands to improve soil
properties (Peltre et al., 2015) and crop yield (Getahun et al., 2012b) without any negative
effect on the surrounding soil or water bodies (Poulsen et al., 2013). However, no
attention is paid to urban-waste compost in developing countries, despite a large amount
of organic waste being produced in cities, and this has become a matter of global
concern. A lack of institutional involvement is the main driver behind the limited use of
urban-waste compost as a soil amendment. Urban-waste composting requires farmers’
participation and hence studies are needed with regard to their attitudes to urban-waste
compost in order to optimise its economic benefits. In addition to this, urban-waste
composts usually have low content of nutrients especially nitrogen (Hargreaves et al.,
2008), therefore studies are required on how to produce nutrient-rich compost at the
lowest cost. N-rich composts are produced by composting urban waste with N-rich
substrates such as manure, however this process results in high N losses and greenhouse
gas emissions (Chapters 3 and 4) and subsequently reduces the agronomic value of
compost and contributes to climate change. As described in Chapter 1, the main aims of
this thesis were therefore (i) to contribute to and strengthen knowledge about the
challenges and opportunities of utilising urban-waste compost as a soil amendment,
particularly in smallholder farming systems, and (ii) to develop low-cost technologies
that improve the fertilising values of urban-waste compost while reducing losses to the
environment and alleviating climate change through the reduction of GHG emissions.
The findings of this thesis come from socioeconomic studies and composting
experiments conducted both in laboratory reactors and under field conditions. In this
chapter, I summarise and contextualise the key findings of the thesis with respect to the
hypotheses stated in Chapter 1. I start by recalling the hypotheses in order to evaluate
whether they were confirmed. I then discuss whether urban-waste composting can be
used as a soil amendment in developing countries. Thirdly, I examine low-cost
Chapter 6
107
technologies that could be used to reduce N losses and GHG emissions from composting
before finally concluding my results and offering suggestions for further studies.
The findings
Despite the benefits of organic amendments on soil properties and crop yield, only a
small number of farmers retain agricultural waste on their farmlands. In Ethiopia, for
example, less than 30% of farmers retain crop residues and/or applied manure on their
farmlands (Nigussie et al., 2015), and in the latter case farmers usually apply organic
amendments at low rates (< 1 t ha-1) (Baudron et al., 2014). The second chapter of my
thesis was therefore designed to answer the question: Why do farmers retain no or
insufficient agricultural waste on their farmlands? Low crop production, a limited number of
animals, insufficient collection of manure and limited availability of labour have been
identified as major causes behind the limited use of agricultural waste (Tittonell et al.,
2005, Kassie et al., 2009; Baudron et al., 2014). I added a further dimension to this issue
and hypothesised that competition for agricultural waste (as animal feed, building
material, fuel and soil amendments) is a major explanatory factor behind the limited use
of soil amendments and soil fertility enhancement. This hypothesis was confirmed by my
results (Chapter 2). I interviewed 220 farmers in Addis Ababa, Ethiopia and observed
that crop residues were mainly used for feed and fuel and that manure was used for fuel
(Fig 6.1). Manure is a source of fuel even for urban dwellers, probably due to high
poverty in urban areas. This high poverty-driven demand creates market opportunities
and entices farmers to sell their agricultural waste to nearby cities, further exacerbating
carbon and nutrient fluxes from the countryside to cities. I also hypothesised that the
allocation of agricultural waste varies between different farmer groups. Farmers with
market-oriented production systems allocate their agricultural waste mainly for soil
amendments compared with resource-poor subsistence farmers. Socioeconomic variables
such as land ownership, shortage of land and access to extension services also influence
farmers’ decisions to retain agricultural waste on their farmlands.
The use of other sources (e.g. urban waste) has been suggested as an alternative
soil amendment, particularly for urban and peri-urban farmers (Danso et al., 2006).
Extensive literature is available on the effect of urban-waste compost on soil properties
(Peltre et al., 2015) and crop yield (Hargreaves et al. 2008). Despite the beneficial effects
of urban-waste compost, < 5% of urban waste is converted into compost (Mengistu,
2013). I expanded the second chapter to address the question: Is there a demand from (per-
)urban farmers for urban-waste compost? I hypothesised that there is indeed a demand for
urban-waste compost, but that this demand varies between different farmer groups. I
observed that about 60% farmers were willing to pay or contribute labour for urban-
waste composting. Farmers with market-oriented production systems showed a higher
demand than resource-poor subsistence farmers. Education, distance between the
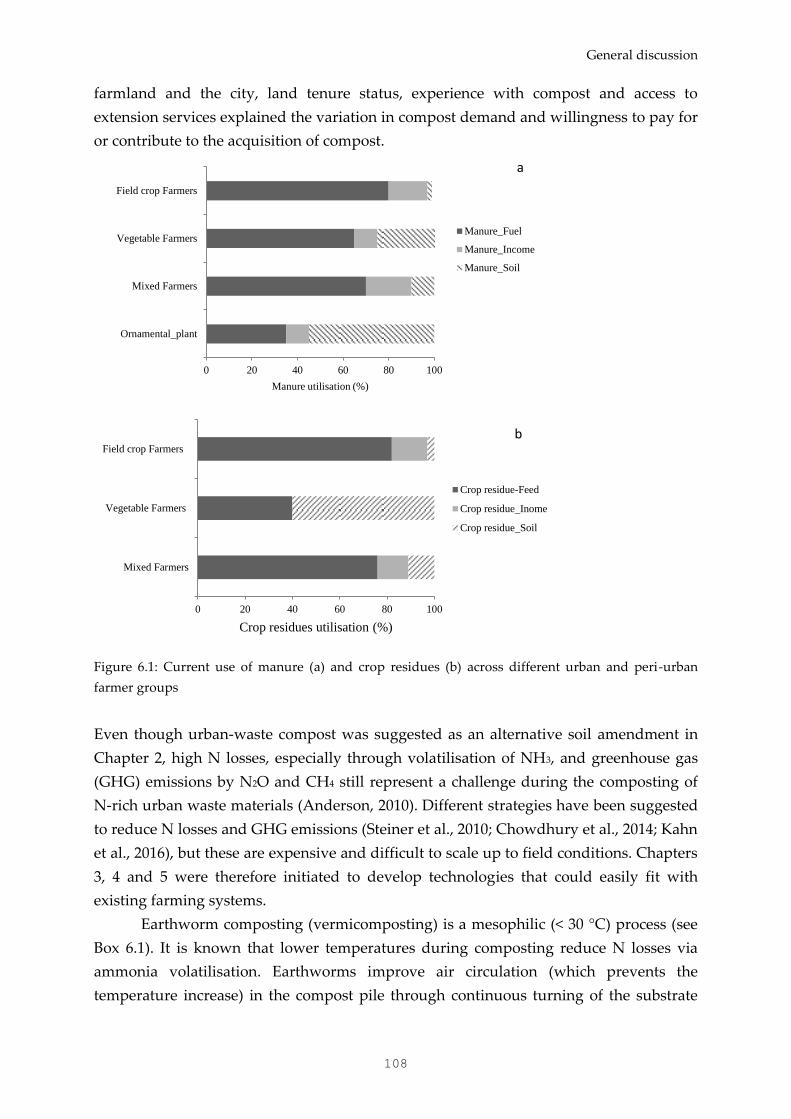
General discussion
108
farmland and the city, land tenure status, experience with compost and access to
extension services explained the variation in compost demand and willingness to pay for
or contribute to the acquisition of compost.
Figure 6.1: Current use of manure (a) and crop residues (b) across different urban and peri-urban
farmer groups
Even though urban-waste compost was suggested as an alternative soil amendment in
Chapter 2, high N losses, especially through volatilisation of NH3, and greenhouse gas
(GHG) emissions by N2O and CH4 still represent a challenge during the composting of
N-rich urban waste materials (Anderson, 2010). Different strategies have been suggested
to reduce N losses and GHG emissions (Steiner et al., 2010; Chowdhury et al., 2014; Kahn
et al., 2016), but these are expensive and difficult to scale up to field conditions. Chapters
3, 4 and 5 were therefore initiated to develop technologies that could easily fit with
existing farming systems.
Earthworm composting (vermicomposting) is a mesophilic (< 30 °C) process (see
Box 6.1). It is known that lower temperatures during composting reduce N losses via
ammonia volatilisation. Earthworms improve air circulation (which prevents the
temperature increase) in the compost pile through continuous turning of the substrate
0 20 40 60 80 100
Ornamental_plant
Mixed Farmers
Vegetable Farmers
Field crop Farmers
Manure utilisation (%)
Manure_Fuel
Manure_Income
Manure_Soil
a
0 20 40 60 80 100
Mixed Farmers
Vegetable Farmers
Field crop Farmers
Crop residues utilisation (%)
Crop residue-Feed
Crop residue_Inome
Crop residue_Soil
b
Chapter 6
109
(Luth et al., 2011). Increased aeration prevents anoxia and reduces GHG emissions. In
chapter 3, I reported that vermicomposting, compared to thermophilic composting,
reduces NH3 losses and GHG emissions. I demonstrated that vermicomposting
decreased total N losses by 20% compared with thermophilic composting. The highest
reduction of N losses by earthworms was observed with substrates at lower C:N ratios.
Existing reports on the effect of earthworms on GHG emissions are contradictory. Hence,
I used different quality substrates (as assessed by C:N ratio and the presence of a labile C
pool) and manipulated several variables (moisture content, earthworm density and
feeding ratio) to clarify understanding of the effect of earthworms on GHG emissions
during composting.
Earthworms decreased CH4 emissions from composting, and this observation was
consistently found in all the experiments. Similarly, earthworms decreased N2O during
vermicomposting compared to thermophilic composting, but I observed that the
earthworm effect varied between substrate quality and earthworm density and feeding
ratio (Chapter 3 and Chapter 5). A higher earthworm abundance (Chapter 3) and feeding
ratio (Chapter 5) increased N2O emissions during vermicomposting. A comparison
between Chapter 3, Chapter 5 and our unpublished data (Motta et al., unpublished) also
suggested that different species of epigeic earthworms used for vermicomposting could
result in different GHG emissions. Earthworms increased CO2 emissions, and this
observation was consistent in all experiments (Chapter 3 and Chapter 5). Earthworms
BOX 6.1. Composting methods
Thermophilic composting and vermicomposting are commonly used composting
techniques. There are two phases in thermophilic composting: the first is the
thermophilic (active) stage, in which rapid decomposition takes place and
temperatures rise above 45 °C and the second is known as the maturation or curing
stage, in which the temperature decreases to ambient value and more stable organic
compounds are degraded at a lower rate. Vermicomposting is a mesophilic (< 30 °C)
process that involves earthworms and associated microorganisms in decomposing and
stabilising organic materials. The temperature during vermicomposting should
remain within a range of 15-30 °C as temperatures above 35 °C kill earthworms.
The mesophilic phase of composting can be achieved by continuously turning
the pile (without using earthworms), but this method requires labour and excessive
aeration could result in NH3 emissions. In my thesis, one experiment compared
vermicomposting with thermophilic composting, while the other two compared
mesophilic composting in the presence and absence of earthworms. In all these
experiments, I demonstrated that earthworms play an important role in mitigating N
losses and GHG emissions during composting.
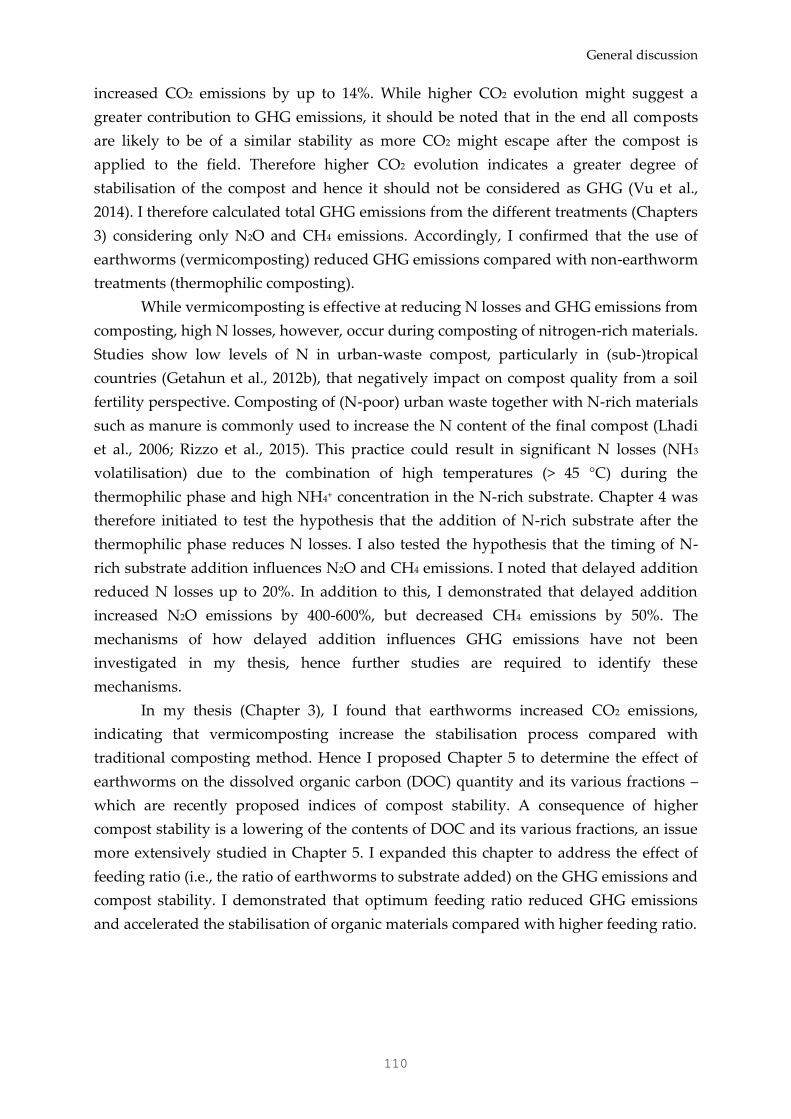
General discussion
110
increased CO2 emissions by up to 14%. While higher CO2 evolution might suggest a
greater contribution to GHG emissions, it should be noted that in the end all composts
are likely to be of a similar stability as more CO2 might escape after the compost is
applied to the field. Therefore higher CO2 evolution indicates a greater degree of
stabilisation of the compost and hence it should not be considered as GHG (Vu et al.,
2014). I therefore calculated total GHG emissions from the different treatments (Chapters
3) considering only N2O and CH4 emissions. Accordingly, I confirmed that the use of
earthworms (vermicomposting) reduced GHG emissions compared with non-earthworm
treatments (thermophilic composting).
While vermicomposting is effective at reducing N losses and GHG emissions from
composting, high N losses, however, occur during composting of nitrogen-rich materials.
Studies show low levels of N in urban-waste compost, particularly in (sub-)tropical
countries (Getahun et al., 2012b), that negatively impact on compost quality from a soil
fertility perspective. Composting of (N-poor) urban waste together with N-rich materials
such as manure is commonly used to increase the N content of the final compost (Lhadi
et al., 2006; Rizzo et al., 2015). This practice could result in significant N losses (NH3
volatilisation) due to the combination of high temperatures (> 45 °C) during the
thermophilic phase and high NH4+ concentration in the N-rich substrate. Chapter 4 was
therefore initiated to test the hypothesis that the addition of N-rich substrate after the
thermophilic phase reduces N losses. I also tested the hypothesis that the timing of N-
rich substrate addition influences N2O and CH4 emissions. I noted that delayed addition
reduced N losses up to 20%. In addition to this, I demonstrated that delayed addition
increased N2O emissions by 400-600%, but decreased CH4 emissions by 50%. The
mechanisms of how delayed addition influences GHG emissions have not been
investigated in my thesis, hence further studies are required to identify these
mechanisms.
In my thesis (Chapter 3), I found that earthworms increased CO2 emissions,
indicating that vermicomposting increase the stabilisation process compared with
traditional composting method. Hence I proposed Chapter 5 to determine the effect of
earthworms on the dissolved organic carbon (DOC) quantity and its various fractions –
which are recently proposed indices of compost stability. A consequence of higher
compost stability is a lowering of the contents of DOC and its various fractions, an issue
more extensively studied in Chapter 5. I expanded this chapter to address the effect of
feeding ratio (i.e., the ratio of earthworms to substrate added) on the GHG emissions and
compost stability. I demonstrated that optimum feeding ratio reduced GHG emissions
and accelerated the stabilisation of organic materials compared with higher feeding ratio.
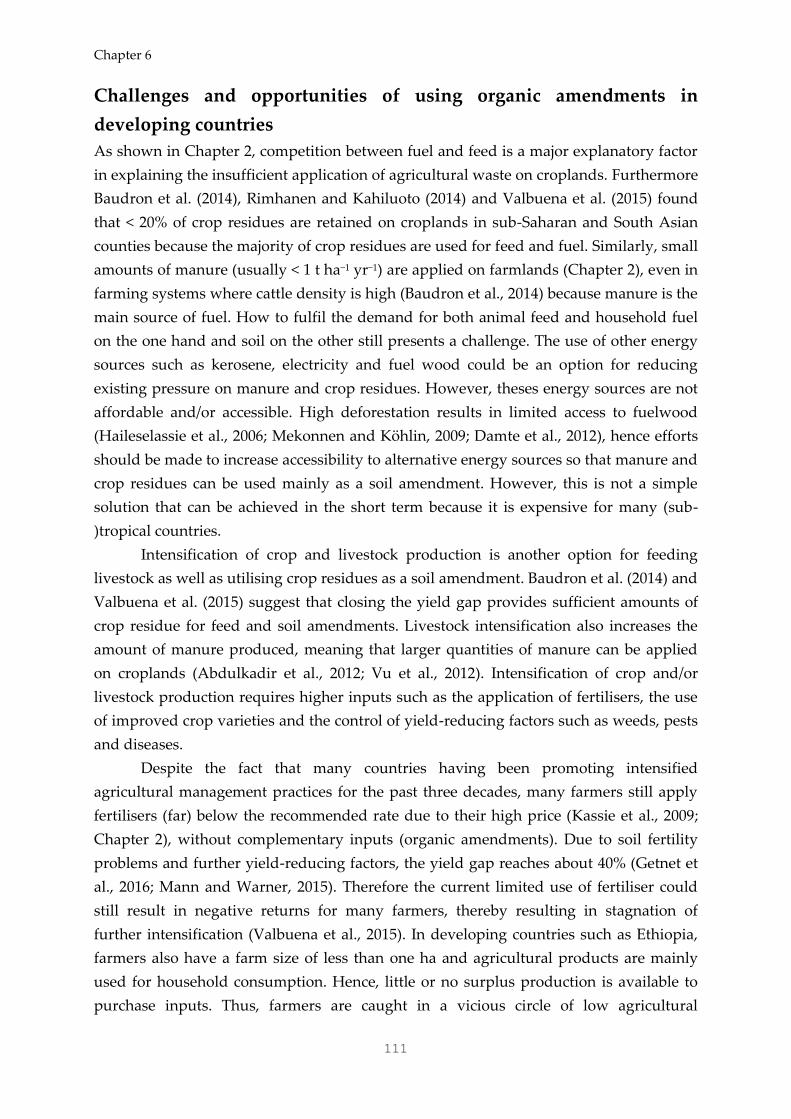
Chapter 6
111
Challenges and opportunities of using organic amendments in
developing countries
As shown in Chapter 2, competition between fuel and feed is a major explanatory factor
in explaining the insufficient application of agricultural waste on croplands. Furthermore
Baudron et al. (2014), Rimhanen and Kahiluoto (2014) and Valbuena et al. (2015) found
that < 20% of crop residues are retained on croplands in sub-Saharan and South Asian
counties because the majority of crop residues are used for feed and fuel. Similarly, small
amounts of manure (usually < 1 t ha−1 yr−1) are applied on farmlands (Chapter 2), even in
farming systems where cattle density is high (Baudron et al., 2014) because manure is the
main source of fuel. How to fulfil the demand for both animal feed and household fuel
on the one hand and soil on the other still presents a challenge. The use of other energy
sources such as kerosene, electricity and fuel wood could be an option for reducing
existing pressure on manure and crop residues. However, theses energy sources are not
affordable and/or accessible. High deforestation results in limited access to fuelwood
(Haileselassie et al., 2006; Mekonnen and Köhlin, 2009; Damte et al., 2012), hence efforts
should be made to increase accessibility to alternative energy sources so that manure and
crop residues can be used mainly as a soil amendment. However, this is not a simple
solution that can be achieved in the short term because it is expensive for many (sub-
)tropical countries.
Intensification of crop and livestock production is another option for feeding
livestock as well as utilising crop residues as a soil amendment. Baudron et al. (2014) and
Valbuena et al. (2015) suggest that closing the yield gap provides sufficient amounts of
crop residue for feed and soil amendments. Livestock intensification also increases the
amount of manure produced, meaning that larger quantities of manure can be applied
on croplands (Abdulkadir et al., 2012; Vu et al., 2012). Intensification of crop and/or
livestock production requires higher inputs such as the application of fertilisers, the use
of improved crop varieties and the control of yield-reducing factors such as weeds, pests
and diseases.
Despite the fact that many countries having been promoting intensified
agricultural management practices for the past three decades, many farmers still apply
fertilisers (far) below the recommended rate due to their high price (Kassie et al., 2009;
Chapter 2), without complementary inputs (organic amendments). Due to soil fertility
problems and further yield-reducing factors, the yield gap reaches about 40% (Getnet et
al., 2016; Mann and Warner, 2015). Therefore the current limited use of fertiliser could
still result in negative returns for many farmers, thereby resulting in stagnation of
further intensification (Valbuena et al., 2015). In developing countries such as Ethiopia,
farmers also have a farm size of less than one ha and agricultural products are mainly
used for household consumption. Hence, little or no surplus production is available to
purchase inputs. Thus, farmers are caught in a vicious circle of low agricultural
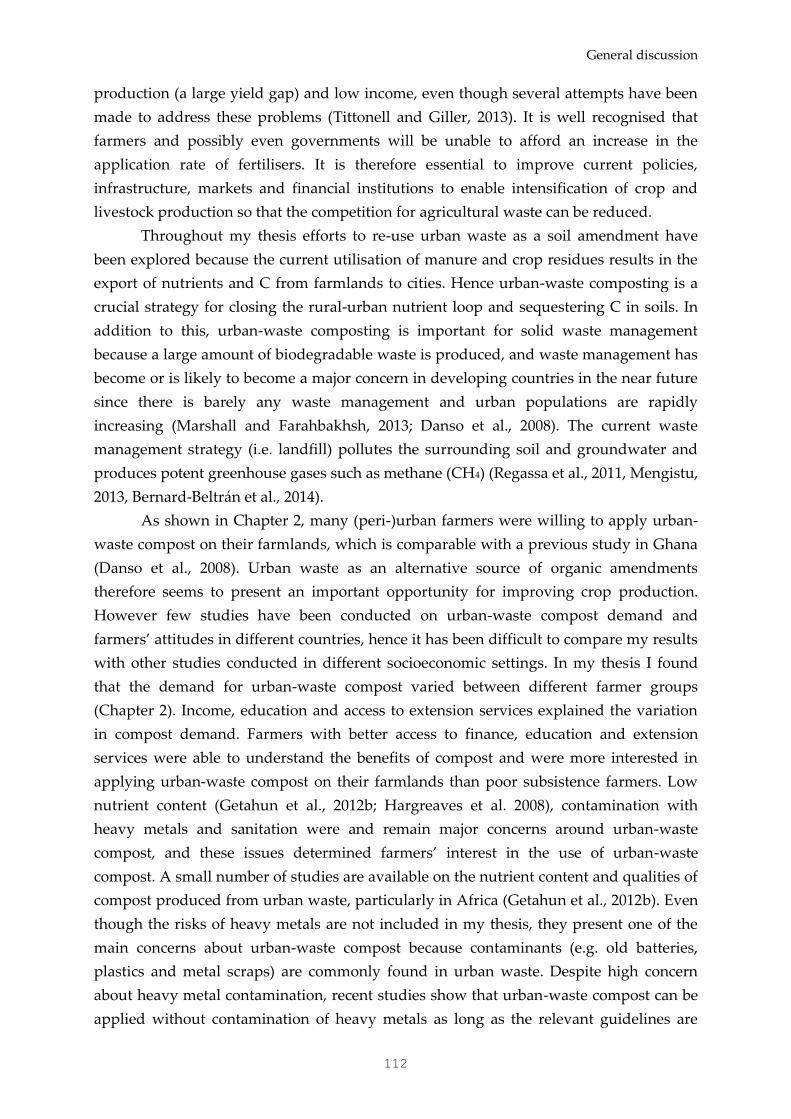
General discussion
112
production (a large yield gap) and low income, even though several attempts have been
made to address these problems (Tittonell and Giller, 2013). It is well recognised that
farmers and possibly even governments will be unable to afford an increase in the
application rate of fertilisers. It is therefore essential to improve current policies,
infrastructure, markets and financial institutions to enable intensification of crop and
livestock production so that the competition for agricultural waste can be reduced.
Throughout my thesis efforts to re-use urban waste as a soil amendment have
been explored because the current utilisation of manure and crop residues results in the
export of nutrients and C from farmlands to cities. Hence urban-waste composting is a
crucial strategy for closing the rural-urban nutrient loop and sequestering C in soils. In
addition to this, urban-waste composting is important for solid waste management
because a large amount of biodegradable waste is produced, and waste management has
become or is likely to become a major concern in developing countries in the near future
since there is barely any waste management and urban populations are rapidly
increasing (Marshall and Farahbakhsh, 2013; Danso et al., 2008). The current waste
management strategy (i.e. landfill) pollutes the surrounding soil and groundwater and
produces potent greenhouse gases such as methane (CH4) (Regassa et al., 2011, Mengistu,
2013, Bernard-Beltrán et al., 2014).
As shown in Chapter 2, many (peri-)urban farmers were willing to apply urban-
waste compost on their farmlands, which is comparable with a previous study in Ghana
(Danso et al., 2008). Urban waste as an alternative source of organic amendments
therefore seems to present an important opportunity for improving crop production.
However few studies have been conducted on urban-waste compost demand and
farmers’ attitudes in different countries, hence it has been difficult to compare my results
with other studies conducted in different socioeconomic settings. In my thesis I found
that the demand for urban-waste compost varied between different farmer groups
(Chapter 2). Income, education and access to extension services explained the variation
in compost demand. Farmers with better access to finance, education and extension
services were able to understand the benefits of compost and were more interested in
applying urban-waste compost on their farmlands than poor subsistence farmers. Low
nutrient content (Getahun et al., 2012b; Hargreaves et al. 2008), contamination with
heavy metals and sanitation were and remain major concerns around urban-waste
compost, and these issues determined farmers’ interest in the use of urban-waste
compost. A small number of studies are available on the nutrient content and qualities of
compost produced from urban waste, particularly in Africa (Getahun et al., 2012b). Even
though the risks of heavy metals are not included in my thesis, they present one of the
main concerns about urban-waste compost because contaminants (e.g. old batteries,
plastics and metal scraps) are commonly found in urban waste. Despite high concern
about heavy metal contamination, recent studies show that urban-waste compost can be
applied without contamination of heavy metals as long as the relevant guidelines are
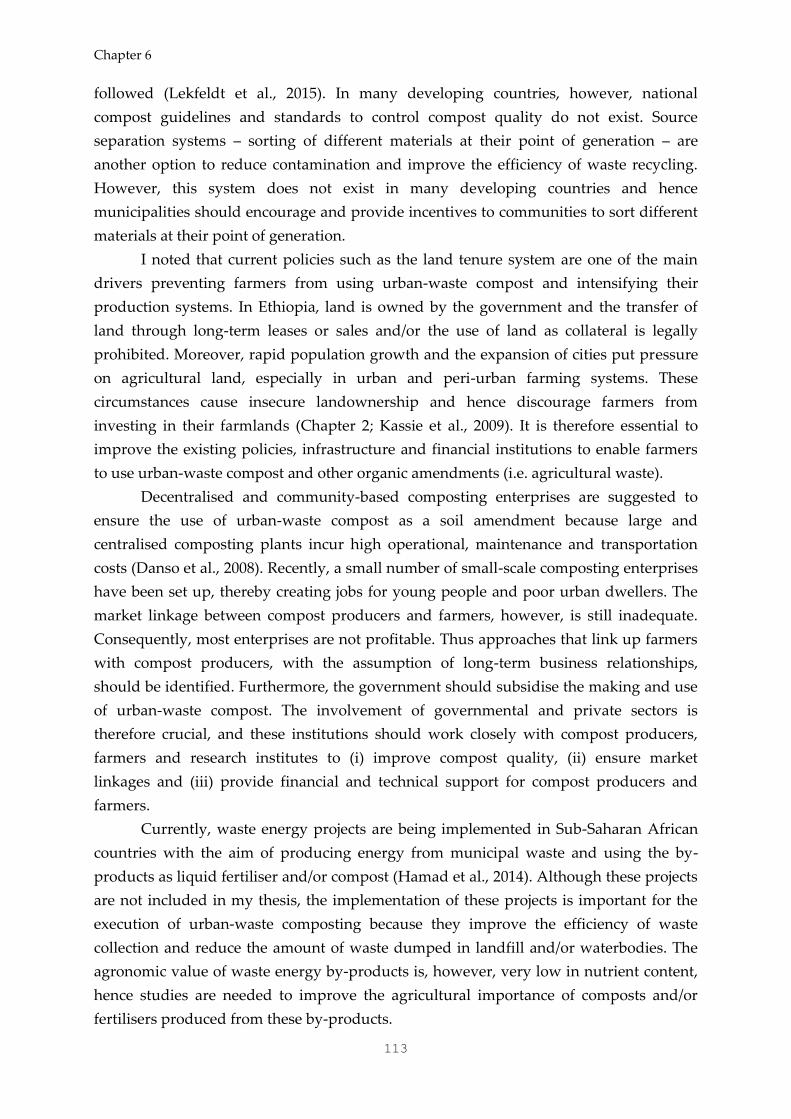
Chapter 6
113
followed (Lekfeldt et al., 2015). In many developing countries, however, national
compost guidelines and standards to control compost quality do not exist. Source
separation systems – sorting of different materials at their point of generation – are
another option to reduce contamination and improve the efficiency of waste recycling.
However, this system does not exist in many developing countries and hence
municipalities should encourage and provide incentives to communities to sort different
materials at their point of generation.
I noted that current policies such as the land tenure system are one of the main
drivers preventing farmers from using urban-waste compost and intensifying their
production systems. In Ethiopia, land is owned by the government and the transfer of
land through long-term leases or sales and/or the use of land as collateral is legally
prohibited. Moreover, rapid population growth and the expansion of cities put pressure
on agricultural land, especially in urban and peri-urban farming systems. These
circumstances cause insecure landownership and hence discourage farmers from
investing in their farmlands (Chapter 2; Kassie et al., 2009). It is therefore essential to
improve the existing policies, infrastructure and financial institutions to enable farmers
to use urban-waste compost and other organic amendments (i.e. agricultural waste).
Decentralised and community-based composting enterprises are suggested to
ensure the use of urban-waste compost as a soil amendment because large and
centralised composting plants incur high operational, maintenance and transportation
costs (Danso et al., 2008). Recently, a small number of small-scale composting enterprises
have been set up, thereby creating jobs for young people and poor urban dwellers. The
market linkage between compost producers and farmers, however, is still inadequate.
Consequently, most enterprises are not profitable. Thus approaches that link up farmers
with compost producers, with the assumption of long-term business relationships,
should be identified. Furthermore, the government should subsidise the making and use
of urban-waste compost. The involvement of governmental and private sectors is
therefore crucial, and these institutions should work closely with compost producers,
farmers and research institutes to (i) improve compost quality, (ii) ensure market
linkages and (iii) provide financial and technical support for compost producers and
farmers.
Currently, waste energy projects are being implemented in Sub-Saharan African
countries with the aim of producing energy from municipal waste and using the by-
products as liquid fertiliser and/or compost (Hamad et al., 2014). Although these projects
are not included in my thesis, the implementation of these projects is important for the
execution of urban-waste composting because they improve the efficiency of waste
collection and reduce the amount of waste dumped in landfill and/or waterbodies. The
agronomic value of waste energy by-products is, however, very low in nutrient content,
hence studies are needed to improve the agricultural importance of composts and/or
fertilisers produced from these by-products.
General discussion
114
Low-cost techniques to reduce N losses and mitigate GHG emissions
during composting
In Chapter 2 I indicated the need for urban-waste composting. However, challenges
remain around how to produce nutrient-rich compost (Danso et al., 2008), reduce N
losses (when starting with N-rich waste) and mitigate GHG emissions during urban-
waste composting (Nigussie et al., 2016) at low costs. Chapter 2 is helpful for
understanding the socio-economic perspective of my project and provides the
foundation for the next chapters of my thesis. In Chapters 3, 4 and 5 I discussed low-cost
technologies that reduce nutrient (mainly N) losses and GHG emissions during urban-
waste composting.
Vermicomposting
Nitrogen losses during composting reduce the agronomic value of compost and
contribute to greenhouse gas emissions. I found N losses of between 30% and 60% of the
initial N content (Chapters 3 and 5), and such losses are comparable with earlier studies
(Bernal et al., 2009; Steiner et al., 2010; Chowbury et al., 2014). The high variation in N
losses was explained by the differences in the N content of the composting materials and
the temperatures in the composting pile. Temperature influenced N losses from
composting because ammonia emissions occur at high temperatures (> 45 °C) (Pagans et
al., 2006). Chapter 3 was therefore initiated to test the effectiveness of earthworm
composting (i.e. vermicomposting) at reducing N losses and GHG emissions because it is
a mesophilic process and earthworms influence N cycling. I demonstrated that
vermicomposting reduced N losses and non-CO2 GHG emissions (N2O and CH4). Higher
N losses in thermophilic composting were observed with substrates with a high nitrogen
content, and the effectiveness of earthworms at reducing N losses was more pronounced
with these substrates. Ammonia volatilisation explained the differences in N losses
between the two composting methods (i.e. thermophilic composting and
vermicomposting).
Different mechanisms explained the decrease in N losses during
vermicomposting. The first obvious mechanism was the temperature effect. Ammonia
volatilisation accounts for about 70% of total N losses (Szanto et al., 2007; Chowdhury et
al., 2014) and occurs at higher temperatures. In contrast, vermicomposting is a
mesophilic process, hence high NH3 volatilisation was not expected. A second
mechanism could be the lowering of pH in vermicomposting experiments (Chapters 3
and 4) compared with conventional composting because NH3 emission occurred more at
a higher pH. In agreement with my results, Wang et al. (2014) and Velasco-Velasco et al.,
(2011) reported low ammonia emissions during vermicomposting. Optimising the
nitrogen contents of the composting materials (i.e. adjusting the C : N ratio to between
25:1 and 30:1) has been recommended to minimise N losses (Chowdhury et al., 2014).
Chapter 6
115
Addition of straw reduced N losses by 24% (Chapter 3), which is consistent with
previous studies (Velasco-Velasco et al., 2011; Chowdhury et al., 2014). In Chapter 2,
however, I demonstrated competing uses of crop residues (straw) for animal feed in
smallholder farming systems. Hence, vermicomposting is a more practical and less
expensive method to reduce N losses during composting compared to using crop
residues. Chapter 5 and Chowdhury et al. (2014) showed that bulking materials (other
than crop residues such as sawdust) could be used to reduce N losses from composting.
However, these materials are expensive and not available in large quantities, particularly
in countries such as Ethiopia. Techniques to control pH (Pagans et al., 2006) and the use
of absorbents (i.e. active carbon, biochar and zeolite) (Steiner et al., 2010; Kahn et al.,
2016) will also result in reduced N losses, but they are expensive and difficult to scale up
to field conditions.
Vermicomposting decreased N2O emissions compared with thermophilic
composting, but the effect of the earthworms’ was affected by substrate quality (nitrogen
content), earthworm abundance and feeding ratio (Chapters 3 and 4). In these chapters, I
used different parameters to explain the effect of earthworms on N2O emissions because
the existing literature is contradictory and requires clarification. In agreement with my
findings, Chan et al. (2010) and Wang et al. (2014) found that earthworms reduce N2O
emissions from composting. The obvious mechanisms for lower N2O emissions during
vermicomposting are: (i) continuous turning of substrates by earthworms, which
increases air circulation and entry of oxygen (Chapter 3; Chan et al., 2010) and (ii)
earthworms accelerate the stabilisation of organic materials (i.e. low content of labile C
for denitrifying bacteria during vermicomposting) (Chapter 4). In contrast to my
findings, our unpublished data (De Mota et al., unpublished) show that continuous
turning of piles by hand leads to lower N2O losses than with earthworms. Similarly,
Lubbers et al. (2013) reported that earthworms induce N2O emissions from soils.
Earthworm-induced N2O emissions are explained by high mineralisation and
denitrification in the earthworm gut (Hobson et al., 2005). Substrate quality (mainly
nitrogen and carbon content) is the key variable that should be considered when
assessing the effect of earthworms on N2O emissions. Lubbers et al. (2013) found higher
earthworm-induced N2O emissions from soils where N content and carbon content are
lower (total nitrogen content of < 1.3 g kg-1 and carbon content of < 30 g kg-1 soil)
compared with vermicomposting experiments (total nitrogen content of 14 g kg-1 and
carbon content of 400 – 500 g kg-1 dry matter) (Chapter 3). Similarly, in our unpublished
data (De Mota et al., unpublished), materials were used that underwent a longer pre-
composting period. It appears that the earthworm gut contributes a small amount to N2O
emissions compared with the denitrification process taking place in the composting
materials. Furthermore, the species used in my experiments (Eisenia fetida in Chapter 3
and a mixture of Eisenia fetida and Dendrobaena veneta in Chapter 5) were different from
the earthworms used in soil experiments (Lumbricus rubellus) and/or species used by De
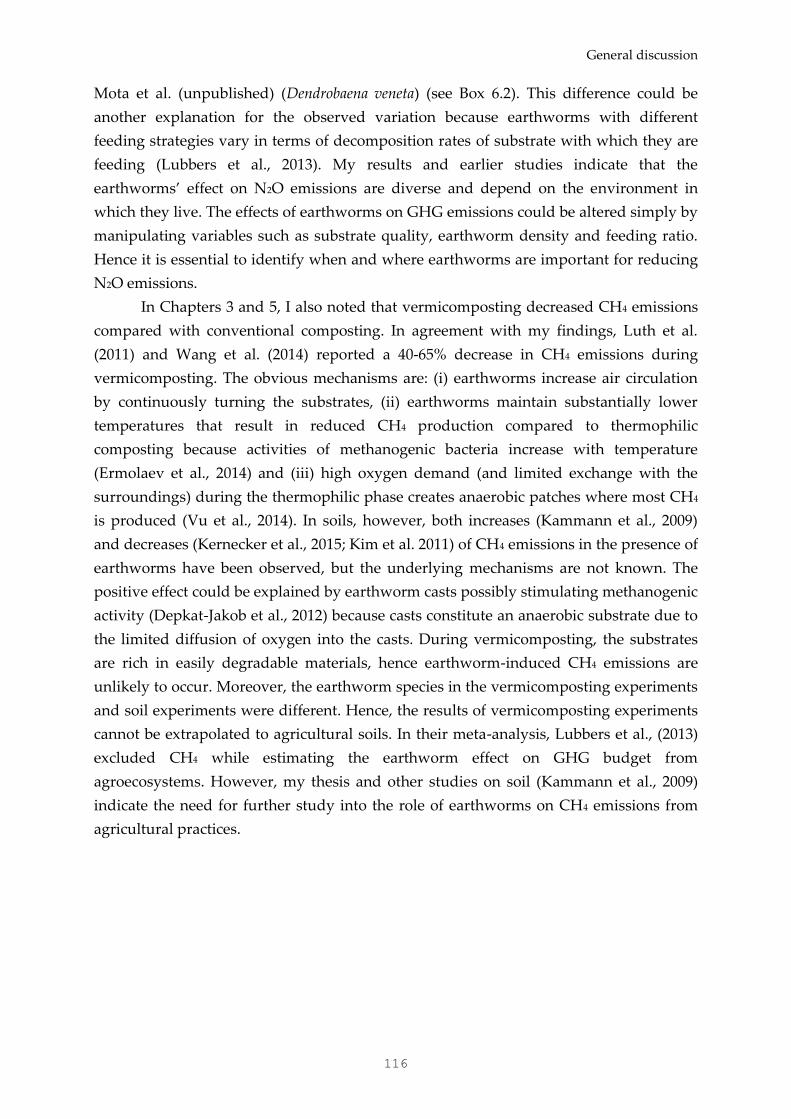
General discussion
116
Mota et al. (unpublished) (Dendrobaena veneta) (see Box 6.2). This difference could be
another explanation for the observed variation because earthworms with different
feeding strategies vary in terms of decomposition rates of substrate with which they are
feeding (Lubbers et al., 2013). My results and earlier studies indicate that the
earthworms’ effect on N2O emissions are diverse and depend on the environment in
which they live. The effects of earthworms on GHG emissions could be altered simply by
manipulating variables such as substrate quality, earthworm density and feeding ratio.
Hence it is essential to identify when and where earthworms are important for reducing
N2O emissions.
In Chapters 3 and 5, I also noted that vermicomposting decreased CH4 emissions
compared with conventional composting. In agreement with my findings, Luth et al.
(2011) and Wang et al. (2014) reported a 40-65% decrease in CH4 emissions during
vermicomposting. The obvious mechanisms are: (i) earthworms increase air circulation
by continuously turning the substrates, (ii) earthworms maintain substantially lower
temperatures that result in reduced CH4 production compared to thermophilic
composting because activities of methanogenic bacteria increase with temperature
(Ermolaev et al., 2014) and (iii) high oxygen demand (and limited exchange with the
surroundings) during the thermophilic phase creates anaerobic patches where most CH4
is produced (Vu et al., 2014). In soils, however, both increases (Kammann et al., 2009)
and decreases (Kernecker et al., 2015; Kim et al. 2011) of CH4 emissions in the presence of
earthworms have been observed, but the underlying mechanisms are not known. The
positive effect could be explained by earthworm casts possibly stimulating methanogenic
activity (Depkat-Jakob et al., 2012) because casts constitute an anaerobic substrate due to
the limited diffusion of oxygen into the casts. During vermicomposting, the substrates
are rich in easily degradable materials, hence earthworm-induced CH4 emissions are
unlikely to occur. Moreover, the earthworm species in the vermicomposting experiments
and soil experiments were different. Hence, the results of vermicomposting experiments
cannot be extrapolated to agricultural soils. In their meta-analysis, Lubbers et al., (2013)
excluded CH4 while estimating the earthworm effect on GHG budget from
agroecosystems. However, my thesis and other studies on soil (Kammann et al., 2009)
indicate the need for further study into the role of earthworms on CH4 emissions from
agricultural practices.
Chapter 6
117
In all the experiments, despite variations in substrate quality (C:N ratio), earthworm
abundance and feeding ratio, CO2 emissions were higher from vermicomposting than
from thermophilic composting (Chapters 3 and 4). Similarly, Chan et al. (2010) found
higher CO2 production from vermicomposting than from conventional composting.
Higher CO2 evolution, which appears to suggest a greater contribution to GHG
emissions by earthworms, in fact indicates a greater degree of stabilisation of the
compost (Bernal et al., 2009; Wichuk and McCartney, 2010). Such results therefore imply
that vermicompost has a greater degree of stability than conventional compost. Similarly
in Chapter 5, I confirmed the higher degree of stabilisation during vermicomposting
using additional parameters such as dissolved organic carbon (DOC) concentration, the
composition of DOC in different fractions and NH4+ : NO3- ratio (Chapter 5). We however
noted that compost stability indices such as total DOC content and NH4+ : NO3- ratio
BOX 6.2. Types of earthworms
Ecologists divide earthworms into three functional groups on the basis of their feeding
and burrowing behaviour, namely: (i) epigeic species that live within the few
centimetres of the soil-litter interface, feed on undecomposed litter and do not make
burrows, (ii) endogeic species that feed on soil and associated organic matter and live
in non-permanent branching burrows below the soil surface, and (iii) anecic species
that feed on the surface litter and pull it into the soil in permanent burrows.
Earthworms used for vermicomposting are epigeic species, but not all epigeic
species are composting worms. There are an estimated 1,800 species of earthworm
worldwide, but only a few of these are used for vermicomposting. The species
currently commonly used in tropical and sub-tropical countries are Eisenia fetida,
Dendrobaena veneta and Eudrilus eugeniae. All of these worms are prolific feeders and
can eat up to half of their weight per day. Even though theses worms are used for
vermicomposting, they vary in terms of substrate affinity, tolerance to external
environments (temperature, pH, EC), biomass and rate of production. Eisenia fetida, for
example, can feed on a wide range of organic waste and survive in temperatures of
between 10 °C to 35 °C. In contrast, Dendrobaena veneta is sensitive to high
temperatures and its production is low in substrates such as manure.
The decomposition and mineralisation processes differ between earthworm
species (Postma-Blaauw et al., 2006). As a result, the earthworms’ effect on N cycling
and GHG emissions vary between earthworm species. For instance, Lubbers et al.
(2013) indicated that earthworm species influence GHG emissions from soils
differently.
General discussion
118
could yield different results. The NH4+ : NO3- ratio depends on the substrate quality
while the DOC concentration is often reported without correcting for non-organic
(mineral) components of composting material. Indices such as a C : N ratio and
temperature are also recommended as indicators of compost maturity (Khan et al., 2014),
however, theses indices also depend on substrate quality. The combined use of multiple
indices is therefore suggested to assess compost stability. Future studies are also needed
to develop a more reliable compost maturity indicator.
Since CO2 evolution indicates a greater degree of stabilisation of compost, only
N2O and CH4 emissions were used in Chapter 3 to estimate the GHG budget of the two
composting methods (vermicomposting and thermophilic composting). The rationale for
excluding CO2 emissions from the total GHG budget was that the less stable composts
produce more CO2 during soil application (Ngo et al., 2013; Sierra et al., 2013), hence the
total CO2 emissions would eventually converge to the same value for all composts. When
CO2 was excluded, vermicomposting reduced total GHG emissions by 26-37% (Chapter
3). The relative contribution of N2O and CH4 emissions to total GHG budget depended
on substrate quality. CH4 emissions dominated the GHG budget when the substrates
contained a high amount of easily degradable C (i.e. vegetable waste), while N2O
emissions dominated with substrates containing high NO3- (i.e. manure).
Even though vermicomposting produces a high-quality compost (Lazcano et al.,
2008; Chapter 3; Chapter 5), vermicomposting is not common practice in many
developing countries. Promotion of vermicomposting technology is still needed,
particularly in developing countries such as Ethiopia. Active participation of institutions
is a key to integrating earthworms into the existing waste management strategy and
closing rural-urban nutrient loops. Further technical and socioeconomic research is
needed to optimise the vermicomposting process. For instance, local earthworm species
should be tested to identify whether they could be used for vermicomposting.
Composting worms such as Eisenia fetida, Dendrobaena veneta and Eudrilus eugeniae should
be introduced. Pathogens such as E. coli and Salmonella are commonly found in urban
waste, hence temperatures above 50 °C for a minimum of three days are required to
destroy these pathogens (Ryckeboer et al., 2003). Sanitation could therefore be the main
concern with vermicomposting of urban waste, but some studies indicate the
effectiveness of vermicomposting at eradicating pathogens (Rodríguez-Canché et al.,
2010; Edwards et al., 2011). However, more studies are still required to understand the
mechanisms of how earthworms eradicate pathogens from the compost pile. Pre-
composting prior to vermicomposting could be another solution to eradicating
pathogens from vermicompost (Wang et al., 2014), however significant N losses could
occur during pre-composting. More research is therefore needed to optimise
vermicomposting technology so that the balance between N losses and sanitation is
maintained. In my thesis, I used kitchen waste that was not contaminated with heavy
metals. In practice, urban waste contains heavy metals, hence further studies are
Chapter 6
119
required to determine the effect of vermicomposting on the bioavailability of heavy
metals during urban-waste composting.
Delayed addition of N-rich substrate
Composting of nitrogen-poor materials such as urban waste with manure is commonly
used to increase the N concentration of compost (Lhadi et al., 2006; Rizzo et al., 2015).
During this composting practice, however, we observed about 60% N losses (Nigussie et
al., 2016b), which is comparable with the losses reported in earlier studies (Bernal et al.,
2009; Steiner et al., 2010). The high N losses were caused by the coexistence of a
thermophilic phase (> 45 °C) with high NH4+ concentrations in the manure, which
generated optimal conditions for ammonia volatilisation. In Chapter 5, I demonstrated
that the addition of N-rich substrate (i.e. poultry manure) after the thermophilic phase
reduced N losses by 20%. My results are in agreement with Bryndum (2014) who
reported a 33% reduction in N losses due to delayed addition. When N-rich substrate
was applied after the thermophilic phase, most added N was exposed to low
temperatures (< 30 °C), which were less conducive to ammonia volatilisation. The
majority of N was prone to NH3 volatilisation when all the N-rich substrate was added at
the beginning. Dresbøll and Thorup-Kristensen (2005) did not observe a significant effect
of delayed addition of N-rich substrate (i.e. clover) on N losses. The differences in NH4+
concentration between these materials (i.e. manure vs. clover) may explain the
differential effect. Poultry manure contains high levels of NH4+, but clover contains
mainly organic N. As a result, the effect of delayed addition is smaller because nitrogen
has to be mineralised before it can volatilise. Moreover, the thermophilic phase lasted for
more than three weeks in my study, but Dresbøll and Thorup-Kristensen (2005) observed
a thermophilic phase that lasted for two weeks. As a result this and the larger fraction of
organic N, NH3 volatilisation was higher in my study than in their experiment.
High temperatures reduce N2O emissions because nitrifying and denitrifying
bacteria are mesophilic (Vu et al., 2015). Consequently, high N2O production occurs after
the thermophilic phase (Hao et al., 2004). Addition of N-rich substrate after the
thermophilic phase therefore increased the accessibility of inorganic N (NH4+ and NO3-)
for nitrifying and denitrifying bacteria, subsequently increasing N2O production. At the
same time, delayed addition decreased CH4 emissions as a result of (i) the absence of
high temperatures in conjunction with reduced available C and N for the methanogens
and (ii) higher methane oxidation due to the similarity between enzymes involved in
methane and ammonium oxidation (Wei et al., 2016).
The main concern with delayed addition of N-rich substrate is whether the
product is stable and free from pathogens and weed seeds because substrate added later
has less time to decompose. In addition to sanitation concerns, compost stability is
crucial because the application of unstable compost can impede crop growth (Wichuk
General discussion
120
and McCartney, 2010). In my thesis, I demonstrate that delayed addition resulted in
compost that was as stable and effective at completely eradicating weed seeds as
traditional composting. Furthermore, the germination test confirmed that the composts
produced by delayed addition were as mature as by the traditional composting method.
My results indicated that farmers could reduce N losses and produce high-agronomic-
value compost simply by manipulating the timing of the addition of N-rich substrate. I
manipulated the timing of the addition of N-rich substrate but in practice, however,
different qualities of materials are added at different times during composting. Further
studies are therefore needed to determine the effect of timing of addition of different
quality materials on the composting process
In Chapter 2, I showed that manure is used mainly for fuel in smallholder farming
systems; hence it is plausible to challenge the applicability of delayed addition in
smallholder farming systems. In Chapter 5, I deliberately used poultry manure because it
has no or little competitive uses in Ethiopia. Furthermore, the management of poultry
manure presents a challenge for many poultry production systems. The use of this N-rich
substrate together with urban waste could therefore be one strategy for increasing the
agronomic value of urban-waste compost. A link between poultry producers (or
livestock producers) and urban-waste compost producers should be established in order
to utilise the manure for urban-waste composting.
Future research directions
Efforts have been made throughout this thesis to illustrate possibilities for closing urban-
rural nutrient cycles through urban-waste composting. However research is still needed
(1) to understand the socio-economic perspective of urban-waste composting and (2) to
improve the nutrient content of urban-waste compost using low-cost technologies.
Furthermore, I encountered limitations when conducting the experiments that are listed
in this thesis. For instance, simple econometric models and a small group of farmers
were used to estimate the current uses of agricultural waste and compost demand.
Therefore, it is recommended that in the future a greater diversity of farming systems
and a wider variety of econometrics approaches be used when assessing the pressure on
agricultural waste and examining the demand for urban-waste compost.
My composting experiments were conducted in small-scale reactors and the
experiments (particularly vermicomposting) were conducted for less than 60 days. Care
should therefore be taken when extrapolating the results to large-scale composting
systems. Most of my experiments do not explain the mechanisms involved in how
different treatments cause N losses and GHG emissions. In addition to this, some
important parameters such as NH3 were not measured directly due to methodological
challenges. I showed that earthworms reduce GHG emissions from composting; however
exactly how this happened was not studied in any detail with regard to microbial
Chapter 6
121
ecology and physiology. Furthermore, how delayed addition influences N2O and CH4
emissions needs further clarification. For instance, I observed the second thermophilic
period during delayed addition, but the advantage and/ or disadvantage of this phase
need further investigation.
Based on the results of my thesis, I recommend the following technical and
socioeconomic research areas:
1. How crop residues and animal manure can fulfil the future demand for both
fuel/feed and soil amendment in smallholder farmers still presents a challenge and
needs prompt solutions
2. Not all compost worms are the same, hence the effect of different earthworm species
on N losses, GHG emissions and composting process should be studied
3. The link between compost stability, dissolved organic carbon (DOC) and DOC
composition needs to be better established. Furthermore, the earthworms’ effect on
DOC composition should be studied (i.e. earthworm abundance, earthworm species
and substrate quality)
4. The effect of the timing of N-rich substrate addition on GHG emissions is a new
concept and future studies are recommended to understand the mechanisms.
5. Studies that address the socioeconomic and cultural issues of urban-waste compost
are needed, such as (i) a cost-benefit analysis of vermicomposting since continuous
addition of substrate for earthworms might be labour intensive, (ii) how institutions
should be organised to encourage their participation in urban-waste composting.
6. Upscaling of vermicomposting and delayed addition of N-rich substrate is needed
Conclusions
The competition for agricultural waste between fuel, animal feed and soil amendments is
a major reason behind the limited use of organic amendments to soils in smallholder
farming systems. Hence technologies that fulfil the demands for feed, fuel and soil
amendments are required. One single technology would not provide the solution;
instead combinations of different technologies are needed. One option could be to use
urban-waste compost as an alternative soil amendment, particularly in (peri-)urban
farming systems. However, this technology would not be achieved without the
involvement of different institutions because considerable investment is required before
urban-waste could be utilised as a soil amendment. Many socioeconomic drivers (i.e.
access to extension services and land tenure systems) influence the adoption of urban-
waste compost. It is therefore essential to improve existing policies, infrastructures and
financial institutions to enable farmers to use urban-waste compost.
Urban-waste compost has a low nutrient content, and high N losses and GHG
emissions occur during the composting of N-rich materials. Efforts should be made to
General discussion
122
increase the agronomic value of urban-waste compost and reduce GHG emissions using
low-cost technologies. Vermicomposting is one strategy for reducing N losses and GHG
emissions from small-scale composting. The effects of vermicomposting, however,
depend on substrate quality (i.e. nitrogen content) and other factors (moisture,
earthworm species and earthworm density). Hence, optimum management practices
should be established to achieve the desired objectives of vermicomposting. Delayed
addition of nitrogen-rich substrate is another option to reduce N losses from urban-waste
composting without having a significant effect on total greenhouse gas emissions or
compost stability. Although vermicomposting and delayed additions of nutrient-rich
substrate are effective in producing high-quality compost, the promotion of these
technologies and the creation of conducive conditions for their use by smallholder
farmers still present major challenges that require the input of natural and social
scientists, policy makers and farmers.
123
References
Abbasi SA, Nayeem-Shah M, Abbasi T (2015). Vermicomposting of phytomass: limitations of the past
approaches and the emerging directions. Journal of Cleaner Production. 47, 70-75.
Abdulkadir A, Dossa LH, Lompo DJP, Abdu N, van Keulen H (2012). Characterization of urban and
peri-urban agroecosystems in three West African cities. International Journal of Agricultural
Sustainability. 10 (4), 289-314.
Abdulkadir A, Leffelaar PA, Agbenin JO, Giller KE (2013). Nutrient flows and balances in urban and
peri-urban agroecosystems of Kano, Nigeria. Nutrient Cycling in Agroecosystems. 95(2), 231-254.
Aira M, Domínguez J (2008). Optimizing vermicomposting of animal wastes: effects of manure
application on C loss and microbial stabilisation. Journal of Environmental Management. 88, 1525 –
1529.
Amsalu A, Stroosnijder L, de Graaff J (2007). Long-term dynamics in land resource use and the driving
forces in the Beressa watershed, highlands of Ethiopia. Journal of Environmental Management. 83,
448–459.
Andersen JK, Boldrin A, Samuelsson J, Christensen TH, Scheutz C (2010). Quantification of
greenhouse gas emissions from windrow composting of garden waste. Journal of Environmental
Quality. 39(2), 713-24.
Aslam, DN, Vander-Gheynst JS (2008). Predicting phytotoxicity of compost-amended soil from
compost stability measurements. Environmental Enginering and Science. 25, 72–81.
Awasthi MK, Wang Q, Huang H, Ren X, Lahori AH, Mahar A, Ali A, Shen F, Li R, Zhang Z (2016).
Influence of zeolite and lime as additives on greenhouse gas emissions and maturity evolution
during sewage sludge composting. Bioresource Technology. 216, 172-181.
Baudron F, Jaleta M, Okitoi O, Tegegn A (2014). Conservation agriculture in African mixed crop-
livestock systems: Conservation agriculture in African mixed crop-livestock systems: Expanding
the niche. Agriculture, Ecosystem and Environment 187:171-182.
Bernad-Beltrán D, Simó A, Bovea MD (2014). Attitude towards the incorporation of the selective
collection of biowaste in a municipal solid waste management system. A case study. Waste
Management. 34, 2434–2444.
Bernal MP, Alburquerque JA, Moral R (2009). Composting of animal manures and chemical criteria for
compost maturity assessment. A review. Bioresource Technology. 100, 5444- 5453.
Boulter-Bitzer JI, Trevors JT, Boland GJ (2006). A polyphasic approach for assessing maturity and
stability in compost intended for suppression of plant pathogens. Applied Soil Ecology. 34, 65–81.
Bryndum S (2014). Biotransformation of organic waste into high quality fertilizer: Potentials and
limitations for compost process optimization and nutrient recycling. PhD dissertation,
Copenhagen University, Denmark, Pp 101.
Bustamante MA, Restrepo AP, Alburquerque JA, Pérez-Murcia MD, Paredes C, Moral R, Bernal MP
(2013). Recycling of anaerobic digestates by composting: effect of the bulking agent used. Journal
of Cleaner Production. 47, 61-69.
Chan YC, Sinha RK, Wang W (2011). Emission of greenhouse gases from home aerobic composting,
anaerobic digestion and vermicomposting of household wastes in Brisbane, Australia. Waste
Management and Research. 29, 540–548.
Chan MT, Selvam A, Wong JWC (2016). Reducing nitrogen loss and salinity during ‘struvite’ food
waste composting by zeolite amendment. Bioresource Technology. 200, 838-844.
S
124
Chen C, Whalen JK, Guo X (2014). Earthworms reduce soil nitrous oxide emissions during drying and
rewetting cycles. Soil Biology and Biochemistry. 68, 117 – 124.
Chowdhury MA, de Neergaard A, Jensen LS (2014). Potential of aeration flow rate and bio-char
addition to reduce greenhouse gas and ammonia emissions during manure composting.
Chemosphere. 97, 16-25.
Condon PM, Mullinix K, Fallick A, Harcourt M (2010). Agriculture on the edge: Strategies to abate
urban encroachment onto agricultural lands by promoting viable human-scale agriculture as an
integral element of urbanization, in: Pearson, C.J., Pilgrim, S., Pretty J., (Eds.), Urban agriculture:
Diverse activities and benefits for city society. International Journal Agricultural Sustainability. 8
(162), 104–115.
Cook KL, Ritchey EL, Loughrin JH, Haley M, Sistani KR, Bolster CH (2015). Effect of turning
frequency and season on composting materials from swine high-rise facilities. Waste
Management. 39, 86-95.
Czepiel P, Douglas E, Harriss R, Crill P (1996). Measurements of N2O from composted organic wastes.
Environmental Science Technology. 30, 2519–2525.
Danso G, Drechsel P, Fialor S, Giordano M (2006). Estimating the demand for municipal waste
compost via farmers' willingness to-pay in Ghana. Waste Management. 26(12),1400-1409.
Damte A, Koch SF, Mekonnen A (2012). Coping with Fuel wood Scarcity Household Responses in
Rural Ethiopia: Environment for Development: Discussion Paper Series 12-01.
De Bon H (2001). Urban and peri urban horticulture in Africa and Asia: Characterization of the
systems and issues of sustainability. Annotated Bibliography on Urban Agriculture.
Wageningen, The Netherlands.
De Mota ACS, Nigussie A., Kuyper TW. Delayed addition of N-rich substrate affects greenhouse gas
emissions during composting. (unpublished)
Depkat-Jakob PS, Hunger S, Schulz K, Brown GG, Tsai SM, Drake HL (2012). Emission of methane by
Eudrilus eugeniae and other earthworms from Brazil. Applied Environmental Microbiology. 78,
3014–3019.
Dercon S, Christiaensen L (2011). Consumption Risk, Technology Adoption, and Poverty Traps:
Evidence from Ethiopia. Journal of Development Economics 96:159–173.
Dias BO, Silva CA, Higashikawa FS, Roig A, Sánchez-Monedero MA (2010). Use of biochar as bulking
agent for the composting of poultry manure: Effect on organic matter degradation and
humification. Bioresource Technology. 101, 1239-1246.
Diogo RVC, Buerkert A, Schlecht E (2010). Horizontal nutrient fluxes and food safety in urban and
peri-urban vegetable and millet cultivation of Niamey, Niger. Nutrient cycle in Agroecosystems.
87,81–102.
Dossa LH, Abdulkadir A, Amadou H, Sangare S, Schlecht E (2011). Exploring the diversity of urban
and peri-urban agricultural systems in Sudano-Sahelian West Africa: An attempt towards a
regional typology. Landscape and urban planning. 102, 197-206.
Drechsel P, Keraita B, Amoah P, Abaidoo RC, Raschid-Sally L, Bahri A (2008). Reducing health risks
from wastewater use in urban and peri-urban sub- Saharan Africa: applying the 2006 WHO
guidelines. Water Science Technology. 57, 1461–1466.
Dresbøll DB. Thorup-Kristensen K (2005). Delayed nutrient application affects mineralisation rate
during composting of plant residues. Bioresource Technology. 96(10), 1093-101.
125
Edwards CA (2011). Human pathogen reduction during vermicomposting. In: Edwards, C.A.,
Arancon, N.Q., Sherman, R. (Eds.), Vermiculture Technology: Earthworms, Organic Wastes and
Environmental Management. CRC Press, Boca Raton, pp. 249–261.
Eklind Y, Sundberg C, Smars S, Steger K, Sundh I, Kirchmann H, Joensson H (2007). Carbon turnover
and ammonia emissions during composting of biowaste at different temperatures. Journal of
Environmental Quality 36, 1512-1520.
Ermolaev E, Sundberg C, Pell M, Jönsson H (2014). Greenhouse gas emissions from home composting
in practice. Bioresource Technology. 151, 174-182.
Folefack A ( 2005). The Use of Compost from Household Waste in Agriculture: Economic and
Environmental Analysis in Cameroon, in: Doppler W., Bauer S. (Eds.), Farming & Rural
Systems Economics. Germany.
García-Gil JC, Ceppi S, Velasca M, Polo A, Senesi N (2004). Long-term effects of amendment with
municipal solid waste compost on the elemental and acid functional group composition and
pH-buffer capacity of soil humic acid. Geoderma 121, 135–142.
García-Marco S, Ravell SR, Chadwi D, Vallejo A, Gregory AS, Cárdena LM (2014). Ranking factors
affecting emissions of GHG from incubated agricultural soils. European Journal of Soil Science. 65,
573–583.
Getahun T, Mengistie E, Haddis A, Wasie F, Alemayehu E, Dadi D, Van Gerven T, Van der Bruggen B
(2012a). Municipal solid waste generation in growing urban areas in Africa: current practices
and relation to socioeconomic factors in Jimma, Ethiopia. Environmental Monitoring and
Assessment. 184(10), 6337-45.
Getahun T, Nigussie A, Entele T, Van Gerven T, Van der Bruggen B (2012b). Effect of turning
frequencies on composting biodegradable municipal solid waste quality. Resource, Conservation
& Recycling. 65, 79-84.
Getnet M., Van Ittersum M., Hengsdijk H., Descheemaeker K (2016). Yield gaps and resource use
across farming zones in the central Rift Valley of Ethiopia. Experimental Agriculture. 52 (4), 493 -
517.
Gittleman M (2009). Urban expansion in Addis Ababa: Effects of the decline of urban agriculture on
livelihood and food security. Tufts University. Presented at the United Nations 17th
Commission on Sustainable Development.
Guerrero LA, Maas G, Hogland W (2013). Solid waste management challenges for cities in developing
countries. Waste Management. 33, 220–232.
Gujarati DN (1995). Basic Econometrics, 3rd Edition. McGraw-Hill, Inc. USA.
Haileselassie A, Priess JA, Veldkamp E, Lesschen JP (2006). Smallholders’ soil fertility management in
the central highlands of Ethiopia: Implications for nutrient stocks, balances and sustainability of
agroecosystems. Nutrient Cycling in Agroecosystems. 75 (3), 135-146.
Hanc A, Dreslova M (2016). Effect of composting and vermicomposting on properties of particle size
fractions. Bioresource Technology. 217, 186-189.
Hamad TA, Agll AA, Hamad YM, Sheffield JW (2014). Solid waste as renewable source of energy:
current and future possibility in Libya. Case Studies in Thermal Engineering. 4, 144–152.
Hao X, Chang C, Larney FJ (2004). Carbon, Nitrogen Balances and Greenhouse Gas Emission during
Cattle Feedlot Manure Composting. Journal of Environmental Quality. 33, 37–44.
Hao X, Larney FJ, Chang C, Travis GR, Nichol CK, Bre E (2005). The Effect of Phosphogypsum on
Greenhouse Gas Emissions during Cattle Manure Composting. Journal of Environmental Quality.
34, 774–781.
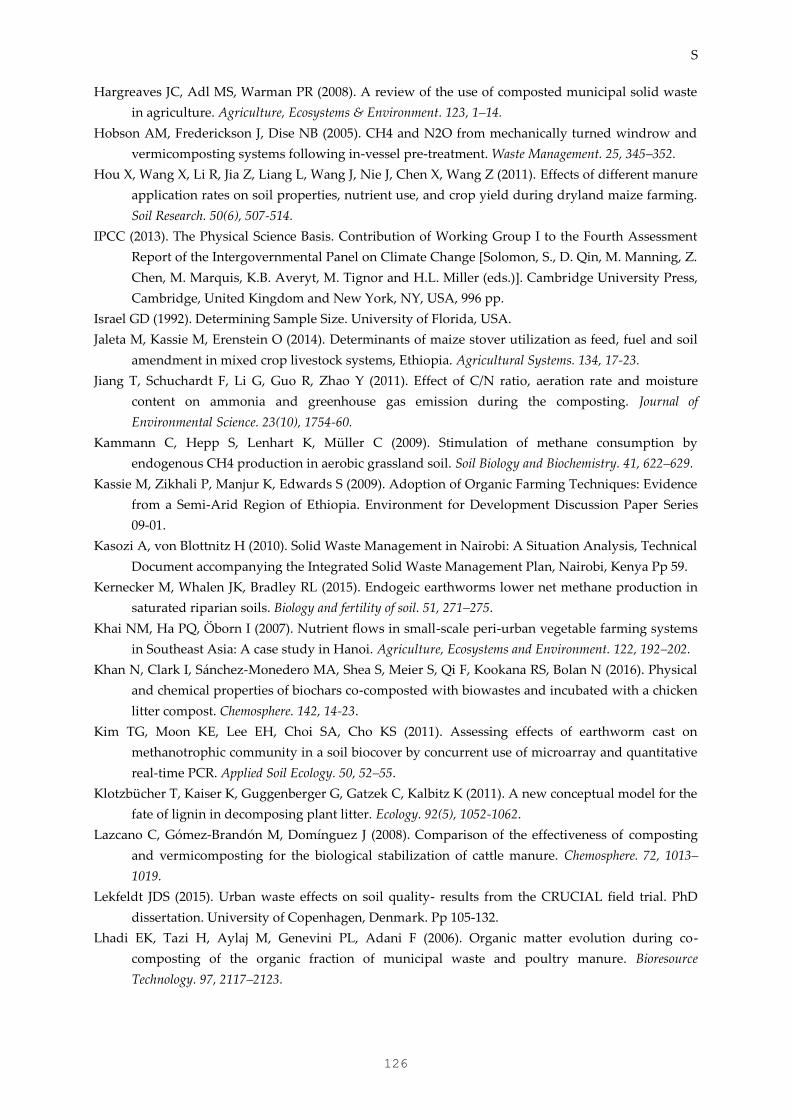
S
126
Hargreaves JC, Adl MS, Warman PR (2008). A review of the use of composted municipal solid waste
in agriculture. Agriculture, Ecosystems & Environment. 123, 1–14.
Hobson AM, Frederickson J, Dise NB (2005). CH4 and N2O from mechanically turned windrow and
vermicomposting systems following in-vessel pre-treatment. Waste Management. 25, 345–352.
Hou X, Wang X, Li R, Jia Z, Liang L, Wang J, Nie J, Chen X, Wang Z (2011). Effects of different manure
application rates on soil properties, nutrient use, and crop yield during dryland maize farming.
Soil Research. 50(6), 507-514.
IPCC (2013). The Physical Science Basis. Contribution of Working Group I to the Fourth Assessment
Report of the Intergovernmental Panel on Climate Change [Solomon, S., D. Qin, M. Manning, Z.
Chen, M. Marquis, K.B. Averyt, M. Tignor and H.L. Miller (eds.)]. Cambridge University Press,
Cambridge, United Kingdom and New York, NY, USA, 996 pp.
Israel GD (1992). Determining Sample Size. University of Florida, USA.
Jaleta M, Kassie M, Erenstein O (2014). Determinants of maize stover utilization as feed, fuel and soil
amendment in mixed crop livestock systems, Ethiopia. Agricultural Systems. 134, 17-23.
Jiang T, Schuchardt F, Li G, Guo R, Zhao Y (2011). Effect of C/N ratio, aeration rate and moisture
content on ammonia and greenhouse gas emission during the composting. Journal of
Environmental Science. 23(10), 1754-60.
Kammann C, Hepp S, Lenhart K, Müller C (2009). Stimulation of methane consumption by
endogenous CH4 production in aerobic grassland soil. Soil Biology and Biochemistry. 41, 622–629.
Kassie M, Zikhali P, Manjur K, Edwards S (2009). Adoption of Organic Farming Techniques: Evidence
from a Semi-Arid Region of Ethiopia. Environment for Development Discussion Paper Series
09-01.
Kasozi A, von Blottnitz H (2010). Solid Waste Management in Nairobi: A Situation Analysis, Technical
Document accompanying the Integrated Solid Waste Management Plan, Nairobi, Kenya Pp 59.
Kernecker M, Whalen JK, Bradley RL (2015). Endogeic earthworms lower net methane production in
saturated riparian soils. Biology and fertility of soil. 51, 271–275.
Khai NM, Ha PQ, Öborn I (2007). Nutrient flows in small-scale peri-urban vegetable farming systems
in Southeast Asia: A case study in Hanoi. Agriculture, Ecosystems and Environment. 122, 192–202.
Khan N, Clark I, Sánchez-Monedero MA, Shea S, Meier S, Qi F, Kookana RS, Bolan N (2016). Physical
and chemical properties of biochars co-composted with biowastes and incubated with a chicken
litter compost. Chemosphere. 142, 14-23.
Kim TG, Moon KE, Lee EH, Choi SA, Cho KS (2011). Assessing effects of earthworm cast on
methanotrophic community in a soil biocover by concurrent use of microarray and quantitative
real-time PCR. Applied Soil Ecology. 50, 52–55.
Klotzbücher T, Kaiser K, Guggenberger G, Gatzek C, Kalbitz K (2011). A new conceptual model for the
fate of lignin in decomposing plant litter. Ecology. 92(5), 1052-1062.
Lazcano C, Gómez-Brandón M, Domínguez J (2008). Comparison of the effectiveness of composting
and vermicomposting for the biological stabilization of cattle manure. Chemosphere. 72, 1013–
1019.
Lekfeldt JDS (2015). Urban waste effects on soil quality- results from the CRUCIAL field trial. PhD
dissertation. University of Copenhagen, Denmark. Pp 105-132.
Lhadi EK, Tazi H, Aylaj M, Genevini PL, Adani F (2006). Organic matter evolution during co-
composting of the organic fraction of municipal waste and poultry manure. Bioresource
Technology. 97, 2117–2123.
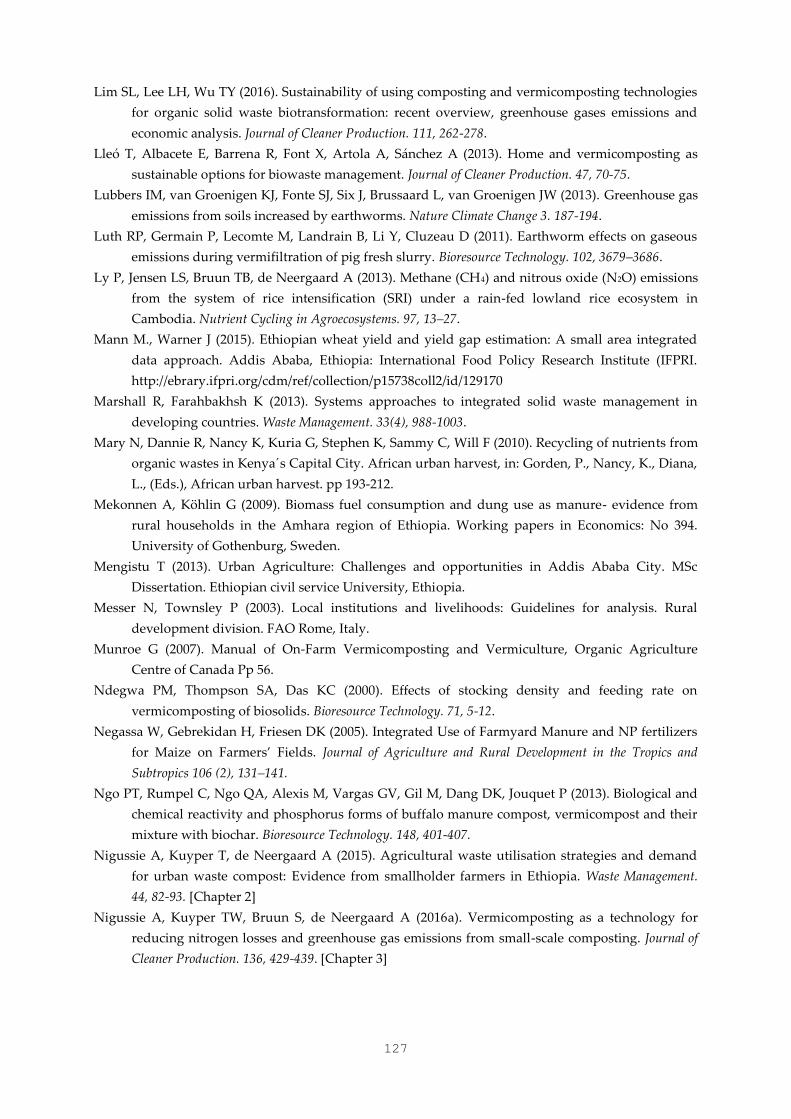
127
Lim SL, Lee LH, Wu TY (2016). Sustainability of using composting and vermicomposting technologies
for organic solid waste biotransformation: recent overview, greenhouse gases emissions and
economic analysis. Journal of Cleaner Production. 111, 262-278.
Lleó T, Albacete E, Barrena R, Font X, Artola A, Sánchez A (2013). Home and vermicomposting as
sustainable options for biowaste management. Journal of Cleaner Production. 47, 70-75.
Lubbers IM, van Groenigen KJ, Fonte SJ, Six J, Brussaard L, van Groenigen JW (2013). Greenhouse gas
emissions from soils increased by earthworms. Nature Climate Change 3. 187-194.
Luth RP, Germain P, Lecomte M, Landrain B, Li Y, Cluzeau D (2011). Earthworm effects on gaseous
emissions during vermifiltration of pig fresh slurry. Bioresource Technology. 102, 3679–3686.
Ly P, Jensen LS, Bruun TB, de Neergaard A (2013). Methane (CH4) and nitrous oxide (N2O) emissions
from the system of rice intensification (SRI) under a rain-fed lowland rice ecosystem in
Cambodia. Nutrient Cycling in Agroecosystems. 97, 13–27.
Mann M., Warner J (2015). Ethiopian wheat yield and yield gap estimation: A small area integrated
data approach. Addis Ababa, Ethiopia: International Food Policy Research Institute (IFPRI.
http://ebrary.ifpri.org/cdm/ref/collection/p15738coll2/id/129170
Marshall R, Farahbakhsh K (2013). Systems approaches to integrated solid waste management in
developing countries. Waste Management. 33(4), 988-1003.
Mary N, Dannie R, Nancy K, Kuria G, Stephen K, Sammy C, Will F (2010). Recycling of nutrients from
organic wastes in Kenya´s Capital City. African urban harvest, in: Gorden, P., Nancy, K., Diana,
L., (Eds.), African urban harvest. pp 193-212.
Mekonnen A, Köhlin G (2009). Biomass fuel consumption and dung use as manure- evidence from
rural households in the Amhara region of Ethiopia. Working papers in Economics: No 394.
University of Gothenburg, Sweden.
Mengistu T (2013). Urban Agriculture: Challenges and opportunities in Addis Ababa City. MSc
Dissertation. Ethiopian civil service University, Ethiopia.
Messer N, Townsley P (2003). Local institutions and livelihoods: Guidelines for analysis. Rural
development division. FAO Rome, Italy.
Munroe G (2007). Manual of On-Farm Vermicomposting and Vermiculture, Organic Agriculture
Centre of Canada Pp 56.
Ndegwa PM, Thompson SA, Das KC (2000). Effects of stocking density and feeding rate on
vermicomposting of biosolids. Bioresource Technology. 71, 5-12.
Negassa W, Gebrekidan H, Friesen DK (2005). Integrated Use of Farmyard Manure and NP fertilizers
for Maize on Farmers’ Fields. Journal of Agriculture and Rural Development in the Tropics and
Subtropics 106 (2), 131–141.
Ngo PT, Rumpel C, Ngo QA, Alexis M, Vargas GV, Gil M, Dang DK, Jouquet P (2013). Biological and
chemical reactivity and phosphorus forms of buffalo manure compost, vermicompost and their
mixture with biochar. Bioresource Technology. 148, 401-407.
Nigussie A, Kuyper T, de Neergaard A (2015). Agricultural waste utilisation strategies and demand
for urban waste compost: Evidence from smallholder farmers in Ethiopia. Waste Management.
44, 82-93. [Chapter 2]
Nigussie A, Kuyper TW, Bruun S, de Neergaard A (2016a). Vermicomposting as a technology for
reducing nitrogen losses and greenhouse gas emissions from small-scale composting. Journal of
Cleaner Production. 136, 429-439. [Chapter 3]
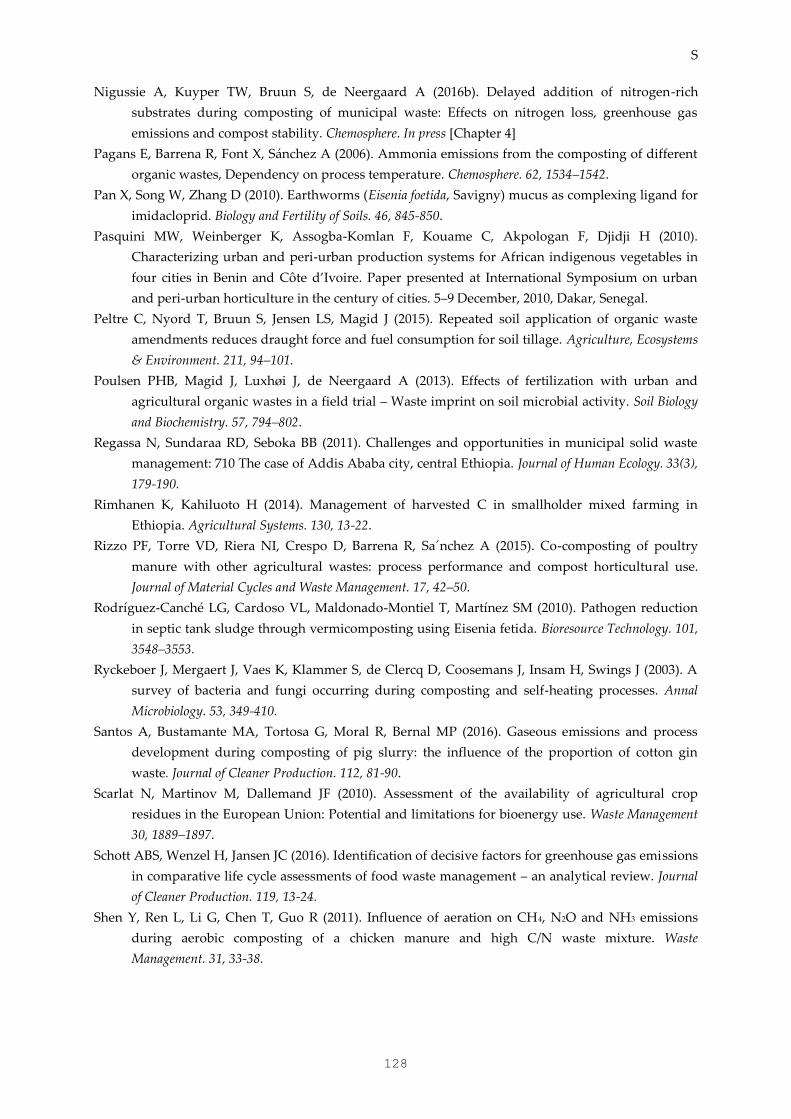
S
128
Nigussie A, Kuyper TW, Bruun S, de Neergaard A (2016b). Delayed addition of nitrogen-rich
substrates during composting of municipal waste: Effects on nitrogen loss, greenhouse gas
emissions and compost stability. Chemosphere. In press [Chapter 4]
Pagans E, Barrena R, Font X, Sánchez A (2006). Ammonia emissions from the composting of different
organic wastes, Dependency on process temperature. Chemosphere. 62, 1534–1542.
Pan X, Song W, Zhang D (2010). Earthworms (Eisenia foetida, Savigny) mucus as complexing ligand for
imidacloprid. Biology and Fertility of Soils. 46, 845-850.
Pasquini MW, Weinberger K, Assogba-Komlan F, Kouame C, Akpologan F, Djidji H (2010).
Characterizing urban and peri-urban production systems for African indigenous vegetables in
four cities in Benin and Côte d’Ivoire. Paper presented at International Symposium on urban
and peri-urban horticulture in the century of cities. 5–9 December, 2010, Dakar, Senegal.
Peltre C, Nyord T, Bruun S, Jensen LS, Magid J (2015). Repeated soil application of organic waste
amendments reduces draught force and fuel consumption for soil tillage. Agriculture, Ecosystems
& Environment. 211, 94–101.
Poulsen PHB, Magid J, Luxhøi J, de Neergaard A (2013). Effects of fertilization with urban and
agricultural organic wastes in a field trial – Waste imprint on soil microbial activity. Soil Biology
and Biochemistry. 57, 794–802.
Regassa N, Sundaraa RD, Seboka BB (2011). Challenges and opportunities in municipal solid waste
management: 710 The case of Addis Ababa city, central Ethiopia. Journal of Human Ecology. 33(3),
179-190.
Rimhanen K, Kahiluoto H (2014). Management of harvested C in smallholder mixed farming in
Ethiopia. Agricultural Systems. 130, 13-22.
Rizzo PF, Torre VD, Riera NI, Crespo D, Barrena R, Sa´nchez A (2015). Co-composting of poultry
manure with other agricultural wastes: process performance and compost horticultural use.
Journal of Material Cycles and Waste Management. 17, 42–50.
Rodríguez-Canché LG, Cardoso VL, Maldonado-Montiel T, Martínez SM (2010). Pathogen reduction
in septic tank sludge through vermicomposting using Eisenia fetida. Bioresource Technology. 101,
3548–3553.
Ryckeboer J, Mergaert J, Vaes K, Klammer S, de Clercq D, Coosemans J, Insam H, Swings J (2003). A
survey of bacteria and fungi occurring during composting and self-heating processes. Annal
Microbiology. 53, 349-410.
Santos A, Bustamante MA, Tortosa G, Moral R, Bernal MP (2016). Gaseous emissions and process
development during composting of pig slurry: the influence of the proportion of cotton gin
waste. Journal of Cleaner Production. 112, 81-90.
Scarlat N, Martinov M, Dallemand JF (2010). Assessment of the availability of agricultural crop
residues in the European Union: Potential and limitations for bioenergy use. Waste Management
30, 1889–1897.
Schott ABS, Wenzel H, Jansen JC (2016). Identification of decisive factors for greenhouse gas emissions
in comparative life cycle assessments of food waste management – an analytical review. Journal
of Cleaner Production. 119, 13-24.
Shen Y, Ren L, Li G, Chen T, Guo R (2011). Influence of aeration on CH4, N2O and NH3 emissions
during aerobic composting of a chicken manure and high C/N waste mixture. Waste
Management. 31, 33-38.
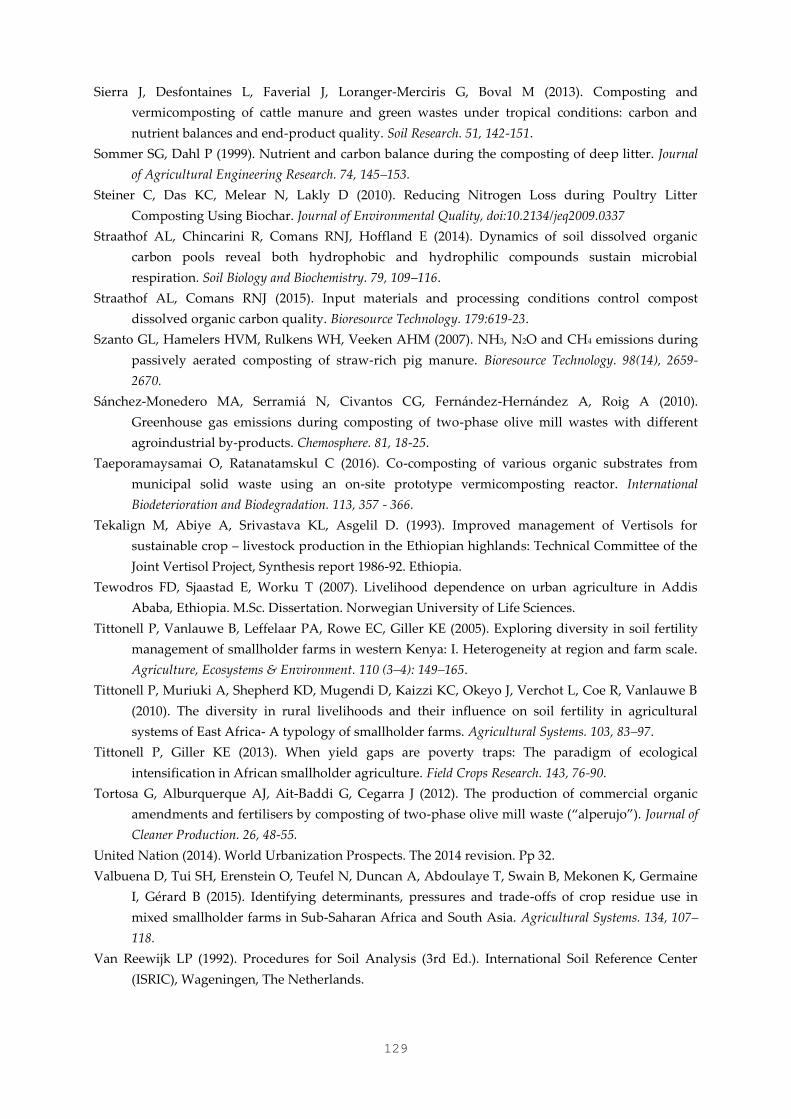
129
Sierra J, Desfontaines L, Faverial J, Loranger-Merciris G, Boval M (2013). Composting and
vermicomposting of cattle manure and green wastes under tropical conditions: carbon and
nutrient balances and end-product quality. Soil Research. 51, 142-151.
Sommer SG, Dahl P (1999). Nutrient and carbon balance during the composting of deep litter. Journal
of Agricultural Engineering Research. 74, 145–153.
Steiner C, Das KC, Melear N, Lakly D (2010). Reducing Nitrogen Loss during Poultry Litter
Composting Using Biochar. Journal of Environmental Quality, doi:10.2134/jeq2009.0337
Straathof AL, Chincarini R, Comans RNJ, Hoffland E (2014). Dynamics of soil dissolved organic
carbon pools reveal both hydrophobic and hydrophilic compounds sustain microbial
respiration. Soil Biology and Biochemistry. 79, 109–116.
Straathof AL, Comans RNJ (2015). Input materials and processing conditions control compost
dissolved organic carbon quality. Bioresource Technology. 179:619-23.
Szanto GL, Hamelers HVM, Rulkens WH, Veeken AHM (2007). NH3, N2O and CH4 emissions during
passively aerated composting of straw-rich pig manure. Bioresource Technology. 98(14), 2659-
2670.
Sánchez-Monedero MA, Serramiá N, Civantos CG, Fernández-Hernández A, Roig A (2010).
Greenhouse gas emissions during composting of two-phase olive mill wastes with different
agroindustrial by-products. Chemosphere. 81, 18-25.
Taeporamaysamai O, Ratanatamskul C (2016). Co-composting of various organic substrates from
municipal solid waste using an on-site prototype vermicomposting reactor. International
Biodeterioration and Biodegradation. 113, 357 - 366.
Tekalign M, Abiye A, Srivastava KL, Asgelil D. (1993). Improved management of Vertisols for
sustainable crop – livestock production in the Ethiopian highlands: Technical Committee of the
Joint Vertisol Project, Synthesis report 1986-92. Ethiopia.
Tewodros FD, Sjaastad E, Worku T (2007). Livelihood dependence on urban agriculture in Addis
Ababa, Ethiopia. M.Sc. Dissertation. Norwegian University of Life Sciences.
Tittonell P, Vanlauwe B, Leffelaar PA, Rowe EC, Giller KE (2005). Exploring diversity in soil fertility
management of smallholder farms in western Kenya: I. Heterogeneity at region and farm scale.
Agriculture, Ecosystems & Environment. 110 (3–4): 149–165.
Tittonell P, Muriuki A, Shepherd KD, Mugendi D, Kaizzi KC, Okeyo J, Verchot L, Coe R, Vanlauwe B
(2010). The diversity in rural livelihoods and their influence on soil fertility in agricultural
systems of East Africa- A typology of smallholder farms. Agricultural Systems. 103, 83–97.
Tittonell P, Giller KE (2013). When yield gaps are poverty traps: The paradigm of ecological
intensification in African smallholder agriculture. Field Crops Research. 143, 76-90.
Tortosa G, Alburquerque AJ, Ait-Baddi G, Cegarra J (2012). The production of commercial organic
amendments and fertilisers by composting of two-phase olive mill waste (“alperujo”). Journal of
Cleaner Production. 26, 48-55.
United Nation (2014). World Urbanization Prospects. The 2014 revision. Pp 32.
Valbuena D, Tui SH, Erenstein O, Teufel N, Duncan A, Abdoulaye T, Swain B, Mekonen K, Germaine
I, Gérard B (2015). Identifying determinants, pressures and trade-offs of crop residue use in
mixed smallholder farms in Sub-Saharan Africa and South Asia. Agricultural Systems. 134, 107–
118.
Van Reewijk LP (1992). Procedures for Soil Analysis (3rd Ed.). International Soil Reference Center
(ISRIC), Wageningen, The Netherlands.
S
130
Van Zomeren A, Comans RNJ (2007). Measurement of humic and fulvic acid concentrations and
dissolution properties by a rapid batch procedure. Environmental Science and Technology. 41,
6755–6761.
Veenhuizen R, Danso G (2007). Profitability and sustainability of urban and peri-urban agriculture.
Agricultural management, marketing and finance occasional paper 19. FAO. Rome, Italy.
Velasco-Velasco J, Parkinson R, Kuri V (2011). Ammonia emissions during vermicomposting of sheep
manure. Bioresource Technology. 102, 10959–10964.
Vu DQ, Tran TM, Nguyen PD, Vu CC, Vu TK, Jensen LS (2012). Effect of biogas technology on
nutrient flows for small scale and medium scale pig farms in vietnam. Nutrient cycling in
Agroecosystem. 94, 1-13.
Vu QD, de Neergaard A, Tran TD, Hoang HTT, Vu VHK, Jensen LS (2015). Greenhouse gas emissions
from passive composting of manure and digestate with crop residues and biochar on small-
scale livestock farms in Vietnam. Environmental Technology. 36 (23), 2925-2934.
Wang J, Hu Z, Xu X, Jiang X, Zheng B, Liu X, Pan X, Kardol P (2014). Emissions of ammonia and
greenhouse gases during combined pre-composting and vermicomposting of duck manure.
Waste Management. 34, 1546–1552.
Wei M, Qiu Q, Qian Y, Cheng L, Guo A (2016). Methane oxidation and response of Methylobacter /
Methylosarcina methanotrophs in flooded rice soil amended with urea. Applied Soil Ecology. 101,
174–184.
Wichuk K, McCartney D (2010). Compost stability and maturity evaluation - a literature review.
Canadian Journal of Civil Engineering. 37, 1505-1523.
Xiao Y, Bai X, Ouyang Z, Zheng H, Xing F (2007). The composition, trend and impact of urban solid
waste in Beijing. Environmental Monitoring and Assessment 135 (1-3), 21-30.
Yang F, Li GX, Yang QY, Luo WH (2013). Effect of bulking agents on maturity and gaseous emissions
during kitchen waste composting. Chemosphere. 93, 1393-1399.
Zhang M, Heaney D, Henriquez B, Solberg E, Bittner E (2006). A four year study on influence of
biosolids/MSW compost application in less productive soils in Alberta: nutrient dynamics.
Compost Science and Utilisation. 14, 68–80.
Summary
131
Summary
Organic amendments (i.e., crop residues, manure and compost) maintain or increase soil
organic matter contents and thereby contribute to enhanced fertiliser use efficiency.
Despite the benefits of organic amendments, many smallholder farmers do not retain
crop residues and manure on their farmlands. Hence, large amounts of nutrients and
carbon are exported from agricultural lands to nearby markets and/or urban areas. At the
same time, a large amount of biodegradable waste is produced in cities, and its
management has become a major concern in developing countries - where waste
management is hardly existing.
My thesis is motivated by the lack of scientific evidence on (i) the socio-economic
perspectives of urban-waste composting, (ii) low-cost technologies that improve the
agronomic value of urban-waste compost, while reducing losses to the environment and
mitigating climate change by reducing greenhouse gas (GHG) emissions. To address
these issues, I conducted both socio-economic studies and composting experiments both
in laboratory reactors and under field conditions.
In Chapter 1, I provide an overview of previous studies conducted on the use of
organic materials (both agricultural and urban waste) for soil amendment, and I list my
hypotheses. In Chapter 2, I determined the current use of agricultural waste (i.e., crop
residues and manure) under different urban and peri-urban farming systems. This
chapter addresses the question Why do farmers retain no or insufficient agricultural waste on
their farmlands? I interviewed 220 farmers in Addis Ababa, Ethiopia using standardised
semi-structured questionnaires, and found that 85% of the crop residues were used for
animal feed, and 80% of manure was used for fuel. Less than 10% of manure and/or crop
residues are retained in the soil, indicating that the current use of agricultural residues
result in an export of a large amount of nutrients and C from the croplands. Manure is a
source of fuel even for urban dwellers. While this demand creates market opportunities
and entices farmers to sell their manure (in the form of dung cake) to the nearby cities, it
exacerbates carbon and nutrient fluxes from the country side to cities. I noted that
farmers with market-oriented production systems allocate their agricultural waste
mainly for soil amendment compared to resource-poor subsistence farmers. In addition
to this, socio-economic variables such as land ownership, shortage of land and access to
extension services influence the farmers’ decision to retain agricultural waste on their
farmlands. I further expanded Chapter 2 to address the question: If urban waste is
composted, is there a demand from (peri-urban) farmers? I assessed the demand for urban-
waste compost (operationalised as farmers willingness to pay and / or to contribute
labour for urban-waste compost), and found that 60% of the farmers were willing to pay
and / or to contribute labour for urban-waste composting. Education, distance of the
farmland from the city, land tenure status, experience with compost, and access to
extension services explained the variation in willingness to pay for or contribute to the
Summary
132
acquisition of compost. My findings in Chapter 2 indicate that competition for
agricultural waste between fuel, feed and soil causes nutrient mining and organic matter
losses from agricultural land; hence, urban-waste compost is an alternative option to
close this loop. But urban-waste composting cannot be achieved without the
involvement of different institutions and needs improvement of the existing policies,
infrastructure and financial institutions.
Even though urban-waste compost has been suggested for soil amendment, a
large amount of N losses and GHG emissions occur during composting of N-rich urban
waste, which consequently reduce the fertilising value of urban-waste compost and
contribute to climate change. The high temperatures during composting are the main
drivers for N losses. Chapter 3 is therefore initiated to evaluate the effectiveness of
earthworm composting (vermicomposting) – a mesophilic (< 30 °C) composting
technique - to reduce N losses and GHG emissions. I demonstrated that
vermicomposting decreased total N losses by 20% compared with thermophilic
composting. The existing reports on the effect of earthworms on GHG emissions are
contradictory. Hence, Chapters 3 used substrates of different quality (as assessed by C:N
ratio and the presence of a labile C pool) and manipulated several variables (moisture
content and earthworm density) to clarify our understanding on the effect of earthworms
on GHG emissions during composting. I noted that earthworms decreased N2O
emissions during composting, but the earthworms effect varied between substrate
quality, earthworm density and feeding ratio. Higher earthworm density increased N2O
emissions during vermicomposting. My findings suggested that different species of
epigeic earthworms could result in different N2O emissions. Earthworms decreased CH4
emissions from composting, and this observation was consistently found in all
experiments. Earthworms increased CO2 emissions, and this observation was also
consistent in all experiments. Higher CO2 evolution indicates a greater degree of
stabilisation of the compost, and it should be noted that in the end all composts are likely
of similar stability as more CO2 might escape after application of the thermophilic
compost to the field. Hence, I decided to exclude CO2 emissions from the total GHG
budget. When CO2 emission is excluded from GHG emissions, vermicomposting reduces
GHG emissions compared with non-earthworm treatments (thermophilic composting).
However, total GHG emissions are higher from vermicomposting than from
thermophilic composting when CO2 is included in the balance.
Low levels of N in urban-waste compost, particularly in (sub-)tropical countries
has been observed, which negatively impacts the agronomic value of compost from a soil
fertility perspective. Composting of (N-poor) urban waste together with N-rich materials
such as manure is commonly used to increase the N content of the final compost. This
practice, however, results in a significant NH3 volatilisation due to the combination of
high temperatures during the thermophilic phase and high NH4+ concentration in the N-
rich substrate. Chapter 4 addresses the question: Does the addition of N-rich substrate after
Summary
133
the thermophilic phase reduce N losses? I conducted a 90 days composting experiment using
N-poor urban waste materials and poultry manure as N-rich substrate. Delayed addition
reduced nitrogen losses by 9-20% compared with traditional composting method.
Furthermore, I tested whether delayed addition influences N2O and CH4 emissions, and
noted that delayed addition increased N2O emissions by 400-600%, but decreased CH4
emissions by 50%. In all, delayed addition had only a marginal effect (P = 0.06) on total
non-CO2 GHG emissions. I also confirmed that delayed addition resulted in compost that
was as stable and effective at completely eradicating weed seeds as single addition.
Hence, I conclude that delayed addition is one option for increasing the fertilising value
of urban-waste compost without having a significant effect on total greenhouse gas
emissions or compost stability.
Because higher CO2 emissions indicates a higher degree of stabilisation, I initiated
Chapter 5 to link the observed effect of earthworms on CO2 emissions with additional
and potentially more reliable indices of compost stability such as dissolved organic
carbon (DOC) quantity and its composition (humic acid, fulvic acid, hydrophobic
neutral, and hydrophilic compounds) – which was a recently proposed indicator of
compost stability. Earthworms showed a lowering of the contents of DOC and its various
fractions compared with non-earthworm treatments, which is a consequence of higher
compost stability. I noted that humic acid fraction was depleted more quickly than the
other hydrophobic compounds, confirming that it is degraded during composting. I
expanded of Chapter 5 to address the effect of feeding ratio – the ratio of earthworms to
the amount of substrate added – on compost stability. The optimum feeding ratio
decreased DOC quantity and its composition compared with higher ratio, which
confirms higher stability under optimum feeding. My findings indicate that earthworms
accelerate the stabilisation of organic materials, and measurement of DOC components
provides greater insight about compost stability. Moreover, feeding ratio should be
considered when assessing the effect of earthworms on stabilisation of biodegradable
waste. In the general discussion (Chapter 6), I synthesised my findings and emphasised
on the challenges to increase soil fertility and sustain crop production in developing
countries, and the opportunities to utilise urban-waste as soil amendment.
Recommendations for future research directions were also included in this chapter.
Finally, I suggested that biodegradable urban waste should be considered as alternative
source for soil amendment. Technologies such as vermicomposting and delayed addition
of N-rich substrate are recommended to reduce N losses and mitigate GHG emissions.
Sammenfatning
134
Sammenfatning
Organiske jordforbedringsmidler (f.eks. afgrøderester, husdyrgødning og kompost)
opretholder eller øger jordens indhold af organisk stof og medvirker hermed til at en
øget udnyttelseseffektivitet af gødning. På trods af fordelene ved de organiske
jordforbedringsmidler fastholder mange husmænd ikke afgrøderester og husdyrgødning
på deres marker. Dermed bliver store mængder af næring og kulstof eksporteret fra
landbrugsområder til nærliggende markeder og/eller byområder. Samtidig bliver der
produceret store mænger biologisk nedbrydeligt affald i byerne og håndteringen af dette
affald er blevet et betydeligt problem in udviklingslande – hvor affaldshåndtering er så
godt som ikke-eksisterende.
Min afhandling er motiveret af fraværet af videnskabelig evidens vedrørende (i)
de socio-økonomiske perspektiver af kompostering af byaffald, (ii) billige teknologier der
forbedrer den agronomiske værdi af byaffaldskompost samtidig med at de kan reducere
tabet til miljøet og afbøde klimaforandring gennem en reduktion af udledning af
drivhusgasser (GHG). For at adressere disse spørgsmål udførte jeg både
socioøkonomiske studier og komposteringsforsøg – både i laboratorieskala og under
markforhold.
I Kapitel 1 giver jeg et overblik over tidligere studier af brugen af organiske
restprodukter (både fra landbruget og i form af byaffald) som jordforbedringsmiddel og
jeg oplister mine hypoteser. I Kapitel 2 undersøger jeg den nuværende anvendelse af
landbrugsaffald (afgrøderester og husdyrgødning) i forskellige landbrugssystemer i byer
og bynære områder. Dette kapitel adresserer spørgsmålet Hvorfor sker det kun i
utilstrækkelig grad eller slet ikke, at bønder fastholder landbrugsaffald på deres jord?
Jeg interviewede 220 bønder i Addis Ababa, Etiopien vha. standardiserede,
semistrukturerede spørgeskemaer og fandt, at 85% af afgrøderesterne blev anvendt til
dyrefoder og at 80% af husdyrgødningen blev anvendt til brændsel. Mindre end 10% af
husdyrgødningen og/eller afgrøderesterne blev fasthold i jorden hvilket indikerer at den
nuværenden anvendelse af landbrugsrestprodukter resulterer i en eksport af store
mængder af næringsstoffer og kulstof fra de dyrkede arealer. Husdyrgødning er en kilde
til brændsel selv for byboere. Mens denne efterspørgsel medfører handelsmuligheder og
ansporer bønder til at sælge deres husdyrgødning (i form af møgkager) til de
nærliggende byer, forstærker denne efterspørgsel også transporten af kulstof of
næringsstoffer fra landet til byerne. Jeg noterede mig, at landbrugere med
markedsorienterede produktionssystemer primært allokerer deres langbrugsaffald til
jordtilsætning i sammenligning med ressourcesvage subsistenslandbrugere. Derudover
påvirker socioøkonomiske faktorer såsom ejerskab til jord, knaphed på jord og adgang til
rådgivningstjenester langbrugernes beslutning om at fastholde langbrugsaffald på deres
Sammenfatning
135
jord. I kapitel 2 adresserede jeg endvidere spørgsmålet: Hvis byaffald bliver
komposteret, er der så en efterspørgsel fra (bynære) landbrugere? Jeg vurderede
efterspørgslen efter byaffaldskompost (operationaliseret som landbrugernes villighed til
at betale og/eller til at bidrage med arbejdskraft i bytte for byaffaldskompost) og fandt at
60% af landbrugerne var villige til at betale og/eller bidrage med arbejdskraft til
kompostering af byaffald. Uddannelse, afstand fra markerne til byen, ejendomsretten til
jorden, erfaring med kompost og adgang til rådgivning forklarede variationen i
villigheden til at betale for eller bidrage til erhvervelsen kompost. Mine fund i kapitel 2
indikerer at konkurrence om landbrugsaffald mellem brændsel, foder og jorden
medfører udpining og tab af organisk stof i landbrugsjorderne; deraf følger det, at
byaffaldskompost udgør et alternativ mulighed for at lukke denne løkke. Men
kompostering af byaffald kan ikke opnås uden involvering af forskellige institutioner og
afhænger af forbedringer af eksisterende politikker, infrastruktur og finansielle
institutioner.
Selvom kompost lavet af byaffald er blevet foreslået som jordforbedringsmiddel
sker der et stort tab af N og emission af drivhusgasser under komposteringen af N-rigt
byaffald hvilket igen fører til en reduktion i gødningsværdien af byaffaldskomposten og
medvirker til klimaforandringer. De høje temperaturer under kompostering en den
primære drivkraft bag N-tabet. Derfor undersøger jeg i Kapitel 3 potentialet af
kompostering vha. regnorme (ormekompostering) - en mesofil (< 30oC)
komposteringsteknik – til at reducere kvælstoftab og emissioner af drivhusgasser. Jeg
demonstrerede at ormekompostering nedsatte det totale kvælstoftab med 20%
sammenlignet med termofil kompostering. De eksisterende studier af effekten af
regnorme på drivhusgasudledninger er modstridende. For at øge vores forståelse af
effekten af regnorme på udledningerne af drivhusgasser anvendte jeg derfor i Kapitel 3
substrater af forskellig kvalitet (bedømt ud fra C:N ratio og tilstedeværelsen af en
letnedbrydelig C pulje) og manipulerede forskellige variable (vandindhold og tætheden
af regnorme). Jeg observerede at regnormene sænkede N2O-udledningerne under
kompostering, men effekten af regnorme varierede afhængig af substratkvalitet, tæthed
af regnorme og forholdet mellem regnorme og foder (fodringsforholdet). En øgning i
regnormstætheden medførte en øgning i N2O-emmisionerne under ormekompostering.
Mine resultater antyder, at forskellige arter af epigæiske regnorme kan medføre
forskellige niveauer af N2O-emmission. Regnorme førte til et fald i CH4-udledningen fra
kompostering og denne observation var konsistent på tværs af alle udførte forsøg.
Regnorme øgede CO2-emmisionerne og denne observation var også konsistent på tværs
af alle udførte forsøg. En højere CO2-udledning indikerer en højere grad af stabilisering
af komposten, og det bør noteres, at det må forventes at alle kompost-typer i sidste ende
sandsynligvis har en lignende stabilitet idet mere CO2 kan tænkes at blive frigivet efter
udbringning af den termofile kompost på marken. Derfor besluttede jeg mig for at
udelade CO2 fra det samlede drivhusgasbudget. Når CO2-udledningerne udelades fra
Sammenfatning
136
drivhusgasudledningerne, medfører ormekompostering en reduktion den totale
udledning af drivhusgasser i sammenligning med den termofile kompostering.
Imidlertid er den totale udledning af drivhusgasser højere fra ormekompostering end fra
termofil kompostering når CO2 inkluderes i regnestykket.
Lave kvælstofniveauer i byaffaldskompost, som især er blevet observeret (sub-
)tropiske lande, påvirker den agronomiske værdi af komposten i negativ retning.
Kompostering af (N-fattigt) byaffald sammen med N-rige materialer såsom
husdyrgødning er en ofte anvendt teknik til at øge N-indholdet i den færdige kompost.
Denne praksis medfører dog også en betragtelig NH3-fordampning på grund af
kombinationen af de høje temperaturer i den termofile fase og høje NH4+-
koncentrationer i det N-rige substrat. Kapitel 4 adresserer spørgsmålet: Fører en
forsinkelse i tilsætningen af det N-rige substrat til efter den termofile fase til en reduktion
i kvælstoftabene? Jeg udførte et 90 dage langt komposteringsforsøg med N-fattige
byaffaldsprodukter og N-rigt kyllingemøg. En forsinket tilsætning af kyllingemøget
reducerede kvælstoftabene med 9-20% sammenlignet med den traditionelle
komposteringsmetode. Endvidere testede jeg hvorvidt forsinket tilsætning påvirkede
udledningerne af N2O og CH4, og noterede at forsinket tilsætning øgede N2O-
udledningerne med 400-600%, men sænkede CH4-udledningerne med 50%. Alt i alt
havde forsinket tilsætning kun en marginal effekt (P = 0,06) på udledningerne af
drivhusgasser fraregnet CO2. Jeg bekræftede, at forsinket tilsætning var lige så effektiv
til at udrydde ukrudtsfrø og resulterede i en kompost der var lige så stabil og effektiv
som den traditionelle metode med en enkelt tilsætning. Jeg konkluderer derfor at
forsinket tilsætning giver mulighed for at øge gødningsværdien af byaffaldskompost
uden at have en signifikant effekt på de totale udledninger af drivhusgasser eller
stabiliteten af komposten.
Idet en højere CO2-udledning indikerer en højere grad af stabilisering påbegyndte
jeg kapitel 5 for at linke de observerede effekter af regnorme på CO2-udleningerne til
supplerende og potentielt mere pålidelige tal for kompoststabilitet såsom mængden af
opløst organisk kulstof (DOC), og dettes sammensætning (humussyre, fulvussyre,
hydrofobe neutrale og hydrofile stoffer), som for nylig er blevet foreslået som indikator
for kompoststabilitet. Jeg noterede mig, at humussyrefraktionen blev udtømt hurtigere
end de øvrige hydrofobe stoffer, hvilket bekræfter at den nedbrydes under
kompostering. Jeg gik videre i kapitel 5 for at adressere effekten af fodringsforholdet på
stabiliteten af kompost. Det optimale forhold sænkede mængden af DOC og medførte en
ændring i sammensætningen af DOC i sammenligning med et højere forhold. Mine
resultater indikerer at regnorme accelerer stabiliseringen af de organiske materialer og at
målinger af DOC-komponenter giver større indsigt vedrørende kompoststabilitet.
Endvidere bør fodringsforholdet tages med i betragtning, når man undersøger effekten
af regnorme på stabilisering af biologisk nedbrydeligt materiale.
Sammenfatning
137
I den generelle diskussion (kapitel 6) syntetiserede jeg mine resultater og
fremhævede de udfordringer der er i forbindelse med at øge jordfrugtbarhed og
opretbolde afgrødeproduktion i udviklingslande og de muligheder der eksisterer for at
anvende byaffald som et jordforbedringsmiddel. Anbefalinger til fremtidig forskning
blev også inkluderet i dette kapitel. Endelig foreslog jeg, at biologisk nedbrydeligt
byaffald burde blive anset for at være et alternativ som jordforbedringsmiddel.
Teknologier såsom ormekompostering og forsinket tilsætning af N-rige substrater
anbefales for at reducere N-tab og afbøde drivhusgasudledninger.
Acknowledgments
I started this long journey somewhat more than four years ago. During this period, I
acquired new skills and knowledge on how to do science in multicultural and
multidisciplinary settings. This journey has now come to an end. Hence I would like to
acknowledge people and institutions who helped me to write this new chapter of my life
with a colorful ink.
First of all, I am greatly indebted to my promoters Prof. Andreas de Neergaard
(Copenhagen University) and Prof. Thomas Kuyper (Wageningen University) and my
co-promoter Dr. Sander Bruun (Copenhagen University). Dear all, I thank you very
much for believing in me and allowing me to be your student. You helped me to focus on
mechanistic studies and scientific writing, and rebuilt me to an independent person who
enjoys scientific challenges. I really appreciate what we discussed as a scientist and
colleague. I am fortunate to have a supervisory team who understand and tolerate the
PhD’s academic difficulties, personal life and cultural shocks. I also thank you for
challenging me with my own experimentations and results. I learned a lot from them.
Your constructive comments on this thesis as well as on my personal character are
indispensable, and lifted me to a better position as a scientist. Your doors were always
open, and made me feel welcome. “Veel dank” Prof. Thom. “Mange tak” Prof. Andreas
and Dr. Sander.
In addition to my supervisory team, many people and institutions contributed
towards the success of this journey. I would like to thank the EACEA (Education, Audio-
visual and Culture Executive Agency) of the European Commission - the Agricultural
Transformation by Innovation (AgTrain) Erasmus Mundus Joint Doctorate Programme –
for funding the project. My special thanks also go to Prof. Lijbert Brussaard for accepting
me for this position and for his kind support, guidance and invaluable comments on my
proposal. I would also thank prof. Rob Comans for helpful discussion on DOC
fractionation and the interpretation of the various fractions. I am grateful to Mr. Lou
Derks from De Polderworm for his interest in my project, technical advice and providing
the earthworms for free.
My gratitude goes to Mr. Morten Læssøe Stephensen (Copenhagen University),
Jaap Nelemans (Wageningen University) and Tamas Salanki (Wageningen University)
for their technical supports during the laboratory work. The kindhearted help of Biruk
Yadessa, Gebremedhin Ambaw and Mikiyas Ahmed during the field work is highly
appreciated. The project would not bear fruit without your support. I would like to
acknowledge Lisbeth Axelsen (Copenhagen University) and Marnella van der Tol
(Wageningen University) for your support in all administrative issues, particularly
during the visa process. Your smile always made me feel home.
Acknowledgments
139
Syed and Niharika, I cannot thank you enough for being the best friends while I
was at Copenhagen. You always motivated me to move forward. I enjoyed the time we
spent together during holidays, birthdays, at Roskilde (Denmark). Syed, I also thank you
for being my paranymph without even knowing what it was. আপনাকে অকনে ধনযবাদ. The
AgTraIn was a great opportunity for me to meet other PhD candidates from different
disciplines and broaden my expertise. I therefore would like to acknowledge all the
AgTraIn family (the passionate, intelligent and industrious PhD candidates and
graduates) for your constructive discussions and inspiration. I learned a lot from you
guys. Ali, Zeinu, Awol and Nesredhin - my Ethiopian fellows at Copenhagen University
– thank you very much for your encouragement and critical comments on my work. I
would also thank you for taking care of my family in my absence. My colleagues from
Copenhagen University, I appreciate your endless support. I cultivate a lot of knowledge
from our weekly presentations. I also enjoyed the brainstorming discussions that we had
about science and life in general. ”Mange tak” guys.
I could manage to meet few people in Wageningen University even though I
stayed only for one year and spent most of my time in the laboratory and/or office. Rima,
Yong, Janna, Joana, Giulia, Ingrid, Ros and my other colleagues at Wageningen
University, I am extremely grateful for the chat that we had at different occasions. Rima,
I also thank you for being my paranymph without any hesitation. Ana de Mota, thank
you very much for your interest to do your M.Sc project with me. I really enjoyed and
learned a lot from the work we did together. Muito obrigado. I am greatly indebted to my
friend Habtamu and his wife Selam for their kind thoughts and warm invitation to their
home whenever I missed injera. I feel home away from home because of you, guys. I owe
you one.
Goytom, Afita, Alula, Abi, Zerhiun and Jose – my fellow Ethiopian students at
Wageningen – I thank you very much for accompanying me to the library (Forum) and
staying there until 23:00hrs every weekday. Your helped me to finish my PhD before my
contract ends. I will really miss you guys. Of course, I already miss the security
announcement “attention (Alula, Goytom) you’re kindly requested to leave the building
immediately”. I always remember the humors, cooks (the chicken) and drinks. Even though
it is still difficult for me to believe that he is gone, I thank my friend Endalkachew Kissi
for encouraged me to apply for the AgTraIn program before four years ago. I will always
remember the crazy things we did together. Too young to die my dear! May God rest
your soul in peace!
The last but not the least, my gratitude goes to my family for their tolerance
during my absences, endless love and emotional support. I would like to thank my wife
– Birtukan Seid Muhe – for her patience and taking care of me during many difficult
times. Your tolerances prove that your love for me is unreserved. Firdos (mama) – my
little one – thank you very much for not crying when I was away from home. Daddy is
Acknowledgments
140
home now and no more Skype. Gashye – my dad – I wish that you could see that your
little one receives a PhD degree. You were always with me when life took me to an
unexpected path. You were the one who re-engineer my life and guided me through the
new journey. You taught me what a father should do for his children. Gashye, your
guiding hand on my shoulder will remain with me forever. May God rest your soul in
peace! Tete – my mom – I am glad because you witnessed the accomplishment of my
PhD. Teteye, I thank you very much for your prayers and to be with Gashye to have
redesigned my life and guided me through the new paths. I wish you Methuselah's age.
ለወይዘሮ ከድጃ አህመድ በፀሎት ስላሰቡኝ አመሰግናለሁ። Dear brothers (Gashaye, Teddy and Ashu) and
sisters (Temebet, Mesye, Temodsh and Yemi), I thank you very much for your prayers
and support throughout this journey. I love you so much. Nephews, Aunties, Uncles,
Cousins and families, I appreciate your unreserved love. እጅግ በጣም አመሰግናለሁ።
Abebe
141
About the author
Abebe Nigussie Nigatu was born on the 6th of April 1982 in
Addis Ababa, Ethiopia. He completed his high-school
education in 2000, and joined Haromaya University
(Ethiopia), then Alemaya University, to pursue his education in agricultural sciences.
He received his Bachelor degree in Plant Sciences in July 2004. While doing a project
for his B.Sc degree on “the pedological characteristics of soils along different land types”, he
had a keen interest in soil biogeochemistry and fertility. Soon after his graduation, he
decided to continue his postgraduate study and received M.Sc degree in soil science
from the same university in July 2006. His M.Sc thesis was on “the contribution of
indigenous tree species for soil fertility”. After his graduation he worked at Ethiopian
Institute of Agricultural Research (EIAR), Mizan-tepi University (Ethiopia) and
Jimma University (Ethiopia).
In 2012, he was awarded an Erasmus mundus Joint Doctorate Programme –
Agricultural Transformation by Innovation (AgTraIn) and started his PhD study at
Wageningen and Copenhagen Universities. He was based at Copenhagen University
in the first three years, and moved to Wageningen in 2015 to finalise his thesis.
142
List of publications
Nigussie, A., Kuyper, TW., Bruun, S., de Neergaard A. (2017). Delayed addition of nitrogen-
rich substrates during composting of municipal waste: Effects on nitrogen loss, greenhouse
gas emissions and compost stability. Chemosphere 166: 352 – 362.
Nigussie, A., Kuyper, TW., Bruun, S., de Neergaard A. (2016). Vermicomposting as a
technology for reducing nitrogen losses and greenhouse gas emissions from small-scale
composting. Journal of Cleaner Production. 139, 429-439.
Zwetsloot, MJ., Lehmann, J., Bauerle, T., Vanek, S., Hestrin, R., Nigussie, A. (2016).
Phosphorus availability from bone char in a P-fixing soil influenced by root-mycorrhizae-
biochar interactions. Plant and Soil, 408:95-105.
Nigussie, A., Kuyper, T.W., de Neergaard, A. (2015). Agricultural waste utilisation strategies
and demand for urban-waste compost: Evidence from smallholder farmers in Ethiopia. Waste
Management. 44, 82 – 93.
Getahun, T., Nigussie, A., Entele, T., Van Gerven, T., Van der Bruggen, B., (2012). Effect of
turning frequencies on composting of biodegradable municipal soil waste quality. Resources,
Conservation and Recycling, 65, 79-84.
Submitted articles
Nigussie, A., Bruun, S., de Neergaard, A., Kuyper, TW. Earthworms change the
quantity and composition of dissolved organic carbon and reduce greenhouse gas
emissions during composting. Submitted to Waste Management
Bryndum, S., Muschler, R., Nigussie, A., Magid, J., de Neergaard, A. Nitrogen-
fertilizing value of compost from sugarcane bagasse and filter cake - Effects of
turning frequency, time of poultry manure addition and placement in soil. Submitted
to Waste Management
143
PE&RC Training and Education Statement
With the training and education activities listed below the PhD candidate has complied with the requirements set by the C.T. de Wit Graduate School for Production Ecology and Resource Conservation (PE&RC) which comprises of a minimum total of 32 ECTS (= 22 weeks of activities) Review of literature (6 ECTS)
- Recycling of urban waste for local vegetable production Writing of project proposal (4.5 ECTS)
- Recycling of urban waste for local vegetable production
Post-graduate courses (18 ECTS) - Plant nutrients cycling in terrestrial ecosystems; Copenhagen University (2013)
- Isotope methods for nutrient carbon dynamics; Copenhagen University (2013) - Joint field course on qualitative analysis; Copenhagen University (2013)
Invited review of (unpublished) journal manuscript (1 ECTS)
- Global Research Journal of Agricultural and Biological Sciences: mushroom consumption habits of Wacha Kebele inhabitants, southwestern Ethiopia (2012)
Competence strengthening / skills courses (9.5 ECTS)
- Academic writing; Copenhagen University (2012) - Presentation techniques; Copenhagen University (2014) - Applied research communication and dissemination for agricultural development; Copenhagen
University (2014) - Project management; Copenhagen University (2015) - Responsible conduct research; Copenhagen University (2016)
PE&RC Annual meetings, seminars and the PE&RC weekend (1.2 ECTS)
- PE&RC Mid-term weekend (2015) - PE&RC Day: one’s waste...another’s treasures? (2015)
Discussion groups / local seminars / other scientific meetings (6.5 ECTS)
- Soil and waste group scientific meetings; Copenhagen University (2012-2015) - Agricultural transformation by innovation scientific meetings (2015-2016)
International symposia, workshops and conferences (6 ECTS)
- Tropentag: bridging the gap between increasing knowledge and decreasing resources; Prague, Czech Republic (2014)
- The 16th RAMIRAN conference: rural - urban symbiosis; Hamburg, Germany (2015) - The 30st international conference on solid waste management; Philadelphia, USA (2015)
Lecturing / supervision of practicals / tutorials (3 ECTS)
- Tropical crop production (2014) - Tropical crop production (2015) - Sustainable land management (2015) - Sustainable agricultural development pathways (2015)
Supervision of a MSc student (3 ECTS)
- Delayed addition N-rich substrate affects GHG emissions during composting; Wageningen University - Waste marketing in Malawi; Copenhagen University
144
Funding
This study was financially supported by the Agricultural Transformation by
Innovation (AgTraIn) Erasmus Mundus Joint Doctorate Programme, funded by the
EACEA (Education, Audio-visual and Culture Executive Agency) of the European
Commission.