operation of a burner rig for thermal gradient cycling of thermal barrier coatings
TRANSCRIPT

1 Copyright © 2014 by ASME
Proceedings of the ASME Turbo Expo 2014
GT2014
June 16-20, Düsseldorf, Germany
GT2014- 26325
OPERATION OF A BURNER RIG FOR THERMAL GRADIENT CYCLING OF THERMAL BARRIER COATINGS
J.P. Feist Sensor Coating Systems London, United Kingdom
P.Y. Sollazzo Sensor Coating Systems London, United Kingdom
C. Pilgrim Sensor Coating Systems London, United Kingdom
J.R. Nicholls Cranfield University
Bedford, United Kingdom
ABSTRACT Thermal barrier coatings (TBC), in combination with
sophisticated cooling systems are crucial for the operation of
highly efficient gas turbines. New generations of coatings will
need to show increased cycling capability as a future energy
mix will contain a high proportion of renewable energy which
will be subject to rapid changes in supply. This will require gas
turbines to be on stand-by to fill shortages in power supply with
short notice. Furthermore, higher operating temperatures are
sought to improve the efficiency of the engine. It is, therefore,
an aim of the industry to find a coating composition or structure
which will enable the operation at temperatures greater than
1250°C and with high cycling capability.
Test methods are required to meet these new operating
conditions to validate new coatings. The maximum temperature
limit of commonly used isothermal or cyclic oxidation tests is
usually the temperature at which the substrate will start to
significantly oxidise. However, there is the technical need to
test the ceramic top layer at elevated surface temperatures up to
1500°C while keeping the substrate ‘cool’. Such capability
would allow the effects of ceramic sintering, and deposit
induced damage to be assessed at the TBC surface. This only
can be performed on a complete coating system, when a
thermal gradient is established throughout the coating.
This paper reviews a burner test facility, designed and built
by Sensor Coating Systems Ltd. (SCS), which combines severe
and frequent cycling with the exposure of the coating to high
surface temperatures and active cooling of the substrate.
Further, this test can include thermal shock by active cooling of
the surface at the end of each cycle. The paper will consider
different operating conditions and will review experiences in
building and operating the rig, including results from thermal
barrier coating tests on electron beam physical vapour
deposition (EBPVD) and atmospheric plasma spray (APS)
samples. Further, the rig is capable of testing optical techniques
such as pyrometry and thermographic phosphor thermometry
for measuring surface temperature in controlled laboratory
conditions and example of this will be presented. The paper
also will reflect on the ISO 13123:201 standard for this type of
test.
INTRODUCTION Efficiency increases in turbine operation have been
achieved mainly through increasing firing temperatures. Apart
from advanced high temperature alloys and sophisticated
cooling methods, thermal barrier coatings (TBCs) have played
a major role in this development. Gas temperatures in today’s
turbines are above the melting point of the metal components –
vanes, blades - in the hot section, the most expensive part of the
turbine. TBCs in combination with internal cooling allow
components to survive higher temperatures while achieving
acceptable life times.
Future changes in the global energy market and in
particular the increasing share of renewable energies in the
energy mix will result in changing operating conditions of gas
turbines when used as back-up power supplies. Electricity
generation from renewable energy sources can change quickly
dependent on, for example weather conditions and hence will
require back-up solutions to avoid power outages. Gas turbines
are best suited to efficiently provide the energy at short notice
and, if necessary, quickly reduce power output when demand is
reduced. This will consequently lead to increased cycling and
hence an appropriate test platform is required.
The coating community has not yet developed a standard
methodology to test all relevant parameters simultaneously. The
main ideas range from isothermal or cyclic oxidation of
samples in a furnace to thermal mechanical fatigue tests.
Further, additional corrosion and erosion tests have been

2 Copyright © 2014 by ASME
developed and were appropriately reported in a comprehensive
overview about test methodologies, with an emphasis on
European activities provided by Vaßen et al [1].
A thermal gradient cycling test combines severe and
frequent cycling with exposure to high temperatures on the
surface of the coating and active cooling of the substrate (at the
back). Further, for a more aggressive test it is possible to
include a thermal shock by active cooling of the surface at the
end of each cycle. Thus, a thermal gradient cycling test should
be representative of current and future operating conditions in
power generation gas turbines, where high cycling frequency at
even higher temperatures will occur due to short-term demand
of energy and higher efficiency needs.
In this paper, the authors briefly review a range of existing
test rigs, review instrumentation related aspects and looking at
a range of applications that may benefit from thermal gradient
testing, where the maximum surface temperature can be as high
as 1500°C, well above the melting point of the substrate alloy,
but representative of service environments. This includes the
testing of APS and EBPVD TBCs and will demonstrate a
method to determine the emissivity of doped TBCs at elevated
temperatures (700°C).
THERMAL BARRIER COATINGS TBCs are multilayered systems which consist of a bond
coat applied to the substrate and a ceramic top coat as the
surface layer. In service, a thermally grown oxide (TGO) forms
between the bond coat and ceramic which acts as an oxidation
barrier. The term TBC usually refers to the ceramic top layer
and this terminology practice will be followed here, although it
should be remembered that it is the alloy/coating system that is
evaluated. For many years yttria partially stabilized zirconia
(YSZ) has been the prime choice for this application due to its
relatively high thermal expansion coefficient, therefore
reducing thermally induced stresses, whilst still having a low
thermal conductivity, that is approximately an order of
magnitude lower than the substrate Ni-base alloy [2]. Between
6 and 8 wt.% yttria is added to partially stabilise the zirconia,
so avoiding the tetragonal to monoclinic phase change, which
can be induced upon cooling from the elevated temperatures in
operation [3]. This phase change causes a 3% volume change,
which in turn leads to stresses and subsequent spallation of the
surface of the coating. Full stabilisation, however, can lead to
the formation of the cubic phase which can compromise cyclic
thermal fatigue life [4].
Two main deposition processes have developed for the
industrial production of TBCs; namely plasma spraying (PS)
and electron beam physical vapour deposition (EB-PVD). The
different processes are known to produce distinctive
microstructures in the coating resulting in different properties.
EB-PVD TBCs exhibit improved strain tolerance, surface finish
and erosion resistance; however, the thermal conductivity is
compromised compared to PS TBCs. As such, the PS technique
is typically used for stationery components or low velocity
components, while EB-PVD is used for rotating parts such as
turbine blades, which rotate at high velocity in the jet engine.
TBCs are complex systems in which the many modes of
failure are related to the operating conditions and the coating
microstructure. In a clean combustion environment the primary
reported failure mechanism of TBCs is caused by the growth of
the TGO layer to an extent which results in a large mismatch
between thermal expansion coefficients and hence large
induced stresses under thermal cycling [5]. The stresses initiate
cracks which cause spallation of the TBC either at the interface
between the TGO and TBC or TGO and bond coat, therefore
complete removal of the protective coating occurs. In higher
temperature regimes, typical surface temperatures >1150°C,
sintering of the TBC can occur causing an increase in thermal
conductivity and stiffness therefore resulting in premature
failure. Whereas at even higher temperatures, >1250°C, molten
glossy deposits may form calcium-magnesium-alumino-silicate
(CMAS) attack that infiltrate the TBC ceramic causing
premature failure [5].
Doping of YSZ with lanthanides such as dysprosium and
europium can give the coating sensing properties such as
temperature [6], but also thickness [7], erosion [8] or corrosion
[9]. When illuminated with short light pulses the coating starts
to phosphoresce and this phosphorescence can be correlated to
temperature.
REVIEW OF BURNER RIGS AND INTERNATIONAL TEST STANDARDS
Although there is a recognised need for thermal gradient
and burner rig testing, there are still a limited number of test
rigs with a wide variation between them and the routines
employed. In an attempt to standardise procedures, an
international standard (ISO 13123:2011) has been generated
[10]. The standard describes the test equipment, method and
reporting which should be used. Despite this standard, there
still remains no common test configuration.
Hollow cylindrical test specimens have been used with
internal cooling to force the thermal gradient through the
coating and enable investigations on the effect of curvature on
the life of the TBC, for example a rig developed at NASA [11]
and Turbomeca [12]. More recently, however, the typical test
specimens are 30mm diameter discs to test flat coated surfaces.
It is critical to accurately measure the temperature of the
sample during such testing. Different methods are employed to
do this. The temperature of the substrate can be monitored
using a thermocouple attached to the back surface [13] or a
pyrometer [14]; but the standard approach is to embed a
thermocouple into the substrate [10, 15, 16]. The surface
temperature is predominantly measured using a pyrometer.
However, the transparency of the YSZ in the infra-red range is
recognised to be a potential source for error for this approach.
This may be overcome by correction of the emissivity [14], the
use of two colour pyrometers [13] or long-wavelength
pyrometers [15]. At wavelengths above approximately 9µm
YSZ can be considered opaque, therefore using pyrometers
with sensitivity in this range ensures the technique measure the
surface temperature of the coating..
The temperature conditions, during the tests, are not

3 Copyright © 2014 by ASME
standardised, nor are the duration of the cycles. Usually tests
are conducted for a fixed period or until failure which,
according to the ISO standard (ISO 13123:2011) is when 20%
of the coated area has spalled judging by visual inspection. The
duration and nature of the cycles can vary significantly between
reported tests. Heating and cooling times of between 75
seconds [14] and 10 minutes [13] have been used. Furthermore,
heating times of up to 60 minutes have been employed with
structured thermal profiles to replicate particular phases within
an operating engine [12]. A heating and cooling time of five
and two minutes respectively has been used previously [15]
and this allows a high frequency of cycles, while achieving
steady state temperature conditions during the heating phase.
Innovative test rig The rig described in this paper is compliant with the
international standard (ISO 13123:2011) so that comparative
testing could be conducted. The laboratory rig configuration
simulates a realistic environment in regards to temperature
gradients, substrate material and coating system. Further, the
accelerated cycling capability allows the simulation of fast
start-and-stop scenarios, but also varying cooling and heating
intervals. This allows customisation to specific engine
operation regimes. Consequently, the authors believe that this
‘high-fidelity’ test is best suited for coating evaluation
achieving technology readiness levels of 5 to 6 [17].
INSTRUMENTATION The thermal gradient test rig can operate with up to 4
burners simultaneously. The test rig is controlled by a computer
and a National Instrument acquisition card. The temperature of
the sample surface is measured by a long wavelength pyrometer
while the sample substrate temperature is measured by a K-type
thermocouple. The gas flow for one burner of the thermal
gradient test rig is illustrated in Fig. 1. The front cooling nozzle
and the burner are mounted on a pneumatic rail. A sample is
tested by alternating heating and cooling. Typically, at Sensor
Coating Systems Ltd. (SCS), the heating phase lasts for five
minutes while the cooling phase lasts for two minutes. This 2-
minute cooling time allows the sample to cool down to almost
room temperature. This type of cycle was adopted from Träger
et al. [15]. However, both heating and cooling duration can be
customised to match envisaged engine operating conditions.
The change between heating and cooling phase is
performed using the pneumatic rail which removes the burner
and positions the cooling nozzle instead. During the heating
phase oxygen and methane gases are flowing to the burner to
generate temperatures up to 1500°C on the surface of the
sample, while the cooling nozzle at the back of the sample
maintains lower substrate temperatures. Micrometric taps are
used to set accurately the flows of the different gases. The
pressure regulators generate independent settings of every
burner by depressurizing the gases to below 10bars. The mass
flow readers (MFR) keep track of the test rig settings. When the
rig is in cooling phase the oxygen supply is stopped by the
oxygen valve, while the methane supply is bypassed through a
common methane micrometric tap to generate a pilot flame.
The sample is maintained in position on the test rig with a
holder designed to retain the sample thanks to a groove inserted
in the sample slot, which is visible in Fig. 4.
Figure 1: Sketch of the burner test rig for 1 sample. The test rig
has 4 burners.
The computer, connected to the acquisition card, runs a
LabVIEW program which controls the operation of the valves
and the rail, monitors and records the temperatures of the long
wavelength pyrometers and the K-type thermocouples. The
LabVIEW program automatically switches off the test rig in
case the monitored temperatures are outside a predefined safety
range. Additionally, a watchdog system automatically switches
off the test rig power supply in case the computer controlling
the rig becomes unresponsive. When the watchdog system
shuts down the power the flames are automatically
extinguished because all the valves are normally closed. With
these safety measures in place the rig can be operated 24/7 for
several hundred hours.
Pyrometry The pyrometer installed on the test rig, monitors the
surface temperature of the coatings. It is a Heitronics infrared
radiation pyrometer which observes radiation in the range of
9.6 to 11.5 μm with an integration time of 30ms. Its emissivity
can be set up with a precision of 0.01. In this wavelength range
the TBC is considered to be opaque [15]. Each pyrometer is
installed 40cm away from the sample surface. The pyrometer is
positioned accurately using a laser pointer and this assures
measurements being taken from the centre of the sample on a
circular area of 5mm in diameter.
Emissivity estimation The setup used to estimate the emissivity of the TBCs is
shown in Fig. 2. The sample was placed on a heating plate with
the TBC facing up. The plate was then heated to approximately
300°C and the substrate and TBC surface temperature was
monitored using a pyrometer and a K-type thermocouple
PC DAQ
Air CH4O2
Thermocouple
Pyrometer
CoolingNozzle
CoolingNozzle
Sample
Valve
Regulator
MFR
Micrometrictap
BurnerSlide
Pilot flameby-pass line

4 Copyright © 2014 by ASME
respectively. The sample was considered to be isothermal, as
such the temperature measured by the pyrometer and
thermocouple should be equal. The emissivity setting on the
pyrometer was adjusted until the pyrometer temperature
matched that of the thermocouple. The corresponding
emissivity setting was considered to be the emissivity of the
TBC, typical values for TBCs are 0.9 or above in the sensitivity
range of the pyrometer used [18].
Figure 2: The sample is positioned on a 300°C heating plate. The
temperature of the surface and the substrate are measured
simultaneously by a pyrometer and thermocouple respectively.
The computer is equipped with NI acquisition card.
The temperatures measured by the pyrometer and the
thermocouple are presented in Fig. 3. The temperature
sinusoidal oscillations are induced by the heating plate
temperature controller. There is no phase shift between the
temperatures measured by the pyrometer and the thermocouple
confirming that the sample is in thermal equilibrium. First the
pyrometer emissivity set to 1. In order to estimate the
emissivity of the sample at around 300°C the temperature
reading difference between the pyrometer and the thermocouple
must be approximately zero. The temperature measured by the
pyrometer follows the Stefan-Boltzmann law, see Eq. (1), and
hence is related to its emissivity settings. In Eq. (1), j* is the
thermal radiation, or irradiance, emitted by the sample, ε is the
emissivity setting of the pyrometer, σ is the Stefan-Boltzmann
constant and T is the temperature measured by the pyrometer.
(1)
The emissivity setting of the pyrometer is changed such that if
the difference between the pyrometer temperature and the
thermocouple temperature is positive the pyrometer emissivity
is decreased. If the difference is negative the emissivity setting
is increased. When the difference is zero the emissivity setting
of the pyrometer is considered to be the emissivity of the
sample. In Fig. 3 between 0 and 7 minutes the emissivity of the
pyrometer is at 1 and the temperature error is equal to about
15°C. The emissivity setting is changed until the sample
emissivity is estimated to be 0.93 and the difference between
the temperature measured by the thermocouple and the
pyrometer is approximately zero.
Figure 3: Recorded data for the thermocouple and the pyrometer
(left y-axis) while estimating the emissivity of the sample. The
difference between the thermocouple and the pyrometer measured
temperature is plotted as the bottom trace and corresponds to the
right y-axis.
Thermocouples and sample geometry The thermocouple installed on the test rig which measures
the substrate temperature is a 1mm diameter K-type
thermocouple. The international thermal gradient test rig
standard recommends a thermocouple size of around 1mm [10].
The voltage generated by the chromel-alumel couple is
measured and compensated with a cold junction temperature by
the NI acquisition card. The thermocouple is not grounded nor
coated.
Figure 4: Drawing of a sample substrate. The bondcoat and the
ceramic are deposited on the top of the substrate. The 1.2mm hole
in the middle is used to insert a 1mm thick thermocouple which
monitors the substrate temperature. Drawing adapted from [15].
The sample geometry and, the hole size and length for the
thermocouple from Fig. 4 is adopted from a previous paper by
Träger et al. [15]. The rounded edges of the substrate shall
reduce premature edge failure of the ceramic coating according
to the same paper.
Temperature measurement variations At the end of a test, the recorded data are processed to
compute the number of cycles the sample experienced and the
average surface and substrate temperature which were applied
during the hot phases.
Sample
Heating plate
Computer
Thermocouple(K-type)

5 Copyright © 2014 by ASME
Figure 5: The cycle experienced by the samples on the test rig is
divided in two phases, the hot phase which lasts 5 minutes and the
cold phase which lasts 2 minutes. The average temperatures
experienced by the sample are calculated by averaging the
measured data which are above 97% of the targeted temperatures.
The number of cycles is calculated by counting the number
of times the data crossed above the half of the test target surface
temperature. The average temperatures are calculated by
averaging the data which are above 97% of the target
temperature. For instance if the substrate target temperature is
900°C, the average temperature of the substrate for the hot
phase is the average of all the thermocouple data which are
above 873°C (900 x 0.97). Fig. 5 shows the data recorded
during 15 minutes. The targeted temperatures (1400°C and
900°C) and the 97% of the targeted temperatures are plotted in
vertical dash lines. From this figure it can be observed that 97%
is a correct approximation to compute the average temperature
because the temperatures of the substrate and the surface are
either already or almost stabilised at the target temperature. The
international standard [10] defines the hot cycle temperature as
±5% of the targeted temperature. For a targeted set-point of
1400°C this equates to keep the temperature between 1330°C
and 1470°C. Typically SCS always keeps the temperatures
within ±1.5% of the targeted temperature, except during the
setup phase where the range is increased to ±5%.
The voltage generated by the chromel-alumel couple of the
K-type thermocouple is digitalised by an 8 bit digital to
analogue converter (DAC). The DAC (NI 4350) is set to
measure temperature between 0 and 1300°C and hence data can
only be acquired every 5°C (1300 / 28). By plotting the
histogram with a bin size of 1°C of the temperature measured
by the thermocouple over a test of 1027 cycles (~120 hours),
peaks will appear every 5°C as shown in Fig. 6. The
intermediate values are coming from the averaging of the
discrete values, because the temperatures are measured as an
averaged temperature over 1 second.
In Fig. 6 the number of occurrences is equivalent to the
number of seconds the sample stayed at the particular
temperature because each measurement is recorded every one
second.
A faster acquisition rate is possible by using a higher speed
Figure 6: A typical histogram of thermocouple temperatures
measured over a test of 1027 cycles (~120 hours). The peaks
represent the digitalisation limit of the 8 bit ADC card (NI 4350).
acquisition card (ADC). However, a compromise must be
reached between accurately following temperature transients
and the size of the recorded temperature data. A sampling rate
of 1Hz was observed to be sufficient to accurately record the
temperature transients during heating and cooling while also
providing manageable dataset sizes.
In Fig. 6 the number of occurrences above 97% of the
target temperature is 185378, which equate to 437 cycles (~51
hours). This means that during a test of 1027 cycles (~120
hours) the sample is exposed for about 42.5% of the time above
97% of the targeted temperature. Assuming that the cooling
time is kept constant at 2 minutes the 42.5% could be increased
to 75% or 90% by increasing the time of the hot phase to 14
and 38 minutes respectively.
The flexibility in the operating cycles is a unique feature of
this type of test rig design which is not always the case for
other gradient cycling rigs [1].
Camera operation The test rig is equipped with web-cameras which take
pictures of each sample surface before and after each heating
phase. From these pictures the ceramic delamination process
can be observed, enabling the operator to determine the exact
number of cycles before TBC failure. Additionally, by collating
these pictures, accelerated movies can be produced to
understand formation of damages or delamination. An example
of a time lapse movie is available at the following reference
[19]. The international thermal gradient test rig standard [10]
recommends the installation of cameras for visual inspection of
the surface damages.
APPLICATIONS AND OPERATION REGIMES The testing conducted on the thermal gradient test rig can
be adapted to study different failure mechanisms of coating
systems. A range of different coating systems have been tested
and this section provides illustrative examples showing the
possible conditions and experience acquired.
0
200
400
600
800
1000
1200
1400
1600
17:42 17:49 17:57
Tem
pe
ratu
re [
°C]
Time [minutes]
Thermocouple Pyrometer
97 % TTarget Surface
Cold phase
Hot phase
TTarget Surface
TTarget Substrate
97% TTarget Substrate
0 7 14
0
1000
2000
3000
4000
5000
6000
7000
8000
9000
10000
800 850 900 950
# O
ccu
ren
ce
Temperature [°C] - Bin size 1°C
97% TTarget
TTarget
TAverage

6 Copyright © 2014 by ASME
APS coatings A sensible testing strategy is to define a standard type of
coating before testing a novel TBC system. This enables the
investigator to make direct and relative comparisons between
their new coating and the standard. In this way accidental small
changes in the operational setup can be eliminated between
different test campaigns. Further slight variations in test
conditions could occur from slot to slot and it is advised to take
this into consideration when setting-up a test programme.
YSZ (700µm)
YSZ composite
(100µm)
YSZ (600µm)
Bondcoat (150µm) Bondcoat (150µm)
Substrate
Substrate
Sample 1 Sample 2 Figure 7: Illustration of tested sample structure. Layer structure
of sample 1 and 2. Bondcoat and TBC are deposited with APS.
This section describes the behaviour of two samples with
different TBC structures tested under the same conditions for
857 cycles (~100 hours) on the same slot. The test objective
was to generate monoclinic phases in a production line coating
and compare this with a new YSZ composite (see Fig. 7). This
required a high surface temperature in combination with
frequent cycling to room temperature. Hence each sample has
its surface temperature exposed to 1400°C (surface target
temperature).
Figure 8: On rig pictures of the samples after 857 cycles (~100
hours) of testing. Sample 1 (right) and sample 2 (left) show signs of
slight edge failure at the top right corner. The thermocouple hole
is positioned at the bottom of the sample.
However, to avoid early coating failure by growth of the
TGO it was decided to keep the substrate temperature at 900°C,
at which temperature the TGO growth has reportedly negligible
effect on the coating life [20] (substrate target temperature).
The thickness of the bondcoat, Amdry 995, on the samples
is 150µm and the thickness of the ceramic layer, deposited with
the APS process, is 700µm. The composition of the TBC layer
of sample 1 is YSZ while the composition of the TBC of
sample 2 is divided into two different materials, a 600µm layer
of YSZ and a 100µm layer of a YSZ composite as shown in
Fig. 7. The thickness of 700µm was chosen to enable the
operator to achieve both target temperatures – surface and
substrate – without using extensive cooling rates and keeping
heating rates to a minimum, hence keeping fuel consumption to
a minimum. A typical gradient across the ceramic is 1K/µm or
lower.
Sample
# of
cycles
performed
Average
surface
temperature
(°C)
Average
substrate
temperature
(°C)
Calculated
temperature
at bond coat
(°C)
1 857 1398 896 930
2 857 1392 896 929
Table 1: Summary of the test conditions for sample 1 and 2.
Whereas the substrate temperatures are similar the surface
temperatures show a difference of 0.4% compared to the targeted
temperature (1400°C)
Table 1 summarises the test conditions of both samples
during the 857-cycle test (~100 hours). The substrate
temperatures are similar but the surface temperatures have a
difference of 6°C which is 0.4% compared to the 1400°C
targeted temperature. The hot phase lasted for 5 minutes and the
cold phase for 2 minutes. In Table 1 the bond coat temperature
is calculated using Eq. (2) where Tp is the pyrometer
temperature (surface) and TTC is the thermocouple temperature
(substrate). ts is the distance between the thermocouple and
substrate surface. k and t are thermal conductivity and thickness
respectively. The subscript letter c refers to the coating while s
refers to the substrate. The values chosen for thermal
conductivity are 30, 0.8 and 1.65 W/mK for the substrate, APS
TBC and EBPVD TBC respectively.
(2)
Fig. 8 shows the pictures of sample 1 and 2 after 857
cycles (~100 hours) of testing on the thermal gradient test rig.
These pictures show edge failure of the coating for both
samples at the top right corner. However, edge failures are
usually less relevant as these are failures introduced by the
specific geometry of the sample. Initial edge failures can grow
into the centre during cycling and this needs to be evaluated
more thoroughly using other characterisation techniques such
as micrographs to analyse microstructures. In this case the
conclusion was that both samples have shown equal durability
for the same number of cycles. The international test standard
ISO 13123:2011 [11] considers a TBC failed when 20% of the
coating is lost.
In the previous test the samples did not show any sign of
major damage after 857 cycles (~100 hours) of testing.
However, using more severe conditions, 1450°C surface and
1050°C substrate temperatures, on a thinner 400µm single layer
YSZ TBCs (APS deposited) damages appear earlier after 64
cycles (~7.5 hours) and progress though the test. The cycle
duration is the same as before. The test lasted for 221 cycles
(~26 hours) and was stopped because 20% of the coating
delaminated.
7 Copyright © 2014 by ASME
Cycle 0 Cycle 64 Cycle 221
Figure 9: On rig pictures. The left picture shows the circular
sample in the cylindrical holder before testing. After 64 cycles
(~7.5 hours) some damage is observed on the sample (middle). At
the end of test, 256 cycles (~30 hours), the damage on the sample
exceeds 20% of the coated area (right).
Fig. 9 shows the sample at three different stages of the test.
The picture on the left of Fig. 9 shows the undamaged sample
at the start of the test. The picture in the centre shows the
sample at cycle 64 when the first TBC losses are seen at the
bottom right. Finally, the picture on the right shows the sample
at the end of the test (cycle 221) when 20% of the coating is
lost.
Cycle 220 Cycle 221
Figure 10: On rig pictures. Damage does not necessarily appear
gradually. From cycle 220 (left) to 221 (right), approximately 15%
of the coated area delaminated.
Depending on the nature of the coating, TBC loss can be
gradual or rapid. Fig. 10 demonstrates the rapid loss of a TBC -
up to 15% of the surface - in only one cycle. These types of
failures can occur when damages are accumulated from the
previous cycles underneath the TBC (eg crack growth). But one
additional cycle is sufficient to trigger the complete
delamination of the damaged part of the coating. This
demonstrates that visual inspection of TBCs in engine
maintenance alone might be insufficient to estimate TBC’s
conditions.
Another test strategy was applied investigating the
extended failure behaviour beyond the 20% coating loss
criterion. Tests were carried out on 300µm APS deposited TBC
samples tested between 1300°C and 1400°C surface
temperature and 950°C and 1050°C substrate temperature. The
aim was to continue testing beyond accumulated loss of 50%.
This was achieved after 286 cycles (~33 hours). Table 2
summarises the results in percentage of coating loss versus the
number of cycles experienced by the sample. Table 2 shows
that the coating lost 10% of its original size at about every 80
cycles. However the last 10%, from 40% to 50%, were lost in
half of the time (~40 cycles) which suggests that the remaining
Coating loss
in %
Cycles
#
Picture Fig 11
As-sprayed 0 A
20 81 B
30 161 C
40 239 N/A
50 286 D
Table 2: Summary of TBC losses in percentage versus the number
of cycles undergone. Pictures of samples in Figure 11.
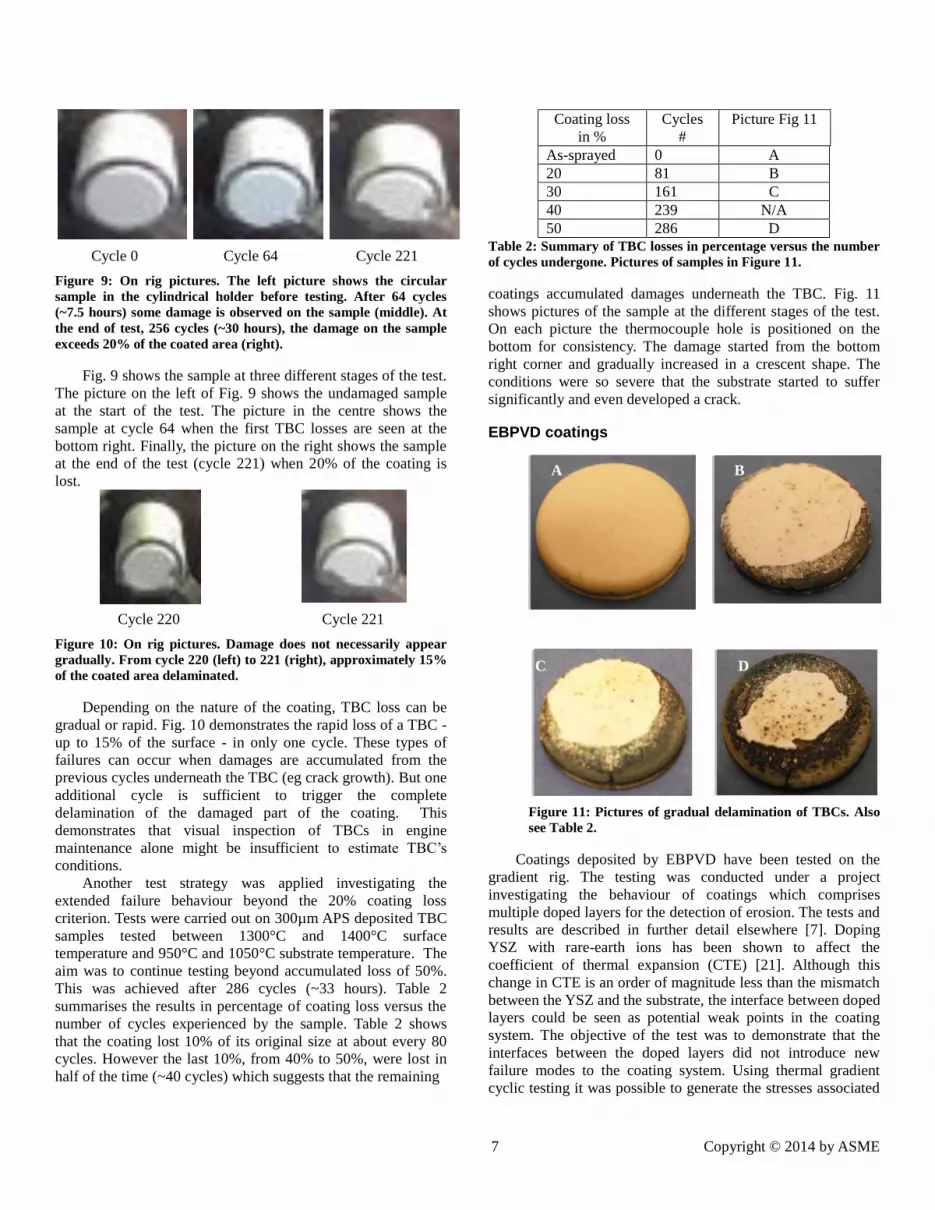
coatings accumulated damages underneath the TBC. Fig. 11
shows pictures of the sample at the different stages of the test.
On each picture the thermocouple hole is positioned on the
bottom for consistency. The damage started from the bottom
right corner and gradually increased in a crescent shape. The
conditions were so severe that the substrate started to suffer
significantly and even developed a crack.
EBPVD coatings
Coatings deposited by EBPVD have been tested on the
gradient rig. The testing was conducted under a project
investigating the behaviour of coatings which comprises
multiple doped layers for the detection of erosion. The tests and
results are described in further detail elsewhere [7]. Doping
YSZ with rare-earth ions has been shown to affect the
coefficient of thermal expansion (CTE) [21]. Although this
change in CTE is an order of magnitude less than the mismatch
between the YSZ and the substrate, the interface between doped
layers could be seen as potential weak points in the coating
system. The objective of the test was to demonstrate that the
interfaces between the doped layers did not introduce new
failure modes to the coating system. Using thermal gradient
cyclic testing it was possible to generate the stresses associated
Figure 11: Pictures of gradual delamination of TBCs. Also
see Table 2.
A B
C D

8 Copyright © 2014 by ASME
with thermal expansion mismatch.
Coating samples were produced at Cranfield University
using a jumping beam EBPVD coater. The samples comprised
Inconel 718 substrates with a platinum enriched nickel
aluminide bond coat and a 150µm thick ceramic overcoat. Two
types of multi-layered sensor coatings, labelled A and B, were
produced along with reference samples comprising only a
single YSZ layer. The tests included two samples of Coating A
and the reference YSZ coating and one sample of Coating B.
The test conditions and results of all the tested samples are
provided in Table 3. The target temperature settings were
1225°C and 1110°C at the surface and substrate respectively,
except for sample A2 where the target settings were 1095°C
and 1250°C for the surface and substrate respectively.
The test conditions were set to achieve a bond coat
temperature at the limit of its operation and a high thermal
gradient through the coating. This was to accelerate the TGO
growth failure to investigate whether failure due to a CTE
mismatch between the doped layers occurred before the
primary failure mode, therefore determining whether the CTE
mismatch was life limiting.
Table 3 shows that, in all samples, the average calculated
bond coat temperature was close to 1150°C. At this
temperature, diffusion of the bond coat becomes significant,
rapidly degrading the performance of the bond coat [22].
Accordingly, these accelerated tests were conducted until
failure of the coating, which was considered to be when 20% of
the ceramic had spalled.
The number of cycles to failure in the different samples
was within the scatter of this type of testing, except for the
sample A2, which was tested under more rigorous conditions. A
photograph of each of the coatings after testing is shown in Fig.
12. In all samples, the failure occurred by delamination which
initiated at the edges of the samples and grew towards the
centre of the sample. This failure is typical of burner rig testing
and is indicative of oxidation induced degradation. The failure
observed in Fig. 12(e) is more extensive than in other samples
because the photograph was taken 20 cycles after failure. The
failure was determined from a significant change in the
recorded temperature traces.
The samples shown in Fig. 12 all have the same
orientation. This is to show that the edge failure does not occur
at the same location on the sample and is not correlated to any
non-uniformity in the rig operation.
The main conclusion of the testing was that the
introduction of doped layers did not destabilise the coating by
inducing ‘white’ failure, i.e. failure within the ceramic overcoat.
Any variation in the CTE between the layers in the ceramic
overcoat was not sufficient to initiate failure before the failure
at the bond coat interface.
Studies on Sensor Thermal Barrier Coatings Sensor TBCs are TBC doped with rare earths elements
such as YSZ:Dy. Their phosphorescence decay time is related
to the temperature at which they are being exposed to and the
technique is also called phosphor thermometry.
Figure 12. Photographs of Sample YSZ (a), YSZ 2 (b), A (c), A 2
(d) and B (e) after thermal cycling testing showing the
delamination of the coating starting from the edge of the sample.
The temperature of the sensor TBC can be measured as long as
optical access is provided. These type of coatings were used to
detect temperatures on nozzle guide vanes, in the combustion
chamber, and rotating turbine blades on an operating Rolls-
Royce engine [23-25].
Table 3. A summary of the thermal gradient cycling test results of
the EBPVD samples
Emissivity is an important input parameter for pyrometer
measurements in an engine and can be affected by several
unknown parameters such as stain on the coating, pollution on
optics, changes in the surfaces morphology or chemistry etc.
This means that pyrometry or infrared detectors can show high
errors in accuracy of absolute temperature readings this is
explained in detail elsewhere [26]. Hence a better
understanding of the real value of the emissivity will result in a
significant improvement of engine pyrometer readings [27].
Emissivity measurements at elevated temperatures are
challenging as the surface of interest needs to be at the specific
temperature while the surroundings need to be at much lower
temperatures when the pyrometer observes the surface. This
usually cannot be achieved in a standard furnace (with optical
access holes) as the black body radiation from the inside of the
furnace would be detected by the pyrometer as a reflection on
the sample surface hence changing the recorded intensity and
the determined emissivity would be close to the one of a black
body.
Surroundings are at ambient temperature, the observed
surface is at high temperature and the pyrometer is insensitive
to the flame heating up the surface.
The set-up is shown in Fig. 13. This time, additional to the
Sample
Cycles
to
failure
Average
surface
temperature
(°C)
Average
substrate
temperature
(°C)
Calculated
temperature
at bond
coat (°C)
YSZ 166 1108 1219 1147.5
YSZ 2 162 1117 1207 1148.5
A 102 1103 1221 1145.5
A 2 135 1095 1239 1146.0
B 167 1105 1216 1148.0

9 Copyright © 2014 by ASME
Figure 13: Sketch of the setup used to estimate the sample
emissivity of the sample. A gradient of 20°C is applied to the
sample. The emissivity is estimated by matching the temperature
measured by the phosphor thermometry probe (OPETS) and the
pyrometer at different emissivity settings.
pyrometer, a phosphor thermometry system monitors the
surface temperature of the sample [28]. The phosphor
thermometry system uses a 355nm laser beam to excite the
phosphorescent material which is embedded inside the TBC.
The Nd:YAG laser (Quantel Brilliant B) generates 200mJ
pulses, which are 6ns long, at a frequency of 10Hz. The laser
beam is reflected with a high laser power mirror to the front of
the OPETS where a dichroic mirror is positioned. The laser
beam excites the location where the pyrometer measures the
sample surface temperature. A fibre bundle routes the
phosphorescence signal collected by the OPETS to a
photomultiplier tube (PMT: Hamamatsu). The thermocouple,
the PMT, and the pyrometer are connected to the computer for
data reading and recording.
The YSZ:Dy coating was heated up to >700°C with a small
temperature gradient (~20°C) across the sample using the
cooling air. The coating surface temperature was measured with
the pyrometer with an emissivity setting of 1 and the substrate
temperature is monitored with a K-type thermocouple. The
temperature graphs are shown in Fig. 14.
In contrast to the previous study when using the heating
plate (Fig. 3), the thermocouple temperature could not be
utilised as it did not reflect the coating temperature due to the
gradient. However, when assuming that the pyrometer and the
sensor coating system both measured the coating temperature
the emissivity can be determined.
Fig. 14 shows the data recorded over a time span of 6
minutes when the rig was operated in steady state conditions.
At first, the pyrometer emissivity setting was set to 1 and Fig.
14 shows a temperature difference between 10°C and 15°C
between the temperatures measured with the pyrometer and the
one measured through phosphorescence. Assuming that both
show temperatures measured at the same location, the
pyrometer’s emissivity setting was reduced from 1 to 0.97 so
that both temperatures matched and showed about 710°C.
This result does not match the expected emissivity of 0.90
to 0.93 and the authors conclude that the assumption that
pyrometer temperature and phosphorescence temperature match
did not hold in a thermal gradient. The phosphorescence signal
detected the temperature further inside the coating and not at its
surface. When assuming an emissivity value of 0.93 the
pyrometer would return a higher temperature value, placing the
phosphorescence temperature inside the thermal barrier coating.
A detailed description of this process can be found in [28].
Figure 14: Recorded data of the pyrometer, thermocouple and
phosphor thermometry probe when estimating the sample
emissivity at 700°C. The bottom trace is the measured
temperature difference between the pyrometer and the phosphor
thermometry probe.
SUMMARY & CONCLUSION This paper reviews some of the operational aspects of a
thermal gradient cycling burner test rig at SCS Ltd. The design
allows simultaneous sample testing under customised operating
conditions.
Temperature ranges are achieved which are in line with
current and future temperature requirements in operating power
generation and aero engine applications. Cycle frequency can
be varied and the durations for hot and cold cycles can be
independently varied, too. This allows maximum flexibility to
tailor tests to customer specific operating conditions.
The paper provides some examples of previous tests on
both APS and EBPVD coatings. Further the issue of changing
surface emissivity is being addressed which could affect
accurate pyrometer measurements. Two methods are introduced
using a hot plate and the gradient rig to demonstrate the
possibility of determining the emissivity of the coating. The
latter utilises a phosphorescence sensor TBC.
This type of test equipment is clearly suitable for
advanced coating testing for technology readiness levels 5 and
6 and simulates future and current operating regimes.
Note: a video demonstration is provided under [29].
ACKNOWLEDGMENTS The authors would like to thank Sensor Coatings Systems Ltd
for the permission to publish. Some aspects of this research
Thermocouple
CoolingNozzle
SampleNd
:YA
G L
aser
PMT
Computer + DAQ
Laser beam
Mirror
Fibre bundle
Burner
-20
0
20
40
60
80
100
650
660
670
680
690
700
710
720
730
00:00 02:00 04:00 06:00
Tem
ep
artu
re d
iffe
ren
ce [
°C]
Tem
pe
ratu
re [
°C]
Time [minutes]
Thermocouple
Difference
Phopshoresence
Target setting
= 1 = 0.97
0 2 4 6
Pyrometer
0 2 4 6

10 Copyright © 2014 by ASME
were supported by the Office of Naval Research and the
Technology Strategy Board.
REFERENCES [1] Vassen, R., Cernuschi, F., Rizzi, G., Scrivani, A.,
Markocsan, N., Östergren, L., Kloosterman, A., Mevrel, R.,
Feist, J., and Nicholls, J., 2008, "Recent activities in the field of
thermal barrier coatings including burner rig testing in the
European Union," Advanced Engineering Materials, 10(10), pp.
907-921.
[2] Cantor, B., Grant, P., and Assender, H., 2001, "Aerospace
materials," Institute of Physics Publishing, pp. 294-310.
[3] Ilavsky, J., Wallace, J., and Stalick, J. K., 2001, "Thermal
spray yttria-stabilized zirconia phase changes during
annealing," Journal of thermal spray technology, 10(3), pp.
497-501.
[4] Guo, S., and Kagawa, Y., 2007, "Isothermal and cycle
properties of EB-PVD yttria-partially-stabilized zirconia
thermal barrier coatings at 1150 and 1300 C," Ceramics
international, 33(3), pp. 373-378.
[5] Strangman, T., Raybould, D., Jameel, A., and Baker, W.,
2007, "Damage mechanisms, life prediction, and development
of EB-PVD thermal barrier coatings for turbine airfoils,"
Surface and Coatings Technology, 202(4-7), pp. 658-664.
[6] Choy, K. L., Heyes, A., and Feist, J., 2000, "Thermal
Barrier Coating with Thermoluminescent Indicator Material
Embedded Therein," WO Patent WO/2000/006,796.
[7] Pilgrim, C., Berthier, S., Feist, J., Wellman, R., and Heyes,
A., 2012, "Photoluminescence for quantitative non-destructive
evaluation of thermal barrier coating erosion," Surface and
Coatings Technology.
[8] Pilgrim, C., Berthier, S., Feist, J., and Heyes, A., 2013,
"High resolution erosion detection in thermal barrier coatings
using photoluminescent layers," Surface and Coatings
Technology.
[9] Feist, J., and Heyes, A. L., 2010, "Coatings and a method of
optically detecting corrosion in coatings," Google Patents.
[10] Institution, B. S., 2011, "Metallic and other inorganic
coatings — Test method of cyclic heating for thermal barrier
coatings under temperature gradient (ISO 13123:2011)."
[11] Miller, R. A., 1997, "Thermal barrier coatings for aircraft
engines: history and directions," Journal of thermal spray
technology, 6(1), pp. 35-42.
[12] Raffaitin, A., Crabos, F., Andrieu, E., and Monceau, D.,
2006, "Advanced burner-rig test for oxidation–corrosion
resistance evaluation of MCrAlY/superalloys systems," Surface
and Coatings Technology, 201(7), pp. 3829-3835.
[13] Xie, X., Guo, H., Gong, S., and Xu, H., 2011, "Thermal
cycling behavior and failure mechanism of LaTi2Al9O19/YSZ
thermal barrier coatings exposed to gas flame," Surface and
Coatings Technology, 205(17–18), pp. 4291-4298.
[14] Eriksson, R., Brodin, H., Johansson, S., Östergren, L., and
Li, X.-H., 2011, "Influence of isothermal and cyclic heat
treatments on the adhesion of plasma sprayed thermal barrier
coatings," Surface and Coatings Technology, 205(23–24), pp.
5422-5429.
[15] Traeger, F., Vaßen, R., Rauwald, K. H., and Stöver, D.,
2003, "Thermal Cycling Setup for Testing Thermal Barrier
Coatings," Advanced Engineering Materials, 5(6), pp. 429-432.
[16] Matsumoto, M., Takayama, H., Yokoe, D., Mukai, K.,
Matsubara, H., Kagiya, Y., and Sugita, Y., 2006, "Thermal cycle
behavior of plasma sprayed La2O3, Y2O3 stabilized ZrO2
coatings," Scripta Materialia, 54(12), pp. 2035-2039.
[17] Banke, J., 2010, "Technology Readiness Levels
Demystified," NASA, NASA.
[18] González-Fernández, L., del Campo, L., Pérez-Sáez, R. B.,
and Tello, M. J., 2012, "Normal spectral emittance of Inconel
718 aeronautical alloy coated with yttria stabilized zirconia
films," Journal of Alloys and Compounds, 513(0), pp. 101-106.
[19] Systems, S. C., 2013,
"http://www.youtube.com/watch?v=YfDauvuhcwA."
[20] Beck, T., Herzog, R., Trunova, O., Offermann, M.,
Steinbrech, R. W., and Singheiser, L., 2008, "Damage
mechanisms and lifetime behavior of plasma-sprayed thermal
barrier coating systems for gas turbines — Part II: Modeling,"
Surface and Coatings Technology, 202(24), pp. 5901-5908.
[21] Liu, Y., Gao, Y., Tao, S., Zhou, X., and Luo, H., 2009,
"La2O3-modified YSZ coatings: High-temperature stability and
improved thermal barrier properties," Surface and Coatings
Technology, 203(8), pp. 1014-1019.
[22] Basuki, E., Crosky, A., and Gleeson, B., 1997,
"Interdiffusion behaviour in aluminide-coated René 80H at
1150°C," Materials Science and Engineering: A, 224(1–2), pp.
27-32.
[23] Feist, J. P., Sollazzo, P. Y., Berthier, S., Charnley, B., and
Wells, J., "Application of an industrial sensor coating system on
a Rolls-Royce jet engine for temperature detection," Proc.
Proceedings of the 6th Conference of the Institute of Diesel and
Gas Turbine Engineers IDGTE, IDGTE, pp. 1-19.
[24] Feist, J. P., Sollazzo, P. Y., Berthier, S., Charnley, B., and
Wells, J., "Precision Temperature detection using a
phosphorescence sensor coating system on a Rolls-Royce Viper
engine, Paper No. GT2012-69779," Proc. Proceedings of the
ASME Turbo Expo.
[25] Feist, J., Sollazzo, P., Berthier, S., Charnley, B., and Wells,
J., 2013, "Application of an Industrial Sensor Coating System
on a Rolls-Royce Jet Engine for Temperature Detection,"
Journal of Engineering for Gas Turbines and Power, 135(1), p.
012101.
[26] Kerr, C., and Ivey, P., 2002, "An overview of the
measurement errors associated with gas turbine aeroengine
pyrometer systems," Measurement Science and Technology,
13(6), p. 873.
[27] Feist, J., Nicholls, J., Fraser, M., and Heyes, A., 2006,
"Measurement, coating and monitoring system and method (US
2009/0122832)."
[28] Yañez Gonzalez, A., Pilgrim, C., Feist, J., Sollazzo, P.,
Beyrau, F., and Heyes, A., "On-line temperature measurement
inside a thermal barrier sensor coating during engine operation
(GT2014-25963)," Proc. ASME Turbo Expo.
[29] http://www.youtube.com/watch?v=T6uXN1__Z7I, 2011,
"Testing for jet engine coatings."