optimization of domestic biogas stove burner for efficient
TRANSCRIPT
The Nelson Mandela AFrican Institution of Science and Technology
NM-AIST Repository https://dspace.mm-aist.ac.tz
Materials, Energy, Water and Environmental Sciences Masters Theses and Dissertations [MEWES]
2020-08
Optimization of domestic biogas stove
burner for efficient energy utilization
Petro, Lucia
NM-AIST
https://dspace.nm-aist.ac.tz/handle/20.500.12479/1300
Provided with love from The Nelson Mandela African Institution of Science and Technology
OPTIMIZATION OF DOMESTIC BIOGAS STOVE BURNER FOR
EFFICIENT ENERGY UTILIZATION
Lucia M. Petro
A Dissertation Submitted in Partial Fulfillment of the Requirements for the Degree of
Master’s in Sustainable Energy Science and Engineering of the Nelson Mandela
African Institution of Science and Technology
Arusha, Tanzania
August, 2020
i
ABSTRACT
The inefficient indoor burning of fuel wood on traditional cook stoves generates pollutants,
primarily carbon monoxide and many other human health-damaging emissions. It is from this
risk that it is necessary to have an immediate shift to alternative cleaner fuel sources. Biogas,
which is among the biofuels from biomass, is one of the resources that play a considerable
part in a more diverse and sustainable global energy mix. For domestic purposes in rural
areas of Tanzania, biogas provides a better option that can supplement the use of fossil fuels
such as wood, charcoal, and kerosene, which is nonrenewable. However, the low efficiency
experienced in the locally made biogas burners hinders the large-scale use of biogas amongst
the population in the country. With the locally made burners, the users of biogas for the
domestic application face problems including heat loss and high gas consumption which
affects the whole cooking process. It is against this backdrop that the current study objectives
incline on designing and improving the efficiency of the locally manufactured burners to
achieve the uniform flow of fuel in the mixing chamber, which will result to the consistent
heat distribution around the cooking pot. The optimization of the burner was done by using
computational fluid dynamics (CFD) through varying the number of flame portholes, air
holes as well as the size of the jet before fabrication. The increased efficiency of the burner
has also contributed by the addition of the fuel distributor. The results showed that the
optimum hole diameter of the jet was 2.5 mm and that of the manifold was 100 mm. The
currently developed biogas burner was tested and compared with the other two locally made
burners. The water boiling test (WBT) on these three burners showed that the developed
burner has a thermal efficiency of 67.01% against 54.61% and 58.82% of Centre for
Agricultural Mechanization and Rural Technology (CARMATEC) and Simgas respectively.
Additionally, the fuel consumption of the developed burner was 736 g/L as compared to 920
g/L for CARMARTEC and 833 g/L for that of Simgas. The developed burner and its
corresponding cook stove are both environmentally friendly and economical for household
utilization in Tanzania and other developing countries.
Keywords: Biogas burner, Computational Fluid Dynamics, optimization, Injector, Efficiency,
Water Boiling Test
ii
DECLARATION
I, Lucia Petro do hereby declare to the Senate of the Nelson Mandela African Institution of
Science and Technology that this dissertation is my own original work and that it has neither
been submitted nor being concurrently submitted for a degree award in any other institution.
Lucia Petro
________________________________________ _________________
Name and signature of candidate Date
The above declaration is confirmed:
Prof. Revocatus Machunda
________________________________________ _________________
Name and signature of supervisor 1 Date
Dr. Thomas Kivevele
________________________________________ _________________
Name and signature of supervisor 2 Date

iii
COPYRIGHT
This dissertation is copyright material protected under the Berne Convention, the Copyright
Act of 1999 and other international and national enactments, on that behalf, on intellectual
property. It must not be reproduced by any means, in full or in part, except for short
extracts in fair dealing; for researcher private study, critical scholarly review or discourse
with an acknowledgement, without written permission of the Deputy Vice-Chancellor for
Academic, Research and Innovation, on behalf of both the author and The Nelson Mandela
African Institution of Science and Technology.
iv
CERTIFICATION
The undersigned certifies that they have read and hereby recommend for acceptance by the
Nelson Mandela African Institution of Science and Technology a dissertation entitled
“Optimization of Domestic Biogas Stove Burner for Efficient Energy Utilization” in
fulfillment of the requirement for the degree of Master’s in Sustainable Energy Science and
Engineering of the Nelson Mandela African Institution of Science and Technology.
Principal supervisor
Prof. Revocatus Machunda
Signature: …………………….… Date: ………..……………
Co-supervisor
Dr. Thomas Kivevele
Signature: ……………………… Date: ……………………
v
ACKNOWLEDGEMENT
My heartfelt appreciation goes to my supervisors Prof. Revocatus Machunda and Dr. Thomas
Kivevele for their intensive support during my research work included but not limited
guidance, fruitful discussion, encouragement and supervision that ensured that this work goes
to completion. The assistance and good cooperation I got from Prof. Siza Tumbo from the
Ministry of Agriculture and Livestock is very much acknowledged. His advice and
suggestions he provided for this research was a plus. I am grateful to Prof. Tatiana and Prof.
Alexander for their close follow up during the whole research period at this Institution.
Special thanks go to Prof. Karoli Njau, Dr. Michael Haule and Mr. Julius Lenguyana for
encouraging me to pursue my studies at NM-AIST. They were always near to me during
difficulties and provided constructive ideas whenever I contacted them. The studies at NM-
AIST have been possible due to the scholarship offered by Water Infrastructure and
Sustainable Energy Futures (WISE–Futures), I acknowledge their support.
I also would like to recognize the assistance done by CAMARTEC staff and Arusha
Technical College especially staff from the Department of Mechanical Engineering during
fabrication of the biogas burner. Finally, I appreciate NM-AIST academic staff and the
school of MEWES specifically for shouldering challenges during my study.

vi
DEDICATION
My dedication goes to my family, specifically my husband Mr. Adam Sangija, my son Pascal
and daughters Ms Angela and Ms Neema Adam for their constant support and for not taking
my absence for granted.
vii
TABLE OF CONTENTS
ABSTRACT ................................................................................................................................ i
DECLARATION ....................................................................................................................... ii
COPYRIGHT ........................................................................................................................... iii
CERTIFICATION .................................................................................................................... iv
ACKNOWLEDGEMENT ......................................................................................................... v
DEDICATION .......................................................................................................................... vi
TABLE OF CONTENTS ......................................................................................................... vii
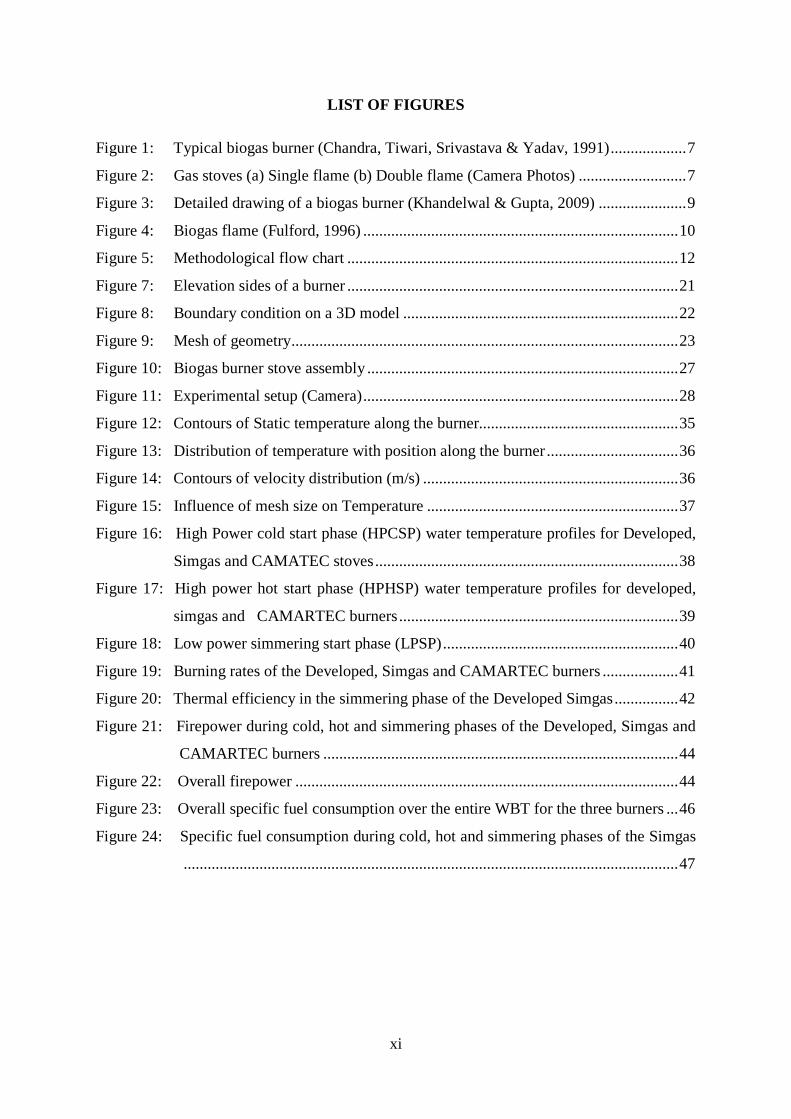
LIST OF FIGURES .................................................................................................................. xi
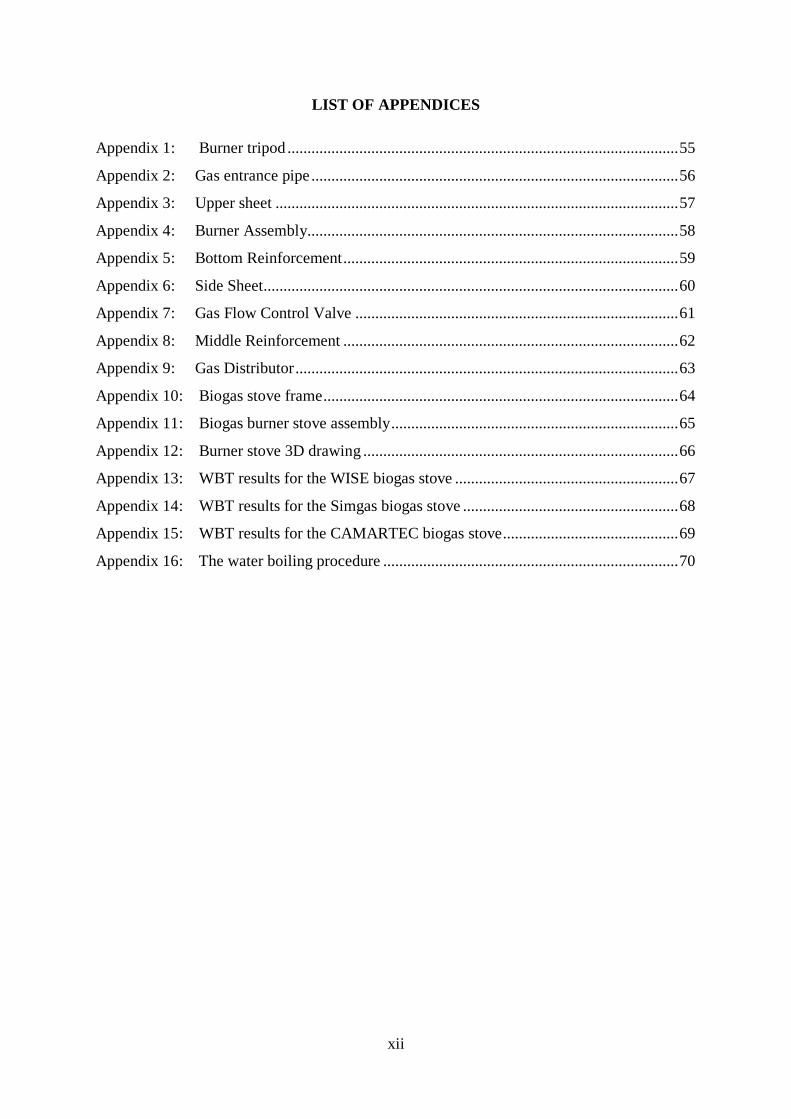
LIST OF APPENDICES .......................................................................................................... xii
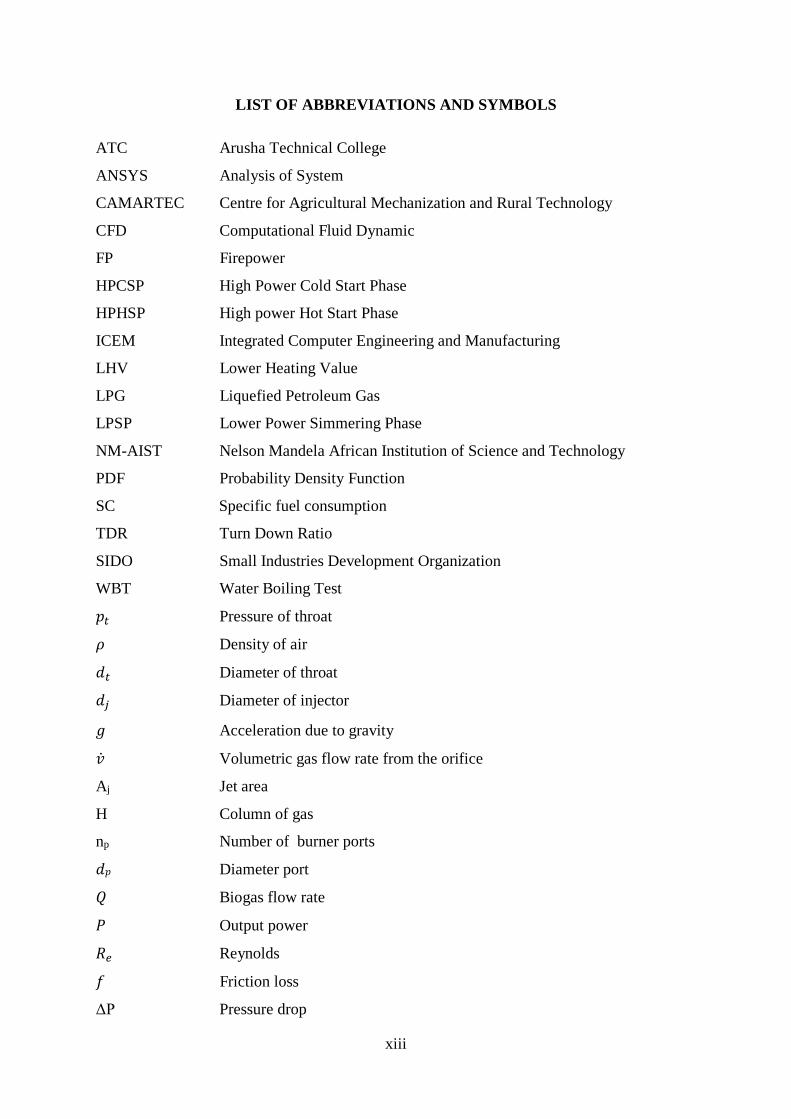
LIST OF ABBREVIATIONS AND SYMBOLS .................................................................. xiii
CHAPTER ONE ........................................................................................................................ 1
INTRODUCTION ..................................................................................................................... 1
1.1 Background of the problem ....................................................................................... 1
1.2 Statement of the problem .......................................................................................... 2
1.3 Rationale of the study ................................................................................................ 3
1.4 Objectives .................................................................................................................. 3
1.4.1 Main objective .............................................................................................. 3
1.4.2 Specific objectives ........................................................................................ 3
1.5 Research equations .................................................................................................... 3
1.6 Significance of the study ........................................................................................... 3
1.7 Delineation of the study ............................................................................................ 4
CHAPTER TWO ....................................................................................................................... 5
LITERATURE REVIEW .......................................................................................................... 5
2.1 Biogas ........................................................................................................................ 5
2.2 Combustion and heat utilization ................................................................................ 5
2.3 Gas stoves .................................................................................................................. 6
2.4 Types of gas stoves.................................................................................................... 7
2.5 Previous research on burners ..................................................................................... 8
2.6 Gas burner ................................................................................................................. 8
2.7 Burner design ............................................................................................................ 9
2.8 Mathematical modeling study by using computational fluid dynamic ..................... 9
2.9 Biogas flame and impact of contaminants in biogas ............................................... 10
viii
2.9.1 Biogas flame ............................................................................................... 10
2.9.2 Impact of contaminants in biogas ............................................................... 11
CHAPTER THREE ................................................................................................................. 12
MATERIALS AND METHODS ............................................................................................. 12
3.1 Methodology ........................................................................................................... 12
3.2 Design of biogas stove ............................................................................................ 13
3.2.1 Analytical design ........................................................................................ 13
3.2.2 Determining the power required ................................................................. 17
3.2.3 Design calculations of stove parameters .................................................... 18
3.2.4 Geometry for a burner ................................................................................ 20
3.3 Computational fluid dynamics (CFD) simulation and optimization of the burner . 21
3.4 Governing Equations ............................................................................................... 25
3.5 Fabrication of the optimized biogas stove burner ................................................... 26
3.5.1 Materials used ............................................................................................. 26
3.5.2 Fabrication of a stove ................................................................................ 26
3.5.3 Prototype and physical layout..................................................................... 26
3.6 Evaluation of the performance of the cookstoves ................................................... 27
3.6.1 Experimental set-up and water boiling test procedure ............................... 27
3.6.2 The water boiling test (WBT) ..................................................................... 28
CHAPTER FOUR .................................................................................................................... 34
RESULTS AND DISCUSSION .............................................................................................. 34
4.1 Results of analytical design ..................................................................................... 34
4.2 Computational fluid dynamic modeling results ...................................................... 34
4.3 Results of experimental test .................................................................................... 37
4.3.1 Burning rate (rb) ......................................................................................... 41
4.3.2 Thermal efficiency, ɳt ................................................................................. 42
4.3.3 Firepower ( FP) ........................................................................................... 43
4.3.4 Specific fuel consumption .......................................................................... 45
CHAPTER FIVE ..................................................................................................................... 48
CONCLUSION AND RECOMMENDATIONS .................................................................... 48
5.1 Conclusion ............................................................................................................... 48
5.2 Recommendations ................................................................................................... 48
REFERENCES ........................................................................................................................ 49
APPENDICES ......................................................................................................................... 54

ix
RESEARCH OUTPUT ............................................................................................................ 71

x
LIST OF TABLES
Table 1: Composition of biogas .............................................................................................. 5
Table 2: Properties of biogas .................................................................................................. 5
Table 3: Settings of the fluent model .................................................................................... 24
Table 4: Model input data of the burner ............................................................................... 24
Table 5: PDF for boundary conditions.................................................................................. 25
Table 6: The results of the analytical design calculation ...................................................... 34
xi
LIST OF FIGURES
Figure 1: Typical biogas burner (Chandra, Tiwari, Srivastava & Yadav, 1991) ................... 7
Figure 2: Gas stoves (a) Single flame (b) Double flame (Camera Photos) ........................... 7
Figure 3: Detailed drawing of a biogas burner (Khandelwal & Gupta, 2009) ...................... 9
Figure 4: Biogas flame (Fulford, 1996) ............................................................................... 10
Figure 5: Methodological flow chart ................................................................................... 12
Figure 7: Elevation sides of a burner ................................................................................... 21
Figure 8: Boundary condition on a 3D model ..................................................................... 22
Figure 9: Mesh of geometry ................................................................................................. 23
Figure 10: Biogas burner stove assembly .............................................................................. 27
Figure 11: Experimental setup (Camera) ............................................................................... 28
Figure 12: Contours of Static temperature along the burner.................................................. 35
Figure 13: Distribution of temperature with position along the burner ................................. 36
Figure 14: Contours of velocity distribution (m/s) ................................................................ 36
Figure 15: Influence of mesh size on Temperature ............................................................... 37
Figure 16: High Power cold start phase (HPCSP) water temperature profiles for Developed,
Simgas and CAMATEC stoves ............................................................................ 38
Figure 17: High power hot start phase (HPHSP) water temperature profiles for developed,
simgas and CAMARTEC burners ...................................................................... 39
Figure 18: Low power simmering start phase (LPSP) ........................................................... 40
Figure 19: Burning rates of the Developed, Simgas and CAMARTEC burners ................... 41
Figure 20: Thermal efficiency in the simmering phase of the Developed Simgas ................ 42
Figure 21: Firepower during cold, hot and simmering phases of the Developed, Simgas and
CAMARTEC burners ......................................................................................... 44
Figure 22: Overall firepower ................................................................................................ 44
Figure 23: Overall specific fuel consumption over the entire WBT for the three burners ... 46
Figure 24: Specific fuel consumption during cold, hot and simmering phases of the Simgas
............................................................................................................................ 47
xii
LIST OF APPENDICES
Appendix 1: Burner tripod .................................................................................................. 55
Appendix 2: Gas entrance pipe ............................................................................................ 56
Appendix 3: Upper sheet ..................................................................................................... 57
Appendix 4: Burner Assembly............................................................................................. 58
Appendix 5: Bottom Reinforcement .................................................................................... 59
Appendix 6: Side Sheet ........................................................................................................ 60
Appendix 7: Gas Flow Control Valve ................................................................................. 61
Appendix 8: Middle Reinforcement .................................................................................... 62
Appendix 9: Gas Distributor ................................................................................................ 63
Appendix 10: Biogas stove frame ......................................................................................... 64
Appendix 11: Biogas burner stove assembly ........................................................................ 65
Appendix 12: Burner stove 3D drawing ............................................................................... 66
Appendix 13: WBT results for the WISE biogas stove ........................................................ 67
Appendix 14: WBT results for the Simgas biogas stove ...................................................... 68
Appendix 15: WBT results for the CAMARTEC biogas stove ............................................ 69
Appendix 16: The water boiling procedure .......................................................................... 70
xiii
LIST OF ABBREVIATIONS AND SYMBOLS
ATC Arusha Technical College
ANSYS Analysis of System
CAMARTEC Centre for Agricultural Mechanization and Rural Technology
CFD Computational Fluid Dynamic
FP Firepower
HPCSP High Power Cold Start Phase
HPHSP High power Hot Start Phase
ICEM Integrated Computer Engineering and Manufacturing
LHV Lower Heating Value
LPG Liquefied Petroleum Gas
LPSP Lower Power Simmering Phase
NM-AIST Nelson Mandela African Institution of Science and Technology
PDF Probability Density Function
SC Specific fuel consumption
TDR Turn Down Ratio
SIDO Small Industries Development Organization
WBT Water Boiling Test
𝑝𝑝𝑡𝑡 Pressure of throat
𝜌𝜌 Density of air
𝑑𝑑𝑡𝑡 Diameter of throat
𝑑𝑑𝑗𝑗 Diameter of injector
𝑔𝑔 Acceleration due to gravity
�̇�𝑣 Volumetric gas flow rate from the orifice
Aj Jet area
H Column of gas
np Number of burner ports
𝑑𝑑𝑝𝑝 Diameter port
𝑄𝑄 Biogas flow rate
𝑃𝑃 Output power
𝑅𝑅𝑒𝑒 Reynolds
𝑓𝑓 Friction loss
ΔP Pressure drop
xiv
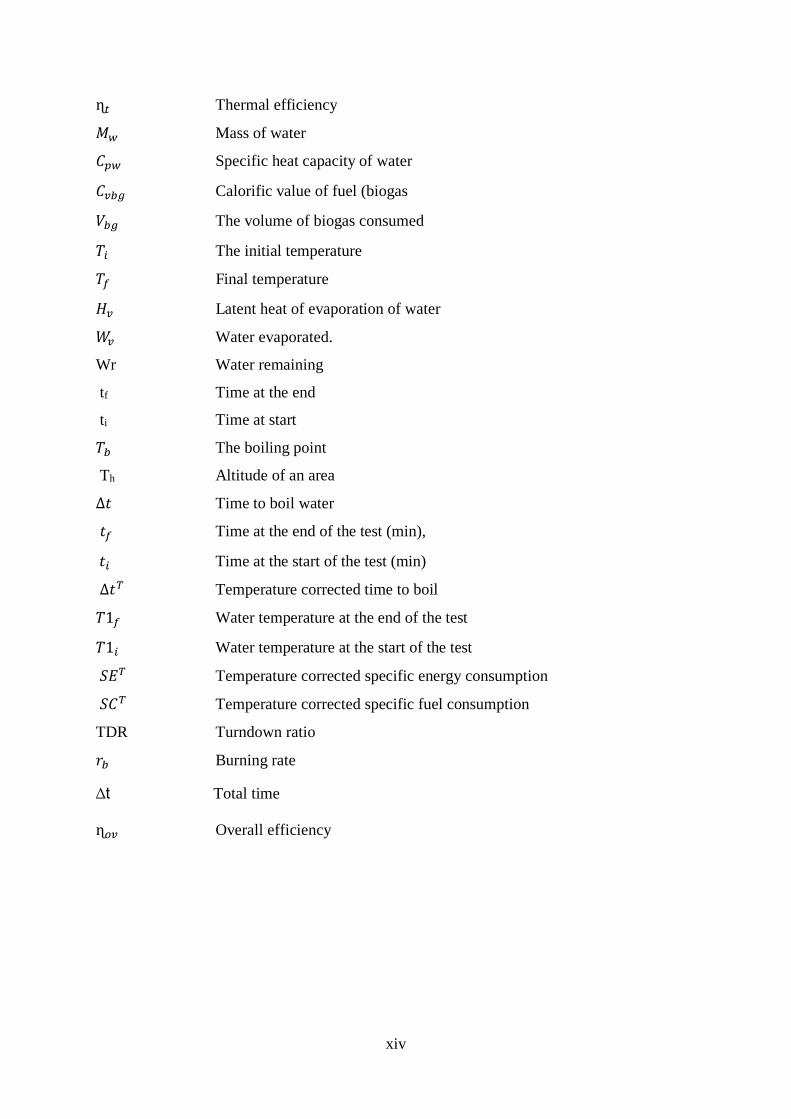
ɳ𝑡𝑡 Thermal efficiency
𝑀𝑀𝑤𝑤 Mass of water
𝐶𝐶𝑝𝑝𝑤𝑤 Specific heat capacity of water
𝐶𝐶𝑣𝑣𝑣𝑣𝑣𝑣 Calorific value of fuel (biogas
𝑉𝑉𝑣𝑣𝑣𝑣 The volume of biogas consumed
𝑇𝑇𝑖𝑖 The initial temperature
𝑇𝑇𝑓𝑓 Final temperature
𝐻𝐻𝑣𝑣 Latent heat of evaporation of water
𝑊𝑊𝑣𝑣 Water evaporated.
Wr Water remaining
tf Time at the end
ti Time at start
𝑇𝑇𝑣𝑣 The boiling point
Th Altitude of an area
∆𝑡𝑡 Time to boil water
𝑡𝑡𝑓𝑓 Time at the end of the test (min),
𝑡𝑡𝑖𝑖 Time at the start of the test (min)
∆𝑡𝑡𝑇𝑇 Temperature corrected time to boil
𝑇𝑇1𝑓𝑓 Water temperature at the end of the test
𝑇𝑇1𝑖𝑖 Water temperature at the start of the test
𝑆𝑆𝑆𝑆𝑇𝑇 Temperature corrected specific energy consumption
𝑆𝑆𝐶𝐶𝑇𝑇 Temperature corrected specific fuel consumption
TDR Turndown ratio
𝑟𝑟𝑣𝑣 Burning rate
∆t Total time
ɳ𝑜𝑜𝑣𝑣 Overall efficiency
1
CHAPTER ONE
INTRODUCTION
1.1 Background of the problem
As a vital need for any growth of a country, about 80% of the population of Tanzania has no
access to energy, specifically electricity. They, therefore, strongly rely on traditional energy
sources including but not limited to charcoal and firewood for cooking, lighting and other
thermal applications as an alternative (Felix & Gheewala, 2011). Approximately 90% of the
entire energy consumption is biomass (Felix & Gheewala, 2011; Rosillo-Calle, 2012).
Environmental destruction caused by the consumption of firewood and charcoal has grown
dramatically and is causing deforestation and soil erosion (Yasar et al., 2017). Heating and
cooking activities in the households are mostly done by the utilization of firewood and
charcoal which causes indoor air pollution resulting in diseases that affect women and
children (Felix & Gheewala, 2011). Renewable energy is an alternative to biomass and will
solve this problem if well exploited (Burke & Dundas, 2015). To realize a significant social
and economic leap, a country should divert its attention to the wind, solar and biogas as
reliable energy. Therefore, to meet the energy requirement, alternative sources of renewable
energy are needed such as biogas to reduce the frequency of using biomass and consequently
reduce over-dependent on the forest resources (Yasar et al., 2017).
Biogas is obtained from inexpensive, readily available material wastes in rural areas, such as
animal wastes and crop wastes (Chandra, Takeuchi & Hasegawa, 2012). In Tanzania,
approximately 21 tons of cow dung are produced each year and can be gasified to generate
heat (Mwakaje, 2008). Biogas is considered as one of the greatest substitutes fuel that can
supplement the use of solid biomass and fossil fuel for domestic applications particularly in
developing countries (Abbasi & Abbasi, 2010). It is currently being used in Tanzania for
heating and cooking (Mwakaje, 2008). It is environmentally friendly, reduces workload and
improves women’s livelihood (Anderman et al., 2015). The country’s dependence on foreign
energy will be reduced if biogas is utilized effectively, has no environmental effects and does
not affect human health (Surendra, Takara, Hashimoto & Khanal, 2014). The challenge arises
that Liquefied Petroleum Gas (LPG) burner does not work directly on biogas (Tumwesige,
Fulford & Davidson, 2014). The Wobbe index for LPG is considered to be twice for that of
biogas which means these burners are not interchangeable gases (Suwansri et al., 2015).
2
Efforts have been put in place to produce and distribute renewable energy technologies by
improving burner cook stoves to have efficient utilization of biogas for domestic cooking.
Appliances used for combustion of gaseous fuel like acetylene, propane and natural gas to
produce a flame with an exception of a few that use both air and fuel for heating products are
generally defined as gas burners (Beyler, 1986). Vital parameters to be observed for
combustion of biogas are flame speed, ignition temperature, gas pressure as well as the rate
of mixing gas and air. The steadiness of biogas flame in reference burners was studied by
Suwansri et al. (2015). However, the biogas used 70% methane including varying the
primary airflow. These stoves are poorly designed especially in areas such as an injector
diameter and throat diameter. To use biogas as an alternative for liquefied petroleum gas
(LPG) in domestic applications, rectifications are required for the burner stoves while
considering health, economic, and environmental issues (Suwansri et al., 2015). The
available biogas burners have not only poor quality and low energy output, but their designs
have also been reported that they do not follow the burner theory sufficiently (Tumwesige,
Fulford & Davidson, 2014).
This study, therefore, will concentrate on adjustments and fabrication of the biogas burner
parameters especially in increasing the diameter of the injector and manifold, improve throat
size, throat diameter and to reduce the distance between burner head and bottom pot, to suit
for the cooking application.
1.2 Statement of the problem
Biogas fuel is reported to be among the best alternative fuels to supplement the use of solid
biomass and fossil fuel for domestic applications. However, their application is discouraged
by the properties of fuel and poorly designed burner stoves which lose heat to the
environment and the increased indoor air pollution due to poor combustion (Tumwesige,
Fulford & Davidson, 2014). Furthermore, the domestic application of the current biogas
plants face challenges of high gas consumption which affects the whole cooking process.
Also, designs of biogas burners have some disadvantages to users such as low heating value
which causes variation for biogas production in digesters and it is also reported that biogas
burners consume more time in cooking compared to those of LPG. This, therefore, means
that there is a loss of heat and flame lift which is normally observed during cooking. Other
factors which cause low efficiency are pot to burner gap, gas pressure, and flame speed
3
(Bailis et al., 2007). In this study, therefore, a biogas burner will be optimized and tested its
performance by comparing with the existing ones.
1.3 Rationale of the study
The users of biogas for the domestic application face problems such as heat loss and high gas
consumption which affects the whole cooking process. The available locally man made
biogas burners have low efficiency, their application is discouraged by the properties of fuel
and poor design which does not follow gas burner theory sufficiently (Tumwesige et al.,
2014). This study will focus on design and fabrication of a biogas burner by improving it’s
parameters, in order to maximize its efficiency.
1.4 Objectives
1.4.1 Main objective
To optimize a domestic biogas stove burner for efficient energy utilization.
1.4.2 Specific objectives
(i) To optimize the efficiency of biogas burner through simulation of key parameters.
(ii) To fabricate and test the performance of the optimized biogas burner.
1.5 Research equations
(i) What are the optimal performance parameters of the biogas burner?
(ii) What is the efficiency of the designed biogas burner?
1.6 Significance of the study
Almost people of the developing country have limited access to grid power and depend on
biomass fuel for cooking and lighting. However, the use of firewood contributes to air
pollution, deforestation and social economic impacts. This research is aimed at improving the
existing biogas burner to maximize its efficiency, reduce gas losses, as well as improve
human health and environmental impact.
4
1.7 Delineation of the study
The delineation of the study in the area of domestic biogas burner stove for the household to
maximize the efficiency of the burner for cooking application. Fabrication of the prototype
was done in the workshops of Centre for Agricultural Mechanization and Rural Technology
(CAMARTEC) and Arusha Technical College (ATC) in Arusha, Tanzania while experiments
to determine the performance of the cook stoves were carried out in the energy lab at
CAMARTEC in Arusha, Tanzania. The experiments were designed to simulate real-life
cooking processes and were conducted using the water boiling test (WBT) software version
3.0 (Bailis et al., 2007). The WBT consists of three components: A test at high power that is
conducted with both cold and hot start conditions and a test at low-power to simulate slow
cooking tasks or tasks that require low heat. The WBT assesses the thermal efficiency (ɳth),
the firepower (FP), and the specific fuel consumption (SC) of the stove.
5
CHAPTER TWO
LITERATURE REVIEW
2.1 Biogas
Biogas has varied composition depending on the characteristics of a feedstock, and amount of
degradation (Karellas, Boukis & Kontopoulos, 2010). Methane is the most active part of
biogas with a percentage of about 50-70% followed by 30-40% carbon dioxide and other
trace gases (Lansing, Botero & Martin, 2008). The energy content of biogas depends on the
composition of methane (Petersson & Wellinger, 2009). Table 1 and Table 2 are shown the
composition and the properties of the biogas.
Table 1: Composition of biogas
Gas Composition %
Carbon dioxide (CO2) 30-40
Methane (CH4) 50-70
Nitrogen (N2) 1-2
Hydrogen (H2) 5-10
Hydrogen Sulfide (H2S) Traces
Water vapour (H2O) 0.3
Igoni et al. (2008)
Table 2: Properties of biogas
Properties Range
The air required for combustion (m3 /m3 ) 5.7
Density (kg/m3) 0.94
Net calorific value (MJ/m3) 21.7
Ignition temperature (0C) 700
Tumwesige, Fulford and Davidson (2014)
2.2 Combustion and heat utilization
A burner is an appliance which is used to convert biogas into useful heating for domestic
cooking (Tumwesige, Fulford & Davidson, 2014). Biogas produced is transported through a
pipe from the small family digester to end-users and is burning directly in the burner. Unlike
6
other applications of biogas which undergo compression, particulate removal and filtration,
cooking does not require compressed biogas and therefore, gas utilization is independent of
gas contamination (Al Seadi et al., 2013). The application of biogas is similar to other
combustible gases such as LPG but with varying properties which means that care must be
taken to ensure efficient combustion.
In comparison with LPG based on important features such as ignition temperature, flame, gas
pressure and gas/air mixing rate, biogas requires less air per cubic meter. This, therefore,
implies that, with a constant amount of air, more biogas is consumed. According to Itodo,
Agyo and Yusuf (2007) about 1 liter of biogas requires 5.7 liters of air for complete
combustion while propane and butane require 23.8 and 30.9 liters of air respectively (Sasse,
Kellner & Kimaro, 1991). The flame speed of LPG is greater than that of biogas. This may be
accomplished by using conical orifices but, the bottom of the cooking pot acts as a speed
breaker for the flame. Given that the efficiency of utilizing biogas is 55% in stoves. This,
therefore, means that using biogas is super alternative energy in farm energy demands (Sasse,
Kellner & Kimaro, 1991).
2.3 Gas stoves
Biogas is burned directly in stoves whereby this is the simplest way of utilizing it in
households. The gas stove is equipment which changes the state fuel of biogas and other
gases such as liquefied fossil fuel gas (LPG). The small amount of hydrogen sulfide or
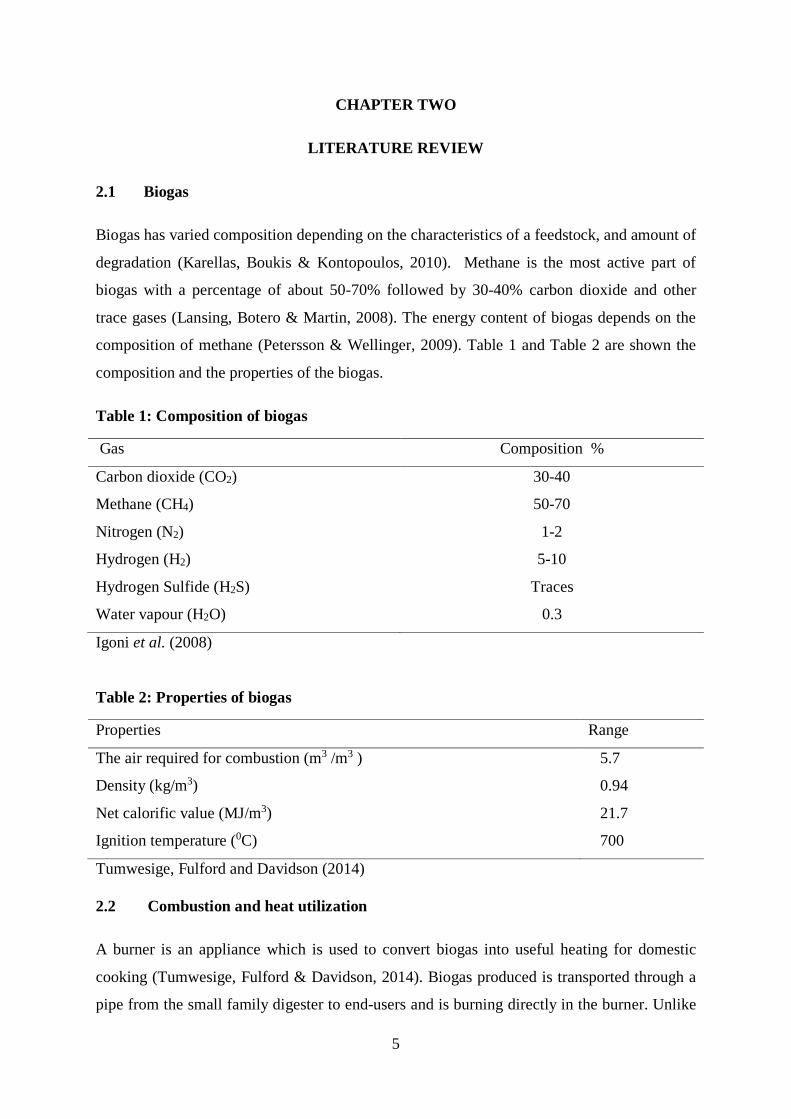
carbon monoxide still exists when biogas is burned. A biogas stove comprises a mixer and
multi-holed burning ports that operate at atmospheric pressure. A normal biogas stove
consists of a gas supply tube, gas injector jet, gas tap/valve, primary air opening(s) or
regulator, gas mixing tube/manifold, throat, burner head, pot supports, burner ports and body
frame as shown in Fig. 1. Other biogas stoves may have one or double burners, the variable
capability to consume from 0.22 to 0.44 m3 of gas per hour or more (Khandelwal & Gupta,
2009). Biogas is delivered to the stove using a supply pipe at a speed which depends on both
the operating pressure and size of the pipe.
The speed of the gas is increased by the injector jet at the inlet of the stove and is dependent
on the diameter of the injector. This results in a draft that consequently sucks in the primary
air which mixes with the gas in the mixing chamber. The speed of the gas in the mixing
chamber is reduced before approaching the burner head. The cone shape of the burner head is
7
modified to balance pressure before the mixture leaves the burner through the ports with a
slightly higher specific flame speed of biogas. Finally, more oxygen (secondary air) is drawn
for complete combustion (Sasse, Kellner & Kimaro, 1991).
Figure 1: Typical biogas burner (Chandra, Tiwari, Srivastava & Yadav, 1991)
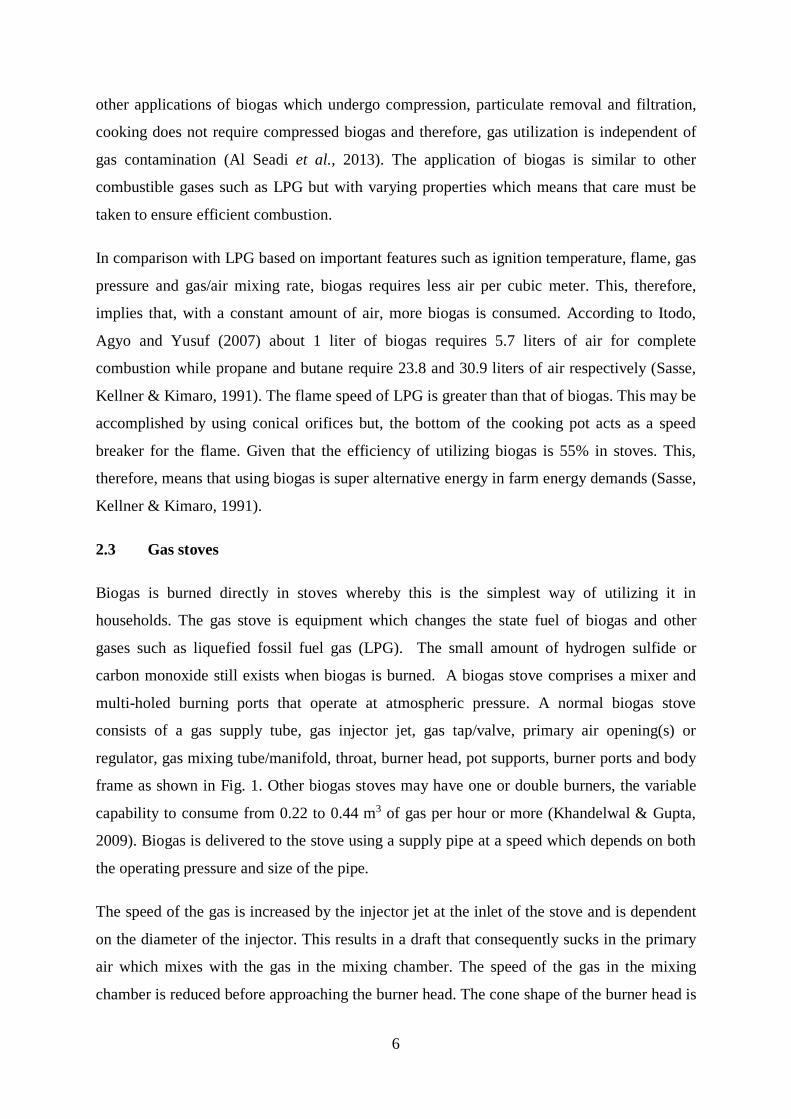
2.4 Types of gas stoves
Several types of biogas burners are used in the world including the Pecking stove used in
China and Jackal stove which is common in Brazil. Others are KIE burner used in Kenya, and
Patel Ge 32 stoves and Patel Ge 8 stoves generally in India (Itodo, Agyo & Yusuf, 2007).
Two types of burners which are single flame burner and double flame as shown in Fig. 2 can
be used to classify a biogas stove, although double burner is the most popular type used
worldwide.
Figure 2: Gas stoves (a) Single flame (b) Double flame (Camera Photos)
8
2.5 Previous research on burners
Historical development of biogas burner began in the late 1970s (Decker, 2017a). Since then,
researchers across the world have recognized the growing need for improvement of biogas
burners to increase heating efficiency. In response to these, there have been several
researchers and published journal articles and reports which describe the development and
various modifications of biogas burners. In 1991, Chandra and colleagues at the Indian
Institute of Technology in New Delhi developed a mathematical model which described the
experimental performance of biogas burner by considering factors such as flame dynamic,
burner head, the distance between the pot and burner head and reported the efficiency of 32 -
49% (Chandra, Tiwari, Srivastava & Yadav, 1991). In 1996 and 2014, Fulford and colleagues
developed a biogas burner design guide and reviewed various biogas stoves designed in
Uganda and reported low burner efficiency.
Furthermore, Itodo, Agyo and Yusuf (2007) modified biogas burners and tested their
performance in cooking rice, boiling water and beans and the resulting efficiencies were
53%, 20% and 56% respectively. Olubiyi (2012) modified and upgraded biogas burners and
obtained efficiencies of 60% and 21% in cooking rice and boiling water respectively. The
Center for Research in Energy and Energy Conservation (CREEC) at Makerere University in
Kampala, Uganda reported an efficiency of 20% tested for eight different biogas stove by
boiling water although there were high levels of carbon monoxide emissions (Tumwesige,
Fulford & Davidson, 2014). Although there have been recent research efforts, in the
development of various domestic biogas burners, the problem of burner efficiency remains a
bottleneck so this research will design the burner to increase its performance.
2.6 Gas burner
Biogas can be utilized as cooking fuel and in any gas-burning appliances that demand low
pressure (such as a lamp, cooking stove, refrigerators etc.). Biogas is a clean gas that burns
with no soot or other pollutants thus it can be used like any other flammable gas for
household and industrial applications. The utilization of biogas requires special design
parameters for biogas burners or modified consumer appliances to meet the properties of
biogas.
9
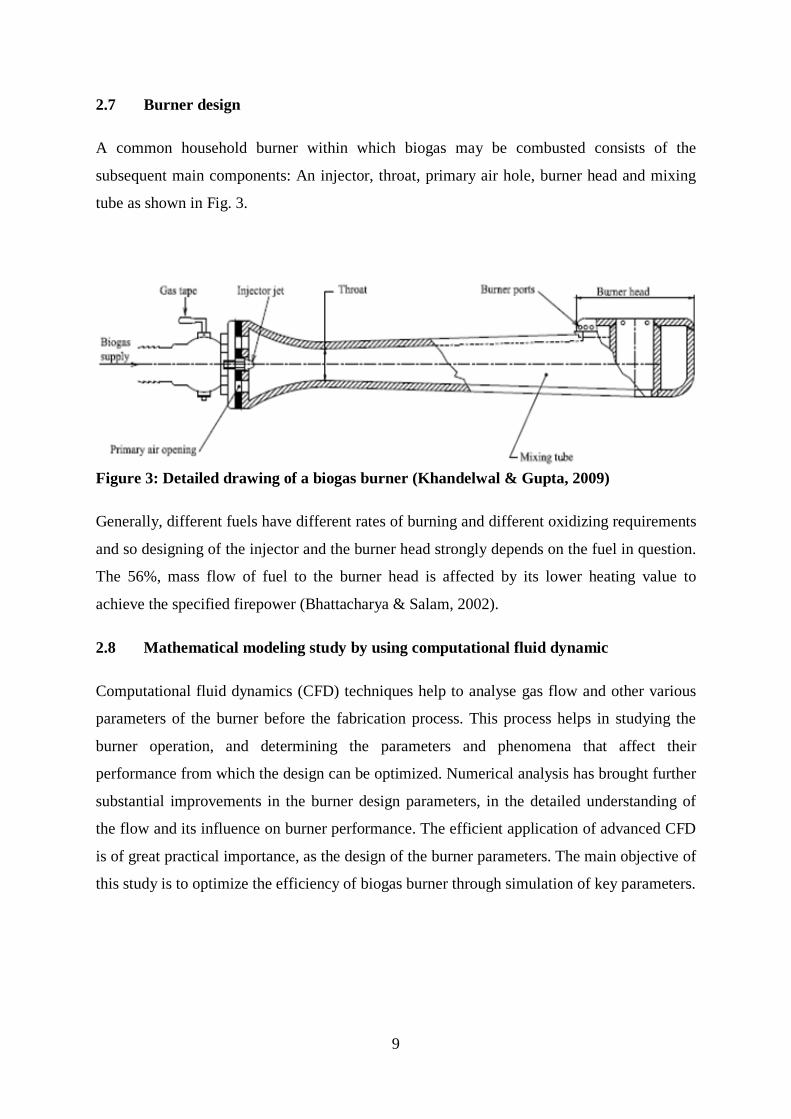
2.7 Burner design
A common household burner within which biogas may be combusted consists of the
subsequent main components: An injector, throat, primary air hole, burner head and mixing
tube as shown in Fig. 3.
Figure 3: Detailed drawing of a biogas burner (Khandelwal & Gupta, 2009)
Generally, different fuels have different rates of burning and different oxidizing requirements
and so designing of the injector and the burner head strongly depends on the fuel in question.
The 56%, mass flow of fuel to the burner head is affected by its lower heating value to
achieve the specified firepower (Bhattacharya & Salam, 2002).
2.8 Mathematical modeling study by using computational fluid dynamic
Computational fluid dynamics (CFD) techniques help to analyse gas flow and other various
parameters of the burner before the fabrication process. This process helps in studying the
burner operation, and determining the parameters and phenomena that affect their
performance from which the design can be optimized. Numerical analysis has brought further
substantial improvements in the burner design parameters, in the detailed understanding of
the flow and its influence on burner performance. The efficient application of advanced CFD
is of great practical importance, as the design of the burner parameters. The main objective of
this study is to optimize the efficiency of biogas burner through simulation of key parameters.
10
2.9 Biogas flame and impact of contaminants in biogas
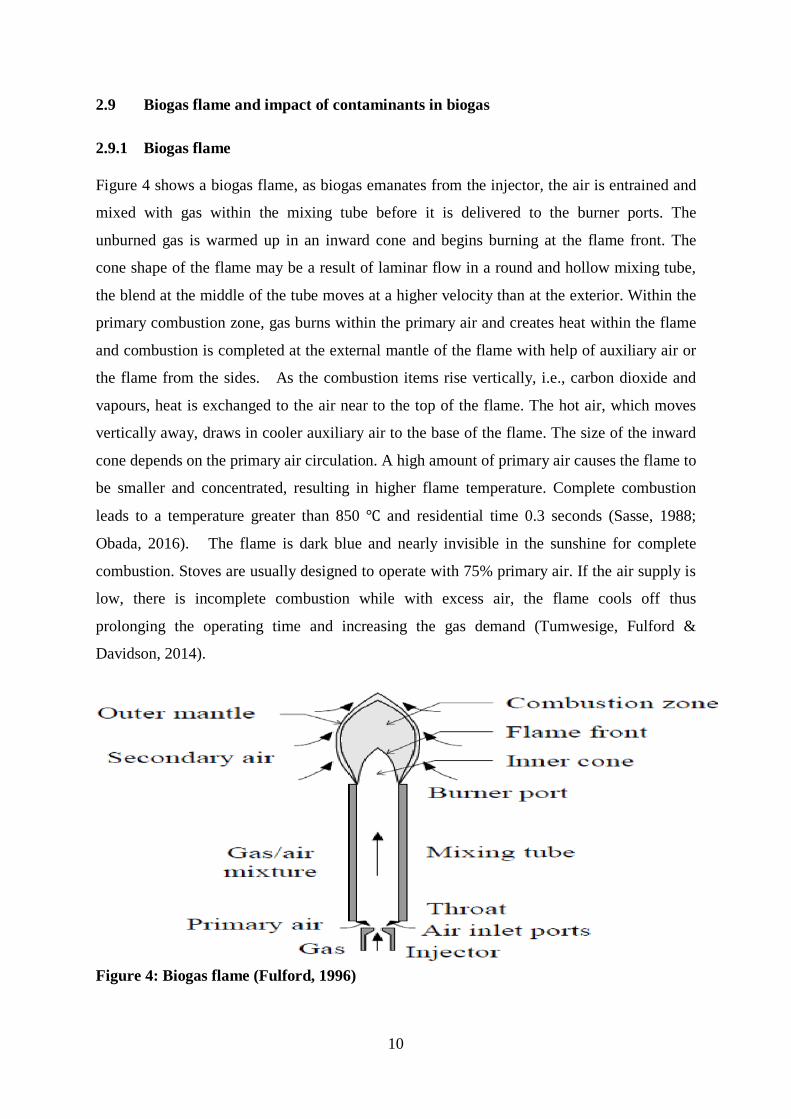
2.9.1 Biogas flame
Figure 4 shows a biogas flame, as biogas emanates from the injector, the air is entrained and
mixed with gas within the mixing tube before it is delivered to the burner ports. The
unburned gas is warmed up in an inward cone and begins burning at the flame front. The
cone shape of the flame may be a result of laminar flow in a round and hollow mixing tube,
the blend at the middle of the tube moves at a higher velocity than at the exterior. Within the
primary combustion zone, gas burns within the primary air and creates heat within the flame
and combustion is completed at the external mantle of the flame with help of auxiliary air or
the flame from the sides. As the combustion items rise vertically, i.e., carbon dioxide and
vapours, heat is exchanged to the air near to the top of the flame. The hot air, which moves
vertically away, draws in cooler auxiliary air to the base of the flame. The size of the inward
cone depends on the primary air circulation. A high amount of primary air causes the flame to
be smaller and concentrated, resulting in higher flame temperature. Complete combustion
leads to a temperature greater than 850 ℃ and residential time 0.3 seconds (Sasse, 1988;
Obada, 2016). The flame is dark blue and nearly invisible in the sunshine for complete
combustion. Stoves are usually designed to operate with 75% primary air. If the air supply is
low, there is incomplete combustion while with excess air, the flame cools off thus
prolonging the operating time and increasing the gas demand (Tumwesige, Fulford &
Davidson, 2014).
Figure 4: Biogas flame (Fulford, 1996)

11
2.9.2 Impact of contaminants in biogas
Significant volumes of carbon dioxide not only trap heat but also cool off the flame
significantly to a point of unsteady state and blow out. The water vapour affects the flame
temperature, lowers both the heating value and air/fuel proportion.
12
CHAPTER THREE
MATERIALS AND METHODS
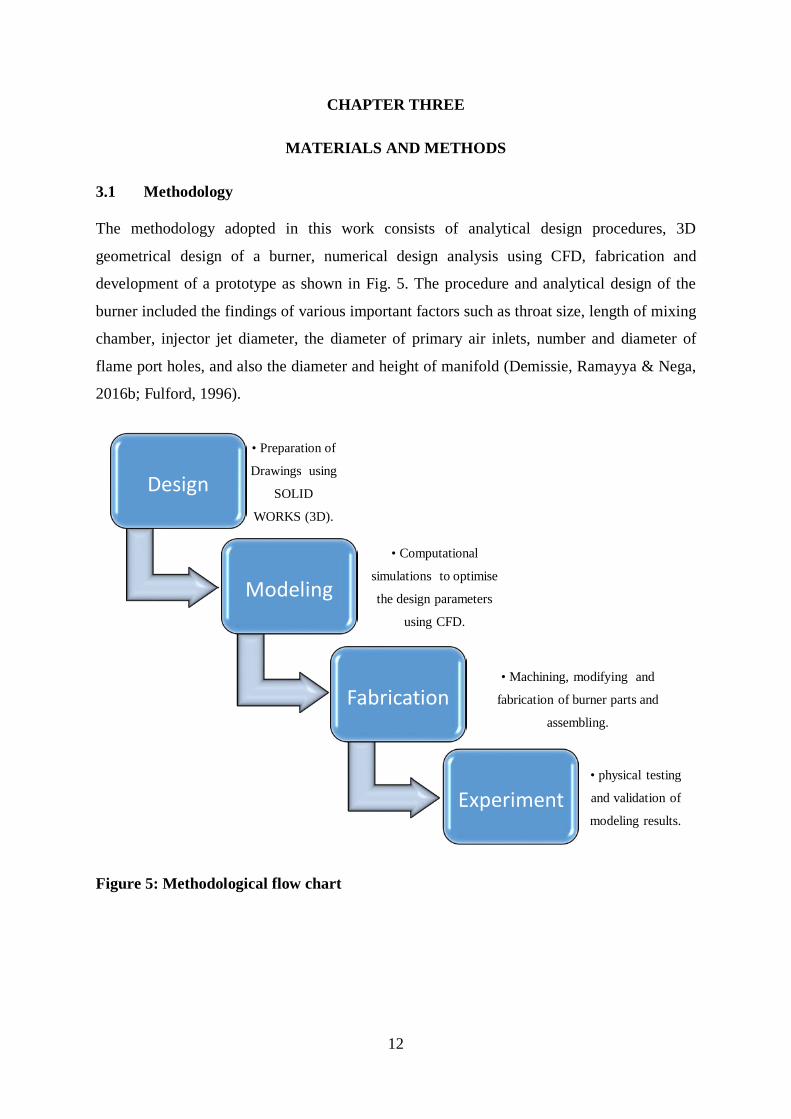
3.1 Methodology
The methodology adopted in this work consists of analytical design procedures, 3D
geometrical design of a burner, numerical design analysis using CFD, fabrication and
development of a prototype as shown in Fig. 5. The procedure and analytical design of the
burner included the findings of various important factors such as throat size, length of mixing
chamber, injector jet diameter, the diameter of primary air inlets, number and diameter of
flame port holes, and also the diameter and height of manifold (Demissie, Ramayya & Nega,
2016b; Fulford, 1996).
Figure 5: Methodological flow chart
Design
• Preparation of
Drawings using
SOLID
WORKS (3D).
Modeling
• Computational
simulations to optimise
the design parameters
using CFD.
Fabrication • Machining, modifying and
fabrication of burner parts and
assembling.
Experiment• physical testing
and validation of
modeling results.
13
3.2 Design of biogas stove
3.2.1 Analytical design
The following important parameters should be considered for the design of an efficient
biogas burner was gas composition, gas pressure, flame speed and pot to burner gap (Obada,
Obi, Dauda & Anafi, 2014). Other important considerations are the smooth gas channel to
reduce air/gas resistance. Spacing and size of air gaps ought to coordinate with the necessity
of gas combustion, a large volume of burner manifold to allow total mixing of the gas and air,
size, shape and number of burner port holes ought to permit simple passage of the gas-air
mixture, the arrangement of stabilized flame and complete combustion of gas without causing
lifting up of flame, of the burner port or flame back stream from burner port to gas mixing
tube and injector jet. The flame ought to be self-stabilizing i.e., flameless zones must re-ignite
consequently within 2 to 3 seconds, in ideal situations, the port should be measured by the
external cone of the flame with no contacts with the internal cone and burner shape and size.
(i) Injector
The size and the structure of the injector should be designed to control the rate of gas/air
supplied and heat released for given gas composition and pressure (Demissie, Ramayya &
Nega, 2016b).
(ii) Discharge from an orifice
An injector changes potential energy from the high-pressure gas supply into the kinetic
energy of a developing gas jet (Demissie, Ramayya & Nega, 2016b). Assuming energy is
conserved and no losses occur in the nozzle, this holds (per unit mass): 12
𝑣𝑣2 = 𝑔𝑔ℎ (3.1)
Where:
�̇�𝑣 - Gas flow rate from the orifice (m3s-1)
Aj - jet area (m2)
g - Acceleration due to gravity
h - The column of gas required to exert gas pressure at the orifice
Gauge pressure (𝑝𝑝) is given as:
𝑝𝑝 = ℎ𝜌𝜌𝑣𝑣𝑔𝑔 (3.2)
Where, 𝜌𝜌𝑣𝑣 = density of biogas (1.15 kg/m3)
14
According to Jones (1989) specific gravity for CH4 and CO2 is 0.554 kg/m3 and 1.519 kg/m3
respectively. Considering the volumetric content of biogas to be 60% CH4 and 40% CO2
(Walsh, Ross, Smith & Harper, 1989) the specific gravity of biogas (s) is calculated as:
s = (0.554× 60100) + (1.519× 40
100) = 0.94 kg/m3
The rate at which gas is delivered to the stove (Q, m3/h) depends on the size of the gas jet
(Diameter: dj, Area: Aj) and the pressure (p, mmHg):
From Equation 3.1 and 3.2:
𝑄𝑄 = 0.046101 × 𝐴𝐴𝑗𝑗 × �𝑝𝑝𝑠𝑠 (3.3)
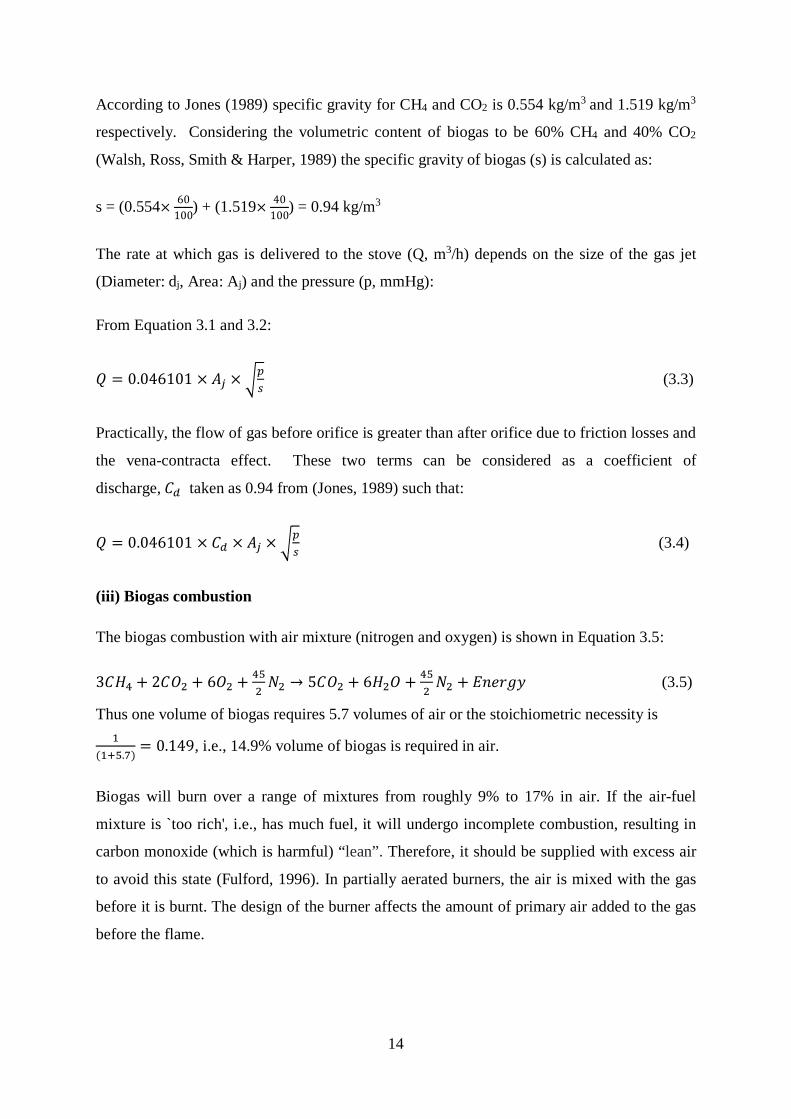
Practically, the flow of gas before orifice is greater than after orifice due to friction losses and
the vena-contracta effect. These two terms can be considered as a coefficient of
discharge, 𝐶𝐶𝑑𝑑 taken as 0.94 from (Jones, 1989) such that:
𝑄𝑄 = 0.046101 × 𝐶𝐶𝑑𝑑 × 𝐴𝐴𝑗𝑗 × �𝑝𝑝𝑠𝑠 (3.4)
(iii) Biogas combustion
The biogas combustion with air mixture (nitrogen and oxygen) is shown in Equation 3.5:
3𝐶𝐶𝐻𝐻4 + 2𝐶𝐶𝑂𝑂2 + 6𝑂𝑂2 + 452
𝑁𝑁2 → 5𝐶𝐶𝑂𝑂2 + 6𝐻𝐻2𝑂𝑂 + 452
𝑁𝑁2 + 𝑆𝑆𝐸𝐸𝐸𝐸𝑟𝑟𝑔𝑔𝐸𝐸 (3.5)
Thus one volume of biogas requires 5.7 volumes of air or the stoichiometric necessity is 1
(1+5.7)= 0.149, i.e., 14.9% volume of biogas is required in air.
Biogas will burn over a range of mixtures from roughly 9% to 17% in air. If the air-fuel
mixture is `too rich', i.e., has much fuel, it will undergo incomplete combustion, resulting in
carbon monoxide (which is harmful) “lean”. Therefore, it should be supplied with excess air
to avoid this state (Fulford, 1996). In partially aerated burners, the air is mixed with the gas
before it is burnt. The design of the burner affects the amount of primary air added to the gas
before the flame.
15
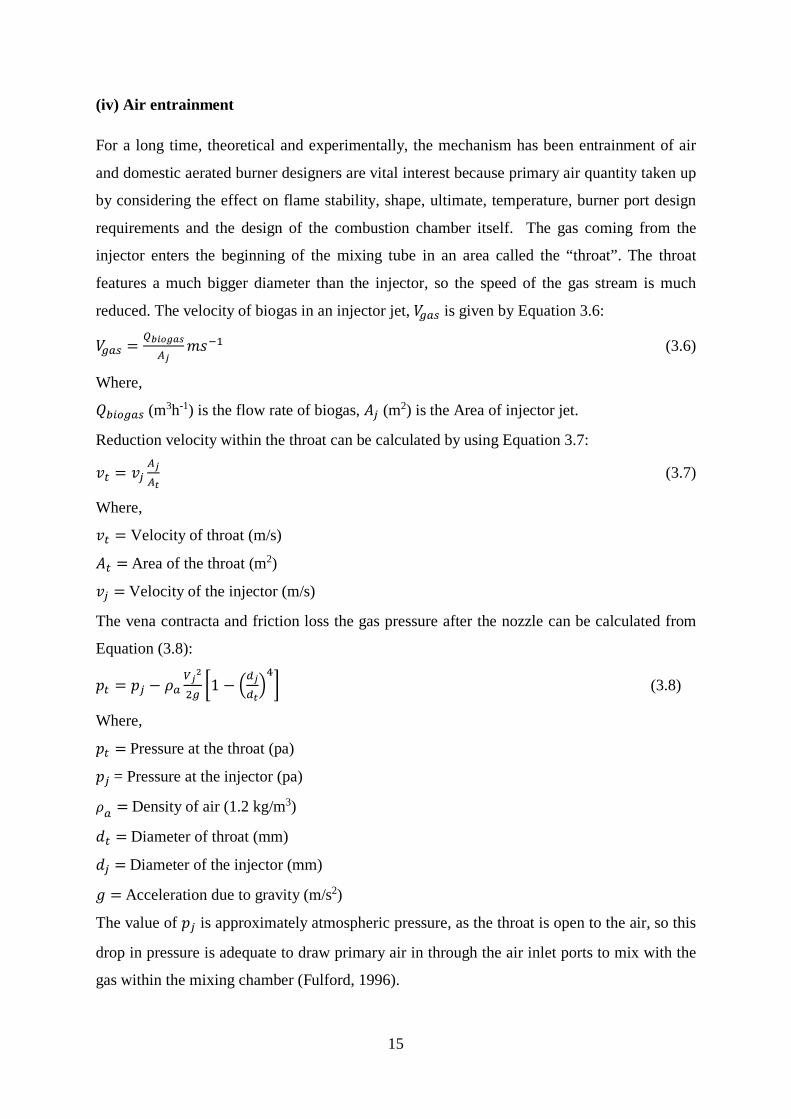
(iv) Air entrainment
For a long time, theoretical and experimentally, the mechanism has been entrainment of air
and domestic aerated burner designers are vital interest because primary air quantity taken up
by considering the effect on flame stability, shape, ultimate, temperature, burner port design
requirements and the design of the combustion chamber itself. The gas coming from the
injector enters the beginning of the mixing tube in an area called the “throat”. The throat
features a much bigger diameter than the injector, so the speed of the gas stream is much
reduced. The velocity of biogas in an injector jet, 𝑉𝑉𝑣𝑣𝑔𝑔𝑠𝑠 is given by Equation 3.6:
𝑉𝑉𝑣𝑣𝑔𝑔𝑠𝑠 =𝑄𝑄𝑏𝑏𝑏𝑏𝑏𝑏𝑏𝑏𝑏𝑏𝑏𝑏
𝐴𝐴𝑗𝑗𝑚𝑚𝑚𝑚−1 (3.6)
Where,
𝑄𝑄𝑣𝑣𝑖𝑖𝑜𝑜𝑣𝑣𝑔𝑔𝑠𝑠 (m3h-1) is the flow rate of biogas, 𝐴𝐴𝑗𝑗 (m2) is the Area of injector jet.
Reduction velocity within the throat can be calculated by using Equation 3.7:
𝑣𝑣𝑡𝑡 = 𝑣𝑣𝑗𝑗𝐴𝐴𝑗𝑗
𝐴𝐴𝑡𝑡 (3.7)
Where,
𝑣𝑣𝑡𝑡 = Velocity of throat (m/s)
𝐴𝐴𝑡𝑡 = Area of the throat (m2)
𝑣𝑣𝑗𝑗 = Velocity of the injector (m/s)
The vena contracta and friction loss the gas pressure after the nozzle can be calculated from
Equation (3.8):
𝑝𝑝𝑡𝑡 = 𝑝𝑝𝑗𝑗 − 𝜌𝜌𝑔𝑔𝑉𝑉𝑗𝑗
2
2𝑣𝑣�1 − �
𝑑𝑑𝑗𝑗
𝑑𝑑𝑡𝑡�
4� (3.8)
Where,
𝑝𝑝𝑡𝑡 = Pressure at the throat (pa)
𝑝𝑝𝑗𝑗 = Pressure at the injector (pa)
𝜌𝜌𝑔𝑔 = Density of air (1.2 kg/m3)
𝑑𝑑𝑡𝑡 = Diameter of throat (mm)
𝑑𝑑𝑗𝑗 = Diameter of the injector (mm)
𝑔𝑔 = Acceleration due to gravity (m/s2)
The value of 𝑝𝑝𝑗𝑗 is approximately atmospheric pressure, as the throat is open to the air, so this
drop in pressure is adequate to draw primary air in through the air inlet ports to mix with the
gas within the mixing chamber (Fulford, 1996).
16
The primary air circulation depends on the “entrainment ratio” (r), which is calculated by the
area of the throat and the injector:
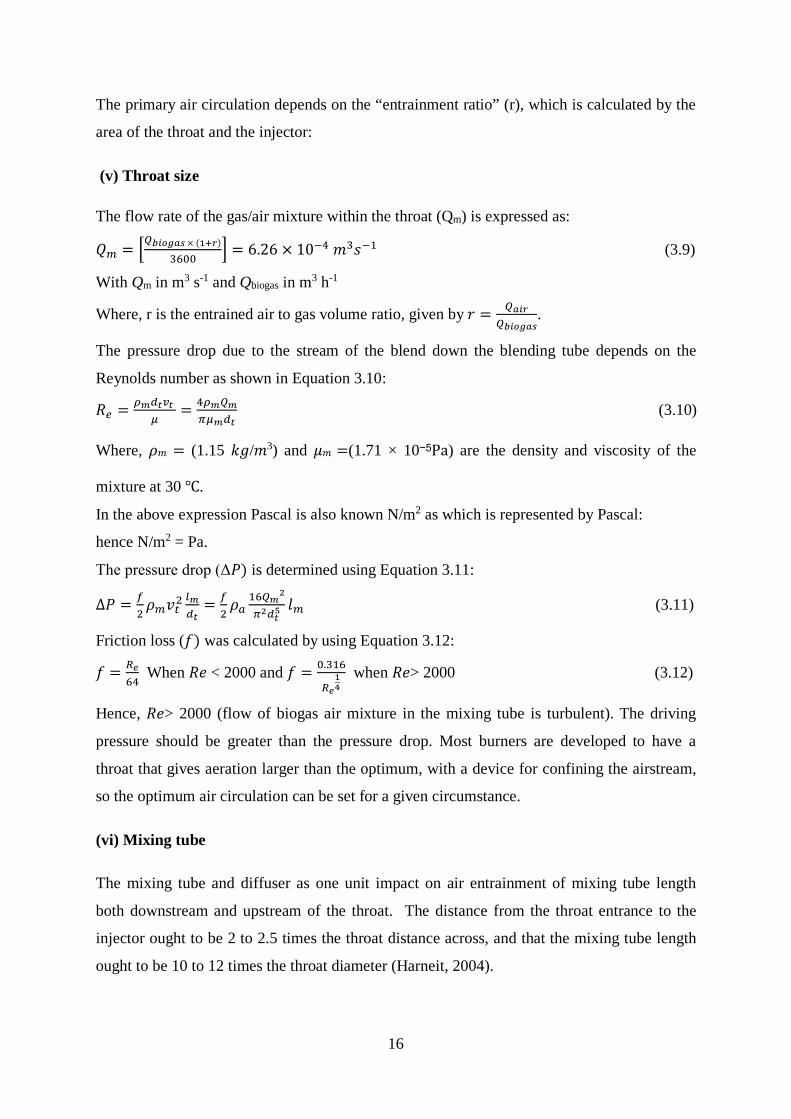
(v) Throat size
The flow rate of the gas/air mixture within the throat (Qm) is expressed as:
𝑄𝑄𝑚𝑚 = �𝑄𝑄𝑏𝑏𝑏𝑏𝑏𝑏𝑏𝑏𝑏𝑏𝑏𝑏 × (1+𝑟𝑟)
3600� = 6.26 × 10⁻⁴ 𝑚𝑚3𝑚𝑚−1 (3.9)
With Qm in m3 s-1 and Qbiogas in m3 h-1
Where, r is the entrained air to gas volume ratio, given by 𝑟𝑟 = 𝑄𝑄𝑏𝑏𝑏𝑏𝑟𝑟𝑄𝑄𝑏𝑏𝑏𝑏𝑏𝑏𝑏𝑏𝑏𝑏𝑏𝑏
.
The pressure drop due to the stream of the blend down the blending tube depends on the
Reynolds number as shown in Equation 3.10:
𝑅𝑅𝑒𝑒 = 𝜌𝜌𝑚𝑚𝑑𝑑𝑡𝑡𝑣𝑣𝑡𝑡 𝜇𝜇
= 4𝜌𝜌𝑚𝑚𝑄𝑄𝑚𝑚𝜋𝜋𝜇𝜇𝑚𝑚𝑑𝑑𝑡𝑡
(3.10)
Where, 𝜌𝜌𝑚𝑚 = (1.15 𝑘𝑘𝑔𝑔/𝑚𝑚3) and 𝜇𝜇𝑚𝑚 =(1.71 × 10⁻⁵Pa) are the density and viscosity of the
mixture at 30 ℃.
In the above expression Pascal is also known N/m2 as which is represented by Pascal:
hence N/m2 = Pa.
The pressure drop (Δ𝑃𝑃) is determined using Equation 3.11:
∆𝑃𝑃 = 𝑓𝑓2
𝜌𝜌𝑚𝑚𝑣𝑣𝑡𝑡2 𝑙𝑙𝑚𝑚
𝑑𝑑𝑡𝑡= 𝑓𝑓
2𝜌𝜌𝑔𝑔
16𝑄𝑄𝑚𝑚2
𝜋𝜋2𝑑𝑑𝑡𝑡5 𝑙𝑙𝑚𝑚 (3.11)
Friction loss (𝑓𝑓) was calculated by using Equation 3.12:
𝑓𝑓 = 𝑅𝑅𝑒𝑒64
When 𝑅𝑅𝐸𝐸 < 2000 and 𝑓𝑓 = 0.316
𝑅𝑅𝑒𝑒14
when 𝑅𝑅𝐸𝐸> 2000 (3.12)
Hence, 𝑅𝑅𝐸𝐸> 2000 (flow of biogas air mixture in the mixing tube is turbulent). The driving
pressure should be greater than the pressure drop. Most burners are developed to have a
throat that gives aeration larger than the optimum, with a device for confining the airstream,
so the optimum air circulation can be set for a given circumstance.
(vi) Mixing tube
The mixing tube and diffuser as one unit impact on air entrainment of mixing tube length
both downstream and upstream of the throat. The distance from the throat entrance to the
injector ought to be 2 to 2.5 times the throat distance across, and that the mixing tube length
ought to be 10 to 12 times the throat diameter (Harneit, 2004).
17
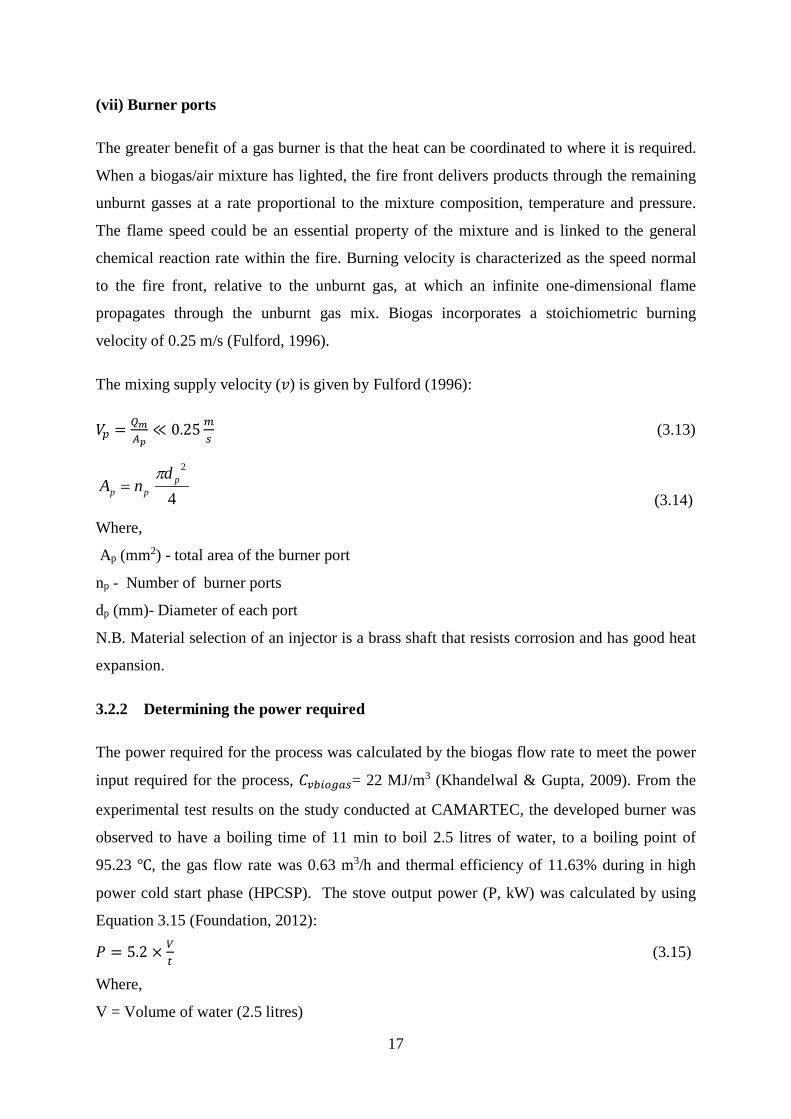
(vii) Burner ports
The greater benefit of a gas burner is that the heat can be coordinated to where it is required.
When a biogas/air mixture has lighted, the fire front delivers products through the remaining
unburnt gasses at a rate proportional to the mixture composition, temperature and pressure.
The flame speed could be an essential property of the mixture and is linked to the general
chemical reaction rate within the fire. Burning velocity is characterized as the speed normal
to the fire front, relative to the unburnt gas, at which an infinite one-dimensional flame
propagates through the unburnt gas mix. Biogas incorporates a stoichiometric burning
velocity of 0.25 m/s (Fulford, 1996).
The mixing supply velocity (𝑣𝑣) is given by Fulford (1996):
𝑉𝑉𝑝𝑝 = 𝑄𝑄𝑚𝑚𝐴𝐴𝑝𝑝
≪ 0.25 𝑚𝑚𝑠𝑠
(3.13)
4
2p
pp
dnA
π=
(3.14)
Where,
Ap (mm2) - total area of the burner port
np - Number of burner ports
dp (mm)- Diameter of each port
N.B. Material selection of an injector is a brass shaft that resists corrosion and has good heat
expansion.
3.2.2 Determining the power required
The power required for the process was calculated by the biogas flow rate to meet the power
input required for the process, 𝐶𝐶𝑣𝑣𝑣𝑣𝑖𝑖𝑜𝑜𝑣𝑣𝑔𝑔𝑠𝑠= 22 MJ/m3 (Khandelwal & Gupta, 2009). From the
experimental test results on the study conducted at CAMARTEC, the developed burner was
observed to have a boiling time of 11 min to boil 2.5 litres of water, to a boiling point of
95.23 ℃, the gas flow rate was 0.63 m3/h and thermal efficiency of 11.63% during in high
power cold start phase (HPCSP). The stove output power (P, kW) was calculated by using
Equation 3.15 (Foundation, 2012):
𝑃𝑃 = 5.2 × 𝑉𝑉𝑡𝑡 (3.15)
Where,
V = Volume of water (2.5 litres)
18
𝑃𝑃 = 5.2 × 2.511
= 1.18 𝑘𝑘𝑊𝑊
The gas through the stove (Q, m3⁄h) can be determined by Equation 3.16 (Foundation, 2012).
𝑄𝑄 = 0.45 × 𝑃𝑃 (3.16)
Where,
𝑄𝑄 = Biogas flow rate
𝑃𝑃 = Output power
So if the desired stove output power is 1.18 kW, the stove ought to have a gas flow of 0.68
m3/h.
The power required was calculated by the biogas flow rate to meet the power input required
for the process, 𝐶𝐶𝑣𝑣𝑣𝑣𝑖𝑖𝑜𝑜𝑣𝑣𝑔𝑔𝑠𝑠= 22 MJ/m3 (Khandelwal & Gupta, 2009).
𝑃𝑃𝑟𝑟𝑒𝑒𝑟𝑟𝑟𝑟𝑖𝑖𝑟𝑟𝑒𝑒𝑑𝑑 = 𝑄𝑄𝑣𝑣𝑖𝑖𝑜𝑜𝑣𝑣𝑔𝑔𝑠𝑠 × 𝐶𝐶𝑣𝑣𝑣𝑣𝑖𝑖𝑜𝑜𝑣𝑣𝑔𝑔𝑠𝑠 = 0.68×22×103
3600= 4.1555 (3.17)
Where,
𝐶𝐶𝑣𝑣𝑣𝑣𝑖𝑖𝑜𝑜𝑣𝑣𝑔𝑔𝑠𝑠 = Calorific value of biogas
𝑃𝑃𝑟𝑟𝑒𝑒𝑟𝑟𝑟𝑟𝑖𝑖𝑟𝑟𝑒𝑒𝑑𝑑 = Power required
The power required of the process is 4.16 kW.
3.2.3 Design calculations of stove parameters
(i) Injector jet diameter or orifice jet diameter
The Injector jet diameter, 𝑑𝑑𝑗𝑗 was calculated from Equation 3.18:
𝑑𝑑𝑗𝑗 = �𝑄𝑄𝑏𝑏𝑏𝑏𝑏𝑏𝑏𝑏𝑏𝑏𝑏𝑏
0.0361×𝐶𝐶𝑑𝑑× �
𝑠𝑠𝑝𝑝
4 = 0.0250 2𝑚𝑚 (3.18)
Where Gas flow rate, 𝑄𝑄𝑣𝑣𝑖𝑖𝑜𝑜𝑣𝑣𝑔𝑔𝑠𝑠 = 0.63 m3/h obtained from the experimental test results
conducted at CAMARTEC for boiling 2.5 litres of water to a boiling point of 95.23 ℃ during
HPCSP. The pressure has been considered from the pressure measurements taken for the bio
digester at CARMATEC was 8.5 mbar and orifice diameter of 2.5 mm has been calculated
from Equation 3.18 and as used as the input value for CFD simulation in Section 3.2.4. The
area of the injector orifice (Aj) was determined as follows.
𝐴𝐴𝑗𝑗 =𝜋𝜋×�𝑑𝑑𝑗𝑗�2
4= 4.908 × 10−06 𝑚𝑚2 (3.19)
The velocity of biogas in an injector jet, 𝑉𝑉𝑣𝑣𝑔𝑔𝑠𝑠 was then
19
𝑉𝑉𝑣𝑣𝑔𝑔𝑠𝑠 =𝑄𝑄𝑏𝑏𝑏𝑏𝑏𝑏𝑏𝑏𝑏𝑏𝑏𝑏
𝐴𝐴𝑗𝑗= 36.165 𝑚𝑚𝑚𝑚−1 (3.20)
Gas flow rate, 𝑄𝑄 = 0.046101 × 𝐶𝐶𝐷𝐷 × 𝑑𝑑𝑗𝑗2 × �𝑝𝑝
𝑠𝑠4 ,
(ii) Determination of throat size, 𝑑𝑑𝑡𝑡
For complete combustion, the stoichiometric air required is 5.7. At that point the entrainment
ratio, 𝑟𝑟 is 5.7/2 = 2.85. The flow rate of the biogas and air mixture at ideal air circulation is
determined by using Equation 3.20; throat diameter was computed using Prig’s formula
which shows in Equation 3.21:
𝑑𝑑𝑡𝑡 = �� 𝑟𝑟√𝑠𝑠
+ 1� 𝑑𝑑𝑗𝑗� = 9.85 𝑚𝑚𝑚𝑚 (3.21)
The stoichiometric air requirement value of primary air of 5.7 specifically instead of using r =
2.85 to perform good aeration and control utilizing primary air stream adjuster. So, the way to
better design the diameter of the throat will be 18 mm, at that point the throat area gets to be
254.469 mm2. The area of air inlet ports must have the same to that of the throat (Fulford,
1996). The exact size depends on the standard pipe sizes available. The gas pressure within
the throat can be evaluated by using Equation 3.8 as:
𝑝𝑝𝑡𝑡 = 𝑝𝑝𝑗𝑗 − 𝜌𝜌𝑔𝑔𝑉𝑉𝑗𝑗
2
2𝑣𝑣�1 − �
𝑑𝑑𝑗𝑗
𝑑𝑑𝑡𝑡�
4� = 99920 𝑃𝑃𝑃𝑃
The value of 𝑝𝑝𝑗𝑗 is 105 Pa as the throat is open to the air. This pressure drop is adequate to
draw primary air by the air inlet ports to mix with the gas within the mixing chamber
(Fulford, 1996). The Reynolds number was calculated by checking the pressure drop due to
the stream of biogas and air mixing within the mixing chamber using Equation 3.10:
𝑅𝑅𝑒𝑒 = 4𝜌𝜌𝑚𝑚𝑄𝑄𝑚𝑚𝜋𝜋𝜇𝜇𝑚𝑚𝑑𝑑𝑡𝑡
= 2978
Hence, Re > 2000 (flow of biogas air- mixture in the mixing tube is turbulent). Friction loss
was calculated using Equation 3.12:
𝑓𝑓 =0.316
�𝑅𝑅𝐸𝐸34�
= 0.316
(2978)14
= 0.0428
20
Pressure drop (ΔP) may well be calculated using Equation 3.11 is ΔP = 1.85 Pa. So, the
driving pressure is higher than pressure drop ∆p within the throat.
(iii) Design of burner port
The flame speed of biogas is only 0.25 m/s (Fulford, 1996). The velocity supply of mixture
(𝑣𝑣𝑝𝑝) using Equation 3.13 is 𝑣𝑣𝑝𝑝 = ≪ 0.25 ms−1. The total area of the burner port will be
calculated as:
𝐴𝐴𝑝𝑝 > 𝑄𝑄𝑚𝑚𝑉𝑉𝑝𝑝
≫ 0.0025 𝑚𝑚2 (3.21)
Fulford (1996) and Itodo, Agyo and Yusuf (2007) in their study utilized 5 mm and 2.5 mm
holes diameter respectively. The flame lift was recorded at a distance across less than 2.5 mm
(Olubiyi, 2012). Utilizing 3 mm port distance across to reduce the problem of flame lift, the
number of ports will be:
𝐸𝐸𝑝𝑝 = 4𝐴𝐴𝑝𝑝
𝜋𝜋𝑑𝑑𝑝𝑝2 = 354 Ports (3.22)
Using flame stabilization, the number of burner ports can be reduced up to 1/5, so 71 ports
are sufficient (Fulford, 1996). Applying 40 holes, with 7.0 mm gap distance between centre
holes, arranged in a circular pattern, gives a total circumference of 40 × (2.5 + 7.0) =
380 𝑚𝑚𝑚𝑚. Using 31 holes, with 4.5 mm gap distance between centre holes are placed around a
top of pitch circle diameter 54 𝑚𝑚𝑚𝑚.
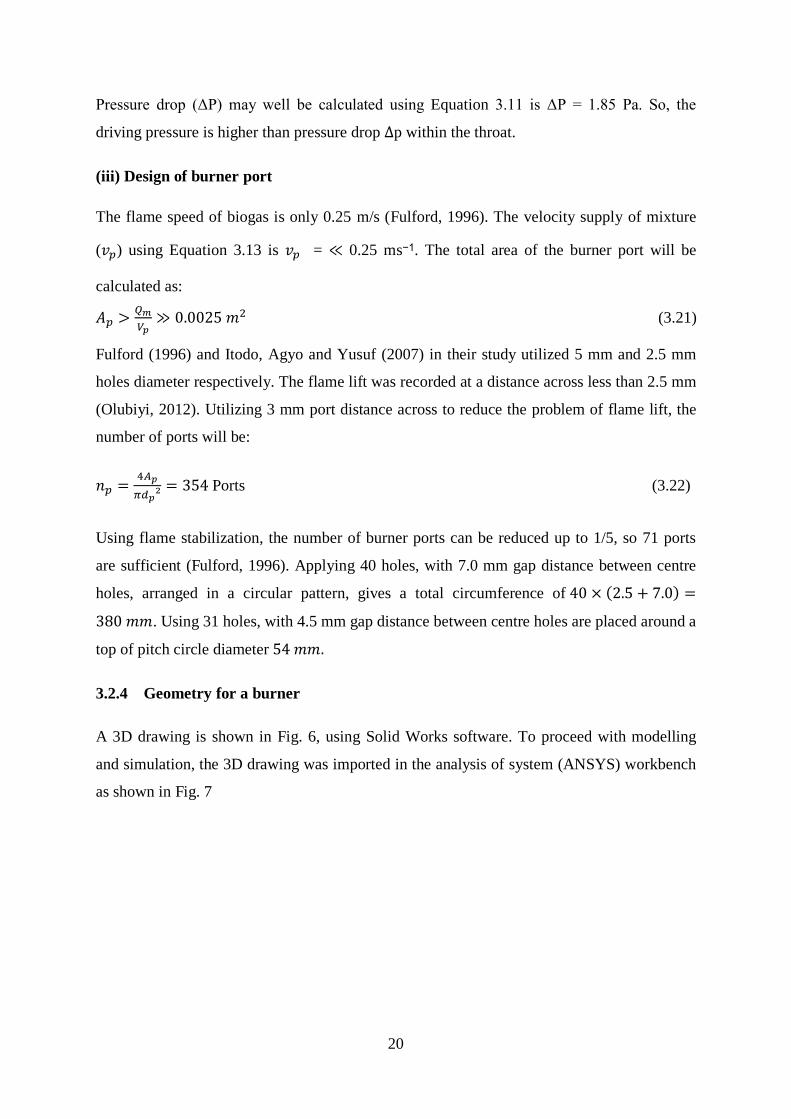
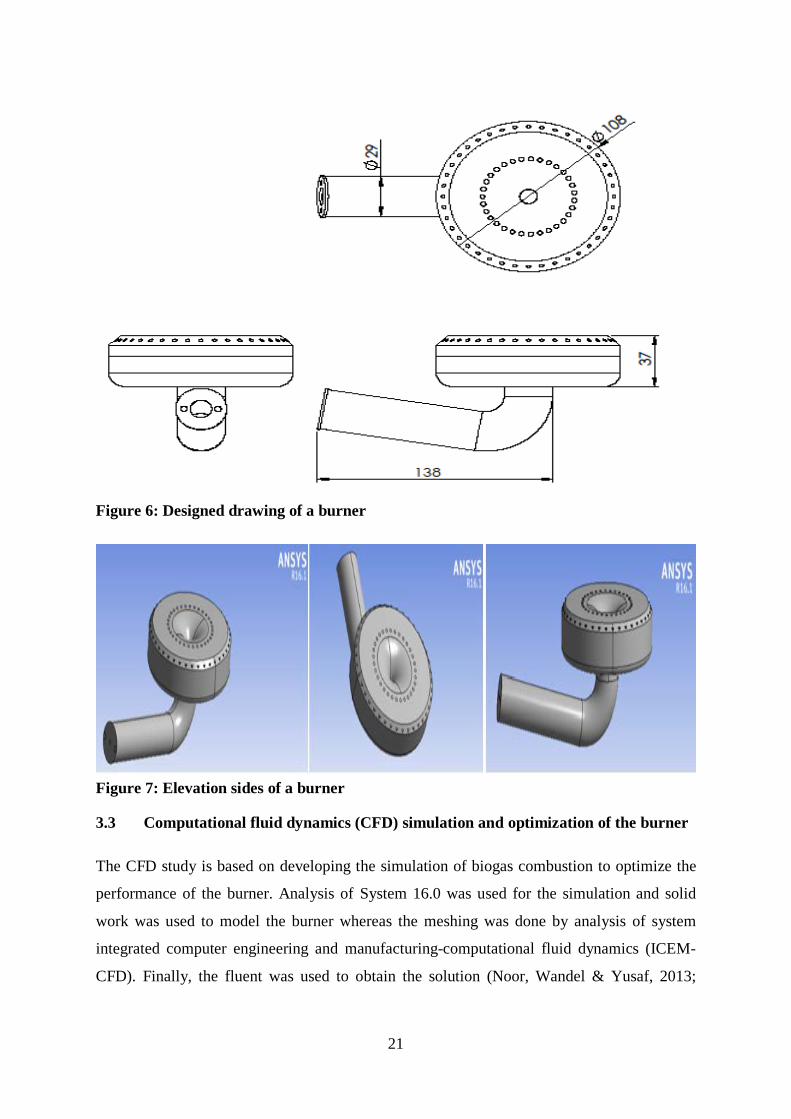
3.2.4 Geometry for a burner
A 3D drawing is shown in Fig. 6, using Solid Works software. To proceed with modelling
and simulation, the 3D drawing was imported in the analysis of system (ANSYS) workbench
as shown in Fig. 7
21
Figure 6: Designed drawing of a burner
Figure 7: Elevation sides of a burner
3.3 Computational fluid dynamics (CFD) simulation and optimization of the burner
The CFD study is based on developing the simulation of biogas combustion to optimize the
performance of the burner. Analysis of System 16.0 was used for the simulation and solid
work was used to model the burner whereas the meshing was done by analysis of system
integrated computer engineering and manufacturing-computational fluid dynamics (ICEM-
CFD). Finally, the fluent was used to obtain the solution (Noor, Wandel & Yusaf, 2013;
22
Nordin, Yunus & Ani, 2014). Computational fluid dynamics can design and simulate a
model without physically building the model.
Numerical modelling techniques including but not limited to CFD methods have gained fame
in academic and industrial sectors because of the availability of efficient computer systems. It
is possible to optimize the system design, operations and understand physicochemical
properties inside the model using CFD simulations which can consequently reduce the
number of experiments required for characterization of the system. Spatial and temporal
profiles of different system variables that may be impossible to measure or are accessible
only by expensive experiments can be obtained through simulations (Nordin, Yunus & Ani,
2014).
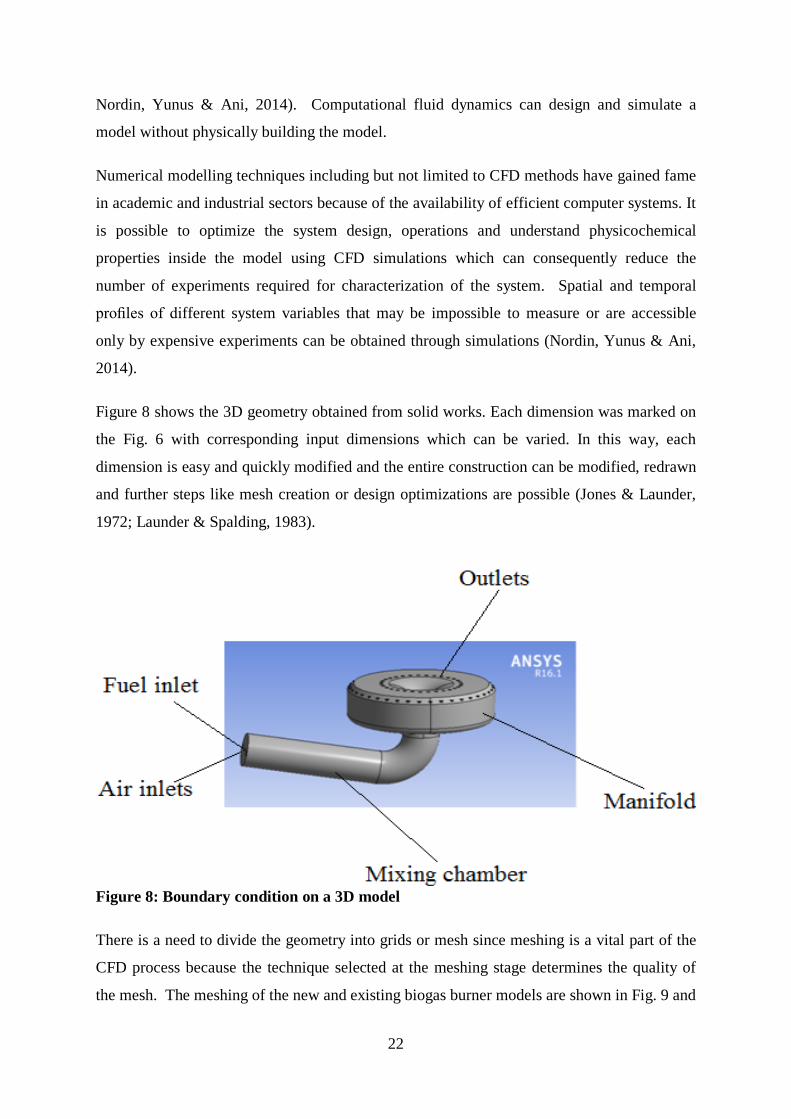
Figure 8 shows the 3D geometry obtained from solid works. Each dimension was marked on
the Fig. 6 with corresponding input dimensions which can be varied. In this way, each
dimension is easy and quickly modified and the entire construction can be modified, redrawn
and further steps like mesh creation or design optimizations are possible (Jones & Launder,
1972; Launder & Spalding, 1983).
Figure 8: Boundary condition on a 3D model
There is a need to divide the geometry into grids or mesh since meshing is a vital part of the
CFD process because the technique selected at the meshing stage determines the quality of
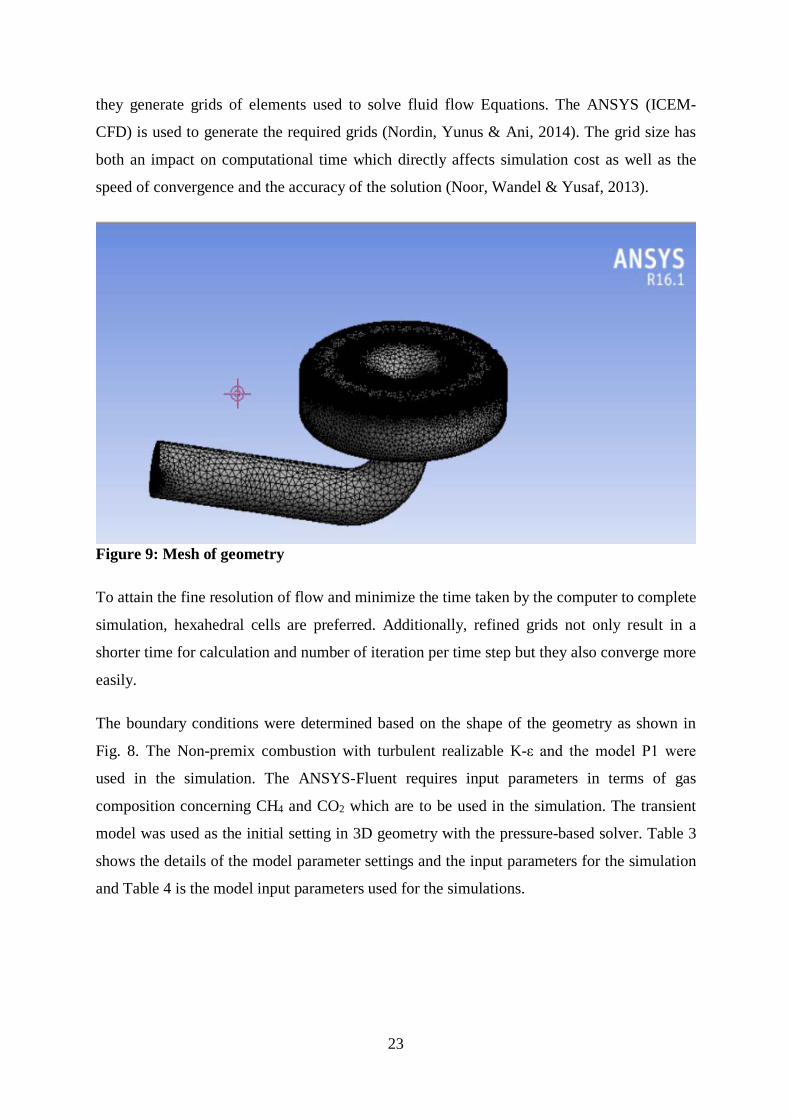
the mesh. The meshing of the new and existing biogas burner models are shown in Fig. 9 and
23
they generate grids of elements used to solve fluid flow Equations. The ANSYS (ICEM-
CFD) is used to generate the required grids (Nordin, Yunus & Ani, 2014). The grid size has
both an impact on computational time which directly affects simulation cost as well as the
speed of convergence and the accuracy of the solution (Noor, Wandel & Yusaf, 2013).
Figure 9: Mesh of geometry
To attain the fine resolution of flow and minimize the time taken by the computer to complete
simulation, hexahedral cells are preferred. Additionally, refined grids not only result in a
shorter time for calculation and number of iteration per time step but they also converge more
easily.
The boundary conditions were determined based on the shape of the geometry as shown in
Fig. 8. The Non-premix combustion with turbulent realizable K-ε and the model P1 were
used in the simulation. The ANSYS-Fluent requires input parameters in terms of gas
composition concerning CH4 and CO2 which are to be used in the simulation. The transient
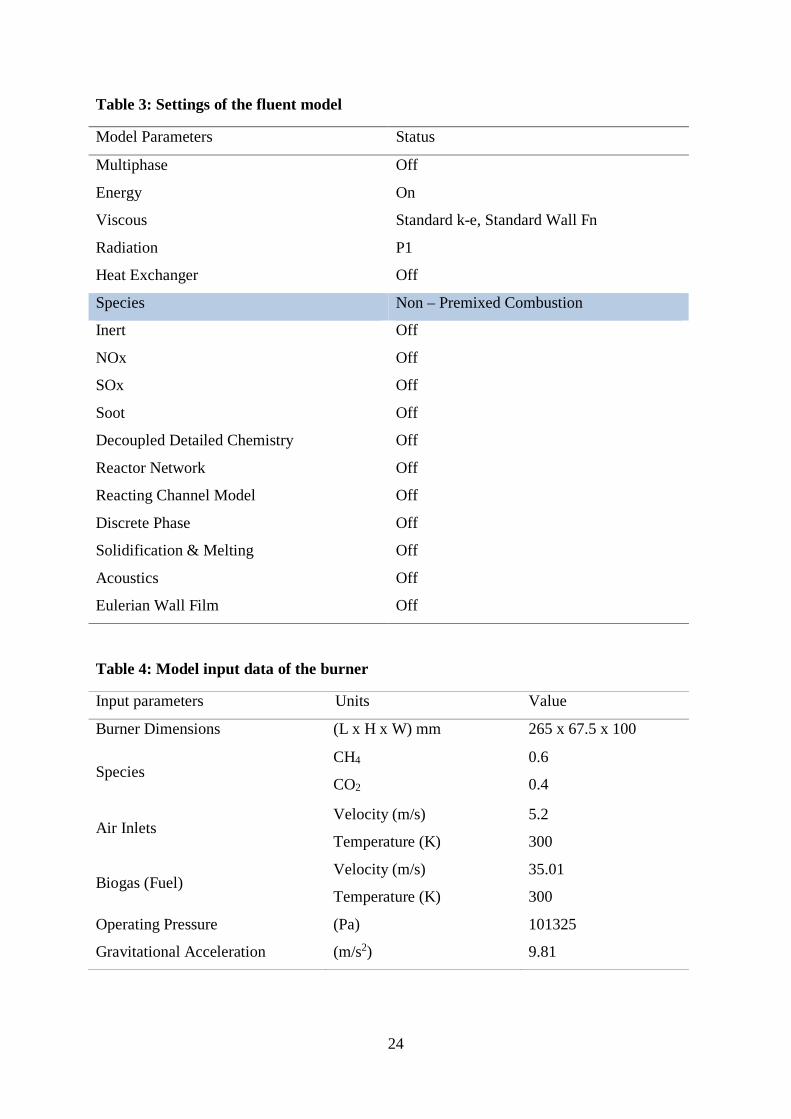
model was used as the initial setting in 3D geometry with the pressure-based solver. Table 3
shows the details of the model parameter settings and the input parameters for the simulation
and Table 4 is the model input parameters used for the simulations.
24
Table 3: Settings of the fluent model
Model Parameters Status
Multiphase Off
Energy On
Viscous Standard k-e, Standard Wall Fn
Radiation P1
Heat Exchanger Off
Species Non – Premixed Combustion
Inert Off
NOx Off
SOx Off
Soot Off
Decoupled Detailed Chemistry Off
Reactor Network Off
Reacting Channel Model Off
Discrete Phase Off
Solidification & Melting Off
Acoustics Off
Eulerian Wall Film Off
Table 4: Model input data of the burner
Input parameters Units Value
Burner Dimensions (L x H x W) mm 265 x 67.5 x 100
Species CH4 0.6
CO2 0.4
Air Inlets Velocity (m/s) 5.2
Temperature (K) 300
Biogas (Fuel) Velocity (m/s) 35.01
Temperature (K) 300
Operating Pressure (Pa) 101325
Gravitational Acceleration (m/s2) 9.81
25
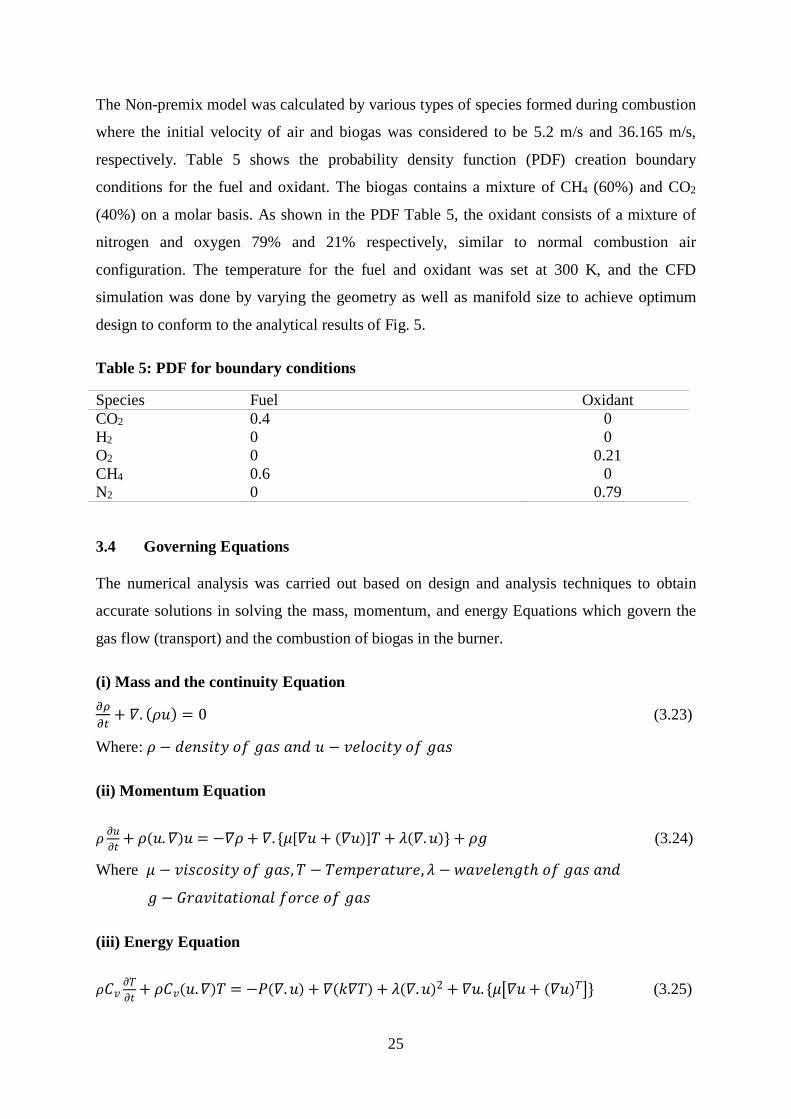
The Non-premix model was calculated by various types of species formed during combustion
where the initial velocity of air and biogas was considered to be 5.2 m/s and 36.165 m/s,
respectively. Table 5 shows the probability density function (PDF) creation boundary
conditions for the fuel and oxidant. The biogas contains a mixture of CH4 (60%) and CO2
(40%) on a molar basis. As shown in the PDF Table 5, the oxidant consists of a mixture of
nitrogen and oxygen 79% and 21% respectively, similar to normal combustion air
configuration. The temperature for the fuel and oxidant was set at 300 K, and the CFD
simulation was done by varying the geometry as well as manifold size to achieve optimum
design to conform to the analytical results of Fig. 5.
Table 5: PDF for boundary conditions
Species Fuel Oxidant CO2 0.4 0 H2 0 0 O2 0 0.21 CH4 0.6 0 N2 0 0.79
3.4 Governing Equations
The numerical analysis was carried out based on design and analysis techniques to obtain
accurate solutions in solving the mass, momentum, and energy Equations which govern the
gas flow (transport) and the combustion of biogas in the burner.
(i) Mass and the continuity Equation 𝜕𝜕𝜌𝜌𝜕𝜕𝑡𝑡
+ 𝛻𝛻. (𝜌𝜌𝜌𝜌) = 0 (3.23)
Where: 𝜌𝜌 − 𝑑𝑑𝐸𝐸𝐸𝐸𝑚𝑚𝑑𝑑𝑡𝑡𝐸𝐸 𝑜𝑜𝑓𝑓 𝑔𝑔𝑃𝑃𝑚𝑚 𝑃𝑃𝐸𝐸𝑑𝑑 𝜌𝜌 − 𝑣𝑣𝐸𝐸𝑙𝑙𝑜𝑜𝑣𝑣𝑑𝑑𝑡𝑡𝐸𝐸 𝑜𝑜𝑓𝑓 𝑔𝑔𝑃𝑃𝑚𝑚
(ii) Momentum Equation
𝜌𝜌 𝜕𝜕𝜌𝜌𝜕𝜕𝑡𝑡 + 𝜌𝜌(𝜌𝜌. 𝛻𝛻)𝜌𝜌 = −𝛻𝛻𝜌𝜌 + 𝛻𝛻. {𝜇𝜇[𝛻𝛻𝜌𝜌 + (𝛻𝛻𝜌𝜌)]𝑇𝑇 + 𝜆𝜆(𝛻𝛻. 𝜌𝜌)} + 𝜌𝜌𝑔𝑔 (3.24)
Where 𝜇𝜇 − 𝑣𝑣𝑑𝑑𝑚𝑚𝑣𝑣𝑜𝑜𝑚𝑚𝑑𝑑𝑡𝑡𝐸𝐸 𝑜𝑜𝑓𝑓 𝑔𝑔𝑃𝑃𝑚𝑚, 𝑇𝑇 − 𝑇𝑇𝐸𝐸𝑚𝑚𝑝𝑝𝐸𝐸𝑟𝑟𝑃𝑃𝑡𝑡𝜌𝜌𝑟𝑟𝐸𝐸, 𝜆𝜆 − 𝑤𝑤𝑃𝑃𝑣𝑣𝐸𝐸𝑙𝑙𝐸𝐸𝐸𝐸𝑔𝑔𝑡𝑡ℎ 𝑜𝑜𝑓𝑓 𝑔𝑔𝑃𝑃𝑚𝑚 𝑃𝑃𝐸𝐸𝑑𝑑
𝑔𝑔 − 𝐺𝐺𝑟𝑟𝑃𝑃𝑣𝑣𝑑𝑑𝑡𝑡𝑃𝑃𝑡𝑡𝑑𝑑𝑜𝑜𝐸𝐸𝑃𝑃𝑙𝑙 𝑓𝑓𝑜𝑜𝑟𝑟𝑣𝑣𝐸𝐸 𝑜𝑜𝑓𝑓 𝑔𝑔𝑃𝑃𝑚𝑚
(iii) Energy Equation
𝜌𝜌𝐶𝐶𝑣𝑣𝜕𝜕𝑇𝑇𝜕𝜕𝑡𝑡 + 𝜌𝜌𝐶𝐶𝑣𝑣(𝜌𝜌. 𝛻𝛻)𝑇𝑇 = −𝑃𝑃(𝛻𝛻. 𝜌𝜌) + 𝛻𝛻(𝑘𝑘𝛻𝛻𝑇𝑇) + 𝜆𝜆(𝛻𝛻. 𝜌𝜌)2 + 𝛻𝛻𝜌𝜌. {𝜇𝜇�𝛻𝛻𝜌𝜌 + (𝛻𝛻𝜌𝜌)𝑇𝑇�} (3.25)
26
Where 𝐶𝐶𝑣𝑣 − 𝐶𝐶𝑃𝑃𝑙𝑙𝑜𝑜𝑟𝑟𝑑𝑑𝑓𝑓𝑑𝑑𝑣𝑣 𝑣𝑣𝑃𝑃𝑙𝑙𝜌𝜌𝐸𝐸 𝑜𝑜𝑓𝑓 𝑔𝑔𝑃𝑃𝑚𝑚, 𝑃𝑃 − 𝑃𝑃𝑟𝑟𝐸𝐸𝑚𝑚𝑚𝑚𝜌𝜌𝑟𝑟𝐸𝐸 𝑜𝑜𝑓𝑓 𝑔𝑔𝑃𝑃𝑚𝑚 𝑃𝑃𝐸𝐸𝑑𝑑 𝑘𝑘 − 𝑣𝑣𝑜𝑜𝑚𝑚𝑡𝑡𝑃𝑃𝐸𝐸𝑡𝑡 𝑣𝑣𝑃𝑃𝑙𝑙𝜌𝜌𝐸𝐸
(iv) Species mass fraction
𝜕𝜕𝜌𝜌𝑚𝑚𝑙𝑙𝜕𝜕𝑡𝑡
+𝛻𝛻. 𝜌𝜌𝜌𝜌𝑚𝑚𝑙𝑙=𝛻𝛻. 𝐷𝐷𝑒𝑒𝛻𝛻𝑚𝑚𝑙𝑙-𝑅𝑅𝑙𝑙 (3.26)
3.5 Fabrication of the optimized biogas stove burner
3.5.1 Materials used
Materials used for the fabrication of a biogas burner are cast brass, flat bar, fibre wood for
legs, stainless steel and noncorrosive paint. Brass scraps and brass chips which were collected
from metal scrapers at SIDO industrial area and other machine shops, in Arusha, Tanzania.
Copper, mild steel and stainless steel materials were purchased from local hardware in
Arusha.
3.5.2 Fabrication of a stove
Fabrication of the prototype was done in the workshops of CAMARTEC and ATC in Arusha,
Tanzania. The stove parameters were obtained from the analytical design calculations. Tripod
and stove frame were made by using mild steel and stainless steel respectively. Tripod was
painted with corrosion-resistant materials to avoid corrosion during the lifetime and the gas
burner was fabricated by using cast brass.
3.5.3 Prototype and physical layout
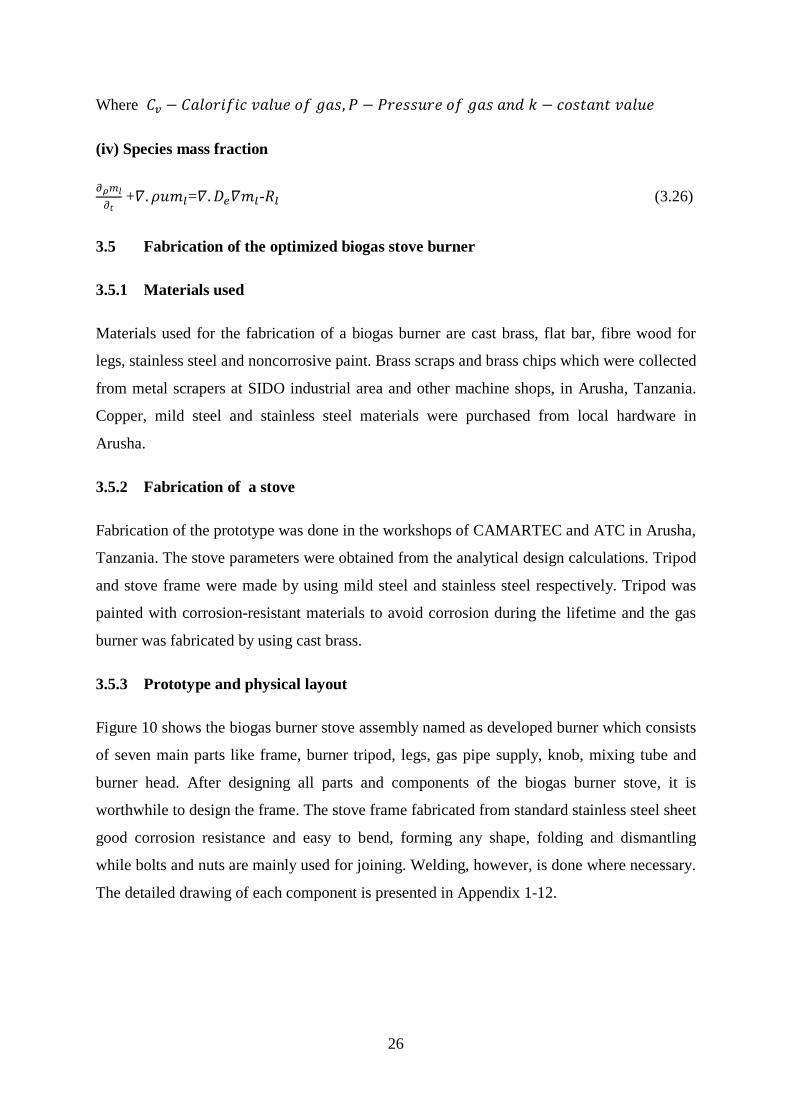
Figure 10 shows the biogas burner stove assembly named as developed burner which consists
of seven main parts like frame, burner tripod, legs, gas pipe supply, knob, mixing tube and
burner head. After designing all parts and components of the biogas burner stove, it is
worthwhile to design the frame. The stove frame fabricated from standard stainless steel sheet
good corrosion resistance and easy to bend, forming any shape, folding and dismantling
while bolts and nuts are mainly used for joining. Welding, however, is done where necessary.
The detailed drawing of each component is presented in Appendix 1-12.
27
Figure 10: Biogas burner stove assembly
3.6 Evaluation of the performance of the cookstoves
Experiments to determine the performance of the cook stoves were carried out in the energy
lab at CAMARTEC in Arusha, Tanzania. The area is located at 1415 m above sea level. One
window and a door were left open during experiments for good ventilation. The performance
of the developed burner stove was compared with that of Simgas and CAMARTEC burner
stoves. The experiments were designed to simulate real-life cooking processes and were
conducted using the WBT software version 3.0 (Bailis et al., 2007).
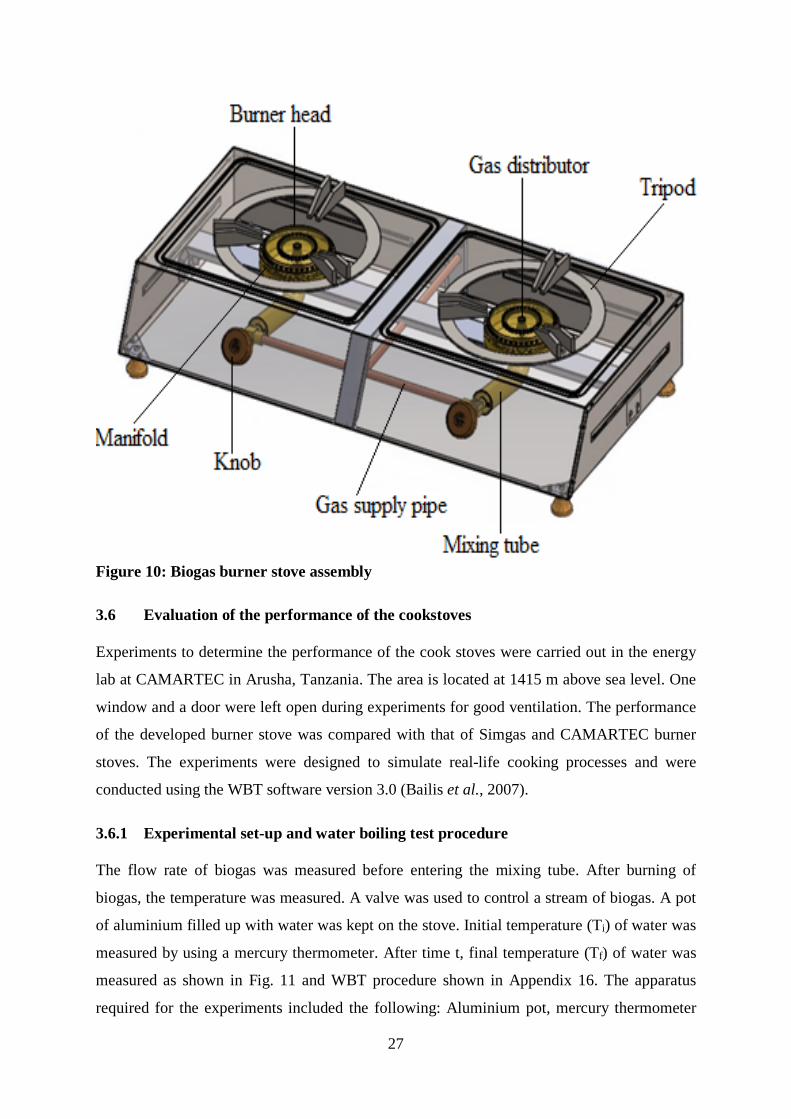
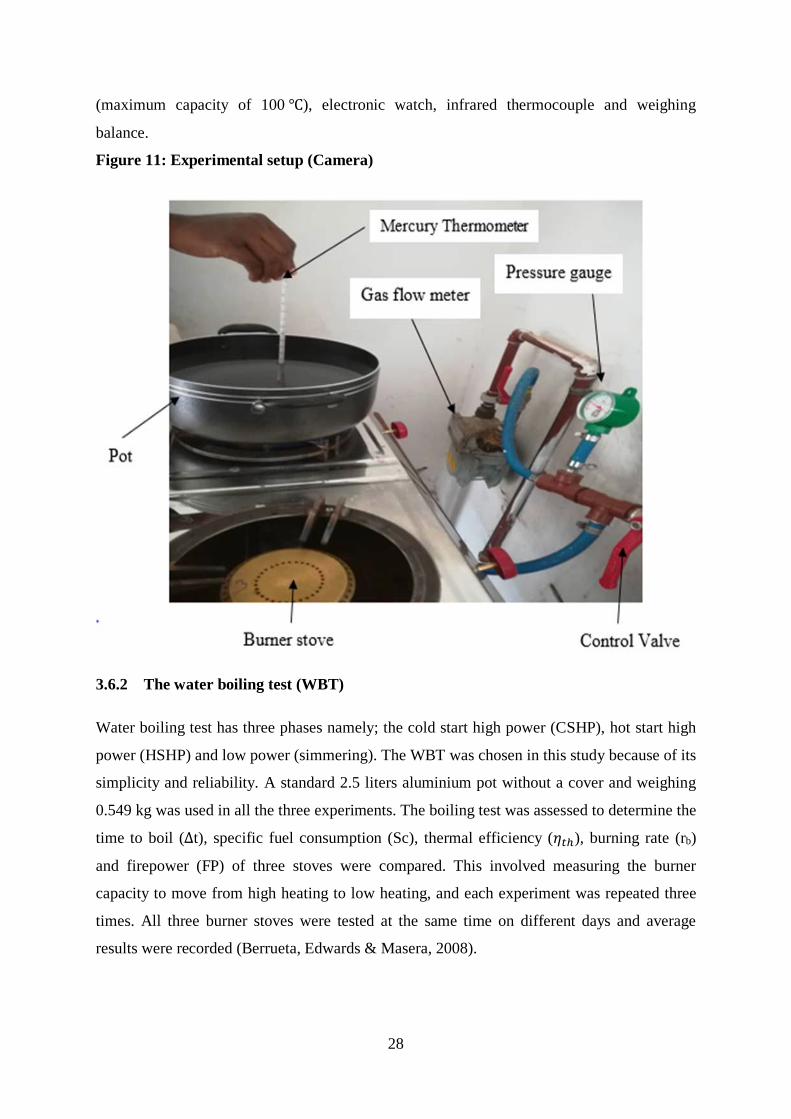
3.6.1 Experimental set-up and water boiling test procedure
The flow rate of biogas was measured before entering the mixing tube. After burning of
biogas, the temperature was measured. A valve was used to control a stream of biogas. A pot
of aluminium filled up with water was kept on the stove. Initial temperature (Ti) of water was
measured by using a mercury thermometer. After time t, final temperature (Tf) of water was
measured as shown in Fig. 11 and WBT procedure shown in Appendix 16. The apparatus
required for the experiments included the following: Aluminium pot, mercury thermometer
28
(maximum capacity of 100 ℃), electronic watch, infrared thermocouple and weighing
balance.
Figure 11: Experimental setup (Camera)
3.6.2 The water boiling test (WBT)
Water boiling test has three phases namely; the cold start high power (CSHP), hot start high
power (HSHP) and low power (simmering). The WBT was chosen in this study because of its
simplicity and reliability. A standard 2.5 liters aluminium pot without a cover and weighing
0.549 kg was used in all the three experiments. The boiling test was assessed to determine the
time to boil (∆t), specific fuel consumption (Sc), thermal efficiency (𝜂𝜂𝑡𝑡ℎ), burning rate (rb)
and firepower (FP) of three stoves were compared. This involved measuring the burner
capacity to move from high heating to low heating, and each experiment was repeated three
times. All three burner stoves were tested at the same time on different days and average
results were recorded (Berrueta, Edwards & Masera, 2008).
29
(i) Determination of local boiling point
The altitude above the sea level at CAMARTEC is 1415 m and this translates to the local
boiling point of 95.23 ℃ according to Equation 3.28 (Bailis et al., 2007).
𝑇𝑇𝑣𝑣 = �100 − ℎ300
� ℃ (3.27)
Where 𝑇𝑇𝑣𝑣 the boiling point (Celsius) and h is the altitude of an area (m)
(ii) Phase 1; cold start high power (CSHP)
This is the primary stage of WBT where water at room temperature (23 ℃) is heated up to a
local boiling temperature (95.23 ℃). The ambient temperature was measured with a mercury
thermometer. The 2.5 litres of water was poured into an aluminium pot weighing 0.549 kg
and the temperature of the water inside the pot was monitored by a mercury thermometer.
The thermometer was suspended at the center of the pot by hand-holding, and the gap
between the bottom surface of the pot and thermometer tip was 5 mm as recommended
(Bailis et al., 2007). Biogas fuel was utilized to heat the water from the initial temperature
(Ti) to the local boiling point. After that, the water was left on the stove for around 5 min
before the stove was switched off. The amount of water remaining after the test, final water
temperature (Tf) and time to boil, ∆𝑡𝑡 were recorded.
(iii) Phase 2: hot start high power (HSHP)
The hot start high power phase includes determination of fuel demand and time required by a
cookstove, while still hot to heat a pot of water to the local boiling point of 95.23 ℃. Similar
steps as in phase 1 were followed, the only difference being that the stove was above ambient
temperature when it was started after boiling, the hot water was not discarded but held for the
third phase. Both temperature and time used in phase 2 were recorded.
(iv) Phase 3: low power (Simmering)
The simmering test was done after the HSHP test and included measuring the stove’s
capacity to move from high to low power. The temperature of the water was kept 3-6 ℃
below the boiling point for 45 min. This stage was utilized to simulate the long time required
for cooking local food. At the end of the experiment, the remaining hot water was weighed.
30
(v) Time to boil water, ( ∆𝑡𝑡)
The time to boil, ∆𝑡𝑡 = 𝑡𝑡𝑓𝑓 − 𝑡𝑡𝑖𝑖
Where
𝑡𝑡𝑓𝑓: End time for test (min),
𝑡𝑡𝑖𝑖 : Start time for test (min)
This parameter was important for high power cold start phase (HPCSP) and high power hot
start phase (HPHSP). For low power (simmering), the test was performed over a set time of
45 min.
(vi) Thermal efficiency, ɳ𝑡𝑡
Thermal efficiency was calculated by the ratio of the energy used during heating and
vaporizing water to the energy consumed by burning the biogas fuel (Demissie, Ramayya &
Nega, 2016a).
𝑇𝑇ℎ𝐸𝐸𝑟𝑟𝑚𝑚𝑃𝑃𝑙𝑙 𝐸𝐸𝑓𝑓𝑓𝑓𝑑𝑑𝑣𝑣𝑑𝑑𝐸𝐸𝐸𝐸𝑣𝑣𝐸𝐸, ɳ𝑡𝑡 = ((𝐶𝐶𝑝𝑝𝑝𝑝×𝑀𝑀𝑝𝑝 )×(𝑇𝑇𝑓𝑓−𝑇𝑇𝑏𝑏))+(𝐻𝐻𝑣𝑣×𝑊𝑊𝑣𝑣)𝐶𝐶𝑣𝑣 𝑏𝑏𝑓𝑓 𝑏𝑏𝑏𝑏𝑏𝑏𝑏𝑏𝑏𝑏𝑏𝑏×𝑉𝑉𝑏𝑏𝑏𝑏
× 100 (3.28)
Where,
𝑉𝑉𝑣𝑣𝑣𝑣: Volume of biogas consumed, m3/h
𝑀𝑀𝑤𝑤: Mass of water boiled, kg
𝐶𝐶𝑣𝑣𝑣𝑣𝑣𝑣: Calorific value of fuel (biogas) = 22 MJ/kg
𝐶𝐶𝑝𝑝𝑤𝑤: Specific heat capacity of water = 4186 J/kg ℃
𝑇𝑇𝑓𝑓: Boiling temperature of water = 95.23 ℃
𝑊𝑊𝑣𝑣: Water evaporated from the pot
𝑇𝑇𝑖𝑖: The initial temperature of the water,℃
𝐻𝐻𝑣𝑣: Latent heat of evaporation of water, 2260 J/g
(vii) Specific fuel consumption (SC)
Specific fuel consumption is the proportion of the sum of biogas fuel consumed to the sum of
water remaining within the pot at the end of the test. Specific fuel consumption was
calculated using Equation 3.30 (Bailis et al., 2007).
𝑆𝑆𝐶𝐶 = 𝑉𝑉𝑏𝑏𝑏𝑏
𝑊𝑊𝑟𝑟 (3.29)
31
where,
SC: Specific fuel consumption of the stove (g/L),
Vbg: Volume of biogas fuel expended during the phase of the test (g) and
Wr: The mass of water remaining at the end of the test (g)
(viii) Firepower (FP)
Firepower is the proportion of fuel energy utilization by stove per unit time. It was calculated
by Equation 3.30 (Bailis et al., 2007).
𝐹𝐹𝑃𝑃 = 𝑉𝑉𝑏𝑏𝑏𝑏×𝐿𝐿𝐻𝐻𝑉𝑉60×(𝑡𝑡𝑓𝑓−𝑡𝑡𝑏𝑏)
(3.30)
Where,
FP: Power of stove in watts,
Vbg: Volume of biogas consumed during the stage of the test (m3/h)
LHV: Lower heat value of the biogas (kJ/kg)
tf : Time at the end of the test (min)
ti: Time at the start of the test (min)
(ix) Burning rate
Burning rate (𝑟𝑟𝑣𝑣) is used to measure the rate of fuel consumption during the experiment.
𝑟𝑟𝑣𝑣 = 𝑣𝑣𝑏𝑏𝑏𝑏
∆𝑡𝑡 (3.31)
Where,
Vbg is the Volume of biogas consumed during the test (m3/h),
∆t is the total time taken to conduct the test (min),
(x) Temperature corrected time to boil(∆𝑡𝑡𝑇𝑇)
This adjusts the results to a standard 75℃ temperature change (from 25-100 ℃). This
adjustment standardizes the results and facilitates comparison between tests that may have
used water with higher or lower initial temperatures. It’s calculated by using the Equation
below.
∆𝑡𝑡𝑇𝑇 = ∆𝑡𝑡 × 75𝑇𝑇1𝑓𝑓−𝑇𝑇1𝑏𝑏
(3.32)
Where ∆𝑡𝑡𝑇𝑇temperature corrected time to boil (min) is, ∆𝑡𝑡 is time to boil (min), 𝑇𝑇1𝑓𝑓 is the
water temperature at the end of the test (℃), 𝑇𝑇1𝑖𝑖 is the water temperature at the start of the
test (℃).
32
(xi) Temperature corrected specific fuel consumption
Corrects specific fuel consumption to account for differences in initial water temperatures.
This facilitates comparison of stoves tested on different days or in different environmental
conditions. The correction is a simple factor that “normalizes” the temperature change
observed in test conditions to a “standard” temperature change of 75℃ (from 25 to 100). It
was calculated using Equation 3.33:
𝑆𝑆𝐶𝐶𝑇𝑇 = 𝑆𝑆𝐶𝐶 × 75𝑇𝑇1𝑓𝑓−𝑇𝑇1𝑏𝑏
(3.33)
Where 𝑆𝑆𝐶𝐶𝑇𝑇 is the temp-corrected specific fuel consumption (grams of fuel/grams of water),
SC is the specific fuel consumption (grams of fuel/liter of water), 𝑇𝑇1𝑓𝑓 is the water
temperature at the end of the test (℃), and 𝑇𝑇1𝑖𝑖 is the water temperature at the start of the test
(℃).
(xii) Temperature corrected specific energy consumption
This metric is a measure of the amount of fuel energy required to produce one litre (or
kilogram) of boiling water starting with a cold stove. It is the temperature corrected specific
fuel consumption multiplied by the energy content of the fuel. It’s calculated by using
Equation 3.34:
𝑆𝑆𝑆𝑆𝑇𝑇 = 𝑆𝑆𝐶𝐶𝑇𝑇 × 𝐿𝐿𝐻𝐻𝑉𝑉1000
(3.34)
Where 𝑆𝑆𝑆𝑆𝑇𝑇 is the temperature corrected specific energy consumption (kJ/litre), 𝑆𝑆𝐶𝐶𝑇𝑇 is the
temp- corrected specific fuel consumption (grams of fuel/grams of water), and LHV is the
lower heating value of the fuel also known as net calorific value (kJ/kg) (Bailis et al., 2007).
(xiv) Turn down ratio (TDR)
This is the ratio of average high firepower to average low firepower. It represents the degree
to which the firepower of the stove can be controlled by the user. It’s calculated using
Equation 3.35:
𝑇𝑇𝐷𝐷𝑅𝑅 = 𝐹𝐹𝐹𝐹𝑐𝑐𝐹𝐹𝐹𝐹𝑏𝑏
(3.35)
33
Where,
𝐹𝐹𝑃𝑃𝑐𝑐 and 𝐹𝐹𝑃𝑃𝑠𝑠: Firepower (W) during cold and simmering phases respectively (Bailis et al.,
2007).
(xv) Overall efficiency and thermal efficiency
Overall efficiency was calculated by dividing output energy by input energy as shown in
Equation 3.37 (Demissie, Ramayya & Nega, 2016a). The heat energy absorbed by the vessel
is also considered.
𝑆𝑆𝑓𝑓𝑓𝑓𝑑𝑑𝑣𝑣𝑑𝑑𝐸𝐸𝐸𝐸𝑣𝑣𝐸𝐸𝑜𝑜𝑣𝑣𝑒𝑒𝑟𝑟𝑔𝑔𝑙𝑙𝑙𝑙 = �(𝑀𝑀𝑝𝑝×𝐶𝐶𝑃𝑃𝑝𝑝(𝑇𝑇𝑏𝑏−𝑇𝑇𝑏𝑏))+(𝑀𝑀𝑣𝑣×𝐶𝐶𝑃𝑃𝑣𝑣(𝑇𝑇𝑏𝑏−𝑇𝑇𝑏𝑏))𝑉𝑉𝑏𝑏𝑏𝑏×𝐶𝐶𝑣𝑣𝑓𝑓
� × 100 (3.36)
Where,
Cpw: Specific heat capacity of water = 4186 J/kg ℃
Mw: Mass of water boiled, kg
Cvf: Calorific value of fuel (biogas) = 22 MJ/kg or 22 MJ/m3
Mv: Mass of the vessel, kg
Vbg: Volume of biogas consumed, m3/h
Ti: The Initial temperature of the water,℃
Cpv: Specific heat capacity of aluminium vessel = 125 J/kg ℃
Tb: Boiling temperature of water
34
CHAPTER FOUR
RESULTS AND DISCUSSION
4.1 Results of analytical design
The procedure and analytical design of the burner included the findings of various important
parameters including throat diameter, length of mixing chamber, injector jet diameter, the
diameter of primary air inlets, number and diameter of flame portholes and also the diameter
and height of manifold. Design calculations using various formulas were applied in obtaining
the different burner parameters presented in Table 6. The design of the parameters between
analytical design calculation and specification values were compared well. In the comparison,
there are some differences which have been observed such as biogas flow rate, throat and
mixing tube length.
Table 6: The results of the analytical design calculation
S/N Parameters Analytical value
Specification values
1 Biogas flow rate (m3h-1) 0.6398 0.648
2 Injector diameter (mm) 2.5 2.5
3 Throat diameter (mm) 18 25
4 Number of burner ports 71 71
5 Mixing tube length (mm) 180 138
6 Internal manifold diameter (mm) 100 100
7 Diameter of burner port (mm) 2.5 2.5
8 Primary air inlet area (mm2) 25.13 25.13
4.2 Computational fluid dynamic modeling results
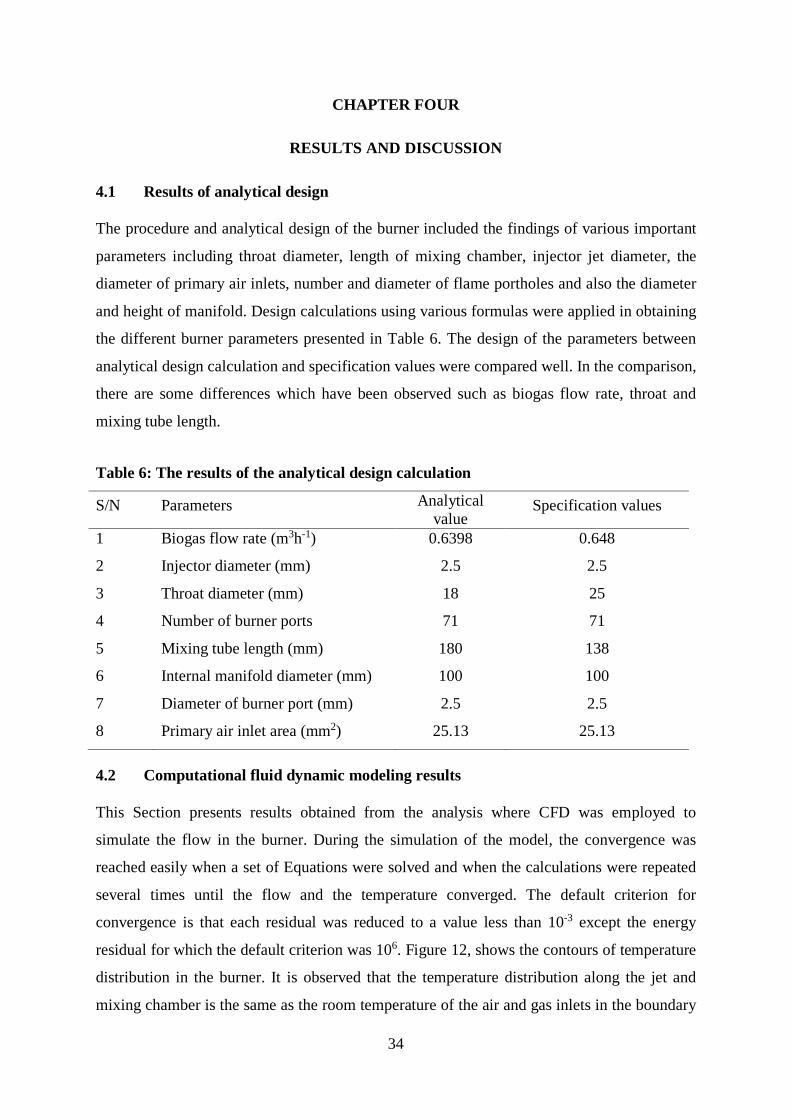
This Section presents results obtained from the analysis where CFD was employed to
simulate the flow in the burner. During the simulation of the model, the convergence was
reached easily when a set of Equations were solved and when the calculations were repeated
several times until the flow and the temperature converged. The default criterion for
convergence is that each residual was reduced to a value less than 10-3 except the energy
residual for which the default criterion was 106. Figure 12, shows the contours of temperature
distribution in the burner. It is observed that the temperature distribution along the jet and
mixing chamber is the same as the room temperature of the air and gas inlets in the boundary
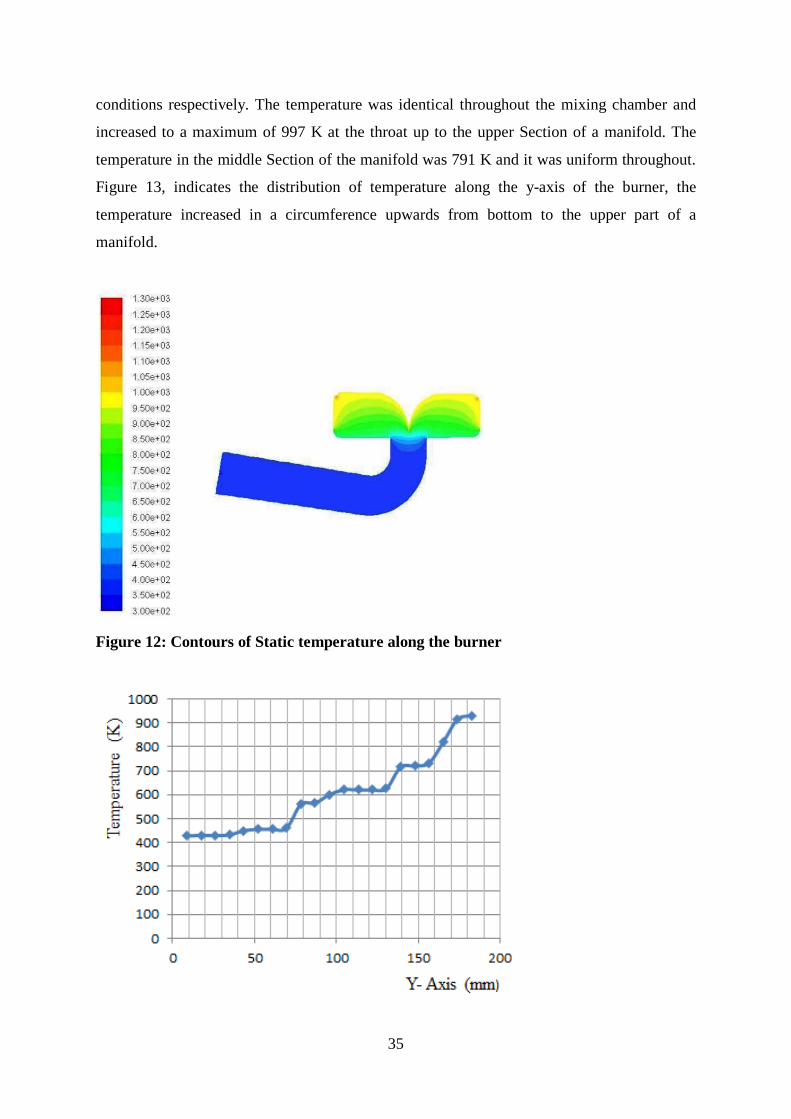
35
conditions respectively. The temperature was identical throughout the mixing chamber and
increased to a maximum of 997 K at the throat up to the upper Section of a manifold. The
temperature in the middle Section of the manifold was 791 K and it was uniform throughout.
Figure 13, indicates the distribution of temperature along the y-axis of the burner, the
temperature increased in a circumference upwards from bottom to the upper part of a
manifold.
Figure 12: Contours of Static temperature along the burner
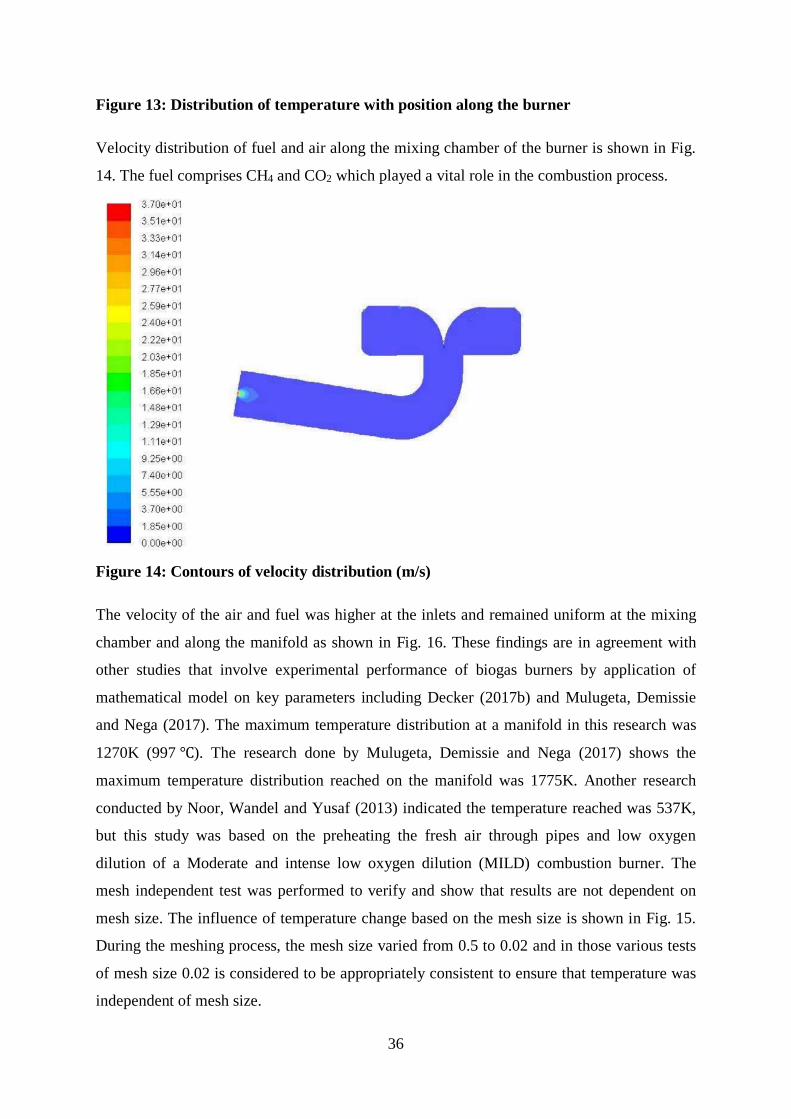
36
Figure 13: Distribution of temperature with position along the burner
Velocity distribution of fuel and air along the mixing chamber of the burner is shown in Fig.
14. The fuel comprises CH4 and CO2 which played a vital role in the combustion process.
Figure 14: Contours of velocity distribution (m/s)
The velocity of the air and fuel was higher at the inlets and remained uniform at the mixing
chamber and along the manifold as shown in Fig. 16. These findings are in agreement with
other studies that involve experimental performance of biogas burners by application of
mathematical model on key parameters including Decker (2017b) and Mulugeta, Demissie
and Nega (2017). The maximum temperature distribution at a manifold in this research was
1270K (997 ℃). The research done by Mulugeta, Demissie and Nega (2017) shows the
maximum temperature distribution reached on the manifold was 1775K. Another research
conducted by Noor, Wandel and Yusaf (2013) indicated the temperature reached was 537K,
but this study was based on the preheating the fresh air through pipes and low oxygen
dilution of a Moderate and intense low oxygen dilution (MILD) combustion burner. The
mesh independent test was performed to verify and show that results are not dependent on
mesh size. The influence of temperature change based on the mesh size is shown in Fig. 15.
During the meshing process, the mesh size varied from 0.5 to 0.02 and in those various tests
of mesh size 0.02 is considered to be appropriately consistent to ensure that temperature was
independent of mesh size.
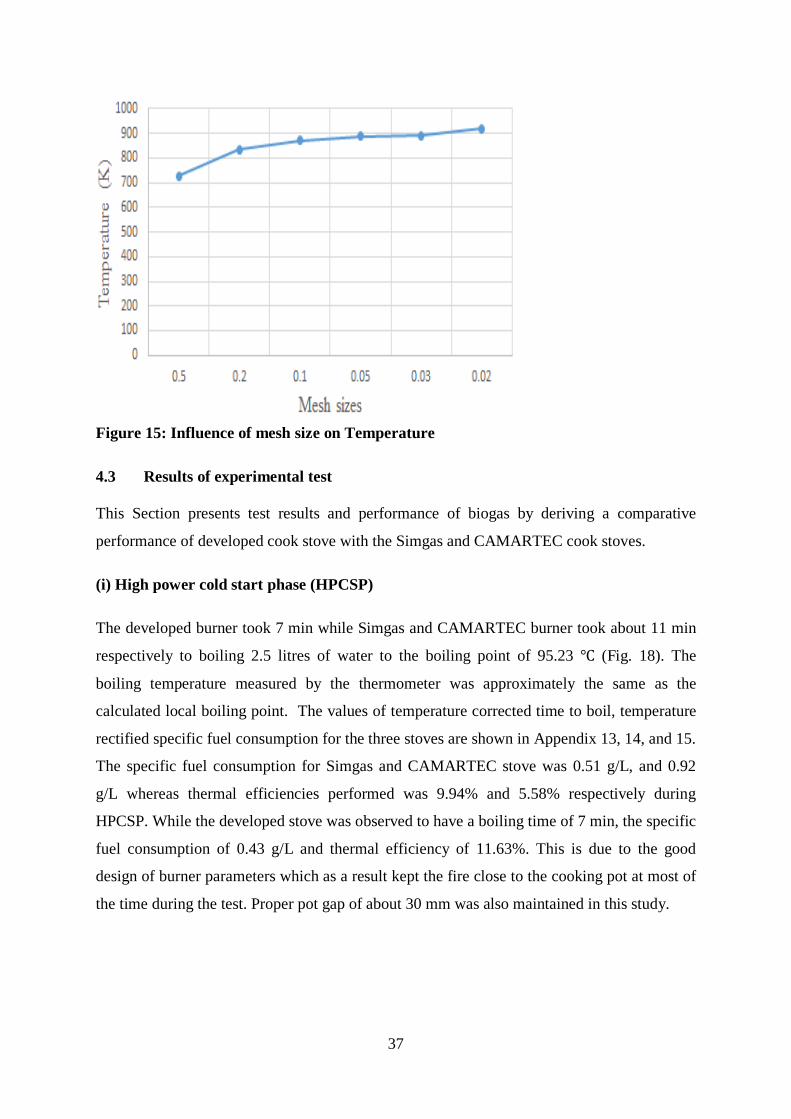
37
Figure 15: Influence of mesh size on Temperature
4.3 Results of experimental test
This Section presents test results and performance of biogas by deriving a comparative
performance of developed cook stove with the Simgas and CAMARTEC cook stoves.
(i) High power cold start phase (HPCSP)
The developed burner took 7 min while Simgas and CAMARTEC burner took about 11 min
respectively to boiling 2.5 litres of water to the boiling point of 95.23 ℃ (Fig. 18). The
boiling temperature measured by the thermometer was approximately the same as the
calculated local boiling point. The values of temperature corrected time to boil, temperature
rectified specific fuel consumption for the three stoves are shown in Appendix 13, 14, and 15.
The specific fuel consumption for Simgas and CAMARTEC stove was 0.51 g/L, and 0.92
g/L whereas thermal efficiencies performed was 9.94% and 5.58% respectively during
HPCSP. While the developed stove was observed to have a boiling time of 7 min, the specific
fuel consumption of 0.43 g/L and thermal efficiency of 11.63%. This is due to the good
design of burner parameters which as a result kept the fire close to the cooking pot at most of
the time during the test. Proper pot gap of about 30 mm was also maintained in this study.
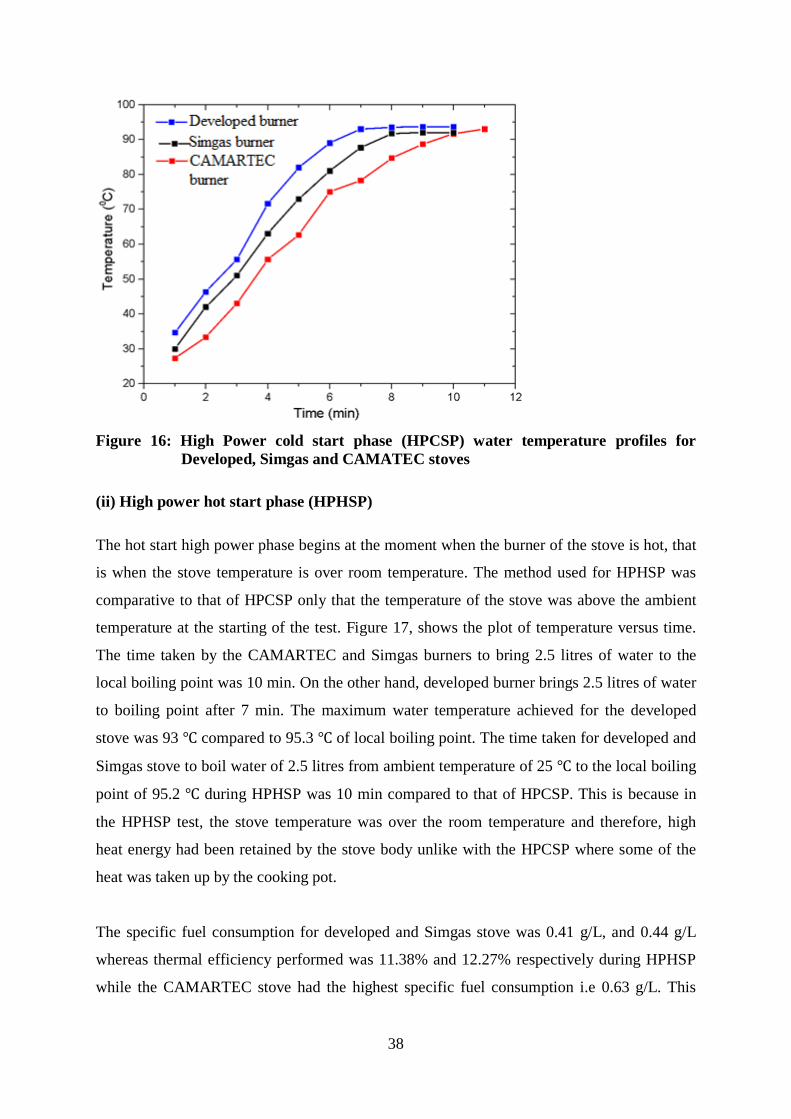
38
Figure 16: High Power cold start phase (HPCSP) water temperature profiles for
Developed, Simgas and CAMATEC stoves
(ii) High power hot start phase (HPHSP)
The hot start high power phase begins at the moment when the burner of the stove is hot, that
is when the stove temperature is over room temperature. The method used for HPHSP was
comparative to that of HPCSP only that the temperature of the stove was above the ambient
temperature at the starting of the test. Figure 17, shows the plot of temperature versus time.
The time taken by the CAMARTEC and Simgas burners to bring 2.5 litres of water to the
local boiling point was 10 min. On the other hand, developed burner brings 2.5 litres of water
to boiling point after 7 min. The maximum water temperature achieved for the developed
stove was 93 ℃ compared to 95.3 ℃ of local boiling point. The time taken for developed and
Simgas stove to boil water of 2.5 litres from ambient temperature of 25 ℃ to the local boiling
point of 95.2 ℃ during HPHSP was 10 min compared to that of HPCSP. This is because in
the HPHSP test, the stove temperature was over the room temperature and therefore, high
heat energy had been retained by the stove body unlike with the HPCSP where some of the
heat was taken up by the cooking pot.
The specific fuel consumption for developed and Simgas stove was 0.41 g/L, and 0.44 g/L
whereas thermal efficiency performed was 11.38% and 12.27% respectively during HPHSP
while the CAMARTEC stove had the highest specific fuel consumption i.e 0.63 g/L. This
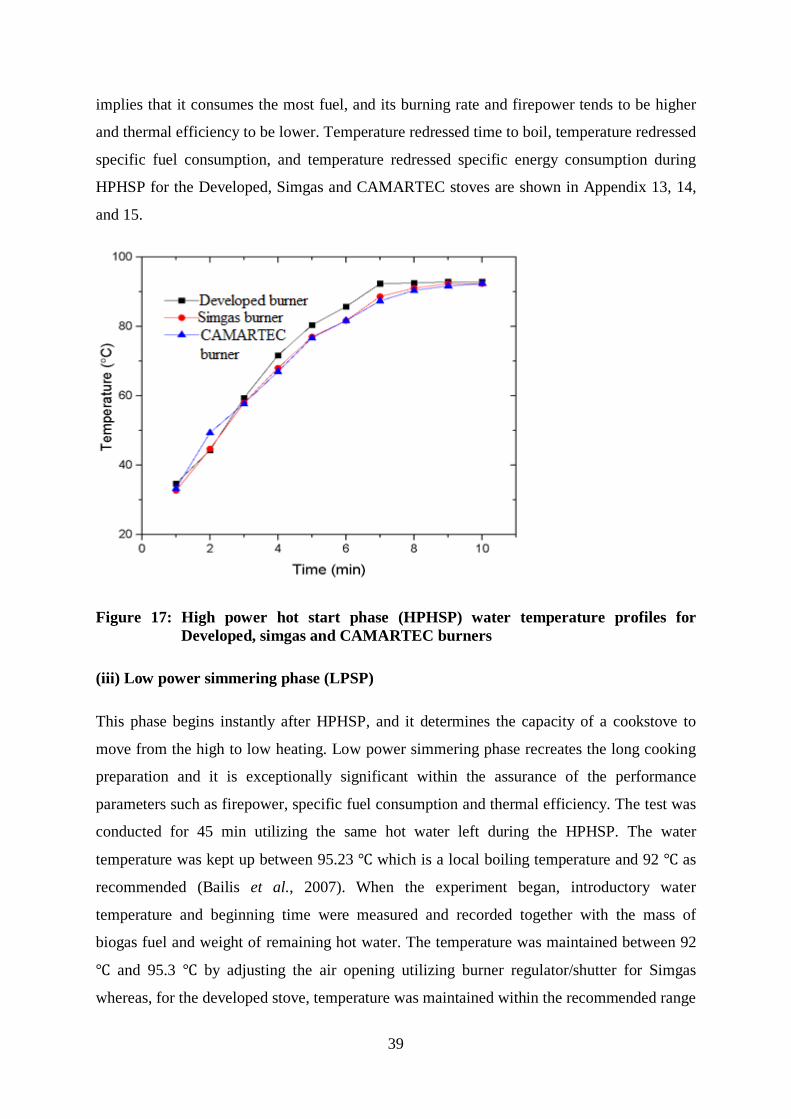
39
implies that it consumes the most fuel, and its burning rate and firepower tends to be higher
and thermal efficiency to be lower. Temperature redressed time to boil, temperature redressed
specific fuel consumption, and temperature redressed specific energy consumption during
HPHSP for the Developed, Simgas and CAMARTEC stoves are shown in Appendix 13, 14,
and 15.
Figure 17: High power hot start phase (HPHSP) water temperature profiles for Developed, simgas and CAMARTEC burners
(iii) Low power simmering phase (LPSP)
This phase begins instantly after HPHSP, and it determines the capacity of a cookstove to
move from the high to low heating. Low power simmering phase recreates the long cooking
preparation and it is exceptionally significant within the assurance of the performance
parameters such as firepower, specific fuel consumption and thermal efficiency. The test was
conducted for 45 min utilizing the same hot water left during the HPHSP. The water
temperature was kept up between 95.23 ℃ which is a local boiling temperature and 92 ℃ as
recommended (Bailis et al., 2007). When the experiment began, introductory water
temperature and beginning time were measured and recorded together with the mass of
biogas fuel and weight of remaining hot water. The temperature was maintained between 92
℃ and 95.3 ℃ by adjusting the air opening utilizing burner regulator/shutter for Simgas
whereas, for the developed stove, temperature was maintained within the recommended range
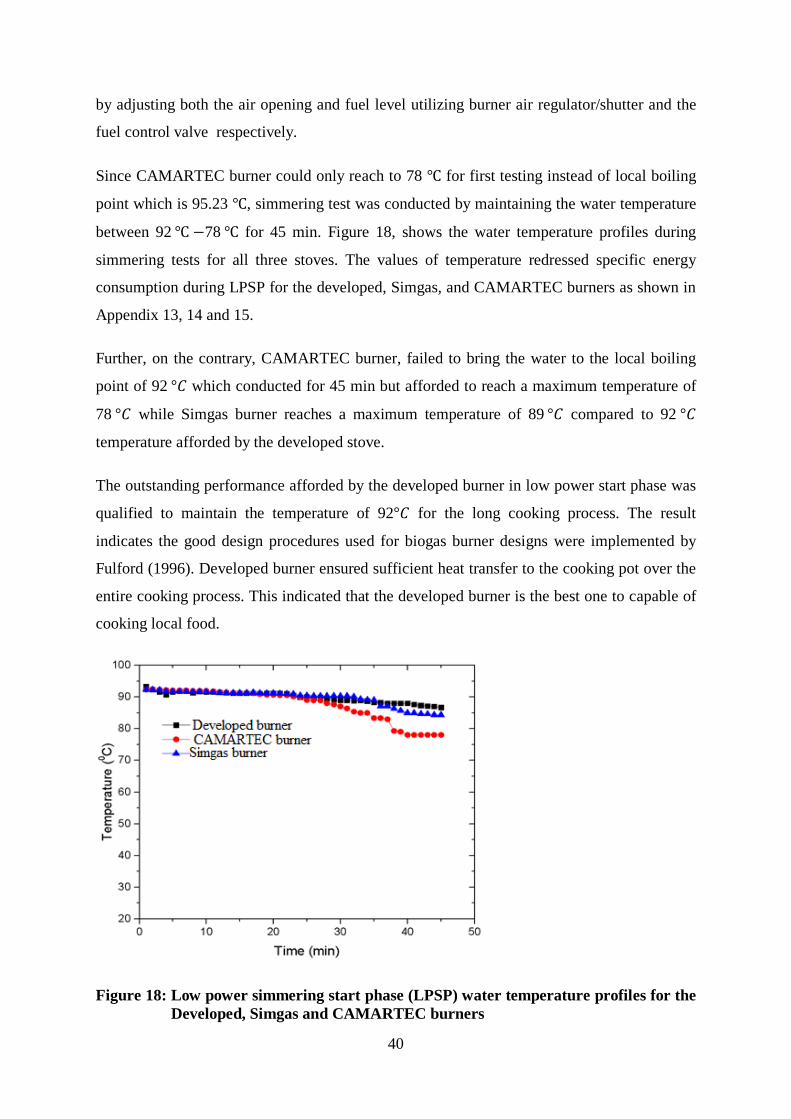
40
by adjusting both the air opening and fuel level utilizing burner air regulator/shutter and the
fuel control valve respectively.
Since CAMARTEC burner could only reach to 78 ℃ for first testing instead of local boiling
point which is 95.23 ℃, simmering test was conducted by maintaining the water temperature
between 92 ℃ −78 ℃ for 45 min. Figure 18, shows the water temperature profiles during
simmering tests for all three stoves. The values of temperature redressed specific energy
consumption during LPSP for the developed, Simgas, and CAMARTEC burners as shown in
Appendix 13, 14 and 15.
Further, on the contrary, CAMARTEC burner, failed to bring the water to the local boiling
point of 92 °𝐶𝐶 which conducted for 45 min but afforded to reach a maximum temperature of
78 °𝐶𝐶 while Simgas burner reaches a maximum temperature of 89 °𝐶𝐶 compared to 92 °𝐶𝐶
temperature afforded by the developed stove.
The outstanding performance afforded by the developed burner in low power start phase was
qualified to maintain the temperature of 92°𝐶𝐶 for the long cooking process. The result
indicates the good design procedures used for biogas burner designs were implemented by
Fulford (1996). Developed burner ensured sufficient heat transfer to the cooking pot over the
entire cooking process. This indicated that the developed burner is the best one to capable of
cooking local food.
Figure 18: Low power simmering start phase (LPSP) water temperature profiles for the Developed, Simgas and CAMARTEC burners
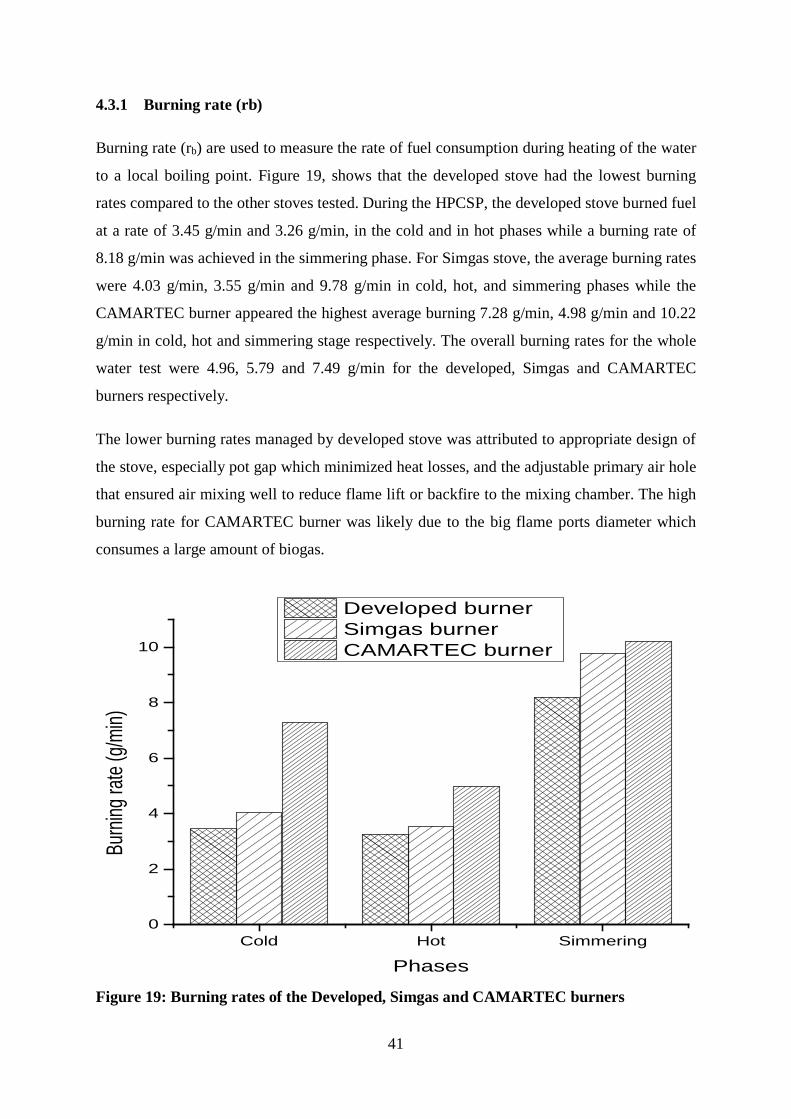
41
4.3.1 Burning rate (rb)
Burning rate (rb) are used to measure the rate of fuel consumption during heating of the water
to a local boiling point. Figure 19, shows that the developed stove had the lowest burning
rates compared to the other stoves tested. During the HPCSP, the developed stove burned fuel
at a rate of 3.45 g/min and 3.26 g/min, in the cold and in hot phases while a burning rate of
8.18 g/min was achieved in the simmering phase. For Simgas stove, the average burning rates
were 4.03 g/min, 3.55 g/min and 9.78 g/min in cold, hot, and simmering phases while the
CAMARTEC burner appeared the highest average burning 7.28 g/min, 4.98 g/min and 10.22
g/min in cold, hot and simmering stage respectively. The overall burning rates for the whole
water test were 4.96, 5.79 and 7.49 g/min for the developed, Simgas and CAMARTEC
burners respectively.
The lower burning rates managed by developed stove was attributed to appropriate design of
the stove, especially pot gap which minimized heat losses, and the adjustable primary air hole
that ensured air mixing well to reduce flame lift or backfire to the mixing chamber. The high
burning rate for CAMARTEC burner was likely due to the big flame ports diameter which
consumes a large amount of biogas.
Figure 19: Burning rates of the Developed, Simgas and CAMARTEC burners
Cold Hot Simmering0
2
4
6
8
10
Burni
ng ra
te (g/
min)
Phases
Developed burner Simgas burner CAMARTEC burner
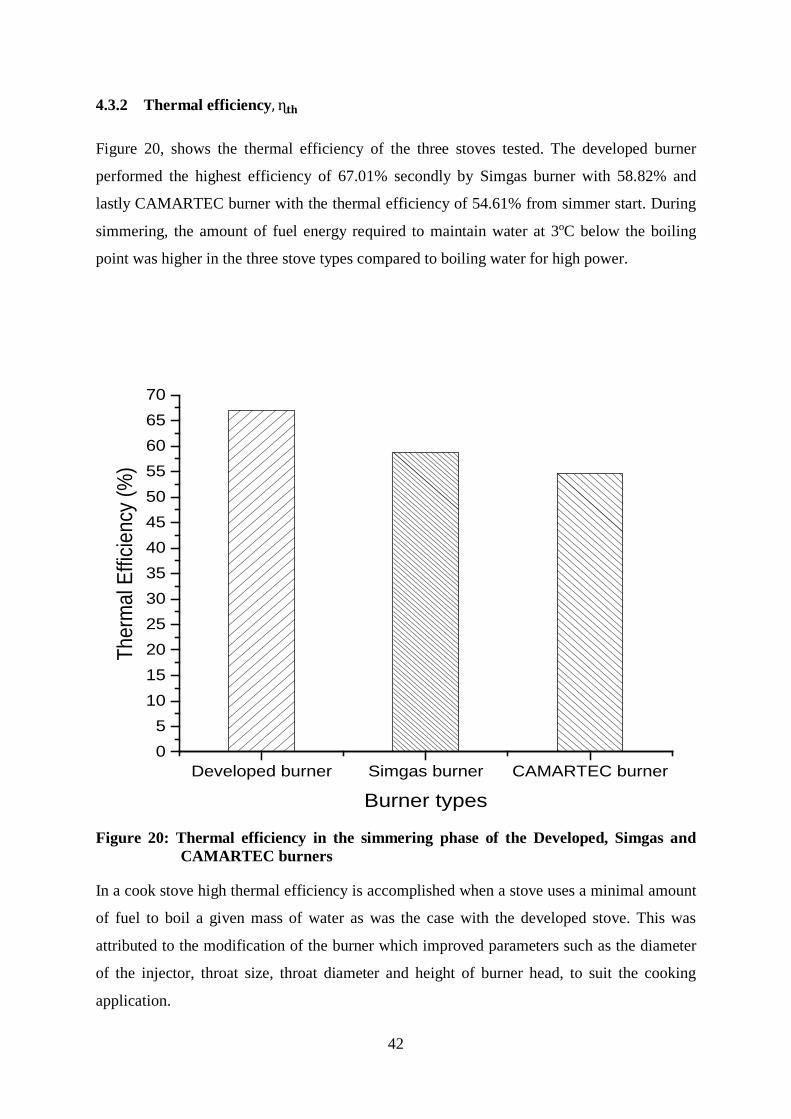
42
4.3.2 Thermal efficiency, ɳ𝐭𝐭𝐭𝐭
Figure 20, shows the thermal efficiency of the three stoves tested. The developed burner
performed the highest efficiency of 67.01% secondly by Simgas burner with 58.82% and
lastly CAMARTEC burner with the thermal efficiency of 54.61% from simmer start. During
simmering, the amount of fuel energy required to maintain water at 3oC below the boiling
point was higher in the three stove types compared to boiling water for high power.
Figure 20: Thermal efficiency in the simmering phase of the Developed, Simgas and
CAMARTEC burners
In a cook stove high thermal efficiency is accomplished when a stove uses a minimal amount
of fuel to boil a given mass of water as was the case with the developed stove. This was
attributed to the modification of the burner which improved parameters such as the diameter
of the injector, throat size, throat diameter and height of burner head, to suit the cooking
application.
Developed burner Simgas burner CAMARTEC burner05
10152025303540455055606570
The
rmal
Effi
cienc
y (%
)
Burner types
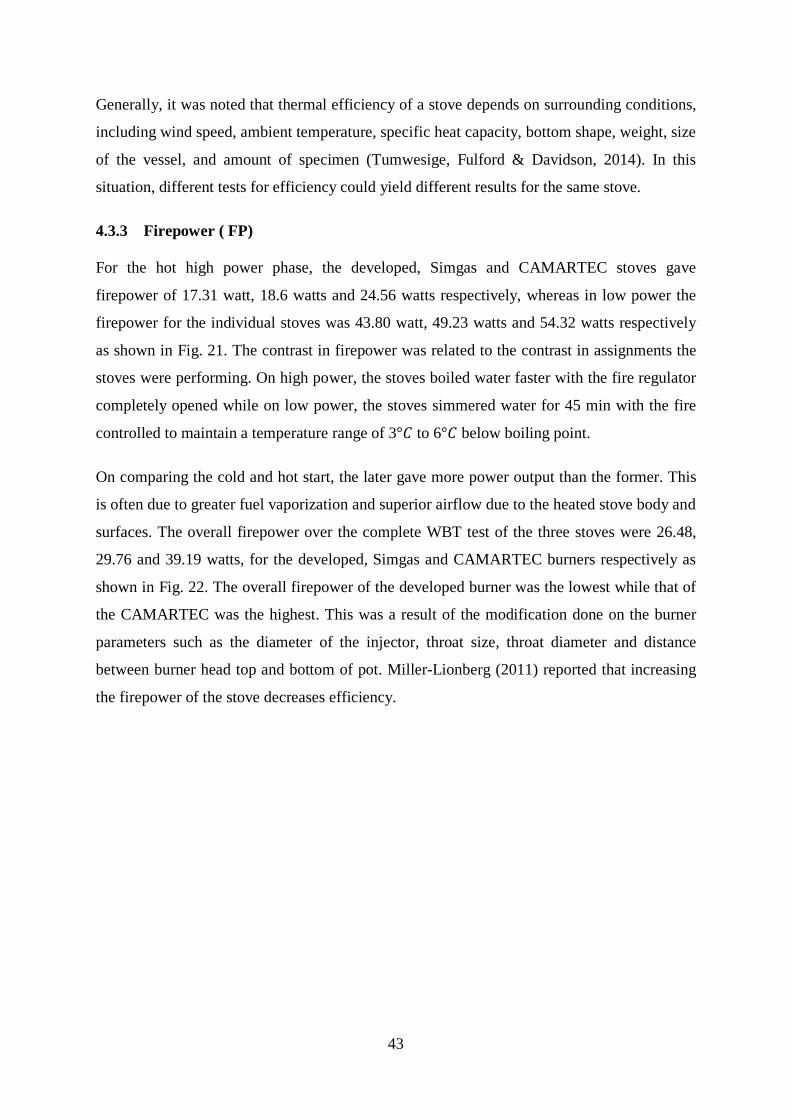
43
Generally, it was noted that thermal efficiency of a stove depends on surrounding conditions,
including wind speed, ambient temperature, specific heat capacity, bottom shape, weight, size
of the vessel, and amount of specimen (Tumwesige, Fulford & Davidson, 2014). In this
situation, different tests for efficiency could yield different results for the same stove.
4.3.3 Firepower ( FP)
For the hot high power phase, the developed, Simgas and CAMARTEC stoves gave
firepower of 17.31 watt, 18.6 watts and 24.56 watts respectively, whereas in low power the
firepower for the individual stoves was 43.80 watt, 49.23 watts and 54.32 watts respectively
as shown in Fig. 21. The contrast in firepower was related to the contrast in assignments the
stoves were performing. On high power, the stoves boiled water faster with the fire regulator
completely opened while on low power, the stoves simmered water for 45 min with the fire
controlled to maintain a temperature range of 3°𝐶𝐶 to 6°𝐶𝐶 below boiling point.
On comparing the cold and hot start, the later gave more power output than the former. This
is often due to greater fuel vaporization and superior airflow due to the heated stove body and
surfaces. The overall firepower over the complete WBT test of the three stoves were 26.48,
29.76 and 39.19 watts, for the developed, Simgas and CAMARTEC burners respectively as
shown in Fig. 22. The overall firepower of the developed burner was the lowest while that of
the CAMARTEC was the highest. This was a result of the modification done on the burner
parameters such as the diameter of the injector, throat size, throat diameter and distance
between burner head top and bottom of pot. Miller-Lionberg (2011) reported that increasing
the firepower of the stove decreases efficiency.
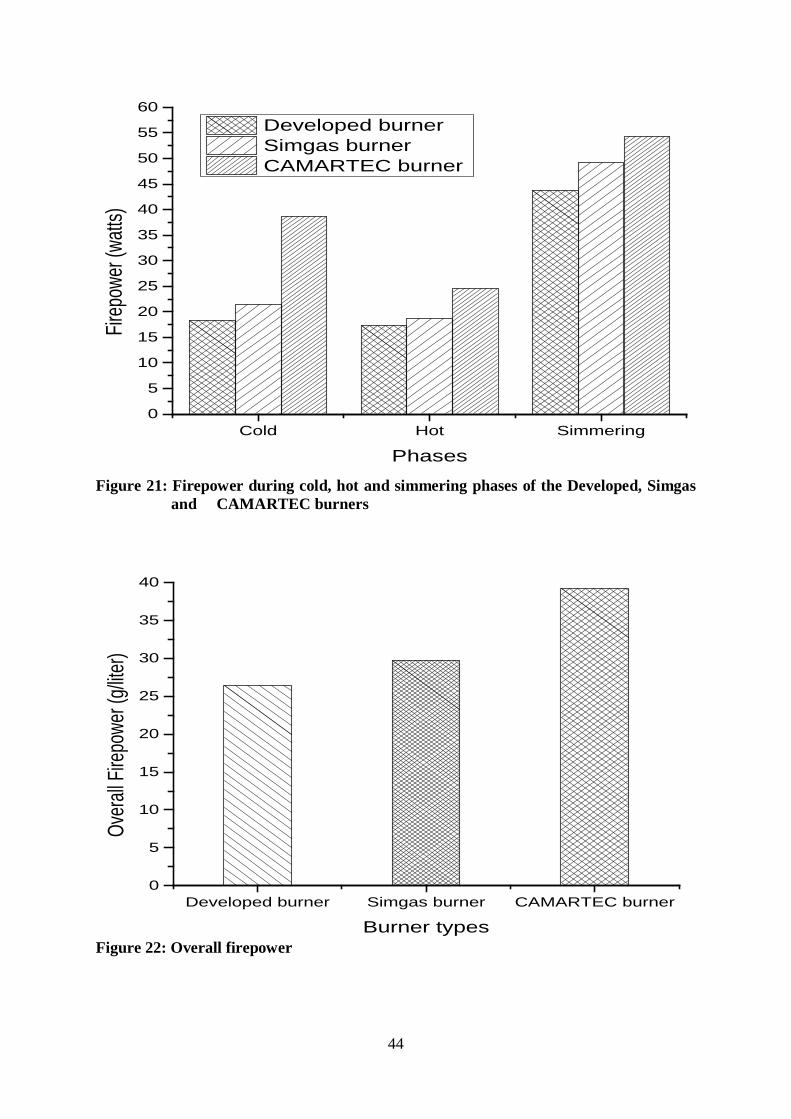
44
Figure 21: Firepower during cold, hot and simmering phases of the Developed, Simgas
and CAMARTEC burners
Figure 22: Overall firepower
Cold Hot Simmering0
5
10
15
20
25
30
35
40
45
50
55
60Fir
epow
er (w
atts)
Phases
Developed burner Simgas burner CAMARTEC burner
Developed burner Simgas burner CAMARTEC burner0
5
10
15
20
25
30
35
40
Overa
ll Fire
powe
r (g/l
iter)
Burner types

45
4.3.4 Specific fuel consumption
Specific fuel consumption is the proportion of the amount of biogas fuel consumed to the
amount of remaining water within the pot at the end of the test. The overall SC over the
whole WBT for each stove was found to be 245.34, 277.68 and 306.68 g/L for the developed,
Simgas and CAMARTEC burners respectively as shown in Fig. 23. The low SFC for
developed burner resulted in higher thermal efficiency as shown in Fig. 20.
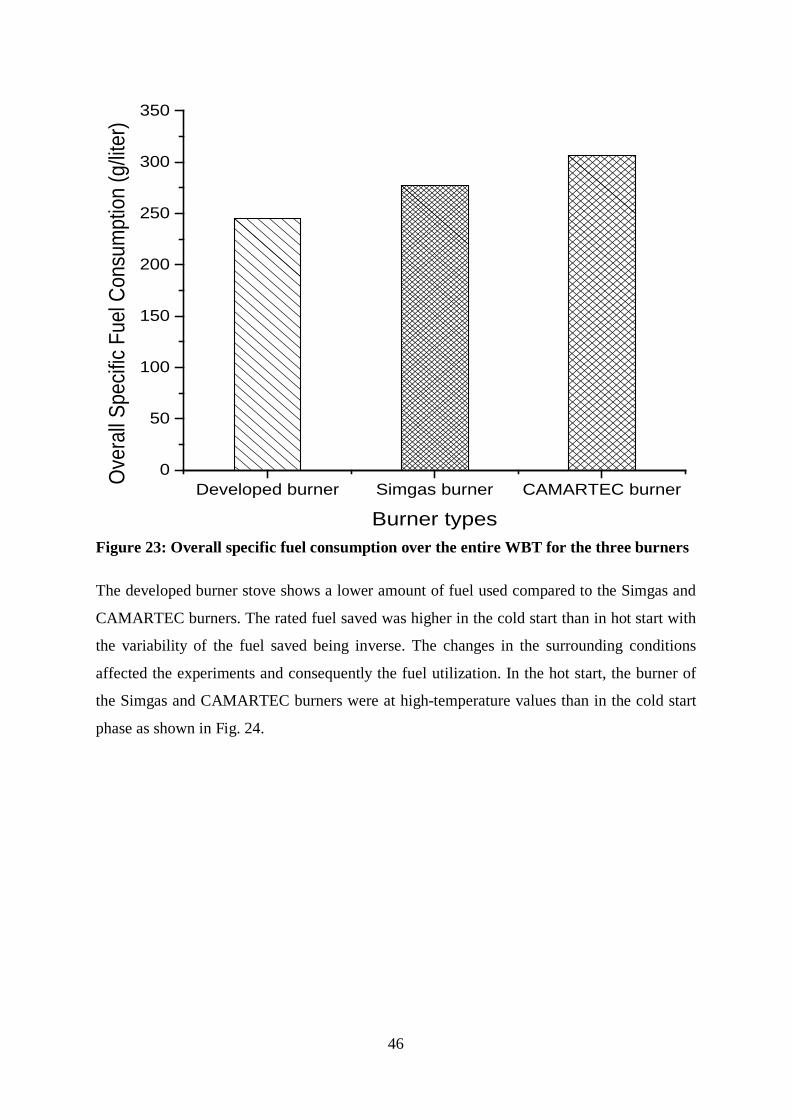
46
Figure 23: Overall specific fuel consumption over the entire WBT for the three burners
The developed burner stove shows a lower amount of fuel used compared to the Simgas and
CAMARTEC burners. The rated fuel saved was higher in the cold start than in hot start with
the variability of the fuel saved being inverse. The changes in the surrounding conditions
affected the experiments and consequently the fuel utilization. In the hot start, the burner of
the Simgas and CAMARTEC burners were at high-temperature values than in the cold start
phase as shown in Fig. 24.
Developed burner Simgas burner CAMARTEC burner0
50
100
150
200
250
300
350Ov
erall
Spe
cific
Fuel
Cons
umpt
ion (g
/liter
)
Burner types
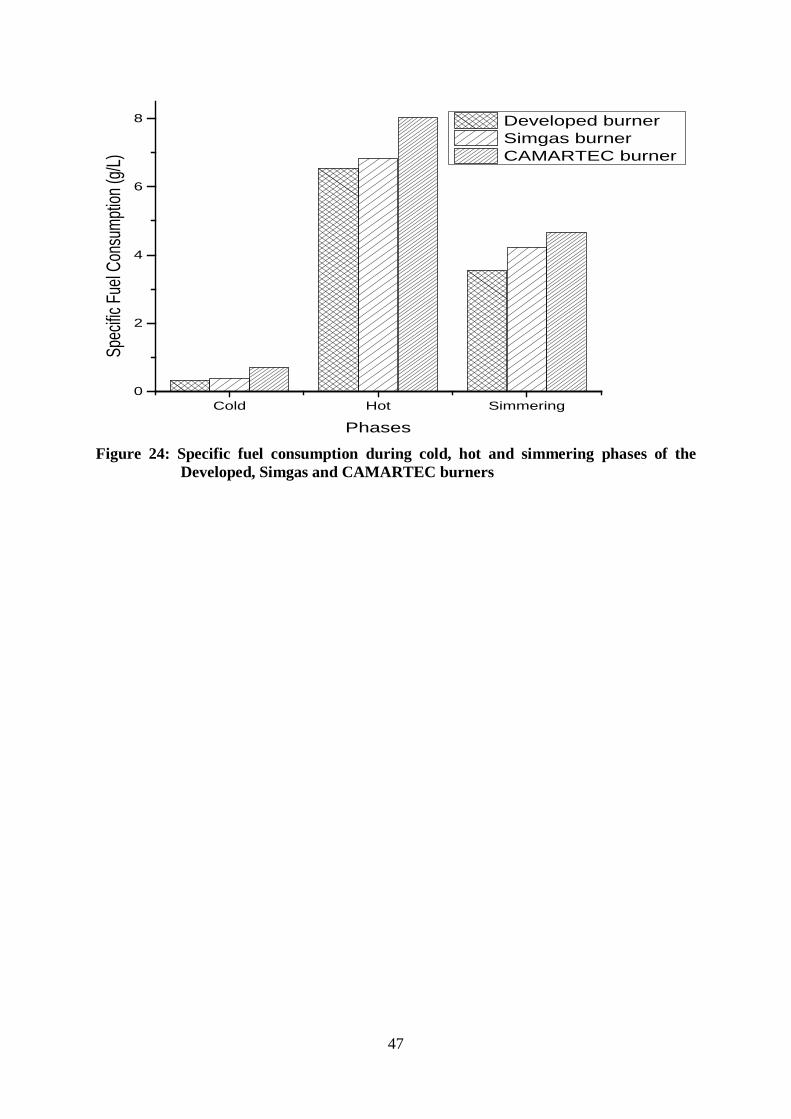
47
Figure 24: Specific fuel consumption during cold, hot and simmering phases of the
Developed, Simgas and CAMARTEC burners
Cold Hot Simmering0
2
4
6
8Sp
ecific
Fuel
Cons
umpti
on (g
/L)
Phases
Developed burner Simgas burner CAMARTEC burner
48
CHAPTER FIVE
CONCLUSION AND RECOMMENDATIONS
5.1 Conclusion
The outcomes of this study present perception in the modelling process of the newly designed
burner and its performance. The design of the burner consisted of theoretical analysis,
numerical design calculations and Computational fluid dynamics (CFD). As per the analytical
design, several formulas were used to design the key parts of a burner. The developed burner
head consists of 40 portholes located on its outer circumference having 2.5 mm diameter
each, and 31 portholes with 2.5 mm diameter each at its top surface. The manifold of a
developed burner has 100 mm internal and 138 mm external diameters respectively. The
tripod and stove frame was made by using mild steel and stainless steel respectively. The
tripod was painted with corrosion-resistant paint to avoid corrosion during the lifetime and
the burner was fabricated by using casted brass. The simulation results show that the
maximum flame temperature observed was 997K against 925K of the experimental
measurements.
The water boiling test (WBT) was conducted for the developed burner, and its thermal
efficiency performance was 67.01% against 54.61% and 58.82% of CARMATEC and
Simgas burners respectively. The comparison for the average fuel consumption was also
conducted between a developed burner and the above - mentioned burners. The test showed
that the developed burner fuel consumption was 736 g/L compared to 920 g/L and 833 g/L
for CARMARTEC and Simgas, respectively. The low fuel consumption observed from the
developed burner as compared to others was due to the proper distribution of fuel on the
cooking pot at most of the time during the test. In this study, the biogas stoves can be
suggested as fetched successful options to the traditional stove.
5.2 Recommendations
Recommendations for future works are the following; assessment of improved Biogas Stove
with preheating of biogas, CO2, H2S and moisture can be minimized by modifications of the
biogas stove. The changes in the surrounding conditions affected the experiments and
consequently, the fuel utilization. The improvement of efficiency of biogas stoves can be
done in different areas of Tanzania.
49
REFERENCES
Abbasi, T., & Abbasi, S. (2010). Biomass energy and the environmental impacts associated
with its production and utilization. Renewable and Sustainable Energy Reviews,
14(3), 267-301. doi: 10.1016/j.rser.2009.11.006.
Alseadi, T., Drosg, B., Fuchs, W., Rutz, D., & Janssen, R. (2013). Biogas digestate quality
and utilization. Australia: Woodhead Publishing Limited.
Anderman, T. L., DeFries, R. S., Wood, S. A., Remans, R., Ahuja, R., & Ulla, S. E. (2015).
Biogas cook stoves for healthy and sustainable diets? A case study in Southern India.
Frontiers in Nutrition, 2(28), 1-12. doi: 10.3389/fnut.2015.00028.
Bailis, P. R., Ogle, D., Maccarty, N., Smith, K. R., & Edwards, R. (2007). The water boiling
test (WBT). Retreived from https:// energypedia.info/ images/
3/38/Wbt_version_3.0_jan2007.pdfhttps://energypedia.info/images/3/38/Wbt_version
_3.0_jan2007.pdf
Berrueta, V. M., Edwards, R. D., & Masera, O. R. (2008). Energy performance of wood-
burning cookstoves in Michoacan, Mexico. Renewable Energy, 33(5), 859-870.
Beyler, C. L. (1986). Major species production by diffusion flames in a two-layer
compartment fire environment. Fire Safety Journal, 10(1), 47-56.
Bhattacharya, S., & Salam, P. A. (2002). Low greenhouse gas biomass options for cooking in
the developing countries. Biomass and Bioenergy, 22(4), 305-317.
Burke, P. J., & Dundas, G. (2015). Female labor force participation and household
dependence on biomass energy: Evidence from national longitudinal data. World
Development, 67, 424-437. doi: 10.1016/j.worlddev.2014.10.034.
Chandra, A., Tiwari, G., Srivastava, V., & Yadav, Y. (1991). Performance evaluation of
biogas burners. Energy Conversion and Management, 32(4), 353-358.
50
Chandra, R., Takeuchi, H., & Hasegawa, T. (2012). Methane production from lignocellulosic
agricultural crop wastes: A review in context to second generation of biofuel
production. Renewable and Sustainable Energy Reviews, 16(3), 1462-1476.
Decker, T. J. (2017b). Modeling tool for household biogas burner flame port design
(Master’s Thesis). Colorado State University: Libraries, Fort Collins, Colorado.
Retrieved from https:// mountainscholar. org/bitstream/handle/ 10217/183948/Decker
_colostate_ 0053N_14315.pdf?sequence=1&isAllowed=y
Demissie, S. W., Ramayya, V. A., & Nega, D. T. (2016a). Design, fabrication and testing of
biogas stove for ‘areke’distillation: The case of Arsi Negele, Ethiopia, targeting
reduction of fuel-wood dependence. International Journal of Engineering Research &
Technology, 5(03), 2278-0181.
Felix, M., & Gheewala, S. H. (2011). A review of biomass energy dependency in Tanzania.
Energy Procedia, 9, 338-343.
Foundation, (2012). Manual for the construction and operation of small and medium size
biogas systems. Bilibiza, Cabo Delgado: Clube de Agricultores.
Fulford, D. (1996). Biogas stove design. Reading, UK: Kingdom Bioenergy, Ltd, 1-21.
Retreived from https:// sswm.info/ sites/ default/ files/ reference_attachments/
FULFORD%201996%20Biogas%20Stove%20Design.pdfhttps:// sswm.info/ sites/
default/ files/ reference_attachments/ FULFORD% 201996%20
Biogas%20Stove%20D esign.pdf
Harneit, U. (2004). Gas burner head assembly: Google Patents. http:// www.
freepatentsonline. com/ y2004/0072112.html
Igoni, A. H., Ayotamuno, M., Eze, C., Ogaji, S., & Probert, S. (2008). Designs of anaerobic
digesters for producing biogas from municipal solid-waste. Applied Energy, 85(6),
430-438.
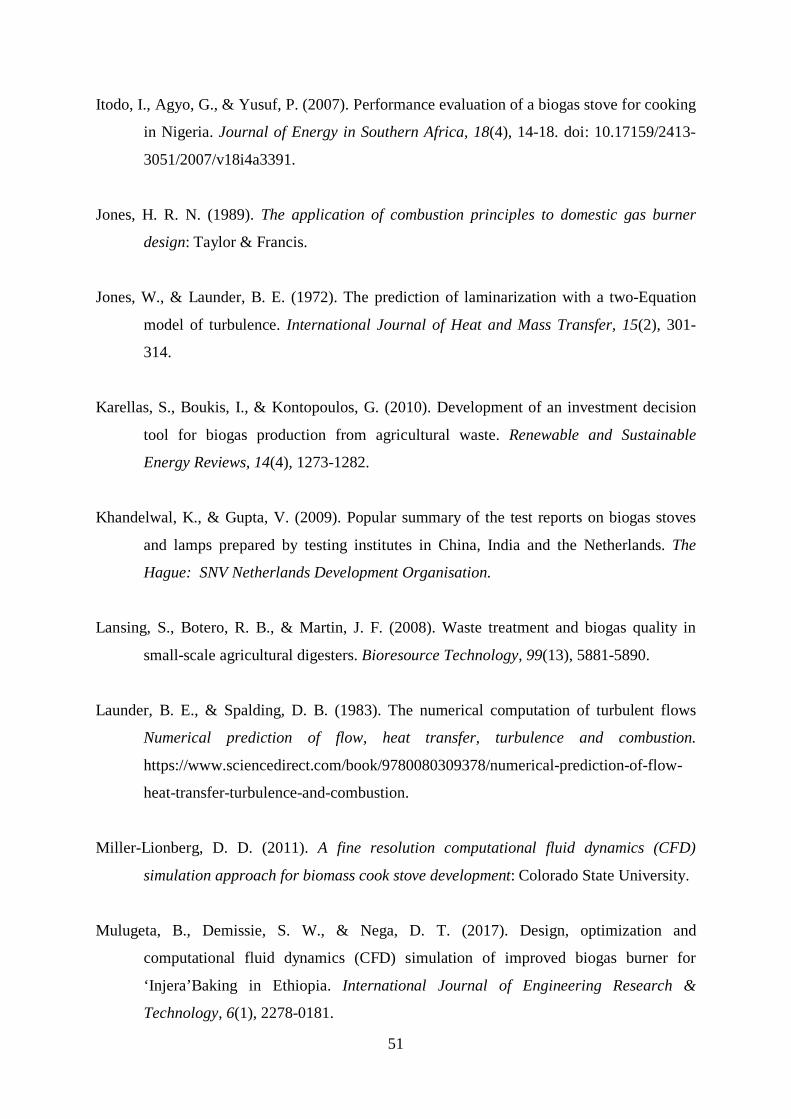
51
Itodo, I., Agyo, G., & Yusuf, P. (2007). Performance evaluation of a biogas stove for cooking
in Nigeria. Journal of Energy in Southern Africa, 18(4), 14-18. doi: 10.17159/2413-
3051/2007/v18i4a3391.
Jones, H. R. N. (1989). The application of combustion principles to domestic gas burner
design: Taylor & Francis.
Jones, W., & Launder, B. E. (1972). The prediction of laminarization with a two-Equation
model of turbulence. International Journal of Heat and Mass Transfer, 15(2), 301-
314.
Karellas, S., Boukis, I., & Kontopoulos, G. (2010). Development of an investment decision
tool for biogas production from agricultural waste. Renewable and Sustainable
Energy Reviews, 14(4), 1273-1282.
Khandelwal, K., & Gupta, V. (2009). Popular summary of the test reports on biogas stoves
and lamps prepared by testing institutes in China, India and the Netherlands. The
Hague: SNV Netherlands Development Organisation.
Lansing, S., Botero, R. B., & Martin, J. F. (2008). Waste treatment and biogas quality in
small-scale agricultural digesters. Bioresource Technology, 99(13), 5881-5890.
Launder, B. E., & Spalding, D. B. (1983). The numerical computation of turbulent flows
Numerical prediction of flow, heat transfer, turbulence and combustion.
https://www.sciencedirect.com/book/9780080309378/numerical-prediction-of-flow-
heat-transfer-turbulence-and-combustion.
Miller-Lionberg, D. D. (2011). A fine resolution computational fluid dynamics (CFD)
simulation approach for biomass cook stove development: Colorado State University.
Mulugeta, B., Demissie, S. W., & Nega, D. T. (2017). Design, optimization and
computational fluid dynamics (CFD) simulation of improved biogas burner for
‘Injera’Baking in Ethiopia. International Journal of Engineering Research &
Technology, 6(1), 2278-0181.
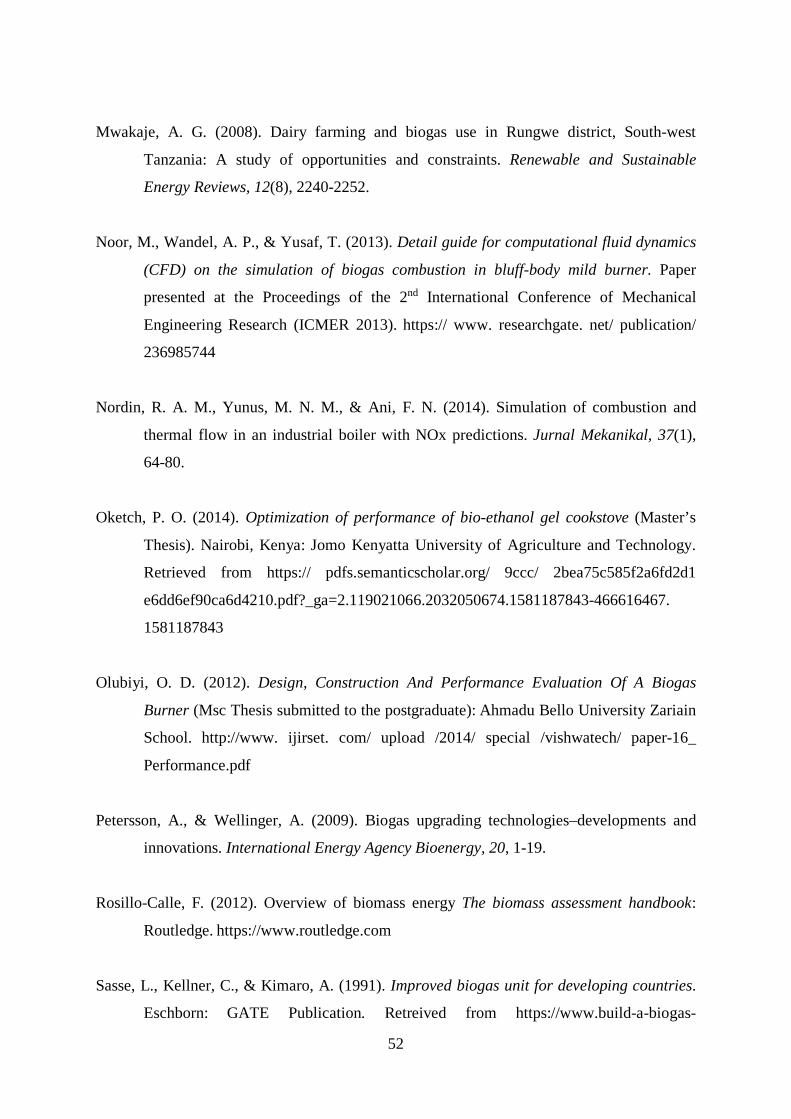
52
Mwakaje, A. G. (2008). Dairy farming and biogas use in Rungwe district, South-west
Tanzania: A study of opportunities and constraints. Renewable and Sustainable
Energy Reviews, 12(8), 2240-2252.
Noor, M., Wandel, A. P., & Yusaf, T. (2013). Detail guide for computational fluid dynamics
(CFD) on the simulation of biogas combustion in bluff-body mild burner. Paper
presented at the Proceedings of the 2nd International Conference of Mechanical
Engineering Research (ICMER 2013). https:// www. researchgate. net/ publication/
236985744
Nordin, R. A. M., Yunus, M. N. M., & Ani, F. N. (2014). Simulation of combustion and
thermal flow in an industrial boiler with NOx predictions. Jurnal Mekanikal, 37(1),
64-80.
Oketch, P. O. (2014). Optimization of performance of bio-ethanol gel cookstove (Master’s
Thesis). Nairobi, Kenya: Jomo Kenyatta University of Agriculture and Technology.
Retrieved from https:// pdfs.semanticscholar.org/ 9ccc/ 2bea75c585f2a6fd2d1
e6dd6ef90ca6d4210.pdf?_ga=2.119021066.2032050674.1581187843-466616467.
1581187843
Olubiyi, O. D. (2012). Design, Construction And Performance Evaluation Of A Biogas
Burner (Msc Thesis submitted to the postgraduate): Ahmadu Bello University Zariain
School. http://www. ijirset. com/ upload /2014/ special /vishwatech/ paper-16_
Performance.pdf
Petersson, A., & Wellinger, A. (2009). Biogas upgrading technologies–developments and
innovations. International Energy Agency Bioenergy, 20, 1-19.
Rosillo-Calle, F. (2012). Overview of biomass energy The biomass assessment handbook:
Routledge. https://www.routledge.com
Sasse, L., Kellner, C., & Kimaro, A. (1991). Improved biogas unit for developing countries.
Eschborn: GATE Publication. Retreived from https://www.build-a-biogas-
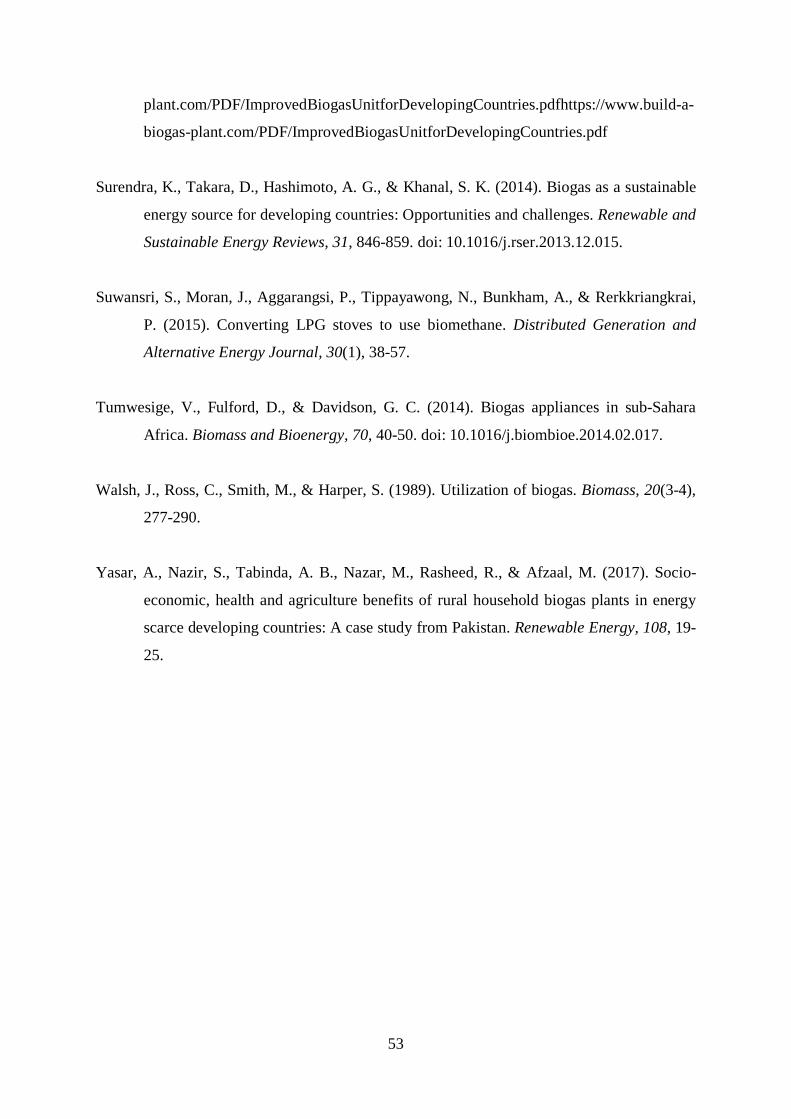
53
plant.com/PDF/ImprovedBiogasUnitforDevelopingCountries.pdfhttps://www.build-a-
biogas-plant.com/PDF/ImprovedBiogasUnitforDevelopingCountries.pdf
Surendra, K., Takara, D., Hashimoto, A. G., & Khanal, S. K. (2014). Biogas as a sustainable
energy source for developing countries: Opportunities and challenges. Renewable and
Sustainable Energy Reviews, 31, 846-859. doi: 10.1016/j.rser.2013.12.015.
Suwansri, S., Moran, J., Aggarangsi, P., Tippayawong, N., Bunkham, A., & Rerkkriangkrai,
P. (2015). Converting LPG stoves to use biomethane. Distributed Generation and
Alternative Energy Journal, 30(1), 38-57.
Tumwesige, V., Fulford, D., & Davidson, G. C. (2014). Biogas appliances in sub-Sahara
Africa. Biomass and Bioenergy, 70, 40-50. doi: 10.1016/j.biombioe.2014.02.017.
Walsh, J., Ross, C., Smith, M., & Harper, S. (1989). Utilization of biogas. Biomass, 20(3-4),
277-290.
Yasar, A., Nazir, S., Tabinda, A. B., Nazar, M., Rasheed, R., & Afzaal, M. (2017). Socio-
economic, health and agriculture benefits of rural household biogas plants in energy
scarce developing countries: A case study from Pakistan. Renewable Energy, 108, 19-
25.

54
APPENDICES
Detail Drawings of Biogas Burner Stove
The Biogas burner stove contains several components which are designed and drawn. The
detail drawing of each component is presented in below Appendices to show dimensions, part
list, quantity and name of the component. All these parts are completed assembly of the
biogas burner stove.
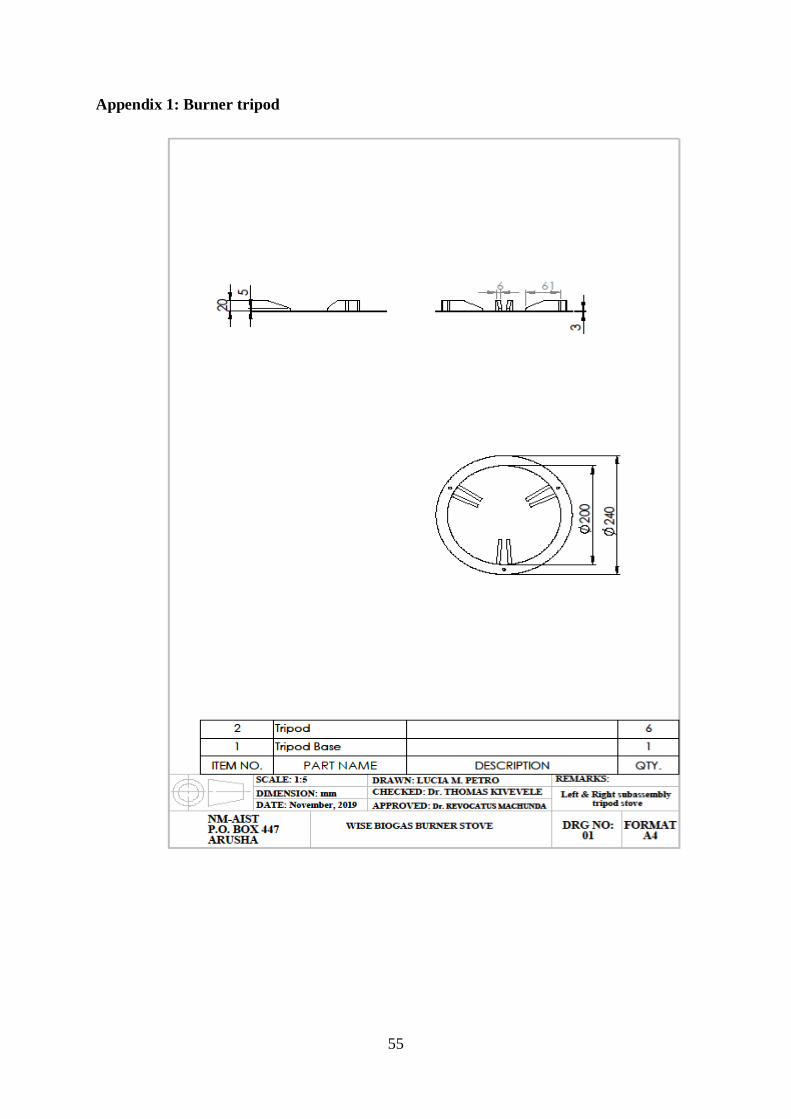
55
Appendix 1: Burner tripod
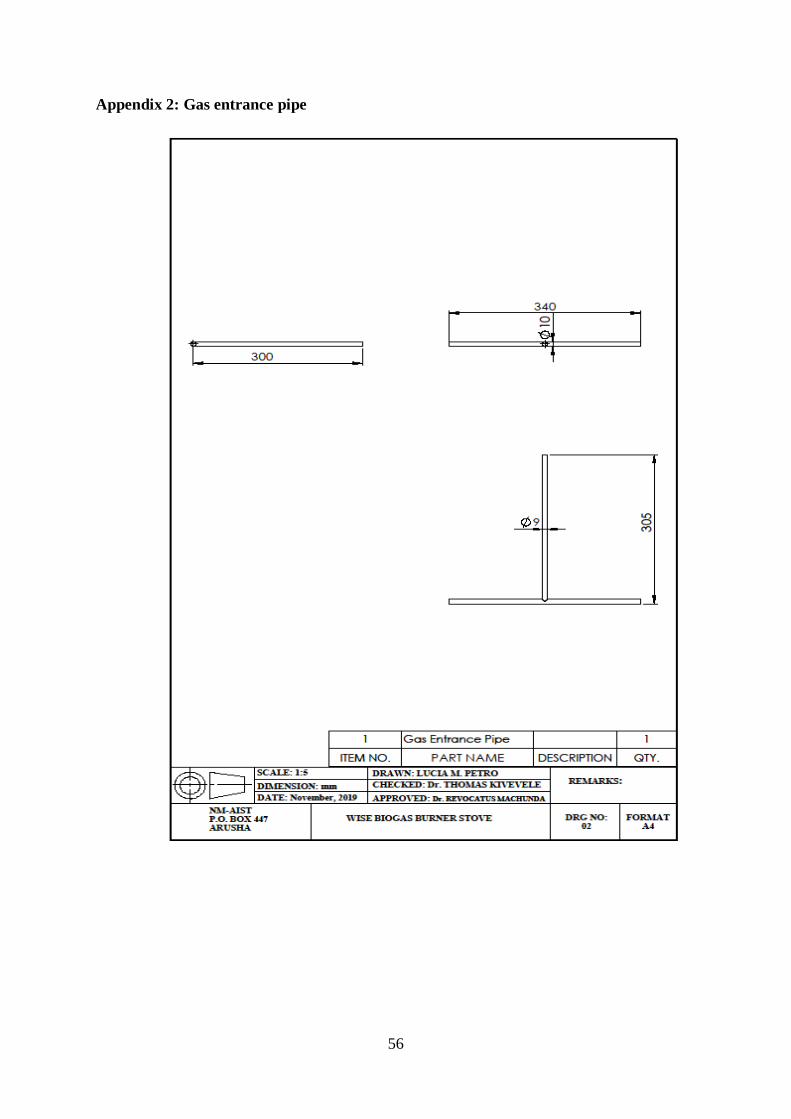
56
Appendix 2: Gas entrance pipe
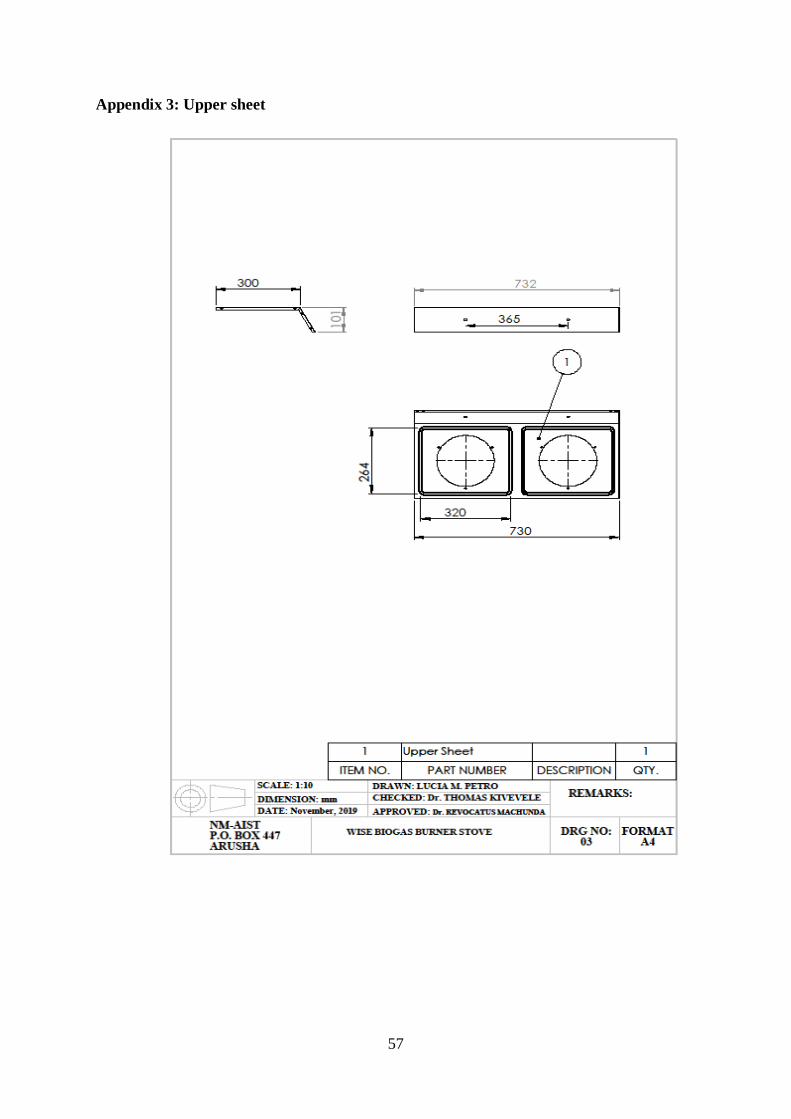
57
Appendix 3: Upper sheet
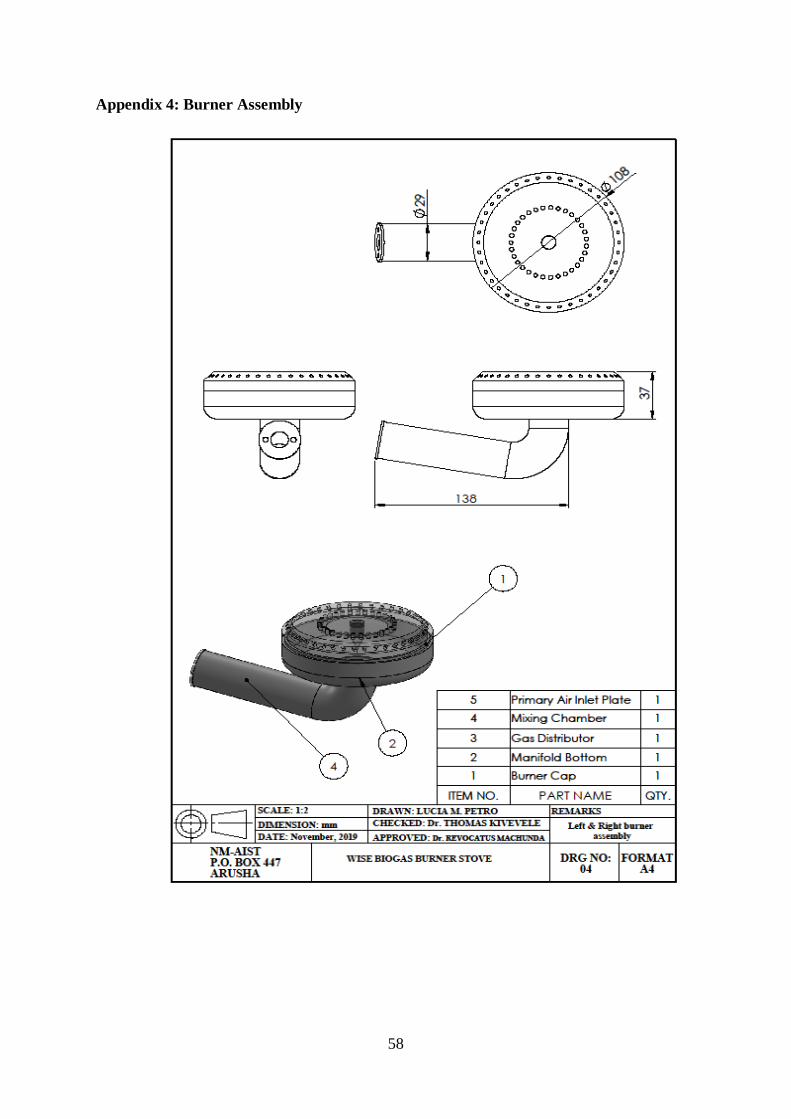
58
Appendix 4: Burner Assembly
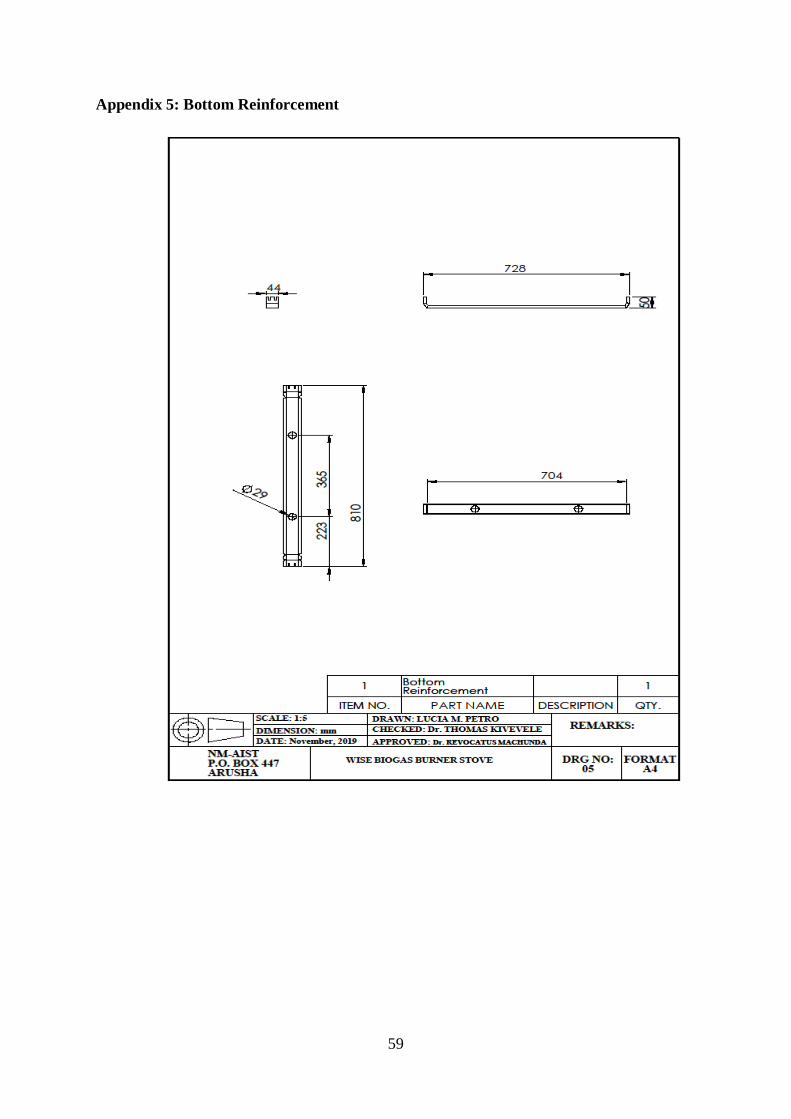
59
Appendix 5: Bottom Reinforcement
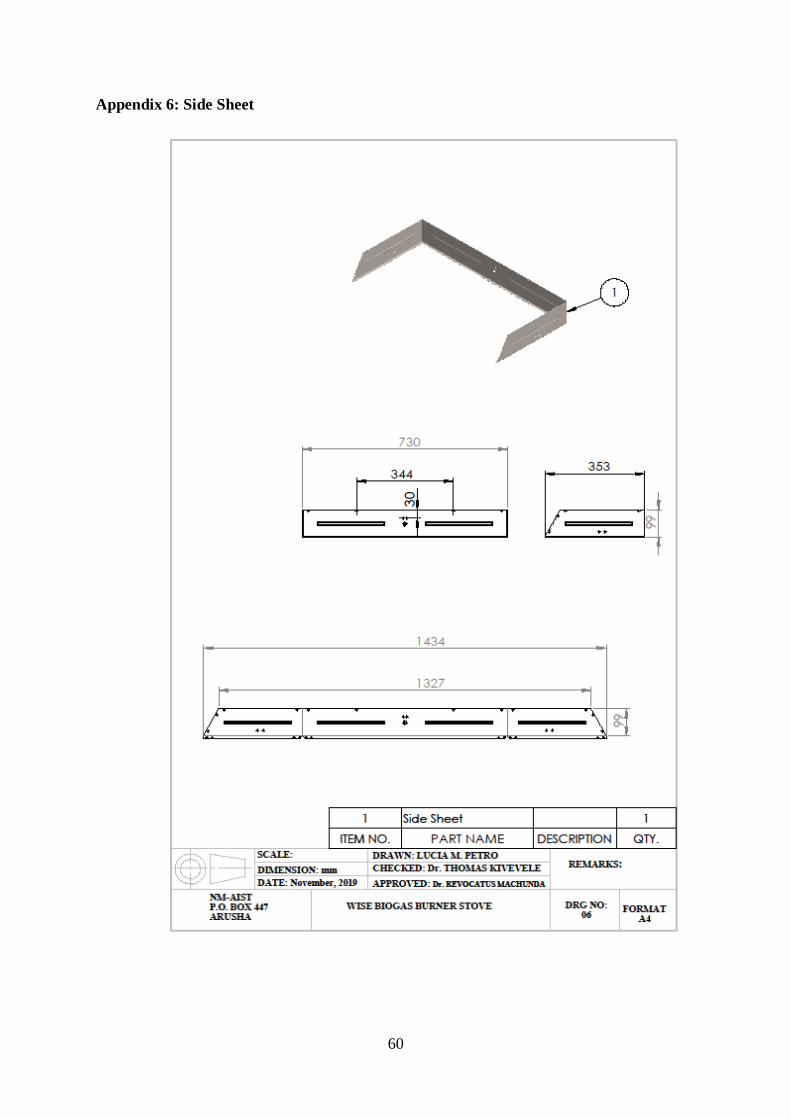
60
Appendix 6: Side Sheet
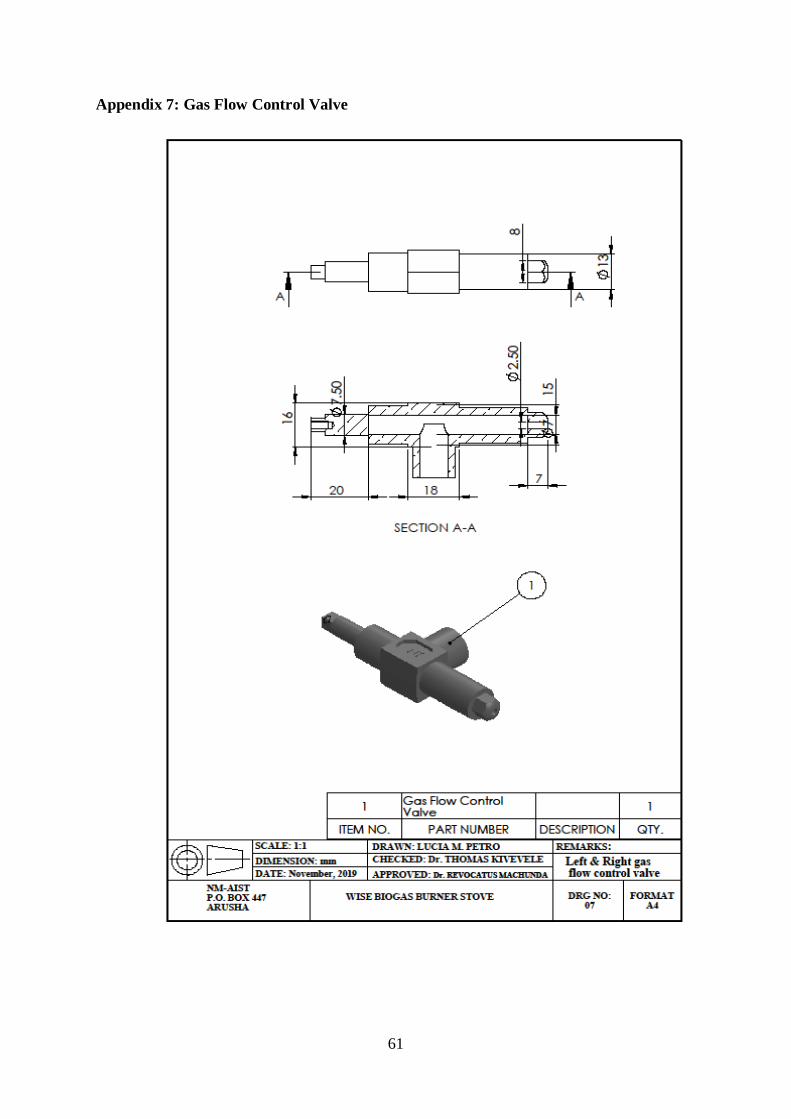
61
Appendix 7: Gas Flow Control Valve
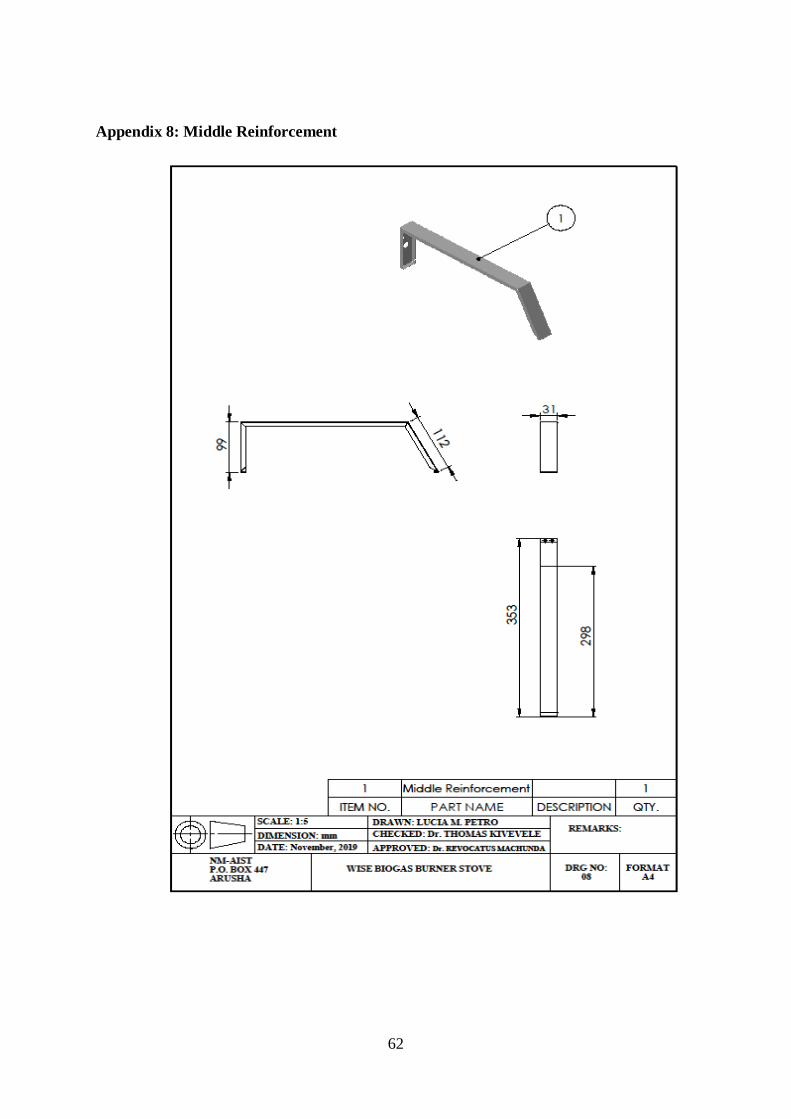
62
Appendix 8: Middle Reinforcement
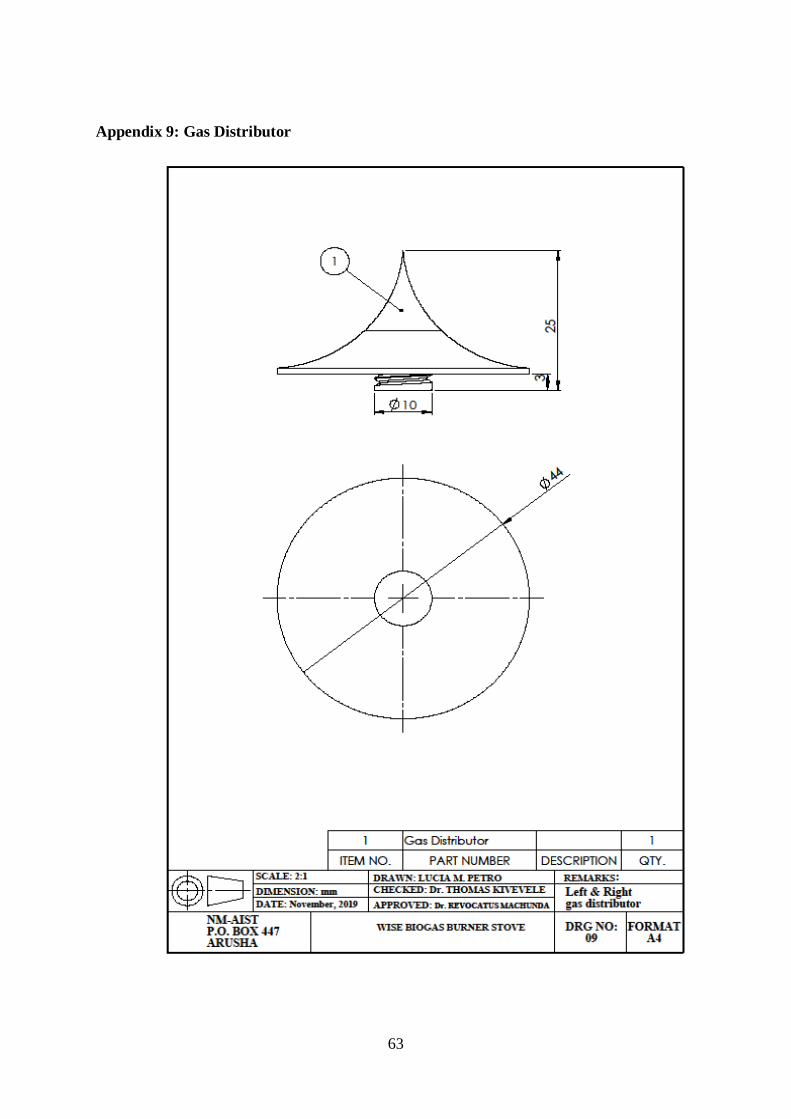
63
Appendix 9: Gas Distributor
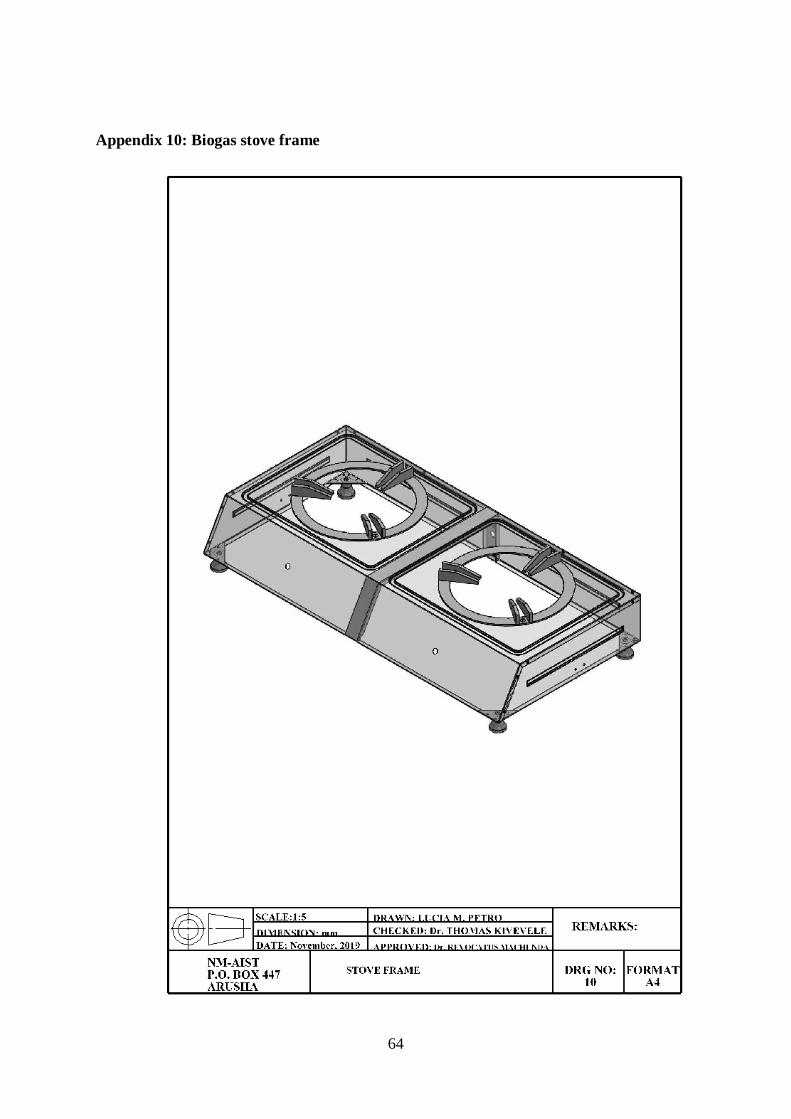
64
Appendix 10: Biogas stove frame
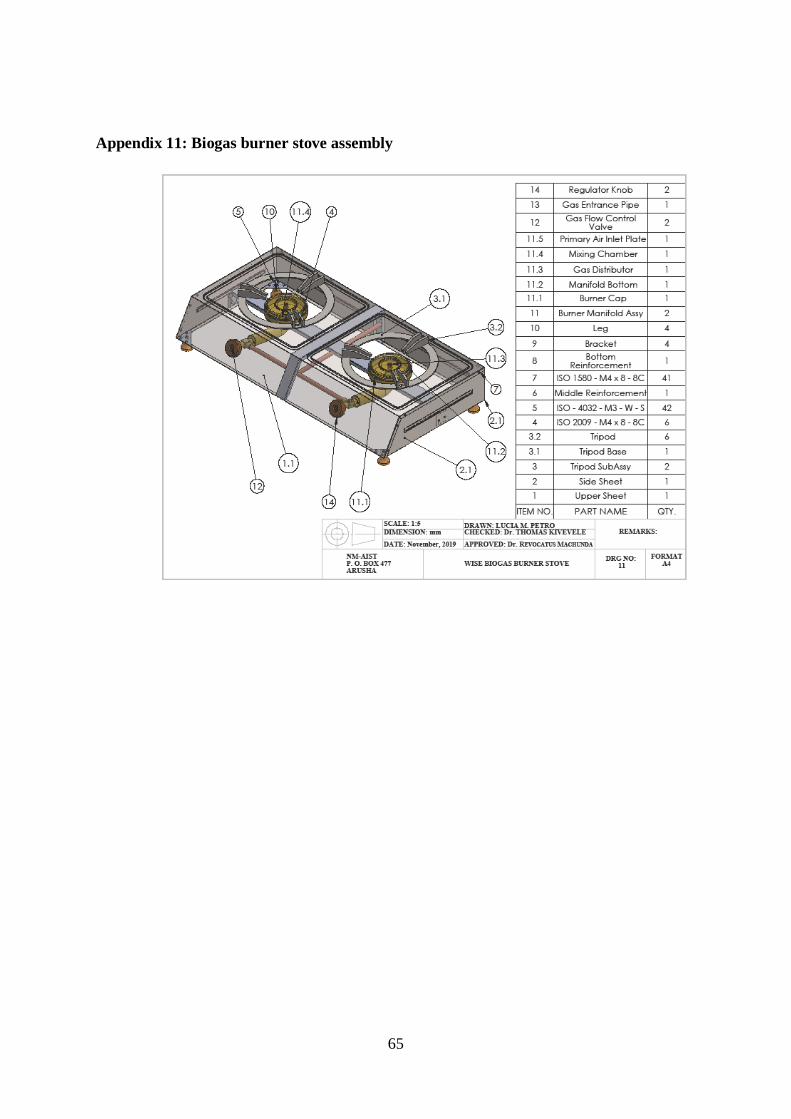
65
Appendix 11: Biogas burner stove assembly
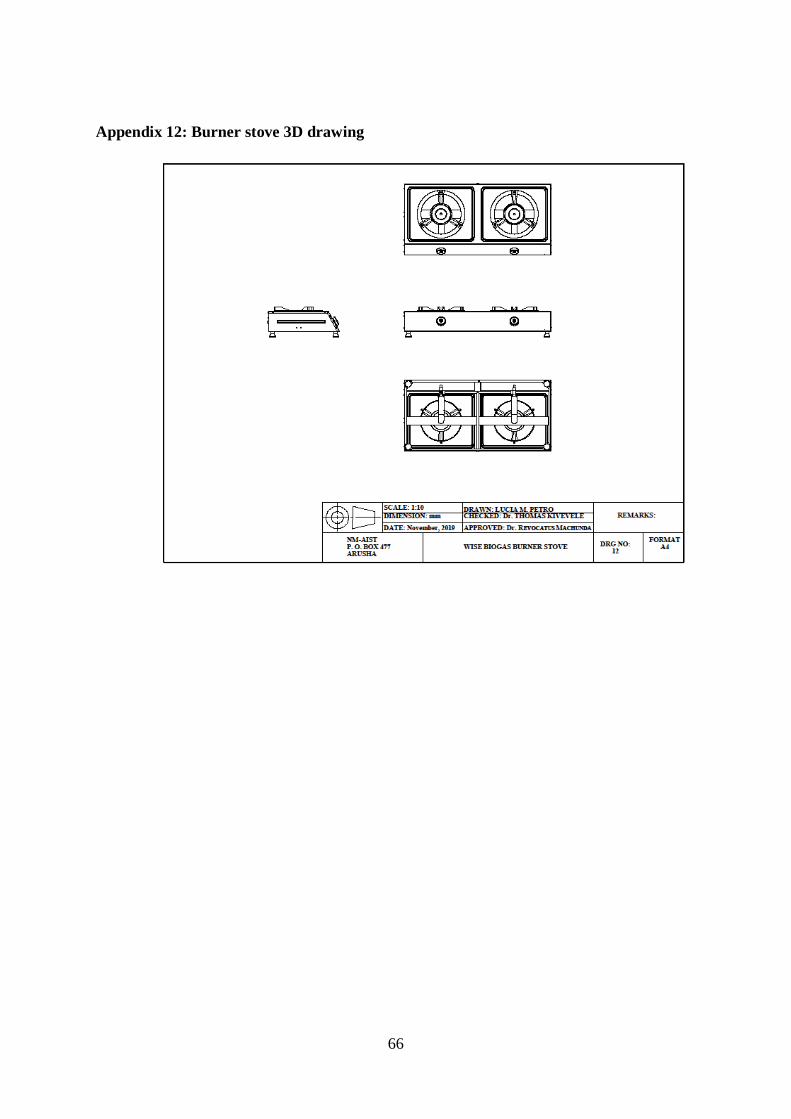
66
Appendix 12: Burner stove 3D drawing
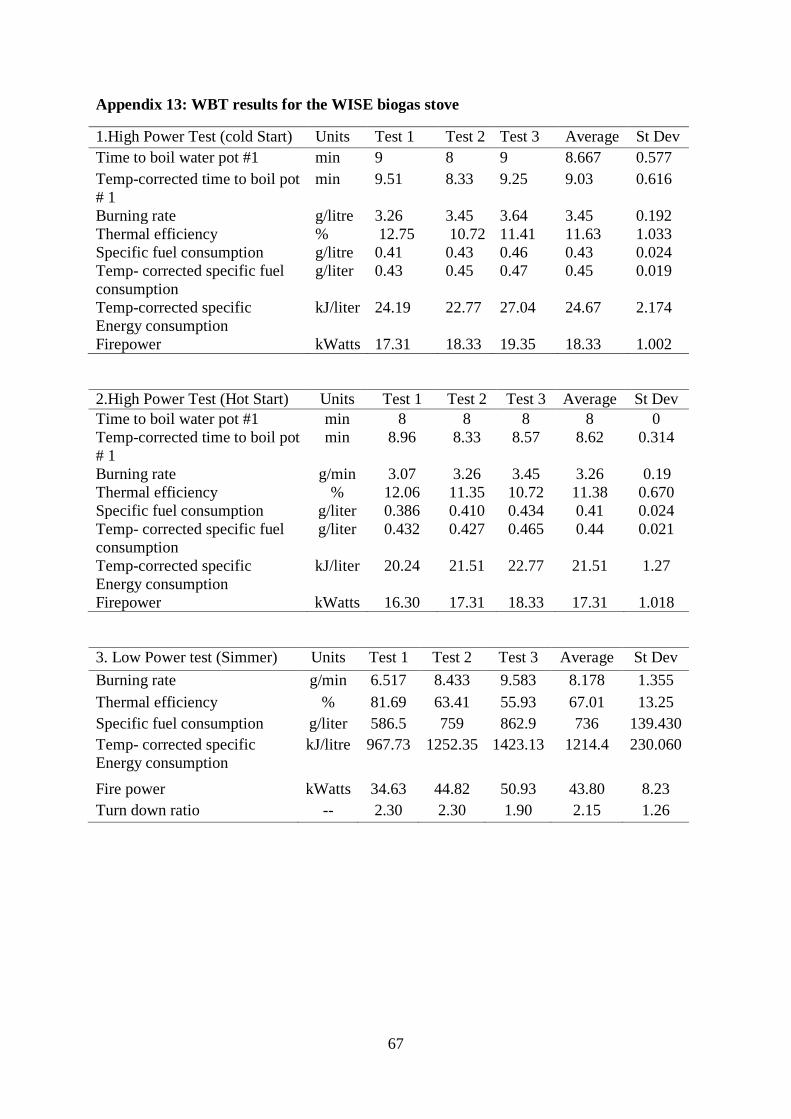
67
Appendix 13: WBT results for the WISE biogas stove
1.High Power Test (cold Start) Units Test 1 Test 2 Test 3 Average St Dev Time to boil water pot #1 min 9 8 9 8.667 0.577 Temp-corrected time to boil pot # 1
min 9.51 8.33 9.25 9.03 0.616
Burning rate g/litre 3.26 3.45 3.64 3.45 0.192 Thermal efficiency % 12.75 10.72 11.41 11.63 1.033 Specific fuel consumption g/litre 0.41 0.43 0.46 0.43 0.024 Temp- corrected specific fuel consumption
g/liter 0.43 0.45 0.47 0.45 0.019
Temp-corrected specific Energy consumption
kJ/liter 24.19 22.77 27.04 24.67 2.174
Firepower kWatts 17.31 18.33 19.35 18.33 1.002
2.High Power Test (Hot Start) Units Test 1 Test 2 Test 3 Average St Dev Time to boil water pot #1 min 8 8 8 8 0 Temp-corrected time to boil pot # 1
min 8.96 8.33 8.57 8.62 0.314
Burning rate g/min 3.07 3.26 3.45 3.26 0.19 Thermal efficiency % 12.06 11.35 10.72 11.38 0.670 Specific fuel consumption g/liter 0.386 0.410 0.434 0.41 0.024 Temp- corrected specific fuel consumption
g/liter 0.432 0.427 0.465 0.44 0.021
Temp-corrected specific Energy consumption
kJ/liter 20.24 21.51 22.77 21.51 1.27
Firepower kWatts 16.30 17.31 18.33 17.31 1.018
3. Low Power test (Simmer) Units Test 1 Test 2 Test 3 Average St Dev Burning rate g/min 6.517 8.433 9.583 8.178 1.355 Thermal efficiency % 81.69 63.41 55.93 67.01 13.25 Specific fuel consumption g/liter 586.5 759 862.9 736 139.430 Temp- corrected specific Energy consumption
kJ/litre 967.73 1252.35 1423.13 1214.4 230.060
Fire power kWatts 34.63 44.82 50.93 43.80 8.23 Turn down ratio -- 2.30 2.30 1.90 2.15 1.26
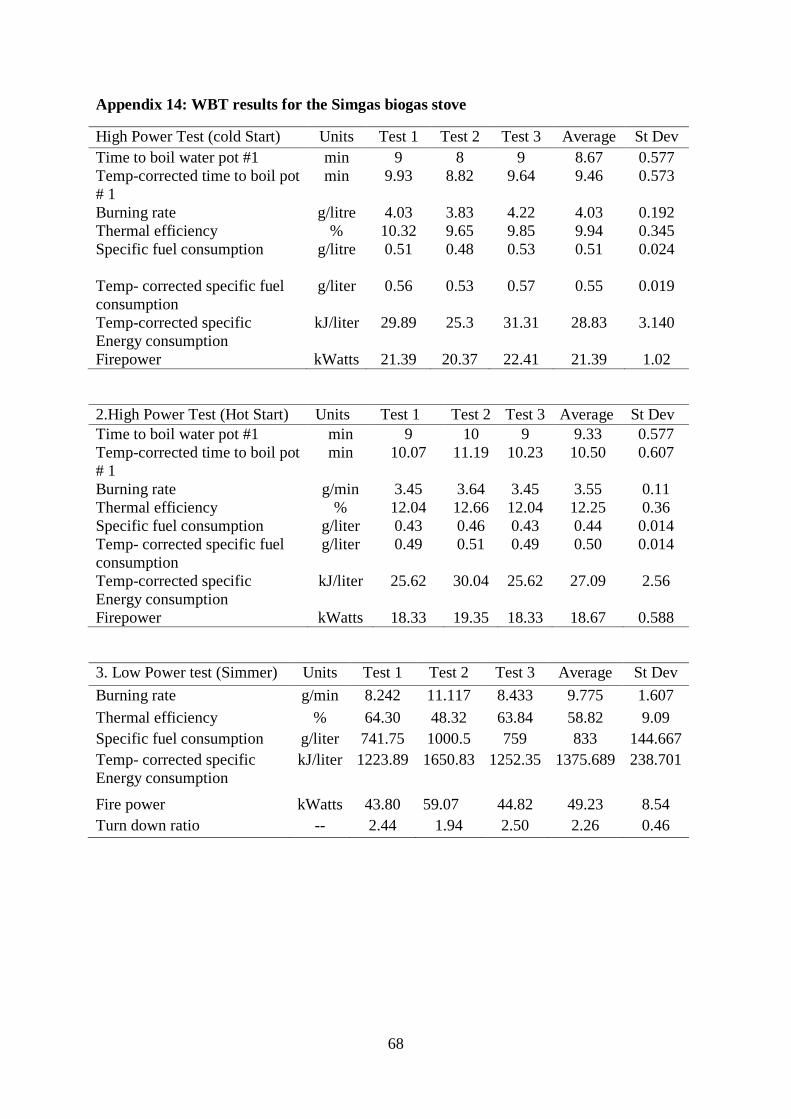
68
Appendix 14: WBT results for the Simgas biogas stove
High Power Test (cold Start) Units Test 1 Test 2 Test 3 Average St Dev Time to boil water pot #1 min 9 8 9 8.67 0.577 Temp-corrected time to boil pot # 1
min 9.93 8.82 9.64 9.46 0.573
Burning rate g/litre 4.03 3.83 4.22 4.03 0.192 Thermal efficiency % 10.32 9.65 9.85 9.94 0.345 Specific fuel consumption
g/litre 0.51 0.48 0.53 0.51 0.024
Temp- corrected specific fuel consumption
g/liter 0.56 0.53 0.57 0.55 0.019
Temp-corrected specific Energy consumption
kJ/liter 29.89 25.3 31.31 28.83 3.140
Firepower kWatts 21.39 20.37 22.41 21.39 1.02
2.High Power Test (Hot Start) Units Test 1 Test 2 Test 3 Average St Dev Time to boil water pot #1 min 9 10 9 9.33 0.577 Temp-corrected time to boil pot # 1
min 10.07 11.19 10.23 10.50 0.607
Burning rate g/min 3.45 3.64 3.45 3.55 0.11 Thermal efficiency % 12.04 12.66 12.04 12.25 0.36 Specific fuel consumption g/liter 0.43 0.46 0.43 0.44 0.014 Temp- corrected specific fuel consumption
g/liter 0.49 0.51 0.49 0.50 0.014
Temp-corrected specific Energy consumption
kJ/liter 25.62 30.04 25.62 27.09 2.56
Firepower kWatts 18.33 19.35 18.33 18.67 0.588
3. Low Power test (Simmer) Units Test 1 Test 2 Test 3 Average St Dev Burning rate g/min 8.242 11.117 8.433 9.775 1.607 Thermal efficiency % 64.30 48.32 63.84 58.82 9.09 Specific fuel consumption g/liter 741.75 1000.5 759 833 144.667 Temp- corrected specific Energy consumption
kJ/liter 1223.89 1650.83 1252.35 1375.689 238.701
Fire power kWatts 43.80 59.07 44.82 49.23 8.54 Turn down ratio -- 2.44 1.94 2.50 2.26 0.46
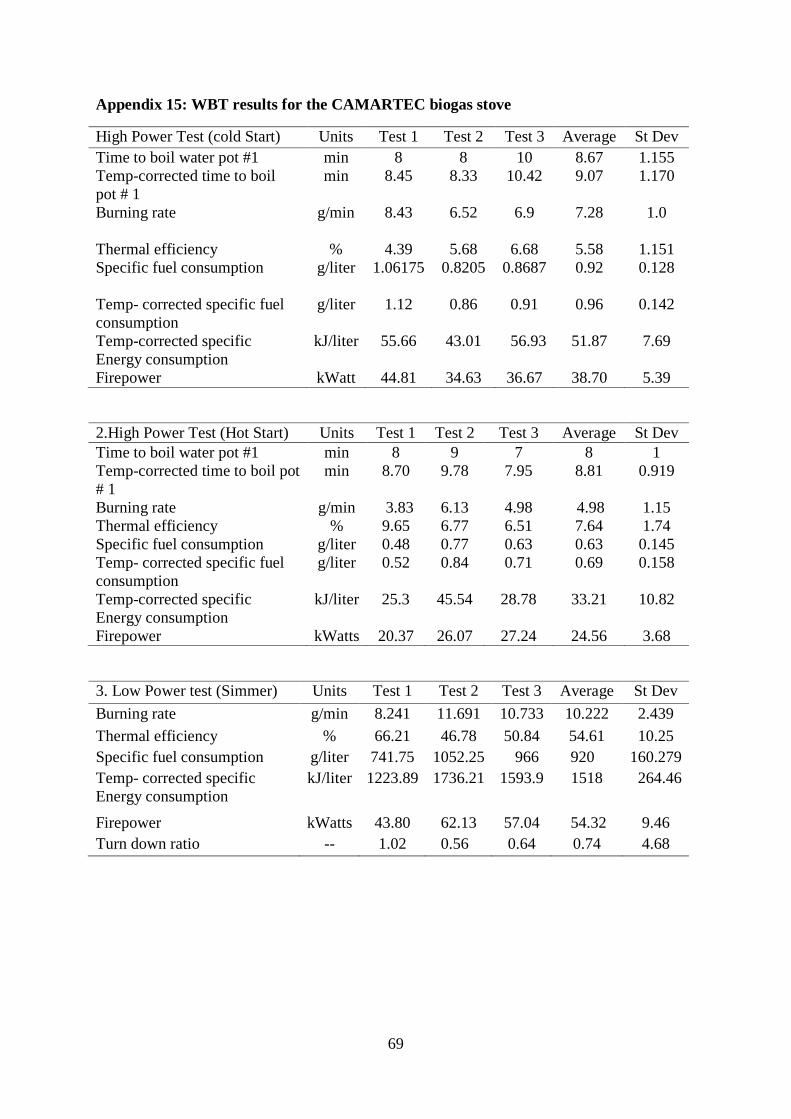
69
Appendix 15: WBT results for the CAMARTEC biogas stove
High Power Test (cold Start) Units Test 1 Test 2 Test 3 Average St Dev Time to boil water pot #1 min 8 8 10 8.67 1.155 Temp-corrected time to boil pot # 1
min 8.45 8.33 10.42 9.07 1.170
Burning rate
g/min 8.43 6.52 6.9 7.28 1.0
Thermal efficiency % 4.39 5.68 6.68 5.58 1.151 Specific fuel consumption
g/liter 1.06175 0.8205 0.8687 0.92 0.128
Temp- corrected specific fuel consumption
g/liter 1.12 0.86 0.91 0.96 0.142
Temp-corrected specific Energy consumption
kJ/liter 55.66 43.01 56.93 51.87 7.69
Firepower kWatt 44.81 34.63 36.67 38.70 5.39
2.High Power Test (Hot Start) Units Test 1 Test 2 Test 3 Average St Dev Time to boil water pot #1 min 8 9 7 8 1 Temp-corrected time to boil pot # 1
min 8.70 9.78 7.95 8.81 0.919
Burning rate g/min 3.83 6.13 4.98 4.98 1.15 Thermal efficiency % 9.65 6.77 6.51 7.64 1.74 Specific fuel consumption g/liter 0.48 0.77 0.63 0.63 0.145 Temp- corrected specific fuel consumption
g/liter 0.52 0.84 0.71 0.69 0.158
Temp-corrected specific Energy consumption
kJ/liter 25.3 45.54 28.78 33.21 10.82
Firepower kWatts 20.37 26.07 27.24 24.56 3.68
3. Low Power test (Simmer) Units Test 1 Test 2 Test 3 Average St Dev Burning rate g/min 8.241 11.691 10.733 10.222 2.439 Thermal efficiency % 66.21 46.78 50.84 54.61 10.25 Specific fuel consumption g/liter 741.75 1052.25 966 920 160.279 Temp- corrected specific Energy consumption
kJ/liter 1223.89 1736.21 1593.9 1518 264.46
Firepower kWatts 43.80 62.13 57.04 54.32 9.46 Turn down ratio -- 1.02 0.56 0.64 0.74 4.68
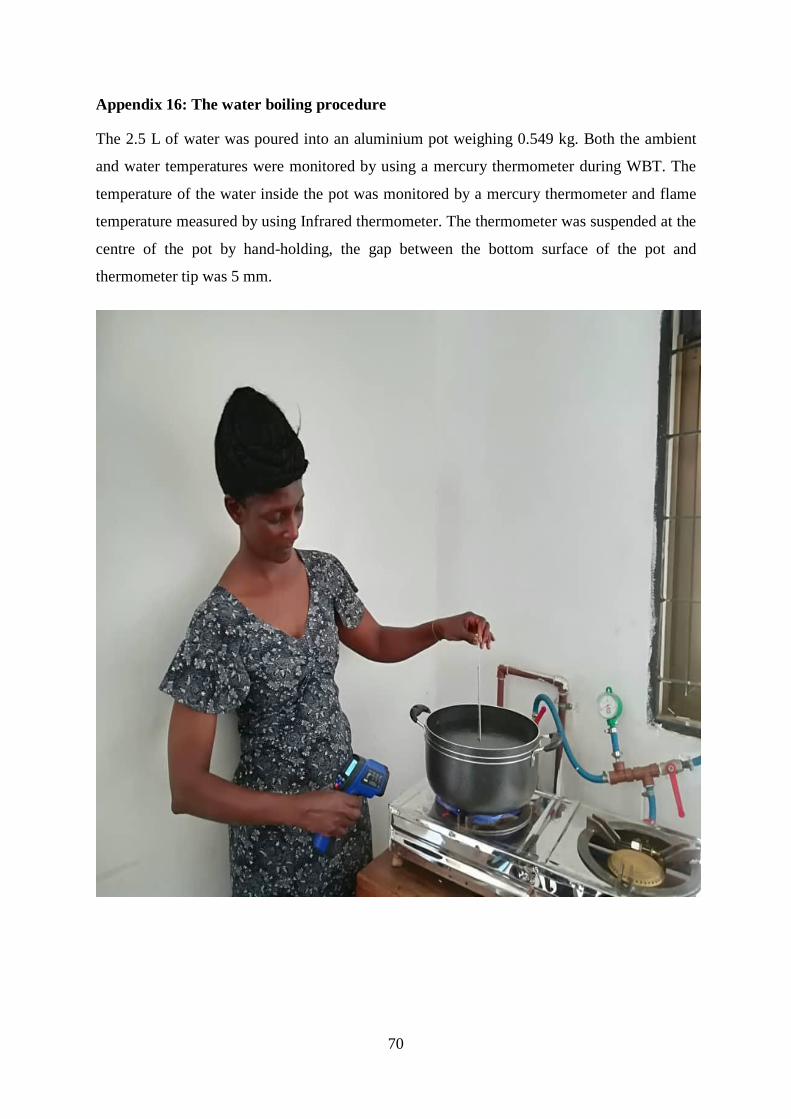
70
Appendix 16: The water boiling procedure
The 2.5 L of water was poured into an aluminium pot weighing 0.549 kg. Both the ambient
and water temperatures were monitored by using a mercury thermometer during WBT. The
temperature of the water inside the pot was monitored by a mercury thermometer and flame
temperature measured by using Infrared thermometer. The thermometer was suspended at the
centre of the pot by hand-holding, the gap between the bottom surface of the pot and
thermometer tip was 5 mm.

71
RESEARCH OUTPUT
1. Research Article 2. Patent 3. Poster
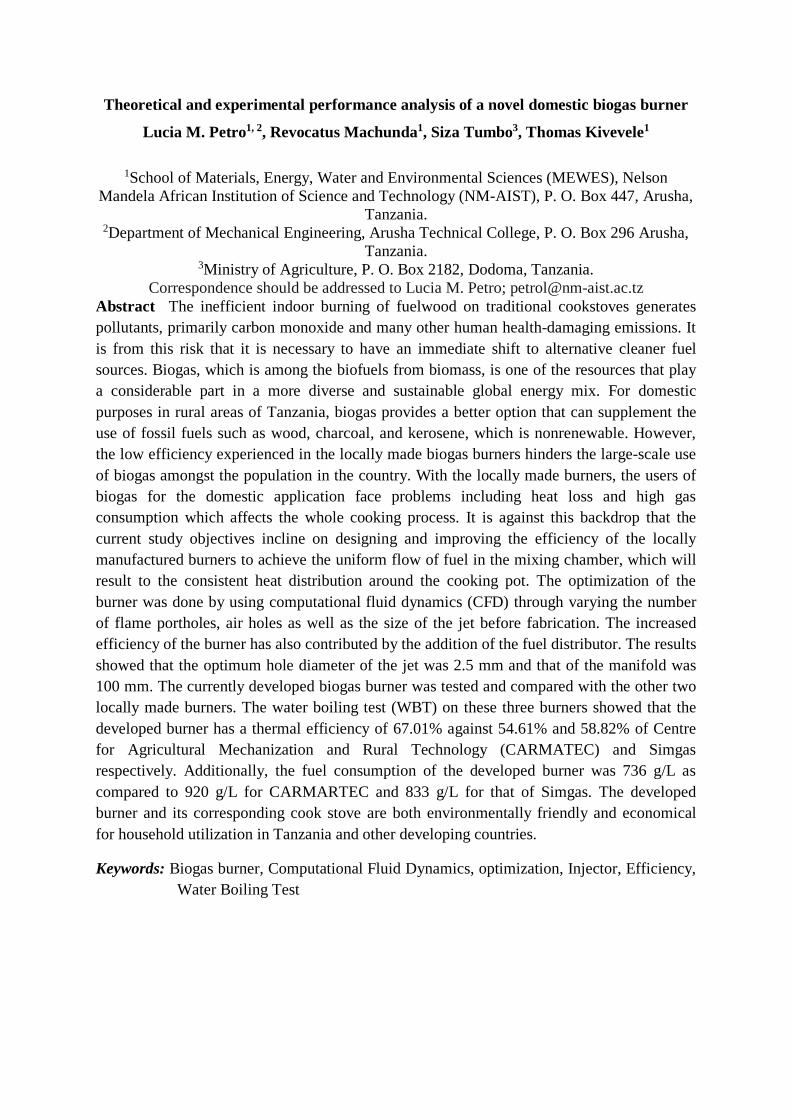
Theoretical and experimental performance analysis of a novel domestic biogas burner
Lucia M. Petro1, 2, Revocatus Machunda1, Siza Tumbo3, Thomas Kivevele1
1School of Materials, Energy, Water and Environmental Sciences (MEWES), Nelson Mandela African Institution of Science and Technology (NM-AIST), P. O. Box 447, Arusha,
Tanzania. 2Department of Mechanical Engineering, Arusha Technical College, P. O. Box 296 Arusha,
Tanzania. 3Ministry of Agriculture, P. O. Box 2182, Dodoma, Tanzania.
Correspondence should be addressed to Lucia M. Petro; [email protected] Abstract The inefficient indoor burning of fuelwood on traditional cookstoves generates pollutants, primarily carbon monoxide and many other human health-damaging emissions. It is from this risk that it is necessary to have an immediate shift to alternative cleaner fuel sources. Biogas, which is among the biofuels from biomass, is one of the resources that play a considerable part in a more diverse and sustainable global energy mix. For domestic purposes in rural areas of Tanzania, biogas provides a better option that can supplement the use of fossil fuels such as wood, charcoal, and kerosene, which is nonrenewable. However, the low efficiency experienced in the locally made biogas burners hinders the large-scale use of biogas amongst the population in the country. With the locally made burners, the users of biogas for the domestic application face problems including heat loss and high gas consumption which affects the whole cooking process. It is against this backdrop that the current study objectives incline on designing and improving the efficiency of the locally manufactured burners to achieve the uniform flow of fuel in the mixing chamber, which will result to the consistent heat distribution around the cooking pot. The optimization of the burner was done by using computational fluid dynamics (CFD) through varying the number of flame portholes, air holes as well as the size of the jet before fabrication. The increased efficiency of the burner has also contributed by the addition of the fuel distributor. The results showed that the optimum hole diameter of the jet was 2.5 mm and that of the manifold was 100 mm. The currently developed biogas burner was tested and compared with the other two locally made burners. The water boiling test (WBT) on these three burners showed that the developed burner has a thermal efficiency of 67.01% against 54.61% and 58.82% of Centre for Agricultural Mechanization and Rural Technology (CARMATEC) and Simgas respectively. Additionally, the fuel consumption of the developed burner was 736 g/L as compared to 920 g/L for CARMARTEC and 833 g/L for that of Simgas. The developed burner and its corresponding cook stove are both environmentally friendly and economical for household utilization in Tanzania and other developing countries.
Keywords: Biogas burner, Computational Fluid Dynamics, optimization, Injector, Efficiency, Water Boiling Test
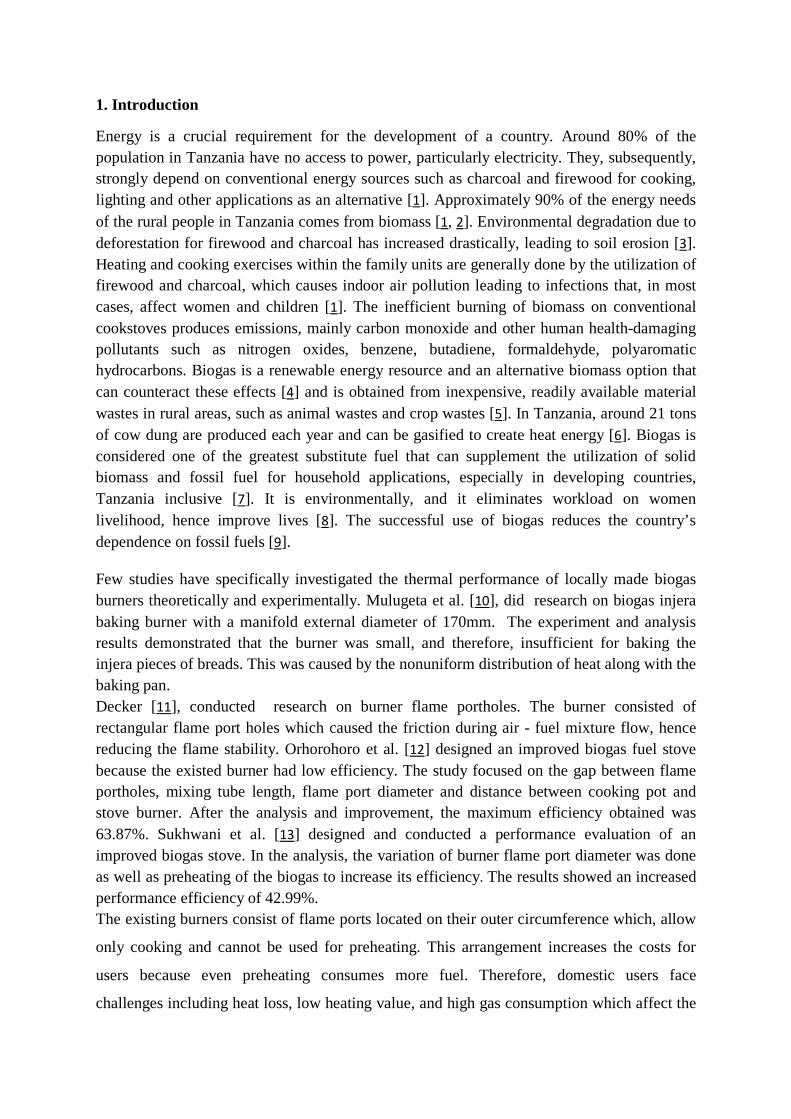
1. Introduction
Energy is a crucial requirement for the development of a country. Around 80% of the population in Tanzania have no access to power, particularly electricity. They, subsequently, strongly depend on conventional energy sources such as charcoal and firewood for cooking, lighting and other applications as an alternative [1]. Approximately 90% of the energy needs of the rural people in Tanzania comes from biomass [1, 2]. Environmental degradation due to deforestation for firewood and charcoal has increased drastically, leading to soil erosion [3]. Heating and cooking exercises within the family units are generally done by the utilization of firewood and charcoal, which causes indoor air pollution leading to infections that, in most cases, affect women and children [1]. The inefficient burning of biomass on conventional cookstoves produces emissions, mainly carbon monoxide and other human health-damaging pollutants such as nitrogen oxides, benzene, butadiene, formaldehyde, polyaromatic hydrocarbons. Biogas is a renewable energy resource and an alternative biomass option that can counteract these effects [4] and is obtained from inexpensive, readily available material wastes in rural areas, such as animal wastes and crop wastes [5]. In Tanzania, around 21 tons of cow dung are produced each year and can be gasified to create heat energy [6]. Biogas is considered one of the greatest substitute fuel that can supplement the utilization of solid biomass and fossil fuel for household applications, especially in developing countries, Tanzania inclusive [7]. It is environmentally, and it eliminates workload on women livelihood, hence improve lives [8]. The successful use of biogas reduces the country’s dependence on fossil fuels [9].
Few studies have specifically investigated the thermal performance of locally made biogas burners theoretically and experimentally. Mulugeta et al. [10], did research on biogas injera baking burner with a manifold external diameter of 170mm. The experiment and analysis results demonstrated that the burner was small, and therefore, insufficient for baking the injera pieces of breads. This was caused by the nonuniform distribution of heat along with the baking pan. Decker [11], conducted research on burner flame portholes. The burner consisted of rectangular flame port holes which caused the friction during air - fuel mixture flow, hence reducing the flame stability. Orhorohoro et al. [12] designed an improved biogas fuel stove because the existed burner had low efficiency. The study focused on the gap between flame portholes, mixing tube length, flame port diameter and distance between cooking pot and stove burner. After the analysis and improvement, the maximum efficiency obtained was 63.87%. Sukhwani et al. [13] designed and conducted a performance evaluation of an improved biogas stove. In the analysis, the variation of burner flame port diameter was done as well as preheating of the biogas to increase its efficiency. The results showed an increased performance efficiency of 42.99%. The existing burners consist of flame ports located on their outer circumference which, allow
only cooking and cannot be used for preheating. This arrangement increases the costs for
users because even preheating consumes more fuel. Therefore, domestic users face
challenges including heat loss, low heating value, and high gas consumption which affect the
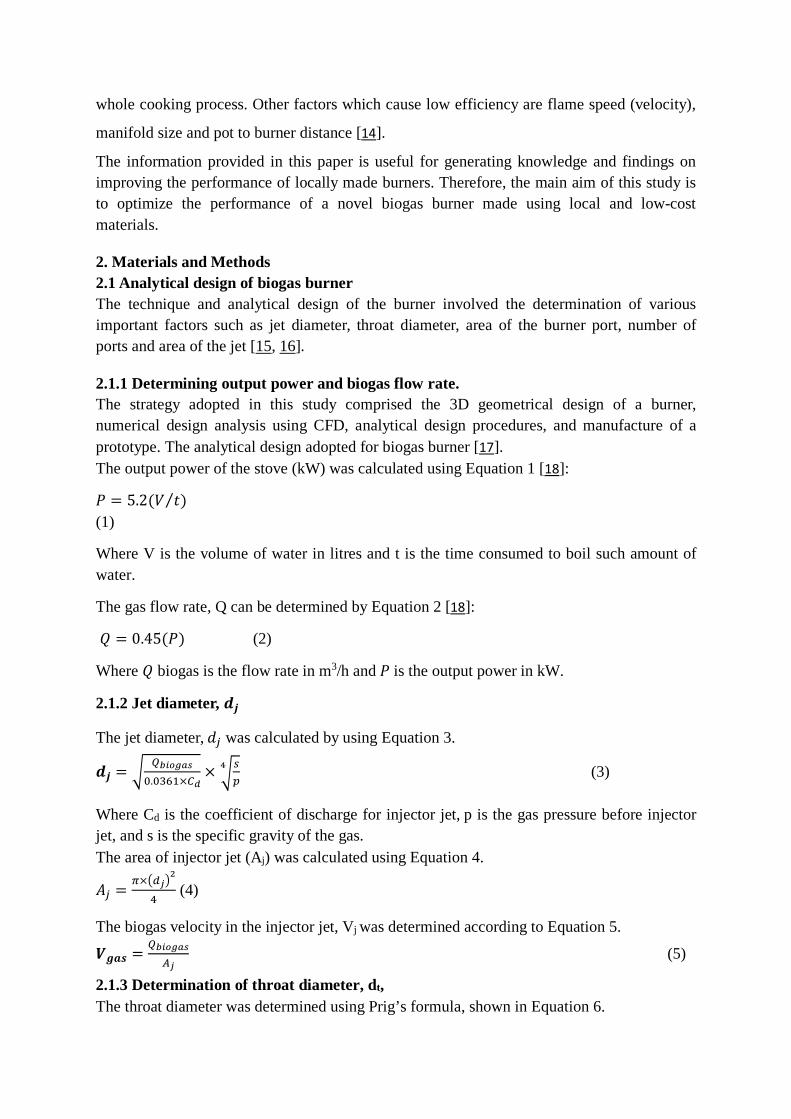
whole cooking process. Other factors which cause low efficiency are flame speed (velocity),
manifold size and pot to burner distance [14].
The information provided in this paper is useful for generating knowledge and findings on improving the performance of locally made burners. Therefore, the main aim of this study is to optimize the performance of a novel biogas burner made using local and low-cost materials.
2. Materials and Methods2.1 Analytical design of biogas burner The technique and analytical design of the burner involved the determination of various important factors such as jet diameter, throat diameter, area of the burner port, number of ports and area of the jet [15, 16].
2.1.1 Determining output power and biogas flow rate. The strategy adopted in this study comprised the 3D geometrical design of a burner, numerical design analysis using CFD, analytical design procedures, and manufacture of a prototype. The analytical design adopted for biogas burner [17]. The output power of the stove (kW) was calculated using Equation 1 [18]:
𝑃𝑃 = 5.2(𝑉𝑉 𝑡𝑡⁄ )(1)
Where V is the volume of water in litres and t is the time consumed to boil such amount of water.
The gas flow rate, Q can be determined by Equation 2 [18]:
𝑄𝑄 = 0.45(𝑃𝑃) (2)
Where 𝑄𝑄 biogas is the flow rate in m3/h and 𝑃𝑃 is the output power in kW.
2.1.2 Jet diameter, 𝒅𝒅𝒋𝒋
The jet diameter, 𝑑𝑑𝑗𝑗 was calculated by using Equation 3.
𝒅𝒅𝒋𝒋 = �𝑄𝑄𝑏𝑏𝑏𝑏𝑏𝑏𝑏𝑏𝑏𝑏𝑏𝑏
0.0361×𝐶𝐶𝑑𝑑× �
𝑠𝑠𝑝𝑝
4 (3)
Where Cd is the coefficient of discharge for injector jet, p is the gas pressure before injector jet, and s is the specific gravity of the gas. The area of injector jet (Aj) was calculated using Equation 4.
𝐴𝐴𝑗𝑗 =𝜋𝜋×�𝑑𝑑𝑗𝑗�2
4 (4)
The biogas velocity in the injector jet, Vj was determined according to Equation 5.
𝑽𝑽𝒈𝒈𝒈𝒈𝒈𝒈 =𝑄𝑄𝑏𝑏𝑏𝑏𝑏𝑏𝑏𝑏𝑏𝑏𝑏𝑏
𝐴𝐴𝑗𝑗(5)
2.1.3 Determination of throat diameter, dt, The throat diameter was determined using Prig’s formula, shown in Equation 6.

𝑑𝑑𝑡𝑡 = �� 𝑟𝑟√𝑠𝑠
+ 1� 𝑑𝑑𝑗𝑗�
(6) Where r is entrainment ratio, and s is the specific gravity of the gas. According to Fulford [16], it is recommended to double the throat diameter for best design.
The exact size depends on the standard pipe sizes available.
2.1.4 Determination of burner port design As suggested by Fulford [16], the stoichiometric flame speed of biogas is 0.25 m/s.
The blending supply velocity, 𝑣𝑣𝑝𝑝 is given by Fulford [16]:
𝑉𝑉𝑝𝑝 = 𝑄𝑄𝑚𝑚𝐴𝐴𝑝𝑝
≪ 0.25 𝑚𝑚 𝑚𝑚⁄ (7)
The burner port area was solved as follows:
𝐴𝐴𝑝𝑝 > 𝑄𝑄𝑚𝑚𝑉𝑉𝑝𝑝
≫ 0.0025𝑚𝑚2
(8) From the design calculations, the centre flame port distance from one hole to another is 3mm to avoid the flame lift. Then, the number of flame portholes was calculated according to Equation 9
𝐸𝐸𝑝𝑝 = 4𝐴𝐴𝑝𝑝
𝜋𝜋𝑑𝑑𝑝𝑝2 (9)
Where np is the number of holes and dp is the diameter of each hole in meters.
2.2 Burner drawings and Geometry modelling The parameters obtained from the analytical design were used to generate 3D drawings of the burner using SOLID WORKS software, as shown in Figure 1.
Figure 1: 3D Geometry of a burner.
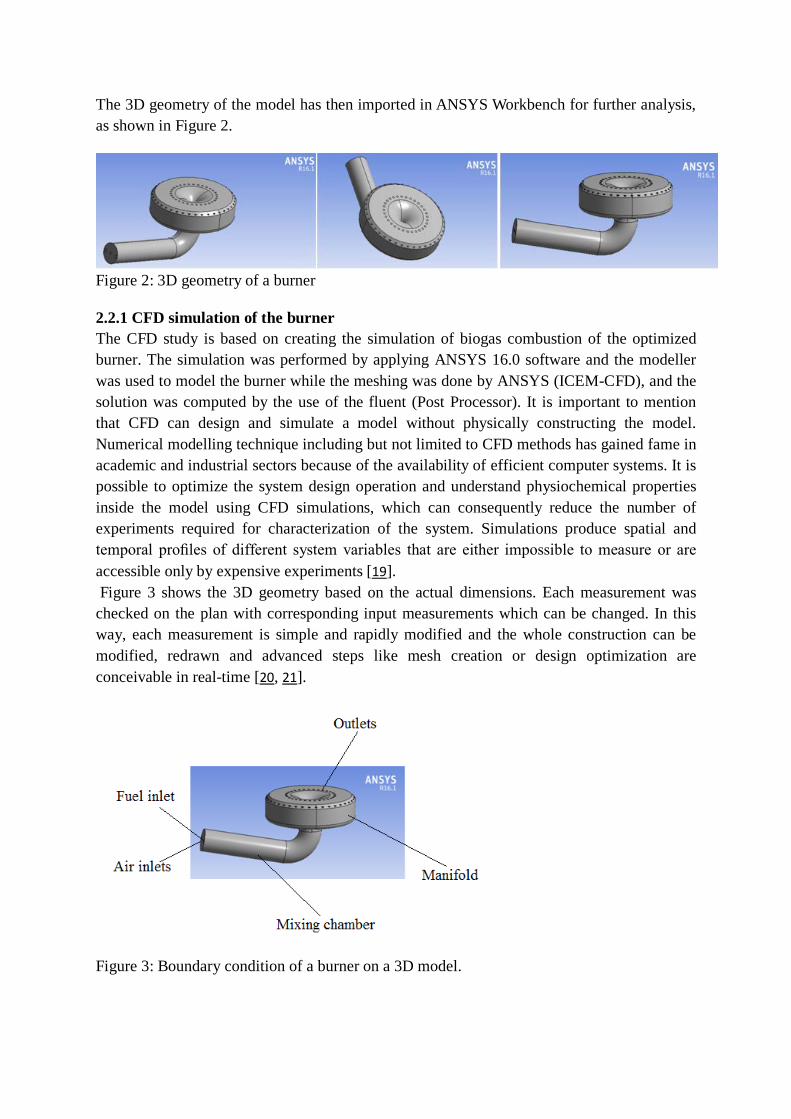
The 3D geometry of the model has then imported in ANSYS Workbench for further analysis, as shown in Figure 2.
Figure 2: 3D geometry of a burner
2.2.1 CFD simulation of the burner The CFD study is based on creating the simulation of biogas combustion of the optimized burner. The simulation was performed by applying ANSYS 16.0 software and the modeller was used to model the burner while the meshing was done by ANSYS (ICEM-CFD), and the solution was computed by the use of the fluent (Post Processor). It is important to mention that CFD can design and simulate a model without physically constructing the model. Numerical modelling technique including but not limited to CFD methods has gained fame in academic and industrial sectors because of the availability of efficient computer systems. It is possible to optimize the system design operation and understand physiochemical properties inside the model using CFD simulations, which can consequently reduce the number of experiments required for characterization of the system. Simulations produce spatial and temporal profiles of different system variables that are either impossible to measure or are accessible only by expensive experiments [19]. Figure 3 shows the 3D geometry based on the actual dimensions. Each measurement was checked on the plan with corresponding input measurements which can be changed. In this way, each measurement is simple and rapidly modified and the whole construction can be modified, redrawn and advanced steps like mesh creation or design optimization are conceivable in real-time [20, 21].
Figure 3: Boundary condition of a burner on a 3D model.
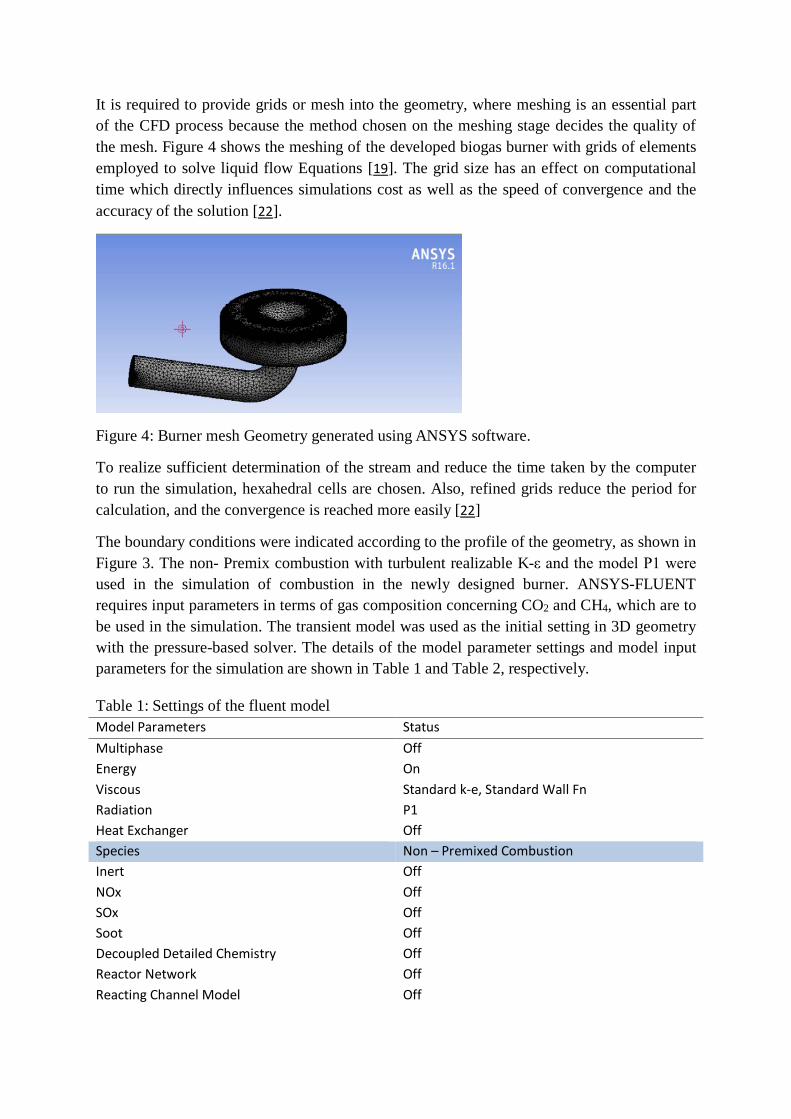
It is required to provide grids or mesh into the geometry, where meshing is an essential part of the CFD process because the method chosen on the meshing stage decides the quality of the mesh. Figure 4 shows the meshing of the developed biogas burner with grids of elements employed to solve liquid flow Equations [19]. The grid size has an effect on computational time which directly influences simulations cost as well as the speed of convergence and the accuracy of the solution [22].
Figure 4: Burner mesh Geometry generated using ANSYS software.
To realize sufficient determination of the stream and reduce the time taken by the computer to run the simulation, hexahedral cells are chosen. Also, refined grids reduce the period for calculation, and the convergence is reached more easily [22]
The boundary conditions were indicated according to the profile of the geometry, as shown in Figure 3. The non- Premix combustion with turbulent realizable K-ε and the model P1 were used in the simulation of combustion in the newly designed burner. ANSYS-FLUENT requires input parameters in terms of gas composition concerning CO2 and CH4, which are to be used in the simulation. The transient model was used as the initial setting in 3D geometry with the pressure-based solver. The details of the model parameter settings and model input parameters for the simulation are shown in Table 1 and Table 2, respectively.
Table 1: Settings of the fluent model Model Parameters Status Multiphase Off Energy On Viscous Standard k-e, Standard Wall Fn Radiation P1 Heat Exchanger Off Species Non – Premixed Combustion Inert Off NOx Off SOx Off Soot Off Decoupled Detailed Chemistry Off Reactor Network Off Reacting Channel Model Off
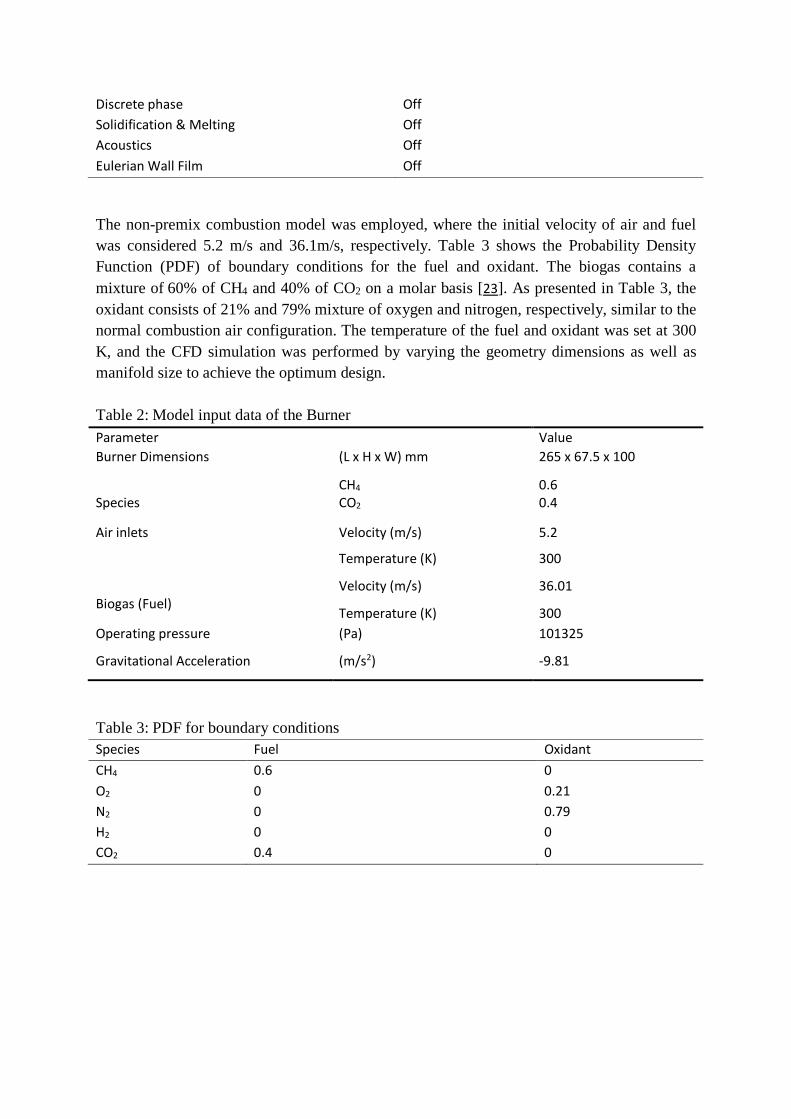
Discrete phase Off Solidification & Melting Off Acoustics Off Eulerian Wall Film Off
The non-premix combustion model was employed, where the initial velocity of air and fuel was considered 5.2 m/s and 36.1m/s, respectively. Table 3 shows the Probability Density Function (PDF) of boundary conditions for the fuel and oxidant. The biogas contains a mixture of 60% of CH4 and 40% of CO2 on a molar basis [23]. As presented in Table 3, the oxidant consists of 21% and 79% mixture of oxygen and nitrogen, respectively, similar to the normal combustion air configuration. The temperature of the fuel and oxidant was set at 300 K, and the CFD simulation was performed by varying the geometry dimensions as well as manifold size to achieve the optimum design.
Table 2: Model input data of the Burner Parameter Value Burner Dimensions (L x H x W) mm 265 x 67.5 x 100
Species CH4 0.6 CO2 0.4
Air inlets Velocity (m/s) 5.2
Temperature (K) 300
Biogas (Fuel) Velocity (m/s) 36.01
Temperature (K) 300 Operating pressure (Pa) 101325
Gravitational Acceleration (m/s2) -9.81
Table 3: PDF for boundary conditions Species Fuel Oxidant CH4 0.6 0 O2 0 0.21 N2 0 0.79 H2 0 0 CO2 0.4 0
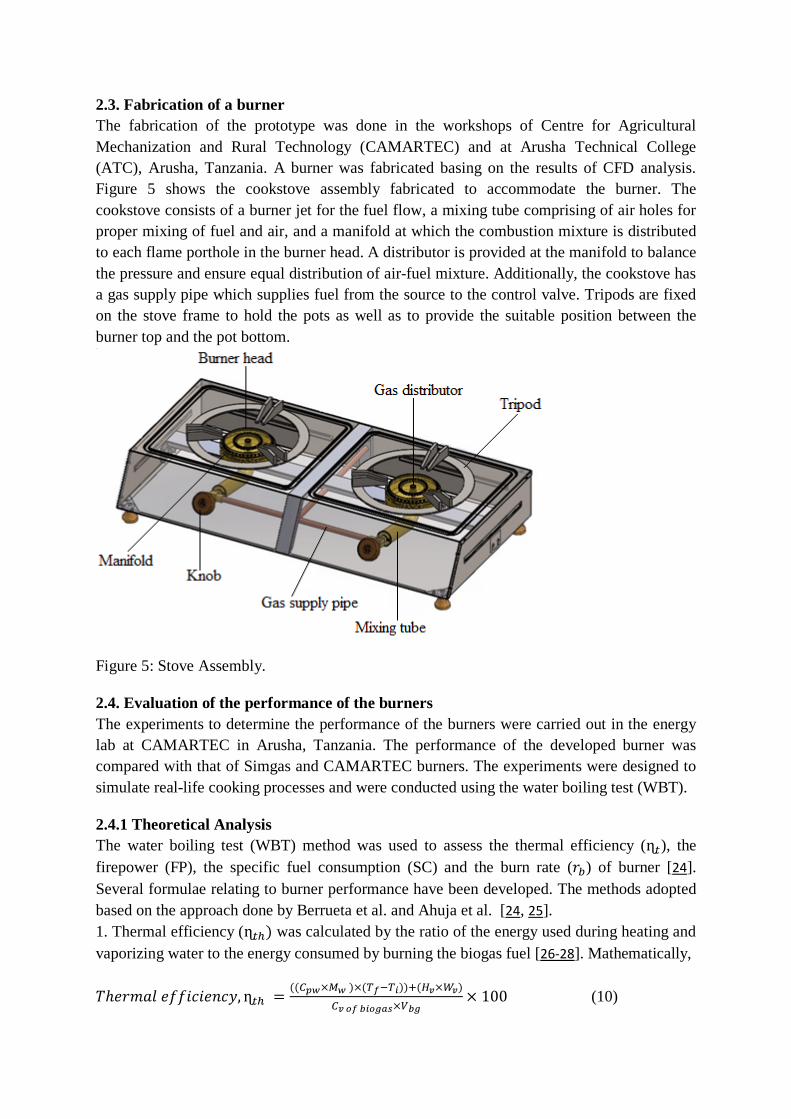
2.3. Fabrication of a burner The fabrication of the prototype was done in the workshops of Centre for Agricultural Mechanization and Rural Technology (CAMARTEC) and at Arusha Technical College (ATC), Arusha, Tanzania. A burner was fabricated basing on the results of CFD analysis. Figure 5 shows the cookstove assembly fabricated to accommodate the burner. The cookstove consists of a burner jet for the fuel flow, a mixing tube comprising of air holes for proper mixing of fuel and air, and a manifold at which the combustion mixture is distributed to each flame porthole in the burner head. A distributor is provided at the manifold to balance the pressure and ensure equal distribution of air-fuel mixture. Additionally, the cookstove has a gas supply pipe which supplies fuel from the source to the control valve. Tripods are fixed on the stove frame to hold the pots as well as to provide the suitable position between the burner top and the pot bottom.
Figure 5: Stove Assembly.
2.4. Evaluation of the performance of the burners The experiments to determine the performance of the burners were carried out in the energy lab at CAMARTEC in Arusha, Tanzania. The performance of the developed burner was compared with that of Simgas and CAMARTEC burners. The experiments were designed to simulate real-life cooking processes and were conducted using the water boiling test (WBT).
2.4.1 Theoretical Analysis The water boiling test (WBT) method was used to assess the thermal efficiency (ɳ𝑡𝑡), the firepower (FP), the specific fuel consumption (SC) and the burn rate (𝑟𝑟𝑣𝑣) of burner [24]. Several formulae relating to burner performance have been developed. The methods adopted based on the approach done by Berrueta et al. and Ahuja et al. [24, 25]. 1. Thermal efficiency (ɳ𝑡𝑡ℎ) was calculated by the ratio of the energy used during heating andvaporizing water to the energy consumed by burning the biogas fuel [26-28]. Mathematically,
𝑇𝑇ℎ𝐸𝐸𝑟𝑟𝑚𝑚𝑃𝑃𝑙𝑙 𝐸𝐸𝑓𝑓𝑓𝑓𝑑𝑑𝑣𝑣𝑑𝑑𝐸𝐸𝐸𝐸𝑣𝑣𝐸𝐸, ɳ𝑡𝑡ℎ = ((𝐶𝐶𝑝𝑝𝑝𝑝×𝑀𝑀𝑝𝑝 )×(𝑇𝑇𝑓𝑓−𝑇𝑇𝑏𝑏))+(𝐻𝐻𝑣𝑣×𝑊𝑊𝑣𝑣)𝐶𝐶𝑣𝑣 𝑏𝑏𝑓𝑓 𝑏𝑏𝑏𝑏𝑏𝑏𝑏𝑏𝑏𝑏𝑏𝑏×𝑉𝑉𝑏𝑏𝑏𝑏
× 100 (10)
Where, 𝑉𝑉𝑣𝑣𝑣𝑣is Volume of biogas consumed, m3/h, 𝑀𝑀𝑤𝑤 is the mass of water boiled, kg, 𝐶𝐶𝑣𝑣𝑣𝑣𝑣𝑣 is the calorific value of fuel (biogas) = 22 MJ/kg, 𝐶𝐶𝑝𝑝𝑤𝑤 is the specific heat capacity of water = 4186 J/kg ℃, 𝑇𝑇𝑓𝑓 is the boiling temperature of water = 95.23 ℃, 𝑊𝑊𝑣𝑣 is the water evaporated from the pot., 𝑇𝑇𝑖𝑖 is the initial temperature of the water,℃ and 𝐻𝐻𝑣𝑣 is the latent heat of evaporation of water, 2260 J/g.
2. Firepower (FP) is the proportion of fuel energy utilization by burner per unit time. It wascalculated by Equation 11[24, 27]. Mathematically,
𝐹𝐹𝑃𝑃 = 𝑉𝑉𝑏𝑏𝑏𝑏×𝐿𝐿𝐻𝐻𝑉𝑉60×(𝑡𝑡𝑓𝑓−𝑡𝑡𝑏𝑏)
(11)
Where FP is the power of burner in watts, Vbg is the volume of biogas consumed during the stage of the test (m3/h), LHV is the lower heat value of the biogas (kJ/kg), it is the time at the end of the test (min), and ti is the time at the start of the test (min).
3. Specific fuel consumption (SC) is the proportion of the amount of biogas fuel consumed tothe amount of water remaining within the pot at the end of the test. SC was calculated using Equation 12 [26]. Mathematically,
𝑆𝑆𝐶𝐶 = 𝑉𝑉𝑏𝑏𝑏𝑏
𝑊𝑊𝑟𝑟 (12)
Where SC is the specific fuel consumption of the burner (g/L), Vbg is the volume of biogas fuel expended during the phase of the test (g), and Wr is the mass of water remaining at the end of the test (g).
4. Burning rate (𝑟𝑟𝑣𝑣) is used to measure the of fuel consumption to bring water to boil duringthe experiment. rb was calculated using Equation 13 [27, 29]. Mathematically
𝑟𝑟𝑣𝑣 = 𝑣𝑣𝑣𝑣𝑣𝑣 ∆𝑡𝑡⁄ (13)
Where Vbg is the Volume of biogas consumed during the test (m3/h), and ∆t is the total time taken to conduct the test (min).
2.4.2 The water boiling test (WBT) The water boiling test consisted of three stages. The first stage conducted a test with both cold and hot start conditions in high power start. The second stage was that of lower power (simmering) which simulate slow-boiling tasks [27]. A standard aluminium pot of 3 litres capacity was used in all three experiments. At the high power cold start phase, 2.5 litres of water was boiled at room temperature up to 95℃ local boiling point. In the high power hot start, the fuel was reset immediately after the cold start phase. The test was repeated to note the difference in performance when the burner is cold and when it is hot. The third stage involved the simmering test, which was done after the high power hot start phase test. This involved measuring the burner capacity to move from high heating to low heating, and each experiment was repeated three times. All three burner stoves were tested at the same time on different days, and average results were recorded [24].
3. Results and Discussions3.1 Computational Fluid Dynamics (CFD) Analysis Table 4 shows the results of the CFD analysis employed in the study to simulate the fluid flow in the burner. During the simulation of the model, the convergence is reached easily when a set of Equations are solved and when the calculations are repeated several times until the flow and the temperature are converged. The default criterion for convergence is that each residual is reduced to a value less than 10-3 except the energy residual for which the default criterion is 10-6.
Table 4: The results of the analytical design and CFD input values s/no Parts Analytical
values CFD values
1 Injector diameter (mm) 2.5 2.5
2 Internal throat diameter (mm) 18 25
3 Number of burner ports 71 71
4 Mixing tube length (mm) 170 138
5 Internal manifold diameter (mm) 100 100
6 Flame port diameter (mm) 2.5 2.5
7 Air inlet diameter (mm) 5.0 5.0
Figure 6 shows the contours of temperature distribution in the burner. It was observed that the temperature distribution along the jet and mixing tube was the same as the room temperature of the air and gas inlets as in the boundary conditions. The temperature was identical throughout the mixing tube and increased to a maximum of 997 K at the manifold. The temperature in the middle Section of the manifold was about 757 K, and it was uniform
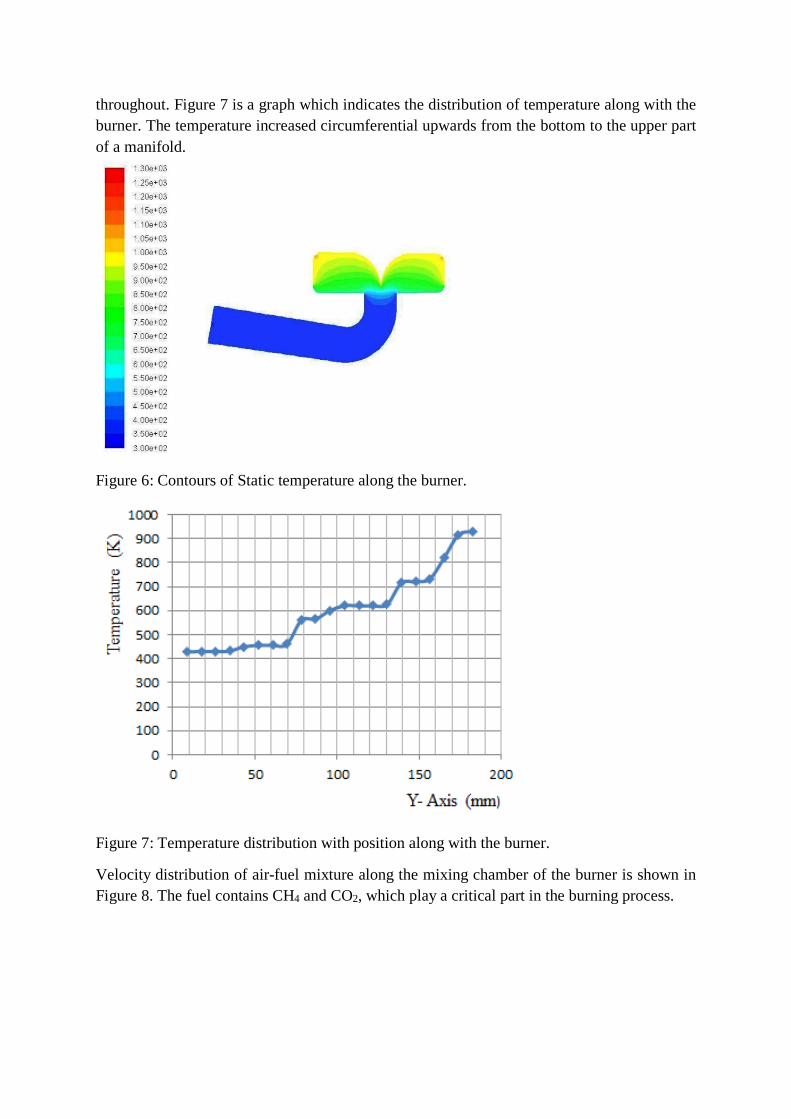
throughout. Figure 7 is a graph which indicates the distribution of temperature along with the burner. The temperature increased circumferential upwards from the bottom to the upper part of a manifold.
Figure 6: Contours of Static temperature along the burner.
Figure 7: Temperature distribution with position along with the burner.
Velocity distribution of air-fuel mixture along the mixing chamber of the burner is shown in Figure 8. The fuel contains CH4 and CO2, which play a critical part in the burning process.
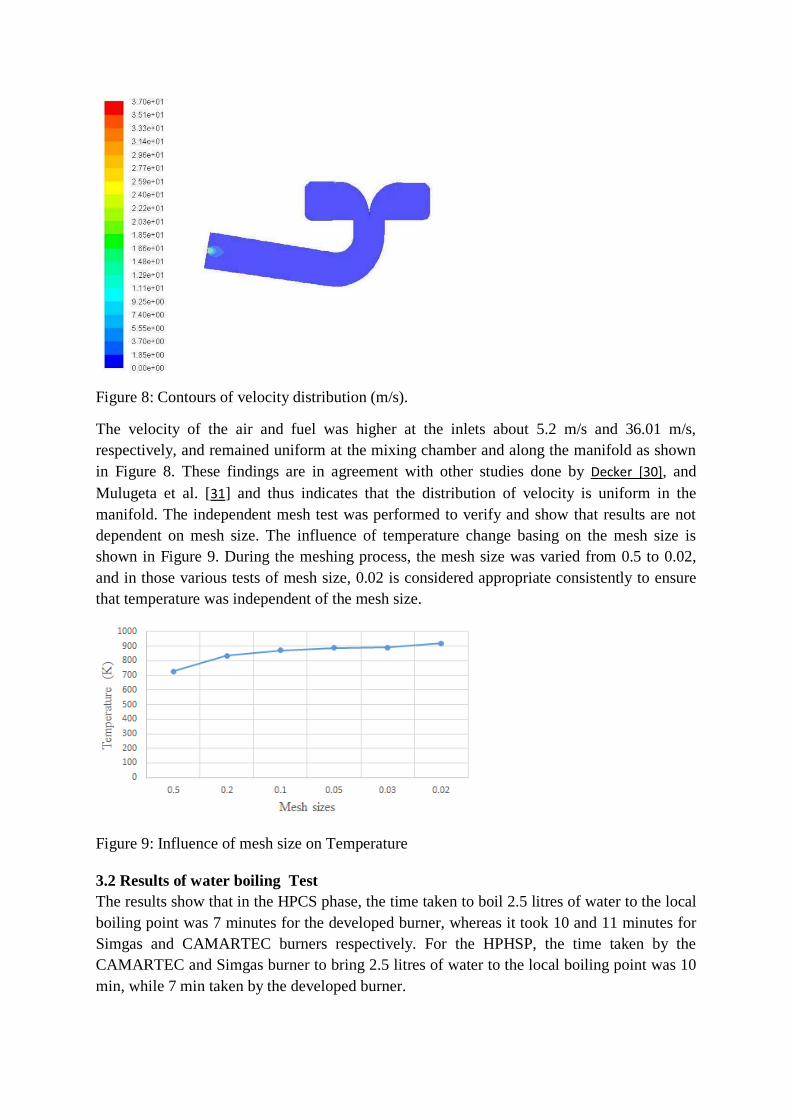
Figure 8: Contours of velocity distribution (m/s).
The velocity of the air and fuel was higher at the inlets about 5.2 m/s and 36.01 m/s, respectively, and remained uniform at the mixing chamber and along the manifold as shown in Figure 8. These findings are in agreement with other studies done by Decker [30], and Mulugeta et al. [31] and thus indicates that the distribution of velocity is uniform in the manifold. The independent mesh test was performed to verify and show that results are not dependent on mesh size. The influence of temperature change basing on the mesh size is shown in Figure 9. During the meshing process, the mesh size was varied from 0.5 to 0.02, and in those various tests of mesh size, 0.02 is considered appropriate consistently to ensure that temperature was independent of the mesh size.
Figure 9: Influence of mesh size on Temperature
3.2 Results of water boiling Test The results show that in the HPCS phase, the time taken to boil 2.5 litres of water to the local boiling point was 7 minutes for the developed burner, whereas it took 10 and 11 minutes for Simgas and CAMARTEC burners respectively. For the HPHSP, the time taken by the CAMARTEC and Simgas burner to bring 2.5 litres of water to the local boiling point was 10 min, while 7 min taken by the developed burner.
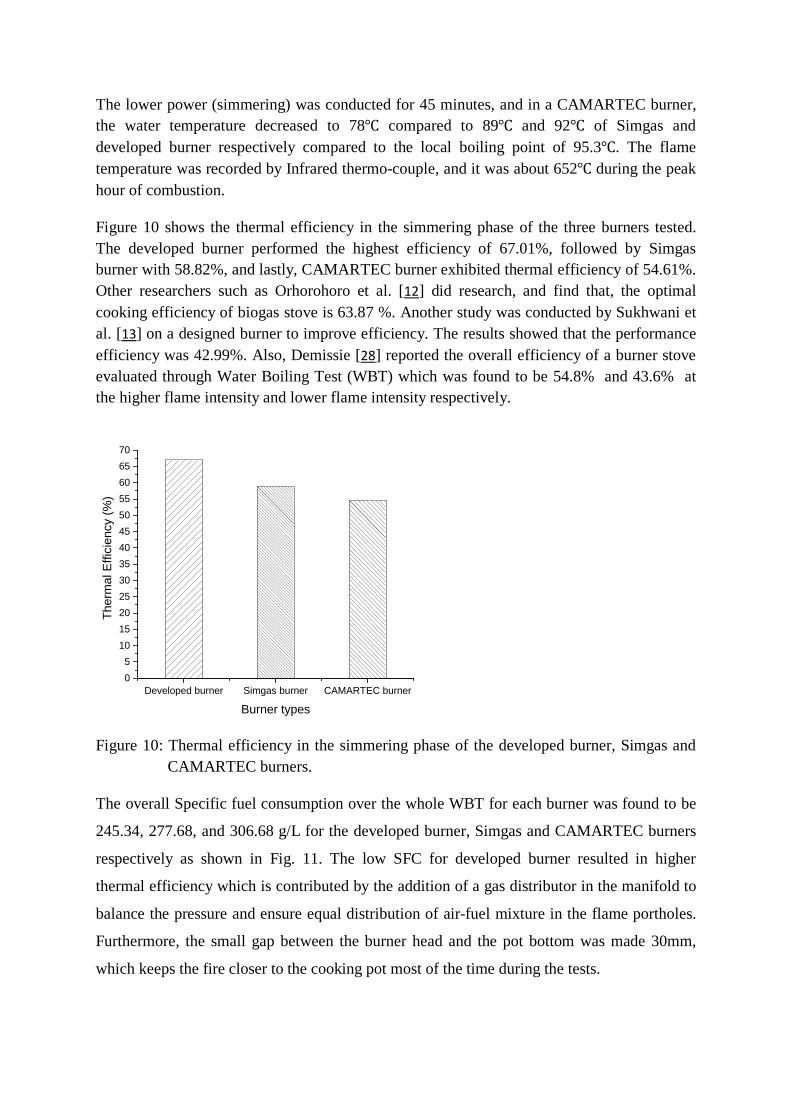
The lower power (simmering) was conducted for 45 minutes, and in a CAMARTEC burner, the water temperature decreased to 78℃ compared to 89℃ and 92℃ of Simgas and developed burner respectively compared to the local boiling point of 95.3℃. The flame temperature was recorded by Infrared thermo-couple, and it was about 652℃ during the peak hour of combustion.
Figure 10 shows the thermal efficiency in the simmering phase of the three burners tested. The developed burner performed the highest efficiency of 67.01%, followed by Simgas burner with 58.82%, and lastly, CAMARTEC burner exhibited thermal efficiency of 54.61%. Other researchers such as Orhorohoro et al. [12] did research, and find that, the optimal cooking efficiency of biogas stove is 63.87 %. Another study was conducted by Sukhwani et al. [13] on a designed burner to improve efficiency. The results showed that the performance efficiency was 42.99%. Also, Demissie [28] reported the overall efficiency of a burner stove evaluated through Water Boiling Test (WBT) which was found to be 54.8% and 43.6% at the higher flame intensity and lower flame intensity respectively.
Developed burner Simgas burner CAMARTEC burner05
10152025303540455055606570
The
rmal
Effi
cien
cy (%
)
Burner types
Figure 10: Thermal efficiency in the simmering phase of the developed burner, Simgas and CAMARTEC burners.
The overall Specific fuel consumption over the whole WBT for each burner was found to be
245.34, 277.68, and 306.68 g/L for the developed burner, Simgas and CAMARTEC burners
respectively as shown in Fig. 11. The low SFC for developed burner resulted in higher
thermal efficiency which is contributed by the addition of a gas distributor in the manifold to
balance the pressure and ensure equal distribution of air-fuel mixture in the flame portholes.
Furthermore, the small gap between the burner head and the pot bottom was made 30mm,
which keeps the fire closer to the cooking pot most of the time during the tests.
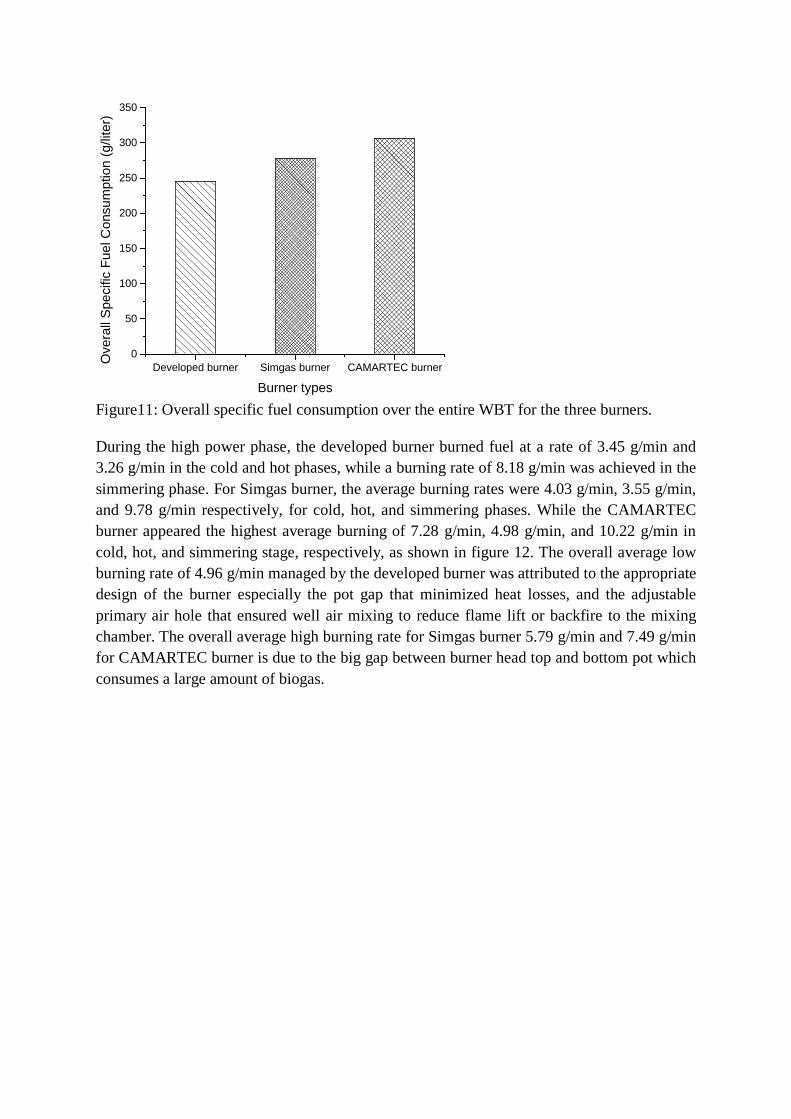
Figure11: Overall specific fuel consumption over the entire WBT for the three burners.
During the high power phase, the developed burner burned fuel at a rate of 3.45 g/min and 3.26 g/min in the cold and hot phases, while a burning rate of 8.18 g/min was achieved in the simmering phase. For Simgas burner, the average burning rates were 4.03 g/min, 3.55 g/min, and 9.78 g/min respectively, for cold, hot, and simmering phases. While the CAMARTEC burner appeared the highest average burning of 7.28 g/min, 4.98 g/min, and 10.22 g/min in cold, hot, and simmering stage, respectively, as shown in figure 12. The overall average low burning rate of 4.96 g/min managed by the developed burner was attributed to the appropriate design of the burner especially the pot gap that minimized heat losses, and the adjustable primary air hole that ensured well air mixing to reduce flame lift or backfire to the mixing chamber. The overall average high burning rate for Simgas burner 5.79 g/min and 7.49 g/min for CAMARTEC burner is due to the big gap between burner head top and bottom pot which consumes a large amount of biogas.
Developed burner Simgas burner CAMARTEC burner0
50
100
150
200
250
300
350O
vera
ll Sp
ecifi
c Fu
el C
onsu
mpt
ion
(g/li
ter)
Burner types
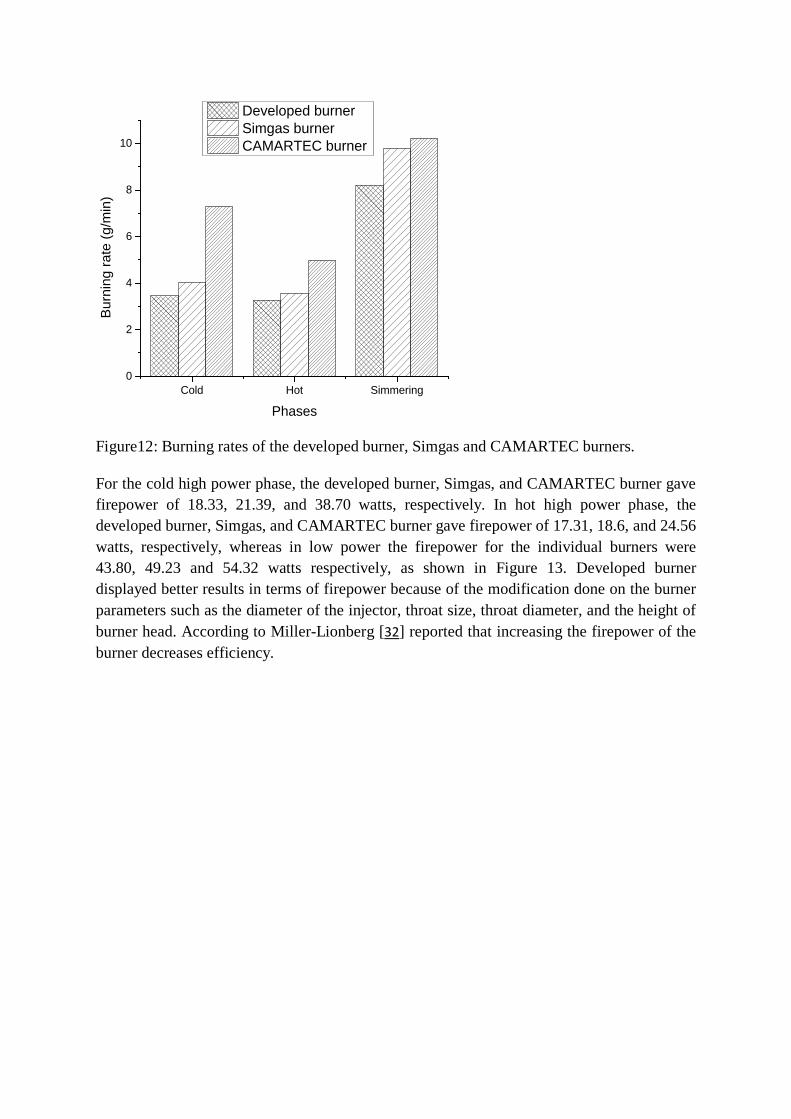
Cold Hot Simmering0
2
4
6
8
10
Burn
ing
rate
(g/m
in)
Phases
Developed burner Simgas burner CAMARTEC burner
Figure12: Burning rates of the developed burner, Simgas and CAMARTEC burners.
For the cold high power phase, the developed burner, Simgas, and CAMARTEC burner gave firepower of 18.33, 21.39, and 38.70 watts, respectively. In hot high power phase, the developed burner, Simgas, and CAMARTEC burner gave firepower of 17.31, 18.6, and 24.56 watts, respectively, whereas in low power the firepower for the individual burners were 43.80, 49.23 and 54.32 watts respectively, as shown in Figure 13. Developed burner displayed better results in terms of firepower because of the modification done on the burner parameters such as the diameter of the injector, throat size, throat diameter, and the height of burner head. According to Miller-Lionberg [32] reported that increasing the firepower of the burner decreases efficiency.
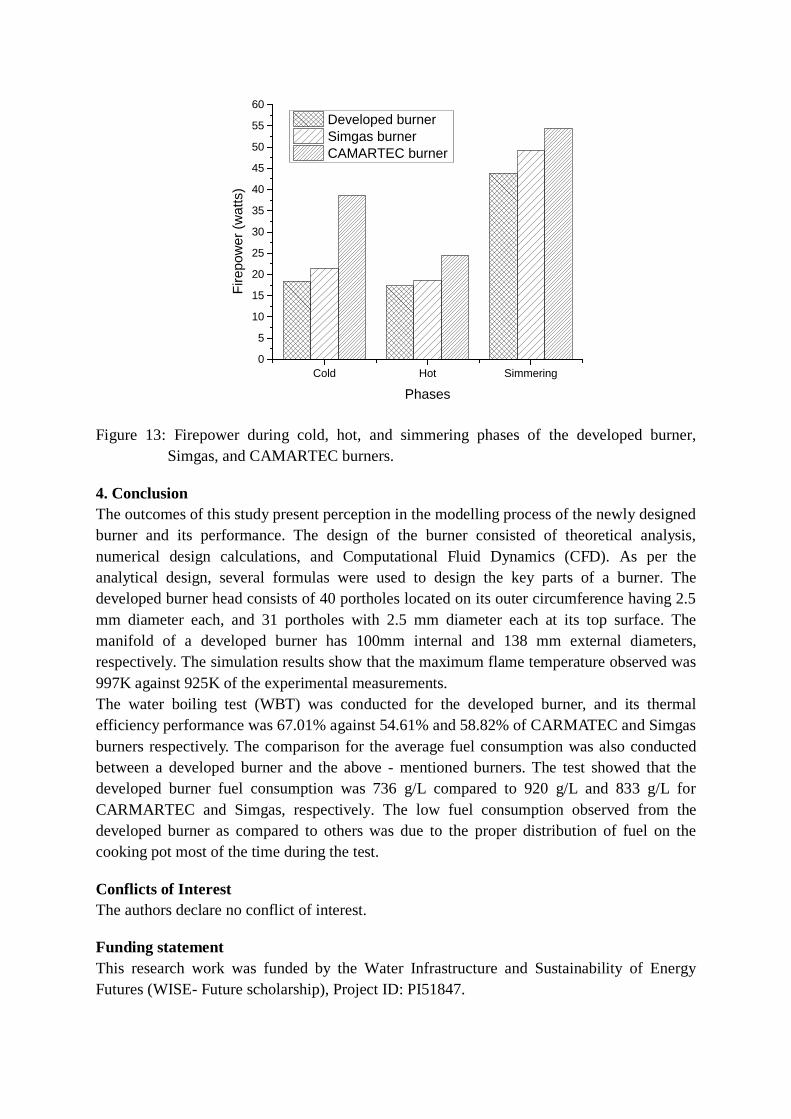
Figure 13: Firepower during cold, hot, and simmering phases of the developed burner, Simgas, and CAMARTEC burners.
4. ConclusionThe outcomes of this study present perception in the modelling process of the newly designed burner and its performance. The design of the burner consisted of theoretical analysis, numerical design calculations, and Computational Fluid Dynamics (CFD). As per the analytical design, several formulas were used to design the key parts of a burner. The developed burner head consists of 40 portholes located on its outer circumference having 2.5 mm diameter each, and 31 portholes with 2.5 mm diameter each at its top surface. The manifold of a developed burner has 100mm internal and 138 mm external diameters, respectively. The simulation results show that the maximum flame temperature observed was 997K against 925K of the experimental measurements. The water boiling test (WBT) was conducted for the developed burner, and its thermal efficiency performance was 67.01% against 54.61% and 58.82% of CARMATEC and Simgas burners respectively. The comparison for the average fuel consumption was also conducted between a developed burner and the above - mentioned burners. The test showed that the developed burner fuel consumption was 736 g/L compared to 920 g/L and 833 g/L for CARMARTEC and Simgas, respectively. The low fuel consumption observed from the developed burner as compared to others was due to the proper distribution of fuel on the cooking pot most of the time during the test.
Conflicts of Interest The authors declare no conflict of interest.
Funding statement This research work was funded by the Water Infrastructure and Sustainability of Energy Futures (WISE- Future scholarship), Project ID: PI51847.
Cold Hot Simmering0
5
10
15
20
25
30
35
40
45
50
55
60
Fire
pow
er (w
atts
)
Phases
Developed burner Simgas burner CAMARTEC burner
Acknowledgements Authors are grateful for the financial support given by WISE Future. They also recognize the assistance done by CAMARTEC staff and Arusha Technical College staff, especially from the Mechanical Engineering Department for their assistance in this study.
5. References
[1] M. Felix and S. H. Gheewala, "A review of biomass energy dependency in Tanzania," Energy procedia, vol. 9, pp. 338-343, 2011.
[2] F. Rosillo Calle, "Overview of biomass energy," in The biomass assessment handbook, ed: Routledge, 2012, pp. 23-48.
[3] A. Yasar, S. Nazir, A. B. Tabinda, M. Nazar, R. Rasheed, and M. Afzaal, "Socio-economic, health and agriculture benefits of rural household biogas plants in energy-scarce developing countries: A case study from Pakistan," Renewable Energy, vol. 108, pp. 19-25, 2017.
[4] P. J. Burke and G. Dundas, "Female labor force participation and household dependence on biomass energy: evidence from national longitudinal data," World Development, vol. 67, pp. 424-437, 2015.
[5] R. Chandra, H. Takeuchi, and T. Hasegawa, "Methane production from lignocellulosic agricultural crop wastes: A review in context to second generation biofuel production," Renewable and Sustainable Energy Reviews, vol. 16, pp. 1462-1476, 2012.
[6] A. G. Mwakaje, "Dairy farming and biogas use in Rungwe district, South-west Tanzania: A study of opportunities and constraints," Renewable and Sustainable Energy Reviews, vol. 12, pp. 2240-2252, 2008.
[7] T. Abbasi and S. Abbasi, "Biomass energy and the environmental impacts associated with its production and utilization," Renewable and sustainable energy reviews, vol. 14, pp. 267-301, 2010.
[8] T. Anderman, R. DeFries, S. Wood, R. Remans, R. Ahuja, and S. Ulla, "Biogas cook stoves for healthy and sustainable diets? A case study in Southern India. Front Nutr 2: 28," ed, 2015.
[9] K. Surendra, D. Takara, A. G. Hashimoto, and S. K. Khanal, "Biogas as a sustainable energy source for developing countries: Opportunities and challenges," Renewable and Sustainable Energy Reviews, vol. 31, pp. 846-859, 2014.
[10] B. Mulugeta, S. W. Demissie, and D. T. Nega, "Design, Optimization and CFD Simulation of Improved Biogas Burner for ‘Injera’Baking in Ethiopia," nternational Journal of Engineering Research & Technology, vol. 6, 2017.
[11] T. J. Decker, "Modeling tool for household biogas burner flame port design, A," Colorado State University. Libraries, 2017.
[12] E. Orhorhoro, J. Oyejide, and S. Abubakar, "Design and Construction of an Improved Biogas Stove," Arid Zone Journal of Engineering, Technology and Environment, vol. 14, pp. 325-335, 2018.
[13] N. P. a. A. N. V. K. Sukhwani, "Design and Performance Evaluation of Improved Biogas Stove (IBS)by Preheating of Biogas," International Journal of Scientific Engineering and Technology, vol. 6, pp. 70-74, 2017.
[14] V. Tumwesige, D. Fulford, and G. C. Davidson, "Biogas appliances in sub-Sahara Africa," Biomass and Bioenergy, vol. 70, pp. 40-50, 2014.
[15] S. W. Demissie, V. A. Ramayya, and D. T. Nega, "Design, Fabrication and Testing of Biogas Stove for ‘Areke’Distillation: The case of Arsi Negele, Ethiopia, Targeting Reduction of Fuel-Wood Dependence," International Journal of Engineering Research, vol. 5, 2016.
[16] D. Fulford, "Biogas stove design," Reading, UK: Kingdom Bioenergy, Ltd, pp. 1-21, 1996.
[17] D. Fulford, "Biogas stove design," Reading, UK: Kingdom Bioenergy, Ltd, 1996. [18] A. f. c. a. F. Foundation, "Manual for the construction and operation of small and
medium size biogas systems," 2012. [19] T. Stolarski, Y. Nakasone, and S. Yoshimoto, Engineering analysis with ANSYS
software: Butterworth-Heinemann, 2018. [20] W. Jones and B. E. Launder, "The prediction of laminarization with a two-Equation
model of turbulence," International journal of heat and mass transfer, vol. 15, pp. 301-314, 1972.
[21] B. E. Launder and D. B. Spalding, "The numerical computation of turbulent flows," in Numerical prediction of flow, heat transfer, turbulence and combustion, ed: Elsevier, 1983, pp. 96-116.
[22] M. Noor, A. P. Wandel, and T. Yusaf, "Detail guide for CFD on the simulation of biogas combustion in bluff-body mild burner," in Proceedings of the 2nd International Conference of Mechanical Engineering Research (ICMER 2013), 2013, pp. 1-25.
[23] A. M. Yousef, Y. A. Eldrainy, W. M. El-Maghlany, and A. Attia, "Upgrading biogas by a low-temperature CO2 removal technique," Alexandria Engineering Journal, vol. 55, pp. 1143-1150, 2016.
[24] V. M. Berrueta, R. D. Edwards, and O. R. Masera, "Energy performance of wood-burning cookstoves in Michoacan, Mexico," Renewable Energy, vol. 33, pp. 859-870, 2008.
[25] D. R. Ahuja, V. Joshi, K. R. Smith, and C. Venkataraman, "Thermal performance and emission characteristics of invented biomass-burning cookstoves: a proposed standard method for evaluation," Biomass, vol. 12, pp. 247-270, 1987.
[26] P. Visser, "The testing of cookstoves: data of water boiling tests as a basis to calculate fuel consumption," Energy for Sustainable Development, vol. 9, pp. 16-24, 2005.
[27] P. R. Bailis, D. Ogle, N. Maccarty, D. S. I. From, K. R. Smith, and R. Edwards, "The water boiling test (WBT)," 2007.
[28] S. W. Demissie, V. A. Ramayya, and D. T. Nega, "Design, Fabrication and Testing of biogas stove for „Areke‟ Distillation: The case of Arsi Negele, Ethiopia, Targeting reduction of fuel wood dependence," International Journal of Engineering Research and Technology, vol. 5, 2016.

[29] P. R. Bailis, D. Ogle, N. Maccarty, D. S. I. From, K. R. Smith, and R. Edwards, "The water boiling test (WBT)," pp. 1-38, 2007.
[30] T. J. Decker, "Modeling tool for household biogas burner flame port design, A," Masters Thesis, Colorado State University. Libraries, Fort Collins, Colorado, 2017.
[31] B. Mulugeta, S. W. Demissie, and D. T. Nega, "Design, Optimization and CFD Simulation of Improved Biogas Burner for ‘Injera’Baking in Ethiopia," nternational Journal of Engineering Research & Technology, vol. 6, pp. 1-7, 2017.
[32] D. D. Miller-Lionberg, A fine-resolution CFD simulation approach for biomass cook stove development: Colorado State University, 2011.
Patent registered in the Business Registrations and Licensing Agency (BRELA)