m.sc. thesis. experimental investigation of oxy-combustion of cng flames stabilized over a...
TRANSCRIPT
EXPERIMENTAL INVESTIGATION OF OXY-COMBUSTION OF CNG
FLAMES STABILIZED OVER A PERFORATED-PLATE BURNER
By
Sherif Samir Ahmed Rashwan
A Thesis Submitted to the
Faculty of Engineering at Cairo University
in Partial Fulfillment of the
Requirements for the Degree of
MASTER OF SCIENCE
in
Mechanical Power Engineering
FACULTY OF ENGINEERING, CAIRO UNIVERSITY
GIZA, EGYPT
2014
EXPERIMENTAL INVESTIGATION OF OXY-COMBUSTION OF CNG
FLAMES STABILIZED OVER A PERFORATED-PLATE BURNER
By
Sherif Samir Ahmed Rashwan
A Thesis Submitted to the
Faculty of Engineering at Cairo University
in Partial Fulfillment of the
Requirements for the Degree of
MASTER OF SCIENCE
in
Mechanical Power Engineering
Under Supervision of
Prof. Dr. Tharwat Wazier Abou-Arab Dr. Abdelmaged Hafez Ibrahim
Mechanical Power Department Mechanical Power Department
Faculty of Engineering, Faculty of Engineering
Cairo University Cairo University
FACULTY OF ENGINEERING, CAIRO UNIVERSITY
GIZA, EGYPT
2014
EXPERIMENTAL INVESTIGATION OF OXY-COMBUSTION OF CNG
FLAMES STABILIZED OVER A PERFORATED-PLATE BURNER
By
Sherif Samir Ahmed Rashwan
A Thesis Submitted to the
Faculty of Engineering at Cairo University
in Partial Fulfillment of the
Requirements for the Degree of
MASTER OF SCIENCE
in
Mechanical Power Engineering
Approved by
Examining committee
Prof. Dr. Tharwat Wazier Abou-Arab, Thesis Main Advisor
Prof. Dr. Hafez Elsalamawy, Member
Prof. Dr. Mohamed Ali Hassan, Member
FACULTY OF ENGINEERING, CAIRO UNIVERSITY
GIZA, EGYPT
2014
Engineer: Sherif Samir Ahmed Rashwan
Date of Birth: 24 / 7 / 1989
Nationality: Egyptian
E-mail: [email protected]
Phone: 01007147502
Address: 170- Tersa Street- Haram Zone- Giza- Egypt
Registration Date: 1 / 11 / 2012
Awarding Date: / /
Degree: Masters of Science
Department: Mechanical Power Engineering
Supervisors: Prof. Dr. Tharwat Wazier Abu- Arab
Dr. Abd Elmaged Hafez Ibrahim
Examiners: Prof. Dr. Tharwat Wazier Abu-Arab
Prof. Dr. Hafez Elsalamawy
Prof. Dr. Mohamed Ali Hassan
Title of Thesis:
Experimental Investigation of oxy-combustion of CNG flames stabilized over a
perforated plate burner.
Key Words: Oxy-Fuel combustion, Air-Fuel combustion, Flammability limits.
Summary:
Carbon dioxide emissions are considered one of the most important factors that cause
global warming. For this reason, it is suggested to burn fuels using an oxidizer mixture
consisting of oxygen and carbon dioxide rather than air. This combustion technique ensures that
the resulting emissions consist mainly of carbon dioxide and water vapor which facilitates
capturing and sequestration of the resulting carbon dioxide gas and thus eliminates or reduces the
release of CO2 emissions into the atmosphere. This technique also eliminates the production of
thermal nitrogen oxides. This study examines the conditions that must be met to ensure stable
flame operation when burning compressed natural gas fuel by using a gas mixture of oxygen
diluted with carbon dioxide stabilized over a perforated-plate burner. Three sets of experiments
are carried out in this study. The first and second sets utilize oxy-fuel combustion technique and
compare the results with corresponding air-fuel combustion technique. The third set is for air-
fuel combustion experiments only. In the first set of experiments, the study identifies the range
of equivalence ratios at a constant oxygen fraction and constant oxidizer mass flow rates for
stable flame operation. The study also documents the visual flame length and color and identifies
the extinction mechanism(s) outside these ranges. For example, for a degree of premixing of L/D
of 7, an oxidizer mass flow rate of 1.32 kg/hr and an oxygen fraction of 36%, stable flame
operation is possible in the range of equivalence ratios of 1.2 to 0.5.
i
Acknowledgment
I am in a debt gratitude to my advisors, Prof. Tharwat Abou– Arab and Dr. Abdelmaged
as well as Eng. Islam Ramadan for their guidance, support and patience throughout this research.
Their trust and high expectations pushed me not only to finish this thesis but towards a new level
of experience.
I am also thankful to all the technicians in the heat lab specially Mr. Ali for his help in
running the experiments late in the night.
My wholehearted gratitude is to my family for their support, love, prayers and scarifies.
Their continuous encouragement throughout the years gave me the strength to reach my goals.
ii
Table of Contents
ACKNOWLEDGMENT........................................................................................................... i
TABLE OF CONTENTS ......................................................................................................... ii
LIST OF TABLES .................................................................................................................. iv
LIST OF FIGURES ................................................................................................................. v
NOMENCLATURE ............................................................................................................... vii
ABSTRACT .......................................................................................................................... viii
Chapter 1: Introduction ........................................................................................................... 1
1.1. Global warming ..................................................................................................................... 1
1.2. Carbon dioxide emissions ..................................................................................................... 3
1.3. Worldwide climate change impact ...................................................................................... 4
1.4. Oxy-fuel combustion methods for carbon capture ............................................................ 7
1.5. Advantages and challenges of oxy-fuel combustion technique ......................................... 8
1.6. Flammability limits ............................................................................................................... 8
1.6.1. Lower flammability limit .............................................................................................. 8
1.6.2. Upper Flammability limit ............................................................................................. 8
1.7. Flame stability mechanism over perforated-plate burner ................................................ 9
1.8. Scope of current work......................................................................................................... 10
Chapter 2: Literature review ................................................................................................ 11
Chapter 3: Experimental Setup ............................................................................................ 18
3.1. Flow diagrams ..................................................................................................................... 18
3.2. Perforated-plate burner ..................................................................................................... 20
3.3. Operation procedure........................................................................................................... 21
3.4. Flame arrestor ..................................................................................................................... 22
3.5. Confinement and exhaust system ...................................................................................... 23
3.6. Fuel supply system .............................................................................................................. 25
3.7. Oxidizer supply system ....................................................................................................... 25
3.8. Instrumentation ................................................................................................................... 26
3.6.1. Flow meters .................................................................................................................. 26
3.9. Average visual flame length measurement ....................................................................... 27
iii
3.10. Table of Experiments ...................................................................................................... 28
Chapter 4: Results and Discussion ........................................................................................ 29
4.1. Oxy-fuel combustion cases and comparison with air ....................................................... 29
4.1.1. Oxy-fuel combustion results, 1st set of experiments ................................................. 30
4.1.1.1. Flammability limits and visual flame appearance at oxygen fraction of 36 % 31
4.1.1.2. Flammability limits and visual flame appearance at oxygen fraction 32 % ...... 34
4.1.1.3. Flammability limits and visual flame appearance of oxygen fraction 29 % ...... 37
4.1.1.4. Extinction mechanisms going to less fuel ............................................................. 40
4.1.1.5. Extinction mechanisms going to more fuel ........................................................... 41
4.1.1.6. Comparisons with air-fuel combustion ................................................................. 42
4.1.1.7. Comparison of visual flame length ........................................................................ 43
4.1.2. Oxy-fuel combustion, 2nd
set of experiments ............................................................ 44
4.1.4.1. Flammability limits ................................................................................................. 44
4.1.4.2. Visible flame appearance ........................................................................................ 45
4.2. Air-fuel combustion cases ................................................................................................... 47
4.2.1. Air-fuel combustion, L/D =7 ...................................................................................... 48
4.2.2. Air-fuel combustion, L/D =25 .................................................................................... 52
4.2.3. Air-fuel combustion, L/D =45 .................................................................................... 54
4.2.4. Air-fuel combustion, L/D =67 .................................................................................... 56
4.2.5. Air-fuel combustion, L/D =128 .................................................................................. 58
4.2.6. Comparison of stability while burning in air ........................................................... 61
4.2.7. Comparison of flame color, air-fuel combustion ...................................................... 62
4.2.8. Comparison of flame length, air-fuel combustion .................................................... 63
Chapter 5: Summary and Conclusion .................................................................................. 64
Suggestions for future Work ................................................................................................. 69
References ............................................................................................................................... 70
APPENDIX (A) ...................................................................................................................... 72
iv
List of Tables
Table 3.1: Specifications of Air and CO2 rotameters ............................................................................ 26
Table 3.2: Specifications of fuel rotameter ........................................................................................... 26
Table 3.3: Specifications of O2 rotameter ............................................................................................. 26
Table 3.4: Set of experiments ............................................................................................................... 28
Table 5.1: Summary of results of the first set of experiments of oxy-fuel combustion ........................ 65
Table 5.2: Summary of results of the second set of experiments of oxy-fuel combustion ................... 66
Table 5.3: Summary of results of the third set of experiments (air-fuel combustion) .......................... 68
v
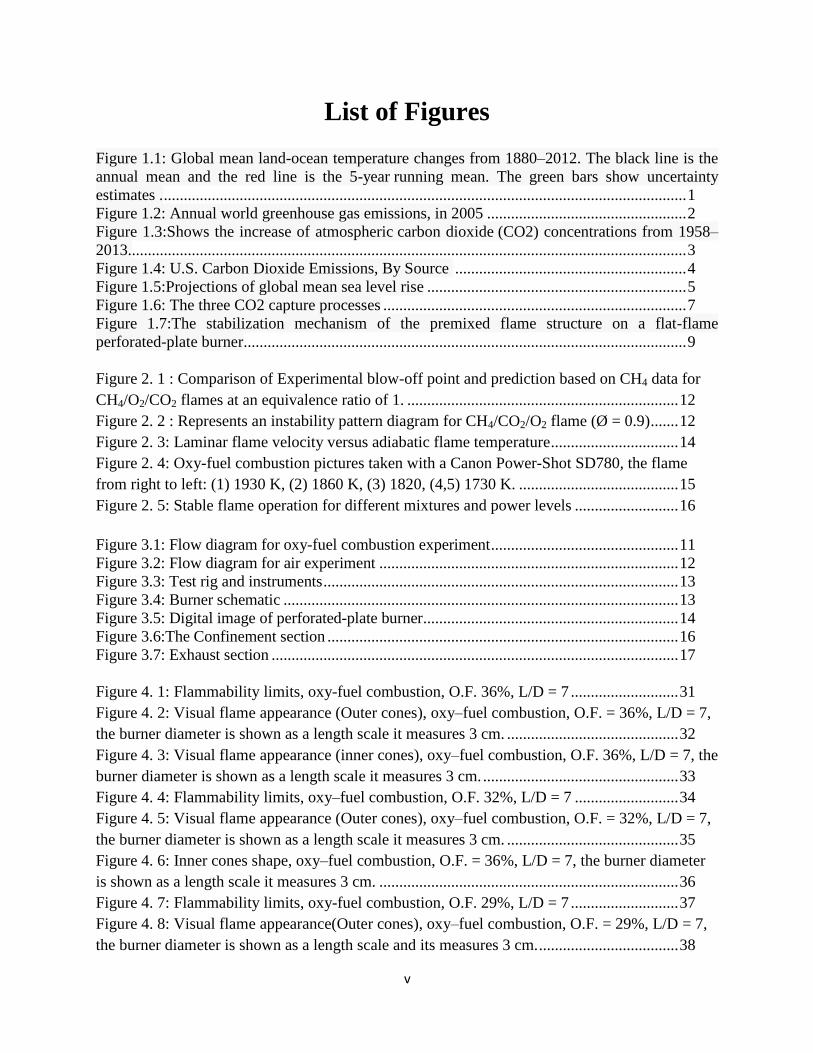
List of Figures
Figure 1.1: Global mean land-ocean temperature changes from 1880–2012. The black line is the
annual mean and the red line is the 5-year running mean. The green bars show uncertainty
estimates . ................................................................................................................................... 1
Figure 1.2: Annual world greenhouse gas emissions, in 2005 .................................................. 2
Figure 1.3:Shows the increase of atmospheric carbon dioxide (CO2) concentrations from 1958–
2013............................................................................................................................................ 3
Figure 1.4: U.S. Carbon Dioxide Emissions, By Source .......................................................... 4
Figure 1.5:Projections of global mean sea level rise ................................................................. 5
Figure 1.6: The three CO2 capture processes ............................................................................ 7
Figure 1.7:The stabilization mechanism of the premixed flame structure on a flat-flame
perforated-plate burner............................................................................................................... 9
Figure 2. 1 : Comparison of Experimental blow-off point and prediction based on CH4 data for
CH4/O2/CO2 flames at an equivalence ratio of 1. .................................................................... 12
Figure 2. 2 : Represents an instability pattern diagram for CH4/CO2/O2 flame (Ø = 0.9) ....... 12
Figure 2. 3: Laminar flame velocity versus adiabatic flame temperature ................................ 14
Figure 2. 4: Oxy-fuel combustion pictures taken with a Canon Power-Shot SD780, the flame
from right to left: (1) 1930 K, (2) 1860 K, (3) 1820, (4,5) 1730 K. ........................................ 15
Figure 2. 5: Stable flame operation for different mixtures and power levels .......................... 16
Figure 3.1: Flow diagram for oxy-fuel combustion experiment ............................................... 11
Figure 3.2: Flow diagram for air experiment ........................................................................... 12
Figure 3.3: Test rig and instruments ......................................................................................... 13
Figure 3.4: Burner schematic ................................................................................................... 13
Figure 3.5: Digital image of perforated-plate burner ................................................................ 14
Figure 3.6:The Confinement section ........................................................................................ 16
Figure 3.7: Exhaust section ...................................................................................................... 17
Figure 4. 1: Flammability limits, oxy-fuel combustion, O.F. 36%, L/D = 7 ........................... 31
Figure 4. 2: Visual flame appearance (Outer cones), oxy–fuel combustion, O.F. = 36%, L/D = 7,
the burner diameter is shown as a length scale it measures 3 cm. ........................................... 32
Figure 4. 3: Visual flame appearance (inner cones), oxy–fuel combustion, O.F. 36%, L/D = 7, the
burner diameter is shown as a length scale it measures 3 cm. ................................................. 33
Figure 4. 4: Flammability limits, oxy–fuel combustion, O.F. 32%, L/D = 7 .......................... 34
Figure 4. 5: Visual flame appearance (Outer cones), oxy–fuel combustion, O.F. = 32%, L/D = 7,
the burner diameter is shown as a length scale it measures 3 cm. ........................................... 35
Figure 4. 6: Inner cones shape, oxy–fuel combustion, O.F. = 36%, L/D = 7, the burner diameter
is shown as a length scale it measures 3 cm. ........................................................................... 36
Figure 4. 7: Flammability limits, oxy-fuel combustion, O.F. 29%, L/D = 7 ........................... 37
Figure 4. 8: Visual flame appearance(Outer cones), oxy–fuel combustion, O.F. = 29%, L/D = 7,
the burner diameter is shown as a length scale and its measures 3 cm. ................................... 38
vi
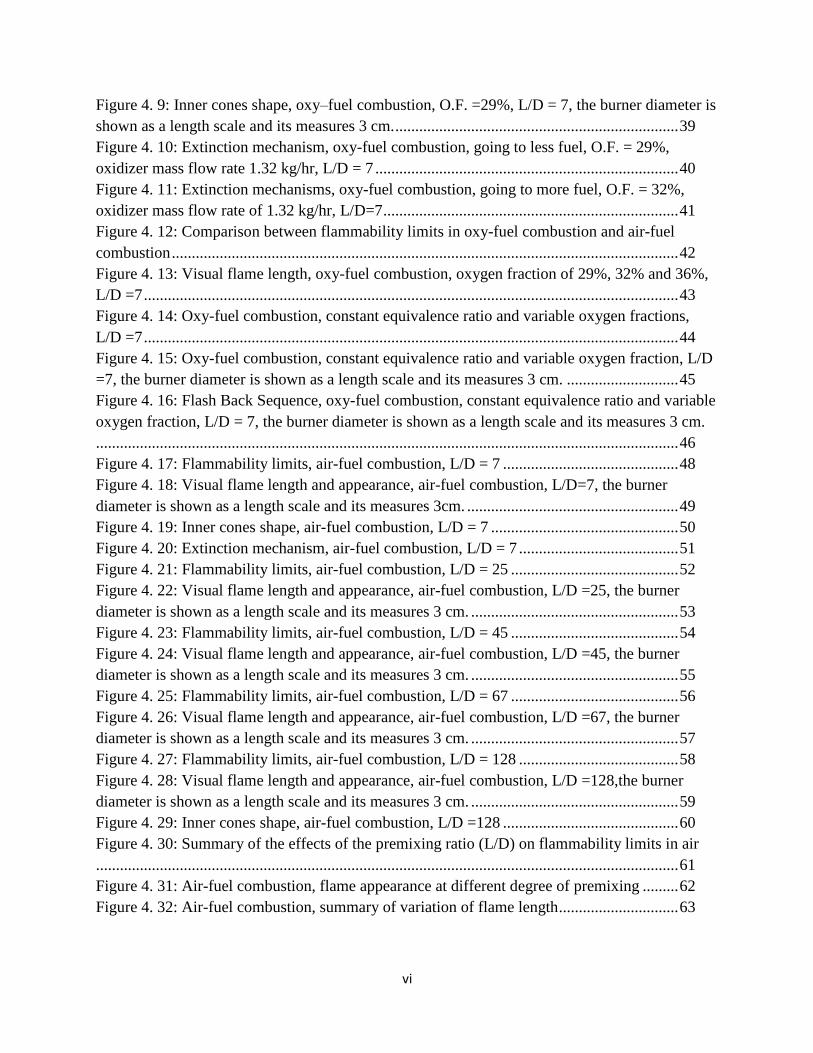
Figure 4. 9: Inner cones shape, oxy–fuel combustion, O.F. =29%, L/D = 7, the burner diameter is
shown as a length scale and its measures 3 cm. ....................................................................... 39
Figure 4. 10: Extinction mechanism, oxy-fuel combustion, going to less fuel, O.F. = 29%,
oxidizer mass flow rate 1.32 kg/hr, L/D = 7 ............................................................................ 40
Figure 4. 11: Extinction mechanisms, oxy-fuel combustion, going to more fuel, O.F. = 32%,
oxidizer mass flow rate of 1.32 kg/hr, L/D=7 .......................................................................... 41
Figure 4. 12: Comparison between flammability limits in oxy-fuel combustion and air-fuel
combustion ............................................................................................................................... 42
Figure 4. 13: Visual flame length, oxy-fuel combustion, oxygen fraction of 29%, 32% and 36%,
L/D =7 ...................................................................................................................................... 43
Figure 4. 14: Oxy-fuel combustion, constant equivalence ratio and variable oxygen fractions,
L/D =7 ...................................................................................................................................... 44
Figure 4. 15: Oxy-fuel combustion, constant equivalence ratio and variable oxygen fraction, L/D
=7, the burner diameter is shown as a length scale and its measures 3 cm. ............................ 45
Figure 4. 16: Flash Back Sequence, oxy-fuel combustion, constant equivalence ratio and variable
oxygen fraction, L/D = 7, the burner diameter is shown as a length scale and its measures 3 cm.
.................................................................................................................................................. 46
Figure 4. 17: Flammability limits, air-fuel combustion, L/D = 7 ............................................ 48
Figure 4. 18: Visual flame length and appearance, air-fuel combustion, L/D=7, the burner
diameter is shown as a length scale and its measures 3cm. ..................................................... 49
Figure 4. 19: Inner cones shape, air-fuel combustion, L/D = 7 ............................................... 50
Figure 4. 20: Extinction mechanism, air-fuel combustion, L/D = 7 ........................................ 51
Figure 4. 21: Flammability limits, air-fuel combustion, L/D = 25 .......................................... 52
Figure 4. 22: Visual flame length and appearance, air-fuel combustion, L/D =25, the burner
diameter is shown as a length scale and its measures 3 cm. .................................................... 53
Figure 4. 23: Flammability limits, air-fuel combustion, L/D = 45 .......................................... 54
Figure 4. 24: Visual flame length and appearance, air-fuel combustion, L/D =45, the burner
diameter is shown as a length scale and its measures 3 cm. .................................................... 55
Figure 4. 25: Flammability limits, air-fuel combustion, L/D = 67 .......................................... 56
Figure 4. 26: Visual flame length and appearance, air-fuel combustion, L/D =67, the burner
diameter is shown as a length scale and its measures 3 cm. .................................................... 57
Figure 4. 27: Flammability limits, air-fuel combustion, L/D = 128 ........................................ 58
Figure 4. 28: Visual flame length and appearance, air-fuel combustion, L/D =128,the burner
diameter is shown as a length scale and its measures 3 cm. .................................................... 59
Figure 4. 29: Inner cones shape, air-fuel combustion, L/D =128 ............................................ 60
Figure 4. 30: Summary of the effects of the premixing ratio (L/D) on flammability limits in air
.................................................................................................................................................. 61
Figure 4. 31: Air-fuel combustion, flame appearance at different degree of premixing ......... 62
Figure 4. 32: Air-fuel combustion, summary of variation of flame length .............................. 63
vii
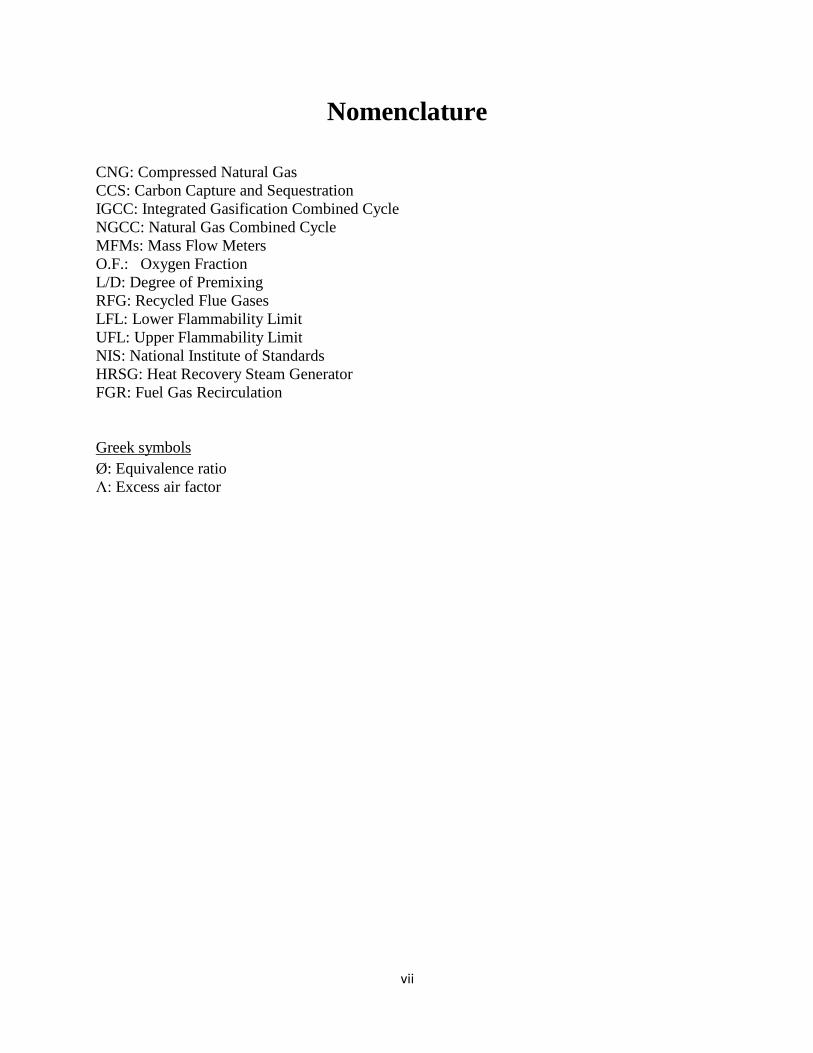
Nomenclature
CNG: Compressed Natural Gas
CCS: Carbon Capture and Sequestration
IGCC: Integrated Gasification Combined Cycle
NGCC: Natural Gas Combined Cycle
MFMs: Mass Flow Meters
O.F.: Oxygen Fraction
L/D: Degree of Premixing
RFG: Recycled Flue Gases
LFL: Lower Flammability Limit
UFL: Upper Flammability Limit
NIS: National Institute of Standards
HRSG: Heat Recovery Steam Generator
FGR: Fuel Gas Recirculation
Greek symbols
Ø: Equivalence ratio
Λ: Excess air factor
viii
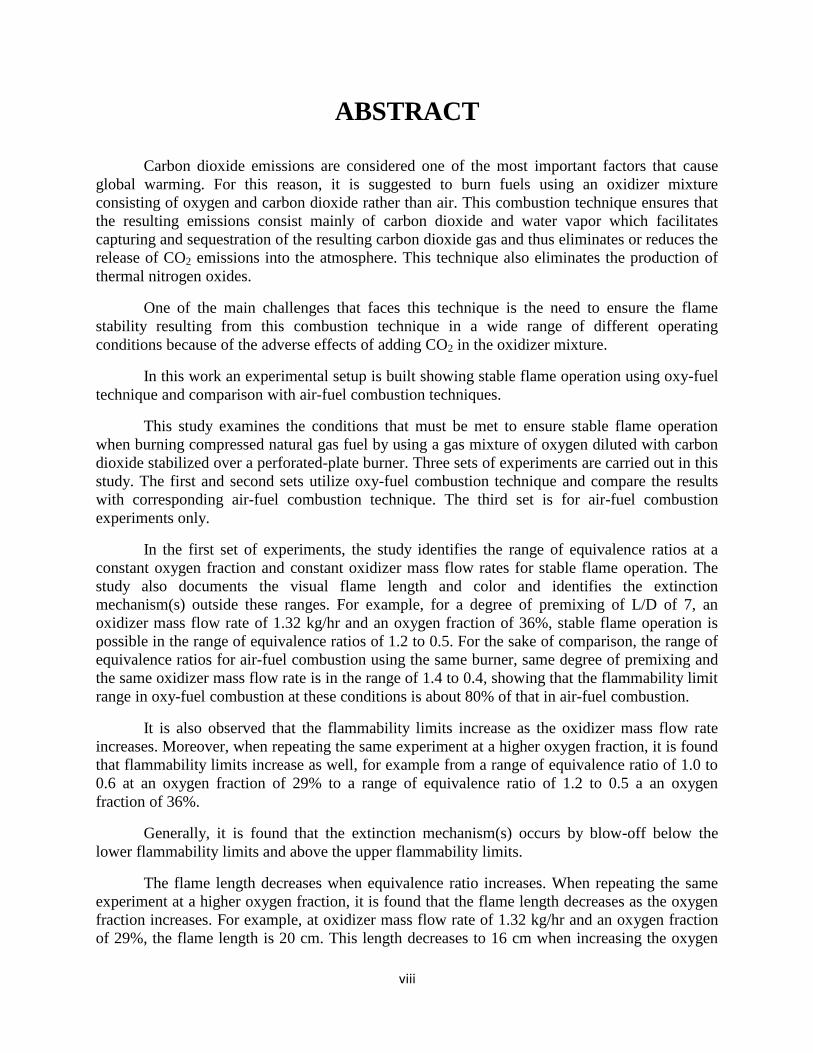
ABSTRACT
Carbon dioxide emissions are considered one of the most important factors that cause
global warming. For this reason, it is suggested to burn fuels using an oxidizer mixture
consisting of oxygen and carbon dioxide rather than air. This combustion technique ensures that
the resulting emissions consist mainly of carbon dioxide and water vapor which facilitates
capturing and sequestration of the resulting carbon dioxide gas and thus eliminates or reduces the
release of CO2 emissions into the atmosphere. This technique also eliminates the production of
thermal nitrogen oxides.
One of the main challenges that faces this technique is the need to ensure the flame
stability resulting from this combustion technique in a wide range of different operating
conditions because of the adverse effects of adding CO2 in the oxidizer mixture.
In this work an experimental setup is built showing stable flame operation using oxy-fuel
technique and comparison with air-fuel combustion techniques.
This study examines the conditions that must be met to ensure stable flame operation
when burning compressed natural gas fuel by using a gas mixture of oxygen diluted with carbon
dioxide stabilized over a perforated-plate burner. Three sets of experiments are carried out in this
study. The first and second sets utilize oxy-fuel combustion technique and compare the results
with corresponding air-fuel combustion technique. The third set is for air-fuel combustion
experiments only.
In the first set of experiments, the study identifies the range of equivalence ratios at a
constant oxygen fraction and constant oxidizer mass flow rates for stable flame operation. The
study also documents the visual flame length and color and identifies the extinction
mechanism(s) outside these ranges. For example, for a degree of premixing of L/D of 7, an
oxidizer mass flow rate of 1.32 kg/hr and an oxygen fraction of 36%, stable flame operation is
possible in the range of equivalence ratios of 1.2 to 0.5. For the sake of comparison, the range of
equivalence ratios for air-fuel combustion using the same burner, same degree of premixing and
the same oxidizer mass flow rate is in the range of 1.4 to 0.4, showing that the flammability limit
range in oxy-fuel combustion at these conditions is about 80% of that in air-fuel combustion.
It is also observed that the flammability limits increase as the oxidizer mass flow rate
increases. Moreover, when repeating the same experiment at a higher oxygen fraction, it is found
that flammability limits increase as well, for example from a range of equivalence ratio of 1.0 to
0.6 at an oxygen fraction of 29% to a range of equivalence ratio of 1.2 to 0.5 a an oxygen
fraction of 36%.
Generally, it is found that the extinction mechanism(s) occurs by blow-off below the
lower flammability limits and above the upper flammability limits.
The flame length decreases when equivalence ratio increases. When repeating the same
experiment at a higher oxygen fraction, it is found that the flame length decreases as the oxygen
fraction increases. For example, at oxidizer mass flow rate of 1.32 kg/hr and an oxygen fraction
of 29%, the flame length is 20 cm. This length decreases to 16 cm when increasing the oxygen
ix
fraction to 36% at the same oxidizer mass flow rate. The flame color changes from blue at higher
equivalence ratios to white at lower equivalence ratios. When repeating the same experiment at a
higher oxygen fraction the flame color changes from blue to white.
In the second set of experiments, the study identifies the range of oxygen fraction at a
constant equivalence ratio of 0.85 and constant oxidizer mass flow rates for stable flame
operation, documents visual flame length and color and identifies the extinction mechanism(s)
outside these ranges. For example, for a degree of premixing L/D of 7, an oxidizer mass flow
rate of 1.32 kg/hr and an equivalence ratio of 0.85, stable flame operation is possible in the range
of oxygen fraction of 28% to 40%. Extinction mechanism occurs below oxygen fraction of 28%
by blow-off and above oxygen fraction of 40% by flash-back. For the sake of comparison stable
flame operation is known to be achievable at an oxygen fraction of 21% in air-fuel combustion.
It is also observed that the flammability limits increase as the oxidizer mass flow rate increases,
the flame length slightly decreases and the flame color changes from bluish to white as the
oxygen fraction increases.
Generally, the lower range of flammability limits and longer flames in oxy-fuel
combustion technique can be attributed to lower flame speeds in oxy-fuel combustion with
respect to air-fuel combustion.
In the third set of experiments, the study identifies the effect of the degree of premixing
on the flammability limits for air-fuel combustion and finds that the flammability limits
decreases and the flame length decreases when increasing the degree of premixing. For example,
for a degree of premixing of L/D of 7 and oxidizer mass flow rate of 1.32 kg/hr, stable flame
operation occurs in the range of equivalence ratios of 1.4 to 0.4. This flammability limit range
decreases to 1.0 to 0.6 at the same oxidizer mass flow rate at a degree of premixing of 128.The
flame color changes from reddish at lower degree of premixing to bluish at higher degree of
premixing.
1
Chapter 1: Introduction
This Chapter introduces global warming, its reasons, the greenhouse gases causing it,
its effects world-wide and some specific effects on Egypt. Then, the oxy-fuel combustion
techniques are introduced, its advantages and disadvantages summarized. The flame stability
is then discussed and the upper and lower flammability limits presented. The chapter ends
with a clear statement of the thesis scope and structure.
1.1. Global warming
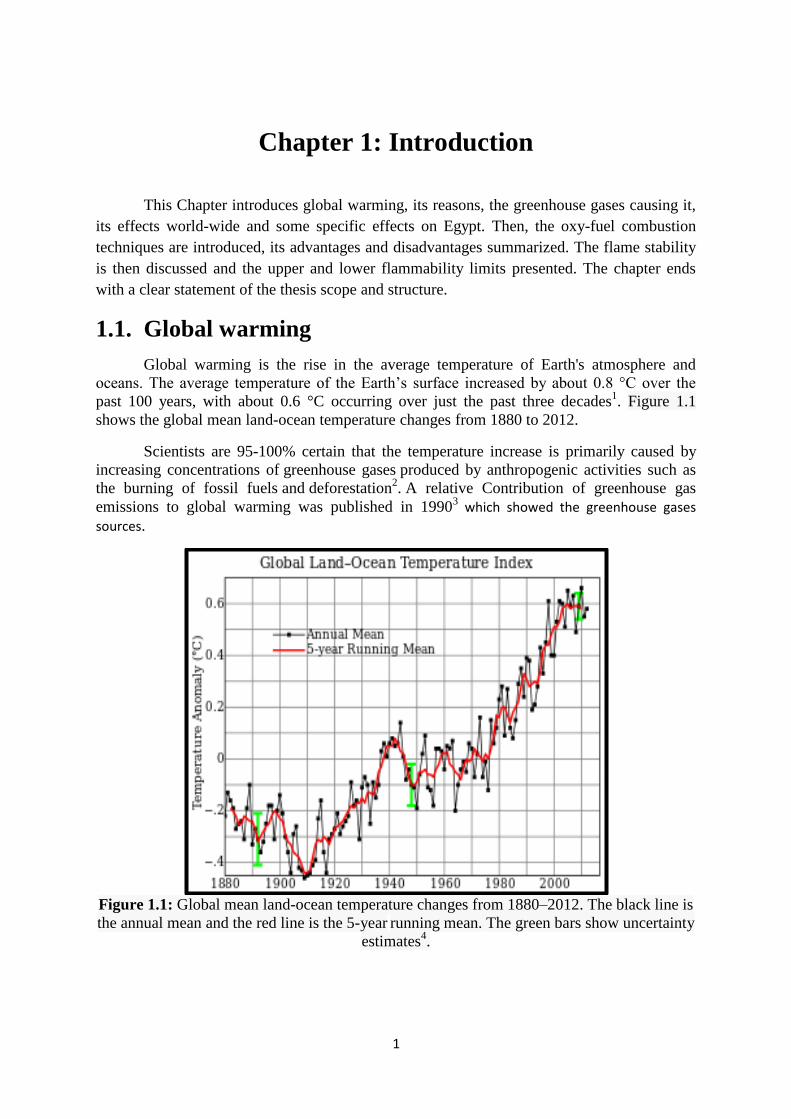
Global warming is the rise in the average temperature of Earth's atmosphere and
oceans. The average temperature of the Earth’s surface increased by about 0.8 °C over the
past 100 years, with about 0.6 °C occurring over just the past three decades 1. Figure 1.1
shows the global mean land-ocean temperature changes from 1880 to 2012.
Scientists are 95-100% certain that the temperature increase is primarily caused by
increasing concentrations of greenhouse gases produced by anthropogenic activities such as
the burning of fossil fuels and deforestation 2. A relative Contribution of greenhouse gas
emissions to global warming was published in 1990 3 which showed the greenhouse gases
sources.
Figure 1.1: Global mean land-ocean temperature changes from 1880–2012. The black line is
the annual mean and the red line is the 5-year running mean. The green bars show uncertainty
estimates 4.
2
Some scientists suggested that this increase in Earth’s temperature due to solar
activities M. Lockwood and C. Frohtic. However, recent evidence suggests that the solar
activities peaked too early to have caused the observed trends in the current climate change 11
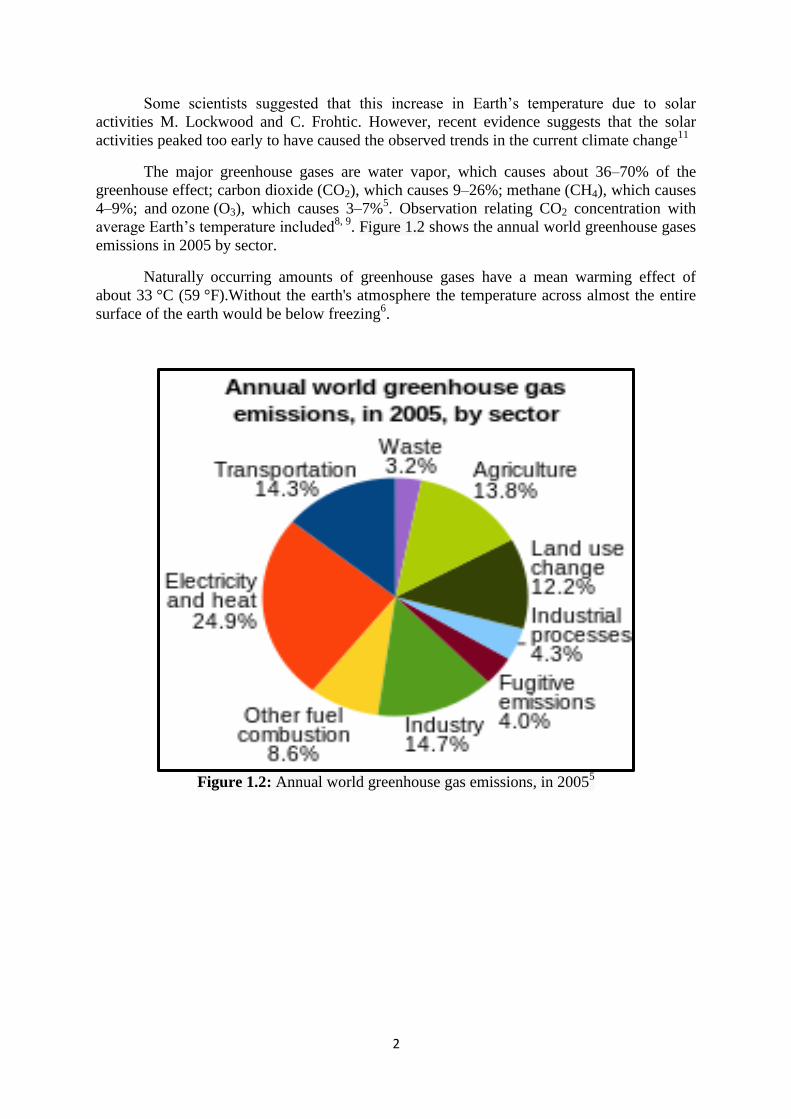
The major greenhouse gases are water vapor, which causes about 36–70% of the
greenhouse effect; carbon dioxide (CO2), which causes 9–26%; methane (CH4), which causes
4–9%; and ozone (O3), which causes 3–7% 5. Observation relating CO2 concentration with
average Earth’s temperature included 8, 9
. Figure 1.2 shows the annual world greenhouse gases
emissions in 2005 by sector.
Naturally occurring amounts of greenhouse gases have a mean warming effect of
about 33 °C (59 °F).Without the earth's atmosphere the temperature across almost the entire
surface of the earth would be below freezing 6.
Figure 1.2: Annual world greenhouse gas emissions, in 2005
5
3
1.2. Carbon dioxide emissions
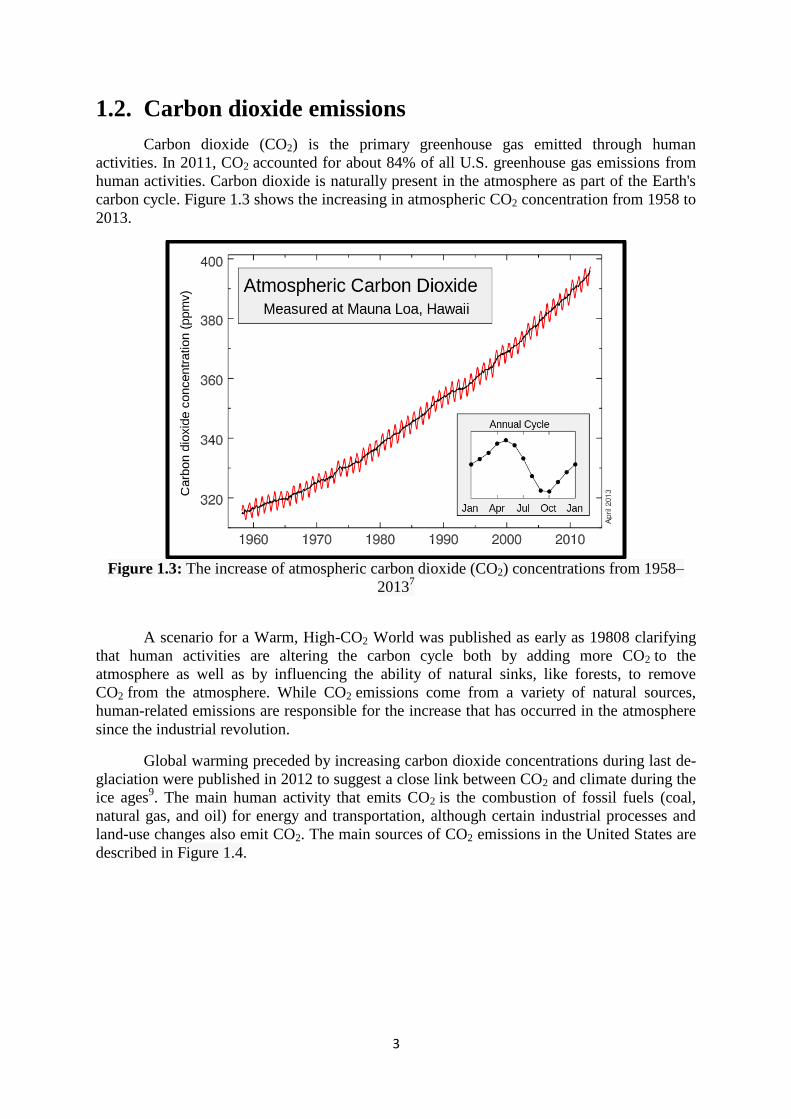
Carbon dioxide (CO2) is the primary greenhouse gas emitted through human
activities. In 2011, CO2 accounted for about 84% of all U.S. greenhouse gas emissions from
human activities. Carbon dioxide is naturally present in the atmosphere as part of the Earth's
carbon cycle. Figure 1.3 shows the increasing in atmospheric CO2 concentration from 1958 to
2013.
Figure 1.3: The increase of atmospheric carbon dioxide (CO2) concentrations from 1958–
2013 7
A scenario for a Warm, High-CO2 World was published as early as 1980 8 clarifying
that human activities are altering the carbon cycle both by adding more CO2 to the
atmosphere as well as by influencing the ability of natural sinks, like forests, to remove
CO2 from the atmosphere. While CO2 emissions come from a variety of natural sources,
human-related emissions are responsible for the increase that has occurred in the atmosphere
since the industrial revolution.
Global warming preceded by increasing carbon dioxide concentrations during last de-
glaciation were published in 2012 to suggest a close link between CO2 and climate during the
ice ages 9. The main human activity that emits CO2 is the combustion of fossil fuels (coal,
natural gas, and oil) for energy and transportation, although certain industrial processes and
land-use changes also emit CO2. The main sources of CO2 emissions in the United States are
described in Figure 1.4.
4
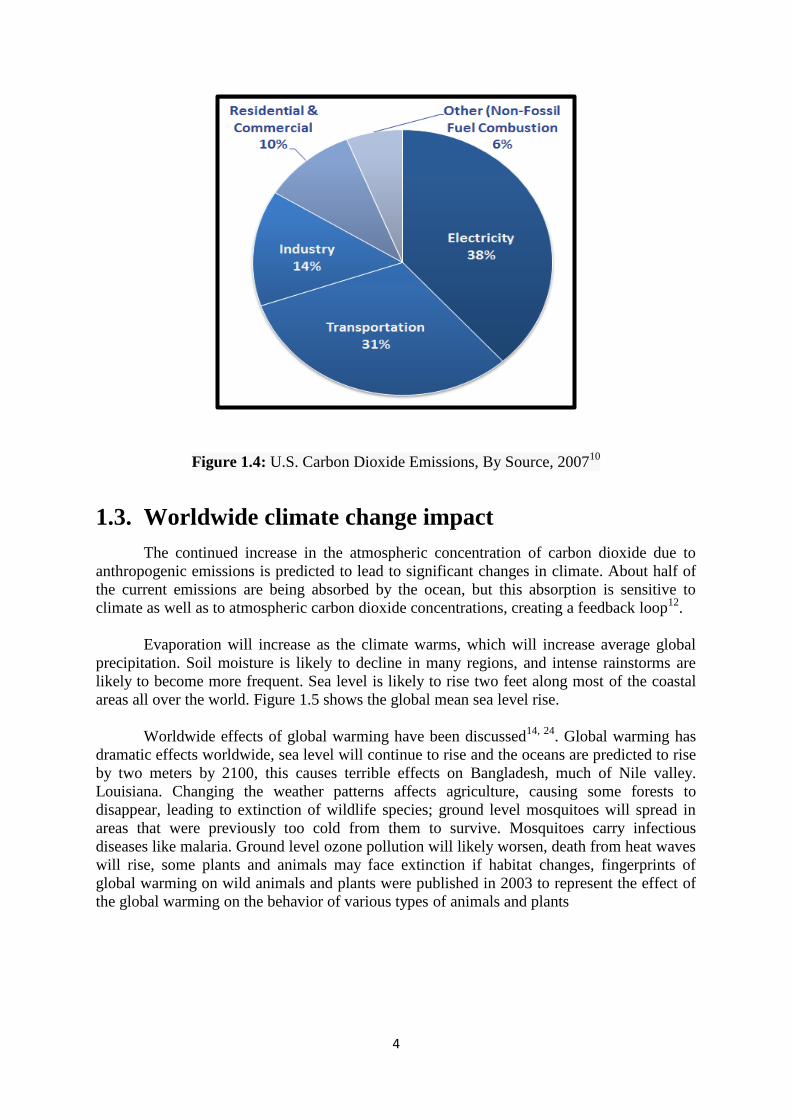
Figure 1.4: U.S. Carbon Dioxide Emissions, By Source, 2007 10
1.3. Worldwide climate change impact
The continued increase in the atmospheric concentration of carbon dioxide due to
anthropogenic emissions is predicted to lead to significant changes in climate. About half of
the current emissions are being absorbed by the ocean, but this absorption is sensitive to
climate as well as to atmospheric carbon dioxide concentrations, creating a feedback loop 12
.
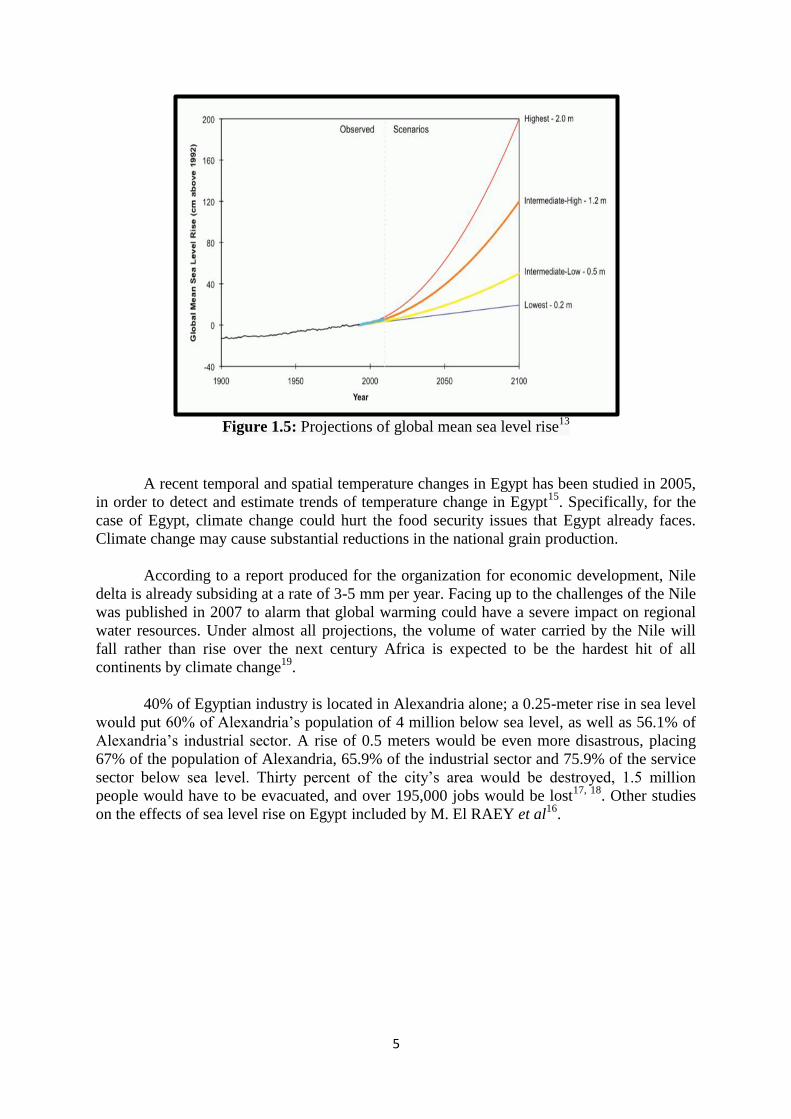
Evaporation will increase as the climate warms, which will increase average global
precipitation. Soil moisture is likely to decline in many regions, and intense rainstorms are
likely to become more frequent. Sea level is likely to rise two feet along most of the coastal
areas all over the world. Figure 1.5 shows the global mean sea level rise.
Worldwide effects of global warming have been discussed 14, 24
. Global warming has
dramatic effects worldwide, sea level will continue to rise and the oceans are predicted to rise
by two meters by 2100, this causes terrible effects on Bangladesh, much of Nile valley.
Louisiana. Changing the weather patterns affects agriculture, causing some forests to
disappear, leading to extinction of wildlife species; ground level mosquitoes will spread in
areas that were previously too cold from them to survive. Mosquitoes carry infectious
diseases like malaria. Ground level ozone pollution will likely worsen, death from heat waves
will rise, some plants and animals may face extinction if habitat changes, fingerprints of
global warming on wild animals and plants were published in 2003 to represent the effect of
the global warming on the behavior of various types of animals and plants
5
Figure 1.5: Projections of global mean sea level rise
13
A recent temporal and spatial temperature changes in Egypt has been studied in 2005,
in order to detect and estimate trends of temperature change in Egypt 15
. Specifically, for the
case of Egypt, climate change could hurt the food security issues that Egypt already faces.
Climate change may cause substantial reductions in the national grain production.
According to a report produced for the organization for economic development, Nile
delta is already subsiding at a rate of 3-5 mm per year. Facing up to the challenges of the Nile
was published in 2007 to alarm that global warming could have a severe impact on regional
water resources. Under almost all projections, the volume of water carried by the Nile will
fall rather than rise over the next century Africa is expected to be the hardest hit of all
continents by climate change 19
.
40% of Egyptian industry is located in Alexandria alone; a 0.25-meter rise in sea level
would put 60% of Alexandria’s population of 4 million below sea level, as well as 56.1% of
Alexandria’s industrial sector. A rise of 0.5 meters would be even more disastrous, placing
67% of the population of Alexandria, 65.9% of the industrial sector and 75.9% of the service
sector below sea level. Thirty percent of the city’s area would be destroyed, 1.5 million
people would have to be evacuated, and over 195,000 jobs would be lost 17, 18
. Other studies
on the effects of sea level rise on Egypt included by M. El RAEY et al 16
.
6
The dramatic effects of global warming on the entire planet have caused many
scientists to think of methods to limit the release of greenhouse gases.
Methods to limit the effects of global warming include using energy more efficient,
developing renewable energy technologies to reduce dependence on fossil fuels. In addition,
recycling saves the energy required to manufacture new products, plant and preserve trees
which can absorb carbon dioxide. Other methods suggesting Hydrogen rather than carbon-
based fuels as well as capturing CO2 produced and saving it under the oceans.
One strategy to reduce the net amount of CO2 released is to sequester (pump into the
earth) the CO2 produced by power plants. Oxy-fuel combustion is one of the viable methods
to facilitate capturing carbon dioxide for sequestration. Carbon capture and sequestration
(CCS) to prevent/reduce climate change via reducing CO2 emissions into the atmosphere,
thus the motivation for this work.
In one form of oxy-fuel combustion, fuel is burnt in oxygen (rather than in air) to
easily obtain a pure stream of carbon dioxide from the products of combustion. This makes
the sequestration much easier but, however, results in extremely high operating temperatures
causing material problems. This implies that some diluents other than nitrogen must be used.
The principle of oxy-fuel combustion for CCS is burning fuel in a mixture of oxygen and a
diluent that are recycled from the flue gas. Since the products of combustion are carbon
dioxide and water, one of these two is used. Once water vapor is condensed from the flue
gases only CO2 remains. Carbon dioxide is currently being studied as the most promising of
the diluents of choice. However, this utilization of carbon dioxide as a diluent impacts the
flame temperature and the stability of combustion.
7
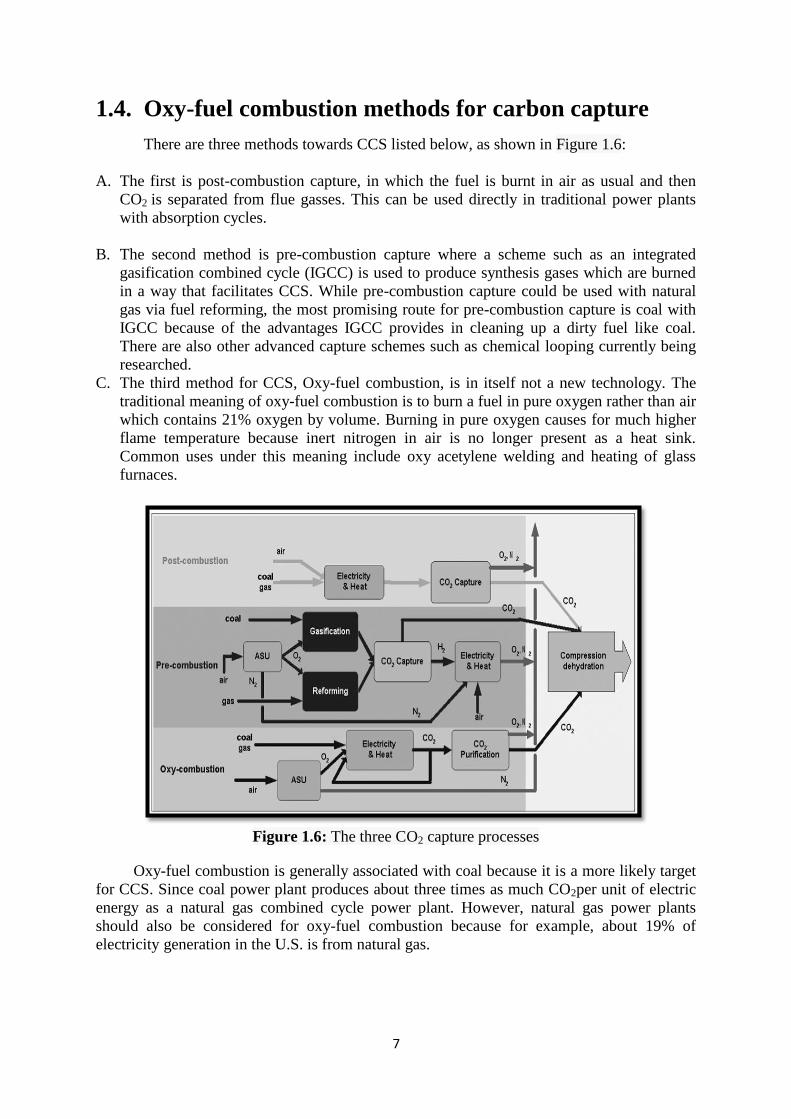
1.4. Oxy-fuel combustion methods for carbon capture
There are three methods towards CCS listed below, as shown in Figure 1.6:
A. The first is post-combustion capture, in which the fuel is burnt in air as usual and then
CO2 is separated from flue gasses. This can be used directly in traditional power plants
with absorption cycles.
B. The second method is pre-combustion capture where a scheme such as an integrated
gasification combined cycle (IGCC) is used to produce synthesis gases which are burned
in a way that facilitates CCS. While pre-combustion capture could be used with natural
gas via fuel reforming, the most promising route for pre-combustion capture is coal with
IGCC because of the advantages IGCC provides in cleaning up a dirty fuel like coal.
There are also other advanced capture schemes such as chemical looping currently being
researched.
C. The third method for CCS, Oxy-fuel combustion, is in itself not a new technology. The
traditional meaning of oxy-fuel combustion is to burn a fuel in pure oxygen rather than air
which contains 21% oxygen by volume. Burning in pure oxygen causes for much higher
flame temperature because inert nitrogen in air is no longer present as a heat sink.
Common uses under this meaning include oxy acetylene welding and heating of glass
furnaces.
Figure 1.6: The three CO2 capture processes
Oxy-fuel combustion is generally associated with coal because it is a more likely target
for CCS. Since coal power plant produces about three times as much CO2per unit of electric
energy as a natural gas combined cycle power plant. However, natural gas power plants
should also be considered for oxy-fuel combustion because for example, about 19% of
electricity generation in the U.S. is from natural gas.
8
1.5. Advantages and challenges of oxy-fuel combustion
technique
The justification for using oxy-fuel combustion is to produce a CO2 rich flue gas
ready for sequestration. Other advantages include that, less heat is lost in the flue gas due to
decrease the flue gas volume. The size of the flue gas treatment equipment can be reduced
also. Furthermore, the concentration of pollutants in the flue gas is higher, making separation
easier. Moreover, heat of condensation can be captured and reused rather than lost in the flue
gas. Because nitrogen from air is not allowed in, thermal nitrogen oxide production is
eliminated. However, a main challenge in this method is the need to guarantee flame stability
when using CO2/O2 mixture as oxidizer, which is most evident in its use as a fire extinguisher
for a certain fires.
The oxy-fuel combustion concept can be simplified to combustion using substitute air
in which N2 is replaced with CO2.However, the combustion characteristics and radiative heat
transfer in oxy-fuel combustion differ from those of air-fuel air due to significant differences
in the physical properties of CO2 and N2 21
. For example, CO2 has higher density than N2,
which affects gas volume and flame shape. The higher density (for example, the density of
the air is 0.434 kg/m3 at 800 K while the density of a CO2/O2 mixture are 0.6174, 0.6119,
0.6045at oxygen fractions of 29%, 32%, 36%, respectively). also leads to higher volumetric
heat capacity which directly affects the temperature level and hence the flame speed and the
flame stability. For the sake of comparison, the stoichiometric oxidizer-to-fuel ratio for
CH4/air mixture is 17.1, while this ratio decreases to 17.5, 15.7 and 13.8 for CH4/CO2/O2 at
oxygen fractions of 29%, 32% and 36%, respectively. On the other hand, the volumetric heat
capacity are 480 J/m3K, 705, 700 and 690 J/m3K for air and a CO2/O2 mixture at an oxygen
fraction of 29%, 32%, 36%, respectively.
In order to maintain sufficiently high temperatures and stable flame operation, the
overall O2 concentration in the O2/CO2 mixture must be higher than 21% 21 22
.
1.6. Flammability limits
The use of carbon dioxide, which is a fire extinguisher, as an input in the combustion
reactants causes a great challenge in the flame stability. This issue is discussed in this section
If small amounts of combustible fuel gas or vapor are added gradually to air, a point
will be reached at which the mixture just becomes flammable. The percentage of fuel gas at
this point is called the lower flammable limit or lean limit. If more fuel is added, another
point will eventually be reached at which the mixture will no longer bum, the percentage of
fuel gas at this point is called the upper flammable limit or rich limit. The range of
flammability becomes wider as the temperature of the unburned mixture increases.
1.6.1. Lower flammability limit
The lower flammability limits (LFL) is the lowest concentration (percentage) of a gas
or a vapor in air capable of producing a flash of fire in presence of an ignition source. At a
concentration in air lower than the LEL, gas mixtures are "too lean" to burn. Methane-air
combustion has a LEL of 5%. If the atmosphere has less than 5% methane, an explosion
cannot occur even if a source of ignition is presented.
9
1.6.2. Upper Flammability limit
The upper flammability limits (UFL) is the highest concentration (percentage) of a
gas or a vapor in air capable of producing a flash of fire in presence of an ignition source.
Concentrations higher than UFL are "too rich" to burn.
1.7. Flame stability mechanism over perforated-plate
burner
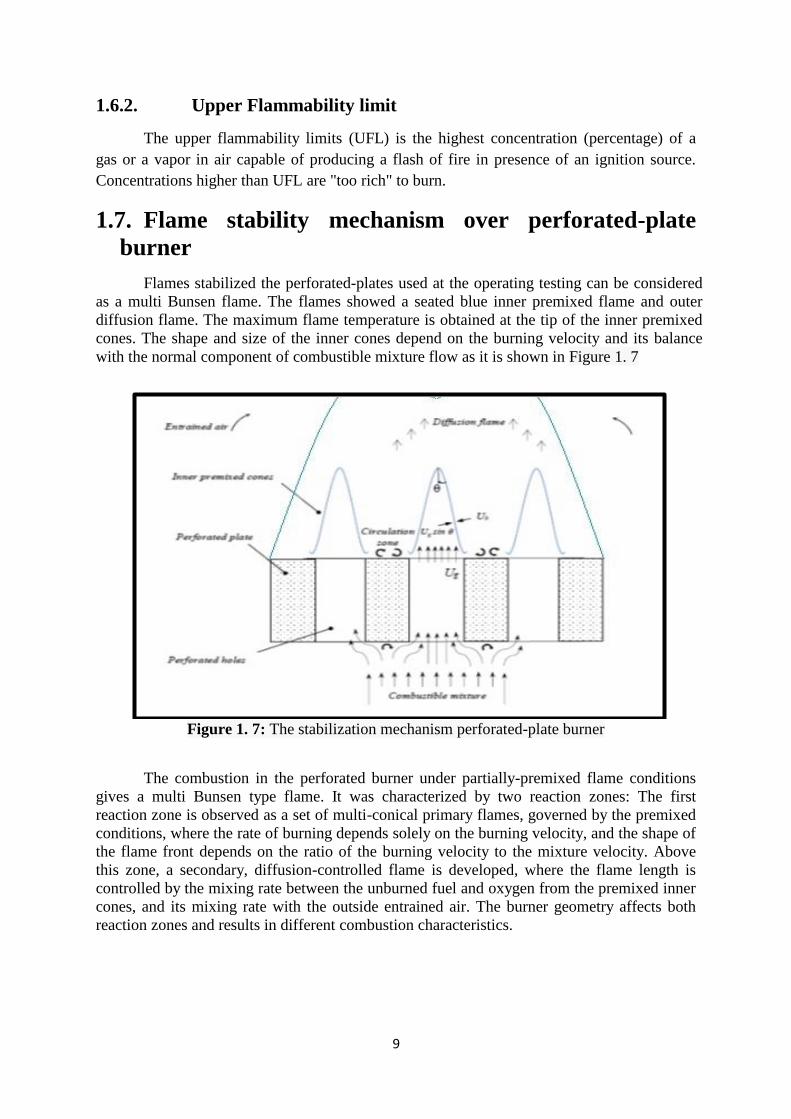
Flames stabilized the perforated-plates used at the operating testing can be considered
as a multi Bunsen flame. The flames showed a seated blue inner premixed flame and outer
diffusion flame. The maximum flame temperature is obtained at the tip of the inner premixed
cones. The shape and size of the inner cones depend on the burning velocity and its balance
with the normal component of combustible mixture flow as it is shown in Figure 1. 7
Figure 1. 7: The stabilization mechanism perforated-plate burner
The combustion in the perforated burner under partially-premixed flame conditions
gives a multi Bunsen type flame. It was characterized by two reaction zones: The first
reaction zone is observed as a set of multi-conical primary flames, governed by the premixed
conditions, where the rate of burning depends solely on the burning velocity, and the shape of
the flame front depends on the ratio of the burning velocity to the mixture velocity. Above
this zone, a secondary, diffusion-controlled flame is developed, where the flame length is
controlled by the mixing rate between the unburned fuel and oxygen from the premixed inner
cones, and its mixing rate with the outside entrained air. The burner geometry affects both
reaction zones and results in different combustion characteristics.
11
1.8. Scope of current work
The scope of the current work is to build, operate and test a perforated-plate burner
operated with controlled O2/CO2 mixtures burning CNG as a fuel and then determine the
flammability limits in oxy-fuel combustion. Three sets of experiments are carried out in this
study.
The first set is to determine the flammability limit of oxy-fuel combustion at the same
oxygen fraction, same oxidizer mass flow rates and different equivalence ratios. In this set of
experiments different oxygen fractions namely 29%, 32% and 36% are used. Also different
oxidizer mass flow rates (1.0, 1.1, 1.2, 1.3, 1.4, 1.5, 1.6, 1.7 kg/hr) are used. Also visual
flame appearance and extinction mechanism(s) are studied. Finally comparison with air is
made at the same oxidizer mass flow rates.
The second set of oxy-fuel combustion experiment is to determine the flammability
limits at the same equivalence ratios, same oxidizer mass flow rates and different oxygen
fractions.
The third set of experiments (air-fuel combustion) studies the effect of degree of
premixing (L/D) on the flammability limits, visual flame appearance and extinction
mechanisms. Different degree of premixing namely 7, 25, 45, 67 and 128 are used.
Chapter 2 describes the literature review and the previous work directly related to this
work. Chapter 3 describes the experimental setup and methods. Chapter 4 presents and
analyzes the experimental data on flame stability, the visual flame appearance and
comparisons with air-fuel combustion. Chapter 5 summarizes the conclusion of this work and
provides recommendations for future work.
In this work, the oxidizer-to-fuel ratio is defined as the ratio of the mass flow rate of
the oxidizer (O2/CO2 mixture in oxy-fuel combustion or air in air-fuel combustion) to the
mass flow rate of the fuel. The equivalence ratio is defined as the ratio of the stoichiometric
oxidizer-to-fuel ratio (OFR) to the used oxidizer-to-fuel ratio. The oxygen fraction (OF) is
defined as the volumetric ratio of O2 in the O2/CO2 mixture. The degree of premixing is
indicated through the L/D ratio, stating the ratio between the duct length measured from the
point of introducing the combustible mixture to the burner and the duct diameter. The flow
Reynolds number is estimated based on the mass flow rate of the combustible mixture, the
combustible mixture kinematic viscosity and the equivalent diameter of the burner holes.
11
Chapter 2: Literature review
The scope of this work is to build, operate and test a perforated-plate burner operated
with controlled O2/CO2 mixtures burning CNG as a fuel and then to determine the
flammability limits in oxy-fuel combustion as compared to air-fuel combustion. Three sets of
experiments are carried out in this study.
This chapter summarizes some of the previous experimental and theoretical work
done on the flame stability the oxy-fuel combustion techniques.
Alberto et al. 2010, studied blow-off measurements for both oxy-fuel combustion
(CH4/O2/CO2) and air-fuel combustion (CH4/air) using a premixed swirl combustor. These
experiments were performed utilizing swirler nozzle burner fitted to a cylindrical combustor.
The fuel is injected 150 cm upstream of the combustor to achieve a premixed condition. The
combustor consists of a quartz tube with a 115 and 120 mmm inner and outer diameters,
respectively. Two quartz tube lengths were tested: 304.8 mm and 508 mm.
They focused on CH4/O2/CO2 flames which are known to be characterized by slower
chemical kinetics than methane-air flames and as such, flame stability is more problematic as
they are easier to blow-off. This issue was investigated experimentally by characterizing the
stability boundaries.
Blow-off measurements were obtained with baseline CH4/air mixtures and with
CH4/O2/CO2. For the CH4/air mixtures, blow off data were obtained by fixing the air flow
rate and fuel/air ratio at some stable value. Then, the fuel flow rate was slowly turned down
until blow-off occurred. As such, blow-off was obtained by decreasing flame temperature and
fuel/air ratio at a nearly constant nozzle exit velocity. For the CH4/O2/CO2 system, blow-off
data was obtained by fixing overall flow rates at some nominal velocity and fixed
fuel/oxygen ratio. Then, the CO2 flow rate was increased until blow-off occurred. As such,
blow-off was obtained at a fixed stoichiometric, a decreasing flame temperature and
increasing nozzle exit velocity.
12
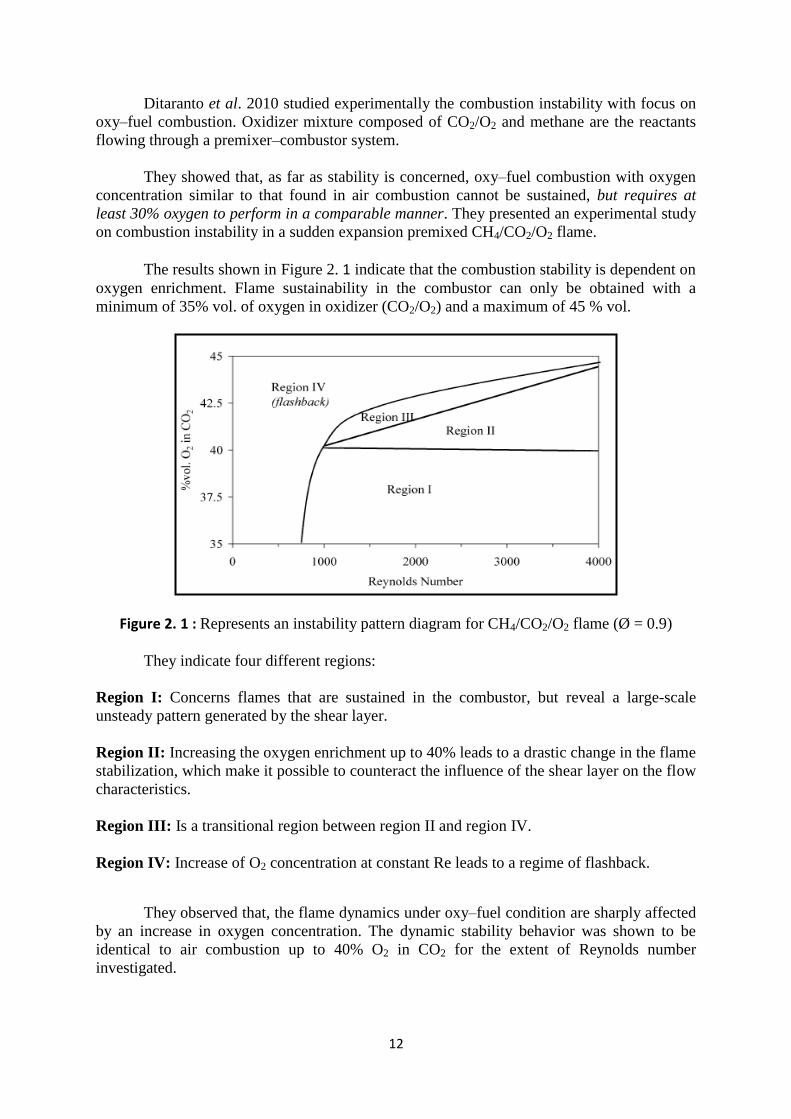
Ditaranto et al. 2010 studied experimentally the combustion instability with focus on
oxy–fuel combustion. Oxidizer mixture composed of CO2/O2 and methane are the reactants
flowing through a premixer–combustor system.
They showed that, as far as stability is concerned, oxy–fuel combustion with oxygen
concentration similar to that found in air combustion cannot be sustained, but requires at
least 30% oxygen to perform in a comparable manner. They presented an experimental study
on combustion instability in a sudden expansion premixed CH4/CO2/O2 flame.
The results shown in Figure 2. 1 indicate that the combustion stability is dependent on
oxygen enrichment. Flame sustainability in the combustor can only be obtained with a
minimum of 35% vol. of oxygen in oxidizer (CO2/O2) and a maximum of 45 % vol.
Figure 2. 1 : Represents an instability pattern diagram for CH4/CO2/O2 flame (Ø = 0.9)
They indicate four different regions:
Region I: Concerns flames that are sustained in the combustor, but reveal a large-scale
unsteady pattern generated by the shear layer.
Region II: Increasing the oxygen enrichment up to 40% leads to a drastic change in the flame
stabilization, which make it possible to counteract the influence of the shear layer on the flow
characteristics.
Region III: Is a transitional region between region II and region IV.
Region IV: Increase of O2 concentration at constant Re leads to a regime of flashback.
They observed that, the flame dynamics under oxy–fuel condition are sharply affected
by an increase in oxygen concentration. The dynamic stability behavior was shown to be
identical to air combustion up to 40% O2 in CO2 for the extent of Reynolds number
investigated.
13
Hu et al. 2013 studied the laminar flame speeds of CH4/O2/CO2 mixtures in
atmospheric conditions were measured using Bunsen method. The whole surface area
methodology based on the images of flame was performed to obtain the laminar flame speeds
of the Bunsen burner. The effect factors on laminar flame velocities of CH4/O2/CO2 mixtures
were discussed, including equivalence ratios (0.8~1.2), oxygen concentrations (25%~35%)
and dilutions (N2, CO2). Results showed that the laminar flame speeds of the premixed oxy-
methane mixture reached a maximum at the stoichiometric ratio of 1 while gradually lowered
on either side. The laminar flame speeds increased with the increase of the O2 concentration
and there was a quadratic function relationship between the flame velocities and the
concentration of the O2. The laminar flame speeds increased with the increase of the O2
concentration. Compared with N2, the high concentration of CO2 decreased the flame speeds
and the measured flame speeds using CO2 as the oxidizer was about one-fifth of that using N2
as the oxidizer.
Because in some situations, condensation of water vapor does not take place with
perfect efficiency, some water vapor may still exist and is routed back as a reactant. In this
case, it is interesting to study the combustion and flame stability of CH4/O2/CO2/H2O
mixtures. Such a study was made by Mazas et al. 2013. They showed that the laminar flame
speed of CH4/O2/CO2/H2O features a linear decrease with increasing steam vol. fraction, even
at high steam dilution rates. They also showed that steam addition has a non-negligible
chemical impact on the flame speed for methane-air flame.
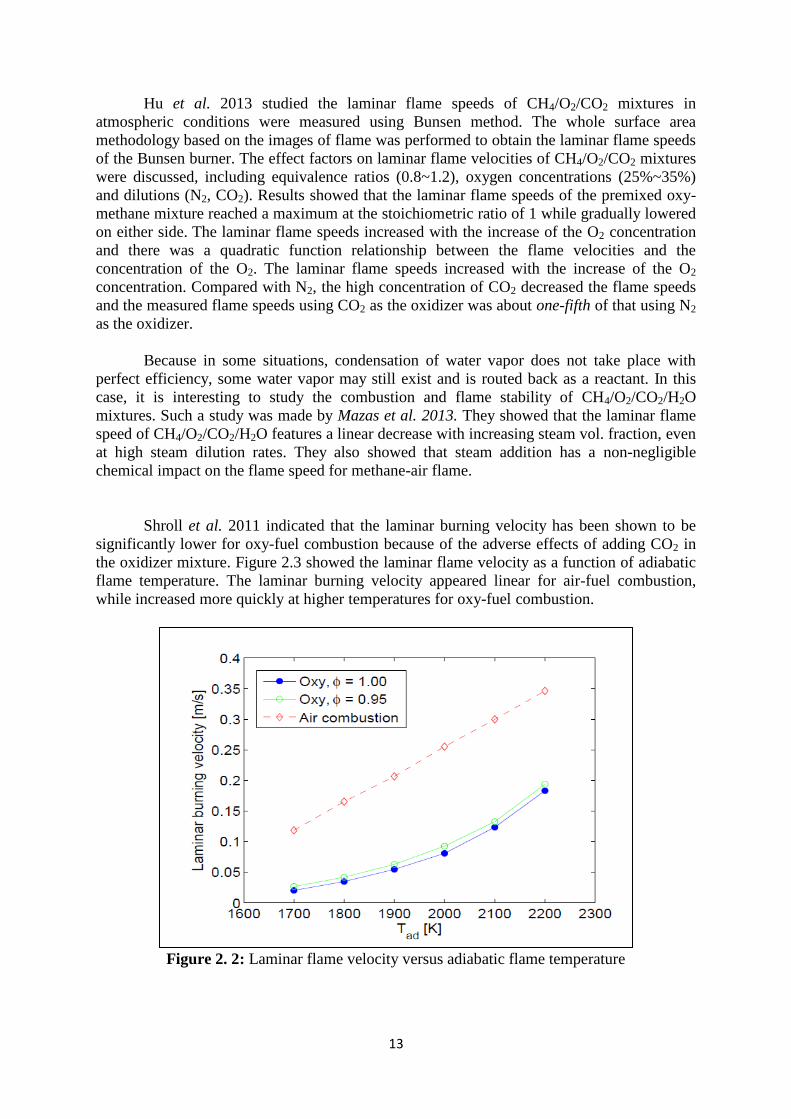
Shroll et al. 2011 indicated that the laminar burning velocity has been shown to be
significantly lower for oxy-fuel combustion because of the adverse effects of adding CO2 in
the oxidizer mixture. Figure 2.3 showed the laminar flame velocity as a function of adiabatic
flame temperature. The laminar burning velocity appeared linear for air-fuel combustion,
while increased more quickly at higher temperatures for oxy-fuel combustion.
Figure 2. 2: Laminar flame velocity versus adiabatic flame temperature
14
They indicated that because of low flame speeds in oxy-fuel combustion,
proportionally larger flame areas should be required for laminar flames and long, weak
flames are expected. However, figure 2.7 shows the effective required area for oxy-fuel and
air fuel flames at the same Reynolds numbers for three temperatures. This flame area is given
by
, where m˚, ρ and SL are the total mass flow rate, gas density and laminar burning
velocity for mixture respectively. At a high temperature of 2200 K, the area needed for oxy-
fuel combustion is only 25% higher than air.
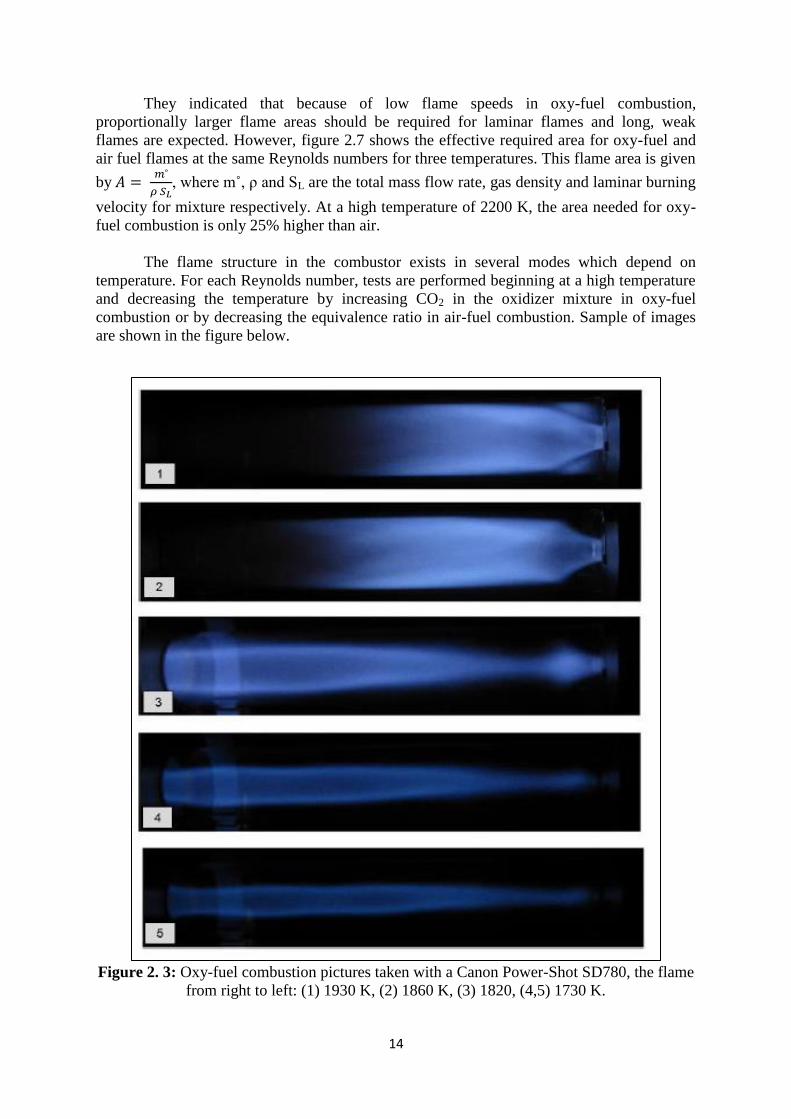
The flame structure in the combustor exists in several modes which depend on
temperature. For each Reynolds number, tests are performed beginning at a high temperature
and decreasing the temperature by increasing CO2 in the oxidizer mixture in oxy-fuel
combustion or by decreasing the equivalence ratio in air-fuel combustion. Sample of images
are shown in the figure below.
Figure 2. 3: Oxy-fuel combustion pictures taken with a Canon Power-Shot SD780, the flame
from right to left: (1) 1930 K, (2) 1860 K, (3) 1820, (4,5) 1730 K.
15
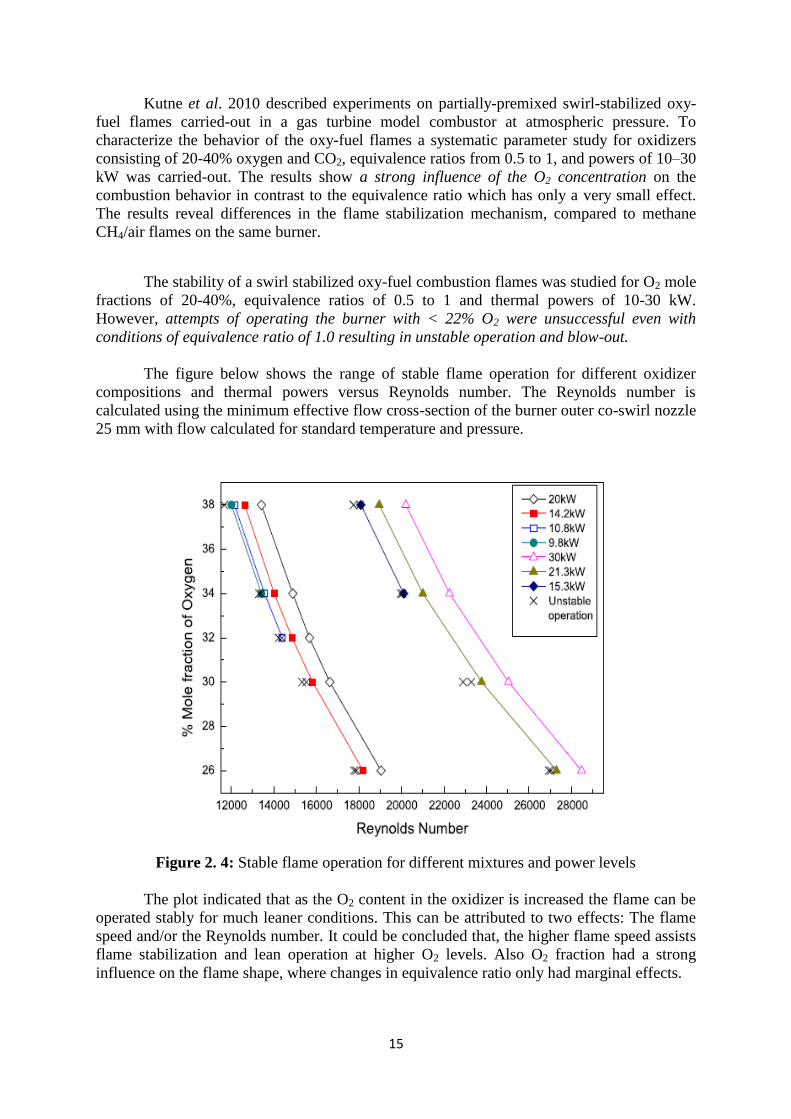
Kutne et al. 2010 described experiments on partially-premixed swirl-stabilized oxy-
fuel flames carried-out in a gas turbine model combustor at atmospheric pressure. To
characterize the behavior of the oxy-fuel flames a systematic parameter study for oxidizers
consisting of 20-40% oxygen and CO2, equivalence ratios from 0.5 to 1, and powers of 10–30
kW was carried-out. The results show a strong influence of the O2 concentration on the
combustion behavior in contrast to the equivalence ratio which has only a very small effect.
The results reveal differences in the flame stabilization mechanism, compared to methane
CH4/air flames on the same burner.
The stability of a swirl stabilized oxy-fuel combustion flames was studied for O2 mole
fractions of 20-40%, equivalence ratios of 0.5 to 1 and thermal powers of 10-30 kW.
However, attempts of operating the burner with < 22% O2 were unsuccessful even with
conditions of equivalence ratio of 1.0 resulting in unstable operation and blow-out.
The figure below shows the range of stable flame operation for different oxidizer
compositions and thermal powers versus Reynolds number. The Reynolds number is
calculated using the minimum effective flow cross-section of the burner outer co-swirl nozzle
25 mm with flow calculated for standard temperature and pressure.
Figure 2. 4: Stable flame operation for different mixtures and power levels
The plot indicated that as the O2 content in the oxidizer is increased the flame can be
operated stably for much leaner conditions. This can be attributed to two effects: The flame
speed and/or the Reynolds number. It could be concluded that, the higher flame speed assists
flame stabilization and lean operation at higher O2 levels. Also O2 fraction had a strong
influence on the flame shape, where changes in equivalence ratio only had marginal effects.
16
The specific objectives of the current work can be summarized, through these set of
experiments.
Three sets of experiments are carried out in this study. The first and second sets utilize
oxy-fuel combustion technique and compare the results with corresponding air-fuel
combustion technique.
The first set of oxy-fuel combustion presents the flammability limits and visible flame
appearance results at constant oxygen fraction (namely 29%, 32% and 36%), at the same
oxidizer mass flow rate (1.32 kg/h) and different equivalence ratios. Also extinction
mechanisms are studied.
The second set of oxy-fuel combustion experiments presents the flammability limits
and the visual flame appearance at the same equivalence ratio of 0.85, same oxidizer mass
flow rates and variable oxygen fractions. Also extinction mechanisms are studied.
The third set of air-fuel combustion presents the flammability limits and the visual
flame appearance for CNG flames burnt in air at different degree of premixing, in L/D range
of 7 to 128. This studies the effect of degree of premixing on stability and it was found that
operation at high L/D is relatively difficult in this existing setup and therefore, this is limited
to air-fuel combustion only.
17
Chapter 3: Experimental Setup
This chapter provides details of the experimental setups used for all oxy-fuel
combustion and air experiments.
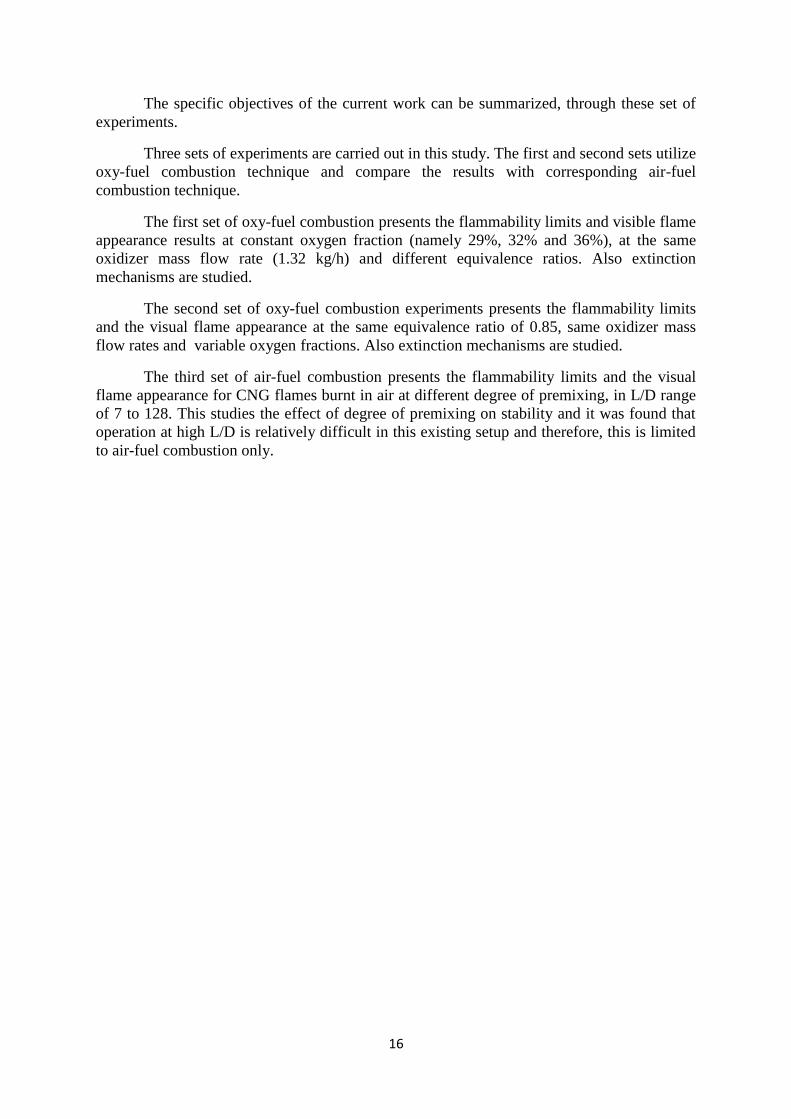
3.1. Flow diagrams
The flow diagram of oxy-fuel combustion experiments shows the fuel inlet to the
burner and the oxidizer mixture made of CO2/O2 flow diagrams in Figure 3.1. The flow
diagram of the air-fuel combustion experiments with variable fuel inlet used to control the
degree of premixing (L/D) is shown in Figure 3.2and a digital picture for the test rig is shown
in Figure 3.3. The test rig consists of an oxidizer supply system, fuel supply system, flow
controllers, measuring instrumentation, pilot flame burner, main burner, confinement, exhaust
system and purging system.
Figure 3.1: Flow diagram for oxy-fuel combustion experiment
For oxy-fuel combustion experiment the flow diagram in the Figure 3.1. The fuel is
supplied from CNG vessel passing through a pressure regulator, a needle valve, a rotameter
then to the burner while the oxidizers are supplied from the vessels of CO2 and O2 to the
burner passing through pressure regulators, rotameters, then are fed to the burner. The
18
oxidizer mixture contains oxygen and carbon dioxides gases. The pressure and temperature of
each gas is measured via rotameter and then a thermocouple respectively. These gases are
mixed in a mixer at degree of premixing of 128. The oxidizer and the fuel are introduced
together into the burner at degree of premixing of 7.
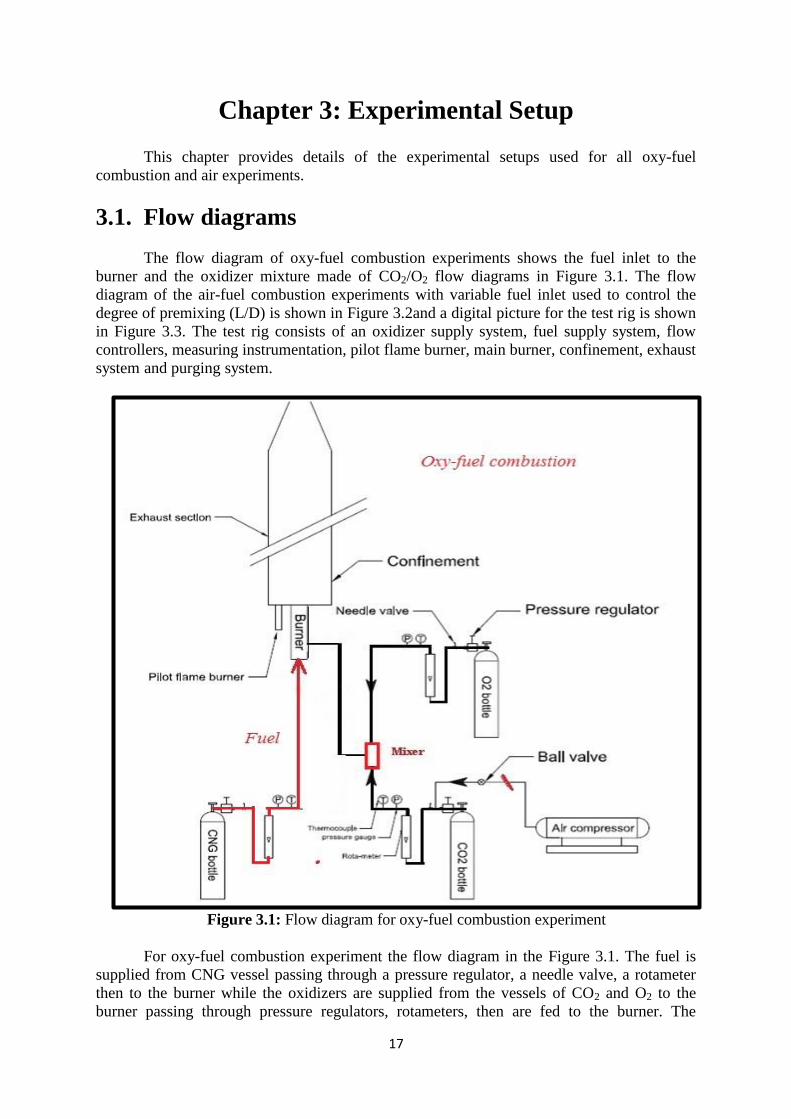
For air-fuel combustion experiment the flow diagram is shown in the Figure 3.2 below,
the fuel is supplied from CNG vessel passing through pressure regulator, needle valve,
rotameter then to the burner while the oxidizer is supplied from the 3 phase compressor of 10
KW.
Figure 3.2: Flow diagram for air experiment
19
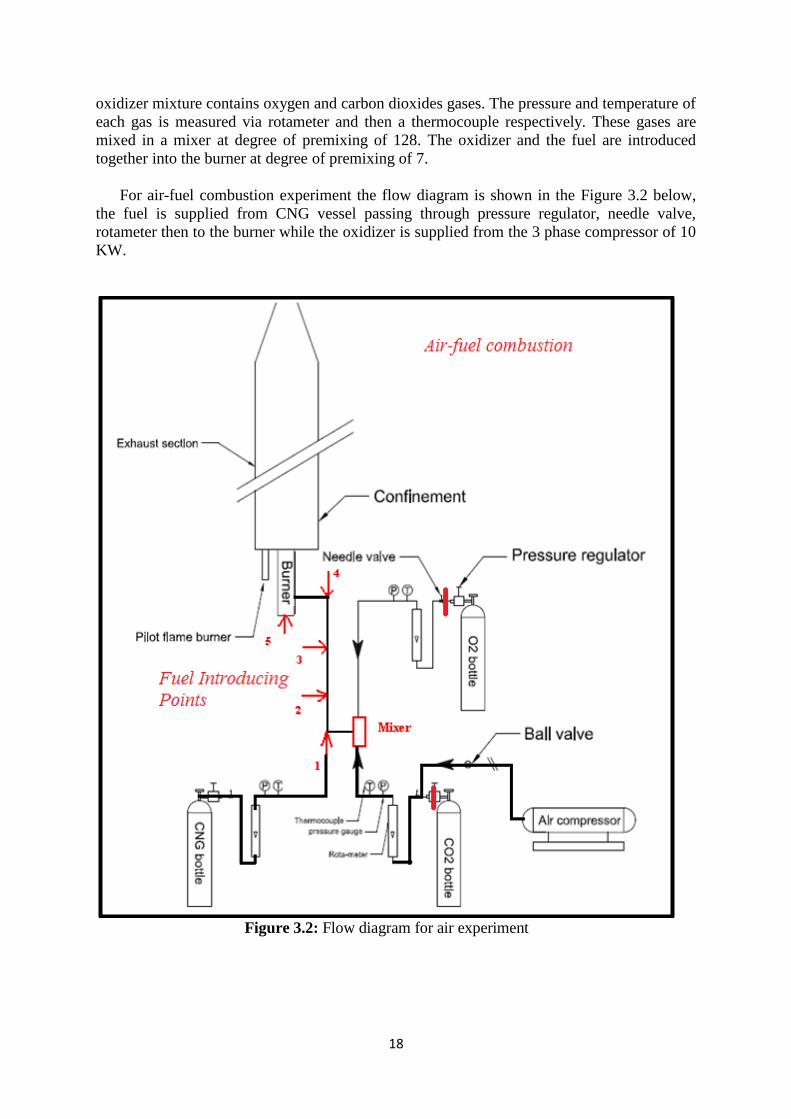
The Figure 3.3 below shows the test rig devices, used for this work.
Figure 3.3: Test rig and instruments
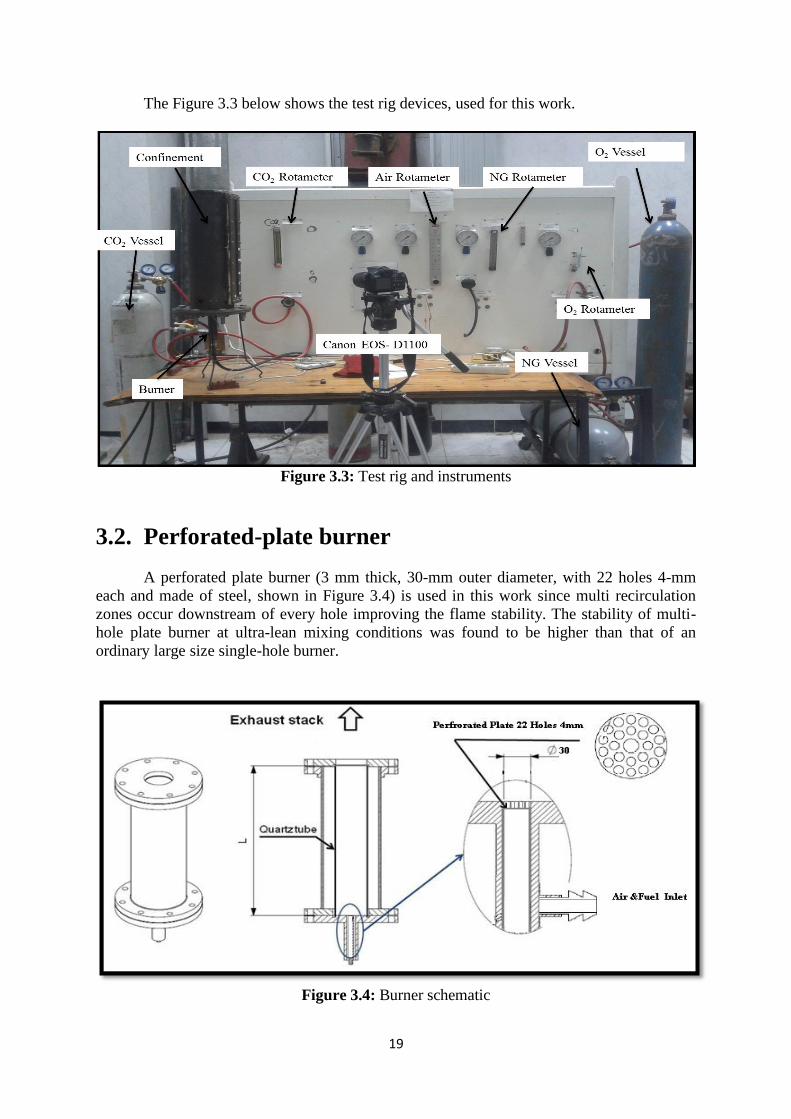
3.2. Perforated-plate burner
A perforated plate burner (3 mm thick, 30-mm outer diameter, with 22 holes 4-mm
each and made of steel, shown in Figure 3.4) is used in this work since multi recirculation
zones occur downstream of every hole improving the flame stability. The stability of multi-
hole plate burner at ultra-lean mixing conditions was found to be higher than that of an
ordinary large size single-hole burner.
Figure 3.4: Burner schematic
21
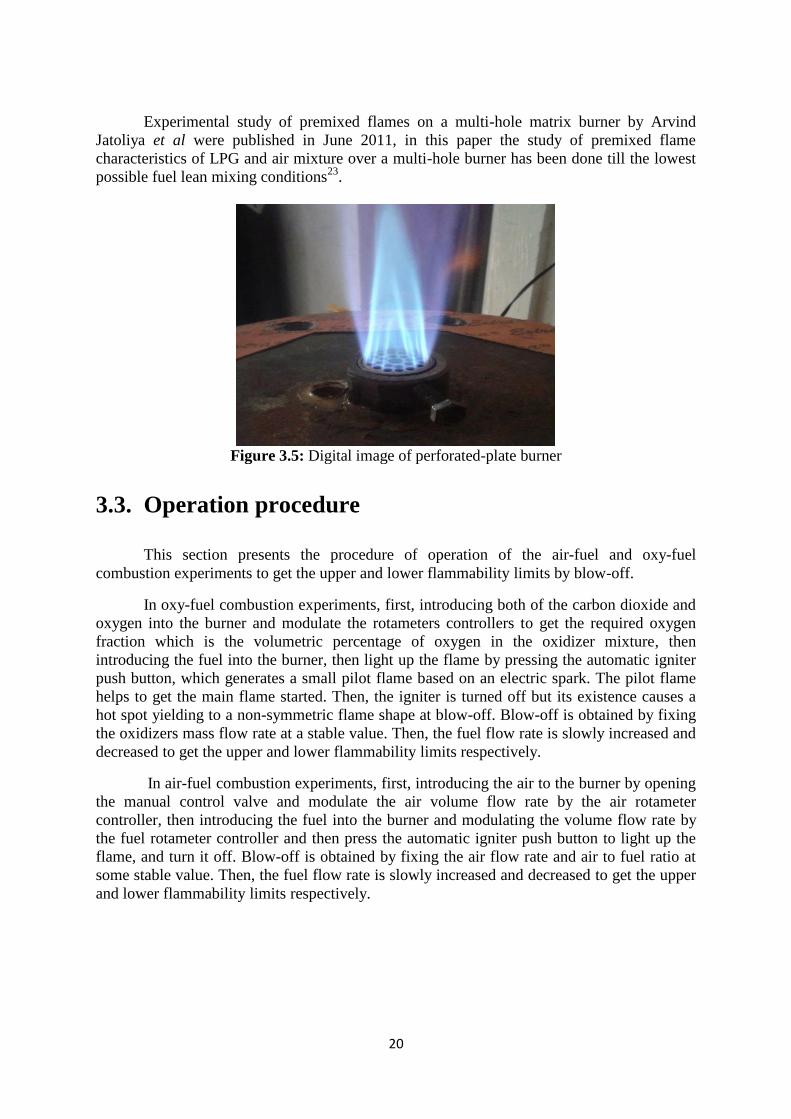
Experimental study of premixed flames on a multi-hole matrix burner by Arvind
Jatoliya et al were published in June 2011, in this paper the study of premixed flame
characteristics of LPG and air mixture over a multi-hole burner has been done till the lowest
possible fuel lean mixing conditions 23
.
Figure 3.5: Digital image of perforated-plate burner
3.3. Operation procedure
This section presents the procedure of operation of the air-fuel and oxy-fuel
combustion experiments to get the upper and lower flammability limits by blow-off.
In oxy-fuel combustion experiments, first, introducing both of the carbon dioxide and
oxygen into the burner and modulate the rotameters controllers to get the required oxygen
fraction which is the volumetric percentage of oxygen in the oxidizer mixture, then
introducing the fuel into the burner, then light up the flame by pressing the automatic igniter
push button, which generates a small pilot flame based on an electric spark. The pilot flame
helps to get the main flame started. Then, the igniter is turned off but its existence causes a
hot spot yielding to a non-symmetric flame shape at blow-off. Blow-off is obtained by fixing
the oxidizers mass flow rate at a stable value. Then, the fuel flow rate is slowly increased and
decreased to get the upper and lower flammability limits respectively.
In air-fuel combustion experiments, first, introducing the air to the burner by opening
the manual control valve and modulate the air volume flow rate by the air rotameter
controller, then introducing the fuel into the burner and modulating the volume flow rate by
the fuel rotameter controller and then press the automatic igniter push button to light up the
flame, and turn it off. Blow-off is obtained by fixing the air flow rate and air to fuel ratio at
some stable value. Then, the fuel flow rate is slowly increased and decreased to get the upper
and lower flammability limits respectively.
21
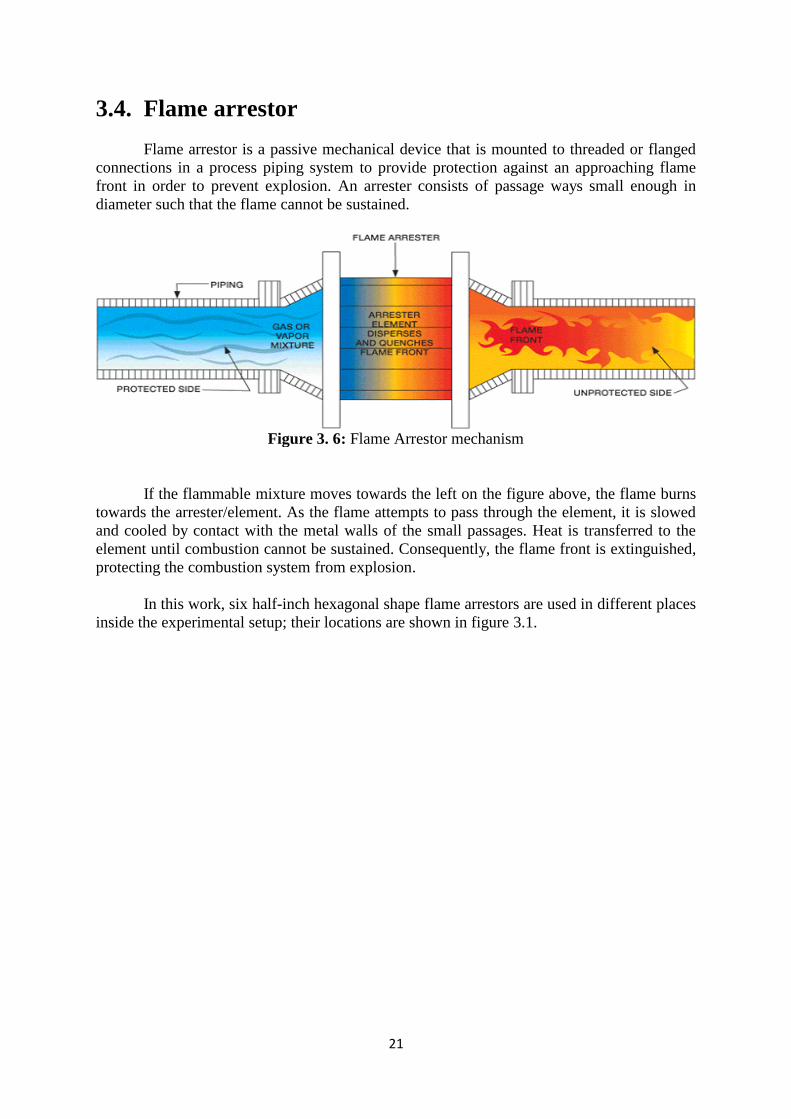
3.4. Flame arrestor
Flame arrestor is a passive mechanical device that is mounted to threaded or flanged
connections in a process piping system to provide protection against an approaching flame
front in order to prevent explosion. An arrester consists of passage ways small enough in
diameter such that the flame cannot be sustained.
Figure 3. 6: Flame Arrestor mechanism
If the flammable mixture moves towards the left on the figure above, the flame burns
towards the arrester/element. As the flame attempts to pass through the element, it is slowed
and cooled by contact with the metal walls of the small passages. Heat is transferred to the
element until combustion cannot be sustained. Consequently, the flame front is extinguished,
protecting the combustion system from explosion.
In this work, six half-inch hexagonal shape flame arrestors are used in different places
inside the experimental setup; their locations are shown in figure 3.1.
22
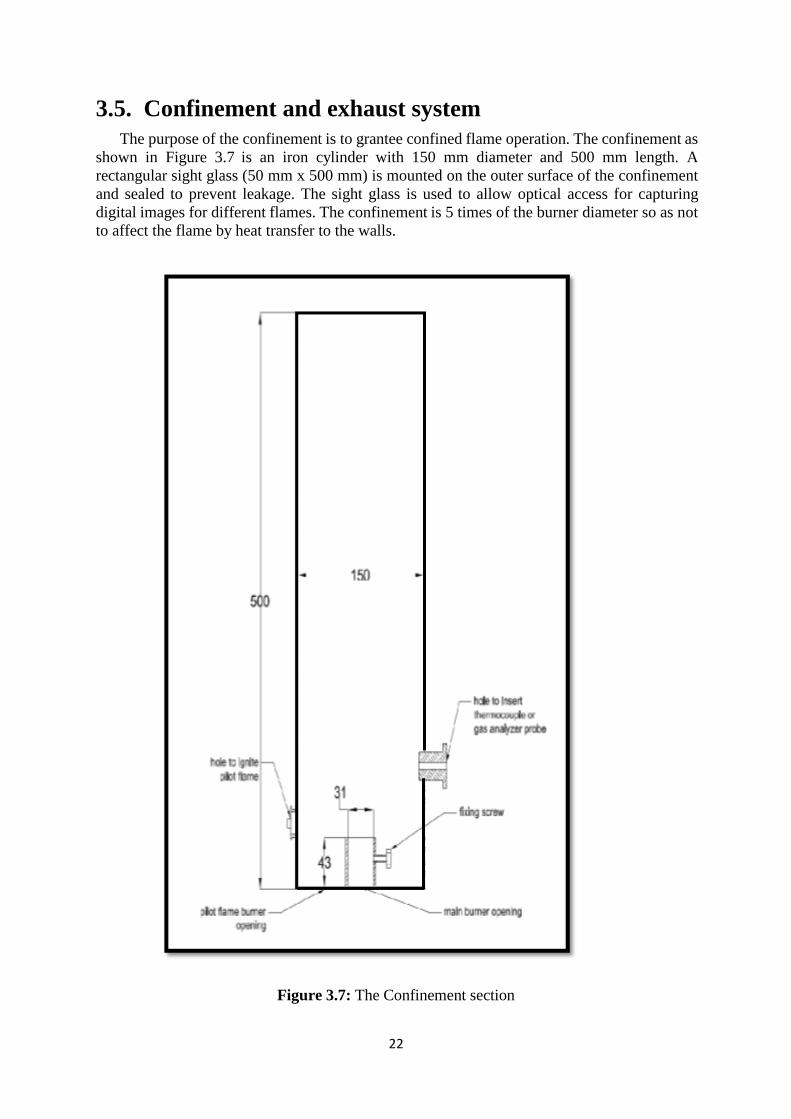
3.5. Confinement and exhaust system
The purpose of the confinement is to grantee confined flame operation. The confinement as
shown in Figure 3.7 is an iron cylinder with 150 mm diameter and 500 mm length. A
rectangular sight glass (50 mm x 500 mm) is mounted on the outer surface of the confinement
and sealed to prevent leakage. The sight glass is used to allow optical access for capturing
digital images for different flames. The confinement is 5 times of the burner diameter so as not
to affect the flame by heat transfer to the walls.
Figure 3.7: The Confinement section
23
The purpose of the exhaust section is to prevent air leakage into the system
particularly during emissions measurements as shown in Error! Reference source not found.
and is fitted at the end combustor. The cylindrical part of this section is 1000 mm long and
150 mm in diameter. The exhaust section ends with a cone with 40 mm exit diameter to
eliminate air entrainment.
3.6. Fuel supply system
A compressed natural gas (CNG) bottle (200 bar) is used in all runs for fuel supply. A
pressure regulator is mounted at the exit of natural gas bottle to reduce the output gas pressure then
the fuel passes through a needle valve followed by a rotameter to measure the gas flow rate. Pressure
and temperature are measured at the exit of the rotameter using pressure gauge (0.1 kg/cm2
resolution, 0 - 4.1 kg/cm2
measuring range, ±2.5% accuracy. and thermocouple type k, respectively.
Finally the fuel is fed to the burner.
3.7. Oxidizer supply system
Air supply system used in air-fuel combustion experiments consists of reciprocating
compressor with large tank. Air supplied from this tank passes through two ball valves followed by
needle valve. Air flow rate is measured using a rotameter. Pressure and temperature of air are
measured at the exit of rotameter using pressure gauge and thermocouple respectively. Air is then fed
to the oxidizer mixer.
Oxygen supply system consists of oxygen bottle (120 bar and 7 m3) with 99.5% purity. The
supplied oxygen passes through a pressure regulator which is followed by a rotameter to measure
flow rate. The pressure and temperature of oxygen are measured at the exit of rotameter using
pressure gauge and thermocouple respectively. Finally the oxygen is fed to the oxidizer mixer.
Carbon dioxide supply system consists of carbon dioxide bottle (70 bar and 25 kg) with
99.5% purity. The supplied carbon dioxide passes through the regulator followed by needle valve. It
passes through a rotameter to measure flow rate. The pressure and temperature were measured at the
exit of rotameter using pressure gauge and thermocouple respectively. The carbon dioxide is fed to
the oxidizer mixer. Oxidizer mixer consists of a pipe of ½" diameter and 2.5 m long, this pipe has
two inlets and one exit, before the exit there are two perforated plates to enhance mixing process and
both pressure and temperature of oxidizer were measured at the end of mixer before delivering to
burner.
24
3.8. Instrumentation
3.6.1. Flow meters
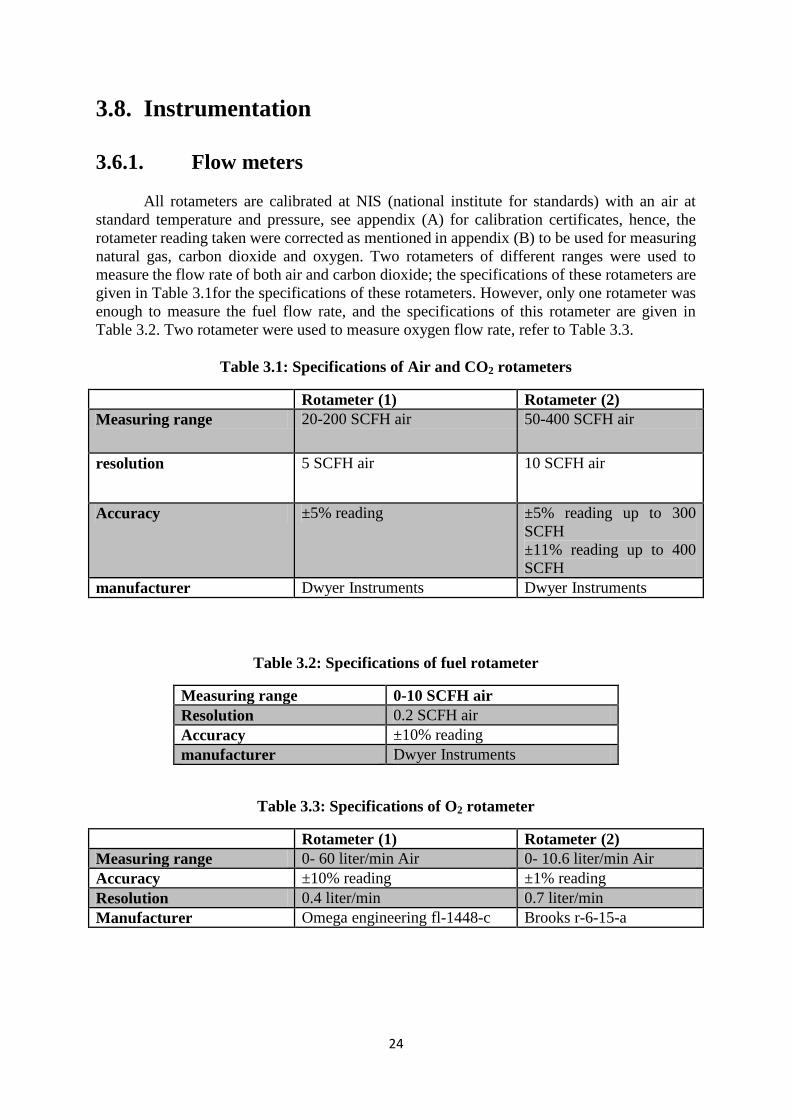
All rotameters are calibrated at NIS (national institute for standards) with an air at
standard temperature and pressure, see appendix (A) for calibration certificates, hence, the
rotameter reading taken were corrected as mentioned in appendix (B) to be used for measuring
natural gas, carbon dioxide and oxygen. Two rotameters of different ranges were used to
measure the flow rate of both air and carbon dioxide; the specifications of these rotameters are
given in Table 3.1for the specifications of these rotameters. However, only one rotameter was
enough to measure the fuel flow rate, and the specifications of this rotameter are given in
Table 3.2. Two rotameter were used to measure oxygen flow rate, refer to Table 3.3.
Table 3.1: Specifications of Air and CO2 rotameters
Rotameter (1) Rotameter (2)
Measuring range 20-200 SCFH air 50-400 SCFH air
resolution 5 SCFH air 10 SCFH air
Accuracy ±5% reading ±5% reading up to 300
SCFH
±11% reading up to 400
SCFH
manufacturer Dwyer Instruments Dwyer Instruments
Table 3.2: Specifications of fuel rotameter
Measuring range 0-10 SCFH air
Resolution 0.2 SCFH air
Accuracy ±10% reading
manufacturer Dwyer Instruments
Table 3.3: Specifications of O2 rotameter
Rotameter (1) Rotameter (2)
Measuring range 0- 60 liter/min Air 0- 10.6 liter/min Air
Accuracy ±10% reading ±1% reading
Resolution 0.4 liter/min 0.7 liter/min
Manufacturer Omega engineering fl-1448-c Brooks r-6-15-a
25
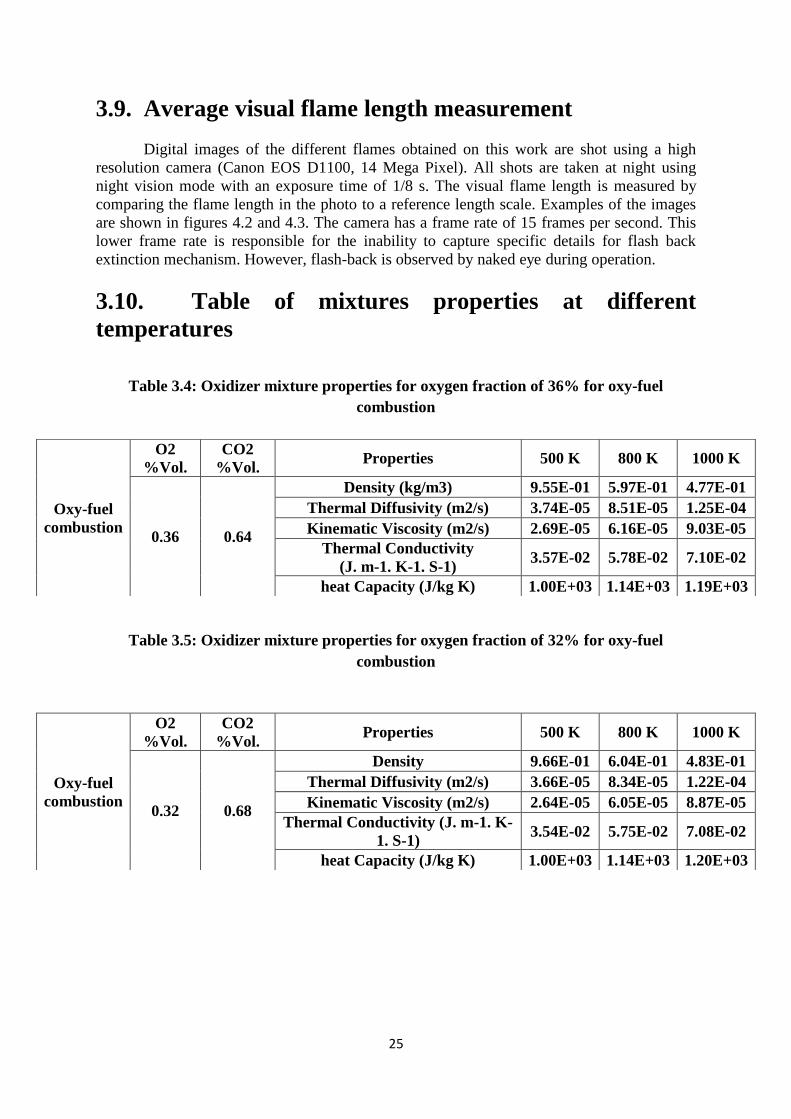
3.9. Average visual flame length measurement
Digital images of the different flames obtained on this work are shot using a high
resolution camera (Canon EOS D1100, 14 Mega Pixel). All shots are taken at night using
night vision mode with an exposure time of 1/8 s. The visual flame length is measured by
comparing the flame length in the photo to a reference length scale. Examples of the images
are shown in figures 4.2 and 4.3. The camera has a frame rate of 15 frames per second. This
lower frame rate is responsible for the inability to capture specific details for flash back
extinction mechanism. However, flash-back is observed by naked eye during operation.
3.10. Table of mixtures properties at different
temperatures
Table 3.4: Oxidizer mixture properties for oxygen fraction of 36% for oxy-fuel
combustion
Table 3.5: Oxidizer mixture properties for oxygen fraction of 32% for oxy-fuel
combustion
Oxy-fuel
combustion
O2
%Vol.
CO2
%Vol. Properties 500 K 800 K 1000 K
0.36 0.64
Density (kg/m3) 9.55E-01 5.97E-01 4.77E-01
Thermal Diffusivity (m2/s) 3.74E-05 8.51E-05 1.25E-04
Kinematic Viscosity (m2/s) 2.69E-05 6.16E-05 9.03E-05
Thermal Conductivity
(J. m-1. K-1. S-1) 3.57E-02 5.78E-02 7.10E-02
heat Capacity (J/kg K) 1.00E+03 1.14E+03 1.19E+03
Oxy-fuel
combustion
O2
%Vol.
CO2
%Vol. Properties 500 K 800 K 1000 K
0.32 0.68
Density 9.66E-01 6.04E-01 4.83E-01
Thermal Diffusivity (m2/s) 3.66E-05 8.34E-05 1.22E-04
Kinematic Viscosity (m2/s) 2.64E-05 6.05E-05 8.87E-05
Thermal Conductivity (J. m-1. K-
1. S-1) 3.54E-02 5.75E-02 7.08E-02
heat Capacity (J/kg K) 1.00E+03 1.14E+03 1.20E+03
26
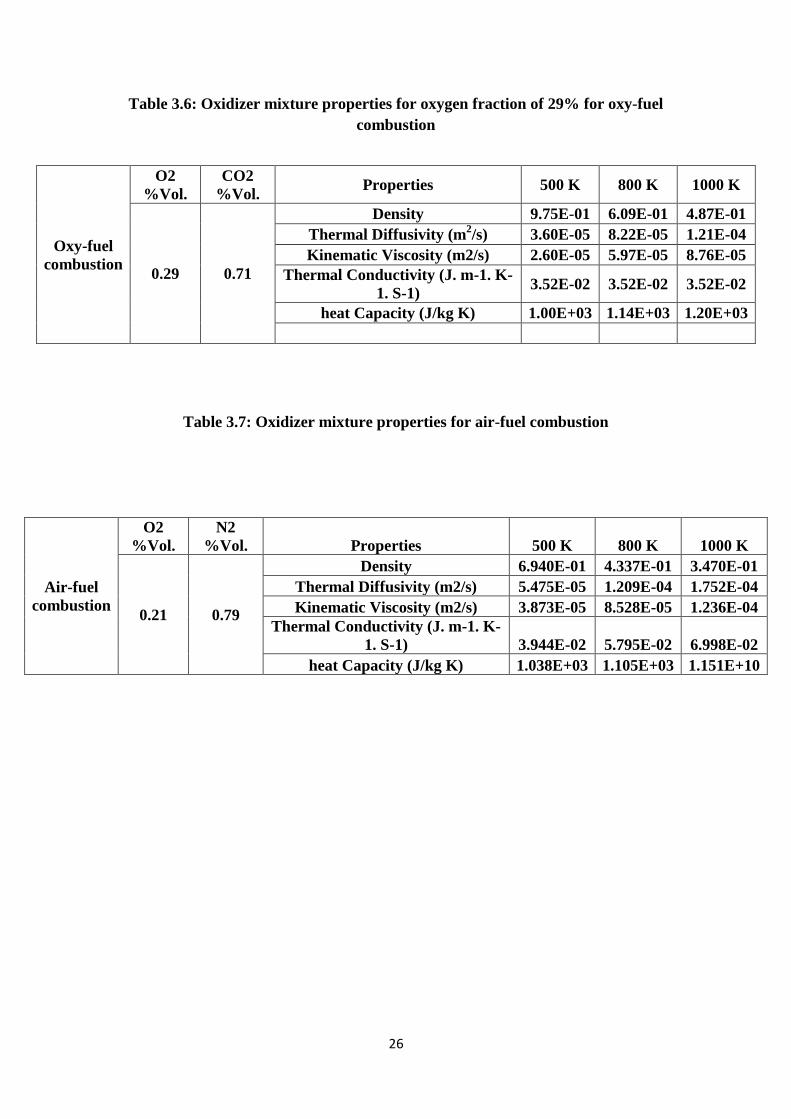
Table 3.6: Oxidizer mixture properties for oxygen fraction of 29% for oxy-fuel
combustion
Table 3.7: Oxidizer mixture properties for air-fuel combustion
Oxy-fuel
combustion
O2
%Vol.
CO2
%Vol. Properties 500 K 800 K 1000 K
0.29 0.71
Density 9.75E-01 6.09E-01 4.87E-01
Thermal Diffusivity (m2/s) 3.60E-05 8.22E-05 1.21E-04
Kinematic Viscosity (m2/s) 2.60E-05 5.97E-05 8.76E-05
Thermal Conductivity (J. m-1. K-
1. S-1) 3.52E-02 3.52E-02 3.52E-02
heat Capacity (J/kg K) 1.00E+03 1.14E+03 1.20E+03
Air-fuel
combustion
O2
%Vol.
N2
%Vol. Properties 500 K 800 K 1000 K
0.21 0.79
Density 6.940E-01 4.337E-01 3.470E-01
Thermal Diffusivity (m2/s) 5.475E-05 1.209E-04 1.752E-04
Kinematic Viscosity (m2/s) 3.873E-05 8.528E-05 1.236E-04
Thermal Conductivity (J. m-1. K-
1. S-1) 3.944E-02 5.795E-02 6.998E-02
heat Capacity (J/kg K) 1.038E+03 1.105E+03 1.151E+10
27
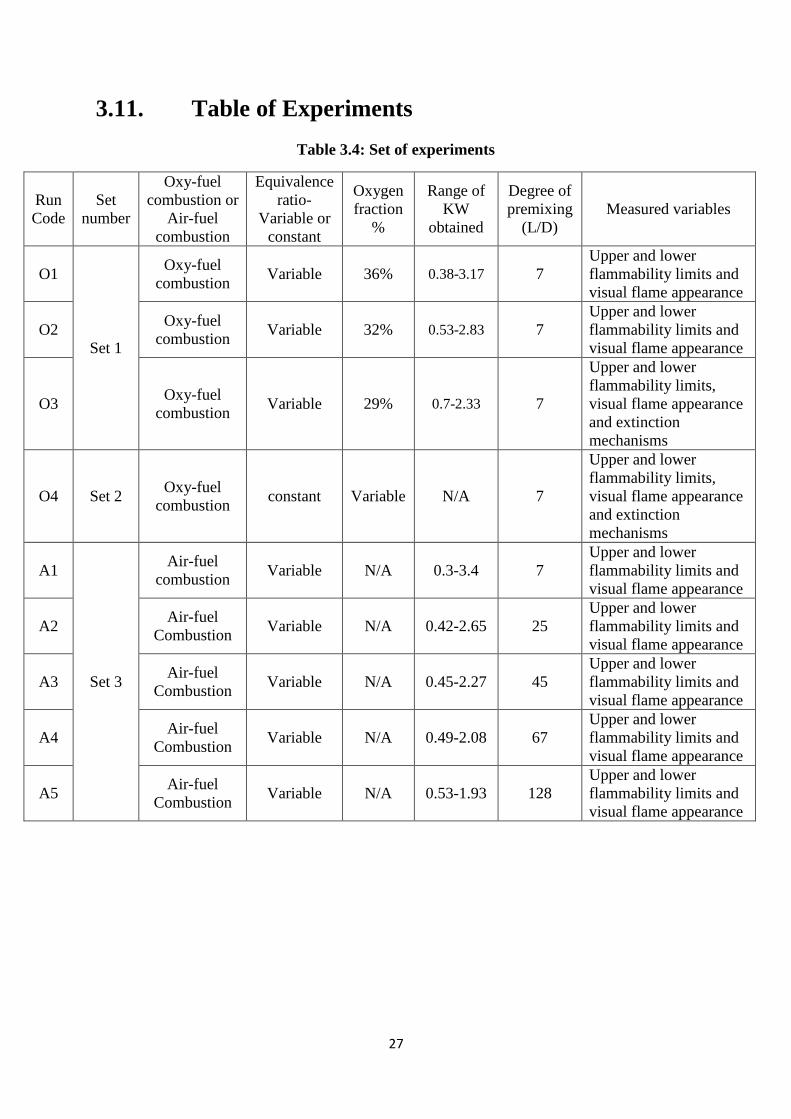
3.11. Table of Experiments
Table 3.4: Set of experiments
Run
Code
Set
number
Oxy-fuel
combustion or
Air-fuel
combustion
Equivalence
ratio-
Variable or
constant
Oxygen
fraction
%
Range of
KW
obtained
Degree of
premixing
(L/D)
Measured variables
O1
Set 1
Oxy-fuel
combustion Variable 36% 0.38-3.17 7
Upper and lower
flammability limits and
visual flame appearance
O2 Oxy-fuel
combustion Variable 32% 0.53-2.83 7
Upper and lower
flammability limits and
visual flame appearance
O3 Oxy-fuel
combustion Variable 29% 0.7-2.33 7
Upper and lower
flammability limits,
visual flame appearance
and extinction
mechanisms
O4 Set 2 Oxy-fuel
combustion constant Variable N/A 7
Upper and lower
flammability limits,
visual flame appearance
and extinction
mechanisms
A1
Set 3
Air-fuel
combustion Variable N/A 0.3-3.4 7
Upper and lower
flammability limits and
visual flame appearance
A2 Air-fuel
Combustion Variable N/A 0.42-2.65 25
Upper and lower
flammability limits and
visual flame appearance
A3 Air-fuel
Combustion Variable N/A 0.45-2.27 45
Upper and lower
flammability limits and
visual flame appearance
A4 Air-fuel
Combustion Variable N/A 0.49-2.08 67
Upper and lower
flammability limits and
visual flame appearance
A5 Air-fuel
Combustion Variable N/A 0.53-1.93 128
Upper and lower
flammability limits and
visual flame appearance
28
Chapter 4: Results and Discussion
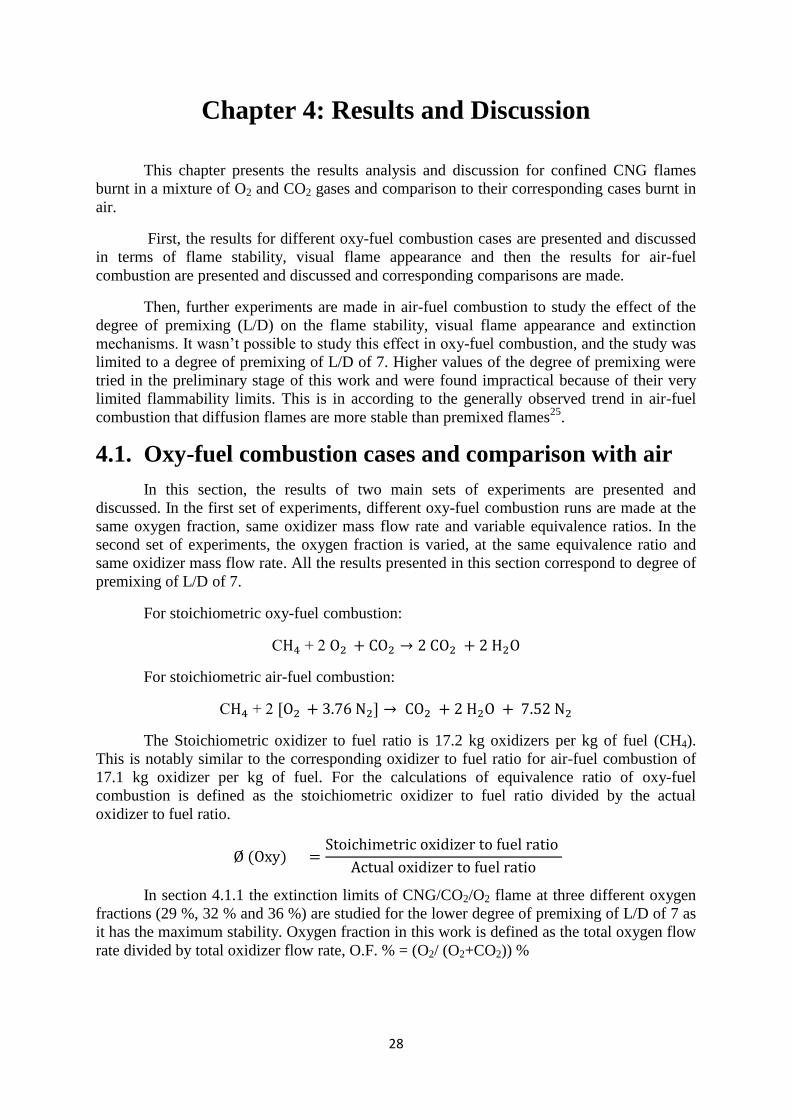
This chapter presents the results analysis and discussion for confined CNG flames
burnt in a mixture of O2 and CO2 gases and comparison to their corresponding cases burnt in
air.
First, the results for different oxy-fuel combustion cases are presented and discussed
in terms of flame stability, visual flame appearance and then the results for air-fuel
combustion are presented and discussed and corresponding comparisons are made.
Then, further experiments are made in air-fuel combustion to study the effect of the
degree of premixing (L/D) on the flame stability, visual flame appearance and extinction
mechanisms. It wasn’t possible to study this effect in oxy-fuel combustion, and the study was
limited to a degree of premixing of L/D of 7. Higher values of the degree of premixing were
tried in the preliminary stage of this work and were found impractical because of their very
limited flammability limits. This is in according to the generally observed trend in air-fuel
combustion that diffusion flames are more stable than premixed flames 25
.
4.1. Oxy-fuel combustion cases and comparison with air
In this section, the results of two main sets of experiments are presented and
discussed. In the first set of experiments, different oxy-fuel combustion runs are made at the
same oxygen fraction, same oxidizer mass flow rate and variable equivalence ratios. In the
second set of experiments, the oxygen fraction is varied, at the same equivalence ratio and
same oxidizer mass flow rate. All the results presented in this section correspond to degree of
premixing of L/D of 7.
For stoichiometric oxy-fuel combustion:
C 2
For stoichiometric air-fuel combustion:
C 2
The Stoichiometric oxidizer to fuel ratio is 17.2 kg oxidizers per kg of fuel (CH4).
This is notably similar to the corresponding oxidizer to fuel ratio for air-fuel combustion of
17.1 kg oxidizer per kg of fuel. For the calculations of equivalence ratio of oxy-fuel
combustion is defined as the stoichiometric oxidizer to fuel ratio divided by the actual
oxidizer to fuel ratio.
In section 4.1.1 the extinction limits of CNG/CO2/O2 flame at three different oxygen
fractions (29 %, 32 % and 36 %) are studied for the lower degree of premixing of L/D of 7 as
it has the maximum stability. Oxygen fraction in this work is defined as the total oxygen flow
rate divided by total oxidizer flow rate, O.F. % = (O2/ (O2+CO2)) %
29
4.1.1. Oxy-fuel combustion results, 1st set of
experiments
This subsection presents the flammability limits and visible flame appearance results
of the first set of experiments of the at constant oxygen fraction (namely 29%, 32% and
36%), at the same oxidizer mass flow rate (1.32 kg/h) and different equivalence ratios, the
flammability limits are presented first, followed by the visual flame appearances (outer cones
and then inner cones) for all three oxygen fractions studied. The extinction mechanism is
found to be the same at all oxygen fractions studied and is captured and discussed for oxygen
fraction of 29%.
4.1.1.1. Flammability limits and visual flame appearance at
oxygen fraction of 36 %
In this subsection, the run set number is O1. The results of flammability limits at
oxygen fraction of 36% are presented and discussed.
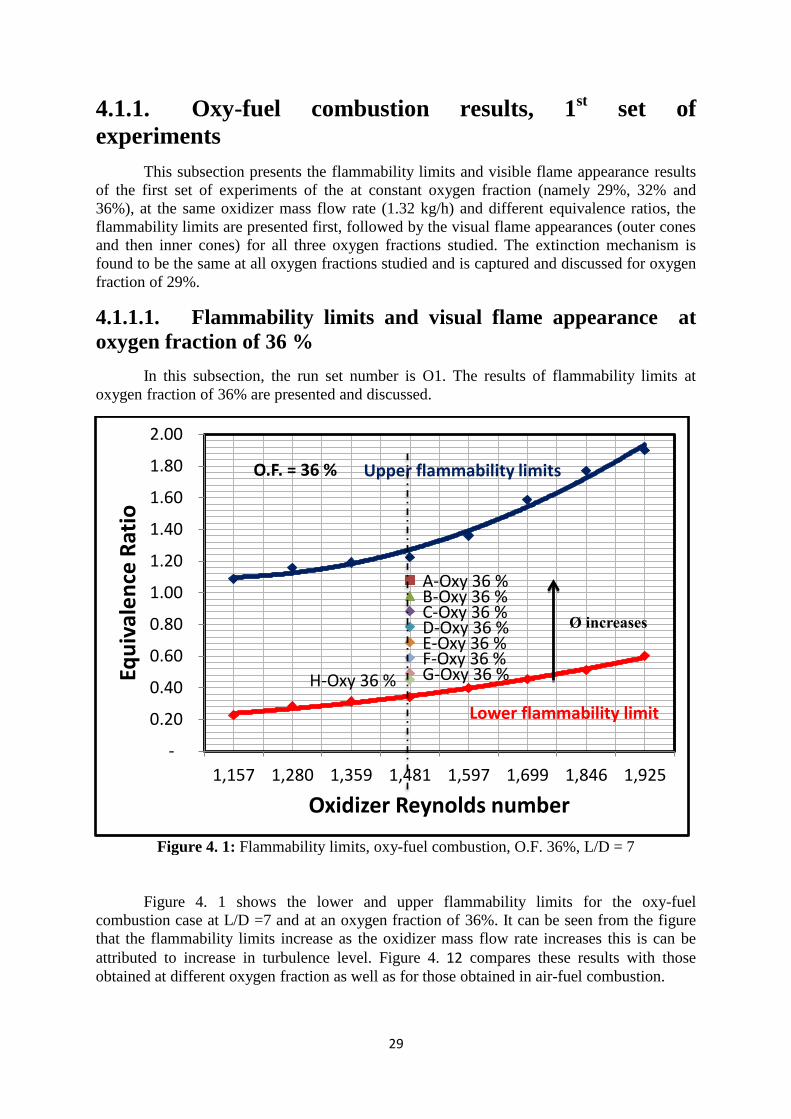
Figure 4. 1: Flammability limits, oxy-fuel combustion, O.F. 36%, L/D = 7
Figure 4. 1 shows the lower and upper flammability limits for the oxy-fuel
combustion case at L/D =7 and at an oxygen fraction of 36%. It can be seen from the figure
that the flammability limits increase as the oxidizer mass flow rate increases this is can be
attributed to increase in turbulence level. Figure 4. 12 compares these results with those
obtained at different oxygen fraction as well as for those obtained in air-fuel combustion.
A-Oxy 36 % B-Oxy 36 % C-Oxy 36 % D-Oxy 36 % E-Oxy 36 % F-Oxy 36 % G-Oxy 36 % H-Oxy 36 %
-
0.20
0.40
0.60
0.80
1.00
1.20
1.40
1.60
1.80
2.00
1,157 1,280 1,359 1,481 1,597 1,699 1,846 1,925
Equ
ival
en
ce R
atio
Oxidizer Reynolds number
Upper flammability limits
Lower flammability limit
Ø increases
O.F. = 36 %
31
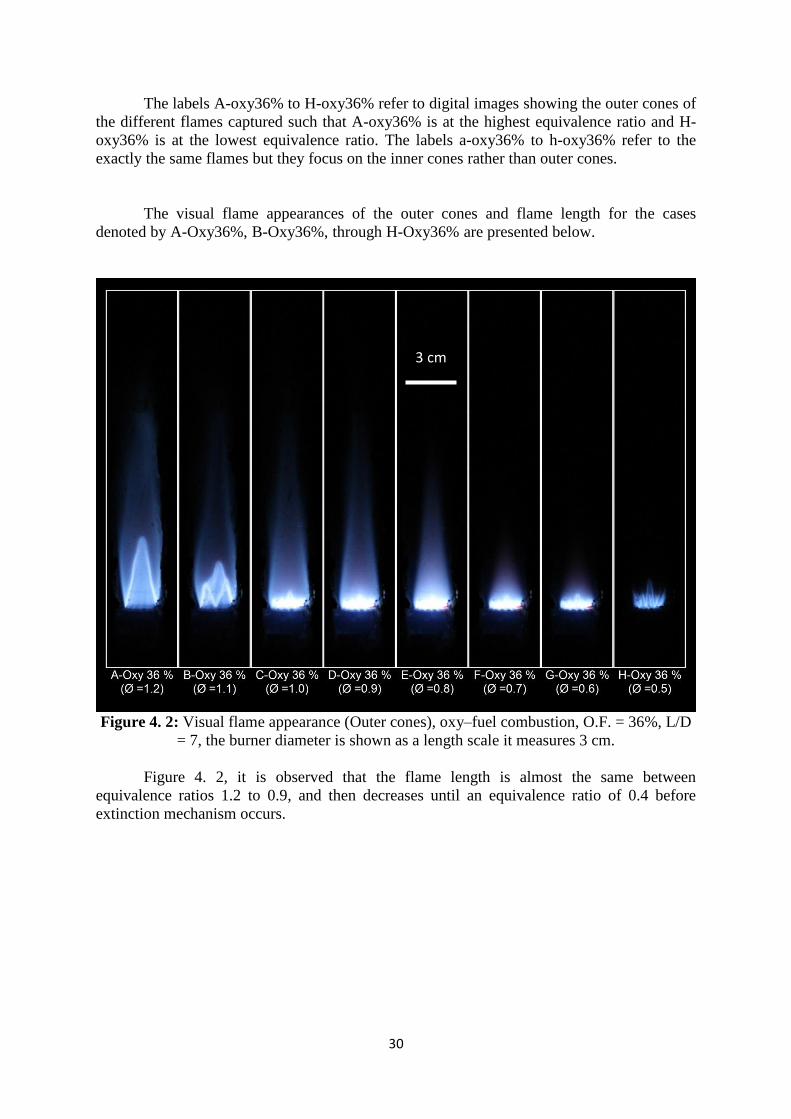
The labels A-oxy36% to H-oxy36% refer to digital images showing the outer cones of
the different flames captured such that A-oxy36% is at the highest equivalence ratio and H-
oxy36% is at the lowest equivalence ratio. The labels a-oxy36% to h-oxy36% refer to the
exactly the same flames but they focus on the inner cones rather than outer cones.
The visual flame appearances of the outer cones and flame length for the cases
denoted by A-Oxy36%, B-Oxy36%, through H-Oxy36% are presented below.
Figure 4. 2: Visual flame appearance (Outer cones), oxy–fuel combustion, O.F. = 36%, L/D
= 7, the burner diameter is shown as a length scale it measures 3 cm.
Figure 4. 2, it is observed that the flame length is almost the same between
equivalence ratios 1.2 to 0.9, and then decreases until an equivalence ratio of 0.4 before
extinction mechanism occurs.
3 cm
31
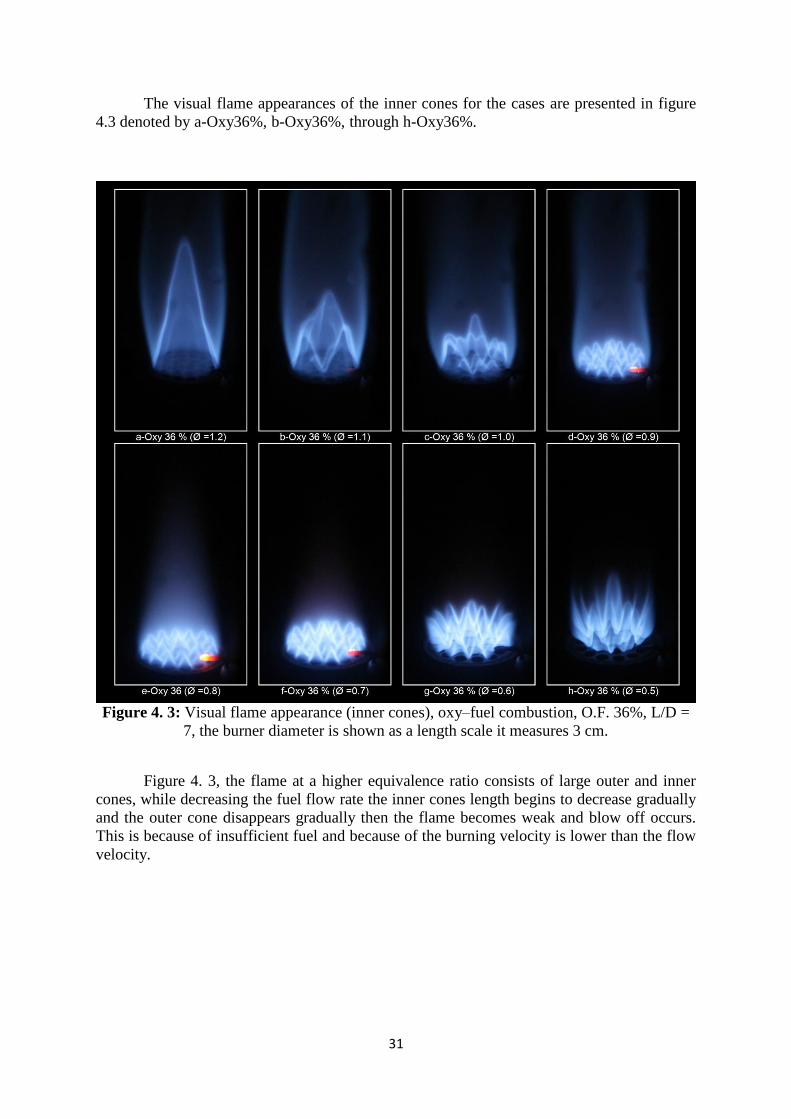
The visual flame appearances of the inner cones for the cases are presented in figure
4.3 denoted by a-Oxy36%, b-Oxy36%, through h-Oxy36%.
Figure 4. 3: Visual flame appearance (inner cones), oxy–fuel combustion, O.F. 36%, L/D =
7, the burner diameter is shown as a length scale it measures 3 cm.
Figure 4. 3, the flame at a higher equivalence ratio consists of large outer and inner
cones, while decreasing the fuel flow rate the inner cones length begins to decrease gradually
and the outer cone disappears gradually then the flame becomes weak and blow off occurs.
This is because of insufficient fuel and because of the burning velocity is lower than the flow
velocity.
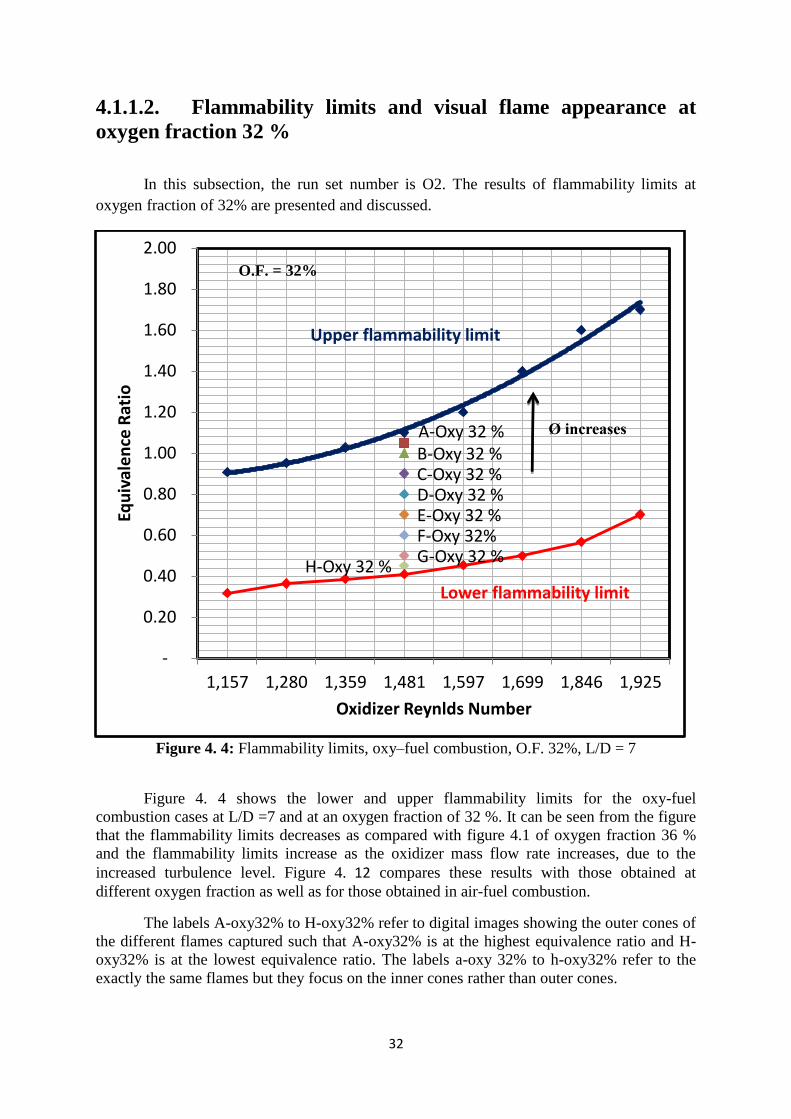
32
4.1.1.2. Flammability limits and visual flame appearance at
oxygen fraction 32 %
In this subsection, the run set number is O2. The results of flammability limits at
oxygen fraction of 32% are presented and discussed.
Figure 4. 4: Flammability limits, oxy–fuel combustion, O.F. 32%, L/D = 7
Figure 4. 4 shows the lower and upper flammability limits for the oxy-fuel
combustion cases at L/D =7 and at an oxygen fraction of 32 %. It can be seen from the figure
that the flammability limits decreases as compared with figure 4.1 of oxygen fraction 36 %
and the flammability limits increase as the oxidizer mass flow rate increases, due to the
increased turbulence level. Figure 4. 12 compares these results with those obtained at
different oxygen fraction as well as for those obtained in air-fuel combustion.
The labels A-oxy32% to H-oxy32% refer to digital images showing the outer cones of
the different flames captured such that A-oxy32% is at the highest equivalence ratio and H-
oxy32% is at the lowest equivalence ratio. The labels a-oxy 32% to h-oxy32% refer to the
exactly the same flames but they focus on the inner cones rather than outer cones.
A-Oxy 32 % B-Oxy 32 % C-Oxy 32 % D-Oxy 32 % E-Oxy 32 % F-Oxy 32% G-Oxy 32 %
H-Oxy 32 %
-
0.20
0.40
0.60
0.80
1.00
1.20
1.40
1.60
1.80
2.00
1,157 1,280 1,359 1,481 1,597 1,699 1,846 1,925
Equ
ival
en
ce R
atio
Oxidizer Reynlds Number
Ø increases
O.F. = 32%
Upper flammability limit
Lower flammability limit
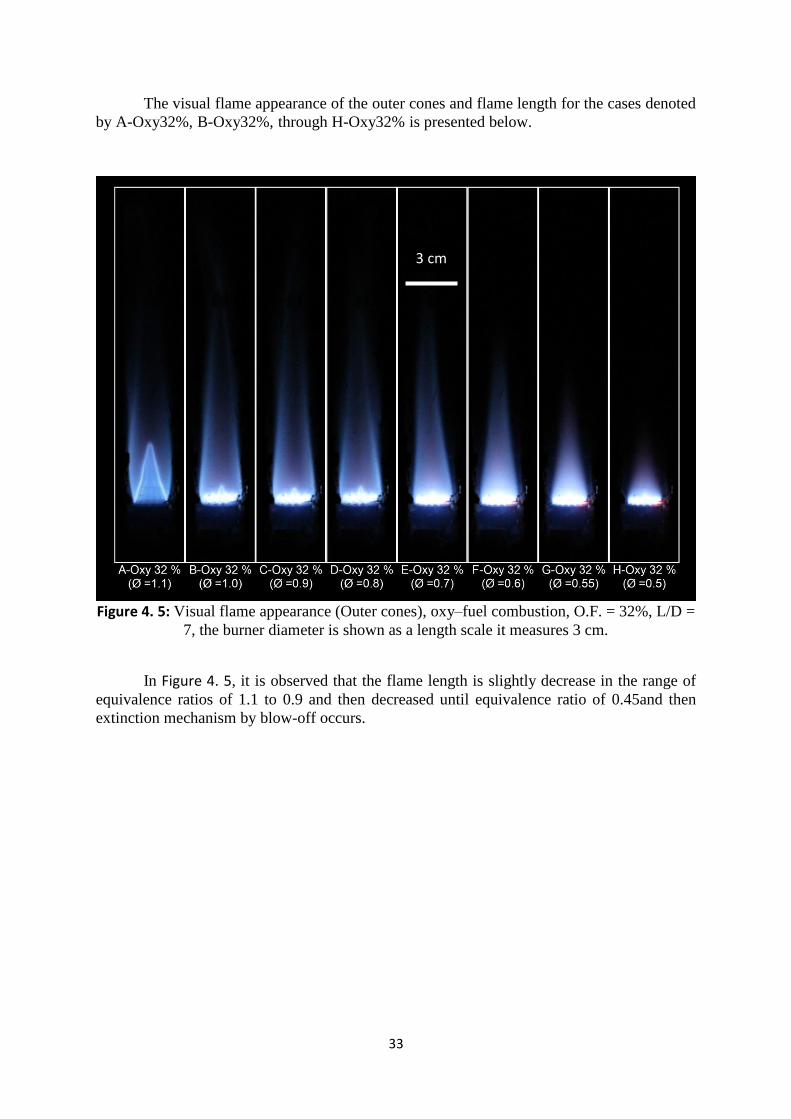
33
The visual flame appearance of the outer cones and flame length for the cases denoted
by A-Oxy32%, B-Oxy32%, through H-Oxy32% is presented below.
Figure 4. 5: Visual flame appearance (Outer cones), oxy–fuel combustion, O.F. = 32%, L/D =
7, the burner diameter is shown as a length scale it measures 3 cm.
In Figure 4. 5, it is observed that the flame length is slightly decrease in the range of
equivalence ratios of 1.1 to 0.9 and then decreased until equivalence ratio of 0.45and then
extinction mechanism by blow-off occurs.
3 cm
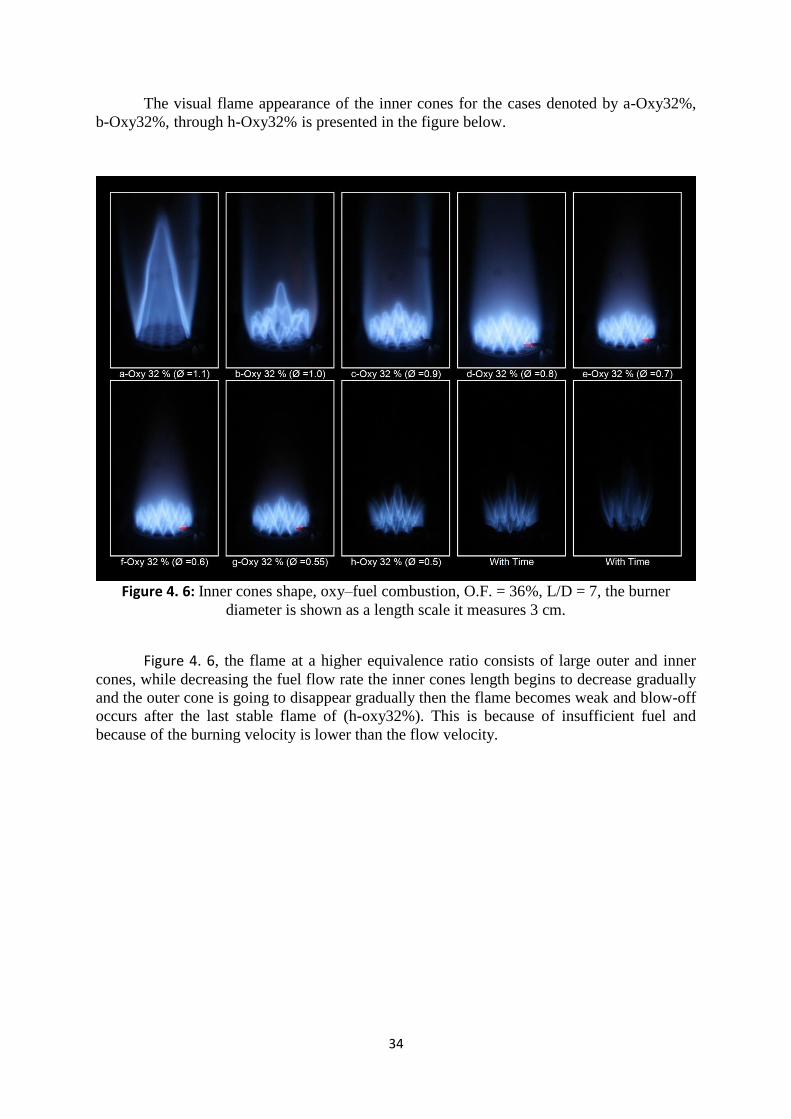
34
The visual flame appearance of the inner cones for the cases denoted by a-Oxy32%,
b-Oxy32%, through h-Oxy32% is presented in the figure below.
Figure 4. 6: Inner cones shape, oxy–fuel combustion, O.F. = 36%, L/D = 7, the burner
diameter is shown as a length scale it measures 3 cm.
Figure 4. 6, the flame at a higher equivalence ratio consists of large outer and inner
cones, while decreasing the fuel flow rate the inner cones length begins to decrease gradually
and the outer cone is going to disappear gradually then the flame becomes weak and blow-off
occurs after the last stable flame of (h-oxy32%). This is because of insufficient fuel and
because of the burning velocity is lower than the flow velocity.
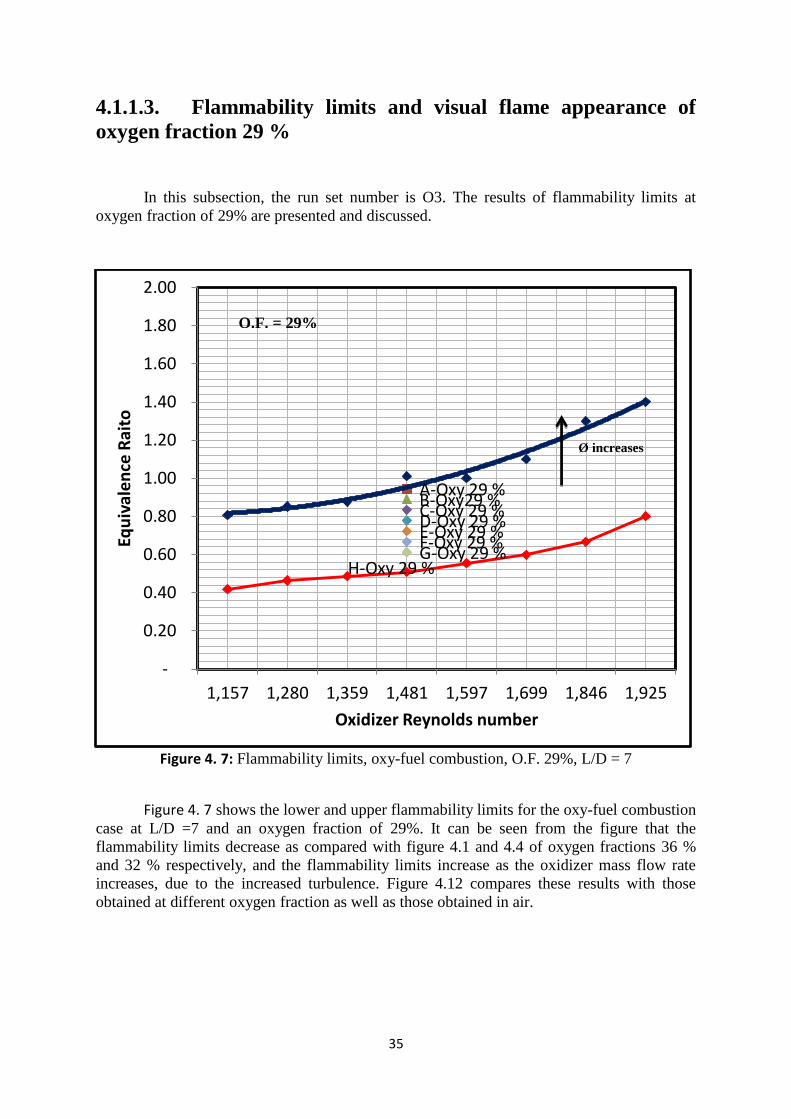
35
4.1.1.3. Flammability limits and visual flame appearance of
oxygen fraction 29 %
In this subsection, the run set number is O3. The results of flammability limits at
oxygen fraction of 29% are presented and discussed.
Figure 4. 7: Flammability limits, oxy-fuel combustion, O.F. 29%, L/D = 7
Figure 4. 7 shows the lower and upper flammability limits for the oxy-fuel combustion
case at L/D =7 and an oxygen fraction of 29%. It can be seen from the figure that the
flammability limits decrease as compared with figure 4.1 and 4.4 of oxygen fractions 36 %
and 32 % respectively, and the flammability limits increase as the oxidizer mass flow rate
increases, due to the increased turbulence. Figure 4.12 compares these results with those
obtained at different oxygen fraction as well as those obtained in air.
A-Oxy 29 % B-Oxy29 % C-Oxy 29 % D-Oxy 29 % E-Oxy 29 % F-Oxy 29 % G-Oxy 29 %
H-Oxy 29 %
-
0.20
0.40
0.60
0.80
1.00
1.20
1.40
1.60
1.80
2.00
1,157 1,280 1,359 1,481 1,597 1,699 1,846 1,925
Equ
ival
en
ce R
aito
Oxidizer Reynolds number
Ø increases
O.F. = 29%
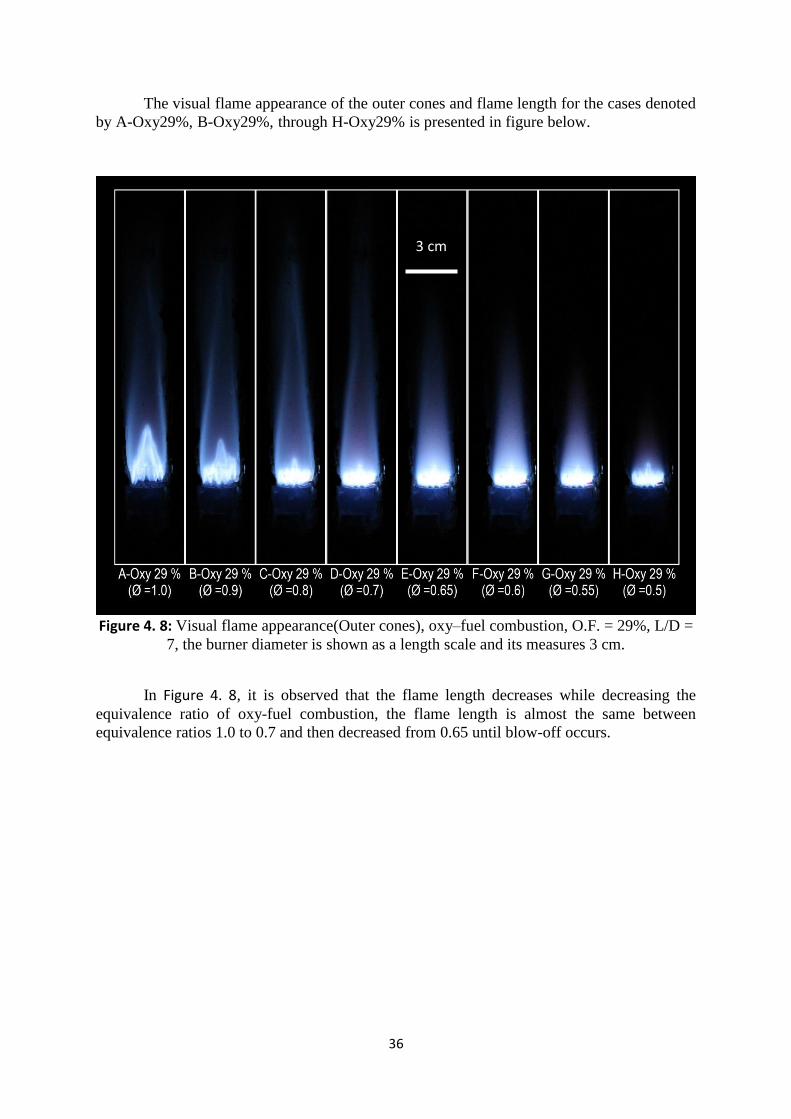
36
The visual flame appearance of the outer cones and flame length for the cases denoted
by A-Oxy29%, B-Oxy29%, through H-Oxy29% is presented in figure below.
Figure 4. 8: Visual flame appearance(Outer cones), oxy–fuel combustion, O.F. = 29%, L/D =
7, the burner diameter is shown as a length scale and its measures 3 cm.
In Figure 4. 8, it is observed that the flame length decreases while decreasing the
equivalence ratio of oxy-fuel combustion, the flame length is almost the same between
equivalence ratios 1.0 to 0.7 and then decreased from 0.65 until blow-off occurs.
3 cm
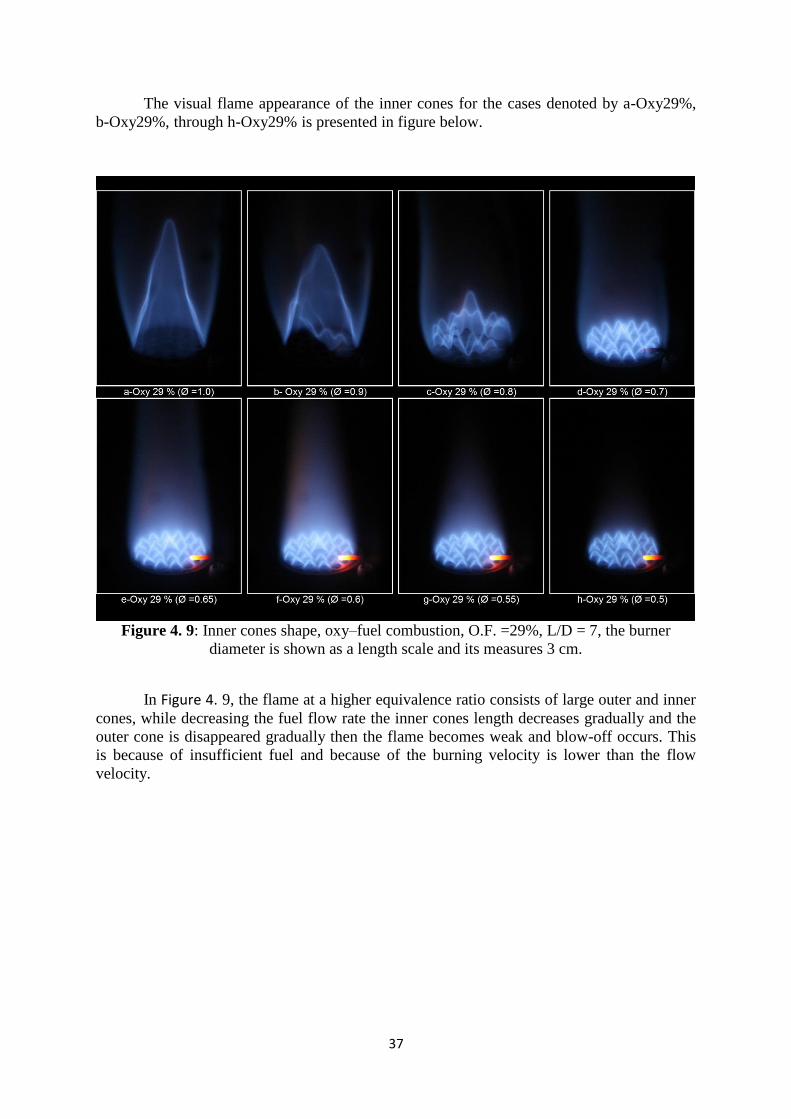
37
The visual flame appearance of the inner cones for the cases denoted by a-Oxy29%,
b-Oxy29%, through h-Oxy29% is presented in figure below.
Figure 4. 9: Inner cones shape, oxy–fuel combustion, O.F. =29%, L/D = 7, the burner
diameter is shown as a length scale and its measures 3 cm.
In Figure 4. 9, the flame at a higher equivalence ratio consists of large outer and inner
cones, while decreasing the fuel flow rate the inner cones length decreases gradually and the
outer cone is disappeared gradually then the flame becomes weak and blow-off occurs. This
is because of insufficient fuel and because of the burning velocity is lower than the flow
velocity.
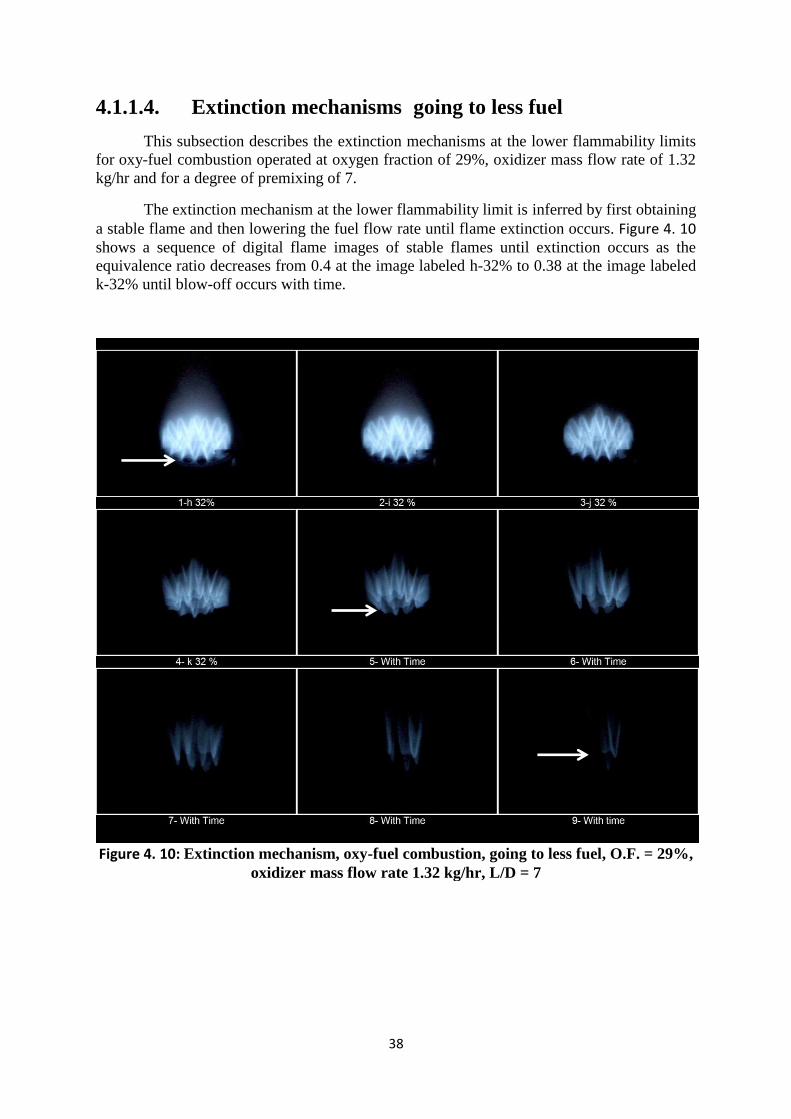
38
4.1.1.4. Extinction mechanisms going to less fuel
This subsection describes the extinction mechanisms at the lower flammability limits
for oxy-fuel combustion operated at oxygen fraction of 29%, oxidizer mass flow rate of 1.32
kg/hr and for a degree of premixing of 7.
The extinction mechanism at the lower flammability limit is inferred by first obtaining
a stable flame and then lowering the fuel flow rate until flame extinction occurs. Figure 4. 10
shows a sequence of digital flame images of stable flames until extinction occurs as the
equivalence ratio decreases from 0.4 at the image labeled h-32% to 0.38 at the image labeled
k-32% until blow-off occurs with time.
Figure 4. 10: Extinction mechanism, oxy-fuel combustion, going to less fuel, O.F. = 29%,
oxidizer mass flow rate 1.32 kg/hr, L/D = 7
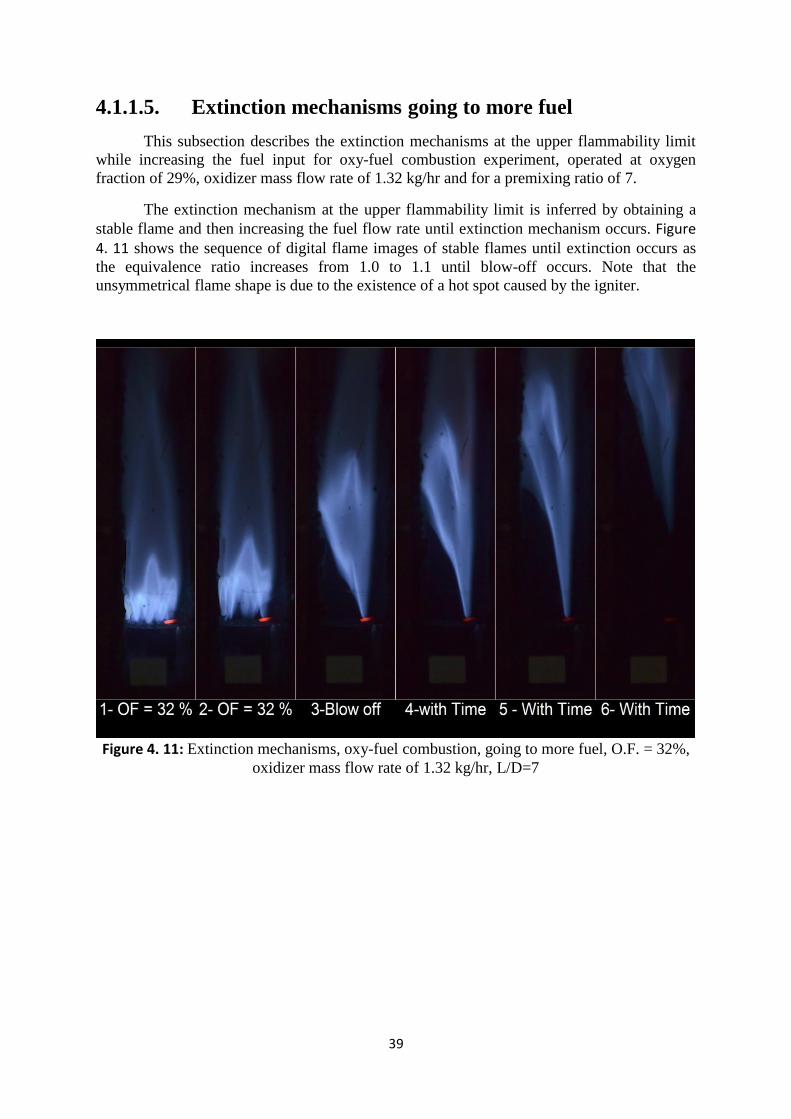
39
4.1.1.5. Extinction mechanisms going to more fuel
This subsection describes the extinction mechanisms at the upper flammability limit
while increasing the fuel input for oxy-fuel combustion experiment, operated at oxygen
fraction of 29%, oxidizer mass flow rate of 1.32 kg/hr and for a premixing ratio of 7.
The extinction mechanism at the upper flammability limit is inferred by obtaining a
stable flame and then increasing the fuel flow rate until extinction mechanism occurs. Figure 4. 11 shows the sequence of digital flame images of stable flames until extinction occurs as
the equivalence ratio increases from 1.0 to 1.1 until blow-off occurs. Note that the
unsymmetrical flame shape is due to the existence of a hot spot caused by the igniter.
Figure 4. 11: Extinction mechanisms, oxy-fuel combustion, going to more fuel, O.F. = 32%,
oxidizer mass flow rate of 1.32 kg/hr, L/D=7
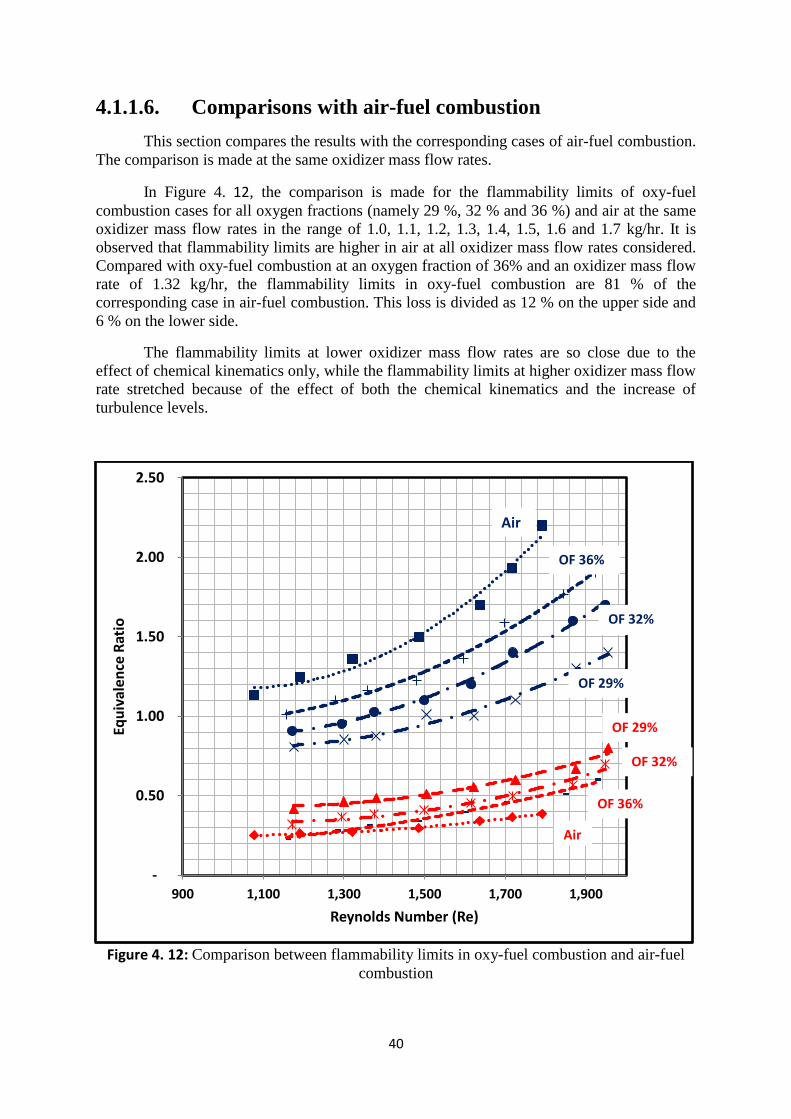
41
4.1.1.6. Comparisons with air-fuel combustion
This section compares the results with the corresponding cases of air-fuel combustion.
The comparison is made at the same oxidizer mass flow rates.
In Figure 4. 12, the comparison is made for the flammability limits of oxy-fuel
combustion cases for all oxygen fractions (namely 29 %, 32 % and 36 %) and air at the same
oxidizer mass flow rates in the range of 1.0, 1.1, 1.2, 1.3, 1.4, 1.5, 1.6 and 1.7 kg/hr. It is
observed that flammability limits are higher in air at all oxidizer mass flow rates considered.
Compared with oxy-fuel combustion at an oxygen fraction of 36% and an oxidizer mass flow
rate of 1.32 kg/hr, the flammability limits in oxy-fuel combustion are 81 % of the
corresponding case in air-fuel combustion. This loss is divided as 12 % on the upper side and
6 % on the lower side.
The flammability limits at lower oxidizer mass flow rates are so close due to the
effect of chemical kinematics only, while the flammability limits at higher oxidizer mass flow
rate stretched because of the effect of both the chemical kinematics and the increase of
turbulence levels.
Figure 4. 12: Comparison between flammability limits in oxy-fuel combustion and air-fuel
combustion
-
0.50
1.00
1.50
2.00
2.50
900 1,100 1,300 1,500 1,700 1,900
Equ
ival
ence
Rat
io
Reynolds Number (Re)
Air
OF 36%
OF 32%
OF 29%
OF 36%
OF 32%
OF 29%
Air
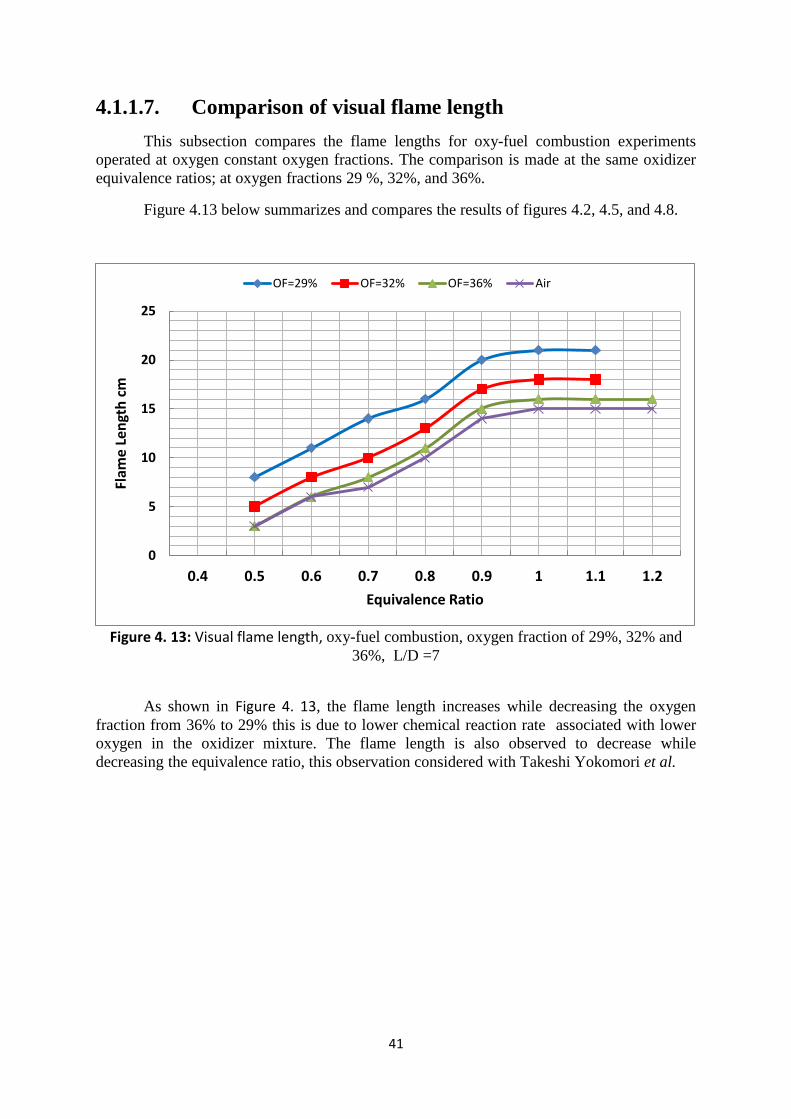
41
4.1.1.7. Comparison of visual flame length
This subsection compares the flame lengths for oxy-fuel combustion experiments
operated at oxygen constant oxygen fractions. The comparison is made at the same oxidizer
equivalence ratios; at oxygen fractions 29 %, 32%, and 36%.
Figure 4.13 below summarizes and compares the results of figures 4.2, 4.5, and 4.8.
Figure 4. 13: Visual flame length, oxy-fuel combustion, oxygen fraction of 29%, 32% and
36%, L/D =7
As shown in Figure 4. 13, the flame length increases while decreasing the oxygen
fraction from 36% to 29% this is due to lower chemical reaction rate associated with lower
oxygen in the oxidizer mixture. The flame length is also observed to decrease while
decreasing the equivalence ratio, this observation considered with Takeshi Yokomori et al.
0
5
10
15
20
25
0.4 0.5 0.6 0.7 0.8 0.9 1 1.1 1.2
Flam
e Le
ngt
h c
m
Equivalence Ratio
OF=29% OF=32% OF=36% Air
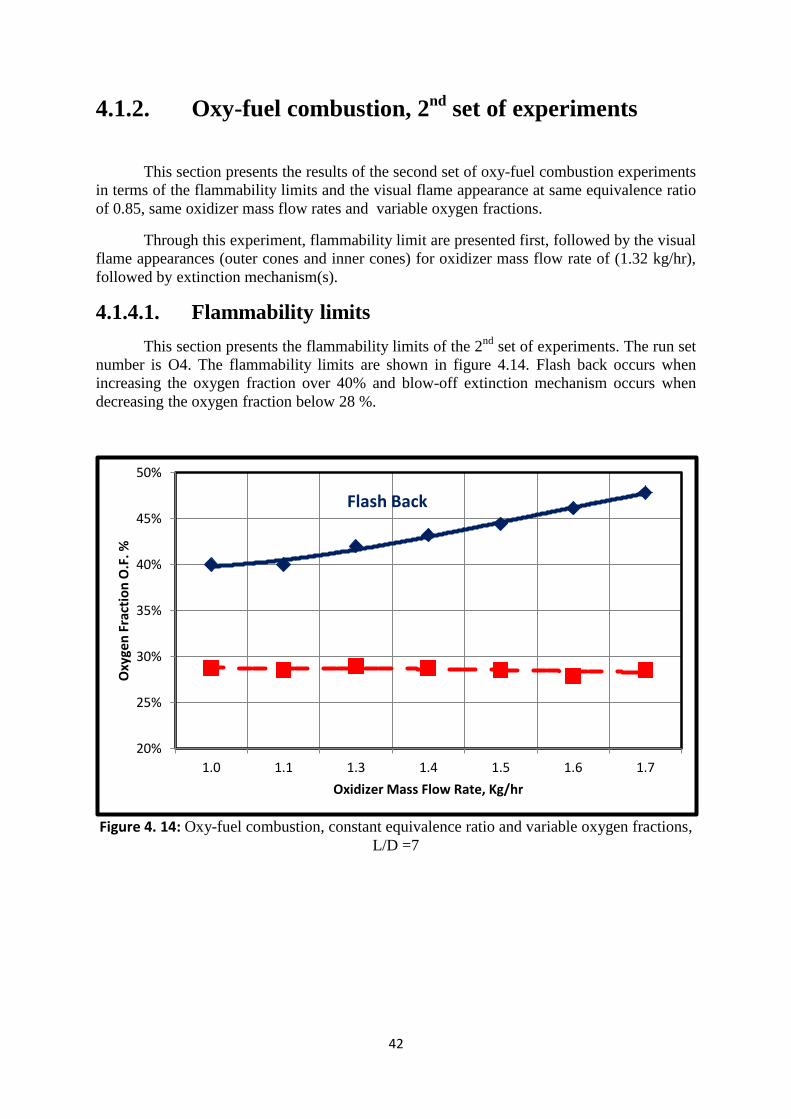
42
4.1.2. Oxy-fuel combustion, 2nd
set of experiments
This section presents the results of the second set of oxy-fuel combustion experiments
in terms of the flammability limits and the visual flame appearance at same equivalence ratio
of 0.85, same oxidizer mass flow rates and variable oxygen fractions.
Through this experiment, flammability limit are presented first, followed by the visual
flame appearances (outer cones and inner cones) for oxidizer mass flow rate of (1.32 kg/hr),
followed by extinction mechanism(s).
4.1.4.1. Flammability limits
This section presents the flammability limits of the 2nd
set of experiments. The run set
number is O4. The flammability limits are shown in figure 4.14. Flash back occurs when
increasing the oxygen fraction over 40% and blow-off extinction mechanism occurs when
decreasing the oxygen fraction below 28 %.
Figure 4. 14: Oxy-fuel combustion, constant equivalence ratio and variable oxygen fractions,
L/D =7
20%
25%
30%
35%
40%
45%
50%
1.0 1.1 1.3 1.4 1.5 1.6 1.7
Oxy
gen
Fra
ctio
n O
.F. %
Oxidizer Mass Flow Rate, Kg/hr
Flash Back
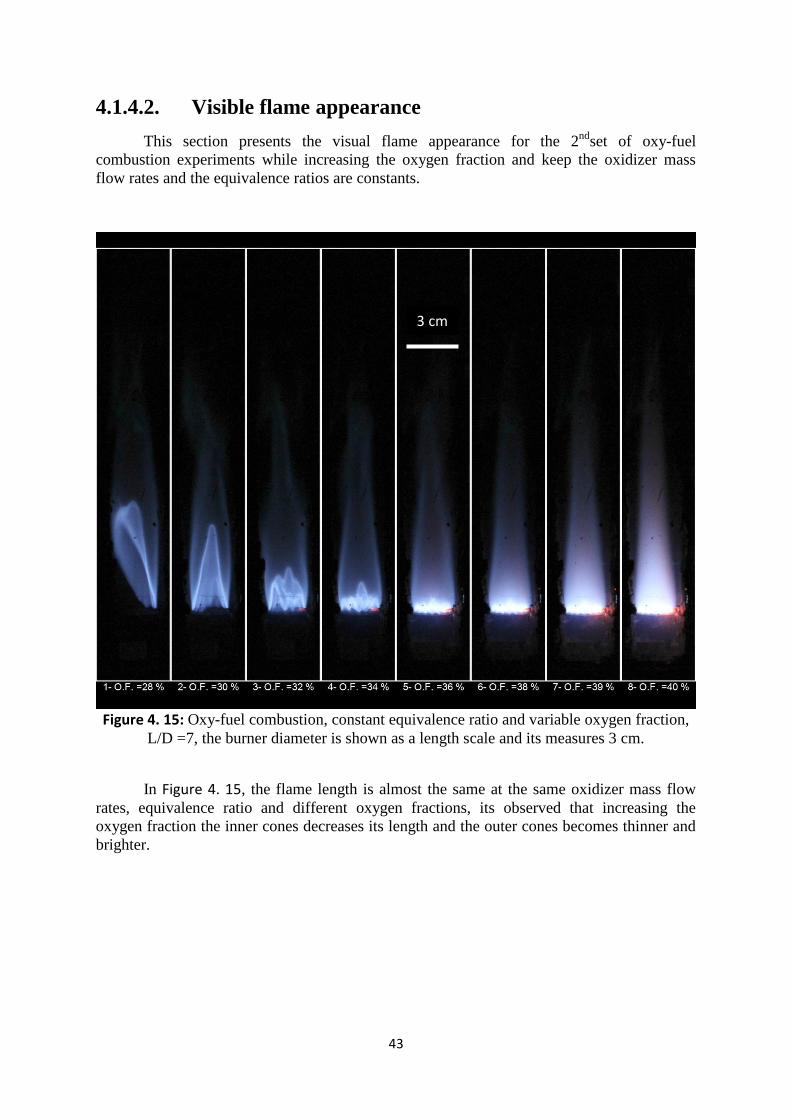
43
4.1.4.2. Visible flame appearance
This section presents the visual flame appearance for the 2nd
set of oxy-fuel
combustion experiments while increasing the oxygen fraction and keep the oxidizer mass
flow rates and the equivalence ratios are constants.
Figure 4. 15: Oxy-fuel combustion, constant equivalence ratio and variable oxygen fraction,
L/D =7, the burner diameter is shown as a length scale and its measures 3 cm.
In Figure 4. 15, the flame length is almost the same at the same oxidizer mass flow
rates, equivalence ratio and different oxygen fractions, its observed that increasing the
oxygen fraction the inner cones decreases its length and the outer cones becomes thinner and
brighter.
3 cm
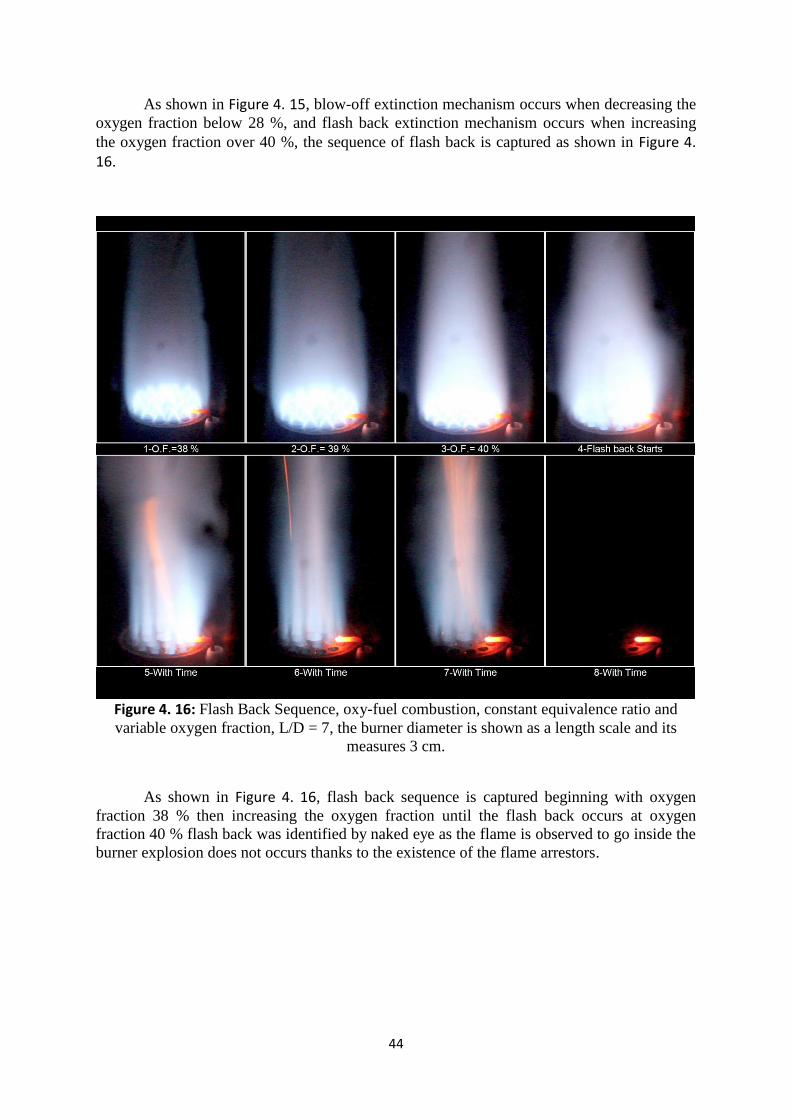
44
As shown in Figure 4. 15, blow-off extinction mechanism occurs when decreasing the
oxygen fraction below 28 %, and flash back extinction mechanism occurs when increasing
the oxygen fraction over 40 %, the sequence of flash back is captured as shown in Figure 4. 16.
Figure 4. 16: Flash Back Sequence, oxy-fuel combustion, constant equivalence ratio and
variable oxygen fraction, L/D = 7, the burner diameter is shown as a length scale and its
measures 3 cm.
As shown in Figure 4. 16, flash back sequence is captured beginning with oxygen
fraction 38 % then increasing the oxygen fraction until the flash back occurs at oxygen
fraction 40 % flash back was identified by naked eye as the flame is observed to go inside the
burner explosion does not occurs thanks to the existence of the flame arrestors.
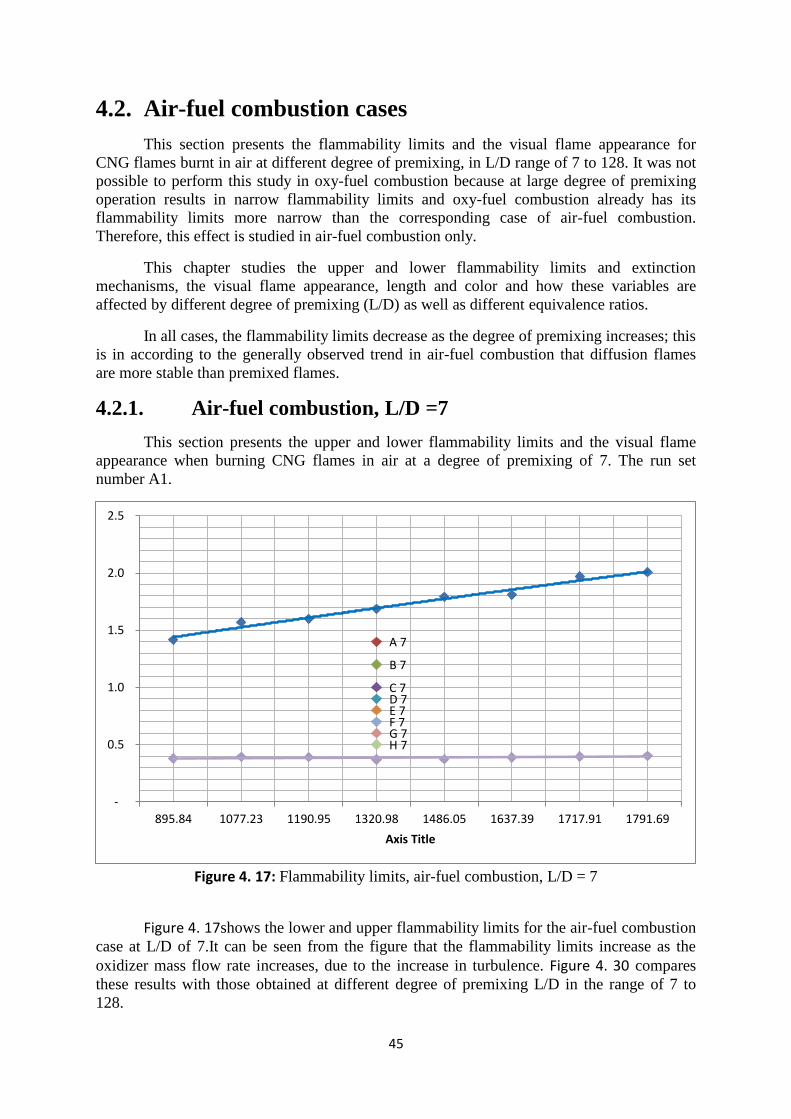
45
4.2. Air-fuel combustion cases
This section presents the flammability limits and the visual flame appearance for
CNG flames burnt in air at different degree of premixing, in L/D range of 7 to 128. It was not
possible to perform this study in oxy-fuel combustion because at large degree of premixing
operation results in narrow flammability limits and oxy-fuel combustion already has its
flammability limits more narrow than the corresponding case of air-fuel combustion.
Therefore, this effect is studied in air-fuel combustion only.
This chapter studies the upper and lower flammability limits and extinction
mechanisms, the visual flame appearance, length and color and how these variables are
affected by different degree of premixing (L/D) as well as different equivalence ratios.
In all cases, the flammability limits decrease as the degree of premixing increases; this
is in according to the generally observed trend in air-fuel combustion that diffusion flames
are more stable than premixed flames.
4.2.1. Air-fuel combustion, L/D =7
This section presents the upper and lower flammability limits and the visual flame
appearance when burning CNG flames in air at a degree of premixing of 7. The run set
number A1.
Figure 4. 17: Flammability limits, air-fuel combustion, L/D = 7
Figure 4. 17shows the lower and upper flammability limits for the air-fuel combustion
case at L/D of 7.It can be seen from the figure that the flammability limits increase as the
oxidizer mass flow rate increases, due to the increase in turbulence. Figure 4. 30 compares
these results with those obtained at different degree of premixing L/D in the range of 7 to
128.
A 7
B 7
C 7 D 7 E 7 F 7 G 7 H 7
-
0.5
1.0
1.5
2.0
2.5
895.84 1077.23 1190.95 1320.98 1486.05 1637.39 1717.91 1791.69
Axis Title
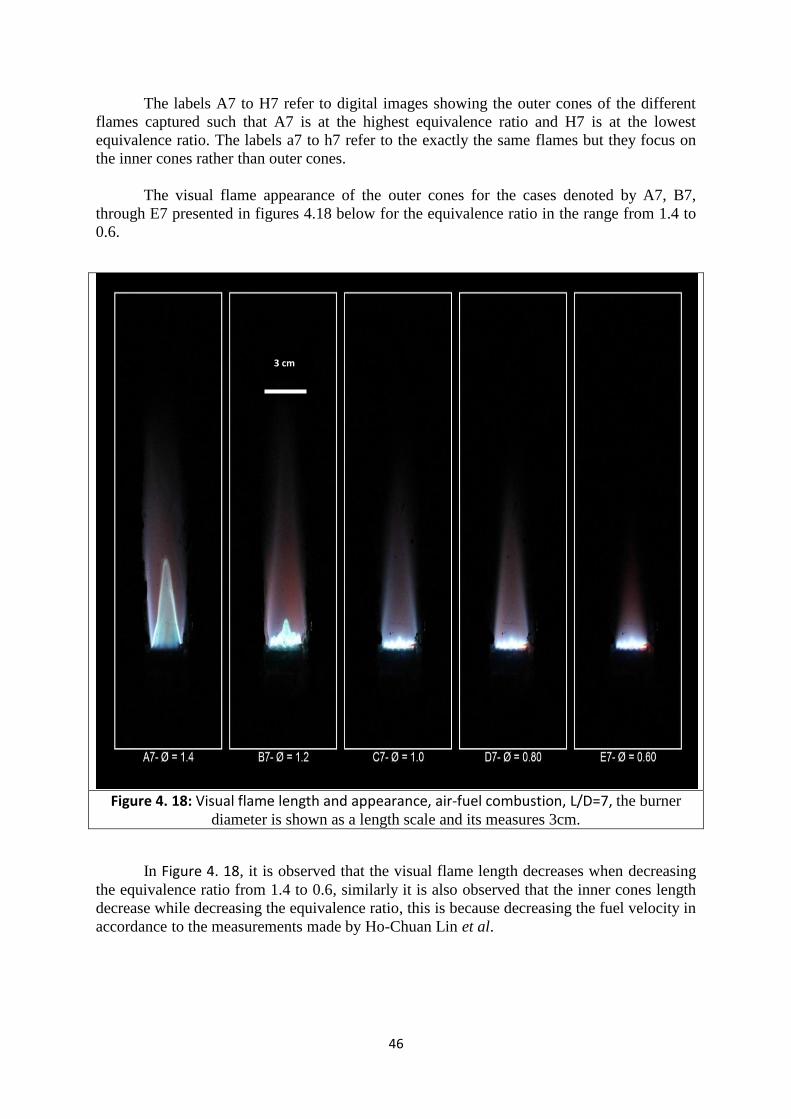
46
The labels A7 to H7 refer to digital images showing the outer cones of the different
flames captured such that A7 is at the highest equivalence ratio and H7 is at the lowest
equivalence ratio. The labels a7 to h7 refer to the exactly the same flames but they focus on
the inner cones rather than outer cones.
The visual flame appearance of the outer cones for the cases denoted by A7, B7,
through E7 presented in figures 4.18 below for the equivalence ratio in the range from 1.4 to
0.6.
Figure 4. 18: Visual flame length and appearance, air-fuel combustion, L/D=7, the burner
diameter is shown as a length scale and its measures 3cm.
In Figure 4. 18, it is observed that the visual flame length decreases when decreasing
the equivalence ratio from 1.4 to 0.6, similarly it is also observed that the inner cones length
decrease while decreasing the equivalence ratio, this is because decreasing the fuel velocity in
accordance to the measurements made by Ho-Chuan Lin et al.
3 cm
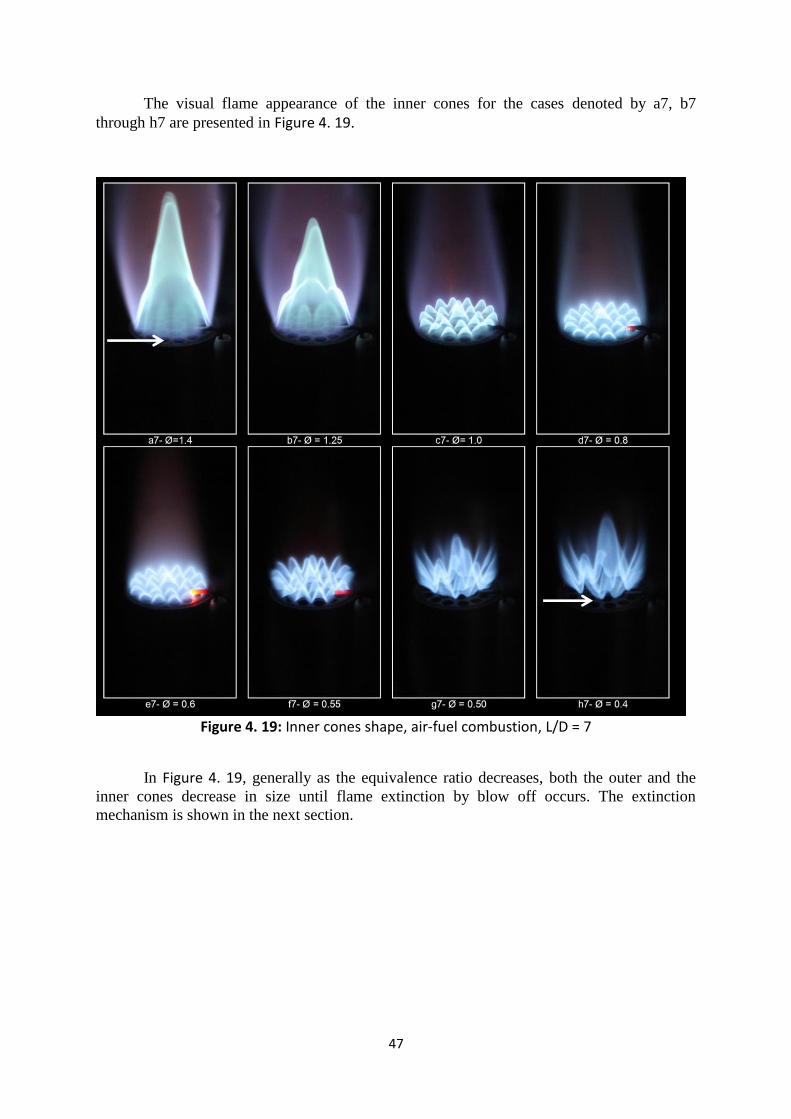
47
The visual flame appearance of the inner cones for the cases denoted by a7, b7
through h7 are presented in Figure 4. 19.
Figure 4. 19: Inner cones shape, air-fuel combustion, L/D = 7
In Figure 4. 19, generally as the equivalence ratio decreases, both the outer and the
inner cones decrease in size until flame extinction by blow off occurs. The extinction
mechanism is shown in the next section.
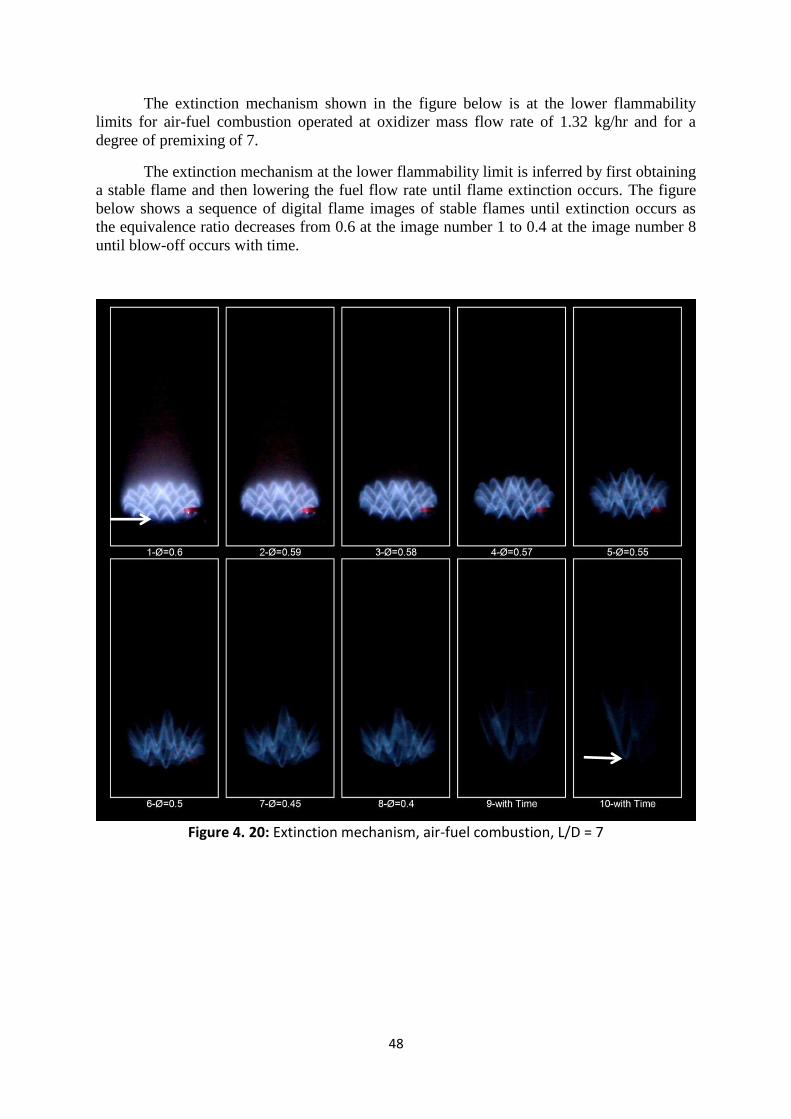
48
The extinction mechanism shown in the figure below is at the lower flammability
limits for air-fuel combustion operated at oxidizer mass flow rate of 1.32 kg/hr and for a
degree of premixing of 7.
The extinction mechanism at the lower flammability limit is inferred by first obtaining
a stable flame and then lowering the fuel flow rate until flame extinction occurs. The figure
below shows a sequence of digital flame images of stable flames until extinction occurs as
the equivalence ratio decreases from 0.6 at the image number 1 to 0.4 at the image number 8
until blow-off occurs with time.
Figure 4. 20: Extinction mechanism, air-fuel combustion, L/D = 7
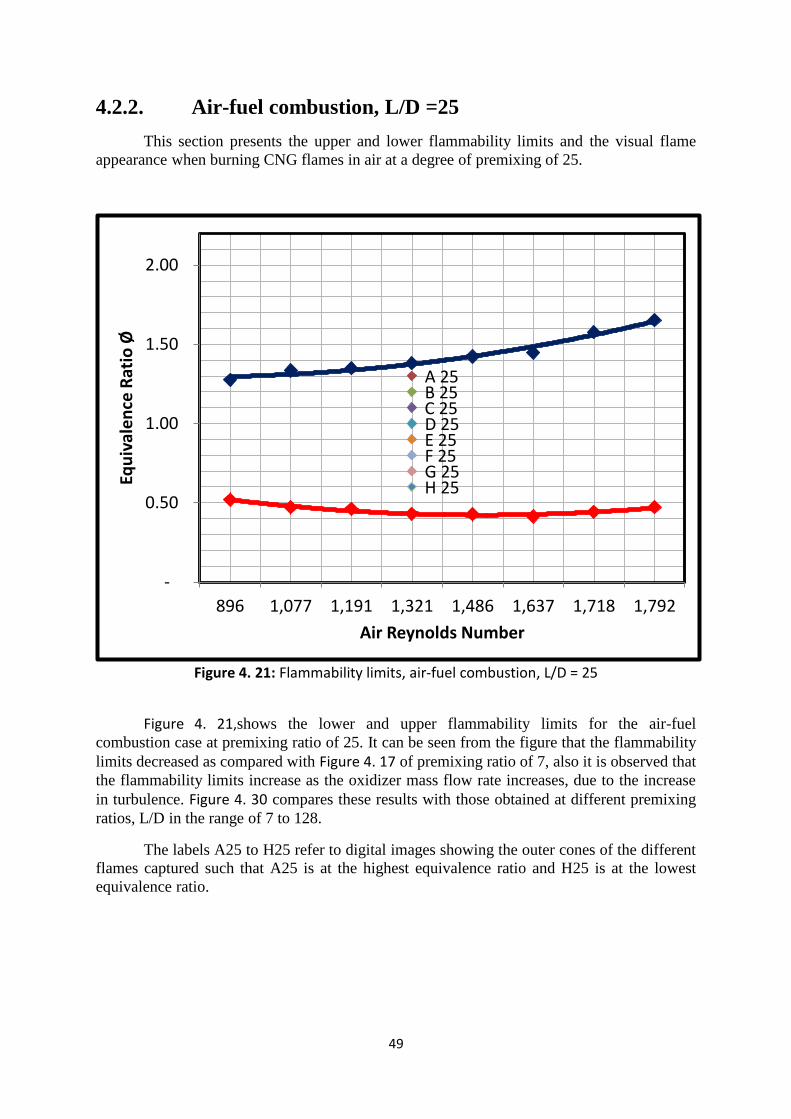
49
4.2.2. Air-fuel combustion, L/D =25
This section presents the upper and lower flammability limits and the visual flame
appearance when burning CNG flames in air at a degree of premixing of 25.
Figure 4. 21: Flammability limits, air-fuel combustion, L/D = 25
Figure 4. 21,shows the lower and upper flammability limits for the air-fuel
combustion case at premixing ratio of 25. It can be seen from the figure that the flammability
limits decreased as compared with Figure 4. 17 of premixing ratio of 7, also it is observed that
the flammability limits increase as the oxidizer mass flow rate increases, due to the increase
in turbulence. Figure 4. 30 compares these results with those obtained at different premixing
ratios, L/D in the range of 7 to 128.
The labels A25 to H25 refer to digital images showing the outer cones of the different
flames captured such that A25 is at the highest equivalence ratio and H25 is at the lowest
equivalence ratio.
A 25 B 25 C 25 D 25 E 25 F 25 G 25 H 25
-
0.50
1.00
1.50
2.00
896 1,077 1,191 1,321 1,486 1,637 1,718 1,792
Equ
ival
en
ce R
atio
Ø
Air Reynolds Number
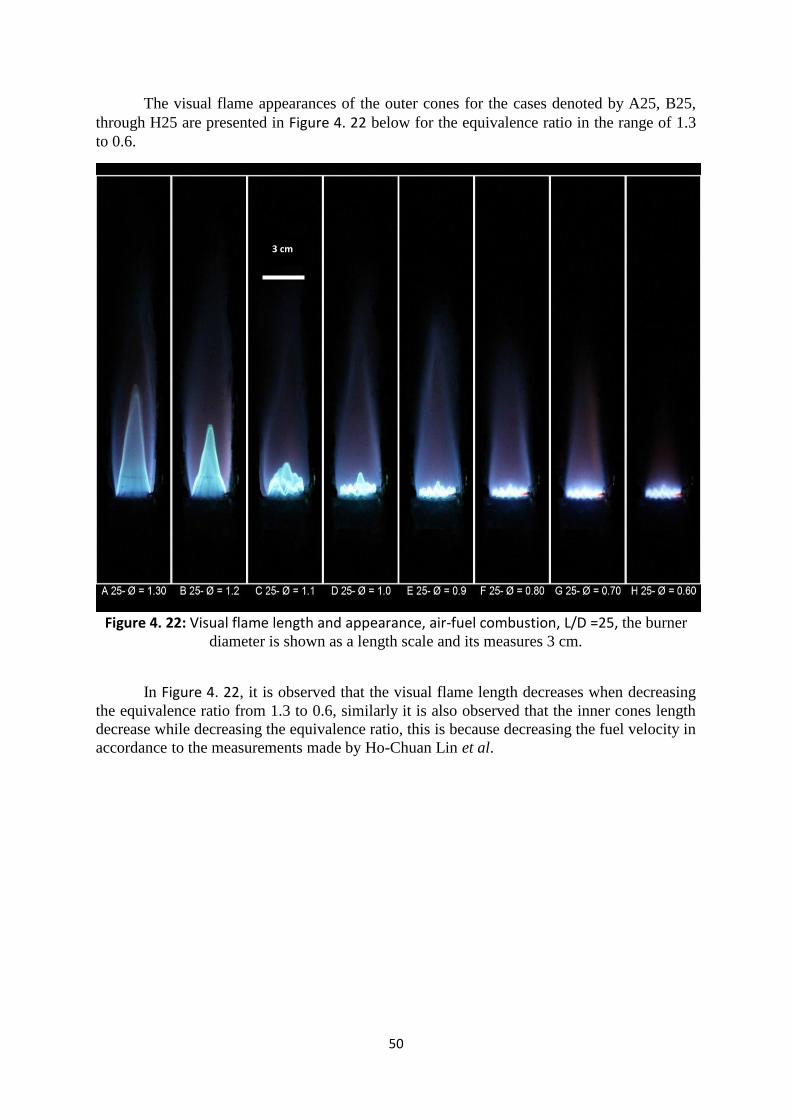
51
The visual flame appearances of the outer cones for the cases denoted by A25, B25,
through H25 are presented in Figure 4. 22 below for the equivalence ratio in the range of 1.3
to 0.6.
Figure 4. 22: Visual flame length and appearance, air-fuel combustion, L/D =25, the burner
diameter is shown as a length scale and its measures 3 cm.
In Figure 4. 22, it is observed that the visual flame length decreases when decreasing
the equivalence ratio from 1.3 to 0.6, similarly it is also observed that the inner cones length
decrease while decreasing the equivalence ratio, this is because decreasing the fuel velocity in
accordance to the measurements made by Ho-Chuan Lin et al.
3 cm
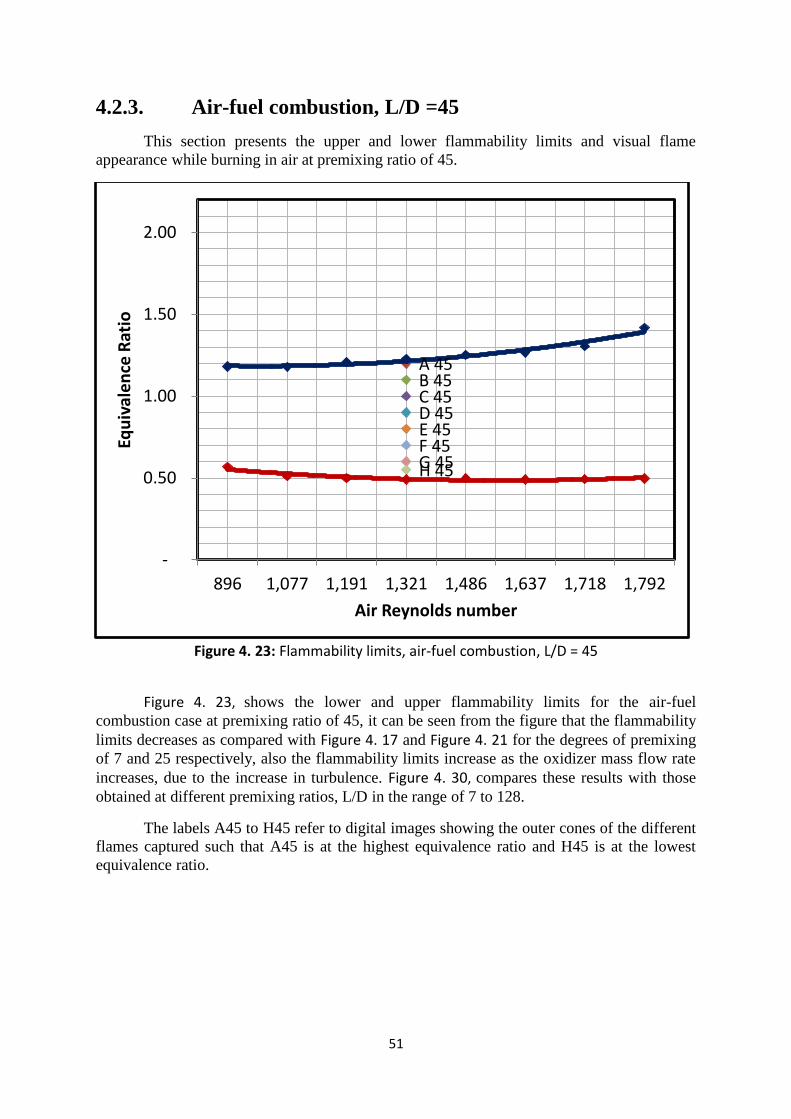
51
4.2.3. Air-fuel combustion, L/D =45
This section presents the upper and lower flammability limits and visual flame
appearance while burning in air at premixing ratio of 45.
Figure 4. 23: Flammability limits, air-fuel combustion, L/D = 45
Figure 4. 23, shows the lower and upper flammability limits for the air-fuel
combustion case at premixing ratio of 45, it can be seen from the figure that the flammability
limits decreases as compared with Figure 4. 17 and Figure 4. 21 for the degrees of premixing
of 7 and 25 respectively, also the flammability limits increase as the oxidizer mass flow rate
increases, due to the increase in turbulence. Figure 4. 30, compares these results with those
obtained at different premixing ratios, L/D in the range of 7 to 128.
The labels A45 to H45 refer to digital images showing the outer cones of the different
flames captured such that A45 is at the highest equivalence ratio and H45 is at the lowest
equivalence ratio.
A 45 B 45 C 45 D 45 E 45 F 45 G 45 H 45
-
0.50
1.00
1.50
2.00
896 1,077 1,191 1,321 1,486 1,637 1,718 1,792
Equ
ival
en
ce R
atio
Air Reynolds number
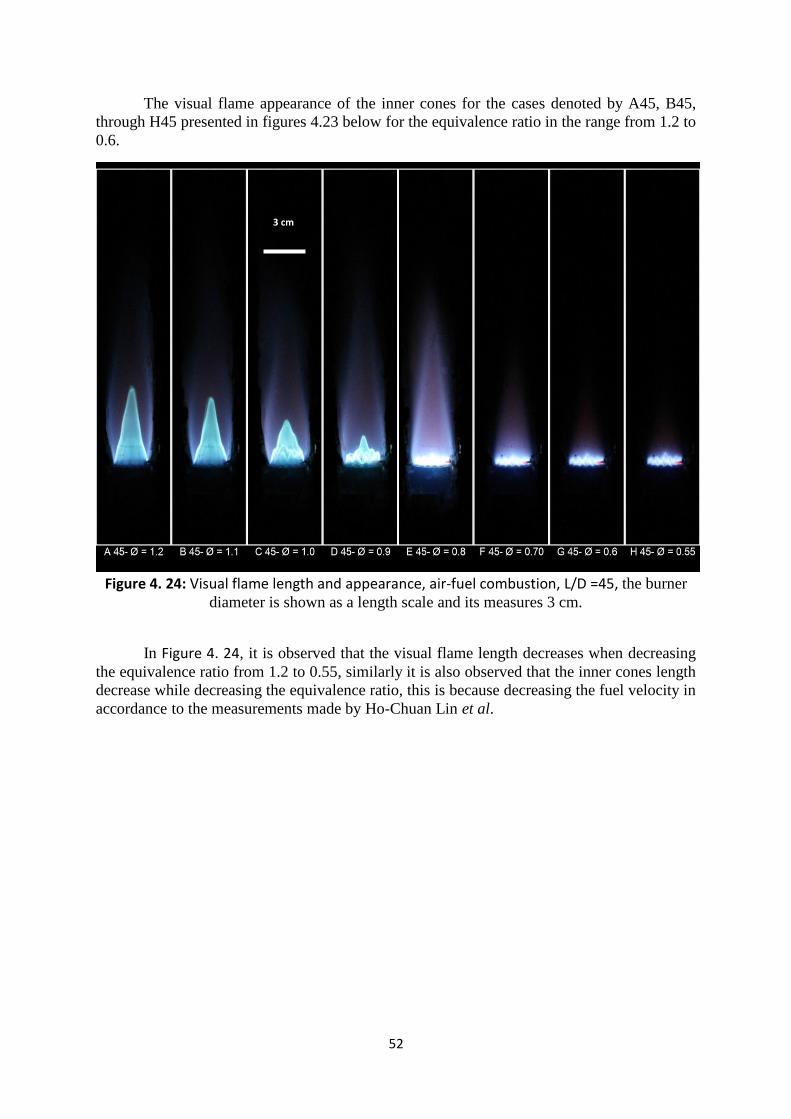
52
The visual flame appearance of the inner cones for the cases denoted by A45, B45,
through H45 presented in figures 4.23 below for the equivalence ratio in the range from 1.2 to
0.6.
Figure 4. 24: Visual flame length and appearance, air-fuel combustion, L/D =45, the burner
diameter is shown as a length scale and its measures 3 cm.
In Figure 4. 24, it is observed that the visual flame length decreases when decreasing
the equivalence ratio from 1.2 to 0.55, similarly it is also observed that the inner cones length
decrease while decreasing the equivalence ratio, this is because decreasing the fuel velocity in
accordance to the measurements made by Ho-Chuan Lin et al.
3 cm
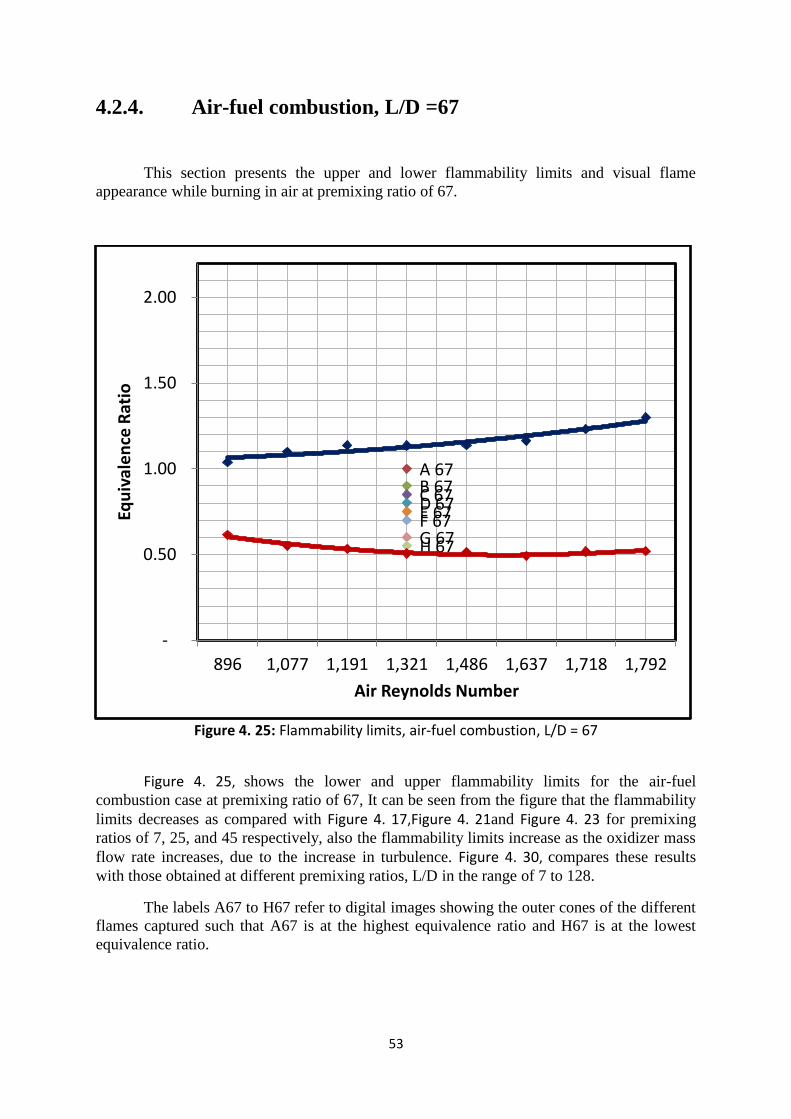
53
4.2.4. Air-fuel combustion, L/D =67
This section presents the upper and lower flammability limits and visual flame
appearance while burning in air at premixing ratio of 67.
Figure 4. 25: Flammability limits, air-fuel combustion, L/D = 67
Figure 4. 25, shows the lower and upper flammability limits for the air-fuel
combustion case at premixing ratio of 67, It can be seen from the figure that the flammability
limits decreases as compared with Figure 4. 17,Figure 4. 21and Figure 4. 23 for premixing
ratios of 7, 25, and 45 respectively, also the flammability limits increase as the oxidizer mass
flow rate increases, due to the increase in turbulence. Figure 4. 30, compares these results
with those obtained at different premixing ratios, L/D in the range of 7 to 128.
The labels A67 to H67 refer to digital images showing the outer cones of the different
flames captured such that A67 is at the highest equivalence ratio and H67 is at the lowest
equivalence ratio.
A 67 B 67 C 67 D 67 E 67 F 67 G 67 H 67
-
0.50
1.00
1.50
2.00
896 1,077 1,191 1,321 1,486 1,637 1,718 1,792
Equ
ival
en
ce R
atio
Air Reynolds Number
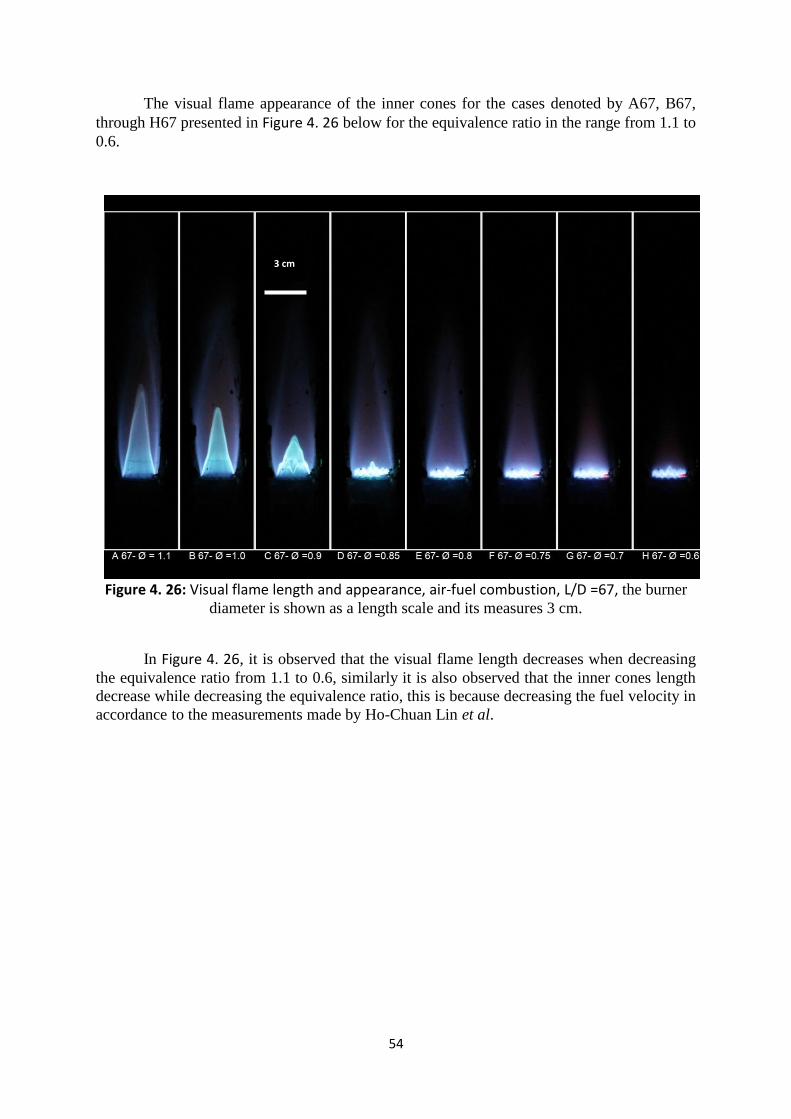
54
The visual flame appearance of the inner cones for the cases denoted by A67, B67,
through H67 presented in Figure 4. 26 below for the equivalence ratio in the range from 1.1 to
0.6.
Figure 4. 26: Visual flame length and appearance, air-fuel combustion, L/D =67, the burner
diameter is shown as a length scale and its measures 3 cm.
In Figure 4. 26, it is observed that the visual flame length decreases when decreasing
the equivalence ratio from 1.1 to 0.6, similarly it is also observed that the inner cones length
decrease while decreasing the equivalence ratio, this is because decreasing the fuel velocity in
accordance to the measurements made by Ho-Chuan Lin et al.
3 cm
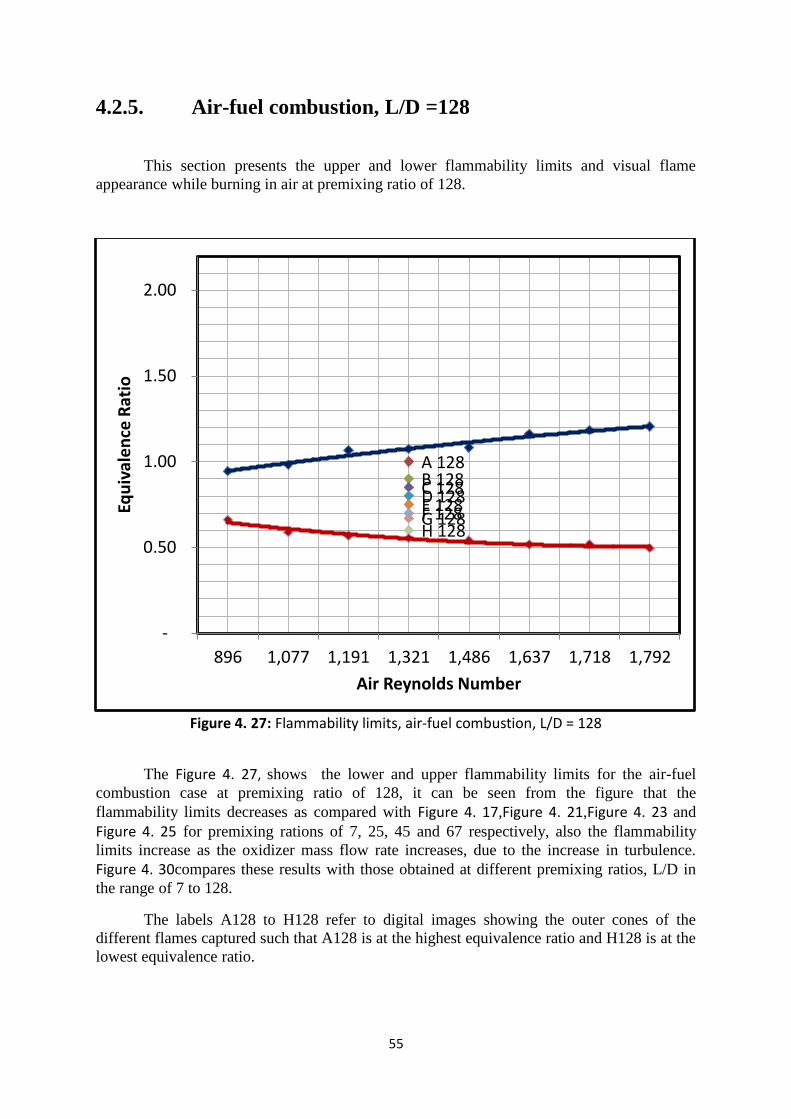
55
4.2.5. Air-fuel combustion, L/D =128
This section presents the upper and lower flammability limits and visual flame
appearance while burning in air at premixing ratio of 128.
Figure 4. 27: Flammability limits, air-fuel combustion, L/D = 128
The Figure 4. 27, shows the lower and upper flammability limits for the air-fuel
combustion case at premixing ratio of 128, it can be seen from the figure that the
flammability limits decreases as compared with Figure 4. 17,Figure 4. 21,Figure 4. 23 and
Figure 4. 25 for premixing rations of 7, 25, 45 and 67 respectively, also the flammability
limits increase as the oxidizer mass flow rate increases, due to the increase in turbulence.
Figure 4. 30compares these results with those obtained at different premixing ratios, L/D in
the range of 7 to 128.
The labels A128 to H128 refer to digital images showing the outer cones of the
different flames captured such that A128 is at the highest equivalence ratio and H128 is at the
lowest equivalence ratio.
A 128 B 128 C 128 D 128 E 128 F 128 G 128 H 128
-
0.50
1.00
1.50
2.00
896 1,077 1,191 1,321 1,486 1,637 1,718 1,792
Equ
ival
en
ce R
atio
Air Reynolds Number
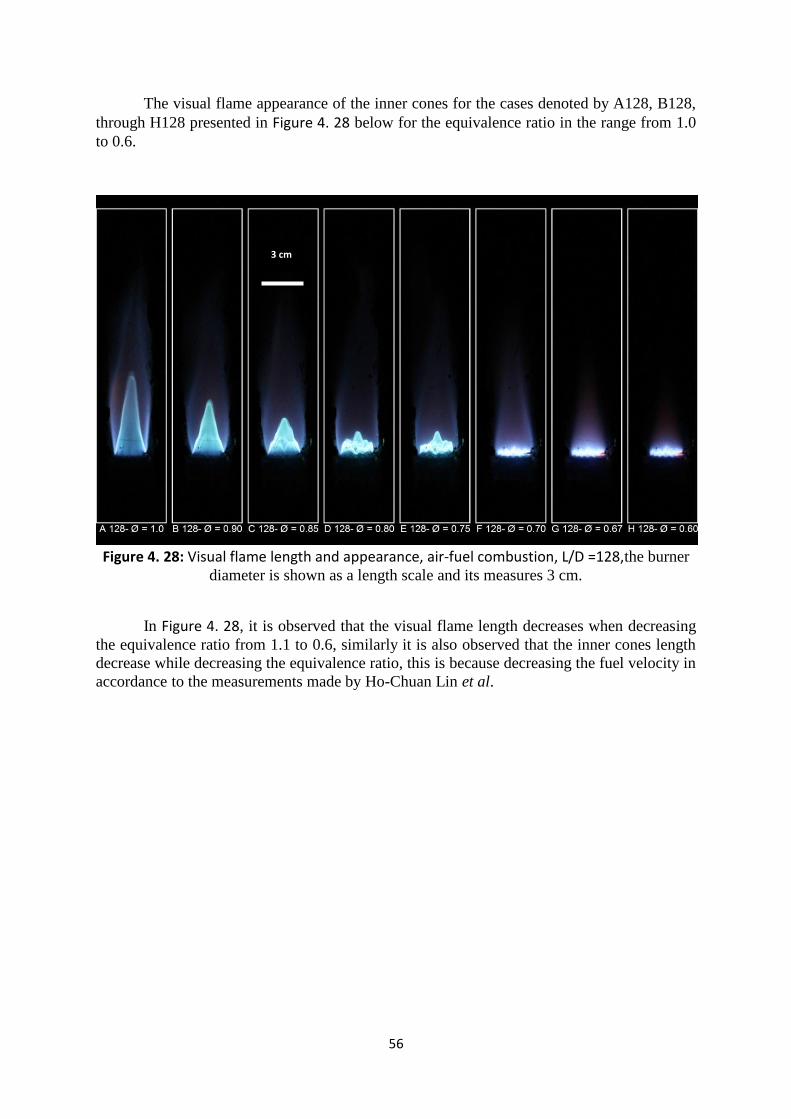
56
The visual flame appearance of the inner cones for the cases denoted by A128, B128,
through H128 presented in Figure 4. 28 below for the equivalence ratio in the range from 1.0
to 0.6.
Figure 4. 28: Visual flame length and appearance, air-fuel combustion, L/D =128,the burner
diameter is shown as a length scale and its measures 3 cm.
In Figure 4. 28, it is observed that the visual flame length decreases when decreasing
the equivalence ratio from 1.1 to 0.6, similarly it is also observed that the inner cones length
decrease while decreasing the equivalence ratio, this is because decreasing the fuel velocity in
accordance to the measurements made by Ho-Chuan Lin et al.
3 cm
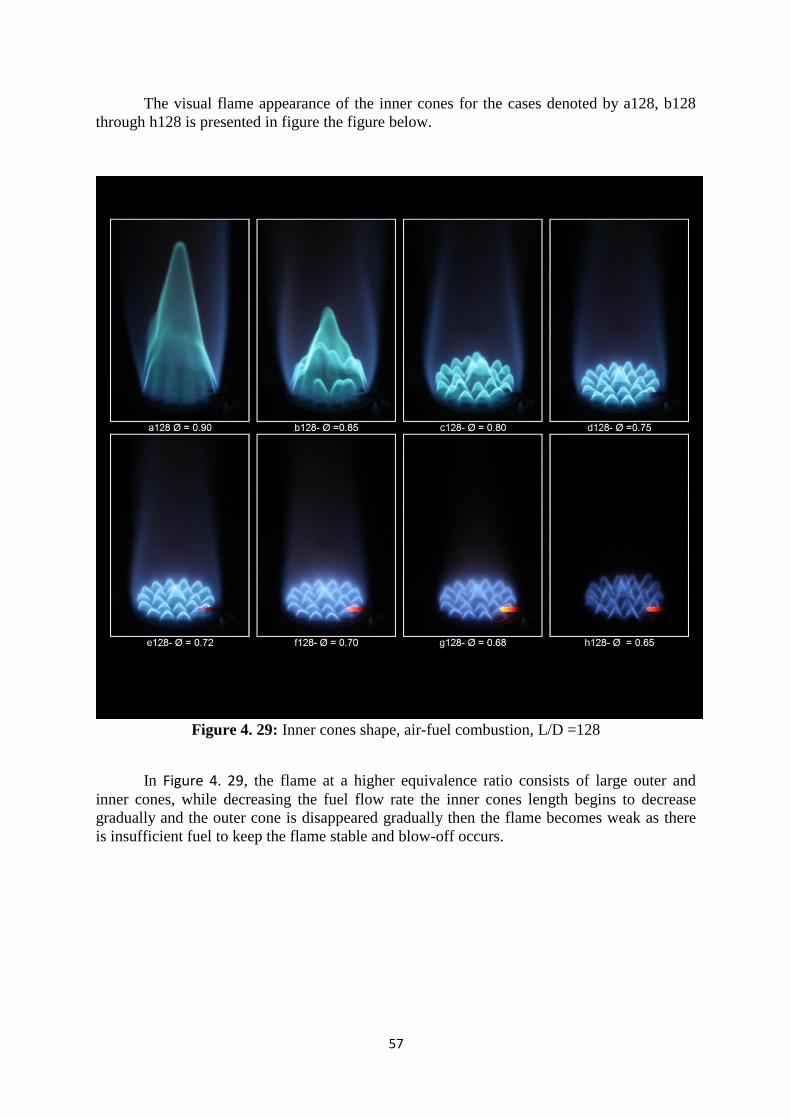
57
The visual flame appearance of the inner cones for the cases denoted by a128, b128
through h128 is presented in figure the figure below.
Figure 4. 29: Inner cones shape, air-fuel combustion, L/D =128
In Figure 4. 29, the flame at a higher equivalence ratio consists of large outer and
inner cones, while decreasing the fuel flow rate the inner cones length begins to decrease
gradually and the outer cone is disappeared gradually then the flame becomes weak as there
is insufficient fuel to keep the flame stable and blow-off occurs.
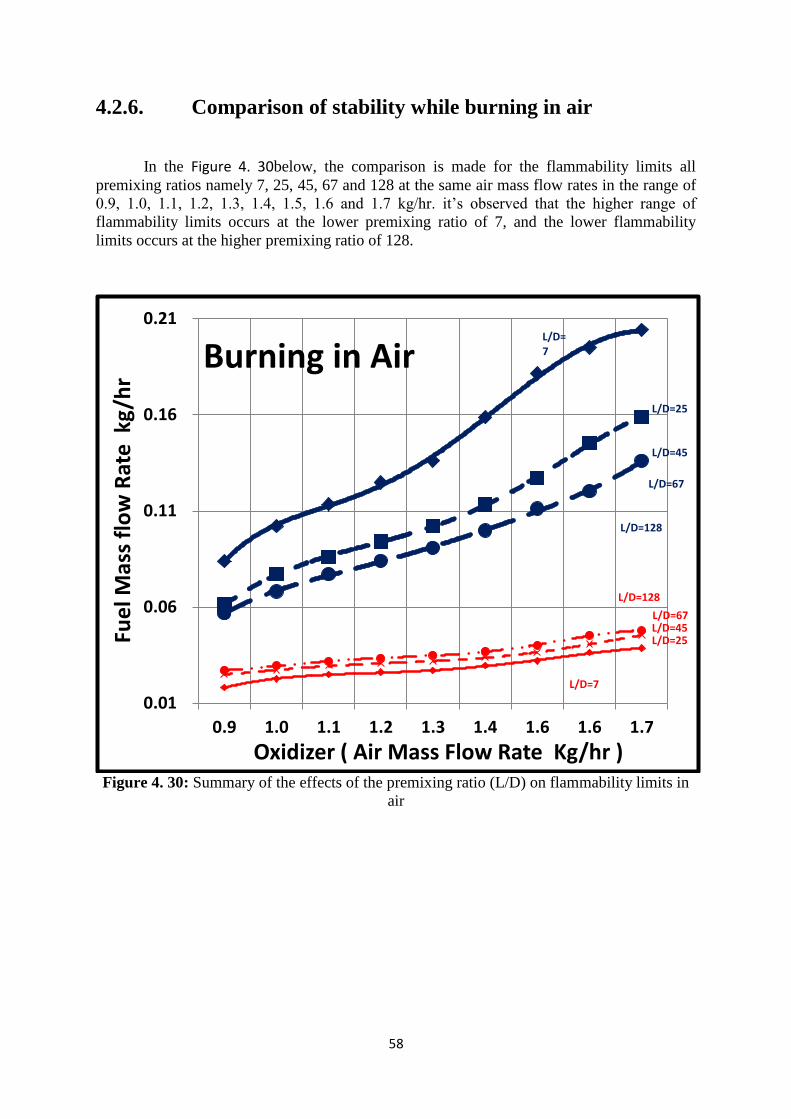
58
4.2.6. Comparison of stability while burning in air
In the Figure 4. 30below, the comparison is made for the flammability limits all
premixing ratios namely 7, 25, 45, 67 and 128 at the same air mass flow rates in the range of
0.9, 1.0, 1.1, 1.2, 1.3, 1.4, 1.5, 1.6 and 1.7 kg/hr. it’s observed that the higher range of
flammability limits occurs at the lower premixing ratio of 7, and the lower flammability
limits occurs at the higher premixing ratio of 128.
Figure 4. 30: Summary of the effects of the premixing ratio (L/D) on flammability limits in
air
0.01
0.06
0.11
0.16
0.21
0.9 1.0 1.1 1.2 1.3 1.4 1.6 1.6 1.7
Fue
l Mas
s fl
ow
Rat
e k
g/h
r
Oxidizer ( Air Mass Flow Rate Kg/hr )
L/D=128
L/D=25
L/D=45
L/D=67
L/D=67
L/D=7
L/D=128
L/D=7
L/D=45 L/D=25
Burning in Air
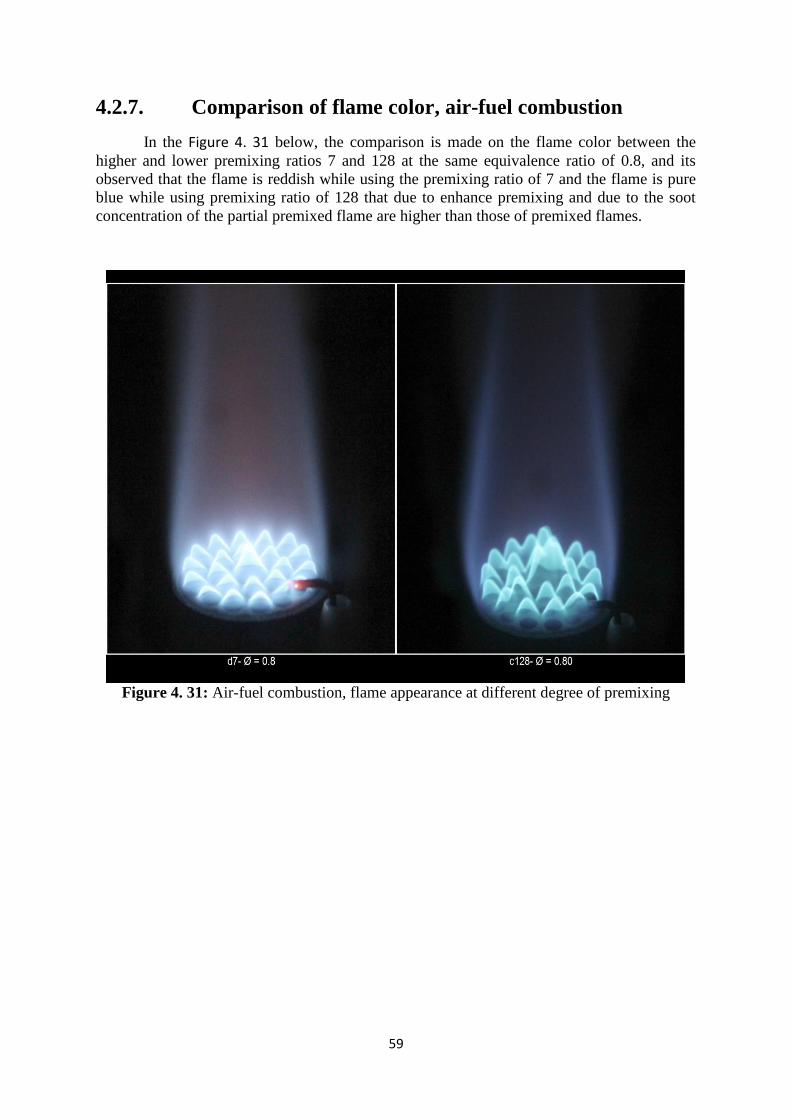
59
4.2.7. Comparison of flame color, air-fuel combustion
In the Figure 4. 31 below, the comparison is made on the flame color between the
higher and lower premixing ratios 7 and 128 at the same equivalence ratio of 0.8, and its
observed that the flame is reddish while using the premixing ratio of 7 and the flame is pure
blue while using premixing ratio of 128 that due to enhance premixing and due to the soot
concentration of the partial premixed flame are higher than those of premixed flames.
Figure 4. 31: Air-fuel combustion, flame appearance at different degree of premixing
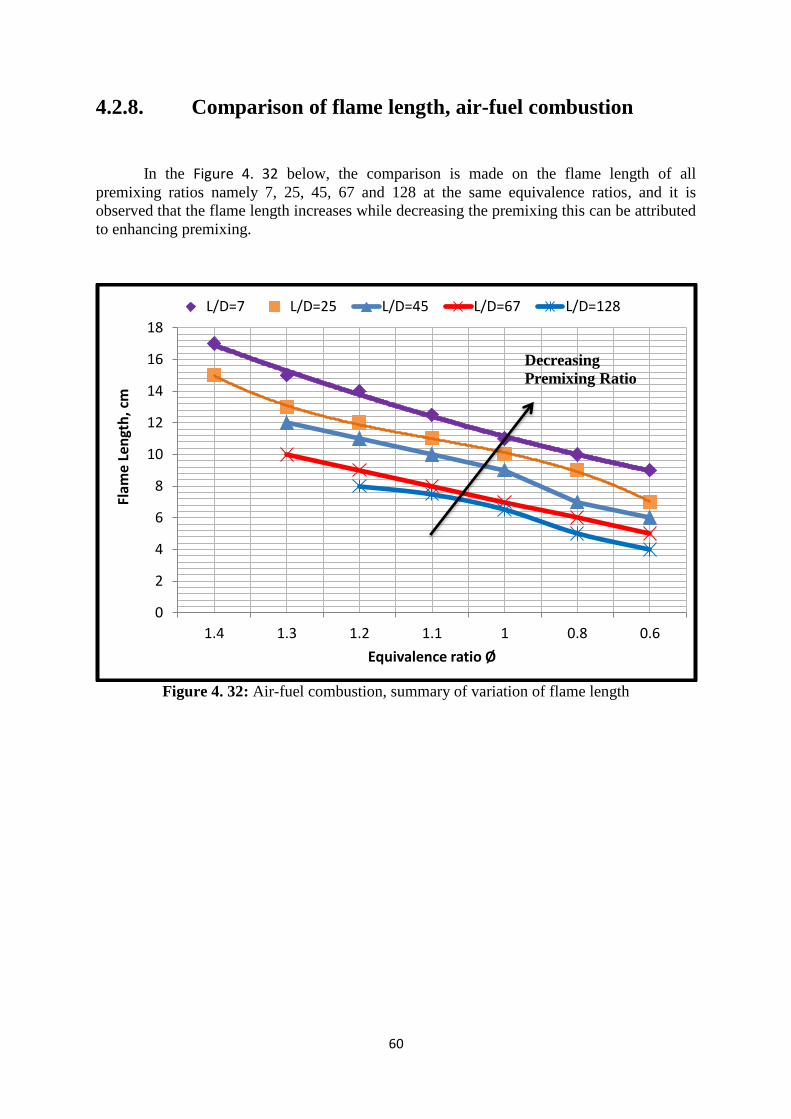
61
4.2.8. Comparison of flame length, air-fuel combustion
In the Figure 4. 32 below, the comparison is made on the flame length of all
premixing ratios namely 7, 25, 45, 67 and 128 at the same equivalence ratios, and it is
observed that the flame length increases while decreasing the premixing this can be attributed
to enhancing premixing.
Figure 4. 32: Air-fuel combustion, summary of variation of flame length
0
2
4
6
8
10
12
14
16
18
1.4 1.3 1.2 1.1 1 0.8 0.6
Flam
e L
en
gth
, cm
Equivalence ratio Ø
L/D=7 L/D=25 L/D=45 L/D=67 L/D=128
Decreasing
Premixing Ratio
61
Chapter 5: Summary and Conclusion
This chapter summarizes the results and the main conclusion of this work. A complete
setup is build allowing stable operation of CNG fuels burnt in a controlled mixture of oxygen
and carbon dioxide stabilized over a perforated plate burner. The work is performed in three
different experiment sets. Tables 1, 2 and 3 summarize the results.
The flammability limits, visual flame appearance and extinction mechanism(s) have
been successfully investigated at a degree of premixing of L/D of 7. The results are compared
to the corresponding air-fuel combustion cases at the same oxidizer mass flow rates.
In the first set of experiments, the study identifies the range of equivalence
ratios at a constant oxygen fraction and constant oxidizer mass flow rates for stable
flame operation, documents the visual flame length and color and identifies the
extinction mechanism(s) outside these ranges. For example, for a degree of
premixing of L/D of 7, an oxidizer mass flow rate of 1.32 kg/hr and an oxygen
fraction of 36%, stable flame operation is possible in the range of equivalence ratios
of 1.2 to 0.5. For the sake of comparison, the range of equivalence ratios for air-fuel
combustion using the same burner, same degree of premixing and the same oxidizer
mass flow rate is in the range of 1.4 to 0.4, showing that the flammability limit
range in oxy-fuel combustion at these conditions is about 80% of that in air-fuel
combustion. Table 5.1 summarizes the results obtained in the first set of
experiments of oxy-fuel combustion.
It is also observed that the flammability limits increase as the oxidizer mass flow rate
increases. Moreover, when repeating the same experiment at a higher oxygen fraction, it is
found that flammability limits increase as well, for example from a range of equivalence ratio
of 1.0 to 0.6 at an oxygen fraction of 29% to a range of equivalence ratio of 1.2 to 0.5 a an
oxygen fraction of 36%.
Generally, it is found that the extinction mechanism(s) occurs by blow-off below the
lower flammability limits and above the upper flammability limits.
The flame length decreases when equivalence ratio increases. When repeating the
same experiment at a higher oxygen fraction, it is found that the flame length decreases as the
oxygen fraction increases. For example, at oxidizer mass flow rate of 1.32 kg/hr and an
oxygen fraction of 29%, the flame length is 20 cm. This length decreases to 16 cm when
increasing the oxygen fraction to 36% at the same oxidizer mass flow rate. The flame color
changes from blue at higher equivalence ratios to white at lower equivalence ratios. When
repeating the same experiment at a higher oxygen fraction the flame color changes from blue
to white.
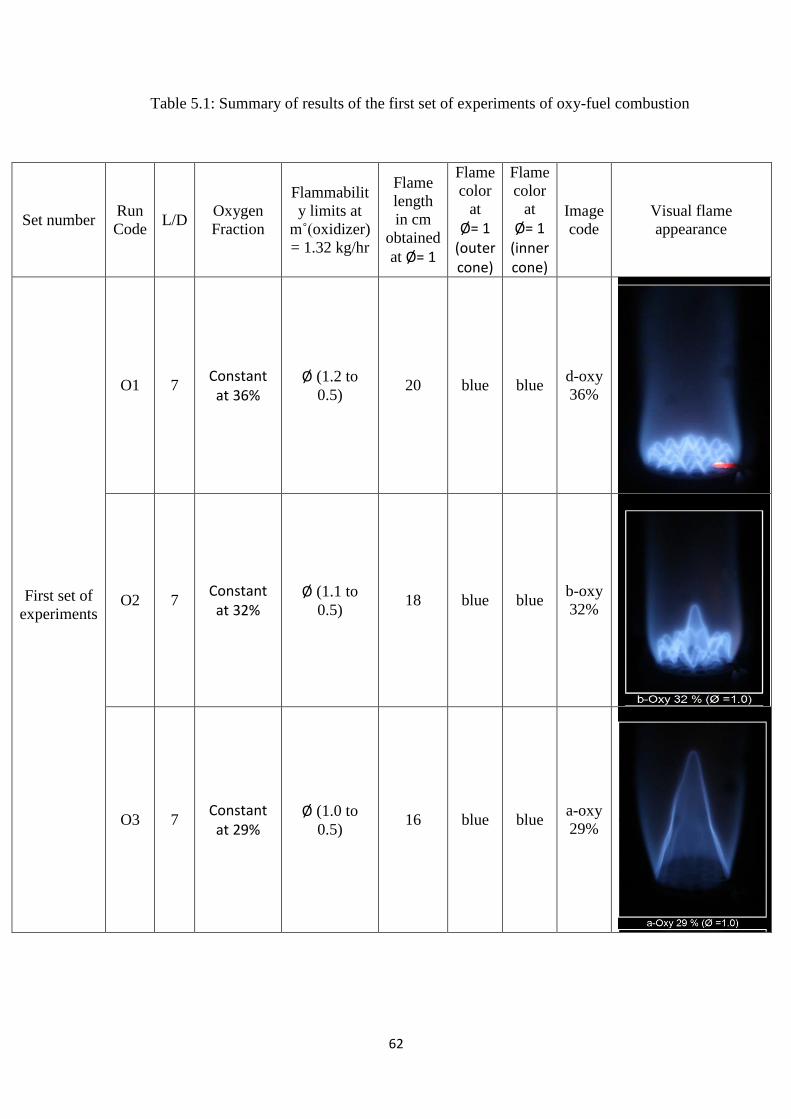
62
Table 5.1: Summary of results of the first set of experiments of oxy-fuel combustion
Set number Run
Code L/D
Oxygen
Fraction
Flammabilit
y limits at
m˚(oxidizer)
= 1.32 kg/hr
Flame
length
in cm
obtained
at Ø= 1
Flame
color
at
Ø= 1 (outer cone)
Flame
color
at
Ø= 1 (inner cone)
Image
code
Visual flame
appearance
First set of
experiments
O1 7 Constant at 36%
Ø (1.2 to
0.5) 20 blue blue
d-oxy
36%
O2 7 Constant at 32%
Ø (1.1 to
0.5) 18 blue blue
b-oxy
32%
O3 7 Constant at 29%
Ø (1.0 to
0.5) 16 blue blue
a-oxy
29%
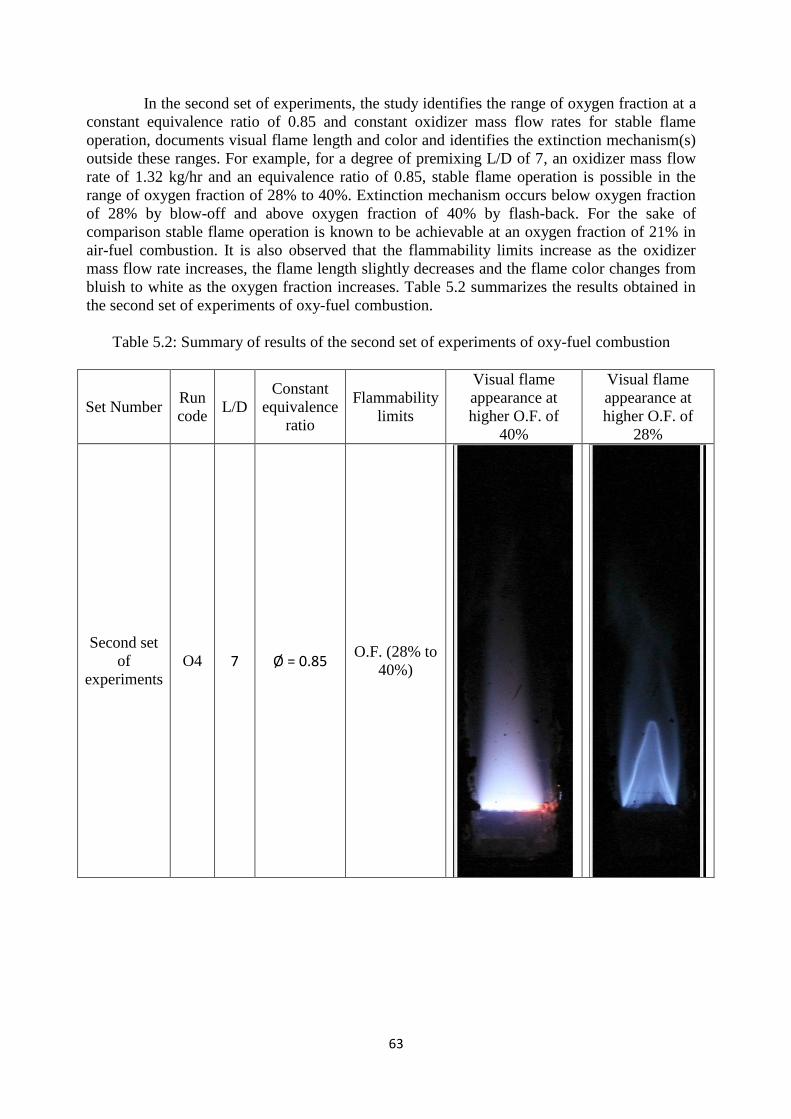
63
In the second set of experiments, the study identifies the range of oxygen fraction at a
constant equivalence ratio of 0.85 and constant oxidizer mass flow rates for stable flame
operation, documents visual flame length and color and identifies the extinction mechanism(s)
outside these ranges. For example, for a degree of premixing L/D of 7, an oxidizer mass flow
rate of 1.32 kg/hr and an equivalence ratio of 0.85, stable flame operation is possible in the
range of oxygen fraction of 28% to 40%. Extinction mechanism occurs below oxygen fraction
of 28% by blow-off and above oxygen fraction of 40% by flash-back. For the sake of
comparison stable flame operation is known to be achievable at an oxygen fraction of 21% in
air-fuel combustion. It is also observed that the flammability limits increase as the oxidizer
mass flow rate increases, the flame length slightly decreases and the flame color changes from
bluish to white as the oxygen fraction increases. Table 5.2 summarizes the results obtained in
the second set of experiments of oxy-fuel combustion.
Table 5.2: Summary of results of the second set of experiments of oxy-fuel combustion
Set Number Run
code L/D
Constant
equivalence
ratio
Flammability
limits
Visual flame
appearance at
higher O.F. of
40%
Visual flame
appearance at
higher O.F. of
28%
Second set
of
experiments
O4 7 Ø = 0.85 O.F. (28% to
40%)
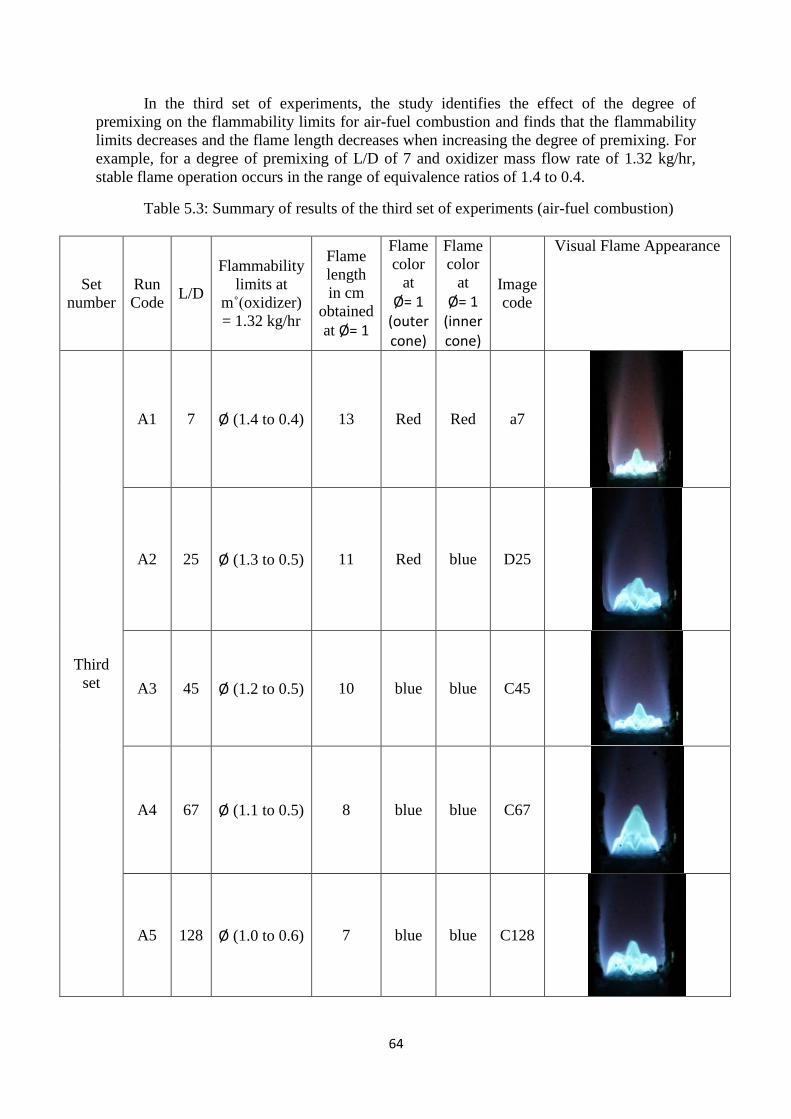
64
In the third set of experiments, the study identifies the effect of the degree of
premixing on the flammability limits for air-fuel combustion and finds that the flammability
limits decreases and the flame length decreases when increasing the degree of premixing. For
example, for a degree of premixing of L/D of 7 and oxidizer mass flow rate of 1.32 kg/hr,
stable flame operation occurs in the range of equivalence ratios of 1.4 to 0.4.
Table 5.3: Summary of results of the third set of experiments (air-fuel combustion)
Set
number
Run
Code L/D
Flammability
limits at
m˚(oxidizer)
= 1.32 kg/hr
Flame
length
in cm
obtained
at Ø= 1
Flame
color
at
Ø= 1 (outer cone)
Flame
color
at
Ø= 1 (inner cone)
Image
code
Visual Flame Appearance
Third
set
A1 7 Ø (1.4 to 0.4) 13 Red Red a7
A2 25 Ø (1.3 to 0.5) 11 Red blue D25
A3 45 Ø (1.2 to 0.5) 10 blue blue C45
A4 67 Ø (1.1 to 0.5) 8 blue blue C67
A5 128 Ø (1.0 to 0.6) 7 blue blue C128
65
Suggestions for future Work
This chapter describes three main suggestions for future work in this research area.
These suggestions are as follows:
Firstly, the current work studies the flammability limits of oxy-fuel combustion
experiments at a degree of premixing of L/D of 7. Studying lower values is possible and can
be done using the existing experimental setup because generally the stability is higher in
diffusion flames than in premixed flames. Higher values of L/D increase the degree of
premixing. Although, premixed flame operation suffers from a narrow stability range that
requires additional safety precautions, this mode of operation enjoys low NOx production,
which can be advantageous if the used fuel contains large amount of nitrogen. It is suggested
to study oxy-fuel combustion in the premixed flame operation mode using higher degree of
premixing in future work. This, however, requires changes in the design to increase stability
and to enhance safety.
Secondly, the use of carbon dioxide in the oxidizer stream may result in a large
amount of carbon monoxide via dissociation in the emissions. This requires careful
monitoring of the resulting emissions. However, typical gas analyzers have a limit on the
maximum carbon dioxide in the gas stream typically 12%, oxy-fuel combustion emissions
contains much higher percentage of carbon dioxide requiring changes on the experimental
setup in order to be able to use the current gas analyzer to analyze the emissions. It is
suggested that future work introduces controlled dilution in the emissions in order to be able
to analyze the resulting emissions and to perform complete flame structure.
Thirdly, modifying existing systems, with minor impact, to employ oxy-fuel
combustion rather than air is a very interesting topic. This work should consider the changes
in stoichiometric conditions, different heat release rates and the different convection and
radiation heat transfer rates and should identify techniques that allow this transfer to occur
with minimal impact on the system.
Fourthly, it is of interest to study the burner geometry in order to improve both the
stability and emissions.
66
References
1. BASC, DELS, 2011, America's Climate Choices. The National Academies Press, Washington,
D.C.
2. BASC, DELS, 2010, Chapter 1: Advancing the Science of Climate Change, America's Climate
Choices, The National Academies press, Washington, D.C.
3. Lashof Danile A., Ahuja Dilip R., 1991, “Relative contributions of greenhouse gas emissions to
global warming”, Letter to Nature, Vol.344, pp. 529-531.
4. Hansen James, Makiko Sato, Reto Ruedy, 2006, "Global Temperature Change", National
Aeronutics and Space Administration Goddard Institute for Space Stidues, Vol.103, pp. 39.
5. Randy Russell, 2007, "The Greenhouse Effect & Greenhouse Gases." University Corporation
for Atmospheric Research.
6. Le Treut Herve, Richard somerville, 2117, “Historical Overview of Climate Change Science” ,
IPCC Fourth Assessment Report: climate change 2007.
7. Earth System Research Lab. Web Site, http://www.esrl.noaa.gov/gmd/obop/mlo/.
8. Wigley T. M. L., Jones P. D. and Kelly P.M., 1980, "Scenario for a warm, high-CO2 World"
MaCmillan Journal, Vol.283 , pp. 18-21.
9. Shakun Jermy D., Clark Peter U., Feng He, 2012, "Global Warming Preceded by the increasing
carbon dioxide concentrations during the last deglaciation" Nature, Vol.448, pp. 49-53.
10. United States Enviromental Protection Agency Web Site, 2011,
<http://www.epa.gov/climatechange/ghgemissions/gases/co2.html>.
11. Stefan Rahmostrof, Lockwood M., Frohlich C., 2007, "No solar hiding place for greenhouse
sceptics" , Nature, Vol.44, pp. 8-9.
12. Cox Peter M., Betts Richard A., Jones Chris D., 2000, "Acceleration of Global Warming due to
Carbon-cycle Feedbacks in a coupled climate model" , Vol.408, pp. 184-187.
13. Parris Adam, Bromirski Peter, burkett Virginia, 2012, "Global Mean Sea Level Rise Scenarios"
, United States National Climate Assessment.
14. Root Terry L., Price Jeff T., Hall Kimberly R., 2003, "Fingerprints of global warming on wild
animals and plants." Nature, Vol.421, pp. 57-60.
15. Domroes Manfred, El Tantawi Attia, 2005, "Recent Temporal and Spatial Temperature
changes in Egypt" International Journal of Climatology, Vol.25, pp. 51-63.
16. El-Raey M., Frihy O., Nasr M., 1997, "Vulnerability Assessment of sea level rise over port said
governorate, Egypt" Enviormental Monitoring and Assessment, Vol.56, pp. 113-128.
67
17. Franziska Pointek, Michael P. Link, Jurgen Scheffran, 2010 "Impacts of climate changes on
the nile river conflict: The Case of Egypt" , pp. 36-41.
18. Samir Riad, 2010, "Climate Change and its possible impact on Egypt", Climate Change
Report, Geology Department, Assiut University.
19. Wilmington, 2007, "Facing up to the challenges of the Nile." International Water Power and
Dam Construction, pp. 12-14.
20. Kanniche Mohamed, René Gros-Bonnivard, Jaud Philipp, 2010, "Pre-combustion post-
combustion and oxy-combustion in thermal power plant for CO2 capture", Applied Thermal
Engineering, Vol.30, pp. 53–62.
21. 10- T. Wall, Y. Liu, C. Spero, L. Elliott, S. Khare and R. Rathnam. An overview on oxyfuel coal
combustion – State of the art research and technology development, Chem. Eng. Res. Des.,
87 (2009) 1003-1016.
22. 11-S. Hjärtstam, K. Andersson, F. Johnsson and B. Leckner, Combustion characteristics of
lignite-fired oxy-fuel flames, Fuel, 88 (2009) 2216-2224.
23. Arvind Jotoliya, Pandian B., Vasudevan Reghavan, 2012, "Experimental Study of Pre-Mixed
Flames on a Multi-Holes Matric Burner", International Journal of Integrated Engineering,
Vol.4, pp. 1-5.
24. Alaa E. Eissa, Zaki M., "The Impact of global climate changes on the aquatic environment",
Science Direct, Vol.4, pp. 251-259.
25. Yung Kim Jih, 2011, "Development of a Micro-Fid Using a Diffusion Flame", M.Sc. Thesis,
University of Illinois at Urbana-Champaign, United States.
26. Amato Alberto, Robert Hudak, Noble David R., 2010, "Methan Oxy-Combustion For Low CO2
Cycles: Blowoff Measurements and Modeling", ASME, pp. 1-11.
27. Ditaranto Mario, Jorgen Hals, 2006, "Combustion instabilities in sudden expansion oxy-fuel
flames", Science Direct, Vol.146, pp. 495-512.
28. Shroll Andrew Philip, 2011, "Dynamic Stability, Blowoff, and flame Characteristics of oxy-fuel
combustion", M.Sc.Thesis, Mechanical Engineering, Massachusetts Institute of Technology.
29. Peter Kutne, Bhavin K. Kapadia, Wolfgang Meier, 2011, "Experimental analysis of
combustion behaviour of oxyfuel flames in a gas turbine model combustor", Journal of
Thermal Science and Technology, Vol.33, pp. 3383-3390.
30. Abdul Rahman Mohd Rosdzimin, Takeshi Yokomori, 2113, “The Response of conical Laminar
Premixed Flame to Equivalence Ratio Oscillations in Rich Conditions”, Journal of Thermal
Science and Technology, Vol.8, pp. 28-48.
31. Hu Xian, Yu Qing-Bo, 2113, “Experimental investigation on laminar flame speeds of premixed
CH4/O2/CO2 mixture”, Journal of Northeastern University, Vol. 34, pp. 1593-1596.
68
32. Mazas A. N., Fiorina B., 2111, ” Effects of Water Vapor Addition on laminar burning velocity
of oxygen-enriched methane flames”, Combustion and Flame, Vol.158, pp. 2428-2440.
33. HO Keun Kim, 2007, “NO reduction in 1.13-0.2 MW oxy-fuel combustor using flue gas
recirculation technology”, Proceeding of the combustion institute, Vol.31, pp. 3377-3384.
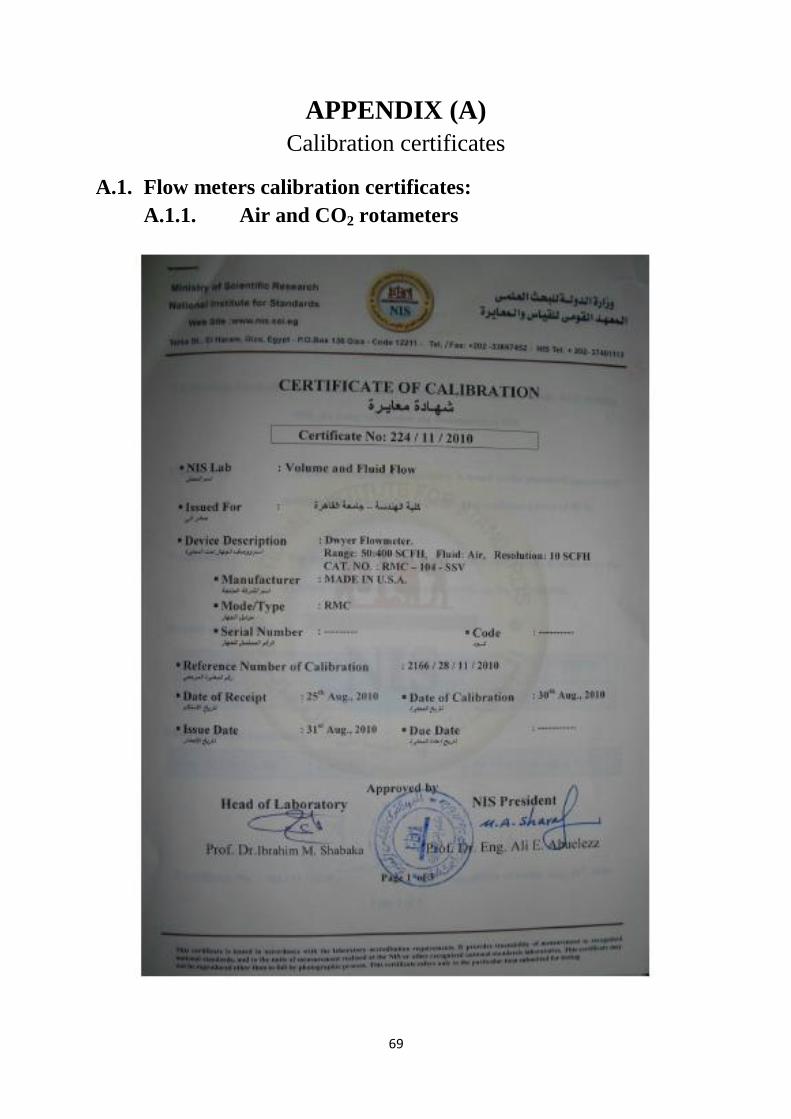
69
APPENDIX (A)
Calibration certificates
A.1. Flow meters calibration certificates:
A.1.1. Air and CO2 rotameters
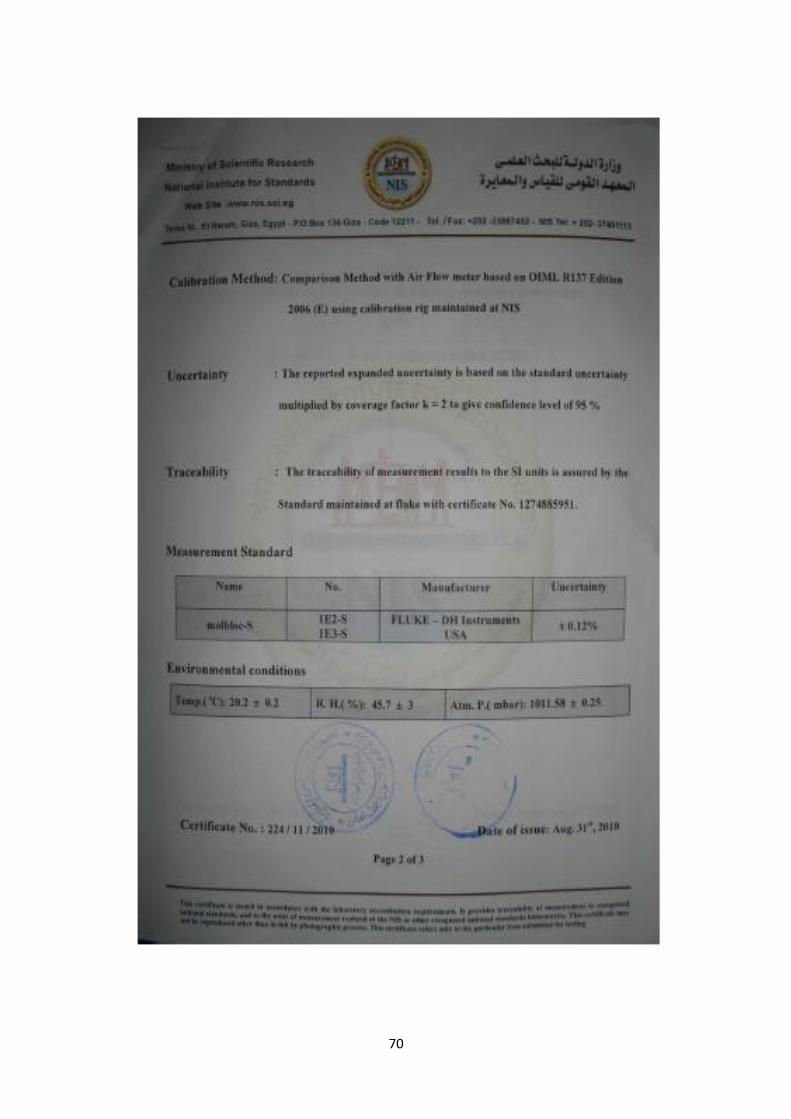
71
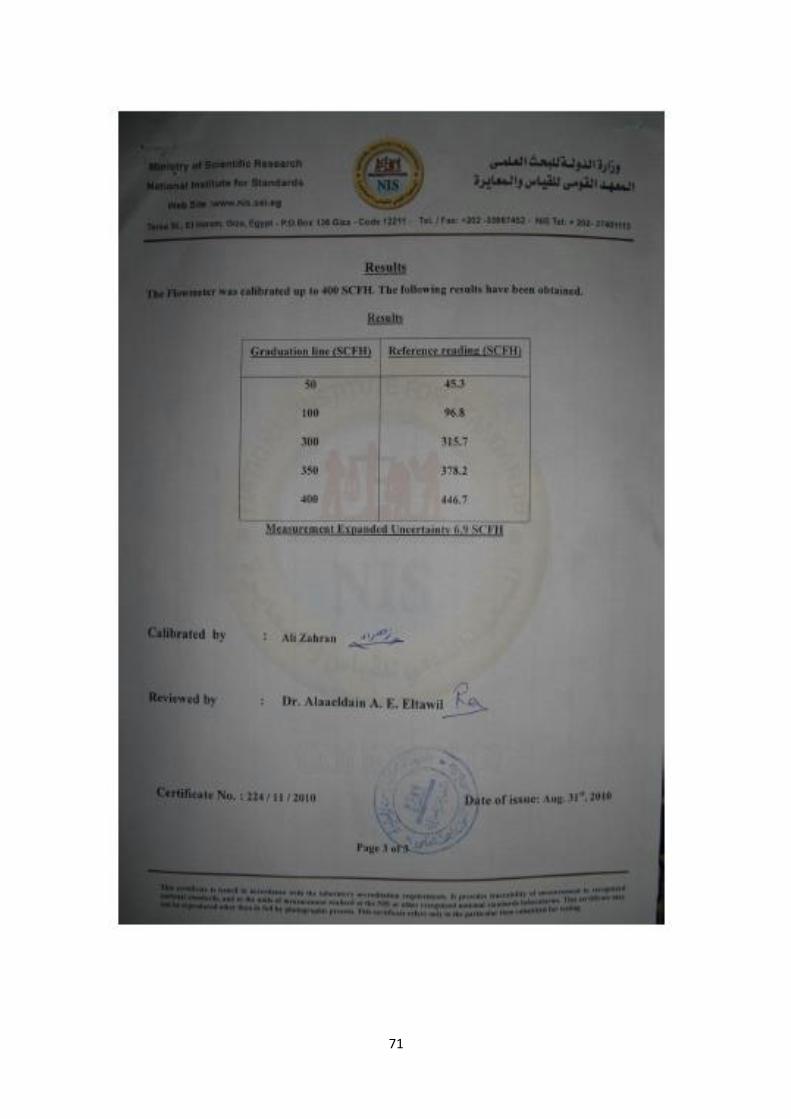
71
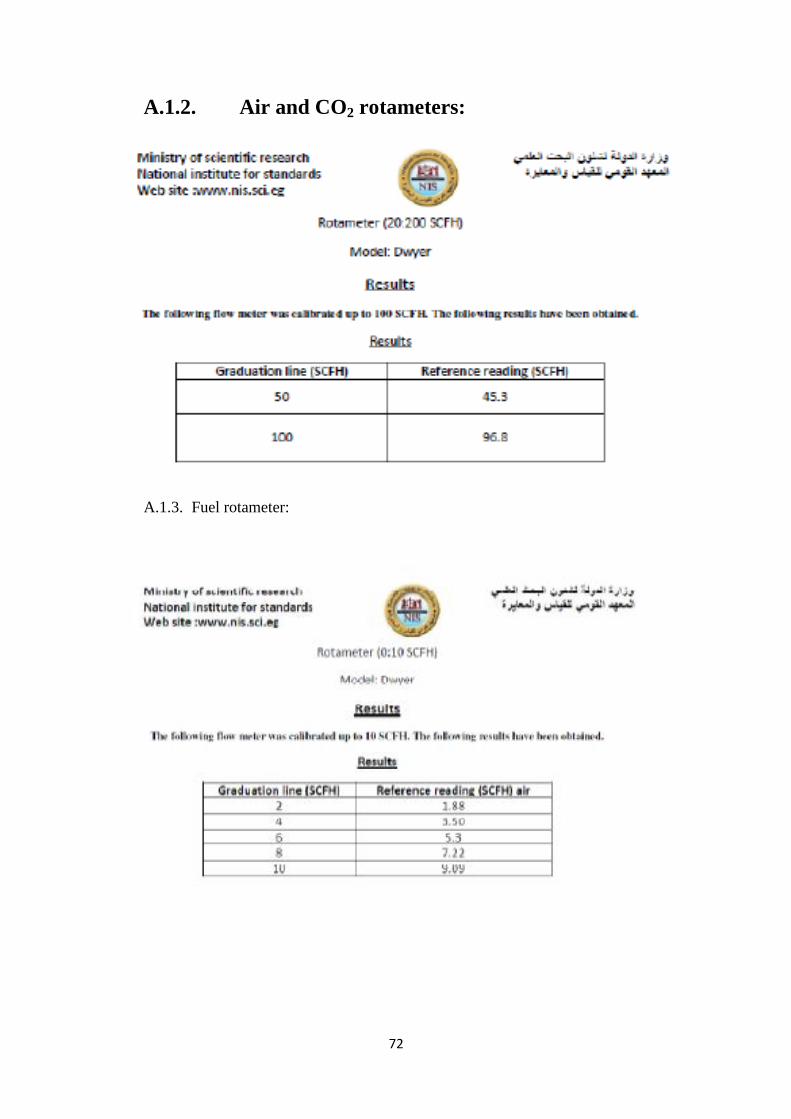
72
A.1.2. Air and CO2 rotameters:
A.1.3. Fuel rotameter:
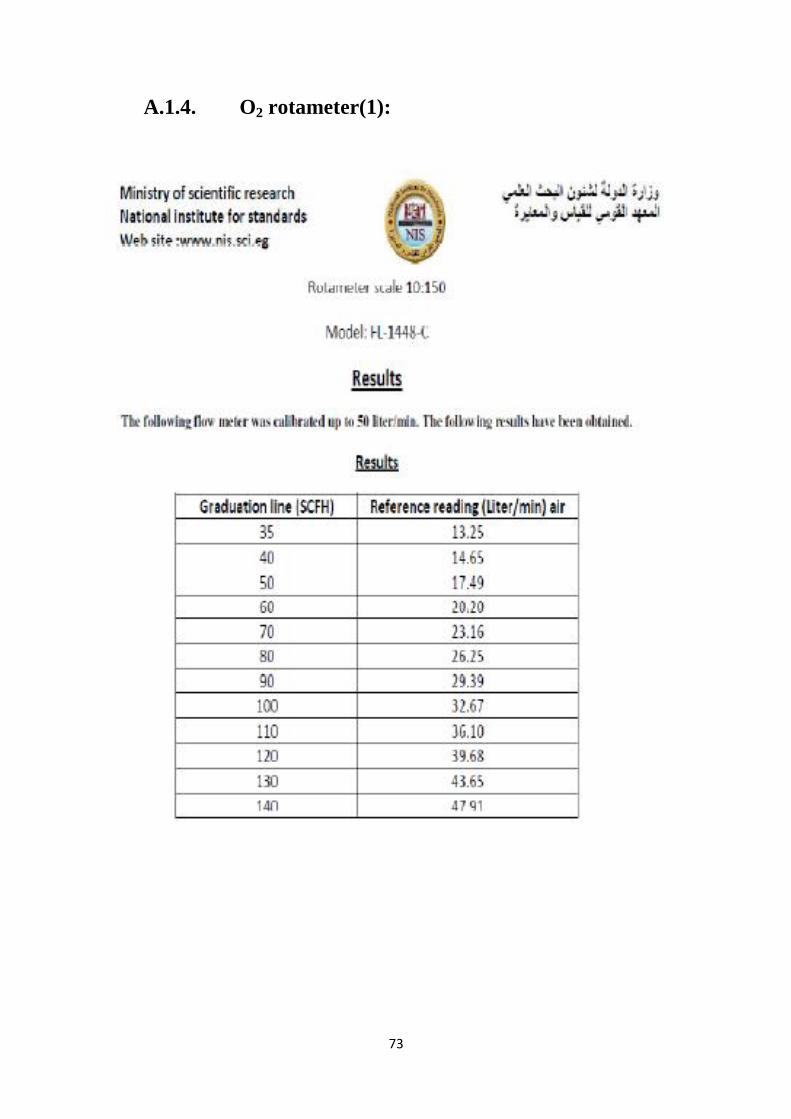
73
A.1.4. O2 rotameter(1):
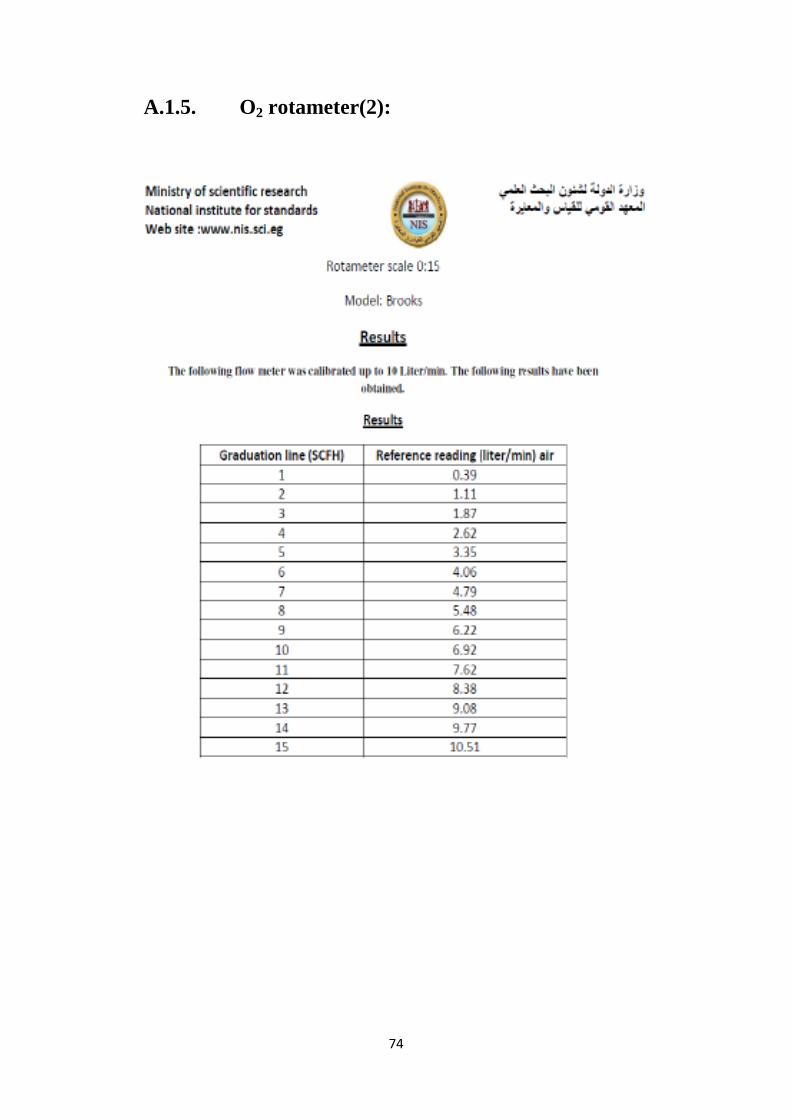
74
A.1.5. O2 rotameter(2):
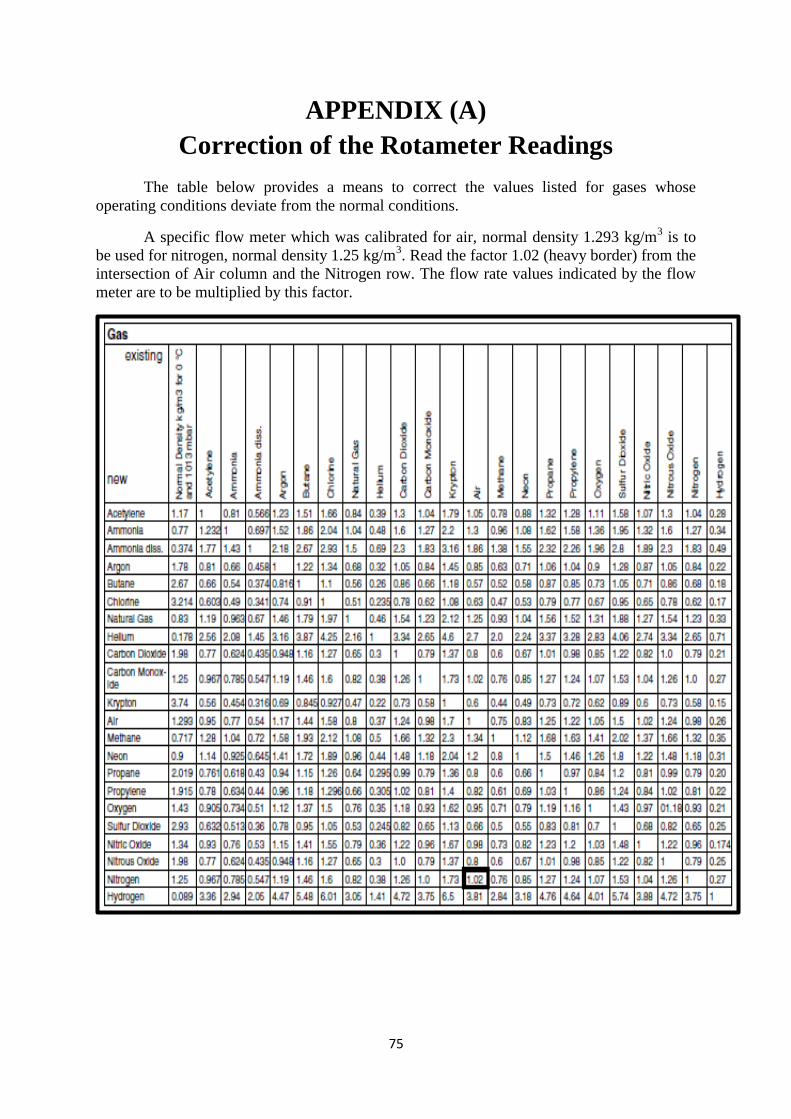
75
APPENDIX (A)
Correction of the Rotameter Readings
The table below provides a means to correct the values listed for gases whose
operating conditions deviate from the normal conditions.
A specific flow meter which was calibrated for air, normal density 1.293 kg/m3 is to
be used for nitrogen, normal density 1.25 kg/m3. Read the factor 1.02 (heavy border) from the
intersection of Air column and the Nitrogen row. The flow rate values indicated by the flow
meter are to be multiplied by this factor.
1
دراسة عملة الحتراق لهب الغاز الطبع المضغوط ف جو من االكسجن و ثان أكسد
الكربون على سطح حارق ذو قرص متعدد الثقوب
اعداد
شرف سمر احمد رشوان/مهندس
رسالة مقدمة ال كلة الهندسة, جامعة القاهرة
كجزء من متطلبات الحصول عل درجة الماجستر
القوي المكانكةف هندسة
كلة الهندسة , جامعة القاهرة
الجزة, جمهورة مصر العربة
4102
2
دراسة عملة الحتراق لهب الغاز الطبع المضغوط ف جو من االكسجن و ثان أكسد
الكربون على سطح حارق ذو قرص متعدد الثقوب
اعداد
شرف سمر احمد رشوان/مهندس
ال كلة الهندسة, جامعة القاهرة رسالة مقدمة
كجزء من متطلبات الحصول عل درجة الماجستر
ف هندسة القوي المكانكة
تحت اشراف
العسوي د. عبد الماجد حافظ ابراهم أ.د. ثروت وزر ابو عرب
مكانكةقسم هندسة القوي المكانكة قسم هندسة القوي ال
كلة الهندسة جامعة القاهرة كلة الهندسة جامعة القاهرة
كلة الهندسة , جامعة القاهرة
الجزة, جمهورة مصر العربة
4102
3
دراسة عملة الحتراق لهب الغاز الطبع المضغوط ف جو من االكسجن و ثان أكسد
ذو قرص متعدد الثقوبالكربون على سطح حارق
اعداد
شرف سمر احمد رشوان/مهندس
رسالة مقدمة ال كلة الهندسة, جامعة القاهرة
كجزء من متطلبات الحصول عل درجة الماجستر
ف هندسة القوي المكانكة
عتمد من لجنة الممتحنن:
عضو اللجنة /المشرف الرئس أ.د. ثروت وزر ابو عرب
االستاذ بهندسة القوي المكانكة بكلة الهندسة, جامعة القاهرة
عضو اللجنة أ.د. حافظ السلماوي
االستاذ بهندسة القوي المكانكة بكلة الهندسة, جامعة الزقازق
عضو اللجنة أ.د. محمد عل حسن
االستاذ بهندسة القوي المكانكة بكلة الهندسة, جامعة القاهرة
كلة الهندسة , جامعة القاهرة
الجزة, جمهورة مصر العربة
4102
4
شريف سمير احمذ رشوان ــــــــــــــذس:مهنــــ 98 98 / 7 / 42 :تاريــخ الميــــالد
مصري :الجنسيـــــــــــــــة 4194/ 10 / 1 :تاريخ التسجيل
/ / :تــــاريخ المنــــح هندسة القوي الميكانيكية: القســـــــــــــــــــــم ماجستير : الذرجــــــــــــــــــــة
ثروت وزير ابو عربأ.د :المشرفون . عبد الماجد حافظ ابراهيم د
ثروت وزير ابو عرب : أ.د لممتحنـــــــونا الزقازيق هندسةاالستاذ ب حافظ السمماوي أ.د أ.د محمد عمي حسن
: عنـــــوان الرسالــة
دراسة عملية الحتراق لهب الغاز الطبيعي المضغوط في جو من االكسجين و ثاني أكسيد الكربون
على سطح حارق ذو قرص متعدد الثقوب
.لاعرشالا حيهتال ,كيزحنا دذح ,نة اكسي االحرزاق -انكهاخ انذانح :
: ملخـــــص البحــــــث ذعرثز اثعاثاخ غاس ثاي أكسيذ انكزت ي أى انعايم انري ذشارن تشكم سهث في ظازج االحرثاس انحزار. ذمو
ذ انذراسح تثحث انشزط اناجة ذافزا نحزق انغاس انطثيعي تاسطح خهيظ يك ي غاس ثاىأكسيذ انكزت
ذرك انعادو اناذجح ي انحزق تذا االسهب أساسا ي األكسجي عه سطح حارق يك ي لزص يرعذد انثمب.
ثا اكسيذ انكزت تخار اناء انذ يسم ذكثيف نيرثمي غاسثاىأكسيذ انكزت فمظ يا يسم اعادج ذذيز أ
يح في ذاج ذ انرم انرخهض اآلي ي. ذض ذج انرميح أيضا عذو ذك أكاسيذ انيرزجي تطزق حزاريح.
االحرزاق ذحذياخ عذيذج أا ضزرج ضا ثثاخ اسرمزار انهة اناذج ع االحرزاق عذو اطفاء ف يذ اسع
ي ظزف انرشغيم انخرهفح.
جحد انذراسح في انحصل عهي نة يسرمز عذ حزق انغاس انطثيعي تذ انرميح حذدخ انذ اناسة نسة كرهح
ان كرهح انلد عذ سة أكسجي يخرهفح في انخهيظ انؤكسذ كا حذدخ انذراسح اآلنياخ انخرهفح انخهيظ انؤكسذ
الطفاء انهة عذ ذخطىذ انسة انحزجح. أيضا لايد انذراسح تمارح ذ انسة انحزجح تظائزا ف حانح انحزق
سع السرمزار انهة عذ ثثاخ انظزف اآلخز.ف ج ي اناء جذخ أ انحزق ف ج ي اناء يفز يذ أ
حذدخ انذراسحأيضا يذىانسة انحزجح نكرهح األكسجي في انخهيظ انؤكسذ انري يجة عذو ذخطيا عذ ثثاخ سث كرهح
انحذ األلصي % 29انخهيظ انؤكسذ ان كرهح انلد جذذأ انحذ األدي نسثح األكسجي في انخهيظ انؤكسذ
حذدخ انذراسح اآلنياخ انخرهفح الطفاء انهة عذ ذخطي ذ انسة انحزجح. % 02
5
انهخض
تعتبررانبعبعاتررازنثررا نترراعانكربرر منبأرابررعصنمررصنكيررشنبأععبمررسنبأتررانتهرراا نبهرررسنبرر ب ن رران ررايا نبالحتباسنبأحاباى.نتقعشنيذهنبأماببر نببحرانبأهراعلنبأعبترانتعب ايرانأحرازنبأطرا نبألب عرانبعببرل ن ر لن.نمرررعصنمررصنثررا ىنترراع نكربرر منبأرابررعصنعنبطربررت صنك رر نبررل نحرراازنمرررعصنمررصن ررا نمتعررممنبأتقررعا
تترعصنبأععبمشنبأعاتت نمصنبأحازنبهذبنبالب عانكبابانمصنتاع نبرب منبأرابرعصنعنب راانبأمرالنبأرذىن برهسنترت فر نأ تبقررانثا ترراع نكربرر منبأرابررعصن قرلنممرران بررهسنبكررام نتررمع اهنكعنبأرت نب مررصنمعرر .نت ررمصنيررذ ن
نبأتقع نك انكمشنترعصنكراب منبأع تاعت صنبلازنحابا .نن
تقع ن انبالحتابزنتحم ازنكم م نكيمهان اعا ن ماصنتبازنعنببتقابانبأ هانبأعاتجنتعبت نيذهنبأ كصنبالحتابزنعنكمشنبعلفالهن نممىنعببعنمصن اعفنبأتهط سنبأم ت ف .
ن
عتحررزنبأماببرر ن ررانبأحيررعسنك ررانأهررانمبررتقانكعررمنحررازنبأطررا نبألب عررانبهررذهنبأتقع رر نعحررممزنمنبأررر نرت ررر نبأع رررعمنكعرررمنعبرررانكربرررت صنم ت فررر ن رررانبأ ررر لنبأمرررمىنبأمعابرررانأعبرررانرت ررر نبأ ررر لنبأم ربررر
بأم ربمنرمانحممزنبأمابب نب أ ازنبأم ت ف نالعلفالنبأ هانكعمنت ل نيذهنبأعبانبأحات .نك ان امرزنبأمابب نبمقااع نيذهنبأعبانبأحات نبع ائايران ر نحاأر نبأحرازن ر نترعنمرصنبأهرعبلنعنعترمزنكصنبأحرازن ر ن
نكعبعنالبتقابانبأ هانكعمنتبازنبأ اعفنب اى.ننتعنمصنبأهعبلن ع انممى
حممزنبأماببر نك رانمرمىنبأعبرانبأحاتر نأرت ر نبطربرت صن رانبأ ر لنبأم ربرمنبأتران ترانكرمشنت ل هانكعمنتبازنعبرب نرت ر نبأ ر لنبأم ربرمنبأر نرت ر نبأع رعمنععترمزنكصنبأحرمنبطمعرانأعبرب نبطربرت صن
حرممزنبأماببر نب أ رازنبأم ت فر نالعلفرالنن%نعن24 يرانيرعنبأحرمنبط%نعنن03 انبأ لنبأم ربمنيعنامزنبأمابب نك انبتعت زنهرسنعنلعسنعنأعصنبأ هانبأعاتجنكرصنبأ هانكعمنت لانيذهنبأعبانبأحات .ن
حررازنبأطررا نبألب عررانبهرررذهنبأتقع رر ن رر ن ررراعفنتهررط سنمبررتقا نم ت فرر نعنمقااعتهرررانمررعنبأحرراالزنبأمعرررا ا نعتررمزنبأماببرر نكصنمررمىنببررتقابانبأ هرران رر مبمن رر نحاأرر نبأحررازن رر نتررعنمررصننأ حررازن رر نتررعنمررصنبأهررعبل.
بأهررعبلنباأمقااعرر نمررعنبأحررازن ررر نتررعنمررصن رر لنترراع نكربررر منبأرابررعصنعنبطربررت ص نكعررمنتبررازنبأ ررراعفنب رراىنعنعتررمزنكصنببررتقابانبأ هرران تحبررصنمررعن ررام نمعررمالزنتررم زنبأ رر لنبأم ربررمنكعنبأهررعبلنعنذأرر ن
عن مبمنببتقابانبأ هانك انمعن ام نعبب نبطربت صن نبأ لنبأم ربم.نبهررسنكراشنأ ام نبال لابان مبمنلعسنبأ ها
نحاأ نبأحازن نتعنمرصن ر لنتراع نكربر منبأرابرعصنعنبطربرت صنكرصنع راهن ر نحاأر نبأحرازنأ ان نتعنمرصن نبأهعبلنعنيعنكعيانياشن عبط نك ذهن نبالكتباانكعمنتعم سنكع م نبأحا زنبأعام نحا
.بأهعبل