monte carlo methods for the study of cation ordering in minerals
TRANSCRIPT
Monte Carlo methods for thestudy of cation ordering in minerals
M C WARREN12 M T DOVE
1 E R MYERS13 A BOSENICK
14 E J PALIN1 C I SAINZ-DIAZ
5B S GUITON1 AND S A T REDFERN1
1 Department of Earth Sciences University of Cambridge Downing Street Cambridge CB2 3EQ UK2 Present address Department of Earth Sciences The University of Manchester Manchester M13 9PL UK3 Present address Department of Pure Mathematics and Mathematical Statistics University of Cambridge 16 MillLane Cambridge CB2 1SB UK4 Present address Martenshofweg 9 24109 Kiel Germany5 Estacion Experimental del Zaidin CSIC C Profesor Albareda 1 18008-Granada Spain
ABSTRACT
This paper reviews recent applications of Monte Carlo methods for the study of cation ordering inminerals We describe the program Ossia99 designed for the simulation of complex ordering processesand for use on parallel computers A number of applications for the study of long-range and short-rangeorder are described including the use of the Monte Carlo methods to compute quantities measured inan NMR experiment The method of thermodynamic integration for the determination of the freeenergy is described in some detail and several applications of the method to determine thethermodynamics of disordered systems are outlined
KEY WORDS Monte Carlo simulation cation ordering NMR phase transitions aluminosilicates
Introduction
THE Monte Carlo (MC) method was invented as atool to generate con gurations of a system fromwhich to calculate thermodynamic averages It isan ideal tool for the computational study ofordering processes in solids when the energy of acon guration can be described by a modelHamiltonian The MC method which is describedin detail in the following section is simple toimplement but extremely powerful in that itallows the generation of many con gurations of asample from which thermodynamic averages canbe calculated
In this paper we describe the implementation ofa MC strategy for the simulation of cationordering in minerals which is based on the useof model interactions as discussed in the previouspaper (Bosenick et al 2001a) and which has
been used in a wide variety of applications(Thayaparam et al 1994 1996 Dove 1999Dove et al 1996 2000 Bosenick et al 2000Warren et al 2000ab) In fact the basicequations and their implementation are appro-priate for any system with atomic orderingincluding metal alloys and ceramic oxidesHowever in this paper we are particularlymotivated by ordering processes such as theordering of AlSi cations on tetrahedral sites orMgAl cations on octahedral sites and even morecomplicated ordering processes Thus the basicHamiltonian expressions and analysis toolsdiscussed in this paper are those most appropriatefor these types of ordering processes The MCmethod can be used for the study of systems withordering phase transitions solid solutions inwhich there is no long-range order and non-convergent ordering processes The MC methodwill give information about both long-range andshort-range order We describe here a number ofexamples of the use of the MC method for studiesof a wide range of ordering processes
2001 The Mineralogical Society
E-mail martinesccamacuk Corresponding author
Mineralogical Magazine April 2001 Vol 65(2) pp 221ndash248
One of the purposes of this paper is to describethe details of an implementation of the MCmethod for massively parallel processor (MPP)machines These are computers that contain manyseparate processors and which therefore canperform many calculations in parallel There areseveral ways in which a simulation procedure canbe parallelized for MPP machines because thereare usually several parallel aspects to the problemSome of these are inherent to the simulationmethod and some to the scienti c applicationsusing the methods We will discuss these issueswith respect to the implementation for MPP
The discussion of the MC method as applied tothe study of cation ordering is developedfollowing speci c approaches with a commonset of examples linking the separate aspects of thediscussions In the next section we describe theMC method its application to the study of cationordering processes and our implementation usingMPP machines We then discuss the use of MCmethods to study long-range order followed by adiscussion of calculations of short-range order andthe link to NMR experiments The third area ofdiscussion is the application of thermodynamicintegration methods to determine thermodynamicproperties
The Monte Carlo method
The basics of the Monte Carlo methodThe simplest implementation of the MC method isfor a system containing spins that point up ordown which are represented by the variable swith values +1 and 1 respectively Consider thecase of a simple antiferromagnetic IsingHamiltonian
H = Ji j
sisj
where the angle brackets are used to denote thatthe sum is over all relevant pairs of neighbouringspins i and j At zero temperature if J gt 0 thelowest energy state has neighbouring spins ofopposite value giving the most negative energyallowed On heating the entropic term in the freeenergy allows some of the spin values to changesign and eventually at a temperature above acritical temperature all spins have equal prob-ability of having each of the two possible valuesThere is no analytic expression for the free energyof this Hamiltonian in three dimensions and in acase like this the MC method provides acomputational method to study the behaviour of
the Hamiltonian We will discuss later how thecase of cation ordering can be represented by aHamiltonian that is very similar to the IsingHamiltonian with the spin variables being used tode ne the occupancy of a given site
The MC procedure is relatively straightforwardin principle (Yeomans 1992) We consider asample containing many spins with a Hamiltonianof the form of the Ising model and we areinterested in the behaviour at temperature TSuppose that a possible change in the systemcauses an energy change E E + DE In the MCmethod a change in the con guration is proposedat random For the Ising model this willcorrespond to changing the sign of a spinchosen at random If the energy change isnegative or zero the change is accepted On theother hand if the change in energy is positive thechange is accepted with probability
P(E E + DE) = exp( bDE)
where b = 1kBT This allows for changes that areunfavourable with respect to energy but of coursesome of these changes will be favourable withrespect to the free energy because of thecorresponding increase in entropy and they canbe accessed through the normal thermal uctua-tions The MC method allows for the calculationof a representative set of states in the total phasespace of the system with the correct thermo-dynamic weighting (ie higher energy states aregenerated less often) The procedure of proposingand testing changes in the con guration followedby accepting or rejecting them is repeated formany steps If the system is started in a non-equilibrium state the rst steps will correspond tothe system relaxing to an equilibrium state Sincecon guration changes corresponding to largedisplacements of ions (eg swapping a pair ofions many unit cells apart) can occur the kineticsof this process are very different to those of thereal system As a result kinetic barriers in the realsystem are often eliminated in the MC methodbut if the set of possible trial changes is not largeequilibrium can still be hard to reach
The con gurations generated after a reasonableperiod of relaxation can then be used to performcalculations of average properties For examplethe order parameter in the Ising model will havethe form
Q1N j
sj
222
MCWARREN ETAL
where the speci c signs depend on the actual sitein the lattice In the MC method it is possible tocalculate the order parameter for each con gura-tion and then simply obtaining the grand averageQ after many steps Since the MC method
ensures that each con guration has the correctthermodynamic weighting the average calculatedfrom the MC method is a good approximation tothe true thermodynamic average Similarly theaverage energy E can also be calculated If onealso calculates the corresponding mean squaredvalues Q2 and E2 the susceptibility and heatcapacity associated with the ordering interactionscan be obtained from standard thermodynamicequations (Yeomans 1992)
w = b( Q2 Q 2)
C = kBb2( E2 E 2)
For accurate calculations it is necessary forthe MC simulation to sample many con gura-tions In the MC method as in any simulationmethod the issue of statistical sampling iscritical and there will be errors associated withany calculation that re ect the quality of thestatistical sampling of the complete set ofcon gurations For quantities that depend onthe differences between averages as in theequations for w and C the issue of statisticalsampling is even more critical Coupled with theissue of the need to generate many MCcon gurations for statistical accuracy is theissue of sample size At an ordering phasetransition the values of both w and C willdiverge At temperatures close to a second-orderphase transition the nite size of the sample willcause these diverges to be rounded This problemis minimized (but never removed) by usinglarger samples This will be illustrated in oneof the examples discussed later in this paper
Implementation for cation ordering
In the previous paper (Bosenick et al 2001a) weshowed that the energy of an ensemble containingtwo types of atoms which we labelled A and Bcan be represented as
NAAJ + E0
where NAA is the number of A A bonds E0 is aconstant term and the exchange energy J iswritten as
J = EAA + EBB 2EAB
The dependence on the number of B B andA B bonds is subsumed into the two terms in theenergy since the numbers of both types of bondsare completely determined by NAA In thepreceding paper (Bosenick et al 2001a) weoutlined how this energy expression can begeneralized for different cases and how it willbe expanded by taking account of different typesof neighbouring atomic sites
By itself this energy expression is notparticularly useful for MC simulations since itis effectively an ensemble sum and we will beinterested in the ordering on individual sites inorder to calculate quantities such as the orderparameter We therefore need to de ne a variableassociated with each site that characterizes theoccupancy of this site Using the two-atomexample we can de ne a variable Sj associatedwith site j such that Sj = 1 if the site is occupied byan A atom and Sj = 0 if it is occupied by a Batom If we take two sites i and j the product SiSj
= 1 if both sites are occupied by A atoms and theproduct is zero otherwise Thus we have
NAA =i j
SiSj
We use the bracket notation i j in thesummation to denote a sum over all interactions(each counted once) rather than a double sum overall atoms (which would count each pair of atomstwice) we will use this nomenclaturethroughout this paper Similarly the number ofA atoms is simply given by
NA =j
Sj
The energy can therefore be expressed in theform of the following Hamiltonian
H =i j
JijSiSj +i
mjSj
where the rst term is the energy associated withthe bonds and the second is a chemical potentialthat operates if A atoms prefer speci c sites in thecrystal The dependence of the exchange interactionJij on the speci c bond re ects the fact that it willbe different for different types of neighbours Forexample usually the values of Jij are not found tobe signi cantly different from zero when sites areseparated by a large distance and the largest valuesof Jij are found for near-neighbour sites The formof the exchange interactions for different cases isdiscussed in more detail in the preceding papertogether with the methods used to obtain their
MONTE CARLO METHODS AND CATION ORDERING IN MINERALS
223
values from empirical force models or quantummechanical calculations (Bosenick et al 2001a)
It is common to use a lsquospin variablersquo to de nethe occupancy of an atomic site for the case wherethere are two types of atoms One such variablecan be de ned as
sj = 2Sj 1
The spin variables sj have values +1 Whenwe sum over interacting sites (ie including onlybonds with a common value of J) we have termsin the Hamiltonian of the form
i j
SiSjzN4
z2 j
sj14
i j
sisj
The rst term is clearly a constant If there is nochange in composition the second term will alsobe a constant or else it can be represented by achemical potential The third term is thecorrespondence to the bond energy The usualchemical potential term can be added as
j
SjN2
12 j
sj
The main point is that there is exibility in howthe site variables (S s or some variation of these)and hence the Hamiltonian are expressedalthough some care will always be needed toensure that the correct factors are transferredbetween different representations
When there are more than two cations thevariables used to describe the site occupancy willneed to be more than simple two-valuedfunctions For example if there are n cationswe can replace the site variable S by the vector Sof length n which will contain zero valueseverywhere except for the element correspondingto the label of the cation on the site Then theHamiltonian can be written in matrix form
H12
i j
STi J ij S j
j
mTj S j
For example if the sample contained Al Mgand Fe cations the site variables can be de ned as
S Mg100
S Al010
S Fe001
It may be more convenient in this case to storethe index of the non-zero element of S on each
site rather than the whole vector (ie the numbers1 2 or 3 to represent Al Mg or Fe in thisexample) J and m are now of matrix form In thisexample the exchange matrix J would be writtenin diagonal form as
JJAl Al 0 0
0 JMg Mg 00 0 JFe Fe
Implementation on a parallel computer Ossia99
Many scienti c problems have parallelism inseveral different ways The actual MC simulationmay be parallel in its basic construction since itinvolves performing similar operations on manyatoms One can imagine a strategy of splitting theensemble across many processors and updatingseveral sites at once Or one could repeat the samesimulation on each processor each having aseparate list of random numbers in order toimprove statistical sampling and thereby reducethe total running time Likewise the simulationcan be run with a different temperature on eachprocessor Each approach represents a differenttype of parallelism in the problem
We usually tend to work with the third strategyThis is partly motivated by the need to performsimulations at many state points for the calcula-tion of the thermodynamics as discussed belowand the exploitation of this aspect of theparallelism of the problem is easier to implementand more ef cient than splitting a singlesimulation over many processors
We have developed a program called Ossia99for performing MC simulations of cation order onparallel computers The program uses theMessage Passing Interface (MPI) protocol in theprogramming to allow information to be passedbetween processors The amount of communica-tion that is required is kept to a bare minimum byonly passing variables at the start and thencollecting all results only at the end Writing to le is therefore left to the end The process ofreading in data such as the range of temperaturesvalues of exchange interactions and neighbourlists (discussed in more detail below) followed byassigning initial conditions for each processor iscarried out on the master processor All relevantinformation is then passed to all the otherprocessors with each processor being assigned asubset of all the MC runs that are required Eachprocessor performs one equilibration run and oneproduction run for each state point assigned to it
224
MCWARREN ETAL
During the production run various runningaverages are collected and at the end of the runthese are processed into a useful form At the endof all the production runs the results are passedback to the master processor sorted into anappropriate order and then printed by the masterprocessor Each individual processor can also printout its nal con guration to an assigned le Themain operation of Ossia99 is illustrated in Fig 1
Although written for parallel computersOssia99 runs equally as ef ciently on a single-processor workstation Ossia99 assumes the use ofHamiltonians of either scalar or matrix forms andallows for the use of a chemical potentialExtension for many-site interactions is straightfor-ward as was needed in our simulations of MgAlordering in spinel (Warren et al 2000ab)discussed below as one of our main examples
The con guration is de ned in terms of a latticeof unit cells as in a crystal Each unit cellcontains a set of labelled cation sites Theoccupancies of the cation sites in each unit cellare described using the vector S described earlier(speci cally by giving the index of the non-zero
element) which allows the simulation of systemscontaining more than two ordering cations TheMC code is not given information about thestructure of the crystal but only about thetopology of the bonds between sites Thisinformation is provided through the use ofneighbour lists which give for each site in eachunit cell the label and neighbouring unit cell ofeach interacting site Separate neighbour lists foreach site are de ned for each type of exchangeinteraction and are given in terms of the relativeposition in the lattice of the unit cell containingthe neighbouring site For example the site 1 ineach unit cell may interact with site 3 in thesame unit cell and site 3 in the neighbouring unitcell along the x direction The neighbour lists arede ned in the input data le and can be quiteextensive there is a separate neighbour list foreach type of interaction One of the merits of thespreadsheet methods discussed in the previouspaper (Bosenick et al 2001a) is that theneighbour lists can be generated automaticallyThe various exchange interactions are de nedusing a set of matrix functions J
FIG 1 Flowchart illustrating the operation of Ossia99
MONTE CARLO METHODS AND CATION ORDERING IN MINERALS
225
An order parameter can usually be de nedusing the following approach Suppose for a givensite in the unit cell the occupancy with respect toone given type of cation averaged over all unitcells is sj such that sj0 is the average occupancyat T = 0 in the ordered structure and sj is theaverage occupancy as T The orderparameter for this site is then de ned as
Qjsj sj
sj 0 sj
This normalization has been chosen such that Q= 1 for complete long-range order and usually thesite occupancy will be unity when Q = 1 Incomplex systems there may not be an anti-ordered state with Q = 1 An overall orderparameter can be de ned by summing over alltypes of cations and over all sites in the unit cell ifthere is only one overall ordering process or elsedifferent order parameters that are associated withspeci c sites can be treated separately Ossia99allows the calculation of the separate orderparameters for different sites and allows sj tobe calculated assuming a completely randommixture at high temperatures or to be given inthe input le The occupancies of the orderedstructure need to be given as input either byspecifying which cations will occupy which sitesor by giving the occupancies directly Ossia99allows three methods to de ne the orderparameters In the rst the disordered occupan-cies sj are calculated as random averages of allthe cations used in the simulation In the secondthe disordered occupancies sj are given in theinput le A third option allows the weighting ofeach site towards the order parameter to be setindependently to allow for very general orderparameters or semi-ordered states where orderedoccupancies will not all be unity After decidingrelative weightings of sites the exact coef cientsand an additive constant can be found byrequiring Qrandom = 0 and Qordered = 1 In manyordering processes the symmetry of the systemmay allow several ordered states to be degenerateAn example is in the ordering of cations in themica sheets discussed below In this case it isuseful to de ne several order parameters andcompute each of them As one ordering processwill dominate all but one of the order parametersshould have zero value but which one may not beknown in advance
It is always possible that with a complexHamiltonian the structure of the ordered phase
may not be known in advance In such a case theappropriate strategy is to plot the structure after along run having cooled from an initial randomcon guration Ossia99 allows for the nalcon guration on each processor to be written toa le in a form suitable for a structure-plottingprogram such as Cerius21 or CrystalMaker1This is also useful for analysing the structures ofpartially ordered or disordered structures and willgive information relevant for constructing appro-priate order parameters
The main design feature of Ossia99 is that itruns simulations at many temperatures withdifferent temperatures spread over the differentprocessors It is possible to start the simulation inan ordered (cold start) or disordered (hot start)con guration It is also possible to start with apartial degree of order (warm start) for caseswhen chemical composition is not commensuratewith ordering at a unit-cell level This isimplemented by de ning the sites that areoccupied by one set of cations and replacingany of these at random by another set of cationssubject to the nal composition required Therange of temperatures can be set to have equalincrements starting from either cold or hot orelse can be run with equal increments of 1Tagain starting from either cold or hot The lattertype of increment is particularly useful forapplications with thermodynamic integration asdiscussed below
Ossia99 is available from httpwwwesccamacukossia as also is an earlier version Ossia98which was designed speci cally for the case oftwo types of ordering cation The www page alsoprovides a detailed manual
Examples of long-range ordering behaviour
Simple AlSi ordering in a three-dimensional structureIn Fig 2 we show the calculation of the orderparameter Q and inverse susceptibility w 1
calculated for an equal mixture of two types ofcation on an ideal tridymite lattice (Dove 1999Dove et al 2000) The results are typical of theordering behaviour of a simple system with acontinuous change in Q on approaching thetransition temperature from below The resultsare not equivalent to those given by a simplemean- eld type theory such as BraggndashWilliamswhere one would expect the following tworelationships (Yeomans 1992)
Qmft (Tc T)12 wmft |Tc T| 1
226
MCWARREN ETAL
These mean- eld relationships are not found inany of the examples of ordering phase transitionswe will show in this paper Instead Q tends to fallmore rapidly on heating towards Tc Most of themodels we investigate fall into classes for whichthe following variations are found (Yeomans1992)
Q(T Tc) (Tc T)b w(T Tc) |Tc T| g
with b lt 12 (typically closer to 13 for three-dimensional systems or 18 for two-dimensionalsystems) and g gt 1 (typically closer to 43 forthree-dimensional systems)
The results shown in Fig 2 highlight the point(made earlier) about nite sample sizes causing arounding of the phase transition This can be seenas the tail in the order parameter above the phasetransition instead of the order parameter fallingsharply to zero Rounding effects can also be seenin the plot of w 1
Ordering in two-dimensional hexagonal netsrepresentative of cation ordering in mica sheets
In Fig 3 we show a hexagonal net representingthe layers of tetrahedral or octahedral sites in amica Models of the ordering interactions(Bosenick et al 2001a Palin et al 2001) haveshown that the four exchange interactions de nedin Fig 3 are positive for both AlSi and MgAl
ordering with J1 having the largest value and J3
the smallest Thus ordering is driven by the needto minimize the number of neighbours containingthe same types of cations For a 13 ratio of twotypes of cations whether AlSi on the tetrahedralsites or MgAl on the octahedral sites the orderedstructure within a layer is found to be that shownin Fig 3 This is distinguished from other possibleordering processes by the sign of J4 (Palin et al2001) The MC simulations were performed byAlSi ordering in the tetrahedral sites ofmuscovite K2Al4(Si6Al2O20)(OH)4 (Palin et al2001) The ordering phase transition is very sharpas indicated by the temperature dependence of theorder parameter heat capacity and susceptibilityshown in Fig 4 In this gure we compare theordering within isolated layers with the orderingwhen we included three-dimensional interactionsbetween the tetrahedral sheets The main detailsare very similar in both cases except that in thethree-dimensional simulation the transition hasbeen shifted to a slightly higher temperature andthe phase transition is even sharper Detailedanalysis of the results for the order parametershow that on heating up to Tc the order parameterfollows the analytical form of the two-dimen-sional Ising-model order parameter (Yeomans1992)
Q(T Tc) (Tc T)18
0 02 04 06 08 05 06 07 08 09 1
c ndash1
00
02
04
06
08
10
Temperature J
Q
FIG 2 Temperature dependence of the order parameter Q and inverse susceptibility w 1 for a system containingequal numbers of Al and Si cations on a kalsilite (KAlSiO4) network of tetrahedral sites obtained from MC
simulations Different coloured points represent different simulation runs
MONTE CARLO METHODS AND CATION ORDERING IN MINERALS
227
The phase transition in the three-dimensionalsimulation could only be studied starting from afully ordered structure and heating from cold Itappeared that if the simulation started from acompletely random arrangement of cations theindividual layers would order independently oncooling and it was not possible for the orderedarrangements in each layer to then shift to be inregister with their neighbouring layers Whilst thishighlights one of the intrinsic problems of the MCmethod namely that of having only a nitesimulation time it does show that the kineticproblem may be also be faced in establishinglong-range order in natural samples
Using a warm start (as de ned earlier) it waspossible to study how the ordering process withina layer will change when the composition changesfrom 13 towards 17 as found in some micas Theresults are shown in Fig 5 Although a clearphase transition is observed with composition of13 no ordered state was found for a single layerwith 17 composition In this case the interactionsdo not have suf cient range to form a continuous
network between sparse Al cations As theconcentration of Al decreases from 25 thisloss of any long-range ordering process can beseen in Fig 5
Coupled AlSi and MgAl ordering in mica structures
We have explored coupled ordering in the micaphengite K2(Al3Mg)(Si7Al)O20(OH)4 This issimilar to muscovite except that there is acoupled-charge substitution of replacing an Alby Mg in the octahedral layer and the replacementof an Al by Si in the tetrahedral layers Now wehave two ordering processes AlSi in thetetrahedral layers and MgAl in the octahedrallayers with a coupling between the two layersThe development of an appropriate modelHamiltonian is sketched brie y in the previouspaper (Bosenick et al 2001a) The exchangeinteractions within both the tetrahedral andoctahedral layers favour the ordered patternsshown in Fig 3 for both types of layersHowever we now have only half the number of
FIG 3 Hexagonal net representing the two-dimensional layers of tetrahedral or octahedral sites in the mica structureThe two sizescolours of spheres show the ordered patterns for a 13 ratio of two types of cations as given by theexchange interactions for AlSi (Palin et al 2001) or MgAl ordering (from Bosenick et al 2001a) as calculatedusing the methods of Bosenick et al (2001a) The four lines indicate the neighbours for which exchange interactions
were de ned
228
MCWARREN ETAL
Al cations in the tetrahedral sheets and it wasshown in Fig 5 that the tetrahedral sheets on their
own will not order with such a low AlSi ratioHowever ordering is possible when there are
00
02
04
06
08
10
12
0 500 1000 1500 2000 2500 3000
Temperature (K)
0 500 1000 1500 2000 2500 3000
1000 1500 2000 2500 30001000 1500 2000 2500 3000
1000 1500 2000 2500 3000 1000 1500 2000 2500 3000
Ord
er p
aram
eter
Hea
t cap
acity
(ar
bitr
ary
units
)In
vers
e su
scep
tibili
ty (
arbi
trar
y un
its)
Two-dimensional interactions Three-dimensional interations
FIG 4 Temperature dependence of the order parameter heat capacity and inverse susceptibility w 1 for AlSiordering in the tetrahedral sheets in muscovite K2Al4(Si6Al2O20)(OH)4 obtained from MC simulations performedwith and without three-dimensional interactions between neighbouring layers of tetrahedra (Palin et al 2001) The
behaviour close to the transition temperature is like that of a two-dimensional Ising model
MONTE CARLO METHODS AND CATION ORDERING IN MINERALS
229
interactions mediated through other layers In thecase of phengite the MC simulations using themodel Hamiltonian give a more complex orderedstructure as shown in Fig 6 This shows anoctahedral layer with one of its neighbouringtetrahedral layers The exchange interactionsfavour the formation of Al Al pairs onneighbouring octahedral and tetrahedral sheetsand this can best be achieved by having theoctahedral sites order in a way that is lessfavourable for the interactions within the octahe-dral layers Speci cally the favoured layerordering has only third-neighbour Mg Mgpairs but the coupling with the tetrahedrallayers forces the ordering to have only second-neighbour Mg Mg pairs The ordering in thetetrahedral layers is based on that obtained inmuscovite but with half of the Al replaced by SiThis arrangement ensures that there are noMg[6] Al[4] neighbours as seen in Fig 6
The MC simulations also showed an interestingordering sequence On cooling (heating) theordering (disordering) in the tetrahedral layers
does not lock in as a single process but as a two-stage process The rst process on coolinginvolves half the tetrahedral sites becomingoccupied by Si and the other half beingdisordered with 75 occupancy by Si and 25occupancy by Al These sites are indicated inFig 6 This rst process is coupled with theordering on the octahedral sites The second set oftetrahedral sites only order at a temperature abouthalf of that of the rst ordering process Thedetails of this ordering sequence are still beinginvestigated but are described here to illustratethe point that relatively complicated behaviourcan arise when a system contains competingordering processes
Non-convergent ordering in spinel MgAl2O4
The ordering process in spinel involves exchangeof Mg and Al cations between octahedral andtetrahedral sites This process does not involve achange in symmetry and therefore does notprecipitate a phase transition but there are many
0
02
04
06
08
1
12
01 015 02 025
Al component x
Q
Q8
0
05
1
0 5000
Q8
T (K)
1040
940
840
FIG 5 Variation of the order parameter Q for the two-dimensional AlSi ordering phase transition in tetrahedrallayers of muscovite with chemical composition AlxSi1 x The main gure shows the dependence of Q and Q8 on Alcomposition x at low temperatures The inset in the lower right corner shows the temperature dependence of Q8 forthree compositions The phase transitions are very sharp and variations are better seen through plots of Q8 than Qfollowing the comment in the text that in two dimensions the temperature dependence of Q is Q (Tc T)18
230
MCWARREN ETAL
aspects of the ordering process that resemble thebehaviour associated with a phase transition Thistype of ordering process is called non-convergentordering and although there is a not a distinctphase transition many systems displaying non-convergent ordering processes have a temperaturedependence that can be described using methodscommonly applied to the study of phasetransitions (Carpenter et al 1994 Carpenter andSalje 1994)
An order parameter can be de ned that isdetermined by the occupancy of the cations on thetwo types of sites The MC simulations wereperformed using a model Hamiltonian that wasparameterized using ab initio quantum mechanics
methods (Warren et al 2000ab Bosenick et al2001a) The calculated temperature-dependenceof the order parameter is shown in Fig 7 where itis compared with experimental measurementsobtained by neutron diffraction data (Redfern etal 1999 ) The experimental data at lowtemperatures are not able to reach equilibriumvalues because of kinetic constraints and thecomparison with the simulation data is notrelevant At temperatures above 900 K wherethe experimental data do correspond to equili-brium the agreement of the MC results with theexperimental data is very good The remarkablepoint about the level of agreement is that it wasachieved without the use of any experimental data
FIG 6 The ordered structure of phengite K2(Al3Mg)(Si7Al)O20(OH)4 as predicted by the MC simulation using themodel Hamiltonian developed by Bosenick et al (2001a) The structure shows the octahedral layer of MgAl cationsand one neighbouring tetrahedral layer of AlSi cations The cations in both layers are arranged on a hexagonal gridwith the two grids displaced with respect to each other The second tetrahedral layer attached to the octahedral layeris displaced in the opposite direction The tetrahedral layer is drawn above the octahedral layer The Al and Sications in the tetrahedral layer are coloured blue and yellow respectively and the Mg and Al cations in theoctahedral layer are coloured red and green respectively The red vertical arrows indicate the chains of tetrahedralsites that remain disordered with respect to the positions of the Al and Si cations on rst cooling below the
temperature at which the octahedral layer begins to order
MONTE CARLO METHODS AND CATION ORDERING IN MINERALS
231
in the development of the model HamiltonianThe good agreement provides some validation ofthe use of the model Hamiltonian as discussed inBosenick et al (2001a)
Cation ordering in the pyroxene diopside Ca-Tschermaksolid solution
In the solid solution diopsidendashCa-TschermakCa[MgxAl1 x]
VI[Si1+xAl1 x]IVO6 with 0 4 x 4 1
the substitution of Al3+ for Si4+ on the tetrahedralsites is coupled with the substitution of Al3+ forMg2+ on the M1 octahedral sites In the end-member Ca-Tschermak where x = 0 half of thetetrahedral sites are occupied by Si and half by Alcations For this pyroxene there are four possiblelong-range ordered structures with completeordering of Al and Si on the tetrahedral chainsconsistent with the Al Al avoidance for nearestneighbour tetrahedral sites along the chains Theircorresponding space groups are C2 C1 P2n andP21n (Okumara et al 1974) Experimentallyonly the disordered high-temperature structure(C2c) has been observed Static lattice energycalculations predict the P21n structure to be themost favourable ordering state energetically TheMC simulations of the ordering process inCa-Tschermak based on a model Hamiltonian
constructed from empirical potential calculationsas described in the previous paper (Bosenick etal 2001a) place the transition from C2c toP21n at a temperature of ~1500 K As will bedescribed below NMR data indicate that thisvalue is an overestimate (Bosenick et al 1999a)and a one-point temperature calibration wouldplace the transition temperature just below1000 K However at temperatures below~1400 K Ca-Tschermak is thermodynamicallyunstable with respect to conversion to grossularand corundum (Gasparik 1984) This explainswhy no ordered Ca-Tschermak has been foundexperimentally On the other hand the effects ofthe ordering interactions will be seen in the short-range order at temperatures substantially aboveTc well into the stability range of Ca-Tschermak
In the solid solution x gt 0 there is alsoordering of Al and Mg on the octahedral sites inaddition to ordering of Al and Si on thetetrahedral sites These two ordering processesare not independent because there are interactionsbetween the cations in the tetrahedral andoctahedral sites Because of this complex orderingbehaviour it is not straightforward to derivepossible ordering patterns for the solid-solutioncomposition by theoretical considerations ascould be done for Ca-Tschermak The lowest-
00
02
04
06
08
10
12
0 1000 2000 3000 4000Temperature (K)
Q
FIG 7 Temperature dependence of the order parameter for MgAl non-convergent ordering in spinel calculated byMC simulations (Warren et al 2000ab) and compared with experimental neutron diffraction data (Redfern et al1999) The experimental data for temperatures below 900 K are lower than equilibrium values because of kineticlimitations Three different experimental runs are coloured differently The ordering in these runs follows different
kinetic histories leading to different degrees of order at low temperatures
232
MCWARREN ETAL
energy state based on a set of exchangeinteractions determined by lattice energy calcula-tions (Bosenick et al 2001a) can be determinedfor any composition by MC simulations In thecase of x = 05 Di50CaTs50 the lowest energycon guration given by the MC simulations had arepeating Al Si Si Si arrangement alongt h e t e t r a h e d r a l c h a i n s a r e p e a t i n g
Mg Al Mg Al arrangement along theoctahedral chain and relative arrangements onthe chains of tetrahedra and octahedra that formAl Al linkages in neighbouring tetrahedral andoctahedral sites In comparison to the high-temperature disordered structure with spacegroup C2c the ordered structure has a unit-cellthat has been doubled in the c direction withspace group C2 This structure is shown in Fig 8The MC simulations of the ordering process showthat the transition temperature for this orderingprocess is substantially below that of the AlSiordering in the CaTs end-member
Short-range order
Short-range order in the MC simulations and NMR dataThe energy computed in a MC simulation arisesdirectly from the short-range interactions whichmeans that information about the short-rangestructure is readily available from the simulationsThere may be many ways of de ning the short-range structure but the most useful procedure formany cases is to compute the components of theshort-range structure that are detected in anexperiment
The most direct experimental technique for themeasurement of short-range order is magic-anglespinning (MAS) NMR (Putnis and Vinograd1999) In principle the spectra from thistechnique for appropriate isotopic species willgive a single peak for each cation of the species ineach different environment There are two factorsthat determine the frequency of each peak in theMAS-NMR spectra The rst is that the speci ctype of site can have a signi cant effect Forexample the crystal structure of cordieriteMg2Al4Si5O18 has two distinct types of tetra-hedral site one of which is in a six-memberedring of tetrahedra and the other in a four-membered ring The frequencies of the peaks inthe spectra can be correlated with the type of siteif the types of site are suf ciently different Incordierite the two types of site can clearly bedistinguished in the MAS-NMR data (Putnis etal 1985) However the intrinsic resolution of the
MAS-NMR spectra means that atoms in verysimilar sites are hard to distinguish So if there is astructural phase transition whether displacive orcation orderdisorder that causes two sites that areequivalent in one phase to become inequivalent inthe other it is quite possible that the splitting ofthe peak will not be easily resolved The secondfactor is that there are shifts in the positions ofpeaks due to differences in the local environmentsof sites that are equivalent on average Forexample in cordierite it is possible to distinguishseparate peaks in the spectrum associated with Sihaving different numbers of Al cations (from 0 to4) in the neighbouring tetrahedral sites (Putnis etal 1985) For the pyropendashgrossular garnet solidsolution it was possible to resolve the effects onthe Si-MAS-NMR spectra of changing thenumber of MgCa cations in both the rst andsecond co-ordination shells (Bosenick et al1995 1999b) These different environmentscorrespond to different types of small clusters ofcations In principle the intensities of the peaksassociated with each type of environment in anysystem will directly give the relative proportionsof the different types of clusters From an analysisof the statistics of bonds (as discussed in theprevious paper Bosenick et al 2001a) it is alsopossible at least in principle to use the MAS-NMR data to determine the numbers of othertypes of bonds such as the numbers of Al Allinkages
The relative proportions of the clusters ofcations corresponding to those detected in anMAS-NMR experiment are easy to calculate in aMC simulation with Ossia99 (although thede nitions need to be given by the user at thestart of the simulation and some manipulation ofthe code will be necessary) The calculation of theMAS-NMR cluster proportions is useful in threerespects First it enables comparison to be madebetween MAS-NMR results and the thermo-dynamic state of the material which can becalculated in the MC simulation using methodsoutlined later Second the comparison of the MCresults with MAS-NMR data enables the simula-tion to be better calibrated For example it maybe shown whether the temperature scale in thesimulations which is set by the energy scale ofthe model Hamiltonian is accurate Thirdassuming that the energy scale of the model isaccurate the correlation of MC results andexperimental MAS-NMR data for materials thatare prepared under non-equilibrium conditionsmay provide information about the state of
MONTE CARLO METHODS AND CATION ORDERING IN MINERALS
233
ordering and the balance between long-range andshort-range order in the material
The discussion here has assumed that the MAS-NMR data can be interpreted unambiguouslyHowever it is often the case that peaks in theMAS-NMR spectra overlap so that it is notpossible to obtain the intensities of all individualpeaks separately This was found for some of the
garnet compositions studied by Bosenick et al(1995) However a good MC simulation willfacilitate interpretation of MAS-NMR data Thisis one of the applications that will characterizeour examples given below
It is important to remark regarding thecomparison between experimental MAS-NMRdata and the results of the MC simulations that
FIG 8 Predicted ordered structure of the 5050 diopsidendashCa-Tschermak structure The SiO4 tetrahedra are colouredblue the MgO6 octahedra are coloured yellow and the AlO4 tetrahedra and AlO6 octahedra are coloured green TheCa cations are not drawn in order to assist clarity The ordered structure was obtained by MC simulation cooling to
low temperature using a model Hamiltonian with exchange interactions described in Bosenick et al (2001a)
234
MCWARREN ETAL
one might expect that even a poor model couldgive a reasonable level of agreement withexperimental data This is because only a smallfraction of all possible con gurations areencompassed in the subset between fully orderedand fully disordered and if the MC Hamiltoniangives the correct ordered structure it may be thatthe main features of the MAS-NMR data(particularly whether peaks are strong or weak)will be relatively easy to reproduce
Short-range order in the garnet pyrope^grossular solidsolution
In Fig 9 we show the temperature dependence ofthe intensities of the stronger MAS-NMR peaks inthe garnet pyropendashgrossular solid solution(MgxCa1 x)3Si3Al2O12 calculated in the MCsimulations and measured experimentally(Bosenick et al 1995 1999b) In this case theMAS-NMR technique is sensitive to the presenceof both rst and second-neighbour shells of atomsabout the Si cations The rst shell contains2 MgCa cations and the second shell contains4 MgCa cations The rst shell can be occupiedin three different ways (2Mg0Ca 1Mg1Ca or0Mg2Ca) while there are ve ways to occupy thesecond shell (4Mg0Ca 3Mg1Ca 2Mg2Ca1Mg3Ca or 0Mg4Ca) The combination ofdifferent rst and second shell con gurationsresults in 365 = 15 different possible MgCaclusters In Fig 9 the clusters have been labelledaccording to the dominant cation in the rst andsecond shell For example for Mg-rich composi-tion in the cluster (24) the rst and second shellare only occupied by Mg-cations and in thecluster (10) the rst shell contains 1 Mg and 1 Cacation while the second shell has 4 Ca cations
In principle each of the 15 clusters shouldcorrespond to an individual 29Si MAS-NMRresonance However in practice some of theclusters have very similar chemical shifts andtherefore their peaks overlap in the MAS-NMRspectra Therefore not all of the observed MAS-NMR resonances can be assigned unequivocallyto speci c clusters In addition depending on thegarnet composition some of the clusters have alow occupancy and their MAS-NMR peaks werenot observed experimentally This may have ledto systematic errors in the determination of therelative MAS-NMR resonance intensities whichwill affect the comparison with the simulationdata Another reason why the correspondencebetween MAS-NMR intensities calculated in the
MC simulations and the experimental data is notas good as possible could be related toinadequacies in the simulation methods Forexample the model used in the simulation issymmetric for compositions either side of themidpoint of the solid solution (Bosenick et al1999a 2000 2001ab) and this symmetry maynot be present in the experimental data (seediscussion in Bosenick et al 2001b)
Aside from the details of the comparisonbetween the experimental data and the MCsimulation one important aspect of the compar-ison between the calculated and observed MAS-NMR cluster probabilities is the extent to whichthey depart from their random values and howthe probabilities change as a function oftemperature In this regard the simulations havemixed success in particular they are better forthe dilute mixtures than for compositions nearer50 In the case of Mix 8515 the simulationsre ect the experimental data on Py85Gr15 in thatthere is little departure from the random valuesand very little variation with temperature ForMix 7525 the trends in the resonance intensitiesobserved in the MAS-NMR spectra of Py75Gr25synthesized at different temperatures are inagreement with those predicted with the MCsimulations The proportions of clusters (24) and(14) increase while those of clusters (23) and(13) decrease simultaneously However in theexperiment the proportion of cluster (24)becomes larger than that of cluster (23) for thelowest synthesis temperature This crossover isnot predicted in the simulation
Short-range order in muscovite
Our second example of the calculation of short-range order is for AlSi ordering in muscoviteFigure 10 shows the calculated temperaturedependence of the Si MAS-NMR spectra inwhich different peaks correspond to differentnumbers of Al neighbours The MAS-NMRspectra change on cooling as the short-rangeorder within the tetrahedral layers drives theformation of long- range order One striking pointis that the calculated intensities only approach thevalues for completely random order at extremelyhigh temperatures (well above the melting andvapour temperatures)
There have been several MAS-NMR studies ofmuscovite at ambient temperature with attemptsto interpret the data in terms of different modelsof order and ordering mechanisms (Herrero et al
MONTE CARLO METHODS AND CATION ORDERING IN MINERALS
235
200 400 600 800 1000 1200 1400 16001800 20000
10
20
30
40
50
12 2213 + 20
14 + 21
23
24
2212
13
14
23
24
Mix 8515N
MR
-clu
ster
occ
upan
cy (
)
200 400 600 800 1000 1200 1400 1600 1800 2000
0
5
10
15
20
25
11 + 04
12
22
13 + 20
14 + 21
23
24
21
1222
14
13
24
23
Mix 7525
200 400 600 800 10001200 1400 1600 1800 2000
0
5
10
15
20
25
21
11
1412
24
22
1323
Mix 7030
200 400 600 800 1000 1200 1400 1600 1800 2000
0
5
10
15
20
25
Gr60Py60
11
12
13
24
22
14
23
11
13
12
Mix 6040
200 400 600 800 1000 1200 1400 16001800 2000
0
5
10
15
20
25
30
2214 + 23
11
13
12
23 = 01
21 = 03
22 = 02
14 = 10
13 = 11
12Mix 5050
Temperature (K)
FIG 9 Temperature dependence of the 29Si MAS-NMR peak intensities in the pyropendashgrossular solid solutioncalculated by MC simulations (Bosenick et al 2000) and compared with experimental data (Bosenick et al 19951999b) The labels on the lines represent the occupancies of the two shells of MgCa sites around the Si tetrahedral
site and are de ned in the text
236
MCWARREN ETAL
1985 1986 1987 1989 Herrero and Sanz 1991Circone et al 1991) The experimental data wereobtained for different compositions and valuesextrapolated for the simulation samples are givenin Fig 10 For both sets of data (Herrero et al1987 Circone et al 1991) the intensities of the
peaks in the MAS-NMR spectra when comparedto the MC results correspond to temperatures justabove the temperature at which long-range orderis established At this temperature there is areasonable amount of short-range order Thisimplies that muscovite is formed with a high-
00
02
04
06
08
10
12
0 500 1000 1500 2000 2500 3000
00
02
04
06
08
10
12
0 500 1000 1500 2000 2500 3000
Temperature (K)
NM
R p
eak
inte
nsiti
es (
rela
tive
units
)
Two-dimensional interactions
Three-dimensional interactions
1Al2Si
2Al1Si
0Al3Si
FIG 10 Temperature dependence of the 29Si MAS-NMR peak intensities in muscovite calculated by MC simulationsusing both two-dimensional and three-dimensional models (Palin et al 2001) The red horizontal lines on the righthand side of each plot represent the experimental values interpolated from the data of Herrero et al (1987) asdiscussed by Palin et al (2000) The important point is that the experimental data are consistent with no long-rangeorder but considerable short-range order corresponding to an equilibrium temperature just above the transition
temperature for long-range order
MONTE CARLO METHODS AND CATION ORDERING IN MINERALS
237
temperature distribution of cations that is thenfrozen into the structure as a non-equilibrium stateof order The point of interest here is that the MCsimulations were able to give a clear interpreta-tion of the MAS-NMR results that was notpossible otherwise
Short-range order in the diopside^Ca-Tschermak solidsolution
29Si MAS-NMR spectroscopy data for severalcompositions in the diopsidendashCa-Tschermak solidsolution series are shown in Fig 11 (our own datareported by Bosenick et al 1999a which are inaccord with the data of Millard and Luth 1998)In the end-member Ca-Tschermak 29Si MAS-NMR spectroscopy gives the AlSi distributionaround the 29Si nuclei in the tetrahedral chainsFigure 12a shows the temperature dependence ofthe three MAS-NMR clusters (2Si0Al 1Si1Al0Si2Al) from MC simulations The relative peakintensities observed for a synthetic Ca-Tschermaksynthesized at 1748 K match the MC occupanciesat a temperature of ~2700 K When this data pointis used to perform a one-point temperaturecalibration of the MC temperature scale thetransition temperature for the ordering phasetransition is shifted from ~ 1500 K to below1000 K (as discussed above in the section onlong-range order)
The 29Si MAS-NMR spectra of members of thediopside-Ca-Tschermak solid-solution shown inFig 11 have four broad resonances (Millard andLuth 1998 Bosenick et al 1999a) Hence inaddition to the AlSi distribution on the twoneighbouring corner-sharing tetrahedra the 29SiMAS-NMR spectroscopy must also be sensitiveto different second-shell neighbours in the solid-solutions These second neighbours correspond tothree neighbouring M1 octahedra that are corner-shared with the tetrahedron that contains a 29Sinucleus In the solid-solution they can beoccupied in four different ways 3Mg0Al2Mg1Al 1Mg2Al or 0Mg3Al We ignore thefact that these three M1 octahedra are notsymmetrically arranged around the tetrahedronA combination of all possible rst and secondshell con gurations results in 364 = 12 differentclusters The clusters will be labelled according tothe number of Al neighbours on tetrahedral andoctahedral sites ie (nAlIVnAlVI)
The assignment of the resonance peaks in theMAS-NMR spectra to the different clusters iscomplicated by the fact that the substitution of Al
for Si in the neighbouring tetrahedral sites resultsin a positive change in the chemical shift whereasthe substitution of Al for Mg on the corner-sharing octahedra results in a negative change inthe chemical shift The absolute changes in thechemical shifts should be larger for a substitutionin the 1st shell compared to a substitution on the2nd shell because of the smaller distance to theMAS-NMR active nuclei However as only fourbroad resonances are observed in comparison tothe twelve possible clusters it is clear that severalclusters must have similar chemical shifts and thatpeak overlapping is present in the spectra Thisproblem is not uncommon in the use of MAS-NMR methods to study cation order and thefollowing discussion will show how MC simula-tions can be used to help interpret the MAS-NMRspectra
The temperature dependence of the relativeoccupancy of the 12 clusters in Di50CaTs50determined with MC simulations is plotted inFig 12b Above the transition temperature thereare no dramatic changes in the cluster occupancyIn the lower part of Fig 12b we compare theexperimental MAS-NMR peak intensities withtwo different MAS-NMR peak assignments iethe occupancies of those clusters that are believedto overlap in the MAS-NMR spectra are summedtogether
The MAS-NMR peak assignment used in thelower left part of Fig 12b is based on the proposalthat the chemical shifts of clusters having 1 2 and3 octahedral Al are very similar and hence thatthe 29Si MAS-NMR is only sensitive to whetherAl is present in the second shell (n Al) or not (n 0)(Millard and Luth 1998 Putnis and Vinograd1999) The agreement between this interpretationof the observed MAS-NMR intensities and theMAS-NMR cluster occupancies from the MCsimulations is very poor For example the relativeintensity of the MAS-NMR peak at 806 ppm is33 but the combination of the occupancies ofclusters (10) and (2Al) where cluster (2Al) isthe sum of clusters (21) (22) and (23) gives amaximum relative intensity of 11 Thesediscrepancies are unlikely to be due to inadequa-cies in the MC simulations but instead theyprobably indicate that the peak assignment is notcorrect Based on the cluster occupancies from theMC simulations a modi ed peak assignment hasbeen obtained and is given in the lower right partof Fig 12b This new assignment results in amuch better agreement with the observed MAS-NMR peak intensities and also gives a much
238
MCWARREN ETAL
better agreement with the experimental MAS-NMR data for compositions Di75CaTs25 andDi25CaTs75 The MAS-NMR data have thusbeen interpreted using the MC results to give an
assignment that might not otherwise have beenfound This is an example of how the MCsimulation method is able to help to derive areliable MAS-NMR peak assignment which
Diopside
Di75CaTs25
Di50CaTs50
Di25CaTs75
Ca-Tschermak
+nAl6+nAl4
(00)
(2Al)(10)
(1Al)(00)
(20) (0Al)
(23)
(13)
(03)
ndash60 ndash70 ndash80 ndash90 ndash100
NMR shift (ppm)
FIG 11 29Si MAS-NMR spectra of members of the diopsidendashCa-Tschermak solid solution for several differentcompositions previously reported by Bosenick et al (1999b) and consistent with the data of Millard and Luth(1998) The labels represent the interpretation of Putnis and Vinograd (1999) the de nitions are given in the textThe arrows at the top show the directions of the shifts of the peaks due to increases in the number of Al cations in the
neighbouring octahedral and tetrahedral sites (Putnis and Vinograd 1999)
MONTE CARLO METHODS AND CATION ORDERING IN MINERALS
239
Temperature (K)1000 2000 3000 4000
(23)
(13)
(03)
a) CaTs
Clu
ster
occ
upan
cy (
)
0
20
40
60
80
100a
b
Clu
ster
occ
upan
cy (
)
0
10
20
30
40
50
60
70
0
10
20
30
40
50
60
70
1000 2000 1000 2000 3000
Temperature (K)
1000 2000 3000
(01)(11)(21)
(00)(10)(20)
(02)(12)(22)
(0 3)(1 3)(2 3)
Di50CaTs50
(00) + (1A l)
(0A l)
(10) + (2Al)
(20)
(00) + (01)+ (12) + (13)
(10) + (11)+ (22) + (23)
(02) + (03)
(20) + (21)
ndash778 ppmndash806 ppmndash842 ppmndash884 ppm
240
MCWARREN
could not be obtained using self-consistencyarguments and theoretical considerations alone
Thermodynamic integration
Background theoryThermodynamic integration provides a route toobtaining the free energy (and hence also entropy)of ordering from MC simulations The method isnot new but it is not often documented in its
general form and as far as we are aware it has notbeen documented in an appropriate form for thetype of problem we are considering here The ideais to start from a model for which the free energyis known exactly and to work from that solutionto the free energy of the model being studied Theimportant component of the theory is the relationbetween the free energy F and the partitionfunction In a discrete formalism the partitionfunction Z is the sum over all states of the system
(01)(11)(21)
(0 0)(1 0)(2 0)
(02)(12)(22)
(03)(13)(23)
Clu
ster
occ
upan
cy (
)
Di25CaTs75
ndash778 ppmndash806 ppmndash842 ppmndash884 ppm
1000 2000 3000
0
10
20
30
40
50
60
70
0
10
20
30
40
50
60
70 (00) + (1Al)
(10) + (2Al)
(0Al)
(2 0)
(00) + (01)+ (12) + (13)
(10) + (11)+ (22) + (23)
(02) + (03)(20)
+ (21)
1000 2000 1000 2000 3000
Temperature (K)
c
FIG 12 Calculation of 29Si MAS-NMR peak intensities by MC simulation (a) (facing page) the Ca-Tschermak end-member (b) (facing page) the Di50CaTs50 solid solution and (c) the Di25CaTs75 solid solution In b and c theupper plot shows the temperature dependence of the 9 peaks expected in the spectra the lower left plot shows thetemperature dependence of the 4 combinations of overlapping peaks assumed as the peak assignment by Putnis andVinograd (1999) and the lower right plot shows a new interpretation based on different combinations of overlapping
peaks All plots show the experimental peak intensities (from Bosenick et al 1999b)
MONTE CARLO METHODS AND CATION ORDERING IN MINERALS
241
Z =j
exp( bEj)
where b = 1kBT (as before) and Ej is the energyof the jth state The energy can be represented bythe Hamiltonian for a given state point in whichcase we could write the partition function as
Zexp bH q dq
dq j
exp bH q j
where q is the vector of the fundamental variablesof the system (such as atom positions) and iseither a continuous variable as in the integralrepresentation or a discrete variable as in thesummation representation For any quantity j(q)that depends on the fundamental variables whichwe now take to be discrete rather than continuousthe average over all con gurations is written as
j = 1Z
jj(qj)exp( bH(qj))
It is impossible to sum over all con gurations butit is found that the way that MC method samples thephase space of con gurations is good enough togive reasonably accurate values of ensembleaverages This statement is proved by the fact thatensemble averages and their standard deviations donot depend on the number of MC steps used in asimulation within the usual limits of statistical noise
The free energy is related to the partitionfunction by
F1b
ln Z
The problem we face in the calculation of F isthat the partition function cannot be computed ina simulation since unlike calculations ofensemble averages it does require calculation ofall terms including those that are of lowprobability The calculation of the free energyrequires a method that is based on the reliablecomputation of ensemble averages and themethod of thermodynamic integration providesthis possibility
The method of thermodynamic integrationrequi res a reference point of a modelHamiltonian for which we know the correspondingfree energy exactly We label this modelHamiltonian as H0 and the corresponding freeenergy is F0 We now de ne the Hamiltonian Hl asa mixture of the actual and model Hamiltonians
Hl = lH + (1 l)H0 = H0 + l(H H0) = H0 + lDH
where l is the mixing parameter which varies invalue between 0 and 1 The last term de nes thedifference quantity DH which we will use belowWe also note for reference below that thedifferential is simply given as qHlql = DH
The free energy can be represented by theintegral
F F0
1
0
Fl
ldl
where Fl is the free energy corresponding to theHamiltonian Hl This can be written in terms ofthe partition function
Zl=j
exp( bHl(qj))
Fl = 1bln Zl = 1
blnj
exp( bHl(qj))
The differential of Fl with respect to l followsas
Fl
l1
bZl
Zl
l
1Zl j
Hl q j
lexp bHl q j
1Zl j
DH q j exp bHl q j
DH l
We have written the last line of this equationexplicitly in order to highlight the fact that thedifferential of Fl is simply equal to the statisticalaverage value of DH calculated from a set ofcon gurations corresponding to the mixedHamiltonian Hl The subscript l on DH l
implies that the average is obtained fromcon gurations generated by the Hamiltonian HlSince average quantities can be calculated withreasonable accuracy we now have a handle on thefree energy
For ordering processes a good modelHamiltonian is the trivial case of having non-interacting cations written mathematically as
H0 = 0
With this choice of model Hamiltonian wehave
Hl = lH DH = H
Hence
Fl
lH l
242
MCWARREN ETAL
This is simply the average energy of a systemsubject to the Hamiltonian lH In practice itmeans running the simulation with interactionscorresponding to the Hamiltonian lH and thencomputing the average energy as if theHamiltonian was really given by H The energyis calculated using H but the simulation thatproduces the con gurations is driven by theHamiltonian lH
A system with the Hamiltonian H0 = 0 willhave complete disorder at all temperatures andthe corresponding free energy F0 will simply beobtained from the con gurational entropy of asystem with a random arrangement If we haveseveral types of atoms on N symmetricallyequivalent sites each with fraction xj we havethe standard result
F0 = Nb 1
jxj lnxj
Taking together the results for qFlql and F0the free energy is given as
F F0
1
0
H ldl
The idea then is to perform calculations of theaverage H l for many values of l and perform anumerical integration The point is that althoughthe MC simulation does not sample the completeset of con gurations the averages that are used inthe integrals can be calculated with suf cientaccuracy to enable the free energy to becalculated with reasonable accuracy
At rst sight it appears costly to have to runthe simulations at many values of l in order todetermine the free energy at a single tempera-ture However it turns out that we can exploitthe situation to enable us to calculate the freeenergy as a function of temperature at no furthercost We noted above that when H0 = 0 Hl = lHThus a simulation performed with Hl attemperature T is equivalent to a simulationperformed with H at temperature Tl = Tl Soif we perform the integration for values of lbetween 0 and lrsquo for a temperature T instead ofbetween 0 and 1 it is equivalent to performingthe integration between 0 and 1 for a temperatureequal to Tlrsquo = Tlrsquo At higher values oftemperature the system is more disordered andthe free energy is closer to the value for arandom system Therefore there is less variationfor different values of l and the number of
points needed to get a good numerical integra-tion is smaller Thus if we run the simulation at agiven temperature for many values of l we canobtain the free energy as a function oftemperature for a wide range of temperaturesabove the notional temperature of the simulationThus we make full use of all the data generatedin the simulation Moreover for each value of lwe can also calculate other ensemble averagessuch as the order parameter or susceptibilitywhich will correspond to the values at atemperature of Tl The only limitation is thatfor numerical integration over l it is better to runthe separate simulations with equal incrementsof l which means that the resultant analysis willhave uniform steps of 1T on the temperaturescale
In the implementation of the method in Ossia99the MC simulation is run for a predeterminednumber nl of equally-spaced values of l between1nl and 1 for a temperature T The nth value isequal to ln = nnl and following the discussionin the previous paragraph corresponds to atemperature Tn = Tln = nlTn The MCsimulation gives the energy El = Hl l forsimulations performed with the Hamiltonian lHfor all values of l at temperature T A separateprogram is used to perform a numerical integra-tion of the values of Ell which are equivalent toH l for all values of l to give the free energy
for temperature T For temperature Tn thenumerical integral is performed for values of lup to ln to give the free energy for thistemperature
Finally we remark that since we have obtainedboth E(T) and F(T) directly from the MCsimulations via the thermodynamic integrationthese two quantities can be combined to give theentropy S(T) using the standard thermodynamicrelation
S TE T F T
T
Thus we can obtain a complete description ofthe thermodynamic properties of a system
This method was used to study the composi-tion and temperature dependence of the thermo-dynamic functions for AlSi ordering ontetrahedral sites of the feldspar structure(Myers et al 1998) Some validation of theresults was provided by the Cluster VariationMethod calculations of Vinograd and Putnis(1998 1999) and Vinograd et al (2001)
MONTE CARLO METHODS AND CATION ORDERING IN MINERALS
243
Thermodynamics of cation ordering in spinelFrom the MC simulations of spinel describedearlier the thermodynamic functions werecalculated using thermodynamic integration(Warren et al 2000ab) These are shown inFig 13 The temperature-dependence of theenthalpy is compared with experimental datafrom Navrotsky and Klappa (1987) in this gureThe baseline values have been adjusted to enablethe experimental and theoretical curves to beplotted together (note that the baseline values arenot de ned on an absolute scale in either case)
The important point of comparison betweenexperiment and theory is the changes of energywith temperature and in this regard theagreement is very good aside from the highest-temperature datum which does not follow thetrend of the other data In Fig 13 the entropy iscompared with the only experimental datumavailable namely an indirect determination atthe single temperature of 1000 K based on phasediagram data (Wood et al 1986) The agreementbetween this one measurement and the MCresults is remarkably good Taken with the
00
50
100
150
-50
00
50
500 1000 1500 2000
Temperature (K)
En
tro
py
(J m
olndash1
Kndash1
)E
nth
alp
y (k
J m
olndash
1)
FIG 13 Thermodynamic functions entropy and enthalpy for the MgAl ordering process in spinel calculated by MCsimulations compared with the few experimental data available The experimental data for enthalpy are from
Navrotsky and Kleppa (1967) and for entropy from Wood et al (1986)
244
MCWARREN ETAL
agreement between the measured and calculatedtemperature dependence of the order parameter(discussed earlier Fig 7) we are able toconclude that the procedure of using a para-meterized Hamiltonian that is obtained from abinitio quantum mechanical calculations is able toreproduce the experimental behaviour remark-ably well It is important to appreciate that noexperimental data were used in any respect in thedetermination of the model Hamiltonian incontrast to empirical potentials which at somestage in their development have been tunedagainst experimental data The point though isnot just that the method gives good agreementwith experimental data but that it can be used toobtain new science insights that cannot bededuced from experiment We now describeone of these insights
The temperature-dependence of the free energyand order parameter calculated by the MCsimulations were tted by a classical Landaufree energy function appropriate for non-conver-gent ordering (Carpenter et al 1994 Carpenterand Salje 1994 Warren et al 2000b) Thisresembles the procedure that is often carried outin experimental studies and was primarily carriedout here in order to provide a numerical test of thepractice In particular we have data for both freeenergy and order parameter whereas it is moreusual to have experimental data only for the orderparameter The tting was carried out only fortemperatures above a minimum temperature inorder to avoid tting to data where effects due tothe second law of thermodynamics not otherwiseincorporated into the Landau theory becomeimportant Two values of the minimum tempera-
ture were tested The results are shown in Fig 14from which it can be seen that the Landaufunction (Carpenter et al 1994 Carpenter andSalje 1994) provides a very good description ofthe high-temperature behaviour of the thermo-dynamics associated with the cation ordering inspinel It is not common to measure free energiesand free energy functions are usually tted only toexperimental data that depend on some derivativeof the free energy In the present case we havebeen able to combine both the free energy and aderivative of the free energy in the tting of aparticular function and have shown that theLandau description works very well Thisprovides a justi cation for tting experimentalmeasurements of the order parameter to a Landauformalism
Entropy of the pyrope^grossular solid solution
The entropy associated with variation of the short-range order across the pyropendashgrossular solutioncalculated in the MC simulations is shown inFig 15 (Bosenick et al 2000) For the moredilute solid solutions there is little variation in theentropy with temperature but for compositions of~11 MgCa the entropy falls considerably oncooling due to the formation of considerableshort-range order It is interesting to compare thescale of the temperature dependence seen in theentropy with that for the calculated MAS-NMRspectra described earlier and shown in Fig 8 It isclear that the entropy is far more sensitive to thedevelopment of short-range ordering than theMAS-NMR results a feature that is also seen inthe pyroxene solid solution (discussed next)
0 1000 2000 3000
ndash30
ndash40
ndash50
ndash60
Temperature (K)
F (
kJ m
olndash1
)
0 1000 2000 3000
10
08
06
04
02
Q
FIG 14 Free energy and order parameter of spinel calculated by the MC simulations and tted by a Landau freeenergy polynomial (after Warren et al 2000b)
MONTE CARLO METHODS AND CATION ORDERING IN MINERALS
245
Entropy of the diopside^Ca-Tschermak solid solution
Studies of the reaction (Gasparik 1984)
3 CaAl2SiO6 gt Ca3Al2Si3O12 + 2 Al2O3
Ca-Tschermack Grossular Corundum
in the temperature range between 1400 1800 Khave shown that the con gurational entropy ofCa-Tschermak is reduced to ~70 of the randomvalue Sran = 1153 J mol 1 K 1
The temperature dependence of the con gura-t ional entropy S of the end- member
Ca-Tschermak calculated in the MC simulationsis shown in Fig 16 Even at temperatures wellabove the ordering-phase transition temperatureshort-range ordering of SiAl in the tetrahedralsites leads to a strong reduction in the entropy Ata temperature of 2700 K which corresponds tothe temperature where the simulated and observedMAS-NMR intensities of Ca-Tschermak matchthe con gurational entropy is 72 J mol 1 K 1Hence because of the existence of short-rangeorder the entropy is reduced to ~65 of the valuefor a completely random arrangement of SiAlcations This is in remarkable agreement with theexperimental observation It is worth noting thatthe change in the entropy (~35) from thecompletely random result is signi cantly largerthan the corresponding change in the MAS-NMRcluster probabilities (~25 at 2700 K) This issimilar to the case of the garnet solid solutiondiscussed above
MC simulations on the solid- solutionsDi75CaTs25 and Di50CaTs50 also predictstrong reductions in the con gurational entropiesIn these members of the solid solution the changesin entropy are much more dramatic than thevariation in the MAS-NMR cluster occupanciesFor example in Di50CaTs50 at 2700 K thereduction in the entropy is 20 from the randomvalue but the changes in the MAS-NMR clusteroccupancies are only 2 In Di75CaTs25 at2700 K the reduction in the entropy is 15smaller than the random value but the variation inthe MAS-NMR cluster occupancies are only ~3The much lower sensitivity of the MAS-NMRcluster occupancies to short-range ordering thanthe sensitivity of the entropy implies that it might
400 600 800 1000 1200 1400 1600 18004
6
8
10
12
14
16
18
Mix 8515
Mix 7525Mix 7030
Mix 6040
Mix 5050
Temperature (K)
Ent
ropy
(J
mol
ndash1 K
ndash1)
FIG 15 Temperature dependence of the entropy formembers of the pyropendashgrossular solid solution calcu-lated by MC simulation (after Bosenick et al 2000)
500 1000 1500 2000 2500 3000 3500 4000
0
2
4
6
8
10
12
Temperature (K)
Ent
ropy
(J
mo
lK)
Di75CaTs25
Di50CaTs50
CaTs
FIG 16 Temperature dependence of the entropy of members of the diopsideCs-Tschermak solid solution calculatedby the MC simulations
246
MCWARREN ETAL
be dif cult to estimate exact entropy values fromMAS-NMR peak intensities This is especially truefor cases where MAS-NMR spectroscopy issensitive to many different cation clustersbecause to rst and second shell interactions asin the case of pyrope-grossular and diopsidendashCa-Tschermak solid-solutions
Conclusions
We have described an implementation of the MCmethod that has been optimized for the study ofcation ordering in complex minerals exploitingthe potential of parallel computers in thedevelopment of the Ossia99 code The approachis to use a parameterized Hamiltonian thatcontains pair interactions to any arbitrarydistance but which can also include site-speci cchemical potential terms and multi-site termsCalculations performed on a wide range ofsystems with different ordering processes haveshown that MC simulations are able to give agood representation of experimental data
We have placed particular emphasis on theability of MC calculations to give informationabout short-range order and thermodynamicproperties The short-range order can be measuredby MAS-NMR spectroscopy which gives directinformation about the relative probabilities offorming small clusters and these clusters caneasily be calculated in an MC simulation Wehave shown however that the direct interpreta-tion of MAS-NMR data can be dif cult and theMC simulations have a signi cant role to play inaiding this interpretation Moreover in somecases it is apparent that the MAS-NMR spectraare less sensitive to changes in overall order thanthe thermodynamic properties These can becalculated in the MC simulations using themethod of thermodynamic integration which aswe have described in this paper lends itself toroutine applications
Acknowledgements
This research has been supported by NERC (GR310606) the EU (Marie Curie fellowship to AB)the Royal Society (travel support for CISD) andAcciones Integradas (UKSpain travel support forCISD and MTD) We are grateful to Julian Gale(Imperial College London) for assistance and forproviding his GULP code The quantummechanics calculations were performed on theparallel computers of the Cambridge High
Performance Computing Facility (funded byEPSRC and the University of Cambridge) Athoughtful review by Richard Harrison is greatlyappreciated
References
Bosenick A Geiger CA Schaller T and Sebald A(1995) An 29Si MAS NMR and IR spectroscopicinvestigation of synthetic pyrope-grossular garnetsolid solutions Amer Mineral 80 691 704
Bosenick A Dove MT Warren MC and Fisher A(1999a) Local cation distribution of Diopside Ca-Tschermak solid solutions A computational and 29SiMAS NMR spectroscopic study Eur J Mineral 9 39
Bosenick A Geiger CA and Phillips BL (1999b)Local Ca-Mg distribution of Mg-rich pyrope-grossular garnets synthesized at different tempera-tures revealed by 29Si MAS NMR spectroscopyAmer Mineral 84 1423 33
Bosenick A Dove MT and Geiger CA (2000)Simulation studies of pyropendashgrossular solid solu-tions Phys Chem Miner 27 398 418
Bosenick A Dove MT Myers ER Palin EJSainz-Diaz CI Guiton B Warren MC CraigMS and Redfern SAT (2001a) Computationalmethods for the study of energies of cationdistributions applications to cation-ordering phasetransitions and solid solutions Mineral Mag 65193 219
Bosenick A Dove MT Heine V and Geiger CA(2001b) Scaling of thermodynamic mixing propertiesin garnet solid solutions Phys Chem Miner (inpress)
Carpenter MA and Salje EKH (1994) Thermo-dynamics of nonconvergent cation ordering inminerals 2 Spinels and the ortho-pyroxene solid-solution Amer Mineral 79 1068 83
Carpenter MA Powell R and Salje EKH (1994)Thermodynamics of nonconvergent cation orderingin minerals 1 An alternative approach AmerMineral 79 1053 67
Circone S Navrotsky A Kitkpatrick RJ andGraham CM (1991) Substitution of [64]Al inphlogopite Mica characterization unit-cell varia-tion 27Al and 29Si MAS-NMR spectroscopy and Al-Si distribution in the tetrahedral sheet AmerMineral 76 1485 501
Dove MT (1999) Orderdisorder phenomena inminerals ordering phase transitions and solidsolutions Pp 451 75 in Microscopic Processes inMinerals (CRA Catlow and K Wright editors)Kluwer The Netherlands
Dove MT Thayaparam S Heine V and HammondsKD (1996) The phenomenon of low AlSi ordering
MONTE CARLO METHODS AND CATION ORDERING IN MINERALS
247
temperatures in aluminosilicate framework struc-tures Amer Mineral 81 349 62
Dove MT Bosenick A Myers ER Warren MCand Redfern SAT (2000) Modelling in relation tocation ordering Phase Trans 71 205 26
Gasparik T (1984) Experimentally determined stabilityof clinopyroxene + garnet + corundum in the systemCaO-MgO-Al2O3-SiO2 Amer Mineral 69 1025 35
Herrero CP and Sanz J (1991) Short-range order ofthe SiAl distribution in layer silicates J PhysChem Solids 52 1129 35
Herrero CP Sanz J and Serratosa JM (1985)Tetrahedral cation ordering in layer silicates by29Si NMR spectroscopy Solid State Comm 53151 4
Herrero CP Sanz J and Serratosa JM (1986) Theelectrostatic enery of micas as a function of Si Altetrahedral ordering J Physics Cond Matter 194169 81
Herrero CP Gregorkiewitz M Sanz J and SerratosaJM (1987) Si-29 MAS-NMR spectroscopy of mica-type silicates - observed and predicted distribution oftetrahedral Al-Si Phys Chem Miner 15 84 90
Herrero CP Sanz J and Serratosa JM (1989)Dispersion of charge de cits in the tetrahedral sheetof phyllosilicates Analysis from 29Si NMR spectraJ Phys Chem 93 4311 5
Millard RL and Luth RW (1998) Tetrahedral SiAldistribution in Di-CaTs clinopyroxenes using 29SiMAS NMR EOS Trans Amer Geophys Union 79S162
Myers ER Heine V and Dove MT (1998)Thermodynamics of AlAl avoidance in the orderingof AlSi tetrahedral framework structures PhysChem Miner 25 457 64
Navrotsky A and Kleppa OJ (1967) The thermo-dynamics of cation distributions in simple spinels JInorg Nucl Chem 29 2701 14
Okamura FP Ghose S and Ohashi H (1974)Structure and crystal chemistry of CalciumTschermakrsquos pyroxene CaAlAlSiO6 AmerMineral 59 549 57
Palin EJ Dove MT Redfern SAT Bosenick ASainz- Diaz C I and Warren MC (2001 )Computational study of tetrahedral Al-Si orderingin muscovite Phys Chem Miner (in press)
Putnis A and Vinograd V (1999) Principles of solid
state NMR spectroscopy and applications todetermining local order in minerals Pp 389 425in Microscopic Processes in Minerals (CRACatlow and K Wright editors) Kluwer TheNetherlands
Putnis A Fyfe CA and Gobbi GC (1985) AlSiordering in cordierite using magic angle spinningNMR 1 Si-29 spectra of synthetic cordierites PhysChem Miner 12 211 6
Redfern SAT Harrison RJ OrsquoNeill HStC andWood DRR (1999) Thermodynamics and kineticsof ordering in MgAl2O4 spinel from 16008C from insitu neutron diffracti on Amer Mineral 84299 310
Thayaparam S Dove MT and Heine V (1994) Acomputer simulation study of AlSi ordering ingehlenite and the paradox of the low transitiontemperature Phys Chem Miner 21 110 6
Thayaparam S Heine V Dove MT and HammondsKD (1996) A computational study of AlSi orderingin cordierite Phys Chem Miner 23 127 39
Vinograd VL and Putnis A (1998) Calculation of thecon gurational entropy of Al Si in layer silicatesusing the cluster variation method Phys ChemMiner 26 135 48
Vinograd VL and Putnis A (1999) The description ofAl Si ordering in aluminosilicates using the clustervariation method Amer Mineral 84 311 24
Vinograd VL Putnis A and Kroll H (2001)Structural discontinuities in plagioclase and con-straints on mixing properties of the low series Acomputational study Mineral Mag 65 1ndash32
Warren MC Dove MT and Redfern SAT (2000a)Ab initio simulations of cation ordering in oxidesapplication to spinel J Phys Cond Matter 12L43 8
Warren MC Dove MT and Redfern SAT (2000b)Disordering of MgAl2O4 spinel from rst principlesMineral Mag 64 311 7
Wood BJ Kirkpatrick RJ and Montez B (1986)Order-disorder phenomena in MgAl2O4 spinel AmerMineral 71 999 1006
Yeomans JM (1992) Statistical Mechanics of PhaseTransitions Oxford University Press New York
[Manuscript received 15 September 2000revised 7 December 2000]
248
MCWARREN ETAL
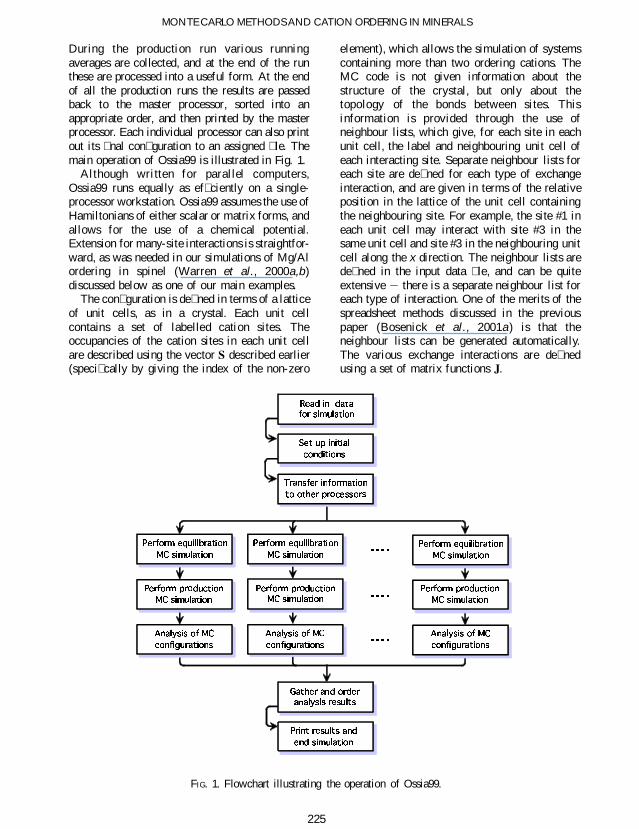
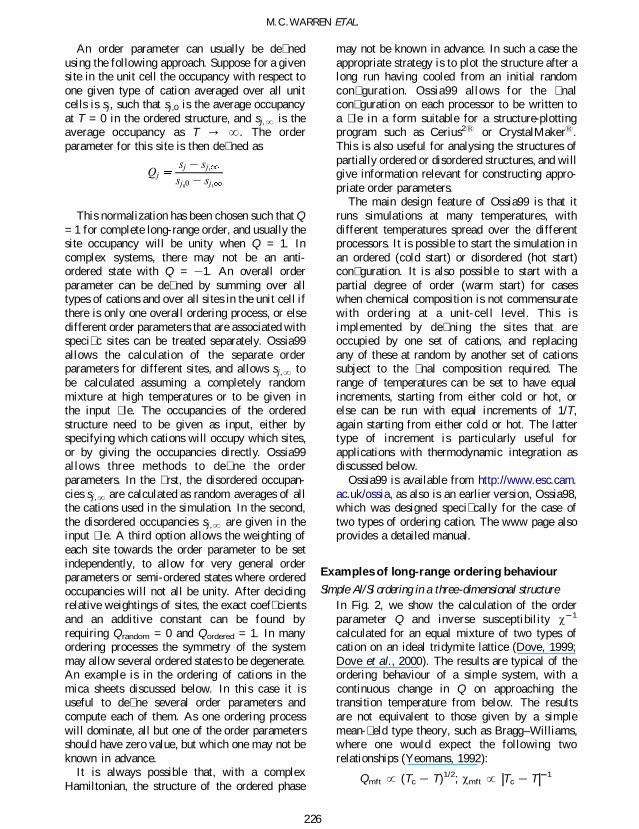
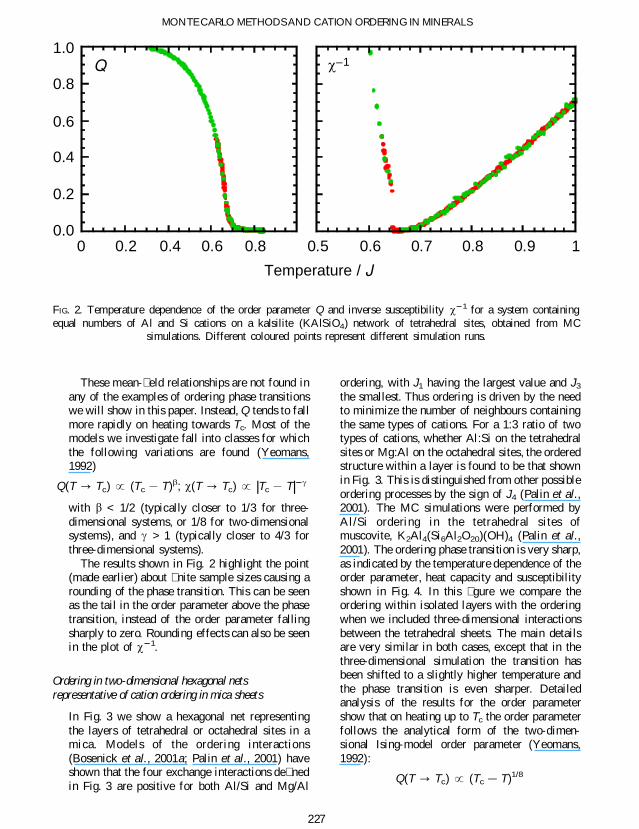
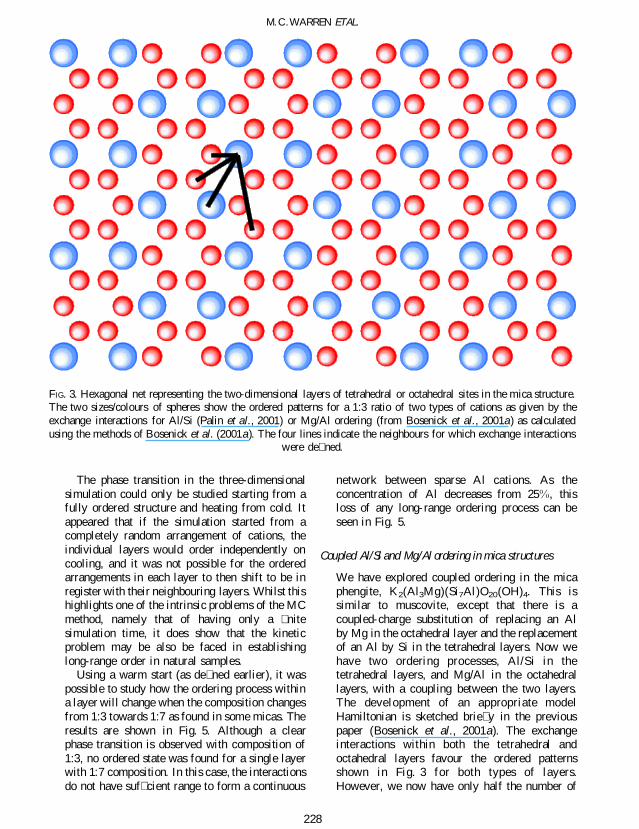
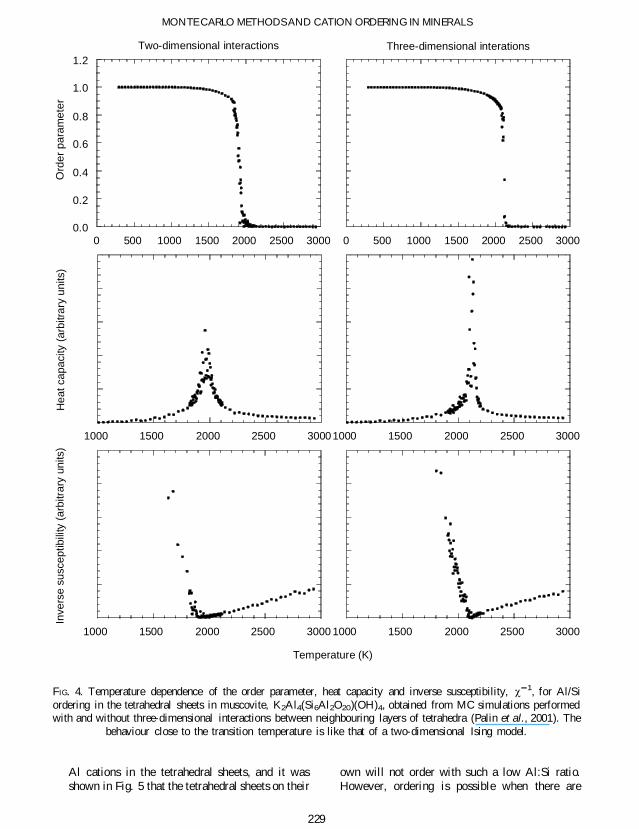
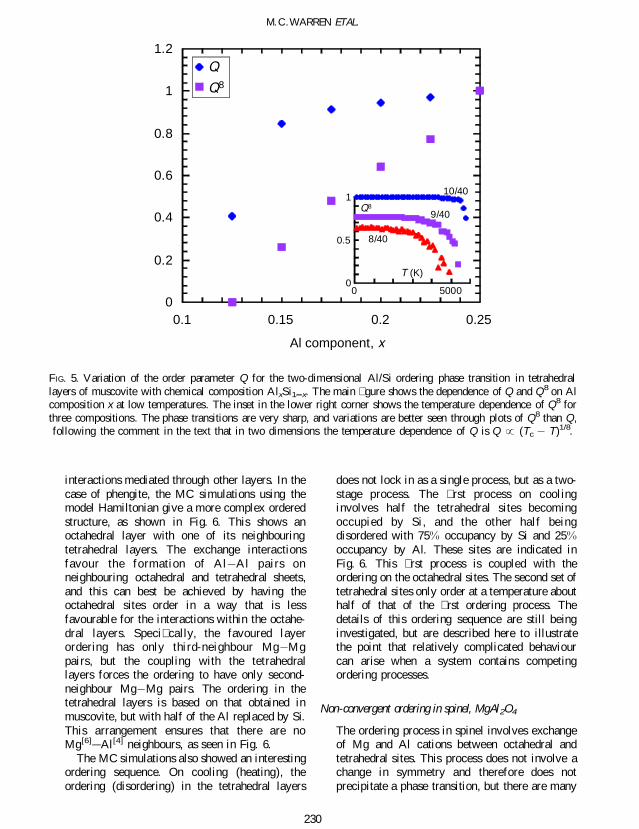
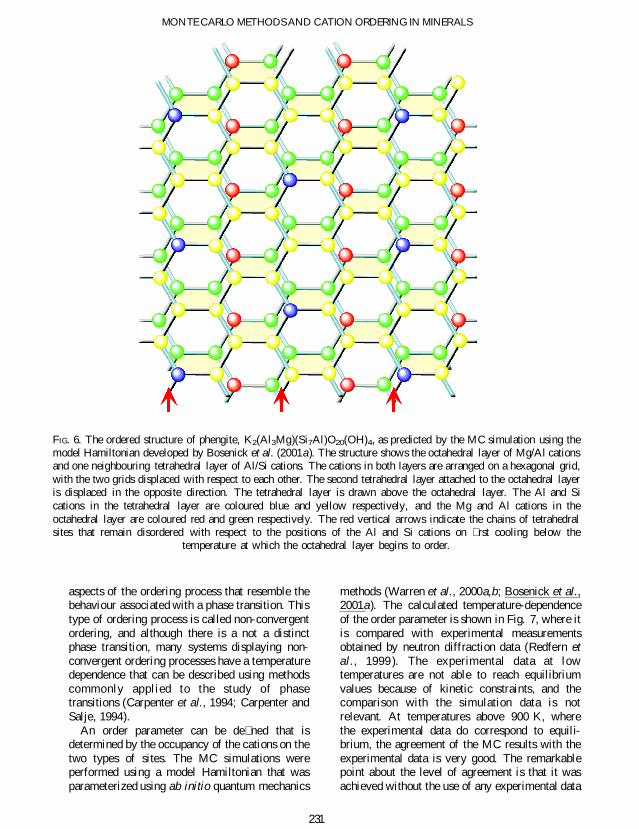
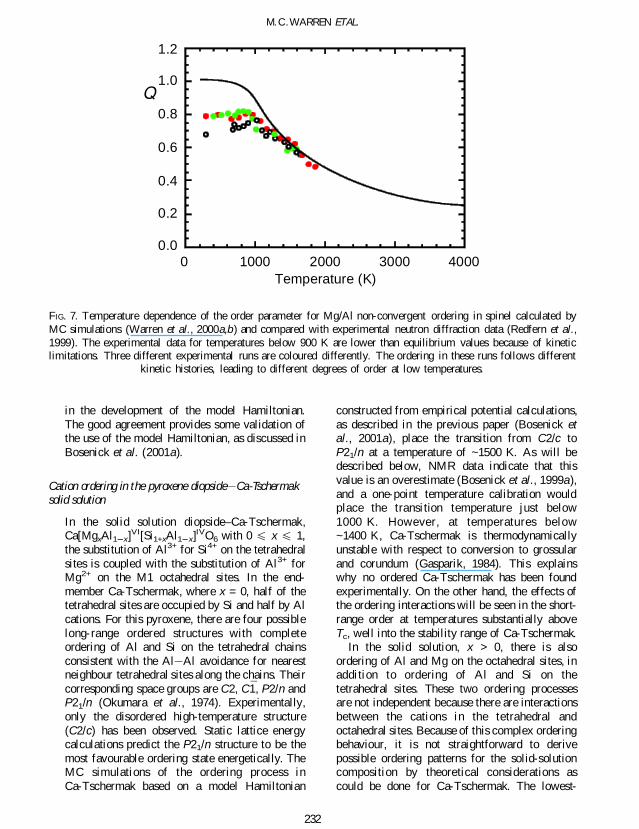
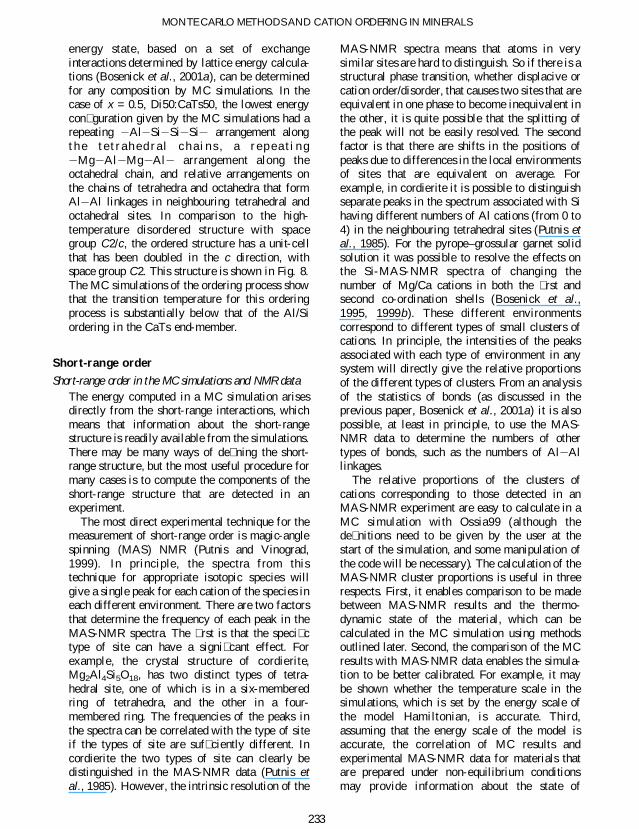
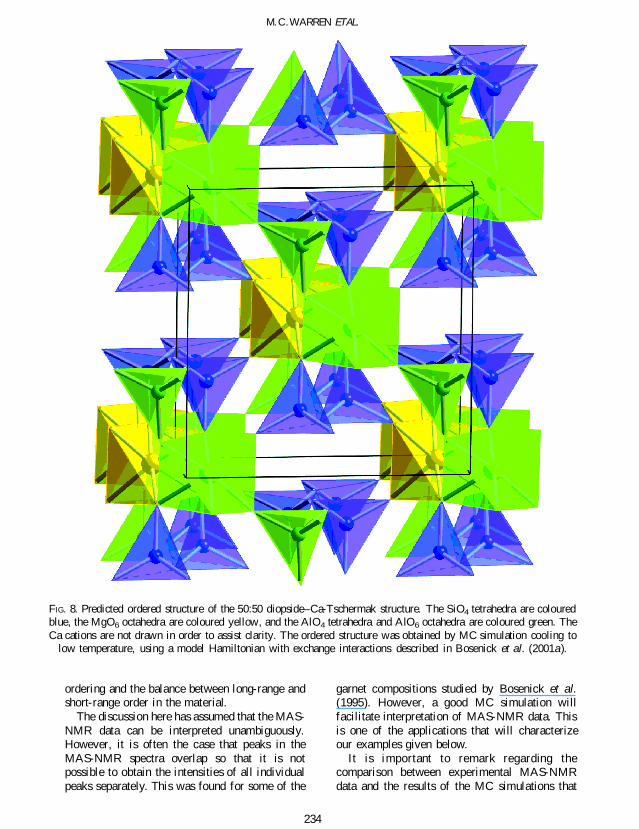
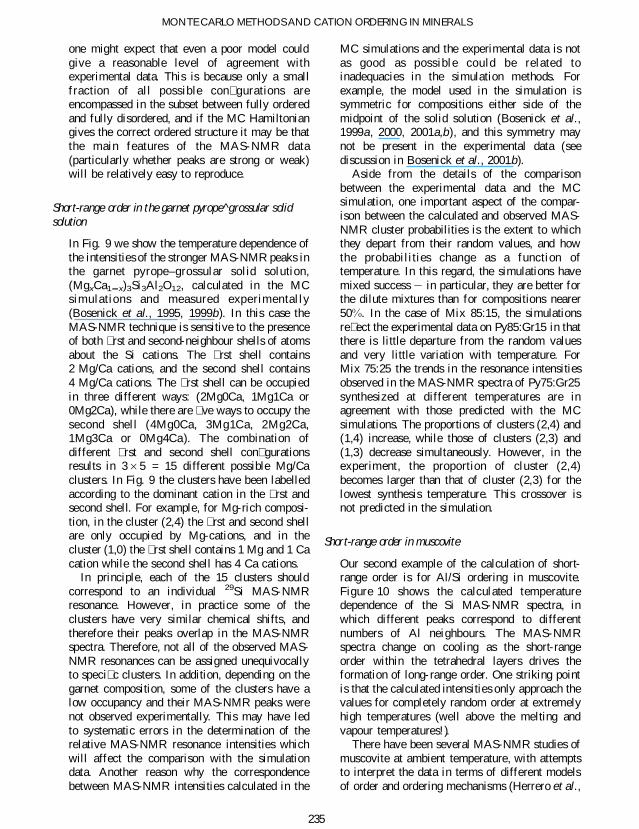
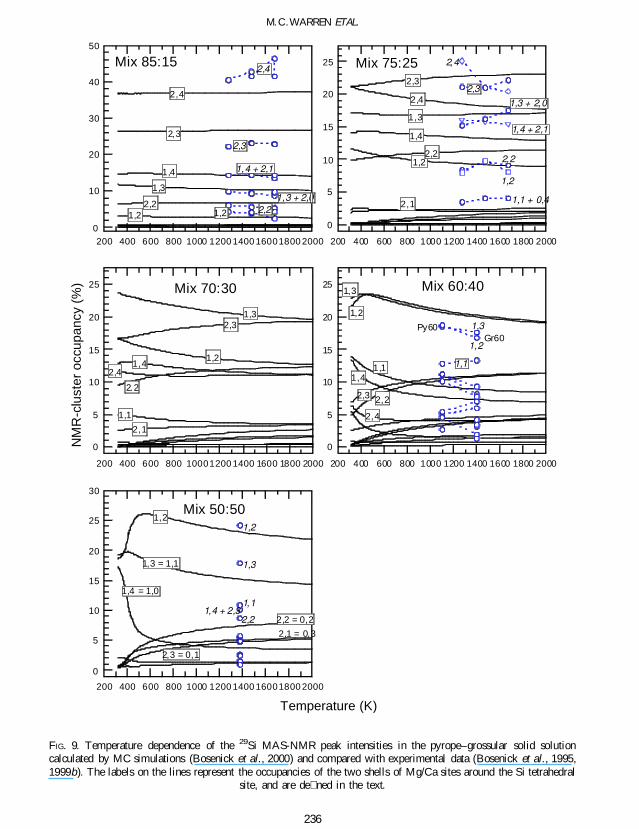
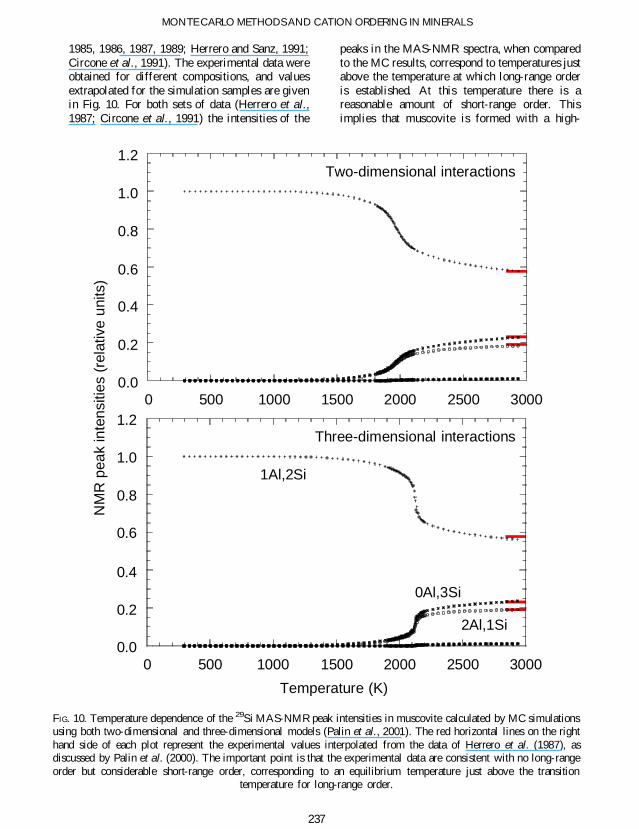
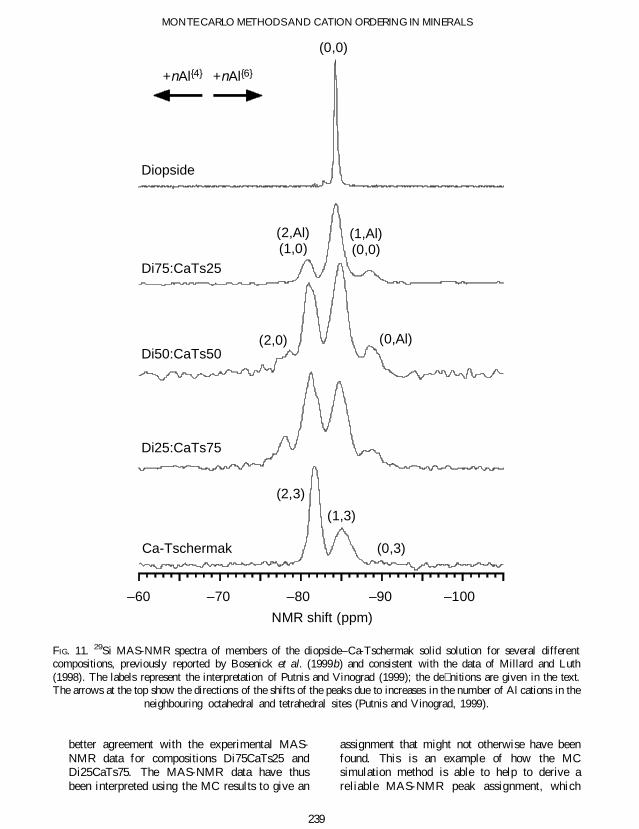
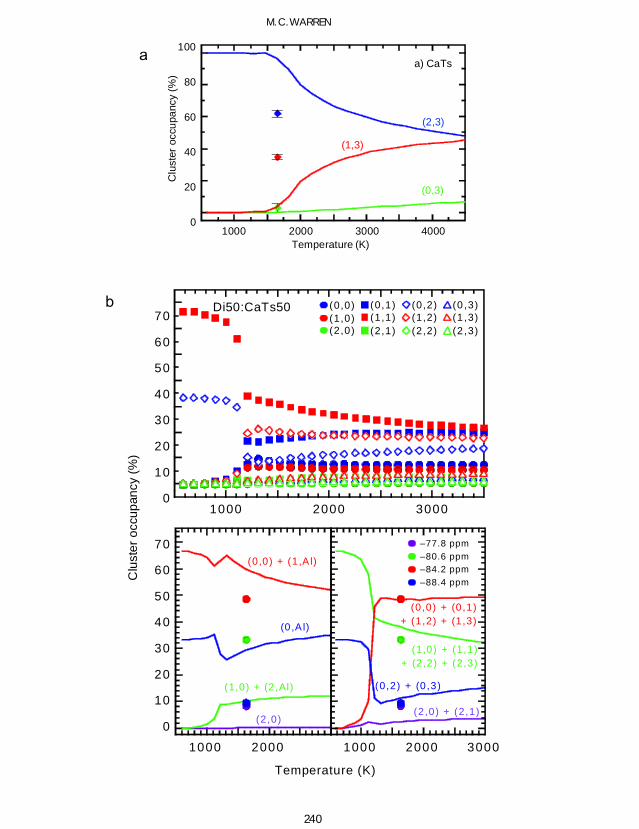
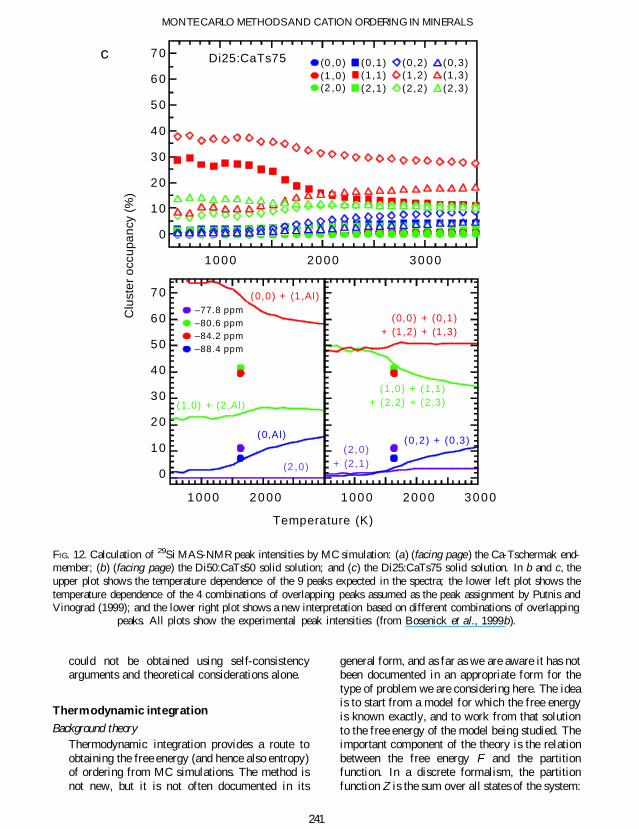
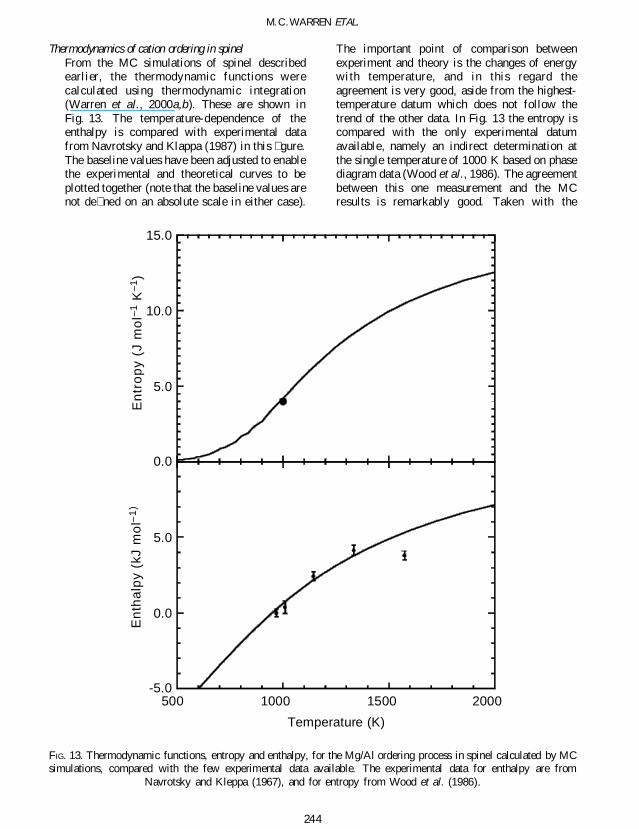
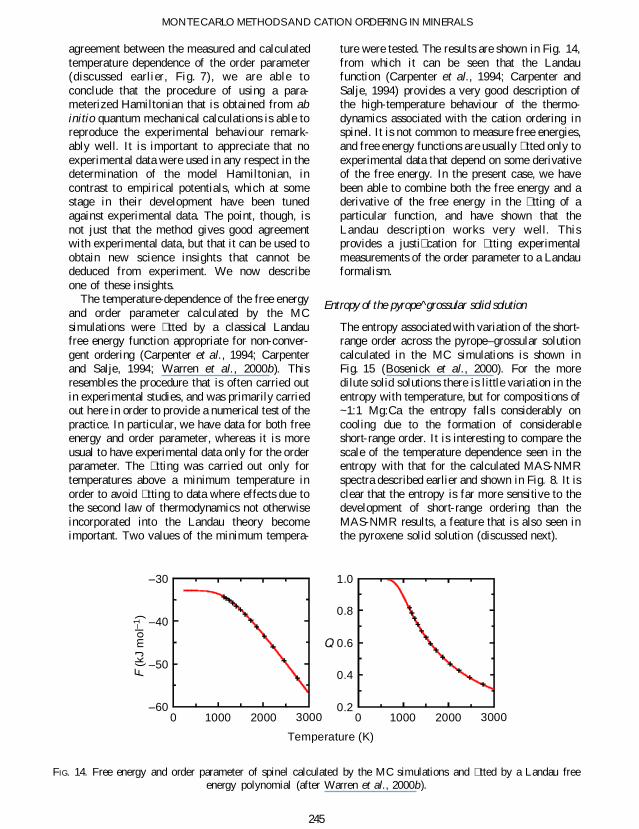
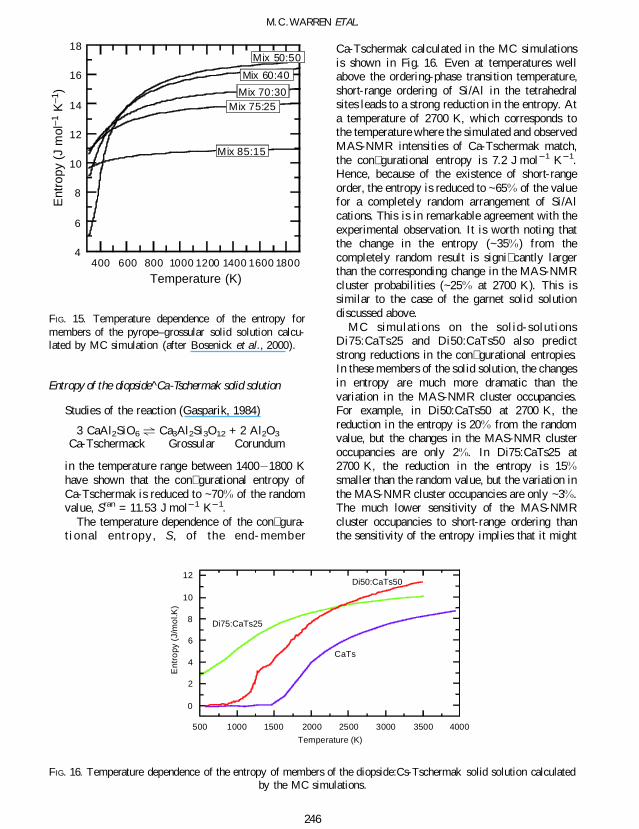
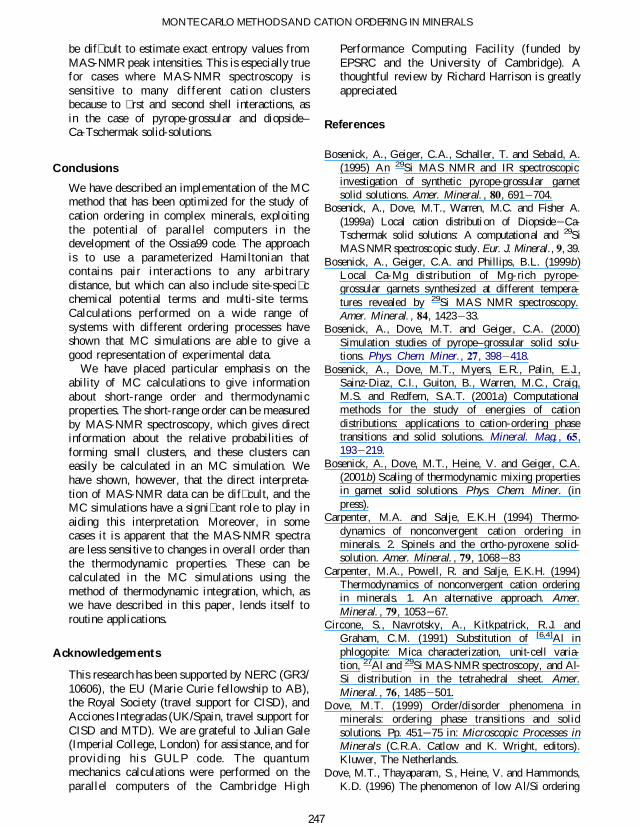