crystal structures and cation sites of the rock-forming minerals
TRANSCRIPT
1
Crystal Structures and Cation Sites of the
Rock‐Forming Minerals
Joseph R. Smyth
Department of Geological Sciences, University of Colorado
and
David L. Bish
Los Alamos National Laboratory
Boston
ALLEN & UNWIN

2
© J.R. Smyth and D.L. Bish, 1988

3
CONTENTS Acknowledgement
Introduction
Unit Cell Tables
Systematic variation of site parameters
Trace and minor element substitutions
1. Single Oxides
1.1. Cuprite group
1.2. Periclase group
1.3. Zincite group
1.4. Tenorite and montroydite
1.5. Corundum group
1.6. Bixbyite group
1.7. Arsenic and antimony sesquioxides
1.8. Rutile group
1.9. TiO2 polymorphs
1.10. MnO2 polymorphs
1.11. Uraninite
1.12. TeO2 polymorphs
2. Multiuple Oxides
2.1. Ilmenite Group
2.2. Perovskite group
2.3. Oxide spinel group
2.4. Pseudobrookite group
2.5. Tungstate group
3. Hydroxides
4. Orthosilicates
4.1. Garnet group
4.2. Olivine group
4.3. Silicate spinel group
4.4. Silicate zircon group
4.5. Willemite group
4.6. Aluminosilicate group
4.7. Humite group
4.8. Titanite group
4
4.9. Staurolite
5. Sorosilicates and cyclosilicates
5.1. Epidote group
5.2. Melilite group
5.3. Wadsleyite group
5.4. Lawsonite
5.5. Tourmaline group
5.6. Vesuvianite
6. Chain silicates
6.1. Orthopyroxenes and primitive clinopyroxenes
6.2. C‐centered clinopyroxenes
6.3. Pyroxenoids
6.4. Ortho‐amphiboles
6.5. Clino‐amphiboles
6.6. Aenigmatite
7. Layer silicates
7.1. Talc and pyrophyllite
7.2. Tri‐octahedral micas
7.3. Di‐octahedral micas
7.4. Clays
8. Framework silicates
8.1. Silica group
8.2. Alkali feldspar group
8.3. Alkaline earth feldspar group
8.4. Feldspathoid group
8.5. Beryl and cordierite
8.6. Scapolite group
8.7. Zeolite group
9. Carbonates, nitrates, sulfates and phosphates
9.1. Calcite group
9.2. Dolomite group
9.3. Aragonite group
9.4. Barite group
9.5. Gypsum and anhydrite
9.6. Apatite
9.7. Monazite

5
10. Halides
10.1. Halite group
10.2. Fluorite group
11. Cation sites listed by mean distance
11.1. Two‐ and three‐fold sites
11.2. Four‐fold sites
11.3. Five‐fold sites
11.4. Six‐fold sites
11.5. Seven‐fold sites
11.6. Eight‐fold sites
11.7. Sites of C.N. > 8
References
Mineral index

6
Acknowledgement
This work was supported in part by the U.S Department of Energy, Office of Basic Energy
Sciences, through several grants to Los Alamos National Laboratory which is operated by the
University of California under contract number W‐7405‐ENG‐6. The author s particularly thank
Dr. George Kolstadt (OBES Chemistry, Earth and Life Sciences) and Dr. Ryszard Gajewski (OBES
Advanced Energy Projects) for generous support of the project. The autyhords thank Drs. Y.
Ohashi (ARCO, Plano, TX), R. X. Fischer (Johannes Gutenberg Universitaet, Mainz) and L.W.
Finger (Carnegie Institution, Washington, DC) for providing computer codes and discussions,
and Drs. George Zweig, Klaus Lackner, and Wes Myers (Los Alamos National Laboratory) for
discussions, support and encouragement throughout the project. Theoretical Division Office of
Los Alamos National Laboratory is also thanked for its support. Tamsin C. McCormick is
gratefully acknowledged for tireless proofreading, technical assistanc and moral support.
Preface to Online Edition
This is the first installment of a free version of the first edition of the book. The data presented
here are identical to those of the first edition and so should be cited as:
Smyth, J.R. and D.L. Bish (1988) Crystal Structures and Cation Sites of the Rock‐Forming
Minerals. Boston, Allen and Unwin, 332pp.

7
INTRODUCTION
Over the past two decades, with the advent of automated x‐ray and neutron single‐crystal
diffractometers, there has been a major improvement in the precision with which atom positions in
minerals are known. Shannon and Prewitt (1969, 1970), Whittaker and Muntus (1970), and Shannon
(1976) have compiled crystal structure data for synthetic compounds and minerals in order to estimate
effective ionic radii. These compilations and estimates have proven immensely useful to geochemists,
mineralogists, and petrologists in understanding the substitution behavior and distribution of elements
in natural systems, eg. Onuma et al. (1968), Jensen (1973), Philpotts (1978). Whereas Bragg et al. (1965)
and Zoltai and Stout (1984) have compiled descriptions of mineral structures, and Wyckoff (1963) has
compiled atom location data for most inorganic structures, there has never been a compilation of data
on the nature of cation sites in minerals.
Robie et al. (1978) compiled thermodynamic data for many of the rock‐forming minerals and
oxides. For some of these compounds there have been more recent and accurate cell determinations, so
that improved data on molar volume and density are available. Further, thermodynamic data
compilations do not include information on atomic environments in these compounds.
We have undertaken a compilation of recent data on crystal structures for a large group of the
common minerals. From atom positional and cell data, we have calculated nearest‐neighbor distances,
coordination numbers, volumes of coordination polyhedra, distortion indices, and electrostatic energies
in a consistent fashion. The objective in this work is to make the recent improvements in crystal
structure data available to a larger group of petrologists and geochemists seeking to understand the
chemical behavior of these minerals in natural systems.
n order to reduce this to a manageable task we have had to make some rather arbitrary decisions
in selecting and grouping the data. First, we have limited the group to the oxygen and halide minerals
with the understanding that ionic radii have at least some relevance to these structures. This has led to
the exclusion of the sulfides from the current compilation. In selecting structures, we have endeavored
to choose ordered end‐members whenever possible so that cation site data will be more easily
interpretable. In order to document atomic environments in standard thermodynamic states we have
included a large number of simple oxide minerals. This has led to the inclusion of some less‐than‐
common minerals in this group, but otherwise we have included only the more common minerals of
igneous, metamorphic, and sedimentary rocks. Finally, in order to facilitate comparisons, we have
grouped together data from isomorphous structures, and in a few cases, polymorphous structures. This
has led to a few instances of duplication which we feel are justified in order to allow comparisons.

8
Unit Cell Tables
We have organized the structure data into those pertaining to unit cells and those pertaining to
specific sites. In addition, we have summarized the site data, grouped them according to coordination
number, and listed the cation sites by mean distance in Chapter 11. Within the mineral groups, unit cell
tables consist of formula, formula weight, calculated density, molar volume, Z, crystal system, class, and
space group, cell parameters, and reference. In general, the formula is that given in the reference,
except that we have omitted elements constituting less than 1.0 weight percent of the mineral. In a few
Figure 0.1. Plot of angle variance versus quadratic elongation for SiO4 tetrahedra. Adjacent points are
connected to show not only the strong correlation between the two factors, but but also that the
angle variance occasionally falls below, but not above, the general trend (see text).
9
instances we have recalculated formulas to the same number of oxygen atoms for comparison across an
isomorphous series. The formula weight, density, and molar volume are our calculation from the stated
formula and unit cell volume. Z is the number of formula units per cell. The reference is not repeated in
the site tables, but site data are presented sequentially in the same order permitting unambiguous
citation.
Site Data Tables
Similar sites in isomorphous series are grouped together to facilitate comparisons and show
variability of analogous features across the series. The tabulated data consist of a site name,
coordination number (C.N.), occupants, point symmetry, Wyckoff notation, cation fractional
coordinates, nearest neighbor distances, mean and standard deviation of distances, polyhedral volume,
quadratic elongation, variance of central angle, electrostatic site energy, and a model charge. The
coordination number is the number of nearest anion neighbors. The occupant is that inferred from the
formula or stated in the reference. In a few instances, for partially occupied sites, a total site occupancy
is given. Tetrahedral Al‐Si occupancies for some of the zeolites were calculated from the mean T‐0
distance when site occupancies were not reported. The point symmetry and Wyckoff notation are those
for the site (Hahn, 1983). Fractional coordinates for the site are included to avoid any ambiguities in site
nomenclature that may arise and to show variability across the series. Individual nearest neighbor
distances are given throughout with a major exception being those for the framework silicate structures
(Chapter 8). With the low symmetries of many of these structures, it was found very difficult to present
these in a way that would be both concise and meaningful. Also, we have omitted the cavity geometries
for the zeolites as these are documented elsewhere (Mortier, 1982).
The mean distance is our calculated average of the given distances. The is the standard deviation of the distances. It is thus an estimate of the distortion of the site, not an estimate of the error
in the determination. Errors are regrettably not given because this would have more than doubled the
size of the data base, greatly complicating the handling of the data. The polyhedral volume (Poly. Vol.),
quadratic elongation (Q.E.), and angle variance (Ang.Var.) were calculated with a slightly modified
version of the program VOLCAL (L.W. Finger, personal communication). The units of polyhedral volume
are cubic Angstroms. Quadratic elongation as defined by Robinson et al. (1971) is unit‐less, and the units
of the variance of the central polyhedral angle are degrees squared. These two quantities are defined
only for octahedra and tetrahedra. The electrostatic site energy was calculated with the program ELEN
(Y. Ohashi, personal communication). Calculations were performed on a VAX 11/750 computer using
double‐precision arithmetic. High symmetry structures were reduced to triclinic symmetry. The units are
kcal/mole and are the amount of electrostatic energy derived by placing one mole of cations of the
stated charge into the site, assuming a purely point charge model. This energy is recalculated as electron
volts (eV) in Chapter 11. The model charge is that used for the electrostatic calculation, however this
may be omitted in instances where it is an integer unambiguously inferred from site occupants. These
energies are included for qualitative comparisons among sites and should not be used for quantitative
calculations because they exclude repulsive forces entirely. In addition, partial charges do not accurately
model the effects of disorder.
10
Systematic Variation of Site Parameters
With a data base of this size, it is relatively straightforward to examine correlations between
various site parameters. Such correlations help explain the nature of variations seen from structure to
structure. Two particularly useful correlations are between angle variance and quadratic elongation and
between electrostatic potential and mean cation‐anion distance for individual sites.
Distortions. There are several parameters that can be used as indicators of distortions or
regularity of coordination polyhedra. For regular tetrahedra and octahedra, the angular distortions are
conveniently indicated by the variance of the central angle (Ang.Var.). In addition to angular distortion is
distance distortion, a convenient measure of which is the standard deviation of the distances () which can be used to indicate distortion of cations of any coordination number. A factor called quadratic
elongation (Q.E.) (Robinson et al., 1971) is also calculated for each octahedron and tetrahedron and is a
convenient measure of both angular and distance distortions. Figure 0.1 is a plot of angle variance
versus quadratic elongation for a large number of tetrahedra and shows that the two parameters are, of
course, strongly correlated. There are a few instances in which the angle variance plots well below the
trend, but no instances in which it plots above. This is likely due to the fact that in a few instances, such
as for a tetrahedron on three‐fold axis, the angles may be more strongly constrained by symmetry than
the distances.
Electrostatic Energies. It is also of interest to examine the variation of electrostatic energy with
distance. The electrostatic energy reported in the site tables is in kcal/mole of sites. In Chapter 11, these
energies are converted to electron‐volts and divided by the charge to give a potential in volts. The total
electrostatic energy of the crystal would then be half the sum for all sites in the formula unit. The total
electrostatic energies calculated for each of these mineral structures is adequate to allow full ionization
of all species to their normal valences, if reasonable allowances for repulsion energies are included in
Born‐Haber calculations.
The electrostatic energy is by no means the total energy of the crystal. It specifically excludes
nearest‐neighbor repulsion energies which may be ten percent or more of total energy. In addition, it
excludes any estimate of distortion energies of electron distributions (e.g. crystal field stabilization
energies) and energies of thermal vibrations. The energies cannot be used to compute heats of
formation or predict relative thermodynamic stability of various polymorphs because the energy
differences between polymorphs is typically much smaller than the excluded terms. The energies are,
however, useful and instructive for qualitative comparisons between sites. Further, much progress has
been made in recent years on prediction of mineral structures based on electrostatic energies combined
with simple to complex expressions for nearest‐neighbor repulsion energies (e.g., Catlow et al., 1982,
Price and Parker, 1984).
11
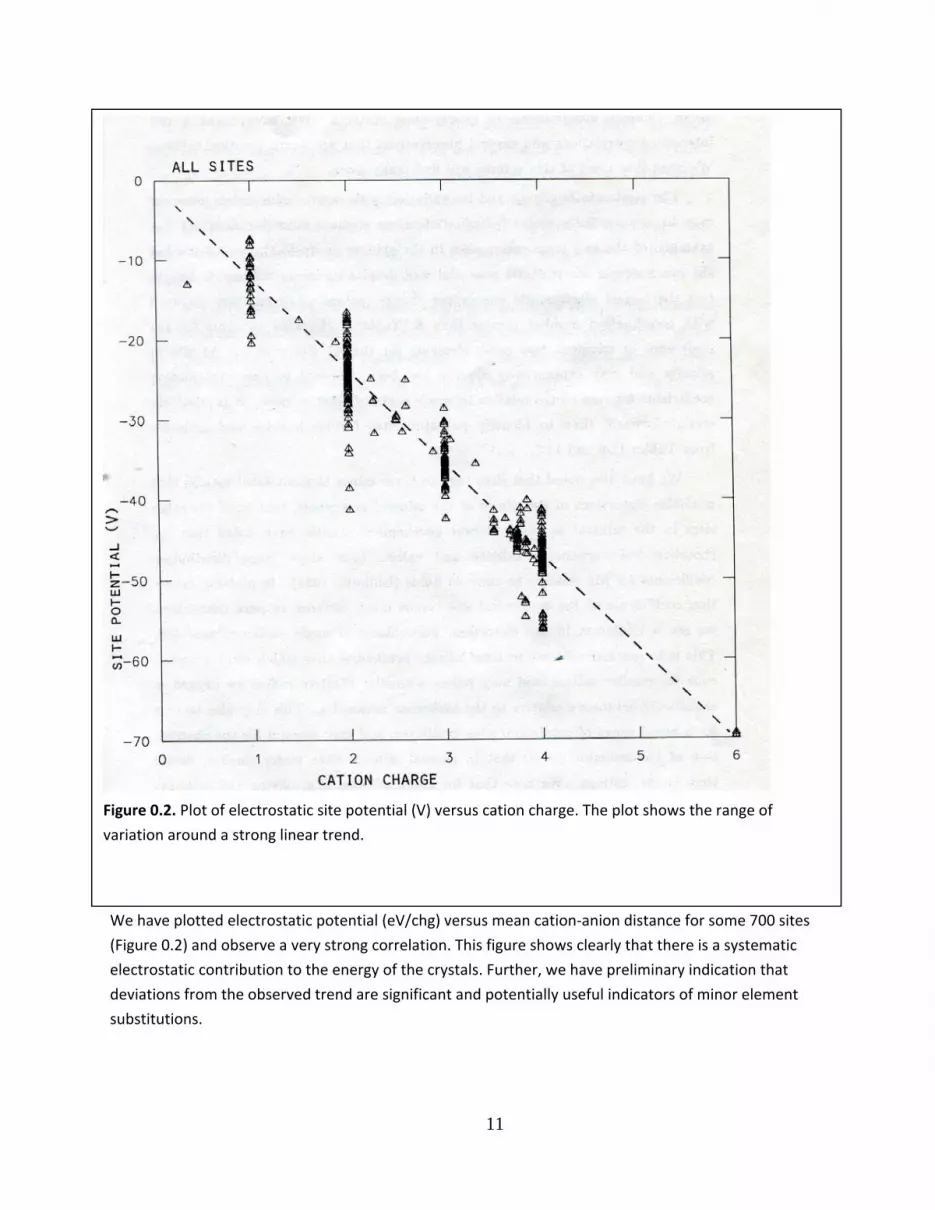
We have plotted electrostatic potential (eV/chg) versus mean cation‐anion distance for some 700 sites
(Figure 0.2) and observe a very strong correlation. This figure shows clearly that there is a systematic
electrostatic contribution to the energy of the crystals. Further, we have preliminary indication that
deviations from the observed trend are significant and potentially useful indicators of minor element
substitutions.
Figure 0.2. Plot of electrostatic site potential (V) versus cation charge. The plot shows the range of
variation around a strong linear trend.
12
Trace and Minor Element Substitutions
One of the major reasons for undertaking this compilation was to provide geochemists with a
convenient and comprehensive source of information on mineral sites. We hope that it will be of use in
understanding trace element and minor element distributions in geochemical systems. We have noted a
few interesting correlations and general observations that are worth mentioning here. We hope that
users of this volume will find many more.
The electrostatic energy and its variation with mean cation‐anion distances may be a potentially
useful indicator of minor element substitution sites. For example, of the two large cation sites in the
epidote group (5.1), the A2 site has the much deeper electrostatic potential well despite its larger
volume. It has, in fact the largest electrostatic energy per charge (potential) of any site surveyed with
coordination number greater than 8 (Table 11.7). This accounts for the preference of trivalent rare earth
elements for the A2 site over the Al site in allanite and may explain why allanite has been observed to
have distribution coefficients for rare earths relative to whole rocks of 1000 or more. It is relatively
straightforward, then, to identify potential sites for lanthanides and actinides from Tables 11.6 and 11.7.
We have also noted that sites tend to favor minor element substitutions that minimize
distortions of the site or of the mineral as a whole, that is, of the other sites in the mineral as well.
Recent geochemical studies have noted that the rhombohedral carbonates siderite and calcite both
show large distribution coefficients for Mn relative to aqueous fluids (Ishikuni, 1984). In plotting
distortion coefficients of the octahedral site versus mean distance in pure carbonates, we see a
minimum in the distortion, particularly in angle variance, near Mn. This is in marked contrast to most
silicate octahedral sites which show a preference for smaller cations and may reflect a smaller effective
radius for oxygen in the silicate octahedra relative to the carbonate octahedra. This may also be true for
a broad range of octahedral sites in silicates and may account for the observation of Goldschmidt (1958)
that, in general, mineral sites prefer smaller, rather than larger, cations. We note that for many silicates
(e.g. olivine and orthopyroxene) the distortions of the octahedral sites decrease with radius at least
down to the radius of Ni and that these structures have a strong preference for smaller cations in these
sites.
The preference for smaller cations by silicate sites is certainly not applicable to sites other than
regular octahedra. The X site in garnet is a fine example. It may contain Ca, Mn, Fe, or Mg and is highly
symmetric with point symmetry 222. Its only measure of distortion, , does not vary strongly with cation radius, but the distortion of the Si site decreases strongly with increasing X‐site radius. We would predict
from these considerations then that if garnet crystallized as a liquidus phase, as it apparently does in the
eclogite system, it would preferentially accept Ca, then Fe, then Mg, and thus possibly enrich residual
liquids in Mg.
We have included these discussions on major and trace element distributions to encourage users
of these tables to look for correlations between crystal structure parameters and element distributions
in natural systems. It is our sincere hope in compiling these

13
Chapter1.SingleOxideMinerals
Oxide minerals of a single cation.
1.1. Cuprite group
1.2. Periclase group
1.3. Zincite group
1.4. Tenorite and montroydite
1.5. Corundum group
1.6. Bixbyite group
1.7. Arsenic and antimony sesquioxides
1.8. Rutile group
1.9. TiO2 polymorphs
1.10. MnO2 polymorphs
1.11. Uraninite
1.12. TeO2 polymorphs

14
1.1. Hemioxides
Table 1.1.1. Cuprite and Ag2O Unit Cells
End Member Cuprite Ag2O
Formula Cu2O Ag2O
Form. Wt. (g) 143.079 231.739
Density (g/cm3) 6.104 7.318
Mol. Vol. (cm3) 23.439 31.667
Z 2 2
Cryst. Sys. Isometric Isometric
Laue Class m3m m3m
Space Group Pn3m Pn3m
Cell Parameters
a (Å) 4.2696 4.720
Vol. 77.833 105.15
Ref. Borie (1974) Borie (1974)

15
Figure 1.1. The crystal structure of cuprite. This structure is not ionic. The Cu and Ag atoms are in
two‐coordination which could not be sustained without the sp or sd hybrid orbitals of the Cu and
Ag atoms. So Na2O and K2O synthetic compounds have the anti‐fluorite structure and do not exist
as minerals as the oxygen atoms readily hydrate to form hydroxides.

16
Table 1.1.2. Cuprite and Ag2O Cation Sites
End Member Cuprite Ag2O
C.N. 2 2
Cation Cu Ag
Point Sym. 3m 3m
Wyckoff Not. 4b 4b
Frac. Coords.
x 0 0
y 0 0
z 0 0
Distances
O (2) 1.849 2.044
Elect.Energy ‐294. ‐266.
17
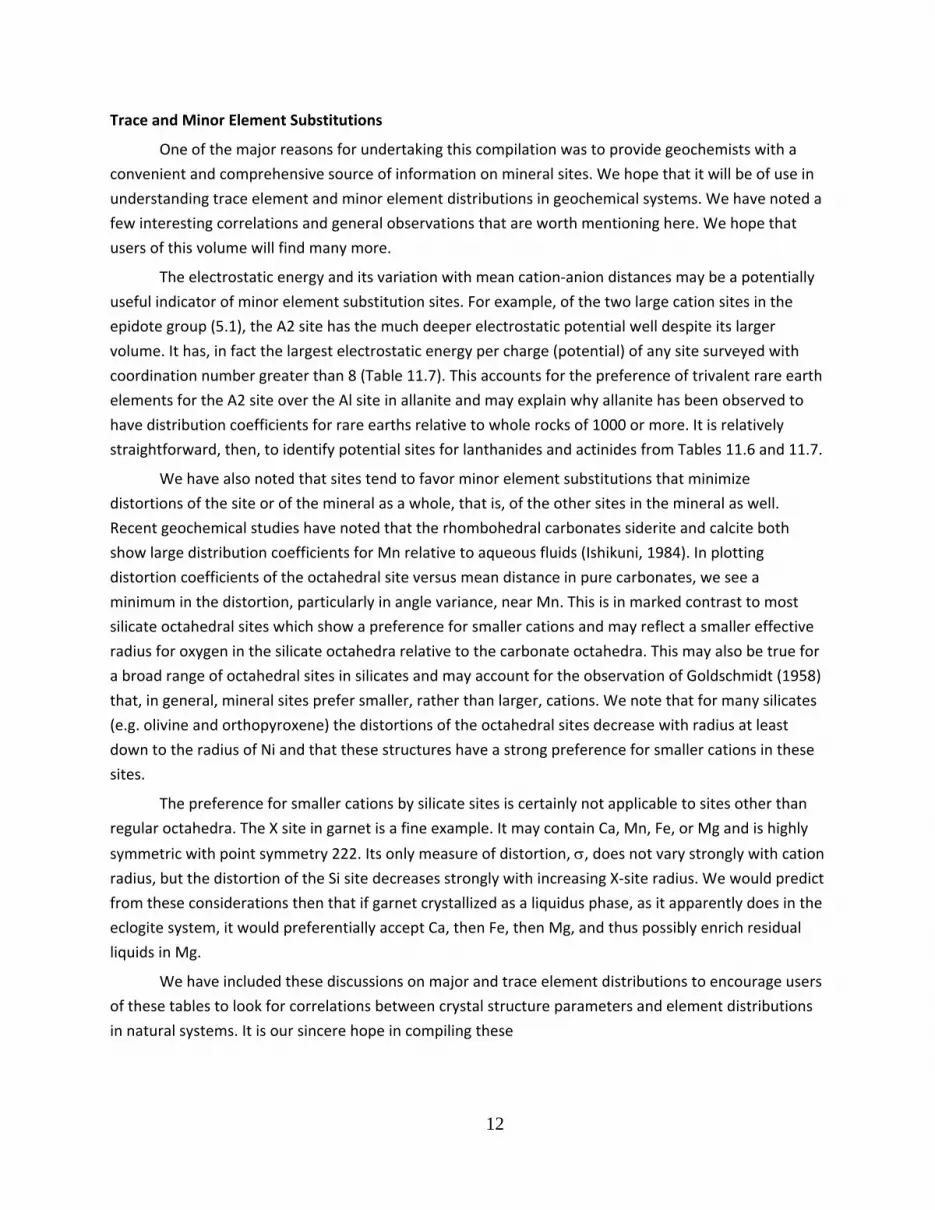
1.2. Monoxides
The monoxides are those minerals that are oxides of a single divalent cation. The simplest are those of
the periclase group that all have the cubic rocksalt (halite) or B1 structure. The monoxides of Be and Zn
have an acentric, piezoelectric structure with the cation in tetrahedral coordination. In addition,
monoxides of Cu (tenorite, CuO), and Hg (montroydite, HgO) have covalent structures with irregular
coordination of the metal atoms.
1.2.1. The Periclase Group
The periclase group consists of monoxides of divalent metal cations, MgO (periclase), FeO (wüstite), CaO
(lime), NiO (bunsenite), and MnO (manganosite). Of these, MgO‐FeO solid solutions (ferro‐periclase) are
believed to compose a significant portion of the lower mantle. This structure is also adopted by NaCl
(halite), KCl (sylvite), and PbS (galena), as well as numerous compounds that are not known to occur
naturally as minerals.
1.2. Periclase Group
Figure 1.2.1. The crystal structure of periclase (MgO) and the other minerals of the
periclase group. Both the cation and anion are in perfectly regular octahedral
coordination with each other.

18
Table 1.2.1. The Periclase Group Unit Cells.
Periclase Wüstite Lime Bunsenite Manganosite
Formula MgO FeO CaO NiO MnO
Form.Wt. 40.312 71.848 56.079 74.709 70.937
Z 4 4 4 4 4
CrystalSystem Cub Cub Cub Cub Cub
PointGroup m3m m3m m3m m3m m3m
SpaceGroup Fm3m Fm3m Fm3m Fm3m Fm3m
UnitCell
a(Å) 4.211 4.3108 4.8105 4.1684 4.446
Vol 74.67 80.11 111.32 72.43 87.88
MolarVol 11.244 12.062 16.762 10.906 13.223
Density 3.585 5.956 3.346 6.850 5.365
Thermal Expansion (Volumetric)
alpha 31.6 33.9 33. 34.5
a0 0.3768 0.3203 0.3032 0.3317
a1 0.7404 1.4836 1.0463 1.2055
a2 ‐0.7446 ‐0.0000 0.0000 ‐0.2094
Elastic Properties
Ks(GPa) 162.7 181. 114.7 153.0
G(Gpa) 131.1 46.1 81.2 68.1
19
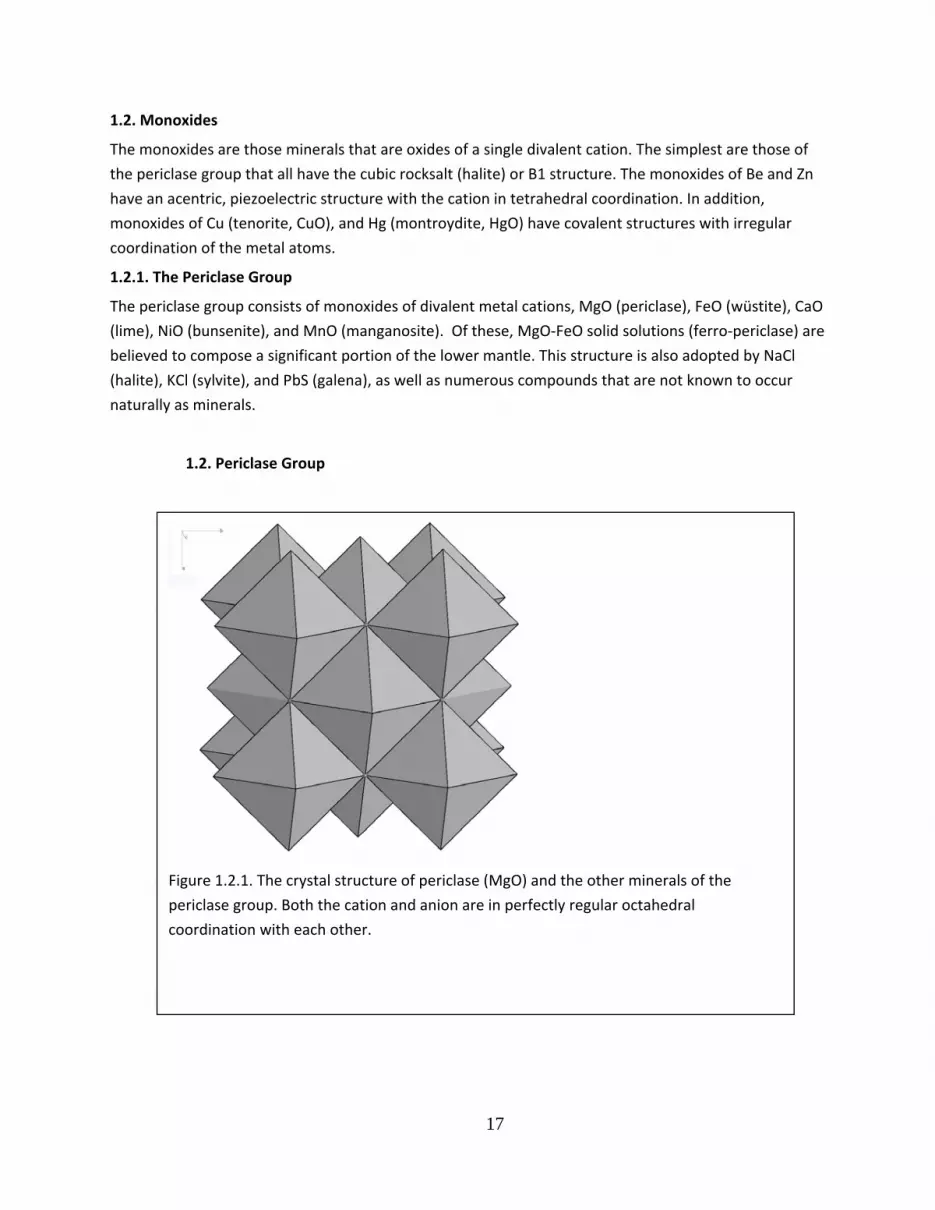
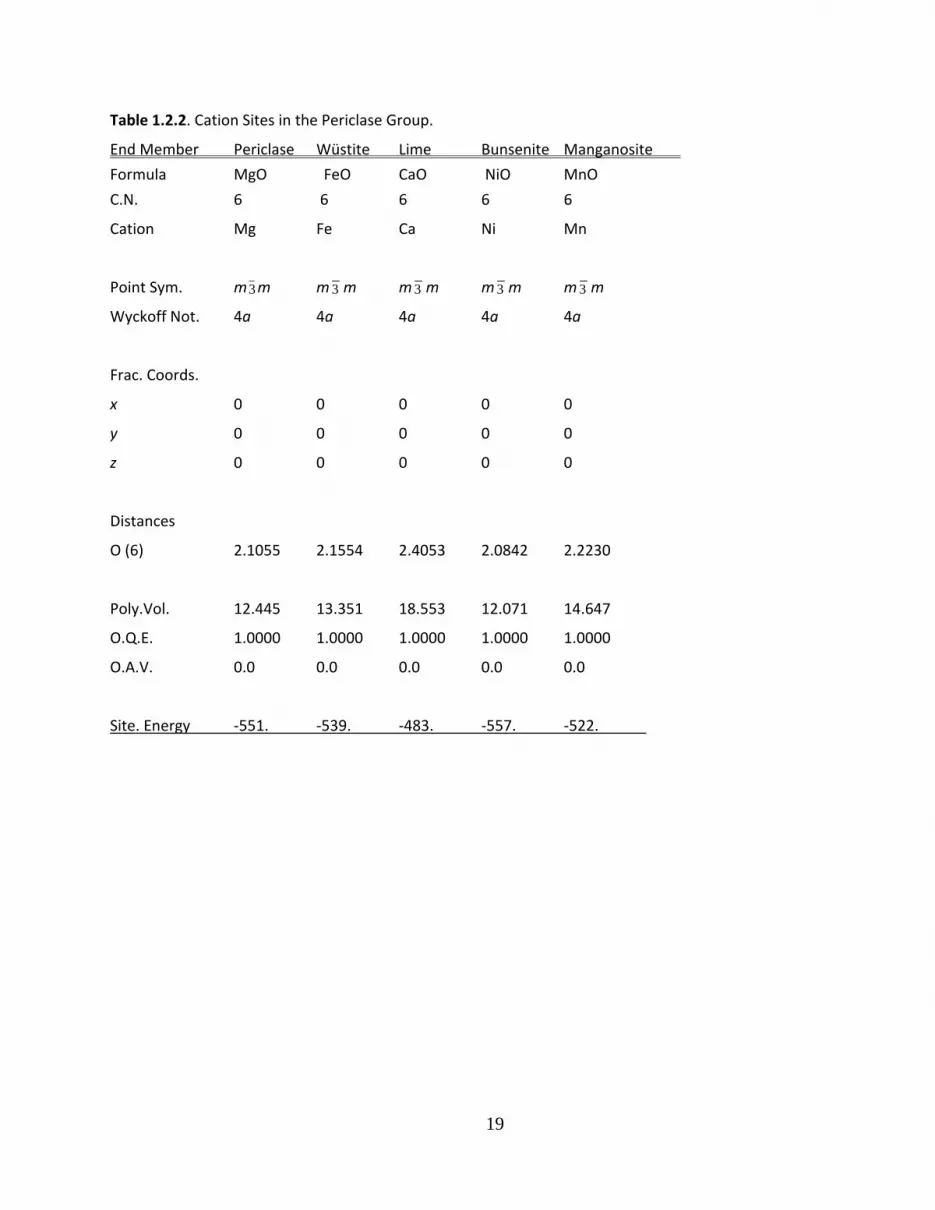
Table 1.2.2. Cation Sites in the Periclase Group.
End Member Periclase Wüstite Lime Bunsenite Manganosite
Formula MgO FeO CaO NiO MnO
C.N. 6 6 6 6 6
Cation Mg Fe Ca Ni Mn
Point Sym. m3m m 3 m m 3 m m 3 m m 3 m
Wyckoff Not. 4a 4a 4a 4a 4a
Frac. Coords.
x 0 0 0 0 0
y 0 0 0 0 0
z 0 0 0 0 0
Distances
O (6) 2.1055 2.1554 2.4053 2.0842 2.2230
Poly.Vol. 12.445 13.351 18.553 12.071 14.647
O.Q.E. 1.0000 1.0000 1.0000 1.0000 1.0000
O.A.V. 0.0 0.0 0.0 0.0 0.0
Site. Energy ‐551. ‐539. ‐483. ‐557. ‐522.
20
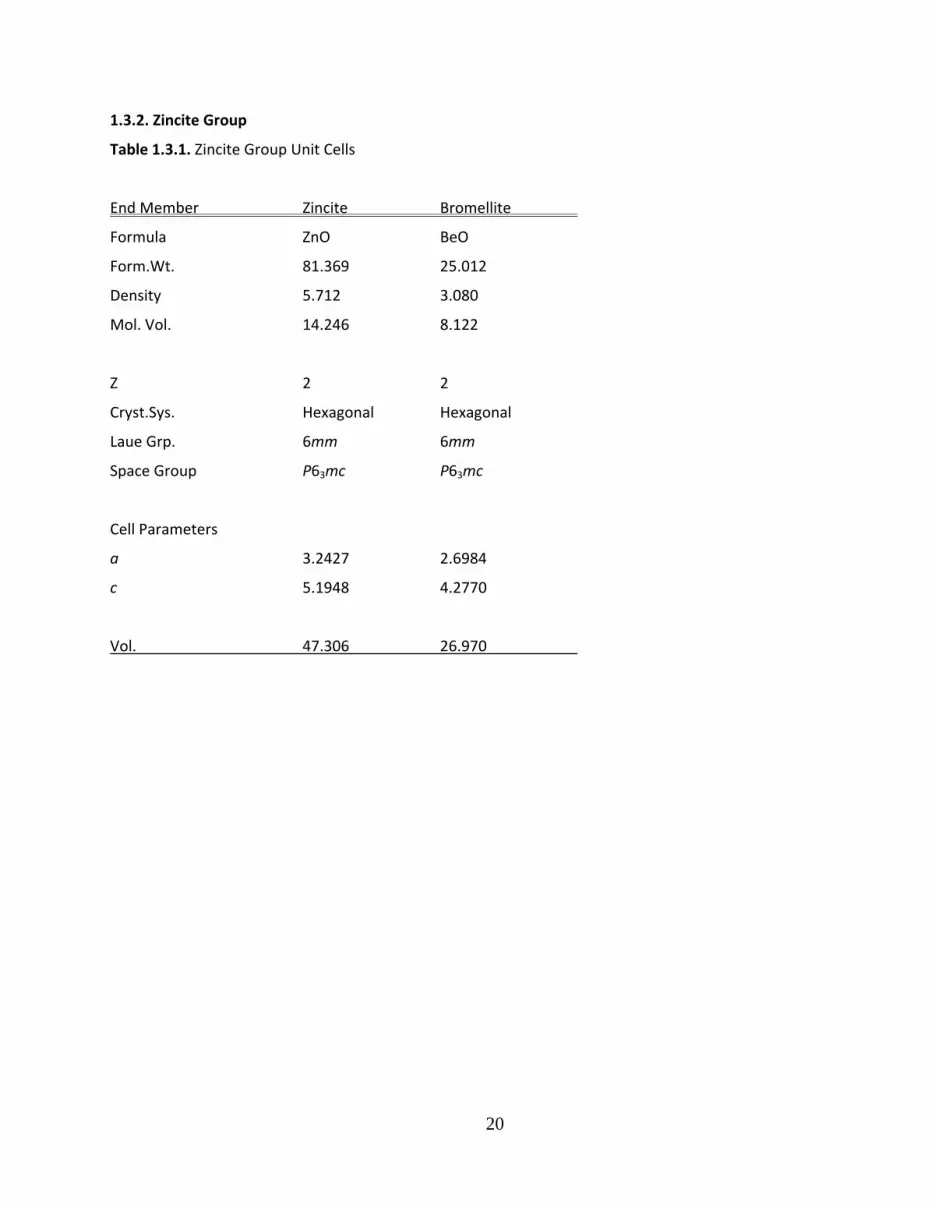
1.3.2. Zincite Group
Table 1.3.1. Zincite Group Unit Cells
End Member Zincite Bromellite
Formula ZnO BeO
Form.Wt. 81.369 25.012
Density 5.712 3.080
Mol. Vol. 14.246 8.122
Z 2 2
Cryst.Sys. Hexagonal Hexagonal
Laue Grp. 6mm 6mm
Space Group P63mc P63mc
Cell Parameters
a 3.2427 2.6984
c 5.1948 4.2770
Vol. 47.306 26.970
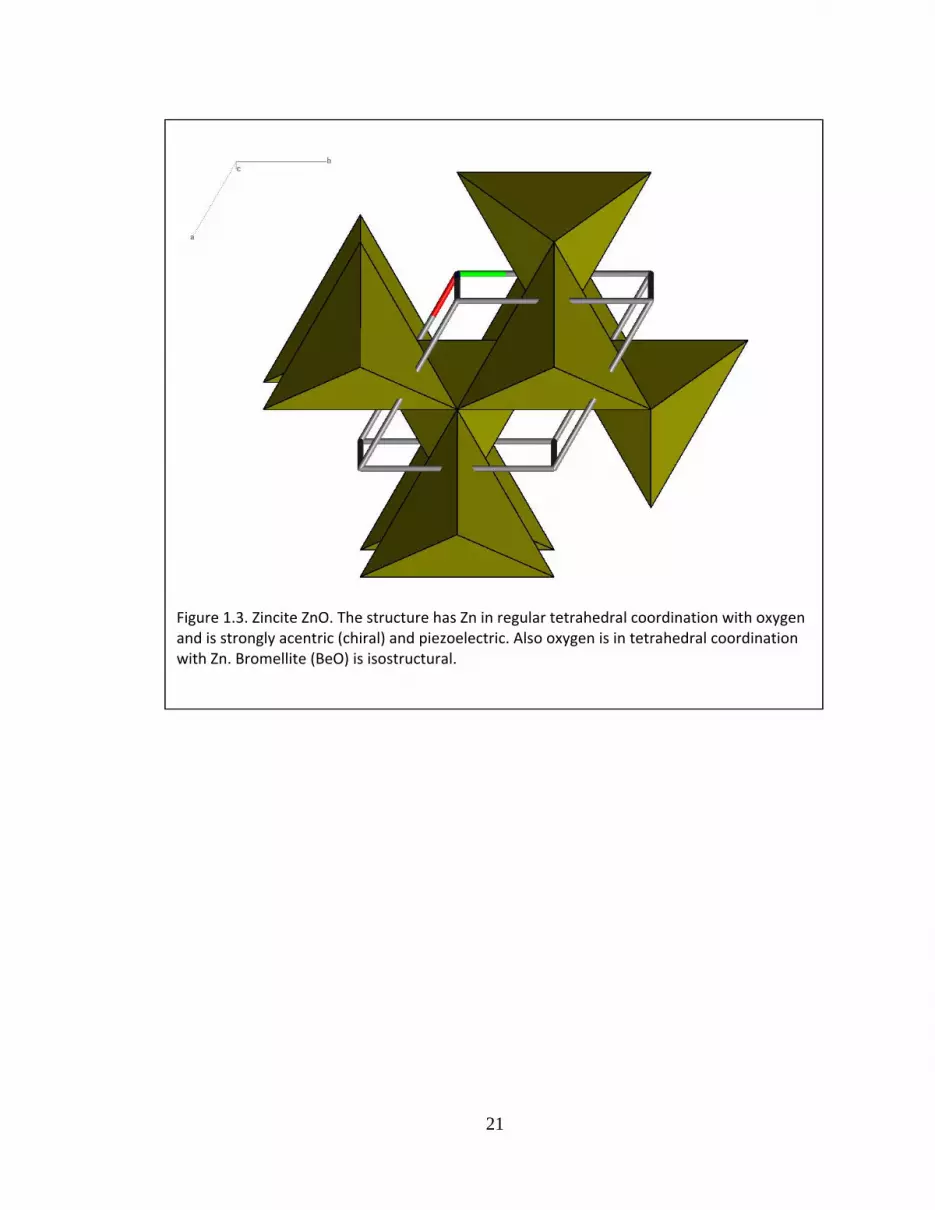
21
Figure 1.3. Zincite ZnO. The structure has Zn in regular tetrahedral coordination with oxygen and is strongly acentric (chiral) and piezoelectric. Also oxygen is in tetrahedral coordination with Zn. Bromellite (BeO) is isostructural.

22
Table 1.3.2. Zincite Group Cation Sites
End Member Zincite Bromellite
Formula ZnO BeO
C.N. 4 4
Cation Zn Be
Point Sym. 3m 3m
Wyckoff Not. 2b 2b
Frac. Coords.
x 1/3 1/3
y 2/3 2/3
z 0 0
Distances
O1(1) 1.988 1.619
O2(3) 1.969 1.642
Mean 1.974 1.636
0.009 0.011
Poly.Vol. 3.942 2.247
TQE 1.0006 1.005
Ang.Var. 2.6 1.5
Site Energy ‐1105. ‐1333.

23
1.4. Tenorite (CuO) and Montroydite (HgO)
Table 1.4.1. Tenorite and Montroydite Unit Cells.
End Member Tenorite Montroydite
Formula CuO HgO
Form.Wt. 75.539 216.589
Density 6.515 11.193
Mol. Vol. 12.109 19.350
Z 4 4
Cryst.Sys. Monoclinic Orthorhombic
Laue Group 2/m mmm
Space Group C2/c Pnma
Cell Parameters
a 4.6837 6.612
b 3.4226 5.520
c 5.1288 3.521
99.54
Vol. 81.080 128.51
Ref. Asbrink & Aurivilius
Norrby (1970) (1956)

24
Figure 1.4a. Tenorite CuO. The structure has Cu2+ in 4‐coordination with oxygen with two more oxygens further away.
Figure 1.4b. Montroydite HgO. The structure is orthorhombic with Hg in irregular 6‐coordination (four close and two further away).
25
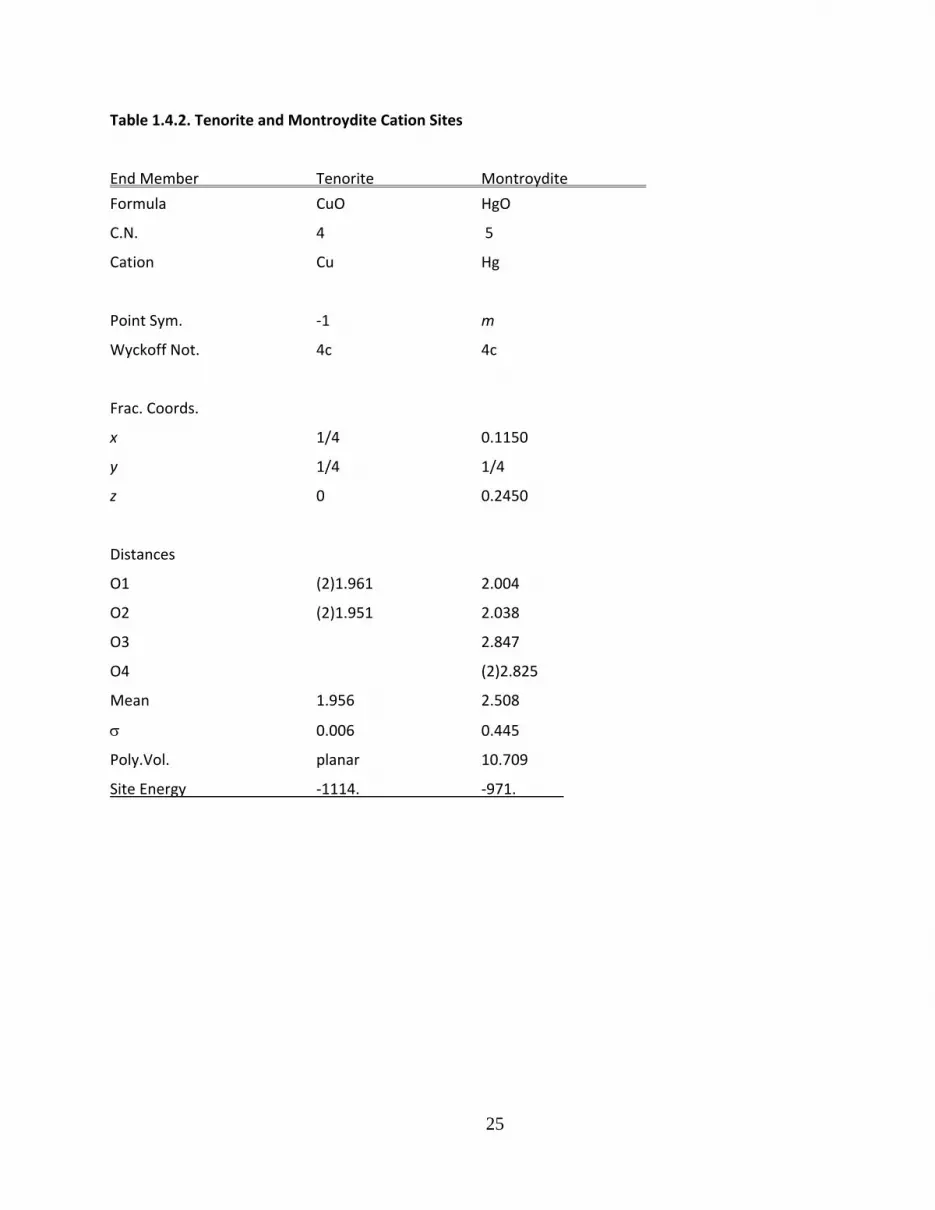
Table 1.4.2. Tenorite and Montroydite Cation Sites
End Member Tenorite Montroydite
Formula CuO HgO
C.N. 4 5
Cation Cu Hg
Point Sym. ‐1 m
Wyckoff Not. 4c 4c
Frac. Coords.
x 1/4 0.1150
y 1/4 1/4
z 0 0.2450
Distances
O1 (2)1.961 2.004
O2 (2)1.951 2.038
O3 2.847
O4 (2)2.825
Mean 1.956 2.508
0.006 0.445
Poly.Vol. planar 10.709
Site Energy ‐1114. ‐971.
26
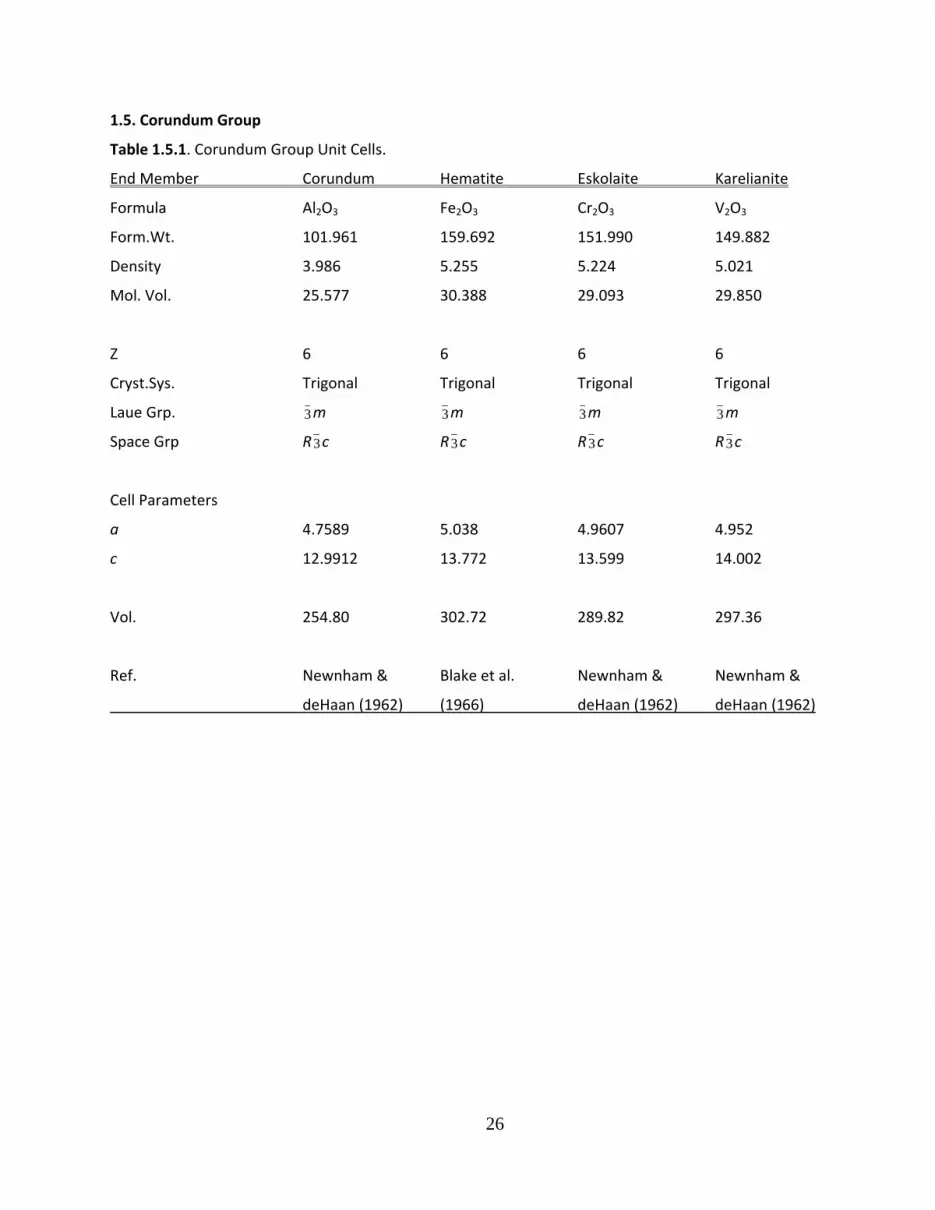
1.5. Corundum Group
Table 1.5.1. Corundum Group Unit Cells.
End Member Corundum Hematite Eskolaite Karelianite
Formula Al2O3 Fe2O3 Cr2O3 V2O3
Form.Wt. 101.961 159.692 151.990 149.882
Density 3.986 5.255 5.224 5.021
Mol. Vol. 25.577 30.388 29.093 29.850
Z 6 6 6 6
Cryst.Sys. Trigonal Trigonal Trigonal Trigonal
Laue Grp. 3m 3m 3m 3m
Space Grp R3c R3c R3c R3c
Cell Parameters
a 4.7589 5.038 4.9607 4.952
c 12.9912 13.772 13.599 14.002
Vol. 254.80 302.72 289.82 297.36
Ref. Newnham & Blake et al. Newnham & Newnham &
deHaan (1962) (1966) deHaan (1962) deHaan (1962)

27
Figure 1.5. Corundum Al2O3. The structure has Al in octahedral coordination with oxygen. The structure is relatively dense with face‐sharing octahedral. Hematite (Fe2O3), eskolaite(Cr2O3), and karelianite (V2O3) are isostructural.
28
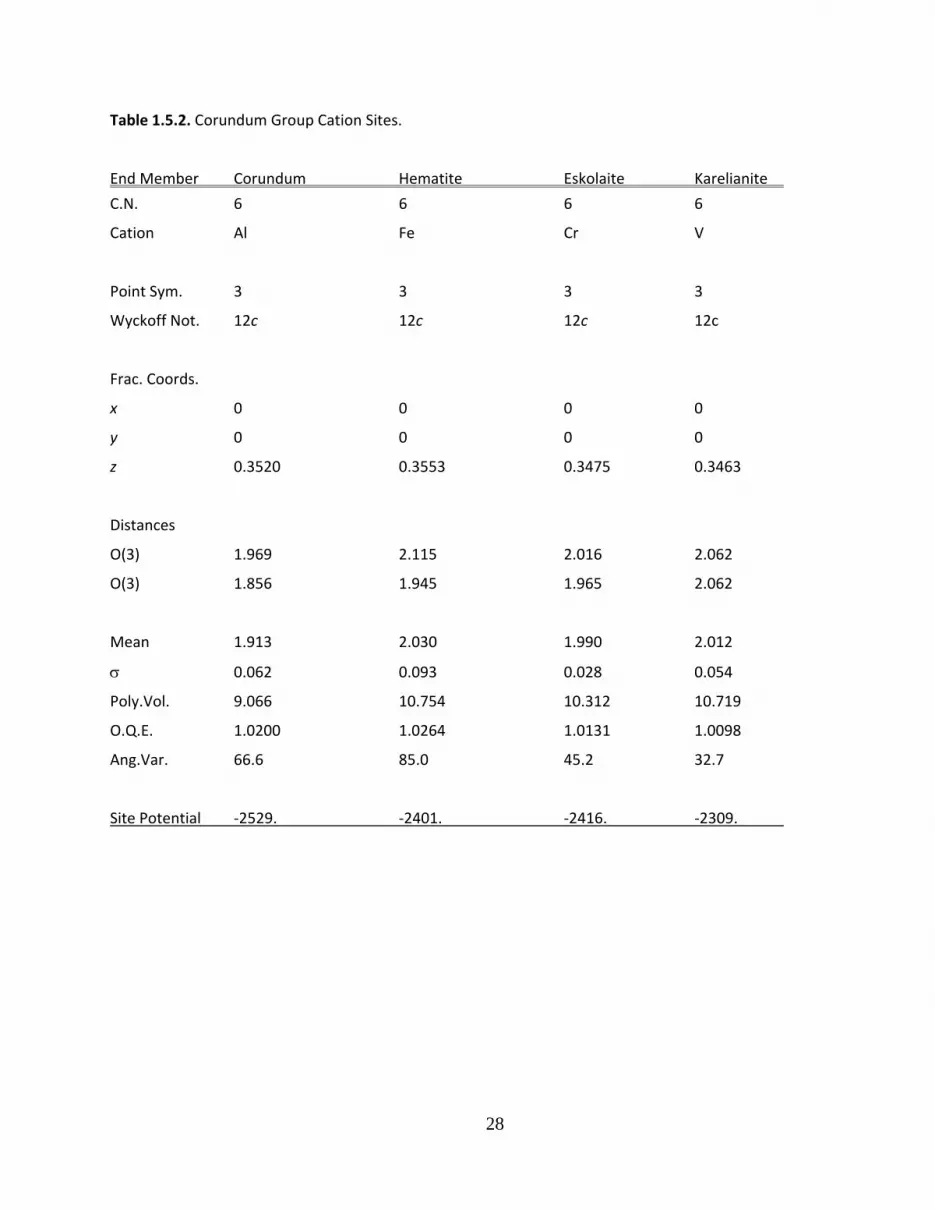
Table 1.5.2. Corundum Group Cation Sites.
End Member Corundum Hematite Eskolaite Karelianite
C.N. 6 6 6 6
Cation Al Fe Cr V
Point Sym. 3 3 3 3
Wyckoff Not. 12c 12c 12c 12c
Frac. Coords.
x 0 0 0 0
y 0 0 0 0
z 0.3520 0.3553 0.3475 0.3463
Distances
O(3) 1.969 2.115 2.016 2.062
O(3) 1.856 1.945 1.965 2.062
Mean 1.913 2.030 1.990 2.012
0.062 0.093 0.028 0.054
Poly.Vol. 9.066 10.754 10.312 10.719
O.Q.E. 1.0200 1.0264 1.0131 1.0098
Ang.Var. 66.6 85.0 45.2 32.7
Site Potential ‐2529. ‐2401. ‐2416. ‐2309.
29
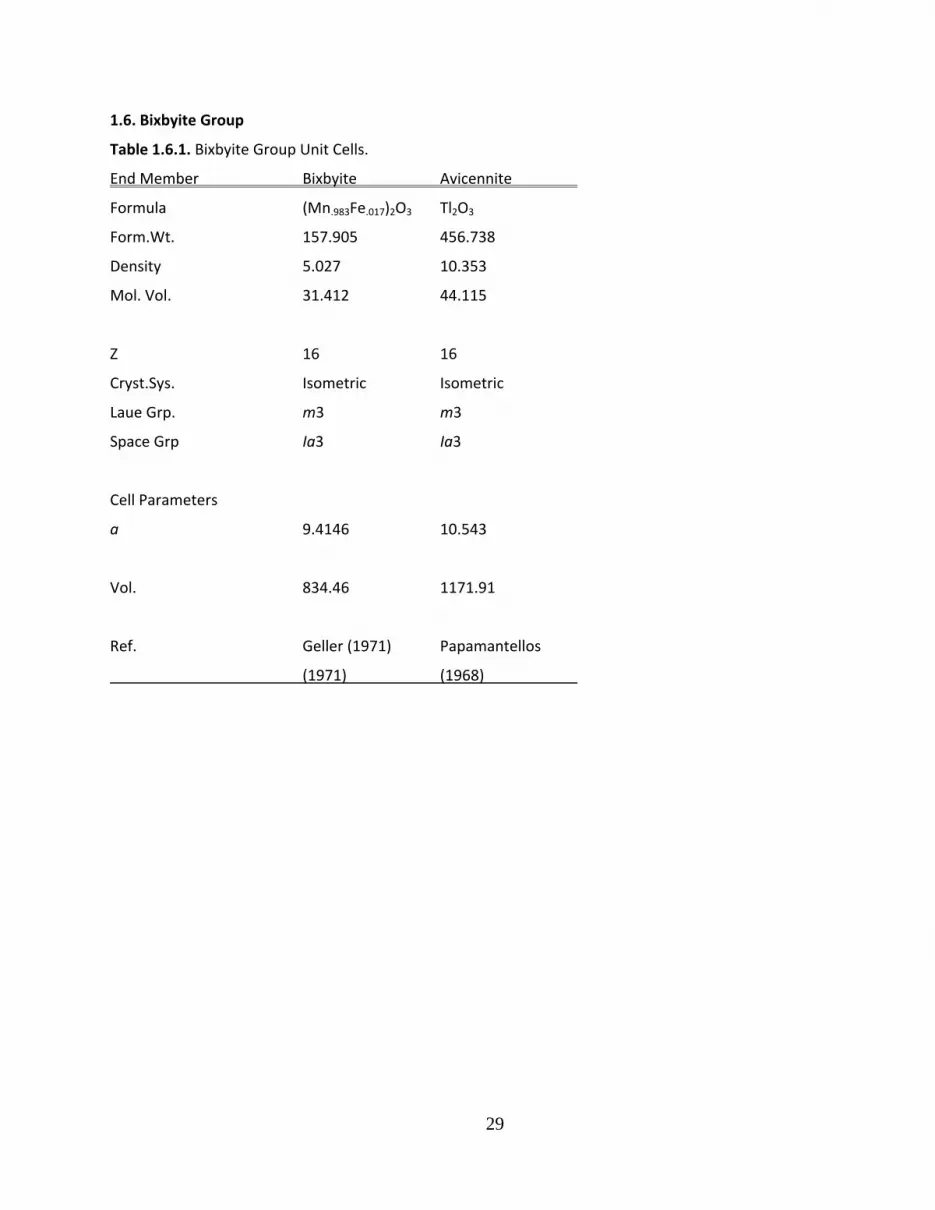
1.6. Bixbyite Group
Table 1.6.1. Bixbyite Group Unit Cells.
End Member Bixbyite Avicennite
Formula (Mn.983Fe.017)2O3 Tl2O3
Form.Wt. 157.905 456.738
Density 5.027 10.353
Mol. Vol. 31.412 44.115
Z 16 16
Cryst.Sys. Isometric Isometric
Laue Grp. m3 m3
Space Grp Ia3 Ia3
Cell Parameters
a 9.4146 10.543
Vol. 834.46 1171.91
Ref. Geller (1971) Papamantellos
(1971) (1968)

30
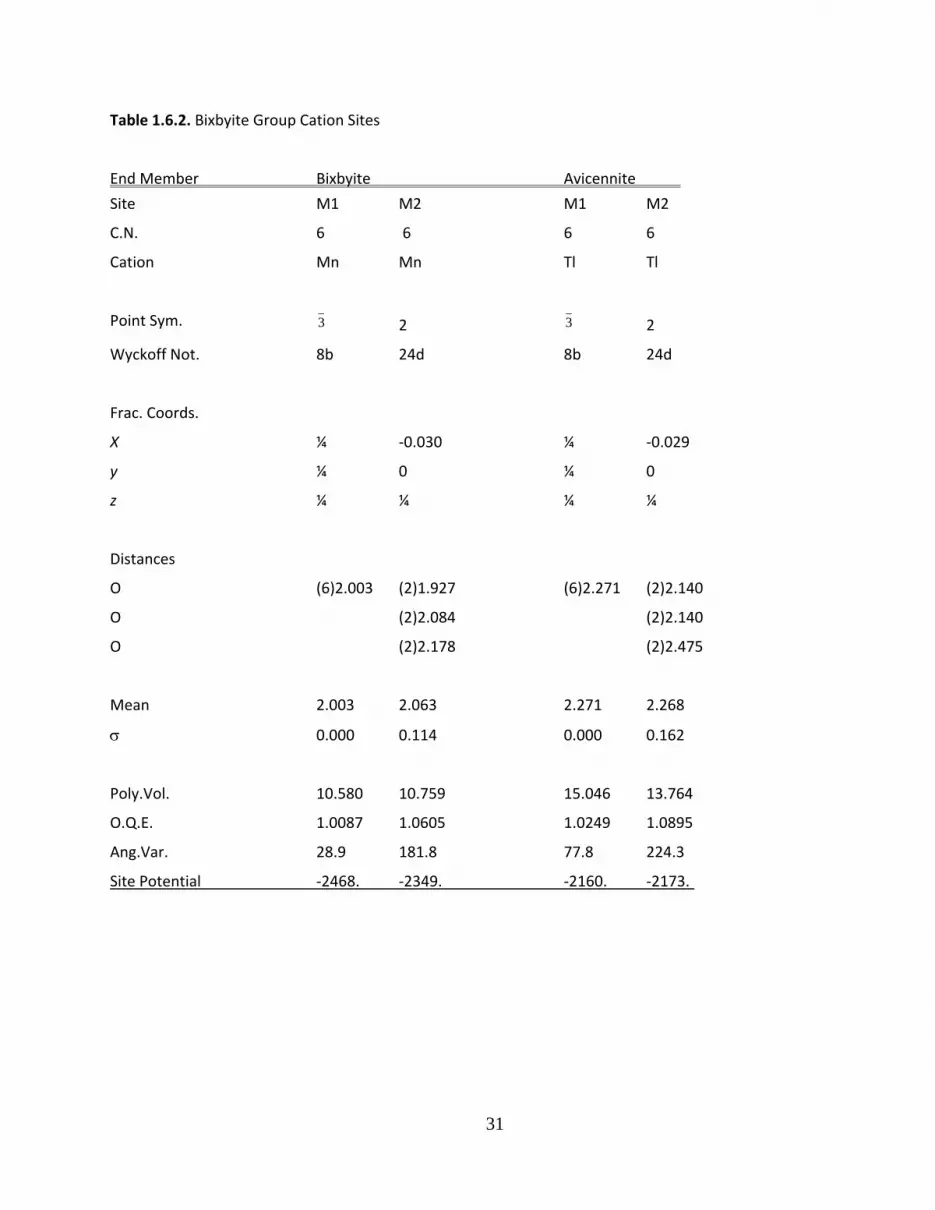
Figure 1.6. Bixbyite Mn2O3. There are two distinct Mn3+ sites, both in octahedral coordination. Mn1 is the more regular with point symmetry 3 , whereas Mn2 is more distorted. Avicennite (Tl2O3), is isostructural, as are several of the pure rare earth sesquioxides.
31
Table 1.6.2. Bixbyite Group Cation Sites
End Member Bixbyite Avicennite
Site M1 M2 M1 M2
C.N. 6 6 6 6
Cation Mn Mn Tl Tl
Point Sym. 3 2 3 2
Wyckoff Not. 8b 24d 8b 24d
Frac. Coords.
X ¼ ‐0.030 ¼ ‐0.029
y ¼ 0 ¼ 0
z ¼ ¼ ¼ ¼
Distances
O (6)2.003 (2)1.927 (6)2.271 (2)2.140
O (2)2.084 (2)2.140
O (2)2.178 (2)2.475
Mean 2.003 2.063 2.271 2.268
0.000 0.114 0.000 0.162
Poly.Vol. 10.580 10.759 15.046 13.764
O.Q.E. 1.0087 1.0605 1.0249 1.0895
Ang.Var. 28.9 181.8 77.8 224.3
Site Potential ‐2468. ‐2349. ‐2160. ‐2173.

32
1.7. Arsenic and Antimony Sesquioxides
Table 1.7.1. Arsenic and Antimony Sesquioxide Unit Cells.
End Member Arsenolite Senarmontite Claudetite Valentinite
Formula As2O3 Sb2O3 As2O3 Sb2O3
Form.Wt. 197.841 291.498 197.841 291.498
Density 3.870 5.583 3.960 5.844
Mol. Vol. 51.127 52.208 49.961 49.887
Z 16 16 4 4
Cryst.Sys. Isometric Isometric Monoclinic Orthorhombic
Laue Grp. m3m m3m 2/m mmm
Space Grp Fd3m Fd3m P21/n Pccn
Cell Parameters
a 11.0744 11.1519 7.99 4.911
b 4.65 12.464
c 9.12 5.412
78.3
Vol. 1358.19 1386.9 331.8 331.27
Ref. Pertlik Svensson Pertlik Svensson
(1978) (1975) (1975) (1974)
33
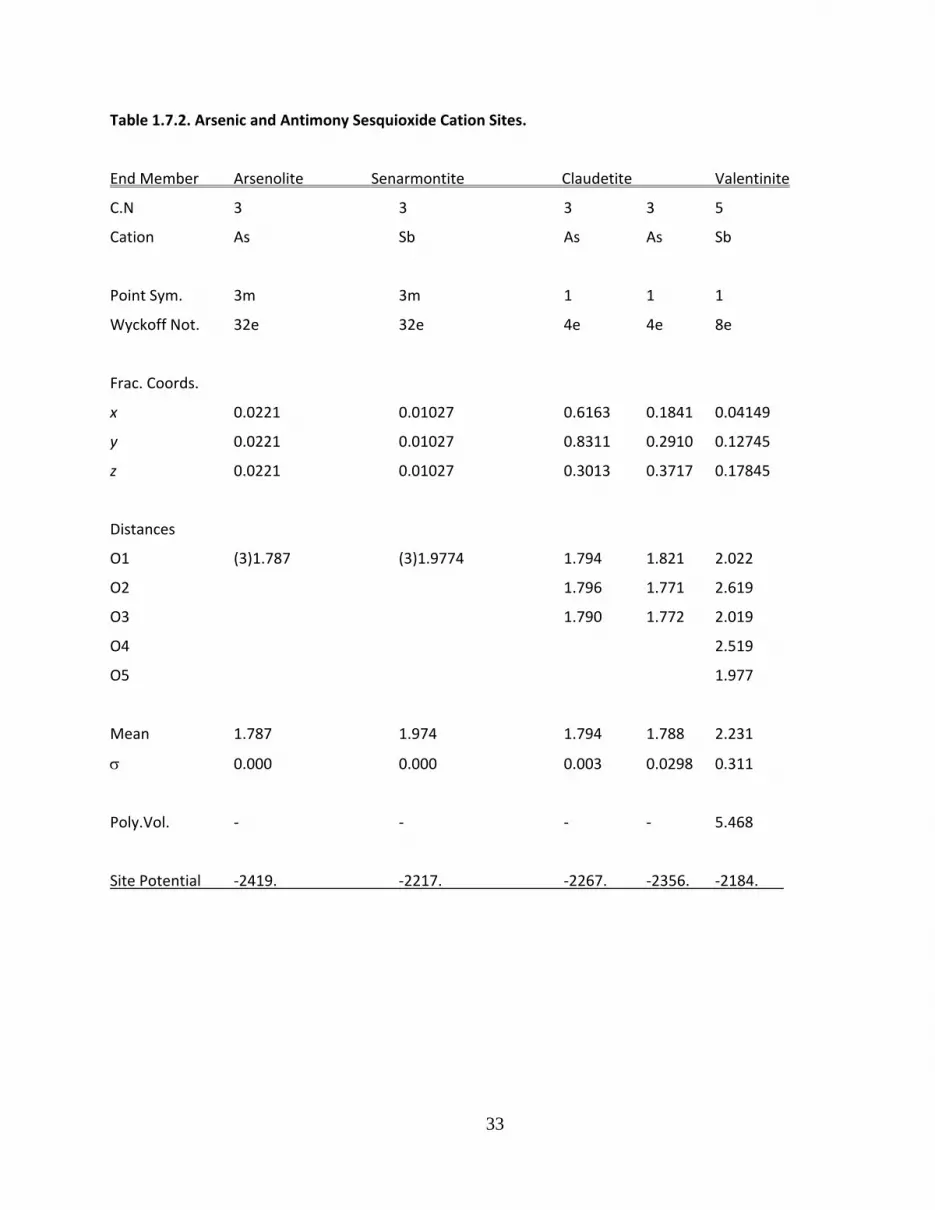
Table 1.7.2. Arsenic and Antimony Sesquioxide Cation Sites.
End Member Arsenolite Senarmontite Claudetite Valentinite
C.N 3 3 3 3 5
Cation As Sb As As Sb
Point Sym. 3m 3m 1 1 1
Wyckoff Not. 32e 32e 4e 4e 8e
Frac. Coords.
x 0.0221 0.01027 0.6163 0.1841 0.04149
y 0.0221 0.01027 0.8311 0.2910 0.12745
z 0.0221 0.01027 0.3013 0.3717 0.17845
Distances
O1 (3)1.787 (3)1.9774 1.794 1.821 2.022
O2 1.796 1.771 2.619
O3 1.790 1.772 2.019
O4 2.519
O5 1.977
Mean 1.787 1.974 1.794 1.788 2.231
0.000 0.000 0.003 0.0298 0.311
Poly.Vol. ‐ ‐ ‐ ‐ 5.468
Site Potential ‐2419. ‐2217. ‐2267. ‐2356. ‐2184.
34
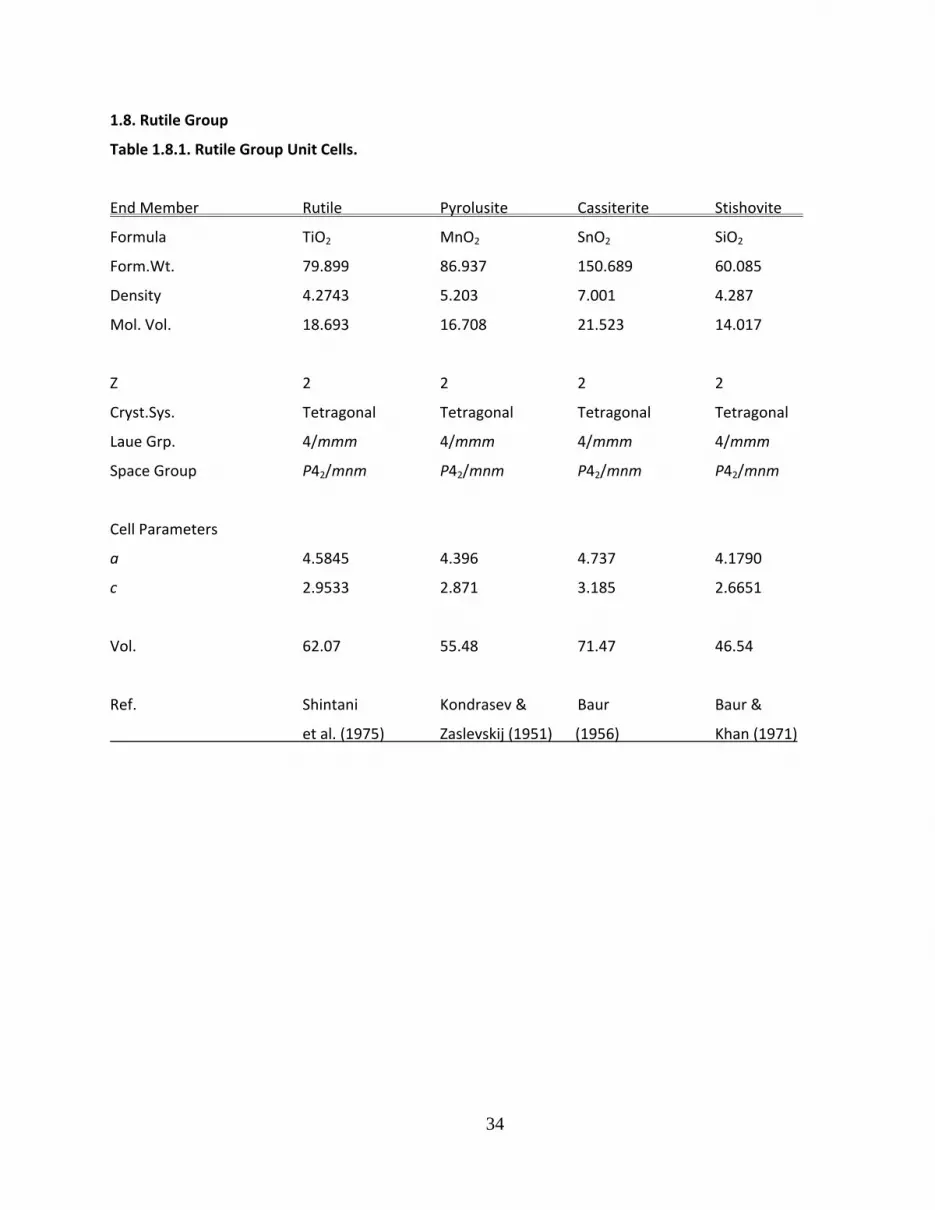
1.8. Rutile Group
Table 1.8.1. Rutile Group Unit Cells.
End Member Rutile Pyrolusite Cassiterite Stishovite
Formula TiO2 MnO2 SnO2 SiO2
Form.Wt. 79.899 86.937 150.689 60.085
Density 4.2743 5.203 7.001 4.287
Mol. Vol. 18.693 16.708 21.523 14.017
Z 2 2 2 2
Cryst.Sys. Tetragonal Tetragonal Tetragonal Tetragonal
Laue Grp. 4/mmm 4/mmm 4/mmm 4/mmm
Space Group P42/mnm P42/mnm P42/mnm P42/mnm
Cell Parameters
a 4.5845 4.396 4.737 4.1790
c 2.9533 2.871 3.185 2.6651
Vol. 62.07 55.48 71.47 46.54
Ref. Shintani Kondrasev & Baur Baur &
et al. (1975) Zaslevskij (1951) (1956) Khan (1971)
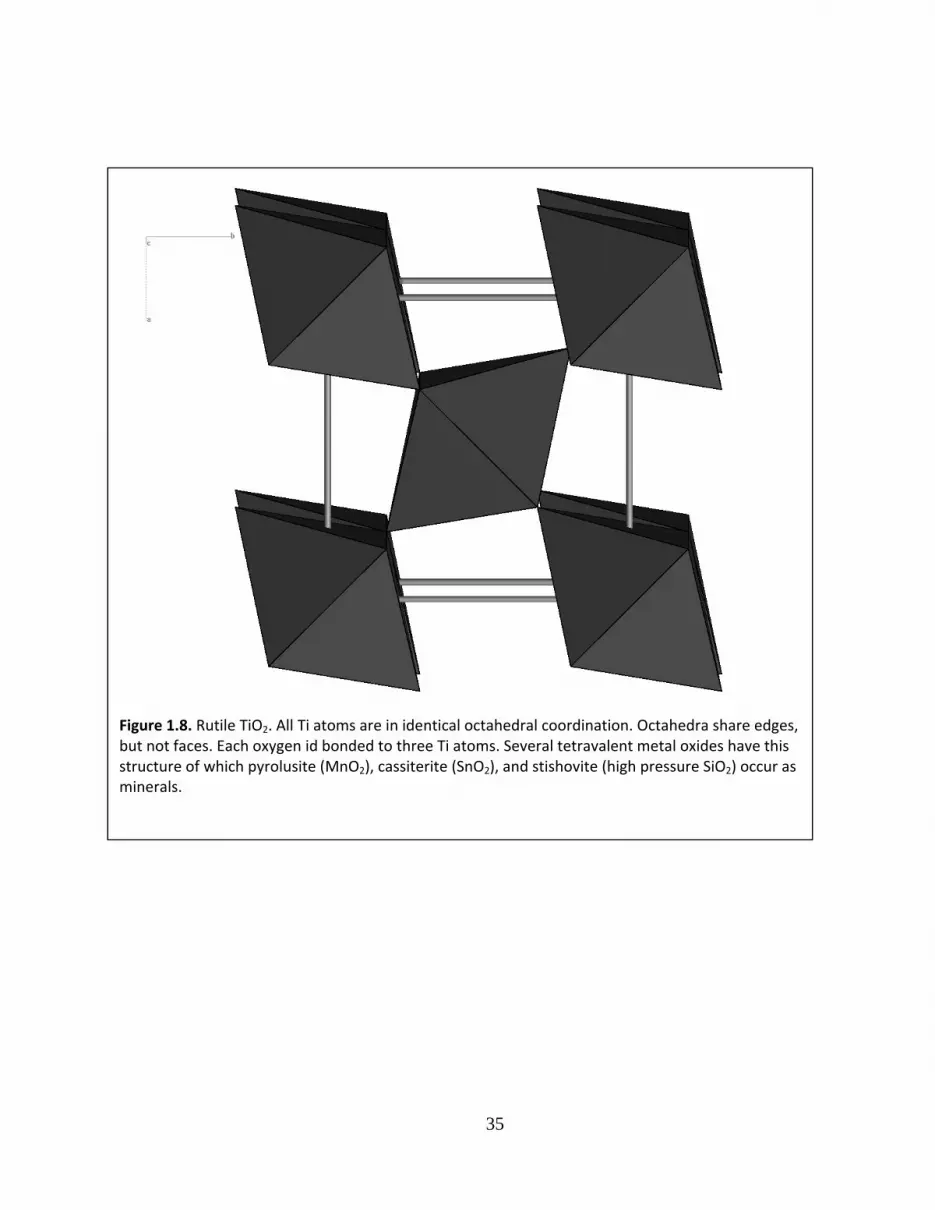
35
Figure 1.8. Rutile TiO2. All Ti atoms are in identical octahedral coordination. Octahedra share edges, but not faces. Each oxygen id bonded to three Ti atoms. Several tetravalent metal oxides have this structure of which pyrolusite (MnO2), cassiterite (SnO2), and stishovite (high pressure SiO2) occur as minerals.

36
Table 1.8.2. Rutile Group Cation Sites
End Member Rutile Pyrolusite Cassiterite Stishovite
C.N. 6 6 6 6
Cation Ti Mn Sn Si
Point Sym. mmm mmm mmm mmm
Wyckoff Not. 2a 2a 2a 2a
Frac. Coords.
X 0 0 0 0
y 0 0 0 0
z 0 0 0 0
Distances
O(2) 1.977 1.878 2.057 1.810
O(4) 1.944 1.891 2.051 1.757
Mean 1.955 1.887 2.053 1.775
0.017 0.007 0.003 0.027
Poly.Vol. 9.846 8.847 11.292 7.365
O.Q.E. 1.0081 1.0079 1.0145 1.0080
Ang.Var. 28.4 28.0 51.1 27.1
Site Potential ‐4133. ‐4289 ‐3953. ‐4550.
37
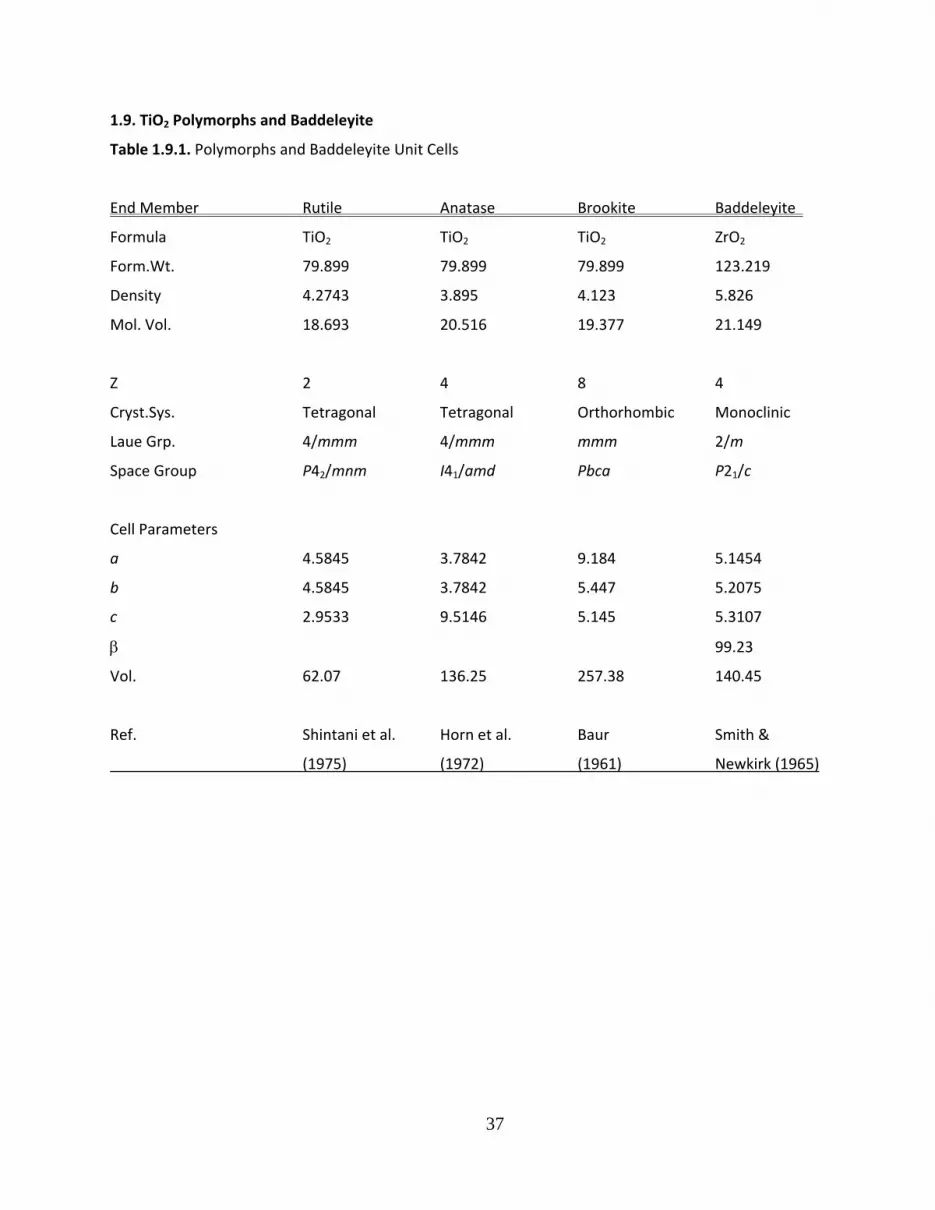
1.9. TiO2 Polymorphs and Baddeleyite
Table 1.9.1. Polymorphs and Baddeleyite Unit Cells
End Member Rutile Anatase Brookite Baddeleyite
Formula TiO2 TiO2 TiO2 ZrO2
Form.Wt. 79.899 79.899 79.899 123.219
Density 4.2743 3.895 4.123 5.826
Mol. Vol. 18.693 20.516 19.377 21.149
Z 2 4 8 4
Cryst.Sys. Tetragonal Tetragonal Orthorhombic Monoclinic
Laue Grp. 4/mmm 4/mmm mmm 2/m
Space Group P42/mnm I41/amd Pbca P21/c
Cell Parameters
a 4.5845 3.7842 9.184 5.1454
b 4.5845 3.7842 5.447 5.2075
c 2.9533 9.5146 5.145 5.3107
99.23
Vol. 62.07 136.25 257.38 140.45
Ref. Shintani et al. Horn et al. Baur Smith &
(1975) (1972) (1961) Newkirk (1965)
38
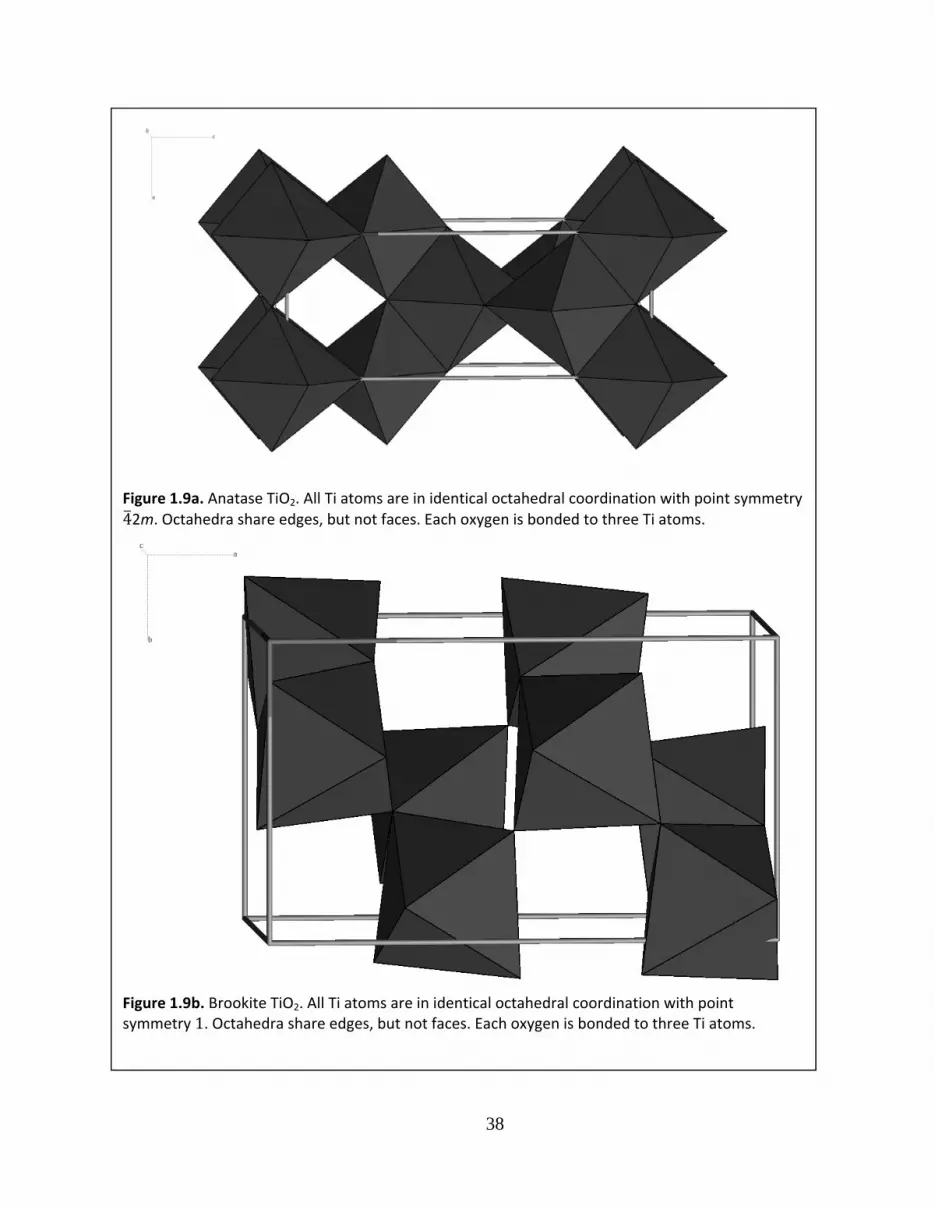
Figure 1.9a. Anatase TiO2. All Ti atoms are in identical octahedral coordination with point symmetry
42m. Octahedra share edges, but not faces. Each oxygen is bonded to three Ti atoms.
Figure 1.9b. Brookite TiO2. All Ti atoms are in identical octahedral coordination with point symmetry1. Octahedra share edges, but not faces. Each oxygen is bonded to three Ti atoms.
39
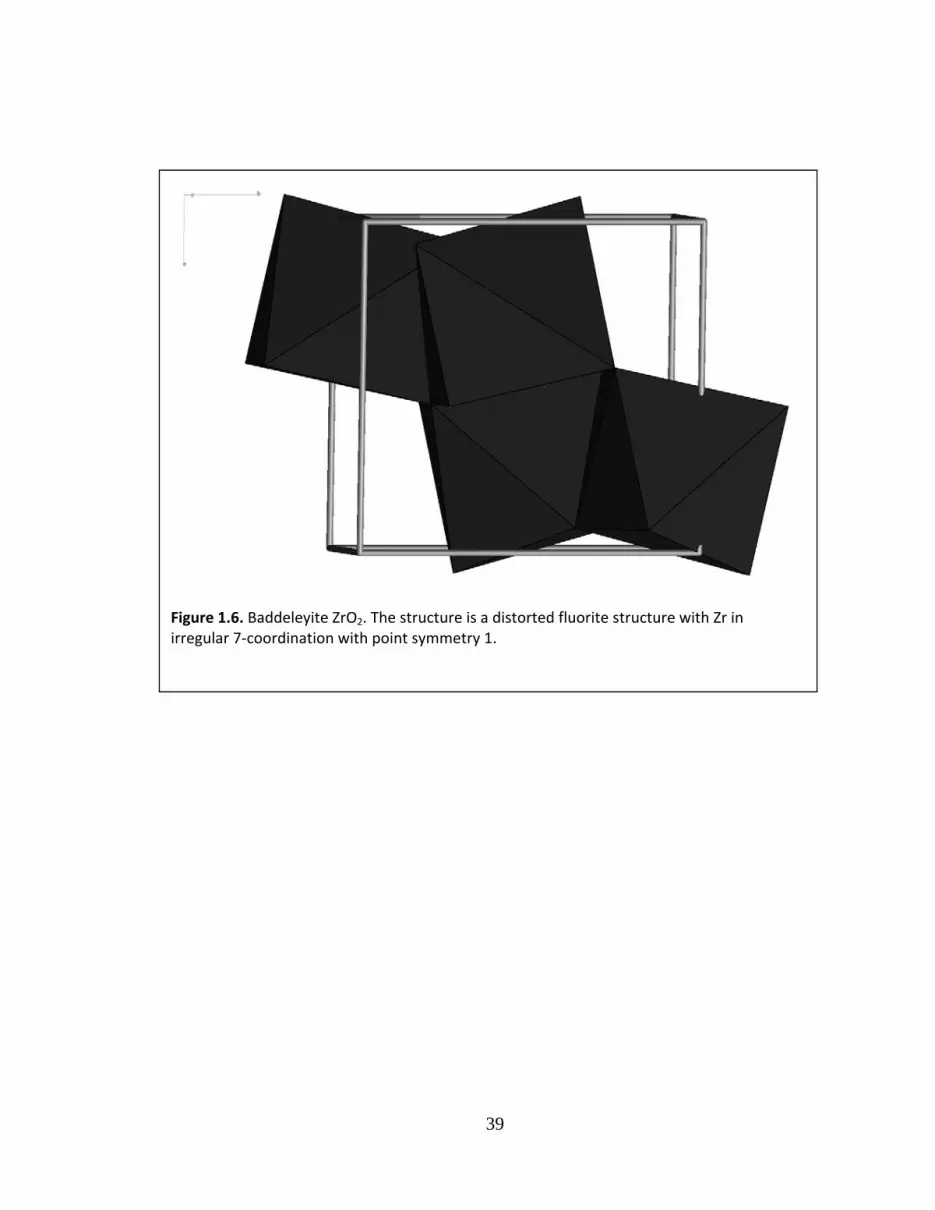
Figure 1.6. Baddeleyite ZrO2. The structure is a distorted fluorite structure with Zr in irregular 7‐coordination with point symmetry 1.
40
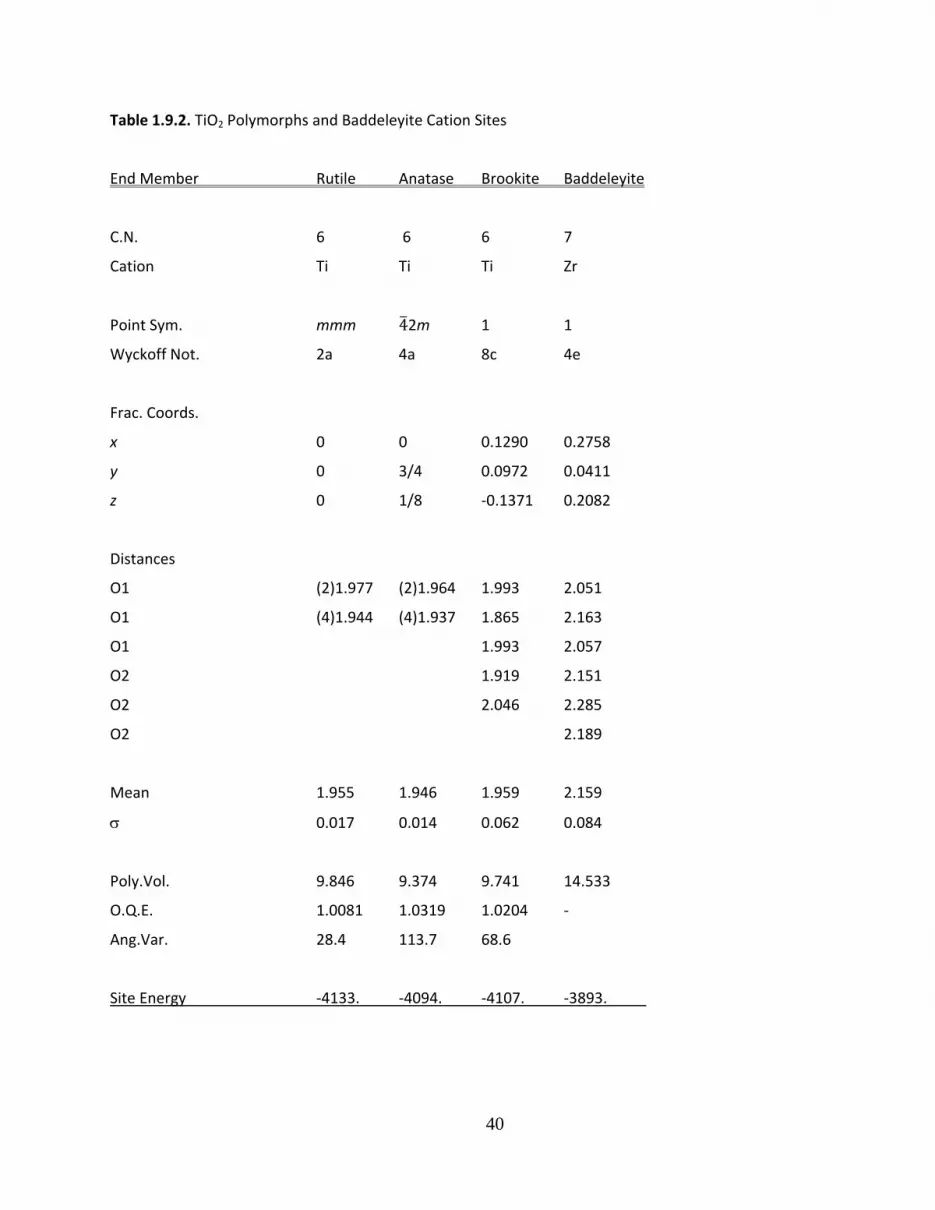
Table 1.9.2. TiO2 Polymorphs and Baddeleyite Cation Sites
End Member Rutile Anatase Brookite Baddeleyite
C.N. 6 6 6 7
Cation Ti Ti Ti Zr
Point Sym. mmm 42m 1 1
Wyckoff Not. 2a 4a 8c 4e
Frac. Coords.
x 0 0 0.1290 0.2758
y 0 3/4 0.0972 0.0411
z 0 1/8 ‐0.1371 0.2082
Distances
O1 (2)1.977 (2)1.964 1.993 2.051
O1 (4)1.944 (4)1.937 1.865 2.163
O1 1.993 2.057
O2 1.919 2.151
O2 2.046 2.285
O2 2.189
Mean 1.955 1.946 1.959 2.159
0.017 0.014 0.062 0.084
Poly.Vol. 9.846 9.374 9.741 14.533
O.Q.E. 1.0081 1.0319 1.0204 ‐
Ang.Var. 28.4 113.7 68.6
Site Energy ‐4133. ‐4094. ‐4107. ‐3893.

41
1.10. MnO2 Polymorphs
Table 1.10.1. MnO2 Polymorph Unit Cells
End Member Pyrolusite Ramsdellite
Formula MnO2 MnO2
Form.Wt. 86.937 86.937
Density 5.203 4.874
Mol. Vol. 16.708 17.838
Z 2 4
Cryst.Sys. Tetragonal Orthorhombic
Laue Grp. 4/mmm mmm
Space Group P42/mnm Pnam
Cell Parameters
a 4.396 9.32
b 4.396 4.46
c 2.871 2.850
Vol. 55.48 118.47
Ref. Kondrasev & Kondrasev &
Zaslevskij (1951) Zaslevskij (1951)

42
Figure 1.10. Ramsdellite MnO2. All Mn4+ atoms are in identical octahedral coordination with point symmetry m.

43
Table 1.10.2. MnO2 Polymorph Cation Sites.
End Member Pyrolusite Ramsdellite
C.N. 6 6
Cation Mn Mn
Point Sym. mmm m
Wyckoff Not. 2a 4c
Frac. Coords.
x 0 0.140
y 0 0.020
z 0 ¼
Distances
O1 (2)1.878 (2)1.949
O1 (4)1.890 (1)1.887
O2 (2)1.861
O2 (1)1.837
Mean 1.887 1.891
0.007 0.048
Poly.Vol. 8.847 8.798
O.Q.E. 1.0079 1.0169
Ang.Var. 28.0 54.1
Site Energy ‐4289. ‐4127.

44
1.11.4 Uraninite Group
Table 1.11.1. Uraninite Group Unit Cells.
End Member Uraninite Thorianite
Formula UO2 ThO2
Form.Wt. 270.029 264.039
Density 10.968 9.987
Mol. Vol. 24.620 26.439
Z 4 4
Cryst.Sys. Isometric Isometric
Laue Grp. m3m m3m
Space Group Fm3m Fm3m
Cell Parameters
a 5.4682 5.5997
Vol. 163.51 175.59
Ref. Leonova Vogel & Kempter
(1959) (1959)

45
Figure 1.11. Uraninite UO2. All U4+ atoms are in identical eight‐fold cubic coordination with
point symmetry m3m. Thorianite (ThO2), cerianite (CeO2), and fluorite (CaF2) are isostructural.

46
Table 1.11.2. Uraninite Group Cation Sites.
End Member Uraninite Thorianite
C.N. 8 8
Cation U4+ Th4+
Point Sym. m3m m3m
Wyckoff Not. 4b 4b
Frac. Coords.
x 0 0
y 0 0
z 0 0
Distances
O(8) 2.368 2.425
Poly.Vol. 40.876 43.807
Site Energy ‐3396. ‐3316.
Ref. Leonova Vogel & Kempter
(1959) (1959)
47
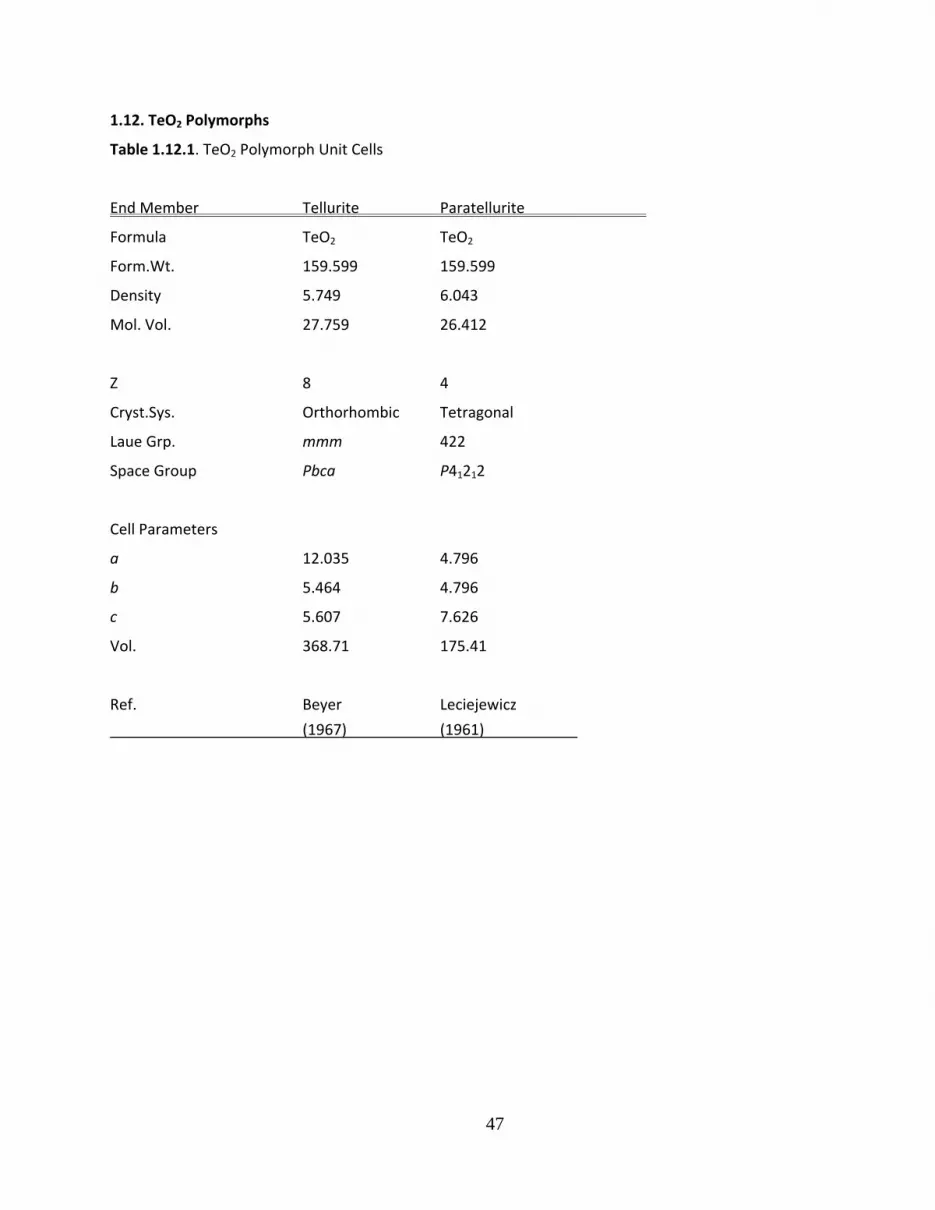
1.12. TeO2 Polymorphs
Table 1.12.1. TeO2 Polymorph Unit Cells
End Member Tellurite Paratellurite
Formula TeO2 TeO2
Form.Wt. 159.599 159.599
Density 5.749 6.043
Mol. Vol. 27.759 26.412
Z 8 4
Cryst.Sys. Orthorhombic Tetragonal
Laue Grp. mmm 422
Space Group Pbca P41212
Cell Parameters
a 12.035 4.796
b 5.464 4.796
c 5.607 7.626
Vol. 368.71 175.41
Ref. Beyer Leciejewicz
(1967) (1961)

48
Table 1.12.2. TeO2 Polymorph Cation Sites
End Member Tellurite Paratellurite
C.N. 4 4
Cation Te Te
Point Sym. 1 2
Wyckoff Not. 8d 4a
Frac. Coords.
X 0.1182 0.0200
y 0.0255 0.0200
z 0.3781 0
Distances
O1 1.877 (2)1.919
O2 2.196 (2)2.087
O3 1.927
O4 2.070
Mean 2.018 2.003
0.144 0.097
Poly.Vol. 2.494 2.508
T.Q.E. 1.424 1.395
Ang.Var. 544. 651.
Site Energy ‐3758. ‐3784.

49
Chapter2.MultipleOxideMinerals
Oxide Minerals of Two or More Cations
2.1 Ilmenite Group
2.2 Perovskite group
2.3 Oxide spinel group
2.4 Pseudobrookite group
2.5 Tungstate group

50
Figure 2.1. The crystal structure of ilmenite (FeTiO3), [1 1 0] projection, c vertical. The structure is
an ordered derivative of the corundum structure with Fe and Ti both in octahedral coordination
but ordered into alternate layers in the c‐direction. The structure is dense with face‐sharing
octahedra.
2.1.1. Ilmenite Group
51
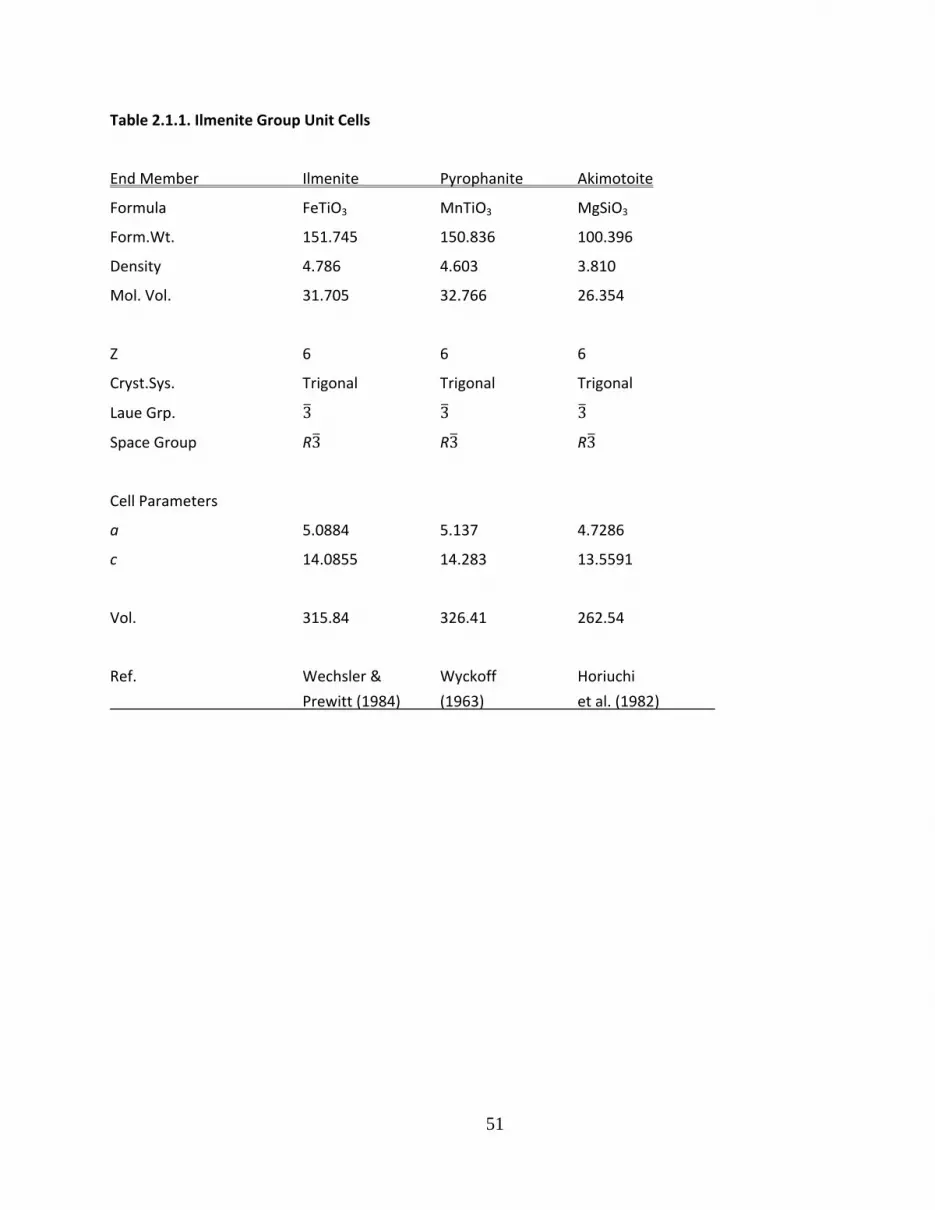
Table 2.1.1. Ilmenite Group Unit Cells
End Member Ilmenite Pyrophanite Akimotoite
Formula FeTiO3 MnTiO3 MgSiO3
Form.Wt. 151.745 150.836 100.396
Density 4.786 4.603 3.810
Mol. Vol. 31.705 32.766 26.354
Z 6 6 6
Cryst.Sys. Trigonal Trigonal Trigonal
Laue Grp. 3 3 3
Space Group R3 R3 R3
Cell Parameters
a 5.0884 5.137 4.7286
c 14.0855 14.283 13.5591
Vol. 315.84 326.41 262.54
Ref. Wechsler & Wyckoff Horiuchi
Prewitt (1984) (1963) et al. (1982)
52
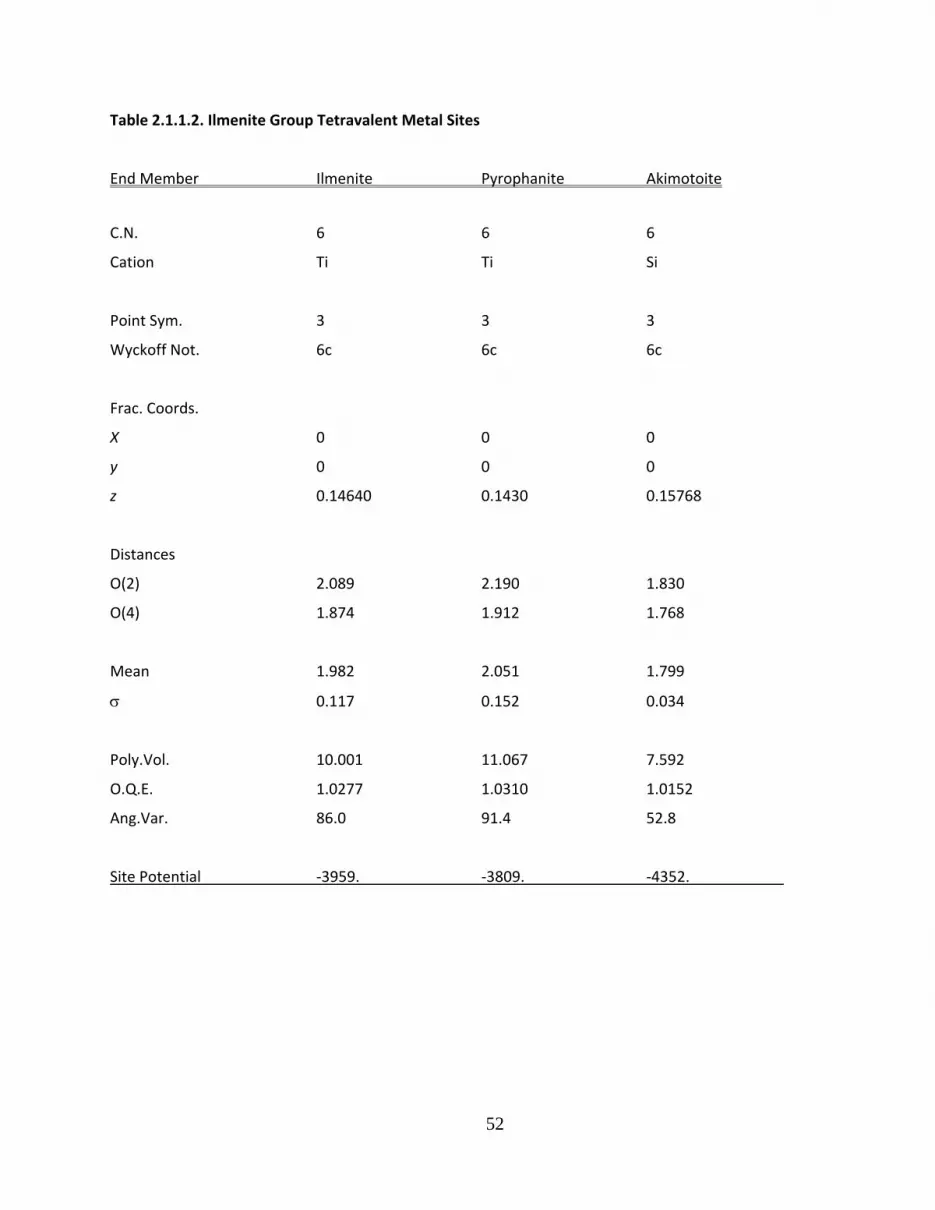
Table 2.1.1.2. Ilmenite Group Tetravalent Metal Sites
End Member Ilmenite Pyrophanite Akimotoite
C.N. 6 6 6
Cation Ti Ti Si
Point Sym. 3 3 3
Wyckoff Not. 6c 6c 6c
Frac. Coords.
X 0 0 0
y 0 0 0
z 0.14640 0.1430 0.15768
Distances
O(2) 2.089 2.190 1.830
O(4) 1.874 1.912 1.768
Mean 1.982 2.051 1.799
0.117 0.152 0.034
Poly.Vol. 10.001 11.067 7.592
O.Q.E. 1.0277 1.0310 1.0152
Ang.Var. 86.0 91.4 52.8
Site Potential ‐3959. ‐3809. ‐4352.
53
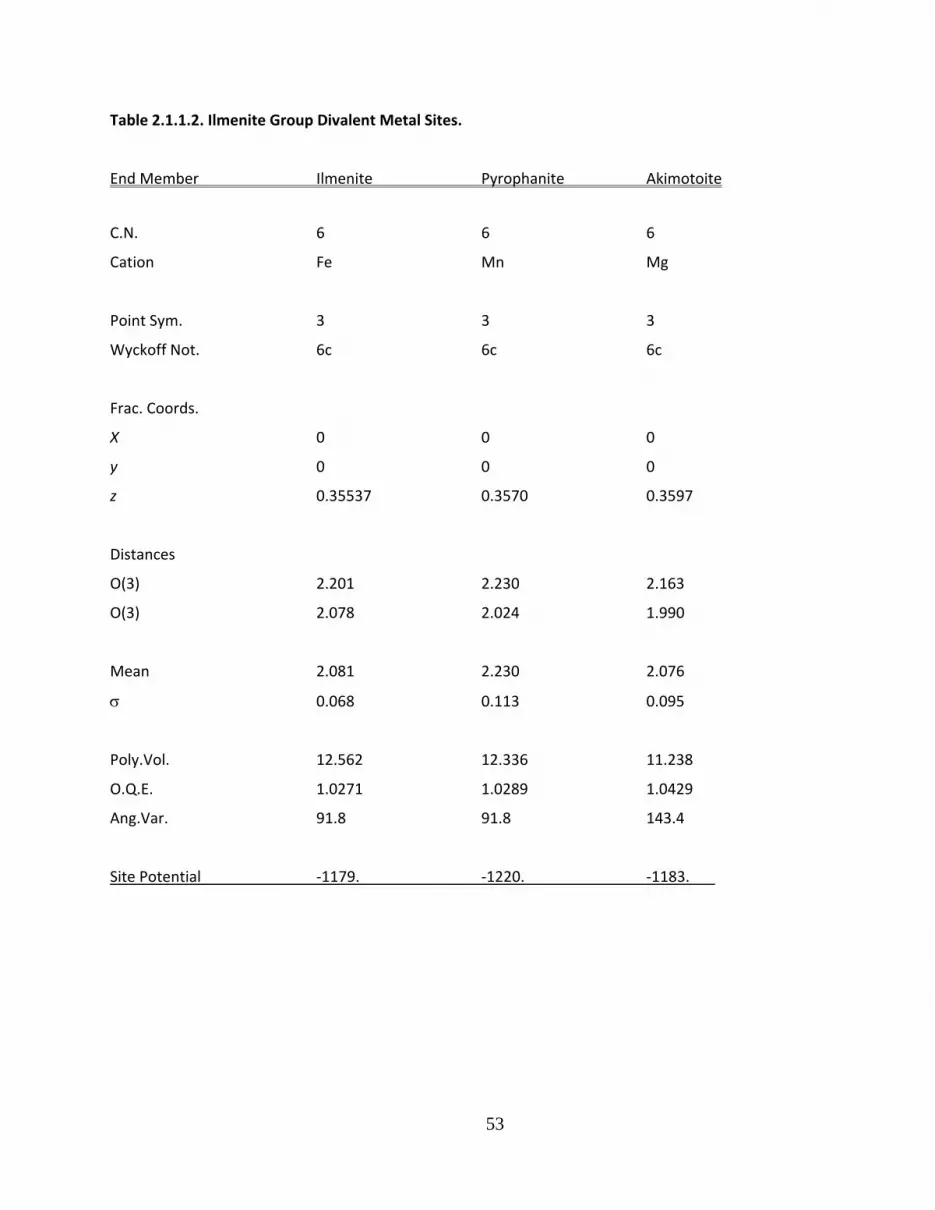
Table 2.1.1.2. Ilmenite Group Divalent Metal Sites.
End Member Ilmenite Pyrophanite Akimotoite
C.N. 6 6 6
Cation Fe Mn Mg
Point Sym. 3 3 3
Wyckoff Not. 6c 6c 6c
Frac. Coords.
X 0 0 0
y 0 0 0
z 0.35537 0.3570 0.3597
Distances
O(3) 2.201 2.230 2.163
O(3) 2.078 2.024 1.990
Mean 2.081 2.230 2.076
0.068 0.113 0.095
Poly.Vol. 12.562 12.336 11.238
O.Q.E. 1.0271 1.0289 1.0429
Ang.Var. 91.8 91.8 143.4
Site Potential ‐1179. ‐1220. ‐1183.

54
2.2. Perovskite Group
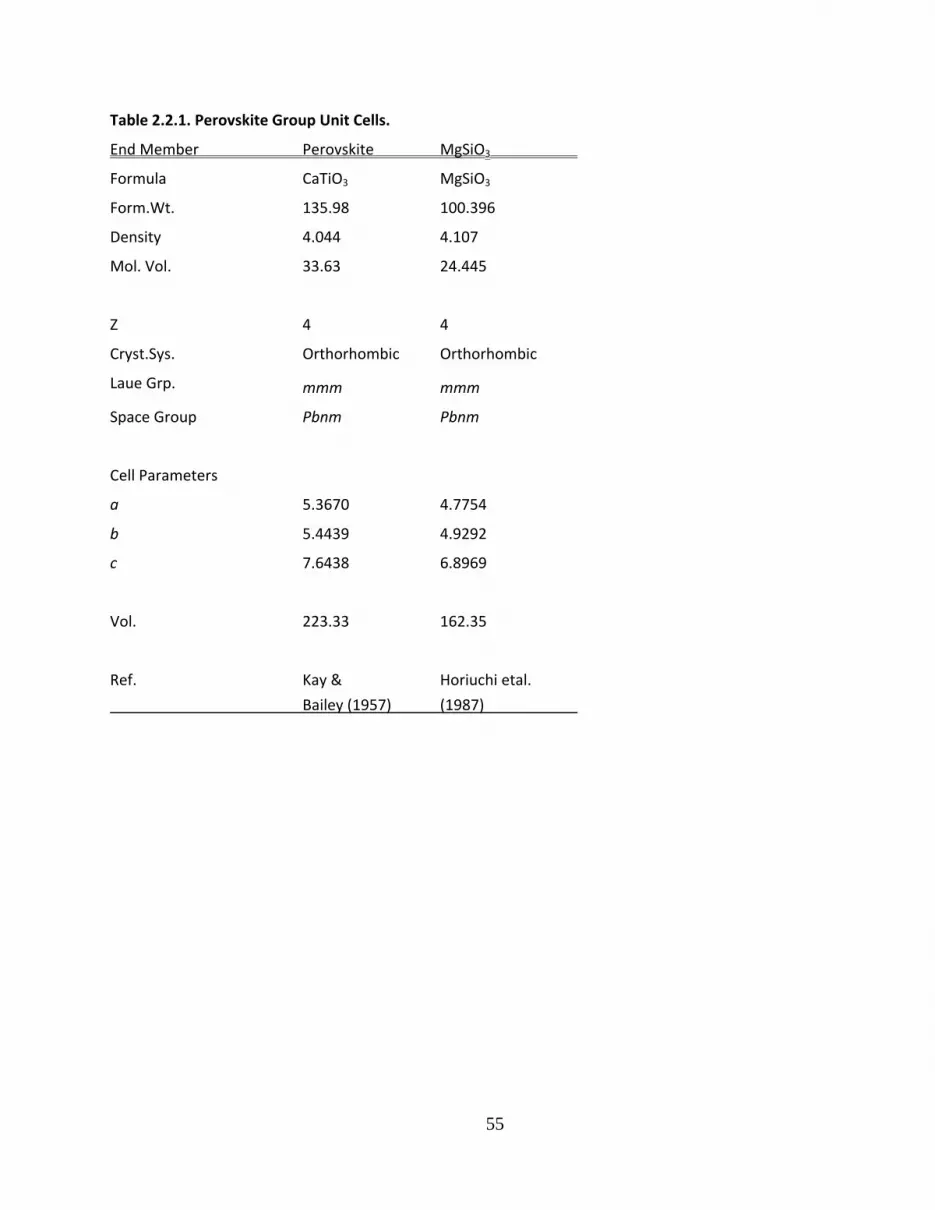
There are numerous compounds with this structure or derivatives. The mineral perovskite is CaTiO3,
but MgSiO3 adopts this structure at pressures above 23 GPa and likely constitutes about 40% of the total
mass of the Earth.
Figure 2.2. Perovskite, CaTiO3, perspective c‐axis projection, a vertical.
55
Table 2.2.1. Perovskite Group Unit Cells.
End Member Perovskite MgSiO3
Formula CaTiO3 MgSiO3
Form.Wt. 135.98 100.396
Density 4.044 4.107
Mol. Vol. 33.63 24.445
Z 4 4
Cryst.Sys. Orthorhombic Orthorhombic
Laue Grp. mmm mmm
Space Group Pbnm Pbnm
Cell Parameters
a 5.3670 4.7754
b 5.4439 4.9292
c 7.6438 6.8969
Vol. 223.33 162.35
Ref. Kay & Horiuchi etal.
Bailey (1957) (1987)
56
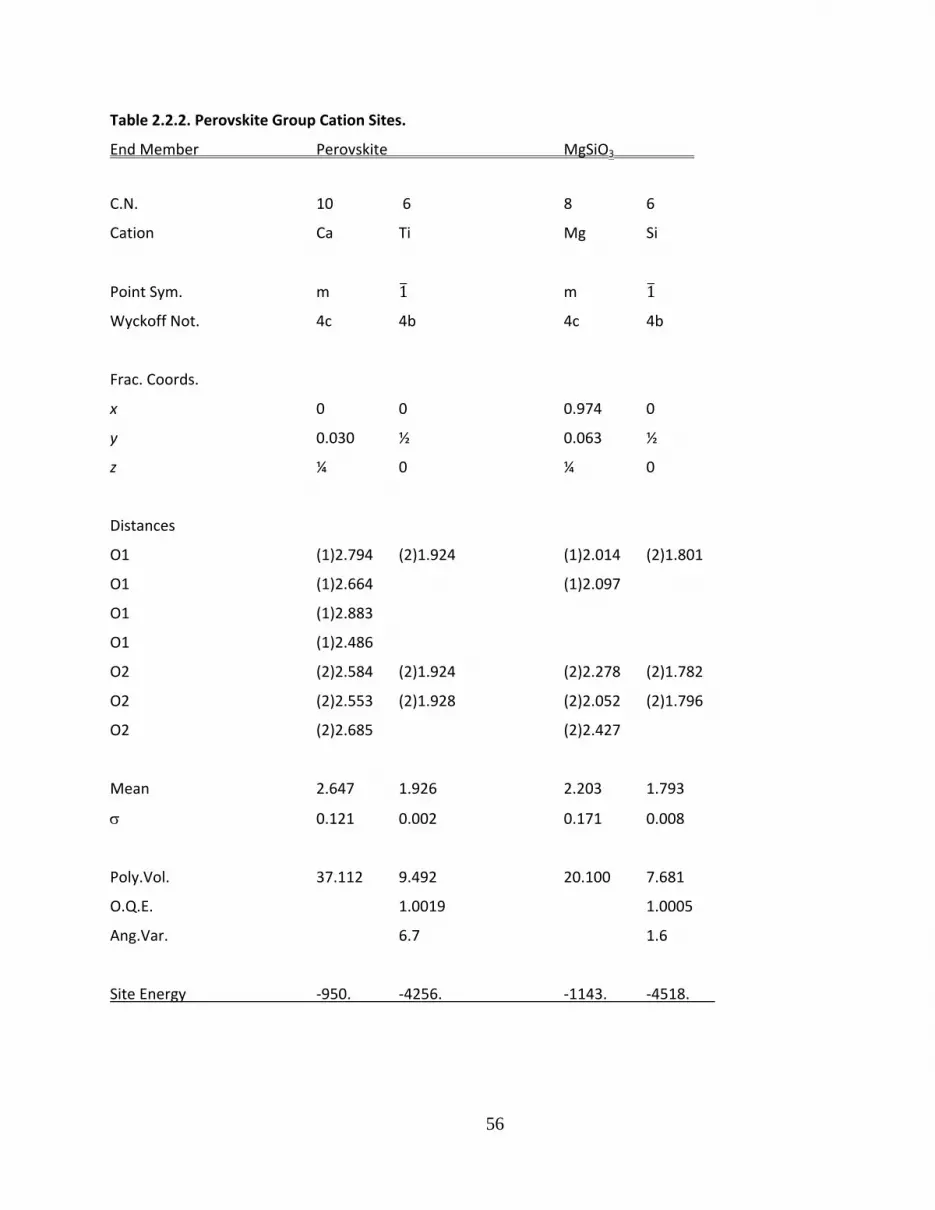
Table 2.2.2. Perovskite Group Cation Sites.
End Member Perovskite MgSiO3
C.N. 10 6 8 6
Cation Ca Ti Mg Si
Point Sym. m 1 m 1
Wyckoff Not. 4c 4b 4c 4b
Frac. Coords.
x 0 0 0.974 0
y 0.030 ½ 0.063 ½
z ¼ 0 ¼ 0
Distances
O1 (1)2.794 (2)1.924 (1)2.014 (2)1.801
O1 (1)2.664 (1)2.097
O1 (1)2.883
O1 (1)2.486
O2 (2)2.584 (2)1.924 (2)2.278 (2)1.782
O2 (2)2.553 (2)1.928 (2)2.052 (2)1.796
O2 (2)2.685 (2)2.427
Mean 2.647 1.926 2.203 1.793
0.121 0.002 0.171 0.008
Poly.Vol. 37.112 9.492 20.100 7.681
O.Q.E. 1.0019 1.0005
Ang.Var. 6.7 1.6
Site Energy ‐950. ‐4256. ‐1143. ‐4518.
57
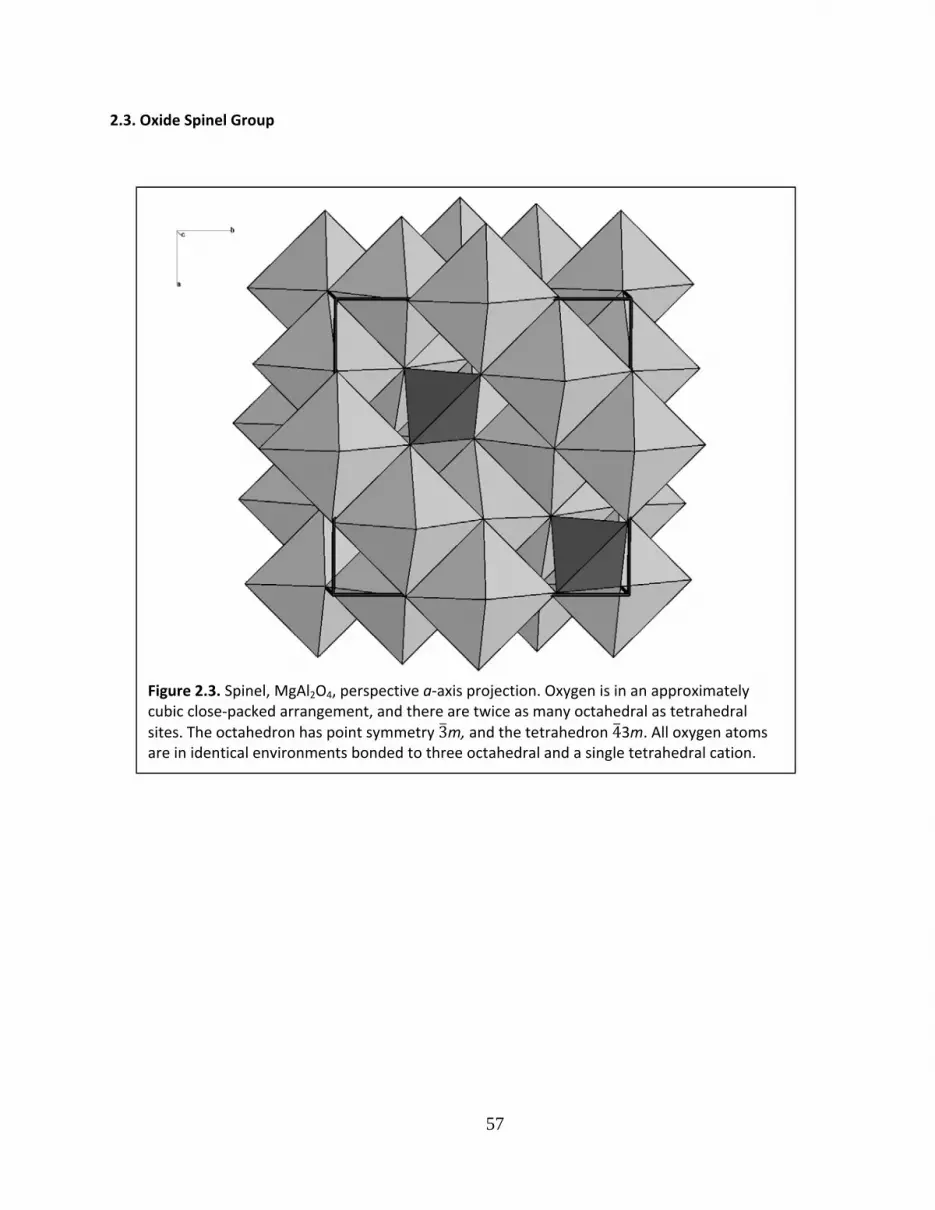
2.3. Oxide Spinel Group
Figure 2.3. Spinel, MgAl2O4, perspective a‐axis projection. Oxygen is in an approximately cubic close‐packed arrangement, and there are twice as many octahedral as tetrahedral
sites. The octahedron has point symmetry 3m, and the tetrahedron 43m. All oxygen atoms are in identical environments bonded to three octahedral and a single tetrahedral cation.
58
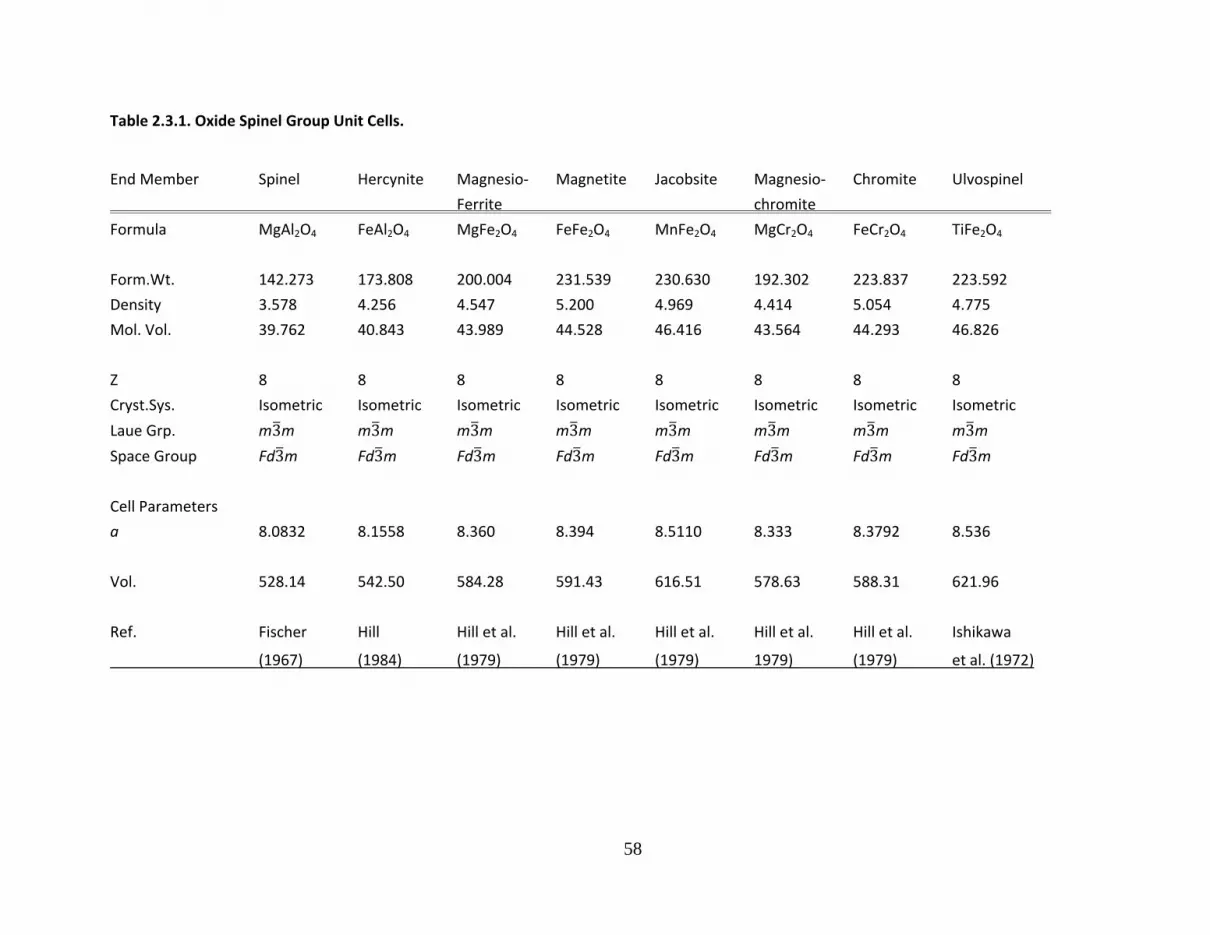
Table 2.3.1. Oxide Spinel Group Unit Cells.
End Member Spinel Hercynite Magnesio‐ Magnetite Jacobsite Magnesio‐ Chromite Ulvospinel
Ferrite chromite
Formula MgAl2O4 FeAl2O4 MgFe2O4 FeFe2O4 MnFe2O4 MgCr2O4 FeCr2O4 TiFe2O4
Form.Wt. 142.273 173.808 200.004 231.539 230.630 192.302 223.837 223.592
Density 3.578 4.256 4.547 5.200 4.969 4.414 5.054 4.775
Mol. Vol. 39.762 40.843 43.989 44.528 46.416 43.564 44.293 46.826
Z 8 8 8 8 8 8 8 8
Cryst.Sys. Isometric Isometric Isometric Isometric Isometric Isometric Isometric Isometric
Laue Grp. m3m m3m m3m m3m m3m m3m m3m m3m
Space Group Fd3m Fd3m Fd3m Fd3m Fd3m Fd3m Fd3m Fd3m
Cell Parameters
a 8.0832 8.1558 8.360 8.394 8.5110 8.333 8.3792 8.536
Vol. 528.14 542.50 584.28 591.43 616.51 578.63 588.31 621.96
Ref. Fischer Hill Hill et al. Hill et al. Hill et al. Hill et al. Hill et al. Ishikawa
(1967) (1984) (1979) (1979) (1979) 1979) (1979) et al. (1972)

59
Table 2.3.2. Oxide Spinel Group Octahedral Sites.
End Member Spinel Hercynite Magnesio‐ Magnetite Jacobsite Magnesio‐ Chromite Ulvospinel
Ferrite chromite
C.N. 6 6 6 6 6 6 6 6
Occupant Al.96Mg.04 Al Mg.45Fe.55 Fe.5Fe.5 Fe.93Mn.07 Cr Cr Fe.5Ti.5
Point Sym 3m 3m 3m 3m 3m 3m 3m 3m
Wyckoff Not. 16d 16d 16d 16d 16d 16d 16d 16d
Frac.Coord.
x ½ ½ ½ ½ ½ ½ ½ ½
y ½ ½ ½ ½ ½ ½ ½ ½
z ½ ½ ½ ½ ½ ½ ½ ½
Distances
O(6) 1.926 1.937 2.033 2.059 2.035 1.994 1.990 2.044
Poly.Vol. 9.371 9.505 11.151 11.612 11.074 10.440 10.322 11.252
O.Q.E. 1.0108 1.0125 1.0033 1.0015 1.0092 1.0087 1.0123 1.0084
Ang.Var. 40.8 47.4 12.2 5.6 34.7 32.8 46.7 31.6
Site Energy ‐2407. ‐2444. ‐1791. ‐1701. ‐2226. ‐2353. ‐2377. ‐2293.
Model Chg. 2.96 3.0 2.55 2.5 2.925 3.0 3.0 3.0

60
Table 2.3.3. Oxide Spinel Group Tetrahedral Sites.
End Member Spinel Hercynite Magnesio‐ Magnetite Jacobsite Magnesio‐ Chromite Ulvospinel
Ferrite chromite
C.N. 4 4 4 4 4 4 4 4
Occupant Mg.93Al.07 Fe Mg.10Fe.90 Fe3+ Mn.85Fe.15 Mg Fe Fe+2
Point Sym 43m 43m 43m 43m 43m 43m 43m 43m
Wyckoff Not. 8a 8a 8a 8a 8a 8a 8a 8a
Frac.Coord
x 1/8 1/8 1/8 1/8 1/8 1/8 1/8 1/8
y 1/8 1/8 1/8 1/8 1/8 1/8 1/8 1/8
z 1/8 1/8 1/8 1/8 1/8 1/8 1/8 1/8
Distances
O(4) 1.924 1.954 1.911 1.887 2.012 1.966 2.006 2.011
Poly.Vol. 3.653 3.827 3.584 3.449 4.181 3.899 4.141 4.172
T.Q.E. 1.0000 1.0000 1.0000 1.0000 1.0000 1.0000 1.0000 1.0000
Ang.Var. 0.0 0.0 0.0 0.0 0.0 0.0 0.0 0.0
Site Energy ‐1269. ‐1179. ‐2211. ‐2384. ‐1293. ‐1189. ‐1149. ‐1164.
Model Chg. 2.07 2.00 2.90 3.0 2.15 2.0 2.0 2.0
61
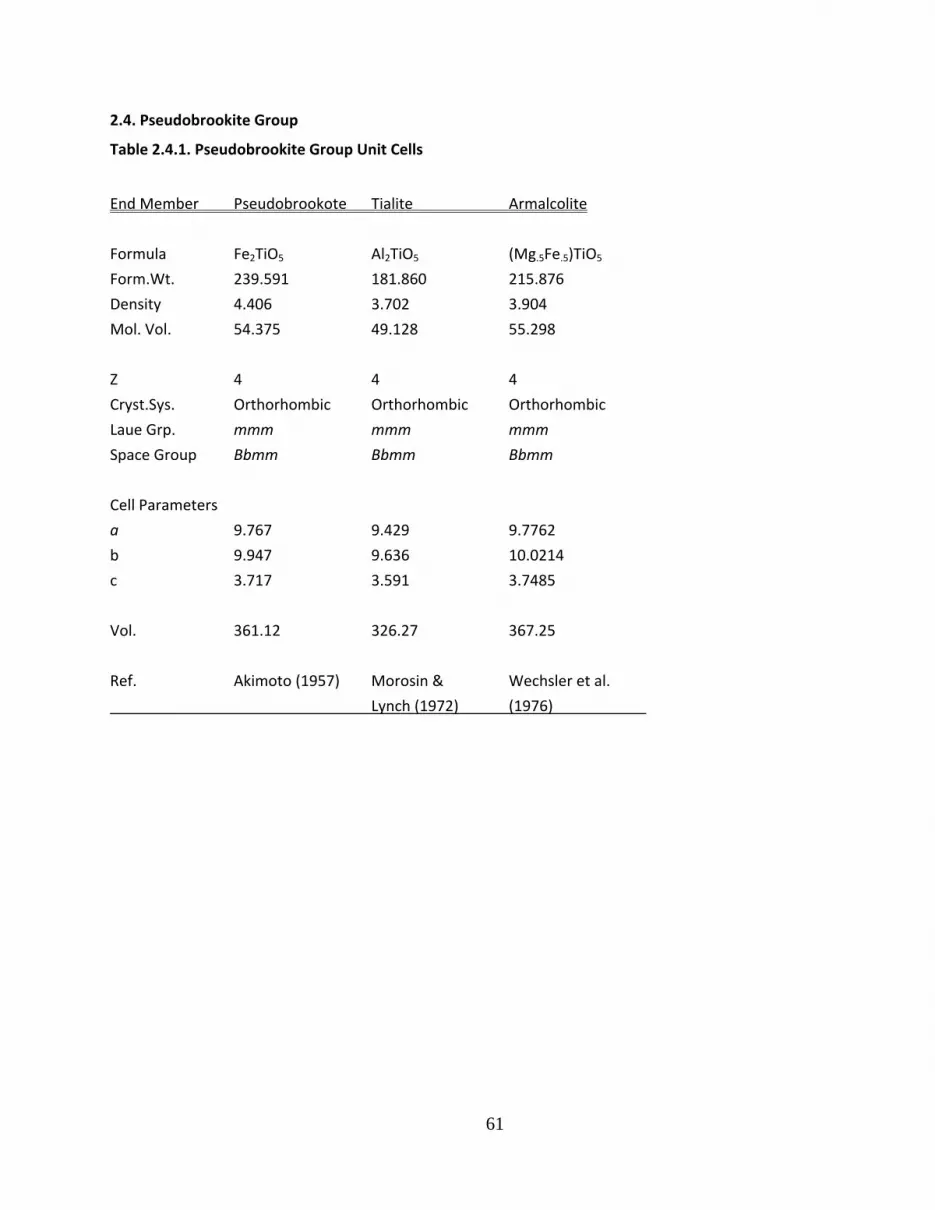
2.4. Pseudobrookite Group
Table 2.4.1. Pseudobrookite Group Unit Cells
End Member Pseudobrookote Tialite Armalcolite
Formula Fe2TiO5 Al2TiO5 (Mg.5Fe.5)TiO5
Form.Wt. 239.591 181.860 215.876
Density 4.406 3.702 3.904
Mol. Vol. 54.375 49.128 55.298
Z 4 4 4
Cryst.Sys. Orthorhombic Orthorhombic Orthorhombic
Laue Grp. mmm mmm mmm
Space Group Bbmm Bbmm Bbmm
Cell Parameters
a 9.767 9.429 9.7762
b 9.947 9.636 10.0214
c 3.717 3.591 3.7485
Vol. 361.12 326.27 367.25
Ref. Akimoto (1957) Morosin & Wechsler et al.
Lynch (1972) (1976)
62
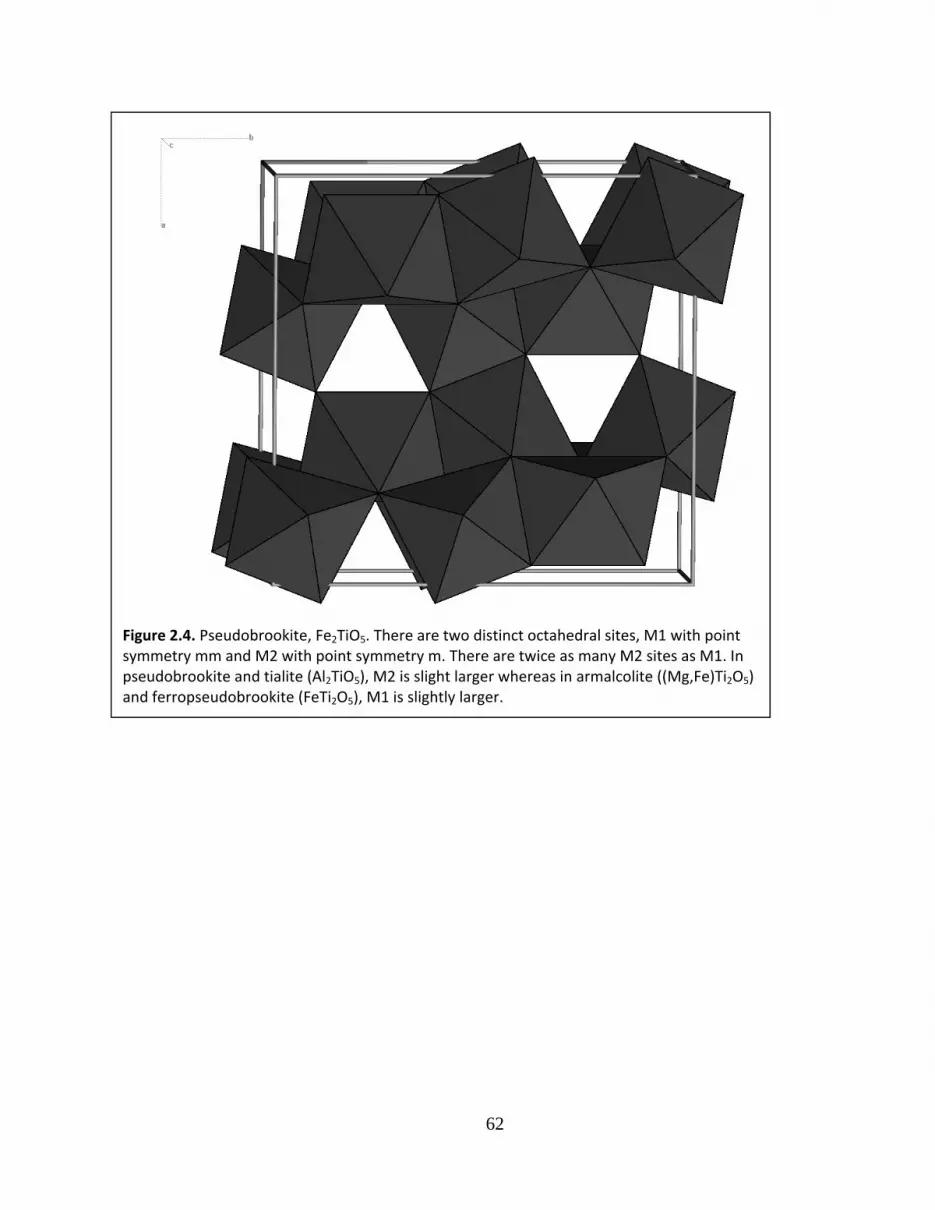
Figure 2.4. Pseudobrookite, Fe2TiO5. There are two distinct octahedral sites, M1 with point symmetry mm and M2 with point symmetry m. There are twice as many M2 sites as M1. In pseudobrookite and tialite (Al2TiO5), M2 is slight larger whereas in armalcolite ((Mg,Fe)Ti2O5) and ferropseudobrookite (FeTi2O5), M1 is slightly larger.
63
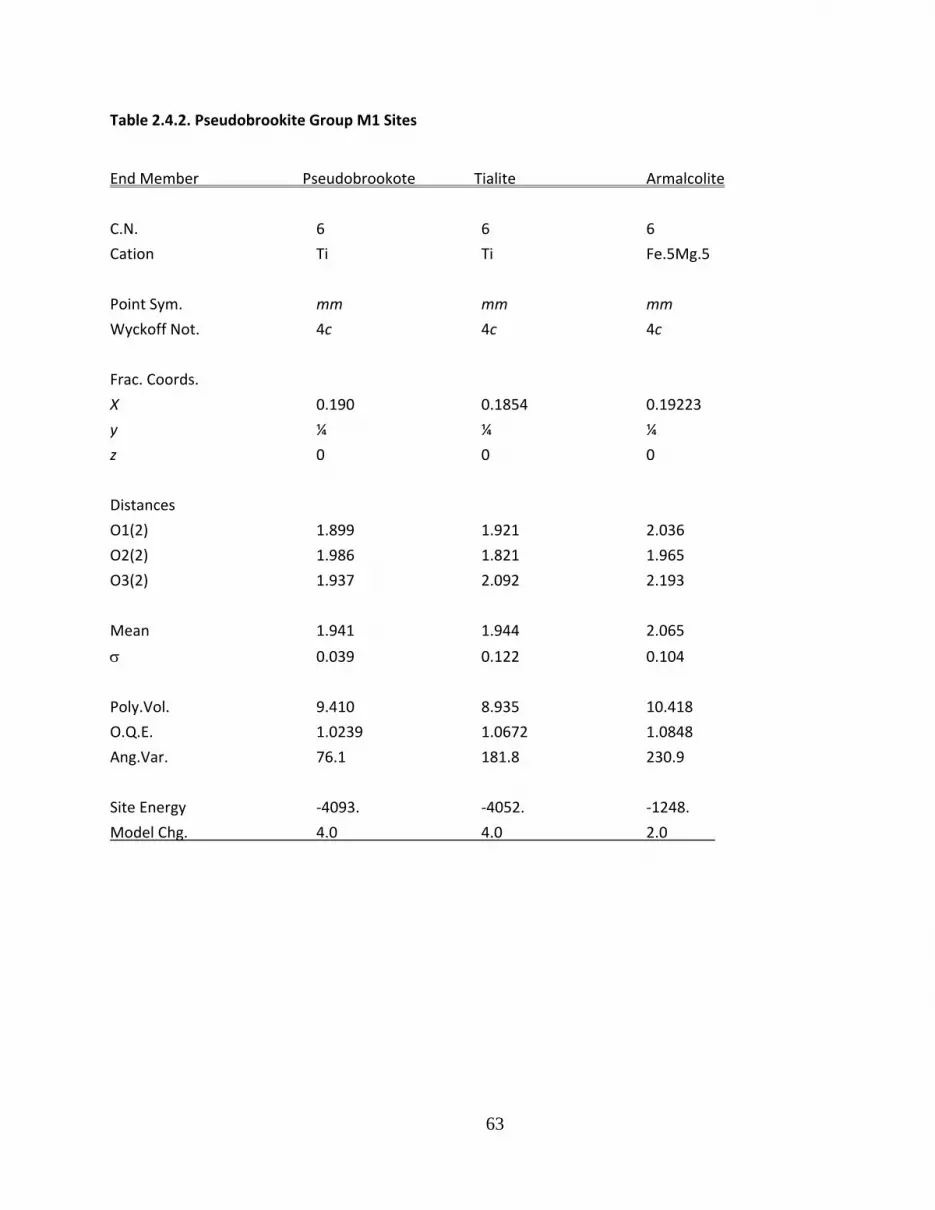
Table 2.4.2. Pseudobrookite Group M1 Sites
End Member Pseudobrookote Tialite Armalcolite
C.N. 6 6 6
Cation Ti Ti Fe.5Mg.5
Point Sym. mm mm mm
Wyckoff Not. 4c 4c 4c
Frac. Coords.
X 0.190 0.1854 0.19223
y ¼ ¼ ¼
z 0 0 0
Distances
O1(2) 1.899 1.921 2.036
O2(2) 1.986 1.821 1.965
O3(2) 1.937 2.092 2.193
Mean 1.941 1.944 2.065
0.039 0.122 0.104
Poly.Vol. 9.410 8.935 10.418
O.Q.E. 1.0239 1.0672 1.0848
Ang.Var. 76.1 181.8 230.9
Site Energy ‐4093. ‐4052. ‐1248.
Model Chg. 4.0 4.0 2.0
64
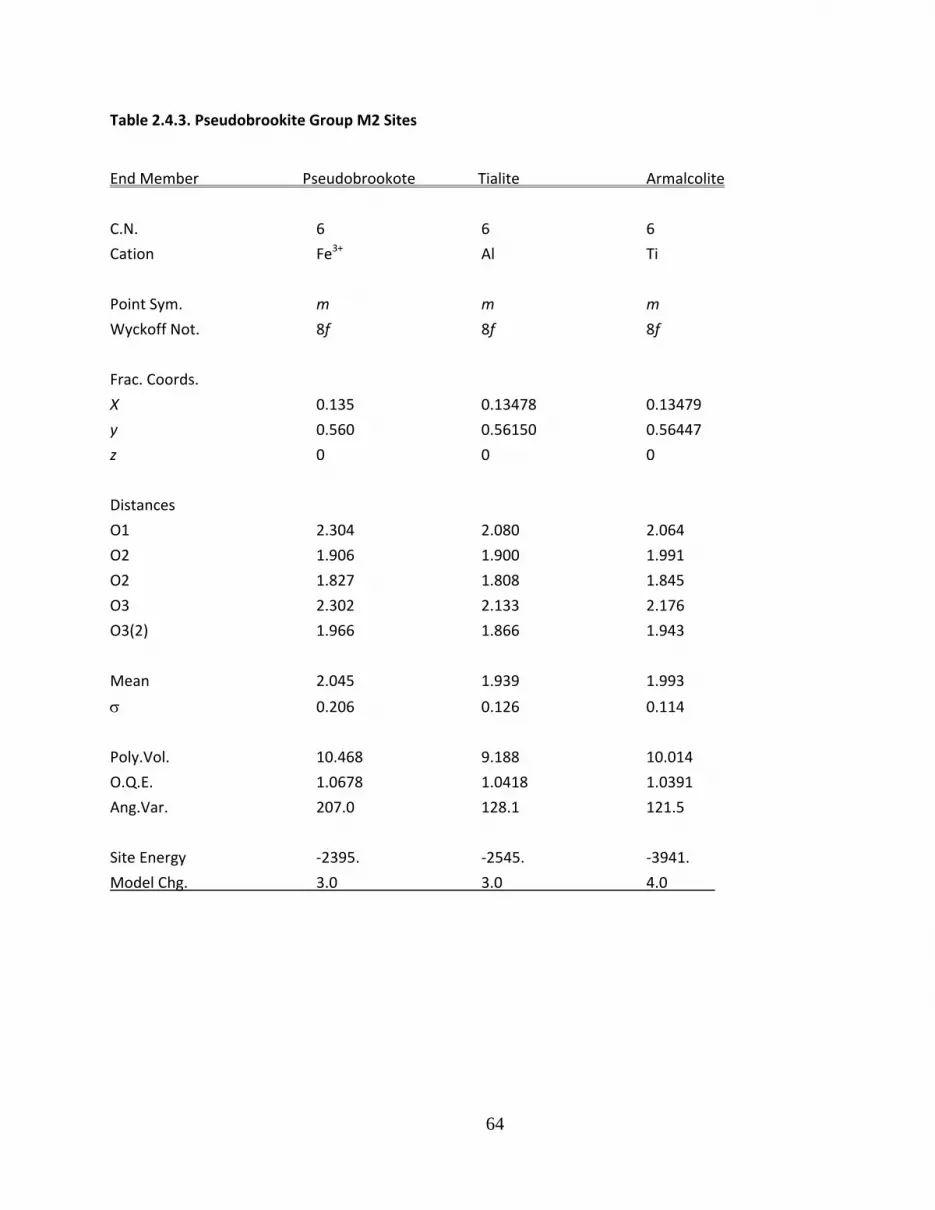
Table 2.4.3. Pseudobrookite Group M2 Sites
End Member Pseudobrookote Tialite Armalcolite
C.N. 6 6 6
Cation Fe3+ Al Ti
Point Sym. m m m
Wyckoff Not. 8f 8f 8f
Frac. Coords.
X 0.135 0.13478 0.13479
y 0.560 0.56150 0.56447
z 0 0 0
Distances
O1 2.304 2.080 2.064
O2 1.906 1.900 1.991
O2 1.827 1.808 1.845
O3 2.302 2.133 2.176
O3(2) 1.966 1.866 1.943
Mean 2.045 1.939 1.993
0.206 0.126 0.114
Poly.Vol. 10.468 9.188 10.014
O.Q.E. 1.0678 1.0418 1.0391
Ang.Var. 207.0 128.1 121.5
Site Energy ‐2395. ‐2545. ‐3941.
Model Chg. 3.0 3.0 4.0
65
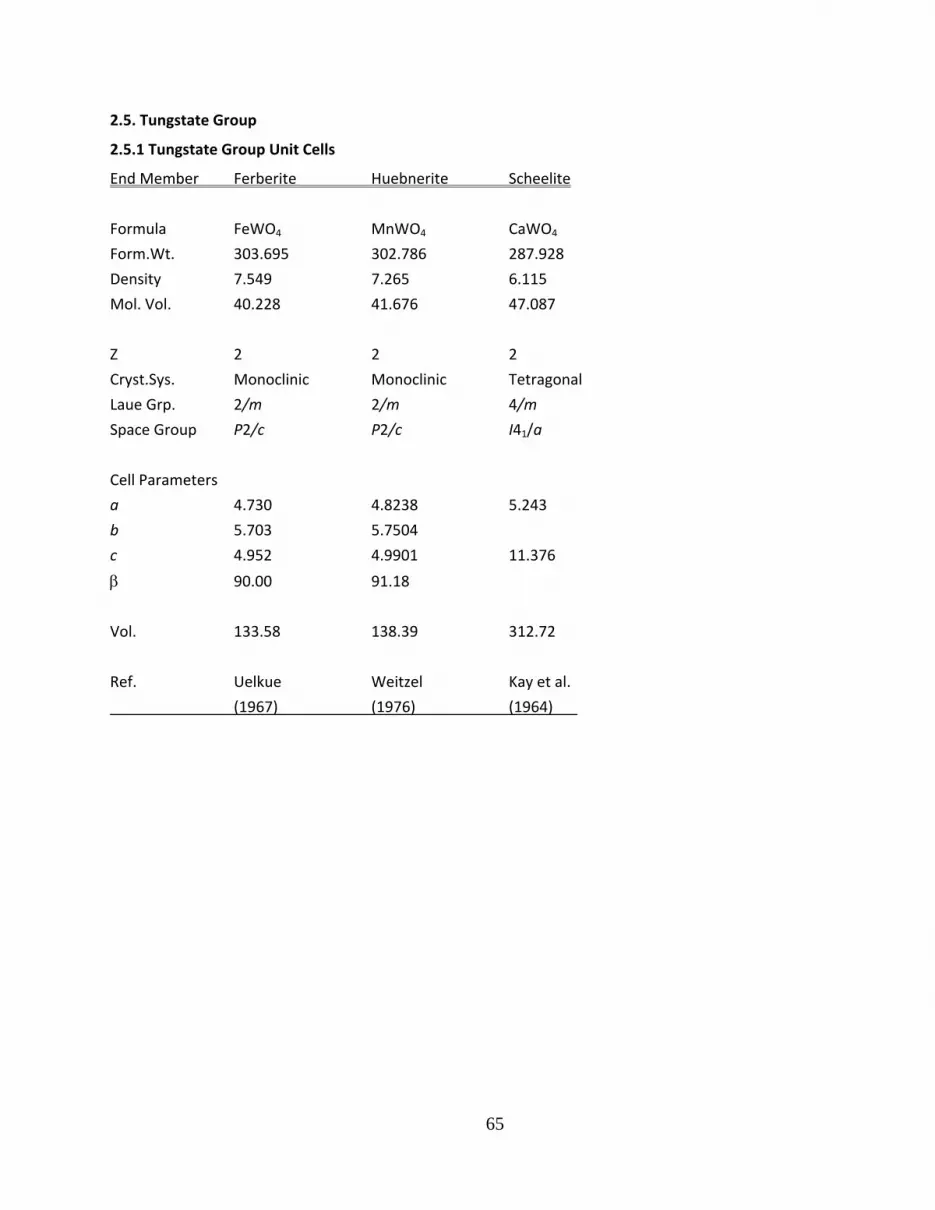
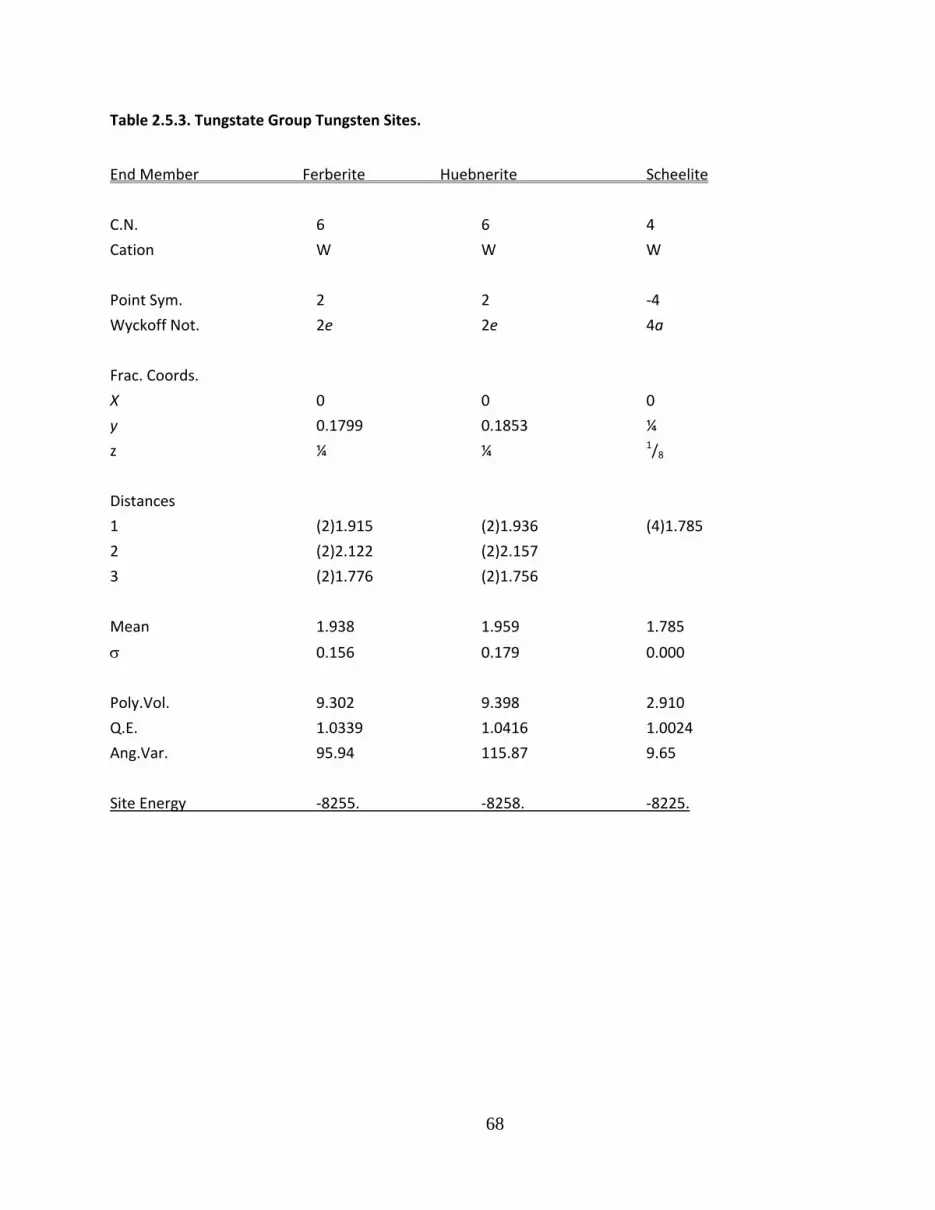
2.5. Tungstate Group
2.5.1 Tungstate Group Unit Cells
End Member Ferberite Huebnerite Scheelite
Formula FeWO4 MnWO4 CaWO4
Form.Wt. 303.695 302.786 287.928
Density 7.549 7.265 6.115
Mol. Vol. 40.228 41.676 47.087
Z 2 2 2
Cryst.Sys. Monoclinic Monoclinic Tetragonal
Laue Grp. 2/m 2/m 4/m
Space Group P2/c P2/c I41/a
Cell Parameters
a 4.730 4.8238 5.243
b 5.703 5.7504
c 4.952 4.9901 11.376
90.00 91.18
Vol. 133.58 138.39 312.72
Ref. Uelkue Weitzel Kay et al.
(1967) (1976) (1964)
66
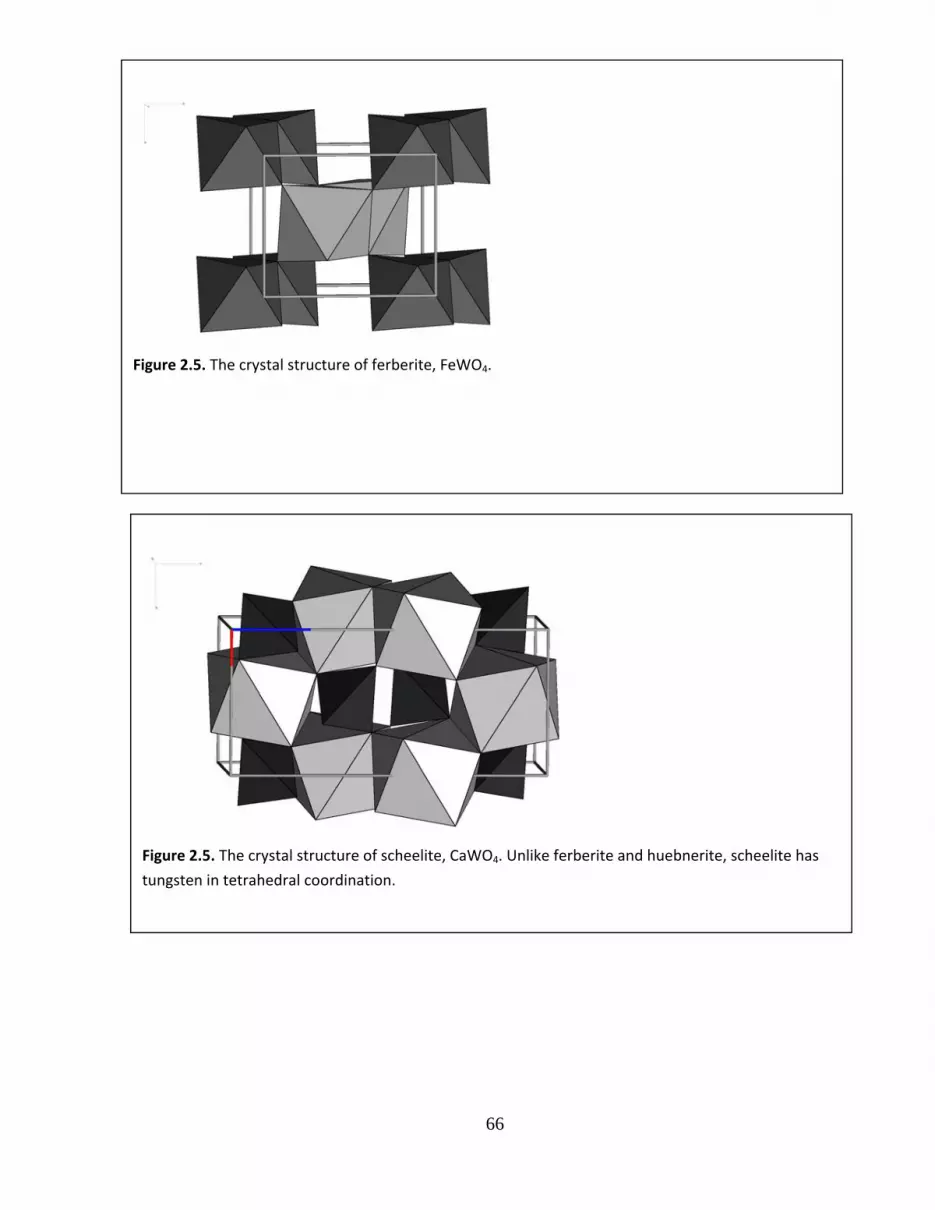
Figure 2.5. The crystal structure of ferberite, FeWO4.
Figure 2.5. The crystal structure of scheelite, CaWO4. Unlike ferberite and huebnerite, scheelite has
tungsten in tetrahedral coordination.

67
Table 2.5.1. Tungstate Group Divalent Sites
End Member Ferberite Huebnerite Scheelite
C.N. 6 6 6
Cation Fe2+ Mn2+ Ca
Point Sym. 2 2 2
Wyckoff Not. 2f 2f 4b
Frac. Coords.
X ½ ½ 0
y 0.6744 0.6866 ¼
z ¼ ¼ 5/8
Distances
1 (2)2.057 (2)2.081 (4)2.479
2 (2)2.183 (2)2.294 (4)2.438
3 (2)2.146 (2)2.154
Mean 2.129 2.176 2.458
0.058 0.097 0.022
Poly.Vol. 12.559 13.286 26.376
O.Q.E. 1.0165 1.0246
Ang.Var. 56.06 80.83
Site Energy ‐1297. ‐1262. ‐1144.
68
Table 2.5.3. Tungstate Group Tungsten Sites.
End Member Ferberite Huebnerite Scheelite
C.N. 6 6 4
Cation W W W
Point Sym. 2 2 ‐4
Wyckoff Not. 2e 2e 4a
Frac. Coords.
X 0 0 0
y 0.1799 0.1853 ¼
z ¼ ¼ 1/8
Distances
1 (2)1.915 (2)1.936 (4)1.785
2 (2)2.122 (2)2.157
3 (2)1.776 (2)1.756
Mean 1.938 1.959 1.785
0.156 0.179 0.000
Poly.Vol. 9.302 9.398 2.910
Q.E. 1.0339 1.0416 1.0024
Ang.Var. 95.94 115.87 9.65
Site Energy ‐8255. ‐8258. ‐8225.

69
Chapter3.HydroxideMinerals
Non‐Silicate Minerals with Hydroxyl (OH) as the Principal Anion
70
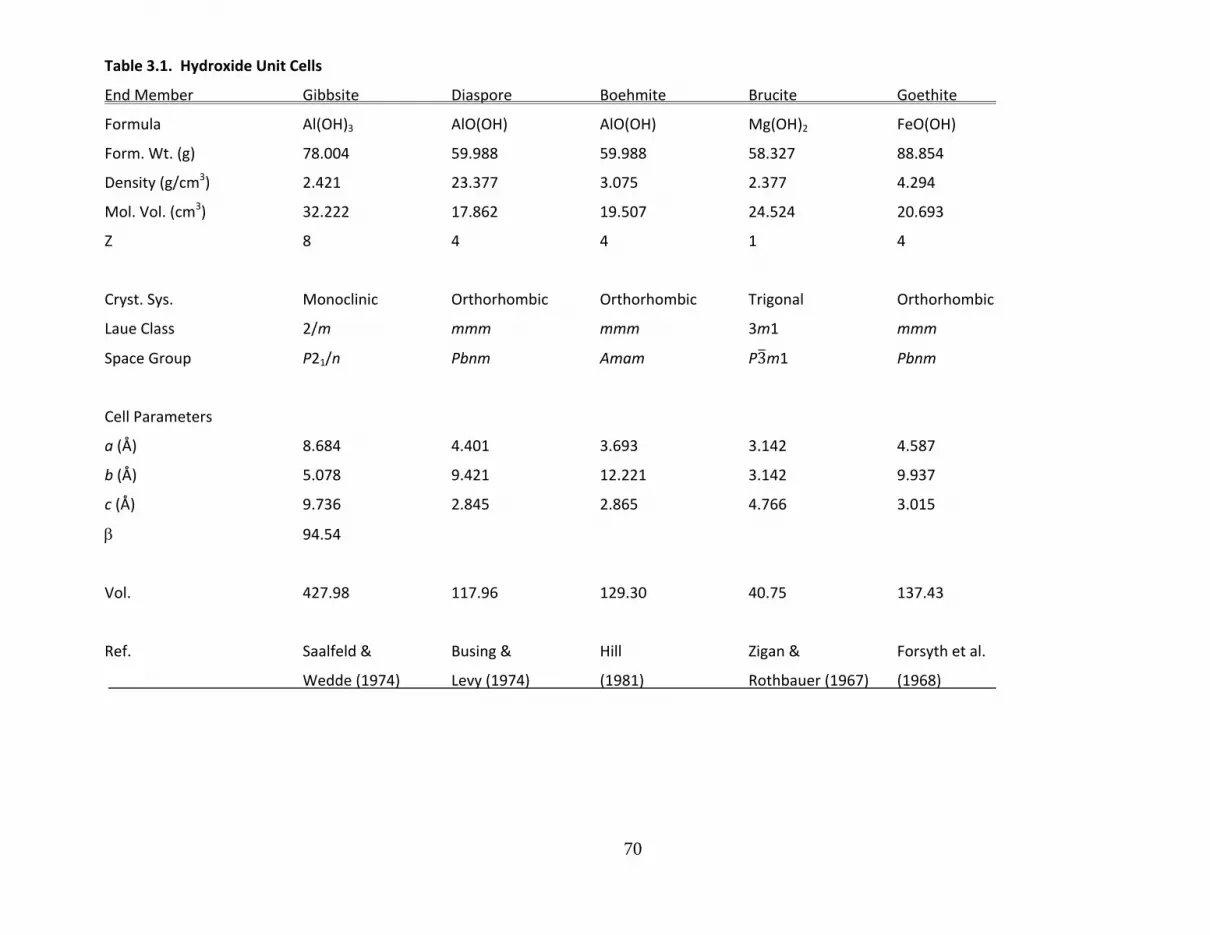
Table 3.1. Hydroxide Unit Cells
End Member Gibbsite Diaspore Boehmite Brucite Goethite
Formula Al(OH)3 AlO(OH) AlO(OH) Mg(OH)2 FeO(OH)
Form. Wt. (g) 78.004 59.988 59.988 58.327 88.854
Density (g/cm3) 2.421 23.377 3.075 2.377 4.294
Mol. Vol. (cm3) 32.222 17.862 19.507 24.524 20.693
Z 8 4 4 1 4
Cryst. Sys. Monoclinic Orthorhombic Orthorhombic Trigonal Orthorhombic
Laue Class 2/m mmm mmm 3m1 mmm
Space Group P21/n Pbnm Amam P3m1 Pbnm
Cell Parameters
a (Å) 8.684 4.401 3.693 3.142 4.587
b (Å) 5.078 9.421 12.221 3.142 9.937
c (Å) 9.736 2.845 2.865 4.766 3.015
94.54
Vol. 427.98 117.96 129.30 40.75 137.43
Ref. Saalfeld & Busing & Hill Zigan & Forsyth et al.
Wedde (1974) Levy (1974) (1981) Rothbauer (1967) (1968)

71
Figure 3.1. Gibbsite (Al(OH)3) c‐axis projection, a horizontal. There are two distinct Al octahedral. All anions are hydroxyls. Spheres are protons.
72
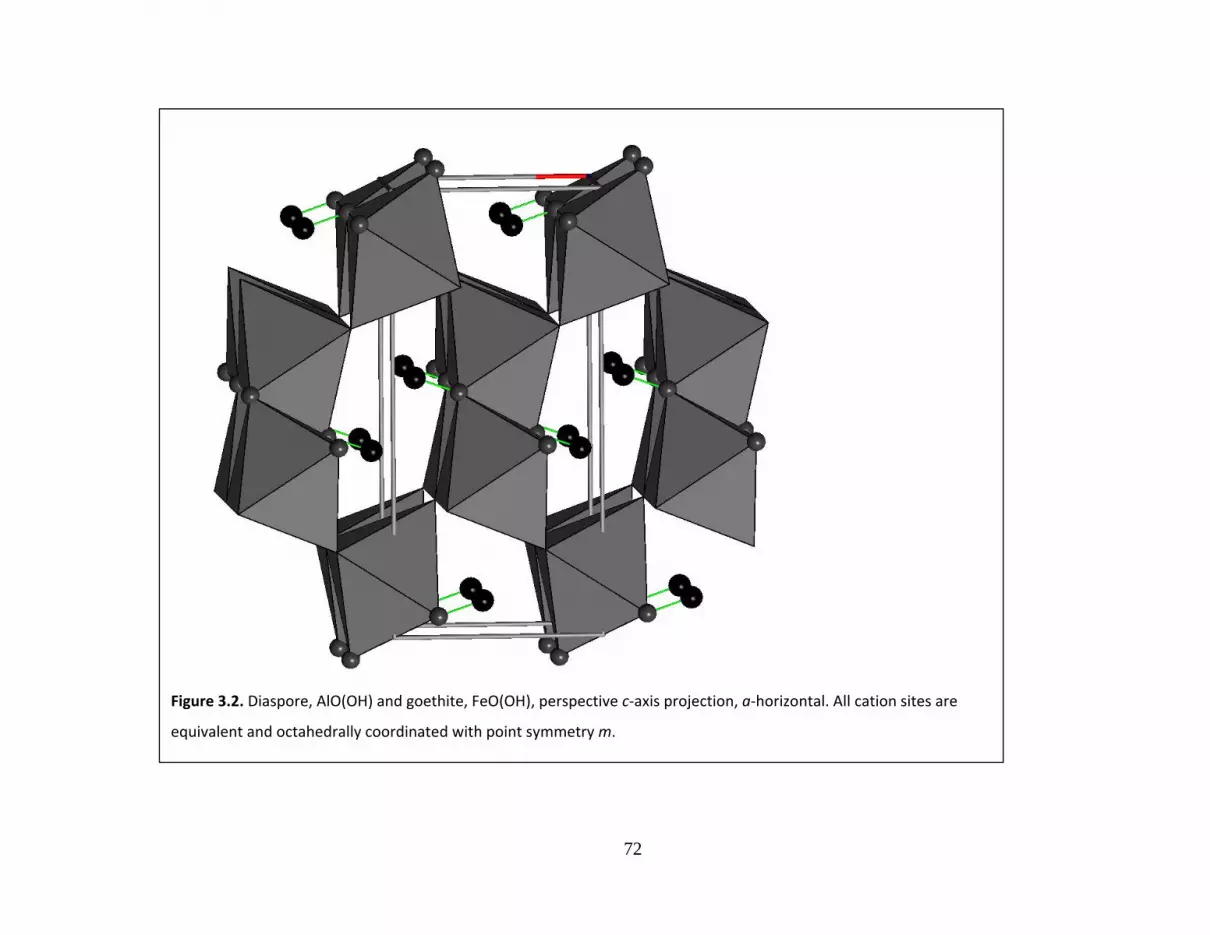
Figure 3.2. Diaspore, AlO(OH) and goethite, FeO(OH), perspective c‐axis projection, a‐horizontal. All cation sites are
equivalent and octahedrally coordinated with point symmetry m.
73
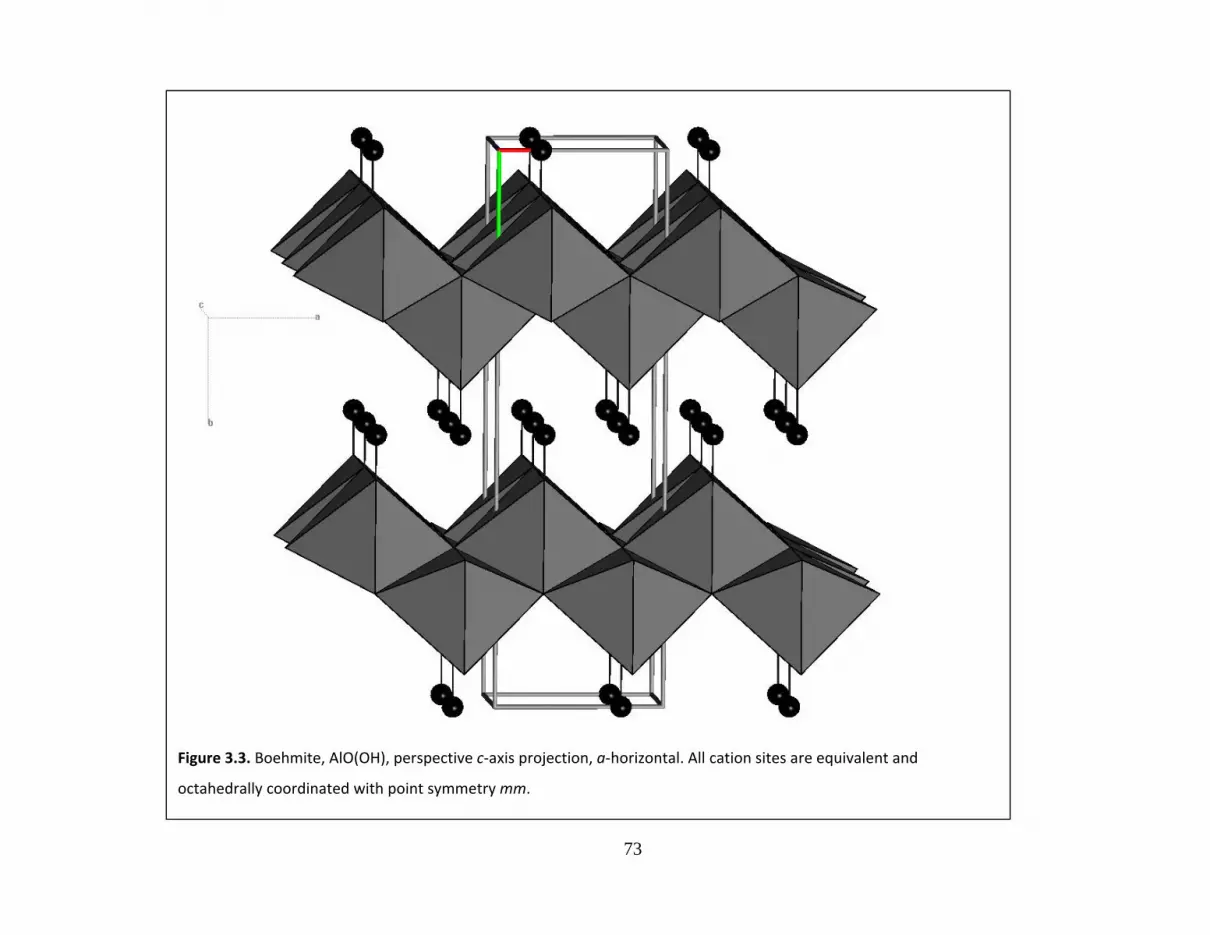
Figure 3.3. Boehmite, AlO(OH), perspective c‐axis projection, a‐horizontal. All cation sites are equivalent and
octahedrally coordinated with point symmetry mm.

74
Figure 3.4. Brucite, Mg(OH)2, perspective c‐axis projection, a‐horizontal. All anions are hydroxyls. All Mg cations are octahedrally
coordinated with point symmetry 3m. This is the typical trioctahedral sheet that is incorporated into many layer silicates.

75
Table 3.2. Hydroxide Cation Sites.
End Member Gibbsite Gibbsite Diaspore Boehmite Brucite Goethite
C.N. 6 6 6 6 6 6 Cation Al1 Al2 Al Al Mg Fe
Point Sym. 1 1 m mm 3m m Wyckoff Not. 4e 4e 4c 4c 1a 4c
Frac. Coords. x 0.1672 0.3344 0.0451 ¼ 0 0.0477 y 0.5259 0.0236 ‐0.1446 ‐0.3178 0 0.8539 z ‐0.0023 ‐0.0024 ¼ 0 0 ¼
Distances O1 1.910 1.930 (2)1.851 (2)1.944 (6)2.011 (2)1.957
(1)1.858 (2)1.878 (1)1.926 (2)1.893
O2 1.922 1.922 (2)1.975 (2)2.095 (1)1.980
O3 1.925 1.881 O4 1.906 1.890 O5 1.832 1.862 O6 1.918 1.947
Mean 1.902 1.905 1.915 1.905 2.099 2.021
0.035 0.033 0.067 0.031 0.000 0.082
Poly.Vol. 9.019 9.061 9.100 9.000 12.039 10.667 O.Q.E. 1.0120 1.0120 1.0205 1.0164 1.0161 1.0226
Ang.Var. 42.5 42.5 64.0 52.0 52.0 69.2
Elect.Energy ‐2408. ‐2396. ‐2484. ‐2204. ‐1139. ‐2352.

76
Chapter4.ORTHOSILICATES
Silicate Minerals with Isolated SiO4 Groups
4.1. Garnet group
4.2. Olivine group
4.3. Silicate spinel group
4.4. Silicate zircon group
4.5. Willemite group
4.6. Aluminosilicate group
4.7. Humite group
4.8. Titanite group
4.9. Staurolite
77
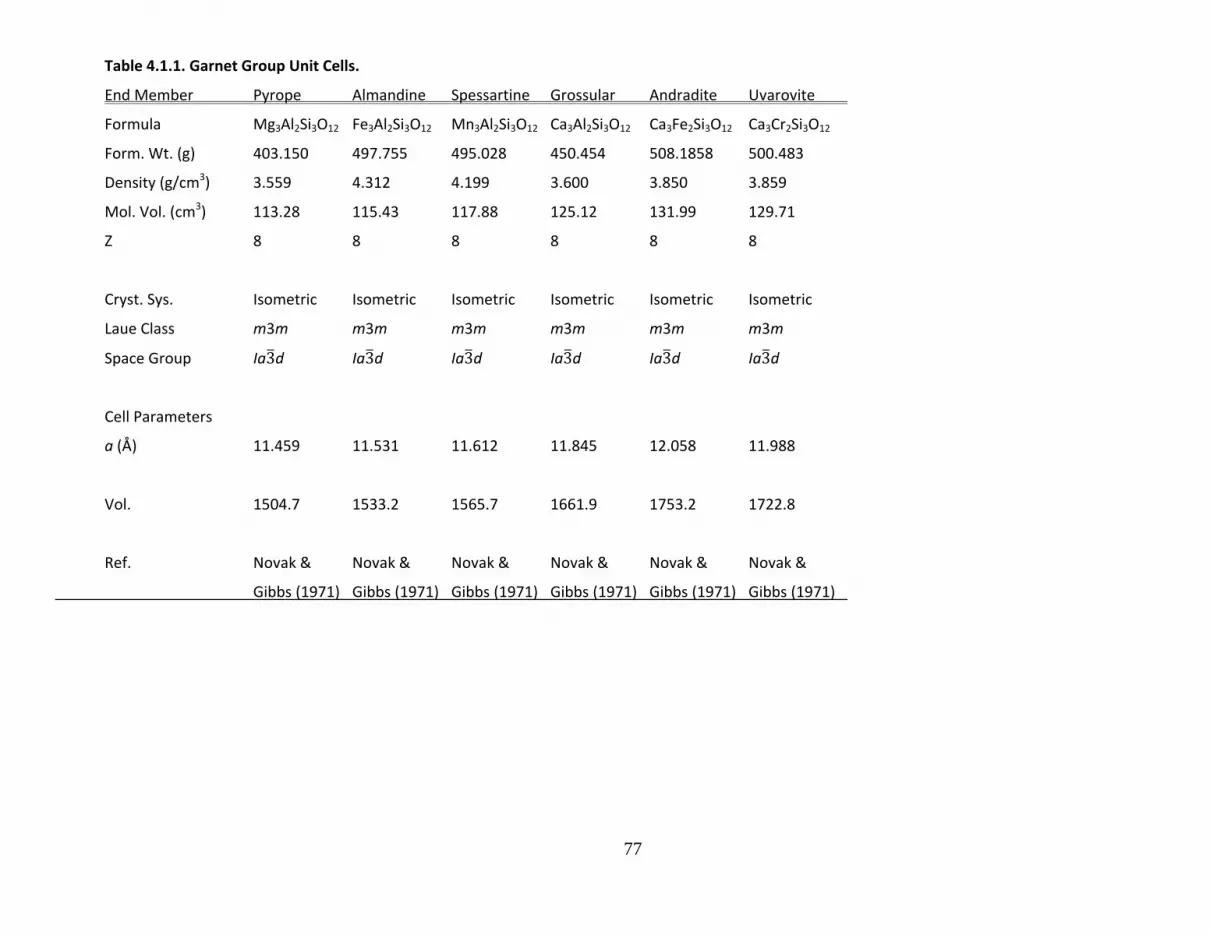
Table 4.1.1. Garnet Group Unit Cells. End Member Pyrope Almandine Spessartine Grossular Andradite Uvarovite
Formula Mg3Al2Si3O12 Fe3Al2Si3O12 Mn3Al2Si3O12 Ca3Al2Si3O12 Ca3Fe2Si3O12 Ca3Cr2Si3O12
Form. Wt. (g) 403.150 497.755 495.028 450.454 508.1858 500.483
Density (g/cm3) 3.559 4.312 4.199 3.600 3.850 3.859
Mol. Vol. (cm3) 113.28 115.43 117.88 125.12 131.99 129.71
Z 8 8 8 8 8 8
Cryst. Sys. Isometric Isometric Isometric Isometric Isometric Isometric
Laue Class m3m m3m m3m m3m m3m m3m
Space Group Ia3d Ia3d Ia3d Ia3d Ia3d Ia3d
Cell Parameters
a (Å) 11.459 11.531 11.612 11.845 12.058 11.988
Vol. 1504.7 1533.2 1565.7 1661.9 1753.2 1722.8
Ref. Novak & Novak & Novak & Novak & Novak & Novak &
Gibbs (1971) Gibbs (1971) Gibbs (1971) Gibbs (1971) Gibbs (1971) Gibbs (1971)

78
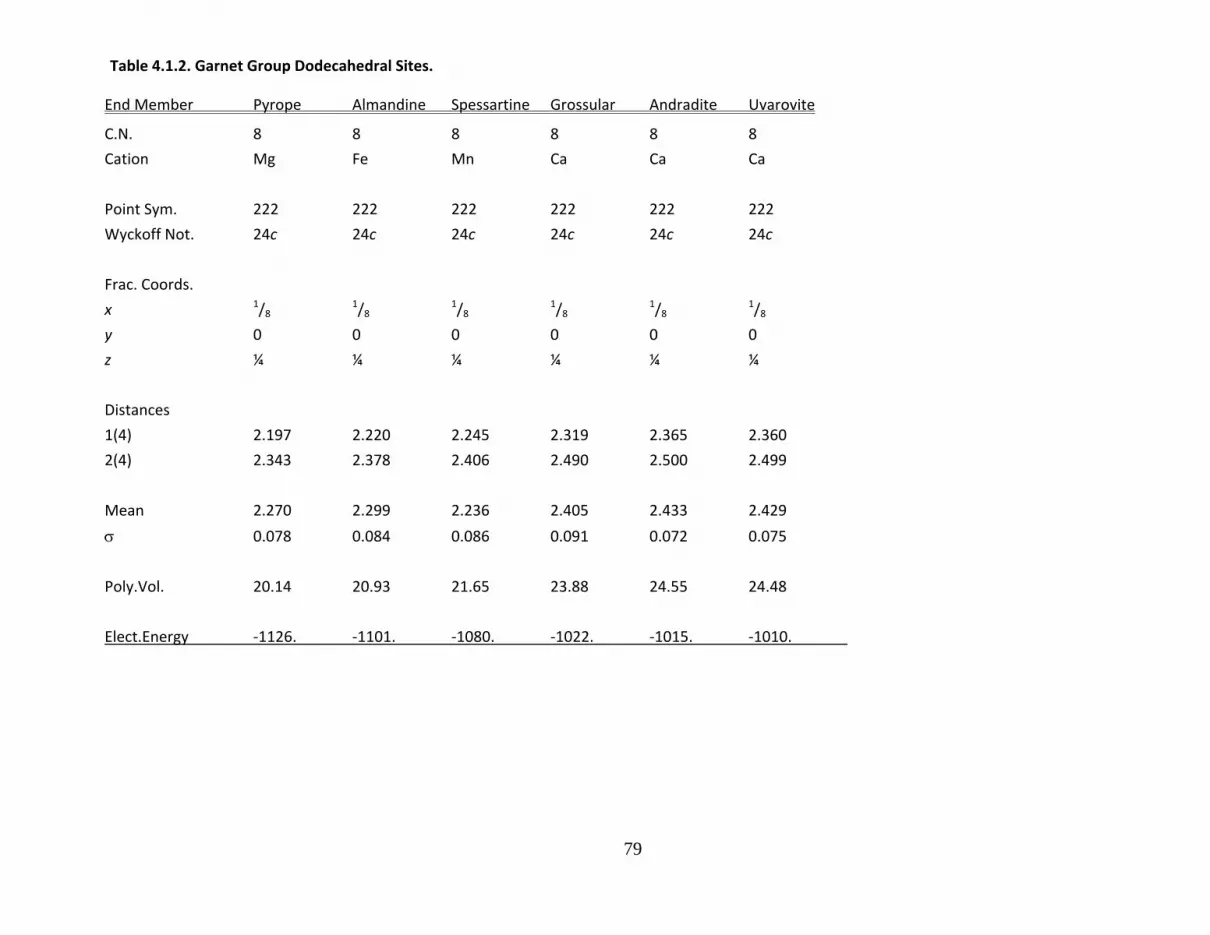
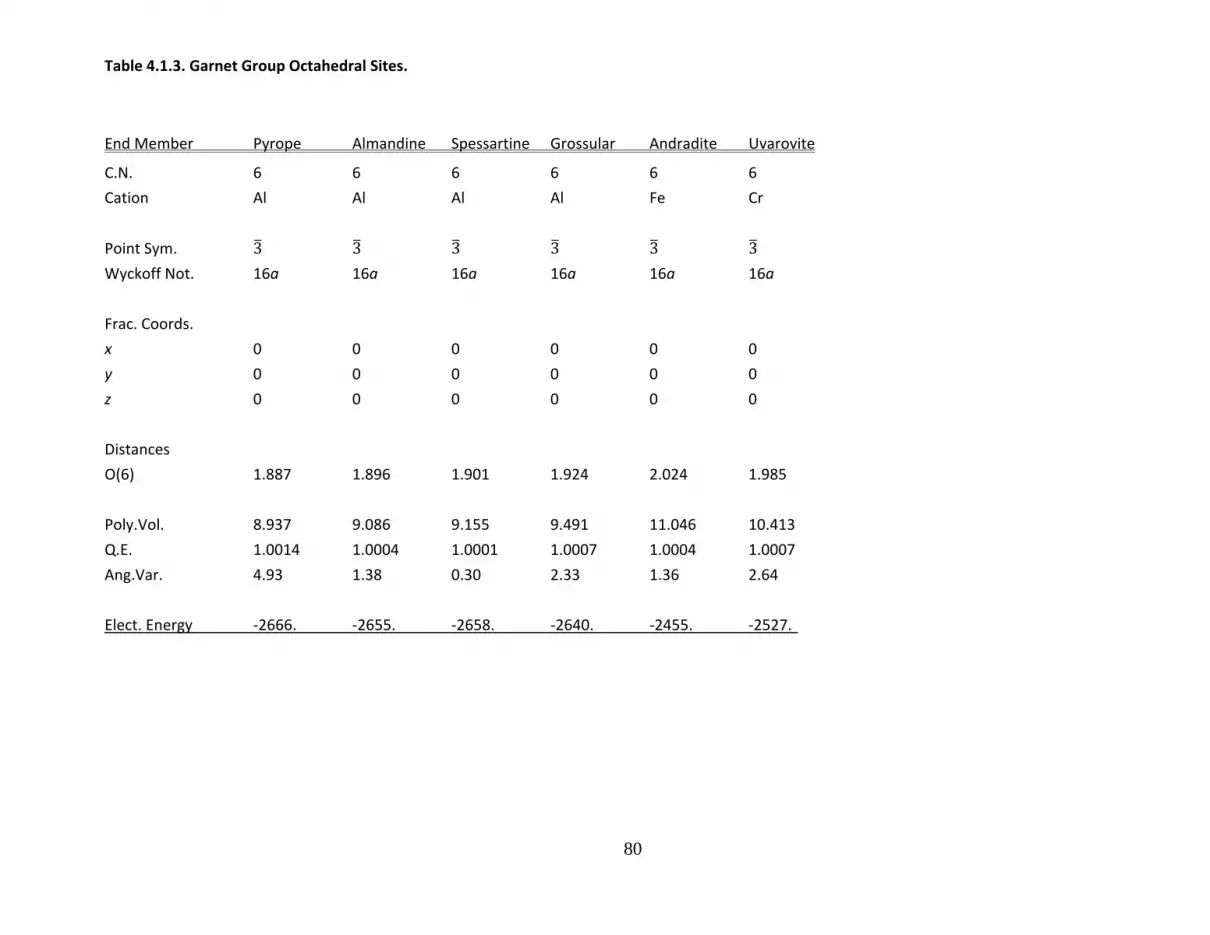
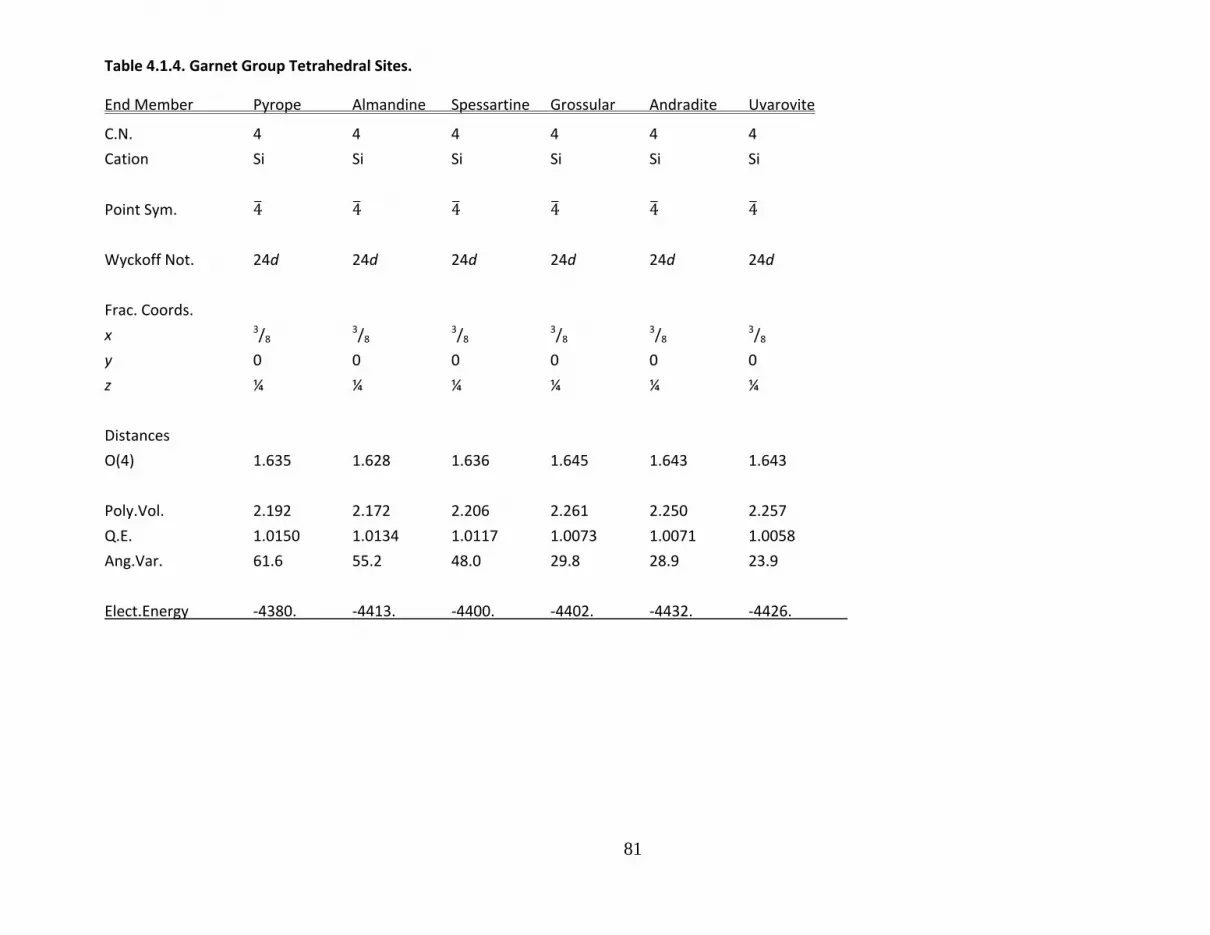
Figure 4.1. Garnet, perspective a‐axis projection. The divalent cation, Mg, Fe2+, Mn2+, or Ca, is in eight‐coordination
(sphere) with point symmetry 222. The trivalent cation is in octahedral coordination with point symmetry 3. Si is in tetrahedral coordination with point symmetry 4. Although all Si‐O distances are the same, the site is one of the most distorted of all silicates. All oxygen atoms are identical and have point symmetry 1.
79
Table 4.1.2. Garnet Group Dodecahedral Sites.
End Member Pyrope Almandine Spessartine Grossular Andradite Uvarovite
C.N. 8 8 8 8 8 8
Cation Mg Fe Mn Ca Ca Ca
Point Sym. 222 222 222 222 222 222
Wyckoff Not. 24c 24c 24c 24c 24c 24c
Frac. Coords.
x 1/8 1/8 1/8 1/8 1/8 1/8
y 0 0 0 0 0 0
z ¼ ¼ ¼ ¼ ¼ ¼
Distances
1(4) 2.197 2.220 2.245 2.319 2.365 2.360
2(4) 2.343 2.378 2.406 2.490 2.500 2.499
Mean 2.270 2.299 2.236 2.405 2.433 2.429
0.078 0.084 0.086 0.091 0.072 0.075
Poly.Vol. 20.14 20.93 21.65 23.88 24.55 24.48
Elect.Energy ‐1126. ‐1101. ‐1080. ‐1022. ‐1015. ‐1010.
80
Table 4.1.3. Garnet Group Octahedral Sites.
End Member Pyrope Almandine Spessartine Grossular Andradite Uvarovite
C.N. 6 6 6 6 6 6
Cation Al Al Al Al Fe Cr
Point Sym. 3 3 3 3 3 3
Wyckoff Not. 16a 16a 16a 16a 16a 16a
Frac. Coords.
x 0 0 0 0 0 0
y 0 0 0 0 0 0
z 0 0 0 0 0 0
Distances
O(6) 1.887 1.896 1.901 1.924 2.024 1.985
Poly.Vol. 8.937 9.086 9.155 9.491 11.046 10.413
Q.E. 1.0014 1.0004 1.0001 1.0007 1.0004 1.0007
Ang.Var. 4.93 1.38 0.30 2.33 1.36 2.64
Elect. Energy ‐2666. ‐2655. ‐2658. ‐2640. ‐2455. ‐2527.
81
Table 4.1.4. Garnet Group Tetrahedral Sites.
End Member Pyrope Almandine Spessartine Grossular Andradite Uvarovite
C.N. 4 4 4 4 4 4
Cation Si Si Si Si Si Si
Point Sym. 4 4 4 4 4 4
Wyckoff Not. 24d 24d 24d 24d 24d 24d
Frac. Coords.
x 3/8 3/8 3/8 3/8 3/8 3/8
y 0 0 0 0 0 0
z ¼ ¼ ¼ ¼ ¼ ¼
Distances
O(4) 1.635 1.628 1.636 1.645 1.643 1.643
Poly.Vol. 2.192 2.172 2.206 2.261 2.250 2.257
Q.E. 1.0150 1.0134 1.0117 1.0073 1.0071 1.0058
Ang.Var. 61.6 55.2 48.0 29.8 28.9 23.9
Elect.Energy ‐4380. ‐4413. ‐4400. ‐4402. ‐4432. ‐4426.

82
Table 4.2.1. Olivine Group Unit Cells.
End Member Forsterite Fayalite Monticellite Kirschsteinite Ca‐olivine Tephroite Co‐olivine Liebenbergite
Formula Mg2SiO4 Fe2SiO4 CaMgSiO4 CaFeSiO4 Ca2SiO4 Mn2SiO4 Co2SiO4 Ni2SiO4
Form. Wt. (g) 140.708 203.778 156.476 188.011 172.744 201.960 209.959 209.503
Density (g/cm3) 3.227 4.402 3.040 3.965 2.969 4.127 4.719 4.921
Mol. Vol. (cm3) 43.603 46.290 51.472 47.415 58.020 48.939 44.493 42.572
Z 4 4 4 4 4 4 4 4
Cryst. Sys. Orthorh. Orthorh. Orthorh. Orthorh. Orthorh. Orthorh. Orthorh. Orthorh.
Laue Class mmm mmm mmm mmm mmm mmm mmm mmm
Space Group Pbnm Pbnm Pbnm Pbnm Pbnm Pbnm Pbnm Pbnm
Cell Parameters
a (Å) 4.7534 4.8195 4.822 4.844 5.078 4.9023 4.7811 4.726
b (Å) 10.1902 10.4788 11.108 10.577 11.225 10.5964 10.2998 10.118
c (Å) 5.9783 6.0873 6.382 6.146 6.760 6.2567 6.0004 5.913
Vol. 289.58 307.42 341.84 314.89 385.32 325.02 295.49 282.75
Ref. Fujino et al. Fujino et al. Onken Brown Czaya Fujino et al. Brown Lager &
(1981) (1981) (1971) (1970) (1971) (1981) (1970) Meagher(1978)

83
Figure 4.2. Olivine, perspective a‐axis projection, c‐vertical. There are two distinct octahedral sites, M1 and M2, and a single Si
tetrahedron. The space group is Pbnm with mirror planes perpendicular to c at ¼ and ¾. M2 and Si are on the mirror planes, and M1 at
the origin.

84
Table 4.2.2. Olivine Group M1 Octahedral Sites.
End Member Forsterite Fayalite Monticellite Kirschsteinite Ca‐olivine Tephroite Co‐olivine Liebenbergite
C.N. 6 6 6 6 6 6 6 6
Cation Mg Fe2+ Mg Fe2+ Ca Mn Co Ni
Point Sym. 1 1 1 1 1 1 1 1
Wyckoff Not. 4a 4a 4a 4a 4a 4a 4a 4a
Frac. Coords.
x 0 0 0 0 0 0 0 0
y 0 0 0 0 0 0 0 0
z 0 0 0 0 0 0 0 0
Distances
O1(2) 2.0838 2.1207 2.193 2.139 2.356 2.2003 2.098 2.064
O2(2) 2.0678 2.1259 2.090 2.098 2.311 2.1671 2.091 2.060
O3(2) 2.1311 2.2363 2.119 2.154 2.388 2.2498 2.167 2.111
Mean 2.094 2.161 2.134 2.130 2.352 2.206 2.119 2.078
0.029 0.058 0.047 0.026 0.035 0.037 0.037 0.026
Poly.Vol. 11.771 12.737 12.420 12.105 15.896 13.499 12.144 11.531
O.Q.E. 1.0269 1.0379 1.0287 1.0427 1.0601 1.0398 1.0294 1.0254
Ang.Var. 95.3 130.1 100.3 147.9 209.0 138.8 102.9 90.3
Elect.Energy ‐1082. ‐1041. ‐1078. ‐1063. ‐945. ‐1015. ‐1064. ‐1090.

85
Table 4.2.3. Olivine Group M2 Octahedral Sites.
End Member Forsterite Fayalite Monticellite Kirschsteinite Ca‐olivine Tephroite Co‐olivine Liebenbergite
C.N. 6 6 6 6 6 6 6 6
Cation Mg Fe2+ Ca Ca Ca Mn Co Ni
Point Sym. m m m m m m m m
Wyckoff Not. 4c 4c 4c 4c 4c 4c 4c 4c
Frac. Coords.
x 0.99169 0.98598 0.9770 0.9888 0.9904 0.98792 0.9915 0.9924
y 0.27739 0.28026 0.2767 0.2799 0.2809 0.28041 0.2764 0.2738
z ¼ ¼ ¼ ¼ ¼ ¼ ¼ ¼
Distances
O1(1) 2.1766 2.2331 2.478 2.388 2.441 2.2782 2.187 2.105
O2(1) 2.0454 2.1109 2.308 2.146 2.286 2.1369 2.072 2.043
O3(2) 2.0658 2.0647 2.287 2.212 2.385 2.1547 2.073 2.053
O3(2) 2.2101 2.2946 411 2.325 2.426 2.3194 2.223 2.171
Mean 2.129 2.177 2.364 2.268 2.392 2.227 2.142 2.100
0.078 0.110 0.080 0.092 0.057 0.088 0.077 0.066
Poly.Vol. 12.401 13.072 16.438 14.549 16.930 13.982 12.606 11.966
O.Q.E. 1.0260 1.0370 1.0481 1.0468 1.0516 1.0367 1.0269 1.0215
Ang.Var. 89.5 124.9 165.6 161.1 180.8 127.0 92.7 74.9
Elect.Energy ‐1160 ‐1136. ‐1010. ‐1061. ‐1008. ‐1102. ‐1153. ‐1179.

86
Table 4.2.4. Olivine Group Tetrahedral Sites.
End Member Forsterite Fayalite Monticellite Kirschsteinite Ca‐olivine Tephroite Co‐olivine Liebenbergite
C.N. 4 4 4 4 4 4 4 4
Cation Si Si Si Si Si Si Si Si
Point Sym. m m m m m m m m
Wyckoff Not. 4c 4c 4c 4c 4c 4c 4c 4c
Frac. Coords.
x 0.42645 0.43122 0.4101 0.4181 0.4293 0.42755 0.4282 0.4276
y 0.09403 0.09765 0.0811 0.0846 0.0959 0.09643 0.0949 0.0944
z ¼ ¼ ¼ ¼ ¼ ¼ ¼ ¼
Distances
O1(1) 1.6139 1.6248 1.614 1.612 1.633 1.6191 1.613 1.620
O2(1) 1.6549 1.6533 1.656 1.568 1.655 1.6578 1.659 1.660
O3(2) 1.6368 1.6333 1.639 1.551 1.647 1.6395 1.656 1.637
Mean 1.636 1.636 1.637 1.570 1.646 1.639 1.636 1.638
0.017 0.012 0.017 0.029 0.009 0.016 0.019 0.016
Poly.Vol. 2.209 2.220 2.220 1.958 2.266 2.232 2.216 2.218
Q.E. 1.0110 1.0085 1.0092 1.0102 1.0062 1.0082 1.0100 1.0118
Ang.Var. 49.4 36.7 40.6 36.8 27.2 36.1 44.3 52.3
Elect.Energy ‐4319. ‐4348. ‐4333. ‐4551. ‐4377. ‐4349. ‐4326. ‐4305.
87
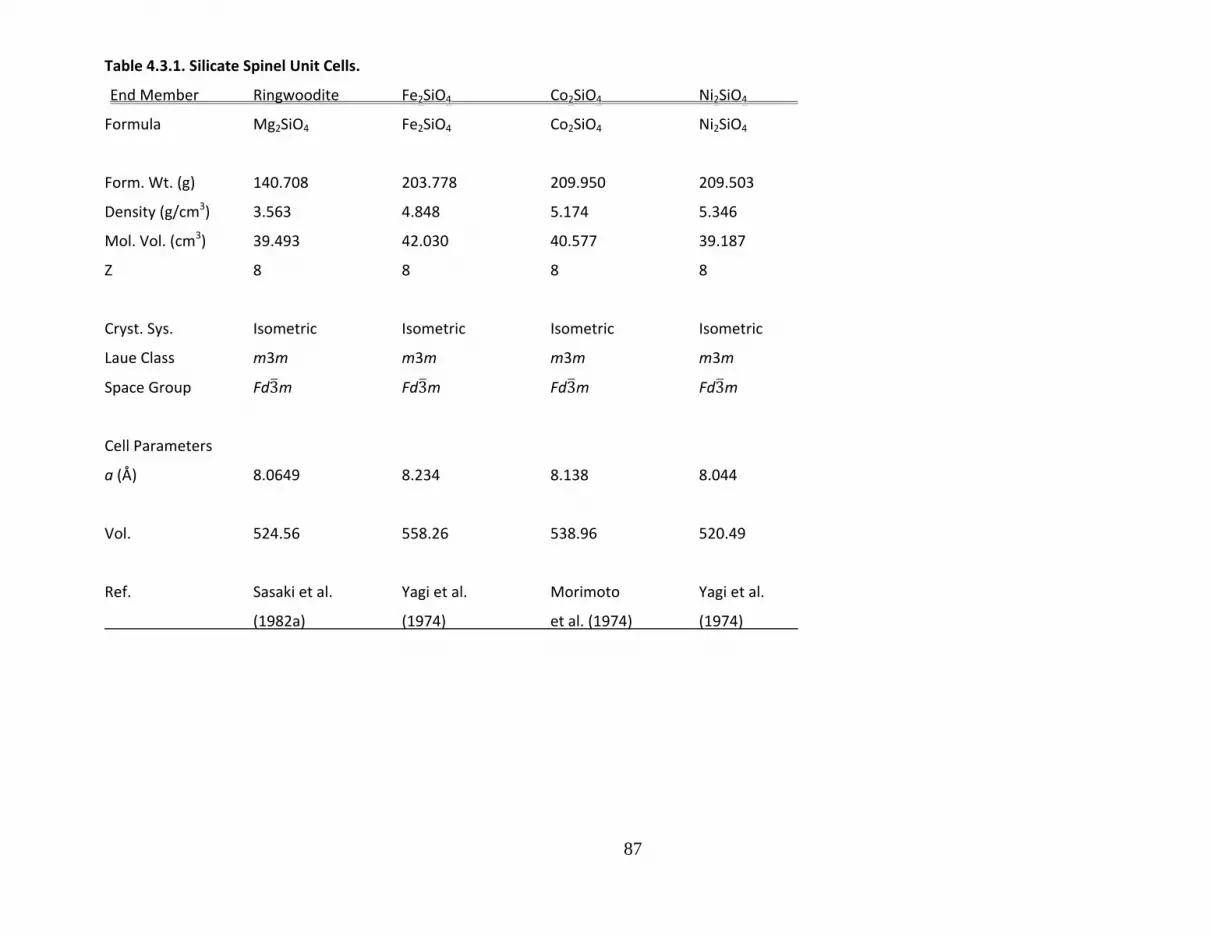
Table 4.3.1. Silicate Spinel Unit Cells.
End Member Ringwoodite Fe2SiO4 Co2SiO4 Ni2SiO4
Formula Mg2SiO4 Fe2SiO4 Co2SiO4 Ni2SiO4
Form. Wt. (g) 140.708 203.778 209.950 209.503
Density (g/cm3) 3.563 4.848 5.174 5.346
Mol. Vol. (cm3) 39.493 42.030 40.577 39.187
Z 8 8 8 8
Cryst. Sys. Isometric Isometric Isometric Isometric
Laue Class m3m m3m m3m m3m
Space Group Fd3m Fd3m Fd3m Fd3m
Cell Parameters
a (Å) 8.0649 8.234 8.138 8.044
Vol. 524.56 558.26 538.96 520.49
Ref. Sasaki et al. Yagi et al. Morimoto Yagi et al.
(1982a) (1974) et al. (1974) (1974)
88
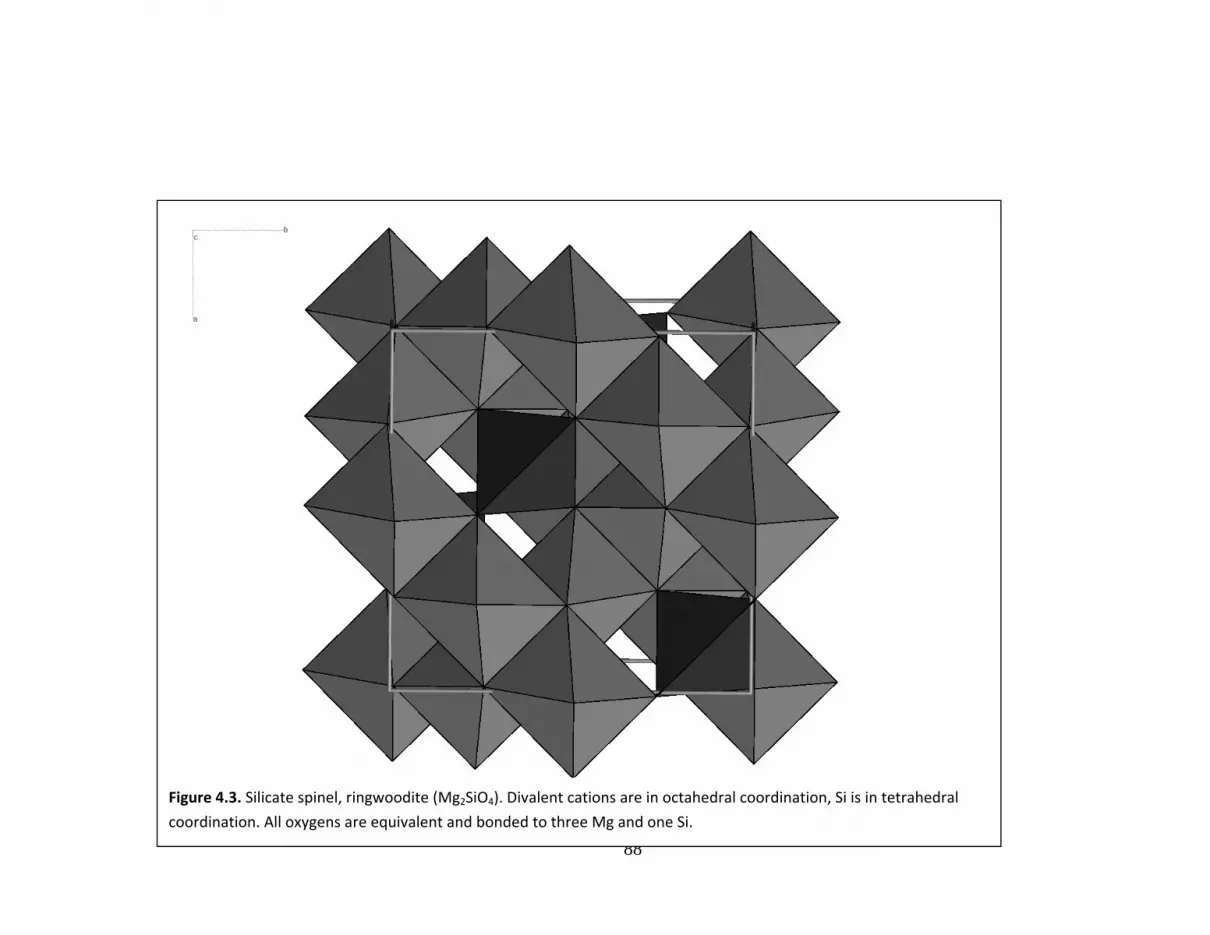
Figure 4.3. Silicate spinel, ringwoodite (Mg2SiO4). Divalent cations are in octahedral coordination, Si is in tetrahedral
coordination. All oxygens are equivalent and bonded to three Mg and one Si.

89
Table 4.3.2. Silicate Spinel Octahedral Sites.
End Member Ringwoodite Fe2SiO4 Co2SiO4 Ni2SiO4
C.N. 6 6 6 6
Occupant Mg Fe2+ Co Ni
Point SYm. 3m 3m 3m 3m
Wyckoff Not. 16d 16d 16d 16d
Frac.Coord.
x ½ ½ ½ ½
y ½ ½ ½ ½
z ½ ½ ½ ½
Distances
O(6) 2.070 2.137 2.103 2.063
Poly.Vol. 11.780 12.912 12.332 11.663
Q.E. 1.0026 1.0051 1.0041 1.0024
Ang.Var. 8.95 17.35 13.95 8.43
Elect. Energy ‐1155. ‐1101. ‐1125. ‐1160.

90
Table 4.3.3. Silicate Spinel Tetrahedral Sites.
End Member Ringwoodite Fe2SiO4 Co2SiO4 Ni2SiO4
C.N. 4 4 4 4
Occupant Si Si Si Si
Point Sym. 43m 43m 43m 43m
Wyckoff Not. 8a 8a 8a 8a
Frac.Coord.
x 1/8 1/8 1/8 1/8
y 1/8 1/8 1/8 1/8
z 1/8 1/8 1/8 1/8
Distances
O(4) 1.655 1.652 1.646 1.654
Poly.Vol. 2.328 2.312 2.290 2.321
Q.E. 1.0000 1.0000 1.0000 1.0000
Ang.Var. 0.0 0.0 0.0 0.0
Elect. Energy ‐4417. ‐4459. ‐4461. ‐4419.

91
Table 4.4 1. Silicate Zircon Unit Cells.
End Member Zircon Hafnon Thorite Coffinite
Formula ZrSiO4 HfSiO4 ThSiO4 USiO4
Form. Wt. (g) 183.304 270.574 324.122 330.114
Density (g/cm3) 4.668 6.976 6.696 7.185
Mol. Vol. (cm3) 39.270 38.787 48.407 45.945
Z 4 4 4 4
Cryst. Sys. Tetragonal Tetragonal Tetragonal Tetragonal
Laue Class 4mm 4mm 4mm 4mm
Space Group I41/amd I41/amd I41/amd I41/amd
Cell Parameters
a (Å) 6.6042 6.5725 7.1328 6.995
c (Å) 5.9796 5.9632 6.3188 6.236
Vol. 260.80 257.60 321.48 305.13
Ref. Hazen & Speer & Taylor & Keller
Finger (1979) Cooper (1982) Ewing (1978) (1963)

92
Figure 4.4. Zircon (ZrSiO4). Zr is in 8‐coordination, Si in tetrahedral coordination. All oxygens are equivalent and bonded
to two Zr and one Si. Both cation sites have point symmetry 42m.

93
Table 4.4.2 Zircon M Sites.
End Member Zircon Hafnon Thorite Coffinite
C.N. 8 8 8 8
Occupant Zr Hf Th U
Point Sym. 42m 42m 42m 42m
Wyckoff Not. 4a 4a 4a 4a
Frac. Coord.
x 0 0 0 0
y ¾ ¾ ¾ ¾
z 1/8 1/8 1/8 1/8
Distances
1(4) 2.129 2.115 2.368 2.323
2(4) 2.267 2.260 2.466 2.430
Mean 2.198 2.187 2.417 2.376
0.074 0.077 0.053 0.057
Poly.Vol. 19.00 18.72 25.32 24.02
Elect.Energy ‐3884. ‐3906. ‐3455. ‐3518.

94
Table 4.4.2. Silicate Zircon Tetrahedral Sites.
End Member Zircon Hafnon Thorite Coffinite
C.N. 4 4 4 4
Occupant Si Si Si Si
Point Sym. 42m 42m 42m 42m
Wyckoff Not. 4b 4b 4b 4b
Frac. Coord.
x 0 0 0 0
y ¼ ¼ ¼ ¼
z 3/8 3/8 3/8 3/8
Distances0 1.635 1.607
Poly.Vol. 2.118 2.107 2.205 2.093
Q.E. 1.0237 1.0239 1.0109 1.0118
Elect.Energy ‐4513. ‐4519. ‐4545. ‐4626.

95
Table 4.5.1. Willemite Group Unit Cells
End Member Willemite Phenacite
Formula Zn2SiO4 Be2SiO4
Form. Wt. (g) 222.824 110.108
Density (g/cm3) 4.221 2.960
Mol. Vol. (cm3) 52.795 37.197
Z
Cryst. Sys. Trigonal Trigonal
Laue Class 3 3
Space Group R3 R3
ell Parameters
a (Å) 13.971 12.472
c (Å) 9.334 8.252
Vol. 1577.8 1111.6
Ref. Simonov Zachariasen
(1977) (1971)
96
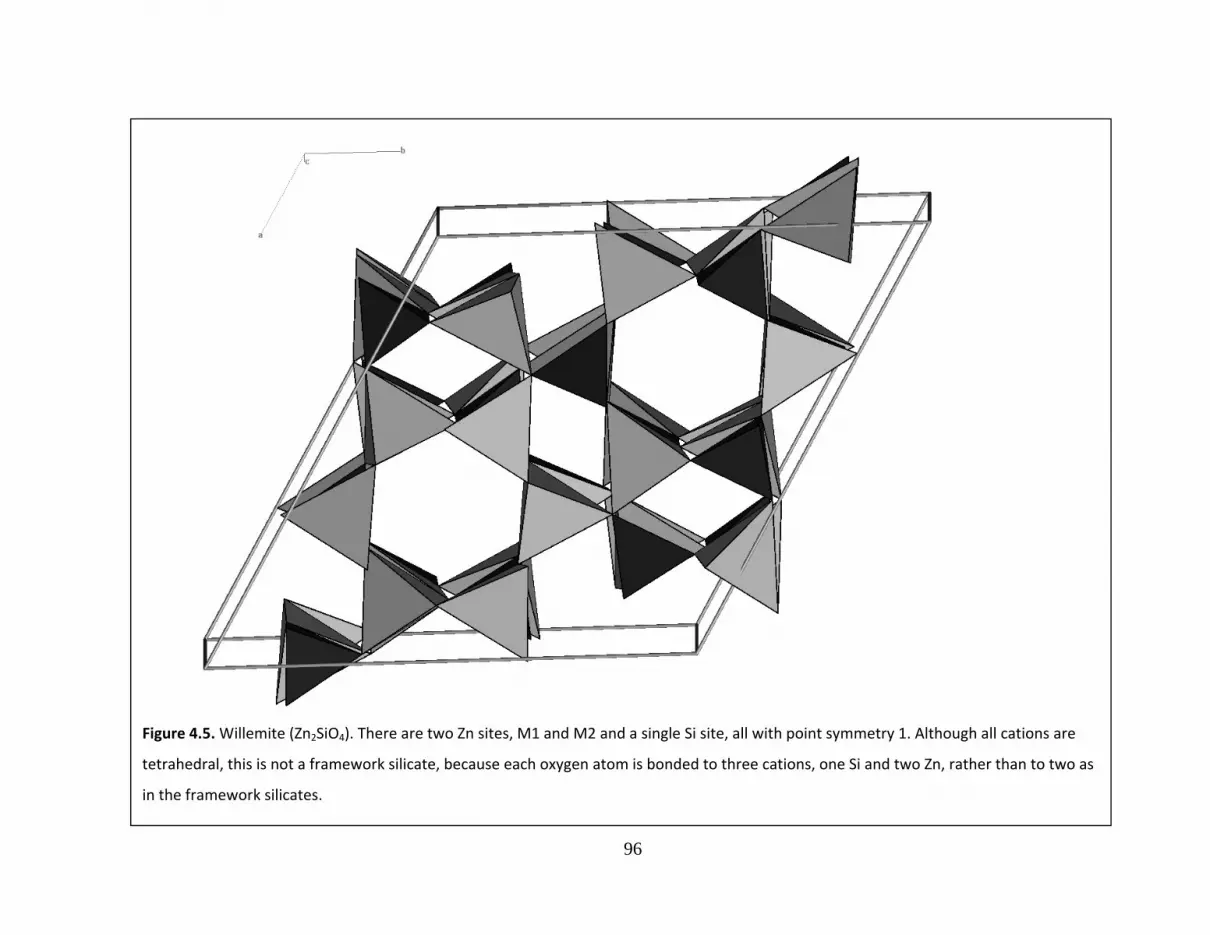
Figure 4.5. Willemite (Zn2SiO4). There are two Zn sites, M1 and M2 and a single Si site, all with point symmetry 1. Although all cations are
tetrahedral, this is not a framework silicate, because each oxygen atom is bonded to three cations, one Si and two Zn, rather than to two as
in the framework silicates.
97
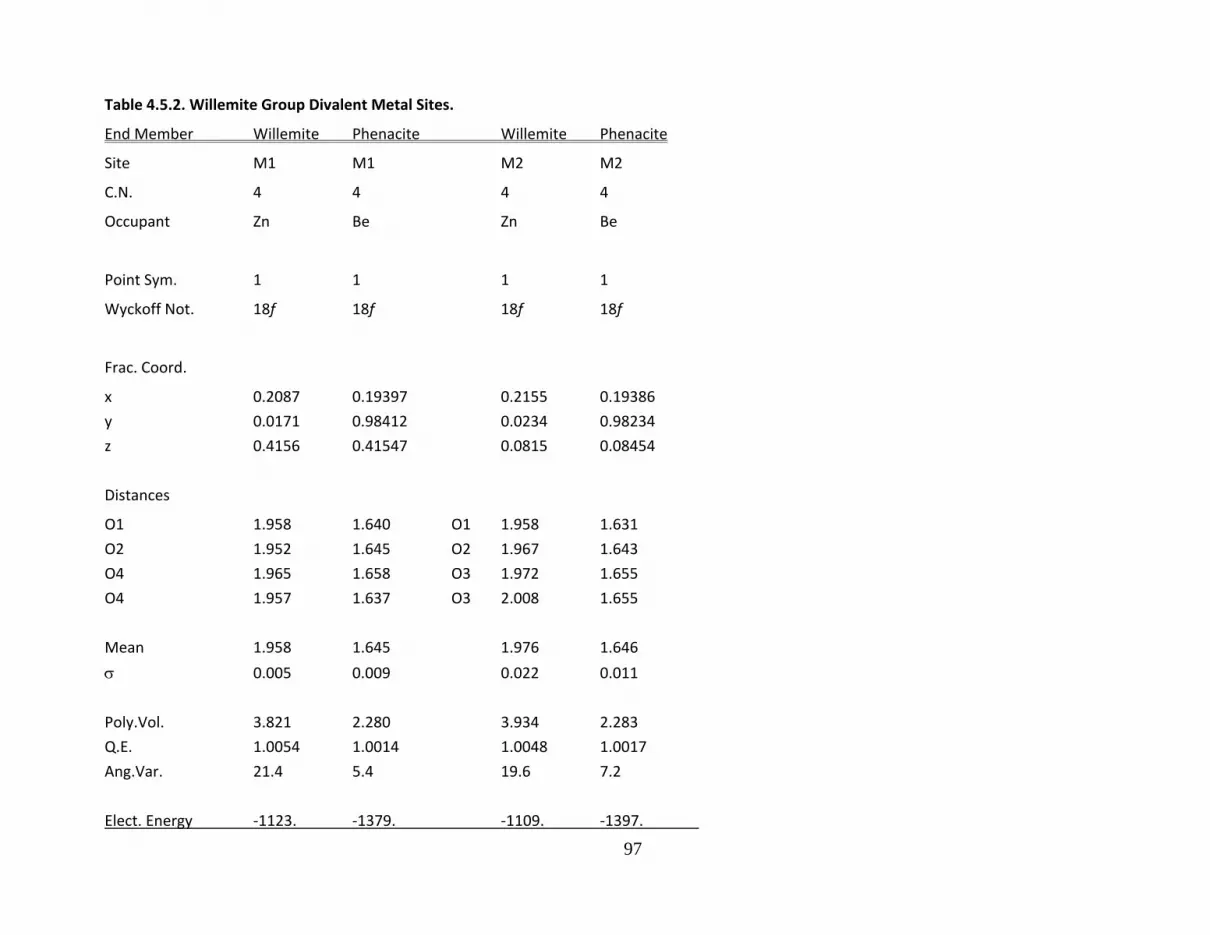
Table 4.5.2. Willemite Group Divalent Metal Sites.
End Member Willemite Phenacite Willemite Phenacite
Site M1 M1 M2 M2
C.N. 4 4 4 4
Occupant Zn Be Zn Be
Point Sym. 1 1 1 1
Wyckoff Not. 18f 18f 18f 18f
Frac. Coord.
x 0.2087 0.19397 0.2155 0.19386
y 0.0171 0.98412 0.0234 0.98234
z 0.4156 0.41547 0.0815 0.08454
Distances
O1 1.958 1.640 O1 1.958 1.631
O2 1.952 1.645 O2 1.967 1.643
O4 1.965 1.658 O3 1.972 1.655
O4 1.957 1.637 O3 2.008 1.655
Mean 1.958 1.645 1.976 1.646
0.005 0.009 0.022 0.011
Poly.Vol. 3.821 2.280 3.934 2.283
Q.E. 1.0054 1.0014 1.0048 1.0017
Ang.Var. 21.4 5.4 19.6 7.2
Elect. Energy ‐1123. ‐1379. ‐1109. ‐1397.
98
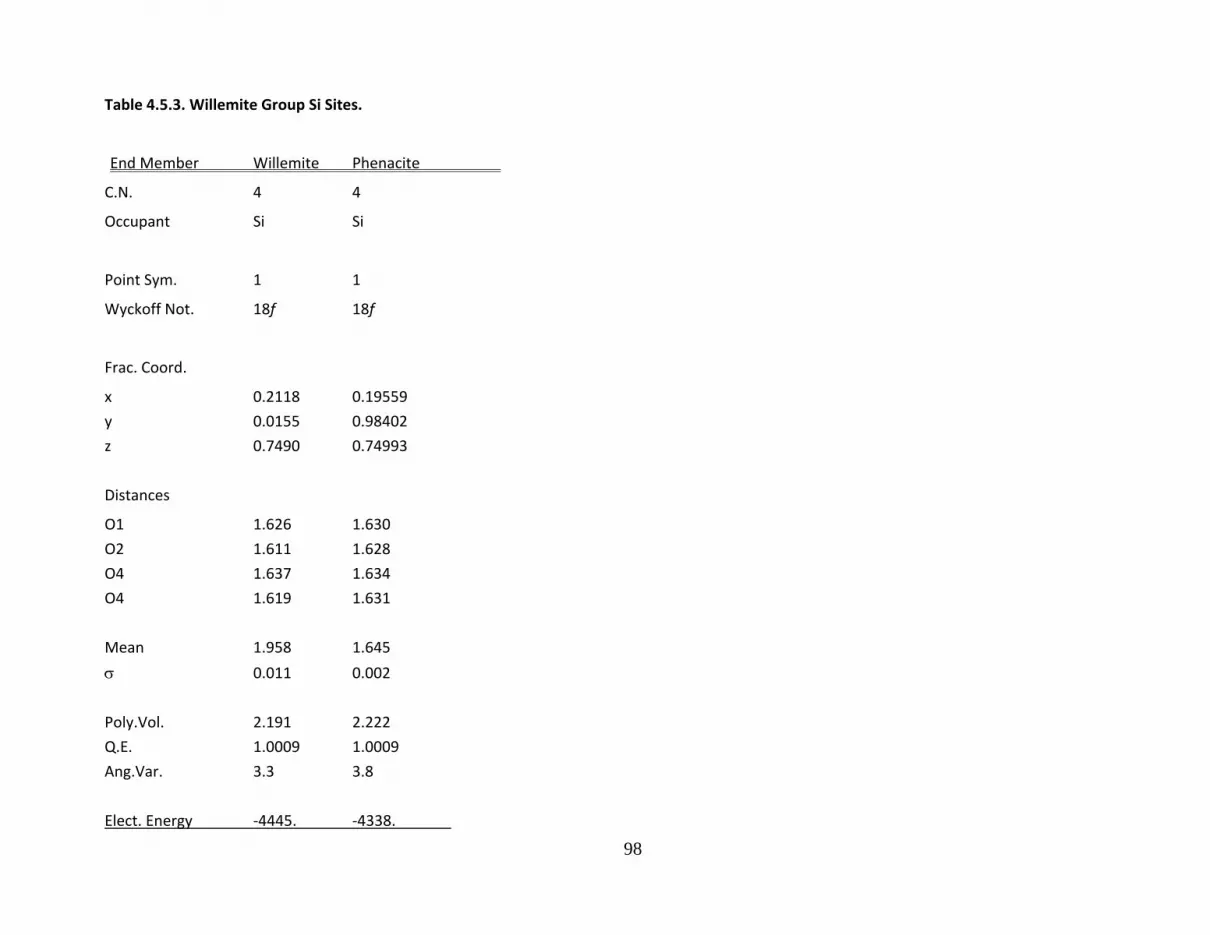
Table 4.5.3. Willemite Group Si Sites.
End Member Willemite Phenacite
C.N. 4 4
Occupant Si Si
Point Sym. 1 1
Wyckoff Not. 18f 18f
Frac. Coord.
x 0.2118 0.19559
y 0.0155 0.98402
z 0.7490 0.74993
Distances
O1 1.626 1.630
O2 1.611 1.628
O4 1.637 1.634
O4 1.619 1.631
Mean 1.958 1.645
0.011 0.002
Poly.Vol. 2.191 2.222
Q.E. 1.0009 1.0009
Ang.Var. 3.3 3.8
Elect. Energy ‐4445. ‐4338.
99
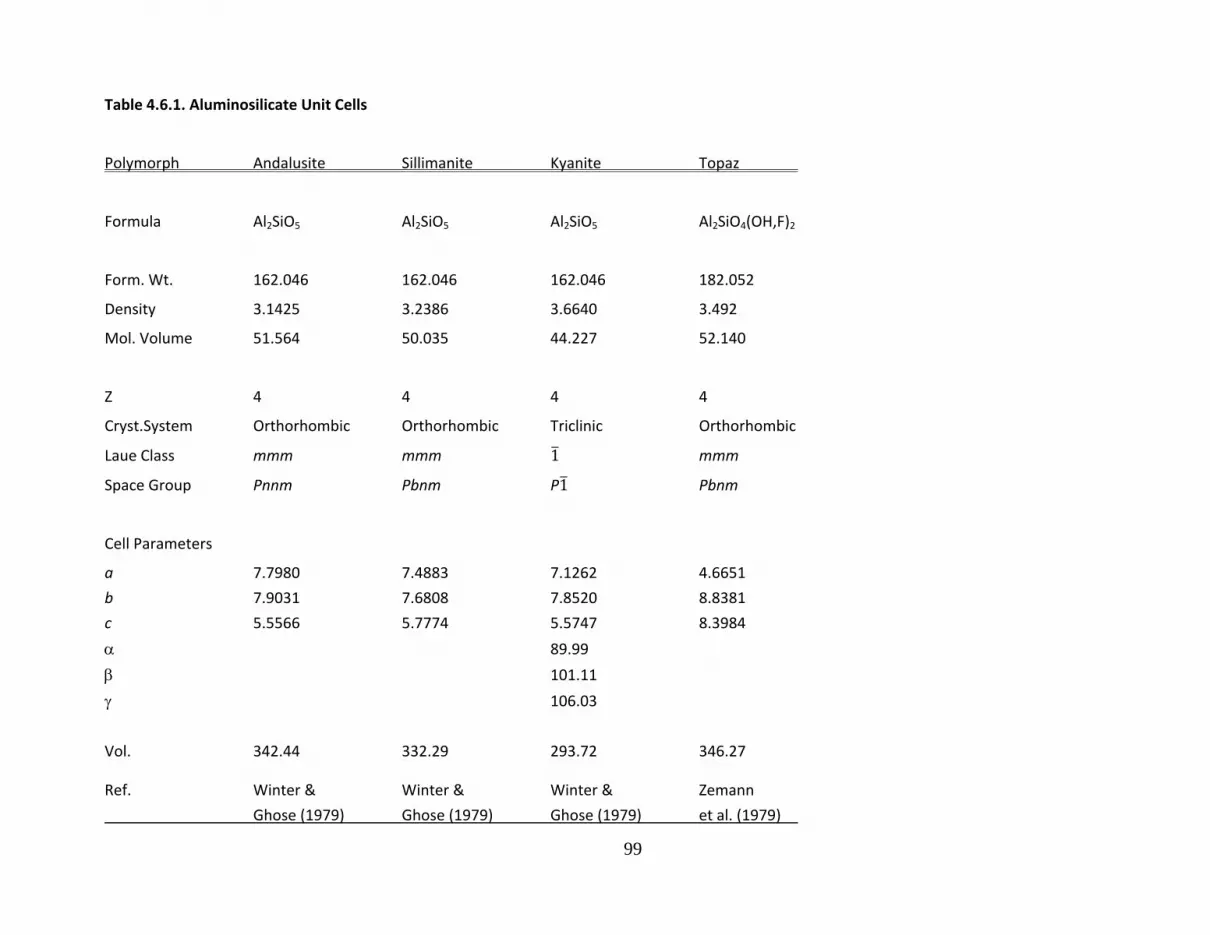
Table 4.6.1. Aluminosilicate Unit Cells
Polymorph Andalusite Sillimanite Kyanite Topaz
Formula Al2SiO5 Al2SiO5 Al2SiO5 Al2SiO4(OH,F)2
Form. Wt. 162.046 162.046 162.046 182.052
Density 3.1425 3.2386 3.6640 3.492
Mol. Volume 51.564 50.035 44.227 52.140
Z 4 4 4 4
Cryst.System Orthorhombic Orthorhombic Triclinic Orthorhombic
Laue Class mmm mmm 1 mmm
Space Group Pnnm Pbnm P1 Pbnm
Cell Parameters
a 7.7980 7.4883 7.1262 4.6651
b 7.9031 7.6808 7.8520 8.8381
c 5.5566 5.7774 5.5747 8.3984
89.99
101.11
106.03
Vol. 342.44 332.29 293.72 346.27
Ref. Winter & Winter & Winter & Zemann
Ghose (1979) Ghose (1979) Ghose (1979) et al. (1979)

100
Figure 4.6.1. Andalusite (Al2SiO5). There are two Al sites, Al1 is in octahedral coordination on the cell edge in point symmetry 2, whereas the other, Al2, is in 5‐coordination with point symmetry m. There is a single Si site in tetrahedral coordination with point symmetry m.

101
Figure 4.6.2. Sillimanite (Al2SiO5). Al1 is in octahedral coordination with point symmetry 1, whereas Al2 is in tetrahedral coordination with point symmetry m. There is a single Si site in tetrahedral coordination with point symmetry m.
102
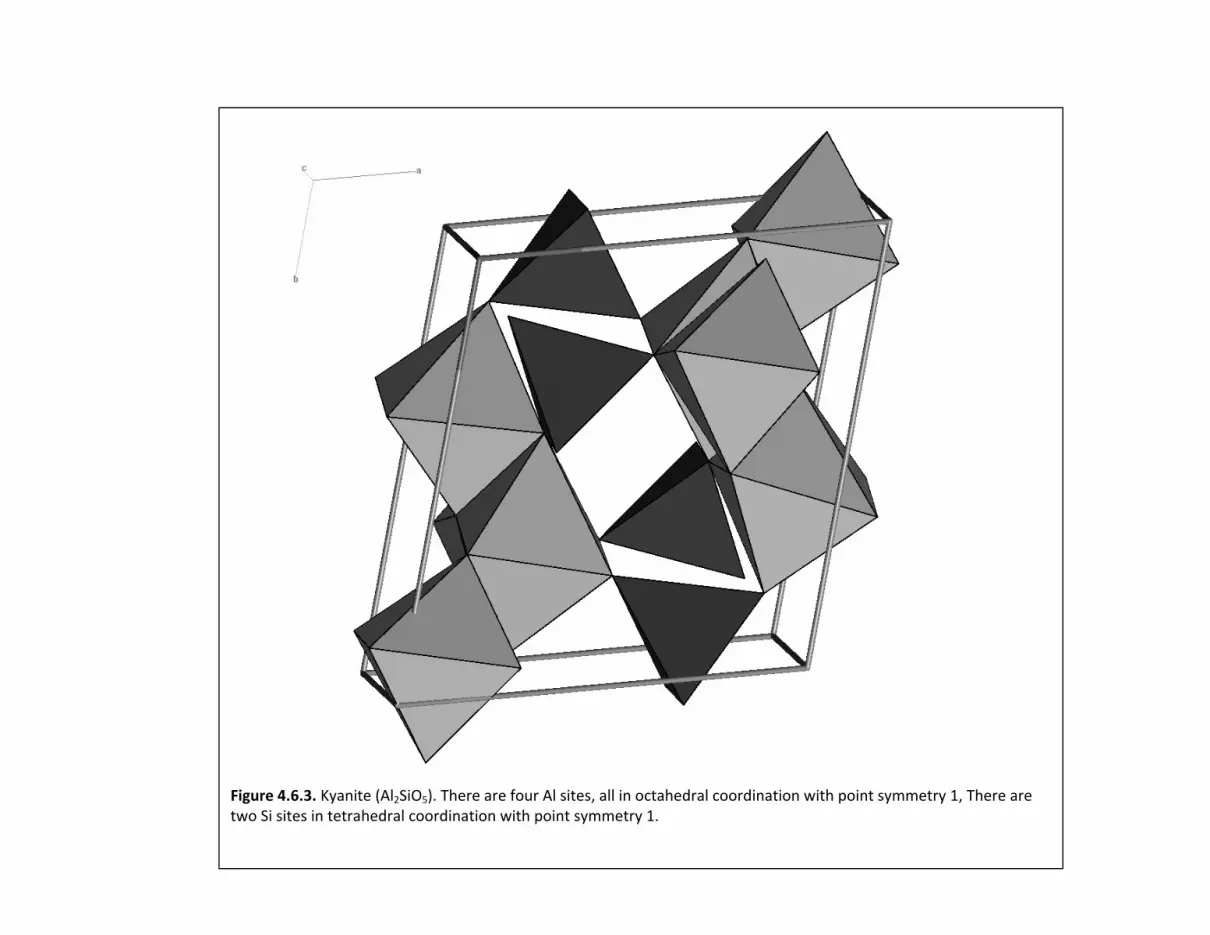
Figure 4.6.3. Kyanite (Al2SiO5). There are four Al sites, all in octahedral coordination with point symmetry 1, There are two Si sites in tetrahedral coordination with point symmetry 1.
103
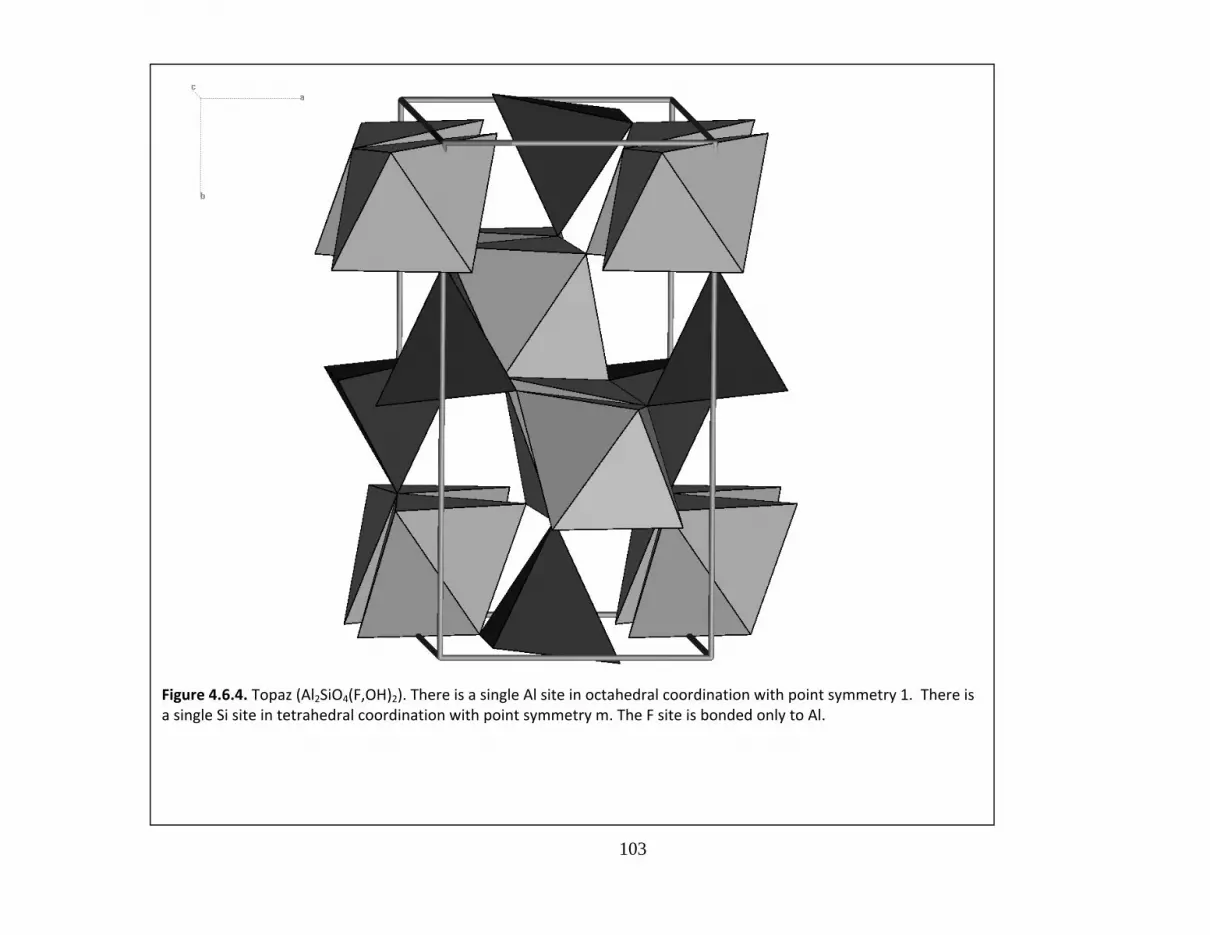
Figure 4.6.4. Topaz (Al2SiO4(F,OH)2). There is a single Al site in octahedral coordination with point symmetry 1. There is a single Si site in tetrahedral coordination with point symmetry m. The F site is bonded only to Al.
104
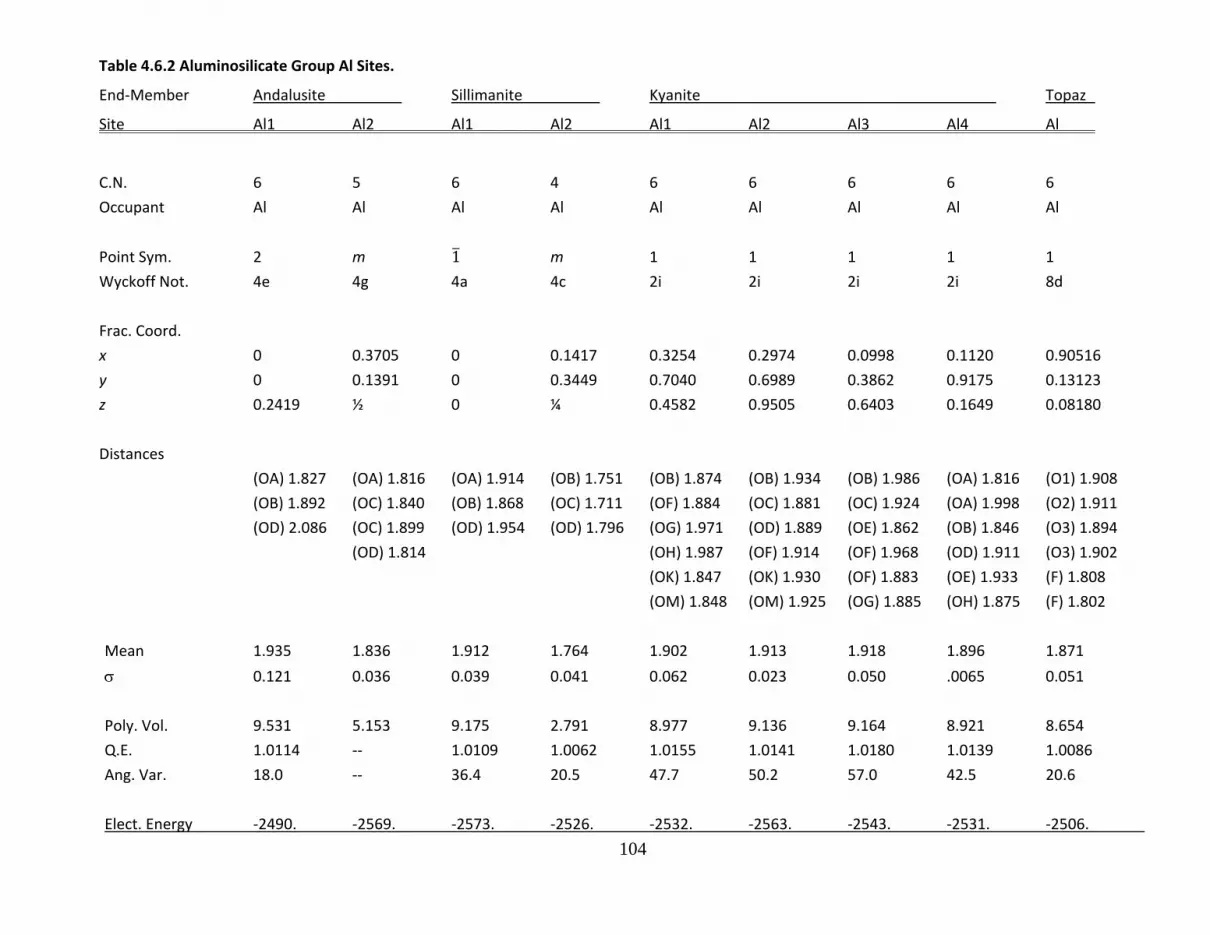
Table 4.6.2 Aluminosilicate Group Al Sites.
End‐Member Andalusite Sillimanite Kyanite Topaz
Site Al1 Al2 Al1 Al2 Al1 Al2 Al3 Al4 Al
C.N. 6 5 6 4 6 6 6 6 6
Occupant Al Al Al Al Al Al Al Al Al
Point Sym. 2 m 1 m 1 1 1 1 1
Wyckoff Not. 4e 4g 4a 4c 2i 2i 2i 2i 8d
Frac. Coord.
x 0 0.3705 0 0.1417 0.3254 0.2974 0.0998 0.1120 0.90516
y 0 0.1391 0 0.3449 0.7040 0.6989 0.3862 0.9175 0.13123
z 0.2419 ½ 0 ¼ 0.4582 0.9505 0.6403 0.1649 0.08180
Distances
(OA) 1.827 (OA) 1.816 (OA) 1.914 (OB) 1.751 (OB) 1.874 (OB) 1.934 (OB) 1.986 (OA) 1.816 (O1) 1.908
(OB) 1.892 (OC) 1.840 (OB) 1.868 (OC) 1.711 (OF) 1.884 (OC) 1.881 (OC) 1.924 (OA) 1.998 (O2) 1.911
(OD) 2.086 (OC) 1.899 (OD) 1.954 (OD) 1.796 (OG) 1.971 (OD) 1.889 (OE) 1.862 (OB) 1.846 (O3) 1.894
(OD) 1.814 (OH) 1.987 (OF) 1.914 (OF) 1.968 (OD) 1.911 (O3) 1.902
(OK) 1.847 (OK) 1.930 (OF) 1.883 (OE) 1.933 (F) 1.808
(OM) 1.848 (OM) 1.925 (OG) 1.885 (OH) 1.875 (F) 1.802
Mean 1.935 1.836 1.912 1.764 1.902 1.913 1.918 1.896 1.871
0.121 0.036 0.039 0.041 0.062 0.023 0.050 .0065 0.051
Poly. Vol. 9.531 5.153 9.175 2.791 8.977 9.136 9.164 8.921 8.654
Q.E. 1.0114 ‐‐ 1.0109 1.0062 1.0155 1.0141 1.0180 1.0139 1.0086
Ang. Var. 18.0 ‐‐ 36.4 20.5 47.7 50.2 57.0 42.5 20.6
Elect. Energy ‐2490. ‐2569. ‐2573. ‐2526. ‐2532. ‐2563. ‐2543. ‐2531. ‐2506.

105
Table 4.6.3. Aluminosilicate Group Si Sites.
End‐Member Andalusite Sillimanite Kyanite Topaz
Site Si Si Si1 Si2 Si
C.N. 4 4 4 4 4
Occupant Si Si Si Si Si
Point Sym. m m 1 1 m
Wyckoff Not. 4g 4c 2i 2i 4c
Frac. Coord.
x 0.2460 0.1533 0.2692 0.2910 0.39955
y 0.2520 0.3402 0.0649 0.3317 0.94084
z 0 ¾ 0.7066 0.1892 ¼
Distances
1 (OB) 1.646 (OA) 1.640 (OD) 1.631 (OA) 1.640 (O1) 1.637
2 (OC) 1.618 (OC) 1.573 (OE) 1.643 (OG) 1.627 (O2) 1.651
3 (OD) 1.630 (2) (OD) 1.645 (2) (OH) 1.621 (OG) 1.627 (O3) 1.643 (2)
(OM) 1.647 (OK) 1.649
Mean 1.631 1.626 1.636 1.636 1.643
0.011 0.0354 0.011 0.010 0.006
Poly. Vol. 2.211 2.203 2.241 2.243 2.277
Q.E. 1.0043 1.0013 1.0012 1.0018 1.0004
Ang. Var. 16.4 3.4 4.8 7.1 1.7
Elect. Energy ‐4404. ‐4426. ‐4443. ‐4458. ‐4402.
106
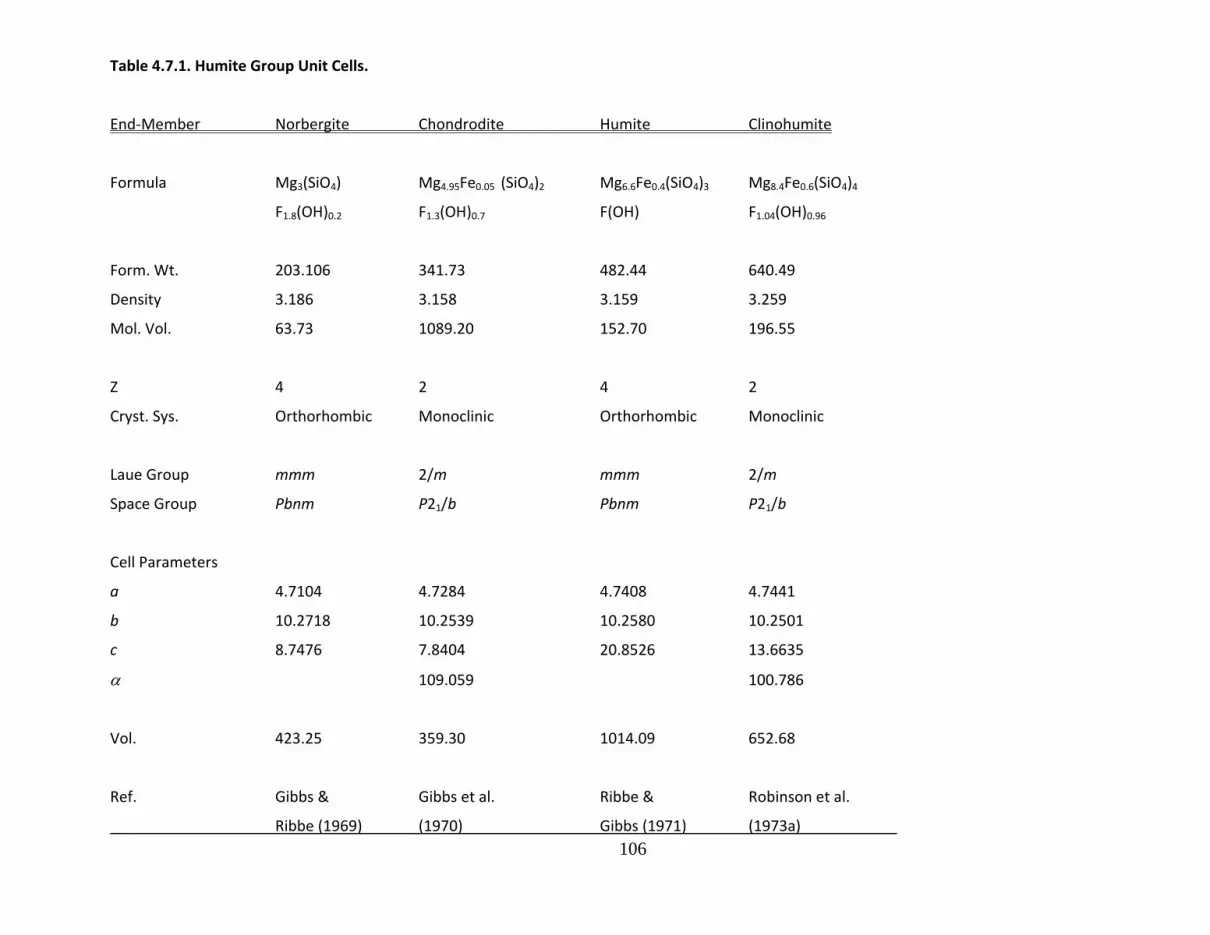
Table 4.7.1. Humite Group Unit Cells.
End‐Member Norbergite Chondrodite Humite Clinohumite
Formula Mg3(SiO4) Mg4.95Fe0.05 (SiO4)2 Mg6.6Fe0.4(SiO4)3 Mg8.4Fe0.6(SiO4)4
F1.8(OH)0.2 F1.3(OH)0.7 F(OH) F1.04(OH)0.96
Form. Wt. 203.106 341.73 482.44 640.49
Density 3.186 3.158 3.159 3.259
Mol. Vol. 63.73 1089.20 152.70 196.55
Z 4 2 4 2
Cryst. Sys. Orthorhombic Monoclinic Orthorhombic Monoclinic
Laue Group mmm 2/m mmm 2/m
Space Group Pbnm P21/b Pbnm P21/b
Cell Parameters
a 4.7104 4.7284 4.7408 4.7441
b 10.2718 10.2539 10.2580 10.2501
c 8.7476 7.8404 20.8526 13.6635
109.059 100.786
Vol. 423.25 359.30 1014.09 652.68
Ref. Gibbs & Gibbs et al. Ribbe & Robinson et al.
Ribbe (1969) (1970) Gibbs (1971) (1973a)

107
Figure 4.7.1. Norbergite (Mg3SiO4(F,OH)2), a‐axis projection, b‐vertical. There are two distinct Mg octahedral, M2 (point symmetry
m) and M3 (point symmetry 1), and a single Si tetrahedron. The F‐OH (sphere) site is bonded only to Mg.

108
Figure 4.7.2. Chondrodite (Mg3SiO4(F,OH)2), a‐axis projection, c*‐vertical. There are three distinct Mg octahedral, M1 (point symmetry
1), M2, and M3 (both with point symmetry 1), and a single Si tetrahedron. The F‐OH (white sphere) site is bonded only to Mg.
109
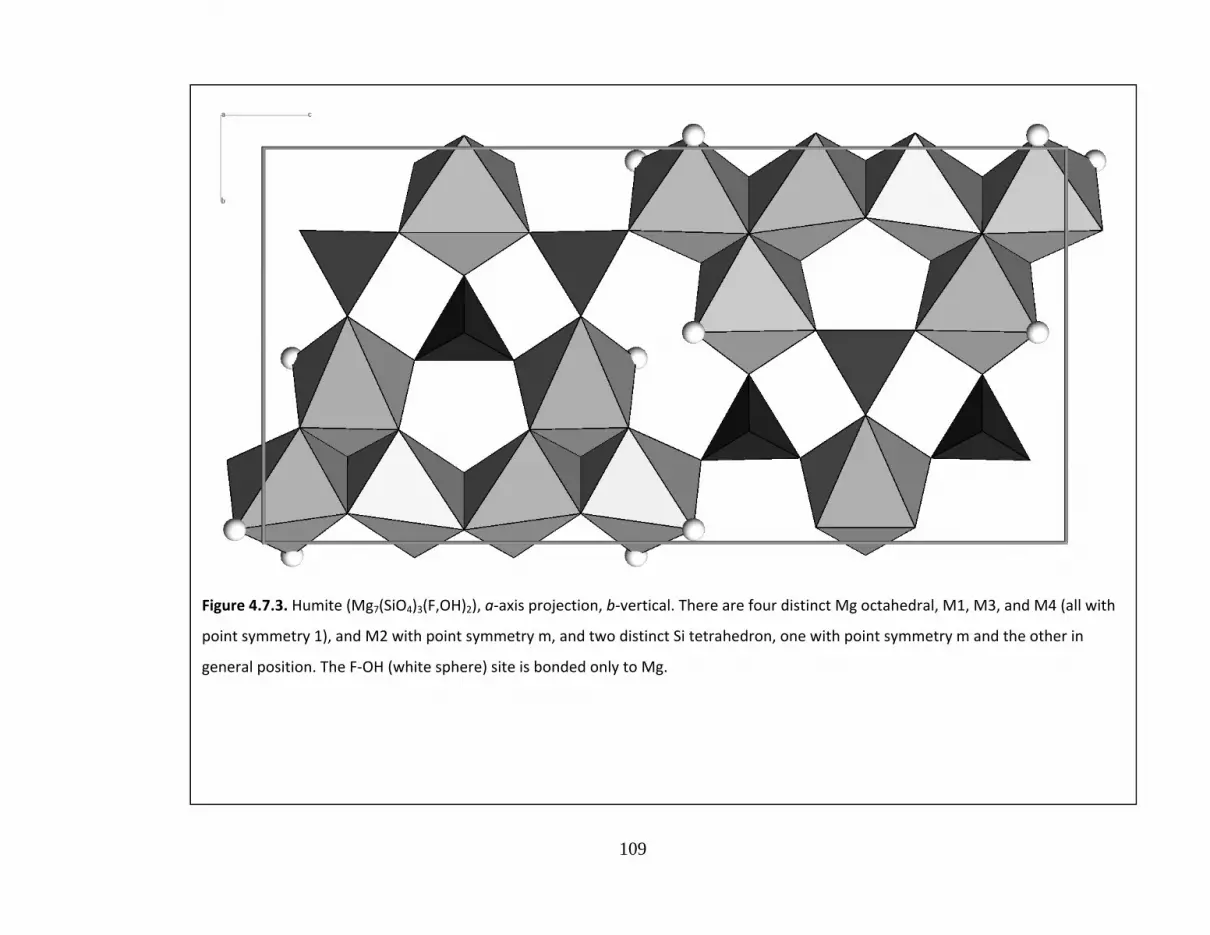
Figure 4.7.3. Humite (Mg7(SiO4)3(F,OH)2), a‐axis projection, b‐vertical. There are four distinct Mg octahedral, M1, M3, and M4 (all with
point symmetry 1), and M2 with point symmetry m, and two distinct Si tetrahedron, one with point symmetry m and the other in
general position. The F‐OH (white sphere) site is bonded only to Mg.
110
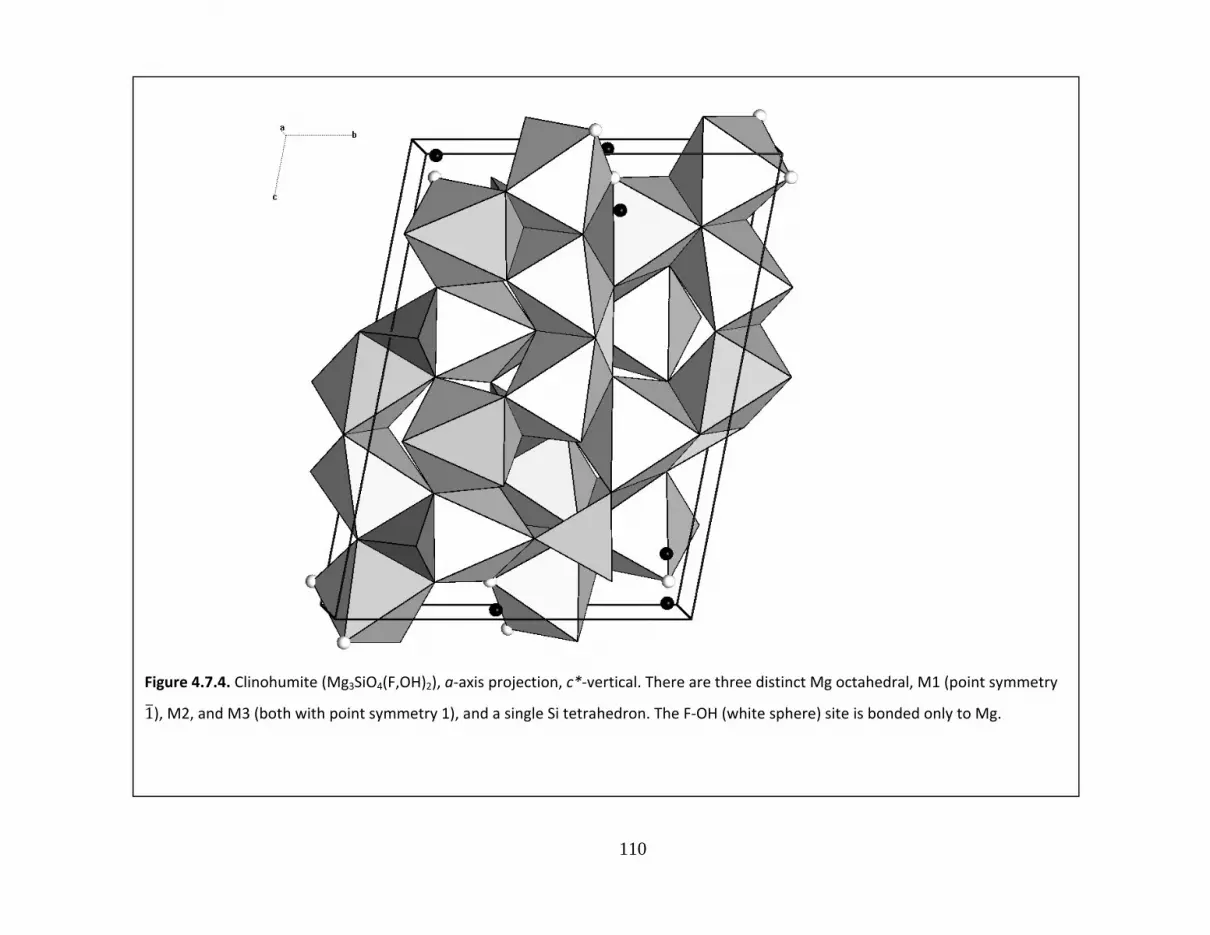
Figure 4.7.4. Clinohumite (Mg3SiO4(F,OH)2), a‐axis projection, c*‐vertical. There are three distinct Mg octahedral, M1 (point symmetry
1), M2, and M3 (both with point symmetry 1), and a single Si tetrahedron. The F‐OH (white sphere) site is bonded only to Mg.

111
Table 4.7.2a. Humite Group (Norbergite and Chondrodite) Octahedral Sites.
End‐Member Norbergite Chondrodite
Site M3 M2 M1 M2 M3
C.N. 6 6 6 6 6
Occupant Mg Mg Mg.95Fe.05 Mg Mg
Point Sym. 1 m 1 1 1
Wyckoff Not. 8d 4c 2d 4e 4e
Frac. Coord.
x 0.9890 0.9924 ½ 0.0091 0.4915
y 0.6330 0.9077 0 0.1731 0.8867
z 0.4305 ¼ ½ 0.3055 0.0791
Distances
Mean 2.068 2.104 2.170 2.116 2.078
0.075 0.100 0.014 0.081 0.072
Poly. Vol. 11.515 12.029 11.965 12.245 11.665
Q.E. 1.0174 1.0236 1.0277 1.0220 1.0179
Ang. Var. 56.5 75.6 100.6 74.0 59.2
Elect. Energy ‐1085. ‐1086. ‐1055. ‐1119. ‐1095.
112
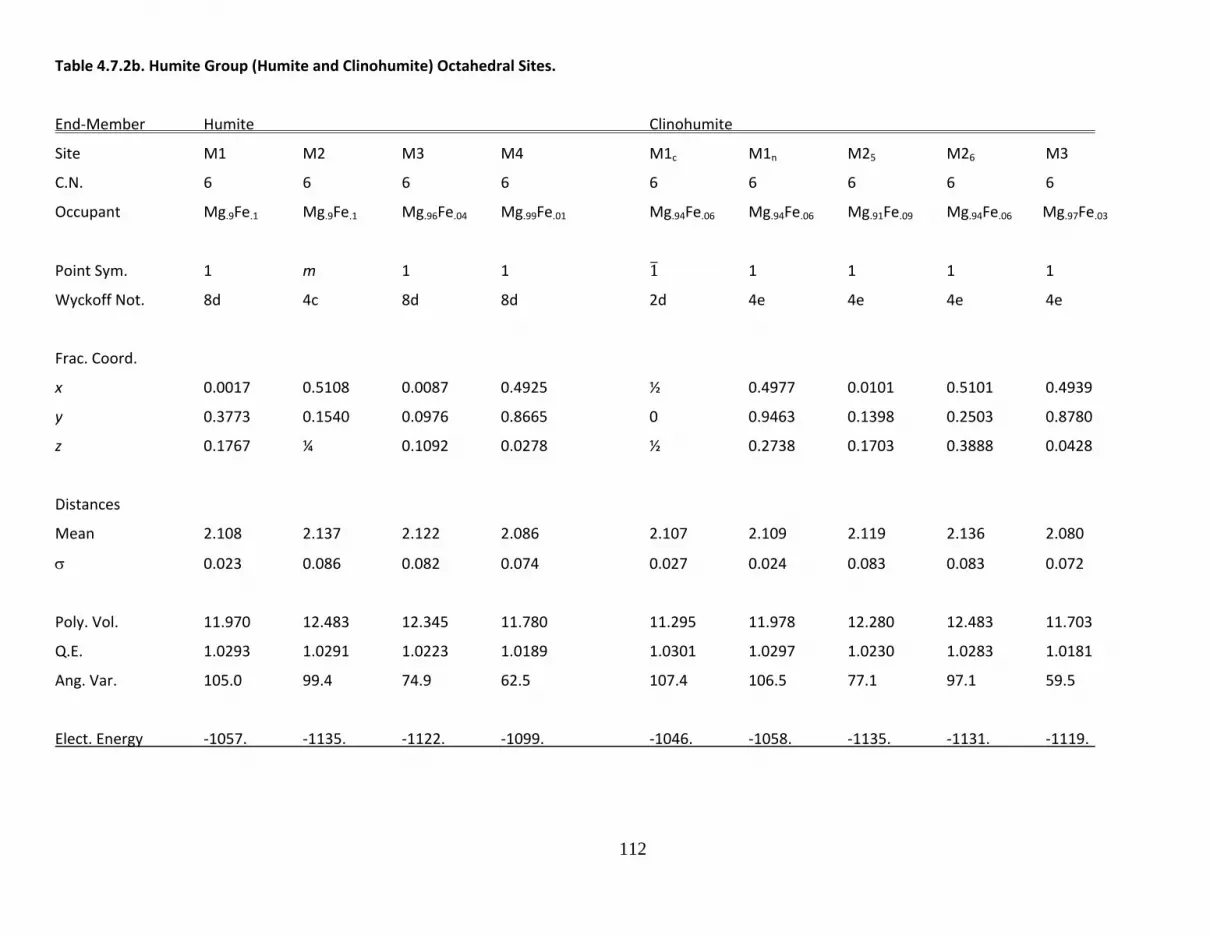
Table 4.7.2b. Humite Group (Humite and Clinohumite) Octahedral Sites.
End‐Member Humite Clinohumite
Site M1 M2 M3 M4 M1c M1n M25 M26 M3
C.N. 6 6 6 6 6 6 6 6 6
Occupant Mg.9Fe.1 Mg.9Fe.1 Mg.96Fe.04 Mg.99Fe.01 Mg.94Fe.06 Mg.94Fe.06 Mg.91Fe.09 Mg.94Fe.06 Mg.97Fe.03
Point Sym. 1 m 1 1 1 1 1 1 1
Wyckoff Not. 8d 4c 8d 8d 2d 4e 4e 4e 4e
Frac. Coord.
x 0.0017 0.5108 0.0087 0.4925 ½ 0.4977 0.0101 0.5101 0.4939
y 0.3773 0.1540 0.0976 0.8665 0 0.9463 0.1398 0.2503 0.8780
z 0.1767 ¼ 0.1092 0.0278 ½ 0.2738 0.1703 0.3888 0.0428
Distances
Mean 2.108 2.137 2.122 2.086 2.107 2.109 2.119 2.136 2.080
0.023 0.086 0.082 0.074 0.027 0.024 0.083 0.083 0.072
Poly. Vol. 11.970 12.483 12.345 11.780 11.295 11.978 12.280 12.483 11.703
Q.E. 1.0293 1.0291 1.0223 1.0189 1.0301 1.0297 1.0230 1.0283 1.0181
Ang. Var. 105.0 99.4 74.9 62.5 107.4 106.5 77.1 97.1 59.5
Elect. Energy ‐1057. ‐1135. ‐1122. ‐1099. ‐1046. ‐1058. ‐1135. ‐1131. ‐1119.

113
Table 4.7.3. Humite Group Tetrahedral Sites.
End‐Member Norbergite Chondrodite Humite Clinohumite
Site Si Si Si1 Si2 Si1 Si2
C.N. 4 4 4 4 4 4
Occupant Si Si Si Si Si Si
Point Sym. m 1 m 1 1 1
Wyckoff Not. 4c 4e 4c 8d 4c 4c
Frac. Coord.
x 0.4195 0.0768 0.0752 0.5765 0.0741 0.0759
y 0.7196 0.1441 0.9691 0.2819 0.0663 0.1771
z ¼ 0.7038 ¼ 0.1059 0.3891 0.8354
Distances
Mean 1.630 1.633 1.629 1.627 1.626 1.638
0.012 0.012 0.009 0.011 0.004 0.014
Poly. Vol. 2.193 2.202 2.188 2.180 2.175 2.219
Q.E. 1.0093 1.0102 1.0090 1.0096 1.0094 1.0109
Ang. Var. 41.3 45.2 38.2 42.5 39.7 48.6
Elect. Energy ‐4321. ‐4305. ‐4293. ‐4346. ‐4299. ‐4333.

114
Table 4.8.1. Titanite Group Unit Cells.
End‐Member Titanite Malayaite
Formula CaTiSiO5 CaSnSiO5
Form. Wt. 196.063 266.853
Density 3.517 4.546
Mol. Vol. 55.748 58.704
Z 4 4
Cryst. Sys. Monoclinic Monoclinic
Laue Class 2/m 2/m
Space Group P21/a A2/a
Cell Parameters
a 7.069 7.149
b 8.722 8.906
c 6.586 6.667
113.86 113.3
Vol. 370.23 389.86
Ref. Speer & Higgins &
Gibbs (1976) Ribbe (1977)

115
Figure 4.8.1. Titanite (CaTiSiO5), c‐axis projection, a‐vertical. Ca (black sphere) is in irregular 7‐coordination, Ti is octahedral, and Si
tetrahedral.
116
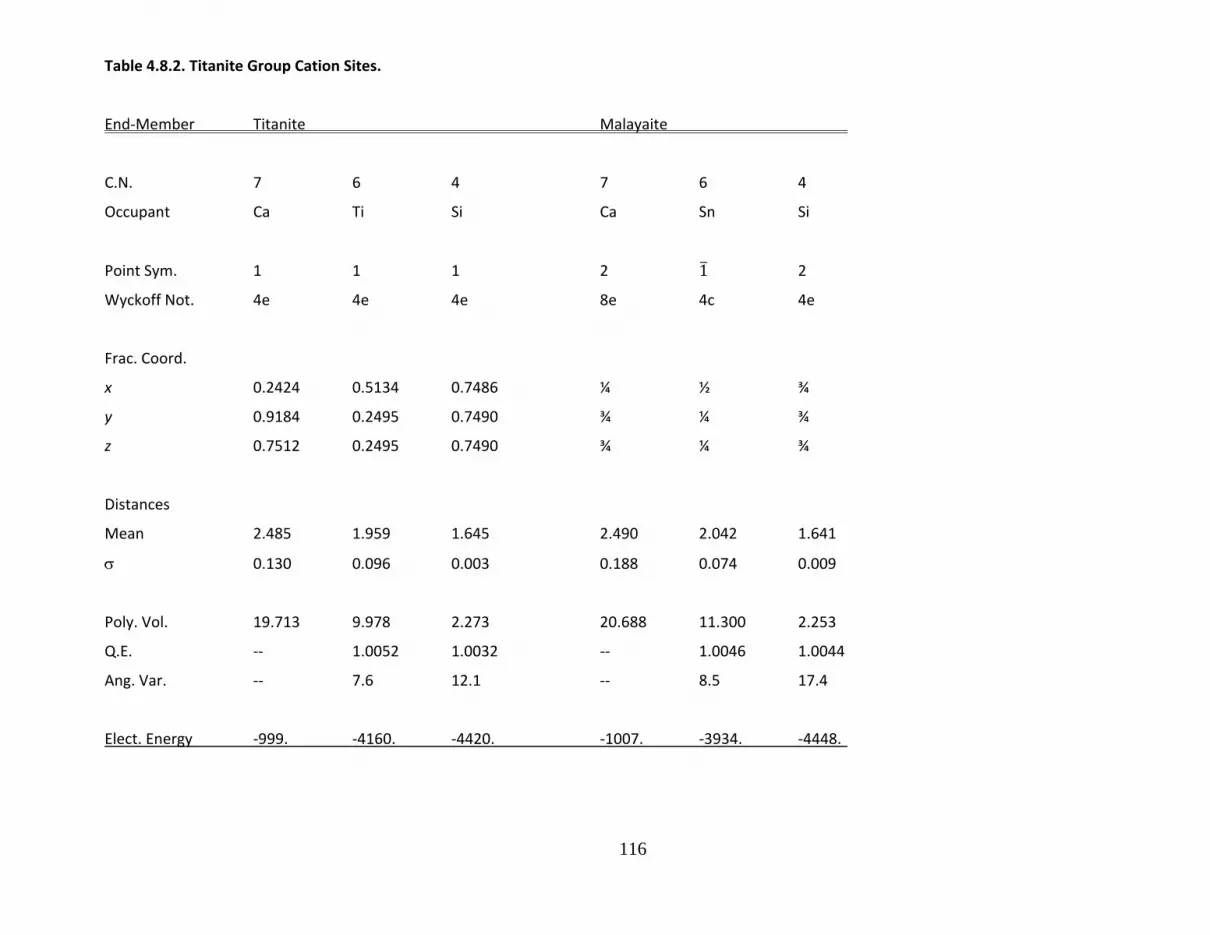
Table 4.8.2. Titanite Group Cation Sites.
End‐Member Titanite Malayaite
C.N. 7 6 4 7 6 4
Occupant Ca Ti Si Ca Sn Si
Point Sym. 1 1 1 2 1 2
Wyckoff Not. 4e 4e 4e 8e 4c 4e
Frac. Coord.
x 0.2424 0.5134 0.7486 ¼ ½ ¾
y 0.9184 0.2495 0.7490 ¾ ¼ ¾
z 0.7512 0.2495 0.7490 ¾ ¼ ¾
Distances
Mean 2.485 1.959 1.645 2.490 2.042 1.641
0.130 0.096 0.003 0.188 0.074 0.009
Poly. Vol. 19.713 9.978 2.273 20.688 11.300 2.253
Q.E. ‐‐ 1.0052 1.0032 ‐‐ 1.0046 1.0044
Ang. Var. ‐‐ 7.6 12.1 ‐‐ 8.5 17.4
Elect. Energy ‐999. ‐4160. ‐4420. ‐1007. ‐3934. ‐4448.

117
Table 4.9.1. Staurolite Unit Cell.
End‐Member Staurolite
Formula Fe4Al18Si8O46(OH)2
Form. Wt. 1703.73
Density 3.823
Mol. Volume 445.67
Z 1
Cryst. Sys. Monoclinic
Laue Class 2/m
Space Group C2/m
Cell Parameters
a 7.8713
b 16.6204
c 5.6560
90.0
Vol. 739.94
Ref. Smith (1968)
118
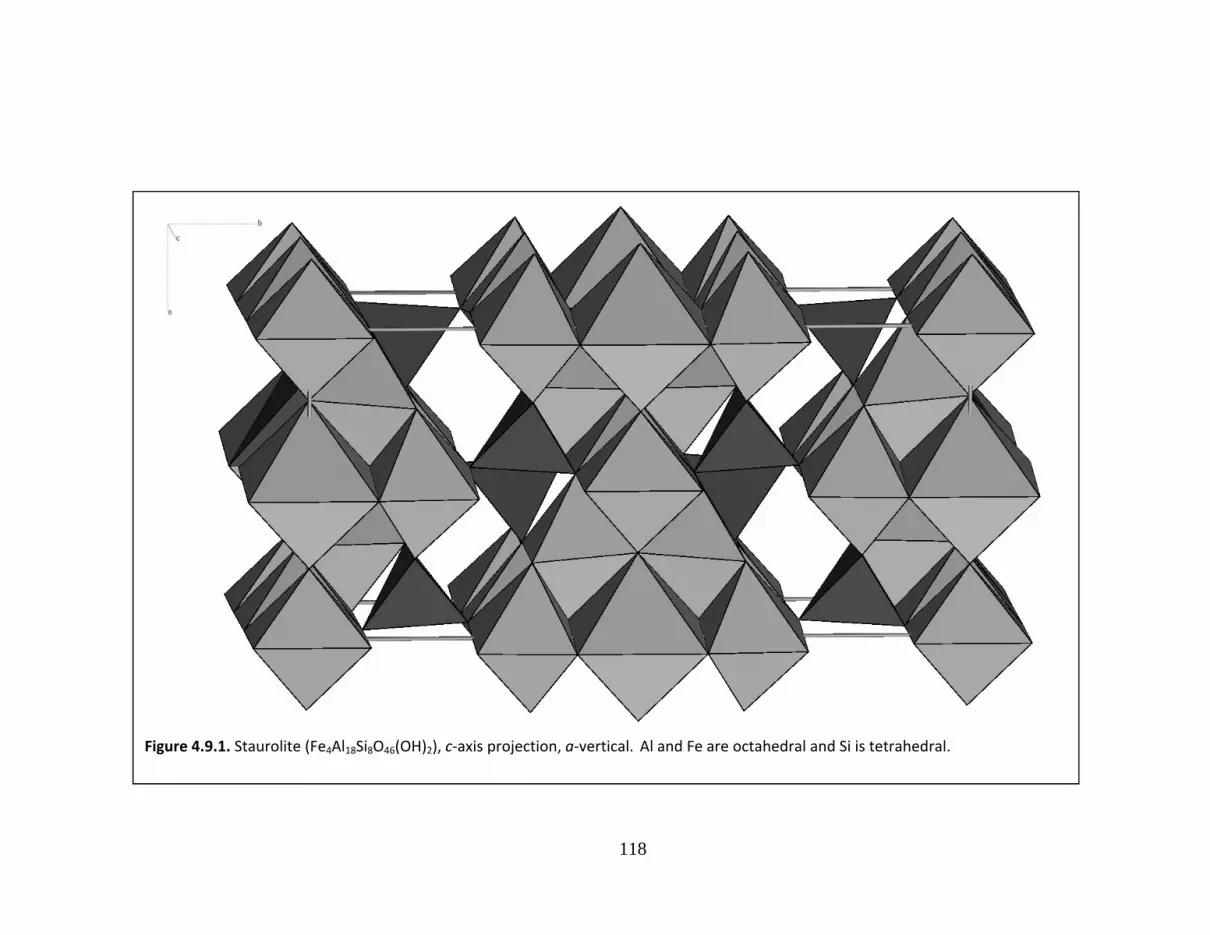
Figure 4.9.1. Staurolite (Fe4Al18Si8O46(OH)2), c‐axis projection, a‐vertical. Al and Fe are octahedral and Si is tetrahedral.

119
Table 4.9.1. Staurolite Fully Occupied Cation Sites.
Site Al1A Al1B Al2 Si
C.N. 6 6 6 4
Occupant Al Al Al Si
Point Sym. 2 2 2 2
Wyckoff Not. 4g 4h 8j 8j
Frac. Coord.
x ½ ½ 0.26536 0.13414
y 0.17511 0.17477 0.41042 0.16612
z 0 ½ 0.25122 0.24902
Distances
Mean 1.911 1.914 1.905 1.641
0.021 0.022 0.029 0.008
Poly. Vol. 9.127 9.169 9.031 2.266
Q.E. 1.0133 1.0132 1.0139 1.0004
Ang. Var. 45.5 45.3 46.3 1.7
Elect. Energy ‐2365. ‐2365. ‐2619. ‐4361.
Model Charge 3.0 3.0 3.0 4.0

120
Table 4.9.1. Staurolite Partially Occupied Cation Sites.
Site Fe U1 U2 Al3A Al3B
C.N. 4 6 6 6 6
Occupant Fe.64Al.36 Fe.68Mn.32 Fe.68Mn.32 Al.67Fe.33 Al.67Fe.33
Occupancy 0.916 0.080 0.038 0.415 0.282
Point Sym. m 2/m 2/m 2/m 2/m
Wyckoff Not. 4i 2b 2d 2a 2c
Frac. Coord.
x 0.39281 ½ ½ 0 0
y 0 0 0 0 0
z 0.24815 0 ½ 0 ½
Distances
Mean 2.008 2.165 2.163 1.972 1.992
0.042 0.040 0.049 0.100 0.106
Poly. Vol. 4.141 12.960 12.957 10.125 10.441
Q.E. 1.0026 1.0299 1.0286 1.0092 1.0083
Ang. Var. 11.5 90.4 85.8 16.6 12.2
Elect. Energy ‐1395. +12. +6. ‐622. ‐369.
Model Charge 2.36 0.16 0.08 1.11 0.75

121
Chapter5.SorosilicateandCyclosilicateMinerals
Silicate Minerals with Si2O7 Groups and Si6O18 Rings
5.1. Epidote Group
5.2. Melilite Group
5.3. Wadsleyite (‐spinel) Group
5.4. Lawsonite
5.5. Tourmaline Group
5.6. Vesuvianite (Idocrase)

122
Table 5.1.1. Epidote Group Unit Cells.
End Member Zoisite Clinozoisite Epidote Epidote Allanite
Formula Ca2Al3 Ca2Al3 Ca2Al2.16 Fe0.84 Ca2Al2.6Fe0.4 Ca1.26RE0.76Al1.83Fe1.17
Si3O12(OH) Si3O12(OH) Si3O12(OH) Si3O12(OH) Si3O12(OH)
Form. Wt. (g) 454.363 454.363 478.610 465.909 565.2
Density (g/cm3) 3.336 3.321 3.465 3.392 3.960
Mol. Vol. (cm3) 136.19 136.83 138.146 137.370 142.737
Z 4 2 2 2 2
Cryst. Sys. Orthorhombic Monoclinic Monoclinic Monoclinic Monoclinic
Laue Class mmm 2/m 2/m 2/m 2/m
Space Group Pnna P21/m P21/m P21/m P21/m
Cell Parameters
a (Å) 16.212 8.879 8.8877 8.8802 8.927
b (Å) 5.559 5.583 5.6275 5.6043 5.761
c (Å) 10.036 10.155 10.1517 10.1541 10.150
115.50 115.383 115.455 10.150
Vol. 904.47 454.36 458.73 456.15 114.77
Ref. Dollase Dollase Gabe et al. Gabe et al. Dollase
(1968) (1968) (1973) (1973) (1971)
123
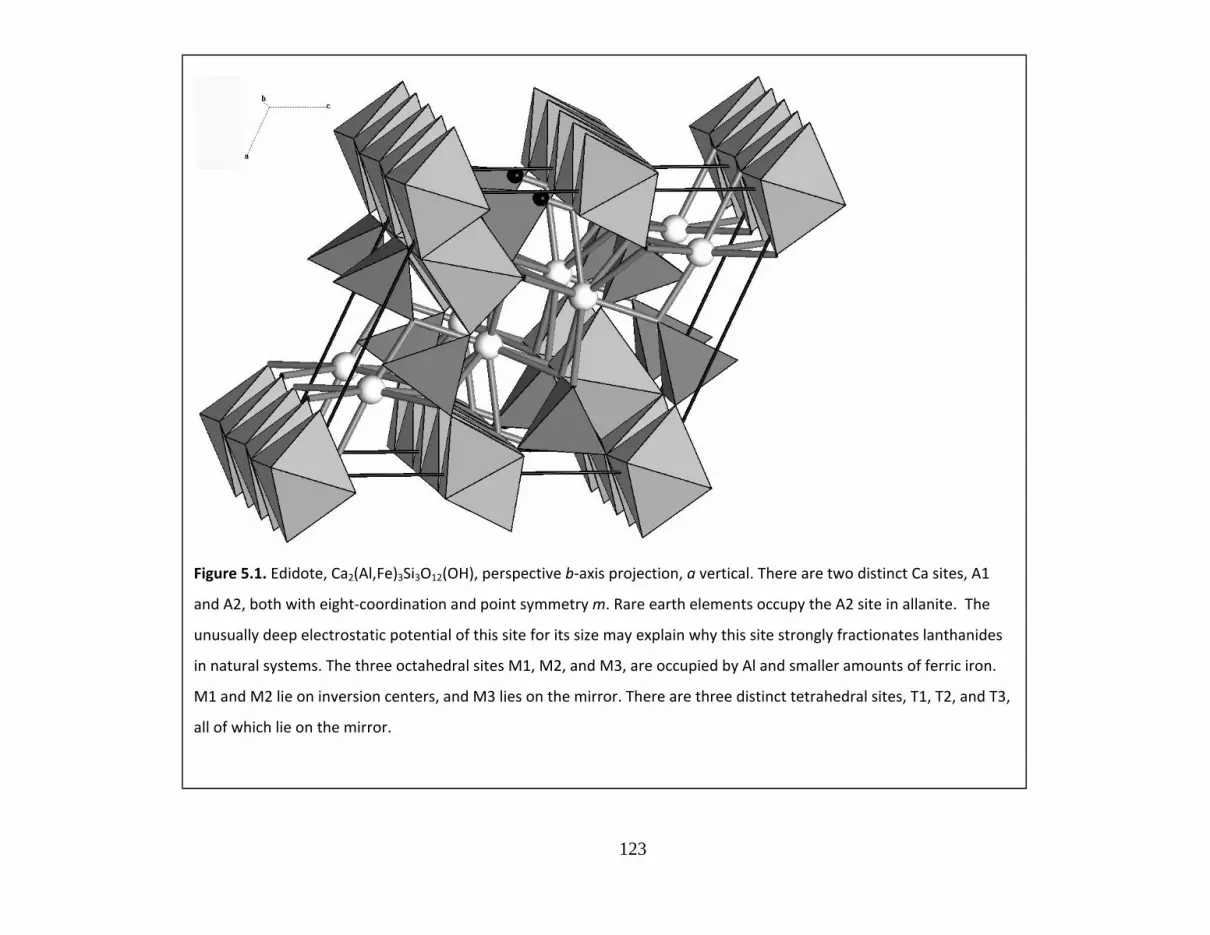
Figure 5.1. Edidote, Ca2(Al,Fe)3Si3O12(OH), perspective b‐axis projection, a vertical. There are two distinct Ca sites, A1
and A2, both with eight‐coordination and point symmetry m. Rare earth elements occupy the A2 site in allanite. The
unusually deep electrostatic potential of this site for its size may explain why this site strongly fractionates lanthanides
in natural systems. The three octahedral sites M1, M2, and M3, are occupied by Al and smaller amounts of ferric iron.
M1 and M2 lie on inversion centers, and M3 lies on the mirror. There are three distinct tetrahedral sites, T1, T2, and T3,
all of which lie on the mirror.
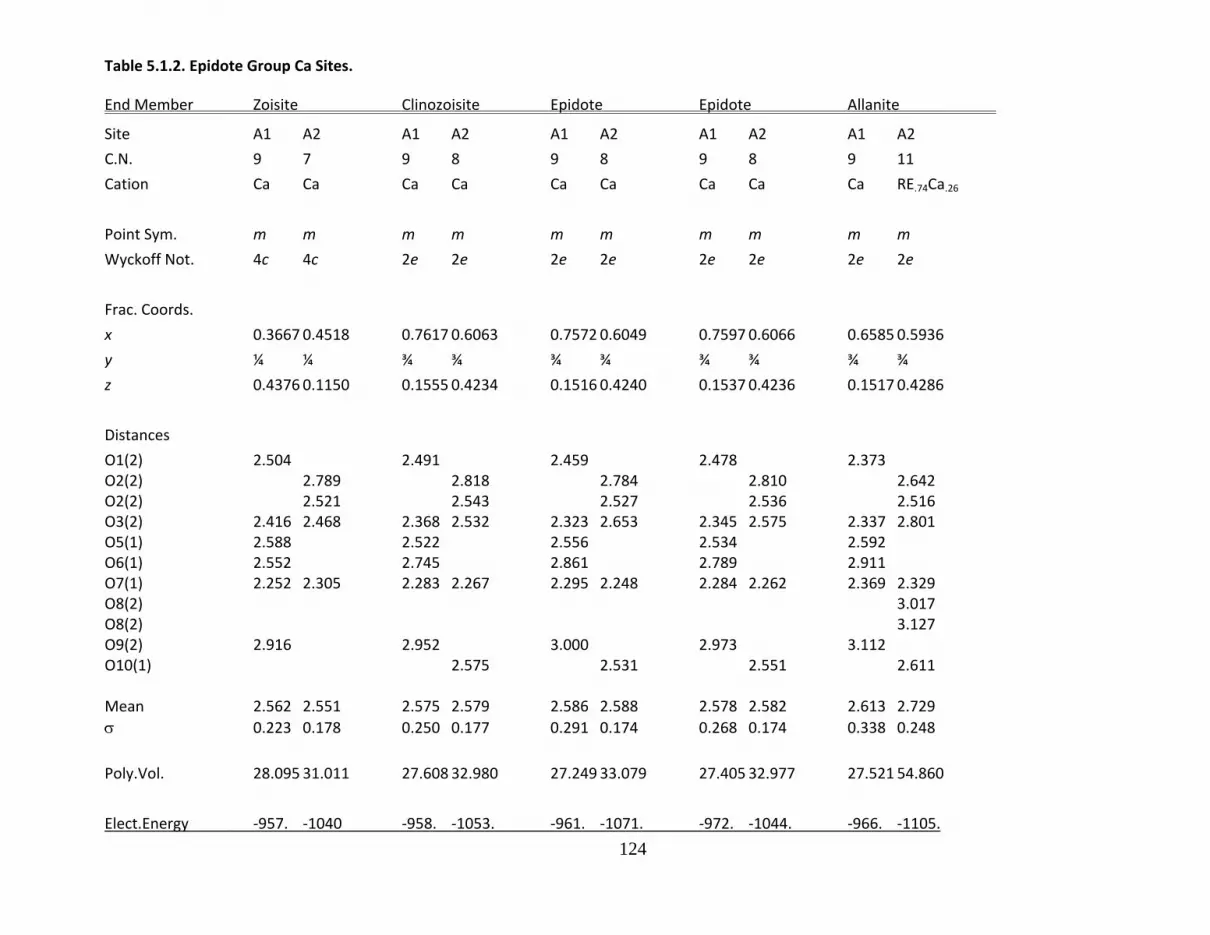
124
Table 5.1.2. Epidote Group Ca Sites.
End Member Zoisite Clinozoisite Epidote Epidote Allanite
Site A1 A2 A1 A2 A1 A2 A1 A2 A1 A2
C.N. 9 7 9 8 9 8 9 8 9 11
Cation Ca Ca Ca Ca Ca Ca Ca Ca Ca RE.74Ca.26
Point Sym. m m m m m m m m m m
Wyckoff Not. 4c 4c 2e 2e 2e 2e 2e 2e 2e 2e
Frac. Coords.
x 0.3667 0.4518 0.7617 0.6063 0.7572 0.6049 0.7597 0.6066 0.6585 0.5936
y ¼ ¼ ¾ ¾ ¾ ¾ ¾ ¾ ¾ ¾
z 0.4376 0.1150 0.1555 0.4234 0.1516 0.4240 0.1537 0.4236 0.1517 0.4286
Distances
O1(2) 2.504 2.491 2.459 2.478 2.373 O2(2) 2.789 2.818 2.784 2.810 2.642 O2(2) 2.521 2.543 2.527 2.536 2.516 O3(2) 2.416 2.468 2.368 2.532 2.323 2.653 2.345 2.575 2.337 2.801 O5(1) 2.588 2.522 2.556 2.534 2.592 O6(1) 2.552 2.745 2.861 2.789 2.911 O7(1) 2.252 2.305 2.283 2.267 2.295 2.248 2.284 2.262 2.369 2.329 O8(2) 3.017 O8(2) 3.127 O9(2) 2.916 2.952 3.000 2.973 3.112 O10(1) 2.575 2.531 2.551 2.611 Mean 2.562 2.551 2.575 2.579 2.586 2.588 2.578 2.582 2.613 2.729
0.223 0.178 0.250 0.177 0.291 0.174 0.268 0.174 0.338 0.248
Poly.Vol. 28.095 31.011 27.608 32.980 27.249 33.079 27.405 32.977 27.521 54.860
Elect.Energy ‐957. ‐1040 ‐958. ‐1053. ‐961. ‐1071. ‐972. ‐1044. ‐966. ‐1105.
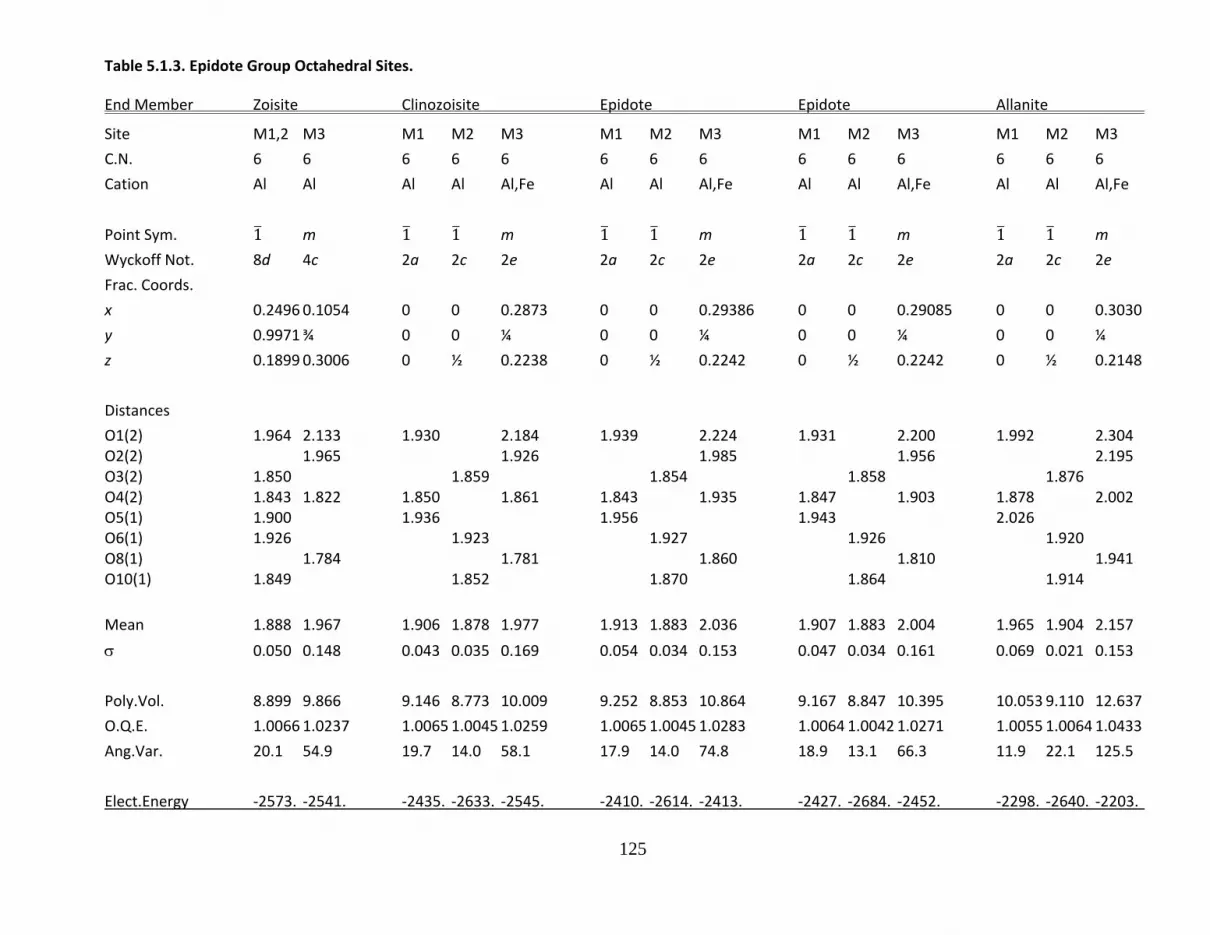
125
Table 5.1.3. Epidote Group Octahedral Sites.
End Member Zoisite Clinozoisite Epidote Epidote Allanite
Site M1,2 M3 M1 M2 M3 M1 M2 M3 M1 M2 M3 M1 M2 M3
C.N. 6 6 6 6 6 6 6 6 6 6 6 6 6 6
Cation Al Al Al Al Al,Fe Al Al Al,Fe Al Al Al,Fe Al Al Al,Fe
Point Sym. 1 m 1 1 m 1 1 m 1 1 m 1 1 m
Wyckoff Not. 8d 4c 2a 2c 2e 2a 2c 2e 2a 2c 2e 2a 2c 2e
Frac. Coords.
x 0.2496 0.1054 0 0 0.2873 0 0 0.29386 0 0 0.29085 0 0 0.3030
y 0.9971 ¾ 0 0 ¼ 0 0 ¼ 0 0 ¼ 0 0 ¼
z 0.1899 0.3006 0 ½ 0.2238 0 ½ 0.2242 0 ½ 0.2242 0 ½ 0.2148
Distances
O1(2) 1.964 2.133 1.930 2.184 1.939 2.224 1.931 2.200 1.992 2.304 O2(2) 1.965 1.926 1.985 1.956 2.195 O3(2) 1.850 1.859 1.854 1.858 1.876 O4(2) 1.843 1.822 1.850 1.861 1.843 1.935 1.847 1.903 1.878 2.002 O5(1) 1.900 1.936 1.956 1.943 2.026 O6(1) 1.926 1.923 1.927 1.926 1.920 O8(1) 1.784 1.781 1.860 1.810 1.941 O10(1) 1.849 1.852 1.870 1.864 1.914
Mean 1.888 1.967 1.906 1.878 1.977 1.913 1.883 2.036 1.907 1.883 2.004 1.965 1.904 2.157
0.050 0.148 0.043 0.035 0.169 0.054 0.034 0.153 0.047 0.034 0.161 0.069 0.021 0.153
Poly.Vol. 8.899 9.866 9.146 8.773 10.009 9.252 8.853 10.864 9.167 8.847 10.395 10.053 9.110 12.637
O.Q.E. 1.0066 1.0237 1.0065 1.0045 1.0259 1.0065 1.0045 1.0283 1.0064 1.0042 1.0271 1.0055 1.0064 1.0433
Ang.Var. 20.1 54.9 19.7 14.0 58.1 17.9 14.0 74.8 18.9 13.1 66.3 11.9 22.1 125.5
Elect.Energy ‐2573. ‐2541. ‐2435. ‐2633. ‐2545. ‐2410. ‐2614. ‐2413. ‐2427. ‐2684. ‐2452. ‐2298. ‐2640. ‐2203.

126
Table 5.1.2. Epidote Group Tetrahedral Sites.
End Member Zoisite Clinozoisite Epidote Epidote Allanite
Site T1 T2 T3 T1 T2 T3 T1 T2 T3 T1 T2 T3 T1 T2 T3
C.N. 4 4 4 4 4 4 4 4 4 4 4 4 4 4 4
Cation Si Si Si Si Si Si Si Si Si Si Si Si Si Si Si
Point Sym. m m m m m m m m m m m m m m m
Wyckoff Not. 4c 4c 4c 2e 2e 2e 2e 2e 2e 2e 2e 2e 2e 2e 2e
Frac. Coords.
x 0.0816 0.4104 0.1601 0.3328 0.6776 0.1822 0.3396 0.6843 0.1839 0.3388 0.6805 0.1830 0.3389 0.6866 0.1880
y ¼ ¾ ¼ ¾ ¼ ¾ ¾ ¼ ¾ ¾ ¼ ¾ ¾ ¼ ¾
z 0.1064 0.2821 0.4356 0.0478 0.2753 0.3158 0.0477 0.2745 0.3184 0.0480 0.2751 0.3169 0.0369 0.2799 0.3240
Distances
O1(2) 1.656 1.652 1.650 1.652 1.645 O2(2) 1.619 1.629 1.627 1.625 1.604 O3(2) 1.621 1.620 1.618 1.619 1.631 O5(1) 1.651 1.662 1.668 1.667 1.657 O6(1) 1.672 1.657 1.638 1.648 1.661 O7(1) 1.586 1.566 1.564 1.562 1.581 O8(1) 1.580 1.593 1.588 1.592 1.603 O9(1) 1.640 1.624 1.627 1.627 1.634 1.631 1.633 1.627 1.651 1.627
Mean 1.635 1.612 1.640 1.625 1.615 1.644 1.624 1.614 1.640 1.625 1.614 1.641 1.630 1.623 1.632
0.033 0.021 0.026 0.041 0.015 0.018 0.041 0.019 0.019 0.043 0.016 0.020 0.033 0.014 0.032
Poly.Vol. 2.226 2.143 2.227 2.190 2.157 2.261 2.190 2.155 2.249 2.191 2.155 2.251 2.217 2.192 2.201
T.Q.E. 1.0049 1.0018 1.0114 1.0034 1.0014 1.0060 1.0033 1.0009 1.0046 1.0035 1.0012 1.0055 1.0027 1.0011 1.0086
Ang.Var. 17.5 7.4 44.3 10.5 6.0 23.9 9.9 3.7 18.4 10.5 5.0 22.2 8.9 4.1 33.5
Elect.Energy ‐4368. ‐4529. ‐4400. ‐4380. ‐4540. ‐4395. ‐4348. ‐4542. ‐4427. ‐4373. ‐4564. ‐4390. ‐4286. ‐4504. ‐4518.

127
Table 5.2.1. Melilite Group Unit Cells.
End Member Na‐Melilite Gehlenite Akermanite
Formula CaNaAlSi2O7 Ca2Al(Al,Si)2O7 Ca2MgSi2O7
Form. Wt. (g) 258.219 274.205 272.640
Density (g/cm3) 2.912 3.006 2.944
Mol. Vol. (cm3) 88.662 91.220 92.619
Z 2 2 2
Cryst. Sys. Tetragonal Tetragonal Tetragonal
Laue Class 42m 42m 42m
Space Group P421m P421m P421m
Cell Parameters
a (Å) 7.6344 7.7173 7.835
c (Å) 5.0513 5.0860 5.010
Vol. 294.41 302.91 307.55
Ref. Louisnathan Louisnathan Kimata & Ii
(1970b) (1970a) (1981)

128
Figure 5.2. Melilite, Ca2MgSi2O7, perspective c‐axis projection, a vertical. The structure resembles a layered structure with
layers of Mg and Si tetrahedral held together with bonds to the Na/Ca atoms (spheres).
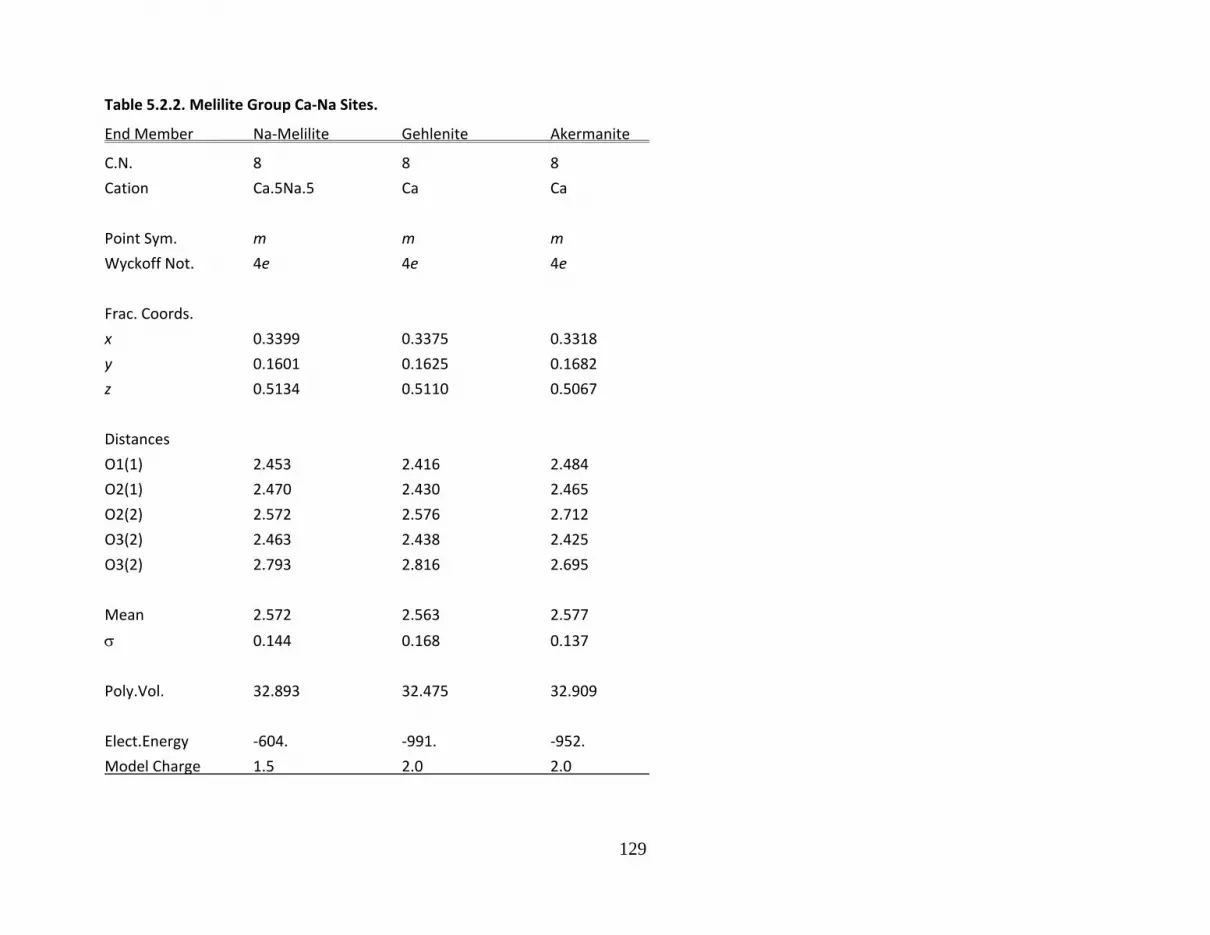
129
Table 5.2.2. Melilite Group Ca‐Na Sites.
End Member Na‐Melilite Gehlenite Akermanite
C.N. 8 8 8
Cation Ca.5Na.5 Ca Ca
Point Sym. m m m
Wyckoff Not. 4e 4e 4e
Frac. Coords.
x 0.3399 0.3375 0.3318
y 0.1601 0.1625 0.1682
z 0.5134 0.5110 0.5067
Distances
O1(1) 2.453 2.416 2.484
O2(1) 2.470 2.430 2.465
O2(2) 2.572 2.576 2.712
O3(2) 2.463 2.438 2.425
O3(2) 2.793 2.816 2.695
Mean 2.572 2.563 2.577
0.144 0.168 0.137
Poly.Vol. 32.893 32.475 32.909
Elect.Energy ‐604. ‐991. ‐952.
Model Charge 1.5 2.0 2.0
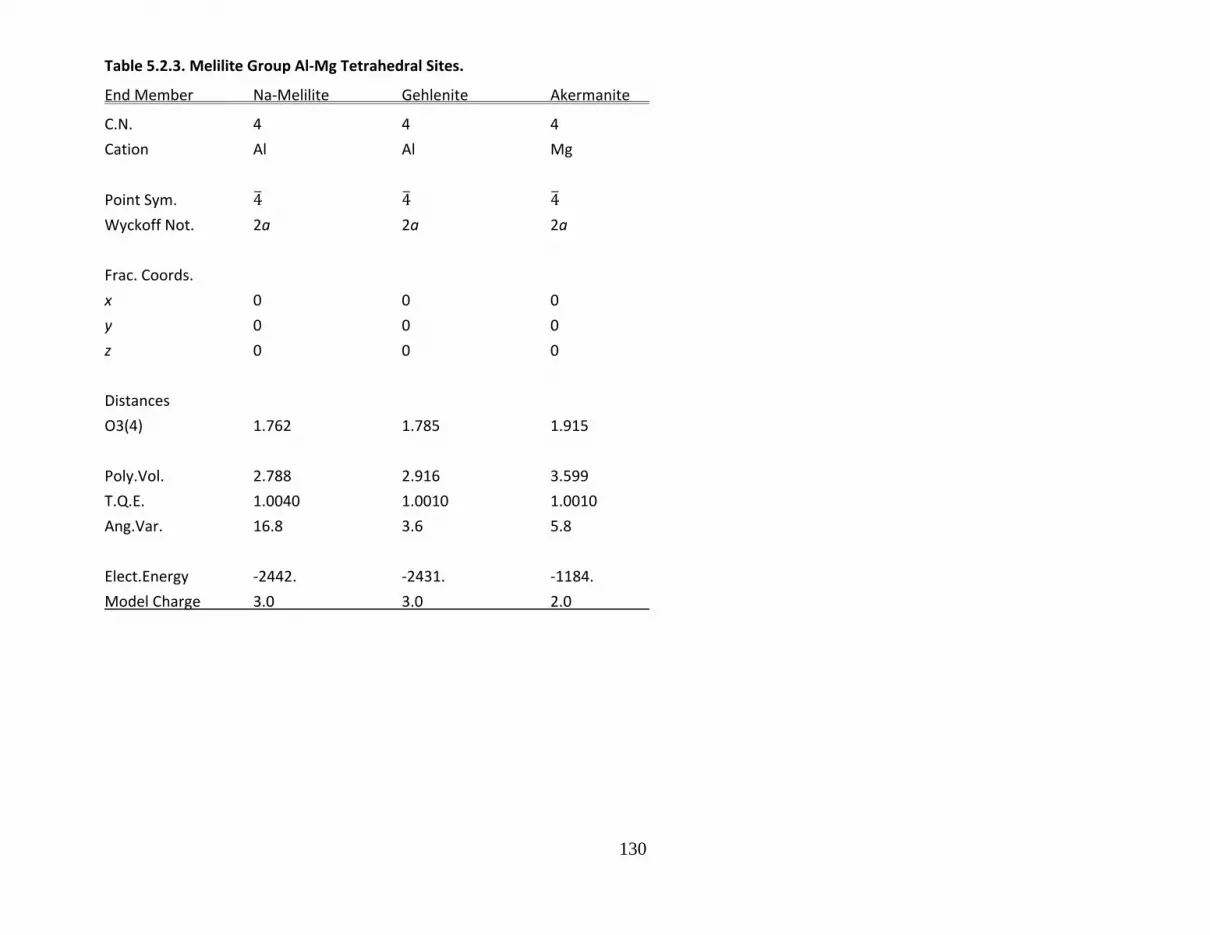
130
Table 5.2.3. Melilite Group Al‐Mg Tetrahedral Sites.
End Member Na‐Melilite Gehlenite Akermanite
C.N. 4 4 4
Cation Al Al Mg
Point Sym. 4 4 4
Wyckoff Not. 2a 2a 2a
Frac. Coords.
x 0 0 0
y 0 0 0
z 0 0 0
Distances
O3(4) 1.762 1.785 1.915
Poly.Vol. 2.788 2.916 3.599
T.Q.E. 1.0040 1.0010 1.0010
Ang.Var. 16.8 3.6 5.8
Elect.Energy ‐2442. ‐2431. ‐1184.
Model Charge 3.0 3.0 2.0
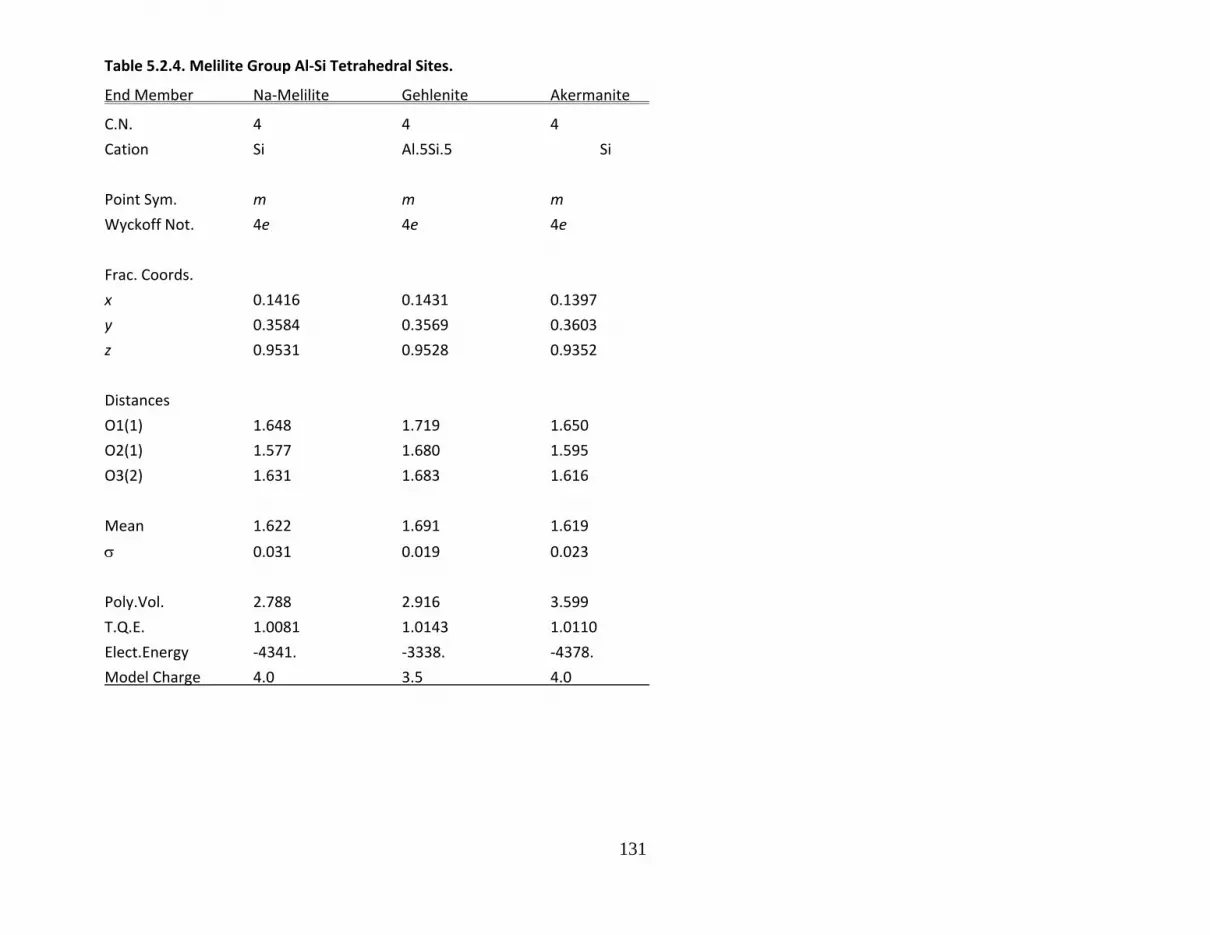
131
Table 5.2.4. Melilite Group Al‐Si Tetrahedral Sites.
End Member Na‐Melilite Gehlenite Akermanite
C.N. 4 4 4
Cation Si Al.5Si.5 Si
Point Sym. m m m
Wyckoff Not. 4e 4e 4e
Frac. Coords.
x 0.1416 0.1431 0.1397
y 0.3584 0.3569 0.3603
z 0.9531 0.9528 0.9352
Distances
O1(1) 1.648 1.719 1.650
O2(1) 1.577 1.680 1.595
O3(2) 1.631 1.683 1.616
Mean 1.622 1.691 1.619
0.031 0.019 0.023
Poly.Vol. 2.788 2.916 3.599
T.Q.E. 1.0081 1.0143 1.0110
Elect.Energy ‐4341. ‐3338. ‐4378.
Model Charge 4.0 3.5 4.0
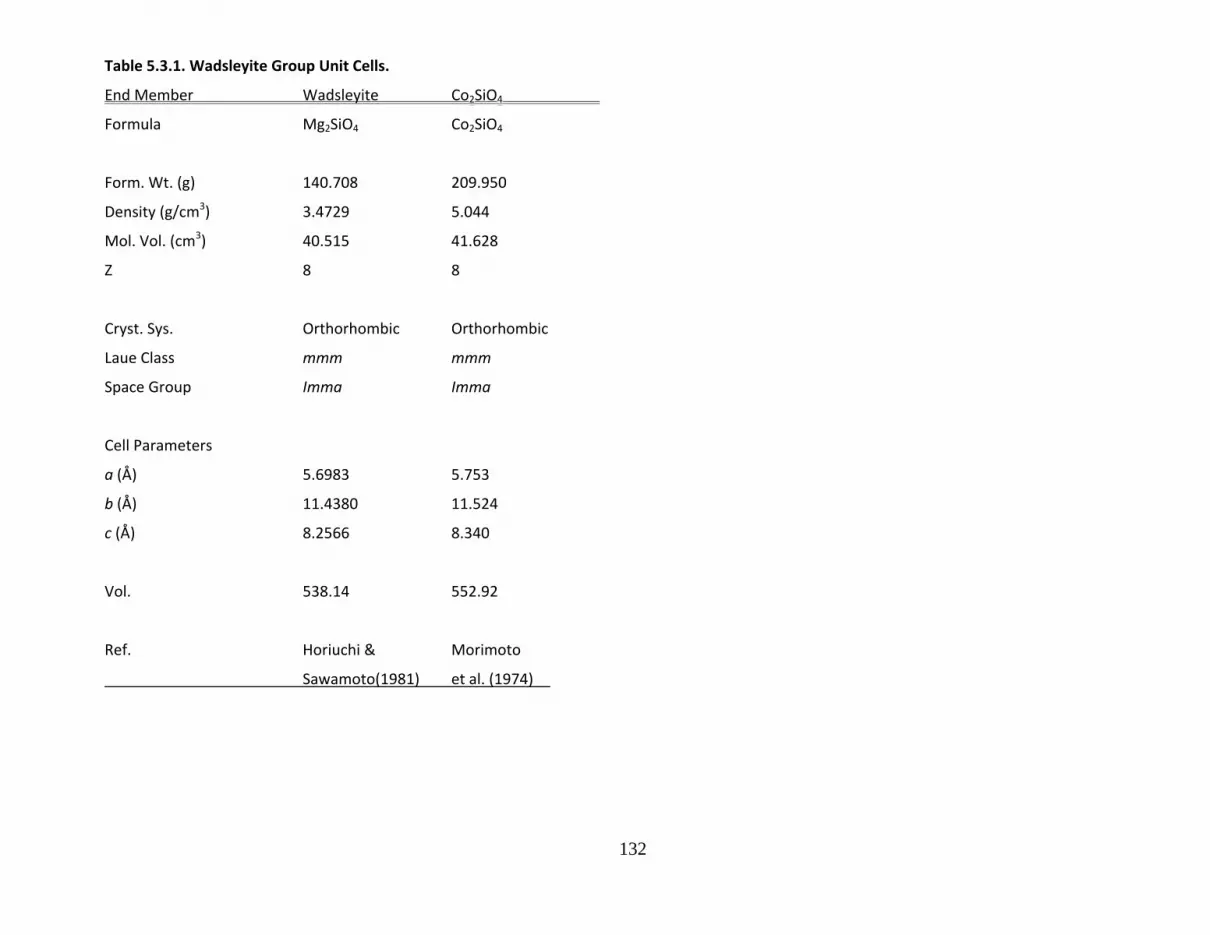
132
Table 5.3.1. Wadsleyite Group Unit Cells.
End Member Wadsleyite Co2SiO4
Formula Mg2SiO4 Co2SiO4
Form. Wt. (g) 140.708 209.950
Density (g/cm3) 3.4729 5.044
Mol. Vol. (cm3) 40.515 41.628
Z 8 8
Cryst. Sys. Orthorhombic Orthorhombic
Laue Class mmm mmm
Space Group Imma Imma
Cell Parameters
a (Å) 5.6983 5.753
b (Å) 11.4380 11.524
c (Å) 8.2566 8.340
Vol. 538.14 552.92
Ref. Horiuchi & Morimoto
Sawamoto(1981) et al. (1974)
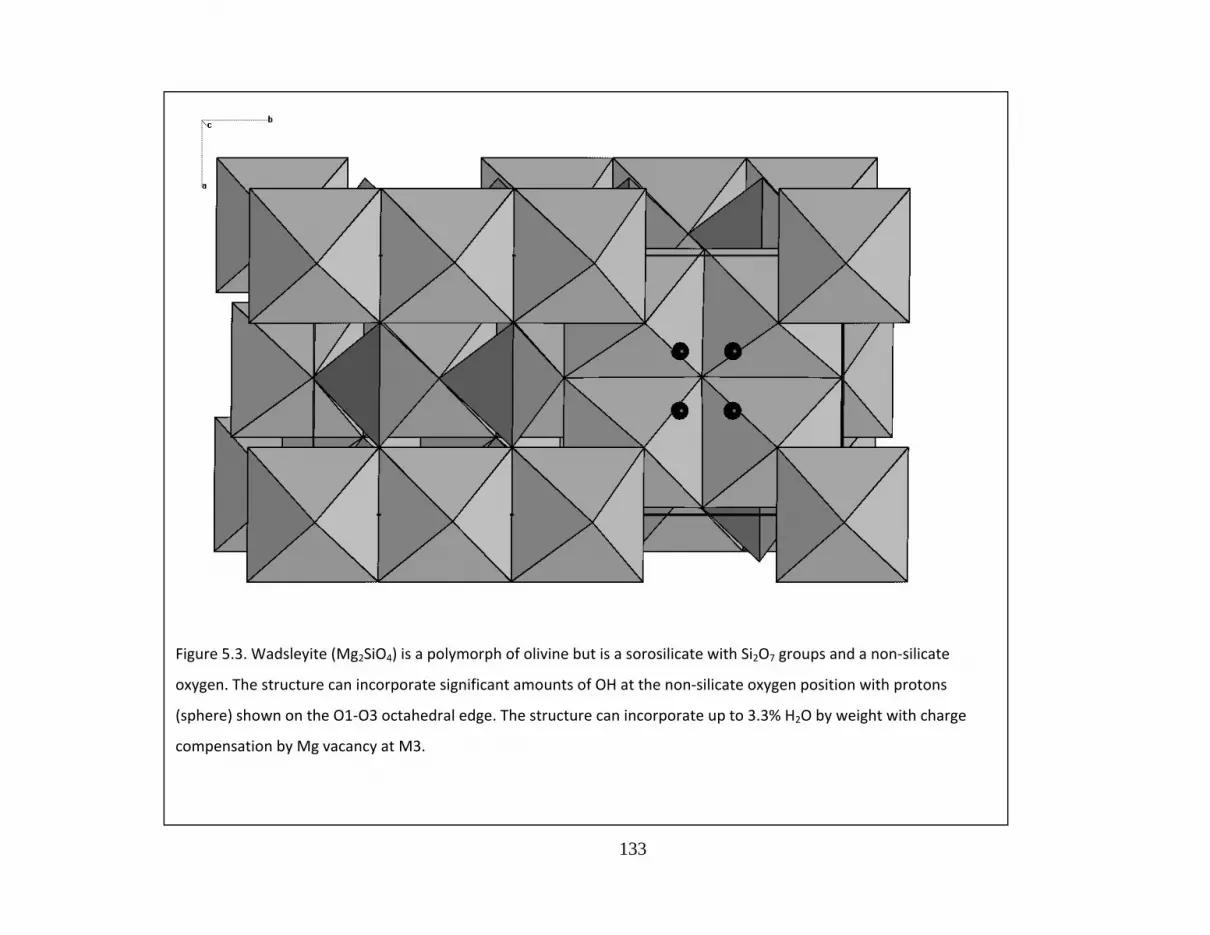
133
Figure 5.3. Wadsleyite (Mg2SiO4) is a polymorph of olivine but is a sorosilicate with Si2O7 groups and a non‐silicate
oxygen. The structure can incorporate significant amounts of OH at the non‐silicate oxygen position with protons
(sphere) shown on the O1‐O3 octahedral edge. The structure can incorporate up to 3.3% H2O by weight with charge
compensation by Mg vacancy at M3.
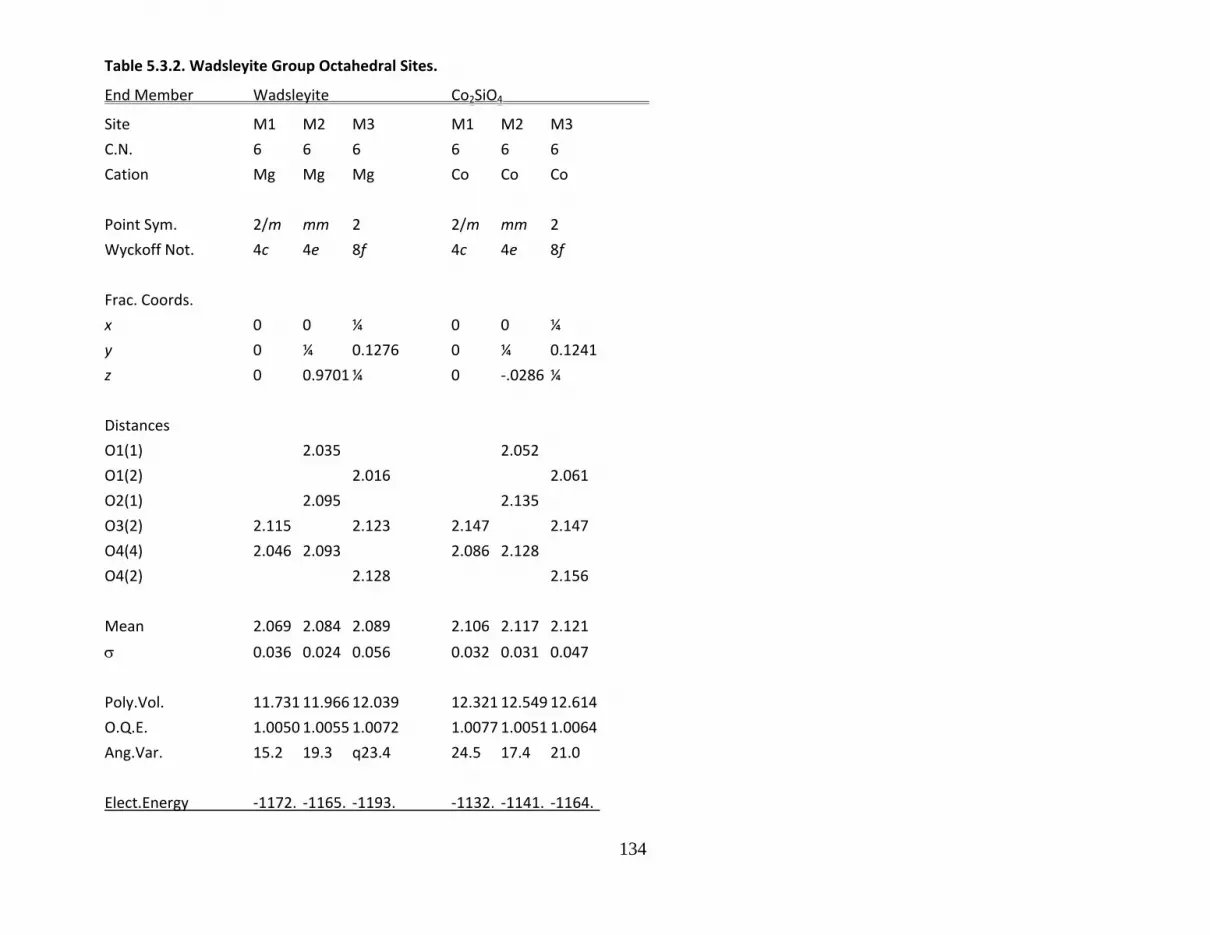
134
Table 5.3.2. Wadsleyite Group Octahedral Sites.
End Member Wadsleyite Co2SiO4
Site M1 M2 M3 M1 M2 M3
C.N. 6 6 6 6 6 6
Cation Mg Mg Mg Co Co Co
Point Sym. 2/m mm 2 2/m mm 2
Wyckoff Not. 4c 4e 8f 4c 4e 8f
Frac. Coords.
x 0 0 ¼ 0 0 ¼
y 0 ¼ 0.1276 0 ¼ 0.1241
z 0 0.9701 ¼ 0 ‐.0286 ¼
Distances
O1(1) 2.035 2.052
O1(2) 2.016 2.061
O2(1) 2.095 2.135
O3(2) 2.115 2.123 2.147 2.147
O4(4) 2.046 2.093 2.086 2.128
O4(2) 2.128 2.156
Mean 2.069 2.084 2.089 2.106 2.117 2.121
0.036 0.024 0.056 0.032 0.031 0.047
Poly.Vol. 11.731 11.966 12.039 12.321 12.549 12.614
O.Q.E. 1.0050 1.0055 1.0072 1.0077 1.0051 1.0064
Ang.Var. 15.2 19.3 q23.4 24.5 17.4 21.0
Elect.Energy ‐1172. ‐1165. ‐1193. ‐1132. ‐1141. ‐1164.
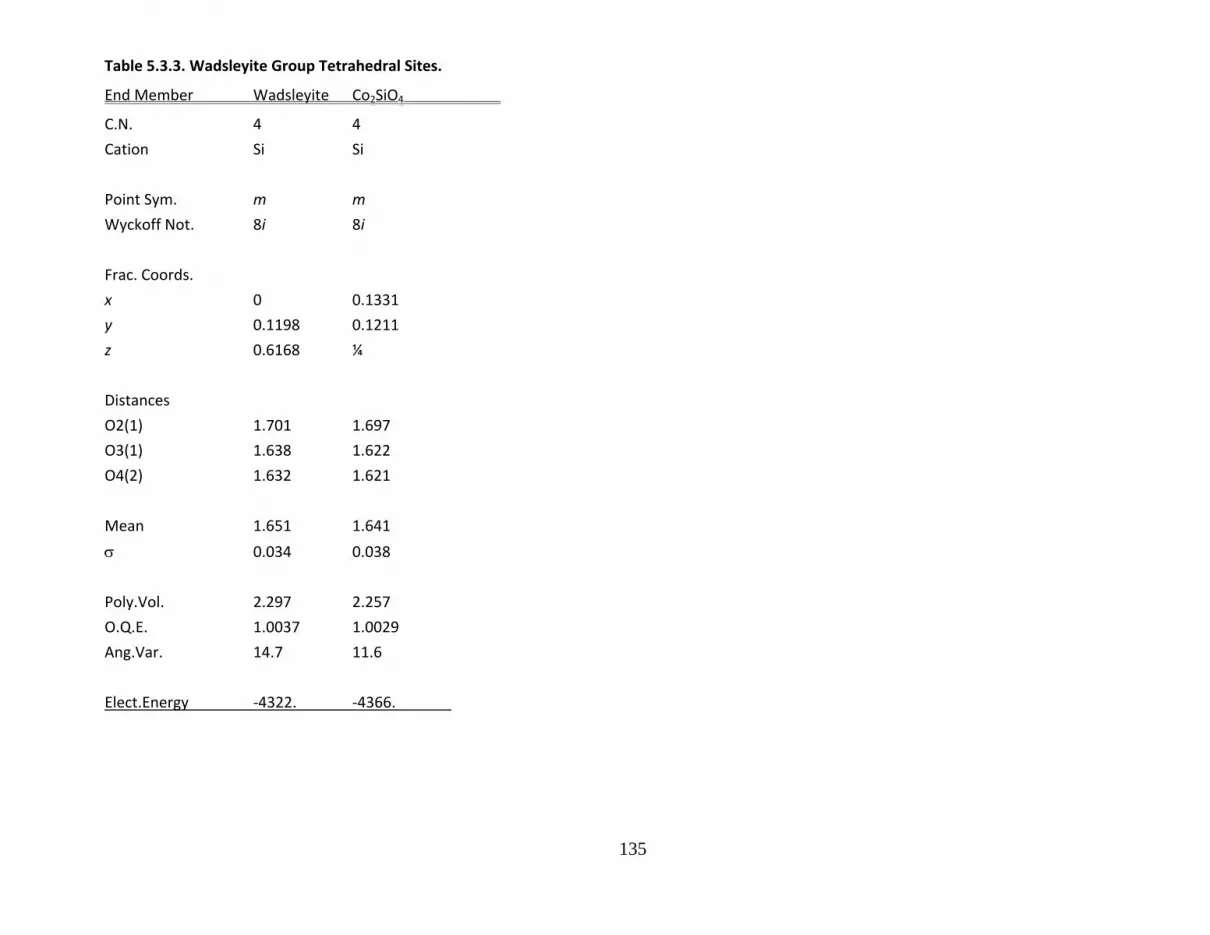
135
Table 5.3.3. Wadsleyite Group Tetrahedral Sites.
End Member Wadsleyite Co2SiO4
C.N. 4 4
Cation Si Si
Point Sym. m m
Wyckoff Not. 8i 8i
Frac. Coords.
x 0 0.1331
y 0.1198 0.1211
z 0.6168 ¼
Distances
O2(1) 1.701 1.697
O3(1) 1.638 1.622
O4(2) 1.632 1.621
Mean 1.651 1.641
0.034 0.038
Poly.Vol. 2.297 2.257
O.Q.E. 1.0037 1.0029
Ang.Var. 14.7 11.6
Elect.Energy ‐4322. ‐4366.

136
Table 5.3.1. Lawsonite Unit Cell.
End Member Lawsonite
Formula CaAl2Si2O7(OH)2H2O
Form.Wt. 314.241
Density (g/cm3) 3.088
Mol. Vol. (cm3) 101.76
Z 4
Cryst. Sys. Orthorhombic
Laue Class mmm
Space Group Ccmm
Cell Parameters
a (Å) 8.795
b (Å) 5.847
c (Å) 13.142
Vol. 675.82
Ref. Baur (1978)
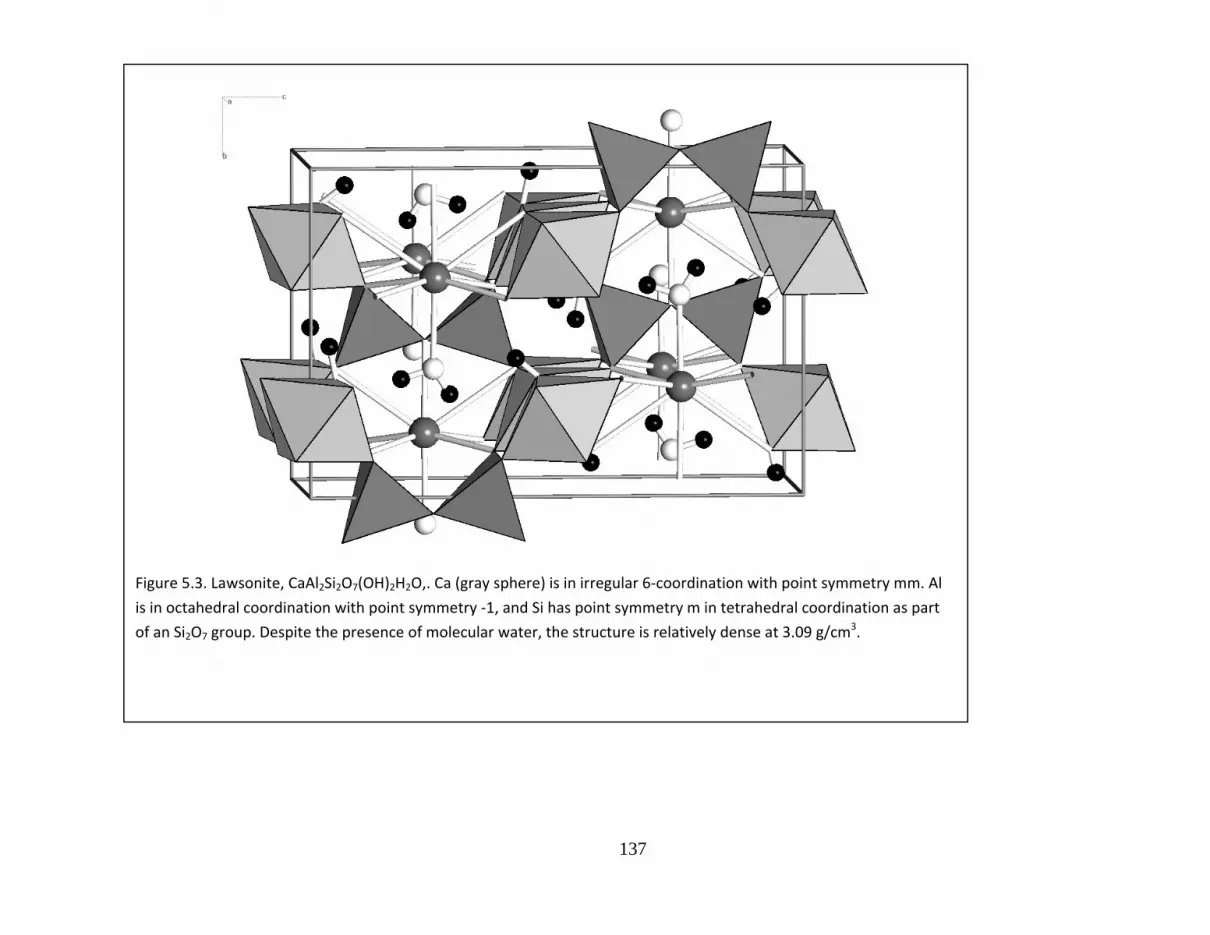
137
Figure 5.3. Lawsonite, CaAl2Si2O7(OH)2H2O,. Ca (gray sphere) is in irregular 6‐coordination with point symmetry mm. Al
is in octahedral coordination with point symmetry ‐1, and Si has point symmetry m in tetrahedral coordination as part
of an Si2O7 group. Despite the presence of molecular water, the structure is relatively dense at 3.09 g/cm3.

138
Table 5.4.2. Lawsonite Cation Sites.
End Member Lawsonite
Site Ca Al Si
C.N. 6 6 4
Cation Ca Al Si
Point Sym. mm 1 m
Wyckoff Not. 4c 8d 8f
Frac. Coords.
x 0.33305 ¼ 0.9804
y 0 ¼ 0
z ¼ 0 0.13298
Distances
Mean 2.421 1.913 1.633
0.038 0.042 0.020
Poly.Vol. 18.315 9.190 2.219
Q.E. 1.0255 1.0112 1.0049
Ang.Var. 78.4 36.7 19.61
Elect.Energy ‐1170. ‐2679. ‐4779.
Model Charge 2.0 3.0 4.0
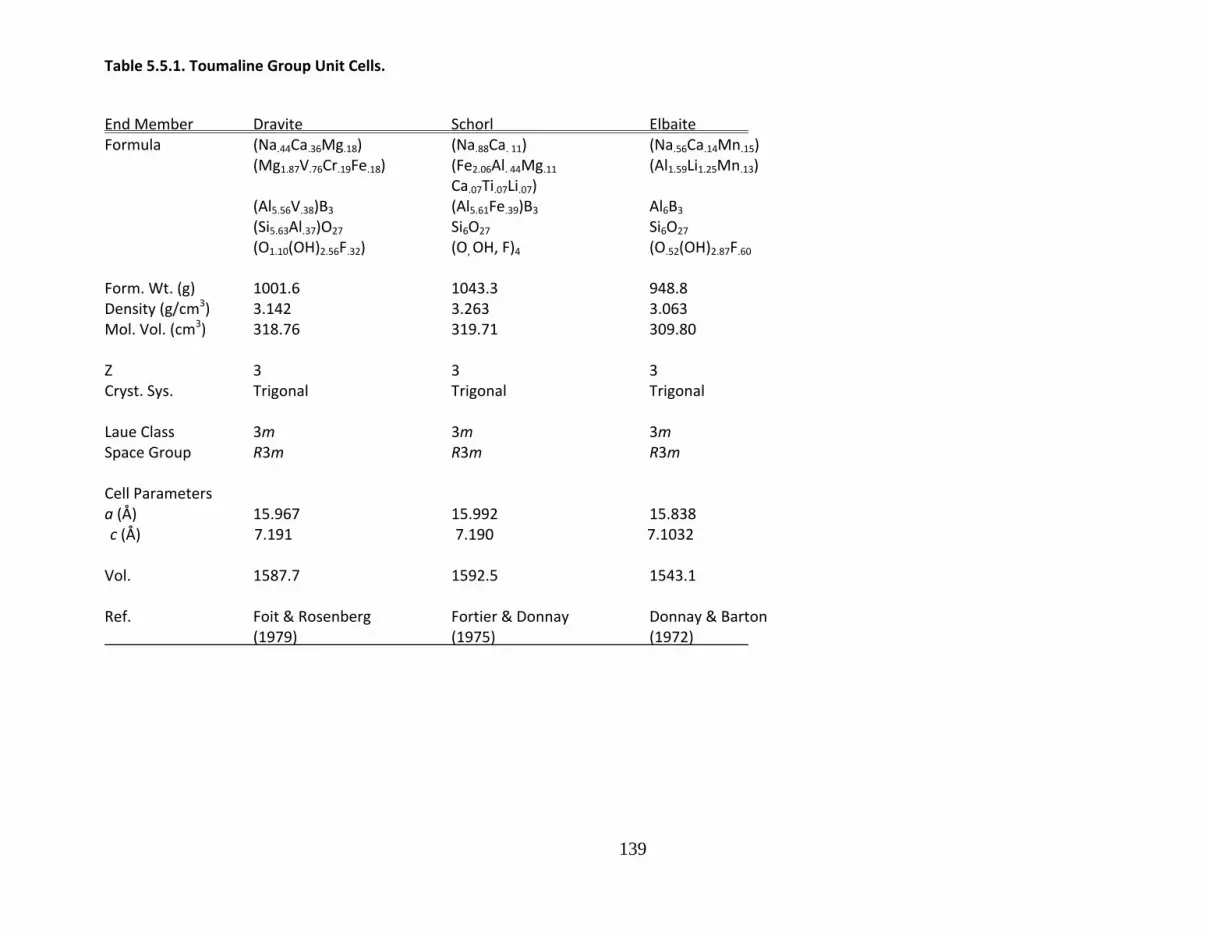
139
Table 5.5.1. Toumaline Group Unit Cells.
End Member Dravite Schorl Elbaite Formula (Na.44Ca.36Mg.18) (Na.88Ca. 11) (Na.56Ca.14Mn.15)
(Mg1.87V.76Cr.19Fe.18) (Fe2.06Al. 44Mg.11 (Al1.59Li1.25Mn.13) Ca.07Ti.07Li.07) (Al5.56V.38)B3 (Al5.61Fe.39)B3 Al6B3 (Si5.63Al.37)O27 Si6O27 Si6O27 (O1.10(OH)2.56F.32) (O, OH, F)4 (O.52(OH)2.87F.60
Form. Wt. (g) 1001.6 1043.3 948.8 Density (g/cm3) 3.142 3.263 3.063 Mol. Vol. (cm3) 318.76 319.71 309.80
Z 3 3 3 Cryst. Sys. Trigonal Trigonal Trigonal
Laue Class 3m 3m 3m Space Group R3m R3m R3m
Cell Parameters a (Å) 15.967 15.992 15.838
c (Å) 7.191 7.190 7.1032
Vol. 1587.7 1592.5 1543.1
Ref. Foit & Rosenberg Fortier & Donnay Donnay & Barton (1979) (1975) (1972)
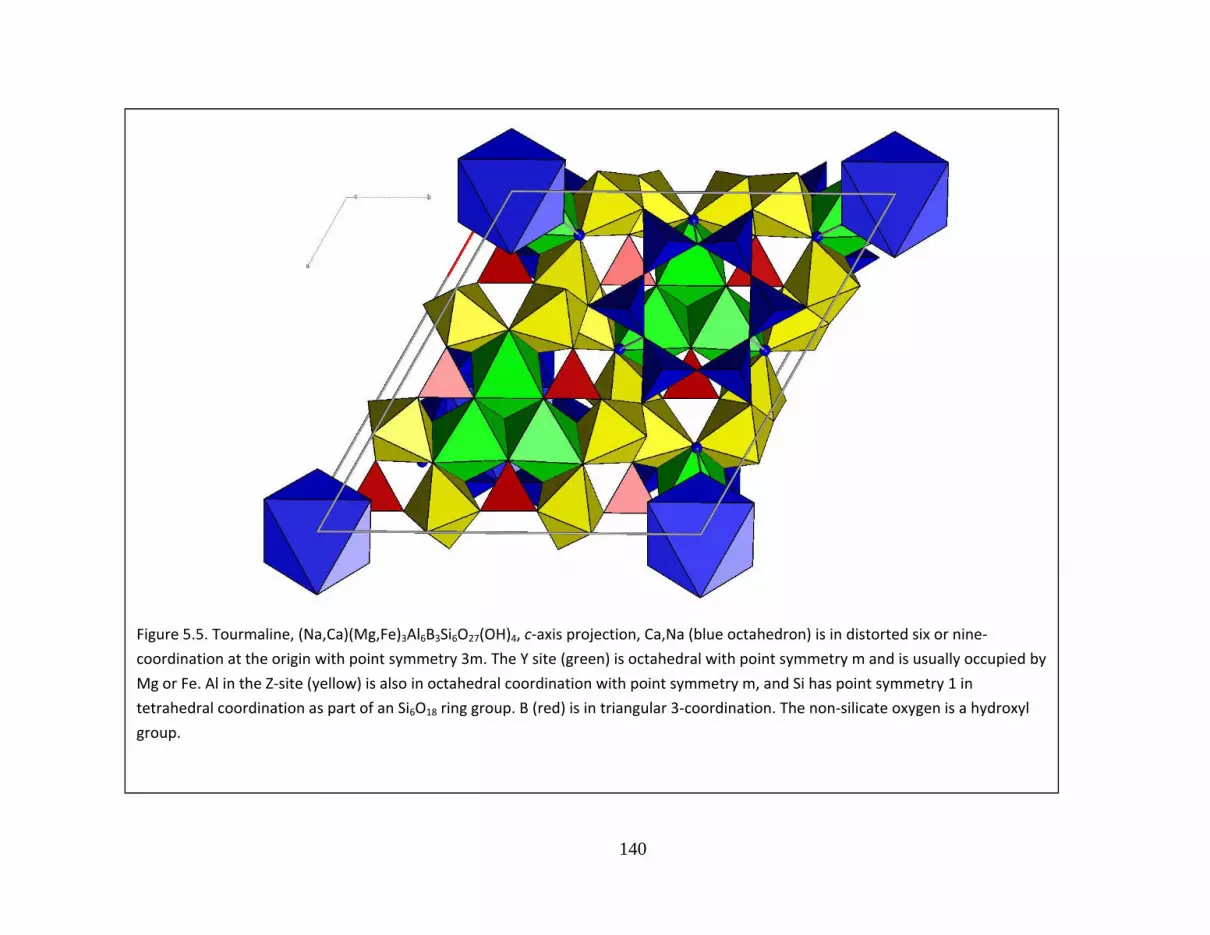
140
Figure 5.5. Tourmaline, (Na,Ca)(Mg,Fe)3Al6B3Si6O27(OH)4, c‐axis projection, Ca,Na (blue octahedron) is in distorted six or nine‐
coordination at the origin with point symmetry 3m. The Y site (green) is octahedral with point symmetry m and is usually occupied by
Mg or Fe. Al in the Z‐site (yellow) is also in octahedral coordination with point symmetry m, and Si has point symmetry 1 in
tetrahedral coordination as part of an Si6O18 ring group. B (red) is in triangular 3‐coordination. The non‐silicate oxygen is a hydroxyl
group.

141
Table 5.5.2 Tourmaline Group X sites
End Member Dravite Schorl Elbaite
C.N. 9 9 9
Cation (Na.44Ca.36Mg.18) (Na.88Ca. 11) (Na.56Ca.14Mn.15)
Point Sym. 3m 3m 3m
Wyckoff Not. 3a 3a 3a
Frac. Coords.
x 0 0 0
y 0 0 0
z 0.21764 0.22353 0.2347
Distances
O2(3) 2.536 2.527 2.458
O4(3) 2.780 2.800 2.816
O5(3) 2.704 2.744 2.738
Mean 2.673 2.690 2.671
0.108 0.125 0.163
Poly.Vol. 31.56 32.32 31.46
Elect.Energy ‐600. ‐349. ‐379.
Model Charge 1.54 1.11 1.14

142
Table 5.5.3 Tourmaline Group Y sites
End Member Dravite Schorl Elbaite
C.N. 6 6 6
Cation Mg.62V.25Cr.06Fe.06 Fe.68Al. 15Mg.04 Al.53Li.42Mn.04
Ca.02Ti.02Li.02
Point Sym. m m m
Wyckoff Not. 9b 9b 9b
Frac. Coords.
x 0.21353 0.12566 0.1234
y x/2 x/2 x/2
z 0.63364 0.62792 0.6348
Distances
O1(1) 1.971 2.069 1.984
O2(2) 2.018 2.013 1.985
O3(1) 2.004 2.175 2.173
O6(2) 2.137 2.046 1.984
Mean 2.025 2.060 2.016
0.057 0.060 0.077
Poly.Vol. 10.715 11.247 10.524
O.Q.E. 1.0230 1.0252 1.0262
Ang.Var. 75.6 80.1 81.2
Elect.Energy ‐1609. ‐1387. ‐1236.
Model Charge 2.32 2.33 2.11

143
Table 5.5.4 Tourmaline Group Z sites
End Member Dravite Schorl Elbaite
C.N. 6 6 6
Cation Al.93V.07 Al. 93Fe.07 Al
Point Sym. 1 1 1
Wyckoff Not. 18c 18c 18c
Frac. Coords.
x 0.29782 0.29883 0.2964
y 0.26152 0.26171 0.2598
z 0.61011 0.61158 0.6105
Distances
O3(1) 1.995 1.973 1.955
O6(1) 1.893 1.878 1.838
O7(1) 1.900 1.890 1.894
O7(2) 1.955 1.969 1.946
O8(1) 1.932 1.929 1.900
O8(1) 1.900 1.890 1.896
Mean 1.929 1.922 1.905
0.040 0.042 0.042
Poly.Vol. 9.379 9.297 9.031
O.Q.E. 1.0141 1.0127 1.0140
Ang.Var. 49.7 42.5 46.9
Elect.Energy ‐2493. ‐2397. ‐2503.
Model Charge 3.0 2.93 3.0
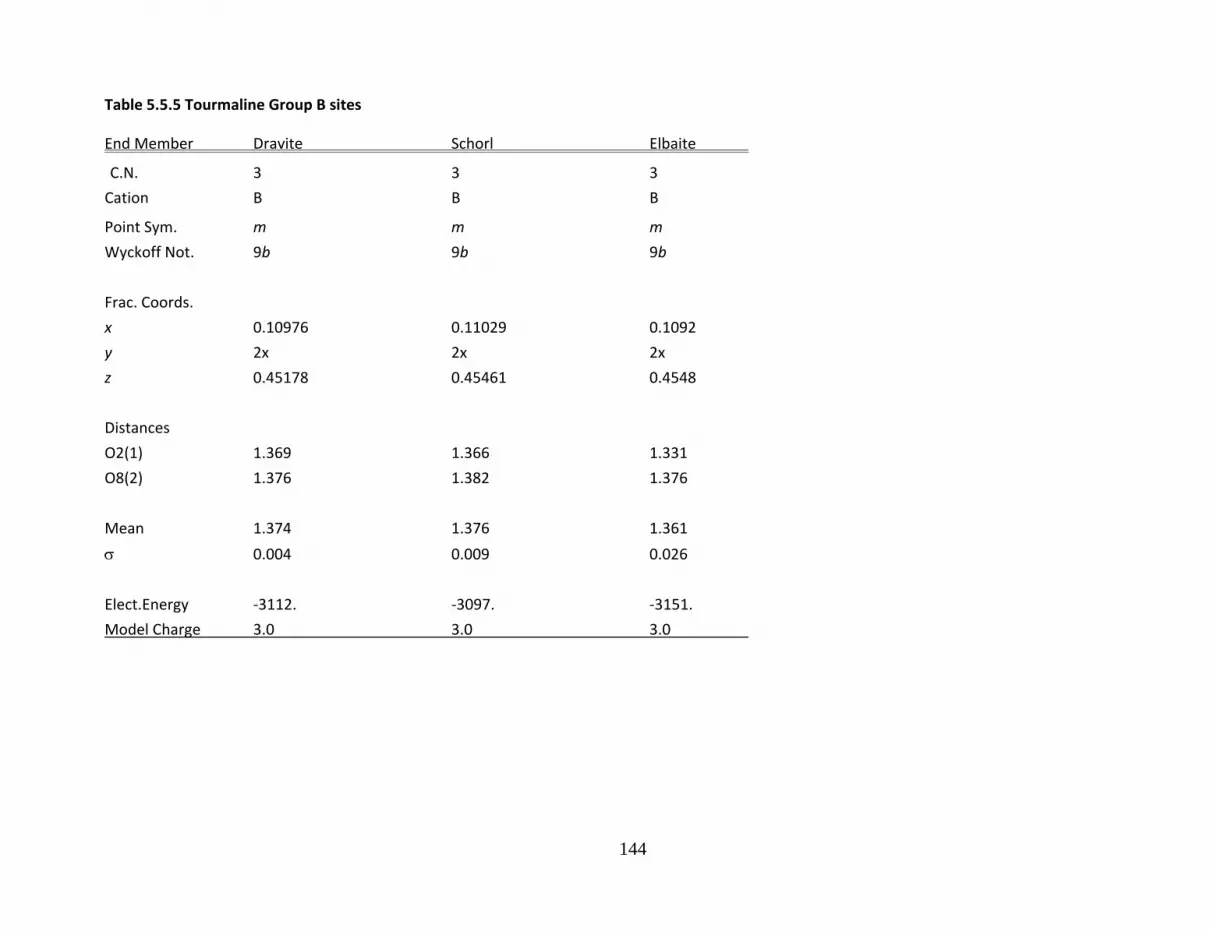
144
Table 5.5.5 Tourmaline Group B sites
End Member Dravite Schorl Elbaite
C.N. 3 3 3
Cation B B B
Point Sym. m m m
Wyckoff Not. 9b 9b 9b
Frac. Coords.
x 0.10976 0.11029 0.1092
y 2x 2x 2x
z 0.45178 0.45461 0.4548
Distances
O2(1) 1.369 1.366 1.331
O8(2) 1.376 1.382 1.376
Mean 1.374 1.376 1.361
0.004 0.009 0.026
Elect.Energy ‐3112. ‐3097. ‐3151.
Model Charge 3.0 3.0 3.0

145
Table 5.5.6 Tourmaline Group Si sites
End Member Dravite Schorl Elbaite
C.N. 4 4 4
Cation Si Si Si
Point Sym. 1 1 1
Wyckoff Not. 18c 18c 18c
Frac. Coords.
x 0.19173 0.19177 0.1917
y 0.18990 0.18986 0.1896
z 0 0 0
Distances
O4(1) 1.630 1.627 1.620
O5(1) 1.645 1.639 1.629
O6(1) 1.613 1.601 1.605
O7(1) 1.612 1.610 1.611
Mean 1.625 1.620 1.616
0.016 0.017 0.010
Poly.Vol. 2.195 2.175 2.161
Q.E. 1.0024 1.0019 1.0019
Ang.Var. 9.8 7.6 7.9
Elect.Energy ‐4247. ‐4425. ‐4401.
Model Charge 4.0 4.0 4.0
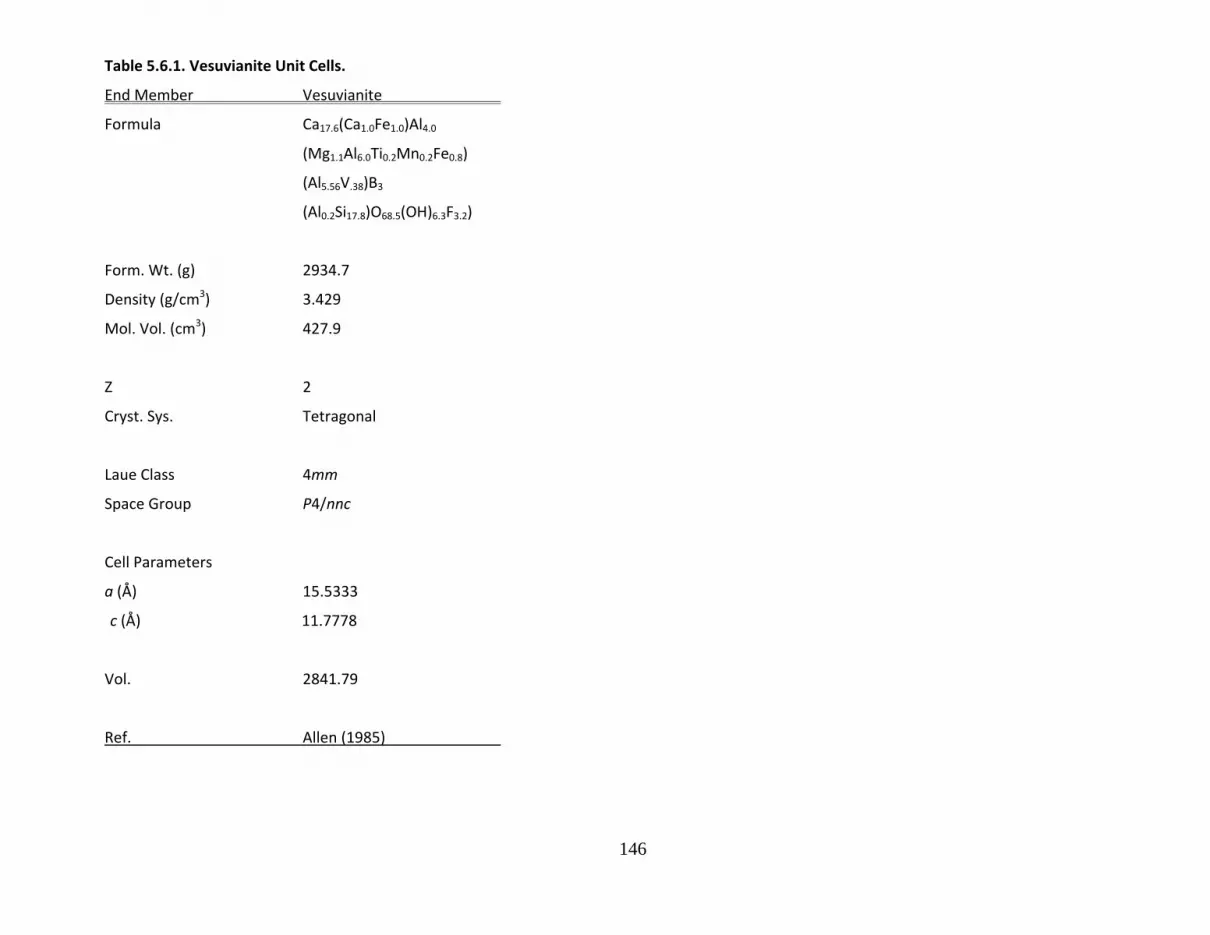
146
Table 5.6.1. Vesuvianite Unit Cells.
End Member Vesuvianite
Formula Ca17.6(Ca1.0Fe1.0)Al4.0
(Mg1.1Al6.0Ti0.2Mn0.2Fe0.8)
(Al5.56V.38)B3
(Al0.2Si17.8)O68.5(OH)6.3F3.2)
Form. Wt. (g) 2934.7
Density (g/cm3) 3.429
Mol. Vol. (cm3) 427.9
Z 2
Cryst. Sys. Tetragonal
Laue Class 4mm
Space Group P4/nnc
Cell Parameters
a (Å) 15.5333
c (Å) 11.7778
Vol. 2841.79
Ref. Allen (1985)
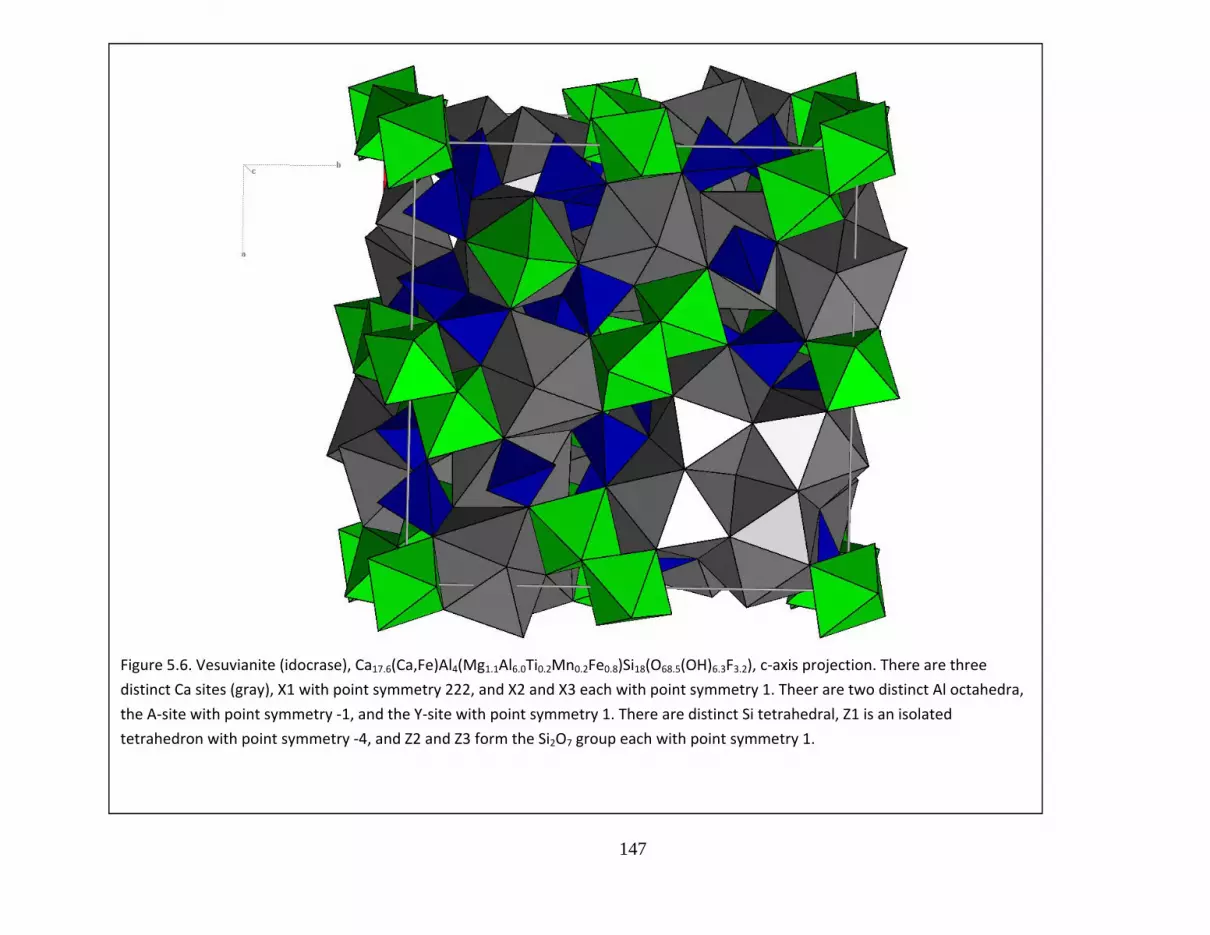
147
Figure 5.6. Vesuvianite (idocrase), Ca17.6(Ca,Fe)Al4(Mg1.1Al6.0Ti0.2Mn0.2Fe0.8)Si18(O68.5(OH)6.3F3.2), c‐axis projection. There are three
distinct Ca sites (gray), X1 with point symmetry 222, and X2 and X3 each with point symmetry 1. Theer are two distinct Al octahedra,
the A‐site with point symmetry ‐1, and the Y‐site with point symmetry 1. There are distinct Si tetrahedral, Z1 is an isolated
tetrahedron with point symmetry ‐4, and Z2 and Z3 form the Si2O7 group each with point symmetry 1.

148
Table 5.6.2. Vesuvianite Ca Sites.
Site X1 X2 X3
C.N. 8 7 8
Cation Ca Ca Ca
Point Sym. 222 1 1
Wyckoff Not. 4c 16k 16k
Frac. Coords.
x ¾ 0.8110 0.8996
y ¼ 0.0438 0.8202
z ¼ 0.3795 0.8866
Distances
Mean 2.421 2.402 2.499
0.105 0.060 0.080
Poly.Vol. 24.405 18.925 27.002
Elect.Energy ‐754. ‐860. ‐1164.
Model Charge 2.0 2.0 2.0
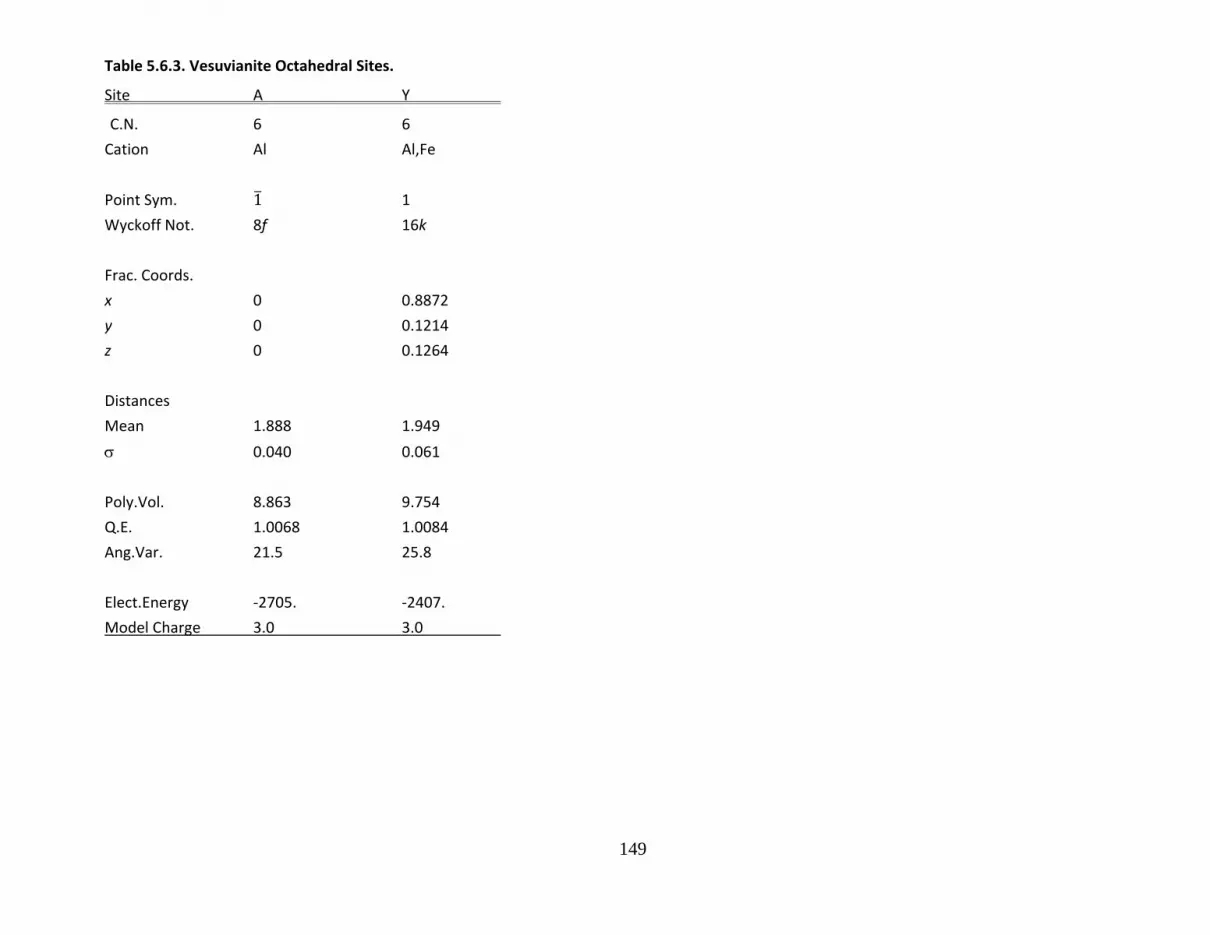
149
Table 5.6.3. Vesuvianite Octahedral Sites.
Site A Y
C.N. 6 6
Cation Al Al,Fe
Point Sym. 1 1
Wyckoff Not. 8f 16k
Frac. Coords.
x 0 0.8872
y 0 0.1214
z 0 0.1264
Distances
Mean 1.888 1.949
0.040 0.061
Poly.Vol. 8.863 9.754
Q.E. 1.0068 1.0084
Ang.Var. 21.5 25.8
Elect.Energy ‐2705. ‐2407.
Model Charge 3.0 3.0

150
Table 5.6.3. Vesuvianite B and C Sites.
Site B C
C.N. 5 8
Cation Fe Ca
Occupancy 0.5 0.5
Point Sym. 4 4
Wyckoff Not. 4e 4e
Frac. Coords.
x ¾ ¾
y ¾ ¾
z 0.0556 0.1408
Distances
Mean 2.107 2.474
0.062 0.195
Poly.Vol. 6.604 32.13
Elect.Energy ‐237. ‐105.
Model Charge 1.0 1.0

151
Table 5.6.3. Vesuvianite Tetrahedral Sites.
Site Z1 Z2 Z3
C.N. 4 4 4
Cation Si Si Si
Point Sym. 4 1 1
Wyckoff Not. 4d 16k 16k
Frac. Coords.
x ¾ 0.8192 0.9175
y ¼ 0.0405 0.8496
z 0 0.8715 0.3644
Distances
Mean 1.640 1.646 1.628
0.0 0.026 0.020
Poly.Vol. 2.245 2.264 2.211
Q.E. 1.0050 1.0074 1.0010
Ang.Var. 20.6 30.2 4.3
Elect.Energy ‐3889. ‐4318. ‐4262.
Model Charge 4.0 4.0 4.0

152
Chapter6.ChainSilicates
Silicate Minerals with SiO3 Single and Si8O22 Double Chains
6.1. Orthopyroxenes and Primitive Clinopyroxenes
6.2. C‐centered Clinopyroxenes
6.3. Pyroxenoids
6.4. Ortho‐amphiboles
6.5. Clino‐amphiboles
6.6. Aenigmatite

153
Table 6.1.1 Orthopyroxene Unit Cells
End Member Orthoenstatite Orthoferrosilite Co‐Opx
Formula Mg2Si2O6 Fe2Si2O6 Co2Si2O6
Form. Wt. (g) 200.792 263.862 270.035
Density (g/cm3) 3.204 4.002 4.222
Mol. Vol. (cm3) 62.676 65.941 63.963
Z 8 8 8
Cryst. Sys. Orthorhombic Orthorhombic Orthorhombic
Laue Class mmm mmm mmm
Space Group Pbca Pbca Pbca
Cell Parameters
a (Å) 18.227 18.427 18.296
b (Å) 8.819 9.076 8.923
c (Å) 5.179 5.237 5.204
Vol. 832.49 875.85 849.58
Ref. Sasaki et al. Sasaki et al. Sasaki et al.
(1982b) (1982b) (1982b)

154
Table 6.1.2 Primitive Clinopyroxene Unit Cells.
End Member Clinoenstatite Clinoferrosilite Mn‐Cpx
Formula Mg2Si2O6 Fe2Si2O6 Mn2Si2O6
Form. Wt. (g) 200.792 263.862 262.044
Density (g/cm3) 3.188 4.005 3.819
Mol. Vol. (cm3) 62.994 65.892 68.608
Z 4 4 4
Cryst. Sys. Monoclinic Monoclinic Monoclinic
Laue Class 2/m 2/m 2/m
Space Group P21/c P21/c P21/c
Cell Parameters
a (Å) 9.626 9.7085 9.864
b (Å) 8.825 9.0872 9.179
c (Å) 5.188 5.2284 5.298
(º) 108.33 108.43 108.22
Vol. 418.36 437.60 455.64
Ref. Morimoto et al. Burnham Tokonami et al.
(1960) (1967) (1979)

155
Figure 6.1. Orthopyroxene, c‐axis projection, a‐horizontal. M1 is a regular octahedron, whereas M2 is distorted. Both M1 and M2
occur in every layer whereas SiA (black) and SiB (gray) occur in distinct tetrahedral layers.

156
Table 6.1.3. Orthopyroxene and P‐Clinopyroxene M1 Sites.
End Member Enstatite Ferrosilite Co‐Opx Enstatite Ferrosilite Mn‐Cpx
C.N. 6 6 6 6 6 6
Cation Mg Fe2+ Co Mg Fe2+ Mn2+
Point Sym. 1 1 1 1 1 1
Wyckoff Not. 8c 8c 8c 4e 4e 4e
Frac. Coords.
x 0.37582 0.37574 0.37597 0.253 0.2508 0.2510
y 0.65379 0.65397 0.65456 0.653 0.6533 0.6507
z 0.86597 0.87456 0.87202 0.220 0.2255 0.2319
Distances O1A 2.151 2.193 2.157 2.022 2.101 2.133 O1A 2.028 2.086 2.047 2.167 2.199 2.255 O1B 2.065 2.128 2.089 2.210 2.200 2.274 O1B 2.172 2.195 2.185 2.007 2.127 2.157 O2A 2.007 2.085 2.060 1.956 2.082 2.114 O2B 2.045 2.122 2.078 2.042 2.114 2.131
Mean 2.078 2.135 2.103 2.067 2.137 2.177
0.068 0.049 0.056 0.099 0.050 0.069
Poly.Vol. 11.83 12.81 12.25 11.61 12.86 13.60 Q.E. 1.0088 1.0088 1.0086 1.0120 1.0083 1.0088 Ang.Var. 26.5 28.7 26.9 31.8 27.1 26.8
Elect.Energy ‐1242. ‐1195. ‐1221. ‐1121. ‐1195. ‐1165.

157
Table 6.1.4. Orthopyroxene and P‐Clinopyroxene M2 Sites.
End Member Enstatite Ferrosilite Co‐Opx Enstatite Ferrosilite Mn‐Cpx
C.N. 6 6 6 6 6 6
Cation Mg Fe2+ Co Mg Fe2+ Mn2+
Point Sym. 1 1 1 1 1 1
Wyckoff Not. 8c 8c 8c 4e 4e 4e
Frac. Coords.
x 0.37677 0.37775 0.37723 0.258 0.2570 0.2535
y 0.48698 0.48566 0.48798 0.014 0.0142 0.0181
z 0.35879 0.36640 0.36164 0.193 0.2233 0.2292
Distances O1A 2.088 2.161 2.177 2.121 2.159 2.180 O1B 2.055 2.123 2.072 2.024 2.135 2.162 O2A 2.032 2.023 2.019 2.057 2.032 2.088 O2B 1.994 1.987 1.982 2.048 1.986 2.053 O3A 2.288 2.453 2.288 2.329 2.444 2.472 O3B 2.447 2.589 2.516 2.286 2.587 2.732
Mean 2.151 2.223 2.182 2.144 2.224 2.281
0.178 0.243 0.218 0.131 0.239 0.266
Poly.Vol. 12.46 13.43 12.86 12.53 13.55 14.45 Q.E. 1.0489 1.0700 1.0597 1.0357 1.0641 1.0746 Ang.Var. 140. 181. 159. 109. 164. 192.
Elect.Energy ‐1134. ‐1099. ‐1119. ‐1281. ‐1092. ‐1063.

158
Table 6.1.5. Orthopyroxene and P‐Clinopyroxene T1 (SiA) Sites.
End Member Enstatite Ferrosilite Co‐Opx Enstatite Ferrosilite Mn‐Cpx
C.N. 4 4 4 4 4 4
Cation Si Si Si Si Si Si
Point Sym. 1 1 1 1 1 1
Wyckoff Not. 8c 8c 8c 4e 4e 4e
Frac. Coords.
x 0.27172 0.27231 0.27200 0.043 0.0447 0.0431
y 0.34162 0.3390 0.34021 0.342 0.3386 0.3385
z 0.05040 0.0494 0.0520 0.294 0.2924 0.2862
Distances O1A 1.611 1.612 1.617 1.655 1.599 1.614 O2A 1.587 1.604 1.597 1.605 1.603 1.603 O3A 1.665 1.652 1.6545 1.626 1.629 1.648 O3A 1.646 1.636 1.635 1.674 1.658 1.666
Mean 1.628 1.626 1.625 1.640 1.622 1.633
0.035 0.022 0.024 0.030 0.027 0.029
Poly.Vol. 2.182 2.181 2.180 2.249 2.173 2.216 Q.E. 1.0099 1.0075 1.0076 1.0044 1.0058 1.0057 Ang.Var. 39.8 31.1 30.7 16.7 24.6 23.2
Elect.Energy ‐4406. ‐4427. ‐4429. ‐4375. ‐4430. ‐4410.

159
Table 6.1.6. Orthopyroxene and P‐Clinopyroxene T2 (SiB) Sites.
End Member Enstatite Ferrosilite Co‐Opx Enstatite Ferrosilite Mn‐Cpx
C.N. 4 4 4 4 4 4
Cation Si Si Si Si Si Si
Point Sym. 1 1 1 1 1 1
Wyckoff Not. 8c 8c 8c 4e 4e 4e
Frac. Coords.
x 0.47358 0.47315 0.47259 0.553 0.5538 0.5498
y 0. 33734 0.3342 0.33561 0.839 0.8339 0.8354
z 0.79827 0.7893 0.79343 0.236 0.2393 0.2448
Distances O1B 1.618 1.619 1.622 1.621 1.614 1.616 O2B 1.588 1.603 1.599 1.587 1.612 1.598 O3B 1. 678 1.667 1.665 1.729 1.685 1.670 O3B 1.675 1.663 1.666 1.710 1.629 1.666
Mean 1.640 1.638 1.638 1.662 1.635 1.637
0.044 0.032 0.034 0.068 0.034 0.036
Poly.Vol. 2.247 2.241 2.241 2.238 2.228 2.240 Q.E. 1.0054 1.0045 1.0048 1.0044 1.0052 1.0042 Ang.Var. 19.4 17.3 17.6 34.1 19.3 14.7
Elect.Energy ‐4351. ‐4354. ‐4345. ‐4276. ‐4367. ‐4376.

160
Table 6.2.1. C‐Centered Clinopyroxene Unit Cells.
End Member Diopside Hedenbergite Jadeite Acmite Ureyite Spodumene Ca‐Tschermaks
Formula CaMgSi2O6 CaFeSi2O6 NaAlSi2O6 NaFeSi2O6 NarSi2O6 LiAlSi2O6 CaAlAlSiO6
Form. Wt. (g) 216.560 248.095 202.140 231.005 227.1545 186.089 218.125
Density (g/cm3) 3.279 3.656 3.341 3.576 3.592 3.176 3.438
Mol. Vol. (cm3) 66.039 67.867 60.508 64.606 63.239 58.596 63.445
Z 4 4 4 4 4 4
Cryst. Sys. Monoclinic Monoclinic Monoclinic Monoclinic Monoclinic Monoclinic Monoclinic
Laue Class 2/m 2/m 2/m 2/m 2/m 2/m 2/m
Space Group C2/c C2/c C2/c C2/c C2/c C2/c C2/c
Cell Parameters
a (Å) 9.746 9.845 9.423 9.658 9.579 9.461 9.609
b (Å) 8.825 9.024 8.564 8.795 8.722 8.395 8.652
c (Å) 5.251 5.245 5.223 5.294 5.267 5.218 5.274
(º) 105.63 104.70 107.56 107.42 107.37 110.09 106.06
Vol. 438.58 450.72 401.85 429.06 419.98 389.15 421.35
Ref. Cameron Cameron Cameron Clark Cameron Sasaki Okamura et al. (1973) et al. (1973) et al. (1973) et al. (1969) et al. (1973) et al. (1980) et al. (1974)
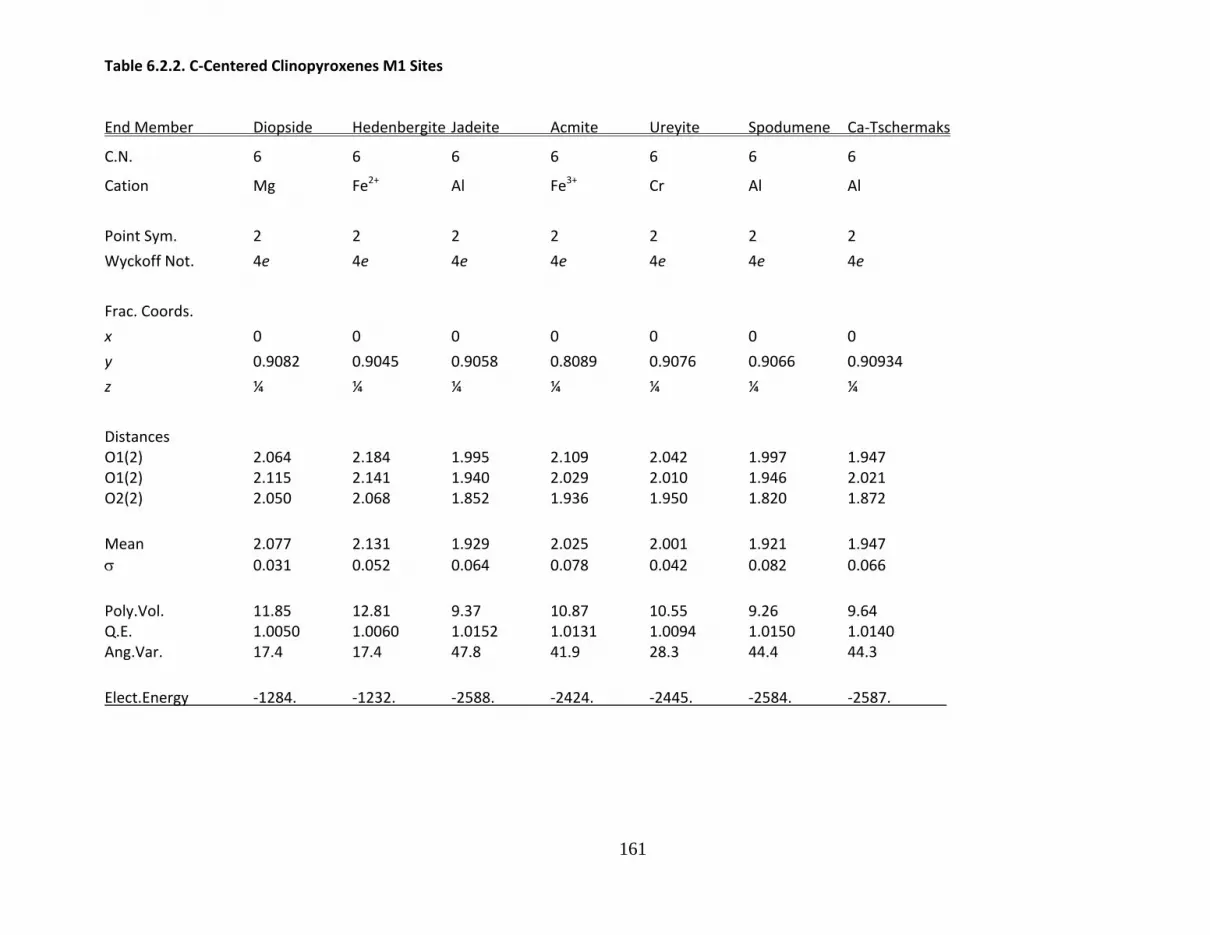
161
Table 6.2.2. C‐Centered Clinopyroxenes M1 Sites End Member Diopside Hedenbergite Jadeite Acmite Ureyite Spodumene Ca‐Tschermaks
C.N. 6 6 6 6 6 6 6
Cation Mg Fe2+ Al Fe3+ Cr Al Al
Point Sym. 2 2 2 2 2 2 2
Wyckoff Not. 4e 4e 4e 4e 4e 4e 4e
Frac. Coords.
x 0 0 0 0 0 0 0
y 0.9082 0.9045 0.9058 0.8089 0.9076 0.9066 0.90934
z ¼ ¼ ¼ ¼ ¼ ¼ ¼
Distances O1(2) 2.064 2.184 1.995 2.109 2.042 1.997 1.947 O1(2) 2.115 2.141 1.940 2.029 2.010 1.946 2.021 O2(2) 2.050 2.068 1.852 1.936 1.950 1.820 1.872
Mean 2.077 2.131 1.929 2.025 2.001 1.921 1.947
0.031 0.052 0.064 0.078 0.042 0.082 0.066
Poly.Vol. 11.85 12.81 9.37 10.87 10.55 9.26 9.64 Q.E. 1.0050 1.0060 1.0152 1.0131 1.0094 1.0150 1.0140 Ang.Var. 17.4 17.4 47.8 41.9 28.3 44.4 44.3
Elect.Energy ‐1284. ‐1232. ‐2588. ‐2424. ‐2445. ‐2584. ‐2587.

162
Table 6.2.3. C‐Centered Clinopyroxenes M2 Sites End Member Diopside Hedenbergite Jadeite Acmite Ureyite Spodumene Ca‐Tschermaks
C.N. 8 8 8 8 8 6 8
Cation Ca Ca Na Na Na Li Ca
Point Sym. 2 2 2 2 2 2 2
Wyckoff Not. 4e 4e 4e 4e 4e 4e 4e
Frac. Coords.
x 0 0 0 0 0 0 0
y 0.3015 0.3003 0.3005 0.2999 0.3008 0.2752 0.31117
z ¼ ¼ ¼ ¼ ¼ ¼ ¼
Distances O1(2) 2.359 2.354 2.356 2.398 2.381 2.111 2.403 O2(2) 2.352 2.342 2.412 2.416 2.389 2.280 2.420 O3(2) 2.561 2.627 2.366 2.430 2.427 2.246 2.469
O3(2) 2.717 2.719 2.741 2.831 2.766 2.549
Mean 2.498 2.511 2.469 2.519 2.491 2.213 2.460
0.163 0.177 0.169 0.193 0.171 0.083 0.061
Poly.Vol. 25.76 26.11 24.58 26.30 25.45 10.78 24.52 Q.E. 1.2172 Ang.Var. 549.
Elect.Energy ‐957. ‐960. ‐313. ‐308. ‐314. ‐347. ‐975.
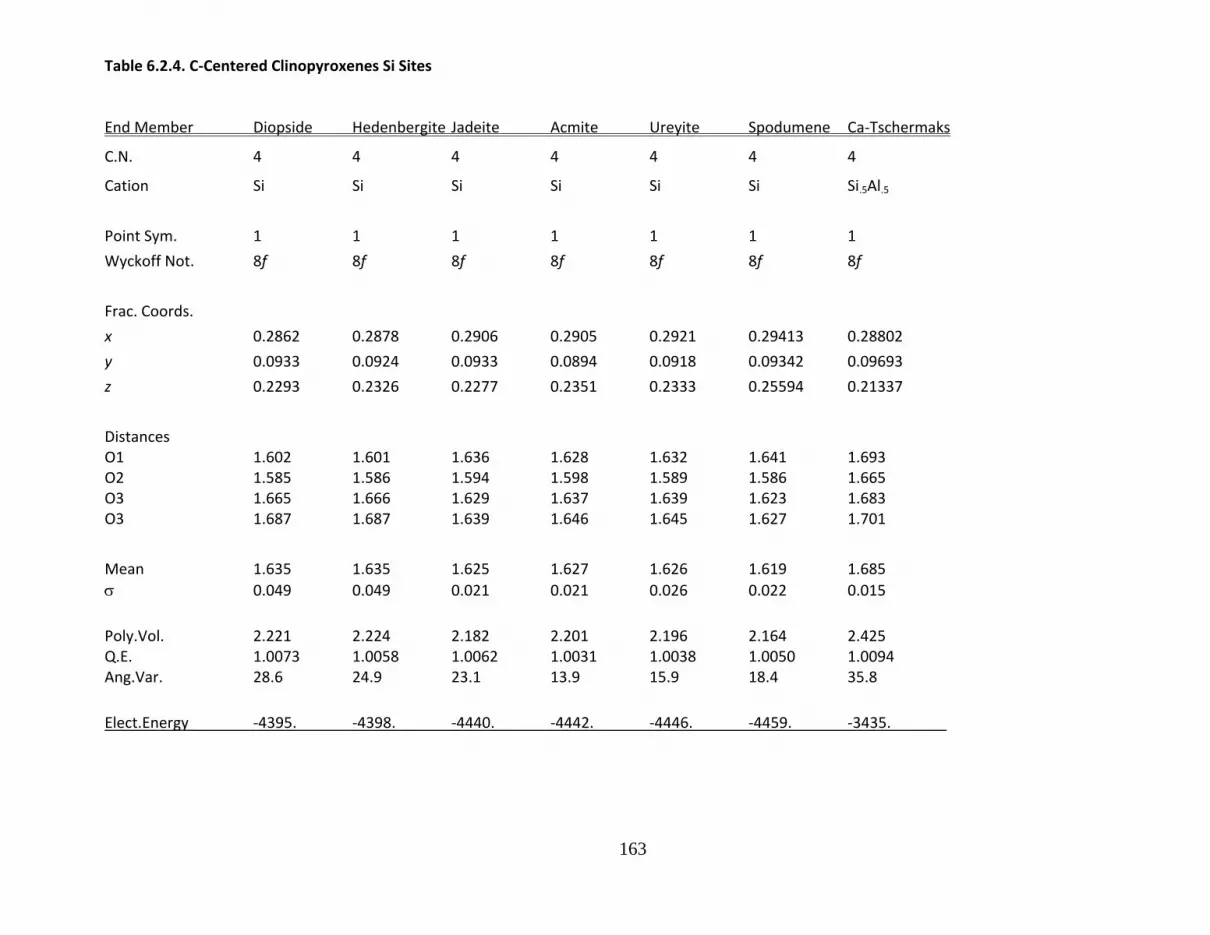
163
Table 6.2.4. C‐Centered Clinopyroxenes Si Sites End Member Diopside Hedenbergite Jadeite Acmite Ureyite Spodumene Ca‐Tschermaks
C.N. 4 4 4 4 4 4 4
Cation Si Si Si Si Si Si Si.5Al.5
Point Sym. 1 1 1 1 1 1 1
Wyckoff Not. 8f 8f 8f 8f 8f 8f 8f
Frac. Coords.
x 0.2862 0.2878 0.2906 0.2905 0.2921 0.29413 0.28802
y 0.0933 0.0924 0.0933 0.0894 0.0918 0.09342 0.09693
z 0.2293 0.2326 0.2277 0.2351 0.2333 0.25594 0.21337
Distances O1 1.602 1.601 1.636 1.628 1.632 1.641 1.693 O2 1.585 1.586 1.594 1.598 1.589 1.586 1.665 O3 1.665 1.666 1.629 1.637 1.639 1.623 1.683
O3 1.687 1.687 1.639 1.646 1.645 1.627 1.701
Mean 1.635 1.635 1.625 1.627 1.626 1.619 1.685
0.049 0.049 0.021 0.021 0.026 0.022 0.015
Poly.Vol. 2.221 2.224 2.182 2.201 2.196 2.164 2.425 Q.E. 1.0073 1.0058 1.0062 1.0031 1.0038 1.0050 1.0094 Ang.Var. 28.6 24.9 23.1 13.9 15.9 18.4 35.8
Elect.Energy ‐4395. ‐4398. ‐4440. ‐4442. ‐4446. ‐4459. ‐3435.

164
Table 6.3.1. Pyroxenoid Unit Cells.
End Member Wollastonite Bustamite Rhodonite Pyroxmangite
Formula Ca3Si3O9 (Ca.78Mn.12Fe.10)3 Mn5Si5O15 Mn7Si7O21
Si3O9
Form. Wt. (g) 349.493 358.572 655.111 917.156
Density (g/cm3) 2.937 3.116 3.752 3.749
Mol. Vol. (cm3) 118.66 115.09 174.62 244.63
Z 4 4 2 2
Cryst. Sys. Triclinic Triclinic Triclinic Triclinic
Laue Class 1 1 1 1
Space Group C1 I1 P1 P1
Cell Parameters
a (Å) 10.104 9.994 7.616 6.721
b (Å) 11.054 10.946 11.851 7.603
c (Å) 7.305 7.231 6.707 17.455
(º) 99.53 99.30 92.55 113.18
(º) 100.56 100.56 94.35 82.27
(º) 83.44 83.29 105.67 94.13
Vol. 788.04 764.30 579.84 812.31
Ref. Ohashi & Ohashi & Narita et al. Narita et al. Finger (1978) Finger (1978) (1977) (1977)

165
Figure 6.3. Wollastonite b‐axis projection, [1 0 1] vertical. The chains have a three–tetrahedron repeat and run parallel to the
triclinic b‐axis. There are three distinct tetrahedra and three distinct Ca‐sites.

166
Table 6.3.2a. Pyroxenoid M Sites.
End‐Member Wollastonite Bustamite
Site M1 M2 M3 M1 M2 M3 M4
C.N. 6 6 7 6 6 6 8
Cation Ca Ca Ca Ca Ca Mn/Fe Ca
Point Sym. 1 1 1 1 1 1 1
Wyckoff Not. 2i 2i 2i 2i 2i 1g 1c
Frac. Coords.
x 0.0212 0.0180 0.0137 0.0222 0.0247 0 0
y 0.7800 0.7803 0.4889 0.7771 0.7766 ½ ½
z 0.0772 0.5717 0.2504 0.8149 0.3133 ½ 0
Distances
Mean 2.373 2.381 2.414 2.348 2.372 2.195 2.490
0.112 0.072 0.117 0.092 0.090 0.036 0.120
Poly.Vol. 16.43 16.61 20.29 16.04 16.24 13.84 24.78
Q.E. 1.0578 1.0555 ‐‐ 1.0514 1.0637 1.0128 ‐‐
Ang.Var. 176.7 177.2 ‐‐ 161.3 189.6 40.9 ‐‐
Elect.Energy ‐1028. ‐992. ‐1022. ‐1036. ‐994. ‐1141. ‐1004.
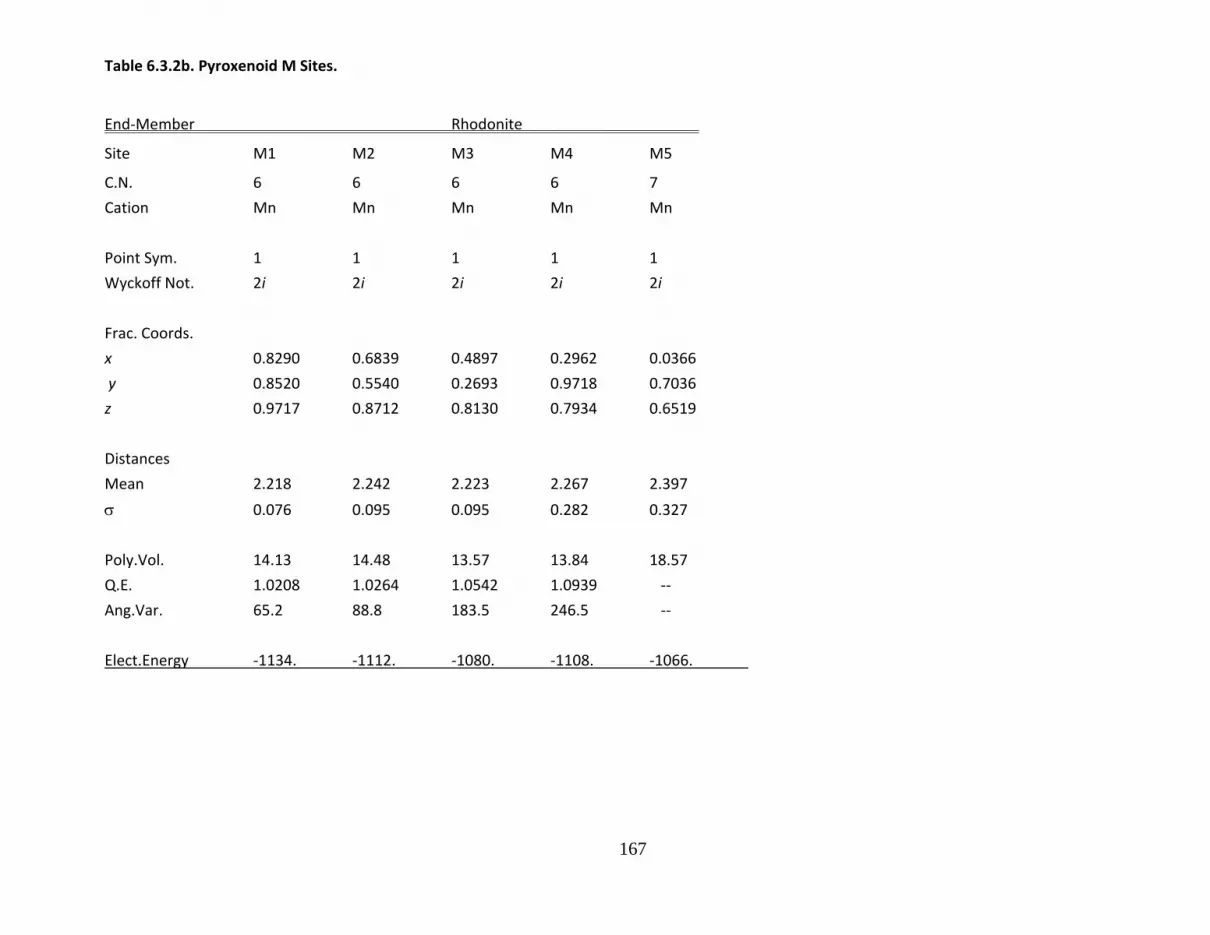
167
Table 6.3.2b. Pyroxenoid M Sites.
End‐Member Rhodonite
Site M1 M2 M3 M4 M5
C.N. 6 6 6 6 7
Cation Mn Mn Mn Mn Mn
Point Sym. 1 1 1 1 1
Wyckoff Not. 2i 2i 2i 2i 2i
Frac. Coords.
x 0.8290 0.6839 0.4897 0.2962 0.0366
y 0.8520 0.5540 0.2693 0.9718 0.7036
z 0.9717 0.8712 0.8130 0.7934 0.6519
Distances
Mean 2.218 2.242 2.223 2.267 2.397
0.076 0.095 0.095 0.282 0.327
Poly.Vol. 14.13 14.48 13.57 13.84 18.57
Q.E. 1.0208 1.0264 1.0542 1.0939 ‐‐
Ang.Var. 65.2 88.8 183.5 246.5 ‐‐
Elect.Energy ‐1134. ‐1112. ‐1080. ‐1108. ‐1066.
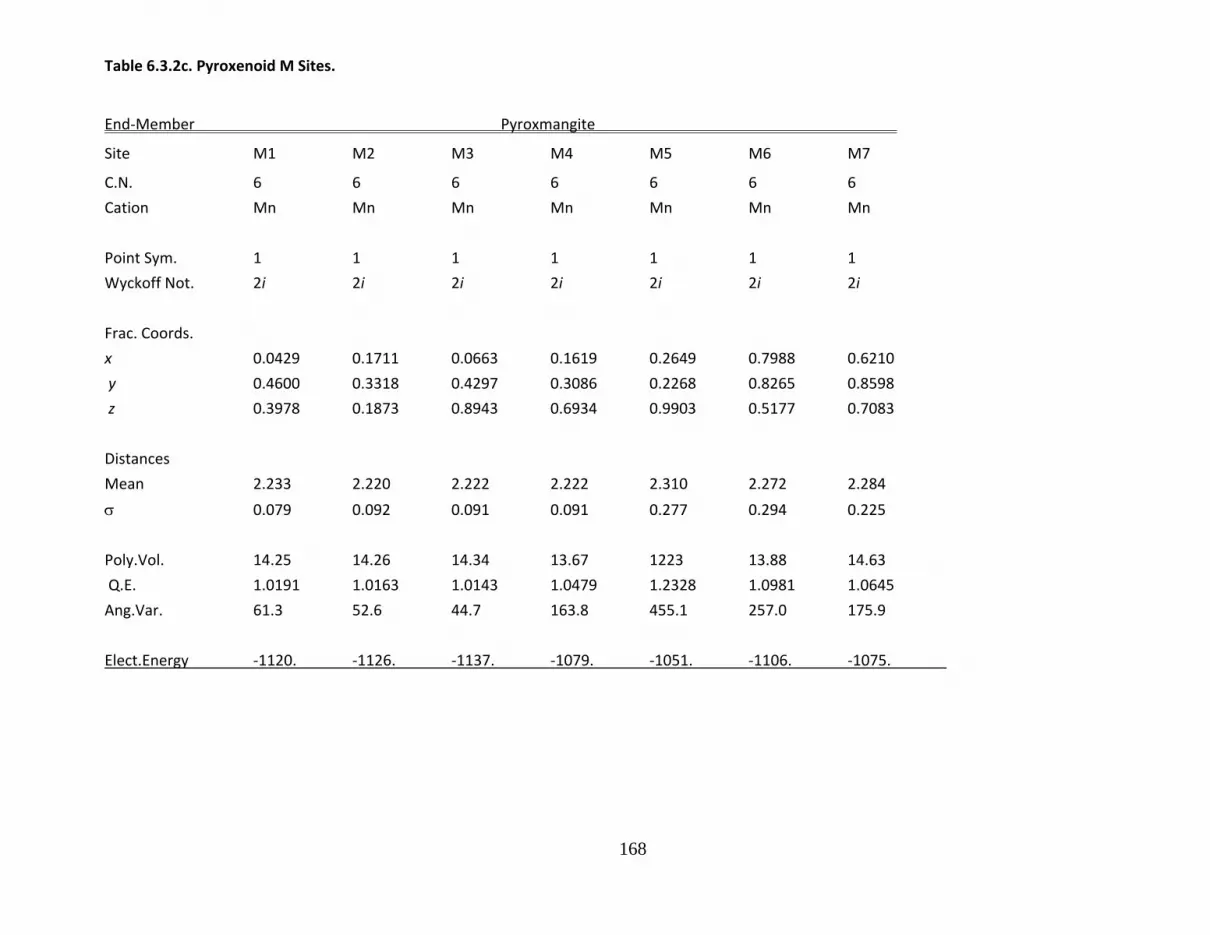
168
Table 6.3.2c. Pyroxenoid M Sites.
End‐Member Pyroxmangite
Site M1 M2 M3 M4 M5 M6 M7
C.N. 6 6 6 6 6 6 6
Cation Mn Mn Mn Mn Mn Mn Mn
Point Sym. 1 1 1 1 1 1 1
Wyckoff Not. 2i 2i 2i 2i 2i 2i 2i
Frac. Coords.
x 0.0429 0.1711 0.0663 0.1619 0.2649 0.7988 0.6210
y 0.4600 0.3318 0.4297 0.3086 0.2268 0.8265 0.8598
z 0.3978 0.1873 0.8943 0.6934 0.9903 0.5177 0.7083
Distances
Mean 2.233 2.220 2.222 2.222 2.310 2.272 2.284
0.079 0.092 0.091 0.091 0.277 0.294 0.225
Poly.Vol. 14.25 14.26 14.34 13.67 1223 13.88 14.63
Q.E. 1.0191 1.0163 1.0143 1.0479 1.2328 1.0981 1.0645
Ang.Var. 61.3 52.6 44.7 163.8 455.1 257.0 175.9
Elect.Energy ‐1120. ‐1126. ‐1137. ‐1079. ‐1051. ‐1106. ‐1075.
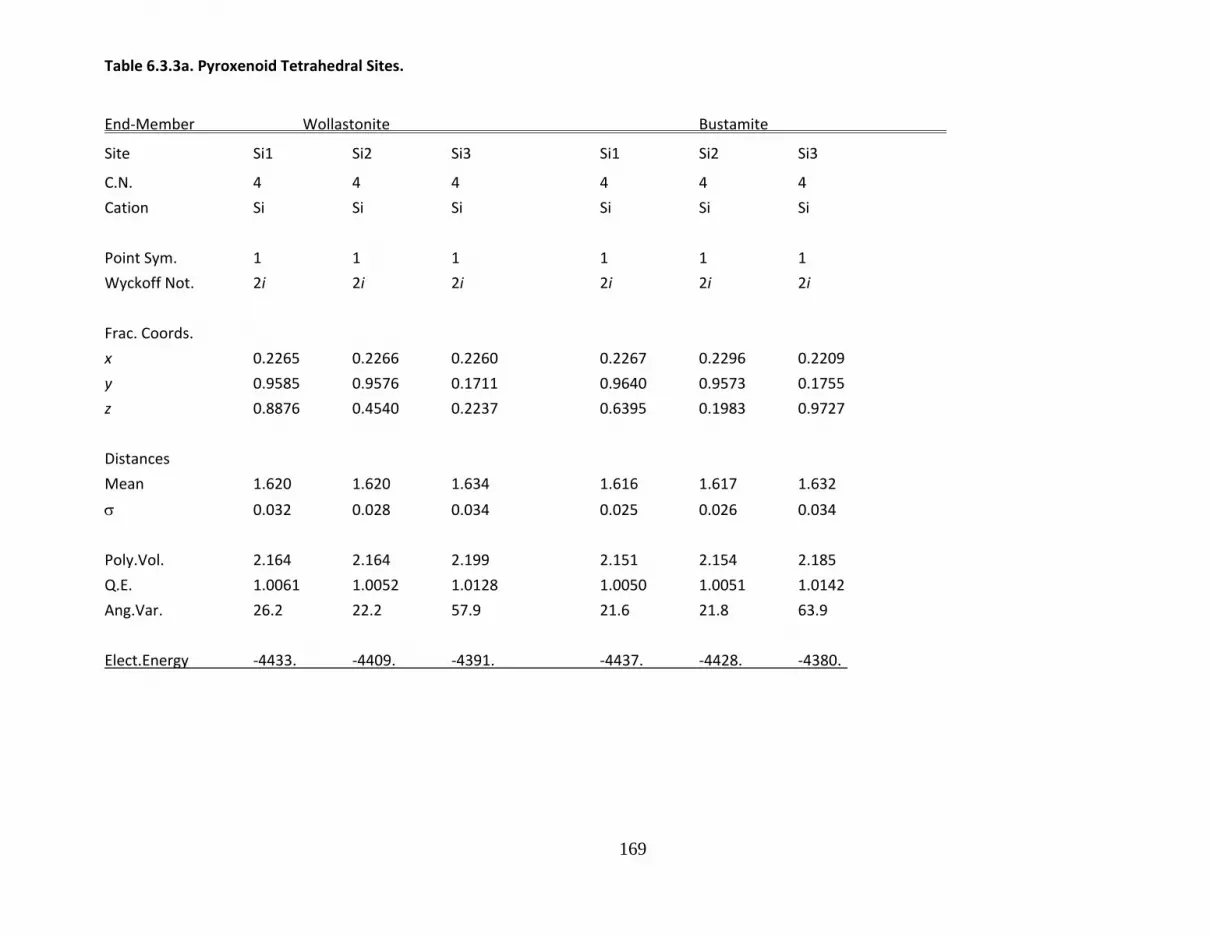
169
Table 6.3.3a. Pyroxenoid Tetrahedral Sites.
End‐Member Wollastonite Bustamite
Site Si1 Si2 Si3 Si1 Si2 Si3
C.N. 4 4 4 4 4 4
Cation Si Si Si Si Si Si
Point Sym. 1 1 1 1 1 1
Wyckoff Not. 2i 2i 2i 2i 2i 2i
Frac. Coords.
x 0.2265 0.2266 0.2260 0.2267 0.2296 0.2209
y 0.9585 0.9576 0.1711 0.9640 0.9573 0.1755
z 0.8876 0.4540 0.2237 0.6395 0.1983 0.9727
Distances
Mean 1.620 1.620 1.634 1.616 1.617 1.632
0.032 0.028 0.034 0.025 0.026 0.034
Poly.Vol. 2.164 2.164 2.199 2.151 2.154 2.185
Q.E. 1.0061 1.0052 1.0128 1.0050 1.0051 1.0142
Ang.Var. 26.2 22.2 57.9 21.6 21.8 63.9
Elect.Energy ‐4433. ‐4409. ‐4391. ‐4437. ‐4428. ‐4380.

170
Table 6.3.3b. Pyroxenoid Tetrahedral Sites.
End‐Member Rhodonite
Site Si1 Si2 Si3 Si4 Si5
C.N. 4 4 4 4 4
Cation Si Si Si Si Si
Point Sym. 1 1 1 1 1
Wyckoff Not. 2i 2i 2i 2i 2i
Frac. Coords.
x 0.2212 0.2593 0.4518 0.7443 0.9226
y 0.1250 0.4672 0.7340 0.0892 0.3451
z 0.4945 0.6366 0.7024 0.7549 0.8483
Distances
Mean 1.623 1.620 1.617 1.623 1.627
0.026 0.020 0.018 0.025 0.024
Poly.Vol. 2.155 2.168 2.140 2.181 2.195
Q.E. 1.0115 1.0049 1.0092 1.0037 1.0044
Ang.Var. 51.6 20.5 37.3 15.5 19.1
Elect.Energy ‐4422. ‐4422. ‐4425. ‐4406. ‐4365.

171
Table 6.3.2c. Pyroxenoid M Sites.
End‐Member Pyroxmangite
Site Si1 Si2 Si3 Si4 Si5 SI6 SI7
C.N. 4 4 4 4 4 4 4
Cation Si Si Si Si Si Si Si
Point Sym. 1 1 1 1 1 1 1
Wyckoff Not. 2i 2i 2i 2i 2i 2i 2i
Frac. Coords.
x 0.2415 0.1205 0.3189 0.7804 0.5711 0.6774 0.4928
y 0.8533 0.9559 0.7563 0.1343 0.3415 0.2374 0.4117
z 0.5653 0.7483 0.8375 0.9702 0.8810 0.6902 0.5888
Distances
Mean 1.629 1.630 1.633 1.629 1.626 1.617 1.632
0.026 0.026 0.033 0.011 0.033 0.014 0.037
Poly.Vol. 2.209 2.211 2.221 2.203 2.177 2.131 2.195
Q.E. 1.0037 1.0039 1.0040 1.0046 1.0087 1.0116 1.0110
Ang.Var. 13.3 16.5 17.0 19.2 35.5 47.1 48.8
Elect.Energy ‐4389. ‐4360. ‐4388. ‐4422. ‐4421. ‐4425. ‐4383.

172
Table 6.4.1 Ortho‐amphibole Unit Cells
End Member Anthophyllite Gedrite
Formula (Mg5.53Fe1.47) (Na.5Ca.03)(Mg4.5Fe1.1Al1.2)
Si8O22(OH)2 (Al1.8Si6.3)O22(OH,F)2
Form. Wt. (g) 827.23 827.42
Density (g/cm3) 3.111 3.184
Mol. Vol. (cm3)
Z
Cryst. Sys. Orthorhombic Orthorhombic
Laue Class mmm mmm
Space Group Pnma Pnma
Cell Parameters
a (Å) 18.560 18.531
b (Å) 18.013 17.741
c (Å) 5.2818 5.249
Vol. 1765.82 1725.65
Ref. Finger Papike &
(19709) Ross(1970)

173
Table 6.4.2. Ortho‐amphibole Octahedral Sites.
End‐Member Anthophyllite Gedrite
Site M1 M2 M3 M4 M1 M2 M3 M4
C.N. 6 6 6 7 6 6 6 7
Cation Mg.96Fe.04 Mg.97Fe.03 Mg.97Fe.03 Mg.35Fe.65 Mg.88Fe.12 Mg.4Al.6 Mg.9Fe.1 Mg.55Fe.45
Point Sym. 1 1 m 1 1 1 m 1
Wyckoff Not. 8d 8d 4c 8d 8d 8d 4c 8d
Frac. Coords.
x 0.12489 0.12488 0.12579 0.12371 0.1244 0.1248 0.1249 0.1189
y 0.16329 0.07317 ¼ ‐.00982 0.1611 0.0731 ¼ ‐.0145
z 0.3911 ‐.1099 ‐.1089 0.3877 0.3737 ‐.1281 ‐.1248 0.3636
Distances
Mean 2.084 2.076 2.070 2.349 2.093 1.987 2.059 2.185
0.032 0.049 0.011 0.374 0.042 0.042 0.035 0.138
Poly.Vol. 11.877 11.765 11.595 17.281 11.923 10.379 11.274 12.766
Q.E. 1.0107 1.0094 1.0138 ‐‐ 1.0171 1.0058 1.0222 1.0622
Ang.Var. 34.7 30.8 44.8 ‐‐ 54.3 18.6 70.8 202.3
Elect.Energy ‐1053. ‐1201. ‐1044. ‐1071 ‐1027. 1906. ‐1054. ‐1059.
Model Charge 2.0 2.0 2.0 2.0 2.0 2.6 2.0 2.0

174
Table 6.4.3. Ortho‐amphibole Tetrahedral Sites.
End‐Member Anthophyllite Gedrite
Site T1A T1B T2A T2B T1A T1B T2A T2B
C.N. 4 4 4 4 4 4 4 4
Cation Si Si Si Si Si.66Al.34 Si.62Al.38 Si Si.84Al.16
Point Sym. 1 1 1 1 1 1 1 1
Wyckoff Not. 8d 8d 8d 8d 8d 8d 8d 8d
Frac. Coords.
x 0.23039 0.01863 0.22731 0.02469 0.2315 0.0202 0.2278 0.0266
y ‐.1654 .16626 ‐.07956 ‐.08177 ‐.1631 ‐.1645 ‐.0760 ‐.0802
z ‐.4334 0.2760 0.0622 ‐.2227 ‐.4487 0.2971 0.0502 ‐.1985
Distances
Mean 1.620 1.622 1.624 1.633 1.650 1.656 1.616 1.649
0.013 0.011 0.023 0.020 0.017 0.009 0.026 0.017
Poly.Vol. 2.183 2.189 2.175 2.221 2.306 2.331 2.140 2.286
Q.E. 1.0002 1.0001 1.0076 1.0046 1.0006 1.0001 1.0087 1.0041
Ang.Var. 0.9 0.3 30.5 18.4 2.3 0.7 33.4 15.5
Elect.Energy ‐4433. ‐4403. ‐4425. ‐4393. ‐3769. ‐3701. ‐4405. ‐4062.
Model Charge 4.0 4.0 4.0 4.0 3.66 3.62 4.0 3.84

175
Table 6.5.1 Clino‐amphibole Unit Cells
End Member Cummingtonlite Pargasite Tremolote Glaucophane
Formula (Na.63K.30) (Na.63K.30)
(Mg0.3Fe1.7) Ca2.0 (Ca1.8Mg.2) (Ca1.8Mg.2)
(Mg4.4Fe.6) (Mg3.25Fe1.1Al.55) Mg5 (Mg3.25Fe1.0Al1.59 Ti.06)
Si8O22(OH)2 (Al1.8Si6.2)O22(OH,F)2 (Al1.8Si6.2)O22(OH,F)2 (Al.08Si7.92)O22(OH,F)2
Form. Wt. (g) 853.72 870.30 824.57 822.03
Density (g/cm3) 3.142 3.165 3.010 3.125
Mol. Vol. (cm3) 271.68 274.94 273.93 262.25
Z 2 2 2 2
Cryst. Sys. Monoclinic Monoclinic Monoclinic Monoclinic
Laue Class 2/m 2/m 2/m 2/m
Space Group C2/m C2/m C2/m C2/m
Cell Parameters
a (Å) 9.51 9.910 9.863 9.541
b (Å) 18.19 18.022 18.048 17.740
c (Å) 5.33 5.312 5.285 5.295
(º) 101.92 105.78 104.79 103.67
Vol. 902.14 912.96 909.60 870.83
Ref. Fischer Robinson Hawthorne & Papike & (1966) et al. (1973b) Grundy (1976) Clark (1968)

176
Figure 6.3. Clino‐amphibole, c‐axis projection, a‐vertical. The A‐site (white sphere) can contain alkali (principally Na or K)
or can be vacant. The non‐silicate oxygen is typically protonated with the proton shown as a black sphere.
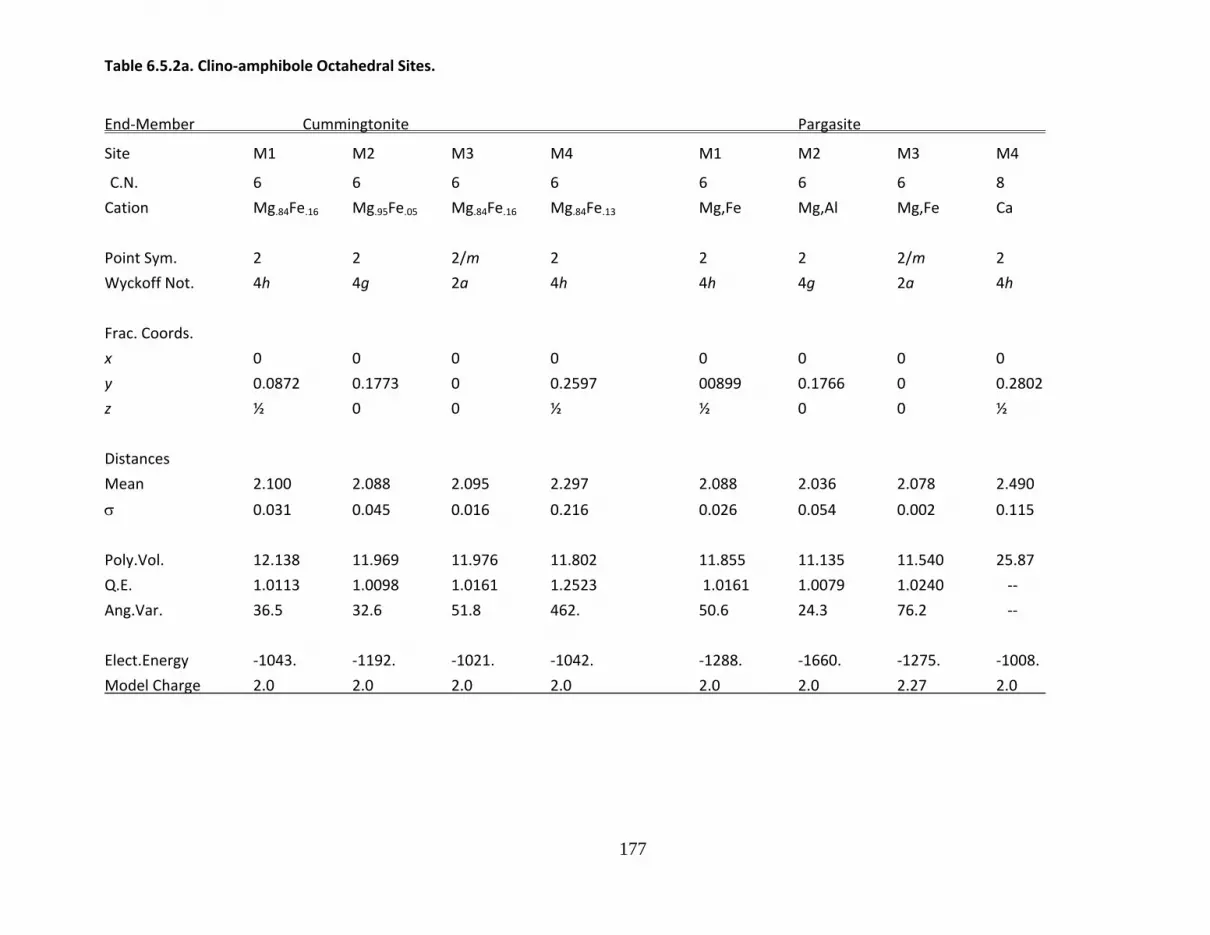
177
Table 6.5.2a. Clino‐amphibole Octahedral Sites.
End‐Member Cummingtonite Pargasite
Site M1 M2 M3 M4 M1 M2 M3 M4
C.N. 6 6 6 6 6 6 6 8
Cation Mg.84Fe.16 Mg.95Fe.05 Mg.84Fe.16 Mg.84Fe.13 Mg,Fe Mg,Al Mg,Fe Ca
Point Sym. 2 2 2/m 2 2 2 2/m 2
Wyckoff Not. 4h 4g 2a 4h 4h 4g 2a 4h
Frac. Coords.
x 0 0 0 0 0 0 0 0
y 0.0872 0.1773 0 0.2597 00899 0.1766 0 0.2802
z ½ 0 0 ½ ½ 0 0 ½
Distances
Mean 2.100 2.088 2.095 2.297 2.088 2.036 2.078 2.490
0.031 0.045 0.016 0.216 0.026 0.054 0.002 0.115
Poly.Vol. 12.138 11.969 11.976 11.802 11.855 11.135 11.540 25.87
Q.E. 1.0113 1.0098 1.0161 1.2523 1.0161 1.0079 1.0240 ‐‐
Ang.Var. 36.5 32.6 51.8 462. 50.6 24.3 76.2 ‐‐
Elect.Energy ‐1043. ‐1192. ‐1021. ‐1042. ‐1288. ‐1660. ‐1275. ‐1008.
Model Charge 2.0 2.0 2.0 2.0 2.0 2.0 2.27 2.0

178
Table 6.5.2b. Clino‐amphibole Octahedral Sites.
End‐Member Tremolite Glaucophanee
Site M1 M2 M3 M4 M1 M2 M3 M4
C.N. 6 6 6 8 6 6 6 8
Cation Mg Mg Mg Ca,Na Mg,Fe Fe,Al Mg,Fe Na
Point Sym. 2 2 2/m 2 2 2 2/m 2
Wyckoff Not. 4h 4g 2a 4h 4h 4g 2a 4h
Frac. Coords.
x 0 0 0 0 0 0 0 0
y 0.0883 0.1770 0 0.2779 00908 0.1807 0 0.2772
z ½ 0 0 ½ ½ 0 0 ½
Distances
Mean 2.074 2.084 2.064 2.518 2.079 1.930 2.094 2.391
0.010 0.058 0.008 0.175 0.018 0.087 0.013 0.195
Poly.Vol. 11.696 11.932 11.498 26.49 11.577 9.4325 11.783 22.65
Q.E. 1.0108 1.0073 1.0133 ‐‐ 1.0237 1.0121 1.0262 ‐‐
Ang.Var. 36.7 25.6 43.8 ‐‐ 79.4 35.8 84.5 ‐‐
Elect.Energy ‐1228. ‐1240. ‐1216. ‐869. ‐1229. ‐2456. ‐1239. ‐249.
Model Charge 2.0 2.0 2.0 1.9 2.0 3.0 2.0 1.0
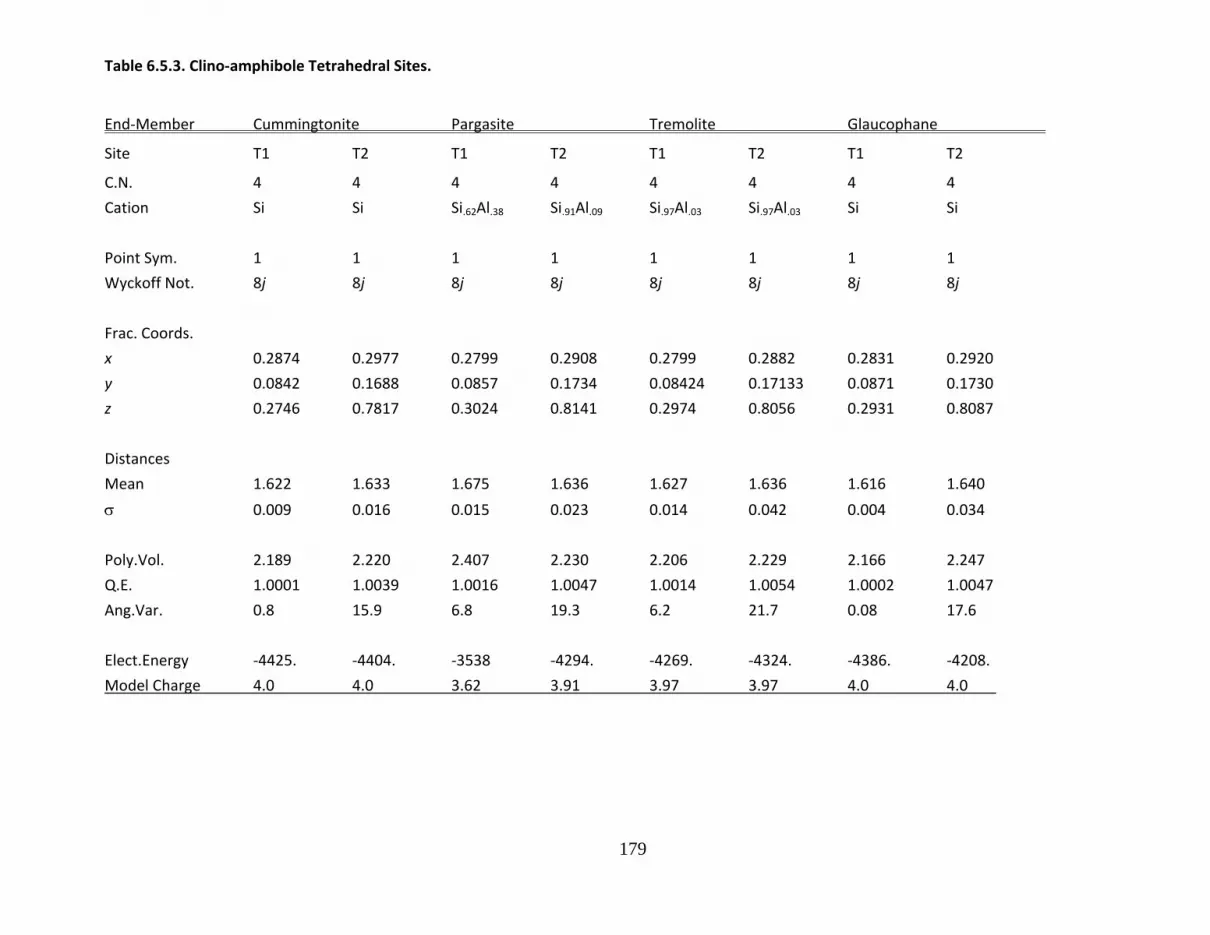
179
Table 6.5.3. Clino‐amphibole Tetrahedral Sites.
End‐Member Cummingtonite Pargasite Tremolite Glaucophane
Site T1 T2 T1 T2 T1 T2 T1 T2
C.N. 4 4 4 4 4 4 4 4
Cation Si Si Si.62Al.38 Si.91Al.09 Si.97Al.03 Si.97Al.03 Si Si
Point Sym. 1 1 1 1 1 1 1 1
Wyckoff Not. 8j 8j 8j 8j 8j 8j 8j 8j
Frac. Coords.
x 0.2874 0.2977 0.2799 0.2908 0.2799 0.2882 0.2831 0.2920
y 0.0842 0.1688 0.0857 0.1734 0.08424 0.17133 0.0871 0.1730
z 0.2746 0.7817 0.3024 0.8141 0.2974 0.8056 0.2931 0.8087
Distances
Mean 1.622 1.633 1.675 1.636 1.627 1.636 1.616 1.640
0.009 0.016 0.015 0.023 0.014 0.042 0.004 0.034
Poly.Vol. 2.189 2.220 2.407 2.230 2.206 2.229 2.166 2.247
Q.E. 1.0001 1.0039 1.0016 1.0047 1.0014 1.0054 1.0002 1.0047
Ang.Var. 0.8 15.9 6.8 19.3 6.2 21.7 0.08 17.6
Elect.Energy ‐4425. ‐4404. ‐3538 ‐4294. ‐4269. ‐4324. ‐4386. ‐4208.
Model Charge 4.0 4.0 3.62 3.91 3.97 3.97 4.0 4.0

180
Table 6.5.4. Clino‐ and Ortho‐amphibole A‐Sites.
End‐Member Pargasite Tremolite Gedrite
Site A A1 A2 A
C.N. 6(12) 10 10 8
Cation Na.63K.30 Na/K Na,K Na.34
Point Sym. 1 m 2 m
Wyckoff Not. 8j 4i 4g 4c
Frac. Coords.
x 0.4733 0.0450 0 0.1151
y 0 ½ 0.4897 ‐¼
z 0.9444 0.1030 0 0.8533
Distances
Mean 3.047 2.912 2.946 2.691
0.323 0.257 0.284 0.291
Poly.Vol. 66.023 46.304 46.914 25.684
Elect.Energy ‐158. ‐2.1 +1.0 ‐81.
Model Charge 1.0 0.08 0.08 0.34
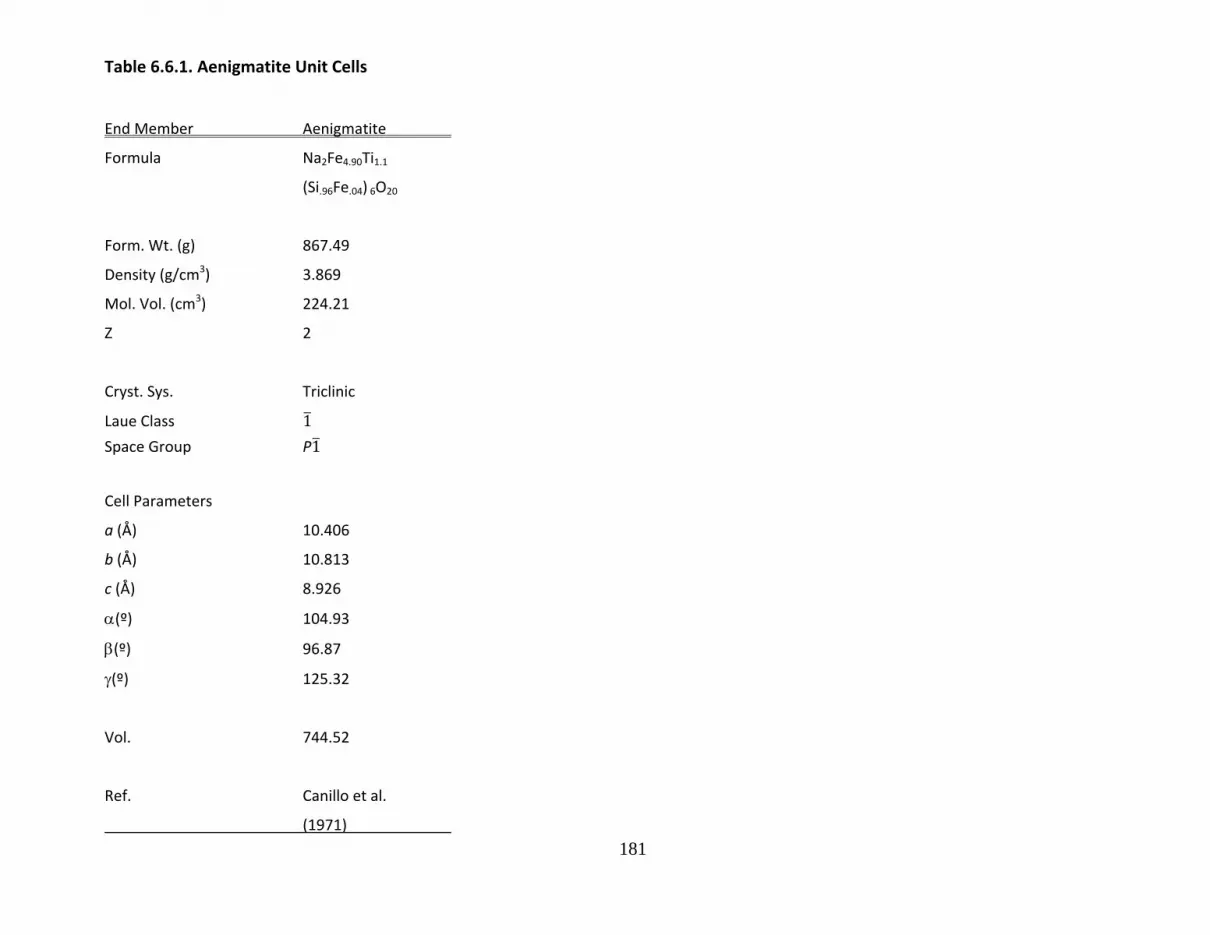
181
Table 6.6.1. Aenigmatite Unit Cells
End Member Aenigmatite
Formula Na2Fe4.90Ti1.1
(Si.96Fe.04) 6O20
Form. Wt. (g) 867.49
Density (g/cm3) 3.869
Mol. Vol. (cm3) 224.21
Z 2
Cryst. Sys. Triclinic
Laue Class 1
Space Group P1
Cell Parameters
a (Å) 10.406
b (Å) 10.813
c (Å) 8.926
(º) 104.93
(º) 96.87
(º) 125.32
Vol. 744.52
Ref. Canillo et al.
(1971)
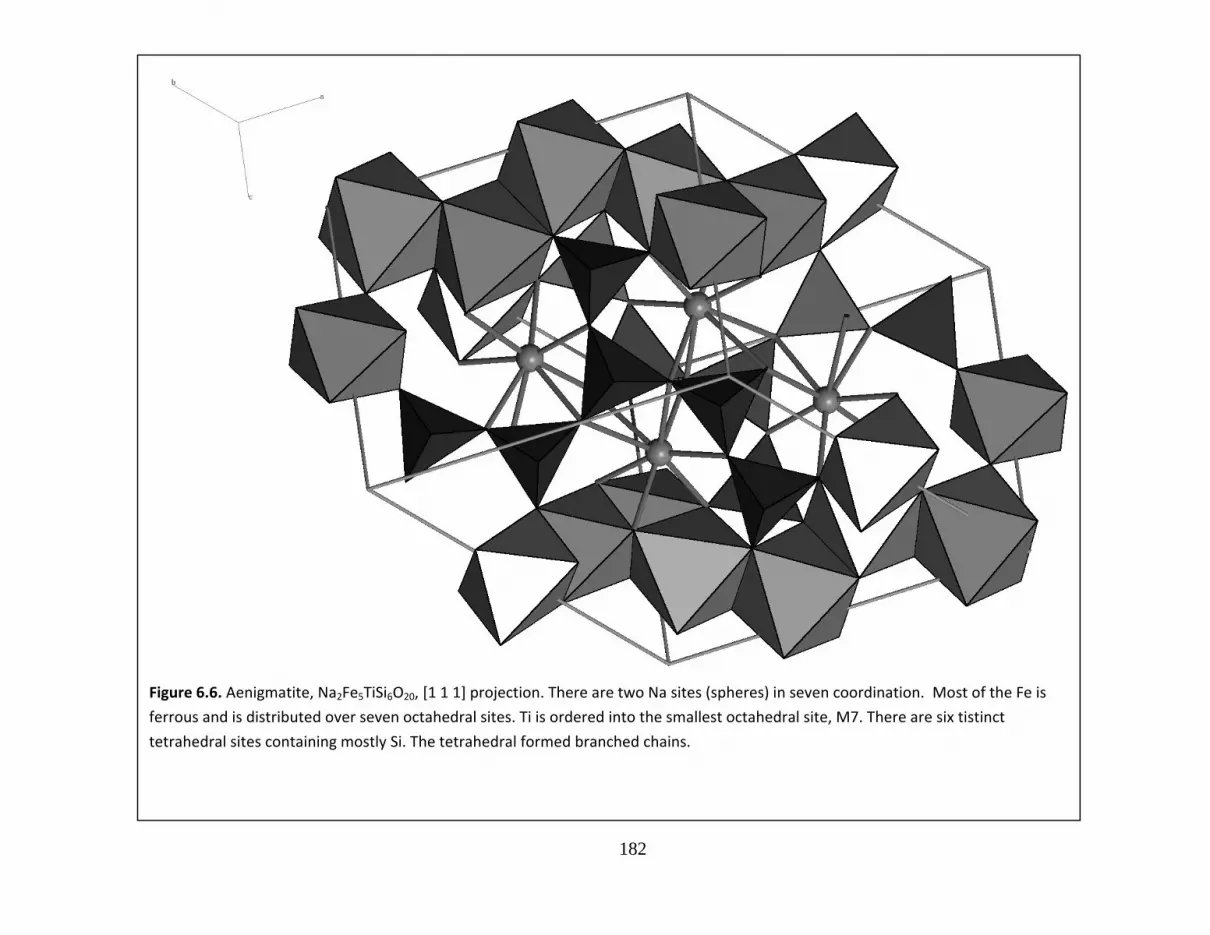
182
Figure 6.6. Aenigmatite, Na2Fe5TiSi6O20, [1 1 1] projection. There are two Na sites (spheres) in seven coordination. Most of the Fe is
ferrous and is distributed over seven octahedral sites. Ti is ordered into the smallest octahedral site, M7. There are six tistinct
tetrahedral sites containing mostly Si. The tetrahedral formed branched chains.
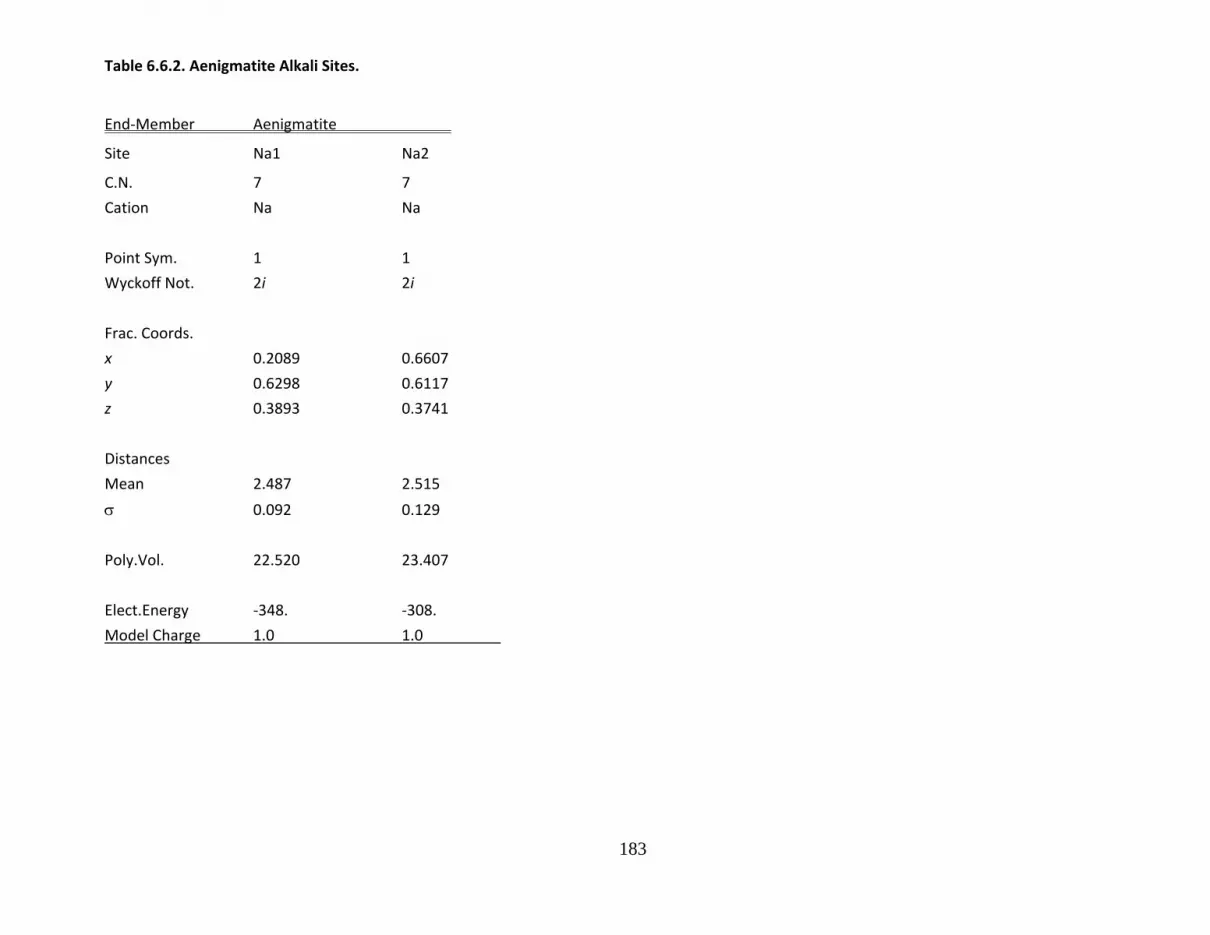
183
Table 6.6.2. Aenigmatite Alkali Sites.
End‐Member Aenigmatite
Site Na1 Na2
C.N. 7 7
Cation Na Na
Point Sym. 1 1
Wyckoff Not. 2i 2i
Frac. Coords.
x 0.2089 0.6607
y 0.6298 0.6117
z 0.3893 0.3741
Distances
Mean 2.487 2.515
0.092 0.129
Poly.Vol. 22.520 23.407
Elect.Energy ‐348. ‐308.
Model Charge 1.0 1.0

184
Table 6.6.3. Aenigmatite Octahedral Sites.
End‐Member Aenigmatite
Site M1 M2 M3 M4 M5 M6 M7
C.N. 6 6 6 6 6 6 6
Cation Fe.89Ti.11 Fe.87Ti.13 Fe.95Ti.05 Fe.76Ti.24 Fe.90Ti.10 Fe Fe.41Ti.59
Point Sym. 1 1 1 1 1 1 1
Wyckoff Not. 1b 1c 2i 2i 2i 2i 2i
Frac. Coords.
x 0 0 0.3214 0.7655 0.0961 0.5959 0.9970
y 0 ½ 0.8528 0.8199 0.9322 0.9432 0.7434
z ½ 0 0.1779 0.1511 0.0530 0.0661 0.2577
Distances
Mean 2.100 2.107 2.129 2.139 2.157 2.168 1.976
0.060 0.070 0.108 0.077 0.027 0.061 0.106
Poly.Vol. 12.112 12.200 12.452 12.657 12.845 12.420 10.189
Q.E. 1.0141 1.0160 1.0241 1.0219 1.0275 1.0091 1.0087
Ang.Var. 43.3 48.7 70.1 68.3 89.9 28.2 22.1
Elect.Energy ‐1366. ‐1503. ‐1280. ‐1538. ‐1252. ‐1067. ‐2815.
Model Charge 2.00 2.26 2.10 2.48 2.20 2.00 3.18
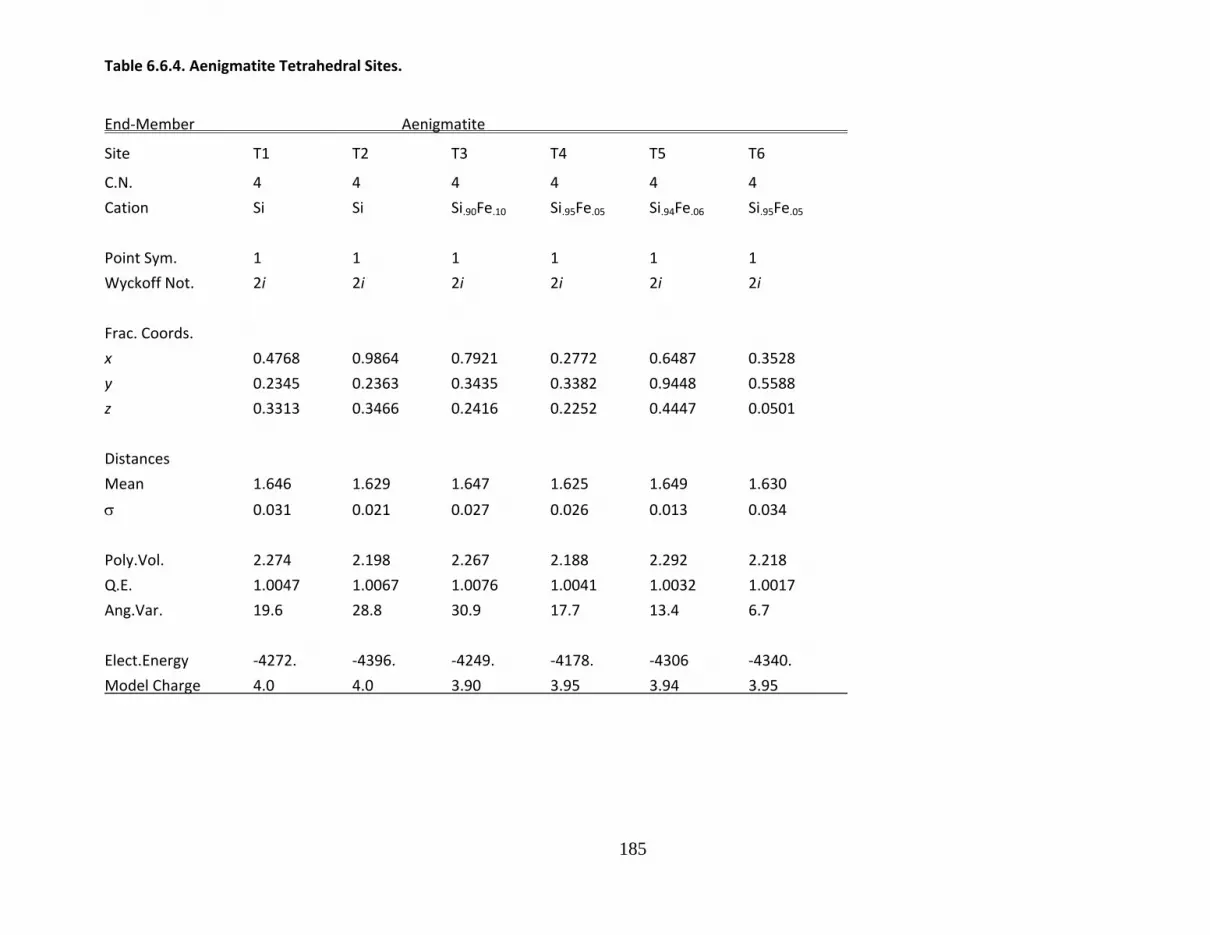
185
Table 6.6.4. Aenigmatite Tetrahedral Sites.
End‐Member Aenigmatite
Site T1 T2 T3 T4 T5 T6
C.N. 4 4 4 4 4 4
Cation Si Si Si.90Fe.10 Si.95Fe.05 Si.94Fe.06 Si.95Fe.05
Point Sym. 1 1 1 1 1 1
Wyckoff Not. 2i 2i 2i 2i 2i 2i
Frac. Coords.
x 0.4768 0.9864 0.7921 0.2772 0.6487 0.3528
y 0.2345 0.2363 0.3435 0.3382 0.9448 0.5588
z 0.3313 0.3466 0.2416 0.2252 0.4447 0.0501
Distances
Mean 1.646 1.629 1.647 1.625 1.649 1.630
0.031 0.021 0.027 0.026 0.013 0.034
Poly.Vol. 2.274 2.198 2.267 2.188 2.292 2.218
Q.E. 1.0047 1.0067 1.0076 1.0041 1.0032 1.0017
Ang.Var. 19.6 28.8 30.9 17.7 13.4 6.7
Elect.Energy ‐4272. ‐4396. ‐4249. ‐4178. ‐4306 ‐4340.
Model Charge 4.0 4.0 3.90 3.95 3.94 3.95
186
Chapter7.LayerSilicateMinerals
Phyllosilicate Minerals
7.1. Talc and Pyrophyllite
7.2. Trioctahedral Micas
7.3. Dioctahedral Micas
7.4. Clays
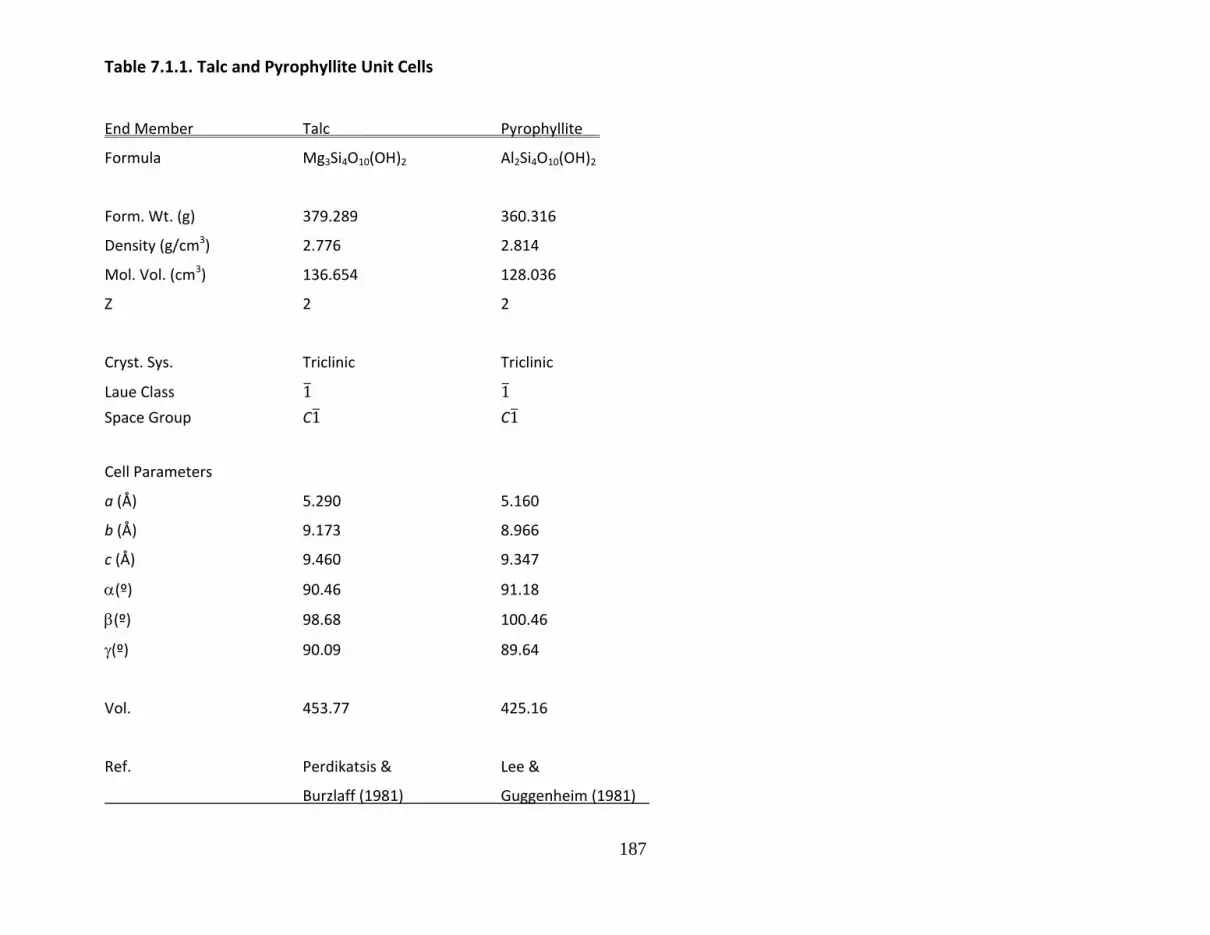
187
Table 7.1.1. Talc and Pyrophyllite Unit Cells
End Member Talc Pyrophyllite
Formula Mg3Si4O10(OH)2 Al2Si4O10(OH)2
Form. Wt. (g) 379.289 360.316
Density (g/cm3) 2.776 2.814
Mol. Vol. (cm3) 136.654 128.036
Z 2 2
Cryst. Sys. Triclinic Triclinic
Laue Class 1 1
Space Group C1 C1
Cell Parameters
a (Å) 5.290 5.160
b (Å) 9.173 8.966
c (Å) 9.460 9.347
(º) 90.46 91.18
(º) 98.68 100.46
(º) 90.09 89.64
Vol. 453.77 425.16
Ref. Perdikatsis & Lee &
Burzlaff (1981) Guggenheim (1981)

188
Figure 7.1a. Talc Mg3Si4O10(OH)2, perspective a‐axis projection, b‐horizontal. There is a complete brucite‐like trioctahedral sheet of Mg
octahedra. There are two distinct octahedral sites; M1 at the origin has pont symmetry 1, and M2 has point symmetry 1. There are
two distinct tetrahedral, both in general positions. The hydroxyl is in the opctahedral sheetat the anio position not bonded to Si.
There is no interlayer ation.

189
Figure 7.1b. Pyrophyllite Al2Si4O10(OH)2, perspective a‐axis projection, b‐horizontal. There is a gibbsite‐like dioctahedral sheet of Al
octahedra. All Al site are equivalent with point symmetry 1. There are two distinct tetrahedral sites, both in general positions. The
hydroxyl is in the opctahedral sheetat the anio position not bonded to Si. There is no interlayer ation.
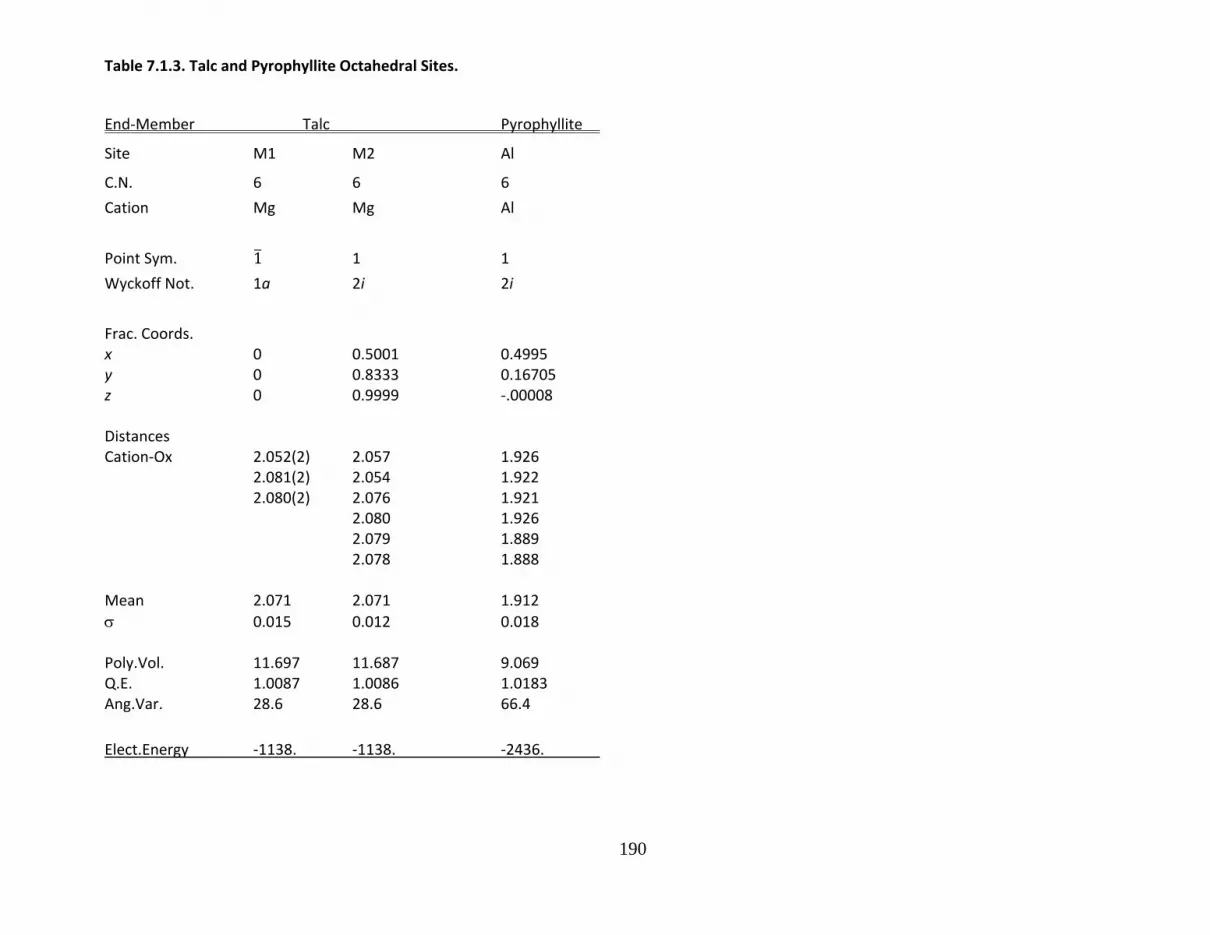
190
Table 7.1.3. Talc and Pyrophyllite Octahedral Sites.
End‐Member Talc Pyrophyllite
Site M1 M2 Al
C.N. 6 6 6
Cation Mg Mg Al
Point Sym. 1 1 1
Wyckoff Not. 1a 2i 2i
Frac. Coords. x 0 0.5001 0.4995 y 0 0.8333 0.16705 z 0 0.9999 ‐.00008
Distances Cation‐Ox 2.052(2) 2.057 1.926 2.081(2) 2.054 1.922 2.080(2) 2.076 1.921 2.080 1.926 2.079 1.889 2.078 1.888 Mean 2.071 2.071 1.912
0.015 0.012 0.018
Poly.Vol. 11.697 11.687 9.069 Q.E. 1.0087 1.0086 1.0183 Ang.Var. 28.6 28.6 66.4
Elect.Energy ‐1138. ‐1138. ‐2436.

191
Table 7.1.3. Talc and Pyrophyllite Tetrahedral Sites.
End‐Member Talc Pyrophyllite
Site Si1 Si2 Si1 Si2
C.N. 4 4 4 4
Cation Si Si Si Si
Point Sym. 1 1 1 1
Wyckoff Not. 2i 2i 2i 2i
Frac. Coords. x 0.2453 0.2459 0.7449 0.7595 y 0.5026 0.8359 ‐.00303 0.32577 z 0.2909 0.2911 0.29169 0.29230
Distances Cation‐Ox 1.621 1.621 1.632 1.634 1.623 1.622 1.616 1.614 1.623 1.624 1.618 1.616 1.625 1.623 1.602 1.607 Mean 1.623 1.622 1.617 1.618
0.002 0.001 0.012 0.012
Poly.Vol. 2.194 2.191 2.168 2.171 Q.E. 1.0000 1.0000 1.0005 1.0004 Ang.Var. 0.2 0.3 2.0 1.7
Elect.Energy ‐4376. ‐4373. ‐4393. ‐4401.

192
Table 7.2.1. Trioctahedral Mica Unit Cells
End‐Member Annite F‐Phlogopite Phlogopite Phlogopite‐N Lepidolite Lepidolite Lepidolite Zinnwaldite Polytype 1M 1M 1M 1M 2M2 2M1 1M 1M Formula (K.88Na.07Ca.03) K (K.77Na.16Ba.06) (K.9Na.02) (K.9Na.1Rb.1)2 (K.9Na.1Rb.1)2 (K.9Na.1Rb.1)2 (K.9Na.05)2 Fe2.4Ti.22Mg.12 Mg3 Mg3 Mg2.7Fe.16Al.08 (Al.6Li.4)4 (Al.6Li.4)4 (Al1.3Li1.7)2 (Al1.05Fe.93Li.67)2
Mn.05Al.09 AlSi3 (Al1.05Si2.95) (Al1.09SI2.91) (Li.95Al.05)2 (Li.9)2 Al1.2Si2.8O10 O9.9 O10 O10 (Al1.3Si6.9) (Al.4Si3.6)2 (Al.64Si3.4)2 (Al.91Si3.09)2
(OH)1.4F.22Cl.05 (OH).16F1.84 (OH).7F1.3 (OH).97F1.13 O20(OH).96F3.0 O20(OH)F3 O20(OH)F3. O20(OH)1.6F2.4 Form. Wt. (g) 490.67 421.268 421.831 422.652 790.04 771.01 793.87 857.99 Density (g/cm3) 3.215 2.875 2.872 2.876 2.791 2.724 2.825 2.986 Mol. Vol. (cm3) 152.63 146.538 146.869 146.967 283.19 283.03 281.00 289.10 Z 2 2 2 2 2 2 2 2
Cryst. Sys. Monoclinic Monoclinic Monoclinic Monoclinic Monoclinic Monoclinic Monoclinic Monoclinic
Laue Class 2/ 2/ 2/ 2/ 2/ 2/ 2/ 2/
Space Group C2/m C2/m C2/m C2/m C2/c C2/c C2/m C2
Cell Parameters a (Å) 5.3860 5.308 5.3078 5.3141 9.04 5.209 5.20 5.296 b (Å) 9.3241 9.183 9.1901 9.2024 5.22 9.053 9.01 9.140 c (Å) 10.2683 10.1369 10.1547 10.1645 20.210 20.185 10.09 10.096
(º) 100.63 100.07 100.08 100.05 99.583 99.125 99.28 100.83
Vol. 506.82 486.60 487.69 488.02 940.38 939.82 466.6 480.00
Ref. Hazen & McCauley Hazen & Joswig Sartori Sartori Sartori Giggenheim Burnham et al. Burnham (1972) et al. (1977) (1976) & Bailey (1973) (1973) (1973) (1973) (1977)

193
Figure 7.2. Phlogopite KMg3AlSi3O10(OH,F)2, perspective a‐axis projection, b‐horizontal. There are two distinct Mg sites, M1 and M2
that make up the trioctahedral sheet. M1 has point symmetry 2/m andM2 has point symmetry 2. Theer is a single tetrahedrala site
partially occupied by Al and partly by Si leaving the T‐O‐T sheet with a net negative charge. The charge is balanced by K (sphere) in the
interlayer positions.
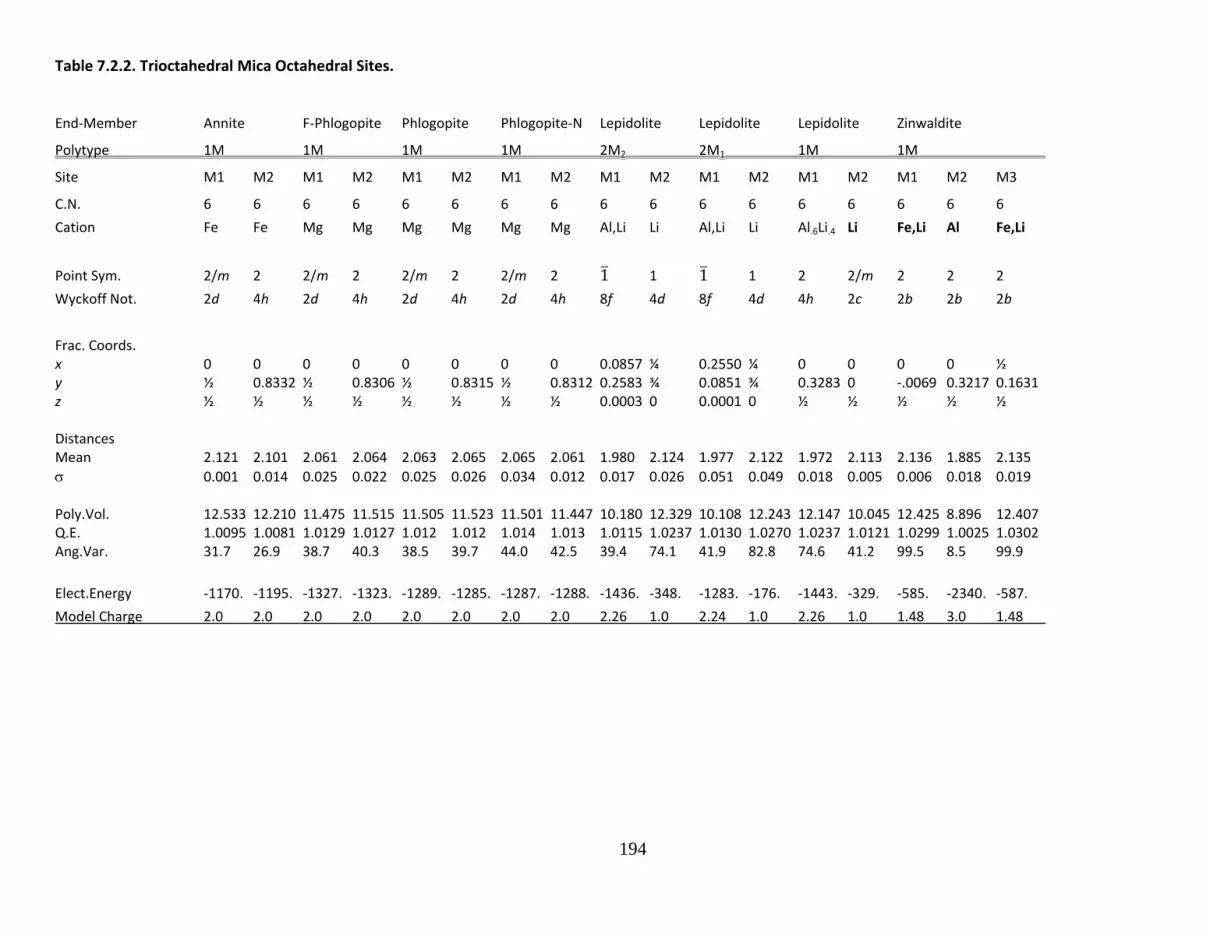
194
Table 7.2.2. Trioctahedral Mica Octahedral Sites.
End‐Member Annite F‐Phlogopite Phlogopite Phlogopite‐N Lepidolite Lepidolite Lepidolite Zinwaldite
Polytype 1M 1M 1M 1M 2M2 2M1 1M 1M
Site M1 M2 M1 M2 M1 M2 M1 M2 M1 M2 M1 M2 M1 M2 M1 M2 M3
C.N. 6 6 6 6 6 6 6 6 6 6 6 6 6 6 6 6 6
Cation Fe Fe Mg Mg Mg Mg Mg Mg Al,Li Li Al,Li Li Al.6Li.4 Li Fe,Li Al Fe,Li
Point Sym. 2/m 2 2/m 2 2/m 2 2/m 2 1 1 1 1 2 2/m 2 2 2
Wyckoff Not. 2d 4h 2d 4h 2d 4h 2d 4h 8f 4d 8f 4d 4h 2c 2b 2b 2b
Frac. Coords. x 0 0 0 0 0 0 0 0 0.0857 ¼ 0.2550 ¼ 0 0 0 0 ½ y ½ 0.8332 ½ 0.8306 ½ 0.8315 ½ 0.8312 0.2583 ¾ 0.0851 ¾ 0.3283 0 ‐.0069 0.3217 0.1631 z ½ ½ ½ ½ ½ ½ ½ ½ 0.0003 0 0.0001 0 ½ ½ ½ ½ ½ Distances Mean 2.121 2.101 2.061 2.064 2.063 2.065 2.065 2.061 1.980 2.124 1.977 2.122 1.972 2.113 2.136 1.885 2.135
0.001 0.014 0.025 0.022 0.025 0.026 0.034 0.012 0.017 0.026 0.051 0.049 0.018 0.005 0.006 0.018 0.019
Poly.Vol. 12.533 12.210 11.475 11.515 11.505 11.523 11.501 11.447 10.180 12.329 10.108 12.243 12.147 10.045 12.425 8.896 12.407 Q.E. 1.0095 1.0081 1.0129 1.0127 1.012 1.012 1.014 1.013 1.0115 1.0237 1.0130 1.0270 1.0237 1.0121 1.0299 1.0025 1.0302 Ang.Var. 31.7 26.9 38.7 40.3 38.5 39.7 44.0 42.5 39.4 74.1 41.9 82.8 74.6 41.2 99.5 8.5 99.9
Elect.Energy ‐1170. ‐1195. ‐1327. ‐1323. ‐1289. ‐1285. ‐1287. ‐1288. ‐1436. ‐348. ‐1283. ‐176. ‐1443. ‐329. ‐585. ‐2340. ‐587.
Model Charge 2.0 2.0 2.0 2.0 2.0 2.0 2.0 2.0 2.26 1.0 2.24 1.0 2.26 1.0 1.48 3.0 1.48
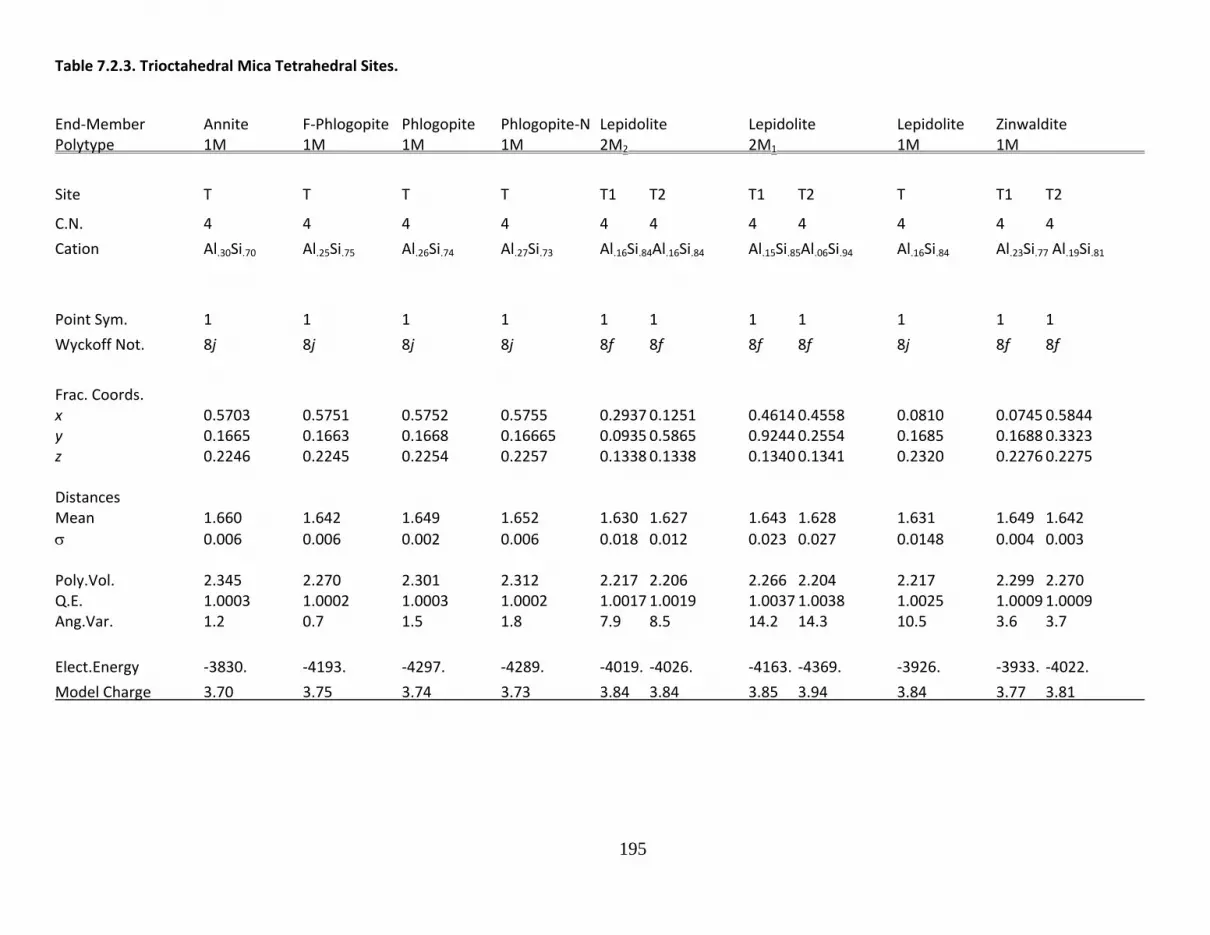
195
Table 7.2.3. Trioctahedral Mica Tetrahedral Sites.
End‐Member Annite F‐Phlogopite Phlogopite Phlogopite‐N Lepidolite Lepidolite Lepidolite Zinwaldite Polytype 1M 1M 1M 1M 2M2 2M1 1M 1M
Site T T T T T1 T2 T1 T2 T T1 T2
C.N. 4 4 4 4 4 4 4 4 4 4 4
Cation Al.30Si.70 Al.25Si.75 Al.26Si.74 Al.27Si.73 Al.16Si.84Al.16Si.84 Al.15Si.85Al.06Si.94 Al.16Si.84 Al.23Si.77 Al.19Si.81
Point Sym. 1 1 1 1 1 1 1 1 1 1 1
Wyckoff Not. 8j 8j 8j 8j 8f 8f 8f 8f 8j 8f 8f
Frac. Coords. x 0.5703 0.5751 0.5752 0.5755 0.2937 0.1251 0.4614 0.4558 0.0810 0.0745 0.5844 y 0.1665 0.1663 0.1668 0.16665 0.0935 0.5865 0.9244 0.2554 0.1685 0.1688 0.3323 z 0.2246 0.2245 0.2254 0.2257 0.1338 0.1338 0.1340 0.1341 0.2320 0.2276 0.2275 Distances Mean 1.660 1.642 1.649 1.652 1.630 1.627 1.643 1.628 1.631 1.649 1.642
0.006 0.006 0.002 0.006 0.018 0.012 0.023 0.027 0.0148 0.004 0.003
Poly.Vol. 2.345 2.270 2.301 2.312 2.217 2.206 2.266 2.204 2.217 2.299 2.270 Q.E. 1.0003 1.0002 1.0003 1.0002 1.0017 1.0019 1.0037 1.0038 1.0025 1.0009 1.0009 Ang.Var. 1.2 0.7 1.5 1.8 7.9 8.5 14.2 14.3 10.5 3.6 3.7
Elect.Energy ‐3830. ‐4193. ‐4297. ‐4289. ‐4019. ‐4026. ‐4163. ‐4369. ‐3926. ‐3933. ‐4022.
Model Charge 3.70 3.75 3.74 3.73 3.84 3.84 3.85 3.94 3.84 3.77 3.81
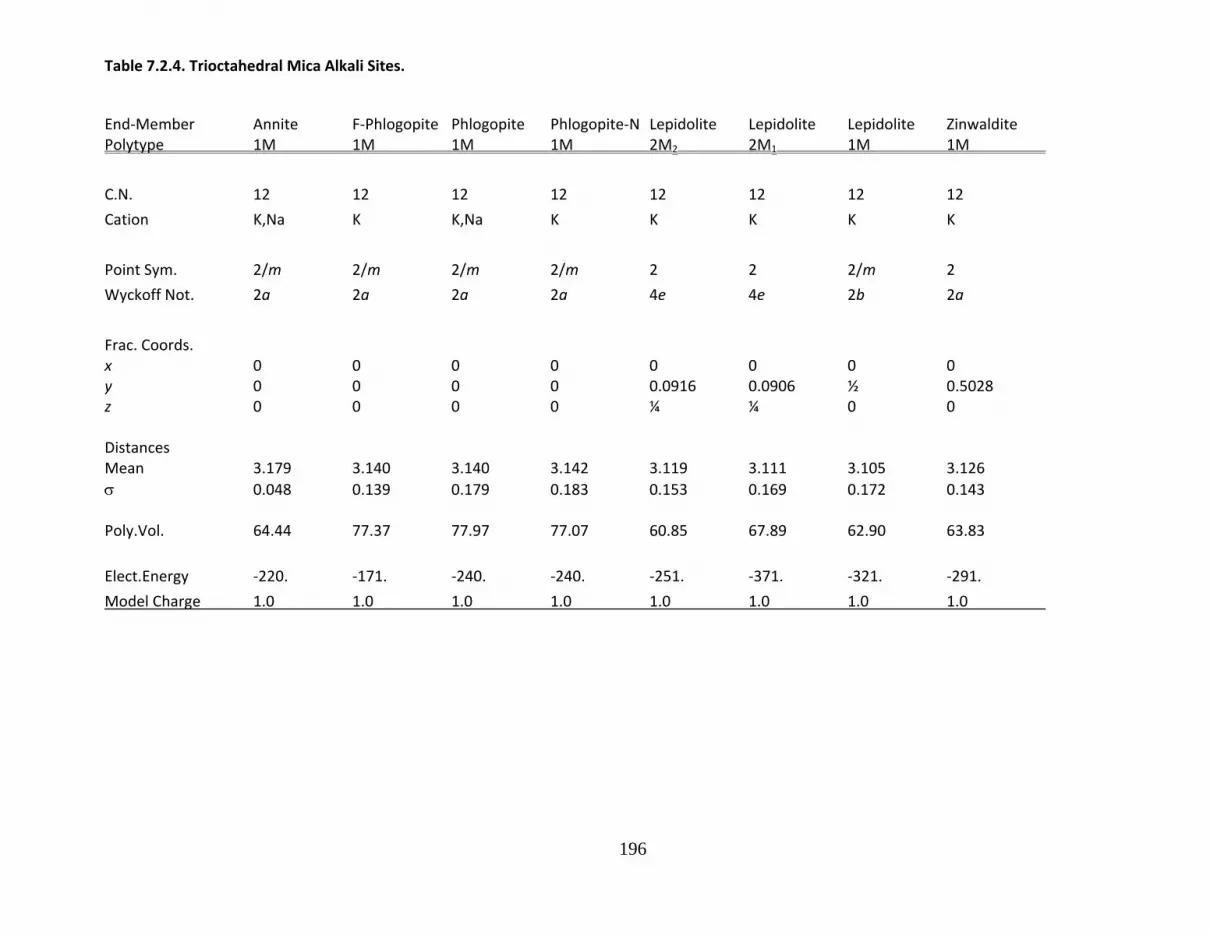
196
Table 7.2.4. Trioctahedral Mica Alkali Sites.
End‐Member Annite F‐Phlogopite Phlogopite Phlogopite‐N Lepidolite Lepidolite Lepidolite Zinwaldite Polytype 1M 1M 1M 1M 2M2 2M1 1M 1M
C.N. 12 12 12 12 12 12 12 12
Cation K,Na K K,Na K K K K K
Point Sym. 2/m 2/m 2/m 2/m 2 2 2/m 2
Wyckoff Not. 2a 2a 2a 2a 4e 4e 2b 2a
Frac. Coords. x 0 0 0 0 0 0 0 0 y 0 0 0 0 0.0916 0.0906 ½ 0.5028 z 0 0 0 0 ¼ ¼ 0 0
Distances Mean 3.179 3.140 3.140 3.142 3.119 3.111 3.105 3.126
0.048 0.139 0.179 0.183 0.153 0.169 0.172 0.143
Poly.Vol. 64.44 77.37 77.97 77.07 60.85 67.89 62.90 63.83
Elect.Energy ‐220. ‐171. ‐240. ‐240. ‐251. ‐371. ‐321. ‐291.
Model Charge 1.0 1.0 1.0 1.0 1.0 1.0 1.0 1.0

197
Table 7.2.1. Trioctahedral Mica Unit Cells
End‐Member Muscovite Paragonite Margarite Polytype 2M1 2M1 2M2 Formula K2 (Na.92K.04Ca.02)2 (K.01Na.19Ca.81)2 Al4 (Al1.99Fe.03Mg.01)2 Al4
Al2Si6 Al2.12Si5.88 (Al1.89Si2.11)2 O20(OH)4 O20(OH)4 O20(OH)4
Form. Wt. (g) 796.627 768.62 791.82 Density (g/cm3) 2.834 2.909 3.061 Mol. Vol. (cm3) 281.14 264.26 258.66 Z 2 2 2
Cryst. Sys. Monoclinic Monoclinic Monoclinic
Laue Class 2/ 2/ m
Space Group C2/c C2/c Cc
Cell Parameters a (Å) 5.1918 5.128 5.1039 b (Å) 9.0153 8.898 8.8287 c (Å) 20.0457 19.287 19.148
(º) 95.735 94.35 95.46
Vol. 933.56 94.35 95.46
Ref. Rothbauer Lin & Guggenheim (1971) Bailey (1984) Bailey (1975,1978)
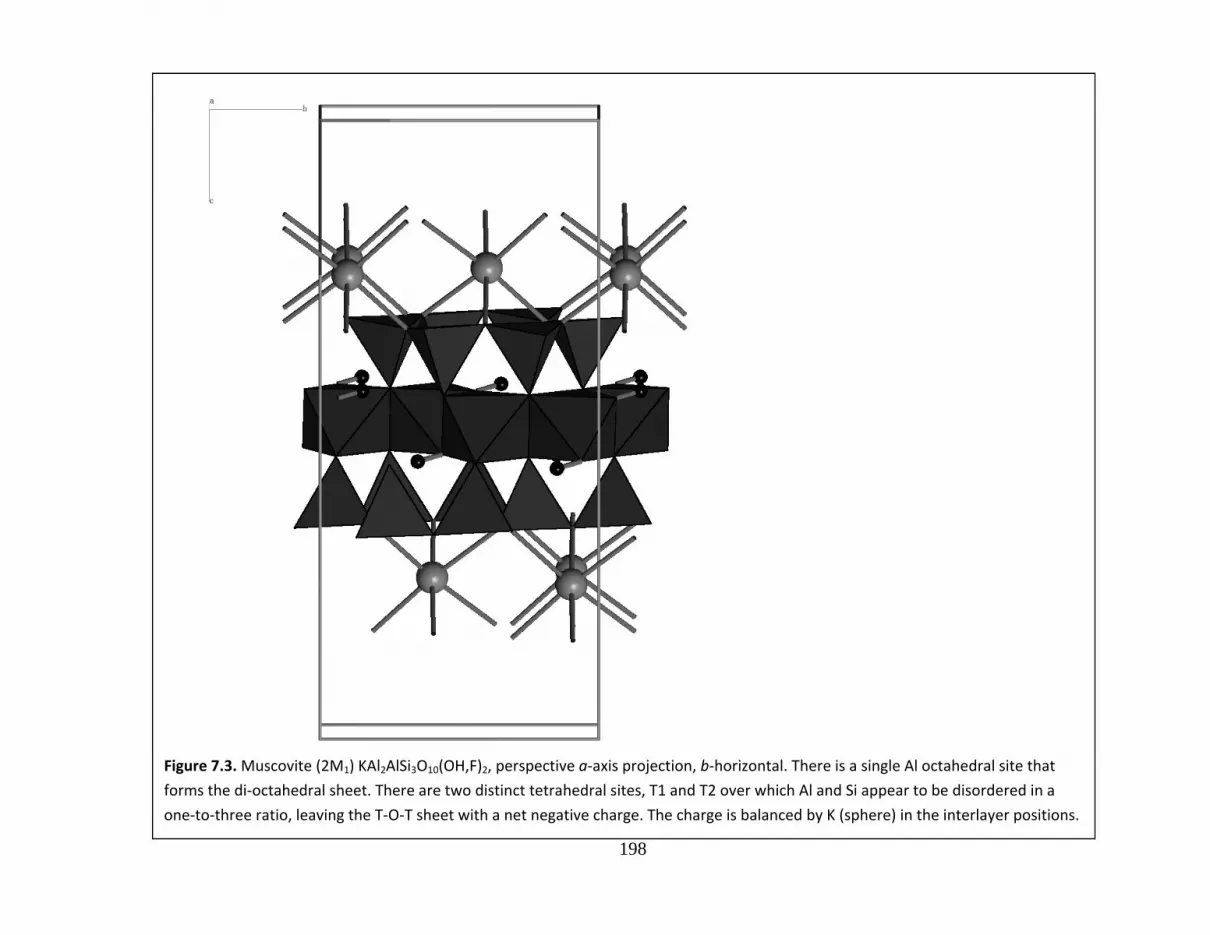
198
Figure 7.3. Muscovite (2M1) KAl2AlSi3O10(OH,F)2, perspective a‐axis projection, b‐horizontal. There is a single Al octahedral site that
forms the di‐octahedral sheet. There are two distinct tetrahedral sites, T1 and T2 over which Al and Si appear to be disordered in a
one‐to‐three ratio, leaving the T‐O‐T sheet with a net negative charge. The charge is balanced by K (sphere) in the interlayer positions.

199
Table 7.3.2. Dioctahedral Mica Octahedral Sites.
End‐Member Muscovite Paragonite Margarite Polytype 2M1 2M1 2M2 Site M1 M2 M2 M3
C.N. 6 6 6 6
Cation Al Al Al Al
Point Sym. 1 1 1 1
Wyckoff Not. 8f 8f 4a 4a
Frac. Coords.
X 0.2502 0.2499 0.7449 0.2488
y 0.0835 0.0832 0.9177 0.0858
z 0.00008 ‐.00002 0.9996 ‐.0003
Distances
Mean 1.930 1.908 1.903 1.915
0.012 0.016 0.034 0.054
Poly.Vol. 9.355 9.040 9.006 9.151
Q.E. 1.0162 1.0162 1.0136 1.0160
Ang.Var. 59.0 59.0 47.9 55.0
Elect.Energy ‐2403. ‐2495. ‐2702 ‐2674.
Model Charge 3.0 3.0 3.0 3.0

200
Table 7.3.3. Dioctahedral Mica Tetrahedral Sites. End‐Member Muscovite Paragonite Margarite Polytype 2M1 2M1 2M2 Site T1 T2 T1 T2 T1 T2 T11 T22
C.N. 4 4 4 4 4 4 4 4
Cation Al.25Si.75 Al.25Si.75 Al.27Si.73 Al.27Si.73 Al.85Si.15 Al.15Si.85 Al.09Si.91 Al.79Si.21
Point Sym. 1 1 1 1 1 1 1 1
Wyckoff Not. 8f 8f 8f 8f 8f 8f 8f 8f
Frac. Coords.
X 0.4646 0.4515 0.9528 0.4401 0.4623 0.4544 0.5336 0.5467
y 0.9291 0.2581 0.4288 0.2578 0.9264 0.2567 0.0739 0.7440
z 0.13553 0.13559 0.1409 0.1409 0.1422 0.1445 0.8551 0.8576
Distances
Mean 1.645 1.644 1.653 1.652 1.747 1.633 1.622 1.736
0.007 0.003 0.004 0.007 0.021 0.006 0.007 0.016
Poly.Vol. 2.279 2.278 2.314 2.312 2.729 2.231 2.186 2.681
Q.E. 1.0012 1.0010 1.0007 1.0007 1.0017 1.0009 1.0006 1.0014
Ang.Var. 5.0 4.1 2.9 3.0 7.3 3.6 2.4 5.5
Elect.Energy ‐3873. ‐3873. ‐3797. ‐3798. ‐2672. ‐4056. ‐4170. ‐2758.
Model Charge 3.75 3.75 3.73 3.73 3.15 3.85 3.91 3.21

201
Table 7.3.4. Dioctahedral Mica Alkali Sites.
End‐Member Muscovite Paragonite Margarite Polytype 2M1 2M1 2M2
C.N. 10 6 6
Cation K Na Ca
Point Sym. 2 2 2
Wyckoff Not. 4e 4e 4a
Frac. Coords. x 0 0 0 y 0.09180 0.0941 0.0933 z ¼ ¼ ¼
Distances Mean 3.031 2.624 2.455
0.224 0.102 0.032
Poly.Vol. 51.27 23.95 19.66
Elect.Energy ‐298. ‐314. ‐920.
Model Charge 1.0 1.0 2.0

202
Table 7.4.1. Clay Mineral Unit Cells
End‐Member Nacrite Dickite Kaolinite Amesite Lizardite
Formula Al2Si2O5(OH)4 Al2Si2O5(OH)4 Al2Si2O5(OH)4 Mg1.7Al.95Fe2+.32 Mg2.79Al.07Fe
2+.04Fe
3+.10
Al.92Si1.09O5(OH)4 Al.17Si1.83O5(OH)4 Form. Wt. (g) 258.162 258.162 258.162 288.02 281.55 Density (g/cm3) 2.602 2.619 2.601 2.778 2.625 Mol. Vol. (cm3) 99.221 98.578 99.326 103.69 107.26 Z 4 4 2 4 1
Cryst. Sys. Monoclinic Monoclinic Triclinic Triclinic Trigonal
Laue Class m m 1 1 31m
Space Group Cc Cc P1 C1 P31m
Cell Parameters a (Å) 8.909 5.1375 5.153 5.319 5.332 b (Å) 5.146 8.9178 8.941 9.208 c (Å) 15.697 14.389 7.403 14.060 7.233
(º) 91.692
(º) 113.70 96.74 104.860 90.27
(º) 89.822
Vol. 658.95 654.68 329.52 688.61 178.09
Ref. Blount et al. Joswig & Suitch & Hall & Bailey Mellini (1969) Drits (1986) Young (1983) (1979) (1982)
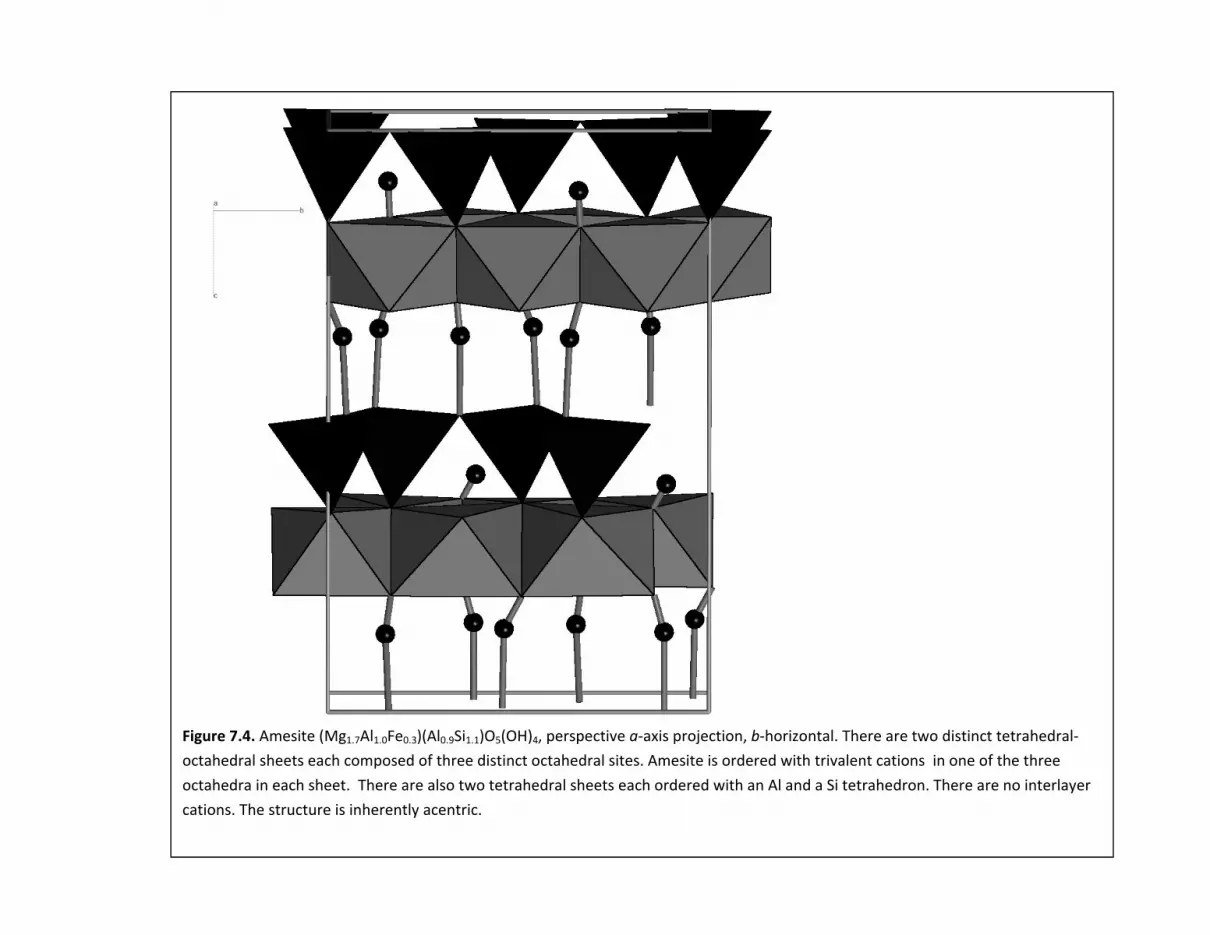
203
Figure 7.4. Amesite (Mg1.7Al1.0Fe0.3)(Al0.9Si1.1)O5(OH)4, perspective a‐axis projection, b‐horizontal. There are two distinct tetrahedral‐
octahedral sheets each composed of three distinct octahedral sites. Amesite is ordered with trivalent cations in one of the three
octahedra in each sheet. There are also two tetrahedral sheets each ordered with an Al and a Si tetrahedron. There are no interlayer
cations. The structure is inherently acentric.

204
Table 7.4.2a. Clay Mineral Octahedral Sites
End‐Member Nacrite Dickite Kaolinite
Site Al(1) Al(2) Al(1) Al(2) Al(1) Al(2) Al(3) Al(4)
C.N. 6 6 6 6 6 6 6 6
Cation Al Al Al Al Al Al Al Al
Point Sym. 1 1 1 1 1 1 1 1
Wyckoff Not. 4a 4a 4a 4a 4a 4a 4a 4a
Frac. Coords.
X 0.1582 0.5004 ‐.0854 0.4153 0.367 0.339 0.846 0.847
y 0.3389 0.3248 0.25257 0.41760 0.490 0.824 ‐.006 0.314
z 0.2202 0.2199 0.23162 0.23092 0.443 0.425 0.442 0.457
Distances
Mean 1.915 1.920 1.900 1.900 1.916 1.885 1.948 1.910
0.075 0.034 0.063 0.056 0.114 0.079 0.095 0.134
Poly.Vol. 9.109 9.192 8.869 8.877 9.022 8.676 9.534 8.920
Q.E. 1.0200 1.0178 1.0211 1.0206 1.0295 1.0205 1.0241 1.0313
Ang.Var. 66.2 63.2 73.2 72.2 91.9 64.4 76.8 93.0
Elect.Energy ‐2541. ‐2536. ‐2560. ‐2523. ‐2663. ‐2648. ‐2493. ‐2640.

205
Table 7.4.2a. Clay Mineral Octahedral Sites
End‐Member Amesite Lizardite
Site M1 M2 M3 M11 M22 M33 M1
C.N. 6 6 6 6 6 6 6
Cation Mg Mg Al Al Mg Mg Mg
Point Sym. 1 1 1 1 1 1 m
Wyckoff Not. 1a 1a 1a 1a 1a 1a 3c
Frac. Coords.
X 0.1668 0.6678 0.6721 0.3337 0.3294 0.8305 0.3327
y 0.1710 0.0013 0.3372 0.3359 0.0003 0.1650 0
z 0.2384 0.2374 0.2373 0.7363 0.7388 0.7385 0.4596
Distances
Mean 2.096 2.087 1.946 1.947 2.096 2.086 2.066
0.021 0.037 0.027 0.022 0.030 0.028 0.032
Poly.Vol. 11.776 11.633 9.677 9.696 11.772 11.624 11.499
Q.E. 1.0287 1.0288 1.0102 1.0102 1.0286 1.0277 1.0155
Ang.Var. 91.0 88.1 33.3 33.5 90.6 88.4 49.2
Elect.Energy ‐1163. ‐1177. ‐2540. ‐2537. ‐1169. ‐1177. ‐1230.

206
Table 7.4.3. Clay Mineral Tetrahedral Sites
End‐Member Nacrite Dickite Kaolinite Amesite Lizardite Site T1 T2 Si1 Si2 T1 T2 T3 T4 T1 T2 T11 T22 T
C.N. 4 4 4 4 4 4 4 4 4 4 4 4 4
Cation Si Si Si Si Si Si Si Si Al.12Si.88 Al.24Si.76Al.27Si.73 Al.21Si.79 Si
Point Sym. 1 1 1 1 1 1 1 1 1 1 1 1 3
Wyckoff Not. 4a 4a 4a 4a 1a 1a 1a 1a 1a 1a 1a 1a 2b
Frac. Coords.
X 0.2022 0.3699 0.0123 ‐.0013 0.047 0.061 0.544 0.579 0 ‐.0059 ‐.0117 0.4900 1/3
y 0.4789 ‐.0139 0.4016 0.0730 0.322 0.662 0.831 0.156 0 0.3353 0.0010 0.1786 2/3
z 0.0311 0.0310 0.0407 0.0401 0.070 0.054 q0.048 0.064 0.0410 0.0416 0.5424 0.5408 0.0766
Distances
Mean 1.617 1.620 1.612 1.612 1.619 1.641 1.659 1.569 1.639 1.726 1.725 1.649 1.638
0.020 0.013 0.009 0.008 0.065 0.087 0.0852 0.087 0.036 0.029 0.010 0.032 0.015
Poly.Vol. 2.155 2.169 2.142 2.144 2.134 2.249 2.325 1.965 2.257 2.651 2.631 2.299 2.255
Q.E. 1.0044 1.0037 1.0024 1.0019 1.0151 1.0072 1.0076 1.0084 1.0008 1.0006 1.0005 1.0007 1.0004
Ang.Var. 17.3 15.4 10.7 8.4 40.5 24.6 20.6 26.8 0.7 1.8 1.9 1.4 1.9
Elect.Energy ‐4225. ‐4219. ‐4245. ‐4244. ‐4343. ‐4135. ‐3957. ‐4292. ‐3934. ‐2736. ‐2826. ‐3832. ‐4112.
Model Charge 4.0 4.0 4.0 4.0 4.0 4.0 4.0 4.0 3.88 3.76 3.73. 3.79 4.0
207
Chapter8.FrameworkSilicateMinerals
Tektosilicate Minerals
8.1. Silica Polymorphs
8.2. Alkali Feldspars
8.3 Alkaline Earth Feldspars
8.4. Feldspathoid Group
8.5. Beryl and Cordierite
8.6. Scapolite Group
8.7. Zeolite Group

208
Table 8.1.1. Silica Polymorph Unit Cells.
Polymorph ‐Quartz Coesite Stishovite ‐Cristobalite ‐Tridymite Formula SiO2 SiO2 SiO2 SiO2 SiO2 Form. Wt. (g) 60.085 60.085 60.085 60.085 60.085 Density (g/cm3) 2.648 2.909 4.287 2.318 2.269 Mol. Vol. (cm3) 22.688 20.657 14.017 25.925 26.478 Z 4 4 2 4 1
Cryst. Sys. Trigonal Monoclinic Tetragonal Tetragonal Monoclinic
Laue Class 32 2/m 4/mmm 422 m
Space Group P3221 or P3121 C2/c P42/mnm P41212 Cc
Cell Parameters a (Å) 4.9134 7.1464 4.1790 4.978 18.494 b (Å) 12.3796 4.991 c (Å) 5.4052 7.1829 2.6651 6.948 25.832
(º) 120.283 117.75
Vol. 113.01 548.76 46.54 172.17 2110.2
Ref. LePage Smyth Baur & Kahn Peacor Kato & Nukui et al. (1980) et al. (1987) (1971) (1973) (1976)

209
Figure 8.1a. Quartz, SiO2, perspective c‐axis projection, a‐vertical. The framework is inherently acentric with left or right‐handed
spirals of corner‐sharing tetrahedral. All tetrahedral are identical. Si has point symmetry 2 whereas O is in the general position
with point symmetry 1. There are two distinct Si‐O distances in the structure. At 573ºC, the structure transforms to hexagonal
with breaking Si‐O bonds.
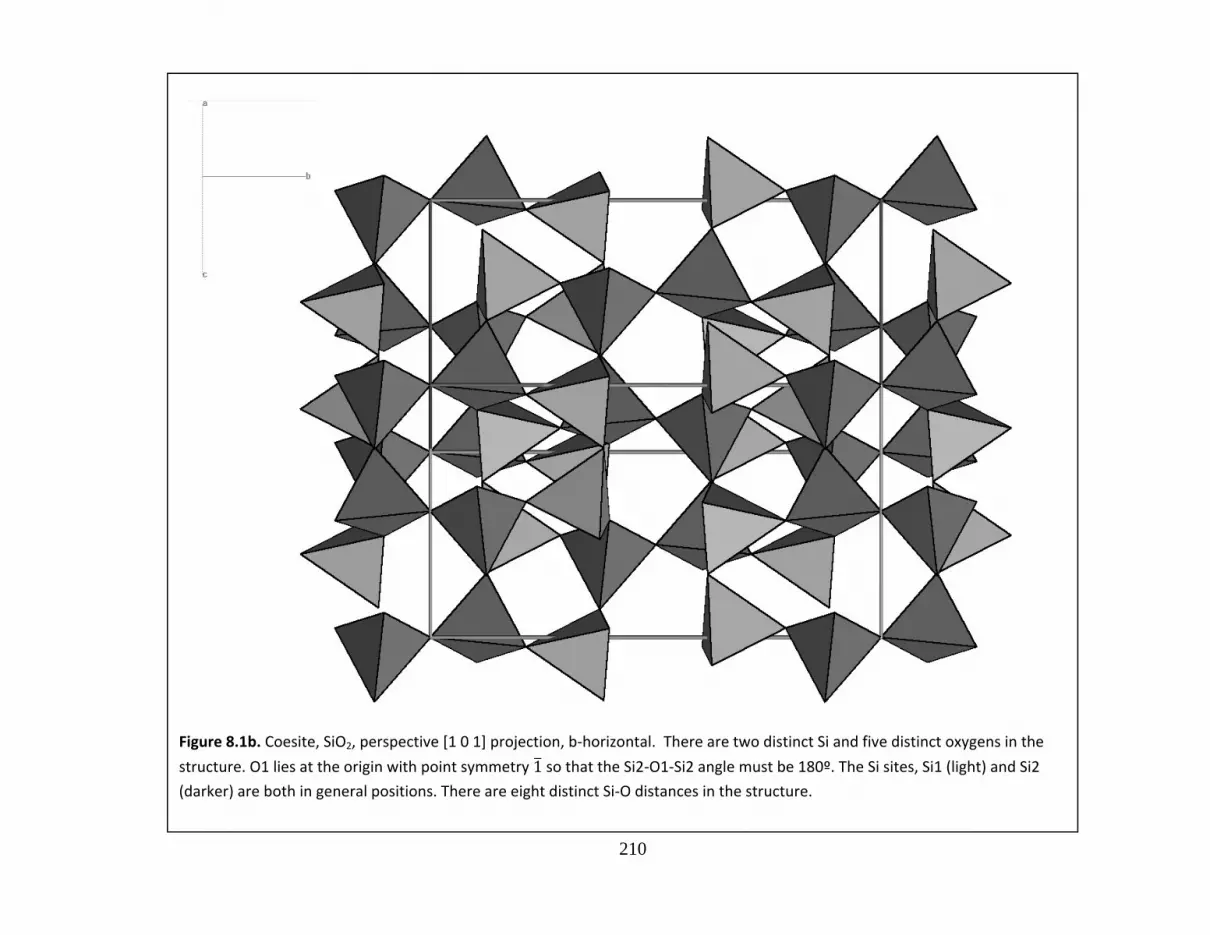
210
Figure 8.1b. Coesite, SiO2, perspective [1 0 1] projection, b‐horizontal. There are two distinct Si and five distinct oxygens in the
structure. O1 lies at the origin with point symmetry 1so that the Si2‐O1‐Si2 angle must be 180º. The Si sites, Si1 (light) and Si2
(darker) are both in general positions. There are eight distinct Si‐O distances in the structure.

211
Figure 8.1c. Cristobalite, SiO2, c‐axis projection, b‐horizontal. At elevated temperature the structure is cubic but become
tetragonal at room temperature on cooling.
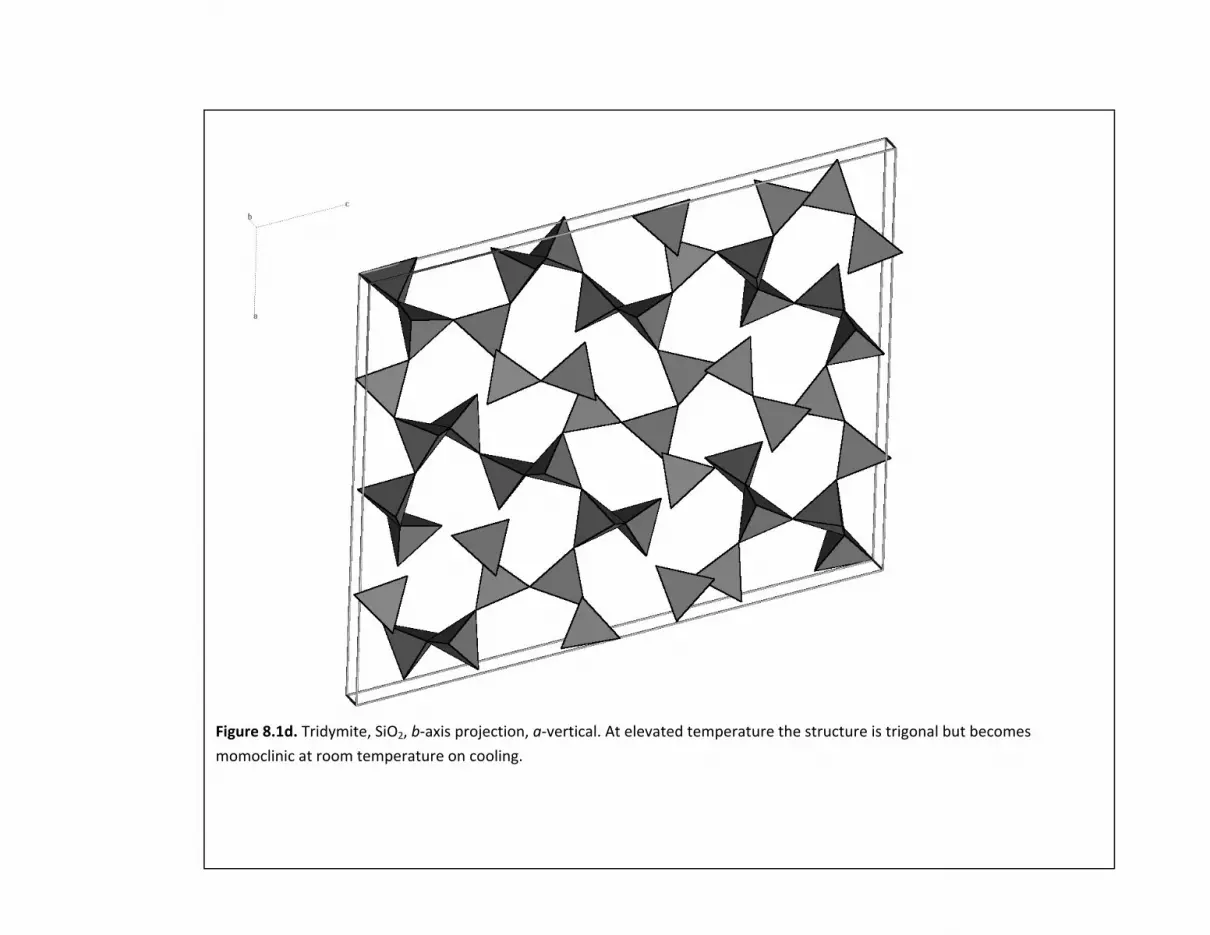
212
Figure 8.1d. Tridymite, SiO2, b‐axis projection, a‐vertical. At elevated temperature the structure is trigonal but becomes
momoclinic at room temperature on cooling.
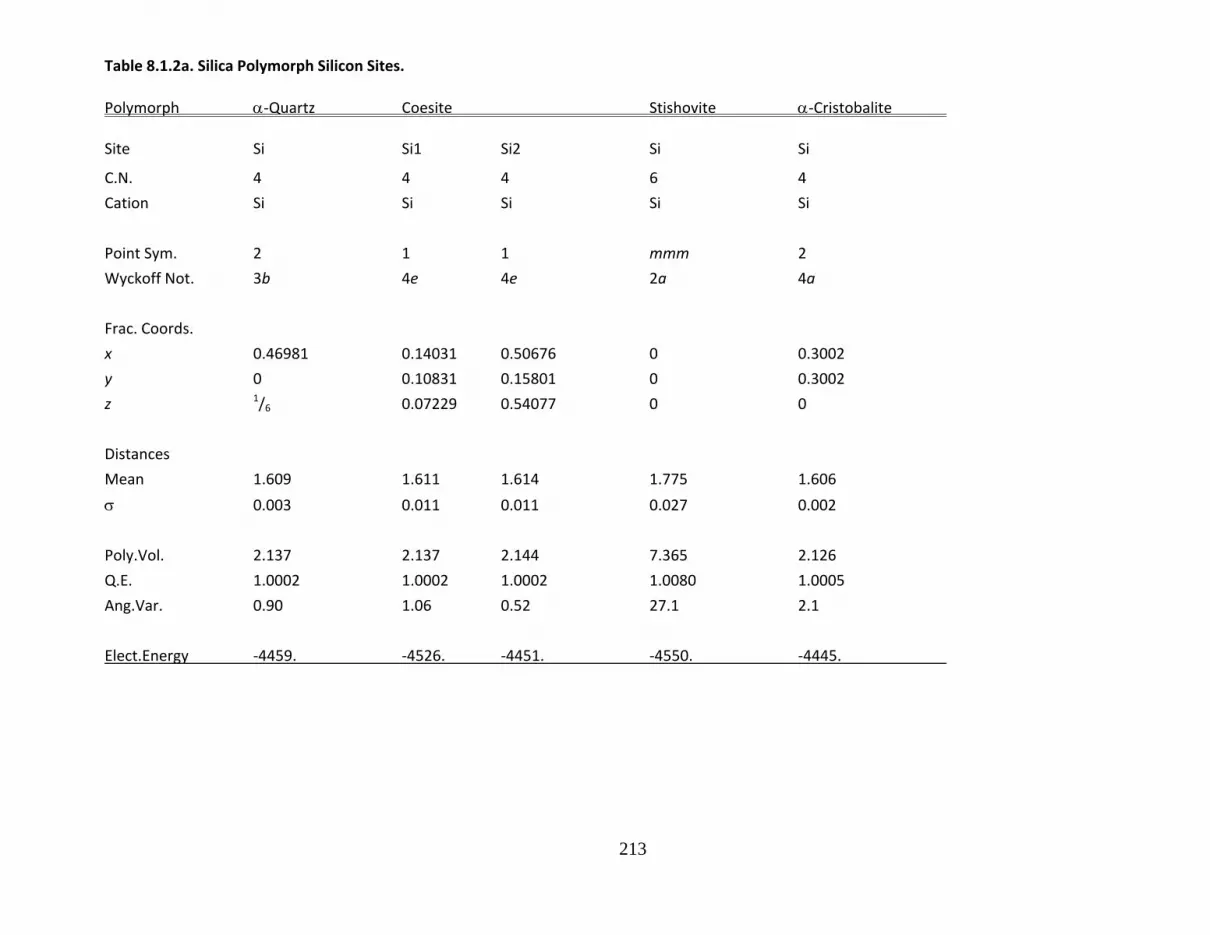
213
Table 8.1.2a. Silica Polymorph Silicon Sites.
Polymorph ‐Quartz Coesite Stishovite ‐Cristobalite Site Si Si1 Si2 Si Si
C.N. 4 4 4 6 4
Cation Si Si Si Si Si
Point Sym. 2 1 1 mmm 2
Wyckoff Not. 3b 4e 4e 2a 4a
Frac. Coords.
x 0.46981 0.14031 0.50676 0 0.3002
y 0 0.10831 0.15801 0 0.3002
z 1/6 0.07229 0.54077 0 0
Distances
Mean 1.609 1.611 1.614 1.775 1.606
0.003 0.011 0.011 0.027 0.002
Poly.Vol. 2.137 2.137 2.144 7.365 2.126
Q.E. 1.0002 1.0002 1.0002 1.0080 1.0005
Ang.Var. 0.90 1.06 0.52 27.1 2.1
Elect.Energy ‐4459. ‐4526. ‐4451. ‐4550. ‐4445.

214
Table 8.1.2b. a‐Tridymite Silicon Sites.
Polymorph ‐Tridymite Site Si1 Si2 Si3 Si4 Si5 Si6 Si7 Si8 Si9 Si10 Si11 Si12
C.N. 4 4 4 4 4 4 4 4 4 4 4 4
Cation Si Si Si Si Si Si Si Si Si Si Si Si
Point Sym. 1 1 1 1 1 1 1 1 1 1 1 1
Wyckoff Not. 8f 8f 8f 8f 8f 8f 8f 8f 8f 8f 8f 8f
Frac. Coords.
x 0.0200 0.2067 0.0349 0.2228 0.0538 0.2427 0.2680 0.451 0.2929 0.4837 0.2991 0.4834
y 0.1896 0.2899 0.7046 0.8046 0.1992 0.2059 0.7848 0.7040 0.3006 0.1994 0.7130 0.8043
z 0.0380 0.0969 0.2021 0.2619 0.3763 0.4377 0.0628 0.1284 0.2329 0.3013 0.3959 0.4606
Distances
Mean 1.605 1.598 1.600 1.597 1.599 1.588 1.604 1.590 1.581 1.588 1.597 1.596
0.024 0.028 0.010 0.024 0.022 0.030 0.019 0.016 0.014 0.018 0.026 0.011
Poly.Vol. 2.1196 2.091 2.099 2.087 2.097 2.052 2.115 2.062 2.026 2.054 2.088 2.086
Q.E. 1.0005 1.0007 1.0003 1.0006 1.0006 1.0007 1.0012 1.0002 1.0005 1.0006 1.0009 1.0003
Ang.Var. 1.46 1.82 1.25 1.90 1.42 1.10 4.33 0.65 209 2.38 1.96 14.06
Elect.Energy ‐4426. ‐4445. ‐4469 ‐4493. ‐4463. ‐4507. ‐4438. ‐4488. ‐4554. ‐4525. ‐4464. ‐4450.

215
Table 8.2.1. Alkali Feldspar Unit Cells.
Polymorph Sanidine Orthoclase Microcline Rb‐Feldspar High Albite Low Albite Formula KAlSi3O8 KAlSi3O8 KAlSi3O8 RbAlSi3O8 NaAlSi3O8 NaAlSi3O8
Form. Wt. (g) 278.337 278.337 278.337 324.705 262.225 262.225
Density (g/cm3) 2.578 2.571 2.567 2.930 2.610 2.621 Mol. Vol. (cm3) 107.958 108.283 108.425 110.825 100.452 100.054 Z 4 4 2 4 1
Cryst. Sys. Monoclinic Monoclinic Triclinic Monoclinic Triclinic Triclinic
Laue Class 2/m 2/m 1 2/m 1 1
Space Group C2/m C2/m C1 C2/m C1 C1
Cell Parameters a (Å) 8.539 8.561 8.560 8.820 8.161 8.142 b (Å) 13.015 12.996 12.964 12.992 12.875 12.785 c (Å) 7.179 7.192 7.215 7.161 7.110 7.159
(º) 90.065 93.53 94.19
(º) 115.90 116.01 115.83 116.24 116.46 116.61
(º) 87.70 90.24 87.68
Vol. 717.15 719.13 720.07 736.01 667.12 664.48
Ref. Phillips & Colville & Brown & Gasperin Winter et al. Harlow & Ribbe (1973) Ribbe (1968) Bailey (1964) (1971) (1979) Brown (1980)

216
Figure 8.2. Albite, NaAlSi3O8, [1 0 1] projection, b‐horizontal. This an illustration of the basic framework common to all feldspars. The
topologic symmetry of the framework is monoclinic, C2/m, and sanidine and disordered (high) albite at high temperature both have this
symmetry with two distinct tetrahedral sites, T1 and T2. Si/Al ordering and collapse of the framework around the smalle Na cation (sphere)
can both result in loweringthe symmetrty to triclinic, C1. The triclinic structure has four distinct tetrahedral T10, T1m, T20 and T2m. Ordering
of Al and Si may then result in all of the Al residing in T10 (lighter tetrahedron). Additional Al cannot then be placed in the ordered structure
without resulying in Al – O – Al bonds which are energetically unfavorable, so the alkaline earth feldspars, anothite and celsian, have a more
complex ordering scheme with a doubled (14Å) c‐axis.
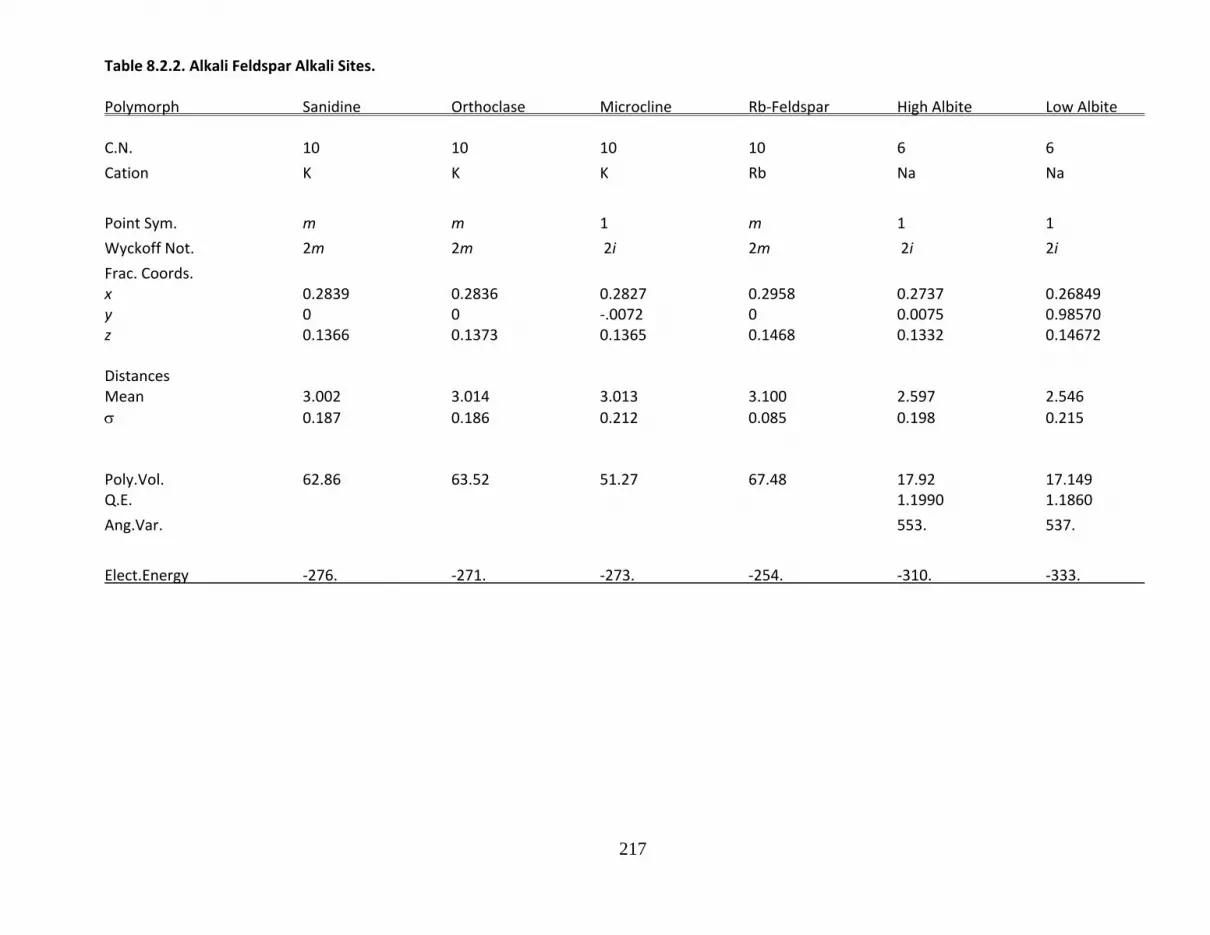
217
Table 8.2.2. Alkali Feldspar Alkali Sites.
Polymorph Sanidine Orthoclase Microcline Rb‐Feldspar High Albite Low Albite C.N. 10 10 10 10 6 6
Cation K K K Rb Na Na
Point Sym. m m 1 m 1 1
Wyckoff Not. 2m 2m 2i 2m 2i 2i
Frac. Coords. x 0.2839 0.2836 0.2827 0.2958 0.2737 0.26849 y 0 0 ‐.0072 0 0.0075 0.98570 z 0.1366 0.1373 0.1365 0.1468 0.1332 0.14672
Distances Mean 3.002 3.014 3.013 3.100 2.597 2.546
0.187 0.186 0.212 0.085 0.198 0.215
Poly.Vol. 62.86 63.52 51.27 67.48 17.92 17.149 Q.E. 1.1990 1.1860
Ang.Var. 553. 537.
Elect.Energy ‐276. ‐271. ‐273. ‐254. ‐310. ‐333.
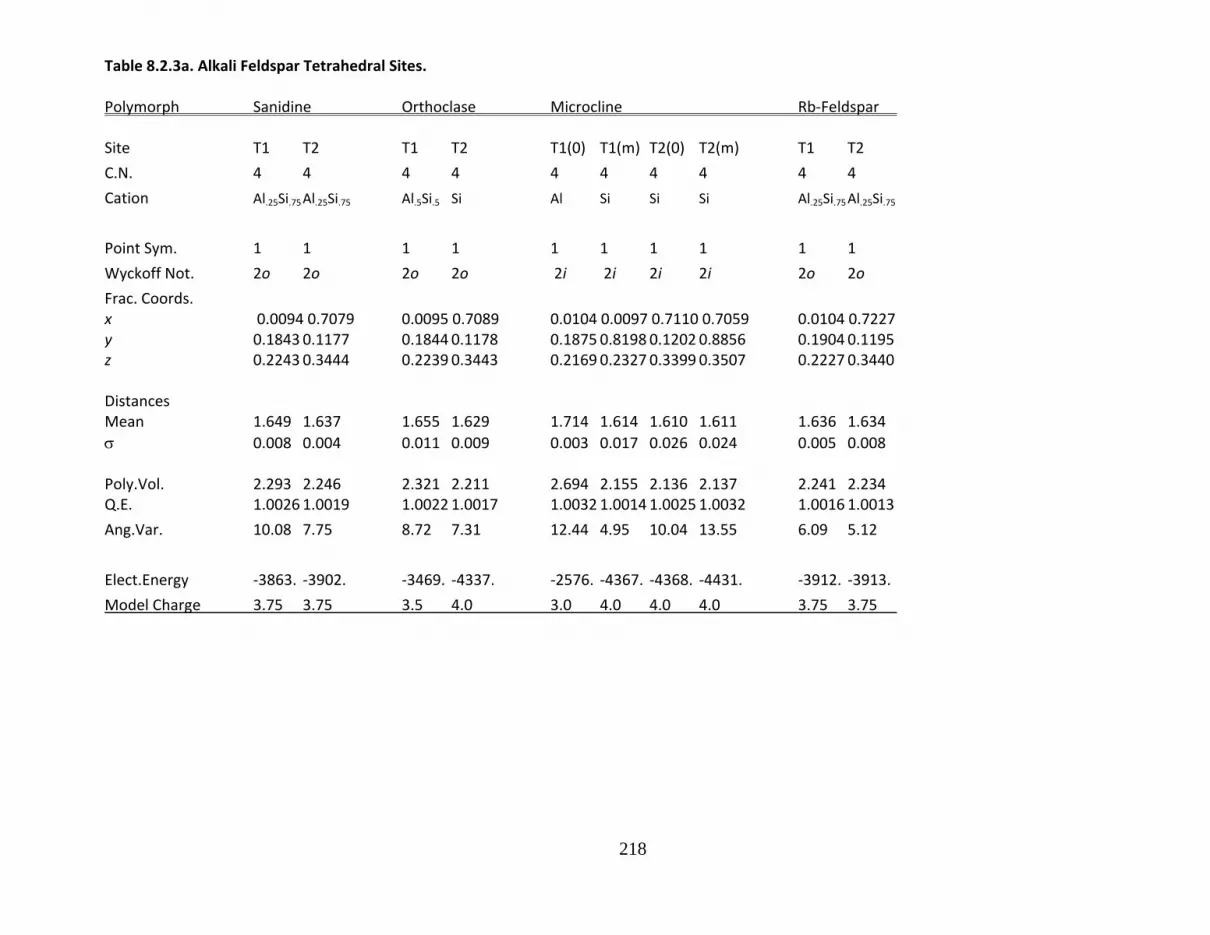
218
Table 8.2.3a. Alkali Feldspar Tetrahedral Sites.
Polymorph Sanidine Orthoclase Microcline Rb‐Feldspar Site T1 T2 T1 T2 T1(0) T1(m) T2(0) T2(m) T1 T2
C.N. 4 4 4 4 4 4 4 4 4 4
Cation Al.25Si.75 Al.25Si.75 Al.5Si.5 Si Al Si Si Si Al.25Si.75 Al.25Si.75
Point Sym. 1 1 1 1 1 1 1 1 1 1
Wyckoff Not. 2o 2o 2o 2o 2i 2i 2i 2i 2o 2o
Frac. Coords. x 0.0094 0.7079 0.0095 0.7089 0.0104 0.0097 0.7110 0.7059 0.0104 0.7227 y 0.1843 0.1177 0.1844 0.1178 0.1875 0.8198 0.1202 0.8856 0.1904 0.1195 z 0.2243 0.3444 0.2239 0.3443 0.2169 0.2327 0.3399 0.3507 0.2227 0.3440
Distances Mean 1.649 1.637 1.655 1.629 1.714 1.614 1.610 1.611 1.636 1.634
0.008 0.004 0.011 0.009 0.003 0.017 0.026 0.024 0.005 0.008
Poly.Vol. 2.293 2.246 2.321 2.211 2.694 2.155 2.136 2.137 2.241 2.234 Q.E. 1.0026 1.0019 1.0022 1.0017 1.0032 1.0014 1.0025 1.0032 1.0016 1.0013
Ang.Var. 10.08 7.75 8.72 7.31 12.44 4.95 10.04 13.55 6.09 5.12
Elect.Energy ‐3863. ‐3902. ‐3469. ‐4337. ‐2576. ‐4367. ‐4368. ‐4431. ‐3912. ‐3913.
Model Charge 3.75 3.75 3.5 4.0 3.0 4.0 4.0 4.0 3.75 3.75

219
Table 8.2.3b. Alkali Feldspar Tetrahedral Sites.
Polymorph High Albite Low Albite Site T1(0) T1(m) T2(0) T2(m) T1(0) T1(m) T2(0) T2(m)
C.N. 4 4 4 4 4 4 4 4
Cation Al.25Si.75 Al.25Si.75 Al.25Si.75 Al.25Si.75 Al Si Si Si
Point Sym. 1 1 1 1 1 1 1 1
Wyckoff Not. 2i 2i 2i 2i 2i 2i 2i 2i
Frac. Coords.
x 0.0090 0.0048 0.3904 0.6849 0.00901 0.00386 0.69201 0.68152 y 0.1649 0.8146 0.1080 0.8726 0.16862 0.82062 0.11036 0.88195 z 0.2147 0.2289 0.3202 0.3537 0.20806 0.23728 0.31508 0.36078
Distances Mean 1.649 1.642 1.641 1.643 1.750 1.624 1.614 1.616
0.005 0.012 0.011 0.010 0.019 0.024 0.016 0.022
Poly.Vol. 2.287 2.267 2.263 2.273 2.700 2.185 2.151 2.158 Q.E. 1.0040 1.0019 1.0017 1.0007 1.0128 1.0044 1.0022 1.0021
Ang.Var. 105.97 7.42 7.02 3.03 51.26 15.78 9.57 8.99
Elect.Energy ‐3839. ‐3915. ‐3911. ‐3880. ‐2530. ‐4363. ‐4375. ‐4393.
Model Charge 3.75 3.75 3.75 3.75 3.0 4.0 4.0 4.0
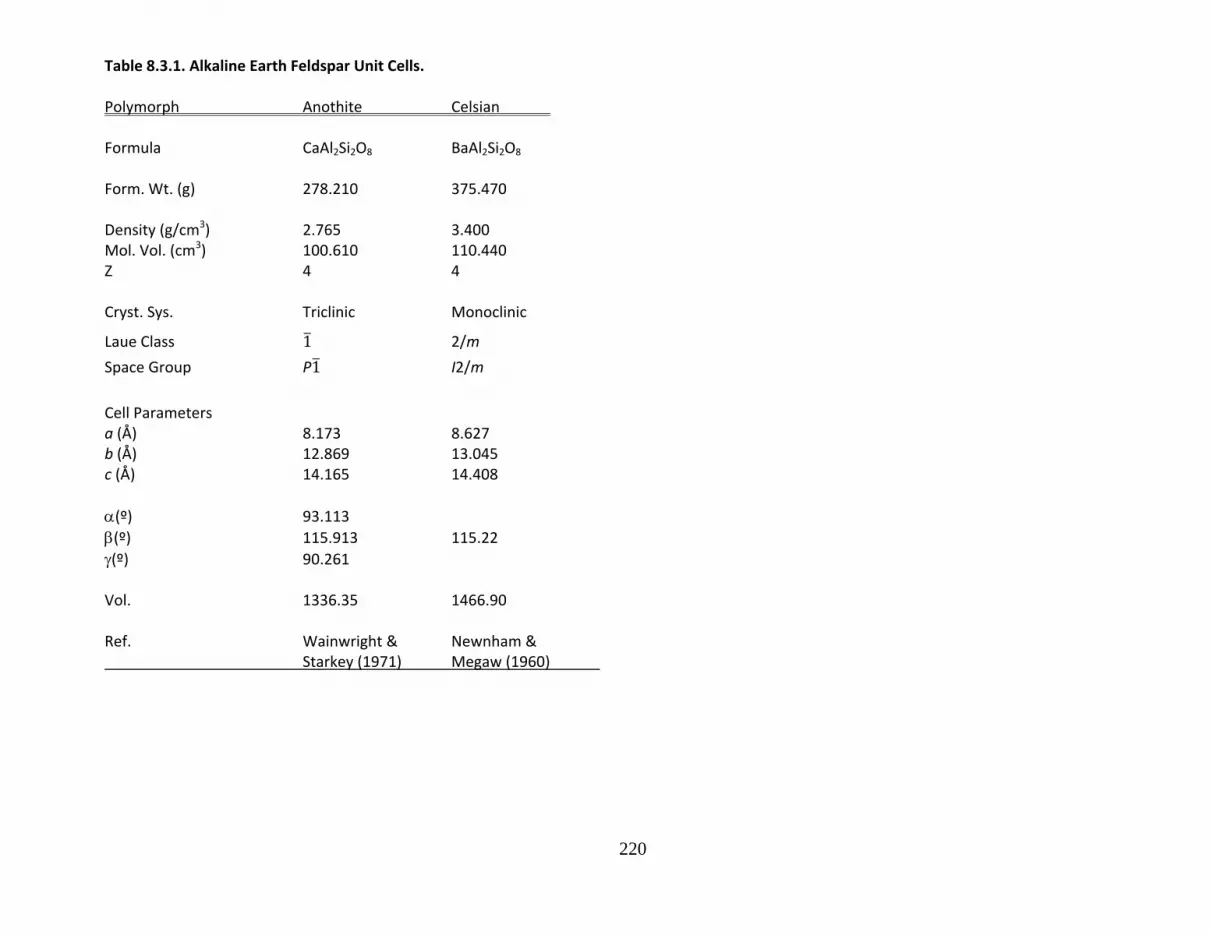
220
Table 8.3.1. Alkaline Earth Feldspar Unit Cells.
Polymorph Anothite Celsian Formula CaAl2Si2O8 BaAl2Si2O8 Form. Wt. (g) 278.210 375.470 Density (g/cm3) 2.765 3.400 Mol. Vol. (cm3) 100.610 110.440 Z 4 4
Cryst. Sys. Triclinic Monoclinic
Laue Class 1 2/m
Space Group P1 I2/m
Cell Parameters a (Å) 8.173 8.627 b (Å) 12.869 13.045 c (Å) 14.165 14.408
(º) 93.113
(º) 115.913 115.22
(º) 90.261 Vol. 1336.35 1466.90
Ref. Wainwright & Newnham & Starkey (1971) Megaw (1960)

221
Table 8.3.1. Alkaline Earth Feldspars Ca and Ba Sites.
Polymorph Anorthite Celsian Site A(000) A(z00) A(0i0) A(zi0) Ba
C.N. 5 6 6 6 9
Cation Ca Ca Ca Ca Ba
Point Sym. 1 1 1 1 m
Wyckoff Not. 2b 2b 2b 2b 2i
Frac. Coords. x 0.2651 0.2692 0.7737 0.7634 0.2826 y 0.9864 0.0312 0.5357 0.5052 0 z 0.0867 0.5354 0.5412 0.0747 0.0653
Distances Mean 2.485 2.516 2.529 2.572 2.921
0.100 0.123 0.150 0.173 0.141
Poly.Vol. 7.861 13.168 12.549 16.201 41.165 Q.E. ‐ 1.378 1.439 1.256 ‐
Ang.Var. ‐ 963.9 41.4 531.8 ‐
Elect.Energy ‐959. ‐957. ‐953. ‐975. ‐809.

222
Table 8.3.1. Alkaline Earth Feldspars Aluminum Sites. Polymorph Anorthite Celsian
Site T1(0z00) T1(0zi0) T1(m000) T1(m0i0) T2(0000) T2(00i0) T2(mz00) T2(mzi0) T1 T2
C.N. 4 4 4 4 4 4 4 4 4 4
Cation Al Al Al Al Al Al Al Al Al Al
Point Sym. 1 1 1 1 1 1 1 1 1 1
Wyckoff Not. 2b 2b 2b 2b 2b 2b 2b 2b 2b 2b
Frac. Coords. x 0.0066 0.4984 0.9912 0.5073 0.6845 0.1907 0.6809 0.1852 0.0073 0.7058 y 0.1610 0.6658 0.8152 0.3145 0.1130 0.6110 0.8719 0.3775 0.1832 0.1205 z 0.6112 0.1128 0.1176 0.6212 0.1519 0.6674 0.6725 0.1816 0.6142 0.1733 Distances Mean 1.747 1.755 1.749 1.744 1.741 1.750 1.744 1.745 1.719 1.712
0.029 0.020 0.035 0.031 0.031 0.017 0.019 0.028 0.014 0.015
Poly.Vol. 2.667 2.667 2.718 2.690 2.694 2.690 2.699 2.716 2.569 2.547 Q.E. 1.0171 1.0269 1.0075 1.0079 1.0039 1.0146 1.0057 1.0024 1.0099 1.0069
Ang.Var. 64.56 99.96 29.84 30.27 14.98 54.13 22.06 9.04 38.37 24.33
Elect.Energy ‐2484. ‐2488. ‐2563. ‐2562. ‐2586. ‐2501. ‐2509. ‐2557. ‐2456. ‐2525.
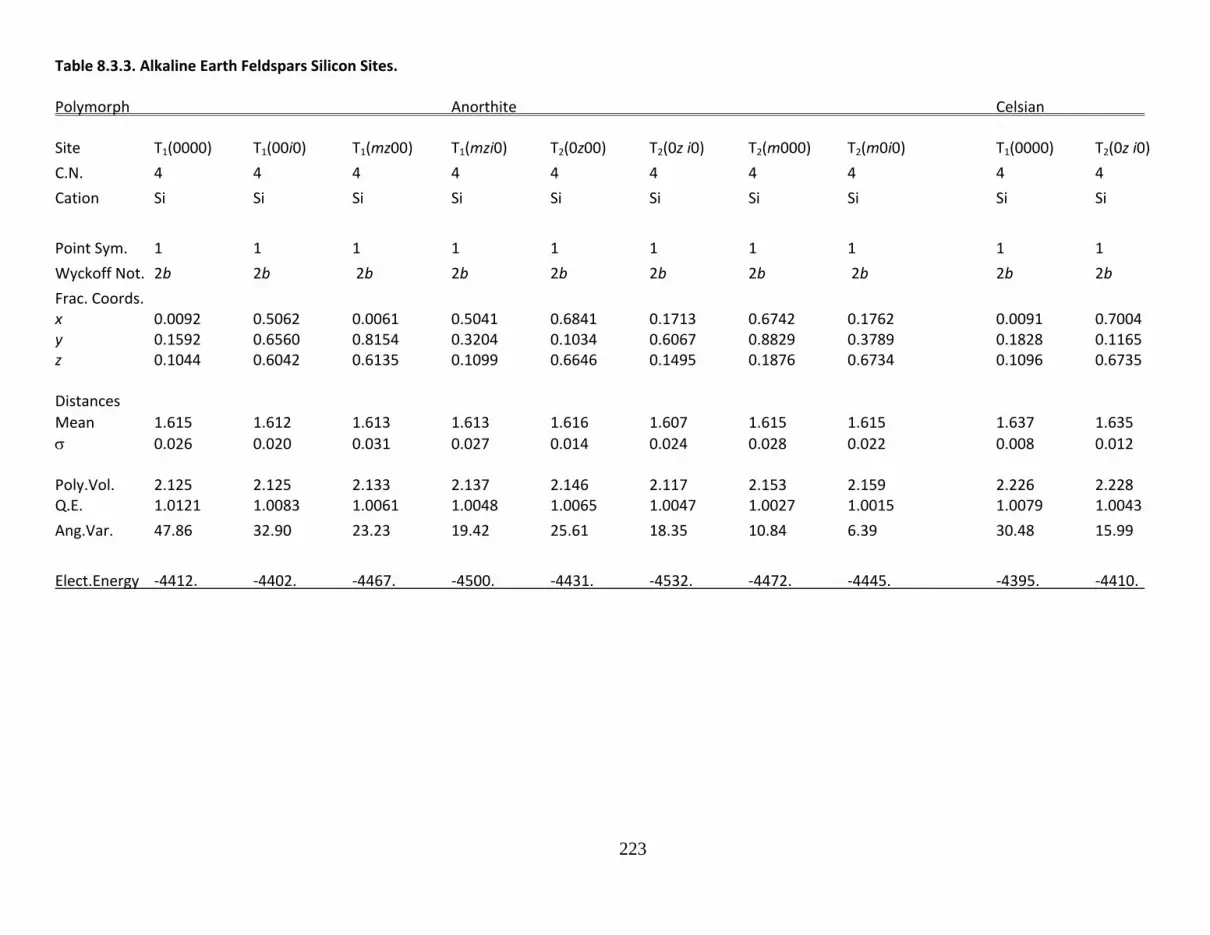
223
Table 8.3.3. Alkaline Earth Feldspars Silicon Sites. Polymorph Anorthite Celsian
Site T1(0000) T1(00i0) T1(mz00) T1(mzi0) T2(0z00) T2(0z i0) T2(m000) T2(m0i0) T1(0000) T2(0z i0)
C.N. 4 4 4 4 4 4 4 4 4 4
Cation Si Si Si Si Si Si Si Si Si Si
Point Sym. 1 1 1 1 1 1 1 1 1 1
Wyckoff Not. 2b 2b 2b 2b 2b 2b 2b 2b 2b 2b
Frac. Coords. x 0.0092 0.5062 0.0061 0.5041 0.6841 0.1713 0.6742 0.1762 0.0091 0.7004 y 0.1592 0.6560 0.8154 0.3204 0.1034 0.6067 0.8829 0.3789 0.1828 0.1165 z 0.1044 0.6042 0.6135 0.1099 0.6646 0.1495 0.1876 0.6734 0.1096 0.6735 Distances
Mean 1.615 1.612 1.613 1.613 1.616 1.607 1.615 1.615 1.637 1.635 0.026 0.020 0.031 0.027 0.014 0.024 0.028 0.022 0.008 0.012
Poly.Vol. 2.125 2.125 2.133 2.137 2.146 2.117 2.153 2.159 2.226 2.228 Q.E. 1.0121 1.0083 1.0061 1.0048 1.0065 1.0047 1.0027 1.0015 1.0079 1.0043
Ang.Var. 47.86 32.90 23.23 19.42 25.61 18.35 10.84 6.39 30.48 15.99
Elect.Energy ‐4412. ‐4402. ‐4467. ‐4500. ‐4431. ‐4532. ‐4472. ‐4445. ‐4395. ‐4410.

224
Table 8.4.1. Feldspathoid Group Unit Cells.
Polymorph Leucite Kalsilite Nepheline Formula KAlSi2O6 KAlSiO4 KNa3Al4Si4O16 Form. Wt. (g) 218.252 158.167 584.332 Density (g/cm3) 2.461 2.621 2.679 Mol. Vol. (cm3) 88.69 60.34 218.09 Z 16 2 2
Cryst. Sys. Tetragonal Hexagonal Hexagonal
Laue Class 4/m 6 6
Space Group I41/a P63 P63
Cell Parameters a (Å) 13.09 5.16 9.993 c (Å) 13.75 8.69 8.374
Vol. 2356. 200.4 724.19
Ref. Mazzi et al. Perrotta & Foreman & (1976) Smith (1967) Peacor (1970)
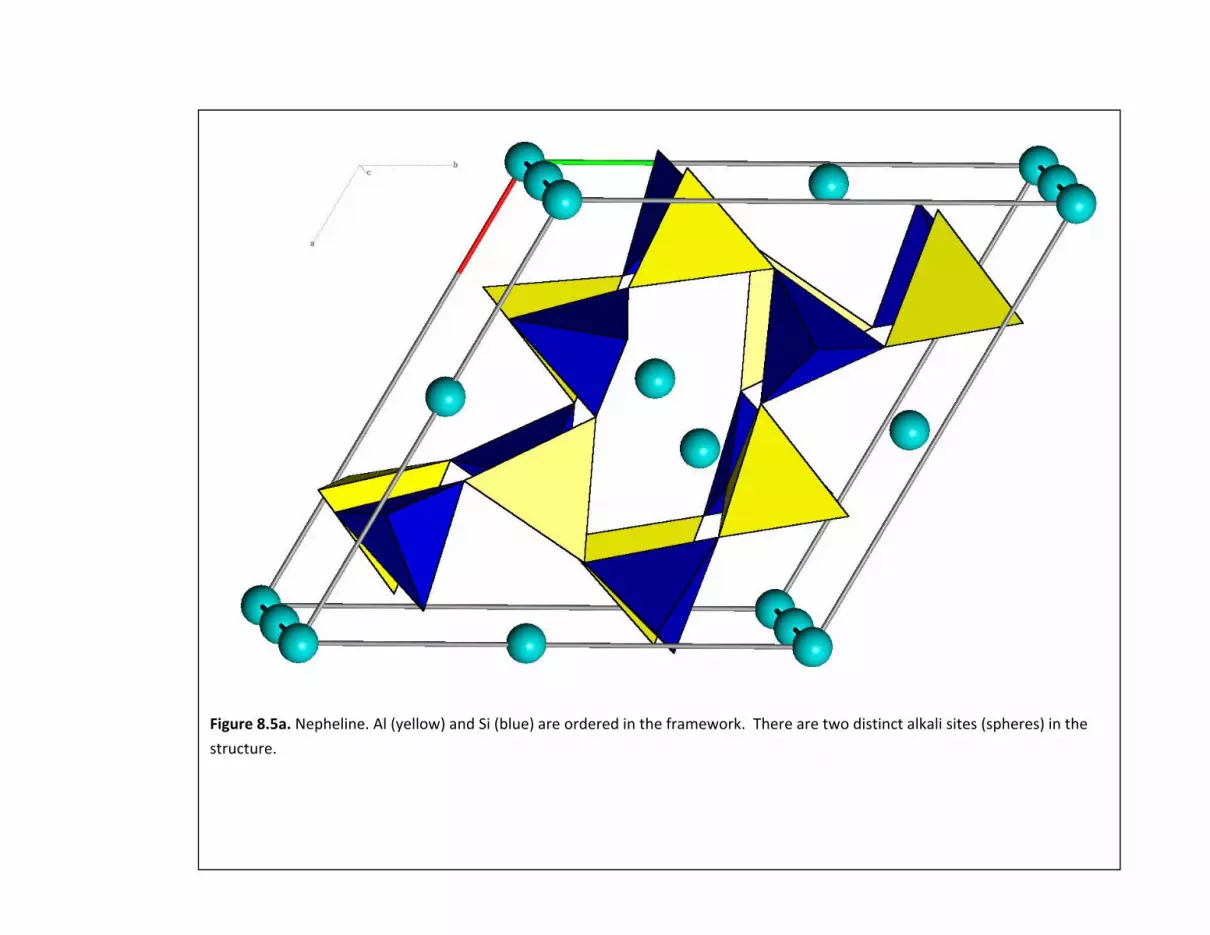
225
Figure 8.5a. Nepheline. Al (yellow) and Si (blue) are ordered in the framework. There are two distinct alkali sites (spheres) in the
structure.

226
Table 8.4.2. Feldspathoid Group Alkali Sites.
Member Leucite Kalsilite Nepheline Site K K K Na
C.N. 6 9 9 8
Cation
Point Sym. 1 3 3 1
Wyckoff Not. 16f 2a 2a 6c
Frac. Coords. x 0.3660 0 0 0.4425 y 0.3645 0 0 0.9968 z 0.1147 0.2411 0.9883 0.9930
Distances Mean 3.015 2.968 3.016 2.620
0.067 0.024 0.030 0.119
Poly.Vol. 23.95 46.96 49.93 26.74 Q.E. 1.3256
Ang.Var. 951.
Elect.Energy ‐237. ‐226. ‐190. ‐278.
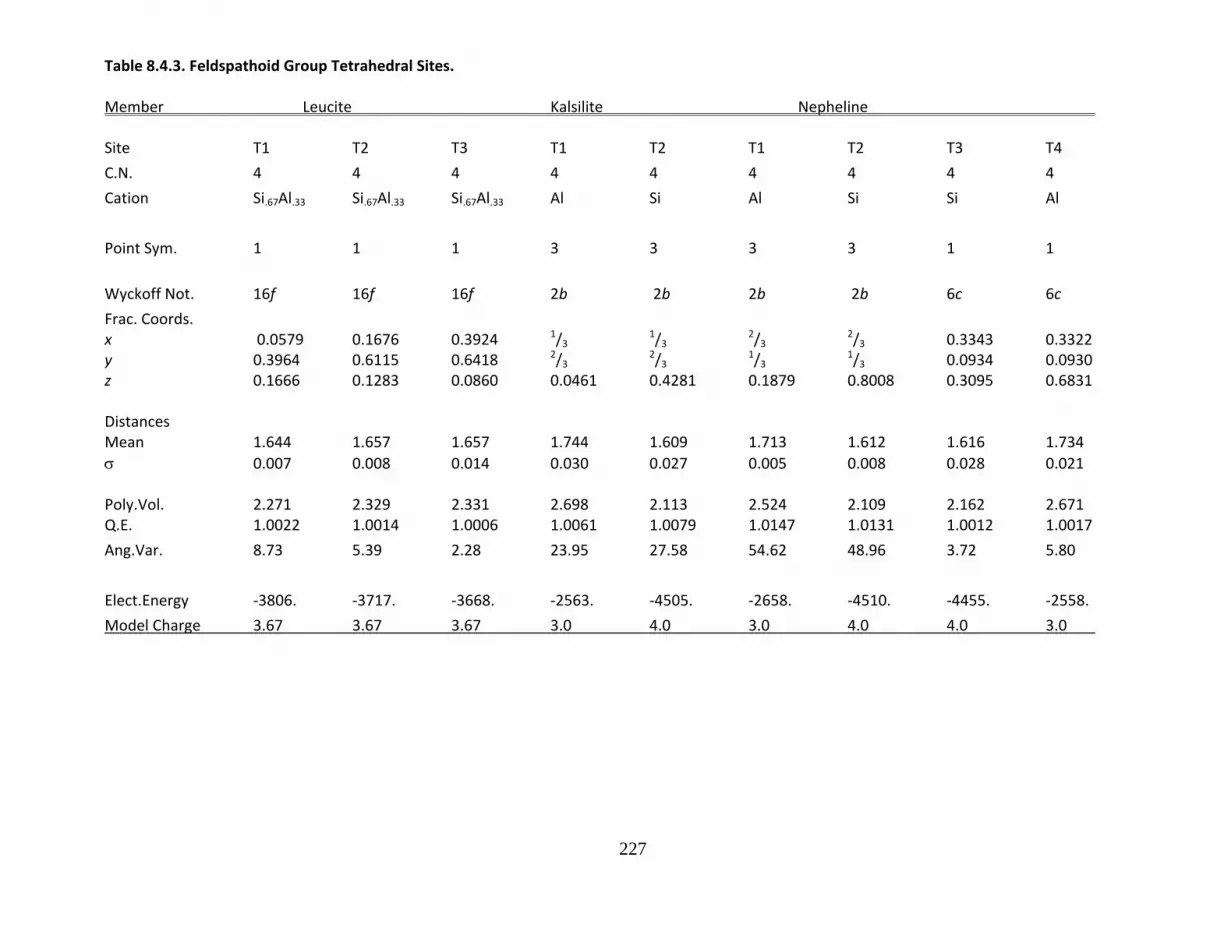
227
Table 8.4.3. Feldspathoid Group Tetrahedral Sites.
Member Leucite Kalsilite Nepheline Site T1 T2 T3 T1 T2 T1 T2 T3 T4
C.N. 4 4 4 4 4 4 4 4 4
Cation Si.67Al.33 Si.67Al.33 Si.67Al.33 Al Si Al Si Si Al
Point Sym. 1 1 1 3 3 3 3 1 1
Wyckoff Not. 16f 16f 16f 2b 2b 2b 2b 6c 6c
Frac. Coords. x 0.0579 0.1676 0.3924 1/3 1/3 2/3 2/3 0.3343 0.3322 y 0.3964 0.6115 0.6418 2/3 2/3 1/3 1/3 0.0934 0.0930 z 0.1666 0.1283 0.0860 0.0461 0.4281 0.1879 0.8008 0.3095 0.6831
Distances Mean 1.644 1.657 1.657 1.744 1.609 1.713 1.612 1.616 1.734
0.007 0.008 0.014 0.030 0.027 0.005 0.008 0.028 0.021
Poly.Vol. 2.271 2.329 2.331 2.698 2.113 2.524 2.109 2.162 2.671 Q.E. 1.0022 1.0014 1.0006 1.0061 1.0079 1.0147 1.0131 1.0012 1.0017
Ang.Var. 8.73 5.39 2.28 23.95 27.58 54.62 48.96 3.72 5.80
Elect.Energy ‐3806. ‐3717. ‐3668. ‐2563. ‐4505. ‐2658. ‐4510. ‐4455. ‐2558.
Model Charge 3.67 3.67 3.67 3.0 4.0 3.0 4.0 4.0 3.0
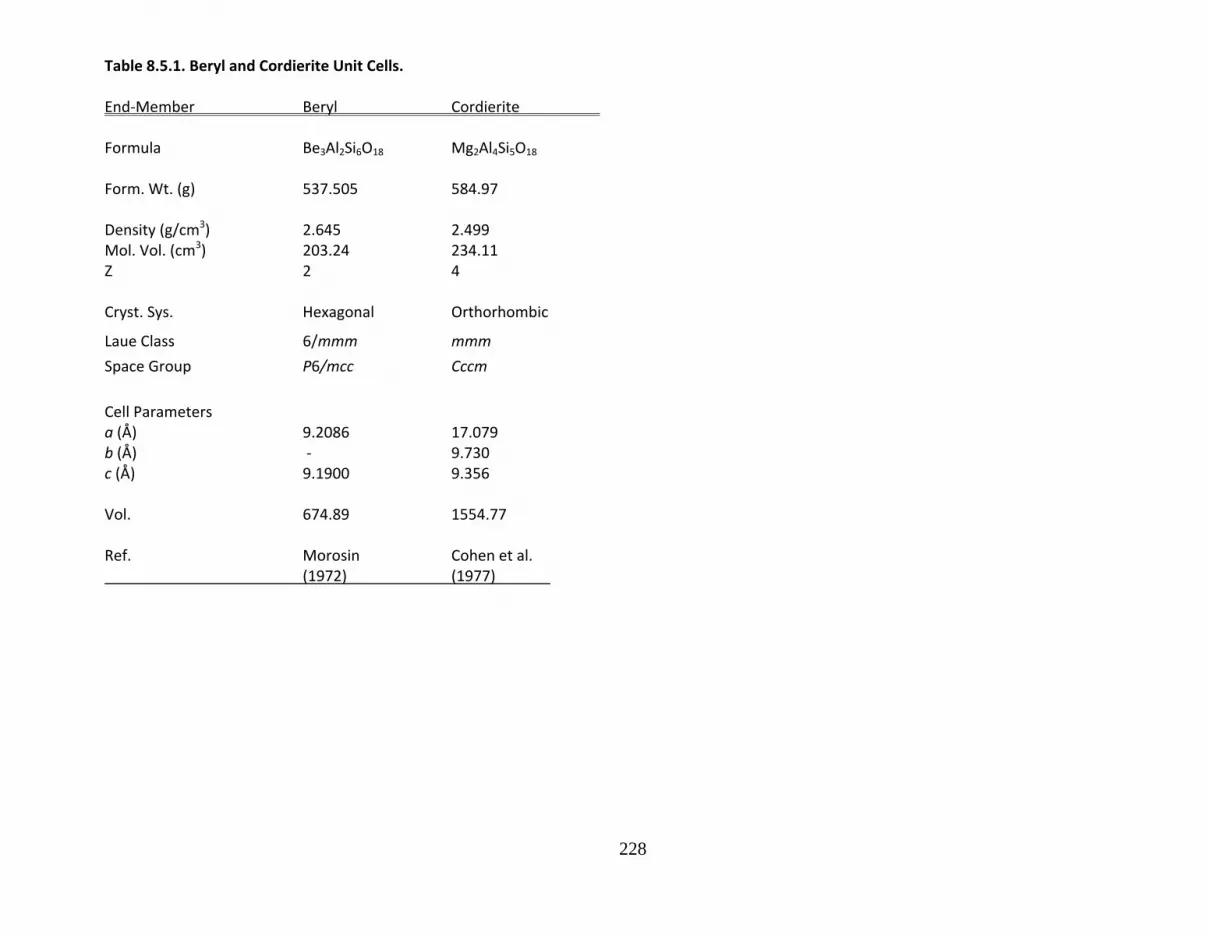
228
Table 8.5.1. Beryl and Cordierite Unit Cells.
End‐Member Beryl Cordierite Formula Be3Al2Si6O18 Mg2Al4Si5O18 Form. Wt. (g) 537.505 584.97 Density (g/cm3) 2.645 2.499 Mol. Vol. (cm3) 203.24 234.11 Z 2 4
Cryst. Sys. Hexagonal Orthorhombic
Laue Class 6/mmm mmm
Space Group P6/mcc Cccm
Cell Parameters a (Å) 9.2086 17.079 b (Å) ‐ 9.730 c (Å) 9.1900 9.356 Vol. 674.89 1554.77
Ref. Morosin Cohen et al. (1972) (1977)

229
Figure 8.5a. Beryl Be3Al2Si6O18. Si6O18 rings dominate the structure with a channel site (sphere) variably occupied by H2O or an alkali
cation. Be (green) is in a distorted tetrahedral site, and Al (yellow) is in octahedral coordination.
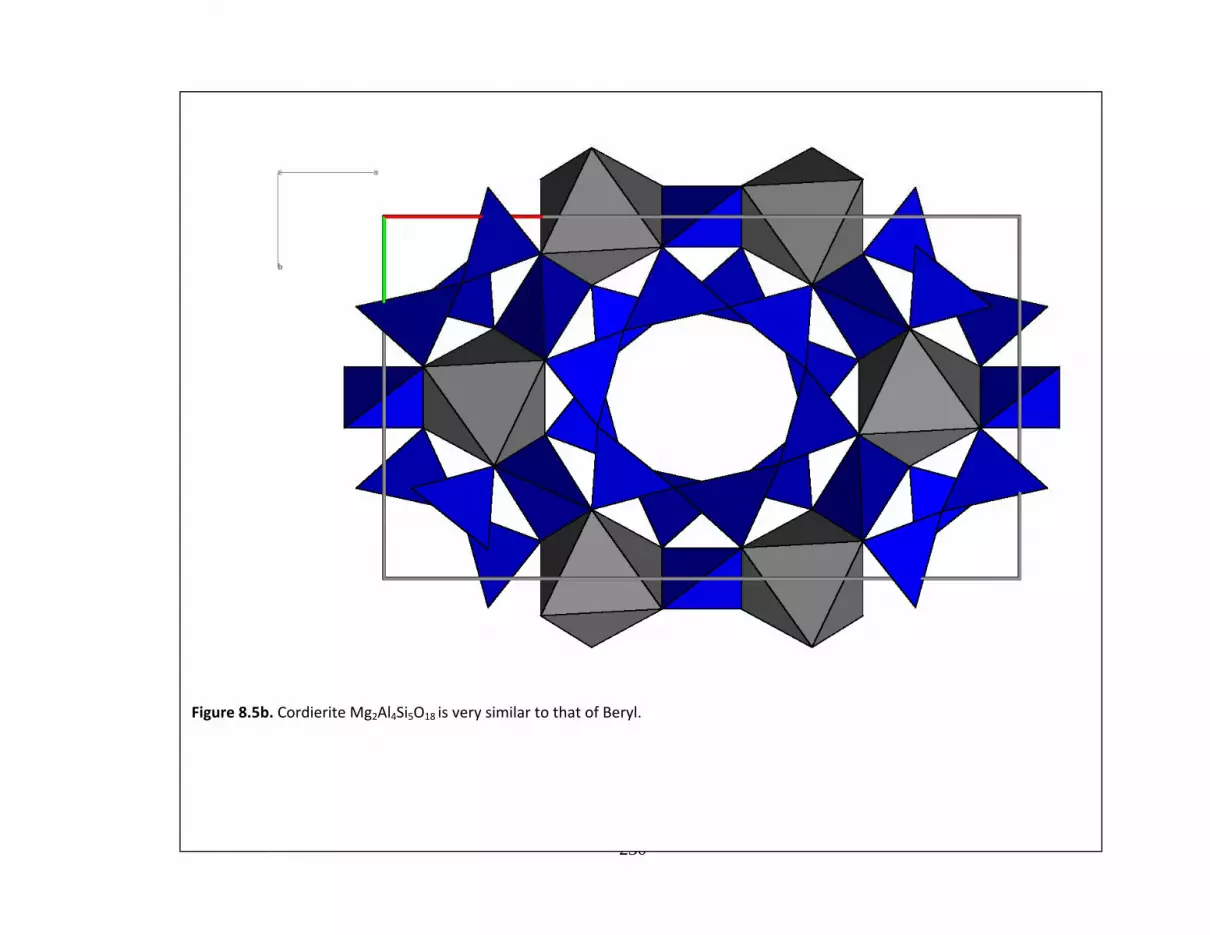
230
Figure 8.5b. Cordierite Mg2Al4Si5O18 is very similar to that of Beryl.

231
Table 8.5.2. Beryl Cation Sites
Member Beryl Site Be Al Si
C.N. 4 6 4
Cation Be Al Si
Point Sym. 222 32 m
Wyckoff Not. 6f 4c 12l
Frac. Coords. x ½ 2/3 0.38749 y 0 1/3 0.11587 z 1/4 ¼ 0
Distances Mean 1.654 1.906 1.608
0.001 0.001 0.015
Poly.Vol. 2.027 8.939 2.123 Q.E. 1.0950 1.0218 1.0006
Ang.Var. 331.7 75.5 1.69
Elect.Energy ‐1348. ‐2086. ‐4474.

232
Table 8.5.3. Cordierite Cation Sites
Member Cordierite Site Alkali M T1‐1 T2‐6 T1‐6 T2‐1 T3‐3
C.N. 8 6 4 4 4 4 4
Cation Na,K Mg Al Al Si Si Si
Point Sym. 2/m 2 2 m 222 m m
Wyckoff Not. 4c 8g 8k 8l 4b 8l 8l
Frac. Coords. x 0 0.1625 ¼ 0.0508 0 0.1926 ‐.1352 y 0 ½ ¼ 0.3079 ½ 0.0778 0.2375 z 0 ¼ 0.2502 0 ¼ 0 0
Distances Mean 2.509 2.110 1.758 1.742 1.626 1.614 1.617
0.160 0.008 0.001 0.036 0.000 0.026 0.027
Poly.Vol. 23.256 11.798 2.581 2.705 2.133 2.155 2.166 Q.E. 1.0406 1.0530 1.0025 1.0226 1.0010 1.0015
Ang.Var. 128.4 195.7 10.6 88.6 4.4 6.3
Elect.Energy 0.0 ‐1119. ‐2419. ‐2596. ‐4327. ‐4450. ‐4429.
Model Charge 0.0 2.0 3.0 3.0 4.0 4.0 4.0

233
Table 8.6.1. Scapolite Group Unit Cells.
End‐Member Marialite Meionite Formula (Ideal) Na4Al3Si9O24Cl Ca4Al6Si6O24CO3
Formula (Obs.) Na2.9Ca.8K.2 Ca3.7Na.2K.1
Al3.7Si8.3O24.2 Ca4Al6Si6O24
Cl.7(CO3).2 Cl.03(CO3).95(SO4).03 Form. Wt. (g) 863.5 932.9 Density (g/cm3) 2.599 2.757 Mol. Vol. (cm3) 332.26 338.40 Z 2 2 Cryst. Sys. Tetragonal Tetragonal
Laue Class 4/m 4/m
Space Group P42/n P42/n
Cell Parameters a (Å) 12.059 12.194 c (Å) 7.587 7.557 Vol. 1103.3 1123.7
Ref. Lin & Burley Lin & Burley (1973a) (1973b)

234
Figure 8.6. Scapolite (Marialite) Na4Al3Si9O24Cl, c‐axis projection. THer are three distiunct tetrahedral sites that contain Al and Si in
various degrees of order. Na (green) is interstitial, and Cl is at the origin and middle of the a‐b face.
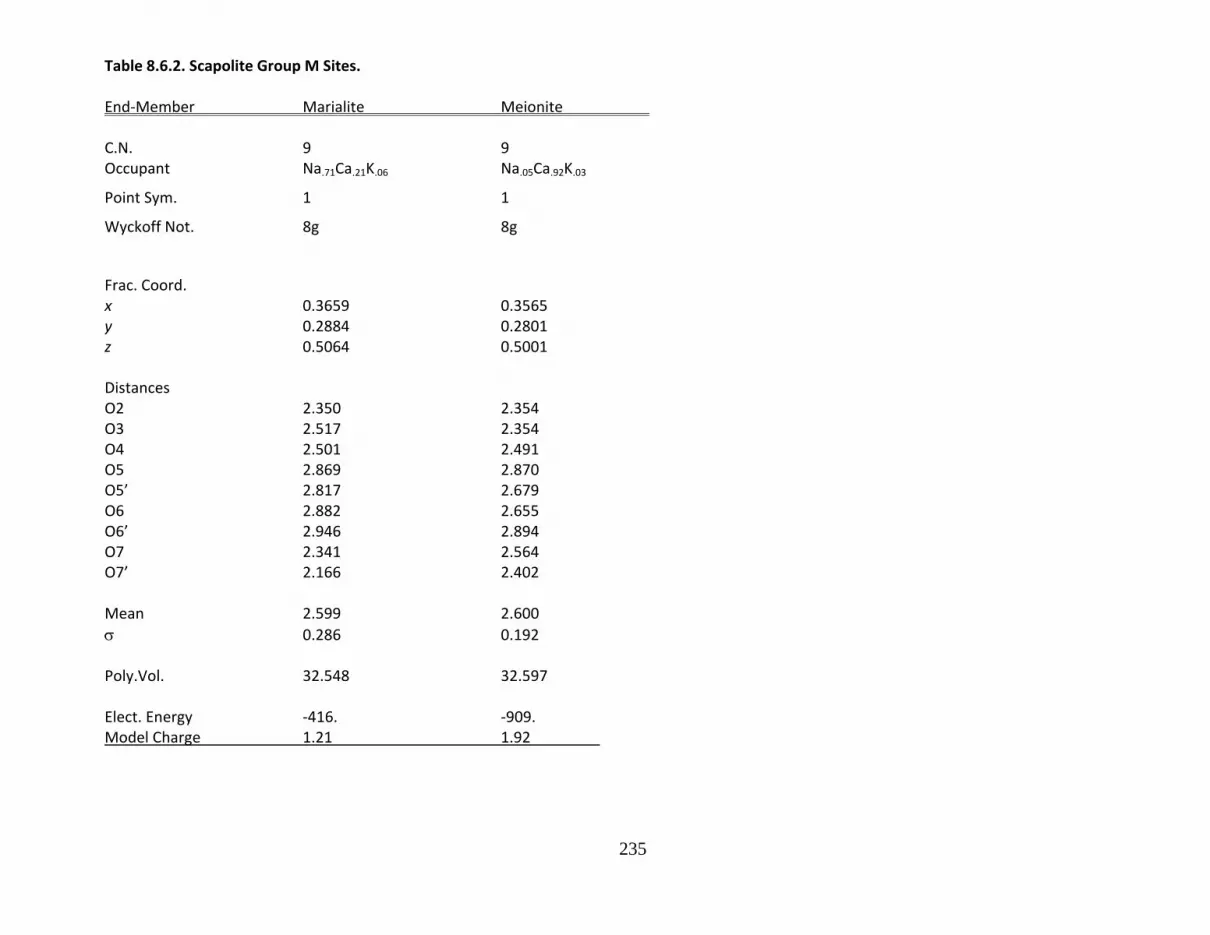
235
Table 8.6.2. Scapolite Group M Sites.
End‐Member Marialite Meionite C.N. 9 9
Occupant Na.71Ca.21K.06 Na.05Ca.92K.03
Point Sym. 1 1
Wyckoff Not. 8g 8g
Frac. Coord. x 0.3659 0.3565 y 0.2884 0.2801 z 0.5064 0.5001 Distances
O2 2.350 2.354 O3 2.517 2.354 O4 2.501 2.491 O5 2.869 2.870 O5’ 2.817 2.679 O6 2.882 2.655 O6’ 2.946 2.894 O7 2.341 2.564 O7’ 2.166 2.402 Mean 2.599 2.600
0.286 0.192 Poly.Vol. 32.548 32.597
Elect. Energy ‐416. ‐909. Model Charge 1.21 1.92

236
Table 8.6.3. Scapolite Group Tetrahedral Sites.
End‐Member Marialite Meionite C.N. 4 4 4 4 4 4
Occupant Si Al.59Si.41 Al.29Si.71 Al.31Si.69 Al.51Si.49 Al.49Si.51
Point Sym. 1 1 1 1 1 1
Wyckoff Not. 8g 8g 8g 8g 8g 8g
Frac. Coord. x 0.3390 0.6621 0.4145 0.3395 0.6599 0.4130 y 0.4100 0.9152 0.8368 0.4074 0.9129 0.8401 z 0.9989 0.7956 0.7085 0.0000 0.7930 0.7072 Distances
1 1.594 1.688 1.646 1.634 1.670 1.679 2 1.612 1.690 1.639 1.674 1.681 1.680 3 1.607 1.693 1.673 1.628 1.681 1.682 4 1.619 1.699 1.644 1.674 1.690 1.673 Mean 1.608 1.693 1.651 1.653 1.681 1.679
0.011 0.005 0.015 0.025 0.008 0.004 Poly.Vol. 2.133 2.474 2.292 2.309 2.414 2.403
Elect. Energy ‐4414. ‐3137. ‐3718. ‐3802. ‐3263. ‐3301. Model Charge 4.0 3.41 3.71 3.69 3.49 3.51
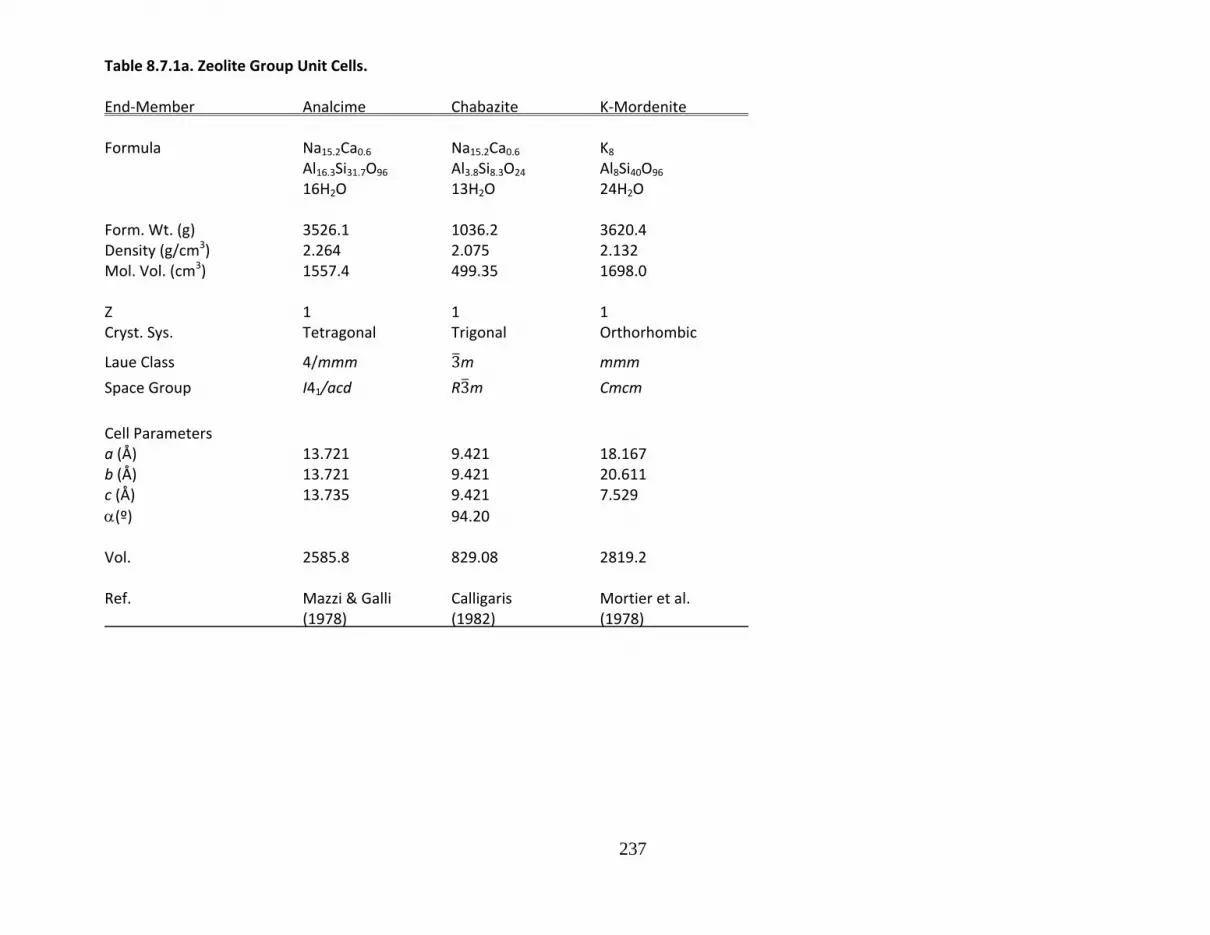
237
Table 8.7.1a. Zeolite Group Unit Cells.
End‐Member Analcime Chabazite K‐Mordenite Formula Na15.2Ca0.6 Na15.2Ca0.6 K8
Al16.3Si31.7O96 Al3.8Si8.3O24 Al8Si40O96
16H2O 13H2O 24H2O
Form. Wt. (g) 3526.1 1036.2 3620.4 Density (g/cm3) 2.264 2.075 2.132 Mol. Vol. (cm3) 1557.4 499.35 1698.0 Z 1 1 1 Cryst. Sys. Tetragonal Trigonal Orthorhombic
Laue Class 4/mmm 3m mmm
Space Group I41/acd R3m Cmcm
Cell Parameters a (Å) 13.721 9.421 18.167 b (Å) 13.721 9.421 20.611 c (Å) 13.735 9.421 7.529
(º) 94.20 Vol. 2585.8 829.08 2819.2
Ref. Mazzi & Galli Calligaris Mortier et al. (1978) (1982) (1978)
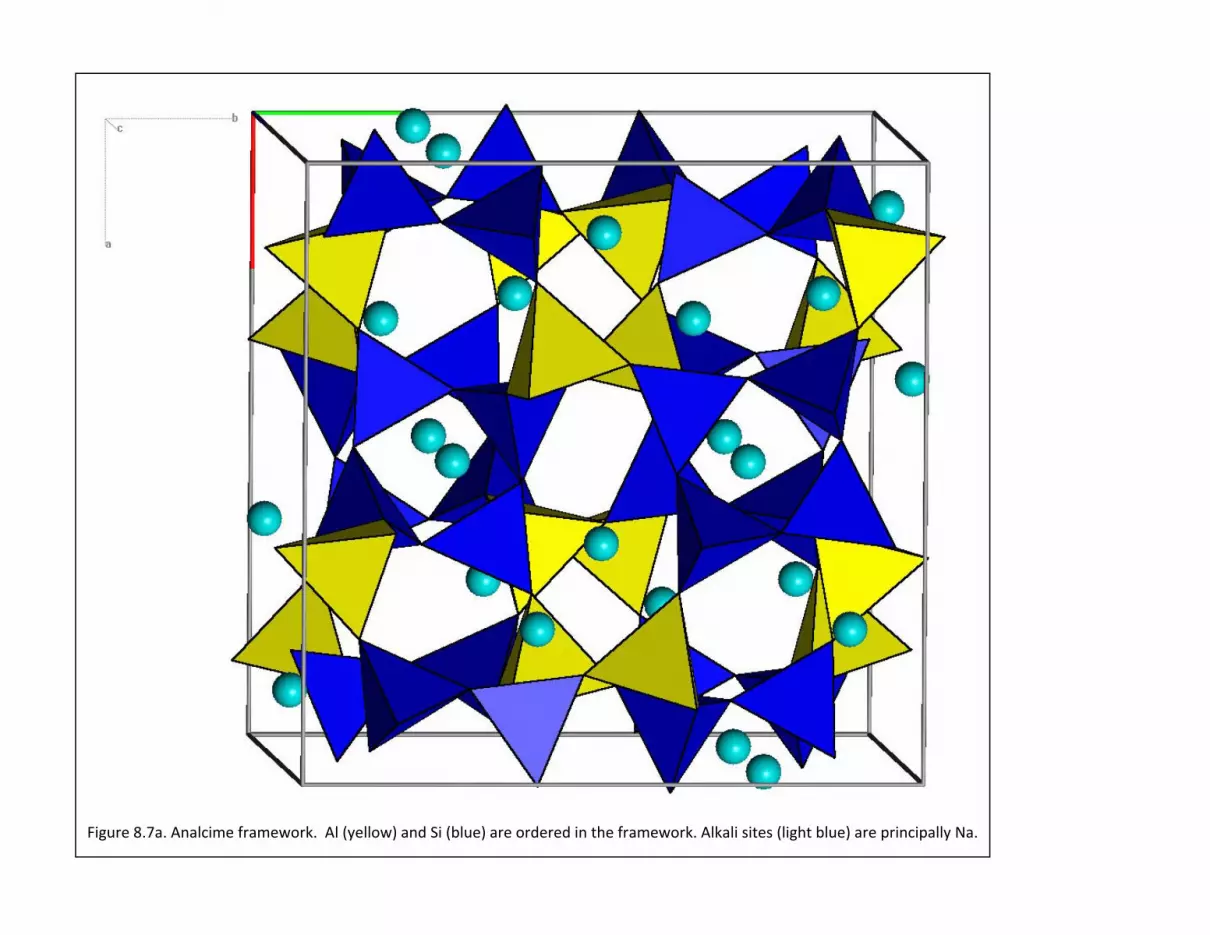
238
Figure 8.7a. Analcime framework. Al (yellow) and Si (blue) are ordered in the framework. Alkali sites (light blue) are principally Na.

239
Figure 8.7b. Mordenite framework
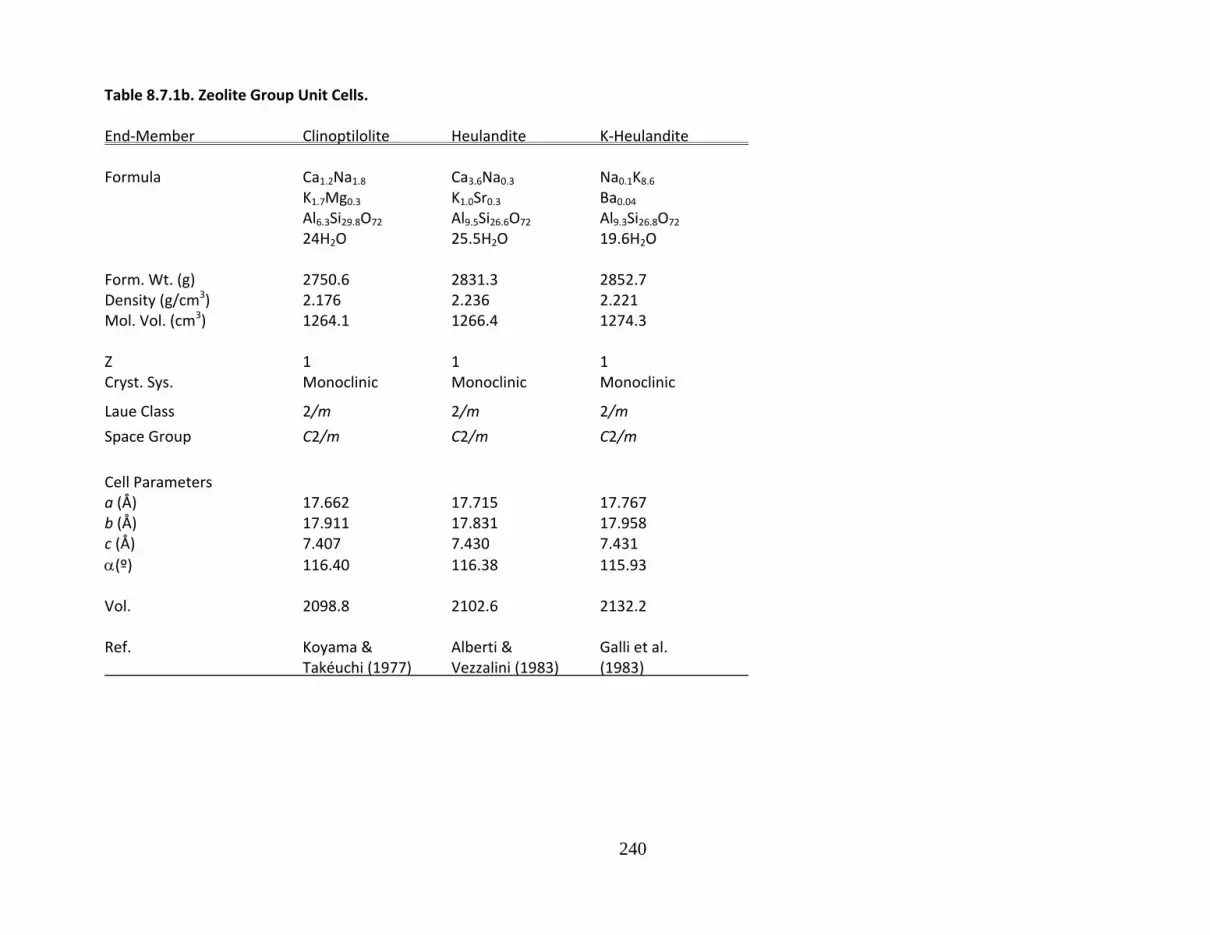
240
Table 8.7.1b. Zeolite Group Unit Cells.
End‐Member Clinoptilolite Heulandite K‐Heulandite Formula Ca1.2Na1.8 Ca3.6Na0.3 Na0.1K8.6 K1.7Mg0.3 K1.0Sr0.3 Ba0.04
Al6.3Si29.8O72 Al9.5Si26.6O72 Al9.3Si26.8O72
24H2O 25.5H2O 19.6H2O
Form. Wt. (g) 2750.6 2831.3 2852.7 Density (g/cm3) 2.176 2.236 2.221 Mol. Vol. (cm3) 1264.1 1266.4 1274.3 Z 1 1 1 Cryst. Sys. Monoclinic Monoclinic Monoclinic
Laue Class 2/m 2/m 2/m
Space Group C2/m C2/m C2/m
Cell Parameters a (Å) 17.662 17.715 17.767 b (Å) 17.911 17.831 17.958 c (Å) 7.407 7.430 7.431
(º) 116.40 116.38 115.93 Vol. 2098.8 2102.6 2132.2
Ref. Koyama & Alberti & Galli et al. Takéuchi (1977) Vezzalini (1983) (1983)

241
Figure 8.7d. Heulandite and clinoptilolite framework. Al and Si are disordered through the framework tetrahedral sites.

242
Table 8.7.1c. Zeolite Group Unit Cells.
End‐Member Thomsonite Harmotome Phillipsite Laumontite Formula NaCa2 Ba2Ca0.5 K2 Ca1.5Na0.4 Ca
Al5Si5O20 Al5Si11O32 Al5Si10O32 Al2Si4O12
6H2O 12H2O 12H2O 4H2O
Form. Wt. (g) 806.6 1466.7 1291.5 470.44 Density (g/cm3) 2.373 2.443 2.120 2.315 Mol. Vol. (cm3) 339.9 600.5 609.1 203.2 Z 4 1 1 4 Cryst. Sys. Orthorhombic Monoclinic Monoclinic Monoclinic
Laue Class mmm 2/m 2/m m
Space Group Pncn P21/m P21/m Am
Cell Parameters a (Å) 13.089 9.879 9.865 7.549 b (Å) 13.047 14.139 14.300 14.740 c (Å) 13.218 8.693 8.668 13.072
(º) 124.81 124.2 90
(º) 111.9 Vol. 2257.3 996.94 1011.35 1349.6
Ref. Alberti et al. Rinaldi et al. Rinaldi et al. Schramm & (1981) (1974) (1974) Fischer (1971)

243
Figure 8.7e. Thomsonite framework. Al (yellow) and Si (blue) are ordered through the framework tetrahedral sites. There are two distinct Ca/Na
sites are shown as spheres with Ca (light blue) and Ca/Na (green).

244
Figure 8.7f. Harmotome framework. Al and Si are disordered through the framework tetrahedral sites. Water molecules are shown as red
speheres and Ba atoms as yellow.

245
Figure 8.7g. Laumontite framework. Al (yellow) and Si (blue) are ordered through the framework tetrahedral sites. Water mol;ecules are shown as
red speheres and Ca atoms as light blue.

246
Table 8.7.1d. Zeolite Group Unit Cells.
End‐Member Natrolite Sodalite Stilbite Formula Na2 Na4 Na1.28Ca4.18Mg.18
Al2Si3O10 Al3Si3O12 Al10.3Si25.7O72
2H2O 13H2O 34H2O
Form. Wt. (g) 380.23 484.61 2698. Density (g/cm3) 2.238 2.306 2.23 Mol. Vol. (cm3) 169.87 210.16 1331. Z 1 1 1 Cryst. Sys. Orthorhombic Isometric Monoclinic
Laue Class mm2 43m 2/m
Space Group Fdd2 P43n C2/m
Cell Parameters a (Å) 18.326 8.870 13.64 b (Å) 18.652 18.24 c (Å) 6.601 11.27
(º) 128.0 Vol. 2256.3 697.86 2210.
Ref. Pechar et al. Loens & Galli (1983) Schulz(1967) (1971)

247
Figure 8.7g. Natrolite framework. Al and Si are disordered through the framework tetrahedral sites. Alkali sites are shown as spheres.
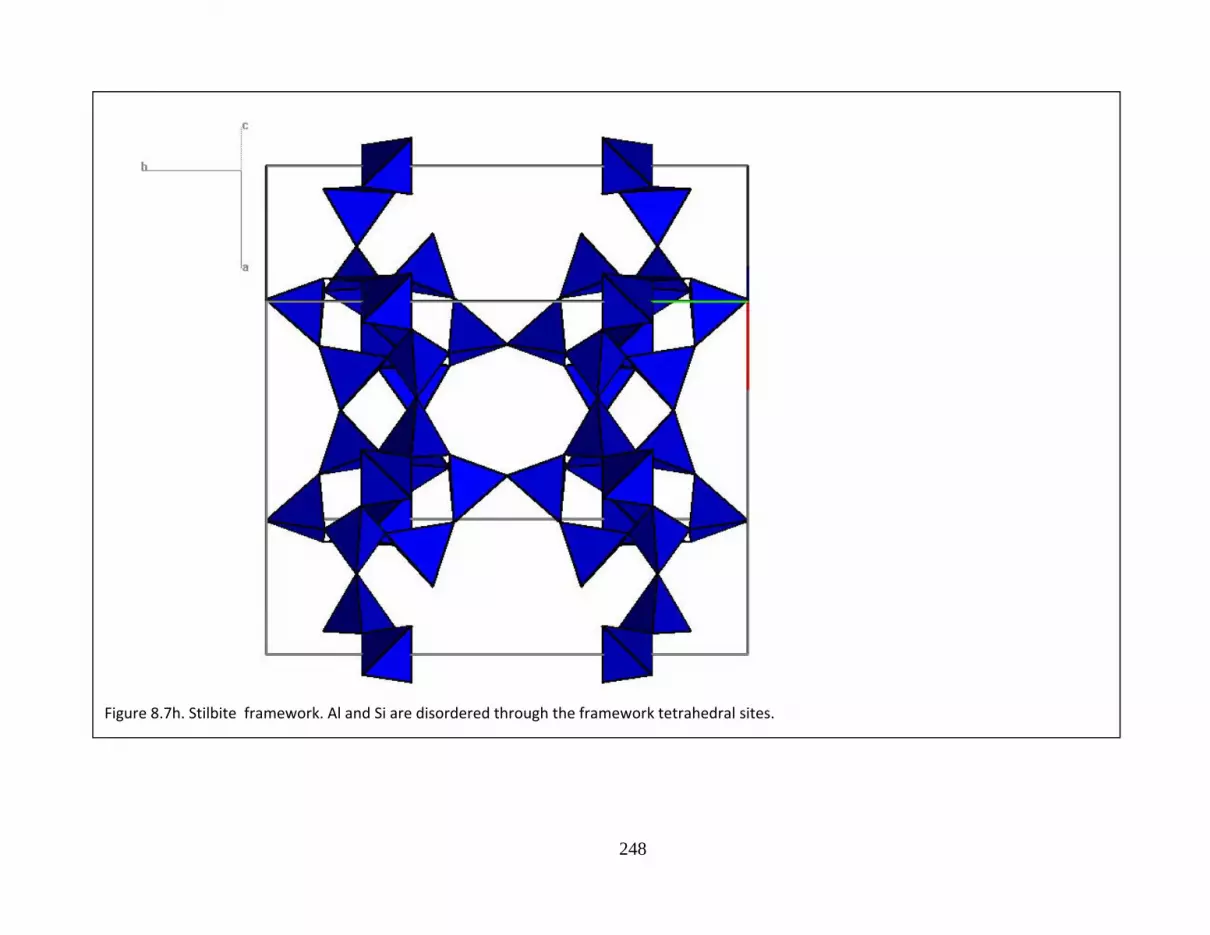
248
Figure 8.7h. Stilbite framework. Al and Si are disordered through the framework tetrahedral sites.
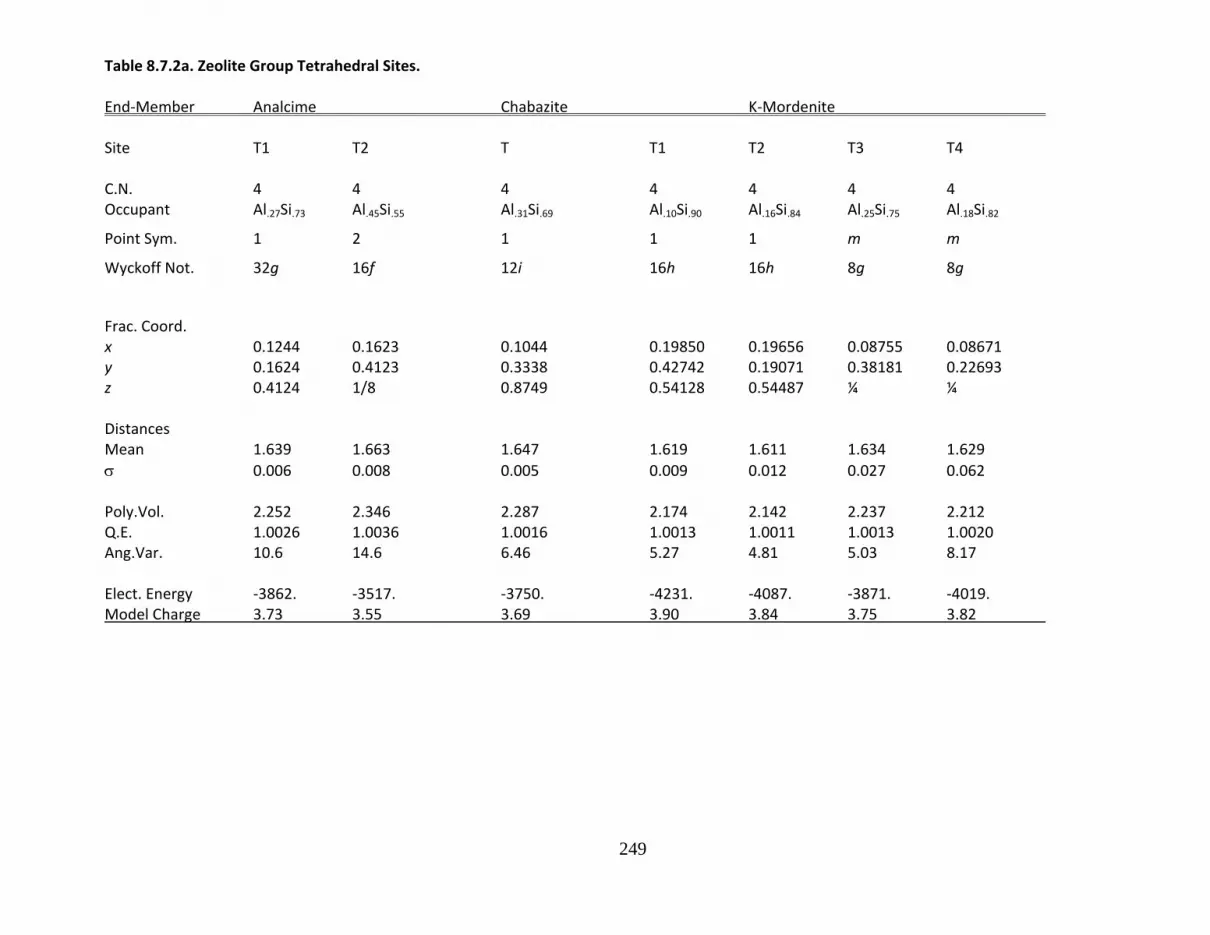
249
Table 8.7.2a. Zeolite Group Tetrahedral Sites.
End‐Member Analcime Chabazite K‐Mordenite Site T1 T2 T T1 T2 T3 T4 C.N. 4 4 4 4 4 4 4
Occupant Al.27Si.73 Al.45Si.55 Al.31Si.69 Al.10Si.90 Al.16Si.84 Al.25Si.75 Al.18Si.82
Point Sym. 1 2 1 1 1 m m
Wyckoff Not. 32g 16f 12i 16h 16h 8g 8g
Frac. Coord. x 0.1244 0.1623 0.1044 0.19850 0.19656 0.08755 0.08671 y 0.1624 0.4123 0.3338 0.42742 0.19071 0.38181 0.22693 z 0.4124 1/8 0.8749 0.54128 0.54487 ¼ ¼ Distances Mean 1.639 1.663 1.647 1.619 1.611 1.634 1.629
0.006 0.008 0.005 0.009 0.012 0.027 0.062 Poly.Vol. 2.252 2.346 2.287 2.174 2.142 2.237 2.212 Q.E. 1.0026 1.0036 1.0016 1.0013 1.0011 1.0013 1.0020 Ang.Var. 10.6 14.6 6.46 5.27 4.81 5.03 8.17
Elect. Energy ‐3862. ‐3517. ‐3750. ‐4231. ‐4087. ‐3871. ‐4019. Model Charge 3.73 3.55 3.69 3.90 3.84 3.75 3.82

250
Table 8.7.2b. Zeolite Group Tetrahedral Sites.
End‐Member Clinoptilolite Heulandite Site T1 T2 T3 T4 T5 T1 T2 T3 T4 T5 C.N. 4 4 4 4 4 4 4 4 4 4
Occupant Al.17Si.83 Al.31Si.69 Al.13Si.87 Al.11Si.89 Al.10Si.90 Al.25Si.75 Al.18Si.82
Point Sym. 1 1 1 1 2 1 1 1 1 2
Wyckoff Not. 8j 8j 8j 8j 4g 8j 8j 8j 8j 4g
Frac. Coord. x 0.17906 0.21334 0.20846 0.06623 0 0.1798 0.2119 0.2078 0.0643 0 y 0.16943 0.41009 0.19034 0.29837 0.21651 0.1689 0.4097 0.1911 0.2992 0.2127 z 0.0963 0.5040 0.7153 0.4148 0 0.0968 0.4996 0.7169 0.4107 0 Distances Mean 1.624 1.645 1.618 1.615 1.614 1.635 1.657 1.623 1.629 1.636
0.005 0.011 0.011 0.004 0.003 0.009 0.012 0.006 0.014 0.015 Poly.Vol. 2.195 2.281 2.169 2.159 2.154 2.241 2.327 2.190 2.214 2.243 Q.E. 1.0010 1.0012 1.0010 1.0010 1.0013 1.0007 1.0028 1.0015 1.0010 1.0016 Ang.Var. 4.49 4.47 3.68 4.15 5.34 3.02 10.58 5.93 4.35 6.21
Elect. Energy ‐4030. ‐3790. ‐4075. ‐4199. ‐4272 ‐3878. ‐3594. ‐4010. ‐4034. ‐3961. Model Charge 3.83 3.69 3.87 3.89 3.90 3.73 3.60 3.83 3.81 3.73

251
Table 8.7.2c. Zeolite Group Tetrahedral Sites.
End‐Member Harmotome Phillipsite Site T1 T2 T3 T4 T1 T2 T3 T4 C.N. 4 4 4 4 4 4 4 4
Occupant Al.31Si.69 Al.31Si.69 Al.31Si.69 Al.31Si.69 Al.33Si.67 Al.33Si.67 Al.33Si.67 Al.33Si.67
Point Sym. 1 1 1 1 1 1 1 1
Wyckoff Not. 4f 4f 4f 4f 4f 4f 4f 4f
Frac. Coord.
x 0.7367 0.4214 0.0577 0.1216 0.7362 0.4206 0.0604 0.1204 y 0.0248 0.1410 0.0075 0.1390 0.0248 0.1409 0.0078 0.1396 z 0.2840 0.0136 0.2898 0.0375 0.2805 0.0019 0.2844 0.0421 Distances Mean 1.653 1.640 1.640 1.645 1.651 1.654 1.664 1.654
0.011 0.007 0.009 0.005 0.008 0.008 0.011 0.010 Poly.Vol. 2.308 2.258 2.260 2.279 2.300 2.319 2.354 2.315 Q.E. 1.0029 1.0011 1.0017 1.0018 1.0029 1.0016 1.0028 1.0015 Ang.Var. 12.00 4.74 6.68 6.90 11.94 6.62 11.40 6.09
Elect. Energy ‐3777. ‐3846. ‐3820. ‐3818. ‐3708. ‐3718. ‐3701. ‐3959. Model Charge 3.69 3.69 3.69 3.69 3.67 3.67 3.67 3.67

252
Table 8.7.2d. Zeolite Group Tetrahedral Sites (continued).
End‐Member Laumontite Site T1 T2 T3 T4 T5 T6 C.N. 4 4 4 4 4 4
Occupant Si1.00 Al.68Si.32 Al.08Si.92 Al.15Si.85 Al.94Si.06 Al.15Si.85
Point Sym. 1 1 1 1 1 1
Wyckoff Not. 4b 4b 4b 4b 4b 4b
Frac. Coord.
x 0.3310 0.7565 0.1638 0.8152 0.2256 0.6465 y 0.2594 0.3700 0.4169 0.3828 0.3098 0.3823 z 0.3814 0.3082 0.3833 0.3828 0.3098 0.3823 Distances Mean 1.603 1.712 1.614 1.631 1.740 1.631
0.016 0.072 0.034 0.015 0.023 0.015 Poly.Vol. 2.109 2.533 2.139 2.220 2.672 2.222 Q.E. 1.0016 1.0122 1.0061 1.0027 1.0083 1.0012 Ang.Var. 6.19 44.24 25.07 10.60 30.87 4.95
Elect. Energy ‐4141. ‐2718. ‐3754. ‐3553. ‐2288. ‐3647. Model Charge 4.00 3.32 3.92 3.85 3.06 3.85

253
Table 8.7.2c. Zeolite Group Tetrahedral Sites.
End‐Member Natrolite Sodalite
Site T1 T2 T3 Si Al C.N. 4 4 4 4 4
Occupant Si Si Al Si Al
Point Sym. 2 1 1 4 4
Wyckoff Not. 8a 16b 16b 6d 6c
Frac. Coord.
x 0 0.15330 0.03780 ¼ ¼ y 0 0.21110 0.09380 0 ½ z 0 0.62370 0.61580 ½ 0
Distances Mean 1.621 1.625 1.737 1.628 1.728
0.007 0.018 0.004 0.0 0.0 Poly.Vol. 2.184 2.201 2.682 2.207 2.648 Q.E. 1.0010 1.0008 1.0022 1.0019 1.0005 Ang.Var. 4.25 3.29 8.88 7.56 2.30
Elect. Energy ‐4228. ‐4291. ‐2476. ‐4361. ‐2526. Model Charge 4.0 4.0 3.0 4.0 3.0

254
Table 8.7.2d. Zeolite Group Tetrahedral Sites (continued).
End‐Member Stilbite Site T1 T2 T3 T4 T5 C.N. 4 4 4 4 4
Occupant Al.29Si.71 Al.29Si.71 Al.29Si.71 Al.29Si.71 Al.29Si.71
Point Sym. 1 1 1 1 2
Wyckoff Not. 8j 8j 8j 8j 4g
Frac. Coord.
x 0.4830 0.2653 0.1892 0.1124 0 y 0.3042 0.3097 0.0893 0.3166 0.2610 z 0.2420 0.2619 0.4846 0.5013 0 Distances Mean 1.647 1.637 1.645 1.638 1.630
0.021 0.009 0.014 0.011 0.019 Poly.Vol. 2.291 2.247 2.282 2.253 2.216 Q.E. 1.0011 1.0015 1.0011 1.0012 1.0020 Ang.Var. 4.53 6.51 4.01 5.10 7.94
Elect. Energy ‐3868. ‐3871. ‐3941. ‐3821. ‐3980 Model Charge 3.71 3.71 3.71 3.71 3.71

255
Chapter9.Carbonates,Nitrates,Sulfates,andPhosphates
9.1. Calcite Group
9.2. Dolomite Group
9.3 Aragonite Group
9.4. Barite Group
9.5. Gypsum and Anhydrite
9.6. Apatite Group
9.7. Monazite
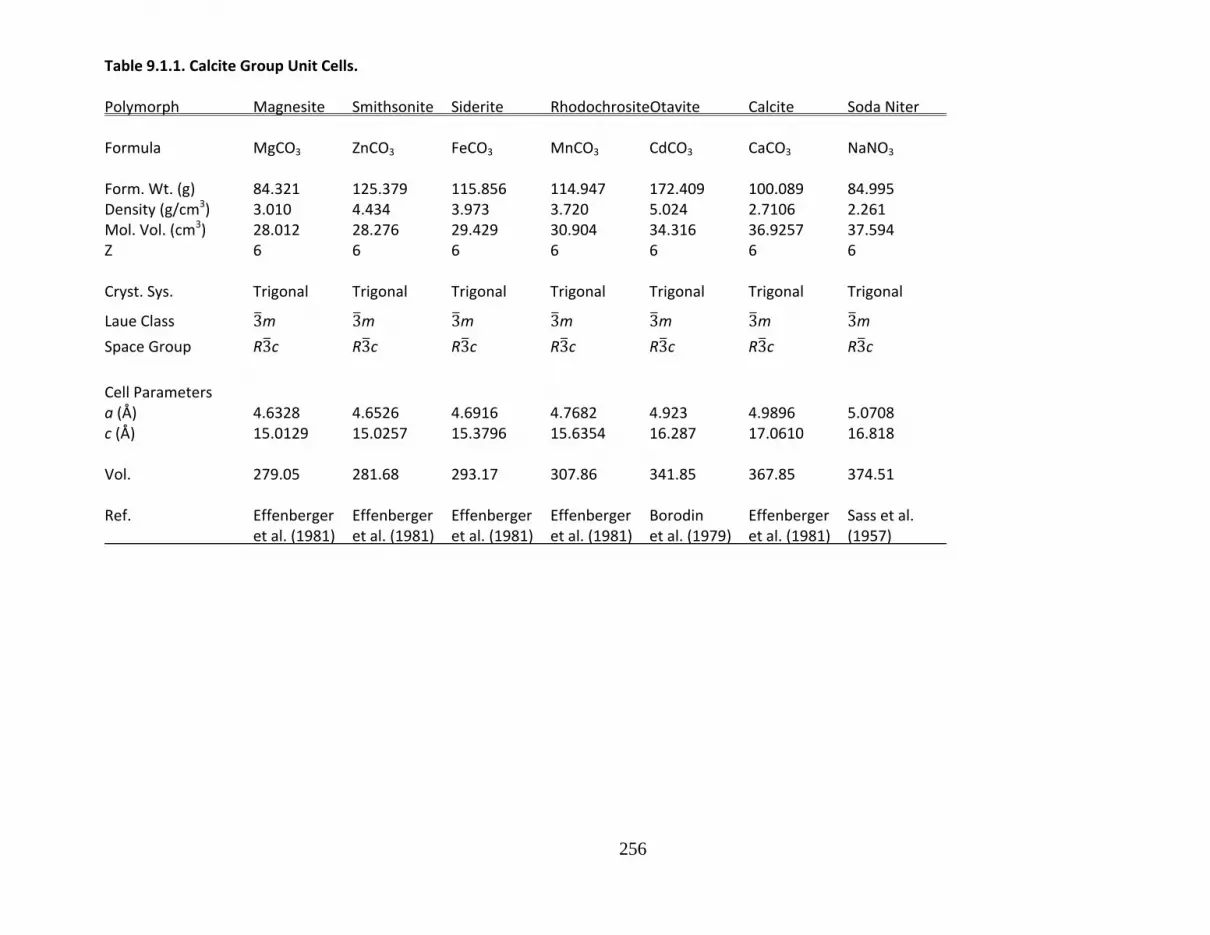
256
Table 9.1.1. Calcite Group Unit Cells.
Polymorph Magnesite Smithsonite Siderite RhodochrositeOtavite Calcite Soda Niter Formula MgCO3 ZnCO3 FeCO3 MnCO3 CdCO3 CaCO3 NaNO3 Form. Wt. (g) 84.321 125.379 115.856 114.947 172.409 100.089 84.995 Density (g/cm3) 3.010 4.434 3.973 3.720 5.024 2.7106 2.261 Mol. Vol. (cm3) 28.012 28.276 29.429 30.904 34.316 36.9257 37.594 Z 6 6 6 6 6 6 6
Cryst. Sys. Trigonal Trigonal Trigonal Trigonal Trigonal Trigonal Trigonal
Laue Class 3m 3m 3m 3m 3m 3m 3m
Space Group R3c R3c R3c R3c R3c R3c R3c
Cell Parameters a (Å) 4.6328 4.6526 4.6916 4.7682 4.923 4.9896 5.0708 c (Å) 15.0129 15.0257 15.3796 15.6354 16.287 17.0610 16.818
Vol. 279.05 281.68 293.17 307.86 341.85 367.85 374.51
Ref. Effenberger Effenberger Effenberger Effenberger Borodin Effenberger Sass et al. et al. (1981) et al. (1981) et al. (1981) et al. (1981) et al. (1979) et al. (1981) (1957)
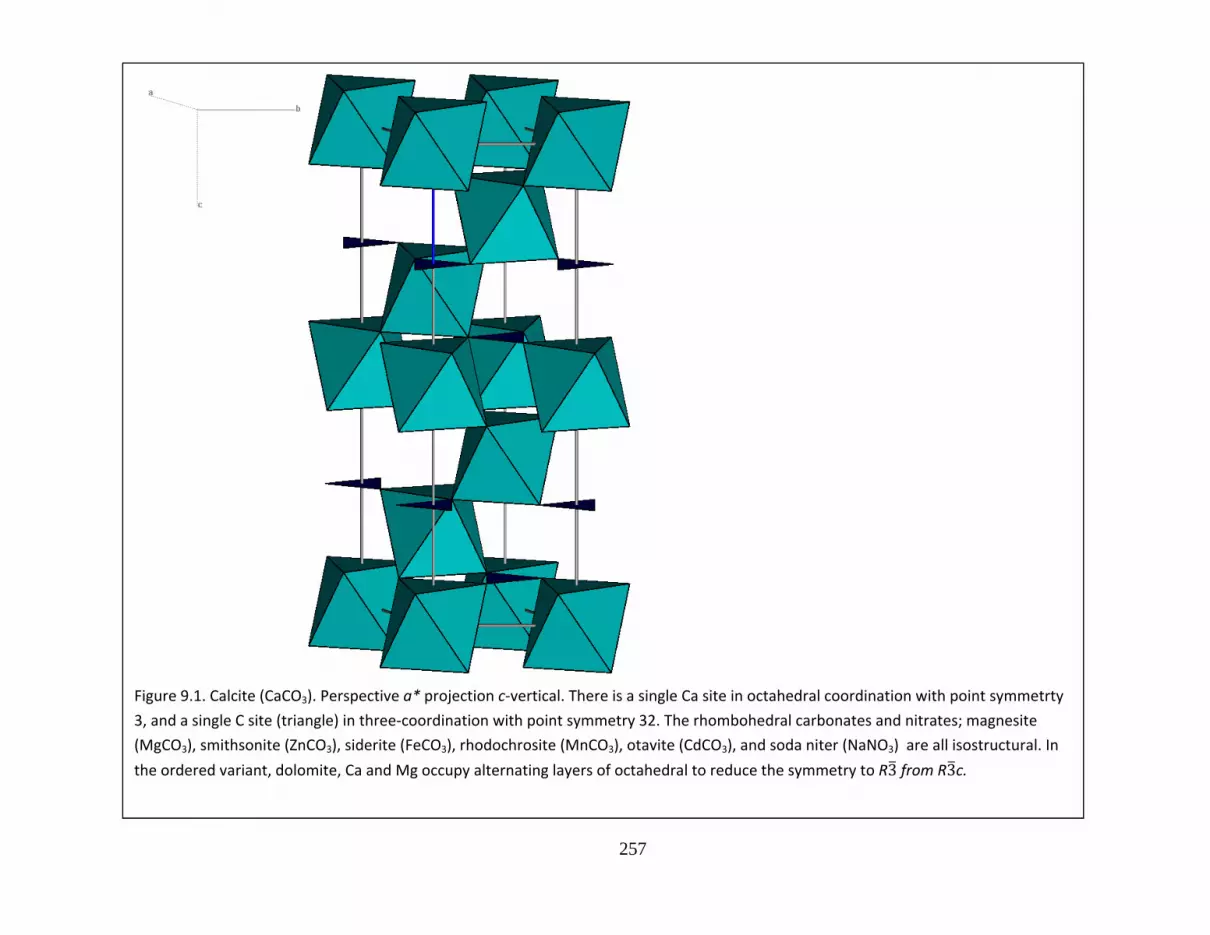
257
Figure 9.1. Calcite (CaCO3). Perspective a* projection c‐vertical. There is a single Ca site in octahedral coordination with point symmetrty
3, and a single C site (triangle) in three‐coordination with point symmetry 32. The rhombohedral carbonates and nitrates; magnesite
(MgCO3), smithsonite (ZnCO3), siderite (FeCO3), rhodochrosite (MnCO3), otavite (CdCO3), and soda niter (NaNO3) are all isostructural. In
the ordered variant, dolomite, Ca and Mg occupy alternating layers of octahedral to reduce the symmetry to R3 from R3c.

258
Table 9.1.2. Calcite Group Octahedral Sites.
End‐Member Magnesite Smithsonite Siderite RhodochrositeOtavite Calcite Soda Niter
C.N. 6 6 6 6 6 6 6
Cation Mg Zn Fe2+ Mn2+ Cd Ca Na
Point Sym. 3 3 3 3 3 3 3
Wyckoff 6b 6b 6b 6b 6b 6b 6b
Frac.Coord. x 0 0 0 0 0 0 0 y 0 0 0 0 0 0 0 z 0 0 0 0 0 0 0
Distances
O(6) 2.102 2.111 2.144 2.190 2.288 2.360 2.417
Poly.Vol. 12.360 12.520 13.122 13.986 15.944 17.468 18.828
Q.E. 1.0010 1.0008 1.0013 1.0009 1.0008 1.0019 1.0000
Ang.Var. 3.55 2.80 4.59 3.42 2.80 7.09 0.06
Elect. Energy ‐1067. ‐1061. ‐1039. ‐1009. ‐1120. ‐1066. ‐295.
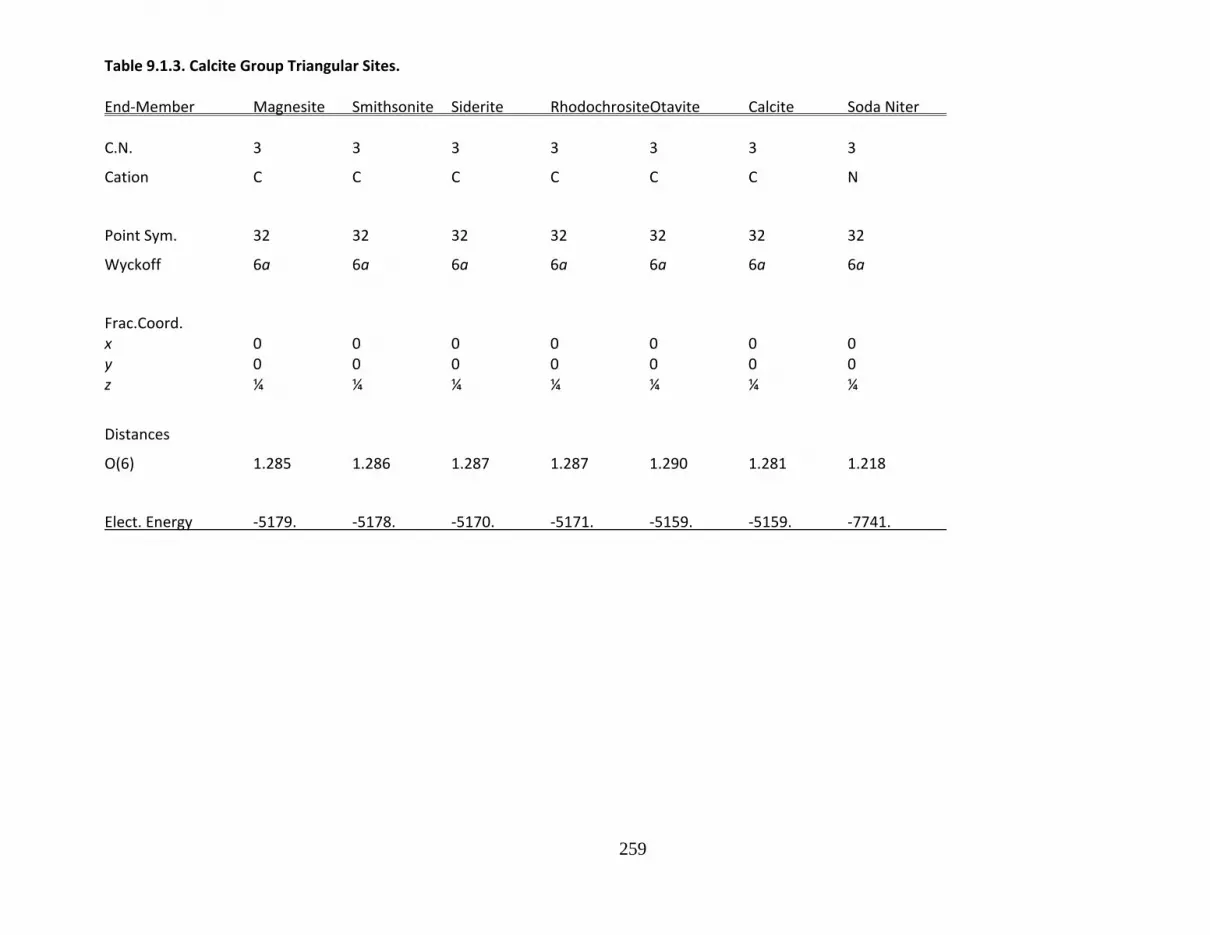
259
Table 9.1.3. Calcite Group Triangular Sites.
End‐Member Magnesite Smithsonite Siderite RhodochrositeOtavite Calcite Soda Niter
C.N. 3 3 3 3 3 3 3
Cation C C C C C C N
Point Sym. 32 32 32 32 32 32 32
Wyckoff 6a 6a 6a 6a 6a 6a 6a
Frac.Coord. x 0 0 0 0 0 0 0 y 0 0 0 0 0 0 0 z ¼ ¼ ¼ ¼ ¼ ¼ ¼
Distances
O(6) 1.285 1.286 1.287 1.287 1.290 1.281 1.218
Elect. Energy ‐5179. ‐5178. ‐5170. ‐5171. ‐5159. ‐5159. ‐7741.

260
Table 9.2.1. Dolomite Group Unit Cells.
Polymorph Dolomite Ankerite Formula CaMg(CO3)2 CaFe(CO3)2 Form. Wt. (g) 184.411 215.946 Density (g/cm3) 2.868 3.293 Mol. Vol. (cm3) 64.293 65.576 Z 3 3
Cryst. Sys. Trigonal Trigonal
Laue Class 3 3
Space Group R3 R3
Cell Parameters a (Å) 4.8069 4.830 c (Å) 16.0034 16.167
Vol. 320.24 326.63
Ref. Reeder Beran & (1983) Zemann (1977)

261
Table 9.2.2. Dolomite Group Octahedral Sites.
End‐Member Dolomite Ankerite Site A B A B
C.N. 6 6 6 6
Cation Ca Mg Ca Fe2+
Point Sym. 3 3 3 3
Wyckoff 3a 3b 3a 3b
Frac.Coord. x 0 0 0 0 y 0 0 0 0 z 0 ½ 0 ½ Distances
O(6) 2.381 2.084 2.371 2.126
Poly.Vol. 17.950 12.060 17.726 12.789
Q.E. 1.0016 1.0008 1.0020 1.0009
Ang.Var. 5.84 3.08 7.33 3.44
Elect. Energy ‐936. ‐1175. ‐944. ‐1141.

262
Table 9.2.3. Dolomite Group Triangular Sites.
End‐Member Dolomite Ankerite
C.N. 3 3
Cation C C
Point Sym. 3 3
Wyckoff 6c 6c
Frac.Coord. x 0 0 y 0 0 z 0.24282 0.2442
Distances
O(6) 1.285 1.286
Elect. Energy ‐5178. ‐5178.

263
Table 9.3.1. Aragonite Group Unit Cells.
Polymorph Aragonite Strontianite Cerussite Witherite Niter Formula CaCO3 SrCO3 PbCO3 BaCO3 KNO3 Form. Wt. (g) 100.089 147.629 267.199 197.349 101.107 Density (g/cm3) 2.930 3.843 6.577 4.314 2.079 Mol. Vol. (cm3) 34.166 38.416 40.629 45.745 48.643 Z 4 4 4 4 4 Cryst. Sys. Orthorhombic Orthorhombic Orthorhombic Orthorhombic Orthorhombic
Laue Class mmm mmm mmm mmm mmm
Space Group Pmcn Pmcn Pmcn Pmcn Pmcn
Cell Parameters a (Å) 4.9614 5.090 5.180 5.3126 5.4119 b (Å) 7.9671 8.358 8.492 8.8958 9.1567 c (Å) 5.7404 5.997 6.134 6.4284 6.5189
Vol. 226.91 255.13 269.83 303.81 323.05
Ref. DeVilliers DeVilliers Sahl DeVilliers Nimmo & Lucas (1971) (1971) (1974) (1971) (1973)

264
Figure 9.3. Aragonite (CaCO3). Perspective c‐axis projection a‐vertical. Ca is in irregular nine‐coordination with point symmetry m, and C
is in triangular tthree‐coordination with point symmetry m. The orthorhombic carbonates and nitrates; strontianite (SrCO3), cerussite
(PbCO3), witherite (BaCO3), and niter (KNO3); are isostructural.
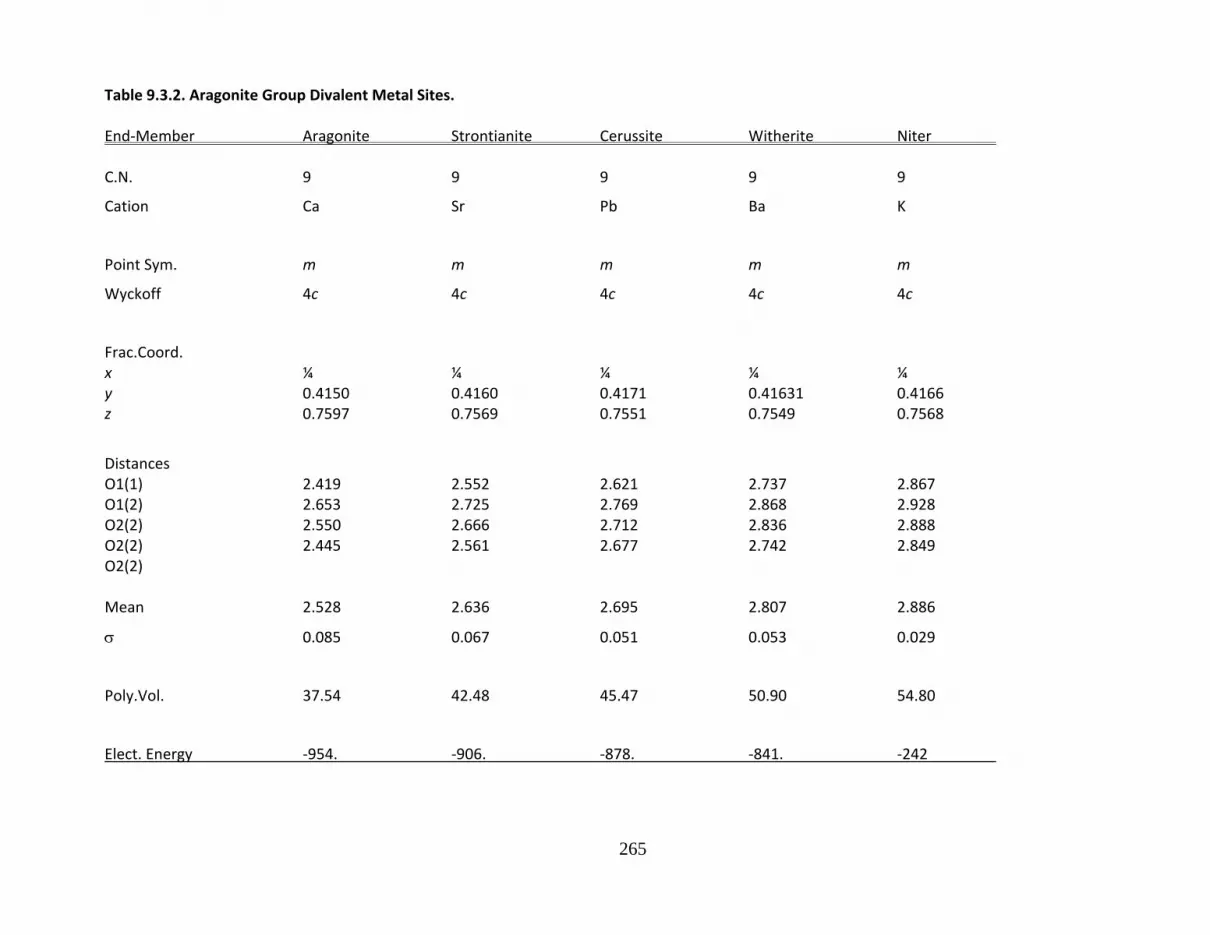
265
Table 9.3.2. Aragonite Group Divalent Metal Sites.
End‐Member Aragonite Strontianite Cerussite Witherite Niter
C.N. 9 9 9 9 9
Cation Ca Sr Pb Ba K
Point Sym. m m m m m
Wyckoff 4c 4c 4c 4c 4c
Frac.Coord. x ¼ ¼ ¼ ¼ ¼ y 0.4150 0.4160 0.4171 0.41631 0.4166 z 0.7597 0.7569 0.7551 0.7549 0.7568
Distances O1(1) 2.419 2.552 2.621 2.737 2.867 O1(2) 2.653 2.725 2.769 2.868 2.928 O2(2) 2.550 2.666 2.712 2.836 2.888 O2(2) 2.445 2.561 2.677 2.742 2.849
O2(2) Mean 2.528 2.636 2.695 2.807 2.886
0.085 0.067 0.051 0.053 0.029
Poly.Vol. 37.54 42.48 45.47 50.90 54.80
Elect. Energy ‐954. ‐906. ‐878. ‐841. ‐242

266
Table 9.3.3. Aragonite Group Triangular Sites.
End‐Member Aragonite Strontianite Cerussite Witherite Niter
C.N. 3 3 3 3 3
Cation C C C C N
Point Sym. m m m m m
Wyckoff 4c 4c 4c 4c 4c
Frac.Coord. x ¼ ¼ ¼ ¼ ¼ y 0.7622 0.7601 0.754 0.7570 0.7548 z ‐.0862 ‐.0864 ‐.092 ‐.0810 ‐.0848
Distances
O1(1) 1.278 1.270 1.30 1.283 1.240 O2(2) 1.284 1.293 1.25 1.289 1.246
Mean 1.282 1.285 1.27 1.287 1.244
0.003 0.014 0.03 0.004 0.003
Elect. Energy ‐5015. ‐5032. ‐5120. ‐5074. ‐7368.

267
Table 9.4.1. Barite Group Unit Cells.
End‐Member Celestine Anglesite Barite Formula SrSO4 PbSO4 BaSO4 Form. Wt. (g) 183.682 303.254 233.402 Density (g/cm3) 3.961 6.321 4.467 Mol. Vol. (cm3) 46.371 47.977 52.245 Z 4 4 4 Cryst. Sys. Orthorhombic Orthorhombic Orthorhombic
Laue Class mmm mmm mmm
Space Group Pbnm Pbnm Pbnm
Cell Parameters a (Å) 6.870 6.959 7.157 b (Å) 8.371 8.482 8.884 c (Å) 5.355 5.398 5.457
Vol. 307.96 318.62 346.97
Ref. Miyake et al. Miyake et al. Miyake et al. (1978) (1978) (1978)

268
Figure 9.4. Barite (BaSO4). Perspective c‐axis projection a‐vertical. Ba is in irregular ten‐coordination with point symmetry m, and S is in a
highly regular tetrahedron, also with point symmetry m. The orthorhombic sulfates; celestine (SrSO4), and anglesite (PbSO4), are
isostructural.
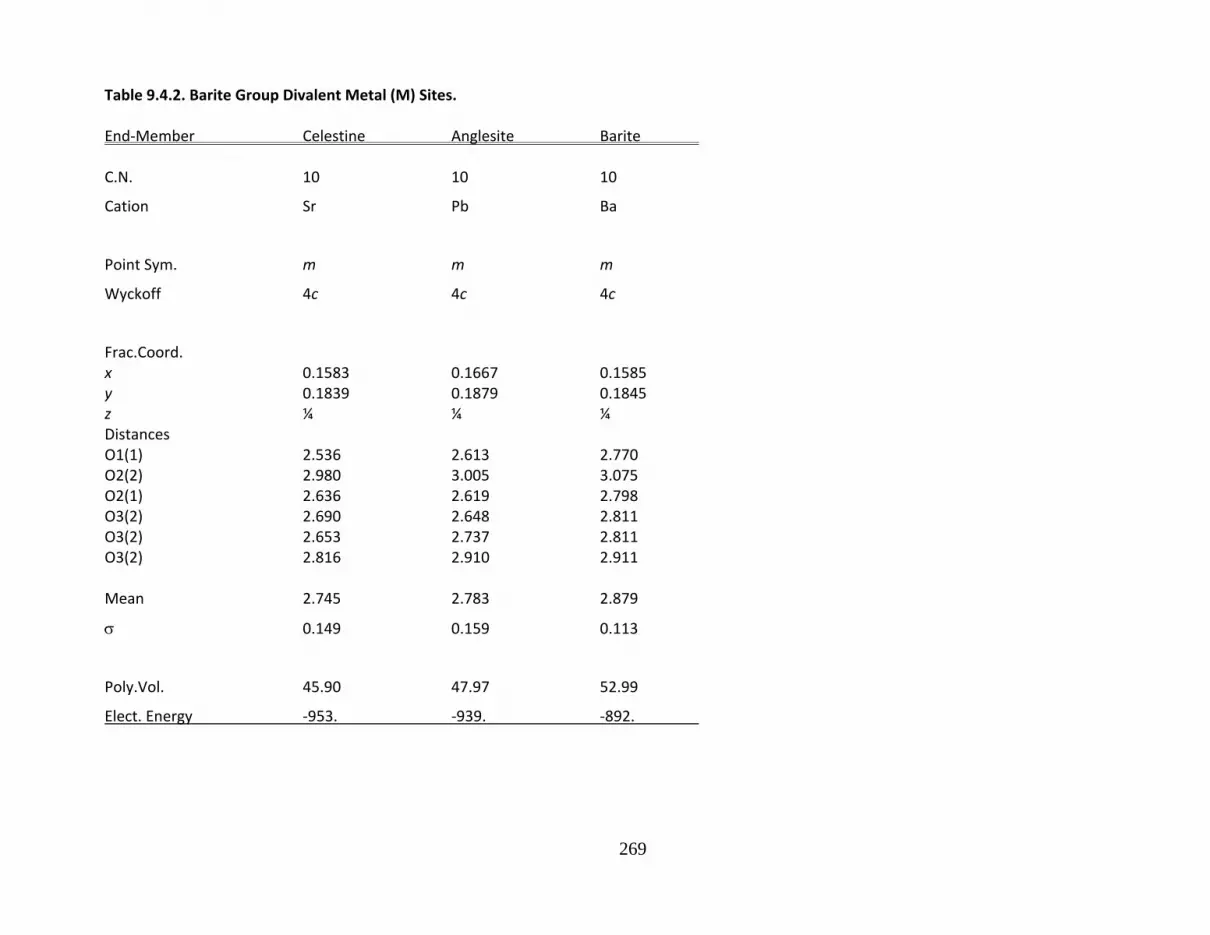
269
Table 9.4.2. Barite Group Divalent Metal (M) Sites.
End‐Member Celestine Anglesite Barite
C.N. 10 10 10
Cation Sr Pb Ba
Point Sym. m m m
Wyckoff 4c 4c 4c
Frac.Coord. x 0.1583 0.1667 0.1585 y 0.1839 0.1879 0.1845 z ¼ ¼ ¼ Distances O1(1) 2.536 2.613 2.770 O2(2) 2.980 3.005 3.075 O2(1) 2.636 2.619 2.798 O3(2) 2.690 2.648 2.811
O3(2) 2.653 2.737 2.811 O3(2) 2.816 2.910 2.911 Mean 2.745 2.783 2.879
0.149 0.159 0.113
Poly.Vol. 45.90 47.97 52.99
Elect. Energy ‐953. ‐939. ‐892.

270
Table 9.4.3. Barite Group Sulfur Sites.
End‐Member Celestine Anglesite Barite
C.N. 4 4 4
Cation S S S
Point Sym. m m m
Wyckoff 4c 4c 4c
Frac.Coord. x 0.1853 0.1842 0.1911 y 0.4382 0.4367 0.4375 z ¼ ¼ ¼ Distances O1(1) 1.452 1.453 1.468 O2(1) 1.472 1.481 1.470 O3(2) 1.486 1.497 1.486
Mean 1.474 1.482 1.478
0.016 0.021 0.010
Poly.Vol. 1.643 1.669 1.655
Q.E. 1.0005 1.0012 1.0004
Ang.Var. 2.31 5.20 2.01
Elect. Energy ‐9648 ‐9590. ‐9622.
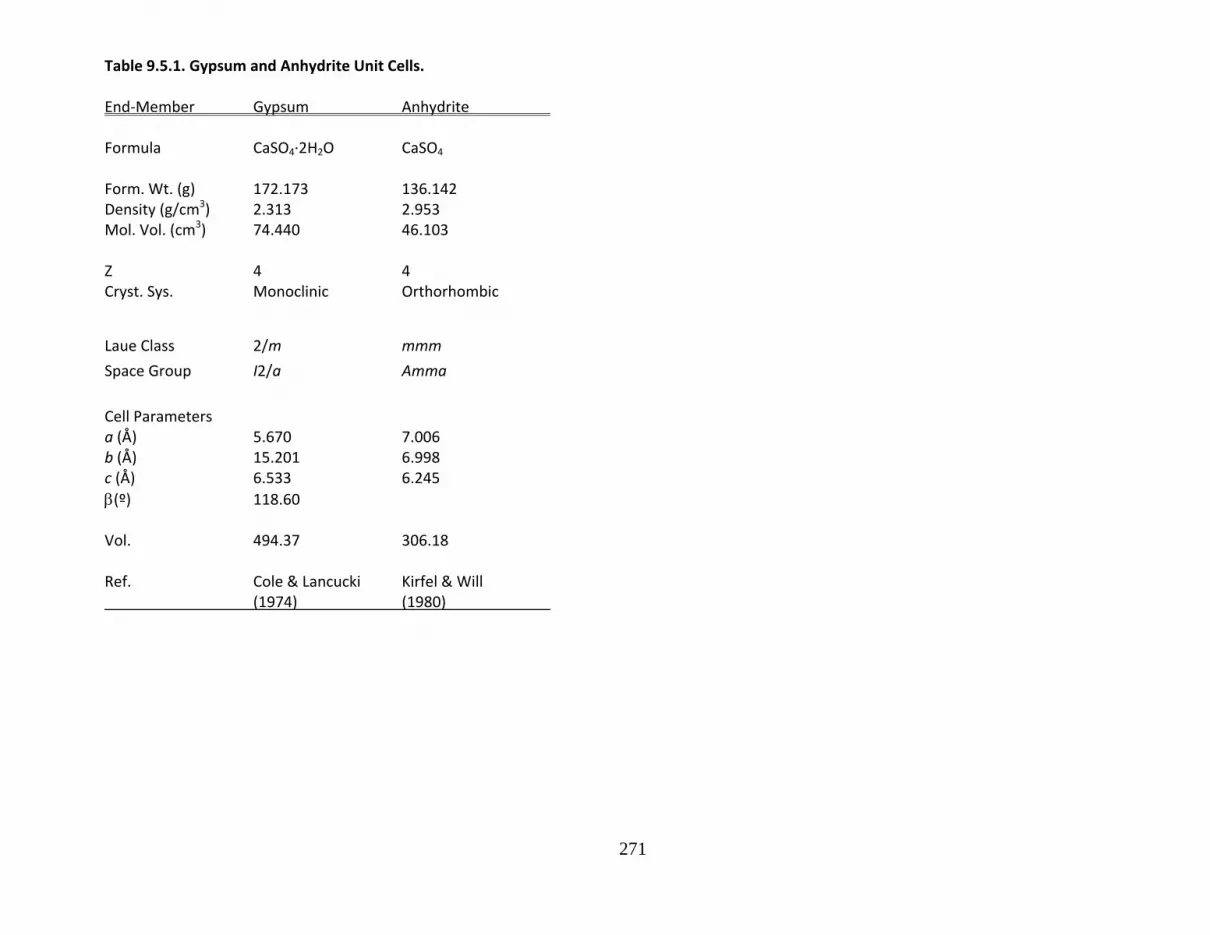
271
Table 9.5.1. Gypsum and Anhydrite Unit Cells.
End‐Member Gypsum Anhydrite Formula CaSO4∙2H2O CaSO4 Form. Wt. (g) 172.173 136.142 Density (g/cm3) 2.313 2.953 Mol. Vol. (cm3) 74.440 46.103 Z 4 4 Cryst. Sys. Monoclinic Orthorhombic
Laue Class 2/m mmm
Space Group I2/a Amma
Cell Parameters a (Å) 5.670 7.006 b (Å) 15.201 6.998 c (Å) 6.533 6.245
(º) 118.60
Vol. 494.37 306.18
Ref. Cole & Lancucki Kirfel & Will (1974) (1980)

272
Figure 9.5. Gypsum (CaSO4∙H2O). Perspective c* projection a‐vertical. Ca is in eight‐coordination with point symmetry 2, and S is in a
highly regular tetrahedron, also with point symmetry 2. The structure contains water molecules (red sphere with blue protons).

273
Figure 9.5. Anhydrite (CaSO4). Perspective c‐axis projection a‐vertical. Ca is in eight‐coordination with point symmetry m2m, and S is in a
highly regular tetrahedron, also with point symmetry m2m.

274
Table 9.5.2. Gypsum and Anhydrite Divalent Metal (Ca) Sites.
End‐Member Gypsum Anhydrite
C.N. 8 8
Cation Ca Ca
Point Sym. 2 m2m
Wyckoff 4e 4c
Frac.Coord. x ½ ¾ y 0.0797 0 z ¼ 0.34765 Distances O1(2) 2.528 2.563 O1(2) 2.464 O2(2) 2.378 2.510
O(w)(2) 2.380 Mean 2.458 2.471
0.084 0.085
Poly.Vol. 25.98 26.43
Elect. Energy ‐978. ‐1014.
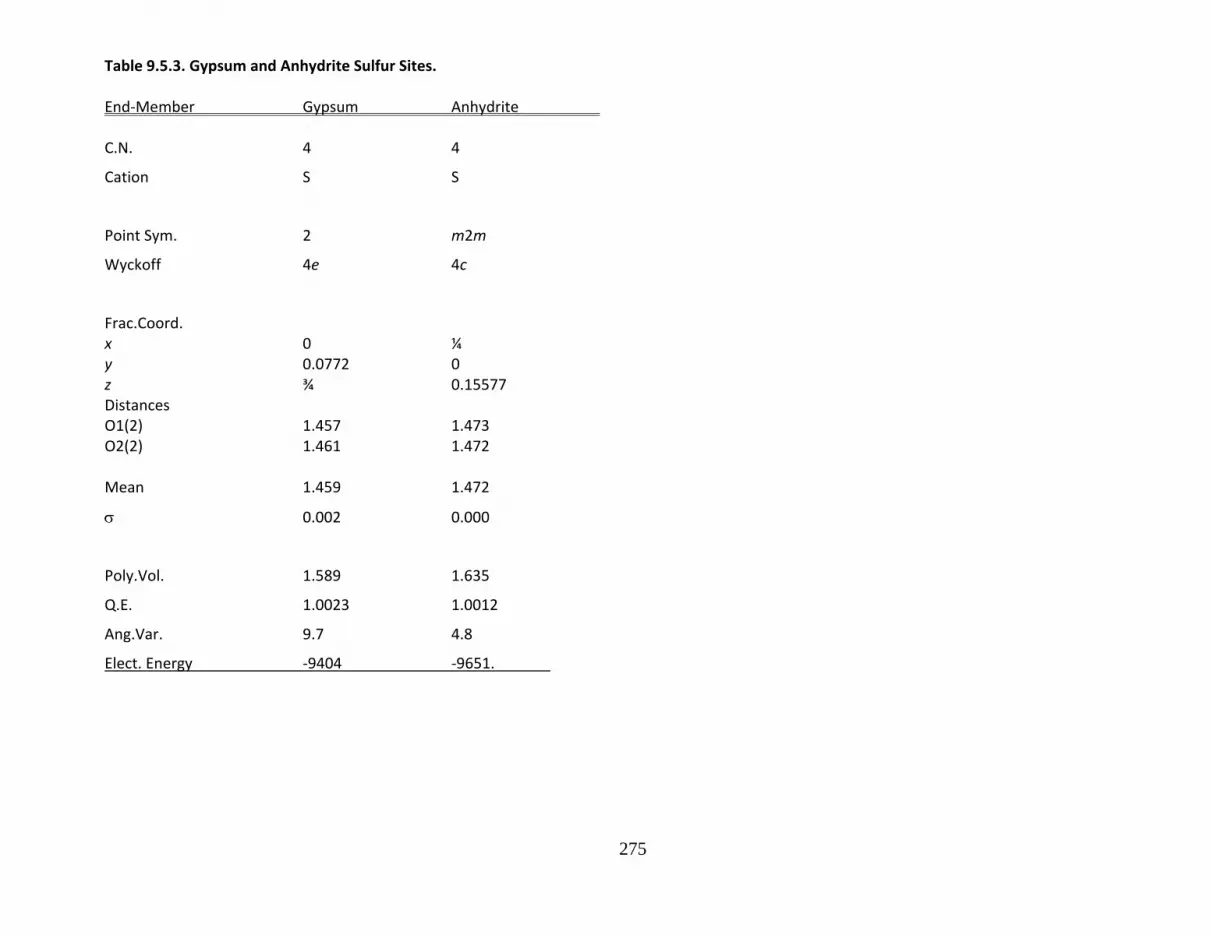
275
Table 9.5.3. Gypsum and Anhydrite Sulfur Sites.
End‐Member Gypsum Anhydrite
C.N. 4 4
Cation S S
Point Sym. 2 m2m
Wyckoff 4e 4c
Frac.Coord. x 0 ¼ y 0.0772 0 z ¾ 0.15577 Distances O1(2) 1.457 1.473 O2(2) 1.461 1.472
Mean 1.459 1.472
0.002 0.000
Poly.Vol. 1.589 1.635
Q.E. 1.0023 1.0012
Ang.Var. 9.7 4.8
Elect. Energy ‐9404 ‐9651.

276
Table 9.6.1. Apatite Group Unit Cells.
End‐Member Hydroxylapatite Fluorapatite Chlorapatite Formula Ca5(PO4)3OH Ca5(PO4)3F Ca5(PO4)3Cl Form. Wt. (g) 502.322 504.313 520.767 Density (g/cm3) 3.153 3.201 3.185 Mol. Vol. (cm3) 159.334 157.527 163.527 Z 2 2 2 Cryst. Sys. Hexagonal Hexagonal Hexagonal
Laue Class 6/m 6/m 6/m
Space Group P63/m P63/m P63/m
Cell Parameters a (Å) 9.424 9.367 9.628 c (Å) 6.879 6.884 6.764
Vol. 529.09 523.09 543.01
Ref. Sudarsanan & Sudarsanan Mackie et al. Young (1969) et al. (1972) (1972

277
Figure 9.6. Fluorapatite (Ca5(PO4)3F). Perspective c‐axis projection a*‐vertical. Theree are two distinct Ca site; Ca1 n(light blue) is in nine‐
coordination with point symmetry 3, and Ca2 (dark blue) is in eight coordination with point symmetry m. There is a single P site in
tetrahedral coordination with point symmetry m. F is shown as a red sphere.

278
Table 9.6.2. Apatite Group Ca Sites.
End‐Member Hydroxylapatite Fluorapatite Chlorapatite
Site Ca1 Ca2 Ca1 Ca2 Ca1 Ca2
C.N. 9 8 9 7 9 8
Cation Ca Ca Ca Ca Ca Ca
Point Sym. 3 m 3 m 3 m
Wyckoff 4f 6h 4f 6h 4f 6h
Frac.Coord. x 1/3 0.2465 1/3 0.2416 1/3 0.2596 y 2/3 0.9931 2/3 0.0071 2/3 0.0053 z 0.0013 ¼ 0.0012 ¼ 0.0038 ¼ Distances O1 (3)2.407 (1)2.705 (3)2.397 (1)2.814 (3)2.398 (1)2.973 O2 (3)2.452 (1)2.357 (3)2.453 (1)2.384 (3)2.448 (1)2.295
O3 (3)2.805 (2)2.344 (3)2.801 (2)2.384 (3)2.789 (2)2.534 O3 (2)2.512 (2)2.398 (2)2.336 OH/F/Cl (2)2.383 (1)2.231 (2)2.801
Mean 2.555 2.443 2.550 2.428 2.545 2.577
0.189 0.127 0.190 0.180 0.184 0.255
Poly.Vol. 31.974 26.138 31.750 21.506 31.977 34.126
Elect. Energy ‐969. ‐1009. ‐984. ‐996. ‐984. ‐976.
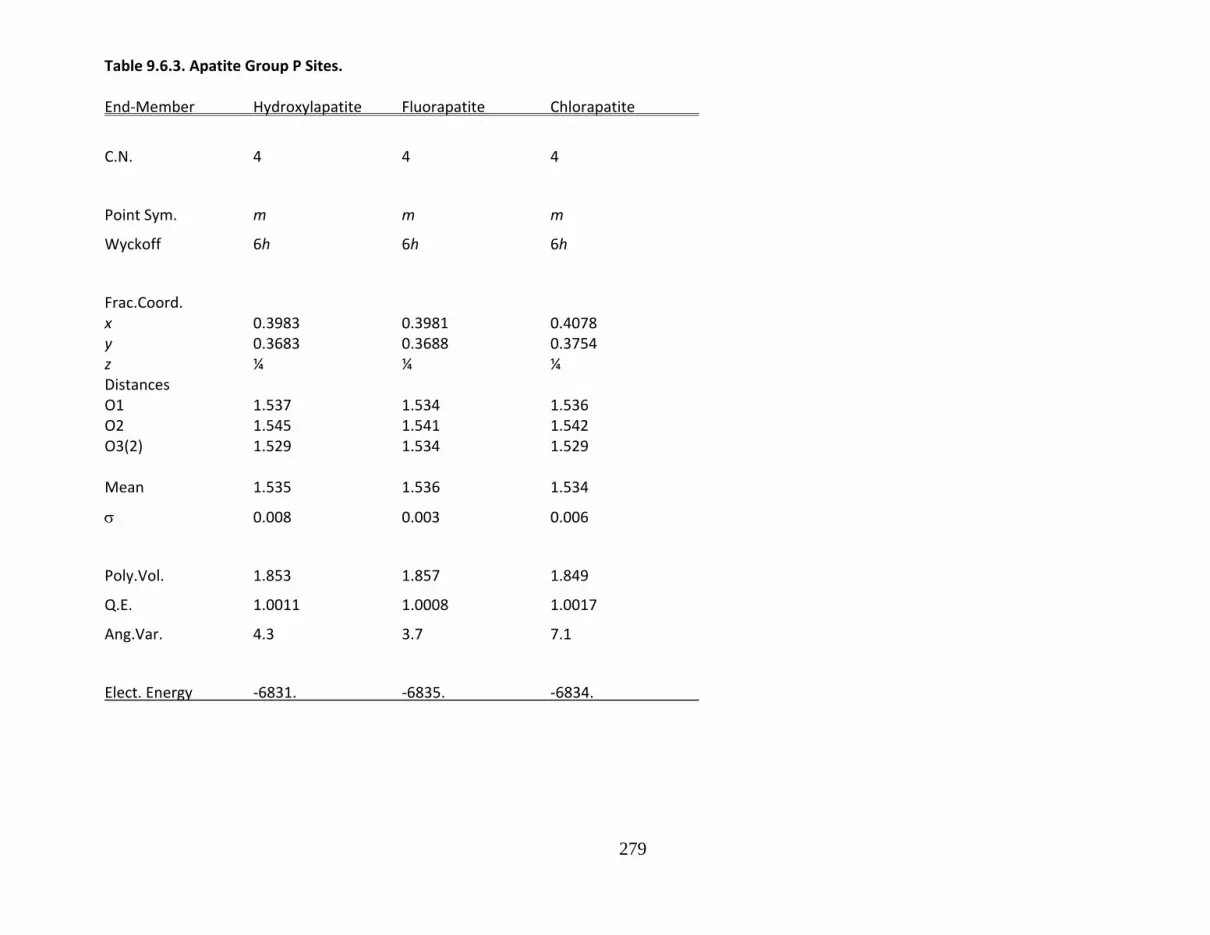
279
Table 9.6.3. Apatite Group P Sites.
End‐Member Hydroxylapatite Fluorapatite Chlorapatite
C.N. 4 4 4
Point Sym. m m m
Wyckoff 6h 6h 6h
Frac.Coord. x 0.3983 0.3981 0.4078 y 0.3683 0.3688 0.3754 z ¼ ¼ ¼ Distances O1 1.537 1.534 1.536 O2 1.545 1.541 1.542
O3(2) 1.529 1.534 1.529 Mean 1.535 1.536 1.534
0.008 0.003 0.006
Poly.Vol. 1.853 1.857 1.849
Q.E. 1.0011 1.0008 1.0017
Ang.Var. 4.3 3.7 7.1
Elect. Energy ‐6831. ‐6835. ‐6834.
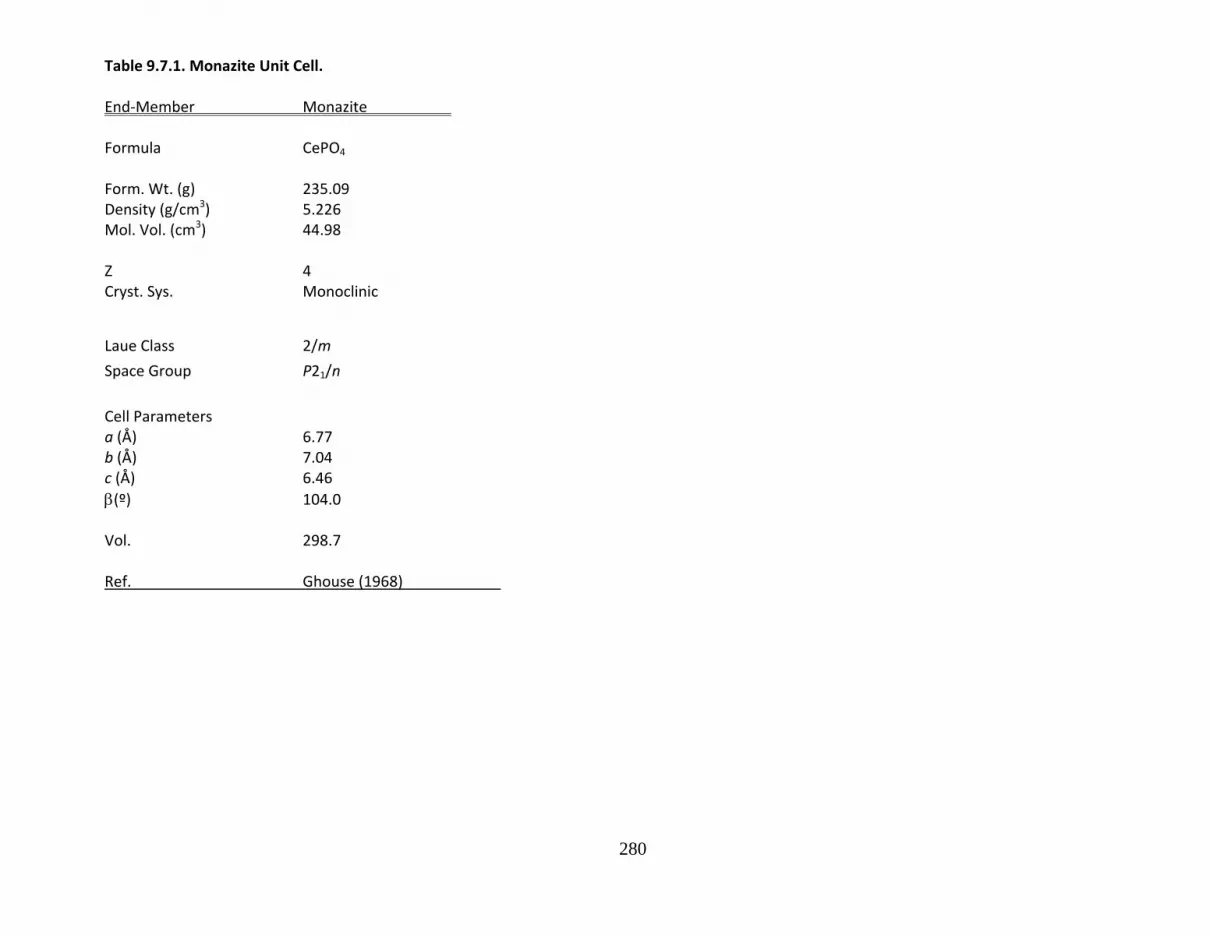
280
Table 9.7.1. Monazite Unit Cell.
End‐Member Monazite Formula CePO4 Form. Wt. (g) 235.09 Density (g/cm3) 5.226 Mol. Vol. (cm3) 44.98 Z 4 Cryst. Sys. Monoclinic
Laue Class 2/m
Space Group P21/n
Cell Parameters a (Å) 6.77 b (Å) 7.04 c (Å) 6.46
(º) 104.0
Vol. 298.7
Ref. Ghouse (1968)
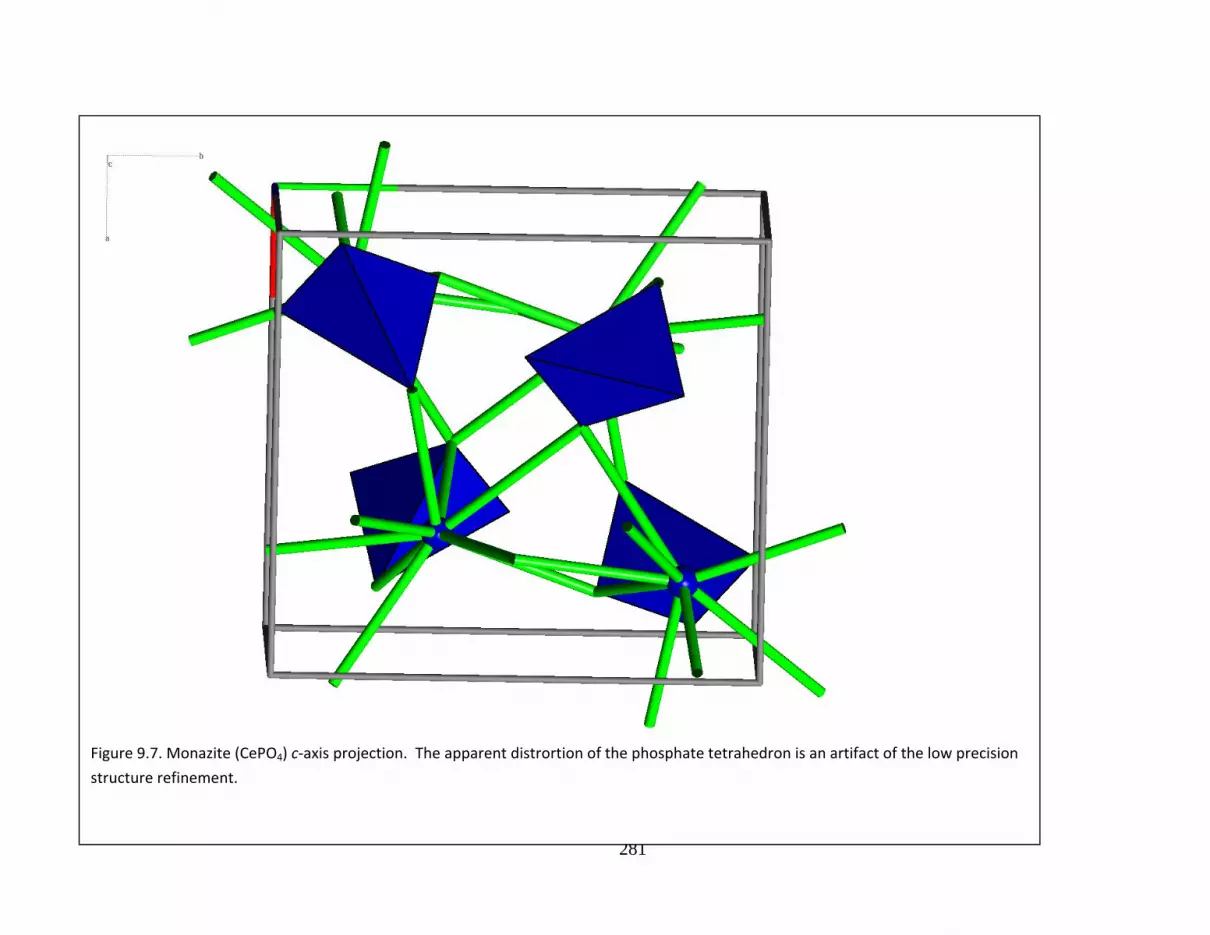
281
Figure 9.7. Monazite (CePO4) c‐axis projection. The apparent distrortion of the phosphate tetrahedron is an artifact of the low precision
structure refinement.
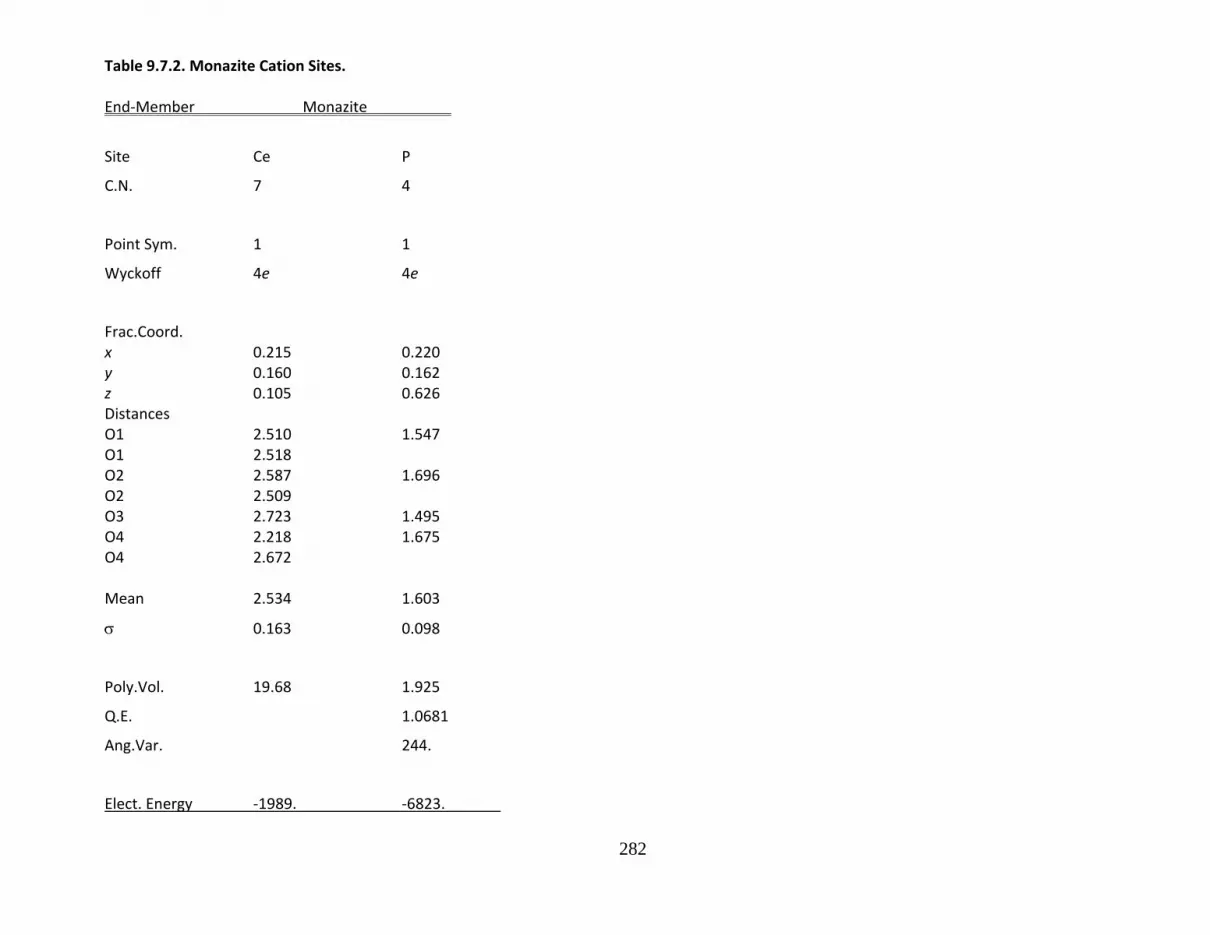
282
Table 9.7.2. Monazite Cation Sites. End‐Member Monazite
Site Ce P
C.N. 7 4
Point Sym. 1 1
Wyckoff 4e 4e
Frac.Coord. x 0.215 0.220 y 0.160 0.162 z 0.105 0.626 Distances O1 2.510 1.547 O1 2.518 O2 2.587 1.696 O2 2.509 O3 2.723 1.495 O4 2.218 1.675
O4 2.672 Mean 2.534 1.603
0.163 0.098
Poly.Vol. 19.68 1.925
Q.E. 1.0681
Ang.Var. 244.
Elect. Energy ‐1989. ‐6823.

283
284
Chapter10.Halides
10.1. Halite Group
10.2. Fluorite Group

285
Table 10.1.1. Halite Group Unit Cells.
End‐Member Halite Sylvite Villiaumite Formula NaCl KCl NaF Form. Wt. (g) 58.443 74.555 41.988 Density (g/cm3) 2.166 1.989 2.837 Mol. Vol. (cm3) 26.985 37.490 14.791 Z 4 4 4 Cryst. Sys. Isometric Isometric Isometric
Laue Class m3m m3m m3m
Space Group Fm3m Fm3m Fm3m
Cell Parameters a (Å) 5.638 6.291 4.614
Vol. 179.22 248.98 98.23
Ref. Wyckoff Wyckoff Wyckoff (1963) (1963) (1963)
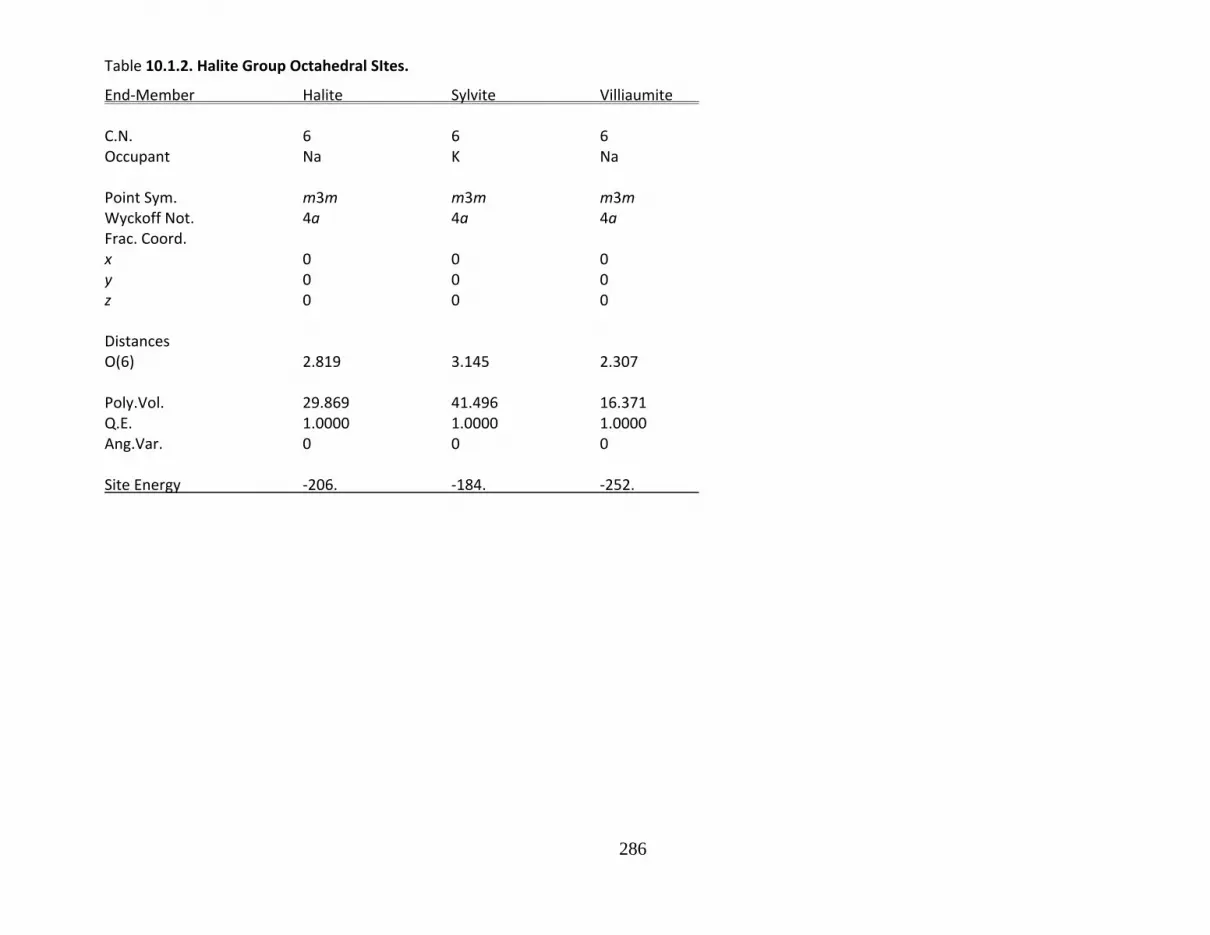
286
Table 10.1.2. Halite Group Octahedral SItes.
End‐Member Halite Sylvite Villiaumite C.N. 6 6 6 Occupant Na K Na Point Sym. m3m m3m m3m
Wyckoff Not. 4a 4a 4a Frac. Coord. x 0 0 0 y 0 0 0
z 0 0 0 Distances O(6) 2.819 3.145 2.307 Poly.Vol. 29.869 41.496 16.371 Q.E. 1.0000 1.0000 1.0000 Ang.Var. 0 0 0 Site Energy ‐206. ‐184. ‐252.
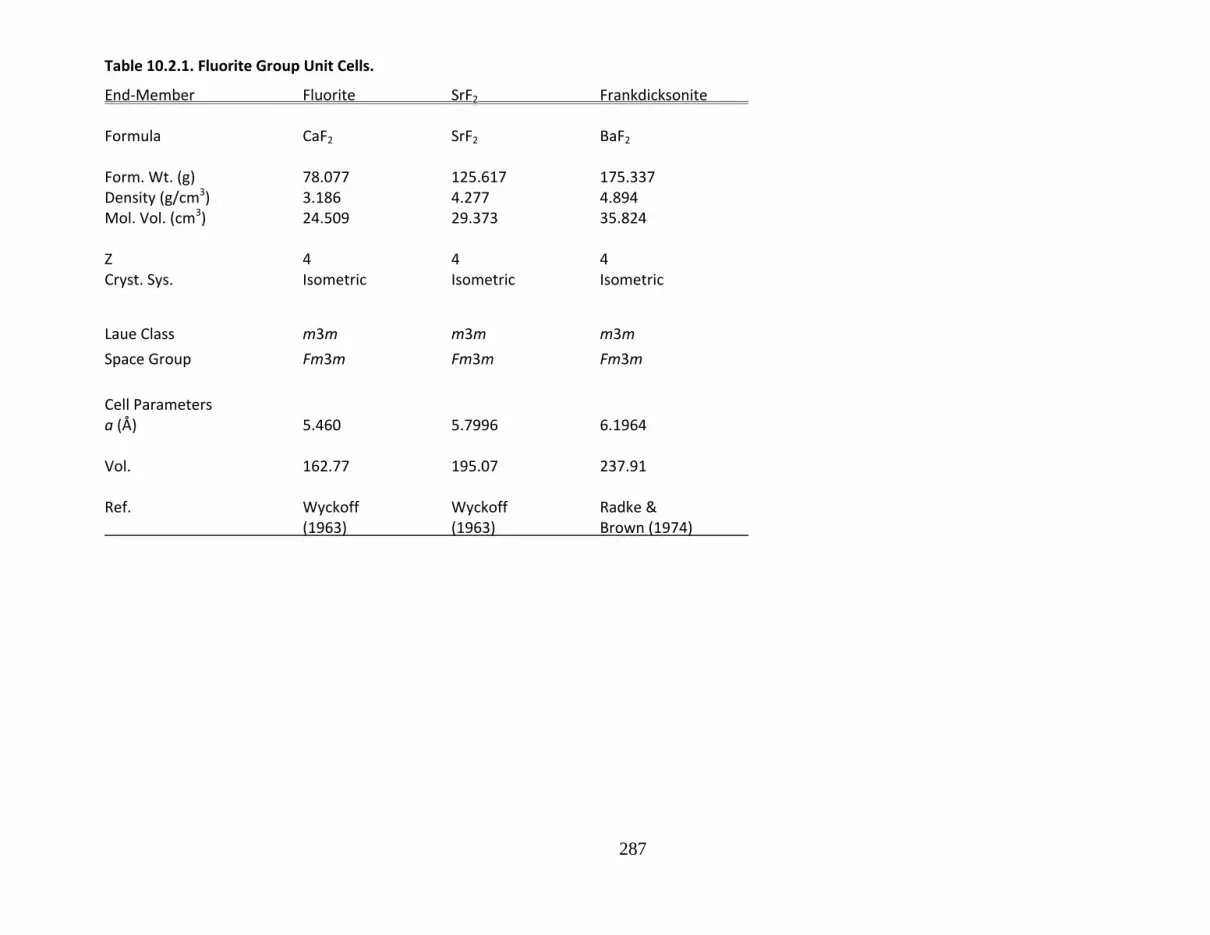
287
Table 10.2.1. Fluorite Group Unit Cells.
End‐Member Fluorite SrF2 Frankdicksonite Formula CaF2 SrF2 BaF2 Form. Wt. (g) 78.077 125.617 175.337 Density (g/cm3) 3.186 4.277 4.894 Mol. Vol. (cm3) 24.509 29.373 35.824 Z 4 4 4 Cryst. Sys. Isometric Isometric Isometric
Laue Class m3m m3m m3m
Space Group Fm3m Fm3m Fm3m
Cell Parameters a (Å) 5.460 5.7996 6.1964
Vol. 162.77 195.07 237.91
Ref. Wyckoff Wyckoff Radke & (1963) (1963) Brown (1974)
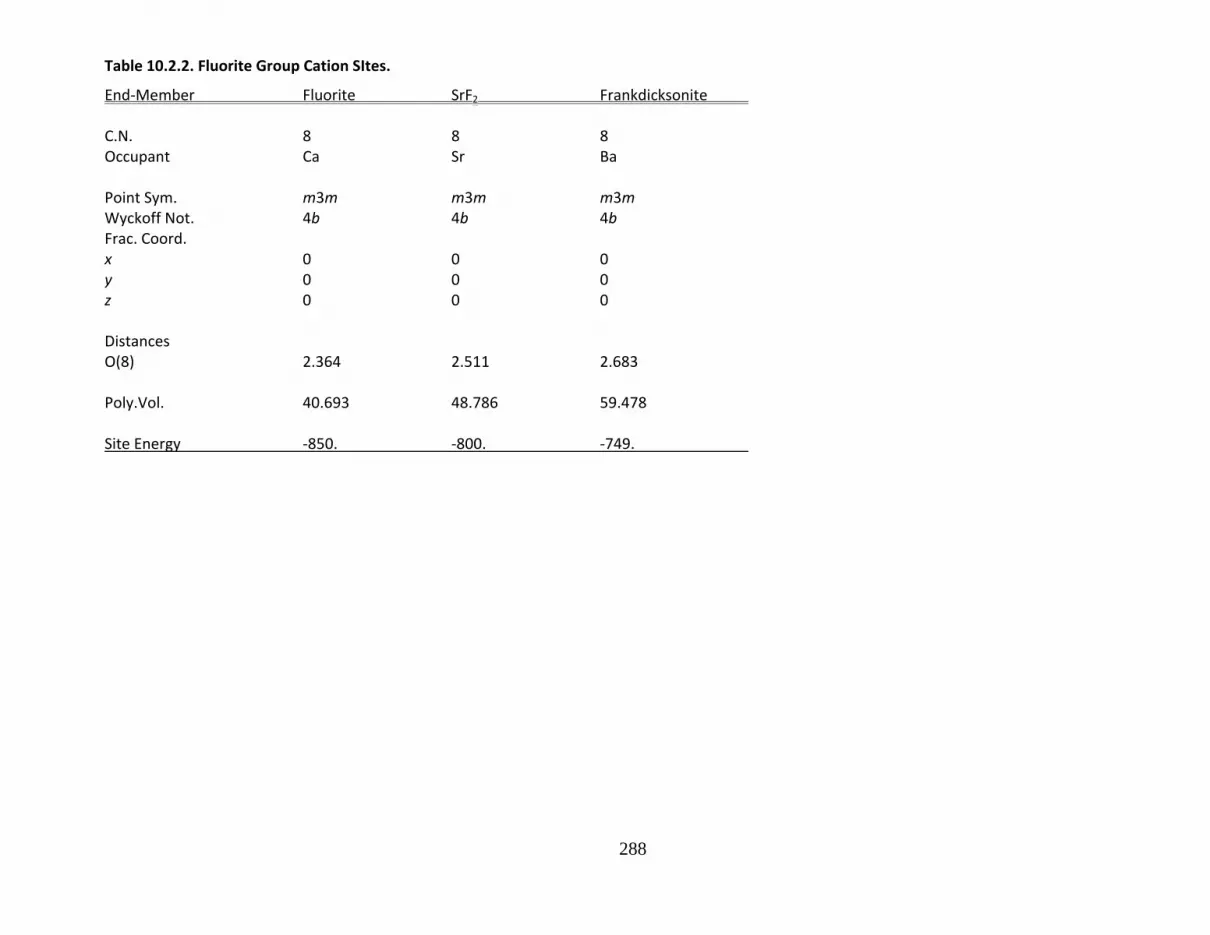
288
Table 10.2.2. Fluorite Group Cation SItes.
End‐Member Fluorite SrF2 Frankdicksonite C.N. 8 8 8 Occupant Ca Sr Ba Point Sym. m3m m3m m3m
Wyckoff Not. 4b 4b 4b Frac. Coord. x 0 0 0 y 0 0 0
z 0 0 0 Distances O(8) 2.364 2.511 2.683 Poly.Vol. 40.693 48.786 59.478 Site Energy ‐850. ‐800. ‐749.
289
Chapter11.CationSitesListedbyMeanDistance
11.1. Two‐fold and Three‐fold Sites
11.2. Four‐fold Sites
11.3. Five‐fold Sites
11.4. Six‐fold Sites
11.5. Seven‐fold Sites
11.6. Eight‐fold Sites
11.7. Sites of Coordination Number Greater than Eight
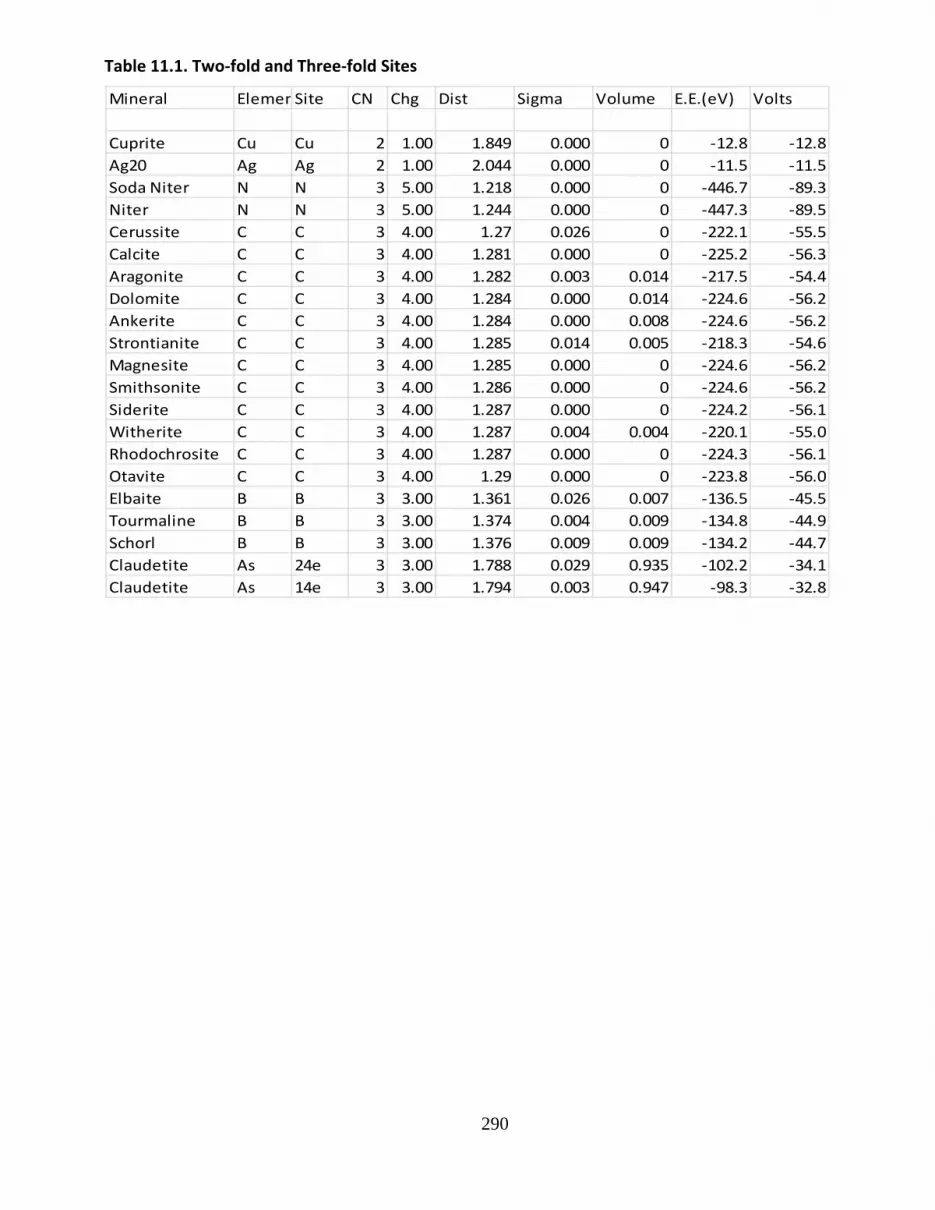
290
Table 11.1. Two‐fold and Three‐fold Sites
Mineral ElemenSite CN Chg Dist Sigma Volume E.E.(eV) Volts
Cuprite Cu Cu 2 1.00 1.849 0.000 0 ‐12.8 ‐12.8
Ag20 Ag Ag 2 1.00 2.044 0.000 0 ‐11.5 ‐11.5
Soda Niter N N 3 5.00 1.218 0.000 0 ‐446.7 ‐89.3
Niter N N 3 5.00 1.244 0.000 0 ‐447.3 ‐89.5
Cerussite C C 3 4.00 1.27 0.026 0 ‐222.1 ‐55.5
Calcite C C 3 4.00 1.281 0.000 0 ‐225.2 ‐56.3
Aragonite C C 3 4.00 1.282 0.003 0.014 ‐217.5 ‐54.4
Dolomite C C 3 4.00 1.284 0.000 0.014 ‐224.6 ‐56.2
Ankerite C C 3 4.00 1.284 0.000 0.008 ‐224.6 ‐56.2
Strontianite C C 3 4.00 1.285 0.014 0.005 ‐218.3 ‐54.6
Magnesite C C 3 4.00 1.285 0.000 0 ‐224.6 ‐56.2
Smithsonite C C 3 4.00 1.286 0.000 0 ‐224.6 ‐56.2
Siderite C C 3 4.00 1.287 0.000 0 ‐224.2 ‐56.1
Witherite C C 3 4.00 1.287 0.004 0.004 ‐220.1 ‐55.0
Rhodochrosite C C 3 4.00 1.287 0.000 0 ‐224.3 ‐56.1
Otavite C C 3 4.00 1.29 0.000 0 ‐223.8 ‐56.0
Elbaite B B 3 3.00 1.361 0.026 0.007 ‐136.5 ‐45.5
Tourmaline B B 3 3.00 1.374 0.004 0.009 ‐134.8 ‐44.9
Schorl B B 3 3.00 1.376 0.009 0.009 ‐134.2 ‐44.7
Claudetite As 24e 3 3.00 1.788 0.029 0.935 ‐102.2 ‐34.1
Claudetite As 14e 3 3.00 1.794 0.003 0.947 ‐98.3 ‐32.8
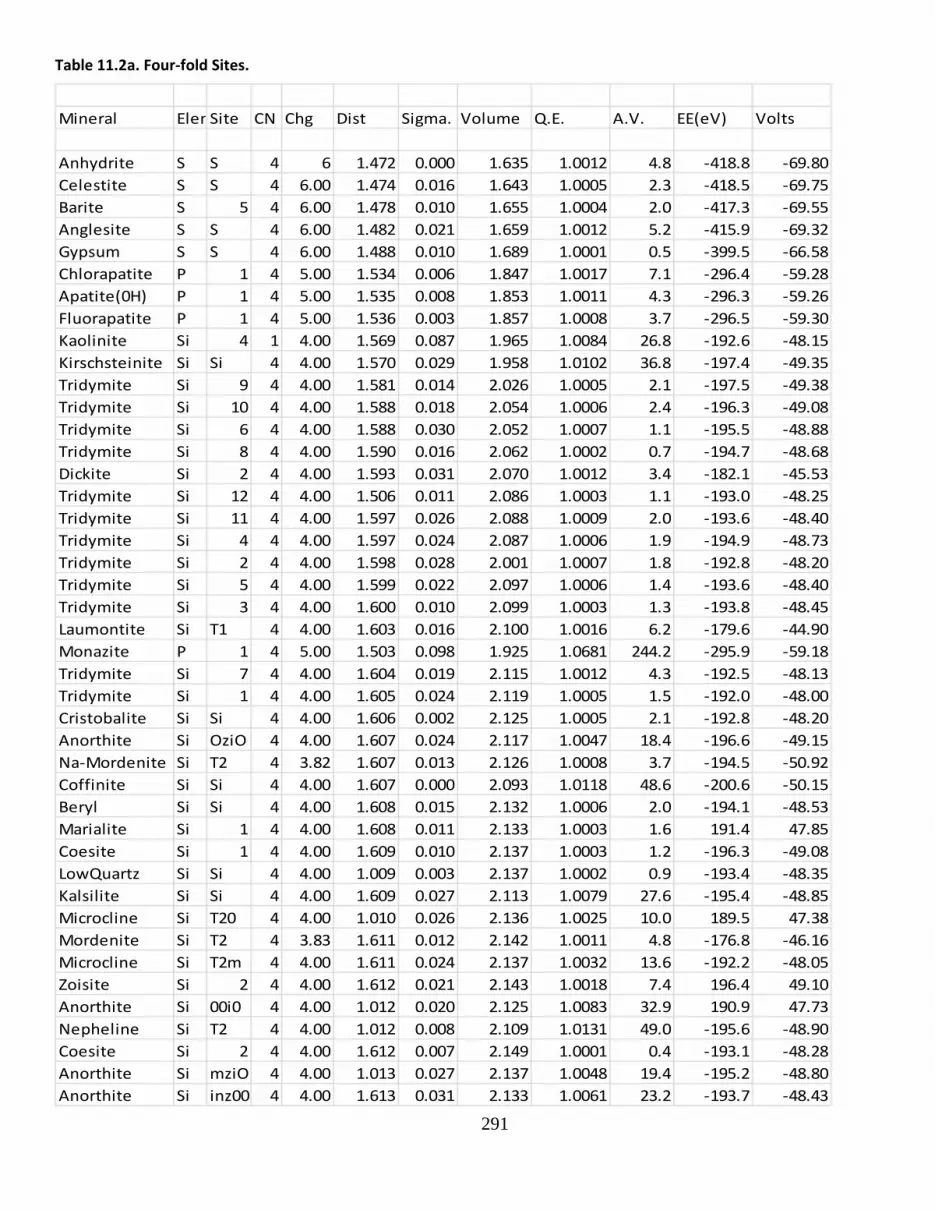
291
Table 11.2a. Four‐fold Sites.
Mineral ElemSite CN Chg Dist Sigma. Volume Q.E. A.V. EE(eV) Volts
Anhydrite S S 4 6 1.472 0.000 1.635 1.0012 4.8 ‐418.8 ‐69.80
Celestite S S 4 6.00 1.474 0.016 1.643 1.0005 2.3 ‐418.5 ‐69.75
Barite S 5 4 6.00 1.478 0.010 1.655 1.0004 2.0 ‐417.3 ‐69.55
Anglesite S S 4 6.00 1.482 0.021 1.659 1.0012 5.2 ‐415.9 ‐69.32
Gypsum S S 4 6.00 1.488 0.010 1.689 1.0001 0.5 ‐399.5 ‐66.58
Chlorapatite P 1 4 5.00 1.534 0.006 1.847 1.0017 7.1 ‐296.4 ‐59.28
Apatite(0H) P 1 4 5.00 1.535 0.008 1.853 1.0011 4.3 ‐296.3 ‐59.26
Fluorapatite P 1 4 5.00 1.536 0.003 1.857 1.0008 3.7 ‐296.5 ‐59.30
Kaolinite Si 4 1 4.00 1.569 0.087 1.965 1.0084 26.8 ‐192.6 ‐48.15
Kirschsteinite Si Si 4 4.00 1.570 0.029 1.958 1.0102 36.8 ‐197.4 ‐49.35
Tridymite Si 9 4 4.00 1.581 0.014 2.026 1.0005 2.1 ‐197.5 ‐49.38
Tridymite Si 10 4 4.00 1.588 0.018 2.054 1.0006 2.4 ‐196.3 ‐49.08
Tridymite Si 6 4 4.00 1.588 0.030 2.052 1.0007 1.1 ‐195.5 ‐48.88
Tridymite Si 8 4 4.00 1.590 0.016 2.062 1.0002 0.7 ‐194.7 ‐48.68
Dickite Si 2 4 4.00 1.593 0.031 2.070 1.0012 3.4 ‐182.1 ‐45.53
Tridymite Si 12 4 4.00 1.506 0.011 2.086 1.0003 1.1 ‐193.0 ‐48.25
Tridymite Si 11 4 4.00 1.597 0.026 2.088 1.0009 2.0 ‐193.6 ‐48.40
Tridymite Si 4 4 4.00 1.597 0.024 2.087 1.0006 1.9 ‐194.9 ‐48.73
Tridymite Si 2 4 4.00 1.598 0.028 2.001 1.0007 1.8 ‐192.8 ‐48.20
Tridymite Si 5 4 4.00 1.599 0.022 2.097 1.0006 1.4 ‐193.6 ‐48.40
Tridymite Si 3 4 4.00 1.600 0.010 2.099 1.0003 1.3 ‐193.8 ‐48.45
Laumontite Si T1 4 4.00 1.603 0.016 2.100 1.0016 6.2 ‐179.6 ‐44.90
Monazite P 1 4 5.00 1.503 0.098 1.925 1.0681 244.2 ‐295.9 ‐59.18
Tridymite Si 7 4 4.00 1.604 0.019 2.115 1.0012 4.3 ‐192.5 ‐48.13
Tridymite Si 1 4 4.00 1.605 0.024 2.119 1.0005 1.5 ‐192.0 ‐48.00
Cristobalite Si Si 4 4.00 1.606 0.002 2.125 1.0005 2.1 ‐192.8 ‐48.20
Anorthite Si OziO 4 4.00 1.607 0.024 2.117 1.0047 18.4 ‐196.6 ‐49.15
Na‐Mordenite Si T2 4 3.82 1.607 0.013 2.126 1.0008 3.7 ‐194.5 ‐50.92
Coffinite Si Si 4 4.00 1.607 0.000 2.093 1.0118 48.6 ‐200.6 ‐50.15
Beryl Si Si 4 4.00 1.608 0.015 2.132 1.0006 2.0 ‐194.1 ‐48.53
Marialite Si 1 4 4.00 1.608 0.011 2.133 1.0003 1.6 191.4 47.85
Coesite Si 1 4 4.00 1.609 0.010 2.137 1.0003 1.2 ‐196.3 ‐49.08
LowQuartz Si Si 4 4.00 1.009 0.003 2.137 1.0002 0.9 ‐193.4 ‐48.35
Kalsilite Si Si 4 4.00 1.609 0.027 2.113 1.0079 27.6 ‐195.4 ‐48.85
Microcline Si T20 4 4.00 1.010 0.026 2.136 1.0025 10.0 189.5 47.38
Mordenite Si T2 4 3.83 1.611 0.012 2.142 1.0011 4.8 ‐176.8 ‐46.16
Microcline Si T2m 4 4.00 1.611 0.024 2.137 1.0032 13.6 ‐192.2 ‐48.05
Zoisite Si 2 4 4.00 1.612 0.021 2.143 1.0018 7.4 196.4 49.10
Anorthite Si 00i0 4 4.00 1.012 0.020 2.125 1.0083 32.9 190.9 47.73
Nepheline Si T2 4 4.00 1.012 0.008 2.109 1.0131 49.0 ‐195.6 ‐48.90
Coesite Si 2 4 4.00 1.612 0.007 2.149 1.0001 0.4 ‐193.1 ‐48.28
Anorthite Si mziO 4 4.00 1.013 0.027 2.137 1.0048 19.4 ‐195.2 ‐48.80
Anorthite Si inz00 4 4.00 1.613 0.031 2.133 1.0061 23.2 ‐193.7 ‐48.43
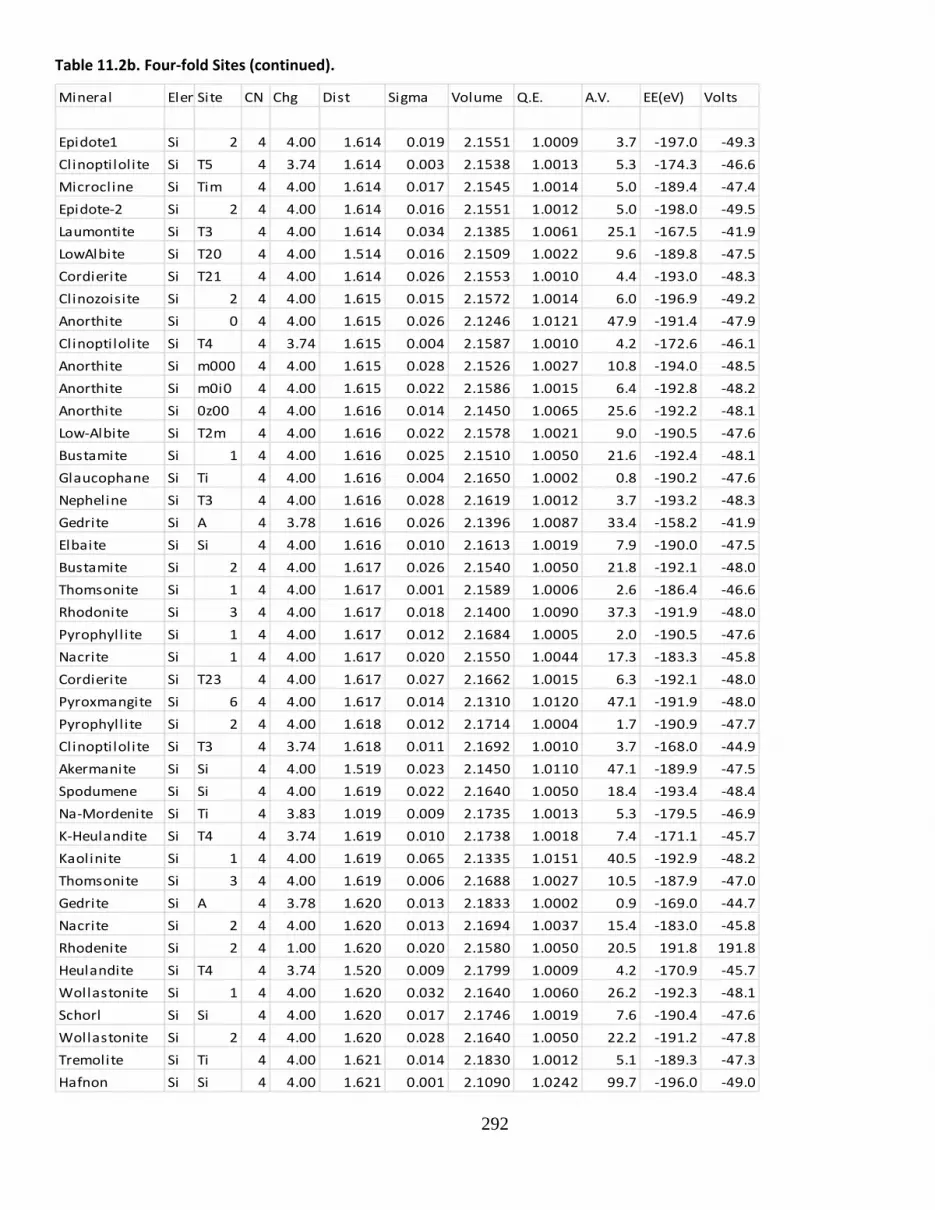
292
Table 11.2b. Four‐fold Sites (continued).
Mineral ElemSite CN Chg Dist Sigma Volume Q.E. A.V. EE(eV) Volts
Epidote1 Si 2 4 4.00 1.614 0.019 2.1551 1.0009 3.7 ‐197.0 ‐49.3
Clinoptilolite Si T5 4 3.74 1.614 0.003 2.1538 1.0013 5.3 ‐174.3 ‐46.6
Microcline Si Tim 4 4.00 1.614 0.017 2.1545 1.0014 5.0 ‐189.4 ‐47.4
Epidote‐2 Si 2 4 4.00 1.614 0.016 2.1551 1.0012 5.0 ‐198.0 ‐49.5
Laumontite Si T3 4 4.00 1.614 0.034 2.1385 1.0061 25.1 ‐167.5 ‐41.9
LowAlbite Si T20 4 4.00 1.514 0.016 2.1509 1.0022 9.6 ‐189.8 ‐47.5
Cordierite Si T21 4 4.00 1.614 0.026 2.1553 1.0010 4.4 ‐193.0 ‐48.3
Clinozoisite Si 2 4 4.00 1.615 0.015 2.1572 1.0014 6.0 ‐196.9 ‐49.2
Anorthite Si 0 4 4.00 1.615 0.026 2.1246 1.0121 47.9 ‐191.4 ‐47.9
Clinoptilolite Si T4 4 3.74 1.615 0.004 2.1587 1.0010 4.2 ‐172.6 ‐46.1
Anorthite Si m000 4 4.00 1.615 0.028 2.1526 1.0027 10.8 ‐194.0 ‐48.5
Anorthite Si m0i0 4 4.00 1.615 0.022 2.1586 1.0015 6.4 ‐192.8 ‐48.2
Anorthite Si 0z00 4 4.00 1.616 0.014 2.1450 1.0065 25.6 ‐192.2 ‐48.1
Low‐Albite Si T2m 4 4.00 1.616 0.022 2.1578 1.0021 9.0 ‐190.5 ‐47.6
Bustamite Si 1 4 4.00 1.616 0.025 2.1510 1.0050 21.6 ‐192.4 ‐48.1
Glaucophane Si Ti 4 4.00 1.616 0.004 2.1650 1.0002 0.8 ‐190.2 ‐47.6
Nepheline Si T3 4 4.00 1.616 0.028 2.1619 1.0012 3.7 ‐193.2 ‐48.3
Gedrite Si A 4 3.78 1.616 0.026 2.1396 1.0087 33.4 ‐158.2 ‐41.9
Elbaite Si Si 4 4.00 1.616 0.010 2.1613 1.0019 7.9 ‐190.0 ‐47.5
Bustamite Si 2 4 4.00 1.617 0.026 2.1540 1.0050 21.8 ‐192.1 ‐48.0
Thomsonite Si 1 4 4.00 1.617 0.001 2.1589 1.0006 2.6 ‐186.4 ‐46.6
Rhodonite Si 3 4 4.00 1.617 0.018 2.1400 1.0090 37.3 ‐191.9 ‐48.0
Pyrophyllite Si 1 4 4.00 1.617 0.012 2.1684 1.0005 2.0 ‐190.5 ‐47.6
Nacrite Si 1 4 4.00 1.617 0.020 2.1550 1.0044 17.3 ‐183.3 ‐45.8
Cordierite Si T23 4 4.00 1.617 0.027 2.1662 1.0015 6.3 ‐192.1 ‐48.0
Pyroxmangite Si 6 4 4.00 1.617 0.014 2.1310 1.0120 47.1 ‐191.9 ‐48.0
Pyrophyllite Si 2 4 4.00 1.618 0.012 2.1714 1.0004 1.7 ‐190.9 ‐47.7
Clinoptilolite Si T3 4 3.74 1.618 0.011 2.1692 1.0010 3.7 ‐168.0 ‐44.9
Akermanite Si Si 4 4.00 1.519 0.023 2.1450 1.0110 47.1 ‐189.9 ‐47.5
Spodumene Si Si 4 4.00 1.619 0.022 2.1640 1.0050 18.4 ‐193.4 ‐48.4
Na‐Mordenite Si Ti 4 3.83 1.019 0.009 2.1735 1.0013 5.3 ‐179.5 ‐46.9
K‐Heulandite Si T4 4 3.74 1.619 0.010 2.1738 1.0018 7.4 ‐171.1 ‐45.7
Kaolinite Si 1 4 4.00 1.619 0.065 2.1335 1.0151 40.5 ‐192.9 ‐48.2
Thomsonite Si 3 4 4.00 1.619 0.006 2.1688 1.0027 10.5 ‐187.9 ‐47.0
Gedrite Si A 4 3.78 1.620 0.013 2.1833 1.0002 0.9 ‐169.0 ‐44.7
Nacrite Si 2 4 4.00 1.620 0.013 2.1694 1.0037 15.4 ‐183.0 ‐45.8
Rhodenite Si 2 4 1.00 1.620 0.020 2.1580 1.0050 20.5 191.8 191.8
Heulandite Si T4 4 3.74 1.520 0.009 2.1799 1.0009 4.2 ‐170.9 ‐45.7
Wollastonite Si 1 4 4.00 1.620 0.032 2.1640 1.0060 26.2 ‐192.3 ‐48.1
Schorl Si Si 4 4.00 1.620 0.017 2.1746 1.0019 7.6 ‐190.4 ‐47.6
Wollastonite Si 2 4 4.00 1.620 0.028 2.1640 1.0050 22.2 ‐191.2 ‐47.8
Tremolite Si Ti 4 4.00 1.621 0.014 2.1830 1.0012 5.1 ‐189.3 ‐47.3
Hafnon Si Si 4 4.00 1.621 0.001 2.1090 1.0242 99.7 ‐196.0 ‐49.0

293
Table 11.2c. Four‐fold Sites (continued).
Mineral Ele Site CN Chg Dist Sigma VolumeQE. AV. EE(eV)
Na‐melilite Si T3 4 4.00 1.622 0.031 2.163 1.0080 36.6 ‐188.3 ‐47.1
Gedrite Si B 4 3.78 1.622 0.011 2.189 1.0001 0.3 ‐206.3 ‐54.6
Margarite Si T11 4 4.00 1.622 0.007 2.186 1.0006 2.4 ‐188.8 ‐47.2
Talc Si 2 4 4.00 1.622 0.001 2.191 1.0000 0.3 ‐189.9 ‐47.5
Na‐Mordenite Si T1 4 3.82 1.622 0.013 2.182 1.0023 9.2 ‐195.1 ‐51.1
Clinoferrosilite Si A 4 4.00 1.622 0.027 2.173 1.0060 24.6 ‐192.1 ‐48.0
Allanite Si 2 4 4.00 1.623 0.014 2.192 1.0011 4.1 ‐195.4 ‐48.9
Rhodonite Si Si4 4 4.00 1.623 0.025 2.181 1.0040 14.5 ‐191.1 ‐47.8
Talc Si Si1 4 4.00 1.623 0.002 2.194 1.0000 0.2 ‐189.8 ‐47.5
Heulandite Si T3 4 3.74 1.623 0.006 2.190 1.0015 5.9 ‐168.2 ‐45.0
Rhodonite Si Si1 4 4.00 1.623 0.026 2.155 1.0115 51.6 ‐191.8 ‐48.0
Zircon Si Si 4 4.00 1.623 0.000 2.118 1.0237 97.8 ‐195.7 ‐48.9
Willemite Si Si 4 4.00 1.623 0.011 2.191 1.0009 3.3 ‐192.8 ‐48.2
LowAlbite Si Tim 4 4.00 1.624 0.024 2.185 1.0044 15.8 ‐189.2 ‐47.3
Na‐Mordenite Si T4 4 3.82 1.624 0.011 2.191 1.0024 10.6 ‐186.5 ‐48.8
Gedrite Si A 4 3.78 1.624 0.023 2.175 1.0076 30.5 ‐155.5 ‐41.1
Clinoptilolite Si Ti 4 3.74 1.624 0.005 2.195 1.0010 4.5 ‐167.2 ‐44.7
Epidote‐1 Si 1 4 4.00 1.624 0.041 2.190 1.0033 9.9 ‐188.6 ‐47.2
Clinozoisite Si 1 4 4.00 1.625 0.041 2.190 1.0034 10.5 ‐190.0 ‐47.5
Heulandite Si Ti 4 3.74 1.625 0.004 2.197 1.0009 4.0 ‐169.3 ‐45.3
Epidote‐2 Si 1 4 4.00 1.625 0.043 2.191 1.0035 10.5 ‐189.7 ‐47.4
Tourmaline Si Al 4 4.00 1.625 0.016 2.195 1.0024 9.8 ‐186.2 ‐46.6
CoOrthopyrox Si A 4 4.00 1.625 0.024 2.180 1.0080 30.7 ‐192.1 ‐48.0
Jadeite Si Si 4 4.00 1.625 0.021 2.182 1.0060 23.1 ‐192.6 ‐48.2
Thomsonite Si 2 4 3.92 1.626 0.007 2.200 1.0015 6.2 ‐181.7 ‐46.4
Ureyite Si Si 4 4.00 1.626 0.026 2.196 1.0040 15.9 ‐192.8 ‐48.2
Pyroxmangite Si 5 4 4.00 1.626 0.033 2.177 1.0090 35.5 ‐191.8 ‐48.0
Cordierite Si T16 4 4.00 1.626 0.000 2.133 1.0226 88.6 ‐187.7 ‐46.9
Orthoferrosilite Si A 4 4.00 1.626 0.022 2.181 1.0080 31.1 ‐192.0 ‐48.0
Sillimanite Si Si 4 4.00 1.626 0.035 2.203 1.0013 3.4 ‐192.0 ‐48.0
Clinohumite Si 1 4 4.00 1.626 0.004 2.175 1.0094 39.7 ‐186.5 ‐46.6
Cummingtonite Si Ti 4 4.00 1.627 0.011 2.212 1.0002 0.6 ‐201.9 ‐50.5
Acmite Si Si 4 4.00 1.627 0.021 2.201 1.0030 13.9 ‐192.7 ‐48.2
Humite Si 2 4 4.00 1.627 0.011 2.180 1.0096 42.5 ‐188.5 ‐47.1
Rhodonite Si 5 4 4.00 1.627 0.024 2.195 1.0040 19.1 ‐189.3 ‐47.3
Heulandite Si T5 4 3.74 1.627 0.004 2.205 1.0010 4.2 ‐173.2 ‐46.3
Tremolite Si Ti 4 4.00 1.627 0.014 2.206 1.0014 6.2 ‐186.2 ‐46.6
Lepidolite Si T2 4 3.84 1.627 0.012 2.206 1.0019 8.5 ‐174.6 ‐45.5
Vesuvianite Si 3 4 4.00 1.628 0.02 2.211 1.0010 4.3 ‐184.8 ‐46.2
Orthoenstatite Si A 4 4.00 1.628 0.035 2.182 1.0099 39.8 ‐191.1 ‐47.8
Cummingtonite Si T2 4 4.00 1.628 0.018 2.202 1.0040 15.7 ‐176.5 ‐44.1
K‐Heulandite Si T3 4 3.74 1.628 0.005 2.206 1.0022 8.7 ‐171.3 ‐45.8
Almandine Si Z 4 4 1.628 0.001 2.172 1.0134 55.2 ‐191.4 ‐47.9
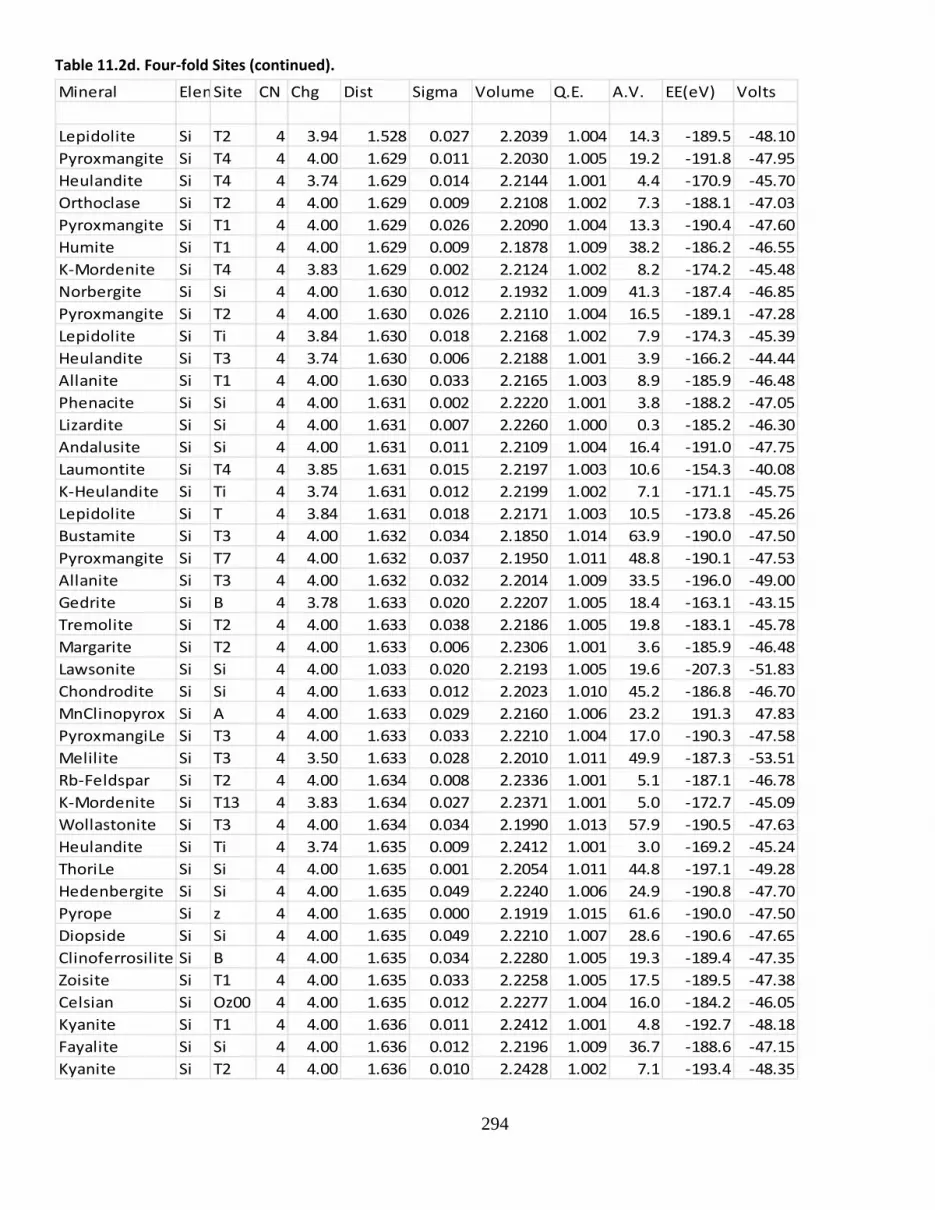
294
Table 11.2d. Four‐fold Sites (continued).
Mineral ElemSite CN Chg Dist Sigma Volume Q.E. A.V. EE(eV) Volts
Lepidolite Si T2 4 3.94 1.528 0.027 2.2039 1.004 14.3 ‐189.5 ‐48.10
Pyroxmangite Si T4 4 4.00 1.629 0.011 2.2030 1.005 19.2 ‐191.8 ‐47.95
Heulandite Si T4 4 3.74 1.629 0.014 2.2144 1.001 4.4 ‐170.9 ‐45.70
Orthoclase Si T2 4 4.00 1.629 0.009 2.2108 1.002 7.3 ‐188.1 ‐47.03
Pyroxmangite Si T1 4 4.00 1.629 0.026 2.2090 1.004 13.3 ‐190.4 ‐47.60
Humite Si T1 4 4.00 1.629 0.009 2.1878 1.009 38.2 ‐186.2 ‐46.55
K‐Mordenite Si T4 4 3.83 1.629 0.002 2.2124 1.002 8.2 ‐174.2 ‐45.48
Norbergite Si Si 4 4.00 1.630 0.012 2.1932 1.009 41.3 ‐187.4 ‐46.85
Pyroxmangite Si T2 4 4.00 1.630 0.026 2.2110 1.004 16.5 ‐189.1 ‐47.28
Lepidolite Si Ti 4 3.84 1.630 0.018 2.2168 1.002 7.9 ‐174.3 ‐45.39
Heulandite Si T3 4 3.74 1.630 0.006 2.2188 1.001 3.9 ‐166.2 ‐44.44
Allanite Si T1 4 4.00 1.630 0.033 2.2165 1.003 8.9 ‐185.9 ‐46.48
Phenacite Si Si 4 4.00 1.631 0.002 2.2220 1.001 3.8 ‐188.2 ‐47.05
Lizardite Si Si 4 4.00 1.631 0.007 2.2260 1.000 0.3 ‐185.2 ‐46.30
Andalusite Si Si 4 4.00 1.631 0.011 2.2109 1.004 16.4 ‐191.0 ‐47.75
Laumontite Si T4 4 3.85 1.631 0.015 2.2197 1.003 10.6 ‐154.3 ‐40.08
K‐Heulandite Si Ti 4 3.74 1.631 0.012 2.2199 1.002 7.1 ‐171.1 ‐45.75
Lepidolite Si T 4 3.84 1.631 0.018 2.2171 1.003 10.5 ‐173.8 ‐45.26
Bustamite Si T3 4 4.00 1.632 0.034 2.1850 1.014 63.9 ‐190.0 ‐47.50
Pyroxmangite Si T7 4 4.00 1.632 0.037 2.1950 1.011 48.8 ‐190.1 ‐47.53
Allanite Si T3 4 4.00 1.632 0.032 2.2014 1.009 33.5 ‐196.0 ‐49.00
Gedrite Si B 4 3.78 1.633 0.020 2.2207 1.005 18.4 ‐163.1 ‐43.15
Tremolite Si T2 4 4.00 1.633 0.038 2.2186 1.005 19.8 ‐183.1 ‐45.78
Margarite Si T2 4 4.00 1.633 0.006 2.2306 1.001 3.6 ‐185.9 ‐46.48
Lawsonite Si Si 4 4.00 1.033 0.020 2.2193 1.005 19.6 ‐207.3 ‐51.83
Chondrodite Si Si 4 4.00 1.633 0.012 2.2023 1.010 45.2 ‐186.8 ‐46.70
MnClinopyrox Si A 4 4.00 1.633 0.029 2.2160 1.006 23.2 191.3 47.83
PyroxmangiLe Si T3 4 4.00 1.633 0.033 2.2210 1.004 17.0 ‐190.3 ‐47.58
Melilite Si T3 4 3.50 1.633 0.028 2.2010 1.011 49.9 ‐187.3 ‐53.51
Rb‐Feldspar Si T2 4 4.00 1.634 0.008 2.2336 1.001 5.1 ‐187.1 ‐46.78
K‐Mordenite Si T13 4 3.83 1.634 0.027 2.2371 1.001 5.0 ‐172.7 ‐45.09
Wollastonite Si T3 4 4.00 1.634 0.034 2.1990 1.013 57.9 ‐190.5 ‐47.63
Heulandite Si Ti 4 3.74 1.635 0.009 2.2412 1.001 3.0 ‐169.2 ‐45.24
ThoriLe Si Si 4 4.00 1.635 0.001 2.2054 1.011 44.8 ‐197.1 ‐49.28
Hedenbergite Si Si 4 4.00 1.635 0.049 2.2240 1.006 24.9 ‐190.8 ‐47.70
Pyrope Si z 4 4.00 1.635 0.000 2.1919 1.015 61.6 ‐190.0 ‐47.50
Diopside Si Si 4 4.00 1.635 0.049 2.2210 1.007 28.6 ‐190.6 ‐47.65
Clinoferrosilite Si B 4 4.00 1.635 0.034 2.2280 1.005 19.3 ‐189.4 ‐47.35
Zoisite Si T1 4 4.00 1.635 0.033 2.2258 1.005 17.5 ‐189.5 ‐47.38
Celsian Si Oz00 4 4.00 1.635 0.012 2.2277 1.004 16.0 ‐184.2 ‐46.05
Kyanite Si T1 4 4.00 1.636 0.011 2.2412 1.001 4.8 ‐192.7 ‐48.18
Fayalite Si Si 4 4.00 1.636 0.012 2.2196 1.009 36.7 ‐188.6 ‐47.15
Kyanite Si T2 4 4.00 1.636 0.010 2.2428 1.002 7.1 ‐193.4 ‐48.35
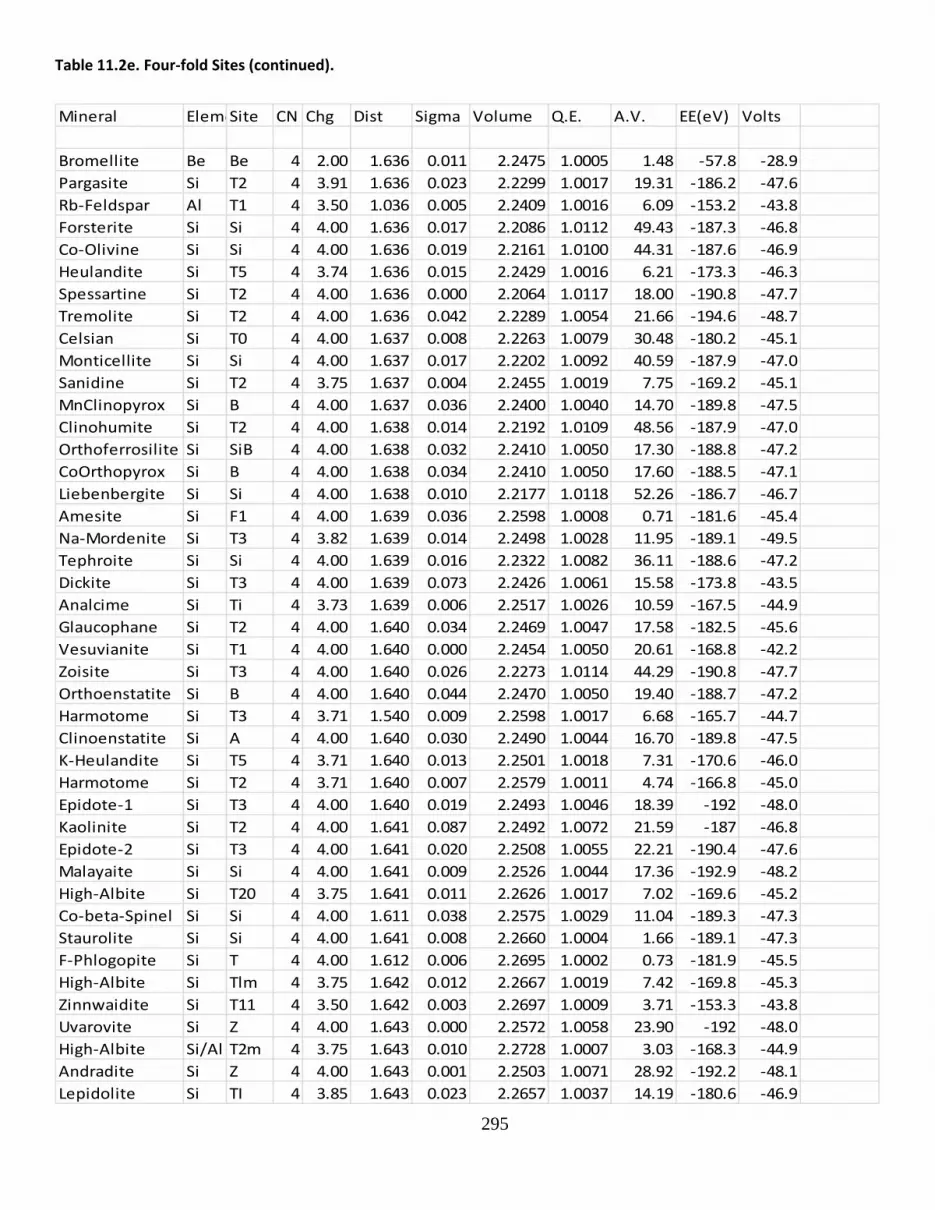
295
Table 11.2e. Four‐fold Sites (continued).
Mineral ElemeSite CN Chg Dist Sigma Volume Q.E. A.V. EE(eV) Volts
Bromellite Be Be 4 2.00 1.636 0.011 2.2475 1.0005 1.48 ‐57.8 ‐28.9
Pargasite Si T2 4 3.91 1.636 0.023 2.2299 1.0017 19.31 ‐186.2 ‐47.6
Rb‐Feldspar Al T1 4 3.50 1.036 0.005 2.2409 1.0016 6.09 ‐153.2 ‐43.8
Forsterite Si Si 4 4.00 1.636 0.017 2.2086 1.0112 49.43 ‐187.3 ‐46.8
Co‐Olivine Si Si 4 4.00 1.636 0.019 2.2161 1.0100 44.31 ‐187.6 ‐46.9
Heulandite Si T5 4 3.74 1.636 0.015 2.2429 1.0016 6.21 ‐173.3 ‐46.3
Spessartine Si T2 4 4.00 1.636 0.000 2.2064 1.0117 18.00 ‐190.8 ‐47.7
Tremolite Si T2 4 4.00 1.636 0.042 2.2289 1.0054 21.66 ‐194.6 ‐48.7
Celsian Si T0 4 4.00 1.637 0.008 2.2263 1.0079 30.48 ‐180.2 ‐45.1
Monticellite Si Si 4 4.00 1.637 0.017 2.2202 1.0092 40.59 ‐187.9 ‐47.0
Sanidine Si T2 4 3.75 1.637 0.004 2.2455 1.0019 7.75 ‐169.2 ‐45.1
MnClinopyrox Si B 4 4.00 1.637 0.036 2.2400 1.0040 14.70 ‐189.8 ‐47.5
Clinohumite Si T2 4 4.00 1.638 0.014 2.2192 1.0109 48.56 ‐187.9 ‐47.0
Orthoferrosilite Si SiB 4 4.00 1.638 0.032 2.2410 1.0050 17.30 ‐188.8 ‐47.2
CoOrthopyrox Si B 4 4.00 1.638 0.034 2.2410 1.0050 17.60 ‐188.5 ‐47.1
Liebenbergite Si Si 4 4.00 1.638 0.010 2.2177 1.0118 52.26 ‐186.7 ‐46.7
Amesite Si F1 4 4.00 1.639 0.036 2.2598 1.0008 0.71 ‐181.6 ‐45.4
Na‐Mordenite Si T3 4 3.82 1.639 0.014 2.2498 1.0028 11.95 ‐189.1 ‐49.5
Tephroite Si Si 4 4.00 1.639 0.016 2.2322 1.0082 36.11 ‐188.6 ‐47.2
Dickite Si T3 4 4.00 1.639 0.073 2.2426 1.0061 15.58 ‐173.8 ‐43.5
Analcime Si Ti 4 3.73 1.639 0.006 2.2517 1.0026 10.59 ‐167.5 ‐44.9
Glaucophane Si T2 4 4.00 1.640 0.034 2.2469 1.0047 17.58 ‐182.5 ‐45.6
Vesuvianite Si T1 4 4.00 1.640 0.000 2.2454 1.0050 20.61 ‐168.8 ‐42.2
Zoisite Si T3 4 4.00 1.640 0.026 2.2273 1.0114 44.29 ‐190.8 ‐47.7
Orthoenstatite Si B 4 4.00 1.640 0.044 2.2470 1.0050 19.40 ‐188.7 ‐47.2
Harmotome Si T3 4 3.71 1.540 0.009 2.2598 1.0017 6.68 ‐165.7 ‐44.7
Clinoenstatite Si A 4 4.00 1.640 0.030 2.2490 1.0044 16.70 ‐189.8 ‐47.5
K‐Heulandite Si T5 4 3.71 1.640 0.013 2.2501 1.0018 7.31 ‐170.6 ‐46.0
Harmotome Si T2 4 3.71 1.640 0.007 2.2579 1.0011 4.74 ‐166.8 ‐45.0
Epidote‐1 Si T3 4 4.00 1.640 0.019 2.2493 1.0046 18.39 ‐192 ‐48.0
Kaolinite Si T2 4 4.00 1.641 0.087 2.2492 1.0072 21.59 ‐187 ‐46.8
Epidote‐2 Si T3 4 4.00 1.641 0.020 2.2508 1.0055 22.21 ‐190.4 ‐47.6
Malayaite Si Si 4 4.00 1.641 0.009 2.2526 1.0044 17.36 ‐192.9 ‐48.2
High‐Albite Si T20 4 3.75 1.641 0.011 2.2626 1.0017 7.02 ‐169.6 ‐45.2
Co‐beta‐Spinel Si Si 4 4.00 1.611 0.038 2.2575 1.0029 11.04 ‐189.3 ‐47.3
Staurolite Si Si 4 4.00 1.641 0.008 2.2660 1.0004 1.66 ‐189.1 ‐47.3
F‐Phlogopite Si T 4 4.00 1.612 0.006 2.2695 1.0002 0.73 ‐181.9 ‐45.5
High‐Albite Si Tlm 4 3.75 1.642 0.012 2.2667 1.0019 7.42 ‐169.8 ‐45.3
Zinnwaidite Si T11 4 3.50 1.642 0.003 2.2697 1.0009 3.71 ‐153.3 ‐43.8
Uvarovite Si Z 4 4.00 1.643 0.000 2.2572 1.0058 23.90 ‐192 ‐48.0
High‐Albite Si/Al T2m 4 3.75 1.643 0.010 2.2728 1.0007 3.03 ‐168.3 ‐44.9
Andradite Si Z 4 4.00 1.643 0.001 2.2503 1.0071 28.92 ‐192.2 ‐48.1
Lepidolite Si TI 4 3.85 1.643 0.023 2.2657 1.0037 14.19 ‐180.6 ‐46.9
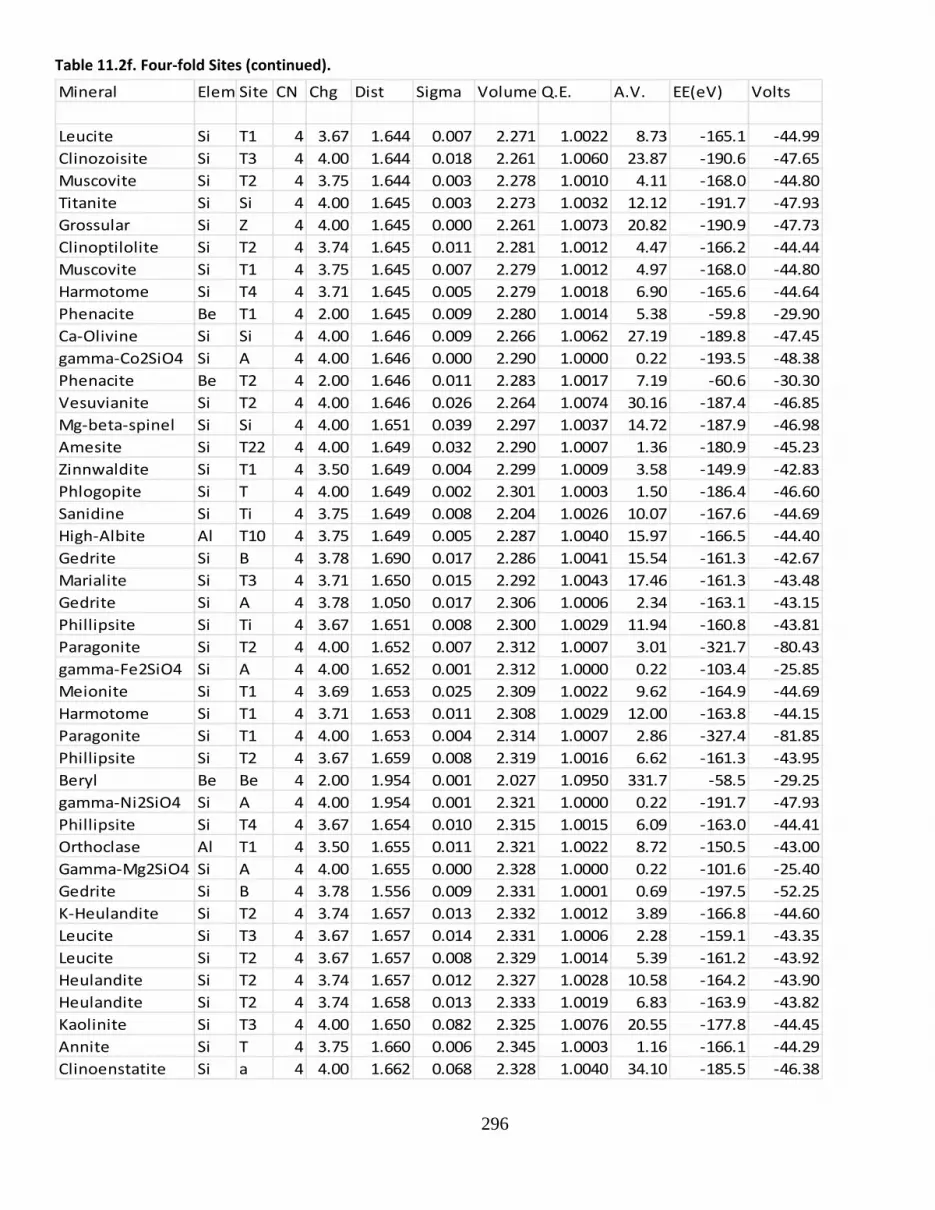
296
Table 11.2f. Four‐fold Sites (continued).
Mineral Elem Site CN Chg Dist Sigma Volume Q.E. A.V. EE(eV) Volts
Leucite Si T1 4 3.67 1.644 0.007 2.271 1.0022 8.73 ‐165.1 ‐44.99
Clinozoisite Si T3 4 4.00 1.644 0.018 2.261 1.0060 23.87 ‐190.6 ‐47.65
Muscovite Si T2 4 3.75 1.644 0.003 2.278 1.0010 4.11 ‐168.0 ‐44.80
Titanite Si Si 4 4.00 1.645 0.003 2.273 1.0032 12.12 ‐191.7 ‐47.93
Grossular Si Z 4 4.00 1.645 0.000 2.261 1.0073 20.82 ‐190.9 ‐47.73
Clinoptilolite Si T2 4 3.74 1.645 0.011 2.281 1.0012 4.47 ‐166.2 ‐44.44
Muscovite Si T1 4 3.75 1.645 0.007 2.279 1.0012 4.97 ‐168.0 ‐44.80
Harmotome Si T4 4 3.71 1.645 0.005 2.279 1.0018 6.90 ‐165.6 ‐44.64
Phenacite Be T1 4 2.00 1.645 0.009 2.280 1.0014 5.38 ‐59.8 ‐29.90
Ca‐Olivine Si Si 4 4.00 1.646 0.009 2.266 1.0062 27.19 ‐189.8 ‐47.45
gamma‐Co2SiO4 Si A 4 4.00 1.646 0.000 2.290 1.0000 0.22 ‐193.5 ‐48.38
Phenacite Be T2 4 2.00 1.646 0.011 2.283 1.0017 7.19 ‐60.6 ‐30.30
Vesuvianite Si T2 4 4.00 1.646 0.026 2.264 1.0074 30.16 ‐187.4 ‐46.85
Mg‐beta‐spinel Si Si 4 4.00 1.651 0.039 2.297 1.0037 14.72 ‐187.9 ‐46.98
Amesite Si T22 4 4.00 1.649 0.032 2.290 1.0007 1.36 ‐180.9 ‐45.23
Zinnwaldite Si T1 4 3.50 1.649 0.004 2.299 1.0009 3.58 ‐149.9 ‐42.83
Phlogopite Si T 4 4.00 1.649 0.002 2.301 1.0003 1.50 ‐186.4 ‐46.60
Sanidine Si Ti 4 3.75 1.649 0.008 2.204 1.0026 10.07 ‐167.6 ‐44.69
High‐Albite Al T10 4 3.75 1.649 0.005 2.287 1.0040 15.97 ‐166.5 ‐44.40
Gedrite Si B 4 3.78 1.690 0.017 2.286 1.0041 15.54 ‐161.3 ‐42.67
Marialite Si T3 4 3.71 1.650 0.015 2.292 1.0043 17.46 ‐161.3 ‐43.48
Gedrite Si A 4 3.78 1.050 0.017 2.306 1.0006 2.34 ‐163.1 ‐43.15
Phillipsite Si Ti 4 3.67 1.651 0.008 2.300 1.0029 11.94 ‐160.8 ‐43.81
Paragonite Si T2 4 4.00 1.652 0.007 2.312 1.0007 3.01 ‐321.7 ‐80.43
gamma‐Fe2SiO4 Si A 4 4.00 1.652 0.001 2.312 1.0000 0.22 ‐103.4 ‐25.85
Meionite Si T1 4 3.69 1.653 0.025 2.309 1.0022 9.62 ‐164.9 ‐44.69
Harmotome Si T1 4 3.71 1.653 0.011 2.308 1.0029 12.00 ‐163.8 ‐44.15
Paragonite Si T1 4 4.00 1.653 0.004 2.314 1.0007 2.86 ‐327.4 ‐81.85
Phillipsite Si T2 4 3.67 1.659 0.008 2.319 1.0016 6.62 ‐161.3 ‐43.95
Beryl Be Be 4 2.00 1.954 0.001 2.027 1.0950 331.7 ‐58.5 ‐29.25
gamma‐Ni2SiO4 Si A 4 4.00 1.954 0.001 2.321 1.0000 0.22 ‐191.7 ‐47.93
Phillipsite Si T4 4 3.67 1.654 0.010 2.315 1.0015 6.09 ‐163.0 ‐44.41
Orthoclase Al T1 4 3.50 1.655 0.011 2.321 1.0022 8.72 ‐150.5 ‐43.00
Gamma‐Mg2SiO4 Si A 4 4.00 1.655 0.000 2.328 1.0000 0.22 ‐101.6 ‐25.40
Gedrite Si B 4 3.78 1.556 0.009 2.331 1.0001 0.69 ‐197.5 ‐52.25
K‐Heulandite Si T2 4 3.74 1.657 0.013 2.332 1.0012 3.89 ‐166.8 ‐44.60
Leucite Si T3 4 3.67 1.657 0.014 2.331 1.0006 2.28 ‐159.1 ‐43.35
Leucite Si T2 4 3.67 1.657 0.008 2.329 1.0014 5.39 ‐161.2 ‐43.92
Heulandite Si T2 4 3.74 1.657 0.012 2.327 1.0028 10.58 ‐164.2 ‐43.90
Heulandite Si T2 4 3.74 1.658 0.013 2.333 1.0019 6.83 ‐163.9 ‐43.82
Kaolinite Si T3 4 4.00 1.650 0.082 2.325 1.0076 20.55 ‐177.8 ‐44.45
Annite Si T 4 3.75 1.660 0.006 2.345 1.0003 1.16 ‐166.1 ‐44.29
Clinoenstatite Si a 4 4.00 1.662 0.068 2.328 1.0040 34.10 ‐185.5 ‐46.38
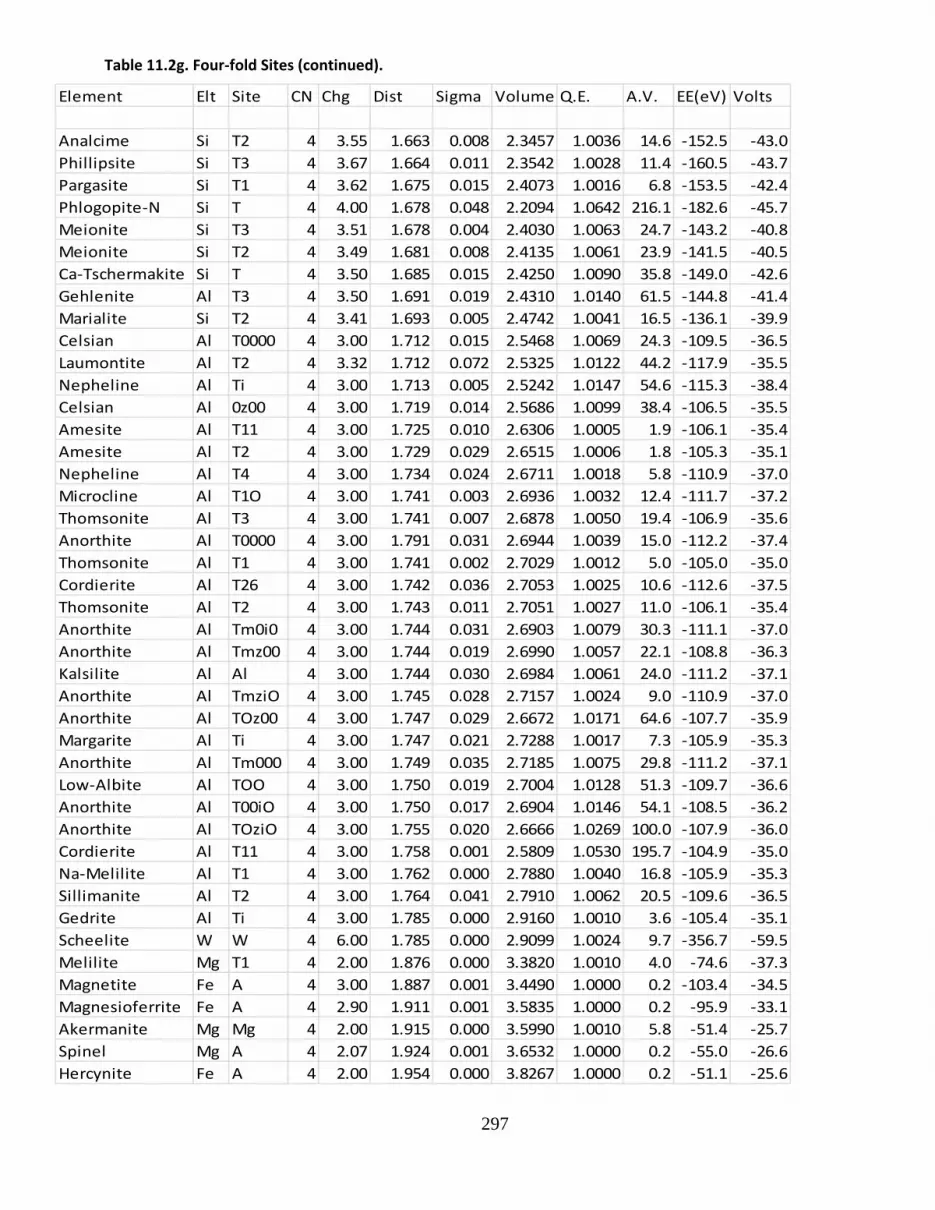
297
Table 11.2g. Four‐fold Sites (continued).
Element Elt Site CN Chg Dist Sigma Volume Q.E. A.V. EE(eV) Volts
Analcime Si T2 4 3.55 1.663 0.008 2.3457 1.0036 14.6 ‐152.5 ‐43.0
Phillipsite Si T3 4 3.67 1.664 0.011 2.3542 1.0028 11.4 ‐160.5 ‐43.7
Pargasite Si T1 4 3.62 1.675 0.015 2.4073 1.0016 6.8 ‐153.5 ‐42.4
Phlogopite‐N Si T 4 4.00 1.678 0.048 2.2094 1.0642 216.1 ‐182.6 ‐45.7
Meionite Si T3 4 3.51 1.678 0.004 2.4030 1.0063 24.7 ‐143.2 ‐40.8
Meionite Si T2 4 3.49 1.681 0.008 2.4135 1.0061 23.9 ‐141.5 ‐40.5
Ca‐Tschermakite Si T 4 3.50 1.685 0.015 2.4250 1.0090 35.8 ‐149.0 ‐42.6
Gehlenite Al T3 4 3.50 1.691 0.019 2.4310 1.0140 61.5 ‐144.8 ‐41.4
Marialite Si T2 4 3.41 1.693 0.005 2.4742 1.0041 16.5 ‐136.1 ‐39.9
Celsian Al T0000 4 3.00 1.712 0.015 2.5468 1.0069 24.3 ‐109.5 ‐36.5
Laumontite Al T2 4 3.32 1.712 0.072 2.5325 1.0122 44.2 ‐117.9 ‐35.5
Nepheline Al Ti 4 3.00 1.713 0.005 2.5242 1.0147 54.6 ‐115.3 ‐38.4
Celsian Al 0z00 4 3.00 1.719 0.014 2.5686 1.0099 38.4 ‐106.5 ‐35.5
Amesite Al T11 4 3.00 1.725 0.010 2.6306 1.0005 1.9 ‐106.1 ‐35.4
Amesite Al T2 4 3.00 1.729 0.029 2.6515 1.0006 1.8 ‐105.3 ‐35.1
Nepheline Al T4 4 3.00 1.734 0.024 2.6711 1.0018 5.8 ‐110.9 ‐37.0
Microcline Al T1O 4 3.00 1.741 0.003 2.6936 1.0032 12.4 ‐111.7 ‐37.2
Thomsonite Al T3 4 3.00 1.741 0.007 2.6878 1.0050 19.4 ‐106.9 ‐35.6
Anorthite Al T0000 4 3.00 1.791 0.031 2.6944 1.0039 15.0 ‐112.2 ‐37.4
Thomsonite Al T1 4 3.00 1.741 0.002 2.7029 1.0012 5.0 ‐105.0 ‐35.0
Cordierite Al T26 4 3.00 1.742 0.036 2.7053 1.0025 10.6 ‐112.6 ‐37.5
Thomsonite Al T2 4 3.00 1.743 0.011 2.7051 1.0027 11.0 ‐106.1 ‐35.4
Anorthite Al Tm0i0 4 3.00 1.744 0.031 2.6903 1.0079 30.3 ‐111.1 ‐37.0
Anorthite Al Tmz00 4 3.00 1.744 0.019 2.6990 1.0057 22.1 ‐108.8 ‐36.3
Kalsilite Al Al 4 3.00 1.744 0.030 2.6984 1.0061 24.0 ‐111.2 ‐37.1
Anorthite Al TmziO 4 3.00 1.745 0.028 2.7157 1.0024 9.0 ‐110.9 ‐37.0
Anorthite Al TOz00 4 3.00 1.747 0.029 2.6672 1.0171 64.6 ‐107.7 ‐35.9
Margarite Al Ti 4 3.00 1.747 0.021 2.7288 1.0017 7.3 ‐105.9 ‐35.3
Anorthite Al Tm000 4 3.00 1.749 0.035 2.7185 1.0075 29.8 ‐111.2 ‐37.1
Low‐Albite Al TOO 4 3.00 1.750 0.019 2.7004 1.0128 51.3 ‐109.7 ‐36.6
Anorthite Al T00iO 4 3.00 1.750 0.017 2.6904 1.0146 54.1 ‐108.5 ‐36.2
Anorthite Al TOziO 4 3.00 1.755 0.020 2.6666 1.0269 100.0 ‐107.9 ‐36.0
Cordierite Al T11 4 3.00 1.758 0.001 2.5809 1.0530 195.7 ‐104.9 ‐35.0
Na‐Melilite Al T1 4 3.00 1.762 0.000 2.7880 1.0040 16.8 ‐105.9 ‐35.3
Sillimanite Al T2 4 3.00 1.764 0.041 2.7910 1.0062 20.5 ‐109.6 ‐36.5
Gedrite Al Ti 4 3.00 1.785 0.000 2.9160 1.0010 3.6 ‐105.4 ‐35.1
Scheelite W W 4 6.00 1.785 0.000 2.9099 1.0024 9.7 ‐356.7 ‐59.5
Melilite Mg T1 4 2.00 1.876 0.000 3.3820 1.0010 4.0 ‐74.6 ‐37.3
Magnetite Fe A 4 3.00 1.887 0.001 3.4490 1.0000 0.2 ‐103.4 ‐34.5
Magnesioferrite Fe A 4 2.90 1.911 0.001 3.5835 1.0000 0.2 ‐95.9 ‐33.1
Akermanite Mg Mg 4 2.00 1.915 0.000 3.5990 1.0010 5.8 ‐51.4 ‐25.7
Spinel Mg A 4 2.07 1.924 0.001 3.6532 1.0000 0.2 ‐55.0 ‐26.6
Hercynite Fe A 4 2.00 1.954 0.000 3.8267 1.0000 0.2 ‐51.1 ‐25.6
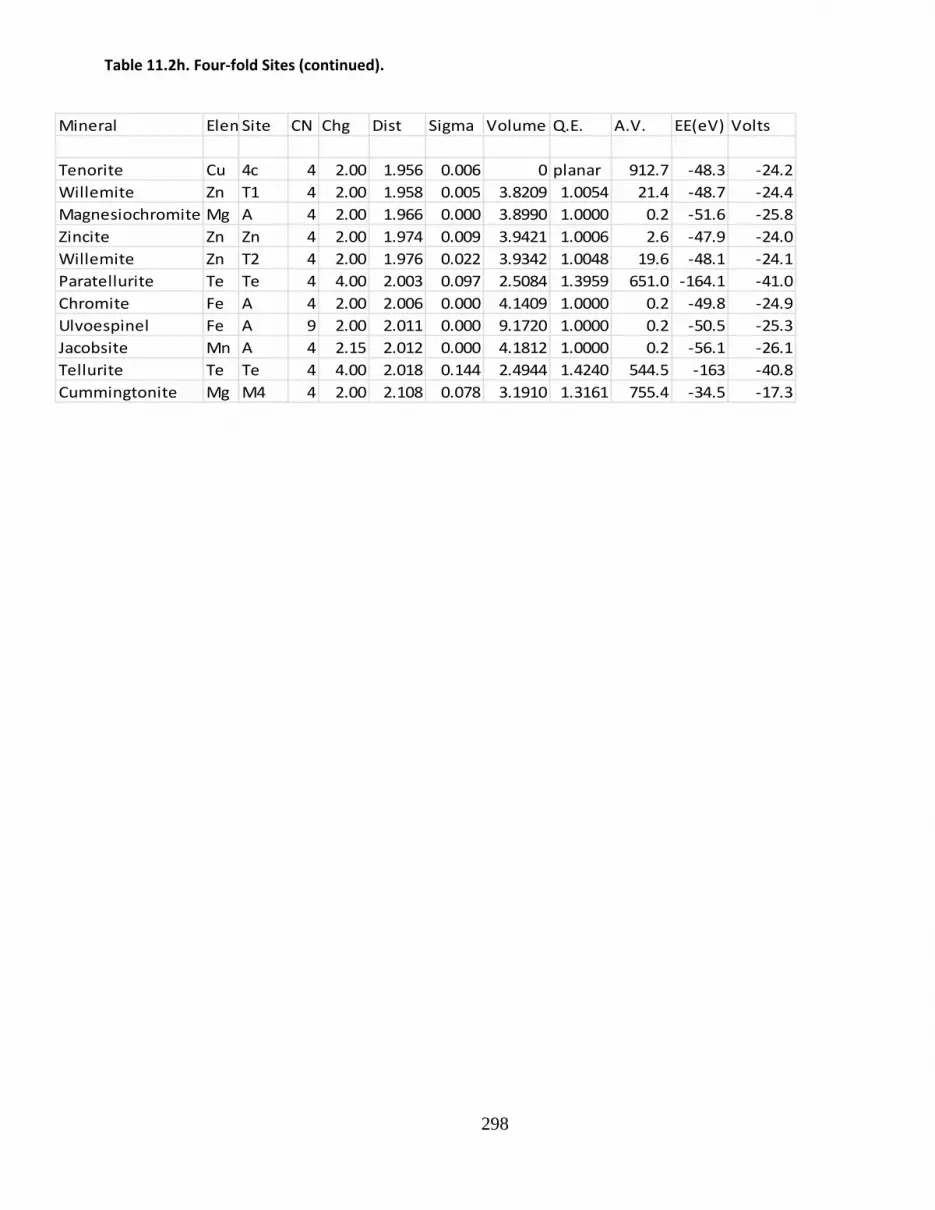
298
Table 11.2h. Four‐fold Sites (continued).
Mineral ElemSite CN Chg Dist Sigma Volume Q.E. A.V. EE(eV) Volts
Tenorite Cu 4c 4 2.00 1.956 0.006 0 planar 912.7 ‐48.3 ‐24.2
Willemite Zn T1 4 2.00 1.958 0.005 3.8209 1.0054 21.4 ‐48.7 ‐24.4
Magnesiochromite Mg A 4 2.00 1.966 0.000 3.8990 1.0000 0.2 ‐51.6 ‐25.8
Zincite Zn Zn 4 2.00 1.974 0.009 3.9421 1.0006 2.6 ‐47.9 ‐24.0
Willemite Zn T2 4 2.00 1.976 0.022 3.9342 1.0048 19.6 ‐48.1 ‐24.1
Paratellurite Te Te 4 4.00 2.003 0.097 2.5084 1.3959 651.0 ‐164.1 ‐41.0
Chromite Fe A 4 2.00 2.006 0.000 4.1409 1.0000 0.2 ‐49.8 ‐24.9
Ulvoespinel Fe A 9 2.00 2.011 0.000 9.1720 1.0000 0.2 ‐50.5 ‐25.3
Jacobsite Mn A 4 2.15 2.012 0.000 4.1812 1.0000 0.2 ‐56.1 ‐26.1
Tellurite Te Te 4 4.00 2.018 0.144 2.4944 1.4240 544.5 ‐163 ‐40.8
Cummingtonite Mg M4 4 2.00 2.108 0.078 3.1910 1.3161 755.4 ‐34.5 ‐17.3

299
Table 11.3. Five‐fold Sites.
Mineral ElemenSite CN Chg Dist Sigma Volume E.E.(eV) Volts
Andalusite Al Al2 5 3.00 1.836 0.036 5.1527 ‐111.9 ‐37.3
Vesuvianite B B 5 3.00 2.107 0.062 6.6091 ‐10.0 ‐3.3
Valentinite Sb 8e 5 3.00 2.231 0.311 5.9679 ‐94.7 ‐31.6
Montroydite Hg 4c 5 2.00 2.508 0.445 10.7091 ‐42.1 ‐21.1

300
Table 11.4a. Six‐fold Sites.
Mineral ElemeSite CN Chg Dist Sigma Volume Q.E. A.V. EE(eV) Volts
Stishovite Si Si 6 4.00 1.775 0.027 7.365 1.0080 27.15 ‐197.3 ‐49.3
MgSiO3‐Perov Si Si 6 4.00 1.793 0.008 7.681 1.0005 1.61 ‐195.1 ‐48.8
MgSiO3‐Ilmenite Si Si 6 4.00 1.799 0.034 7.592 1.0152 52.76 ‐188.8 ‐47.2
Dickite Al Al3 6 3.00 1.832 0.123 7.847 1.0335 98.59 ‐127.3 ‐42.4
Clinozoisite Al Al2 6 3.00 1.878 0.035 8.773 1.0045 14.04 ‐114.2 ‐38.1
Epidote‐2 Al M2 6 3.00 1.883 0.034 8.847 1.0042 13.09 ‐116.4 ‐38.8
Epidote‐1 Al M2 6 3.00 1.883 0.034 8.853 1.0045 14.01 ‐113.4 ‐37.8
Zinnwaldite Al M2 6 3.00 1.885 0.015 8.896 1.0025 8.52 ‐97.4 ‐32.5
Kaolinite Al Al2 6 3.00 1.885 0.079 8.676 1.0205 64.43 ‐91.8 ‐30.6
Pyrope Al Y 6 3.00 1.887 0.001 8.937 1.0014 4.93 115.1 38.4
Pyrolusite Mn Mn 6 4.00 1.887 0.007 8.847 1.0079 27.99 ‐186.1 ‐46.5
Staurolite Fe Fe 6 2.36 1.888 0.190 7.380 1.1482 386 ‐60.5 ‐25.6
Vesuvianite Al Al 6 3.00 1.888 0.040 8.893 1.0068 21.51 ‐117.4 ‐39.1
Zoisite Al Al12 6 3.00 1.888 0.050 8.899 1.0066 20.05 ‐111.6 ‐37.2
Ramsdellite Mn Mn 6 4.00 1.891 0.048 8.798 1.0169 54.10 ‐179 ‐44.8
Almandine Al Y 6 3.00 1.896 0.601 9.086 1.0004 1.38 ‐115.2 ‐38.4
Kyanite Al Al4 6 3.00 1.896 0.065 8.921 1.0139 42.49 ‐109.8 ‐36.6
Spessartine Al Y 6 3.00 1.901 0.001 9.155 1.0001 0.30 ‐115.3 ‐38.4
Kyanite Al Al1 6 3.00 1.902 0.062 8.977 1.0155 47.70 ‐109.8 ‐36.6
Gibbsite Al Al1 6 3.00 1.902 0.035 9.019 1.0120 42.21 ‐104.4 ‐34.8
Margarite Al M2 6 3.00 1.903 0.034 9.006 1.0136 47.93 ‐116.7 ‐38.9
Allanite Al M2 6 3.00 1.904 0.021 9.110 1.0064 22.12 ‐114.5 ‐38.2
Boehmite Al Al 6 3.00 1.905 0.031 9.000 1.0164 52.07 ‐95.6 ‐31.9
Elbaite Al Mg 6 3.00 1.905 0.042 9.031 1.0140 46.89 ‐107.5 ‐35.8
Staurolite Al Al2 6 3.00 1.905 0.028 9.031 1.0139 46.26 ‐113.6 ‐37.9
Gibbsite Al Al2 6 3.00 1.905 0.033 9.061 1.0120 42.53 ‐103.9 ‐34.6
Clinozoisite Al Al1 6 3.00 1.906 0.043 9.146 1.0065 19.65 ‐105.6 ‐35.2
Beryl Al Al 6 3.00 1.906 0.001 8.939 1.0218 75.53 ‐90.5 ‐30.2
Epidote‐2 Al MI 6 3.00 1.907 0.047 9.167 1.0064 18.85 ‐105.3 ‐35.1
Paragonite Al M2 6 2.00 1.908 0.016 9.040 1.0162 58.98 ‐110.6 ‐55.3
Kaolinite Al Al4 6 3.00 1.910 0.134 8.920 1.0313 92.96 ‐94.6 ‐31.5
Staurolite Al 1A 6 3.00 1.911 0.021 9.127 1.0133 45.47 ‐102.6 ‐34.2
Pyrophyllite Al Al 6 3.00 1.912 0.018 9.069 1.0183 66.43 ‐105.7 ‐35.2
Sillimanite Al Al1 6 3.00 1.912 0.039 9.175 1.0109 36.36 ‐111.6 ‐37.2
Dickite Al Al2 6 3.00 1.912 0.114 8.760 1.0450 140.60 ‐118.8 ‐39.6
Kyanite Al Al2 6 3.00 1.913 0.023 9.136 1.0141 50.21 ‐111.2 ‐37.1
Corundum Al Al 6 3.00 1.913 0.062 9.066 1.0200 66.59 ‐109.7 ‐36.6
Lawsonite Al Al 6 3.00 1.913 0.042 9.190 1.0112 36.74 ‐116.6 ‐38.9
Epidote‐1 Al MI 6 3.00 1.913 0.054 9.252 1.0065 17.94 ‐104.5 ‐34.8
Staurolite Al 1B 6 3.00 1.914 0.022 9.169 1.0132 45.32 102.6 34.2
Nacrite Al Al1 6 3.00 1.915 0.075 9.109 1.0200 66.20 ‐110.2 ‐36.7
Margarite Al M3 6 3.00 1.915 0.054 9.151 1.0160 54.95 ‐115.6 ‐38.5
Diaspore Al Al 6 3.00 1.915 0.067 9.100 1.0205 63.98 ‐107.7 ‐35.9
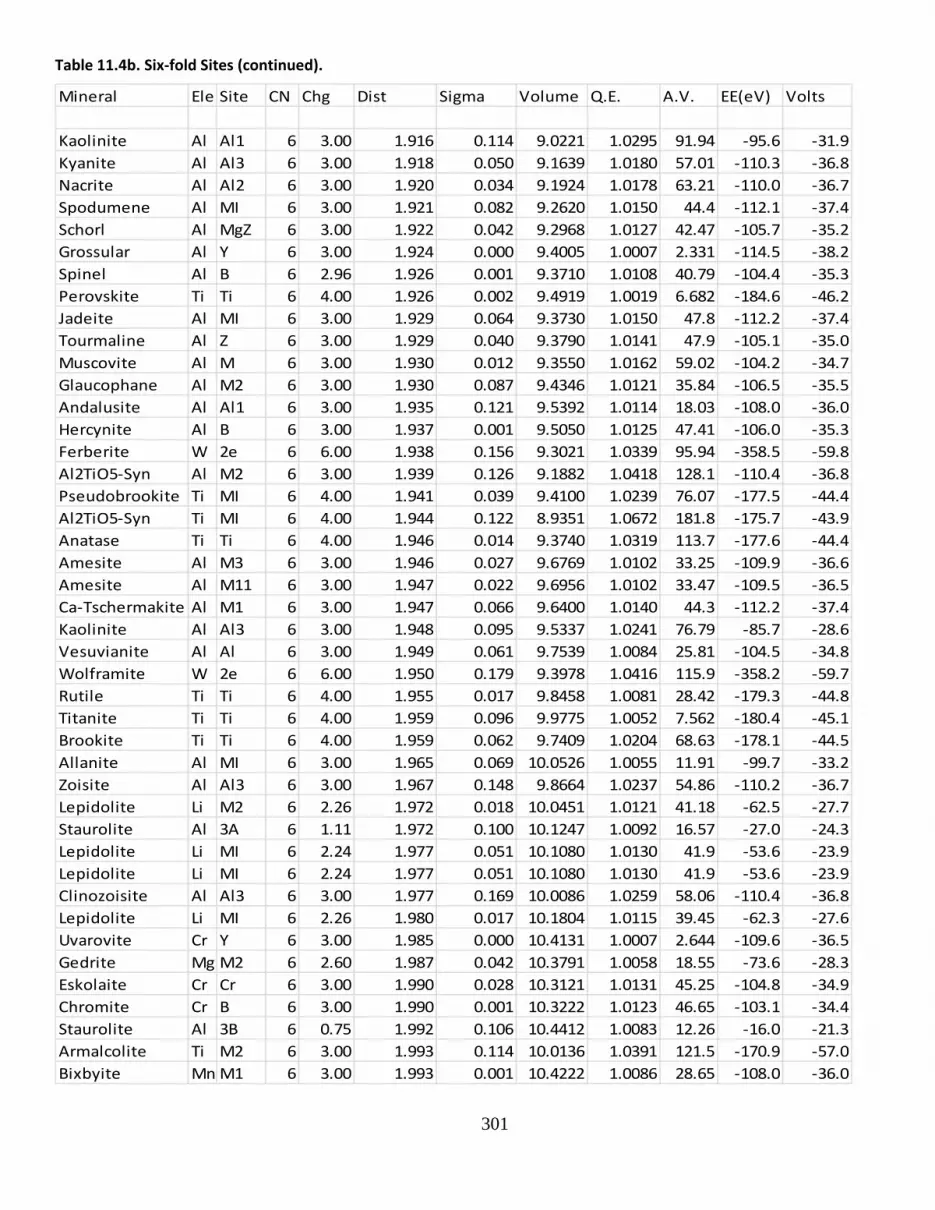
301
Table 11.4b. Six‐fold Sites (continued).
Mineral Ele Site CN Chg Dist Sigma Volume Q.E. A.V. EE(eV) Volts
Kaolinite Al Al1 6 3.00 1.916 0.114 9.0221 1.0295 91.94 ‐95.6 ‐31.9
Kyanite Al Al3 6 3.00 1.918 0.050 9.1639 1.0180 57.01 ‐110.3 ‐36.8
Nacrite Al Al2 6 3.00 1.920 0.034 9.1924 1.0178 63.21 ‐110.0 ‐36.7
Spodumene Al MI 6 3.00 1.921 0.082 9.2620 1.0150 44.4 ‐112.1 ‐37.4
Schorl Al MgZ 6 3.00 1.922 0.042 9.2968 1.0127 42.47 ‐105.7 ‐35.2
Grossular Al Y 6 3.00 1.924 0.000 9.4005 1.0007 2.331 ‐114.5 ‐38.2
Spinel Al B 6 2.96 1.926 0.001 9.3710 1.0108 40.79 ‐104.4 ‐35.3
Perovskite Ti Ti 6 4.00 1.926 0.002 9.4919 1.0019 6.682 ‐184.6 ‐46.2
Jadeite Al MI 6 3.00 1.929 0.064 9.3730 1.0150 47.8 ‐112.2 ‐37.4
Tourmaline Al Z 6 3.00 1.929 0.040 9.3790 1.0141 47.9 ‐105.1 ‐35.0
Muscovite Al M 6 3.00 1.930 0.012 9.3550 1.0162 59.02 ‐104.2 ‐34.7
Glaucophane Al M2 6 3.00 1.930 0.087 9.4346 1.0121 35.84 ‐106.5 ‐35.5
Andalusite Al Al1 6 3.00 1.935 0.121 9.5392 1.0114 18.03 ‐108.0 ‐36.0
Hercynite Al B 6 3.00 1.937 0.001 9.5050 1.0125 47.41 ‐106.0 ‐35.3
Ferberite W 2e 6 6.00 1.938 0.156 9.3021 1.0339 95.94 ‐358.5 ‐59.8
Al2TiO5‐Syn Al M2 6 3.00 1.939 0.126 9.1882 1.0418 128.1 ‐110.4 ‐36.8
Pseudobrookite Ti MI 6 4.00 1.941 0.039 9.4100 1.0239 76.07 ‐177.5 ‐44.4
Al2TiO5‐Syn Ti MI 6 4.00 1.944 0.122 8.9351 1.0672 181.8 ‐175.7 ‐43.9
Anatase Ti Ti 6 4.00 1.946 0.014 9.3740 1.0319 113.7 ‐177.6 ‐44.4
Amesite Al M3 6 3.00 1.946 0.027 9.6769 1.0102 33.25 ‐109.9 ‐36.6
Amesite Al M11 6 3.00 1.947 0.022 9.6956 1.0102 33.47 ‐109.5 ‐36.5
Ca‐Tschermakite Al M1 6 3.00 1.947 0.066 9.6400 1.0140 44.3 ‐112.2 ‐37.4
Kaolinite Al Al3 6 3.00 1.948 0.095 9.5337 1.0241 76.79 ‐85.7 ‐28.6
Vesuvianite Al Al 6 3.00 1.949 0.061 9.7539 1.0084 25.81 ‐104.5 ‐34.8
Wolframite W 2e 6 6.00 1.950 0.179 9.3978 1.0416 115.9 ‐358.2 ‐59.7
Rutile Ti Ti 6 4.00 1.955 0.017 9.8458 1.0081 28.42 ‐179.3 ‐44.8
Titanite Ti Ti 6 4.00 1.959 0.096 9.9775 1.0052 7.562 ‐180.4 ‐45.1
Brookite Ti Ti 6 4.00 1.959 0.062 9.7409 1.0204 68.63 ‐178.1 ‐44.5
Allanite Al MI 6 3.00 1.965 0.069 10.0526 1.0055 11.91 ‐99.7 ‐33.2
Zoisite Al Al3 6 3.00 1.967 0.148 9.8664 1.0237 54.86 ‐110.2 ‐36.7
Lepidolite Li M2 6 2.26 1.972 0.018 10.0451 1.0121 41.18 ‐62.5 ‐27.7
Staurolite Al 3A 6 1.11 1.972 0.100 10.1247 1.0092 16.57 ‐27.0 ‐24.3
Lepidolite Li MI 6 2.24 1.977 0.051 10.1080 1.0130 41.9 ‐53.6 ‐23.9
Lepidolite Li MI 6 2.24 1.977 0.051 10.1080 1.0130 41.9 ‐53.6 ‐23.9
Clinozoisite Al Al3 6 3.00 1.977 0.169 10.0086 1.0259 58.06 ‐110.4 ‐36.8
Lepidolite Li MI 6 2.26 1.980 0.017 10.1804 1.0115 39.45 ‐62.3 ‐27.6
Uvarovite Cr Y 6 3.00 1.985 0.000 10.4131 1.0007 2.644 ‐109.6 ‐36.5
Gedrite Mg M2 6 2.60 1.987 0.042 10.3791 1.0058 18.55 ‐73.6 ‐28.3
Eskolaite Cr Cr 6 3.00 1.990 0.028 10.3121 1.0131 45.25 ‐104.8 ‐34.9
Chromite Cr B 6 3.00 1.990 0.001 10.3222 1.0123 46.65 ‐103.1 ‐34.4
Staurolite Al 3B 6 0.75 1.992 0.106 10.4412 1.0083 12.26 ‐16.0 ‐21.3
Armalcolite Ti M2 6 3.00 1.993 0.114 10.0136 1.0391 121.5 ‐170.9 ‐57.0
Bixbyite MnM1 6 3.00 1.993 0.001 10.4222 1.0086 28.65 ‐108.0 ‐36.0

302
Table 11.4c. Six‐fold Sites (continued).
Mineral ElemSite CN Chg Dist Sigma Volume Q.E. A.V. EE(eV) Volts
Magnesiochromite Cr B 6 3.00 1.994 0.001 10.4402 1.0087 32.8 ‐102.1 ‐34.0
Ureyite Cr MI 6 3.00 2.001 0.042 10.5450 1.0090 28.3 ‐106.0 ‐35.3
Epidote‐2 Al M3 6 3.00 2.004 0.161 10.3952 1.0271 66.3 ‐106.4 ‐35.5
Karelianite V V 6 3.00 2.012 0.054 10.7190 1.0098 32.7 ‐100.1 ‐33.4
Elbaite Al Li 6 2.00 2.016 0.077 10.5238 1.0262 81.2 ‐49.8 ‐24.9
Goethite Fe Fe 6 3.00 2.021 0.082 10.6673 1.0226 69.2 ‐102.0 ‐34.0
Andradite Fe Y 6 3.00 2.024 0.000 11.0462 1.0004 1.4 ‐106.5 ‐35.5
Acmite Fe M1 6 3.00 2.025 0.078 10.8690 1.0130 41.9 ‐105.1 ‐35.0
Tourmaline Mg Y 6 2.00 2.025 0.057 10.7153 1.0230 75.6 ‐57.7 ‐28.9
Hematite Fe Fe 6 3.00 2.030 0.093 10.7541 1.0264 85.0 ‐104.1 ‐34.7
Ilmenite Ti Ti 6 4.00 2.032 0.119 10.6405 1.0372 116.9 ‐166.0 ‐41.5
Magnesioferrite Fe B 6 2.55 2.033 0.001 11.1510 1.0033 12.2 ‐77.7 ‐30.5
Jacobsite Fe B 6 2.92 2.035 0.001 11.0765 1.0092 34.7 ‐96.5 ‐33.0
Epidote‐1 Al M3 6 3.00 2.036 0.153 10.8636 1.0283 74.8 ‐104.7 ‐34.9
Pargasite Mg M2 6 2.27 2.036 0.054 11.1352 1.0079 24.3 ‐72.0 ‐31.7
Malayaite Sn Sn 6 4.00 2.042 0.074 11.2996 1.0046 8.5 ‐170.6 ‐42.7
Ulvoespinel Fe B 6 3.00 2.044 0.001 11.2515 1.0084 31.6 ‐99.5 ‐33.2
Bixbyite Mn M2 6 3.00 2.044 0.163 10.2390 1.0790 203.7 ‐103.8 ‐34.6
Pseudobrookite Fe M2 6 3.00 2.045 0.206 10.4678 1.0678 207.0 ‐103.9 ‐34.6
Pyrophanite Ti Ti 6 4.00 2.051 0.152 11.0674 1.0310 91.4 ‐165.2 ‐41.3
Cassiterite Sn Sn 6 4.00 2.053 0.003 11.2922 1.0145 51.1 ‐171.5 ‐42.9
Lizardite Mg Mg 6 2.00 2.053 0.032 11.2391 1.0182 58.0 ‐77.1 ‐38.6
Gedrite Mg M3 6 2.00 2.059 0.035 11.2735 1.0222 70.8 ‐56.0 ‐28.0
Magnetite Fe B 6 2.50 2.059 0.001 11.6121 1.0015 5.6 ‐73.8 ‐29.5
Schorl Al Y 6 2.00 2.060 0.060 11.2467 1.0252 80.1 ‐49.0 ‐24.5
F‐Phlogopite Mg MI 6 2.00 2.061 0.025 11.4748 1.0120 38.7 ‐57.6 ‐28.8
gammaNi2SiO4 Ni B 6 2.00 2.063 0.001 11.6627 1.0024 8.4 ‐50.3 ‐25.2
Phlogopite‐N Mg M2 6 2.00 2.063 0.017 11.4807 1.0127 41.5 ‐56.3 ‐28.2
Phlogopite Mg MI 6 2.00 2.063 0.025 11.5047 1.0119 38.5 ‐55.9 ‐28.0
Tremolite Mg M3 6 2.00 2.064 0.008 11.4982 1.0135 43.9 ‐65.9 ‐33.0
F‐Phlogopite Mg M2 6 2.00 2.064 0.022 11.5150 1.0126 40.9 ‐57.4 ‐28.7
Armalcolite Fe MI 6 4.00 2.065 0.104 10.4180 1.0898 230.8 ‐54.1 ‐13.5
Phlogopite Mg M2 6 2.00 2.065 0.020 11.5227 1.0122 39.7 ‐55.7 ‐27.9
Tremolite Mg M3 6 2.00 2.066 0.007 11.5315 1.0133 43.4 ‐57.3 ‐28.7
Phlogopite‐N Mg MI 6 2.00 2.066 0.023 11.5344 1.0129 41.8 ‐55.0 ‐27.5
Clinoenstatite Mg MI 6 2.00 2.067 0.099 11.6140 1.0120 31.8 ‐48.6 ‐24.3
Norbergite Mg M3 6 2.00 2.068 0.075 11.5149 1.0174 56.5 ‐47.1 ‐23.6
Mg‐beta‐spinel Mg MI 6 2.00 2.069 0.036 11.7310 1.0050 15.2 ‐50.8 ‐25.4
Gamma‐Mg2SiO4 Mg B 6 2.00 2.070 0.001 11.7800 1.0026 9.0 ‐50.1 ‐25.1
Gedrite Mg M3 6 2.00 2.070 0.011 11.5949 1.0138 44.8 ‐54.8 ‐27.4
Talc Mg M1 6 2.00 2.071 0.015 11.6973 1.0087 28.6 ‐49.4 ‐24.7
Talc Mg M2 6 2.00 2.071 0.012 11.6871 1.0086 28.6 ‐49.4 ‐24.7
Tremolite Mg MI 6 2.00 2.074 0.010 11.6961 1.0111 36.7 ‐65.7 ‐32.9

303
Table 11.4d. Six‐fold Sites (continued).
Mineral ElemeSite CN Chg Dist Sigma Volume Q.E. A.V. EE(eV) Volts
Tremolite Mg MI 6 2.00 2.075 0.009 11.7230 1.0108 35.75 ‐55.7 ‐27.9
MgSiO3‐Ilmenite Mg Mg 6 2.00 2.076 0.095 11.2378 1.0429 193.40 ‐51.3 ‐25.7
Gedrite Mg M2 6 2.60 2.076 0.049 11.7651 1.0094 30.80 ‐65.1 ‐25.0
Diopside Mg MI 6 2.00 2.077 0.031 11.8480 1.0050 17.40 ‐55.7 ‐27.9
Tremolite Mg M2 6 2.00 2.077 0.054 11.8284 1.0073 22.96 ‐50.1 ‐25.1
Chondrodite Mg M3 6 2.00 2.078 0.072 11.6653 1.0179 59.24 ‐47.5 ‐23.8
Liebenbergite Ni M1 6 2.00 2.078 0.026 11.5308 1.0254 90.29 ‐47.3 ‐23.7
Pargasite Mg M3 6 2.00 2.078 0.002 11.5404 1.0240 76.20 ‐55.3 ‐27.7
Orthoenstatite Mg MI 6 2.00 2.078 0.068 11.8250 1.0090 26.50 ‐53.9 ‐27.0
Glaucophane Mg MI 6 2.00 2.079 0.018 11.5769 1.0237 79.39 ‐53.3 ‐26.7
Clinohumite Mg M3 6 2.00 2.080 0.072 11.7030 1.0181 59.46 ‐48.5 ‐24.3
Ilmenite Fe Fe 6 2.00 2.081 0.066 11.4248 1.0354 117.80 ‐54.4 ‐27.2
Gedrite Mg MI 6 2.00 2.089 0.032 11.8768 1.0107 34.66 ‐49.7 ‐24.9
Dolomite Mg Mg 6 2.00 2.084 0.001 12.0598 1.0008 3.08 ‐51.0 ‐25.5
Bunsenite Ni Ni 6 2.00 2.084 0.001 12.0713 1.0000 0.00 ‐48.3 ‐24.2
Tremolite Mg M2 6 2.00 2.084 0.058 11.9321 1.0081 25.58 ‐61.3 ‐30.7
Mg‐beta‐spinel Mg M2 6 2.00 2.084 0.024 11.9663 1.0055 19.38 ‐50.5 ‐25.3
Humite Mg M3 6 2.00 2.086 0.074 11.7797 1.0189 62.53 ‐47.7 ‐23.9
Amesite Mg M33 6 2.00 2.086 0.028 11.6242 1.0277 88.95 ‐50.7 ‐25.4
Amesite Mg M2 6 2.00 2.087 0.037 11.6334 1.0278 88.11 ‐50.8 ‐25.4
Cummingtonite Mg M2 6 2.00 2.087 0.040 11.9501 1.0100 33.24 ‐43.0 ‐21.5
Pargasite Mg MI 6 2.00 2.088 0.026 11.8550 1.0160 50.60 ‐55.9 ‐28.0
Mg‐beta‐spinel Mg M3 6 2.00 2.089 0.056 12.0394 1.0072 23.44 ‐51.7 ‐25.9
Cummingtonite Mg M3 6 2.00 2.091 0.016 11.8993 1.0167 54.06 ‐61.1 ‐30.6
Gedrite Mg M1 6 2.00 2.093 0.042 11.9232 1.0171 54.26 ‐50.0 ‐25.0
Glaucophane Mg M3 6 2.00 2.094 0.013 11.7829 1.0262 84.52 ‐53.7 ‐26.9
Forsterite Mg MI 6 2.00 2.094 0.029 11.7711 1.0269 95.28 ‐46.9 ‐23.5
Amesite Mg M22 6 2.00 2.096 0.030 11.7721 1.0286 90.64 ‐50.4 ‐25.2
Amesite Mg MI 6 2.00 2.096 0.021 11.7764 1.0287 91.04 ‐50.3 ‐25.2
Cummingtonite Mg MI 6 2.00 2.098 0.018 12.1099 1.0115 37.69 ‐51.1 ‐25.6
Brucite Mg Mg 6 2.00 2.099 0.001 12.0394 1.0161 52.05 ‐49.4 ‐24.7
Liebenbergite Ni M2 6 2.00 2.100 0.060 11.9660 1.0215 74.89 ‐51.1 ‐25.6
Annite Fe M2 6 2.00 2.101 0.014 12.2102 1.0081 26.86 ‐51.8 ‐25.9
Magnesite Mg Mg 6 2.00 2.102 0.001 12.3599 1.0010 3.55 ‐46.3 ‐23.2
CoOrthopyrox Co MI 6 2.00 2.103 0.056 12.2520 1.0090 26.90 ‐53.0 ‐26.5
gammaCo2SiO4 Co B 6 2.00 2.103 0.001 12.3315 1.0041 13.95 ‐48.8 ‐24.4
Norbergite Mg M2 6 2.00 2.104 0.100 12.0294 1.0236 75.64 ‐47.1 ‐23.6
Periclase Mg Mg 6 2.00 2.105 0.001 12.4452 1.0000 0.00 ‐47.8 ‐23.9
Co‐beta‐Spinel Co M1 6 2.00 2.106 0.032 12.3213 1.0077 24.51 ‐49.1 ‐24.6
Chondrodite Mg M1 6 2.00 2.107 0.014 11.9654 1.0277 100.70 ‐45.8 ‐22.9
Clinohumite Mg M1c 6 2.00 2.107 0.027 11.9247 1.0301 107.40 ‐45.4 ‐22.7
Humite Mg MI 6 2.00 2.108 0.023 11.9691 1.0293 109.00 ‐45.8 ‐22.9
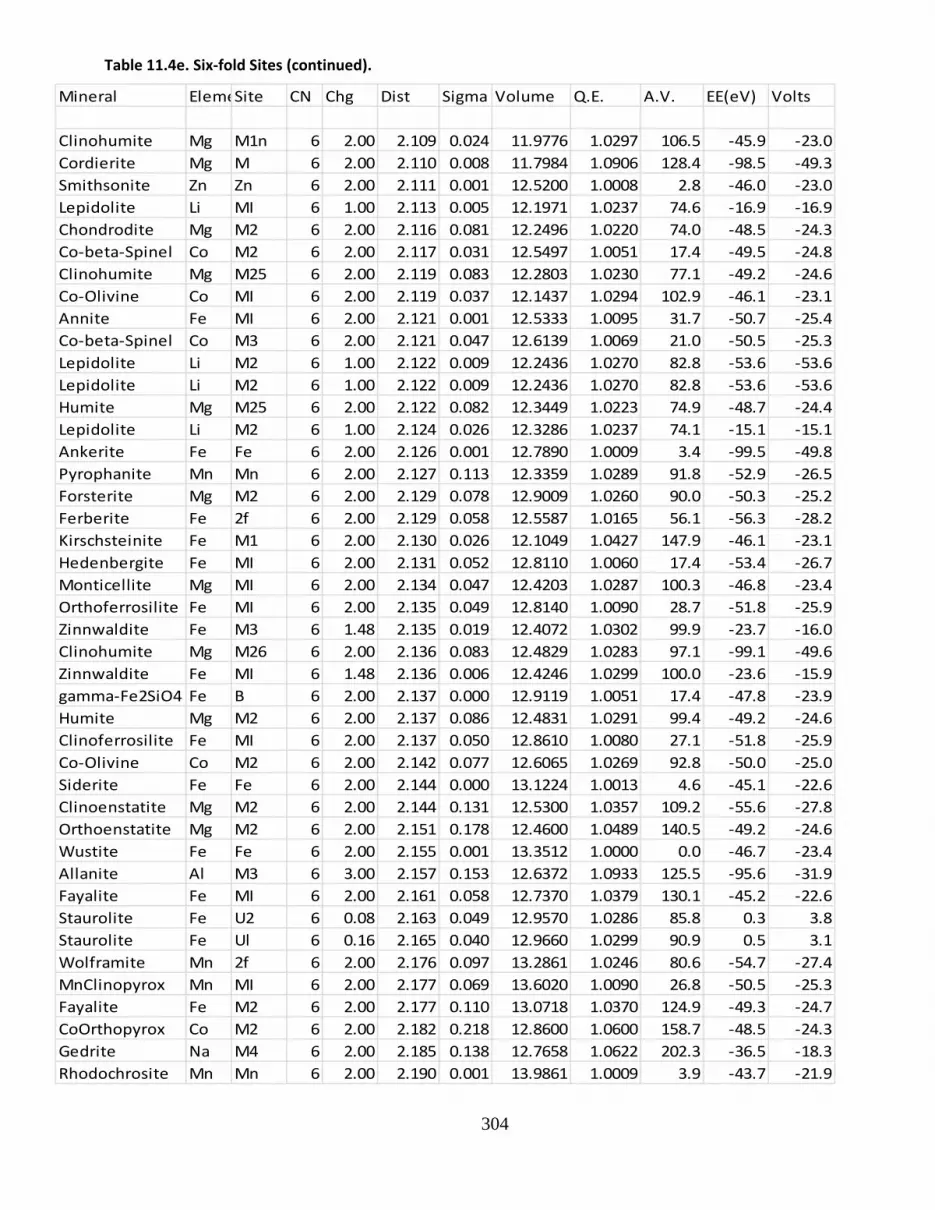
304
Table 11.4e. Six‐fold Sites (continued).
Mineral ElemeSite CN Chg Dist Sigma Volume Q.E. A.V. EE(eV) Volts
Clinohumite Mg M1n 6 2.00 2.109 0.024 11.9776 1.0297 106.5 ‐45.9 ‐23.0
Cordierite Mg M 6 2.00 2.110 0.008 11.7984 1.0906 128.4 ‐98.5 ‐49.3
Smithsonite Zn Zn 6 2.00 2.111 0.001 12.5200 1.0008 2.8 ‐46.0 ‐23.0
Lepidolite Li MI 6 1.00 2.113 0.005 12.1971 1.0237 74.6 ‐16.9 ‐16.9
Chondrodite Mg M2 6 2.00 2.116 0.081 12.2496 1.0220 74.0 ‐48.5 ‐24.3
Co‐beta‐Spinel Co M2 6 2.00 2.117 0.031 12.5497 1.0051 17.4 ‐49.5 ‐24.8
Clinohumite Mg M25 6 2.00 2.119 0.083 12.2803 1.0230 77.1 ‐49.2 ‐24.6
Co‐Olivine Co MI 6 2.00 2.119 0.037 12.1437 1.0294 102.9 ‐46.1 ‐23.1
Annite Fe MI 6 2.00 2.121 0.001 12.5333 1.0095 31.7 ‐50.7 ‐25.4
Co‐beta‐Spinel Co M3 6 2.00 2.121 0.047 12.6139 1.0069 21.0 ‐50.5 ‐25.3
Lepidolite Li M2 6 1.00 2.122 0.009 12.2436 1.0270 82.8 ‐53.6 ‐53.6
Lepidolite Li M2 6 1.00 2.122 0.009 12.2436 1.0270 82.8 ‐53.6 ‐53.6
Humite Mg M25 6 2.00 2.122 0.082 12.3449 1.0223 74.9 ‐48.7 ‐24.4
Lepidolite Li M2 6 1.00 2.124 0.026 12.3286 1.0237 74.1 ‐15.1 ‐15.1
Ankerite Fe Fe 6 2.00 2.126 0.001 12.7890 1.0009 3.4 ‐99.5 ‐49.8
Pyrophanite Mn Mn 6 2.00 2.127 0.113 12.3359 1.0289 91.8 ‐52.9 ‐26.5
Forsterite Mg M2 6 2.00 2.129 0.078 12.9009 1.0260 90.0 ‐50.3 ‐25.2
Ferberite Fe 2f 6 2.00 2.129 0.058 12.5587 1.0165 56.1 ‐56.3 ‐28.2
Kirschsteinite Fe M1 6 2.00 2.130 0.026 12.1049 1.0427 147.9 ‐46.1 ‐23.1
Hedenbergite Fe MI 6 2.00 2.131 0.052 12.8110 1.0060 17.4 ‐53.4 ‐26.7
Monticellite Mg MI 6 2.00 2.134 0.047 12.4203 1.0287 100.3 ‐46.8 ‐23.4
Orthoferrosilite Fe MI 6 2.00 2.135 0.049 12.8140 1.0090 28.7 ‐51.8 ‐25.9
Zinnwaldite Fe M3 6 1.48 2.135 0.019 12.4072 1.0302 99.9 ‐23.7 ‐16.0
Clinohumite Mg M26 6 2.00 2.136 0.083 12.4829 1.0283 97.1 ‐99.1 ‐49.6
Zinnwaldite Fe MI 6 1.48 2.136 0.006 12.4246 1.0299 100.0 ‐23.6 ‐15.9
gamma‐Fe2SiO4 Fe B 6 2.00 2.137 0.000 12.9119 1.0051 17.4 ‐47.8 ‐23.9
Humite Mg M2 6 2.00 2.137 0.086 12.4831 1.0291 99.4 ‐49.2 ‐24.6
Clinoferrosilite Fe MI 6 2.00 2.137 0.050 12.8610 1.0080 27.1 ‐51.8 ‐25.9
Co‐Olivine Co M2 6 2.00 2.142 0.077 12.6065 1.0269 92.8 ‐50.0 ‐25.0
Siderite Fe Fe 6 2.00 2.144 0.000 13.1224 1.0013 4.6 ‐45.1 ‐22.6
Clinoenstatite Mg M2 6 2.00 2.144 0.131 12.5300 1.0357 109.2 ‐55.6 ‐27.8
Orthoenstatite Mg M2 6 2.00 2.151 0.178 12.4600 1.0489 140.5 ‐49.2 ‐24.6
Wustite Fe Fe 6 2.00 2.155 0.001 13.3512 1.0000 0.0 ‐46.7 ‐23.4
Allanite Al M3 6 3.00 2.157 0.153 12.6372 1.0933 125.5 ‐95.6 ‐31.9
Fayalite Fe MI 6 2.00 2.161 0.058 12.7370 1.0379 130.1 ‐45.2 ‐22.6
Staurolite Fe U2 6 0.08 2.163 0.049 12.9570 1.0286 85.8 0.3 3.8
Staurolite Fe Ul 6 0.16 2.165 0.040 12.9660 1.0299 90.9 0.5 3.1
Wolframite Mn 2f 6 2.00 2.176 0.097 13.2861 1.0246 80.6 ‐54.7 ‐27.4
MnClinopyrox Mn MI 6 2.00 2.177 0.069 13.6020 1.0090 26.8 ‐50.5 ‐25.3
Fayalite Fe M2 6 2.00 2.177 0.110 13.0718 1.0370 124.9 ‐49.3 ‐24.7
CoOrthopyrox Co M2 6 2.00 2.182 0.218 12.8600 1.0600 158.7 ‐48.5 ‐24.3
Gedrite Na M4 6 2.00 2.185 0.138 12.7658 1.0622 202.3 ‐36.5 ‐18.3
Rhodochrosite Mn Mn 6 2.00 2.190 0.001 13.9861 1.0009 3.9 ‐43.7 ‐21.9

305
Table 11.4f. Six‐fold Sites (continued).
Mineral ElemeSite CN Chg Dist Sigma Volume Q.E. A.V. EE(eV) Volts
Bustamite Mn M3 6 2.00 2.195 0.036 13.841 1.013 40.9 ‐49.5 ‐24.8
Tephroite Mn MI 6 2.00 2.206 0.037 13.499 1.040 138.8 ‐44.0 ‐22.0
Spodumene Li M2 6 1.00 2.213 0.083 10.776 1.217 549.4 ‐15.1 ‐15.1
Rhodonite Mn M1 6 2.00 2.218 0.076 14.135 1.021 65.1 ‐49.2 ‐24.6
Pyroxmangite Mn M2 6 2.00 2.220 0.092 14.264 1.016 52.6 ‐48.8 ‐24.4
Paragonite Al M1 6 2.00 2.221 0.047 13.851 1.036 107.9 ‐99.6 ‐49.8
Pyroxmangite Mn M3 6 2.00 2.222 0.091 14.339 1.014 44.7 ‐49.3 ‐24.7
Pyroxmangite Mn M4 6 2.00 2.222 0.091 13.671 1.048 163.8 ‐46.8 ‐23.4
Rhodonite Mn M3 6 2.00 2.223 0.095 13.572 1.054 183.5 ‐46.8 ‐23.4
Pyroxmangite Mn M1 5 2.00 2.223 0.079 14.255 1.020 61.3 ‐48.6 ‐24.3
Manganosite Mn Mn 6 2.00 2.223 0.001 14.647 1.000 0.0 ‐45.3 ‐22.7
Orthoferrosilite Fe M2 6 2.00 2.223 0.293 13.430 1.070 181.2 ‐47.7 ‐23.9
Clinoferrosilite Fe M2 6 2.00 2.224 0.239 13.553 1.064 164.3 ‐47.4 ‐23.7
Tephroite Mn M2 6 2.00 2.227 0.088 13.982 1.037 127.0 ‐47.8 ‐23.9
Rhodonite Mn M2 6 2.00 2.242 0.095 14.480 1.026 88.8 ‐48.2 ‐24.1
Kirschsteinite Ca M2 6 2.00 2.268 0.092 14.549 1.047 161.1 ‐46.0 ‐23.0
Avicennite Tl Tl2 6 3.00 2.268 0.162 13.765 1.090 229.3 ‐94.3 ‐31.4
Avicennite Tl Tl1 6 3.00 2.271 0.000 15.046 1.025 77.8 ‐93.7 ‐31.2
Pyroxmangite Mn M6 6 2.00 2.272 0.294 13.875 1.098 257.0 ‐48.0 ‐24.0
MnClinopyrox Mn M2 6 2.00 2.281 0.266 14.952 1.075 192.0 ‐46.1 ‐23.1
Pyroxmangite Mn M7 6 2.00 2.284 0.225 14.631 1.065 175.9 ‐46.6 ‐23.3
Otavite Cd Cd 6 2.00 2.288 0.000 15.944 1.001 2.8 ‐48.6 ‐24.3
Villiaumite Na Na 6 1.00 2.307 0.001 16.371 1.000 0.0 ‐10.9 ‐10.9
Pyroxmangite Mn M5 6 2.00 2.310 0.277 12.230 1.233 455.1 ‐45.6 ‐22.8
Bustamite Ca M1 6 2.00 2.348 0.092 16.036 1.051 161.3 ‐94.9 ‐47.5
Ca‐Olivine Ca M1 6 2.00 2.352 0.035 15.896 1.060 209.0 ‐41.0 ‐20.5
Calcite Ca Ca 6 2.00 2.360 0.000 17.468 1.002 7.1 ‐46.2 ‐23.1
Monticellite Ca M2 6 2.00 2.364 0.080 16.438 1.048 165.6 ‐43.8 ‐21.9
Ankerite Ca Ca 6 2.00 2.371 0.001 17.726 1.002 7.3 ‐40.9 ‐20.5
Bustamite Ca M2 6 2.00 2.372 0.090 16.240 1.064 189.6 ‐43.1 ‐21.6
Wollastonite Ca M1 6 2.00 2.373 0.112 16.430 1.058 176.8 ‐33.2 ‐16.6
Wollastonite Ca M2 6 2.00 2.381 0.072 16.605 1.056 177.2 ‐38.6 ‐19.3
Dolomite Ca Ca 6 2.00 2.381 0.001 18.000 1.002 5.8 ‐40.6 ‐20.3
Glaucophane Na M4 6 1.00 2.391 0.048 12.555 1.283 748.6 ‐10.8 ‐10.8
Ca‐Olivine Ca M2 6 2.00 2.392 0.057 16.930 1.052 180.8 ‐43.7 ‐21.9
Lime Ca Ca 6 2.00 2.905 0.001 18.553 1.000 0.0 ‐41.9 ‐21.0
SodaNiter Na Na 6 1.00 2.417 0.001 18.828 1.000 0.1 ‐20.4 ‐20.4
Tremolite Ca M4 6 2.00 2.419 0.100 12.536 1.316 730.3 ‐35.7 ‐17.9
Lawsonite Ca Ca 6 2.00 2.421 0.038 18.315 1.023 78.4 ‐50.7 ‐25.4
Anorthite Ca Ca0 6 2.00 2.453 0.119 15.222 1.189 513.1 ‐41.6 ‐20.8
Margarite Ca Ca 6 2.00 2.455 0.033 19.660 1.002 6.6 ‐39.7 ‐19.9
Gedrite Na A 6 0.34 2.550 0.155 18.747 1.120 319.6 ‐4.4 ‐12.9
High‐Albite Na Na 6 1.00 2.597 0.198 17.922 1.199 553.2 ‐13.4 ‐13.4
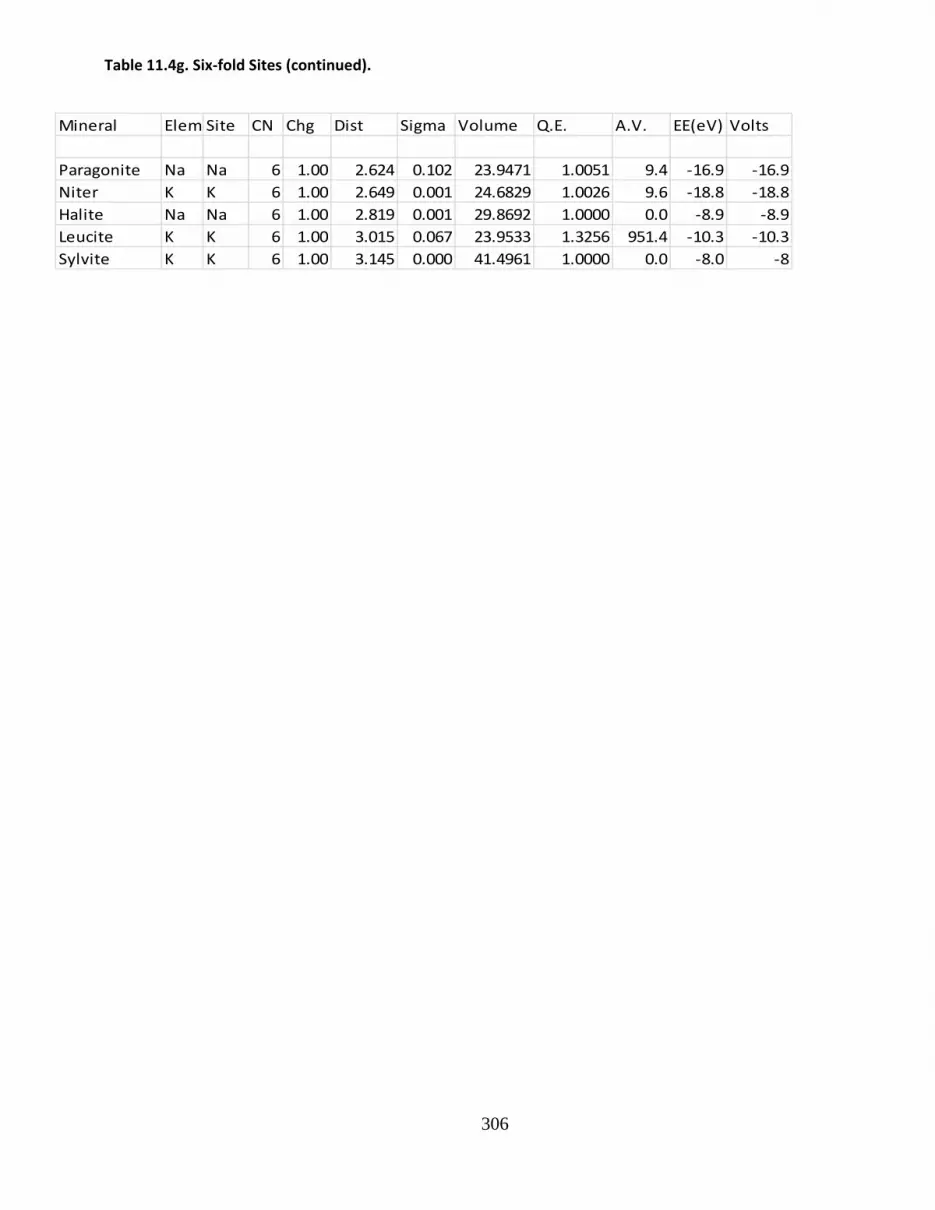
306
Table 11.4g. Six‐fold Sites (continued).
Mineral Elem Site CN Chg Dist Sigma Volume Q.E. A.V. EE(eV) Volts
Paragonite Na Na 6 1.00 2.624 0.102 23.9471 1.0051 9.4 ‐16.9 ‐16.9
Niter K K 6 1.00 2.649 0.001 24.6829 1.0026 9.6 ‐18.8 ‐18.8
Halite Na Na 6 1.00 2.819 0.001 29.8692 1.0000 0.0 ‐8.9 ‐8.9
Leucite K K 6 1.00 3.015 0.067 23.9533 1.3256 951.4 ‐10.3 ‐10.3
Sylvite K K 6 1.00 3.145 0.000 41.4961 1.0000 0.0 ‐8.0 ‐8

307
Table 11.5. Seven‐fold Sites.
Mineral Element Site CN Chg Dist Sigma Volume E.E.(eV) Volts
Baddeleyite Zr Zr 7 4.00 2.159 0.084 14.533 ‐168.9 ‐42.2
Gedrite Na M9 7 2.00 2.349 0.374 17.281 ‐34.0 ‐17.0
Rhodonite Mn M4 7 2.00 2.356 0.349 15.845 ‐48.1 ‐24.1
Rhodonite Mn M5 7 2.00 2.397 0.327 18.567 ‐46.2 ‐23.1
Vesuvianite Ca Ca2 7 2.00 2.402 0.060 18.925 ‐37.3 ‐18.7
Wollastonite Ca M3 7 2.00 2.414 0.117 20.291 ‐82.7 ‐41.4
Fluorapatite Ca Ca2 7 2.00 2.428 0.180 21.506 ‐43.2 ‐21.6
Titanite Ca Ca 7 2.00 2.458 0.130 19.713 ‐43.3 ‐21.7
Anorthite Ca z00 7 2.00 2.490 0.132 20.697 ‐41.5 ‐20.8
Malayaite Ca Ca 7 2.00 2.490 0.188 20.688 ‐43.7 ‐21.9
Anorthite Ca OiO 7 2.00 2.502 0.155 21.088 ‐41.3 ‐20.7
Anorthite Ca ziO 7 2.00 2.533 0.188 21.900 ‐42.3 ‐21.2
Monazite Ce Ce1 7 3.00 2.534 0.163 19.676 ‐86.3 ‐28.8
Zoisite Ca Ca2 7 2.00 2.551 0.178 31.011 ‐45.1 ‐22.6
Low‐Albite Na Na 7 1.00 2.611 0.259 22.457 ‐14.4 ‐14.4

308
Table 11.6. Eight‐fold Sites.
Mineral ElemeSite CN Chg Dist Sigma Volume E.E.(e1)Volts
Hafnon Hf Hf 8 4.00 2.188 0.078 18.7427 ‐196.0 ‐49.0
Zircon Zr Zr 8 4.00 2.198 0.074 19.0044 ‐168.4 ‐42.1
MgSiO3‐Perovskite Mg Mg 8 2.00 2.203 0.171 20.1002 ‐49.6 ‐24.8
Pyrope Mg X 8 2.00 2.270 0.078 20.1374 ‐48.8 ‐24.4
Almandine Fe A 8 2.00 2.299 0.084 20.9299 ‐47.8 ‐23.9
Spessartine Mn X 8 2.00 2.326 0.086 21.6500 ‐46.8 ‐23.4
Fluorite Ca Ca 8 2.00 2.364 0.001 40.6928 ‐61.7 ‐30.9
Uraninite U U 8 4.00 2.368 0.000 40.8764 ‐147.3 ‐36.8
Coffinite U U 8 4.00 2.376 0.057 24.0361 152.6 38.2
Grossular Ca X 8 2.00 2.405 0.091 23.8806 ‐44.3 ‐22.2
Thorite Th Th 8 4.00 2.417 0.053 25.3243 ‐149.8 ‐37.5
Vesuvianite Ca Ca1 8 2.00 2.421 0.105 24.4046 ‐32.7 ‐16.4
Thorianite Th Th 8 4.00 2.425 0.000 43.8969 ‐143.8 ‐36.0
Uvarovite Ca X 8 2.00 2.429 0.075 24.4760 ‐43.8 ‐21.9
Andradite Ca X 8 2.00 2.433 0.072 24.5480 ‐44.0 ‐22.0
Apatite(OH) Ca Ca2 8 2.00 2.443 0.127 26.1375 ‐43.8 ‐21.9
Scheelite Ca Ca 8 2.00 2.458 0.022 26.3758 ‐49.6 ‐24.8
Ca‐Tschermakite Ca M2 8 2.00 2.460 0.061 24.5210 ‐42.3 ‐21.2
Gypsum Ca Ca 8 2.00 2.463 0.127 26.1169 ‐42.6 ‐21.3
Jadeite Na M2 8 1.00 2.469 0.169 24.5830 ‐13.6 ‐13.6
Anhydrite Ca Ca 8 2.00 2.471 0.085 26.4332 ‐44.0 ‐22.0
Vesuvianite Ca C 8 1.00 2.474 0.258 32.1330 ‐4.6 ‐4.6
Bustamite Ca M4 8 2.00 2.490 0.120 24.7800 ‐43.5 ‐21.8
Pargasite Ca M4 8 2.00 2.490 0.115 25.8711 ‐43.7 ‐21.9
Ureyite Na M2 8 1.00 2.491 0.171 25.4480 ‐13.6 ‐13.6
Diopside Ca M2 8 2.00 2.498 0.163 25.7600 ‐41.5 ‐20.8
Vesuvianite Ca Ca3 8 2.00 2.499 0.080 27.0015 ‐50.5 ‐25.3
Cordierite Na Alk 8 0.00 2.509 0.160 23.2560 0.0 0.0
Hedenbergite Ca M2 8 2.00 2.511 0.177 26.1070 ‐41.6 ‐20.8
SrF2 Sr Sr 8 2.00 2.511 0.001 48.7679 ‐60.6 ‐30.3
Tremolite Ca M4 8 2.00 2.518 0.175 26.4916 ‐43.9 ‐22.0
Acmite Na M2 8 1.00 2.519 0.193 26.2950 ‐13.4 ‐13.4
Gehlenite Ca Ca 8 2.00 2.563 0.168 32.4750 ‐43.0 ‐21.5
Melilite Ca Ca 8 1.50 2.570 0.139 32.7450 ‐38.1 ‐25.4
Na‐melilite Ca Ca 8 1.50 2.572 0.144 32.8930 16.2 10.8
Akermanite Ca Ca 8 2.00 2.577 0.137 32.9090 ‐41.3 ‐20.7
Chlorapatite Ca Ca2 8 2.00 2.577 0.255 34.1257 ‐42.3 ‐21.2
Clinozoisite Ca Ca2 8 2.00 2.579 0.177 32.8896 ‐45.7 ‐22.9
Epidote‐2 Ca Ca2 8 2.00 2.582 0.174 32.9768 ‐45.3 ‐22.7
Epidote‐1 Ca Ca2 8 2.00 2.588 0.174 33.0794 ‐46.5 ‐23.3
Nepheline Na Na 8 1.00 2.620 0.119 26.7431 ‐12.1 ‐12.1
Frankdickson Ba Ba 8 2.00 2.683 0.001 59.4782 ‐59.5 ‐29.8
Microcline K K 8 1.00 2.925 0.111 36.3958 ‐11.8 ‐11.8

309
Table 11.7. Sites of Coordination Number Greater Than Eight.
Mineral ElemenSite CN Chg Dist Sigma Volume E.E.(eV) Volts
Aragonite Ca Ca 9 2.00 2.528 0.085 37.542 ‐41.4 ‐20.7
Chlorapatite Ca Ca1 9 2.00 2.545 0.184 31.977 ‐42.7 ‐21.4
Fluorapatite Ca Ca1 9 2.00 2.550 0.190 31.750 ‐42.7 ‐21.4
Apatite(OH) Ca Ca1 9 2.00 2.555 0.189 31.974 ‐42.0 ‐21.0
Zoisite Ca Ca1 9 2.00 2.562 0.223 28.005 ‐41.5 ‐20.8
Clinozoisite Ca Ca1 9 2.00 2.575 0.250 27.608 ‐41.6 ‐20.8
Epidote‐2 Ca Ca1 9 2.00 2.578 0.268 27.405 ‐42.2 ‐21.1
Epidote‐1 Ca Ca1 9 2.00 2.586 0.291 27.249 ‐41.7 ‐20.9
Marialite Na Na 9 1.21 2.599 0.286 32.548 ‐18.0 ‐14.9
Meionite Na Na 9 1.92 2.600 0.192 32.508 ‐30.4 ‐15.8
Allanite Ca Al 9 2.00 2.613 0.338 27.531 ‐41.4 ‐20.7
Strontianite Sr Sr 9 2.00 2.636 0.067 42.481 ‐30.3 ‐15.2
Elbaite Na CaMn 9 1.00 2.671 0.163 31.460 ‐13.8 ‐13.8
Tourmaline Na Na 9 1.00 2.673 0.108 31.564 ‐14.4 ‐14.4
Schorl Na CaMn 9 1.00 2.673 0.108 31.560 ‐13.8 ‐13.8
Cerussite Pb Pb 9 2.00 2.695 0.051 45.467 ‐38.1 ‐19.1
Witherite Ba Ba 9 2.00 2.807 0.053 50.896 ‐36.5 ‐18.3
Celsian Ba Ba 9 2.00 2.921 0.141 41.165 ‐35.1 ‐17.6
Sanidine K K 9 1.00 2.958 0.133 54.421 ‐12.0 ‐12.0
Kalsilite K K 9 1.00 2.968 0.024 46.686 ‐9.8 ‐9.8
Orthoclase K K 9 1.00 2.071 0.133 55.162 ‐11.8 ‐11.8
Nepheline K K 9 1.00 3.016 0.030 49.925 ‐8.2 ‐8.2
Perovskite Ca Ca 10 2.00 2.647 0.121 37.112 ‐41.2 ‐20.6
Celestite Sr Sr 10 2.00 2.745 0.149 45.896 ‐41.3 ‐20.7
Anglesite Pb Pb 10 2.00 2.783 0.159 47.969 ‐40.7 ‐20.4
Barite Ba Ba 10 2.00 2.879 0.113 52.989 ‐38.7 ‐19.4
Muscovite K K 10 1.00 3.031 0.224 51.267 ‐12.9 ‐12.9
Rb‐Feldspar Rb Rb 10 1.00 3.100 0.085 67.480 ‐10.9 ‐10.9
Allanite La A2 11 2.00 2.729 0.248 54.860 ‐47.0 ‐23.5
Lepidolite K K 12 1.00 3.105 0.172 62.898 ‐10.5 ‐10.5
Lepidolite K K 12 1.00 3.111 0.169 62.892 ‐0.7 ‐0.7
Lepidolite K K 12 1.00 3.111 0.169 62.802 ‐0.7 ‐0.7
Lepidolite K K 12 1.00 3.119 0.153 60.848 ‐10.9 ‐10.9
Zinnwaldite K 1 12 1.00 3.126 0.143 63.825 ‐12.1 ‐12.1
F‐Phlogopite K K 12 1.00 3.140 0.139 77.367 ‐7.4 ‐7.4
Phlogopite K K 14 1.00 3.121 0.172 80.449 ‐10.4 ‐10.4
Phlogopite‐N K K 14 1.00 3.122 0.176 80.557 ‐10.4 ‐10.4
Annite K K 14 1.00 3.159 0.068 81.199 ‐9.5 ‐9.5

310
REFERENCES
Akimoto, S., T. Nagata, and T. Katsura (1957) The TiFe2O5 – Ti2FeO5 solid solution series. Nature 179, 37‐38.
Alberti, A., and G. Vezzalini (1983) Thermal behavior of heulandites: a structural study of the dehydration of the Nadap heulandite. Tschermaks Minewral. Petrol. Mitteilungen 31, 259‐270.
Allen, F. (1985) Chemical and structural variations in vesuvianite (Ph.D. Thesis) Harvard University 440 pp.
Angel, R.J., L.W. Finger, R.M. Hazen, M. Kanzaki, D.J. Weidner, R.C. Liebermann, D.R. Veblen (1989) Structure and twinning of single‐crystal MgSiO3 garnet synthesized at 17GPa and 1800ºC. American Mineralogist 74, 509‐512.
Armbruster, T., C.A. Geiger and G.A. Lager (1992) Single‐crystal X‐ray structure study of synthetic pyrope‐almandine garnets at 100 and 293K. American Mineralogist 77, 512‐521.
Asbrink, S., L.‐J. Norrby (1970) A refinement of the structure of copper (II) oxide with a discussion of some exceptional e.s.d.s. Acta Crystallographica B26, 8‐15.
Aurivilius, K. (1956) The crystalk structure of mercury (II) oxide. Acta Crystallographica 9, 685‐686.
Baur, W.H. (1956) Ueber die Verfeinerung der Kristalstrukturbestimmung einiger Vertreter des Rutiltyps: TiO2, SnO2, GeO2, MnF2. Acta Crystallographica 9, 515‐520.
Baur, W.H. (1959) Die Kristalstruktur des Edelamblygonits LiAlPO4(OH,F). Acta Crystallographica 12, 988‐984.
Baur, W.H. (1961) Atomabstaende und Bildungswinkel im Brookit, TiO2. Acta Crystallographica 14, 214‐216.
Baur, W.H. (1978) Crystal structure refinement of lawsonite. American Mineralogist 63, 311‐315.
Borie, B. (1974) Thermally excited forbidden reflections. Acta Crystallographica A30, 337‐341.
Borodin, V.L., V.I. Lyutin,V.V. Ilyukhin, and N.V. Belov (1979) Isomorphous calcite‐otavite series. Doklady Akademia Nauk SSSR 245, 1099‐1101.
Bragg, W.L., G.F. Claringbull, and W.L. Taylor (1965) Crystal Structures of Minerals. Cornell University Press, Ithaca, 409 p.
Brown, B.E. and S.W. Bailey (1964) The structure of maximum microcline. Acta Crystallographica 17, 1391‐1400.
Brown, G.E. (1970) The crystal chemistry of the olivines (PhD. Thesis). Virginia Polytechnic Institute and State University, Blackburg, VA 121 p.
Burnham, C.W. (1967) Ferrosilite. Carnegie Institution of Washington Yearbook 65, 285‐290.
Busing, W.R., and H.A. Levy (1958) A single‐crystal neutron study of diaspore AlO(OH). Acta Crystallographica 11, 798‐803.
Cameron, M., S. Sueno, C.T. Prewitt, and J.J. Papike (1973) High temperature crystal chemistry of acmite, diopside, hedenbergite, jadeite, spodumene, and ureyite. American Mineralogist 58, 594‐618.
Calligaris, M., G. Nardin, and L. Randaccio (1982) Cation site location in a natural chabazite. Acta Crystallographica B38, 602‐605.
Cannillo, E., F. Mazzi, J.H. Fang, P.D. Robinson, and Y. Ohya (1971) The crystal structure of aenigmatite. American Mineralogist 56, 427‐446.
Catlow, C.R.A., J.M. Thomas, S.C. Parker, and D.A. Jefferson (1982) Simulating silicate structures and the stability of pyroxenoids. Nature 295, 658‐662.
Clark, J.R., D.E. Appleman, and J.J. Papike (1969) Crystal‐chemical characterization of clinopyroxenes based on eight new structure refinements. Mineralogical Society of America Spec. Pap. 2, 31‐50.
Cohen, J.P., F.K. Ross, and G.V. Gibbs (1977) An X‐ray and neutron diffraction study of hydrous low cordierite. American Mineralogist 62, 67‐78.
Cole, W.F. and C.J. Lancucki (1974) A refinement of the crystal structure of gypsum, CaSO4.2H2O. Acta Crystallographica B30, 921‐929.
311
Colville, A.A., and P.H. Ribbe (1968) The crystal structure of adularia and a refinement of the crystal structure of orthoclase. American Mineralogist 53, 25‐37.
Czaya, R. (1971) Refinement of the structure of ‐Ca2SiO4. Acta Crystallographica B27, 848‐849.
DeVilliers, J.P.R. (1971) Crystal structures of aragonite, strontianite, and witherite. American Mineralogist 56, 758‐767.
Dollase, W.A. (1968) Refinement of the crystal structures of zoisite and clinozoisite. American Mineralogist 53, 1882‐1898.
Dollase, W.A. (1971) Refinement of the crystal structures of epidote, allanite, and hancockite. American Mineralogist 56, 447‐464.
Donnay, G. and R. Barton, Jr. (!972) Refinement of the crystal structure of elbaite and the mechanism of tourmaline solid solution. Tschermaks Mineralogische und Petrologische Mitteilungen 18, 273‐286.
Effenberger, H., K. Mereiter, and J. Zemann (1981) Crystal structure refinements of magnesite, calcite, rhodochrosite, siderite, smithsonite, and dolomite, with discussion of some aspects of the stereochemistry of calcite type carbonates. Zeitschruft fuer Kristallographie 156, 233‐243.
Finger, L.W. (1970) Refinement of the crystal structure of anthophyllite. Carnegie Institution of Washingon Yearbook 68, 282‐288.
Fischer, K. (1966) A further refinement of the crystal structure of cummingtonite (Mg,Fe)7(Si4O11)2(OH)2. American Mineralogist 51, 814‐818.
Foit, F.F. Jr., and P.E. Rosenberg (1979) The structure of vanadium‐bearing tourmaline and its implications regarding tourmaline solid solutions. American Mineralogist 64, 788‐798.
Foreman, N. and D.R. Peacor (1970) Reffinement of the nepheline structure at several temperatures. Zeit. Fuer Krist. 132, 45‐70.
Forsyth, J.B., I.G. Hedley, and C.E. Johnson (1968) The magnetic structure and hyperfine field of goethite (a‐FeOOH). Journal of Physics C1, 179‐188.
Fortier, S. and G. Donnay (1975) Schorl refinement showing the composition dependence of the tourmaline structure. Canadian Mineralogist 13, 173‐177.
Foster, P.K., and A.J.E. Welch (1956) Metal oxide solution: I. Lattice constants and phase relations in ferrous oxide (wustite) and in solid solutions of ferrous oxide and manganous oxide. Transactions Faraday Society 52, 1626‐1634.
Fujine, K., S. Sasaki, Y. Takeuchi, and R. Sadanaga (1981) X‐ray determination of electron distributions in forsterite, fayalite, and tephroite. Acta Crystallographica B37, 513‐518.
Gabe, E.J., J.C. Portheine, and S.H. Whitlow (1973) A reinvestigation of epidote structure: confirmation of the iron location. American Mineralogist 58, 218‐223.
Galli, E. (1971) Refienemnt of the crystal structure of stilbite. Acta Crystallographica B27, 833‐841.
Galli, E., G. Gottardi, H. Mayer, A. Preisinger, and E. Passaglia (1983) The structure of potassium‐exchanged heulandite at 293, 373, and 593 K. Acta Crystallographica B27, 189‐197.
Gasperin, M. (1971) Structure crystalline de RbAlSi3O8. Acta Crystallographica B27, 854‐855.
Geller, S. (1971) Structures of ‐Mn2O3, (Mn0.983Fe0.017)2O3 and (Mn.37Fe.63)2O3 and relation to magnetic ordering. Acta Crystallographica B27, 821‐828.
Ghouse, K.M. (1968) Refinement of the crystal structure of heat treated monazite crystal. Indian Journal of Pure and Applied Physics 6, 265‐268.
Gibbs, G.V., and P.H. Ribbe (1969) The crystal structures of the humite minerals I. Norbergite. American Mineralogist 54, 376‐390.
Gibbs, G.V., P.H. Ribbe, and C.P. Anderson (1970) The crystal structures of the humite minerals II. Chondrodite. American Mineralogist 55, 1182‐1194.
Goldschmidt, V.M. (1958) Geochemistry. Oxford University Press, London, 730p.
312
Guggenheim, S., and S.W. Bailey (1975) Refinement of the margarite structure in subgroup symmetry. American Mineralogist 60, 1023‐1029.
Guggenheim, S., and S.W. Bailey (1977) Refinement of the zinnwaldite‐1M structure in subgroup symmetry. American Mineralogist 62, 1158‐1167.
Guggenheim, S., and S.W. Bailey (1978) Refinement of the margarite structure in subgroup symmetry: correction, further refinement and comments. American Mineralogist 63, 186‐187.
Hahn, T. (1983) International Tables for Crystallography, Volume A. Space Group Symmetry. D. Reidel, Boston, 854p.
Hall, S.H. and S.W. Bailey (1979) Cation ordering in amesite. Clays and Clay Minerals 27, 241‐247.
Harlow, G.E. and G.E. Brown (1980) Low albite: An X‐ray and neutron diffraction study. American Mineralogist 65, 986‐995.
Hawthorne, F.C., and H.D. Grundy (1976) The crystal chemistry of the amphiboles: IV. X‐ray and neutron refinements of the crystal structure of trtremolite. Canadian Mineralogist 14, 334‐345.
Hazen, R.M., and C.W. Burnham (1973) The crystal structure of one‐layer phlogopite and annite. American Mineralogist 58, 889‐900.
Hazen, R.M. (1976) The effects of temperature and pressure on the cell dimension and X‐ray temperature factors of periclase. American Mineralogist 61, 266‐271.
Hazen, R.M., and L.W. Finger (1979) Crystal structure and compressibility of zircon at high pressure. American Mineralogist 64, 196‐201.
Higgins, J.B., and P.H. Ribbe (1977) the structure of malayaite, CaSnOSiO4, a tin analog of titanite. American Mineralogist 62 801‐806.
Hill, R.J., J.R. Craig, and G.V. Gibbs (1979) Systematics of the spinel structure type. Physics and Chemistry of Minerals 4, 317‐339.
Horiuchi, H., and H. Sawamoto (1981) b‐Mg2SiO4: Single‐crystal X‐ray diffraction stidy. American Mineralogist 66, 568‐575.
Horiuchi, H., M. Hirano, E. Ito, and Y. Matsui (1982) MgSiO3 (ilmenite‐type): Single crystal X‐ray diffraction study. American Mineralogist 788‐793.
Horiuchi, H.., E. Ito, and D.J. Weidner (1987) Perovskite‐type MgSiO3: Single‐crystal X‐ray diffraction study. American Mineralogist 72, 357‐360.
Horn, M., C.F. Schwertfeger, and E.P. Meagher (19720 refinement of the structure of anatase at several temperatures. Zeit. Krist. 136, 273‐281.
Ishikawa, Y., S. Sato, and y. Syono (1972) Neutron and magnetic studies of a single crystal of Fe2TiO4. Technical Report of the Institute for Solid State Physics, University of Tokyo.
Ishikuni, M. (1984) Anionic substitution in calcium carbonate. The Significance of Trace Elements in Solving Petrologic Problems and Controversies. (S.S. Augistithus ed.) Theophrastus, Athens.
Jensen, B. (!973) Patterns of trace element partitioning. Geochim. Gosmochim. Acta 37, 2227‐2242.
Joswig, W. (1972) Neutronenbeugungsmessungen an einem 1M‐phlogopit. Neues Jahrbuch fur Mineralogie, Monatshefte 1‐11.
Joswig, W., and V. A. Drits (1986) The orientation of the hydroxyl groups in dickite by X‐ray diffraction. Neues Jahrbuch fur Mineralogie, Monatshefte 19‐22.
Kato, K., and A. Nukui (1976) Die Kristallstruktur des monoklinen Tief‐Tridymit. Acta Crystallographica B32, 2486‐2491.
Kay, H.F., and P.C. Bailey (1957) Structure and properties of CaTiO3. Acta Crystallographica 10, 219‐226.
Kay, M.I., B.C. Frazer, and I. Almodovar (1964) Neutron diffraction refinement of CaWO4. Journal of Chemical Physics 40, 504‐506.
Keller, C. (1963) Untersuchungen ueber die Germanate und Silikate Typs ABO3 der vierwertigen Elemente Thorium bis Americium. Nukleonik 5, 41‐48.

313
Kimata, M. and N. Ii (1981) The crystal structure of synthetic akermanite, Ca2MgSi2O7. Neues Jahrbuch fuer Mineralogie Monatshefte 1‐10.
Kirfel, A., and G. Will (1980) Charge density in anhydrite, CaSO4, from X‐ray and neutron diffraction measurements. Acta Crystallographica B36, 2881‐2890.
Kondrasev, Ju.D. and A.I. Zaslavskij (1951) The crystal structures and modifications of manganese dioxide. Izvestia Akademia Nauk SSSR Fiz. 15, 179‐186.
Koyama, K. and Y. Takeuchi (1977) Clinoptilolite: the distribution of potassium atoms and its role in thermal stability. Zeit. Krist. 145, 216‐239.
Lager, G.A. and E.P. Meagher (1978) High temperature structure study of six olivines. American Mineralogist 63, 365‐377.
Leciejewicz, J. (1961) The crystal structure of tellurium dioxide: A redetermination by neutron diffraction. Zeit. Krist. 116, 345‐353.
Lee, J.H. and S. Guggenheim (1981) Single crystal x‐ray refinement of pyrophyllite‐1Tc. American Mineralogist 66, 350‐357.
Leonova, V.A. (1959) Effect of contamination on the lattice parameters of uraninite. Doklady Akademia Nauk SSSR 126, 1342‐1346.
LePage, Y., L.D. Calvert, and E.J. Gabe (1980) Parameter variation in low quartz between 94 and 298K. Journal Physics and Chemistry of Solids 41, 721‐725.
Lin, C. and S.W. Bailey (1984) The crystal structure of paragonite‐2M1. Amer. Mineral. 69, 122‐127.
Lin, S.B. and B.J. Burley (1973a) Crystal structure of a sodium and chlorine‐rich scapolite. Acta Cryst. B29, 1272‐1278.
Lin, S.B. and B.J. Burley (1973b) Crystal structure of meionite. Acta Cryst. B29, 2024‐2026.
Loens, J. and H. Schulz (1967) Struktuverveinerung von Sodalith, Na8Si6Al6O24Cl2. Acta Cryst. 23, 434‐436.
Louisnathan, S.J. (1970a) Refinement of the crystal structure of a natural gehlenite, Ca2Al(AlSi)2O7. Canadian Mineral. 10, 822‐837.
Louisnathan, S.J. (1970b) The crystal structure of synthetic soda melilite, NaCaAlSi2O7. Zeit. Krist. 131, 314‐321.
Mackie, P.E., J.C. Elliott, and R.A. Young (1972) Monoclinic structure of synthetic Ca5(PO4)3Cl, chlorapatite. Acta Cryst. B28, 1840‐1848.
Mazzi, F., E. Galli, and G. Gottardi (1976) The crstal structure of tetragonal leucite. Amer. Mineral. 61, 108‐115.
Mazzi, F., and E. Galli (1978) Is each analcime different? Amer. Mineral. 63, 448‐464.
McCauley, J.W., R.E. Newnham, and G.V. Gibbs (1973) Crystal structure analysis of synthetic fluorophlogopite. Amer. Mineral. 58, 249‐254.
Mellini, M. (1982) The crystal structure of lizardite 1T: Hydrogen bonds and polytypism. Amer. Mineral. 67, 587‐598.
Miyake, M., I. Minato, H. Morikawa, and S. Iwai (1978) Crystal structures and sulfate force constants of barite, celestite, and anglesite. Amer. Mineral.63, 506‐510.
Morimoto, N., D.E. Appleman, and H.T. Evans (1960) The crystal structures of clinoenstatite and pigeonite. Zeit. Krist. 114, 120‐147.
Morimoto, N., M. Tokonami, M. Watanabe, and K. Koto (1974) Crystal structures of three polymorphs of Co2SiO4. Amer. Mineral. 59, 475‐485.
Morosin, B. and R.W. Lynch (1972) Structure studies on Al2TiO5 at room temperature and at 600ºC. Acta Cryst. B28, 1040‐1046.
Morosin, B. (1972) Crystal structure and thermal expansion of beryl. Acta Cryst. B28, 1899‐1903.
Mortier, L., J.J. Pluth, and J.V. Smith (1978) Positions of cations and molecules in zeolites with the mordenite type framework IV. Dehydrated and re‐hydrated K‐exchanged ptilolite. Pergamon, New York.
Mortier, W.J. (1982) Compilation of Extraframework Sites in Natural Zeolites. Butterworth & Co., Surry, U.K.
314
Narita, H., K. Koto, and N. Morimoto (1977) The crystal structures of MnSiO3 polymorphs (rhodonite‐ and pyroxmangite‐type). Mineralogical Journal 8, 329‐342.
Newnham, R.E. and H.D. Megaw (1960) The crystal structure of celsian (barium feldspar). Acta Cryst. 13, 303‐312.
Newnham, R.E. and Y.M. deHaan (1962) Refinement of the ‐Al2O3, Ti2O3, V2O3, and Cr2O3 structures. Zeit. Krist. 117, 235‐237.
Nimmo, J.K. and B.W. Lucas (1973) A neutron diffraction determination of the crystal structure of alpha‐phase potassium nitrate at 25º and 100ºC. Journal of Physics C6, 201‐211.
Novak, G.A. and G.V. Gibbs (1971) The crystal chermistry of the silicate garnets. Amer. Mineral. 56, 791‐825.
Ohashi, Y. and L.W. Finger (1978) The role of octaherdral cations in pyroxenoid crystal chemistry I. Bustamite, wollastonite, and the pectolite‐schizolite‐serandite series. Amer. Mineral. 63, 274‐288.
Okamura, F.P., S. Ghose, and H. Ohashi (1974) Structure and crystal chemisytry of calcium‐Tschermak’s pyroxene., CaAlAlSiO6. Amer. Mineral. 59, 549‐557.
Onken, H. (1965) Verfeinerung der Kristalstruktur von Monticellit. Tschermaks Mineralogishe und Petrologische Mitteilung 10, 34‐44.
Onuma, N., H. Higuchi, H. Wakita, and H. Nagasawa (1968) Trace element partition between two pyroxenes and the hjost lava. Earth and Planetary Science Letters 5, 47‐51.
Papamantellos, P. (1968) Verfeinerung der Tl2O3‐Struktur mittels neutronenbeugung. Zeit. Krist. 126, 142‐146.
Papike, J.J. and J.R. Clark (1970) The crystal structure and cation distribution of glaucophane. American Mineralogist 53, 1156‐1173.
Papike, J.J. and M. Ross (1970) Gedrites: crystal structures and intracrystalline cation distributions. Amer. Ineral. 55, 1945‐1972.
Pauling, L. (1930) The crystal structure of pseudobrookite. Zeit. Krist. 73, 97‐112.
Peacor, D.R. (1973) High‐temperature single‐crystal study of the cristobalite inversion. Zeit. Krist. 138, 274‐298.
Pechar, F., W. Schaefer, and G. Will (1983) A neutron diffraction refinement of the crystal structure of natural natrolite, Na2Al2Si3O10∙2H2O. Zeit. Krist. 164, 19‐24.
Perdikatsis, B. and H. Burzlaff (1981) Struktuirverfeinerung am Talk, Mg3[(OH)2Si4O10]. Zeit. Krist. 156, 177‐186.
Perrotta, A.J. and J.V. Smith (1967) The crystal structure of kalsilite KAlSiO4. Mineralogical Magazine 35, 588‐595.
Pertlik, F. (1975) Verfeinerung Verfeinerung der Kristallstruktur von Claudetit (As2O3). Monatshefte für Chemie 106,755‐762.
Pertlik, F. (1978) Strukturverfeinerungvon kubischem As2O3 (Arsenolith) mit Einkristalldaten. Czechoslovak Journal of Physics B28, 170‐176.
Phillips M.W. and P.H. Ribbe (1973) The structures of monoclinic potassium‐rich feldspars. Amer.Mineral. 58, 263‐270.
Philpotts, J.A. (1978) The law of constant rejection. Geochim. Cosmochim. Acta 42, 909‐920.
Price, G.D. and S.C. Parker (1984) Computer simulation of the structural and physical properties of teholivine and spinel polymorphs of Mg2SiO4. Physics and Chemmistry of Minerals 10, 209‐216.
Radke, A.S. nad G.E. Brown (1974) Frankdicksonite BaF2, a new mineral from Nevada. American Mineral. 59, 885‐888.
Reeder, R.J. (1983) Crystal chemistry opf the rhombohedral carbonates. Reviews in Mineralogy 11, 1‐47.
Ribbe, P.H. and G.V. Gibbs (1971) Crystal structures of the humite minerals III.Mg/Fe ordering in humite and its relation to other ferromagnesian silicates. Amer. Mineral. 56, 1155‐1173.
Rinaldi, R., J.J. Pluth, and J.V. Smith (1974) Zeolites of the phillipsite family: Refinement of the crystal structures of phillipsite and harmotome. Acta Cryst. B30, 2426‐2433.
Robie, R.A., B.S. Hemingway and J.R. Fisher (1978) Thermodynamic properties of minerals and related substances at 298.15K and 1 bar (105 Pascal) pressure and at higher temperatures. U.S. Geological Survey Bulletin 1452.
Robie, R.A., B.S. Hemingway and J.R. Fisher (1978) Thermodynamnic properties of minerals and related substances at 298.15K and 1 bar (105 Pascal) pressure and at higher temperatures. U.S. Geological Survey Bulletin 1452.

315
Robinson, K. , G.V. Gibbs, and P.H. Ribbe (1971) Quadratic elongation: a quantitative measure of distrortion in coordination polyhedral. Scince 172, 567‐570.
Robinson, K. , G.V. Gibbs, and P.H. Ribbe (1973a) The crystal structures of eth humite minerals IV. Clinohumite and titanoclinohumite. Amer. Mineral. 58, 43‐49.
Robinson, K. , G.V. Gibbs, P.H. Ribbe, and M.R. Hall (1973b) Cation distribution in three hornblendes. American Journal of Science 273a, 522‐535.
Rothbauer, R. (1971) Untersuchung eines 2M1‐Muskovite mit Neutronenstrahlen. Neues Jahrbuch fur Mineralogie Monatshefte, 143‐154.
Saalfeld, H. and M. Wedde (1974) Refinement of the crystal structure of gibbsite, Al(OH)3. Zeit. Krist. 139, 129‐135.
Sabine, T.M. and S. Hogg (1969) The wurtzite Z‐parameter for beryllium oxide and zinc oxde. Acta Cryst. B25, 2254‐2256.
Sahl, K. (1974) Verfeinerung der Kristalstruktur von Cerussite, PbCO3. Zeit. Krist. 139, 215‐222.
Sartori, F., M. Franzini, and S. Merlino (1973) Crystal structure of 2M2 lepidolite. Acta Cryst. B29, 573‐578.
Sartori, F. (1976) The crystal structure of 1M lepidolite. Tschermaks Mineralogische und Petrologische Mitteilungen 23 65‐75.
Sartori, F. (1976) The crystal structure of 2M1 lepidolite. Tschermaks Mineralogische und Petrologische Mitteilungen 24 23‐37.
Sasaki, S., K. Fujino, Y. Takeuchi, and R. Sadanaga (1980) On the estiomation of atomic charges by the XC‐ray methopd for some oxides and silicates. Acta Cryst. A36, 904‐915.
Sasaki, S., C.T. Prewitt, Y Sato, and E. Ito (1982a) Single crystal X‐ray study of ‐Mg2SiO4. Jour. Geophys. Res. 87, 7829‐7832.
Sasaki, S., Y. Takeuchi, K. Fujino, and S. Akimoto (1982b) Electron density distributions of three orthopyroxenes, Mg2Si2O6, Co2Si2O6, and Fe2Si2O6. Zeit. Krist. 158, 279‐297.
Sass, R.L., R. Vidale, and J. Donohue (1957) Interatomic distances and thermal anisotropy in sodium nitrate and calcite. Acta Cryst. 10, 567‐570.
Schramm, V. and K.F. Fischer (1971) Refinement of the crystal structure of laumontite. Molecular Seive Zeolites I, Advances in Chemistry Series 101, 259‐265.
Shannon, R.D. and C.T. Prewitt (1969) Effective ionic radii in oxides and fluorides. Acta Cryst. B25, 925‐945.
Shannon, R.D. and C.T. Prewitt (1970) Revised values of effective ionic radii. Acta Cryst. B26, 1042‐1048.
Shannon, R.D. (1976) Revised effective ionic radii and systematic studies of interatomic distances in halides and chalcogenides. Acta Cryst. A32, 751‐767.
Shintani, H., S. Sato, and Y. Saito (1975) Electron density distrbutions in rutile crystals. Acta Cryst. B31, 1981‐1982.
Shirane, G., S.J. Pickart, and Y. Ishikawa (1959) Neutron diffraction study of antiferromagnetic MnTiO3 and NiTiO3. Jour. Physics Society of Japan 14, 1352‐1360.
Simonov, M.A., P.A. Sandomerski, F.K. Egorov‐Tesmenko, and N.V. Belov (1977) Crystal structure of willemite, Zn2SiO4. Kristallographiya (Doklady Akademia Nauk SSSR) 237, 581‐584.
Smith, D.K., and H.W. Newkirk (1965) The crystal structure of baddeleyite (monoclinic ZrO2) and its relation to the polymorphism of ZrO2. Acta Cryst. 18, 983‐991.
Smith, J.V. 9168) The crystal structure of stauroite. Amer. Mineral. 53, 1139‐1155.
Smyth, J.R., J.V. Smith, G. Artioli, and A. Kvick (1987) Crystal structures of coesite, a high pressure form of SiO2, at 15K and 298K: test of bonding models. Jour. Physical Chemistry 91, 988‐992.
Speer, J.A. and G.V. Gibbs (1976) Crystal structure of synthetic titanite, CaTiOSiO4, and the domain texturesof natural titanites. Amer. Mineral 61, 238‐247.
Speer, J.A. and B.J. Cooper (1982) Crystal structure of synthetic hafnon, HfSiO4, comparison with zircon and the actinide orthosilicates. Amer. Mineral. 67, 238‐247.

316
Sudarsanan, K. and R.A. Young (1969) Significant precision in crystal structure details: Holly Springs hydroxyapatite. Acta Cryst. B25, 1534‐1543.
Sudarsanan, K., P.E. Mackie, and R.A. Young (1972) Comparison of synthetic and mineral fluorapatite, Ca5(PO4)3F, in crystallographic detail. Materials Research Bulletin 7, 1331‐1338.
Suitch, P.R. and R.A. Young (1983) Atom positions in highly ordered kaolinite. Clays and Clay Minerals 31, 357‐366
Svennson, C. (1974) The crystalstructure of orthorhombic antimony trioxide Sb2O3. Acta Cryst. B30, 458‐461.
Svennson, C. (1974) The crystalstructure of cubic antimony trioxide Sb2O3. Acta Cryst. B31, 2016‐2018.
Taylor, M. and R.C. Ewing (1978) The crystal structures of the ThSiO4 polymorphs: huttonite and thorite. Acta Cryst. B34. 1074‐1079.
Tokonami, M., H. Horiuchi, A. Nakano, S. Akimoto, and N. Morimoto (1979) The crystal structure of pyroxene‐type MnSiO3. Mineralogical Journal 9, 424‐426.
Uelkue, D. (1967) Untersuchung zur Kristalstruktur und magnetischen struktur des Ferberits FeWO4. Zett. Krist.124, 192‐219.
Vogel, R.E. and C.P. Kempter (1959) Mathematical technique for the precision determination of lattice constants. U.S. Atomic Energy Commission LA‐2317, 30p.
Wainwright J.E. and J. Starkeyt (1971) A refinement of the structure of anorthite. Zeit. Krist. 133, 75‐84.
Wechsler, B.A., C.T. Prewitt and J.J. Papike (1976) Chemistry and structure of lunar and synthetic armalcolite. EPSL 29, 91‐103.
Wechsler, B.A., and C.T. Prewitt (1984) Crystl structure of ilmenite (FeTiO3) at high temperature and high pressure. Amer. Mineral. 69, 176‐185.
Weitzel, H. (1976) Kristalstrukturverfeinerung von Wolframiten und Columbiten. Zeit. Krist. 144, 238‐258.
Whittaker, E.J.W. and R. Muntus (1970) Ionic radii for use in geochemistry. Geochim Cosmochim. Acta 34, 945‐959.
Winter, J.K., F.P. Okamura and S. Ghose (1979) A high temepratrure structural study of high albite, monalbite, and the albite‐monalbite phase transition. Amer. Miineral. 64, 409‐423.
Wyckoff, R.G.W. (1963) Crystal Structures. John Wiley & Sons, New York.
Yagi, T., F. Marumo, and S. Akimoto (1974) Crystl structures of spinel polymorphs of Fe2SiO4 and Ni2SiO4. Amer. Mineral. 59, 486‐490.
Zachariasen, W.H. (1971) Refined crystal structure of phenacite, Be2SiO4. Kristallographiya 16, 1161‐1166.
Zemann, J., El. Zobetz, G. Hager, and H. Vollenkle (1979) Strukturbestimmung eines OH‐reichen Topases. Oesterreichische Akademie der Vissenschaften 6, 145‐147.
Zigan, F. and R. Rothbauer (1967) Neutronenbeugungsmessungen am Brucit. Neues Jahrbuch fur Mineralogie Monashefte, 137‐143.
Zoltai, T. and J.H. Stout (1984) Mineralogy: Concepts and Principles, Burgess, Minneapolis, 505p.