prediction of cation exchange capacity using
TRANSCRIPT
PREDICTION OF CATION EXCHANGE CAPACITY USING VISIBLE AND NEAR INFRARED SPECTROSCOPY Yücel Tekin, Yahya Ulusoy Vocational School of Technical Sciences.
Uludag University, Bursa, Turkey.
=H\QDO�7�PVDYDú Agricultural Faculty.
Uludag University, Bursa, Turkey.
Abdul M. Mouazen
Environmental Science and Technology Department. Cranfield University, United Kingdom.
ABSTRACT
Visible and near infrared (vis-NIR) spectroscopy holds large potential for the measurement of physico-chemical properties of different natural resources including soils. This study was conducted to investigate the potential of the vis-NIR spectroscopy for the measurement of cation exchange capacity (CEC) in laboratory and on-line field conditions. The diffuse reflectance spectra of 294 fresh soil samples collected from two fields (F1 and F2) in Turkey were measured using a fibre-type vis-NIR spectrophotometer. Partial least squares (PLS) regression analyses with full cross-validation were performed to establish prediction models for CEC. Laboratory measured, laboratory vis-NIR predicted and on-line vis-NIR predicted maps using the prediction set of samples were produced and statistically compared with kappa value. Results showed that the laboratory prediction performance of CEC in the prediction set was successful for both fields, with average R2 values of 0.92 (F1) and 0.74 (F2), average root mean square error of prediction (RMSEP) of 1.89 % (F1) and 1.58 % (F2) and average residual prediction deviation (RPD) of 3.69 (F1) and 1.84 (F2). On-line field measurement was also successfully predicted with average R2 values of 0.75 (F1) and 0.73 (F2), average RMSEP of 4.79 % and 1.58 % (F2) and RPD of 1.45 (F1) and 1.36 (F2). The output of the Kappa statistics test comparing between laboratory measured CEC and laboratory vis-NIR predicted �ț� ������ CEC maps for F1 indicated substantial agreement whereas moderate agreement for F2 was observed. This study proves that soil CEC can be successfully measured with vis-NIR spectroscopy under laboratory and on-line scanning. Keywords: on-line soil sensor, vis-NIR spectroscopy, cation exchange capacity, soil mapping
2
INTRODUCTION
Proximal soil sensing is one of the promising techniques to help soil management with decision support tools. Visible and near infrared (vis-NIR) spectroscopy is the most rapid measurement techniques to supply accurate and meaningful data to this decision support tools. It has become most attractive technique for acquiring proximaly sensed soil data, as some recent studies by Mouazen et al., (2007), Viscarra-Rossel and Chen (2011), Tekin et al., (2013), and Kodaira & Shibusawa (2013) proved it to provide accurate quantification of main physical and chemical soil properties that is useful for digital soil mapping and for precision agriculture applications.
The range of soil nutrients and their availability to plants are basic components determining soil fertility. Cation exchange capacity (CEC), one of the important physico-chemical properties, colloidal fraction (amount and type of clay and organic matter) of soil and is associated with a range of plant nutrients. CEC is a measure of the soil ability to hold positively charged ions and is an important indicator of soil fertility. It is an important property for site specific management of soil nutrients in precision agriculture. Generally, CEC values increase with the increase in the content of the colloidal fraction of the soil. The conventional analytical methods used for the determination of CEC are expensive, difficult and time consuming, because different cations must be extracted and determined. Therefore, researchers attempted to find alternative solutions that are fast, cost effective and easy. One of the main methods explored was vis-NIR spectroscopy. This is due to the fact that vis-NIR spectra of soils contain large sets of spectral information, which can be extracted with suitable chemometrics. The complex relationship between spectral signatures and the soil property can be better modeled by, multivariate regression methods, which have an advantage over simple bivariate relationships based on, for example, peak intensity measurements (Soriano-Disla et al., 2014). Partial least squares (PLS) regression is the most common technique adopted today to model the relationships between infrared spectral intensities characteristics of the soil components and the soil properties through derived PLS loadings, scores, and regression coefficients (Janik et al., 2014).So far, vis-NIR spectroscopy has shown different degree of success for the measurement of CEC, depending on the measurement type e.g. under laboratory or on-line field conditions (Savvides et al., 2010; Bilgili et al., 2010; Leone et al., 2012; Cañasveras et al., 2012; Marin-Gonzalez et al., 2013). No reports on on-line measurement of CEC in arid and semi-arid environment can be found in the literature.
The aim of this study is to explore the potential of a vis-NIR on-line sensor to measure CEC and to develop CEC map using individual field and mixed field data sets in two fields in Turkey with semiarid environment.
MATERIALS AND METHODS
On-line soil sensor
The on-line sensor consisted of a subsoiler, to the back of which an optical probe is attached (Mouazen, 2006). The subsoiler (acting as a soil cutting tool)
3
and the optical probe are set on a simple metal frame (Mouazen et al., 2005). A metal frame of the on-line sensor has been manufactured in Uludag University using the same design patented by Mouazen (2006). The on-line soil sensor was mounted on the three-point linkage of a tractor to collect soil spectra under mobile conditions. To measure soil spectra, AgroSpec mobile, fiber type, vis–NIR spectrophotometer (Tec5 Technology for Spectroscopy, Germany) was used. A differential global positioning system (DGPS) (EZ-Guide 250, Trimble, USA) was used to record the position of the o-line measured spectra with sub-meter accuracy. The AgroSpec software, a platform for the mobile spectrometer system was used to acquire spectral and GPS data.
Experimental site and on-line measurement
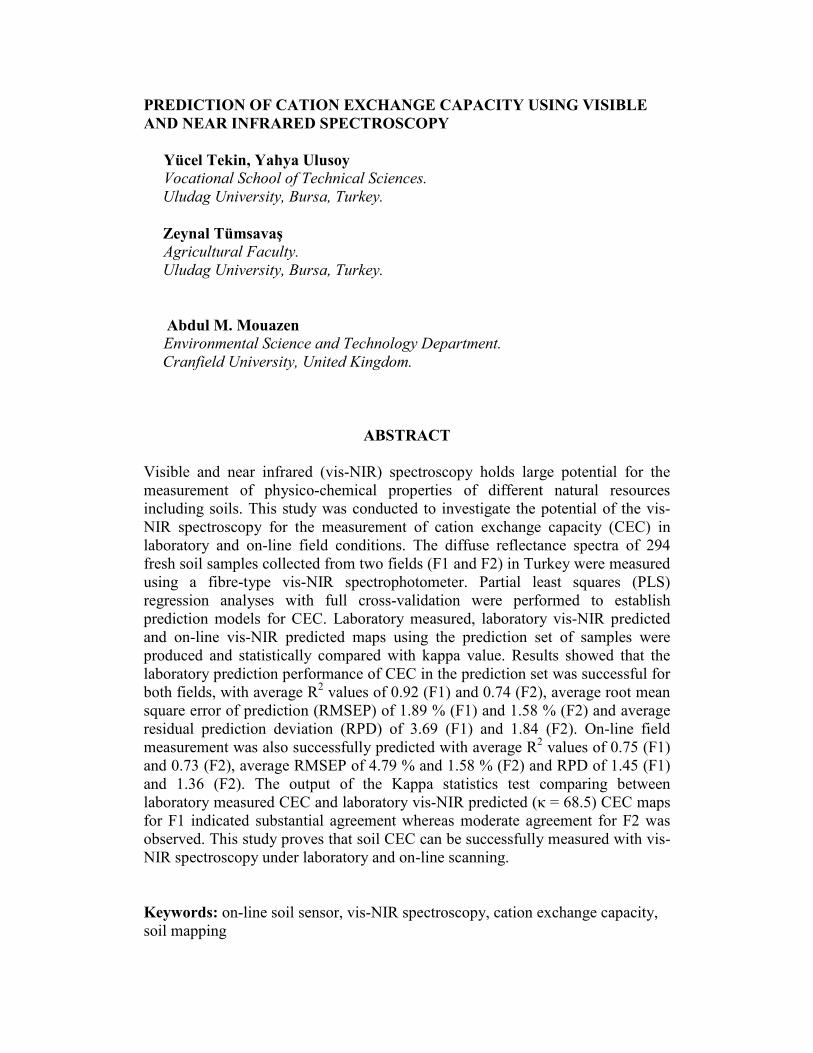
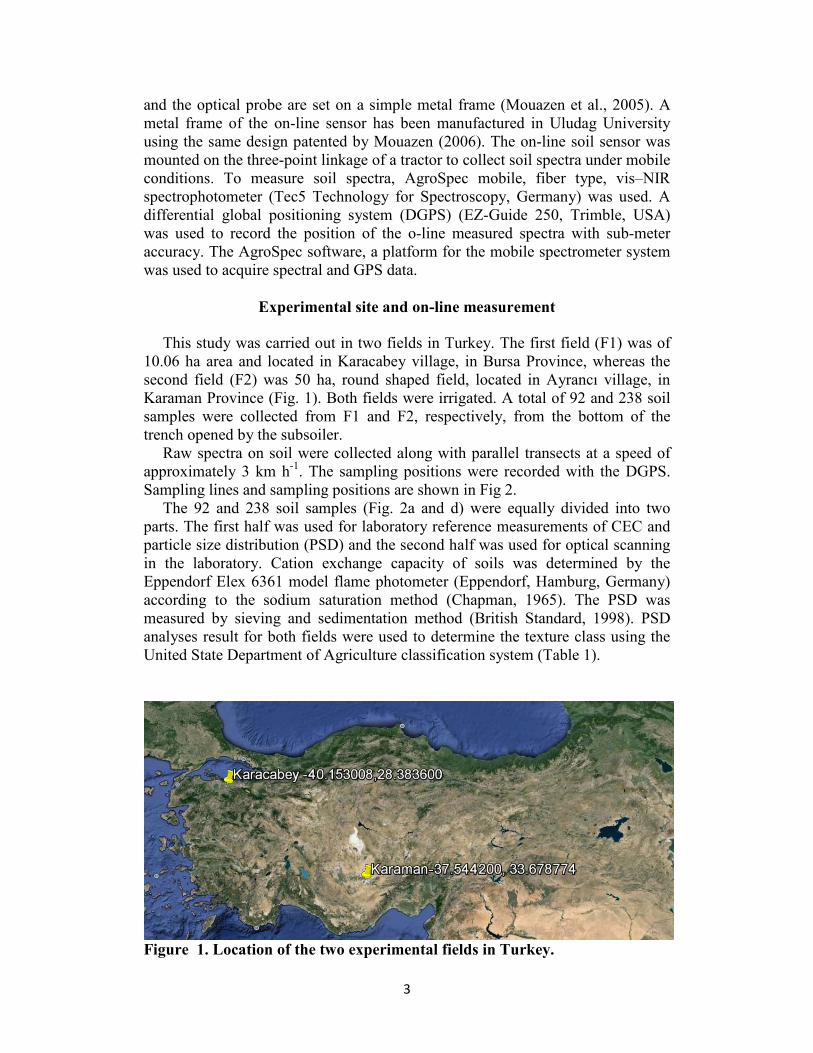
This study was carried out in two fields in Turkey. The first field (F1) was of 10.06 ha area and located in Karacabey village, in Bursa Province, whereas the second field (F2) was 50 ha, round shaped field, located in $\UDQF� YLOODJH�� LQ�Karaman Province (Fig. 1). Both fields were irrigated. A total of 92 and 238 soil samples were collected from F1 and F2, respectively, from the bottom of the trench opened by the subsoiler.
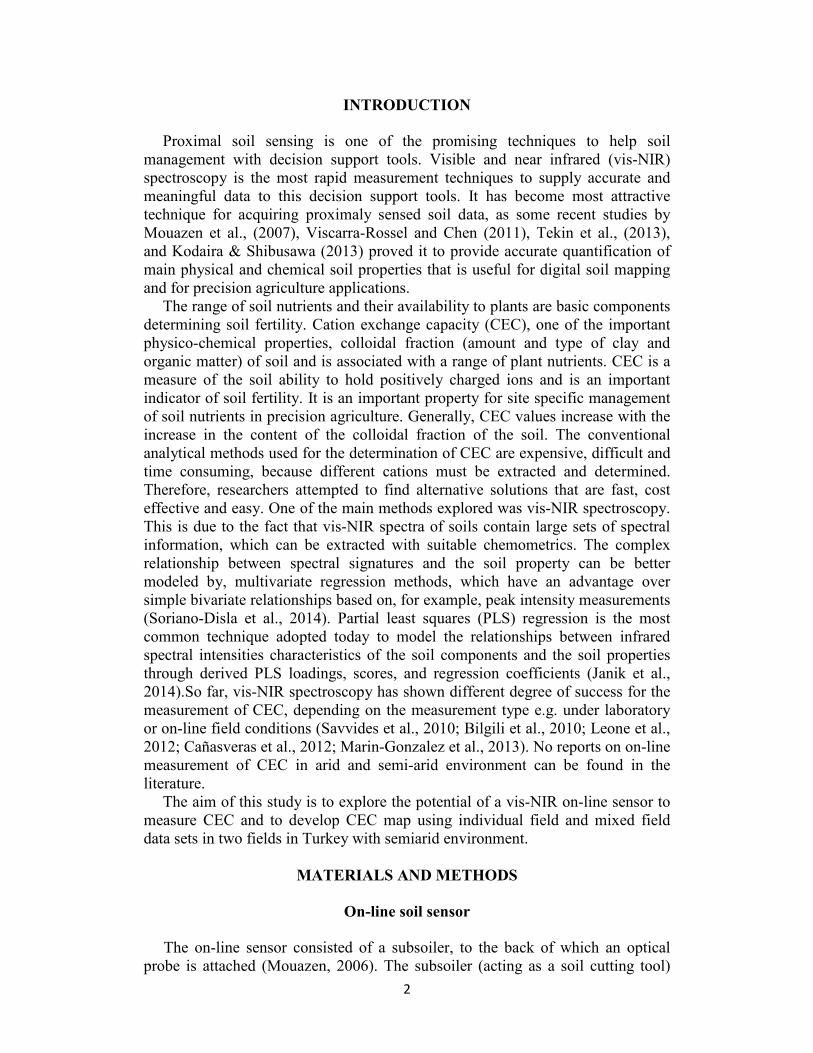
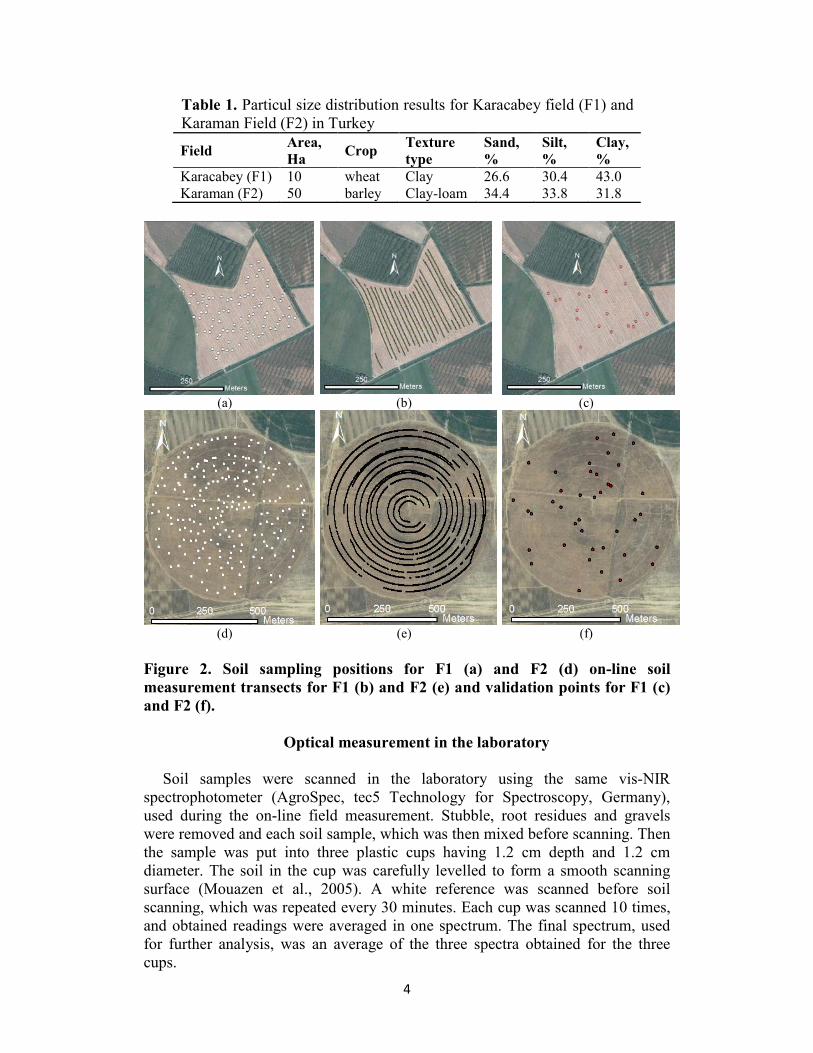
Raw spectra on soil were collected along with parallel transects at a speed of approximately 3 km h-1. The sampling positions were recorded with the DGPS. Sampling lines and sampling positions are shown in Fig 2.
The 92 and 238 soil samples (Fig. 2a and d) were equally divided into two parts. The first half was used for laboratory reference measurements of CEC and particle size distribution (PSD) and the second half was used for optical scanning in the laboratory. Cation exchange capacity of soils was determined by the Eppendorf Elex 6361 model flame photometer (Eppendorf, Hamburg, Germany) according to the sodium saturation method (Chapman, 1965). The PSD was measured by sieving and sedimentation method (British Standard, 1998). PSD analyses result for both fields were used to determine the texture class using the United State Department of Agriculture classification system (Table 1).
Figure 1. Location of the two experimental fields in Turkey.
4
Table 1. Particul size distribution results for Karacabey field (F1) and Karaman Field (F2) in Turkey
Field Area, Ha Crop Texture
type Sand, %
Silt, %
Clay, %
Karacabey (F1) 10 wheat Clay 26.6 30.4 43.0 Karaman (F2) 50 barley Clay-loam 34.4 33.8 31.8
(a) (b) (c)
(d) (e) (f)
Figure 2. Soil sampling positions for F1 (a) and F2 (d) on-line soil measurement transects for F1 (b) and F2 (e) and validation points for F1 (c) and F2 (f).
Optical measurement in the laboratory
Soil samples were scanned in the laboratory using the same vis-NIR
spectrophotometer (AgroSpec, tec5 Technology for Spectroscopy, Germany), used during the on-line field measurement. Stubble, root residues and gravels were removed and each soil sample, which was then mixed before scanning. Then the sample was put into three plastic cups having 1.2 cm depth and 1.2 cm diameter. The soil in the cup was carefully levelled to form a smooth scanning surface (Mouazen et al., 2005). A white reference was scanned before soil scanning, which was repeated every 30 minutes. Each cup was scanned 10 times, and obtained readings were averaged in one spectrum. The final spectrum, used for further analysis, was an average of the three spectra obtained for the three cups.
5
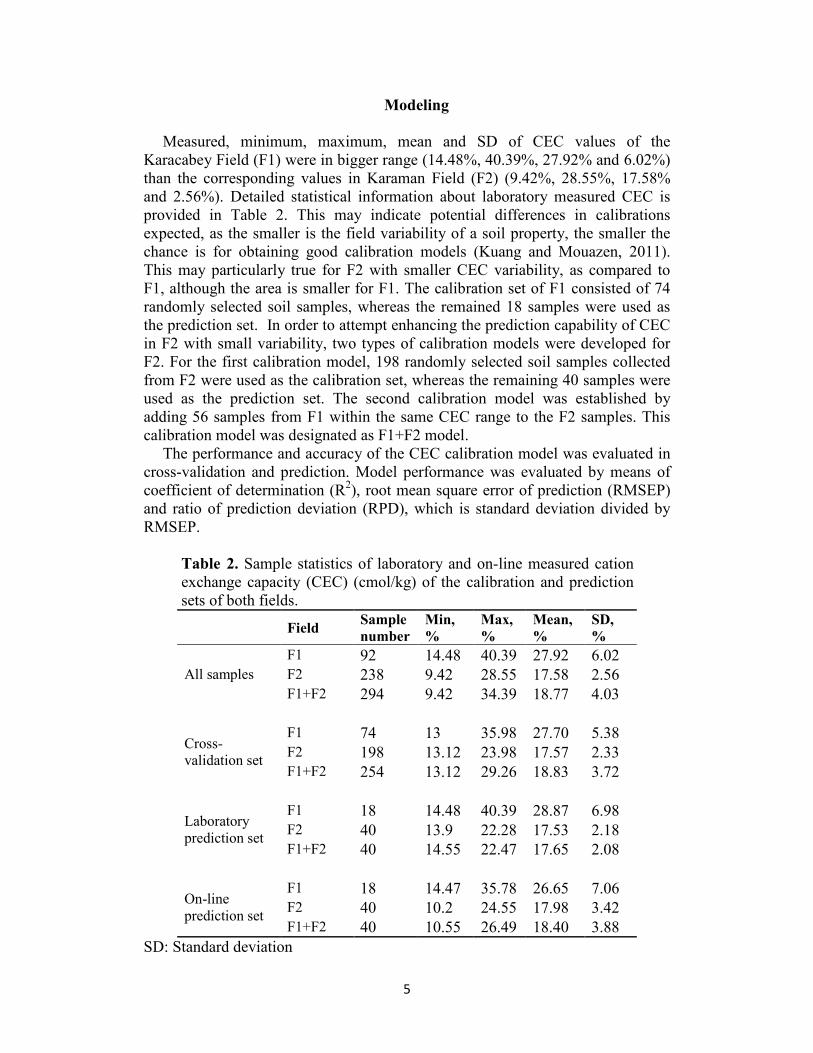
Modeling Measured, minimum, maximum, mean and SD of CEC values of the
Karacabey Field (F1) were in bigger range (14.48%, 40.39%, 27.92% and 6.02%) than the corresponding values in Karaman Field (F2) (9.42%, 28.55%, 17.58% and 2.56%). Detailed statistical information about laboratory measured CEC is provided in Table 2. This may indicate potential differences in calibrations expected, as the smaller is the field variability of a soil property, the smaller the chance is for obtaining good calibration models (Kuang and Mouazen, 2011). This may particularly true for F2 with smaller CEC variability, as compared to F1, although the area is smaller for F1. The calibration set of F1 consisted of 74 randomly selected soil samples, whereas the remained 18 samples were used as the prediction set. In order to attempt enhancing the prediction capability of CEC in F2 with small variability, two types of calibration models were developed for F2. For the first calibration model, 198 randomly selected soil samples collected from F2 were used as the calibration set, whereas the remaining 40 samples were used as the prediction set. The second calibration model was established by adding 56 samples from F1 within the same CEC range to the F2 samples. This calibration model was designated as F1+F2 model.
The performance and accuracy of the CEC calibration model was evaluated in cross-validation and prediction. Model performance was evaluated by means of coefficient of determination (R2), root mean square error of prediction (RMSEP) and ratio of prediction deviation (RPD), which is standard deviation divided by RMSEP.
Table 2. Sample statistics of laboratory and on-line measured cation exchange capacity (CEC) (cmol/kg) of the calibration and prediction sets of both fields.
Field Sample number
Min, %
Max, %
Mean, %
SD, %
All samples F1 92 14.48 40.39 27.92 6.02 F2 238 9.42 28.55 17.58 2.56 F1+F2 294 9.42 34.39 18.77 4.03
Cross-validation set
F1 74 13 35.98 27.70 5.38 F2 198 13.12 23.98 17.57 2.33 F1+F2 254 13.12 29.26 18.83 3.72
Laboratory prediction set
F1 18 14.48 40.39 28.87 6.98 F2 40 13.9 22.28 17.53 2.18 F1+F2 40 14.55 22.47 17.65 2.08
On-line prediction set
F1 18 14.47 35.78 26.65 7.06 F2 40 10.2 24.55 17.98 3.42 F1+F2 40 10.55 26.49 18.40 3.88
SD: Standard deviation
6
Development of CEC maps Three categories of CEC maps were developed for both field; (1) Laboratory
reference analyses maps (based on laboratory measured of the prediction samples), (2) laboratory and on-line predicted maps based on validation points and (3) full-data points maps based on all on-line vis-NIR predicted points. Inverse distance weighing (IDW) interpolation method was used to develop the laboratory measured, laboratory predicted and on-line predicted maps of category 1 and 2. The full-point maps (category 3) were developed with kriging. All maps were developed using ArcGis 10 (ESRI, USA) software. The advanced parameters option allowed control of the semivariogram used for kriging. To observe visual relationship between different maps, ArcGIS Geostatistical Analyst General Quantile-quantile (Q-Q) tools were used. To compare statistical relationship of pairs of maps Kappa statistics (Cohen, 1960) were performed to calculate Kappa value (ț�� using SPSS (Statistical Package for the Social Sciences, IBM, USA). The Kappa statistics was carried for the following pairs of maps: 1- Laboratory measured versus laboratory vis-NIR predicted CEC of the independent samples, 2- Laboratory measured versus on-line vis-NIR predicted CEC of the independent samples, 3- Full-point vis-NIR predicted versus laboratory measured CEC of the independent samples.
RESULTS AND DISCUSSION
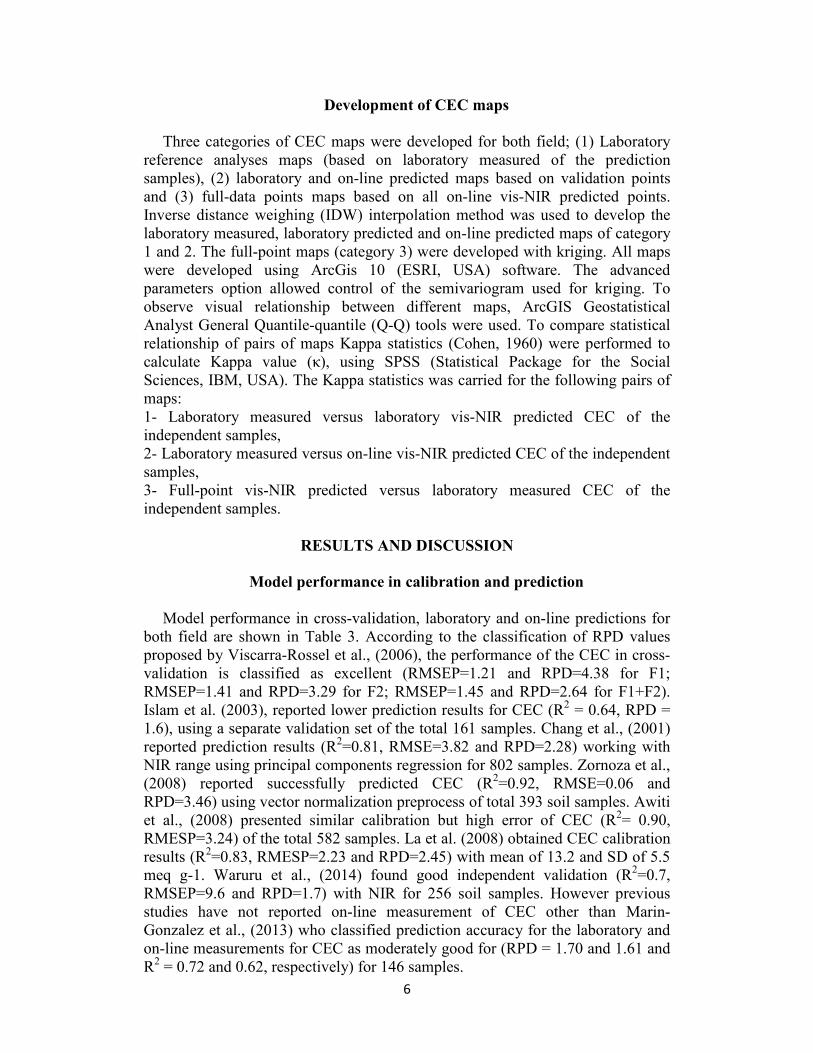
Model performance in calibration and prediction Model performance in cross-validation, laboratory and on-line predictions for
both field are shown in Table 3. According to the classification of RPD values proposed by Viscarra-Rossel et al., (2006), the performance of the CEC in cross-validation is classified as excellent (RMSEP=1.21 and RPD=4.38 for F1; RMSEP=1.41 and RPD=3.29 for F2; RMSEP=1.45 and RPD=2.64 for F1+F2). Islam et al. (2003), reported lower prediction results for CEC (R2 = 0.64, RPD = 1.6), using a separate validation set of the total 161 samples. Chang et al., (2001) reported prediction results (R2=0.81, RMSE=3.82 and RPD=2.28) working with NIR range using principal components regression for 802 samples. Zornoza et al., (2008) reported successfully predicted CEC (R2=0.92, RMSE=0.06 and RPD=3.46) using vector normalization preprocess of total 393 soil samples. Awiti et al., (2008) presented similar calibration but high error of CEC (R2= 0.90, RMESP=3.24) of the total 582 samples. La et al. (2008) obtained CEC calibration results (R2=0.83, RMESP=2.23 and RPD=2.45) with mean of 13.2 and SD of 5.5 meq g-1. Waruru et al., (2014) found good independent validation (R2=0.7, RMSEP=9.6 and RPD=1.7) with NIR for 256 soil samples. However previous studies have not reported on-line measurement of CEC other than Marin-Gonzalez et al., (2013) who classified prediction accuracy for the laboratory and on-line measurements for CEC as moderately good for (RPD = 1.70 and 1.61 and R2 = 0.72 and 0.62, respectively) for 146 samples.
7
Table 3. Summary of cation exchange capacity (CEC) model performance in cross-validation, laboratory and on-line predictions.
Field R2 RMSEP, % RPD intercept Slope
Cross-validation Set
F1 0.82 1.21 4.38 0.58 0.98 F2 0.58 1.41 3.29 0.85 0.95 F1+F2 0.83 1.45 2.64 2.99 0.83
Laboratory prediction
F1 0.92 1.89 3.69 1.41 0.95 F2 0.72 1.54 1.89 6.23 0.63 F1+F2 0.74 1.58 1.84 6.95 0.60
On-line prediction
F1 0.75 4.79 1.45 2.56 0.79 F2 0.70 1.86 1.56 0.55 0.98 F1+F2 0.73 2.13 1.36 1.8 1.14
RMSEP: Root mean square error of prediction RPD: Residual prediction deviation The performance of the vis-NIR models for the prediction of CEC of the
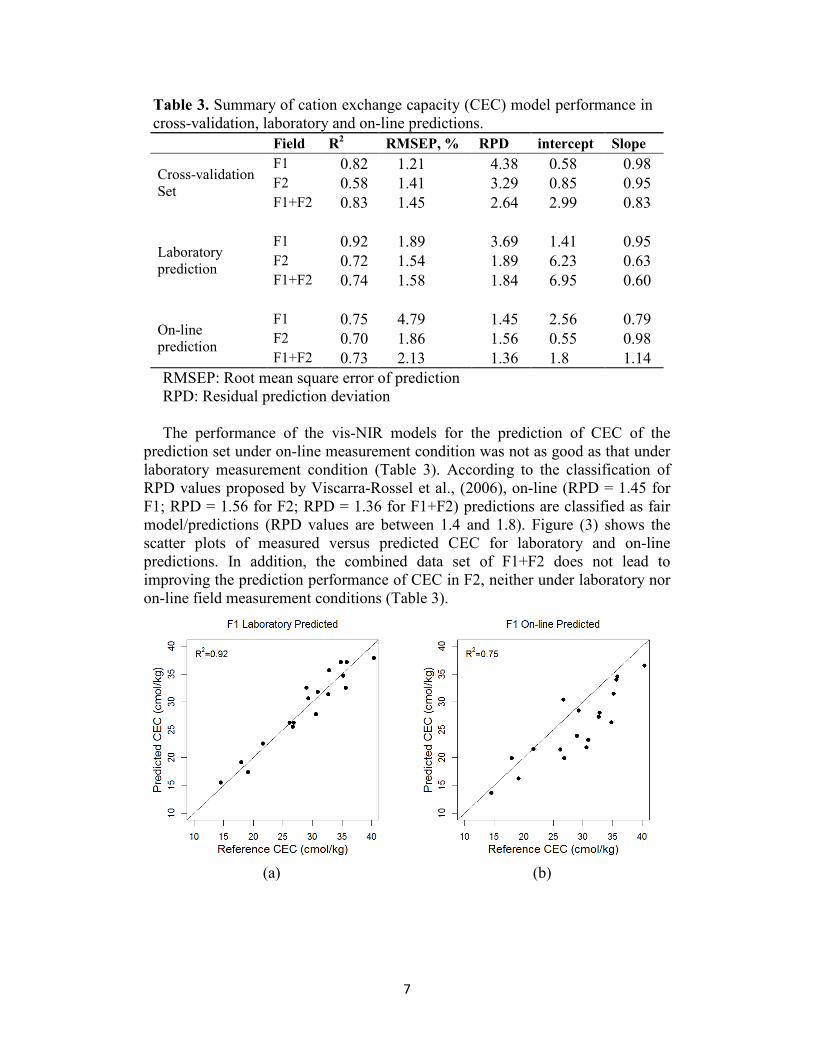
prediction set under on-line measurement condition was not as good as that under laboratory measurement condition (Table 3). According to the classification of RPD values proposed by Viscarra-Rossel et al., (2006), on-line (RPD = 1.45 for F1; RPD = 1.56 for F2; RPD = 1.36 for F1+F2) predictions are classified as fair model/predictions (RPD values are between 1.4 and 1.8). Figure (3) shows the scatter plots of measured versus predicted CEC for laboratory and on-line predictions. In addition, the combined data set of F1+F2 does not lead to improving the prediction performance of CEC in F2, neither under laboratory nor on-line field measurement conditions (Table 3).
(a) (b)
8
(c) (d)
(e) (f)
Figure 3. Scatter plot of predicted versus laboratory measured cation exchange capacity (CEC) of the prediction set for laboratory scanned (18 samples) (a) and on-line scanned soil spectra (b) of F1; laboratory scanned (40 samples) (c) and on-line scanned soil spectra (d) of F2; laboratory scanned (40 samples) (e) and on-line scanned soil spectra (f) of F1+F2 models
Mapping
Comparison maps of laboratory and vis-NIR maps of CEC Comparison between laboratory measured, laboratory vis-NIR predicted and
on-line vis-NIR predicted maps using the prediction set of 18 samples of F1 shows reasonable spatial similarity, with high and low concentration zones of CEC are distinguishable clearly (Fig.4).
9
(a) (b) (c)
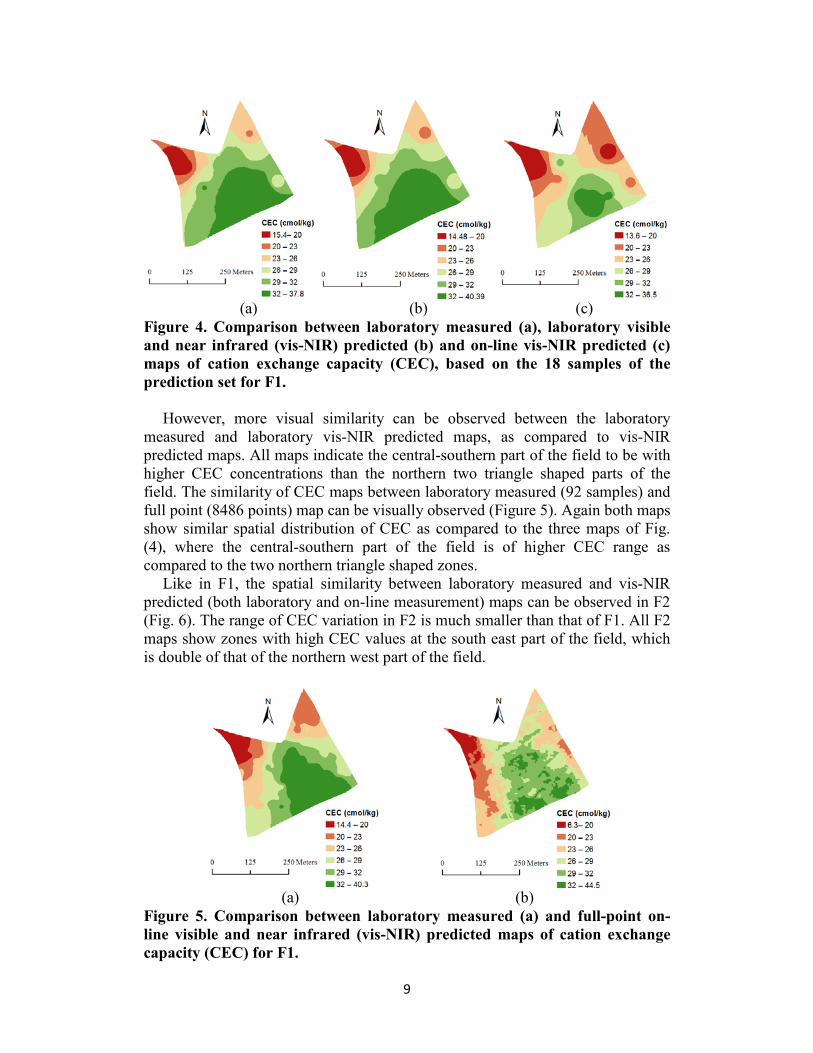
Figure 4. Comparison between laboratory measured (a), laboratory visible and near infrared (vis-NIR) predicted (b) and on-line vis-NIR predicted (c) maps of cation exchange capacity (CEC), based on the 18 samples of the prediction set for F1.
However, more visual similarity can be observed between the laboratory
measured and laboratory vis-NIR predicted maps, as compared to vis-NIR predicted maps. All maps indicate the central-southern part of the field to be with higher CEC concentrations than the northern two triangle shaped parts of the field. The similarity of CEC maps between laboratory measured (92 samples) and full point (8486 points) map can be visually observed (Figure 5). Again both maps show similar spatial distribution of CEC as compared to the three maps of Fig. (4), where the central-southern part of the field is of higher CEC range as compared to the two northern triangle shaped zones.
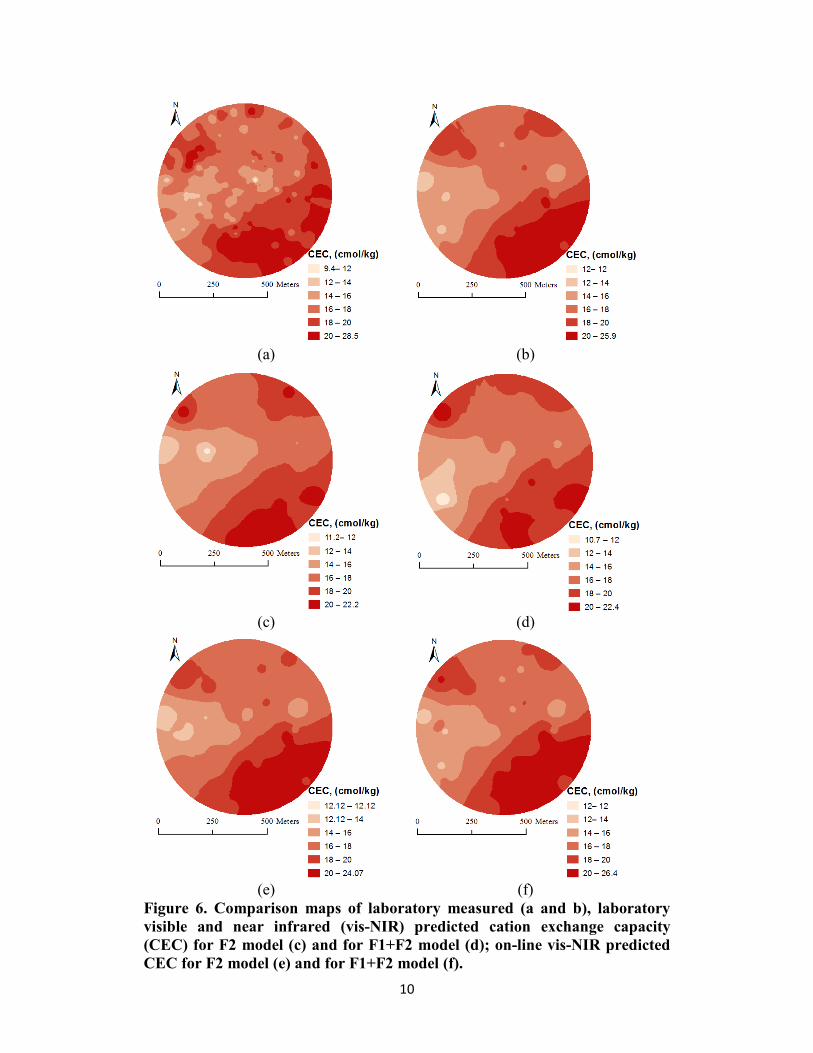
Like in F1, the spatial similarity between laboratory measured and vis-NIR predicted (both laboratory and on-line measurement) maps can be observed in F2 (Fig. 6). The range of CEC variation in F2 is much smaller than that of F1. All F2 maps show zones with high CEC values at the south east part of the field, which is double of that of the northern west part of the field.
(a) (b)
Figure 5. Comparison between laboratory measured (a) and full-point on-line visible and near infrared (vis-NIR) predicted maps of cation exchange capacity (CEC) for F1.
10
(a) (b)
(c) (d)
(e) (f)
Figure 6. Comparison maps of laboratory measured (a and b), laboratory visible and near infrared (vis-NIR) predicted cation exchange capacity (CEC) for F2 model (c) and for F1+F2 model (d); on-line vis-NIR predicted CEC for F2 model (e) and for F1+F2 model (f).
11
(a) (b)
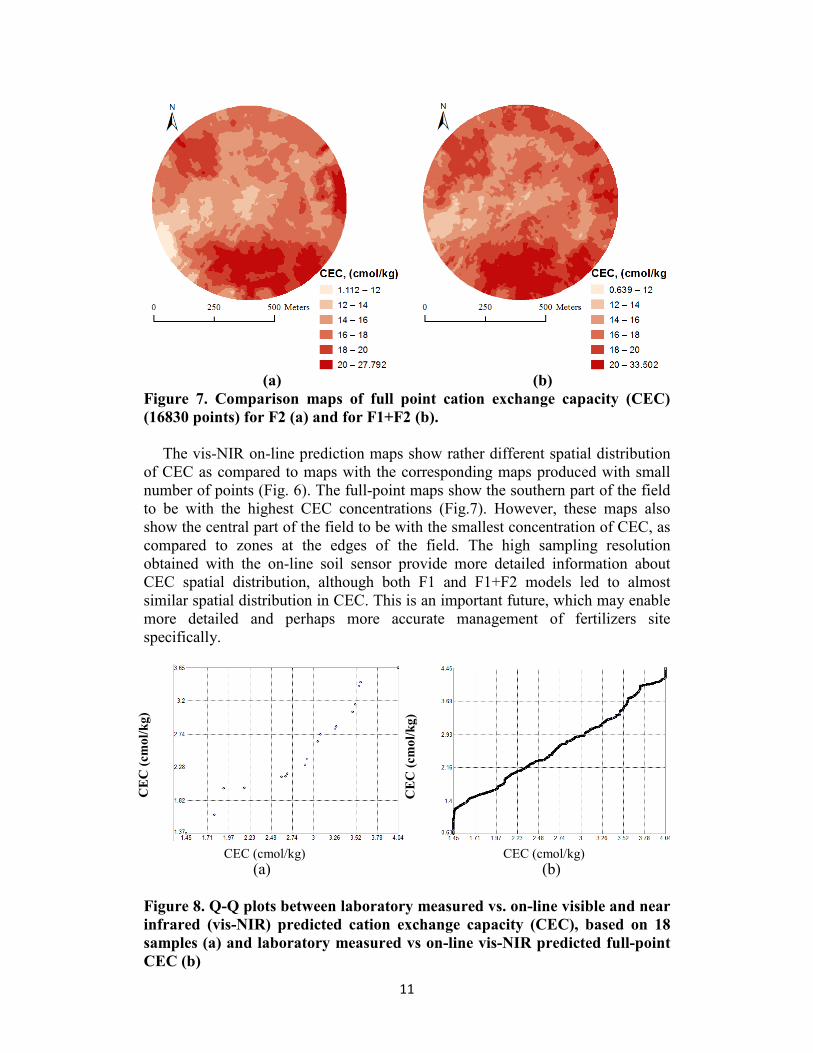
Figure 7. Comparison maps of full point cation exchange capacity (CEC) (16830 points) for F2 (a) and for F1+F2 (b).
The vis-NIR on-line prediction maps show rather different spatial distribution of CEC as compared to maps with the corresponding maps produced with small number of points (Fig. 6). The full-point maps show the southern part of the field to be with the highest CEC concentrations (Fig.7). However, these maps also show the central part of the field to be with the smallest concentration of CEC, as compared to zones at the edges of the field. The high sampling resolution obtained with the on-line soil sensor provide more detailed information about CEC spatial distribution, although both F1 and F1+F2 models led to almost similar spatial distribution in CEC. This is an important future, which may enable more detailed and perhaps more accurate management of fertilizers site specifically.
(a) (b) Figure 8. Q-Q plots between laboratory measured vs. on-line visible and near infrared (vis-NIR) predicted cation exchange capacity (CEC), based on 18 samples (a) and laboratory measured vs on-line vis-NIR predicted full-point CEC (b)
CE
C (c
mol
/kg)
CEC (cmol/kg)
CE
C (c
mol
/kg)
CEC (cmol/kg)
12
General Q-Q plot was used to assess the visual similarity of the distributions of datasets of F1 (Fig. 8). Q-Q plots compare the quintiles of data distribution with the quintiles of standardized theoretical distribution from a specified family of distributions (ArcGis, 2014). Q-Q plots for laboratory measured reference CEC vs laboratory vis-NIR predicted CEC (Fig. 8a) based on 18 samples of the prediction set shows normal distribution of the datasets, indicating high similarity between the two maps. Similarly, Q-Q plot, comparison between laboratory measured (all 92 samples) CEC with on-line predicted full-point (6486 points) CEC maps show reasonable spatial similarity (Fig. 8b), due to the normal distribution exhibited.
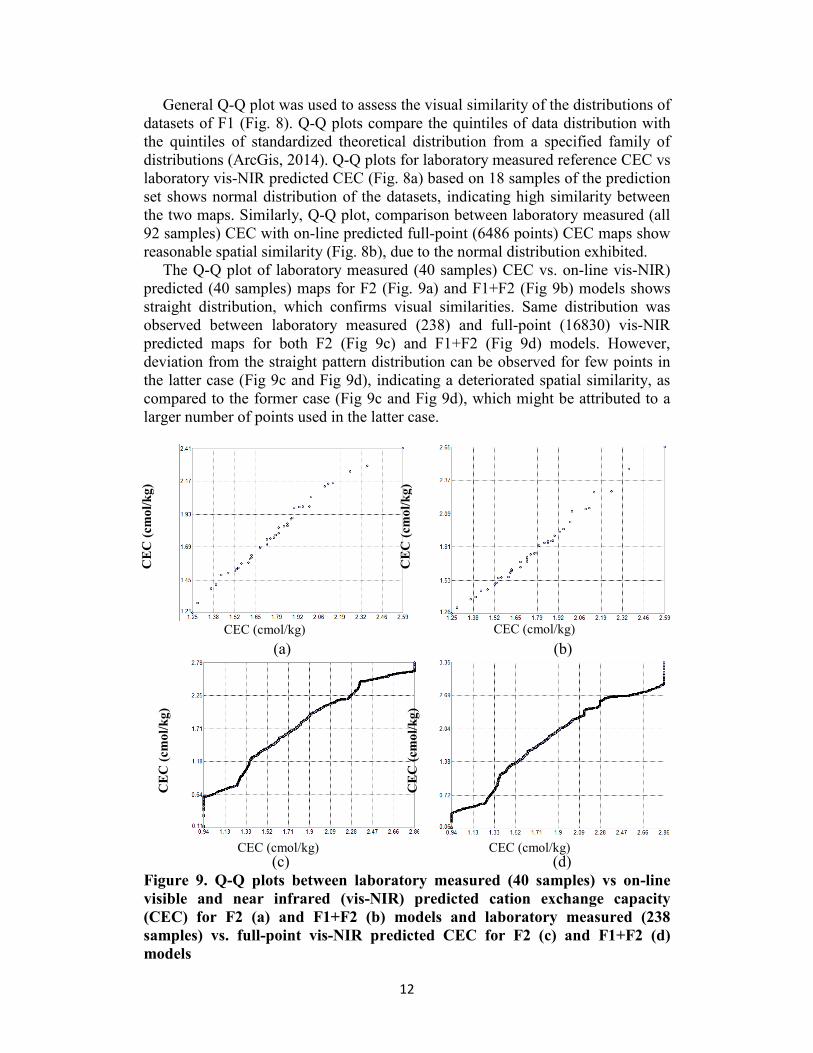
The Q-Q plot of laboratory measured (40 samples) CEC vs. on-line vis-NIR) predicted (40 samples) maps for F2 (Fig. 9a) and F1+F2 (Fig 9b) models shows straight distribution, which confirms visual similarities. Same distribution was observed between laboratory measured (238) and full-point (16830) vis-NIR predicted maps for both F2 (Fig 9c) and F1+F2 (Fig 9d) models. However, deviation from the straight pattern distribution can be observed for few points in the latter case (Fig 9c and Fig 9d), indicating a deteriorated spatial similarity, as compared to the former case (Fig 9c and Fig 9d), which might be attributed to a larger number of points used in the latter case.
(a) (b)
(c) (d) Figure 9. Q-Q plots between laboratory measured (40 samples) vs on-line visible and near infrared (vis-NIR) predicted cation exchange capacity (CEC) for F2 (a) and F1+F2 (b) models and laboratory measured (238 samples) vs. full-point vis-NIR predicted CEC for F2 (c) and F1+F2 (d) models
CEC (cmol/kg)
CEC (cmol/kg)
CE
C (c
mol
/kg)
CE
C (c
mol
/kg)
CE
C (c
mol
/kg)
CE
C (c
mol
/kg)
CEC (cmol/kg)
CEC (cmol/kg)
13
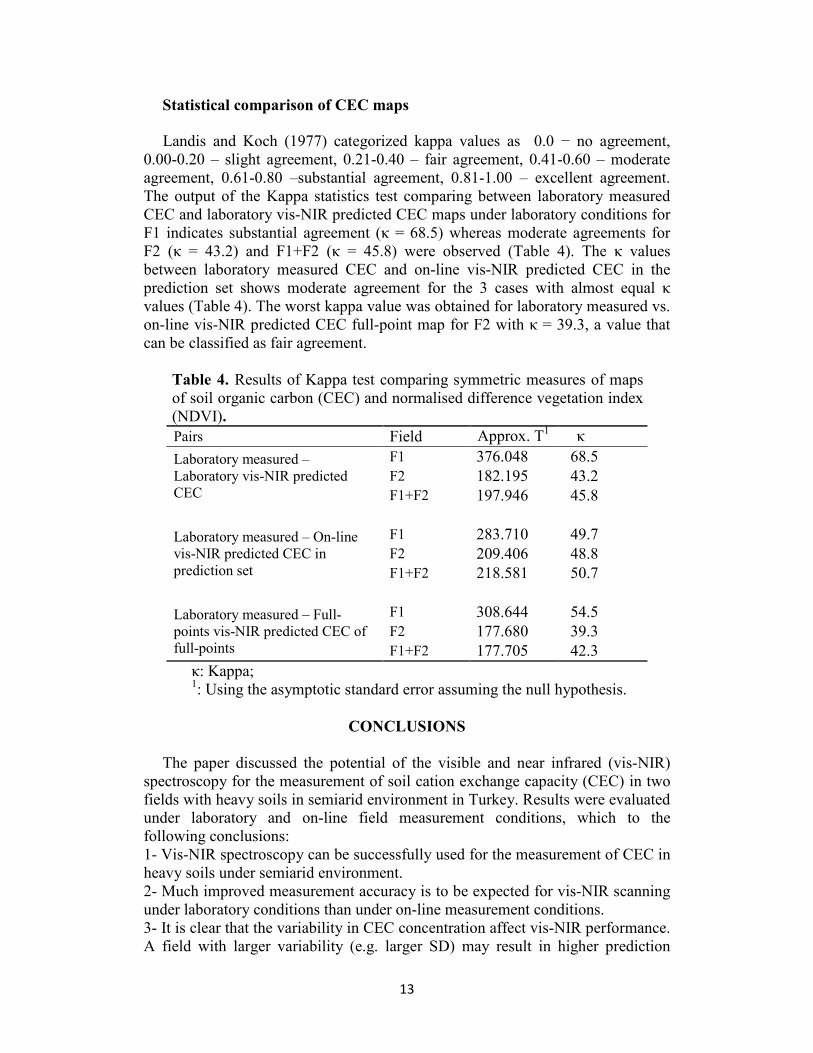
Statistical comparison of CEC maps
Landis and Koch (1977) categorized kappa values as ���� í� QR� DJUHHPHQW��0.00-0.20 – slight agreement, 0.21-0.40 – fair agreement, 0.41-0.60 – moderate agreement, 0.61-0.80 –substantial agreement, 0.81-1.00 – excellent agreement. The output of the Kappa statistics test comparing between laboratory measured CEC and laboratory vis-NIR predicted CEC maps under laboratory conditions for F1 indicates substantial agreement (ț = 68.5) whereas moderate agreements for F2 (ț = 43.2) and F1+F2 (ț = 45.8) were observed (Table 4). The ț� values between laboratory measured CEC and on-line vis-NIR predicted CEC in the prediction set shows moderate agreement for the 3 cases with almost equal ț values (Table 4). The worst kappa value was obtained for laboratory measured vs. on-line vis-NIR predicted CEC full-point map for F2 with ț = 39.3, a value that can be classified as fair agreement.
Table 4. Results of Kappa test comparing symmetric measures of maps of soil organic carbon (CEC) and normalised difference vegetation index (NDVI). Pairs Field Approx. T1 ț Laboratory measured – Laboratory vis-NIR predicted CEC
F1 376.048 68.5 F2 182.195 43.2 F1+F2 197.946 45.8
Laboratory measured – On-line vis-NIR predicted CEC in prediction set
F1 283.710 49.7 F2 209.406 48.8 F1+F2 218.581 50.7
Laboratory measured – Full-points vis-NIR predicted CEC of full-points
F1 308.644 54.5 F2 177.680 39.3 F1+F2 177.705 42.3
ț��.DSSD�� 1: Using the asymptotic standard error assuming the null hypothesis.
CONCLUSIONS
The paper discussed the potential of the visible and near infrared (vis-NIR)
spectroscopy for the measurement of soil cation exchange capacity (CEC) in two fields with heavy soils in semiarid environment in Turkey. Results were evaluated under laboratory and on-line field measurement conditions, which to the following conclusions: 1- Vis-NIR spectroscopy can be successfully used for the measurement of CEC in heavy soils under semiarid environment. 2- Much improved measurement accuracy is to be expected for vis-NIR scanning under laboratory conditions than under on-line measurement conditions. 3- It is clear that the variability in CEC concentration affect vis-NIR performance. A field with larger variability (e.g. larger SD) may result in higher prediction
14
accuracy that a field with a smaller variability even if the area of the less variable field is 5 times larger than that with larger variability. 4- Vis-NIR predicted maps of CEC were similar to the corresponding measured maps. However, more detailed maps that showed different spatial distribution were observed for the full-point map, as compared to maps developed with a limited number of points. A further work is being undertaken to establish links between the crop characteristics and yield with CEC measured with the on-line vis-NIR spectroscopy sensor.
REFERENCES ArcGis help. Available online: http://resources.arcgis.com/en/help/ (accessed on
03 March 2014). Awiti, A.O., Walsh, M.G., Shepherd, K.D., Kinyamario, J., 2008. Soil condition
classification using infrared spectroscopy: a proposition for assessment of soil condition along a tropical forest-cropland chronosequence. Geoderma 143: 73–84.
Bilgili, A. V., Van Es, H. M., Akbas. F., Durak, A. and Hively, W. D. 2010. Visible-Near infrared reflectance spectroscopy for assessment of soil properties in a semiarid area of turkey. J. of Arid Environments. 74:229–238.
British Standard – Soil quality – Part 5: Physical methods – Section 5.4 Determination of particle size distribution in mineral soil material – Method by sieving and sedimentation. 1998.
Cañasveras Sánchez, J. C., Barrón, V., del Campillo, M. C., Viscarra-Rossel R. A. 2012. Reflectance spectroscopy: a tool for predicting soil properties related to the incidence of Fe chlorosis. Span. J. Agric. Res.10: 1133-1142
Chang, C., Laird, D.A., Mausbach, M.J., Hurburgh Jr., C.R. 2001. Near-Infrared Reflectance Spectroscopy-Principal Components Regression Analyses of soil properties. Soil Sci. Soc. Am. J. 65: 480–490.
Chapman, H. D. 1965. Cation-exchange capacity. In Black, C.A. (ed.). Methods of Soil Analysis. Part 2. Academic Press, New York, pp. 891-901.
Janik, L.J., Forrester, S.T., Rawson, A. 2009. The prediction of soil chemical and physical properties from mid-infrared spectroscopy and combined partial least-squares regression and neural networks (PLS-NN) analysis. Chemometr. Intell. Lab. 97: 179–188.
Kodaira, M. and Shibusawa, S. 2013. Using a mobile real-time soil visible-near infrared sensor for high resolution soil property mapping. Geoderma. 199, Special Issue (SI), 64–79.
Kuang, B., Mouazen, A.M. 2011. Calibration of visible and near infrared spectroscopy for soil analysis at the field scale on three European farms. Eur. J. Soil Sci. 62: 629–636.
La, W.J., Sudduth, K.A., Chung, S.O., Kim, H.J. 2008. Preprocessing and calibration of optical diffuse reflectance signal for estimation of soil physical and chemical properties in the central USA. Biosyst. Eng. 33: 430–437.
Landis, J.R.; Koch, G.G. 1977, The measurement of observer agreement for categorical data. Biometrics 33: 159–174.
15
Leone, A.P., Viscarra-Rossel, R.A., Amenta, P., Buondonno, A. 2012. Prediction of soil properties with PLSR and vis-NIR spectroscopy: Application to Mediterranean soils from Southern Italy. Curr. Anal. Chem. 8: 283-299.
Marin-Gonzalez, O., Kuang, B., Quraishi, M.Z., Munóz-García, M.Á. Mouazen, A.M. 2013. On-line measurement of soil properties without direct spectral response in near infrared spectral range. Soil Till. Res. 132: 21-29.
Mouazen, A.M., De Baerdemaeker, J., Ramon, H. 2005. Towards development of on-line soil moisture content sensor using a fibre-type NIR spectrophotometer. Soil Till. Res. 80: 171-183.
Mouazen, A.M. Soil Survey Device. International publication published under the patent cooperation treaty (PCT). World Intellectual Property Organization, International Bureau. International Publication Number: WO2006/015463, PCT/BE2005/000129, IPC: G01N21/00, G01N21/00. 2006.
Mouazen, A.M., Maleki, M.R., De Baerdemaeker, J., Ramon, H. 2007. On-line measurement of some selected soil properties using a VIS–NIR sensor. Soil Till. Res. 93: 13-27.
Savitzky, A. and Golay, M. J. E. 1964. Smoothing and differentiation of data by simplified least squares procedures. Anal. Chem. 36:1627- 1639.
Savvides, A., Corstanje, R., Baxter, S. J., Rawlins, B. G. and Lark, R. M. 2010. The relationship between diffuse spectral reflectance of the soil and its cation exchange capacity is scale-dependent. Geoderma. 154:353–358.
Soriano-Disla, J.M., Janik, L.J., Viscarra Rossel, R.A., MacDonald, L.M., McLaughlin, M.J. The Performance of visible, near-, and mid-infrared reflectance spectroscopy for prediction of soil physical, chemical, and biological properties. Appl. Spectrosc. Rev. 2014, 49: 139-186.
Tekin Y., Kuang, B., Mouazen A.M. 2013. Potential of on-line visible and near infrared spectroscopy for measurement of pH for deriving variable rate lime recommendations. Sensors. 13: 10177-10190.
Viscarra-Rossel, R.A., Walvoort, D.J.J., McBratney, A.B., Janik, L.J., Skjemstad, J.O. Visible, near infrared, mid infrared or combined diffuse reflectance spectroscopy for simultaneous assessment of various soil properties. Geoderma 2006, 131: 59-75.
Viscarra-Rossel, R.A. and Chen, C. 2011. Digitally mapping the information content of visible–near infrared spectra of surficial Australian soils. Remote Sens. Environ. 115: 1443–1455.
Vohland, M. and Emmerling, C. 2011. Determination of total soil organic C and hot water-extractable C from VIS-NIR soil reflectance with partial least squares regression and spectral feature selection techniques. Eur. J. Soil Sci. 62: 598–606.
Waruru, B.K., Shepherd, K.D., Ndegwa, G.M., Kamoni, P.T., Sila, A.M. 2014. Rapid estimation of soil engineering properties using diffuse reflectance near infrared spectroscopy. Biosyst. Eng. 121: 177-185.
Zornoza, R., Guerrero, C., Mataix-Solera, J., Scow, K.M., Arcenegui, V., Mataix-Beneyto, J. 2008. Near infrared spectroscopy for determination of various physical, chemical and biochemical properties in Mediterranean soils. Soil Biol. Biochem. 40: 1923–1930.