karnataka - indian minerals yearbook 2017
TRANSCRIPT

11-1
STATE REVIEWS
56th Edition
STATE REVIEWS (Karnataka)
(FINAL RELEASE)
GOVERNMENT OF INDIA
MINISTRY OF MINES INDIAN BUREAU OF MINES
Indira Bhavan, Civil Lines,
NAGPUR – 440 001
PHONE/FAX NO. (0712) 2565471 PBX : (0712) 2562649, 2560544, 2560648
E-MAIL : [email protected] Website: www.ibm.gov.in
March, 2018
Indian Minerals Yearbook 2017
(Part- I)

11-2
STATE REVIEWS
KARNATAKAMineral Resources
Karn ataka ha s the d ist inct ion of beingthe principal gold producing State in the country.The State is the sole producer of felsite and oneof the leading producer of iron ore, chromite,dolomite, dunite, kyanite and shale. Karnatakahosts the country's 79% vanadium ore, 72% ironore (magnetite), 65% corundum, 42% tungstenore, 36% asbestos, 27% limestone, 21% gold ore(primary), 20% granite (dimension stone), 20%manganese ore, 17% dunite, 13% kyanite, 10%PGM (metal) resources.
The importan t mineral -occurrence foundi n t h e S ta t e a re bauxi te i n Bela ga vi ,Chikkamagaluru, Uttara & Dakshina Kannada andUdupi districts; china clay in Bengaluru, Belagavi,Ballari, Bidar, Chikkamagaluru, Dharwad, Gadag,Hassa n , Haver i , Kolar, Ut tara & Daksh inaKannada, Shivamogga and Tumakuru districts;chromite in Chikkamagaluru, Hassan and Mysurudi st r ic ts; dolomite in Bagal kot , Belagavi ,Vijayapura, Chitradurga, Mysuru, Uttara Kannadaand Tumakuru districts; dunite/pyroxenite inChikkamagaluru, Hassan and Mysuru districts;felspar in Bengaluru, Belagavi, Chitradurga andHa ssa n d is t r i c ts ; f i r e cl ay i n Benga l u r u ,Ch i t r a durga, Dh a r wa d , Ha ssa n , Kol a r ,Shivamogga and Tumakuru districts; gold inCh i tr adurga, Dharwad, Gadag, Kalaburagi ,Hassan, Haveri, Kolar, Raichur and Tumakurudistricts; iron ore (hematite) in Bagalkot, Ballari,Vijayapura, Ch ikkamagaluru, Chi t r adurga,Dharwad, Gadag, Uttara Kannada, Shivamoggaand Tumakuru districts; iron ore (magnetite) inChikkamagaluru, Hassan, Uttara & DakshinaKannada and Shivamogga districts; kyanite inChikkamagaluru, Chitradurga, Coorg, Mandya,Mysuru, Shivamogga and Dakshina Kannadadistricts; limestone in Bagalkot, Belagavi, Ballari,Vi jaya pura , Ch ikka maga luru , Ch i t r a durga,Davangere, Gadag, Kalaburagi, Hassan, Mysuru,Ut ta ra & Daksh in a Kann ada, Sh ivamogga,Tumakuru and Udupi distr icts; magnesite inCoorg, Mandya and Mysuru districts; manganeseore in Belagavi , Bal lar i , Ch ikkamaga luru,
Ch i t r a dur ga , Da va n ger e , Ut ta r a Ka n na da ,Shivamogga and Tumakuru distr icts; ochre inBa l l a r i an d Bi da r d i st r i c t s; quar tz/ s i l i c asand i n Ba ga l kot , Benga l u r u , Bel a ga vi ,Ballari, Chikkamagaluru, Chitradurga, Davangere,Dharwad, Gadag, Kalaburagi, Hassan, Haveri,Kolar , Koppal , Man dya , Mysuru , Ut t ara &Da ksh i na Kan n a da , Ra i chur, Sh i va m ogga ,Tumakuru and Udupi dist r icts; Q uartzite inBelagavi district; and talc/steatite/soapstone inBallari, Chikkamagaluru, Chitradurga, Hassan,Mandya, Mysuru, Raichur and Tumakuru districts.
Oth er m in er al s th at occur i n th e St a t eare asbestos in Chikkamagaluru, Hassan, Mandya,Mysuru and Sh ivam ogga di st r i cts; baryte sand pyrite in Chitradurga district; calcite inBelagavi, Vijayapura and Mysuru districts; copperin Chikkamagaluru, Chi tradurga, Kalaburgi,Hassan, Uttara Kannada, Raichur and Shivamoggadist r icts; corundum in Bengaluru, Ballari ,Chitradurga, Coorg, Hassan, Mandya, Mysurua nd T um a kur u d i st r ic t s ; ful l e r ' s e ar th i nBelagavi and Kalaburagi distr icts; granite inBa gal kot , Ben ga lu r u , Bel la r i , Vi ja yapur a ,Chamrajanagar, Chikkamagaluru, Chitradurga,Coorg, Dharwad, Gadag, Kalaburagi, Hassan,Kolar , Koppal , Man dya , Mysuru , Ut t ara &Dakshina Kannada, Raichur, Tumakuru and Udupidistricts; graphite in Kolar and Mysuru districts;gypsum in Kalaburagi distr ict; molybdenum inKolar and Raichur distr icts; nickel in UttaraKannada distr ict; Platinum Group of Metals inDavangere district; sillimanite in Hassan, Mysuruand Daksh ina Kannada dist r icts; si lver inChi tr adurga and Raichur distr icts; t itaniummi ne r a ls i n Hassa n , Ut ta r a Ka n n a da a n dShivamogga distr icts; tungsten in Gadag, Kolarand Raichur distr icts; vanadium in Hassan ,Uttara Kannada and Shivamogga districts; andvermiculi te in Hassan, Mandya and Mysurudistricts (Table - 1).
Exploration & DevelopmentT h e det a i l s of expl or a t i on a ct i vi t i es
conducted by GSI for gold , iron ore & rare earthelements and also various agencies(MECL) during2016-17 are furnished in Table - 2.

11-3
STATE REVIEWS
(Con
td.)
Tabl
e –
1 :
Res
erve
s/R
esou
rces
of
Min
eral
s a
s on
1.4
.201
5: K
arna
taka
Res
erve
sR
emai
ning
res
ourc
esTo
tal
Min
eral
Uni
tPr
oved
Prob
able
Tota
lFe
asib
ility
Pre-
feas
ibili
tyM
easu
red
Indi
cate
dIn
ferr
edR
econ
nais
sanc
eTo
tal
reso
urce
sST
D 1
11(A
)ST
D21
1ST
D33
1ST
D33
2ST
D33
3ST
D33
4(B
)(A
+B)
STD
121
STD
122
STD
221
STD
222
Asb
esto
sto
nne
--
--
--
--
2441
037
5841
420
-82
8245
782
8245
7B
aryt
es#
tonn
e-
--
-78
296
1362
2014
252
--
1517
5-
2439
4324
3943
Bau
xite
'000
ton
nes
126
1123
3140
4389
2468
864
1082
2220
3560
3-
4124
645
635
Cal
cite
#to
nne
--
--
3180
0-
1590
0-
1440
051
547
-11
3647
1136
47C
hina
cla
y#'0
00 t
onne
s33
047
2-
802
1768
747
2683
2203
6044
324
803
6030
2568
3425
7636
Chr
omit
e'0
00 t
onne
s31
534
072
727
300
230
96-
2025
9-
905
1631
Cop
per
Ore
'000
ton
nes
314
-55
787
264
-24
4517
5068
3322
701
-33
793
3466
5
M
etal
'000
ton
nes
3.52
-4.
197.
710.
49-
16.0
422
65.7
711
7.49
-22
1.79
229.
50C
orun
dum
tonn
e-
--
-64
920
756
5359
013
3827
575
5267
519
9566
1995
66D
olom
ite#
000
ton
nes
2860
959
1060
9340
612
1626
466
8492
0285
1976
244
4553
3713
482
5857
3162
6344
Dun
ite#
000
ton
nes
3074
1818
932
820
034
2390
9-
4606
-28
549
3183
1Fe
lspa
r#to
nne
--
--
1036
7573
613
1070
5525
000
1351
3317
7300
3900
6256
7662
5676
Fire
cla
y#'0
00 t
onne
s14
6-
-14
624
734
020
03-
226
8832
-11
648
1179
4Fu
llers
ear
th##
tonn
e-
--
--
-58
200
-55
1640
1557
156
-21
6699
6G
old
O
re
(Pr
imar
y)to
nne
1039
5000
2499
000
4221
0013
3161
0012
7053
613
0300
010
7866
124
9799
6882
0459
516
0203
2437
6730
0090
5300
8410
3846
184
Met
al
(Pr
imar
y)to
nne
53.3
47.
770.
4261
.53
5.24
3.85
8.53
120.
7328
.67
38.2
943
.78
249.
0931
0.62
Gra
nite
##
(D
imen
sion
Ston
e)'0
00 c
um26
363
1938
921
836
6758
7-
--
238
1231
625
8012
784
2565
992
7030
693
3789
3G
raph
ite
tonn
e-
--
-14
0827
1875
048
821
-41
605
1494
03-
3994
0639
9406
Gyp
sum
#'0
00 t
onne
s-
--
--
--
--
3784
-37
8437
84Ir
on O
re
(Hae
mat
ite)
'000
ton
nes
4166
8446
169
8739
455
0247
5181
5548
231
2116
3224
8299
4409
466
9239
1769
5619
1660
724
6685
4Ir
on O
re
(Mag
netit
e) '0
00 t
onne
s31
912
7-
446
1200
22-
1837
514
9895
747
9372
5345
018
3400
0078
0174
478
0219
0K
yani
teto
nne
--
--
6374
6015
930
1136
3038
6247
1610
502
1053
1529
-13
2952
9813
2952
98L
imes
tone
'000
ton
nes
4610
4921
5411
1379
515
7699
849
7136
5599
0313
5552
215
7250
113
9207
7134
9525
88-
5285
8420
5443
5419
Mag
nesi
te'0
00 t
onne
s12
6412
5-
1389
566
190
391
8810
3179
168
4592
5981

11-4
STATE REVIEWS
Res
erve
sR
emai
ning
res
ourc
esTo
tal
Min
eral
Uni
tPr
oved
Prob
able
Tota
lFe
asib
ility
Pre-
feas
ibili
tyM
easu
red
Indi
cate
dIn
ferr
edR
econ
nais
sanc
eTo
tal
reso
urce
sST
D 1
11(A
)ST
D21
1ST
D33
1ST
D33
2ST
D33
3ST
D33
4(B
)(A
+B)
STD
121
STD
122
STD
221
STD
222
Man
gane
se
ore
'000
ton
nes
9196
-15
093
4614
003
1022
511
430
1498
7306
5433
329
2310
1718
1110
64M
olyb
denu
m
Ore
tonn
e-
--
--
--
--
1320
900
-13
2090
013
2090
0
Con
tain
ed
MoS
2to
nne
--
--
--
--
-17
18.7
0-
1718
.70
1718
.70
Nic
kel
Ore
mil
lion
ton
nes
--
--
--
--
-0.
23-
0.23
0.23
Och
reto
nnes
--
--
--
1766
367
--
-20
000
1786
367
1786
367
Pt.
Gro
up o
f
M
etal
sto
nne
--
--
--
--
--
1.50
1.50
1.50
Pyri
te'0
00 t
onne
s-
--
--
--
--
3000
-30
0030
00Q
uart
zite
#'0
00 t
onne
s23
1-
-23
169
4859
2-
-49
1417
3073
5375
84Q
uart
z-
Silic
a Sa
nd#
'000
ton
nes
7975
417
1807
1019
915
904
6695
9448
9452
5207
752
584
794
9499
3Si
llim
anite
tonn
e-
--
--
--
--
9827
25-
9827
2598
2725
Silv
er
O
reto
nne
1062
0000
1730
000
-12
3500
00-
-69
462
--
3141
50-
3836
1212
7336
12
M
etal
tonn
e2.
710.
24-
2.95
--
0.48
--
2.92
-3.
406.
35Ta
lc-S
teat
ite-
So
apst
one#
'000
ton
nes
4653
182
280
5878
251
1120
811
96-
1800
2081
Tun
gste
n
O
reto
nne
--
--
--
-15
3611
5211
8054
9917
2921
9338
246
3667
7818
3667
7818
Con
tain
ed
W
O3
tonn
e-
--
--
--
2915
1775
142
1403
6235
6235
Vana
dium
Ore
tonn
e-
--
--
5000
0040
0000
0-
-14
8844
30-
1938
4430
1938
4430
Met
alto
nne
--
--
-70
056
00-
-43
197.
55-
4949
7.55
4949
7.55
Verm
icul
iteto
nne
--
--
1355
022
520
2945
0-
1562
6665
8-
1337
4013
3740
Tabl
e-1
(Con
cld.
)
Figu
res
roun
ded
off.
# D
ecla
red
as m
inor
min
eral
vid
e G
azet
te n
otif
icat
ion
date
d 10
.02.
2015
.##
M
inor
min
eral
bef
ore
Gaz
ette
not
ific
atio
n da
ted
10.0
2.20
15.

11-5
STATE REVIEWS
Table – 2 : Details of Exploration Activities in Karnataka, 2016-17
Agency/ Location Mapping Drilling Sampling RemarksMineral/ (No.) Reserves/Resources estimatedDistrict Scale Area No. of Meterage
(sq km) boreholes
(Contd.)
G-4 stage reconnaissance survey forbauxite was taken up by geologicalmapping. The la terite profilecomposed of limonite, goethite,haematite, laterite and free silica indifferent proportions is found at allplaces. Lithomarge, at the bottommost part of lateritic profile isgenerally not very well developed inmost of the exposed sections. Thetotal 65 sq km area is covered bylaterite capped plateaus. The averagethickness of the la terite profile isapproximately 6.5 m. Based on theanalytical chemical data values, Fecontent varies from 1.428 to 48.27%and values of Fe2O 3 content variesfrom 2.04 to 69.1%. Values of Al2O3
content varies from 10.52 to 56.17%.Values of SiO2 content varies from2.87 to 73.8%. Values of Al2O3 rangingfrom 39 to 56% have been reportedfrom the bedrock sample analysis inthe Navilga and Haldipur plateau. TheXRD results of bauxite samples showsgibbsite in major amount, Kaolinitein minor amount and quartz in traceamount.
G3 stage preliminary exploration foriron ore resource was carried out innotified Block 4B/C116/MMM 2003of Kumaraswamy Hill Range bygeological mapping. An impersistentiron ore band of average width 34 mand cumulative length of 1180 m hadbeen delineated. The total surface areaof the ore body is 0.04 sq km withmineralisation factor 0.027. The ironore band predominantly consist ofhematite, goethite, with minoramount of ferruginous clay, limoniteand specularite. The average (of 18samples) Fe% in the band is 44.79%.
On request from DGM, Govt.of Karnataka, a G-3 stagepreliminary exploration for iron oreresources in blocks 13/1(north) and6B/C116MMM 2003 was taken upwith an objective to establish the gradeof the iron ore bodies and assess the
GSIBauxi teUttara Western Ghat belt, 1:12500 6 5 - - -Kannada in Kabri-Honnabar-
Apsarkond areas
Iron oreBallari Kumaraswamy, 1:2000 0.04 - - -
Hill Range,
Ramanadurga, 1:2000 - - - -Hill Range,

11-6
STATE REVIEWS
Table – 2 (contd.)
Agency/ Location Mapping Drilling Sampling RemarksMineral/ (No.) Reserves/Resources estimatedDistrict Scale Area No. of Meterage
(sq km) boreholes
(Contd. )
resources in the area along withdetailed mapping. BIF bands areassociated with shale. The shale isferruginous at places, theconcentration of hematite is moreforming pocket deposit. The bandediron formation is the most importantlitho unit of the study area because itis the high grade iron ore deposits.The surfacial width of individual bandsvaries between 5 and 160 m.
On request from DGM, Govt. ofKarnataka, a G-3 stage preliminaryexploration for iron ore resource inblocks 13/1(north) and 6A/C116MMM 2003 was carried out withan objective to establish the grade ofthe iron ore bodies and assess theresource in the area along with detailedmapping. A single band of iron orebody with strike length of 1500 mand true thickness of 170-180 m istargeted for exploration. Total 121samples collected from mineralisedzone shows Fe content varying from13.65 to 66.07% with an average of51.41%. Analytical results of 95samples have given Fe values abovecut-off grade (45%).
G3 stage preliminary exploration foriron ore resource in selected free holdareas in the both blocks were carriedout by detailed mapping. The lithounits exposed in the area are dolomiticlimestone, Mn phyllite, argillite andbanded hematite quartzite.Exploration will continue.
G-4 stage reconnaissance survey forbanded Iron Formation (BIF) wastaken up by large scale mapping alongwith collection of samples coveringthe iron ore formations locatedin parts of Shikaripura ta luka.A cumulative strike length of 31,825m of BIF band was delineated duringthe present field programme. Fourpotential BIF bands were identifiedbased on iron oxide content
Chitradurga & Kenkere block in, 1:2000 2 - - -Tumakuru Hosadurga Taluka &
ChikkanayakanahalliTaluka
Haveri & Shikaripura, - 100 - - -Shivamogga taluka
1:2000 - - - 121

11-7
STATE REVIEWSTable – 2 (contd.)
Agency/ Location Mapping Drilling Sampling RemarksMineral/ (No.) Reserves/Resources estimatedDistrict Scale Area No. of Meterage
(sq km) boreholes
(magnetite, hematite + goethite).strike length and width. These bandsare numbered as IX, X, Xl and XIIfrom South of Kaginalli toNagavanda area. The analyticalresults of 5l BRS have been receivedso far. Out of the 51 samples, 16samples have Fe2O3 less than 20%with an average grade of 11.9%, 13samples have Fe2O3 values from 20to 30% with an average grade of23.55%, 10 samples have Fe2O 3
between 30 to 45% with an averagegrade or 34 .35% and 12 sampleshave Fe2O3 between 30% to 45% withan average Fe2O 3 of 52 .26%. Theanalytical results of 61 trenchsamples have been received so far.The wt% of trench samples forFe2O3<20% is shown by 31 nos. ofsamples with an average grade of8.60%. The wt% of Fe2O 3 rangingbetween 20-30% in 8 samples withan average grade of 23.67%, 30-45%is shown by 10 samples with anaverage or 34.71% and Fe2O3>45%is observed in 12 samples with anaverage or 51 .75%. Based on theresults received so far, BIF bands IX,XI and XII are of low to mediumgrade iron ore potential.
G-4 reconnaissance survey wastaken up for manganese protore.The investigation was proposed bythe DMG, Govt. of Karnataka.Evidences for multiple phases ofdeformations are observed atmany places. The manganeseconcentration is found in thefractured zones a t the hinges offolds. The main protore formingmanganese minerals are psilomelaneand pyrolusite occurring as irregularpockets and lenses and confined tothe banded iron–manganese chert.The analytical results are awaited.However, based on available bed rockand trench samples results, Mnvalues range from 0.78% to 27.4%and Fe values from 7.54% to45.78%.
Mang anes eTumakuru Doddaguni - - - - -
basin
(Contd. )

11-8
STATE REVIEWSTable – 2 (contd.)
Agency/ Location Mapping Drilling Sampling RemarksMineral/ (No.) Reserves/Resources estimatedDistrict Scale Area No. of Meterage
(sq km) boreholes
G-4 reconnaissance survey for tin,tungsten, lithium bearing zone wastaken up in the granitoids aroundJalihalli, Wengalapur, Anandapur andGopalapur, Raichur district. Bedrocksamples, stream sediment samples,trench samples, PCS, petrographicsamples were collected foridentification of potential zones forSn, W and Li mineralisation. The areashows low potential with respect tomineralisation of Sn, W and Li as nomajor pegmatite veins or probablealteration zones were observed. Thinsection studies indicate the presenceof several REE phases like allanite,monazite, sphene, xenotime etc. inthe granites and pegmatites.
G-2 stage general exploration wastaken up for gold in this block. Quartzcarbonate veins carries goldmineralisation in the form ofauriferous veins. Gold grains occur asinclusions in pyrrhotite, arsenopyrite,galena and as stringers anddisseminations associated with pyrite,chalcopyrite, sphalerite andloellingite. Total nine boreholesdrilled to target mineralised BIF bandnos. I, IV, V and VI. Chemical analysisresults of 3 boreholes has beenreceived from HGML so far. The firstborehole has given gold values of 0.8g/t/0.5 m in Band-I, 0.4 to 0.6g/t/1.0 min Band IV and 0 .4g/t/0.5 m inBand V. The second borehole hasgiven average gold values of 0.53g/t/1.5 m to 1.1g/t/1.0 m in Band I, 0.2g/t/1.0 m to 0.6g/t/1.5 m in band IVand 0.5g/t/1.15 m in band –VI. Thethird borehole has given average goldvalue of 3.1g/t/1.5 m in quartz veinintruded into meta basalt, 0.2g/t/0.5mat closure of Band-I and IV, 0.75g/t/4.5m in Band-V and 0.4 to 0.6g/t/0.5min Band-VI.
During G2 stage of exploration forgold in Ajjanahall east block, MECLcarried out large scale mapping of1.00 sq km area on 1:1000 scale, coredrilling of 19 boreholes for totalmeterage of 5061.00 m and collectionof 3346 nos. of primary, check,
(Contd. )
Tin, Tungsten, Lithium bearing zoneJalihalli, Deodurg 1:50000 350 - - -Wengalapur, project 1:12500 150 - - -Anandapur &Gopalapur,Raichur
Ajjanahalli 1:1000 1.00 1 9 5061.00 3796east block
GoldTumakuru Ajjanahalli - - 9 - -
Block-E

11-9
STATE REVIEWSTable – 2 (contd.)
Agency/ Location Mapping Drilling Sampling RemarksMineral/ (No.) Reserves/Resources estimatedDistrict Scale Area No. of Meterage
(sq km) boreholes
duplicate half core samples for Au;151 nos primary samples each for Asand Sb; 50 nos composite samples forPb, An and Cu; 50 nos samples forpetrological studies; 50 nos samplesfor mineragraphic studies; 39 & 50samples for XRD & spectroscopicstudies, respectively; 60 nos samplesfor specific gravity determination andone sample for beneficia tion.Estimated 1 .061 million tonnes ofgold ore with 2.39 g/t Au at 0.50 g/tAu cut-off under UNFC indicated(332) category. This inclues a llprevious estimations made by variousexploration agencies at different time.
G2 stage general exploration for goldwas carried out in this block. Theblock forms the southern continuityof Ajjanahalli main block. G-2 stageof exploration was carried out tointersect the mineralised zones in theBlock – D to test the mineralisedzones at second level (120 m verticaldepth). Out of 10 boreholes, threeboreholes have been drilled tointersect the mineralised zone IIIand 5 boreholes have been drilled tointersect the MZ-V at second level(120 m vertical depth). One boreholeof 327.30 m depth was drilled in theSW part of the block on the basis ofthe GPR survey. Total 733 nos. ofborehole core sample have been sentfor gold analysis by fire assay method.Gold analysis of 3 boreholes hasbeen received so far. In firstborehole average gold values of themineralised zones are 0.20g/t/0 .5m,0.40g/t/0.50 m and 0.20/t/1.0 m,whereas, the second boreholemineralised zones intersected withvalues of 0.40g/t/0.60 m, 0.60g/t/1.50m and 0.45g/t/2 .0 m. In the 3 rd
borehole gold values are of 0.53g/t/1.50 m and 0.27g/t/1.50 m.
G3 stage preliminary exploration forgold was carried out in ParamanahalliCentral and North blocks. Duringearlier work, in central and northblocks, 3 auriferous zones, viz eastern,middle and western, with strike lengths
Chitradurga Paramanahalli - - - - -Central &North blocks
(Contd. )
Tumakuru Ajjanahalli - - 1 0 2231.70 733Block-D

11-10
STATE REVIEWS
having 250m, 400m and 700m couldbe delineated by trenching andsampling. Au potential, with anaverage grade of 1.2g/t over 4 m and1.6 g/t over 1.33 m has been estimatedfor the eastern and middle zones,respectively. A prominent 700 m longwestern main auriferous ore zone withan average tenor of 2.3 g/t Au over1.26m, forming the northernextension of main auriferous ore zonesin the south block was traced incentral block. The Au assay valuesare sporadically distributed throughout the zone but more enrichment isnoticed in the central part. The Auvalues range from 0.10g/t to 9.59g/tover 1-2 m width and 0.44g/t over 5m from bedrock profile sampling dataat 500 m due the above auriferous orezones suggest the probable extensionof the above western main lode toabout > 1.8 km. A resource potentialof 0.395 million tonnes of gold orewith grade ranging from 0.9 to 4.17g/t and width ranging from 0.5 to 3mcould be estimated. Only a part ofanalysis is received which is not muchencouraging while the remainingresults are awaited.
G4 stage reconnaissance survey wascarried out for gold and associatedminerals around Bagali andUppanayakanahalli area . Themineralisation in the area isassociated with the alteration zonesbetween the schist belt and the BIF aswell as the metabasalts of the area.Au values of 30 and 45 ppb arereported from BIF collected fromthe Huligudda ridge and its extension.However, a value of 125 ppb gold isassociated with carbonated metabasaltat 3 km east of Uppanayakanahalli.
G4 stage reconnaissance surveyfor gold was taken up in Nyamati blockin parts of Davangere and Shimogadistrict. A series of old workings,shafts and one adit were observedin the area. The mineralisation in theKudrekonda area was reportedlyassociated with the ‘Turnbull Reef’which is exposed in the adit.It appears in the adit as smokysheared quartz vein of 1.5 m width.
(Contd. )
Table – 2 (contd.)
Agency/ Location Mapping Drilling Sampling RemarksMineral/ (No.) Reserves/Resources estimatedDistrict Scale Area No. of Meterage
(sq km) boreholes
Ballari Bagali & 1:12500 100.0 - - -Uppanayakanahalli 1:2000 0.50 - - -area
Davangere & Nyamati 1:50000 450.0 - - -Shivamogga block 1:12500 150.0 - - -
11-11
STATE REVIEWS
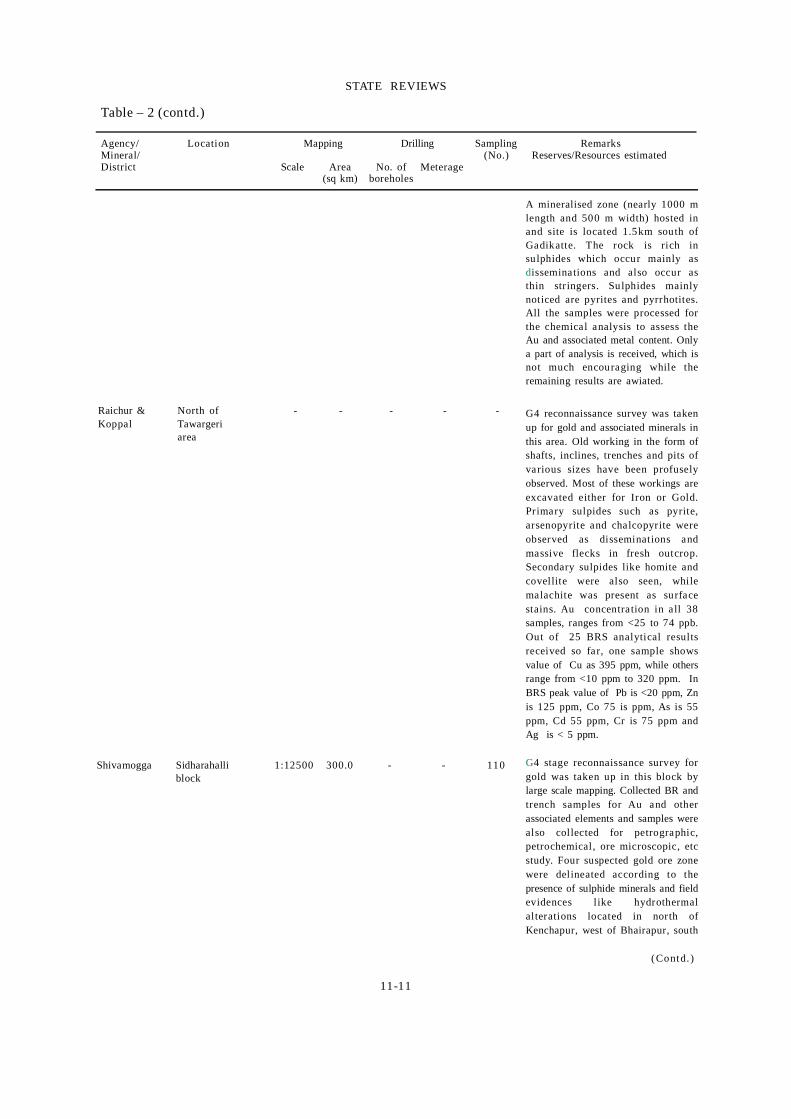
A mineralised zone (nearly 1000 mlength and 500 m width) hosted inand site is located 1.5km south ofGadikatte. The rock is rich insulphides which occur mainly asdisseminations and also occur asthin str ingers. Sulphides mainlynoticed are pyrites and pyrrhotites.All the samples were processed forthe chemical analysis to assess theAu and associated metal content. Onlya part of analysis is received, which isnot much encouraging while theremaining results are awiated.
G4 reconnaissance survey was takenup for gold and associated minerals inthis area. Old working in the form ofshafts, inclines, trenches and pits ofvarious sizes have been profuselyobserved. Most of these workings areexcavated either for Iron or Gold.Primary sulpides such as pyrite,arsenopyrite and chalcopyrite wereobserved as disseminations andmassive flecks in fresh outcrop.Secondary sulpides like homite andcovellite were also seen, whilemalachite was present as surfacestains. Au concentration in a ll 38samples, ranges from <25 to 74 ppb.Out of 25 BRS analytical resultsreceived so far, one sample showsvalue of Cu as 395 ppm, while othersrange from <10 ppm to 320 ppm. InBRS peak value of Pb is <20 ppm, Znis 125 ppm, Co 75 is ppm, As is 55ppm, Cd 55 ppm, Cr is 75 ppm andAg is < 5 ppm.
G4 stage reconnaissance survey forgold was taken up in this block bylarge scale mapping. Collected BR andtrench samples for Au and otherassociated elements and samples werealso collected for petrographic,petrochemical, ore microscopic, etcstudy. Four suspected gold ore zonewere delineated according to thepresence of sulphide minerals and fieldevidences like hydrothermalalterations located in north ofKenchapur, west of Bhairapur, south
Table – 2 (contd.)
Agency/ Location Mapping Drilling Sampling RemarksMineral/ (No.) Reserves/Resources estimatedDistrict Scale Area No. of Meterage
(sq km) boreholes
(Contd. )
Raichur & North of - - - - -Koppal Tawargeri
area
Shivamogga Sidharahalli 1:12500 300.0 - - 110block

11-12
STATE REVIEWSTable – 2 (contd.)
Agency/ Location Mapping Drilling Sampling RemarksMineral/ (No.) Reserves/Resources estimatedDistrict Scale Area No. of Meterage
(sq km) boreholes
of Siddarahalli and SW ofJambadahalla. The sulphide mineralsidentified are pyrite, chalcopyrite,pyrrhotite, malachite in associationwith sphalerite, galena, magnetite andarsenopyrite. Out of analytical resultsof 110 BRS samples only ten sampleshave analysed gold values > 25 ppbranging from 30 ppb - 1186 ppb.Values of associated Cu, Zn, Ni, Cr etcare not significant. Out of theanalytical results of 50 trench samplesonly 4 have gold values > 25 ppbranging from 38-494 ppb.
A G4 stage reconnaissance surveyfor gold was taken up in this Block.The gold values ranges from 25 to1040 ppb and the important assaysare as follows. A 230 m zone ofcarbonatised BIF was traced at thesouthern part of the block. Two ofthese samples collected from this zoneare reported with gold values 550 ppband 1040 ppb, respectively. Anothersample collected from limonitised BIFin the eastern part yielded 510 ppbAu over a width of 2.4 m.
G4 stage reconnaissance survey forgold was taken up in and around thisarea in parts of Shivamogga andDavangere districts. Six samples outof 20 collected from Tarlaghatta areahas analysed gold value ranging from28 to 40 ppb in strike contributionfor about 1 km. Along with theseanother two BRS analysed haveyielded 282 ppb and 30 ppb of Auvalue. Two samples of one trenchhave analysed Au values of 60 ppband 636 ppb of Au. Only one sampleof another trench have given Au valueof 106 ppb. Apart from this, basedon the results received so far no othermineralised zone is established in thearea.
G3 stage preliminary exploration forSMS grade limestone was taken up tolocate and intersect desired limestonebody in the area. All boreholesintersected the expected limestone.Analytical results of a few greylimestone and pink limestone samples
Tumakuru Timmanahalli - 1.50 - - -block
Shivamogga Yerekatte & 1:12500 150.0 - - 2 0Davangere Siddapura area
(Contd. )
Limes toneBelagavi Hoskoti & 1:4000 2 7 1054 -
Salapur

11-13
STATE REVIEWS
Agency/ Location Mapping Drilling Sampling RemarksMineral/ (No.) Reserves/Resources estimatedDistrict Scale Area No. of Meterage
(sq km) boreholes
Table - 2 (Contd.)
(Contd. )
Belagavi Around Tondikati, 1:4000 2 - - 1 1Chippalkati andadjoining areasof Yadwad
show CaO in the range of 42 to 51%.Based on visual estimation andavailable BRS analytical results, someband within variegated limestone arelikely to be cement grade. Resourceswill be estimated after the receipt ofchemical results.
During G3 stage exploration for SMSgrade limestone, various litho unitslike dolomitic limestone, greylimestone, pink & white limestone,purple laminated limestone, bandedlimestone and variegated limestonewere mapped. Analytical results fromManami block have some encouragingresults in terms of CaO %. The foursamples collected from greylimestone, pink white limestone,banded limestone & variegatedlimestone analysed Cao > 40%. Theaverage SiO2 in grey limestone is 24 -28%, banded limestone 1 - 3% andpink white limestone 3 - 11%. Thepercentage of Fe2O3, Al2O3 and TiO2 ishigh in grey limestone. Furtherexploration activities in the area hasbeen closed.
Exploration was carried out with anobjective of determination of i) Lump& fines ratio ii) mineralised/ non-mineralised area iii) associatedminerals and quantification ofresources as per threshold value, etc.Estimated a net reserve of a) 4.203million tonnes of iron ore withaverage grade of Fe 57.28%, SiO2
5.42%, Al2O3 at 45% Fe cut-off, b)3.630 million tonnes of net reservewith average grade of Fe 60.36%, SiO26.82%, Al2O3 4.48% at Fe 55% cut-off under (121) category.
Exploration was carried out with anobjective of determination of i) Lump& fines ratio, ii) mineralised/non-mineralised area, i ii) associatedminerals and quantification ofresources as per threshold value, etc.Estimated a net reserve of,a) 2.153 million tonnes with averagegrade of Fe 54.37%, SiO2 19.02%,Al2O3 3.02%, Fe 45% cut-off, b) 1.323million tonnes with average grade of
MECLIron OreBallari M/s S.B. Minerals 1:1000 0.394 2 4 1050.5 972
Ltd, ML No. 2550
M/s Trident 1:1000 0.3243 1 9 856.1 789Minerals Ltd,ML No. 2315

11-14
STATE REVIEWS
Ballari Kanhaiyalal 1:1000 0.3009 1 9 1278.3 1191DudheriaML No. 2563Ramanadurga village
Fe 59.57, SiO2 11.10%, Al2O3 2.89%at Fe 55% cut off under (121)category.
Exploration was carried out with anobjective of determination of i) Lump& fines ratio, ii) mineralised/non-mineralised area, i ii) associatedminerals and quantification ofresources as per threshold value, etc.Estimated a net reserve ofa) 9.26 million tonnes with averagegrade of Fe 50.89%, SiO2 17.9%,Al2O3 4.56% at Fe 45% cut-off, b)4.588 million tonnes with averagegrade of Fe 59.34%, SiO2 8.85%, Al2O3
4.36% at Fe 55% cut-off under (121)category.
Exploration was carried out with anobjective of determination of i) Lump& fines ratio, ii) mineralised/non-mineralised area, i ii) associatedminerals and quantification ofresources as per threshold value, etc.Estimated a net reserve ofa) 4.542 million tonnes with averagegrade of Fe 49.52%, SiO2 23.97%,Al2O3 2.87% at Fe 45% cut-off, b)1.141 million tonnes with averagegrade of Fe 59.26%, SiO2 4.30%, Al2O32.44% at Fe 55% cut-off under (121)category.
Exploration was carried out with anobjective of determination of i) Lump& fines ratio, ii) mineralised/non-mineralised area, i ii) associatedminerals and quantification ofresources as per threshold value, etc.Estimated a net reserve ofa) 63.331 million tonnes with averagegrade of Fe 58.84%, SiO2 6.54%, Al2O34.25%, b) 48.102 million tonnes withaverage grade of Fe 62.75%, SiO2
3.40%, Al2O3 3.25% at Fe 55% cut-off under (121) category.
Exploration was carried out with anobjective of determination of i) Lump& fines ratio, ii) mineralised/non-mineralised area, i ii) associatedminerals and quantification ofresources as per threshold value, etc.
Smt.Santhalakshmi 1:1000 0.3253 2 0 1119.8 1063JayaramML No. 2553Kallahalli village
M/s.H.Rangana 1:1000 0.6066 4 8 3280.7 3071Goud, ML No. 2148Ramgad Range
(Contd. )
M/s.Bharat Mines & 1:1000 0.2447 1 9 880.80 1338Minerals Ltd,ML No. 2245,KumaraswamyRange
Agency/ Location Mapping Drilling Sampling RemarksMineral/ (No.) Reserves/Resources estimatedDistrict Scale Area No. of Meterage
(sq km) boreholes
Table - 2 (Contd.)

11-15
STATE REVIEWS
Estimated a net reserve ofa) 7.577 million tonnes with averagegrade of Fe 52.19%, SiO2 9.74%, Al2O36.85%, b) 2.917 million tonnes withaverage grade of Fe 59.18%, SiO2
4.65%, Al2O3 4.65% at Fe 55% cut-off under (121) category.
Exploration was carried out with anobjective of determination of i) thestrike and depth continuity of ironore in the mining lease area, ii) Lump& fines ratio, ii i) mineralised/non-mineralised area, iv) associatedminerals and quantification ofresources as per threshold value, etc.Estimated a net reserve of a) 9.708million tonnes with average grade ofFe 55.96%, SiO2 13.39% and Al2O33.20% at Fe 45% cut-off, b) 8 .407million tonnes with average grade ofFe 60.96%, SiO2 6.82% and Al2O3
3.44% at Fe 55% cut-off under (121)category.
Exploration was carried out with anobjective of determination of i) thestrike and depth continuity of ironore in the mining lease area, ii) Lump& fines ratio, ii i) mineralised/non-mineralised area, iv) associatedminerals and quantification ofresources as per threshold value, etc.No mineralised zone could bedemarcated within the area atthreshold value cut-off (45% Fe).Hence, resources not estimated.
Exploration was carried out with anobjective of determination of i) thestrike and depth continuity of ironore in the mining lease area, ii) Lump& fines ratio, ii i) mineralised/non-mineralised area, iv) associatedminerals and quantification ofresources as per threshold value, etc.
Exploration was carried out with anobjective of determination of i) thestrike and depth continuity of ironore in the mining lease area, ii) Lump& fines ra tio, i ii) mineralised/non-mineralised area, iv) associatedminerals and quantification of
Ballari M/s.Mysore 1:1000 0.2447 2 3 1253.7 1977Minerals Ltd,ML No. 995Donimalai Range
Sri N. Manzoor 1:1000 0.1571 1 6 883.50 434Ahmed.,ML No. 1324/2616,North of Venkatgirivillage
M/s.Veeyam 1:100 0.2004 - - -Pvt Ltd.,ML No. 2615,Vadrahalli Village
M/s S.B. Minerals 1:1000 0.7125 6 539.00 582Ltd, ML No. 2515Vysankari village
(Contd. )
Agency/ Location Mapping Drilling Sampling RemarksMineral/ (No.) Reserves/Resources estimatedDistrict Scale Area No. of Meterage
(sq km) boreholes
Table - 2 (Contd.)

11-16
STATE REVIEWS
Ballari M/s Rajapur 1:100 0.9175 3 226.00 257ML No. 2190
resources as per threshold value, etc.Estimated a net resource of 0.896million tonnes with average grade ofFe 52.84%, SiO2 19.55% and Al2O3
3.57% at Fe 45% cut-off undermeasured (331) and indicated (332)categories.
Exploration was carried out with anobjective of determination of i) thestrike and depth continuity of ironore in the mining lease area, ii)Lump& fines ratio, ii i) mineralised/non-mineralised area, iv) associatedminerals and quantification ofresources as per threshold value, etc.Estimated a net resource of 0.088million tonnes with average grade ofFe 36.01%, SiO2 38.48% and Al2O3
1.41% at Fe 35% planning cut-offgrade under measured (331) andindicated (332) categories.
Exploration was carried out with anobjective of determination of i) thestrike and depth continuity of ironore in the mining lease area, ii) Lump& fines ratio, ii i) mineralised/non-mineralised area, iv) associatedminerals and quantification ofresources as per threshold value, etc.Estimated a net resource of i) 3.645million tonnes with average grade ofFe 37.19%, SiO2 19.42% and Al2O31.91% at Fe 35% cut-off value undermeasured (331) and indicated (332)categories, ii) 0.931 million tonnesof manganese resources with averagegrade of Mn 12.71% and Fe 27.39%at Mn 10% cut-off value.
Exploration was carried out with anobjective of determination of i) thestrike and depth continuity of ironore in the mining lease area, ii) Lump& fines ratio, ii i) mineralised/non-mineralised area, iv) associatedminerals and quantification ofresources as per threshold value, etc.Estimated a net resource of i) Ironore a t 3 .303 million tonnes withaverage grade of Fe 46.43%, SiO2
30.33% and Al2O3 1.67% at Fe 45%
Chitradurga Sri Allum 1:1000 0.2453 2 5 1330.00 5919VeerabhadrappaML No. 2436Kenchihalli village,Hosadurga Taluka
M/s Thangavelu 1:1000 0.6092 4 2 2101.90 6762and othersML No. 2585,Doddabyaladakere villageHosadurga Taluka
(Contd. )
Agency/ Location Mapping Drilling Sampling RemarksMineral/ (No.) Reserves/Resources estimatedDistrict Scale Area No. of Meterage
(sq km) boreholes
Table - 2 (Contd.)

11-17
STATE REVIEWS
cut-off value under measured (331)and indicated (332) categories, i i)Limestone at 5 .650 million tonneswith average grade of CaO 37.35%,MgO 13.05% and SiO2 13.05% at CaO35% cut-off value., iii) Dolomite at8.994 million tonnes with averagegrade of MgO 15.18% and CaO28.71%, at CaO 15% cut-off value,iv) Manganese ore at 4.803 milliontonnes with average grade of Mn15.43%.
Exploration was carried out with anobjective of determination of i) thestrike and depth continuity of ironore in the mining lease area, ii) Lump& fines ratio, ii i) mineralised/non-mineralised area, iv) associatedminerals and quantification ofresources as per threshold value, etc.Estimated a net resource of i) 0.598million tonnes with average grade ofFe 54.28%, SiO2 11.95% and Al2O3
4.76% at Fe 45% cut-off value underUNFC measured (331) and indicated(332) categories.
Exploration was carried out with anobjective of determination of i) thestrike and depth continuity of ironore in the mining lease area, ii) Lump& fines ratio, ii i) mineralised/non-mineralised area, iv) associatedminerals and quantification ofresources as per threshold value, etc.Estimated a net reserve of a) 34.939million tonnes with average grade ofFe 53.46%, SiO2 8.41% and Al2O3
8.68% at Fe 45% cut-off value, b)18.168 million tonnes with averagegrade of Fe 56.66%, SiO2 6.15% andAl2O3 7.15% at Fe 55% cut-off valueunder UNFC code (121) category,
Exploration was carried out with anobjective of determination of i) thestrike and depth continuity of ironore in the mining lease area, ii) Lump& fines ratio, ii i) mineralised/non-mineralised area, iv) associatedminerals and quantification of
Tumakuru M/s Karnataka 1:1000 0.0647 8 361.00 472Limpo CementIndustry, ML No.2650,Honnebagi &Bullenahalli village
M/s Deepchand 1:1000 0.0647 4 7 2528.00 6471Kishanlal,ML No.2348,Chikkanayakanahalliand Tiptur Taluka
M/s Mysore 1:1000 1.2265 2 2 1512.00 3002Stoneware &Potteries Ltd.,ML No.2521,Somanahalli &Sondenahalli Villages,Chikkanayakanahalliand Tiptur Taluka
(Contd. )
Agency/ Location Mapping Drilling Sampling RemarksMineral/ (No.) Reserves/Resources estimatedDistrict Scale Area No. of Meterage
(sq km) boreholes
Table - 2 (Contd.)

11-18
STATE REVIEWS
resources as per threshold value, etc.Estimated a net reserve of a) 12.945million tonnes with average grade ofFe 54.04%, SiO2 9.24% and Al2O3
7.96% at Fe 45% cut-off value,b) 8.782 million tonnes with averagegrade of Fe 56.47%, SiO2 7.15% andAl2O3 6.79% at Fe 55% cut-off valueunder UNFC code (121) category.
Exploration was carried out with anobjective of determination of i) thestrike and depth continuity of ironore in the mining lease area, ii) Lump& fines ratio, ii i) mineralised/non-mineralised area, iv) associatedminerals and quantification ofresources as per threshold value, etc.Estimated a net resource of 0.869million tonnes with average grade ofFe 46.92%, SiO2 11.63% and Al2O3
9.72% at Fe 45% cut off value underUNFC code (331) / (332) categories.
Exploration was carried out with anobjective of determination of i) thestrike and depth continuity of ironore in the mining lease area, ii) Lump& fines ratio, ii i) mineralised/non-mineralised area, iv) associatedminerals and quantification ofresources as per threshold value, etc.Estimated a net resource of 1.765million tonnes with average grade ofFe 49.02%, SiO2 7.95%, Al2O3 2.10%and Mn 3.70% at Fe 45% cut-off valueunder UNFC code (331) / (332)categories.
Tumakuru Sri B.R. 1:1000 0.2371 2 2 584.40 657SurendranathSingh,ML No.2187,Honnebagi &Bullenahalli Villages
Agency/ Location Mapping Drilling Sampling RemarksMineral/ (No.) Reserves/Resources estimatedDistrict Scale Area No. of Meterage
(sq km) boreholes
Table - 2 (Concld.)
M/s Sri G. 1:1000 1.2742 2.42 1697.00 6714RajashekharML No.2229,Mavinahalli Village,Gubbi Taluka

11-19
STATE REVIEWS
ProductionGold, iron ore, manganese ore and limestone
are the important minerals produced in Karnatakastate. The value of minor minerals production wasestimated at ̀ 1,321 crore for the year 2016-17.
The number of reporting mines in Karnatakawas 141 during 2016-17 (Table-3).
Table – 3 : Mineral Production in Karnataka, 2014-15 to 2016-17(Excluding Atomic Minerals)
(Value in ` '000)
2014-15 2015-16 2016-17 (P)Mineral Unit
No. of Quantity Value No. of Quantity Value No. of Quantity Valuemines mines mines
All Minerals 197 77157908 160 55849293 141 67681353
Bauxite t 2 127500 31875 2 12050 5423 2 386 171 Chromite t 4 2674 16044 3 1808 10884 3 782 4321 Gold Ore t - 443279 - - 558803 - - 576699 - Gold kg 3 1430 3572107 3 1310 3178752 3 1579 4316986 Iron Ore '000t 6 7 20205 55165630 6 9 25036 34659850 5 8 26363 43850893 Manganese Ore t 1 4 206700 933894 1 1 145623 410733 9 261374 1189857
Silver* kg - 139 5103 - 122 4048 - 169 6640 Dolomite# t 1 3 619367 208550 - - - - - - Dunite# t 1 1123 164 - - - - - - Fireclay# t - 2965 2535 - - - - - - Felsite# t 2 324 242 - - - - - - Graphite
(r.o.m.) t 2 - - 1 - - 1 - - Kaolin# t 1 1984 6271 - - - - - - Kyanite t 1 4400 3520 1 - - 1 - - Laterite# t 1 121200 52154 - - - - - - Limestone '000t 6 2 24008 3782551 6 6 27062 4325671 6 0 29784 5057615 Limeshell t 1 200 240 2 1221 1258 2 4003 6596
Magnesite t 3 9129 40910 2 8161 39962 2 8391 35562 Quartz# t 5 88673 30344 - - - - - - Quartzite# t 1 8500 4505 - - - - - - Silica Sand# t 1 3 88773 39998 - - - - - - Shale# t - 646286 48559 - - - - - - Vermiculite t 1 - - - - - - - -
Minor Minerals@ - - 13212712 - - 13212712 - - 13212712
Note: The number of mines excludes s ilver and minor minerals.* Recovered at Raichur and Tumkur during refining o f gold .@ Figures for earlier years have been repeated as estimates because o f non-receipt of data.# Declared as minor mineral vide Gazette Notfication dated 10.02.2015.
Mineral-based Industry
The present status of each mineral-basedindustry is not readily available. However, theimportant mineral-based industries in organisedsector in the State are given in Table - 4.

11-20
STATE REVIEWS
Table - 4 (Contd.)
Industry/plant Capacity('000 tpy)
(Contd. ) (Contd. )
AbrasivesGrindwell Norton Ltd, Bengaluru. NA
Sri Sadguru Abrasives Pvt. Ltd, Mache, 24 (t)Distt. Belagavi.
AluminaHindalco Industries Ltd, Belagavi. 350 (alumina)
C e m e ntACC Ltd, Wadi (Wadi & Wadi New), 6030Distt. Gulbarga.
ACC Ltd, Kuduthini, Ballari (G). 1100
ACC Ltd, Thondebhavi, Distt. Chikkaballapur (G). 1660
Bagalkot Cement Industries Ltd, 600Distt. Bagalkot.
Chettinad Cement, Kallur, Distt. Kalaburagi. 2500
Dalmia Cement, Yadwad, Distt. Belagavi. 4000
Heidelberg Cement India Ltd, 510(Formerly Mysore Cements Ltd)Ammasandra, Distt. Tumakuru.
J. K. Cement Ltd, Muddapur, Distt. Bagalkot. 3000
JSW Cement, Vijaynagar, Distt. Ballari. 600
Kesoram Industries, Vasavadatta Cement, 5750Sedam, Distt. Kalaburagi.
Kalaburagi Cement Pvt Ltd (formerly Vicatsagar) 2290Chatrasala, Distt. Kalaburagi.
Ramco Cement Ltd, Mathodu, 290Distt. Chitradurga.
Ultratech Cement, Raj Shree Cement, 3200Malkhed, Distt. Kalaburagi.
Ultratech Cement, Ginigera, 1300Distt. Koppal (G).
Ce ramicCeramic Products Ltd, Khanapur, Distt. Belagavi. 5
H&R Johnson (India) Ltd, Hubballi. 47.72
Murudeshwar Ceramics Ltd, Dharwad. 115
The Mysore Spongware Pipes Potteries Ltd, 6Solandavanahalli, Bengaluru.
C he micalSolaris Chem Tech Industries Ltd, 59.4 (causticBhinga, Distt. Uttara Kannada. soda), 52.3 (Cl),
133.7 (HCl)24.0 (H3PO4)
FertilizerK. P. R. Fertilizers Ltd Halvarthi, Koppal. 60 (SSP)
Mangalore Chemical & Fertilizers Ltd, 379.5 (Urea)Panambur, Mangaluru. 260 (DAP)
40 (Complex)
Tungabhadra Fertilizers & Chemicals Ltd, 45 (SSP)Munirabad, Koppal.
Iron & SteelJSW Steel Ltd, Vijayanagar, 9200 (pellets)Distt. Ballari. 720 (pig iron) 10000 (crude/liquid steel)
12950 (sinter)
Visvesvaraya Iron & Steel Ltd, 205 (pig iron)Bhadravati, Distt. Shivamogga. 118(crude/liquid steel) 4.8 (refractory bricks)
Sunvik Steels Pvt. Ltd, 60 (sponge iron)Jodidevarahally, Distt. Tumakuru. 60 (TMT bar)
Pe llet sKIOCL, Mangaluru. 3500 (pellets)
6700 (conc.)227 (pig iron)
BMM Ispat, Danapur, Distt. Ballari. 2400 (pellets)
Xindia Steel, Koppal. 800 (pellets)
Pig IronUni-Metal Ispat Ltd, Ballari. 7 5
Kalyani Ferrous Ind. Ltd, Koppal. 120
Kirloskar Ferrous Industries Ltd, Bevinahalli, 240Distt. Koppal.
Sponge IronAgrawal Sponge & Energy (P) Ltd, 7 2Kuduthini, Distt. Ballari.
Balakundi Premium Steels Pvt. Ltd, 3 4Halakundi, Distt. Ballari.
Table – 4 : Principal Mineral-basedIndustries in Karnataka
Industry/plant Capacity ('000 tpy)

11-21
STATE REVIEWS
Table - 4 (Contd.)
Industry/plant Capacity('000 tpy)
Table - 4 (Concld.)
Industry/plant Capacity('000 tpy)
(Contd. )
Bellary Ispat (P) Ltd, Halakundi 3 3Distt. Ballari.
Ballary Steel & Alloys Ltd, Ballari. 6 0
Benaka Sponge Iron Pvt. Ltd, Belagal, 6 0Distt. Ballari.
Dhruvdesh Metasteel Pvt. Ltd, 6 0Hirebaganal, Distt. Koppal.
Divya Jyoti Steel Ltd, Taranagar, Distt. Ballari. 3 0
Embitee Iron & Steel Pvt. Ltd, Ballari. 6 0
Gayatri Metals Pvt Ltd, Belagal, Distt. Ballari. 3 0
Janki Corp. Ltd, Sidiginamola, Distt. Ballari. 180
Haryana Steel and Power, Shanthigrama, 3 5Distt. Hassan.
Hare Krishna Metallics Pvt Ltd, Hire Baganal, 7 5Distt. Koppal.
Hospet Ispat Pvt. Ltd, 6 0Allanagar Bagnal Road, Distt. Koppal.
Hothur Ispat Pvt. Ltd, Veniveerpur, 6 0Distt. Ballari.
KMMI Steel Pvt. Ltd, Yerabanahally, 120Distt. Ballari.
Mastek Steels Pvt. Ltd, Halakundi, 105Distt. Ballari.
Noble Distillaries & Powers Ltd, 7 2Sirivar, Distt. Ballari.
PGM Ferro Steel Pvt. Ltd, Hariganadani, 6 0Distt. Ballari.
Popuri Steels Ltd, Halakundi, 3 0Distt. Ballari.
Rayon Steel Pvt Ltd, Veniverapur, 6 0Distt. Ballari.
Rengineni Steel Pvt. Ltd, Halakundi, 2 5Distt. Ballari.
Shree Venkteshwara Sponge & Power Ltd, 3 0Halakundi, Distt. Ballari.
Yashshvi Steel & Alloys Ltd, Halakundi, 3 0Distt. Ballari.
Ferro AlloysDandeli Steel & Ferro Alloys Ltd, Dandeli. 6
Sandur Manganese & Iron Ore Ltd, Vyasankere 2 4Distt. Ballari.
S.R. Chemicals & Ferro Alloys Ltd, 0.3Honaga, Distt. Belagavi.
Thermit Alloys Pvt. Ltd, Shivamogga. 1.2
Petroleum RefineryMRPL, Mangaluru. 15000
G; Grinding UnitNote: Data for fertilizer and cement industries is taken fromIndian Fertilizer Scenario, 2016/FAI Statistics, 2015-16 andSurvey of Cement Industry & Directory, 2016 respectively.