indian minerals yearbook 2019
TRANSCRIPT
1
MANGANESE ORE
Indian Minerals Yearbook 2019 (Part-III: Mineral Reviews)
58th Edition
MANGANESE ORE
(FINAL RELEASE)
GOVERNMENT OF INDIA MINISTRY OF MINES
INDIAN BUREAU OF MINES
Indira Bhavan, Civil Lines, NAGPUR – 440 001
PHONE/FAX NO. (0712) 2565471
PBX : (0712) 2562649, 2560544, 2560648 E-MAIL : [email protected]
Website: www.ibm.gov.in
August, 2021

2
INDIAN MINERALS YEARBOOK 2019 - VOL.III
Manganese occurs as silvery grey in colour andis very hard and brittle in nature. It is always
available in combination with iron, laterite and otherminerals. Manganese in alloy form is an essential inputin steel making and steel is one of the most importantindicators of growth in the industrial economy of anycountry. In recent years, the trade volume of manganeseore has grown world over and also in India. Presently,India is one of the major importers of manganese ore inthe world. Manganese ores of major commercialimportance are: (i) pyrolusite (MnO2, Mn about 63.2%);(ii) psilomelane (manganese oxide, containing water andvarying amounts of oxides of Ba, K and Na as impurities;(Mn commonly 45-60%); (iii) manganite (Mn2O3.H2O,Mn about 62.4%); and (iv) braunite (3Mn2O3, MnSiO8,Mn about 62% and SiO2 about 10%).
Indian manganese ore deposits occur mainly asmetamorphosed bedded sedimentary depositsassociated with Gondite Series (Archaeans) ofMadhya Pradesh (Balaghat, Chhindwara & Jhabuadistricts), Maharashtra (Bhandara & Nagpur districts),Gujarat (Panchmahal district), Odisha (Sundargarhdistrict) and with Kodurite Series (Archaeans) ofOdisha (Ganjam & Koraput districts) and AndhraPradesh (Srikakulam & Visakhapatnam districts).
RESERVES/RESOURCESThe total reserves/resources of manganese
ore in the country as on 1.04.2015 has been placedat 495.87 million tonnes as per NMI database,based on UNFC system. Out of these, 93.47 milliontonnes are categor ised as Reserves and thebalance 402.40 million tonnes are in the RemainingResources category. Gradewise, Ferromanganesegrade accounts for 7%, Medium grade 11%, BFgrade 28% and the remaining 54% are of Mixed,Low, Others, Unclassified, and Not-known gradesincluding 0.17 million tonnes of Battery/Chemicalgrade.
Statewise, Odisha tops the total reserves/resources with 44% share followed by Karnataka22%, Madhya Pradesh 12%, Maharashtra & Goa7% each, Andhra Pradesh 4% and Jharkhand 2%.Rajasthan, Gujarat, Telangana and West Bengaltogether shared the remaining 2% resources(Table- 1).
20 Manganese Ore
EXPLORATION & DEVELOPMENTThe exploration and development details, if
any are given in the Review on "Exploration &Development" under "General Reviews".
PRODUCTION AND STOCKSThe production of manganese ore at
2,820 thousand tonnes during 2018-19 increased byabout 8% as compared to that in the previous year.
There were 140 reporting mines during 2018-19 asagainst 149 in the previous year. Besides, manganeseore production was reported as associate mineral by12 mines in 2018-19.
In 2018-19, twenty-four Public Sector mines jointlyaccounted for 46% of the total production. Thecontribution of captive mines was 10% of the totalproduction.
As regards gradewise composition of productionin 2018-19, 68% of the total production was of lowergrade (below 35% Mn), 21% of medium grade (35-46%Mn) and 10% was of high grade (above 46% Mn).Production of manganese dioxide was 35,783 tonnesduring the year.
Madhya Pradesh, the leading manganese oreproducing State, accounted for 33% of the totalproduction in 2018-19, which is followed byMaharashtra (27%) and Odisha (16%) (Tables- 2 to 6).

3
MANGANESE ORE
Tabl
e –
1 : R
eser
ves/
Res
ourc
es o
f M
anga
nese
Ore
as
on 0
1.04
.201
5(B
y G
rade
s/St
ates
)(I
n '0
00 t
onne
s)
Res
erve
sR
emai
ning
Res
ourc
esTo
tal
Stat
e/G
rade
Prov
edPr
obab
leTo
tal
Feas
ibili
tyPr
e-fe
asib
ility
Mea
sure
dIn
dica
ted
Infe
rred
Rec
onns
aiss
ance
Tota
lR
esou
rces
STD
111
STD
121
STD
122
(A)
STD
211
STD
221
STD
222
STD
331
STD
332
STD
333
STD
334
(B
)(A
+B)
All
Indi
a :
To
tal
6298
219
715
1077
893
475
7074
244
606
7382
318
189
4280
313
5722
1651
340
2399
4958
74
By
Gra
des
Bat
tery
/Che
mic
al-
--
-4
912
426
112
–16
716
7Fe
rro-
man
gane
se70
6917
4024
2811
237
4241
3219
4230
1288
5236
6602
466
2528
236
520
Med
ium
2299
-97
532
7411
545
2053
1248
944
813
3321
424
116
4940
952
683
BF
8195
873
2167
1123
529
841
7823
2111
430
1110
853
5173
152
8812
9662
1408
97M
ixed
1199
331
015
1222
449
533
6122
6262
1198
811
2619
518
2103
0M
ediu
m &
BF
mix
ed68
1215
0614
8298
0045
7123
6741
9952
1553
5316
032
221
3795
747
757
Ferr
o-m
anga
nese
,m
ediu
m &
BF
mix
ed25
038
1251
529
137
844
5952
4497
1125
541
495
3210
195
3341
878
7972
3Fe
rro-
man
gane
se &
BF
580
1402
636
2618
137
8185
4811
1358
912
3317
4560
2328
025
898
Low
(-)
25%
Mn
1087
349
469
1905
8575
743
6483
3916
4040
3547
8227
386
2929
1B
enef
icia
ble
1389
974
1423
3786
680
8401
226
-26
014
3745
6015
565
1953
1O
ther
s84
5616
617
687
9828
1014
5913
9018
887
2845
-87
8017
578
Unc
lass
ifie
d80
214
742
113
7020
9453
5341
8484
4953
5384
6222
115
2348
4N
ot-K
now
n56
39-
9568
-68
-15
611
08-
1400
1495
By
Stat
esA
ndhr
a Pr
ades
h22
3563
720
8649
5867
538
777
318
832
2069
8745
712
687
1764
5G
oa-
--
-13
954
1511
9177
4826
294
64-
3441
634
416
Guj
arat
708
--
708
--
--
-21
80-
2180
2888
Jhar
khan
d18
40-
328
2168
1710
795
1476
-17
841
7711
2694
6111
629
Kar
nata
ka91
96-
150
9346
1400
310
225
1143
014
9873
0654
333
2923
1017
1811
1064
Mad
hya
Prad
esh
2022
767
6029
0429
891
5802
2779
6421
325
1048
120
15-
2782
357
713
Mah
aras
htra
1086
717
8710
5513
710
1974
4966
7207
-53
5033
6943
2291
036
619
Odi
sha
1670
310
528
3413
3064
332
622
2394
237
292
1613
015
119
4876
411
889
1857
6021
6403
Raj
asth
an10
51-
647
1697
--
--
-40
30-
4030
5727
Tela
ngan
a15
63
196
355
2-
46-
886
203
7612
1415
68W
est
Ben
gal
--
--
--
--
-20
0-
200
200
Fig
ures
rou
nded
off

4
INDIAN MINERALS YEARBOOK 2019 - VOL.III
The mine-head closing stock was 2,889 thousandtonnes for the year 2018-19 as against 1,951 thousandtonnes for the previous year [(Tables - 7 (A) and 7 (B)].
Table – 2 : Principal Producers of Manganese Ore, 2018-19
Location of mineName & address of Producer
State District
MOIL Ltd,MOIL Bhavan, Madhya Pradesh Balaghat1A, Katol Road, Chhaoni,Nagpur- 440 013 Maharashtra BhandaraMaharashtra Nagpur
Sandur Manganese Karnataka Ballari& Iron Ores Ltd,No. 9, Bellary Road,Sadashivanagar,Bengaluru- 560 080.Karnataka
Tata Steel Ltd, Odisha KeonjharBombay House,24, Homi Mody Street, Fort,Mumbai- 400 001,Maharashtra
R.B.S.S. Durga Prasad Andhra Pradesh Vizianagaram& F.N. Das,Sriram Nagar,Garividi Railway Station,Distt Vizianagaram-535 101Andhra Pradesh
M/S Suryavansham Madhya Pradesh JabalpurMining & Minerals (P) Ltd,67/2, Patrakar Colony,Indore- 452 001Madhya Pradesh
Mangilal Rungta, Odisha KeonjharRungta Office,Main Road, Barbil,Distt Keonjhar,Odisha-758 035
S. R. Ferro Alloys, Madhya Pradesh Jhabua9, Sidheswar Colony,Distt Jhabua- 457 661.Madhya Pradesh
S.K. Sarawagi & Co. Pvt.Ltd, Andra Pradesh Vizianagaram10/1/31, Signature Towers,Level -4, Waltair Uplands,Distt Visakhapatnam,Andhra Pradesh-530 003
Aryan Mining & Trading Odisha SundargarhCorporation (P) Ltd,P1, Hide Lane, Aryan House, 8th Floor,Kolkata - 700 073
Shobha Minerals Madhya Pradesh Jabalpur765, Napier Town,Distt Jabalpur - 482 001Madhya Pradesh
The average daily employment of labour inmanganese ore mines was 14,096 in 2018-19 as against12,903 in the previous year.

5
MANGANESE ORE
Table–3 : Principal Producers of Manganese Dioxide, 2018-19
Location of mineName & address of Producer
State District
MOIL Ltd, Maharashtra BhandaraMOIL Bhavan,1A-Katol Road,Nagpur-440 013,Maharashtra
Tata Steel Ltd, Odisha KeonjharBombay House24, Homi Mody Street, Fort,Mumbai- 400 001,Maharashtra
Rungta Mines Ltd, Odisha Sundargarh8A, Express Tower,42A, Shakespeare Sarani,Kolkata-700 017,West Bengal
Mangilal Rungta, Odisha KeonjharRungta Office,Main Road, Distt KeonjharBarbil-758 035,Odisha
M/s Bonai Industrial, Odisha SundargarhCompany Ltd, Rungta Office,Main Road, Barbil,Keonjhar-758 035,Odisha
Table – 4 : Production of Manganese Ore, 2016-17 to 2018-19(By States)
(Quantity in tonnes; Value in ` '000)
2016-17 2017-18 2018-19 (P)State
Quantity Value Quantity Value Quantity Value
India 2395134 16248429 2599815 19907474 2820227 22702512
Andhra Pradesh 232257 729003 172174 706314 293279 1238252
Gujarat 43057 20605 18362 11496 - -
Jharkhand 508 3440 4783 44527 4785 43752
Karnataka 261372 1159755 294261 1541069 332162 2090722
Madhya Pradesh 650316 4532518 837041 6760106 944207 7820952
Maharashtra 604300 6181596 731457 7243631 761424 8225757
Odisha 587517 3547363 516862 3497593 464665 3197782
Rajasthan 2545 7635 7502 22506 9410 28230
Telangana 13262 66514 17373 80232 10295 57065

6
INDIAN MINERALS YEARBOOK 2019 - VOL.III
Table – 5 (A) : Gradewise Production of Manganese Ore, 2017-18(By Sectors/States/Districts)
(Quantity in tonnes; Value in ` '000)
State/ Production By Grades: Mn Content TotalDistrict No. of
mines MnO2 46% and 35% to 25% to below 25% Quantity Valueabove below 46% below 35%
India 149(11) 15783 259088 595107 1276874 452963 2599815 19907474
Public Sector 2 4 2994 178718 363341 627210 54328 1226591 12036156
Private Sector 125(11) 12789 80370 231766 649664 398635 1373224 7871318
Andhra Pradesh 2 7 - - 19380 57784 95010 172174 706314
Vizianagaram 2 7 - - 19380 57784 95010 172174 706314
Go a 3 * - - - - - - -
South Goa 3 * - - - - - - -
Gujarat 1 - - - - 18362 18362 11496
Panchmahal 1 - - - - 18362 18362 11496
Jharkhand 3(1) - - 1830 2946 7 4783 44527
Singhbhum (West) 3(1) - - 1830 2946 7 4783 44527
Karnataka 10(2) - - 37816 178873 77572 294261 1541069
Ballari 2(2) - - 27816 169230 58460 265506 1434947
Chitradurga 3 - - - - 11567 11567 27457
Davanagere 4 - - - 9643 6245 15888 75740
Tumakuru 1 - - - - 1300 1300 2925
Madhya Pradesh 42(4) - 156652 106778 387796 185815 837041 6760106
Balaghat 31(1) - 149419 90007 310380 30004 579811 5455270
Chhindwara 4 - 7233 16771 13991 3351 41345 495184
Jabalpur 6(3) - - - - 152460 152460 564641
Jhabua 1 - - - 63425 - 63425 245011
Maharashtra 2 4 2994 29927 309289 353346 35901 731457 7243631
Bhandara 3 2994 7386 198732 256522 19858 485492 4777772
Nagpur 2 1 - 22541 110557 96824 16043 245965 2465859
O dis ha 33(4) 12789 72509 120014 283939 27611 516862 3497593
Keonjhar 19(2) 9993 71332 108453 160731 15346 365855 2230855
Sundargarh 14(2) 2796 1177 11561 123208 12265 151007 1266738
Rajasthan 1 - - - 7502 - 7502 22506
Banswara 1 - - - 7502 - 7502 22506
Telangana 5 - - - 4688 12685 17373 80232
Adilabad 5 - - - 4688 12685 17373 80232
Figures in parentheses indicate associate mines of iron ore, la terite , l imestone and quartz.* Only labour reported.

7
MANGANESE ORE
Table – 5 (B) : Gradewise Production of Manganese Ore, 2018-19 (P)(By Sectors/States/Districts)
(Quantity in tonnes; Value in ` '000)
State/ Production By Grades: Mn Content TotalDistrict No. of
mines MnO2 46% and 35% to 25% to below 25% Quantity Valueabove below 46% below 35%
India 140(12) 35783 291845 577628 1216233 698738 2820227 22702512
Public Sector 24 29689 167385 365573 659908 67856 1290411 13663638
Private Sector 116(12) 6094 124460 212055 556325 630882 1529816 9036874
Andhra Pradesh 2 7 - - 14240 51109 227930 293279 1238252
Vizianagaram 2 7 - - 14240 51109 227930 293279 1238252
Go a 2 * - - - - - - -
South Goa 2 * - - - - - - -
Gujarat 1 * - - - - - - -
Panchmahals 1 * - - - - - - -
Jhar khand 4(1) - - 1134 3643 8 4785 43752
Singhbhum (West) 4(1) - - 1134 3643 8 4785 43752
Karnataka 9(2) - - 65092 173704 93366 332162 2090722
Ballari 1(2) - - 65092 162909 61871 289872 1957597
Chitradurga 3 - - - - - 11930 23624
Davanagere 4 - - - 10795 18615 29410 106392
Tumakuru 1 - - - - 950 950 3109
Madhya Pradesh 40(5) - 149748 102449 439673 252337 944207 7820952
Balaghat 30(1) - 144874 89168 366342 43953 644337 6683428
Chhindwara 4 - 4874 13281 6809 7991 32955 376309
Jabalpur 5(4) - - - 1 0 200393 200403 429068
Jhabua 1 - - - 66512 - 66512 332147
Maharashtra 2 0 29689 22632 311469 339160 58474 761424 8225757
Bhandara 2 29689 319 182059 250342 41658 504067 5047695
Nagpur 1 8 - 22313 129410 88818 16816 257357 3178062
O d is ha 30(4) 6094 119465 83244 194962 60900 464665 3197782
Keonjhar 17(2) 5437 119236 78030 127131 59993 389827 2499890
Sundargarh 13(2) 657 229 5214 67831 907 74838 697892
Rajasthan 1 - - - 9410 - 9410 28230
Banswara 1 - - - 9410 - 9410 28230
Telangana 6 - - - 4572 5723 10295 57065
Adilabad 6 - - - 4572 5723 10295 57065
Figures in parentheses indicate associated mines of iron ore, laterite, limestone and quartz.
* Only labour reported.

8
INDIAN MINERALS YEARBOOK 2019 - VOL.III
Table – 6 : Production of Manganese Ore, 2017-18 and 2018-19(By Frequency Groups)
(Quantity in tonnes)
No. of mines Production Percentage in total CumulativeProduction Production percentageGroup
2017-18 2 01 8-1 9 (P) 2017-18 2 01 8-1 9 (P) 2017-18 2 01 8-1 9 (P) 2017-18 2 01 8-1 9 (P)
Total 149(11) 140(12) 2599815 2820226 100.00 100.00 - - Up to 1000 6 9 65(1) 8859 8687 0.34 0.31 0.34 0.31 1001 - 5000 37(5) 25(5) 108143 81038 4.16 2.87 4.5 3.18 5001 - 10000 13(1) 18(1) 99386 144284 3.82 5.12 8.32 8.3 10001 - 20000 8(3) 8(1) 152241 130872 5.86 4.64 14.18 12.94 20001 - 30000 3 4(1) 70222 110639 2.70 3.92 16.88 16.86 30001 - 40000 3 4(1) 103734 171972 3.99 6.10 20.87 22.96 40001 - 50000 2(1) 2(1) 132948 142865 5.11 5.07 25.98 28.03 50001 and above 14(1) 14(1) 1924282 2029869 74.02 71.97 100.00 100.00
Figures in parentheses indicate associated mines of iron ore, laterite, limestone and quartz.
Table – 7 (A) : Mine-head Closing Stocks of Manganese Ore, 2017-18(By States/Grades)
(In tonnes)
Grades : Mn content TotalState Quantity
MnO2 46% and 35% to 25% to below 25%above below 46% below 35%
India 3588 26313 100487 461635 1358803 1950826Andhra Pradesh - - 2 9 45004 21431 66464Goa - - - - - -Gujarat - - - - 646042 646042Jharkhand 1 2 4 1845 5269 245 7384Karnataka - - 250 51440 205631 257321Madhya Pradesh - 22122 17190 40643 352729 432684Maharashtra 1167 968 33583 26267 26068 88053Odisha 2420 3199 47590 291137 104426 448772Rajasthan - - - 1367 - 1367Telangana - - - 508 2231 2739
Table – 7 (B) : Mine-headClosing Stocks of Manganese Ore, 2018-19 (P)(By States/Grades)
(In tonnes)
Grades : Mn contentState
MnO2 46% and 35% to 25% to below 25% Total above below 46% below 35% Quantity
India 17443 20732 74051 388043 2388946 2889215Andhra Pradesh - - 1 8 33432 19278 52728Goa - - - - - -Gujarat - - - - 597329 597329Jharkhand 1 2 3 779 3596 189 4588Karnataka - - 9 8 25174 214917 240189Madhya Pradesh - 14663 20001 53353 476073 564090Maharashtra 15074 733 17767 22824 25123 81521Odisha 2368 5313 35389 247113 1054848 1345030Rajasthan - - - 1529 - 1529Telangana - - - 1022 1189 2211

9
MANGANESE ORE
Quantity of Manganese Production in Different States, 2018-19
Value of Manganese Production in Different States, 2018-19
Value `2270crore

1 0
INDIAN MINERALS YEARBOOK 2019 - VOL.III
MINING, PROCESSING,MARKETING & TRANSPORT
Manganese ore mining in the country is carriedout by opencast as well as by underground methods.Of the 142 mines, 8 are underground(3 in Madhya Pradesh and 5 in Maharashtra). Sevenunderground mines were operated byMOIL Ltd, a Public Sector company, and one byM/s J.K. Minerals, Balaghat (Madhya Pradesh), aprivate company. All the underground minesare mechanised or semi-mechanised and adoptcut and fill method of stoping. In Kandri mine,hydraulic sand stowing has been introduced inplace of manual filling system. This system is faster,cheaper and requires less manpower. Conventionaltimber supports are replaced by cable bolting pre-mining support to increase safety and productivity.In Balaghat underground mechanised mine,overhand flat back cut-and-fill method with rockbolting support and sand stowing is being practisedto fill up the voids with a level interval of 30 m andsize of stope block as 30 m x 30 m to 60 m x 30 m. SideDump Loaders (SDL) of 0.66 cu. m bucket capacitywere also deployed in underground levels formechanised loading of run -of- mine (r.o.m.) in stopes.Tyre mounted Rocker shovel was also introduced inBalaghat mine for mechanised loading of ore fromore drive at stripping area. Deepening of high speedvertical shaft up to 750 m is in progress in Balaghat,up to 169 m in Chikla mine, up to 245 m in Kandrimine and up to 160 m in Mansar mine of MOIL. Sinkingof high speed vertical shafts up to 160 m, 330 m and324 m is in progress at Mansar, Gumgaon and Ukwamines, respectively. MOIL has also plans to increaseits production from present level of 1.2 million tonnesto 3.00 million tonnes by 2030.
The open-pits are usually worked manually bybenching method, using portable compressors,jackhammers and dumper trucks. Tirodi mine of MOILis worked by opencast mechanised method. Height ofthe benches in overburden is kept at 7.5 m and that inthe ore at 6 m. Drills of 100 mm dia. with 0.9 to 1.7 m3
capacity of shovels and 20-25 tonnes dumpers are usedfor production, loading and transport.
The workings vary from shallow depth inlateritoid-type deposits in Odisha, Karnataka and Goato deep operations in deposits of a more regular
nature found in Madhya Pradesh, Maharashtra andAndhra Pradesh. Bulldozers are used where theoverburden is soft. In a few cases, tramways are laidupto the working face and loaded tubs are pushedmanually to the dumping ground. In Odisha, Goaand Karnataka, ore is worked by loosening theground either with crowbars or by blastings. Afterpicking up manganese ore, the waste is removed tothe dumping ground. Mining of bedded ore inMadhya Pradesh and Maharashtra is generallycarried out by drilling and blasting.
Hand sorting and visual grading are adoptedwidely to upgrade the ore. Scrubber is also used forwashing the ore at some mines. Manual as well asmechanised jigging is done in a few mines.
MOIL has set up an integrated manganese orebeneficiation plant at Dongri Buzurg mine inBhandara district, Maharashtra, with 4 lakh tonnesannual capacity to process r.o.m. The plant isequipped with handling, crushing, wet screening,drying and magnetic separation facilities in onecomplex. It has also installed a manganese orebeneficiation plant of 5,00,000 tonnes per annumcapacity at Balaghat mine in order to conserve mineraland profitably utilise the low/medium- grade ore. Theplant facilities include crushing, wet screening,classification and jigging operations.
The plant upgrades the low/medium-grade finesin to h igh grade and the value addi t ion isaround 3-4 times, in case of low-grade fines. TheCompany is plann ing to set up a sin teringplant for agglomeration of these fines. Afteragglomerat ion , these fines wil l be ut i l isedin ferroalloys production.
Most of the producers market manganese oredirectly to the industrial units. In a few cases,especially in case of supplies of special type of oreor a semi-processed product, middlemen are foundto be involved in marketing. Ore from mines is usuallysold to the domestic consumers, either at the rail-head or ex-plant. In cases of Integrated Iron & Steeland Ferromanganese Industry, the units draw theirsupplies largely from captive mines. However, specialore types for specific purposes are obtained fromother producers. In case of ore meant for exports,producers other than MOIL Ltd supply it to MMTC,the canalising agency, either at rail-head or at the port.

1 1
MANGANESE ORE
Transport of manganese ore from mines tora il -head is general ly done by t rucks fromwhere it is transported to ports by rail wagons. Fromthe mine of MOIL in Balaghat district, MadhyaPradesh, the ore is transported by aerial ropewaysto the loading bins at the rail-heads. Battery locowas introduced for underground transport of r.o.m.tub from ore pass chute to skip bunker. In Goa, ore inbulk is carr ied by road-cum-river routes uptoMormugao harbour and in a few cases by rail wherethe mines are close to the railways. The ore loadingat river-head into barges is carried out mechanically.
ENVIRONMENTAL PROTECTIONIn order to embark upon low-carbon growth
trajectory, MOIL has taken up some measures, suchas, recycle and reuse of water for beneficiation,construct ion of strong parapet wal ls andafforestation in all its mines. The Company has alsoset up a wind energy farm of 20 MW capacity atDewas, Madhya Pradesh. The Company has alsoplans to install 10.5 MW capacity solar power plantat all its mines in Maharashtra and Madhya Pradesh.R&D work was taken up by MOIL to improve thesafety, productivity and environmental standards inthe mines by introducing newer technology inconsultation with reputed academic and CSIR-R&Dinstitutions of the country.
Various energy saving projects are underprocess, such as, installation of solar roof top atadministrative buildings at all mines; five MW solarpower projects in mine areas in Maharashtra; 5.5 MWsolar power projects in Madhya Pradesh as well asinstallation of small size compressors in undergroundmines for energy saving.
Manganism–a health condition attributed tomanganese poisoning–has been reported to bedetected in case of five persons working with BHPBilliton's Metalloys, a manganese alloy plant inSouth Africa. Manganism shows symptoms similarto Parkinson's disease and psychotic behaviour butconditions of development of the disease are notproperly understood.
USES & SPECIFICATIONSClassification of manganese ore, ferruginous
manganese ore, siliceous manganese ore, dioxidemanganese ore, and manganiferous iron ore is laiddown by BIS vide specification no. IS: 11895- 2006(Reaffirmed 2008). Manganese ore is an importantmaterial in iron and steel metallurgy, where it is usedboth in the ore form and as ferromanganese.Manganese improves strength, toughness, hardnessand workability of steel, acts as a deoxidiser anddesulphuriser and also helps in getting ingots freefrom blowholes. About 90 to 95% world productionof manganese ore is used in metallurgy of iron andsteel. High amount of phosphorous makes themanganese ore unsuitable for its metallurgical use,whereas, high phosphorous and high iron contentsmake it unsuitable for Battery Industry. Manganesehas no sa t isfactory subst i tute in it s majorapplications. The specifications of manganese oreby different industries are detailed below:
In Iron & Steel Industry, the BIS:11281-2005(Reaffirmed 2008) specification is laid down formanganese ore. However, specifications based onthe user industry indicate that normally manganeseore containing 28 to 35% Mn is used. Ore sizegenerally varies from 10 to 40 mm. For otherconstituents general stipulations are Fe: 16 to 22%,SiO2 : 2 to 8%, Al2O3 : 5 to 8% and P: 0.3% maximum.
For manganese ore used in FerromanganeseIndustry, besides manganese con tent , otherimportant considerations are high manganese to ironrat io and a very low con ten t of deleter iousphosphorous. Specifications of manganese ore forferromanganese are prescribed by the Bureau ofIndian Standards vide IS: 4763-2006, (SecondRevision, Reaffirmed 2010). BIS has also laid downthe specifications of manganese ore sinters forblending for ferromanganese production videIS:12596-1989 (Reaffirmed 2009). User's specificationsof manganese ore for Ferromanganese/ Silico-manganese industries are furnished in Table- 8.
Table – 8 : User's Specifications of Manganese Ore in different Ferromanganese/Silico-manganese Units
Name and location of plant Specifications of ore consumed
Andhra PradeshFerro-Alloys Corp. Ltd, Mn: 70-75%Shreeram Nagar, Dist. Vizianagram. C: 6-8%Nav Bharat Ferro-Alloys Ltd, Mn: 28-50%, P: 0.1-0.3%, SiO2: 8-30%Paloncha, Khammam. Fe :5-8%
(Contd.)

1 2
INDIAN MINERALS YEARBOOK 2019 - VOL.III
Name and location of plant Specifications of ore consumed
ChhattisgarhSarda Energy & Minerals Ltd Mn: 28-30% (Low P)Raipur Mn: 37-40%, 42-44%,
46% (High P)Monnet Ispat & Energy Ltd, Mn: 28-46%Raipur Fe : 5-16%
SiO2: 6-34%S & P: 0.05-0.28%Size: 0-100% (lumps & fines)
Hira Power & Steel Ltd, Raipuri) Jain Carbides & Chemicals Ltd, Raipur (Unit-I). Mn: 32-35%ii) Jain Carbides & Chemicals Ltd, Raipur (Unit-II). Mn: 32-35%KarnatakaS. R. Chemicals & Ferro Alloys, Belagavi. Mn: 38-40%, Fe: 18-23%Thermit Alloys Ltd, Shivamogga. Mn: 48-54%
KeralaINDSIL Hydro Power and Fe-Mn ratio 1:3 toManganese Ltd, 5% (50%) 1:5 toPallatheri 8% (50%)Palakkad P: 0.05% max.
Al2O3: 3 to 5% max.
Madhya PradeshMOIL, Ferro-manganese Plant, Mn: 46-48%Bharveli, Dist. Balaghat.MaharashtraChandrapur Ferro Alloys Ltd,(Formerly Maharashtra Electro-Smelt Ltd) Mn: 38-46%,Chandrapur Fe: 6-17%
SiO2+Al2O3: 10-16%P: 0.5-0.25% max.+100 mm, 10% max.+10-100 mm, 80-85% min.+5-10 mm, 10% max.
Nagpur Power & Industries Ltd, Mn: 42-46%,Nagpur. Fe: 7-8%,
SiO2: 3.6%,Al2O3: 6-7%,
P: 0.10-0.12%Size: 5-25 mm
Natural Sugar & Allied Ind. Ltd, Size: 10-80 mmSai Nagar Ranjani, Dist. OsmanabadO dis haTata Steel Ltd, Joda, Mn: 43%, min. (for FeMn)Kendujhar 36% min. (for SiMn),
Size: 10-75 mm(for FeMn & SiMn)Captive Mn Ore Size (mm)Below 35% (10-75) + 5%35% to 46% (10-75) + 5%46% to 49% (10-75) + 5%Dioxide + 49% (10-75) + 5%MOIL, Mn OreBelow 35% (10-75) + 5%Imported Mn46 to 49% (10-75) + 5%
Tamil NaduSilcal Metallurgical Ltd, Mn: 35-40% & aboveRamanuja Nagar, Coimbatore Size: 35 mmWest BengalCosmic Ferro Alloys Ltd, Bankura Size: 75 mm
Table-8 (Contd.)

1 3
MANGANESE ORE
Manganese dioxide is used for manufacturingdry cell batteries in which it functions as a depolariserof hydrogen. For use in dry cell battery, BIS hasprescribed Specification No. IS:11153-1996 (FirstRevision, Reaffirmed 2010) for manganese dioxide.Suitability of ore depends not only on manganesedioxide content but also on its crystallographicstructure. Ore having predominant gamma structure isrequired. The ore must have high manganese dioxideand low iron content, a certain degree of porosity andmoderate hardness. It should be free from metalliccompounds, such as, copper, nickel, cobalt, arsenic,lead and antimony, which are electronegative to zinc(container). User industry specifications are MnO2 70%(min.), Fe 6% (max.), moisture 4% (max.), Cu 0.02% (max.)and Ni 0.02% (max.). The size requirement lays downthat 90% material should pass through 300 mesh and100% through 100 mesh. User industry specificationsfor Electrolytic Manganese Dioxide (EMD) used in drycell battery are MnO2 90% (min.), Fe (as oxide) 0.05%(max.), moisture 4% (max.), Pb 0.15% (max.) and pH 4.5to 5.6. The size requirements are same as those formanganese dioxide ore.
Manganese ore is also used in the manufacture ofvarious chemicals, such as, potassium permanganate,hydroquinone, manganese sulphate, manganesechloride, manganese phosphate, etc. In ChemicalIndustry, generally high-grade material is used forpotassium permanganate. Ore containing MnO280% (min.), SiO2 5% (max.), Fe2O3 5% (max.) and200 to 250 mesh ore size is used. In Glass Industry,ore analysing MnO2 80% (preferably 86% min.),Fe2O3 5% (preferably 0.75% max.), SiO2 2.8% (max.),Al2O3 1.1% (max.), BaO 1.3% (max.), CaO 0.4% (max.)and MgO 0.4% (max.) is consumed.
Requirement of manganese dioxide forExplosive and Pyrotechnic industries as laid downin IS : 5713-1981 (First Revision, Reaffirmed 2011)
by BIS is as follows: MnO2 80% by mass (min.),moisture 1% (max.), matter soluble in water 0.2% (max.)and water soluble chlorides (as NaCl) 0.05% (max).There are three types of material with abovecomposition which show variation in their particle size:Type A, Type B and Type C. Particle size (max.) is 600microns for Type A, 150 microns for Type B and74 microns for Type C ore. In addition, grit contentshould be 1% (max.) for Type A ore. For Match Industry,the MnO2 content shall be 50% (min.).
Pyrolusite is used generally to impart glaze to thepottery and to make coloured bricks. It also finds useas driers for oils, varnishes and paints. Manganesesulphide is used in the manufacture of salts and in calicoprinting. Manganese chloride is used in cotton textileas a bronze dye. Manganese salts are used inphotography and in leather and matchbox industries.
CONSUMPTIONThe consumption of manganese ore in all industries
was about 2.06 million tonnes in 2018-19 as against2.70 million tonnes in 2017-18. Ferroalloys industriesaccounted for about 89% consumption followed byIron & Steel (10%). The remaining (1%) was shared byBattery, Electrode, Chemical, Zinc Smelter and AlloySteel industries. The apparent consumption ofmanganese ore was 5548 thousand tonnes during theyear 2018-19.(Table- 9).
The consumption of ferromanganese in 2017-18decreased by 36% to 51 thousand tonnes from 79thousand tonnes in the previous year. Iron & steelIndustry was the bulk consumer of ferromanganeseaccounting for about 87% consumption in 2017-18.The remaining 13% was consumed in alloy steel,foundry and electrode industries. Consumption ofsilicomanganese which was 161 thousand tonnes in2016-17 decreased to 123 thousand tonnes in 2017-18(Tables- 10 & 11).
Table – 9 : Estimated Consumption* of Manganese Ore, 2016-17 to 2018-19(By Industries)
(In tonnes)
Industry 2016-17 2017-18 (R) 2018-19 (P)
All Industries 2868300 2701700 2061700
Ferroalloys 2707500 2538100 1845400
Iron & steel 131600 128100 198300
Others: (Alloy steel, 29200 35500 18000chemical, zinc smelter,Battery & electrode )
Figures rounded off* Includes actual reported consumption and/or estimates made wherever required. Paucity of data, hence coverage may not becomplete.Note: The apparent consumption of manganese ore was 5548 thousand tonnes during the year 2018-19.
1 4
INDIAN MINERALS YEARBOOK 2019 - VOL.III
Table – 10 : Consumption* of Ferromanganese,2015-16 to 2017-18
(By Industries)(In tonnes)
Industry 2015-16 2016-17 (R) 2017-18 (P)
All Industries 130700 79300 50800
Alloy steel 11900 6600 6600
Iron & steel 117100 72200 44100
Other 1700 500 100
Figures rounded off
* Includes actual reported consumption and/or estimates madewherever required; Paucity of data has posed restriction to thedata coverage on consumption.
Table – 11 : Consumption* of Silicomanganese,2015-16 to 2017-18
(By Industries)(In tonnes)
Industry 2015-16 2016-17 (R) 2017-18 (P)
All Industries 256400 161400 122600
Alloy steel 12600 9900 9900
Iron & steel 243500 151400 112700
Others 300 100 ++(Electrode, Foundry)
Figures rounded off* Includes actual reported consumption and/or estimates madewherever required; Paucity of data has posed restriction to thedata coverage on consumption.
INDUSTRYManganese alloys are the largest produced
ferroalloys in the world with a share of about 41% ofthe global production of ferroalloys. For production ofone tonne of ferro manganese, about 2.6 tonnes ofmanganese ore, 0.5 tonne of reductant and 3 MWh ofelectricity inputs are required. As per Indian FerroAlloys Producers' Association (IFAPA), the totalinstalled capacity of manganese alloys includingferromanganese/silicomanganese in the country wasestimated to be around 3.16 million tonnes per annum.
MOIL had set up a High Intensity MagneticSeparation Plant and 1,000 tpy Electrolytic ManganeseDioxide (EMD) Plant at Dongri Buzurg mine.The capacity of the EMD Plant was increased from1000 tpy to 1,500 tpy capacity during 2018-19.In 2018-19, about 992 tonnes of EMD was produced asagainst 875 tonnes in 2017-18. Ferromanganese plantof 10,000 tonnes per annum has been set up atBharveli, Balaghat. In 2018-19, 11,003 tonnes of ferro-manganese was produced as compared to 10,573 tonnesin the previous year.
FerromanganeseThe total production of various types of
manganese alloys (high-carbon ferromanganese,medium-carbon ferromanganese and low-carbonferromanganese) was about 5.18 lakh tonnes in 2018-19which was the same in the year 2017-18 as per MonthlyStatistics of Mineral Production (March, 2019- FinalRelease). It is to be noted that the data coverage ispartial and does not reflect the actual production.
SilicomanganeseSilicomanganese is a combination of 60-70%
Mn, 10-20% silica and about 20% carbon. As perMonthly Statistics of Mineral Production (March,
2019- Final Release), production of silico-manganesewas reported at 3,45,291 tonnes in 2018-19 ascompared to 3,11,326 tonnes in 2017-18. It is to benoted that the data coverage is partial and does notreflect the actual production. MOIL was consideringsetting up of ferro-manganese and silicomanganeseplants through joint venture companies with RINL andSAIL, namely, 31,000 tpy ferromanganese and 75,000tpy silico-manganese plants at Nandini near Bhilai,Chhattisgarh and a 20,000 tpy ferromanganese and37,000 tpy silicomanganese plants at Bobbili,Vizianagaram district, Andhra Pradesh with RINL.These projects are not viable at present especially onaccount of the present power tariffs of the StateElectricity Boards. Activities in respect of both thesejoint venture companies have been put on hold.
The major factor driving the production ofmanganese alloys is high production growth of lownickel austenitic stainless steel. India is emerging asthe largest producer of this steel where manganese isadded substituting the expensive nickel.Iron & Steel
Iron & Steel Industry was the second majorconsumer of manganese ore wherein manganese ore isused directly as a blast furnace feed.Details on consumption, specifications andsource of supply of manganese ore to major iron &steel plants in the country in 2017-18 and2018-19 are furnished in Table-12.Dry Battery
Dry battery Industry also consumes EMD alongwith natural manganese dioxide ore. The only oneplant of 1,000 tpy capacity producing EMD isowned by MOIL and is located in Bhandara districtof Maharashtra.

1 5
MANGANESE ORE
SUBSTITUTESCost and technology mili ta te against
substitution in major applications. However, foreconomic reasons, there is only limited substitution
in minor applications in Chemical and Batteryindustries. The Steel Industry has, however, madegreat strides in economising the use of manganese,largely through changes in steel-making techniques.
(Contd. )
Table – 12 : Consumption, Specifications and Source of Supply of Manganese Ore indifferent Iron and Steel Plants, 2017-18 and 2018-19
Production of pig iron/hot Consumption ofPlant metal ( tonnes) Mn-ore (tonnes) Specifications of Source
ore consumed2017-18 2018-19 (P) 2017-18 2018-19 (P)
Bhilai Steel Plant, Hot metal Hot metal Size: 25 to 85 mm MOIL/Bhilai Nagar, Durg 4280056 4751515 5845 6186 Mn: 30% min. TirodiChhattisgarh. SiO2: 30% max. Balaghat
Al2O3: 5% max.P: 0.3% max.
Bokaro Steel Plant, Hot metal Hot metal NA NA NA -Bokaro, Jharkhand. 4045681 4209268
Durgapur Steel Plant, Hot metal Hot metal NA NA NA -Durgapur, 2282182 2515068West Bengal.
Rourkela Steel Plant, Hot metal Hot metal NA NA - -Rourkela, Odisha. 3319398 3836421
IISCO Steel Plant, Hot metal Hot metal NA NA Mn (dry) 30% (min.) -Burnpur, NA NA -10 mm - 10.0% max.Dist. Burdwan, +40 mm - 15% max.West Bengal- 713 325.
Visvesvaraya Hot metal Hot metal NA NA - -Iron and Steel Ltd, NA NABhadravati,Shivamogga,Karnataka.
KIOCL Ltd, Hot metal Hot metal NA NA Fe: 25-50% min. MilanPellet Plant, NA NA MnO2: 44% min. Minerals,Mangaluru, SiO2 +Al2O3 : 12% max. KarnatakaDakshina Kannada,Karnataka.
Visakhapatnam NA NA NA NA Mn: 28%, (min.) Garividi,Steel Plant, Fe: 16% AndhraVisakhapatnam, SiO2: 25% max. PradeshAndhra Pradesh. Size: 10-60 mm (BF)
(-) 10 mm (SP)
IDCOL, Kalinga Iron Hot metal Hot metal NA NA Size: 10-40 mm From own/Works Ltd, NA NA NA NA local minesBarbil,Kendujhar, Odisha.
Gordan Steel Hot metal Hot metalIndia Ltd, NA NA NA NA Mn 28-35% Mn -Jaonbulapadu,Anantapur,Andhra Pradesh.
Tata Steel Ltd, Hot metal Hot metal 167 296 Mn 25% to below 35% BichakundiJamshedpur, 10948835 10839210 Mine,Jharkhand. Keonjhar

1 6
INDIAN MINERALS YEARBOOK 2019 - VOL.III
Kirloskar Ferrous Pig iron Pig iron NA NA NA NAIndustries Ltd, 588000 588000Bevinahalli, 583 234,Koppal,Karnataka.
LANCO Industries Pig iron+ Pig iron+ NA NA NA NALtd, Chittoor, (molten metal) (molten metal)Andhra Pradesh. NA NA
Visa Steel Ltd, Hot metal Hot metal NA NA below 35% Mn SiljodaKalinganagar, NA NA MinesJajpur, Odisha.
Sunflag Iron & Steel Hot metal Hot metal NA NA 25% to below -Co. Ltd, Warrthy, 35% MnBhandara, 319598 311821Maharashtra.
Jaiswal NecoIndustries Ltd, Hot metal Hot metal NA NA Mn:26-28% -Siltara, Raipur, NA NA Size:10-60 mmChhattisgarh.
Jaiswal Neco Hot metal Hot metal - - NA NAIndustries Ltd, NA NABallari, Karnataka.
Tata Metalliks Ltd, Hot metal Hot metal NA NA NA NAKharagpur, Medinipur, NA NAWest Bengal.
JSW Steel Ltd, Hot metal Hot metal NA NASalem, NA NA - -Tamil Nadu- 636 453.
JSW Steel Ltd, Hot metal Hot metal - - NA NAVidyanagari, NA NABallari, Karnataka.
Rashmi Metaliks Ltd, Hot metal Hot metal NA 450 NA NAGokulpur, 169910 172612West Midnapore,West Bengal.
Sona Alloys P. Ltd, Hot metal Hot metal NA NA NA NALonad, Pune, NA NA - - - -Maharashtra.
Aparant Iron & Pig Iron Pig Iron NA NA NA NASteel Pvt.Ltd, Goa. NA NA
Uttam Galva Hot metal Hot metalMetallics Ltd, 533036 476535 NA NA NA NABhugaon- 442 001,Wardha, Maharashtra.
Tata Metalliks Ltd, Hot metal Hot metal 9679 9576 NA NAGokulpur, Maheshpur 499540 518170West Bengal.
(Contd. )
Table - 12 (Contd)
Production of pig iron/hot Consumption ofPlant metal (tonnes) Mn-ore (tonnes) Specifications of Source
ore consumed
2017-18 2018-19 (P) 2017-18 2018-19 (P)

1 7
MANGANESE ORE
TECHNICAL POSSIBILITIESThe deep-sea nodules can be a potent ial
resource of manganese in the next decades to come.There is a trend towards using lower grades of oresin ferromanganese production. New steel-makingpractices and techniques are reducing the amount ofmanganese consumed in the process. However,counter balancing this to some extent is a trend towardshigher manganese specifications for modern steels.
TRADE POLICY
Export PolicyThe Foreign Trade Policy, 2015-20 and the
policy on export as per ITC (HS), 2018 schedule 2as follows:
HS Code Item description Policy
2602 00 Manganese ores Freeand concentratesincluding ferruginousManganese oresand concentrateswith Manganesecontent of 20% or morecalculated on the dry wet.
Import PolicyImports of manganese ore and concentrates
including fer r uginous manganese ores andconcentrates containing 20% or more manganese(calculated on dry weight basis), agglomeratedmanganese ore sinters, etc. are freely allowed.
WORLD REVIEWThe total world reserve of manganese ore
is approximately 810 million tonnes of metalcontent which is unevenly distributed (Table-13).Reserves are located in South Africa (32%), Brazil(17% ), Australia (12%), Gabon (8%), China (7%)and India (4%). Only a small fraction of globalmanganese reserves is economical. It is fact thatcontinues to prompt and support interests indeep-sea manganese nodules, which constitute anenormous untapped resource. Most nodules arefound in areas of deep-sea floor at water depthsof 5 to 7 km.The Pacific Ocean alone is estimatedto con tain about 2.5 bil lion tonnes nodulescontaining about 25% Mn, making them similar inabundance to low-grade land-based deposits.Most major steel-making nations lack manganeseresources. North America reportedly has less than
Vedanta Ltd, NA NA NA NA - -Navelim Amona,Marcela, Goa.
Neelachal Ispat NA NA NA NA - -Nigam Ltd,Kalinga Nagar,Duburi, Jajpur, Odisha.
Suraj Products Ltd, NA NA NA NA - -Barpali, Rajgangpur,Sundargarh, Odisha.
SLR Metaliks Ltd, NA NA NA NA - -A-2/452, Sector-8Rihini, Delhi, 110 085.
Jindal Saw Ltd, 455205 478861 7082 3801 Mn 25% to -Mundra, below 35%Gujarat.
SLR Metaliks Ltd, NA NA NA NA - -Narayan Devara Kere,Hagari Bommana Halli,Karnataka
Table - 12 (Conld)
Production of pig iron/hot Consumption ofPlant metal (tonnes) Mn-ore (tonnes) Specifications of Source
ore consumed
2017-18 2018-19 (P) 2017-18 2018-19 (P)

1 8
INDIAN MINERALS YEARBOOK 2019 - VOL.III
Table – 13 : World Reserves of Manganese Ore(By Principal Countries)
(In '000 tonnes of metal content)
Country Reserves
World: Total (rounded off) 81 00 00
Australia (a) 10 00 00
Brazil 14 00 00
Burma NA
China 54000
Cote d'Ivoire NA
Gabon 61000
Georgia NA
Ghana 13000
India* 34000
Kazakhstan, (concentrate) 50 00
Malaysia NA
Mexico 50 00
South Africa 26 00 00
Ukraine, (concentrate) 14 00 00
USA -
Other countries Small
Source: USGS Mineral Commodity Summaries, 2020.
(a): Joint Ore Reserve Committee compliant reserves wereabout 45 million tonnes of manganese content. _ : Zero
*: India's total reserves/resources of manganese ore as perNMI database based on UNFC system have been estimatedat 495.87 million tonnes as on 1.4.2015. _ : Zero
Table – 14 : World Production of Manganese Ore(By Principal Countries)
(In '000 tonnes)
Country 2016 2017 2018
World:Total 50800 48200 53000
Australia 5328 6172 7211
Brazil 2881 3273 3200
Chinae 15528 8500 9000
Gabon 3413 4163 4330
Ghana 2018 3004 4552
India* 2395 2589 2759
Kazakhstan 1601 1460 1427
Malaysia 701 1226 1263
South Africae 13745 13889 14918
Ukraine 1328 1758 1845
Other countries 1872 2166 2462
Source: BGS, World Mineral Production, 2014-2018.
(a): Years ended 31st March following that stated.
* India 's production o f manganese ore in 2016-17,2017-18 and 2018-19 was 2,395 thousand tonnes, 2,600thousand tonnes and 2,820 thousand tonnes, respectively.
1% world reserves and the United States is saidt o ha ve l ea n g r a de r eser ves wh i ch wou l dpoten tia lly en tai l h igh extr act ion cost. Th issituation has created an active global trade inmanganese ore and manganese alloys.
World production of manganese ore in 2018was estimated to be around 53 million tonnes ascompared to 48.20 million tonnes in 2017. SouthAfrica was the leading producer contr ibutingabout 28% followed by China (17%), Australia(14%), Ghana (9%), Gabon (8%), Brazil (6%), India(5%) and Ukraine (3%) (Table-14). Theproduction of manganese ore is linked with theproduction of steel. The Steel Industry consumesit in the form of ore and manganese alloys.
FOREIGN TRADEExports
Expor ts of Manganese Ore increasedsubstantially by 26% to 55,845 tonnes in 2018-19from 44,167 tonnes in 2017-18. Out of the total exportsin 2018-19, only 2 tonnes of manganese ore having+46% Mn of valve `55,000 was exported. Exports ofManganese Ore (Others) were at 55,843 tonnes ascompared to 19,367 tonnes in the preceding year.More than 59% of exports was to China and40% exports to Indonesia. Exports of Manganeseoxide (total) decreased by 13% to 18,035 tonnes in2018-19 as against 20,771 tonnes in 2017-18.Manganese dioxide exports in 2018-19 decreasedslightly by less than a per cent to 2,529 tonnes from2,545 tonnes in 2017-18. Exports were mainly toUAE (19%), Poland (13%), Bangladesh (11%) andKenya (10%). In 2018-19, exports of Manganese &Alloys (including waste & scrap) increased by 50%to 456 tonnes as compared to 305 tonnes in theprevious year. Exports of Manganese & Alloys(wrought & unwrought) in 2018-19 increaseddrastically by 54% to 414 tonnes as compared to269 tonnes in the previous year (Tables- 15 to 28).

1 9
MANGANESE ORE
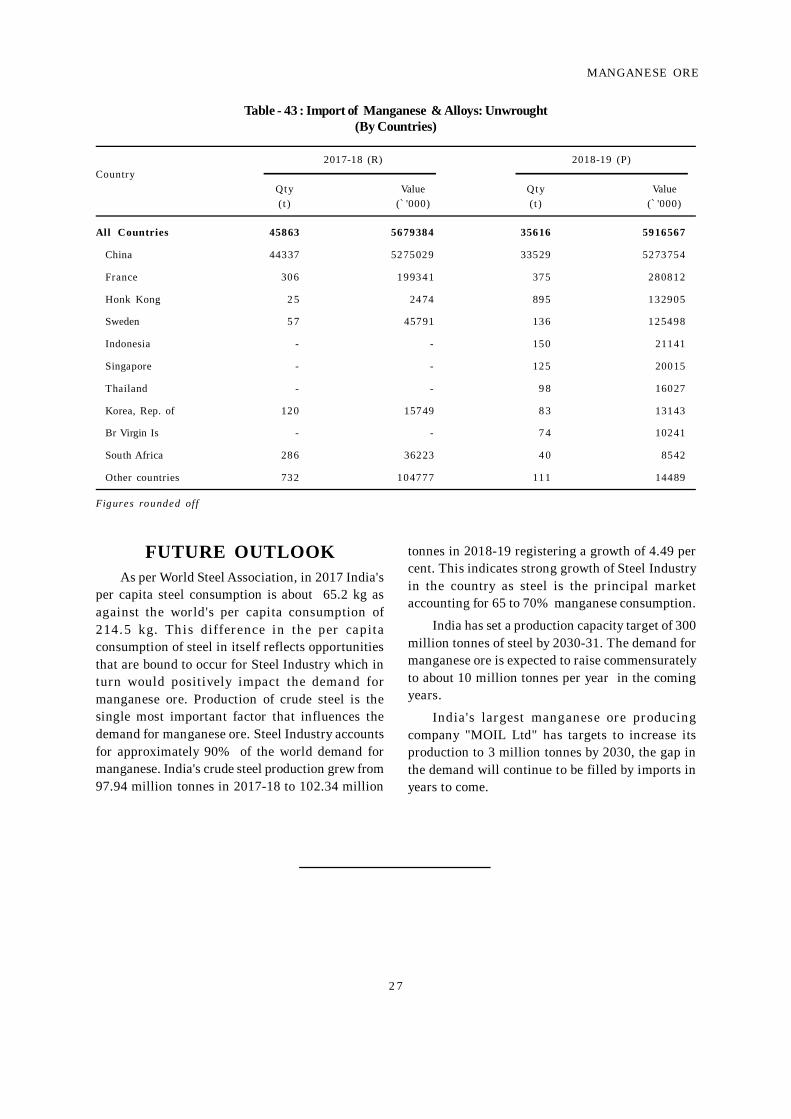
ImportsImports of Manganese Ore decreased by 23% to
2.78 million tonnes in 2018-19 from 3.63 million tonnesin the previous year. South Africa with 45% andAustralia, Brazil, Gabon, & Cote d'Ivoire with 8% eachwere the main suppliers of manganese ore in2018-19. Out of the total Manganese Ore imported,the contribution of Manganese Ore having +46%Mn was 2,19,963 tonnes (8%), Manganese Orehaving 35-46% Mn was 16,41,885 tonnes (59%),Manganese Ore having 30 to 35% Mn was 3,95,736tonnes (14%) and Manganese Ore (Others) was4,28,446 tonnes (15%). In 2018-19, imports ofManganese dioxide were 9,164 tonnes. Imports weremainly from China (68%), Belgium (15%) and Peru(14%). In 2018-19 imports of Manganese oxide (total)were 23,978 tonnes. During 2018-19, imports ofManganese & Alloys (including waste and scrap)were 45,868 tonnes, out of which Manganese &Alloys (wrought/unwrought) comprised 45,838tonnes. Imports of Manganese & Alloys NES werenegligible. Imports of Manganese Waste & Scrapwere at 28 tonnes in 2018-19 (Tables- 29 to 43).
Table – 15 : Exports of Manganese Ore : Total(By Countries)
2017-18 (R) 2018-19 (P)Country
Qty Value Qty Value(t ) (` '000) (t ) (` '000)
All Countries 44167 508784 55845 138120
Indonesia - - 22535 75396
China 43800 490447 33000 49003
Netherlands 167 9342 100 6559
Turkey 7 2 4092 5 0 3382
Sri Lanka 2 7 523 5 0 1023
Taiwan - - 1 4 978
Uganda 3 2 418 6 4 864
Nepal 2 0 1083 8 438
Kenya - - 1 1 255
Djibouti - - 1 0 184
Other countries 49 2878 3 3 7
Figures rounded off
Table – 16 : Exports of Manganese Ore (46% or more Mn)(By Countries)
2017-18 (R) 2018-19 (P)Country
Qty Value Qty Value(t ) (` '000) (t ) (` '000)
All Countries ++ 2 9 2 5 5Turkey - - 2 5 5Bangladesh ++ 2 9 - -China ++ ++ - -
Figures rounded off
Table – 17 : Exports of Manganese Ore (Others)(By Countries)
2017-18 (R) 2018-19 (P)Country
Qty Value Qty Value(t ) (` '000) (t ) (` '000)
All Countries 19367 177006 55843 138063Indonesia - - 22535 75396China 19000 158698 33000 49003Netherlands 167 9342 100 6559Turkey 7 2 4092 4 8 3328Sri Lanka 2 7 523 5 0 1023Taiwan - - 1 4 978Uganda 3 2 418 6 4 864Nepal 2 0 1083 8 438Kenya - - 1 1 255Djibouti - - 1 0 184Other countries 4 9 2850 3 3 5
Figures rounded off

2 0
INDIAN MINERALS YEARBOOK 2019 - VOL.III
Table – 19: Exports of Manganese Dioxide(By Countries)
2017-18 (R) 2018-19 (P)Country
Qty Value Qty Value(t ) (` '000) (t ) (` '000)
All Countries 2545 123550 2529 118447
UAE 3 7 2019 480 23665
UK 5 5 4602 240 20029
Poland 197 10586 319 19509
Italy 5 0 2524 235 10837
Bangladesh 233 6834 269 7576
Malaysia 6 0 3600 105 6543
Kenya 201 3309 253 4494
Saudi Arabia 7 6 4654 8 8 4180
Japan 2 1 561 168 4030
Vietnam 5 0 1317 102 3105
Other countries 1565 83545 269 14478
Figures rounded off
Table – 18: Exports of Manganese Oxide(By Countries)
2017-18 (R) 2018-19 (P)Country
Qty Value Qty Value(t ) (` '000) (t ) (` '000)
All Countries 20771 1016498 18035 928690
France 1931 72303 3153 138637
Vietnam 1465 75166 1441 81604
Indonesia 1161 60265 1282 73447
Canada 989 53997 1151 68183
Australia 999 49605 1232 54774
UK 680 37781 815 51023
Spain 1361 66683 786 40177
USA 216 11612 429 29893
Russia 1622 75464 533 29401
Turkey 1475 76431 548 29244
Other countries 8872 437190 6665 332306
Figures rounded off

2 1
MANGANESE ORE
Table – 20: Exports of Manganese Oxide(Other than Manganese Dioxide)
(By Countries)
2017-18 (R) 2018-19 (P)Country
Qty Value Qty Value(t ) (` '000) (t ) (` '000)
All Countries 18226 892948 15506 810243
France 1931 72303 3153 138637
Vietnam 1415 73850 1339 78499
Indonesia 1141 59366 1282 73387
Canada 989 53997 1151 68182
Australia 999 49605 1232 54774
Spain 1324 64972 775 39278
UK 625 33179 575 30994
Russia 1622 75464 533 29400
USA 216 11265 424 28718
Turkey 1475 76431 521 28108
Other countries 6489 322516 4521 240265
Table – 21: Exports of Manganese & Alloys(Incl. Waste & Scrap)
(By Countries)
2017-18 (R) 2018-19 (P)Country
Qty Value Qty Value(t ) (` '000) (t ) (` '000)
All Countries 305 207272 456 312178
France 165 107544 282 197735
China 5 8 45633 5 1 46336
Croatia 9 12318 9 12804
Germany 1 1786 5 2 11795
Brazil 1 1634 6 8270
Italy 3 5192 3 5406
Poland 1 1382 3 4488
Romania 3 5100 2 4424
Philippines 1 0 1877 2 2 4409
Malaysia 3 3769 3 3577
Other countries 5 2 21038 2 4 12933
Table – 22: Exports of Manganese & Alloys :(Wrought/Unwrought)
(By Countries)
2017-18 (R) 2018-19 (P)Country
Qty Value Qty Value(t ) (` '000) (t ) (` '000)
All Countries 269 199909 414 300771
France 144 102595 241 186443
China 5 8 45623 5 1 46323
Croatia 9 12318 9 12804
Germany 1 1786 5 2 11795
Brazil 1 1634 6 8270
Italy 3 5192 3 5406
Poland 1 1382 3 4488
Romania 3 5100 2 4424
Philippines 1 0 1877 2 2 4409
Malaysia 3 3769 3 3577
Other countries 3 7 18634 2 3 12831
Figures rounded offFigures rounded off
Figures rounded off

2 2
INDIAN MINERALS YEARBOOK 2019 - VOL.III
Table - 24: Exports of Manganese & AlloysUnwrought
(By Countries)
2017-18 (R) 2018-19 (P)Country
Qty Value Qty Value(t ) (` '000) (t ) (` '000)
All Countries 258 197846 402 298135
France 144 102595 241 186443
China 5 8 45623 5 1 46323
Croatia 9 12318 9 12804
Germany 1 1786 5 2 11795
Brazil 1 1634 5 8193
Italy 3 5192 3 5406
Poland 1 1382 3 4488
Romania 3 5100 2 4424
Philippines - - 2 2 4409
Malaysia 2 3665 2 3431
Other countries 3 6 18551 1 2 10418
Table - 25 : Exports of Manganese & Alloys :NES
(By Countries)
2017-18 (R) 2018-19 (P)Country
Qty Value Qty Value(t ) (` '000) (t ) (` '000)
All Countries 6 1742 ++ 8 2
Uganda - - ++ 3 5
Serbia - - ++ 3 0
Indonesia - - ++ 6
UAE ++ 118 ++ 6
Bhutan - - ++ 5
Guinea - - ++ ++
France 1 658 - -
Bangladesh 3 552 - -
Taiwan 2 357 - -
Pakistan ++ 5 6 - -
Other countries ++ 1 - -
Figures rounded off Figures rounded off
Table - 23 : Exports of Manganese :Wrought
(By Countries)
2017-18 (R) 2018-19 (P)Country
Qty Value Qty Value(t ) (` '000) (t) (` '000)
All Countries 11 2063 1 2 2636
Nigeria - - 5 1178
Saudi Arabia - - 2 433
Taiwan - - 2 389
Pakistan ++ 4 6 2 319
Malaysia 1 104 1 146
Brazil - - ++ 7 7
Kenya - - ++ 5 2
UK ++ 3 7 ++ 4 1
Philippines 1 0 1877 - -
Figures rounded off

2 3
MANGANESE ORE
Table - 26 : Exports of Manganese Ore(35% or More but Below 46% Mn)
(By Countries)
2017-18 (R) 2018-19 (P)Country
Qty Value Qty Value(t ) (` '000) (t ) (` '000)
All Countries 24800 331750 - -
China 24800 331750 - -
Figures rounded off
Table – 29: Imports of Manganese Ore : Total(By Countries)
2017-18 (R) 2018-19 (P)Country
Qty Value Qty Value(t ) (` '000) (t ) (` '000)
All Countries 3627742 50633966 2784473 48484514
South Africa 2118574 25889561 1254315 20953738
Australia 482439 9254873 224161 5129502
Brazil 209888 3134341 210423 4169187
Gabon 476301 6802381 227873 3529302
Singapore 4897 172930 159424 3401667
Cote d'Ivoire 248064 4089651 218262 2931916
UAE - - 160487 2451109
Uruguay - - 85207 1520168
Tanzania 8585 151455 58094 1105758
France - - 41630 916413
Other countries 78994 1138774 144597 2375754
Figures rounded off
Table – 30 : Imports of Manganese Ore(46% or more Mn)
(By Countries)
2017-18 (R) 2018-19 (P)
CountryQty Value Qty Value(t ) (` '000) (t ) (` '000)
All Countries 327431 5971223 219963 5275364
Australia 225430 4437683 100095 2401033
Brazil 6326 115947 38306 953476
UAE - - 18640 452561
Cote d'Ivoire 3422 65019 12396 326806
South Africa 58521 658103 15863 307341
Tanzania 3509 58416 11145 243190
Singapore 4872 172068 5211 203253
Zambia 21392 378006 9317 171483
Senegal 2351 49999 5066 114773
Congo, Dem. Rep. of - - 2682 70947
Other countries 1608 35082 1242 30501
Figures rounded off
Table – 28 : Exports of ManganeseWaste & Scrap(By Countries)
2017-18 (R) 2018-19 (P)Country
Qty Value Qty Value(t ) (` '000) (t ) (` '000)
All Countries 3 0 5620 4 1 11325
France 2 0 4290 4 1 11292
Spain - - ++ 2 1
China ++ 1 0 ++ 1 3
Oman 1 0 1306 - -
USA ++ 1 4 - -
Figures rounded off
Table – 27 : Exports of Manganese Ore(Ferruginous, 10% or More but Below 30% Mn)
(By Countries)
2017-18 (R) 2018-19 (P)Country
Qty Value Qty Value(t ) (` '000) (t ) (` '000)
All Countries - - ++ 2
Maldives - - ++ 2
Figures rounded off

2 4
INDIAN MINERALS YEARBOOK 2019 - VOL.III
Table – 31 : Imports of Manganese Ore(35% or more but below 46% Mn)
(By Countries)
2017-18 (R) 2018-19 (P)Country
Qty Value Qty Value(t ) (` '000) (t ) (` '000)
All Countries 2095807 30130889 1641885 29972597
South Africa 1274430 17105173 749657 13966672
Gabon 384281 5732586 185054 3002040
Singapore 2 5 862 126289 2592572
Australia 148282 2943513 92253 1972141
Brazil 113767 1714590 90203 1671243
Uruguay - - 85207 1520168
UAE - - 85534 1345064
Cote d'Ivoire 150531 2250716 92464 1329363
France - - 41630 916413
Tanzania 1452 24386 35579 639261
Other countries 23102 359063 58015 1017660
Figures rounded off
Table – 33 : Imports of Manganese Ore (Others)(By Countries)
2017-18 (R) 2018-19 (P)Country
Qty Value Qty Value(t ) (` '000) (t ) (` '000)
All Countries 658891 9452943 428446 7545578
South Africa 346855 4111376 248937 3949261
Brazil 89795 1303804 80862 1530670
Australia 108727 1873677 31813 756329
Singapore - - 27924 605842
Tanzania 3624 68652 10533 212027
Angola - - 4894 132859
Zambia 790 20299 5182 94885
Gabon 23894 395355 6968 81305
Congo, P. Rep. - - 2023 50232
Cote d' Ivoire 82007 1619785 4625 43920
Other countries 3199 39995 4685 88248
Figures rounded off
Table – 32 : Imports of Manganese Ore(30% or more but below 35% Mn)
(By Countries)
2017-18 (R) 2018-19 (P)Country
Qty Value Qty Value(t ) (` '000) (t ) (` '000)
All Countries 494928 4658514 395736 4809679
South Africa 412809 3810428 205999 2440126
Cote d' Ivoire 12104 151131 71331 838567
UAE - - 44818 554253
Gabon 68189 621440 35851 445957
Hong Kong - - 29678 436257
Myanmar - - 2890 32403
Turkey 952 11553 1708 19260
Brazil - - 1052 13798
Tanzania - - 836 11280
Egypt - - 755 10719
Other countries 873 7962 818 7059
Figures rounded off
Table – 34 : Imports of Manganese Dioxide(By Countries)
2017-18 (R) 2018-19 (P)Country
Qty Value Qty Value(t ) (` '000) (t ) (` '000)
All Countries 7760 771226 9164 892944
China 7610 739269 6199 743044
Belgium 140 27851 1417 68718
Peru - - 1257 41528
Hong Kong - - 270 31821
UAE - - 1 2 5261
USA 6 1834 9 2287
UK ++ 243 ++ 153
Germany 4 1989 ++ 132
Australia ++ 2 0 - -
Korea, Rep. of ++ 2 0 - -
Figures rounded off

2 5
MANGANESE ORE
Table –36 : Imports of Manganese & Alloys(Incl. Waste & Scrap)
(By Countries)
2017-18 (R) 2018-19 (P)Country
Qty Value Qty Value(t ) (` '000) (t ) (` '000)
All Countries 55819 6878790 45868 7676643
China 54207 6462674 43752 7031795
France 306 199341 379 281390
Hong Kong 2 5 2474 895 132905
Sweden 5 8 45798 136 125498
Indonesia - - 150 21141
Singapore - - 125 20015
Thailand - - 9 8 16027
Korea, Rep. of 120 15749 8 3 13143
Br. Virgin Is - - 7 4 10241
South Africa 286 36223 6 5 9133
Other countries 817 116531 111 15355
Figures rounded off
Table –37 : Imports of Manganese & Alloys(Wrought/Unwrought)
(By Countries)
2017-18 (R) 2018-19 (P)Country
Qty Value Qty Value(t ) (` '000) (t ) (` '000)
All Countries 55766 6871294 45838 7674481China 54156 6457154 43751 7031668France 306 199341 375 280812Hong Kong 2 5 2474 895 132905Sweden 5 7 45791 136 125498Indonesia - - 150 21141Singapore - - 125 20015Thailand - - 9 8 16027Korea, Rep. of 120 15749 8 3 13143Br. Virgin Is - - 7 4 10241South Africa 286 36223 4 0 8542Other countries 816 114562 111 14489
Figures rounded off
Table –38 : Imports of Manganese (Wrought)(By Countries)
2017-18 (R) 2018-19 (P)Country
Qty Value Qty Value(t ) (` '000) (t ) (` '000)
All Countries 9903 1191910 10223 1757913China 9819 1182125 10223 1757913Gabon 8 4 9783 - -UK ++ 2 - -
Figures rounded off
Table –39 : Imports of Manganese & Alloys NES(By Countries)
2017-18 (R) 2018-19 (P)Country
Qty Value Qty Value(t ) (` '000) (t ) (` '000)
All Countries 5 2 7496 ++ 993
UK ++ 224 ++ 284
UAE - - ++ 271
Germany 1 1417 ++ 143
China 5 1 5520 ++ 127
USA ++ 234 ++ 124
Austria ++ 9 4 ++ 4 2
Belgium - - - -
Sweden ++ 7 - -
Figures rounded off
Table – 35 : Imports of Manganese Oxide(Other than Manganese Dioxide)
(By Countries)
2017-18 (R) 2018-19 (P)Country
Qty Value Qty Value(t ) (` '000) (t ) (` '000)
All Countries 6902 302587 14814 552990
South Africa 4768 96115 12960 313552
Belgium 945 134510 816 126879
China 102 13133 370 60939
UAE ++ 3 9 2 7 11253
Peru 800 24218 317 9507
USA 6 8 7731 6 3 7875
Germany 2 6 9442 1 7 6828
Singapore - - 145 4956
Brazil 7 5 4291 5 0 3836
Netherlands - - 2 4 2348
Other countries 118 13108 2 5 5017
Figures rounded off

2 6
INDIAN MINERALS YEARBOOK 2019 - VOL.III
Table – 40 : Imports of Manganese Ore(Ferruginous, 10% or more but Below 30% Mn)
(By Countries)
2017-18 (R) 2018-19 (P)Country
Qty Value Qty Value(t ) (` '000) (t ) (` '000)
All Countries 50684 420398 98443 881294
Cote d'Ivoire - - 37446 393260
South Africa 25959 204482 33860 290337
Korea, Rep. of - - 14714 93020
UAE - - 10499 90617
Kenya - - 650 5548
Albania - - 735 4800
Turkey - - 539 3712
Malaysia 24725 215916 - -
Figures rounded off
Table –41 : Import of Manganese Oxide(By Countries)
2017-18 (R) 2018-19 (P)Country
Qty Value Qty Value(t ) (` '000) (t ) (` '000)
All Countries 14662 1073812 23977 1445933
China 7712 752402 6569 803983
South Africa 4768 96115 12960 313552
Belgium 1085 162361 2233 195597
Peru 800 24218 1574 51035
Hong Kong - _ 270 31821
UAE ++ 3 9 3 9 16514
USA 7 4 9565 7 1 10161
Germany 3 0 11431 1 7 6960
Singapore - - 145 4956
Brazil 7 5 4291 5 0 3836
Other countries 118 13390 4 9 7518
Figures rounded off
Table – 42 : Import of Manganese Waste and Scrap
(By Countries)
2017-18 (R) 2018-19 (P)Country
Qty Value Qty Value(t ) (` '000) (t ) (` '000)
All Countries - - 2 8 1169
South Africa - - 2 5 591
France - - 3 578
Figures rounded off
2 7
MANGANESE ORE
Table - 43 : Import of Manganese & Alloys: Unwrought(By Countries)
2017-18 (R) 2018-19 (P)Country
Qty Value Qty Value(t ) (` '000) (t ) (` '000)
All Countries 45863 5679384 35616 5916567
China 44337 5275029 33529 5273754
France 306 199341 375 280812
Honk Kong 2 5 2474 895 132905
Sweden 5 7 45791 136 125498
Indonesia - - 150 21141
Singapore - - 125 20015
Thailand - - 9 8 16027
Korea, Rep. of 120 15749 8 3 13143
Br Virgin Is - - 7 4 10241
South Africa 286 36223 4 0 8542
Other countries 732 104777 111 14489
Figures rounded off
FUTURE OUTLOOKAs per World Steel Association, in 2017 India's
per capita steel consumption is about 65.2 kg asagainst the world's per capita consumption of214.5 kg. Th is difference in the per capitaconsumption of steel in itself reflects opportunitiesthat are bound to occur for Steel Industry which inturn would positively impact the demand formanganese ore. Production of crude steel is thesingle most important factor that influences thedemand for manganese ore. Steel Industry accountsfor approximately 90% of the world demand formanganese. India's crude steel production grew from97.94 million tonnes in 2017-18 to 102.34 million
tonnes in 2018-19 registering a growth of 4.49 percent. This indicates strong growth of Steel Industryin the country as steel is the principal marketaccounting for 65 to 70% manganese consumption.
India has set a production capacity target of 300million tonnes of steel by 2030-31. The demand formanganese ore is expected to raise commensuratelyto about 10 million tonnes per year in the comingyears.
India's largest manganese ore producingcompany "MOIL Ltd" has targets to increase itsproduction to 3 million tonnes by 2030, the gap inthe demand will continue to be filled by imports inyears to come.