division of minerals
TRANSCRIPT
STATE OF NEVADA COMMISSION ON MINERAL RESOURCES
DIVISION OF MINERALS 400 W. King Street, Suite 106 Carson City, Nevada 89703
(775) 684-7040 Fax (775) 684-7052 http://minerals.nv.gov/
Las Vegas Office: 2030 E. Flamingo Rd. #220, Las Vegas, NV 89119
Phone: (702) 486-4343; Fax: (702) 486-4345
BRIAN SANDOVAL
Governor
RICHARD PERRY
Administrator
Dennis Bryan; Small-Scale Mining and Prospecting Fred D. Gibson, Jr., General Public Arthur Henderson; Oil and Gas
Commission on Mineral Resources John Mudge; Large-Scale MiningDavid Parker; Exploration and Development
John H. Snow; Geothermal ResourcesRichard DeLong, Chairman; Large-Scale Mining
COMMISSION ON MINERAL RESOURCES Legislative Counsel Bureau
401 South Carson St. #4100, Carson City, NV 89701
Thursday May 19, 2016 1:00 P.M.
Agenda CALL TO ORDER
The Agenda for this meeting of the Commission on Mineral Resources has been properly posted for this date and time in accordance with NRS requirement.
ROLL CALL PLEDGE OF ALLEGIANCE COMMENTS BY THE GENERAL PUBLIC
Pursuant to N.R.S. 241, this time is devoted to comments by the public, if any, and discussion of those comments. No action may be taken upon a matter raised under this item on the agenda until the matter itself has been specifically included on a successive agenda and identified as an item for possible action. All public comments will be limited to 5 minutes for each person. ACTION WILL NOT BE TAKEN
I. MINUTES
A. Approval of the February 4, 2016 meeting minutes FOR POSSIBLE ACTION
II. NEW BUSINESS
A. Attracting mineral exploration and development capital to Nevada: FOR DISCUSSION ONLY A report on Nevada’s presence at the Prospectors and Developers Association of Canada (PDAC) conference in Toronto, and Association for Mineral Exploration BC Roundup in British Columbia. Sheldon Mudd, GOED and Dave Shaddrick, Nevada Mineral Exploration Coalition. 30 minutes
B. Strategic Planning Session for Fiscal Years 2018-19. FOR POSSIBLE ACTION The State budget kickoff meeting was held on March 9th, with directions and schedules from the Governor’s finance office. The Governor’s Office provided a new Strategic Planning framework document outlining a vision, mission and strategic priorities for State Agencies, Boards and Commissions. Division Staff held a meeting on April 1 to develop budget assumptions and possible initiatives. to align with the Governor’s Strategic Planning Framework. Rich Perry will present assumptions and possible initiatives, and schedule for completing the budget process. 60 minutes
C. Presentation on Nevada Mineral, Geothermal and Oil production for 2015. FOR DISCUSSION ONLY Production reporting for CY 2015 is now complete and will be presented. Mike Visher. 15 minutes
III. OLD BUSINESS A. NDOM fiscal year 2016 Forecast and Reserve. FOR DISCUSSION ONLY
Mike Visher – 15 minutes
B. Annual Oil and Geothermal well inspection update, FOR DISCUSSION ONLY and new access database of oil wells in Nevada Lowell Price – 15 minutes C. BLM Proposed Mineral Withdrawal update FOR DISCUSSION ON NDOM developed maps and backup information for the areas of high mineral potential listed in the Governor’s comment letter to BLM of January 15, 2016. NDOM was chosen and agreed to act as a cooperating agency in the development of the EIS on the mineral withdrawal. Rich Perry - 15 minutes
IV. STAFF REPORTS
1) Mining/Reclamation Bond Pool – Mike Visher 2) Correspondence
V. SPECIAL PRESENTATION
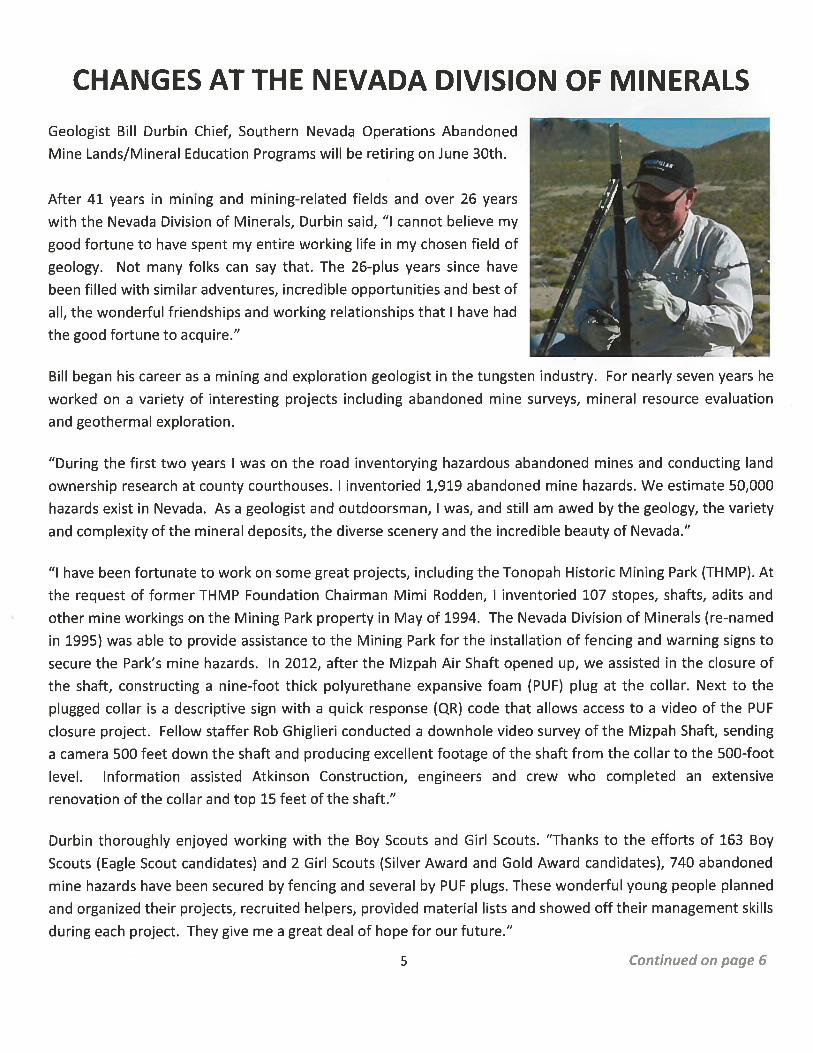
Presentation and award by the Commission to Bill Durbin for 27 years of service to the Division of Minerals. Chairman Rich DeLong. COMMISSION BUSINESS A. Determination of time and place of next CMR meeting COMMENTS BY THE GENERAL PUBLIC Pursuant to N.R.S. 241, this time is devoted to comments by the public, if any, and discussion of those
comments. No action may be taken upon a matter raised under this item on the agenda until the matter itself has been specifically included on a successive agenda and identified as an item for possible action. All public comments will be limited to 5 minutes for each person. ACTION WILL NOT BE TAKEN
ADJOURNMENT NOTICE TO PERSONS WITH DISABILITIES Members of the public who are disabled and require special accommodations or assistance at the meeting are requested to notify the Division of Minerals, 400 W. King Street, suite 106, Carson City, NV 89701 or contact Valerie Kneefel at (775) 684-7043 or Email [email protected] The Commission will be attending a field trip on Friday May 20, 2016. The Commission will tour the Hectatone Drilling Fluid Plant in Fernley at 9 A.M., and the AGRU Nevada liner plant in Fernley at 11:00 A.M. Members of the public may attend but must provide their own transportation and safety equipment. Advanced notification is required. Please call Valerie Kneefel at (775) 684-7043.
Page 2 of 2

I. MINUTES
STATE OF NEVADA COMMISSION ON MINERAL RESOURCES
DIVISION OF MINERALS 400 W. King Street, Suite 106 Carson City, Nevada 89703
(775) 684-7040 Fax (775) 684-7052 http://minerals.nv.gov/
Las Vegas Office: 2030 E. Flamingo Rd. #220, Las Vegas, NV 89119
Phone: (702) 486-4343; Fax: (702) 486-4345
BRIAN SANDOVAL
Governor
RICHARD PERRY
Administrator
Dennis Bryan; Small-Scale Mining and Prospecting Fred D. Gibson, Jr., General Public Arthur Henderson; Oil and Gas
Commission on Mineral Resources John Mudge; Large-Scale MiningDavid Parker; Exploration and Development
John H. Snow; Geothermal ResourcesRichard DeLong, Chairman; Large-Scale Mining
COMMISSION ON MINERAL RESOURCES Clark County Commission Chambers
500 S. Grand Central Pkwy., Las Vegas, NV 89155
Thursday February 4, 2016 9:00 A.M.
Minutes
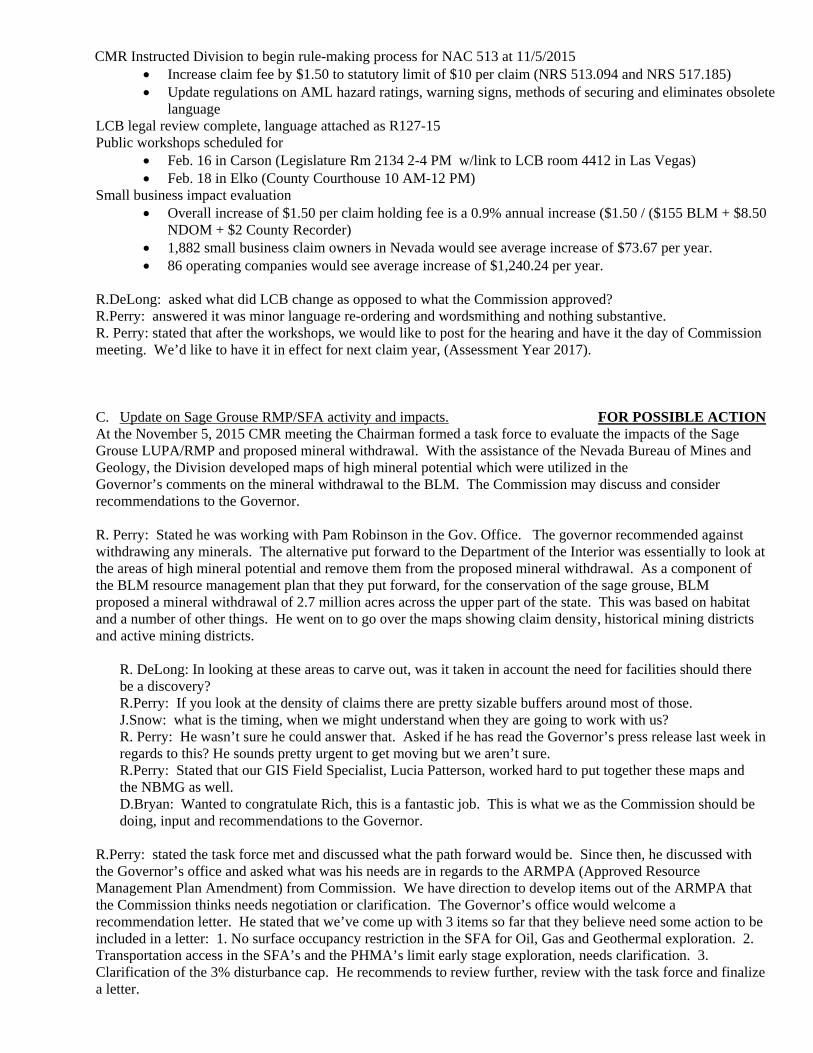
COMMISSIONERS IN ATTENDANCE Richard DeLong (Chairperson) Fred Gibson Dennis Bryan John Snow David Parker Art Henderson John Mudge not in attendance
STAFF IN ATTENDANCE
Richard Perry Valerie Kneefel Mike Visher Robert Ghiglieri Bryan Stockton (Senior Deputy Attorney General) Garrett Wake Bill Durbin
CALL TO ORDER
Meeting was called to order at 9:00 AM The Agenda for this meeting of the Commission on Mineral Resources has been properly posted for this date
and time in accordance with NRS requirement. ROLL CALL: Valerie Kneefel took roll call: Richard DeLong, Dennis Bryan, David Parker, Fred Gibson, John Snow. (John Mudge was not in attendance) PLEDGE OF ALLEGIANCE: Led by Richard DeLong COMMENTS BY THE GENERAL PUBLIC Pursuant to N.R.S. 241, this time is devoted to comments by the public, if any, and discussion of those comments. No action may be taken upon a matter raised under this item on the agenda until the matter itself has been specifically included on a successive agenda and identified as an item for possible action. All public comments will be limited to 5 minutes for each person. ACTION WILL NOT BE TAKEN
I. MINUTES
A. Approval of the November 5, 2015 meeting minutes FOR POSSIBLE ACTION Motion Approval of the November 5, 2015 minutes by: page 2 of 11 change by Rich DeLong change the word “roads” to “area”. Dennis Bryan made a motion to approve the change. Seconded by: Fred Gibson. Unanimously carried.
II. NEW BUSINESS
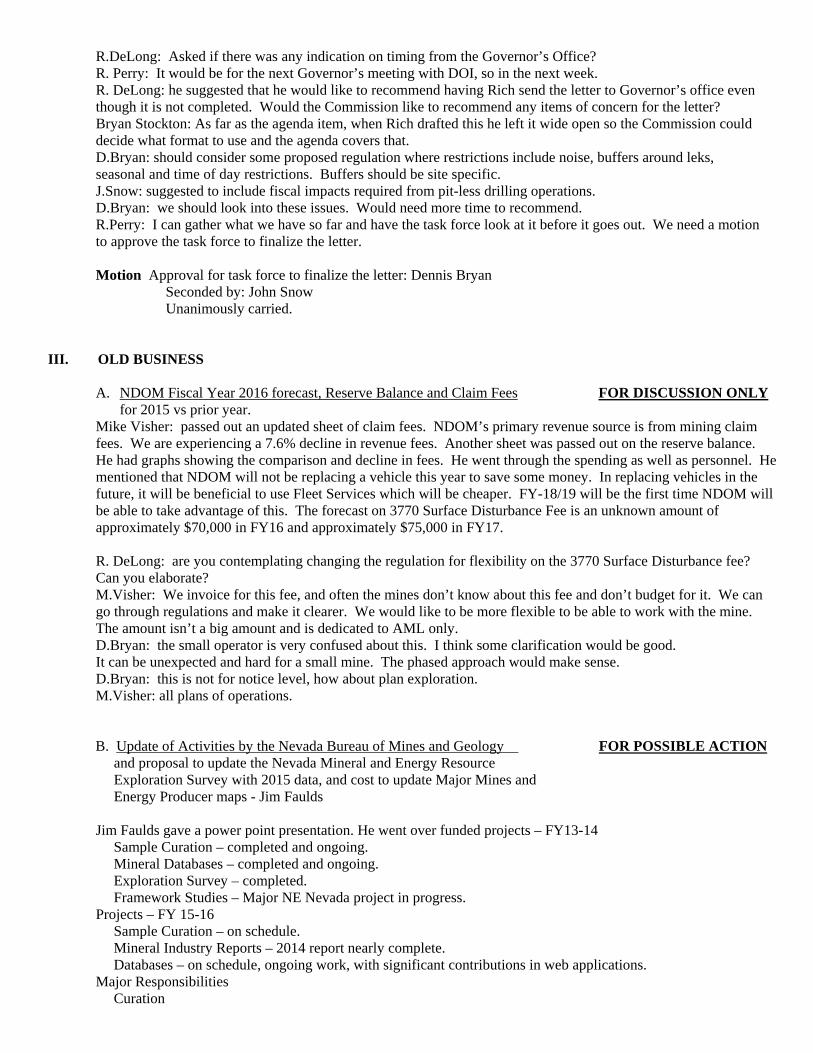
A. Thorium Energy Presentation FOR POSSIBLE ACTION Commissioner Henderson requested investigation of the use and availability of thorium for power production at the August 27, 2015 CMR meeting. Garrett Wake has researched this topic and will present findings.
G. Wake presented a power point on the use of Thorium (Th-232) as a replacement for Uranium (U-235) in the Production of Electrical Energy. As of 2014, the U.S. generated nearly 800b kWh of electricity by means of nuclear fission (NEI, 2015).
• This is almost double the production of the world’s second largest producer (France; 418b kWh), and more than one third of the world’s total nuclear-electricity generation (NEI, 2015).
• The estimated amount of electricity generated in the U.S. (from all sources) in 2013 was just above four-trillion kWh, of which 19% was produced from nuclear sources (Conti et al, p.24).
• Nearly one fifth of the U.S. electrical-energy production comes from nuclear sources. Fissile uranium fuel rods, filled with enriched uranium (increased U-235 vs 238) pellets, are placed into a controlled environment. A catalyst (neutron source) is used to begin a sustained chain reaction in the fissile uranium rods. The chain reaction is maintained at a critical level (a net balance of neutron gain and loss). A by-product of nuclear fission is heat, which is used to boil a fluid (water) into steam. The steam is routed through a system of turbines, which generate electrical energy. In the U.S. there are two common types of nuclear reactors:
Pressure Water Reactors (PWAs) and, Boiling Water Reactors
Both use basically the same concept (steam rotates turbines for electrical generation). Both have advantages and disadvantages when compared. Pros: Possibly 3-4x more crustal abundance, though skeptics argue U-238 is significantly abundant in seawater. No Enrichment Since Th-232 is fertile, a chain reaction could be stopped quickly (unlike traditional fissile U-235 reactions). Few Th-fueled reactors exist today, but the technology has been tested and is viable. The time could be near for a shift – nearly all U.S. reactors will be >60 years old by 2050 at the end of their 20 year license renewal. Countries like China and India are already building/have built Th-based reactors. Possibility of using spent-U/Pu waste in Th reactors, essentially reusing the waste over-and-over again, eliminating the need to store it. Cons: Start-up costs will be high. It may be difficult to retrofit current U.S. reactors to accept Th (to be viable) – methods have been proposed. Many models require separation of U-233 from Th-232, which could be costly and hazardous to human health (robotics technology could eliminate health hazard). Unknowns: Better/worse for proliferation? U-233 just as weaponizable as Pu-239, possibly harder to separate. Radiotoxicity and storage? Th byproducts typically non-transuranic, but produce more gamma radiation. Less safe to work with. Radioactive decay?: Th waste <500yr half-life (vs 10,000yr U-Pu) and there is 1,000 to 10,000x less waste. Thorium is becoming a “buzzword” in the media and on the internet, and it does have merit. Th-232 has qualities that surpass U-235/238, but it has some pitfalls as well. Remember, the design of the reactor can make as much of a difference in safety and production as the fuel used. Commissioners thank Mr. Wake for the presentation. No motion was made.
B. Status on Regulation changes in NAC 513, including claim fee increase FOR DISCUSSION ONLY At the November 5, 2015 CMR meeting, the Commission directed staff to draft language and begin rule-making on changes to Chapter 513, including language clean-up and changes to the abandoned mine lands program and a possible fee increase of $1.50 per claim to the statutory limit of $10 per claim. Rich Perry gave a power point presentation. The workshop was posted and they will be Feb 16 in Carson City video conference to Las Vegas and Feb 18 in Elko. Draft language can be found on the Minerals website.
CMR Instructed Division to begin rule-making process for NAC 513 at 11/5/2015 Increase claim fee by $1.50 to statutory limit of $10 per claim (NRS 513.094 and NRS 517.185) Update regulations on AML hazard ratings, warning signs, methods of securing and eliminates obsolete
language LCB legal review complete, language attached as R127-15 Public workshops scheduled for
Feb. 16 in Carson (Legislature Rm 2134 2-4 PM w/link to LCB room 4412 in Las Vegas) Feb. 18 in Elko (County Courthouse 10 AM-12 PM)
Small business impact evaluation Overall increase of $1.50 per claim holding fee is a 0.9% annual increase ($1.50 / ($155 BLM + $8.50
NDOM + $2 County Recorder) 1,882 small business claim owners in Nevada would see average increase of $73.67 per year. 86 operating companies would see average increase of $1,240.24 per year.
R.DeLong: asked what did LCB change as opposed to what the Commission approved? R.Perry: answered it was minor language re-ordering and wordsmithing and nothing substantive. R. Perry: stated that after the workshops, we would like to post for the hearing and have it the day of Commission meeting. We’d like to have it in effect for next claim year, (Assessment Year 2017).
C. Update on Sage Grouse RMP/SFA activity and impacts. FOR POSSIBLE ACTION At the November 5, 2015 CMR meeting the Chairman formed a task force to evaluate the impacts of the Sage Grouse LUPA/RMP and proposed mineral withdrawal. With the assistance of the Nevada Bureau of Mines and Geology, the Division developed maps of high mineral potential which were utilized in the Governor’s comments on the mineral withdrawal to the BLM. The Commission may discuss and consider recommendations to the Governor. R. Perry: Stated he was working with Pam Robinson in the Gov. Office. The governor recommended against withdrawing any minerals. The alternative put forward to the Department of the Interior was essentially to look at the areas of high mineral potential and remove them from the proposed mineral withdrawal. As a component of the BLM resource management plan that they put forward, for the conservation of the sage grouse, BLM proposed a mineral withdrawal of 2.7 million acres across the upper part of the state. This was based on habitat and a number of other things. He went on to go over the maps showing claim density, historical mining districts and active mining districts.
R. DeLong: In looking at these areas to carve out, was it taken in account the need for facilities should there be a discovery? R.Perry: If you look at the density of claims there are pretty sizable buffers around most of those. J.Snow: what is the timing, when we might understand when they are going to work with us? R. Perry: He wasn’t sure he could answer that. Asked if he has read the Governor’s press release last week in regards to this? He sounds pretty urgent to get moving but we aren’t sure. R.Perry: Stated that our GIS Field Specialist, Lucia Patterson, worked hard to put together these maps and the NBMG as well. D.Bryan: Wanted to congratulate Rich, this is a fantastic job. This is what we as the Commission should be doing, input and recommendations to the Governor.
R.Perry: stated the task force met and discussed what the path forward would be. Since then, he discussed with the Governor’s office and asked what was his needs are in regards to the ARMPA (Approved Resource Management Plan Amendment) from Commission. We have direction to develop items out of the ARMPA that the Commission thinks needs negotiation or clarification. The Governor’s office would welcome a recommendation letter. He stated that we’ve come up with 3 items so far that they believe need some action to be included in a letter: 1. No surface occupancy restriction in the SFA for Oil, Gas and Geothermal exploration. 2. Transportation access in the SFA’s and the PHMA’s limit early stage exploration, needs clarification. 3. Clarification of the 3% disturbance cap. He recommends to review further, review with the task force and finalize a letter.
R.DeLong: Asked if there was any indication on timing from the Governor’s Office? R. Perry: It would be for the next Governor’s meeting with DOI, so in the next week. R. DeLong: he suggested that he would like to recommend having Rich send the letter to Governor’s office even though it is not completed. Would the Commission like to recommend any items of concern for the letter? Bryan Stockton: As far as the agenda item, when Rich drafted this he left it wide open so the Commission could decide what format to use and the agenda covers that. D.Bryan: should consider some proposed regulation where restrictions include noise, buffers around leks, seasonal and time of day restrictions. Buffers should be site specific. J.Snow: suggested to include fiscal impacts required from pit-less drilling operations. D.Bryan: we should look into these issues. Would need more time to recommend. R.Perry: I can gather what we have so far and have the task force look at it before it goes out. We need a motion to approve the task force to finalize the letter. Motion Approval for task force to finalize the letter: Dennis Bryan Seconded by: John Snow Unanimously carried.
III. OLD BUSINESS A. NDOM Fiscal Year 2016 forecast, Reserve Balance and Claim Fees FOR DISCUSSION ONLY
for 2015 vs prior year. Mike Visher: passed out an updated sheet of claim fees. NDOM’s primary revenue source is from mining claim fees. We are experiencing a 7.6% decline in revenue fees. Another sheet was passed out on the reserve balance. He had graphs showing the comparison and decline in fees. He went through the spending as well as personnel. He mentioned that NDOM will not be replacing a vehicle this year to save some money. In replacing vehicles in the future, it will be beneficial to use Fleet Services which will be cheaper. FY-18/19 will be the first time NDOM will be able to take advantage of this. The forecast on 3770 Surface Disturbance Fee is an unknown amount of approximately $70,000 in FY16 and approximately $75,000 in FY17. R. DeLong: are you contemplating changing the regulation for flexibility on the 3770 Surface Disturbance fee? Can you elaborate? M.Visher: We invoice for this fee, and often the mines don’t know about this fee and don’t budget for it. We can go through regulations and make it clearer. We would like to be more flexible to be able to work with the mine. The amount isn’t a big amount and is dedicated to AML only. D.Bryan: the small operator is very confused about this. I think some clarification would be good. It can be unexpected and hard for a small mine. The phased approach would make sense. D.Bryan: this is not for notice level, how about plan exploration. M.Visher: all plans of operations.
B. Update of Activities by the Nevada Bureau of Mines and Geology FOR POSSIBLE ACTION and proposal to update the Nevada Mineral and Energy Resource Exploration Survey with 2015 data, and cost to update Major Mines and Energy Producer maps - Jim Faulds
Jim Faulds gave a power point presentation. He went over funded projects – FY13-14 Sample Curation – completed and ongoing. Mineral Databases – completed and ongoing. Exploration Survey – completed. Framework Studies – Major NE Nevada project in progress.
Projects – FY 15-16 Sample Curation – on schedule. Mineral Industry Reports – 2014 report nearly complete. Databases – on schedule, ongoing work, with significant contributions in web applications.
Major Responsibilities Curation
Information Publication Sales Repository Collections Outreach
Most visit website (Aug ‘15 to January ‘16): Sessions – 12,878 Users – 8,123 Page-views – 57,759
Page views on Shopping Cart Major Mines of Nevada – 445 Mineral Industry – 750 Mining Claim Procedures – 126 Nevada Active Mines and Energy Producers – 151 Nevada Petroleum and Geothermal Society – 214 NBMG Petroleum pubs and data – 172
2nd Annual Open House (October) – 75 visitors Nevada’s Big One: 1915 Pleasant Valley Earthquake Discover Nevada through Maps Carson City: The Capitol of Earthquake Country From Comstock to Carlin: Nevada’s Booming Legacy of Precious Metal Discoveries
Six months of activity (Aug’15-Jan’16) All states All continents Dozens of countries Multiple publication types
State support is only ~$30k/year for GBSSRL Repository of all state’s geologic data Critical for industries Crucial for public safety No fees designated for GBSSRL operations Lost $300k/year in funding during recession
Sample Curation: FY2015-2016 - $35,000 expended
Maintain staffing at GBSSRL • Manager – Craig dePolo • Physical Curator – David Davis • Student Workers
Curate samples, cuttings, files for minerals, oil-gas, and geothermal Develop, maintain, and enhance various web applications General web maintenance and updates
Minerals >680 mining district files added, with 300 added to spreadsheet 4th Ward School scanned and added to Mining District files Retrieved large collection from Allied Nevada Gold, including Eureka, Searchlight, Flowery, Electrum, Minden, Hawthorne, Gabbs Valley 970 boxes of core catalogued in GBSSRL
Oil and Gas Added 4 new records, 8 new sets of samples 300 sets of oil and gas cuttings placed in storage Updated spreadsheets & web applications
Geothermal Added 26 new records 8 sets of new cuttings 76 wells completed in 2010 released Updated spreadsheets & web applications
Mineral Databases:
$35k allocated in FY’15 – $35k expended Expended on staff at GBSSRL and Cart/GIS
Accomplishments: General web maintenance and development NBMG web server migration to UNR server Coordination with UNR IT Governor’s office maps/GIS support on mineral resources in sage grouse habitat Development of new mining district web application/web database Updated 43-101 reports and web application Added topographic bases to all maps available on NBMG website Development and release of new shopping cart
Mineral Industry Reports: $30k allocated, $26+k expended Expended on staff and publications Less than expected as David Davis covered by College of Science in FY’15-16 Completed and released 2014 Major Mines of Nevada. 2014 MI report nearly complete with release anticipated for March. Future: Need to compile and synthesize historic production and reserve data from reports
Sage Grouse Study Area Maps: Collaborated with NDOM to provide maps of mineral and geothermal potential Showed burn areas - ~25% of SFA’s Submitted to Governor’s office
Geologic Framework Studies –NE Nevada: $100k allocated; $76k expended Marys River-Starr Basins (oil and gas)
Published Heelfly Creek Quad Ongoing Herder Creek Quad-75% complete
Pequop-Ruby Mountains Completed Pequop Summit Quad Initiating Independence Valley NE (Long Canyon deposit) Welcome Quad completed
Central Robinson Mts Kinsley Mts RBM pit, Bald Mountain Mine McDermitt caldera geologic map Eureka Mining district Heath Canyon – Grant Range White Pine County geothermal potential report Geochronology – 20 Ar/Ar dates Chemical analyses GSN paper on Pequop Mts
Proposal – Update of Exploration Survey and Major Mines and Energy Producers Map: $50k allocated and expended in FY13 for compiling 2011 data Accomplishments
Data from 185 companies $675M spent in Nevada Completed report Discussed at previous meetings
Updates needed Important to document trends Rectify major non-compliers Available for 2017 legislature
Total costs - $40,000 Salaries for staff and faculty for Exploration Survey Cartographic/GIS work on Major Mines and Energy Map Editing and printing costs
D.Bryan: asked, $40,000 to update the exploration survey from 5 years ago?
J.Faulds: If we did it now it would be for 2014. D. Bryan: it also includes the map? J. Faulds: Yes both the survey and the map, we just estimate the cost in lumping them together. D.Parker: what kind of public interest did you find for the publication that was actually received? Do you have any statistics or numbers on how many publications were actually requested? J. Faulds: It’s free on the web, and we don’t have the ability to see how many downloads there actually are. R.Perry: commented that we asked Jim and his staff to come up with a cost of what it would take to update this. We were looking for a baseline year as a tool for concrete numbers on the last year before the sage grouse ARMPA went into effect. R.DeLong: would that be done prior to 2017? J.Faulds: yes. We have limited staff but can get it done. D.Parker: would this be a negative impact on the division’s budget? R.Perry: we don’t have the money right now. In the annual $2/claim fee contract, you have the ability to request where that money goes. If the claim increase is successful, we could do this in the future at some point, but not at this point. D.Parker: when do you need this money or commitment? J.Faulds: we would need it in the next couple of months. We would really need to know by March. R.DeLong: would these monies, assuming they get allocated, would this be this fiscal year or next? J.Faulds: next FY D.Bryan: asked for clarification if we have additional claim fees would we be able to cover this? R.Perry; your talking about FY-17, and I can’t predict that. We could propose to form a team to propose funding for the bureau at the next legislative session. That would require some organizing to go after some general funding. Not sure what kind of response they would receive. I would hate to say for long term using claim fees, since that doesn’t seem to work well. D.Bryan: the university has been adamant that any lobbying goes through the president’s office at the university. J.Faulds: there may be some distinction between the funds for statewide programs and the university. We are still restricted from lobbying. We might be able to combine our efforts with NDOM. It’s worth discussing. R.DeLong: I see benefit to reaching out to the president of the university. To make sure they understand how beneficial the Bureau is to the mining industry. D.Parker: can the Commission act on your behalf? J.Faulds: not sure R. DeLong; we also need to go through the Governor’s office. R.Perry: I’m thinking a team of stakeholders including the Commission. Proposed through a legislator and we don’t have to be the driver. If it were just CMR then yes we would need to go through the Governor’s office.
No Motion was made.
C. 2015 AML Program re-cap and 2016 planning FOR DISCUSSION ONLY
Activities, accomplishments trends and metrics for calendar 2105 will be presented and plans for 2016 outlined. Rob Ghiglieri R. Ghiglieri gave a power point presentation. AML Review: The program completed its 29th year with 19,500 Hazards inventoried, 15,800 Secured at a 81% securing rate 56,000 non-hazards inventoried, 5 current staff members. This will be reduced to 4 on June 30th One contractor, EPS. 2015 Review: There were NO reported injuries or fatality reported in 2015! This is the second year in a row without an incident. The summer internship was 6 students for 13 weeks Held the first winter internship, 4 students for 3 weeks in both southern and northern NV. Performed permanent closures in Churchill, Esmeralda, & Nye Counties. Converted to a SQL database from the Access. Performed the first digital field investigations 2015 Numbers: 663 Loggings, 435 Revisits, 879 Securings, 635 Fenced or posted, 244 gated / backfilled/ PUF (Numbers are subject to change). Work was completed in all 17 counties. Database Development: The AML Access database was transferred to a SQL database and had a limited launch in May 2015. The new database is a SQL based language with a web interface know as SOSA (Stay Out, Stay Alive)
Currently all data is managed from the SOSA interface with no NDOM direct access into SQL Server Management Studio (SSMS), NDOM staff has been introduced into SSMS and will be trained on to properly manage the AML database on the new SQL interface. He brought up the website for the commission to view. https://amlsosa.nv.gov/SOSA/ Internet accessible site showing all the sites, selecting a specific site will show pictures and all the info.
R. DeLong: this has taken our database to a whole new level. What about the BLM and Forest Service, can they download their info into it? R.Ghiglieri: not yet. D.Parker: can you include their info? R.Ghiglieri: yes, they send it to us and we upload it. R.Ghiglieri: this database has been funded by USACE.
AML Program Funding Trends: FY 2016 is estimated to have a $298,691 or 58% decrease of AML funds expended from 2012. The represented funding pays for:
AML supplies, Contracting work, AML specific computer software, Travel Per Diem, Trucks including maintenance, supplies & fuel, Mail‐outs, Printing for AML field work and AML education
This does not include NDOM staff and intern salaries, or overhead Program Alterations: To adapt to the decreasing budget the AML program has: Minimized work by the contractor, Reduced the amount of Summer Interns from 8 to 6. Deferred purchasing new a truck until FY 2017. Requested additional funding from Federal Agencies (Assistance Agreements and MOUs) and performed less fieldwork. 2016 Plan: Continue working with USACE and TerraSpectra to develop the SQL database. Training for staff. Possible continuation of funding for the next 2‐3 years. Expand the digital field investigations and start beta testing with the summer interns. 6 summer interns (14 weeks) Continue our public awareness campaign. Possible remake of the NDOM “Stay Out, Stay Alive” video. 2016 Projects: 3 closure projects (FY16), Mint Shaft, Chukar 3, Mound House. Start resolving the logistical issues associated with the Arden complex closure. New Assistance Agreement with the BLM. Continue working with the USFS MOU. Categorical Exclusion with the BLM closures. Joint NDOM/NDEP UAV demonstration project Funded by RAMS. FY 2017 Risks and Opportunities: RAMS program funding. BLM/USFS Assistance agreements, $49,000+$18,000=$67,000 FY16. Claim Fees Nevada BLM inventory program. Federal Legislation. Southern Nevada Public Land Management Act (SNPLMA).
R.DeLong: how does our database rank to other states database as far as for sophistication? R.Ghiglieri: OSM oversees a lot of the database. Calif. and Colorado is way behind. Our database is top end and is much better now than what most other states have. NV BLM and Forest Service want to use our db. J.Snow: does NDEP have their own database for tailings? R.Ghiglieri: they don’t do any physical closures they cap them. NDEP doesn’t have an inventory list, they rely on ours.
D. Education Activities and Outreach FOR DISCUSSION ONLY Bill Durbin will present the accomplishments, challenges and metrics of the Division’s educational outreach program for calendar 2015. Bill Durbin gave a power point presentation. Public outreach and education staff presentations - calendar year 2015: 192 Presentations made. 17.5 Presentations per staff member. Exceeds NDOM performance indicator of 1 presentation per month per staff person (11x12=132 Presentations). Outreach to 18,482 persons. 114 Classroom presentations to 5,700 students. 41 presentations to civic groups, clubs, organizations. 5 media presentations, 10 presentations to scout troops and youth organizations. 11 AML safety training presentations to eagle scout service. Project Participants: 112 Presentations in Northern Nevada. 76 Presentations in Southern Nevada. 4 presentations out of state (including AEMA conference-Spokane) Upcoming Southern Nevada Education & Outreach: Durango High School – January 20‐23 – 13 sessions – Minerals in Dental Hygiene, Paste with a Taste activity,
AML – 560 to 600 students. Southern Nevada Science Teachers Association (SNSTA) Conference –NDOM display/handout materials –Western High School – February 6. Pat Diskin Elementary School Career Fair – March 18. Southern Nevada Earth Science Education Workshop – March 22‐23 –Faith Lutheran High School Eagle Scout Service Projects – Calendar Year 2015: 11 projects completed in 2015-Clark (8), Lincoln (1) and Lyon (2). 44 Hazards secured. 12 previously secured hazards re-visited and re-secured. 7 projects pending for 2016 in Clark and Lyon counties, 1 proposed for Douglas county. Total to date: 165 Scout projects completed since 1992. Total of 740 hazards secured and 148 previously secured hazards re-visited and re-secured.
E. MSM annual $2 per claim consideration FOR POSSIBLE ACTION The Commission signed an inter-local contract with the University in 2008 to collect $2 per claim annually to assist with funding the Mackay School of Earth Science and Engineering education activities. The amount is based on mining claim filings for the previous year, or 2015. The current five-year agreement, which was renewed in early 2013, expires in 2018. Note: Russ Fields at UNR was brought in by conference phone for this agenda item.
R.Perry: showed a graph/fee claim history of the Mackay $2 claim fee history. The Commission has the ability under terms of the agreement item 4, goes to the final page, consultation with Dean as to where to allocate the funds. The final document in there is the first document from the University, regarding the Marigold royalty. R.DeLong: Commissioner Mudge and I are on the committee to see how the funds are allocated from the Marigold endowment. D.Bryan is on the advisory board. They take a 3-year rolling average at a calculated interest rate, and so far funds have been available for the last 2 years. The decision has been for the past 2 years to retain funds and let the amount grow until it’s a more meaningful amount to apply for appropriate use. D.Bryan: the way the funds are put into the account, they can’t use them for a while. Since it’s an endowment, it needs to grow. R.DeLong: Since it’s based on a rolling average, the first year is essentially a few to $10,000. R.Perry: Russ Fields is on the phone. Do you want to add to the discussion? R.Fields: Everything that has been said is correct. The Marigold quasi endowment is growing well but it takes a while because we are working on the earnings. The $2 claim is being used for mining engineering faculty. We are very happy to come to the Commission and discuss how that money is being used. Primarily it used to offset the cost of mining engineering faculty. R.Perry: had a question to R.Fields regarding the Marigold quasi endowment; is the market value number in the document sent to the Commission the amount that has gone in according to item 5 on the attachment? The detail there had the royalty going to the university, first ½ million and then the second $250,000 to the Mackay endowment? R.Fields: he indicated he wasn’t looking at the attachment, but it should be. The only endowment involved with Marigold is the Mackay Quasi endowment. What goes to the University goes to the president and his staff. R.DeLong: asked the Commission if we continue to provide the $2 claim for an additional year. In addition, to go with that is there anything we as the commission want to add to does we want to direct how that money should be applied? D.Bryan: the $2 claim fee should go to Mackay. One of the things that he wanted to bring up to Russ was that part of the money is going to the NBMG, I think it’s a great use of that money. Would like to see that continued. R.Fields: the amount last year exceeded the approximate $400,000 that it was originally based on. Now there some extreme needs at the gold building, sample center DRI. We were able to put a portion of the $2 fee toward an individual who is just a key employee at the gold building as well as continued to fund a good portion of the faculty. As we look at the overall budget we always keep in mind how to best utilize those funds to meet the criteria in the 2008 agreement. R. DeLong: would like to second Dennis’ position and continue at least for this next year the $2 claim to Mackay. I would like to see additional funds go to the NBMG, specifically going to the funding of updating the mineral exploration survey for 2015. R.Fields: That’s a good suggestion. we are looking for funds to support the positions within the faculty in mining and metallurgical engineering department. Industry has come forward in the past and have been very supportive. We’ve been working hard to make sure we are supported when the $2 claim fee ends. He reads the Commission loud and clear when it comes to the support of NBMG, which is a part of Mackay of
course. D.Parker: there was a request for $40,000 to update the mineral exploration survey report. We were hoping you could see a way to fund that effort. A.Henderson: we would like to support Mackay but also like to support the Bureau. I would like to see you send that message that we would like to keep the doors open for the Bureau. R.Fields: Mackay and the Bureau are one in the same and know it has to be supported. When Jim gets back we will sit down with the Dean and look at these numbers.
Motion Approval of MSM annual $2 per claim with support on the NBMG mineral exploration consideration by: Dennis Bryan with the stipulation that we highly encourage you to help the Bureau in updating the mining exploration survey for 2015.
Seconded by: Dave Parker Unanimously carried.
IV. STAFF REPORTS
1) Mining/Reclamation Bond Pool – Mike Visher Mike Visher showed a Bond pool report/graph Activity is low. Limited increases and some reductions, seeing difficulty in companies raising money.
2) Oil, Gas, and Geothermal – Rich Perry (Oil and geothermal drilling update) Rich Perry showed a map of NV showing the Oil and Geothermal wells drilled for 2015. He then did a power point presentation going over total permits issued and total well drilled. 2016 Inspections, sundry notices. Oil, Gas and Geothermal activity 2015 through 4th quarter. A.Henderson: received a call from Noble, decided to no longer invest in NV. They are focusing in Texas and Colorado. They are looking for someone to come in and take over. J.Snow: Just goes to show that we are still a frontier state. R. Perry: they still have 3 obligation wells that have to be drilled. Not sure that they will abandon it. We did remind them that we need to have plugging of wells and pad reclamation done.
3) Administrator’s report- Rich Perry 4) Correspondence – none
COMMISSION BUSINESS A.Determination of time and place of next CMR meeting. Carson City (Hearing and Quarterly Meeting) May 19, 2016 Thursday. With a Field Trip on the 20th. Henderson requested to have future CMR meetings on Thursday and Fridays. COMMENTS BY THE GENERAL PUBLIC Pursuant to N.R.S. 241, this time is devoted to comments by the public, if any, and discussion of those
comments. No action may be taken upon a matter raised under this item on the agenda until the matter itself has been specifically included on a successive agenda and identified as an item for possible action. All public comments will be limited to 5 minutes for each person. ACTION WILL NOT BE TAKEN
ADJOURNMENT AT 12:01 PM.

II. NEW BUSINESS
II. A. Attracting mineral exploration and
development capital to Nevada

THIS SECTION IS INTENTIONALLY LEFT BLANK.
HAND OUTS AND PRESENTATION WILL BE GIVEN AT THE
MEETING.

II. B. Strategic Planning Session for Fiscal
Years 2018‐19

Nevada’s Strategic Planning Framework 2016 - 2020
Nevada’sStrategicPlanning Framework
“Generations to Come”
2016 - 2020
First EditionApril 11, 2016
Nevada’s Strategic Planning Framework 2016 - 2020
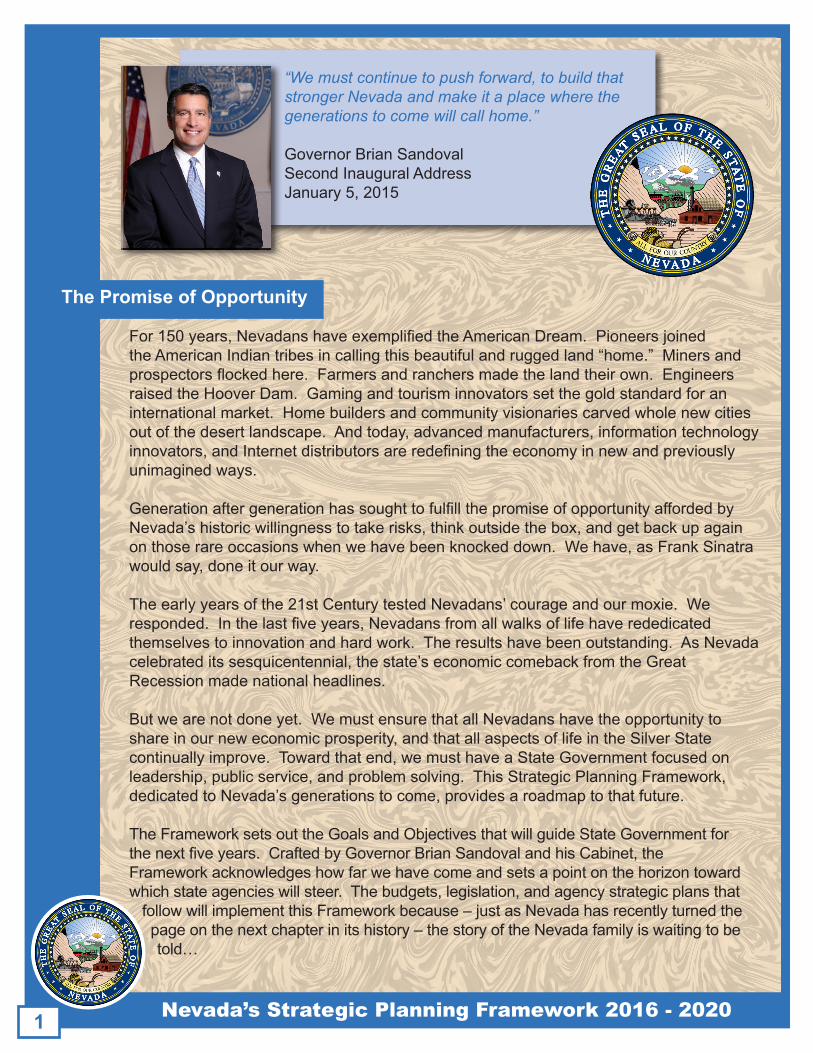
“We must continue to push forward, to build that stronger Nevada and make it a place where the generations to come will call home.”
Governor Brian SandovalSecond Inaugural AddressJanuary 5, 2015
The Promise of Opportunity
For150years,NevadanshaveexemplifiedtheAmericanDream.Pioneersjoined theAmericanIndiantribesincallingthisbeautifulandruggedland“home.”Minersand prospectorsflockedhere.Farmersandranchersmadethelandtheirown.Engineers raisedtheHooverDam.Gamingandtourisminnovatorssetthegoldstandardforan internationalmarket.Homebuildersandcommunityvisionariescarvedwholenewcities outofthedesertlandscape.Andtoday,advancedmanufacturers,informationtechnology innovators,andInternetdistributorsareredefiningtheeconomyinnewandpreviously unimaginedways.
Generationaftergenerationhassoughttofulfillthepromiseofopportunityaffordedby Nevada’shistoricwillingnesstotakerisks,thinkoutsidethebox,andgetbackupagain onthoserareoccasionswhenwehavebeenknockeddown.Wehave,asFrankSinatra wouldsay,doneitourway.
Theearlyyearsofthe21stCenturytestedNevadans’courageandourmoxie.We responded.Inthelastfiveyears,Nevadansfromallwalksoflifehaverededicated themselvestoinnovationandhardwork.Theresultshavebeenoutstanding.AsNevada celebrateditssesquicentennial,thestate’seconomiccomebackfromtheGreat Recessionmadenationalheadlines.
Butwearenotdoneyet.WemustensurethatallNevadanshavetheopportunityto shareinourneweconomicprosperity,andthatallaspectsoflifeintheSilverState continuallyimprove.Towardthatend,wemusthaveaStateGovernmentfocusedon leadership,publicservice,andproblemsolving.ThisStrategicPlanningFramework, dedicatedtoNevada’sgenerationstocome,providesaroadmaptothatfuture.
TheFrameworksetsouttheGoalsandObjectivesthatwillguideStateGovernmentfor thenextfiveyears.CraftedbyGovernorBrianSandovalandhisCabinet,the Frameworkacknowledgeshowfarwehavecomeandsetsapointonthehorizontoward whichstateagencieswillsteer.Thebudgets,legislation,andagencystrategicplansthat followwillimplementthisFrameworkbecause–justasNevadahasrecentlyturnedthe pageonthenextchapterinitshistory–thestoryoftheNevadafamilyiswaitingtobe told…
1
Nevada’s Strategic Planning Framework 2016 - 2020
Where We Are Headed
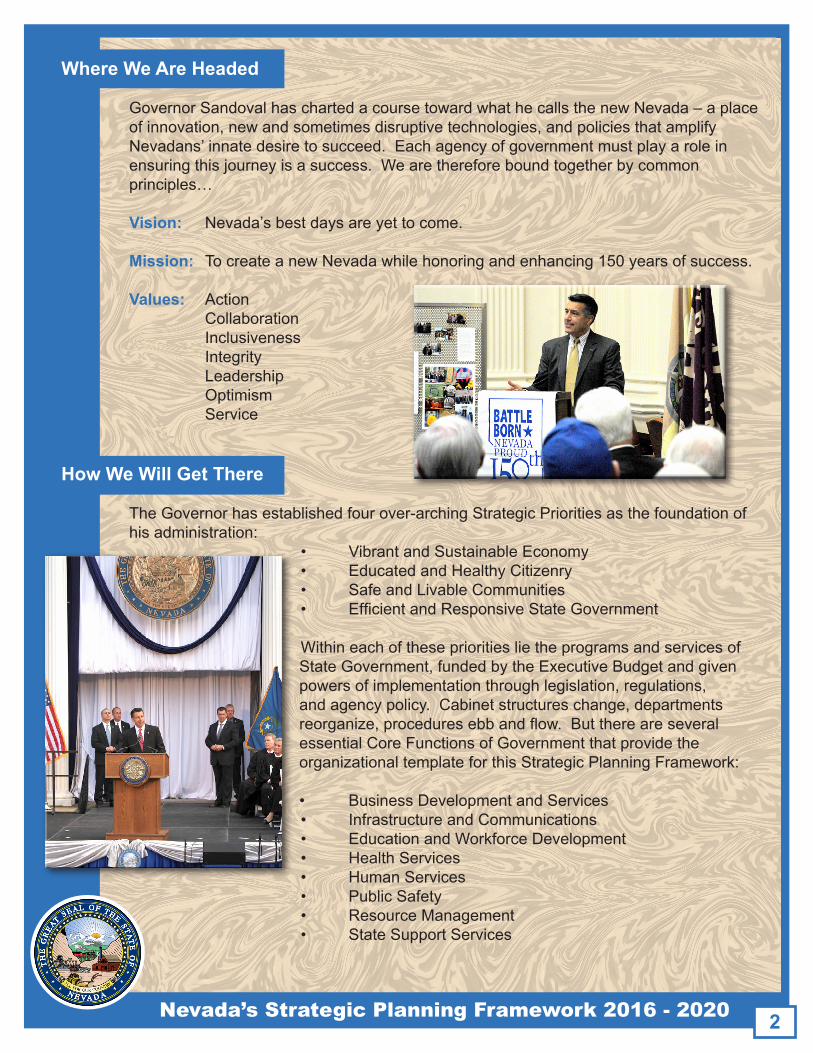
GovernorSandovalhaschartedacoursetowardwhathecallsthenewNevada–aplace ofinnovation,newandsometimesdisruptivetechnologies,andpoliciesthatamplify Nevadans’innatedesiretosucceed.Eachagencyofgovernmentmustplayarolein ensuringthisjourneyisasuccess.Wearethereforeboundtogetherbycommon principles…
Vision: Nevada’sbestdaysareyettocome.
Mission: TocreateanewNevadawhilehonoringandenhancing150yearsofsuccess.
Values: Action Collaboration Inclusiveness Integrity Leadership Optimism Service
How We Will Get There
TheGovernorhasestablishedfourover-archingStrategicPrioritiesasthefoundationof hisadministration:
• VibrantandSustainableEconomy• EducatedandHealthyCitizenry• SafeandLivableCommunities• EfficientandResponsiveStateGovernment
WithineachoftheseprioritieslietheprogramsandservicesofStateGovernment,fundedbytheExecutiveBudgetandgivenpowersofimplementationthroughlegislation,regulations,andagencypolicy.Cabinetstructureschange,departmentsreorganize,proceduresebbandflow.ButthereareseveralessentialCoreFunctionsofGovernmentthatprovidetheorganizationaltemplateforthisStrategicPlanningFramework: • BusinessDevelopmentandServices• InfrastructureandCommunications• EducationandWorkforceDevelopment• HealthServices• HumanServices
• PublicSafety • ResourceManagement • StateSupportServices
2
Nevada’s Strategic Planning Framework 2016 - 2020
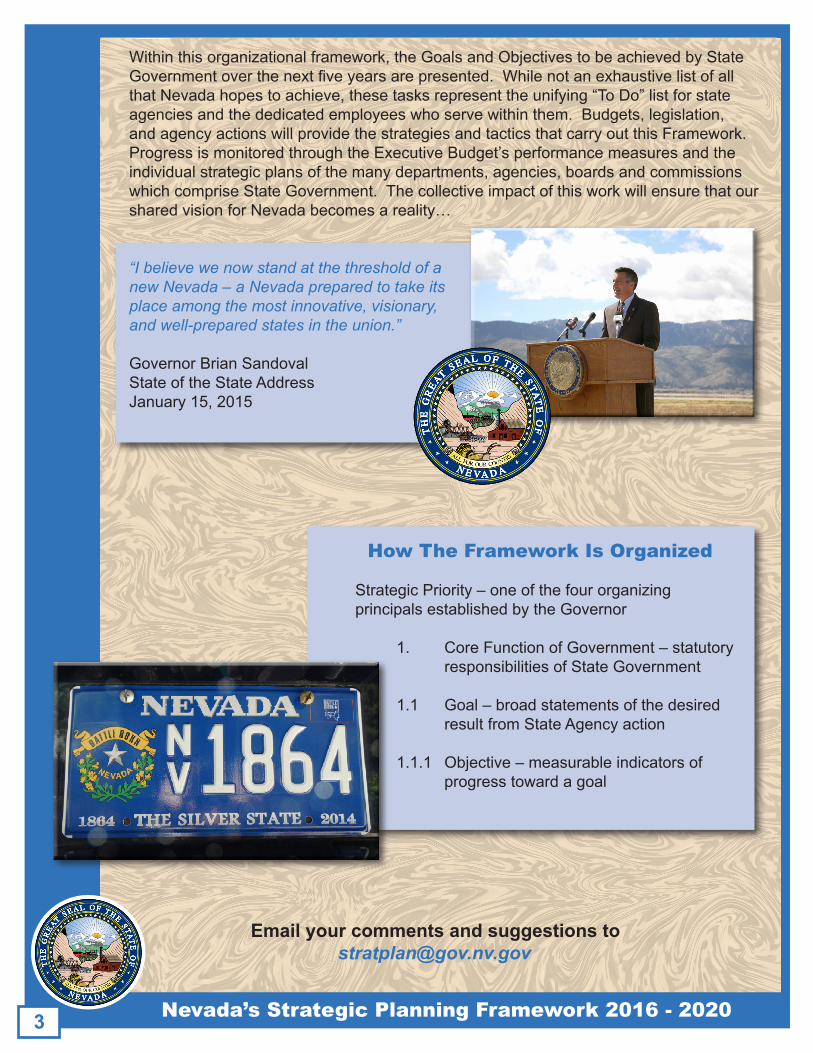
Withinthisorganizationalframework,theGoalsandObjectivestobeachievedbyState Governmentoverthenextfiveyearsarepresented.Whilenotanexhaustivelistofall thatNevadahopestoachieve,thesetasksrepresenttheunifying“ToDo”listforstate agenciesandthededicatedemployeeswhoservewithinthem.Budgets,legislation, andagencyactionswillprovidethestrategiesandtacticsthatcarryoutthisFramework. ProgressismonitoredthroughtheExecutiveBudget’sperformancemeasuresandthe individualstrategicplansofthemanydepartments,agencies,boardsandcommissions whichcompriseStateGovernment.Thecollectiveimpactofthisworkwillensurethatour sharedvisionforNevadabecomesareality…
“I believe we now stand at the threshold of a new Nevada – a Nevada prepared to take its place among the most innovative, visionary, and well-prepared states in the union.”
Governor Brian Sandoval StateoftheStateAddress January 15, 2015
How The Framework Is Organized
StrategicPriority–oneofthefourorganizingprincipalsestablishedbytheGovernor
1. CoreFunctionofGovernment–statutory responsibilitiesofStateGovernment 1.1 Goal–broadstatementsofthedesired resultfromStateAgencyaction 1.1.1 Objective–measurableindicatorsof progresstowardagoal
Email your comments and suggestions to [email protected]
3

Nevada’s Strategic Planning Framework 2016 - 2020
VIBRANT AND SUSTAINABLE ECONOMY
NootherstateinthenationfelttheeffectsoftheGreatRecessionasseverelyasNevadadid.Asaresult,adecades-longconversationaboutdiversifyinganeconomyheavilydependentondisposableincomereachedaphaseofurgencythatcompelleddeliberateandtargetedactiontotransformNevada’seconomiclandscape.WhileNevada’straditionalandfoundationalindustriesandsectorsremaininextricablylinkedtothestate’ssuccess,effortsmustcontinuetorecruitandretaindynamic,emergingbusinessesthatareontheforefrontofinnovationandthatofferjobopportunitiesforanewgenerationofworkers.WhilethenewNevadaeconomywillbebuiltontheemergingindustriesandtechnologiesofthefuture,wemustalsoguardourcompetitive
advantageandreputationforexcellenceinfoundationalindustriessuchasgaming,tourism, agriculture,andmining.Themomentumthathasbeengeneratedoverthelastfiveyearsmust continue,notonlytoensureafullrecoveryfromtheeconomicdownturnof2008,butalsoto ensurethatwhenthenextdownturnstrikes,Nevada’seconomicvitalitywillbefortified.
1. BUSINESS DEVELOPMENT AND SERVICES
1.1 Lead the nation in high-quality job creation. 1.1.1 By2020,thejobgrowthrateinNevadawillexceedthenationalaverage. 1.1.2 Meetorexceednationalrealwagegrowthratesonanannualbasis. 1.1.3 Nevadawillincreasethenumberofjobsinthefollowingemergingsectors: • AdvancedManufacturing • FoodManufacturing • InformationTechnology • HealthCare • Logistics • RenewableEnergyTechnologyandDevelopment • Unmanned(Autonomous)SystemsandAdvancedMobility • WaterTechnology 1.1.4 Cultivateadiverseandinclusiveworkforceandensureequalemploymentopportunities.
1.2 Ensure a business-friendly regulatory environment. 1.2.1 Instillaregulatoryandadministrativeframework thatminimizesbureaucraticbarriersto businesssuccess. 1.2.2 Expediteprofessionallicensureinallfields.
1.3 Maintain our historic leadership role in tourism and gaming. 1.3.1 Fosterinnovationinthegamingandentertainment` industries. 1.3.2 Achievea25%increaseinout-of-statevisitor countsoverthenextdecade. 1.3.3 Demonstratequantifiablegainsinthe18-34age demographic.
4
Nevada’s Strategic Planning Framework 2016 - 2020
2. INFRASTRUCTURE AND COMMUNICATIONS
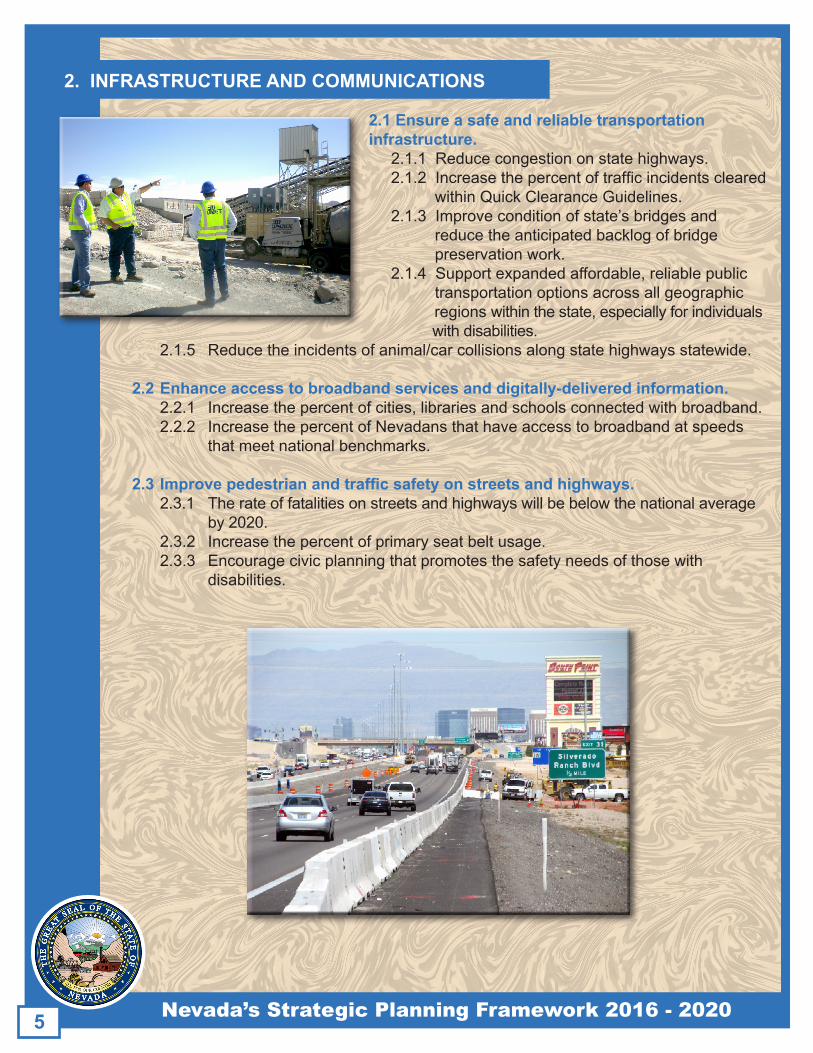
2.1 Ensure a safe and reliable transportation infrastructure.2.1.1Reducecongestiononstatehighways.2.1.2Increasethepercentoftrafficincidentscleared withinQuickClearanceGuidelines.2.1.3Improveconditionofstate’sbridgesand reducetheanticipatedbacklogofbridge preservationwork.2.1.4Supportexpandedaffordable,reliablepublic transportationoptionsacrossallgeographic regionswithinthestate,especiallyforindividuals
withdisabilities. 2.1.5 Reducetheincidentsofanimal/carcollisionsalongstatehighwaysstatewide.
2.2 Enhance access to broadband services and digitally-delivered information. 2.2.1 Increasethepercentofcities,librariesandschoolsconnectedwithbroadband. 2.2.2 IncreasethepercentofNevadansthathaveaccesstobroadbandatspeeds thatmeetnationalbenchmarks.
2.3Improvepedestrianandtrafficsafetyonstreetsandhighways. 2.3.1 Therateoffatalitiesonstreetsandhighwayswillbebelowthenationalaverage by2020. 2.3.2 Increasethepercentofprimaryseatbeltusage. 2.3.3 Encouragecivicplanningthatpromotesthesafetyneedsofthosewith disabilities.
5
Nevada’s Strategic Planning Framework 2016 - 2020
EDUCATED AND HEALTHY CITIZENRY
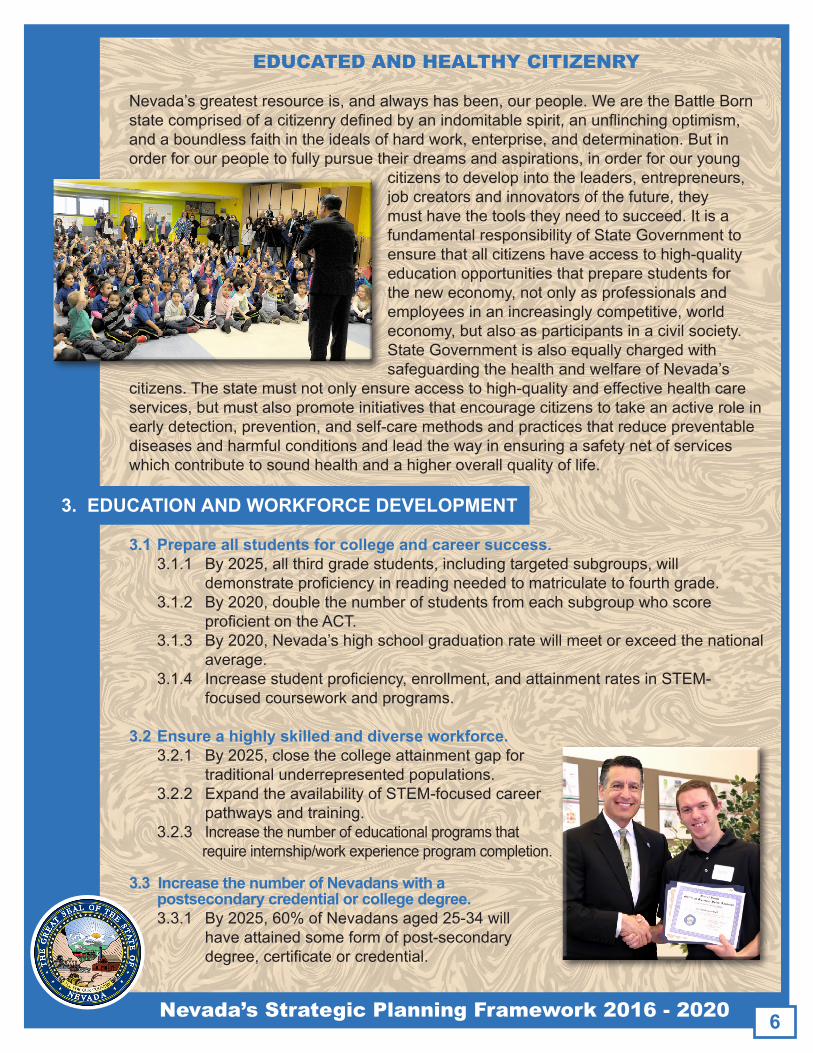
Nevada’sgreatestresourceis,andalwayshasbeen,ourpeople.WearetheBattleBorn statecomprisedofacitizenrydefinedbyanindomitablespirit,anunflinchingoptimism, andaboundlessfaithintheidealsofhardwork,enterprise,anddetermination.Butin orderforourpeopletofullypursuetheirdreamsandaspirations,inorderforouryoung
citizenstodevelopintotheleaders,entrepreneurs,jobcreatorsandinnovatorsofthefuture,theymusthavethetoolstheyneedtosucceed.ItisafundamentalresponsibilityofStateGovernmenttoensurethatallcitizenshaveaccesstohigh-qualityeducationopportunitiesthatpreparestudentsfortheneweconomy,notonlyasprofessionalsandemployeesinanincreasinglycompetitive,worldeconomy,butalsoasparticipantsinacivilsociety.StateGovernmentisalsoequallychargedwithsafeguardingthehealthandwelfareofNevada’s
citizens.Thestatemustnotonlyensureaccesstohigh-qualityandeffectivehealthcare services,butmustalsopromoteinitiativesthatencouragecitizenstotakeanactiverolein earlydetection,prevention,andself-caremethodsandpracticesthatreducepreventable diseasesandharmfulconditionsandleadthewayinensuringasafetynetofservices whichcontributetosoundhealthandahigheroverallqualityoflife.
3. EDUCATION AND WORKFORCE DEVELOPMENT
3.1 Prepare all students for college and career success. 3.1.1 By2025,allthirdgradestudents,includingtargetedsubgroups,will demonstrateproficiencyinreadingneededtomatriculatetofourthgrade. 3.1.2 By2020,doublethenumberofstudentsfromeachsubgroupwhoscore proficientontheACT. 3.1.3 By2020,Nevada’shighschoolgraduationratewillmeetorexceedthenational average. 3.1.4 Increasestudentproficiency,enrollment,andattainmentratesinSTEM- focusedcourseworkandprograms.
3.2 Ensure a highly skilled and diverse workforce. 3.2.1 By2025,closethecollegeattainmentgapfor traditionalunderrepresentedpopulations. 3.2.2 ExpandtheavailabilityofSTEM-focusedcareer pathwaysandtraining. 3.2.3 Increasethenumberofeducationalprogramsthat requireinternship/workexperienceprogramcompletion.
3.3 Increase the number of Nevadans with a postsecondary credential or college degree. 3.3.1 By2025,60%ofNevadansaged25-34will haveattainedsomeformofpost-secondary degree,certificateorcredential.
6
Nevada’s Strategic Planning Framework 2016 - 2020
4. HEALTH SERVICES
4.1 Promote health and wellness across all age groups. 4.1.1By2025,reducethenumberofdeathsfrom preventablediseasesandconditionswith provenearlydetectionandtreatmentmethods tobelowthenationalaverage. 4.1.2By2020,increaseimmunizationratesamong Nevadachildrenforrecommendedcombined vaccineseriesby10%,from67.7%to77.7%.
4.2 Improve the quality and accessibility of primary medical services. 4.2.1 By2025,connectallruralhospitals,healthclinics,andstatecorrectional facilitiestoabroadbandconnectionsufficienttoprovidetele-healthservices. 4.2.2 Increasethenumberofmedicalprofessionalsbyleveragingeducational resources,residencies,andstreamliningStatelicensing.
4.3 Reduce the prevalence of risky and addictive behaviors. 4.3.1 ReducesuicideratesamongNevada’sveterans,seniorcitizens,andthose youngerthan18yearstobelowthenationalaverageby2020. 4.3.2 Reduceheroinandopioidoverdosedeathsby5%peryearbeginningin2017. 4.3.3 By2020,institutionalizetheuseofScreening,BriefInterventionandReferral Treatmentmethodologyinallintegratedbehavioralhealthandprimarycaresettings.
5. HUMAN SERVICES
5.1 Reduce the unemployment rate among target populations. 5.1.1 By2020,Nevada’soverallunemploymentratewillbelowerthanthenational unemploymentrate. 5.1.2 Theunemploymentrateforveteranswillbebelowthenationalaverage. 5.1.3 Theunemploymentrateforpersonswithdisabilitieswillbereducedby50%. 5.1.4 TheunemploymentrateforAfricanAmericanswillbeatorbelowthestate’s unemploymentrate.
5.2 Improve the accessibility and quality of supportive services for at-risk populations. 5.2.1 Increaseby20%thenumberofchildrenscreenedforautismbyage24months. 5.2.2 Increaseby20%theavailabilityofhome-and-community-basedservicesto vulnerableadults. 5.2.3 IncreaseEarlyandPeriodicScreening, Diagnosis,andTreatment(EPSDT) screeningratioby20%by2020.
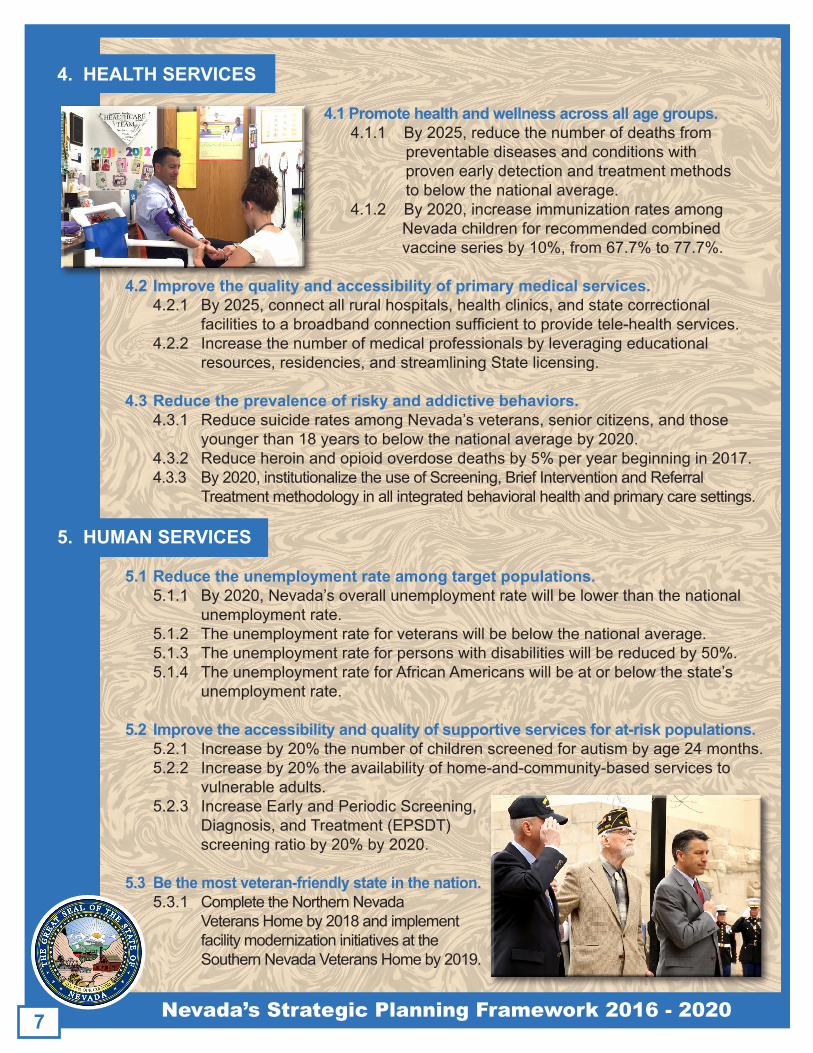
5.3 Be the most veteran-friendly state in the nation. 5.3.1 CompletetheNorthernNevada VeteransHomeby2018andimplement facilitymodernizationinitiativesatthe SouthernNevadaVeteransHomeby2019.
7
Nevada’s Strategic Planning Framework 2016 - 2020
5.3.2 EnsurethatallNevadaveterans,nomatterwheretheyliveinthestate,have knowledgeofandaccesstobenefitsandopportunitiesforwhichtheyareeligible. 5.3.3 Reduceveteranhomelessnesstofunctionalzeroby2020. 5.3.4 EnsurethateveryNevadaveteranwhoobtainsapostsecondarycredential, certificate,ordegreeisfullyemployedwithalivablewagesixmonthsaftergraduation. 5.3.5 Ensurethateverygenerationofveteransisacknowledgedinaceremony, informationcampaign,orotherformofannualrecognition.
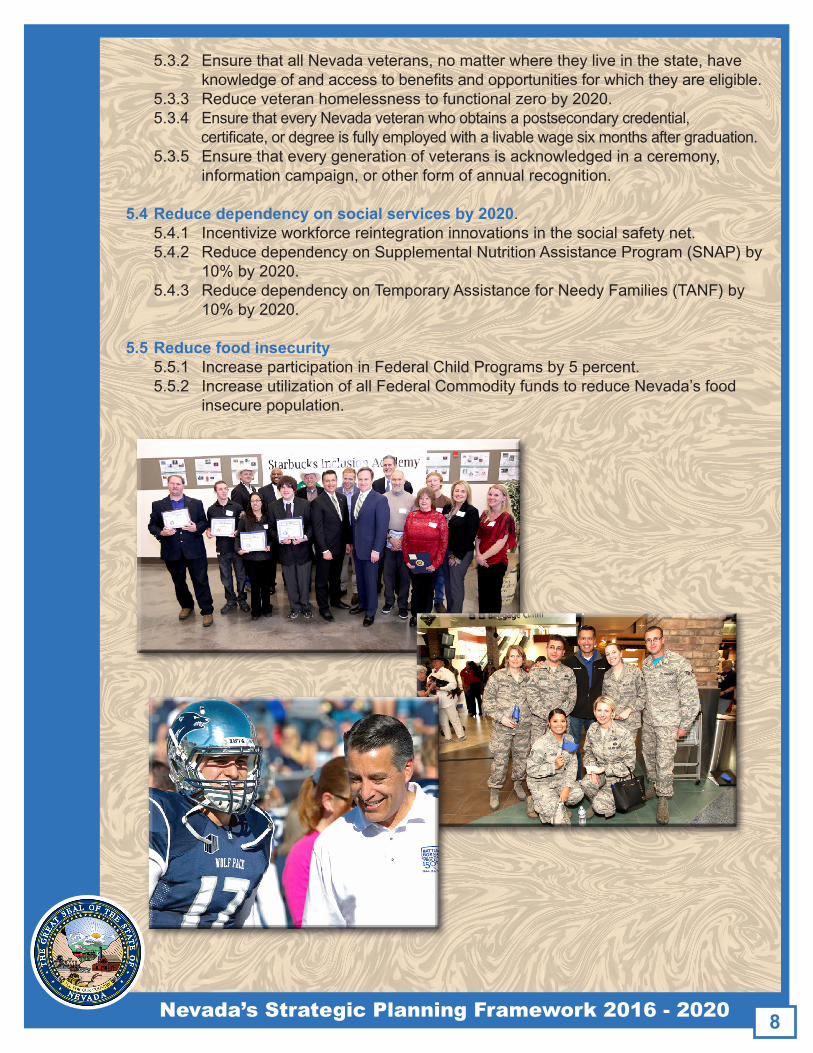
5.4 Reduce dependency on social services by 2020. 5.4.1 Incentivizeworkforcereintegrationinnovationsinthesocialsafetynet. 5.4.2 ReducedependencyonSupplementalNutritionAssistanceProgram(SNAP)by 10%by2020. 5.4.3 ReducedependencyonTemporaryAssistanceforNeedyFamilies(TANF)by 10%by2020. 5.5 Reduce food insecurity 5.5.1 IncreaseparticipationinFederalChildProgramsby5percent. 5.5.2 IncreaseutilizationofallFederalCommodityfundstoreduceNevada’sfood insecurepopulation.
8
Nevada’s Strategic Planning Framework 2016 - 2020
SAFE AND LIVABLE COMMUNITIES
PerhapsnootherresponsibilityofStateGovernmentisascriticalasmaintaininglawand orderandensuringthepublic’ssafetyinanenvironmentthatisconducivetotheirhealth andwell-being.Thispriorityisnecessarynotonlyasaqualityoflifeconsiderationfor
privatecitizens,butalsowithinthecontextofeconomicdevelopmentefforts,asnewbusinessesconsiderrelocatingtoNevadaandneedconfidencethatemployeesandtheirfamilieswillbesafe.Nevada’slawenforcementpersonnelmustbesufficientlytrainedandequippedtorespondeffectivelytocrimeandpublicsafetyincidentsandemergencies,includingcyber-securitythreats,Nevada’ssafetyinfrastructuremustbemodernizedtoensureoptimumresiliencytonaturalandman-madedisasters,andourfamilies,ourcitizens,andourbusinessesmust
havefullandcompleteconfidencethattheylive,work,andoperateinastatethatissafeand secure.Allofthismusttakeplaceagainstthebackdropofcleanairandwater,withsensible environmentalstewardshiprootedintheculturalandhistoriclandscapethatinturnmakes Nevadaunique.Wemustprovideadequateopenspace,includingstateparks,andrecognize thatNevadaisastatewithalonghistoryofdrought,whilecontinuingtograpplewiththeissue offederalcontrolovermostofNevada’spubliclands.
6. PUBLIC SAFETY
6.1 Prevent crime and protect the rights of all Nevadans. 6.1.1 By2020,reduceprisoninmaterecidivismby10%througheducationprograms andinterventionservicesandresources,particularlyintheareasofbehavioral health,drugaddiction,andworkforcetraining. 6.1.2 Reduceincidentsofdomesticviolenceby10%by2020. 6.1.3 Nevada’slawenforcementofficerswillhaveaccesstooffender,parole,and probationinformationthroughasecureinterfacewithamobiledevice. 6.1.4 Modernizepublicsafetypersonneltrainingprograms. 6.1.5 Improvetheconnectivityofthestatewideemergencycommunicationnetwork.
6.2 Ensure Nevada’s justice systems and law enforcement processes are effective and fair. 6.2.1 Reducebacklogofcourtcasesbyadditional20%by2020.
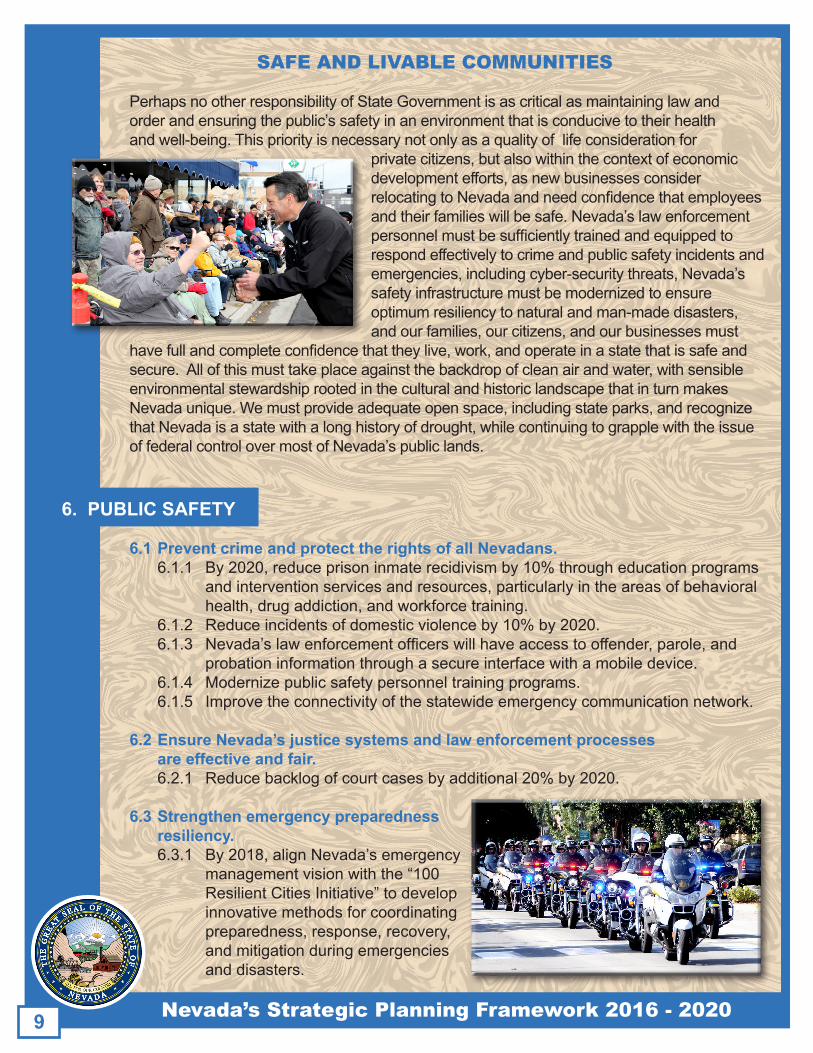
6.3 Strengthen emergency preparedness and resiliency. 6.3.1 By2018,alignNevada’semergency managementvisionwiththe“100 ResilientCitiesInitiative”todevelop innovativemethodsforcoordinating preparedness, response, recovery, andmitigationduringemergencies anddisasters.
9
Nevada’s Strategic Planning Framework 2016 - 2020
6.3.2 Alignexistingresourcestobuildstatewidecapacitytorespondtoandrecoverfrom man-madeornaturalemergenciesanddisasters,focusingespeciallyonCyber Security. 6.3.3 ApplynewtechnologiessuchasUnmannedAerialVehiclesinawaythatbetter preparesthestate’sresponsecapabilitiestomaximizeemergencyanddisaster resiliencyinthenewNevada. 6.3.4 Establishastatewidefoodsecuritypreparednessinfrastructurethatincludes sustainableagriculturalresources.
7. RESOURCE MANAGEMENT
7.1 Protect and sustainably manage natural resources. 7.1.1 Promotewaterconservationandmanagementactionstoprepareforsevere droughtconditionsthataffectNevadaandotherstatesinthewesternregion. 7.1.2 Implementbothastatemultiple-uselandspolicyandastatewidelanduse planandprocessthatoutlinesthestate’scommitmenttoutilizingpubliclands forconservation,recreation,sportsmen,grazing,mining,economic development,andcommunityexpansionpurposes. 7.1.3 Determineasustainablefundingstreamforthestateparksystemandincrease thenumberofstateparks.
7.2 Become the nation’s leading producer and consumer of clean and renewable energy.7.2.1By2020,completean“electric highway”systemservingtheentire state.7.2.2Significantlyreducethepercentageof importedfossilfuelsoverthenext10 years.7.2.3Reducecarbonemissiontoalevelator belowacceptedfederalstandards.
7.3 Celebrate and enhance cultural and heritage resources. 7.3.1Increasethenumberofopportunitiesforeducational,artisticandcultural enrichment. 7.3.2CompletetheStewartIndianSchoolHistoricExperiencebyDecember,2018.
10
Nevada’s Strategic Planning Framework 2016 - 2020
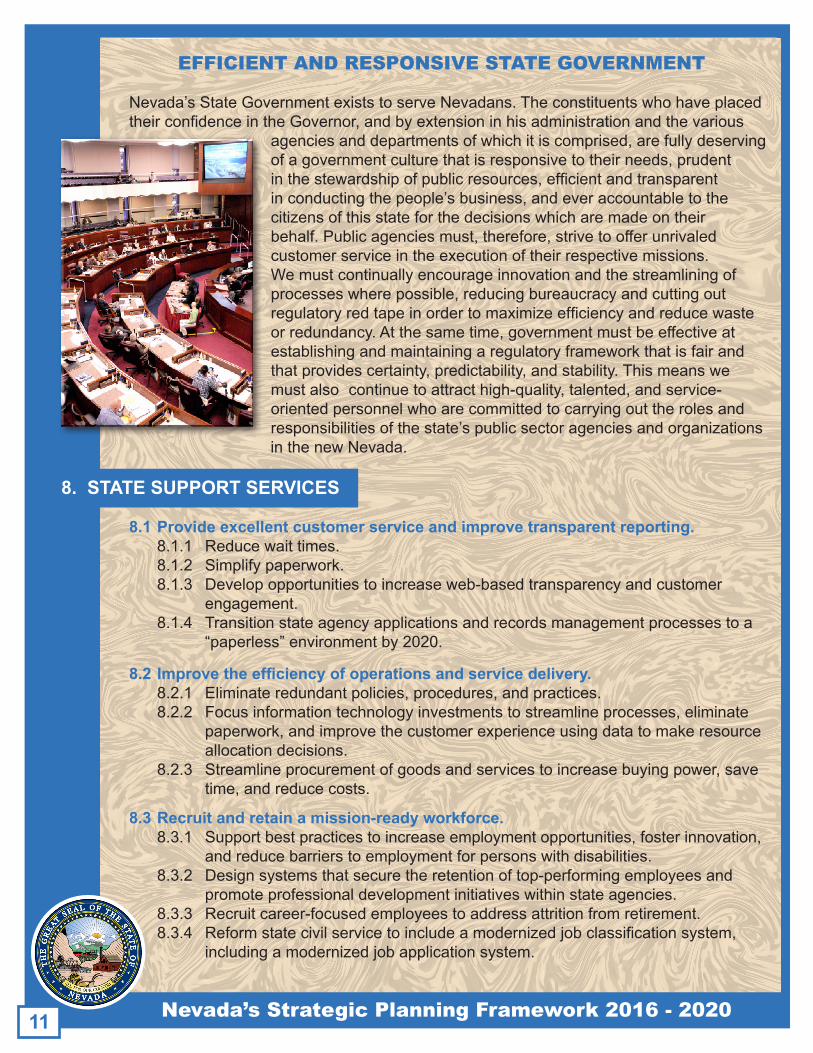
EFFICIENT AND RESPONSIVE STATE GOVERNMENT
Nevada’sStateGovernmentexiststoserveNevadans.Theconstituentswhohaveplaced theirconfidenceintheGovernor,andbyextensioninhisadministrationandthevarious
agenciesanddepartmentsofwhichitiscomprised,arefullydeservingofagovernmentculturethatisresponsivetotheirneeds,prudentinthestewardshipofpublicresources,efficientandtransparentinconductingthepeople’sbusiness,andeveraccountabletothecitizensofthisstateforthedecisionswhicharemadeontheirbehalf.Publicagenciesmust,therefore,strivetoofferunrivaledcustomerserviceintheexecutionoftheirrespectivemissions.Wemustcontinuallyencourageinnovationandthestreamliningofprocesseswherepossible,reducingbureaucracyandcuttingoutregulatoryredtapeinordertomaximizeefficiencyandreducewasteorredundancy.Atthesametime,governmentmustbeeffectiveatestablishingandmaintainingaregulatoryframeworkthatisfairandthatprovidescertainty,predictability,andstability.Thismeanswemustalsocontinuetoattracthigh-quality,talented,andservice-orientedpersonnelwhoarecommittedtocarryingouttherolesandresponsibilitiesofthestate’spublicsectoragenciesandorganizations
inthenewNevada.
8. STATE SUPPORT SERVICES
8.1 Provide excellent customer service and improve transparent reporting. 8.1.1 Reducewaittimes. 8.1.2 Simplifypaperwork. 8.1.3 Developopportunitiestoincreaseweb-basedtransparencyandcustomer engagement. 8.1.4 Transitionstateagencyapplicationsandrecordsmanagementprocessestoa “paperless”environmentby2020.
8.2Improvetheefficiencyofoperationsandservicedelivery. 8.2.1 Eliminateredundantpolicies,procedures,andpractices. 8.2.2 Focusinformationtechnologyinvestmentstostreamlineprocesses,eliminate paperwork,andimprovethecustomerexperienceusingdatatomakeresource allocationdecisions. 8.2.3 Streamlineprocurementofgoodsandservicestoincreasebuyingpower,save time,andreducecosts.
8.3 Recruit and retain a mission-ready workforce. 8.3.1 Supportbestpracticestoincreaseemploymentopportunities,fosterinnovation, andreducebarrierstoemploymentforpersonswithdisabilities. 8.3.2 Designsystemsthatsecuretheretentionoftop-performingemployeesand promoteprofessionaldevelopmentinitiativeswithinstateagencies. 8.3.3 Recruitcareer-focusedemployeestoaddressattritionfromretirement. 8.3.4 Reformstatecivilservicetoincludeamodernizedjobclassificationsystem, includingamodernizedjobapplicationsystem.
11
Nevada’s Strategic Planning Framework 2016 - 2020
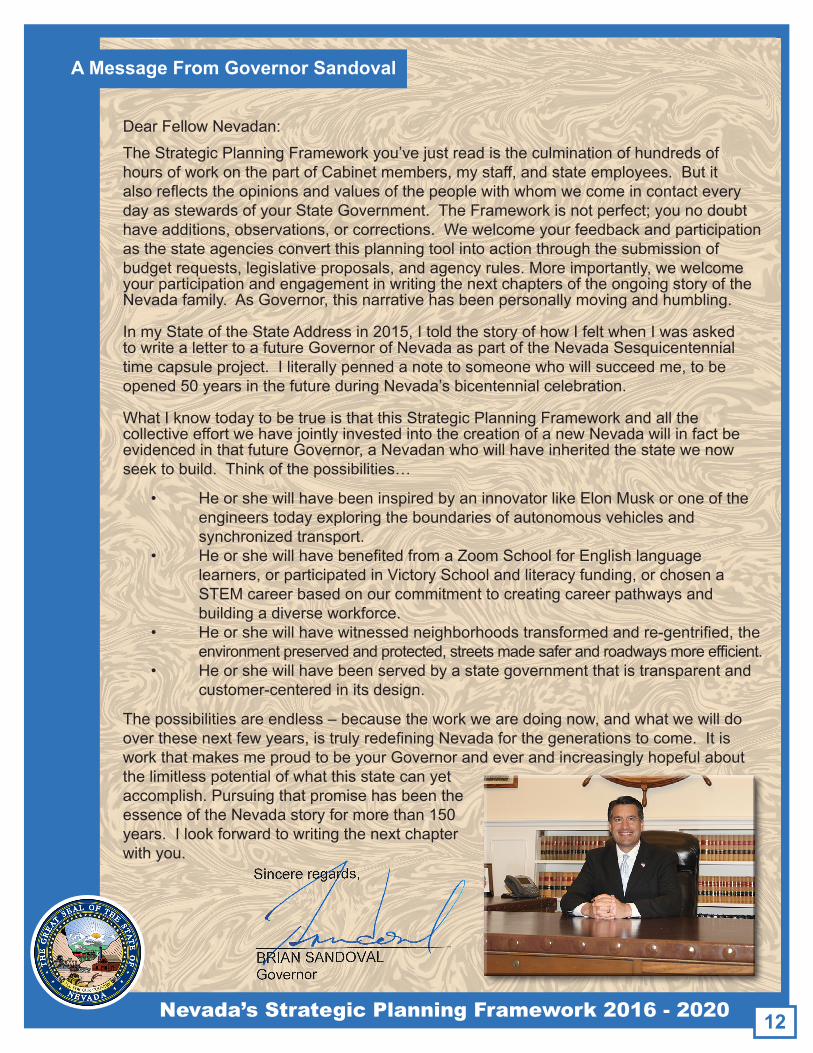
A Message From Governor Sandoval
DearFellowNevadan: TheStrategicPlanningFrameworkyou’vejustreadistheculminationofhundredsof hoursofworkonthepartofCabinetmembers,mystaff,andstateemployees.Butit alsoreflectstheopinionsandvaluesofthepeoplewithwhomwecomeincontactevery dayasstewardsofyourStateGovernment.TheFrameworkisnotperfect;younodoubt haveadditions,observations,orcorrections.Wewelcomeyourfeedbackandparticipation asthestateagenciesconvertthisplanningtoolintoactionthroughthesubmissionof budgetrequests,legislativeproposals,andagencyrules.Moreimportantly,wewelcome yourparticipationandengagementinwritingthenextchaptersoftheongoingstoryofthe Nevadafamily.AsGovernor,thisnarrativehasbeenpersonallymovingandhumbling.
InmyStateoftheStateAddressin2015,ItoldthestoryofhowIfeltwhenIwasasked towritealettertoafutureGovernorofNevadaaspartoftheNevadaSesquicentennial timecapsuleproject.Iliterallypennedanotetosomeonewhowillsucceedme,tobe opened50yearsinthefutureduringNevada’sbicentennialcelebration. WhatIknowtodaytobetrueisthatthisStrategicPlanningFrameworkandallthe collectiveeffortwehavejointlyinvestedintothecreationofanewNevadawillinfactbe evidencedinthatfutureGovernor,aNevadanwhowillhaveinheritedthestatewenow seektobuild.Thinkofthepossibilities…
• HeorshewillhavebeeninspiredbyaninnovatorlikeElonMuskoroneofthe engineerstodayexploringtheboundariesofautonomousvehiclesand synchronizedtransport. • HeorshewillhavebenefitedfromaZoomSchoolforEnglishlanguage learners,orparticipatedinVictorySchoolandliteracyfunding,orchosena STEMcareerbasedonourcommitmenttocreatingcareerpathwaysand buildingadiverseworkforce. • Heorshewillhavewitnessedneighborhoodstransformedandre-gentrified,the environmentpreservedandprotected,streetsmadesaferandroadwaysmoreefficient. • Heorshewillhavebeenservedbyastategovernmentthatistransparentand customer-centeredinitsdesign.
Thepossibilitiesareendless–becausetheworkwearedoingnow,andwhatwewilldo overthesenextfewyears,istrulyredefiningNevadaforthegenerationstocome.Itis workthatmakesmeproudtobeyourGovernorandeverandincreasinglyhopefulabout thelimitlesspotentialofwhatthisstatecanyet accomplish.Pursuingthatpromisehasbeenthe essenceoftheNevadastoryformorethan150 years.Ilookforwardtowritingthenextchapter withyou.
12
Nevada’s Strategic Planning Framework • Essential Core Functions of Government:
• Business Development and Services • Infrastructure and Communications • Education and Workforce Development • Health Services • Human Services • Public Safety • Resource Management • State Support Services 6
Nevada’s Strategic Planning Framework • How the Framework is Organized:
1. Core Function of Government 1.1 Goal – broad results statement 1.1.1 Objective – measurable indicators
7
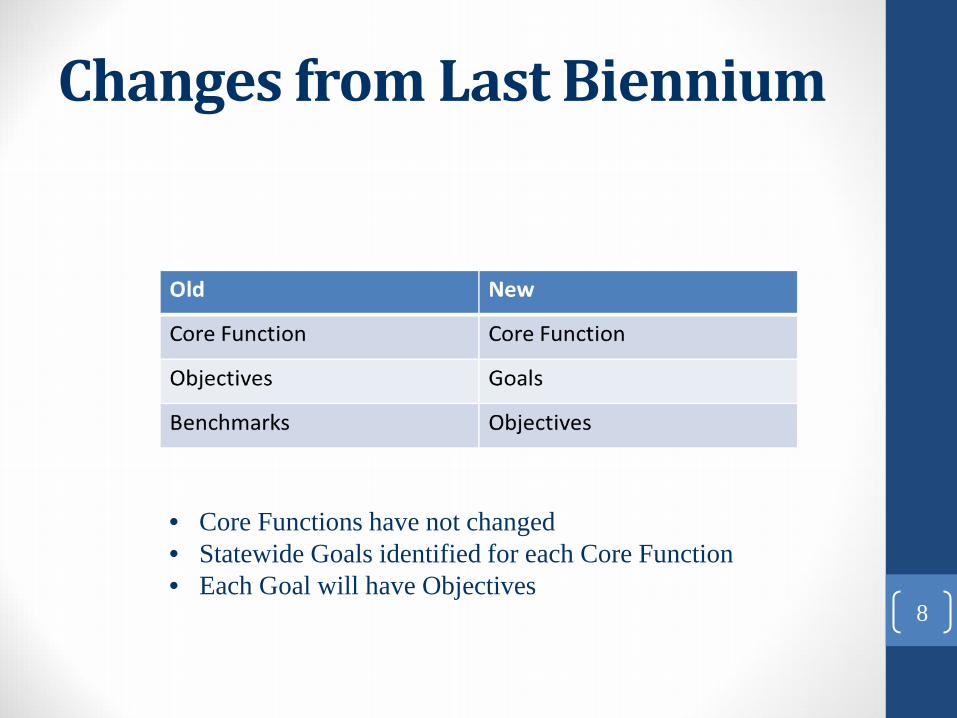
Changes from Last Biennium
8
• Core Functions have not changed • Statewide Goals identified for each Core Function • Each Goal will have Objectives
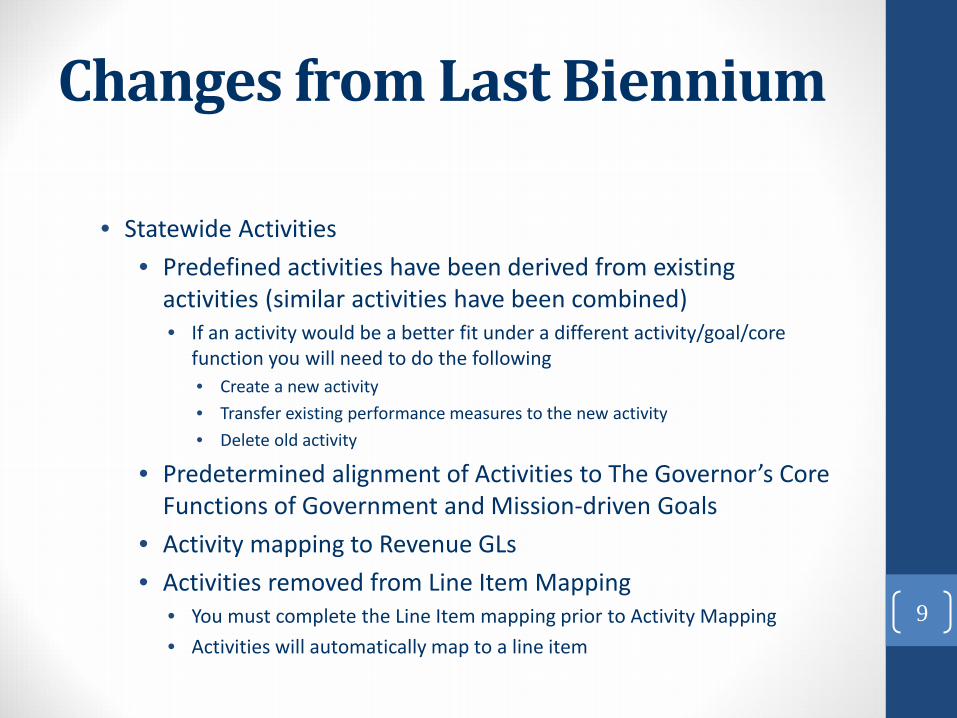
Changes from Last Biennium
• Statewide Activities • Predefined activities have been derived from existing
activities (similar activities have been combined) • If an activity would be a better fit under a different activity/goal/core
function you will need to do the following • Create a new activity • Transfer existing performance measures to the new activity • Delete old activity
• Predetermined alignment of Activities to The Governor’s Core Functions of Government and Mission-driven Goals
• Activity mapping to Revenue GLs • Activities removed from Line Item Mapping
• You must complete the Line Item mapping prior to Activity Mapping • Activities will automatically map to a line item
9
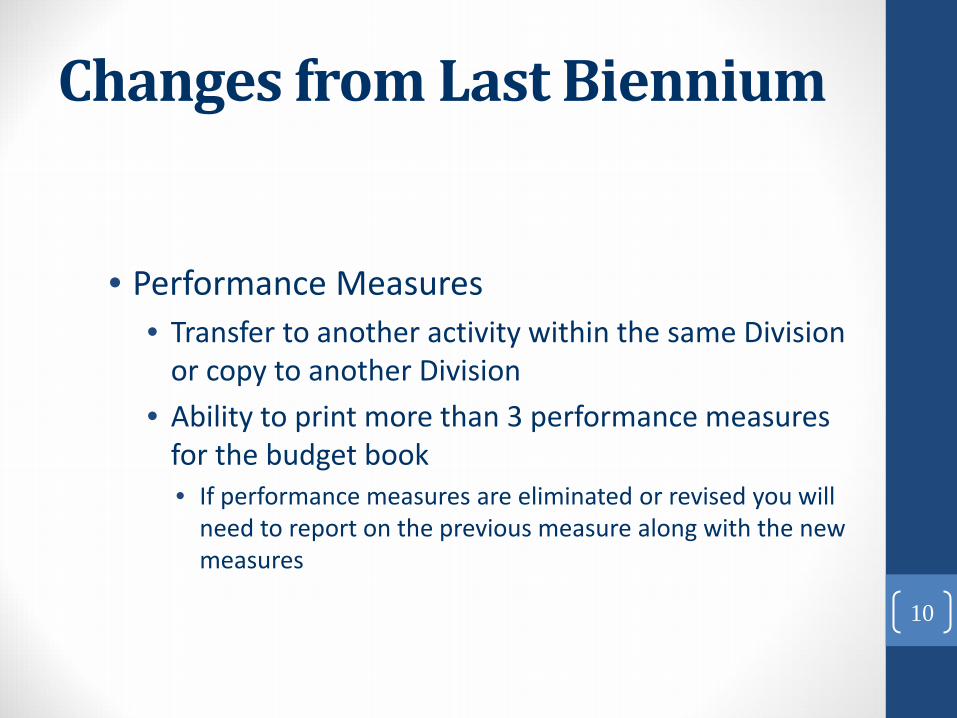
Changes from Last Biennium
• Performance Measures • Transfer to another activity within the same Division
or copy to another Division • Ability to print more than 3 performance measures
for the budget book • If performance measures are eliminated or revised you will
need to report on the previous measure along with the new measures
10
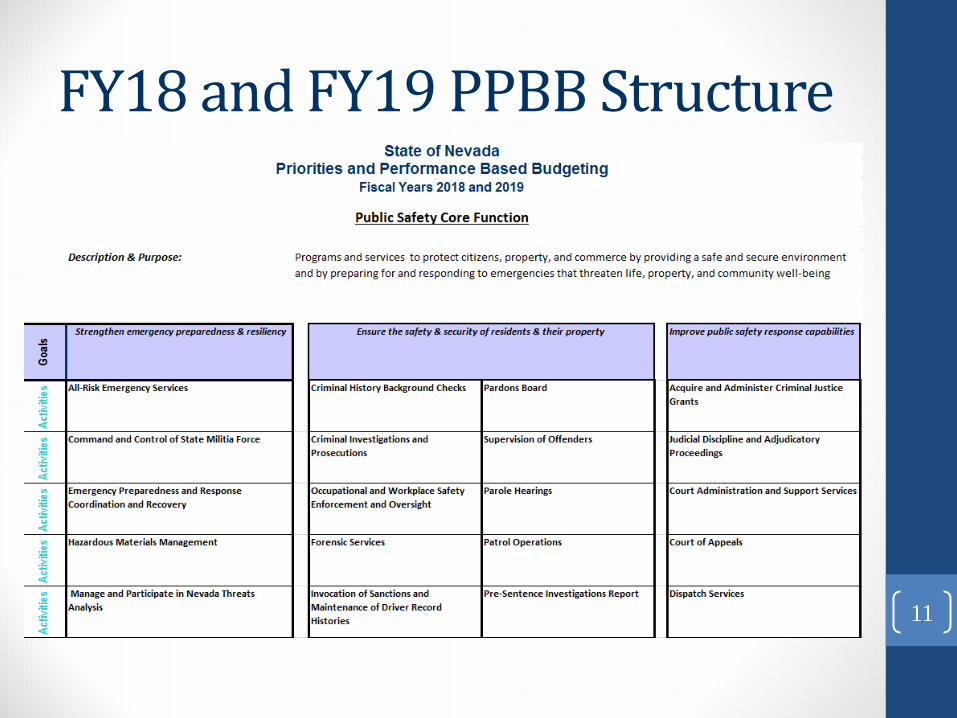
FY18 and FY19 PPBB Structure
11
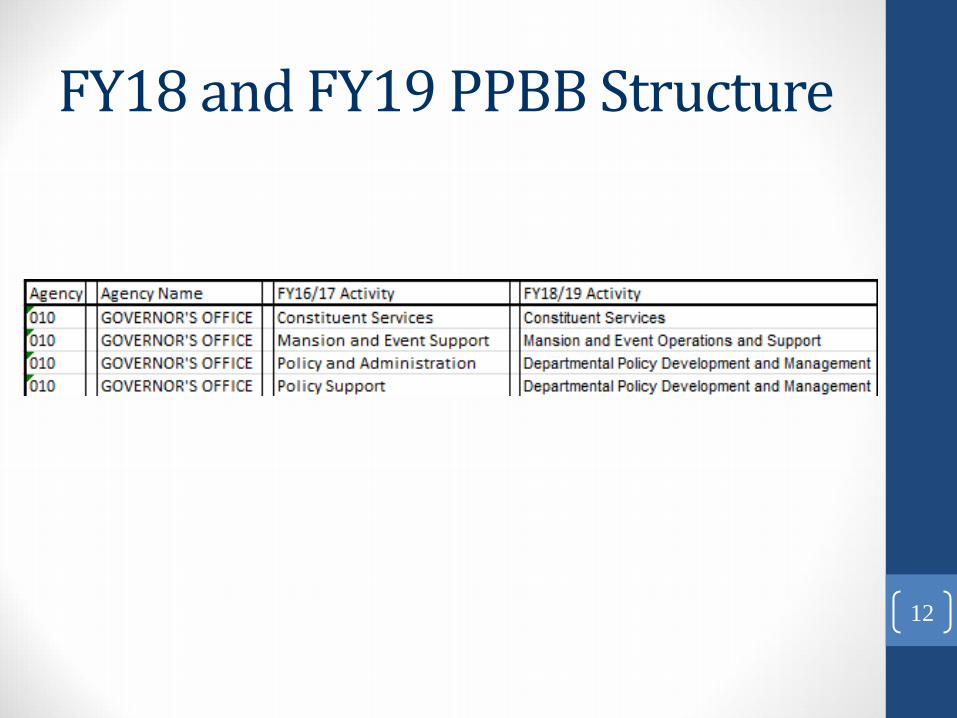
FY18 and FY19 PPBB Structure
12
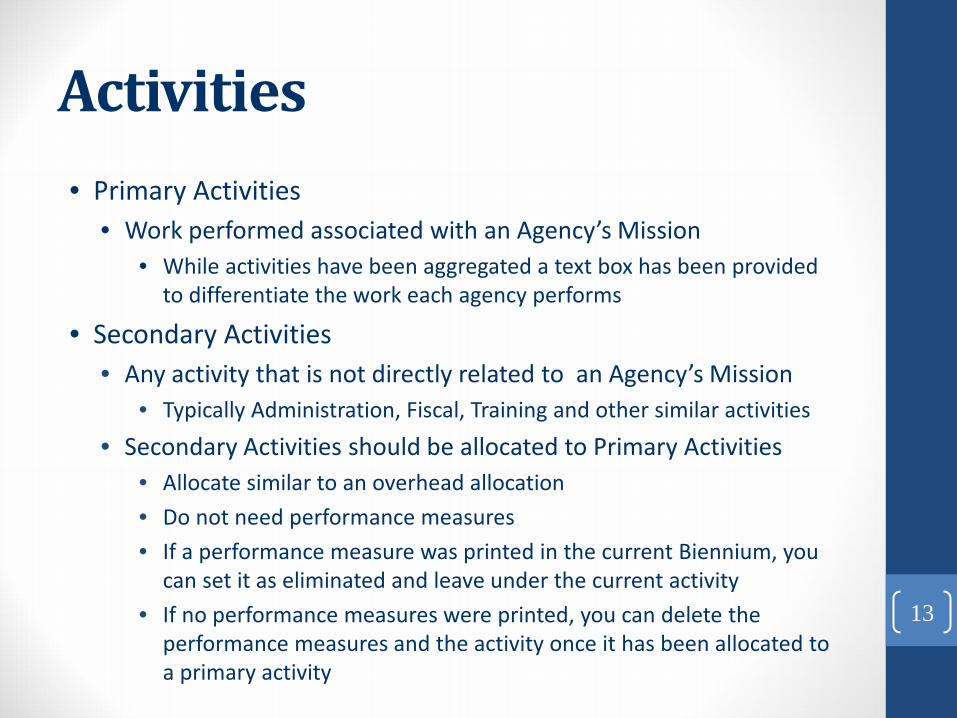
Activities • Primary Activities
• Work performed associated with an Agency’s Mission • While activities have been aggregated a text box has been provided
to differentiate the work each agency performs
• Secondary Activities • Any activity that is not directly related to an Agency’s Mission
• Typically Administration, Fiscal, Training and other similar activities • Secondary Activities should be allocated to Primary Activities
• Allocate similar to an overhead allocation • Do not need performance measures • If a performance measure was printed in the current Biennium, you
can set it as eliminated and leave under the current activity • If no performance measures were printed, you can delete the
performance measures and the activity once it has been allocated to a primary activity
13
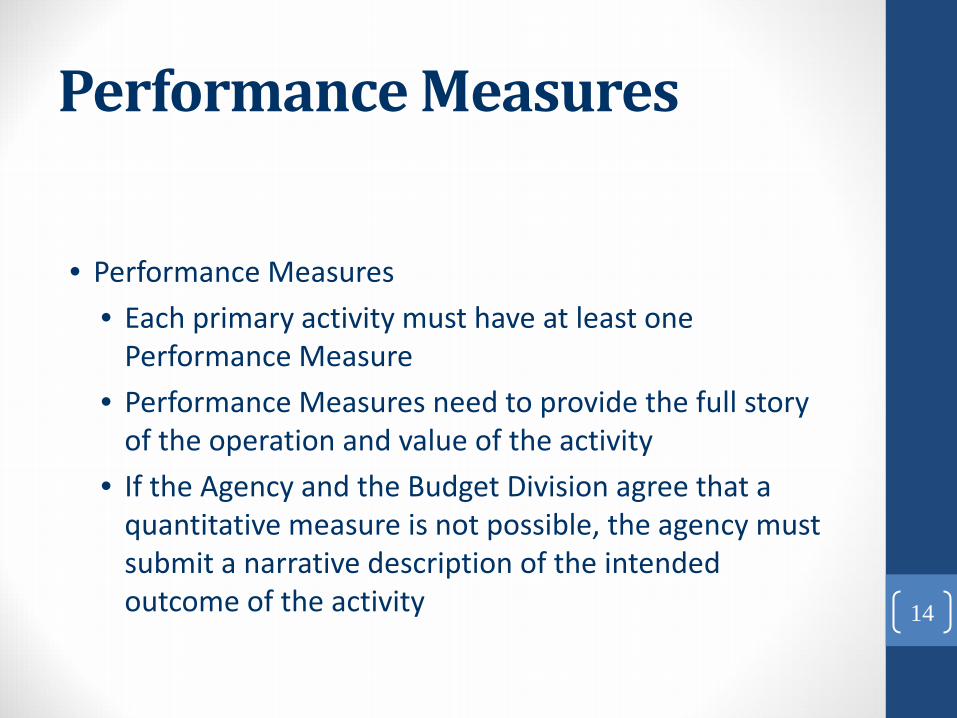
Performance Measures
• Performance Measures • Each primary activity must have at least one
Performance Measure • Performance Measures need to provide the full story
of the operation and value of the activity • If the Agency and the Budget Division agree that a
quantitative measure is not possible, the agency must submit a narrative description of the intended outcome of the activity 14
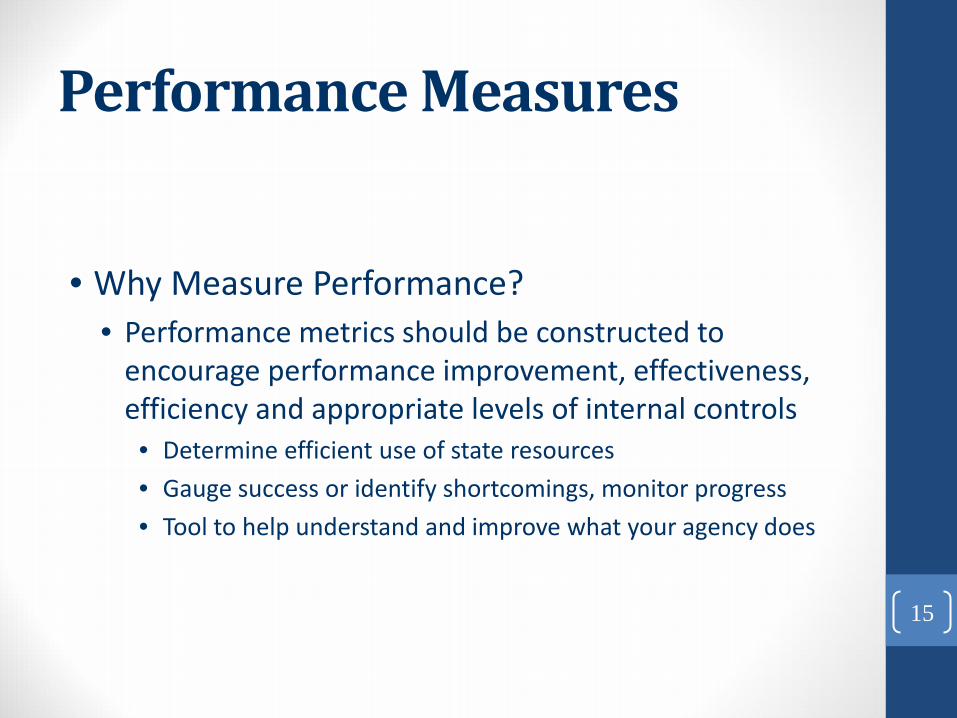
Performance Measures
• Why Measure Performance? • Performance metrics should be constructed to
encourage performance improvement, effectiveness, efficiency and appropriate levels of internal controls • Determine efficient use of state resources • Gauge success or identify shortcomings, monitor progress • Tool to help understand and improve what your agency does
15

Performance Measures
• Types of Performance Measures • Efficiency
• How are we performing our core mission? • Are we over, under or on budget? • Are we ahead of, behind or on schedule? • Are we utilizing more, less or forecasted amount of resources?
• Outcome • Did we achieve the expected results?
• Identifies the actual impact or benefit of an agencies actions.
• Effectiveness • Is anyone better off? • Are we doing the right things?
16
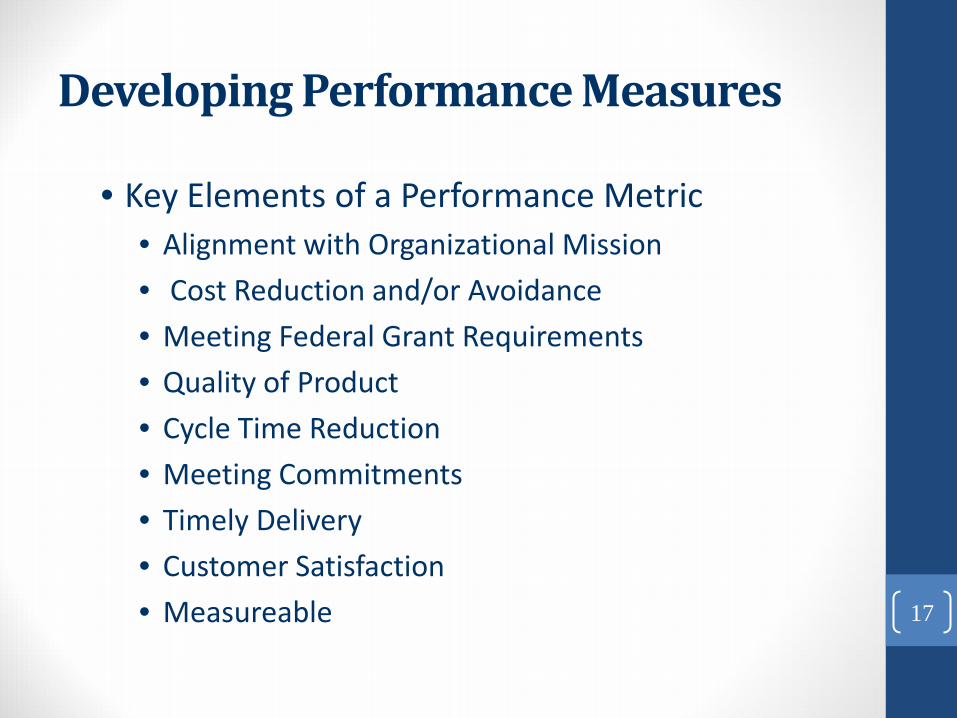
Developing Performance Measures
• Key Elements of a Performance Metric • Alignment with Organizational Mission • Cost Reduction and/or Avoidance • Meeting Federal Grant Requirements • Quality of Product • Cycle Time Reduction • Meeting Commitments • Timely Delivery • Customer Satisfaction • Measureable
17
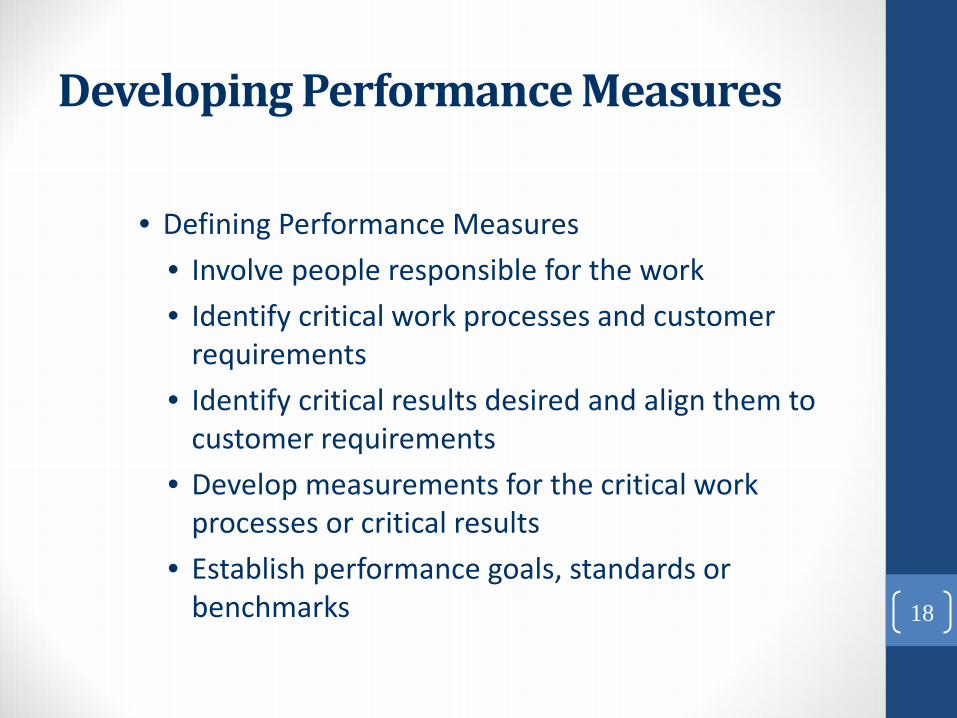
Developing Performance Measures
• Defining Performance Measures • Involve people responsible for the work • Identify critical work processes and customer
requirements • Identify critical results desired and align them to
customer requirements • Develop measurements for the critical work
processes or critical results • Establish performance goals, standards or
benchmarks
18
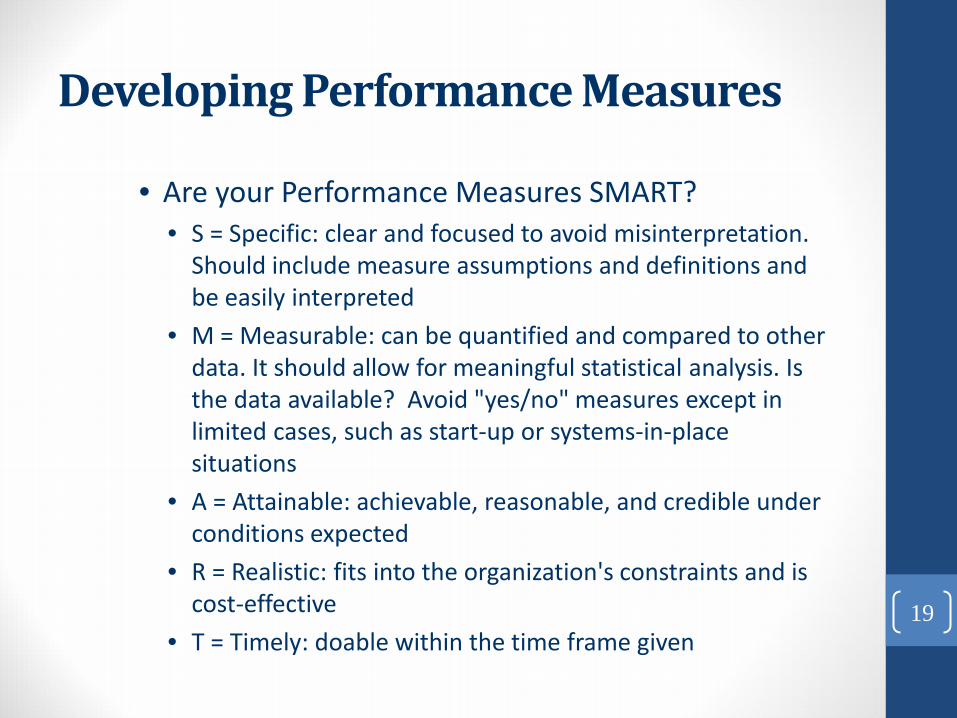
Developing Performance Measures
• Are your Performance Measures SMART? • S = Specific: clear and focused to avoid misinterpretation.
Should include measure assumptions and definitions and be easily interpreted
• M = Measurable: can be quantified and compared to other data. It should allow for meaningful statistical analysis. Is the data available? Avoid "yes/no" measures except in limited cases, such as start-up or systems-in-place situations
• A = Attainable: achievable, reasonable, and credible under conditions expected
• R = Realistic: fits into the organization's constraints and is cost-effective
• T = Timely: doable within the time frame given
19
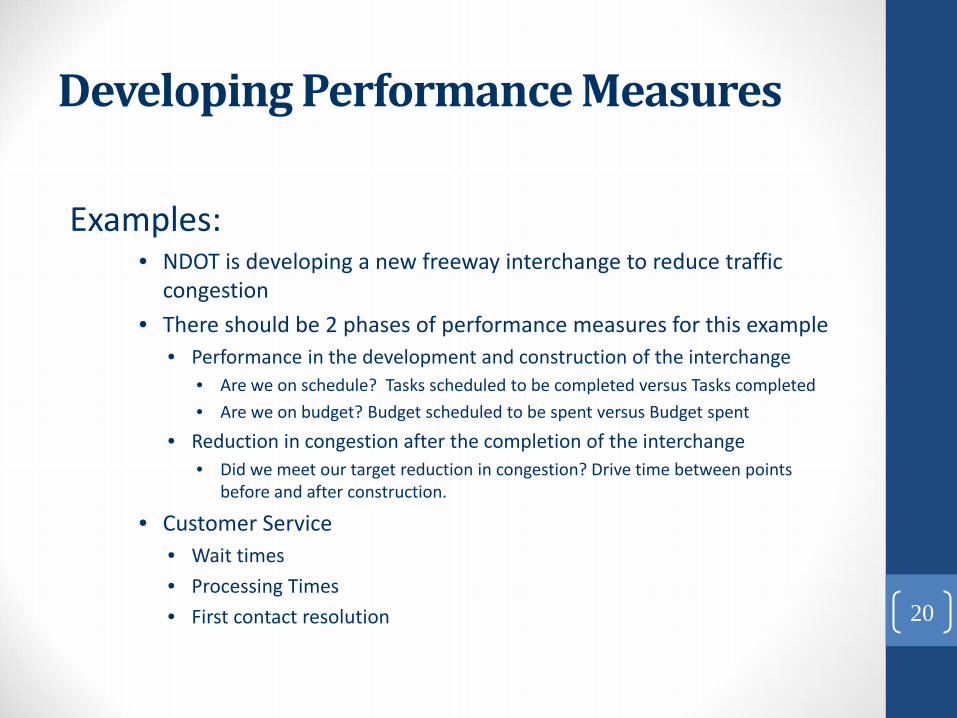
Developing Performance Measures
Examples: • NDOT is developing a new freeway interchange to reduce traffic
congestion • There should be 2 phases of performance measures for this example
• Performance in the development and construction of the interchange • Are we on schedule? Tasks scheduled to be completed versus Tasks completed • Are we on budget? Budget scheduled to be spent versus Budget spent
• Reduction in congestion after the completion of the interchange • Did we meet our target reduction in congestion? Drive time between points
before and after construction.
• Customer Service • Wait times • Processing Times • First contact resolution
20
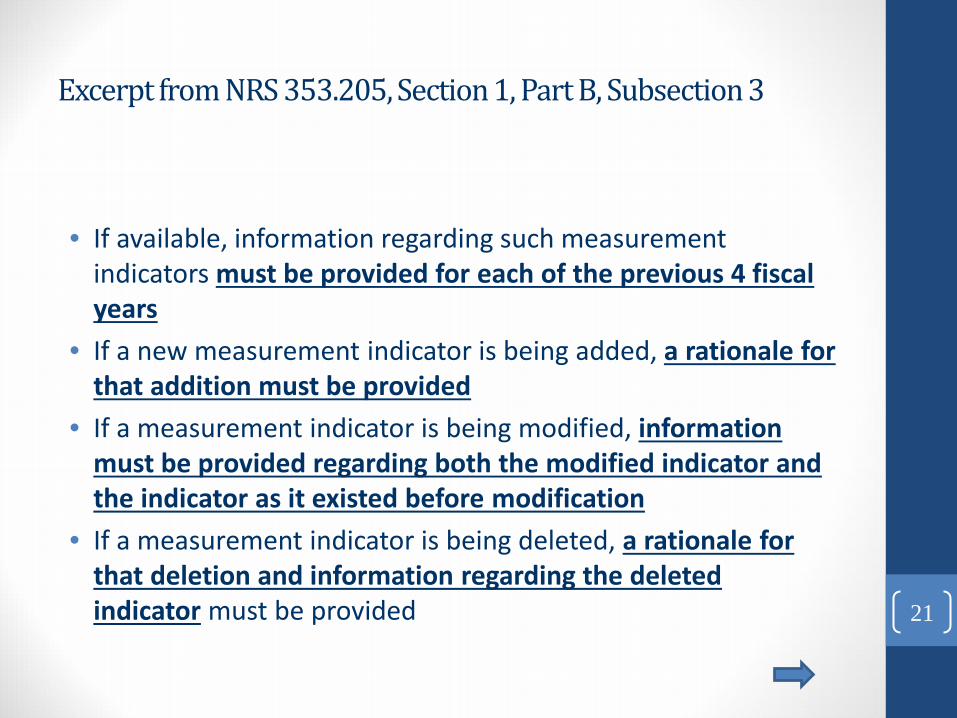
Excerpt from NRS 353.205, Section 1, Part B, Subsection 3
• If available, information regarding such measurement indicators must be provided for each of the previous 4 fiscal years
• If a new measurement indicator is being added, a rationale for that addition must be provided
• If a measurement indicator is being modified, information must be provided regarding both the modified indicator and the indicator as it existed before modification
• If a measurement indicator is being deleted, a rationale for that deletion and information regarding the deleted indicator must be provided 21

II. C. Presentation on Nevada Mineral,
Geothermal and Oil production for
2015
THIS SECTION IS INTENTIONALLY LEFT BLANK.
HAND OUTS AND PRESENTATION WILL BE GIVEN AT THE
MEETING.

III. OLD BUSINESS
III. A. NDOM fiscal year 2016 Forecast and
Reserve.
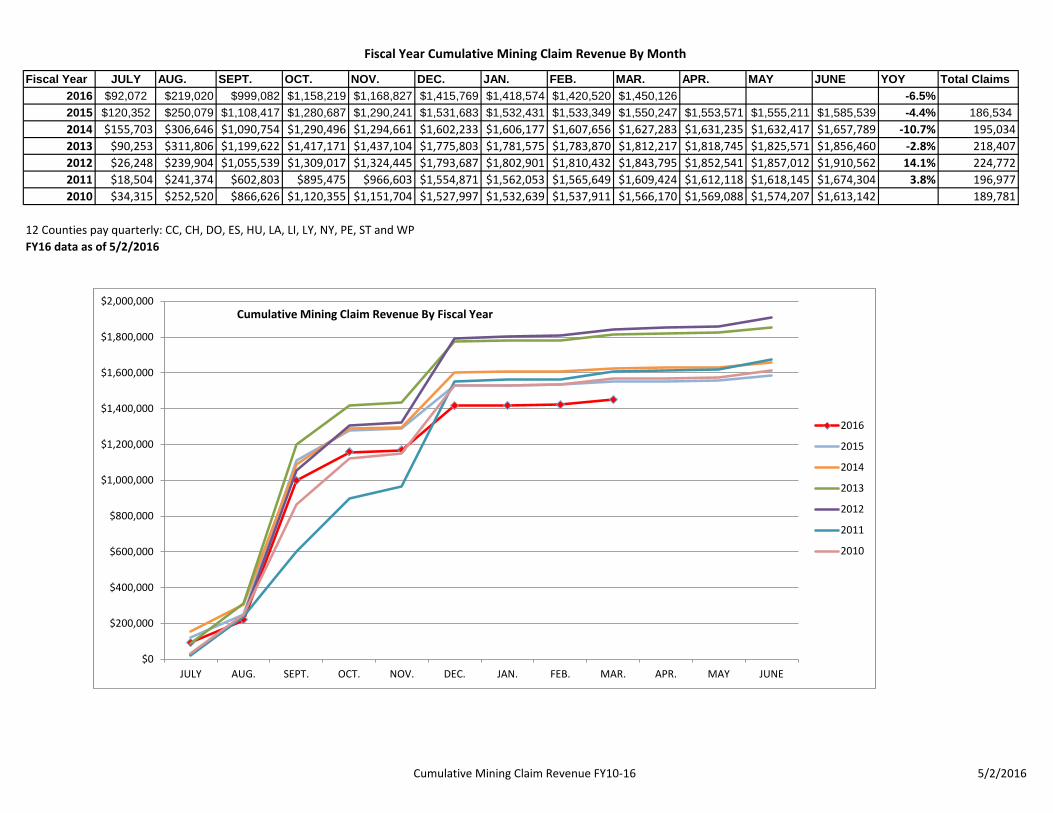
Fiscal Year Cumulative Mining Claim Revenue By Month
Cumulative Mining Claim Revenue FY10-16 5/2/2016
Fiscal Year JULY AUG. SEPT. OCT. NOV. DEC. JAN. FEB. MAR. APR. MAY JUNE YOY Total Claims
2016 $92,072 $219,020 $999,082 $1,158,219 $1,168,827 $1,415,769 $1,418,574 $1,420,520 $1,450,126 -6.5%
2015 $120,352 $250,079 $1,108,417 $1,280,687 $1,290,241 $1,531,683 $1,532,431 $1,533,349 $1,550,247 $1,553,571 $1,555,211 $1,585,539 -4.4% 186,534
2014 $155,703 $306,646 $1,090,754 $1,290,496 $1,294,661 $1,602,233 $1,606,177 $1,607,656 $1,627,283 $1,631,235 $1,632,417 $1,657,789 -10.7% 195,0342013 $90,253 $311,806 $1,199,622 $1,417,171 $1,437,104 $1,775,803 $1,781,575 $1,783,870 $1,812,217 $1,818,745 $1,825,571 $1,856,460 -2.8% 218,4072012 $26,248 $239,904 $1,055,539 $1,309,017 $1,324,445 $1,793,687 $1,802,901 $1,810,432 $1,843,795 $1,852,541 $1,857,012 $1,910,562 14.1% 224,7722011 $18,504 $241,374 $602,803 $895,475 $966,603 $1,554,871 $1,562,053 $1,565,649 $1,609,424 $1,612,118 $1,618,145 $1,674,304 3.8% 196,9772010 $34,315 $252,520 $866,626 $1,120,355 $1,151,704 $1,527,997 $1,532,639 $1,537,911 $1,566,170 $1,569,088 $1,574,207 $1,613,142 189,781
12 Counties pay quarterly: CC, CH, DO, ES, HU, LA, LI, LY, NY, PE, ST and WPFY16 data as of 5/2/2016
$0
$200,000
$400,000
$600,000
$800,000
$1,000,000
$1,200,000
$1,400,000
$1,600,000
$1,800,000
$2,000,000
JULY AUG. SEPT. OCT. NOV. DEC. JAN. FEB. MAR. APR. MAY JUNE
2016
2015
2014
2013
2012
2011
2010
Cumulative Mining Claim Revenue By Fiscal Year
FY14 - FY16_042916, Reserve 5/2/2016
$0
$200,000
$400,000
$600,000
$800,000
$1,000,000
$1,200,000
$1,400,000
$1,600,000
$1,800,000
$2,000,000
July August September October November December January February March April May June
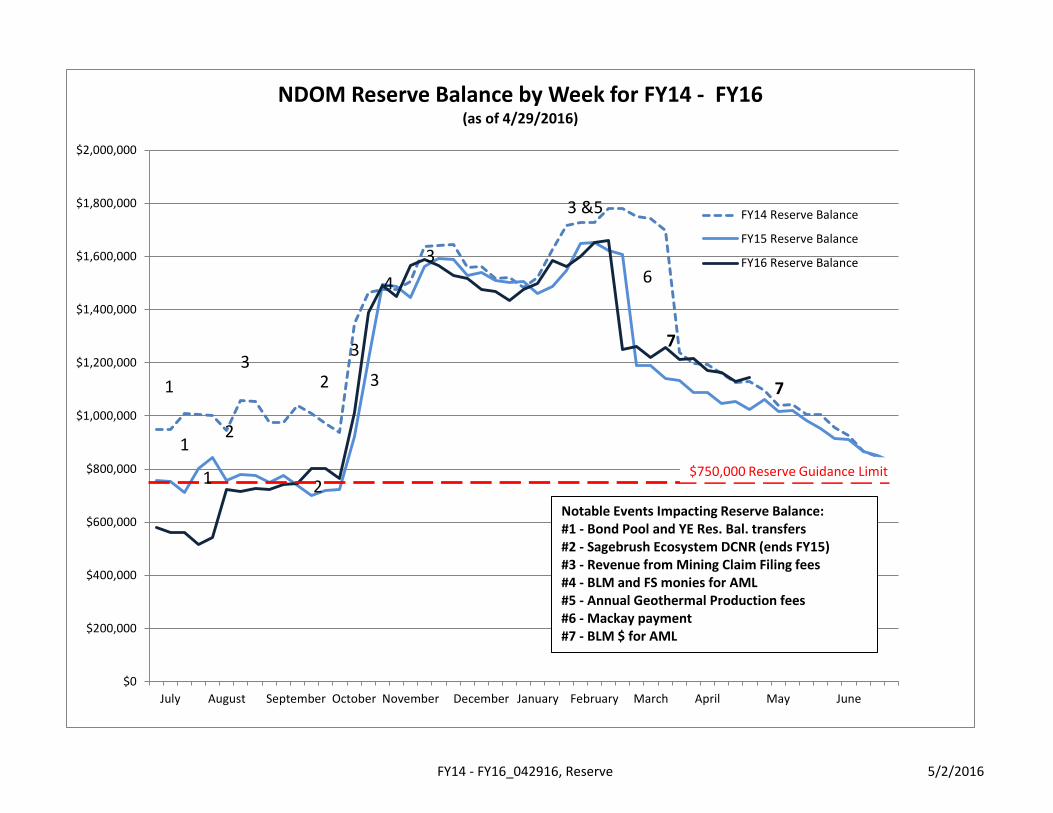
NDOM Reserve Balance by Week for FY14 - FY16 (as of 4/29/2016)
FY14 Reserve Balance
FY15 Reserve Balance
FY16 Reserve Balance
Notable Events Impacting Reserve Balance: #1 - Bond Pool and YE Res. Bal. transfers #2 - Sagebrush Ecosystem DCNR (ends FY15) #3 - Revenue from Mining Claim Filing fees #4 - BLM and FS monies for AML #5 - Annual Geothermal Production fees #6 - Mackay payment #7 - BLM $ for AML
2
2
2
3
3 6
3 &5
$750,000 Reserve Guidance Limit
4
3 1
1
3 7
1
7
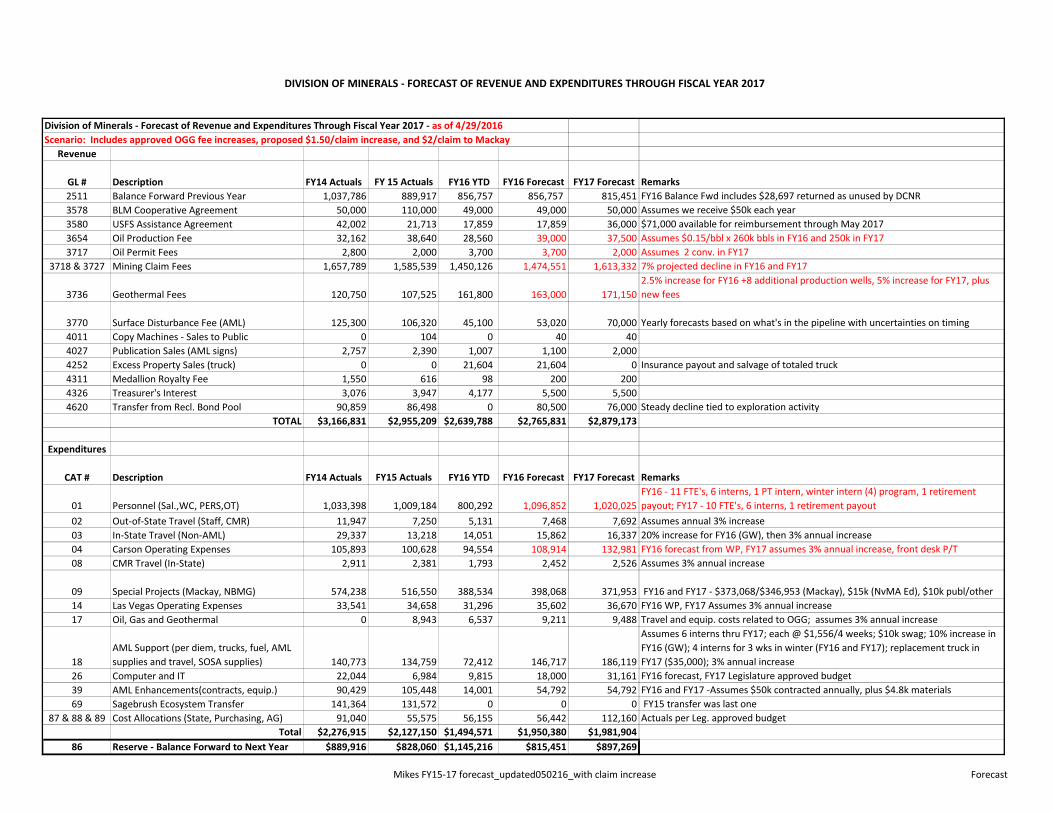
DIVISION OF MINERALS - FORECAST OF REVENUE AND EXPENDITURES THROUGH FISCAL YEAR 2017
Mikes FY15-17 forecast_updated050216_with claim increase Forecast
Division of Minerals - Forecast of Revenue and Expenditures Through Fiscal Year 2017 - as of 4/29/2016Scenario: Includes approved OGG fee increases, proposed $1.50/claim increase, and $2/claim to Mackay
Revenue
GL # Description FY14 Actuals FY 15 Actuals FY16 YTD FY16 Forecast FY17 Forecast Remarks2511 Balance Forward Previous Year 1,037,786 889,917 856,757 856,757 815,451 FY16 Balance Fwd includes $28,697 returned as unused by DCNR3578 BLM Cooperative Agreement 50,000 110,000 49,000 49,000 50,000 Assumes we receive $50k each year3580 USFS Assistance Agreement 42,002 21,713 17,859 17,859 36,000 $71,000 available for reimbursement through May 20173654 Oil Production Fee 32,162 38,640 28,560 39,000 37,500 Assumes $0.15/bbl x 260k bbls in FY16 and 250k in FY173717 Oil Permit Fees 2,800 2,000 3,700 3,700 2,000 Assumes 2 conv. in FY17
3718 & 3727 Mining Claim Fees 1,657,789 1,585,539 1,450,126 1,474,551 1,613,332 7% projected decline in FY16 and FY17
3736 Geothermal Fees 120,750 107,525 161,800 163,000 171,1502.5% increase for FY16 +8 additional production wells, 5% increase for FY17, plus new fees
3770 Surface Disturbance Fee (AML) 125,300 106,320 45,100 53,020 70,000 Yearly forecasts based on what's in the pipeline with uncertainties on timing4011 Copy Machines - Sales to Public 0 104 0 40 404027 Publication Sales (AML signs) 2,757 2,390 1,007 1,100 2,0004252 Excess Property Sales (truck) 0 0 21,604 21,604 0 Insurance payout and salvage of totaled truck4311 Medallion Royalty Fee 1,550 616 98 200 2004326 Treasurer's Interest 3,076 3,947 4,177 5,500 5,5004620 Transfer from Recl. Bond Pool 90,859 86,498 0 80,500 76,000 Steady decline tied to exploration activity
TOTAL $3,166,831 $2,955,209 $2,639,788 $2,765,831 $2,879,173
Expenditures
CAT # Description FY14 Actuals FY15 Actuals FY16 YTD FY16 Forecast FY17 Forecast Remarks
01 Personnel (Sal.,WC, PERS,OT) 1,033,398 1,009,184 800,292 1,096,852 1,020,025FY16 - 11 FTE's, 6 interns, 1 PT intern, winter intern (4) program, 1 retirement payout; FY17 - 10 FTE's, 6 interns, 1 retirement payout
02 Out-of-State Travel (Staff, CMR) 11,947 7,250 5,131 7,468 7,692 Assumes annual 3% increase03 In-State Travel (Non-AML) 29,337 13,218 14,051 15,862 16,337 20% increase for FY16 (GW), then 3% annual increase04 Carson Operating Expenses 105,893 100,628 94,554 108,914 132,981 FY16 forecast from WP, FY17 assumes 3% annual increase, front desk P/T08 CMR Travel (In-State) 2,911 2,381 1,793 2,452 2,526 Assumes 3% annual increase
09 Special Projects (Mackay, NBMG) 574,238 516,550 388,534 398,068 371,953 FY16 and FY17 - $373,068/$346,953 (Mackay), $15k (NvMA Ed), $10k publ/other14 Las Vegas Operating Expenses 33,541 34,658 31,296 35,602 36,670 FY16 WP, FY17 Assumes 3% annual increase17 Oil, Gas and Geothermal 0 8,943 6,537 9,211 9,488 Travel and equip. costs related to OGG; assumes 3% annual increase
18AML Support (per diem, trucks, fuel, AML supplies and travel, SOSA supplies) 140,773 134,759 72,412 146,717 186,119
Assumes 6 interns thru FY17; each @ $1,556/4 weeks; $10k swag; 10% increase in FY16 (GW); 4 interns for 3 wks in winter (FY16 and FY17); replacement truck in FY17 ($35,000); 3% annual increase
26 Computer and IT 22,044 6,984 9,815 18,000 31,161 FY16 forecast, FY17 Legislature approved budget39 AML Enhancements(contracts, equip.) 90,429 105,448 14,001 54,792 54,792 FY16 and FY17 -Assumes $50k contracted annually, plus $4.8k materials69 Sagebrush Ecosystem Transfer 141,364 131,572 0 0 0 FY15 transfer was last one
87 & 88 & 89 Cost Allocations (State, Purchasing, AG) 91,040 55,575 56,155 56,442 112,160 Actuals per Leg. approved budgetTotal $2,276,915 $2,127,150 $1,494,571 $1,950,380 $1,981,904
86 Reserve - Balance Forward to Next Year $889,916 $828,060 $1,145,216 $815,451 $897,269

DIVISION OF MINERALS - FORECAST OF REVENUE AND EXPENDITURES THROUGH FISCAL YEAR 2017
Mikes FY15-17 forecast_updated050216_without claim increase Forecast
Division of Minerals - Forecast of Revenue and Expenditures Through Fiscal Year 2017 - as of 4/29/2016Scenario: Includes approved OGG fee increases and $2/claim to Mackay; without $1.50/claim increase
Revenue
GL # Description FY14 Actuals FY 15 Actuals FY16 YTD FY16 Forecast FY17 Forecast Remarks2511 Balance Forward Previous Year 1,037,786 889,917 856,757 856,757 815,411 FY16 Balance Fwd includes $28,697 returned as unused by DCNR3578 BLM Cooperative Agreement 50,000 110,000 49,000 49,000 50,000 Assumes we receive $50k each year3580 USFS Assistance Agreement 42,002 21,713 17,859 17,859 36,000 $71,000 available for reimbursement through May 20173654 Oil Production Fee 32,162 38,640 28,560 39,000 37,500 Assumes $0.15/bbl x 260k bbls in FY16 and 250k in FY173717 Oil Permit Fees 2,800 2,000 3,700 3,700 2,000 Assumes 2 conv. in FY17
3718 & 3727 Mining Claim Fees 1,657,789 1,585,539 1,450,126 1,474,551 1,371,333 7% projected decline in FY16 and FY17
3736 Geothermal Fees 120,750 107,525 161,800 163,000 171,1502.5% increase for FY16 +8 additional production wells, 5% increase for FY17, plus new fees
3770 Surface Disturbance Fee (AML) 125,300 106,320 45,100 53,020 70,000 Yearly forecasts based on what's in the pipeline with uncertainties on timing4027 Publication Sales (AML signs) 2,757 2,390 1,007 1,100 1,1004252 Excess Property Sales (truck) 0 0 21,604 21,604 0 Insurance payout and salvage of totaled truck4311 Medallion Royalty Fee 1,550 616 98 200 2004326 Treasurer's Interest 3,076 3,947 4,177 5,500 5,5004620 Transfer from Recl. Bond Pool 90,859 86,498 0 80,500 76,000 Steady decline tied to exploration activity
TOTAL $3,166,831 $2,955,105 $2,639,788 $2,765,791 $2,636,194
Expenditures
CAT # Description FY14 Actuals FY15 Actuals FY16 YTD FY16 Forecast FY17 Forecast Remarks
01 Personnel (Sal.,WC, PERS,OT) 1,033,398 1,009,184 800,292 1,096,852 1,020,025FY16 - 11 FTE's, 6 interns, 1 PT intern, winter intern (4) program, 1 retirement payout; FY17 - 10 FTE's, 6 interns, 1 retirement payout
02 Out-of-State Travel (Staff, CMR) 11,947 7,250 5,131 7,468 7,692 Assumes annual 3% increase03 In-State Travel (Non-AML) 29,337 13,218 14,051 15,862 16,337 20% increase for FY16 (GW), then 3% annual increase04 Carson Operating Expenses 105,893 100,628 94,554 108,914 132,981 FY16 forecast from WP, FY17 assumes 3% annual increase, front desk P/T08 CMR Travel (In-State) 2,911 2,381 1,793 2,452 2,526 Assumes 3% annual increase
09 Special Projects (Mackay, NBMG) 574,238 516,550 388,534 398,068 371,953 FY16 and FY17 - $373,068/$346,953 (Mackay), $15k (NvMA Ed), $10k publ/other14 Las Vegas Operating Expenses 33,541 34,658 31,296 35,602 36,670 FY16 WP, FY17 Assumes 3% annual increase17 Oil, Gas and Geothermal 0 8,943 6,537 9,211 9,488 Travel and equip. costs related to OGG; assumes 3% annual increase
18AML Support (per diem, trucks, fuel, AML supplies and travel, SOSA supplies) 140,773 134,759 72,412 146,717 186,119
Assumes 6 interns thru FY17; each @ $1,556/4 weeks; $10k swag; 10% increase in FY16 (GW); 4 interns for 3 wks in winter (FY16 and FY17); replacement truck in FY17 ($35,000); 3% annual increase
26 Computer and IT 22,044 6,984 9,815 18,000 31,161 FY16 forecast, FY17 Legislature approved budget39 AML Enhancements(contracts, equip.) 90,429 105,448 14,001 54,792 54,792 FY16 and FY17 -Assumes $50k contracted annually, plus $4.8k materials69 Sagebrush Ecosystem Transfer 141,364 131,572 0 0 0 FY15 transfer was last one
87 & 88 & 89 Cost Allocations (State, Purchasing, AG) 91,040 55,575 56,155 56,442 112,160 Actuals per Leg. approved budgetTotal $2,276,915 $2,127,150 $1,494,571 $1,950,380 $1,981,904
86 Reserve - Balance Forward to Next Year $889,916 $828,060 $1,145,216 $815,411 $654,290

III. B. Annual Oil and Geothermal well
inspection update

Well Inspections FY 16 as of May 2, 2016
Total Wells
Wells Needed for FY16
Wells Inspected
% of Total Needed
Wells Remaining
Geothermal (25 Operators) 462 154 213Oil (9 Operators) 128 43 40Totals 590 197 253 128% -56

Items Evaluated During Well Inspections
Correct signage in place
Well pad condition and access to wellhead
Wellhead condition
Wellhead cellar (if present)
Condition of pipeline and tank battery (if either are present)
Condition of collection pit
Proximity of well location to general public access or surface waters
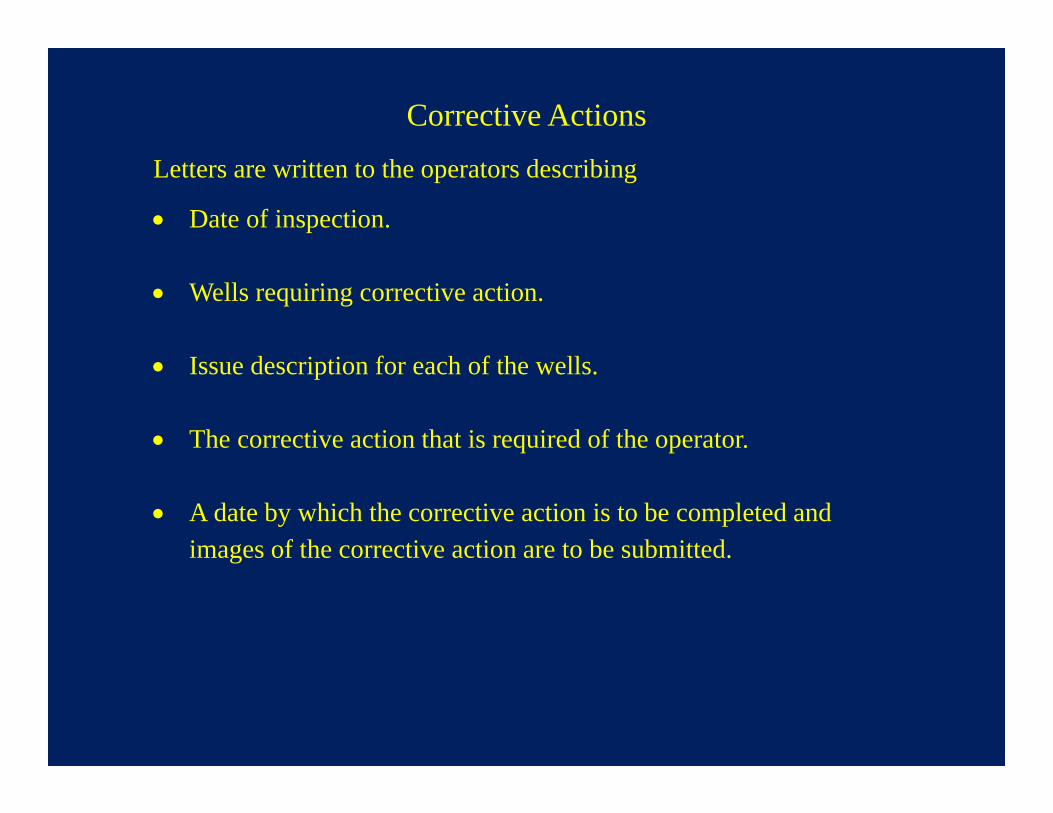
Corrective Actions
Letters are written to the operators describing
Date of inspection.
Wells requiring corrective action.
Issue description for each of the wells.
The corrective action that is required of the operator.
A date by which the corrective action is to be completed and images of the corrective action are to be submitted.
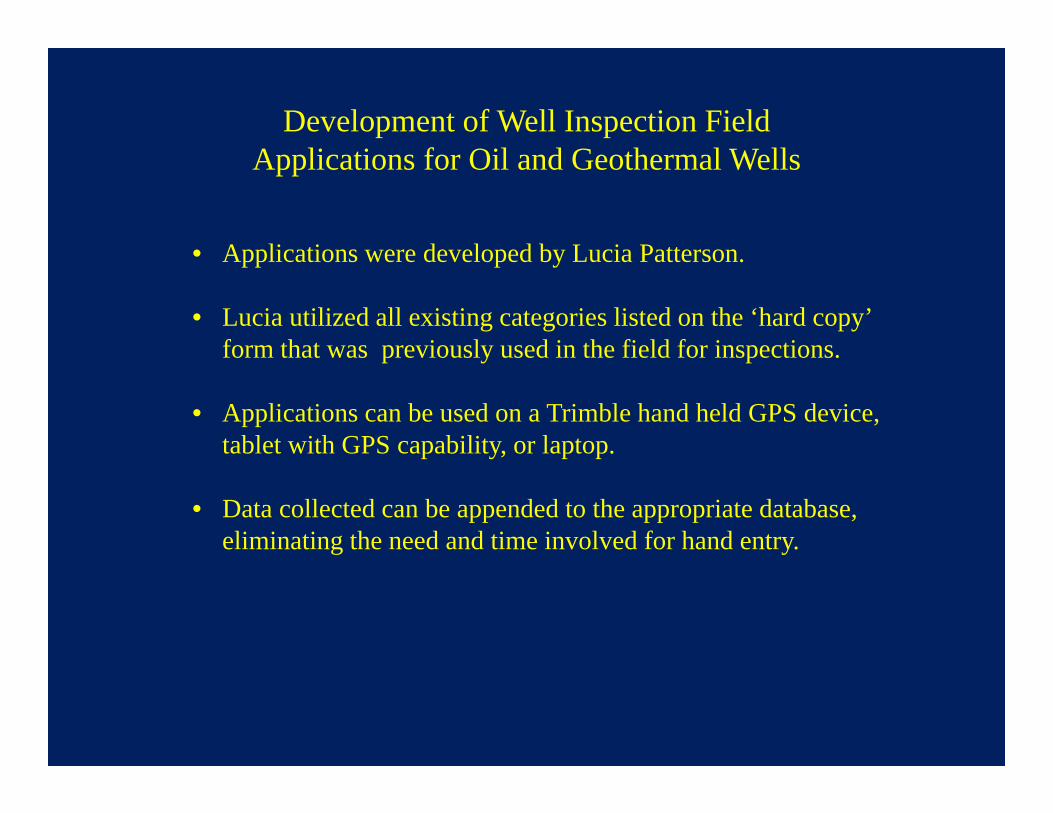
Development of Well Inspection Field Applications for Oil and Geothermal Wells
• Applications were developed by Lucia Patterson.
• Lucia utilized all existing categories listed on the ‘hard copy’ form that was previously used in the field for inspections.
• Applications can be used on a Trimble hand held GPS device, tablet with GPS capability, or laptop.
• Data collected can be appended to the appropriate database, eliminating the need and time involved for hand entry.
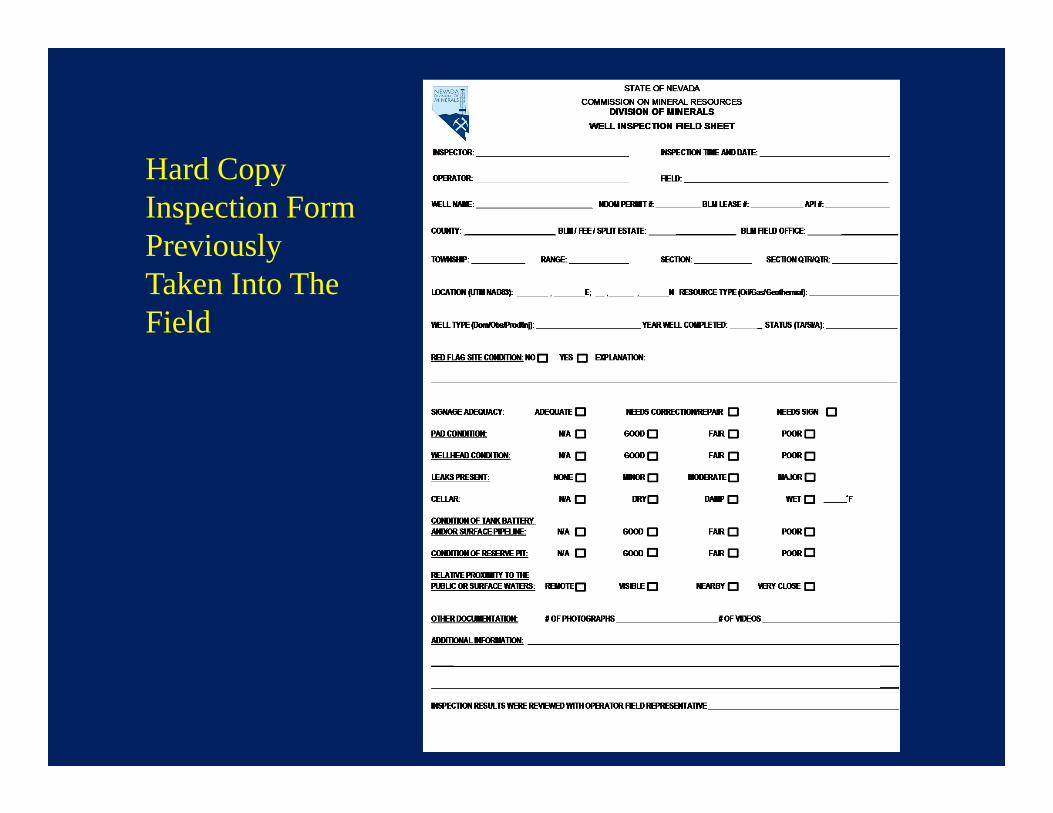
Hard Copy Inspection Form Previously Taken Into The Field
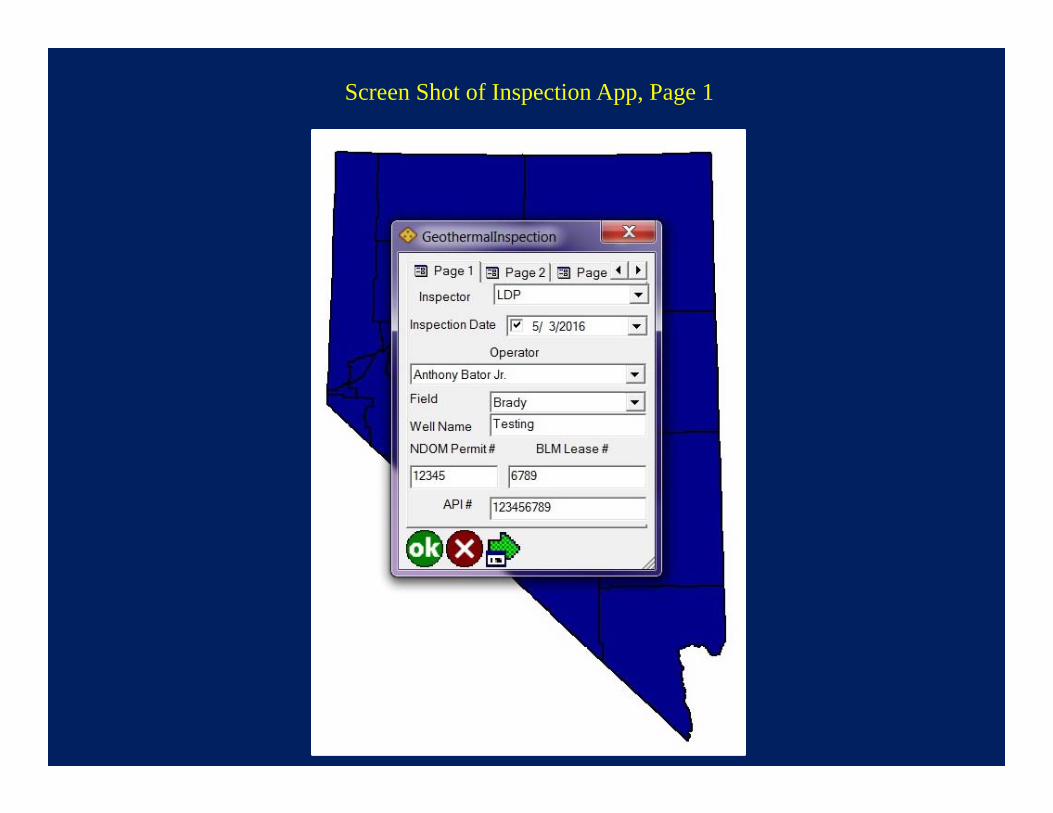
Screen Shot of Inspection App, Page 1

Screen Shot of Inspection App, Page 2
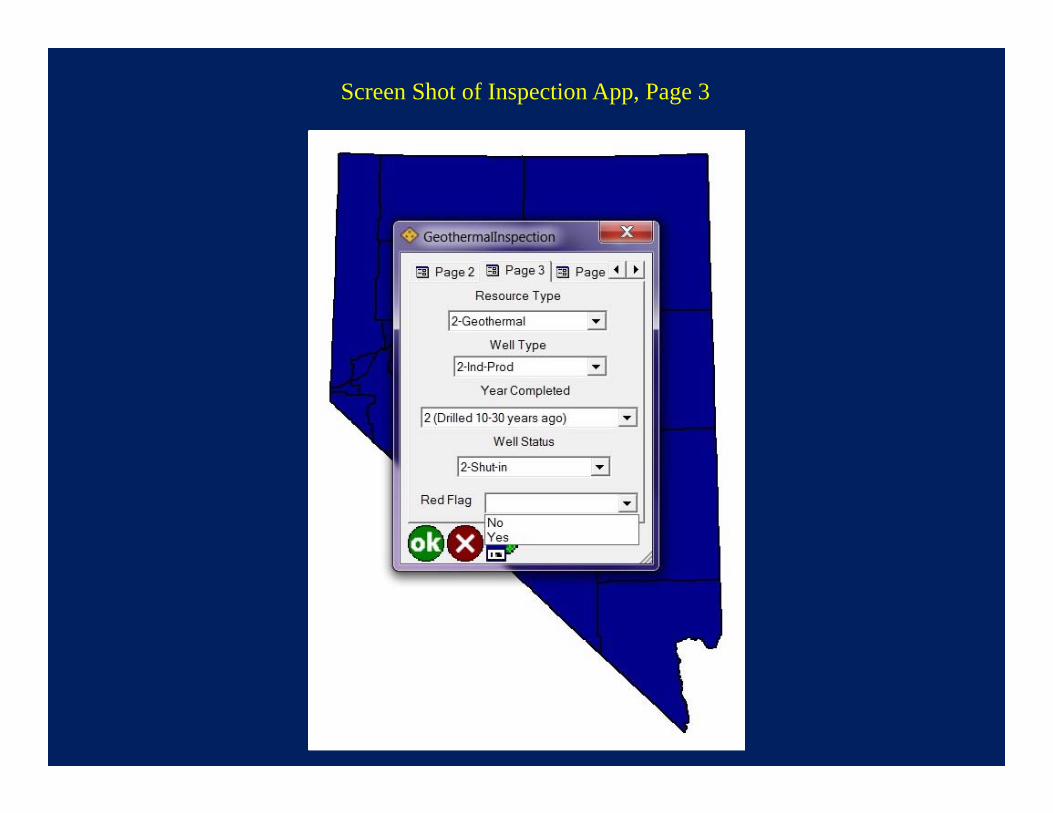
Screen Shot of Inspection App, Page 3

Screen Shot of Inspection App, Page 4

Screen Shot of Inspection App, Page 5
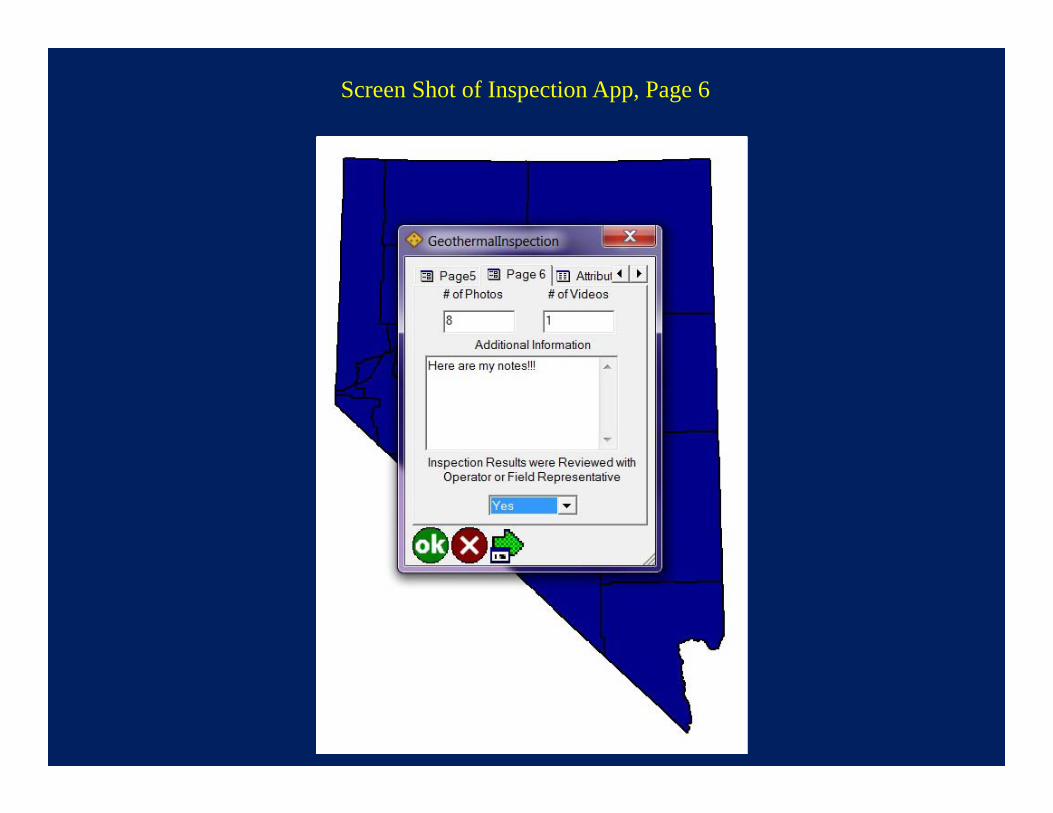
Screen Shot of Inspection App, Page 6

Fictitious and blank well inspection form with operator, well name, and location filled out
Database Generated Forms

Fictitious completed well inspection form with operator, well name, location, and well inspection filled out.
Reports can be printed to mail to operators or electronically sent.
Database Generated Reports
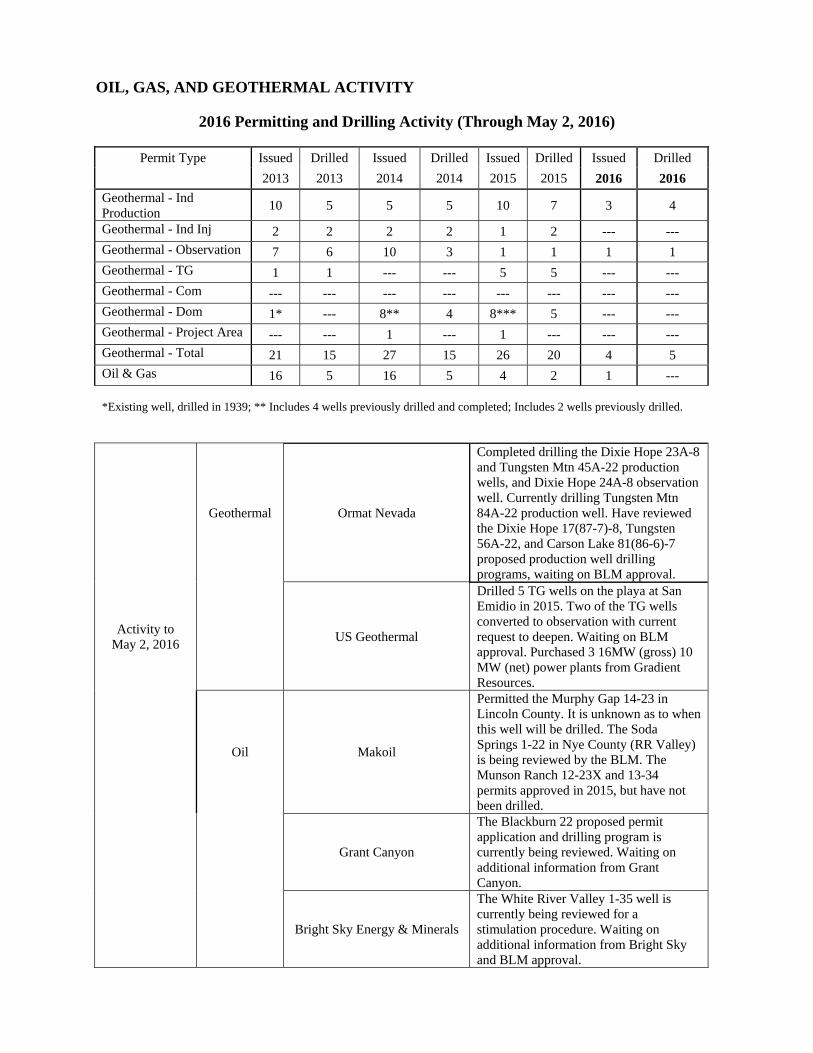
OIL, GAS, AND GEOTHERMAL ACTIVITY
2016 Permitting and Drilling Activity (Through May 2, 2016)
Permit Type Issued Drilled Issued Drilled Issued Drilled Issued Drilled
2013 2013 2014 2014 2015 2015 2016 2016
Geothermal - Ind Production
10 5 5 5 10 7 3 4
Geothermal - Ind Inj 2 2 2 2 1 2 --- --- Geothermal - Observation 7 6 10 3 1 1 1 1 Geothermal - TG 1 1 --- --- 5 5 --- --- Geothermal - Com --- --- --- --- --- --- --- --- Geothermal - Dom 1* --- 8** 4 8*** 5 --- --- Geothermal - Project Area --- --- 1 --- 1 --- --- --- Geothermal - Total 21 15 27 15 26 20 4 5 Oil & Gas 16 5 16 5 4 2 1 --- *Existing well, drilled in 1939; ** Includes 4 wells previously drilled and completed; Includes 2 wells previously drilled.
Geothermal Ormat Nevada
Completed drilling the Dixie Hope 23A-8 and Tungsten Mtn 45A-22 production wells, and Dixie Hope 24A-8 observation well. Currently drilling Tungsten Mtn 84A-22 production well. Have reviewed the Dixie Hope 17(87-7)-8, Tungsten 56A-22, and Carson Lake 81(86-6)-7 proposed production well drilling programs, waiting on BLM approval.
Activity to May 2, 2016
US Geothermal
Drilled 5 TG wells on the playa at San Emidio in 2015. Two of the TG wells converted to observation with current request to deepen. Waiting on BLM approval. Purchased 3 16MW (gross) 10 MW (net) power plants from Gradient Resources.
Oil Makoil
Permitted the Murphy Gap 14-23 in Lincoln County. It is unknown as to when this well will be drilled. The Soda Springs 1-22 in Nye County (RR Valley) is being reviewed by the BLM. The Munson Ranch 12-23X and 13-34 permits approved in 2015, but have not been drilled.
Grant Canyon
The Blackburn 22 proposed permit application and drilling program is currently being reviewed. Waiting on additional information from Grant Canyon.
Bright Sky Energy & Minerals
The White River Valley 1-35 well is currently being reviewed for a stimulation procedure. Waiting on additional information from Bright Sky and BLM approval.
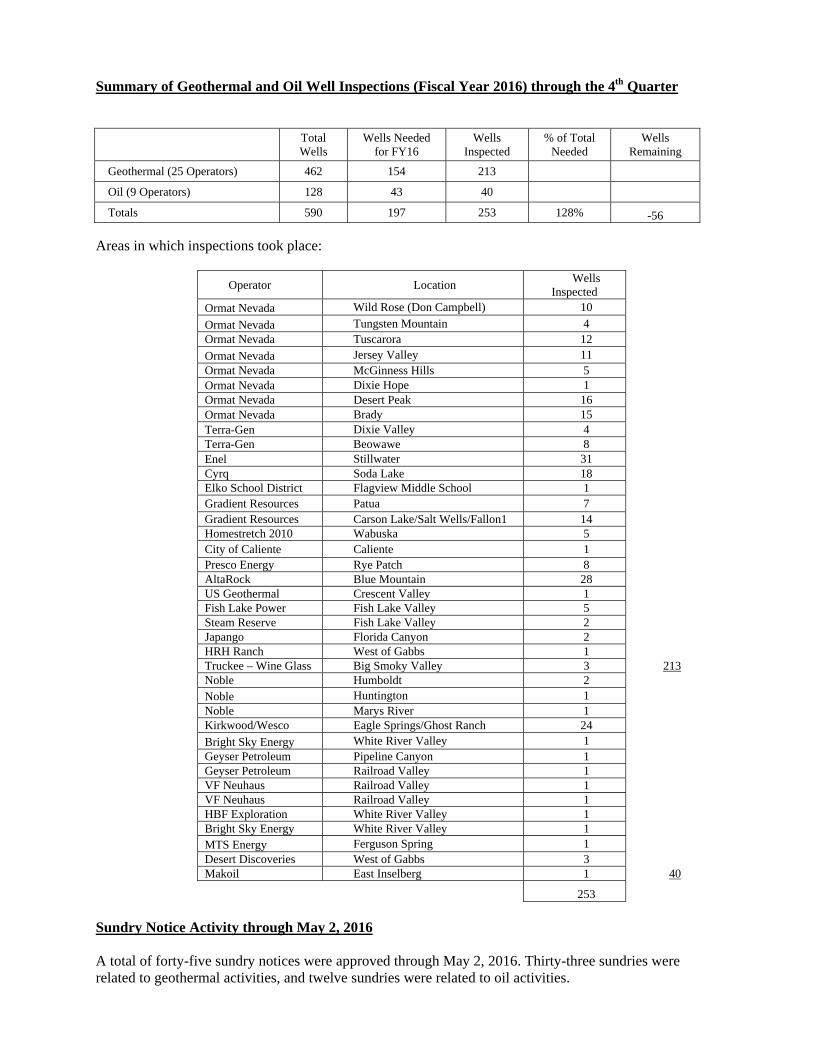
Summary of Geothermal and Oil Well Inspections (Fiscal Year 2016) through the 4th Quarter
Total Wells
Wells Needed for FY16
Wells Inspected
% of Total Needed
Wells Remaining
Geothermal (25 Operators) 462 154 213
Oil (9 Operators) 128 43 40
Totals 590 197 253 128% -56
Areas in which inspections took place:
Operator Location Wells
Inspected Ormat Nevada Wild Rose (Don Campbell) 10
Ormat Nevada Tungsten Mountain 4 Ormat Nevada Tuscarora 12
Ormat Nevada Jersey Valley 11 Ormat Nevada McGinness Hills 5 Ormat Nevada Dixie Hope 1 Ormat Nevada Desert Peak 16 Ormat Nevada Brady 15 Terra-Gen Dixie Valley 4 Terra-Gen Beowawe 8 Enel Stillwater 31 Cyrq Soda Lake 18 Elko School District Flagview Middle School 1 Gradient Resources Patua 7 Gradient Resources Carson Lake/Salt Wells/Fallon1 14 Homestretch 2010 Wabuska 5 City of Caliente Caliente 1 Presco Energy Rye Patch 8 AltaRock Blue Mountain 28 US Geothermal Crescent Valley 1 Fish Lake Power Fish Lake Valley 5 Steam Reserve Fish Lake Valley 2 Japango Florida Canyon 2 HRH Ranch West of Gabbs 1 Truckee – Wine Glass Big Smoky Valley 3 213 Noble Humboldt 2 Noble Huntington 1 Noble Marys River 1 Kirkwood/Wesco Eagle Springs/Ghost Ranch 24
Bright Sky Energy White River Valley 1 Geyser Petroleum Pipeline Canyon 1 Geyser Petroleum Railroad Valley 1 VF Neuhaus Railroad Valley 1 VF Neuhaus Railroad Valley 1 HBF Exploration White River Valley 1 Bright Sky Energy White River Valley 1 MTS Energy Ferguson Spring 1 Desert Discoveries West of Gabbs 3 Makoil East Inselberg 1 40
253
Sundry Notice Activity through May 2, 2016 A total of forty-five sundry notices were approved through May 2, 2016. Thirty-three sundries were related to geothermal activities, and twelve sundries were related to oil activities.

III. C. BLM Proposed Mineral Withdrawal
update

THIS SECTION IS INTENTIONALLY LEFT BLANK.
HAND OUTS AND PRESENTATION WILL BE GIVEN AT THE
MEETING.

IV. STAFF REPORTS
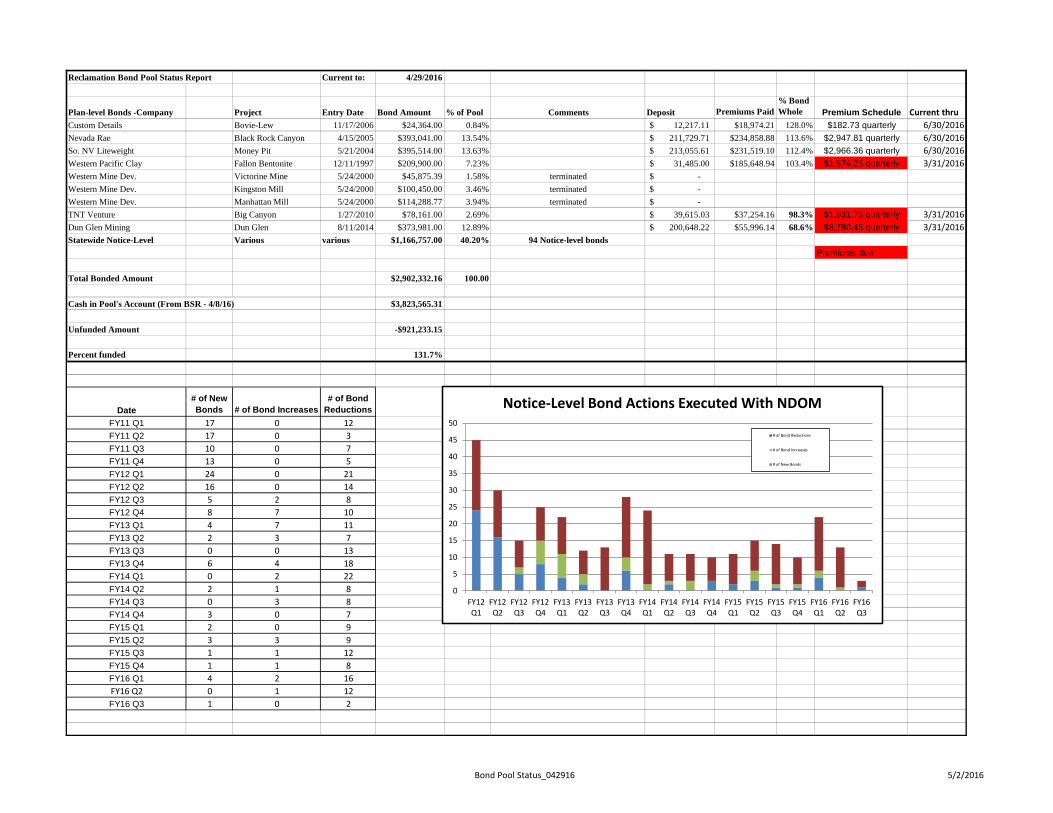
Bond Pool Status_042916 5/2/2016
Reclamation Bond Pool Status Report Current to: 4/29/2016
Plan-level Bonds -Company Project Entry Date Bond Amount % of Pool Comments Deposit Premiums Paid% Bond Whole Premium Schedule Current thru
Custom Details Bovie-Lew 11/17/2006 $24,364.00 0.84% 12,217.11$ $18,974.21 128.0% $182.73 quarterly 6/30/2016Nevada Rae Black Rock Canyon 4/15/2005 $393,041.00 13.54% 211,729.71$ $234,858.88 113.6% $2,947.81 quarterly 6/30/2016So. NV Liteweight Money Pit 5/21/2004 $395,514.00 13.63% 213,055.61$ $231,519.10 112.4% $2,966.36 quarterly 6/30/2016Western Pacific Clay Fallon Bentonite 12/11/1997 $209,900.00 7.23% 31,485.00$ $185,648.94 103.4% $1,574.25 quarterly 3/31/2016Western Mine Dev. Victorine Mine 5/24/2000 $45,875.39 1.58% terminated -$
Western Mine Dev. Kingston Mill 5/24/2000 $100,450.00 3.46% terminated -$
Western Mine Dev. Manhattan Mill 5/24/2000 $114,288.77 3.94% terminated -$
TNT Venture Big Canyon 1/27/2010 $78,161.00 2.69% 39,615.03$ $37,254.16 98.3% $1,931.75 quarterly 3/31/2016Dun Glen Mining Dun Glen 8/11/2014 $373,981.00 12.89% 200,648.22$ $55,996.14 68.6% $8,780.45 quarterly 3/31/2016Statewide Notice-Level Various various $1,166,757.00 40.20% 94 Notice-level bonds
Premiums due
Total Bonded Amount $2,902,332.16 100.00
Cash in Pool's Account (From BSR - 4/8/16) $3,823,565.31
Unfunded Amount -$921,233.15
Percent funded 131.7%
Date# of New Bonds # of Bond Increases
# of Bond Reductions
FY11 Q1 17 0 12FY11 Q2 17 0 3FY11 Q3 10 0 7FY11 Q4 13 0 5FY12 Q1 24 0 21FY12 Q2 16 0 14FY12 Q3 5 2 8FY12 Q4 8 7 10FY13 Q1 4 7 11FY13 Q2 2 3 7FY13 Q3 0 0 13FY13 Q4 6 4 18FY14 Q1 0 2 22FY14 Q2 2 1 8FY14 Q3 0 3 8FY14 Q4 3 0 7FY15 Q1 2 0 9FY15 Q2 3 3 9FY15 Q3 1 1 12FY15 Q4 1 1 8FY16 Q1 4 2 16FY16 Q2 0 1 12FY16 Q3 1 0 2
0
5
10
15
20
25
30
35
40
45
50
FY12Q1
FY12Q2
FY12Q3
FY12Q4
FY13Q1
FY13Q2
FY13Q3
FY13Q4
FY14Q1
FY14Q2
FY14Q3
FY14Q4
FY15Q1
FY15Q2
FY15Q3
FY15Q4
FY16Q1
FY16Q2
FY16Q3
Notice-Level Bond Actions Executed With NDOM
# of Bond Reductions
# of Bond Increases
# of New Bonds
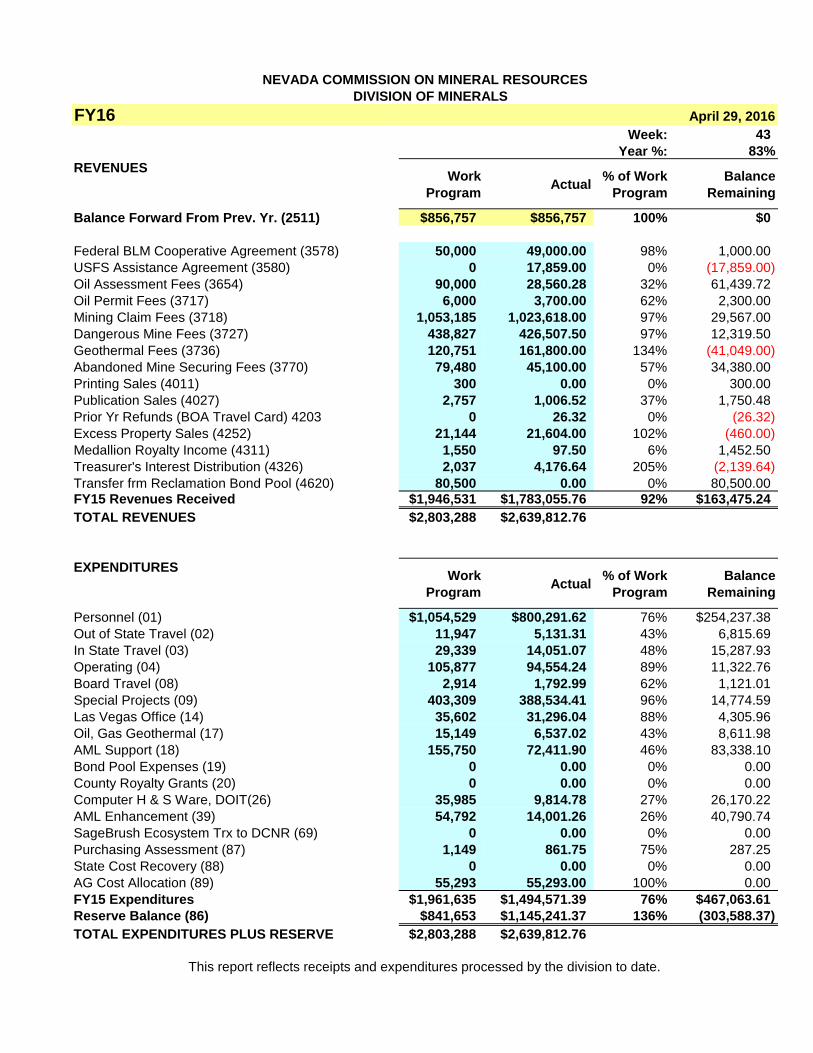
DIVISION OF MINERALS
FY16Week: 43
Year %: 83%REVENUES
Work Program
Actual% of Work
ProgramBalance
Remaining
Balance Forward From Prev. Yr. (2511) $856,757 $856,757 100% $0
Federal BLM Cooperative Agreement (3578) 50,000 49,000.00 98% 1,000.00USFS Assistance Agreement (3580) 0 17,859.00 0% (17,859.00)Oil Assessment Fees (3654) 90,000 28,560.28 32% 61,439.72Oil Permit Fees (3717) 6,000 3,700.00 62% 2,300.00Mining Claim Fees (3718) 1,053,185 1,023,618.00 97% 29,567.00Dangerous Mine Fees (3727) 438,827 426,507.50 97% 12,319.50Geothermal Fees (3736) 120,751 161,800.00 134% (41,049.00)Abandoned Mine Securing Fees (3770) 79,480 45,100.00 57% 34,380.00Printing Sales (4011) 300 0.00 0% 300.00Publication Sales (4027) 2,757 1,006.52 37% 1,750.48Prior Yr Refunds (BOA Travel Card) 4203 0 26.32 0% (26.32)Excess Property Sales (4252) 21,144 21,604.00 102% (460.00)Medallion Royalty Income (4311) 1,550 97.50 6% 1,452.50Treasurer's Interest Distribution (4326) 2,037 4,176.64 205% (2,139.64)Transfer frm Reclamation Bond Pool (4620) 80,500 0.00 0% 80,500.00FY15 Revenues Received $1,946,531 $1,783,055.76 92% $163,475.24TOTAL REVENUES $2,803,288 $2,639,812.76
EXPENDITURESWork
ProgramActual
% of Work Program
Balance Remaining
Personnel (01) $1,054,529 $800,291.62 76% $254,237.38Out of State Travel (02) 11,947 5,131.31 43% 6,815.69In State Travel (03) 29,339 14,051.07 48% 15,287.93Operating (04) 105,877 94,554.24 89% 11,322.76Board Travel (08) 2,914 1,792.99 62% 1,121.01Special Projects (09) 403,309 388,534.41 96% 14,774.59Las Vegas Office (14) 35,602 31,296.04 88% 4,305.96Oil, Gas Geothermal (17) 15,149 6,537.02 43% 8,611.98AML Support (18) 155,750 72,411.90 46% 83,338.10Bond Pool Expenses (19) 0 0.00 0% 0.00County Royalty Grants (20) 0 0.00 0% 0.00Computer H & S Ware, DOIT(26) 35,985 9,814.78 27% 26,170.22AML Enhancement (39) 54,792 14,001.26 26% 40,790.74SageBrush Ecosystem Trx to DCNR (69) 0 0.00 0% 0.00Purchasing Assessment (87) 1,149 861.75 75% 287.25State Cost Recovery (88) 0 0.00 0% 0.00AG Cost Allocation (89) 55,293 55,293.00 100% 0.00FY15 Expenditures $1,961,635 $1,494,571.39 76% $467,063.61Reserve Balance (86) $841,653 $1,145,241.37 136% (303,588.37)TOTAL EXPENDITURES PLUS RESERVE $2,803,288 $2,639,812.76
NEVADA COMMISSION ON MINERAL RESOURCES
This report reflects receipts and expenditures processed by the division to date.
April 29, 2016
Education Notes When should we teach kids about rocks and minerals?
Since starting with the NvMA, I have been heavily involved with our Education Committee. Members of
the committee include teachers and other education focused professionals. Another group we work
closely with, the Nevada Division of Minerals, also does a fantastic job of not only supporting the
Education Committee’s and NvMA’s efforts, but also spends a great deal of time in classrooms
themselves, educating Nevada’s students.
One topic the committee spends a fair amount of time discussing is what is the appropriate age to really
start engaging children on rocks, minerals, and how mining impacts their everyday lives. Personally, I
have advocated that third grade is the right time. Students start to become more interested in science at
that age, and it gives them a good base as they move into fourth grade, where mining is tied into their
education through Nevada history. As they continue to age, I have also noticed students becoming
interested in the large equipment mines use, the explosions (of course), and the science that goes into it
all.
However, my line of thought was completely thrown on its head last week sitting down with my family for
dinner. We went through the usual routine of me asking my kids how their day went, and what they
learned at school that day. As most parents know, this usually takes a little coaxing to find out what
they’ve really been up to at school.
But to my surprise, my kindergarten aged daughter started eagerly discussing the visitor she’d had at
school that day.. a �”jolla-gis”. Then she pulled out a bag of rocks she had been given by the Division of
Minerals, with samples of obsidian, pumice, magnetite, and sulfur.
She could tell me all about the stinky rock, the one that floats, the glass rock (complete with knowing the
name, obsidian), and the magnetic rock. Keep in mind, this is the same child whose highlight on a recent
fieldtrip to the planetarium was sitting next to her friend on the bus. Since learning about geology from
NDOM�s wonderful Lucia Patterson, my daughter has asked me to go out rock collecting nearly every
day.
To say I learned a thing or two from this experience would be an understatement. I’m completely
rethinking my opinions of when to introduce young children to rocks and minerals. Thankfully, our friends
at the Division of Minerals have already figured this out and are out there educating our sons and
daughters about the unique geology in their state. I personally cannot wait to get out there and join them
in a classroom as soon as possible.
You can reach Joe Riney at [email protected]
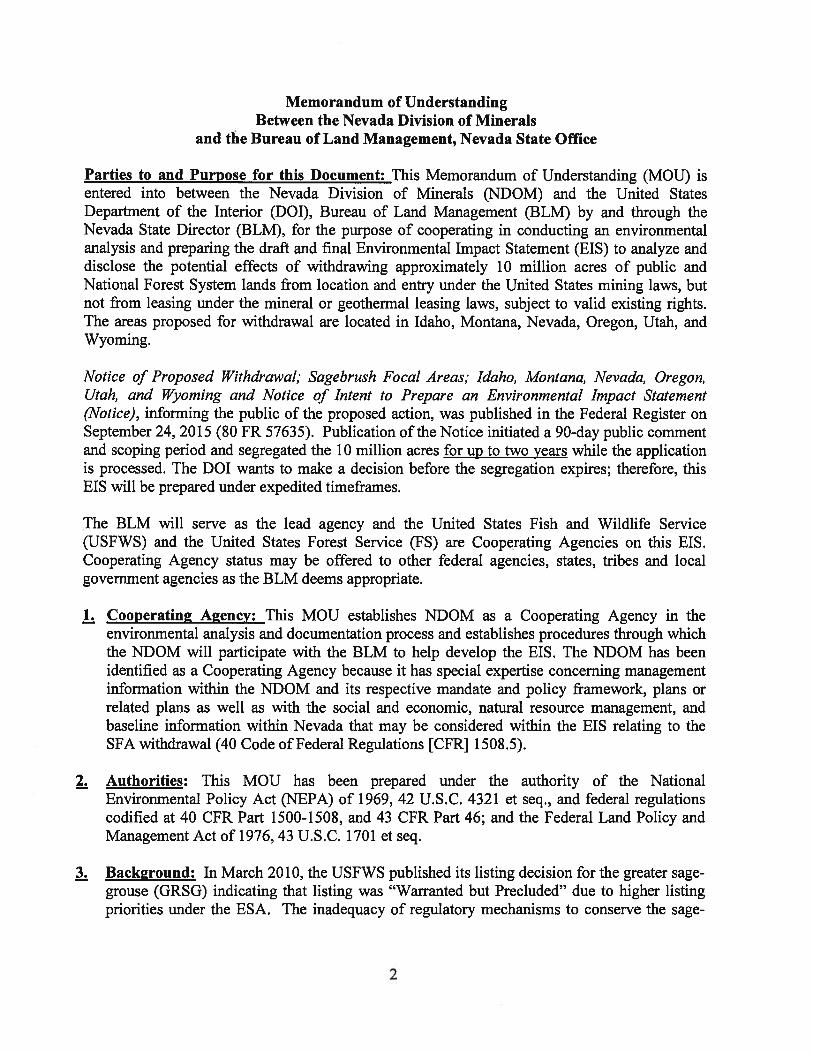
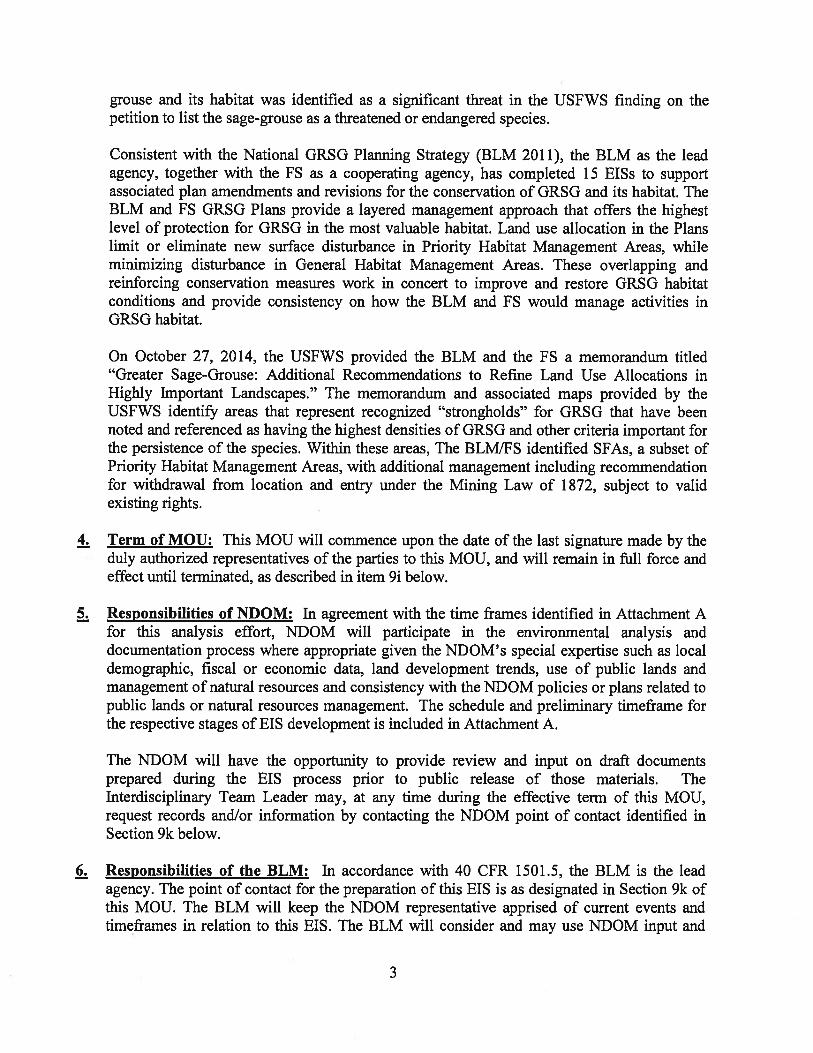

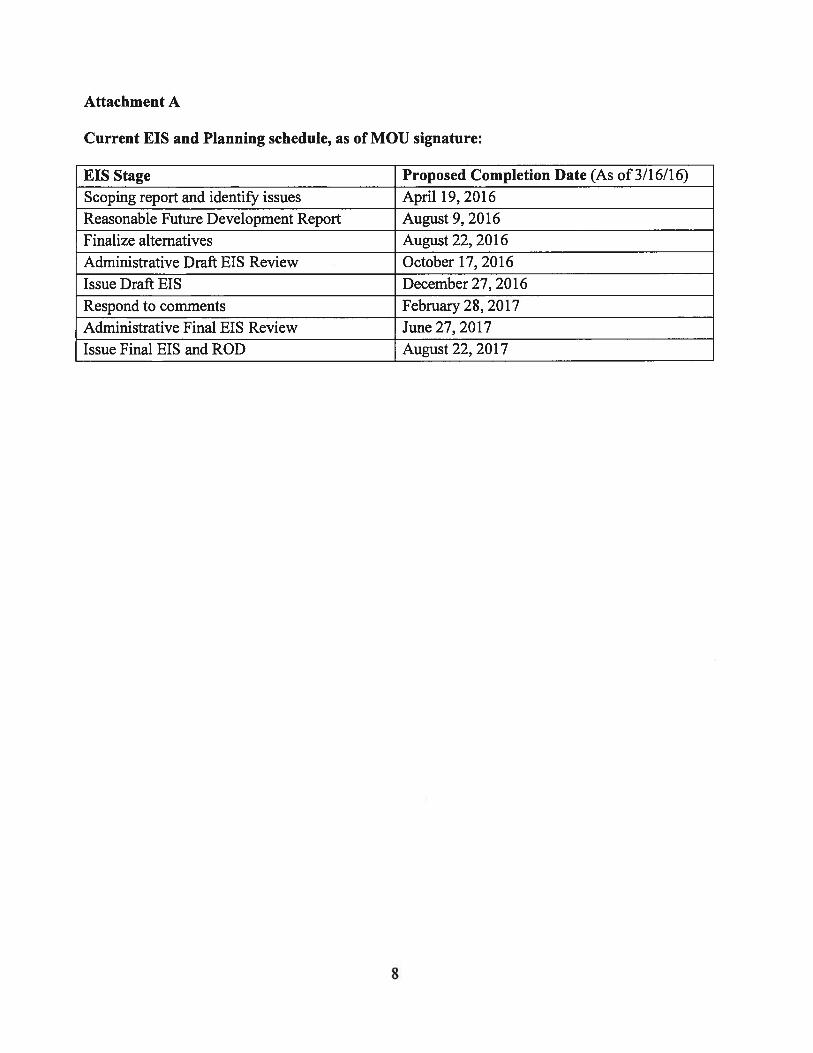

V. SPECIAL PRESENTATION