forming limit curve (flc) and forming limit diagram (fld)
TRANSCRIPT
Forming Limit Curve (FLC) and Forming Limit Diagram (FLD)
Introduction
Formability is the ability of sheet metal to undergo shape change without failure by necking or tearing [1].
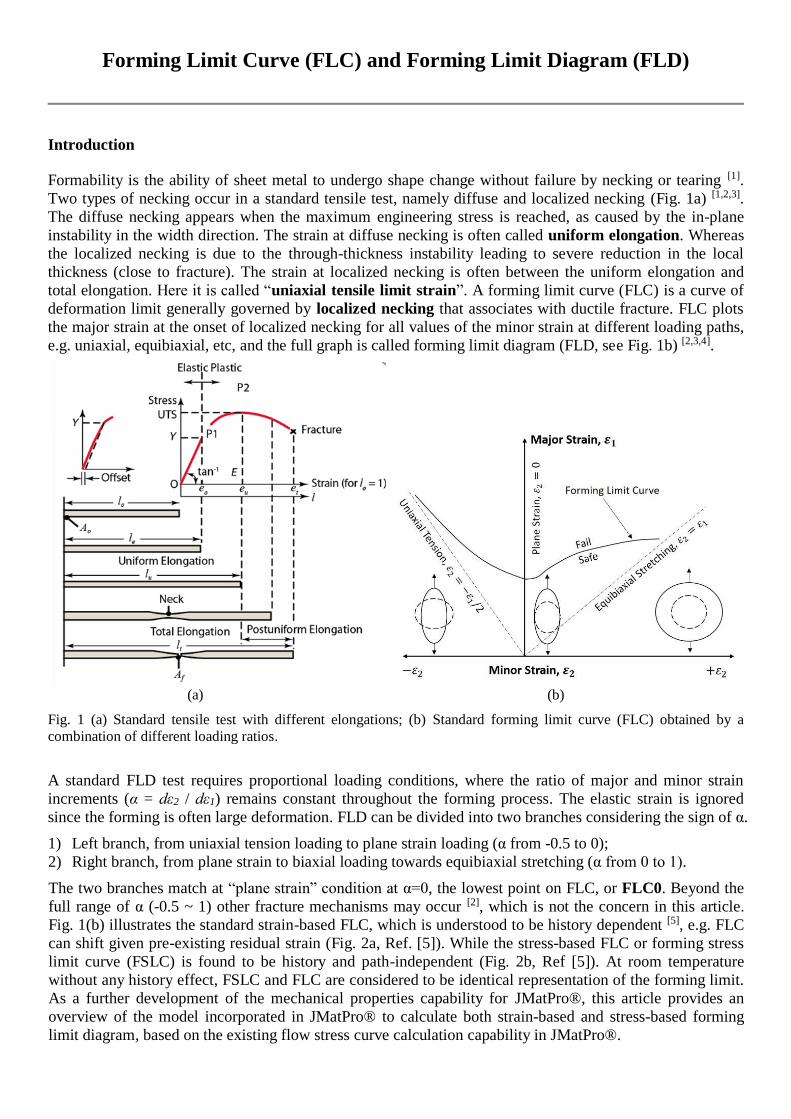
Two types of necking occur in a standard tensile test, namely diffuse and localized necking (Fig. 1a) [1,2,3].
The diffuse necking appears when the maximum engineering stress is reached, as caused by the in-plane
instability in the width direction. The strain at diffuse necking is often called uniform elongation. Whereas
the localized necking is due to the through-thickness instability leading to severe reduction in the local
thickness (close to fracture). The strain at localized necking is often between the uniform elongation and
total elongation. Here it is called “uniaxial tensile limit strain”. A forming limit curve (FLC) is a curve of
deformation limit generally governed by localized necking that associates with ductile fracture. FLC plots
the major strain at the onset of localized necking for all values of the minor strain at different loading paths,
e.g. uniaxial, equibiaxial, etc, and the full graph is called forming limit diagram (FLD, see Fig. 1b) [2,3,4].
(a) (b)
Fig. 1 (a) Standard tensile test with different elongations; (b) Standard forming limit curve (FLC) obtained by a
combination of different loading ratios.
A standard FLD test requires proportional loading conditions, where the ratio of major and minor strain
increments (α = dε2 / dε1) remains constant throughout the forming process. The elastic strain is ignored
since the forming is often large deformation. FLD can be divided into two branches considering the sign of α.
1) Left branch, from uniaxial tension loading to plane strain loading (α from -0.5 to 0);
2) Right branch, from plane strain to biaxial loading towards equibiaxial stretching (α from 0 to 1).
The two branches match at “plane strain” condition at α=0, the lowest point on FLC, or FLC0. Beyond the
full range of α (-0.5 ~ 1) other fracture mechanisms may occur [2], which is not the concern in this article.
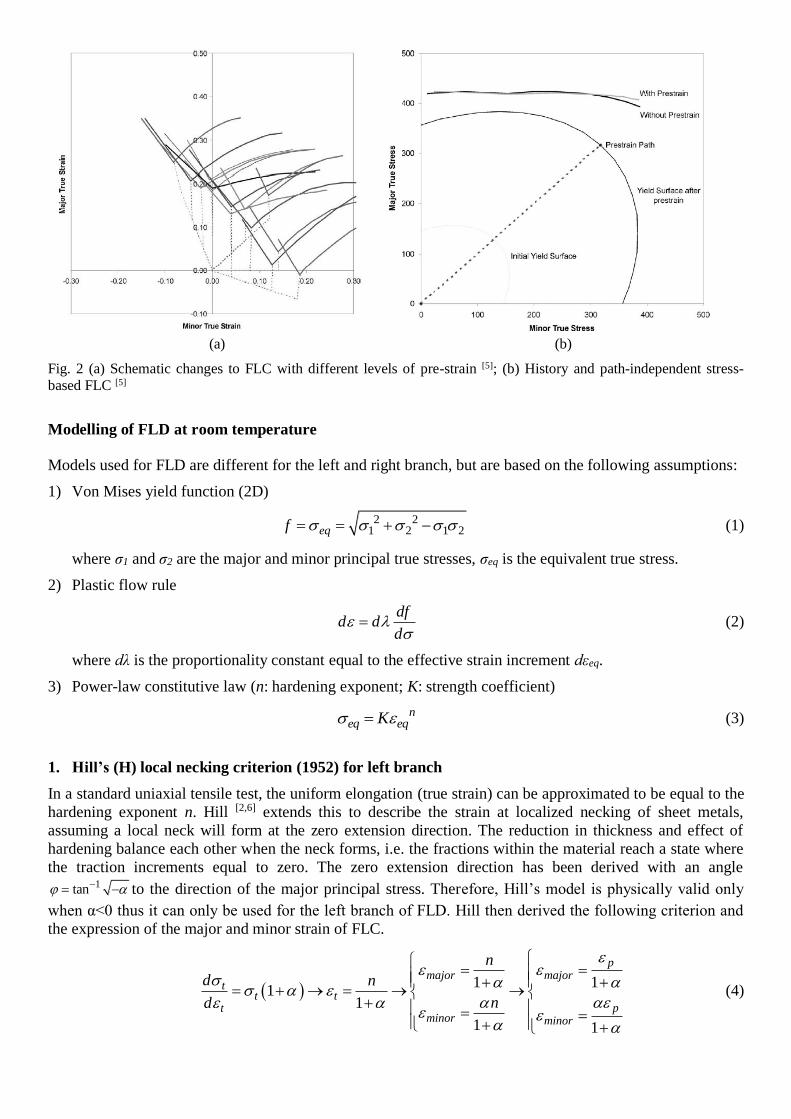
Fig. 1(b) illustrates the standard strain-based FLC, which is understood to be history dependent [5], e.g. FLC
can shift given pre-existing residual strain (Fig. 2a, Ref. [5]). While the stress-based FLC or forming stress
limit curve (FSLC) is found to be history and path-independent (Fig. 2b, Ref [5]). At room temperature
without any history effect, FSLC and FLC are considered to be identical representation of the forming limit.
As a further development of the mechanical properties capability for JMatPro®, this article provides an
overview of the model incorporated in JMatPro® to calculate both strain-based and stress-based forming
limit diagram, based on the existing flow stress curve calculation capability in JMatPro®.
(a) (b)
Fig. 2 (a) Schematic changes to FLC with different levels of pre-strain [5]; (b) History and path-independent stress-
based FLC [5]
Modelling of FLD at room temperature
Models used for FLD are different for the left and right branch, but are based on the following assumptions:
1) Von Mises yield function (2D)
2 21 2 1 2eqf = = + − (1)
where σ1 and σ2 are the major and minor principal true stresses, σeq is the equivalent true stress.
2) Plastic flow rule
dfd d
d
= (2)
where dλ is the proportionality constant equal to the effective strain increment dεeq.
3) Power-law constitutive law (n: hardening exponent; K: strength coefficient)
neq eqK = (3)
1. Hill’s (H) local necking criterion (1952) for left branch
In a standard uniaxial tensile test, the uniform elongation (true strain) can be approximated to be equal to the
hardening exponent n. Hill [2,6] extends this to describe the strain at localized necking of sheet metals,
assuming a local neck will form at the zero extension direction. The reduction in thickness and effect of
hardening balance each other when the neck forms, i.e. the fractions within the material reach a state where
the traction increments equal to zero. The zero extension direction has been derived with an angle 1tan −= − to the direction of the major principal stress. Therefore, Hill’s model is physically valid only
when α<0 thus it can only be used for the left branch of FLD. Hill then derived the following criterion and
the expression of the major and minor strain of FLC.
( ) 1 11
1
1 1
pmajor major
tt t
ptminor minor
n
d n
nd
= = + +
= + → = → → + = =
+ +
(4)
where the subscript “t” represents true stress/strain. Note we have replaced n with a characteristic elongation
term εp, which provides some flexibilities in the calculation and further calibration as many factors may
cause a shift in FLC, such as sheet thickness (a standard value is ~1mm) [7], forming speed (or strain rate)
and temperature [3,4]. The strain rate and temperature effect is tackled later, while the thickness effect is
ignored. p is equivalent to FLC0 (Eq. 4, Fig. 1b, 0 = ), and in uniaxial stretching ( 0.5 = − ) the localized
necking occurs at 2p. If all other factors (e.g. sheet thickness, strain rate and temperature) can be ignored,
2εp in FLD can be approximated to be the uniaxial tensile limit strain (Fig. 1a) obtained from a standard
uniaxial tensile test (although specimens and procedures of the two tests are different). Combining Eqs. (1)-
(4), the corresponding stress-based FLD can be obtained.
( )
( )
( )
( )
2
2
2
2
2 12
3 13 1
2 11 2
3 13 1
n
pmajor
n
pminor
K
K
+ ++ = ++ + + ++ = ++ +
(5)
2. Bressan-William’s (BW) shear instability criterion for right branch
Bressan and William’s theory [8] deals with biaxial stretching, assuming that the instability starts when the
local shear stress along the pure shear strain direction exceeds a critical value, which can be predicted from
the major principal stress simply from Mohr’s circle.
21 11
1sin 2 1 cos 2
2 2 2cr
+= = − =
+ (6)
where cos 2 / ( 2) = − + represents the orientation of the plane of critical shear stress. By matching BW
criterion and Hill expression at plane strain condition (α = 0), the critical shear stress can be calibrated.
( )
( )
( )0
22
2 3 1 31
3 3 21 2
3 1 3
n
p
n major
p
cr n
p
minor
K
KK
=
+ =
+ = →
+ =
+
(7)
Further, combining Eqs. (1)-(3) and (7), the major and minor strain of right branch of FLC can be obtained
1/2
2
1/2
2
1
11
1
11
n
pmajor
n
pminor
+ + = ++ + + + =
++ +
(8)
The modified Hill and Bressan-William (HBW) criterion is the fundamental framework of FLD calculation
here with three governing parameters (n, K, εp), while the loading ratio α is a known parameter in the
forming process. The modified HBW criterion will be compared with the following alternative models in the
Case studies of available strain-based FLD data at room temperature.
1) Marciniak-Kuczynski (MK) geometrical imperfection theory [3,4]
Material contains an initial defect characterized by either a geometric variation in the thickness with
some physical connection with the initial porosity [9] or material non-uniformity in the hardening
exponent [7]. Instability starts when the defect has grown extensively to a critical ratio compared with
that of the “healthy” region. Either option would give rise to a new fitting parameter.
2) Storen-Rice (SR) bifurcation or vertex theory [2-5]
Instability starts when a bifurcation or vertex, as associated with the uncertain direction of plastic flow
which triggers inhomogeneous deformation, eventually develops on a yield surface.
3) Swift (S) biaxial diffuse necking criterion [2]
Instability starts when diffuse necking occurs along both principal directions of stress.
4) Tresca (T) maximum shear stress criterion [2]
Instability starts when the maximum shear stress exceeds a critical value.
Details of these models can be found in the references and are not shown here, but for all the above models,
the prerequisite for FLD computation is the flow stress curve calculation, which is available in JMatPro®.
Case studies at room temperature (RT)
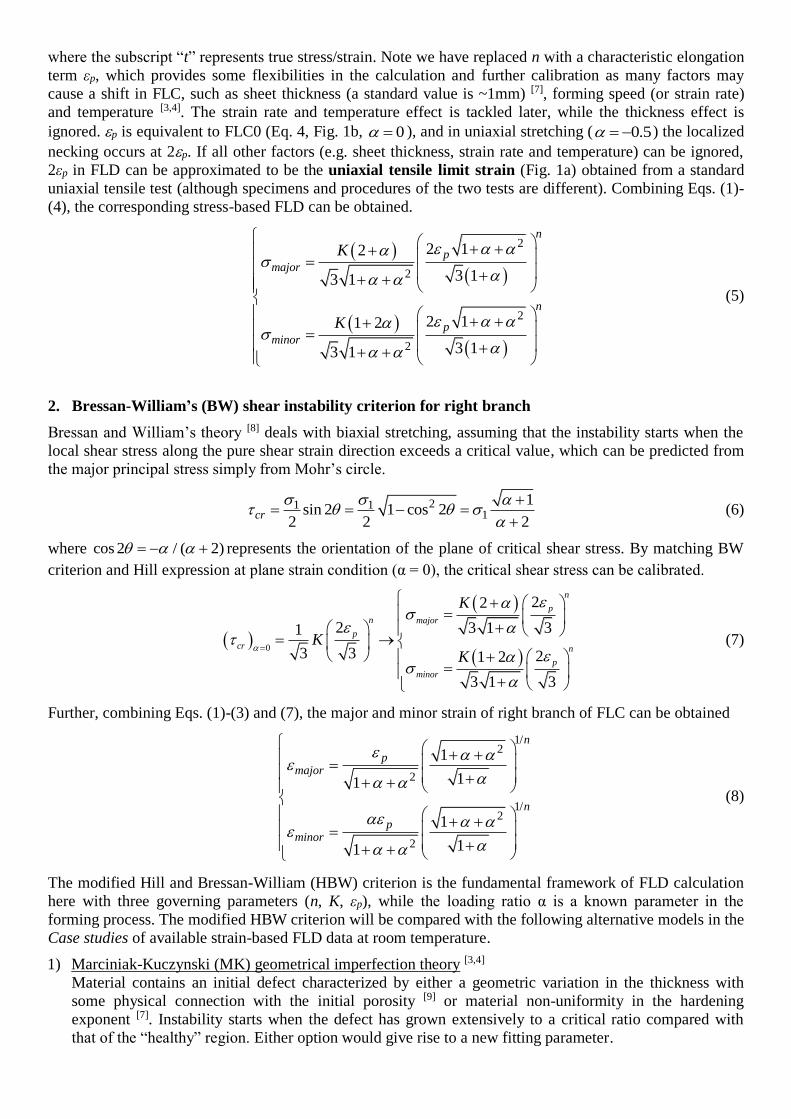
In this section, we evaluate the strain-based FLD at room temperature (RT). Firstly, a data collection of
FLC0 and n of a series of Al and Fe alloys is summarized in Table 1 (the thickness range has been chosen
around 1mm), showing the variation of FLC0 against n. The average FLC0 is found to be ~ n for Al alloys
and ~ 1.5 n for Fe alloys. The discrepancy can be attributed to the generally higher anisotropy in Fe alloys
than Al alloys. Such relationship between FLC0 (or εp) and n for Al and Fe alloys has been found to be
generally consistent with that obtained from the flow stress curve calculation in JMatPro®.
Table 1. Evaluation of FLC0 for Al and Fe alloys at room temperature (t: thickness)
Al alloys Fe alloys
Material t (mm) n FLC0 FLC0 / n Material t (mm) n FLC0 FLC0 / n
Al 1100 [7] 1 0.04 0.05 1.25 DX 53D [7] 1 0.154 0.265 1.721
Al 5182 [7] 1 0.17 0.17 1 ZStE 340 [7] 1.25 0.165 0.253 1.533
AA3003-H16 [7] 0.7 0.173 0.155 0.896 Micro Alloy
Steel [7]
1.2 0.188 0.27 1.436
Al 5754 [7] 1 0.177 0.17 0.96 ZStE 180 BH [7] 0.77 0.19 0.318 1.674
Al 2024 [7] 0.813 0.191 0.2 1.047 ZStE 220P [7] 0.8 0.197 0.256 1.3
AA 3105-U [7] 1 0.21 0.2 0.952 High strength
steel [7]
1 0.21 0.31 1.476
A 5182-O [7] 1 0.21 0.22 1.048 Rimming steel [7] 1 0.21 0.28 1.333
Al 6016-T4 [7] 1 0.22 0.2 0.909 DX 54D [7] 0.8 0.215 0.341 1.586
Al 1050 [7] 1 0.222 0.203 0.914 AK steel [7] 0.97 0.217 0.36 1.659
AA 8011-U [7] 1 0.24 0.2 0.833 IF-HS [7] 0.84 0.23 0.327 1.422
Al 1100 [7] 1 0.25 0.24 0.96 VDIF [7] 0.85 0.23 0.38 1.652
A 1100-O [7] 1 0.26 0.268 1.031 Mild steel
fep04 [7]
0.7 0.237 0.3 1.266
AA 3105-H [7] 1 0.29 0.3 1.034 Mild steel [7] 1 0.24 0.4 1.667
A 5182-O [7] 1 0.323 0.285 0.882 EDD [7] 0.8 0.25 0.36 1.44
AA 5182-O [10] 1 0.225 0.22 0.978 IF [7] 1 0.26 0.39 1.5
AA 3003 [11] 0.7 0.163 0.16 0.982 IF [7] 1.01 0.27 0.377 1.396
AA 6016-T4 [12] 1 0.185 0.185 1 DC04 [16] 0.77 0.195 0.25 1.282
AA 2024 [13] 1-1.2 0.165 0.16 0.97 DC06 [16] 0.8 0.251 0.3 1.195
AA 5083 [14] 1 0.22 0.2 0.909 AKDQ [17] 0.7 0.22 0.4 1.818
AA 3105 [2] 1 0.25 0.21 0.84
AA7075-T6 [15] 0.78 0.1 0.1 1
Average 0.971 Average 1.492
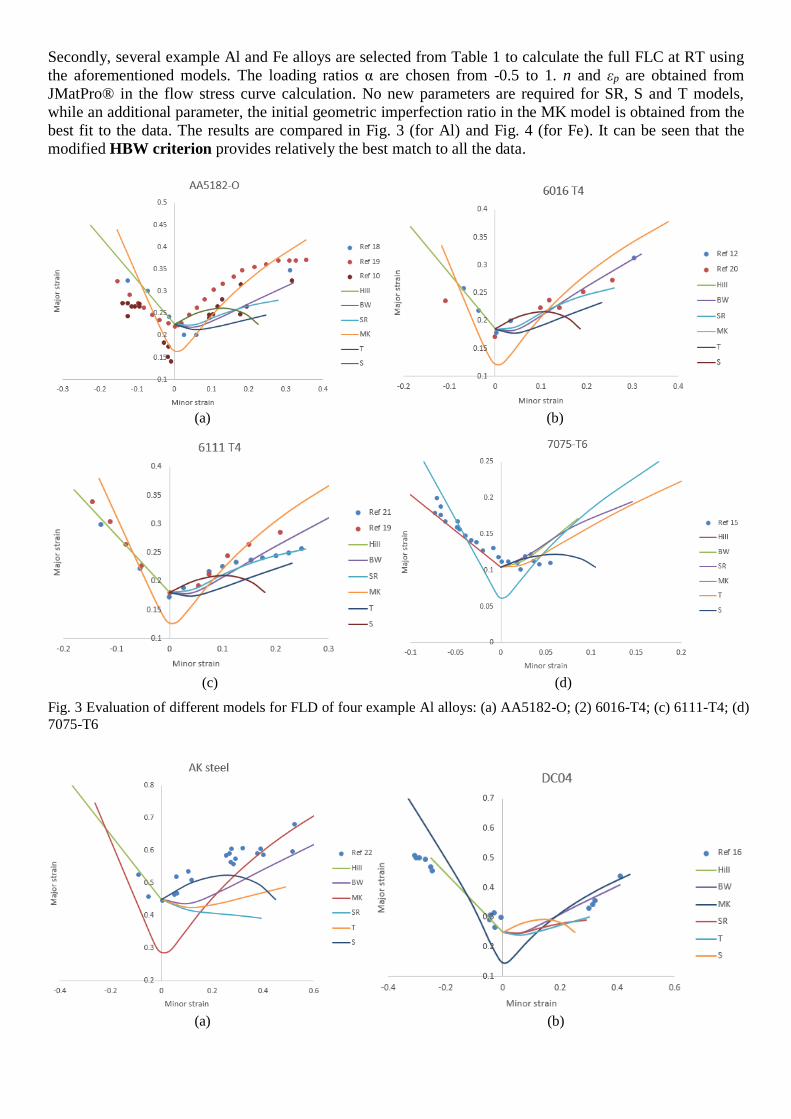
Secondly, several example Al and Fe alloys are selected from Table 1 to calculate the full FLC at RT using
the aforementioned models. The loading ratios α are chosen from -0.5 to 1. n and εp are obtained from
JMatPro® in the flow stress curve calculation. No new parameters are required for SR, S and T models,
while an additional parameter, the initial geometric imperfection ratio in the MK model is obtained from the
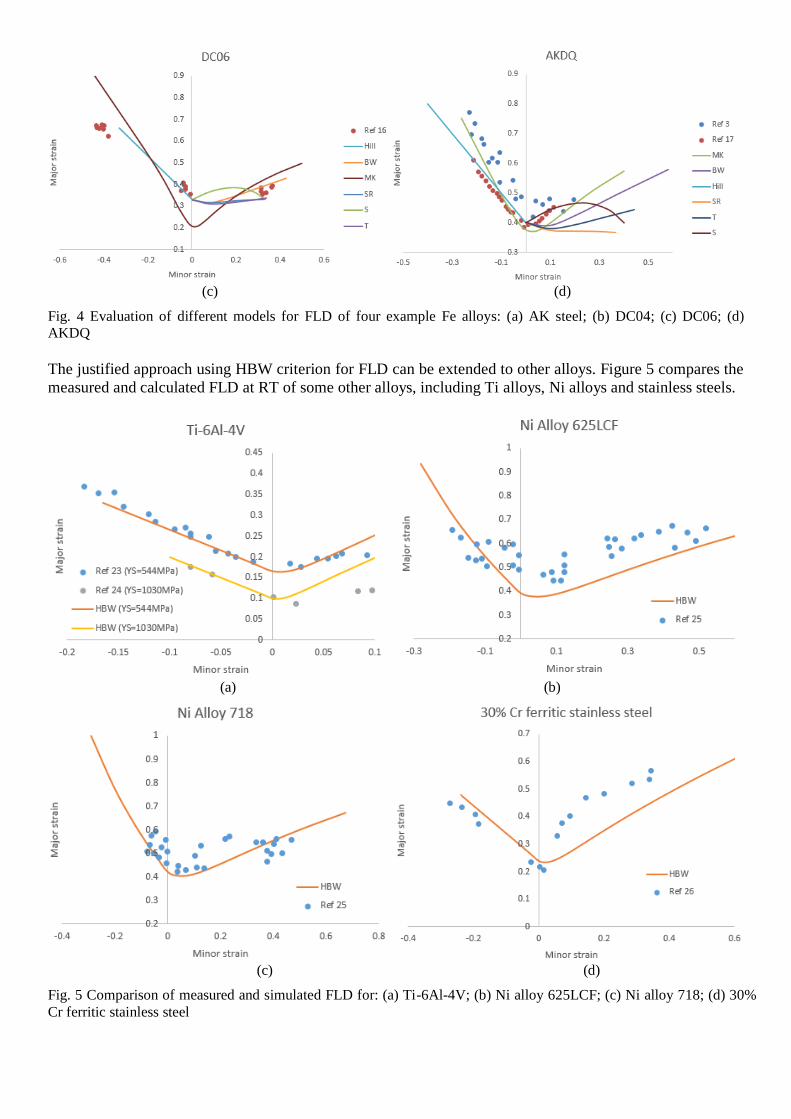
best fit to the data. The results are compared in Fig. 3 (for Al) and Fig. 4 (for Fe). It can be seen that the
modified HBW criterion provides relatively the best match to all the data.
(a) (b)
(c) (d)
Fig. 3 Evaluation of different models for FLD of four example Al alloys: (a) AA5182-O; (2) 6016-T4; (c) 6111-T4; (d)
7075-T6
(a) (b)
(c) (d)
Fig. 4 Evaluation of different models for FLD of four example Fe alloys: (a) AK steel; (b) DC04; (c) DC06; (d)
AKDQ
The justified approach using HBW criterion for FLD can be extended to other alloys. Figure 5 compares the
measured and calculated FLD at RT of some other alloys, including Ti alloys, Ni alloys and stainless steels.
(a) (b)
(c) (d)
Fig. 5 Comparison of measured and simulated FLD for: (a) Ti-6Al-4V; (b) Ni alloy 625LCF; (c) Ni alloy 718; (d) 30%
Cr ferritic stainless steel
Modelling of FLD at elevated temperatures
The formability of sheet metals has been found to increase with temperature during warm/hot forming
process. However, determining FLDs experimentally at warm/hot forming conditions is technically difficult,
time-consuming and costly, thus data of FLD at elevated temperatures is much less available compared with
the RT counterpart. One significant complexity is the forming speed or strain rate sensitivity. Eq. (3) can be
changed to incorporate the strain rate sensitivity
( )0
mneq eq eqK = (9)
where m is called strain rate sensitivity factor, 0 is a reference strain rate. However, uncertainty of FLD
calculation increases due to the following additional complexities:
• K, n and m are all temperature-dependent;
• m is often considered to be a constant, but its value is rather an approximation (obtained at a certain
value of strain from two tests with different strain rates, ( ) ( )2 1 2 1ln lnm = );
• In the FLD experiment, constant forming speed does not infer constant strain rate at all times and
regions, thus the enhanced strain rate sensitivity of the sample at elevated temperatures is difficult to
describe with a single equation.
In literature, SR and MK models have been extended to combine with Eq. (9) to calculate FLD at elevated
temperatures. However, both models contain additional fitting parameters and are rather case-sensitive
requiring careful calibration, considering the above uncertainties.
In JMatPro®, the strain rate sensitivity of the flow stress behaviour at elevated temperatures is treated
differently, considering that defects (dislocations and voids) can be generated more slowly at elevated
temperatures and the deformation mechanism may change from dislocation glide to dislocation climb, i.e.
creep flow softening may dominate [27,28]. In addition, the enhanced mobility of defects helps alleviate, to
some extent, the residual stress and the concentration of defects at certain regions. All of these can lead to a
delayed localized necking due to the competition between strengthening and softening.
Here we explore the capability of the modified HBW criterion, combined with the temperature-dependent
flow stress curve functionality in JMatPro®, to deal with FLD at elevated temperatures. The approach
remains generally the same as described before, except that the uniaxial tensile limit strain is determined
with the aid of a modified Clift ductile fracture-based criteria [29]:
2
0
p
d C = (10)
where C is a material-specific constant to be calculated from the reference flow stress curve at RT.
Case studies at elevated temperatures
Here we evaluate the strain-based FLD at elevated temperatures. Only some Al and Fe alloys have been
selected due to the data availability. For each alloy, the value of C is firstly obtained from the calculated
flow stress curve at RT at reference strain rate ( 0 in Eq. 9) with readily known uniaxial tensile limit strain.
Then it is combined with the flow stress curve at actual temperature and strain rate to calculate the actual
limit strain (or FLC0). The full FLC is then calculated by the HBW criterion.
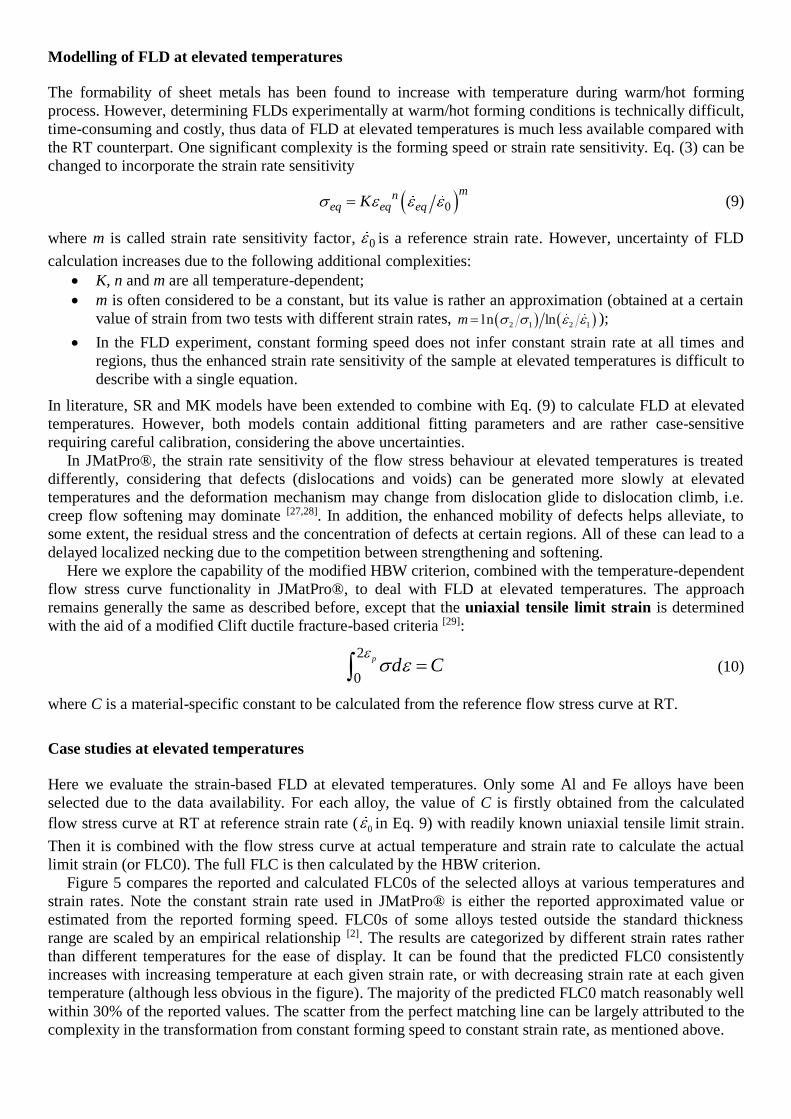
Figure 5 compares the reported and calculated FLC0s of the selected alloys at various temperatures and
strain rates. Note the constant strain rate used in JMatPro® is either the reported approximated value or
estimated from the reported forming speed. FLC0s of some alloys tested outside the standard thickness
range are scaled by an empirical relationship [2]. The results are categorized by different strain rates rather
than different temperatures for the ease of display. It can be found that the predicted FLC0 consistently
increases with increasing temperature at each given strain rate, or with decreasing strain rate at each given
temperature (although less obvious in the figure). The majority of the predicted FLC0 match reasonably well
within 30% of the reported values. The scatter from the perfect matching line can be largely attributed to the
complexity in the transformation from constant forming speed to constant strain rate, as mentioned above.
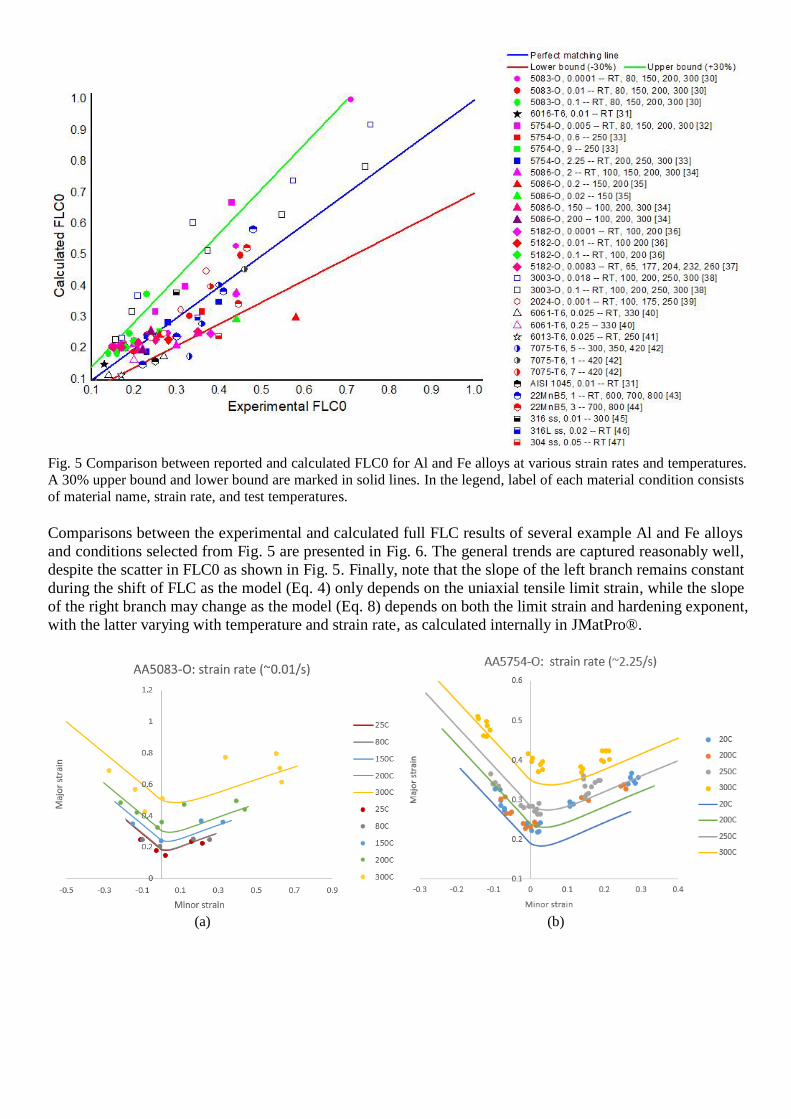
Fig. 5 Comparison between reported and calculated FLC0 for Al and Fe alloys at various strain rates and temperatures.
A 30% upper bound and lower bound are marked in solid lines. In the legend, label of each material condition consists
of material name, strain rate, and test temperatures.
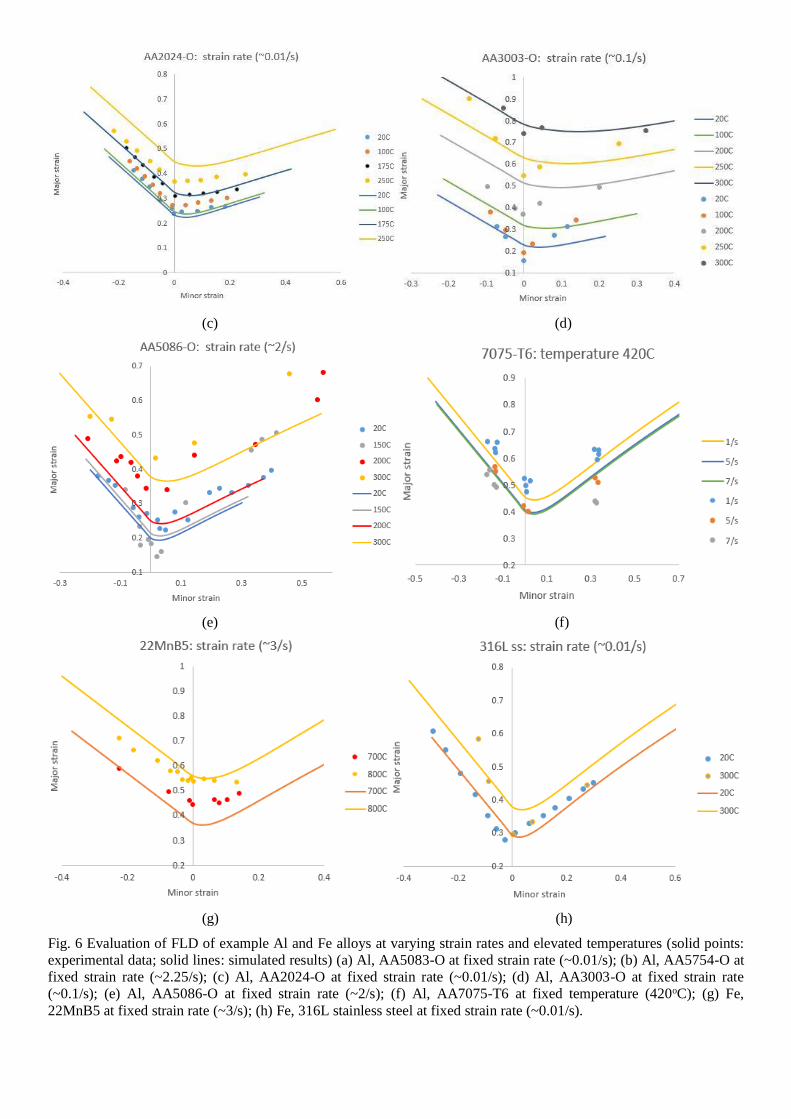
Comparisons between the experimental and calculated full FLC results of several example Al and Fe alloys
and conditions selected from Fig. 5 are presented in Fig. 6. The general trends are captured reasonably well,
despite the scatter in FLC0 as shown in Fig. 5. Finally, note that the slope of the left branch remains constant
during the shift of FLC as the model (Eq. 4) only depends on the uniaxial tensile limit strain, while the slope
of the right branch may change as the model (Eq. 8) depends on both the limit strain and hardening exponent,
with the latter varying with temperature and strain rate, as calculated internally in JMatPro®.
(a) (b)
(c) (d)
(e) (f)
(g) (h)
Fig. 6 Evaluation of FLD of example Al and Fe alloys at varying strain rates and elevated temperatures (solid points:
experimental data; solid lines: simulated results) (a) Al, AA5083-O at fixed strain rate (~0.01/s); (b) Al, AA5754-O at
fixed strain rate (~2.25/s); (c) Al, AA2024-O at fixed strain rate (~0.01/s); (d) Al, AA3003-O at fixed strain rate
(~0.1/s); (e) Al, AA5086-O at fixed strain rate (~2/s); (f) Al, AA7075-T6 at fixed temperature (420oC); (g) Fe,
22MnB5 at fixed strain rate (~3/s); (h) Fe, 316L stainless steel at fixed strain rate (~0.01/s).
Conclusion
To summarize, the forming limit diagram (FLD) calculation for a range of alloys is explored. Combined
with the existing flow stress curve capability in JMatPro®, feasibility of a number of analytical FLD models
are evaluated for room temperature (RT) FLD calculation and the modified joint Hill and Bressan-William
model (HBW criterion) in general gives the best match across the collected experimental data. The approach,
with the aid of modified Clift ductile fracture criterion, is also capable of tackling the effect of varying strain
rates and temperatures on FLD. It provides further insight on the correlation between the tensile flow
behavior and formability of a given material, and can be applied to aid the materials selection in industry
regarding the sheet metal forming.
References
1. https://en.wikipedia.org/wiki/Forming_limit_diagram
2. Paul, S.K. Theoretical analysis of strain-and stress-based forming limit diagrams. J Strain Analysis. 2013, 48(3):
177-188.
3. Jie, M., Cheng, C.H., Chan, L.C., Chow, C.L. Forming limit diagrams of strain-rate-dependent sheet metals. Int. J.
Mech. Sci. 2009, 51: 269-275.
4. Min, J. Lin, J., Li, J., Bao, W. Investigation on hot forming limits of high strength steel 22MnB5. Comp Mater Sci.
2010, 49: 326-332.
5. Stoughton, T.B., Zhu X. Review of theoretical models of the strain-based FLD and their relevance to the stress-
based FLD. Int J Plast. 2004, 20: 1463-1486.
6. Hill, R. On discontinuous plastic states with special reference to localized necking in thin sheets. J Mech Phys
Solids. 1952, 1: 19-30.
7. Ghazanfari, A., Assempour, A. Calibration of forming limit diagrams using a modified Marciniak-Kuczynski
model and an empirical law. Mater Des. 2012, 34: 185-191.
8. Bressan, J.D., William, J.A. The use of a shear instability criterion to predict local necking in sheet metal
deformation. Int. J. Mech. Sciences. 1983, 25: 155-168.
9. Barlat, F., Richmond, O. Modelling macroscopic imperfections for the prediction of flow localization and fracture.
Fatigue Fract Engng Mater Struct. 2003, 26: 311-321.
10. Banabic, D. Anisotropy and formability of AA5182-O aluminium alloy sheets. CIRP Annals – Manufacturing
Technology. 2004, 53: 219-222.
11. Ahmadi, S., Eivani, A.R., Akbarzadeh, A. An experimental and theoretical study on the prediction of forming
limit diagrams using new BBC yield criteria and M-K analysis. Comp. Mater. Sci. 2009, 44: 1272-1280.
12. Banabic, D., Lazarescu, L., Paraianu, L., Ciobanu, I., Nicodim, I., Comsa, D.S. Development of a new procedure
for the experimental determination of the forming limit curves. CIRP Annals – Manufacturing Technology. 2013,
62: 255-258.
13. Turkoz, M., Yigit, O., Dilmec, M., Halkaci, H.S. Construction of forming limit diagrams for AA 5754 and AA
2024 aluminium alloys. Proceedings of the 12th International Conference on Aluminium Alloys. 2010: 516-521.
14. Janbakhsh, M., Djavanroodi, F., Riahi, M. A comparative study on determination of forming limit diagrams for
industrial aluminium sheet alloys considering combined effect of strain path, anisotropy and yield locus. J Strain
Analysis. 2012, 47(6): 350-361.
15. Janbakhsh, M., Loghmanian, S.M.R., Djavanroodi, F. Application of different Hill’s yield criteria to predict limit
strains for aerospace titanium and aluminium sheet alloys. Int J Advanced Design and Manufacturing Technology.
2014, 7: 35-44.
16. Janssens, K., Lambert, F., Vanrostenberghe, S., Vermeulen, M. Statistical evaluation of the uncertainty of
experimentally characterised forming limits of sheet steel. J Mater. Process. Tech. 2001, 112: 174-184.
17. Strano, M., Colosimo, B.M. Logistic regression analysis for experimental determination of forming limit diagrams.
Int. J Mach. Tool. Manu. 2006, 46: 673-682.
18. Abovyan, T., Kridli, G.T., Friedman, P.A., Ayoub, G. Formability prediction of aluminium sheet alloys under
isothermal forming conditions. J Manuf Process. 2015, 20: 406-413.
19. Signorelli, J.W., Bertinetti, M.A., Turner, P.A. Predictions of forming limit diagrams using a rate-dependent
polycrystal self-consistent plasticity model. Int J. Plast. 2009, 25: 1-25.
20. Butuc, M.C., Gracio, J.J., da Rocha, A.B. An experimental and theoretical analysis on the application of stress-
based forming limit criterion. Int. J. Mech. Sciences. 2006, 48: 414-429.
21. Chow, C.L., Yang, X.J., Chu, E. Prediction of forming limit diagram based on damage coupled kinematic-
isotropic hardening model under nonproportional loading. J. Eng. Mater. Technol. 2002, 124: 259-265.
22. Ganjiani, M., Assempour, A. An improved analytical approach for determination of forming limit diagrams
considering the effects of yield functions. J. Mater. Process. Tech. 2007, 18: 598-607.
23. Djavanroodi, F., Derogar, A. Experimental and numerical evaluation of forming limit diagram for Ti6Al4V
titanium and Al6061-T6 aluminum alloys sheets. Mater. Des. 2010, 31: 4866-4875.
24. Badr, O.M.M.M. Forming behaviour analysis and constitutive modelling of Ti-6Al-4V at room temperature. PhD
thesis for Deakin University. 2014.
25. Roamer, P., Van Tyne, C.J., Matlock, D.K., Meier, A.M., Ruble, H., Suarez, F. Room temperature formability of
alloys 625LCF, 718 and 718SPF. Proceedings of TMS, Superalloys, 1997, 315-329.
26. Bong, H.J., Barlat, F., Lee, M.G., Ahn, D.C. The forming limit diagram of ferritic stainless steel sheets:
experiments and modelling. Int. J. Mech. Sciences. 2012, 64: 1-10.
27. Guo, Z., Saunders. N., Miodownik, A.P., Schille, J.P. Quantification of high temperature strength of nickel-based
superalloys. Mater. Sci. Forum. 2007, 546-549: 1319-1326.
28. Guo, Z., Saunders, N., Schille, J.P., Miodownik, A.P. Modelling high temperature flow stress curves of titanium
alloys. Proceedings of MRS Conference. 2008.
29. Clift, S.E., Hartley, P., Sturgess, C.E.N., Rowe, G.W. Fracture prediction in plastic deformation processes. Int. J.
Mech. Sciences. 1990, 32(1): 1-17.
30. Naka, T., Torikai, G., Hino, R., Yoshida, F. The effects of temperature and forming speed on the forming limit
diagram for type 5083 aluminum-magnesium alloy sheet. J. Mater. Process. Tech. 2001, 113: 648-653.
31. Gerdooei, M., Dariani, B.M., Liaghat, G.H. Effect of material models on formability of sheet metals in explosive
forming. Proceedings of the World Congress on Engineering, WCE 2009, UK.
32. Palumbo, G., Tricarico, L. Numerical and experimental investigations on the warm deep drawing process of
circular aluminium alloy specimens. J. Mater. Process. Tech. 2007, 184: 115-123.
33. Shao, Z., Bai, Q., Li, N., Lin, J., Shi, Z., Stanton, M., Watson, D., Dean, T. Experimental investigation of forming
limit curves and deformation features in warm forming of an aluminium alloy. Proceedings of the Institution of
Mechanical Engineers, Part B: Journal of Engineering Manufacture. 2016, 232(3), 465-474.
34. Zhang, C., Chu, X., Guines, D., Leotoing, L., Ding, J., Zhao, G. Effects of temperature and strain rate on the
forming limit curves of AA5086 sheet. Procedia Engineering. 2014, 81: 772-778.
35. Chu, X., Leotoing, L., Guines, D., Ragneau, E. Temperature and strain rate influence on AA5086 forming limit
curves: experimental results and discussion on the validity of the M-K model. Int. J. Mech. Sciences. 2014, 78: 27-
34.
36. Khan, A.S., Baig, M. Anisotropic responses, constitutive modeling and the effects of strain-rate and temperature
on the formability of an aluminium alloy. Int J. Plast. 2011, 27: 522-538.
37. Abedrabbo, N., Pourboghrat, F., Carsley, J. Forming of AA5182-O and AA5754-O at elevated temperatures using
coupled thermo-mechanical finite element models. Int J. Plast. 2007, 23: 841-875.
38. Bagheriasl, R. Formability of aluminium alloy sheet at elevated temperature. Thesis for DPhil degree in
University of Waterloo. 2012.
39. Ali, W.J., Jumah, O.T. Warm forming of aluminium alloy 2024 at different temperatures. Al-Rafidain Engineering.
2012, 20(2): 78-85.
40. Chen, Z., Fang, G., Zhao, J. Formability evaluation of aluminum alloy 6061-T6 sheet at room and elevated
temperatures. J. Mater. Eng. Perform. 2017, 26(9): 4626-4637.
41. Dicecco, S., Butcher, C., Worswick, M., Boettcher, E., Chu, E., Shi, C. Determination of forming limit diagrams
of AA6013-T6 aluminum alloy sheet using a time and position dependent localized necking criterion. IOP Conf.
Ser. : Mater. Sci. Eng. 2016: 159.
42. Gao, H., Politis, D.J., Luan, X., Ji, K., Zhang, Q., Zheng, Y., Gharbi, M., Wang, L. Forming limit prediction for
AA7075 alloys under hot stamping conditions. J. Phys.: Conf. Ser. 2017, 896 012089.
43. Shi, D.Y., Ying, L., Hu, P., Lu, J.D., Zhao, X., Liu, W.Q. Experimental and numerical determination of thermal
forming limit diagrams (TFLD) of high strength steel 22MnB5. AIP Conf. Proc. 2013, 1532: 406-413.
44. Li, F.F., Fu, M.W., Lin, J.P., Wang, X.N. Experimental and theoretical study on the hot forming limit of 22MnB5
steel. Int. J. Adv. Manuf. Technol. 2014, 71: 297-306.
45. Hussaini, S.M., Krishna, G., Gupta, A.K., Singh, S.K. Development of experimental and theoretical forming limit
diagrams for warm forming of austenitic stainless steel 316. J Manuf Process. 2015, 18: 151-158.
46. Kathiravan, S., Sait, A.N., Ravichandran, M. Experimental investigation on stretchability of an austenitic stainless
steel 316L. Iranian J. Mater. Form. 2016, 3(1), 55-64.
47. Kolasangiani, K., Shariati, M., Farhangdoost, K. Prediction of forming limit curves (FLD, MSFLD and FLSD)
and necking time for SS304L sheet using finite element method and ductile fracture criteria. J. Comput. Appl. Res.
Mech. Eng. 2015, 4(2), 121-132.