ordering in red abalone nacre
TRANSCRIPT
1
Ordering in Red Abalone Nacre
Rebecca A. Metzler1, Dong Zhou1, Mike Abrecht2, Susan N. Coppersmith1,
and P.U.P.A. Gilbert1,*
1 Department of Physics, University of Wisconsin, Madison, WI 53706, USA.
2 Synchrotron Radiation Center, 3731 Schneider Drive, Stoughton, WI 53589, USA.
* Previously publishing as Gelsomina De Stasio. Corresponding author:
Keywords: X-ray Linear Dichroism, XLD, XANES, NEXAFS, X-PEEM, synchrotron,
spectromicroscopy, Nacre, Abalone, Biomineral, crystal, Polarization, Orientation,
Red abalone nacre is an intensely studied biomineral, and yet its formation
mechanism remains poorly understood.1-5
Here we report quantitative
measurements probing the degree of order of the aragonite tablets in nacre, and
show that order develops over a distance of about 50 microns. These observations
indicate that the orientational order of aragonite tablets in nacre is established
gradually and dynamically, and we show that a model of controlled assembly based
on suppression of the crystal growth rate along a specific direction, when growth is
confined in a layered structure, yields a tablet pattern consistent with those revealed
by detailed experimental measurements3. This work provides strong evidence that
the organism’s control of crystal orientation in nacre occurs via regulation of crystal
nucleation and growth as opposed to direct templation6 or heteroepitaxial growth
4
on organic molecules on the organic matrix sheets. 5,7,8

2
Nacre, or mother-of-pearl, is widely studied because of its self-assembled, efficient and
accurately ordered architecture, its toughness, and its fascinating and poorly understood
formation mechanisms.1 Nacre is a composite of layered 400-nm thick aragonite
crystalline tablets oriented with their (001) crystal axes within ±11° of the normal to the
layer plane7 and stacked irregularly
3, and 30-nm thick organic matrix sheets.
9 Aragonite,
a hard but brittle orthorhombic CaCO3 polymorph, accounts for 95% of nacre’s mass, yet
nacre is 3000 times tougher than aragonite.10
No synthetic composites outperform their
components by such large factors. It is therefore of great interest to understand nacre
formation.
We present here x-ray photoelectron emission spectromicroscopy (X-PEEM) data on red
abalone shells that yield unprecedented detailed and quantitative information about the
location, size and orientation of individual tablets with sub-micron spatial resolution, a
large field of view including hundreds of tablets, straightforward sample preparation, and
negligible radiation damage. The data exhibit a systematic spatial variation, indicating
that the aragonite tablets in nacre order dynamically, and are consistent with a theoretical
model in which aragonite crystal layers are nucleated sequentially in the presence of
confining matrix sheets and grow epitaxially on aragonite crystals in layers below, with
the growth rate of aragonite crystals in the (001) crystal direction lower than in the ab-
plane.
Illuminating polycrystalline samples with polarized soft-x-rays generates a spectroscopic
effect known as x-ray linear dichroism11,12
in x-ray absorption near-edge structure
(XANES) spectra.13
This effect is widely studied in man-made liquid crystals,12
chemisorbed11
and magnetic materials, 14,15
occasionally in geologic minerals,16,17
and
was recently discovered in nacre.3 When XANES spectroscopy is combined with X-
PEEM imaging, the linear dichroism generates imaging contrast between differently
oriented adjacent microcrystals, denoted polarization-dependent imaging contrast
(PIC).3,18
Because of aragonite’s hexagonal symmetry in the ab-plane, the contrast arises
from differences in the crystals’ c-axes orientation (3,13).3,13
In this work we analyzed
eleven samples from four different red abalone shells, approximately 10-cm long, with
3
the X-PEEM Spectromicroscope for PHotoelectron Imaging of Nanostructures with X-
rays (SPHINX).18
The shells were cut, embedded, polished and Pt coated as described
previously.5
We characterize quantitatively tablet size, tablet crystal orientation, and stacking
direction; they all show greater disorder near the boundary between the nacre and
prismatic layers, with order evolving over a length scale of approximately 50 microns.
Figure 1 shows a series of O maps acquired with SPHINX at and away from the prismatic
boundary. In Figure 1 adjacent tablets exhibit strikingly strong contrast, as shown by the
different gray levels, due to different orientations of adjacent crystalline tablets in each
nacre layer.17
As can be seen in Figure 1, the contrast is greatest near the nacre-prismatic boundary, and
diminishes as the distance from the boundary increases. Figure 2 reports the magnitude
of the variation of PIC at each distance from the boundary. The contrast arising from c-
axis misorientation of tablet crystals is largest near the nacre-prismatic boundary, and
decreases moving away from the boundary, reaching its steady-state value at distances of
50 !m. Low but still distinct PIC is observed across the whole 2-mm thickness of nacre.
Supplementary Table 1 reports PIC range data for one shell up to 50 !m from the
boundary. The disorder in tablet crystal orientation (Figure 2) as revealed by the
variability in the gray scale of the image and in tablet widths (Supplementary Figure 1)
evolve systematically as one moves away from the prismatic boundary. The systematic
evolution of the degree of order is incompatible with a mechanism in which tablet crystal
orientation is determined entirely by direct templation by the organic matrix sheets or
acidic macromolecules on the sheets, because such mechanism would not yield evolution
of the degree of order as one moves away from the prismatic boundary. Our results are
consistent with previous synchrotron x-ray micro-diffraction observations reporting that
nacre tablets in red abalone are less co-oriented near the nacre-prismatic boundary, and
become more co-oriented and ordered within 100 !m of the boundary.19
PIC resolves

4
orientation differences between individual neighboring tablets in a large field of view,
providing statistical information that is a basis for comparison with theoretical modeling.
Figure 3A, a PIC image taken near the nacre-prismatic boundary, has stacks of co-
oriented tablets with the same gray level, consistent with the idea that mineral bridges20
through porous organic nucleation sites21,22,3
conserve the orientation of crystals in
successive layers. The stacks of co-oriented tablets have finite height, so it is plausible
that only a small fraction of nucleation sites nucleate new crystal orientations.
The main and new assumption we make in our model is that:
• The growth rate along the (001) direction (the c-axis direction) of aragonite tablets in
nacre is slower than the growth rates along the a- and b-axes. This assumption is
consistent with reports that nacre proteins suppress the growth rate of carbonates along
(001).23,24,25
The other, more conventional, assumptions are:
• Organic matrix sheets confine the growth of the aragonite tablets.2,8
• There is a single nucleation site per nacre tablet.2,8
• Nucleation sites are independently and randomly distributed on organic matrix sheets.3
• Tablets in a given layer grow until they reach confluence.26
• A tablet in a given layer is highly probable to have the same orientation as the tablet
directly below its nucleation site. 20
• The c-axis orientations of the aragonite tablets in the first layer are not aligned. This
assumption is consistent with previous observations,19
and further supported by the
experimental data presented here.
• In the calculations shown here, growth of a given layer is completed before the next
layer is nucleated. This limit is adopted purely for simplicity; more realistic columnar
growth27
actually increases the probability that tablets with high growth velocity
preferentially reach the nucleation sites in the overlying matrix sheet, which enhances
the orientational ordering via the mechanism we describe.

5
These assumptions yield the simulated model configuration shown in Figure 3B, which is
strikingly similar to the experimental data in Figure 3A. The spread in the growth speeds
of different crystal orientations determines the length over which the ordering evolves,
and the fraction of tablets that fail to adopt the crystal orientation of the tablets below
their nucleation sites determines the ultimate degree of order far from the prismatic
boundary (in Fig. 3B, the spread in growth velocities is ~20%, and 2.8% of tablets are
misaligned with respect to the underlying ones). Supplementary Figure 2 shows that both
the model and red abalone nacre have occasional configurations with tablet widths that
are significantly larger than in typical configurations. The growth model’s behavior and
its relations to models studied in the context of population biology are discussed further
in the Supplementary Information.
The remarkable resemblance of the experimentally observed tablet orientation patterns
and the configurations yielded by the model provide strong evidence that the growth rate
of aragonite crystals in nacre is greatest when the c-axes are oriented perpendicular to the
organic matrix sheets. We now show why suppression of the rate of aragonite crystal
growth along (001) gives rise to tablet growth rates with this property.
Because the nacre tablets are constrained by organic matrix sheets, decreasing the growth
rate along (001) until it is slower than along the a- and b-axes causes the tablets with
(001) axis perpendicular to the matrix sheets to grow the fastest. (This mechanism
assumes that an “ordering protein” is available to suppress the aragonite growth rate
along (001) in the inter-sheet space or gel in which aragonite tablets grow. 28,29
In this
scenario the “ordering protein” acts stereochemically.23
The organic matrix sheets play a
critical role – in their absence, crystals align with their fastest-growing axes parallel to
the growth direction, as in eggshells.30
Figure 4 illustrates the mechanism; when the
crystal is oriented with the c-axis perpendicular to the sheets, then it can grow in its fast a
and b directions without running into the organic matrix sheets.
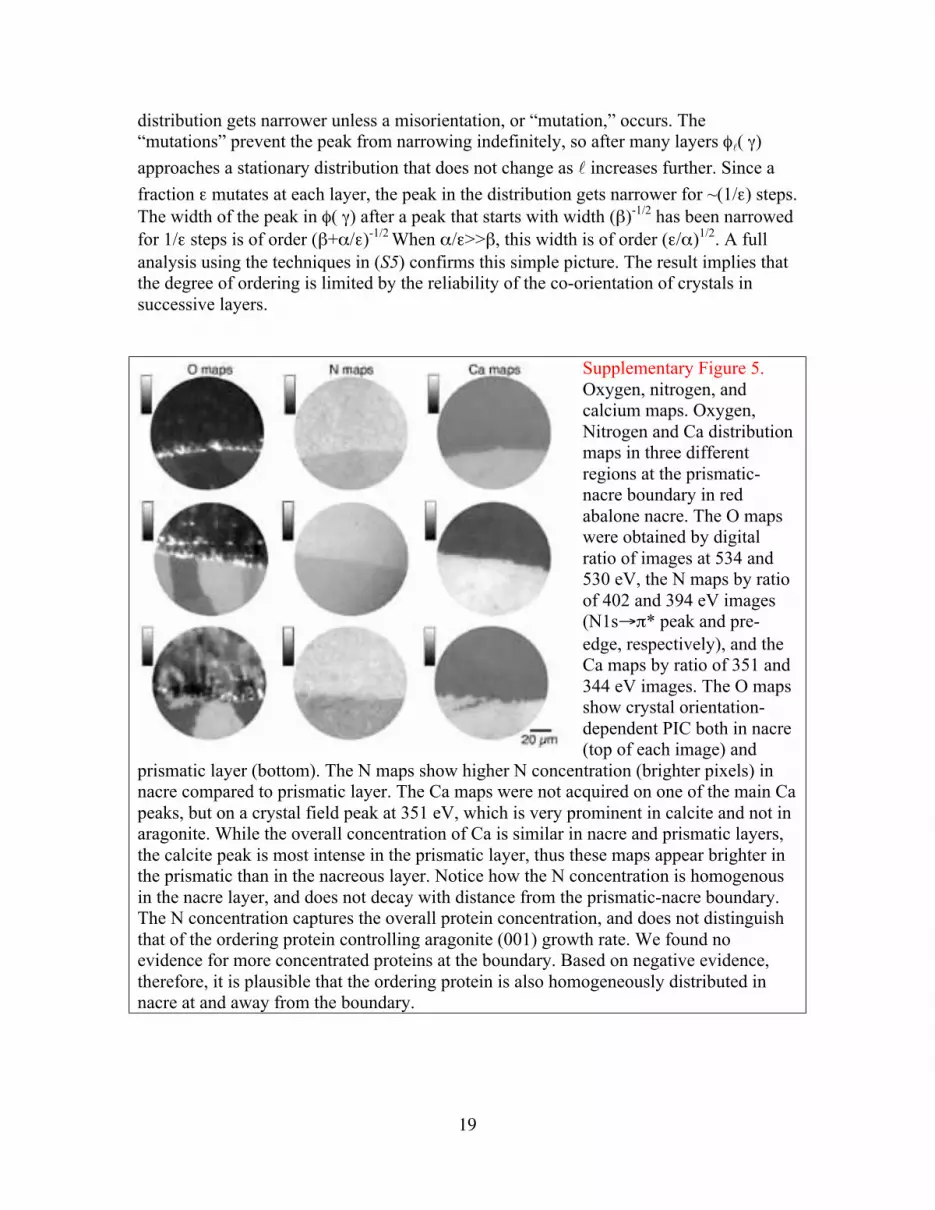
We investigated the spatial distribution of proteins in nacre at and near the boundary, by
mapping nitrogen. The results of Supplementary Figure 5 show greater concentration of

6
proteins in nacre than in the prismatic layer. The total protein concentration in nacre does
not exhibit a gradient but is constant at and away from the boundary.
In summary, we have demonstrated that the complex pattern of aragonite tablet
orientations in nacre provides evidence that the crystal orientation order of the tablets is
induced by a dynamical mechanism implemented by an “ordering protein” that
suppresses the rate of aragonite crystal growth along (001). The ordering mechanism
presented here contrasts with the common hypothesis that aragonite order is the result of
templation by or heteroepitaxial growth on organic molecules on the matrix sheets. Direct
and abrupt templation from the organic matrix sheets does not account for the
characteristic pattern of tablet orientations, nor for the gradual increase of order observed
moving away from the prismatic boundary. The dynamic mechanism of growth control
by an “ordering protein” described here provides a realistic theoretical growth model, in
good agreement with experimental data.
References
1. A. M. Belcher et al. Nature 381, 56 - 58 (1996).
2. H. A. Lowenstam, S. Weiner, On Biomineralization (Oxford Univ. Press, Oxford,
1989).
3. R. A. Metzler et al., Phys. Rev. Lett. 98, 268102 (2007).
4. S. W. Wise, Jr., Science 167, 1486-1488 (1970).
5. P. U. P. A. Gilbert, B. H. Frazer, M. Abrecht, in Molecular Geomicrobiology, J. F.
Banfield, K. H. Nealson, J. Cervini-Silva, Eds. (Mineralogical Soc. Am., Washington
DC, 2005), Vol. 59, p. 157.
6. C. S. Chan & De Stasio et al. Science 303, 1656-1658 (2004).
7. Y. Levi-Kalisman, G. Falini, L. Addadi, S. Weiner, J. Struct. Biol. 135, 8-17 (2001).
8. S. Mann, Biomineralization: Principles and Concepts in Bioinorganic Materials
Chemistry (Oxford Univ. Press, Oxford, 2001).
9. I. M. Weiss, C. Renner, M. G. Strigl, M. Fritz, Chem. Mater. 14, 3252 (2002).
10. J. D. Currey, Proc. R. Soc. Lond. B. 196, 443 (1977).

7
11. J. Stöhr, K. Baberschke, R. Jaeger, R. Treichler, S. Brennan, Phys. Rev. Lett. 47,
381-384 (1981).
12. J. Stöhr, et al., Science 292, 2299-2302 (2001).
13. J. Stöhr, NEXAFS Spectroscopy (Springer-Verlag, Berlin, 1992).
14. C. Roth, F. U. Hillebrecht, H. Rose, E. Kisker, Phys. Rev. Lett. 70, 3479 (1993).
15. J. Stöhr, et al., Phys. Rev. Lett. 83, 1862 (1999).
16. P. A. van Aken, S. Lauterbach, Phys. and Chem. of Minerals 30, 469 (2003).
17. L. K. Templeton, Acta Cryst. A53, 352 (1997).
18. B. H. Frazer, et al., Ultramicroscopy 99, 87-94 (2004).
19. E. DiMasi and M. Sarikaya, J. Mater. Res. 19, 1471 (2004).
20. T. E. Schäffer, et al., Chem. Mater. 9, 1731-1740 (1997).
21. F. Song, X. H. Zhang, Y. L. Bai, J. Mater. Res. 17, 1567-1570 (2002).
22. F. Nudelman, B. A. Gotliv, L. Addadi, S. Weiner, J. Struct. Biol. 153, 176-187
(2006).
23. L. Addadi and S. Weiner, Proc. Natl. Acad. Sci. U. S. A. 82, 4110-4114 (1985).
24. A. P. Wheeler, J. W. George, C. A. Evans, Science 212, 1397-1398 (1981).
25. A. Lin and M. A. Meyers, Mat. Sci. and Eng. A 390, 27-41 (2005).
26. M. Rousseau, et al., J. Struct. Biol. 149, 149-157 (2005).
27. M. Fritz et al., Nature 371, 49-51 (1994).
28. Y. Levi-Kalisman, G. Falini, L. Addadi, S. Weiner, J. Struct. Biol. 135, 8-17 (2001).
29. H. Li, L. A. Estroff, J. Am. Chem. Soc. 129, 5480-5483 (2007).
30. H. Silyn-Roberts, R. M. Sharp, Proc. Roy. Soc. London. Ser. B 227, 303-324 (1986).
Acknowledgements
This work was supported by NSF awards PHY-0523905 and CHE-0613972, and UW-
Graduate School Vilas Award to PUPAG, and NSF award DMR-0209630 to SNC. The
experiments were performed at the UW-SRC, supported by NSF award DMR-0537588.
Supporting Online Material
Detailed quantitative characterization of the evolution of order observed in our
experiments (Supplementary Table 1, Supplementary Figure 1)

8
Demonstration that sample-to-sample variability in the model is consistent with the
variability observed in the experimental data (Supplementary Figure 2)
Discussion of the theoretical model (Supplementary Text Section 1)
Numerical results from the model (Supplementary Text Section 1a, Supplementary
Figures 3 and 4)
Results from analytic theory (Supplementary Text Section 1b)
Oxygen, nitrogen, and calcium maps (Supplementary Figure 5)
Tablet stacking direction versus distance from the prismatic-nacre boundary
(Supplementary Figure 6).
Supplementary References

9
Figure 1
A B C
Figure 1. (A) Visible light microscope composite image of a polished section of red abalone
shell, acquired in differential interference contrast (Nomarski) mode. The rectangles outline
the areas in which the O maps in (B) were acquired with SPHINX, while the magenta arrow
indicates the nacre prismatic boundary, which runs horizontally across the entire image. (B)
Series of five X-PEEM polarization-dependent imaging contrast (PIC) oxygen maps, obtained
from ratios of image at 534 eV and 518 eV, that is, !*/pre-edge. The pixel intensity in the
SPHINX oxygen or carbon PIC maps the angle between the tablet c-axis and the polarization
vector. The different gray levels in PIC maps correspond to variations in the intensity of the
534 eV peak, which is the O1s"!* transition of the carbonate CO bonds. (The 290.3 eV peak
of C1s"!*, not shown, maps similarly.) The growth direction was 61° from the polarization
vector and 60° from the sample normal. These PIC maps demonstrate how the !* PIC
contrast diminishes with the distance from the boundary, but persists across the entire nacre
thickness. (C) Magnified PIC oxygen maps at and away from the boundary (arrow), showing
co-oriented columns of tablets, and the contrast among them.

10
Figure 2
Figure 2. The range of polarization-dependent imaging contrast (PIC) versus distance
from the prismatic boundary, in the direction of nacre growth. At each distance, in
oxygen PIC maps, we measured the mean gray level in the brightest tablet, in the darkest
tablet, and subtracted the latter from the former to obtain the PIC range. (A) PIC range
from three different red abalone shells, represented by solid colored dots. The contrast
range decreases with distance from the boundary, stabilizing at 50 !m. Simulation data
from the theoretical model are also reported as open blue circles. (B) In one red abalone
shell the PIC range was measured up to a distance of 800 !m and found to fluctuate
around 50 at distances greater than 50 !m from the boundary. The data exhibit
considerable scatter, but are consistent with numerical simulations of our theoretical
model (the details of this comparison are in the Supplementary Information). The blue
line is a fit of the model data, with fit parameters: c1 = 54; c2 = 135; and c3 = 0.08.

11
Figure 3
A BFigure 3. (A) Oxygen PIC data
showing the pattern of contrast for a
region of nacre (top) near the
boundary with the prismatic layer
(bottom). Stacks of tablets with the
same gray level have the same
crystal orientation, and the decrease
in overall contrast moving away from
the nacre-prismatic boundary
indicates that tablet c-axis
orientations become closer to perpendicular to the organic matrix layers.
(B) Simulation results for a model in which each layer grows to completion before the next layer
is nucleated, all nucleation sites are randomly distributed and uncorrelated, and each tablet
adopts the orientation of the tablet below its nucleation site with probability 1-#. The growth
rates of the tablets in the first layer as well as those not co-oriented with the tablet below are
chosen uniformly and randomly in the range [1-$/2, 1+$/2]. Parameter values are #=0.028,
$=0.2. A two-dimensional vertical slice through the three-dimensional simulation is shown.
Gray levels denote the growth rates of the tablets (light represents higher growth rate). The
decrease in disorder moving away from the boundary and the overall morphology are
remarkably similar to the experimental data.
Figure 4
Figure 4. Illustration of why slowing crystal
growth along the c-axis in the presence of a
confining layered organic matrix yields slower
tablet growth. The two ellipses have the same
area, but when the minor axis is misoriented from
the layer normal, more of the area is outside the
layer (shown in blue). When growth is arrested as
the crystal runs into the organic matrix sheet, then the amount of tablet that actually grows
inside the confined layer (shown in magenta) is greater for a tablet with the c-axis
perpendicular to the sheets, that is, parallel to the nacre growth direction. The smaller the
angle % the faster the growth.

12
Supplementary Information
Ordering of Crystalline Tablets in Nacre
Rebecca A. Metzler1, Dong Zhou1, Mike Abrecht2, Susan N. Coppersmith1,
and P.U.P.A. Gilbert1,*
1 Department of Physics, University of Wisconsin, Madison, WI 53706, USA.
2 Synchrotron Radiation Center, 3731 Schneider Drive, Stoughton, WI 53589, USA.
* Previously publishing as Gelsomina De Stasio. Corresponding author:
This supplement contains:
Detailed quantitative characterization of the evolution of order observed in our
experiments (Supplementary Table 1, Supplementary Figure 1)
Demonstration that sample-to-sample variability in the model is consistent with the
variability observed in the experimental data (Supplementary Figure 2)
Discussion of the theoretical model (Supplementary Text Section 1)
Numerical results from the model (Supplementary Text Section 1a, Supplementary
Figures 3 and 4)
Comparison of model with experimental data (Supplementary Text Section 1b)
Results from analytic theory (Supplementary Text Section 1c)
Oxygen, nitrogen, and calcium maps (Supplementary Figure 5)
Tablet stacking direction versus distance from the prismatic-nacre boundary
(Supplementary Figure 6)
Supplementary References

13
Supplementary Table 1. Quantification of evolution of PIC contrast as a function of
distance from the prismatic-nacre boundary.
Distance from
boundary (!m)
Brightest tablet
mean gray level
in O map
!*/pre-edge
Darkest tablet
mean gray level
in O map
!*/pre-edge
PIC contrast range
(brightest-darkest
mean gray levels)
0.5 183 38 145
2 220 49 171
3 177 43 134
4 208 43 165
6 214 46 168
9 210 55 155
11 241 54 187
13 192 53 139
15 132 48 84
16 127 45 82
20 101 48 53
25 82 47 35
27 79 49 30
30 193 104 89
32 201 106 95
34 186 107 79
36 174 114 60
38 162 103 59
40 134 102 32
42 133 108 25
44 142 99 43
46 134 98 36
48 148 98 50
50 180 108 32

14
Supplementary Figure 1.
Evolution of aragonite
tablet widths with
distance from the
prismatic-nacre
boundary. (A) The
average tablet width
versus distance from the
nacre-prismatic
boundary. The error bars
represent the standard
deviation. The widths of 1500 tablets from five different regions in three different
shells were measured. The exponential fit shown (blue curve) is obtained by fitting the
exponential form to the results of a numerical simulation of our model described in
Supplementary Text Section 1b with parameter values #=0.025, $=0.3 (the resulting fit
parameters c1, c2 and c3 are 2.47 !m, 3.06 !m and 0.15 !m-1
; in the fit formula, d is the
distance from the nacre-prismatic boundary). (B) The average tablet width in a single
shell was measured up to a distance of 800 !m, and found to vary between 2-20 !m.
Tablets reach their final average width of 5.5 !m at distances greater than 50 !m from
the boundary.
A B
Supplementary Figure 2.
Variability of tablet stacking
morphology from
experimental measurements
on nacre and from the
theoretical model.
Experimental data and
theoretical model of nacre
growth near the prismatic-
nacre boundary. In both
images from bottom to top we display the prismatic layer, the boundary, and nacre. (A)
Among the dozens of regions at the boundary we analyzed in red abalone nacre, this is
the only one exhibiting larger tablet width near the boundary. (B) Simulation results
for a nacre model in which all input parameters were identical to those of Figure 3B
(#=0.028, $=0.2) but the tablets appear considerably wider. The similarity of tablet
width in these two unusual cases shows that statistical variability is sufficient to justify
the anomalous tablet width seen in this nacre region.
Supplementary Text Section 1: Properties of the model incorporating differential
growth rates and co-oriented nucleation.
In our model of nacre growth, the tablets in each layer are nucleated at random locations,
and it is assumed that growth in a given layer is completed before tablets in the

15
succeeding layer are nucleated. The growth rates in the first layer are chosen uniformly at
random in the interval [1-$/2, 1+$/2], and the tablets in each layer grow to confluence.
With probability 1-# a tablet has the same growth rate as the tablet below its nucleation
site, while with probability # the tablet is assigned a growth rate chosen uniformly at
random from the range [1-$/2, 1+$/2]. Figure 2 and Supplementary Figure 1 show that
the experimentally measured dependence of tablet widths and gray levels on position
match closely those of the model for the parameter values #=0.025, $=0.3, while the
pattern of nacre tablet orientations on a single sample shown in Figure 3 matches closely
the results of a numerical simulation of this model using parameter values #=0.028,
$=0.2. Here, we illustrate the dependence of the behavior on the parameters # and $.
Section b) presents the details of the method used to compare the model to the
experiment, and Section c) presents a simple analytic probabilistic analytic model that
enables one to understand qualitatively some features of the behavior. The analytic model
is closely related to models studied in population biology (S1-S5).
a) Numerical results.
Simulation method: Each layer in the simulation was a square of dimension 400&400 (the
length unit is arbitrary, and is adjusted when the results are compared with experimental
data) with 600 nucleation sites randomly chosen from a probability distribution with
uniform spatial density. The growth rates in the initial layer are chosen uniformly at
random in the interval [1-$/2, 1+$/2]. In subsequent layers, 600 nucleation points are
randomly chosen with uniform spatial density in the 400&400 square. For each
nucleation site, with probability 1-# the tablet’s growth rate is the same as for the tablet
directly below the nucleation site, and with probability # it is chosen randomly and
uniformly in the range [1-$/2, 1+$/2]. The outer 10% of the transverse dimensions of the
simulational domain are discarded in all plots to avoid possible boundary effects.
The main text shows the results of a numerical simulation with parameter values $=0.2
and #=0.028. Here, runs with different values of $ and # are shown to illustrate how the
behavior depends on the choice of model parameters. Supplementary Figure 3 shows runs
with #=0 and two values of $, 0.20 and 0.30.

16
Supplementary Figure 3:
Results of model
simulations with
different values of the
parameter $ governing
the growth rate
variability.
Configurations of the
model with #=0 (all
tablets have the
orientation of tablet below their nucleation sites). The graphs are two-dimensional
vertical cuts through a three-dimensional sample. Left panel: $=0.2, and right panel:
$=0.3. The gray scales in the figures show the growth rate range [1-$/2,1+$/2], with
lighter colors denoting larger values. Changing $ changes only the rate at which ordering
evolves.
Supplementary Figure 4, in which we present configurations of the model with $=0.2 and
two values of #, 0.05 and 0.1, shows that increasing # decreases the tablet stack heights
and also cuts off the development of the ordering.
Supplementary Figure 4:
Results of model
simulations with
different values of the
parameter # governing
the fraction of tablets,
which fail to co-orient
with the tablet below
their nucleation site.
Two-dimensional slices
of three-dimensional configurations of the model with $=0.2. Left panel: #=0.05, and
right panel: #=0.1. The gray scales in the figures show the range [1-$/2,1+$/2], with
lighter colors denoting larger values. Increasing # decreases the size of the tablet stacks
and cuts off the development of the ordering, so that the degree of order saturates instead
of growing indefinitely as when #=0 (Supplementary Figure 3).
b) Procedure for comparing model to experimental data.
The initial conditions for the model were chosen to correspond to a uniform distribution
of initial tablet orientations (the solid angle corresponding to a range of values between %
and %+d% between the tablet c-axis and the normal to layers is proportional to sin!%!d%!=
d(cos %), while the tablet growth rate as a function of misorientation % varies quadratically
near its maximum, and so can be approximated as v cos %). The parameter $ that
characterizes the range of growth rates depends both on the range of initial tablet

17
misorientations and on the magnitude of the variation of the growth velocity with
misorientation angle.
The values for tablet widths were taken to be
!
1
Nt (l), where Nt(l) is the number of
tablets with distinct growth rates in layer l. The conversion between number of layers
and distance is straightforward, using the layer thickness that we measured to be 0.4 µm.
The one unknown overall scale parameter of the tablet widths is adjusted by matching the
model results to experimental data. The l-dependence of Nt(l) is insensitive to the value
of $ unless it is quite large; the size of the overall change in the mean tablet width
increases as # is decreased, while the initial rise in the mean tablet width is determined by
the effective random walk of tablet boundaries and is not sensitive to the values of either
of the parameters in the model.
The experimental data for the difference between the minimum and maximum gray scale
values for tablets in a given layer (mean tablet widths ~6 µm) in a field of view of ~40
µm were compared to the values of the 15th percentile of the gray scale values in the
model at the nucleation sites in each layer. Once again, the conversion from number of
layers to distance is known, and an overall scale factor for the gray scale is determined by
comparing to the experimental data.
c) Analytic theory.
The theory presented here is similar to Ginzburg-Landau theories (S6) commonly used in
statistical physics (S7) in that the functional forms follow from symmetry considerations
and therefore they involve some unknown coefficients. Even though the numerical values
of some coefficients are not known, the analytic theory is very useful for obtaining
insight into the interplay between the various parameters in the problem. The theory is
closely related to other theories that have been studied in the context of population
biology (S1-S5,S8).
It is useful to think explicitly about the analogy between the growth model for nacre and
the mutation-selection models used in population biology. Our model posits that
variability in the orientations of the c-axes of the tablets gives rise to variability in the
tablet growth rates, and moreover that the tablets with c-axes perpendicular to the layer
grow the fastest. The faster growth of tablets of a given orientation is analogous, in
population biology, to species with higher fitness that reproduce faster than species with
lower fitness. When a tablet in the next layer nucleates, one of two things happen. The
first possibility is for the tablet to have the same orientation as the tablet directly below
its nucleation site (analogous to inheritance), and the second is for the tablet to have a
randomly chosen orientation (analogous to mutation). Selection is the tendency to get a
larger fraction of the area filled with tablets with higher growth rates, which occurs
because tablets that grow quickly will take up more of the area than those that grow
slowly, increasing the probability that a given randomly located nucleation point is over a
tablet with a higher growth rate.

18
We define 'l(%) to be the fraction of the area in layer l misoriented from the normal by an
angle %. This function is a direct analog of a fitness function in population biology.
Tablets with % = 0 grow fastest and therefore their share of the area in layer l+1 will be
greater than in layer l. Because the maximum is at % = 0, one expects the dependence of
'l(%) on % to be quadratic. Therefore,
!
"l+1 #( )"
l#( )
=1
Nl+1
1$%# 2
2
&
' (
)
* + ,
1
Nl+1
e$%# 2 /2,
where ( is a numerical coefficient and Nl is a normalization factor that is fixed by the
normalization condition
!
1= "l+1(# )d#
$%
2
%
2
& =1
Nl
e$'# 2 /2"
l(#)d#
$%
2
%
2
& .
We assume that the distribution of angles % is not too broad (an assumption that is well-
satisfied in nacre), so that replacing the quadratic with a Gaussian is a good
approximation, and also that extending the limits of integration from -) to ) introduces
negligible error, and find
!
Nl+1 = e
"#$ 2 /2%l($)d$
"&
&
' .
We also assume that there is a small probability # that, when a tablet nucleates, instead of
adopting the same % as the tablet below its nucleation site, it takes on a value chosen from
a probability distribution w(%), that we will choose that to also be Gaussian,
w(%)=(*/2!)1/2
exp(-*% 2/2). (This process is analogous to a mutation term in a population
genetics model (S3).) Therefore, the overall evolution is governed by the dynamical
equation:
!
"l+1 #( ) = $
%
2&
'
( )
*
+ ,
1/2
e-%# 2 /2 + 1-$( )
1
Nl+1
"l#( )e-.#
2/2
.
First note that when the co-orientation of tablets in successive layers is perfect, so that
#=0, this model is easily solved for any initial distribution, '1(%), by noting that the
normalization at each step need not be calculated explicitly, so that
!
"l+1 #( )$"1 #( )e%l&# 2 /2.
It follows immediately that when the co-orientation of successive layers is perfect, then
for any ( > 0 the width of the distribution decreases as the square root of the number of
layers and becomes arbitrarily narrow as the number of layers tends to infinity.
Now we consider the effects of nonzero but small #, so that the co-orientation between
successive layers is not quite perfect. The intuitive picture of the process is that the
19
distribution gets narrower unless a misorientation, or “mutation,” occurs. The
“mutations” prevent the peak from narrowing indefinitely, so after many layers 'l( %)
approaches a stationary distribution that does not change as l increases further. Since a
fraction # mutates at each layer, the peak in the distribution gets narrower for ~(1/#) steps.
The width of the peak in '( %) after a peak that starts with width (*)-1/2
has been narrowed
for 1/# steps is of order (*+(/#)-1/2 When (/#>>*, this width is of order (#/()
1/2. A full
analysis using the techniques in (S5) confirms this simple picture. The result implies that
the degree of ordering is limited by the reliability of the co-orientation of crystals in
successive layers.
Supplementary Figure 5.
Oxygen, nitrogen, and
calcium maps. Oxygen,
Nitrogen and Ca distribution
maps in three different
regions at the prismatic-
nacre boundary in red
abalone nacre. The O maps
were obtained by digital
ratio of images at 534 and
530 eV, the N maps by ratio
of 402 and 394 eV images
(N1s"!* peak and pre-
edge, respectively), and the
Ca maps by ratio of 351 and
344 eV images. The O maps
show crystal orientation-
dependent PIC both in nacre
(top of each image) and
prismatic layer (bottom). The N maps show higher N concentration (brighter pixels) in
nacre compared to prismatic layer. The Ca maps were not acquired on one of the main Ca
peaks, but on a crystal field peak at 351 eV, which is very prominent in calcite and not in
aragonite. While the overall concentration of Ca is similar in nacre and prismatic layers,
the calcite peak is most intense in the prismatic layer, thus these maps appear brighter in
the prismatic than in the nacreous layer. Notice how the N concentration is homogenous
in the nacre layer, and does not decay with distance from the prismatic-nacre boundary.
The N concentration captures the overall protein concentration, and does not distinguish
that of the ordering protein controlling aragonite (001) growth rate. We found no
evidence for more concentrated proteins at the boundary. Based on negative evidence,
therefore, it is plausible that the ordering protein is also homogeneously distributed in
nacre at and away from the boundary.

20
Supplementary Figure 6.
Evolution of degree of order
in tablet stacking direction
with distance from the
prismatic-nacre boundary.
Tablet stacking direction as
a function of distance from
the boundary. (A) Oxygen
!*/pre-edge map of 60°
section of red abalone shell
at the boundary. The axis of
each tablet stack was drawn
in red over the image, to
indicate the direction of
stacking with respect to the
nacre growth direction,
which in this image is
vertical and upward. (B) All
measured angles between
the red axes and the growth direction are plotted as a function of distance from the
boundary, corrected for polishing angles. The distance was measured at the center of
each axis. Stack directions from three different shells were measured, and are reported in
different colored dots. Notice how the angles are comprised within ±60° at the boundary
and only within ±20° after 30 !m from the boundary. (C) Oxygen !*/pre-edge map of
the same red abalone sample as in (A), analyzed approximately 300 !m from the
boundary. (D) The angles measured from the map in (C) and others, show a variation
within ±20° far from the boundary. These angles are underestimated for two distinct
reasons. The sample surface shows a 60° section rather than a 90° cross-section. The
layers appear therefore thicker, and the axis angles are smaller. Furthermore, since we
are looking at a 2D section and not a 3D representation of nacre, the components of all
angles towards and away from the reader are not apparent. Both effects contribute to an
underestimation of the stacking direction angles. It is possible, therefore, that the real
angles at the boundary vary by more than ±60°, even possibly approaching the limit of
randomly directed stacks, which vary between ±90°. It is remarkable how, from the
complete disorder of random or near-random directions, stacking of co-oriented tablets is
harnessed within a mere 50 !m. The model also yields stacking angles that decrease as
one moves away from the boundary even for tablet growth that is fully layer-by-layer
and from random nucleation sites in each layer, because the mean tablet width is larger
farther from the prismatic boundary. However, the degree of orientational ordering
depends strongly on whether or not the growth is completely layer-by-layer, and detailed
comparison of tablet orientations with models with layer growth that is not fully
sequential is an interesting open problem.

21
Supplementary References
S1. M. Kimura, Proc. Nat. Acad. Sci. USA 54, 731-736 (1965).
S2. J. F. Crow, M. Kimura, An Introduction to Population Genetics Theory (Harper and
Row, New York, 1970).
S3. M. Turelli, Theoret. Pop. Biol. 25, 138-193 (1984).
S4. R. Burger, I. M. Bomze, Adv. Appl. Prob. 28, 227-251 (1996).
S5. S. N. Coppersmith, R. D. Blank, L. P. Kadanoff, J. Stat. Phys. 97, 429-457 (1999).
S6. V. L. Ginzburg, L. D. Landau, Zh. Eksp. Teor. Fiz. 20, 1064 (1950).
S7. N. Goldenfeld, Lectures on Phase Transitions and the Renormalization Group
(Perseus Publishing, Reading, MA, 1992).
S8. D. Waxman, J. R. Peck, Science 279, 1210-1213 (1998).