mars reconnaissance orbiter ka-band (32 ghz) demonstration: cruise phase operations
TRANSCRIPT
Mars Reconnaissance Orbiter Ka-band (32 GHz)
Demonstration: Cruise Phase Operations
Shervin Shambayati, David Morabito, James S. Border, Faramaz Davarian,
Dennis Lee, Ricardo Mendoza, Michael Britcliffe and Sander Weinreb
Jet Propulsion Laboratory, 4800 Oak Grove Dr., Pasadena, CA 91109, USA
The X-band (8.41 GHz) frequency currently used for deep space telecommunicationsis too narrow (50 MHz) to support future high rate missions. Because of this NASA hasdecided to transition to Ka-band (32 GHz) frequencies. As weather effects cause muchlarger fluctuations on Ka-band than on X-band, the traditional method of using a fewdBs of margin to cover these fluctuations is wasteful of power for Ka-band; therefore, adifferent operations concept is needed for Ka-band links. As part of the development ofthe operations concept for Ka-band, NASA has implemented a fully functioning Ka-bandcommunications suite on its Mars Reconnaissance Orbiter (MRO). This suite will be usedduring the primary science phase to develop and refine the Ka-band operations conceptfor deep space missions. In order to test the functional readiness of the spacecraft and theDeep Space Network’s (DSN) readiness to support the demonstration activities a seriesof passes over DSN 34-m Beam Waveguide (BWG) antennas were scheduled during thecruise phase of the mission. MRO was launched on August 12, 2005 from Kennedy SpaceCenter, Cape Canaveral, Florida, USA and went into Mars Orbit on March 10, 2006. Atotal of ten telemetry demonstration and one high gain antenna (HGA) calibration passeswere allocated to the Ka-band demonstration. Furthermore, a number of “shadow” passeswere also scheduled where, during a regular MRO track over a Ka-band capable antenna,Ka-band was identically configured as the X-band and tracked by the station. In addition,nine Ka-band delta differential one way ranging (∆DOR) passes were scheduled. Dur-ing these passes, the spacecraft and the ground system were put through their respectivepaces. Among the highlights of these was setting a single day record for data return from adeep space spacecraft (133 Gbits) achieved during one 10-hour pass; achieving the highestdata rate ever from a planetary mission (6 Mbps) and successfully demonstrating Ka-bandDDOR. In addition, DSN performed well. However, there are concerns with the activepointing of the Ka-band antennas as well as delivery of the monitor data from the stations.The spacecraft also presented challenges not normally associated with planetary missionsmostly because of its very high equivalent isotropic radiated power (EIRP). This causedproblems in accurately evaluating the in-flight EIRP of the spacecraft which led to diffi-culties evaluating the quality of the HGA calibration data. These led to the developmentof additional measurement techniques that could be used for future high-power deep spacemissions.
I. Introduction
NASA’s Mars Reconnaissance Orbiter (MRO) is carrying a full suite of 32 GHz (Ka-band) telecommuni-cations equipment in order to demonstrate the feasibility of Ka-band use for deep space telecommunications.This demonstration is necessary as the 50 MHz of bandwidth allocated at 8.41 GHz (X-band) is too smallto handle the higher data rates expected from future deep space missions. As Ka-band is more susceptible
1 of 26
American Institute of Aeronautics and Astronautics
to severe weather events, the operations concept that will be validated through this demonstration is basedon maximizing the average data return on the Ka-band link subject to a minimum availability.1–3
It was decided that during the cruise period various ground and spacecraft functions are to be verifiedthrough ten dedicated Ka-band demonstration passes. In addition to these, several ∆ Differential One-WayRanging (∆DOR)passes as well as a number of “shadow” passes where X-band and Ka-band links on thespacecraft were identically configured were scheduled.
As a result of these passes, it was determined that MRO is fully capable of supporting the Ka-banddemonstration activities during the two-year primary science phase (PSP). However, there were some short-comings observed on the ground system side. These issues are currently under investigation and will beresolved in all likelihood before the start of PSP activities.
The paper is organized in the following manner: In Section II an overview of the demonstration along witha brief description of spacecraft and ground system capabilities. In Section III an overview of the telemetryand navigation performance of the ten dedicated passes as well the “shadow” passes of the Ka-band link isdiscussed. In addition, performance of the ground system in terms of antenna pointing and measuring of thesignal-to-noise ratio is considered. In Section IV the issue of measuring the spacecraft EIRP is looked at inmore detail. Section V covers the ∆DOR performance of the Ka-band during the cruise. Finally, in SectionVI conclusions are reached.
II. Demonstration Overview
A. Demonstration Objectives
The objectives of this demonstration are to validate the proposed Ka-band operations concept for deepspace missions which maximizes the average data return subject to a minimum availability requirement andto modify the operations concept according to experience. Furthermore, this demonstration is to identifyshortcomings in the ground systems for tracking of Ka-band and if possible propose remedies for them.4,5
The objective of the passes assigned for Ka-band demonstration are to verify that both the spacecraftand the ground systems have the necessary functionalities for the Ka-band demonstration activities duringthe PSP. In addition, the cruise passes will allow the Ka-band demonstration team to become familiarwith project procedures and interfaces so that during the PSP, Ka-band activities will be performed withminimum amount of friction.
B. MRO Spacecraft
Mars Reconnaissance Orbiter was launched from Kennedy Space Center on August 12, 2005 and went intoMars Orbit on March 10, 2006. The spacecraft will finish its aerobraking maneuvers by September 2006after which it will go through a series of calibration activities. From October 7, 2006 through November7, 2006, the spacecraft will be in superior solar conjunction during which time communications with thespacecraft will be limited and thus, spacecraft operations will be kept at a minimum. From November8, 2006 through November 18, 2006 the spacecraft will be in its primary science phase (PSP) when thespacecraft will gather more data on Mars than all the past missions to Mars combined. During the solarconjunctions period the Ka-band demonstration is allocated on average one pass per day. During the PSP,the Ka-band demonstration is allocated two passes a week and one ∆DOR pass a month.6
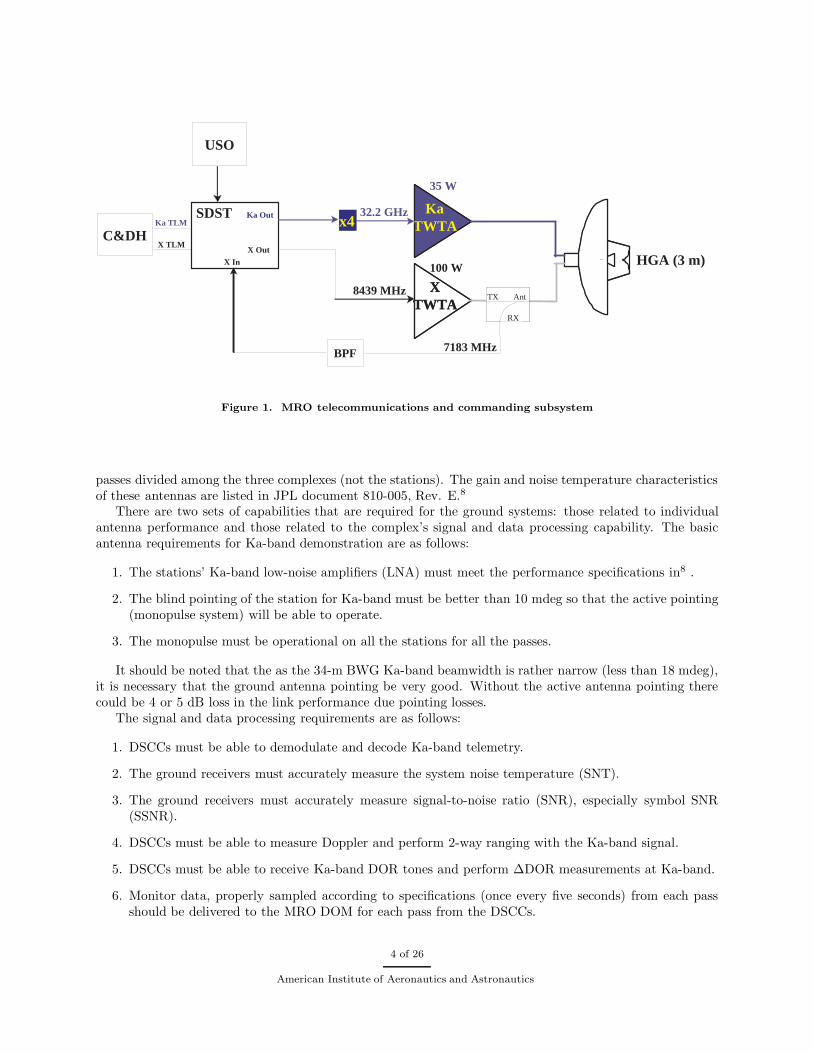
The Ka-band suite on MRO consists of a 35-watt Traveling Wave Tube Amplifier (TWTA) and a 3-meter parabolic antenna which produces an Equivalent Isotropic Radiated Power (EIRP) of 101.3 dBm. Bycomparison, the X-band system has two 100-watt TWTAs (one as a backup) with the same 3-meter dishproducing an EIRP of 96.5 dBm. The reason that the Ka-band system has a larger EIRP is entirely due tothe higher gain of the antenna at Ka-band.7 There are two small deep space transponders (SDSTs) on thespacecraft (again one as a back-up) for modulation of the data. A simplified block is shown in Fig. 1.
Although the spacecraft is capable of using both turbo coding with block length 8920 bits and rates 1/2,
2 of 26
American Institute of Aeronautics and Astronautics
1/3 and 1/6 and Reed-Solomon (RS) coding (concatenation with (7,1/2) convolutional code is done by theSDST), there are limitations on simultaneous X-band and Ka-band operations. These limitations are:
1. If X-band and Ka-band carry different data types, one has to use turbo coding; the other has to useRS coding.
2. If X-band and Ka-band carry different data types, the combined channel symbol rate of the two bandsshould be no greater than 6 Msps. For concatenated codes this includes the symbol rate increase dueto the use of (7,1/2) code.
3. If both channels carry identical data, then symbol rate on a single channel cannot exceed 6 Msps. Forconcatenated codes this includes the symbol rate increase due to the use of (7,1/2) code.
4. Turbo codes can support a maximum of 1.5 Mbps with rate 1/2 code due to ground decoder hardwarelimitations.
The ranging modulation and data modulation index for each band are independently configurable. Inaddition, due to spectrum limitation during the PSP for symbol rates above 2 Msps QPSK modulation isused for X-band. For Ka-band BPSK modulation is always used.
DOR tones can be modulated on both X-band and Ka-band. Ka-band uses wider DOR tones thanX-band because of availability of more spectrum thus providing improved ∆DOR performance over X-band(see Section V).
The basic requirements on spacecraft for the Ka-band demonstration are that:
1. The spacecraft must be capable of producing adequate EIRP for Ka-band (greater than 100 dBm).
2. The spacecraft’s Ka-band link must be fully configurable in accordance to the MRO Telecom DesignControl Document7.
3. The link’s data rate and modulation index could be changed during a pass according to the backgroundsequence.
4. The spacecraft must be capable of producing wideband DOR tones for Ka-band.
5. The spacecraft must be capable of modulating uplinked ranging tones on the Ka-band downlink.
The data rate change requirement is a necessity for Ka-band as the link performance changes significantlyas a function of elevation. As for the modulation index changes during a pass, it is hoped for that eventhough we are unable to change the spacecraft data rates with real time commands, through the use ofmodulation index changes in real time we could emulate the signal-to-noise ratio (SNR) changes that wouldresults from data rate changes. In addition, modulation index changes allow us to change the SNR in orderto obtain thresholds for different coding and modulation types.
C. Ground Systems
Part of the Ka-band demonstration is to assess the readiness of the Deep Space Network (DSN) to trackKa-band signals from deep space missions. DSN consists of three Deep Space Communication Complexes(DSCCs) located at Goldstone, California; near Canberra, Australia and near Madrid, Spain. These siteswere selected by NASA in order to provide both round the clock coverage for missions that need them andto provide north-south coverage for the DSN.
There are four Deep Space Stations (DSSs, as the DSN antennas are called) in the DSN that are capableof receiving Ka-band. All these antennas are part of the 34-meter beam waveguide (BWG) subnet of theDSN. These are DSS-25 and DSS-26 at Goldstone, DSS-34 at Canberra and DSS-55 at Madrid. Duringthe Ka-band demonstration it is expected that all these stations will be used with roughly equal number of
3 of 26
American Institute of Aeronautics and Astronautics
HGA (3 m) HGA (3 m)
SDST Ka Out
X Out
X In
Ka TWTA
Ka TWTA
X TWTA
X TWTA
RX
Ant TX
RX
Ant
RX
Ant TX
BPF
x4
USO
C&DH Ka TLM
X TLM
35 W
100 W
8439 MHz
7183 MHz
32.2 GHz
Figure 1. MRO telecommunications and commanding subsystem
passes divided among the three complexes (not the stations). The gain and noise temperature characteristicsof these antennas are listed in JPL document 810-005, Rev. E.8
There are two sets of capabilities that are required for the ground systems: those related to individualantenna performance and those related to the complex’s signal and data processing capability. The basicantenna requirements for Ka-band demonstration are as follows:
1. The stations’ Ka-band low-noise amplifiers (LNA) must meet the performance specifications in8 .
2. The blind pointing of the station for Ka-band must be better than 10 mdeg so that the active pointing(monopulse system) will be able to operate.
3. The monopulse must be operational on all the stations for all the passes.
It should be noted that the as the 34-m BWG Ka-band beamwidth is rather narrow (less than 18 mdeg),it is necessary that the ground antenna pointing be very good. Without the active antenna pointing therecould be 4 or 5 dB loss in the link performance due pointing losses.
The signal and data processing requirements are as follows:
1. DSCCs must be able to demodulate and decode Ka-band telemetry.
2. The ground receivers must accurately measure the system noise temperature (SNT).
3. The ground receivers must accurately measure signal-to-noise ratio (SNR), especially symbol SNR(SSNR).
4. DSCCs must be able to measure Doppler and perform 2-way ranging with the Ka-band signal.
5. DSCCs must be able to receive Ka-band DOR tones and perform ∆DOR measurements at Ka-band.
6. Monitor data, properly sampled according to specifications (once every five seconds) from each passshould be delivered to the MRO DOM for each pass from the DSCCs.
4 of 26
American Institute of Aeronautics and Astronautics
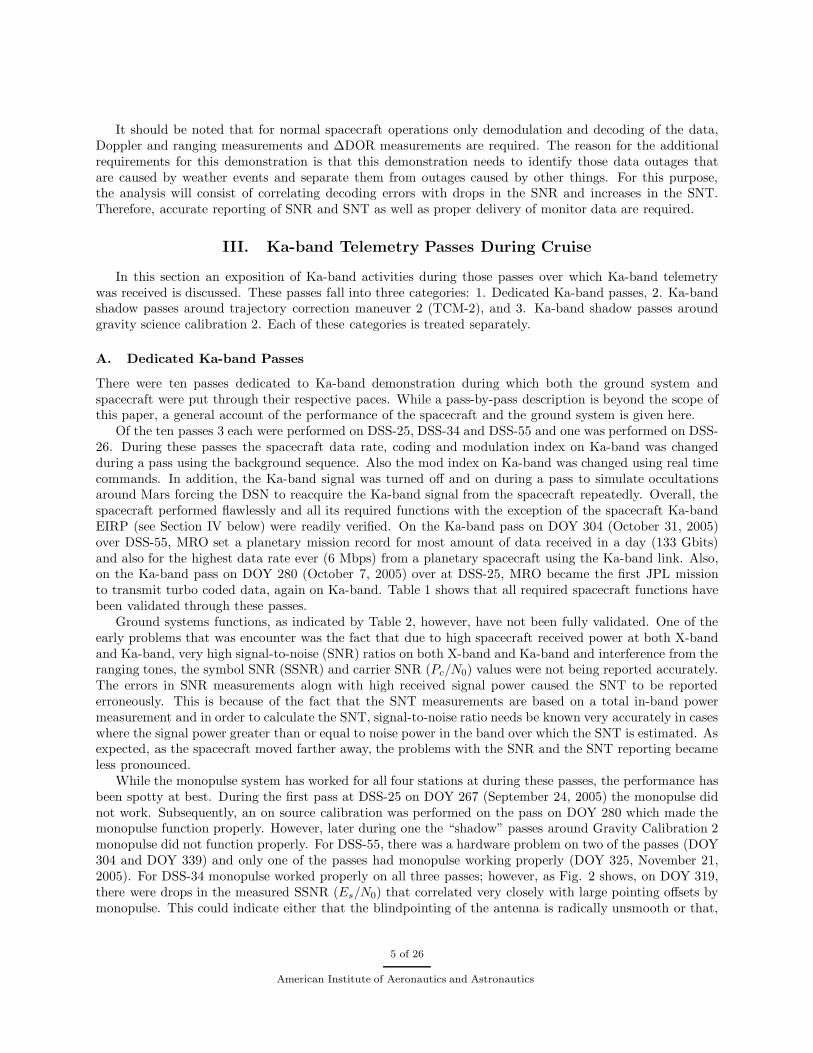
It should be noted that for normal spacecraft operations only demodulation and decoding of the data,Doppler and ranging measurements and ∆DOR measurements are required. The reason for the additionalrequirements for this demonstration is that this demonstration needs to identify those data outages thatare caused by weather events and separate them from outages caused by other things. For this purpose,the analysis will consist of correlating decoding errors with drops in the SNR and increases in the SNT.Therefore, accurate reporting of SNR and SNT as well as proper delivery of monitor data are required.
III. Ka-band Telemetry Passes During Cruise
In this section an exposition of Ka-band activities during those passes over which Ka-band telemetrywas received is discussed. These passes fall into three categories: 1. Dedicated Ka-band passes, 2. Ka-bandshadow passes around trajectory correction maneuver 2 (TCM-2), and 3. Ka-band shadow passes aroundgravity science calibration 2. Each of these categories is treated separately.
A. Dedicated Ka-band Passes
There were ten passes dedicated to Ka-band demonstration during which both the ground system andspacecraft were put through their respective paces. While a pass-by-pass description is beyond the scope ofthis paper, a general account of the performance of the spacecraft and the ground system is given here.
Of the ten passes 3 each were performed on DSS-25, DSS-34 and DSS-55 and one was performed on DSS-26. During these passes the spacecraft data rate, coding and modulation index on Ka-band was changedduring a pass using the background sequence. Also the mod index on Ka-band was changed using real timecommands. In addition, the Ka-band signal was turned off and on during a pass to simulate occultationsaround Mars forcing the DSN to reacquire the Ka-band signal from the spacecraft repeatedly. Overall, thespacecraft performed flawlessly and all its required functions with the exception of the spacecraft Ka-bandEIRP (see Section IV below) were readily verified. On the Ka-band pass on DOY 304 (October 31, 2005)over DSS-55, MRO set a planetary mission record for most amount of data received in a day (133 Gbits)and also for the highest data rate ever (6 Mbps) from a planetary spacecraft using the Ka-band link. Also,on the Ka-band pass on DOY 280 (October 7, 2005) over at DSS-25, MRO became the first JPL missionto transmit turbo coded data, again on Ka-band. Table 1 shows that all required spacecraft functions havebeen validated through these passes.
Ground systems functions, as indicated by Table 2, however, have not been fully validated. One of theearly problems that was encounter was the fact that due to high spacecraft received power at both X-bandand Ka-band, very high signal-to-noise (SNR) ratios on both X-band and Ka-band and interference from theranging tones, the symbol SNR (SSNR) and carrier SNR (Pc/N0) values were not being reported accurately.The errors in SNR measurements alogn with high received signal power caused the SNT to be reportederroneously. This is because of the fact that the SNT measurements are based on a total in-band powermeasurement and in order to calculate the SNT, signal-to-noise ratio needs be known very accurately in caseswhere the signal power greater than or equal to noise power in the band over which the SNT is estimated. Asexpected, as the spacecraft moved farther away, the problems with the SNR and the SNT reporting becameless pronounced.
While the monopulse system has worked for all four stations at during these passes, the performance hasbeen spotty at best. During the first pass at DSS-25 on DOY 267 (September 24, 2005) the monopulse didnot work. Subsequently, an on source calibration was performed on the pass on DOY 280 which made themonopulse function properly. However, later during one the “shadow” passes around Gravity Calibration 2monopulse did not function properly. For DSS-55, there was a hardware problem on two of the passes (DOY304 and DOY 339) and only one of the passes had monopulse working properly (DOY 325, November 21,2005). For DSS-34 monopulse worked properly on all three passes; however, as Fig. 2 shows, on DOY 319,there were drops in the measured SSNR (Es/N0) that correlated very closely with large pointing offsets bymonopulse. This could indicate either that the blindpointing of the antenna is radically unsmooth or that,
5 of 26
American Institute of Aeronautics and Astronautics
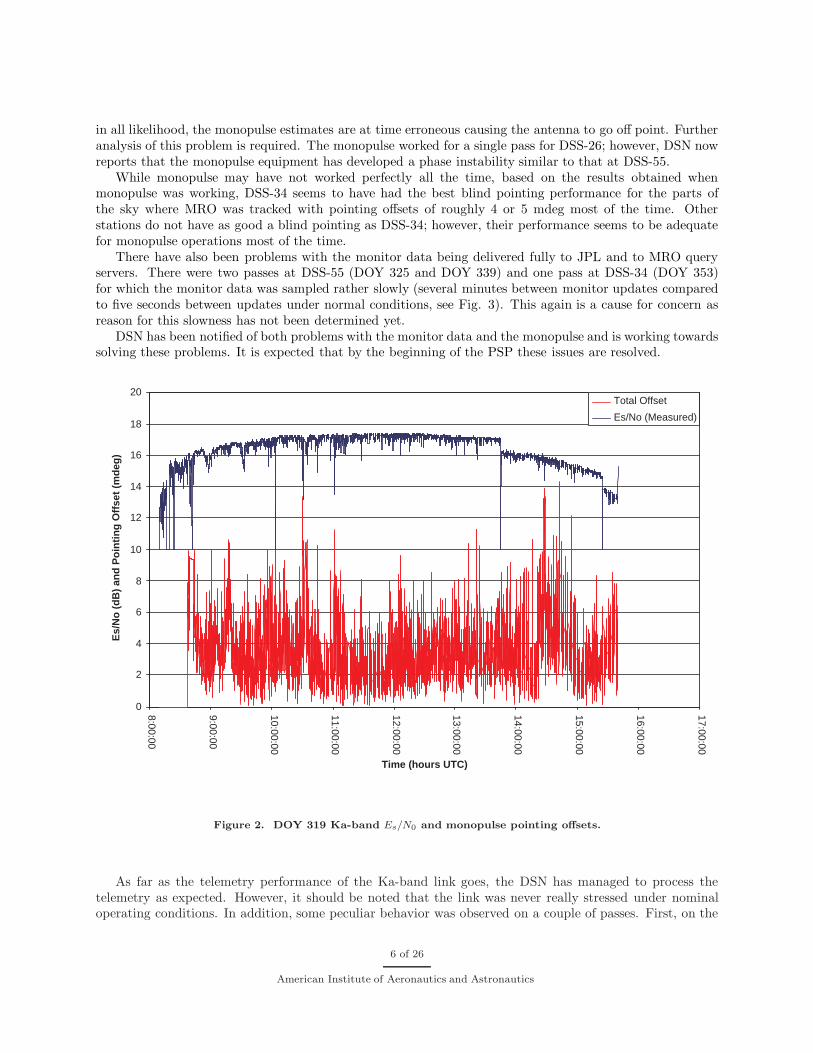
in all likelihood, the monopulse estimates are at time erroneous causing the antenna to go off point. Furtheranalysis of this problem is required. The monopulse worked for a single pass for DSS-26; however, DSN nowreports that the monopulse equipment has developed a phase instability similar to that at DSS-55.
While monopulse may have not worked perfectly all the time, based on the results obtained whenmonopulse was working, DSS-34 seems to have had the best blind pointing performance for the parts ofthe sky where MRO was tracked with pointing offsets of roughly 4 or 5 mdeg most of the time. Otherstations do not have as good a blind pointing as DSS-34; however, their performance seems to be adequatefor monopulse operations most of the time.
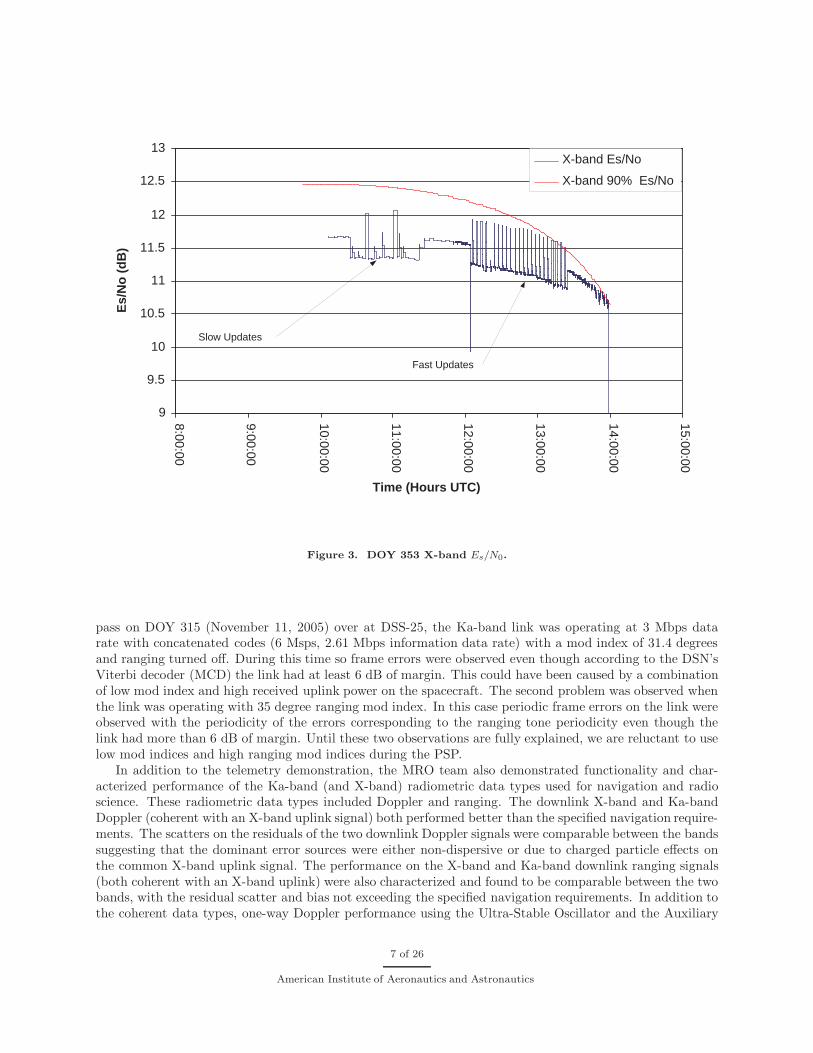
There have also been problems with the monitor data being delivered fully to JPL and to MRO queryservers. There were two passes at DSS-55 (DOY 325 and DOY 339) and one pass at DSS-34 (DOY 353)for which the monitor data was sampled rather slowly (several minutes between monitor updates comparedto five seconds between updates under normal conditions, see Fig. 3). This again is a cause for concern asreason for this slowness has not been determined yet.
DSN has been notified of both problems with the monitor data and the monopulse and is working towardssolving these problems. It is expected that by the beginning of the PSP these issues are resolved.
0
2
4
6
8
10
12
14
16
18
20
8:00:00
9:00:00
10:00:00
11:00:00
12:00:00
13:00:00
14:00:00
15:00:00
16:00:00
17:00:00
Time (hours UTC)
Es/
No
(d
B)
and
Po
inti
ng
Off
set
(md
eg)
Total Offset
Es/No (Measured)
Figure 2. DOY 319 Ka-band Es/N0 and monopulse pointing offsets.
As far as the telemetry performance of the Ka-band link goes, the DSN has managed to process thetelemetry as expected. However, it should be noted that the link was never really stressed under nominaloperating conditions. In addition, some peculiar behavior was observed on a couple of passes. First, on the
6 of 26
American Institute of Aeronautics and Astronautics
9
9.5
10
10.5
11
11.5
12
12.5
13
8:00:00
9:00:00
10:00:00
11:00:00
12:00:00
13:00:00
14:00:00
15:00:00
Time (Hours UTC)
Es/
No
(d
B)
X-band Es/No
X-band 90% Es/No
Slow Updates
Fast Updates
Figure 3. DOY 353 X-band Es/N0.
pass on DOY 315 (November 11, 2005) over at DSS-25, the Ka-band link was operating at 3 Mbps datarate with concatenated codes (6 Msps, 2.61 Mbps information data rate) with a mod index of 31.4 degreesand ranging turned off. During this time so frame errors were observed even though according to the DSN’sViterbi decoder (MCD) the link had at least 6 dB of margin. This could have been caused by a combinationof low mod index and high received uplink power on the spacecraft. The second problem was observed whenthe link was operating with 35 degree ranging mod index. In this case periodic frame errors on the link wereobserved with the periodicity of the errors corresponding to the ranging tone periodicity even though thelink had more than 6 dB of margin. Until these two observations are fully explained, we are reluctant to uselow mod indices and high ranging mod indices during the PSP.
In addition to the telemetry demonstration, the MRO team also demonstrated functionality and char-acterized performance of the Ka-band (and X-band) radiometric data types used for navigation and radioscience. These radiometric data types included Doppler and ranging. The downlink X-band and Ka-bandDoppler (coherent with an X-band uplink signal) both performed better than the specified navigation require-ments. The scatters on the residuals of the two downlink Doppler signals were comparable between the bandssuggesting that the dominant error sources were either non-dispersive or due to charged particle effects onthe common X-band uplink signal. The performance on the X-band and Ka-band downlink ranging signals(both coherent with an X-band uplink) were also characterized and found to be comparable between the twobands, with the residual scatter and bias not exceeding the specified navigation requirements. In addition tothe coherent data types, one-way Doppler performance using the Ultra-Stable Oscillator and the Auxiliary
7 of 26
American Institute of Aeronautics and Astronautics
Oscillator on-board the spacecraft was also characterized and found to be consistent with expectations basedon specifications or pre-flight measurements. In addition to analyzing performance of the individual X-bandand Ka-band frequency bands, the difference of simultaneous X-band minus Ka-band downlink frequencydata were examined for the purpose of identifying un-common or dispersive error sources. The utilization ofapplying media calibration techniques on the data is currently being investigated for the purpose of realizingany improved performance.
Finally, these passes helped the Ka-band demonstration team and the spacecraft sequencing team to fullyunderstand each other’s modus operandi. For example, bit rate that the sequencing team uses is referenced tothe input to the SDST. As the turbo encoding of the data occurs before SDST, this means that the requiredinformation bit rate by the Ka-band team has to be divided by the code rate for turbo coded data beforethat data rate is requested to be programmed by the sequencing team. This was not understood before thesepasses.
B. “Shadow” Passes around TCM-2
For these passes, the Ka-band team used the opportunity that the spacecraft was being continuously trackedfrom November 14 through November 20, 2005 to have the spacecraft send down telemetry on the Ka-bandlink whenever the spacecraft was being tracked by a Ka-band capable antenna. The Ka-band configurationfor these passes were identical to X-band configuration,i.e., 550 Kbps concatenated coded data (1.1 Msps,480 Kbps information data rate) with 72 degrees mod index; however the ranging was turned off for Ka-band.The monopulse were not used for these passes.
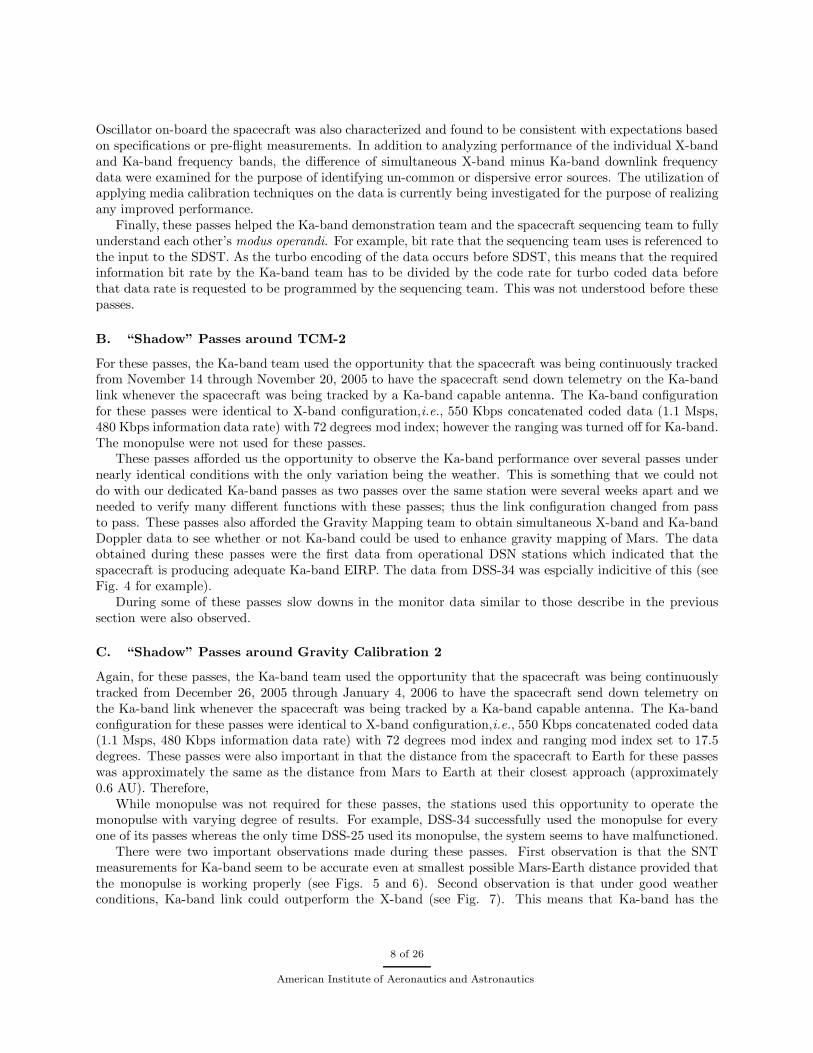
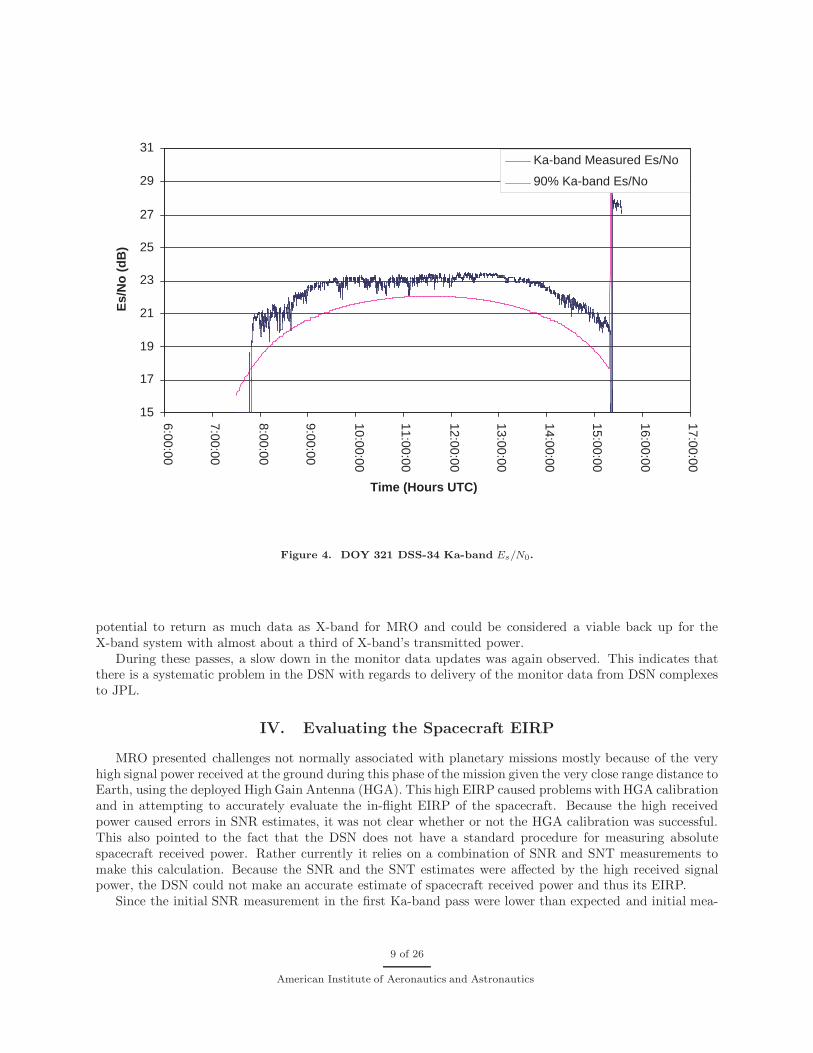
These passes afforded us the opportunity to observe the Ka-band performance over several passes undernearly identical conditions with the only variation being the weather. This is something that we could notdo with our dedicated Ka-band passes as two passes over the same station were several weeks apart and weneeded to verify many different functions with these passes; thus the link configuration changed from passto pass. These passes also afforded the Gravity Mapping team to obtain simultaneous X-band and Ka-bandDoppler data to see whether or not Ka-band could be used to enhance gravity mapping of Mars. The dataobtained during these passes were the first data from operational DSN stations which indicated that thespacecraft is producing adequate Ka-band EIRP. The data from DSS-34 was espcially indicitive of this (seeFig. 4 for example).
During some of these passes slow downs in the monitor data similar to those describe in the previoussection were also observed.
C. “Shadow” Passes around Gravity Calibration 2
Again, for these passes, the Ka-band team used the opportunity that the spacecraft was being continuouslytracked from December 26, 2005 through January 4, 2006 to have the spacecraft send down telemetry onthe Ka-band link whenever the spacecraft was being tracked by a Ka-band capable antenna. The Ka-bandconfiguration for these passes were identical to X-band configuration,i.e., 550 Kbps concatenated coded data(1.1 Msps, 480 Kbps information data rate) with 72 degrees mod index and ranging mod index set to 17.5degrees. These passes were also important in that the distance from the spacecraft to Earth for these passeswas approximately the same as the distance from Mars to Earth at their closest approach (approximately0.6 AU). Therefore,
While monopulse was not required for these passes, the stations used this opportunity to operate themonopulse with varying degree of results. For example, DSS-34 successfully used the monopulse for everyone of its passes whereas the only time DSS-25 used its monopulse, the system seems to have malfunctioned.
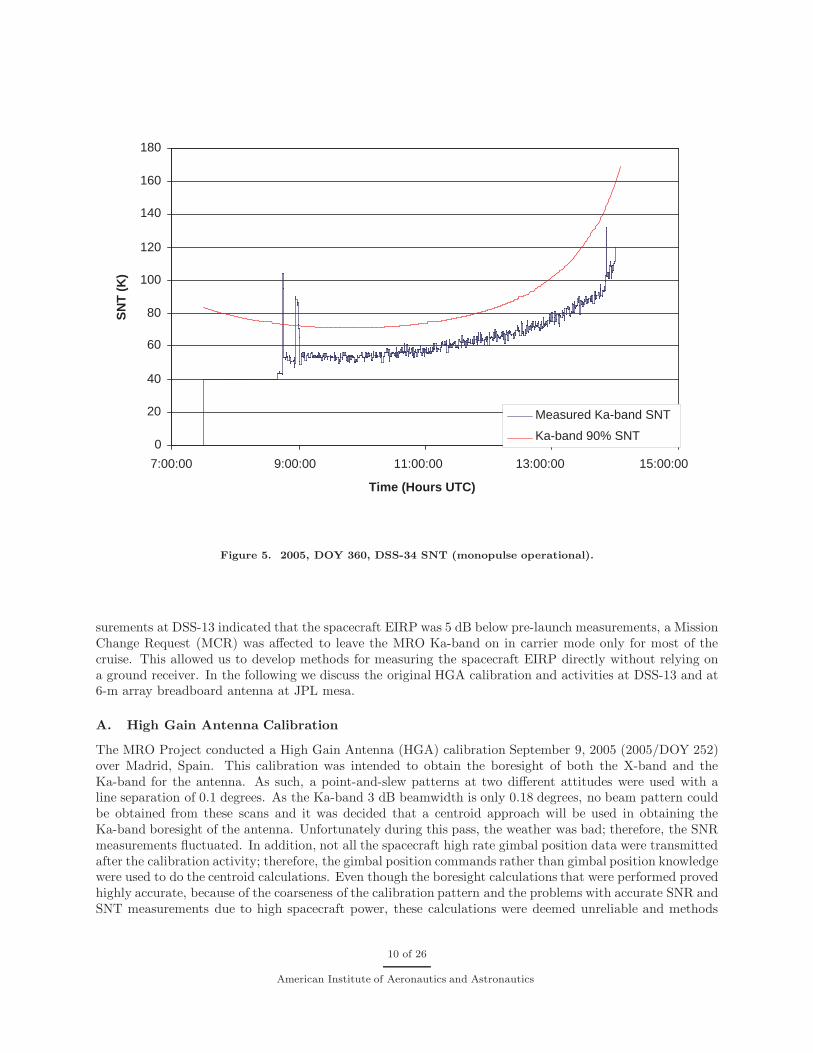
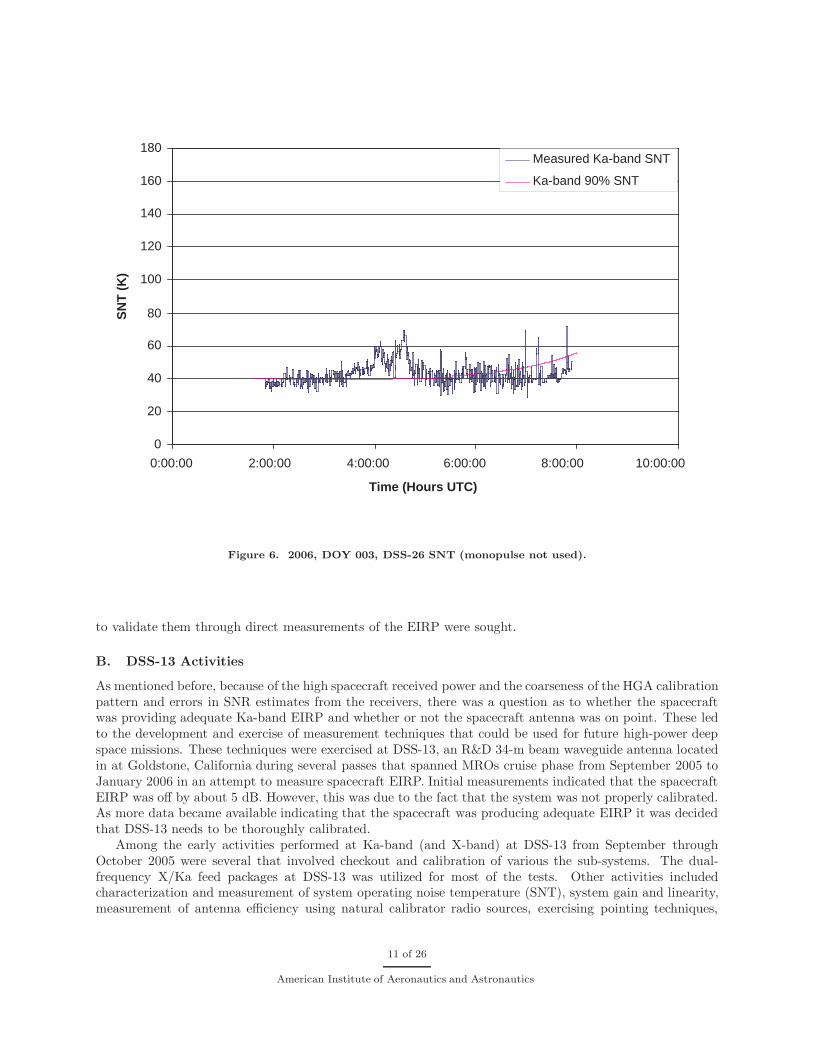
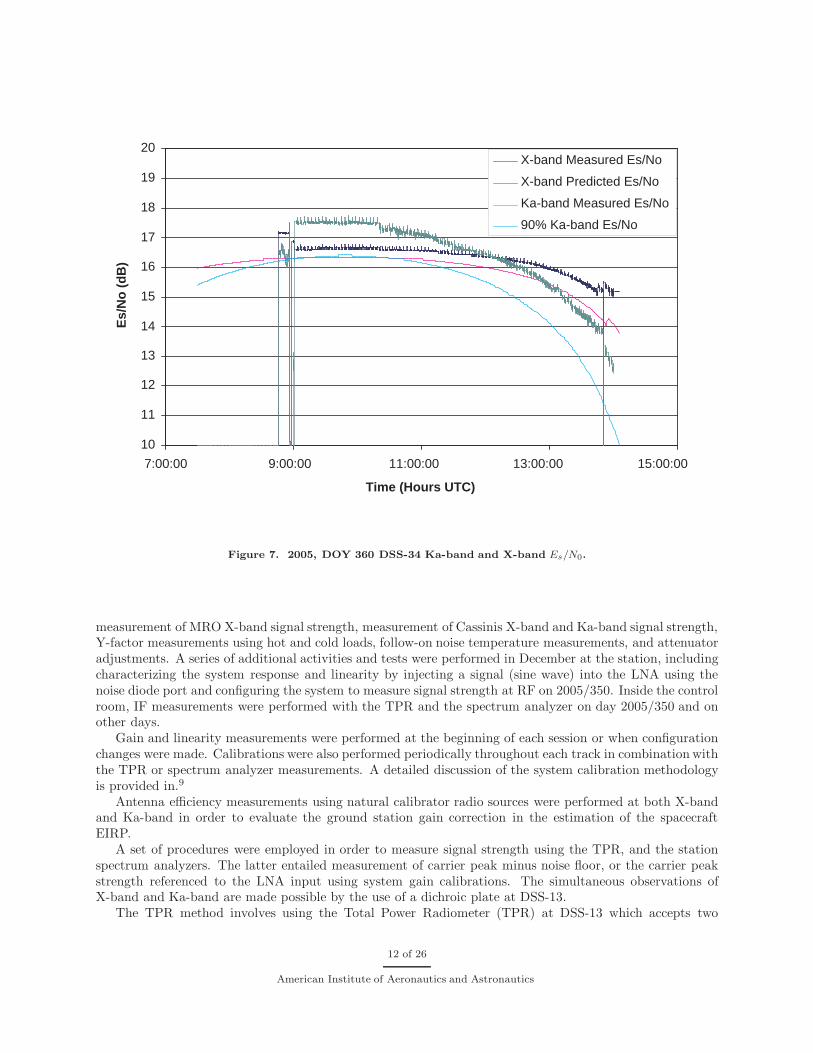
There were two important observations made during these passes. First observation is that the SNTmeasurements for Ka-band seem to be accurate even at smallest possible Mars-Earth distance provided thatthe monopulse is working properly (see Figs. 5 and 6). Second observation is that under good weatherconditions, Ka-band link could outperform the X-band (see Fig. 7). This means that Ka-band has the
8 of 26
American Institute of Aeronautics and Astronautics
15
17
19
21
23
25
27
29
31
6:00:00
7:00:00
8:00:00
9:00:00
10:00:00
11:00:00
12:00:00
13:00:00
14:00:00
15:00:00
16:00:00
17:00:00
Time (Hours UTC)
Es/
No
(d
B)
Ka-band Measured Es/No
90% Ka-band Es/No
Figure 4. DOY 321 DSS-34 Ka-band Es/N0.
potential to return as much data as X-band for MRO and could be considered a viable back up for theX-band system with almost about a third of X-band’s transmitted power.
During these passes, a slow down in the monitor data updates was again observed. This indicates thatthere is a systematic problem in the DSN with regards to delivery of the monitor data from DSN complexesto JPL.
IV. Evaluating the Spacecraft EIRP
MRO presented challenges not normally associated with planetary missions mostly because of the veryhigh signal power received at the ground during this phase of the mission given the very close range distance toEarth, using the deployed High Gain Antenna (HGA). This high EIRP caused problems with HGA calibrationand in attempting to accurately evaluate the in-flight EIRP of the spacecraft. Because the high receivedpower caused errors in SNR estimates, it was not clear whether or not the HGA calibration was successful.This also pointed to the fact that the DSN does not have a standard procedure for measuring absolutespacecraft received power. Rather currently it relies on a combination of SNR and SNT measurements tomake this calculation. Because the SNR and the SNT estimates were affected by the high received signalpower, the DSN could not make an accurate estimate of spacecraft received power and thus its EIRP.
Since the initial SNR measurement in the first Ka-band pass were lower than expected and initial mea-
9 of 26
American Institute of Aeronautics and Astronautics
0
20
40
60
80
100
120
140
160
180
7:00:00 9:00:00 11:00:00 13:00:00 15:00:00
Time (Hours UTC)
SN
T (
K)
Measured Ka-band SNT
Ka-band 90% SNT
Figure 5. 2005, DOY 360, DSS-34 SNT (monopulse operational).
surements at DSS-13 indicated that the spacecraft EIRP was 5 dB below pre-launch measurements, a MissionChange Request (MCR) was affected to leave the MRO Ka-band on in carrier mode only for most of thecruise. This allowed us to develop methods for measuring the spacecraft EIRP directly without relying ona ground receiver. In the following we discuss the original HGA calibration and activities at DSS-13 and at6-m array breadboard antenna at JPL mesa.
A. High Gain Antenna Calibration
The MRO Project conducted a High Gain Antenna (HGA) calibration September 9, 2005 (2005/DOY 252)over Madrid, Spain. This calibration was intended to obtain the boresight of both the X-band and theKa-band for the antenna. As such, a point-and-slew patterns at two different attitudes were used with aline separation of 0.1 degrees. As the Ka-band 3 dB beamwidth is only 0.18 degrees, no beam pattern couldbe obtained from these scans and it was decided that a centroid approach will be used in obtaining theKa-band boresight of the antenna. Unfortunately during this pass, the weather was bad; therefore, the SNRmeasurements fluctuated. In addition, not all the spacecraft high rate gimbal position data were transmittedafter the calibration activity; therefore, the gimbal position commands rather than gimbal position knowledgewere used to do the centroid calculations. Even though the boresight calculations that were performed provedhighly accurate, because of the coarseness of the calibration pattern and the problems with accurate SNR andSNT measurements due to high spacecraft power, these calculations were deemed unreliable and methods
10 of 26
American Institute of Aeronautics and Astronautics
0
20
40
60
80
100
120
140
160
180
0:00:00 2:00:00 4:00:00 6:00:00 8:00:00 10:00:00
Time (Hours UTC)
SN
T (
K)
Measured Ka-band SNT
Ka-band 90% SNT
Figure 6. 2006, DOY 003, DSS-26 SNT (monopulse not used).
to validate them through direct measurements of the EIRP were sought.
B. DSS-13 Activities
As mentioned before, because of the high spacecraft received power and the coarseness of the HGA calibrationpattern and errors in SNR estimates from the receivers, there was a question as to whether the spacecraftwas providing adequate Ka-band EIRP and whether or not the spacecraft antenna was on point. These ledto the development and exercise of measurement techniques that could be used for future high-power deepspace missions. These techniques were exercised at DSS-13, an R&D 34-m beam waveguide antenna locatedin at Goldstone, California during several passes that spanned MROs cruise phase from September 2005 toJanuary 2006 in an attempt to measure spacecraft EIRP. Initial measurements indicated that the spacecraftEIRP was off by about 5 dB. However, this was due to the fact that the system was not properly calibrated.As more data became available indicating that the spacecraft was producing adequate EIRP it was decidedthat DSS-13 needs to be thoroughly calibrated.
Among the early activities performed at Ka-band (and X-band) at DSS-13 from September throughOctober 2005 were several that involved checkout and calibration of various the sub-systems. The dual-frequency X/Ka feed packages at DSS-13 was utilized for most of the tests. Other activities includedcharacterization and measurement of system operating noise temperature (SNT), system gain and linearity,measurement of antenna efficiency using natural calibrator radio sources, exercising pointing techniques,
11 of 26
American Institute of Aeronautics and Astronautics
10
11
12
13
14
15
16
17
18
19
20
7:00:00 9:00:00 11:00:00 13:00:00 15:00:00
Time (Hours UTC)
Es/
No
(d
B)
X-band Measured Es/No
X-band Predicted Es/No
Ka-band Measured Es/No
90% Ka-band Es/No
Figure 7. 2005, DOY 360 DSS-34 Ka-band and X-band Es/N0.
measurement of MRO X-band signal strength, measurement of Cassinis X-band and Ka-band signal strength,Y-factor measurements using hot and cold loads, follow-on noise temperature measurements, and attenuatoradjustments. A series of additional activities and tests were performed in December at the station, includingcharacterizing the system response and linearity by injecting a signal (sine wave) into the LNA using thenoise diode port and configuring the system to measure signal strength at RF on 2005/350. Inside the controlroom, IF measurements were performed with the TPR and the spectrum analyzer on day 2005/350 and onother days.
Gain and linearity measurements were performed at the beginning of each session or when configurationchanges were made. Calibrations were also performed periodically throughout each track in combination withthe TPR or spectrum analyzer measurements. A detailed discussion of the system calibration methodologyis provided in.9
Antenna efficiency measurements using natural calibrator radio sources were performed at both X-bandand Ka-band in order to evaluate the ground station gain correction in the estimation of the spacecraftEIRP.
A set of procedures were employed in order to measure signal strength using the TPR, and the stationspectrum analyzers. The latter entailed measurement of carrier peak minus noise floor, or the carrier peakstrength referenced to the LNA input using system gain calibrations. The simultaneous observations ofX-band and Ka-band are made possible by the use of a dichroic plate at DSS-13.
The TPR method involves using the Total Power Radiometer (TPR) at DSS-13 which accepts two
12 of 26
American Institute of Aeronautics and Astronautics
2005/350 DSS-13 MRO Ka-band
100
150
200
250
300
350
400
6:00:00 7:12:00 8:24:00 9:36:00 10:48:00
Time, UTC
Sys
tem
No
ise
Tem
per
atu
re In
crea
se ,
K
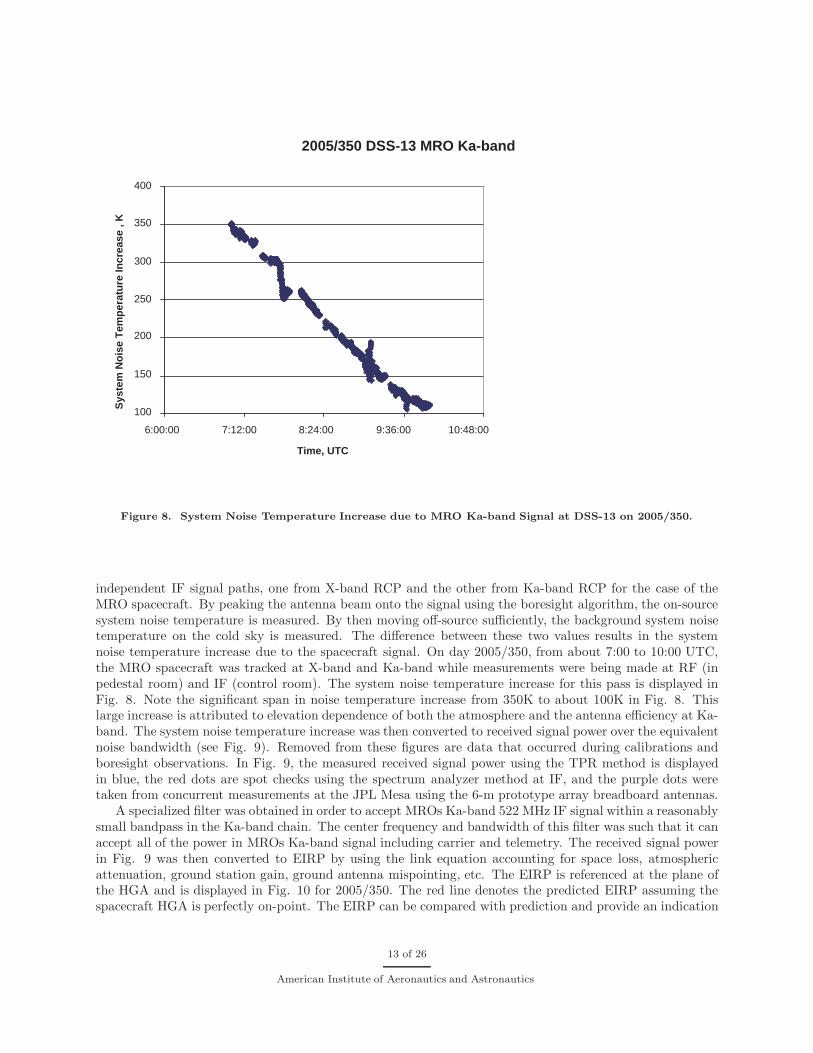
Figure 8. System Noise Temperature Increase due to MRO Ka-band Signal at DSS-13 on 2005/350.
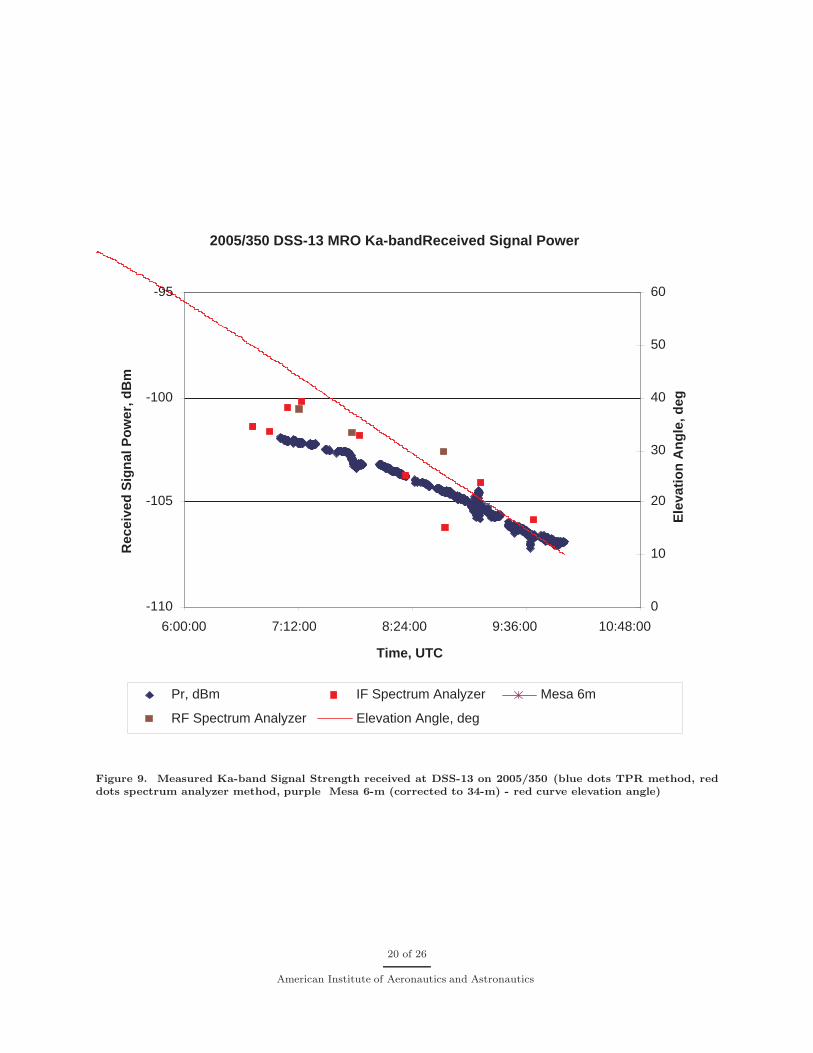
independent IF signal paths, one from X-band RCP and the other from Ka-band RCP for the case of theMRO spacecraft. By peaking the antenna beam onto the signal using the boresight algorithm, the on-sourcesystem noise temperature is measured. By then moving off-source sufficiently, the background system noisetemperature on the cold sky is measured. The difference between these two values results in the systemnoise temperature increase due to the spacecraft signal. On day 2005/350, from about 7:00 to 10:00 UTC,the MRO spacecraft was tracked at X-band and Ka-band while measurements were being made at RF (inpedestal room) and IF (control room). The system noise temperature increase for this pass is displayed inFig. 8. Note the significant span in noise temperature increase from 350K to about 100K in Fig. 8. Thislarge increase is attributed to elevation dependence of both the atmosphere and the antenna efficiency at Ka-band. The system noise temperature increase was then converted to received signal power over the equivalentnoise bandwidth (see Fig. 9). Removed from these figures are data that occurred during calibrations andboresight observations. In Fig. 9, the measured received signal power using the TPR method is displayedin blue, the red dots are spot checks using the spectrum analyzer method at IF, and the purple dots weretaken from concurrent measurements at the JPL Mesa using the 6-m prototype array breadboard antennas.
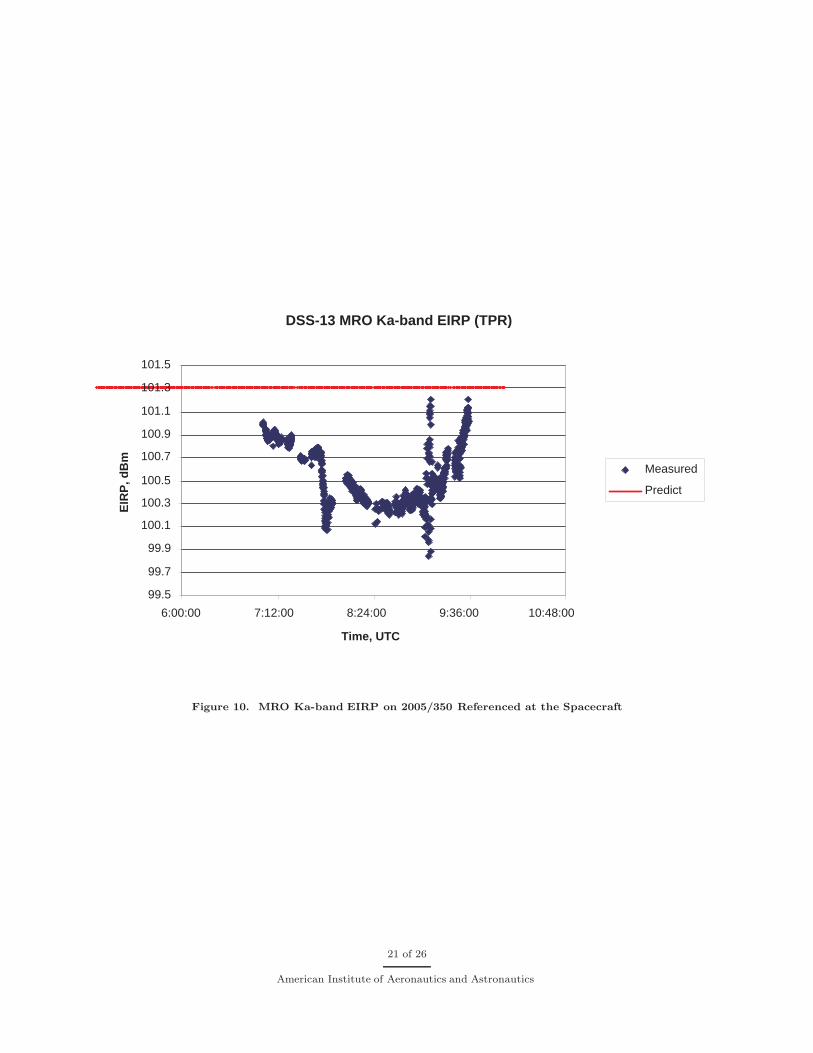
A specialized filter was obtained in order to accept MROs Ka-band 522 MHz IF signal within a reasonablysmall bandpass in the Ka-band chain. The center frequency and bandwidth of this filter was such that it canaccept all of the power in MROs Ka-band signal including carrier and telemetry. The received signal powerin Fig. 9 was then converted to EIRP by using the link equation accounting for space loss, atmosphericattenuation, ground station gain, ground antenna mispointing, etc. The EIRP is referenced at the plane ofthe HGA and is displayed in Fig. 10 for 2005/350. The red line denotes the predicted EIRP assuming thespacecraft HGA is perfectly on-point. The EIRP can be compared with prediction and provide an indication
13 of 26
American Institute of Aeronautics and Astronautics
of how well the spacecraft is performing or of any problem such as spacecraft mis-pointing. The gain of thereceiving antenna utilized curves derived from the antenna efficiency measurements of natural radio sourcecalibrators as a function of station elevation angle. The atmospheric attenuation was calculated using surfacemeteorological parameters input into a weather model a.
Note that the measured EIRP is usually within 1 dB of the predicted and displays some interestingsignatures that are not yet understood, but may be possibly attributed to deficiency in the efficiency modelor possibly spacecraft motion. The uncertainty in Ka-band efficiency is anticipated to lie within 0.6 dB.Other error contributions such as atmospheric attenuation are small.
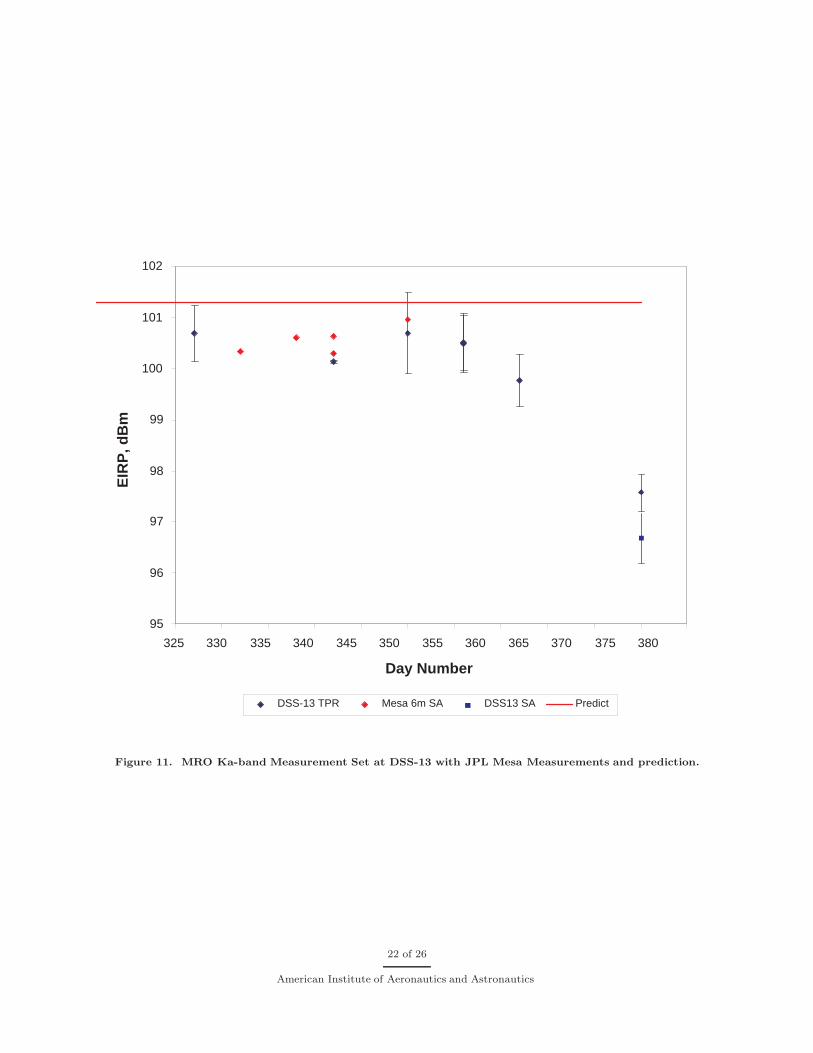
In addition to the 2005/350 track, there were several other tracks conducted for the goal of measuringKa-band EIRP as summarized in Fig. 11. The red diamonds were measurements performed at the 6-m prototype array antennas located on the Mesa at JPL. All of the DSS-13 measurements utilized theTotal Power Radiometer (TPR) or station spectrum analyzers (SA). Note that between days 2005/325 and2005/360, there is good agreement between the measurements all being consistent with the MRO spacecraftbeing on-point. The measurements conducted on January 10, 2006 (day 375) was found to be about 4 dBlow, but was related to a spacecraft safing event that occurred on January 3, 2006 and is understood.
The measurements depicted in Fig. 11 confirm that the MRO Ka-band EIRP measured at DSS-13 isconsistent with the HGA being reasonably on-point, and lies within about 1 dB of predict. The error barson the DSS-13 TPR measurements represent the standard deviation of the measurements about the meanvalue over each pass, except for one pass for which the measurement was a spot check, in which case theerror bar was assigned a value of 0.5 dB to account for unknown effects. Error bars were not available forthe JPL Mesa measurements but are expected to be relatively small.
The same procedures were exercised for the simultaneous X-band signal emitted by MRO, and the X-bandEIRP was found to be near predict.
C. 6-meter Antennas
The two 6-meter array breadboard antennas at JPL’s mesa are intended as testbeds for the DSN’s largeantenna array project. These antennas have a gain of 65.5 dB at Ka-band and have a cryogenically cooledfeed producing a very low noise system. These antenna did not have any receiving equipment, but they didhave a hetrodyne mixer for downconverting the Ka-band RF signal to 1 GHz IF.
At these 6-m antennas a spectrum analyzer attached to a laptop was used to measure the spacecraftEIRP. These measurements were based on an initial calculation of received carrier power (Pc) and usinggeometry and knowledge about the gain of the antenna to obtain the EIRP measurements. The carrierpower is obtained in the following manner: first the antenna is off pointed and SNT is measured whilethe spectrum analyzer is hooked up to the IF. Matching the noise floor on the spectrum analyzer to theSNT calibrates the spectrum analyzer. Then the spacecraft signal is tracked and based on the previousnoise calibration of the spectrum analyzer Pc is calculated. Fig. 12 shows a spectrum plot from DOY 333(November 29, 2005) from antenna 1 and how the Pc was calculated from this spectrum.
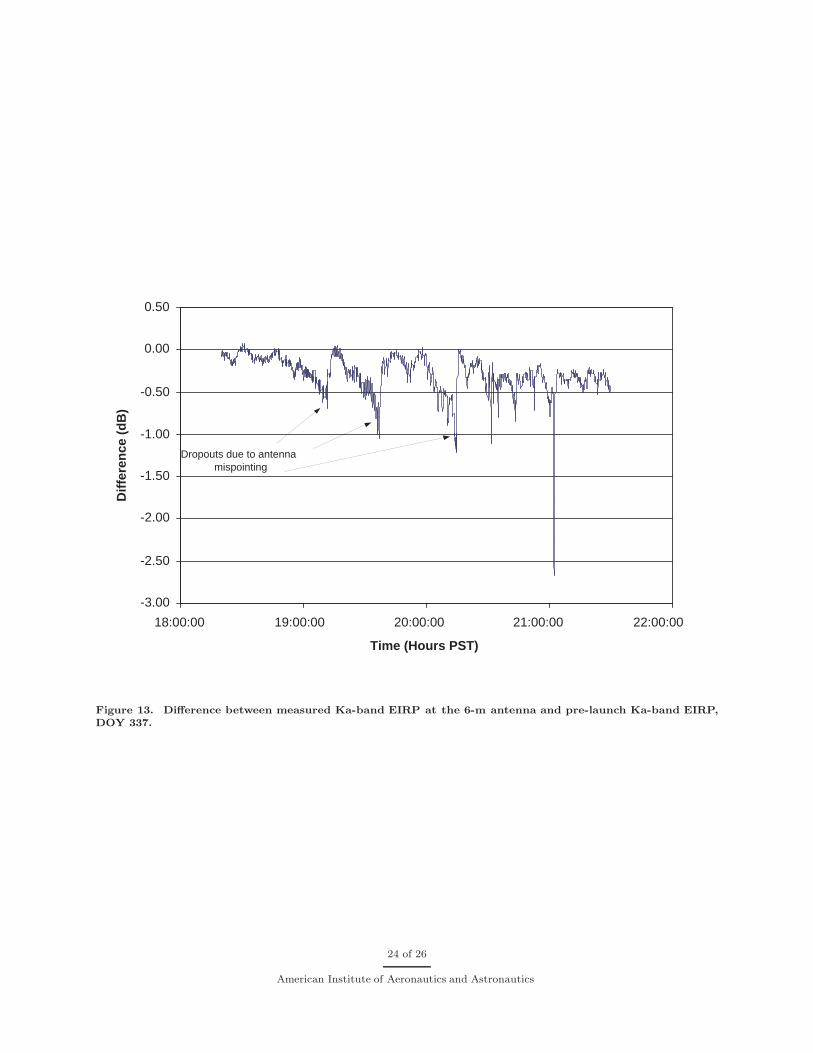
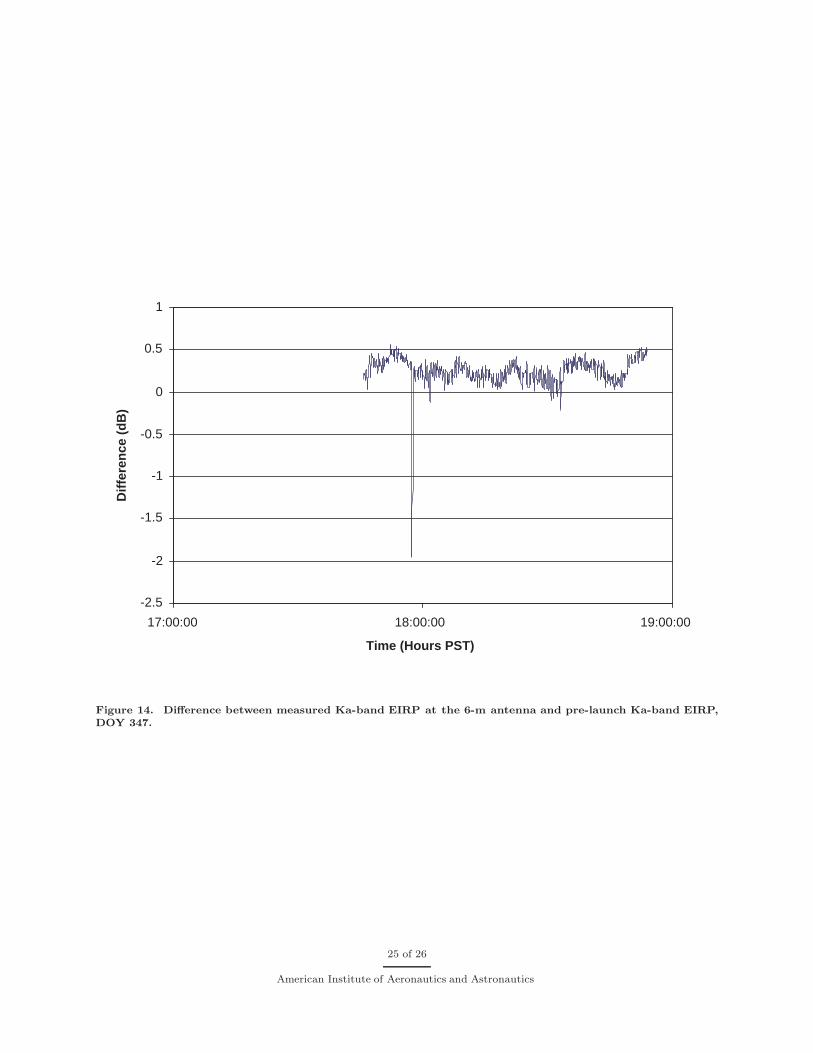
When the spectrum analyzer is hooked up to a laptop, Pc measurements could be made regularly fromwhich the spacecraft EIRP could be calculated. Figs. 13 and 14 show the difference between the measuredEIRP and pre-launch EIRP for DOY 337 (December 3, 2005) and DOY 347 (December 13, 2005), respectivelyobtained in this manner. As these figures indicate, the EIRP measurements match the pre-launch EIRPmeasurements very well.
This method of measuring the spacecraft EIRP could be easily adopted by the DSN for making directpower measurement by hooking up a spectrum analyzer to the IF patch panel at each complex.
aThe weather model was developed by Dr. Stephen Slobin of JPL
14 of 26
American Institute of Aeronautics and Astronautics
V. ∆DOR Passes
The technique of Delta Differential One-way Ranging (∆DOR) has proved to be valuable for supportingspacecraft cruise navigation, especially for missions with tight targeting requirements at Mars. Spacecrafttransmit tones, referred to as DOR tones, with a wide spacing from the carrier to enable these measurements.Today, measurements are made operationally in the DSN at X-band frequencies and provide an angularposition accuracy of about 2.5 nrad. The deep space spectrum allocation and the restricted bandwidth ofspacecraft transmitters at X-band limit the accuracy that can be achieved. The wider spectrum allocation fordeep space tracking at Ka-band will enable an advance in ∆DOR measurement accuracy. Higher accuracyis needed to support future navigation challenges such as Mars landings or encounters with outer planetmoons.
In a ∆DOR measurement, VLBI systems are used at two stations to make high rate recordings ofsignals from spacecraft and angularly nearby radio sources. Antennas alternate between spacecraft andradio sources about ten times in one hour. Radio source observations calibrate the system. For each source,the difference in signal arrival time between stations is measured and delivered to the navigation team. TheMRO spacecraft emits DOR tones at both X-band and Ka-band. The DOR tone frequency is 19 MHz atX-band, yielding a spanned bandwidth of 38 MHz. The MRO transponder was designed for a DOR tonefrequency of 76 MHz at Ka-band, providing a factor of four increase in spanned bandwidth. About 50 ∆DORmeasurements were scheduled during cruise to support navigation. Of these, nine were selected to have dualband X/Ka downlinks to demonstrate performance at Ka-band. Measurements were completed using theDSN 34m BWG antennas that have X/Ka feeds. These measurements were the first ∆DOR measurementsto be attempted at 32 GHz.
To prepare for these measurements, surveys were made of radio source flux, using NRAOs Very LargeBaseline Array, at 24 GHz and 43 GHz. Information from this survey was used to select radio sources toobserve at 32 GHz. In the DSN, models for antenna pointing were improved to allow blind pointing tothe coordinates of faint radio sources. The receiver used for VLBI data recording was modified to have alarger front end bandwidth that allowed reception of the entire Ka-band spectrum allocation for deep space,including the received frequencies of the MRO DOR tones.
Data were successfully acquired at X-band and Ka-band for seven of the nine scheduled measurements.The measured data at Ka-band are in general agreement with the measured data at X-band and the precisionof the Ka-band measurements is within expectations. The DSN receiving system worked well at 32 GHz.Antenna pointing was generally good, but some loss of signal power occurred due to errors in pointing thatexceeded the very tight 4 mdeg requirement. One of the selected radio sources was found to have insufficientflux for use in these measurements, given the recording bandwidth that was used. Otherwise data acquisitionwas nominal.
Eventually, an operational system at Ka-band is expected to provide better accuracy than the currentX-band system. The wider span of DOR tones improves group delay precision and reduces error due todispersive instrumental phase. Both of these effects scale with spanned bandwidth. A higher data recordingrate has been used at Ka-band, improving the precision of radio source delays. But higher system temperatureand lower quasar flux at Ka-band reduce the benefits of the above mentioned effects. Ionospheric path delayis reduced by a factor of 15 at Ka-band relative to X-band. Radio source cores are more compact at higherfrequencies, implying that, given sufficient source survey effort, an improved astrometric reference catalogcould be defined using X/Ka data than is available today using S/X data.
The expected ∆DOR measurement accuracy is shown in Fig. 15 for three cases: MRO X-band data, MROKa-band data, and proposed future Ka-band data. Except for effects that depend on recording bandwidth,spanned bandwidth, and ionospheric path delay, all assumptions are the same for the three cases. For MRO,the quasar system noise error is reduced by v2 at Ka-band. This is the net effect of system temperature x2higher at Ka, quasar flux x2 lower at Ka, spanned bandwidth x4 higher at Ka, and record rate x2 higherat Ka. For a future Ka-band system, the record rate could be further increased by x4 and the spannedbandwidth could be further increased by x2. Dispersive instrumental phase is x4 smaller at Ka for MRO
15 of 26
American Institute of Aeronautics and Astronautics
and would be x8 smaller for the future system. Ionospheric path delay is x15 smaller at Ka since chargedparticle delay goes as one over frequency squared.
Fig. 15 shows expected one sigma accuracy for typical observing conditions for the three cases. Someimprovement is seen at Ka-band for MRO, and further improvement in some error components is seen forthe proposed higher bandwidth system at Ka-band. But to take advantage of the reduction in the errorcomponents that is provided by transitioning to Ka-band frequencies, other work will be needed to realizea significant improvement in end-to-end system performance. An improvement in troposphere calibrationwill be needed. This could be achieved by making use of high performance water vapor radiometers at eachtracking station. Improvements in realtime knowledge of earth orientation will be needed. This could beachieved by using a system similar to the ∆DOR system for making quick turnaround VLBI measurementsof UT1. Finally, improvements in the global reference frame, including station coordinates and quasarcoordinates, will be needed. This will require a measurement and analysis campaign, over several years,using radio source data at X-band and Ka-band. If development work is completed in these areas, thenend-to-end system performance at Ka-band could improve to the 1-nrad level or better.
VI. Conclusion
As the results from the Ka-band activities durig MRO cruise indicate, the spacecraft is fully capableof supporting the Ka-band demonstration during the PSP and the DSN is almost ready. The issues withthe monopulse antenna pointing and delivery of the monitor data still remain. However, these issues areexpected to be solved before the start of the PSP. As a result of Ka-band cruise activities MRO has set severalmilestones for planetary missions including most amount of data in a single day (133 Gbits) and highestdata rate (6 Mbps). MRO also successfully demonstrated during the cruise Ka-band ∆ DOR operations.Furthermore, as a result of Ka-band cruise activities, techniques for direct measurement of spacecraft receivedpower have been developed.
Acknowledgments
This work was performed at Jet Propulsion Laboratory, California Institute of Technology, under acontract with National Aeronautics and Space Administration. The authors would like to thank Wallace Taifor programmatic support of this activity and James E. Graf, MRO project manager. In addition, thanksgo to JPL’s Roy Gladden and the entire sequencing team as well as William Adams of Lockheed-MartinCorporation for supporting MRO Ka-band sequencing. The authors would also like to thank Paul Dendrenosfor providing support in conducting tests and measuring RF system parameters and working many late shiftsat DSS-13 on moments notice; Bill Lake for assisting in DSS-13 preparation activities, providing real-timesupport and working late shifts on moments notice; Ron Littlefair of DSS-13 for addressing MRO printingissues, and performing requested tasks on short notice and Bob Rees for coordinating DSS-13 station support.We would also like to thank other JPL participants at DSS-13 during the 2005/350 pass: Brad Arnold, ManuelFranco, Sam Zingales, and Stan Butman. Also thanks go to JPL’s Andre Jongeling for his superb work onWVSR. The authors also appreciate the assistance and feedback provided by Dolan Highsmith of the MRONavigation Team, Sami Asmar of the Radio Science Systems Group and Alex Konopliv of the MRO GravityScience Team. Further thanks go to Philip Good of Infiniti Engineering Inc. for support of HGA calibrationactivities, to JPL’s Chau Buu, J. Adrew O’Dea and Jeff Berner for support with DSN receivers and themonopulse, and to Miles Sue and the entire JPL Spectrum Management group for evaluating feasibility ofBPSK use with X-band during the cruise.
16 of 26
American Institute of Aeronautics and Astronautics
References
1Shambayati, S., “Optimization of a Deep-Space Ka-Band Link Using Atmospheric-Noise-Temperature Statistics,” TMOProgress Report 42-139, July-September 1999, pp. 1-16, Jet Propulsion Laboratory, Pasadena, CA, November 15, 1999.
2Shambayati, S., “Maximization of Data Return at X-Band and Ka-Band on the DSN’s 34-Meter Beam-Waveguide Anten-nas,” IPN Progress Report 42-148, October-December 2001, pp. 1-20, February 15, 2002.
3Shambayati, S., “On the Use of W-Band for Deep-Space Communications,” IPN Progress Report 42-154, April-June 2003,pp. 1-17, Jet Propulsion Laboratory, Pasadena, CA, August 15, 2003.
4Davarian, F., Shambayati, S. and Slobin, S., “Deep Space Ka-Band Link Management and Mars Reconnaissance Orbiter:Long-Term Weather Statistics Versus Forecasting,” Proceeding of IEEE, Volume 92, Number 12, December 2004.
5Shambayati, S., Davarian, F. and Morabito, D., “Link Design and Planning for Mars Reconnaissance Orbiter (MRO)Ka-band (32 GHz) Telecom Demonstration,” IEEE Aerospace Conference, Big Sky, MT, March 2005.
6Lock, R., and Sharrow, R., Mars Reconnaissance Orbiter Mission Plan, Rev. C, JPL Document D-22239, Jet PropulsionLaboratory, Pasadena, CA, July 2005.
7Lee, D. K., MRO Telecom Design Control Document, Rev. A, JPL Document D-22724, Jet Propulsion Laboratory,Pasadena, CA, July 2005.
8Slobin, S.D., DSMS Telecommunications Link Design Handbook, Module 104, Rev. B: 34-m BWG Stations Telecom-munications Interfaces, http://deepspace.jpl.nasa.gov/dsndocs/810-005/104/104B.pdf, JPL Document 810-005, Jet PropulsionLaboratory, Pasadena, CA, August 2005.
9Stelzried, C. T. , and Klein, M. J.,“Precision DSN Radiometer Systems: Impact on Microwave Calibrations”, Proceedingsof the IEEE, vol. 82, pp. 776-787, May 1994.
10Morabito, D. D., “The Characterization of a 34-Meter Beam-Waveguide Antenna at Ka-band (32 GHz) and X-band (8.4GHz)”, IEEE Antennas and Propagation Magazine, Vol. 41, No. 4, pp. 23-34, August 1999.
17 of 26
American Institute of Aeronautics and Astronautics
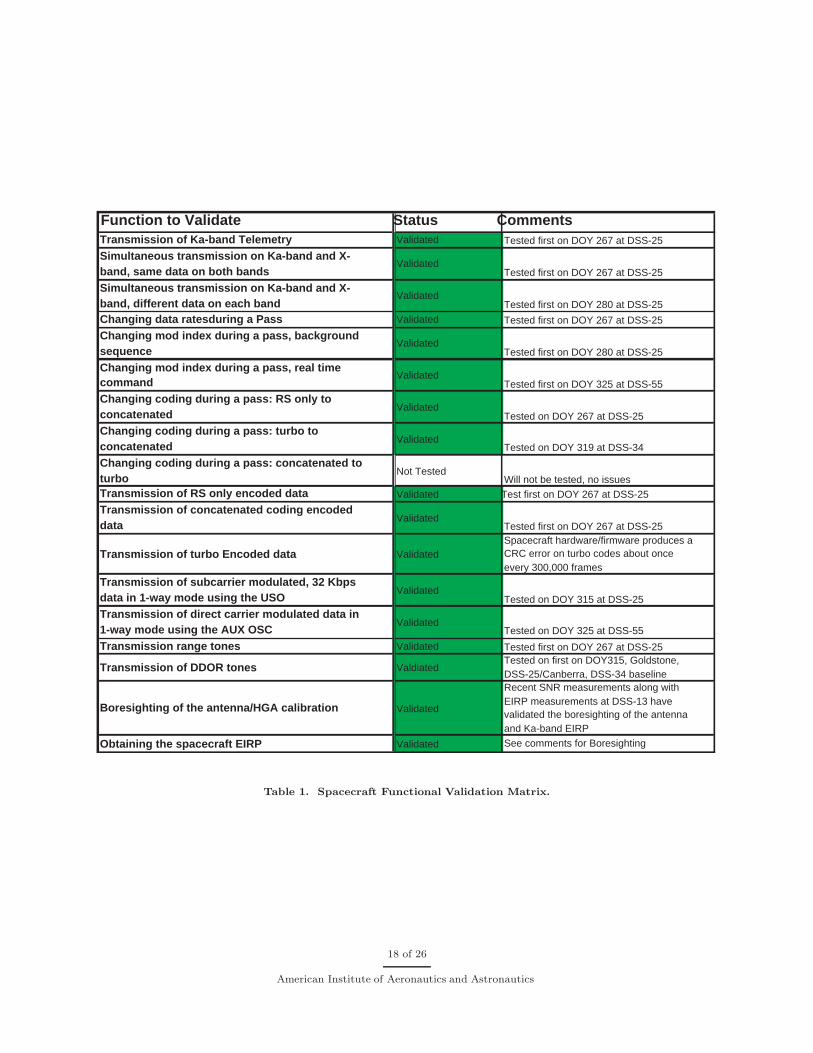
Function to Validate Status Comments Transmission of Ka-band Telemetry Validated Tested first on DOY 267 at DSS-25
Simultaneous transmission on Ka-band and X- band, same data on both bands
Validated Tested first on DOY 267 at DSS-25
Simultaneous transmission on Ka-band and X- band, different data on each band
Validated Tested first on DOY 280 at DSS-25
Changing data ratesduring a Pass Validated Tested first on DOY 267 at DSS-25
Changing mod index during a pass, background sequence
Validated Tested first on DOY 280 at DSS-25
Changing mod index during a pass, real time command
Validated Tested first on DOY 325 at DSS-55
Changing coding during a pass: RS only to concatenated
Validated Tested on DOY 267 at DSS-25
Changing coding during a pass: turbo to concatenated
Validated Tested on DOY 319 at DSS-34
Changing coding during a pass: concatenated to turbo
Not Tested Will not be tested, no issues
Transmission of RS only encoded data Validated Test first on DOY 267 at DSS-25
Transmission of concatenated coding encoded data
Validated Tested first on DOY 267 at DSS-25
Transmission of turbo Encoded data Validated Spacecraft hardware/firmware produces a CRC error on turbo codes about once every 300,000 frames
Transmission of subcarrier modulated, 32 Kbps data in 1-way mode using the USO
Validated Tested on DOY 315 at DSS-25
Transmission of direct carrier modulated data in 1-way mode using the AUX OSC
Validated Tested on DOY 325 at DSS-55
Transmission range tones Validated Tested first on DOY 267 at DSS-25
Transmission of DDOR tones Valdiated Tested on first on DOY315, Goldstone, DSS-25/Canberra, DSS-34 baseline
Boresighting of the antenna/HGA calibration Validated
Recent SNR measurements along with EIRP measurements at DSS-13 have validated the boresighting of the antenna and Ka-band EIRP
Obtaining the spacecraft EIRP Validated See comments for Boresighting
Table 1. Spacecraft Functional Validation Matrix.
18 of 26
American Institute of Aeronautics and Astronautics
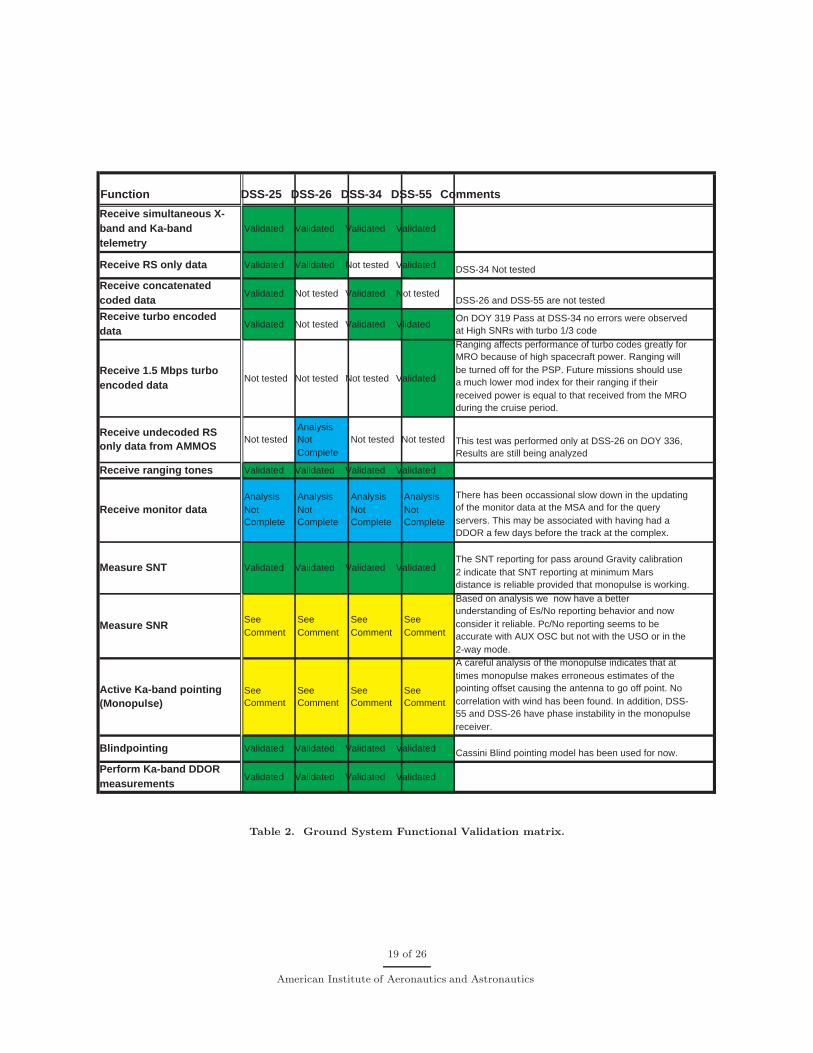
Function DSS-25 DSS-26 DSS-34 DSS-55 Comments
Receive simultaneous X- band and Ka-band telemetry
Validated Validated Validated Validated
Receive RS only data Validated Validated Not tested Validated DSS-34 Not tested
Receive concatenated coded data
Validated Not tested Validated Not tested DSS-26 and DSS-55 are not tested
Receive turbo encoded data
Validated Not tested Validated Vlidated On DOY 319 Pass at DSS-34 no errors were observed at High SNRs with turbo 1/3 code
Receive 1.5 Mbps turbo encoded data
Not tested Not tested Not tested Validated
Ranging affects performance of turbo codes greatly for MRO because of high spacecraft power. Ranging will be turned off for the PSP. Future missions should use a much lower mod index for their ranging if their received power is equal to that received from the MRO during the cruise period.
Receive undecoded RS only data from AMMOS
Not tested Analysis Not Complete
Not tested Not tested This test was performed only at DSS-26 on DOY 336, Results are still being analyzed
Receive ranging tones Validated Validated Validated Validated
Receive monitor data Analysis Not Complete
Analysis Not Complete
Analysis Not Complete
Analysis Not Complete
There has been occassional slow down in the updating of the monitor data at the MSA and for the query servers. This may be associated with having had a DDOR a few days before the track at the complex.
Measure SNT Validated Validated Validated Validated The SNT reporting for pass around Gravity calibration 2 indicate that SNT reporting at minimum Mars distance is reliable provided that monopulse is working.
Measure SNR See Comment
See Comment
See Comment
See Comment
Based on analysis we now have a better understanding of Es/No reporting behavior and now consider it reliable. Pc/No reporting seems to be accurate with AUX OSC but not with the USO or in the 2-way mode.
Active Ka-band pointing (Monopulse)
See Comment
See Comment
See Comment
See Comment
A careful analysis of the monopulse indicates that at times monopulse makes erroneous estimates of the pointing offset causing the antenna to go off point. No correlation with wind has been found. In addition, DSS- 55 and DSS-26 have phase instability in the monopulse receiver.
Blindpointing Validated Validated Validated Validated Cassini Blind pointing model has been used for now.
Perform Ka-band DDOR measurements
Validated Validated Validated Validated
Table 2. Ground System Functional Validation matrix.
19 of 26
American Institute of Aeronautics and Astronautics
2005/350 DSS-13 MRO Ka-bandReceived Signal Power
-110
-105
-100
-95
6:00:00 7:12:00 8:24:00 9:36:00 10:48:00
Time, UTC
Rec
eive
d S
ign
al P
ow
er, d
Bm
0
10
20
30
40
50
60
Ele
vati
on
An
gle
, deg
Pr, dBm IF Spectrum Analyzer Mesa 6m
RF Spectrum Analyzer Elevation Angle, deg
Figure 9. Measured Ka-band Signal Strength received at DSS-13 on 2005/350 (blue dots TPR method, reddots spectrum analyzer method, purple Mesa 6-m (corrected to 34-m) - red curve elevation angle)
20 of 26
American Institute of Aeronautics and Astronautics
DSS-13 MRO Ka-band EIRP (TPR)
99.5
99.7
99.9
100.1
100.3
100.5
100.7
100.9
101.1
101.3
101.5
6:00:00 7:12:00 8:24:00 9:36:00 10:48:00
Time, UTC
EIR
P, d
Bm
Measured
Predict
Figure 10. MRO Ka-band EIRP on 2005/350 Referenced at the Spacecraft
21 of 26
American Institute of Aeronautics and Astronautics
95
96
97
98
99
100
101
102
325 330 335 340 345 350 355 360 365 370 375 380
Day Number
EIR
P, d
Bm
DSS-13 TPR Mesa 6m SA DSS13 SA Predict
Figure 11. MRO Ka-band Measurement Set at DSS-13 with JPL Mesa Measurements and prediction.
22 of 26
American Institute of Aeronautics and Astronautics
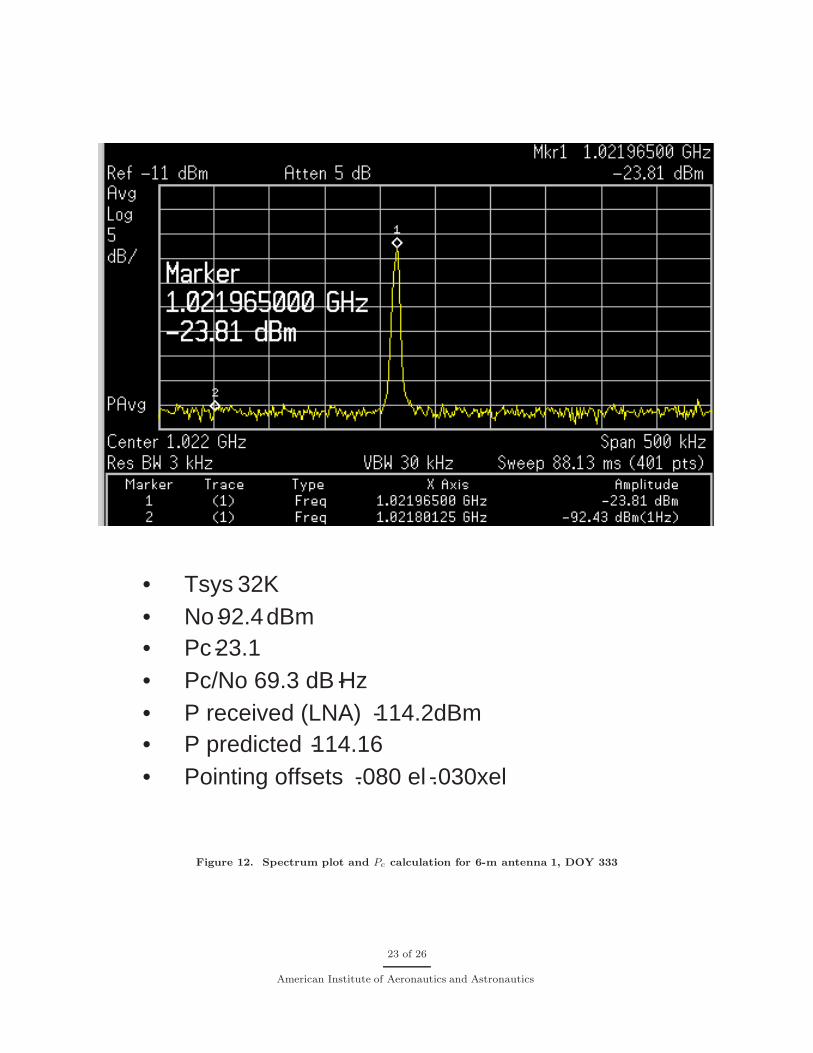
• Tsys 32K • No - 92.4 dBm • Pc - 23.1 • Pc/No 69.3 dB - Hz • P received (LNA) - 114.2dBm • P predicted - 114.16 • Pointing offsets - .080 el - .030xel
Figure 12. Spectrum plot and Pc calculation for 6-m antenna 1, DOY 333
23 of 26
American Institute of Aeronautics and Astronautics
-3.00
-2.50
-2.00
-1.50
-1.00
-0.50
0.00
0.50
18:00:00 19:00:00 20:00:00 21:00:00 22:00:00
Time (Hours PST)
Dif
fere
nce
(d
B)
Dropouts due to antenna mispointing
Figure 13. Difference between measured Ka-band EIRP at the 6-m antenna and pre-launch Ka-band EIRP,DOY 337.
24 of 26
American Institute of Aeronautics and Astronautics
-2.5
-2
-1.5
-1
-0.5
0
0.5
1
17:00:00 18:00:00 19:00:00
Time (Hours PST)
Dif
fere
nce
(d
B)
Figure 14. Difference between measured Ka-band EIRP at the 6-m antenna and pre-launch Ka-band EIRP,DOY 347.
25 of 26
American Institute of Aeronautics and Astronautics
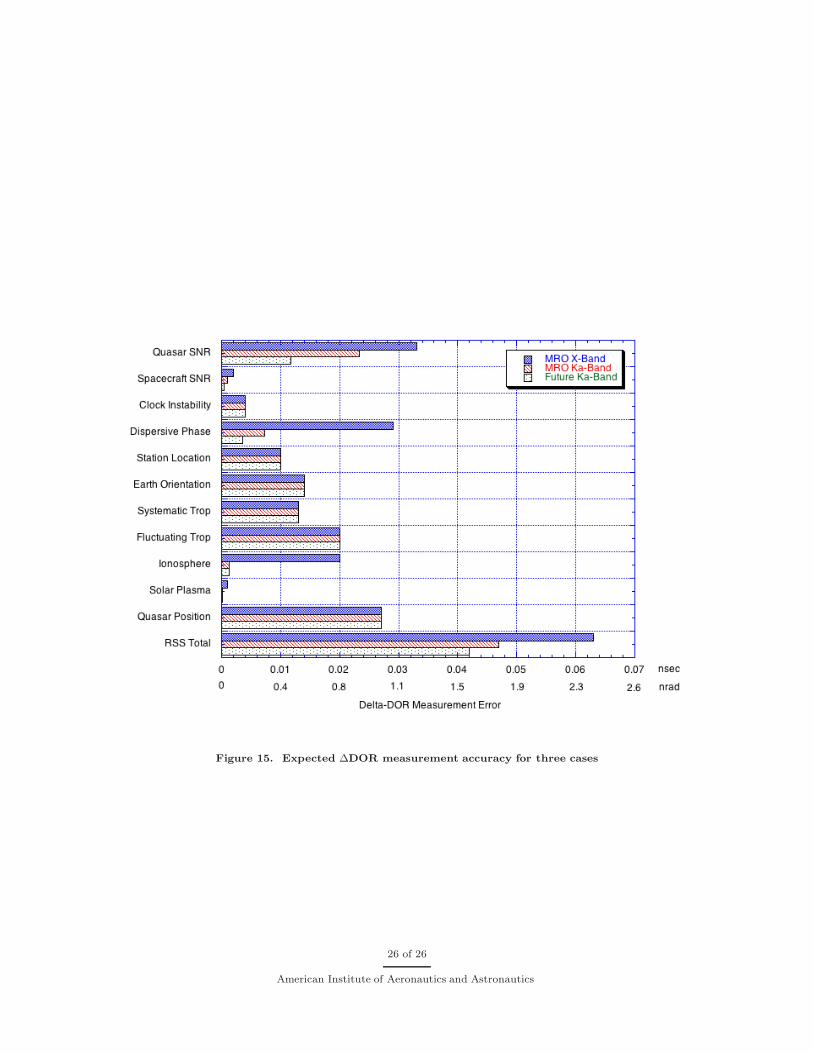
Figure 15. Expected ∆DOR measurement accuracy for three cases
26 of 26
American Institute of Aeronautics and Astronautics