reconnaissance paleomagnetic results from western cuba
TRANSCRIPT
ELSEVIER Tectonophysics 253 (1996) 65-81
TECTONOPHYSICS
Reconnaissance paleomagnetic results from western Cuba
Mikhail L. Bazhenov a,b.,, Andrzej Pszczolkowski c, Stanislav V. Shipunov a
a Geological Institute, Russian Academy of Sciences, Pyzhevsky per., 7, Moscow, 109017, Russia b Laboratoire de Paleomagnetisme, lnstitut de Physique du Globe de Paris, 4, pl. Jussieu, 75230 Paris Cedex 05, France
c Instytut Nauk Geologicznych Polskiej Akademii Nauk, Al. Zwirki i Wigury 93, 02-089 Warszawa, Poland
Received 27 May 1994; accepted 30 May 1995
Abstract
A paleomagnetic study of Mesozoic rocks from the Sierra de Los Organos and Sierra del Rosario fold belts of western Cuba revealed postfolding magnetisation in diabases of the Late Jurassic E1 SAbalo Formation and carbonates of the middle Cretaceous Pons and the Late Cretaceous Carmita and Moreno formations. Steep components with inclinations of about 70 ° were isolated from all three formations; at the same time, postfolding shallow components were also found in a few samples of the Pons limestones. We rule out a possibility to account for these results by either horizontal movements or non-dipole field anomaly. Neither very appealing is a hypothesis of a post-remagnetization tilt of the entire region. All the components appear to be confined to a plane perpendicular to the main structural trends; we hypothesize that the remanences might have been distorted or re-aligned during deformation; this assumption, however, is far from being proven. In contrast, well-defined characteristic components were isolated from basaits of the Aptian-Albian Encrucijada ( D / I = 2470/23 °, K = 14, a95 z 9.0 °) and the Late Cretaceous Orozco ( D / l = 2280/22 °, K = 110, a95 = 4.7) formations from the Bahia Honda zone in the north of western Cuba; the remanence in the Encrucijada Formation is shown to predate deformation. Mean inclinations in both formations match those in Cretaceous volcanics from central Cuba, and all the results show lower latitudes than expected from the reference data for the North American plate thus implying that volcanic domains of Cuba were displaced northward by about 1000 km prior to the Middle Eocene. Cretaceous declinations in western and central Cuba differ by about the same amount as the major structural trends of these two areas suggesting oroclinal bending of Cuba. At the same time, both areas are rotated counterclockwise with respect to North America thus implying movements on a broader scale.
1. Introduct ion
The use of paleomagnetism in the study of tec-
tonic movements is clearly vital for our understand-
ing of the Caribbean (Gose, 1985; MacDonald, 1990)
but to date the number of studies are few. As for
* Corresponding author.
Cuba, it was a paleomagnetic terra incognita up to
recently, when a short paper was published on Mid-
dle Cretaceous paleomagnetic results from the Zaza
terrane of central Cuba (Renne et al., 1991). For
western Cuba, paleomagnetic data are still limited to
those reported in abstracts (Renne et al., 1989; Perez Lazo et al., 1989)
The Cordillera de Guaniguanico of the Pinar del
Rio Province of westem Cuba (Fig. 1A) can be
divided into the Sierra de los Organos and Sierra del
0040-1951/96/$15.00 © 1996 Elsevier Science B.V. All rights reserved SSDI 0040- 1951(95)00061-5
66 M.L. Bazhenov et al. / Tectom)physics 253 (1996)65-81
Rosario belts (Pard©, 1975; Pszczolkowski, 1977; Pszczolkowski, 1978); numerous nappes were recog- nised in each belt (Rigassi-Studer, 1963; Hatten, 1967; Pszczolkowski, 1977; Piotrowska, 1978). The former belt consists of Jurassic to Lower Eocene rocks (Pszczolkowski, 1978) which were deformed in the Early to Middle Eocene. The Sierra del Rosario
belt occupies the northeastern part of the Guaniguanico zone but Jurassic to Paleocene forma- tions of this belt can also be traced to the southwest- em end of the zone (Fig. 1A). Thrusting here also occurred in the Early to early Middle Eocene.
The Bahia Honda tectonostratigraphic zone com- prises ophiolites and volcanic arc rocks and extends
HABANA
A
_ 22o30'N
I I I 84°00'W 83°30'W
50 km DEL
[~ : : ] 1
FAg,,
-- 22o00,N
,:
SC-2 ')
o ,,~o 80-1 ,,,~.~o
i 1 kmj
t r ~
B ( J ~ R - 1 ,
AR-2 '
i / ,
_ J I PONS
s
E ¢ ~Zo ' - PN _ , - q ~ H . e
i u P I S ~
--84o00'W
", O R - l ©
~ J
2kmF '
t J \
, t
~n
S EN ,2".._
,yo, ~11 e o - 6 ,-1%~
83o30'W 83°00'W I I
BAHIA fr - /
, ~ ~ ' - ' " , . O R - 2 • kJ
c "~BAHIA HONDA' ", _ _
'Lo MO-1,2 . - - - - p ~ o , 0 M 0 - 3
. -Q M0-4 ,5 P-4© 22°50'N-
p ,~O . . _ ~,-< ES
- - , " ~['~ A R ' 4 " ,
" O AR-5 ":'I 4 83 il 0'W ,
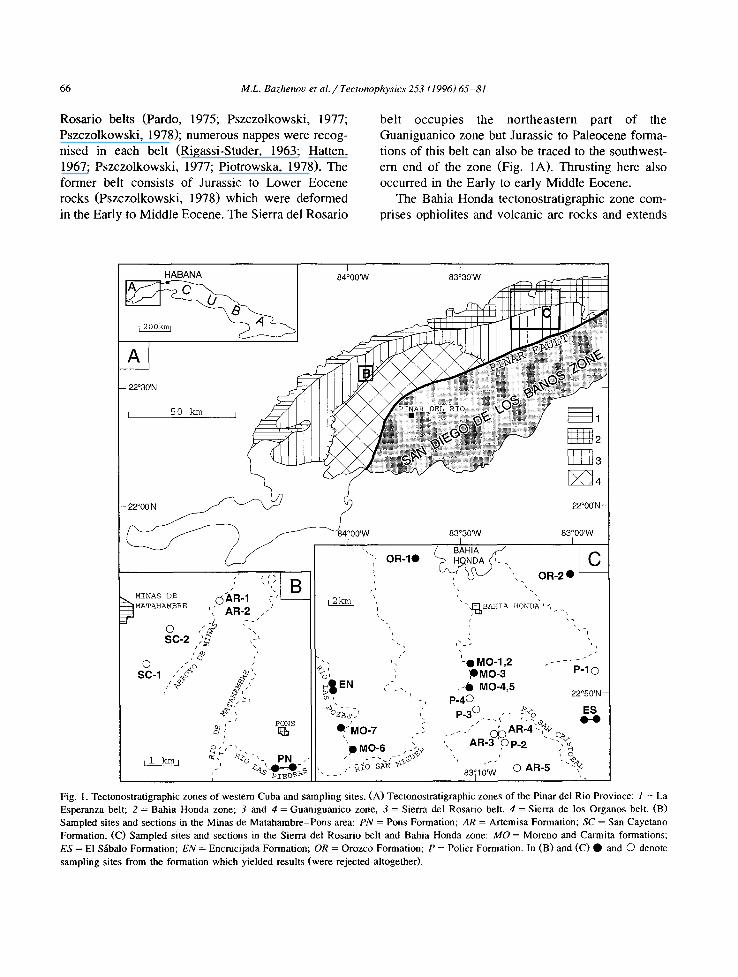
Fig. h Tectonostratigraphic zones of western Cuba and sampling sites. (A) Tectonostratigraphic zones of the Pinar del Rio Province: 1 = La Esperanza belt; 2 = Bahia Honda zone; 3 and 4 = Guaniguanico zone, 3 = Sierra del Rosario belt, 4 = Sierra de los Organos belt. (B) Sampled sites and sections in the Minas de Matahambre-Pons area: PN = Pons Formation; AR = Artemisa Formation; SC = San Cayetano Formation. (C) Sampled sites and sections in the Sierra del Rosario belt and Bahia Honda zone: MO = Moreno and Carmita formations; ES = El Shbalo Formation; EN = Encrucijada Formation; OR = Orozco Formation; P = Polier Formation. In (B) and (C) • and O denote
sampling sites from the formation which yielded results (were rejected altogether).
M.L. Bazhenov et al. / Tectonophysics 253 (1996) 65-81 67
along the northern coast of western Cuba (Fig. 1A). Pillow basalts, radiolarian cherts, pelagic limestones and sometimes volcanoclastics of the Encrucijada Formation up to 900 m thick are regarded as a part of Bahia Honda ophiolites (Fonseca et al., 1984). However, Iturralde-Vinent (1994) interprets the En- crucijada Formation as a rock sequence that be- longed to an ocean basin and was juxtaposed to the Guaniguanico margin. The Bahia Honda volcanic arc represented by iavas and tufts of the Orozco Forma- tion, became extinct in the Campanian as the result of the early Campanian tectonic phase (Pszczolkow- ski and Flores, 1986). Both the Encrucijada and Orozco volcanics were thrust over the Guaniguanico zone in the Early to Middle Eocene.
The following formations were sampled during three field excursions (eleven working days in total) in 1988. In the Sierra de los Organos belt, light to dark-grey limestones of the Aptian-Turonian Pons Formation (Hatten, 1957; Pszczolkowski, 1978 and unpublished data) were sampled along a continuous section across both limbs of a fold in a tectonic window (locality PN, Fig. 1B). Limestones and marls of the Cenomanian-Turonian Carmita and Santo- nian-Campanian Moreno formations (Pszczolkow- ski, 1984 and unpublished data) were studied at seven sites in the Sierra del Rosario belt (sites MO-1 to MO-7, Fig. 1C). Mafic rocks with sedimentary interbeds of the Jurassic (Pszczolkowski, 1989) E1 Sfibalo Formation were sampled in the east-central part of the same belt (locality ES, Fig. 1C). In the Bahia Honda zone (Fig. 1A), basalts and deposits of the Aptian-Albian (Zalepughin et al., 1982) Encruci- jada Formation were sampled at least at fifteen strati- graphic levels along a section in the Las Pozas River valley (locality EN, Fig. 1C). Coniacian-Santonian (Furrazola-Bermudez et al., 1978) probably to early Campanian (Florez Abin, 1983) tufts and basalts of the Orozco Formation were sampled from two small shallow pits about 10 km apart (sites OR-1 and OR-2, Fig. 1C).
In total, about 140 hand-samples oriented with magnetic compass were taken in the Guaniguanico and Bahia Honda zones. One hand-sample was taken at a stratigraphic level, sampling points being spaced 1-5 m in cross section. Thus, each site or section represents a part of a formation up to 100 m thick. Only the Pons Formation was sampled from two
limbs of a fold for a fold test; in the other cases, only smaller structural variations were found.
We also collected about 80 hand-samples from terrigenous rocks of the Early Jurassic-middle Ox- fordian San Cayetano Formation at two sites (SC-1 and SC-2), limestones of the Late Jurassic Artemisa Formation at five sites (AR-1 to AR-5) and fine- grained sandstones of the Valanginian-Aptian Polier Formation at four sites (P-1 to P-4, Fig. 1B-C). These rocks yielded no meaningful results due to their weak magnetization and /o r large scatter of paleomagnetic data.
2. Treatments
One or two, sometimes three specimens from each hand-sample were studied. Volcanics of the E1 S~balo, Encrucijada and Orozco formations were subjected to stepwise thermal cleaning in a home- made oven and measured on a Czechoslovakian spinner magnetometer JR-4 in the Paleomagnetic Laboratory in Moscow. Sediments of the Pons, Moreno and Carmita formations were thermally de- magnetized and measured on a CTF cryogenic mag- netometer in the Paleomagnetic Laboratory in Paris. Isolated magnetization components (Kirschvink, 1980) from each specimen were used for computa- tion of sample means, which in turn were used for calculation of formation means. Converging remag- netization circles (Halls, 1976) were used at speci- men level.
3. Results
3.1. The P o n s F o r m a t i o n
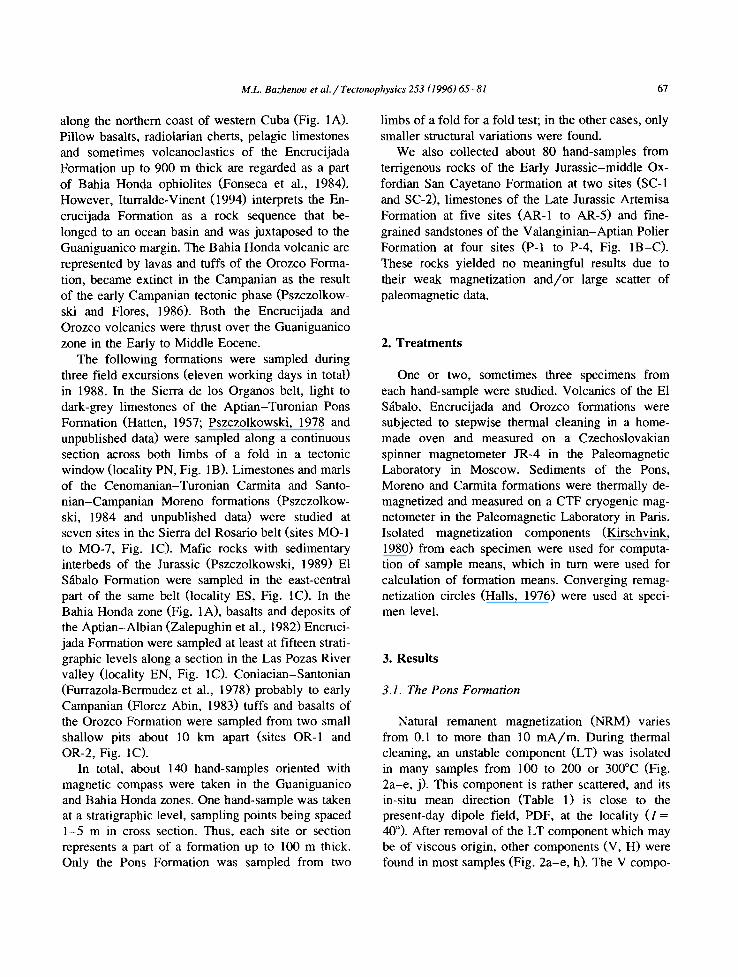
Natural remanent magnetization (NRM) varies from 0.1 to more than 10 m A / m . During thermal cleaning, an unstable component (LT) was isolated in many samples from 100 to 200 or 300°C (Fig. 2a-e, j). This component is rather scattered, and its in-situ mean direction (Table 1) is close to the present-day dipole field, PDF, at the locality ( I = 40°). After removal of the LT component which may be of viscous origin, other components (V, H) were found in most samples (Fig. 2a-e, h). The V compo-
68 M.L. Bazhenoo et al. / Tectonophysics 253 (1996) 65-81
W
32
o
Up a wj i~_~ ~- -N 42O 45OC V
11~t5L T1-4
N ~ 153-3
L . 1 o -2A/, m " ~
NRMoJ ~'10o
o
.~s,4 I i iN
39O
• -3
L ~ l o o
"S 490; N
>V 28c > 166-3
~o- LT
1oo
E Down EDown E ;)own E- Down
W, Up e f W Up h ! ~ ~o Ji w/up S i . I " N ' s50 N 4~"
. : ". . s , , . . ~ , ~ J ~ . V~!i 144-3 V\ / + . . . . ~ "-~"/r-=- ' 'J 'P(- E
- ; 200 :E .,r ~ - , , L v k ~,^ , f . . . : :o :~: - : .... I.. ' ~ c J ____ _ \,, \l.O-.t . . . . : : / ~ : . . . . 7° \~,owu,
' 80 E-Down E Down ~20o E ;)own
W
E
up i
32Z 10 "2Nm I I I
Down
N
i
N
M.L. Bazhenov et aL / Tectonophysics 253 (1996) 65-81 69
N N
w ~ + + + + + + . . + . t + + + + + + + + j ~++ + . . ~ + > a + + + + + * + ~ \ • : / \ -;'_ /
4- C .4-
.4-
.4-
.4-
.4-
w ~- E +
.4-
.4-
.4-
+ . o ' ...... '?
+
.4-
/ / - .4- \ ~
I I + If\
/ , ®.4- -~'~l,~ ~, ' ,+ ; , , W ~ + + + + + + + + + + + + + + m ~ 4 ~ t + + + + + +-~.+___.-e'+ + + i . ÷ + + E
. . . /
$ s
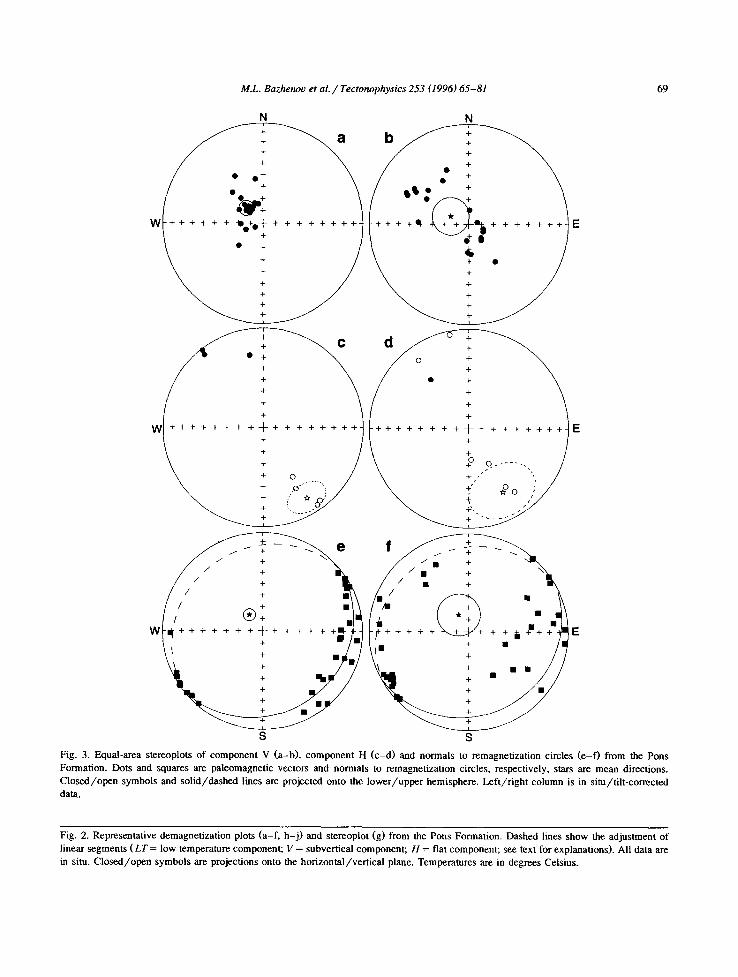
Fig. 3. Equal-area stereoplots of component V (a-b), component H (c -d) and normals to remagnetization circles (e - f ) from the Pons Formation. Dots and squares are paleomagnetic vectors and normals to remagnetization circles, respectively, stars are mean directions. Closed/open symbols and solid/dashed lines are projected onto the lower/upper hemisphere. Left/right column is in situ/tilt-corrected data.
Fig. 2. Representative demagnetization plots (a-f , h- j ) and stereoplot (g) from the Pons Formation. Dashed lines show the adjustment of linear segments (LT = low temperature component; V = subvertical component; H = flat component; see text for explanations). All data are in situ. Closed/open symbols are projections onto the horizontal/vertical plane. Temperatures are in degrees Celsius.
70 M.L. Bazhem~v et al. / Tectonophysics 253 (1996)65-81
nent has always the normal polarity and is much better grouped in situ than after tilt correction (Fig. 3a, b); the fold test (McFadden and Jones, 1981) unambiguously points to its postfolding age (Table 1). Usually, component V shows rectilinear decay to the origin (Fig. 2a-d). In five samples, however, still another component could be recognized (Fig. 2e-h). The third component (H) accounts for just a few
percents of the NRM intensity and has a shallow inclination with two polarities (Fig. 3c, d). Surpris- ingly enough, only a shallow component was found in two samples where it accounts for a larger part of the NRM intensity (Fig. 2i, j). These seven shallow directions are better grouped in geographic coordi- nates, and the fold test (McElhinny, 1964) points to a postfolding origin of component H (Table 1).
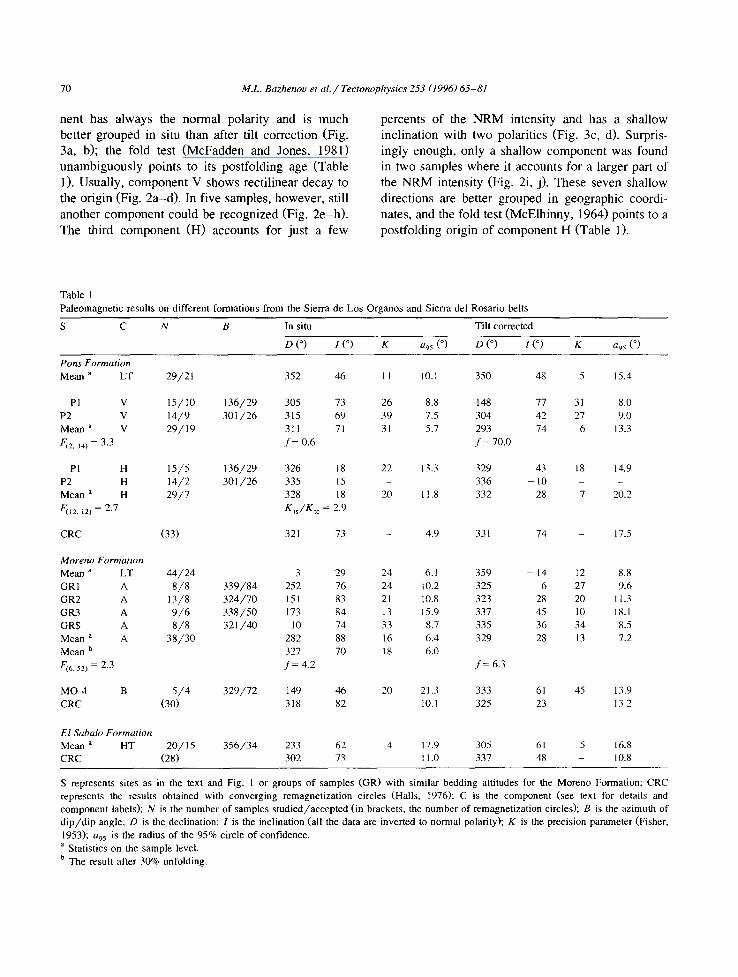
Table 1 Paleomagnetic results on different formations from the Sierra de Los Organos and Sierra del Rosario belts
S C N B In situ Tilt corrected
D (°) I (o) K a95 (°) D (o) 1 (°) K a95 (o)
Pans Formation Mean ~ LT 29/21 352 46 11 10.1
PI V 15/10 136/29 305 73 26 8.8
P2 V 14 /9 301 /26 315 69 39 7.5 Mean a V 29 /19 311 71 31 5.7
~2, 3~) = 3.3 f = 0.6
PI H 15/5 136/29 326 18 22 13.3 P2 H 14/2 301/26 335 15 - - Mean a H 2 9 / 7 328 18 20 11.8
F(12.12 ) = 2.7 Kis/Ktc = 2.9
350 48 5 15.4
148 77 31 8.0 304 42 27 9.0 293 74 6 13.3
f = 70.0
329 43 18 14.9 336 - 1 0 - - 332 28 7 20.2
CRC (33) 321 73 - 4.9 331 74 - 17.5
Moreno Formation Mean a LT 4 4 / 2 4 3 29 24 6. I GRI A 8 / 8 339 /84 252 76 24 10.2 GR2 A 13/8 324 /70 151 83 21 10.8 GR3 A 9 / 6 338 /50 173 84 13 15.9 GR$ A 8 / 8 321/40 10 74 33 8.7 Mean a A 38 /30 282 88 16 6.4 Mean u 327 70 18 6.0
/7(6.52) = 2.3 f = 4.2
359 - 1 4 12 8.8 325 6 27 9.6 323 28 20 11.3 337 45 10 18.1 335 36 34 8.5 329 28 13 7.2
f = 6 . 3
MO-4 B 5 / 4 329 /72 149 46 20 21.3 333 61 45 13.9 CRC (30) 318 82 10.1 325 23 13.2
El Sabalo Formation Mean a HT 20/15 356 /34 233 62 4 17.9 305 61 5 16.8 CRC (28) 302 73 - 11.0 337 48 - 10.8
S represents sites as in the text and Fig. 1 or groups of samples (GR) with similar bedding attitudes for the Moreno Formation; CRC represents the results obtained with converging remagnetization circles (Halls, 1976); C is the component (see text for details and component labels); N is the number of samples studied/accepted (in brackets, the number of remagnetization circles); B is the azimuth of d ip /d ip angle; D is the declination; 1 is the inclination (all the data are inverted to normal polarity); K is the precision parameter (Fisher,
1953); 095 is the radius of the 95% circle of confidence. a Statistics on the sample level. u The result after 30% unfolding.
M.L. Bazhenou et al. / Tectonophysics 253 (1996) 65-81 71
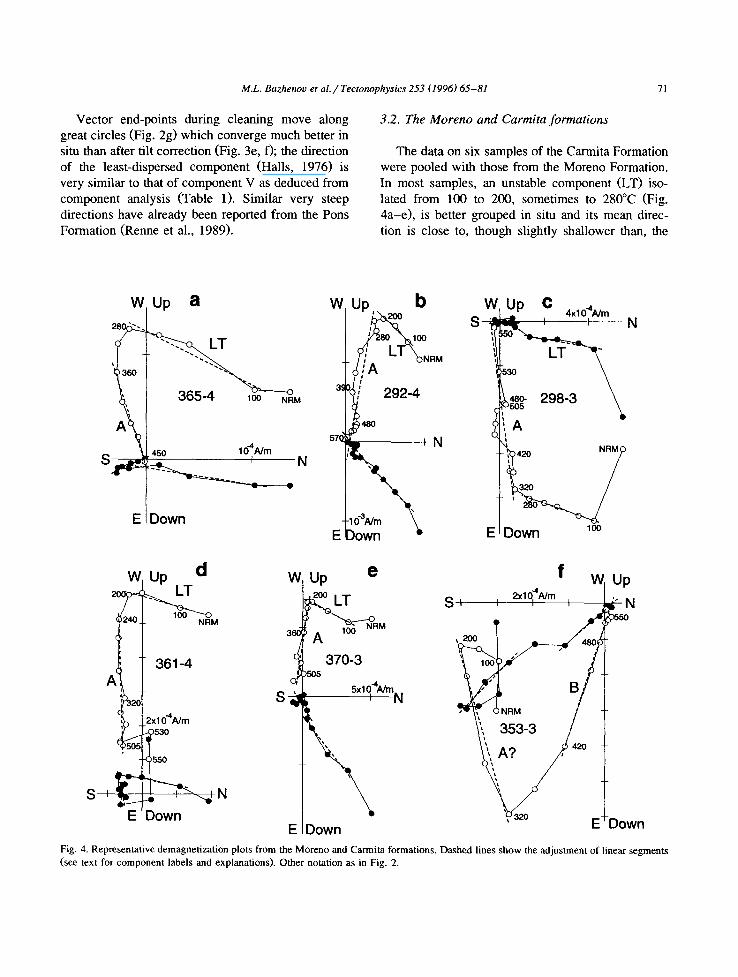
Vector end-points during cleaning move along great circles (Fig. 2g) which converge much better in situ than after tilt correction (Fig. 3e, f); the direction of the least-dispersed component (Halls, 1976) is very similar to that of component V as deduced from component analysis (Table 1). Similar very steep directions have already been reported from the Ports Formation (Renne et al., 1989).
3.2. The Moreno and Carmita formations
The data on six samples of the Carmita Formation were pooled with those from the Moreno Formation. In most samples, an unstable component (LT) iso- lated from 100 to 200, sometimes to 280°C (Fig. 4a-e), is better grouped in situ and its mean direc- tion is close to, though slightly shallower than, the
.W. Up a WUp, b
- - o . . ,
A ~ ,,.~vo-w. ,w NRM ~ll480 292-4
IN 450 10"4Nm , ~ S r N STO_ ,~
E Down *
W S '"
E
Up C 4xl 0"4Nm ---" i ~ N .T\ ; : o - 298-3 \ u505 . . . .
A I
Down 1oo
S
W Jp d
A ~ _ 361-4
=rc~20 Zxl0-4Nm
E Down
W Up e
360 I~ NRM A
~ 370-3
5xl0"4Nm s N
E Down
S I
f W I 2X1Ol~Nm I
48£
100 "
E
Up
Down
Fig, 4. Representative demagnetization plots from the Moreno and Carmita formations. Dashed lines show the adjustment of linear segments (see text for component labels and explanations). Other notation as in Fig. 2.
72 M.L. Bazhenoo et aL / Tectonophysics 253 (1996)65-81
PDF direction for the area (Table 1); this component is probably of viscous origin. After removal of com- ponent LT, another component (A) was isolated from
most samples from sites MO-1-3, -5 and -6. In some cases, it decays to the origin (Fig. 4a, b); usually, however, it does not (Fig. 4c-e), thus implying that
N
W
W
S
N
¢++,+++++jE
k 0 4- 0 OO 0 / + 0 0 O + oOooO oO o/
~ + o ooo/ "~ +o o ~o7
d
E
+,,"" "k
) 0::<.!,
%.i.:- • /
S
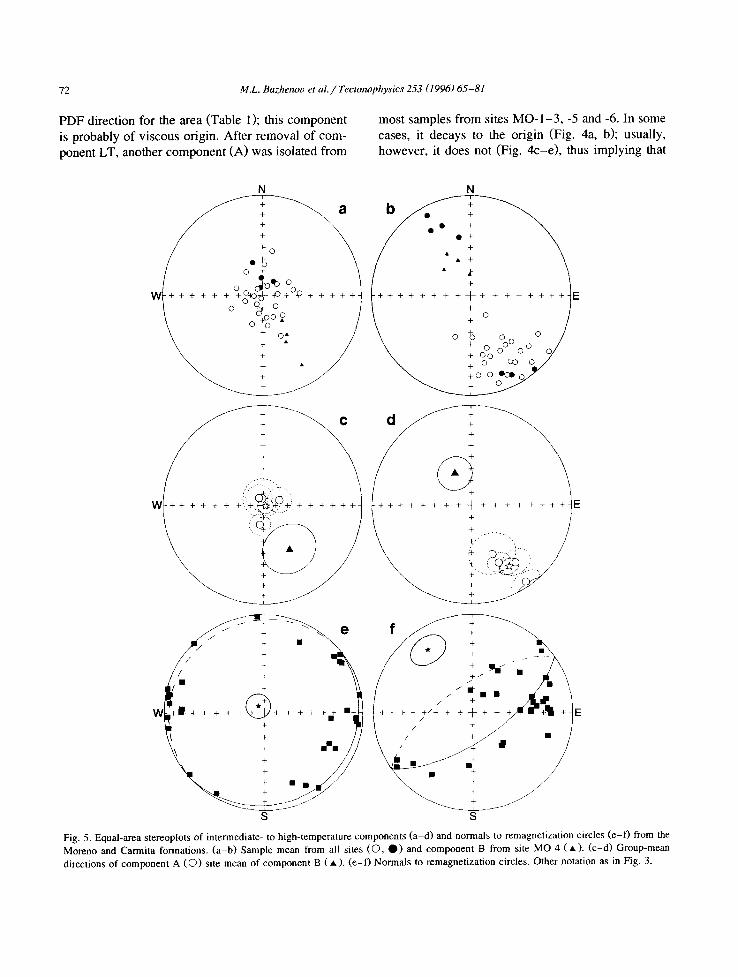
Fig. 5, Equal-area stereoplots of intermediate- to high-temperature components (a-d) and normals to remagnetization circles (e-f) from the Moreno and Carmita formations. (a-b) Sample mean from all sites (O , O ) and component B from site MO-4 (A) . (c-d) Group-mean directions of component A (O) site mean of component B ( • ) . (e- f ) Normals to remagnetization circles. Other notation as in Fig. 3.
M.L. Bazhenou et al. / Tectonophysics 253 (1996)65-81 73
still another component may be present. Unfortu- nately, the measurements often become erratic above 500°C (Fig. 4d) thus preventing further demagnetiza- tion.
A somewhat different demagnetization pattern was found at sites MO-4 and MO-7. At the latter, consis- tent results were obtained for component LT only, whereas components isolated at higher temperatures
were chaotic and therefore excluded from further analysis. In contrast, two consistent components were recognized at site MO-4. A component isolated from 200 to 320°C (Fig. 4f), sometimes to 350°C, how- ever, is quite different from the LT directions from other sites but very similar to those of component A from the other sites. Still another component (B) was resolved at this site above 400 ° (Fig. 4f).
N Up
1din 413-4
W I ~ i E
100e/T~ S Down
W
N Up
161Nm 530 I E H T ~ ' 1 0 0
i 300 S~ Down
N
53C -0"-
Up
424-4 /
5xl0"lA/m~ '
T,°°
Down 250.-350~
N Up
% I
- - " "~ ~",a 417-4 lolNm
S Down
E
W
N
I I , ~ ! a lOlAjm 550
Up
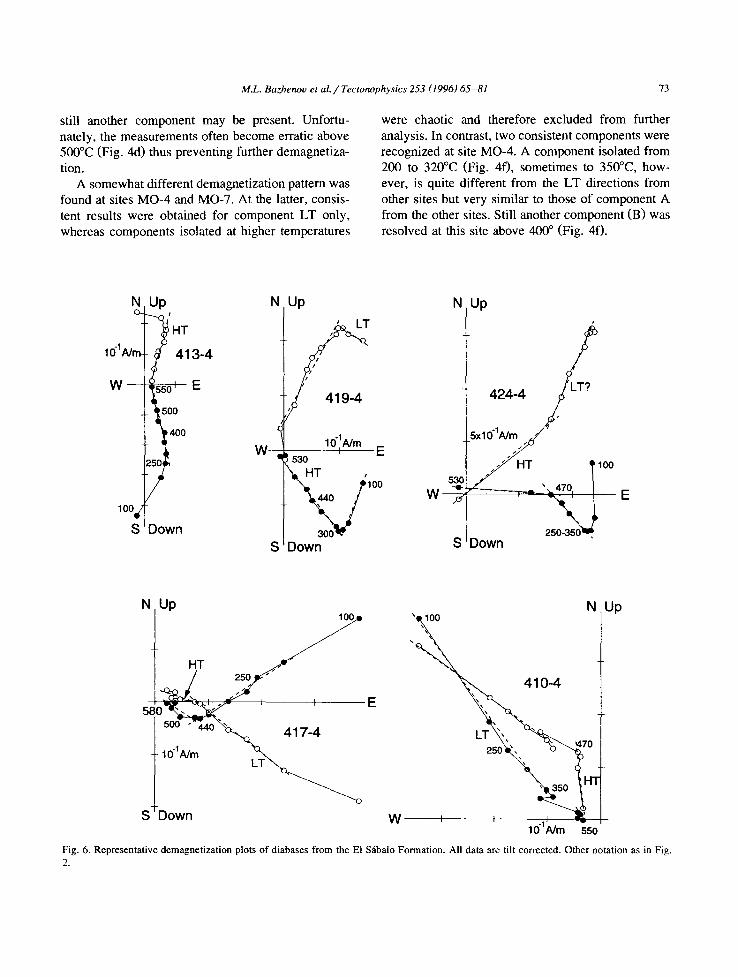
Fig. 6. Representative demagnetization plots of diabases from the El S~ibalo Formation. All data are tilt corrected. Other notation as in Fig. 2.
74 M.L. Bazhenoo et a l . / Tectoru~physics 253 (1996) 65-81
When directions of component A from sites MO- 1-3, -5 and -6 and both components from site MO-4 were plotted on the stereonet, most in-situ vectors proved to gravitate to the stereonet pole with the exception of high-temperature component B from site MO-4 (Fig. 5a, b). The intersection of remagne- tization circles defines a direction of the least-disper- sed component which is close to overall mean of subvertical component (Table 1).
The grouping of the subvertical directions is slightly, but not significantly better in situ than after tilt correction. Bedding attitudes differ considerably within each site, and the fold test (McFadden and Jones, 1981) could not be performed directly. So, all bedding measurements were pooled and then divided into four more compact groups, and the correspond- ing group means were calculated (Fig. 4c, d; Bazhenov and Shipunov, 1991). Even after this, the calculated statistics are larger than the critical ones thus precluding a definite conclusion on the rema- nence age. The best data grouping is achieved at 30% unfolding (Table 1), but the improvement of clustering is significant at the 90% level only with respect to the tilt-corrected data. At this stage of analysis, the only conclusion is that the subvertical component A in the Moreno sediments was acquired at the final stages of deformation; to the same effect speaks a better clustering of normals to remagnetiza- tion circles in situ than after tilt correction (Fig. 5e, f). This component is reversed in most samples but a few normal directions appear to be almost perfectly antipodal (Fig. 5a). The age of component B cannot be reliably established; it is worth noting, however, that the tilt-corrected directions of component B are close to in-situ directions of component A.
3.3. The El Sdbalo Formation
No meaningful results were derived from sedi- ments of this formation because of the NRM erratic behaviour during cleaning. In diabases, NRM inten- sity decreased several fold after heating to 100°; after that, one or often two components can be isolated in most samples (Fig. 6). With a few exceptions, com- ponent directions are consistent at the within-sample level. The scatter, however, is very high at the between-sample level: the LTC component is nearly chaotic with a precision parameter less than 2 both in
N
+ . \ \
- I + ' + + , + + , + , + + + I + I , I, :::, :' ?,' ,/ /
2,- : .7Y
$
Fig. 7. Equal-area stereoplot of normals to remagnetization circles from the E1 Sfibalo Formation. All data are in situ. Other notation as in Fig. 3.
situ and after tilt correction. The HTC component, though slightly better grouped (Table 1), is also very scattered and can hardly be used for interpretation.
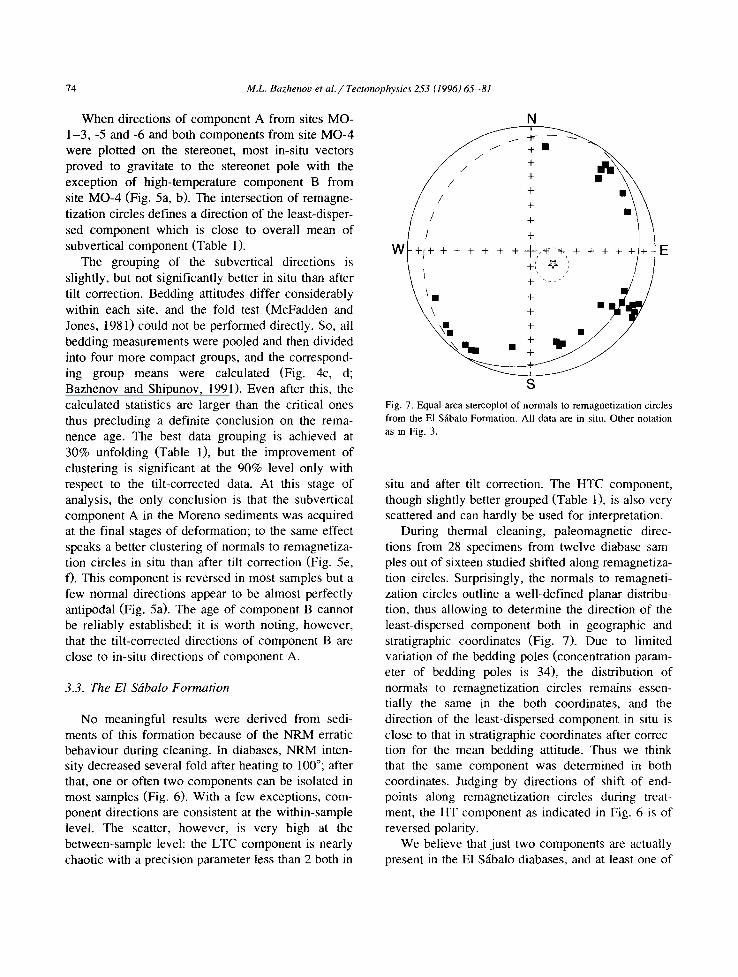
During thermal cleaning, paleomagnetic direc- tions from 28 specimens from twelve diabase sam- ples out of sixteen studied shifted along remagnetiza- tion circles. Surprisingly, the normals to remagneti- zation circles outline a well-defined planar distribu- tion, thus allowing to determine the direction of the least-dispersed component both in geographic and stratigraphic coordinates (Fig. 7). Due to limited variation of the bedding poles (concentration param- eter of bedding poles is 34), the distribution of normals to remagnetization circles remains essen- tially the same in the both coordinates, and the direction of the least-dispersed component in situ is close to that in stratigraphic coordinates after correc- tion for the mean bedding attitude. Thus we think that the same component was determined in both coordinates. Judging by directions of shift of end- points along remagnetization circles during treat- ment, the HT component as indicated in Fig. 6 is of reversed polarity.
We believe that just two components are actually present in the El S~ibalo diabases, and at least one of
M.L. Bazhenov et al. / Tectonophysics 253 (1996) 65-81 75
them has rather well clustered directions as evi- denced by converging remagnetization circles (Fig. 7), whereas the other is probably chaotic. The un- blocking spectra of these two components, however, are strongly overlapping and very variable. It may be due to strong weathering and lateritization; indeed,
the pillow-lava structure could be observed in com- pletely lateritized outcrops of this formation.
3.4. The Encrucijada Formation
No interpretable results were derived from sedi- ments because of weak magnetization and unstable
W
NRM
~ 1 I a I 2xl 0"lNm
320 500 ~ j '~
~ 268-1
N _Up
S
E
Down
_, c .1°o W _ ,.~ lO Nm __ f--
2off~ ~ ~ 324-1 S
ldZNrn d N I
. ~ " 320
NRM " :
. ~ ~ o o 326-1
S
Up E
52O
Down
W-
-1 N | Up W • I I I 2x101 Nm_~ ~1"- E
b '°°
oo/j 319-2
• NRM
S Down
10.2N m N Up W i i t I ~:1 E
,,. 520
280 331-1
Down
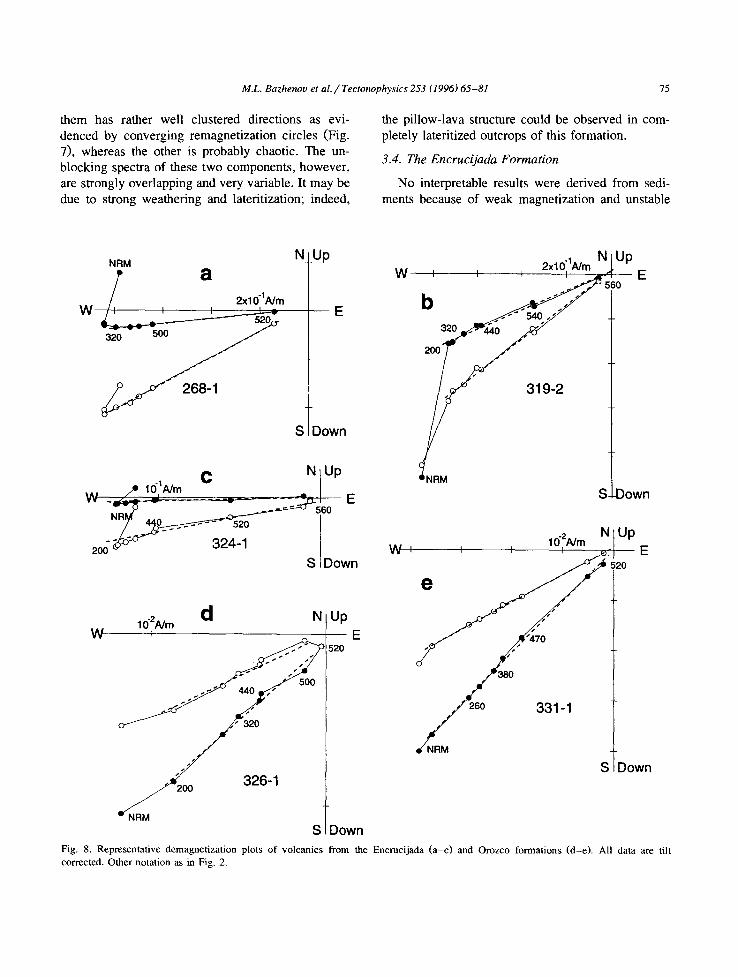
Fig. 8. Representative demagnetization plots of volcanics from the Encrucijada (a-c) and Orozco formations (d-e). All data are tilt corrected. Other notation as in Fig. 2.
76 M.L. Bazhemw et al. / Tectonophysics 253 (1996) 65-81
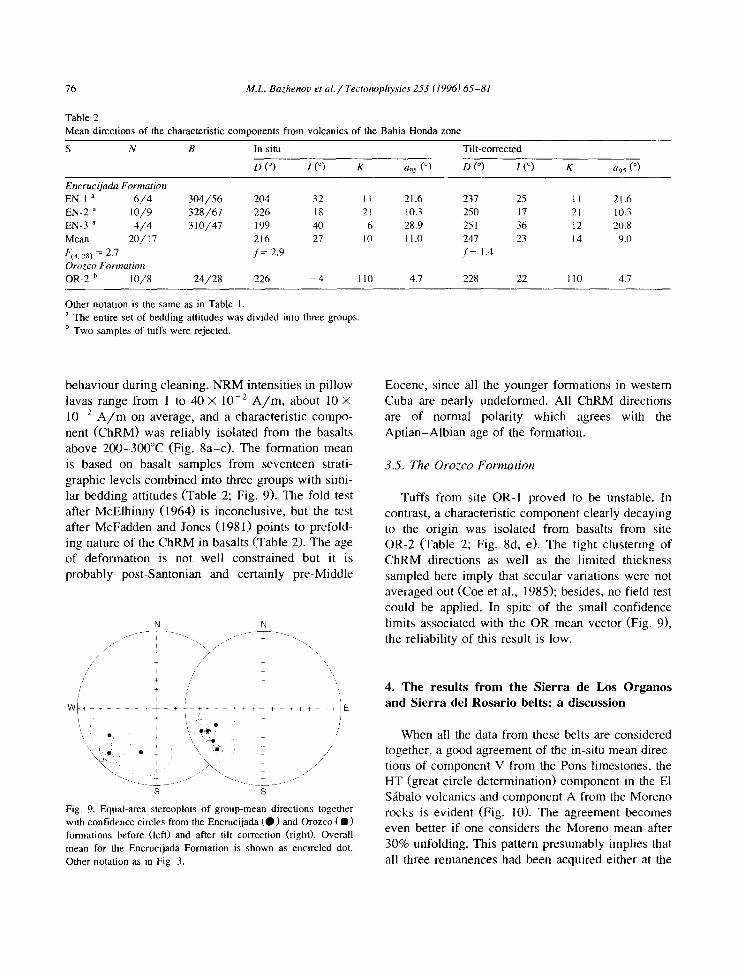
Table 2 Mean directions of the characteristic components from volcanics of the Bahia Honda zone
S N B In situ
D ( ° ) 1 ( ° ) K a9 5 ( o )
Tilt-corrected
D (°) I (°) K a95 (°)
Encrucijada Formation EN-1 a 6 /4 304/56 204 32 11 21.6 EN-2 a 10/9 328/67 226 18 21 10.3 EN-3 a 4 /4 310/47 199 40 6 28.9 Mean 20/17 216 27 10 11.0 F(< 28) = 2.7 f = 2.9 Orozco Formation OR-2 b 10/8 24/28 226 -- 4 110 4.7
237 25 11 21.6 250 17 21 10.3 251 36 12 20.8 247 23 14 9.0 f = 1.4
228 22 110 4.7
Other notation is the same as in Table 1. a The entire set of bedding attitudes was divided into three groups. b Two samples of tufts were rejected.
behav iour during cleaning. N R M intensit ies in pi l low lavas range f rom 1 to 40 × 10 -2 A / m , about 10 ×
10 -2 A / m on average, and a character is t ic compo-
nent ( C h R M ) was rel iably isolated f rom the basalts
above 2 0 0 - 3 0 0 ° C (Fig. 8 a - c ) . The format ion mean
is based on basalt samples f rom seventeen strati-
graphic levels combined into three groups with simi-
lar bedding attitudes (Table 2; Fig. 9). The fold test
after McElh inny (1964) is inconclus ive , but the test
after McFadden and Jones (1981) points to prefold- ing nature o f the C h R M in basalts (Table 2). The age
of deformat ion is not wel l constra ined but it is
probably post-Santonian and certainly pre -Middle
N
/ / + ~.. / / / /
/
+ / / +
I, ,,
' ' • + ?-±o i' \ . • + ,~ :;, ;
N
+ " \ , \
+ + + ~ k + - +
+ /
/ /
+~E
/
" - . e J - ~ - + J
s s
Fig. 9. Equal-area stereoplots of group-mean directions together with confidence circles from the Encrucijada (O) and Orozco ( • ) formations before (left) and after tilt correction (right). Overall mean for the Encrucijada Formation is shown as encircled dot. Other notation as in Fig. 3.
Eocene , since all the younger format ions in western
Cuba are nearly undeformed. All C h R M directions
are o f normal polari ty which agrees with the
A p t i a n - A l b i a n age o f the format ion.
3.5. The Orozco Format ion
Tufts f rom site OR-1 proved to be unstable. In
contrast, a characteris t ic componen t clearly decaying
to the origin was isolated f rom basalts f rom site OR-2 (Table 2; Fig. 8d, e). The tight clustering o f
C h R M direct ions as well as the l imited thickness
sampled here imply that secular variat ions were not
averaged out (Coe et al., 1985); besides, no field test
could be applied. In spite o f the small conf idence
l imits associated with the O R mean vector (Fig. 9), the reliabil i ty o f this result is low.
4. The results from the Sierra de Los Organos and Sierra del Rosario belts: a discussion
When all the data f rom these belts are considered together, a good agreement o f the in-situ mean direc-
tions o f componen t V f rom the Pons l imestones, the HT (great circle de terminat ion) componen t in the E1
S~balo vo lcan ics and c o m p o n e n t A f rom the Moreno
rocks is ev ident (Fig. 10). The agreement becomes even better if one considers the Moreno mean after
30% unfolding. This pattern presumably implies that
all three remanences had been acquired ei ther at the
M.L. Bazhenov et al . / Tectonophysics 253 (1996) 65-81 77
N
++ +
/ PONs-H \.. + s~ / '\, + sSS~
S S
I EL SAI~AL'Q~ ~ s I
s s / m "\
S j 'S S \'~,
$
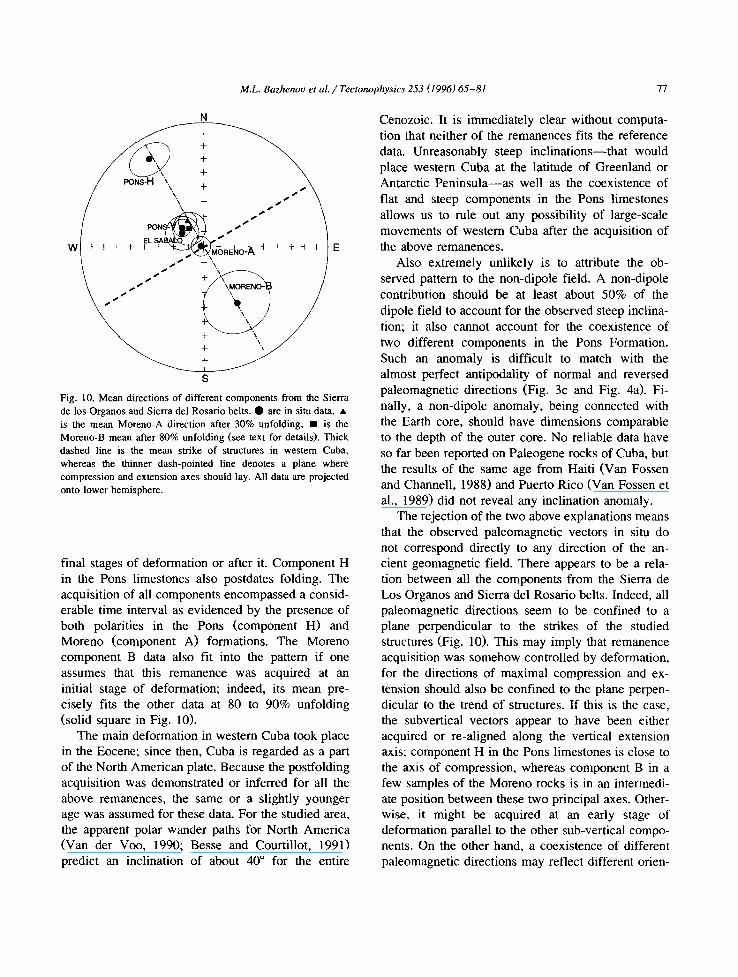
Fig. 10. Mean directions of different components from the Sierra de los Organos and Sierra del Rosario belts. • are in situ data, • is the mean Moreno-A direction after 30% unfolding, • is the Moreno-B mean after 80% unfolding (see text for details). Thick dashed line is the mean strike of structures in western Cuba, whereas the thinner dash-pointed line denotes a plane where compression and extension axes should lay. All data are projected onto lower hemisphere.
final stages of deformation or after it. Component H in the Pons limestones also postdates folding. The acquisition of all components encompassed a consid- erable time interval as evidenced by the presence of both polarities in the Pons (component H) and Moreno (component A) formations. The Moreno component B data also fit into the pattern if one assumes that this remanence was acquired at an initial stage of deformation; indeed, its mean pre- cisely fits the other data at 80 to 90% unfolding (solid square in Fig. 10).
The main deformation in western Cuba took place in the Eocene; since then, Cuba is regarded as a part of the North American plate. Because the postfolding acquisition was demonstrated or inferred for all the above remanences, the same or a slightly younger age was assumed for these data. For the studied area, the apparent polar wander paths for North Amer ica (Van der Voo, 1990; Besse and Courtillot, 1991) predict an inclination of about 40 ° for the entire
Cenozoic. It is immediately clear without computa- tion that neither of the remanences fits the reference data. Unreasonably steep inc l ina t ions - - tha t would place western Cuba at the latitude of Greenland or Antarctic P e n i n s u l a - - a s well as the coexistence of flat and steep components in the Pons l imestones allows us to rule out any possibil i ty of large-scale movements of western Cuba after the acquisition of the above remanences.
Also extremely unlikely is to attribute the ob- served pattern to the non-dipole field. A non-dipole contribution should be at least about 50% of the dipole field to account for the observed steep inclina- tion; it also cannot account for the coexistence of two different components in the Pons Formation. Such an anomaly is difficult to match with the almost perfect antipodality of normal and reversed paleomagnetic directions (Fig. 3c and Fig. 4a). Fi- nally, a non-dipole anomaly, being connected with the Earth core, should have dimensions comparable to the depth of the outer core. No reliable data have so far been reported on Paleogene rocks of Cuba, but the results of the same age from Haiti (Van Fossen and Channell, 1988) and Puerto Rico (Van Fossen et al., 1989) did not reveal any inclination anomaly.
The rejection of the two above explanations means that the observed paleomagnetic vectors in situ do not correspond directly to any direction of the an- cient geomagnetic field. There appears to be a rela- tion between all the components from the Sierra de Los Organos and Sierra del Rosario belts. Indeed, all paleomagnetic directions seem to be confined to a plane perpendicular to the strikes of the studied structures (Fig. 10). This may imply that remanence acquisition was somehow controlled by deformation, for the directions of maximal compression and ex- tension should also be confined to the plane perpen- dicular to the trend of structures. If this is the case, the subvertical vectors appear to have been either acquired or re-al igned along the vertical extension axis; component H in the Pons l imestones is close to the axis of compression, whereas component B in a few samples of the Moreno rocks is in an intermedi- ate position between these two principal axes. Other- wise, it might be acquired at an early stage of deformation parallel to the other sub-vertical compo- nents. On the other hand, a coexistence of different paleomagnetic directions may reflect different often-
78 M.L. Bazhenov et al. / Tectonophysics 253 (1996) 65-81
tation of the stress ellipsoid axes at different stages of deformation.
Such a pattern, however, has never been observed either in the field or laboratory experiments (Klig- field et al., 1983; Cogne and Perroud, 1987). The strain hypothesis, however, infers strong internal de- formation, but neither cleavage nor other types of internal deformation were observed in either forma- tion. Besides, any internal deformation could hardly be so uniform as to result in close agreement of paleomagnetic directions from the sections about 100 km apart. Anisotropy of magnetic susceptibility might have been of help for testing the strain hypothesis; unfortunately, these sediments are very weakly mag- netized, and AMS measurements could not be per- formed. Nevertheless, the hypothesis that observed pattern of paleomagnetic directions is related to the deformational process cannot now be discarded.
In principle, it is possible that the studied forma- tions were tilted after thrusting and folding and acquisition of remanence because the precise posi- tion of a rock mass with respect to the paleohorizon- tal is unknown for a postfolding component. Actu- ally, tilt correction does shift the Moreno and El Sfibalo remanences to more "reasonable" intermedi- ate inclinations (about 40°). Moreover, it does not contradict the above conclusion on the postfolding age of magnetization, because minor variations in the bedding of the Moreno Formation may in fact be older than the general northward tilt, whereas the E1 Sfibalo volcanics are essentially monoclinal. The magnitude of the required tilt is about 30 ° northward. Some geological data also favour post-remagnetiza- tion tilt (e.g., stronger uplift of the Sierra de los Organos belt compared to the Sierra del Rosario belt, and the continuing compression during the post-Mid- dle Eocene uplift of the cordillera (Pszczolkowski, 1994).
It is more difficult, however, to fit the Ports data into this pattern. First, this formation is exposed on two gentle-dipping limbs of a fold with NE-SW- striking horizontal fold axis. A large tilt after folding and remagnetization would have resulted in a struc- ture more complex before this tilt than after it, which is unlikely. Second, the component H data remain unaccounted for. Nevertheless, at this time, we can- not definitely either prove or rule out the post-re- magnetization tilt hypothesis.
5. Tectonic implications of the data from the Bahia Honda zone
The results from the Encrucijada (EN) and Orozco (OR) formations from the Bahia Honda zone appear to be mutually consistent (Fig. 9): the tightly clus- tered OR vectors fall within the more diffuse EN data, though the corresponding means are signifi- cantly different in declination. The ChRM in the Encrucijada volcanics is shown to predate deforma- tion. The EN and OR means before and after tilt correction are far away from either the present-day field or the previously discussed postfolding compo- nents from the zones to the south. The normal polar- ity of the observed ChRM's agrees with the age of these rocks and the ChRM acquisition during the Cretaceous quiet interval. Therefore, the ChRM's in the Encrucijada and Orozco formations are at least pre-Middle Eocene in age and probably primary.
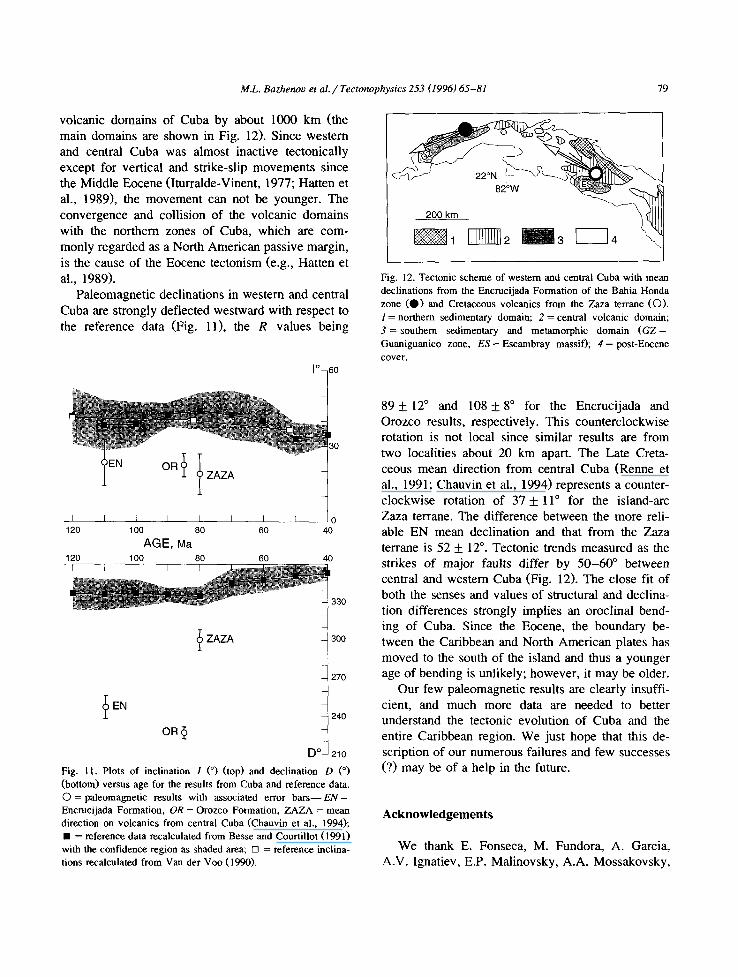
We compared our data with the apparent polar wander path for the North American plate (Van der Voo, 1990; Besse and Courtillot, 1991) and com- puted flattening, F, rotation, R, and their confidence limits as suggested by Demarest (1983). The EN and OR mean inclinations are shallower than the refer- ence inclinations, although the confidence interval of the former slightly overlaps that of the reference curve (Fig. 11). Also shown here is the Late Creta- ceous result from the island-arc Zaza terrane of central Cuba (Renne et al., 1991; Chauvin et al., 1994) which is consistent with our data and also shallower than the reference data. Because of differ- ence in ages of these three results, it is difficult to precisely calculate the F value and its confidence limits. As an approximation, the F value is about 15-20 ° .
This observed pattern is important in two rela- tions. First, it is robust with respect to remanence ages: even assuming an Eocene age for the rema- nence in these Cretaceous rocks leaves the inclina- tions shallower than the reference ones, though the F value diminishes. Second, it cannot result from erro- neous tilt corrections, since the in-situ inclinations from western (Table 2) and central (Chauvin et al., 1994) Cuba are close to or shallower than the tilt- corrected ones.
Thus we come to the conclusion that the calcu- lated F value represents a northward transport of the
M.L. Bazhenov et al. / Tectonophysics 253 (1996) 65-81 79
volcanic domains of Cuba by about 1000 km (the main domains are shown in Fig. 12). Since western and central Cuba was almost inactive tectonically except for vertical and strike-slip movements since the Middle Eocene (Iturralde-Vinent, 1977; Hatten et al., 1989), the movement can not be younger. The
convergence and collision of the volcanic domains with the northern zones of Cuba, which are com- monly regarded as a North American passive margin, is the cause of the Eocene tectonism (e.g., Hatten et
al., 1989). Paleomagnetic declinations in western and central
Cuba are strongly deflected westward with respect to the reference data (Fig. 11), the R values being
io 00
120 100 80 60 4 0
AGE, Ma 120 100 80 60 40
- 330
ZAZA - 3oo
- 270
E N - 240
OR ~
D °-- 21o
Fig. I I. Plots of inclination I (°) (top) and declination D (o)
(bottom) versus age for the results from Cuba and reference data. O = paleomagnetic results with associated error bars--EN =
Encrucijada Formation, OR = Orozco Formation, ZAZA = mean direction on volcanics from central Cuba (Chauvin et al., 1994); • = reference data recalculated from Besse and Courtillot (1991) with the confidence region as shaded area; [] = reference inclina- tions recalculated from Van der Voo (1990).
200 km
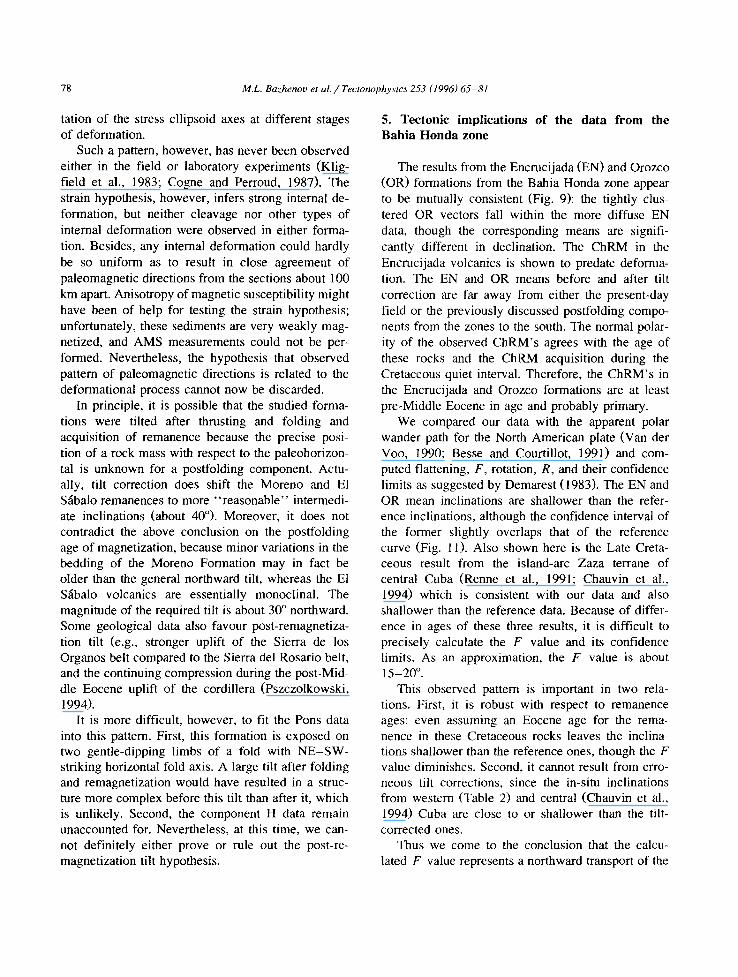
82°W
Fig. 12. Tectonic scheme of western and central Cuba with mean declinations from the Encrucijada Formation of the Bahia Honda zone (O) and Cretaceous volcanics from the Zaza terrane (O). 1 = northern sedimentary domain; 2 = central volcanic domain; 3 = southern sedimentary and metamorphic domain ( G Z =
Guaniguanico zone, ES = Escambray massif); 4 = post-Eocene cover.
8 9 ± 12 ° and 108 + 8 ° for the Encrucijada and Orozco results, respectively. This counterclockwise rotation is not local since similar results are from two localities about 20 km apart. The Late Creta- ceous mean direction from central Cuba (Renne et al., 1991; Chauvin et al., 1994) represents a counter- clockwise rotation of 37 ± 11 ° for the island-arc Zaza terrane. The difference between the more reli- able EN mean declination and that from the Zaza terrane is 52 ± 12 °. Tectonic trends measured as the strikes of major faults differ by 5 0 - 6 0 ° between central and western Cuba (Fig. 12). The close fit of both the senses and values of structural and declina- tion differences strongly implies an oroclinal bend- ing of Cuba. Since the Eocene, the boundary be- tween the Caribbean and North American plates has moved to the south of the island and thus a younger age of bending is unlikely; however, it may be older.
Our few paleomagnetic results are clearly insuffi- cient, and much more data are needed to better understand the tectonic evolution of Cuba and the entire Caribbean region. We just hope that this de- scription of our numerous failures and few successes (?) may be of a help in the future.
Acknowledgements
We thank E. Fonseca, M. Fundora, A. Garcia, A.V. Ignatiev, E.P. Malinovsky, A.A. Mossakovsky,
80 M.L. Bazhenov et al. / Tectonophysics 253 (1996) 65-81
G.E. Nekrasov, L. Penialver, M.L. Somin and I.V. Tsyganova for logistical support and assistance with field and laboratory work. The critical reviews by W.D. MacDonald, P.R. Renne, J.E.T. Channell, R. Van der Voo and an anonymous reviewer helped us to improve and clarify this paper. M.B. is very grateful to everybody in the Paleomagnetic Labora- tory in Paris. This study was partly supported by the Earth Crust Commission of the Academies of Sci- ences of the East European countries.
IPGP contribution NS 1374.
References
Bazhenov, M.L. and Shipunov, S.V,, 1991. Fold test in paleomag- netism: new approaches and reappraisal of data. Earth Planet. Sci. Lett., 104: 16-24.
Besse, J. and Courtillot, V., 1991. Revised and synthetic polar wander paths of the African, Eurasian, North American and Indian plates, and true polar wander since 200 Ma. J. Geo- phys. Res., 96: 4029-4050.
Chauvin, A., Bazhenov, M.L. and Beaudouin, T., 1994. A recon- naissance paleomagnetic study of Cretaceous rocks from cen- tral Cuba. Geophys. Res. Lett., 21: 1691-1694.
Coe, R.S., Globerman, B.R., Plumley, P.W. and Thrupp, G.A., 1985. Paleomagnetic results from Alaska and their tectonic implications. In: D.G. Howell (Editor), Tectonostratigraphic Terranes of the Circum-Pacific Region. Circum-Pac. Counc. Energy Miner. Resour., Earth Sci. Ser., 1: 85-108.
Cogne, J.-P. and Perroud, H., 1987. Unstraining paleomagnetic vectors: the current state of debate. EOS Trans. Am. Geophys. Union, 68(705): 711-712.
Demarest, H.H. Jr., 1983. Error analysis for the determination of tectonic rotation from paleomagnetic data. J. Geophys. Res., 88: 4321-4328.
Fisher, R.A., 1953. Dispersion on a sphere. Proc. R. Soc. London, Ser. A., 217: 295-305.
Florez Abin, E., 1983. Radiolarios de algunas formaciones del Cretacico-Paleogeno Inferior de Cuba occidental. Cienc. Tierra Espacio, 7: 3-36.
Fonseca, E., Zalepughin, V. and Heredia, M., 1984. Particulari- dades de la estructura de la asociacion ofiolitica de Cuba. Cienc. Tierra Espacio, 9: 31-46.
Furrazola-Bermudez, G., Sanchez Arango, R., Garsia, R. and Basov, V.A., 1978. Nuevo esquema de correlacion estrati- grafica de las principales formaciones geologicas de Cuba. Mineria Cuba, 4: 36-52.
Gose, W.A., 1985. Caribbean tectonics from a paleomagnetic perspective. In: Great American Biot. Interchange. New York, NY, London, pp. 281-301.
Hatten, C.W., 1957. Geologic report of the Sierra de los Organos. Fondo Geologico, Havana (unpubl.).
Halls, H.C., 1976. A least-squares method to fmd a remanence direction from converging remagnetization circles. Geophys. J. R. Astron. SOC., 45: 297-304.
Hatten, C.W., 1967. Principal features of Cuban geology: Discus- sion. Am. Assoc. Pet. Geol. Bull., 51: 780-789.
Hatten, C.W., Somin, M.L., Millan, G., Renne, P.R., Kistler, R.W. and Mattison, J.M., 1989. Tectonostratigraphic units of Central Cuba. Trans. 1 lth Caribb. Geol. Conf., Barbados, 35: 1-14.
lturralde-Vinent, M.A., 1977. Los movimientos tectonicos de la etapa de desarrollo plataformico en Cuba. Acad. Cienc. Cuba, Inf. Cienc. Tecn., 20: 1-24.
lturralde-Vinent, M.A., 1994. Cuban geology: a new plate-tectonic synthesis, J. Pet. Geol., 17: 39-70.
Kirschvink, J.L., 1980. The least-square line and plane and the analysis of palaeomagnetic dam. Geophys. J. R. Astron. Soc., 62: 699-718.
Kligfield, R., Lowrie, W., Hirt, A. and Siddans, A.W.B., 1983. Effect of progressive deformation on remanent magnetization of Permian red beds from the Alps Maritime (France). Tectonophysics, 97: 59-85.
MacDonald, W.D., 1990. Survey of Caribbean paleomagnetism. In: G. Dengo and J.E. Case (Editors), The Caribbean Region. (The Geology of North America, vol. H.) Geol. Soc. Am., Boulder, CO, pp. 395-404.
McElhinny, M.W., 1964. Statistical significance of the fold test in palaeomagnetism. Geophys. J. R. Astron. Soc., 8: 338-340.
McFadden, P.L. and Jones, D.L,, 1981. The fold test in palaeo- magnetism. Geophys. J. R. Astron. Soc., 67: 53-58.
Pardo, G., 1975. Geology of Cuba. In: A.E.M. Naim and F.G. Stehli (Editors), The Ocean Basins and Margins, Vol. 3 - - The Gulf of Mexico and the Caribbean. Plenum Press, New York-London, pp. 553-615.
Perez Lazo, J., Fundora Granda, M., Garcia Rivero, A.E. and Ferran Cruz, C., 1989. Investigaciones paleomagneticas en Cuba. Implicaciones tectonicas. 1st Congr. Cubano Geol. Ha- vana, Resum. Progr., pp. 207-208.
Piotrowska, K., 1978. Nappe structures in the Sierra de los Organos, western Cuba. Acta Geol. Pol., 28: 97-170.
Pszczolkowski, A., 1977. Nappe structure of Sierra del Rosario (Cuba). Bull. Acad. Polon. Sci., Ser. Sci. Terre, 24: 205-215.
Pszczolkowski, A., 1978. Geosynclinal sequences of the Cordillera de Guaniguanico in Western Cuba: their lithostratigraphy, facies development and paleogeography. Acta Geol. Polon,, 28: 1-96.
Pszczolkowski, A., 1984. Nuevos datos sobre la litoestratigrafia de los sedimentos del Cretacico y Paleogeno de la Sierra del Rosario, provincia de Pinar del Rio. X Jornada Cientifica, Inst. Geol. Paleontol., Acad. Cienc. Cuba, Resum. 37.
Pszczolkowski, A., 1989. La edad y posicion de la secuencia vulcanogeno-sedimentaria (Formacion El S~ibalo) en la estruc- tura geologica de la Sierra del Rosario (Cuba occidental). 1st Congr. Cubano Geol. Resum. Progr., Havana, p. 66.
Pszczolkowski, A., 1994. Interrelationship of the terranes in west- ern and central Cuba - - Comment. Tectonophysics, 234: 339-344.
Pszczolkowski, A. and Flores, R., 1986. Fases tectonicas del
M.L. Bazhenou et al. / Tectonophysics 253 (1996)65-8l 81
Cretacico y del Paleogeno en Cuba occidental y central. Bull. Pol. Acad. Sci., 34: 95-111.
Renne, P.R., Scott, G.R., Linares Cala, E. and Hatten, C.W., 1989. Paleomagnetic results from Jurassic-Cretaceous rocks of the Zaza terrane and Pinar del Rio province. 1st Congr. Cubano Geol. Resum. Progr. Havana, p. 109.
Renne, P.R., Scott, G.R., Doppelhammer, S.K., Linares Cala, E. and Hargraves, R.B., 1991. Discordant mid-Cretaceous paleo- magnetic pole from the Zaza terrane of Central Cuba. Geo- phys. Res. Lett., 18: 455-458.
Rigassi-Studer, D., 1963. Sur la geologie de la Sierra de los Organos, Cuba. Arch. Sci., Soc. Phys. Hist. Nat. Geneve, 16: 339-350.
Van der Voo, R., 1990. Phanerozoic paleomagnetic poles from Europe and North America and comparisons with continental reconstructions. Rev. Geophys., 28: 167-206.
Van Fossen, M.C. and Channell, J.E.T., 1988. Paleomagnetism of Late Cretaceous and Eocene limestones and chalks from Haiti. Tectonics, 7: 601-612.
Van Fossen, M.C., Channell, J.E.T. and Schelleckens, J.H., 1989. Paleomagnetic evidence for Tertiary anticlockwise rotation in Southwest Puerto Rico. Geophys. Res. Lett., 16: 819-822.
Zalepughin, V., Fonseca, E. and Diaz de Villalvilla, L., 1982. Asociaciones vulcanogenas de la provincia de Pinar del Rio. Ser. Geol. Cent. Invest. Geol., 6: 42-74.