lamp: the lyman alpha mapping project on nasa’s lunar reconnaissance orbiter mission
TRANSCRIPT
Space Sci Rev (2010) 150: 161–181DOI 10.1007/s11214-009-9578-6
LAMP: The Lyman Alpha Mapping Project on NASA’sLunar Reconnaissance Orbiter Mission
G. Randall Gladstone · S. Alan Stern · Kurt D. Retherford · Ronald K. Black ·David C. Slater · Michael W. Davis · Maarten H. Versteeg · Kristian B. Persson ·Joel W. Parker · David E. Kaufmann · Anthony F. Egan · Thomas K. Greathouse ·Paul D. Feldman · Dana Hurley · Wayne R. Pryor · Amanda R. Hendrix
Received: 10 October 2008 / Accepted: 6 October 2009 / Published online: 12 December 2009© Springer Science+Business Media B.V. 2009
Abstract The Lyman Alpha Mapping Project (LAMP) is a far-ultraviolet (FUV) imagingspectrograph on NASA’s Lunar Reconnaissance Orbiter (LRO) mission. Its main objectivesare to (i) identify and localize exposed water frost in permanently shadowed regions (PSRs),(ii) characterize landforms and albedos in PSRs, (iii) demonstrate the feasibility of usingnatural starlight and sky-glow illumination for future lunar surface mission applications, and(iv) characterize the lunar atmosphere and its variability. As a byproduct, LAMP will map alarge fraction of the Moon at FUV wavelengths, allowing new studies of the microphysicaland reflectance properties of the regolith. The LAMP FUV spectrograph will accomplishthese objectives by measuring the signal reflected from the night-side lunar surface and inPSRs using both the interplanetary HI Lyman-α sky-glow and FUV starlight as light sources.Both these light sources provide fairly uniform, but faint, illumination. With the expectedLAMP sensitivity, by the end of the primary 1-year LRO mission, the SNR for a Lyman-αalbedo map should be >100 in polar regions >1 km2, providing useful FUV constraintsto help characterize subtle compositional and structural features. The LAMP instrument is
G.R. Gladstone (�) · K.D. Retherford · R.K. Black · D.C. Slater · M.W. Davis · M.H. Versteeg ·K.B. Persson · T.K. GreathouseSouthwest Research Institute, 6220 Culebra Road, San Antonio, TX 78238, USAe-mail: [email protected]
S.A. Stern · J.W. Parker · D.E. Kaufmann · A.F. EganSouthwest Research Institute, 1050 Walnut Street, Suite 400, Boulder, CO 80302, USA
P.D. FeldmanThe Johns Hopkins University, 3400 North Charles Street, Baltimore, MD 21218, USA
D. HurleyThe Johns Hopkins University Applied Physics Laboratory, 111000 Johns Hopkins Road,Laurel, MD 20723, USA
W.R. PryorCentral Arizona College, 8470 North Overfield Road, Coolidge, AZ 85228, USA
A.R. HendrixJet Propulsion Laboratory, 4800 Oak Grove Drive, Pasadena, CA 91109, USA
162 G.R. Gladstone et al.
based on the flight-proven Alice series of spectrographs flying on the Rosetta comet missionand the New Horizons Pluto mission. A general description of the LAMP instrument and itsinitial ground calibration results are presented here.
Keywords Lunar · Ultraviolet · LRO · Lyman-α
1 Introduction
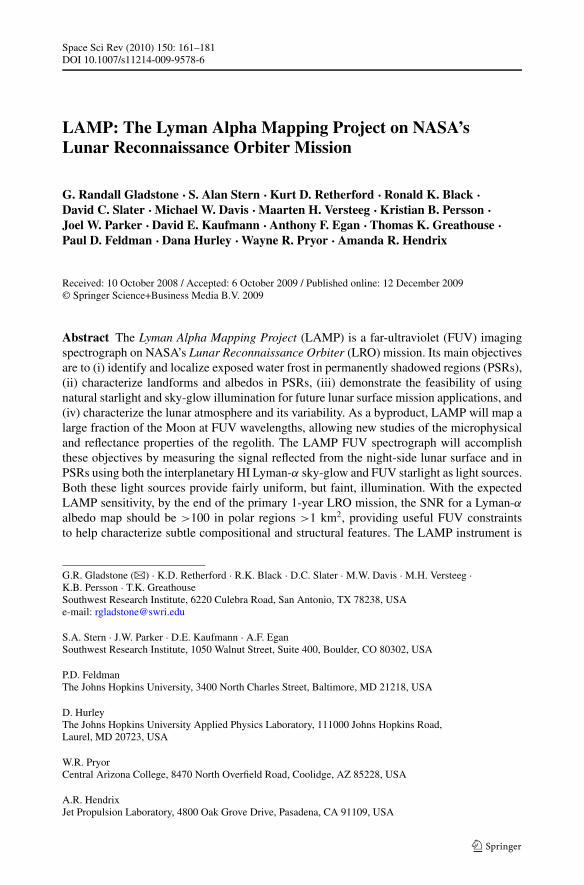
The Lunar Reconnaissance Orbiter (LRO) is the first of a series of missions planned byNASA to explore and characterize the Moon in anticipation of future human missions. TheLRO mission is tasked with satisfying precursor exploration objectives that will support fu-ture robotic and human landed missions. The specific goals of LRO are to: (1) establish thelunar radiation environment, (2) obtain a 3-D topographic grid with high spatial resolution,(3) assess the resources available near the lunar poles, and (4) obtain a global inventory ofelemental and mineralogical composition at high spatial resolution (Chin et al. 2007). With anominal reconnaissance mission of 1 year, LRO will have a 3-axis stabilized, nadir-pointingattitude and will maintain a circular polar orbit at an altitude of 30–70 km above the lunarsurface. The orbital period of LRO will be about 113 minutes, and the east longitude of theascending node will decrease by ∼1◦/orbit (∼12–13◦/day). A second year of science obser-vations with LRO is planned by NASA’s Science Mission Directorate (SMD); however, thespacecraft orbit during this mission phase is not yet finalized. Figure 1 illustrates LAMP’snominal nadir view of the lunar surface from the LRO spacecraft.
The objectives of the LAMP investigation are to (1) identify and localize exposed wa-ter frost in permanently shadowed regions (PSRs), (2) characterize landforms and albe-dos in PSRs, (3) demonstrate the feasibility of using natural starlight and sky-glow il-lumination for future lunar surface mission applications, and (4) characterize the lunaratmosphere and its variability. The LAMP instrument is a “close cousin” of the sensitive(∼1 Rayleigh level), lightweight (∼4 kg), low-power (∼4 W) Alice imaging ultravioletspectrograph (UVS) currently in flight on the ESA/NASA Rosetta comet orbiter (Stern et al.1998; Slater et al. 2001) and NASA New Horizons missions (Stern et al. 2005, 2008; Slateret al. 2005). LAMP will be the first UVS to operate in lunar orbit since that on the Apollo17 mission in 1972.
2 Scientific Objectives
It is commonly believed that the coldest sub-units of PSRs, where exposed volatiles are mostlikely to exist, are completely dark, since they are not even exposed to earthshine. However,this standard assumption that the coldest PSRs must be devoid of light is incorrect. Starlightprovides a faint but detectable light source at UV, visible and infrared wavelengths. More-over, at far-ultraviolet (FUV) wavelengths the entire sky is aglow, faintly illuminating thePSRs. The FUV light source illuminating all PSRs comes from resonance fluorescence ofsolar Lyman-α emission by neutral H atoms in the interplanetary heliosphere. This fluo-rescence generates a diffuse glow at the 121.6 nm H Lyman-α spectral line. The Lyman-αsky-glow has been studied extensively by spacecraft dating back over 35 years (e.g., Ajelloet al. 1987; Pryor et al. 2008), and its deleterious (sputtering and photolyzing) effect onexposed lunar H2O-ice has been appreciated for a long time as well (Morgan and She-mansky 1991). The brightness of the Lyman-α sky-glow as seen from Earth orbit varies
LAMP: The Lyman Alpha Mapping Project 163
Fig. 1 LAMP’s nadir-viewing geometry on LRO. The LAMP field of view of 0.3◦ × 6◦ results in a footprintof 260 m × 5.2 km from an altitude of 50 km
seasonally and with the Sun’s activity, but is typically a few hundred Rayleighs, whichcorresponds to a characteristic flux of ∼108 Lyman-α photons falling on each square cen-timeter of the lunar surface every second. Occasionally (e.g., when the Sun is active), theLyman-α sky brightness can be 2–3 times brighter. Even at a level well below the typical108 photons/cm2/sec, the Lyman-α sky line produces sufficient signal for even the smallLAMP instrument to see terrains in the Moon’s permanently shadowed regions. In additionto the Lyman-α sky-glow, the cumulative light from UV-bright (typically B spectral class)stars also provides weak but detectable night-side illumination (e.g., Mathis et al. 1983;Henry 2002). These two sources of illumination, along with the ability to observe the sunlitlunar atmosphere above a dark surface, allow us to address LAMP’s four main objectives.
2.1 Searching for Frost
The presence of an excess H signature in the lunar regolith, as detected by neutron spec-troscopy (Feldman et al. 2001), cannot guarantee the hydrogen is in the form of water(Crider and Vondrak 2003; Hodges 2002), especially as there is no supporting radar sig-nature (Simpson and Tyler 1999; Campbell et al. 2006). LAMP provides a way to spectrallyfingerprint exposed H2O frost in the lunar polar regions for the first time. This will be ac-complished using observations illuminated purely by Lyman-α sky-glow and broadbandFUV starlight. The lifetime of exposed water frost in polar cold traps is predicted to beshort, owing to regolith gardening and sputtering processes (Morgan and Shemansky 1991;Crider and Vondrak 2003). However, even if this is true, thin surface films of recently de-posited frost must exist in equilibrium set by the balance between source and loss rates to
164 G.R. Gladstone et al.
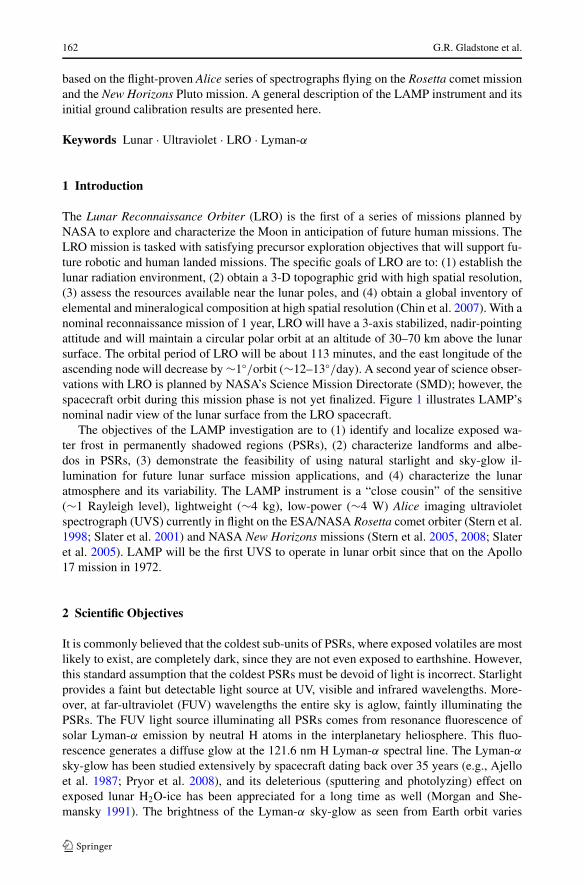
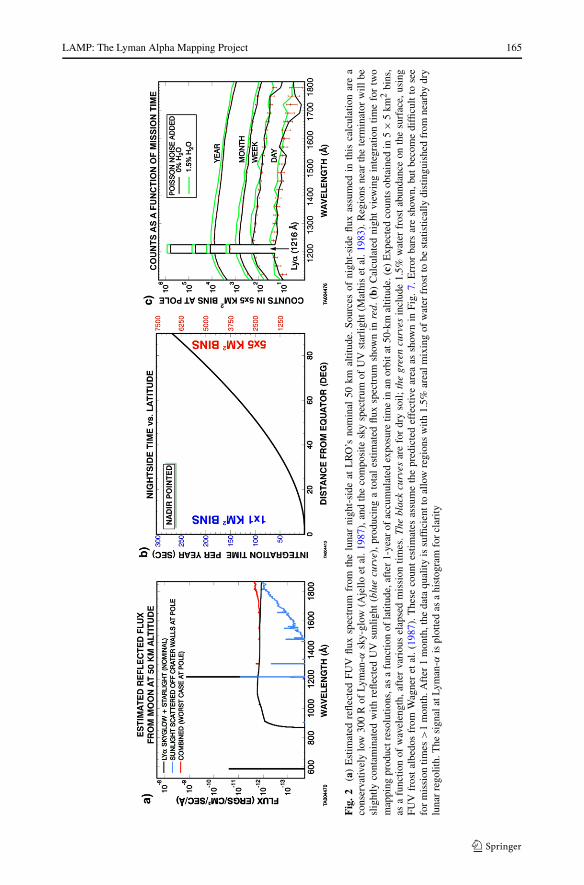
the pole, and their discovery would be a major find for LRO and an attractive prize forlanded polar missions. Water ice has a diagnostic spectral reflectance signature at FUVwavelengths, as evidenced by laboratory studies (Wagner et al. 1987) and observed fromicy satellites (Hendrix 1996; Hendrix and Hansen 2008). Depending on grain size and otherfactors, water frost shows a strong absorption edge at ∼160–180 nm. At wavelengths lessthan the edge the reflectivity is ∼2%, while at longer wavelengths the reflectivity is ∼35%.Owing to this signature, FUV spectroscopy provides a way to directly fingerprint H2O-frostexposed on the lunar surface, even at the relatively small (∼4%) mixing ratios predicted byvolatile transport models (Crider and Vondrak 2003) and the 1.5% level implied by LunarProspector neutron spectroscopy (Feldman et al. 2001). To make these detections LAMPwill obtain spectral maps across the lunar surface, identify regions of suspected frost pres-ence through their Lyman-α albedo (which will be lower than in drier surrounding regions),and retrieve H2O frost abundances (or strong upper limits) by rationing PSR spectra aboveand below the 160–180 nm absorption edge to those of waterless (“dry”) regions nearby thePSRs. Figure 2a shows the estimated flux from the lunar surface at LRO’s nominal altitude,broken out by its major illumination sources. Figure 2b shows the calculated nightside ob-serving time LAMP achieves after a 1-year LRO mission, as a function of resolution elementsize and latitude. Figure 2c shows a conservative estimate of the count spectra LAMP willachieve, as a function of wavelength, on surface units with and without H2O frost. Note thatneither the aggregate FUV starlight, nor the Lyman-α sky-glow, normally vary rapidly intime (solar flare times will be excluded from the data). The opposition effect (e.g., Hapkeet al. 1998) may occasionally be important if UV-bright stars pass overhead in the final LROorbit. Sky illumination brightness variations can be accounted for using data available frominstruments now in space (e.g., SWAN on SOHO; Bertaux et al. 1997), supported by modelsof sky-glow Lyman-α (e.g., Pryor et al. 2008) and stellar FUV (e.g., Henry 2002) emissions.
2.2 PSR Mapping and Night Vision
It is well known that the brightness of starlight in the visible is sufficient to allow militaryand other dark-night applications using night vision technology. This fact can be exploitedfor lunar exploration, and LAMP will serve as a first demonstration of this capability, usingUV starlight and Lyman-α sky-glow as its light source. Because the combined flux of UVstarlight and Lyman-α sky-glow in LAMP’s 57–196 nm passband is only about 17% ofthe total due to visible starlight, LAMP will prove the technique’s feasibility for both UVand visible/NIR lunar polar/night vision systems with considerable margin. Such a low-level natural light vision system could provide vision capability for future rover and humanexploration at night or in PSRs, and might do so with fewer of the power demands associatedwith operating artificial lighting at night or in polar regions.
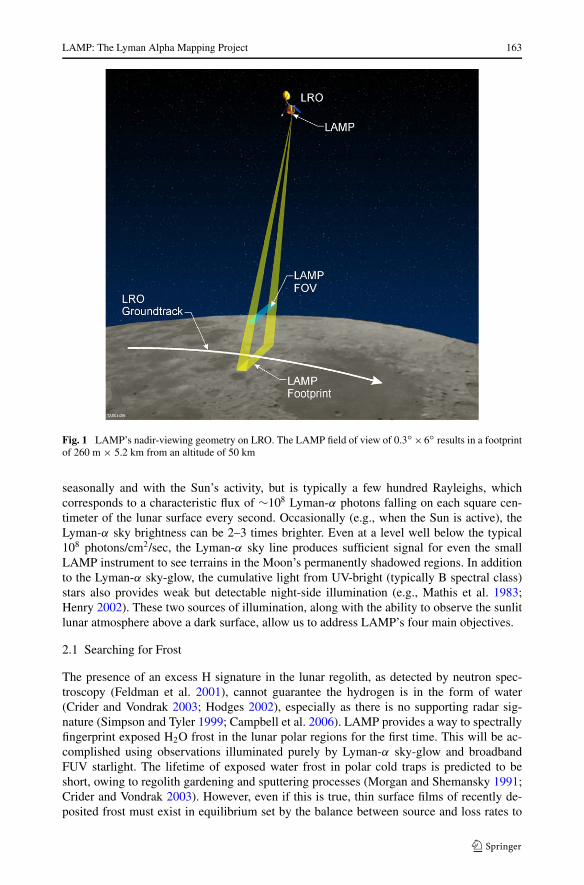
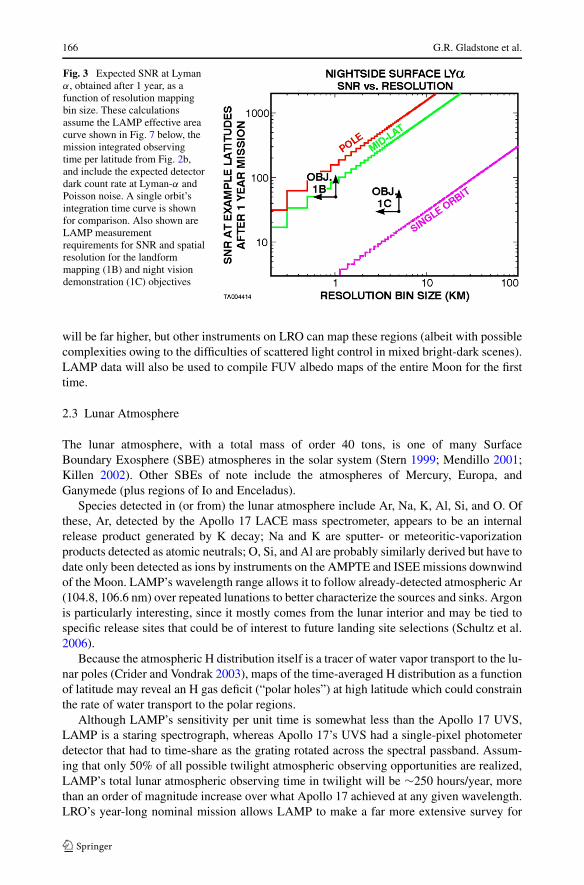
The same data that LAMP collects to achieve the polar/night vision objective also sat-isfies its objective of obtaining landform maps of the PSRs. Using only FUV starlight andLyman-α sky-glow, LAMP is capable of mapping even the darkest PSRs—where no re-flected sunshine or earthshine is available whatsoever. Figure 3 shows signal-to-noise ratio(SNR) calculations that demonstrate the feasibility of achieving these LAMP objectives.These estimated SNRs were computed for typical lunar surface reflectivities (∼4%) mea-sured by the Astro-2 HUT and Apollo 17 UV instruments (Henry et al. 1995). Figure 3shows that for illumination by Lyman-α sky-glow alone (i.e., neglecting FUV starlight, andin the complete absence of reflected sunshine or earthshine), LAMP will achieve SNRs of>30 per 200 × 200 m2 resolution element near the poles (using the predicted effective areacurve of Fig. 7). The SNR achieved by LAMP in regions illuminated by scattered sunlight
LAMP: The Lyman Alpha Mapping Project 165
Fig
.2
(a)
Est
imat
edre
flect
edFU
Vflu
xsp
ectr
umfr
omth
elu
nar
nigh
t-si
deat
LR
O’s
nom
inal
50km
altit
ude.
Sour
ces
ofni
ght-
side
flux
assu
med
inth
isca
lcul
atio
nar
ea
cons
erva
tivel
ylo
w30
0R
ofLy
man
-αsk
y-gl
ow(A
jello
etal
.198
7),a
ndth
eco
mpo
site
sky
spec
trum
ofU
Vst
arlig
ht(M
athi
set
al.1
983)
.Reg
ions
near
the
term
inat
orw
illbe
slig
htly
cont
amin
ated
with
refle
cted
UV
sunl
ight
(blu
ecu
rve)
,pr
oduc
ing
ato
tal
estim
ated
flux
spec
trum
show
nin
red.
(b)
Cal
cula
ted
nigh
tvi
ewin
gin
tegr
atio
ntim
efo
rtw
om
appi
ngpr
oduc
tres
olut
ions
,as
afu
nctio
nof
latit
ude,
afte
r1-
year
ofac
cum
ulat
edex
posu
retim
ein
anor
bita
t50-
kmal
titud
e.(c
)E
xpec
ted
coun
tsob
tain
edin
5×
5km
2bi
ns,
asa
func
tion
ofw
avel
engt
h,af
ter
vari
ous
elap
sed
mis
sion
times
.The
blac
kcu
rves
are
for
dry
soil;
the
gree
ncu
rves
incl
ude
1.5%
wat
erfr
ost
abun
danc
eon
the
surf
ace,
usin
gFU
Vfr
ost
albe
dos
from
Wag
ner
etal
.(19
87).
The
seco
unt
estim
ates
assu
me
the
pred
icte
def
fect
ive
area
assh
own
inFi
g.7.
Err
orba
rsar
esh
own,
but
beco
me
diffi
cult
tose
efo
rm
issi
ontim
es>
1m
onth
.Aft
er1
mon
th,t
heda
taqu
ality
issu
ffici
entt
oal
low
regi
ons
with
1.5%
area
lmix
ing
ofw
ater
fros
tto
best
atis
tical
lydi
stin
guis
hed
from
near
bydr
ylu
nar
rego
lith.
The
sign
alat
Lym
an-α
ispl
otte
das
ahi
stog
ram
for
clar
ity
166 G.R. Gladstone et al.
Fig. 3 Expected SNR at Lymanα, obtained after 1 year, as afunction of resolution mappingbin size. These calculationsassume the LAMP effective areacurve shown in Fig. 7 below, themission integrated observingtime per latitude from Fig. 2b,and include the expected detectordark count rate at Lyman-α andPoisson noise. A single orbit’sintegration time curve is shownfor comparison. Also shown areLAMP measurementrequirements for SNR and spatialresolution for the landformmapping (1B) and night visiondemonstration (1C) objectives
will be far higher, but other instruments on LRO can map these regions (albeit with possiblecomplexities owing to the difficulties of scattered light control in mixed bright-dark scenes).LAMP data will also be used to compile FUV albedo maps of the entire Moon for the firsttime.
2.3 Lunar Atmosphere
The lunar atmosphere, with a total mass of order 40 tons, is one of many SurfaceBoundary Exosphere (SBE) atmospheres in the solar system (Stern 1999; Mendillo 2001;Killen 2002). Other SBEs of note include the atmospheres of Mercury, Europa, andGanymede (plus regions of Io and Enceladus).
Species detected in (or from) the lunar atmosphere include Ar, Na, K, Al, Si, and O. Ofthese, Ar, detected by the Apollo 17 LACE mass spectrometer, appears to be an internalrelease product generated by K decay; Na and K are sputter- or meteoritic-vaporizationproducts detected as atomic neutrals; O, Si, and Al are probably similarly derived but have todate only been detected as ions by instruments on the AMPTE and ISEE missions downwindof the Moon. LAMP’s wavelength range allows it to follow already-detected atmospheric Ar(104.8, 106.6 nm) over repeated lunations to better characterize the sources and sinks. Argonis particularly interesting, since it mostly comes from the lunar interior and may be tied tospecific release sites that could be of interest to future landing site selections (Schultz et al.2006).
Because the atmospheric H distribution itself is a tracer of water vapor transport to the lu-nar poles (Crider and Vondrak 2003), maps of the time-averaged H distribution as a functionof latitude may reveal an H gas deficit (“polar holes”) at high latitude which could constrainthe rate of water transport to the polar regions.
Although LAMP’s sensitivity per unit time is somewhat less than the Apollo 17 UVS,LAMP is a staring spectrograph, whereas Apollo 17’s UVS had a single-pixel photometerdetector that had to time-share as the grating rotated across the spectral passband. Assum-ing that only 50% of all possible twilight atmospheric observing opportunities are realized,LAMP’s total lunar atmospheric observing time in twilight will be ∼250 hours/year, morethan an order of magnitude increase over what Apollo 17 achieved at any given wavelength.LRO’s year-long nominal mission allows LAMP to make a far more extensive survey for
LAMP: The Lyman Alpha Mapping Project 167
neutral species than achieved previously. LRO’s orbit near 50 km altitude is well suited toobserving many species in the lunar atmosphere, which have characteristic scale heights of50–100 km (meaning most of the atmospheric column of these species will be below thespacecraft).
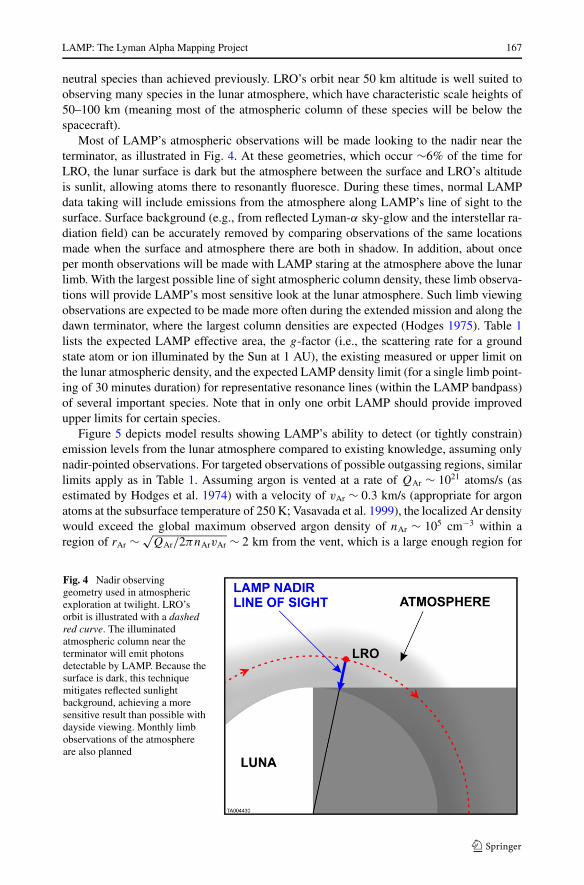
Most of LAMP’s atmospheric observations will be made looking to the nadir near theterminator, as illustrated in Fig. 4. At these geometries, which occur ∼6% of the time forLRO, the lunar surface is dark but the atmosphere between the surface and LRO’s altitudeis sunlit, allowing atoms there to resonantly fluoresce. During these times, normal LAMPdata taking will include emissions from the atmosphere along LAMP’s line of sight to thesurface. Surface background (e.g., from reflected Lyman-α sky-glow and the interstellar ra-diation field) can be accurately removed by comparing observations of the same locationsmade when the surface and atmosphere there are both in shadow. In addition, about onceper month observations will be made with LAMP staring at the atmosphere above the lunarlimb. With the largest possible line of sight atmospheric column density, these limb observa-tions will provide LAMP’s most sensitive look at the lunar atmosphere. Such limb viewingobservations are expected to be made more often during the extended mission and along thedawn terminator, where the largest column densities are expected (Hodges 1975). Table 1lists the expected LAMP effective area, the g-factor (i.e., the scattering rate for a groundstate atom or ion illuminated by the Sun at 1 AU), the existing measured or upper limit onthe lunar atmospheric density, and the expected LAMP density limit (for a single limb point-ing of 30 minutes duration) for representative resonance lines (within the LAMP bandpass)of several important species. Note that in only one orbit LAMP should provide improvedupper limits for certain species.
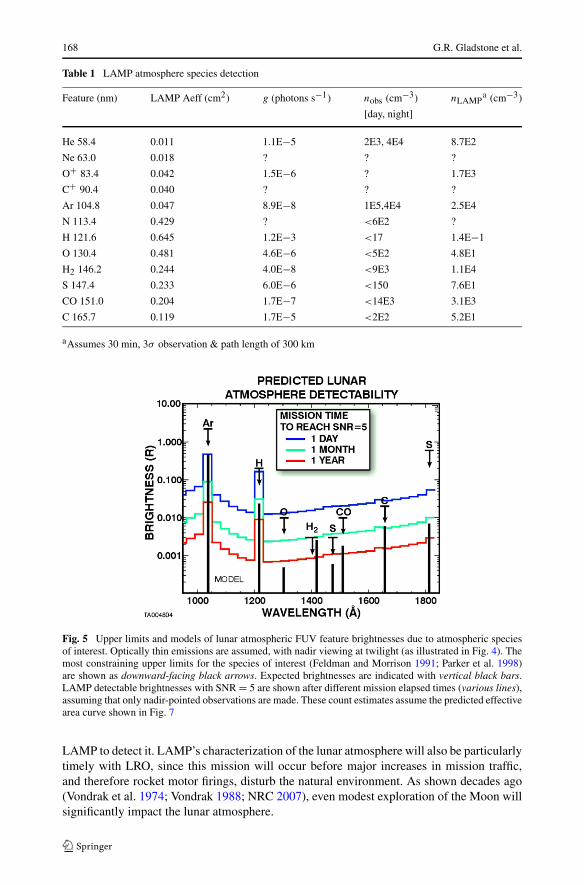
Figure 5 depicts model results showing LAMP’s ability to detect (or tightly constrain)emission levels from the lunar atmosphere compared to existing knowledge, assuming onlynadir-pointed observations. For targeted observations of possible outgassing regions, similarlimits apply as in Table 1. Assuming argon is vented at a rate of QAr ∼ 1021 atoms/s (asestimated by Hodges et al. 1974) with a velocity of vAr ∼ 0.3 km/s (appropriate for argonatoms at the subsurface temperature of 250 K; Vasavada et al. 1999), the localized Ar densitywould exceed the global maximum observed argon density of nAr ∼ 105 cm−3 within aregion of rAr ∼ √
QAr/2πnArvAr ∼ 2 km from the vent, which is a large enough region for
Fig. 4 Nadir observinggeometry used in atmosphericexploration at twilight. LRO’sorbit is illustrated with a dashedred curve. The illuminatedatmospheric column near theterminator will emit photonsdetectable by LAMP. Because thesurface is dark, this techniquemitigates reflected sunlightbackground, achieving a moresensitive result than possible withdayside viewing. Monthly limbobservations of the atmosphereare also planned
168 G.R. Gladstone et al.
Table 1 LAMP atmosphere species detection
Feature (nm) LAMP Aeff (cm2) g (photons s−1) nobs (cm−3) nLAMPa (cm−3)
[day, night]
He 58.4 0.011 1.1E−5 2E3, 4E4 8.7E2
Ne 63.0 0.018 ? ? ?
O+ 83.4 0.042 1.5E−6 ? 1.7E3
C+ 90.4 0.040 ? ? ?
Ar 104.8 0.047 8.9E−8 1E5,4E4 2.5E4
N 113.4 0.429 ? <6E2 ?
H 121.6 0.645 1.2E−3 <17 1.4E−1
O 130.4 0.481 4.6E−6 <5E2 4.8E1
H2 146.2 0.244 4.0E−8 <9E3 1.1E4
S 147.4 0.233 6.0E−6 <150 7.6E1
CO 151.0 0.204 1.7E−7 <14E3 3.1E3
C 165.7 0.119 1.7E−5 <2E2 5.2E1
aAssumes 30 min, 3σ observation & path length of 300 km
Fig. 5 Upper limits and models of lunar atmospheric FUV feature brightnesses due to atmospheric speciesof interest. Optically thin emissions are assumed, with nadir viewing at twilight (as illustrated in Fig. 4). Themost constraining upper limits for the species of interest (Feldman and Morrison 1991; Parker et al. 1998)are shown as downward-facing black arrows. Expected brightnesses are indicated with vertical black bars.LAMP detectable brightnesses with SNR = 5 are shown after different mission elapsed times (various lines),assuming that only nadir-pointed observations are made. These count estimates assume the predicted effectivearea curve shown in Fig. 7
LAMP to detect it. LAMP’s characterization of the lunar atmosphere will also be particularlytimely with LRO, since this mission will occur before major increases in mission traffic,and therefore rocket motor firings, disturb the natural environment. As shown decades ago(Vondrak et al. 1974; Vondrak 1988; NRC 2007), even modest exploration of the Moon willsignificantly impact the lunar atmosphere.
LAMP: The Lyman Alpha Mapping Project 169
3 Instrument Description
3.1 Overview
The photon-counting LAMP imaging spectrograph is closely based on the Pluto Alice(P-Alice) instrument design (Stern et al. 2005, 2008; Slater et al. 2005) which is, inturn, based largely on the Rosetta Alice (R-Alice) instrument design (Stern et al. 1998;Slater et al. 2001), with only relatively minor changes in baffling, software, and the ad-dition of a lunar terminator sensor (see below). In this section we provide a description ofthe instrument, concentrating on the differences with the P-Alice design.
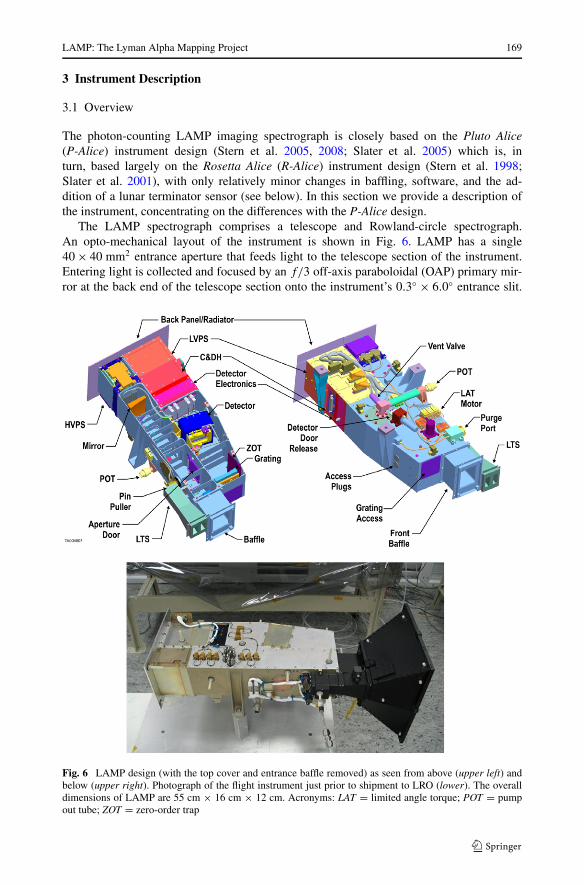
The LAMP spectrograph comprises a telescope and Rowland-circle spectrograph.An opto-mechanical layout of the instrument is shown in Fig. 6. LAMP has a single40 × 40 mm2 entrance aperture that feeds light to the telescope section of the instrument.Entering light is collected and focused by an f/3 off-axis paraboloidal (OAP) primary mir-ror at the back end of the telescope section onto the instrument’s 0.3◦ × 6.0◦ entrance slit.
Fig. 6 LAMP design (with the top cover and entrance baffle removed) as seen from above (upper left) andbelow (upper right). Photograph of the flight instrument just prior to shipment to LRO (lower). The overalldimensions of LAMP are 55 cm × 16 cm × 12 cm. Acronyms: LAT = limited angle torque; POT = pumpout tube; ZOT = zero-order trap
170 G.R. Gladstone et al.
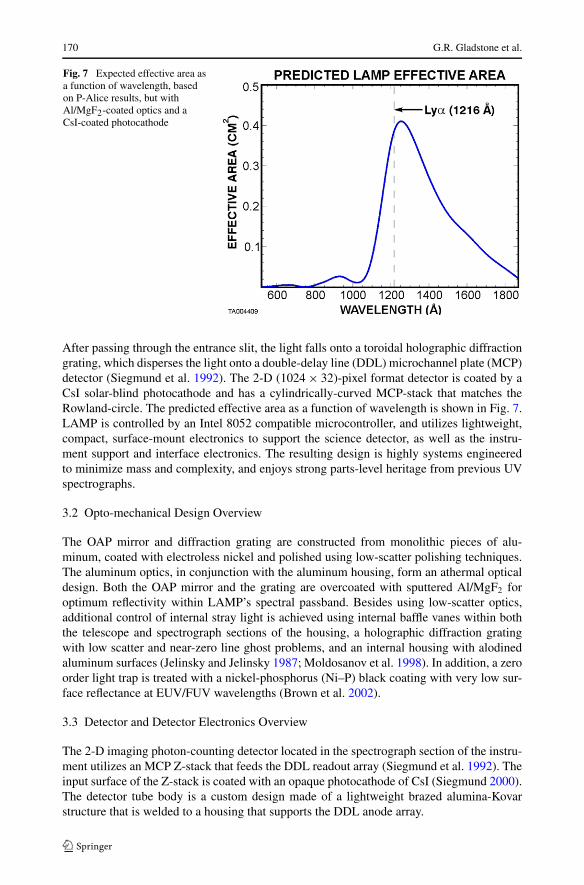
Fig. 7 Expected effective area asa function of wavelength, basedon P-Alice results, but withAl/MgF2-coated optics and aCsI-coated photocathode
After passing through the entrance slit, the light falls onto a toroidal holographic diffractiongrating, which disperses the light onto a double-delay line (DDL) microchannel plate (MCP)detector (Siegmund et al. 1992). The 2-D (1024 × 32)-pixel format detector is coated by aCsI solar-blind photocathode and has a cylindrically-curved MCP-stack that matches theRowland-circle. The predicted effective area as a function of wavelength is shown in Fig. 7.LAMP is controlled by an Intel 8052 compatible microcontroller, and utilizes lightweight,compact, surface-mount electronics to support the science detector, as well as the instru-ment support and interface electronics. The resulting design is highly systems engineeredto minimize mass and complexity, and enjoys strong parts-level heritage from previous UVspectrographs.
3.2 Opto-mechanical Design Overview
The OAP mirror and diffraction grating are constructed from monolithic pieces of alu-minum, coated with electroless nickel and polished using low-scatter polishing techniques.The aluminum optics, in conjunction with the aluminum housing, form an athermal opticaldesign. Both the OAP mirror and the grating are overcoated with sputtered Al/MgF2 foroptimum reflectivity within LAMP’s spectral passband. Besides using low-scatter optics,additional control of internal stray light is achieved using internal baffle vanes within boththe telescope and spectrograph sections of the housing, a holographic diffraction gratingwith low scatter and near-zero line ghost problems, and an internal housing with alodinedaluminum surfaces (Jelinsky and Jelinsky 1987; Moldosanov et al. 1998). In addition, a zeroorder light trap is treated with a nickel-phosphorus (Ni–P) black coating with very low sur-face reflectance at EUV/FUV wavelengths (Brown et al. 2002).
3.3 Detector and Detector Electronics Overview
The 2-D imaging photon-counting detector located in the spectrograph section of the instru-ment utilizes an MCP Z-stack that feeds the DDL readout array (Siegmund et al. 1992). Theinput surface of the Z-stack is coated with an opaque photocathode of CsI (Siegmund 2000).The detector tube body is a custom design made of a lightweight brazed alumina-Kovarstructure that is welded to a housing that supports the DDL anode array.
LAMP: The Lyman Alpha Mapping Project 171
To capture the entire 57–196 nm passband and 6◦ spatial FOV, the size of the detector’sactive area is 35 mm (in the dispersion direction) by 20 mm (in the spatial dimension),with a pixel format of (1024 × 32)-pixels. The 6◦ slit-height is imaged onto the central 22of the detector’s 32 spatial channels; the remaining spatial channels are used for dark countmonitoring. Our pixel format allows Nyquist sampling with a spectral resolution of 0.36 nm,and an angular resolution of ∼0.6◦.
The MCP Z-stack is composed of three 80:1 length-to-diameter (L/D) MCPs which arecylindrically curved with a radius-of-curvature of 75 mm to match the Rowland-circle foroptimum focus. The total Z-Stack resistance is ∼300 M�. The MCPs are rectangular informat (46 × 30 mm2), with 12-µm diameter pores. Above the MCP Z-Stack is a repellergrid that is biased ∼900 V more negative than the top of the MCP Z-Stack. This repellergrid reflects electrons liberated in the interstitial regions of the MCP back down to the MCPinput surface to enhance the detector quantum efficiency. The MCP Z-stack requires a highvoltage bias of ∼−3 kV; an additional −600 V is required between the MCP Z-stack outputand the anode array (the anode array is referenced to ground). The overall detector gain is∼2E7(+/−25%). At an expected average count rate of 1000 count/s, the amount of chargeas a function of time is ∼0.1 Coulomb/year.
3.4 Instrument Electrical Design Overview
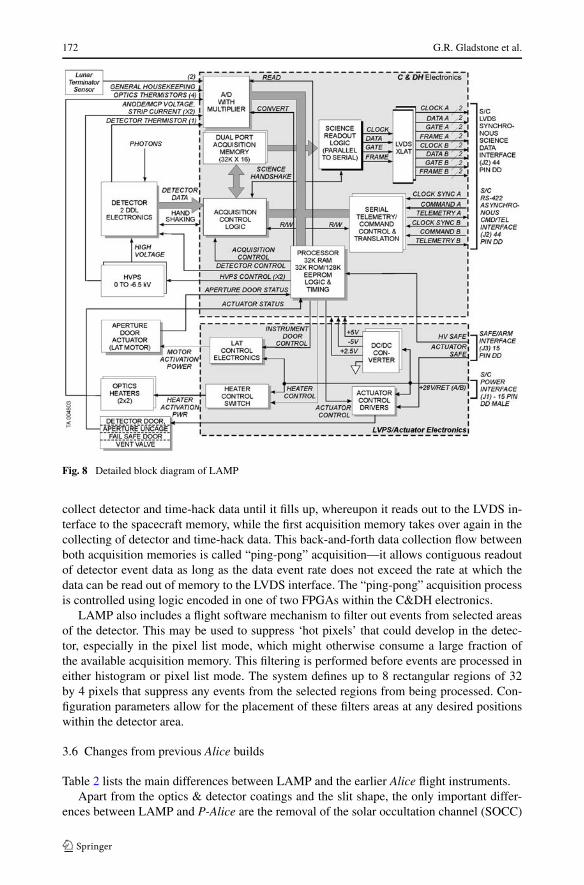
The LAMP instrument support electronics are largely single-string, but include redundantfeatures for certain important functions. The LAMP electronics include redundant low-voltage power supplies (LVPS) and actuator electronics, the single-string command and datahandling (C&DH) electronics, the redundant optics decontamination heater system, and theredundant detector high-voltage power supplies (HVPSs). All of these sub-systems are con-trolled by a radiation-hardened version of the Intel 8052 microprocessor with 32 kB of fuseprogrammable PROM, 128 kB of EEPROM, 32 kB of SRAM, and 128 kB of acquisitionmemory. The C&DH electronics are contained on four circuit boards located just behind thedetector electronics (see Fig. 6). A detailed block diagram of these electronics is shown inFig. 8.
3.5 Data Collection Modes Overview
The predicted sensitivity of LAMP is such that we expect a data rate of ∼1000 counts/s,both on the nightside with the aperture door open and on the dayside through the pinhole. Aswith P-Alice, LAMP has two detector data collection modes: (i) pixel list mode; and (ii) his-togram mode. However, because of its nature, nearly all the LAMP data will be obtainedin pixel list mode (exceptions will be made for flat-field and MCP pulse height distributionmeasurements). The science data from the detector is collected in a dual port acquisitionmemory that consists of two separate 32 k × 16-bit memory channels. In pixel list modeeach memory channel can hold up to 32 k detector and/or time-hack events, where eachdetector event consists of a 16-bit word—an x-position word 10 bits in length, a y-positionword 5 bits in length, and a single status bit that distinguishes between a time hack word anda detector event word. A time hack word includes a single status bit plus 15-bits that encodesthe instrument time. When 32 k detector address and time-hack events have accumulated inone of the two acquisition memories, that acquisition memory stops accumulating event dataand begins to read the data out to a parallel-to-serial converter and a low-voltage differentialsignaling (LVDS) interface to the spacecraft on-board memory. At the same time that thisLVDS readout is taking place, the other side of the dual acquisition memory continues to
172 G.R. Gladstone et al.
Fig. 8 Detailed block diagram of LAMP
collect detector and time-hack data until it fills up, whereupon it reads out to the LVDS in-terface to the spacecraft memory, while the first acquisition memory takes over again in thecollecting of detector and time-hack data. This back-and-forth data collection flow betweenboth acquisition memories is called “ping-pong” acquisition—it allows contiguous readoutof detector event data as long as the data event rate does not exceed the rate at which thedata can be read out of memory to the LVDS interface. The “ping-pong” acquisition processis controlled using logic encoded in one of two FPGAs within the C&DH electronics.
LAMP also includes a flight software mechanism to filter out events from selected areasof the detector. This may be used to suppress ‘hot pixels’ that could develop in the detec-tor, especially in the pixel list mode, which might otherwise consume a large fraction ofthe available acquisition memory. This filtering is performed before events are processed ineither histogram or pixel list mode. The system defines up to 8 rectangular regions of 32by 4 pixels that suppress any events from the selected regions from being processed. Con-figuration parameters allow for the placement of these filters areas at any desired positionswithin the detector area.
3.6 Changes from previous Alice builds
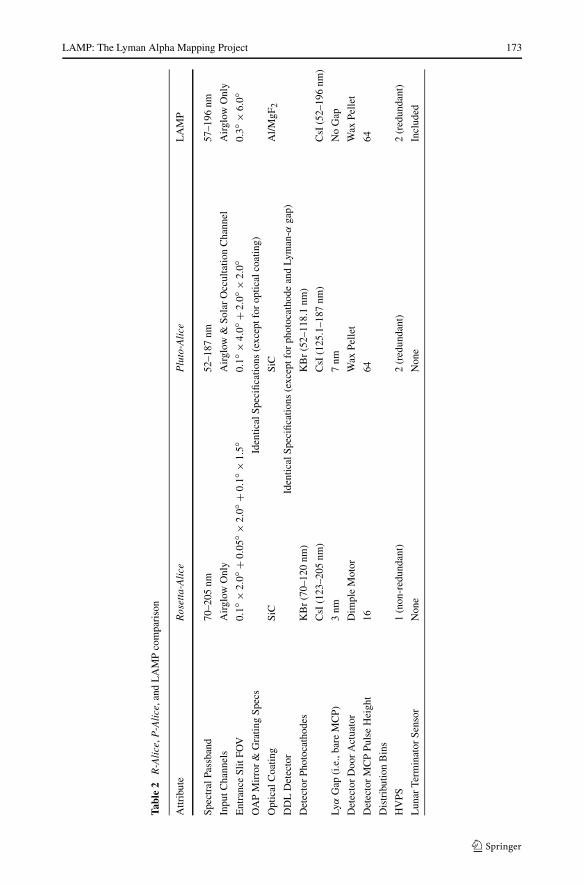
Table 2 lists the main differences between LAMP and the earlier Alice flight instruments.Apart from the optics & detector coatings and the slit shape, the only important differ-
ences between LAMP and P-Alice are the removal of the solar occultation channel (SOCC)
LAMP: The Lyman Alpha Mapping Project 173
Tabl
e2
R-A
lice
,P-A
lice
,and
LA
MP
com
pari
son
Attr
ibut
eR
oset
ta-A
lice
Plu
to-A
lice
LA
MP
Spec
tral
Pass
band
70–2
05nm
52–1
87nm
57–1
96nm
Inpu
tCha
nnel
sA
irgl
owO
nly
Air
glow
&So
lar
Occ
ulta
tion
Cha
nnel
Air
glow
Onl
y
Ent
ranc
eSl
itFO
V0.
1◦×
2.0◦
+0.
05◦ ×
2.0◦
+0.
1◦×
1.5◦
0.1◦
×4.
0◦+
2.0◦
×2.
0◦0.
3◦×
6.0◦
OA
PM
irro
r&
Gra
ting
Spec
sId
entic
alSp
ecifi
catio
ns(e
xcep
tfor
optic
alco
atin
g)
Opt
ical
Coa
ting
SiC
SiC
Al/M
gF2
DD
LD
etec
tor
Iden
tical
Spec
ifica
tions
(exc
eptf
orph
otoc
atho
dean
dLy
man
-αga
p)
Det
ecto
rPh
otoc
atho
des
KB
r(7
0–12
0nm
)K
Br
(52–
118.
1nm
)
CsI
(123
–205
nm)
CsI
(125
.1–1
87nm
)C
sI(5
2–19
6nm
)
Lyα
Gap
(i.e
.,ba
reM
CP)
3nm
7nm
No
Gap
Det
ecto
rD
oor
Act
uato
rD
impl
eM
otor
Wax
Pelle
tW
axPe
llet
Det
ecto
rM
CP
Puls
eH
eigh
t16
6464
Dis
trib
utio
nB
ins
HV
PS1
(non
-red
unda
nt)
2(r
edun
dant
)2
(red
unda
nt)
Lun
arTe
rmin
ator
Sens
orN
one
Non
eIn
clud
ed
174 G.R. Gladstone et al.
and the addition of the Lunar Terminator Sensor (LTS). The SOCC was included in the NewHorizons P-Alice for solar occultation observations, which are not needed on LRO. The LTShas been added to protect the highly-sensitive LAMP instrument from observing the rela-tively bright daylight regions of the Moon with its aperture door open, either by loweringthe detector high voltage or closing the aperture door. Note that the LRO spacecraft enforcesa solar avoidance zone of 60◦ (primarily for the LRO cameras, which have no shutters). Inany case, LAMP will safe itself within 1 second if the count rate exceeds a certain amount(typically set at ∼30,000 counts/s). The design of the LTS uses redundant Si PN photodi-ode detectors and amplifier electronics which are fed by an externally mounted mechanicalcollimator that over-samples the LAMP field of view. The LTS field of view is 3◦ × 10◦for both a “forward” photodiode (parallel to the LAMP slit but canted at 1.5◦ ahead of thetrack of the LAMP boresight) and an “aft” photodiode (parallel to the LAMP slit but cantedat 1.5◦ behind of the track of the LAMP boresight). The signal from these two diodes areeach differenced at a 10-Hz rate with “dark” photodiodes (to correct for temperature effects)and combined (in a programmable way) to provide LAMP’s response to the crossing ofthe terminator (from day to night or vice versa). Depending on the orientation of the LROspacecraft, the forward and aft LTS photodiodes will switch roles several times during themission. The LAMP aperture door has a small (2-mm diameter) hole in it which allows day-side observations at about the same count rate with the door closed as are observed on thenight side when the aperture door is open. Currently, the LRO mission plan calls for usingthe LTS to lower and raise the detector high voltage during the first month of operations,then using the LTS to close and open the aperture to allow continuous LAMP day and nightside observations for the remainder of the mission.
4 Ground Calibration Radiometric Performance
After it was assembled and through with environmental testing, just prior to delivery toGSFC for integration on the LRO spacecraft, LAMP underwent a series of tests to character-ize its radiometric performance. Specifically, the dark count, spatial and spectral resolution,wavelength calibration, scattered light sensitivity, and effective area were measured. Whileuseful for estimating the expected on-orbit instrument performance, each of these measure-ments will be superceded by further tests during commissioning of LAMP in lunar orbit. Inaddition, some important calibration data (e.g., flat field measurements) are only obtainedafter launch.
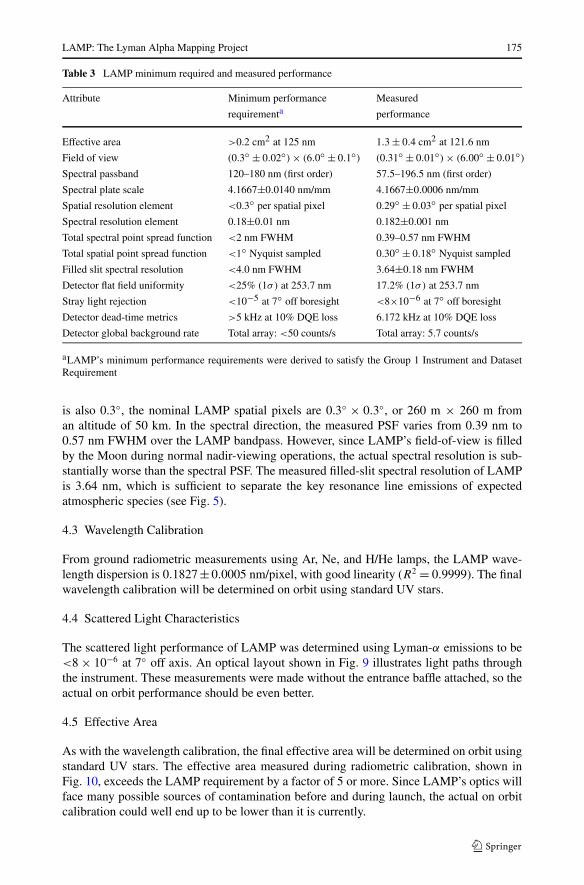
Table 3 lists the LAMP requirements and radiometric calibration results for several keyperformance metrics.
4.1 Dark Count Rate
The dark count rate measured for the LAMP detector, as averaged over the three most recent1000-s dark exposures, is 5.7 counts/s. The on-orbit count rate will be considerably larger(probably ∼20 counts/s or so) due to the energetic particle environment in space. For com-parison, the R-Alice count rate measured during ground calibration was only 3.2 counts/s,while after launch it became ∼20 counts/s.
4.2 Spatial/Spectral Resolution
The point-spread function (PSF) is undersampled in the spatial direction, as the LAMP pix-els (0.3◦) are substantially larger than the PSF expected from raytracing. Since the slit width
LAMP: The Lyman Alpha Mapping Project 175
Table 3 LAMP minimum required and measured performance
Attribute Minimum performance Measured
requirementa performance
Effective area >0.2 cm2 at 125 nm 1.3 ± 0.4 cm2 at 121.6 nm
Field of view (0.3◦ ± 0.02◦) × (6.0◦ ± 0.1◦) (0.31◦ ± 0.01◦) × (6.00◦ ± 0.01◦)
Spectral passband 120–180 nm (first order) 57.5–196.5 nm (first order)
Spectral plate scale 4.1667±0.0140 nm/mm 4.1667±0.0006 nm/mm
Spatial resolution element <0.3◦ per spatial pixel 0.29◦ ± 0.03◦ per spatial pixel
Spectral resolution element 0.18±0.01 nm 0.182±0.001 nm
Total spectral point spread function <2 nm FWHM 0.39–0.57 nm FWHM
Total spatial point spread function <1◦ Nyquist sampled 0.30◦ ± 0.18◦ Nyquist sampled
Filled slit spectral resolution <4.0 nm FWHM 3.64±0.18 nm FWHM
Detector flat field uniformity <25% (1σ) at 253.7 nm 17.2% (1σ) at 253.7 nm
Stray light rejection <10−5 at 7◦ off boresight <8×10⁻⁶ at 7◦ off boresight
Detector dead-time metrics >5 kHz at 10% DQE loss 6.172 kHz at 10% DQE loss
Detector global background rate Total array: <50 counts/s Total array: 5.7 counts/s
aLAMP’s minimum performance requirements were derived to satisfy the Group 1 Instrument and DatasetRequirement
is also 0.3◦, the nominal LAMP spatial pixels are 0.3◦ × 0.3◦, or 260 m × 260 m froman altitude of 50 km. In the spectral direction, the measured PSF varies from 0.39 nm to0.57 nm FWHM over the LAMP bandpass. However, since LAMP’s field-of-view is filledby the Moon during normal nadir-viewing operations, the actual spectral resolution is sub-stantially worse than the spectral PSF. The measured filled-slit spectral resolution of LAMPis 3.64 nm, which is sufficient to separate the key resonance line emissions of expectedatmospheric species (see Fig. 5).
4.3 Wavelength Calibration
From ground radiometric measurements using Ar, Ne, and H/He lamps, the LAMP wave-length dispersion is 0.1827 ± 0.0005 nm/pixel, with good linearity (R2 = 0.9999). The finalwavelength calibration will be determined on orbit using standard UV stars.
4.4 Scattered Light Characteristics
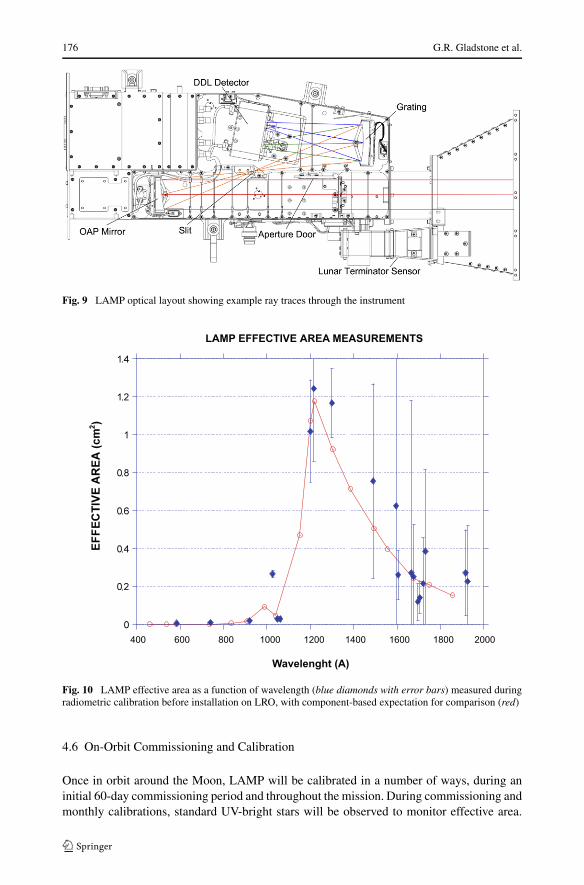
The scattered light performance of LAMP was determined using Lyman-α emissions to be<8 × 10⁻⁶ at 7◦ off axis. An optical layout shown in Fig. 9 illustrates light paths throughthe instrument. These measurements were made without the entrance baffle attached, so theactual on orbit performance should be even better.
4.5 Effective Area
As with the wavelength calibration, the final effective area will be determined on orbit usingstandard UV stars. The effective area measured during radiometric calibration, shown inFig. 10, exceeds the LAMP requirement by a factor of 5 or more. Since LAMP’s optics willface many possible sources of contamination before and during launch, the actual on orbitcalibration could well end up to be lower than it is currently.
176 G.R. Gladstone et al.
Fig. 9 LAMP optical layout showing example ray traces through the instrument
Fig. 10 LAMP effective area as a function of wavelength (blue diamonds with error bars) measured duringradiometric calibration before installation on LRO, with component-based expectation for comparison (red)
4.6 On-Orbit Commissioning and Calibration
Once in orbit around the Moon, LAMP will be calibrated in a number of ways, during aninitial 60-day commissioning period and throughout the mission. During commissioning andmonthly calibrations, standard UV-bright stars will be observed to monitor effective area.
LAMP: The Lyman Alpha Mapping Project 177
Both pointed (histogram) and scanned (pixel list) observations will be made, and a few verybright stars will be viewed through the aperture door pinhole. Besides pointed observations,the stellar sources are also rastered across and along the LAMP slit to provide accurateslit dimensions, vignetting information, and row-to-row variations in detector sensitivity.To characterize scattered light performance, we plan to slew the closed door across thebright limb, and follow up these observations with similar slews in which the aperture dooris opened as soon as possible after the slit has moved off the bright limb. The wavelengthscale will be determined through dayside observations of reflected sunlight, where there willbe numerous well-known emission lines spaced throughout the LAMP bandpass. Filled-slit line shapes are acquired by looking at the interplanetary Lyman alpha signal, flat fieldinformation is obtained by summing dayside data (with the LRO spacecraft temporarilyrotated at a 90◦ yaw so that each row of the LAMP detector covers exactly the same surfaceregions). Also during commissioning the optimal high voltage and discriminator settings arefound, by inspection of a matrix of test observations and pulse height distributions (PHDs).The PHD is only obtained during histogram observations (which will be acquired duringmonthly calibrations for monitoring purposes).
Another important part of our commissioning activities will be to determine the ana-log and digital deadtimes which can decrease the measured signal at large count rates (thedigital deadtime is likely to be larger because of the extra processing required by the elec-tronics). Ground tests by the detector provider indicate a digital deadtime of 18 µs, whichcorresponds to a 10% lower measured count rate at an input count rate of 6173 counts/s.From in-flight observations on New Horizons, which uses an identical detector and detectorelectronics, we expect that paralyzable deadtime effects are seen until the input count rate is>50,000 counts/s. All lunar observations should be well within the range where only non-paralyzable deadtime is important. We plan to confirm the deadtime by observing severalwell-known UV stars with a variety of brightnesses.
The monthly calibrations are handled separately from the normal data pipeline (i.e., theywill be planned, reduced and analyzed by hand).
5 Data Products
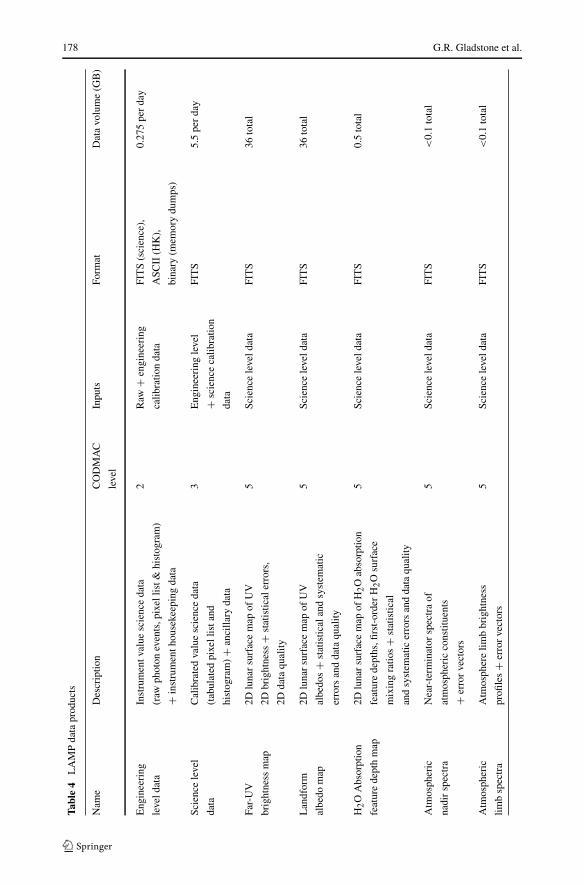
LAMP will deliver (at intervals of 3–6 months after the data is acquired) both low-level(Committee on Data Management, Archiving, and Computing—CODMAC—level 2 and 3)and high-level (CODMAC level 5) data products to the PDS Imaging Node for permanentstorage and public access. In normal science operations, the raw LAMP low-speed house-keeping (HK) files will consist of one 128-byte packet per second for each ∼113 minuteLRO orbit (i.e., ∼6780 packets), plus a 64 byte file header. The raw LAMP science datafiles will consist of a number of instrument-generated 65536-byte frames, each preceded bya 6-byte acquisition time field, plus a 64-byte file header. The exact number of science dataframes will vary from file to file. When operated in the nominal pixel list mode with a 4-mshack rate, LAMP is expected to generate approximately 285 data frames per orbit, whentaking data over the entire orbit. Low-level data products generated from a typical orbit areexpected to average ∼450 MB (cf., Table 4). The actual data volume will depend on thesolar, stellar, and Lyman-α sky-glow illumination, the lunar FUV reflectivity, and LAMP’sin-orbit sensitivity.
As mentioned above, the total daily volume of LAMP pipeline low-level data productsproduced will be approximately 5.5 GB (i.e., ∼2 TB over the nominal 1-year LRO mission).Each file of these low-level data products contain the following nine types of data as FITS
178 G.R. Gladstone et al.
Tabl
e4
LA
MP
data
prod
ucts
Nam
eD
escr
iptio
nC
OD
MA
CIn
puts
Form
atD
ata
volu
me
(GB
)
leve
l
Eng
inee
ring
Inst
rum
entv
alue
scie
nce
data
2R
aw+
engi
neer
ing
FIT
S(s
cien
ce),
0.27
5pe
rda
y
leve
ldat
a(r
awph
oton
even
ts,p
ixel
list&
hist
ogra
m)
calib
ratio
nda
taA
SCII
(HK
),
+in
stru
men
thou
seke
epin
gda
tabi
nary
(mem
ory
dum
ps)
Scie
nce
leve
lC
alib
rate
dva
lue
scie
nce
data
3E
ngin
eeri
ngle
vel
FIT
S5.
5pe
rda
y
data
(tab
ulat
edpi
xell
ista
nd+
scie
nce
calib
ratio
n
hist
ogra
m)+
anci
llary
data
data
Far-
UV
2Dlu
nar
surf
ace
map
ofU
V5
Scie
nce
leve
ldat
aFI
TS
36to
tal
brig
htne
ssm
ap2D
brig
htne
ss+
stat
istic
aler
rors
,
2Dda
taqu
ality
Lan
dfor
m2D
luna
rsu
rfac
em
apof
UV
5Sc
ienc
ele
veld
ata
FIT
S36
tota
l
albe
dom
apal
bedo
s+
stat
istic
alan
dsy
stem
atic
erro
rsan
dda
taqu
ality
H2O
Abs
orpt
ion
2Dlu
nar
surf
ace
map
ofH
2O
abso
rptio
n5
Scie
nce
leve
ldat
aFI
TS
0.5
tota
l
feat
ure
dept
hm
apfe
atur
ede
pths
,firs
t-or
der
H2O
surf
ace
mix
ing
ratio
s+
stat
istic
al
and
syst
emat
icer
rors
and
data
qual
ity
Atm
osph
eric
Nea
r-te
rmin
ator
spec
tra
of5
Scie
nce
leve
ldat
aFI
TS
<0.
1to
tal
nadi
rsp
ectr
aat
mos
pher
icco
nstit
uent
s
+er
ror
vect
ors
Atm
osph
eric
Atm
osph
ere
limb
brig
htne
ss5
Scie
nce
leve
ldat
aFI
TS
<0.
1to
tal
limb
spec
tra
profi
les+
erro
rve
ctor
s
LAMP: The Lyman Alpha Mapping Project 179
extensions:
1. Calibrated Histogram (Aperture Door Open): A reconstructed histogram generated fromraw pixel list data but with instrumental corrections and calibrations applied (e.g., deadtime and dark count corrections, flat-fielding, effective area, and wavelength calibra-tions). Only the pixel list data acquired when the aperture door was open are includedin this dataset.
2. Calibrated Histogram (Aperture Door Closed): Similar to the first dataset, but the re-constructed histogram here is generated from data acquired when the aperture door wasclosed.
3. Acquisition List: A list of the generated acquisitions (i.e., the frames of data of which thefile is comprised) as determined from the housekeeping data file.
4. Calibrated Pixel List Mode Data: A calibrated version of the complete pixel list sciencedataset from the raw data product, plus propagated estimated errors introduced by theseparate calibration steps and ancillary spatial location information.
5. Calibrated Histogram Mode Data: A calibrated version of the complete histogram sciencedataset from the raw data product, plus propagated estimated errors introduced by theseparate calibration steps. Since LAMP will be operated nearly entirely in pixel list mode,this extension will generally be empty.
6. Calibrated Calculated Count Rate: A high-resolution sequence of UV photon count ratescomputed from the calibrated pixel list data for each acquisition (nominally the wholeorbit). The resolution of this count rate sequence depends on the commanded hack rate.If no consecutive pixel list science data are available, this dataset will contain lowerresolution (1 Hz) count rate data from the housekeeping data file.
7. High-rate LTS Data: LAMP housekeeping data contain up to 10 values per second of gainand offset corrected measurement values from each of the Lunar Terminator Sensors.This dataset provides the full 10 Hz LTS dataset.
8. Housekeeping Data: This dataset contains the complete housekeeping dataset, both inraw and (where applicable) calibrated engineering units.
9. Wavelength Lookup Table: This dataset contains a 1024×32 image whose floating-pointpixel values are the wavelengths corresponding to the pixel locations on the detector.
LAMP high-level data products include brightness maps (global and of selected fea-tures) over specific wavelength ranges, similarly constructed albedo maps (i.e., brightnessmaps normalized by the illumination), band depth maps (i.e., maps of color ratio comparingalbedo maps for wavelength ranges on and off important absorption bands), and atmosphericspectra of global and specific features (e.g., the dawn terminator, the LCROSS impact site,regions of possible recent outgassing). The high-level data products will use the ensemblelow-level pixel lists as input, from which individual photon events will be selected for in-clusion based on criteria such as timing, wavelength, emission and incidence angles, andspacecraft location and attitude. For the mapping products an important intermediate prod-uct is the exposure map, which provides the time that LAMP actually observed a givensurface element under the conditions of the selected criteria. For the albedo and band depthmaps, another important intermediate product is the sky illumination (from the Lyman-αsky-glow, UV starlight, and, for near-terminator regions, scattered sunlight) as a functionof wavelength and time for each surface element of interest. The high-level data productswill be produced regularly during the nominal mission, but will be refined after the end ofthe nominal mission to include important inputs from other LRO instruments (e.g., surfaceroughness and slope estimates from LOLA).
180 G.R. Gladstone et al.
6 Summary
LRO is planned for launch in the spring of 2009, with a 1-year nominal mission in lunarorbit, followed by an additional year of science operations. Monthly in-flight calibrationobservations of hot UV stars are planned for LAMP during the mission to characterize itsin-flight performance. The LAMP design is based on the simple and successful Alice spec-trographs, and will be used to search for exposed frosts, to map landforms in permanentlyshadowed regions of the Moon, and to survey the tenuous lunar atmosphere; it will alsodemonstrate Lyman-α assisted vision techniques for possible application in future missionsto the lunar poles or in night side operations. During the additional year of science, depend-ing on the orbit, LAMP will make further atmospheric observations (of Earth as well as theMoon) and will perform specific observations related to the study of space weathering andmineralogy of certain lunar craters.
Acknowledgements We wish to thank the entire LAMP proposal team at SwRI, as well as Ossy Siegmund,John Vallerga and Rick Raffanti at Sensor Sciences, and Craig Tooley, Arlin Bartels, Mary Reden, Jo-AnneBaker, Gordon Chin, John Keller, and Rich Vondrak of the LRO Project Office at NASA GSFC. This workwas supported by NASA contract NNG05EC87C.
References
J.M. Ajello, A.I. Stewart, G.E. Thomas, A. Graps, Solar cycle study of interplanetary Lyman-alphavariations—Pioneer Venus Orbiter sky background results. Astrophys. J. 317, 964–986 (1987)
J.-L. Bertaux, E. Quémerais, R. Lallement, E. Kyrölä, W. Schmidt, T. Summanen, J.P. Goutail, M. Berthé,J. Costa, T. Holzer, First results from SWAN Lyman alpha solar wind mapper on SOHO. Sol. Phys. 175,737–770 (1997)
R.J.C. Brown, P.J. Brewer, M.J.T. Milton, The physical and chemical properties of electroless nickel-phosphorus black surfaces. J. Mater. Chem. 12, 2749–2754 (2002)
D.B. Campbell, B.A. Campbell, L.M. Carter, J.-L. Margot, N.J.S. Stacy, No evidence for thick deposits ofice at the lunar south pole. Nature 443, 835–837 (2006)
G. Chin, S. Brylow, M. Foote, J. Garvin, J. Kasper, J. Keller, M. Litvak, I. Mitrofanov, D. Paige, K. Raney,M. Robinson, A. Sanin, D. Smith, H. Spence, P. Spudis, S.A. Stern, M. Zuber, Lunar ReconnaissanceOrbiter Overview: The instrument suite and mission. Space Sci. Rev. 129, 391–419 (2007)
D.H. Crider, R.R. Vondrak, Space weathering effects on lunar cold trap deposits. J. Geophys. Res. 108(E7),5079 (2003). doi:10.1029/2002JE002030
P.D. Feldman, D. Morrison, The Apollo 17 Ultraviolet Spectrometer: Lunar atmosphere measurements revis-ited. Geophys. Res. Lett. 18(11), 2105–2108 (1991)
W.C. Feldman, S. Maurice, D.J. Lawrence, R.C. Little, S.L. Lawson, O. Gasnault, R.C. Wiens, B.L. Barra-clough, R.C. Elphis, T.H. Prettyman, J.T. Steinberg, A.B. Binder, Evidence for water ice near the lunarpoles. J. Geophys. Res. 106, 23231–23251 (2001)
B. Hapke, R. Nelson, W. Smythe, The opposition effect of the Moon: Coherent backscatter and shadowhiding. Icarus 133, 89–97 (1998)
A.R. Hendrix, The Galileo Ultraviolet Spectrometer: in-flight calibration and the ultraviolet albedos of theMoon, Gaspra, Ida and Europa, Ph.D. thesis, University of Colorado, Boulder, 1996
A.R. Hendrix, C.J. Hansen, Ultraviolet observations of Phoebe from the Cassini UVIS. Icarus 193, 323–333(2008)
R.C. Henry, P.D. Feldman, J.W. Kruk, A.F. Davidsen, S.T. Durrance, Ultraviolet albedo of the Moon with theHopkins Ultraviolet Telescope. Astrophys. J. 454, L69–L72 (1995)
R.C. Henry, The local interstellar ultraviolet radiation field. Astrophys. J. 570, 697–707 (2002)R.R. Hodges, Formation of the lunar atmosphere. Moon 14, 139–157 (1975)R.R. Hodges, Reanalysis of Lunar Prospector neutron spectrometer observations over the lunar poles. J. Geo-
phys. Res. 107, 5125 (2002). doi:10.1029/2000JE001483R.R. Hodges, J.H. Hoffman, F.S. Johnson, The lunar atmosphere. Icarus 21, 415–426 (1974)P. Jelinsky, S. Jelinsky, Low reflectance EUV materials: a comparative study. Appl. Opt. 26(4), 613–615
(1987)
LAMP: The Lyman Alpha Mapping Project 181
R.M. Killen, Source and maintenance of the argon atmospheres of Mercury and the Moon. Meteorit Planet.Sci. 37(9), 1223–1231 (2002)
J. Mathis, P. Mezger, N. Panagia, Interstellar radiation field and dust temperatures in the diffuse interstellarmatter and in giant molecular clouds. Astron. Astrophys. 128, 212–229 (1983)
M. Mendillo, The atmosphere of the Moon. Earth Moon Planets 85/86, 271–277 (2001)K.A. Moldosanov, M.A. Samsonov, L.S. Kim, R. Henneck, O.H.W. Siegmund, J. Warren, S. Cully, D. Marsh,
Highly absorptive coating for the vacuum ultraviolet range. Appl. Opt. 37(1), 93–97 (1998)T.H. Morgan, D.E. Shemansky, Limits to the lunar atmosphere. J. Geophys. Res. 96, 1351–1367 (1991)National Research Council, The Scientific Context for Exploration of the Moon (The National Academies
Press, Washington, 2007), 120 pp.J. Parker, S.A. Stern, G.R. Gladstone, J. Shull, The spectroscopic detectability of argon in the lunar at-
mosphere. Astrophys. J. 509, L61–L64 (1998)W.R. Pryor, P. Gangopadhyay, B. Sandel, T. Forrester, E. Quemerais, E. Moebius, L. Esposito, A.I.F. Stewart,
B. McClintock, A. Jouchoux, J. Colwell, V. Izmodenov, Y. Malena, W.K. Tobiska, D.E. Shemansky,J.M. Ajello, C. Hansen, M. Bzowski, P. Frisch, Radiation transport of heliospheric Lyman-alpha fromcombined Cassini and Voyager data sets. Astron. Astrophys. 491, 21–28 (2008)
P.H. Schultz, M.I. Staid, C.M. Pieters, Lunar activity from recent gas release. Nature 444, 184–186 (2006)O.H.W. Siegmund, Microchannel plate imaging detector technologies for UV instruments, in Conference
Proceedings From X-rays to X-band—Space Astrophysics Detectors and Detector Technologies (SpaceTelescope Science Institute, 2000)
O.H.W. Siegmund, J. Stock, R. Raffanti, D. Marsh, M. Lampton, Planar delay line readouts for high resolu-tion astronomical EUV/UV spectroscopy, in UV and X-Ray Spectroscopy of Astrophysical and Labora-tory Plasmas, Proceedings from the 10th International Colloquium, Berkeley, CA, 3–5 February 1992(1992), pp. 383–386
R.A. Simpson, G.L. Tyler, Reanalysis of Clementine bistatic radar data from the lunar south pole. J. Geophys.Res. 104, 3845–3862 (1999)
D.C. Slater, S.A. Stern, T. Booker, J. Scherrer, M.F. A’Hearn, J.L. Bertaux, P.D. Feldman, M.C. Festou,O.H.W. Siegmund, Radiometric and calibration performance results for the Rosetta UV imaging spec-trometer Alice, in UV/EUV and Visible Space Instrumentation for Astronomy and Solar Physics, ed.by O.H.W. Siegmund, S. Fineschi, M.A. Gummin. Proceedings of SPIE, vol. 4498 (SPIE, Bellingham,2001), pp. 239–247
D.C. Slater, M.W. Davis, C.B. Olkin, S.A. Stern, J. Scherrer, Radiometric performance results of the NewHorizons’ Alice UV imaging spectrograph, in X-Ray, UV, Visible, and IR Instrumentation for PlanetaryMissions, ed. by O.H.W. Siegmund, G.R. Gladstone. Proceedings of SPIE, vol. 5906B (SPIE, Belling-ham, 2005)
S.A. Stern, The lunar atmosphere: history, status, current problems, and context. Rev. Geophys. 37, 453–491(1999)
S.A. Stern, D.C. Slater, W. Gibson, J. Scherrer, M. A’Hearn, J.-L. Bertaux, P.D. Feldman, M.C. Festou, Alice:an ultraviolet imaging spectrometer for the Rosetta Orbiter. Adv. Space Res. 21, 1517–1525 (1998)
S.A. Stern, J.R. Scherrer, D.C. Slater, G.R. Gladstone, L.A. Young, G.J. Dirks, J.M. Stone, M.W. Davis,Alice: The ultraviolet imaging spectrograph aboard the New Horizons spacecraft, in X-Ray, UV, Visible,and IR Instrumentation for Planetary Missions, ed. by O.H.W. Siegmund, G.R. Gladstone. Proceedingsof SPIE, vol. 5906B (SPIE, Bellingham, 2005)
S.A. Stern, D.C. Slater, J.R. Scherrer, J.M. Stone, G.J. Dirks, M.H. Versteeg, M.W. Davis, G.R. Gladstone,J.Wm. Parker, L.A. Young, O.H.W. Siegmund, Alice: the ultraviolet imaging spectrograph aboard theNew Horizons Pluto-Kuiper Belt mission. Space Sci. Rev. 140, 155–187 (2008)
A.R. Vasavada, D.A. Paige, S.E. Wood, Near-surface temperatures on Mercury and the Moon and the stabilityof polar ice deposits. Icarus 141, 179–193 (1999)
R.R. Vondrak, Lunar base activities and the lunar environment. LPI Contribution 652, 246 (1988)R.R. Vondrak, J.W. Freeman, R.A. Lindeman, Measurements of lunar atmospheric loss rate, in Proc. 5th
Lunar Sci. Conf. (1974), p. 2945J.K. Wagner, B.W. Hapke, E.N. Wells, Atlas of reflectance spectra of terrestrial, lunar, and meteoritic powders
and frosts from 92 to 1800 nm. Icarus 69, 14–28 (1987)