liquidity constraints and firms' linkages with multinationals
TRANSCRIPT
Electronic copy available at: http://ssrn.com/abstract=1360685
LICOS Discussion Paper Series
Discussion Paper 225/2008
Liquidity Constraints and Linkages with Multinationals
Beata S. Javorcik, Mariana Spatareanu
Katholieke Universiteit Leuven LICOS Centre for Institutions and Economic Performance Huis De Dorlodot Deberiotstraat 34 – mailbox 3511 B-3000 Leuven BELGIUM TEL:+32-(0)16 32 65 98 FAX:+32-(0)16 32 65 99 http://www.econ.kuleuven.be/licos
Electronic copy available at: http://ssrn.com/abstract=1360685
Liquidity Constraints
and Linkages with Multinationals
Beata S. Javorcik*
and
Mariana Spatareanu**
Abstract: Using a unique data set from the Czech Republic for 1994-2003, this study examines the relationship between a firm’s liquidity constraints and its supply linkages with multinational corporations (MNCs). The empirical analysis indicates that Czech firms supplying MNCs are less credit constrained than non-suppliers. A closer inspection of the timing of the effect, however, suggests that this result is due to less constrained firms self-selecting into becoming MNC suppliers rather than the benefits derived from the supplying relationship. As recent literature finds that productivity spillovers from foreign direct investment (FDI) are most likely to take place through contacts between MNCs and their local suppliers, our finding suggests that well-developed financial markets may be needed in order to take full advantage of the benefits associated with FDI inflows. Keywords: foreign direct investment, cash flow, liquidity constraints
* University of Oxford and CEPR, Department of Economics, Manor Road Building, Oxford OX1 3UQ, United Kingdon. Email: [email protected]** Rutgers University, Department of Economics, 360 Dr. Martin Luther King, Jr. Blvd., Newark, NJ 07102, United States. Email: [email protected].
1
I. Introduction
The role of financial sector development in fostering economic growth has received a lot of attention in recent years. In an influential paper, Rajan and Zingales (1998) provided evidence suggesting that financial sector development reduces the costs of external finance to firms, by demonstrating that industrial sectors that are relatively more in need of external finance grow disproportionately faster in countries with more developed financial markets.
More recent research has argued that access to financing may promote economic
growth by allowing firms to tap into new sources of knowledge by selling in foreign markets or becoming suppliers to multinationals (MNCs). In a theoretical contribution, Chaney (2005) has shown that if firms must pay entry costs in order to sell in a foreign market and if they face liquidity constraints to finance these costs, only those firms that have sufficient liquidity will be able to export. While a set of firms could profitably export, they are prevented from doing so because they lack sufficient liquidity. Manova (2006) has provided empirical support for this view by showing that countries with better developed financial systems tend to export relatively more in highly external capital dependent industries and in sectors with fewer collateralizable assets. A theoretical model and a calibration exercise undertaken by Alfaro et al. (2006) has suggested that well developed local financial markets are needed in order for host countries to benefit from spillovers from foreign direct investment (FDI). It is because access to financing allows local entrepreneurs to start supplying MNCs and in this way benefit from knowledge spillovers from FDI. And indeed, in a cross-country growth regression Alfaro et al. (2004) have found that FDI inflows contribute to a faster economic growth only in the presence of well-developed financial markets.1
The relationship between facing financing constraints and supplying MNCs,
however, could go both ways. If a firm needs some investment in order to become an MNC supplier (e.g., to upgrade the product quality or increase the scale of production) then the causality will go from the absence of liquidity constraints to becoming an MNC supplier. However, it is also possible that receiving a contract from an MNC increases the creditworthiness of the supplier in the eyes of a lending institution and thus makes it easier to obtain a loan or other outside financing.
The purpose of this paper is to examine the relationship between liquidity
constraints and being an MNC supplier using the approach pioneered by Fazzari, Hubbard and Petersen (1988). Our analysis is possible thanks to a unique data set collected by the World Bank through two surveys of domestic and foreign companies in the Czech Republic in 2003 and 2004. The surveys allow us to identify companies making sales to MNCs operating in the country along with the detailed information about the duration and the characteristics of these relationships. The survey responses are supplemented with panel data on firms’ balance sheets and profit and loss statements
1 A related literature has examined the relationship between country-level FDI inflows and firm-level financing constraints. In a cross-country study, Harrison, Love and McMillan (2004) show that FDI inflows are associated with a reduction in financing constraints. In contrast, in a firm-level analysis of Cote d’Ivoire, Harrison and McMillan (2003) find that borrowing by foreign firms exacerbates credit constraints of domestic firms.
2

from a commercial database (Amadeus). Our data set spans the period 1994-2003 and includes 319 Czech firms, 88 of which are MNC suppliers observed both before and after starting the relationship with MNCs.
The Czech Republic is suitable place to study this question for several reasons.
After starting its transition from central planning to a free market economy, it has received large inflows of foreign direct investment. At the end of 2003 (the last year of our sample), the stock of FDI it had received reached 45.3 billion dollars or 4,439 dollars per capita. Survey evidence suggests that MNCs are actively engaged in local sourcing. They purchase about half of intermediate inputs (in terms of value) from Czech suppliers. The virtual absence of FDI before the beginning of transition also means that supplying relationships between MNCs and Czech firms are of a relatively new vintage. Finally, as is the case with all transition countries many local firms tend to be liquidity constrained (Konings, Rizov and Vandenbussche 2003).
Survey evidence suggests that before signing a purchase order, multinationals
often explicitly require their future Czech suppliers to make some improvements or investments. This was the case for more than a quarter of all suppliers surveyed by the World Bank in 2004.2 The prospect of a contract from a multinational also induced Czech suppliers to undertake improvements on their own. Thirty-six percent of suppliers reported making improvements with the explicit purpose of finding a multinational customer.3 It is also striking that 17 percent of Czech companies surveyed reported getting a quality certification (e.g., ISO 9000) in order to become suppliers to multinationals. These firms constituted 40 percent of all companies reporting having such a certification. In sum, complying with the expectations or requirements imposed by MNCs may be more difficult or even impossible for potential suppliers that do not have access to credit. And indeed credit constraints faced by Czech companies were mentioned by MNCs as one of the top factors preventing them from sourcing more inputs locally (Javorcik and Spatareanu 2005).
At the same time, contracts from MNCs (or prospects of such contracts) may have
eased credit constraints of potential or actual suppliers. 31 out of 137 MNCs surveyed in the Czech Republic in 2003 reported providing their suppliers with advance payments and financing. Similarly, a quarter of suppliers reported that being a MNC supplier helped them obtain a bank loan.
The results of our empirical analysis indicate that Czech firms supplying
multinationals tend to be less liquidity constrained than other firms. However, a careful examination of the timing of the phenomenon suggests that this result is due to the self-selection of less liquidity constrained firms into supplying relationships rather than suppliers benefiting from the interactions with multinational customers. The data suggest that MNC suppliers are already less liquidity constrained before starting their relationship with an MNC and continue to be less liquidity constrained for the duration of the 2 The most frequent requirements were improvements to the quality assurance process, acquisition of a costly quality certification (such as an ISO 9000), improvements to the timeliness of deliveries, use of a new technology or purchase of new equipment. 3 These improvements included investment in new machinery and equipment, improving product quality, staff training, increasing production volume, reducing the share of defective units produced and reorganizing manufacturing lines.
3
relationship. To eliminate the possibility that this finding is driven by MNCs extending credit to their future suppliers, we show that the result is robust to excluding from the sample suppliers that had received this type of assistance from their MNC customers. Similarly, to eliminate the possibility that a future contract from an MNC increases creditworthiness of a Czech firm, we show that the results hold after excluding from the sample firms that identified a supply relationship with a MNC that helped them obtain finance from a Czech or a foreign bank. We also show that higher liquidity ratio is a robust predictor of the supplying status. Finally, we find that after we instrument for the supplying status, firms doing business with MNCs are no different from other firms in terms of liquidity constraints.
Given that the recent empirical literature has suggested that linkages between multinationals and their local suppliers are the key channel through which indigenous firms benefit from inflows of FDI (Javorcik 2004, Javorcik and Spatareanu 2008, Blalock and Gertler 2008), understanding how firms become MNC suppliers has important policy implications. Our findings suggest that in the absence of well functioning credit markets, local firms may find it difficult to start business relationships with MNCs and thus may not be able to reap the benefits of productivity spillovers that such relationships bring. A caution is, however, needed when interpreting these findings. While our results are suggestive of well functioning credit markets being important in facilitating business relationships between local firms and MNCs, they do not suggest that a well developed financial market is a sufficient condition for such relationships to take place. Other factors, such as a certain level of sophistication of the local manufacturing sector, may be needed in order for these relationships to materialize.
This study is structured as follows. The next section presents the data and the summary statistics. Section 3 reviews the related literature. Section 4 discusses the estimation strategy and the results. Section 5 concludes. II. Data and Summary Statistics
Examining the questions asked by this study poses big data challenges. Information on the type of customers supplied by firms (and hence their MNC supplying status) is typically not collected by statistical agencies, tax authorities or commercial databases. While time-varying information on relationships with MNC customers can be obtained through firm-level surveys, such surveys cannot be used to collect long spans of historical data on firm balance sheets and profit and loss statements. Thus, in order to conduct our study we had to combine enterprise survey information with historical firm-level data from a commercial database. Thanks to doing so, we created a unique data set which allows us to examine the relationship between financial constraints and MNC supplying status.
The survey information we use comes from two enterprise surveys conducted by
the World Bank in the Czech Republic in 2003 and 2004. The surveys were carried out by a professional polling company by means of face-to-face interviews with senior managers taking place at respondents’ workplaces. All respondents were guaranteed full anonymity. The data was collected for 857 Czech firms and 256 foreign owned firms
4
operating in the country. In the analysis, we rely only on data for Czech firms. The focus of the first survey was on manufacturing firms, i.e. firms operating in sectors 15-36 according to NACE classification, while the second one covered both manufacturing and services industries. About 1/5th of the respondents were located in the capital city of Prague, while the rest was distributed across all regions in the country.
The survey data allow us to identify firms making sales to MNCs operating in the
Czech Republic, give us information on the duration of these relationships and other company characteristics. In the 2003 survey, respondents were asked to indicate the year they became suppliers to multinationals. The 2004 survey distinguished between the date of signing the contract and the date of making the first delivery. When using the 2004 survey, we use the date of signing the contract as the date of becoming an MNC supplier. Out of 857 Czech firms in the sample, 390 are suppliers to MNCs (331 suppliers operate in the manufacturing sector, while 59 are services firms).4 As new investment in physical assets is more likely to be important for manufacturing firms wanting to become MNC suppliers than for services companies, our analysis focuses on the manufacturing sector. However, including services firms in the sample would not change the conclusions of this study.
The results of the surveys were supplemented with financial information on
interviewed firms, which was taken from a commercial database Amadeus compiled by Bureau van Dijk. The additional financial information including figures on sales, tangible fixed assets, depreciation, profit (loss), etc. is available for approximately 2/3 of firms in the sample. This remarkably rich database comprises detailed firm-level information for the period 1994-2003. After deleting incomplete or inconsistent data and extreme outliers5 we are left with 2,136 firm-year observations on 386 Czech manufacturing firms, 155 are MNC suppliers. As we are concerned about the self-selection of firms into supplying relationships, we do not include in the sample suppliers whom we cannot observe before they start their relationship with an MNC. This leaves us with 1,735 firm-year observations on 319 Czech firms, 88 of which are MNC suppliers. MNC suppliers are distributed across many industries, including: food products and beverages, machinery and equipment, fabricated metal products, rubber and plastic products, just to name a few examples.
Table 1 presents the summary statistics comparing suppliers to non-suppliers. We
find that MNC suppliers are somewhat larger in terms of employment, they tend to invest more (relative to their capital stock), they have a higher debt (relative to their capital stock) and a higher liquidity ratio. They also tend to be older, more profitable and exhibit higher labor productivity. They are more likely to export, have an ISO certification and employ managers speaking a foreign language. However, they tend to experience a lower sales growth and are less likely to have managers with a foreign work experience.
4 The high percentage of MNC suppliers in our dataset reflects deliberate oversampling, which was done through a phone pre-screening of potential survey respondents. 5 Negative values of tangible fixed assets, sales, depreciation were dropped. We also dropped the 1% tails of the following variables: sales growth, tangible fixed assets growth and cash flow deflated by tangible fixed assets.
5
The Czech Republic is an ideal setting for our analysis for three reasons. First, as mentioned in the introduction, the country has received large inflows of foreign direct investment. In the early years of the transition process, food, beverage and tobacco sector as well as other consumer goods industries received large FDI inflows as many MNCs were entering the country in the hope of securing a first mover advantage in a newly open market. Thanks to the central location, reputation for high quality engineers and the fast progress of reforms the country has also attracted many MNCs wishing to establish export platforms supplying the neighboring European Union. By the end of our sample period (2003), 21 percent was manufacturing FDI stock was found in automotive industry, 14 percent in petroleum, chemical, rubber and plastic products and 12 percent in other non-metallic products. Opening of services industries to FDI stimulated massive inflows into financial intermediation, real estate and wholesale and retail trade. From the mid-1990s on, FDI flows into services have exceeded those directed into manufacturing.
Second, MNCs operating in the Czech Republic appear to be relying heavily on
Czech suppliers. Ninety percent of MNCs interviewed in the 2003 survey reported purchasing inputs from at least one Czech company.6 The median MNC had a sourcing relationship with 10 Czech suppliers while an MNC in the top quartile with at least 30. When asked about the share of inputs purchased from each type of suppliers (in terms of value), MNCs indicated sourcing on average 48.3 percent of inputs from Czech enterprises, as compared to 33.3 and 12.6 percent from firms in the EU/Eastern Europe and MNCs located in the Czech Republic, respectively.7 The share of inputs coming from the other regions appeared to be negligible. Since average figures do not always give an accurate impression, it is worthwhile to report some more statistics. Fifty-five out of 114 MNCs, which answered this question, reported buying at least half of their inputs from Czech suppliers. More than a tenth of respondents acquired all of their intermediates from Czech enterprises. Around forty percent of MNCs expected to purchase more inputs from Czech suppliers in the future.8
Third, while during the period under study the Czech Republic possessed
reasonably developed financial markets, their sophistication and the level of competition (at least in the first half of the sample period) were not yet at the level observed in industrialized countries. To illustrate this point, we compare several indicators of financial market development from an updated version of the database produced by Beck, Demirgurc-Kunt and Levine (1999). For instance during the first year covered by the sample, 1994, the ratio of bank deposits to GDP, a common measure of the magnitude of financial intermediation, was equal to 0.58 in the Czech Republic, which was much higher than the average of 0.36 found in upper middle income countries in the same year, though somewhat lower than the average of 0.67 observed in high income countries. Czech private bond market was, however, much less well developed. The ratio of private
6 Note that the question specifically asked respondents not to include suppliers of services, such as catering or cleaning, etc. 7 Note that MNCs with no sourcing from a particular group of suppliers are included in that group’s average. 8 Note that these figures are similar to those collected in other surveys. For instance, the Opinion Window survey commissioned by CzechInvest in 2002 found that MNCs in the Czech Republic sourced on average 32.2 percent of their inputs locally in 2000 and 34.7 percent in 2001. This share was expected to increase to 35.8 percent in 2002. Similarly, CzechInvest reported that 57 percent of MNCs indicated their ability to increase local content (CzechInvest Factsheet No. 3, January 2002).
6
bond market capitalization to GDP (measured as the total amount of outstanding domestic debt securities issued by private domestic entities divided by GDP) reached only 0.02, as compared to 0.34 and 0.07 in high and upper middle income countries, respectively. In terms of bank overhead costs relative to total assets, the Czech Republic ranked on par with high income countries (0.03) and appeared much more efficient than an average upper middle income economy (0.05). Banking sector in the Czech Republic was appeared to be highly concentrated, though. Defining concentration as the ratio of the three largest banks' assets to total banking sector assets, we find the figure of 0.78 for the Czech Republic which much higher than that the ratio of 0.64 in high income economies and 0.67 in upper middle income economies. During the period under study, the Czech banking sector saw significant restructuring, privatization and entry of foreign investors.
III. The Role of Cash Flow
Ever since the influential paper by Fazzari, Hubbard and Petersen (1988) a large number of studies have examined the effects of liquidity constraints on investment. These papers challenged the neoclassical theory of investment, which suggests that the decision to invest is driven solely by the relative prices, and a firm’s financial structure is irrelevant to investment since external funds provide a perfect substitute for internal capital. Or, as put by Modigliani and Miller (1958), with perfect capital markets, a firm’s investment decision is independent of its financial condition. The alternative research agenda proposed by Fazzari et al. (1988) was based on the burgeoning informational asymmetries literature: in an environment with informational asymmetries, external funds may be more costly and thus provide an imperfect substitute for internal capital. The difference arises to compensate lenders for the adverse selection and moral hazard problems associated with borrowers. If this is the case, then investment should respond positively to increases in internal funds available for investment.
The primary way of testing this hypothesis is to estimate the investment equation
including a measure of the expected profitability of the firm along with a measure of its net worth. To the extent that the measure of net worth (usually cash flow) predicts investment behavior, researchers have concluded that financing constraints are present.
The nature and the interpretation of the link between investment and cash flow is subject to an on-going debate. One stream of the literature, starting with Fazzari et al. (1988) and followed by Hoshi et al. (1991), Lizal and Svejnar (2002) and others, argues that investment cash flow sensitivities can be interpreted as evidence of financial constraints. However, Kaplan and Zingales (1997, 2000) question the approach of Fazzari et al. (1988) and provide evidence suggesting that investment cash flow sensitivity is not a measure of liquidity constraints due to non-monotonicities. Fazzari et al (2000) challenge their conclusions and derive the conditions under which the relationship between investment and cash flow is monotonic. Fazzari et al. basically argue that if the a priori classification of firms is based on criteria that result in large differences in the marginal cost of external funds across groups, constrained firms with large cost of external financing will have larger investments cash flow sensitivity than the relatively unconstrained firms that have very small cost of external funds. Although the debate on
7
the interpretation of the investment cash flow sensitivity is still unresolved, we follow the Fazzari et al. (1988) argument in this study. IV. Empirical analysis Baseline specification
As our empirical strategy, we choose to estimate the traditional accelerator
specification (see also Gelos and Werner 2002, Konings, Rizov and Vandenbussche, 2003). In our empirical model, the growth rate of sales is the accelerator variable, which is expected to be a reasonable proxy for short-term changes in the expected profitability. We include cash flow in order to capture liquidity constraints and an interaction of cash flow with an MNC supplier dummy to examine whether MNC suppliers are subject to different liquidity constraints than other firms. Our baseline specification is as follows:
Iit/Kit-1 = α0 + α1 ΔSit/Sit-1 + α2 CFit/Kit-1 + α3 CFit/Kit-1*Supplierit + α4 Supplierit + +α5 CFit/Kit-1*ln(VA/L) + α6 ln(VA/L) + α7 CFit/Kit-1*Exporterit + α8 Exporterit +
+ α9 CFit/Kit-1*SOEit + α10 SOEit + α11 ln(Sizeit) + α12 ln(Ageit) + + α13 Debt/Kit-1+ αi + αt + εit (1)
where Iit stands for gross investment undertaken by firm i at time t. It is defined as a change in tangible fixed assets plus depreciation. Kit stands for real capital stock and is proxied by deflated tangible fixed assets. Sit represents real sales, and CFit is the real cash flow. The cash flow variable is reported in the Amadeus database where it is defined as the sum of profit (loss) after taxation, extraordinary profit (loss) and depreciation. We normalize investment and cash flow variables by the capital stock in order to control for the size effect. We deflate sales and cash flow by wholesale price deflators specific to 3-digit NACE sectors, obtained from the Czech Statistical Office (CSO). In the case of tangible fixed assets and depreciation, we use a deflator for tangible fixed assets obtained from the CSO. Supplierit is a time-varying dummy variable taking the value of one if firm i is an MNC supplier at time t. It is defined based on the information obtained from enterprise surveys.
The coefficient α2 captures the sensitivity of firms’ level investment to internal funds. If a firm is liquidity constrained, that is, if the desired investment level is constrained by the availability of internal finance, we expect the coefficient to be positive and statistically significant. With perfect capital markets, the firm and lender would be indifferent between internal and external financing and hence we would expect the coefficient to be equal to zero.
The goal of our analysis is to examine the link between access to credit and the MNC supplier status. A priori we would expect that having a contract from a well-known MNC may increase the creditworthiness of Czech suppliers and thus ease their financing constraints. Therefore, we would expect MNC suppliers to be less dependent on their internal cash flow than non-suppliers. To examine this effect we interact cash flow with the indicator variable for MNC suppliers. If firms supplying MNCs are not liquidity constrained, we would expect the sum of the coefficients α2 and α3 to be equal to zero.
8
One may be concerned that the ability of firms to obtain external financing and to become MNC suppliers may be driven by some other factors. For instance, it is possible that more productive firms are better positioned to become MNC suppliers and are identified by lenders as lower risk borrowers. To attenuate this concern, we control for labor productivity (defined as the log of the value added per worker) and its interaction with cash flow. Similarly, exporters may possess qualities that make it easier for them to obtain MNC contracts and at the same time their existing relationships with buyers abroad may make them lower risk borrowers. Therefore, we use the survey data to control for the firm’s exporting status and its interaction with cash flow. Finally, we use a dummy to capture differ investment behavior of state-owned enterprises (SOEs) and an interaction of the dummy with cash flow to capture the possibility that SOEs may enjoy soft budget constraints (for evidence supporting this view see Svejnar and Lizal 2002). SOEs in the sample are identified based on the survey which asked whether a company was established as an SOE and whether and when it was privatized.
The model also includes several firm-specific time-varying factors that might influence the level of investment. We control for a firm’s size, measured by employment and expressed in the log form, the log of a firm’s age and the level of the long-term debt normalized by capital stock. To control for the unobserved heterogeneity across firms we estimate a model using firm fixed effects (αi). We also include year fixed effects (αt) which capture aggregate conditions affecting the cost of capital in a particular year, so it is not necessary to control for interest rates or tax rates.
A common concern with the cash flow sensitivity approach is that the cash flow
variable may pick up more than just pure liquidity effects. However, this paper focuses on comparing cash flow sensitivity across firms, and so as long as the above bias does not vary systematically by MNC supplier status, it is not a major concern for our study.
The estimation results from our baseline specification are presented in Table 2. In the first column, we test for the direct effect of cash flow on the investment decision. The results suggest that firms operating in the Czech Republic are liquidity constrained. The coefficient on the cash flow is positive and statistically significant at the one percent level, reflecting that internal funds are indeed an important determinant of the investment decision. As expected, the sales growth coefficient is also positive and statistically significant.
In column 2, we repeat the exercise using lagged cash flow. The estimation results
lead to similar conclusions, albeit the magnitude of the coefficient is somewhat smaller. While it might be preferable to employ lagged rather than contemporaneous values of cash flow, doing so would significantly reduce the sample size. Therefore, we choose to rely on the contemporaneous figures.
In column 3, we examine whether the link between cash flow and investment
differs between MNC suppliers and other firms. We introduce in the model a dummy that takes the value of 1 in each year in which the firm is supplying a MNC operating in the Czech Republic and zero otherwise. We also interact the dummy with cash flow. If firms having linkages with multinationals find it easier to obtain credit, then the sum of the coefficients on cash flow and the interaction term should not be statistically significant. While cash flow continues to bear a positive and statistically significant coefficient, the
9

interaction term is negative and statistically significant at the one percent level. The F-test reported at the bottom of the table indicates that we cannot reject the hypothesis that the sum of the two coefficients in equal to zero. This suggests that, in contrast to other firms, MNC suppliers do not face liquidity constraints. Neither labor productivity nor its interaction with cash flow reaches conventional significance levels. The supplier dummy itself is not statistically significant suggesting that MNC suppliers do not differ in their investment behavior from other firms.9
Next we want to make sure that our finding is indeed due firms being MNC
suppliers rather than exporters. One may expect that firms engaged in exporting may be less credit constrained thanks to a steady stream of income from more creditworthy foreign customers. At the same time, due to their experience of dealing with foreign buyers they may be better positioned to become MNC suppliers. We also control for potential firm-level determinants of investment behavior.
Our findings are robust to these additional controls. The coefficient on the
interaction between the MNC supplier dummy and cash flow remains negative and statistically significant at the one percent level. As before, the F-test suggests that MNC suppliers do not face liquidity constraints. In contrast, exporters appear to be liquidity constrained. The interaction term is not statistically significant and the F-test rejects an absence of a link between investment and cash flow.10 The likely explanation is that many Czech firms which continued to sell to their Slovak customers after the split of Czechoslovakia in 1993 are considered to be exporters, yet their Slovak buyers unlikely to be more creditworthy than Czech buyers. This also explains why such a high percentage of observations in the sample pertain to exporters.11 The additional controls for size, age and debt level do not appear to be statistically significant.
Svejnar and Lizal (2002) found that SOEs in the Czech Republic were facing soft
budget constraints in the 1990s. As we have only 19 SOEs in our sample, many of which were privatized during the period considered, we are not very concerned that their presence affects our main findings but nevertheless in column 5 we add an SOE dummy and its interaction with cash flow. Neither variable appears to be statistically significant, but as expected the F-test cannot reject the hypothesis that SOEs are not credit constraints. Our finding with respect to MNC suppliers remains unchanged.
In the last column of Table 2, we include all controls listed in equation 1 and
confirm our earlier conclusions. Cash flow variable bears a positive and statistically significant coefficient, and its interaction with the MNC supplier dummy is negative and significant at the one percent level. Based on these coefficients and the F-test we conclude that while Czech firms in general appear to be liquidity constrained, this is not true of MNC suppliers. As before, our results suggest that SOEs may be subject to soft budget constraints.
9 Though note that some differences may be captured by firm fixed effects included in the model. 10 Note that excluding the supplier dummy and its interaction with cash flow from the model would not change this conclusion. 11 Slovakia is the second largest export market for Czech firms.
10
Are future MNC suppliers less credit constrained?
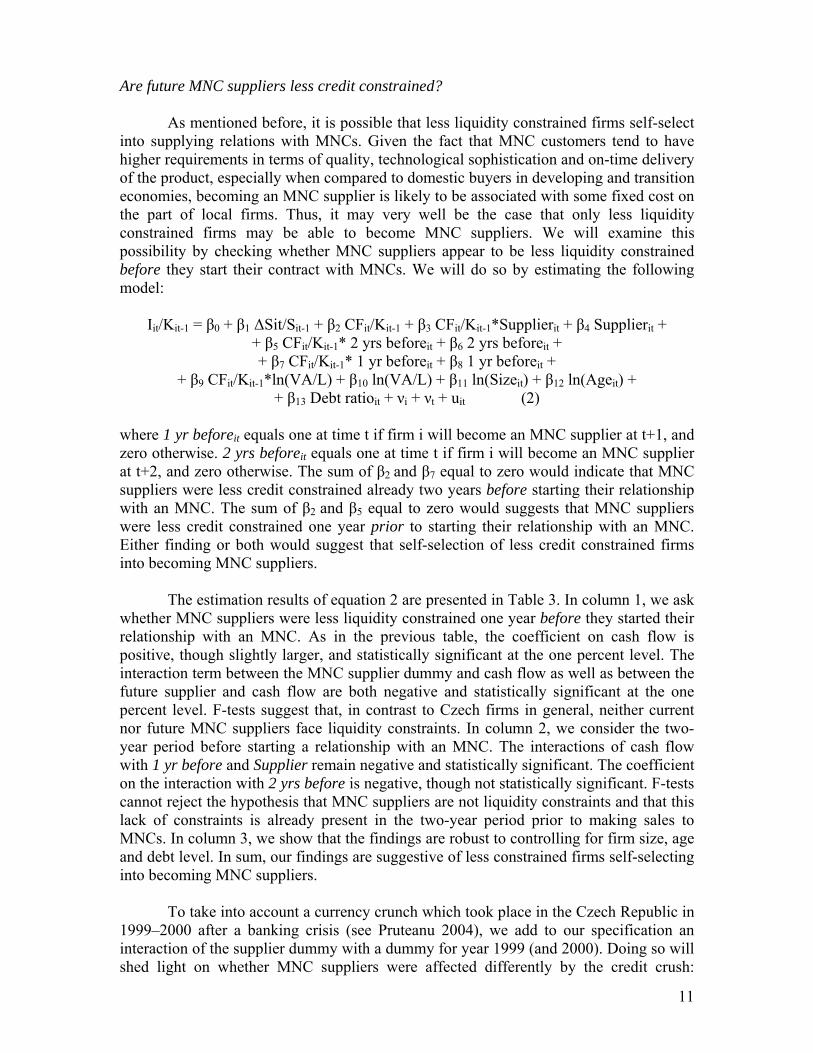
As mentioned before, it is possible that less liquidity constrained firms self-select into supplying relations with MNCs. Given the fact that MNC customers tend to have higher requirements in terms of quality, technological sophistication and on-time delivery of the product, especially when compared to domestic buyers in developing and transition economies, becoming an MNC supplier is likely to be associated with some fixed cost on the part of local firms. Thus, it may very well be the case that only less liquidity constrained firms may be able to become MNC suppliers. We will examine this possibility by checking whether MNC suppliers appear to be less liquidity constrained before they start their contract with MNCs. We will do so by estimating the following model:
Iit/Kit-1 = β0 + β1 ΔSit/Sit-1 + β2 CFit/Kit-1 + β3 CFit/Kit-1*Supplierit + β4 Supplierit +
+ β5 CFit/Kit-1* 2 yrs beforeit + β6 2 yrs beforeit + + β7 CFit/Kit-1* 1 yr beforeit + β8 1 yr beforeit +
+ β9 CFit/Kit-1*ln(VA/L) + β10 ln(VA/L) + β11 ln(Sizeit) + β12 ln(Ageit) + + β13 Debt ratioit + νi + νt + uit (2)
where 1 yr beforeit equals one at time t if firm i will become an MNC supplier at t+1, and zero otherwise. 2 yrs beforeit equals one at time t if firm i will become an MNC supplier at t+2, and zero otherwise. The sum of β2 and β7 equal to zero would indicate that MNC suppliers were less credit constrained already two years before starting their relationship with an MNC. The sum of β2 and β5 equal to zero would suggests that MNC suppliers were less credit constrained one year prior to starting their relationship with an MNC. Either finding or both would suggest that self-selection of less credit constrained firms into becoming MNC suppliers.
The estimation results of equation 2 are presented in Table 3. In column 1, we ask whether MNC suppliers were less liquidity constrained one year before they started their relationship with an MNC. As in the previous table, the coefficient on cash flow is positive, though slightly larger, and statistically significant at the one percent level. The interaction term between the MNC supplier dummy and cash flow as well as between the future supplier and cash flow are both negative and statistically significant at the one percent level. F-tests suggest that, in contrast to Czech firms in general, neither current nor future MNC suppliers face liquidity constraints. In column 2, we consider the two-year period before starting a relationship with an MNC. The interactions of cash flow with 1 yr before and Supplier remain negative and statistically significant. The coefficient on the interaction with 2 yrs before is negative, though not statistically significant. F-tests cannot reject the hypothesis that MNC suppliers are not liquidity constraints and that this lack of constraints is already present in the two-year period prior to making sales to MNCs. In column 3, we show that the findings are robust to controlling for firm size, age and debt level. In sum, our findings are suggestive of less constrained firms self-selecting into becoming MNC suppliers.
To take into account a currency crunch which took place in the Czech Republic in
1999–2000 after a banking crisis (see Pruteanu 2004), we add to our specification an interaction of the supplier dummy with a dummy for year 1999 (and 2000). Doing so will shed light on whether MNC suppliers were affected differently by the credit crush:
11
MNCs with their global distribution networks are less affected by changes in the Czech market and thus less likely to make adjustments to relationships with their suppliers. As evident from column 4, however, we find no indication of MNC suppliers exhibiting investment behavior different from that of other firms during the credit crunch period. Neither of the interaction terms is statistically significant. Our other conclusions remain unchanged.
To account for the possibility that firms in growing sectors might be more likely
to be both MNC suppliers and less liquidity constrained, we introduce in the regression interactions between dummies for 2-digit NACE codes (18 in total) and the cash flow variable. Only two of these interaction terms are statistically significant (furniture; computer, electronic and optical products) suggesting that firms in these sectors are more credit constrained. The results confirm our previous findings that suppliers to MNCs are less liquidity constrained than the rest of domestic firms, and that the effect is already present two years prior to signing a contract with a MNC. In this specification, we also find a positive link between the level of debt and investment, and we observe that firms with higher labor productivity tend to be less credit constrained.
One may wonder about the results of F-tests based not only on the coefficient on
cash flow and its interaction with the current (or future) supplying status but also taking into account the interaction of cash flow with labor productivity. We performed such tests taking into account the average level of labor productivity observed among current (or future, as appropriate) suppliers and found support for our earlier conclusions. Both current and future MNC suppliers do not appear to be credit constrained.
Finally, in robustness checks not reported to save space we found that our
conclusions would not be affected by dropping observations with negative values of cash flow or including industry-year fixed effects.
As another way of shedding light on the link between credit constraints and the
MNC supplying status, we estimate a probit model where we aim to explain the supplying status (Supplierit is the dependent variable) with lagged liquidity ratio, gross profit (logged) and debt (normalized by capital). Liquidity ratio is defined as the difference between current assets and current liabilities, divided by total assets. We also control for firm size (in terms of employment), age and labor productivity as well as 3-digit industry and year fixed effects. The results, presented in Appendix Table A1, show a positive and statistically significant link between lagged liquidity ratio, lagged gross profit and the probability of being an MNC supplier. We find no statistically significant coefficients on debt, employment and labor productivity. Somewhat puzzled by the last finding, we also experiment with measuring performance using the total factor productivity estimated using sector-specific production function (OLS or Olley-Pakes (1996) method). We find that once we control for liquidity ratio, gross profit and debt, firm productivity is not a good predictor of the supplying status. Finally, the data also indicate that younger firms are more likely to be MNC suppliers.12
12 We also experimented with a probit model predicting the decision of Czech firms to become MNC suppliers rather than the decision to supply MNCs in a given year. Liquidity ratio and firm size were found to be the main predictors of the decision to become an MNC supplier.
12
In sum, our findings are suggestive of less liquidity constrained firms self-selecting into being MNC suppliers. This is consistent with the observation that in order to obtain contracts from MNCs firms need to meet stringent requirements of multinational customers and only firms with access to financing may be able to do so. The data collected in the surveys are in line with these conclusions. Most suppliers make improvements within the 12-month period preceding signing a contract with an MNC. Most frequent changes include improvements to product quality, staff training and increasing labor productivity. Many of them are probably done in connection with obtaining ISO certifications. Over 40 percent of suppliers were required by prospective MNC customers to obtain such a certification. As the certification process is quite costly, as it usually involves services of specialized consulting firms, it is not surprising that only firms that are less liquidity constrained may be able to do it.
Robustness checks To eliminate the possibility that our findings could be driven by MNC extending
credit to their future suppliers, we remove from our sample 15 Czech firms reporting in the surveys receiving some sort of financial help from their MNC customers. The results, presented in the first two columns of Table 4, confirm the earlier pattern. We find that MNC suppliers are less liquidity constrained already two years prior to serving an MNC customer and they remain less liquidity constrained while serving the MNC customer.
To examine the possibility that our findings could be due to future MNC suppliers
presenting a lower credit risk thanks to having secured a contract from an MNC, we drop from the sample Czech suppliers reporting in the survey that having a supplying relationship with a MNC helped them obtain financing from a Czech or a foreign bank. As evident from the last two columns of Table 4, eliminating these 24 firms from the sample does not affect our results. We confirm that MNC suppliers are less credit constrained and find evidence suggestive of less constrained firms firms self-selecting into becoming MNC suppliers.
Instrumental variable approach Given the evidence suggestive of self-selection of less credit constrained firms into supplying relationships with MNCs and the possibility of the cash flow variable being endogenous, the final step in our analysis involves the instrumental variable approach. We use the GMM system estimation, proposed by Blundell and Bond (1999), and instrument for sales growth, labor productivity, the supplier status, cash flow and the cash flow interactions. The GMM systems estimator combines a differenced and a level equation to form a system GMM. Lagged levels are used as instruments for the contemporary differences and lagged differences are used as instruments for the level equation.
We also use several additional instruments in our estimation. It is likely that firms
whose managers speak foreign languages or have foreign experience are better positioned to obtain contracts from multinationals. Thus, as our instruments for the supplying status we use dummies if the firm manager is proficient in a foreign language or has foreign
13

experience. The level of proficiency was determined by whether the manager is able to conduct business negotiations in this language or able to understand a business agreement written in the language. As thanks to their experience of dealing with foreign customers, exporters may find it easier to become MNC suppliers, we use the second lag of the exporting status as an instrument. All the above variables come from the survey.
Second, it is likely that proximity to MNCs facilitates business relationships.
Thus, our instrument set also includes proxies for the presence of multinationals in the same industry as well as in downstream industries. The proxy for the presence of MNCs in the same sector is defined as the share of the sector output produced by foreign firms. More specifically, it is calculated by weighting the output of each firm in sector j (Yft) by the share of the firm’s equity owned by foreigners (Foreign Shareft) and then dividing it by the total output of sector j:
∑∑
∈
∈
∗=
j f allfor f
f allfor fjt
ShareForeign sector same in the MNCs
ft
jftft
Y
Y
The proxy for the presence of multinationals in downstream sectors (i.e. sectors supplied by firm i operating in sector j) is defined following Javorcik (2004) as:
∑∑
∑∈
∈≠
∗∗=
k ft
kftft
j jk Y
Y
f allfor f
f allfor fk ifk jt
ShareForeign customers MNC Potential α
That is we use αjk the proportion of sector j’s output supplied to a downstream sector k calculated based on the 1999 input-output matrix of the Czech Republic to weight the MNC presence in each downstream sector k. As the formula indicates, inputs supplied within the sector are not included. Thus the greater the foreign presence in sectors supplied by industry j and the larger the share of output supplied to industries with a multinational presence, the higher the value of the variable.13 The above calculations are based on all firms included in the Amadeus database rather than just firms in our sample.
To instrument for cash flow, sales growth, and labor productivity we use second
lags of these variables. To instrument for interactions of cash flow with the MNC supplier dummy, we use interactions of cash flows with instruments mentioned above. Each column of Table 5 lists instruments included in a given specification.
The number of observations in Table 5 is smaller than in the previous
specifications. We lose one year of data as the model includes first differences and lagged investment among explanatory variables. We lose further years of data as our instruments are based on second and further lags.
13 To illustrate the meaning of the variable, suppose that the sugar industry sells half of its output to jam producers and half to chocolate producers. If no multinationals are producing jam but half of all chocolate production comes from foreign affiliates, Potential MNC customersjt will be calculated as follows: ½*0 + ½*½ = ¼.
14
While the small number of observations suggests that there results should be treated with caution, we nevertheless find them to be informative. As reported in Table 5, the Hansen test for overidentification restrictions shows that one cannot reject the null at conventional significance levels. The Arellano-Bond test shows that one cannot reject the null of no second-order serial correlation. These specification tests suggest that these baseline regressions yield consistent estimates.
The GMM results suggest that the supplier status does not have a significant
impact on firm’s liquidity constraints, once self-selection is taken into account. In none of the cases (and many other regressions estimated but not reported here to save space), is the interaction term between cash flow and the supplier status statistically significant. In all specifications, the F-test rejects an absence of a relationship between cash flow and investment for MNC suppliers. As expected, the cash flow variable remains statistically significant in all regressions, suggesting that domestic firms are liquidity constrained, even after accounting for possible endogeneity problems. In summary, the evidence suggests that suppliers are different from non-suppliers in terms of liquidity constraints, but the effect appears to be due to self-selection rather than to a relationship with an MNC leading to easing of supplier’s financial constraints.
V. Conclusions
Many countries around the world strive to attract FDI believing that foreign investors not only bring capital but also serve as a channel of knowledge transfer across international borders. As policy makers hope that some of this knowledge will result in externalities that will benefit domestic producers, they are willing to offer often very generous incentive packages to foreign investors. For instance, 59 of 108 countries surveyed by the World Bank reported offering some type of FDI incentives in 2004 (Harding and Javorcik 2007).
A recent survey of the empirical literature on FDI spillovers (Görg and
Greenaway 2004) has concluded that such spillovers are most likely to take place between MNCs and their local suppliers. This means that understanding factors allowing local firms become suppliers to MNCs may have strong implications for knowledge spillovers and public policy choices with respect to treatment of FDI.
This study uses a unique data set from the Czech Republic, which includes
information on whether or not firms supply MNCs and the timing of the relationship, to study the link between credit constraints and the MNC supplier status. Several observations emerge from the study. First, in contrast to Czech firms in general, which face financial constraints, MNC suppliers do not appear to be liquidity constrained. Second, the data suggest that the lack of liquidity constraints is present prior to firms starting their relationships with MNCs, which is consistent with unconstrained firms self-selecting into supplying with MNCs.
A caution is, however, needed when interpreting these findings. While our finding
is robust to a number of controls that may be driving both access to credit and the ability of firms to supply MNCs, there always exists a possibility that the list of controls in incomplete. Thus, even though our results are suggestive of well functioning credit
15

markets being important in facilitating business relationships between local firms and MNCs, they do not suggest that a well developed financial market is a sufficient condition for such relationships to take place. Many other factors, such as a certain level of sophistication of the local manufacturing sector, a match between the skill endowment of the host economy and the sourcing needs of MNCs and good business environment may be needed in order for these relationships to materialize. We think it is possible to generalize our findings to other upper middle income economies, but probably not to low income countries.
16
References Alfaro, Laura, Areendam Chanda, Sebnem Kalemli-Ozcan, and Selin Sayek, 2005. "FDI and Economic Growth: The Role of Local Financial Markets." Journal of International Economics 65(2). Alfaro, Laura, Areendam Chanda, Sebnem Kalemli-Ozcan, and Selin Sayek, 2006. “How Does Foreign Direct Investment Promote Economic Growth?” NBER Working Paper No. 12522 (September). Beck, Thorsten, Asli Demirgurc-Kunt and Ross Levine, 1999.”A New Database on Financial Development and Structure,” World Bank Policy Research Working Paper No. 2146. Blalock, Garrick and Paul J. Gertler, 2008. “Welfare Gains from Foreign Direct Investment through Technology Transfer to Local Suppliers," Journal of International Economics, 74(2): 402-421. Blundell, Richard, and Steve Bond, 1998. "Initial conditions and moment restrictions in dynamic panel data models," Journal of Econometrics, 87: 115-43. Chaney, Thomas, 2005. “Liquidity Constrained Exporters,” Working Paper, University of Chicago, Dept. of Economics. Fazzari, Steve M., R.G. Hubbard, and Petersen, Bruce C., 1988. “Financing Constraints and Corporate Investment,” Brookings Papers on Economic Activity, 1: 141-195. Fazzari Steve M., Glenn R. Hubbard, and Bruce C. Petersen, 2000. "Financing Constraints and Corporate Investment: Response to Kaplan and Zingales", Quarterly Journal of Economics, 115(2), 695-705 Gelos, R. Gaston and Alejandro Werner, 2002. “Financial Liberalization, Credit Constraints, and Collateral: Investment in the Mexican Manufacturing Sector,” Journal of Development Economics, 67: 1-27. Görg, Holger and David Greenaway, 2004. “Much Ado about Nothing? Do Domestic Firms Really Benefit from Foreign Direct Investment?” World Bank Research Observer, 19(2): 171-197. Harrison, Ann and Margaret McMillan, 2003. “Does Direct Foreign Investment Affect Domestic Firms' Credit Constraints?” Journal of International Economics, 61(1): 73-100. Harrison, Ann E., Inessa Love, and Margaret S. McMillan, 2004. "Global capital flows and financing constraints," Journal of Development Economics, 75(1): 269-301. Harding, Torfinn and Beata S. Javorcik, 2007. “Developing economies and international investors: Do investment promotion agencies bring them together?” World Bank Policy Research Working Paper No. 4339.
17
Hoshi, Takeo, Anyl Kashyap, and David Scharfstein , 1991. "Corporate Structure, Liquidity, and Investment: Evidence from Japanese Industrial Groups," Quarterly Journal of Economics, 106, 33-60 Javorcik Beata Smarzynska, 2004. “Does Foreign Direct Investment Increase the Productivity of Domestic Firms? In Search of Spillovers through Backward Linkages,” American Economic Review, 94(3): 605-627. Javorcik Beata Smarzynska, 2007. “Foreign Direct Investment and International Technology Transfer: What Do We Know? What Would We Like to Know?” World Bank mimeo. Javorcik, Beata Smarzynska and Mariana Spatareanu, 2005. “Disentangling FDI Spillover Effects: What Do Firm Perceptions Tell Us?” in Theodore Moran, Edward Graham and Magnus Blomström, eds., Does Foreign Direct Investment Promote Development?, Institute for International Economics, Washington, D.C. Javorcik, Beata Smarzynska and Mariana Spatareanu, 2008. “To Share or Not To Share: Does Local Participation Matter for Spillovers from FDI?” Journal of Development Economics, 85(1-2): 194-217. Kaplan, Steven and Luigi Zingales, 1997. "Do Investment-Cash Flow Sensitivities Provide Useful Measures of Financing Constraints?," Quarterly Journal of Economics, 112:169-215 Kaplan, St. and L. Zingales, 2000. “Investment-Cash Flow Sensitivities Are not Valid Measures of Financing Constraints,” Quarterly Journal of Economics, 115(2): 707- 712. Konings, Josef, Marian Rizov and Hylke Vandenbussche. 2003. “Investment and Credit Constraints in Transition Economies: Micro Evidence from Poland, the Czech Republic, Bulgaria and Romania,” Economic Letters 78: 253 - 258. Lizal, Lubomir and Jan Sjejnar, 2002. “Investment, Credit Rationing, And The Soft Budget Constraint: Evidence From Czech Panel Data,” Review of Economics and Statistics, 84(2): 353-370. Manova, Kalina, 2006. “Credit Constraints in Trade: Financial Development and Export Composition,” mimeo, Harvard University. Modigliani, Franco. and Merton. Miller, 1958. "The Cost of Capital, Corporation Finance and the Theory of Investment," American Economic Review, 48(3): 261-297. Olley, Steven G. and Pakes, Ariel, 1996. “The Dynamics of Productivity in the Telecommunications Equipment Industry.” Econometrica, 64(6): 1263–97. Pruteanu, A., 2004. “Was There Evidence of Credit Rationing in the Czech Republic?” Eastern European Economics, 42(5): 58 – 72
18

Rajan, Raghuram and Luigi Zingales, 1998. "Financial Development and Growth," American Economic Review, 88(3): 559-586.
19
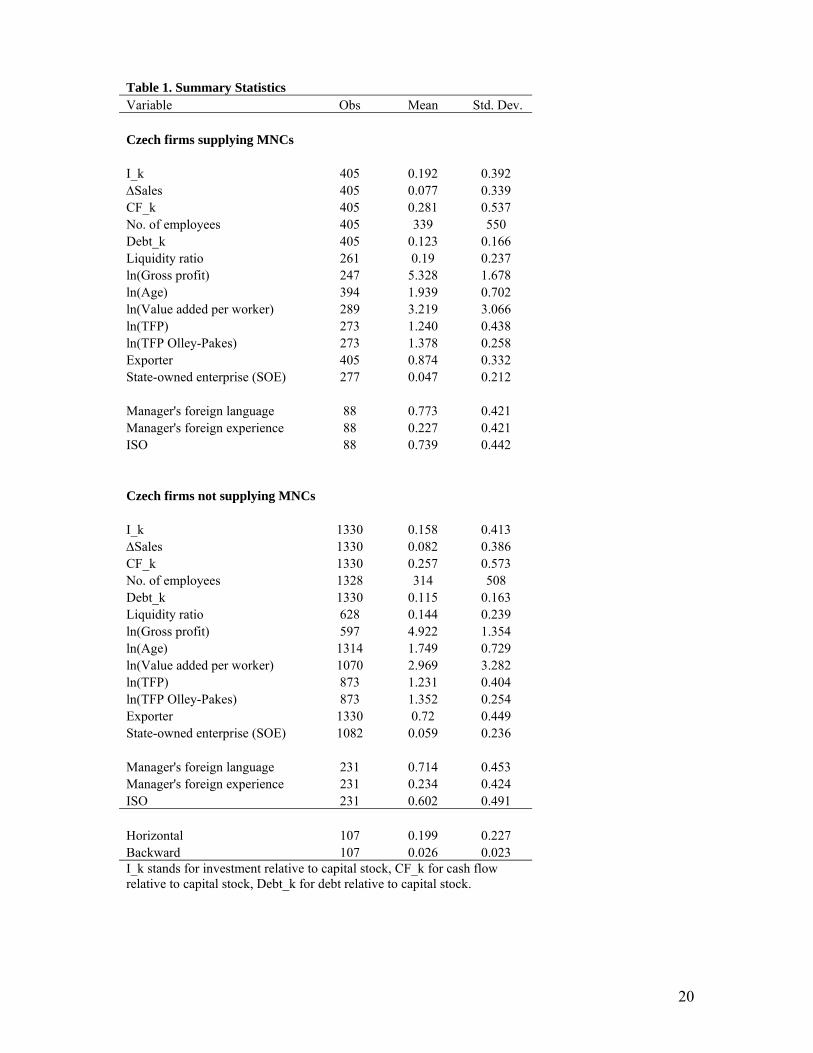
Table 1. Summary Statistics Variable Obs Mean Std. Dev. Czech firms supplying MNCs I_k 405 0.192 0.392 ΔSales 405 0.077 0.339 CF_k 405 0.281 0.537 No. of employees 405 339 550 Debt_k 405 0.123 0.166 Liquidity ratio 261 0.19 0.237 ln(Gross profit) 247 5.328 1.678 ln(Age) 394 1.939 0.702 ln(Value added per worker) 289 3.219 3.066 ln(TFP) 273 1.240 0.438 ln(TFP Olley-Pakes) 273 1.378 0.258 Exporter 405 0.874 0.332 State-owned enterprise (SOE) 277 0.047 0.212 Manager's foreign language 88 0.773 0.421 Manager's foreign experience 88 0.227 0.421 ISO 88 0.739 0.442 Czech firms not supplying MNCs I_k 1330 0.158 0.413 ΔSales 1330 0.082 0.386 CF_k 1330 0.257 0.573 No. of employees 1328 314 508 Debt_k 1330 0.115 0.163 Liquidity ratio 628 0.144 0.239 ln(Gross profit) 597 4.922 1.354 ln(Age) 1314 1.749 0.729 ln(Value added per worker) 1070 2.969 3.282 ln(TFP) 873 1.231 0.404 ln(TFP Olley-Pakes) 873 1.352 0.254 Exporter 1330 0.72 0.449 State-owned enterprise (SOE) 1082 0.059 0.236 Manager's foreign language 231 0.714 0.453 Manager's foreign experience 231 0.234 0.424 ISO 231 0.602 0.491 Horizontal 107 0.199 0.227 Backward 107 0.026 0.023 I_k stands for investment relative to capital stock, CF_k for cash flow relative to capital stock, Debt_k for debt relative to capital stock.
20
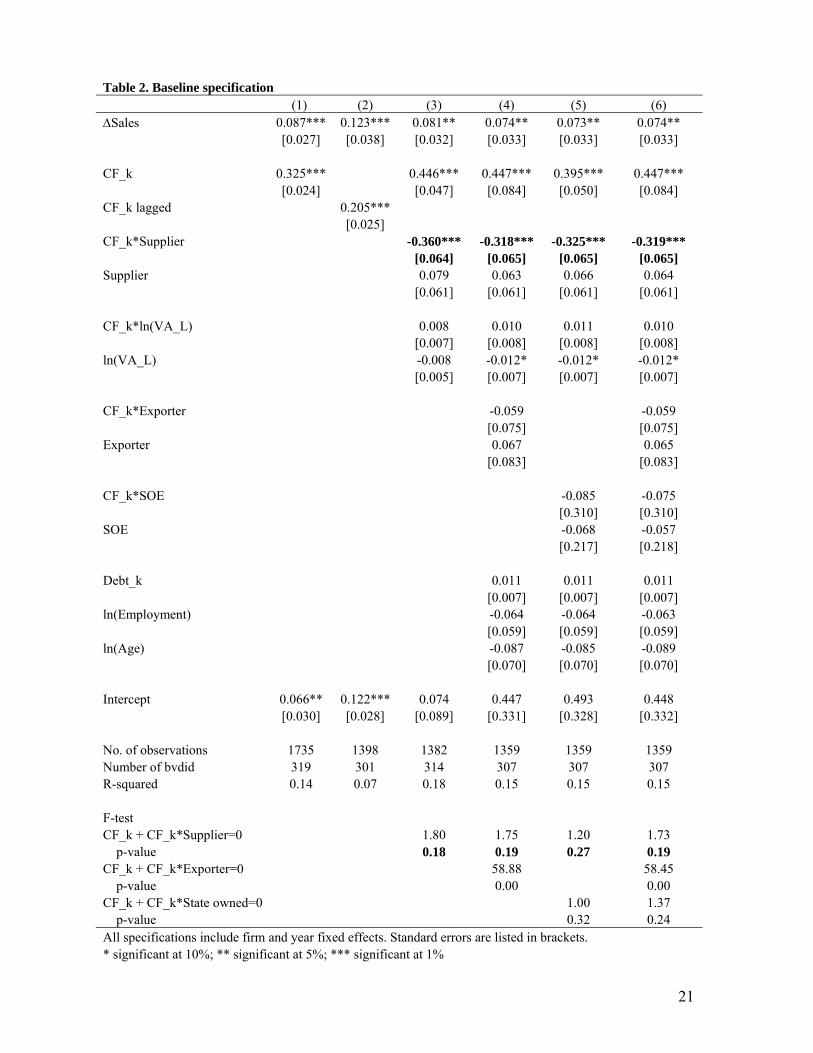
Table 2. Baseline specification (1) (2) (3) (4) (5) (6) ΔSales 0.087*** 0.123*** 0.081** 0.074** 0.073** 0.074** [0.027] [0.038] [0.032] [0.033] [0.033] [0.033] CF_k 0.325*** 0.446*** 0.447*** 0.395*** 0.447*** [0.024] [0.047] [0.084] [0.050] [0.084] CF_k lagged 0.205*** [0.025] CF_k*Supplier -0.360*** -0.318*** -0.325*** -0.319*** [0.064] [0.065] [0.065] [0.065] Supplier 0.079 0.063 0.066 0.064 [0.061] [0.061] [0.061] [0.061] CF_k*ln(VA_L) 0.008 0.010 0.011 0.010 [0.007] [0.008] [0.008] [0.008] ln(VA_L) -0.008 -0.012* -0.012* -0.012* [0.005] [0.007] [0.007] [0.007] CF_k*Exporter -0.059 -0.059 [0.075] [0.075] Exporter 0.067 0.065 [0.083] [0.083] CF_k*SOE -0.085 -0.075 [0.310] [0.310] SOE -0.068 -0.057 [0.217] [0.218] Debt_k 0.011 0.011 0.011 [0.007] [0.007] [0.007] ln(Employment) -0.064 -0.064 -0.063 [0.059] [0.059] [0.059] ln(Age) -0.087 -0.085 -0.089 [0.070] [0.070] [0.070] Intercept 0.066** 0.122*** 0.074 0.447 0.493 0.448 [0.030] [0.028] [0.089] [0.331] [0.328] [0.332] No. of observations 1735 1398 1382 1359 1359 1359 Number of bvdid 319 301 314 307 307 307 R-squared 0.14 0.07 0.18 0.15 0.15 0.15 F-test CF_k + CF_k*Supplier=0 1.80 1.75 1.20 1.73 p-value 0.18 0.19 0.27 0.19 CF_k + CF_k*Exporter=0 58.88 58.45 p-value 0.00 0.00 CF_k + CF_k*State owned=0 1.00 1.37 p-value 0.32 0.24 All specifications include firm and year fixed effects. Standard errors are listed in brackets. * significant at 10%; ** significant at 5%; *** significant at 1%
21
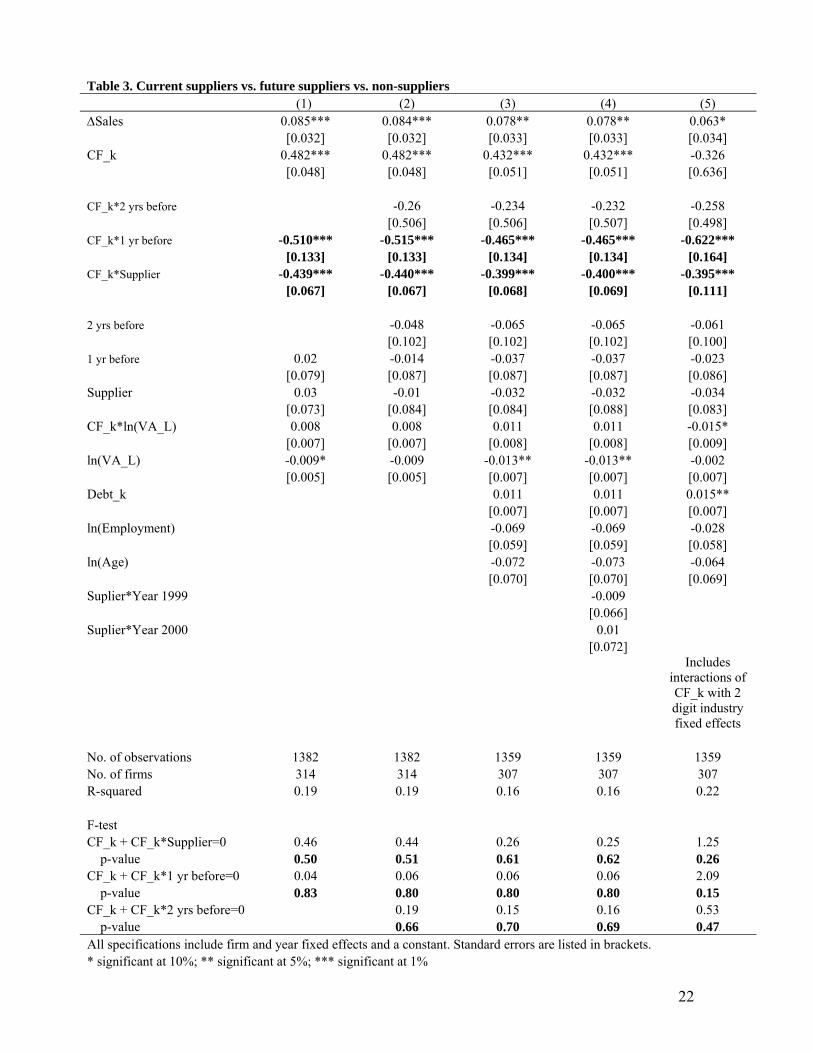
Table 3. Current suppliers vs. future suppliers vs. non-suppliers (1) (2) (3) (4) (5) ΔSales 0.085*** 0.084*** 0.078** 0.078** 0.063* [0.032] [0.032] [0.033] [0.033] [0.034] CF_k 0.482*** 0.482*** 0.432*** 0.432*** -0.326 [0.048] [0.048] [0.051] [0.051] [0.636] CF_k*2 yrs before -0.26 -0.234 -0.232 -0.258 [0.506] [0.506] [0.507] [0.498] CF_k*1 yr before -0.510*** -0.515*** -0.465*** -0.465*** -0.622*** [0.133] [0.133] [0.134] [0.134] [0.164] CF_k*Supplier -0.439*** -0.440*** -0.399*** -0.400*** -0.395*** [0.067] [0.067] [0.068] [0.069] [0.111] 2 yrs before -0.048 -0.065 -0.065 -0.061 [0.102] [0.102] [0.102] [0.100] 1 yr before 0.02 -0.014 -0.037 -0.037 -0.023 [0.079] [0.087] [0.087] [0.087] [0.086] Supplier 0.03 -0.01 -0.032 -0.032 -0.034 [0.073] [0.084] [0.084] [0.088] [0.083] CF_k*ln(VA_L) 0.008 0.008 0.011 0.011 -0.015* [0.007] [0.007] [0.008] [0.008] [0.009] ln(VA_L) -0.009* -0.009 -0.013** -0.013** -0.002 [0.005] [0.005] [0.007] [0.007] [0.007] Debt_k 0.011 0.011 0.015** [0.007] [0.007] [0.007] ln(Employment) -0.069 -0.069 -0.028 [0.059] [0.059] [0.058] ln(Age) -0.072 -0.073 -0.064 [0.070] [0.070] [0.069] Suplier*Year 1999 -0.009 [0.066] Suplier*Year 2000 0.01 [0.072]
Includes interactions of CF_k with 2 digit industry fixed effects
No. of observations 1382 1382 1359 1359 1359 No. of firms 314 314 307 307 307 R-squared 0.19 0.19 0.16 0.16 0.22 F-test CF_k + CF_k*Supplier=0 0.46 0.44 0.26 0.25 1.25 p-value 0.50 0.51 0.61 0.62 0.26 CF_k + CF_k*1 yr before=0 0.04 0.06 0.06 0.06 2.09 p-value 0.83 0.80 0.80 0.80 0.15 CF_k + CF_k*2 yrs before=0 0.19 0.15 0.16 0.53 p-value 0.66 0.70 0.69 0.47 All specifications include firm and year fixed effects and a constant. Standard errors are listed in brackets. * significant at 10%; ** significant at 5%; *** significant at 1%
22
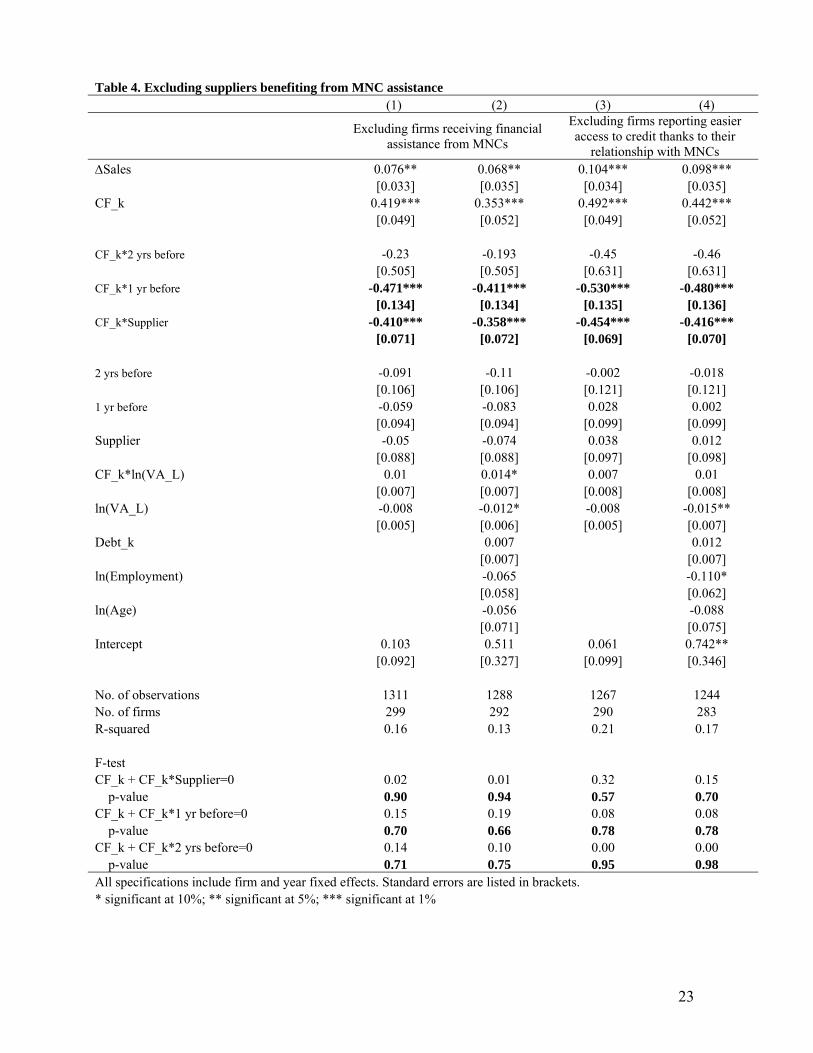
Table 4. Excluding suppliers benefiting from MNC assistance (1) (2) (3) (4)
Excluding firms receiving financial assistance from MNCs
Excluding firms reporting easier access to credit thanks to their
relationship with MNCs ΔSales 0.076** 0.068** 0.104*** 0.098*** [0.033] [0.035] [0.034] [0.035] CF_k 0.419*** 0.353*** 0.492*** 0.442*** [0.049] [0.052] [0.049] [0.052] CF_k*2 yrs before -0.23 -0.193 -0.45 -0.46 [0.505] [0.505] [0.631] [0.631] CF_k*1 yr before -0.471*** -0.411*** -0.530*** -0.480*** [0.134] [0.134] [0.135] [0.136] CF_k*Supplier -0.410*** -0.358*** -0.454*** -0.416*** [0.071] [0.072] [0.069] [0.070] 2 yrs before -0.091 -0.11 -0.002 -0.018 [0.106] [0.106] [0.121] [0.121] 1 yr before -0.059 -0.083 0.028 0.002 [0.094] [0.094] [0.099] [0.099] Supplier -0.05 -0.074 0.038 0.012 [0.088] [0.088] [0.097] [0.098] CF_k*ln(VA_L) 0.01 0.014* 0.007 0.01 [0.007] [0.007] [0.008] [0.008] ln(VA_L) -0.008 -0.012* -0.008 -0.015** [0.005] [0.006] [0.005] [0.007] Debt_k 0.007 0.012 [0.007] [0.007] ln(Employment) -0.065 -0.110* [0.058] [0.062] ln(Age) -0.056 -0.088 [0.071] [0.075] Intercept 0.103 0.511 0.061 0.742** [0.092] [0.327] [0.099] [0.346] No. of observations 1311 1288 1267 1244 No. of firms 299 292 290 283 R-squared 0.16 0.13 0.21 0.17 F-test CF_k + CF_k*Supplier=0 0.02 0.01 0.32 0.15 p-value 0.90 0.94 0.57 0.70 CF_k + CF_k*1 yr before=0 0.15 0.19 0.08 0.08 p-value 0.70 0.66 0.78 0.78 CF_k + CF_k*2 yrs before=0 0.14 0.10 0.00 0.00 p-value 0.71 0.75 0.95 0.98 All specifications include firm and year fixed effects. Standard errors are listed in brackets. * significant at 10%; ** significant at 5%; *** significant at 1%
23
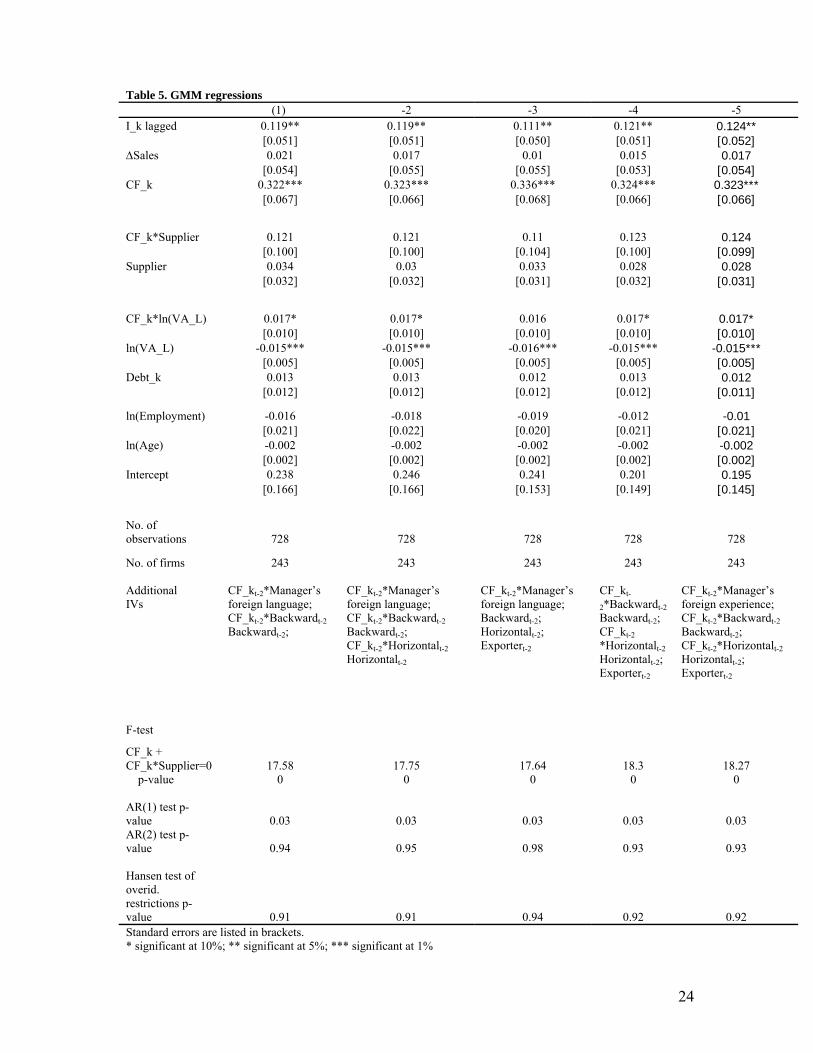
Table 5. GMM regressions (1) -2 -3 -4 -5 I_k lagged 0.119** 0.119** 0.111** 0.121** 0.124** [0.051] [0.051] [0.050] [0.051] [0.052] ΔSales 0.021 0.017 0.01 0.015 0.017 [0.054] [0.055] [0.055] [0.053] [0.054] CF_k 0.322*** 0.323*** 0.336*** 0.324*** 0.323*** [0.067] [0.066] [0.068] [0.066] [0.066]
CF_k*Supplier 0.121 0.121 0.11 0.123 0.124 [0.100] [0.100] [0.104] [0.100] [0.099] Supplier 0.034 0.03 0.033 0.028 0.028 [0.032] [0.032] [0.031] [0.032] [0.031]
CF_k*ln(VA_L) 0.017* 0.017* 0.016 0.017* 0.017* [0.010] [0.010] [0.010] [0.010] [0.010] ln(VA_L) -0.015*** -0.015*** -0.016*** -0.015*** -0.015*** [0.005] [0.005] [0.005] [0.005] [0.005] Debt_k 0.013 0.013 0.012 0.013 0.012 [0.012] [0.012] [0.012] [0.012] [0.011]
ln(Employment) -0.016 -0.018 -0.019 -0.012 -0.01 [0.021] [0.022] [0.020] [0.021] [0.021] ln(Age) -0.002 -0.002 -0.002 -0.002 -0.002 [0.002] [0.002] [0.002] [0.002] [0.002] Intercept 0.238 0.246 0.241 0.201 0.195 [0.166] [0.166] [0.153] [0.149] [0.145]
No. of observations 728 728 728 728 728
No. of firms 243 243 243 243 243
CF_kt-2*Manager’s foreign language;
CF_kt-2*Manager’s foreign language;
CF_kt-2*Manager’s foreign language;
CF_kt-
2*Backwardt-2 CF_kt-2*Manager’s foreign experience;
CF_kt-2*Backwardt-2 CF_kt-2*Backwardt-2 Backwardt-2; Backwardt-2; CF_kt-2*Backwardt-2 Backwardt-2; Backwardt-2;
CF_kt-2*Horizontalt-2 Horizontalt-2
Horizontalt-2; Exportert-2
CF_kt-2 *Horizontalt-2 Horizontalt-2; Exportert-2
Backwardt-2; CF_kt-2*Horizontalt-2 Horizontalt-2; Exportert-2
Additional IVs
F-test
CF_k + CF_k*Supplier=0 17.58 17.75 17.64 18.3 18.27 p-value 0 0 0 0 0 AR(1) test p-value 0.03 0.03 0.03 0.03 0.03 AR(2) test p-value 0.94 0.95 0.98 0.93 0.93 Hansen test of overid. restrictions p-value 0.91 0.91 0.94 0.92 0.92 Standard errors are listed in brackets. * significant at 10%; ** significant at 5%; *** significant at 1%
24
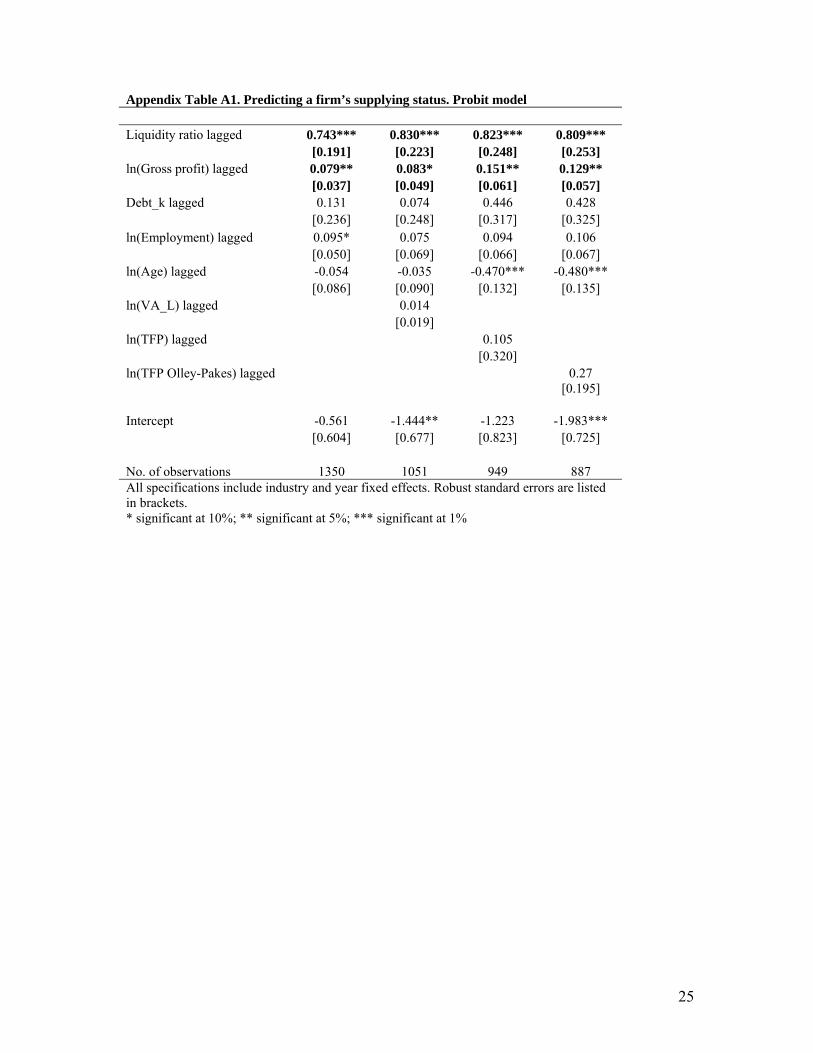
Appendix Table A1. Predicting a firm’s supplying status. Probit model Liquidity ratio lagged 0.743*** 0.830*** 0.823*** 0.809*** [0.191] [0.223] [0.248] [0.253] ln(Gross profit) lagged 0.079** 0.083* 0.151** 0.129** [0.037] [0.049] [0.061] [0.057] Debt_k lagged 0.131 0.074 0.446 0.428 [0.236] [0.248] [0.317] [0.325] ln(Employment) lagged 0.095* 0.075 0.094 0.106 [0.050] [0.069] [0.066] [0.067] ln(Age) lagged -0.054 -0.035 -0.470*** -0.480*** [0.086] [0.090] [0.132] [0.135] ln(VA_L) lagged 0.014 [0.019] ln(TFP) lagged 0.105 [0.320] ln(TFP Olley-Pakes) lagged 0.27
[0.195]
Intercept -0.561 -1.444** -1.223 -1.983*** [0.604] [0.677] [0.823] [0.725] No. of observations 1350 1051 949 887 All specifications include industry and year fixed effects. Robust standard errors are listed in brackets. * significant at 10%; ** significant at 5%; *** significant at 1%
25