liquidity position of citizen bank
TRANSCRIPT

A FIELD REPORT WRITING
ON
LIQUIDITY POSTION
OF
CITIZEN BANK INTERNATIONAL LTD
KATHMANDU, NEPAL
Submitted To:
Office of dean
Faculty of Management
Purbanchal University
Biratnagar
Submitted By:
Smita Shrestha
Asian college of management and technology
P.U Registration No:
Symbol No:
In the partial fulfillment of the requirement for the degree
Of
Bachelor of Business Administration (BBA) fifth semester
April,2014

Acknowledgement
This report has been prepared in partial fulfillment of the requirement for the degree of
Bachelor Administration (BBA) 5th semester. I would like to express my gratitude to
Purbanchal University for providing me with a great opportunity of preparing this project
report in accordance to its syllabus. I was very much anxious, and excited writing a report
of this kind, first time ever in my career. What so ever the situation, this report is finally
prepared with the help and guidance from my teachers and friends. I highly appreciate
and honor the efforts of Purbanchal University to develop required attitude, abilities and
practical skills in students which constitute a foundation for their competent and
responsibilities business managers.
I would like to thanks those who help in this project report .My thanks go to lectures of
field report whose valuable suggestion and advices guided to the completion of this
report.
And lastly I would like to thanks staffs of Citizen Bank International Ltd for
co-operation in providing all the necessary information and data for preparing this report.
Thank you,
Miss Smita Shrestha
Asian College of Management & Technology

TABLE OF CONTENTS
Recommendation
Acknowledgement
Abbreviations
List of Tables and Figures
Page no
Chapter I: INTRODUCTION 1
Title
1.1General background 11.1.1Introduction of banks 11.1.2 Commercial banks in Nepal 21.1.3 Introduction of Citizen Bank International Ltd 2-31.1.4 List of Commercial bank in Nepal 4-51.1.5 Branches of CBIL 5-61.1.6 Nature of study 7
1.1.6.1 Liquidity defined/what is liquidity? 71.1.6.2 The demand and supply of bank ltd 7- 8
1.1.6.2.1demand of bank ltd 71.1.6.2.2 supply of bank ltd 8
1.1.6.3 Why manage liquidity? 9

1.2Area of study 8-9
1.3Issue to be addressed/questions to be answered 9
1.4Objectives of the study 9
1.5Needs of the study 9
1.6 Organization study 9
1.6.1 Chapter plan 9-10
1.6.2 Research Methodology 10
1.6.3 Research Design 10
1.6.4 Nature and sources of Data 11
1.6.4.1 Primary Data 11
1.6.4.2 Secondary Data 11
1.6.5 Data Collection Procedure 11
1.6.5.1 Data presentation 11-12
1.6.5.2 Data analytical tools 12
1.7 Limitation of the study 12

Chapter II: DATA PRESENTATION & ANALYSIS 13
2.1 Data presentation 13
2.1.1Financial Analysis
2.2 Data analysis 14
2.2.1 Ratio Analysis 14
2.2.2 Profitability Ratios 15
2.2.3 Meaning and Concept of profitability 15
2.2.4 Meaning and Concept of profitability ratios 15
2.3 Major finding 27
Chapter III: Summary, Conclusion and Recommendation 28
3.1 Summary 29
3.2 Conclusion 29
3.3 Recommendation 30
Bibliography
Annex

ABBERVATIONS
CBIL Citizen Bank International Limited
& And
% Percentage
No Number
FY Fiscal Year
NRB Nepal Rastriya Bank
BBA Bachelor in Business Administration
NPR Net Profit Ratio
GPR Gross Profit Ratio
OPR Operating Profit Ratio
ROE Return on Assets
ROA Return on Assets
EPS Earning Per Share
ISR Interest Spread Ratio
WWW World Wide Web
NEPSE Nepal Stock Exchange

LIST OF TABLES
Table No Title Page No
Table 2.1 Gross profit ratio 16
Table 2.2 Net profit ratio 18
Table 2.3 Operation profit ratio. 19
Table 2.4 Return on Assets 21
Table 2.5 Return on Equity 22
Table 2.6 Earnings per share 24
Table 2.7 Interest spread Ratios 25
LIST OF FIGURES
Figures No Title Page. No
Figure no 2.1 Gross profit ratio`` 17
Figure no 2.2 Net profit ratio 18
Figure no 2.3 Operation profit ratio. 20
Figure no 2.4 Return on Assets 21
Figure no 2.5 Return on Equity 23
Figure no 2.6 Earnings per share 24
Figure no 2.7 Interest spread Ratios 26
BIBLIOGRAPHY
Annual report of Citizen Bank International Limited
Agrawal, Dr.GR (2000)- “Marketing Management in Nepal”, Kathmandu: M.K Publisher & distributors.
Bajaracharya, B.C (2000)-”Business Statistics and Management”, Kathmandu: M.M Publication, Third Edition.
Panta,Pream Raj,(2012),”Social Science Research and Thesis writing,” Kathmandu: Buddha Publication.
Shrestha M.K & Bhandari D.B (2004),”Financial Market & Institution” Kathmandu: Asmita books & Stationery.
Websites:
www.ctznbank.com
www.google.com
www.financialmarket.com
pg. 8

CHAPTER –I
INTRODUCTION
1.1GENERAL BACKGROUND
1.1.1 INTRODUCTION OF THE BANKSGenerally, bank is an institution which accepts deposits, makes business loans, and offers
related services. Commercial banks also allow for a variety of deposit accounts, such as
checking, saving, and time deposit. There institutions are run to make a profit and owned
by a group of individuals, yet some may be members of the Federal Reserve System.
While commercial banks offer services to individuals, they are primary concerned with
receiving deposits and lending to businesses. In an economy the bank is regarded as one
of the economic backbone of the country for its development. Bank is a financial
institution that deals in money. The basic function of bank is collecting deposit and
granting the loans. It involves in credit creation that in related to creation of deposit and
loan. In the economy, the banks collects small saving of general people, accumulative it
and lends the productive sectors of the society for the overall economic development.
According to Scholars, “The bank is defined as factory of money for credit where it does
not purchase goods and sells it rather produces credit inform of deposit and sells it
inform of loans.” Thus in conclusion, we can say that bank is an organization which
deals with the monetary transactions for the mobilization of idle money or deposits in
productive sectors, is essentially essential for the development of the whole net.
pg. 9

1.1.2 COMMERCIAL BANK IN NEPALThe history of financial and economic development in Nepal is not very old. It has gone
through different stages, during the PM Ranodip Singh around 1972 A.D. “TEJARATH
ADDA” was introduced, which brought a reform in economic and financial section. The
main purpose of “TEJARATH ADDA” was to provide credit facilities to the general
public at confessional rate. However the installment of “KHUSI KHANA” as a banking
agency during the king Prithivi Narayan Shah could also be regarded as the first step
towards banking in Nepal. After that the first commercial bank of Nepal, Nepal bank
Limited (NBL) was lunched with the cooperation of imperial bank of India in November
1937. Holding 51% government equity. The second commercial bank, Rastriya Banijya
bank come into existence in 1966 A.D. with 100% government ownership. In early 1980,
to meet the need of health completion in the financial system, Nepal allowed to entry of
foreign banks as joint ventures with up to maximum of 50% equity participation.
Nepal Arab bank limited was the first joint venture bank which was established with the
joint venture of Arab bank emirates in 1984. in 1986, Nepal grind lays bank limited (now
chartered bank limited) entered in Nepali financial market as a joint venture with ANZ-
Grind lays.
1.1.3 Introduction of Citizen Bank International LtdCitizen Bank international limited(CBIL) was established on June 21, 2007 and
commenced is commercial operation from 20th April 2007.The head office of the bank is
located at Sharada Sadan, Kamaladi. It is an “A” level financial institution as licensed by
the Nepal Rastra Bank(NRB) as well as a public limited company established under
company act 2056.It is promoted by eminent personalities/business and industrial houses
and reputed individuals having high social standing. It is promoted by prominent
personalities‟ business/industrial house and reputed individuals having high social
standings .It is managed by a team of experienced bankers and professionals. With the
increasing level of liberalization, privatization and globalization in this sector the
commercial bank such as “Citizens bank international ltd.”, are established to aid the
economic growth and development of this nation. Today’s bank plays a vital role for the
pg. 10

economic development of the country Massive changes and developments have taken
place during the past two decades in the financial sector. Amidst all these changes, for
economic growth and development of New Nepal, Liberalization, Privatization and
Globalization in this sector has given birth to the largest commercial bank,.
It is managed by a team of experienced bankers and professionals It provides various
banking services to a wide range of customers including banks, insurance companies,
industrial trading houses, airlines, hotels, and many other sectors
Vision
To be the leading bank known for its service excellence in the region.
Mission
To be a trustworthy partner for the progress of individuals and institutions by designing,
producing and delivering the best financial solutions. The Bank will constantly strive to
inculcate in its services five corporate values as follows:
Customer Focus
we are committed to meet the financial needs of our customers and exceed their
expectations through innovative solutions.
Service Excellence
we promise to deliver customer centered products and services par excellence.
Human Resource
We employ bright, honest, helpful and pleasant people. We nurture and empower them to
achieve their full potential.
Corporate Governance
We believe in being accountable, conducting business ethically and maintaining
transparency.
pg. 11

Social Responsibility
We are committed to take social initiatives for the development of the nation.
1.1.4 LIST OF COMMERCIAL BANK IN NEPAL:
S.No. Name of commercial banks
1 Nepal Bank ltd.
2 Rastriya Banijya Bank Ltd.
3 Agriculture Development Bank Ltd.
4 Nabil Bank Ltd.
5 Nepal Investment Bank Ltd.
6 Standard Chartered Bank Nepal Ltd.
7 Himalayan Bank Ltd.
8 Nepal SBI Bank Ltd.
9 Nepal Bangladesh Bank Ltd.
10 Everest Bank Ltd.
11 Bank of Kathmandu Ltd.
12 Nepal Credit and Commercial Bank ltd.
13 Lumbini Bank Ltd.
14 Nepal Industrial and Commercial Bank Ltd.
15 Machhapuchre Bank Ltd.
16 Kumari Bank Ltd.
17 Laxmi Bank Ltd.
18 Siddhartha Bank Ltd.
19 Global Bank Ltd.
20 Citizens Bank International Ltd.
21 Prime Commercial Bank Ltd.
22 Sunrise Bank Ltd.
23 Bank of Asia Nepal Ltd.
24 DCBL Bank Ltd.
25 NMB Bank Nepal Ltd.
26 Kist Bank Ltd.
27 Janata Bank Nepal Ltd.
pg. 12

28
29
Mega Bank Nepal Ltd.
Commerce and Trust Bank Nepal Ltd
30 Civil Bank Ltd.
31 Century Commercial Bank Ltd.
Source:” www.nrb.org.np”
1.1.5 Branch of Citizen Bank international Ltd
District Branch location
Banke Nepalgunj Branch Dhambouji Chowk,
Bara Pathalaiya, Pipra Simra – 9
Bhaktapur Khauma-15
Bhaktapur Bayakha Bazar – 7, Thimi
Chitawan Narayanghat Branch Lions Chowk,Bharatpur-4
Dang New Road-11
Dhanusa BhanuChowk-2
Dolakha Bich Bazar
Humla Simikot-2, Mathilo Bazaar
Jhapa Birtamod Branch Kakadvitta Road,Anarmani VDC-3,Birtamod
Kailali Dhangadhi Branch,Main Road,Kailali
Kanchanpur Municipality – 4 (Nearby Buspark)
Kaski Pokhara Branch, Nayasadak,Pokhara-9,Kaski,Nepal
Kathmandu Corporate Office/Kamaladi Branch, Sharada Sadan
Kathmandu Bouddha Branch ,Jorpati -3, Bouddha
Kathmandu New Road Branch,Kathmandu-23, Naya Sadak,Basantapur
pg. 13

Kathmandu Koteshwor Branch,Kathmandu-10,Koteshwor
KathmanduKalanki Branch
Ganesh Man Singh Marg, (Near Kalanki Mandir)
Kathmandu Thahiti Branch,Thahiti Chowk, Thahiti, Kathmandu
Kathmandu Nayabazar Branch,V.S. Complex, Sohrakhutte, Nayabazar,
KathmanduMaitidevi Branch
Setopul, Maitidevi
Kathmandu Saraswatinagar – 6, Kapan Marg
Kathmandu Narayan Gopal Chowk
Kathmandu Naya Bazar – 17
Kathmandu Samakhushi Branch
Lalitpur Kumaripati Branch,Lalitpur-5,Kumaripati
Lalitpur Chayabahal-2
Morang Biratnagar Branch, Dharan Road-8,
Myagdi New Road – 1, Beni Bazar
Parsa Birgunj Branch,Adarsha Nagar Chowk,Main Road
Rupandehi Butwal Branch,Pushpalal Park
Sunsari Itahari-1, Dharan road
Surkhet Sunny Hall Line, Surkhet-6
Udayapur Gaighat Bazar – 4
Source from www.ctznbank.com
pg. 14

1.1.6 Nature of study
1.1.6.1 Liquidity defined/what is liquidity?
Liquidity is the availability of cash amount and at the time of needed at a reasonable cost.
Liquidity can be defined as bank’s capacity to pay cash in exchange of deposits. And
assets is said to be liquid when it is readily converted into cash with little or no capital
loss or price deprecation.
It is the status & part of the assets which can be used to meet the obligation of the banks.
Commercial bank holds liquid assets balances in the form of currency, bank balance,
marketable securities and other assets immediately convertible into cash. Liquidity can be
viewed in terms of liquidity stored in the balance sheet and in terms of liquidity available
through purchase funds.
1.1.6.2 Demand and Supply of Bank Liquidity
1.1.6.2.1 Demand of Bank Liquidity
Commercial banks need liquidity to meet loan demand and deposit withdrawals such as:
Repay deposits:
The various deposits taken by bank are repayable on demand or fixed maturity along with
interest, so demand for liquidity arises.
Meet contingent liability:
Banks carry out off balance sheet activities like letter of credit, acceptance, guarantee,
forward exchange contract etc. For carrying out all those activities, the bank needs
sufficient liquidity.
Disburse loans and advances:
pg. 15

The main profit earing function of banks is by giving loans and advances. Some loans are
disbursed at once while some loans are withdrawn by the customers as per their
requirement.
1.1.6.2.2 Supply of Bank Liquidity
To meet foregoing demands for liquidity, banks can draw upon several potential sources
of supply. The most important sources is receipt of new customer deposits, both from
newly opened accounts and from new deposits placed in exiting accounts. Another
element in the supply of bank liquidity from customers repaying their loans.
These various sources of liquidity demand and supply come together determine each
bank’s net liquidity position at any moment in time.
1.1.6.3 Why manage liquidity?
The purpose of managing liquid assets is to minimize the opportunity cost of holding
cash and maximizes the opportunity cost holding cash and maximize on the portion of the
funds that is not required immediately. Business firms need to maintain a certain degree
of liquidity in the form of cash in hands, bank deposits & marketable securities to meet
daily operating expenses and short term financial obligation.
1.2 Area of study
Liquidity ratios are used to determine a company’s ability to meet its short-term debt
obligations. Investors often take a close look at liquidity ratios when performing
fundamental analysis on a firm. Since a company that is consistently having trouble
meeting its short-term debt is at a higher risk of bankruptcy, liquidity ratios are a good
measure of whether a company will be able to comfortably continue as a going concern
any type of ratio analysis should be looked at within the correct context. For instance,
investors should always look at a company’s ratios against those of its competitors, its
sector and its industry and over a period of several years. In this issue’s Fundamental
pg. 16

Focus, we investigate liquidity ratios using time-series analysis, competitive analysis and
sector and industry analysis.
1.3 Issues to be addressed/question to be answered The question that were from the organization:-
What is the level of current assets related to current liabilities of the bank?
Why do the banks maintain the liquidity position?
What are benefits of adequate capital of the bank?
1.4 Objectives of the studyThe main objective of the study is to analyze the Citizen Bank International Ltd
liquidity position. Other objectives can be listed below:
To show the level of current assets relative to current liabilities of the bank.
To analyze the financial performance, profitability.
To suggest the amount of the optimum level of liquidity and manage the policy.
1.5 Needs of the study The essence of the liquidity management problem for a bank may be described
into statements:
The demands for bank liquidity are rarely equal to the supply of the liquidity at
any particular moment in time. The bank must continually deal with either a
liquidity deficit or liquidity surplus.
1.6Organization of the study
1.6.1 Chapter plan The study is divided into 3 chapters such as
pg. 17

Introduction
Presentation and analysis of data
Summary, conclusion and recommendation
1.6.2 Research methodology
The method which is use in the research is called research methodology. How the data is
collected and which source the research use for getting the data is under the research
methodology. Research methodology covers the data analysis tools as well. It helps in
carrying out the entire research work in desired way.
1.6.3 Research Design
A research design is the arrangement conditions, for the collection and analysis of data in
a manner that aims to combined relevance to the research purpose with economy in
procedures.
The present study is mainly based on 2 types design ie descriptive and analytical. The
descriptive research presents the general pattern of liquid assets, cash and marketable
securities. The analytical research design makes the analysis of gathered facts and
information and makes critical evaluation of it.This study aims on the financial analysis
of the Nepal investment bank Ltd. This study is mainly based on primary data and
secondary data.
The primary data, which are collected directly from the question answer, direct
interview with customer and office staffs.
The secondary data are collected from respective annual reports especially from
the Citizen bank web sites and various other journals and from security bond Nepal
(SUBO) and Nepal stock exchange (NEPSE).
pg. 18

1.6.4 Nature and Source of Data
There are mainly 2 types of nature of data which are mentioned below:
Primary data:
Primary data are those fresh and original data, which are collected and recorded by the
investigator or researcher. They are collected from face to face dealing with the investors
and members in the organization.
.Secondary data:
Secondary data are those data that have been collected earlier for some purpose.
These data are borrows from others who have collected them for some purpose.
This fieldwork report is total based on the secondary data. The sources of
secondary data are as follows:
CBIL Reports.
Website of CBIL, www.ctznbank.com
1.6.5 Data collection procedure
As stated earlier, this report is purely based on secondary data annual report of the bank
for the study. This report is prepare by using real data obtained from various sources like
financial news newspaper, magazine of commercial work and annual report.
1.6.5.1 Data presentation
Presentation means the presentation of the collected data through table; figure etc.
presentation is the process of understanding the study or the report and calculating the
pg. 19

opinion. An analysis of a data means the process where the statement or the report gets
resolve by breaking them into simple statement. Analysis means to find out something
and give opinion about the presented data.
1.6.5.2 Data analytical tools
Data analysis tools means which tools the research used for present and analyzed the
data. The main tools of analysis are mathematical and statistical tools. In this reports
statistical and financial ratio tools is used for data analysis. Mean and correlation is
calculated for analysis the data as statistical tools
1.7 limitations of the study Different companies operate in different industries each having different
environmental conditions such as regulation, market structure, etc. Such factors
are so significant that a comparison of two companies from different industries
might be misleading.
Financial accounting information is affected by estimates and assumptions.
Accounting standards allow different accounting policies, which impairs
comparability and hence ratio analysis is less useful in such situations
Ratio gives false result, if they are calculated from incorrect accounting data.
Ratios are calculated on the basis of past data. Therefore, they don’t provide
complete information for future forecasting.
pg. 20

Chapter-II
DATA PRESENTATION AND ANALYSIS
2.1Data presentation
2.1.1Financial Analysis:The process of evaluating businesses, projects, budgets and other finance-related entities
to determine their suitability for investment. Typically, financial analysis is used to
analyze whether an entity is stable, solvent, liquid, or profitable enough to be invested in.
When looking at a specific company, the financial analyst will often focus on the income
statement, balance sheet, and cash flow statement. In addition, one key area of financial
analysis involves extrapolating the company's past performance into an estimate of the
company's future performance. Financial analysis can be performance by insiders or by
parties outside the firm visa creditors, investors, government, financial analysis and
others. The primary tools of the financial analysis are financial ratio.
But the reporter isn’t subject to calculation of financial ratio.by the topic. The report is
limited to the calculation of the set of commonly used liquidity ratios and integrated
models analyzing the liquidity position. Generally, the liquidity position is the key of the
creditors to know the firm’s ability to meet there claim over the short period of time.
However the analysis in this report is not interested in analyzing the firm’s ability to meet
their current obligation.
pg. 21

2.2 Data Analysis
2.2.1 Ratio Analysis
A ratio defined as the “relationship between two numbers, amount, or measurement,
which shows how much greater on is than the others.” Ratio helps to summarize the large
quantities of financial data and to make qualitative judgment about the firm’s financial
performance. Quantitative analysis of information contained in a company’s financial
statements. Ratio analysis is based on line items in financial statements like the balance
sheet, income statement and cash flow statement; the ratios of one item – or a
combination of items - to another item or combination are then calculated. Ratio analysis
is used to evaluate various aspects of a company’s operating and financial performance
such as its efficiency, liquidity, profitability and solvency.
The trend of these ratios over time is studied to check whether they are improving or
deteriorating. Ratios are also compared across different companies in the same sector to
see how they stack up, and to get an idea of comparative valuations. Ratio analysis is a
cornerstone of fundamental analysis.
2.2.2 Types of Ratios
The ratios are calculates to serve the objectives of the users or the analyisis.to
suit the need of the analysis ratios have been grouped as below:
1. Liquidity ratios
2. Leverage ratios
3. Activity ratios
4. Profitability ratios
5. Market value ratios
Liquidity ratios measure the firm’s ability to meet current obligations.
Leverage ratios show the proportions of the debt & equity in financing the firm’s asset
this ratio is known as debt management ratio.
Activity ratio also known as asset management ratios, measure how effectively the firm
managing its assets.
pg. 22

Profitability ratios measure the overall performance & the effective ness of the firm. It
shows the combined effects of the liquidity, assets management and debt management on
operating results.
2.3. Meaning and Concept of profitabilityProfitability is the primary goal of all business ventures. Without profitability the
business will not survive in the long run. So measuring current and past profitability and
projecting future profitability is very important. Every firm is most concerned with its
profitability. One of the most frequently used tools of financial ratio analysis is
profitability ratios which are used to determine the company's bottom line and its return
to its investors. Profitability measures are important to company managers and owners
alike. If a small business has outside investors who have put their own money into the
company, the primary owner certainly has to show profitability to those equity investors.
2.3.1Meaning and Concept of profitability ratiosProfitability is an indicator of success in business. Measurement of profitability is the
main concern for all interested parties, i.e. creditors, investors, owners and management.
Net sales are taken as a denominator in calculating all the ratios for return. Gross profit
margin, operating profit margin and net profit margin represent the company’s ability to
translate sales into profit at different stages of measurement. Some major profitability
ratios are performed below :
1) Gross Profit Ratio (GPR)
2) Net Profit Ratio (NPR)
3) Operation Profit Ratio (OPR)
4) Return on Assets (ROA)
5) Return on Equity (ROE)
6) Earnings per Share (EPS)
7) Interest Spread Ratio (ISR)
pg. 23

2.2.3.1 Gross Profit Ratio (GPR):
The gross profit margin looks at cost of goods sold as a percentage of sales. This ratio
looks at how well a company controls the cost of its inventory and the manufacturing of
its products and subsequently passes on the costs to its customers. The larger the gross
profit margin, the better for the company
The formula for calculating gross profit margin is
Table:2.1
Gross Profit Ratio (In millions)
Fiscal Year Gross Profit Total Interest
Revenue
GPR
2065/66 150.64 758.256 19.87%
2066/67 305.14 1398.83 21.97%
2067/68 312.37 1795.23 17.41%
2068/69 355.39 1980.32 17.94%
2069/70 627.02 2211.98 28.34%
Source: Annual report of CBIL( FY 2065/66- 2069/70)
Table shows the change in gross profit ratio of Citizen Bank International Limited from
the period 2065/66 to 2069/70. The highest GPR was 28.34% in the fiscal year 28.34%
and the lowest was 17.41% in the fiscal year 2067/68.
pg. 24
GPM=Gross Profit
x 100Sales

Figure 2.1
Gross profit ratio
2065/66 2066/67 2067/68 2068/69 2069/700
500
1000
1500
2000
2500
Gross profit ratio
The above bar diagram shows the GPR of CBIL which is decreasing at first year 2065/66
and slowly increasing at last 4 years.
2.2.2.2Net Profit Ratio (NPR):
When doing a simple profitability ratio analysis, net profit margin is the most often
margin ratio used. It is ratio between net income and sales. The net profit margin shows
how much of each sales dollar shows up as net income after all expenses are paid.
The formula for net profit margin is:
NPR =Net Profit
x 100Sales
pg. 25

Table 2.2
Net Profit Ratio (NPR): (In millions)
Fiscal Year Net Profit Total Interest
Revenue
NPR
2065/66 95.809 758.256 12.68%
2066/67 193.56 1398.83 13.87%
2067/68 198.56 1795.23 11.06%
2068/69 224.79 1980.32 11.35%
2069/70 413.24 2211.98 18.68%
Source: Annual report of CBIL( FY 2065/66- 2069/70)
Table and chart shows the change in net profit ratio of Citizen Bank International Ltd.
from the period 2065/66 to 2069/70. The highest NPR was 18.68 % in the fiscal year
2069/70 and the lowest was 11.06 % in the fiscal year 2067/68.
Figure 2.2
Net profit ratio
2065/66 2066/67 2067/68 2068/69 2069/700%
10%
20%
30%
40%
50%
60%
70%
80%
90%
100%
Net profit ratio
Series4NPRTotal Intrest Revenue
pg. 26

The above bar diagram shows the PR of CBIL which is decreasing at first year 2065/66
and slowly increasing at last 4 years.
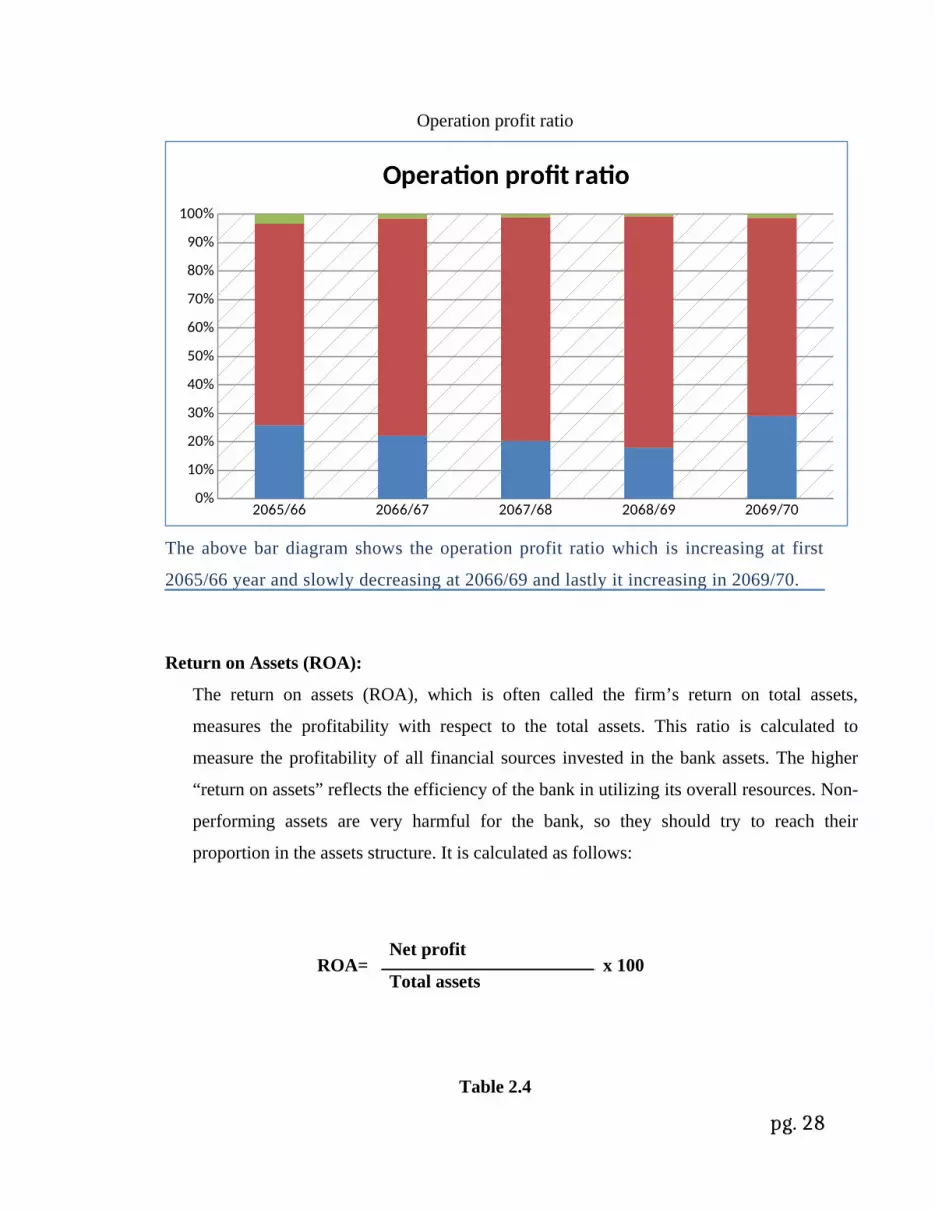
Operation Profit Ratio:
It shows the relationship between operating profit and sales and indicates operating profit
of a firm. Higher operating profit ratio is preferred because it is good sign of operating
efficiency of a firm.
The formula for operating profit margin is:
OPR =Operating Profit
x 100Sales
Table 2.3
Operation Profit Ratio: (in millions)
Fiscal Year Operation Profit Total Interest
Revenue
Operation Profit
Ratio
2065/66
275.74
758.256 36.36%
2066/67 405.51 1398.83 28.98%
2067/68 461.90 1795.23 25.79%
2068/69 435.22 1980.32 21.97%
2069/70 919.10 2211.98 41.55%
Source: Annual report of CBIL( FY 2065/66- 2069/70)
Table shows the change in operating profit ratio of CBIL from the period 2065/66to
2069/70. The highest OPR was 41.55% in the fiscal year 2069/70 and the lowest was
21.97% in the fiscal year 2068/69.
Figure 2.3
pg. 27
Operation profit ratio
2065/66 2066/67 2067/68 2068/69 2069/700%
10%
20%
30%
40%
50%
60%
70%
80%
90%
100%
Operation profit ratio
The above bar diagram shows the operation profit ratio which is increasing at first
2065/66 year and slowly decreasing at 2066/69 and lastly it increasing in 2069/70.
Return on Assets (ROA):
The return on assets (ROA), which is often called the firm’s return on total assets,
measures the profitability with respect to the total assets. This ratio is calculated to
measure the profitability of all financial sources invested in the bank assets. The higher
“return on assets” reflects the efficiency of the bank in utilizing its overall resources. Non-
performing assets are very harmful for the bank, so they should try to reach their
proportion in the assets structure. It is calculated as follows:
Table 2.4
pg. 28
ROA=Net profit
x 100Total assets

Return on Assets
( in millions)
Fiscal Year Net Profit Total Assets ROA
2065/66 95.809 12966.04 0.00735
2066/67 193.56 16516.88 0.0117
2067/68 198.56 16816.49 0.0118
2068/69 224.79 20068.50 0.0112
2069/70 413.24 25979.51 0.0159
Source: Annual report of CBIL( FY 2065/66- 2069/70)
From above table we can see that total assets is increasing all over the year and the net profit
is increasing process which makes ROA process. The highest ROA obtained is 0.0159 which
is in the year 2069/70 and the lowest is 0.00735 which is in the year 2065/70.
Figure 2.4
Return on Assets
2065/66 2066/67 2067/68 2068/69 2069/700
5000
10000
15000
20000
25000
30000
Return on assets
The above bar diagram shows the Return on ratio which is decreasing at first 2065/66year
and increasing at last 4 years.
pg. 29

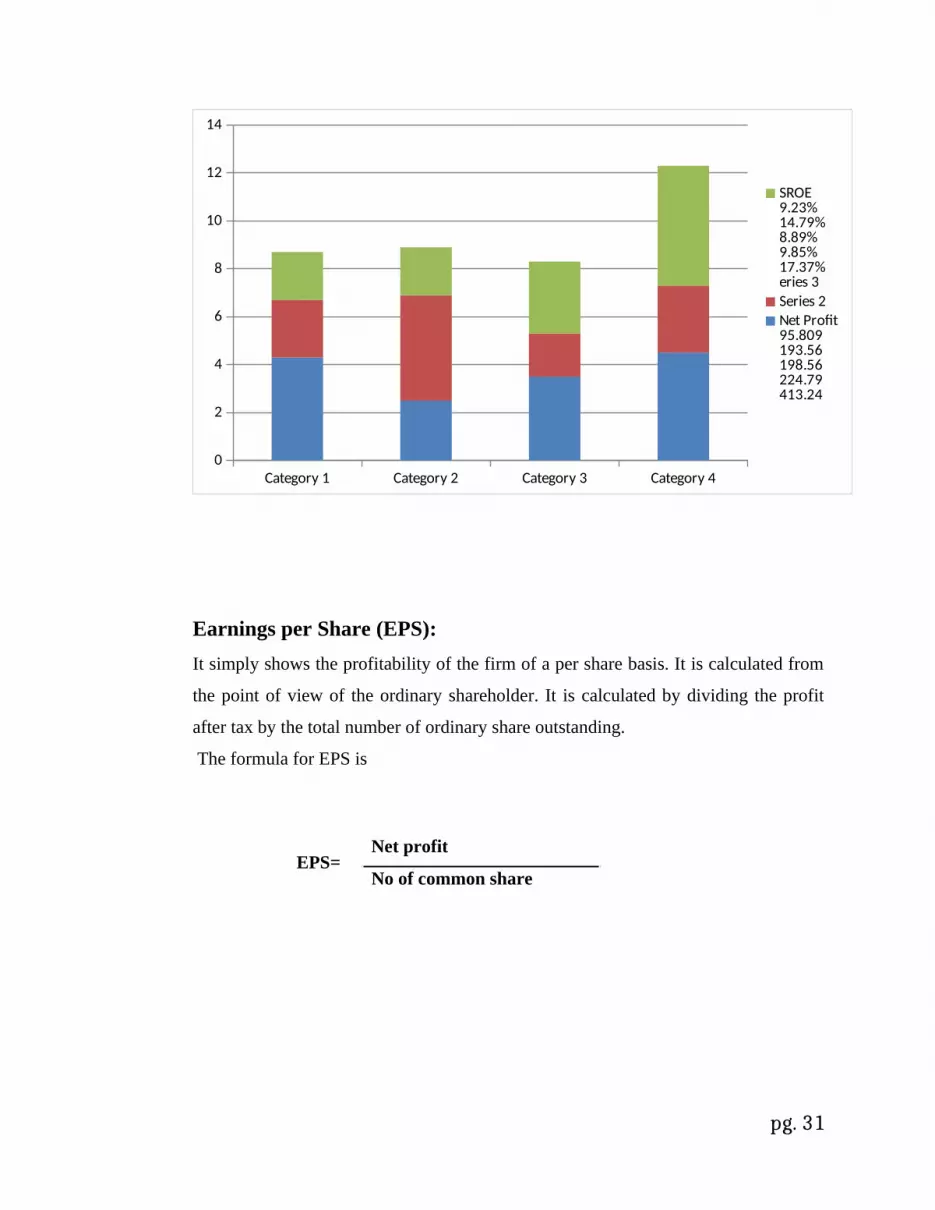
Return on Equity (ROE)
The return on equity (ROE) measures the return on the owner’s investment in the firm.
Higher ratio of return on equity is better for owner.
ROE is calculated as follows:
ROE =
Table 2.5
Return on Equity
(in millions)
Fiscal Year Net Profit Equity ROE
2065/66 95.809 9.23%
2066/67 193.56 14.79%
2067/68 198.56 8.89%
2068/69 224.79 9.85%
2069/70 413.24 17.37%
Source: Annual report of CBIL( FY 2065/66- 2069/70)
pg. 30
Net profitx 100
Total equity
Category 1 Category 2 Category 3 Category 40
2
4
6
8
10
12
14
SROE9.23%14.79%8.89%9.85%17.37%eries 3Series 2Net Profit95.809193.56198.56224.79413.24
Earnings per Share (EPS):It simply shows the profitability of the firm of a per share basis. It is calculated from
the point of view of the ordinary shareholder. It is calculated by dividing the profit
after tax by the total number of ordinary share outstanding.
The formula for EPS is
pg. 31
EPS=Net profit
No of common share

Table 2.6
Earnings per share
Source:
Annual
report
of
CBIL( FY 2065/66- 2069/70)
Table shows the change in EPS of Citizen Bank from the period 2065/66 to 2069/70. The
highest EPS was 35.63 in the fiscal year 2064/65 and the lowest was 12.68 in the fiscal year
2068/68. Therefore from above analysis we can say that the earning power of NCCB is in
good condition
Figure 2.6
Earnings per share
2065/66 2066/67 2067/68 2068/69 2069/700%
10%
20%
30%
40%
50%
60%
70%
80%
90%
100%
Earnings per share
Axis Title
pg. 32
Fiscal Year Net profit No. of common
share
EPS
2065/66 95.809 100.00 0.95%
2066/67 193.56 120.69 1.60%
2067/68 198.56 210.00 0.94%
2068/69 224.79 210.18 1.06%
2069/70 413.24 210.18 1.96%

Interest Spread Ratio (ISR):
Interest spread ratio (ISR) shows the relationship between interests to total assets of
the firm. Spread is the difference between interest income and interest expenses. So
higher this value, higher will be this ratio. Higher value of this ratio indicates better
financial position of the organization. It is calculated as follows:
Table 2.7
Interest spread Ratios
Year Interest Income Interest expenses Total AssetsInterest Spread
Ratio (in %)
2065/66 758.25 508.80 12966.04 758.21%
2066/67 1398.83 950.90 16516.88 1398.77%
2067/68 1795.23 1236.32 16816.49 1795.15%
2068/69 1980.32 1405.86 20068.50 1980.25%
2069/70 2211.98 1176.91 25979.51 2211.93%
Source: Annual report of CBIL( FY 2065/66- 2069/70)
pg. 33
ISR = (INTEREST INCOME – INTEREST EXPENSE)
TOTAL ASSETS

2065/66 2066/67 2067/68 2068/69 2069/700
5000
10000
15000
20000
25000
30000
Interest IncomeInterest expenenseTotal Assets
Interest Spread
pg. 34

2.3 Major Finding
The major finding from primary data can be outlined as under:
From the primary sources, the liquidity position of CIBL is in good position. It
maintains its financial position in every situation. The customers of this bank are
satisfied with this bank.
The legal documents demanded by bank in regard loans and deposit is bound to
make any genuine costumer fill irritated, so the banks should appropriate
stapes toward it.
The bank should give immediate response to the new starting business by
lowering the loans provided.
The
pg. 35

CHAPTER-III
SUMMARY, CONCLUSION AND RECOMMENDATION
3.1 Summary It is growing and doing well with sound participate management and efficiency of
employees. It has made its unique position in the competition of commercial bank.
Liquidity is defined as bank’s capacity to pay cash in exchange of deposit. Liquidity
position of the banks is the key factor of sound operating position. The banks having
maintain sufficient amount of liquidity because there will be large proportion of deposits
payable on demand, inability of banks to pay deposits on demand damages the credit
worthiness of the bank .This in turns, may lead to run in bank and collapse of the bank.
This study is confined to Citizen Bank International Limited is done with the main purpose of
analyzing the profitability performance of this bank from the FY 2065/66 to FY 2069/70. The
data presented in the tabular and graphical forms. A ratio analysis has been used to evaluate
the profitability performance of this company. Thus, this report gives the general idea about
the profitability position of CIBL.
3.2 Conclusion
pg. 36

The main objective of this study is to analyze the liquidity position of CBIL and to
provide recommendation based on the study. From the analysis of primary and
secondary, we have rough idea about the liquidity position trend of CBIL for the period
2065/66 to 2069/70 .the ratio of cash and bank balance to current assets of CBIL is
getting stronger and better. . The detailed conclusion of every ratio is as follows
The highest GPR is 28.34% in the FY 2069/70 and the lowest is 17.41% in the FY
2067/68. It declines due to high margin between gross profit and total interest
revenue (sales).
The highest NPR is 18.68% in the FY 2069/ 70 and it lowest NPR is 11.06% in
FY 2067/68. NPR is regularly declining due to large margin between the net profit
and the total interest revenue.
The highest OPR is 41.55% in the FY 2069/70 and the lowest is 21.97% in the
year 2068/69. It declines due to high margin between earning and sales (interest
revenue).
The ROA of the starting FY 2065/66 is 0.00735 and it increasing throughout the
year and at the end FY 2069/70 it becomes 0.0159. Here, ROA increasing due to
heavy investment on assets and getting returns.
The ROE of NCCB is in declining position. The ROE of the starting FY 2064/65 is
0.7280 which is good enough but in the ending FY 2068/69 it declines to 0.0924
which shows the companies ineffectiveness towards returns of net profit.
The Earning Per Share (EPS) of CBIL at starting FY 2065/66 is 9.95% 1.60%
and 0.94% but it increase to 1.06% and 1.96% at last 2 years.
The interest spread ratio of CIBL at first year 758.21 % and it regularly increasing.
The lowest ISR is 758.21% at the beginning year FY 2065/66. ISR increase due to
having the large margin between interest in deposit and interest while providing
loan
pg. 37

3.3 Recommendation
From the above study, it can be considered that the current position of liquidity of CIBL
is fairly well enough. However, the following recommendation can be made based on the
study.
CIBL should maintain the current ratio of cash and bank balance to current assets
ratio.
Formulate the clear vision, mission of the organization to attract customers and
make aware to employees and customers.
Show the interest rate on deposits and create awareness of the service of the
organization for landing to customers by displaying in notice board.
Standardize the operations of the various departments in all branches of the banks.
Improve service quality of official so as to maintain customer faith and image of
the bank.
pg. 38