a comparitive study on liquidity position ... - jetir.org
TRANSCRIPT
© 2019 JETIR February 2019, Volume 6, Issue 2 www.jetir.org (ISSN-2349-5162)
JETIR1902A44 Journal of Emerging Technologies and Innovative Research (JETIR) www.jetir.org 281
A COMPARITIVE STUDY ON LIQUIDITY
POSITION OF HCLTECHNOLOGIES
LIMITIEDAND WIPRO LIMITIED.
1Mrs.R.Judith Priya, 2Ms. Sujitha K , 3Ms. Priyanka C.S, 4Ms. Veena S 1Assistant Professor, 2Final year student, 3Final year student, 4Final year student
1,2,3,4 Department of Commerce with Professional Accounting, 1,2,3,4 PSGR Krishnammal College for Women, Coimbatore, India.
ABSTRACT: A ratio analysis is a quantitative analysis of information contained in a company's financial
statements. Ratioanalysis is used to evaluate various aspects of a company's operating and financial
performance such as its efficiency, liquidity, profitability and solvency. Ratio Analysis as a tool possesses
several important features. The data, which are provided by financial statements, are readily available and
facilitates the comparison of firms which differ in size. Ratios can be used to compare a firm's financial
performance with industry averages. Ratios helps to determine the area where it has improved its financial
performances and it also helps to make additional improvements at a required places.
Index Term - Liquidity ratios.
1. INTRODUCTION
LIQUIDITY
Liquidity ratio analysis refers to the use of several ratios to determine the ability of an
organization to pay its bills in a timely manner. This analysis is especially important for
lenders and creditors, who want to gain some idea of the financial situation of a borrower or customer
before granting them credit. There are several ratios available for this analysis, all of which use the same
concept of to short-term liability.
2. OBJECTIVE
Liquidity tells about the business capacity to meet short term needs of funds by the business.
To analyse and compare the liquidity position of HCL Technologies Limited and WIPRO
Limited.
3. OVERVIEW OF HCL TECHNOLOGIES LIMITED AND WIPRO LIMITED
3.1.HCL Technologies Limited
© 2019 JETIR February 2019, Volume 6, Issue 2 www.jetir.org (ISSN-2349-5162)
JETIR1902A44 Journal of Emerging Technologies and Innovative Research (JETIR) www.jetir.org 282
HCL (Hindustan Computers Limited) is a leading global Technology and IT enterprise whose
range of services spans Product Engineering and Technology Development, Application Services, BPO
Services, Distribution of Technology, Telecom products, Infrastructure Services, IT Hardware, Systems
Integration in India. Hindustan Computers Limited, the other name for HCL Technologies Limited which
offers services like ; engineering; research and development, remote infrastructure management, IT
consulting, enterprise transformation; and business process outsourcing. The company has offices in 32
countries world over. Today, HCL has 45,000 employees of diverse nationalities, operating across 17countries
including 360 service centers in India. HCL has global partnerships with many leading 1000 firms, including
many IT and Technologies.The company is working on Project Samudhay; through which it has adopted a
100 villages and is driving transformation in them in the areas of water; women’s welfare; education; health
and malnutrition; sanitation. It is also associated with an NGO called UdayanGhar through which it promotes
all-round community development. HCL Technologies is also working on a program “Go Green”, through
which it works towards design
3.2.Wipro Limited
Wipro Limited (Wipro), incorporated on December 29, 1945, is a global information
technology,consulting and BPS provider. It operates through two segments: IT Services and IT Products. The
Company's IT Services business provides a range of IT and IT-enabled services. IT Products segment provides
a range of third-party IT products. It was incorporated in Amalner, Maharashtra by Mohamed Premji as
"Western India Vegetable Products Limited", later abbreviated to "Wipro". It was initially started as a
manufacturer of vegetable and refined oils in Amalner, Maharashtra, India under the trade names of Camel,
kisan and sunflower. The IT Services segment primarily consists of IT Service offerings to its customers
organized by industry verticals, which include Banking, Financial Services and Insurance (BFSI), Healthcare
and Life Sciences (HLS), Retail, Consumer Goods, Transport and Government (RCTG), Energy, Natural
Resources and Utilities (ENU), Manufacturing and High-Tech (MFG), and Global Media and Telecom
(GMT).
4. REVIEW OF LITERATURE
B.S.R. Murthy, V. Ramakrishna, M. Madhavi, M. Muniraja, M. Prasad Naik (April 2018)1 examined
the measures of liquidity management has no significant impact on profitability. This result prove that every
profitability ratio is influenced by different liquidity and risk factors throughout the world all financial
managers makes financing decisions by considering an object of wealth maximization, a whole range of
techniques may be used to maximize revenue and minimize costs.
© 2019 JETIR February 2019, Volume 6, Issue 2 www.jetir.org (ISSN-2349-5162)
JETIR1902A44 Journal of Emerging Technologies and Innovative Research (JETIR) www.jetir.org 283
Mr. R. Narayanan and Dr. R. Hamsalakshmi (July 2014)2analysed that performance of selected variables
are in increasing trend during the study period. There is a relationship exists between liquidity and operating
profitability hence it is recommended that to improve working capital position and operating profit margin
the companies has to concentrate on utilization short term loans and advances, cost of raw materials, cost of
fuel and manufacturing expenses so that performances of net worth also improves.
Sebastian OfumbiaUremadu, Ben - Caleb Egbide, Patrick E.Enyi (2012)3analysed the present empirical
evidence of the effect of working capital management and liquidity on corporate profits using a cross sectional
time data for the year 2005-2006. This micro – data were analysed using descriptive statistics and an OLS
methodology. The authors find a positive effect of inventory conversion period.
Ajanthan. A (2013)4examined the nature and extent of the nexus between liquidity and possibility in profit
oriented quoted trading companies and also to determine whether any relationships exist between the two
performance measures. Results of this study found that correlation and regression results are significantly
positive associated to the firm profitability.
5. ANALYSIS
The statistical tools used are given below:
1) Current Ratio
2) Liquid Ratio
3) Absolute Liquid Ratio
4) Inventory Turnover Ratio
5) Working Capital Turnover Ratio
6) Inventory Conversion Period
5.1 CURRENT RATIO:
This ratio shows the relationship between current assets and current liabilities of a company. It is an important
measure of analysing the firm’s ability to pay off its current obligations out of its short term resources. The
rule of thumb about the CR is 2:1. This rule is based on the logic that in the worse situation even if the
possibility of 50% shrinkage in the value of current assets.
CURRENT ASSETS
© 2019 JETIR February 2019, Volume 6, Issue 2 www.jetir.org (ISSN-2349-5162)
JETIR1902A44 Journal of Emerging Technologies and Innovative Research (JETIR) www.jetir.org 284
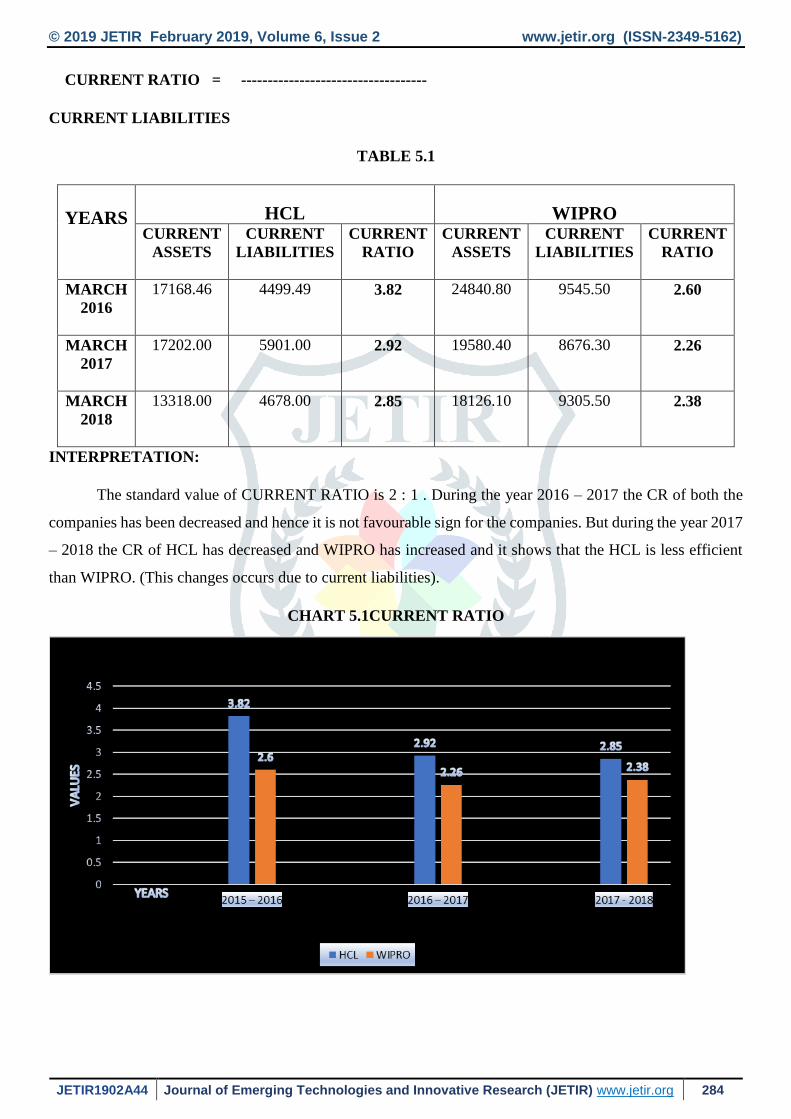
CURRENT RATIO = -----------------------------------
CURRENT LIABILITIES
TABLE 5.1
YEARS
HCL
WIPRO
CURRENT
ASSETS
CURRENT
LIABILITIES
CURRENT
RATIO
CURRENT
ASSETS
CURRENT
LIABILITIES
CURRENT
RATIO
MARCH
2016
17168.46 4499.49 3.82
24840.80 9545.50 2.60
MARCH
2017
17202.00 5901.00 2.92
19580.40 8676.30 2.26
MARCH
2018
13318.00 4678.00 2.85
18126.10 9305.50 2.38
INTERPRETATION:
The standard value of CURRENT RATIO is 2 : 1 . During the year 2016 – 2017 the CR of both the
companies has been decreased and hence it is not favourable sign for the companies. But during the year 2017
– 2018 the CR of HCL has decreased and WIPRO has increased and it shows that the HCL is less efficient
than WIPRO. (This changes occurs due to current liabilities).
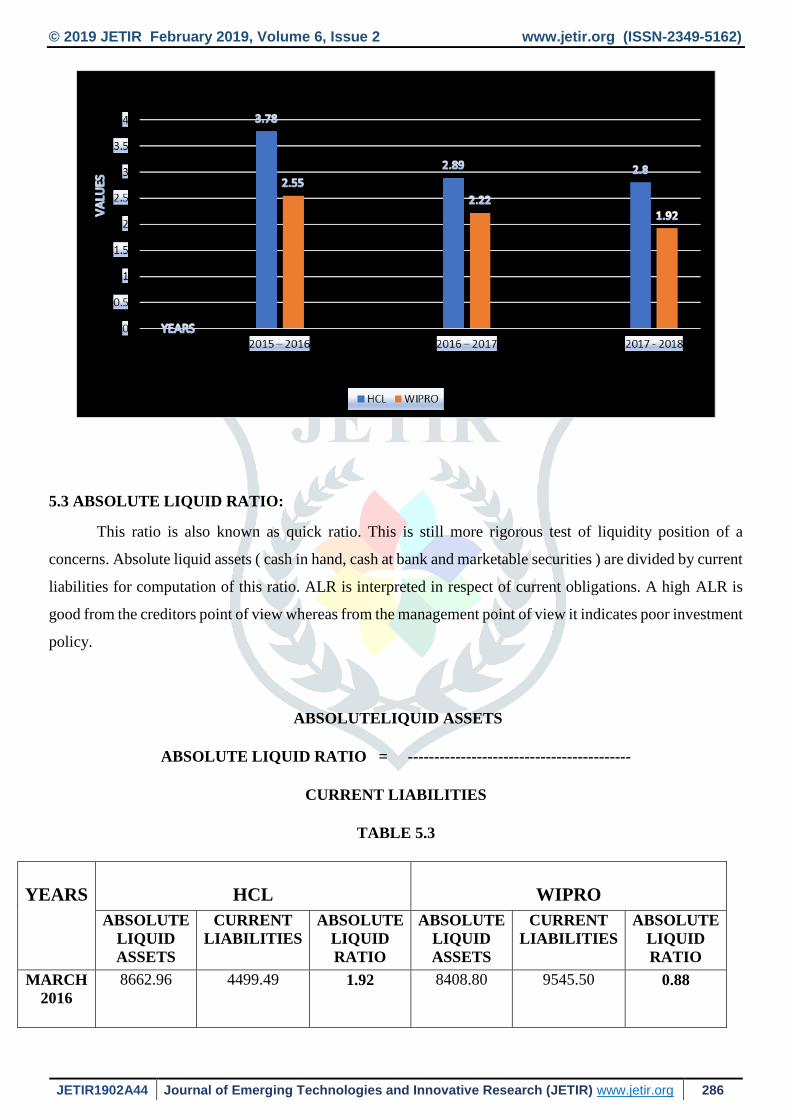
CHART 5.1CURRENT RATIO
© 2019 JETIR February 2019, Volume 6, Issue 2 www.jetir.org (ISSN-2349-5162)
JETIR1902A44 Journal of Emerging Technologies and Innovative Research (JETIR) www.jetir.org 285
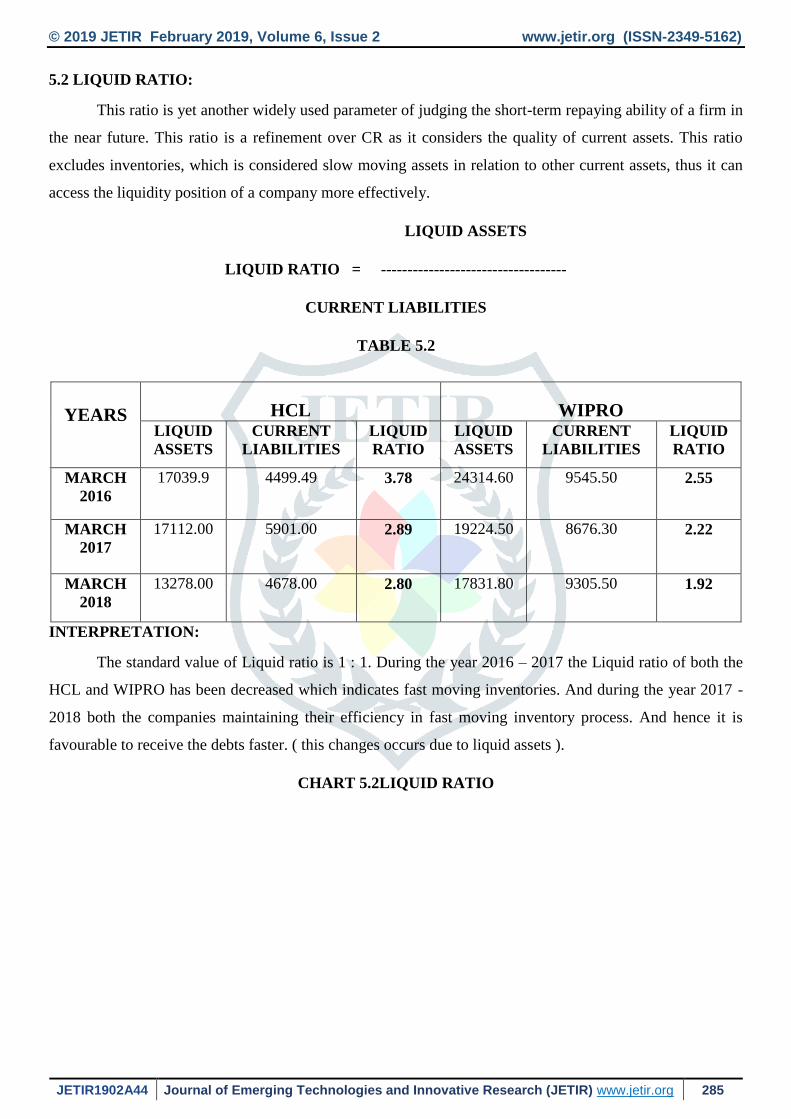
5.2 LIQUID RATIO:
This ratio is yet another widely used parameter of judging the short-term repaying ability of a firm in
the near future. This ratio is a refinement over CR as it considers the quality of current assets. This ratio
excludes inventories, which is considered slow moving assets in relation to other current assets, thus it can
access the liquidity position of a company more effectively.
LIQUID ASSETS
LIQUID RATIO = -----------------------------------
CURRENT LIABILITIES
TABLE 5.2
INTERPRETATION:
The standard value of Liquid ratio is 1 : 1. During the year 2016 – 2017 the Liquid ratio of both the
HCL and WIPRO has been decreased which indicates fast moving inventories. And during the year 2017 -
2018 both the companies maintaining their efficiency in fast moving inventory process. And hence it is
favourable to receive the debts faster. ( this changes occurs due to liquid assets ).
CHART 5.2LIQUID RATIO
YEARS
HCL
WIPRO
LIQUID
ASSETS
CURRENT
LIABILITIES
LIQUID
RATIO
LIQUID
ASSETS
CURRENT
LIABILITIES
LIQUID
RATIO
MARCH
2016
17039.9 4499.49 3.78 24314.60 9545.50 2.55
MARCH
2017
17112.00 5901.00 2.89 19224.50 8676.30 2.22
MARCH
2018
13278.00 4678.00 2.80 17831.80 9305.50 1.92
© 2019 JETIR February 2019, Volume 6, Issue 2 www.jetir.org (ISSN-2349-5162)
JETIR1902A44 Journal of Emerging Technologies and Innovative Research (JETIR) www.jetir.org 286
5.3 ABSOLUTE LIQUID RATIO:
This ratio is also known as quick ratio. This is still more rigorous test of liquidity position of a
concerns. Absolute liquid assets ( cash in hand, cash at bank and marketable securities ) are divided by current
liabilities for computation of this ratio. ALR is interpreted in respect of current obligations. A high ALR is
good from the creditors point of view whereas from the management point of view it indicates poor investment
policy.
ABSOLUTELIQUID ASSETS
ABSOLUTE LIQUID RATIO = ------------------------------------------
CURRENT LIABILITIES
TABLE 5.3
YEARS
HCL
WIPRO
ABSOLUTE
LIQUID
ASSETS
CURRENT
LIABILITIES
ABSOLUTE
LIQUID
RATIO
ABSOLUTE
LIQUID
ASSETS
CURRENT
LIABILITIES
ABSOLUTE
LIQUID
RATIO
MARCH
2016
8662.96 4499.49 1.92 8408.80 9545.50 0.88
© 2019 JETIR February 2019, Volume 6, Issue 2 www.jetir.org (ISSN-2349-5162)
JETIR1902A44 Journal of Emerging Technologies and Innovative Research (JETIR) www.jetir.org 287
MARCH
2017
7962.00 5901.00 1.34 3516.60 8676.30 0.405
MARCH
2018
2325.00 4678.00 0.49 2322.00 9305.50 0.25
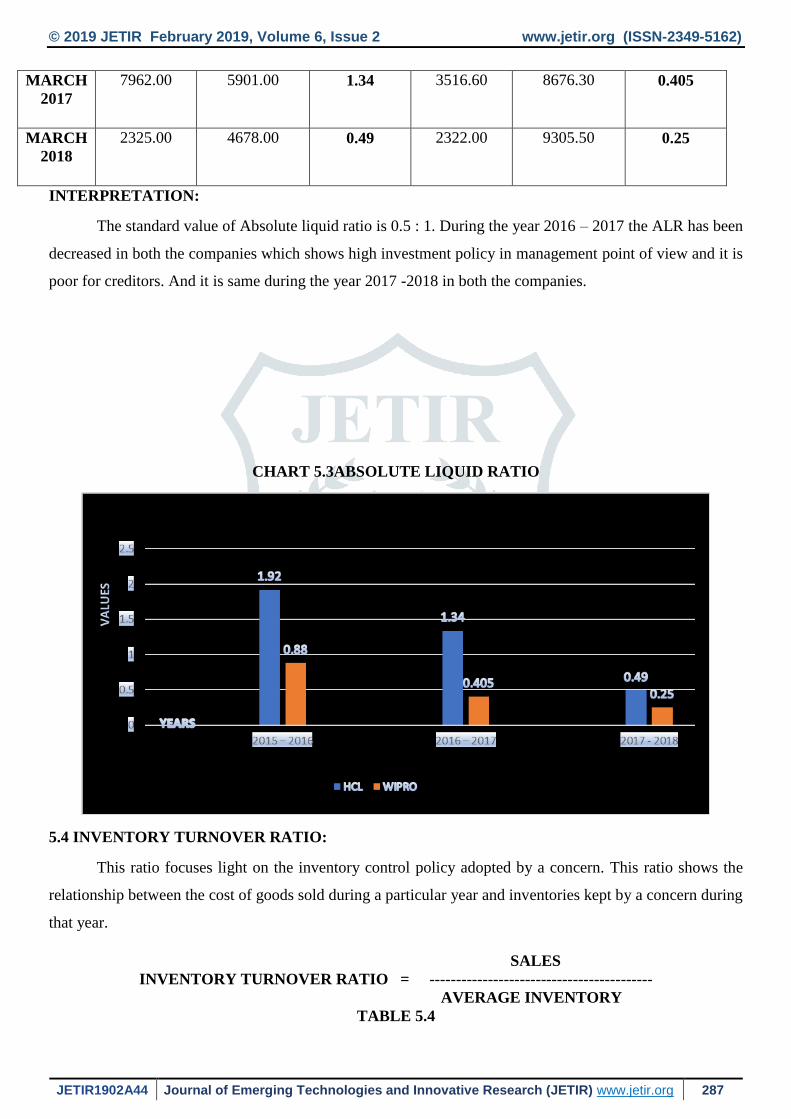
INTERPRETATION:
The standard value of Absolute liquid ratio is 0.5 : 1. During the year 2016 – 2017 the ALR has been
decreased in both the companies which shows high investment policy in management point of view and it is
poor for creditors. And it is same during the year 2017 -2018 in both the companies.
CHART 5.3ABSOLUTE LIQUID RATIO
5.4 INVENTORY TURNOVER RATIO:
This ratio focuses light on the inventory control policy adopted by a concern. This ratio shows the
relationship between the cost of goods sold during a particular year and inventories kept by a concern during
that year.
SALES
INVENTORY TURNOVER RATIO = ------------------------------------------
AVERAGE INVENTORY
TABLE 5.4
© 2019 JETIR February 2019, Volume 6, Issue 2 www.jetir.org (ISSN-2349-5162)
JETIR1902A44 Journal of Emerging Technologies and Innovative Research (JETIR) www.jetir.org 288
YEARS
HCL
WIPRO
SALES AVERAGE
INVENTORY
INVENTORY
TURNOVER
RATIO
SALES AVERAGE
INVENTORY
INVENTORY
TURNOVER
RATIO
MARCH
2016
7376.20 106.105 69.52 33211.20 502.80 66.05
MARCH
2017
10564.00 109.28 96.67 34313.00 441.05 77.79
MARCH
2018
12055 65.00 185.46 33660.90 325.10 103.54
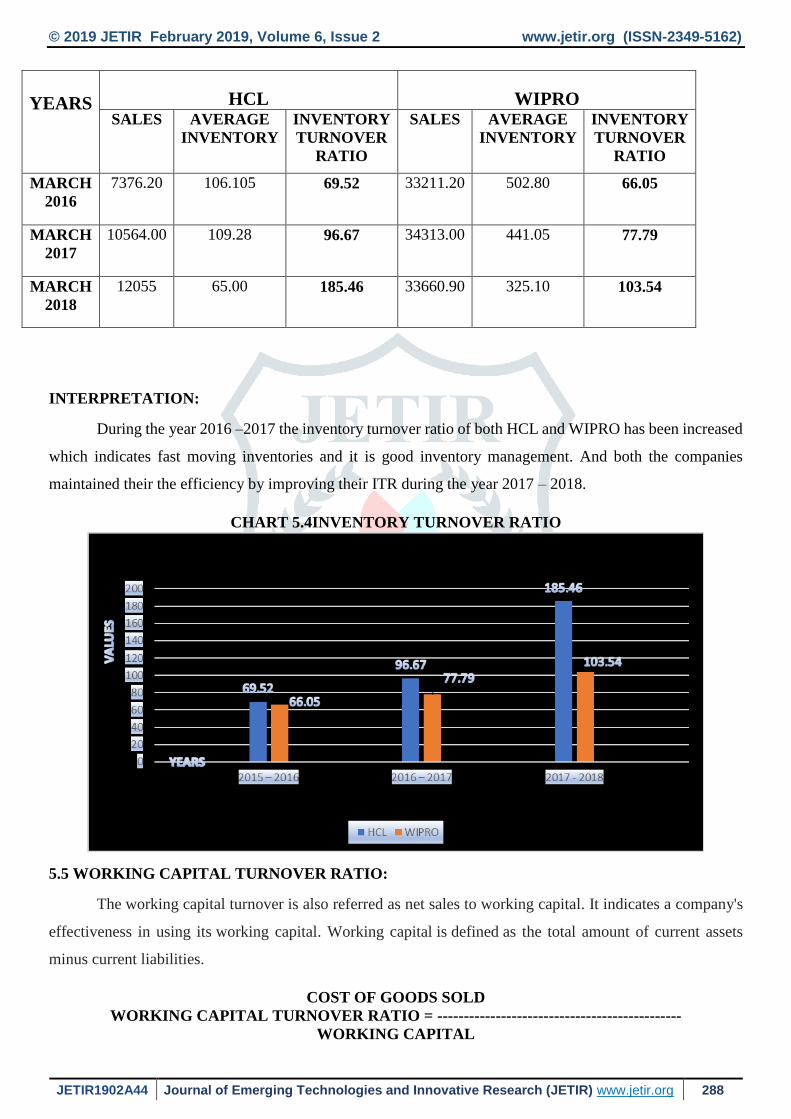
INTERPRETATION:
During the year 2016 –2017 the inventory turnover ratio of both HCL and WIPRO has been increased
which indicates fast moving inventories and it is good inventory management. And both the companies
maintained their the efficiency by improving their ITR during the year 2017 – 2018.
CHART 5.4INVENTORY TURNOVER RATIO
5.5 WORKING CAPITAL TURNOVER RATIO:
The working capital turnover is also referred as net sales to working capital. It indicates a company's
effectiveness in using its working capital. Working capital is defined as the total amount of current assets
minus current liabilities.
COST OF GOODS SOLD
WORKING CAPITAL TURNOVER RATIO = ----------------------------------------------
WORKING CAPITAL
© 2019 JETIR February 2019, Volume 6, Issue 2 www.jetir.org (ISSN-2349-5162)
JETIR1902A44 Journal of Emerging Technologies and Innovative Research (JETIR) www.jetir.org 289
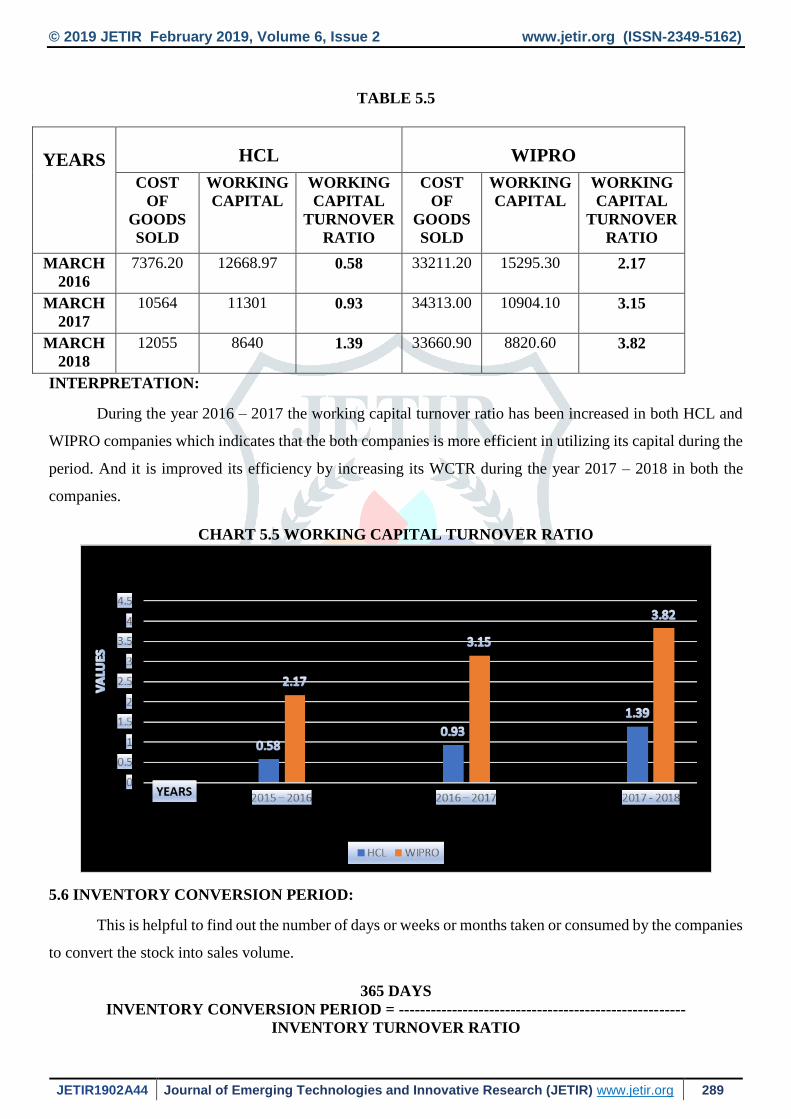
TABLE 5.5
YEARS
HCL
WIPRO
COST
OF
GOODS
SOLD
WORKING
CAPITAL
WORKING
CAPITAL
TURNOVER
RATIO
COST
OF
GOODS
SOLD
WORKING
CAPITAL
WORKING
CAPITAL
TURNOVER
RATIO
MARCH
2016
7376.20 12668.97 0.58 33211.20 15295.30 2.17
MARCH
2017
10564 11301 0.93 34313.00 10904.10 3.15
MARCH
2018
12055 8640 1.39 33660.90 8820.60 3.82
INTERPRETATION:
During the year 2016 – 2017 the working capital turnover ratio has been increased in both HCL and
WIPRO companies which indicates that the both companies is more efficient in utilizing its capital during the
period. And it is improved its efficiency by increasing its WCTR during the year 2017 – 2018 in both the
companies.
CHART 5.5 WORKING CAPITAL TURNOVER RATIO
5.6 INVENTORY CONVERSION PERIOD:
This is helpful to find out the number of days or weeks or months taken or consumed by the companies
to convert the stock into sales volume.
365 DAYS
INVENTORY CONVERSION PERIOD = ------------------------------------------------------
INVENTORY TURNOVER RATIO
© 2019 JETIR February 2019, Volume 6, Issue 2 www.jetir.org (ISSN-2349-5162)
JETIR1902A44 Journal of Emerging Technologies and Innovative Research (JETIR) www.jetir.org 290
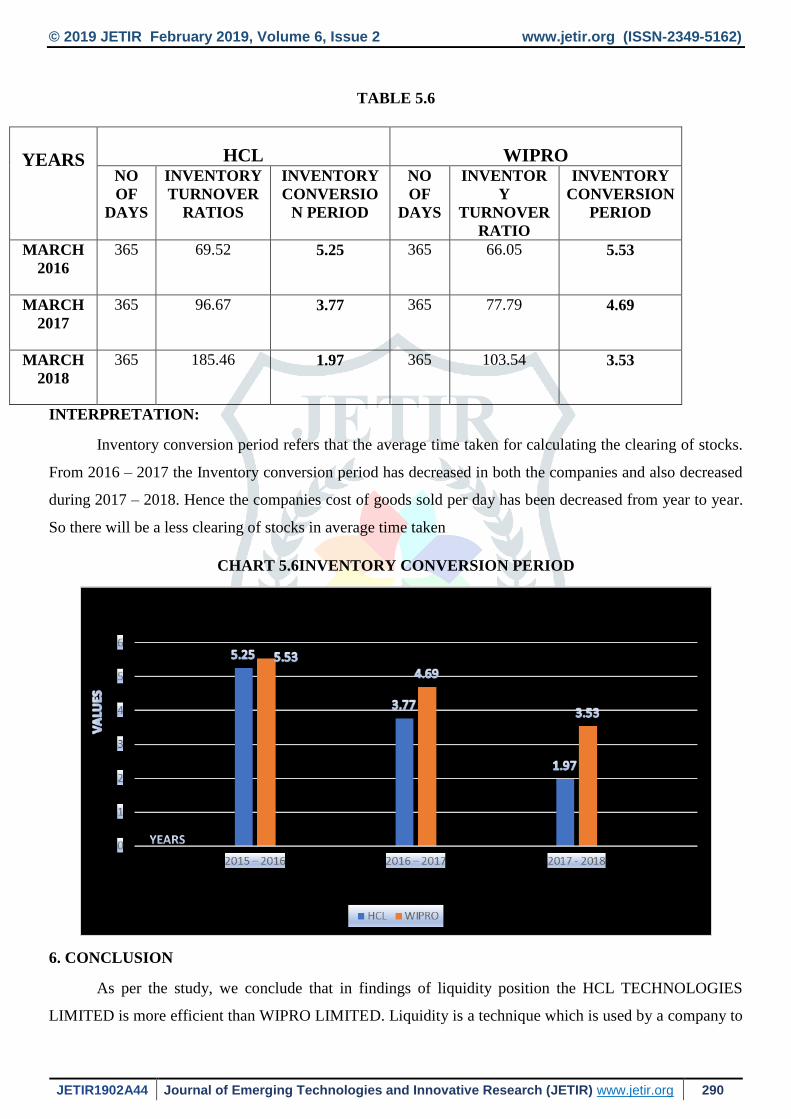
TABLE 5.6
YEARS
HCL
WIPRO
NO
OF
DAYS
INVENTORY
TURNOVER
RATIOS
INVENTORY
CONVERSIO
N PERIOD
NO
OF
DAYS
INVENTOR
Y
TURNOVER
RATIO
INVENTORY
CONVERSION
PERIOD
MARCH
2016
365 69.52 5.25 365 66.05 5.53
MARCH
2017
365 96.67 3.77 365 77.79 4.69
MARCH
2018
365 185.46 1.97 365 103.54 3.53
INTERPRETATION:
Inventory conversion period refers that the average time taken for calculating the clearing of stocks.
From 2016 – 2017 the Inventory conversion period has decreased in both the companies and also decreased
during 2017 – 2018. Hence the companies cost of goods sold per day has been decreased from year to year.
So there will be a less clearing of stocks in average time taken
CHART 5.6INVENTORY CONVERSION PERIOD
6. CONCLUSION
As per the study, we conclude that in findings of liquidity position the HCL TECHNOLOGIES
LIMITED is more efficient than WIPRO LIMITED. Liquidity is a technique which is used by a company to
© 2019 JETIR February 2019, Volume 6, Issue 2 www.jetir.org (ISSN-2349-5162)
JETIR1902A44 Journal of Emerging Technologies and Innovative Research (JETIR) www.jetir.org 291
convert its assets(current) into cash within the short time and without the loss of value. But the companies
liquidity position was unfavourable because the companies has liquidity problems by working capital and
inventories in which the average time taken is more in clearing of stocks. In liquidity position, companies Net
profit after tax must be increase year to year. Companies must reduce its sales value so it will lead to increase
in profit earning. But overall the liquidity ratios tells that HCL TECHNOLOGIES LIMITED is more efficient
in financial performances and its improving its position for the better growth.
7. REFERENCE
1. B.S.R. Murthy, V. Ramakrishna, M. Madhavi, M. Muniraja, M. Prasad Naik, “A study on
relationship between liquidity and profitability of selected Indian Tyres Companies”. International
journal for research in applied science and engineering technologies (IJRASET). ISSN.NO:2321-9653,
IC value 45.98, SJ impact factor 6.887 volume 6, issue IV, April 2018. www.ijraset.com.
2. Mr. R. Narayanan and Dr. R. Hamsalakshmi, “Analysis of liquidity and operating profitability of
selected Power Sector Companies in India”. IISR- International journal of scientific research, volume 3
issue 7, July 2014, ISSN.NO:2277-8179.
3. Sebastian OfumbiaUremadu, Ben - Caleb Egbide, Patrick E.Enyi, “working capital management,
liquidity and profitability among quoted firms in Nigeria evidence from the productive sector”.
International journal of Academic Research in Accounting, Finance and management science. Volume
2 issue 1 (2012), ISSN. NO: 2255-8329.
4. Ajanthan. A, “A Nexus Study between Liquidity and Profitability: Study Of Trading Companies In Sri
Lanka”. European Journal of Business and Management. www.iiste.org, University of Jaffna, Faculty of
Management Studies and Commerce.ISSN.NO:2222-1905(PAPER), ISSN.NO:2222-2389(ONLINE),
Volume 5, number 7 (2013).