the relationship between firm's stock liquidity
TRANSCRIPT
THE RELATIONSHIP BETWEEN FIRM’S STOCK LIQUIDITY
AND DIVIDENDS POLICY
(Empirical Study on Jordanian Banks Listed on Amman Stock Exchange)
By
Mahmud Abdlqader Na’ura
Student Number: 20149101
Supervisor
Prof. Mahmoud AlKhalialeh
This Thesis Submitted to Zarqa University in a Partial Fulfilment of the
Requirements for Master’s Degree in Accounting
Faculty of Graduate Studies
Zarqa University
May 2016


iii
Dedication
To Our Great Prophet Muhammad (ملسو هيلع هللا ىلص-)
The Master of Tolerance
As His Wise Sayings on the Importance of “KNOWLEDGE’’
“My Lord, save me from the useless knowledge.”(1)
To My Beloved Mother
All That I am, or Hope to Be, I Owe to You
1. (Sahih Muslim)

iv
Acknowledgements
Firstly, I would like to express my sincere gratitude to my supervisor
Prof. Mahmoud AlKhalialeh for the continuous support to me, for his
patience, motivation, and immense knowledge. His guidance helped me all
the time of this research and the writing of this thesis. I could not have
imagined having a better supervisor and mentor for my study.
Moreover, I would like to thank Prof. Abdel-Naser Nour, for his
insightful comments, encouragement, and for his supportive questions,
which stimulated me to widen my research from various perspectives.
Without their precious support, it would not be possible to conduct this
study.
Mahmud Na’ura
May 2016
v
List of Contents
Committee Decision……………………………………………………………….. ii
Dedication………………………………………………………………………….. iii
Acknowledgement…………………………………………………………………. iv
List of Contents……………………………………………………………………. v
List of Tables………………………………………………………………………. vi
List of Abbreviations………………………………………………………………. vii
Abstract…………………………………………………………………………….. viii
Chapter 1
1.1 Introduction…………………………………………………… 2
1.2 The Problem of the Study…………………………………….. 3
1.3 The Purpose of the Study……………………………………... 4
1.4 Significance of the Study……………………………………... 4
Chapter 2
2.1 Theoretical Framework……………………………………….. 7
2.2 Literature Review……………………………………………... 22
2.3 Summary of Literature Review……………………………….. 32
2.4 Research Hypotheses…………………………………………. 35
Chapter 3
3.1 Population……………………………………………………… 37
3.2 Sample…………………………………………………………. 38
3.3 Study Tools…..……………………………………………….... 38
3.4 Variables and Measurements…………………………………... 39
3.5 Statistical Techniques Used……………………………………. 42
3.6 Schematic Diagram of the Study………………………………. 43
Chapter 4
4.1 Descriptive Statistics…………………………………………… 45
4.2 Multicollinearity Test for the OLS Regression………………… 48
4.3 Correlation Results……………………………………………... 51
4.4 Hypotheses Testing and Results Discussions…………………... 52
Chapter 5
5.1 Conclusions…………………………………………………….. 60
5.2 Recommendations……………………………………………… 63
References……………………………………………………………………………. 65
Abstract (in the second language)……………………………………………………. 69
vi
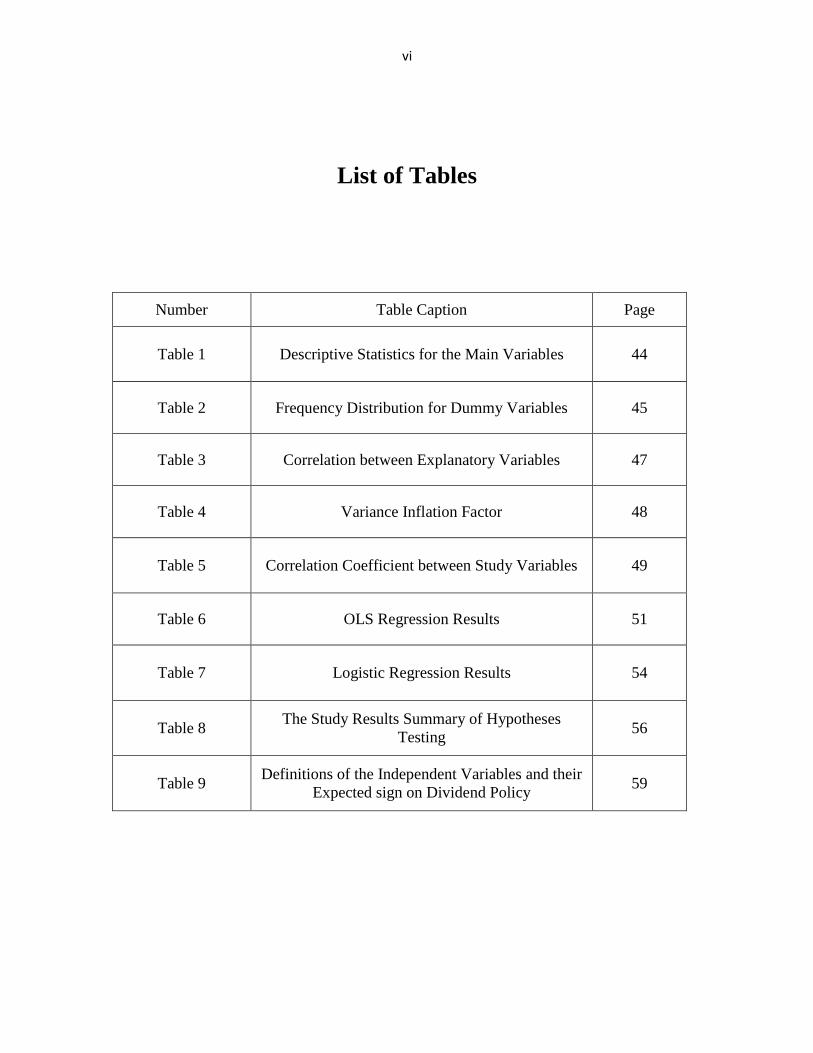
List of Tables
Number Table Caption Page
Table 1 Descriptive Statistics for the Main Variables 44
Table 2 Frequency Distribution for Dummy Variables 45
Table 3 Correlation between Explanatory Variables 47
Table 4 Variance Inflation Factor 48
Table 5 Correlation Coefficient between Study Variables 49
Table 6 OLS Regression Results 51
Table 7 Logistic Regression Results 54
Table 8 The Study Results Summary of Hypotheses
Testing 56
Table 9 Definitions of the Independent Variables and their
Expected sign on Dividend Policy 59

vii
List of Abbreviations
Abbreviations
ASE Amman Stock Exchange
DPS Dividend Per Share
EPS Earnings Per Share
DPO Dividend Payout Ratio
DP Dividend Payer
P Profitability
FS Firm Size
GO Growth Opportunities
SPRD Stock Relative Spread
TO Stock Turnover
ROE Return on Equity
ROA Return on Assets
NPV Net Present Value
viii
THE RELATIONSHIP BETWEEN FIRM’S STOCK LIQUIDITY
AND DIVIDENDS POLICY
(EMPIRICAL STUDY ON JORDANIAN BANKS LISTED IN AMMAN STOCK EXCHANGE)
BY
MAHMUD ABDLQADER NA’URA
SUPERVISOR
DR. MAHMOUD ALKHALIALEH, PROF.
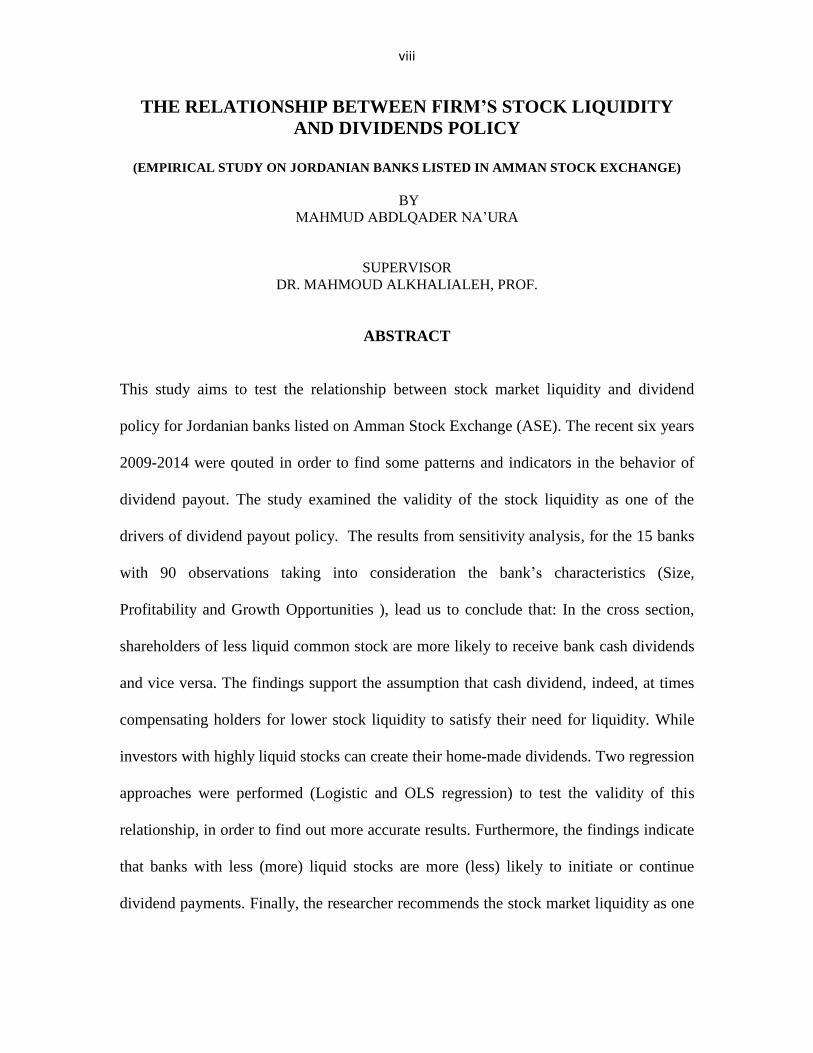
ABSTRACT
This study aims to test the relationship between stock market liquidity and dividend
policy for Jordanian banks listed on Amman Stock Exchange (ASE). The recent six years
2009-2014 were qouted in order to find some patterns and indicators in the behavior of
dividend payout. The study examined the validity of the stock liquidity as one of the
drivers of dividend payout policy. The results from sensitivity analysis, for the 15 banks
with 90 observations taking into consideration the bank’s characteristics (Size,
Profitability and Growth Opportunities ), lead us to conclude that: In the cross section,
shareholders of less liquid common stock are more likely to receive bank cash dividends
and vice versa. The findings support the assumption that cash dividend, indeed, at times
compensating holders for lower stock liquidity to satisfy their need for liquidity. While
investors with highly liquid stocks can create their home-made dividends. Two regression
approaches were performed (Logistic and OLS regression) to test the validity of this
relationship, in order to find out more accurate results. Furthermore, the findings indicate
that banks with less (more) liquid stocks are more (less) likely to initiate or continue
dividend payments. Finally, the researcher recommends the stock market liquidity as one

ix
of the determinants when predict cash dividend for the Jordanian banks listed on Amman
Stock Exchange.
1
Chapter 1: General Framework
1.1 Introduction
1.2 The Problem of the Study
1.3 The Purposes of Study
1.4 Significance of the study

2
In this chapter, this study represents the problem of the study and how it will contribute in
settle the problem; furthermore, the study explains the purposes of the study and the
significance of the study.
1.1 Introduction:
Dividend policy is one of the most controversial issues in the existing researches since it
attempts to balance the conflict between managers and investors who take the risk by
investing in the stocks of particular company, the scholars have latterly started looking at
firms dividend policy in emerging markets and increasingly recognized that dividend policy
may be affected by the stock liquidity. (Botoc and Pirtea, 2014)
The researcher seeks to test the relationship between banks stock liquidity and dividend
policy and provides evidence of the link between firm dividend policy and stock liquidity.
It examines whether the owners of less (more) liquid common stock are more (less) likely
to receive cash dividends.
The study attempts to provide additional insight into dividend policies in emerging markets
and perform the analysis while taking into consideration the firm size, profitability, and
growth opportunities. The need to control for these variables take place since the liquidity
of the firm's common stock can also be related to the size, profitability, and growth
opportunities of the firm. Therefore, it is important to examine the link between firm
dividend policy and liquidity after controlling for the possibility of such a relation. The
study sheds additional light on ‗dividend puzzle‘ by providing evidence from an emerging
market such as Jordan.

3
1.2 The Problem of the Study:
The conflict of interest between shareholders and banks managers have been subjected to
wide research for a long time with several theories in order to find some patterns and
indicators in the behavior of dividend payouts(Griffin, 2010).
Banks in Jordan encountering a problem in relationship between their stock liquidity and
dividend policy, which need to be determined in addition to develop new policies that will
satisfy shareholders and meet the needs of banks management, the researcher believe that
with investigating this problem and find some patterns to explain this relationship will
contributes in settle the conflicts between stakeholders.
Study results may be used by stakeholders to take decision from alternatives when deciding
to invest based on dividend yield for Jordanian banks. Furthermore, the study provides the
base to predict dividend revenues in the future using the respectable determinants.
(Singhania and Gupta, 2012)
Several studies extended these issues in the developed countries, for Jordan market, to the
best of my knowledge; few studies examined the relationship between stock liquidity and
dividend policy. This study will be prepared to answer the following questions:
Q1: What is the impact of bank stock liquidity on dividend policy?
Q2: What is the impact of bank‘s size on dividend policy?
Q3: What is the impact of bank‘s profitability on dividend policy?
Q4: What is the impact of bank‘s growth opportunities on dividend policy?
4
1.3 Purposes of Study:
The purposes of the study are summarized as the following:
1. Identify the problem of the relationship between bank‘s stock liquidity and dividend
policy and contribute to find the optimum policies of interest for stakeholders.
2. To present the related theoretical and empirical point of view.
3. The study was prepared in a partial fulfilment of the requirements for master‘s
degree in accounting.
1.4 Significance of the study:
The significance of the study arises from being the first study in Jordan which studied the
relationship between bank‘s stock liquidity and dividend policy which covered the
Jordanian banks listed in Amman stock exchange for the recent six years period between
2009-2014.
A company's dividend policy provides guidance on when and how much to pay or not to
pay stockholders dividends and use profits for other purposes. When profits are held and
not paid out as dividends, funds can be used for new product development, market
expansion, or acquisition of other companies. The study also provides a guidance to
investors and stockholders by creating subtitles to evaluate the firm dividend policy which
enable them to make the investment decision and examines the alternatives. (Erbschloe,
2014)
To the investors, the study findings will be a cornerstone for them to establish optimum
portfolios to be held at any given time, given the liquidity levels and the expected
dividends. It will empower them to know what kind of information to be disclosed by firms
5
on the financial statement pertaining to liquidity and dividend payout ratio for rational
decisions on companies to invest in.
For academicians, the findings of this study will make contributions to the existing
hypothesis on investor‘s behavior towards liquidity of a firm and it will be used to establish
research gaps and provide reference for further research under the field of dividend policy
and liquidity.
For organizations and banks, the study will enable managers to institute policies that can
create optimal liquidity levels and implement healthier dividend policies. Lastly,
researchers will benefit by having in-depth understanding of the effect and correlation
between stock liquidity and dividend payout policies of the banks. (Kibet, 2012)

6
Chapter 2: Theoretical Framework & Literature
Review
2.1 Introduction
2.2 Theoretical Framework
2.3 Literature Review
2.4 Summary of Literature Review
2.5 Research Hypotheses
7
2.1 Introduction
In this chapter, this study explains the theoretical issue regarding stock liquidity as well
dividend payout policy. In addition, this chapter also provides a review of previous
empirical studies related to the subject of the study that have been carried out in different
fields from hypotheses, which were developed.
2.2 Theoretical Framework
Investigations and literature on dividend policy have expanded to a large body of
theoretical and empirical studies, especially of the dividend irrelevance hypothesis of
Miller and Modigliani (1961). There is no general conclusions that have yet emerged
after several years of investigation, and scholars can often disagree even about the
same empirical evidence. This study concentrates on providing the reader with a
comprehensive understanding of dividends and dividend policy by reviewing the
main theories and explanations of dividend policy including dividend irrelevance
hypothesis of Miller and Modigliani. This study also seeks to present the main empirical
studies on determinants of stock liquidity. The study realized at a conclusion that the
famous saying of Fisher Black (1974) regarding dividend policy "the harder we look
at the dividends picture, the more it seems like a puzzle, with pieces that just do not fit
together"

8
Earnings Dividend and Dividend Policy
Commonly dividends are defined as the distribution of earnings (past or present) among the
shareholders of the company in proportion to their ownership (Frankfurter et al, 2003).
The payment dividends is an important indicating device used by corporations which
routinely need cash in order to replace inventory and other assets whose replacement costs
have increased or to expand capacity. As a result, corporations rarely distribute all of their
net income to stockholders. Young, growing corporations may pay no dividends at all,
while more mature corporations may distribute a significant percentage of their profits to
stockholders as dividends. (Azhagaiah and Priya, 2008)
Dividends can be distributed only when the corporation's board of directors declare a
dividend. Declaration is known as the date when board declares the dividend and it is on
this date the liability for the dividend is created. Lawfully, corporations should have a
credit balance in Retained Earnings account in order to declare a dividend. Virtually, a
corporation must also have available cash balance large enough to pay the dividend without
affecting the upcoming needs, such as asset growth and payments on existing liabilities.
(Fama and French, 2000)
Dividend policies are defined as a firm's strategies with regards to paying out earnings as
dividends contra retaining to reinvestment them in the firm. Dividend policy is the division
of profit between payments to shareholders and retained earnings on the balance sheet
accounts. It is thus an important part of the firm's long-term financing plans. Dividend
policies including three approaches which have emerged as the most vastly supported
throughout the finance community. (Kyle et al, 2013)

9
The first approach is the Smoothed Residual Dividend Policy. The principle for this policy
is that the annual/quarterly change in the dollar amount of the dividend is kept to a
minimum. Corporations who use this policy head for to delay any major changes to the
dollar amount of their dividends paid to investors and do not react to short-lived changes in
earnings. Being that these temporary changes in earnings can fluctuate drastically, the
payout ratio for the particular firm can swing dramatically. The DPS is kept constant and is
only altered if the long run profitability forecast of the firm has been modified.
The second approach of dividend policy is referred to as the Pure Residual Dividend
Policy. By this policy, which puts a large assurance on fundamental analysis, theorize at the
comparison between a firm‘s return on equity (ROE) and the rate of return that an investor
could achieved by an alternative venture. The policy states that if the firm can achieve a
higher ROE than an equally risky investment could be achieved in the market, investors
prefer the company reinvest or plowback that dividend rather than pay it out. A time a firm
has determined their optimal capital budget and the sufficient capital has been allocated to
internal investments, then the remaining residual funds can then be used to payout a
dividend accordingly. Since this policy‘s influence on the amount of dividend payout varies
with the amount of earnings the firm generates, the dollar amount of paid out funds to
investors can fluctuate vastly.
The third approach of dividend policy is the Constant Payout Residual Dividend policy
approach. By this policy embodies the idea that a company should work to ensure that the
payout ratio remains stable. To ensure that the payout ratio remains stable, management
must adjust the dollar amount of dividends paid out according to the quarterly earnings
results. This theory differs from the aforesaid Pure Residual Dividend Policy, since there is
10
no consideration of whether or not the firm can obtain a higher rate of return than that of an
alternative investment of equal risk that their investors could achieved in the financial
market. It is necessary that the issues beyond the payout of a dividend both from investor‘s
perspective and the management‘s perspective be addressed. By analyzing the effects of
dividend policy on stock price volatility. (Kyle et al, 2013)
Reasons of why corporations pay dividends?
The paid of dividend can be for many reasons. In some cases, dividends are paid to satisfy
present stockholders (Azhagaiah and Priya, 2008). When high standard executives hold
large of stock quantities, paying dividends can be seen as a form of a bonus for this
executives. In certain cases, dividends may be paid as an indicator that the company is
gainful. This may impact the opinions of stock analysts or future investors in the company
(Li and Zhao, 2008). Corporations have attempted to use dividend payouts as a way to
favorably influence their stock price. Announcing a major dividend payout, or making a
larger than normal payout of dividends, may result in improved stock prices in the short-
term, there is little supporting evidence that the strategy is constantly successful (Wann et
al, 2008).
Firm's dividend policies continue to puzzle financial researchers and scholars. Miller and
Modigliani (1961) advance the dividend irrelevance proposition—in perfect capital markets
populated by rational investors, a firm's value is just a technique of the firm's investment
opportunities and it is not connected with payout policy, a large body of literature examines
the importance that managers and investors attach to dividend policy in light of the
11
irrelevance proposition. The occurrence point of these studies is to question some of the
assumptions that define the perfect capital markets analyzed by Miller and Modig (1961).
One assumption of the dividend irrelevance proposition is that trading is frictionless so that
investors can invest or liquidate their investments in a firm without incurring any direct or
indirect costs at trading and without alteration the price of the underlying securities. If
markets have no trading friction, investors with liquidity needs can create homemade
dividends at no cost by selling the proper amount of their holdings stock in the corporation.
As a result, investors should be indifferent between receiving a dollar of dividends and
selling a dollar's worth of their investment. In actuality, trading friction is spreading widely
throughout financial markets. Investors have to pay trading commissions and they either
have to provide a price concession for an immediate execution or they have to wait until
optimal execution of their trades. (Banerjee et al, 2007)
Stocks that pay cash dividends allow investors to satisfy their liquidity needs with less or
no trading and thus enable them to avoid trading friction,- When trading friction exists in
financial markets, an immediate implication of Miller and Modigliani (1961) is that, other
things equal, firms with less liquid shares (i.e., shares with higher trading friction) are more
inclined to pay dividends relative to firms with more liquid shares-an implication we term
the "liquidity hypothesis of dividends." (Miller and Modigliani, 1961)

12
Free Cash Flow Theory:
Free cash flow represents the residual cash after deducting the money required for
expansion and growth from operating cash flow, the assumption of free cash flow theory
that firm will not be able to pay dividend to shareholders unless it generate the cash needed
to maintain or expand its assets base and ensure to pursue opportunities that enhance firm
value such as develop new products or make acquisitions. Excess cash can create
overinvestment problem because they may be used to fund negative NPV projects and the
management may wastefully use excess cash. To alleviate these problems, firms paying
dividends to return excess cash to shareholders. (Thanatawee, 2011)
Life-Cycle Theory:
The firm life cycle theory of dividends asserts that the ideal dividend policy of a firm rely
on the stage of firm in its life cycle. The implicit premise is that firms usually follow a life-
cycle track from origin to maturity that is connected with a declining investment
opportunity series and growth rate, and the cost of raising external capital decreased. The
ideal dividend policy, originate from a trade-off between the costs and benefits of raising
capital for new investments, evolves with these life-cycle-related changes. As the firm
becomes more mature the ideal payout ratio increases. The empirical evidence generally
supports the theory, in that dividend payment propensity is related to life-cycle
characteristics – dividend payers are mature firms, with a high ratio of earned to
contributed capital, while young, high growth firms do not pay dividends. (Thanatawee,
2011)
13
The Bird in the Hand Theory:
The theory of bird in the hand illustrates that shareholders favour dividends (certain) to
retained earnings (less certain): then, corporations have to set a large dividend payout ratio
to maximize firm stock price. Walter (1963) present the bird in the hand theory, which says
that investors always prefer cash in hand rather than a future promise of capital gain due to
minimizing risk in the early 1970s and 1980s.
Tax Preference Theory
This theory indicates that dividends are subject to a higher tax cut than capital gains. This
theory further argues that dividends are subjected to tax directly, while capital gains tax
will be realized when a stock is sold only. Therefore, for tax-related purposes, shareholders
favour the retention of a firm‘s gain over the distribution of cash dividends. The advantage
of capital gains treatment, however, may lead investors to prefer a low dividend payout, as
opposed to a high payout. (Gardon, 1963)
The Agency Theory:
This theory is based on the conflict between managers and shareholder and the percentage
of equity controlled by insider ownership should influence the dividend policy. Miller and
Scholes (1978) find that the effect of tax preferences on clientele and conclude different tax
rates on dividends and capital gain lead to different clientele. (Boshkoska, 2015)
14
Signaling Theory
Signaling theory was analyzed in the early 1980s; it revealed that information asymmetry
between managers and outside shareholders allows managers to use dividends as a tool to
signal private information about a firm‘s performance to outsiders. The explanation
regarding the signaling theory given Williams (1985) dividends allay information
asymmetric between managers and shareholders by delivering inside information of firm
future prospects. Easterbrook (1984) gives further explanation regarding agency cost
problem and says that there are two forms of agency costs; one is the cost monitoring and
other is cost of risk aversion on the part of directors or managers.
Transaction Cost and Residual Theory
Another explanation for dividend policy is based on the transaction cost and residual
theory. This theory indicates that firms incurring large transaction costs will be required to
reduce dividend payouts to avoid the costs of external financing. (Easterbrook, 1984)
15
2.1.2 Stock Liquidity
Stock liquidity definition comprises many important forms. Some scholars assert on the
pace of transactions, arguing that liquidity is the ability to make a transaction quickly and
with no negative major influence on the price (minor change in the price accepted). Other
scholars describe the liquidity as low transaction costs or as high activity of transactions.
Other researchers propose that the stock liquidity may be considered as the frequency of
stock trading in a market. Popularization of these considerations propositions that the stock
liquidity is the ability to buy or sell a stock quickly and in a high-volume with no
significant influence on price and without incurring high transaction costs. (Norvaisiene
and Stankeviciene, 2014).
However, it is difficult to find an easy definition for Liquidity and the existence of common
definition of liquidity is unpresented. Generally, modest definition in one sentence
mentioned that liquidity in a financial market is the ability to absorb smoothly the flow of
buying and selling orders are not able to capture the phenomenon liquidity, since liquidity
consists more than one-dimensional variable but consists many dimensions and there are
four general aspects or dimensions generally distinguished: (Wyss, 2004)
1. Trading Time: The ability to perform immediate transaction at the common price. Time
of waiting between next trades or the inverse, the number of trades per time unit are
measures for trading time.
2. Tightness: The ability to buy and to sell an asset at about the same price at the same time.
Tightness shows in the clearest way the cost associated with transacting or the cost of
immediacy. Measures for tightness are the different versions of the spread.
16
3. Depth: The ability to buy or to sell a certain amount of an asset without influence on the
quoted price.
A sign of illiquidity is an adverse market impact for the investor when trading. Market
depth can be measured, aside from the depth itself, by the order ratio, the trading volume or
the flow ratio.
4. Resiliency: The ability to buy or to sell a certain amount of an asset with little influence
on the quoted price.
In order to measure the liquidity (Wyss, 2004) found that liquidity itself is not observable
and it should be proxied by various measures of liquidity. He states that the results of using
various measures of liquidity could be conflicted when estimating the liquidity of market,
the measure of liquidity classified into two forms, first is the one-dimensional which takes
one variable only into account, whereas the multi-dimensional liquidity measures try to
hold various variables in one measure.
. In order to measure stock liquidity and its impact on dividend policy, company internal
factors must be considered since this factors affects the liquidity, Norvaisiene and
Stankeviciene (2014) examined company internal factors that‘s may affects the liquidity,
their findings that there is positive relationship between company size and its stock
liquidity as well other scientists confirmed, furthermore they found that assets liquidity is
an important factor that affecting the stock liquidity, the results findings that there is
significant positive relationship exists among the liquidity of assets and the liquidity of a
stock and this positive impact will be greater in case of low growth potential.

17
(Alnaif, 2014) investigated the company internal factors that affected the stock liquidity
and he found that the major factors must be considered while determine the stock liquidity
as the following:
Firm's Size : a positive relationship between firm‘s size and stock liquidity are expected,
the company stock liquidity will increase as the firm‘s size increase, since large companies
are attract the investors and followed by analysts, furthermore, the size of large firms
allows it to disclose a lot of information thereby liquidity will improved and information
asymmetry will be reduced.
Firm's Profitability: Generally, investors prefer the profitable firm stock with high return
on assets, so there is positive relationship between firm‘s profitability and stock liquidity.
Earnings per Share: illiquid stock require higher return to the investors, then a negative
relationship between earnings per share and stock liquidity are expected.
To select a liquidity measure it should be informed that no single measurement can capture
all liquidity aspects or dimensions, liquidity measures can classified into three categories
with different measurements (Abdourahmane and Tonny 2002):
1. Transaction cost measures:
The distinction can be made between implicit transaction costs, which relate to expenses
such as order processing costs and taxes associated with trades, and implicit transaction
(execution) costs. Because bid-ask spreads may capture nearly all of these costs, they are
the most commonly used measure of transaction costs, in dealer markets, the bid-ask
spreads may reflect:

18
i. Order processing costs.
ii. Asymmetric information costs.
iii. Inventory carrying costs.
iv. Oligopolistic market structure costs.
Immediacy, for instance, is fostered by the existence of dealers who stand ready to buy and
sell specific quantity of a financial instrument at the quoted bid and ask prices. This service
entails inventory-carrying costs depending on the dealers squaring their positions toward
the end of day which they must recover in addition to their order processing costs. But
dealers also incur a risk by standing ready to trade based on asymmetric information. They
must charge a premium to compensate for potential losses in providing a continuous
market. Such cost are smaller, if there are numerous participants willing to trade with
dealers, and thus revealing their asymmetric information. In addition, since immediacy is
bought at a price, the latter is influenced by competition. Thus, a few dealers with
oligopolistic power may have higher discretionary fees for immediacy. (Abdourahmane and
Tonny, 2002)
The cost of trading financial assets and trading frictions can be captured by this measure in
the markets, the best example of the transaction cost measures is the bid-ask spread which
calculated as follow: (Heflin et al, 2001)
For each value of the sample and for each day, the difference between the best purchase
price and the best sale price divided by the average of the two prices. Indeed, it is
calculated over a year. And it is equal to the average of the spread computed for this period.
The higher bid-ask ratio come with lower liquidity. (Attig, et al, 2006), (Damodaran,
2005).
19
2. Volume based measures:
Volume based measures are most useful in measuring breadth (the existence of both
numerous and large orders in volume with minimal transaction price impact). Markets that
are deep tend to foster breadth since large orders can be divided into several smaller orders
to minimize the impact on transaction prices. Large numbers of trades are valuable source
of information for transactors and particularly dealers. They obtain information from order
flows, and imbalances in this order flow give them information about the accuracy of their
quoted prices. Changes in these quoted prices trigger balancing order flows, which would
counter price movements that are not warranted by fundamentals (resiliency). This process
allow dealers to have a continuous information source as to whether price changes are
permanent or transitory. When markets lack breadth and depth, the absence of the
continuous information source provided by numerous and frequent trades may result in
price discontinuities and uncertainty about equilibrium prices. Selling and buying sides of
the market exist, transactors, and particularly dealers, may be able to execute orders without
having to take risky inventory positions. Trading can also be enhanced if market makers
can easily identify potential buyers and sellers, such as institutional investors with large
portfolios. Trading volume is traditionally used to measure the existence of numerous
market participants and transaction. Trading volume can be given more meaning by relating
it to outstanding volume of the asset being considered. (Abdourahmane and Tonny 2002)
In order to capture the breadth and depth, this measure comparing the volume of transaction
to price variability and find the liquid markets, the best example of the volume base
measures is the turnover, which calculated as follow:
20
The ratio of shares traded to shares outstanding for calendar year i, Turnover captures
trading frequency, that is, a stock with a higher (lower) turnover rate indicates that
investors tend to hold the stock over a shorter (longer) time horizon; hence the stock is
more (less) liquid, so there is a positive relationship between stock turnover and stock
liquidity. This is consistent with Amihud (2002)‘s argument. Existing research has widely
used share turnover as a proxy for liquidity; see for example. Datar et al (1998).
3. Equilibrium price-based measures:
This measurement try to capture orderly movements towards equilibrium price to mainly
measure resiliency. The definition of the equilibrium price is a situation in which
the supply of a stock is exactly equal to its demand. Since there is
neither surplus nor shortage in the market, price tends to remain stable in this situation and
there is no pressure to change the price. Measure of liquidity when no information is hitting
a stock must be more relevant than measures of liquidity when new information leads to
new equilibrium values, thus unrefined measures of liquidity maybe nothing more than
some kind of weighted average reflecting the frequency with which new information hits
one stock as compared with other. (Bernstein, 1987)
Ideally, there is thus a need for an underlying structural model to identify the equilibrium
price, but given the difficulty in determining whether new information is needed affecting
the price of an instrument. (Hasbrouk and Schwartz, 1998)
The market efficiency coefficient exploits the facts that price movements are more
continuous in liquid markets, even if new information is affecting the equilibrium prices;
21
the equation below measures the market efficiency coefficient: (Abdourahmane and Tonny
2002)
MEC = Var (Rt) / (T*Var(Rt))
Where:
T : number of short periods in each longer period.
Var (Rt) : variance of the logarithm of long-period return
(T*Var(Rt)) : variance of the logarithm of short-period return
The ratio would tend to be closer but slightly below one in more resilient markets, since a
minimum of short-term volatility should be expected. Indeed, prices of assets with low
market resiliency may exhibit greater volatility (more transitory changes) between periods
in which their equilibrium price is changing. Factors that foster excessive short-period
volatility (overshooting) reslt in MEC substantially below one. These factors include prices
rounding, spreads, and inaccurate price discovery. (Bernstein, 1987)
For the best results, we use the transactions cost measure (bid-ask spread) in addition
to volume-based measure (turnover) to capture the liquidity and examine its impact
on dividend policy of the Jordanian banks listed in Amman stock exchange.
.
22
2.3 Discussing the Literature Review
In the early phases of corporate history, managers understand and realized the importance
of high and constant dividend distributions. In some methods, this was due to the analogy
investors made with the other form of financial security then traded, denominated
government bonds. Bonds paid a regular and stable interest payment, and corporate
managers realized that investors preferred shares that performed like bonds ‗paid a regular
and stable dividend‘. For example, Bank of North America in 1781 paid dividends after
only six months of operations, and the bank decade entitled the board of directors to
distribute dividends regularly out of profits. ―Paying consistent dividends remained of
substantial importance to managers during the first half of the 19th century‖. In addition to
the importance placed by investors on dividend stability, another issue of late corporate
dividend policy to emerge early in the nineteenth century was that dividends viewed as an
important type of information. The lack, inaccuracy and deficiency of financial information
usually resulted in investors choose their valuation of corporations through their dividend
payments rather than reported income. In short, investors were usually suffering with
inaccurate data regarding the performance of a firm, and investors chose to use dividend
policy as a way of predicting what management‘s views about future performance might be
occurred. Consequently, an increase in divided payments tended to be reflected in
increasing of stock prices. As corporations became conscious of this outcome, it increased
the possibility that managers of corporations might be use dividends to indicate strong
earnings prospects and/or to support a company‘s share price because investors may read
dividend announcements as a proxy for income growth. (Al-Malkawi et al, 2010)
23
In sum, three mains conflicted theories of dividends payments can be viewed. Some argue
that arising dividend payments increases a firm‘s value. Another argue claims that high
dividend payouts have the adverse effect on a firm‘s value; that is, it minimize firm value.
The third theoretical approach emphasize that dividends should be irrelevant and all effort
spent on the dividend decision is useless.(Frankfurter et al, 2003)
Magni (2007) investigate Miller and Modigliani‘s (1961) evidence of dividend irrelevance
is based on the assumption that the amount of free cash flow generated by the fixed
investment policy is equal or less than the dividends distributed to investors and dividend
policy is not irrelevant if retention is allowed, Magni (2007) viewed that even in case of
retention the dividend irrelevance proposition holds. He found that the main assumption has
not to do with retention but with the net present value of the additional funds (either
retained or raised): if net present value is zero, dividend irrelevance applies. Until the
present, the dichotomy retention or no-retention is valuable, because if agency problems are
present, managers tend to retain funds and invest them in negative net present value plans,
thus the zero net present value assumption must be set aside, as well that dividend
irrelevance no more apply. The dichotomy retention/no-retention is still useful: if retention
is chosen by managers, then net present value is determined by managers‘ actions; if extra-
distribution is chosen by managers, net present value is determined by expectations of new
shareholders. In other way, investor‘s wealth is fully controllable by managers only in case
of retention. So, retention has not to do with irrelevance but has to do with the
controllability of investor‘s wealth by managers. Managers have motivation in retaining
earnings because they can fully control investor‘s wealth. Therefore, one may certainly
24
claim that retention bears a strong relation to dividend irrelevance issues if agency
problems are assumed.
Kibet (2010) examined the effect of firm (liquidity, leverage, profitability, cash flow, corporate
tax, sales growth, earning per share) on dividend policy of companies listed in Nairobi stock
exchange for the period of 2007-2011, the findings from the firms considered presented that,
there exist a positive influence of liquidity on dividend payout. As the level of liquidity
increases, the dividends paid out level do also increase and vice versa. From the data collected,
analyzed and conclusion made thereof showed that, firms maintain high liquidity thresholds in
order to mitigate any likelihood of financial distress and they do this by embracing the best
business practices through optimum working capital management. It also showed that firms
maintain high liquidity levels in order to settle dividends as they fall due. The study also
revealed that profitability plays a major role in dividend payout and consequently the
companies which posted higher profits translated this to higher dividends paid out to investors.
Profitability of a firm is an indicator of a firms‘ capacity to pay dividends and thus higher
profits declared signals higher dividend payout. Earnings per share had an insignificant effect
on dividend payout, meaning that even if the return per share is high, the same will not translate
to higher dividends.
In India, (Singhania and Gupta, 2012), investigated the determinants of dividend in 50
index companies, they examined the impact of four variables whether it has significant
influence on the dividend policy or not, these variables are firm‘s size (market
capitalization), firm‘s growth and investment opportunity, the firm‘s debt structure and firm
profitability and experience, the findings propose that debt structure and firm profitability
and experience are found to be insignificant in the Indian companies and this results do
25
negate some theories of dividend determinants. Firm‘s size, firm‘s growth and investment
opportunity found to be significant.
Some researchers examined the drivers of dividend payout policy using generalized method
of moment‘s system technique as (Botoc and Pirtea, 2014), they examined the drivers of
dividend payout policy by analyzing the pattern of 2,636 corporations from sixteen non-
developing countries (emerging). According to the generalized method of moment‘s system
technique, the major finding support residual cash flow theory as well as the substitution
form, and stand in against to the life-cycle theory. The findings from sensitivity analysis
was leading to conclude that if shareholders protection is high, then cash needed in
explaining dividend payout is more significant; and if shareholders protection is poor,
liquidity appears to be more significant. The prospectors on this topic are Miller and
Modigliani (1961), the originator of the dividend irrelevance theory. According to this
theory, dividend relevance theories have been advanced. Such theories include , life cycle,
bird in the hand, free cash flow ,tax preference, catering, signaling, agency costs and
clientele effects.
Botoc and Pirtea (2014) were attempt to provide more results for the residual cash flow
theory using the relationship between cash position and dividend payout. Because
dividends are paid from cash, and, in accounting terms, dividends represent current
obligations (liabilities), they suggest a proxy that reflects the ability of a company to use
current assets less stock (liquidity ratio) to pay off current liabilities, and a proxy that
indicates how much cash is used in day-to-day activities which identified as working
capital. Furthermore (Botoc and Pirtea, 2014) investigated whether the results of the
previous findings have changed over time. Their findings support for the theory of residual
26
cash flow of dividend because liquidity and cash management impact dividend
distributions. Particularly, when shareholders highly protected, cash needs is more
necessary in explaining dividend distributions, and when shareholders protection is low,
liquidity appears to be more important. In addition they found support for the substitution
model of dividends payout. , ignored of the firm‘s risk, the higher dividend distributions are
expected in countries with weak shareholders protection for the need of developing a good
reputation. According to traditional measures, the business cycle seems to be insignificant
in explaining the dividend distributions, in contrast with the life-cycle theory of dividends,
the major differences are the insignificance of growth opportunities and the positive effect
of debt ratio, the later being consistent with the trade-off theory of capital structure.
Generally, corporations from emerging countries display dividend distributions models that
are relatively similar to those of corporations from developed countries.
The impact of firm stock liquidity on dividend payout policy were examined by Griffin
(2010), he suggest a negative and inverse relationship and referred to dividends indeed at
times compensating for lower stock liquidity holders, Companies that used to distribute
dividends are often traded at a premium against those that do not distribute dividends.
Shareholders in the corporations can receive cash flow and the need to sell shares are not
necessary; therefore, traditionally, corporations tend to pay relatively high dividends which
hold by those on a fixed income. Executives compare the degree of current level of
dividend with those in that past and current earnings and tend to make stable level of
dividends over the time. Corporations alternatives of preferred option depends on many
assumptions, First assumption is the future performance and projects that the firm has.
Company with high future growth opportunities (holds many projects) used to held the

27
dividends to minimum or totally retained and vice versa. Furthermore, the expectations of
the shareholders whether the company will pay dividends or not are highly important, since
company history with high and continues dividend paying expected to suffer of sudden
inverse of dividends payout policy related to the stock price. Thus, companies are required
to give a visible indications regarding expected future dividends policy. Furthermore,
Griffin (2010) found that if shares receiving dividends then the need for liquidity will be
eliminated, because shareholder will not be forced to wait along for a buyers or sacrifice
with lower price to attract buyers, so dividends will provide the investors with returns
needed. In the opposite side, liquid shares holders can create their own quickly dividends
by selling a portion of portfolio with low cost, perhaps with higher prices. But he still in
doubt if this inverse relationship valid in emerging countries because the liquidity is lower
than which founded in developed countries.
Al-Qaisi and Omet (2010) examined the stability issue of dividend policy and or its
determinants for Jordanian companies listed in Amman Stock Exchange for the period of
1995-2005, their study try to answer the question ‗if the Jordanian companies follow stable
dividend policy‘ and they compare between companies sectors or groups, the results of
their study indicated that listed Jordanian companies follow stable policies and the extent of
this stability is much lower than companies which are listed on more advanced stock
markets such as the USA. In addition, the results reflect the fact that the banking and
services companies follow more stable dividend policies than the industrial and insurance
companies.
28
Al-Haddad et al (2011) examined the dividend policy of listed banking corporations in the
Amman Stock Exchange (ASE) during the period (2000-2006). Dividend payout ratios and
the related dividend policy's stability are also examined; the results found that the banking
sector follows unstable cash dividend policies.
Ahmad and Wardani (2014) focused on the effect of fundamental factor on dividend policy
of 98 firms listed Indonesia Stock Exchange during the period of 2006 to 2009. The study
used logit regression to find the relationship between independent variable and dependent
variable. The study findings that profitability and firm size have positive significantly
correlation with dividend policy. Liquidity and leverage have negative significantly
correlation with dividend policy. Moreover, the results show that growth opportunities has
no significant correlation with dividend policy.
Measuring the liquidity in emerging markets were analyzed by Lesmond (2005) using bid-
ask spreads as closely mirror to propose liquidity estimates. These results show that Latin
American markets are generally less liquid than are the South Asian, East Asian, European,
and African/Middle-Eastern markets, regardless of size grouping. Combining the results for
price, volume, and firm size categorizations, these results highlight the limits of using
general country descriptors or firm characteristics of trade difficulty for liquidity
assessments in emerging markets.
Amihud (2002) examined the proposition that asset expected returns are increasing in
illiquidity, and how it is known that illiquidity explains differences in expected returns
across stocks, a result that is confirmed here. His findings that, over time, market expected
illiquidity affects the ex-ante stock excess return, and provides compensation for the lower
29
liquidity of stocks relative to that of Treasury securities. And, expected stock excess returns
are not constant but rather vary over time as a function of changes in market illiquidity.
Sudhahar and Saroja (2010) investigated the trends and determinants of the dividend policy
of banks in India which are actively traded under Bombay Stock Exchange for the period of
ten years 1997-2007, the results found that Indian banks have adopted a consistent dividend
policy during the study period. It is found that 50% of the banks have distributed more than
36% of their earnings as dividend. Furthermore, the dividend policy of Indian banks is also
effect positively by return on investment (ROI), followed by last year dividend payout ratio
and volume of sales.
In Egypt market, Omran and Pointon (2004) found a link between dividends and firm
liquidity and profitability; the results find that reductions in dividends are associated with a
lack of liquidity and profitability. Their findings support the arguments, for actively traded
shares, retentions are more significant than dividends while for the non-actively traded
shares, the accounting book value is the most important determinant of the share price, and
not dividends or earnings. Dividend Payout Ratios. Small firms pay out less (retain more).
The result suggests a role for reducing dividends and retaining more in order to finance
investment opportunities. In order to finance investment opportunities, firms whose shares
are not actively traded tend not to pay out a smaller proportion of earnings as dividends.
Banerjee et al, (2007) examines this liquidity hypothesis of dividends. They taking into
consideration the control variables through their analysis, which includes firm profitability,
size, and growth opportunities. They believe that the need to control for these variables
arises for at least two reasons. First, their use as determinants of dividend policy is
consistent with the role of dividends in controlling the agency costs of free cash flow
30
(Easterbrook, 1984) and with a pecking order pattern, where firms avert issuing securities
due to asymmetric information costs and other flotation costs and consequences. The
significance of these characteristics in the firm's decision to pay dividends is empirically
examined in Fama and French (2000). Second, common stock liquidity of the firms can
also be related to the profitability, size and growth opportunities of the firm. Thus, it is
important to examine the impact of stock liquidity on dividend policy after taking in
consideration of the controlling for the potential of such a relation. The main conclusions of
their research was summarized that in the cross section, firms with high liquid stocks (i.e.,
stocks with high trading activity, a low proportion of no trading days, and a low price
impact of order flow) are less likely to pay dividends (and vice versa). These results persist
after the taking into consideration the firm control variables explained. Furthermore in
liquid markets, investors will have a lower demand for cash dividends from the stocks they
hold since investors can create homemade dividends cheaply. As a consequence, firms with
less (more) liquid stocks will have higher (lower) incentives to distribute cash dividends to
investors. They found also that cash dividends and stock market liquidity act as alternative
from investor's point of view. Companies that declared dividend distributions reduce the
values sensitivity to aggregate liquidity, maybe because they lower investor exposure to
systematic liquidity risk. Thus, the effect of dividend policy on firm value is possible
because of market insufficiency.
Contribution/ Originality, and different of other studies:
The inverse relationship validity of stock liquidity and dividend payout were examined and
settled in many developed countries markets, for emerging countries the validity of this
inverse relationship still in doubt because the liquidity is lower than which founded in
31
developed countries and the investors may cannot create their own dividends by stock
trading (Griffin, 2010), thus, this study is prepared to test the validity of this inverse
relationship and matching between developed and emerging markets, to the best of my
knowledge few studies were investigated this relationship in emerging countries, this issue
not examined in Jordanian emerging market for the quoted period from 2009-2014, the
banks characteristics were taken in consideration to don‘t negate many researches.
32
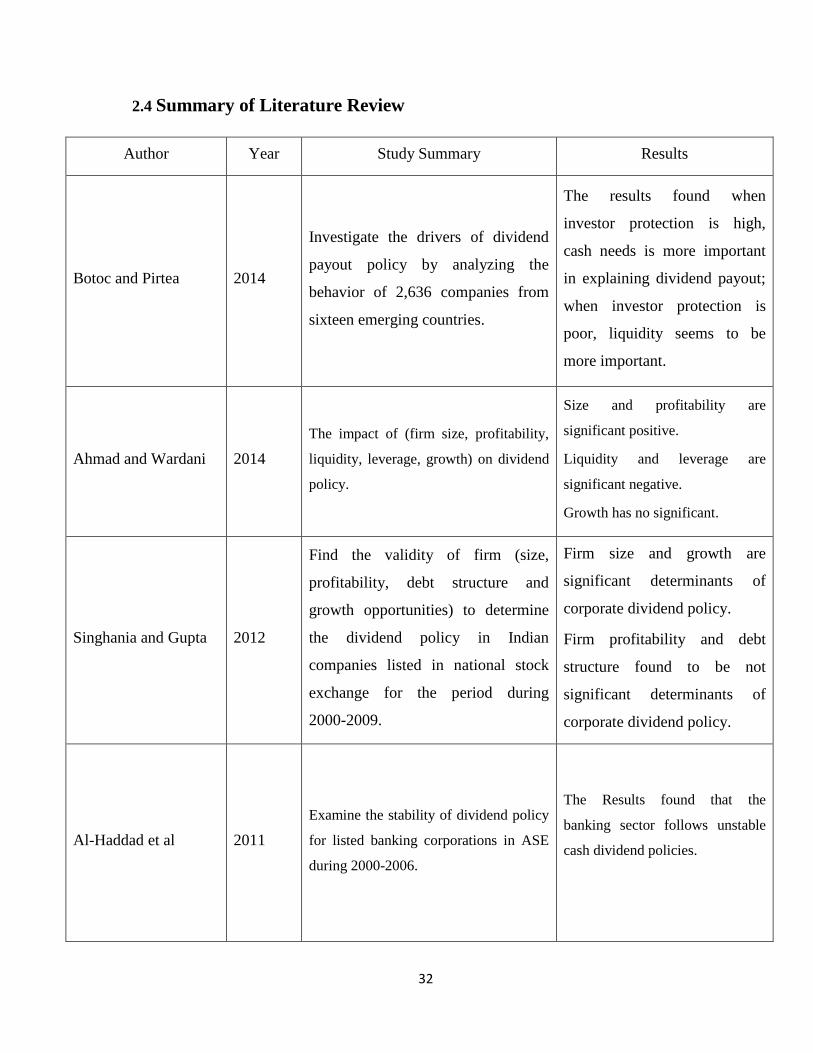
2.4 Summary of Literature Review
Author Year Study Summary Results
Botoc and Pirtea 2014
Investigate the drivers of dividend
payout policy by analyzing the
behavior of 2,636 companies from
sixteen emerging countries.
The results found when
investor protection is high,
cash needs is more important
in explaining dividend payout;
when investor protection is
poor, liquidity seems to be
more important.
Ahmad and Wardani 2014
The impact of (firm size, profitability,
liquidity, leverage, growth) on dividend
policy.
Size and profitability are
significant positive.
Liquidity and leverage are
significant negative.
Growth has no significant.
Singhania and Gupta 2012
Find the validity of firm (size,
profitability, debt structure and
growth opportunities) to determine
the dividend policy in Indian
companies listed in national stock
exchange for the period during
2000-2009.
Firm size and growth are
significant determinants of
corporate dividend policy.
Firm profitability and debt
structure found to be not
significant determinants of
corporate dividend policy.
Al-Haddad et al 2011
Examine the stability of dividend policy
for listed banking corporations in ASE
during 2000-2006.
The Results found that the
banking sector follows unstable
cash dividend policies.
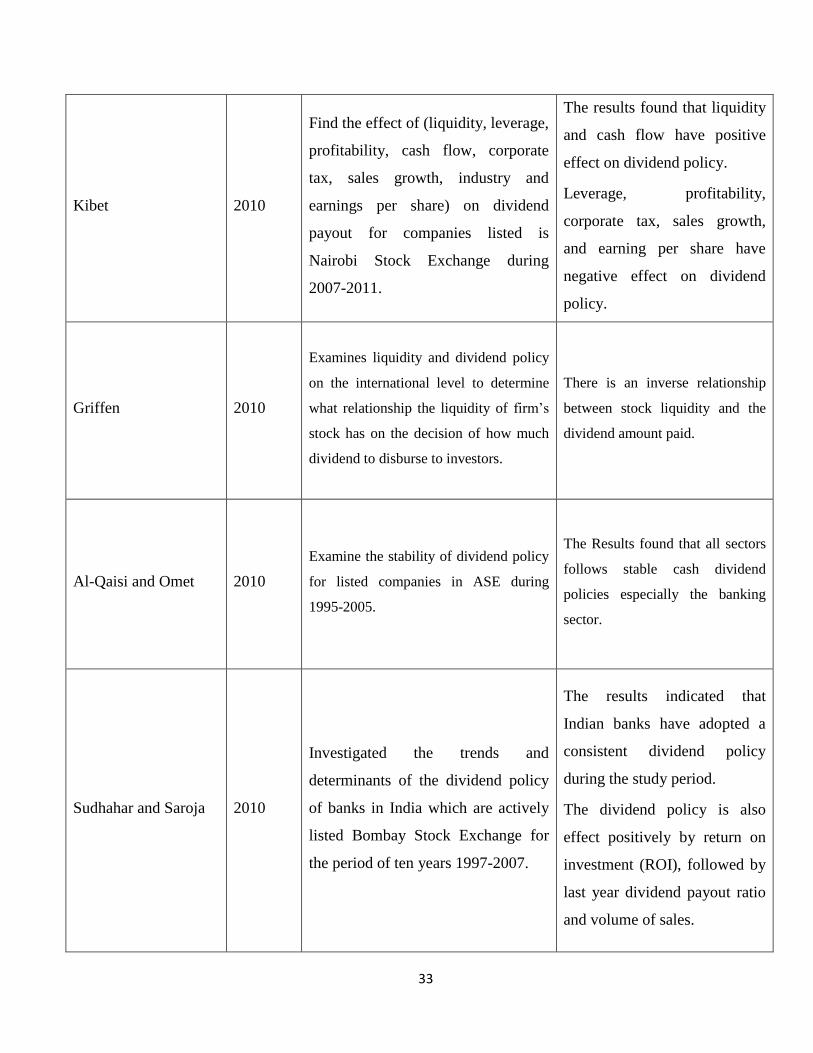
33
Kibet 2010
Find the effect of (liquidity, leverage,
profitability, cash flow, corporate
tax, sales growth, industry and
earnings per share) on dividend
payout for companies listed is
Nairobi Stock Exchange during
2007-2011.
The results found that liquidity
and cash flow have positive
effect on dividend policy.
Leverage, profitability,
corporate tax, sales growth,
and earning per share have
negative effect on dividend
policy.
Griffen 2010
Examines liquidity and dividend policy
on the international level to determine
what relationship the liquidity of firm‘s
stock has on the decision of how much
dividend to disburse to investors.
There is an inverse relationship
between stock liquidity and the
dividend amount paid.
Al-Qaisi and Omet 2010
Examine the stability of dividend policy
for listed companies in ASE during
1995-2005.
The Results found that all sectors
follows stable cash dividend
policies especially the banking
sector.
Sudhahar and Saroja 2010
Investigated the trends and
determinants of the dividend policy
of banks in India which are actively
listed Bombay Stock Exchange for
the period of ten years 1997-2007.
The results indicated that
Indian banks have adopted a
consistent dividend policy
during the study period.
The dividend policy is also
effect positively by return on
investment (ROI), followed by
last year dividend payout ratio
and volume of sales.

34
Magni 2007
The study test Miller and Modigliani‘s
(1961) proof of dividend irrelevance,
which based on the assumption that the
amount of dividends distributed to
shareholders is equal or greater than the
free cash flow generated by the fixed
investment policy and claim that, if
retention is allowed, dividend policy is
not irrelevant.
The key assumption has not to do
with retention but with the NPV
of the extra funds. If NPV is zero,
dividend irrelevance applies. Yet,
the dichotomy retention/no-
retention is useful, because if
agency problems are present,
managers tend to retain funds and
invest them in negative-NPV
projects, and therefore the zero-
NPV assumption must does not
apply any more.
Banerjee et al, 2007
The impact of firm (liquidity, size,
profitability, growth) on dividend
policy.
Size and profitability are
significant positive, Liquidity and
Growth are significant negative
Lesmond 2005 Measuring the liquidity in emerging
markets using bid-ask spreads
Results show that Latin
American markets are
generally less liquid than are
the South Asian, East Asian,
European, and African,
Middle-Eastern markets.
Omran and Pointon 2004
Try to find a link between dividend
and firm (liquidity, profitability, size,
growth).
Dividend has positive link with
firm profitability and size.
Dividend has negative link with
firm growth and stock liquidity.
Amihud 2002
Examined the proposition that asset
expected returns are increasing in
illiquidity.
His findings that, over time,
market expected illiquidity
affects the ex-ante stock excess
return, and provides
compensation for the lower
liquidity of stocks.
35
2.5 Research Hypotheses:
Reference to the literature review the following formulated hypotheses will be tested on
order to achieve the study objectives:
HO1: There is no significant relationship between bank‘s stock liquidity and bank‘s
dividend policy.
HO2: There is no significant relationship between bank‘s size and bank‘s dividend policy.
HO3: There is no significant relationship between bank‘s profitability and bank‘s dividend
policy.
HO4: There is no significant relationship between bank‘s growth opportunities and bank‘s
dividend policy.
36
Chapter 3: Methodology
3.1 Population
3.2 Sample
3.3 Data Sources
3.4 Variables and Measurements
3.5 Statistical Techniques Used
3.6 Schematic Diagram of the Study
37
3.1 Population
Study population includes all Jordanian banks listed in Amman Stock Exchange (ASE),
which consist of 15 banks according to the official website, the reasons behind choosing the
banks sector were as follows:
1. The necessary data of the banks are available to achieve the objective of the study
during 2009-2014. Furthermore, the financial reports are available for those banks for
the study period.
2. In order to achieve study objectives and do not negate some theories, we adopted the
population as in many studies which investigated in dividend payout policy such as the
study of Sudhahar (2010), Linda et al (2012), Kanas (2012), Magen (1971) and
Mayne(1980).
3. Jordan's banking sector is one of the main pillars of economic support.
4. Jordan's banking sector subjected to the following:
Corporate Governance according to the instructions of the Central Bank of
Jordan, which focuses on the principles of Corporate Governance issued by the
Organization for Economic Cooperation and Development (OECD).
International financial reporting standards disclosure (IFRS).
Committees resulted from B.O.D as Audit committee, Internal Control
Committee that result in more transparent and regular disclosures.
Securities exchange commission regulations.
The Basel Committee on Banking Supervision regulation, Basel I, II and Basell
III.
38
Advanced technological systems: banks depends on high-security advanced
technological systems which reduce human error, intentional or unintentional
and offers the possibility of early and rapid detection of any deviation or
malfunction.
3.2 Sample
This study consists of all fifteen Jordanian banks listed in Amman stock exchange (ASE) ,
the most recent six years from (2009-2014) were quoted, the final number of banks
included in the study analysis was 15 banks with 90 observations, outliers observations
were winsorized at their annual 0.5th
and 99.5th
percentile in order to ensure that our results
are not driven by extreme values.
3.3 Study Tools
3.3.1 Data Sources
Main data was obtained and collected from Amman stock exchange website, Secondary
data was extracted from the audited annual reports and financial statements disclosed in the
quoted banks websites for the years needed. Data requirements on additional variables used
in some of the tests dictate the actual sample sizes of these tests.
3.3.2 Framework of Data Collection
The study focused on the test of relationship between bank‘s stock liquidity and dividend
policy for Jordanian banks listed on Amman stock exchange, the researcher was able to
obtain the above information from the company guide uploaded at ASE website, which
consist all the financial ratios needed for this empirical study.
39
3.4 Variables and Measurements
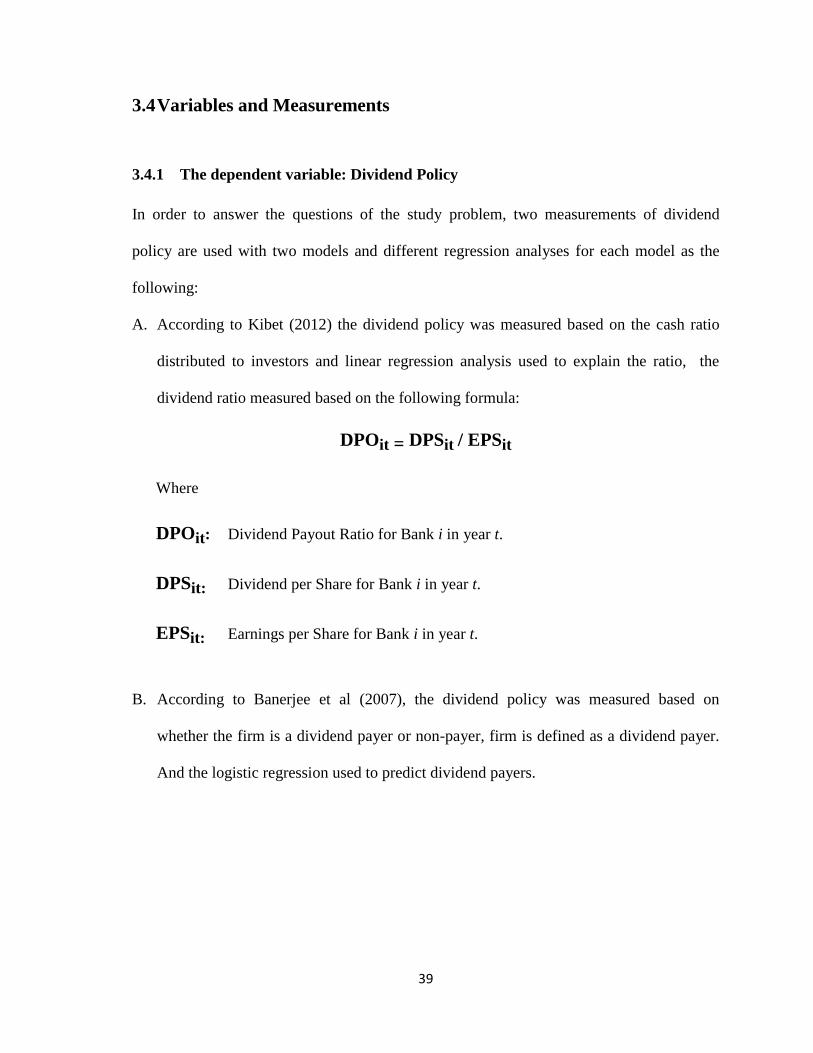
3.4.1 The dependent variable: Dividend Policy
In order to answer the questions of the study problem, two measurements of dividend
policy are used with two models and different regression analyses for each model as the
following:
A. According to Kibet (2012) the dividend policy was measured based on the cash ratio
distributed to investors and linear regression analysis used to explain the ratio, the
dividend ratio measured based on the following formula:
DPOit = DPSit / EPSit
Where
DPOit: Dividend Payout Ratio for Bank i in year t.
DPSit: Dividend per Share for Bank i in year t.
EPSit: Earnings per Share for Bank i in year t.
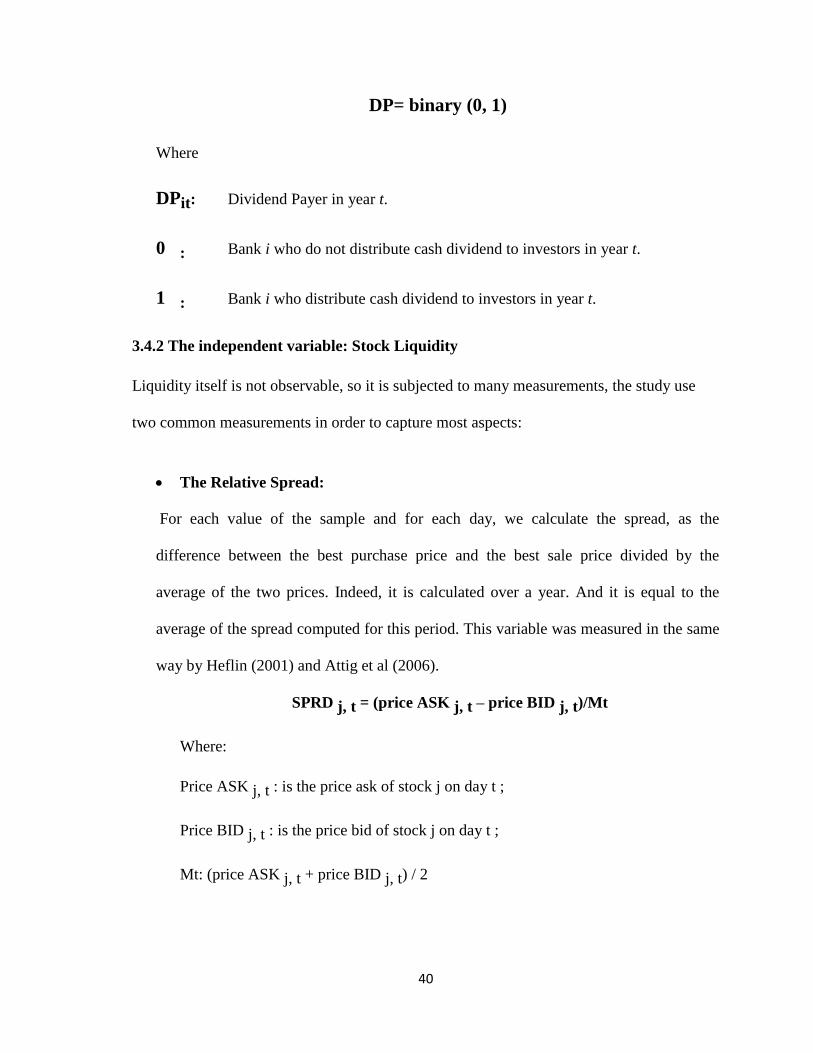
B. According to Banerjee et al (2007), the dividend policy was measured based on
whether the firm is a dividend payer or non-payer, firm is defined as a dividend payer.
And the logistic regression used to predict dividend payers.
40
DP= binary (0, 1)
Where
DPit: Dividend Payer in year t.
0 : Bank i who do not distribute cash dividend to investors in year t.
1 : Bank i who distribute cash dividend to investors in year t.
3.4.2 The independent variable: Stock Liquidity
Liquidity itself is not observable, so it is subjected to many measurements, the study use
two common measurements in order to capture most aspects:
The Relative Spread:
For each value of the sample and for each day, we calculate the spread, as the
difference between the best purchase price and the best sale price divided by the
average of the two prices. Indeed, it is calculated over a year. And it is equal to the
average of the spread computed for this period. This variable was measured in the same
way by Heflin (2001) and Attig et al (2006).
SPRD j, t = (price ASK j, t – price BID j, t)/Mt
Where:
Price ASK j, t : is the price ask of stock j on day t ;
Price BID j, t : is the price bid of stock j on day t ;
Mt: (price ASK j, t + price BID j, t) / 2
41
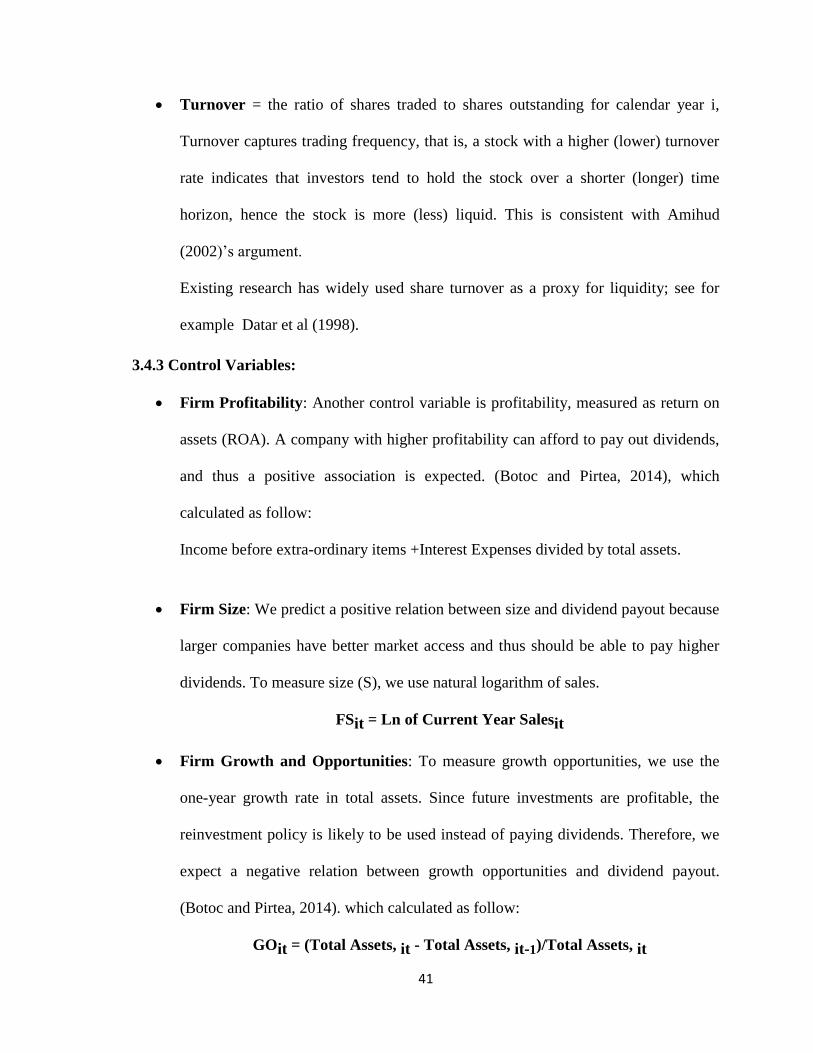
Turnover = the ratio of shares traded to shares outstanding for calendar year i,
Turnover captures trading frequency, that is, a stock with a higher (lower) turnover
rate indicates that investors tend to hold the stock over a shorter (longer) time
horizon, hence the stock is more (less) liquid. This is consistent with Amihud
(2002)‘s argument.
Existing research has widely used share turnover as a proxy for liquidity; see for
example Datar et al (1998).
3.4.3 Control Variables:
Firm Profitability: Another control variable is profitability, measured as return on
assets (ROA). A company with higher profitability can afford to pay out dividends,
and thus a positive association is expected. (Botoc and Pirtea, 2014), which
calculated as follow:
Income before extra-ordinary items +Interest Expenses divided by total assets.
Firm Size: We predict a positive relation between size and dividend payout because
larger companies have better market access and thus should be able to pay higher
dividends. To measure size (S), we use natural logarithm of sales.
FSit = Ln of Current Year Salesit
Firm Growth and Opportunities: To measure growth opportunities, we use the
one-year growth rate in total assets. Since future investments are profitable, the
reinvestment policy is likely to be used instead of paying dividends. Therefore, we
expect a negative relation between growth opportunities and dividend payout.
(Botoc and Pirtea, 2014). which calculated as follow:
GOit = (Total Assets, it - Total Assets, it-1)/Total Assets, it
42
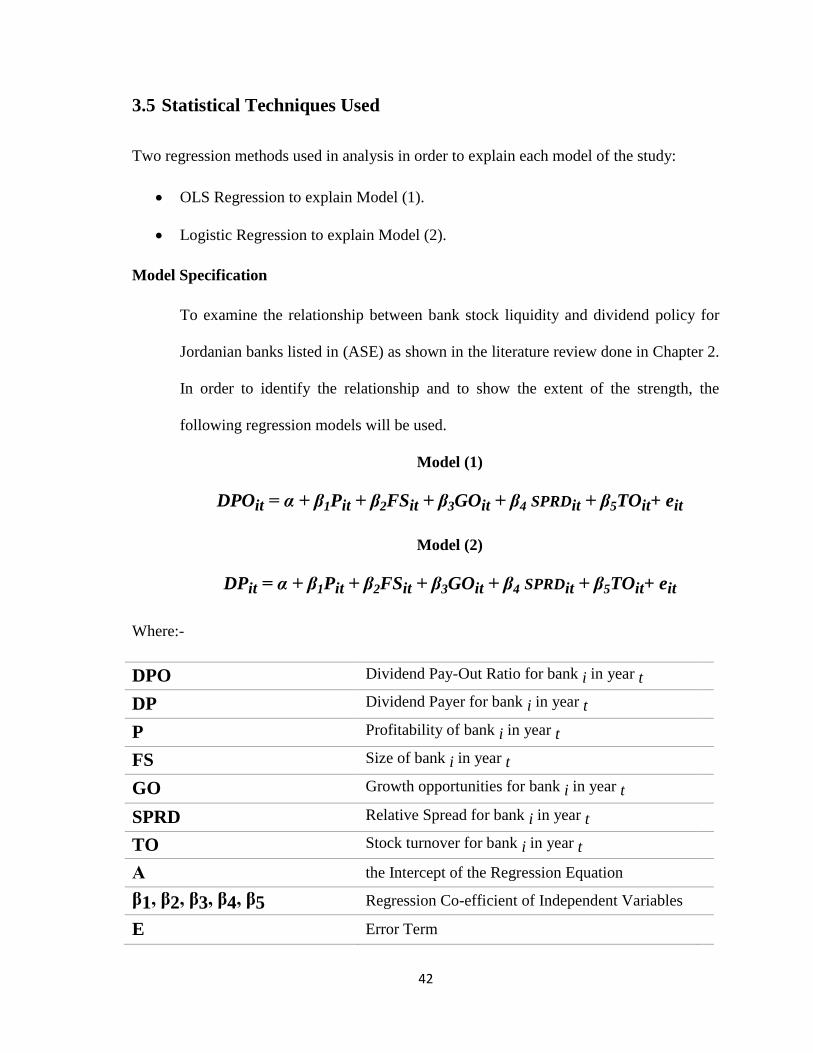
3.5 Statistical Techniques Used
Two regression methods used in analysis in order to explain each model of the study:
OLS Regression to explain Model (1).
Logistic Regression to explain Model (2).
Model Specification
To examine the relationship between bank stock liquidity and dividend policy for
Jordanian banks listed in (ASE) as shown in the literature review done in Chapter 2.
In order to identify the relationship and to show the extent of the strength, the
following regression models will be used.
Model (1)
DPOit = α + β1Pit + β2FSit + β3GOit + β4 SPRDit + β5TOit+ eit
Model (2)
DPit = α + β1Pit + β2FSit + β3GOit + β4 SPRDit + β5TOit+ eit
Where:-
DPO Dividend Pay-Out Ratio for bank i in year t
DP Dividend Payer for bank i in year t
P Profitability of bank i in year t
FS Size of bank i in year t
GO Growth opportunities for bank i in year t
SPRD Relative Spread for bank i in year t
TO Stock turnover for bank i in year t
Α the Intercept of the Regression Equation
β1, β2, β3, β4, β5 Regression Co-efficient of Independent Variables
E Error Term
43
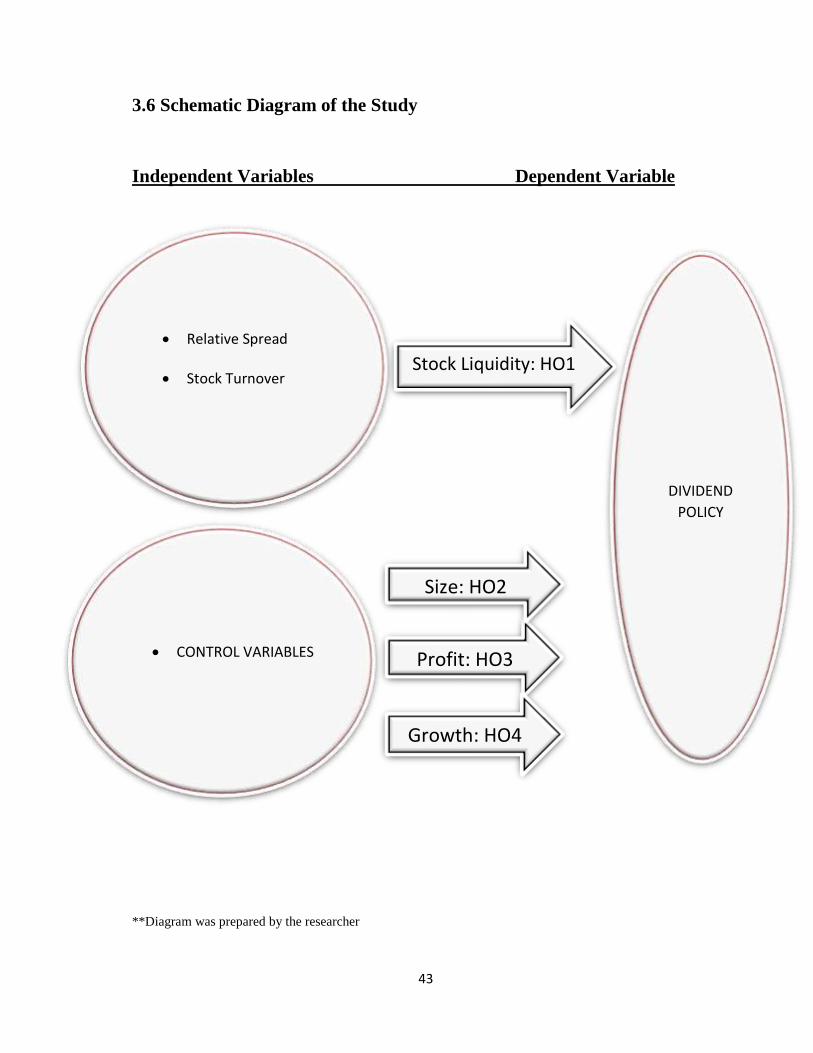
3.6 Schematic Diagram of the Study
Independent Variables Dependent Variable
**Diagram was prepared by the researcher
Relative Spread
Stock Turnover
CONTROL VARIABLES Profit: HO3
DIVIDEND
POLICY
Size: HO2
Growth: HO4
Stock Liquidity: HO1
44
Chapter 4: Analysis and Results
4.1 Introduction
4.2 Descriptive Statistics
4.3 Multicollinearity test
4.4 Correlation Results
4.5 Hypotheses Testing and Results Discussion
45
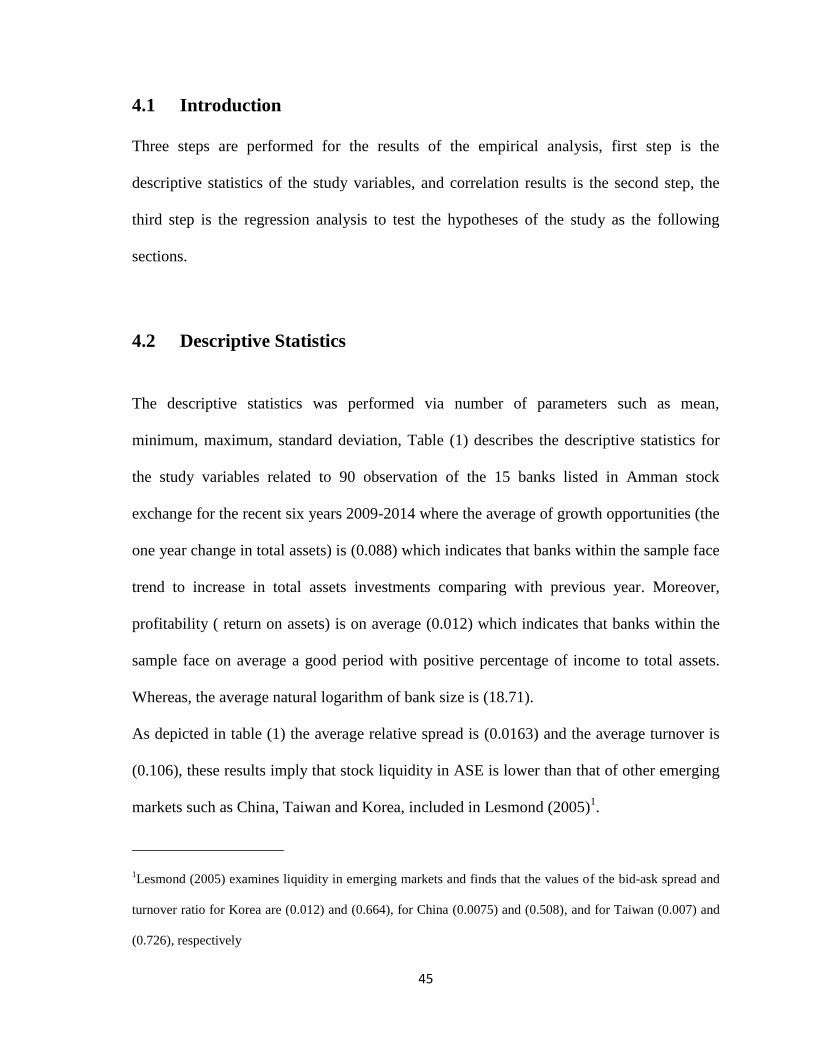
4.1 Introduction
Three steps are performed for the results of the empirical analysis, first step is the
descriptive statistics of the study variables, and correlation results is the second step, the
third step is the regression analysis to test the hypotheses of the study as the following
sections.
4.2 Descriptive Statistics
The descriptive statistics was performed via number of parameters such as mean,
minimum, maximum, standard deviation, Table (1) describes the descriptive statistics for
the study variables related to 90 observation of the 15 banks listed in Amman stock
exchange for the recent six years 2009-2014 where the average of growth opportunities (the
one year change in total assets) is (0.088) which indicates that banks within the sample face
trend to increase in total assets investments comparing with previous year. Moreover,
profitability ( return on assets) is on average (0.012) which indicates that banks within the
sample face on average a good period with positive percentage of income to total assets.
Whereas, the average natural logarithm of bank size is (18.71).
As depicted in table (1) the average relative spread is (0.0163) and the average turnover is
(0.106), these results imply that stock liquidity in ASE is lower than that of other emerging
markets such as China, Taiwan and Korea, included in Lesmond (2005)1.
___________________
1Lesmond (2005) examines liquidity in emerging markets and finds that the values of the bid-ask spread and
turnover ratio for Korea are (0.012) and (0.664), for China (0.0075) and (0.508), and for Taiwan (0.007) and
(0.726), respectively
46
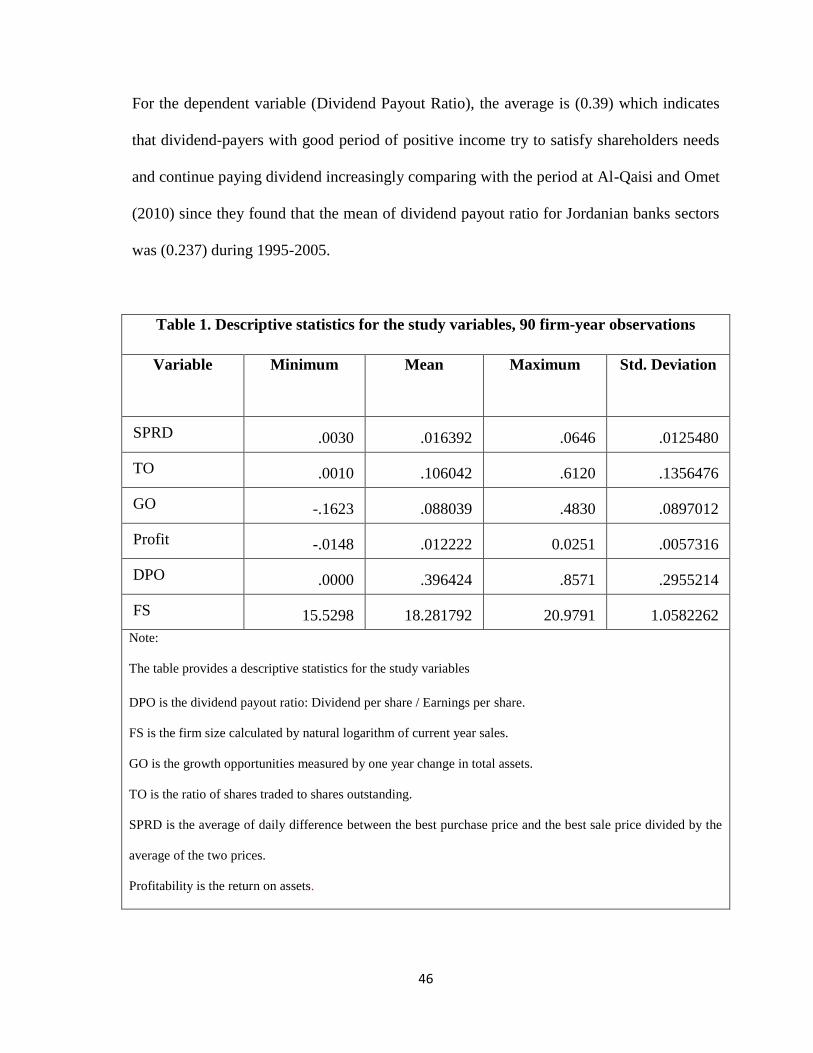
For the dependent variable (Dividend Payout Ratio), the average is (0.39) which indicates
that dividend-payers with good period of positive income try to satisfy shareholders needs
and continue paying dividend increasingly comparing with the period at Al-Qaisi and Omet
(2010) since they found that the mean of dividend payout ratio for Jordanian banks sectors
was (0.237) during 1995-2005.
Table 1. Descriptive statistics for the study variables, 90 firm-year observations
Variable Minimum Mean Maximum Std. Deviation
SPRD .0030 .016392 .0646 .0125480
TO .0010 .106042 .6120 .1356476
GO -.1623 .088039 .4830 .0897012
Profit -.0148 .012222 0.0251 .0057316
DPO .0000 .396424 .8571 .2955214
FS 15.5298 18.281792 20.9791 1.0582262
Note:
The table provides a descriptive statistics for the study variables
DPO is the dividend payout ratio: Dividend per share / Earnings per share.
FS is the firm size calculated by natural logarithm of current year sales.
GO is the growth opportunities measured by one year change in total assets.
TO is the ratio of shares traded to shares outstanding.
SPRD is the average of daily difference between the best purchase price and the best sale price divided by the
average of the two prices.
Profitability is the return on assets.

47
Table (2) depicts the frequency distribution for the dividend payers and non-payers of 15
bank listed on ASE during the study period.
Table 2. Frequency distribution for dummy variable
Variable Frequency Percent
Dividend-Payers 63 70
Non-Payers 27 30
Total 90 100
The table depicts that 70% of the observations showed that firm‘s strategy is to divide the
profit between payments to shareholders and retained earnings (i.e. Dividend payers) while
30% of the observations showed that the firm‘s strategy was to retain the profit instead of
distribute it as a dividend (i.e. non-payers) which indicate the dominant Jordanian bank
over the study period are dividend-payer and thus try to satisfy their shareholders‘ need.
48
4.3 Multicollinearity Test
Before interpreting the results of this study two methods were used to test whether there
is multicollinearity between the explanatory variables; the correlation matrix and
variance inflation factor (VIF).
4.3.1 Correlation between independent variables
Table (3) provides a correlation matrix between explanatory variables where according to
Filed (2005) multicollinearity problem exists when the independent variables are highly
correlated particularly when correlation coefficient is more than ( 0 .80 or 0 .90),
however table (3) indicates that correlation among explanatory variables are less than
0.8 or .90. whereas, this does not mean that multicollinearity problem does not exist
since Myers (as cited in Tauringana and Arfifa, 2013) stated that multicollinearity
problem may exist in spite that the correlation coefficients are not very high thus further
test should be run to ensure that multicollinearity problem does not exist and this can
be done through variance inflation factors (VIFs) test.
49
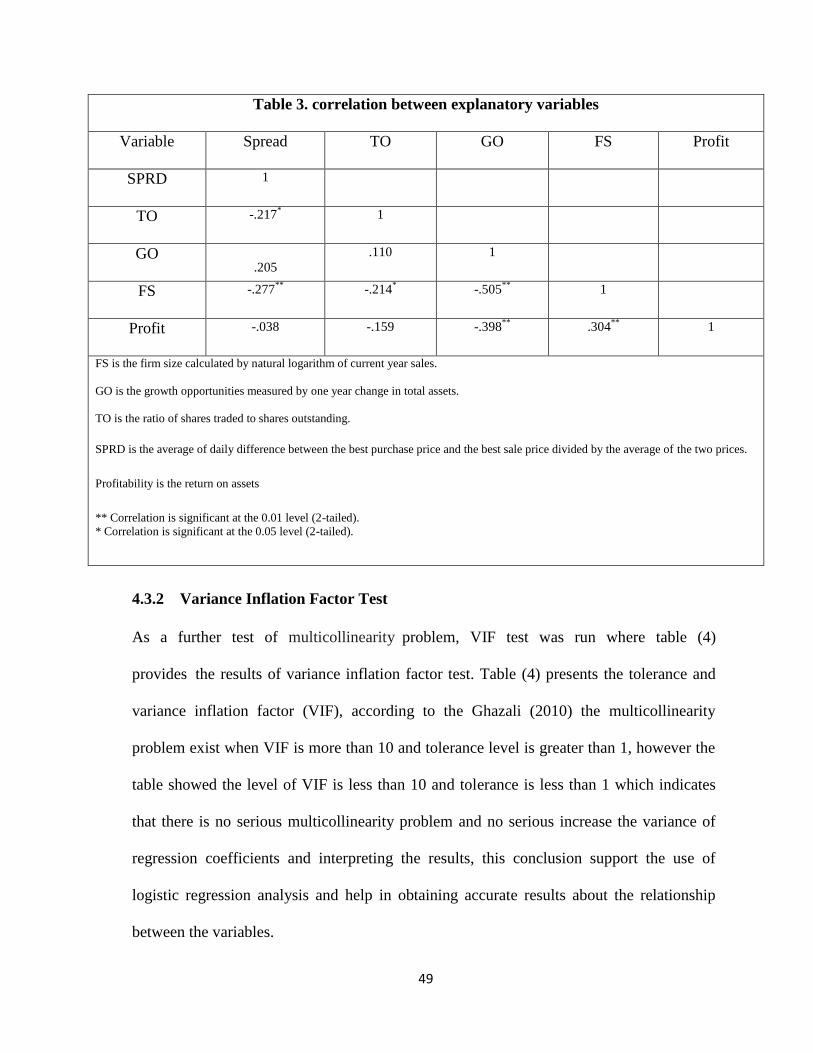
Table 3. correlation between explanatory variables
Variable Spread TO GO FS Profit
SPRD 1
TO -.217*
1
GO .205
.110 1
FS -.277**
-.214*
-.505**
1
Profit -.038 -.159 -.398**
.304**
1
FS is the firm size calculated by natural logarithm of current year sales.
GO is the growth opportunities measured by one year change in total assets.
TO is the ratio of shares traded to shares outstanding.
SPRD is the average of daily difference between the best purchase price and the best sale price divided by the average of the two prices.
Profitability is the return on assets
** Correlation is significant at the 0.01 level (2-tailed).
* Correlation is significant at the 0.05 level (2-tailed).
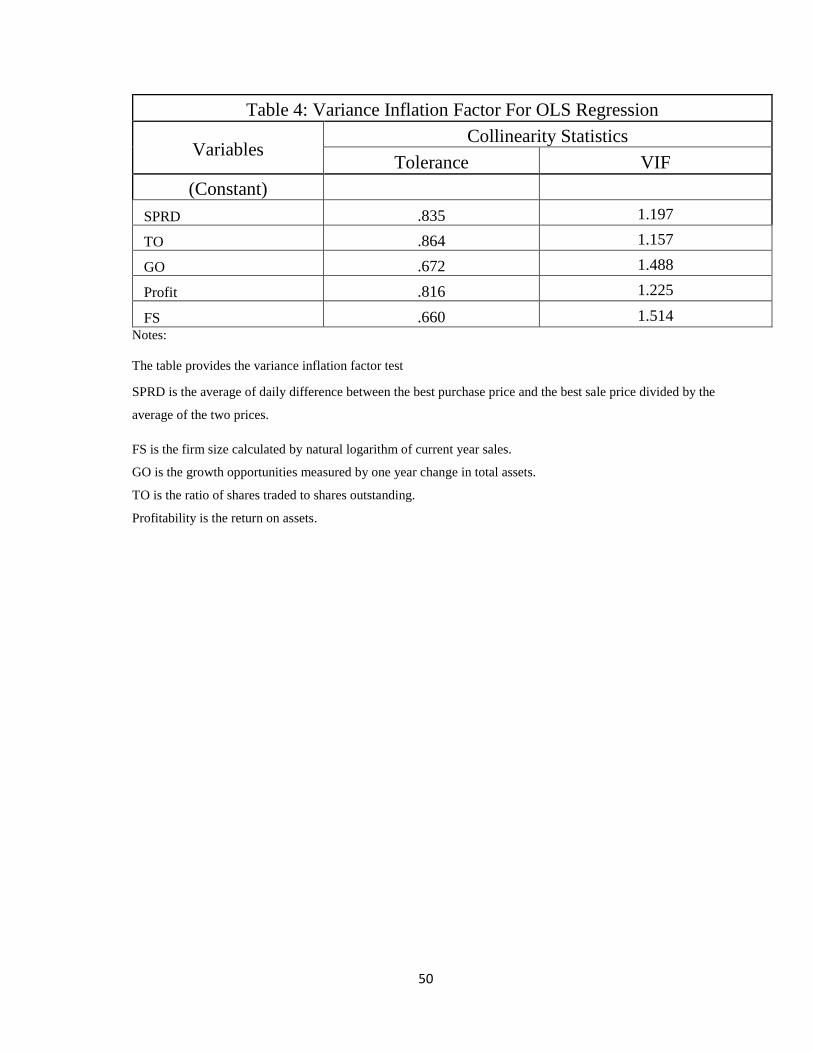
4.3.2 Variance Inflation Factor Test
As a further test of multicollinearity problem, VIF test was run where table (4)
provides the results of variance inflation factor test. Table (4) presents the tolerance and
variance inflation factor (VIF), according to the Ghazali (2010) the multicollinearity
problem exist when VIF is more than 10 and tolerance level is greater than 1, however the
table showed the level of VIF is less than 10 and tolerance is less than 1 which indicates
that there is no serious multicollinearity problem and no serious increase the variance of
regression coefficients and interpreting the results, this conclusion support the use of
logistic regression analysis and help in obtaining accurate results about the relationship
between the variables.
50
Table 4: Variance Inflation Factor For OLS Regression
Variables Collinearity Statistics
Tolerance VIF
(Constant)
SPRD .835 1.197
TO .864 1.157
GO .672 1.488
Profit .816 1.225
FS .660 1.514
Notes:
The table provides the variance inflation factor test
SPRD is the average of daily difference between the best purchase price and the best sale price divided by the
average of the two prices.
FS is the firm size calculated by natural logarithm of current year sales.
GO is the growth opportunities measured by one year change in total assets.
TO is the ratio of shares traded to shares outstanding.
Profitability is the return on assets.
51
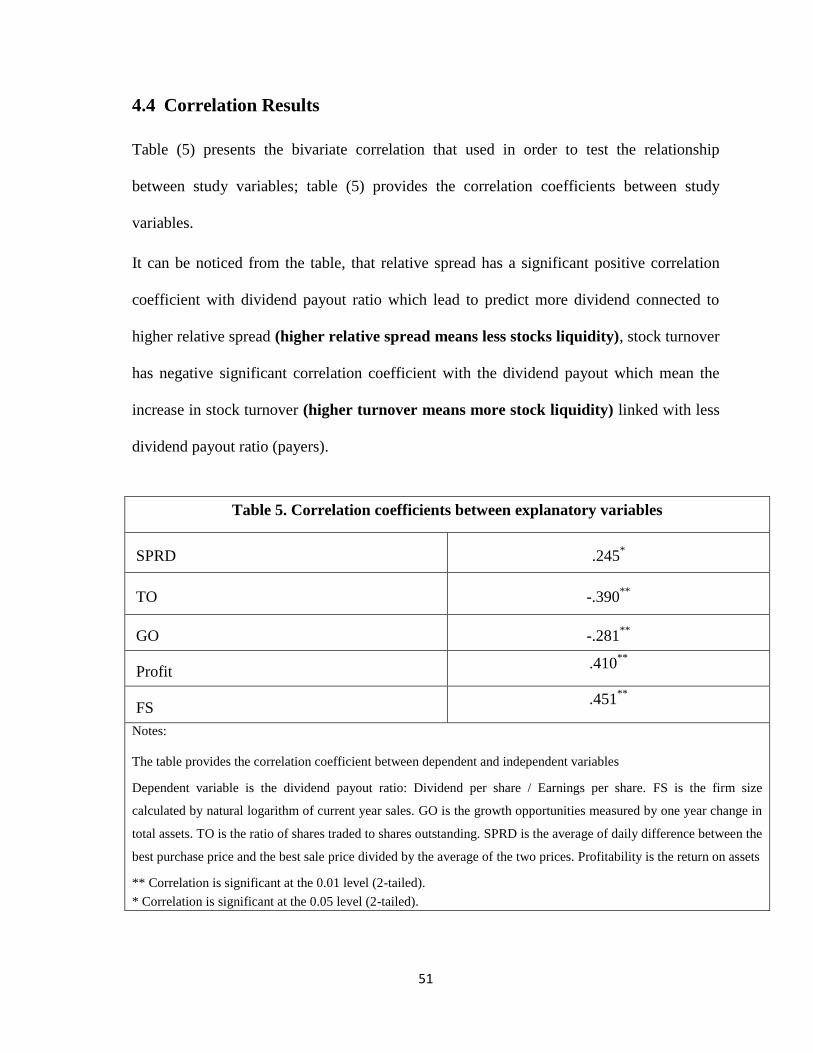
4.4 Correlation Results
Table (5) presents the bivariate correlation that used in order to test the relationship
between study variables; table (5) provides the correlation coefficients between study
variables.
It can be noticed from the table, that relative spread has a significant positive correlation
coefficient with dividend payout ratio which lead to predict more dividend connected to
higher relative spread (higher relative spread means less stocks liquidity), stock turnover
has negative significant correlation coefficient with the dividend payout which mean the
increase in stock turnover (higher turnover means more stock liquidity) linked with less
dividend payout ratio (payers).
Table 5. Correlation coefficients between explanatory variables
SPRD .245*
TO -.390**
GO -.281**
Profit .410
**
FS .451
**
Notes:
The table provides the correlation coefficient between dependent and independent variables
Dependent variable is the dividend payout ratio: Dividend per share / Earnings per share. FS is the firm size
calculated by natural logarithm of current year sales. GO is the growth opportunities measured by one year change in
total assets. TO is the ratio of shares traded to shares outstanding. SPRD is the average of daily difference between the
best purchase price and the best sale price divided by the average of the two prices. Profitability is the return on assets
** Correlation is significant at the 0.01 level (2-tailed).
* Correlation is significant at the 0.05 level (2-tailed).
52
As can be noticed, bank growth opportunities has negative a significant correlation
coefficient with the dividend payout which indicates that individually the increase in bank
growth opportunities do decrease the dividend, bank size has positive significant
correlation coefficient with the dividend payout which mean the smaller bank size the less
dividend payer when consider them individually which don‘t negate several theories, bank
profitability has positive correlation coefficient with the dividend payout which mean that
individually the more profitable bank the highest dividend payer which also don‘t negate
several theories.
4.5 Hypotheses Testing and Results Discussion
4.5.1 OLS Regression Results
In order to achieve study objective to examine the influence of stock liquidity and dividend
payout ratio (the amount paid to investors) the OLS regression was run, where table (6)
reports the results of model (1)
The results as summarized in the table suggest that the 42.2% variation in the dependent
variable can be explained by the explanatory variables. Moreover, this model is significant
with F-statistic value of (13.935) and p=0.000, suggesting that the model is statistically
valid. Accordingly, the first null hypothesis HO1 is rejected and the alternative one is
accepted which states ―There is relationship between bank‘s stock liquidity and dividend
policy‖. This result support the results of Griffin (2010); Li et al (2014); Banerjee et al
(2007).

53
Table 6. OLS regression results
Variable Coefficients T-value Sig.
(Constant) -1.982 -3.727 .000
Spread 7.853
3.778 .000**
Turnover -0.403
-2.131 .036*
Growth -0.047
-.145 .885
Profitability 13.459
2.923 .004**
Size 0.117
4.207 .000**
R Square = 45.3%
Adj-R2 = 42.2%
F= 13.935
Sig. = 0.000
Notes:
The table provides OLS regression results for model (1) of the study. The model is:
DPOit = α + β1Pit + β2FSit + β3GOit + β4 SPRDit + β5TOit+ e1it
DPO is the dividend payout ratio: Dividend per share / Earnings per share. FS is the firm size calculated by
natural logarithm of current year sales. GO is the growth opportunities measured by one year change in total
assets.
TO is the ratio of shares traded to shares outstanding. SPRD is the average of daily difference between the
best purchase price and the best sale price divided by the average of the two prices. Profitability is the return
on assets.
** Significant at the 0.01 level (2-tailed).
* Significant at the 0.05 level (2-tailed).
The results revealed that dividend policy is positively affected by relative spread, an
indication that the higher the relative spread and thus the lower the stock liquidity the
higher the dividend payout ratio, this results is significant at 0.01 level of significance.
54
Accordingly, it can be concluded that there is a positive relationship between relative
spread and dividend policy.
As can be noticed in table (6), the dividend policy is affected negatively by stock turnover,
an indication that the lower the stock turnover (i.e. the lower the stock liquidity) the higher
the dividend pay-out ratio where this result is significant at 0.05 level of significance.
Accordingly, it can be concluded that there is a negative relationship between stock
turnover and dividend policy.
The results showed that dividend policy is positively affected by bank‘s size at 0.01 level of
significance, which mean that the larger bank size the more likely the bank is to pay more
amount of dividend and vice versa, Accordingly, the second null hypothesis HO2 is
rejected and the alternative one is accepted which state ―there is a significant relationship
between bank size and dividend policy‖. This result supports the results of Kuzul and Orsag
(2011); Fama & French (2000); Banerjee et al (2007).
The results also showed that dividend policy is positively affected by bank‘s profitability at
0.01 level of significance, which mean that bank with more return on assets are more likely
to pay more amount of dividend and vice versa. Accordingly, the third null hypothesis
HO3 is rejected and the alternative one is accepted which states that ―there is a significant
relationship between bank‘s profitability and dividend policy‖, this result supports the
arguments of Sudhahar and Saroja (2010); Omran and Pointon (2010); Kuzul and Orsag
(2011); Fama and French (2000) and inconsistent with the arguments of Singhania and
Gupta (2012) where their results found dividend payout ratio to be insignificant with
profitability.
55
The results also pointed out that bank‘s growth is insignificant related to dividend policy,
Accordingly, the fourth null hypothesis HO4 is accepted which states that ―there is no
significant relationship between bank‘s growth opportunities and dividend policy‖, this
result is consistent with Ahmad and Wardani (2014) and inconsistent with Kibet (2010),
Singhania and Gupta (2012), Banergee et al (2007).

56
4.5.2 Logistic Regression Results
Table (7) depicts the results of model (2) which aims to examine the relationship between
the likelihood of paying dividend and banks‘ stock liquidity.
Table 7. Logistic regression results
Variable B Sig.
(Constant) -193.855 .006
Spread 211.200 .044*
Turnover -12.204 .031*
Growth -5.948 .553
Profitability 867.503 .031*
Size 10.206 .006**
Cox & Snell R Square = 0.636 Chi-Square = 91.053 Sig. = 0.000
Notes:
The table provides Logistic linear regression results for model (2) of the study. The model is:
DPit = α + β1Pit + β2FSit + β3GOit + β4 SPRDit + β5TOit+ e2it
DP is dividend payer: Assign one if company pay dividend and zero otherwise. FS is the firm size calculated
by natural logarithm of current year sales. GO is the growth opportunities measured by one year change in
total assets.
TO is the ratio of shares traded to shares outstanding. SPRD is the average of daily difference between the
best purchase price and the best sale price divided by the average of the two prices. Profitability is the return
on assets.
** Significant at the 0.01 level (2-tailed).
* Significant at the 0.05 level (2-tailed).
57
As revealed in table (7), relative spread is positively influence the likelihood of dividend at
0.05 level of significance, an indication that banks with high relative spread and thus lower
stock liquidity are more likely motivated to pay dividend. The results also showed that
stock turnover is negatively influence the possibility of dividend at 0.05 level of
significance, an indication that banks with high stock turnover and thus high stock liquidity
are less likely motivated to pay dividend. Consequently, it can be argued that there is a
negative relationship between bank‘s stock liquidity and dividend policy. These outcomes
are consistent with Banerjee et al (2007), Ahmad and Wardani (2014).
The results indicated that bank‘s growth opportunities are insignificant related to the
possibility of paying dividend which is consistent with the OLS regression results and
support the results of Ahmad and Wardani (2014) and inconsistent with Kibet (2010),
Singhania and Gupta (2012), Banergee et al (2007).
As can be noticed from the table, the probability of dividend payments is positively
affected by bank‘s size at 0.05 level of significance, an indication that large banks are more
likely pay dividend to their shareholder relative to small one. This result is consistent with
Kuzul and Orsag (2011); Fama & French (2000); Banerjee et al (2007).
The table also indicates that the likelihood of paying divided is positively affected by
bank‘s profitability at 0.01 level of significance, an indication that profitable companies are
more likely motivated to pay dividend and satisfy their shareholder. This result is consistent
with Sudhahar and Saroja (2010); Omran and Pointon (2010); Kuzul and Orsag (2011);
Fama and French (2000) and contradict with the arguments of Singhania and Gupta (2012),
where their results found dividend payout ratio to be insignificant with profitability.
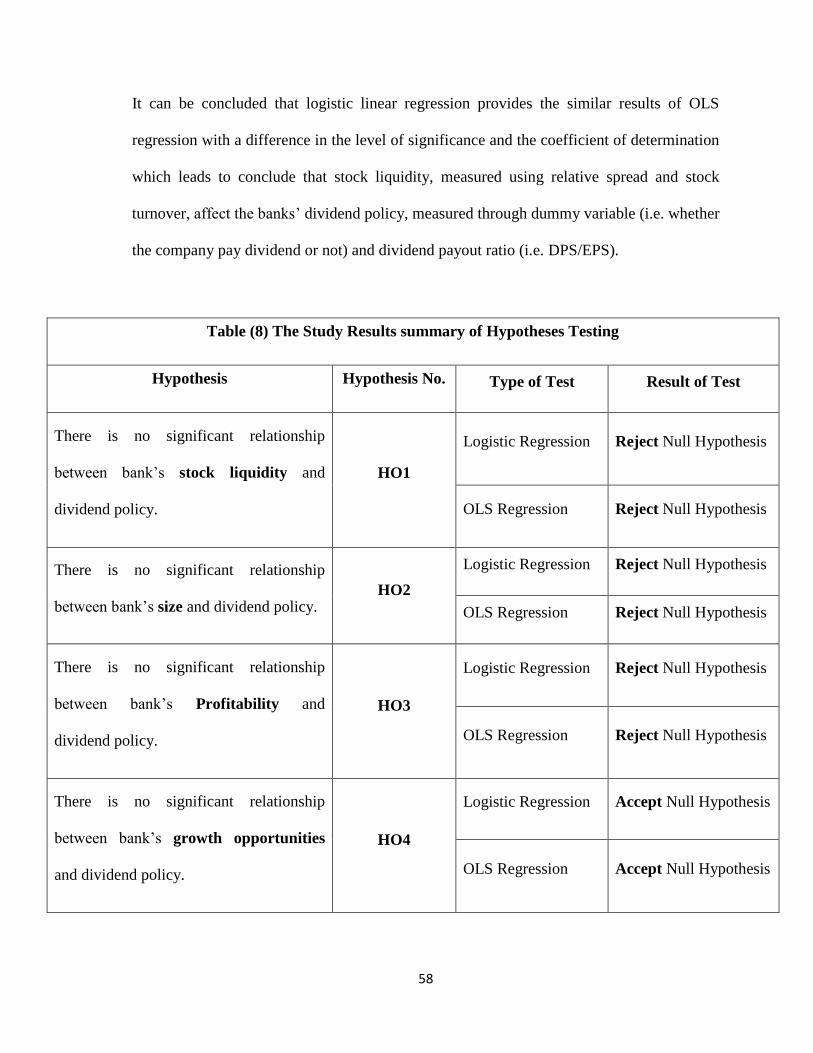
58
It can be concluded that logistic linear regression provides the similar results of OLS
regression with a difference in the level of significance and the coefficient of determination
which leads to conclude that stock liquidity, measured using relative spread and stock
turnover, affect the banks‘ dividend policy, measured through dummy variable (i.e. whether
the company pay dividend or not) and dividend payout ratio (i.e. DPS/EPS).
Table (8) The Study Results summary of Hypotheses Testing
Hypothesis Hypothesis No. Type of Test Result of Test
There is no significant relationship
between bank‘s stock liquidity and
dividend policy.
HO1
Logistic Regression Reject Null Hypothesis
OLS Regression Reject Null Hypothesis
There is no significant relationship
between bank‘s size and dividend policy. HO2
Logistic Regression Reject Null Hypothesis
OLS Regression Reject Null Hypothesis
There is no significant relationship
between bank‘s Profitability and
dividend policy.
HO3
Logistic Regression Reject Null Hypothesis
OLS Regression Reject Null Hypothesis
There is no significant relationship
between bank‘s growth opportunities
and dividend policy.
HO4
Logistic Regression Accept Null Hypothesis
OLS Regression Accept Null Hypothesis
59
Chapter 5: Conclusions and Recommendations
5.1 Introduction
5.2 Conclusions
5.3 Recommendations

60
5.1 Introduction
This chapter contains of conclusions of the study ―The Relationship between Firm‘s Stock
Liquidity and Dividends Policy: Empirical Study on Jordanian Banks Listed on Amman
Stock Exchange‖. Furthermore, this chapter includes the most important recommendations
of the study in the light of the results of the study.
5.2 Conclusions
Based on what has been discussed during the study data analysis and testing of the
hypotheses, the researcher come out with the following conclusions:
The inverse relationship validity of stock liquidity and dividend policy were examined and
settled in many developed countries‘ markets. For emerging countries the validity of this
inverse relationship still in doubt because the liquidity is lower than which was found in
developed countries (Griffin, 2010), and the investors who invest in the stock of certain
bank may be unable to create their own dividends by stock speculating. Thus, this study is
prepared to test the validity of this inverse relationship and matching between developed
and emerging markets. To the best of my knowledge, few studies were investigating this
relationship in emerging countries; the bank‘s characteristics were taken into consideration
to avoid negating many research studies.
The results of testing hypothesis HO1 using logistic regression indicates that the amount of
dividend paid is affected negatively by stock liquidity, which means that bank‘s with more
stock liquidity have the less ability to pay dividend and vice versa. The payout policy of
bank is related to the liquidity of its common stock. In illiquid markets, investors will have
a higher demand for cash dividends from the stocks they hold. In highly liquid markets,
61
however, investors can cheaply create homemade dividends. As a result, banks with more
(less) liquid stocks will have lower (higher) incentives to distribute cash dividends to
shareholders.
Furthermore, the results of testing hypothesis HO1 using OLS regression indicates that
dividend payout ratio is affected negatively by stock liquidity, hence dividend payout ratio
is affected positively by relative spread (higher spread results in illiquid stocks), and
dividend payout ratio is affected negatively by stock turnover (higher turnover resulted in
higher liquidity) which means that investor with more (less) stock liquidity are less (more)
likely to receive more dividend.
And the results of testing hypothesis HO2, HO3, HO4 using OLS regression indicates that
dividend payout ratio affected positively by bank‘s profitability, which means that bank‘s
with more return on assets ratio are more likely to pay more amount of dividend and vice
versa, while dividend payout ratio is not affected by bank‘s growth opportunities which do
negate some theories. Furthermore, dividend payout ratio is affected positively by the
bank‘s size which means that larger banks are most likely to pay more amount of dividend
and vice versa.
Finally, the findings provide support to the assumption that dividends indeed at times
compensating holders for lower stock liquidity to satisfy their demand for liquidity, while
investors with highly liquid stocks can create homemade dividends, Furthermore, we find
that banks with less (more) liquid stocks are more (less) likely to initiate or continue or pay
larger dividend ratio. Finally, we recommend the stock market liquidity as a substitute to
predict dividend payers and dividend ratio. Table (9) represents the definitions of the
independent variables and their expected sign on dividend policy as a result of the study.
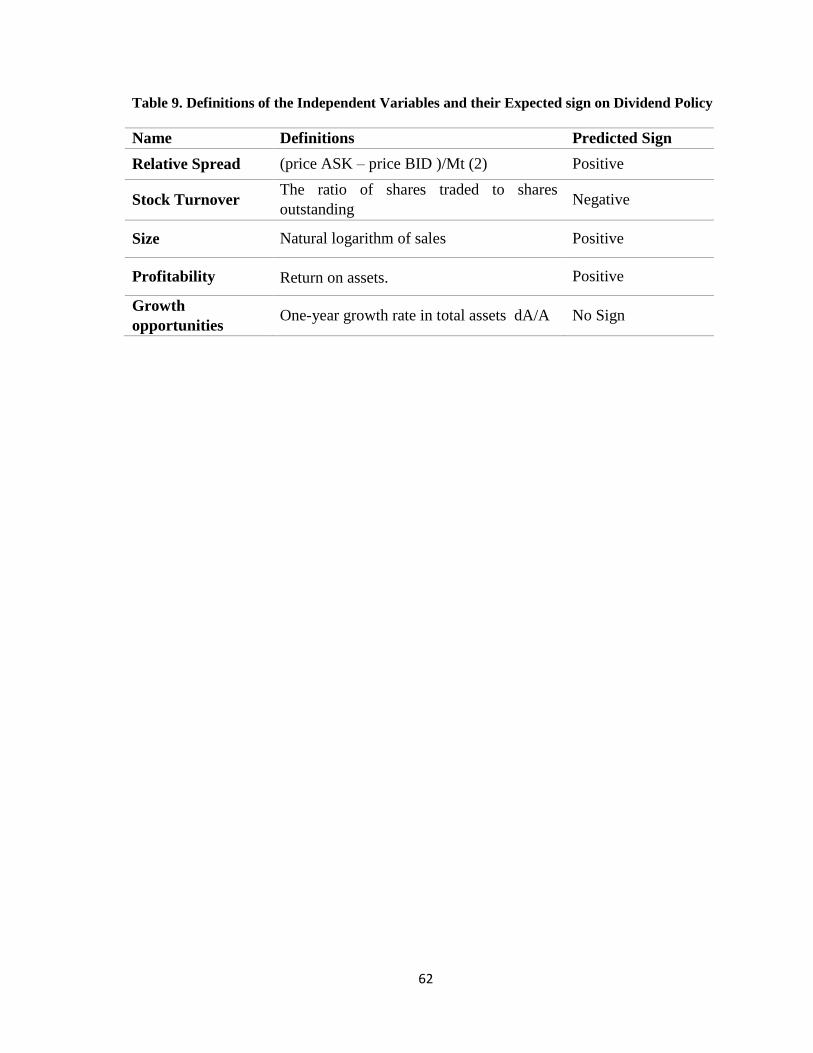
62
Table 9. Definitions of the Independent Variables and their Expected sign on Dividend Policy
Name Definitions Predicted Sign
Relative Spread (price ASK – price BID )/Mt (2) Positive
Stock Turnover The ratio of shares traded to shares
outstanding Negative
Size Natural logarithm of sales Positive
Profitability Return on assets. Positive
Growth
opportunities One-year growth rate in total assets dA/A No Sign
63
5.3 Recommendations
The results of the study realized on the conclusion of the famous saying of Fisher
Black regarding dividend policy "the harder we look at the dividends picture, the
more it seems like a puzzle, with pieces that just do not fit together". By looking at the
results of the study data analysis and testing of hypotheses, the researcher recommend the
following:
To the investors, the study recommends to use the study findings as a cornerstone for
them to establish optimum portfolios to be held at any given time, given the liquidity
levels and the expected dividends. It will empower them to know the kind of
information to be disclosed by firms on the financial statement pertaining to liquidity
and dividend payout ratio for rational decisions on bank to invest in.
For academicians, the study recommends to add the findings of the study contributions
to the existing hypothesis on investor‘s behavior towards liquidity of a firm and it will
be used to establish research gaps and provide reference for further research under the
field of dividend policy and liquidity.
For banks, the study recommends to use the findings which will enable managers to
institute policies that can create optimal liquidity levels and implement healthier
dividend policies.

64
For future studies, it is recommended to extend with banks characteristics such as debt
structure, investor‘s protection level, assets liquidity; and deal with the firm
characteristics as dependent rather than simply as ―control variables‖. Furthermore,
expansion with more sectors such as industrial companies with more observations could
be more useful in enabling the researchers to generalize the results and enhancing the
quality of results itself, also the study recommend to use different measurements for the
study variables especially the liquidity various measurements in order to add more
justifications for the results.
Finally, the researcher recommends future studies concerning testing the validity of
cash flow theory and life-cycle theory as one of the dividend drivers of Jordanian
companies.
65
REFERENCES
1) Al-Malkawi, Husam-Aldin Nizar. Rafferty, Michael and Pillai, Rekha (2010).
Dividend Policy: A Review of Theories and Empirical Evidence, International
Bulletin of Business Administration, 9, 5-24.
2) Abdourahmane, Sarr and Lybec, Tonny (2002), Measuring Liquidity in Financial
Markets, International Monetary Fund, WP/02/232, 9-23.
3) Al-Haddad, Wessam. Al-Zorqan, Saleh. Musa, Shukairi and Noor, Mahmood
(2011), The Effect of Dividend Policy Stability on the Performancee of Banking
Sector Listed on Amman Stock Exchange, International Journal of Humanities
and Social Science, 5, 1-5.
4) Ahmad, Gatot Nazir and Wardani, Vina Kusuma (2014). The Effect of Fundemental
Factors to Dividend Policy: Evidence in Indonesia Stock Exchange, International
Journal of Business and Commerce, 4, 1-12
5) Allen, Linda. Gottesman, Aron. Saunders, Anthony and Tang, Yi (2012). The Role
of Banks in Dividend Policy, Financial Management, 62, 3-21.
6) Alnaif , Khaled Lafi (2014). Stock Liquidity Determination Evidence from Amman
Stock Exchange, Asian Economic and Financial Review, 4(12), 2-10.
7) Amihud, Yakov (2002). Illiquidity and Stock Returns: Cross-section and Time-
series Effects, Journal of Financial Markets, 5, 1-25.
8) Attig N., Fong W.M., Gadhoum Y. and Lang L.H.P., (2006). Effects of Large
Shareholding on Information Asymmetry and Stock Liquidity. Journal of Banking
& Finance, 30, pp 2875-2892.
9) Al-Qaisi, Khaldoun and Omet, Ghassan (2010). Dividend Policy at the Amman
Stock Exchange: The Stability Issue During 1995-2005, Dirasat, Administrative
Sciences, 37, 2-7.
10) Azhagaiah, R. and Priya .N, S. (2008). The Impact of Dividend Policy on
Shareholders' Wealth, International Research Journal of Finance & Economics,
(20), 181-187.
11) Banerjee, Suman. Gatchev, Vladimir and Spindt, Paul A (2007). Stock Market
Liquidity and Firm Dividend Policy, Journal of Financial and Quantitative
Analysis, 42, 1-28.
12) Bernstien, Peter (1987), Liquidity Stock, Market and Market Makers, Financial
Management (Summer), 3, 54-62
66
13) Boshkoska, Meri (2015), The Agency Problem: Measures for Its Overcoming,
International Journal of Business and Management, Vol. 10, No. 1, 2-6.
14) Botoc, Claudiu and Pirtea, Marilen (2014). Dividend Payout-Policy Drivers:
Evidence from Emerging Countries, Emerging Markets Finance & Trade, 50, 2-
19.
15) Damodaran, Aswath (2005). Marketability and Value: Measuring the Illiquidity
Discount, Stern School of Business, 4, 7-8.
16) Datar, V.; N. Naik; and R. Radclifte (1998). Liquidity and Stock Returns: An
Alternative Test. Journal of Financial Markets, 1, 203-219.
17) Erbschloe, Michael (2014). Dividend Policy, Research Starters Academic Topic
Overview, 6, 2-8.
18) Easterbrook, Frank (1984). Two Agency-Cost Explanations of Dividends, The
American Economic Review, 74, 650-659.
19) Frankfurter, G.M. Wood, B and Wansley, James (2003). Dividend Policy: Theory
and Practice. USA, Academic Press, 1, 211-256.
20) Filed, Andy (2009). Discovering Statistics Using Spss, Second Edition, Sage
Publications Ltd London.
21) Fama, Eugene and French, Kenneth (2000). Disappearing Dividends: Changing
Firm Characteristics or Lower Propensity to Pay?, The Center for Research in
Security Prices, 509: 3-40.
22) Fischer, Black (1974). The Effects of Dividend Yield and Dividend Policy on
Common Stock Prices and Return, Journal of Financial Economics, 1, 2-43.
23) Griffin, Carroll Howard (2010). Liquidity and Dividend Policy: International
Evidence, International Business Research, Vol. 3, No. 3, 1-7.
24) Ghazali, Nazil (2010). Ownership Structure, Corporate Governance and Corporate
Performance in Malaysia, International Journal of Commerce and Management,
20(2), 109-119.
25) Gordon, M, J. (1963). Optimal Investment and Financing Policy, Journal of
Finance 18, 264-272
26) Hasbrouk, J and Robert, Schwartz (1998), Liquidity Execution Cost in Equity
Market, Journal of Portfolio Management, 14, 10-16
27) Heflin F., Shaw K. W. and Wild J. J. (2001), Disclosure Quality and Market
Liquidity, Social Science Research Network, 251849, 2-20.
67
28) Kanas, Angelos (2012). Bank Dividends, Real GDP Growth and Default Risk.
International Journal of Finance & Economics, 19, 4-12.
29) Kibet, Kimutai Pius (2010). The Effects of Liquidity on Dividend Pay Out:
Companies Listed at the Nairobi Securities Exchange, University of Nairobi,
D61/61486/2010.
30) Kožul, Antonija and Orsag, Silvije (2011). Firm-level Factors Influencing Dividend
Policy: International Journal of Management Cases, 37, 1-9.
31) Kyle, Profilet A and Frank, Bacon (2013). Dividend Policy and Stock Price
Volatility in the U.S. Equity Capital Market, ASBBS Annual Conference: Las
Vegas, 1, 2-12.
32) Lesmond, David (2005). Liquidity of Emerging Markets, Journal of Financial
Economics, 5, 38-68.
33) Li, K., and Zhao, X. (2008). Asymmetric Information and Dividend Policy,
Financial Management (Blackwell Publishing Limited), 37(4), 673-694.
34) Li, Mao Liang. Chui, Chin Man and Li, Chang Qing (2014), Dividend, Liquidity
and Firm Valuation: Evidence from China AB Share Markets. Applied Financial
Economics, 24, No. 9, 8-17.
35) Magni, Carlo Alberto (2007). Relevance or Irrelevance of Retention for Dividend
Policy Irrelevance, Munich Personal Repec Archive, 15689, 2-20.
36) Magen, S. D. (1971). Cost of Capital and Dividend Policies in Commercial Banks,
Journal of Financial and Quantitative Analysis, 3, 2-13.
37) Mayne, Lucille S. (1980). Bank Dividend Policy and Holding Company Affiliation,
Journal of Financial and Quantitative Analysis, 2, 2-11.
38) Miller, M. H., and F Modigliani (1961). Dividend Policy, Growth, and the
Valuation of Shares, Journal of Business, 34, 411-433.
39) Norvaišienė, Rasa and Stankevičienė, Jurgita (2014), Companies‘ Internal Factors
and Stock Liquidity: Evidence from the Baltic Markets, Economics and Business,
023, 2-6.
40) Omran, Mohammed and Pointon, John (2004). Dividend Policy, Trading
Characteristics and Share Prices: Empirical Evidence from Egyptian Firms,
International Journal of Theoretical and Applied Finance, 7, No. 2, 7-13.
41) Singhania, Monica and Gupta, Akshay (2012). Determinants of Corporate Dividend
Policy: A Tobit Model Approach, Management Development Institute, 09722629,
1-9.
68
42) Sudhahar, M. Saroja, T (2010). Determinants of Dividend Policy in Indian Banks:
An Empirical Analysis, Journal of Bank Management, 3, 6-12.
43) Tauringana, V., & Afrifa, G. A. (2013). The Relative Importance of Working
Capital Management and Its Components to SMEs' Profitability. Journal of Small
Business and Enterprise Development, 20, 453-469.
44) Thanatawee, Yordying (2011), Life-Cycle Theory and Free Cash Flow Hypothesis:
Evidence from Dividend Policy in Thailand, International Journal of Financial
Research, Vol. 2, No. 2; 1-9.
45) Omran, Mohammed and Pointon, John (2010). Dividend Policy, Trading
Characteristics and Share Prices: Empirical Evidence from Egyptian Firms,
International Journal of Theoretical and Applied Finance, 7, No. 2, 7-13.
46) Walter, J,E., (1963). Dividend Policy: Its Influence on the Value of the
Enterprise, Journal of Finance 18, 280-291.
47) Wyss, Rico von (2004). Measuring and Predicting Liquidity in the Stock Market,
University St. Gallen, 2899, 117-176.
48) Wann, C., Long, D., Pearson, D., and Wann, G. (2008). Liquidity Shock Induced
Dividend Change: Market Reaction by Firm Quality, Journal of the Academy of
Business & Economics, 8(4), 137-151.
49) William, Joseph (1985); Dividends, Dilution, and Taxes: A Signaling Equilibrium,
The Journal of Finance, Vol. 40, No. 4, pp. 1053-1070

69
العالقة بين سيولة أسهم الشركات وسياسة توزيعات األرباح ) دراسة تطبيقية عمى البنوك االردنية المدرجة في سوق عمان المالي(
إعداد محمود عبدالقادر ناعورة
المشرف
الخاليلةعبذ الحليم األستار الذكتور محمود
الملخص
لمبنوك األردنية المدرجة في سوق عمان وسياسة توزيع األرباح بنوكر العالقة بين سيولة أسهم الاختبا تهدف الدراسة إلى
في محاولة إليجاد بعض األنماط والمؤشرات لسياسة توزيع 9002-9002من خير لمالي خالل السنوات الستة األا
بنكا 01توزيعات األرباح، وكانت نتائج تحميل بيانات األرباح، اختبرت الدراسة صالحية سيولة األسهم كأحد محددات
مشاهد مع االخذ بعين االعتبار خصائص البنوك وهي حجم البنك وربحية البنك ودرجة نمو 20والتي احتوت عمى
البنك, اظهرت أن المستثمرين في األسهم ذات السيولة المنخفضة يحصمون عمى توزيعات اعمى بينما يحصل
األسهم ذات السيولة العالية عمى توزيعات اقل.المستثمرين في
ان توزيعات األرباح تكون ضرورية لتعويض المستثمرين في األسهم ذات السيولة المنخفضة تدعم نتائج البحث فرضية
تم استخدام نوعين من تحميل بينما يحقق المستثمرين في األسهم ذات السيولة العالية عوائدهم من خالل التداول.
صالحية العالقة بارالختواالنحدار المتعدد )الثنائي( رمزيار الختبار الفرضيات حيث تم استخدام االنحدار الاالنحد
ولمحصول عمى نتائج دقيقة. كما اشارت الدراسة الى ان البنوك ذات سيولة األسهم المنخفضة تقوم باإلعالن وتوزيع
بإمكانية استخدام سيولة أسهم البنوك كمحدد لتوزيعات األرباح. وأوصت الدراسة األرباح بشكل متكرر ومستمر.

70
(1)Appendix
Jordanian Banks Listed on Amman Stock Exchange (ASE)
االسم المختصر للبنك السوق الرمز الرقمي الرمز الحرفي
JOIB 111001 1 البنك اإلسالمي األردني
JOKB 111002 1 البنك األردني الكويتي
JCBK 111003 1 البنك التجاري األردني
THBK 111004 1 بنك االسكان
AJIB 111005 1 بنك االستثمار العربي
JDIB 111006 2 بنك األردن دبي اإلسالمي
UBSI 111007 1 االتحادبنك
ABCO 111009 1 العربية المؤسسةبنك
INVB 111014 1 البنك االستثماري
EXFB 111017 1 المالبنك
SGBJ 111020 1 األردن-بنك سوسيته جنرال
CABK 111021 1 بنك القاهرة عمان
BOJX 111022 1 بنك االردن
AHLI 111033 1 البنك االهلي
ARBK 113023 1 البنك العربي