the relationship between environmental efficiency and manufacturing firm's growth
TRANSCRIPT
This paper can be downloaded without charge at:
The Fondazione Eni Enrico Mattei Note di Lavoro Series Index: http://www.feem.it/Feem/Pub/Publications/WPapers/default.htm
Social Science Research Network Electronic Paper Collection:
http://ssrn.com/abstract=1318332
The opinions expressed in this paper do not necessarily reflect the position of Fondazione Eni Enrico Mattei
Corso Magenta, 63, 20123 Milano (I), web site: www.feem.it, e-mail: [email protected]
The Relationship Between Environmental Efficiency and Manufacturing Firm’s Growth Giulio Cainelli, Massimiliano Mazzanti and
Roberto Zoboli
NOTA DI LAVORO 99.2008
DECEMBER 2008 CCMP – Climate Change Modelling and Policy
Giulio Cainelli, University of Bari
Massimiliano Mazzanti, Department of Economics Institutions & Territory, University of Ferrara
Roberto Zoboli, Catholic University of Milan & CERIS CNR Milan
The Relationship Between Environmental Efficiency and Manufacturing Firm’s Growth
Summary This paper investigates the empirical link between emission intensity and economic growth, using a very large data set of 61,219 Italian manufacturing firms over the period 2000-2004. As a measure of lagged environmental performance (efficiency) at firm level we exploit NAMEA sector for CO2, NOx, SOx data over 1990-1999. The paper tests the extent to which (past) environmental efficiency/intensity, which is driven by structural features and firm strategic actions, including responses to policies, influences firms growth. Our results show, first, a typical trade off generally appearing for the three core environmental emissions we analyse: lower environmentally efficiency in the recent past allows higher degrees of freedom to firms and relax the constraints for growth, at least in this short/medium term scenario. Nevertheless, the size of the estimated coefficients is not large. Trade off are significant for two emission indicators out of two, but quite negligible in terms of impacts, besides the case of CO2. For example, growth is reduced by far less than 0.1% in association to a 1% increase of environmental efficiency. Environmental efficiency does not seem a primary cost factor and constraint to growth if compared to other factors affecting firm targets and firm competitiveness. In addition, non-linearity seems to characterise the economic growth-environmental performance relationship. Signals of inverted U shape appears: this may be a signal that both firm strategies and recent policy efforts are affecting the dynamic relationship between environmental efficiency and economic productivity, turning it from an usual trade off to a possible joint complementary/co-dynamics, where bad environmental performances hamper firm growth and investments in greener technologies may be associated to positive economic performances of firms and sectors.
Keywords: Firm growth, Manufacturing, Emission intensity, Economic performance, Environmental performance
JEL: C23, D21, O32, Q55
Address for correspondence: Massimiliano Mazzanti University of Ferrara Department of Economics Institutions and Territory via Voltapaletto, 11 44100 Ferrara Italy E-mail: [email protected]
2
1. Introduction
Over the last few years, the relationship between environmental performance (emission intensity,
environmental efficiency, eco-strategies, etc.) and economic performance has received increased
attention, also thanks to its role within the ‘Lisbon Objectives’ on growth and innovation and the
‘Gothenburg priorities’ on sustainable development.
Within this debate, manufacturing has received much attention, given its relatively high impacts on the
environment, and higher innovation potential. The research directions of higher added value are
currently three: (i) the effects of environmental performances and innovations on economic
performances, given the relatively wider space the drivers of environmental innovations have occupied
(Mazzanti and Zoboli, 2008a,b); (ii) an increasing attention to the dynamics of relationships in the short
run and medium/long run; (iii), extending at micro and meso levels the analyses from manufacturing to
other industries, as recently proposed by Cainelli et al. (2007) and Mazzanti and Zoboli (2009).
This paper aims at providing a contribution on points (i) and (ii) above. It focuses on manufacturing
industry; nevertheless, it uses a very large data set, compared to predominant survey-based analyses
relying on often small scale samples. It does not suffer from cross-sectional biases, often plaguing ad hoc
survey data which rarely escape the ‘cross section trap’, if not by repeated surveys over time, since it
models a dynamic relationship between emission intensity1 and firm-level economic growth, in others
words environmental and economic performances at the firm level.
More specifically, this paper investigates the empirical link between firms economic growth and
emission intensity, using a very large data set of more than 60,000 Italian manufacturing firms.
Economic data refer to the period 2000-2004. In order to circumvent the unavailability of data on
environmental performance indicators at this level of microeconomic detail, we use as a measure of
environmental efficiency by exploiting sector based NAMEA data, from which we recover firm based
data. The Italian NAMEA provides detailed data at two digit level on main emissions, value added and
employees over 1990-2003. Taking data for the periods 1990-1999 and 1992-1995 in order to impose a
lag structure to the modelled relationship, we reconstruct emission per employees ratios at firm level by
using sector coefficients of emissions per unit of labour and panel data on employment of firms, as a
pragmatic and only available proxy of environmental efficiency from official data at firm level.
Using this approach, the paper specifically tests the extent to which (past) environmental
efficiency/intensity, which is driven by structural features and firm strategic actions, including eventual
responses to policies, influences firms economic growth in a short-medium term scenario if we
consider the lag we are able to structure between environmental and economic performances.
1 ‘Emission intensity’, namely emissions per unit of labour, is the proxy for ‘environmental efficiency’ we here exploit. Further analyses may be carried out by using alternatively ‘emissions per unit of value added’. This is actually the inverse of ‘environmental efficiency’ as a ratio, but we follow this standard form, widely used in NAMEA analyses (Femia and Panfili, 2005).
3
The paper is organised as follows. Section 2 presents a short summary of the literature that aims at
synthesising the state of the art of various research directions focusing on environmental innovation,
environmental performances and economic performances at firm level. Section 3 is first addressed to
the definition of the conceptual framework on which research hypotheses are based, and then
consequently discusses data sources, the empirical model and the econometric methodology. Section 4
presents and comments on empirical outcomes. Section 5 concludes and suggests lines of future
research.
2. Related literature
A first main stream of research deals with the drivers of eco-innovation strategies. The seminal work by Jaffe and
Palmer (1997), which studies environmental innovation (R&D and patents) at industry level, was
followed by Brunnermeier and Cohen (2003), which employs panel data on manufacturing industries to
provide new evidence on the determinants of environmental innovation, measured by number of
patents. The European setting has recently been the source of some interesting evidence: Rennings et
al., (2003) exploit OECD survey data in order to investigate whether environmental auditing schemes
and pollution abatement innovation are correlated, similarly to the more recent work by Arimura et al.
(2008) on Japan. Mazzanti and Zoboli (2005, 2008a, b) present evidence for the manufacturing sector at
a district level, focussing on an extended set of drivers (environmental R&D, policy induced costs,
EMS, industrial relations, other innovations). Frondel et al., (2004) use an OECD survey dataset on
manufacturing firms and study internal firm-based strategies, external policy variables, and test drivers
for end-of-pipe measures or integrated cleaner production processes. For a recent comprehensive
analysis of all works on innovation drivers we refer to Johnstone (2007).
A second stream of research is focussed on environmental innovation and (its) employment effects. The main
contributions in this stream include Rennings and Zwick (2001), Rennings et al. (2001), Pfeiffer and
Rennings (1999). What is relevant to our study is the main hypothesis that increasing environmental
efficiency by environmental innovations strengthens competitiveness and the firm performance, with
or without policy stimulus. An ancillary hypothesis is that eco-efficiency investments require higher
amounts of labour. The reasoning is that, on the one hand, product innovation spurs employment since
it creates new demand, while, on the other hand, process innovations decrease employment since they
are usually labour saving. Some employment compensation may occur as a result of indirect
price/market driven effects. It should be noted that this is a two stage process in which first the firm
decides whether or not to invest in innovation, and second optimizes the volume of labour following
the innovation process.
Rennings and Zwick (2001) is based on a sample of eco-innovative firms for five EU countries, in the
manufacturing and service sectors. This is a rather unique study which provides evidence related to
4
manufacturing but also includes some evidence concerning eco-innovations in the service sector. They
find that in most firms employment does not change as a consequence of innovation, but this may be
due to the limited period covered by the survey. Econometric results show that, apart from some
effects registered for product innovations, eco-innovation typologies do not influence the level of
employment, though as expected (Caroli and van Reenen, 2001), according to their evidence
environmentally oriented innovations seem to lead to a skills bias effect. Also, end of pipe innovations
are related to a higher probability of job losses, while innovations in recycling have a positive effect on
employment.
Employment effects may be thus be unevenly distributed, with strong negative effects from
environmental strategies/policies on low skills intensive industries and potentially positive effects on
other industries. It could also be argued that product and process eco-innovation strategies may bring
about (potentially negative) net effects on employment, attributable to a destruction of the low skilled
labour force (administrative staff) and a creation of high skilled positions (R&D).
Third, there is a complementary stream of literature that has focused on the various static and dynamic relationships
between eco-innovation, environmental performances and firm performances2. Konar and Cohen (2001) investigated
the effect on firm market performance of tangible and intangible assets, including two environmental
performance-related elements as explanatory factors. Cohen et al. (1997) also analysed the relationship
between environmental and financial performances. Overall, these authors found that investing in a
‘green’ portfolio did not incur a penalty and even produced positive returns.
Less recent works by Gray and Shadbegian (1995) used total factor productivity and growth rates for
plants over 1979-1990 as performance indicators to test the impact of environmental regulation and
pollution abatement expenditures. They found that $1 more expenditure on abatement is associated
with more than 1$ worth of productivity losses. They found that, when analysing variation over time or
growth rates, the relationship between abatement costs and productivity is not significant. Greenstone
(2001) estimates the effects of environmental regulations, using data for 1,75 million observations of
plants in the 1967-87 US censuses of manufacturers. Environmental regulations negatively affect
growth in employment, output and capital shipments.
Finally, we would point to recent EU based studies, that focus on the (short term) effects of
environmental strategies on the stock performances of corporations, using standard cross section/panel
approaches (Ziegler et al., 2008) and ‘event’ studies that analyse whether there are exogenous
unexpected policy effects on the short term performance of environmentally minded firms. The latter
are criticized for their intrinsic very short term focus. Although valuable, and based on official datasets,
2 A fourth correlated stream of research focuses on the ‘drivers of firm environmental performance’ including, among others, Foulon et al. (2002), Cole at al (2005), Collins and Harris (2003). This is minor in scale given the paucity of data and the difficulty of eliciting such data on real environmental outcomes (non monetary quantification of externalities) even by surveys
5
we believe that the value of evidence focusing on stock market performance is limited since the
majority of firms, especially in Italy, are of medium or small sized, and do not appear in stock market
data. Innovation dynamics are close to productivity trends which, in the end, are the main engines of
firm performance.
Our paper is embedded in the third research directions, focusing on the effects of environmental
(emission) intensity on firms economic performance here measured by firms turnover growth. The
possible contribution of our work stems from: the focus on a dynamic perspective, the use of real firm
performance indicators, the lagged structure of the data set and the very large number of firms. The
main ‘limit’ is the exploitation of sector data instead of micro data for proxing environmental
emissions, depending on the general unavailability of real environmental performances measures at the
microeconomic level, for large sample of firms in Italy. This is confirmed by the recent paper by
Arimura et al. (2008) who study the ISO/EMS (voluntary agreements) effects on environmental
performances on the basis of an OECD survey on environmental performance of firms. It is striking
that the dependent variable ‘environmental performances’ is constructed by means of self reported data
using an ordered format (no change, decrease or increase in emissions). Though the authors carry out
some test and external validity checking for assuring data credibility, the answers seem to be affected by
the typical bias that may arise when likert scale are offered, with in addition the fact that the issue is
highly critical from a firm’s perspective. Thus, though the first best would to use real environmental
performance data at the firm level (challenge for future research in the future), and the exploitation of
self reported survey data is a plausible second best, the (panel) nature of NAMEA data disaggregated at
two digit level offer a robust framework that hybridize firm and sector data to analyse economic-
environment relationship3.
3. Conceptual framework, data and methodology
3.1 The theoretical framework
This section briefly sketches the main elements of the conceptual framework on which the set of
hypothesis tested in the empirical part is rooted, trying to discuss what factors may support ‘joint’
economic-environmental performances at firm level (Mazzanti and Zoboli, 2009).
A first set of factors revolve around the ‘Porter’s hypothesis’ (Jaffe et al., 1995). Environmental
regulation may influence innovation and market (rent) creation. In the long run, regulation costs, or
environmental R&D expenditures, are more than compensated for by the benefits of innovation in
terms of higher efficiency and/or higher value added. This conclusion seems to run counter to the
conventional wisdom that environmental regulation (like any other regulation, of course) or
3 A rare set of studies that use real environmental performances to study the co-evolutionary effects between firm performances (turnover and profits) and emission intensity of firms are by Earnhart and Lizal (2006, 2007, 2008), who exploit a 1996-98 panel for Czech firms. The panel is nevertheless limited to around 400 firms.
6
spontaneous investments in green firm performances impose significant direct and indirect costs on
firms and industries, with the primary effect of impacting negatively on economic performance, and
especially (labour and total factor) productivity.
Following the mainstream reasoning, if the firm is optimising resource in production, before the
implementation of (new) environmental regulation, any additional abatement cost or innovation cost
deriving from policy enforcement will lead, at least in the short run, to an equivalent reduction in
productivity/performance, since labour and capital inputs are re-allocated from ‘usual’ or scheduled
production output to ‘environmental output’ (pollution reduction).
This emphasis on substitution may stem from the roles in neo-classic reasoning of the assumption of
optimal allocation of resources in the status quo and of input prices (and green taxes) as innovation
levers. In fact, resource prices have been the main driver of change only in specific conditions of strong
relative price changes coupled with structural economic transformations. More generally it is
technology that affects prices by changing factor combinations and capital intensity. In other
approaches, the development of new production processes is viewed as an ongoing process within
firms and sectors less reliant on input prices, except in particular circumstances (Kemp, 1997; Krozer
and Nentjes, 2006).
Economies of scale and scope are another argument leading to depart from conventional view..
Complementarity and economies of scale and scope, among other factors, might lead to states where
the productivity effect of environmental investments or compliance becomes positive (plausibly in the
medium long run) 4.
A more general question is whether it is possible to separate eco-innovation from other typologies of
innovation. In practice it is often not easy to separate the two (Rennings, 2000). With or without policy
aimed at innovations, cost-saving motivations and demand-related product market objectives could
work as innovation drivers. All could be complementary in the ultimate aim of enhancing firm
productivity, and no sharply defined difference between them may be possible, in that (i) eco-
innovations may generate low or high eco-impacts depending on their nature and their integration with
other innovations; (ii) standard innovations may also provide eco-innovations. Much of the current
empirical research is aimed at disentangling intended and unintended (e.g. mere cost savings in the
more general meaning) eco-effects stemming from innovations: in these approaches, only those
innovations linked to intended ‘proper’ environmental strategies and effects are classified as eco-
innovations. A broad definition of eco-innovations encompasses intentional and unintentional actions.
4 “The choice to invest in either change in production process or end of pipe will be used to evaluate the extent to which production and abatement is undertaken jointly. End of pipe technologies are considered to reflect evidence of the existence of a separable production function, with production the conventional output and abatement of pollution as essentially separate plants within a single facility. Different resources are used for each plant. Production process is considered to reflect a production process in which abatement and production of the conventional output are integrated, allowing for the complementary use of inputs in both abatement and production” (Labonne and Johnstone, 2007, p.3).
7
This may lead to a framework in which economic and environmental goals are more easily identified as
being complementary, and are integrated. Jaffe et al. (1995, 2003) note that firms can engage in some or
a great deal of pollution control “Besides end of pipe technologies, firms usually have strong difficulties
in accounting for specific capital and current environmental expenditures”. As discussed above, it
might also be due to the entangled nature of many environmental and ‘normal’ innovations.
This likely ‘jointness’ of ‘eco’ and ‘normal’ innovations has some connections with the evolutionary
perspective on industrial dynamics, where the balance between firms’ entries and exits is the main
driver of development. Along these lines, environmental pressures could constitute an increasing wedge
between innovative firms (sectors) and less innovative firms, which could in the end, disappear. The
former may demonstrate higher performance on all-inclusive innovative grounds, positively integrating
and correlating environmental and non-environmental dynamics. According to evolutionary theory,
interlinked technologies evolve along a dynamic path, generating positive spillovers and effects on
productivity. This discussion can also be positioned with the analysis of complementarity regarding
input factors in the production of innovation and higher performance practices (Milgrom and Roberts,
1990, 1995; Mohnen and Roller, 2005; Laursen and Foss, 2003; Mazzanti and Zoboli, 2008b).
Complementarity generates increasing returns and non-appropriable innovation rents.
Another motivation is related to the issue of rent generation and appropriability. The production of
some ‘environmental goods’ is associated with rents that are appropriable, at least partially, by firms.
They are in fact correctly defined as the private share of an impure public good, which encompasses
other entangled pure public features. Many environmental innovations combine an environmental
benefit with a benefit for the company or user. The gaps between environmentally accounted and
standard productivity often emerges in the differences between natural resources and correlated
externalities (Bruvoll et al., 2003). Thus, the innovation potential of policies, and the associated
innovative endogenous strategy of firms depend on the features of the environmental goods. Those
goods may be characterised by private appropriable rents and by public good elements. This
complementarity in production, i.e. a technologically-based positive correlation between the private
(fully appropriable) and the public good elements is potentially linked both to the kind of externalities
we are dealing with, e.g. local/global emissions, private or public product/process (Kotchen, 2005;
Rubbelke, 2003; Loschel and Rubbelke, 2005), and to technological factors, e.g. the relationships
existing among apparently separate technological dynamics.
Technology and externalities are in any case theoretically interrelated environments; and non-
convexities in production could be an important element for the joint production of private and public
values, depending on fixed costs and technological constraints (Papandreou, 2000; Boscolo and
Vincent, 2003).
8
To sum up, the key question revolves around the possibility that firms may adopt some environmental
strategies even on an endogenous market-based path. Starting with the Porter’s framework we
discussed elements that might enrich the set of motivations behind a possible joint path of
environmental and labour productivity in the medium-long run, even in the absence of direct policy
intervention. Evolutionary theories and borderline issues, such as complementarity, could constitute
some conceptual pillars that extend the intrinsically static neoclassic reasoning.
The ‘pessimistic’ view of a trade-off between firms’ environmental and non-environmental strategies
may be mitigated by a framework in which those complementarities, which at heart involve different
technological innovations (labour-oriented, environmentally-oriented), might explain, at least in part,
why sustained increasing environmental efficiency is compatible with sustained increasing labour
productivity in the ex post setting.
3.2 The set of tested hypotheses
We now specify the main research hypotheses we are testing, that arise from the above discussion.
[H.1]. The sign of the dynamic relationship between emission intensity at time t-1 and economic
performance specified as firm growth, at time t, is investigated, by using two different time lags:
emission intensity per unit of labour averaged over 92-94 and over 95-99. We do expect the closer the
lag is the more probable that environmental efficiency and economic performances are characterised by
a trade off rather than complementary dynamics. Disentangled dynamics (statistical insignificance) are
also a possibility if economic performance is independent on environmental elements.
[H.2]. The shape of the relationship is also investigated by specifying quadratic forms for emission
intensity. Non-linearity is a real world feature that is analysed in both mainstream and alternative
perspectives, but that assumes special relevance in dynamic scenarios. Were the relationship is non-
linear, that is not only the cross-section (sector) heterogeneity and the lag difference between the two
‘productivities’ that matter, but also the level of the environmental performances matters. Critical
thresholds may exist, and we do expect non-linear dynamics to represent the real world situation of
many environmental-economic co-dynamics. It is nevertheless difficult to assess ex ante which shape is
the more likely one, given empirical evidence is still scarce. If the non linear relationship assumes a U
shape, this would mean that at low emission intensity the relationship with economic performance is
associated to a complementary content, then trade off emerge when the environmental efficiency
worsen. Otherwise, in presence of an inverted U shape, the trade off between economic and
environmental performances is mitigated at higher environmental intensity. Further increases in
environmental intensity hampers growth and leads to a co-dynamics between the two sides of firm
9
objectives. In other words, it may be that only at quite high, or comparatively high, environmental
pressures, firms (sectors) endogenously implement (innovative) strategies or are subject to policies,
that help achieving a joint dynamic relationship between environmental and economic performances.
Summing up, we carry out various tests on whether environmental efficiency, deriving from innovation
and structural changes leading to emission reduction is, following technology-based and externality-
based complementarities relationships (Mazzanti and Zoboli, 2008a, b), positively associated with firms
growth. The hypothesis we implicitly assume in the empirical model is that environmental impacts
(environmental efficiency) are also dependent on the core dynamics of innovation, driven by structural
factors (e.g. firm size), policy levers, and idiosyncratic strategic factors (R&D). In other words, we
explicitly test whether the two objectives of the firm: environmental and economic performances, are
disentangled (no significant correlation), positively related (correlation/complementarity between the
two), or negatively correlated (substitution or trade-off framework).
As discussed in Section 3.1, this ‘complementarity’ may be opposed to the ‘substitution hypothesis’
which often derives from a usual neoclassic reasoning, which tends to hide the possibility that firms
adopt environmental innovation in a non policy scenario. In fact, if the firm is optimizing resource
allocation in production (before environmental regulations), any additional abatement cost or
innovation cost deriving from policy enforcement leads, at least in the short run, to an equal reduction
in productivity. .
3.3. The data set
3.3.1. Economic performances
The data-set used in this paper was drawn from AIDA: a commercial database collected by Bureau Van
Dijck. This large data set of Italian joint stock companies reports balance sheets data such as sales,
value added, number of employees, labour cost, technical assets, etc. Using this statistical source, for
the period 2000-2004, we built a panel composed of more than 61,000 Italian manufacturing firms. For
all these firms we have the following information: (i) the industry in which they operate; (ii) the
geographic location; (iii) a size variable measured through the number of employees over the period
2000-2004. In addition, we have, for a sub-sample of these firms, other two information: i.e., (i) sales
and (ii) age. This second sample is composed of 36,312 firms. We use these two data sets in relation to
the stage of the Heckman procedure we consider below. Specifically, the first larger data set is used to
estimate the selection equation where the dependent variable is constituted by a dummy variable that
takes the value 1 whether all information on sales and age are available for the period 2000-2004 and
the value 0 otherwise. The second smaller data set is used to estimate the growth equations which allow
us to investigate on the empirical link between environmental and economic performances, respectively
emission per employees and turnover. In Tables 1-3 we report the distribution of firms and employees
10
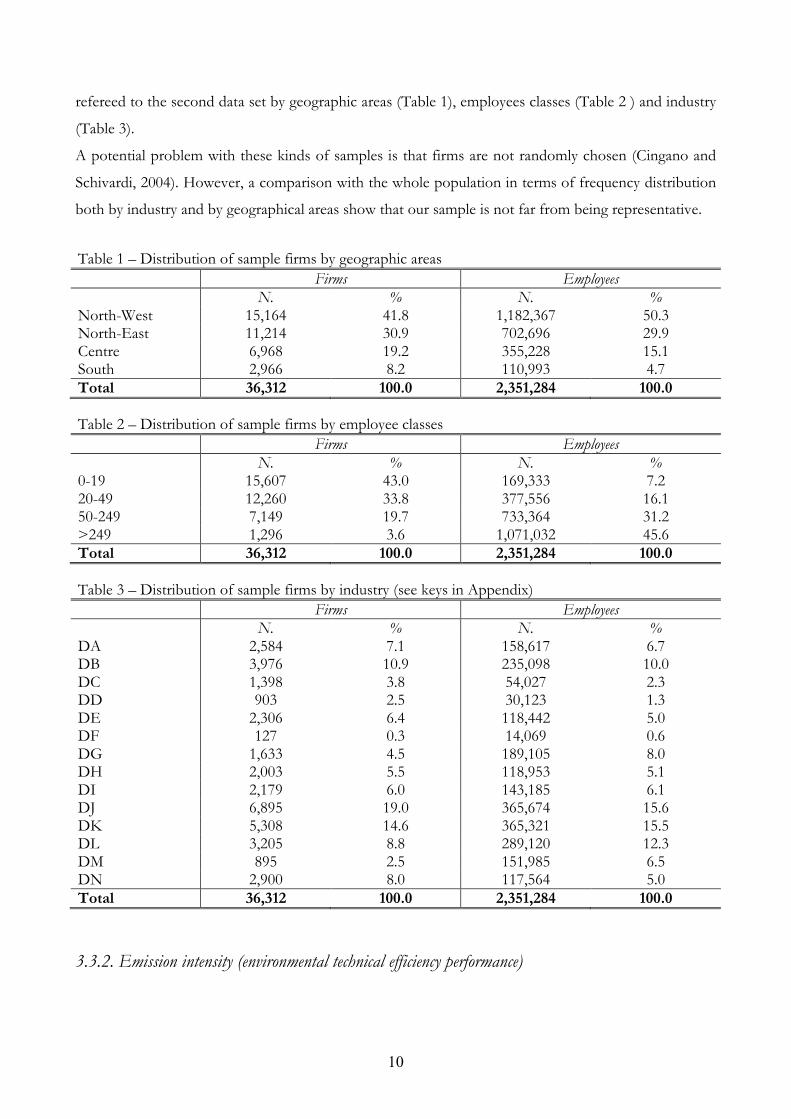
refereed to the second data set by geographic areas (Table 1), employees classes (Table 2 ) and industry
(Table 3).
A potential problem with these kinds of samples is that firms are not randomly chosen (Cingano and
Schivardi, 2004). However, a comparison with the whole population in terms of frequency distribution
both by industry and by geographical areas show that our sample is not far from being representative.
Table 1 – Distribution of sample firms by geographic areas
Firms Employees
N. % N. % North-West 15,164 41.8 1,182,367 50.3 North-East 11,214 30.9 702,696 29.9 Centre 6,968 19.2 355,228 15.1 South 2,966 8.2 110,993 4.7 Total 36,312 100.0 2,351,284 100.0
Table 2 – Distribution of sample firms by employee classes
Firms Employees
N. % N. % 0-19 15,607 43.0 169,333 7.2 20-49 12,260 33.8 377,556 16.1 50-249 7,149 19.7 733,364 31.2 >249 1,296 3.6 1,071,032 45.6 Total 36,312 100.0 2,351,284 100.0
Table 3 – Distribution of sample firms by industry (see keys in Appendix)
Firms Employees
N. % N. % DA 2,584 7.1 158,617 6.7 DB 3,976 10.9 235,098 10.0 DC 1,398 3.8 54,027 2.3 DD 903 2.5 30,123 1.3 DE 2,306 6.4 118,442 5.0 DF 127 0.3 14,069 0.6 DG 1,633 4.5 189,105 8.0 DH 2,003 5.5 118,953 5.1 DI 2,179 6.0 143,185 6.1 DJ 6,895 19.0 365,674 15.6 DK 5,308 14.6 365,321 15.5 DL 3,205 8.8 289,120 12.3 DM 895 2.5 151,985 6.5 DN 2,900 8.0 117,564 5.0 Total 36,312 100.0 2,351,284 100.0
3.3.2. Emission intensity (environmental technical efficiency performance)
11
Environmental performances are taken from the NAMEA source5. The Italian NAMEA provides
detailed data at two digit level on main emissions, value added and employees over 1990-2003. Here we
focus on 1990-1999 for establishing a lagged structure to the analysis (see below).
Taking data for the period 1990-1999 in order to impose a lag structure to the modelled relationship,
and focusing on some primary environmental efficiency measures of industries (tons of emission for
CO2, SOx, NOX per unit of labour, full time equivalent jobs (FTEJ)), we reconstruct environmental
technical efficiency ratios at firm level by using sector-level coefficients of emission/FTEJ, i.e. the only
available proxy for environmental efficiency at sector level, and our AIDA data on firm employees6.
This is the only plausible way to recover firm-level data on environmental performances in order to
exploit the very rich information contained respectively in the Italian NAMEA and AIDA.
We set up average emission/employee for the two periods 1992-1994 and 1995-1999 for assessing
relationships at different lag distances between environmental performances and firm’s growth7. Years
1990 and 1991 were in the end discarded given problems with sector comparability over time within
different NAMEA. Average values are taken both for testing the technical efficiency effects using two
different time periods, and since emission data are characterised by yearly-specific volatility that is
mitigated and smoothed by taking averages.
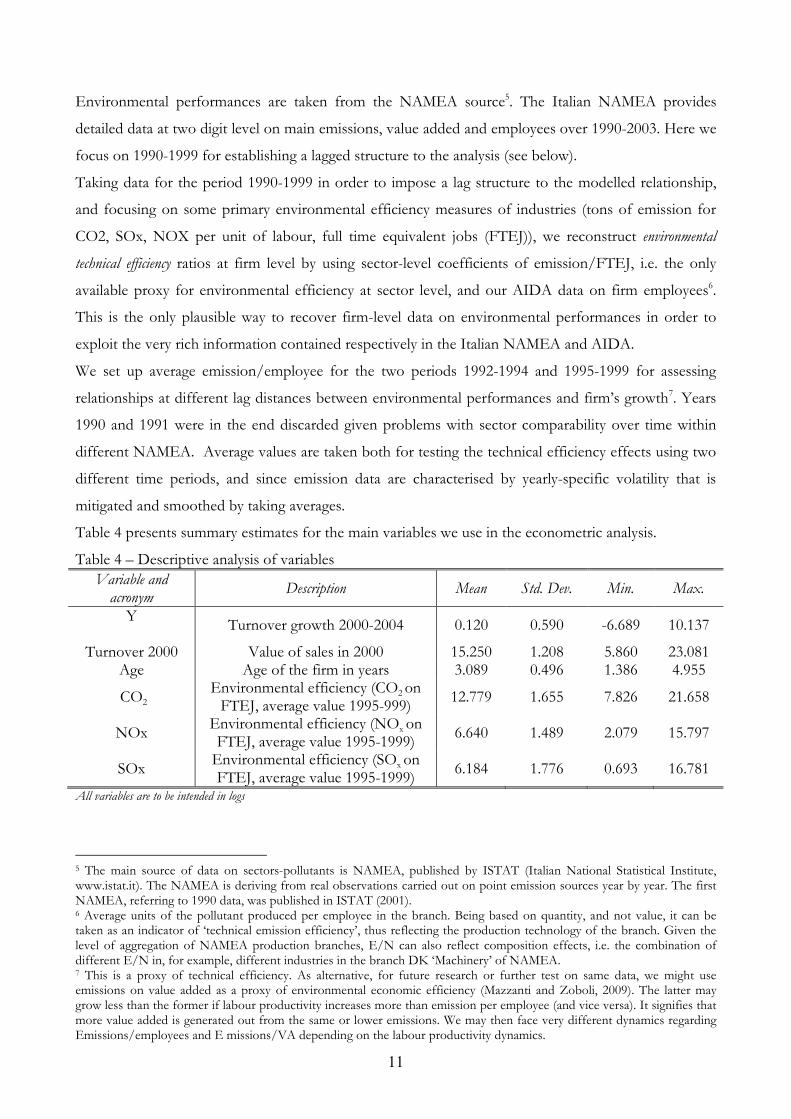
Table 4 presents summary estimates for the main variables we use in the econometric analysis.
Table 4 – Descriptive analysis of variables
Variable and acronym
Description Mean Std. Dev. Min. Max.
Y
Turnover growth 2000-2004 0.120 0.590 -6.689 10.137
Turnover 2000 Value of sales in 2000 15.250 1.208 5.860 23.081 Age Age of the firm in years 3.089 0.496 1.386 4.955
CO2 Environmental efficiency (CO2 on FTEJ, average value 1995-999)
12.779 1.655 7.826 21.658
NOx Environmental efficiency (NOx on FTEJ, average value 1995-1999)
6.640 1.489 2.079 15.797
SOx Environmental efficiency (SOx on FTEJ, average value 1995-1999)
6.184 1.776 0.693 16.781
All variables are to be intended in logs
5 The main source of data on sectors-pollutants is NAMEA, published by ISTAT (Italian National Statistical Institute, www.istat.it). The NAMEA is deriving from real observations carried out on point emission sources year by year. The first NAMEA, referring to 1990 data, was published in ISTAT (2001). 6 Average units of the pollutant produced per employee in the branch. Being based on quantity, and not value, it can be taken as an indicator of ‘technical emission efficiency’, thus reflecting the production technology of the branch. Given the level of aggregation of NAMEA production branches, E/N can also reflect composition effects, i.e. the combination of different E/N in, for example, different industries in the branch DK ‘Machinery’ of NAMEA. 7 This is a proxy of technical efficiency. As alternative, for future research or further test on same data, we might use emissions on value added as a proxy of environmental economic efficiency (Mazzanti and Zoboli, 2009). The latter may grow less than the former if labour productivity increases more than emission per employee (and vice versa). It signifies that more value added is generated out from the same or lower emissions. We may then face very different dynamics regarding Emissions/employees and E missions/VA depending on the labour productivity dynamics.
12
3.3. Empirical model and methodological issues
The empirical specification used in this paper is within the established and well developed literature
based on Gibrat’s law on proportionate effects. This hypothesis states that the probability of a given
proportionate change in size during a specified period of time is the same for all firms in a given
industry, regardless of their size at the beginning of the period (Mansfield, 1962). Following Evans
(1987a, b), we adopt a ‘growth version’ of this model, specifying the dependent variable as firm size
growth and not firm size at time t. The independent variable remains size at time t-1. We test this
hypothesis for sales/turnover8. Although most studies focus on employment as a proxy for size, there
are an (increasing) number of investigations on the literature based on other measures of size and
performances, from profitability to asset value9.
We opt for the Gibrat model for a variety of reasons. In absence of a panel of data framework, we deal
with a hybrid cross section environment with a lag structure in the empirical model that circumvents
endogeneity. Instead of relying on a simple cross section specification, we prefer using such model
given that it has shown good performances in previous studies (Cainelli et al., 2007) and are related to a
well developed and consolidated literature, mainly established in the evolutionary economics
environment. Panel analyses may be scope for future (more valuable) research though we remark that
our lagged model is specifically aimed at coping with endogeneity that would be a methodological and
conceptual issue in a panel world.
According to this literature, it is also relevant to deal with exit/entry flows over the period. Gibrat’s law
could also be valid for certain defined sub-samples of firms (young, innovative, etc.). From a
methodological point of view, this calls for econometric techniques that tackle sample selection bias.
Finally, some recent papers (Lotti et al., 2007) argue that while the law may fail on an ex ante basis (that
is on the total firms) since small and medium sized firms (SMEs) grow faster, in an ex post ‘equilibrium’,
after the market has cleaned the industry through competition pressures, this law may hold for the core
of survivor firms. Short run and long run differences in the validity of Gibrat’s law may thus occur, and
they can be associated with exit/entry flows and the evolution of industry towards a core set of firms.
The period of observation is generally not so long as to detect these differences in the short to long
run. In any case our study is not primarily focused on testing Gibrat’s law, which is the framework in
8 We use turnover instead of productivity (turnover / employees) for two reasons. First, it is coherent with most Gibrat’s literature. Secondly, though it might be of interest an investigation between environmental and economic efficiency correlation (Mazzanti and Zoboli, 2009), the period 2000-2004 is atypical, witnessing in Italy a decrease or a stagnation of labour productivity for many industrial sectors, partly due to an increase of the workforce and employment (mainly women, immigrants, atypical contracts) in association with a low growth of value added. 9 For a recent work which like ours uses size measures such as real gross output, employment and real value added, see Harris and Trainor (2005), who analyse manufacturing sectors in a panel framework to study the relationship between growth and size, rejecting the law in all observed cases. Other recent works dealing with measures other or in addition to employment size are Dunne and Hughes (1994), Delmar et al. (2003), Audretsch et al. (2004), Del Monte and Papagni (2003), who deal with Italian manufacturing firms in 1989-1997. A very detailed and comprehensive survey in this literature is presented by Santarelli et al., (2006), to which we refer the reader.
13
which we test out hypotheses. Nevertheless, our result should be interpreted as biased towards the
short to medium term10.
The specification we used to empirically test the relationship between emission intensities and firms
size growth is (Evans, 1988a, 1988b):
(1) ( ) ( ) ( ) ( ) ( )iggiiiiiiitivageYYYY ++++=−=∆ βX
'
i,2000,2000,2004,,4 lnlnlnlnln δγα
where 2004,iY and 2000,iY are sales of firm i in 2004 and 2000, iage denotes firm age, iX is a set of
variables, including the emission intensity at sector level, and finally iv is the error term with the usual
statistical properties.
It is worth noting that this relationship is also investigated by specifying quadratic terms both for sales
and age and for emission intensity indicators. This is done in order to capture potential non-linear
effects among these covariates and the dependent variable.
To overcome potential selection bias, we estimated equation (1) using the Heckman two-step
procedure (Cainelli et al., 2007)11. In the first step we estimate a selection equation where the dependent
variable is constituted by a dummy variable taking value 1 whether all information on sales and age are
available for the period 2000-2004 and the value 0 otherwise. As explanatory variables of this selection
equation we use four geographic (North_West, North_East, Centre and South) and four size (D19,
D20_49, D50_249 and D250) dummies. The residuals of this regression were used to construct a
selection bias factor, which is equivalent to the Inverse Mill’s Ratio. This factor accounts for the effects
of all unmeasured characteristics which are related to the selection variable. The Inverse Mill’s Ratio is
introduced as an extra explanatory variable in the second stage of the Heckman procedure, which
consists of estimating the growth equation (1) using Maximum Likelihood estimators and using the
selection bias control factor as an additional independent variable. In this way, we obtain efficient and
consistent estimates of the unknown coefficients of the equations. Finally, since emission intensity data
are calculated at firm level by exploiting emissions/employees ratio from the industry level, we estimate
10 Here we cannot directly assess the role of policies as the driver of innovation, or consequently performance. Nevertheless, if we exclude anticipation strategies, the period under observation is one when major policies were still not implemented at EU and national levels. We can assume therefore that such innovation strategies are purely endogenous and depend on firms’ strategic management, as (discussed) in Mazzanti and Zoboli (2009). This could explain in part the coherent but reduced number of first mover firms focussing on innovation for environmental purposes. 11 In our case, the dependent variable in the first stage takes the value 1 if all information (including sales and age) on firm i are available, and 0 otherwise. The covariates used in the first stage to estimate the selection equation are the following: (i) a constant term, (ii) four geographic dummies (North-West; North-East, South and Centre), (iii) four size dummies (D19, D20_49, D50_249 and D250), and finally (iv) nine industry dummies.
14
standard errors, that are robust to arbitrary cluster correlation. This procedure allows us to account for
clustering in emission intensity data derived from NAMEA (Wooldridge, 2003, 2006) 12.
4. Empirical results We sum up the main results of our investigations. First, we find expected result in the first step, that
shows the relevant influence by size, industry and geographic location.
Secondly, we focus on the core aspects of second stage regressions, where the proper Gibrat model is
investigated (tables 5-7 for the three different categories of emissions).
As far as the regressions without environmental performances (not shown) indicates significant and
negative signs attached to age and turnover: firm growth is more likely to be experienced by small
firms, an expected plausible result, and by younger firms, again as expected.
The relationship appears to be nevertheless non-linear: quadratic forms show U shapes for both
factors. This may signify that (very) young and (very) old firms are the ones experiencing higher growth
over 2000-200413. The same holds regarding the scale/size of firms: low and high turnovers per
employee are associated to higher growths. All in all, non-linearity is empirically relevant. Those
outcomes do not change when we include environmental efficiency indicators (see below).
As a third step, regarding the core analyses of environmental – economic relationships, we first note
that linear forms in tables 5-7 seem to support a positive and significant coefficient for all the three
emission categories. Thus, recalling H1, we would be in front of a (usual) ‘trade off’ between different
kinds of performance: the higher emission intensity per employee (over 1995-99), the higher firm
growth is (over 2000-2004). Firm growth thus appears ‘not constrained’ by bad environmental
performances; on the reversal side, more environmental efficient firms (perhaps within greener sectors)
do not touch with hand the payoffs of ‘greener investments’.
Motivations may be many and various. In part this evidence may be linked to weak policy pressures on
more polluting firms, mainly when focusing on a global externality like CO2 which has been regulated
from early-2000s on through the IPPC directive and the emission trading (EU ETS) scheme for CO2.
In any case we do not find here evidence of proactive co-dynamics between environmental and
economic realms14. A positive sign in the estimated coefficient here means that increasing
environmental efficiency leads to some economic costs in terms of lower growth. Those are the
‘implied cost’ of eventual improvements in environmental performances, that should be weighted
12 As additional analysis, in order to circumvent the problem of exploiting as source emission sector data, we estimated fitted values of environmental efficiency for firms, using as regressors in the first stage R&D expenses, size and sector dummies. In the end, looking at methodological oriented literature and comparing results of the two estimation techniques, which here do not differ much, we opted for the specific cluster correlation technique for estimation of parameters, that is offering more robust estimates. 13 We note that this period is one of the most critical, in negative terms, for the Italian economy. 14 We stress this is the ‘average’ figure regarding manufacturing firms.
15
against market (appropriable) and non market benefits accruing from such improvements. Viceversa,
being less environmentally benign relax the constraints to growth.
It is worth noting, nevertheless, that the size of the estimated coefficients is not large, besides that for
CO2: trade off are statistically significant, but quite negligible in terms of impacts for SOx and NOx.
Since also the size of coefficients (‘economic significance’) matters as well as its statistical significance
(Ziliak and Mcloskey, 2004), environmental performance does not seem a primary cost and constraint
to growth if compared to other factors affecting firm targets15. The result for CO2 emissions seems to
highlight that, by being CO2 emission related to energy consumption and end-of-pipe solutions for
CO2 emissions being limited, to reduce CO2 emissions may result in a stronger negative effect on firm
growth compared to other air pollutants.
Those outcomes also do not mirror the environmental-economic ‘efficiency’ co-dynamics found by
Mazzanti and Zoboli (2009) who use panel NAMEA data over 1990-2001 for emission intensity of
value added and value added per employee at the NAMEA-sector level. Nevertheless, the two studies,
though conceptually close, are hardly comparable from an empirical point of view: We here exploit a
lagged model instead of a panel, with some differences in the considered period, and the analysis was
there on the all macro NAMEA sectors, not just manufacturing. Both studies point out the importance
of non-linear paths characterising the links and evolution of economic and environmental
performances.
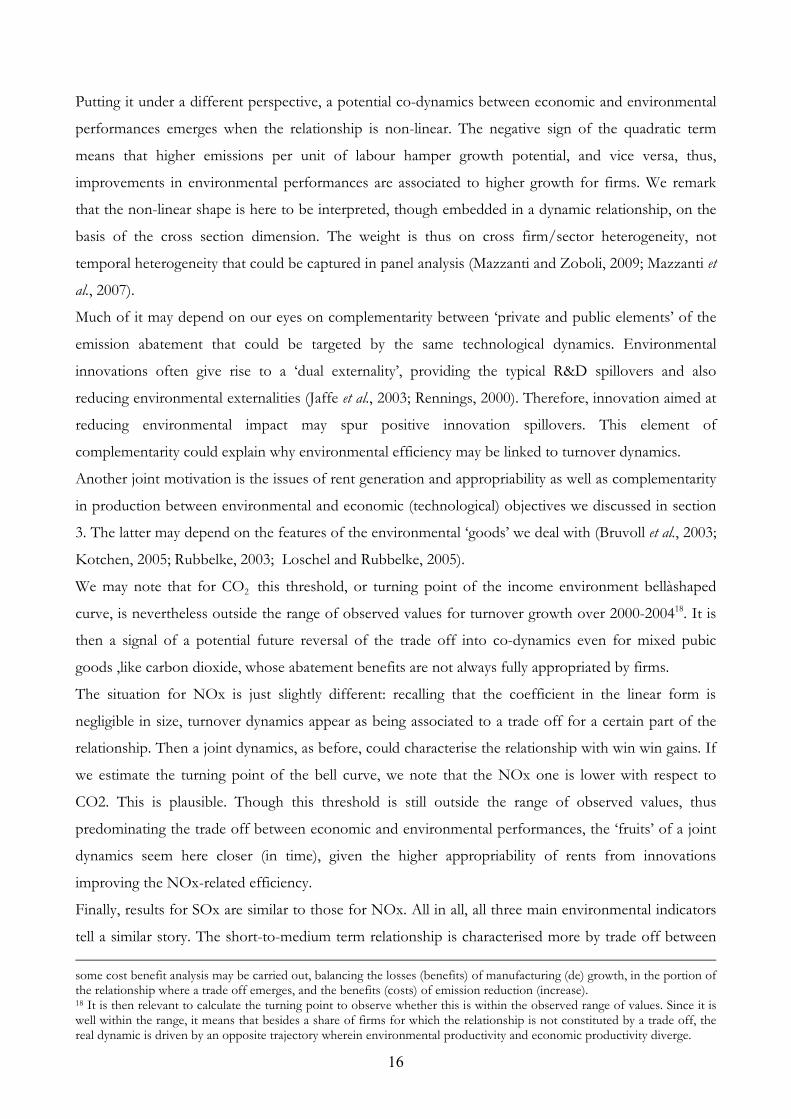
Finally, the ‘non linear’ (quadratic models at right hand columns of tables 5-7) analyses on the income-
environment relationship here envisaged tells us additional insights {H2}. In fact, regarding CO2, a
robust inverted U, or bell shaped16, endogenous dynamics seem to signal the possibility of experiencing
a reduction of growth after a threshold is reached. The income-environment relationship is not similar
across the range of environmental performances/efficiency. Very inefficient performances in terms of
emissions per unit of labour penalise firms even in the core performances. An explanation among
others may be that pollution effects are (fully) externalized up to a point, then, when a threshold is
surpassed, bad environmental performances present negative effects on firm performances. A linked
argument is that of ‘diminishing marginal returns’ of the ‘input’ emission, related to energy use and
capital intensity. Returns that may also become negative as shown here, even from a private persctive,
without accounting the social cost of emission production17.
15 At least for SOx and NOx, the growth decrease that ‘follows’ an environmental improvement of 1% in efficiency is less than 0.1%, but half percentage point of growth when considering CO2.. 16 We remark that the estimation of standard errors, that are robust to arbitrary cluster correlation has improved CO2 results. The bell shape was just weakly significant without such a correction. Even for NOx, the quadratic specification was completely insignificant. 17 The bell shaped curve also recall the possibility of envisaging an ‘optimal’ growth, associated to the turning point. This optimal growth is still not reached here, and is close for SOx and NOx. We nevertheless stress that also external costs should be accounted for when determining such optimal growth of firms. A balance of private and social costs/benefits of pollution is needed. Given that estimates for the abatement costs and external costs of emission are available in the UE,
16
Putting it under a different perspective, a potential co-dynamics between economic and environmental
performances emerges when the relationship is non-linear. The negative sign of the quadratic term
means that higher emissions per unit of labour hamper growth potential, and vice versa, thus,
improvements in environmental performances are associated to higher growth for firms. We remark
that the non-linear shape is here to be interpreted, though embedded in a dynamic relationship, on the
basis of the cross section dimension. The weight is thus on cross firm/sector heterogeneity, not
temporal heterogeneity that could be captured in panel analysis (Mazzanti and Zoboli, 2009; Mazzanti et
al., 2007).
Much of it may depend on our eyes on complementarity between ‘private and public elements’ of the
emission abatement that could be targeted by the same technological dynamics. Environmental
innovations often give rise to a ‘dual externality’, providing the typical R&D spillovers and also
reducing environmental externalities (Jaffe et al., 2003; Rennings, 2000). Therefore, innovation aimed at
reducing environmental impact may spur positive innovation spillovers. This element of
complementarity could explain why environmental efficiency may be linked to turnover dynamics.
Another joint motivation is the issues of rent generation and appropriability as well as complementarity
in production between environmental and economic (technological) objectives we discussed in section
3. The latter may depend on the features of the environmental ‘goods’ we deal with (Bruvoll et al., 2003;
Kotchen, 2005; Rubbelke, 2003; Loschel and Rubbelke, 2005).
We may note that for CO2 this threshold, or turning point of the income environment bellàshaped
curve, is nevertheless outside the range of observed values for turnover growth over 2000-200418. It is
then a signal of a potential future reversal of the trade off into co-dynamics even for mixed pubic
goods ,like carbon dioxide, whose abatement benefits are not always fully appropriated by firms.
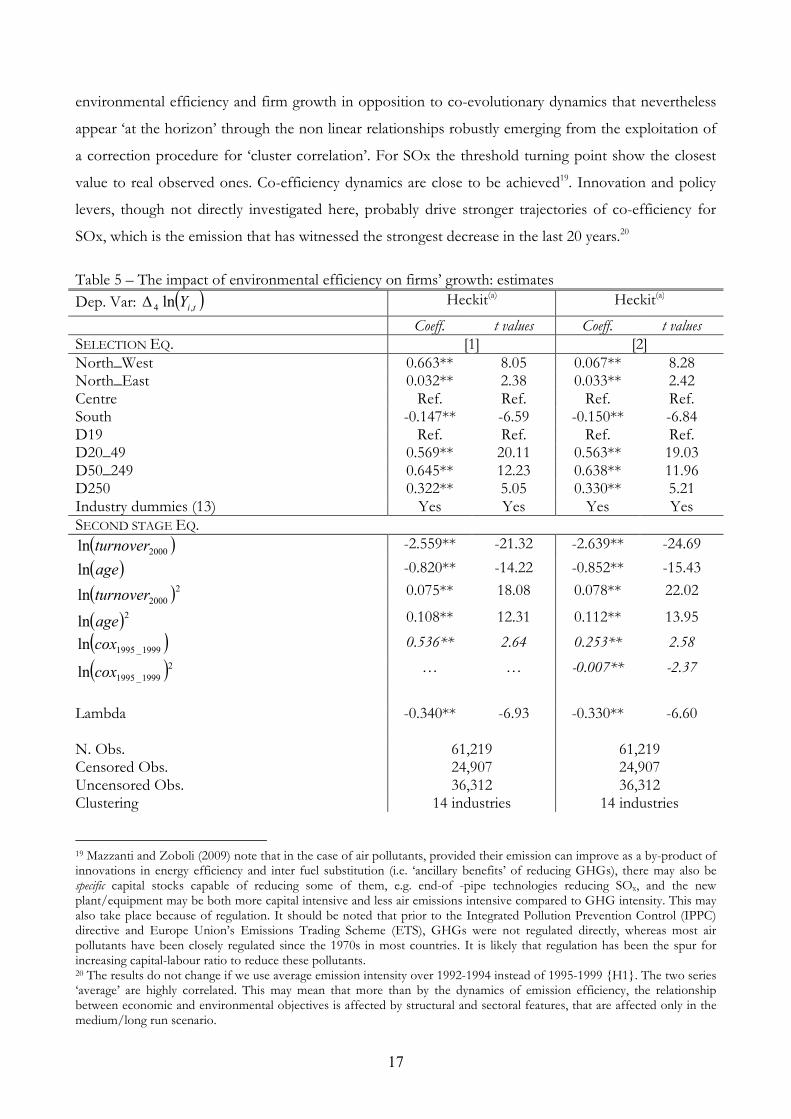
The situation for NOx is just slightly different: recalling that the coefficient in the linear form is
negligible in size, turnover dynamics appear as being associated to a trade off for a certain part of the
relationship. Then a joint dynamics, as before, could characterise the relationship with win win gains. If
we estimate the turning point of the bell curve, we note that the NOx one is lower with respect to
CO2. This is plausible. Though this threshold is still outside the range of observed values, thus
predominating the trade off between economic and environmental performances, the ‘fruits’ of a joint
dynamics seem here closer (in time), given the higher appropriability of rents from innovations
improving the NOx-related efficiency.
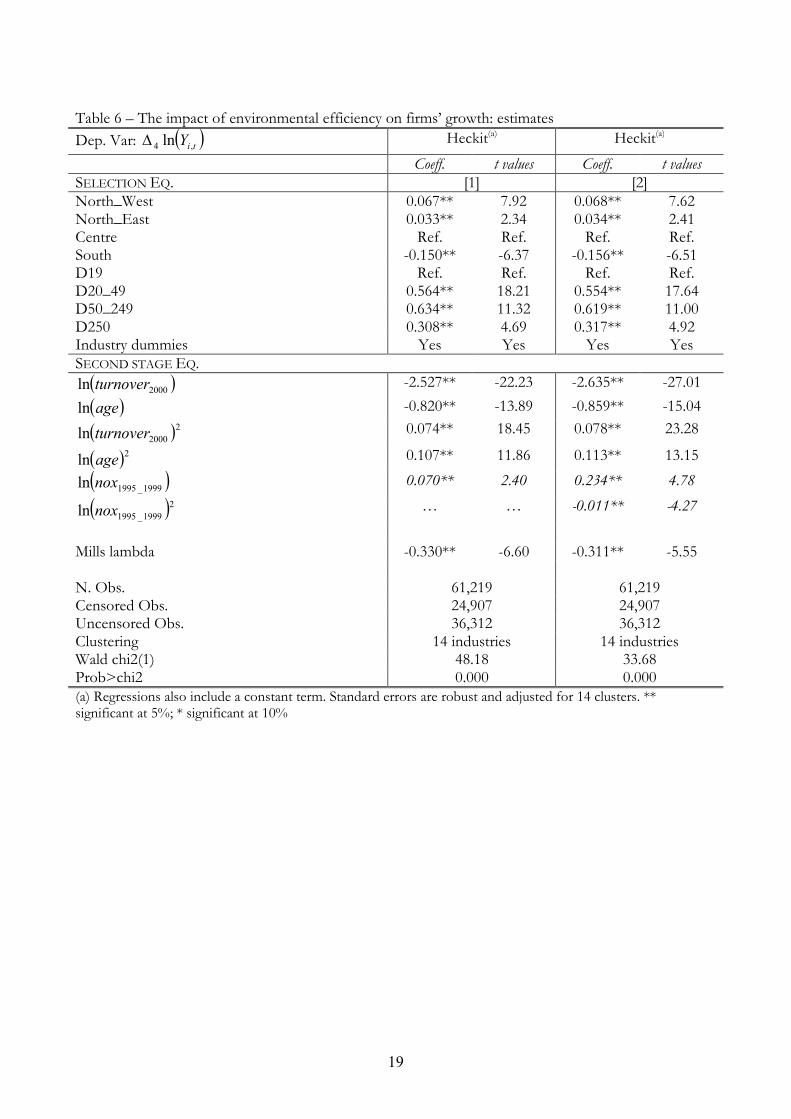
Finally, results for SOx are similar to those for NOx. All in all, all three main environmental indicators
tell a similar story. The short-to-medium term relationship is characterised more by trade off between
some cost benefit analysis may be carried out, balancing the losses (benefits) of manufacturing (de) growth, in the portion of the relationship where a trade off emerges, and the benefits (costs) of emission reduction (increase). 18 It is then relevant to calculate the turning point to observe whether this is within the observed range of values. Since it is well within the range, it means that besides a share of firms for which the relationship is not constituted by a trade off, the real dynamic is driven by an opposite trajectory wherein environmental productivity and economic productivity diverge.
17
environmental efficiency and firm growth in opposition to co-evolutionary dynamics that nevertheless
appear ‘at the horizon’ through the non linear relationships robustly emerging from the exploitation of
a correction procedure for ‘cluster correlation’. For SOx the threshold turning point show the closest
value to real observed ones. Co-efficiency dynamics are close to be achieved19. Innovation and policy
levers, though not directly investigated here, probably drive stronger trajectories of co-efficiency for
SOx, which is the emission that has witnessed the strongest decrease in the last 20 years.20
Table 5 – The impact of environmental efficiency on firms’ growth: estimates
Dep. Var: ( )tiY ,4 ln∆ Heckit(a) Heckit(a)
Coeff. t values Coeff. t values
SELECTION EQ. [1] [2] North_West 0.663** 8.05 0.067** 8.28 North_East 0.032** 2.38 0.033** 2.42 Centre Ref. Ref. Ref. Ref. South -0.147** -6.59 -0.150** -6.84 D19 Ref. Ref. Ref. Ref. D20_49 0.569** 20.11 0.563** 19.03 D50_249 0.645** 12.23 0.638** 11.96 D250 0.322** 5.05 0.330** 5.21 Industry dummies (13) Yes Yes Yes Yes SECOND STAGE EQ.
( )2000ln turnover -2.559** -21.32 -2.639** -24.69
( )ageln -0.820** -14.22 -0.852** -15.43
( )22000ln turnover 0.075** 18.08 0.078** 22.02
( )2ln age 0.108** 12.31 0.112** 13.95
( )1999_1995ln cox 0.536** 2.64 0.253** 2.58
( )21999_1995ln cox … … -0.007** -2.37
Lambda -0.340** -6.93 -0.330** -6.60 N. Obs. 61,219 61,219 Censored Obs. 24,907 24,907 Uncensored Obs. 36,312 36,312 Clustering 14 industries 14 industries
19 Mazzanti and Zoboli (2009) note that in the case of air pollutants, provided their emission can improve as a by-product of innovations in energy efficiency and inter fuel substitution (i.e. ‘ancillary benefits’ of reducing GHGs), there may also be specific capital stocks capable of reducing some of them, e.g. end-of -pipe technologies reducing SOx, and the new plant/equipment may be both more capital intensive and less air emissions intensive compared to GHG intensity. This may also take place because of regulation. It should be noted that prior to the Integrated Pollution Prevention Control (IPPC) directive and Europe Union’s Emissions Trading Scheme (ETS), GHGs were not regulated directly, whereas most air pollutants have been closely regulated since the 1970s in most countries. It is likely that regulation has been the spur for increasing capital-labour ratio to reduce these pollutants. 20 The results do not change if we use average emission intensity over 1992-1994 instead of 1995-1999 {H1}. The two series ‘average’ are highly correlated. This may mean that more than by the dynamics of emission efficiency, the relationship between economic and environmental objectives is affected by structural and sectoral features, that are affected only in the medium/long run scenario.

18
Wald chi2(1) 54.35 50.44 Prob>chi2 0.000 0.000 (a) Regressions also include a constant term. Standard errors are robust and adjusted for 14 clusters. ** significant at 5%; * significant at 10%
19
Table 6 – The impact of environmental efficiency on firms’ growth: estimates
Dep. Var: ( )tiY ,4 ln∆ Heckit(a) Heckit(a)
Coeff. t values Coeff. t values
SELECTION EQ. [1] [2] North_West 0.067** 7.92 0.068** 7.62 North_East 0.033** 2.34 0.034** 2.41 Centre Ref. Ref. Ref. Ref. South -0.150** -6.37 -0.156** -6.51 D19 Ref. Ref. Ref. Ref. D20_49 0.564** 18.21 0.554** 17.64 D50_249 0.634** 11.32 0.619** 11.00 D250 0.308** 4.69 0.317** 4.92 Industry dummies Yes Yes Yes Yes SECOND STAGE EQ.
( )2000ln turnover -2.527** -22.23 -2.635** -27.01
( )ageln -0.820** -13.89 -0.859** -15.04
( )22000ln turnover 0.074** 18.45 0.078** 23.28
( )2ln age 0.107** 11.86 0.113** 13.15
( )1999_1995ln nox 0.070** 2.40 0.234** 4.78
( )21999_1995ln nox … … -0.011** -4.27
Mills lambda -0.330** -6.60 -0.311** -5.55 N. Obs. 61,219 61,219 Censored Obs. 24,907 24,907 Uncensored Obs. 36,312 36,312 Clustering 14 industries 14 industries Wald chi2(1) 48.18 33.68 Prob>chi2 0.000 0.000 (a) Regressions also include a constant term. Standard errors are robust and adjusted for 14 clusters. ** significant at 5%; * significant at 10%
20
Table 7 – The impact of environmental efficiency on firms’ growth: estimates
Dep. Var: ( )tiY ,4 ln∆ Heckit(a) Heckit(a)
Coeff. t values Coeff. t values
SELECTION EQ. [1] [2] North_West 0.065** 7.79 0.065** 8.01 North_East 0.032** 2.36 0.032** 2.40 Centre Ref. Ref. Ref. Ref. South -0.144** -6.40 -0.146** -6.52 D19 Ref. Ref. Ref. Ref. D20_49 0.574** 21.31 0.567** 20.17 D50_249 0.654** 12.46 0.646** 12.24 D250 0.332** 5.14 0.334** 5.29 Industry dummies (13) Yes Yes Yes Yes SECOND STAGE EQ.
( )2000ln turnover -2.582** -20.82 -2.648** -23.99
( )ageln -0.818** -13.12 -0.845** -14.61
( )22000ln turnover 0.076** 17.79 0.079** 21.19
( )2ln age 0.108** 12.15 0.112** 13.14
( )1999_1995ln sox 0.041** 2.20 0.122** 2.37
( )21999_1995ln sox … … -0.006** -2.13
Lambda -0.348** -7.25 -0.340** -6.66 N. Obs. 61,219 61,219 Censored Obs. 24,907 24,907 Uncensored Obs. 36,312 36,312 Clustering 14 industries 14 industries Wald chi2(1) 60.00 52.34 Prob>chi2 0.000 0.000 (a) Regressions also include a constant term. Standard errors are robust and adjusted for 14 clusters. ** significant at 5%; * significant at 10%
5. Conclusions
This paper presents evidences on the empirical link between firm size /economic performances in
terms of sales/turnover growth and emission intensity indicators capturing environmental technical
efficiency, by originally using a very large firm based data set of thousands of Italian manufacturing
firms. This data set refers to the period 2004-2000 for turnover growth and to 1992-1999 for
environmental efficiency performances. We test the extent to which (past) environmental
efficiency/intensity, which is driven by structural features and firm strategic actions, including eventual
responses to policies, influences firm’s growth. The main added value of the paper is the use of real
environmental performances data merged with economic performances indicators for a very large
sample of firms in a dynamic perspective. The evidence we provide is basically ‘policy-free’ for carbon
21
dioxide since Italy did not experienced policies over the 90’s. Though policy valuation will be an
interesting point to be added in the future, evidence on how firms behave without regulatory
interventions is also of high interest to understand the relationship between economic and
environmental performances, as a food for thought for management and policy making.
First, a typical trade off generally appears to emerge for the three environmental emission categories we
analyse here, when focusing on a linear specification of the income-environment relationship: less
environmental oriented productions allow higher degrees of freedom and less constraint for growth.
We do not find evidence of current pro-active co-dynamics between environmental and economic
realms. Increasing environmental efficiency leads to some economic costs in terms of lower firm
growth, at least for our manufacturing firms and in this short/medium run oriented empirical scenario.
Viceversa, being less environmentally benign relax the constraints to growth. However, the size of the
estimated coefficients is not large besides CO2: trade off are statistically significant but quite negligible
in terms of effective average impacts. As example, for SOx and NOx growth is reduced by less than
0.10% for a 1% increase of environmental efficiency; the percentage move up to half a point of growth
for CO2 ‘abatements’. All in all, then, the ‘environmental factor’ does not seem a primary cost and
constraint to growth, if compared to other factors affecting firm targets and firm competitiveness.
In addition, and highly important, non linear analyses of the relationships, nevertheless, tell us to some
respect a different story. Results show that the link between emission efficiency and firm growth is in
fact robustly non linear. Inverted U shapes appear for all three emission efficiency indicators: this may
be a signal that both firm strategies and recent policy efforts, are affecting the relationship between
environmental efficiency and economic performance, possibly turning it in the near future from a trade
off to joint complementary/co-dynamics. Though our evidence is of cross sectional nature capturing
sector heterogeneity more than time dynamics, we might affirm that the potential co-dynamics between
environmental and economic performances appears close from the evidence, and more likely to be
achieved in the next future for NOx and SOx. This evidence is plausible with the higher appropriability
of (higher) environmental performances deriving from innovation actions of manufacturing firms.
The story we discuss here for Italy over the 1990s is a sort of ‘policy free’ scenario; it is thus consistent
that CO2 appears as the environmental factor less likely to be associated to win win complementary
income-environment dynamics in the next future. The endogenous evolution of income and
environmental factors linked by the web of firms-based and sector-specific innovation contents may
not suffice, as highlighted by other studies, for coping with this externality. The relatively less
significant evidence for carbon dioxide also calls for policy advices in favour of more stringent policies
for emission that are characterised by a largest part of public good (not appropriable) content.

22
Our results could open a new window of empirical evidence that supports the existence of a dynamic
and evolving of trade-off between environmental and economic strategies of industrial firms, up to
achieve a complementarity between the two.
Further research rooting on this paper may be provided in the future both by using panel data analysis
over 2000-2004, exploiting new updated NAMEA data, and estimating the reverse causal effects
(economic performance � environmental performances) when emission data after 2004 are available.
In the context of this century, some analysis of policy effects may be introduced, among others those
deriving from the European emission trading scheme for carbon dioxide operating since 2005.
23
References
Audretsch D. Klomp L. Thurik R. (2002), Gibrat’s Law: are the services different? ERIM Research paper series, ERIM Report series reference n. ERS 2002-04-STR, Erasmus University of Rotterdam.
Audretsch D. Klomp L. Santarelli E. Thurik R. (2004), Gibrat’s Law: are the services different?, Review of Industrial organisation, vol.24, pp.301-24.
Arimura T. Hibiki A. Katayama H. (2008), Is a voluntary approach a n effective environmental policy instrument? A case for environmental management systems, Journal of Environmental Economics and Management, vol.55, pp.281-95.
Boscolo, M., Vincent, J., 2003. Non convexities in the production of timber, biodiversity and carbon sequestration. Journal of Environmental Economics and Management 46 (2), 251-68.
Brunnermeier S. Cohen M. (2003), The Determinants of Environmental Innovation in US Manufacturing Industries, Journal of Environmental Economics and Management, vol. 45, pp. 278-93. Cainelli G. Evangelista R. Savona M. (2006), Innovation and economic performance in services: a firm level
analysis, Cambridge Journal of Economics, vol.30, pp.435-458. Cainelli G. Mazzanti M. Zoboli R. (2007), Environmentally-oriented innovative strategies and firm performances in services, Nota di lavoro FEEM, Milan Calvo J. (2006), Testing Gibrat’s Law for small young and innovating firms, Small Business Economics, vol.26,
pp.117-123. Cleff T. Rennings K. (1999), Determinants of Environmental Product and Process Innovation - Evidence from
the Mannheim Innovation Panel and a Follow-Up Telephone Survey, European Environment Vol. 9, No. 5, 191-201.
Cole M.A., Elliott R. Shimamoto K. (2005), Industrial characteristics, Environmental regulations and air pollution: an analysis of the UK manufacturing sector, Journal of Environmental Economics and Management, vol.50, n.1, pp. 121-43.
Collins A. Harris R. (2005), The impact of foreign ownership and efficiency on pollution abatement expenditures by chemical plants: some UK evidence, Scottish Journal of Political Economy, vol.52, n.5.
Cohen M. Fenn S. Konar S. (1997), Environmental and Financial performance: are they related?, mimeo. Delmar F. Davidsson P. Gartner W.B., 2003, Arriving at the high growth firm, Journal of Business Venturing, vol.18,
n.2, pp.189-216. Del Monte A. Papagni E. (2003), R&D and the growth of firms. An empirical analysis of a panel of Italian Firms,
Research Policy, vol.32, pp.1003-14. Dunne T. Hughes P. (1994), Age, size, growth and survival: UK companies in the 1980s, Journal of Industrial
Economics, vol.42, pp.115-140. Earnhart D. Lizal L. (2008), Exploring the links between financial performance and environmental performance
in a transition economy, paper presented at the DIME international conference ‘Innovation, sustainability and policy’, University Montesquieu IV, Bordeaux, 11-13 September 2008.
- (2007), Does Better Environmental Performance Affect Revenues, Cost, or Both? Evidence From a Transition Economy, William Davidson Institute Working Papers Series wp856, William Davidson Institute at the University of Michigan Stephen M. Ross Business School.
- (2006), Effects of Ownership and Financial Status on Corporate Environmental Performance, Journal of Comparative Economics, vol. 34, n.1, pp. 111-129.
Evans D. S. (1987a), The relationship between firm growth, size and age: estimates for 100 manufacturing industries, The Journal of Industrial Economics, vol. 35, n.4, pp.567-81.
- (1987b), Tests of alternative Theories of firm growth, The Journal of Political Economy, vol.95, n.4 pp.657-674. Femia, A., Panfili, P. (2005), Analytical applications of the NAMEA. Paper presented at the annual meeting of
the Italian Statistics society. Rome, mimeo. Foulon J. Lanoie P. Laplante B. (2002), Incentives for Pollution control: Regulation or Information? Journal of
Environmental Economics and Management, vol.44, pp.169-187. Frondel M. Horbach J. Rennings K. Requate T. (2004), Environmental Policy Tools and Firm-level Management
Practices: Empirical Evidence for Germany, CAU economics working paper n.2, Department of Economics, Kiel, mimeo.
Frondel M. Horbach J. Rennings K. (2004), What triggers Environmental Management and Innovation?, RWI Discussion Papers, n. 15, Essen, RWI, mimeo.
24
Frondel M. Horbach J. Rennings K. (2004), End-of-Pipe or Cleaner Production? An Empirical Comparison of Environmental Innovation Decisions Across OECD Countries, working paper n.82, Centre for European Economic Research (ZEW), Mannheim.
Gray W. Shadbegian R. (1993), Environmental regulation and manufacturing productivity at the plant level, discussion paper US Department of Commerce, Centre for Economic Studies, Washington D.C.
- (1995), Pollution, Abatement Costs, Regulation, and Plant-level Productivity, NBER Working Paper 4994, NBER, mimeo.
Greenstone M. (2001), The Impacts of Environmental Regulations on Industrial Activity: Evidence from the 1970 and 1977 Clean Air Act Amendments and the Census of Manufacturers, NBER Working Paper n.8484, NBER, mimeo.
Harris R. Trainor M. (2005), Plant level analyses using the ARD: another look at the Gibrat’s Law, Scottish Journal of Political Economy, vol.52, pp.492-518.
Jaffe A. Palmer K. (1997), Environmental regulation and innovation: a panel data study, The Review of Economics and Statistics, vol.79, n.4, pp. 610-619.
Jaffe A. Newell R. Stavins R. (2003), Technological change end the environment, in K-G. Maeler, J.R. Vincent (eds.), Handbook of Environmental Economics. Vol. 1, Elsevier, Amsterdam.
Johnstone N. (2007), Environmental Policy and Corporate Behaviour, Edward Elgar, Cheltenham, UK. Kemp, R., 1997, Environmental Policy and Technical Change, Edward Elgar, Cheltenham. Konar S. Cohen M. (2001), Does the market value environmental performance?, The Review of Economics and
Statistics, vol.83, n.2, pp.281-89. Kotchen, M., 2005. Impure public goods and the comparative statics of environmentally friendly consumption.
Journal of Environmental Economics and Management 49, 281-300. Krozer, Y., Nentjes, A., 2006. An essay on innovations for sustainable development. Environmental Sciences 3 (3),
163-74. Labonne, J., Johnstone, N., 2007. Environmental policy and economies of scope in facility level environmental
practices. mimeo. Laursen, K., Foss, N.J., 2003. New Human resource management practices, complementarities and the impact of
innovation performance. Cambridge Journal of Economics 27, 243-63. Loschel, A., Rubbelke, T.G., 2005. Impure public goods and technological Interdependencies, Fondazione ENI
Enrico Mattei Working paper n.60, FEEM, Milan. Lotti F. Santarelli E. Vivarelli M. (2007), Defending Gibrat’s law’s as a long run regularity, IZA DP n.2744. Lotti F. Santarelli E. Vivarelli M. (2001), The relationship between size and growth: the case of Italian newborn
firms, Applied Economics Letters, vol. 8, pp.451-454. Mansfield K. (1962), Entry, Gibrat’s Law, Innovation and the growth of firms, American Economic Review, vol.52,
pp.1023-51. Mazzanti M. Montini A. Zoboli R., (2007), Environmental Kuznets Curves for air pollution in Italy. Evidence
from sector accounting and provincial data, Economia Politica, n.3. Mazzanti M. Zoboli R. (2005), The drivers of environmental innovation in local manufacturing systems, Economia
Politica, n.3, pp.399-438. Mazzanti M. Zoboli R. (2009), Environmental efficiency and labour productivity: trade-off or joint dynamics?,
Ecological Economics, forthcoming. Mazzanti M. Zoboli R. (2008a), Embedding Environmental Innovation in Local Production Systems: SME
strategies, networking and industrial relations, International Review of Applied Economics, forthcoming. Mazzanti M. Zoboli R. (2008b), Complementarities, firm strategy and environmental innovations. Environmental
Sciences 5(1), 17-40. Milgrom, P., Roberts, J., 1990. The economics of modern manufacturing: technology, strategy and organization.
The American Economic Review. 80 (3), 511-528 - (1995). Complementarities and fit Strategy, structure, and organizational change in manufacturing. Journal of
Accounting and Economics 19(2-3), 179-208. Mohnen, P., Roller, L.H., 2005. Complementarities in Innovation Policy. European Economic Review 49 (6), 1431-
50. Nelson R. Winter S. (1982), An Evolutionary Theory of Economic Change, Belknap Press/Harvard, University Press,
Cambridge. Papandreou, A., 2000. Externality, convexity and institutions, Fondazione ENI Enrico Mattei Working paper n.
48, FEEM, Milan. Pfeiffer F. Rennings K. (1999), Employment impacts of cleaner production, Discussion paper n.46 Centre for
European Economic Research (ZEW), Mannheim.
25
Porter M. - Van der Linde C. (1995), Toward a new Conception of the Environment-Competitiveness Relationship, Journal of Economic Perspectives, vol. 9, n. 4, pp. 97-118.
Rennings K. (2000), Redefining innovation – eco innovation research and the contribution from ecological economics, Ecological Economics, vol.32, n.2, pp. 5-17.
Rennings K. Ziegler A. Ankele K. Hoffmann E. Nill J. (2003), The influence of the EU environmental management and auditing schemes on environmental innovations and competitiveness in Germany. An analysis on the basis of case studies and a large scale survey, Discussion paper 03-14, ZEW, Mannheim.
Rennings K. Ziegler A. Zwick T. (2001), Employment changes in environmentally innovative firms, Discussion paper n.46 Centre for European Economic Research (ZEW), Mannheim.
Rennings K. Zwick T. (2001), The Employment Impact of Cleaner Production on the Firm Level. Empirical Evidence from a Survey in Five European Countries, Discussion paper, Centre for European Economic Research (ZEW), Mannheim.
Rubbelke, D., 2003. An analysis of differing abatement incentives. Resource and Energy Economics 25 (3), 269-94. Santarelli E. Klomp L. Thurik R. (2006), “Gibrat’s Law: an overview of the empirical literature”, in Santarelli E.
(eds.), Entrepreneurship, growth and innovation: the dynamics of firms and industries, Springer, New York. Ziegler A. Schroder M. Rennings K. (2008), The effect of environmental and social performance on the stock
performance of European corporations, Environmental & Resource Economics, Forthcoming. Wooldridge J. M. (2006), Cluster-Sample Methods in Applied Econometrics: An Extended Analysis, mimeo,
Department of Economics, Michigan State University. - (2003), Cluster-Sample Methods in Applied Econometrics, American Economic Review, vol. 93, 133-138. Ziliak S. Mckloskey D. (2004), Size matters: the standard error of regressions in the American economic review,
Journal of Socio Economics, vol.33, n.5, pp.527-46.

26
Appendix
Table A.1 – Classification of manufacturing activities
Codes Description DA Food products, beverages and tobacco DB Textile and clothing DC Leather and leather products DD Wood and wood products
DE Pulp, paper, and paper products, publishing and printing
DF Coke, refined petroleum products, and nuclear fuel
DG Chemicals, chemical products, and man-made fibres
DH Rubber and plastic products DI Non-metallic mineral products DJ Basic metals and fabricated metal products DK Machinery and equipment DL Electrical and optical equipment DM Transport equipment DN Other manufacturing
NOTE DI LAVORO DELLA FONDAZIONE ENI ENRICO MATTEI Fondazione Eni Enrico Mattei Working Paper Series
Our Note di Lavoro are available on the Internet at the following addresses: http://www.feem.it/Feem/Pub/Publications/WPapers/default.htm
http://www.ssrn.com/link/feem.html http://www.repec.org
http://agecon.lib.umn.edu http://www.bepress.com/feem/
NOTE DI LAVORO PUBLISHED IN 2008 CCMP 1.2008 Valentina Bosetti, Carlo Carraro and Emanuele Massetti: Banking Permits: Economic Efficiency and
Distributional Effects CCMP 2.2008 Ruslana Palatnik and Mordechai Shechter: Can Climate Change Mitigation Policy Benefit the Israeli Economy?
A Computable General Equilibrium Analysis KTHC 3.2008 Lorenzo Casaburi, Valeria Gattai and G. Alfredo Minerva: Firms’ International Status and Heterogeneity in
Performance: Evidence From Italy KTHC 4.2008 Fabio Sabatini: Does Social Capital Mitigate Precariousness? SIEV 5.2008 Wisdom Akpalu: On the Economics of Rational Self-Medication CCMP 6.2008 Carlo Carraro and Alessandra Sgobbi: Climate Change Impacts and Adaptation Strategies In Italy. An
Economic Assessment ETA 7.2008 Elodie Rouvière and Raphaël Soubeyran: Collective Reputation, Entry and Minimum Quality Standard IEM 8.2008 Cristina Cattaneo, Matteo Manera and Elisa Scarpa: Industrial Coal Demand in China: A Provincial Analysis IEM 9.2008 Massimiliano Serati, Matteo Manera and Michele Plotegher: Modeling Electricity Prices: From the State of the
Art to a Draft of a New Proposal CCMP 10.2008 Bob van der Zwaan and Reyer Gerlagh: The Economics of Geological CO2 Storage and Leakage KTHC 11.2008 Maria Francesca Cracolici and Teodora Erika Uberti: Geographical Distribution of Crime in Italian Provinces:
A Spatial Econometric Analysis KTHC 12.2008 Victor Ginsburgh, Shlomo Weber and Sheila Weyers: Economics of Literary Translation. A Simple Theory and
Evidence NRM 13.2008 Carlo Giupponi, Jaroslav Mysiak and Alessandra Sgobbi: Participatory Modelling and Decision Support for
Natural Resources Management in Climate Change Research NRM 14.2008 Yaella Depietri and Carlo Giupponi: Science-Policy Communication for Improved Water Resources
Management: Contributions of the Nostrum-DSS Project CCMP 15.2008 Valentina Bosetti, Alexander Golub, Anil Markandya, Emanuele Massetti and Massimo Tavoni: Abatement Cost
Uncertainty and Policy Instrument Selection under a Stringent Climate Policy. A Dynamic Analysis KTHC 16.2008 Francesco D’Amuri, Gianmarco I.P. Ottaviano and Giovanni Peri: The Labor Market Impact of Immigration in
Western Germany in the 1990’s KTHC 17.2008 Jean Gabszewicz, Victor Ginsburgh and Shlomo Weber: Bilingualism and Communicative Benefits CCMP 18.2008 Benno Torgler, María A.GarcíaValiñas and Alison Macintyre: Differences in Preferences Towards the
Environment: The Impact of a Gender, Age and Parental Effect PRCG 19.2008 Gian Luigi Albano and Berardino Cesi: Past Performance Evaluation in Repeated Procurement: A Simple Model
of Handicapping CTN 20.2008 Pedro Pintassilgo, Michael Finus, Marko Lindroos and Gordon Munro (lxxxiv): Stability and Success of
Regional Fisheries Management Organizations CTN 21.2008 Hubert Kempf and Leopold von Thadden (lxxxiv): On Policy Interactions Among Nations: When Do
Cooperation and Commitment Matter? CTN 22.2008 Markus Kinateder (lxxxiv): Repeated Games Played in a Network CTN 23.2008 Taiji Furusawa and Hideo Konishi (lxxxiv): Contributing or Free-Riding? A Theory of Endogenous Lobby
Formation CTN 24.2008 Paolo Pin, Silvio Franz and Matteo Marsili (lxxxiv): Opportunity and Choice in Social Networks CTN 25.2008 Vasileios Zikos (lxxxiv): R&D Collaboration Networks in Mixed Oligopoly CTN 26.2008 Hans-Peter Weikard and Rob Dellink (lxxxiv): Sticks and Carrots for the Design of International Climate
Agreements with Renegotiations CTN 27.2008 Jingang Zhao (lxxxiv): The Maximal Payoff and Coalition Formation in Coalitional Games CTN 28.2008 Giacomo Pasini, Paolo Pin and Simon Weidenholzer (lxxxiv): A Network Model of Price Dispersion CTN 29.2008 Ana Mauleon, Vincent Vannetelbosch and Wouter Vergote (lxxxiv): Von Neumann-Morgenstern Farsightedly
Stable Sets in Two-Sided Matching CTN 30.2008 Rahmi İlkiliç (lxxxiv): Network of Commons CTN 31.2008 Marco J. van der Leij and I. Sebastian Buhai (lxxxiv): A Social Network Analysis of Occupational Segregation CTN 32.2008 Billand Pascal, Frachisse David and Massard Nadine (lxxxiv): The Sixth Framework Program as an Affiliation
Network: Representation and Analysis CTN 33.2008 Michèle Breton, Lucia Sbragia and Georges Zaccour (lxxxiv): Dynamic Models for International Environmental
Agreements
PRCG 34.2008 Carmine Guerriero: The Political Economy of Incentive Regulation: Theory and Evidence from US States IEM 35.2008 Irene Valsecchi: Learning from Experts PRCG 36.2008 P. A. Ferrari and S. Salini: Measuring Service Quality: The Opinion of Europeans about Utilities ETA 37.2008 Michele Moretto and Gianpaolo Rossini: Vertical Integration and Operational Flexibility CCMP 38.2008 William K. Jaeger and Van Kolpin: The Environmental Kuznets Curve from Multiple Perspectives PRCG 39.2008 Benno Torgler and Bin Dong: Corruption and Political Interest: Empirical Evidence at the Micro Level KTHC 40.2008 Laura Onofri, Paulo A.L.D. Nunes, Jasone Cenoz and Durk Gorter: Language Diversity in Urban Landscapes:
An econometric study CTN 41.2008 Michel Le Breton, Valery Makarov, Alexei Savvateev and Shlomo Weber (lxxxiv): Multiple Membership and
Federal Sructures NRM 42.2008 Gideon Kruseman and Lorenzo Pellegrini: Institutions and Forest Management: A Case Study from Swat,
Pakistan SIEV 43.2008 Pietro Caratti and Ludovico Ferraguto: Analysing Regional Sustainability Through a Systemic Approach: The
Lombardy Case Study KTHC 44.2008 Barbara Del Corpo, Ugo Gasparino, Elena Bellini and William Malizia: Effects of Tourism Upon the Economy
of Small and Medium-Sized European Cities. Cultural Tourists and “The Others” CTN 45.2008 Dinko Dimitrov and Emiliya Lazarova: Coalitional Matchings ETA 46.2008 Joan Canton, Maia David and Bernard Sinclair-Desgagné: Environmental Regulation and Horizontal Mergers
in the Eco-industry ETA 47.2008 Stéphane Hallegatte: A Proposal for a New Prescriptive Discounting Scheme: The Intergenerational Discount
Rate KTHC 48.2008 Angelo Antoci, Paolo Russu and Elisa Ticci: Structural Change, Environment and Well-being: Interactions
Between Production and Consumption Choices of the Rich and the Poor in Developing Countries PRCG 49.2008 Gian Luigi Albano, Federico Dini Roberto Zampino and Marta Fana: The Determinants of Suppliers’
Performance in E-Procurement: Evidence from the Italian Government’s E-Procurement Platform CCMP 50.2008 Inmaculada Martínez-Zarzoso: The Impact of Urbanization on CO2 Emissions: Evidence from Developing
Countries KTHC 51.2008 Michele Moretto and Sergio Vergalli: Managing Migration through Quotas: an Option-theory Perspective KTHC 52.2008 Ugo Gasparino, Elena Bellini, Barbara Del Corpo and William Malizia: Measuring the Impact of Tourism
Upon Urban Economies: A Review of Literature ETA 53.2008 Reyer Gerlagh, Snorre Kverndokk and Knut Einar Rosendahl: Linking Environmental and Innovation Policy KTHC 54.2008 Oguzhan C. Dincer and Burak Gunalp: Corruption, Income Inequality, and Poverty in the United States PRCG 55.2008 Carmine Guerriero: Accountability in Government and Regulatory Policies: Theory and Evidence KTHC 56.2008 Tanmoyee Banerjee (Chatterjee) and Nilanjana Mitra: Export, Assembly-line FDI or FDI with the Possibility of
Technology Diffusion: Optimal Entry Mode for Multinationals ETA 57.2008 Xavier Pautrel: Environmental Policy, Education and Growth: A Reappraisal when Lifetime Is Finite CCMP 58.2008 Natalia Zugravu, Katrin Millock and Gérard Duchene: The Factors Behind CO2 Emission Reduction in
Transition Economies NRM 59.2008 Benno Torgler, María A.García-Valiñas and Alison Macintyre: Justifiability of Littering: An Empirical
Investigation SIEV 60.2008 Paolo Rosato, Anna Alberini, Valentina Zanatta and Margaretha Breil: Redeveloping Derelict and Underused
Historic City Areas: Evidence from a Survey of Real Estate Developers CTN 61.2008 Ricardo Nieva: Networks with Group Counterproposals CTN 62.2008 Michael Finus and Dirk T.G. Rübbelke: Coalition Formation and the Ancillary Benefits of Climate Policy SIEV 63.2008 Elisabetta Strazzera, Elisabetta Cerchi and Silvia Ferrini: A Choice Modelling Approach for Assessment of Use
and Quasi-Option Values in Urban Planning for Areas of Environmental Interest SIEV 64.2008 Paolo Rosato, Lucia Rotaris, Margaretha Breil and Valentina Zanatta: Do We Care about Built Cultural
Heritage? The Empirical Evidence Based on the Veneto House Market KTHC 65.2008 Luca Petruzzellis and Antonia Rosa Guerrieri: Does Network Matter in International Expansion? Evidence from
Italian SMEs NRM 66.2008 Sheila M. Olmstead and Robert N. Stavins: Comparing Price and Non-price Approaches to Urban Water
Conservation CCMP 67.2008 Robert N. Stavins: Addressing Climate Change with a Comprehensive U.S. Cap-and-Trade System CCMP 68.2008 Geoffrey J. Blanford, Richard G. Richels and Thomas F. Rutherford: Impact of Revised CO2 Growth Projections
for China on Global Stabilization Goals CCMP 69.2008 Valentina Bosetti, Carlo Carraro, Alessandra Sgobbi and Massimo Tavoni: Delayed Action and Uncertain
Targets. How Much Will Climate Policy Cost? CCMP 70.2008 Valentina Bosetti, Carlo Carraro and Massimo Tavoni: Delayed Participation of Developing Countries to
Climate Agreements: Should Action in the EU and US be Postponed? SIEV 71.2008 Massimiliano Mazzanti, Anna Montini and Francesco Nicolli: Embedding Landfill Diversion in Economic,
Geographical and Policy Settings Panel based evidence from Italy ETA 72.2008 Reyer Gerlagh and Matti Liski: Strategic Resource Dependence CCMP 73.2008 Sonia Ben Kheder and Natalia Zugravu: The Pollution Haven Hypothesis: A Geographic Economy Model in a
Comparative Study SIEV 74.2008 Jérôme Massiani and Paolo Rosato: The Preferences of Trieste Inhabitants for the Re-use of the Old Port: A
Conjoint Choice Experiment SIEV 75.2008 Martin F. Quaas and Sjak Smulders: Pollution and the Efficiency of Urban Growth CCMP 76.2008 Anil Markandya and Dirk T.G. Rübbelke: Impure Public Technologies and Environmental Policy
KTHC 77.2008 Gianmarco I P Ottaviano and Giovanni Peri: Immigration and National Wages: Clarifying the Theory and the Empirics
CCMP 78.2008 Vivekananda Mukherjee, Dirk T.G. Rübbelke and Tilak Sanyal: Technology Transfer in the Non-traded Sector as a Means to Combat Global Warming
SIEV 79.2008 A. Ghermandi, J.C.J.M. van den Bergh, L.M. Brander, H.L.F. de Groot, and P.A.L.D. Nunes: The Economic Value of Wetland Conservation and Creation: A Meta-Analysis
CCMP 80.2008 Snorre Kverndokk and Adam Rose: Equity and Justice in Global Warming Policy ETA 81.2008 Sonia Oreffice: Sexual Orientation and Household Decision Making. Same-Sex Couples’ Balance of Power and
Labor Supply Choices CCMP 82.2008 Robert N. Stavins: A Meaningful U.S. Cap-and-Trade System to Address Climate Change NRM 83.2008 Ruben N. Lubowski, Andrew J. Plantinga and Robert N. Stavins: What Drives Land-Use Change in the United
States? A National Analysis of Landowner Decisions CSRM 84.2008 Forest L. Reinhardt, Robert N. Stavins, and Richard H. K. Vietor: Corporate Social Responsibility Through an
Economic Lens CCMP 85.2008 Valentina Bosetti, Carlo Carraro, Alessandra Sgobbi and Massimo Tavoni: Modelling Economic Impacts of
Alternative International Climate Policy Architectures. A Quantitative and Comparative Assessment of Architectures for Agreement
PRCG 86.2008 Gian Luigi Albano, Federico Dini and Roberto Zampino: Bidding for Complex Projects: Evidence From the Acquisitions of IT Services
SIEV 87.2008 Dennis Guignet and Anna Alberini: Voluntary Cleanups and Redevelopment Potential: Lessons from Baltimore, Maryland
IEM 88.2008 Louis-Gaëtan Giraudet and Philippe Quirion: Efficiency and Distributional Impacts of Tradable White Certificates Compared to Taxes, Subsidies and Regulations
CCMP 89.2008 Damien Demailly and Philippe Quirion: Changing the Allocation Rules in the EU ETS: Impact on Competitiveness and Economic Efficiency
CCMP 90.2008 Judson Jaffe and Robert N. Stavins: Linkage of Tradable Permit Systems in International Climate Policy Architecture
SIEV 91.2008 Silvio Giove, Paolo Rosato and Margaretha Breil: A Multicriteria Approach for the Evaluation of the Sustainability of Re-use of Historic Buildings in Venice
CCMP 92.2008 Corrado Di Maria, Sjak Smulders and Edwin van derWerf: Absolute Abundance and Relative Scarcity: Announced Policy, Resource Extraction, and Carbon Emissions
CCMP 93.2008 Dirk T.G. Rübbelke and Nathan Rive: Effects of the CDM on Poverty Eradication and Global Climate ProtectionSIEV 94.2008 Massimiliano Mazzanti and Roberto Zoboli: Waste Generation, Incineration and Landfill Diversion. De-
coupling Trends, Socio-Economic Drivers and Policy Effectiveness in the EU CCMP 95.2008 Benno Torgler, María A.García Valiñas and Alison Macintyre: Environmental Participation and Environmental
Motivation CCMP 96.2008 Geoffrey Heal and Nori Tarui: Technology Diffusion, Abatement Cost, and Transboundary Pollution CCMP 97.2008 Alessio D'Amato and Edilio Valentini: Enforcement and Environmental Quality in a Decentralized Emission
Trading System CTN CCMP
98.2008 99.2008
Shao-Chin Sung and Dinko Dimitrov: Computational Complexity in Additive Hedonic Games Giulio Cainelli, Massimiliano Mazzanti and Roberto Zoboli: The Relationship Between Environmental Efficiency and Manufacturing Firm’s Growth
(lxxxiv) This paper was presented at the 13th Coalition Theory Network Workshop organised by the Fondazione Eni Enrico Mattei (FEEM), held in Venice, Italy on 24-25 January 2008.
2008 SERIES
CCMP Climate Change Modelling and Policy (Editor: Carlo Carraro)
SIEV Sustainability Indicators and Environmental Valuation (Editor: Carlo Carraro)
NRM Natural Resources Management (Editor: Carlo Giupponi)
KTHC Knowledge, Technology, Human Capital (Editor: Gianmarco Ottaviano)
IEM International Energy Markets (Editor: Matteo Manera)
CSRM Corporate Social Responsibility and Sustainable Management (Editor: Giulio Sapelli)
PRCG Privatisation Regulation Corporate Governance (Editor: Bernardo Bortolotti)
ETA Economic Theory and Applications (Editor: Carlo Carraro)
CTN Coalition Theory Network