euro-asian transport linkages - unece
TRANSCRIPT
Economic Commission for Europe
Inland Transport Committee
Eightieth session
Geneva, 20-23 February 2018
Item 5 (a) (ii) of the provisional agenda
Strategic questions of a modal and thematic nature: Project related activities -
Euro-Asian Transport Links (EATL) Project
Report on Phase III of the Euro-Asian Transport Links Project
Note by the secretariat
Summary
This document presents the full report of the phase III of the Euro-Asian Transport
Links project.
This report is the outcome of work of the Gorup of Experts on Euro-Asian Transport
Links in phase III of the project. The drafting was supported by consultant: Scientific
and Research Institute of Motor Transport (NIIAT).
This document is accompanied by ECE/TRANS/2018/9 which contains the
background and summary of the report of the phase III of the Euro-Asian Transport
Links project.
The Committee is invited to take note of the findings of the report for future
development of EATL at the national, international and industrial levels and provide
guidance on the way forward. The Committee is also invited to approve the report.
Informal document ITC (2018) No. 8
Distr.: General 5 February 2018 English only
2
TABLE OF CONTENTS
List of Tables ................................................................................................................................................................. 5
List of Figures ............................................................................................................................................................... 6
ABBREVIATIONS ....................................................................................................................................................... 8
INTRODUCTION ....................................................................................................................................................... 10
PART I. EURO-ASIAN TRADE ROUTES AND FREIGHT FLOWS ...................................................................... 14
I.1. Economics and trade current situation in EATL Region ........................................................................... 14
I.1.1. General overview .............................................................................................................................. 14
I.1.2. East Asia ........................................................................................................................................... 17
I.1.3. South Eastern Europe ........................................................................................................................ 18
I.1.4. Commonwealth of Independent States .............................................................................................. 20
I.1.5 Conclusions ................................................................................................................................................ 22
I.2. Euro-Asian trade flows and inland transport.............................................................................................. 22
I.2.1. Main commodity groups ................................................................................................................... 22
I.2.2. Main trade partners ........................................................................................................................... 28
I.3. Euro-Asian transport flows ........................................................................................................................ 40
I.3.1. EATL transport flows general overview ........................................................................................... 40
I.3.2. Liner shipping situation ..................................................................................................................... 42
I.3.3. Railway transport .............................................................................................................................. 47
I.3.4. Road transport ................................................................................................................................... 86
I.3.5. Air transport ...................................................................................................................................... 89
I.4. Transport Infrastructure of EATL routes development .............................................................................. 95
I.4.1. Sea ports and their hinterland connections role in EATL corridors .................................................. 95
I.4.2. Infrastructure of EATL railway routes .............................................................................................. 99
I.4.3. Infrastructure of EATL road routes ................................................................................................. 104
I.4.4. Air transport infrastructure .............................................................................................................. 108
I.4.5. Logistic centres and dry ports in the EATL system ........................................................................ 109
1.5. Comparative analysis of the duration and expenses of different modes of transport between Europe and
Asia on selected Euro-Asian routes ...................................................................................................................... 111
PART II. CURRENT INITIATIVES, PROJECTS AND STUDIES IN EATL REGION ........................................ 127
3
II.1. Overview of international studies, programmes and initiatives on Euro-Asian transport links development
127
II.1.2. United Nations Economic and Social Commission for Asia and the Pacific .................................. 129
II.1.3. United Nations Office of the High Representative for the Least Developed Countries, Landlocked
Developing Countries and the Small Island Developing States ........................................................................ 130
II.1.4. United Nations Conference on Trade and Development ................................................................. 131
II.1.5. United Nations Special Programme for the Economies of Central Asia ......................................... 131
II.1.6. European Union .............................................................................................................................. 132
II.1.7. Eurasian Economic Union ............................................................................................................... 133
II.1.8. Silk Road Economic BELT Initiative.............................................................................................. 134
II.1.9. Organization for Security and Co-operation in Europe ................................................................... 136
II.1.10. Organization for Cooperation of Railways .......................................................................................... 137
II.1.11. Organization of the Black Sea Economic Cooperation ........................................................................ 139
II.1.12.Trans-Caspian International Transport Initiative .................................................................................. 140
II.1.13. Economic Cooperation Organization ................................................................................................... 142
II.1.14. Organization for Democracy and Economic Development .................................................................. 142
II.1.15. World Bank .......................................................................................................................................... 143
II.1.16 Central Asia Regional Economic Cooperation Program ....................................................................... 144
II.1.17. Islamic Development Bank .................................................................................................................. 146
II.1.18. European Bank for Reconstruction and Development ......................................................................... 147
II.1.19. International Road Transport Union .................................................................................................... 148
II.1.20. International Union of Railways .......................................................................................................... 149
II.1.21. Coordinating Council on Trans-Siberian Transportation ..................................................................... 149
II.1.22. Global Partnership for Sustainable Transport ...................................................................................... 150
II.2. Joint Initiatives and projects implemented by International organisations .............................................. 150
II.3. Most important national level programmes and projects ......................................................................... 151
PART III. MAIN OBSTACLES HAMPERING THE EURO-ASIAN TRANSPORT LINKS DEVELOPMENT .. 166
III.1. General overview ......................................................................................................................................... 166
III.2 Border crossings on EATL inland routes ...................................................................................................... 166
III.2.1 Border crossing infrastructure ......................................................................................................... 168
III.2.2 Border crossing processes and procedures ...................................................................................... 168
III.3 Road transport ............................................................................................................................................... 168

4
III.3 Rail transport ................................................................................................................................................. 170
III.4 Intermodal transport ...................................................................................................................................... 171
III.5 Public and private interests, cross-country cooperation ................................................................................ 172
III.6. Conclusions .................................................................................................................................................. 172
PART IV. EATL: LOOKING INTO THE FUTURE................................................................................................ 173
PART V. CONCLUSIONS AND RECOMMENDATIONS .................................................................................... 188
REFERENCES .......................................................................................................................................................... 195
ANNEXES ................................................................................................................................................................ 197
5
List of Tables
Table 1.1 Economic growth by main trade partners in Europe and Asia, 2013–2016 and
forecast for 2017-2018 (Percentage change)
Table 1.2 Growth in merchandise trade volume by Europe and Asia, 2013–2016 and forecast
for 2017-2018 (Percentage change)
Table 1.3 Rates of growth of real GDP in China, Mongolia and Republic of Korea in 2013–
2016 and forecast for 2017-2018 (Percentage change)
Table 1.4 Changes in value and volume of export and import of goods by countries of Eastern
Asia in 2013–2016 and forecast for 2017-2018 (Percentage change)
Table 1.5 Rates of growth of real GDP in selected countries of South Eastern Europe in 2013–
2016 and forecast for 2017-2018 (Percentage change)
Table 1.6 Changes in value and volume of export and import of goods by countries of South
Eastern Europe (excluding Turkey) in 2013–2016 and forecast for 2017-2018
(Percentage change)
Table 1.7 Rates of growth of real GDP in CIS member States and Georgia in 2013–2016 and
forecast for 2017-2018 (Percentage change)
Table 1.8 EATL countries bilateral and multilateral trade agreements
Table 1.9 Changes in value and volume of export and import of goods by CIS countries in
2013–2016 and forecast for 2017-2018 (Percentage change)
Table 1.10 Cargoes identified as suitable for inland long-distance transport between Europe and
Asia
Table 1.11 Import of goods to Asia from selected European countries in 2010, million US
dollars
Table 1.12 Export of goods from Asia to selected European countries in 2010, million US
dollars
Table 1.13 Import of goods to Asia from selected European countries in 2011, million US
dollars
Table 1.14 Export of goods from Asia to selected European countries in 2011, million US
dollars
Table 1.15 Import of goods to Asia from selected European countries in 2012, million US
dollars
Table 1.16 Export of goods from Asia to selected European countries in 2012, million US
dollars
Table 1.17 Import of goods to Asia from selected European countries in 2013, million US
dollars
Table 1.18 Export of goods from Asia to selected European countries in 2013, million US
dollars
Table 1.19 Import of goods to Asia from selected European countries in 2014, million US
dollars
Table 1.20 Export of goods from Asia to selected European countries in 2014, million US
dollars
Table 1.21 Import of goods to Asia from selected European countries in 2015, million US
dollars
Table 1.22 Export of goods from Asia to selected European countries in 2015, million US
dollars
Table 1.23 Volume of goods transported between the European Union and China by modes of
transport in 2011-2016, million tonnes
Table 1.24 Average cost of one tonne transported between the European Union and China by
modes of transport in 2011-2016, US Dollars
Table 1.25 Port-to-port freight index list on trade routes China – Europe shipping lines (U.S.
Dollars per TEU) on April 6, 2017
Table 1.26 Container freight markets and rates on trade routes Far East – Europe (U.S. Dollars
per TEU)
Table 1.27 Volume of international transport of goods by rail between some neighbouring
railways in EATL countries in 2015, thousands tonnes
Table 1.28 Container services to/from China offered by DB Schenker and Trans Eurasia
Logistics (TEL)
Table 1.29 Block Container Trains Europe - China in 2014
6
Table 1.30 List of block trains routes and contrailer services on the railways of OSJD member
States (as of 14.10.2016)
Table 1.31 Existing (possible) cargo flows by road transport between Europe and Asia in
accordance with concluded bilateral/multilateral agreements on international road
transport
Table 1.32 Historical and forecast air cargo annual growth rates, per cent
Table 1.33 EATL system seaports and their relation to EATL routes
Table 1.34 Biggest Western European container terminals served Europe – Asia shipping lines
and their throughput, 2013, 2014 and 2015 (Thousands of 20-foot equivalent units
and percentage change)
Table 1.35 Biggest Asian container terminals served Europe – Asia shipping lines and their
throughput, 2013, 2014 and 2015 (Thousands of 20-foot equivalent units and
percentage change)
Table 1.36 EATL Rail Routes: number of gauge changes and ferry crossings
Table 1.37 EATL Road Routes
Table 1.38 Top airports served Euro-Asian cargo flows, 2011-2016, thousands tonnes
Table 1.39 Selected results of the comparative analysis of the maritime and inland Eurasian
routes (EATL phase II study)
Table 1.40 Value of time options
Table 1.41 Comparison of routes taking into account the value of time
Table 1.42 Regionalization of trade between the European Union and China within Chinese
regions
Table 1.43 NSTR/1 commodity classification and value of time for commodity groups
Table 1.44 Main model parameters for 2010 and 2020
Table 1.45 Estimated 2010 and 2020 rail corridor and maritime volumes between China and
EU-28
Table 1.46 Route 1a components
Table 1.47 Route 1b components
Table 1.48 Route 2a components
Table 1.49 Route 2b components
Table 1.50 Route 3b components
Table 1.51 Route 4b components
Table 1.52 SREB Transport corridors and their potential
Table 4.1 Strengths - Weaknesses - Opportunities- Threats (SWOT) matrix for further EATL
development
List of Figures
Figure 1.1 Growth in volume of world merchandise trade and real GDP, 2005-2015 (percentage
change)
Figure 1.2 Volume of merchandise exports and imports by Europe and Asia in 2012-2016,
seasonally adjusted indices, 2012Q1=10
Figure 1.3 Dynamics of trade in goods between selected European and Asian countries in 2010-
2015, billion US Dollars
Figure 1.4 Share of volume of trade in goods between selected European and Asian countries in
world merchandise trade in 2011-2015, per cent
Figure 1.5 Dynamics of trade in containerizable goods between selected European and Asian
countries in 2011-2015, billion US Dollars
Figure 1.6 The share of containerizable goods in total volume of trade between selected European
and Asian countries in 2011-2015, per cent
Figure 1.7 Market share by modes of transport in cargo flows (in tonnes) between European Union
and China in 2011-2016, per cent
Figure 1.8 Containerized cargo flows on major East–West container trade routes (million TEUs),
1995–2016
Figure 1.9 Containerized cargo flows on Asia-Europe and Europe-Asia container trade routes
(million TEUs), 2009–2016
Figure 1.10 Market share by alliance on the Far East-Europe shipping lines, April 2016
Figure 1.11 Container Global Aggregated Price Index, January 2013 – October 2016
7
Figure 1.12 China forwarders freight index, China-Europe shipping lines (U.S. Dollars per TEU),
2010-2017
Figure 1.13 TransContainer Service China – Europe - China
Figure 1.14 Container Service Souzhou (China) – Warsaw (Poland) by Transcontainer
Figure 1.15 Container Service Hamburg - Beijing
Figure 1.16 Container Service from Republic of Korea to Europe
Figure 1.17 FELB Technology of Container delivery between China and Europe
Figure 1.18 Souzhou (China) – Europe Container Services by RZD Logistics
Figure 1.19 Asia – Europe Container Services by RZDL and FELB
Figure 1.20 Regular Intermodal China – Europe Services by DB Schenker Rail AG and TEL
Figure 1.21 Rail Network Covered by DB Schenker operations
Figure 1.22 Regular Intermodal Services between China and Hungary/Austria
Figure 1.23 Regular FESCO Intermodal Services
Figure 1.24 Mongolian Vector Container Block Train Route
Figure 1.25 COSCO Logistics railway routes
Figure 1.26 Wuhan-Europe freight trains operation scheme (source – Hubay Government site)
Figure 1.27 Number of block trains routes in OSJD member States in 2016
Figure 1.28 Volume of international road transport between Kazakhstan and European countries in
2011-2016, thousands tonnes
Figure 1.29 The share of Europe – Asia and Asia Europe directions in the total volume of road
transport of goods between Kazakhstan and European countries in 2011-2016, per cent
Figure 1.30 Total air cargo traffic carried by freight airlines on the Europe Asia routes in comparison
with other main transcontinental air transport markets, per cent
Figure 1.31 Volume of Europe – Asia air cargo traffic in 1995-2015, millions tonnes
Figure 1.32 Annual growth of air cargo flows on the routes Asia – Europe and Europe – Asia in
1998-2013, million tonnes
Figure 1.33 Air cargo structure by main commodity groups on the routes Asia – Europe and Europe –
Asia in 2015, per cent
Figure 1.34 Europe-Asia air cargo market forecast till 2033 by Boeing, millions tonnes
Figure 1.35 Asia-Europe air cargo market forecast till 2033 by Boeing, millions tonnes
Figure 1.36 Scheme of Imam Khomeini port (Iran) – Bazargan (border with Turkey) corridor as a
section of EATL8, EATL5 rail routes
Figure 1.37 Australian road vehicle types
Figure 1.38 Eurokombi concept
Figure 1.39 Structure of time/costs considered by the EATL phase II study
Figure 1.40 Transport routes considered by the CEFIR study
Figure 1.41 Time – distance diagram for routes 1a and 1b
Figure 1.42 Cost – distance diagram for routes 1a and 1b
Figure 1.43 Time – distance diagram for routes 2a and 2b
Figure 1.44 Cost – distance diagram for routes 2a and 2b
Figure 1.45 Time – distance diagram for routes 3a and 3b
Figure 1.46 Cost – distance diagram for routes 3a and 3b
Figure 1.47 Time – distance diagram for routes 4a and 4b
Figure 1.48 Cost – distance diagram for routes 4a and 4b
Figure 2.1 Map of TEN-T corridors
Figure 2.2 Silk Road Economic Belt and the 21st Century Maritime Silk Road corridors as
described in the Vision and Actions on Jointly building the Silk Road Economic Belt and
21-st Century Maritime Silk Road document
Figure 2.3 CAREC corridors
Figure 2.4 Transit rail corridors in Mongolia
Figure 2.5 Time of railway transit via territory of Mongolia in 2015, hours
Figure 2.6 Via Carpatia Transport Corridor Project
Figure 3.1 Average border crossing times, Uzbekistan road BCP, 2013
Figure 3.2 Average border crossing times for selected BCP, 2013
8
ABBREVIATIONS
ADB Asian Development Bank
AIIB Asian Infrastructure Investment Bank
ASEAN Association of Southeast Asian Nations
BSEC Organization of the Black Sea Economic Cooperation
BSEC-URTA BSEC Union of Road Transport Associations
CAREC Central Asian Regional Economic Development Program
CCTP Coordinating Council on Trans-Siberian Transportation International Association
CEFIR Centre for Economic and Financial Research at the New Economic School
CIM Uniform Rules concerning the Contract of International Carriage of Goods by Rail
CIM/SMGS Unified Rail Consignment Note
CIS Commonwealth of Independent States
COSCO China Ocean Shipping Company
COTIF Convention concerning International Carriage by Rail
EAEU Eurasian Economic Union
EATL Euro-Asian Transport Links
EBRD European Bank for Reconstruction and Development
ECO Economic Cooperation Organization
EDB Euro-Asian Development Bank
EEC Eurasian Economic Commission
EECCA Eastern Europe, Caucasus and Central Asia
EU European Union
FAS FESCO Amur Shuttle
FASw FESCO Amur Shuttle westbound
FBS FESCO Baltic Shuttle service
FELB Far East Land Bridge
FESCO Far East Shipping Company
FMS FESCO Moscow Shuttle
FMSe FESCO Moscow Shuttle eastbound
FOB free on board
FOS FESCO Ob Shuttle
FSS FESCO Siberian Shuttle
FSSe FESCO Siberian Shuttle eastbound
FUS FESCO Ural Shuttle
GDP gross domestic product
GIS Geographical Information System
GPST Global Partnership for Sustainable Transport
GUAM Organization for Democracy and Economic Development
GVC Global value chain
IBRD International Bank for Reconstruction and Development
ICT information and communication technology
IDA International Development Association
IDB Islamic Development Bank
IGC Intergovernmental Commission
IM Infrastructure Manager
IMF International Monetary Fund
IRF International Road Federation
ISIC International Road Transport Union
ISIC International Standard Industrial Classification
KTZ Kazakhstan Railways
LDC Least developed countries
LHV long and heavy vehicles
9
LLDC Landlocked developing countries
MLA Multilateral Agreement
OBOR “One Belt, One Road” Initiative
OECD Organisation for Economic Co-operation and Development
OPEC Organization of the Petroleum Exporting Countries
OSCE Organization for Security and Co-operation in Europe
OSJD Organization for Cooperation of international Railways
OTIF Intergovernmental Organisation for International Carriage by Rail
PETC Pan-European Transport Corridors
RZD Russian Railways
RZDL Russian Railways (RZD) Logistics
SDGs Sustainable Development Goals
SITC Standard International Trade Classification
SMGS Agreement on Direct International Goods Transport by Rail
SPECA United Nations Special Programme for the Economies of Central Asia
SREB Silk Road Economic Belt
TAR Trans-Asian Railway Network
TEL Trans Eurasia Logistics
TEM Trans-European Motorways Project
TEN-T Trans-European Network – Transport
TER Trans-European Railways Project
TEU Twenty-foot equivalent unit
TFA WTO Trade Facilitation Agreement
TRACECA Transport Corridor Europe – Caucasus – Asia
TSR Trans-Siberian Railway
TWG Thematic Working Group
UIC International Union of Railways
UNCTAD United Nations Conference on Trade and Development
UN DESA United Nations Department of Economic and Social Affairs
UNDP United Nations Development Program
UN ECE United Nations Economic Commission for Europe
UN OHRLLS United Nations Office of the High Representative for the Least Developed Countries,
Landlocked Developing Countries and the Small Island Developing States
UN ESCAP United Nations Economic and Social Commission for Asia and Pacific
UNWTO United Nations World Tourism Organization
UTLC United Transport and Logistics Company
WCM World Container Model
WCO World Customs Organization
WTO World Trade Organization
XUAR Xinjiang Uyghur Autonomous Region, China
Some of the Internet addresses provided as references throughout this report were available at the time of writing but
may no longer be accessible.

10
INTRODUCTION
Previous phases of the Euro-Asian Transport Links project
The Euro-Asian Transport Links (EATL) was a long-term project in recent decades between
many countries in Europe and Asia, and was supported by international institutions and the
transport business community in an aim to improve the conditions for trade and socioeconomic
development on the continent.
EATL started in 2002 with ECE and ESCAP.
Phase I, “Capacity-building for Developing Interregional Land and Land-cum-sea Transport
Linkages” was implemented during 2002-2007. It identified the main Euro-Asian road, rail and
inland water transport routes, sea and inland river ports, and prioritized the development
initiatives on the routes. It first analysed the physical and non-physical barriers to transport and
cargo flows on the routes. A Group of Experts was established, and proved effective for
coordinating the development of coherent Euro-Asian inland transport links.
Phase II was pursued by ECE during 2008-2013 to help the participating countries agree on nine
rail and nine road routes which were considered to be the principle transport links between
Europe and Asia, from the proposed 311 initiatives. The initiatives were evaluated for relevance,
importance for international traffic, and for their value to connect Asia with Europe. The
assessment of transport investment needs on the routes at the multi-country level was also
undertaken in this phase. A comparative analysis of the Euro-Asian railway transport versus
maritime transport, and a comparative scenario analysis of cargo flow on nine door-to-door
routes in terms of time and cost, or a SWOT analysis of the EATL routes were produced. ECE
also developed a free Geographical Information System (GIS) interactive application with access
to the database on EATL routes. The Group of Experts continued to provide an effective
platform for cooperation between EATL countries.
Phase III of Euro-Asian Transport Links project
The second EATL ministerial meeting (26 February 2013, Geneva) endorsed the phase II final
report and supported in its joint declaration a continuation of the project in phase III. Phase III
was considered to be the most critical phase, aiming to improve the operational capacity and
connectivity of the inland transport links between Europe and Asia.
Phase III was supported by 38 countries: Afghanistan, Armenia, Azerbaijan, Belarus, Belgium,
Bosnia and Herzegovina, Bulgaria, China, Croatia, Cyprus, Finland, France, Georgia, Germany,
Greece, Iran (Islamic Republic of), Italy, Kazakhstan, Kyrgyzstan, Latvia, Lithuania,
Luxembourg, Malta, Mongolia, Pakistan, Poland, Portugal, Republic of Moldova, Romania,
Russian Federation, Serbia, Spain, Tajikistan, The former Yugoslav Republic of Macedonia,
Turkey, Turkmenistan, Ukraine and Uzbekistan.
The Group of Experts analyzed trends in trade between Europe and Asia, evaluated cargo flows
on EATL routes, compared delivery times and expenses on different routes between Europe and
Asia, analyzed the possibilities for integrating time schedules and coordinating tariffs, reviewed
different initiatives and projects on EATL routes, and identified main obstacles that hamper
cargo flows on EATL routes.
11
Several major events in the world at this time had a direct impact on the development of EATL,
and attached value to operationalizing EATL inland routes by seeing the importance of
operationalizing routes in advancing regional and global development agendas, i.e.:
(a) The United Nations General Assembly adopted resolution 69/213 “Role of transport and
transit corridors in ensuring international cooperation for sustainable development” (December
2014),
(b) The United Nations General Assembly adopted resolution 70/1 “Transforming our world:
the 2030 Agenda for Sustainable Development” (September 2015) and resolution 70/197
“Towards comprehensive cooperation among all modes of transport for promoting sustainable
multimodal transit corridors” (December 2015),
(c) The Second United Nations Conference on Landlocked Developing Countries adopted
the “Vienna Programme of Action for Landlocked Developing Countries for the Decade 2014-
2024” (November 2014);
(d) The first United Nations Global Conference on Sustainable Transport initiated the
Ashgabat Process on Sustainable Transport (November 2016), and
(e) China launched the “One Belt - One Road initiative (OBOR)” (May 2017).
Another key event for EATL was the Inland Transport Committee session (February 2017),
where ministers of transport, high-level representatives from 58 countries and the European
Commissioner for Transport signed the ministerial resolution “Embracing the new era for
sustainable inland transport and mobility”, and also agreed to work towards improved regional
and intercontinental connectivity with special attention to the EATL project through policy
coordination and facilitation of seamless transport.
Benefits from the Euro-Asian Transport Links project
Operationalizing EATL routes improve capacity, connectivity and the economic efficiency of the
routes, which should affect several areas of the EATL countries, especially the EATL developing
countries. The actions should:
(a) Achieve the Sustainable Development Goals: operationalization of EATL routes is
fundamental to progress in realizing the 2030 Agenda for Sustainable Development and in
achieving the Goals 2, 3, 7, 8, 9, 11, 12 and 13. Reliable and efficient Euro-Asian inland
transport routes are not only transport and transit corridors, but economic corridors that support
sustainable transport, inclusive growth, job creation, poverty reduction, access to markets.
Effective operationalization of the routes would also contribute to fighting climate change,
reducing air pollution and improving road safety.
(b) Develop international logistics chains: operationalization of EATL routes provides
conditions for increasing cargo volumes — time-sensitive, high-value commodities — on
primarily rail routes, and thus logistics chains should further develop in EATL area pushing
further an increase of cargo volumes.
(c) Respond to the challenges of the landlocked developing countries (LLDCs):
operationalization of EATL routes removes fragmentation of supply chains, should decrease
transport costs by 50 per cent between a landlocked country and the nearest foreign sea port. It
should also help LLDCs to fully benefit from access to the global market. In addition, it should
help LLDCs to achieve priorities of the Vienna Programme of Action (VPoA), including:
12
(i) Reduction of travel time on corridors and at borders, and to improve intermodal
connectivity (objectives under Priority 1 of the VPoA "Fundamental transit policy issues");
(ii) Significant increase of the quality of roads, including increase of the share of paved roads
in accordance with international standards; expansion and upgrade of the railway infrastructure
and removal of missing links in the regional road and railway transit networks (Priority 2
“Infrastructure development and maintenance”) ;
(iii) Significant increase of the value added and manufactured exports of LLDCs with the
objective of substantially diversifying their markets and products (Priority 3 “International trade
and trade facilitation”);
(iv) Promotion of regional integration by strengthening regional trade and transport (Priority 4
“Regional integration and cooperation”).
(d) Facilitate regional trade, primarily in Central Asia: especially in the context of the
implementation of the WTO Trade Facilitation Agreement that came into force on 22 January
2017. In particular, “point-focused” investment projects and institutional improvements should
contribute to trade facilitation and increasing connectivity in Central Asia.
Report of phase III of the Euro-Asian Transport Links project
The report of phase III has five chapters on analysis, conclusions and recommendations for
improving the operationalization of EATL inland routes.
Chapter I analyses the economic situation and trends in trade, describes the EATL routes and
provides a comparative analysis of the delivery times and expenses of different modes of
transport on selected routes between Europe and Asia. It further identifies cargo for which the
EATL inland routes could be competing with the maritime and air routes between Europe and
Asia. The key conclusions of this chapter are:
• Economic growth and growth in international trade are not the drivers for increasing in
freight flows as the past has seen it,
• Even if the inland routes can never compete in volume of freight with maritime routes,
they can be increasingly used for high value and time-sensitive freight,
• Markets create new opportunities - e.g. e-commerce - that can increase freight flows on
inland routes,
• Inland routes to compete for high-value and time sensitive (e.g. e-commerce) cargo need
to respond to the requirements of modern supply chains,
• Railway transport is developing but more development is needed - removal of existing
infrastructural gaps and more importantly further adjustments to the requirements of modern
supply chains are necessary,
• Regular operation of container block trains is most competitive, logistics-market-oriented
model for enhanced operationalization of EATL inland routes, and
• Road transport does not operate yet on long distance (East and South East Asia to
Europe), the role of road transport needs to be carefully considered.

13
Chapter II reviews numerous initiatives, projects (either national or undertaken by various
international organizations) and programmes that support the development of EATL inland
routes. However, despite forprogress, more progress and development are needed.
Chapter III identifies and describes the obstacles and bottlenecks to the flow of cargo on the
EATL inland routes. Physical and, in particular, the non-physical barriers, identified as the main
obstacles in developing the EATL inland routes, are explained in detail. Among the main
obstacles are delays at border crossings mainly due to process inefficiencies, availability and
processing of various permits, visa procedures, full paper documentation, differences in legal
regimes, poor service, inflexibility for re-routing, and uncompetitive and changing tariffs.
Chapter IV updates the EATL SWOT analysis from phase II. The strengths, weaknesses,
opportunities and threats are presented by different issues, among them, e.g. (i) access to markets
for LLDCs, (ii) international trade between Europe and Asia, (iii) EATL infrastructure, and (iv)
harmonization of procedures between EATL countries.
Finally, Chapter V makes recommendations for future development of EATL at the national,
international and industrial levels. These recommendations for consideration and action of
governments, international organizations, non-governmental organizations, business and other
stakeholders are provided in a format of actionable initiatives.
The Way forward
The knowledge gathered, the strengths to build on and weaknesses to eliminate, the opportunities
to seize and weaknesses to address for the EATL inland routes in phase III, and the concrete
recommendations provided as actionable initiatives that governments, international
organizations, non-governmental organizations and businesses could undertake, offer the right
basis to continue the work leading to further and continuous improvement in the
operationalization of the EATL inland routes. To succeed in this work, EATL countries
supported by the international and business community need to work together in order to
eliminate any weak points on the EATL inland routes.
***
14
PART I. EURO-ASIAN TRADE ROUTES AND FREIGHT FLOWS
I.1. Economics and trade current situation in EATL Region
I.1.1. General overview
Economic growth and effective transport connectivity are closely interrelated in the vast Euro-
Asian landmass.
By further operationalizing the inland transport routes between Europe and Asia, more countries
and people in both regions will be able to participate in global production networks and global
distribution and value chains.
On the other hand, economic growth in countries along Euro-Asian inland routes is accompanied
by an increase in exports and imports and demand for transport services. Expansion of trade
geography requires diversification of transport links, optimization of transport costs, as well as
time for delivery of goods.
Thus, the economic and trade situation in the EATL countries is a leading indicator of changes in
cargo flows along inland routes connecting Europe and Asia.
Achieving the general goals of the EATL project is more complicated under the economic
downturn condition and the selection of tactical priorities needs balanced analysis of
possibilities.
Global economic activity and international trade remained subdued in 2012-2016. During this
period the rate of growth of world merchandise trade (by volume) oscillated between 1.3 and 2.7
per cent. These growth rates were significantly below the average annual rate of 7.2 per cent
recorded during the 2003–2007 pre-crisis period.
Falling short of expectations and below the prefinancial crisis levels, growth in world GDP
expanded by 2.5 per cent in 2015 and by 2.3 per cent in 2016 (Table 1.1). Underpinning the
sluggish global economy were the feeble pace of global investment, dwindling world trade
growth, flagging productivity growth and high levels of debt. Low commodity prices had
exacerbated these factors in many commodity-exporting countries since mid-2014. World GDP
was forecasted to expand by 2.7 per cent in 2017 and 2.9 per cent in 2018, with this modest
recovery more an indication of economic stabilization than a signal of a robust and sustained
revival of global demand.
Table 1.1
Economic growth by main trade partners in Europe and Asia, 2013–2016 and forecast for 2017-2018 (Percentage
change)
2013 2014 2015 2016
Forecast
2017 2018
World 2.2 2.6 2.5 2.2 2.7 2.9
Developed economies 1.1 1.7 2.1 1.5 1.7 1.8
- European Union-28 0.3 1.5 2.2 1.8 1.8 1.8
- Japan 1.4 - 0.1 0.6 0.5 0.9 0.9
Developing economies 4.6 4.3 3.8 3.6 4.4 4.7
- East and South Asia 6.1 6.1 5.7 5.7 5.9 5.9
- China 7.7 7.3 6.9 6.6 6.5 6.5
- India 6.3 7.3 7.3 7.6 7.7 7.6
Transition economies 2.0 0.9 -2.8 - 0.2 1.4 2.0
- Russian Federation 1.3 0.7 -3.7 -0.8 1.0 1.5
Source: UN (2017) World Economic Situation and Prospects 2017
Note: Forecast, based in part on Project LINK.
15
Diverging individual country performances unfolded against the background of lower oil and
commodity price levels, weak global demand and a slowdown in China. China’s transition from
an investment and export led-growth model had an impact on global manufacturing activity,
aggregate demand, investment and commodity prices.
Developing country growth decelerated from 4.4 per cent in 2014 to 3.9 per cent in 2015 and 3.6
per cent in 2016, although still accounting for 70 per cent of global expansion (International
Monetary Fund, 2016). China’s economy slowed over the period 2014-2016 too, although it was
still growing at a relatively high rate (GDP growth decelerated from 7.3 per cent in 2014 to 6.9
per cent in 2015 and 6.6 per cent in 2016). China, as it was said, was growing at two speeds, with
its manufacturing sector facing overcapacity and limited growth, while its consumer-driven
services sector was growing at a rapid pace (The Economist Intelligence Unit, 2016a). India was
growing faster than China in that period, as its GDP growth, supported by factors such as
infrastructure investment, accelerated to 7.3 per cent in 2015 and 7.6 per cent in 2016.
Following a 2.8 per cent contraction in 2015, the aggregate GDP of the Commonwealth of
Independent States (CIS) and South-Eastern Europe contracted further by an estimated 0.2 per
cent in 2016. Economic activity was expected to recover in 2017 and 2018, with aggregate GDP
expanding at 1.4 per cent and 2.0 per cent, respectively. The economies of the CIS have entered
a period of tentative stabilization. While output continued to decline in several countries in 2016,
the aggregate indicators of the region started to show some improvement. The contraction in
GDP in 2016 was much milder than in 2015, and a return to a low growth trajectory was
expected for 2017. In South-Eastern Europe, economic growth accelerated further, largely owing
to the strength of domestic factors.
Growth in the European Union improved to 2.2 per cent in 2015 and 1.8 per cent in 2016,
supported in particular by higher domestic consumption and investment levels and by falling
energy prices.
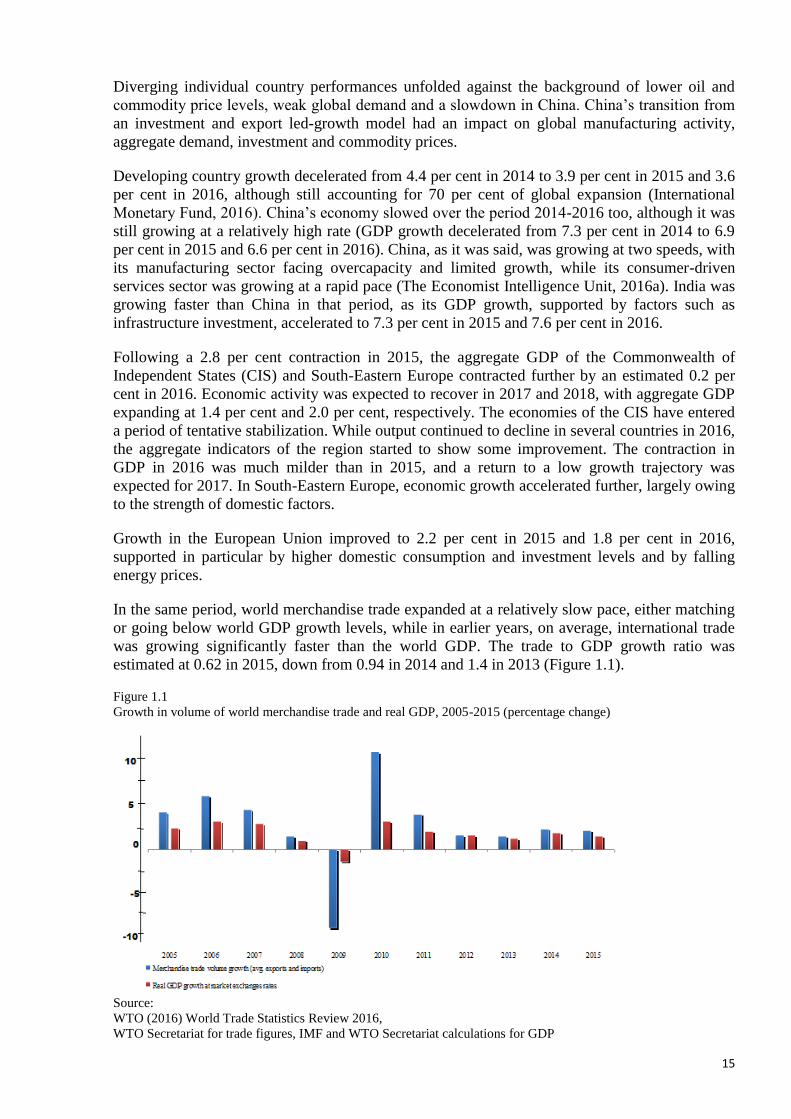
In the same period, world merchandise trade expanded at a relatively slow pace, either matching
or going below world GDP growth levels, while in earlier years, on average, international trade
was growing significantly faster than the world GDP. The trade to GDP growth ratio was
estimated at 0.62 in 2015, down from 0.94 in 2014 and 1.4 in 2013 (Figure 1.1).
Figure 1.1
Growth in volume of world merchandise trade and real GDP, 2005-2015 (percentage change)
Source:
WTO (2016) World Trade Statistics Review 2016,
WTO Secretariat for trade figures, IMF and WTO Secretariat calculations for GDP
16
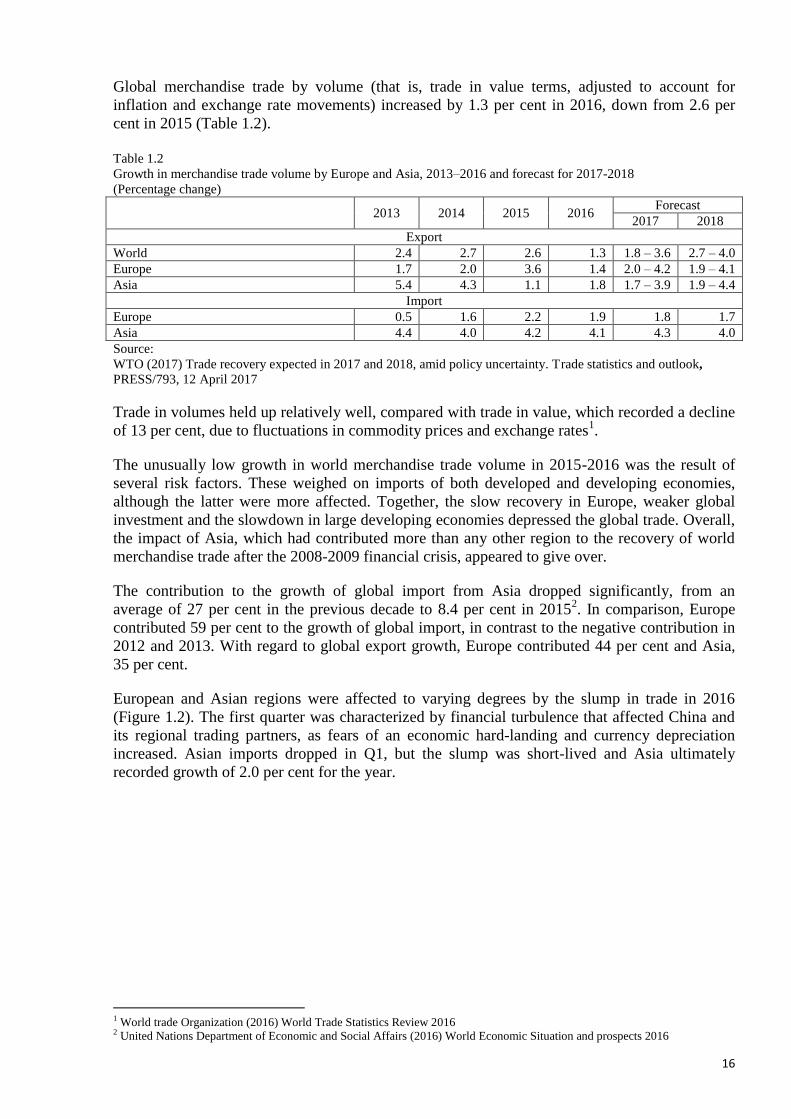
Global merchandise trade by volume (that is, trade in value terms, adjusted to account for
inflation and exchange rate movements) increased by 1.3 per cent in 2016, down from 2.6 per
cent in 2015 (Table 1.2).
Table 1.2
Growth in merchandise trade volume by Europe and Asia, 2013–2016 and forecast for 2017-2018
(Percentage change)
2013 2014 2015 2016
Forecast
2017 2018
Export
World 2.4 2.7 2.6 1.3 1.8 – 3.6 2.7 – 4.0
Europe 1.7 2.0 3.6 1.4 2.0 – 4.2 1.9 – 4.1
Asia 5.4 4.3 1.1 1.8 1.7 – 3.9 1.9 – 4.4
Import
Europe 0.5 1.6 2.2 1.9 1.8 1.7
Asia 4.4 4.0 4.2 4.1 4.3 4.0
Source:
WTO (2017) Trade recovery expected in 2017 and 2018, amid policy uncertainty. Trade statistics and outlook,
PRESS/793, 12 April 2017
Trade in volumes held up relatively well, compared with trade in value, which recorded a decline
of 13 per cent, due to fluctuations in commodity prices and exchange rates1.
The unusually low growth in world merchandise trade volume in 2015-2016 was the result of
several risk factors. These weighed on imports of both developed and developing economies,
although the latter were more affected. Together, the slow recovery in Europe, weaker global
investment and the slowdown in large developing economies depressed the global trade. Overall,
the impact of Asia, which had contributed more than any other region to the recovery of world
merchandise trade after the 2008-2009 financial crisis, appeared to give over.
The contribution to the growth of global import from Asia dropped significantly, from an
average of 27 per cent in the previous decade to 8.4 per cent in 20152. In comparison, Europe
contributed 59 per cent to the growth of global import, in contrast to the negative contribution in
2012 and 2013. With regard to global export growth, Europe contributed 44 per cent and Asia,
35 per cent.
European and Asian regions were affected to varying degrees by the slump in trade in 2016
(Figure 1.2). The first quarter was characterized by financial turbulence that affected China and
its regional trading partners, as fears of an economic hard-landing and currency depreciation
increased. Asian imports dropped in Q1, but the slump was short-lived and Asia ultimately
recorded growth of 2.0 per cent for the year.
1 World trade Organization (2016) World Trade Statistics Review 2016 2 United Nations Department of Economic and Social Affairs (2016) World Economic Situation and prospects 2016

17
Figure 1.2
Volume of merchandise exports and imports by Europe and Asia in 2012-2016, seasonally adjusted indices,
2012Q1=100
Source:
WTO (2017) Trade recovery expected in 2017 and 2018, amid policy uncertainty. Trade statistics and outlook,
PRESS/793, 12 April 2017
The contraction of both exports and imports in Eastern Asia in 2015 had negative impacts on the
trade of other developing economies, in particular manufacturing export-dependent economies in
developing Asia. China accounted for about 20 per cent of the slowdown in import growth of
developing economies and countries with economies in transition in 2014–20153. In contrast,
India experienced a surge in its import demand (10.1 per cent).
I.1.2. East Asia
During 2012-2016 the Asian region’s trade growth performed below the pre-financial crisis
levels. Such a long and uninterrupted trade slowdown was unprecedented, and was a cause for
concern that a “new trend” of a weaker trade growth was being reached. Trade between Asia and
Europe contracted noticeably in 2015-2016. The contraction occurred despite GDP growth in the
European Union. The growth in traditional export markets for Asia did not transfer to increased
demand for its goods4.
Structural factors such as economic rebalancing in China were also at play, with the country’s
import composition expected to gradually shift away from intermediate goods and capital goods,
which at that time accounted for over 70 per cent of the region’s exports to China. Even though
tariff rates had fallen significantly for over a decade, non-tariff measures on goods appeared to
be on the rise. While cumulative non-tariff measures imposed on East Asia experienced a steady
increase between 2000 and 2015, the pace appeared to have accelerated during the post-crisis
period. These barriers might have partly contributed to the weak export performance in the 2012-
2016 period.
While the economic outlook was relatively more optimistic for East Asia compared to most of
the other developing regions, risks for the region remained tilted to the downside. Factors that
could drive faster economic growth in 2017, such as stronger demand in developed economies,
higher global commodity prices and rising infrastructure investment were subject to considerable
3 Ibidem 4 UNESCAP (2016) Asia-Pacific Trade and Investment Report 2016. Recent Trends and Developments

18
uncertainty. High and rising corporate and household debt in several economies in the region,
including China, posed downside risks to growth (Table 1.3).
Table 1.3
Rates of growth of real GDP in China, Mongolia and Republic of Korea in 2013–2016 and forecast for 2017-2018
(Percentage change)
2008-2015
average 2013 2014 2015 2016
Forecast
2017 2018
China 8.6 7.7 7.3 6.9 6.6 6.5 6.5
Mongolia 8.0 11.6 7.9 2.3 0.0 2.1 3.9
Republic of Korea 3.1 2.9 3.3 2.6 2.8 2.9 2.8
Source:
UN (2017) World Economic Situation and Prospects 2017
Note: Forecast, based in part on Project LINK.
The physical volume of exports still grew at 0.8 per cent in 2016. The fall in export value had
thus been driven primarily by a sharp fall in prices in 2015, due in turn to slower demand growth
by regional powers (in particular China) and elsewhere (Table 1.4).
Table 1.4
Changes in value and volume of export and import of goods by countries of Eastern Asia in 2013–2016 and forecast
for 2017-2018 (Percentage change)
2010 2011 2012 2013 2014 2015 2016
Forecast
2017 2018
Value of export (U.S. Dollars) 28.3 18.4 4.7 4.8 3.3 -5.3 -0.7 5.7 6.6
Value of import (U.S. Dollars) 32.5 21.8 4.6 4.4 1.7 -8.7 1.6 7.5 7.5
Volume of export (metric tonnes) 14.7 10.2 48.8 7.1 5.2 1.1 0.8 2.6 3.9
Volume of import (metric tonnes) 18.3 10.7 4.8 6.8 4.4 2.1 1.5 3.4 4.1
Source:
UN (2017) World Economic Situation and Prospects 2017
Note: Forecast, based in part on Project LINK.
As global economic growth remained more anaemic, intraregional cooperation between East
Asia and Central Asia region was in a better position and carried greater potential than
cooperation with countries outside the region. The increase in the intraregional import share
reflected the fact the while the absolute value of intraregional imports fell in 2015, it did so by
less than the overall contraction in imports into the region. This was particularly the case for
imports from China by many Central Asian states, which fell only slightly in 2015.
The Chinese initiative "One Belt – One Road" (OBOR) and its “Silk Road Economic Belt”
component was launched in 2017 with the aim specifically to strengthen the realization of the
possibilities of intraregional trade and economic cooperation, which should provide an additional
impetus to the development of transport along Euro-Asian inland routes.
Hence the severe contraction in world trade in 2015 and the reduced output among several
extraregional developing countries produced the opportunity for relatively more intraregional
trade
I.1.3. South Eastern Europe
Economic growth in the region of South Eastern Europe, which covers Balkan states and Turkey,
accelerated from 0.5 per cent in 2015 to 1.2 per cent in 2016, due mainly to an easing of the
recession in the Russian Federation as oil prices stabilized.
Economic activity in South-Eastern Europe gained further strength in 2016, driven by the strong
pick-up in Turkey and Serbia, the region’s one of the largest economies. The improved
performance was driven largely by domestic factors. However, there were marked differences

19
across the region, with some countries, in particular The former Yugoslav Republic of
Macedonia, losing momentum. The region’s GDP growth was projected to strengthen from an
estimated 2.6 per cent in 2016 to 3.1 per cent in 2017 and 3.3 per cent in 2018 (forecasted GDP
growth in each country in Table 1.5). However, average growth was expected to remain weaker
than in the pre-crisis period, when it had been accompanied by heavy private and public
borrowing. Risks remained tilted to the downside, and included the possibility of further
weakness in commodity prices, disruptions in financial markets, slower-than-expected Euro Area
growth. Key policy challenges included ensuring macroeconomic stability during the adjustment
to lower commodity prices and dealing with sizable macroeconomic and financial
vulnerabilities.
Table 1.5
Rates of growth of real GDP in selected countries of South Eastern Europe in 2013–2016 and forecast for 2017-
2018 (Percentage change)
2008-2015
average 2013 2014 2015 2016
Forecast
2017 2018
Bosnia Herzegovina 1.2 2.4 1.1 3.2 2.1 2.9 3.0
Serbia 0.6 2.6 -1.8 0.7 2.7 3.0 3.0
The former Yugoslav
Republic of Macedonia 2.5 2.7 3.8 3.7 2.3 3.0 3.5
Turkey 3.3 4.2 2.9 4.0 3.1 3.1 3.5
Source:
UN (2017) World Economic Situation and Prospects 2017
Note: Forecast, based in part on Project LINK.
The region remained closely linked with the European Union, which continue to influence
economic prospects. A possible intensification of the refugee crisis would have negative
implications, if it resulted in disrupting trade flows. The region still remained highly dependent
on external financing. In the aftermath of the Brexit vote, there was a risk that funding from the
European Union may diminish if the United Kingdom of Great Britain and Northern Ireland
eventually would exit the European Union. In addition, the weaker pound sterling associated
with the increased uncertainty might continue to weigh on the value of remittances received by
the region.
The physical volume of exports still grew at 6.0 per cent in 2015 and 6.0 in 2016. The fall in
export value in 2015 had thus been driven primarily by a sharp fall in commodity prices (Table
1.6).
Table 1.6
Changes in value and volume of export and import of goods by countries of South Eastern Europe (excluding
Turkey) in 2013–2016 and forecast for 2017-2018 (Percentage change)
2010 2011 2012 2013 2014 2015 2016
Forecast
2017 2018
Value of export (U.S. Dollars) 14.3 21.2 -6.4 16.3 4.6 -10.7 6.9 8.7 8.1
Value of import (U.S. Dollars) 2.4 20.0 -6.7 5.4 3.7 -13.5 6.9 7.2 7.8
Volume of export (metric tonnes) 15.7 7.3 0.5 12.0 7.6 6.0 6.0 6.0 5.2
Volume of import (metric tonnes) 3.6 6.1 0.9 1.4 8.9 3.6 5.6 4.0 5.3
Source:
UN (2017) World Economic Situation and Prospects 2017
Note: Forecast, based in part on Project LINK.
According to the Turkstat data and Economic Outlook provided by Turkish authorities5, Turkey
had been pursuing an export-led growth policy since 1980. By virtue of economic reforms,
restrictions on imports were lifted, safeguard practices were reduced, and foreign exchange
transactions were liberalized. As a result of the economic reforms carried out during the last
5 http://www.mfa.gov.tr/prospects-and-recent-developments-in-the-turkish-economy.en.mfa

20
decade, both the volume and composition of the Turkish trade had radically changed. For the
100th Anniversary of the Republic (2023), main export target of Turkey was expected to reach
500 billion U.S. Dollars.
Further dynamic development of economic cooperation and trade was expected between Turkey
and the countries of Central Asia, Iran, Pakistan and India, which would promote the growth of
demand for cross-border transportation services.
I.1.4. Commonwealth of Independent States
Since the collapse of the Soviet Union, the successor states that formed the Commonwealth of
Independent States (CIS) as well as Georgia have suffered from various cyclical crises.
Following the severe terms-of-trade shock of 2014/15 and the consequent economic contraction
in most of the CIS energy exporters, the region’s economies entered a period of tentative
stabilization. Economic activity in parts of the CIS continued to decline in 2016, but at a much
reduced pace. As a result of the more moderate contraction in the Russian Federation and the
return to sluggish growth in Ukraine, the aggregate indicators of the region improved. Some
Central Asian economies, such as Tajikistan and Uzbekistan, continued to register strong growth
(Table 1.7). The aggregate GDP of the CIS was estimated to have fallen by 0.3 per cent in 2016,
following a decline of 3 per cent in 2015. In 2017, the region was expected to return to growth,
but amid continued fragilities the expansion would be muted, projected at 1.4 per cent. Growth
was forecasted to pick up to 2.0 per cent in 2018.
Table 1.7
Rates of growth of real GDP in CIS member States and Georgia in 2013–2016 and forecast for 2017-2018
(Percentage change)
2008-2015
average 2013 2014 2015 2016
Forecast
2017 2018
Net fuel exporters
- Azerbaijan 4.6 5.8 2.8 1.1 -2.9 1.0 1.5
- Kazakhstan 4.4 6.0 4.3 1.2 0.3 1.4 2.5
- Russian Federation 0.9 1.3 0.7 -3.7 -0.8 1.0 1.5
- Turkmenistan 10.3 10.2 10.3 6.7 6.0 6.1 6.5
- Uzbekistan 8.3 8.0 8.1 8.0 7.4 6.0 6.4
Net fuel importers
- Armenia 1.9 3.3 3.6 3.0 2.5 2.7 3.0
- Belarus 2.9 1.0 1.6 -.38 -2.7 1.5 1.9
- Kyrgyzstan 4.3 10.5 4.3 3.5 0.2 2.3 2.3
- Republic of Moldova 3.4 9.4 4.6 -0.5 1.2 2.5 3.0
- Tajikistan 6.0 7.4 6.8 6.0 6.4 5.1 4.8
- Ukraine -2.7 0.0 -6.6 -9.9 0.8 1.9 3.2
CIS 1.4 2.0 1.0 -3.0 -0.3 1.4 2.0
Georgia 3.6 3.3 4.6 2.8 2.8 3.0 4.2
Source:
UN (2017) World Economic Situation and Prospects 2017
Note: Forecast, based in part on Project LINK.
The economies of these countries differ in size and industry composition. Most of the CIS
countries had gone through transition from centrally planned to market economies reaching
different transformation results. Turkmenistan and Uzbekistan were still characterised by
relatively closed markets.
With Tajikistan’s accession to the WTO in March 2013 eight CIS countries were WTO members
by the time this report was written and five were observer members. Armenia, Belarus,
Kazakhstan, Kyrgyzstan and the Russian Federation formed Eurasian Economic Union (EAEU)
with single economic and customs space and common market of transport services. CIS

21
countries had also signed multiple bilateral and multilateral trade agreements, among them, the
CIS Free Trade Agreement (CISFTA) (Table 1.8).
Table 1.8
EATL countries bilateral and multilateral trade agreements
Countries WTO
TFA EAEU CISFTA
EU
Association
Bilateral trade Agreements with EATL
countries
Armenia (AM) 2003 Yes Yes KZ, MD, RU,TM, UK, GE, KZ
Azerbaijan (AZ) Observer RU, GE; UK
Belarus (BY) Observer Yes Yes UK, RU
China (CN) 2001 GE, PK
Georgia (GE) 2000 Yes AM, AZ, KZ, TR, TM, RU, UZ, CN
Iran (IR) Observer
Kazakhstan (KZ) 2015 Yes Yes AM, GE, UK, RU, KZ,
Kyrgyzstan (KY) 1998 Yes Yes AM, KZ, MD, RU, UZ, UK
Moldova (MD) 2001 Yes Yes KY, AM, UK, RU
Russian
Federation (RU) 2012 Yes Yes
AM, GE, BY, AZ, KZ, MD, TJ, TM, UK,
UZ
Tajikistan (TJ) 2013 Yes RU, UK
Turkey (TR) 1995 GE
Turkmenistan
(TM) No AM, GE, UK, RU
Ukraine (UK) 2008 Yes AM, GE, KY, AZ, BY, KZ, MD, RU, TJ,
KZ, TM, TR, UZ
Uzbekistan (UZ) Observer Yes KY, RU, UK
Source: UNECE, WP.5 GE2 Informal Doc #1
The Russian Federation was not only the biggest economy of the CIS in terms of GDP but also
in terms of merchandise trade. Russian exports accounted for 384 billion US Dollars in 2016,
while Armenia only exported goods with a value of 3.2 billion US Dollars.
External balances deteriorated in most CIS countries. The region’s aggregate current account
surplus shrank sharply, driven by trends in the Russian Federation. The contraction of exports in
2016 exceeded the observed fall in imports. The region’s terms of trade continued to deteriorate,
albeit at a much reduced pace and an improvement was expected in 2017-2018
In the Russian Federation, imports have started to pick up while exports remain subdued. The
resulting pressure on the balance of payment was offset by a reduction in capital outflows. A
major external adjustment took place in the period 2014-16 in Ukraine as a consequence of the
currency depreciation. In Kyrgyzstan and Tajikistan, current account deficits remained very
large.
The physical volume of exports still slow grew at 0.4 per cent in 2015 and 0.1 in 2016. The fall
in export value in 2014-2016 had thus been driven primarily by a sharp fall in commodity prices
and sanctions imposed on the Russian Federation (Table 1.9).
Table 1.9
Changes in value and volume of export and import of goods by CIS countries in 2013–2016 and forecast for 2017-
2018 (Percentage change)
2010 2011 2012 2013 2014 2015 2016
Forecast
2017 2018
Value of export (U.S. Dollars) 28.5 31.4 3.2 -1.0 -5.8 -29.2 -7.4 14.5 12.4
Value of import (U.S. Dollars) 24.3 29.2 8.8 3.2 -9.9 -28.5 -8.1 10.4 9.3
Volume of export (metric tonnes) 6.5 2.6 1.0 2.4 -0.4 0.4 0.1 1.7 2.3
Volume of import (metric tonnes) 17.7 16.8 8.8 2.7 -7.7 -19.1 -8.4 6.9 6.6
Source: UN (2017) World Economic Situation and Prospects 2017
Note: Forecast, based in part on Project LINK.
22
The economic outlook was facing continued downside risks as the recovery of commodity prices
was expected to be limited and the region’s economies would need to search for new drivers of
growth. The ability to overcome the dependence on primary commodities and low-tech exports
was constrained by inadequate access to modern technology and limited resources for
investment. Currency depreciations, in part, were harmful and their full consequences had yet to
be seen. On the other hand, weaker currencies provided opportunities for economic
diversification, but the supply response would be limited by sluggish domestic and external
demand, credit rationing, and subdued investment. For the smaller CIS economies,
diversification of their export markets remained an important challenge.
I.1.5 Conclusions
Global recovery continued in 2016-2017, however, at a slow pace, with momentum created by
growth rate reduction in China and other Asian developing economies. Developments in the
Chinese economy and related spillover effects on other large developing countries impacted all
Euro-Asian trade, both for developed and developing countries, including Central Asian
countries as LLDCs . Other factors – namely, lower commodity and oil price levels, eroding
terms of trade in many commodity and oil-exporting countries, weaker global demand and
investment levels, geopolitical tensions and political unrest – contributed to increasing
uncertainty, growing downside risks and challenging the outlook for merchandise trade and
transport between Europe and Asia.
The economic slowdown in Asia was influencing the global economy and trade sharply and
probably would for a long enough period stay as the dominating external factor. Because of that,
growth of international trade would not be the main driver for the increase of Euro-Asian cargo
flows and the expansion of transport links, as it was during phases I and II of the EATL project.
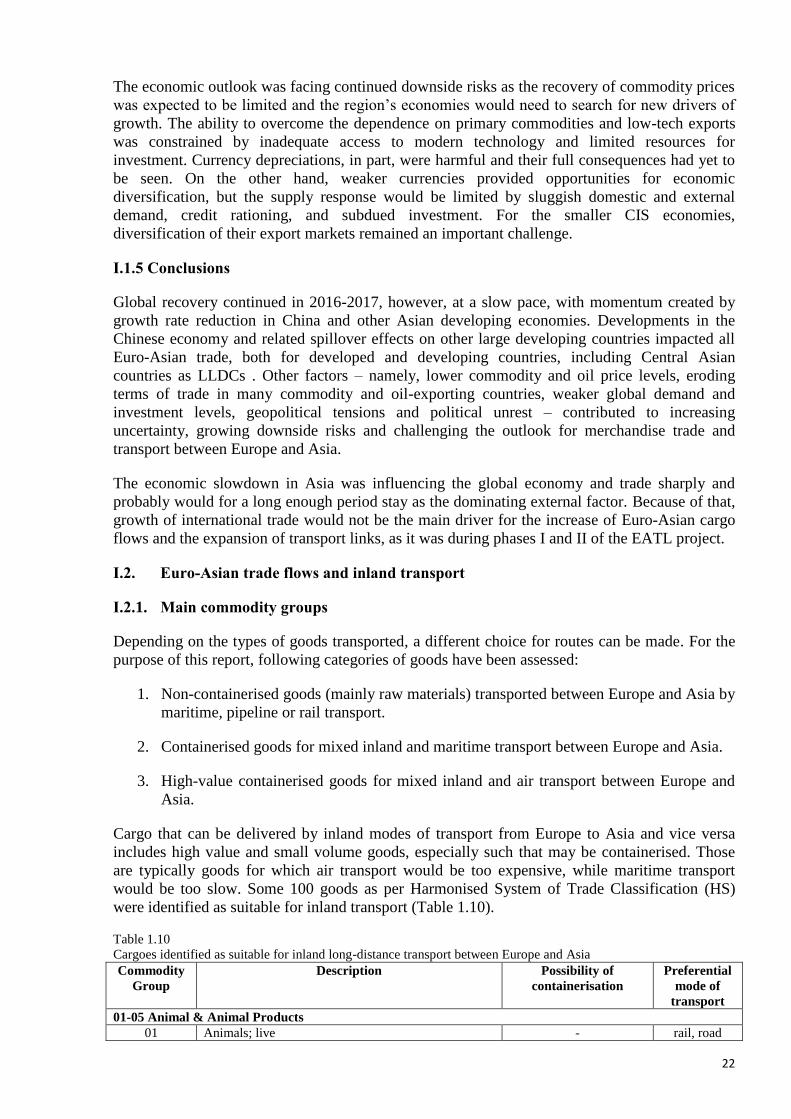
I.2. Euro-Asian trade flows and inland transport
I.2.1. Main commodity groups
Depending on the types of goods transported, a different choice for routes can be made. For the
purpose of this report, following categories of goods have been assessed:
1. Non-containerised goods (mainly raw materials) transported between Europe and Asia by
maritime, pipeline or rail transport.
2. Containerised goods for mixed inland and maritime transport between Europe and Asia.
3. High-value containerised goods for mixed inland and air transport between Europe and
Asia.
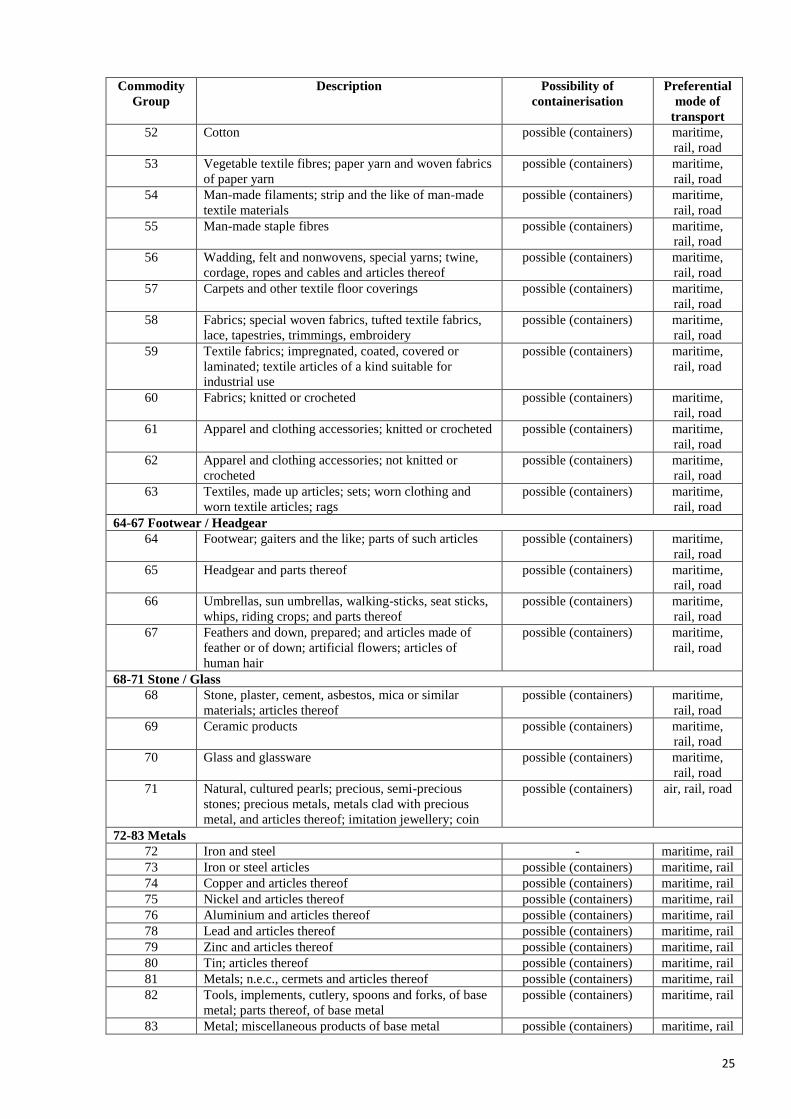
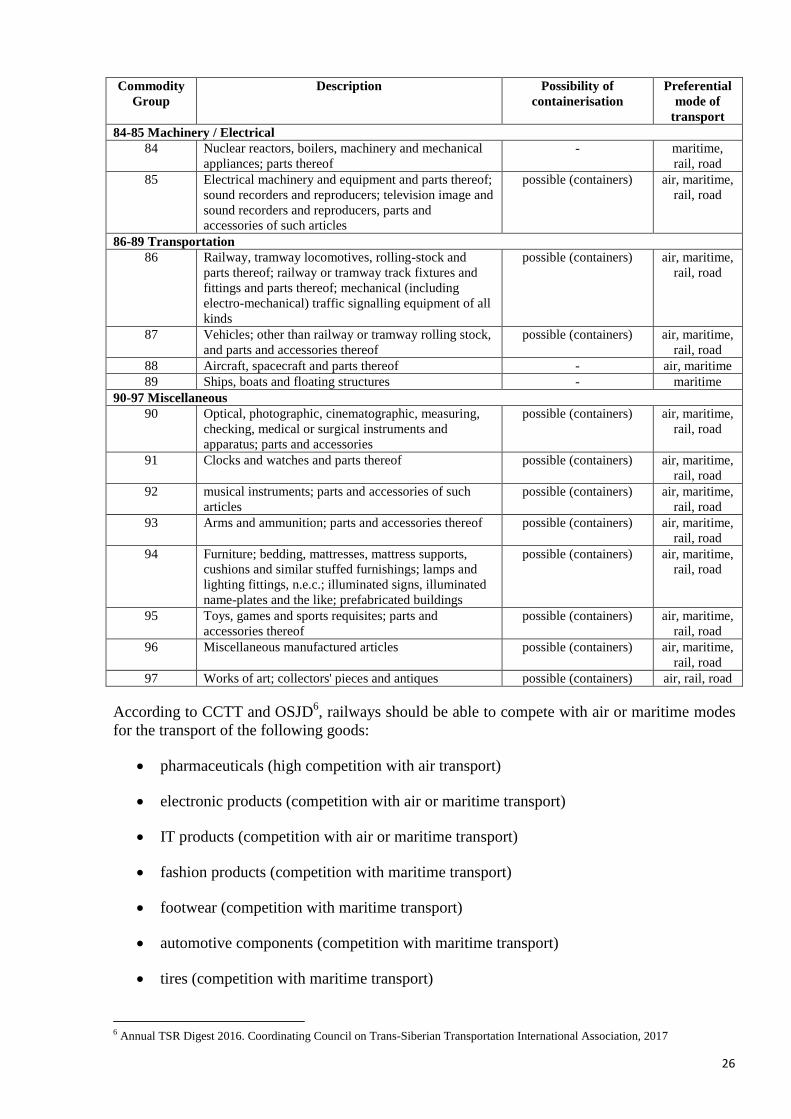
Cargo that can be delivered by inland modes of transport from Europe to Asia and vice versa
includes high value and small volume goods, especially such that may be containerised. Those
are typically goods for which air transport would be too expensive, while maritime transport
would be too slow. Some 100 goods as per Harmonised System of Trade Classification (HS)
were identified as suitable for inland transport (Table 1.10).
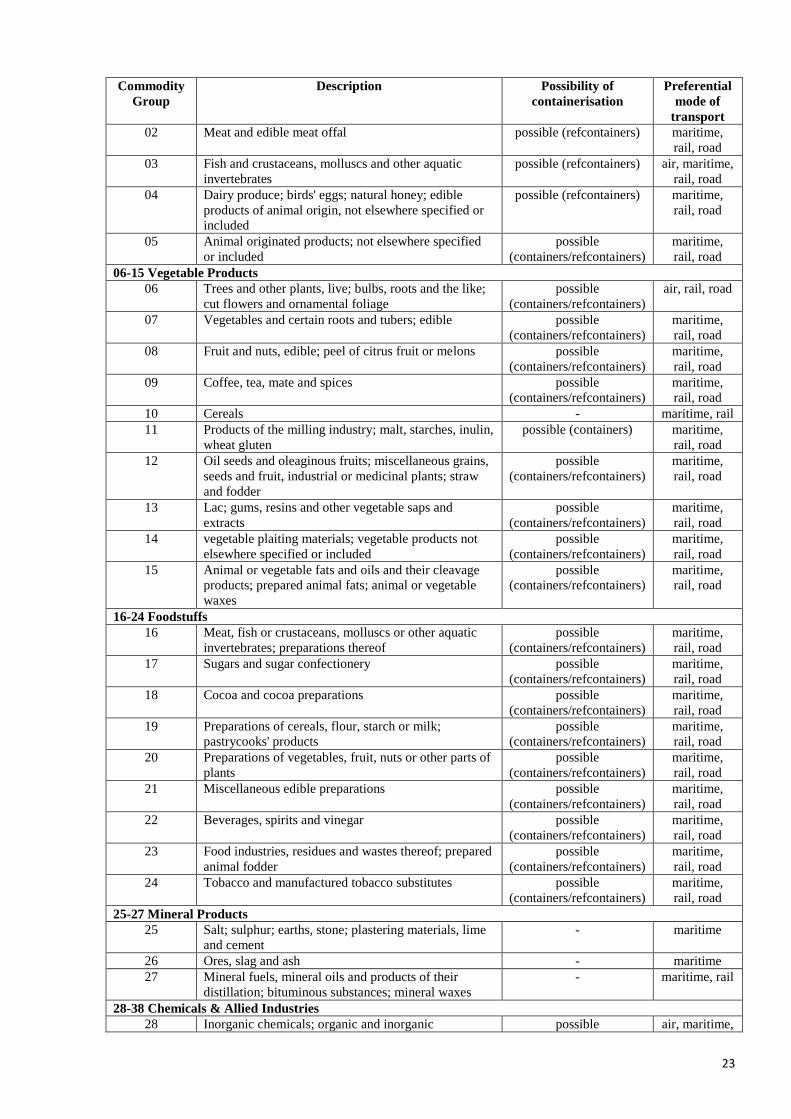
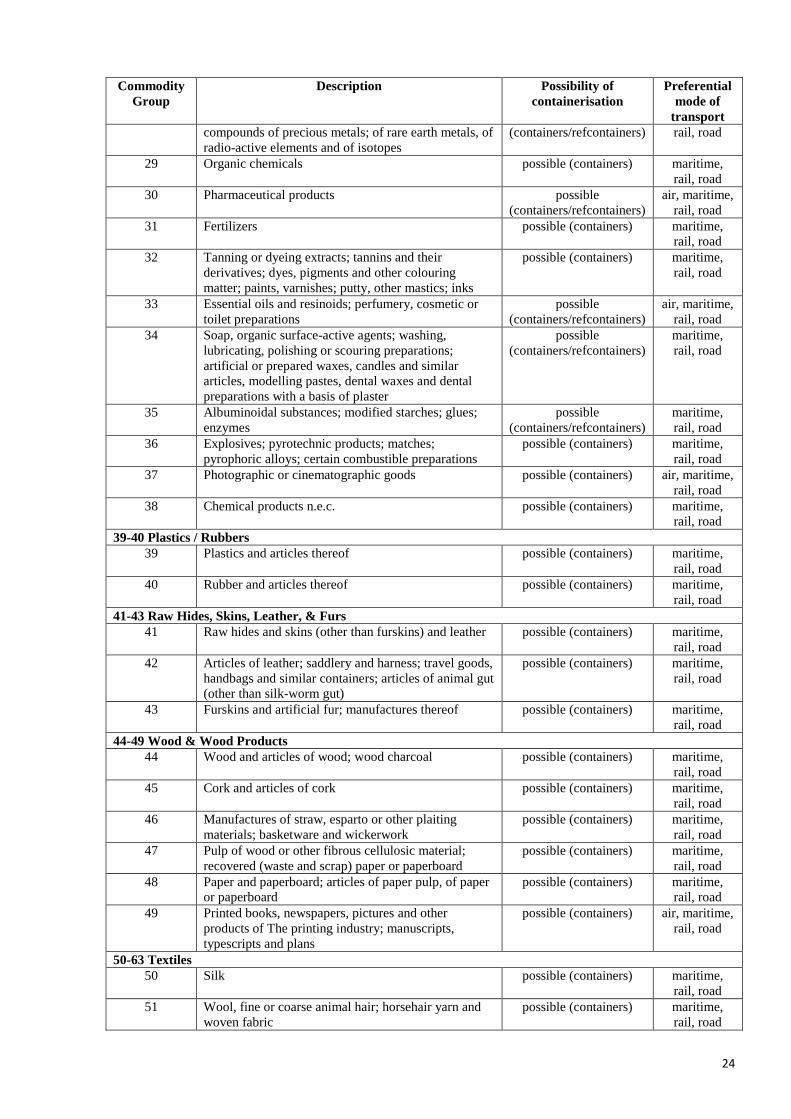
Table 1.10
Cargoes identified as suitable for inland long-distance transport between Europe and Asia
Commodity
Group
Description Possibility of
containerisation
Preferential
mode of
transport
01-05 Animal & Animal Products
01 Animals; live - rail, road
23
Commodity
Group
Description Possibility of
containerisation
Preferential
mode of
transport
02 Meat and edible meat offal possible (refcontainers) maritime,
rail, road
03 Fish and crustaceans, molluscs and other aquatic
invertebrates
possible (refcontainers) air, maritime,
rail, road
04 Dairy produce; birds' eggs; natural honey; edible
products of animal origin, not elsewhere specified or
included
possible (refcontainers) maritime,
rail, road
05 Animal originated products; not elsewhere specified
or included
possible
(containers/refcontainers)
maritime,
rail, road
06-15 Vegetable Products
06 Trees and other plants, live; bulbs, roots and the like;
cut flowers and ornamental foliage
possible
(containers/refcontainers)
air, rail, road
07 Vegetables and certain roots and tubers; edible possible
(containers/refcontainers)
maritime,
rail, road
08 Fruit and nuts, edible; peel of citrus fruit or melons possible
(containers/refcontainers)
maritime,
rail, road
09 Coffee, tea, mate and spices possible
(containers/refcontainers)
maritime,
rail, road
10 Cereals - maritime, rail
11 Products of the milling industry; malt, starches, inulin,
wheat gluten
possible (containers) maritime,
rail, road
12 Oil seeds and oleaginous fruits; miscellaneous grains,
seeds and fruit, industrial or medicinal plants; straw
and fodder
possible
(containers/refcontainers)
maritime,
rail, road
13 Lac; gums, resins and other vegetable saps and
extracts
possible
(containers/refcontainers)
maritime,
rail, road
14 vegetable plaiting materials; vegetable products not
elsewhere specified or included
possible
(containers/refcontainers)
maritime,
rail, road
15 Animal or vegetable fats and oils and their cleavage
products; prepared animal fats; animal or vegetable
waxes
possible
(containers/refcontainers)
maritime,
rail, road
16-24 Foodstuffs
16 Meat, fish or crustaceans, molluscs or other aquatic
invertebrates; preparations thereof
possible
(containers/refcontainers)
maritime,
rail, road
17 Sugars and sugar confectionery possible
(containers/refcontainers)
maritime,
rail, road
18 Cocoa and cocoa preparations possible
(containers/refcontainers)
maritime,
rail, road
19 Preparations of cereals, flour, starch or milk;
pastrycooks' products
possible
(containers/refcontainers)
maritime,
rail, road
20 Preparations of vegetables, fruit, nuts or other parts of
plants
possible
(containers/refcontainers)
maritime,
rail, road
21 Miscellaneous edible preparations possible
(containers/refcontainers)
maritime,
rail, road
22 Beverages, spirits and vinegar possible
(containers/refcontainers)
maritime,
rail, road
23 Food industries, residues and wastes thereof; prepared
animal fodder
possible
(containers/refcontainers)
maritime,
rail, road
24 Tobacco and manufactured tobacco substitutes possible
(containers/refcontainers)
maritime,
rail, road
25-27 Mineral Products
25 Salt; sulphur; earths, stone; plastering materials, lime
and cement
- maritime
26 Ores, slag and ash - maritime
27 Mineral fuels, mineral oils and products of their
distillation; bituminous substances; mineral waxes
- maritime, rail
28-38 Chemicals & Allied Industries
28 Inorganic chemicals; organic and inorganic possible air, maritime,
24
Commodity
Group
Description Possibility of
containerisation
Preferential
mode of
transport
compounds of precious metals; of rare earth metals, of
radio-active elements and of isotopes
(containers/refcontainers) rail, road
29 Organic chemicals possible (containers) maritime,
rail, road
30 Pharmaceutical products possible
(containers/refcontainers)
air, maritime,
rail, road
31 Fertilizers possible (containers) maritime,
rail, road
32 Tanning or dyeing extracts; tannins and their
derivatives; dyes, pigments and other colouring
matter; paints, varnishes; putty, other mastics; inks
possible (containers) maritime,
rail, road
33 Essential oils and resinoids; perfumery, cosmetic or
toilet preparations
possible
(containers/refcontainers)
air, maritime,
rail, road
34 Soap, organic surface-active agents; washing,
lubricating, polishing or scouring preparations;
artificial or prepared waxes, candles and similar
articles, modelling pastes, dental waxes and dental
preparations with a basis of plaster
possible
(containers/refcontainers)
maritime,
rail, road
35 Albuminoidal substances; modified starches; glues;
enzymes
possible
(containers/refcontainers)
maritime,
rail, road
36 Explosives; pyrotechnic products; matches;
pyrophoric alloys; certain combustible preparations
possible (containers) maritime,
rail, road
37 Photographic or cinematographic goods possible (containers) air, maritime,
rail, road
38 Chemical products n.e.c. possible (containers) maritime,
rail, road
39-40 Plastics / Rubbers
39 Plastics and articles thereof possible (containers) maritime,
rail, road
40 Rubber and articles thereof possible (containers) maritime,
rail, road
41-43 Raw Hides, Skins, Leather, & Furs
41 Raw hides and skins (other than furskins) and leather possible (containers) maritime,
rail, road
42 Articles of leather; saddlery and harness; travel goods,
handbags and similar containers; articles of animal gut
(other than silk-worm gut)
possible (containers) maritime,
rail, road
43 Furskins and artificial fur; manufactures thereof possible (containers) maritime,
rail, road
44-49 Wood & Wood Products
44 Wood and articles of wood; wood charcoal possible (containers) maritime,
rail, road
45 Cork and articles of cork possible (containers) maritime,
rail, road
46 Manufactures of straw, esparto or other plaiting
materials; basketware and wickerwork
possible (containers) maritime,
rail, road
47 Pulp of wood or other fibrous cellulosic material;
recovered (waste and scrap) paper or paperboard
possible (containers) maritime,
rail, road
48 Paper and paperboard; articles of paper pulp, of paper
or paperboard
possible (containers) maritime,
rail, road
49 Printed books, newspapers, pictures and other
products of The printing industry; manuscripts,
typescripts and plans
possible (containers) air, maritime,
rail, road
50-63 Textiles
50 Silk possible (containers) maritime,
rail, road
51 Wool, fine or coarse animal hair; horsehair yarn and
woven fabric
possible (containers) maritime,
rail, road
25
Commodity
Group
Description Possibility of
containerisation
Preferential
mode of
transport
52 Cotton possible (containers) maritime,
rail, road
53 Vegetable textile fibres; paper yarn and woven fabrics
of paper yarn
possible (containers) maritime,
rail, road
54 Man-made filaments; strip and the like of man-made
textile materials
possible (containers) maritime,
rail, road
55 Man-made staple fibres possible (containers) maritime,
rail, road
56 Wadding, felt and nonwovens, special yarns; twine,
cordage, ropes and cables and articles thereof
possible (containers) maritime,
rail, road
57 Carpets and other textile floor coverings possible (containers) maritime,
rail, road
58 Fabrics; special woven fabrics, tufted textile fabrics,
lace, tapestries, trimmings, embroidery
possible (containers) maritime,
rail, road
59 Textile fabrics; impregnated, coated, covered or
laminated; textile articles of a kind suitable for
industrial use
possible (containers) maritime,
rail, road
60 Fabrics; knitted or crocheted possible (containers) maritime,
rail, road
61 Apparel and clothing accessories; knitted or crocheted possible (containers) maritime,
rail, road
62 Apparel and clothing accessories; not knitted or
crocheted
possible (containers) maritime,
rail, road
63 Textiles, made up articles; sets; worn clothing and
worn textile articles; rags
possible (containers) maritime,
rail, road
64-67 Footwear / Headgear
64 Footwear; gaiters and the like; parts of such articles possible (containers) maritime,
rail, road
65 Headgear and parts thereof possible (containers) maritime,
rail, road
66 Umbrellas, sun umbrellas, walking-sticks, seat sticks,
whips, riding crops; and parts thereof
possible (containers) maritime,
rail, road
67 Feathers and down, prepared; and articles made of
feather or of down; artificial flowers; articles of
human hair
possible (containers) maritime,
rail, road
68-71 Stone / Glass
68 Stone, plaster, cement, asbestos, mica or similar
materials; articles thereof
possible (containers) maritime,
rail, road
69 Ceramic products possible (containers) maritime,
rail, road
70 Glass and glassware possible (containers) maritime,
rail, road
71 Natural, cultured pearls; precious, semi-precious
stones; precious metals, metals clad with precious
metal, and articles thereof; imitation jewellery; coin
possible (containers) air, rail, road
72-83 Metals
72 Iron and steel - maritime, rail
73 Iron or steel articles possible (containers) maritime, rail
74 Copper and articles thereof possible (containers) maritime, rail
75 Nickel and articles thereof possible (containers) maritime, rail
76 Aluminium and articles thereof possible (containers) maritime, rail
78 Lead and articles thereof possible (containers) maritime, rail
79 Zinc and articles thereof possible (containers) maritime, rail
80 Tin; articles thereof possible (containers) maritime, rail
81 Metals; n.e.c., cermets and articles thereof possible (containers) maritime, rail
82 Tools, implements, cutlery, spoons and forks, of base
metal; parts thereof, of base metal
possible (containers) maritime, rail
83 Metal; miscellaneous products of base metal possible (containers) maritime, rail
26
Commodity
Group
Description Possibility of
containerisation
Preferential
mode of
transport
84-85 Machinery / Electrical
84 Nuclear reactors, boilers, machinery and mechanical
appliances; parts thereof
- maritime,
rail, road
85 Electrical machinery and equipment and parts thereof;
sound recorders and reproducers; television image and
sound recorders and reproducers, parts and
accessories of such articles
possible (containers) air, maritime,
rail, road
86-89 Transportation
86 Railway, tramway locomotives, rolling-stock and
parts thereof; railway or tramway track fixtures and
fittings and parts thereof; mechanical (including
electro-mechanical) traffic signalling equipment of all
kinds
possible (containers) air, maritime,
rail, road
87 Vehicles; other than railway or tramway rolling stock,
and parts and accessories thereof
possible (containers) air, maritime,
rail, road
88 Aircraft, spacecraft and parts thereof - air, maritime
89 Ships, boats and floating structures - maritime
90-97 Miscellaneous
90 Optical, photographic, cinematographic, measuring,
checking, medical or surgical instruments and
apparatus; parts and accessories
possible (containers) air, maritime,
rail, road
91 Clocks and watches and parts thereof possible (containers) air, maritime,
rail, road
92 musical instruments; parts and accessories of such
articles
possible (containers) air, maritime,
rail, road
93 Arms and ammunition; parts and accessories thereof possible (containers) air, maritime,
rail, road
94 Furniture; bedding, mattresses, mattress supports,
cushions and similar stuffed furnishings; lamps and
lighting fittings, n.e.c.; illuminated signs, illuminated
name-plates and the like; prefabricated buildings
possible (containers) air, maritime,
rail, road
95 Toys, games and sports requisites; parts and
accessories thereof
possible (containers) air, maritime,
rail, road
96 Miscellaneous manufactured articles possible (containers) air, maritime,
rail, road
97 Works of art; collectors' pieces and antiques possible (containers) air, rail, road
According to CCTT and OSJD6, railways should be able to compete with air or maritime modes
for the transport of the following goods:
pharmaceuticals (high competition with air transport)
electronic products (competition with air or maritime transport)
IT products (competition with air or maritime transport)
fashion products (competition with maritime transport)
footwear (competition with maritime transport)
automotive components (competition with maritime transport)
tires (competition with maritime transport)
6 Annual TSR Digest 2016. Coordinating Council on Trans-Siberian Transportation International Association, 2017
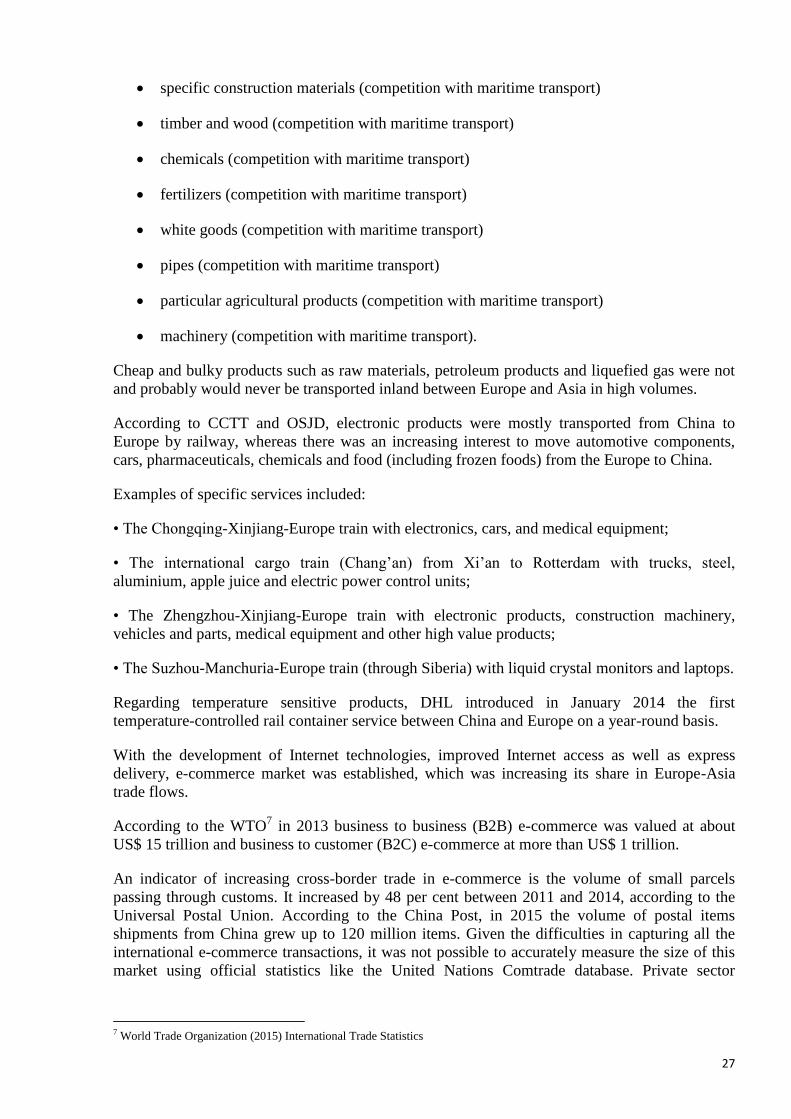
27
specific construction materials (competition with maritime transport)
timber and wood (competition with maritime transport)
chemicals (competition with maritime transport)
fertilizers (competition with maritime transport)
white goods (competition with maritime transport)
pipes (competition with maritime transport)
particular agricultural products (competition with maritime transport)
machinery (competition with maritime transport).
Cheap and bulky products such as raw materials, petroleum products and liquefied gas were not
and probably would never be transported inland between Europe and Asia in high volumes.
According to CCTT and OSJD, electronic products were mostly transported from China to
Europe by railway, whereas there was an increasing interest to move automotive components,
cars, pharmaceuticals, chemicals and food (including frozen foods) from the Europe to China.
Examples of specific services included:
• The Chongqing-Xinjiang-Europe train with electronics, cars, and medical equipment;
• The international cargo train (Chang’an) from Xi’an to Rotterdam with trucks, steel,
aluminium, apple juice and electric power control units;
• The Zhengzhou-Xinjiang-Europe train with electronic products, construction machinery,
vehicles and parts, medical equipment and other high value products;
• The Suzhou-Manchuria-Europe train (through Siberia) with liquid crystal monitors and laptops.
Regarding temperature sensitive products, DHL introduced in January 2014 the first
temperature-controlled rail container service between China and Europe on a year-round basis.
With the development of Internet technologies, improved Internet access as well as express
delivery, e-commerce market was established, which was increasing its share in Europe-Asia
trade flows.
According to the WTO7 in 2013 business to business (B2B) e-commerce was valued at about
US$ 15 trillion and business to customer (B2C) e-commerce at more than US$ 1 trillion.
An indicator of increasing cross-border trade in e-commerce is the volume of small parcels
passing through customs. It increased by 48 per cent between 2011 and 2014, according to the
Universal Postal Union. According to the China Post, in 2015 the volume of postal items
shipments from China grew up to 120 million items. Given the difficulties in capturing all the
international e-commerce transactions, it was not possible to accurately measure the size of this
market using official statistics like the United Nations Comtrade database. Private sector
7 World Trade Organization (2015) International Trade Statistics

28
estimates, however, indicated that the Asia-Pacific region was the largest e-commerce market in
2014.
According to AliResearch, by 2020, more than 900 million people around the world would be
international online shippers with their purchases accounting for nearly 30 per cent of all global
B2C transactions. China should become the largest cross-border B2C market by 2020, with the
transaction volume of goods purchased online reaching $245 billion8.
At the same time, e-shops as the biggest participants in the e-commerce market would aim at
optimization of goods (postal parcels) shipment routes to customers in order to speed up the
delivery and minimize costs.
Inland transport was a good candidate for gaining a good market share. According to UPS
Study9, the delivery of goods transported via the inland route in the Chengdu – Lodz and
Zhangzhou – Hamburg service was twice as fast as via maritime route with 70 per cent price
advantage vis-à-vis the air transport. The survey undertaken among UPS clients showed that 71
per cent of the interviewers were willing to switch to the inland transport.
I.2.2. Main trade partners
For the purposes of this report, the matrix of corresponding European and Asian countries was
developed.
All countries participating in the EATL project were divided into 2 groups:
1) Countries participating in the Euro-Asian trade from the side of Asian continent
(Afghanistan, Armenia, Azerbaijan, China, India*, Iran, Japan*, Kazakhstan, Republic of
Korea*, Kyrgyzstan, Mongolia, Pakistan, Russian Federation, Tajikistan, Turkey,
Turkmenistan, Uzbekistan);
2) Countries participating in the Euro-Asian trade from the side of European continent
(European Union member States, Belarus, Bosnia and Herzegovina, Georgia, Republic of
Moldova, Russian Federation, Serbia, Switzerland, The former Yugoslav Republic of
Macedonia, Turkey and Ukraine).
Two matrices - Asian exports to Europe and Asian import from Europe - were developed with
the following in mind.
1) European Union member States represented in the matrix as the EU-28 ,
2) Three countries, as marked by * above that did not participate in the EATL project, are
also included in the matrix due to their gravity (potential gravity) to the Euro-Asian land
transit: India, Japan and the Republic of Korea,
3) Two countries – the Russian Federation and Turkey – are included twice, both in the
European part of the matrix, and in its Asian part. This is done due to the fact that these
countries, being at the crossroads of continents, conduct trade from Europe as well from
Asia and both trade flows are oriented to Euro-Asian inland transit.
In accordance with the United Nations Comtrade database, the total volume of trade between
Europe and Asia, which can be served by inland transport routes, was 1 751.4 billion US Dollars
8 CCTT (2016) Annual TSR Digest 9 UPS (2016) Pulse of the Online Shopper
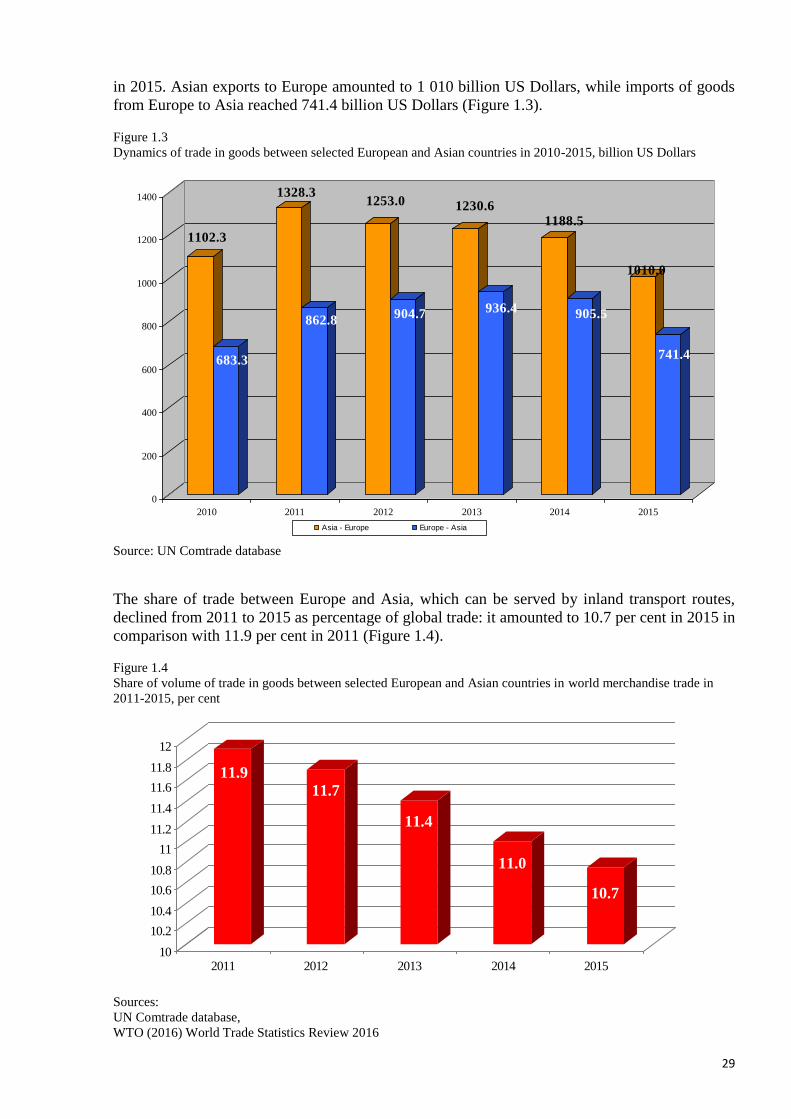
29
in 2015. Asian exports to Europe amounted to 1 010 billion US Dollars, while imports of goods
from Europe to Asia reached 741.4 billion US Dollars (Figure 1.3).
Figure 1.3
Dynamics of trade in goods between selected European and Asian countries in 2010-2015, billion US Dollars
1102.3
683.3
1328.3
862.8
1253.0
904.7
1230.6
936.4
1188.5
905.5
1010.0
741.4
0
200
400
600
800
1000
1200
1400
2010 2011 2012 2013 2014 2015
Asia - Europe Europe - Asia
Source: UN Comtrade database
The share of trade between Europe and Asia, which can be served by inland transport routes,
declined from 2011 to 2015 as percentage of global trade: it amounted to 10.7 per cent in 2015 in
comparison with 11.9 per cent in 2011 (Figure 1.4).
Figure 1.4
Share of volume of trade in goods between selected European and Asian countries in world merchandise trade in
2011-2015, per cent
11.9
11.7
11.4
11.0
10.7
10
10.2
10.4
10.6
10.8
11
11.2
11.4
11.6
11.8
12
2011 2012 2013 2014 2015
Sources:
UN Comtrade database,
WTO (2016) World Trade Statistics Review 2016
30
The matrix of trade flows between the selected European and Asian countries are presented in
Tables 1.11-1.22 while figures with flows for certain types of commodity nomenclature are
presented in the Annex.

Table 1.11
Import of goods to Asia from selected European countries in 2010, million US dollars
Countries of Asia
(Importers)
Countries of Europe (exporters)
Belarus
Bosnia and
Herzegovina
Georgia EU-28
FYR
Macedonia
Moldova
Russian
Federation
Serbia
Switzerland Turkey
Ukraine
TOTAL
Afghanistan 14.7 1.2 0.0 1 024.8 0.1 0.6 539.0 28.4 5.3 259.9 14.0 1 888.0
Armenia 42.1 0.0 160.2 732.9 0.1 1.4 396.1 0.6 33.9 0.0 201.3 1 568.6
Azerbaijan 140.2 0.4 244.0 3 106.6 1.7 7.5 1476.9 5.8 136.6 1 551.2 610.8 7 281.7
China 475.8 5.0 24.3 149 968.7 89.2 2.3 19 783.0 7.3 7 178.1 2 259.8 1 316.6 181 110.1
Iran 97.2 30.3 12.1 14 975.8 1.8 3.1 3 359.0 32.3 674.9 3 043.4 1 030.7 23 260.6
Kazakhstan 464.8 0.0 47.9 6 918.8 0.3 30.5 10 690.4 4.6 168.3 819.9 1 300.5 20 446.0
Kyrgyzstan 85.5 0.0 3.1 278.9 2.5 975.4 7.3 129.2 75.0 1 556.9
Mongolia 13.2 0.1 0.1 319.6 0.2 936.6 0.3 2.7 11.2 33.3 1 317.3
Pakistan 33.7 0.1 0.0 4 938.5 0.1 0.1 104.3 1.2 283.9 248.2 113.0 5 723.1
Russian Federation 9 953.6 25.7 33.9 114 019.1 26.7 404.0 - 534.7 2 585.7 4 631.5 13 431.9 145 646.8
Tajikistan 42.1 0.0 2.5 191.0 0.7 672.6 1.5 3.4 144.1 74.7 1 132.6
Turkey 104.8 55.0 216.0 81 219.9 50.9 67.5 13 958.6 88.0 2 030.2 - 3 026.6 100 817.5
Turkmenistan 87.2 0.0 12.2 956.7 0.1 1.0 717.5 2.8 16.0 1 139.2 208.9 3 141.6
Uzbekistan 95.1 0.0 6.7 1 646.6 4.5 1 663.5 1.5 96.1 283.0 228.5 4 025.5
India *) 330.8 26.3 12.0 46 159.0 2.4 3.4 5 406.3 9.7 2 464.6 606.8 1 426.0 56 447.3
Japan *) 3.6 0.4 8.1 58 173.1 0.9 0.4 12 496.6 1.6 6 474.0 272.3 104.8 77 535.8
Republic of Korea *) 25.1 0.1 7.0 36 987.1 1.8 0.0 10 407.9 0.9 2183.7 304.6 498.0 50 416.2
TOTAL 12 009.5 144.6 790.1 521 617.1 176.1 529.7 83 583.7 721.2 24 344.7 15 704.3 23 694.6 683 315.6
Source: UN Comtrade database
*) India, Japan and Republic of Korea are non EATL project countries
Table 1.12
Export of goods from Asia to selected European countries in 2010, million US dollars
Countries of Asia
(Exporters)
Countries of Europe (importers)
Belarus
Bosnia and
Herzegovina
Georgia EU-28
FYR
Macedonia
Moldova
Russian
Federation
Serbia
Switzerland Turkey
Ukraine
TOTAL
Afghanistan 2.0 0.0 0.0 54.6 0.0 19.5 0.0 0.6 5.1 0.5 82.3
Armenia 5.1 0.1 45.5 343.0 0.0 0.9 158.5 0.8 3.2 2.6 17.9 577.6
Azerbaijan 6.0 0.0 464.2 12 866.2 0.2 0.2 385.9 0.5 924.6 865.1 951.2 16464.1
China 1 684.1 444.0 333.7 37 4248.6 288.8 320.2 38 960.9 1 202.5 5 848.2 17 180.8 4 700.4 445 212.2
Iran 7.6 2.4 55.1 19 242.4 5.5 1.0 271.6 15.8 42.5 7 644.8 49.9 27 338.6
Kazakhstan 405.8 6.1 91.6 21 070.4 1.5 15.8 4 449.4 30.4 1 075.6 2 471.0 766.2 30 383.8
Kyrgyzstan 8.3 0.2 1.4 263.1 1.1 0.5 393.3 3.8 0.1 30.9 6.2 708.9
Mongolia 0.0 0.0 133.9 0.2 0.0 79.1 0.0 1.2 0.9 11.1 226.4
Pakistan 15.7 5.5 2.0 5 070.4 4.9 2.9 240.2 9.2 60.5 749.9 55.2 6 216.4
Russian Federation 18 080.6 805.2 279.7 212 788.6 552.5 586.5 2 157.2 1 000.2 21 599.6 22 198.0 280 048.1

32
Countries of Asia
(Exporters)
Countries of Europe (importers)
Belarus
Bosnia and
Herzegovina
Georgia EU-28
FYR
Macedonia
Moldova
Russian
Federation
Serbia
Switzerland Turkey
Ukraine
TOTAL
Tajikistan 5.5 0.0 0.1 75.1 0.0 0.0 213.7 0.4 0.2 283.7 3.5 582.2
Turkey 259.4 256.4 883.6 56 159.6 261.7 205.8 4 866.0 324.9 736.0 1 298.3 65 251.7
Turkmenistan 3.6 0.1 59.2 485.6 1.3 1.7 148.0 1.5 0.1 386.3 31.4 1 118.8
Uzbekistan 58.5 0.3 9.7 459.3 0.4 3.6 1 513.5 9.5 32.8 861.4 81.7 3 030.7
India *) 152.0 36.5 32.5 44 119.1 34.5 26.0 2 143.3 113.4 969.5 3 409.9 680.7 51 717.4
Japan *) 184.8 55.8 80.9 89 101.9 45.4 34.4 10 259.7 136.9 3 537.3 3 297.8 801.8 107 536.7
Republic of Korea *) 139.2 45.6 29.3 52 186.8 43.4 23.3 7 281.5 126.0 422.4 4 764.0 768.0 65 829.5
TOTAL 21 018.2 1 658.2 2 368.5 888 668.6 1 241.4 1 222.8 71 384.1 4 132.8 14 655.0 63 553.8 32 422.0 1102 325.4
Source: UN Comtrade database
*) India, Japan and Republic of Korea are non EATL project countries
Table 1.13
Import of goods to Asia from selected European countries in 2011, million US dollars
Countries of Asia
(Importers)
Countries of Europe (exporters)
Belarus
Bosnia and
Herzegovina
Georgia EU-28
FYR
Macedonia
Moldova
Russian
Federation
Serbia
Switzerland Turkey
Ukraine
TOTAL
Afghanistan 140.3 1.6 2.1 1 247.5 0.6 5.4 801.3 10 10.8 276 14.1 2 509.7
Armenia 24.2 0.1 218.4 896.7 0.2 2.9 437.1 0.7 29.2 0.2 227.6 1 837.3
Azerbaijan 138.6 0.5 425.8 4 010.6 0.2 5.7 2 196.4 3.9 236.5 2 064.2 708.3 9 790.7
China 631.6 5.8 28.9 189 785.8 127.5 3.9 34 692.4 15.3 9 971.2 2 466.6 2180 239 909.0
Iran 124.5 32.3 16.2 14 604.4 0.9 1.0 3 277.1 48.4 761.5 3 589.7 1 127.4 23 583.4
Kazakhstan 668.7 0.1 156.9 8 326.1 0.2 45.5 14 173.7 9.9 318.1 947.9 1 857.5 26 504.6
Kyrgyzstan 218.2 0.1 7.6 568.0 2.9 1 156.4 0.0 9.0 180.4 111.3 2 253.9
Mongolia 77.4 0.0 0.8 573.8 0.1 1 485.6 0.4 9.9 43.4 45.3 2 236.7
Pakistan 48.8 0.4 0.4 5 226.4 0.1 126.3 0.4 315.4 213.7 183.7 6 115.6
Russian Federation 14 397.7 37.8 21.2 151 061.7 39.6 625.5 792.3 3 396.5 5 992.7 19 819.7 196 184.7
Tajikistan 50.1 0.0 4.5 195.0 0.0 1.2 721.4 0.8 4.3 172.6 60.2 1 210.1
Turkey 128.6 106.7 214.1 101 945.9 73.4 73.4 15 086.8 183.2 2 421.7 3 748.6 123 982.4
Turkmenistan 213.8 0.0 5.5 1 326.0 0.1 1.2 1 116.9 1.4 23.6 1 493.4 241.9 4 423.8
Uzbekistan 63.8 0.0 12.8 1 810.3 5.8 1 983.1 2.7 100.5 354.5 353.8 4 687.3
India *) 331.2 15.2 19.3 56 460.9 18.1 5.6 4 665.7 8.4 3364.8 756.1 2 265.3 67 910.6
Japan *) 12.2 0.3 2.9 68 275.1 1.1 0.9 14 234.7 2.3 7 509.2 296.4 152.5 90 487.6
Republic of Korea *) 8.6 0.2 8.5 42 235.3 19.4 0.2 13 329.7 1.4 2 620.4 527.8 467.6 59 219.1
TOTAL 17 278.3 201.1 1145.9 648 549.5 281.3 781.3 109 484.6 1081.5 31 102.6 19 375.6 33 564.8 862 846.5
Source: UN Comtrade database
*) India, Japan and Republic of Korea are non EATL project countries
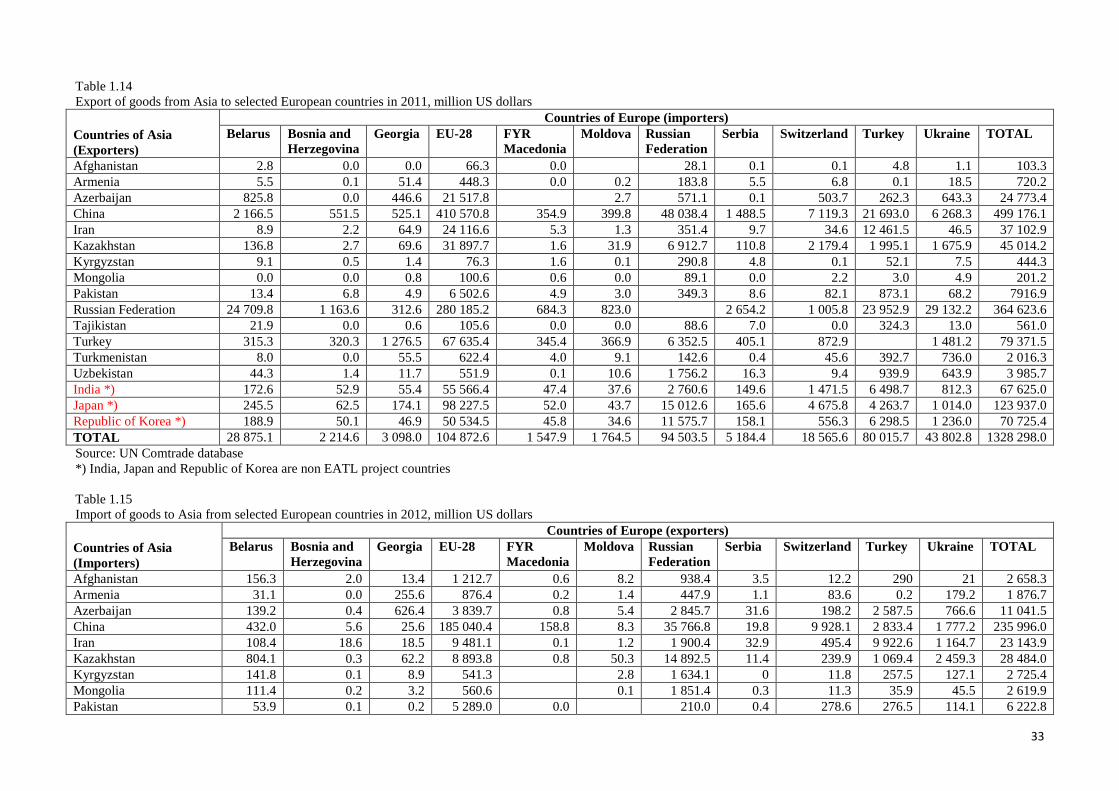
33
Table 1.14
Export of goods from Asia to selected European countries in 2011, million US dollars
Countries of Asia
(Exporters)
Countries of Europe (importers)
Belarus
Bosnia and
Herzegovina
Georgia EU-28
FYR
Macedonia
Moldova
Russian
Federation
Serbia
Switzerland Turkey
Ukraine
TOTAL
Afghanistan 2.8 0.0 0.0 66.3 0.0 28.1 0.1 0.1 4.8 1.1 103.3
Armenia 5.5 0.1 51.4 448.3 0.0 0.2 183.8 5.5 6.8 0.1 18.5 720.2
Azerbaijan 825.8 0.0 446.6 21 517.8 2.7 571.1 0.1 503.7 262.3 643.3 24 773.4
China 2 166.5 551.5 525.1 410 570.8 354.9 399.8 48 038.4 1 488.5 7 119.3 21 693.0 6 268.3 499 176.1
Iran 8.9 2.2 64.9 24 116.6 5.3 1.3 351.4 9.7 34.6 12 461.5 46.5 37 102.9
Kazakhstan 136.8 2.7 69.6 31 897.7 1.6 31.9 6 912.7 110.8 2 179.4 1 995.1 1 675.9 45 014.2
Kyrgyzstan 9.1 0.5 1.4 76.3 1.6 0.1 290.8 4.8 0.1 52.1 7.5 444.3
Mongolia 0.0 0.0 0.8 100.6 0.6 0.0 89.1 0.0 2.2 3.0 4.9 201.2
Pakistan 13.4 6.8 4.9 6 502.6 4.9 3.0 349.3 8.6 82.1 873.1 68.2 7916.9
Russian Federation 24 709.8 1 163.6 312.6 280 185.2 684.3 823.0 2 654.2 1 005.8 23 952.9 29 132.2 364 623.6
Tajikistan 21.9 0.0 0.6 105.6 0.0 0.0 88.6 7.0 0.0 324.3 13.0 561.0
Turkey 315.3 320.3 1 276.5 67 635.4 345.4 366.9 6 352.5 405.1 872.9 1 481.2 79 371.5
Turkmenistan 8.0 0.0 55.5 622.4 4.0 9.1 142.6 0.4 45.6 392.7 736.0 2 016.3
Uzbekistan 44.3 1.4 11.7 551.9 0.1 10.6 1 756.2 16.3 9.4 939.9 643.9 3 985.7
India *) 172.6 52.9 55.4 55 566.4 47.4 37.6 2 760.6 149.6 1 471.5 6 498.7 812.3 67 625.0
Japan *) 245.5 62.5 174.1 98 227.5 52.0 43.7 15 012.6 165.6 4 675.8 4 263.7 1 014.0 123 937.0
Republic of Korea *) 188.9 50.1 46.9 50 534.5 45.8 34.6 11 575.7 158.1 556.3 6 298.5 1 236.0 70 725.4
TOTAL 28 875.1 2 214.6 3 098.0 104 872.6 1 547.9 1 764.5 94 503.5 5 184.4 18 565.6 80 015.7 43 802.8 1328 298.0
Source: UN Comtrade database
*) India, Japan and Republic of Korea are non EATL project countries
Table 1.15
Import of goods to Asia from selected European countries in 2012, million US dollars
Countries of Asia
(Importers)
Countries of Europe (exporters)
Belarus
Bosnia and
Herzegovina
Georgia EU-28
FYR
Macedonia
Moldova
Russian
Federation
Serbia
Switzerland Turkey
Ukraine
TOTAL
Afghanistan 156.3 2.0 13.4 1 212.7 0.6 8.2 938.4 3.5 12.2 290 21 2 658.3
Armenia 31.1 0.0 255.6 876.4 0.2 1.4 447.9 1.1 83.6 0.2 179.2 1 876.7
Azerbaijan 139.2 0.4 626.4 3 839.7 0.8 5.4 2 845.7 31.6 198.2 2 587.5 766.6 11 041.5
China 432.0 5.6 25.6 185 040.4 158.8 8.3 35 766.8 19.8 9 928.1 2 833.4 1 777.2 235 996.0
Iran 108.4 18.6 18.5 9 481.1 0.1 1.2 1 900.4 32.9 495.4 9 922.6 1 164.7 23 143.9
Kazakhstan 804.1 0.3 62.2 8 893.8 0.8 50.3 14 892.5 11.4 239.9 1 069.4 2 459.3 28 484.0
Kyrgyzstan 141.8 0.1 8.9 541.3 2.8 1 634.1 0 11.8 257.5 127.1 2 725.4
Mongolia 111.4 0.2 3.2 560.6 0.1 1 851.4 0.3 11.3 35.9 45.5 2 619.9
Pakistan 53.9 0.1 0.2 5 289.0 0.0 210.0 0.4 278.6 276.5 114.1 6 222.8
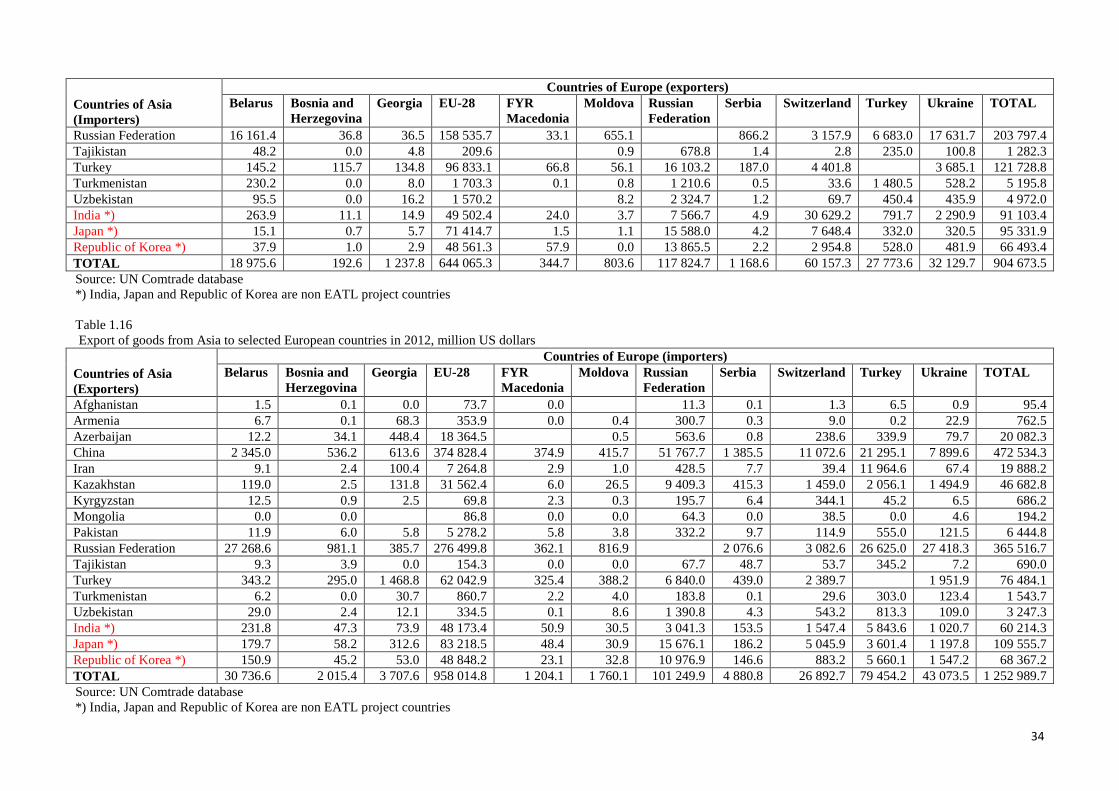
34
Countries of Asia
(Importers)
Countries of Europe (exporters)
Belarus
Bosnia and
Herzegovina
Georgia EU-28
FYR
Macedonia
Moldova
Russian
Federation
Serbia
Switzerland Turkey
Ukraine
TOTAL
Russian Federation 16 161.4 36.8 36.5 158 535.7 33.1 655.1 866.2 3 157.9 6 683.0 17 631.7 203 797.4
Tajikistan 48.2 0.0 4.8 209.6 0.9 678.8 1.4 2.8 235.0 100.8 1 282.3
Turkey 145.2 115.7 134.8 96 833.1 66.8 56.1 16 103.2 187.0 4 401.8 3 685.1 121 728.8
Turkmenistan 230.2 0.0 8.0 1 703.3 0.1 0.8 1 210.6 0.5 33.6 1 480.5 528.2 5 195.8
Uzbekistan 95.5 0.0 16.2 1 570.2 8.2 2 324.7 1.2 69.7 450.4 435.9 4 972.0
India *) 263.9 11.1 14.9 49 502.4 24.0 3.7 7 566.7 4.9 30 629.2 791.7 2 290.9 91 103.4
Japan *) 15.1 0.7 5.7 71 414.7 1.5 1.1 15 588.0 4.2 7 648.4 332.0 320.5 95 331.9
Republic of Korea *) 37.9 1.0 2.9 48 561.3 57.9 0.0 13 865.5 2.2 2 954.8 528.0 481.9 66 493.4
TOTAL 18 975.6 192.6 1 237.8 644 065.3 344.7 803.6 117 824.7 1 168.6 60 157.3 27 773.6 32 129.7 904 673.5
Source: UN Comtrade database
*) India, Japan and Republic of Korea are non EATL project countries
Table 1.16
Export of goods from Asia to selected European countries in 2012, million US dollars
Countries of Asia
(Exporters)
Countries of Europe (importers)
Belarus
Bosnia and
Herzegovina
Georgia EU-28
FYR
Macedonia
Moldova
Russian
Federation
Serbia
Switzerland Turkey
Ukraine
TOTAL
Afghanistan 1.5 0.1 0.0 73.7 0.0 11.3 0.1 1.3 6.5 0.9 95.4
Armenia 6.7 0.1 68.3 353.9 0.0 0.4 300.7 0.3 9.0 0.2 22.9 762.5
Azerbaijan 12.2 34.1 448.4 18 364.5 0.5 563.6 0.8 238.6 339.9 79.7 20 082.3
China 2 345.0 536.2 613.6 374 828.4 374.9 415.7 51 767.7 1 385.5 11 072.6 21 295.1 7 899.6 472 534.3
Iran 9.1 2.4 100.4 7 264.8 2.9 1.0 428.5 7.7 39.4 11 964.6 67.4 19 888.2
Kazakhstan 119.0 2.5 131.8 31 562.4 6.0 26.5 9 409.3 415.3 1 459.0 2 056.1 1 494.9 46 682.8
Kyrgyzstan 12.5 0.9 2.5 69.8 2.3 0.3 195.7 6.4 344.1 45.2 6.5 686.2
Mongolia 0.0 0.0 86.8 0.0 0.0 64.3 0.0 38.5 0.0 4.6 194.2
Pakistan 11.9 6.0 5.8 5 278.2 5.8 3.8 332.2 9.7 114.9 555.0 121.5 6 444.8
Russian Federation 27 268.6 981.1 385.7 276 499.8 362.1 816.9 2 076.6 3 082.6 26 625.0 27 418.3 365 516.7
Tajikistan 9.3 3.9 0.0 154.3 0.0 0.0 67.7 48.7 53.7 345.2 7.2 690.0
Turkey 343.2 295.0 1 468.8 62 042.9 325.4 388.2 6 840.0 439.0 2 389.7 1 951.9 76 484.1
Turkmenistan 6.2 0.0 30.7 860.7 2.2 4.0 183.8 0.1 29.6 303.0 123.4 1 543.7
Uzbekistan 29.0 2.4 12.1 334.5 0.1 8.6 1 390.8 4.3 543.2 813.3 109.0 3 247.3
India *) 231.8 47.3 73.9 48 173.4 50.9 30.5 3 041.3 153.5 1 547.4 5 843.6 1 020.7 60 214.3
Japan *) 179.7 58.2 312.6 83 218.5 48.4 30.9 15 676.1 186.2 5 045.9 3 601.4 1 197.8 109 555.7
Republic of Korea *) 150.9 45.2 53.0 48 848.2 23.1 32.8 10 976.9 146.6 883.2 5 660.1 1 547.2 68 367.2
TOTAL 30 736.6 2 015.4 3 707.6 958 014.8 1 204.1 1 760.1 101 249.9 4 880.8 26 892.7 79 454.2 43 073.5 1 252 989.7
Source: UN Comtrade database
*) India, Japan and Republic of Korea are non EATL project countries
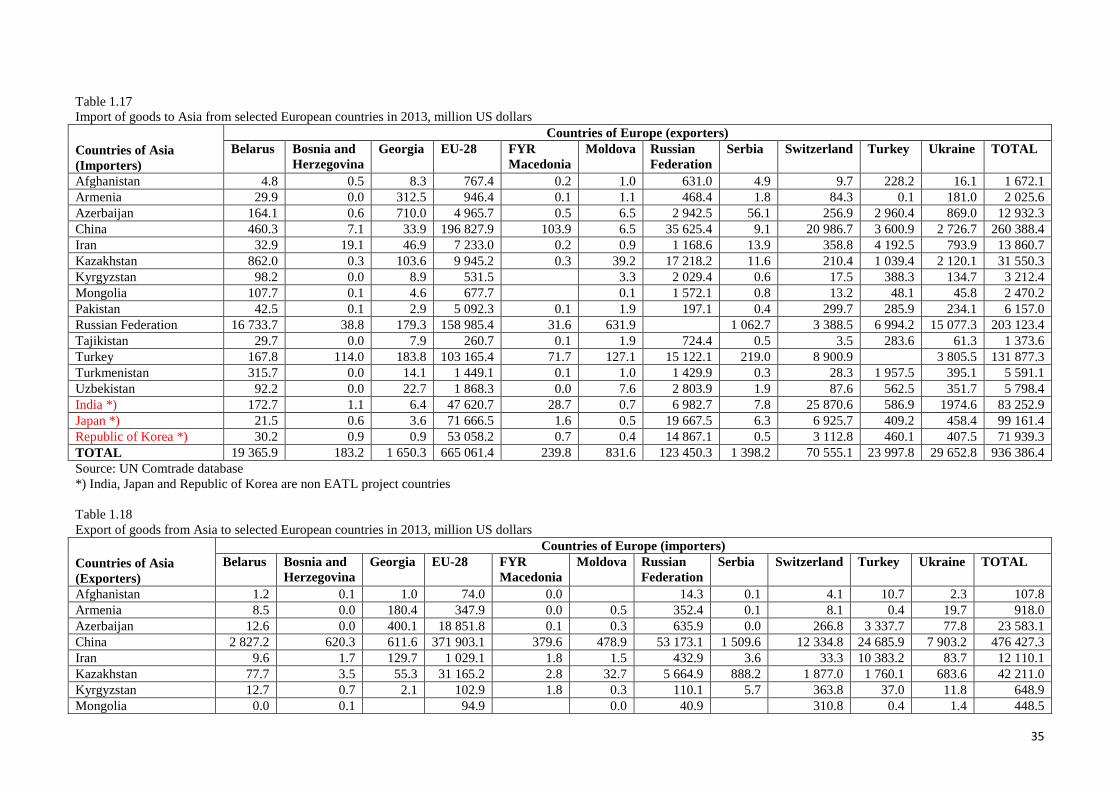
35
Table 1.17
Import of goods to Asia from selected European countries in 2013, million US dollars
Countries of Asia
(Importers)
Countries of Europe (exporters)
Belarus
Bosnia and
Herzegovina
Georgia EU-28
FYR
Macedonia
Moldova
Russian
Federation
Serbia
Switzerland Turkey
Ukraine
TOTAL
Afghanistan 4.8 0.5 8.3 767.4 0.2 1.0 631.0 4.9 9.7 228.2 16.1 1 672.1
Armenia 29.9 0.0 312.5 946.4 0.1 1.1 468.4 1.8 84.3 0.1 181.0 2 025.6
Azerbaijan 164.1 0.6 710.0 4 965.7 0.5 6.5 2 942.5 56.1 256.9 2 960.4 869.0 12 932.3
China 460.3 7.1 33.9 196 827.9 103.9 6.5 35 625.4 9.1 20 986.7 3 600.9 2 726.7 260 388.4
Iran 32.9 19.1 46.9 7 233.0 0.2 0.9 1 168.6 13.9 358.8 4 192.5 793.9 13 860.7
Kazakhstan 862.0 0.3 103.6 9 945.2 0.3 39.2 17 218.2 11.6 210.4 1 039.4 2 120.1 31 550.3
Kyrgyzstan 98.2 0.0 8.9 531.5 3.3 2 029.4 0.6 17.5 388.3 134.7 3 212.4
Mongolia 107.7 0.1 4.6 677.7 0.1 1 572.1 0.8 13.2 48.1 45.8 2 470.2
Pakistan 42.5 0.1 2.9 5 092.3 0.1 1.9 197.1 0.4 299.7 285.9 234.1 6 157.0
Russian Federation 16 733.7 38.8 179.3 158 985.4 31.6 631.9 1 062.7 3 388.5 6 994.2 15 077.3 203 123.4
Tajikistan 29.7 0.0 7.9 260.7 0.1 1.9 724.4 0.5 3.5 283.6 61.3 1 373.6
Turkey 167.8 114.0 183.8 103 165.4 71.7 127.1 15 122.1 219.0 8 900.9 3 805.5 131 877.3
Turkmenistan 315.7 0.0 14.1 1 449.1 0.1 1.0 1 429.9 0.3 28.3 1 957.5 395.1 5 591.1
Uzbekistan 92.2 0.0 22.7 1 868.3 0.0 7.6 2 803.9 1.9 87.6 562.5 351.7 5 798.4
India *) 172.7 1.1 6.4 47 620.7 28.7 0.7 6 982.7 7.8 25 870.6 586.9 1974.6 83 252.9
Japan *) 21.5 0.6 3.6 71 666.5 1.6 0.5 19 667.5 6.3 6 925.7 409.2 458.4 99 161.4
Republic of Korea *) 30.2 0.9 0.9 53 058.2 0.7 0.4 14 867.1 0.5 3 112.8 460.1 407.5 71 939.3
TOTAL 19 365.9 183.2 1 650.3 665 061.4 239.8 831.6 123 450.3 1 398.2 70 555.1 23 997.8 29 652.8 936 386.4
Source: UN Comtrade database
*) India, Japan and Republic of Korea are non EATL project countries
Table 1.18
Export of goods from Asia to selected European countries in 2013, million US dollars
Countries of Asia
(Exporters)
Countries of Europe (importers)
Belarus
Bosnia and
Herzegovina
Georgia EU-28
FYR
Macedonia
Moldova
Russian
Federation
Serbia
Switzerland Turkey
Ukraine
TOTAL
Afghanistan 1.2 0.1 1.0 74.0 0.0 14.3 0.1 4.1 10.7 2.3 107.8
Armenia 8.5 0.0 180.4 347.9 0.0 0.5 352.4 0.1 8.1 0.4 19.7 918.0
Azerbaijan 12.6 0.0 400.1 18 851.8 0.1 0.3 635.9 0.0 266.8 3 337.7 77.8 23 583.1
China 2 827.2 620.3 611.6 371 903.1 379.6 478.9 53 173.1 1 509.6 12 334.8 24 685.9 7 903.2 476 427.3
Iran 9.6 1.7 129.7 1 029.1 1.8 1.5 432.9 3.6 33.3 10 383.2 83.7 12 110.1
Kazakhstan 77.7 3.5 55.3 31 165.2 2.8 32.7 5 664.9 888.2 1 877.0 1 760.1 683.6 42 211.0
Kyrgyzstan 12.7 0.7 2.1 102.9 1.8 0.3 110.1 5.7 363.8 37.0 11.8 648.9
Mongolia 0.0 0.1 94.9 0.0 40.9 310.8 0.4 1.4 448.5

36
Countries of Asia
(Exporters)
Countries of Europe (importers)
Belarus
Bosnia and
Herzegovina
Georgia EU-28
FYR
Macedonia
Moldova
Russian
Federation
Serbia
Switzerland Turkey
Ukraine
TOTAL
Pakistan 15.8 7.3 5.4 6 015.2 6.6 2.7 350.0 9.8 105.3 436.7 93.8 7 048.6
Russian Federation 22 573.3 1 022.0 503.2 274 191.1 163.6 788.0 1 903.5 4 736.4 25 064.2 23 244.0 354 189.3
Tajikistan 4.9 0.4 0.0 119.0 0.0 37.9 1.2 50.3 371.4 5.2 590.3
Turkey 397.4 234.4 1 408.9 66 910.3 314.5 381.0 7 272.8 530.9 1 471.3 1 852.9 80 774.4
Turkmenistan 3.4 0.0 47.9 1 150.1 1.1 3.2 139.4 0.1 0.9 653.8 100.5 2 100.4
Uzbekistan 33.6 3.4 15.5 328.1 0.3 9.8 1 256.9 0.4 1 539.0 815.4 91.6 4 094.0
India *) 181.1 54.4 55.7 48 869.6 68.7 35.0 3 091.2 173.9 1 662.3 6 367.8 838.6 61 398.3
Japan *) 213.0 51.7 319.9 75 062.1 55.5 37.3 13 560.5 124.2 4 026.5 3 453.2 985.0 97 888.9
Republic of Korea *) 204.7 47.7 70.7 47 592.5 29.1 33.9 10 305.4 141.1 709.3 6 088.3 830.6 66 053.3
TOTAL 26 576.7 2 047.7 3 807.4 943 806.9 1 025.5 1 805.1 96 438.6 5 292.4 29 500.0 83 466.2 36 825.7 1 230 592.2
Source: UN Comtrade database
*) India, Japan and Republic of Korea are non EATL project countries
Table 1.19
Import of goods to Asia from selected European countries in 2014, million US dollars
Countries of Asia
(Importers)
Countries of Europe (exporters)
Belarus
Bosnia and
Herzegovina
Georgia EU-28
FYR
Macedonia
Moldova
Russian
Federation
Serbia
Switzerland Turkey
Ukraine
TOTAL
Afghanistan 4.2 0.1 1.5 640.8 0.3 0.1 407.6 5.1 8 186.2 10.2 1 264.1
Armenia 27.2 0.0 280.6 937.9 0.3 2.1 534.8 1.7 125.2 173.4 2 083.2
Azerbaijan 186.6 0.9 544.2 4 605.1 0.6 5.9 2 144.3 15.7 192 2 874.6 591.6 11 161.5
China 639.0 9.2 90.4 217 443.3 92.6 8.2 37 414.6 14.2 18 407.1 2 861.1 2 674.1 279 653.8
Iran 84.3 2.1 28.2 8 487.2 0.8 2.1 1 325.5 15.9 666.1 3 886.2 703.4 15 201.8
Kazakhstan 875.5 0.1 88.6 8 922.5 0.1 45.3 13 862.3 16.8 235.6 977.5 1 073.2 26 097.5
Kyrgyzstan 88.8 0.0 10.0 530.2 3.3 1 737.7 1.4 15.9 421.4 102.5 2 911.2
Mongolia 21.7 0.1 2.3 438.4 0.2 0.0 1 460.4 0.6 10.5 35.3 38.0 2 007.5
Pakistan 42.6 0.1 0.7 5 253.6 1.2 7.9 143.1 0.7 299.0 259.3 397.8 6 406.0
Russian Federation 15 071.6 54.0 270.0 136 267.3 42.1 423.7 1 029.1 3 174.6 5 943.0 9 799.1 172 074.5
Tajikistan 30.6 0.9 10.8 286.1 0.0 2.0 890.9 0.8 121.0 277.4 46.7 1 667.2
Turkey 161.3 155.5 222.4 98 243.6 67.6 104.7 14 755.2 230.9 4 902.1 3 561.4 122 404.7
Turkmenistan 174.0 0.0 14.3 1 451.9 0.2 1.2 1 137.7 1.6 22.2 2 231.2 431.3 5 465.6
Uzbekistan 67.1 0.0 54.8 2 061.8 8.1 3 113.6 7.2 142.7 603.0 308.6 6 366.9
India *) 210.4 0.5 10.8 46 196.2 22.0 0.6 4 395.7 8.7 21 118.4 586.6 1 817.4 74 367.3
Japan *) 12.5 1.5 3.3 69 751.7 1.2 1.4 19 830.8 6.8 6 981.3 375.5 209.6 97 175.6
Republic of Korea *) 42.6 4.4 3.5 56 802.1 0.1 0.1 18 081.8 2.4 3 242.3 470.5 510.3 79 160.1
TOTAL 17 740.0 229.4 1 636.4 658 319.7 229.3 616.7 121 236.0 1 359.6 59 664.0 21 988.8 22 448.6 905 468.5
Source: UN Comtrade database

37
*) India, Japan and Republic of Korea are non EATL project countries
Table 1.20
Export of goods from Asia to selected European countries in 2014, million US dollars
Countries of Asia
(Exporters)
Countries of Europe (importers)
Belarus
Bosnia and
Herzegovina
Georgia EU-28
FYR
Macedonia
Moldova
Russian
Federation
Serbia
Switzerland Turkey
Ukraine
TOTAL
Afghanistan 1.4 0.4 63.3 0.0 0.1 12.7 0.1 0.1 16.5 1.0 95.6
Armenia 9.0 0.0 205.1 304.4 0.0 0.4 314.2 0.1 4.8 1.5 13.3 852.8
Azerbaijan 18.4 0.3 349.1 17 548.6 0.0 0.1 452.3 0.4 441.2 291.3 43.7 19 145.4
China 948.0 922.5 733.0 400 507.7 433.0 481.2 50 583.0 1 561.1 13 284.7 24 918.2 5408.9 499 781.3
Iran 6.1 2.3 122.7 1 532.3 1.6 1.1 355.1 3.9 32.7 9 833.3 52.7 11 943.8
Kazakhstan 82.5 2.7 35.2 31 209.4 1.8 27.3 7172.4 198.0 1 034.6 1 236.3 375.8 41 376.0
Kyrgyzstan 6.5 0.7 2.7 105.3 2.1 0.4 70.9 4.8 425.1 65.6 4.3 688.4
Mongolia 0.7 0.0 98.5 0.0 0.0 40.4 0.0 421.6 0.1 0.6 561.9
Pakistan 6.5 9.8 4.0 7 317.3 5.4 2.9 310.9 14.8 117.8 435.5 100.7 8325.6
Russian Federation 21 868.6 876.8 462.1 220 906.1 140.1 717.2 2 340.4 3 314.9 25 288.6 12678.7 288 593.5
Tajikistan 4.0 0.0 0.0 81.1 0.0 0.0 37.3 0.0 121.7 160.9 3.2 408.2
Turkey 338.7 394.8 1 727.3 72 035.9 377.8 300.9 6 654.3 589.7 3626.9 1298.2 87 344.5
Turkmenistan 5.1 0.1 69.3 1 083.9 1.5 0.0 90.9 0.6 29.9 623.3 24.6 1929.2
Uzbekistan 21.7 2.3 13.4 309.7 0.2 15.4 869.8 0.0 1 336.2 780.7 72.8 3422.2
India *) 71.0 68.3 50.5 49 144.7 48.2 36.9 3 170.7 139.9 1 777.0 6 898.6 656.4 62062.2
Japan *) 88.5 64.3 368.2 72 951.9 64.1 45.8 10 917.4 107.5 3 985.2 3 199.9 612.6 92405.4
Republic of Korea *) 62.7 52.3 51.5 51 477.0 32.6 38.6 8 972.5 119.8 690.1 7548.3 478.3 69523.7
TOTAL 23 539.4 2 397.6 4 194.1 926 677.1 1 108.4 1 668.3 90 024.8 5 081.1 30 644.5 81 298.6 21825.8 1188459.7
Source: UN Comtrade database
*) India, Japan and Republic of Korea are non EATL project countries
Table 1.21
Import of goods to Asia from selected European countries in 2015, million US dollars
Countries of Asia
(Importers)
Countries of Europe (exporters)
Belarus
Bosnia and
Herzegovina
Georgia EU-28
FYR
Macedonia
Moldova
Russian
Federation
Serbia
Switzerland Turkey
Ukraine
TOTAL
Afghanistan 0.0 345.7 157.4 0.0 6.1 85.8 8.2 603.2
Armenia 27.8 0.1 157.0 696.7 0.4 1.1 510.8 1.6 34.5 101.6 1 531.6
Azerbaijan 137.8 0.3 241.0 3 823.8 0.5 3.5 1 676.2 7.4 174.8 1 898.7 318.8 8 282.8
China 780.7 16.0 125.8 188 821.4 142.8 8.6 28 335.0 20.2 20 291.8 2 414.9 2 399.1 243 356.3
Iran 39.0 0.9 35.8 7 154.0 0.3 0.9 1017.2 9.4 945.7 3 664.2 533.6 13 401.0
Kazakhstan 522.8 0.3 45.0 6 865.8 0.0 58.6 10 301.6 24.4 172.4 750.2 712.7 19 453.8
Kyrgyzstan 55.4 0.0 6.7 298.6 0.1 1.9 1 289.4 8.0 17.1 294.7 75.5 2 047.4
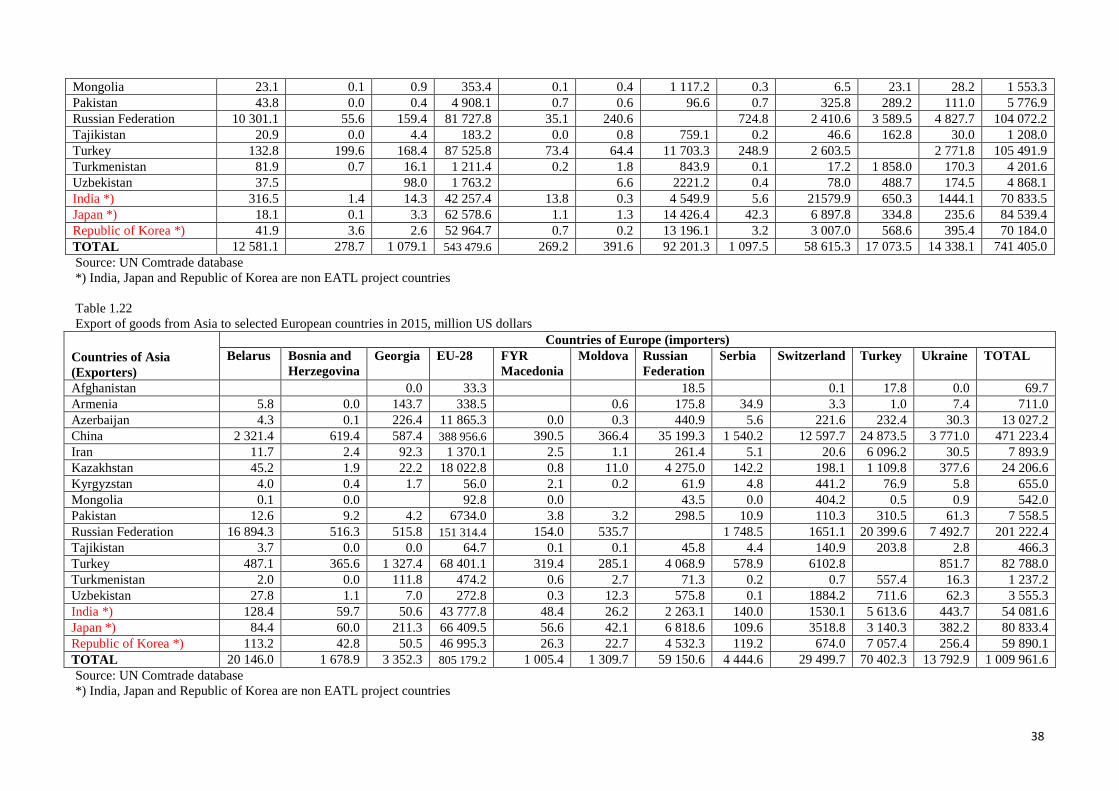
38
Mongolia 23.1 0.1 0.9 353.4 0.1 0.4 1 117.2 0.3 6.5 23.1 28.2 1 553.3
Pakistan 43.8 0.0 0.4 4 908.1 0.7 0.6 96.6 0.7 325.8 289.2 111.0 5 776.9
Russian Federation 10 301.1 55.6 159.4 81 727.8 35.1 240.6 724.8 2 410.6 3 589.5 4 827.7 104 072.2
Tajikistan 20.9 0.0 4.4 183.2 0.0 0.8 759.1 0.2 46.6 162.8 30.0 1 208.0
Turkey 132.8 199.6 168.4 87 525.8 73.4 64.4 11 703.3 248.9 2 603.5 2 771.8 105 491.9
Turkmenistan 81.9 0.7 16.1 1 211.4 0.2 1.8 843.9 0.1 17.2 1 858.0 170.3 4 201.6
Uzbekistan 37.5 98.0 1 763.2 6.6 2221.2 0.4 78.0 488.7 174.5 4 868.1
India *) 316.5 1.4 14.3 42 257.4 13.8 0.3 4 549.9 5.6 21579.9 650.3 1444.1 70 833.5
Japan *) 18.1 0.1 3.3 62 578.6 1.1 1.3 14 426.4 42.3 6 897.8 334.8 235.6 84 539.4
Republic of Korea *) 41.9 3.6 2.6 52 964.7 0.7 0.2 13 196.1 3.2 3 007.0 568.6 395.4 70 184.0
TOTAL 12 581.1 278.7 1 079.1 543 479.6 269.2 391.6 92 201.3 1 097.5 58 615.3 17 073.5 14 338.1 741 405.0
Source: UN Comtrade database
*) India, Japan and Republic of Korea are non EATL project countries
Table 1.22
Export of goods from Asia to selected European countries in 2015, million US dollars
Countries of Asia
(Exporters)
Countries of Europe (importers)
Belarus
Bosnia and
Herzegovina
Georgia EU-28
FYR
Macedonia
Moldova
Russian
Federation
Serbia
Switzerland Turkey
Ukraine
TOTAL
Afghanistan 0.0 33.3 18.5 0.1 17.8 0.0 69.7
Armenia 5.8 0.0 143.7 338.5 0.6 175.8 34.9 3.3 1.0 7.4 711.0
Azerbaijan 4.3 0.1 226.4 11 865.3 0.0 0.3 440.9 5.6 221.6 232.4 30.3 13 027.2
China 2 321.4 619.4 587.4 388 956.6 390.5 366.4 35 199.3 1 540.2 12 597.7 24 873.5 3 771.0 471 223.4
Iran 11.7 2.4 92.3 1 370.1 2.5 1.1 261.4 5.1 20.6 6 096.2 30.5 7 893.9
Kazakhstan 45.2 1.9 22.2 18 022.8 0.8 11.0 4 275.0 142.2 198.1 1 109.8 377.6 24 206.6
Kyrgyzstan 4.0 0.4 1.7 56.0 2.1 0.2 61.9 4.8 441.2 76.9 5.8 655.0
Mongolia 0.1 0.0 92.8 0.0 43.5 0.0 404.2 0.5 0.9 542.0
Pakistan 12.6 9.2 4.2 6734.0 3.8 3.2 298.5 10.9 110.3 310.5 61.3 7 558.5
Russian Federation 16 894.3 516.3 515.8 151 314.4 154.0 535.7 1 748.5 1651.1 20 399.6 7 492.7 201 222.4
Tajikistan 3.7 0.0 0.0 64.7 0.1 0.1 45.8 4.4 140.9 203.8 2.8 466.3
Turkey 487.1 365.6 1 327.4 68 401.1 319.4 285.1 4 068.9 578.9 6102.8 851.7 82 788.0
Turkmenistan 2.0 0.0 111.8 474.2 0.6 2.7 71.3 0.2 0.7 557.4 16.3 1 237.2
Uzbekistan 27.8 1.1 7.0 272.8 0.3 12.3 575.8 0.1 1884.2 711.6 62.3 3 555.3
India *) 128.4 59.7 50.6 43 777.8 48.4 26.2 2 263.1 140.0 1530.1 5 613.6 443.7 54 081.6
Japan *) 84.4 60.0 211.3 66 409.5 56.6 42.1 6 818.6 109.6 3518.8 3 140.3 382.2 80 833.4
Republic of Korea *) 113.2 42.8 50.5 46 995.3 26.3 22.7 4 532.3 119.2 674.0 7 057.4 256.4 59 890.1
TOTAL 20 146.0 1 678.9 3 352.3 805 179.2 1 005.4 1 309.7 59 150.6 4 444.6 29 499.7 70 402.3 13 792.9 1 009 961.6
Source: UN Comtrade database
*) India, Japan and Republic of Korea are non EATL project countries
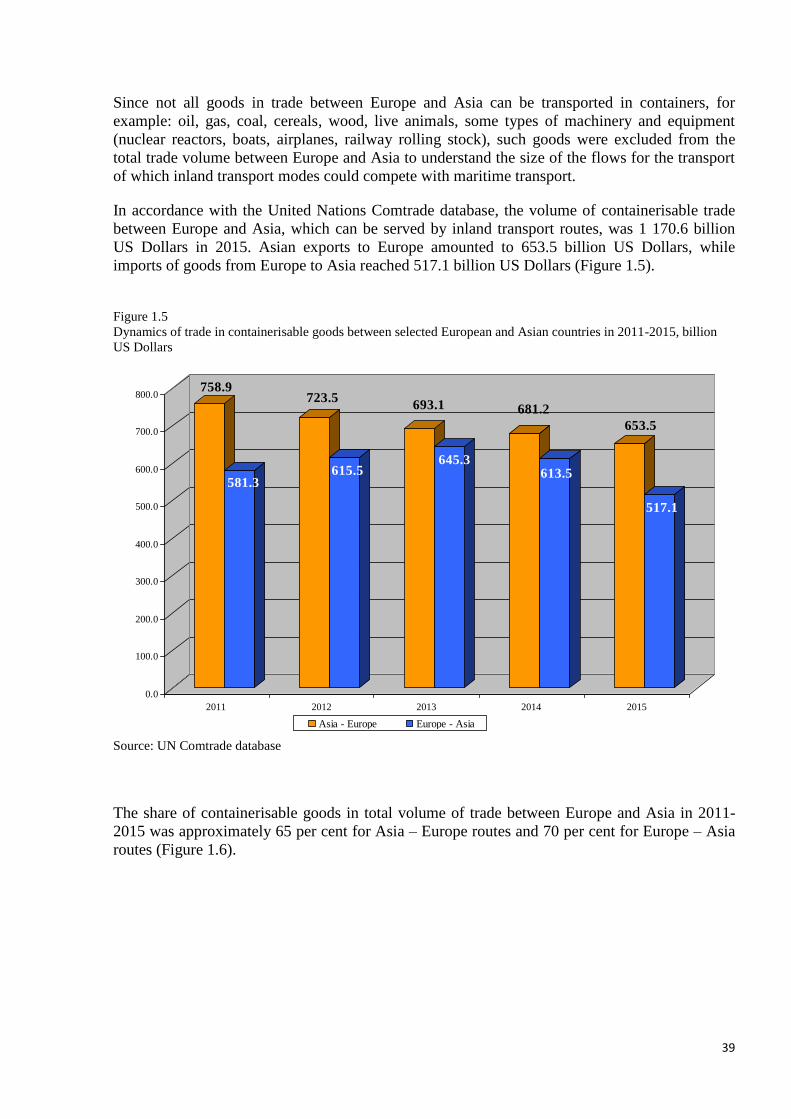
39
Since not all goods in trade between Europe and Asia can be transported in containers, for
example: oil, gas, coal, cereals, wood, live animals, some types of machinery and equipment
(nuclear reactors, boats, airplanes, railway rolling stock), such goods were excluded from the
total trade volume between Europe and Asia to understand the size of the flows for the transport
of which inland transport modes could compete with maritime transport.
In accordance with the United Nations Comtrade database, the volume of containerisable trade
between Europe and Asia, which can be served by inland transport routes, was 1 170.6 billion
US Dollars in 2015. Asian exports to Europe amounted to 653.5 billion US Dollars, while
imports of goods from Europe to Asia reached 517.1 billion US Dollars (Figure 1.5).
Figure 1.5
Dynamics of trade in containerisable goods between selected European and Asian countries in 2011-2015, billion
US Dollars
758.9
581.3
723.5
615.5
693.1
645.3
681.2
613.5
653.5
517.1
0.0
100.0
200.0
300.0
400.0
500.0
600.0
700.0
800.0
2011 2012 2013 2014 2015
Asia - Europe Europe - Asia
Source: UN Comtrade database
The share of containerisable goods in total volume of trade between Europe and Asia in 2011-
2015 was approximately 65 per cent for Asia – Europe routes and 70 per cent for Europe – Asia
routes (Figure 1.6).
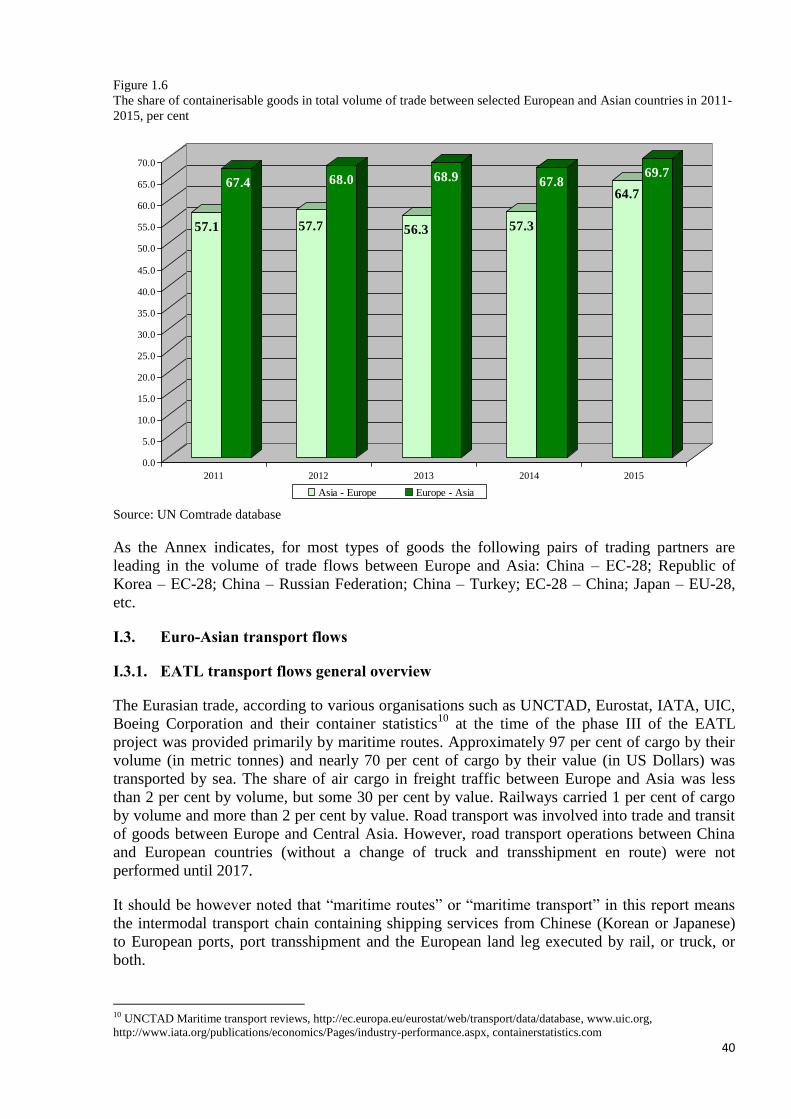
40
Figure 1.6
The share of containerisable goods in total volume of trade between selected European and Asian countries in 2011-
2015, per cent
57.1
67.4
57.7
68.0
56.3
68.9
57.3
67.864.7
69.7
0.0
5.0
10.0
15.0
20.0
25.0
30.0
35.0
40.0
45.0
50.0
55.0
60.0
65.0
70.0
2011 2012 2013 2014 2015
Asia - Europe Europe - Asia
Source: UN Comtrade database
As the Annex indicates, for most types of goods the following pairs of trading partners are
leading in the volume of trade flows between Europe and Asia: China – ЕС-28; Republic of
Korea – ЕС-28; China – Russian Federation; China – Turkey; EC-28 – China; Japan – EU-28,
etc.
I.3. Euro-Asian transport flows
I.3.1. EATL transport flows general overview
The Eurasian trade, according to various organisations such as UNCTAD, Eurostat, IATA, UIC,
Boeing Corporation and their container statistics10
at the time of the phase III of the EATL
project was provided primarily by maritime routes. Approximately 97 per cent of cargo by their
volume (in metric tonnes) and nearly 70 per cent of cargo by their value (in US Dollars) was
transported by sea. The share of air cargo in freight traffic between Europe and Asia was less
than 2 per cent by volume, but some 30 per cent by value. Railways carried 1 per cent of cargo
by volume and more than 2 per cent by value. Road transport was involved into trade and transit
of goods between Europe and Central Asia. However, road transport operations between China
and European countries (without a change of truck and transshipment en route) were not
performed until 2017.
It should be however noted that “maritime routes” or “maritime transport” in this report means
the intermodal transport chain containing shipping services from Chinese (Korean or Japanese)
to European ports, port transshipment and the European land leg executed by rail, or truck, or
both.
10 UNCTAD Maritime transport reviews, http://ec.europa.eu/eurostat/web/transport/data/database, www.uic.org,
http://www.iata.org/publications/economics/Pages/industry-performance.aspx, containerstatistics.com
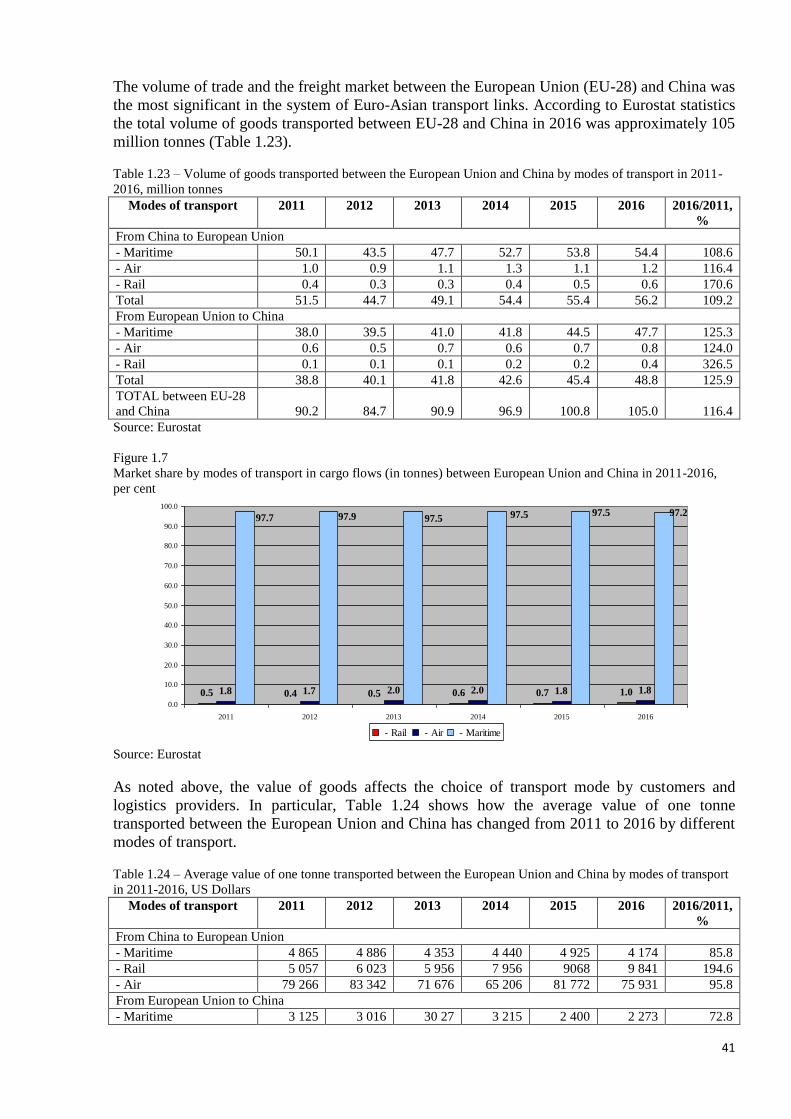
41
The volume of trade and the freight market between the European Union (EU-28) and China was
the most significant in the system of Euro-Asian transport links. According to Eurostat statistics
the total volume of goods transported between EU-28 and China in 2016 was approximately 105
million tonnes (Table 1.23).
Table 1.23 – Volume of goods transported between the European Union and China by modes of transport in 2011-
2016, million tonnes
Modes of transport 2011 2012 2013 2014 2015 2016 2016/2011,
%
From China to European Union
- Maritime 50.1 43.5 47.7 52.7 53.8 54.4 108.6
- Air 1.0 0.9 1.1 1.3 1.1 1.2 116.4
- Rail 0.4 0.3 0.3 0.4 0.5 0.6 170.6
Total 51.5 44.7 49.1 54.4 55.4 56.2 109.2
From European Union to China
- Maritime 38.0 39.5 41.0 41.8 44.5 47.7 125.3
- Air 0.6 0.5 0.7 0.6 0.7 0.8 124.0
- Rail 0.1 0.1 0.1 0.2 0.2 0.4 326.5
Total 38.8 40.1 41.8 42.6 45.4 48.8 125.9
TOTAL between EU-28
and China 90.2 84.7 90.9 96.9 100.8 105.0 116.4
Source: Eurostat
Figure 1.7
Market share by modes of transport in cargo flows (in tonnes) between European Union and China in 2011-2016,
per cent
0.5 0.4 0.5 0.6 0.7 1.01.8 1.7 2.0 2.0 1.8 1.8
97.297.597.597.597.997.7
0.0
10.0
20.0
30.0
40.0
50.0
60.0
70.0
80.0
90.0
100.0
2011 2012 2013 2014 2015 2016
- Rail - Air - Maritime
Source: Eurostat
As noted above, the value of goods affects the choice of transport mode by customers and
logistics providers. In particular, Table 1.24 shows how the average value of one tonne
transported between the European Union and China has changed from 2011 to 2016 by different
modes of transport.
Table 1.24 – Average value of one tonne transported between the European Union and China by modes of transport
in 2011-2016, US Dollars
Modes of transport 2011 2012 2013 2014 2015 2016 2016/2011,
%
From China to European Union
- Maritime 4 865 4 886 4 353 4 440 4 925 4 174 85.8
- Rail 5 057 6 023 5 956 7 956 9068 9 841 194.6
- Air 79 266 83 342 71 676 65 206 81 772 75 931 95.8
From European Union to China
- Maritime 3 125 3 016 30 27 3 215 2 400 2 273 72.8
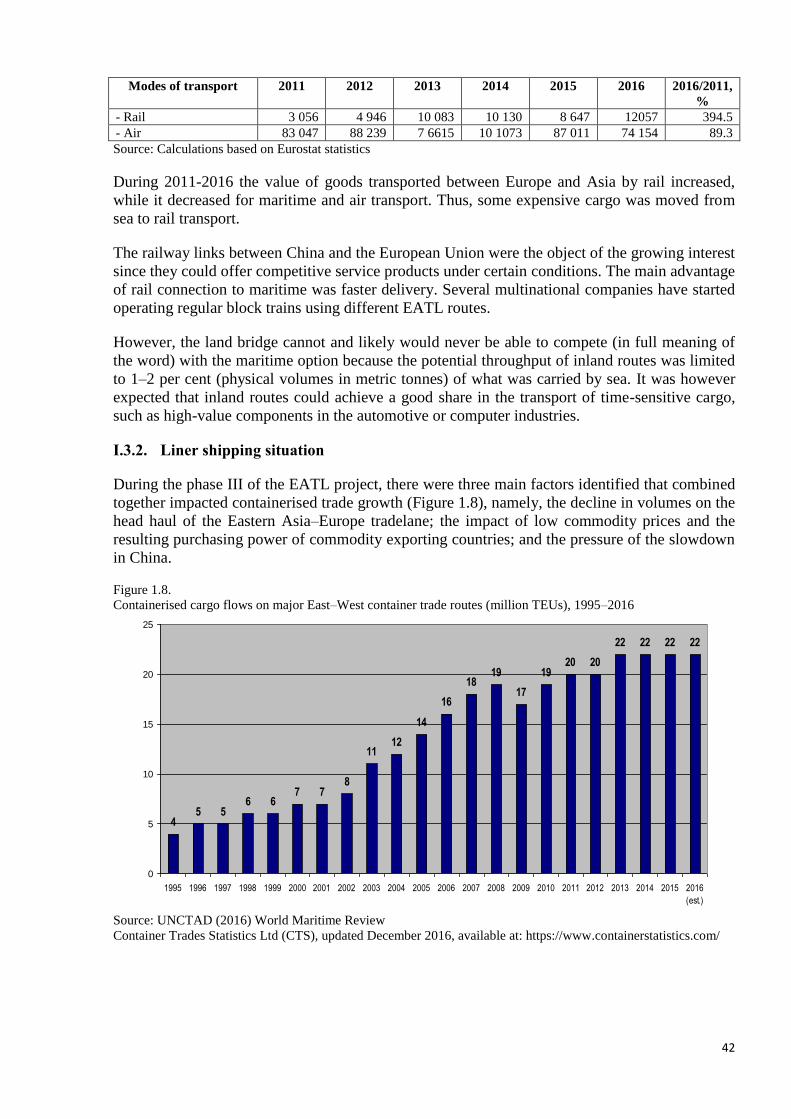
42
Modes of transport 2011 2012 2013 2014 2015 2016 2016/2011,
%
- Rail 3 056 4 946 10 083 10 130 8 647 12057 394.5
- Air 83 047 88 239 7 6615 10 1073 87 011 74 154 89.3
Source: Calculations based on Eurostat statistics
During 2011-2016 the value of goods transported between Europe and Asia by rail increased,
while it decreased for maritime and air transport. Thus, some expensive cargo was moved from
sea to rail transport.
The railway links between China and the European Union were the object of the growing interest
since they could offer competitive service products under certain conditions. The main advantage
of rail connection to maritime was faster delivery. Several multinational companies have started
operating regular block trains using different EATL routes.
However, the land bridge cannot and likely would never be able to compete (in full meaning of
the word) with the maritime option because the potential throughput of inland routes was limited
to 1–2 per cent (physical volumes in metric tonnes) of what was carried by sea. It was however
expected that inland routes could achieve a good share in the transport of time-sensitive cargo,
such as high-value components in the automotive or computer industries.
I.3.2. Liner shipping situation
During the phase III of the EATL project, there were three main factors identified that combined
together impacted containerised trade growth (Figure 1.8), namely, the decline in volumes on the
head haul of the Eastern Asia–Europe tradelane; the impact of low commodity prices and the
resulting purchasing power of commodity exporting countries; and the pressure of the slowdown
in China.
Figure 1.8.
Containerised cargo flows on major East–West container trade routes (million TEUs), 1995–2016
45 5
6 67 7
8
1112
14
16
1819
17
1920 20
22 22 22 22
0
5
10
15
20
25
1995 1996 1997 1998 1999 2000 2001 2002 2003 2004 2005 2006 2007 2008 2009 2010 2011 2012 2013 2014 2015 2016
(est.)
Source: UNCTAD (2016) World Maritime Review
Container Trades Statistics Ltd (CTS), updated December 2016, available at: https://www.containerstatistics.com/

43
Figure 1.9
Containerised cargo flows on Asia-Europe and Europe-Asia container trade routes (million TEUs), 2009–2016
11.5
13.314.1
13.714.3
15.2 14.915.3
5.5 5.76.2 6.3
6.9 6.8 6.8 7.0
0
2
4
6
8
10
12
14
16
18
2009 2010 2011 2012 2013 2014 2015 2016 (est.)
Asia - Europe Europe - Asia
Source: UNCTAD (2016) World Maritime Review
The decline in 2015 of European containerised trade seemed inconsistent with data indicating
that, during that year, intra-European trade was outpaced. While intraregional imports grew by
1.4 per cent, imports from the rest of the world remained flat. The share of intraregional imports
of total European imports increased from 60 per cent in 2007 to 65 per cent in 201511
. Combined
with statistics showing a relatively strong demand in Europe for consumer goods during the year,
it was argued that a shift may be unfolding towards regional and closer-to-end-market sourcing
of goods.
Problems affecting the container freight market in 2015 were linked with the diverging and
persistent global supply-and-demand trends and growing imbalances. This situation was
expected to continue throughout 2017 and 2018. Despite weak demand and low freight rates,
carriers continued to invest in large vessels. The global container ship fleet grew by 4.6 per cent
in 2016 and was projected to grow another 5.6 per cent in 201712
. Such a pace would continue to
outstrip global container demand and exacerbate market fundamentals and in turn challenge
container ship market conditions and freight rates in the short term, especially on the main
tradelanes13
. Consequently, poor performance was also expected and may result in further
consolidation and restructuring of the container shipping industry.
Regular shipping liners were dominating in the Euro-Asian trade due to their incomparable
economies of scale and punctual services, which was highly valued in modern supply chains.
Maritime transport also showed high market flexibility that helped the industry keep customers
loyal.
This flexibility was achieved by introducing slow steaming and creating shipping alliances. It
resulted in offering flexible service rates.
11 Danish Ship Finance (2016). Shipping market review. Available at http://www.shipfinance.dk/en/shippingresearch/~/
media/PUBLIKATIONER/Shipping-Market-Review/Shipping-Market-Review---May-2016.ashx 12 AlixPartners (2016a). Container Shipping Outlook 2016: Overcapacity Catches Industry in Undertow. Outlook
Transportation and Logistics. Available at http://legacy.alixpartners.com/en/LinkClick.aspx?fileticket=F8t292
19hJg%3d&tabid=635 13 Clarksons Research (2016). Dry Bulk Trade Outlook

44
Slow steaming - reduced vessel speeds to save fuel and cut costs - adopted by the majority of
shipping liners was one of the important features that changed the maritime business since the
2009 crisis.
According to Clarksons Research14
, prior to implementing slow steaming, a typical structure for
a service from the Far East to Europe included eight ships in operation to maintain weekly calls
over a period of 56 days for full rotation (28 days for one leg). With the implementation of slow
steaming, the number of operated vessels increased to ten to maintain weekly calls, while transit
times increased to 70 days for a full rotation (35 days for one leg). At the same time, such a
speed reduction impacted almost 50 per cent of the bunker cost of a mega-containership and a
little bit more on the cost of a 5,000 TEU’s ship. Besides, slow steaming obviously decreased
environmental pollution.
Many shippers accepted a shift to slow steaming since decreased tariff seemed very attractive
under the crisis pressure (see Figure 1.11 and table 1.19). However, others with high value
merchandise rather opposed the practice due to increased pipeline inventory associated with
longer transit times.
There was no generally accepted opinion about the future of slow steaming. It gave however a
chance for rail operators to offer competitive services to customers who believe that slow
steaming was not acceptable for their business model.
Creation of shipping alliances was the market trend that reflected the market players’ intention to
establish sustainable large-scale units that would be able to optimize the utilization of
participants’ assets and services on the main tradelanes. Vessel-sharing within the alliance
helped the carriers to increase service frequency without introducing extra vessels. Rate
“harmonization” within the alliances, although legally prohibited, also took place.
In 2016 there were four main container carrier alliances approved by the regulators in the
European Union, United States of America and China: 2M, Ocean 3, KYH and G615
. These
alliances controlled more than 70 per cent of the cargo volumes moving on the major East-West
tradelanes.
Almost all of the 14 largest shipping companies making up 73.1 per cent of the market share
belonged to these alliances. As of July 2016, the world’s shipping alliances were aligned as
follows: 2M Alliance: Maersk and MSC; Ocean Three Alliance: CMA CGM, UASC,
China Shipping; G6 Alliance: NYK Line, OOCL, APL, MOL, Hapag-Lloyd, HMM; CKYHE
Alliance: K Line, COSCO, HANJIN, Evergreen, Yang Ming (Figure 1.10). Among the top
independent carriers were PIL, ZIM, Wan Hai Lines, X-Press Feeders and KMTC.
In 2017-2018, the world of shipping alliances may see changes and reorganizations may affect
nearly all of the above lines. Hapag-Lloyd, which recently merged with UASC, and five Asian
carriers want to form the new vessel-sharing alliance called THE Alliance. In addition, HMM
was expected to join Maersk and MSC in the 2M alliance.
The exact impact of this new alignment of the major container ship operators had yet to be fully
assessed. Shippers were advocating for greater scrutiny and the need to conduct reviews to
determine how the alliances were impacting the industry. An immediate consequence of
14
Clarksons Research (2016). Dry Bulk Trade Outlook 15
Thefour alliances mentioned include the following carriers: 2M - Maersk and Mediterranean Shipping Co., Ocean 3 - CMA CGM,
United Arab Shipping Co. and China Shipping, CKYHE - Cosco, “K” Line, Yang Ming, Hanjin, Evergreen, G6 - APL, MOL, Hyundai
Merchant Marine, OOCL, NYK Line, Hapag-Lloyd.

45
consolidation was the tendency for alliances to focus on reduction of transit times and increase of
reliability to attract shippers, at the expense of services and port calls16
. In any case, the alliances
seemed to offer a solution for maritime shipping companies to strengthen their market position
on the East-West tradelanes. The establishment of new alliances and rounds of restructuring was
expected to continue, as it was unlikely that the market would stabilize shortly.
Figure 1.10
Market share by alliance on the Far East-Europe shipping lines, April 2016
Source: Alphaliner Newsletter no 17 - 2016
Flexible rates could have been introduced by maritime shipping companies as a result of slow
steaming and a set-up of alliances, which helped to bring down the cost of operation and thus to
keep business competitive. The crisis period illustrated that very well. Figure 1.14 shows the
dynamics of Chinese forwarders freight index. The rate per 20ft container fell down from US
Dollars 1 826 in March 2010 to US Dollars 739 in March 2017.
The general trend across the East-West sea routes was the decline of rates reflecting the
economic situation. This trend is illustrated by Figure 1.11, 1.12 and Tables 1.25 and 1.26. The
Far East–Northern Europe trade route freight rates, for example, averaged as low as US Dollars
629 per TEU in 2015, down by almost 46 per cent from the 2014 average and by 65 per cent,
compared with rates of 2010. In contrast, Far East–Mediterranean spot rates fell by 41 per cent,
reaching US Dollars 739 per TEU, a decline of 41 per cent, compared with rates in 2014, and
almost 58 per cent less than rates of 2010.
In 2015, containerised trade continued to face the upsizing of container ships which influence the
rates on the Europe-Asia lines. The average ship size in the global fleet increased at a cumulative
annual growth rate of 1.9 per cent in 2001–2009 and 18.2 per cent in 2010–201517
.
16 King M (2016). Alliances to cut port calls to reduce transit times. Lloyd’s Loading List. 7 June 17 Davidson N (2016) Juggling bigger ships, mega-alliances and slower growth. Presented at the Terminal Operations Conference
Europe. Hamburg, Germany
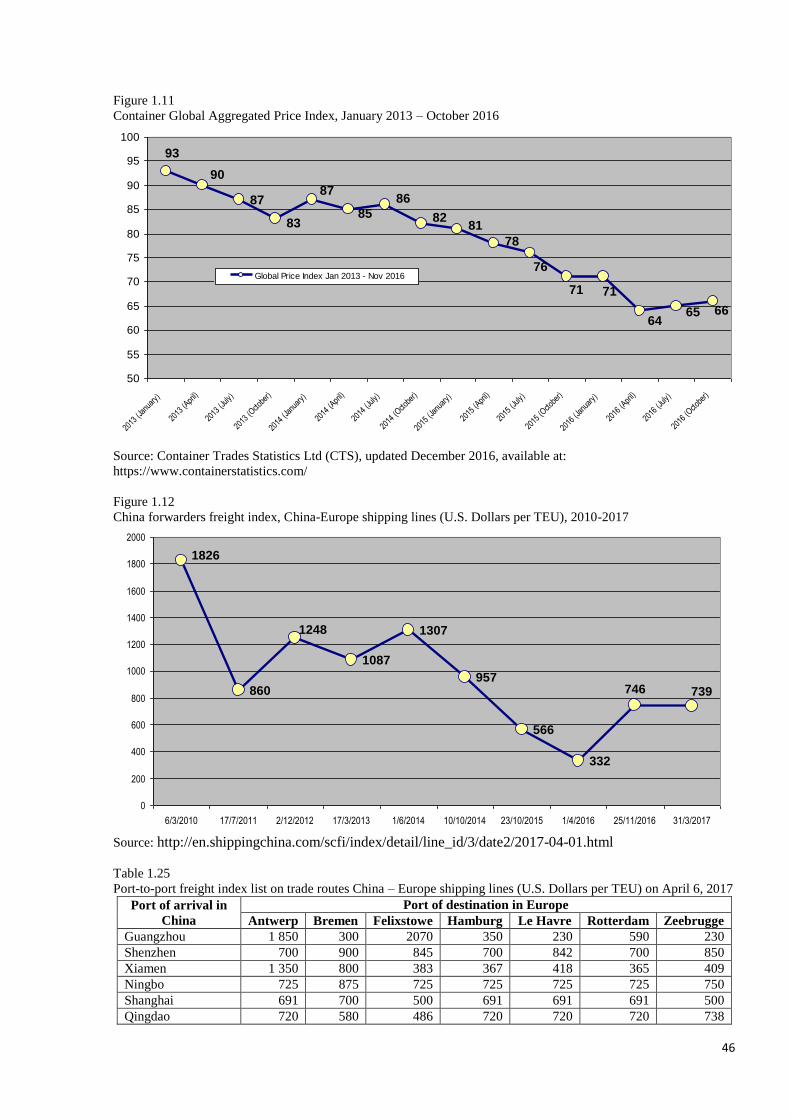
46
Figure 1.11
Container Global Aggregated Price Index, January 2013 – October 2016
87
93
90
83
87
85
86
8281
78
76
71 71
6465 66
50
55
60
65
70
75
80
85
90
95
100
2013
(Jan
uary
)
2013
(Apr
il)
2013
(July
)
2013
(Octo
ber)
2014
(Jan
uary
)
2014
(Apr
il)
2014
(July
)
2014
(Octo
ber)
2015
(Jan
uary
)
2015
(Apr
il)
2015
(July
)
2015
(Octo
ber)
2016
(Jan
uary
)
2016
(Apr
il)
2016
(July
)
2016
(Octo
ber)
Global Price Index Jan 2013 - Nov 2016
Source: Container Trades Statistics Ltd (CTS), updated December 2016, available at:
https://www.containerstatistics.com/
Figure 1.12
China forwarders freight index, China-Europe shipping lines (U.S. Dollars per TEU), 2010-2017
860
1087
1307
957
566
332
739746
1248
1826
0
200
400
600
800
1000
1200
1400
1600
1800
2000
6/3/2010 17/7/2011 2/12/2012 17/3/2013 1/6/2014 10/10/2014 23/10/2015 1/4/2016 25/11/2016 31/3/2017
Source: http://en.shippingchina.com/scfi/index/detail/line_id/3/date2/2017-04-01.html
Table 1.25
Port-to-port freight index list on trade routes China – Europe shipping lines (U.S. Dollars per TEU) on April 6, 2017
Port of arrival in
China
Port of destination in Europe
Antwerp Bremen Felixstowe Hamburg Le Havre Rotterdam Zeebrugge
Guangzhou 1 850 300 2070 350 230 590 230
Shenzhen 700 900 845 700 842 700 850
Xiamen 1 350 800 383 367 418 365 409
Ningbo 725 875 725 725 725 725 750
Shanghai 691 700 500 691 691 691 500
Qingdao 720 580 486 720 720 720 738
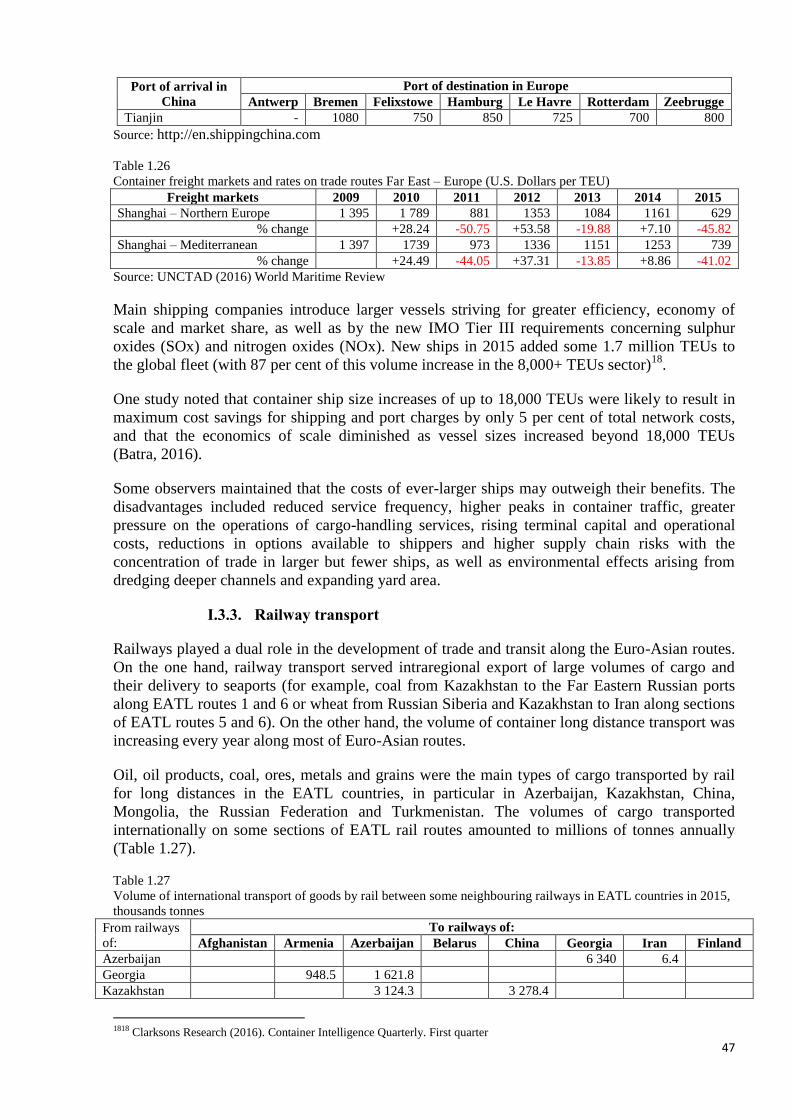
47
Port of arrival in
China
Port of destination in Europe
Antwerp Bremen Felixstowe Hamburg Le Havre Rotterdam Zeebrugge
Tianjin - 1080 750 850 725 700 800
Source: http://en.shippingchina.com
Table 1.26
Container freight markets and rates on trade routes Far East – Europe (U.S. Dollars per TEU)
Freight markets 2009 2010 2011 2012 2013 2014 2015
Shanghai – Northern Europe 1 395 1 789 881 1353 1084 1161 629
% change +28.24 -50.75 +53.58 -19.88 +7.10 -45.82
Shanghai – Mediterranean 1 397 1739 973 1336 1151 1253 739
% change +24.49 -44.05 +37.31 -13.85 +8.86 -41.02
Source: UNCTAD (2016) World Maritime Review
Main shipping companies introduce larger vessels striving for greater efficiency, economy of
scale and market share, as well as by the new IMO Tier III requirements concerning sulphur
oxides (SOx) and nitrogen oxides (NOx). New ships in 2015 added some 1.7 million TEUs to
the global fleet (with 87 per cent of this volume increase in the 8,000+ TEUs sector)18
.
One study noted that container ship size increases of up to 18,000 TEUs were likely to result in
maximum cost savings for shipping and port charges by only 5 per cent of total network costs,
and that the economics of scale diminished as vessel sizes increased beyond 18,000 TEUs
(Batra, 2016).
Some observers maintained that the costs of ever-larger ships may outweigh their benefits. The
disadvantages included reduced service frequency, higher peaks in container traffic, greater
pressure on the operations of cargo-handling services, rising terminal capital and operational
costs, reductions in options available to shippers and higher supply chain risks with the
concentration of trade in larger but fewer ships, as well as environmental effects arising from
dredging deeper channels and expanding yard area.
I.3.3. Railway transport
Railways played a dual role in the development of trade and transit along the Euro-Asian routes.
On the one hand, railway transport served intraregional export of large volumes of cargo and
their delivery to seaports (for example, coal from Kazakhstan to the Far Eastern Russian ports
along EATL routes 1 and 6 or wheat from Russian Siberia and Kazakhstan to Iran along sections
of EATL routes 5 and 6). On the other hand, the volume of container long distance transport was
increasing every year along most of Euro-Asian routes.
Oil, oil products, coal, ores, metals and grains were the main types of cargo transported by rail
for long distances in the EATL countries, in particular in Azerbaijan, Kazakhstan, China,
Mongolia, the Russian Federation and Turkmenistan. The volumes of cargo transported
internationally on some sections of EATL rail routes amounted to millions of tonnes annually
(Table 1.27).
Table 1.27
Volume of international transport of goods by rail between some neighbouring railways in EATL countries in 2015,
thousands tonnes
From railways
of:
To railways of:
Afghanistan Armenia Azerbaijan Belarus China Georgia Iran Finland
Azerbaijan 6 340 6.4
Georgia 948.5 1 621.8
Kazakhstan 3 124.3 3 278.4
1818 Clarksons Research (2016). Container Intelligence Quarterly. First quarter
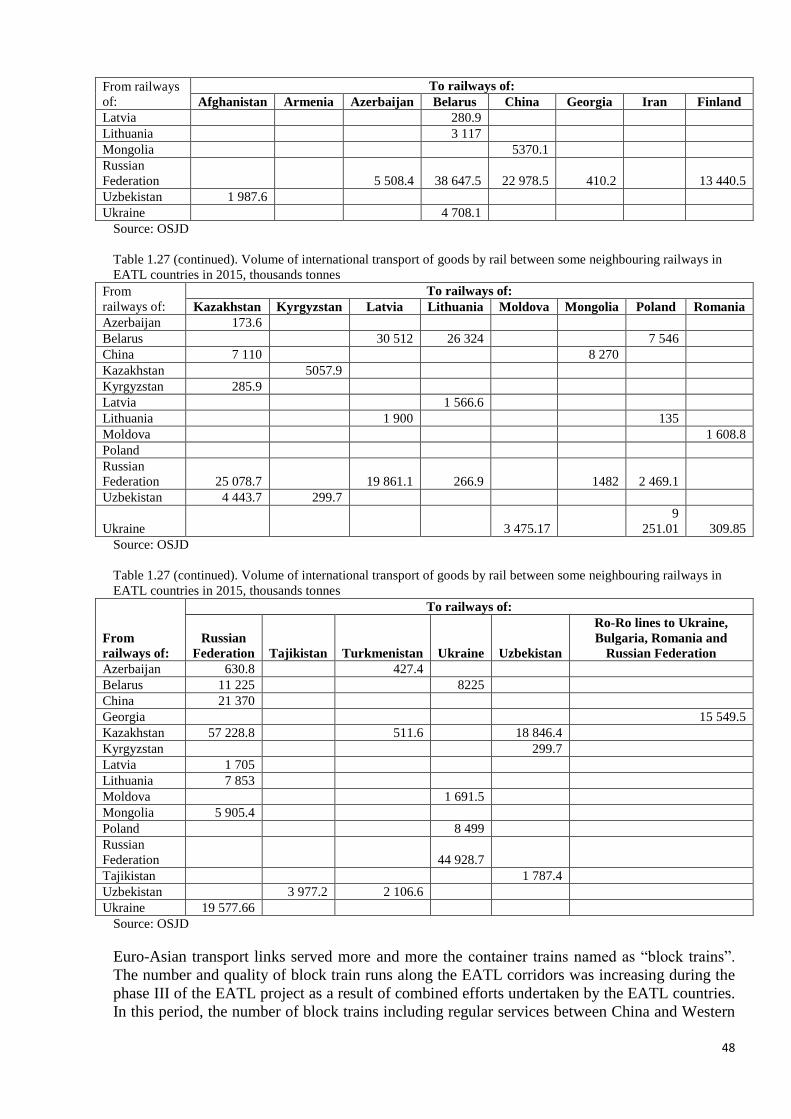
48
From railways
of:
To railways of:
Afghanistan Armenia Azerbaijan Belarus China Georgia Iran Finland
Latvia 280.9
Lithuania 3 117
Mongolia 5370.1
Russian
Federation 5 508.4 38 647.5 22 978.5 410.2 13 440.5
Uzbekistan 1 987.6
Ukraine 4 708.1
Source: OSJD
Table 1.27 (continued). Volume of international transport of goods by rail between some neighbouring railways in
EATL countries in 2015, thousands tonnes
From
railways of:
To railways of:
Kazakhstan Kyrgyzstan Latvia Lithuania Moldova Mongolia Poland Romania
Azerbaijan 173.6
Belarus 30 512 26 324 7 546
China 7 110 8 270
Kazakhstan 5057.9
Kyrgyzstan 285.9
Latvia 1 566.6
Lithuania 1 900 135
Moldova 1 608.8
Poland
Russian
Federation 25 078.7 19 861.1 266.9 1482 2 469.1
Uzbekistan 4 443.7 299.7
Ukraine 3 475.17
9
251.01 309.85
Source: OSJD
Table 1.27 (continued). Volume of international transport of goods by rail between some neighbouring railways in
EATL countries in 2015, thousands tonnes
From
railways of:
To railways of:
Russian
Federation Tajikistan Turkmenistan Ukraine Uzbekistan
Ro-Ro lines to Ukraine,
Bulgaria, Romania and
Russian Federation
Azerbaijan 630.8 427.4
Belarus 11 225 8225
China 21 370
Georgia 15 549.5
Kazakhstan 57 228.8 511.6 18 846.4
Kyrgyzstan 299.7
Latvia 1 705
Lithuania 7 853
Moldova 1 691.5
Mongolia 5 905.4
Poland 8 499
Russian
Federation 44 928.7
Tajikistan 1 787.4
Uzbekistan 3 977.2 2 106.6
Ukraine 19 577.66
Source: OSJD
Euro-Asian transport links served more and more the container trains named as “block trains”.
The number and quality of block train runs along the EATL corridors was increasing during the
phase III of the EATL project as a result of combined efforts undertaken by the EATL countries.
In this period, the number of block trains including regular services between China and Western

49
Europe steadily grew, as more and more wide range of consignors perceived railways as an
alternative to sea and air transport.
Many initiatives on block train runs that hand been launched as pilot project, became thereafter
regular container services. The main objective of these initiatives and projects was the creation
of modern and competitive container transport services between Asia and Europe and making a
profit through the attractiveness of new container services for consumers (cargo owners and
logistics providers).
Most of the projects were implemented jointly by railway companies (both – owners of
infrastructure and fleet operators) from different countries, logistics providers, transnational
multimodal transport operators and, sometimes, shipping companies (for example, Russian
shipping company FESCO implemented projects on inland container services).
EATL Rail routes 1 and 2.
In 2015, 1 269 container trains proceeded in transit along the EATL Route 1 and 2. The number
of block trains runs increased by 255 trains as compared to 2014 (growth by 25 per cent),
including 581 block trains China – Europe – China - grown by 327 trains (or by 2.2 times).
Major operators of container trains in the China - Europe - China service (Table 1.28 – 1.29) on
various sections of the Trans-Siberian Route were as follows: CRCT, CRIMT, Kaztransservice,
Kedetrans, RZD Logistics, TransContainer, UTLC, Belintertrans, Trans- Rail BCh, InterRail
Holding, DB Schenker, TEL and FELB.
Table 1.28
Container services to/from China offered by DB Schenker and Trans Eurasia Logistics (TEL)
Route Europe – China (Eastbound) China – Europe (Westbound)
Southern Duisburg – Chongqing
First train: trial runs in 2013
Departure days: on request
Chongqing – Duisburg
Since 2011
From terminal to terminal Lead time: 17 days
Departure day: every Saturday, Tuesday, Thursday
Lodz – Chengdu
First train: trial runs in 2014
Departure days: on request
Chengdu – Lodz
Since April 2013
From terminal to terminal Lead time: 15 days
Departure day: every Saturday, Wednesday
Hamburg – Zhengzhou
First train: trial runs in 2013 via Mongolia
Departure days: non regular service
Hamburg – Zhengzhou
Since July 2013
From terminal to terminal Lead time: 16 days
Departure day: every Saturday, Wednesday
Northern Points in Europe – China
Block trains: no scheduled train services
Single containers/groups of containers: regulars
departures from different European points
Souzhou – Warsaw
Since April 2014
From terminal to terminal Lead time: 14 days
Departure day: one time every 10 days
Source: Annual TSR Digest 2015. CCTT, 2016
Table 1.29
Block Container Trains Europe - China in 2014
From To Number of runs
China – Europe (Westbound)
Zhengzhou Hamburg 52
Chongqing Duisburg 79
Chongqing Cherkessk 6
Chengdu Lodz 25
Wuhan Points in Czechia, Poland and Germany 37
Souzhou Warsaw 43
Yiwu Madrid 4
Yiwu Points in Poland 2

50
From To Number of runs
Hefei Points in Germany 2
Shixjeczy Chelyabinsk 1
Kunming Rotterdam 1
Europe – China (Eastbound)
Duisburg Chongqing 33
Hamburg Zhengzhou 21
Madrid * Yiwu 2
Hamburg * Wuhan 9
Brest * Souzhou 6
Brest Shenyang 3
* New routes
Source: Annual TSR Digest 2015. CCTT, 2016
The inventory coverage of the cargo transported by rail was included IT products (mobile
phones, computers, etc.), clothes, shoes, automobiles and spare parts, bakery products, wine,
coffee beans, etc.
Due to the e-commerce growth postal items were expected to constitute significant cargo base
and increase transport volumes between China and Europe. CRCT organised pilot transportation
from Chungking, Urumchi and Zhengzhou to Kazakhstan, as well as from Harbin to Russian
Federation.
Projects of TransContainer
Project dedicated to BMW automobile spare parts transportation from Germany to China was
jointly implemented by TransContainer (Russian Federation) and Far East Land Bridge and
started at September 2010. Initially the transportation was carried out via the Chop station. In
November 2010 the route was changed to the Dobra station. TransContainer railcars and
containers provided by Far East Land Bridge were used for the transportation. Three block trains
a week at average were dispatched. The ‘door-to-door’ delivery via the Leipzig / Wackersdorf
(Germany) - Dobra / Brest - Zabaikalsk - Shenyang (China) route took 22 - 25 days (Figure
1.13).
Figure 1.13
TransContainer Service China – Europe - China
Source: TransContainer, CCTP (Annual TSR Digest 2015. Coordinating Council on Trans-Siberian Transportation
International Association, 2016)
In 2014, 164 block trains were dispatched to Europe. Within those trains there were 13,409
TEUs transported which was a 47 per cent increase compared to the same period of 2013. In

51
2014, 100 container trains were dispatched to Zabaikalsk. Within those trains there were 9,287
TEU transported which was a 57 per cent increase compared to the same period of 2013. In the
course of 7 months of 2015, 90 container trains were dispatched to Europe. Within those trains
there were 6,266 TEU transported which was a 6 per cent decrease compared to the same period
of 2014.
In the course of 7 months of 2015, 65 container trains were dispatched to Zabaikalsk (Figure
1.14). Within those trains there were 5,334 TEU transported which was a 2 per cent decrease
compared to the same period of 2014.
Figure 1.14
Container Service Souzhou (China) – Warsaw (Poland) by TransContainer
Source: TransContainer, CCTP (Annual TSR Digest 2015. Coordinating Council on Trans-Siberian Transportation International
Association, 2016)
Figure 1.15
Container Service Hamburg - Beijing
Source: TransContainer, CCTP (Annual TSR Digest 2015. Coordinating Council on Trans-Siberian Transportation International
Association, 2016)
Figure 1.16
Container Service from Republic of Korea to Europe

52
Source: TransContainer, CCTP (Annual TSR Digest 2015. Coordinating Council on Trans-Siberian Transportation International
Association, 2016)
TransContainer services via Port Vostochny
Container train No. 1031 / 1032 NakhodkaVostochnaya - Zaschita
The route was used for Kia and GM automobile spare part transportation. TransContainer was
the service operator. In 2014, 74 trains were dispatched on this route with 9,285 TEU transported
which was 13 per cent fewer than in 2013.
Container train No. 1029 / 1030 NakhodkaVostochnaya - Sergeli
The route from Korea to Uzbekistan via the territories of Kazakhstan and Russian Federation
was used for the GM - Uzbekistan joint venture automobile spare part transportation.
Furthermore, the route was used for mix freight, synthetic resin and polyethylene transportation.
In 2014, 54 trains were dispatched on this route with 70,073 TEU transported.
Container train No. 1029 /1030 NakhodkaVostochnaya - Qostanay
The route was used for SsangYong Motor Company, Iveco, and Toyota automobile spare parts
transportation. In 2014, 36 trains were dispatched on this route with 4,658 TEU transported
which was 18 per cent more than in 2013.
Container train No. 1031 /1032 NakhodkaVostochnaya - Ulugh Beg
The route was used for Isuzu mini-van spare part transportation to the SamAuto factory in
Uzbekistan. In 2014, 17 trains were dispatched on this route with 1,789 TEU transported which
was 2.2 times as much as in 2013.
Container train No.1031 / 1032 NakhodkaVostochnaya - Pitnyak
The route from Korea to Uzbekistan via the territories of Kazakhstan and Russian Federation
was used for the GM - Uzbekistan joint venture automobile spare part transportation. In 2014, 25
trains were dispatched on this route with 2,795 TEU transported.
Projects of RZD Logistics (RZDL) and Far East Land Bridge (FELB)
In order to establish transport and logistics chains in the international market RZDL (Russian
Railways subsidiary) applied competences of its affiliates - Far East Land Bridge (FELB)
specialising on transit railway container transportation on the China - Europe - China route via
Zabaikalsk, while YuXinOu (Chongqing) Logistics Co. Ltd. operated regular railway container
transportation on the Trans-Kazakhstani China - Europe - China route.

53
Figure 1.17
FELB Technology of Container delivery between China and Europe
Source: Annual TSR Digest 2015. CCTT, 2016
FELB used border points for cargo heading from China to Europe, such as Brest / Malaszewicze
(Belarus / Poland) for cargo transported to Poland, Germany, Netherlands and Belgium; Dobra /
Chop (Slovakia / Ukraine) - to Czech Republic, Slovakia, Italy, Austria and Slovenia; Zahony /
Chop (Hungary / Ukraine) - to Hungary, South Germany and Austria. The commodities
delivered across these routes were electronics and automotive manufacturers.
A new FELB service on the Trans-Siberian Route was the container train service from Suzhou
(Figure 1.18), a large industrial centre in the South-Eastern part of China, heading to Warsaw,
Hamburg and Duisburg (Germany). Trains were dispatched from China to Europe on a daily
basis.
It took RZDL and FELB only a few years of operation on the Trans-Siberian Route to double-cut
the trip time. In 2016 average transit time of transportation was 14 - 16 days. Other advantages
of the service included an option of ordering ‘door- to-door’ delivery and less-than-car load
freight transportation.
The total number of containers transported in 2014 by RZDL in the China - Europe - China
transit service via the Trans-Siberian route and its Trans-Kazakhstan branch amounted to
approximately 27 thousand TEU.
Figure 1.18
Souzhou (China) – Europe Container Services by RZD Logistics
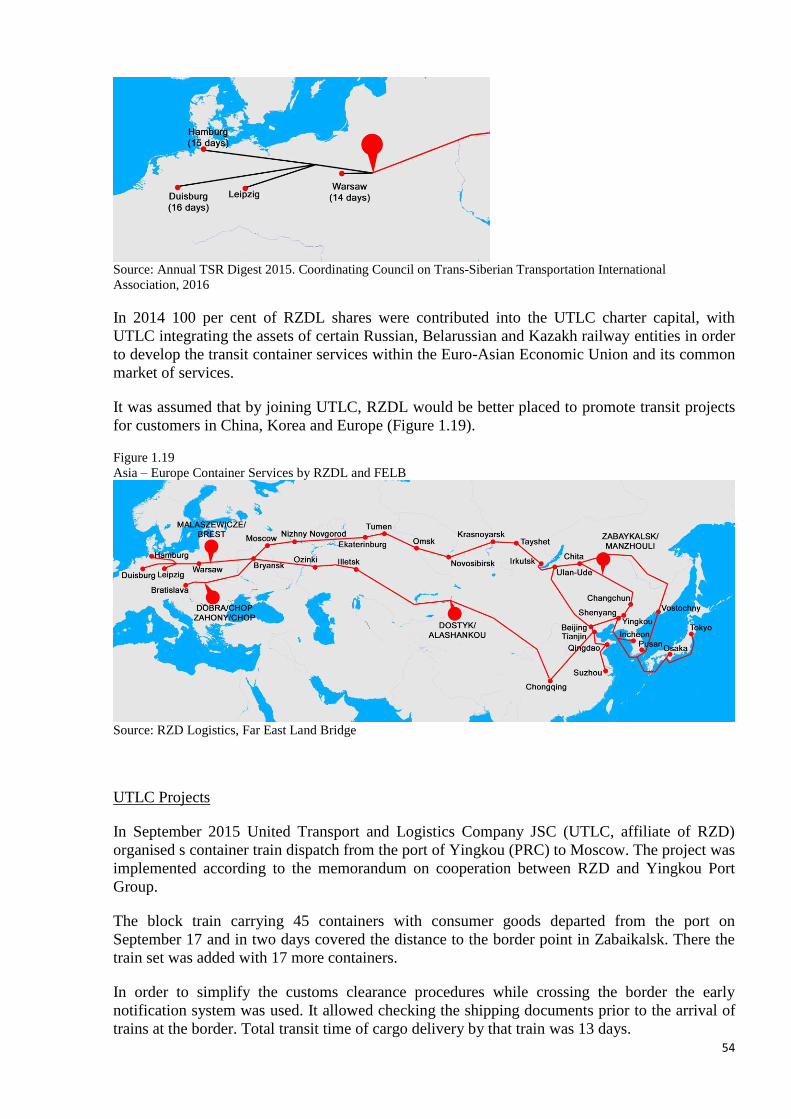
54
Source: Annual TSR Digest 2015. Coordinating Council on Trans-Siberian Transportation International
Association, 2016
In 2014 100 per cent of RZDL shares were contributed into the UTLC charter capital, with
UTLC integrating the assets of certain Russian, Belarussian and Kazakh railway entities in order
to develop the transit container services within the Euro-Asian Economic Union and its common
market of services.
It was assumed that by joining UTLC, RZDL would be better placed to promote transit projects
for customers in China, Korea and Europe (Figure 1.19).
Figure 1.19
Asia – Europe Container Services by RZDL and FELB
Source: RZD Logistics, Far East Land Bridge
UTLC Projects
In September 2015 United Transport and Logistics Company JSC (UTLC, affiliate of RZD)
organised s container train dispatch from the port of Yingkou (PRC) to Moscow. The project was
implemented according to the memorandum on cooperation between RZD and Yingkou Port
Group.
The block train carrying 45 containers with consumer goods departed from the port on
September 17 and in two days covered the distance to the border point in Zabaikalsk. There the
train set was added with 17 more containers.
In order to simplify the customs clearance procedures while crossing the border the early
notification system was used. It allowed checking the shipping documents prior to the arrival of
trains at the border. Total transit time of cargo delivery by that train was 13 days.
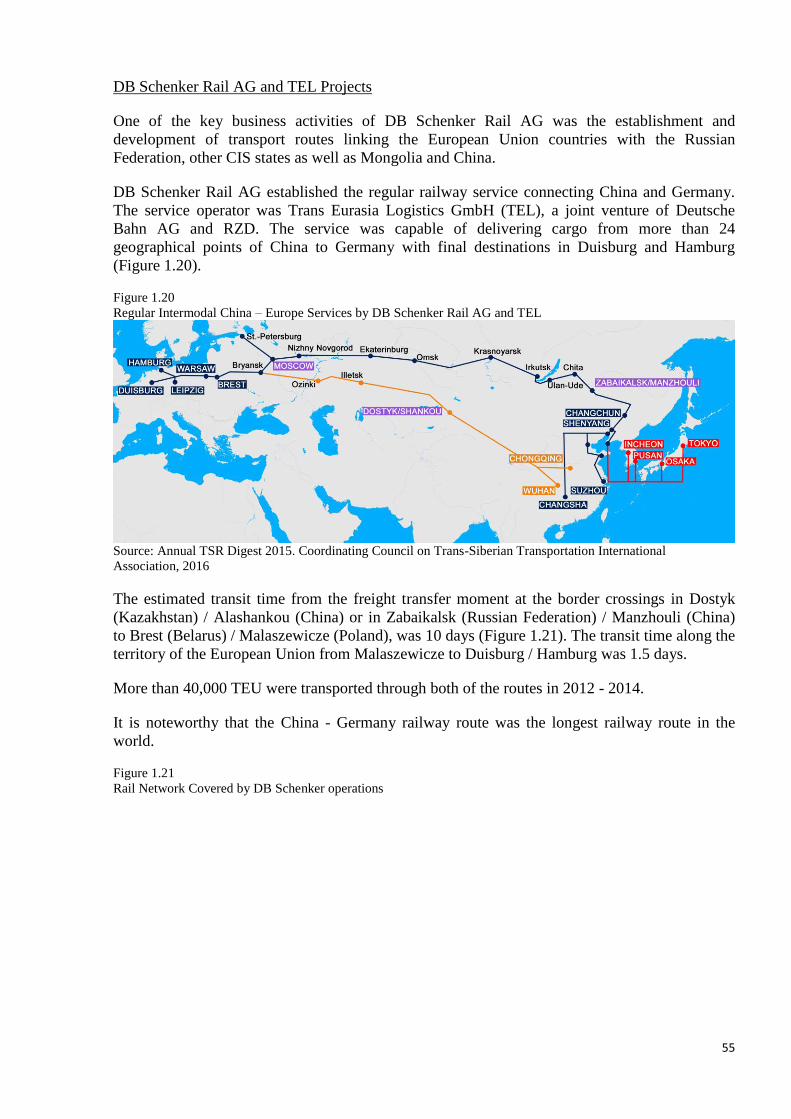
55
DB Schenker Rail AG and TEL Projects
One of the key business activities of DB Schenker Rail AG was the establishment and
development of transport routes linking the European Union countries with the Russian
Federation, other CIS states as well as Mongolia and China.
DB Schenker Rail AG established the regular railway service connecting China and Germany.
The service operator was Trans Eurasia Logistics GmbH (TEL), a joint venture of Deutsche
Bahn AG and RZD. The service was capable of delivering cargo from more than 24
geographical points of China to Germany with final destinations in Duisburg and Hamburg
(Figure 1.20).
Figure 1.20
Regular Intermodal China – Europe Services by DB Schenker Rail AG and TEL
Source: Annual TSR Digest 2015. Coordinating Council on Trans-Siberian Transportation International
Association, 2016
The estimated transit time from the freight transfer moment at the border crossings in Dostyk
(Kazakhstan) / Alashankou (China) or in Zabaikalsk (Russian Federation) / Manzhouli (China)
to Brest (Belarus) / Malaszewicze (Poland), was 10 days (Figure 1.21). The transit time along the
territory of the European Union from Malaszewicze to Duisburg / Hamburg was 1.5 days.
More than 40,000 TEU were transported through both of the routes in 2012 - 2014.
It is noteworthy that the China - Germany railway route was the longest railway route in the
world.
Figure 1.21
Rail Network Covered by DB Schenker operations
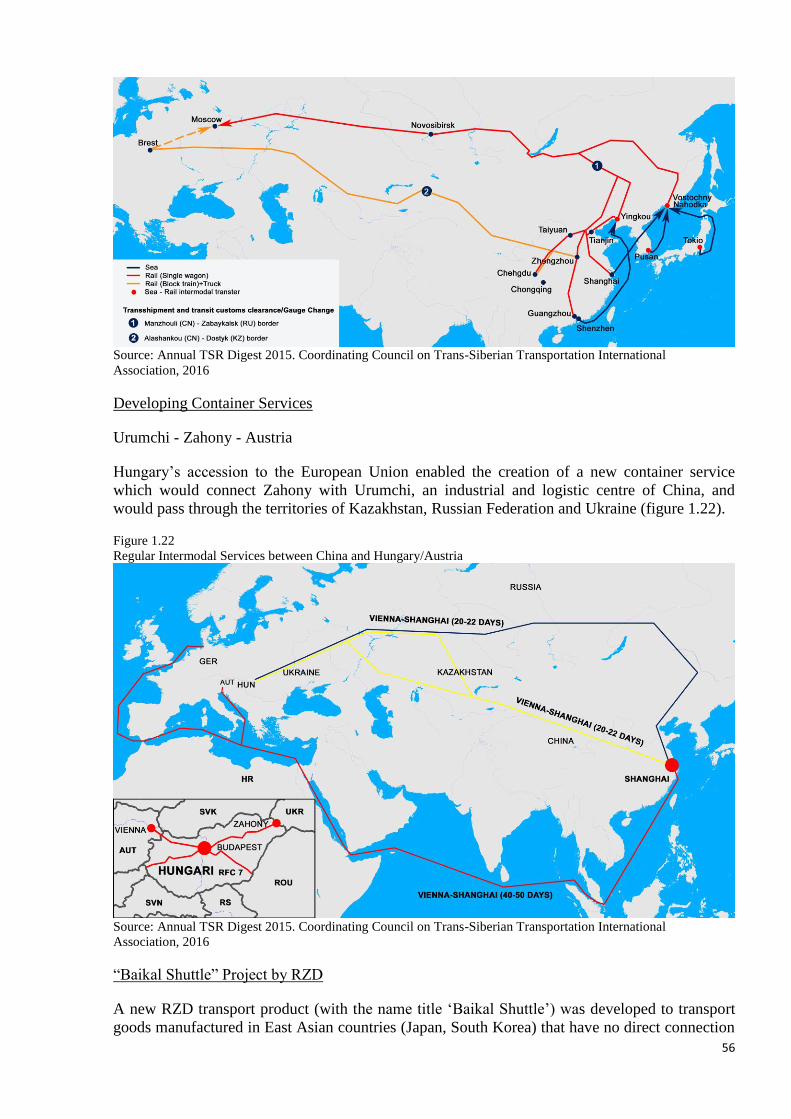
56
Source: Annual TSR Digest 2015. Coordinating Council on Trans-Siberian Transportation International
Association, 2016
Developing Container Services
Urumchi - Zahony - Austria
Hungary’s accession to the European Union enabled the creation of a new container service
which would connect Zahony with Urumchi, an industrial and logistic centre of China, and
would pass through the territories of Kazakhstan, Russian Federation and Ukraine (figure 1.22).
Figure 1.22
Regular Intermodal Services between China and Hungary/Austria
Source: Annual TSR Digest 2015. Coordinating Council on Trans-Siberian Transportation International
Association, 2016
“Baikal Shuttle” Project by RZD
A new RZD transport product (with the name title ‘Baikal Shuttle’) was developed to transport
goods manufactured in East Asian countries (Japan, South Korea) that have no direct connection
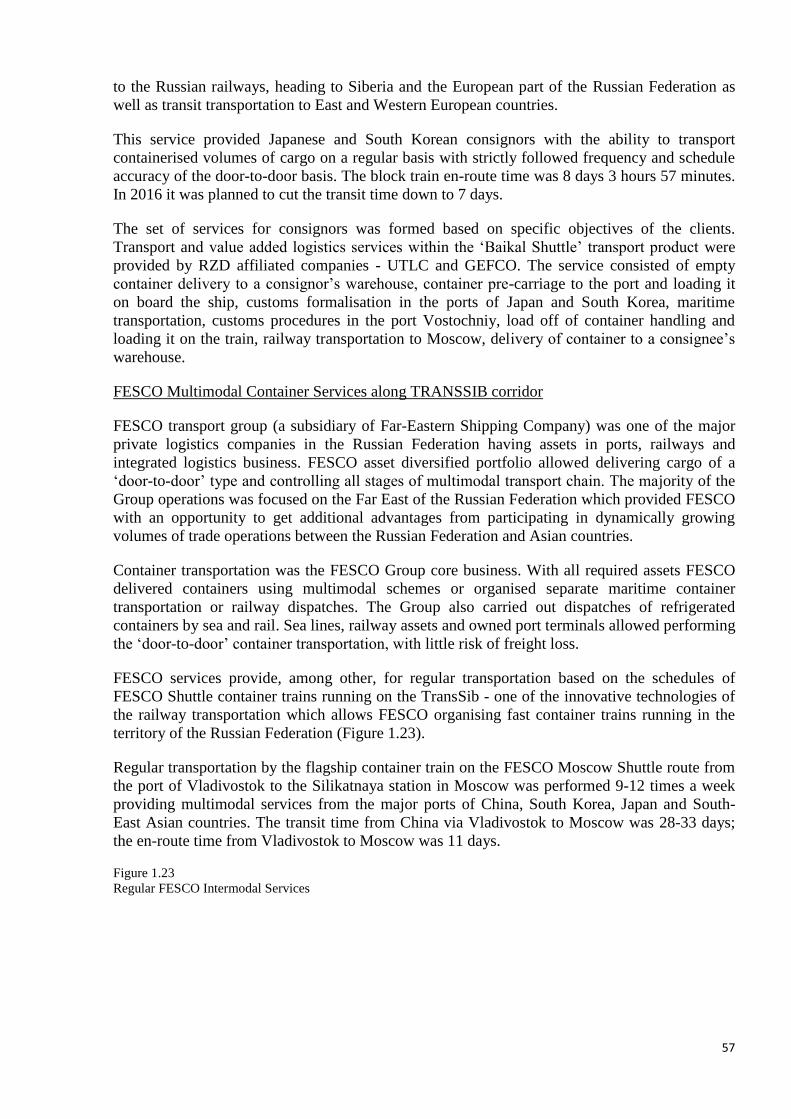
57
to the Russian railways, heading to Siberia and the European part of the Russian Federation as
well as transit transportation to East and Western European countries.
This service provided Japanese and South Korean consignors with the ability to transport
containerised volumes of cargo on a regular basis with strictly followed frequency and schedule
accuracy of the door-to-door basis. The block train en-route time was 8 days 3 hours 57 minutes.
In 2016 it was planned to cut the transit time down to 7 days.
The set of services for consignors was formed based on specific objectives of the clients.
Transport and value added logistics services within the ‘Baikal Shuttle’ transport product were
provided by RZD affiliated companies - UTLC and GEFCO. The service consisted of empty
container delivery to a consignor’s warehouse, container pre-carriage to the port and loading it
on board the ship, customs formalisation in the ports of Japan and South Korea, maritime
transportation, customs procedures in the port Vostochniy, load off of container handling and
loading it on the train, railway transportation to Moscow, delivery of container to a consignee’s
warehouse.
FESCO Multimodal Container Services along TRANSSIB corridor
FESCO transport group (a subsidiary of Far-Eastern Shipping Company) was one of the major
private logistics companies in the Russian Federation having assets in ports, railways and
integrated logistics business. FESCO asset diversified portfolio allowed delivering cargo of a
‘door-to-door’ type and controlling all stages of multimodal transport chain. The majority of the
Group operations was focused on the Far East of the Russian Federation which provided FESCO
with an opportunity to get additional advantages from participating in dynamically growing
volumes of trade operations between the Russian Federation and Asian countries.
Container transportation was the FESCO Group core business. With all required assets FESCO
delivered containers using multimodal schemes or organised separate maritime container
transportation or railway dispatches. The Group also carried out dispatches of refrigerated
containers by sea and rail. Sea lines, railway assets and owned port terminals allowed performing
the ‘door-to-door’ container transportation, with little risk of freight loss.
FESCO services provide, among other, for regular transportation based on the schedules of
FESCO Shuttle container trains running on the TransSib - one of the innovative technologies of
the railway transportation which allows FESCO organising fast container trains running in the
territory of the Russian Federation (Figure 1.23).
Regular transportation by the flagship container train on the FESCO Moscow Shuttle route from
the port of Vladivostok to the Silikatnaya station in Moscow was performed 9-12 times a week
providing multimodal services from the major ports of China, South Korea, Japan and South-
East Asian countries. The transit time from China via Vladivostok to Moscow was 28-33 days;
the en-route time from Vladivostok to Moscow was 11 days.
Figure 1.23
Regular FESCO Intermodal Services
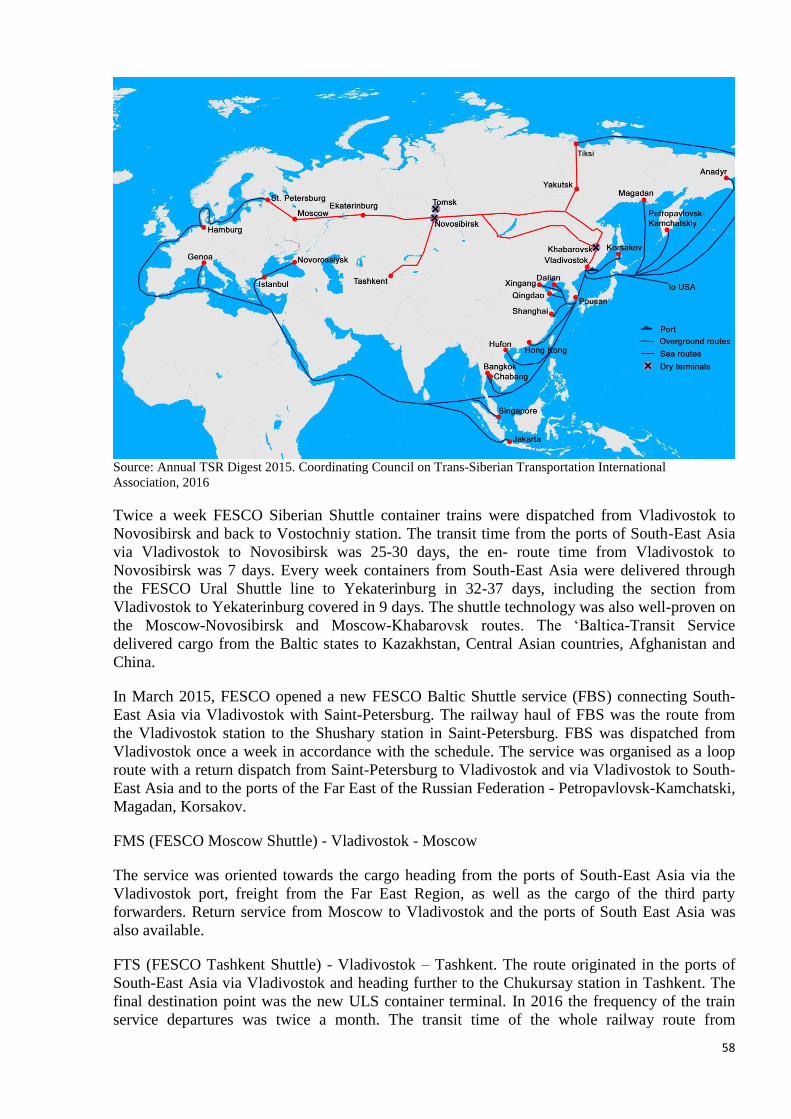
58
Source: Annual TSR Digest 2015. Coordinating Council on Trans-Siberian Transportation International
Association, 2016
Twice a week FESCO Siberian Shuttle container trains were dispatched from Vladivostok to
Novosibirsk and back to Vostochniy station. The transit time from the ports of South-East Asia
via Vladivostok to Novosibirsk was 25-30 days, the en- route time from Vladivostok to
Novosibirsk was 7 days. Every week containers from South-East Asia were delivered through
the FESCO Ural Shuttle line to Yekaterinburg in 32-37 days, including the section from
Vladivostok to Yekaterinburg covered in 9 days. The shuttle technology was also well-proven on
the Moscow-Novosibirsk and Moscow-Khabarovsk routes. The ‘Baltica-Transit Service
delivered cargo from the Baltic states to Kazakhstan, Central Asian countries, Afghanistan and
China.
In March 2015, FESCO opened a new FESCO Baltic Shuttle service (FBS) connecting South-
East Asia via Vladivostok with Saint-Petersburg. The railway haul of FBS was the route from
the Vladivostok station to the Shushary station in Saint-Petersburg. FBS was dispatched from
Vladivostok once a week in accordance with the schedule. The service was organised as a loop
route with a return dispatch from Saint-Petersburg to Vladivostok and via Vladivostok to South-
East Asia and to the ports of the Far East of the Russian Federation - Petropavlovsk-Kamchatski,
Magadan, Korsakov.
FMS (FESCO Moscow Shuttle) - Vladivostok - Moscow
The service was oriented towards the cargo heading from the ports of South-East Asia via the
Vladivostok port, freight from the Far East Region, as well as the cargo of the third party
forwarders. Return service from Moscow to Vladivostok and the ports of South East Asia was
also available.
FTS (FESCO Tashkent Shuttle) - Vladivostok – Tashkent. The route originated in the ports of
South-East Asia via Vladivostok and heading further to the Chukursay station in Tashkent. The
final destination point was the new ULS container terminal. In 2016 the frequency of the train
service departures was twice a month. The transit time of the whole railway route from

59
Vladivostok to Chukuray was 12 days, the return trip of containers after unloading in Tashkent
was 12 days. The multimodal route also implied a possibility of delivering cargo based on the
‘final mile’ principle, i.e. to the client’s door in the range of 500 km from the final destination
point.
FESCO also provided the following services:
- FSS (FESCO Siberian Shuttle) - Vladivostok – Novosibirsk and FSSe (FESCO Siberian Shuttle
eastbound) - Novosibirsk – Vladivostok;
- FUS (FESCO Ural Shuttle) - Vladivostok – Yekaterinburg;
- FAS (FESCO Amur Shuttle) - Moscow – Khabarovsk and FASw (FESCO Amur Shuttle
westbound) - Khabarovsk – Moscow;
- FOS (FESCO Ob Shuttle) - Moscow - Novosibirsk
- FLS (FESCO Lena Shuttle) - Moscow - Yakutsk/ Berkakit; Vladivostok – Yakutsk. The transit
time from Moscow to Berkakit was 15-17 days, and to Yakutsk 21-23 days. The dispatches from
Vladivostok to Berkakit were expected to be carried out once in 6-10 days with the transit time
of 6-8 days.
Container services to/from Mongolia
The ‘Mongolian Vector’ train had been in service since 2002 running from Europe to Mongolia
on the Brest - Ulan-Bator route.
The train was dispatched from Brest on a regular basis on the 10th, 20th and 30th day of every
month. The transit time en-route from Brest to Ulan-Bator (7,340 km) at the end of 2014 was 12
days.
Starting from 1 March 2005 the route of the ‘Mongolian Vector’ container train (Figure 1.24)
was extended to China on the Hohhot (China) - Erlyan - Naushki - Brest - Duisburg route (9,821
km) via Mongolia, once a month, with the transit time of 18 days. In 2006, approximately 600
TEUs were transported in both directions. The ‘Mongolian Vector’ container train was in service
within the framework of the joint UNESCAP and OSJD project aiming at improving the
effectiveness of the Euro-Asian railway routes.
Starting from May 2014 a China - Europe train started its service on the Erlyan - Naushki - Brest
route. The train was dispatched once a month. In 2016, there was a loop route between Europe
and China with the container train running in both directions.
Figure 1.24
Mongolian Vector Container Block Train Route
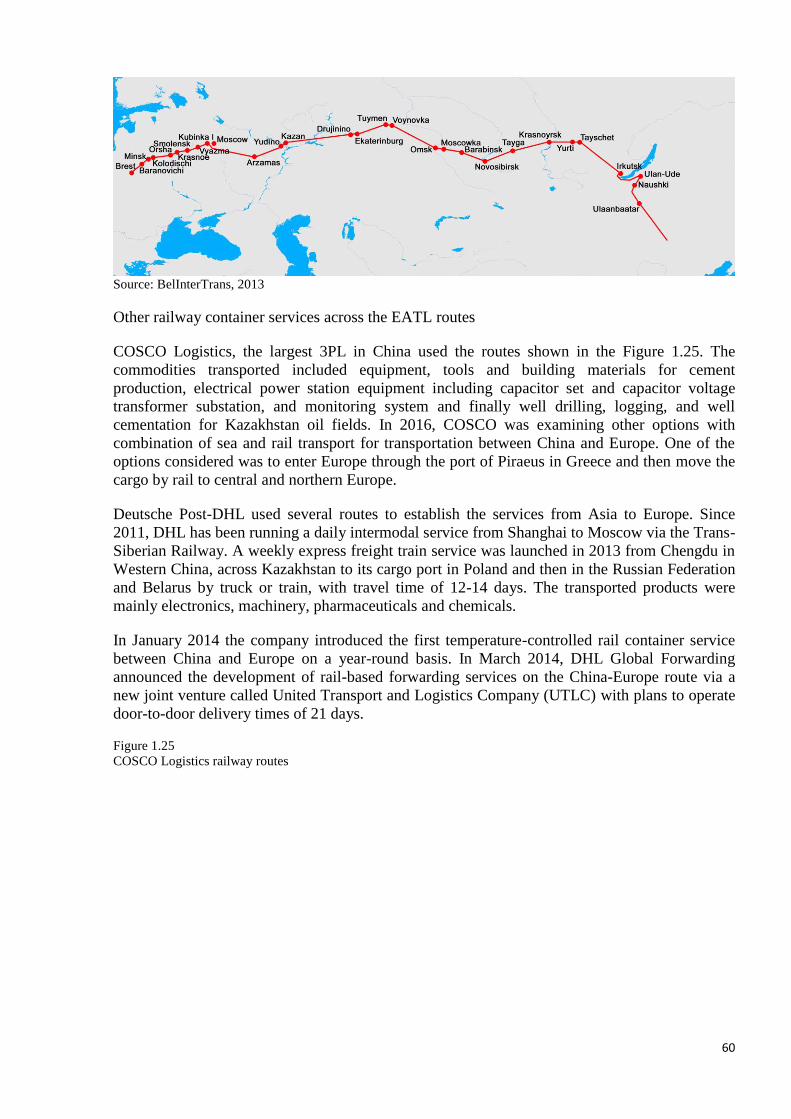
60
Source: BelInterTrans, 2013
Other railway container services across the EATL routes
COSCO Logistics, the largest 3PL in China used the routes shown in the Figure 1.25. The
commodities transported included equipment, tools and building materials for cement
production, electrical power station equipment including capacitor set and capacitor voltage
transformer substation, and monitoring system and finally well drilling, logging, and well
cementation for Kazakhstan oil fields. In 2016, COSCO was examining other options with
combination of sea and rail transport for transportation between China and Europe. One of the
options considered was to enter Europe through the port of Piraeus in Greece and then move the
cargo by rail to central and northern Europe.
Deutsche Post-DHL used several routes to establish the services from Asia to Europe. Since
2011, DHL has been running a daily intermodal service from Shanghai to Moscow via the Trans-
Siberian Railway. A weekly express freight train service was launched in 2013 from Chengdu in
Western China, across Kazakhstan to its cargo port in Poland and then in the Russian Federation
and Belarus by truck or train, with travel time of 12-14 days. The transported products were
mainly electronics, machinery, pharmaceuticals and chemicals.
In January 2014 the company introduced the first temperature-controlled rail container service
between China and Europe on a year-round basis. In March 2014, DHL Global Forwarding
announced the development of rail-based forwarding services on the China-Europe route via a
new joint venture called United Transport and Logistics Company (UTLC) with plans to operate
door-to-door delivery times of 21 days.
Figure 1.25
COSCO Logistics railway routes
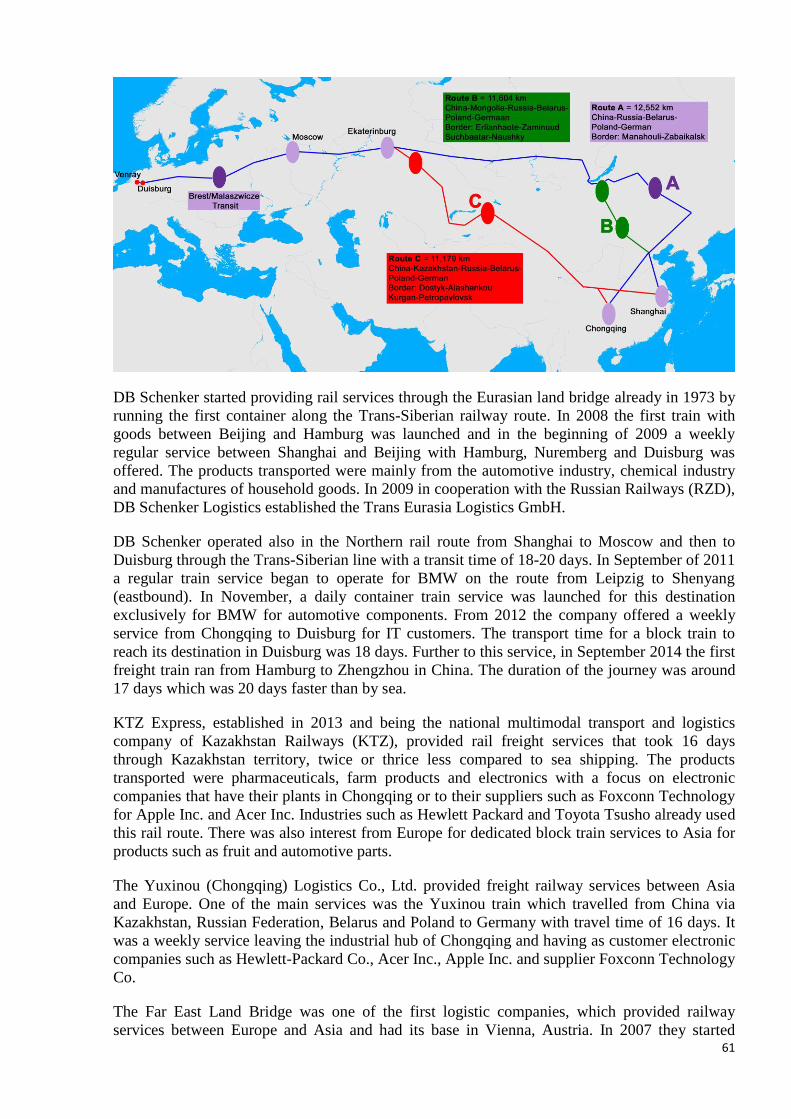
61
DB Schenker started providing rail services through the Eurasian land bridge already in 1973 by
running the first container along the Trans-Siberian railway route. In 2008 the first train with
goods between Beijing and Hamburg was launched and in the beginning of 2009 a weekly
regular service between Shanghai and Beijing with Hamburg, Nuremberg and Duisburg was
offered. The products transported were mainly from the automotive industry, chemical industry
and manufactures of household goods. In 2009 in cooperation with the Russian Railways (RZD),
DB Schenker Logistics established the Trans Eurasia Logistics GmbH.
DB Schenker operated also in the Northern rail route from Shanghai to Moscow and then to
Duisburg through the Trans-Siberian line with a transit time of 18-20 days. In September of 2011
a regular train service began to operate for BMW on the route from Leipzig to Shenyang
(eastbound). In November, a daily container train service was launched for this destination
exclusively for BMW for automotive components. From 2012 the company offered a weekly
service from Chongqing to Duisburg for IT customers. The transport time for a block train to
reach its destination in Duisburg was 18 days. Further to this service, in September 2014 the first
freight train ran from Hamburg to Zhengzhou in China. The duration of the journey was around
17 days which was 20 days faster than by sea.
KTZ Express, established in 2013 and being the national multimodal transport and logistics
company of Kazakhstan Railways (KTZ), provided rail freight services that took 16 days
through Kazakhstan territory, twice or thrice less compared to sea shipping. The products
transported were pharmaceuticals, farm products and electronics with a focus on electronic
companies that have their plants in Chongqing or to their suppliers such as Foxconn Technology
for Apple Inc. and Acer Inc. Industries such as Hewlett Packard and Toyota Tsusho already used
this rail route. There was also interest from Europe for dedicated block train services to Asia for
products such as fruit and automotive parts.
The Yuxinou (Chongqing) Logistics Co., Ltd. provided freight railway services between Asia
and Europe. One of the main services was the Yuxinou train which travelled from China via
Kazakhstan, Russian Federation, Belarus and Poland to Germany with travel time of 16 days. It
was a weekly service leaving the industrial hub of Chongqing and having as customer electronic
companies such as Hewlett-Packard Co., Acer Inc., Apple Inc. and supplier Foxconn Technology
Co.
The Far East Land Bridge was one of the first logistic companies, which provided railway
services between Europe and Asia and had its base in Vienna, Austria. In 2007 they started
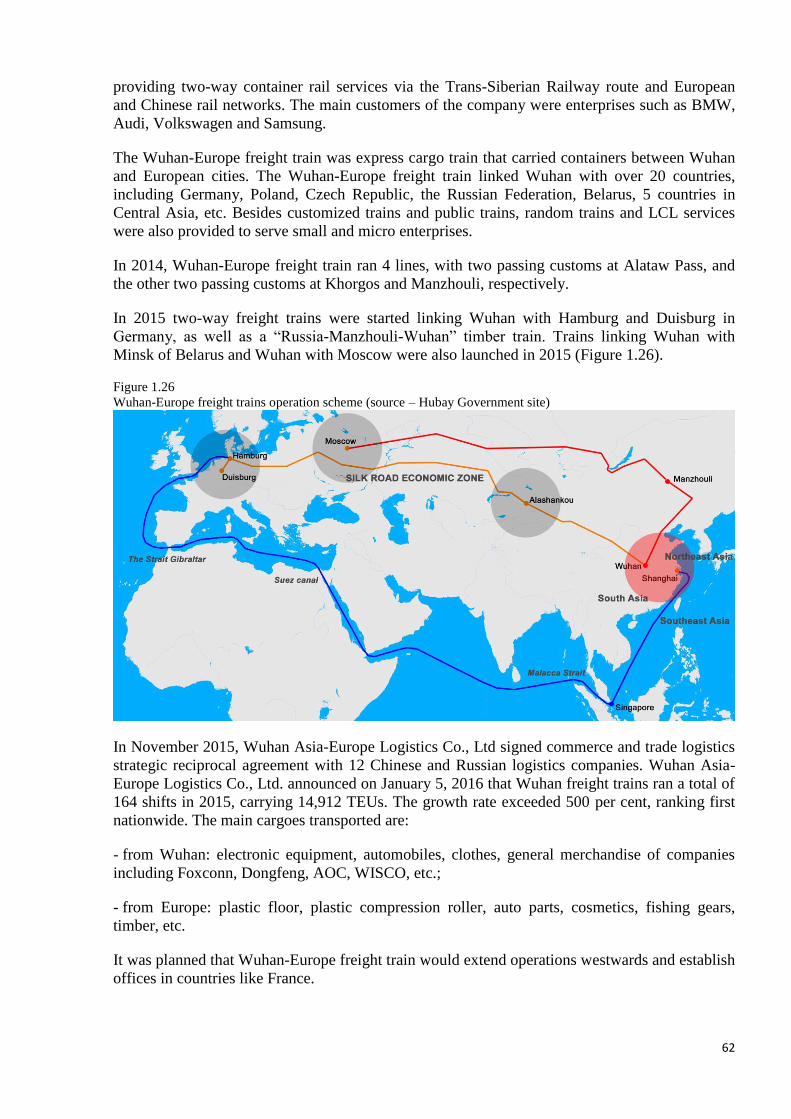
62
providing two-way container rail services via the Trans-Siberian Railway route and European
and Chinese rail networks. The main customers of the company were enterprises such as BMW,
Audi, Volkswagen and Samsung.
The Wuhan-Europe freight train was express cargo train that carried containers between Wuhan
and European cities. The Wuhan-Europe freight train linked Wuhan with over 20 countries,
including Germany, Poland, Czech Republic, the Russian Federation, Belarus, 5 countries in
Central Asia, etc. Besides customized trains and public trains, random trains and LCL services
were also provided to serve small and micro enterprises.
In 2014, Wuhan-Europe freight train ran 4 lines, with two passing customs at Alataw Pass, and
the other two passing customs at Khorgos and Manzhouli, respectively.
In 2015 two-way freight trains were started linking Wuhan with Hamburg and Duisburg in
Germany, as well as a “Russia-Manzhouli-Wuhan” timber train. Trains linking Wuhan with
Minsk of Belarus and Wuhan with Moscow were also launched in 2015 (Figure 1.26).
Figure 1.26
Wuhan-Europe freight trains operation scheme (source – Hubay Government site)
In November 2015, Wuhan Asia-Europe Logistics Co., Ltd signed commerce and trade logistics
strategic reciprocal agreement with 12 Chinese and Russian logistics companies. Wuhan Asia-
Europe Logistics Co., Ltd. announced on January 5, 2016 that Wuhan freight trains ran a total of
164 shifts in 2015, carrying 14,912 TEUs. The growth rate exceeded 500 per cent, ranking first
nationwide. The main cargoes transported are:
- from Wuhan: electronic equipment, automobiles, clothes, general merchandise of companies
including Foxconn, Dongfeng, AOC, WISCO, etc.;
- from Europe: plastic floor, plastic compression roller, auto parts, cosmetics, fishing gears,
timber, etc.
It was planned that Wuhan-Europe freight train would extend operations westwards and establish
offices in countries like France.
63
China Railway Express Co., Ltd. was founded in 1993 based in Beijing, China. The first China –
Europe container block train under the family brand “China Railway Express” arrived in Poland.
In June 2016 the train set off from station in Chengdu, the capital of the Chinese province of
Sichuan crossing the territories of Kazakhstan, the Russian Federation and Belarus arrived in 12
days in Warsaw.
The twenty-two carriage train delivered electronics goods and auto parts to the Polish State
Railways (PKP) Cargo Terminal in Warsaw. The arrival of the China Railway Express marked
the opening of the New Silk Road - a Chinese project to open a new commercial route linking
Asia and Europe. At the same time, a container block train with Polish goods set off in the
opposite direction to China.
The business model of railway transportation within the described supply chains was based on
the “corporate” scheduled block trains serving individual shippers and operating from plant to
plant (or from the plant to logistic centre). These trains supported constant guaranteed industrial
cargo flows of the selected customers. Most of the examples described in I.3.3 followed this
model.
The next step – introduction of regular services for customers shipping less than full train loads –
was expected to be more complicated. To make the business viable and to attract enough traffic
the transport operator should contact numerous shippers not only in the origin point, but all along
the route. Intermediate stops on the way also mean contracting local terminal operators and
probably freight forwarders.
At the time of writing this report, there were not so many known services of this type, but the
number of known examples was increasing. Often “corporate” train operators used the excessive
capacity to attract customers from the market which seemed to be the natural way to develop
regular container services.
EATL Rail route 4
A new container line kicked off along EATL route 4 from Halkali (Turkey) to Wien (Austria)
from 14 July 2017. The train was owned by TurkRail Demiryolu Tasimacilik. New generation
container wagons are preferred for this train.
Other train service along this route included:
- the container train running twice a week between Cerkezkoy (Turkey) - Bulgaria - Serbia
- Hungary - Giengen (Germany) which started in April 2016
- the container train running twice a week between Budapest (Hungary) - Romania -
Bulgaria - Halkali (Turkey) which started in June 2016.
EATL Rail routes 6, 7 and 8
Certain container services were put in operation by the railways of Iran, in particular:
Block train from Bandarabaas (Iran) to Almaty (Kazakhstan) lunched in 2012 along the
North - South International Transport Corridor;
Block train Turkey- Iran-Pakistan lunched in 2009 along Trans Asian Railway (TAR);
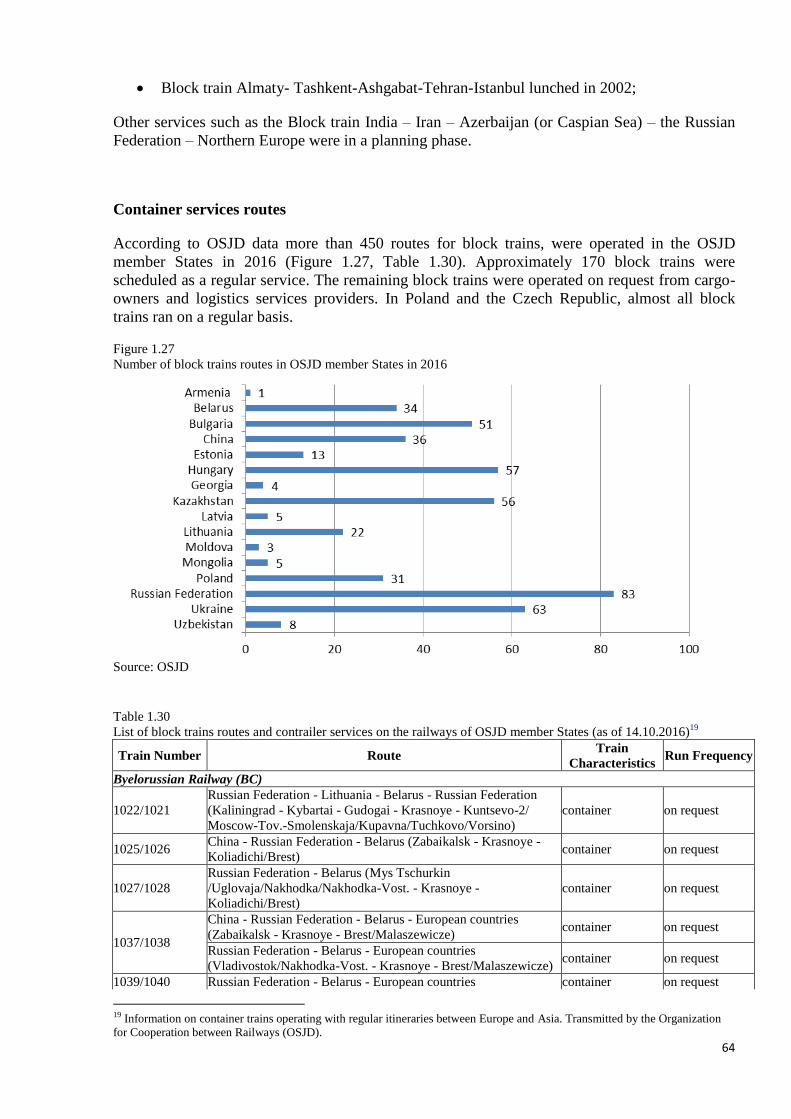
64
Block train Almaty- Tashkent-Ashgabat-Tehran-Istanbul lunched in 2002;
Other services such as the Block train India – Iran – Azerbaijan (or Caspian Sea) – the Russian
Federation – Northern Europe were in a planning phase.
Container services routes
According to OSJD data more than 450 routes for block trains, were operated in the OSJD
member States in 2016 (Figure 1.27, Table 1.30). Approximately 170 block trains were
scheduled as a regular service. The remaining block trains were operated on request from cargo-
owners and logistics services providers. In Poland and the Czech Republic, almost all block
trains ran on a regular basis.
Figure 1.27
Number of block trains routes in OSJD member States in 2016
Source: OSJD
Table 1.30
List of block trains routes and contrailer services on the railways of OSJD member States (as of 14.10.2016)19
Train Number Route Train
Characteristics Run Frequency
Byelorussian Railway (BC)
1022/1021
Russian Federation - Lithuania - Belarus - Russian Federation
(Kaliningrad - Kybartai - Gudogai - Krasnoye - Kuntsevo-2/
Moscow-Tov.-Smolenskaja/Kupavna/Tuchkovo/Vorsino)
container on request
1025/1026 China - Russian Federation - Belarus (Zabaikalsk - Krasnoye -
Koliadichi/Brest) container on request
1027/1028
Russian Federation - Belarus (Mys Tschurkin
/Uglovaja/Nakhodka/Nakhodka-Vost. - Krasnoye -
Koliadichi/Brest)
container on request
1037/1038
China - Russian Federation - Belarus - European countries
(Zabaikalsk - Krasnoye - Brest/Malaszewicze) container on request
Russian Federation - Belarus - European countries
(Vladivostok/Nakhodka-Vost. - Krasnoye - Brest/Malaszewicze) container on request
1039/1040 Russian Federation - Belarus - European countries container on request
19 Information on container trains operating with regular itineraries between Europe and Asia. Transmitted by the Organization
for Cooperation between Railways (OSJD).
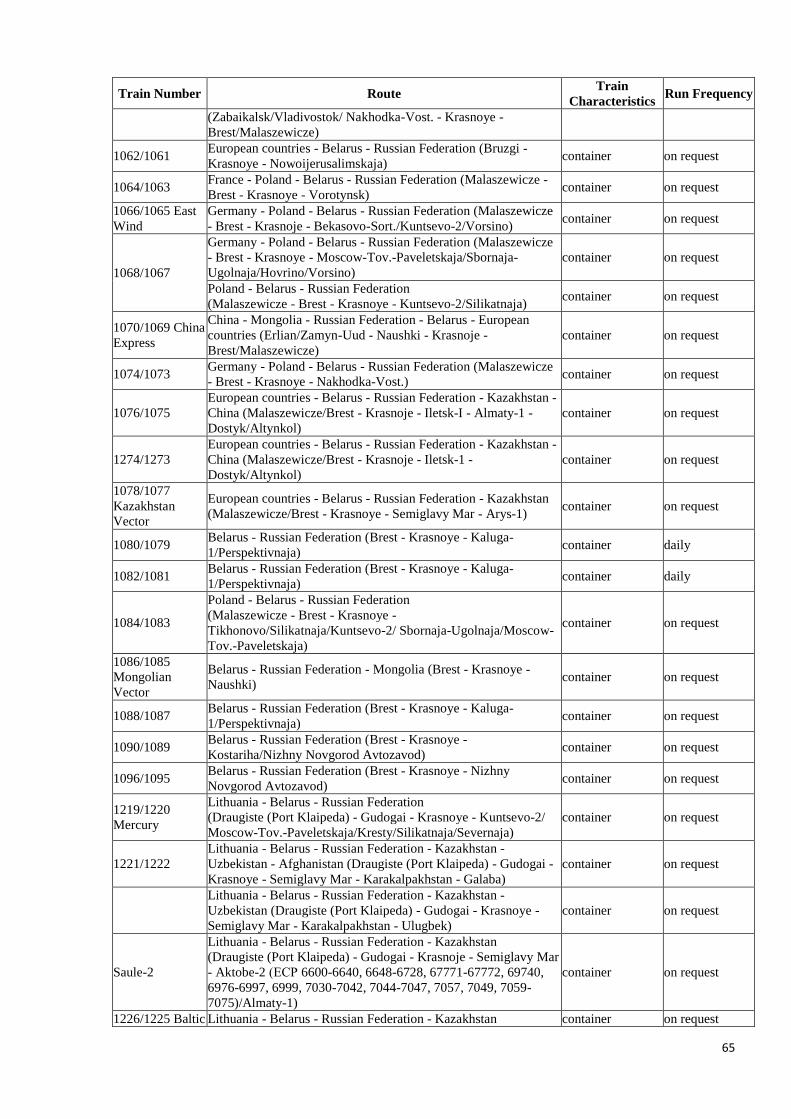
65
Train Number Route Train
Characteristics Run Frequency
(Zabaikalsk/Vladivostok/ Nakhodka-Vost. - Krasnoye -
Brest/Malaszewicze)
1062/1061 European countries - Belarus - Russian Federation (Bruzgi -
Krasnoye - Nowoijerusalimskaja) container on request
1064/1063 France - Poland - Belarus - Russian Federation (Malaszewicze -
Brest - Krasnoye - Vorotynsk) container on request
1066/1065 East
Wind
Germany - Poland - Belarus - Russian Federation (Malaszewicze
- Brest - Krasnoje - Bekasovo-Sort./Kuntsevo-2/Vorsino) container on request
1068/1067
Germany - Poland - Belarus - Russian Federation (Malaszewicze
- Brest - Krasnoye - Moscow-Tov.-Paveletskaja/Sbornaja-
Ugolnaja/Hovrino/Vorsino)
container on request
Poland - Belarus - Russian Federation
(Malaszewicze - Brest - Krasnoye - Kuntsevo-2/Silikatnaja) container on request
1070/1069 China
Express
China - Mongolia - Russian Federation - Belarus - European
countries (Erlian/Zamyn-Uud - Naushki - Krasnoje -
Brest/Malaszewicze)
container on request
1074/1073 Germany - Poland - Belarus - Russian Federation (Malaszewicze
- Brest - Krasnoye - Nakhodka-Vost.) container on request
1076/1075
European countries - Belarus - Russian Federation - Kazakhstan -
China (Malaszewicze/Brest - Krasnoje - Iletsk-I - Almaty-1 -
Dostyk/Altynkol)
container on request
1274/1273
European countries - Belarus - Russian Federation - Kazakhstan -
China (Malaszewicze/Brest - Krasnoje - Iletsk-1 -
Dostyk/Altynkol)
container on request
1078/1077
Kazakhstan
Vector
European countries - Belarus - Russian Federation - Kazakhstan
(Malaszewicze/Brest - Krasnoye - Semiglavy Mar - Arys-1) container on request
1080/1079 Belarus - Russian Federation (Brest - Krasnoye - Kaluga-
1/Perspektivnaja) container daily
1082/1081 Belarus - Russian Federation (Brest - Krasnoye - Kaluga-
1/Perspektivnaja) container daily
1084/1083
Poland - Belarus - Russian Federation
(Malaszewicze - Brest - Krasnoye -
Tikhonovo/Silikatnaja/Kuntsevo-2/ Sbornaja-Ugolnaja/Moscow-
Tov.-Paveletskaja)
container on request
1086/1085
Mongolian
Vector
Belarus - Russian Federation - Mongolia (Brest - Krasnoye -
Naushki) container on request
1088/1087 Belarus - Russian Federation (Brest - Krasnoye - Kaluga-
1/Perspektivnaja) container on request
1090/1089 Belarus - Russian Federation (Brest - Krasnoye -
Kostariha/Nizhny Novgorod Avtozavod) container on request
1096/1095 Belarus - Russian Federation (Brest - Krasnoye - Nizhny
Novgorod Avtozavod) container on request
1219/1220
Mercury
Lithuania - Belarus - Russian Federation
(Draugiste (Port Klaipeda) - Gudogai - Krasnoye - Kuntsevo-2/
Moscow-Tov.-Paveletskaja/Kresty/Silikatnaja/Severnaja)
container on request
1221/1222
Lithuania - Belarus - Russian Federation - Kazakhstan -
Uzbekistan - Afghanistan (Draugiste (Port Klaipeda) - Gudogai -
Krasnoye - Semiglavy Mar - Karakalpakhstan - Galaba)
container on request
Lithuania - Belarus - Russian Federation - Kazakhstan -
Uzbekistan (Draugiste (Port Klaipeda) - Gudogai - Krasnoye -
Semiglavy Mar - Karakalpakhstan - Ulugbek)
container on request
Saule-2
Lithuania - Belarus - Russian Federation - Kazakhstan
(Draugiste (Port Klaipeda) - Gudogai - Krasnoje - Semiglavy Mar
- Aktobe-2 (ЕСР 6600-6640, 6648-6728, 67771-67772, 69740,
6976-6997, 6999, 7030-7042, 7044-7047, 7057, 7049, 7059-
7075)/Almaty-1)
container on request
1226/1225 Baltic Lithuania - Belarus - Russian Federation - Kazakhstan container on request
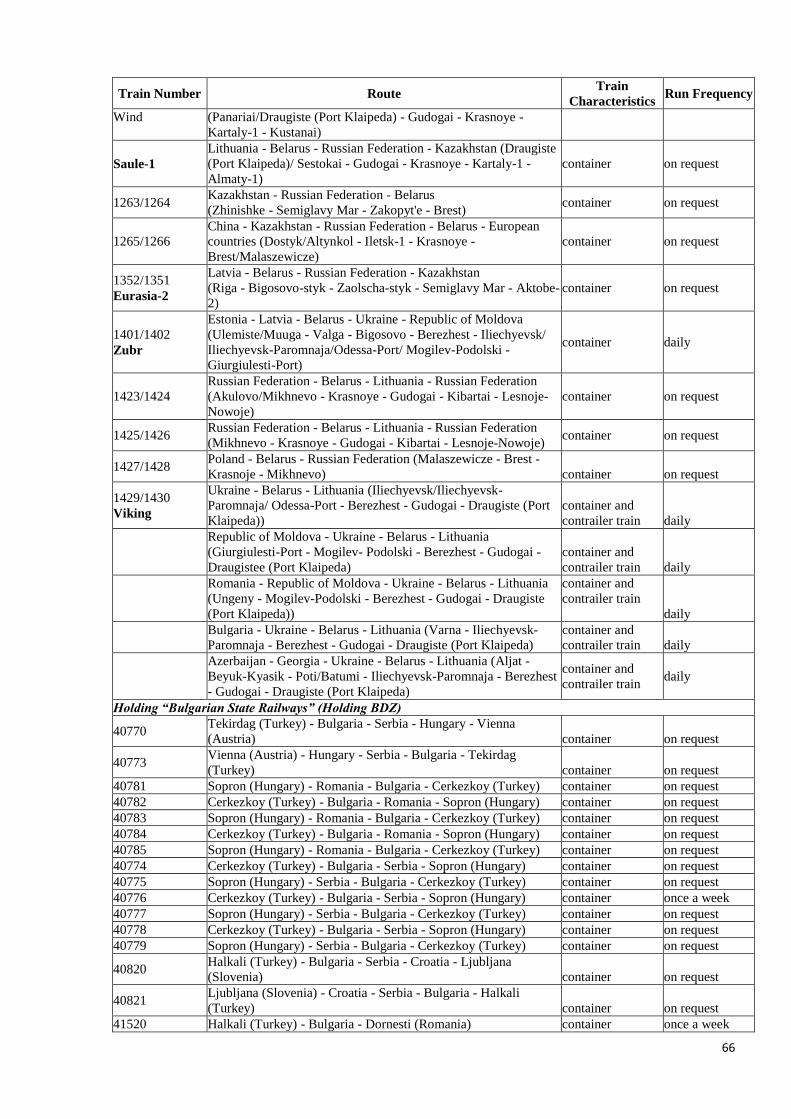
66
Train Number Route Train
Characteristics Run Frequency
Wind (Panariai/Draugiste (Port Klaipeda) - Gudogai - Krasnoye -
Kartaly-1 - Kustanai)
Saule-1
Lithuania - Belarus - Russian Federation - Kazakhstan (Draugiste
(Port Klaipeda)/ Sestokai - Gudogai - Krasnoye - Kartaly-1 -
Almaty-1)
container on request
1263/1264 Kazakhstan - Russian Federation - Belarus
(Zhinishke - Semiglavy Mar - Zakopyt'e - Brest) container on request
1265/1266
China - Kazakhstan - Russian Federation - Belarus - European
countries (Dostyk/Altynkol - Iletsk-1 - Krasnoye -
Brest/Malaszewicze)
container on request
1352/1351
Eurasia-2
Latvia - Belarus - Russian Federation - Kazakhstan
(Riga - Bigosovo-styk - Zaolscha-styk - Semiglavy Mar - Aktobe-
2)
container on request
1401/1402
Zubr
Estonia - Latvia - Belarus - Ukraine - Republic of Moldova
(Ulemiste/Muuga - Valga - Bigosovo - Berezhest - Iliechyevsk/
Iliechyevsk-Paromnaja/Odessa-Port/ Mogilev-Podolski -
Giurgiulesti-Port)
container daily
1423/1424
Russian Federation - Belarus - Lithuania - Russian Federation
(Akulovo/Mikhnevo - Krasnoye - Gudogai - Kibartai - Lesnoje-
Nowoje)
container on request
1425/1426 Russian Federation - Belarus - Lithuania - Russian Federation
(Mikhnevo - Krasnoye - Gudogai - Kibartai - Lesnoje-Nowoje) container on request
1427/1428 Poland - Belarus - Russian Federation (Malaszewicze - Brest -
Krasnoje - Mikhnevo) container on request
1429/1430
Viking
Ukraine - Belarus - Lithuania (Iliechyevsk/Iliechyevsk-
Paromnaja/ Odessa-Port - Berezhest - Gudogai - Draugiste (Port
Klaipeda))
container and
contrailer train daily
Republic of Moldova - Ukraine - Belarus - Lithuania
(Giurgiulesti-Port - Mogilev- Podolski - Berezhest - Gudogai -
Draugistee (Port Klaipeda)
container and
contrailer train daily
Romania - Republic of Moldova - Ukraine - Belarus - Lithuania
(Ungeny - Mogilev-Podolski - Berezhest - Gudogai - Draugiste
(Port Klaipeda))
container and
contrailer train
daily
Bulgaria - Ukraine - Belarus - Lithuania (Varna - Iliechyevsk-
Paromnaja - Berezhest - Gudogai - Draugiste (Port Klaipeda)
container and
contrailer train daily
Azerbaijan - Georgia - Ukraine - Belarus - Lithuania (Aljat -
Beyuk-Kyasik - Poti/Batumi - Iliechyevsk-Paromnaja - Berezhest
- Gudogai - Draugiste (Port Klaipeda)
container and
contrailer train daily
Holding “Bulgarian State Railways” (Holding BDZ)
40770 Tekirdag (Turkey) - Bulgaria - Serbia - Hungary - Vienna
(Austria) container on request
40773 Vienna (Austria) - Hungary - Serbia - Bulgaria - Tekirdag
(Turkey) container on request
40781 Sopron (Hungary) - Romania - Bulgaria - Cerkezkoy (Turkey) container on request
40782 Cerkezkoy (Turkey) - Bulgaria - Romania - Sopron (Hungary) container on request
40783 Sopron (Hungary) - Romania - Bulgaria - Cerkezkoy (Turkey) container on request
40784 Cerkezkoy (Turkey) - Bulgaria - Romania - Sopron (Hungary) container on request
40785 Sopron (Hungary) - Romania - Bulgaria - Cerkezkoy (Turkey) container on request
40774 Cerkezkoy (Turkey) - Bulgaria - Serbia - Sopron (Hungary) container on request
40775 Sopron (Hungary) - Serbia - Bulgaria - Cerkezkoy (Turkey) container on request
40776 Cerkezkoy (Turkey) - Bulgaria - Serbia - Sopron (Hungary) container once a week
40777 Sopron (Hungary) - Serbia - Bulgaria - Cerkezkoy (Turkey) container on request
40778 Cerkezkoy (Turkey) - Bulgaria - Serbia - Sopron (Hungary) container on request
40779 Sopron (Hungary) - Serbia - Bulgaria - Cerkezkoy (Turkey) container on request
40820 Halkali (Turkey) - Bulgaria - Serbia - Croatia - Ljubljana
(Slovenia) container on request
40821 Ljubljana (Slovenia) - Croatia - Serbia - Bulgaria - Halkali
(Turkey) container on request
41520 Halkali (Turkey) - Bulgaria - Dornesti (Romania) container once a week
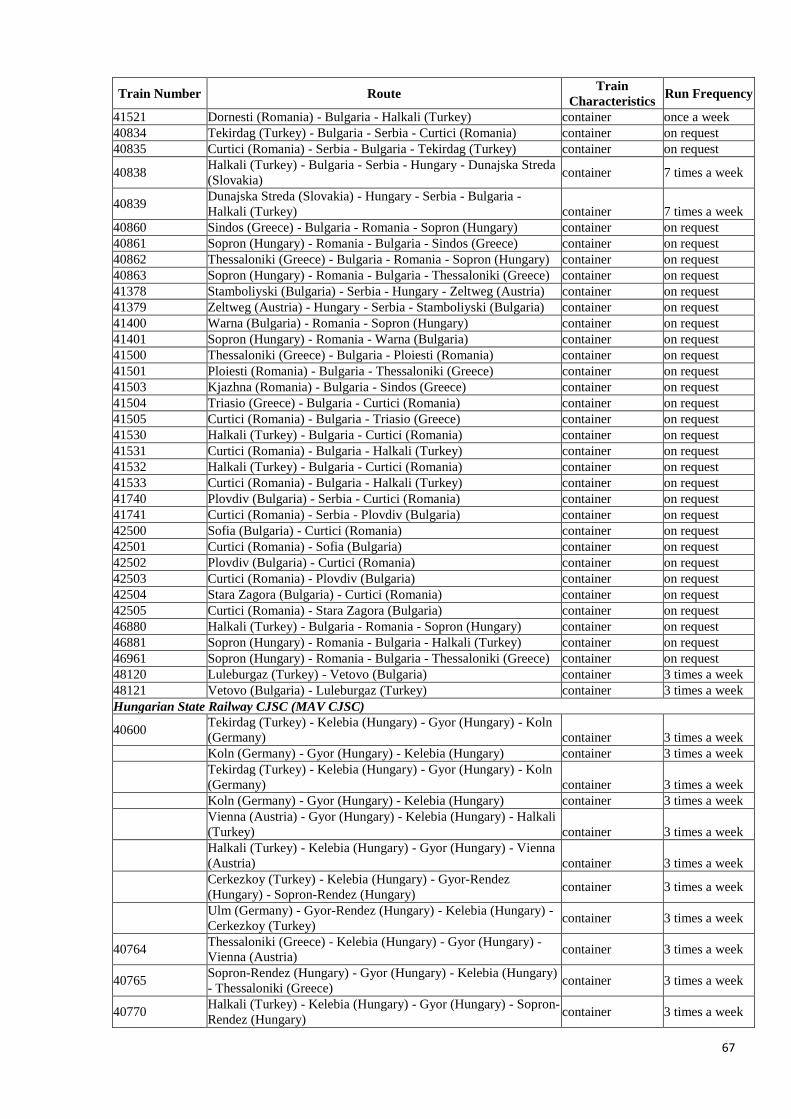
67
Train Number Route Train
Characteristics Run Frequency
41521 Dornesti (Romania) - Bulgaria - Halkali (Turkey) container once a week
40834 Tekirdag (Turkey) - Bulgaria - Serbia - Curtici (Romania) container on request
40835 Curtici (Romania) - Serbia - Bulgaria - Tekirdag (Turkey) container on request
40838 Halkali (Turkey) - Bulgaria - Serbia - Hungary - Dunajska Streda
(Slovakia) container 7 times a week
40839 Dunajska Streda (Slovakia) - Hungary - Serbia - Bulgaria -
Halkali (Turkey) container 7 times a week
40860 Sindos (Greece) - Bulgaria - Romania - Sopron (Hungary) container on request
40861 Sopron (Hungary) - Romania - Bulgaria - Sindos (Greece) container on request
40862 Thessaloniki (Greece) - Bulgaria - Romania - Sopron (Hungary) container on request
40863 Sopron (Hungary) - Romania - Bulgaria - Thessaloniki (Greece) container on request
41378 Stamboliyski (Bulgaria) - Serbia - Hungary - Zeltweg (Austria) container on request
41379 Zeltweg (Austria) - Hungary - Serbia - Stamboliyski (Bulgaria) container on request
41400 Warna (Bulgaria) - Romania - Sopron (Hungary) container on request
41401 Sopron (Hungary) - Romania - Warna (Bulgaria) container on request
41500 Thessaloniki (Greece) - Bulgaria - Ploiesti (Romania) container on request
41501 Ploiesti (Romania) - Bulgaria - Thessaloniki (Greece) container on request
41503 Kjazhna (Romania) - Bulgaria - Sindos (Greece) container on request
41504 Triasio (Greece) - Bulgaria - Curtici (Romania) container on request
41505 Curtici (Romania) - Bulgaria - Triasio (Greece) container on request
41530 Halkali (Turkey) - Bulgaria - Curtici (Romania) container on request
41531 Curtici (Romania) - Bulgaria - Halkali (Turkey) container on request
41532 Halkali (Turkey) - Bulgaria - Curtici (Romania) container on request
41533 Curtici (Romania) - Bulgaria - Halkali (Turkey) container on request
41740 Plovdiv (Bulgaria) - Serbia - Curtici (Romania) container on request
41741 Curtici (Romania) - Serbia - Plovdiv (Bulgaria) container on request
42500 Sofia (Bulgaria) - Curtici (Romania) container on request
42501 Curtici (Romania) - Sofia (Bulgaria) container on request
42502 Plovdiv (Bulgaria) - Curtici (Romania) container on request
42503 Curtici (Romania) - Plovdiv (Bulgaria) container on request
42504 Stara Zagora (Bulgaria) - Curtici (Romania) container on request
42505 Curtici (Romania) - Stara Zagora (Bulgaria) container on request
46880 Halkali (Turkey) - Bulgaria - Romania - Sopron (Hungary) container on request
46881 Sopron (Hungary) - Romania - Bulgaria - Halkali (Turkey) container on request
46961 Sopron (Hungary) - Romania - Bulgaria - Thessaloniki (Greece) container on request
48120 Luleburgaz (Turkey) - Vetovo (Bulgaria) container 3 times a week
48121 Vetovo (Bulgaria) - Luleburgaz (Turkey) container 3 times a week
Hungarian State Railway CJSC (MAV CJSC)
40600 Tekirdag (Turkey) - Kelebia (Hungary) - Gyor (Hungary) - Koln
(Germany) container 3 times a week
Koln (Germany) - Gyor (Hungary) - Kelebia (Hungary) container 3 times a week
Tekirdag (Turkey) - Kelebia (Hungary) - Gyor (Hungary) - Koln
(Germany) container 3 times a week
Koln (Germany) - Gyor (Hungary) - Kelebia (Hungary) container 3 times a week
Vienna (Austria) - Gyor (Hungary) - Kelebia (Hungary) - Halkali
(Turkey) container 3 times a week
Halkali (Turkey) - Kelebia (Hungary) - Gyor (Hungary) - Vienna
(Austria) container 3 times a week
Cerkezkoy (Turkey) - Kelebia (Hungary) - Gyor-Rendez
(Hungary) - Sopron-Rendez (Hungary) container 3 times a week
Ulm (Germany) - Gyor-Rendez (Hungary) - Kelebia (Hungary) -
Cerkezkoy (Turkey) container 3 times a week
40764 Thessaloniki (Greece) - Kelebia (Hungary) - Gyor (Hungary) -
Vienna (Austria) container 3 times a week
40765 Sopron-Rendez (Hungary) - Gyor (Hungary) - Kelebia (Hungary)
- Thessaloniki (Greece) container 3 times a week
40770 Halkali (Turkey) - Kelebia (Hungary) - Gyor (Hungary) - Sopron-
Rendez (Hungary) container 3 times a week

68
Train Number Route Train
Characteristics Run Frequency
Hisar (Turkey) - Kelebia (Hungary) - Gyor (Hungary) - Sopron-
Rendez (Hungary) container 3 times a week
Sopron-Rendez (Hungary) - Gyor (Hungary) - Kelebia (Hungary)
- Halkali (Turkey) container 3 times a week
40775 Sopron-Rendez (Hungary) - Gyor-Rendez (Hungary) - Kelebia
(Hungary) - Halkali (Turkey) container 3 times a week
40776 Halkali (Turkey) - Kelebia (Hungary) - Gyor (Hungary) - Sopron-
Rendez (Hungary) container 3 times a week
40838 Halkali (Turkey) - Kelebia (Hungary) - Komarom (Hungary) -
Dunajska Streda (Slovakia) container 2 times a week
40839 Dunajska Streda (Slovakia) - Komarom (Hungary) - Kelebia
(Hungary) - Halkali (Turkey) container 2 times a week
41126 Soroksar-Terminal (Hungary) - Hegyeshalom (Hungary) - Neuss
(Germany) container 5 times a week
41127 Neuss (Germany) - Hegyeshalom (Hungary) - Soroksar-Terminal
(Hungary) container 5 times a week
41129 Neuss (Germany) - Hegyeshalom (Hungary) - Soroksar-Terminal
(Hungary) container 5 times a week
41170 Dobra TKD (Slovakia) - Slovenske Nove Mesto (Slovakia) -
Hegyeshalom (Hungary) - Villach Sud (Austria) container once a week
Villach Sud (Austria) - Hegyeshalom (Hungary) - Slovenske
Nove Mesto (Slovakia) - Dobra TKD (Slovakia) container once a week
Dobra TKD (Slovakia) - Slovenske Nove Mesto (Slovakia) -
Hegyeshalom (Hungary) - Villach Sud (Austria) container once a week
Villach Sud (Austria) - Hegyeshalom (Hungary) - Hidasnemeti
(Hungary) - Dobra TKD (Slovakia) container once a week
Vienna (Austria) - Hegyeshalom (Hungary) - Soroksar-Terminal
(Hungary) container on request
Soroksar-Terminal (Hungary) - Hegyeshalom (Hungary) - Vienna
(Austria) container on request
Vienna (Austria) - Hegyeshalom (Hungary) - Soroksar-Terminal
(Hungary) container on request
Stamboliyski (Bulgaria) - Kelebia (Hungary) - Hegyeshalom
(Hungary) - Sankt Michel (Austria) container once a week
Zeltweg (Austria) - Hegyeshalom (Hungary) - Subotica (Serbia) -
Stamboliyski (Bulgaria) container once a week
41382 Soroksar Ut (Hungary) - Hegyeshalom (Hungary) - Austria container 5 times a week
41384 Soroksar-Terminal (Hungary) - Hegyeshalom (Hungary) - Austria container 5 times a week
42020 Koper (Slovenia) - Hodos (Slovenia) - Soroksar-Terminal
(Hungary) container 5 times a week
42021 Soroksar-Terminal (Hungary) - Hodos (Slovenia) - Koper
(Slovenia) container 5 times a week
42022 Koper (Slovenia) - Hodos (Slovenia) - Soroksar-Terminal
(Hungary) container 5 times a week
42023 Soroksar-Terminal (Hungary) - Hodos (Slovenia) - Koper
(Slovenia) container 5 times a week
42024 Koper (Slovenia) - Hodos (Slovenia) - Soroksar-Terminal
(Hungary) container 5 times a week
42025 Soroksar-Terminal (Hungary) - Hodos (Slovenia) - Koper
(Slovenia) container 5 times a week
42050 Koper (Slovenia) - Hodos (Slovenia) - Budaors (Hungary) container 2 times a week
42051 Budaors (Hungary) - Hodos (Slovenia) - Koper (Slovenia container 2 times a week
42052 Koper (Slovenia) - Hodos (Slovenia) - Budaors (Hungary) container 2 times a week
Chiajna (Romania) - Curtici (Romania) - Gyor (Hungary) -
Lambach (Austria) container 3 times a week
Lambach (Austria) - Gyor (Hungary) - Curtici (Romania) -
Chiajna (Romania) container 3 times a week
42900 Rijeka (Croatia) - Gyekenyes (Hungary) - Soroksar -Terminal
(Hungary) container once a week
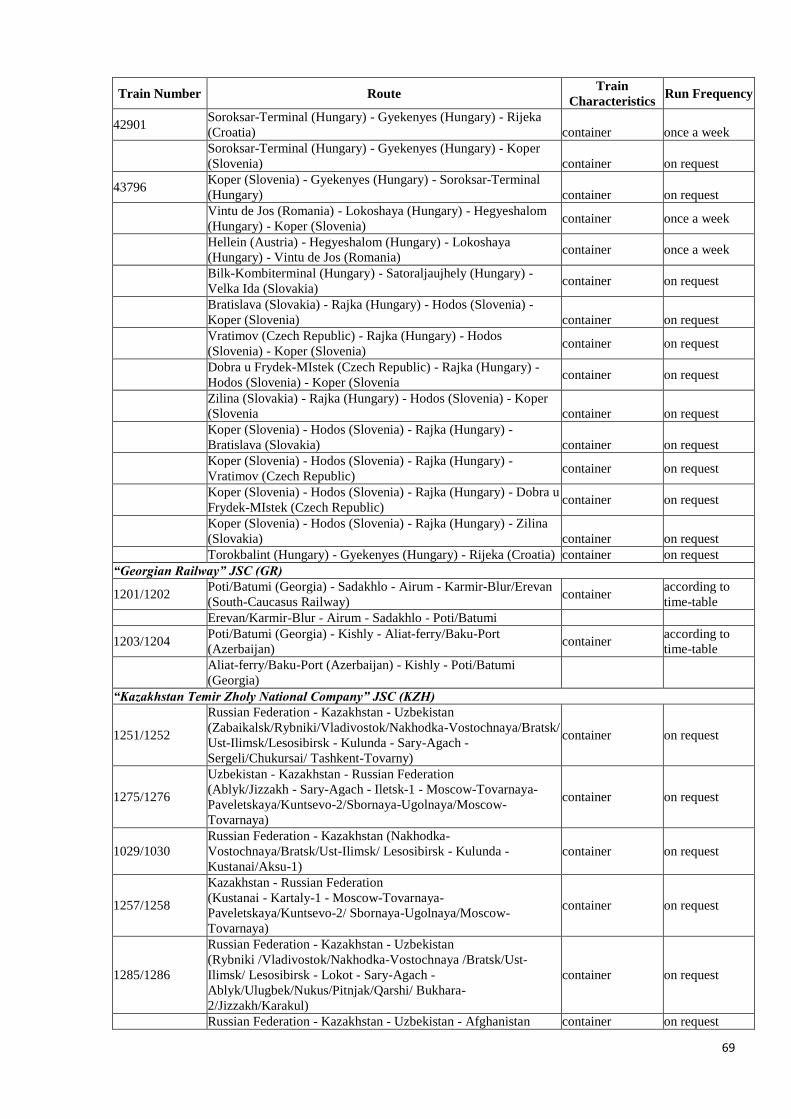
69
Train Number Route Train
Characteristics Run Frequency
42901 Soroksar-Terminal (Hungary) - Gyekenyes (Hungary) - Rijeka
(Croatia) container once a week
Soroksar-Terminal (Hungary) - Gyekenyes (Hungary) - Koper
(Slovenia) container on request
43796 Koper (Slovenia) - Gyekenyes (Hungary) - Soroksar-Terminal
(Hungary) container on request
Vintu de Jos (Romania) - Lokoshaya (Hungary) - Hegyeshalom
(Hungary) - Koper (Slovenia) container once a week
Hellein (Austria) - Hegyeshalom (Hungary) - Lokoshaya
(Hungary) - Vintu de Jos (Romania) container once a week
Bilk-Kombiterminal (Hungary) - Satoraljaujhely (Hungary) -
Velka Ida (Slovakia) container on request
Bratislava (Slovakia) - Rajka (Hungary) - Hodos (Slovenia) -
Koper (Slovenia) container on request
Vratimov (Czech Republic) - Rajka (Hungary) - Hodos
(Slovenia) - Koper (Slovenia) container on request
Dobra u Frydek-MIstek (Czech Republic) - Rajka (Hungary) -
Hodos (Slovenia) - Koper (Slovenia container on request
Zilina (Slovakia) - Rajka (Hungary) - Hodos (Slovenia) - Koper
(Slovenia container on request
Koper (Slovenia) - Hodos (Slovenia) - Rajka (Hungary) -
Bratislava (Slovakia) container on request
Koper (Slovenia) - Hodos (Slovenia) - Rajka (Hungary) -
Vratimov (Czech Republic) container on request
Koper (Slovenia) - Hodos (Slovenia) - Rajka (Hungary) - Dobra u
Frydek-MIstek (Czech Republic) container on request
Koper (Slovenia) - Hodos (Slovenia) - Rajka (Hungary) - Zilina
(Slovakia) container on request
Torokbalint (Hungary) - Gyekenyes (Hungary) - Rijeka (Croatia) container on request
“Georgian Railway” JSC (GR)
1201/1202 Poti/Batumi (Georgia) - Sadakhlo - Airum - Karmir-Blur/Erevan
(South-Caucasus Railway) container
according to
time-table
Erevan/Karmir-Blur - Airum - Sadakhlo - Poti/Batumi
1203/1204 Poti/Batumi (Georgia) - Kishly - Aliat-ferry/Baku-Port
(Azerbaijan) container
according to
time-table
Aliat-ferry/Baku-Port (Azerbaijan) - Kishly - Poti/Batumi
(Georgia)
“Kazakhstan Temir Zholy National Company” JSC (KZH)
1251/1252
Russian Federation - Kazakhstan - Uzbekistan
(Zabaikalsk/Rybniki/Vladivostok/Nakhodka-Vostochnaya/Bratsk/
Ust-Ilimsk/Lesosibirsk - Kulunda - Sary-Agach -
Sergeli/Chukursai/ Tashkent-Tovarny)
container on request
1275/1276
Uzbekistan - Kazakhstan - Russian Federation
(Ablyk/Jizzakh - Sary-Agach - Iletsk-1 - Moscow-Tovarnaya-
Paveletskaya/Kuntsevo-2/Sbornaya-Ugolnaya/Moscow-
Tovarnaya)
container on request
1029/1030
Russian Federation - Kazakhstan (Nakhodka-
Vostochnaya/Bratsk/Ust-Ilimsk/ Lesosibirsk - Kulunda -
Kustanai/Aksu-1)
container on request
1257/1258
Kazakhstan - Russian Federation
(Kustanai - Kartaly-1 - Moscow-Tovarnaya-
Paveletskaya/Kuntsevo-2/ Sbornaya-Ugolnaya/Moscow-
Tovarnaya)
container on request
1285/1286
Russian Federation - Kazakhstan - Uzbekistan
(Rybniki /Vladivostok/Nakhodka-Vostochnaya /Bratsk/Ust-
Ilimsk/ Lesosibirsk - Lokot - Sary-Agach -
Ablyk/Ulugbek/Nukus/Pitnjak/Qarshi/ Bukhara-
2/Jizzakh/Karakul)
container on request
Russian Federation - Kazakhstan - Uzbekistan - Afghanistan container on request

70
Train Number Route Train
Characteristics Run Frequency
(Nakhodka-Vostochnaya - Lokot - Sary-Agach - Galaba)
1031/1032
Russian Federation - Kazakhstan
(Perwaya Rechka/Ussuriysk/ Khabarovsk-2/ Zabaikalsk/
Vladivostok/ Nakhodka-Vostochnaya/Bratsk/Ust-
Ilimsk/Lesosibirsk - Lokot - Zashchita/Zhety-Su/Almaty-
1/Sorokovaya)
container on request
Russian Federation - Kazakhstan(Nakhodka-Vostochnaya - Lokot
- Sorokovaya/ Astana/Atyrau/Mangyshlak/Aktau-Port) container on request
Kazakhstan - Russian Federation(Zhinishke/Aksu-1 - Lokot -
Nakhodka-Vostochnaya) container on request
Kazakhstan - Russian Federation(Zashchita - Lokot - Moscow-
Tovarnaya- Paveletskaya/Kuntsevo-2/Sbornaya-
Ugolnaya/Moscow-Tovarnaya)
container on request
1033/1034 Russian Federation - Kazakhstan (Novorossiysk - Kartaly-1 -
Kustanai) container on request
1035/1036 Russian Federation - Kazakhstan (Buslovskaya - Semiglavy Mar -
Zhinishke) container on request
Russian Federation - Kazakhstan (Vorsino/Tuchkovo - Semiglavy
Mar - Almaty-1) container on request
1070/1069
Czech Republic/Slovakia - Poland - Belarus - Russian Federation
- Kazakhstan (Malaszewicze - Brest - Krasnoye - Kartaly-1 -
Zashchita)
container on request
1045/1046 Russian Federation - Kazakhstan - Turkmenistan (Nakhodka-
Vostochnaya - Lokot - Bolashak - Turkmenbashi-2) container on request
1072/1071 Kazakhstan - Russian Federation - Belarus (Aksu-1 - Kartaly-1 -
Krasnoye - Brest) container on request
1076/1075
European countries - Belarus - Russian Federation - Kazakhstan -
China (Malaszewicze - Brest - Krasnoye - Iletsk-1 - Almaty-1 -
Dostyk/Altynkol)
container on request
Altynkol - Almaty-1 - Altynkol
1273/1274
Poland - Belarus - Russian Federation - Kazakhstan - China
(Malaszewicze - Brest - Krasnoye - Iletsk-1 - Dostyk/Altynkol -
Chengdu)
container on request
1078/1077
Kazakhstan
Vector
Germany - Poland - Belarus - Russian Federation - Kazakhstan
(Malaszewicze - Brest - Krasnoye - Semiglavy Mar - Arys-1) container on request
1142/1141 Aksu-1 - Dostyk container on request
1221/1222
Saule-2
Lithuania - Belarus - Russian Federation - Kazakhstan -
Uzbekistan - Afghanistan (Draugiste (Port Klaipeda) - Gudogai -
Krasnoye - Semiglavy Mar - Karakalpakstan - Galaba)
container on request
Lithuania - Belarus - Russian Federation - Kazakhstan -
Uzbekistan (Draugiste (Port Klaipeda) - Gudogai - Krasnoye -
Semiglavy Mar - Karakalpakstan - Ulugbek)
container on request
Lithuania - Belarus - Russian Federation - Kazakhstan
(Draugiste (Port Klaipeda) - Gudogai - Krasnoye - Semiglavy
Mar - Aktobe (ЕСР 6600-6640, 6648-6728, 67771-67772, 69740,
6976-6997, 6999, 7030-7042,7044-7047, 7057, 7049, 7059-
7075)/Almaty-1)
container on request
1271/1272
Saule-3
Lithuania - Latvia - Russian Federation - Kazakhstan
(Draugiste/Port Klaipeda) - Eglaine - Zilupe - Semiglavy Mar -
Almaty-1)
container on request
1226/1225 Baltic
Wind
Lithuania - Belarus - Russian Federation - Kazakhstan
(Paneriai/Draugiste (Port Klaipeda) - Gudogai - Krasnoye -
Kartaly-1 - Kustanai)
container on request
1253/1254 New
Silk Way
China - Kazakhstan - Russian Federation - Ukraine -
Slovakia/Hungary (Dostyk/ Altynkol - Iletsk-1 - Zernovo - Chop -
Dobra/Chop, Batevo - Budapest)
container on request
1255/1256 China - Kazakhstan - Uzbekistan (Altynkol/Dostyk - Sary-Agach
- Ablyk/ Sergeli/ Chukursai/Tashkent-Tovarny) container on request

71
Train Number Route Train
Characteristics Run Frequency
1267/1268 Kazakhstan - Russian Federation (Zhety-Su - Semiglavy Mar -
Obninskoye) container on request
China - Kazakhstan - Russian Federation
(Dostyk - Semiglavy Mar - Moscow-Tovarnaya-
Paveletskaya/Silikatnaya)
container on request
China - Kazakhstan - Russian Federation (Dostyk - Semiglavy
Mar - Kupavna/ Khovrino/Kresty/Kuntsevo-2) container on request
1259/1260
Saule
China - Kazakhstan - Russian Federation - Belarus - Lithuania -
European countries (Dostyk/Altynkol - Iletsk-1 - Krasnoye -
Gudogai - Draugiste (Port Klaipeda)/Sestokai)
container on request
Saule-1
Lithuania - Belarus - Russian Federation - Kazakhstan (Draugiste
(Port Klaipeda)/ Sestokai - Gudogai - Krasnoye - Kartaly-1 -
Almaty-1)
container on request
1262/1261 China - Kazakhstan - Uzbekistan
(Altynkol/Dostyk - Sary-Agach - Ablyk/Sergeli/ Chukursai) container on request
1263/1264 Kazakhstan - Russian Federation - Belarus
(Zhinishke - Semiglavy Mar - Zakopytie - Brest) container on request
1265/1266
China - Kazakhstan - Russian Federation - Belarus - Poland -
Germany (Dostyk/Altynkol - Iletsk-1 - Krasnoye - Brest -
Malaszewicze)
container on request
1269/1270
China - Kazakhstan - Russian Federation
(Dostyk/Altynkol - Semiglavy Mar - Novorossiysk/Krasnodar-
Sortirovochny)
container on request
1271/1272 Kazakhstan - Russian Federation - Belarus - Lithuania
(Zhinishke - Semiglavy Mar - Zakopytie - Gudogai - Klaipeda) container on request
1278/1277 Russian Federation - Kazakhstan - China (Buslovskaya - Iletsk-1
- Dostyk) container on request
1280/1279
Nomad Express
China - Kazakhstan - Azerbaijan - Georgia
(Dostyk/Altynkol - Aktau-Port-Ferry - Alyat - Beyuk-Kyasik -
Tbilisi-
Uzlovaya/Poti)
container on request
1282/1281
China - Kazakhstan - Russian Federation - Azerbaijan - Georgia
(Dostyk - Semiglavy Mar - Samur - Beyuk-Kyasik - Tbilisi-
Uzlovaya)
container on request
1284/1283 China - Kazakhstan - Russian Federation (Dostyk - Kartaly-1 -
Formachyevo) container on request
1287/1288 China - Kazakhstan - Turkmenistan - Iran along the route Dostyk/
Altynkol - Bolashak - Sarahs container on request
1292/1291 Russian Federation - Kazakhstan - China (Vartsila - Iletsk-1 -
Dostyk) container on request
1293/1294
Kyrgyzstan - Kazakhstan - Russian Federation
(Alamedin - Lugovaya - Semiglavy Mar - Khovrino/ Kuntsevo-
2/Vorsino)
container on request
1350/1349
Eurasia-1
Latvia - Russian Federation - Kazakhstan
(Riga - Zilupe - Semiglavy Mar - Aktobe) container on request
1415/1416 Estonia - Russian Federation - Kazakhstan
(Muuga - Pechory-Pskovskiye - Iletsk-1 - Almaty-1) container on request
Estonia - Russian Federation - Kazakhstan - Uzbekistan -
Afghanistan (Muuga - Pechory-Pskovskiye - Semiglavy Mar -
Karakalpakstan - Galaba)
container on request
Estonia - Russian Federation
(Muuga - Pechory-Pskovskiye - Tolyatti/Zhigulyevskoye More) container on request
1418/1417
Baltica-Transit
Estonia/Lithuania - Latvia (Rezekne) - Russian Federation -
Kazakhstan - Uzbekistan (Valga/ Eglaine - Zilupe - Semiglavy
Mar - Aktobe - Sary-Agach - Chukursai)
container on request
Estonia/ Lithuania - Latvia (Rezekne) - Russian Federation -
Kazakhstan (Valga/Eglaine - Zilupe - Semiglavy Mar - Almaty-1) container on request
Estonia/Lithuania - Latvia (Rezekne) - Russian Federation -
Kazakhstan - Uzbekistan - Afghanistan container on request
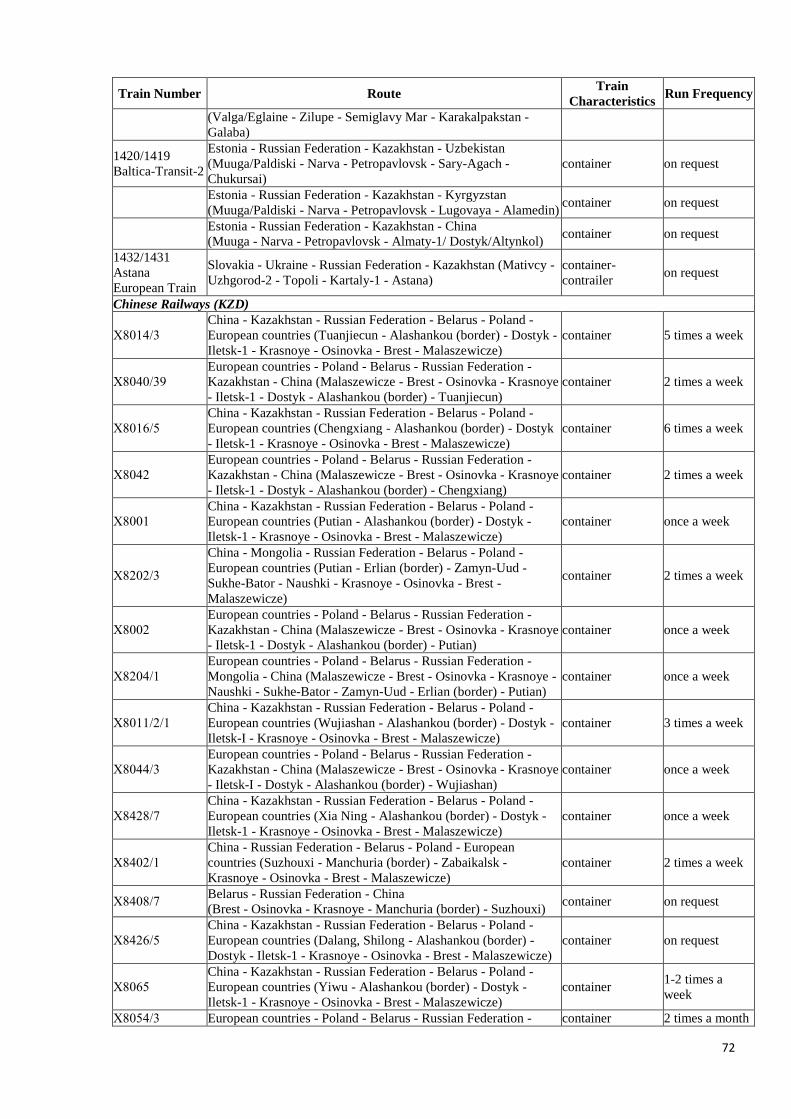
72
Train Number Route Train
Characteristics Run Frequency
(Valga/Eglaine - Zilupe - Semiglavy Mar - Karakalpakstan -
Galaba)
1420/1419
Baltica-Transit-2
Estonia - Russian Federation - Kazakhstan - Uzbekistan
(Muuga/Paldiski - Narva - Petropavlovsk - Sary-Agach -
Chukursai)
container on request
Estonia - Russian Federation - Kazakhstan - Kyrgyzstan
(Muuga/Paldiski - Narva - Petropavlovsk - Lugovaya - Alamedin) container on request
Estonia - Russian Federation - Kazakhstan - China
(Muuga - Narva - Petropavlovsk - Almaty-1/ Dostyk/Altynkol) container on request
1432/1431
Astana
European Train
Slovakia - Ukraine - Russian Federation - Kazakhstan (Mativcy -
Uzhgorod-2 - Topoli - Kartaly-1 - Astana)
container-
contrailer on request
Chinese Railways (KZD)
Х8014/3
China - Kazakhstan - Russian Federation - Belarus - Poland -
European countries (Tuanjiecun - Alashankou (border) - Dostyk -
Iletsk-1 - Krasnoye - Osinovka - Brest - Malaszewicze)
container 5 times a week
Х8040/39
European countries - Poland - Belarus - Russian Federation -
Kazakhstan - China (Malaszewicze - Brest - Osinovka - Krasnoye
- Iletsk-1 - Dostyk - Alashankou (border) - Tuanjiecun)
container 2 times a week
Х8016/5
China - Kazakhstan - Russian Federation - Belarus - Poland -
European countries (Chengxiang - Alashankou (border) - Dostyk
- Iletsk-1 - Krasnoye - Osinovka - Brest - Malaszewicze)
container 6 times a week
Х8042
European countries - Poland - Belarus - Russian Federation -
Kazakhstan - China (Malaszewicze - Brest - Osinovka - Krasnoye
- Iletsk-1 - Dostyk - Alashankou (border) - Chengxiang)
container 2 times a week
Х8001
China - Kazakhstan - Russian Federation - Belarus - Poland -
European countries (Putian - Alashankou (border) - Dostyk -
Iletsk-1 - Krasnoye - Osinovka - Brest - Malaszewicze)
container once a week
Х8202/3
China - Mongolia - Russian Federation - Belarus - Poland -
European countries (Putian - Erlian (border) - Zamyn-Uud -
Sukhe-Bator - Naushki - Krasnoye - Osinovka - Brest -
Malaszewicze)
container 2 times a week
Х8002
European countries - Poland - Belarus - Russian Federation -
Kazakhstan - China (Malaszewicze - Brest - Osinovka - Krasnoye
- Iletsk-1 - Dostyk - Alashankou (border) - Putian)
container once a week
Х8204/1
European countries - Poland - Belarus - Russian Federation -
Mongolia - China (Malaszewicze - Brest - Osinovka - Krasnoye -
Naushki - Sukhe-Bator - Zamyn-Uud - Erlian (border) - Putian)
container once a week
Х8011/2/1
China - Kazakhstan - Russian Federation - Belarus - Poland -
European countries (Wujiashan - Alashankou (border) - Dostyk -
Iletsk-I - Krasnoye - Osinovka - Brest - Malaszewicze)
container 3 times a week
Х8044/3
European countries - Poland - Belarus - Russian Federation -
Kazakhstan - China (Malaszewicze - Brest - Osinovka - Krasnoye
- Iletsk-I - Dostyk - Alashankou (border) - Wujiashan)
container once a week
Х8428/7
China - Kazakhstan - Russian Federation - Belarus - Poland -
European countries (Xia Ning - Alashankou (border) - Dostyk -
Iletsk-1 - Krasnoye - Osinovka - Brest - Malaszewicze)
container once a week
Х8402/1
China - Russian Federation - Belarus - Poland - European
countries (Suzhouxi - Manchuria (border) - Zabaikalsk -
Krasnoye - Osinovka - Brest - Malaszewicze)
container 2 times a week
Х8408/7 Belarus - Russian Federation - China
(Brest - Osinovka - Krasnoye - Manchuria (border) - Suzhouxi) container on request
Х8426/5
China - Kazakhstan - Russian Federation - Belarus - Poland -
European countries (Dalang, Shilong - Alashankou (border) -
Dostyk - Iletsk-1 - Krasnoye - Osinovka - Brest - Malaszewicze)
container on request
Х8065
China - Kazakhstan - Russian Federation - Belarus - Poland -
European countries (Yiwu - Alashankou (border) - Dostyk -
Iletsk-1 - Krasnoye - Osinovka - Brest - Malaszewicze)
container 1-2 times a
week
Х8054/3 European countries - Poland - Belarus - Russian Federation - container 2 times a month
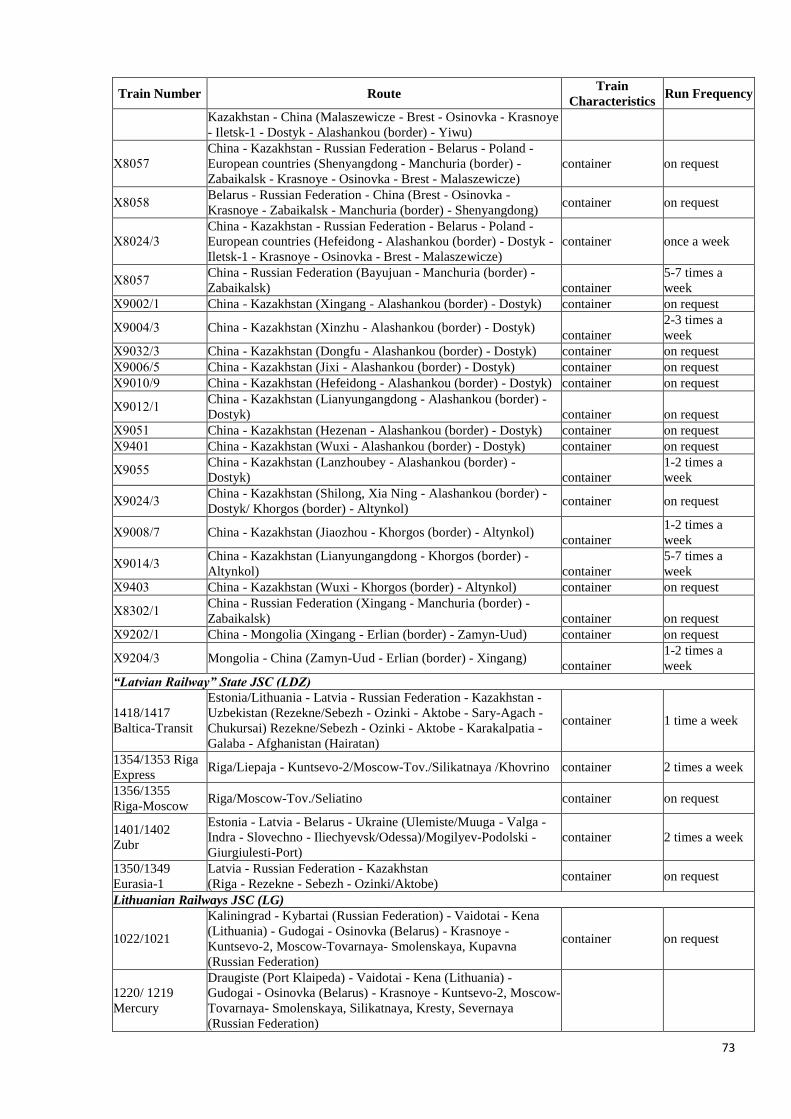
73
Train Number Route Train
Characteristics Run Frequency
Kazakhstan - China (Malaszewicze - Brest - Osinovka - Krasnoye
- Iletsk-1 - Dostyk - Alashankou (border) - Yiwu)
Х8057
China - Kazakhstan - Russian Federation - Belarus - Poland -
European countries (Shenyangdong - Manchuria (border) -
Zabaikalsk - Krasnoye - Osinovka - Brest - Malaszewicze)
container on request
Х8058 Belarus - Russian Federation - China (Brest - Osinovka -
Krasnoye - Zabaikalsk - Manchuria (border) - Shenyangdong) container on request
Х8024/3
China - Kazakhstan - Russian Federation - Belarus - Poland -
European countries (Hefeidong - Alashankou (border) - Dostyk -
Iletsk-1 - Krasnoye - Osinovka - Brest - Malaszewicze)
container once a week
Х8057 China - Russian Federation (Bayujuan - Manchuria (border) -
Zabaikalsk) container
5-7 times a
week
Х9002/1 China - Kazakhstan (Xingang - Alashankou (border) - Dostyk) container on request
Х9004/3 China - Kazakhstan (Xinzhu - Alashankou (border) - Dostyk) container
2-3 times a
week
Х9032/3 China - Kazakhstan (Dongfu - Alashankou (border) - Dostyk) container on request
Х9006/5 China - Kazakhstan (Jixi - Alashankou (border) - Dostyk) container on request
Х9010/9 China - Kazakhstan (Hefeidong - Alashankou (border) - Dostyk) container on request
Х9012/1 China - Kazakhstan (Lianyungangdong - Alashankou (border) -
Dostyk) container on request
Х9051 China - Kazakhstan (Hezenan - Alashankou (border) - Dostyk) container on request
Х9401 China - Kazakhstan (Wuxi - Alashankou (border) - Dostyk) container on request
Х9055 China - Kazakhstan (Lanzhoubey - Alashankou (border) -
Dostyk) container
1-2 times a
week
Х9024/3 China - Kazakhstan (Shilong, Xia Ning - Alashankou (border) -
Dostyk/ Khorgos (border) - Altynkol) container on request
Х9008/7 China - Kazakhstan (Jiaozhou - Khorgos (border) - Altynkol) container
1-2 times a
week
Х9014/3 China - Kazakhstan (Lianyungangdong - Khorgos (border) -
Altynkol) container
5-7 times a
week
Х9403 China - Kazakhstan (Wuxi - Khorgos (border) - Altynkol) container on request
Х8302/1 China - Russian Federation (Xingang - Manchuria (border) -
Zabaikalsk) container on request
Х9202/1 China - Mongolia (Xingang - Erlian (border) - Zamyn-Uud) container on request
Х9204/3 Mongolia - China (Zamyn-Uud - Erlian (border) - Xingang) container
1-2 times a
week
“Latvian Railway” State JSC (LDZ)
1418/1417
Baltica-Transit
Estonia/Lithuania - Latvia - Russian Federation - Kazakhstan -
Uzbekistan (Rezekne/Sebezh - Ozinki - Aktobe - Sary-Agach -
Chukursai) Rezekne/Sebezh - Ozinki - Aktobe - Karakalpatia -
Galaba - Afghanistan (Hairatan)
container 1 time a week
1354/1353 Riga
Express Riga/Liepaja - Kuntsevo-2/Moscow-Tov./Silikatnaya /Khovrino container 2 times a week
1356/1355
Riga-Moscow Riga/Moscow-Tov./Seliatino container on request
1401/1402
Zubr
Estonia - Latvia - Belarus - Ukraine (Ulemiste/Muuga - Valga -
Indra - Slovechno - Iliechyevsk/Odessa)/Mogilyev-Podolski -
Giurgiulesti-Port)
container 2 times a week
1350/1349
Eurasia-1
Latvia - Russian Federation - Kazakhstan
(Riga - Rezekne - Sebezh - Ozinki/Aktobe) container on request
Lithuanian Railways JSC (LG)
1022/1021
Kaliningrad - Kybartai (Russian Federation) - Vaidotai - Kena
(Lithuania) - Gudogai - Osinovka (Belarus) - Krasnoye -
Kuntsevo-2, Moscow-Tovarnaya- Smolenskaya, Kupavna
(Russian Federation)
container on request
1220/ 1219
Mercury
Draugiste (Port Klaipeda) - Vaidotai - Kena (Lithuania) -
Gudogai - Osinovka (Belarus) - Krasnoye - Kuntsevo-2, Moscow-
Tovarnaya- Smolenskaya, Silikatnaya, Kresty, Severnaya
(Russian Federation)
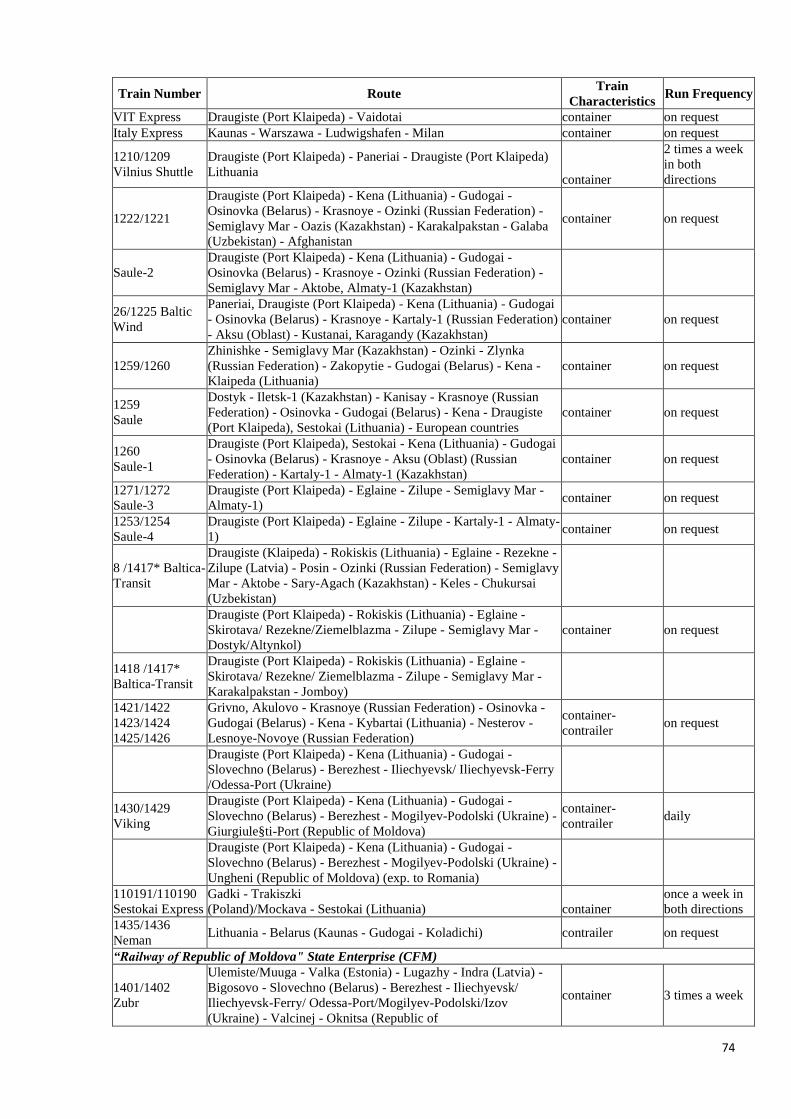
74
Train Number Route Train
Characteristics Run Frequency
VIT Express Draugiste (Port Klaipeda) - Vaidotai container on request
Italy Express Kaunas - Warszawa - Ludwigshafen - Milan container on request
1210/1209
Vilnius Shuttle
Draugiste (Port Klaipeda) - Paneriai - Draugiste (Port Klaipeda)
Lithuania container
2 times a week
in both
directions
1222/1221
Draugiste (Port Klaipeda) - Kena (Lithuania) - Gudogai -
Osinovka (Belarus) - Krasnoye - Ozinki (Russian Federation) -
Semiglavy Mar - Oazis (Kazakhstan) - Karakalpakstan - Galaba
(Uzbekistan) - Afghanistan
container on request
Saule-2
Draugiste (Port Klaipeda) - Kena (Lithuania) - Gudogai -
Osinovka (Belarus) - Krasnoye - Ozinki (Russian Federation) -
Semiglavy Mar - Aktobe, Almaty-1 (Kazakhstan)
26/1225 Baltic
Wind
Paneriai, Draugiste (Port Klaipeda) - Kena (Lithuania) - Gudogai
- Osinovka (Belarus) - Krasnoye - Kartaly-1 (Russian Federation)
- Aksu (Oblast) - Kustanai, Karagandy (Kazakhstan)
container on request
1259/1260
Zhinishke - Semiglavy Mar (Kazakhstan) - Ozinki - Zlynka
(Russian Federation) - Zakopytie - Gudogai (Belarus) - Kena -
Klaipeda (Lithuania)
container on request
1259
Saule
Dostyk - Iletsk-1 (Kazakhstan) - Kanisay - Krasnoye (Russian
Federation) - Osinovka - Gudogai (Belarus) - Kena - Draugiste
(Port Klaipeda), Sestokai (Lithuania) - European countries
container on request
1260
Saule-1
Draugiste (Port Klaipeda), Sestokai - Kena (Lithuania) - Gudogai
- Osinovka (Belarus) - Krasnoye - Aksu (Oblast) (Russian
Federation) - Kartaly-1 - Almaty-1 (Kazakhstan)
container on request
1271/1272
Saule-3
Draugiste (Port Klaipeda) - Eglaine - Zilupe - Semiglavy Mar -
Almaty-1) container on request
1253/1254
Saule-4
Draugiste (Port Klaipeda) - Eglaine - Zilupe - Kartaly-1 - Almaty-
1) container on request
8 /1417* Baltica-
Transit
Draugiste (Klaipeda) - Rokiskis (Lithuania) - Eglaine - Rezekne -
Zilupe (Latvia) - Posin - Ozinki (Russian Federation) - Semiglavy
Mar - Aktobe - Sary-Agach (Kazakhstan) - Keles - Chukursai
(Uzbekistan)
Draugiste (Port Klaipeda) - Rokiskis (Lithuania) - Eglaine -
Skirotava/ Rezekne/Ziemelblazma - Zilupe - Semiglavy Mar -
Dostyk/Altynkol)
container on request
1418 /1417*
Baltica-Transit
Draugiste (Port Klaipeda) - Rokiskis (Lithuania) - Eglaine -
Skirotava/ Rezekne/ Ziemelblazma - Zilupe - Semiglavy Mar -
Karakalpakstan - Jomboy)
1421/1422
1423/1424
1425/1426
Grivno, Akulovo - Krasnoye (Russian Federation) - Osinovka -
Gudogai (Belarus) - Kena - Kybartai (Lithuania) - Nesterov -
Lesnoye-Novoye (Russian Federation)
container-
contrailer on request
Draugiste (Port Klaipeda) - Kena (Lithuania) - Gudogai -
Slovechno (Belarus) - Berezhest - Iliechyevsk/ Iliechyevsk-Ferry
/Odessa-Port (Ukraine)
1430/1429
Viking
Draugiste (Port Klaipeda) - Kena (Lithuania) - Gudogai -
Slovechno (Belarus) - Berezhest - Mogilyev-Podolski (Ukraine) -
Giurgiule§ti-Port (Republic of Moldova)
container-
contrailer daily
Draugiste (Port Klaipeda) - Kena (Lithuania) - Gudogai -
Slovechno (Belarus) - Berezhest - Mogilyev-Podolski (Ukraine) -
Ungheni (Republic of Moldova) (exp. to Romania)
110191/110190
Sestokai Express
Gadki - Trakiszki
(Poland)/Mockava - Sestokai (Lithuania) container
once a week in
both directions
1435/1436
Neman Lithuania - Belarus (Kaunas - Gudogai - Koladichi) contrailer on request
“Railway of Republic of Moldova" State Enterprise (CFM)
1401/1402
Zubr
Ulemiste/Muuga - Valka (Estonia) - Lugazhy - Indra (Latvia) -
Bigosovo - Slovechno (Belarus) - Berezhest - Iliechyevsk/
Iliechyevsk-Ferry/ Odessa-Port/Mogilyev-Podolski/Izov
(Ukraine) - Valcinej - Oknitsa (Republic of
container 3 times a week
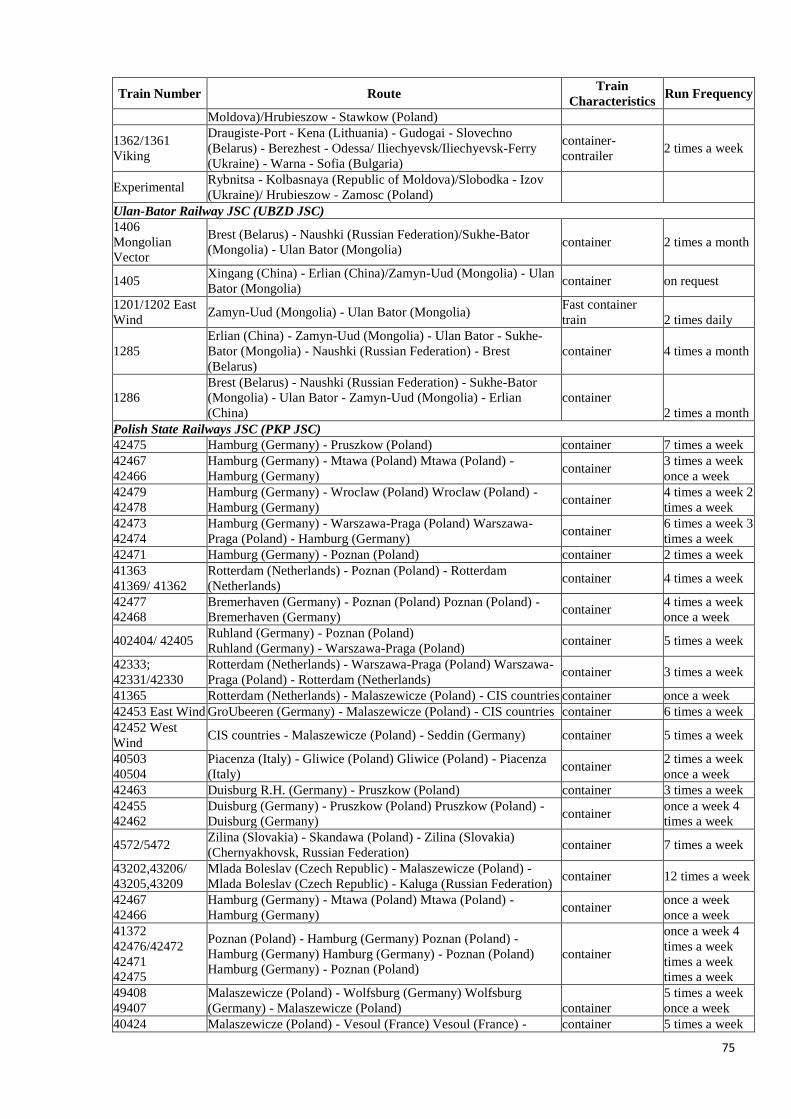
75
Train Number Route Train
Characteristics Run Frequency
Moldova)/Hrubieszow - Stawkow (Poland)
1362/1361
Viking
Draugiste-Port - Kena (Lithuania) - Gudogai - Slovechno
(Belarus) - Berezhest - Odessa/ Iliechyevsk/Iliechyevsk-Ferry
(Ukraine) - Warna - Sofia (Bulgaria)
container-
contrailer 2 times a week
Experimental Rybnitsa - Kolbasnaya (Republic of Moldova)/Slobodka - Izov
(Ukraine)/ Hrubieszow - Zamosc (Poland)
Ulan-Bator Railway JSC (UBZD JSC)
1406
Mongolian
Vector
Brest (Belarus) - Naushki (Russian Federation)/Sukhe-Bator
(Mongolia) - Ulan Bator (Mongolia) container 2 times a month
1405 Xingang (China) - Erlian (China)/Zamyn-Uud (Mongolia) - Ulan
Bator (Mongolia) container on request
1201/1202 East
Wind Zamyn-Uud (Mongolia) - Ulan Bator (Mongolia)
Fast container
train 2 times daily
1285
Erlian (China) - Zamyn-Uud (Mongolia) - Ulan Bator - Sukhe-
Bator (Mongolia) - Naushki (Russian Federation) - Brest
(Belarus)
container 4 times a month
1286
Brest (Belarus) - Naushki (Russian Federation) - Sukhe-Bator
(Mongolia) - Ulan Bator - Zamyn-Uud (Mongolia) - Erlian
(China)
container
2 times a month
Polish State Railways JSC (PKP JSC)
42475 Hamburg (Germany) - Pruszkow (Poland) container 7 times a week
42467
42466
Hamburg (Germany) - Mtawa (Poland) Mtawa (Poland) -
Hamburg (Germany) container
3 times a week
once a week
42479
42478
Hamburg (Germany) - Wroclaw (Poland) Wroclaw (Poland) -
Hamburg (Germany) container
4 times a week 2
times a week
42473
42474
Hamburg (Germany) - Warszawa-Praga (Poland) Warszawa-
Praga (Poland) - Hamburg (Germany) container
6 times a week 3
times a week
42471 Hamburg (Germany) - Poznan (Poland) container 2 times a week
41363
41369/ 41362
Rotterdam (Netherlands) - Poznan (Poland) - Rotterdam
(Netherlands) container 4 times a week
42477
42468
Bremerhaven (Germany) - Poznan (Poland) Poznan (Poland) -
Bremerhaven (Germany) container
4 times a week
once a week
402404/ 42405 Ruhland (Germany) - Poznan (Poland)
Ruhland (Germany) - Warszawa-Praga (Poland) container 5 times a week
42333;
42331/42330
Rotterdam (Netherlands) - Warszawa-Praga (Poland) Warszawa-
Praga (Poland) - Rotterdam (Netherlands) container 3 times a week
41365 Rotterdam (Netherlands) - Malaszewicze (Poland) - CIS countries container once a week
42453 East Wind GroUbeeren (Germany) - Malaszewicze (Poland) - CIS countries container 6 times a week
42452 West
Wind CIS countries - Malaszewicze (Poland) - Seddin (Germany) container 5 times a week
40503
40504
Piacenza (Italy) - Gliwice (Poland) Gliwice (Poland) - Piacenza
(Italy) container
2 times a week
once a week
42463 Duisburg R.H. (Germany) - Pruszkow (Poland) container 3 times a week
42455
42462
Duisburg (Germany) - Pruszkow (Poland) Pruszkow (Poland) -
Duisburg (Germany) container
once a week 4
times a week
4572/5472 Zilina (Slovakia) - Skandawa (Poland) - Zilina (Slovakia)
(Chernyakhovsk, Russian Federation) container 7 times a week
43202,43206/
43205,43209
Mlada Boleslav (Czech Republic) - Malaszewicze (Poland) -
Mlada Boleslav (Czech Republic) - Kaluga (Russian Federation) container 12 times a week
42467
42466
Hamburg (Germany) - Mtawa (Poland) Mtawa (Poland) -
Hamburg (Germany) container
once a week
once a week
41372
42476/42472
42471
42475
Poznan (Poland) - Hamburg (Germany) Poznan (Poland) -
Hamburg (Germany) Hamburg (Germany) - Poznan (Poland)
Hamburg (Germany) - Poznan (Poland)
container
once a week 4
times a week
times a week
times a week
49408
49407
Malaszewicze (Poland) - Wolfsburg (Germany) Wolfsburg
(Germany) - Malaszewicze (Poland) container
5 times a week
once a week
40424 Malaszewicze (Poland) - Vesoul (France) Vesoul (France) - container 5 times a week
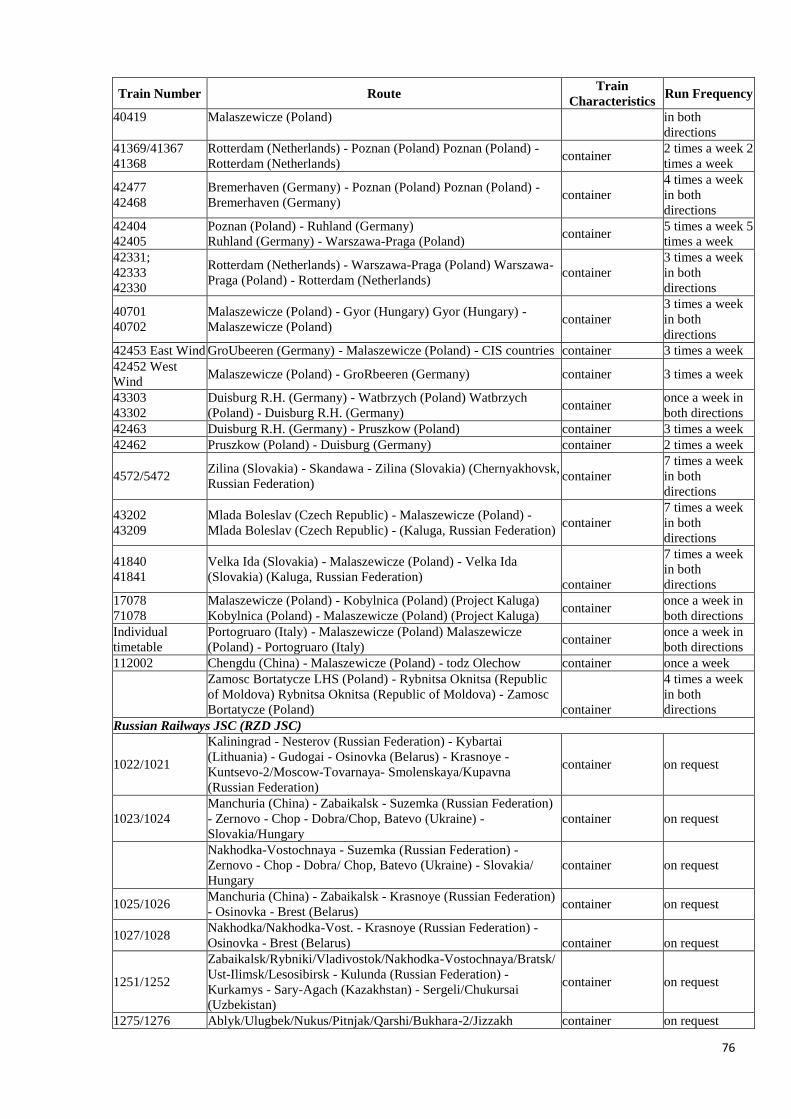
76
Train Number Route Train
Characteristics Run Frequency
40419 Malaszewicze (Poland) in both
directions
41369/41367
41368
Rotterdam (Netherlands) - Poznan (Poland) Poznan (Poland) -
Rotterdam (Netherlands) container
2 times a week 2
times a week
42477
42468
Bremerhaven (Germany) - Poznan (Poland) Poznan (Poland) -
Bremerhaven (Germany) container
4 times a week
in both
directions
42404
42405
Poznan (Poland) - Ruhland (Germany)
Ruhland (Germany) - Warszawa-Praga (Poland) container
5 times a week 5
times a week
42331;
42333
42330
Rotterdam (Netherlands) - Warszawa-Praga (Poland) Warszawa-
Praga (Poland) - Rotterdam (Netherlands) container
3 times a week
in both
directions
40701
40702
Malaszewicze (Poland) - Gyor (Hungary) Gyor (Hungary) -
Malaszewicze (Poland) container
3 times a week
in both
directions
42453 East Wind GroUbeeren (Germany) - Malaszewicze (Poland) - CIS countries container 3 times a week
42452 West
Wind Malaszewicze (Poland) - GroRbeeren (Germany) container 3 times a week
43303
43302
Duisburg R.H. (Germany) - Watbrzych (Poland) Watbrzych
(Poland) - Duisburg R.H. (Germany) container
once a week in
both directions
42463 Duisburg R.H. (Germany) - Pruszkow (Poland) container 3 times a week
42462 Pruszkow (Poland) - Duisburg (Germany) container 2 times a week
4572/5472 Zilina (Slovakia) - Skandawa - Zilina (Slovakia) (Chernyakhovsk,
Russian Federation) container
7 times a week
in both
directions
43202
43209
Mlada Boleslav (Czech Republic) - Malaszewicze (Poland) -
Mlada Boleslav (Czech Republic) - (Kaluga, Russian Federation) container
7 times a week
in both
directions
41840
41841
Velka Ida (Slovakia) - Malaszewicze (Poland) - Velka Ida
(Slovakia) (Kaluga, Russian Federation) container
7 times a week
in both
directions
17078
71078
Malaszewicze (Poland) - Kobylnica (Poland) (Project Kaluga)
Kobylnica (Poland) - Malaszewicze (Poland) (Project Kaluga) container
once a week in
both directions
Individual
timetable
Portogruaro (Italy) - Malaszewicze (Poland) Malaszewicze
(Poland) - Portogruaro (Italy) container
once a week in
both directions
112002 Chengdu (China) - Malaszewicze (Poland) - todz Olechow container once a week
Zamosc Bortatycze LHS (Poland) - Rybnitsa Oknitsa (Republic
of Moldova) Rybnitsa Oknitsa (Republic of Moldova) - Zamosc
Bortatycze (Poland) container
4 times a week
in both
directions
Russian Railways JSC (RZD JSC)
1022/1021
Kaliningrad - Nesterov (Russian Federation) - Kybartai
(Lithuania) - Gudogai - Osinovka (Belarus) - Krasnoye -
Kuntsevo-2/Moscow-Tovarnaya- Smolenskaya/Kupavna
(Russian Federation)
container on request
1023/1024
Manchuria (China) - Zabaikalsk - Suzemka (Russian Federation)
- Zernovo - Chop - Dobra/Chop, Batevo (Ukraine) -
Slovakia/Hungary
container on request
Nakhodka-Vostochnaya - Suzemka (Russian Federation) -
Zernovo - Chop - Dobra/ Chop, Batevo (Ukraine) - Slovakia/
Hungary
container on request
1025/1026 Manchuria (China) - Zabaikalsk - Krasnoye (Russian Federation)
- Osinovka - Brest (Belarus) container on request
1027/1028 Nakhodka/Nakhodka-Vost. - Krasnoye (Russian Federation) -
Osinovka - Brest (Belarus) container on request
1251/1252
Zabaikalsk/Rybniki/Vladivostok/Nakhodka-Vostochnaya/Bratsk/
Ust-Ilimsk/Lesosibirsk - Kulunda (Russian Federation) -
Kurkamys - Sary-Agach (Kazakhstan) - Sergeli/Chukursai
(Uzbekistan)
container on request
1275/1276 Ablyk/Ulugbek/Nukus/Pitnjak/Qarshi/Bukhara-2/Jizzakh container on request
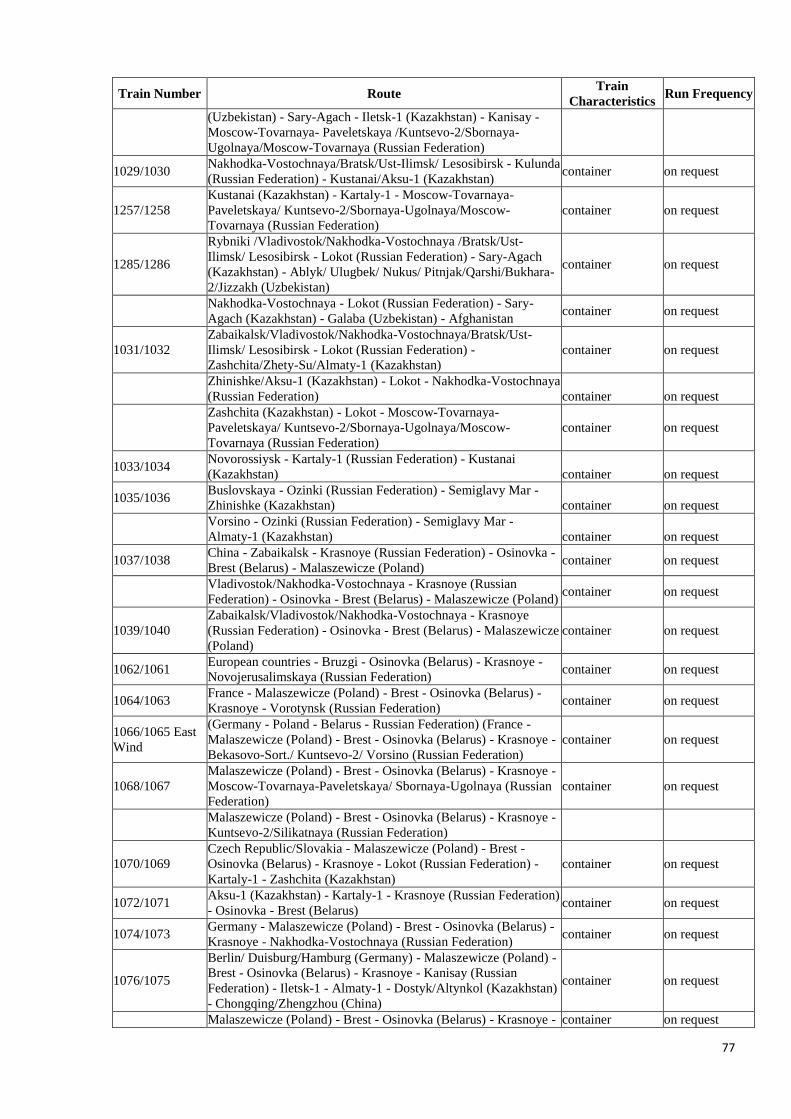
77
Train Number Route Train
Characteristics Run Frequency
(Uzbekistan) - Sary-Agach - Iletsk-1 (Kazakhstan) - Kanisay -
Moscow-Tovarnaya- Paveletskaya /Kuntsevo-2/Sbornaya-
Ugolnaya/Moscow-Tovarnaya (Russian Federation)
1029/1030 Nakhodka-Vostochnaya/Bratsk/Ust-Ilimsk/ Lesosibirsk - Kulunda
(Russian Federation) - Kustanai/Aksu-1 (Kazakhstan) container on request
1257/1258
Kustanai (Kazakhstan) - Kartaly-1 - Moscow-Tovarnaya-
Paveletskaya/ Kuntsevo-2/Sbornaya-Ugolnaya/Moscow-
Tovarnaya (Russian Federation)
container on request
1285/1286
Rybniki /Vladivostok/Nakhodka-Vostochnaya /Bratsk/Ust-
Ilimsk/ Lesosibirsk - Lokot (Russian Federation) - Sary-Agach
(Kazakhstan) - Ablyk/ Ulugbek/ Nukus/ Pitnjak/Qarshi/Bukhara-
2/Jizzakh (Uzbekistan)
container on request
Nakhodka-Vostochnaya - Lokot (Russian Federation) - Sary-
Agach (Kazakhstan) - Galaba (Uzbekistan) - Afghanistan container on request
1031/1032
Zabaikalsk/Vladivostok/Nakhodka-Vostochnaya/Bratsk/Ust-
Ilimsk/ Lesosibirsk - Lokot (Russian Federation) -
Zashchita/Zhety-Su/Almaty-1 (Kazakhstan)
container on request
Zhinishke/Aksu-1 (Kazakhstan) - Lokot - Nakhodka-Vostochnaya
(Russian Federation) container on request
Zashchita (Kazakhstan) - Lokot - Moscow-Tovarnaya-
Paveletskaya/ Kuntsevo-2/Sbornaya-Ugolnaya/Moscow-
Tovarnaya (Russian Federation)
container on request
1033/1034 Novorossiysk - Kartaly-1 (Russian Federation) - Kustanai
(Kazakhstan) container on request
1035/1036 Buslovskaya - Ozinki (Russian Federation) - Semiglavy Mar -
Zhinishke (Kazakhstan) container on request
Vorsino - Ozinki (Russian Federation) - Semiglavy Mar -
Almaty-1 (Kazakhstan) container on request
1037/1038 China - Zabaikalsk - Krasnoye (Russian Federation) - Osinovka -
Brest (Belarus) - Malaszewicze (Poland) container on request
Vladivostok/Nakhodka-Vostochnaya - Krasnoye (Russian
Federation) - Osinovka - Brest (Belarus) - Malaszewicze (Poland) container on request
1039/1040
Zabaikalsk/Vladivostok/Nakhodka-Vostochnaya - Krasnoye
(Russian Federation) - Osinovka - Brest (Belarus) - Malaszewicze
(Poland)
container on request
1062/1061 European countries - Bruzgi - Osinovka (Belarus) - Krasnoye -
Novojerusalimskaya (Russian Federation) container on request
1064/1063 France - Malaszewicze (Poland) - Brest - Osinovka (Belarus) -
Krasnoye - Vorotynsk (Russian Federation) container on request
1066/1065 East
Wind
(Germany - Poland - Belarus - Russian Federation) (France -
Malaszewicze (Poland) - Brest - Osinovka (Belarus) - Krasnoye -
Bekasovo-Sort./ Kuntsevo-2/ Vorsino (Russian Federation)
container on request
1068/1067
Malaszewicze (Poland) - Brest - Osinovka (Belarus) - Krasnoye -
Moscow-Tovarnaya-Paveletskaya/ Sbornaya-Ugolnaya (Russian
Federation)
container on request
Malaszewicze (Poland) - Brest - Osinovka (Belarus) - Krasnoye -
Kuntsevo-2/Silikatnaya (Russian Federation)
1070/1069
Czech Republic/Slovakia - Malaszewicze (Poland) - Brest -
Osinovka (Belarus) - Krasnoye - Lokot (Russian Federation) -
Kartaly-1 - Zashchita (Kazakhstan)
container on request
1072/1071 Aksu-1 (Kazakhstan) - Kartaly-1 - Krasnoye (Russian Federation)
- Osinovka - Brest (Belarus) container on request
1074/1073 Germany - Malaszewicze (Poland) - Brest - Osinovka (Belarus) -
Krasnoye - Nakhodka-Vostochnaya (Russian Federation) container on request
1076/1075
Berlin/ Duisburg/Hamburg (Germany) - Malaszewicze (Poland) -
Brest - Osinovka (Belarus) - Krasnoye - Kanisay (Russian
Federation) - Iletsk-1 - Almaty-1 - Dostyk/Altynkol (Kazakhstan)
- Chongqing/Zhengzhou (China)
container on request
Malaszewicze (Poland) - Brest - Osinovka (Belarus) - Krasnoye - container on request
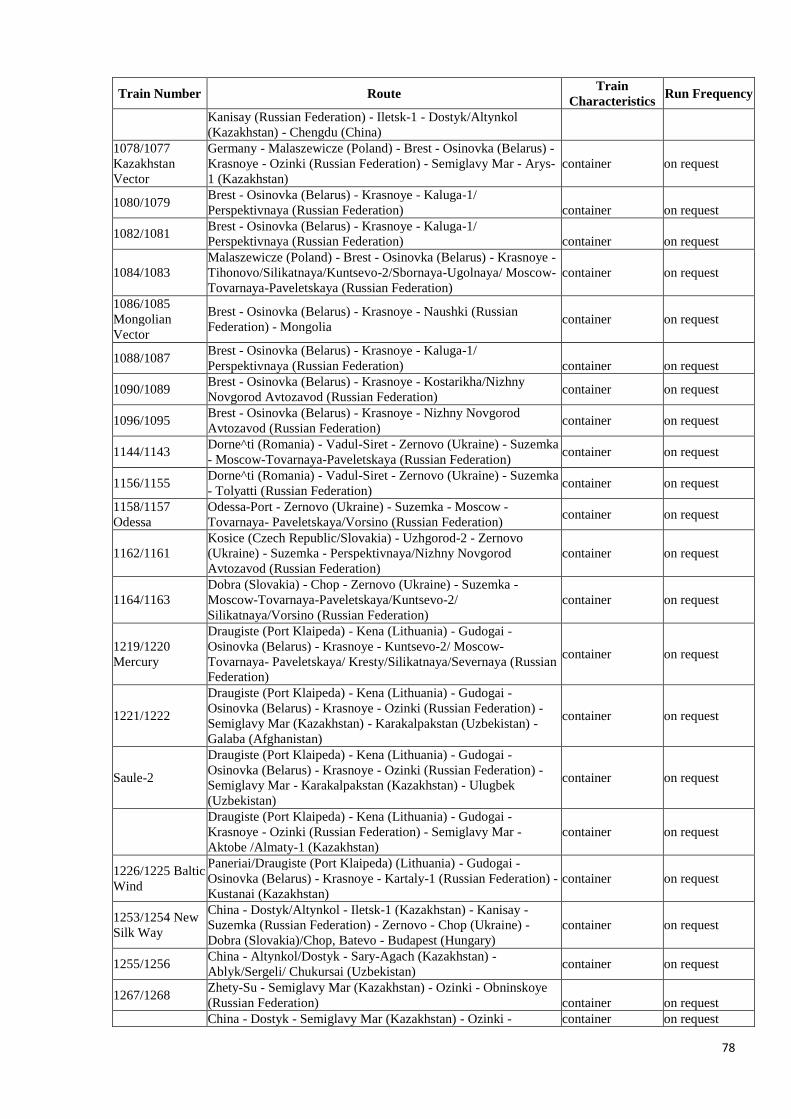
78
Train Number Route Train
Characteristics Run Frequency
Kanisay (Russian Federation) - Iletsk-1 - Dostyk/Altynkol
(Kazakhstan) - Chengdu (China)
1078/1077
Kazakhstan
Vector
Germany - Malaszewicze (Poland) - Brest - Osinovka (Belarus) -
Krasnoye - Ozinki (Russian Federation) - Semiglavy Mar - Arys-
1 (Kazakhstan)
container on request
1080/1079 Brest - Osinovka (Belarus) - Krasnoye - Kaluga-1/
Perspektivnaya (Russian Federation) container on request
1082/1081 Brest - Osinovka (Belarus) - Krasnoye - Kaluga-1/
Perspektivnaya (Russian Federation) container on request
1084/1083
Malaszewicze (Poland) - Brest - Osinovka (Belarus) - Krasnoye -
Tihonovo/Silikatnaya/Kuntsevo-2/Sbornaya-Ugolnaya/ Moscow-
Tovarnaya-Paveletskaya (Russian Federation)
container on request
1086/1085
Mongolian
Vector
Brest - Osinovka (Belarus) - Krasnoye - Naushki (Russian
Federation) - Mongolia container on request
1088/1087 Brest - Osinovka (Belarus) - Krasnoye - Kaluga-1/
Perspektivnaya (Russian Federation) container on request
1090/1089 Brest - Osinovka (Belarus) - Krasnoye - Kostarikha/Nizhny
Novgorod Avtozavod (Russian Federation) container on request
1096/1095 Brest - Osinovka (Belarus) - Krasnoye - Nizhny Novgorod
Avtozavod (Russian Federation) container on request
1144/1143 Dorne^ti (Romania) - Vadul-Siret - Zernovo (Ukraine) - Suzemka
- Moscow-Tovarnaya-Paveletskaya (Russian Federation) container on request
1156/1155 Dorne^ti (Romania) - Vadul-Siret - Zernovo (Ukraine) - Suzemka
- Tolyatti (Russian Federation) container on request
1158/1157
Odessa
Odessa-Port - Zernovo (Ukraine) - Suzemka - Moscow -
Tovarnaya- Paveletskaya/Vorsino (Russian Federation) container on request
1162/1161
Kosice (Czech Republic/Slovakia) - Uzhgorod-2 - Zernovo
(Ukraine) - Suzemka - Perspektivnaya/Nizhny Novgorod
Avtozavod (Russian Federation)
container on request
1164/1163
Dobra (Slovakia) - Chop - Zernovo (Ukraine) - Suzemka -
Moscow-Tovarnaya-Paveletskaya/Kuntsevo-2/
Silikatnaya/Vorsino (Russian Federation)
container on request
1219/1220
Mercury
Draugiste (Port Klaipeda) - Kena (Lithuania) - Gudogai -
Osinovka (Belarus) - Krasnoye - Kuntsevo-2/ Moscow-
Tovarnaya- Paveletskaya/ Kresty/Silikatnaya/Severnaya (Russian
Federation)
container on request
1221/1222
Draugiste (Port Klaipeda) - Kena (Lithuania) - Gudogai -
Osinovka (Belarus) - Krasnoye - Ozinki (Russian Federation) -
Semiglavy Mar (Kazakhstan) - Karakalpakstan (Uzbekistan) -
Galaba (Afghanistan)
container on request
Saule-2
Draugiste (Port Klaipeda) - Kena (Lithuania) - Gudogai -
Osinovka (Belarus) - Krasnoye - Ozinki (Russian Federation) -
Semiglavy Mar - Karakalpakstan (Kazakhstan) - Ulugbek
(Uzbekistan)
container on request
Draugiste (Port Klaipeda) - Kena (Lithuania) - Gudogai -
Krasnoye - Ozinki (Russian Federation) - Semiglavy Mar -
Aktobe /Almaty-1 (Kazakhstan)
container on request
1226/1225 Baltic
Wind
Paneriai/Draugiste (Port Klaipeda) (Lithuania) - Gudogai -
Osinovka (Belarus) - Krasnoye - Kartaly-1 (Russian Federation) -
Kustanai (Kazakhstan)
container on request
1253/1254 New
Silk Way
China - Dostyk/Altynkol - Iletsk-1 (Kazakhstan) - Kanisay -
Suzemka (Russian Federation) - Zernovo - Chop (Ukraine) -
Dobra (Slovakia)/Chop, Batevo - Budapest (Hungary)
container on request
1255/1256 China - Altynkol/Dostyk - Sary-Agach (Kazakhstan) -
Ablyk/Sergeli/ Chukursai (Uzbekistan) container on request
1267/1268 Zhety-Su - Semiglavy Mar (Kazakhstan) - Ozinki - Obninskoye
(Russian Federation) container on request
China - Dostyk - Semiglavy Mar (Kazakhstan) - Ozinki - container on request
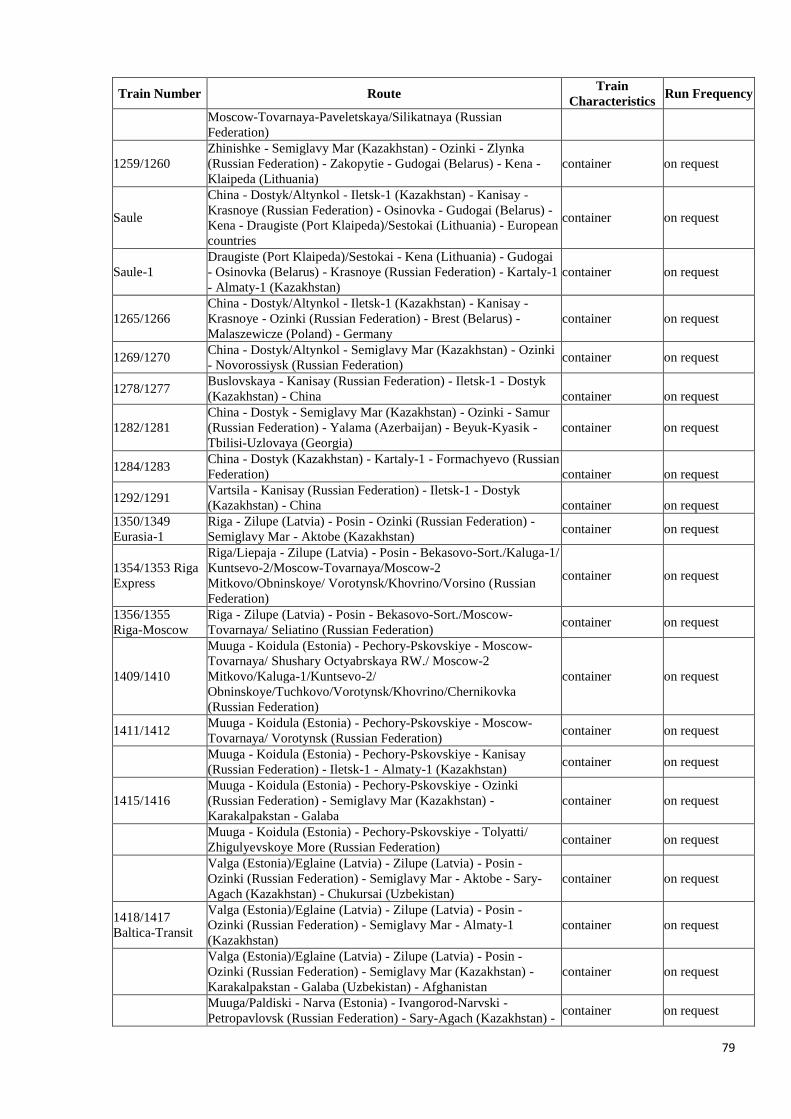
79
Train Number Route Train
Characteristics Run Frequency
Moscow-Tovarnaya-Paveletskaya/Silikatnaya (Russian
Federation)
1259/1260
Zhinishke - Semiglavy Mar (Kazakhstan) - Ozinki - Zlynka
(Russian Federation) - Zakopytie - Gudogai (Belarus) - Kena -
Klaipeda (Lithuania)
container on request
Saule
China - Dostyk/Altynkol - Iletsk-1 (Kazakhstan) - Kanisay -
Krasnoye (Russian Federation) - Osinovka - Gudogai (Belarus) -
Kena - Draugiste (Port Klaipeda)/Sestokai (Lithuania) - European
countries
container on request
Saule-1
Draugiste (Port Klaipeda)/Sestokai - Kena (Lithuania) - Gudogai
- Osinovka (Belarus) - Krasnoye (Russian Federation) - Kartaly-1
- Almaty-1 (Kazakhstan)
container on request
1265/1266
China - Dostyk/Altynkol - Iletsk-1 (Kazakhstan) - Kanisay -
Krasnoye - Ozinki (Russian Federation) - Brest (Belarus) -
Malaszewicze (Poland) - Germany
container on request
1269/1270 China - Dostyk/Altynkol - Semiglavy Mar (Kazakhstan) - Ozinki
- Novorossiysk (Russian Federation) container on request
1278/1277 Buslovskaya - Kanisay (Russian Federation) - Iletsk-1 - Dostyk
(Kazakhstan) - China container on request
1282/1281
China - Dostyk - Semiglavy Mar (Kazakhstan) - Ozinki - Samur
(Russian Federation) - Yalama (Azerbaijan) - Beyuk-Kyasik -
Tbilisi-Uzlovaya (Georgia)
container on request
1284/1283 China - Dostyk (Kazakhstan) - Kartaly-1 - Formachyevo (Russian
Federation) container on request
1292/1291 Vartsila - Kanisay (Russian Federation) - Iletsk-1 - Dostyk
(Kazakhstan) - China container on request
1350/1349
Eurasia-1
Riga - Zilupe (Latvia) - Posin - Ozinki (Russian Federation) -
Semiglavy Mar - Aktobe (Kazakhstan) container on request
1354/1353 Riga
Express
Riga/Liepaja - Zilupe (Latvia) - Posin - Bekasovo-Sort./Kaluga-1/
Kuntsevo-2/Moscow-Tovarnaya/Moscow-2
Mitkovo/Obninskoye/ Vorotynsk/Khovrino/Vorsino (Russian
Federation)
container on request
1356/1355
Riga-Moscow
Riga - Zilupe (Latvia) - Posin - Bekasovo-Sort./Moscow-
Tovarnaya/ Seliatino (Russian Federation) container on request
1409/1410
Muuga - Koidula (Estonia) - Pechory-Pskovskiye - Moscow-
Tovarnaya/ Shushary Octyabrskaya RW./ Moscow-2
Mitkovo/Kaluga-1/Kuntsevo-2/
Obninskoye/Tuchkovo/Vorotynsk/Khovrino/Chernikovka
(Russian Federation)
container on request
1411/1412 Muuga - Koidula (Estonia) - Pechory-Pskovskiye - Moscow-
Tovarnaya/ Vorotynsk (Russian Federation) container on request
Muuga - Koidula (Estonia) - Pechory-Pskovskiye - Kanisay
(Russian Federation) - Iletsk-1 - Almaty-1 (Kazakhstan) container on request
1415/1416
Muuga - Koidula (Estonia) - Pechory-Pskovskiye - Ozinki
(Russian Federation) - Semiglavy Mar (Kazakhstan) -
Karakalpakstan - Galaba
container on request
Muuga - Koidula (Estonia) - Pechory-Pskovskiye - Tolyatti/
Zhigulyevskoye More (Russian Federation) container on request
Valga (Estonia)/Eglaine (Latvia) - Zilupe (Latvia) - Posin -
Ozinki (Russian Federation) - Semiglavy Mar - Aktobe - Sary-
Agach (Kazakhstan) - Chukursai (Uzbekistan)
container on request
1418/1417
Baltica-Transit
Valga (Estonia)/Eglaine (Latvia) - Zilupe (Latvia) - Posin -
Ozinki (Russian Federation) - Semiglavy Mar - Almaty-1
(Kazakhstan)
container on request
Valga (Estonia)/Eglaine (Latvia) - Zilupe (Latvia) - Posin -
Ozinki (Russian Federation) - Semiglavy Mar (Kazakhstan) -
Karakalpakstan - Galaba (Uzbekistan) - Afghanistan
container on request
Muuga/Paldiski - Narva (Estonia) - Ivangorod-Narvski -
Petropavlovsk (Russian Federation) - Sary-Agach (Kazakhstan) - container on request
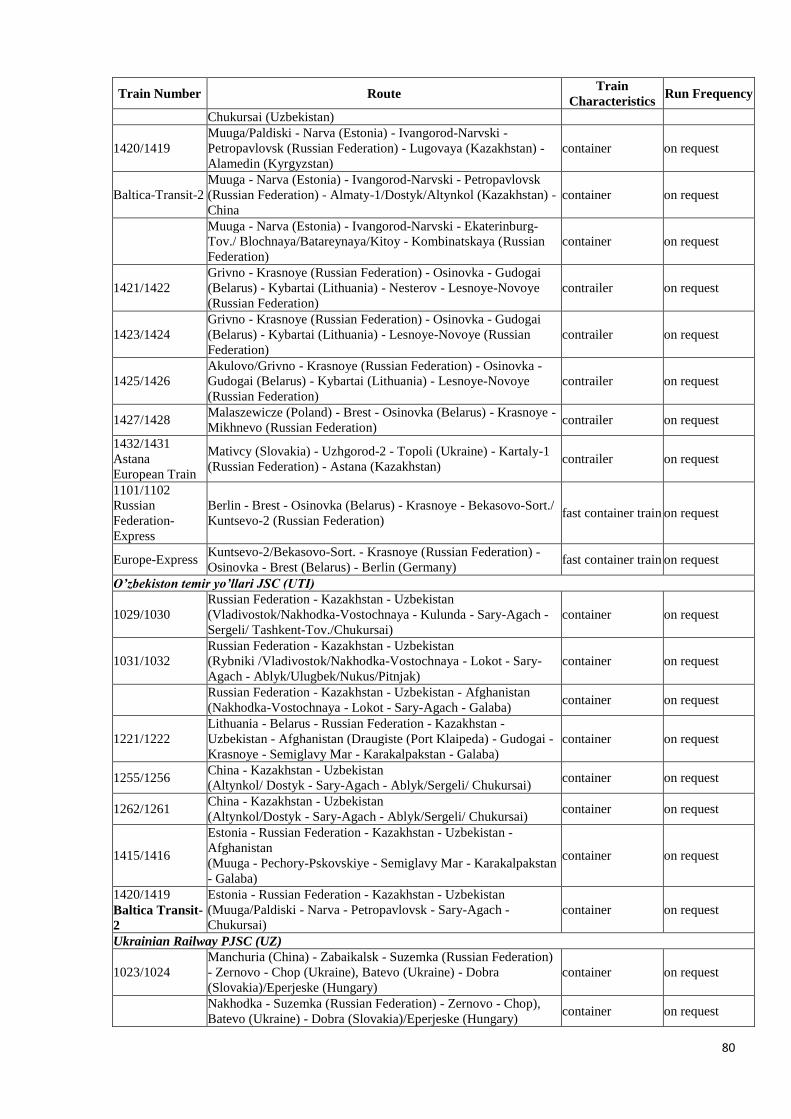
80
Train Number Route Train
Characteristics Run Frequency
Chukursai (Uzbekistan)
1420/1419
Muuga/Paldiski - Narva (Estonia) - Ivangorod-Narvski -
Petropavlovsk (Russian Federation) - Lugovaya (Kazakhstan) -
Alamedin (Kyrgyzstan)
container on request
Baltica-Transit-2
Muuga - Narva (Estonia) - Ivangorod-Narvski - Petropavlovsk
(Russian Federation) - Almaty-1/Dostyk/Altynkol (Kazakhstan) -
China
container on request
Muuga - Narva (Estonia) - Ivangorod-Narvski - Ekaterinburg-
Tov./ Blochnaya/Batareynaya/Kitoy - Kombinatskaya (Russian
Federation)
container on request
1421/1422
Grivno - Krasnoye (Russian Federation) - Osinovka - Gudogai
(Belarus) - Kybartai (Lithuania) - Nesterov - Lesnoye-Novoye
(Russian Federation)
contrailer on request
1423/1424
Grivno - Krasnoye (Russian Federation) - Osinovka - Gudogai
(Belarus) - Kybartai (Lithuania) - Lesnoye-Novoye (Russian
Federation)
contrailer on request
1425/1426
Akulovo/Grivno - Krasnoye (Russian Federation) - Osinovka -
Gudogai (Belarus) - Kybartai (Lithuania) - Lesnoye-Novoye
(Russian Federation)
contrailer on request
1427/1428 Malaszewicze (Poland) - Brest - Osinovka (Belarus) - Krasnoye -
Mikhnevo (Russian Federation) contrailer on request
1432/1431
Astana
European Train
Mativcy (Slovakia) - Uzhgorod-2 - Topoli (Ukraine) - Kartaly-1
(Russian Federation) - Astana (Kazakhstan) contrailer on request
1101/1102
Russian
Federation-
Express
Berlin - Brest - Osinovka (Belarus) - Krasnoye - Bekasovo-Sort./
Kuntsevo-2 (Russian Federation) fast container train on request
Europe-Express Kuntsevo-2/Bekasovo-Sort. - Krasnoye (Russian Federation) -
Osinovka - Brest (Belarus) - Berlin (Germany) fast container train on request
O’zbekiston temir yo’llari JSC (UTI)
1029/1030
Russian Federation - Kazakhstan - Uzbekistan
(Vladivostok/Nakhodka-Vostochnaya - Kulunda - Sary-Agach -
Sergeli/ Tashkent-Tov./Chukursai)
container on request
1031/1032
Russian Federation - Kazakhstan - Uzbekistan
(Rybniki /Vladivostok/Nakhodka-Vostochnaya - Lokot - Sary-
Agach - Ablyk/Ulugbek/Nukus/Pitnjak)
container on request
Russian Federation - Kazakhstan - Uzbekistan - Afghanistan
(Nakhodka-Vostochnaya - Lokot - Sary-Agach - Galaba) container on request
1221/1222
Lithuania - Belarus - Russian Federation - Kazakhstan -
Uzbekistan - Afghanistan (Draugiste (Port Klaipeda) - Gudogai -
Krasnoye - Semiglavy Mar - Karakalpakstan - Galaba)
container on request
1255/1256 China - Kazakhstan - Uzbekistan
(Altynkol/ Dostyk - Sary-Agach - Ablyk/Sergeli/ Chukursai) container on request
1262/1261 China - Kazakhstan - Uzbekistan
(Altynkol/Dostyk - Sary-Agach - Ablyk/Sergeli/ Chukursai) container on request
1415/1416
Estonia - Russian Federation - Kazakhstan - Uzbekistan -
Afghanistan
(Muuga - Pechory-Pskovskiye - Semiglavy Mar - Karakalpakstan
- Galaba)
container on request
1420/1419
Baltica Transit-
2
Estonia - Russian Federation - Kazakhstan - Uzbekistan
(Muuga/Paldiski - Narva - Petropavlovsk - Sary-Agach -
Chukursai)
container on request
Ukrainian Railway PJSC (UZ)
1023/1024
Manchuria (China) - Zabaikalsk - Suzemka (Russian Federation)
- Zernovo - Chop (Ukraine), Batevo (Ukraine) - Dobra
(Slovakia)/Eperjeske (Hungary)
container on request
Nakhodka - Suzemka (Russian Federation) - Zernovo - Chop),
Batevo (Ukraine) - Dobra (Slovakia)/Eperjeske (Hungary) container on request
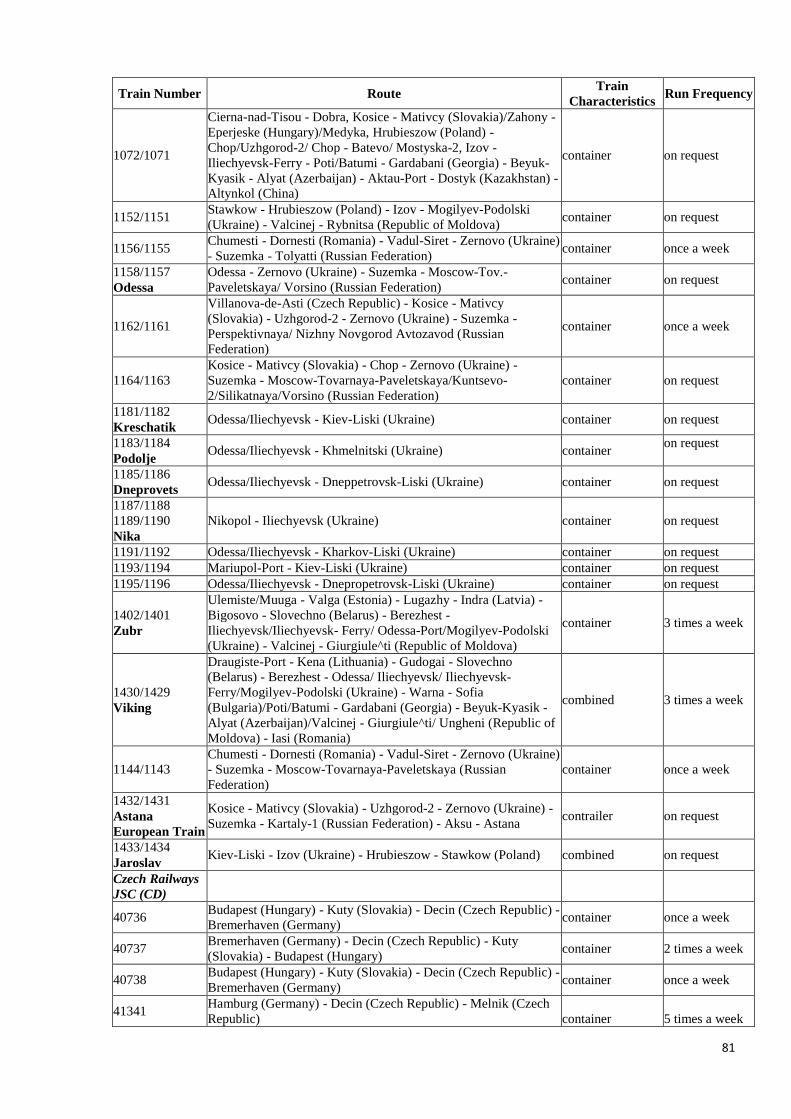
81
Train Number Route Train
Characteristics Run Frequency
1072/1071
Cierna-nad-Tisou - Dobra, Kosice - Mativcy (Slovakia)/Zahony -
Eperjeske (Hungary)/Medyka, Hrubieszow (Poland) -
Chop/Uzhgorod-2/ Chop - Batevo/ Mostyska-2, Izov -
Iliechyevsk-Ferry - Poti/Batumi - Gardabani (Georgia) - Beyuk-
Kyasik - Alyat (Azerbaijan) - Aktau-Port - Dostyk (Kazakhstan) -
Altynkol (China)
container on request
1152/1151 Stawkow - Hrubieszow (Poland) - Izov - Mogilyev-Podolski
(Ukraine) - Valcinej - Rybnitsa (Republic of Moldova) container on request
1156/1155 Chumesti - Dornesti (Romania) - Vadul-Siret - Zernovo (Ukraine)
- Suzemka - Tolyatti (Russian Federation) container once a week
1158/1157
Odessa
Odessa - Zernovo (Ukraine) - Suzemka - Moscow-Tov.-
Paveletskaya/ Vorsino (Russian Federation) container on request
1162/1161
Villanova-de-Asti (Czech Republic) - Kosice - Mativcy
(Slovakia) - Uzhgorod-2 - Zernovo (Ukraine) - Suzemka -
Perspektivnaya/ Nizhny Novgorod Avtozavod (Russian
Federation)
container once a week
1164/1163
Kosice - Mativcy (Slovakia) - Chop - Zernovo (Ukraine) -
Suzemka - Moscow-Tovarnaya-Paveletskaya/Kuntsevo-
2/Silikatnaya/Vorsino (Russian Federation)
container on request
1181/1182
Kreschatik Odessa/Iliechyevsk - Kiev-Liski (Ukraine) container on request
1183/1184
Podolje Odessa/Iliechyevsk - Khmelnitski (Ukraine) container
on request
1185/1186
Dneprovets Odessa/Iliechyevsk - Dneppetrovsk-Liski (Ukraine) container on request
1187/1188
1189/1190
Nika
Nikopol - Iliechyevsk (Ukraine) container on request
1191/1192 Odessa/Iliechyevsk - Kharkov-Liski (Ukraine) container on request
1193/1194 Mariupol-Port - Kiev-Liski (Ukraine) container on request
1195/1196 Odessa/Iliechyevsk - Dnepropetrovsk-Liski (Ukraine) container on request
1402/1401
Zubr
Ulemiste/Muuga - Valga (Estonia) - Lugazhy - Indra (Latvia) -
Bigosovo - Slovechno (Belarus) - Berezhest -
Iliechyevsk/Iliechyevsk- Ferry/ Odessa-Port/Mogilyev-Podolski
(Ukraine) - Valcinej - Giurgiule^ti (Republic of Moldova)
container 3 times a week
1430/1429
Viking
Draugiste-Port - Kena (Lithuania) - Gudogai - Slovechno
(Belarus) - Berezhest - Odessa/ Iliechyevsk/ Iliechyevsk-
Ferry/Mogilyev-Podolski (Ukraine) - Warna - Sofia
(Bulgaria)/Poti/Batumi - Gardabani (Georgia) - Beyuk-Kyasik -
Alyat (Azerbaijan)/Valcinej - Giurgiule^ti/ Ungheni (Republic of
Moldova) - Iasi (Romania)
combined 3 times a week
1144/1143
Chumesti - Dornesti (Romania) - Vadul-Siret - Zernovo (Ukraine)
- Suzemka - Moscow-Tovarnaya-Paveletskaya (Russian
Federation)
container once a week
1432/1431
Astana
European Train
Kosice - Mativcy (Slovakia) - Uzhgorod-2 - Zernovo (Ukraine) -
Suzemka - Kartaly-1 (Russian Federation) - Aksu - Astana contrailer on request
1433/1434
Jaroslav Kiev-Liski - Izov (Ukraine) - Hrubieszow - Stawkow (Poland) combined on request
Czech Railways
JSC (CD)
40736 Budapest (Hungary) - Kuty (Slovakia) - Decin (Czech Republic) -
Bremerhaven (Germany) container once a week
40737 Bremerhaven (Germany) - Decin (Czech Republic) - Kuty
(Slovakia) - Budapest (Hungary) container 2 times a week
40738 Budapest (Hungary) - Kuty (Slovakia) - Decin (Czech Republic) -
Bremerhaven (Germany) container once a week
41341 Hamburg (Germany) - Decin (Czech Republic) - Melnik (Czech
Republic) container 5 times a week
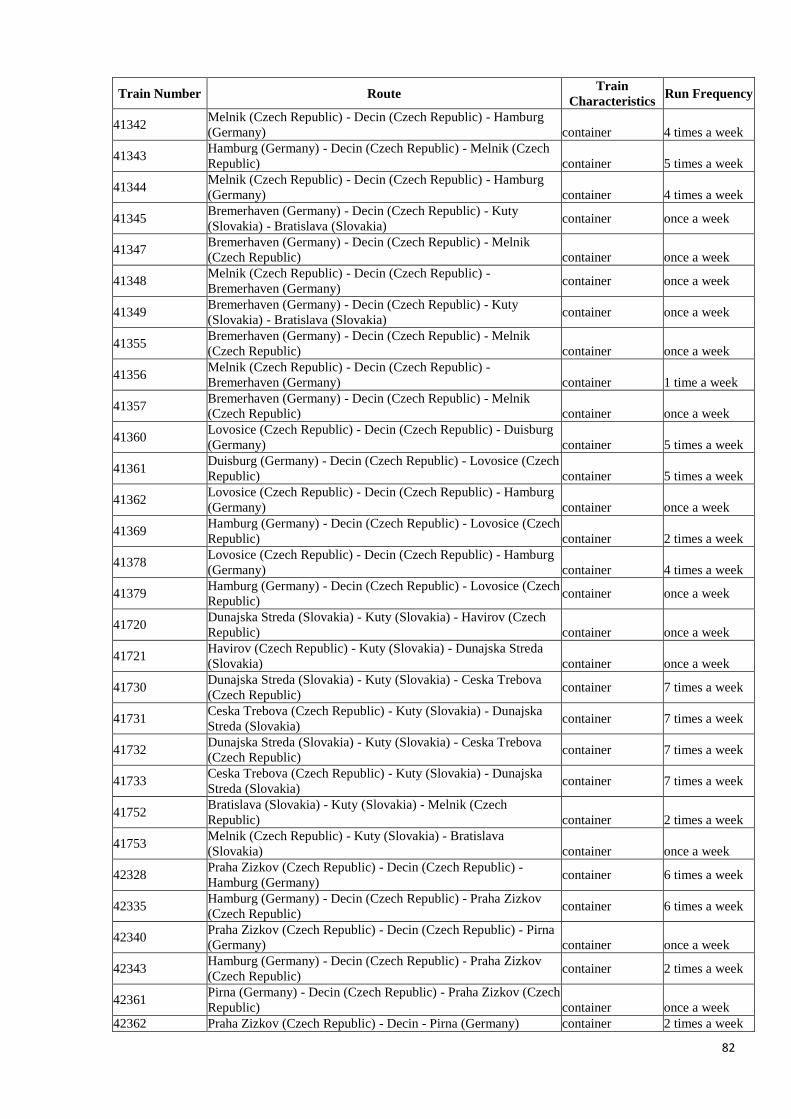
82
Train Number Route Train
Characteristics Run Frequency
41342 Melnik (Czech Republic) - Decin (Czech Republic) - Hamburg
(Germany) container 4 times a week
41343 Hamburg (Germany) - Decin (Czech Republic) - Melnik (Czech
Republic) container 5 times a week
41344 Melnik (Czech Republic) - Decin (Czech Republic) - Hamburg
(Germany) container 4 times a week
41345 Bremerhaven (Germany) - Decin (Czech Republic) - Kuty
(Slovakia) - Bratislava (Slovakia) container once a week
41347 Bremerhaven (Germany) - Decin (Czech Republic) - Melnik
(Czech Republic) container once a week
41348 Melnik (Czech Republic) - Decin (Czech Republic) -
Bremerhaven (Germany) container once a week
41349 Bremerhaven (Germany) - Decin (Czech Republic) - Kuty
(Slovakia) - Bratislava (Slovakia) container once a week
41355 Bremerhaven (Germany) - Decin (Czech Republic) - Melnik
(Czech Republic) container once a week
41356 Melnik (Czech Republic) - Decin (Czech Republic) -
Bremerhaven (Germany) container 1 time a week
41357 Bremerhaven (Germany) - Decin (Czech Republic) - Melnik
(Czech Republic) container once a week
41360 Lovosice (Czech Republic) - Decin (Czech Republic) - Duisburg
(Germany) container 5 times a week
41361 Duisburg (Germany) - Decin (Czech Republic) - Lovosice (Czech
Republic) container 5 times a week
41362 Lovosice (Czech Republic) - Decin (Czech Republic) - Hamburg
(Germany) container once a week
41369 Hamburg (Germany) - Decin (Czech Republic) - Lovosice (Czech
Republic) container 2 times a week
41378 Lovosice (Czech Republic) - Decin (Czech Republic) - Hamburg
(Germany) container 4 times a week
41379 Hamburg (Germany) - Decin (Czech Republic) - Lovosice (Czech
Republic) container once a week
41720 Dunajska Streda (Slovakia) - Kuty (Slovakia) - Havirov (Czech
Republic) container once a week
41721 Havirov (Czech Republic) - Kuty (Slovakia) - Dunajska Streda
(Slovakia) container once a week
41730 Dunajska Streda (Slovakia) - Kuty (Slovakia) - Ceska Trebova
(Czech Republic) container 7 times a week
41731 Ceska Trebova (Czech Republic) - Kuty (Slovakia) - Dunajska
Streda (Slovakia) container 7 times a week
41732 Dunajska Streda (Slovakia) - Kuty (Slovakia) - Ceska Trebova
(Czech Republic) container 7 times a week
41733 Ceska Trebova (Czech Republic) - Kuty (Slovakia) - Dunajska
Streda (Slovakia) container 7 times a week
41752 Bratislava (Slovakia) - Kuty (Slovakia) - Melnik (Czech
Republic) container 2 times a week
41753 Melnik (Czech Republic) - Kuty (Slovakia) - Bratislava
(Slovakia) container once a week
42328 Praha Zizkov (Czech Republic) - Decin (Czech Republic) -
Hamburg (Germany) container 6 times a week
42335 Hamburg (Germany) - Decin (Czech Republic) - Praha Zizkov
(Czech Republic) container 6 times a week
42340 Praha Zizkov (Czech Republic) - Decin (Czech Republic) - Pirna
(Germany) container once a week
42343 Hamburg (Germany) - Decin (Czech Republic) - Praha Zizkov
(Czech Republic) container 2 times a week
42361 Pirna (Germany) - Decin (Czech Republic) - Praha Zizkov (Czech
Republic) container once a week
42362 Praha Zizkov (Czech Republic) - Decin - Pirna (Germany) container 2 times a week
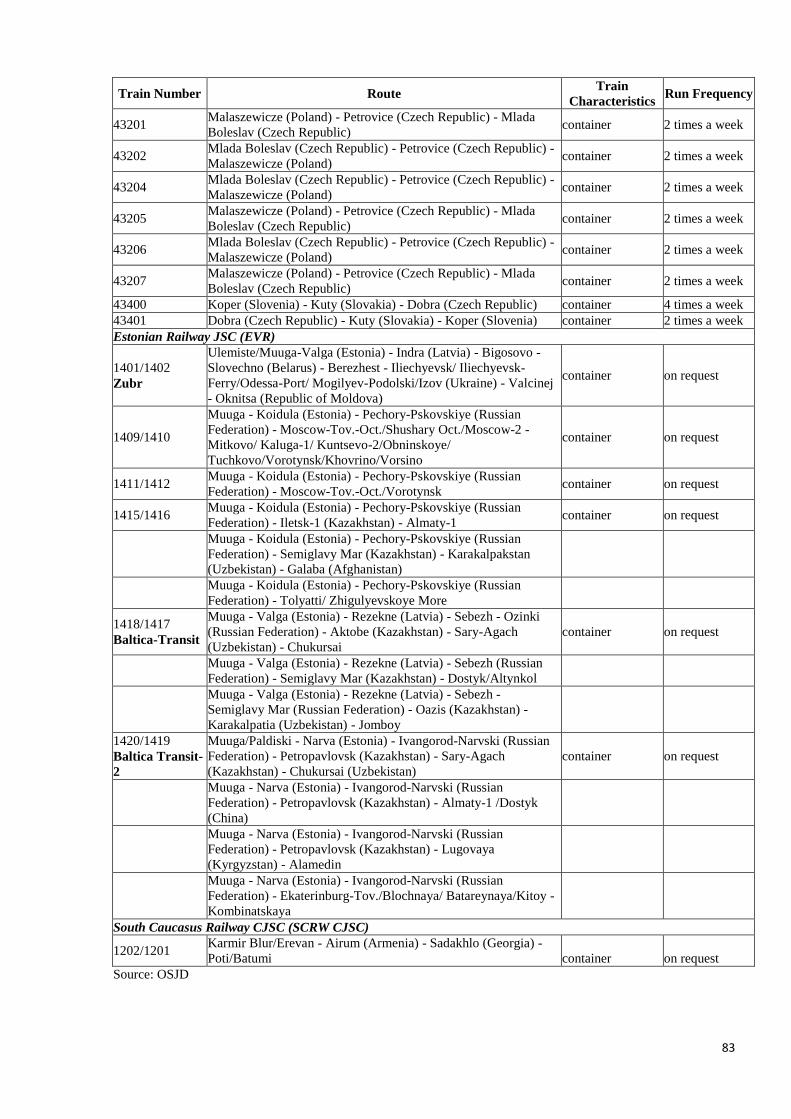
83
Train Number Route Train
Characteristics Run Frequency
43201 Malaszewicze (Poland) - Petrovice (Czech Republic) - Mlada
Boleslav (Czech Republic) container 2 times a week
43202 Mlada Boleslav (Czech Republic) - Petrovice (Czech Republic) -
Malaszewicze (Poland) container 2 times a week
43204 Mlada Boleslav (Czech Republic) - Petrovice (Czech Republic) -
Malaszewicze (Poland) container 2 times a week
43205 Malaszewicze (Poland) - Petrovice (Czech Republic) - Mlada
Boleslav (Czech Republic) container 2 times a week
43206 Mlada Boleslav (Czech Republic) - Petrovice (Czech Republic) -
Malaszewicze (Poland) container 2 times a week
43207 Malaszewicze (Poland) - Petrovice (Czech Republic) - Mlada
Boleslav (Czech Republic) container 2 times a week
43400 Koper (Slovenia) - Kuty (Slovakia) - Dobra (Czech Republic) container 4 times a week
43401 Dobra (Czech Republic) - Kuty (Slovakia) - Koper (Slovenia) container 2 times a week
Estonian Railway JSC (EVR)
1401/1402
Zubr
Ulemiste/Muuga-Valga (Estonia) - Indra (Latvia) - Bigosovo -
Slovechno (Belarus) - Berezhest - Iliechyevsk/ Iliechyevsk-
Ferry/Odessa-Port/ Mogilyev-Podolski/Izov (Ukraine) - Valcinej
- Oknitsa (Republic of Moldova)
container on request
1409/1410
Muuga - Koidula (Estonia) - Pechory-Pskovskiye (Russian
Federation) - Moscow-Tov.-Oct./Shushary Oct./Moscow-2 -
Mitkovo/ Kaluga-1/ Kuntsevo-2/Obninskoye/
Tuchkovo/Vorotynsk/Khovrino/Vorsino
container on request
1411/1412 Muuga - Koidula (Estonia) - Pechory-Pskovskiye (Russian
Federation) - Moscow-Tov.-Oct./Vorotynsk container on request
1415/1416 Muuga - Koidula (Estonia) - Pechory-Pskovskiye (Russian
Federation) - Iletsk-1 (Kazakhstan) - Almaty-1 container on request
Muuga - Koidula (Estonia) - Pechory-Pskovskiye (Russian
Federation) - Semiglavy Mar (Kazakhstan) - Karakalpakstan
(Uzbekistan) - Galaba (Afghanistan)
Muuga - Koidula (Estonia) - Pechory-Pskovskiye (Russian
Federation) - Tolyatti/ Zhigulyevskoye More
1418/1417
Baltica-Transit
Muuga - Valga (Estonia) - Rezekne (Latvia) - Sebezh - Ozinki
(Russian Federation) - Aktobe (Kazakhstan) - Sary-Agach
(Uzbekistan) - Chukursai
container on request
Muuga - Valga (Estonia) - Rezekne (Latvia) - Sebezh (Russian
Federation) - Semiglavy Mar (Kazakhstan) - Dostyk/Altynkol
Muuga - Valga (Estonia) - Rezekne (Latvia) - Sebezh -
Semiglavy Mar (Russian Federation) - Oazis (Kazakhstan) -
Karakalpatia (Uzbekistan) - Jomboy
1420/1419
Baltica Transit-
2
Muuga/Paldiski - Narva (Estonia) - Ivangorod-Narvski (Russian
Federation) - Petropavlovsk (Kazakhstan) - Sary-Agach
(Kazakhstan) - Chukursai (Uzbekistan)
container on request
Muuga - Narva (Estonia) - Ivangorod-Narvski (Russian
Federation) - Petropavlovsk (Kazakhstan) - Almaty-1 /Dostyk
(China)
Muuga - Narva (Estonia) - Ivangorod-Narvski (Russian
Federation) - Petropavlovsk (Kazakhstan) - Lugovaya
(Kyrgyzstan) - Alamedin
Muuga - Narva (Estonia) - Ivangorod-Narvski (Russian
Federation) - Ekaterinburg-Tov./Blochnaya/ Batareynaya/Kitoy -
Kombinatskaya
South Caucasus Railway CJSC (SCRW CJSC)
1202/1201 Karmir Blur/Erevan - Airum (Armenia) - Sadakhlo (Georgia) -
Poti/Batumi container on request
Source: OSJD
84
The container trains, as compared to conventional trains, were assessed to be 20-30 per cent
more efficient since they used simplified documents of carriage and could move faster through
border crossing.
According to CCTT TSR Annual digest 2016 competitive advantages of cargo transport with
container block trains included:
Relatively low rates for a long-distance transport (per the ‘price - delivery period’
criteria);
Absence of real alternatives for some routes (for example for routes from/to landlocked
regions);
High delivery speed, especially in transit;
Quality of service;
Cargo safety;
Regular service and stable transit time;
Simple and transparent document flow.
In order to further improve competitiveness of block trains, in particular vis-à-vis other modes of
transport, and since the quality of physical infrastructure of the EATL routes was uneven, the
EATL project had identified and prioritized infrastructure investment needs to remove existing
gaps as well as upgrade and modernize infrastructure, equipment and facilities along the routes
(i.e. electrification of railways, building and upgrading container depots or intermodal terminals).
Nonetheless, it was even more important to adjust to requirements of modern supply chains if
block trains were to further develop in EATL area.
“Supply chains compete, not companies” - this principle developed by Martin Christopher, one
of the classics of logistics and supply chain management, was the key to understanding the
situation and the prospects of the Euro-Asian inland routes.
Globalization together with introduction of logistics principles into production, trade and
distribution had dramatically changed the nature of supply chains. To be adequate to their
desirable role, EATL inland routes should meet the requirements of modern supply chains for
which the transport routes provide proper connectivity, capacity and economic efficiency.
The following principal features of modern supply chains should be mentioned in this context.
1) Integrated management: The first principle feature of modern supply chains that, in many
ways, predetermines the rest is the presence of the integrated management.
Traditional supply chains (the “old” Silk Way is probably the best historic example) had
represented the long enough series of sales in the trading cities along the route connected by
trade caravans on land or by commercial shipping. Fragmentation was the key characteristics of
the players’ relationship. Each of them was interested and responsible only for one particular
chain link.
Modern supply chains are under the constant control which is usually carried out by high level
logistic providers acting on behalf of the focus companies of the supply chains. The entire
85
logistic network within the supply chain is constantly customized according to the market
situation. Functions, costs, responsibilities and risks are distributed among the players and
planning is done across the supply chain according to the strategic interests of the whole system.
The management criteria within the supply chain are much more complicated than just “time and
costs”. The economic idea of supply chain management is sometimes expressed as “to reduce the
total cost of owning materials and services across the entire chain”, which leads to integrated
control of stock – either moving or at rest - as well as of all kinds of services, costs, risks, etc.
Accordingly, modern supply chains managers are not using just one particular “best” route or
mode of transportation or transport operator while making decisions. They need to have several
options to combine them within the currently optimal decision. Their choice is not only the
transport route itself, however “short” or “fast” or “cheap” it can be. The logistics business
environment along the tradelane, availability of logistic services, friendly and predictable
administrative procedures, ability to flexibly switch the flow between different intermediate
points – all this is important in decision making as well as political stability along the entire
tradelane and safety and security factors.
2) Flexible routing: While the traditional supply chain is something like the fixed sequence of
nodes and links between the origin and destination points, the modern supply chain looks more
than a network connecting the regions where commodity flows are nucleated and absorbed. The
actual routes can vary within this network depending on the changing situation on the
commodity markets served by the supply chain and on the transport services market.
In many cases the actual route is not the shortest one, even for one particular mode, because of
the hub&spoke technologies often used by long-haul transport operators (for the sake of
transport flows efficiency) and logistic providers (for the sake of commodity flows efficiency).
3) Special role of nodes: Nodes of traditional supply chains – sea and inland waterway ports,
dry ports, railway stations, etc., had always performed the obviously necessary connecting and
transshipment functions within the supply chains. At the same time, traditionally they also
created inevitable obstacles for traffic and cargo flows, sometimes being the bottlenecks within
the supply chains.
“Traditional” node is the spot where the flow of vehicles and commodities are interrupted and
players that have to cooperate in resumption of this flow often having contradictory interests.
Some local players – both state agencies and commercial intermediaries - pursue pure revenue
goals. The procedures are often aimed not at speeding the process but at collecting more fees
(formal and sometimes informal). Scarcity of resources is a typical system problem and long
enough waiting time for cargo - either on board the vehicles or in the warehouses - is a rule.
Different types of cargo are handled which aggravates the problems. Additional services adding
to the total value of goods are rare. The market position of the “traditional” node is often a
monopoly since it gains an advantage, primarily, due to its geographical position.
Nodes of modern supply chains are quite different. Supply chain connectivity and increasing of
flows is the main goal for the players in charge, including the governmental agencies. Fast and
cheap transshipment is the main efficiency factor. The technologies used are focused on
intermodal units, primarily – containers. Handling operations are complemented by value added
logistic services. Nodes compete with each other because their main advantages – services
quality, price as well as the set of transport services catering for particular node – do not so much
depend on the location factors.

86
4) Intermodality. Modern intercontinental supply chains are intermodal by their nature. Most of
origins and destinations in the Euro-Asian trade in principle cannot be connected by services of
one single transport mode. It means that in spite of intermodal competition (which is one of the
drivers of transport system efficiency) different modes are compelled to co-operate within the
transportation process. If the transport operator is in the position to succeed in the supply chain
he must either be capable to design intermodal transport product engaging other modes’
operators on attractive terms (as many shipping companies do) or it should be ready to be
engaged to participate in such a product designed by someone else. The latter means offering
reliable transport service with guaranteed parameters as well as meeting the market standards for
intermodal transportation.
5) Regular transport services. One of the most important qualities highly valued in modern
supply chains is the availability of regular transport services. Regular service with pre-
announced call points, schedules and tariffs is ideal from the point of view of supply chain
design and planning and it can be utilized on the “plug and play” basis without additional
trimming. It is commonly accepted that the minimum frequency of the regular long-haul
transport service suitable for most international supply chains is a weekly service although the
well-developed tradelanes show the example of several services a day offered by a number of
competing transport operators. Combining the regular services of different modes (e.g., ship and
rail) allows creating efficient intermodal transport services within the supply chains.
I.3.4. Road transport
Road transport played an undeservedly small role in Euro-Asian trade, serving primarily intra-
regional connectivity. However, as various programs and project implemented during the phase
III of the EATL project showed, for example ADB CAREC Program or a NELTI Project road
transport could be an efficient option for moving cargo between Europe and some Asian
countries, such as Central Asian countries, Mongolia or Afghanistan). They also showed that
road infrastructure was not an impediment to a long-distance transport.
The projects further showed advantages that road transport could offer, among them:
Guarantee competitive tariff rates
High quality and safety of cargo delivery (cargo safety conditions, absence of
transloading, door-to-door logistics, customs safety,);
Absence of cargo shipment accumulation (in contrast to rail or maritime transport);
Benefits for small and medium enterprises, involved into export and import of goods, as
well as for customers.
According to IRU Permits Study20
based on the World Bank QuARTA methodology21
, permit
systems were one of the key mechanisms to obtain access to markets for international road
transport operators.
There were 286 bilateral road transport agreements applied only in 12 countries of Eurasia –
Armenia, Azerbaijan, Belarus, Georgia, Kazakhstan, Kyrgyzstan, Republic of Moldova, Russian
Federation, Tajikistan, Turkmenistan, Ukraine and Uzbekistan - participating in the EATL
20 IRU (2016) An analysis of international road transport permit systems in Eurasia: current practices and prospects 21 World Bank (2013) Quantitative Analysis of Road Transport Agreements (QuARTA)
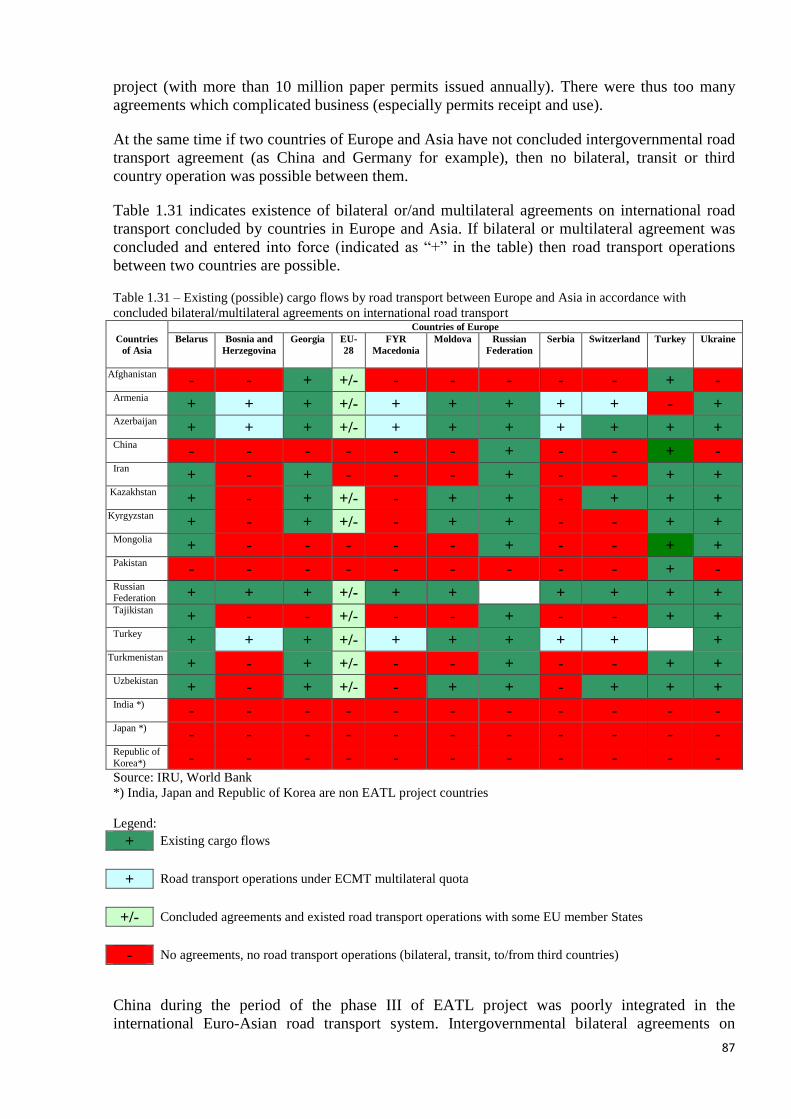
87
project (with more than 10 million paper permits issued annually). There were thus too many
agreements which complicated business (especially permits receipt and use).
At the same time if two countries of Europe and Asia have not concluded intergovernmental road
transport agreement (as China and Germany for example), then no bilateral, transit or third
country operation was possible between them.
Table 1.31 indicates existence of bilateral or/and multilateral agreements on international road
transport concluded by countries in Europe and Asia. If bilateral or multilateral agreement was
concluded and entered into force (indicated as “+” in the table) then road transport operations
between two countries are possible.
Table 1.31 – Existing (possible) cargo flows by road transport between Europe and Asia in accordance with
concluded bilateral/multilateral agreements on international road transport
Countries
of Asia
Countries of Europe
Belarus
Bosnia and
Herzegovina
Georgia EU-
28
FYR
Macedonia
Moldova
Russian
Federation
Serbia
Switzerland Turkey
Ukraine
Afghanistan
- - + +/- - - - - - + - Armenia + + + +/- + + + + + - + Azerbaijan
+ + + +/- + + + + + + + China
- - - - - - + - - + - Iran
+ - + - - - + - - + + Kazakhstan
+ - + +/- - + + - + + + Kyrgyzstan
+ - + +/- - + + - - + + Mongolia
+ - - - - - + - - + + Pakistan
- - - - - - - - - + - Russian
Federation + + + +/- + + + + + + Tajikistan
+ - - +/- - - + - - + + Turkey + + + +/- + + + + + +
Turkmenistan + - + +/- - - + - - + +
Uzbekistan
+ - + +/- - + + - + + + India *)
- - - - - - - - - - - Japan *)
- - - - - - - - - - - Republic of
Korea*) - - - - - - - - - - -
Source: IRU, World Bank
*) India, Japan and Republic of Korea are non EATL project countries
Legend:
+ Existing cargo flows
+ Road transport operations under ECMT multilateral quota
+/- Concluded agreements and existed road transport operations with some EU member States
- No agreements, no road transport operations (bilateral, transit, to/from third countries)
China during the period of the phase III of EATL project was poorly integrated in the
international Euro-Asian road transport system. Intergovernmental bilateral agreements on

88
international road transport were concluded only with 4 countries (Kazakhstan, the Kyrgyzstan,
Russian Federation and Tajikistan) and as of May 2017 also with Turkey. Trilateral agreement
China – Mongolia – Russian Federation (Intergovernmental Agreement on International Road
Transport along Asian Highway Network) signed on December 2016, was still expected to enter
into force. Furthermore, there was a quadrilateral agreement signed between China, Kazakhstan,
Kyrgyzstan and Pakistan that envisaged transit cargo transportation related to Chinese and
Pakistani trade across the Central Asia. But this quadrilateral agreement was not used yet in
practice.
China had a restrictive permit system for road transport of goods. These restrictions included:
Lack of possibility of transit across the Chinese territory for transport operators from the
Eurasian countries,
Strictly prescribed routes and border crossing points for transport of goods,
Lack of possibility for entering China for transport operators of a country even if such
concluded a bilateral agreement with China through another country (e.g., the Russian
carriers were not allowed to enter China through the territory of Kyrgyzstan),
Limitations related to the distance of entering into the territory of China for the transport
operators from the Eurasian countries,
Lack of possibility for transport of goods between China and its neighbours by the
carriers from third countries.
The indicated limitations resulted in the situation that all international transport of goods to and
from China were of near-border nature with the exception of transport between Pakistan and
China. The prerequisite of international transport for long distances was cargo reloading near the
Chinese border. Thus, the volume of international road transport between China and its trade
partners was significantly small as compared to the Chinese trade potential. Moreover, until the
time this report was prepared, road transport of goods between China and Europe was
impossible.
Thus, to integrate China in regional and the Eurasian road transport market would require review
of provisions of the existing bilateral agreements on international road transport. Development
mechanisms for transport shall be found, however, not only between China and its neighbours
but between China and the European countries. The latter would require a solution to transit of
Chinese cargo across the territory of Central Asia. The entry in force of Shanghai Cooperation
Organization (SCO) Agreement between China and the Central Asian countries (to the extent of
transit, bilateral transport and transport to/from third countries) in the beginning of 2017 should
help develop the road transport.
In view of poor integration of China in the international road transport, the most significant
market of road transport between Europe and Asia were road transport operations between
Kazakhstan and European countries.
In 2016, this market was estimated at 780 thousand tonnes, a decrease by 9.4 per cent compared
to the level of 2015 and 31.1 per cent compared to the level of 2013, mainly due to the
continuing decline in the supply of imported goods from Europe by road transport (Figure 1.28).
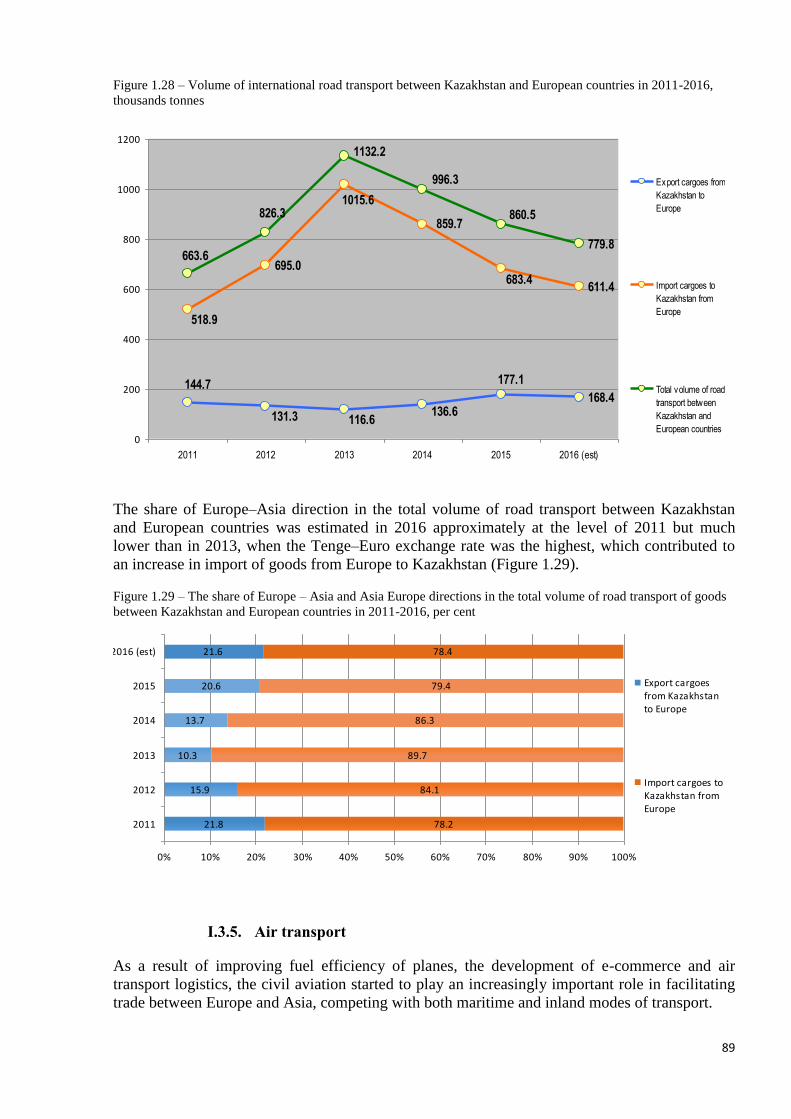
89
Figure 1.28 – Volume of international road transport between Kazakhstan and European countries in 2011-2016,
thousands tonnes
168.4
695.0
611.4
779.8
144.7
131.3 116.6136.6
177.1
518.9
1015.6
859.7
683.4
663.6
826.3
1132.2
996.3
860.5
0
200
400
600
800
1000
1200
2011 2012 2013 2014 2015 2016 (est)
Export cargoes from
Kazakhstan to
Europe
Import cargoes to
Kazakhstan from
Europe
Total volume of road
transport between
Kazakhstan and
European countries
The share of Europe–Asia direction in the total volume of road transport between Kazakhstan
and European countries was estimated in 2016 approximately at the level of 2011 but much
lower than in 2013, when the Tenge–Euro exchange rate was the highest, which contributed to
an increase in import of goods from Europe to Kazakhstan (Figure 1.29).
Figure 1.29 – The share of Europe – Asia and Asia Europe directions in the total volume of road transport of goods
between Kazakhstan and European countries in 2011-2016, per cent
21.8
15.9
10.3
13.7
20.6
21.6
78.2
84.1
89.7
86.3
79.4
78.4
0% 10% 20% 30% 40% 50% 60% 70% 80% 90% 100%
2011
2012
2013
2014
2015
2016 (est)
Export cargoesfrom Kazakhstanto Europe
Import cargoes toKazakhstan fromEurope
I.3.5. Air transport
As a result of improving fuel efficiency of planes, the development of e-commerce and air
transport logistics, the civil aviation started to play an increasingly important role in facilitating
trade between Europe and Asia, competing with both maritime and inland modes of transport.
90
Cargo air transport services on the tradelanes that connect Asia with Europe grew well above
long-term trend – from 2000s to 2017 (Table 1.32)
Table 1.32- Historical and forecast air cargo annual growth rates, per cent Air cargo markets History 2005-2015 Forecast 2015-2035
World 2.0 4.2
Europe – Asia 2.1 4.6
Source: Boeing (2016) World Air Cargo Forecast 2016-2017
Global e-commerce was projected to more than double over between 2015 and 2020, growing
from $1.7 trillion to $3.6 trillion by 2020. The Asia-Pacific region was the fastest growing e-
commerce trading block, with China at the forefront. China’s e-commerce market was expected
to be bigger than the combined existing markets of the United States of America, Great Britain,
Japan, Germany and France by 2020.
The explosive growth of e-commerce demand for business to consumer (B2C) deliveries of retail
purchases may usher the next freight transport revolution and competitive switching e-commerce
flows to air transport from traditional shipping liners. For the major express carriers, including
UPS, DHL, and FedEx, as well as newer entrants such as SF Express in China, e-commerce
flows were already the core business.
In 2015 air cargo was less than 1 per cent of world trade tonnage, yet 35 per cent of world trade
value was carried by air. Air transport was critical for serving markets that demand speed and
reliability for delivery of goods. The highest value commodities, including computing
equipment, machinery and electrical equipment, accounted for the highest share of airborne trade
tonnage versus their share of containership tonnage. It was therefore expected that until 2030, as
the world GDP would grow and the world population would demand higher value goods, the
value per tonne of goods traded between Europe and Asia would rise. As the average value per
tonne of traded goods would rise, air cargo should be able to gain more market.
Airlines used freight planes (freighters) which were particularly well suited for transporting
high-value goods between Europe and Asia. They provided highly controlled transport, direct
routing, reliability, and unique capacity considerations (volume, weight, hazmat, and
dimensional). The distinct advantages of freighter aircraft allowed operators to offer a higher
value of service. Freighters generated 90 per cent of air cargo industry revenues, a percentage
that has remained relatively constant over time. Additionally, more than half of air cargo traffic
was carried on freighters. The share of cargo carried on freighters remained high in markets
across the world, especially in the world’s largest trade routes Asia–Europe, where
approximately 80 per cent of total air cargo traffic was carried by freighter airplanes (Figure
1.30).
Express carriers continued to operate substantial freighter fleets, flying 40 per cent of the
widebody freighters and generating 40 per cent of air cargo industry revenues in 2015. These
operators used freighters as a link in their door-to-door proprietary transport network, a network
that is tailored to the needs of their customers by using unique schedules. The business model of
express carriers cannot be replicated using only lower-hold capacity.
The majority of the remaining large freighter capacity was deployed for air freight. Air freight
demand was highly concentrated with 85 per cent of scheduled large freighter flights operated
out of the top 50 cargo airports, including airports across Asia, Middle East and Europe. Air
cargo between Europe and Asia was composed of three main service sectors: scheduled freight,
charter freight, and mail. Scheduled freight was the largest component, accounting for more than
90 per cent of all air cargo traffic. Scheduled freight included general and express (sometimes
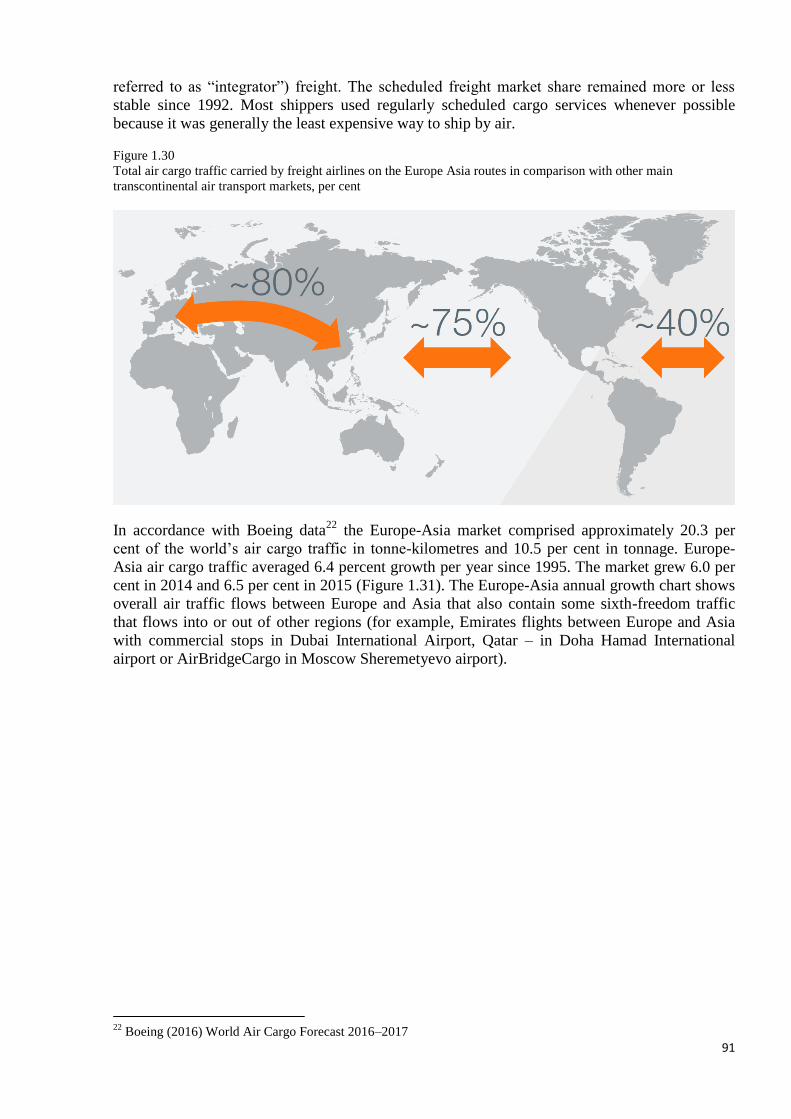
91
referred to as “integrator”) freight. The scheduled freight market share remained more or less
stable since 1992. Most shippers used regularly scheduled cargo services whenever possible
because it was generally the least expensive way to ship by air.
Figure 1.30
Total air cargo traffic carried by freight airlines on the Europe Asia routes in comparison with other main
transcontinental air transport markets, per cent
In accordance with Boeing data22
the Europe-Asia market comprised approximately 20.3 per
cent of the world’s air cargo traffic in tonne-kilometres and 10.5 per cent in tonnage. Europe-
Asia air cargo traffic averaged 6.4 percent growth per year since 1995. The market grew 6.0 per
cent in 2014 and 6.5 per cent in 2015 (Figure 1.31). The Europe-Asia annual growth chart shows
overall air traffic flows between Europe and Asia that also contain some sixth-freedom traffic
that flows into or out of other regions (for example, Emirates flights between Europe and Asia
with commercial stops in Dubai International Airport, Qatar – in Doha Hamad International
airport or AirBridgeCargo in Moscow Sheremetyevo airport).
22
Boeing (2016) World Air Cargo Forecast 2016–2017
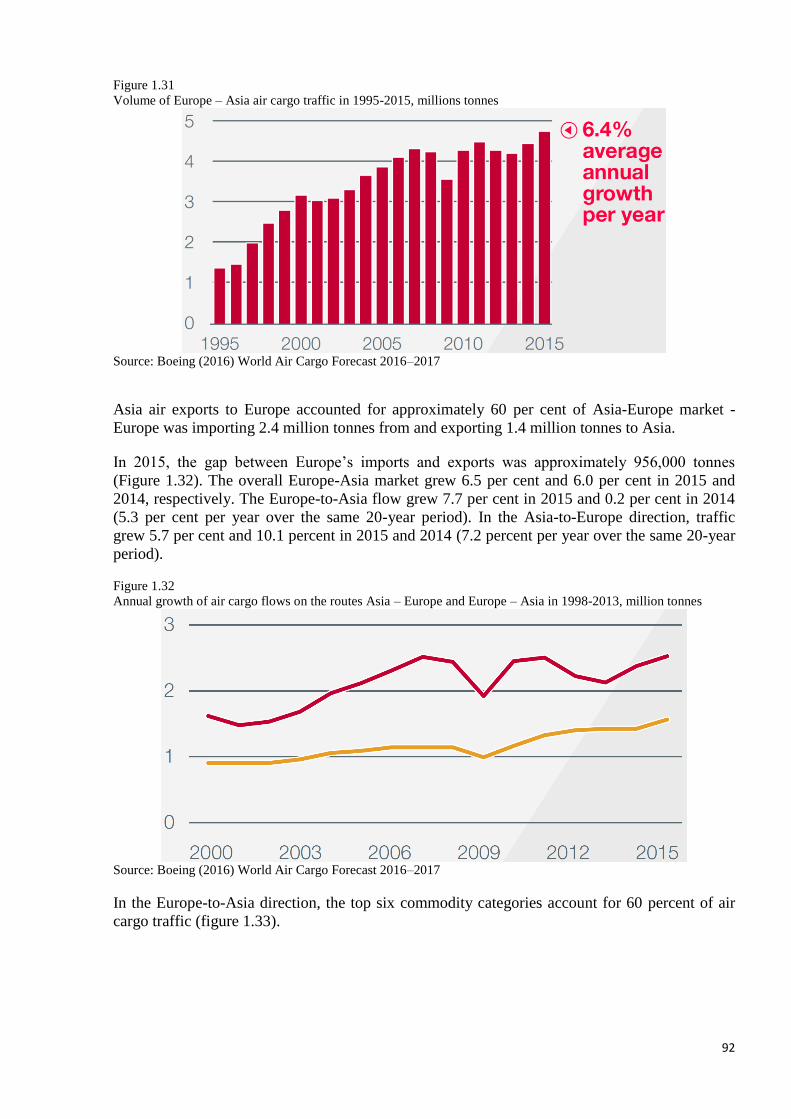
92
Figure 1.31
Volume of Europe – Asia air cargo traffic in 1995-2015, millions tonnes
Source: Boeing (2016) World Air Cargo Forecast 2016–2017
Asia air exports to Europe accounted for approximately 60 per cent of Asia-Europe market -
Europe was importing 2.4 million tonnes from and exporting 1.4 million tonnes to Asia.
In 2015, the gap between Europe’s imports and exports was approximately 956,000 tonnes
(Figure 1.32). The overall Europe-Asia market grew 6.5 per cent and 6.0 per cent in 2015 and
2014, respectively. The Europe-to-Asia flow grew 7.7 per cent in 2015 and 0.2 per cent in 2014
(5.3 per cent per year over the same 20-year period). In the Asia-to-Europe direction, traffic
grew 5.7 per cent and 10.1 percent in 2015 and 2014 (7.2 percent per year over the same 20-year
period).
Figure 1.32
Annual growth of air cargo flows on the routes Asia – Europe and Europe – Asia in 1998-2013, million tonnes
Source: Boeing (2016) World Air Cargo Forecast 2016–2017
In the Europe-to-Asia direction, the top six commodity categories account for 60 percent of air
cargo traffic (figure 1.33).
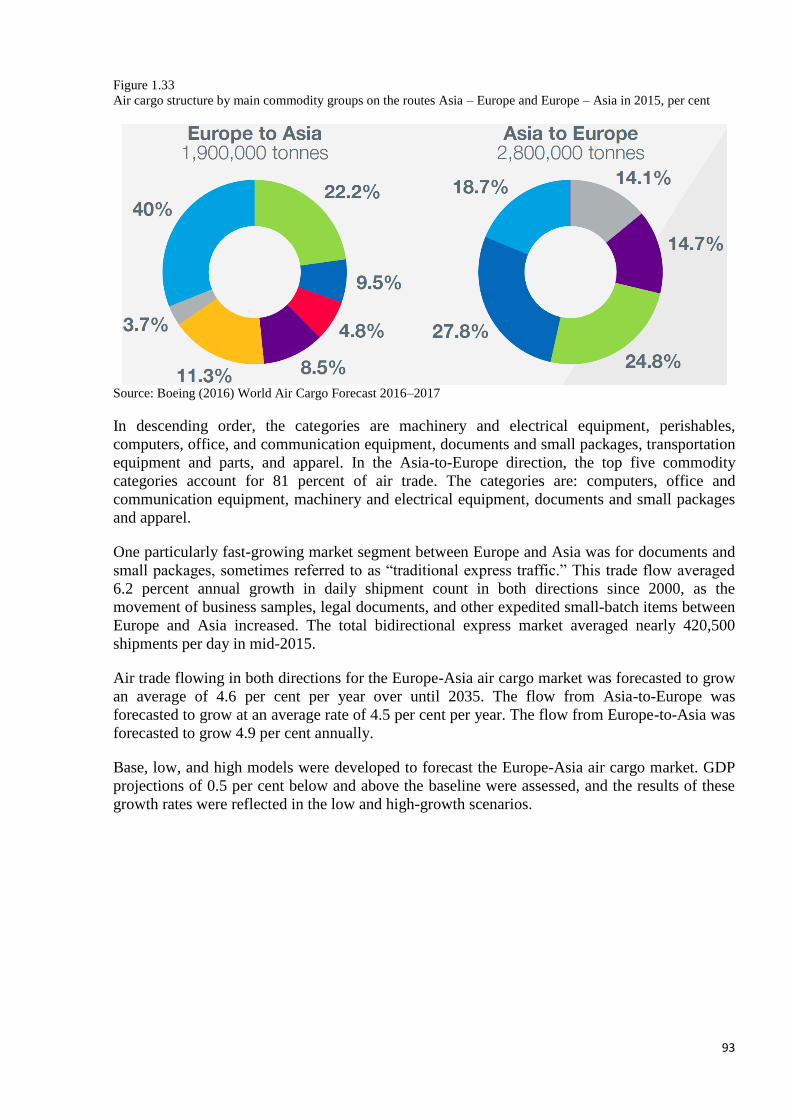
93
Figure 1.33
Air cargo structure by main commodity groups on the routes Asia – Europe and Europe – Asia in 2015, per cent
Source: Boeing (2016) World Air Cargo Forecast 2016–2017
In descending order, the categories are machinery and electrical equipment, perishables,
computers, office, and communication equipment, documents and small packages, transportation
equipment and parts, and apparel. In the Asia-to-Europe direction, the top five commodity
categories account for 81 percent of air trade. The categories are: computers, office and
communication equipment, machinery and electrical equipment, documents and small packages
and apparel.
One particularly fast-growing market segment between Europe and Asia was for documents and
small packages, sometimes referred to as “traditional express traffic.” This trade flow averaged
6.2 percent annual growth in daily shipment count in both directions since 2000, as the
movement of business samples, legal documents, and other expedited small-batch items between
Europe and Asia increased. The total bidirectional express market averaged nearly 420,500
shipments per day in mid-2015.
Air trade flowing in both directions for the Europe-Asia air cargo market was forecasted to grow
an average of 4.6 per cent per year over until 2035. The flow from Asia-to-Europe was
forecasted to grow at an average rate of 4.5 per cent per year. The flow from Europe-to-Asia was
forecasted to grow 4.9 per cent annually.
Base, low, and high models were developed to forecast the Europe-Asia air cargo market. GDP
projections of 0.5 per cent below and above the baseline were assessed, and the results of these
growth rates were reflected in the low and high-growth scenarios.
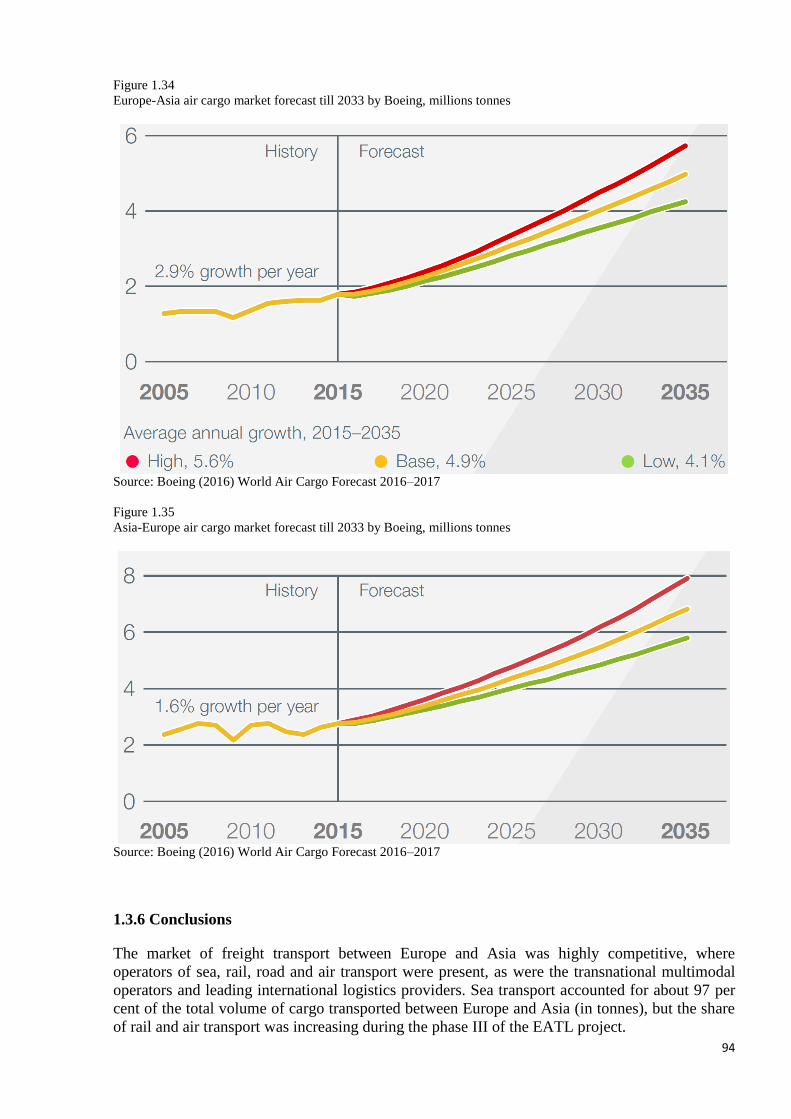
94
Figure 1.34
Europe-Asia air cargo market forecast till 2033 by Boeing, millions tonnes
Source: Boeing (2016) World Air Cargo Forecast 2016–2017
Figure 1.35
Asia-Europe air cargo market forecast till 2033 by Boeing, millions tonnes
Source: Boeing (2016) World Air Cargo Forecast 2016–2017
1.3.6 Conclusions
The market of freight transport between Europe and Asia was highly competitive, where
operators of sea, rail, road and air transport were present, as were the transnational multimodal
operators and leading international logistics providers. Sea transport accounted for about 97 per
cent of the total volume of cargo transported between Europe and Asia (in tonnes), but the share
of rail and air transport was increasing during the phase III of the EATL project.
95
Maritime transport was by large the main transport mode due to low rates, high accuracy and
timetable compliance, close cooperation with logistics providers in Europe and Asia, the
established geography of production located near seaports, the introduction of new solutions
such as slow steaming with reduced costs as effect. However, maritime transport was not suited
to meet the expectations of e-commerce consumers, who were interested in short delivery times.
The contribution of railways into the Euro-Asian transport linkages development was growing
steadily through the increasing of the number of regular scheduled block train runs along EATL
routes.
Road transport served only intra-regional connectivity and trade of Central Asian LLDCs with
Europe, China and Middle East. Possible start of long distance haulage between China and
Europe was associated with practical implementation of the SCO Intergovernmental Agreement
and thus creation of favourable conditions for road transport. The conditions for non-
discriminatory market access should be settled between China and all interested countries in
Europe by concluding bilateral or multilateral agreements on international road transport to
commence commercial operations on the China-Europe routes.
Air transport was expected to become a serious competitor to both maritime and land transport in
the segment of delivery of high-value and time-sensitive cargo between Europe and Asia. Air
transport claimed to be a key player in the delivery of e-commerce and express postal items from
China and other Asian countries to Europe, taking into account the “explosive” growth of this
segment.
I.4. Transport Infrastructure of EATL routes development
I.4.1. Sea ports and their hinterland connections role in EATL corridors
Seaports were of great importance for EATL countries. They not only enabled overseas trade for
maritime and landlocked countries but also offered effective transhipment between maritime and
other transport modes. Trade and transport flows passing through sea ports and the port access
infrastructure benefited from the economies of scale that makes inland transport in hinterland
areas (which can extend for thousands of kilometres) cost-effective.
The role of seaports in Euro-Asian trade was evolving with the progress in development of
supply chains. This evolution had been most evident in the transport system of the European
Union and thereafter in East Asia, where sea ports were deeply integrated in the whole logistic
infrastructure.
Since the first decade of XXI century, a ‘terminalisation phase’ of ports development was
continuing. Port business was increasingly focused on specialized terminals through which the
hinterland was served. Ports were no longer considered to be purely transfer centres, but were
becoming comprehensive flow-through areas within logistics chains, which were functionally
linked to distribution developments in the hinterland.
Inland logistic centres, terminals and dry ports (in accordance with Intergovernmental
Agreement on Dry Ports, a dry port of international importance shall refer to an inland location
as a logistics centre connected to one or more modes of transport for the handling, storage and
regulatory inspection of goods moving in international trade and the execution of applicable
customs control and formalities) in Europe and in East Asia were becoming important
consolidation hubs for seaports. They acted not only as cargo-bundling points, reducing capacity
pressure on seaport terminals, but also as distribution centres. Seaports and inland terminals
belonged to the intermodal transport system serving the supply chains.
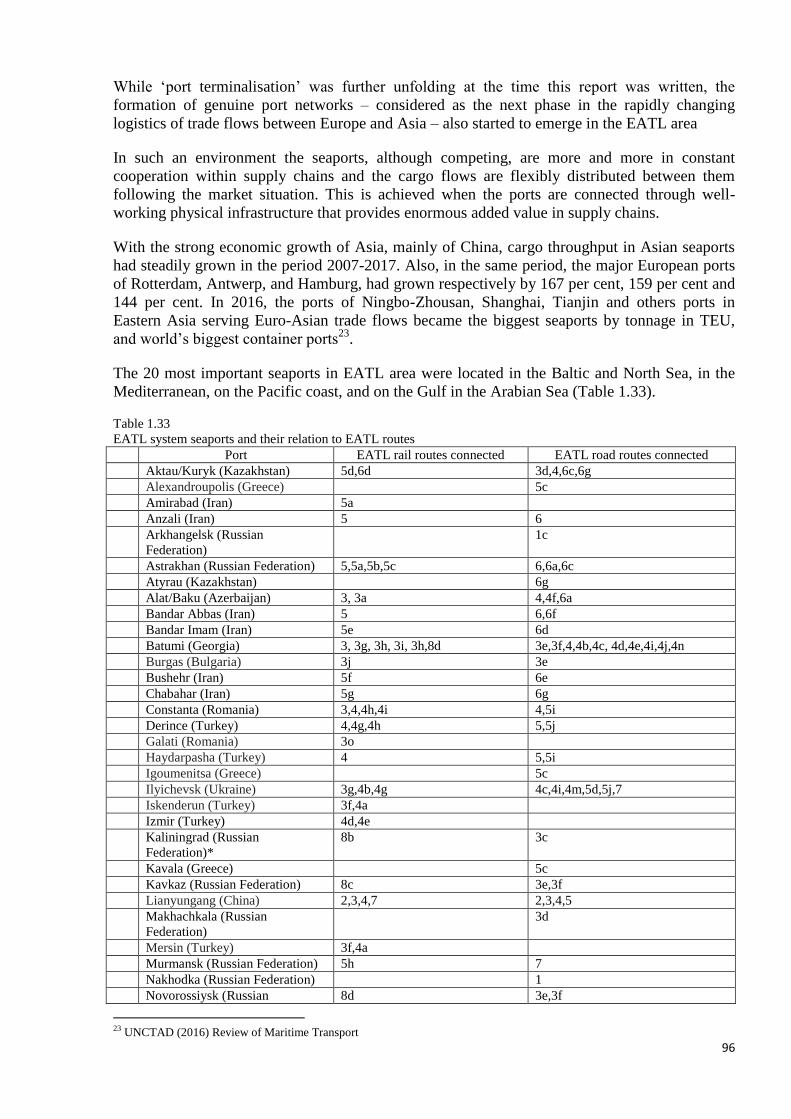
96
While ‘port terminalisation’ was further unfolding at the time this report was written, the
formation of genuine port networks – considered as the next phase in the rapidly changing
logistics of trade flows between Europe and Asia – also started to emerge in the EATL area
In such an environment the seaports, although competing, are more and more in constant
cooperation within supply chains and the cargo flows are flexibly distributed between them
following the market situation. This is achieved when the ports are connected through well-
working physical infrastructure that provides enormous added value in supply chains.
With the strong economic growth of Asia, mainly of China, cargo throughput in Asian seaports
had steadily grown in the period 2007-2017. Also, in the same period, the major European ports
of Rotterdam, Antwerp, and Hamburg, had grown respectively by 167 per cent, 159 per cent and
144 per cent. In 2016, the ports of Ningbo-Zhousan, Shanghai, Tianjin and others ports in
Eastern Asia serving Euro-Asian trade flows became the biggest seaports by tonnage in TEU,
and world’s biggest container ports23
.
The 20 most important seaports in EATL area were located in the Baltic and North Sea, in the
Mediterranean, on the Pacific coast, and on the Gulf in the Arabian Sea (Table 1.33).
Table 1.33
EATL system seaports and their relation to EATL routes
Port EATL rail routes connected EATL road routes connected
Aktau/Kuryk (Kazakhstan) 5d,6d 3d,4,6c,6g
Alexandroupolis (Greece) 5c
Amirabad (Iran) 5a
Anzali (Iran) 5 6
Arkhangelsk (Russian
Federation)
1c
Astrakhan (Russian Federation) 5,5a,5b,5c 6,6a,6c
Atyrau (Kazakhstan) 6g
Alat/Baku (Azerbaijan) 3, 3a 4,4f,6a
Bandar Abbas (Iran) 5 6,6f
Bandar Imam (Iran) 5e 6d
Batumi (Georgia) 3, 3g, 3h, 3i, 3h,8d 3e,3f,4,4b,4c, 4d,4e,4i,4j,4n
Burgas (Bulgaria) 3j 3e
Bushehr (Iran) 5f 6e
Chabahar (Iran) 5g 6g
Constanta (Romania) 3,4,4h,4i 4,5i
Derince (Turkey) 4,4g,4h 5,5j
Galati (Romania) 3o
Haydarpasha (Turkey) 4 5,5i
Igoumenitsa (Greece) 5c
Ilyichevsk (Ukraine) 3g,4b,4g 4c,4i,4m,5d,5j,7
Iskenderun (Turkey) 3f,4a
Izmir (Turkey) 4d,4e
Kaliningrad (Russian
Federation)*
8b 3c
Kavala (Greece) 5c
Kavkaz (Russian Federation) 8c 3e,3f
Lianyungang (China) 2,3,4,7 2,3,4,5
Makhachkala (Russian
Federation)
3d
Mersin (Turkey) 3f,4a
Murmansk (Russian Federation) 5h 7
Nakhodka (Russian Federation) 1
Novorossiysk (Russian 8d 3e,3f
23 UNCTAD (2016) Review of Maritime Transport
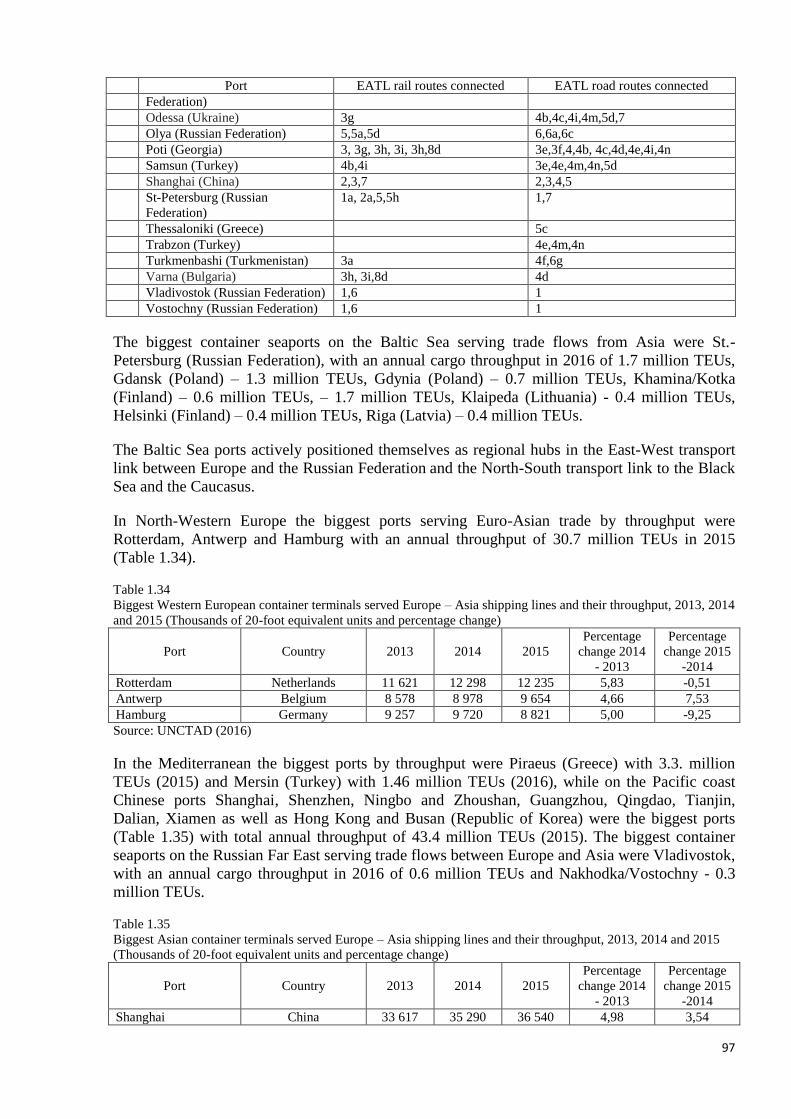
97
Port EATL rail routes connected EATL road routes connected
Federation)
Odessa (Ukraine) 3g 4b,4c,4i,4m,5d,7
Olya (Russian Federation) 5,5a,5d 6,6a,6c
Poti (Georgia) 3, 3g, 3h, 3i, 3h,8d 3e,3f,4,4b, 4c,4d,4e,4i,4n
Samsun (Turkey) 4b,4i 3e,4e,4m,4n,5d
Shanghai (China) 2,3,7 2,3,4,5
St-Petersburg (Russian
Federation)
1a, 2a,5,5h 1,7
Thessaloniki (Greece) 5c
Trabzon (Turkey) 4e,4m,4n
Turkmenbashi (Turkmenistan) 3a 4f,6g
Varna (Bulgaria) 3h, 3i,8d 4d
Vladivostok (Russian Federation) 1,6 1
Vostochny (Russian Federation) 1,6 1
The biggest container seaports on the Baltic Sea serving trade flows from Asia were St.-
Petersburg (Russian Federation), with an annual cargo throughput in 2016 of 1.7 million TEUs,
Gdansk (Poland) – 1.3 million TEUs, Gdynia (Poland) – 0.7 million TEUs, Khamina/Kotka
(Finland) – 0.6 million TEUs, – 1.7 million TEUs, Klaipeda (Lithuania) - 0.4 million TEUs,
Helsinki (Finland) – 0.4 million TEUs, Riga (Latvia) – 0.4 million TEUs.
The Baltic Sea ports actively positioned themselves as regional hubs in the East-West transport
link between Europe and the Russian Federation and the North-South transport link to the Black
Sea and the Caucasus.
In North-Western Europe the biggest ports serving Euro-Asian trade by throughput were
Rotterdam, Antwerp and Hamburg with an annual throughput of 30.7 million TEUs in 2015
(Table 1.34).
Table 1.34
Biggest Western European container terminals served Europe – Asia shipping lines and their throughput, 2013, 2014
and 2015 (Thousands of 20-foot equivalent units and percentage change)
Port Country 2013 2014 2015
Percentage
change 2014
- 2013
Percentage
change 2015
-2014
Rotterdam Netherlands 11 621 12 298 12 235 5,83 -0,51
Antwerp Belgium 8 578 8 978 9 654 4,66 7,53
Hamburg Germany 9 257 9 720 8 821 5,00 -9,25
Source: UNCTAD (2016)
In the Mediterranean the biggest ports by throughput were Piraeus (Greece) with 3.3. million
TEUs (2015) and Mersin (Turkey) with 1.46 million TEUs (2016), while on the Pacific coast
Chinese ports Shanghai, Shenzhen, Ningbo and Zhoushan, Guangzhou, Qingdao, Tianjin,
Dalian, Xiamen as well as Hong Kong and Busan (Republic of Korea) were the biggest ports
(Table 1.35) with total annual throughput of 43.4 million TEUs (2015). The biggest container
seaports on the Russian Far East serving trade flows between Europe and Asia were Vladivostok,
with an annual cargo throughput in 2016 of 0.6 million TEUs and Nakhodka/Vostochny - 0.3
million TEUs.
Table 1.35
Biggest Asian container terminals served Europe – Asia shipping lines and their throughput, 2013, 2014 and 2015
(Thousands of 20-foot equivalent units and percentage change)
Port Country 2013 2014 2015
Percentage
change 2014
- 2013
Percentage
change 2015
-2014
Shanghai China 33 617 35 290 36 540 4,98 3,54
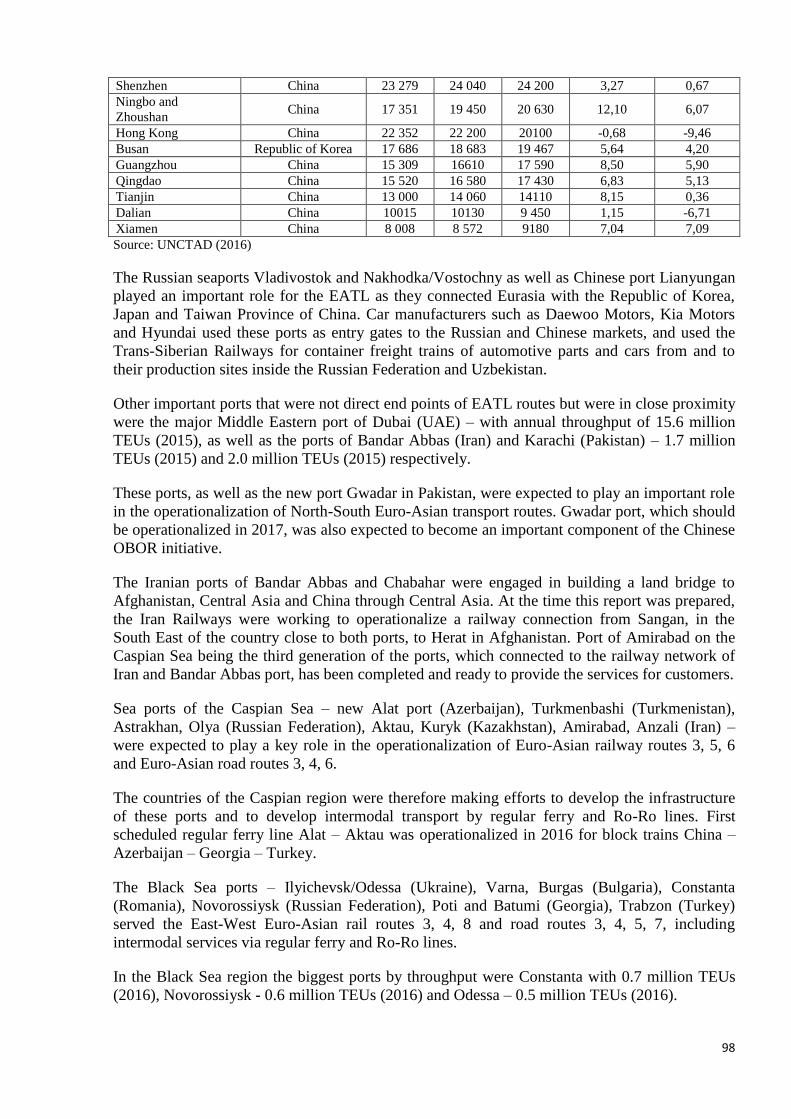
98
Shenzhen China 23 279 24 040 24 200 3,27 0,67
Ningbo and
Zhoushan China 17 351 19 450 20 630 12,10 6,07
Hong Kong China 22 352 22 200 20100 -0,68 -9,46
Busan Republic of Korea 17 686 18 683 19 467 5,64 4,20
Guangzhou China 15 309 16610 17 590 8,50 5,90
Qingdao China 15 520 16 580 17 430 6,83 5,13
Tianjin China 13 000 14 060 14110 8,15 0,36
Dalian China 10015 10130 9 450 1,15 -6,71
Xiamen China 8 008 8 572 9180 7,04 7,09
Source: UNCTAD (2016)
The Russian seaports Vladivostok and Nakhodka/Vostochny as well as Chinese port Lianyungan
played an important role for the EATL as they connected Eurasia with the Republic of Korea,
Japan and Taiwan Province of China. Car manufacturers such as Daewoo Motors, Kia Motors
and Hyundai used these ports as entry gates to the Russian and Chinese markets, and used the
Trans-Siberian Railways for container freight trains of automotive parts and cars from and to
their production sites inside the Russian Federation and Uzbekistan.
Other important ports that were not direct end points of EATL routes but were in close proximity
were the major Middle Eastern port of Dubai (UAE) – with annual throughput of 15.6 million
TEUs (2015), as well as the ports of Bandar Abbas (Iran) and Karachi (Pakistan) – 1.7 million
TEUs (2015) and 2.0 million TEUs (2015) respectively.
These ports, as well as the new port Gwadar in Pakistan, were expected to play an important role
in the operationalization of North-South Euro-Asian transport routes. Gwadar port, which should
be operationalized in 2017, was also expected to become an important component of the Chinese
OBOR initiative.
The Iranian ports of Bandar Abbas and Chabahar were engaged in building a land bridge to
Afghanistan, Central Asia and China through Central Asia. At the time this report was prepared,
the Iran Railways were working to operationalize a railway connection from Sangan, in the
South East of the country close to both ports, to Herat in Afghanistan. Port of Amirabad on the
Caspian Sea being the third generation of the ports, which connected to the railway network of
Iran and Bandar Abbas port, has been completed and ready to provide the services for customers.
Sea ports of the Caspian Sea – new Alat port (Azerbaijan), Turkmenbashi (Turkmenistan),
Astrakhan, Olya (Russian Federation), Aktau, Kuryk (Kazakhstan), Amirabad, Anzali (Iran) –
were expected to play a key role in the operationalization of Euro-Asian railway routes 3, 5, 6
and Euro-Asian road routes 3, 4, 6.
The countries of the Caspian region were therefore making efforts to develop the infrastructure
of these ports and to develop intermodal transport by regular ferry and Ro-Ro lines. First
scheduled regular ferry line Alat – Aktau was operationalized in 2016 for block trains China –
Azerbaijan – Georgia – Turkey.
The Black Sea ports – Ilyichevsk/Odessa (Ukraine), Varna, Burgas (Bulgaria), Constanta
(Romania), Novorossiysk (Russian Federation), Poti and Batumi (Georgia), Trabzon (Turkey)
served the East-West Euro-Asian rail routes 3, 4, 8 and road routes 3, 4, 5, 7, including
intermodal services via regular ferry and Ro-Ro lines.
In the Black Sea region the biggest ports by throughput were Constanta with 0.7 million TEUs
(2016), Novorossiysk - 0.6 million TEUs (2016) and Odessa – 0.5 million TEUs (2016).

99
In conclusion, Seaports located in the EATL area, as showed above, played a dual role in the
operationalization of Euro-Asian inland transport links. Baltic, North and Pacific seaports as well
as port on Persian Gulf created conditions for the development of hinterlands by actively
cooperating with railway and road transport operators (the length of hinterlands can be very
significant for landlocked countries, for example, Kazakhstan's transport links with ports on the
Black and Baltic seas exceed 3000 km). Ports on the Caspian Sea and, in part, ports on the Black
Sea ensured the connectivity of sections of some Euro-Asian routes. The development of
intermodal technologies and services, including ferry and Ro-Ro lines from these ports, was
further expected to significantly enhance the efficiency and competitiveness of rail and road
routes connecting Europe and Asia in both West-East and North-South directions.
I.4.2. Infrastructure of EATL railway routes
Railway corridors in and outside the EATL region connect the countries with ports and
international markets. However, the existing rail network does not necessarily match the
changing trade patterns it is meant to serve. Growing export and import activity with China and
Europe are being served insufficiently. Railways have the potential to transform the EATL
region especially landlocked countries in Central Asia into being land-linked and connecting it
better with its rapidly growing neighbours. Although rail infrastructure has contributed in
maintaining the competitiveness of the Euro-Asian trade, its quality needs to be improved so that
the improved railways will facilitate increased regional cooperation and integration.
Out of the nine EATL rail routes, six are in the East—West Direction, and three in the North—
South direction (Table 1.36). Eight from nine of rail routes at the time this report was written
were already used by regular or ad-hoc block trains connecting Asia, East Russia and Europe.
Table 1.36 - EATL Rail Routes: number of gauge changes and ferry crossings
1
"Trans-Siberian Railway, Northern Road"
West (N and E EU (Finland, Latvia, Lithuania, Poland, Hungary)) to East (Russian Pacific)
Countries crossed: Russian Federation, Belarus or Ukraine
Number of gauge changes: 0
2
"Trans-Siberian Railway, Southern Route"
West (N and E EU (Finland, Lithuania, Poland, Hungary)) to East (China)
Countries crossed: Ukraine, or Belarus, Russian Federation, Kazakhstan, China
Number of gauge changes: 1 (Kazakhstan/China)
3
West (SE EU (Hungary, Romania, Bulgaria) through Caucasus and Central Asia to East (China)
Countries crossed: Moldova, Turkey, Georgia, Azerbaijan, Armenia, Turkmenistan, Uzbekistan,
Tajikistan, Kyrgyzstan, Kazakhstan, China
Number of gauge changes: 1 (Kazakhstan/China)
Number of ferry crossings: 2 (Caspian and Black Sea)
4
"Southern Silk Road" or "Trans Europe-Asia Route" West (SE EU (Bulgaria) through Iran and Central
Asia to East (China)
Countries crossed: Turkey, Iran, Turkmenistan, Uzbekistan, Kazakhstan, China
Number of gauge changes: 2 (Iran/ Turkmenistan, Kazakhstan/China)
5
North (N EU (Finland)) through Caucasus and Central Asia to South (Iran)
Countries crossed: Russian Federation, Azerbaijan, Iran, Turkmenistan, Kazakhstan, Uzbekistan
Number of gauge changes: 1 (Kazakhstan/China)
Number of ferry crossings: 1 (Black Sea)
6
West (E EU (Hungary, Poland)) to through Central Asia to East (Russian Pacific Coast)23
Countries
crossed: Ukraine, Moldova, Russian Federation, Kazakhstan
Number of gauge changes: 0
7
West (E EU (Hungary and Poland)) through Central Asia to East (China)
Countries crossed: Ukraine, Kazakhstan, Uzbekistan, China)
Number of gauge changes: 1 (Kazakhstan/China)
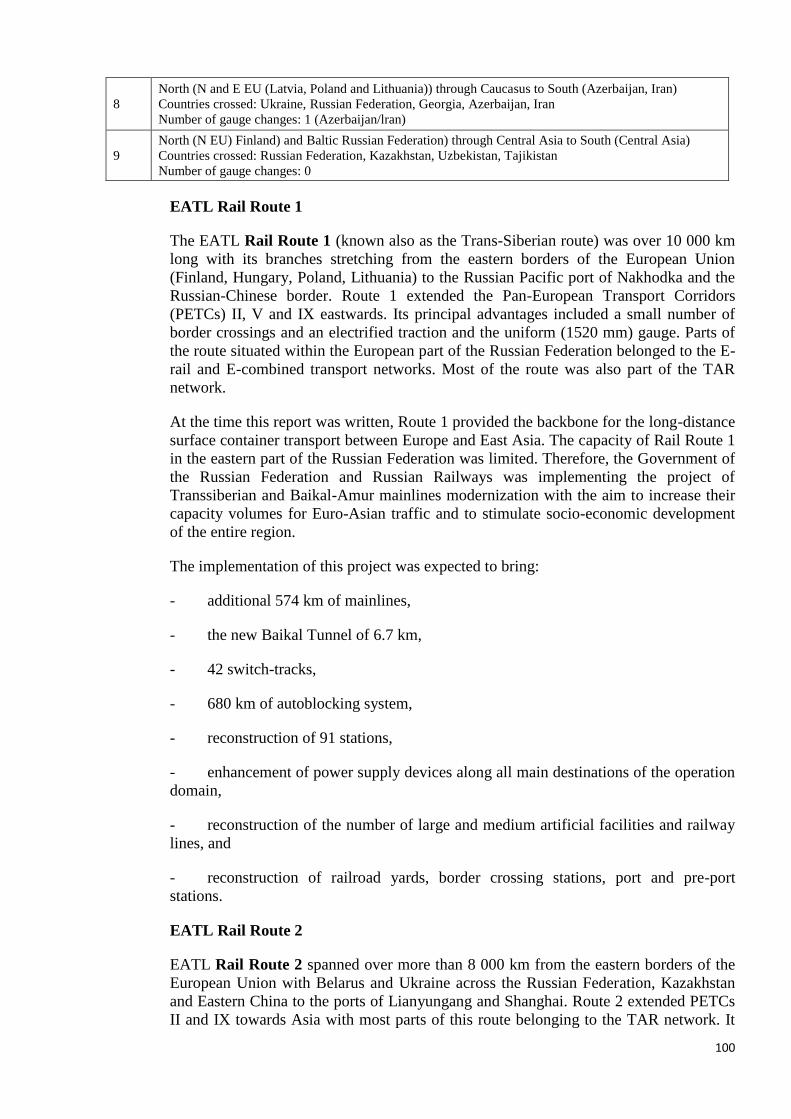
100
8
North (N and E EU (Latvia, Poland and Lithuania)) through Caucasus to South (Azerbaijan, Iran)
Countries crossed: Ukraine, Russian Federation, Georgia, Azerbaijan, Iran
Number of gauge changes: 1 (Azerbaijan/lran)
9
North (N EU) Finland) and Baltic Russian Federation) through Central Asia to South (Central Asia)
Countries crossed: Russian Federation, Kazakhstan, Uzbekistan, Tajikistan
Number of gauge changes: 0
EATL Rail Route 1
The EATL Rail Route 1 (known also as the Trans-Siberian route) was over 10 000 km
long with its branches stretching from the eastern borders of the European Union
(Finland, Hungary, Poland, Lithuania) to the Russian Pacific port of Nakhodka and the
Russian-Chinese border. Route 1 extended the Pan-European Transport Corridors
(PETCs) II, V and IX eastwards. Its principal advantages included a small number of
border crossings and an electrified traction and the uniform (1520 mm) gauge. Parts of
the route situated within the European part of the Russian Federation belonged to the E-
rail and E-combined transport networks. Most of the route was also part of the TAR
network.
At the time this report was written, Route 1 provided the backbone for the long-distance
surface container transport between Europe and East Asia. The capacity of Rail Route 1
in the eastern part of the Russian Federation was limited. Therefore, the Government of
the Russian Federation and Russian Railways was implementing the project of
Transsiberian and Baikal-Amur mainlines modernization with the aim to increase their
capacity volumes for Euro-Asian traffic and to stimulate socio-economic development
of the entire region.
The implementation of this project was expected to bring:
- additional 574 km of mainlines,
- the new Baikal Tunnel of 6.7 km,
- 42 switch-tracks,
- 680 km of autoblocking system,
- reconstruction of 91 stations,
- enhancement of power supply devices along all main destinations of the operation
domain,
- reconstruction of the number of large and medium artificial facilities and railway
lines, and
- reconstruction of railroad yards, border crossing stations, port and pre-port
stations.
EATL Rail Route 2
EATL Rail Route 2 spanned over more than 8 000 km from the eastern borders of the
European Union with Belarus and Ukraine across the Russian Federation, Kazakhstan
and Eastern China to the ports of Lianyungang and Shanghai. Route 2 extended PETCs
II and IX towards Asia with most parts of this route belonging to the TAR network. It

101
coincided with Route 1 on the sections between the European Union border and the city
of Yekaterinburg in central Russian Federation. There were some infrastructural
limitations identified for this route:
- Change of gauge: the broad 1520 mm gauge changed at the Kazakh-Chinese
border to the 1435 mm standard prevailing in China;
- Sections of the routes were not electrified (Dostyk – Aktogay – Mointy railway
line);
- Out of date infrastructure and equipment at border crossings;
- The capacity of the section between Kazakhstan and the Chinese ports was limited
(some sections, i.e. Iletsk – Zhaysan, Kyzyl-Orda – Shieli were single track railways) .
EATL Rail Route 3
The main branch of the EATL Rail Route 3 led from the South-eastern European
Union border (Hungary-Romania) to the Lianyungang and Shanghai ports. Route 3
extended PETCs IV, VIII and IX as well as the TRACECA routes to Eastern China.
Significant parts of the route belonged to the TAR network.
Route 3 included two ferry crossings, from Constanta on the Romanian Black Sea coast
to the Georgian ports of Batumi or Poti and from the Azerbaijan port of Alat on the
Caspian Sea to the Kazakh ports of Aktau and Kuryk (Kazakhstan in 2016 completed
the construction of a new railway line Borzhakty - Ersai (length 16.6 km) to Kuryk
port).
Route 3 and its branches passed through a significant number of countries and border
crossings. Gauge changes were necessary at the borders of CIS countries with China
and Romania.
In 2016 a new electrified railway line Angren-Pap (section 3n of Rail Route 3) in
Uzbekistan with a length of 123.2 km, as well as the Kamchik Tunnel (19.2 km) were
put in operation. Railway stations Kul, Orzu, Chodak, Kop, Koshminor and Pap were
opened for operation.
Also, after completion in 2017 of the new railway section EATL 3m from Kars
(Turkey) to Akhalkalakhi (Georgia) with total length of 105 kilometres, this Route 3
was expected to be fully operationalized between Azerbaijan (Baku/Alat) and Europe
via Turkey. The capacity of railway line Baku – Tbilisi – Akhalkalaki – Kars was
expected to reach 6.5 million tonnes in the short-term and 17 million tonnes in the long-
term.
EATL Rail Route 4
The EATL Rail Route 4 provided a link between South-Eastern Europe and the
Lianyungang and Shanghai ports, passing through Bulgaria, Turkey, Iran, Uzbekistan
and Kazakhstan. It provided an extension to PETCs IV, VIII, X and the TRACECA
route to the Chinese seaboard, also with parts of the route belonging to the TAR
network. There were two main limitations for this route:
- there were two gauge changes (Iran-Turkmen border and the Kazakh-Chinese
border), and

102
- large sections of Route 4 were not electrified.
EATL Rail Route 5
The EATL Rail Route 5 connected northern Europe to Iran, extending from the
Finnish-Russian border southward to the Caspian Sea and terminating at the port of
Bandar Abbas in the Persian Gulf. Almost the entire route was part of the TAR network.
At the time this report was written, the capacity of Route 5 was limited by one missing
link on the territory of Iran between Gazvin-Rasht-Astara.
The Gazvin-Rasht section with 164 km length was under construction with 93 percent
physical progress. It was predicted that this section would be completed by the end of
2017. For the Rasht –Astara segment with 164 km there was a search for investors.
EATL Rail Route 6
The EATL Rail Route 6 provided a connection between the eastern borders of the
European Union (Hungary, Poland) with Russian Pacific coast, moving across Ukraine
and the Russian Federation (south of Route 1) towards the port of Vladivostok as well
as traversing the Kazakh territory.
Route 6 provided an extension of PETCs III, V and IX towards the Pacific Ocean.
Again, parts of the route belonged to the TAR network.
EATL Rail Route 7
The EATL Rail Route 7 provided a connection between the European Union and the
Lianyungang and Shanghai ports, passing through the territory of Ukraine, the Russian
Federation, Kazakhstan, Uzbekistan and China. It extended PETCs III and V and
belonged to the TAR network. Large sections of Route 7 on the Kazakh, Uzbek and
Chinese territory were not electrified.
EATL Rail Route 8
The EATL Rail Route 8 passed from Poland to Ukraine, southern Russian Federation,
Georgia and Azerbaijan to the Iranian border at Astara. It provided another extension to
PETCs III and V with most parts of the route belonging to the TAR network. Imam
Khomeini port (Iran) – Bazargan (border with Turkey) - Caucuses, as part of this route
was one of the priorities of the transport infrastructure development in Iran (Figure
1.36). Projects on upgrading of railway sections along this route were under
consideration.
This route was one of the main routes of the Persian Gulf- Black Sea Corridor
Agreement which was finalized among Iran, Azerbaijan, Armenia, Georgia, Bulgaria,
and Greece in 2016.
EATL Rail Route 9
The EATL Rail Route 9 provided a connection from the northern Europe through the
Russian Federation to Central Asia (Kazakhstan, Uzbekistan and Tajikistan). Significant
parts of the route belonged to the TAR network. Since long sections of Route 9 were not
electrified, the capacity of the route was subject to limitations.
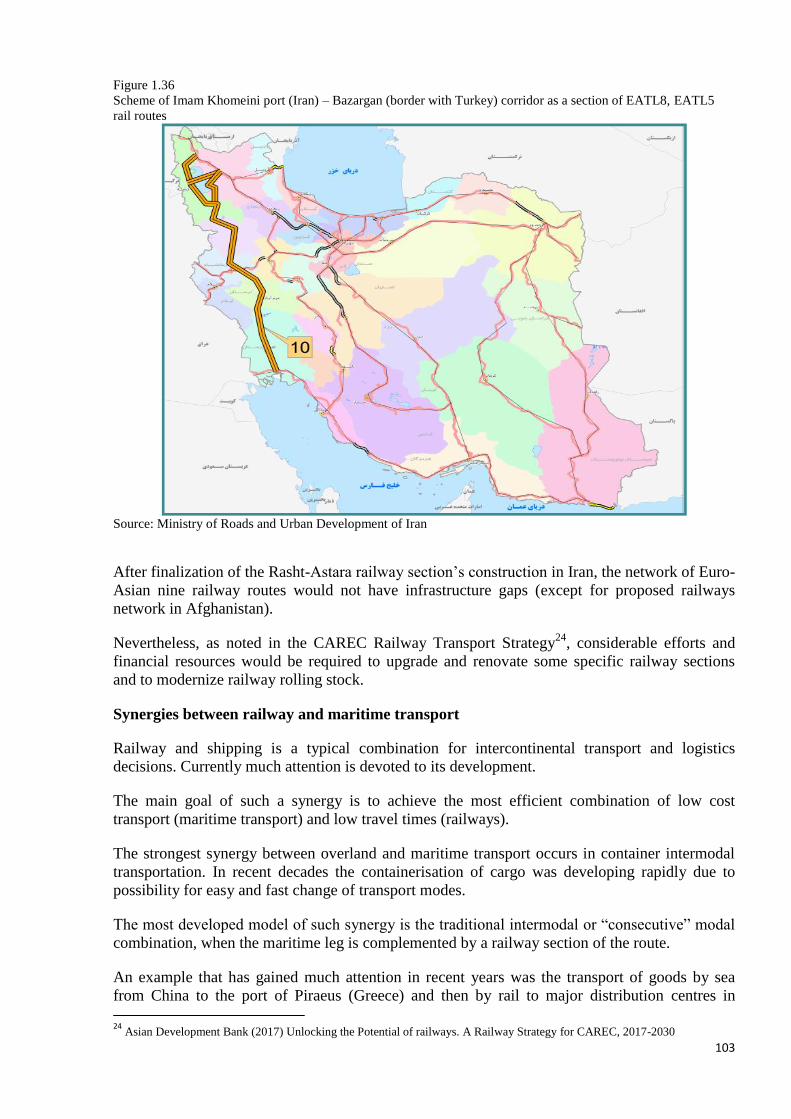
103
Figure 1.36
Scheme of Imam Khomeini port (Iran) – Bazargan (border with Turkey) corridor as a section of EATL8, EATL5
rail routes
Source: Ministry of Roads and Urban Development of Iran
After finalization of the Rasht-Astara railway section’s construction in Iran, the network of Euro-
Asian nine railway routes would not have infrastructure gaps (except for proposed railways
network in Afghanistan).
Nevertheless, as noted in the CAREC Railway Transport Strategy24
, considerable efforts and
financial resources would be required to upgrade and renovate some specific railway sections
and to modernize railway rolling stock.
Synergies between railway and maritime transport
Railway and shipping is a typical combination for intercontinental transport and logistics
decisions. Currently much attention is devoted to its development.
The main goal of such a synergy is to achieve the most efficient combination of low cost
transport (maritime transport) and low travel times (railways).
The strongest synergy between overland and maritime transport occurs in container intermodal
transportation. In recent decades the containerisation of cargo was developing rapidly due to
possibility for easy and fast change of transport modes.
The most developed model of such synergy is the traditional intermodal or “consecutive” modal
combination, when the maritime leg is complemented by a railway section of the route.
An example that has gained much attention in recent years was the transport of goods by sea
from China to the port of Piraeus (Greece) and then by rail to major distribution centres in
24
Asian Development Bank (2017) Unlocking the Potential of railways. A Railway Strategy for CAREC, 2017-2030
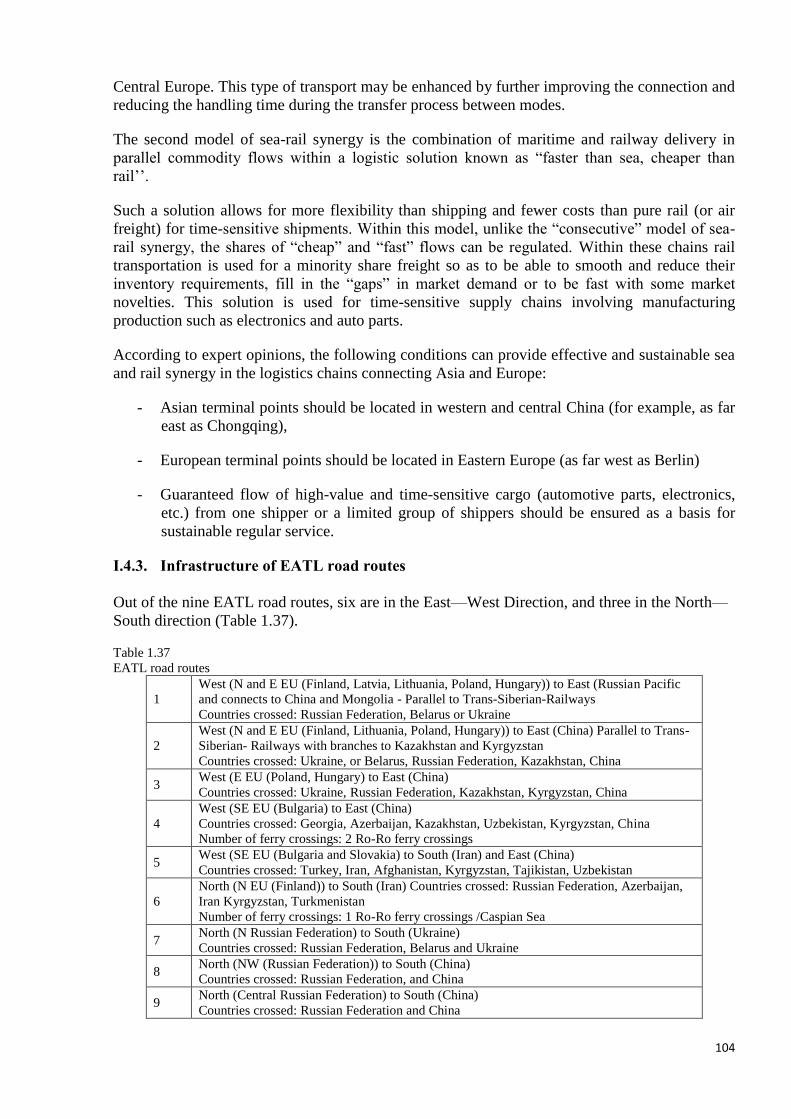
104
Central Europe. This type of transport may be enhanced by further improving the connection and
reducing the handling time during the transfer process between modes.
The second model of sea-rail synergy is the combination of maritime and railway delivery in
parallel commodity flows within a logistic solution known as “faster than sea, cheaper than
rail’’.
Such a solution allows for more flexibility than shipping and fewer costs than pure rail (or air
freight) for time-sensitive shipments. Within this model, unlike the “consecutive” model of sea-
rail synergy, the shares of “cheap” and “fast” flows can be regulated. Within these chains rail
transportation is used for a minority share freight so as to be able to smooth and reduce their
inventory requirements, fill in the “gaps” in market demand or to be fast with some market
novelties. This solution is used for time-sensitive supply chains involving manufacturing
production such as electronics and auto parts.
According to expert opinions, the following conditions can provide effective and sustainable sea
and rail synergy in the logistics chains connecting Asia and Europe:
- Asian terminal points should be located in western and central China (for example, as far
east as Chongqing),
- European terminal points should be located in Eastern Europe (as far west as Berlin)
- Guaranteed flow of high-value and time-sensitive cargo (automotive parts, electronics,
etc.) from one shipper or a limited group of shippers should be ensured as a basis for
sustainable regular service.
I.4.3. Infrastructure of EATL road routes
Out of the nine EATL road routes, six are in the East—West Direction, and three in the North—
South direction (Table 1.37).
Table 1.37
EATL road routes
1
West (N and E EU (Finland, Latvia, Lithuania, Poland, Hungary)) to East (Russian Pacific
and connects to China and Mongolia - Parallel to Trans-Siberian-Railways
Countries crossed: Russian Federation, Belarus or Ukraine
2
West (N and E EU (Finland, Lithuania, Poland, Hungary)) to East (China) Parallel to Trans-
Siberian- Railways with branches to Kazakhstan and Kyrgyzstan
Countries crossed: Ukraine, or Belarus, Russian Federation, Kazakhstan, China
3 West (E EU (Poland, Hungary) to East (China)
Countries crossed: Ukraine, Russian Federation, Kazakhstan, Kyrgyzstan, China
4
West (SE EU (Bulgaria) to East (China)
Countries crossed: Georgia, Azerbaijan, Kazakhstan, Uzbekistan, Kyrgyzstan, China
Number of ferry crossings: 2 Ro-Ro ferry crossings
5 West (SE EU (Bulgaria and Slovakia) to South (Iran) and East (China)
Countries crossed: Turkey, Iran, Afghanistan, Kyrgyzstan, Tajikistan, Uzbekistan
6
North (N EU (Finland)) to South (Iran) Countries crossed: Russian Federation, Azerbaijan,
Iran Kyrgyzstan, Turkmenistan
Number of ferry crossings: 1 Ro-Ro ferry crossings /Caspian Sea
7 North (N Russian Federation) to South (Ukraine)
Countries crossed: Russian Federation, Belarus and Ukraine
8 North (NW (Russian Federation)) to South (China)
Countries crossed: Russian Federation, and China
9 North (Central Russian Federation) to South (China)
Countries crossed: Russian Federation and China

105
EATL Road Route 1
The EATL Road Route 1 started on the eastern borders of the European Union with
Belarus as well as the Russian Federation and continued across the Russian territory to its
Pacific coast, extending PETCs II, V and IX. Parts of the route belonged to the Asian
Highway (AH) network. It ran parallel to the EATL Rail Route 1. The uneven quality of
road infrastructure implied that this route was unlikely to be used widely for
transcontinental trucking or passenger car trips, especially during the winter months.
There were a number of projects to improve the infrastructure. On the territory of the
Russian Federation, the construction of a new motorway St. Petersburg-Moscow was in the
development. Two sections of this motorway entered in operation in 2017. Also, a
construction of a new motorway - Moscow bypass (“Central Ring Road”) was carried out.
EATL Road Route 2
The EATL Road Route 2 is parallel to the Rail Route 2. It extends PETCs II and IX and
almost the whole route belongs to the AH network.
EATL Road Route 3
The EATL Road Route 3 started on the eastern borders of the EU with Ukraine and ended
on the Chinese seaboard (Lianyungang and Shanghai ports), passing through the Ukraine,
Russian Federation, Kazakhstan, Kyrgyzstan and Eastern China. Route 3 extended PETCs
II, IV, V, VIII and IX eastward and parts of the route belonged to the AH network.
Altogether, there were eight border crossings between the points of origin and final
destinations in China. The road quality varied significantly, especially in Central Asia.
The construction of the road route Europe - Western China (part of the EATL Route 3, as
well as part of EATL Routes 2 and 4 between Shymkent and Lianyungang) was completed
on the territories of Kazakhstan and China (length of the route is 2787 km in Kazakhstan
and 3425 km in China). In 2017, a modern crossing point was expected to be
commissioned. The construction of the Nur-Jol border crossing point was expected to be
completed by the end of 2017. On the territory of the Russian Federation the construction
of road route Europe - Western China was in the process.
EATL Road Route 4
The EATL Road Route 4 connected South-Eastern Europe to the Lianyungang and
Shanghai ports, passing across Romania, Georgia, Azerbaijan, Kazakhstan, Uzbekistan,
Kyrgyzstan and eastern China. It provided an extension to PETCs IV, V and IX. Route 4
involved two Ro-Ro ferry crossings (from Romania to Georgia and Azerbaijan to
Kazakhstan) and eight border crossings. The quality of the road was uneven, changing
from a broad four-lane highway to a narrow two-lane road in some parts.
EATL Road Route 5
The EATL Road Route 5 connected South-East Europe to the Lianyungang and Shanghai
ports, starting at the Serbian-Bulgarian border and continuing through Bulgaria, Turkey,
Iran, Afghanistan, Uzbekistan and Kyrgyzstan. It extended PETCs IV, V, VIII and IX.
Significant parts of the route belong to the AH network. There were eight border crossings
and the road quality varied significantly, in particular in Central Asia.

106
EATL Road Route 6
The EATL Road Route 6 connected northern Europe to Iran, extending from the Finnish-
Russian border southward to the Caspian Sea and terminating at the port of Bandar Abbas
in the Persian Gulf. Almost the whole route belonged to the AH network and it ran in
parallel to the EATL Rail Route 5.
EATL Road Route 7
The EATL Road Route 7 connected the Murmansk port on the northern shore of the Kola
Peninsula (in the proximity of Finland and Norway) with the Odessa port in southern
Ukraine while passing through northwest Russian Federation and Belarus. Between St
Petersburg and Odessa, Route 7 coincided with the PETC IX.
EATL Road Route 8
The EATL Road Route 8 was not operational for transit between China and the Russian
Federation in 2017 – only bilateral transport operations were provided between Mongolia
and the Russian Federation and separately – from Mongolia to China.
EATL Road Route 9
The EATL Road Route 9 was not operational for transit between China and Russian
Federation before 2017.
There were a number of common infrastructural issues identified for the routes that impede the
development of long road haulage. Due to different standards for axle load, weight and
dimensions of trucks in the EATL countries, and especially between the European Union, CIS
and China the available road infrastructure did not support the operation of same vehicles from
the start to the end of any of the routes. Also, all the routes were characterized by outdated
infrastructure of border crossing points and undeveloped roadside ancillary infrastructure.
The average standard gross weight of the freight road vehicle all around the world was about 40
tonnes which provided the payload of about 20 tonnes. The allowed length of the road
combination rarely exceeded 20 meters. And yet, the full vehicle weight was limited by the
bridges construction on the EATL routes; the allowed axle load depended on the carrying
capacity of the road along the various routes’ sections. The vehicle length depended on road
safety standards adopted in country.
The harmonization of standards for road parameters and introduction of long and heavy vehicles
(LHV), or road trains, was considered to be one of the opportunities to increase the efficiency of road
transport in the EATL area.
This trucking concept came from remote areas in Australia, the United States, and Western
Canada. In this concept, a road train consists of a relatively conventional prime mover, but
instead of pulling one trailer or semi-trailer, the road train pulls two or more of them.
Australia had the largest and heaviest road-legal vehicles in the world, with some configurations
topping out at close to 200 tonnes of the gross vehicle weight. The majority were between 80 and
120 tonnes. The train length reached 53 meters (see figure 1.37).
Axle loads of the road train did not exceed the limit because the number of axles supporting the
LHV was higher according to its increased length. As for the high gross vehicle weight, it was
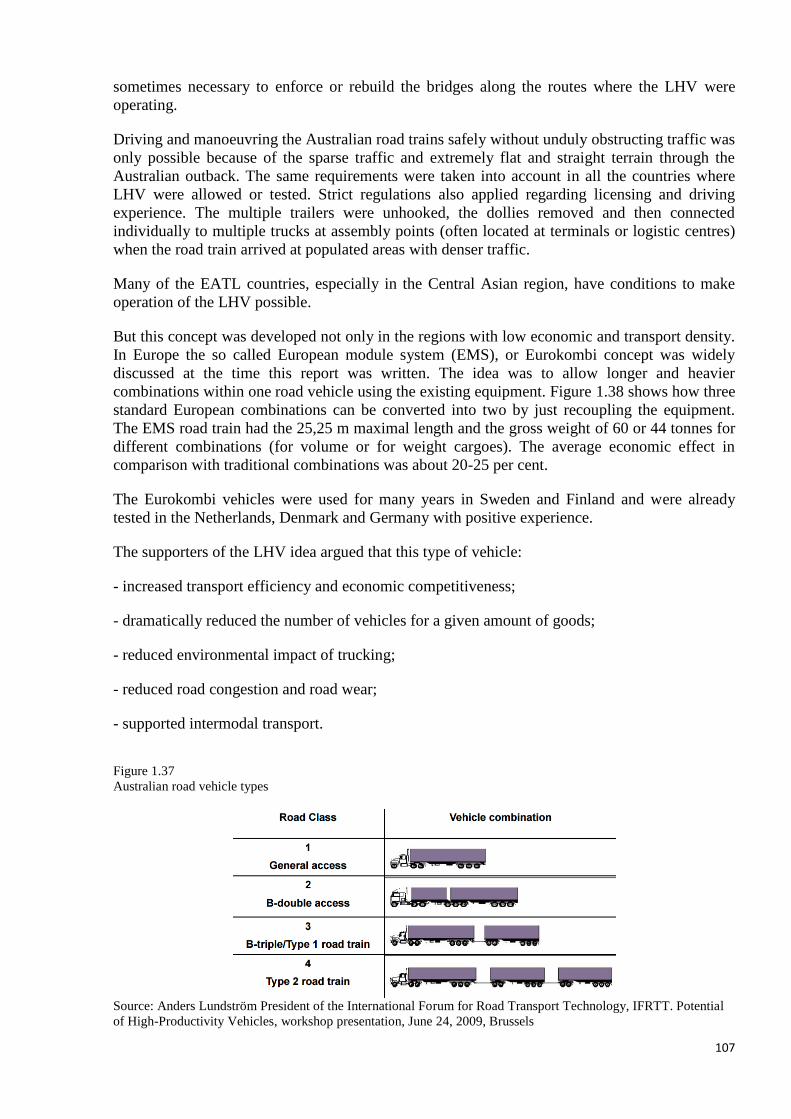
107
sometimes necessary to enforce or rebuild the bridges along the routes where the LHV were
operating.
Driving and manoeuvring the Australian road trains safely without unduly obstructing traffic was
only possible because of the sparse traffic and extremely flat and straight terrain through the
Australian outback. The same requirements were taken into account in all the countries where
LHV were allowed or tested. Strict regulations also applied regarding licensing and driving
experience. The multiple trailers were unhooked, the dollies removed and then connected
individually to multiple trucks at assembly points (often located at terminals or logistic centres)
when the road train arrived at populated areas with denser traffic.
Many of the EATL countries, especially in the Central Asian region, have conditions to make
operation of the LHV possible.
But this concept was developed not only in the regions with low economic and transport density.
In Europe the so called European module system (EMS), or Eurokombi concept was widely
discussed at the time this report was written. The idea was to allow longer and heavier
combinations within one road vehicle using the existing equipment. Figure 1.38 shows how three
standard European combinations can be converted into two by just recoupling the equipment.
The EMS road train had the 25,25 m maximal length and the gross weight of 60 or 44 tonnes for
different combinations (for volume or for weight cargoes). The average economic effect in
comparison with traditional combinations was about 20-25 per cent.
The Eurokombi vehicles were used for many years in Sweden and Finland and were already
tested in the Netherlands, Denmark and Germany with positive experience.
The supporters of the LHV idea argued that this type of vehicle:
- increased transport efficiency and economic competitiveness;
- dramatically reduced the number of vehicles for a given amount of goods;
- reduced environmental impact of trucking;
- reduced road congestion and road wear;
- supported intermodal transport.
Figure 1.37
Australian road vehicle types
Source: Anders Lundström President of the International Forum for Road Transport Technology, IFRTT. Potential
of High-Productivity Vehicles, workshop presentation, June 24, 2009, Brussels
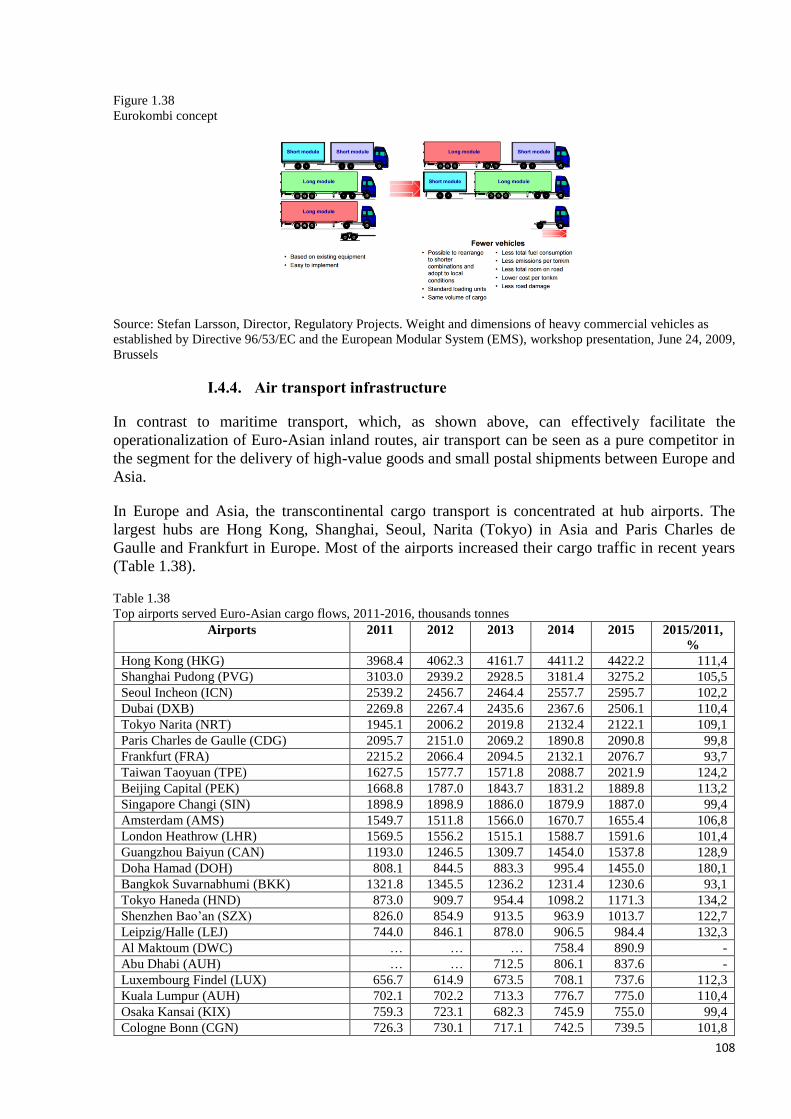
108
Figure 1.38
Eurokombi concept
Source: Stefan Larsson, Director, Regulatory Projects. Weight and dimensions of heavy commercial vehicles as
established by Directive 96/53/EC and the European Modular System (EMS), workshop presentation, June 24, 2009,
Brussels
I.4.4. Air transport infrastructure
In contrast to maritime transport, which, as shown above, can effectively facilitate the
operationalization of Euro-Asian inland routes, air transport can be seen as a pure competitor in
the segment for the delivery of high-value goods and small postal shipments between Europe and
Asia.
In Europe and Asia, the transcontinental cargo transport is concentrated at hub airports. The
largest hubs are Hong Kong, Shanghai, Seoul, Narita (Tokyo) in Asia and Paris Charles de
Gaulle and Frankfurt in Europe. Most of the airports increased their cargo traffic in recent years
(Table 1.38).
Table 1.38
Top airports served Euro-Asian cargo flows, 2011-2016, thousands tonnes
Airports 2011 2012 2013 2014 2015 2015/2011,
%
Hong Kong (HKG) 3968.4 4062.3 4161.7 4411.2 4422.2 111,4
Shanghai Pudong (PVG) 3103.0 2939.2 2928.5 3181.4 3275.2 105,5
Seoul Incheon (ICN) 2539.2 2456.7 2464.4 2557.7 2595.7 102,2
Dubai (DXB) 2269.8 2267.4 2435.6 2367.6 2506.1 110,4
Tokyo Narita (NRT) 1945.1 2006.2 2019.8 2132.4 2122.1 109,1
Paris Charles de Gaulle (CDG) 2095.7 2151.0 2069.2 1890.8 2090.8 99,8
Frankfurt (FRA) 2215.2 2066.4 2094.5 2132.1 2076.7 93,7
Taiwan Taoyuan (TPE) 1627.5 1577.7 1571.8 2088.7 2021.9 124,2
Beijing Capital (PEK) 1668.8 1787.0 1843.7 1831.2 1889.8 113,2
Singapore Changi (SIN) 1898.9 1898.9 1886.0 1879.9 1887.0 99,4
Amsterdam (AMS) 1549.7 1511.8 1566.0 1670.7 1655.4 106,8
London Heathrow (LHR) 1569.5 1556.2 1515.1 1588.7 1591.6 101,4
Guangzhou Baiyun (CAN) 1193.0 1246.5 1309.7 1454.0 1537.8 128,9
Doha Hamad (DOH) 808.1 844.5 883.3 995.4 1455.0 180,1
Bangkok Suvarnabhumi (BKK) 1321.8 1345.5 1236.2 1231.4 1230.6 93,1
Tokyo Haneda (HND) 873.0 909.7 954.4 1098.2 1171.3 134,2
Shenzhen Bao’an (SZX) 826.0 854.9 913.5 963.9 1013.7 122,7
Leipzig/Halle (LEJ) 744.0 846.1 878.0 906.5 984.4 132,3
Al Maktoum (DWC) … … … 758.4 890.9 -
Abu Dhabi (AUH) … … 712.5 806.1 837.6 -
Luxembourg Findel (LUX) 656.7 614.9 673.5 708.1 737.6 112,3
Kuala Lumpur (AUH) 702.1 702.2 713.3 776.7 775.0 110,4
Osaka Kansai (KIX) 759.3 723.1 682.3 745.9 755.0 99,4
Cologne Bonn (CGN) 726.3 730.1 717.1 742.5 739.5 101,8

109
Source: ACI
The infrastructure of air transit of cargo and multimodal air transport logistics was being actively
developed in a number of EATL countries during the phase III of the EATL project. Among
others, the following airports were expanding their cargo capacities: Ataturk (Istanbul),
Sheremetyevo (Moscow), Geydar Aliev (Baku) and Ashgabat International Airport.
A serious challenge to the growth of the inland transport of high-value goods and postal
shipments by EATL routes was the intensive development of cargo terminals at the airports in
the countries of Middle East and related growth of transit air cargo traffic (the share of transit
reaches 60-70 per cent of the total volume of air cargo and mail transhipment at these airports).
I.4.5. Logistic centres and dry ports in the EATL system
Smooth functioning of the supply chain always required adequate logistic infrastructure. At the
time this report was written logistic centres were considered to be the mandatory components of
logistic infrastructure carrying on numerous functions in the supply chains.
Logistics centres (LC) or dry ports had the most extensive structure of all components
comprising the logistics network. They were composed of many collaborating facilities and
cooperating logistics operators. LC enabled to conduct operations on goods in connection with
warehousing and goods relocation between the shipper and the consignee, providing intermodal
transport and value-added services.
Intermodal terminal was the specific component of the logistic centre. It served not only as a
pivot where cargo (usually in containers, contrailers or swap-bodies) was transhipped between
the modes. Intermodal terminals were the origin/destination points for regularly operating block-
trains linking one LC with other LCs located in sea ports, surface transport nodes, logistic hubs
or industrial areas.
While in Europe and in North America LCs had become the compulsory component of logistic
infrastructure, Asia was in the early stage of LC development during the phase III of the EATL
project. To speed up their development, in 2013 the Intergovernmental Agreement on Dry Ports
was concluded under the auspices of the United Nations Economic and Social Commission for
Asia and the Pacific (UNESCAP). The Agreement was aimed to promote the cooperation for the
development of dry ports in the Asia-Pacific region. As of August 2017, the Agreement has been
signed by 17 and ratified by 13 UNESCAP member States.
The Agreement identified a number of existing and potential dry port locations that were to be
the basis of a coordinated effort to create nodes along an international integrated intermodal
transport and logistics system.
According to the Agreement, a dry port of international importance (“dry port”) referred to an
“inland location as a logistics centre connected to one or more modes of transport for the
handling, storage and regulatory inspection of goods moving in international trade and the
execution of applicable customs control and formalities”.
The Agreement (in its Annex I) identifies the dry ports locations. They were chosen considering
the following factors:
a) inland capitals, provincial/state capitals;
b) existing and potential industrial and agriculture centres;
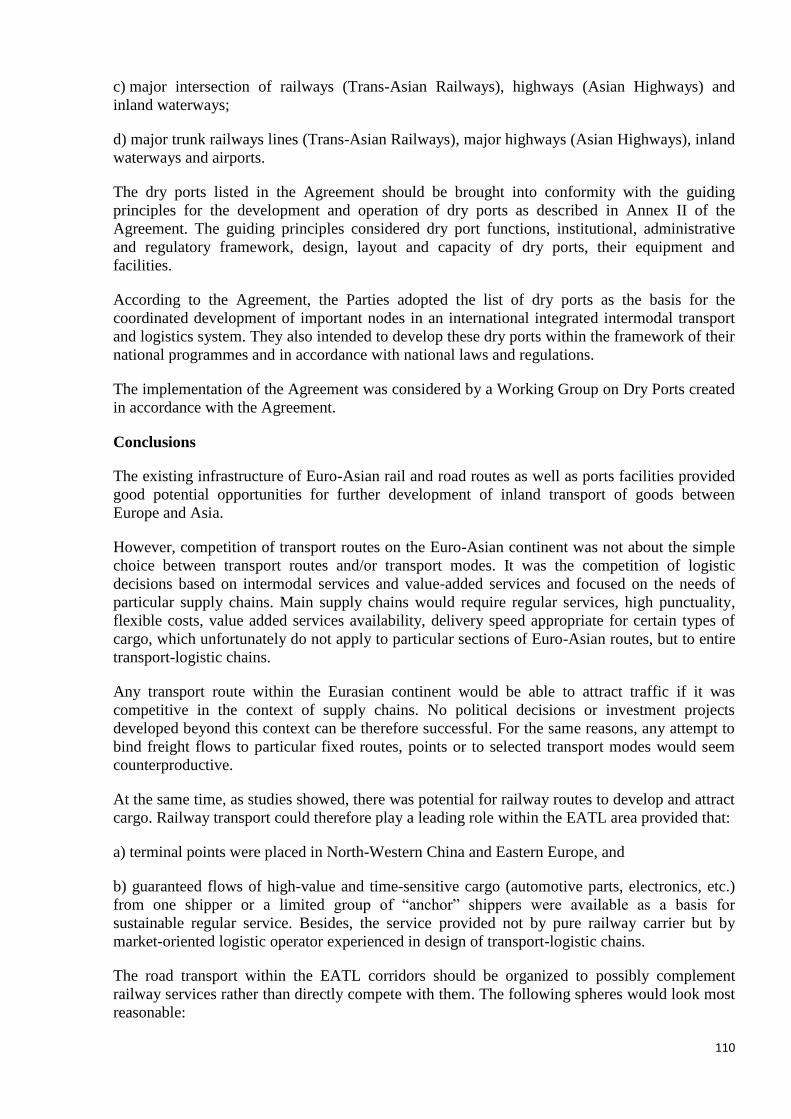
110
c) major intersection of railways (Trans-Asian Railways), highways (Asian Highways) and
inland waterways;
d) major trunk railways lines (Trans-Asian Railways), major highways (Asian Highways), inland
waterways and airports.
The dry ports listed in the Agreement should be brought into conformity with the guiding
principles for the development and operation of dry ports as described in Annex II of the
Agreement. The guiding principles considered dry port functions, institutional, administrative
and regulatory framework, design, layout and capacity of dry ports, their equipment and
facilities.
According to the Agreement, the Parties adopted the list of dry ports as the basis for the
coordinated development of important nodes in an international integrated intermodal transport
and logistics system. They also intended to develop these dry ports within the framework of their
national programmes and in accordance with national laws and regulations.
The implementation of the Agreement was considered by a Working Group on Dry Ports created
in accordance with the Agreement.
Conclusions
The existing infrastructure of Euro-Asian rail and road routes as well as ports facilities provided
good potential opportunities for further development of inland transport of goods between
Europe and Asia.
However, competition of transport routes on the Euro-Asian continent was not about the simple
choice between transport routes and/or transport modes. It was the competition of logistic
decisions based on intermodal services and value-added services and focused on the needs of
particular supply chains. Main supply chains would require regular services, high punctuality,
flexible costs, value added services availability, delivery speed appropriate for certain types of
cargo, which unfortunately do not apply to particular sections of Euro-Asian routes, but to entire
transport-logistic chains.
Any transport route within the Eurasian continent would be able to attract traffic if it was
competitive in the context of supply chains. No political decisions or investment projects
developed beyond this context can be therefore successful. For the same reasons, any attempt to
bind freight flows to particular fixed routes, points or to selected transport modes would seem
counterproductive.
At the same time, as studies showed, there was potential for railway routes to develop and attract
cargo. Railway transport could therefore play a leading role within the EATL area provided that:
a) terminal points were placed in North-Western China and Eastern Europe, and
b) guaranteed flows of high-value and time-sensitive cargo (automotive parts, electronics, etc.)
from one shipper or a limited group of “anchor” shippers were available as a basis for
sustainable regular service. Besides, the service provided not by pure railway carrier but by
market-oriented logistic operator experienced in design of transport-logistic chains.
The road transport within the EATL corridors should be organized to possibly complement
railway services rather than directly compete with them. The following spheres would look most
reasonable:

111
a) short-run cross border trade;
b) long haul transport on the lanes where railway links do not exist or cannot provide effective
services for certain commodities (perishable, expensive, etc.); and
c) “road section” of intermodal rail-road transport service.
For effective long-haul trucking it would be important to provide the even weight/length
limitations for road transport along the main EATL routes.
It is worth noting that on short and mid-term horizon, air transport would be increasingly
competitive with the Euro-Asian inland transport in the sector of high-value goods and e-
commerce.
The role of logistic centres in the EATL development was underestimated. Established in the
hubs of EATL network, logistic centres could play the role of modern market-oriented nodes of
supply chains improving the competitiveness of the entire EATL system.
1.5. Comparative analysis of the duration and expenses of different modes of transport
between Europe and Asia on selected Euro-Asian routes
Factors such as total transport time (including the delays on the way), full delivery costs, service
frequency and reliability, cargo “time sensitivity”, value added services en route require
adequate consideration for choosing the most appropriate transport mode and route for a specific
cargo.
These factors were evaluated for different maritime and inland routes between Europe and Asia
in various research studies so as to reach a better understanding whether:
- routes had principle advantages or disadvantages compared to others;
- any route could be considered as the most competitive one; and
- any route had specific limitations to attract specific volumes of cargo.
This section of the report contains conclusions from several studies on the maritime and inland
routes comparative analysis, as follows:
- Study 1: an upgraded analysis undertaken during phase II of the EATL project;
- Study 2: an analysis undertaken by the Russian Centre for Economic and Financial Research at
the New Economic School (CEFIR);
- Study 3:a research provided by PLASKE – freight forwarding company involved in the Euro-
Asian intermodal container transportation; and
- Study 4: a research by the Eurasian Development Bank.
Study 1
The phase II EATL Study had contained the section dedicated to comparative analysis of the
maritime and inland Euro-Asian routes based on the time-cost methodology. The analysis had
included the total time and costs within the entire supply chain, which include road transport
costs of moving containers from/to the warehouse/port, terminal handling charges, and
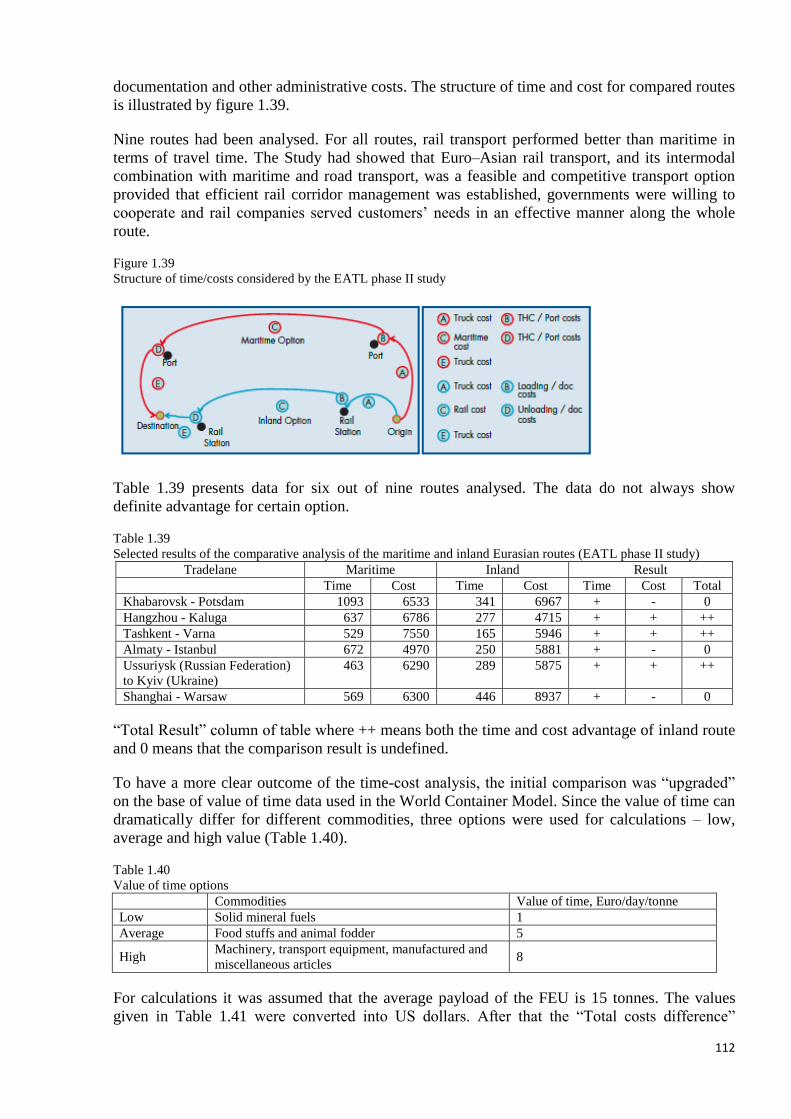
112
documentation and other administrative costs. The structure of time and cost for compared routes
is illustrated by figure 1.39.
Nine routes had been analysed. For all routes, rail transport performed better than maritime in
terms of travel time. The Study had showed that Euro–Asian rail transport, and its intermodal
combination with maritime and road transport, was a feasible and competitive transport option
provided that efficient rail corridor management was established, governments were willing to
cooperate and rail companies served customers’ needs in an effective manner along the whole
route.
Figure 1.39
Structure of time/costs considered by the EATL phase II study
Table 1.39 presents data for six out of nine routes analysed. The data do not always show
definite advantage for certain option.
Table 1.39
Selected results of the comparative analysis of the maritime and inland Eurasian routes (EATL phase II study)
Tradelane Maritime Inland Result
Time Cost Time Cost Time Cost Total
Khabarovsk - Potsdam 1093 6533 341 6967 + - 0
Hangzhou - Kaluga 637 6786 277 4715 + + ++
Tashkent - Varna 529 7550 165 5946 + + ++
Almaty - Istanbul 672 4970 250 5881 + - 0
Ussuriysk (Russian Federation)
to Kyiv (Ukraine)
463 6290 289 5875 + + ++
Shanghai - Warsaw 569 6300 446 8937 + - 0
“Total Result” column of table where ++ means both the time and cost advantage of inland route
and 0 means that the comparison result is undefined.
To have a more clear outcome of the time-cost analysis, the initial comparison was “upgraded”
on the base of value of time data used in the World Container Model. Since the value of time can
dramatically differ for different commodities, three options were used for calculations – low,
average and high value (Table 1.40).
Table 1.40
Value of time options
Commodities Value of time, Euro/day/tonne
Low Solid mineral fuels 1
Average Food stuffs and animal fodder 5
High Machinery, transport equipment, manufactured and
miscellaneous articles 8
For calculations it was assumed that the average payload of the FEU is 15 tonnes. The values
given in Table 1.41 were converted into US dollars. After that the “Total costs difference”
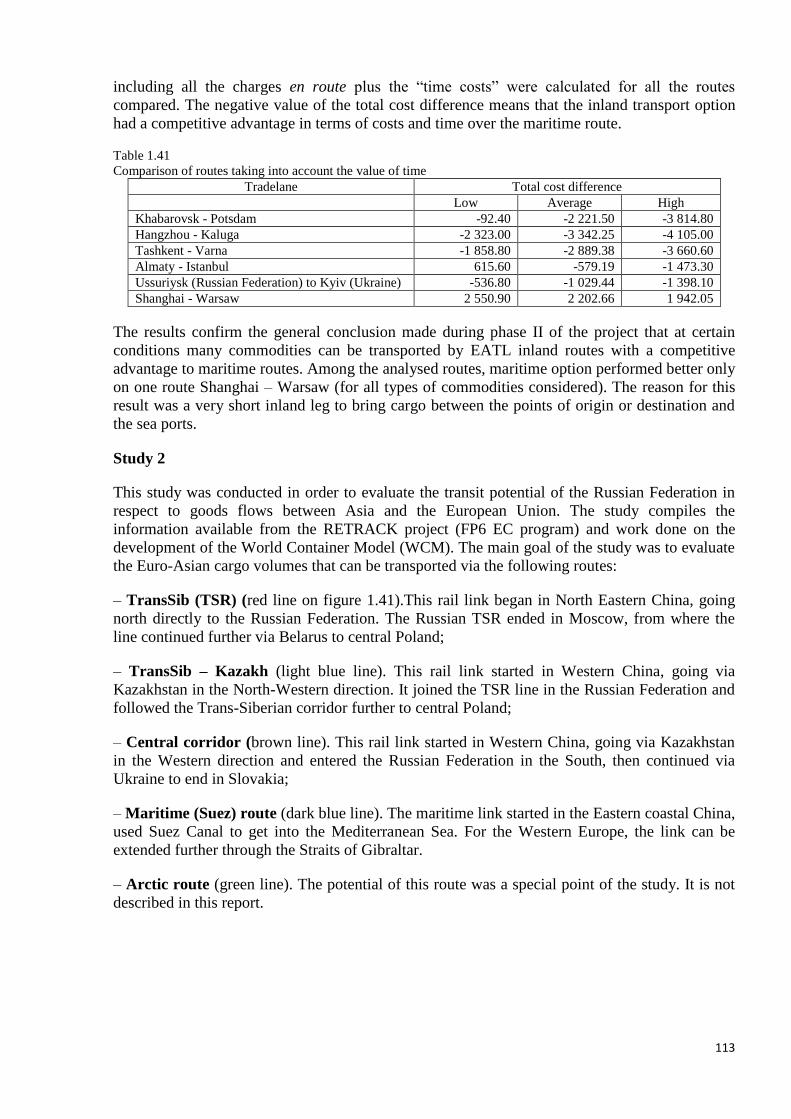
113
including all the charges en route plus the “time costs” were calculated for all the routes
compared. The negative value of the total cost difference means that the inland transport option
had a competitive advantage in terms of costs and time over the maritime route.
Table 1.41
Comparison of routes taking into account the value of time
Tradelane Total cost difference
Low Average High
Khabarovsk - Potsdam -92.40 -2 221.50 -3 814.80
Hangzhou - Kaluga -2 323.00 -3 342.25 -4 105.00
Tashkent - Varna -1 858.80 -2 889.38 -3 660.60
Almaty - Istanbul 615.60 -579.19 -1 473.30
Ussuriysk (Russian Federation) to Kyiv (Ukraine) -536.80 -1 029.44 -1 398.10
Shanghai - Warsaw 2 550.90 2 202.66 1 942.05
The results confirm the general conclusion made during phase II of the project that at certain
conditions many commodities can be transported by EATL inland routes with a competitive
advantage to maritime routes. Among the analysed routes, maritime option performed better only
on one route Shanghai – Warsaw (for all types of commodities considered). The reason for this
result was a very short inland leg to bring cargo between the points of origin or destination and
the sea ports.
Study 2
This study was conducted in order to evaluate the transit potential of the Russian Federation in
respect to goods flows between Asia and the European Union. The study compiles the
information available from the RETRACK project (FP6 EC program) and work done on the
development of the World Container Model (WCM). The main goal of the study was to evaluate
the Euro-Asian cargo volumes that can be transported via the following routes:
– TransSib (TSR) (red line on figure 1.41).This rail link began in North Eastern China, going
north directly to the Russian Federation. The Russian TSR ended in Moscow, from where the
line continued further via Belarus to central Poland;
– TransSib – Kazakh (light blue line). This rail link started in Western China, going via
Kazakhstan in the North-Western direction. It joined the TSR line in the Russian Federation and
followed the Trans-Siberian corridor further to central Poland;
– Central corridor (brown line). This rail link started in Western China, going via Kazakhstan
in the Western direction and entered the Russian Federation in the South, then continued via
Ukraine to end in Slovakia;
– Maritime (Suez) route (dark blue line). The maritime link started in the Eastern coastal China,
used Suez Canal to get into the Mediterranean Sea. For the Western Europe, the link can be
extended further through the Straits of Gibraltar.
– Arctic route (green line). The potential of this route was a special point of the study. It is not
described in this report.
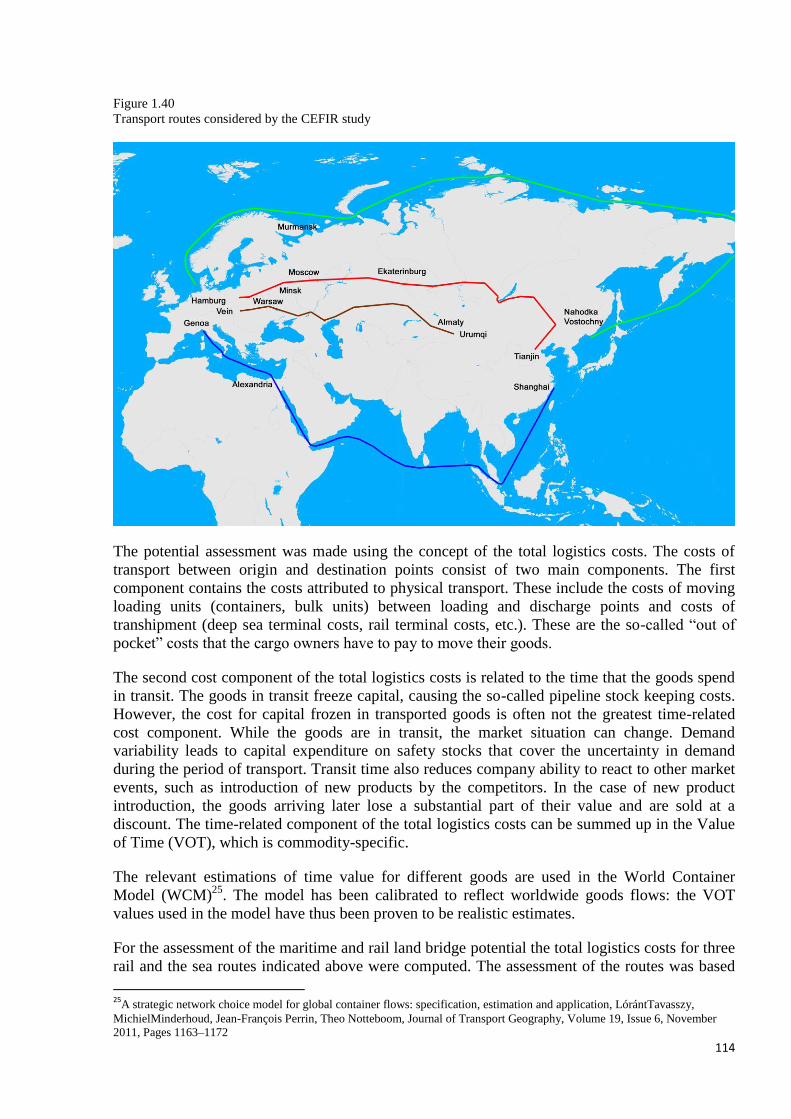
114
Figure 1.40
Transport routes considered by the CEFIR study
The potential assessment was made using the concept of the total logistics costs. The costs of
transport between origin and destination points consist of two main components. The first
component contains the costs attributed to physical transport. These include the costs of moving
loading units (containers, bulk units) between loading and discharge points and costs of
transhipment (deep sea terminal costs, rail terminal costs, etc.). These are the so-called “out of
pocket” costs that the cargo owners have to pay to move their goods.
The second cost component of the total logistics costs is related to the time that the goods spend
in transit. The goods in transit freeze capital, causing the so-called pipeline stock keeping costs.
However, the cost for capital frozen in transported goods is often not the greatest time-related
cost component. While the goods are in transit, the market situation can change. Demand
variability leads to capital expenditure on safety stocks that cover the uncertainty in demand
during the period of transport. Transit time also reduces company ability to react to other market
events, such as introduction of new products by the competitors. In the case of new product
introduction, the goods arriving later lose a substantial part of their value and are sold at a
discount. The time-related component of the total logistics costs can be summed up in the Value
of Time (VOT), which is commodity-specific.
The relevant estimations of time value for different goods are used in the World Container
Model (WCM)25
. The model has been calibrated to reflect worldwide goods flows: the VOT
values used in the model have thus been proven to be realistic estimates.
For the assessment of the maritime and rail land bridge potential the total logistics costs for three
rail and the sea routes indicated above were computed. The assessment of the routes was based
25
A strategic network choice model for global container flows: specification, estimation and application, LórántTavasszy,
MichielMinderhoud, Jean-François Perrin, Theo Notteboom, Journal of Transport Geography, Volume 19, Issue 6, November
2011, Pages 1163–1172
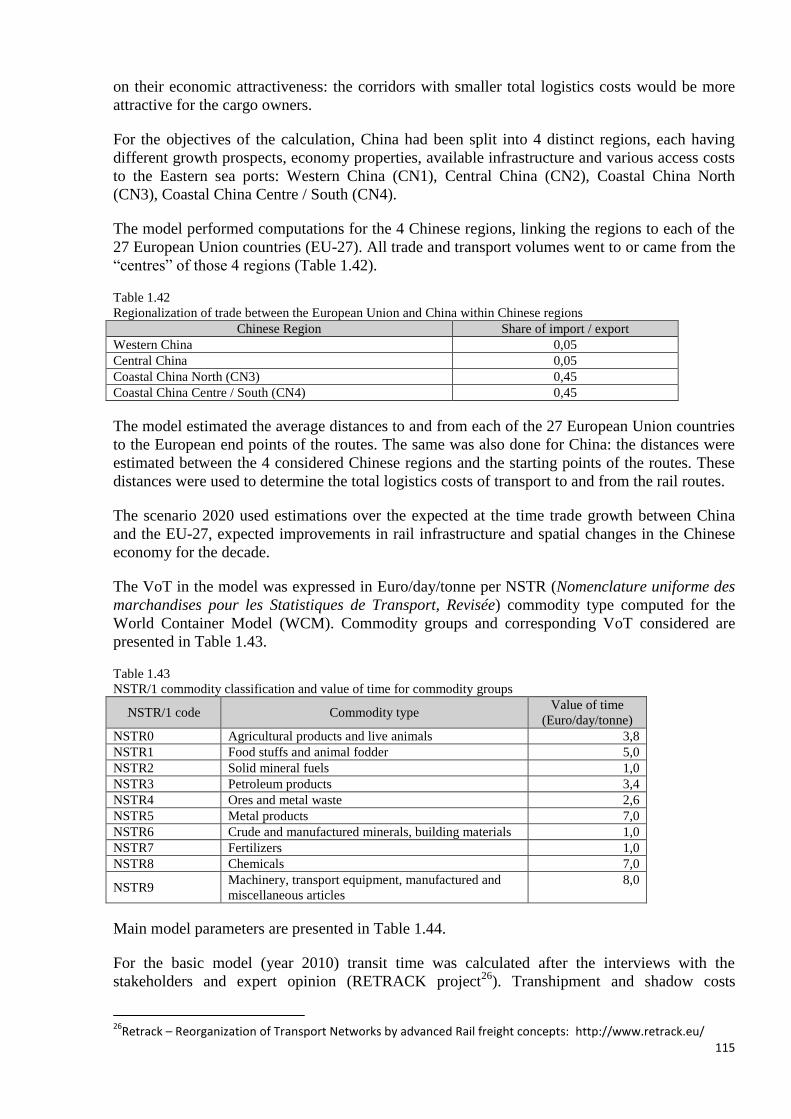
115
on their economic attractiveness: the corridors with smaller total logistics costs would be more
attractive for the cargo owners.
For the objectives of the calculation, China had been split into 4 distinct regions, each having
different growth prospects, economy properties, available infrastructure and various access costs
to the Eastern sea ports: Western China (CN1), Central China (CN2), Coastal China North
(CN3), Coastal China Centre / South (CN4).
The model performed computations for the 4 Chinese regions, linking the regions to each of the
27 European Union countries (EU-27). All trade and transport volumes went to or came from the
“centres” of those 4 regions (Table 1.42).
Table 1.42
Regionalization of trade between the European Union and China within Chinese regions
Chinese Region Share of import / export
Western China 0,05
Central China 0,05
Coastal China North (CN3) 0,45
Coastal China Centre / South (CN4) 0,45
The model estimated the average distances to and from each of the 27 European Union countries
to the European end points of the routes. The same was also done for China: the distances were
estimated between the 4 considered Chinese regions and the starting points of the routes. These
distances were used to determine the total logistics costs of transport to and from the rail routes.
The scenario 2020 used estimations over the expected at the time trade growth between China
and the EU-27, expected improvements in rail infrastructure and spatial changes in the Chinese
economy for the decade.
The VoT in the model was expressed in Euro/day/tonne per NSTR (Nomenclature uniforme des
marchandises pour les Statistiques de Transport, Revisée) commodity type computed for the
World Container Model (WCM). Commodity groups and corresponding VoT considered are
presented in Table 1.43.
Table 1.43
NSTR/1 commodity classification and value of time for commodity groups
NSTR/1 code Commodity type Value of time
(Euro/day/tonne)
NSTR0 Agricultural products and live animals 3,8
NSTR1 Food stuffs and animal fodder 5,0
NSTR2 Solid mineral fuels 1,0
NSTR3 Petroleum products 3,4
NSTR4 Ores and metal waste 2,6
NSTR5 Metal products 7,0
NSTR6 Crude and manufactured minerals, building materials 1,0
NSTR7 Fertilizers 1,0
NSTR8 Chemicals 7,0
NSTR9 Machinery, transport equipment, manufactured and
miscellaneous articles
8,0
Main model parameters are presented in Table 1.44.
For the basic model (year 2010) transit time was calculated after the interviews with the
stakeholders and expert opinion (RETRACK project26
). Transhipment and shadow costs
26
Retrack – Reorganization of Transport Networks by advanced Rail freight concepts: http://www.retrack.eu/
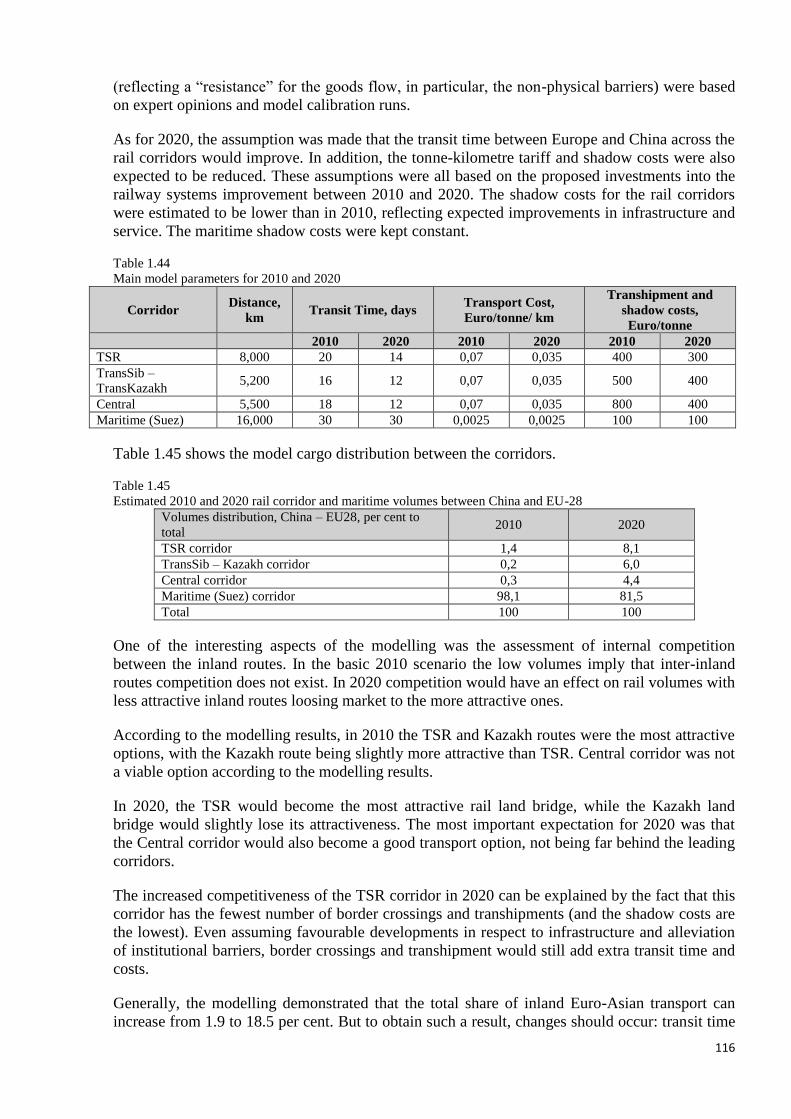
116
(reflecting a “resistance” for the goods flow, in particular, the non-physical barriers) were based
on expert opinions and model calibration runs.
As for 2020, the assumption was made that the transit time between Europe and China across the
rail corridors would improve. In addition, the tonne-kilometre tariff and shadow costs were also
expected to be reduced. These assumptions were all based on the proposed investments into the
railway systems improvement between 2010 and 2020. The shadow costs for the rail corridors
were estimated to be lower than in 2010, reflecting expected improvements in infrastructure and
service. The maritime shadow costs were kept constant.
Table 1.44
Main model parameters for 2010 and 2020
Corridor Distance,
km Transit Time, days
Transport Cost,
Euro/tonne/ km
Transhipment and
shadow costs,
Euro/tonne
2010 2020 2010 2020 2010 2020
TSR 8,000 20 14 0,07 0,035 400 300
TransSib –
TransKazakh 5,200 16 12 0,07 0,035 500 400
Central 5,500 18 12 0,07 0,035 800 400
Maritime (Suez) 16,000 30 30 0,0025 0,0025 100 100
Table 1.45 shows the model cargo distribution between the corridors.
Table 1.45
Estimated 2010 and 2020 rail corridor and maritime volumes between China and EU-28
Volumes distribution, China – EU28, per cent to
total 2010 2020
TSR corridor 1,4 8,1
TransSib – Kazakh corridor 0,2 6,0
Central corridor 0,3 4,4
Maritime (Suez) corridor 98,1 81,5
Total 100 100
One of the interesting aspects of the modelling was the assessment of internal competition
between the inland routes. In the basic 2010 scenario the low volumes imply that inter-inland
routes competition does not exist. In 2020 competition would have an effect on rail volumes with
less attractive inland routes loosing market to the more attractive ones.
According to the modelling results, in 2010 the TSR and Kazakh routes were the most attractive
options, with the Kazakh route being slightly more attractive than TSR. Central corridor was not
a viable option according to the modelling results.
In 2020, the TSR would become the most attractive rail land bridge, while the Kazakh land
bridge would slightly lose its attractiveness. The most important expectation for 2020 was that
the Central corridor would also become a good transport option, not being far behind the leading
corridors.
The increased competitiveness of the TSR corridor in 2020 can be explained by the fact that this
corridor has the fewest number of border crossings and transhipments (and the shadow costs are
the lowest). Even assuming favourable developments in respect to infrastructure and alleviation
of institutional barriers, border crossings and transhipment would still add extra transit time and
costs.
Generally, the modelling demonstrated that the total share of inland Euro-Asian transport can
increase from 1.9 to 18.5 per cent. But to obtain such a result, changes should occur: transit time

117
should decrease by 25-30 per cent, transport costs should be at 50 per cent level compared to the
2010 basis and transhipment and shadow costs should decrease significantly.
Study 3
The target of the research was the comparison of time and cost for cargo transportation via three
rail EATL routes (No. 1, 2 and 7) and the sea route from China. The origin points were located
nearby the sea (Shanghai) and inland (Beijing). Destination point was Warsaw (Poland).
The 40’box containing motors for household sewing machines (cargo that requires no additional
control measures), net weight 20 tonnes, was chosen as the object of transport.
The specified delivery time was the smallest possible on the market.
Seven routes were chosen for the analysis: two of them connecting Shanghai and Warsaw and
four between Beijing and Warsaw:
1a) Shanghai-Shanghai sea port – containership by sea - port of Gdańsk – railway container
train - Warsaw;
1b) Shanghai- Railway route EATL No. 7 (China-[BCP Alashankou/Dostyk]-Kazakhstan-[BCP
Saryagash/Keles]-Uzbekistan-[BCP Beyneu (Karakalpakia) /Oasis]- Kazakhstan -[BCP
Aksaraiskaya/Ganyushkino]-Russian Federation-[BCP Gukovo/Krasnaya Mogila] - Ukraine-
[BCP Mostiska/Pshemyshl]-Poland), Warsaw;
2a) Beijing-railway container train -port Shanghai- containership by sea-port of Gdańsk- railway
container train - Warsaw;
2b) Beijing - railway route EATL No. 7 (China-[BCP Alashankou/Dostyk]-Kazakhstan-
[BCPSaryagash/Keles]-Uzbekistan-[BCP Beyneu (Karakalpakia) / Oasis]- Kazakhstan-[BCP
Aksaraiskaya / Ganyushkino]-Russian Federation-[BCP Gukovo/Krasnaya Mogila] – Ukraine -
[BCP Mostiska/Pshemyshl] -Poland), Warsaw;
3a) Beijing-railway container train -port Shanghai-containership by sea -port of Gdańsk-railway
container train -Warsaw (coincides with route 2 (a));
3b) Beijing-railway container train route No. 1 EATL (China-[ BCPMančžouli/Zabaykalsk]-
Russian Federation (Trans-Siberian railway)-[BCP Red/Osinovka]-Belarus-[BCP
Brest/Terespol]-Poland), Warsaw;
4a) Beijing-railway container train -port Shanghai-containership by sea -port of Gdańsk-railway
container train -Warsaw (coincides with route 2 (a));
4b) Beijing-railway route EATL No. 2 (China-[BCPAlashankou/Dostyk]-Kazakhstan-[BCP
Petropavlovsk (Mamlyutka)/Kokchetav]-Russian Federation-[Red/Osinovka]-Belarus-[BCP
Brest/Terespol]-Poland), Warsaw.
Case 1. Comparison of routes 1a and 1b (tables 1.46-1.47, figures 1.42-1.43) shows that rail
traffic between China and Poland through Central Asia will be competitive for the carriage of
containers in container trains only (average speed of 1000 km/day). The difference in delivery
times in favour of railways in this case is big enough: 28 days.
Under normal conditions (standard train) this time advantage will likely be lost due to downtime
of a train on the border crossings.
118
At the same time, cost difference was the largest of all of the scenarios in the study: inland route
was more expensive than sea by 8 500 US Dollars. The railroad crosses the territory of 7
countries (Kazakhstan, twice), and the total length of the route is 11 653 km.
Table 1.46
Route 1a components
Route section Length, km Price, US Dollars
(Commercial offer)
Price, US
Dollars
(Internet data)
Time, hours
Port Handling costs Shanghai sea port - 100 100 -
Other costs Shanghai sea port - 150 150 -
Shanghai port-port of Gdansk (by sea) 20 486 2189 2 350 981
Port Handling costs Gdansk sea port - 165.5 165.5 -
Other costs Gdansk sea port - 250 250 -
Port Gdansk- Warsaw (by rail) 373 445 445 14,5
Warsaw rail terminal handling costs - 35 35 -
Warsaw rail terminal other costs - 45 45 -
TOTAL 20 859 3 379.5 3 540.5 995.5
Table 1.47
Route 1b components
Route section Length, km Price, US Dollars
(Railway tariffs)
Time, hours
Shanghai rail terminal handling costs - 25 -
Shanghai rail terminal other costs - 30 -
China (by rail) Shanghai Jun-Gunlu-Alashankou 4 529 6 247 114
Kazakhstan (by rail) Dostyk-Sary-Agach 1 831 910 50
Uzbekistan (by rail) Keles-Karakalpakia 1 686 1 399 46.5
Kazakhstan (by rail) Oasis-Dina Nurpeisova 796 982 25
Russian Federation (by rail) Kigaš-Gukovo 862 988 27
Ukraine (by rail) Krasnaya Mogila-Mostiska II 1 576 718 43
Poland (by rail) Pshemyshl-Warsaw 380 445 9
Warsaw rail terminal handling costs - 35 -
Warsaw rail terminal other costs - 45 -
Total 11 660 11 824 314.5
Figure 1.41
Time – distance diagram for routes 1a and 1b
Shanghai
Warsaw
Gdansk
Warsaw
DISTANCE, KM
Sea route (1a)
Rail route (1b)
(1b))
TIME, HOURS
119
Figure 1.42
Cost – distance diagram for routes 1a and 1b
Table 1.48
Route 2a components
Route section Length,
km
Price, US Dollars
(Commercial offer)
Price, US
Dollars (Internet data)
Time,
hours
Beijing – Shanghai sea port (by rail) 1 095 1 548 1 548 26
Other costs Shanghai sea port - 100 100 -
Shanghai port-port of Gdansk (by sea) - 150 150 -
Port Handling costs Gdansk sea port 20 486 2 189 2 350 981
Other costs Gdansk sea port - 165.5 165.5 -
Port Gdansk- Warsaw (by rail) - 250 250 -
Warsaw rail terminal handling costs 373 445 445 14,5
Warsaw rail terminal other costs - 35 35 -
Other costs Shanghai sea port - 45 45 -
TOTAL 21 954 4 927 5 088 1 021.5
Table 1.49
Route 2b components
Route section Length, km Price, US Dollars
(Railway tariffs)
Time, hours
Beijing rail terminal handling costs - 25 -
Beijing rail terminal other costs - 30 -
China (by rail) Beijing -Alashankou 3 354 4 724 86.5
Kazakhstan (by rail) Dostyk-Sary-Agach 1 831 910 50
Uzbekistan (by rail) Keles-Karakalpakia 1 686 1 399 46.5
Kazakhstan (by rail) Oasis-Dina Nurpeisova 796 982 25
Russian Federation (by rail) Kigaš-Gukovo 862 1 113 27
Ukraine (by rail) Krasnaya Mogila-Mostiska II 1 576 718 43
Poland (by rail) Pshemyshl-Warsaw 380 445 9
Warsaw rail terminal handling costs - 35 -
Warsaw rail terminal other costs - 45 -
Total 10 485 10 426 287
Warsaw
Warsaw
Gdansk
Shanghai
COSTS, US Dollars
DISTANCE, KM
Sea route (1a)
Rail route (1b)
(1b))

120
Figure 1.43
Time – distance diagram for routes 2a and 2b
Figure 1.44
Cost – distance diagram for routes 2a and 2b
Case 2. Comparison of routes 2a and 2b shows the same tendency as in case 1.
Case 3. Route 3a is identical to route 2a. Data for route 3b components is shown in table 1.50.
Table 1.50
Route 3b components
Route section Length, km Price, US Dollars
(Railway tariffs)
Time, hours
Beijing rail terminal handling costs - 25 -
Beijing rail terminal other costs - 30 -
China (by rail) Beijing-Manzhouli 2 335 3 234 62
Russian Federation (by rail) Zabaikalsk-
Krasnoe
7 069 1 806 174
Belarus (by rail) Osinovka-Brest 609 487 20
Poland (by rail) Terespol-Warsaw 210 330 5
Warsaw rail terminal handling costs - 35 -
Warsaw rail terminal other costs - 45 -
TOTAL 10 223 5 992 261
TIME, HOURS
Beijing
Warsaw
Gdansk
Warsaw
DISTANCE, KM
Sea route (2a)
Rail route (2b)
(1b))
Warsaw
Warsaw
Gdansk
Beijing
COSTS, US Dollars
DISTANCE, KM
Sea route (2a)
Rail route (2b)
(1b))

121
Figure 1.45
Time – distance diagram for routes 3a and 3b
Figure 1.46
Cost – distance diagram for routes 3a and 3b
In this case, the advantage of rail transport is obvious. The difference in delivery times is
enormous: 31 days in favour of rail. Due to this and given the cost difference that accounts for
only 1 065 US Dollars railway route would be quite competitive with sea in this case.
Case 4. Data for route 4b is shown in table 1.51.
Table 1.51
Route 4b components
Route section Length, km Price, US Dollars
(Railway tariffs)
Time, hours
Beijing rail terminal handling costs - 25 -
Beijing rail terminal other costs - 30 -
China (by rail) Beijing -Alashankou 3 354 4 675 86.5
Kazakhstan (by rail) Dostyk-Petropavlovsk 1 904 942 52
Russian Federation (by rail) Petropavlovsk-
Krasnoe
2 845 1 311 74
Belarus (by rail) Osinovka-Brest 609 487 20.5
Poland (by rail) Terespol-Warsaw 210 330 5
Warsaw rail terminal handling costs - 35 -
TIME, HOURS
Beijing
Warsaw Gdansk
Warsaw
DISTANCE, KM
Sea route (3a)
Rail route (3b)
(1b))
Beijing
Warsaw
Warsaw
Gdansk
COSTS, US Dollars
DISTANCE, KM
Sea route (3a)
Rail route (3b)
(1b))

122
Warsaw rail terminal other costs - 45 -
Total 8 922 7 880 238
Figure 1.47
Time – distance diagram for routes 4a and 4b
Figure 1.48
Cost – distance diagram for routes 4a and 4b
The difference in the cost of shipping container for these two routes was $ 2 953. The above
chart clearly reflects the impact of generally higher costs for rail transportation. The railroad
crosses the territory of 5 countries, and the total length of the route was 8 922 km, which is
shorter than along the route of the Trans-Siberian railway, but due to crossing the territory of
Belarus the price for rail transportation increased significantly. The difference in delivery times
compared to maritime transport was 33 days.
It should be noted that all the data relating to the cost of transportation on selected routes was
taken from the public open sources: open publication of official statistics of the EATL countries
and international organizations; analytical, statistical and empirical publications in specialized
media; web sites of state and private companies as well as web resources created for the
exchange of trade information.
At the same time, for each particular case, price of transport are subject of negotiation between
shippers, carriers and other interested parties. Typically, this leads to the establishment of an
acceptable price for all parties, which can differ significantly from the average, indicative figures
obtained in this and other studies.
TIME, HOURS
Beijing
Warsaw Gdansk
Warsaw
DISTANCE, KM
Sea route (4a)
Rail route (4b)
(1b))
Warsaw
Warsaw
Gdansk
Beijing
COSTS, US Dollars
DISTANCE, KM
Sea route (4a)
Rail route (4b)
(1b))
123
Study 4
The Eurasian Development Bank published in 2016 the research note containing some
preliminary estimates in regard to the potential transport capacity and investment needs of
various Silk Road Economic Belt (SREB) transport routes that run across the Eurasian Economic
Union’s countries.
The study argued that the huge potential presented by inland routes from China through Central
Asia to Europe was not being utilized. According to the study, out of all inland routes, only two
were in actual operation:
- Urumqi (XUAR) – Kazakhstan – Omsk – Moscow – EU (as regards transit, its estimated
utilization ratio at 20 per cent); and
- Shanghai – Trans-Siberian Railroad – Brest (Trans-Siberian Railroad utilization ratio reached
100 per cent).
The inland routes were considerably more expensive than the marine routes. The study estimated the
cost of marine transportation along the Shanghai – Rotterdam route as 10 cents per tonne per
mile, while the cost of railroad transportation was as high as 30 cents per tonne per mile.
Therefore, the study argued that meaningful trading volumes can be generated on inland routes
only for cargo flows from China's central and western provinces.
The list of goods that can be profitably carried by land from central and eastern provinces was
very limited and contained:
- export goods originating from China's western provinces (mostly the Xinjiang Uyghur
Autonomous Region, the Tibet Autonomous Region, and the Qinghai Province). The alternative
for those provinces was to take the goods to the shore (about 3,000 km), and then carry them by
sea;
- limited selection of goods originating from China's central and eastern provinces. These were
high unit added value products (electronic devices, automotive parts, pharmaceuticals, standard
and costume jewellery, etc.) and goods with critical delivery times (some food products,
premium textiles).
The study pointed out at 6 potential transit corridors that could be used to deliver cargo along the
China – Europe route. These corridors were analysed regarding their condition at the time of the
study and a potential that can be reached after upgrade.
Route 1: Urumqi (XUAR) – Kazakhstan – Omsk – Moscow – EU. The cost of cargo delivery via
this route strongly depended on the mode of transport: it amounted to about US$ 1,300 per 1
TEU for railroad carriage. Design capacity of this route was the highest among all SREB routes
at 300,000 TEUs. Its utilization ratio did not exceed 20 per cent of maximum capacity. The most
established version of the Urumqi – EU route was the transport route passing through the
following cities: Lianyungang, Zhengzhou, Lanzhou, Urumqi, Khorgos, Almaty, Kyzylorda,
Aktobe, Orenburg, Kazan, Nizhny Novgorod, Moscow, and Saint-Petersburg with access to
Baltic Sea ports. The bulk of transit cargo used this route and the Trans-Siberian Railroad. One
of its key advantages was that there was only one customs border between China and
Kazakhstan. The route's most critical problem was its limited throughput capacity. To make it
competitive, it needed to be overhauled, and its transport and logistical infrastructure needed to
be expanded.
124
The volume of funding required to modernize and improve railroads in the Russian Federation
and Kazakhstan, to develop the Urumqi – Omsk – Moscow – EU route, and to build or
modernise six major logistical centres (including those already in operation) was estimated at
US$ 6 billion. Modernization will make it possible not only to boost cargo turnover, but also to
bring railroad transportation tariffs down from 1 300 US Dollars per 1 TEU to 1 000 US Dollars
per 1 TEU.
Route 2: Shanghai – Trans-Siberian Railroad – Brest; cargoes were delivered from China
through Russian Far East Maritime Province (PrimorskyKrai). The cost of cargo delivery from
Vladivostok to Moscow using the Trans-Siberian Railroad stood at about 1,100 US Dollars per 1
TEU, and 1 400 US Dollars per 2 TEUs at the time of the study. The cost of railroad cargo
delivery from Shanghai to Brest (including freight costs) would be about 2 200 US Dollars per 1
TEU, and 3 000 US Dollars per 2 TEUs. The overall throughput capacity of the routes was 250
000 TEUs, and it was already being fully utilized. The key problem of the route was that it had to
use the busiest section of the Trans-Siberian Railroad: Omsk – Novosibirsk. This route was also
longer than the Kazakhstan route. To improve this route, it would require construction of a
number of new railroads, in some cases in mountainous areas. Subject to all those factors, the
study argued that this route would hardly prove to be attractive to China.
Estimates of required investments into modernization of the Trans-Siberian Railroad varied. The
cost of construction of new additional sorting stations with adjacent container logistical terminals
was estimated at 2 billion US Dollars. Efficient utilization and modernization of existing private
terminals and Russian Railways terminals and construction of several new logistical centres
could reduce that cost to 1.2-1.4 billion US Dollars. This would make it possible not only to
increase the cargo turnover, but also to reduce transport tariffs to less than 1 100 US Dollars per
1 TEU for the Trans-Siberian Railroad, and to about 1 000 US Dollars per 1 TEU for the Urumqi
– Omsk – Brest route.
Route 3: Urumqi – Aktau – Makhachkala – Novorossiysk – Constanta. The cost of transport
(including transshipment to container carriers) stood at about 4 000 US Dollars per 1 TEU for
deliveries to the European Union, and 3 200 US Dollars per 1 TEU for deliveries to the south of
the Russian Federation. In theory, this route could be used to transport about 100 000TEUs per
year (subject to existing port capacity and available fleet).
Route 4: Urumqi – Aktau – Makhachkala – Tbilisi – Constanta. The cost of cargo deliveries
from China to Georgia would amount to 3 700 US Dollars per 1 TEU. The route's theoretical
throughput capacity at the time of the study did not exceed 50 000 TEUs per year (subject to
existing port capacity and available fleet).
The first issue arising in connection with further development of trans-Caspian routes was that
none of the existing Caspian ports was ready to process large cargo flows at the time the study
was done. All port facilities required serious modernization. To use trans-Caspian routes, it
would be necessary not only to modernize the ports, but also to build new container logistical
centres. Another problem was the need to use additional maritime transport.
Route 5: Urumqi – Aktau – Baku – Poti – Constanta. This route was the most expensive and had
the least throughput capacity of all the routes described above; besides, it was used very little, if
at all. The cost of railroad cargo delivery was as high as 5 000 US Dollars.
This route would require the most significant outlays, including completion of construction of
container facilities in Baku and port facilities in Poti, reconstruction of motorways, construction
of tunnels and container logistical centres. Total required capital expenditures were estimated at

125
not less than 8 billion US Dollars. That figure combined with the need to transship cargo at
several ports made the route not very competitive.
Route 6: Urumqi – transit via Kazakhstan – Teheran (Iran). This route was much cheaper, and its
throughput capacity was much higher. The cost of railroad cargo delivery was up to 1 700 US
Dollars per 1 TEU. Potential capacity of this route was one the highest among all routes described
above, and stood at 300 000 TEUs.
Minimum target investments required to develop this route were estimated at 2 billion US Dollars
(source: Ministry of Transportation of Iran). Design of the route development program was still to be
finalized.
Table 1.52 contains the main characteristics of the routes described above.
Table 1.52
SREB Transport corridors and their potential
Route Estimated route
capacity,
thousand TEUs
Railroad
Transportation
Cost, US$/TEU
Potential
Throughput
Capacity Post-
Modernisation,
thousand TEUs
Railroad
Transportation Cost
Post-Modernisation,
US$/TEU
Urumqi (XUAR) –
Kazakhstan – Omsk –
Moscow - EU
300 1 300 1 000 1 000
Shanghai – Trans-Siberian
Railroad - Brest
250 2 200 1 000 1 000
Urumqi (XUAR) – Aktau –
Makhachkala – Novorossiysk
- Constanta
100 4 000 1 000 1600
Urumqi (XUAR) – Aktau –
Makhachkala – Tbilisi
50 3 700 1 000 1 600
Urumqi (XUAR) – Aktau –
Baku – Poti - Constanta
50 5 000 1 500
Urumqi (XUAR) – transit to
EU via Kazakhstan and Iran
300 1 700 1 000
The study concluded that transport corridors through Central Asia and the Russian Federation may
potentially attract about 4 per cent of total China – European Union maritime cargo flows. Target
export groups included a broad range of products manufactured in China's western provinces (mostly
the Xinjiang Uyghur Autonomous Region, the Tibet Autonomous Region, and the Qinghai
Province), and a limited selection of goods originating from its central and eastern provinces.
Implementation of development programs and satellite investment projects could increase the
throughput capacity of SREB transport corridors to 3 million TEUs (which would be about 13 per
cent of the Euro-Asian container flow as per 2017 data).
According to the study, the optimal outcome would be one where up to 1 million TEUs would travel
through Kazakhstan to the Russian Federation with subsequent partial delivery to the European
Union (up to 30 per cent), and another 1 million TEUs would transit through Aktau in the direction
of Novorossiysk via Makhachkala to be evenly divided between the Russian and South-European
markets.
The study also pointed out that an important restriction exists: attainment of maximum cargo
throughput capacity by the SREB routes would be contingent on the Kazakhstan transport system
becoming capable of absorbing 3 million TEUs.
126
Kazakhstan already had the required basic infrastructure (railroads, motorways, ports) in place.
However, there was a major shortage of technological superstructures – modern container processing
centres, customs terminals, and related logistical services. Qualified staff was also in short supply.
Taken together, those factors constituted a critical infrastructural barrier preventing any major
increase of cargo flows through Central Asia.

127
PART II. CURRENT INITIATIVES, PROJECTS AND STUDIES IN EATL
REGION
II.1. Overview of international studies, programmes and initiatives on Euro-Asian
transport links development
II.1.1. United Nations Economic Commission for Europe (UNECE)
The United Nations Economic Commission for Europe (UNECE), and more in particular, its
Sustainable Transport Division, at the time of writing this report, was managing number of
initiatives and activities relevant to the development of EATL. Most importantly, UNECE
provided secretariat and thus managed the phase III of the EATL project. UNECE, as the
custodian of several international agreements that provide the necessary international framework
in support of a development of coherent road, rail, inland waterways as well as combined road
and rail networks, continued to manage these agreements. Similarly, UNECE continued to
manage international agreements in support of improving transport connectivity. It managed
those key agreements together with and for their Contracting Parties. These legal instruments
are:
a) The European Agreement on Main International Traffic Arteries (AGR),
b) The European Agreement on Main International Railway Lines (AGC),
c) The European Agreement on Important International Combined Transport Lines and Related
Installations (AGTC),
d) The European Agreement on Main Inland Waterways of International Importance (AGN),
e) 1968 Convention on Road Traffic,
f) 1968 Convention on Road Signs and Signals,
g) Convention on the Contract for the International Carriage of Goods by Road (CMR),
h) Additional Protocol to the CMR Concerning the Electronic Consignment Note (e-CMR),
i) Customs Convention on the International Transport of Goods under Cover of TIR Carnets
(TIR Convention)
j) International Convention on the Harmonization of Frontier Controls of Goods,
k) Customs Convention on Containers,
l) European Agreement concerning the International Carriage of Dangerous Goods by Road
(ADR), and
m) Agreement on the International Carriage of Perishable Foodstuffs and on the Special
Equipment to be Used for such Carriage (ATP).
The first four international infrastructure agreements define respectively the E transport networks
for different modes as well as the minimum technical requirements according to which the
relevant infrastructures should be built. AGTC also includes operational parameters for
combined transport services.
128
They are the only agreements in the Pan-European region that provide a basis for the long-term
development of coherent international networks for the various modes of inland transport. As
such, they were taken as a basis for the determination of the Pan-European transport corridors at
the Pan-European Transport Conferences in Crete (1994) and Helsinki (1997).
The E road and E rail networks represent the most useful basis for the identification of priority
Euro–Asian transport corridors.
The 1968 Conventions on Road Traffic and on Road Signs and Signals are the international
treaties designed to facilitate international road traffic and to increase road safety by establishing
standard traffic rules and by standardizing the signage system for road traffic (road signs, traffic
lights and road markings) in use internationally among their Contracting Parties.
The Convention on the Contract for the International Carriage of Goods by Road (CMR) relates
to various legal issues concerning international transportation of cargo by road, including
requirements for a consignment note. Additional Protocol to the CMR Concerning the Electronic
Consignment Note provides a framework for establishing an electronic consignment note.
The Customs Convention on the International Transport of Goods under Cover of TIR Carnets
(TIR Convention) establishes a global customs transit system by allowing goods in customs-
sealed vehicles and freight containers to transit countries without border checks, through the use
of one internationally recognized and harmonized customs control document: the TIR Carnet.
TIR significantly reduces border waiting times while enhancing security, decreasing costs and
increasing road transport efficiency in many countries of Europe and Asia. It streamlines border
crossing procedures by having customs formalities done at the origin and destination, rather than
at each frontier, guaranteeing payment of customs duties and taxes and offering free of charge,
web-based pre-declaration and other IT risk management tools.
The International Convention on the Harmonization of Frontier Controls of Goods
(Harmonization Convention, 1982) establishes commonly agreed requirements for coordinated
border management and reduction of border formalities as well as the number and duration of all
types of border controls of goods, be it for health reasons (medico-sanitary, veterinary,
phytosanitary), for reasons of compliance with technical standards or for quality inspections in
general, and applies to all goods being imported, exported or in transit. In 2008, a new Annex to
the Convention on road transport came into force and covers, inter alia, facilitation of visa
procedures for professional drivers, standardized weighing operations and international vehicle
weight certificate, minimum infrastructure requirements for efficient border crossing points and
provisions to monitor the border crossing performance. A similar annex for rail border crossing
came into force at the end of 2011.
The Customs Convention on Containers allows for shipping containers to be brought from a
ratifying state into a ratifying state duty- and tax-free for a period of three months.
The European Agreement concerning the International Carriage of Dangerous Goods by Road
(ADR) establishes that apart from some excessively dangerous goods, other dangerous goods
may be carried internationally in road vehicles subject to compliance with the conditions laid
down for the dangerous goods, in particular as regards their packaging and labelling; and the
conditions laid down for the construction, equipment and operation of the vehicle carrying the
dangerous goods.
The Agreement on the International Carriage of Perishable Foodstuffs and on the Special
Equipment to be Used for such Carriage (ATP) mandates that certain types of equipment be used
129
to transport perishable food across borders and that such equipment will be regularly inspected
ATP applies to transport by road and by rail.
At the time of preparations of this report, UNECE also coordinated work on a Trans-European
network for motorways (TEM) and rail (TER) in Central, Eastern and South-Eastern Europe.
This work was aimed at ensuring seamless connections throughout this geographical area,
including access to markets. More in particular:
TEM Project, accepted in 1977 as a sub-regional cooperation among Central, Eastern and South
Eastern European countries, aimed at facilitating road traffic in the region, to improve the quality and
efficiency of transport operations, to balance existing gaps and disparities between motorway
networks in Western, Eastern, Central and South-Eastern Europe, and to assist the integration process
of European transport infrastructure systems. It was the backbone of the Pan-European Road
Corridors in Central and Eastern Europe (CEE) and of the Transport Infrastructure Needs
Assessment (TINA) exercise.
TER Project, established in 1990 as a sub-regional cooperation among Central, Eastern and
South-Eastern European countries, aimed at assisting the integration process of European
transport rail infrastructure systems, and at developing a coherent and efficient international
railway and combined transport system in accordance with the AGC and AGTC).
TEM and TER Projects were managed based on a Master Plan which set out the priority
infrastructure needs, the backbone networks and a realistic investment plan to develop them.
The original Master Plan was published in 2006 presenting a reliable and pragmatic short-,
medium- and long-term investment strategy for developing road, rail and combined transport
backbone networks in the participating countries. The document was revised between 2008 and
2011 in order to analyse the results of road and rail infrastructure development, to describe the
existing status of road and rail networks, and to set out their development programme until 2020.
The revised Master Plan contained 294 road projects with total budget of 115.1 billion Euros and
191 rail projects with total budget of 73.3 billion Euros.
II.1.2. United Nations Economic and Social Commission for Asia and the Pacific
The United Nations Economic and Social Commission for Asia and the Pacific (UNESCAP), its
Transport Division, worked with its member States to strengthen connectivity, optimize the use
of existing infrastructure and increase the level of integration between the different transport
modes.
Similarly to UNECE, UNESCAP managed several infrastructure agreements, as their custodian,
relevant to the development of EATL, among them:
(a) Intergovernmental Agreement on the Asian Highway Network,
(b) Intergovernmental Agreement on the Trans-Asian Railway Network, and
(c) Intergovernmental Agreement on Dry Ports
In order to finance transport infrastructure and systems in accordance with the agreements,
UNESCAP offered advice on financing options and advocated for public-private partnerships
including network coordination, and provided diagnostic workshops and online training
materials and courses.
130
UNESCAP managed in 2016 a project on the Development of seamless rail-based intermodal
transport services in Northeast and Central Asia for enhancing Euro-Asian transport links. The
goals of this project were to:
(i) review transport documentation, conventions and procedures applying to intermodal cargo
transport across maritime and land borders in the sub-region;
(ii) identify problems related to border crossing efficiency which may be resolved by
streamlining and harmonization of existing documentation and procedures; and
(iii) recommend improvements to documentation and procedures with a view to eliminating
delays to transport at seaports and land borders and contributing to seamless transport flows
across borders.
UNESCAP also organised fact-finding missions to five participating countries in this project:
China, Kazakhstan, Mongolia Russian Federation and South Korea.
The project was concluded with a study issued by UNESCAP which provided the analysis of the
situation and presented recommendations for the harmonization and improvement of
documentation and procedures in Northeast and Central Asia. In particular, the study prepared
based on desk research and data made available by freight forwarders and governments,
recommended the adoption of a new multi-modal transport document for international shipment.
II.1.3. United Nations Office of the High Representative for the Least Developed
Countries, Landlocked Developing Countries and the Small Island Developing
States
The United Nations Office of the High Representative for the Least Developed Countries,
Landlocked Developing Countries and the Small Island Developing States (UN OHRLLS)
continued to support efficient transit cooperation during the duration of the phase III of the
project. Most importantly, UN OHRLLS organized the Second United Nations Conference on
Landlocked Developing Countries in 2014 in Vienna, Austria, at which a programme of action
was adopted – the “Vienna Programme of Action for Landlocked Developing Countries
(LLDCs) for the Decade 2014-2024”.
This Vienna Programme, building upon an earlier Almaty Programme of Action and centred
upon addressing the challenges faced by LLDCs, aimed at contributing to the eradication of
poverty stemming from the countries’ landlockedness, through the implementation of specific
actions in the priority areas identified by the document:
Priority 1: Fundamental transit policy issues
Priority 2: Infrastructure development and maintenance
(a) Transport infrastructure
(b) Energy and information and communications technology infrastructure
Priority 3: International trade and trade facilitation
(a) International trade
(b) Trade facilitation
131
Priority 4: Regional integration and cooperation
Priority 5: Structural economic transformation
Priority 6: Means of implementation
The Report on review of the initial implementation of the Vienna Programme of Action
developed by UN OHRLLS in 2016 for the Meeting of Ministers of Transport of Landlocked
Developing Countries (October 2016, Santa Cruz, Bolivia), and First Global Conference on
Sustainable Transport (November 2016, Ashgabat, Turkmenistan) highlighted the progress
achieved with regard to transit corridor performance, infrastructure development and
maintenance, international trade facilitation, and bi- and multi-lateral cooperation involving
LLDCs and their transit neighbours. The report provided several recommendations on policy
options and some practical suggestions for possible new collaborative project initiatives, in areas
such as:
- the priorities in transport infrastructure for sustainable development of LLDCs
- international, regional and bilateral cooperation for trade and transport facilitation,
- technologies for sustainable transport,
- financing of infrastructure,
- structural economic transformation, and
- road safety.
II.1.4. United Nations Conference on Trade and Development
The United Nations Conference on Trade and Development (UNCTAD) worked during the
phase III of the EATL project with LLDCs and supported them in tackling persisting and
emerging challenges by providing advisory services and organizing high-level expert group
meetings, among others to address key challenges faced by these countries. In particular,
UNCTAD prepared policy-focused studies at the request of LLDCs and supported LLDCs to
attract foreign direct investments.
II.1.5. United Nations Special Programme for the Economies of Central Asia
The United Nations Special Programme for the Economies of Central Asia (SPECA), a joint
UNECE-UNESCAP initiative, continued to contribute to the EATL development. The SPECA
Thematic Working Group on Sustainable Transport, Transit and Connectivity (TWG-STTC),
earlier called Project Working Group on Transport and Border Crossing, focused in the period of
the phase III of the EATL project on inland transport infrastructure development, facilitation of
border-crossing procedures, railway and intermodal transport development and improvement of
road safety in the region.
Box 1. Priorities for SPECA region
Member States: Afghanistan, Azerbaijan, Kazakhstan, Kyrgyzstan, Tajikistan, Turkmenistan and
Uzbekistan.
Priorities that are most
important for the
EATL development
Implementation of international transport conventions and agreements;
Coordinated development of inland transport infrastructure;
Establishment and operation of national coordinating mechanisms for transport
facilitation;
Identification and elimination of major bottlenecks along international transport
132
routes;
Creation of inland transport database;
Establishment and strengthening of public-private partnership in transport;
Road safety improvement;
Assistance in achieving SDG related to sustainable transport and connectivity
The TWG-STTC at its meetings regularly recommended SPECA countries to:
• Make additional progress related to accession to and implementation of UN transport legal
instruments,
• Harmonize transport infrastructure development plans relying on established frameworks
(EATL; Intergovernmental Agreement on the Asian Highway Network, Intergovernmental
Agreement on the Trans-Asian Railway Network, the Intergovernmental Agreement on Dry Ports),
• Further facilitate international road and rail transport,
• Take actions to implement the UN Decade of Action for Road Safety, 2011-2020, and
• Take actions to improve robustness and reliability of transport statistics as a tool to support
governments or decision makers to make informed transport decisions.
The SPECA Governing Council agreed at its 10th session in November 2015 to include additional
activities in the TWG-STTC Programme of Work for 2018-19 aimed at:
supporting the efforts of the participating countries to implement 2030 development agenda
by enhancing the sustainability of transport;
ensuring more focus on those efforts which would result in strengthening regional
cooperation aimed at achieving transport related SDGs;
serving as a forum for inland transport stakeholders to discuss strategic issues, exchange of
experiences, lessons learned and good practice, as well as for national and subregional efforts
in transport sector related to increasing sustainability of transport and achieving SDGs; and
developing and implement transport projects, when possible, in line with relevant SDGs and
targets to contribute to 2030 development agenda;
II.1.6. European Union
The European Union worked on improvement of transport connectivity in the Union itself as
well as with the Union’s Eastern and Southern neighbours and through them with countries of
Central and East Asia. This work implemented in the period of the phase III of the EATL project
contributed to the development of EATL.
As far as the Union internal policy was concerned, the European Union introduced in January
2014 a new transport infrastructure policy, whose objective was to strengthen the connectivity in
the Union, by building the core network corridors which would represent the strategic heart of
the trans-European transport network (TEN-T) and its extension to neighbouring countries
(Figure 2.5 shows interconnection between TEN-T and Turkey’s rail networks27
).
27
http://ec.europa.eu/transport/infrastructure/tentec/tentec-
portal/site/maps_upload/annexes/annex3/Annex%20III%20-%20VOL%2032.pdf
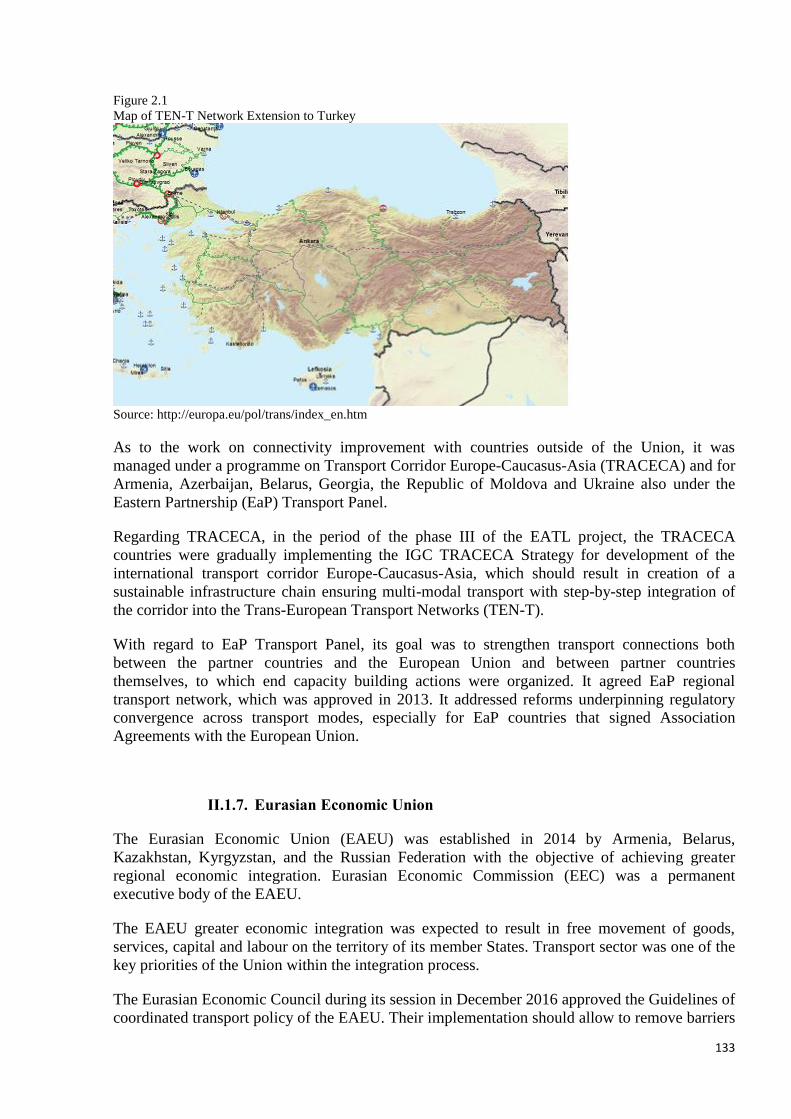
133
Figure 2.1
Map of TEN-T Network Extension to Turkey
Source: http://europa.eu/pol/trans/index_en.htm
As to the work on connectivity improvement with countries outside of the Union, it was
managed under a programme on Transport Corridor Europe-Caucasus-Asia (TRACECA) and for
Armenia, Azerbaijan, Belarus, Georgia, the Republic of Moldova and Ukraine also under the
Eastern Partnership (EaP) Transport Panel.
Regarding TRACECA, in the period of the phase III of the EATL project, the TRACECA
countries were gradually implementing the IGC TRACECA Strategy for development of the
international transport corridor Europe-Caucasus-Asia, which should result in creation of a
sustainable infrastructure chain ensuring multi-modal transport with step-by-step integration of
the corridor into the Trans-European Transport Networks (TEN-T).
With regard to EaP Transport Panel, its goal was to strengthen transport connections both
between the partner countries and the European Union and between partner countries
themselves, to which end capacity building actions were organized. It agreed EaP regional
transport network, which was approved in 2013. It addressed reforms underpinning regulatory
convergence across transport modes, especially for EaP countries that signed Association
Agreements with the European Union.
II.1.7. Eurasian Economic Union
The Eurasian Economic Union (EAEU) was established in 2014 by Armenia, Belarus,
Kazakhstan, Kyrgyzstan, and the Russian Federation with the objective of achieving greater
regional economic integration. Eurasian Economic Commission (EEC) was a permanent
executive body of the EAEU.
The EAEU greater economic integration was expected to result in free movement of goods,
services, capital and labour on the territory of its member States. Transport sector was one of the
key priorities of the Union within the integration process.
The Eurasian Economic Council during its session in December 2016 approved the Guidelines of
coordinated transport policy of the EAEU. Their implementation should allow to remove barriers

134
for transport by all modes and create a single transport space and a common market of transport
services within the Union until 2025.
According to the Guidelines the main objectives of the coordinated transport policy were
integration of transport systems of the member States into the global transport system, efficient
use of transit potential of member States, improvement of transport safety and transport service
quality and attraction of foreign investments.
Among other issues, the implementation of the policy should result in the establishment and
development of Eurasian Transport Corridors, the increase of the Union’s transit potential, the
coordination of transport infrastructure development, the establishment of logistics centres and
setting up transport organisations for ensuring optimisation of freight transport.
Moreover, EEC started to work jointly with the Silk Road Economic Belt (SREB) Initiative. This
partnership was approved by the presidents of the EAEU members States and China. It was
aimed to:
reinforce interaction in logistics, transport infrastructure and intermodal transport, and
implement transport infrastructure projects to expand and develop regional value chains.
During 2016 more than 40 specific projects of transport infrastructure development were
identified in the framework of partnership. The partnership was expected to help create modern
systems of international logistics centres and hubs on major international transport corridors
crossing Eurasia: Western Europe–Western China, North–South, East–West and Northern Sea
Route. Also meridian transport links passing through Mongolia and Kazakhstan and connecting
Siberia with central and western regions of China and countries of Central and South Asia were
expected to be developed through the partnership.
For EAEU member States the partnership was expected to provide an inflow of investment in
transport infrastructure modernisation, and as side effect strengthen mutual trade between the
countries of the Union and increase their investment attractiveness. In the long term it was
expected to drive growth in other economic sectors.
Box 2. EAEU’s priorities in the EATL context
Status IGO
Activity’s geographical coverage 5 countries from Europe and Asia
Focus creation of single transport space and a common market of transport
services;
establishment and development of Eurasian Transport Corridors;
capacity building of the Union’s transit potential;
establishment of logistics centres and transport organisations ensuring
optimisation of transport of goods, etc.
Main projects, programs and
initiatives aimed to EATL
development
Joint Partnership between Eurasian Economic Union and «Silk Road
Economic Belt» Project - aimed to reinforcing interaction in logistics,
transport infrastructure and intermodal transport; implementing transport
infrastructure projects to expand and develop regional production tides.
Web www.eurasiancommission.org/en/
II.1.8. Silk Road Economic BELT Initiative
The Silk Road Economic Belt and 21st Century Maritime Silk Road (Belt and Road Initiative) --
as a significant development strategy -- was launched in March 2016 by the Chinese government
with the intention of promoting economic cooperation among countries along the proposed Belt
135
and Road routes. The Initiative was designed to enhance efficient allocation of resources,
achieve greater market integration and create a regional economic cooperation framework for a
benefit of all.
The Belt and Road Initiative was designed to be pursued on the basis of existing bilateral and
multilateral cooperation mechanisms. Steps were also envisaged to advance in signing
memoranda of understanding or co-operation plans for the establishment of bilateral
demonstration projects and to prepare implementation plan and action roadmap for advancing
the Belt and Road strategy.
A 40 billion US Dollars Silk Road Fund was established to finance the Belt and Road Initiative,
and in particular infrastructure projects as well as industrial and financial cooperation. The Fund
was set up as a limited liability company in December 2014 with its founding shareholders
including China’s State Administration of Foreign Exchange, the China Investment Corp, the
Export-Import Bank of China and the China Development Bank.
The new multilateral development bank -- Asian Infrastructure Investment Bank (AIIB) -- was
also set up with a view to complementing and cooperating with the existing multilateral
development banks in order to address infrastructure needs in Asia. AIIB was expected to focus
on the development of transport infrastructure and logistics but also telecommunications and
urban development.
As for transport links, the Belt and Road Initiative was designed to connect Asia, Europe and
Africa along five routes:
- The Silk Road Economic Belt with roads
o from China to Europe through Central Asia and the Russian Federation;
o from China to Middle East through Central Asia; and
o from China through Southeast Asia, South Asia to the Indian Ocean.
- The 21st Century Maritime Silk Road connecting
o Chinese coastal ports through the South China Sea and Indian Ocean to Europe;
and
o China coastal ports with countries in the South Pacific Ocean through the South
China Sea.
Figure 2.2
Silk Road Economic Belt and the 21st Century Maritime Silk Road corridors as described in the Vision and Actions
on Jointly building the Silk Road Economic Belt and 21-st Century Maritime Silk Road document
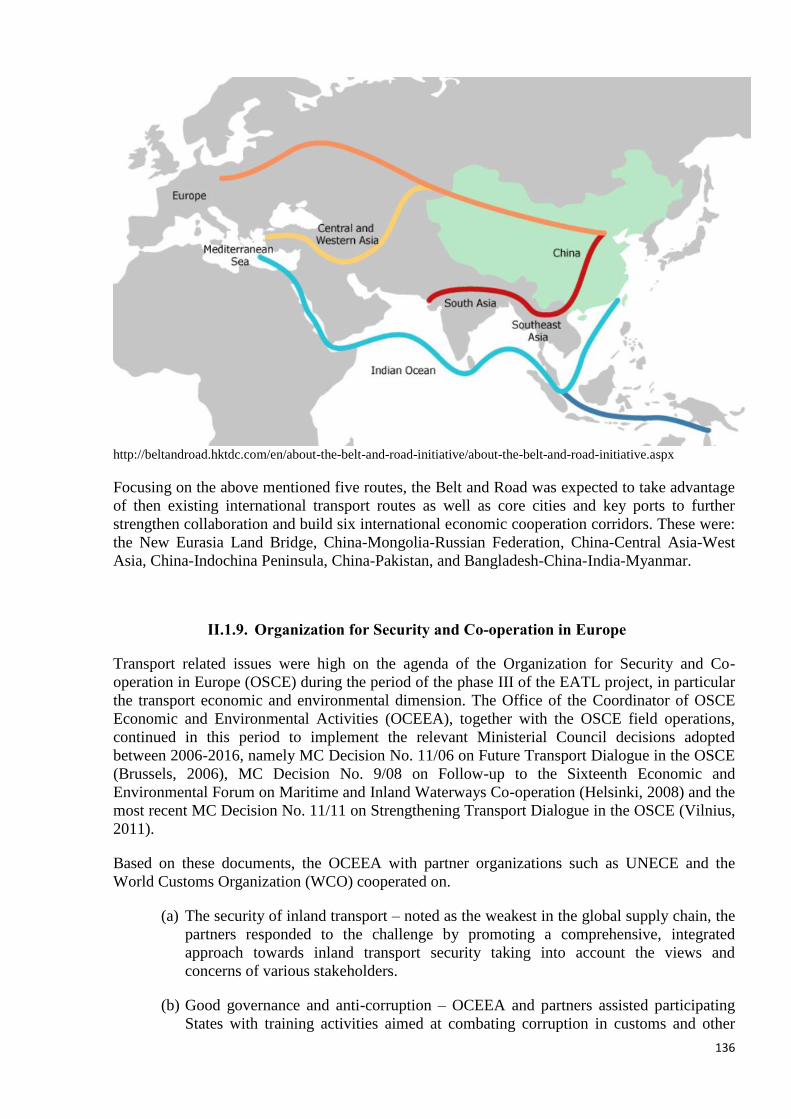
136
http://beltandroad.hktdc.com/en/about-the-belt-and-road-initiative/about-the-belt-and-road-initiative.aspx
Focusing on the above mentioned five routes, the Belt and Road was expected to take advantage
of then existing international transport routes as well as core cities and key ports to further
strengthen collaboration and build six international economic cooperation corridors. These were:
the New Eurasia Land Bridge, China-Mongolia-Russian Federation, China-Central Asia-West
Asia, China-Indochina Peninsula, China-Pakistan, and Bangladesh-China-India-Myanmar.
II.1.9. Organization for Security and Co-operation in Europe
Transport related issues were high on the agenda of the Organization for Security and Co-
operation in Europe (OSCE) during the period of the phase III of the EATL project, in particular
the transport economic and environmental dimension. The Office of the Coordinator of OSCE
Economic and Environmental Activities (OCEEA), together with the OSCE field operations,
continued in this period to implement the relevant Ministerial Council decisions adopted
between 2006-2016, namely MC Decision No. 11/06 on Future Transport Dialogue in the OSCE
(Brussels, 2006), MC Decision No. 9/08 on Follow-up to the Sixteenth Economic and
Environmental Forum on Maritime and Inland Waterways Co-operation (Helsinki, 2008) and the
most recent MC Decision No. 11/11 on Strengthening Transport Dialogue in the OSCE (Vilnius,
2011).
Based on these documents, the OCEEA with partner organizations such as UNECE and the
World Customs Organization (WCO) cooperated on.
(a) The security of inland transport – noted as the weakest in the global supply chain, the
partners responded to the challenge by promoting a comprehensive, integrated
approach towards inland transport security taking into account the views and
concerns of various stakeholders.
(b) Good governance and anti-corruption – OCEEA and partners assisted participating
States with training activities aimed at combating corruption in customs and other

137
border services. In carrying out these activities, the objective was to raise awareness
of the existing tools to fight corruption in border services and to work with
participating States to identify concrete national follow-up activities in this field.
(c) International legal instruments – OCEEA and partners assisted participating States in
organizing regional training activities and national seminars to discuss the
implementation of the following international legal instruments in Eastern and South-
Eastern Europe, the Caucasus and Central Asia: United Nations International
Convention on the Harmonization of Frontier Control of Goods (‘Harmonization
Convention’); WCO revised Kyoto Convention on the Simplification and
Harmonization of Customs Procedures; and WCO SAFE Framework of Standards to
Secure and Facilitate Global Trade.
(d) Assistance to Landlocked Developing Countries – OSCE supported its nine member
States with the status of LLDCs in addressing their challenges associated with
dependence on the transit services of non-landlocked neighbours. Helping to establish
efficient transport systems through genuine public and private partnerships between
LLDCs, transit countries and their development partners, OSCE focused on tackling
non-physical obstacles to trade and transport.
(e) OSCE-UNECE Handbook of Best Practices at Border Crossings – OCEEA and
UNECE jointly released in February 2012 the OSCE-UNECE Handbook of Best
Practices at Border Crossings: A Trade and Transport Facilitation Perspective. The
handbook aimed to assist OSCE participating States and UNECE member States,
particularly those which are LLDCs with limited access to world markets, in
developing more efficient border, transport and customs policies. The publication
provided an overview of a range of reference materials and over 120 best practice
examples. It covered areas such as available legal instruments, inter-agency and
international co-operation, balancing security and facilitation measures, freight
processing, risk management, border crossing point design, ICT technology use,
human resource management and benchmarking.
II.1.10. Organization for Cooperation of Railways
The Organization for Cooperation of Railways (OSJD) continued to work with its member States
to improve the coordination of international rail transport during the period of the phase III of the
EATL project. Concerning especially the transports between Europe and Asia, it helped develop
cooperation between railways and with other international organizations.
Box 3. OSJD priorities related to the EATL development
Member States: Azerbaijan, Albania, Afghanistan, Belarus, Bulgaria, Hungary, Vietnam, Georgia, Iran,
Kazakhstan, China, Democratic People's Republic of Korea, Cuba, Kyrgyzstan, Latvia,
Lithuania, Moldova, Mongolia, Poland, Russian Federation, Romania, Slovakia,
Tajikistan, Turkmenistan, Uzbekistan, Ukraine, Czech Republic, Estonia.
Apart from them, OSJD incorporates 7 railways with observer status from: France
(SNCF), Germany (DB AG), Finland (VR), Serbia (ZS), Greece (OSE), Austrian-
Hungarian company "GySEV", Federal Passenger Company (FPC JSC, Russian
Federation).
OSJD priorities most
important for the
EATL development
Development and improvement of international railway transportation with the
traffic between Europe and Asia, including combined transportation;
Development of consentaneous transport policy in the field of international
railway traffic;

138
Improvement of international transport law, administration of the Convention
concerning International Goods Traffic by Rail (SMGS) and other legal
documents connected with the international railway traffic;
Co-operation on the solution of the problems connected with the economic,
information, scientific, technological and ecological aspects of railway transport;
Development of measures aimed at the increase of railway transport
competitiveness;
Co-operation in the field of railway operation and technical matters connected
with further development of international railway traffic;
Collaboration with other international organizations, engaged in railway
transportation matters, including those of combined transport.
OSJD continued with its annual analysis of technical and operational indicators and technical
equipment on 13 OSJD corridors between Europe and Asia as they had been established in 1996.
The goal of the analysis on infrastructure and border crossings data was to look for ways to
improve the rail freight transport and to offer comprehensive measures for improvement in
management of international rail transport operations along the transport corridors between
Europe and Asia.
The XLIII session of the OSJD Ministerial Conference (Ulan-Bator, Mongolia, June 2-5, 2015)
approved Comprehensive plans of carriage improvement and the development of OSJD Railway
Transport Corridors 4, 6 and 11 for a period up to 2020 and reported on the progress of the
related comprehensive plans for transport corridors Nos. 9, 12 and 13.
The interested countries signed memoranda of understanding for the development of these
corridors, which served as a basis for coordinated actions by these countries to reorganize and
modernize pertinent railway lines.
One of the projects initiated by OSJD and aimed to improve the conditions of Euro-Asian
railway transport was the introduction of the CIM/SMGS consignment note. It combines the
required CIM and SMGS contracts of carriage into one single transport document.
The customs authorities from EU/EFTA customs area officially recognized it for use as transit
declaration T as well as in SMGS regime as a national customs (transit) document. The
CIM/SMGS consignment note may be used not only for wagonload services, but also for
Combined Transport.
Furthermore, OSJD continued development of an action plan for implementation of the
Memorandum on cooperation in the technical, operational and commercial development of
corridors 1-13. Under OSJD auspices experts had studied the possibilities of connecting new
lines to the OSJD railway transport corridors, what resulted in:
- extending OSJD railway transport corridor 12 through the territory of the Republic of
Moldova from Ocniţa station to Vălcineţ station and then through the territory of Ukraine to
Zhmerinka station with the condition to preserve the existing crossing capacity in the territory of
Ukraine (these changes were approved at the annual meeting of the OSJD Commission on
Transport Policy and Development Strategy (October 6-9, 2015, the OSJD Committee)), and
- connecting the following railway lines to corridors 2, 5, 8:
- Iletsk – Kabdyagash – Nikeltau – Tobol as a branch line of OSJD railway
transport corridor 2;
- Zhetygen – Altynkol as a branch line of OSJD Railway Transport Corridor 5;
139
- Beyneu – Uzen – Bolashak OSJD Transport Corridor 8; and
- Dostyk – Mointy – Zhezkazgan – Saksaulskaya – Beyneu – Aktau-Port OSJD
railway transport corridor 10.
In this connection, a resolution was passed to update the Comprehensive plans on improvement
of the railway operations and development of OSJD Railway Transport Corridors 2, 5, 8, 10 and
12 up to 2020 and to review their engineering and operational documentation, as well as to
amend the Memorandum on cooperation in the engineering, operational and commercial
development of the OSJD railway transport corridors.
The extension of OSJD Railway Transport Corridor 9 to connect port Odessa, port Ilyichyevsk
(Ukraine), through the territory of Belarus, with the port Klaipeda (Lithuania) was under
discussion at the time this report was prepared.
In addition, the OSJD Commission on Freight Traffic continued its work to:
- update the existing international agreements and contracts in the field of combined
transportation between Europe and Asia;
- implement harmonized tariffs for freight transit;
- update the existing rules on common use of freight wagons in the international traffic in order
to harmonise these rules internationally;
- harmonise the system of cargo classification and coding;
- plan and organise container block trains between Europe and Asia, also in combined transport;
- implement uniform CIM/SMGS consignments note in the rail transport between Europe and
Asia; and
- increase the efficiency and competitiveness of the international railway transport and modal
shift from other modes of transport.
II.1.11. Organization of the Black Sea Economic Cooperation
During the period of the phase III of the EATL project the Organization of the Black Sea
Economic Cooperation (BSEC) continued its activities to:
Facilitate international road transport of goods in the BSEC region (in the framework of
the Memorandum of Understanding on Facilitation of Road Transport of Goods in the
BSEC Region), including implementation of “BSEC Permit system” project in 2013-
2017 and BSEC Pilot Project on introducing the International Vehicle Weight Certificate
in the BSEC Region,
Create integrated road and sea transport infrastructure network in the BSEC region (in the
framework of the Memorandum of Understanding for the Coordinated Development of
the Black Sea Ring Highway and the Memorandum of Understanding on the
Development of the Motorways of the Sea in the BSEC Region)
140
Develop intermodal transportation including ferry and passenger lines in the Black Sea
Region
Implement priorities for 2016-2018 indicated in the BSEC Economic Agenda: Towards
an Enhanced BSEC Partnership adopted in 2012 and referring to:
1) Promotion of sustainable transport systems, which meet the economic, social and
environmental needs of the people of the Black Sea Region, in order to reduce
regional disparities and to link the BSEC Region’s transport infrastructure to
European and Asian Networks
2) Acceleration of the efforts at the national level and within the BSEC framework in
order to further proceed with the implementation of the BSEC projects in the field
of transport, especially the Black Sea Ring Highway and the Development of the
Motorways of the Sea in the BSEC Region
3) Elaboration of joint transport projects of regional impact within the framework of
BSEC mechanisms, public-private partnerships, and with the participation of other
regional and international organizations, including the EU and International
Financial Institutions
4) Consideration of the possibility of elaborating a regional integrated maritime policy
in the field of Maritime Transport, Ports, Shipbuilding and Ship Repairing in the
BSEC Region as an important factor for sustainable economic growth.
5) Development of modern competitive Ro-Ro ferry and cruise lines in the Black Sea
Region benefitting from international experiences, best practices, and the newest
equipment and technologies on shipping safety. and
6) Improvement of the road safety in the BSEC Region in the framework of the United
Nations Decade of Action for Road Safety (2011-2020).
II.1.12.Trans-Caspian International Transport Initiative
As a part of the “New Silk Road” intermodal East-West transport infrastructure initiative,
Azerbaijan, Kazakhstan, Georgia and Turkey agreed on creation of the Trans-Caspian
International Transport Route (TITR).
In the framework of the TITR project, a cargo train from China was expected to reach Europe in
less than 14 days, which would have been the most competitive route in terms of transport time.
It was taking about 15-19 days for a cargo train departing from China and passing through the
Russian Federation to reach Europe, and more than a month for a cargo from the Eastern China
to arrive in Europe using the existing maritime route.
The agreement on the establishment of the Coordination Committee to develop TITR was signed
by the representatives of the national railway companies from Azerbaijan, Kazakhstan and
Georgia, and the representatives of the ports of Aktau and Baku during the 2nd International
Transport and Logistics Business Forum “New Silk Road” in November 2013. During the 5th
meeting of the Coordination Committee in October2014 participants of the TITR project agreed
to accept the Turkish State Railways to the Coordinating Committee.
141
Under the auspices of the Coordination Committee route tests were carried out. The first
container train over the Trans-Caspian International Transport Route was launched on 28 July
2015. The test cargo train departed from the Xinjiang province in China, travelled along the
Shihezi-Dostyk-Aktau-Alyat-Keshla route through the territories of Kazakhstan and Azerbaijan,
and arrived at the Baku International Trade Port complex, located in the town of Alyat (around
30 miles south west of Baku).
The train carried caustic soda and consisted of 41 platforms and 82 containers, weighing 20
tonnes each. It travelled 4,000 kilometres in 6 days, passing through the Kazakh port of Aktau. It
was the first successful attempt to launch a cargo train from China to the Caspian region through
the Caspian Sea.
This test showed a capability of the states involved in providing a competitive route from Asia to
Europe.
The second test involving a container train on the Trans-Caspian International Transport Route
arrived in Georgia on 3 October 3 2015. The train, consisting of 44 containers, departed from the
Chinese Xinjiang province, travelled on the Alashankou-Dostyk-Aktau-Alyat-Tbilisi route and
arrived in Georgia in eight days. The second test train showed that the organization of the
container service on the China-Kazakhstan-Azerbaijan-Georgia-Turkey route could meet the
expectations of the TITR members.
It was expected that approximately 300-400 thousand containers would be transported via the
TITR by 2020 ensuring at an average speed of up to 1,100 km a day. Participants of TITR
predicted that the route would initially be able to transport up to 5.5 million tonnes of cargo
annually, increasing to 13.5 million tonnes per year by 2020.
During the meeting in Baku in January 2015, the Coordination Committee reached an agreement
on the adoption of measures for utilizing the new Zhezkazgan - Beineurailway lines and on the
capacity of Kazakhstan's Aktau and Azerbaijan’s Baku seaports in order to create favourable
tariff conditions.
In January 2016, Azerbaijan, Kazakhstan, Georgia and Ukraine decided to apply the competitive
feed-in tariffs for cargo transportation via the TITR. New competitive tariffs were introduced for
the TITR since 1 June 2016 with the view to reduce the costs of international cargo
transportation.
In October 2016, Azerbaijan, Kazakhstan and Georgia (railways and port administrations) signed
an agreement on the establishment of the “Trans-Caspian International Transport Route”
Association with its office in Astana. Its role was to attract transit and foreign trade cargo, as
well as develop integrated logistics products via the TITR. The agreement contained regulations
on the membership in the Union of Legal Entities of the Association, composition of a working
group on development of the transport route, action plan for 2017, the Association’s charter and
its logo.
To make TITR a competitive route and to reach the necessary capacity, a few projects needed
still to be successfully finished:
- elimination of a missing link of the 826-kilometer Baku-Tbilisi-Kars (BTK) railway
section, expected to be open by the end of 2017 and have an annual carrying capacity of
6.5 million tonnes in the short term,
142
- full integration of TITR with the “Marmaray” rail project under the Istanbul Straits
(Bosporus) ,
- expansion works in the Aktau port to put in operation a new grain terminal with a
capacity of 1.5 million tonnes and two additional dry-cargo terminals with a total
capacity of 1.5 million tonnes expected to be finished in 2017 and increase the port
capacity from 16.8 million tonnes to 21 million tonnes per year,
- purchase of two universal ferries, and
- expansion works in the Alyat port complex to increase its annual capacity up to 25
million tonnes.
II.1.13. Economic Cooperation Organization
The Economic Cooperation Organization, with its Directorate of Transport and Communications
continued to facilitate ECO Agreements and Declarations in the transport and communications
field to foster economic cooperation, integration and cohesiveness in the ECO region during the
phase III of the EATL project. These agreements are: the Quetta Plan of Action; the Istanbul
Declaration (ECO Long Term Perspectives); the Almaty Outline Plan for the Development of
Transport Sector in the ECO region; the Ashgabat Declaration of 1997; the Programme of
Action for ECO Decade of Transport and Communications; and the Transit Transport
Framework Agreement (TTFA).
ECO played an important role in ensuring considerable progress in interconnecting road and
railway networks between Central Asian countries and Iran, Pakistan and Turkey, as well as in
improving international road transport among all ECO countries especially through assistance in
construction of missing links in the ECO region.
The following projects were implemented in the framework of ECO Transport Agenda during
the phase III of the EATL project:
TIR System test along the road transport corridor Islamabad ‐ Tehran – Istanbul;
Establishment of Kyrgyzstan – Tajikistan – Afghanistan – Iran (KTAI) Rail and Road
Corridors
Development of Iran – Turkmenistan – Kazakhstan Railway Project with total length 900
km (ECO Rail Corridor IV) coordinated by the established ECO Trilateral Coordination
Committee
Implementation of Qazvin-Rasht-Astara (ECO Rail Corridor III) Railway Project
Container block trains development along ECO Corridors
Creation of Motor Vehicle Third Party Liability Insurance in the ECO Region.
II.1.14. Organization for Democracy and Economic Development
The Organization for Democracy and Economic Development (GUAM) continued during the
phase III of the EATL project to implement its 2013 Concept of GUAM Transport Corridor
development in the following areas:
- Transit operationalisation via South Caucasus Black and Caspian Seas,
143
- Efficiency improvement of GUAM's transport corridor as an economically advantageous
link between Europe and Asia;
- Integration of the GUAM transport corridor with the network of combined transport
systems connecting the Black and Baltic Seas;
- Extension of the Poti-Baku-Aktau-Almaty block train route to the route of the Viking
combined train and the Zubr block train;
- Transport safety and environmental protection.
In the framework of GUAM Project on Trade and Transport Facilitation (TTF) in 2013-2017 the
activities on pre-declaration development and digitalization of transport and transit procedures
along GUAM corridor were carried out. The results of these activities were considered during
the meeting of GUAM Trade and Transport Facilitation Steering Committee (May 31 – June 2,
2017, Nakhichivan, Azerbaijan).
II.1.15. World Bank
The transport sector constituted a significant part of the World Bank’s portfolio during the the
phase III of the EATL project. The World Bank transport projects spanned all transport modes
and operational environments in Europe and Asia, including rail, road and intermodal transport.
The World Bank’s strategy in the transport sector, and companion business plan for 2016-18
aimed to facilitate the movement of goods in developing countries by focusing on mobility
solutions that provide greater access, efficiency and safety, all in a climate-friendly way.
The following projects related to Euro-Asian transport links were implementing by World Bank
or with World Bank active participation:
- Three Gorges Modern Logistics Centre Infrastructure Project (China, 2017-2023, 200
million US Dollars committed by World Bank),
- Corridor X Highway (between Nis and Dimitrovgrad and Grabonica and Donji
Neradovac) (Serbia, from 2016, 38.9 million US Dollars additional financing committed
by World Bank),
- Centre West Regional Development Corridor (Kazakhstan, 2016-2021, 977.9 million US
Dollars committed by World Bank),
- CN-Hubei Xiaogan Logistics Infrastructure (China, 2016-2021, 100 million US Dollars
committed by World Bank ),
- Azerbaijan Highway 3 (M4 road from Baku to Shamakhi) (Azerbaijan, from 2016, 140
million US Dollars additional financing committed by World Bank),
- Wuhan Integrated Transport Development, including integrated corridor and road safety
improvements in Anlu and intelligent transport systems in Wuhan (China, 2016-2021,
120 million US Dollars committed by World Bank),
- East-West Highway Corridor Improvement (Georgia, 2015-2020, 140 million US Dollars
committed by World Bank),
144
- Road Sector Development Project, with the aim to improve transport connectivity,
maintenance operations, and road safety for road users (Ukraine, 2015-2021, 560 million
US Dollars committed by World Bank),
- Trans-Hindukush Road Connectivity Project (Afghanistan, 2015-2022, 250 million US
Dollars committed by World Bank),
- Pap-Angren Railway (Uzbekistan, 2015-2019, 195 million US Dollars committed by
World Bank ),
- Transit Corridor (M6 Minsk – Grodno) Improvement Project (Belarus, 2014-2020, 250
million US Dollars committed by World Bank),
- National and Regional Roads Rehabilitation (FYR Macedonia, 2014-2019, 71 million US
Dollars committed by World Bank ),
- Central Asia Road Links with the aim to increase transport connectivity between the
Kyrgyzstan and Tajikistan (Kyrgyzstan, 2014-2019, 45 million US Dollars committed by
World Bank),
- Third East West Highway Improvement Additional Financing (Georgia, from 2012, 43
million US Dollars committed by World Bank),
- East-West Roads Project (Almaty-Korgos Section): Western Europe - Western China
International Transit Corridor (Kazakhstan, 2011-2016, 1 068 million US Dollars
committed by World Bank), and
- National Road Rehabilitation (Osh-Batken-Isfana) Project (Kyrgyzstan, 2011-2016, 16
million US Dollars additional financing committed by World Bank).
II.1.16 Central Asia Regional Economic Cooperation Program
The Central Asia Regional Economic Cooperation (CAREC) continued its work on
implementing a Strategic Framework for the Central Asia Regional Economic Cooperation
Program 2011-2020 (CAREC 2020) in the period of the phase III of the EATL project.
Since the start of the CAREC program, transport and trade facilitation had formed its backbone.
The CAREC Transport and Trade Facilitation Strategy (TTFS) was initially formulated for the
period 2008–2017. It was subsequently refined and extended to cover the period until 2020,
referred to as TTFS 2020. The operational priorities of TTFS 2020 included:
(i) Multimodal corridor network development, consisting of support to corridor
extensions; railway network and multimodal logistics hub development; and border
crossing point improvements along CAREC’s six corridors;
Corridor 1: Europe-East Asia;
Corridor 2: Mediterranean-East Asia;
Corridor 3: Russian Federation-Middle East and South Asia;
Corridor 4: Russian Federation-East Asia;
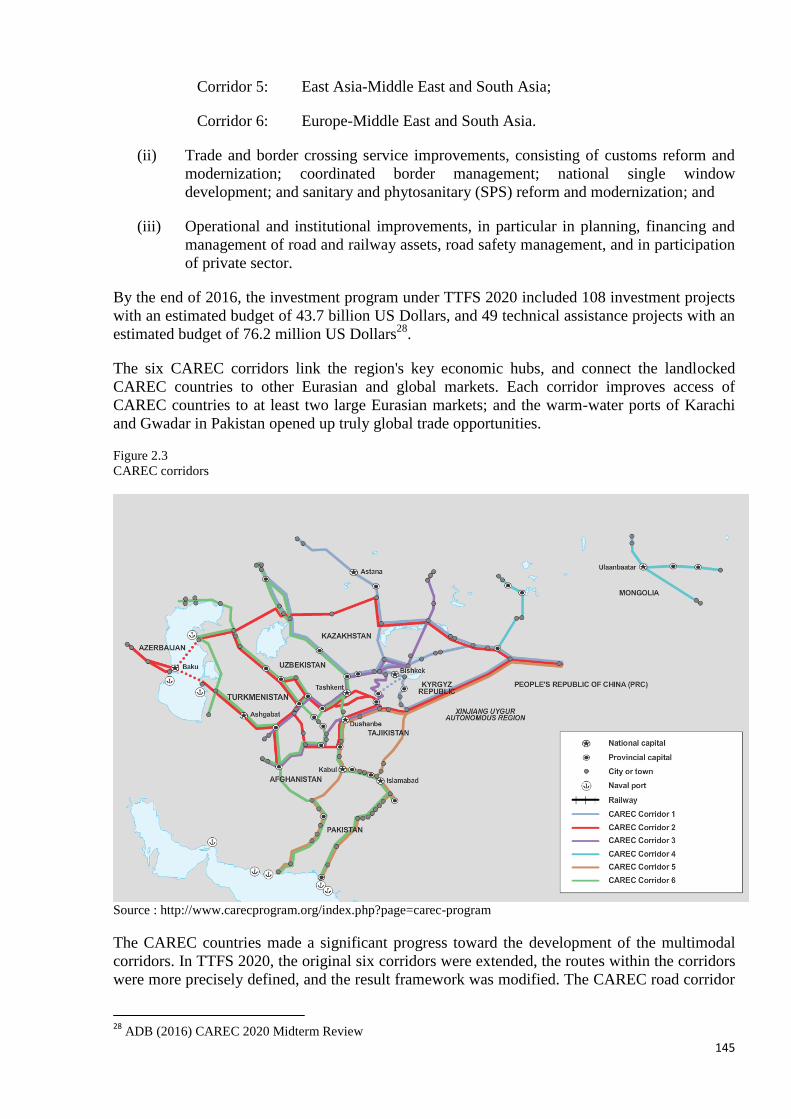
145
Corridor 5: East Asia-Middle East and South Asia;
Corridor 6: Europe-Middle East and South Asia.
(ii) Trade and border crossing service improvements, consisting of customs reform and
modernization; coordinated border management; national single window
development; and sanitary and phytosanitary (SPS) reform and modernization; and
(iii) Operational and institutional improvements, in particular in planning, financing and
management of road and railway assets, road safety management, and in participation
of private sector.
By the end of 2016, the investment program under TTFS 2020 included 108 investment projects
with an estimated budget of 43.7 billion US Dollars, and 49 technical assistance projects with an
estimated budget of 76.2 million US Dollars28
.
The six CAREC corridors link the region's key economic hubs, and connect the landlocked
CAREC countries to other Eurasian and global markets. Each corridor improves access of
CAREC countries to at least two large Eurasian markets; and the warm-water ports of Karachi
and Gwadar in Pakistan opened up truly global trade opportunities.
Figure 2.3
CAREC corridors
Source : http://www.carecprogram.org/index.php?page=carec-program
The CAREC countries made a significant progress toward the development of the multimodal
corridors. In TTFS 2020, the original six corridors were extended, the routes within the corridors
were more precisely defined, and the result framework was modified. The CAREC road corridor
28
ADB (2016) CAREC 2020 Midterm Review
146
network was expected to reach 29,350 km by 2020 rather than 24,000 km by 2017, the initial
target of the TTFS.
The TTFS result framework identified three physical infrastructure targets to be achieved by
2020, the completion of (i) 7,800 km of road construction or rehabilitation; (ii) 1,800 km of
newly constructed railway track; and (iii) 2,000 km of renovated, electrified, or signalized
railway track. In addition, CAREC targets are five multimodal logistics centres being operational
and at least five border crossing points (BCPs) being improved by 2020.
The TTFS 2020 and action plan were implemented with outputs on or ahead of target. The 809
km of expressways or national highways built, upgraded or improved by the end of 2015 brought
the cumulative road infrastructure to 93 per cent of the total 7,800 km corridor length targeted
for construction or improvement by 2020. No new railways were completed during 2015, while
achievements in the railway projects surpassed already in 2017 the 2020 targets. Thirteen
projects in other transport subsectors (including two ports, two logistics centres, three BCPs)
were completed (e.g. BCP in Tajikistan) or in course of implementation during 2017 (e.g. BCP
in Tajikistan and the Kyrgyzstan and three in Pakistan).
In 2015, CAREC decided to further prioritize four key areas of immediate importance: (i) road
safety, (ii) road asset management (RAM), (iii) railways and (iv) transport facilitation (CAREC,
2015a). In these new areas, the following actions were taken:
• A Railway Working Group was created to prepare CAREC Railway Strategy.
• A high-level Commitment to Road Safety was endorsed by the CAREC member Countries in
2015
• A CAREC Road Safety Strategy was under preparation.
• For RAM, member Countries were using CAREC as a platform to share practical knowledge.
Two knowledge products, reference notes on performance-based road maintenance contracts and
a compendium of best practices in road asset management were under preparation.
• For transport facilitation, member countries used CAREC to reinvigorate discussions and
actions on freedom of movement. In one practical example, Pakistan, Kyrgyzstan, Kazakhstan
and China were working under CAREC to revive the dormant Quadrilateral Traffic in Transit
Agreement (QTTA).
II.1.17. Islamic Development Bank
The Islamic Development Bank continued to provide financing to the development of regional
transport corridors. In particular, IDB supported numerous projects in Central Asia, assisting the
countries in construction and reconstruction during the period of 2013-2017 of almost 1,300 km
of motorways and more than 300 km of railways that were part of the CAREC road corridors.
IDB participated especially in the following projects:
- road development of regional importance in Azerbaijan and Kyrgyzstan with support of 471
million US Dollars;
- development of alternative road on corridor North-South in Kyrgyzstan;
- road reconstruction in Uzbekistan from Guzar to Beyneu, which was the part of Uzbek national
highway project; and
147
- the construction of the road from Kulyab to Khalaikum in Tajikistan, to offer a new road to
China.
In 2016 transport sector-related projects accounted for 30 per cent of the IDB’s cumulative
operations portfolio. IDB approved 9 operations in the transport sector in 11 member countries
for 1.53 billion US Dollars, of which, 51 per cent went to the rail sector and 38 per cent to the
roads sector. The share of Central Asian states in this transport infrastructure financing was 43
per cent.
IDB also paid a great attention to trade facilitation and removal of trade barriers. It continued via
its programs and workshops to encourage its member countries to adopt good practices for
international trade.
II.1.18. European Bank for Reconstruction and Development
The European Bank for Reconstruction and Development (EBRD) pursued its activities to
develop safe, secure and sustainable transport systems, which balance economic, environmental
and social needs in its member countries.
The EBRD priorities within the transport sector included:
- promoting market based transport - EBRD worked to improve the efficiency, market-
orientation and financial sustainability of the transport sector. This included supporting
the development of the private market for transport services and increasing private sector
participation in the provision of transport infrastructure through concessions;
- developing sustainable transport - EBRD was committed to supporting the development of
sustainable transport networks including issues such as climate change mitigation and
adaptation, integrated network development, pollution prevention, air quality and biodiversity
protection, economic inclusion and gender equality and road safety;
- broadening activity within the sector - the Bank was committed to expanding the boundaries of
its activities in the transport sector to finance the needs of emerging sub-sectors. The need for
freight services was growing, including road freight, therefore the Bank promoted optimization
of networks for achieving sustainable development and reduction of CO2 from transport
operations.
During the period of the phase III of the EATL project EBRD:
- supported the initial restructuring of the national railways company KTZ. The Bank
made several investments to help the company finance increasingly advanced efficiency
measures. The Bank also participated in a bond issuance, which helped the company finance
much-needed logistics infrastructure to increase cargo transit along the trade route from China to
Europe;
- participated in the AIG Silk Road Fund in Azerbaijan. AIG Silk Road Fund was a private
equity investment fund targeting Kazakhstan, Uzbekistan, Azerbaijan, Kyrgyzstan, Tajikistan
and Turkmenistan. The Fund was expected to provide equity finance to small and medium-sized
private sector enterprises and joint ventures operating in the countries of Central Asia;
- participated in the implementation of East-West road corridor project in Kazakhstan;
- participated in a landmark transaction in Turkey in a major infrastructure project – the Eurasia
Tunnel – built under the Istanbul Straits (Bosporus). EBRD’s 150 million US Dollars loan was to

148
complement the US$ 1.4 billion financing The Eurasia Tunnel was designed to improve traffic
management in this highly congested city. It connects Istanbul’s European and Anatolian sides –
and, wider, Turkey’s European and Asian road networks.
II.1.19. International Road Transport Union
In the period of the phase III of the EATL project the International Road Transport Union (IRU)
finished implementing its New Eurasian Land Transport Initiative (NELTI) with the objectives
to:
- contribute to the development of international road transport between Europe, Asia and Middle
East and facilitation of border crossing procedures especially in Central Asian LLDCs;
- increase the contribution of road transport to international trade and socio economic
development; and
- offer alternative delivery routes to maritime shipments to assist businesses in LLDCs.
NELTI was designed to support independent transport companies from Eurasian countries in
improving delivery of industrial and consumer goods across the Eurasian landmass, along five
different routes.
NELTI monitoring unveiled a high competitive potential for the development of the NELTI
northern, central and southern routes. However, the data also highlighted that 40 per cent of road
transport time along the routes of the Silk Road was lost at borders due to inappropriate border
crossing procedures which impede trade growth along the entire Eurasian landmass. In addition,
approximately 30 per cent of the transport costs were due to unofficial payments, borne by the
hauliers en route and at border crossing points.
In 2016-2017 IRU worked closely with Chinese authorities to help them implement the
provisions of the TIR Convention and lead to China ratifying this legal instrument.
Implementation the TIR Convention in China was marking an important step in improving land
and multimodal transport between Asia and Europe. The TIR system was expected to underpin
China’s One Belt, One Road Initiative and boost trade and development with neighbouring
countries, in particular Kazakhstan, Kyrgyzstan, Mongolia, the Russian Federation and
Tajikistan.
During the period of the phase III of the EATL project, the first trials of TIR’s fully paperless
digital transit service, or e-TIR, were successfully conducted between Iran and Turkey. The tests
were run by IRU, UNECE, the Turkish and Iranian customs authorities, pioneering volunteer
transport operators, as well as IRU members and TIR guaranteeing associations from the two
countries, ICCIMA and TOBB respectively. The pilot tests demonstrated not only that the
system worked in a live transit situation, but also how risk of fraud and the customs’
administrative burden could be reduced. The services were highly rated by the transport
operators, customs officials and TIR associations. Following the success of the pilots, other
countries expressed interest in organising eTIR pilots, including Kazakhstan, Moldova and
Ukraine, the latter for an intermodal pilot across the Black Sea29
.
29
IRU (2017) Going Global. Annual Report 2016

149
II.1.20. International Union of Railways
The International Union of Railways (UIC) pursued its work to promote intercontinental and
transcontinental rail traffic. With its Global Team of Experts (GTE) involving rail and non-rail
key stakeholders (railway undertakings, freight forwarders, rail associations, potential customers,
shipping lines and others), UIC worked on initiating and steering projects creating the right
framework conditions for developing long-distance rail traffic. In particular GTE activities
focused on:
- analysing and generalizing information on technical compatibility and interoperability within
international transport corridors (ITCs);
- summarizing the results of activities among international organizations and certain railway
operators aimed at improving transport along ITCs;
- forecasting of freight and passenger transport volumes, establishing a data base of freight points
of origin and destination as well as volumes structure; and
- developing a marketing approach to improve the appeal of ITCs for freight owners and
forwarders, presenting the opportunities and prospects of ITCs development.
II.1.21. Coordinating Council on Trans-Siberian Transportation
The Coordinating Council on Trans-Siberian Transportation (CCTT) continued to cooperate with
governments and international organizations to create new technologies for facilitating border
crossing by block-trains, to help harmonise transport and transit law and to reduce barriers on
rail routes between Europe and Asia.
CCTT led or contributed to several projects in the period of EATL phase III project, among
them:
- “Digital train” project which was aimed at increasing of Trans-Siberian rail route
competitiveness through implementation of end-to-end IT technologies in the area of
international rail transport and border crossing. Pilot block train operations under this
project started from Wuhan, China to Pardubice, Czech Republic in November 2012 and
from Chengdu, China to Łódź, Poland in December 2012.
- “Guaranteed transport and logistics product” which promoted operation of block trains
between China and Europe: rail transport by block train “Baltic Transit” and
implementation of “TransSib in 7 days” Initiative. A Memorandum of Understanding on
ensuring the safety of block trains on the route China-Europe-China was signed in the
framework of the Project.
- “The Trans-Siberian route: a multimodal Eurasian transport network” which promoted
rail transport of goods between Europe and Asia by publishing annual Trans-Siberian
Route review.
- “Security train” which promoted armed protection of containers and block trains in
transit.
- “Express delivery” which was aimed at developing post items delivery from China to
Europe in block trains.
150
II.1.22. Global Partnership for Sustainable Transport
The Global Partnership for Sustainable Transport (GPST) was created in November 2015
to contribute to the implementation of United Nations transport-related Declarations, Resolutions
and other recommendations at the national, regional and international levels through advocacy,
awareness raising, partnership building and through technical and analytical work. As a global,
business and industry led, multi-modal, strategic, action-oriented, multi-stakeholder platform, the
GPST recognised that public-private partnerships would play a vital role in helping United
Nations member States to implement their decisions, in order to achieve maximum positive
economic, environmental and social impact.
GPST members and partners also acknowledged that given the resources, expertise and
competence they possess, they could be effective in translating United Nations member State
commitments into actionable, result-oriented recommendations that can be implemented by
governments and businesses.
Since its launch, the GPST continued to exercise a leading role in supporting governments to
take actions to strengthen the international legal framework for sustainable transport in order to
achieve progress in promoting more conducive environments for trade, transport and transit
facilitation. The GPST worked closely with businesses in the transport industry to identify best
practices that promote global development objectives and win-win outcomes for both
governments and businesses, and disseminated these best practices widely.
Recognizing big potential of EATL and their contribution to social and economic development of
large number of countries in Europe and Asia, including LLDCs, the GPST developed a new project,
entitled the “Global Silk Routes Initiative” (GSR), which is an international comprehensive
framework for multilateral dialogue on policy options and possible measures to enhance sustainable
transport systems, inclusive of all modes of transport, in particular in developing countries, but with
added perspective of the developed countries gained during preceded expansion of global trade.
II.2. Joint Initiatives and projects implemented by International organisations
Unified legal regime
The EATL area was characterised at the time this report was written by different legal regimes
for rail transport. The majority of the EATL countries were members of the OSJD and party to
its legal agreements, such as the SMGS. Others were members of the OTIF and its legal regimes,
such as the COTIF/CIM 92, and some are members of both (Poland, the Baltic states and several
others).
When a railway route laying across countries using different regimes was taken, two different
consignment notes for rail freight, each based on the respective legal regime, were to be
completed. Railway operators or freight forwarders therefore had to re-write a consignment note
when crossing into the territory where the different legal regime applied.
The legal regimes also differed in other important aspects such as liabilities, and therefore
increased uncertainty for crossborder rail freight transport in EATL area.
A common CIM/SMGS consignment note was developed by OSJD and CIT to avoid reissuing
of transport documents and by doing so to simplify customs clearance.
The benefits of the joint CIM/SMGS could be significant for reducing delays in cross-border rail
transport. Tests showed the use of CIM/SMGS consignment note could reduce the standing time
151
of rolling stock at borders from three days to 1.5 hours. This considerably would increase the
competitiveness of rail freight transportation.
The CIM/ SMGS consignment note could also be issued as an electronic document so that it
could be exchanged electronically in advance with authorities and other transport parties.
The benefits called for action. Consequently, in 2013 a joint declaration expressing willingness
to create a common legal regime for rail traffic across Asia and Europe was signed by 37
countries at a ministerial meeting in Geneva. The signatories were: Armenia, Azerbaijan,
Belarus, Belgium, Bosnia-Herzegovina, Bulgaria, Croatia, Cyprus, Czech Republic, Estonia,
Finland, France, Germany, Greece, Italy, Kazakhstan, Kyrgyzstan, Latvia, Lithuania, The former
Yugoslav Republic of Macedonia, Malta, Moldova, Mongolia, Netherlands, Pakistan, Poland,
Portugal, Romania, Russian Federation, Serbia, Spain, Sweden, Switzerland, Tajikistan, Turkey,
Ukraine and Uzbekistan.
During the seventy-eighth session of the UNECE Inland Transport Committee a resolution on
Unified Railway Law was considered and adopted30
. By adopting this resolution the UNECE
Inland Transport Committee welcomed the work undertaken and report prepared by the Group of
Experts towards Unified Railway Law, having managed, in three years, to prepare legal
provisions towards the Unified Railway Law.
These provisions included the contract of carriage and took into consideration good practices
already implemented by the Uniform rules concerning the Contract of Carriage of Goods by Rail
(CIM-COTIF Convention) and SMGS Agreement as well as other International Transport
Conventions.
In 2016, a road map for performing the pilot tests of legal provisions was discussed and adopted
by the Railway Undertakings and the inauguration of those pilot tests was agreed.
On 15-17 May 2017 a meeting of experts from Railway Undertakings - German DB AG
(Germany), PKP Cargo (Poland) and JSC Russian Railways (Russian Federation) - on "virtual
verification" of legal provisions was held in Berlin in accordance with the "road map" agreed
upon by experts. Virtual test (without physically carrying of cargo) was aimed to elaborate of
possible scenarios that may develop in the context of transportation - shortage, loss of cargo,
damage.
At the same time, the issue of how the legal provisions could be applied to physical transport
operations before their formal entry into force remained unresolved (that is in the absence of an
international intergovernmental treaty between states that would implement the legal provisions
in their territories.
In addition, the form of unified railway waybill was not created yet. The approaches to resolve
this issue were different: in the SMGS area, the waybill was approved by the state, and in the
CIM area by the carriers or their associations.
II.3. Most important national level programmes and projects
Azerbaijan
Azerbaijan started during the phase III of the EATL project a number of national projects aimed
at renovation of railways infrastructure. By 2017, 383 km of railway sections and their catenary
30
Draft ITC Resolution No. 263 on Unified Railway Law. Doc. ECE/TRANS/2016/17
152
system were renewed or rebuild. Construction works were completed in sub-stations for
transforming electrical supply system from DC to AC in Baku-Boyuk Kesik section (East-West
Corridor).
Another 271 km were under renovation in 2017 including renewal of catenary system and
upgrade of communication and signalling systems. Purchase of new locomotives and different
types of wagons was also planned. The renovation of the infrastructure, once completed, should
result in increasing average speeds of freight trains up to 60 km/h and for passenger trains up to
100 km/h.
Also an 8.3 km single-track extension of railway network to the border with Iran was completed
in 2016, which led to elimination of a missing link. It was expected that with it a direct railway
transit between Iran and the Russian Federation be established.
Azerbaijan also developed feasibility studies in 2016 for modernisation of Baku-Yalama railway
section and for Yalama-Astara route (North-South Corridor).
Belarus
During the time of phase III of the EATL project, Belarus improved train handling procedures at
Brest border crossing resulting in reducing the train stopping from 36 to 10 hours with
transhipment and down to 6 hours without transhipment.
Belarus also adopted the use of CIM/SMGS consignment note. Only in 2015 more than 29
thousands TEUs run under this consignment note.
In 2015, as part of development of the railway infrastructure, several projects were successfully
completed:
- Extension of the receiving-departure lines of Orsha-Centralnaya railway station and
Sitnitsa railway station, and
- Development of the second stage of the Project on electrification of the 86 km of Gomel
– Zhlobin section.
Belarussian Railways also purchased 279 new freight wagons in 2015.
Bulgaria
In 2015, the Bulgarian Railways continued reconstruction and modernisation of OSJD Railway
Corridor No. 6, and modernised Septemvri – Plovdiv and Plovdiv – Burgas sections. Plovdiv
intermodal terminal was under construction at the time of writing of this report.
Also in 2015, the National Railway Infrastructure Company (NRIC) put in operation on a
permanent basis the Train Information System (TIS) of the International Organisation of Rail
Infrastructure Managers. TIS enabled both Bulgarian and foreign operators to monitor the
movement of their trains in real-time. Besides, the train information system made it possible to
monitor train delays at the border crossing points and causes thereof.
China
China put in operation 912 km of new railway lines during 2013-2015.
153
The Chinese Railways introduced the principle of independent administrative and economic
functions. In order to promote the innovative structural systems and to accelerate the railway
construction, measures were developed to:
- facilitate administrative procedures;
- consolidate railway transport control and management;
- promote railway tariff reform;
- coordinate railway transport development.
Iran
Iran implemented several projects during the phase III of the EATL project. In particular the
following infrastructure projects were completed:
- Missing link of Khaf – Sangan – Harat railway;
- Railway North-South corridor between Iran, Turkmenistan, Kazakhstan with completion
of 940 km of new railways; and
- Iran – Azerbaijan railway connection through completion of the railway link and bridge
Astara (IR) – Astara (AZ).
Iran also signed the Ashgabat Agreement between Iran, Oman, Turkmenistan and Uzbekistan
with the aim to create an international transport and transit corridor between the signatory
countries. The country further negotiated a transit agreement for Persian Gulf - Black Sea
corridor between Iran, Azerbaijan, Armenia, Georgia, and Bulgaria. This agreement was
expected to be signed by the end of 2017. Iran also ratified UNESCAP Intergovernmental
Agreement on Dry Ports.
Last but not least, “Road safety action plan” for 2015-2020 was in the process of
implementation.
Kazakhstan
By 2017 reconstruction work was completed on the Western Europe – Western China corridor
(section of EATL 3 and EATL 4 Road routes) and the Astana-Kostanay-Chelyabinsk (EATL 2d
Road route), Astana-Petropavlovsk (section of EATL 2 Road route), Pavlodar-Omsk (section of
EATL 2b Road route), and Beyneu-Shetpe (section of EATL 4 Road route) highways as well as
Astana-Temirtau and Almaty-Kapchagay road sections.
Kyrgyzstan
The Kyrgyz Railway modernized during 2011-2015 some 150 km railway lines of the northern
and southern sections by placing new reinforced concrete and timber sleepers. It put in service
six new generation diesel locomotives. Also two car-repair plants were established for
modernisation and repairs of freight wagons and passenger coaches that should allow extending
the life of wagons.
Fibre-optic communication lines were installed at Lugovaya – Bishkek – Rybachye section.
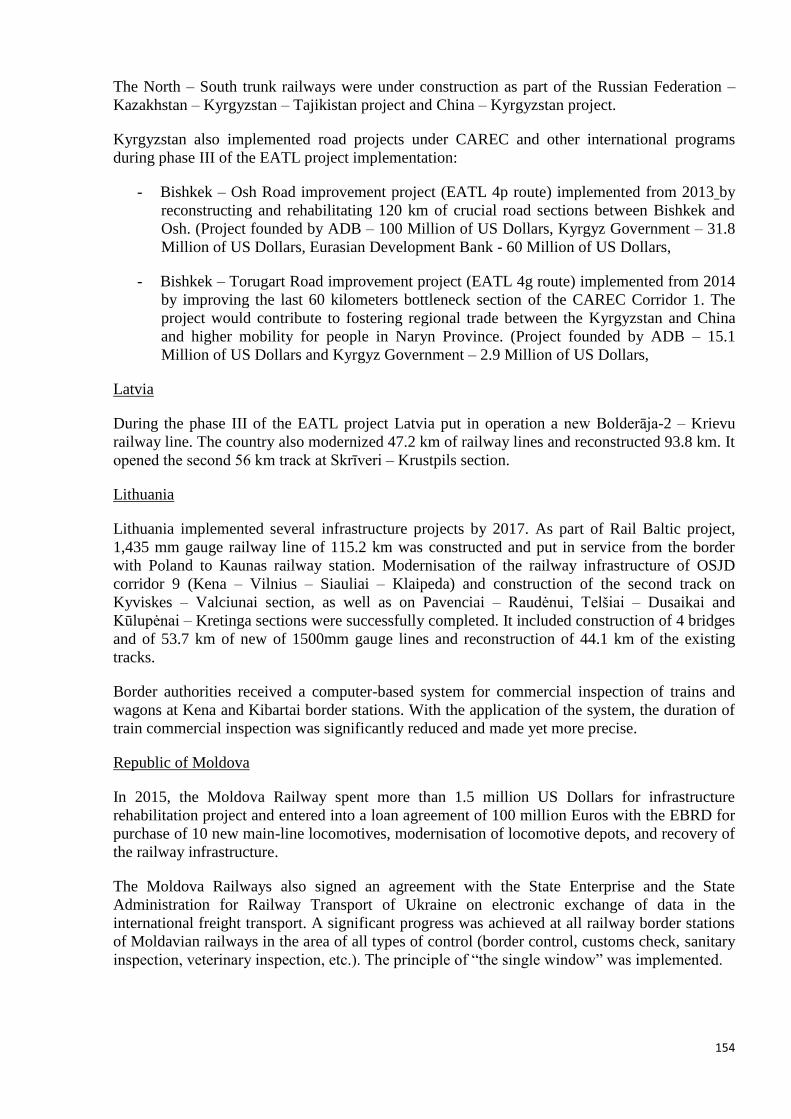
154
The North – South trunk railways were under construction as part of the Russian Federation –
Kazakhstan – Kyrgyzstan – Tajikistan project and China – Kyrgyzstan project.
Kyrgyzstan also implemented road projects under CAREC and other international programs
during phase III of the EATL project implementation:
- Bishkek – Osh Road improvement project (EATL 4p route) implemented from 2013 by
reconstructing and rehabilitating 120 km of crucial road sections between Bishkek and
Osh. (Project founded by ADB – 100 Million of US Dollars, Kyrgyz Government – 31.8
Million of US Dollars, Eurasian Development Bank - 60 Million of US Dollars,
- Bishkek – Torugart Road improvement project (EATL 4g route) implemented from 2014
by improving the last 60 kilometers bottleneck section of the CAREC Corridor 1. The
project would contribute to fostering regional trade between the Kyrgyzstan and China
and higher mobility for people in Naryn Province. (Project founded by ADB – 15.1
Million of US Dollars and Kyrgyz Government – 2.9 Million of US Dollars,
Latvia
During the phase III of the EATL project Latvia put in operation a new Bolderāja-2 – Krievu
railway line. The country also modernized 47.2 km of railway lines and reconstructed 93.8 km. It
opened the second 56 km track at Skrīveri – Krustpils section.
Lithuania
Lithuania implemented several infrastructure projects by 2017. As part of Rail Baltic project,
1,435 mm gauge railway line of 115.2 km was constructed and put in service from the border
with Poland to Kaunas railway station. Modernisation of the railway infrastructure of OSJD
corridor 9 (Kena – Vilnius – Siauliai – Klaipeda) and construction of the second track on
Kyviskes – Valciunai section, as well as on Pavenciai – Raudėnui, Telšiai – Dusaikai and
Kūlupėnai – Kretinga sections were successfully completed. It included construction of 4 bridges
and of 53.7 km of new of 1500mm gauge lines and reconstruction of 44.1 km of the existing
tracks.
Border authorities received a computer-based system for commercial inspection of trains and
wagons at Kena and Kibartai border stations. With the application of the system, the duration of
train commercial inspection was significantly reduced and made yet more precise.
Republic of Moldova
In 2015, the Moldova Railway spent more than 1.5 million US Dollars for infrastructure
rehabilitation project and entered into a loan agreement of 100 million Euros with the EBRD for
purchase of 10 new main-line locomotives, modernisation of locomotive depots, and recovery of
the railway infrastructure.
The Moldova Railways also signed an agreement with the State Enterprise and the State
Administration for Railway Transport of Ukraine on electronic exchange of data in the
international freight transport. A significant progress was achieved at all railway border stations
of Moldavian railways in the area of all types of control (border control, customs check, sanitary
inspection, veterinary inspection, etc.). The principle of “the single window” was implemented.
155
Republic of Moldova also adopted the use of CIM/SMGS consignment note resulting in
approximately 25 thousands consignments carried over the territory of the Republic of Moldova
under this regime in 2015 only.
Mongolia
Mongolia joined to new container services along the routes Chengdu (China) – UBZD – RZD –
Łódź (Poland) and Zhengzhou (China) – UBZD – RZD – Duisburg (Germany) during the period
of the phase III of the EATL project (Figure 2.8).
Also a new 24.5 km railway line for iron ore transportation was put in operation. Mongolia also
installed and put into operation three new remote control crossing loops.
The country implemented Annex 9 to the International Convention on Harmonisation of Frontier
Controls of Goods, thanks to which the time of border control of freight trains between Mongolia
and the Russian Federation was reduced by 45 minutes.
Figure 2.4
Transit rail corridor in Mongolia
Time of railway transit via territory of Mongolia (figure 2.9) in 2015 equalled to:
- 30 hours from Sukhbaatar to Zamiin-Uud; and
- 36 hours from Zamiin-Uud to Sukhbaatar.
Figure 2.5
Time of railway transit via territory of Mongolia in 2015, hours

156
Source: UNESCAP (2015) Railway transport facilitation in Mongolia. Presentation of joint UNESCAP – UIC Seminar
“Facilitation and Costing of Railway Services along the Trans-Asian Railway” Bangkok, 09-11 December 2015
Poland
Poland modernised over 800 km of railway lines by 2015 due to which the train time en routes
Trójmiasto – Wroclaw, Poznan – Krakow, Warsaw – Bielsko-Biala, Olsztyn – Bydgoszcz was
significantly reduced.
The PKP Cargo JSC further developed the container terminals at Poznan-Franovo station in
Poland (owned by PKP Cargo), as well as in Czech Ostrava- Paskov (a terminal owned by
Advanced World Transport, an affiliate of PKP Cargo Group).
The PKP Cargo JSC actively participated in the stimulation of the railway traffic from China to
West and South Europe as part of the New Silk Road (to more than 10 trips weekly).
The PKP Cargo JSC purchased 15 multisystem freight locomotives for service on the transborder
lines.
Poland also made improvements to security and train monitoring putting is service unmanned
aerial vehicles. This action led to reducing losses due to theft almost by 60 per cent.
The Government of Poland has recently revealed new and extensive plans for road infrastructure
development along the new “Via Carpatia” Transport corridor. It runs through Lithuania, Poland,
Slovakia, Hungary, Romania and Bulgaria to Greece. The potential of Via Carpatia may benefit
to EATL transport routes, both within and outside the EU, and also those leading to the Balkans.
The road is designed to branch out to Ukraine and Belarus, as well as to the Baltic harbours in
the Tricity (Gdynia, Sopot and Gdańsk).
The Council of Ministers at its meeting on 20 June 2017 decided to raise by PLN 28 billion the
financial limit for the road construction programme. Out of this amount, PLN 21 billion would
be allocated to the construction of Via Carpatia. The additional funds would enable the
contractors to build all the missing sections of the road between Rzeszów and Lublin on time.
Via Carpatia in Poland would have nearly 700 kilometres.
Figure 2.6
Via Carpatia Transport Corridor Project
157
Source:
http://www.sejm.gov.pl/Sejm8.nsf/v4Komunikat.xsp?documentId=CBCE79C441AF78DAC125814D003D8B93&la
ng=EN
In 2025, Via Carpatia shall be ready for use at its entire length.
Romania
CFR-Marfa – Romanian Freight Operator - carried almost 20 thousand operations with the
unified CIM/SMGS consignment note.
Romania modernized railway lines Câmpina – Predeal, Bucharest – Braşov, Curtici – Simeria,
Braşov – Simeria which resulted in increasing speeds at those lines to 160 km/h.
The country further modernised 16 railway stations, among them: Giurgiu, Slatina, Bistriţa Nord,
Botoşani and Vaslui.
Russian Federation
Russian Railways continued to develop the East-West and North–South Euro-Asian transport
routes by:
implementing infrastructure projects, such as: (i) the modernisation of the Trans-Siberian
Railway and the development of the railway system in Russian Far East, (ii) the removal
of bottlenecks along the EATL Route 1 (BAM and TransSib railways), (iii) the
construction of dedicated high-speed railways, and (iv) the development of border
crossing infrastructure and hinterland connections to ports etc.;
undertaking the systemic development of logistics technologies, information and
communications systems for transit traffic;
cooperating with neighbouring countries to improving tariff policy;
simplifying the procedures for processing freight transit;
158
developing technological schemes for interaction between various modes of transport.
The Russian Railways successfully completed reconstruction projects of Babaevo station of the
Oktyabrskaya Railway and construction of new Chernyshevskoye border station of the
Kaliningradskaya Railway. Several other infrastructure projects continued in 2017, among them
technical upgrade of Petushki – Nizhni Novgorod section of the Gorkovskaya Railway and
reconstruction of Tonnelnaya station of the Northern Caucasian Railway, of Cherepovets-II
station of the Northern Railway, of Volkhovstroy-I station of the Oktyabrskaya Railway, of
Kinel stations of the Kuybyshevskaya Railway, and of Ekaterinburg-Sortirovochnaya station of
the Sverdlovskaya Railway.
In 2016 Russian Railways also purchased 500 new locomotives and 240 rolling stock units.
The opening to competition in the freight wagon operations encouraged third party investments
of over 10 billion US Dollars in construction and modernisation of the carriage rolling stock.
This resulted in improving the wagon freight fleet that reached 1.1 million units by the April
2017.
During the special workshop in Ulan-Ude, Russian Federation (August 30-31, 2017), leaders of
transport ministries of the Russian Federation, Mongolia and China expressed their readiness to
speed up the work on the operationalisation of the Asian Highway road route 4: Russian
Federation-Mongolia-China (Novosibirsk – Biysk – Urumqi). In this regard, the Russian
Federation confirmed its plans for the reconstruction of roads, including the M-52 "Chuyskiy
tract" (Novosibirsk - Biysk - Mongolian border) road sections.
The Parties noted the importance of legal harmonisation of international road transport along
new road routes based on UN agreements and conventions. During the meeting, special focus
was on the harmonisation of the transport of dangerous and perishable goods and drivers’ rest
and working times. China confirmed that it is conducting internal work for accession to the ADR
Agreement.
Furhtermore, a milestone trilateral agreement between Mongolia, China and the Russian
Federation has been signed to establish a new trade corridor Ulan-Ude – Ulan-Bator – Tianjin,
while providing additional access to sea for landlocked Mongolia.
The trilateral intergovernmental agreement was signed by the transport ministries of China,
Mongolia and the Russian Federation at the United Nations Economic and Social Commission
for Asia and the Pacific (UNESCAP) Ministerial Conference on Transport in Moscow
(December 2016). Eliminating transit barriers and significantly reducing delivery times, the
agreement was expected to facilitate international road transport along the Asian Highway
network.
A China-Russian Federation pilot trade caravan successfully tested the 2,200 km inland trade
route between China, Mongolia and the Russian Federation in August 2016.
Once in force, the agreement would be open for accession by other Asian Highway member
countries to further enhance regional connectivity, international trade and ultimately economic
growth for those communities along the route and beyond.
During the special workshop in Ulan-Ude, Russian Federation (August 30-31, 2017) the Parties
noted the importance of Agreement for bilateral and multilateral cooperation between three
countries and stated the need for further strengthening of the work within the framework of the
159
“One Belt - One Road” strategy. The Parties confirmed their purpose to launch traffic along the
AH3 road route Russian Federation-Mongolia-China as early as 2018.
Tajikistan
Tajikistan put in service a new 40.7 km Vahdat – Yavan railway and continued to modernize
Rahaty – Vahdat – Elok and Kurgantube – Yavan railway sections.
Tajikistan implemented road projects under CAREC and other international programs during
phase III of the EATL project, as follows:
- Dushanbe – Kurgan-Tube Road improvement project (EATL 5l route) implemented from
2016. Project founded by ADB – 65.2 Million of US Dollars, Government of Tajikistan –
17.2 Million of US Dollars, Clean Energy Fund - 2 Million of US Dollars, OPEC – 12
Million of US Dollars
- Sayron-Karamik Road improvement project (EATL 5g route) implemented from 2013 by
improving 88 kilometres section and rehabilitating 87 km Vose-Hovaling section.
(Project founded by ADB – 0.5 Million of US Dollars and Kyrgyz Government – 0.15
Million of US Dollars,
Turkey
During the period of the phase III of the EATL project Turkey focused on the following projects:
Marmaray project
Marmaray Project provided an uninterrupted railway connection between Asia and Europe with
a 13.6 km Istanbul Straits (Bosporus) crossing and a 76 km high-capacity line between Gebze
and Halkalı. The project was completed on 29 October 2013. Cargo transportation was expected
to be operational following the completion of integration works of Marmaray by 31 December
2018.
In conjunction with the Baku-Tiflis-Kars rail line, Marmaray would enable virtually
uninterrupted intermodal services between all European countries via Turkey to Central Asian
countries and China. Additionally, it would offer market actors an alternative to the Trans-
Siberian route.
Eurasia Tunnel
The Eurasia Tunnel Project (Istanbul Straits (Bosporus) Road Tube Crossing Project) connected
the Asian and European sides of Istanbul via a highway tunnel which goes underneath the
seabed. The two floored highway tunnel is 5.4 km long. The Eurasia Tunnel Project substantially
reduced the period of local transport in an area of intensive traffic. Travel time between the
Asian and European sides decreased from 100 minutes to 15 minutes. 24 hour continuous
operation was commenced as of January 2017.
Baku-Tbilisi-Kars (BTK) Railway Project
With the increase of the freights coming from China on the east-west axis, there was an
emerging need to connect Turkey to the region via railway.
BTK Project was foreseen to give acceleration to the development of the transportation on the
Caspian Sea and was expected to bring railway as an alternative transport modal additional to
160
highway and airway. With this project, railway was expected be used both for freight and
passenger transportation in Azerbaijan, Georgia and Turkey.
The Baku-Tbilisi-Kars Railway Project was a Joint Initiative of Turkey, Georgia and Azerbaijan.
The project included construction of 79 km railways in Turkey, 29 km in Georgia and
rehabilitation and reconstruction of existing railway route in Azerbaijan and Georgia. The second
Test Run of the Railway Line was held on 26 September 2017. The railway route is composed of
two lines from Kars to Aktalkalaki, single line from Aktalkalaki to Tbilisi, two lines from Tbilisi
to Baku. Newly constructed sections in Turkey and Georgia have the track gauge of 1435 mm.
The BTK Railway came in operation on 30 October 2017 and was planned to carry 6.5 million
tonnes of cargo annually in the first stage of operation between Asia and Europe.
Karaman-Ulukışla 2nd Line Infrastructure and Superstructure Construction Project
It was planned to turn the Konya-Karaman-Ulukışla-Yenice Section into double line compatible
with 160-200 km/h with the purpose of increasing the freight and passenger potential on the
Ankara-Konya-Adana and İstanbul-Eskişehir-Afyon-Konya-Adana corridor. The delivery of the
site was made on 22.09.2016 and the duration of work is 1200 days. The project was planned to
be completed in 2020.
Osmangazi Bridge
The Gebze–Orhangazi–İzmir Motorway (including Osmangazi Bridge and the Connecting
Roads) was being constructed at the time this report was prepared through Build–Operate–
Transfer financing model. Osmangazi Bridge was completed as part of the motorway project and
was opened to traffic on June 30, 2016. Osmangazi Bridge was at the time of its opening in the
4th place among the largest main span suspension bridges in the World.
It was projected that the travel time between İstanbul and İzmir which took 8–9 hours would
reduce to 3–3.5 hours and the traffic load on the axis of İstanbul–Bursa–İzmir would decrease by
30 per cent when the motorway project would finish.
• Yavuz Sultan Selim Bridge
The North Marmara Motorway / Odayeri–Kurtköy Section (Including Istanbul Straits (Bosporus)
Third Bridge) Project includes İstanbul Third Strait Bridge (Yavuz Sultan Selim Bridge) which
has 2x4 lane motorway and 2x1 railway pass on the same deck. The Yavuz Sultan Selim Bridge
was opened to traffic in August 2016. The Yavuz Sultan Selim Bridge was at the time of its
opening the world’s longest bridge with railway system with 1,408 m main span, the highest
tower of the world with 320 m height, and the widest bridge of the world with 59 m deck width.
3-Storey Great Istanbul Tunnel Project
The project with approximately 3.5 billion US Dollars cost, planned to be contracted with Build-
Operate-Transfer Model, would comprise a 16.15 km long 2x2 lane Highway Connection
between European Side TEM Hasdal Junction - Asian Side TEM Çamlık Junction, and a 31 km
long High-Speed Metro Connection between European Side (Bakırköy) İncirli - Asian Side
(Kadıköy) Söğütlüçeşme.
Canakkale 1915 Bridge
The Canakkale 1915 is a 3.7 km suspension bridge was under construction over the Dardanelles
Straits in the Canakkale province of Turkey. The Bridge wass part of the Malkara-Çanakkale
161
Motorway project and once constructred would connect the Lapseki District to the Gelibolu
District (Gallipoli) of the Canakkale province.
The Bridge was built with a build-own-transfer (BOT) model at an estimated cost of $2.8bn.
Ground-breaking for this project took place in March 2017 and the construction was expected to
be completed by 2023 to coincide with Turkey’s centennial celebrations.
The Bridge once constructred would provide direct access from Europe to the south-western part
of Turkey and should improve the transportation network in the country as well as promote
socio-economic growth and tourism.
Ten-T Network
The updating procedure for TEN-T (Trans European) Network Map was completed. All the
Turkish ports that are above the mentioned handling amount and meet criteria defind by the
European Commission were included in the updated map.
Facilitation of Border Crossings
e-TIR Pilot Projects
Turkey launched e-TIR Pilot Projects with Iran and Georgia respectively.
In this context, the first e-TIR Pilot Project was developed by UNECE-IRU and conducted by
the Turkish and Iranian Customs Administrations. This project aimed at Customs to Business
and Business to Customs (C2B2C) electronic data exchange.
Additionally, Turkey and Georgia ran customs to Customs (C2C) electronic data exchange under
the aegis of UNECE.
NCTS
As of January 2012, all customs offices in Turkey started to use the New Computerised Transit
System (NCTS), which was a system of electronic declarations and processing that enables
traders to submit national and common transit declarations electronically. The system reduced
the costs incurred with the paper-based system of declaring goods. NCTS also reduced time
spent at customs by sending declarations electronically in advance of shipments. The system
significantly contributed to increased efficiency of transit operations, prevention and detection of
fraud and acceleration of transit transactions.
Within the scope of the simplification and acceleration of border crossings and reduction of
procedures in railway cargoes, as of April 2016, Turkish State Railways were authorized to
transport cargo by railway in a simplified manner in accordance with the Common Transit
Convention and the Turkish Customs Code. With this authorization, the CIM Consignment Note
can be used as a transit declaration in railway transportation.
ECO ITI Road Transport Corridor
The project for establishment of a Road Transport Corridor between Islamabad-Tehran-İstanbul
(ITI) was approved by the 8th Ministerial Meeting on Transport and Communications of the
Economic Cooperation Organization in Ashgabat on 28-29 June 2011.
162
The main goal of the project was to contribute to the sustainable development and poverty
reduction through enhancement of transit trade among the enroute member States. Hence, a
significant component of the Silk Road Initiative was to be vitalized.
The Terms of Reference were approved by the relevant countries at the Road Committee of
Transit Transport Coordination Council Meeting held on 11 November 2015 in Ankara.
Pursuing the internal processes conducted by Pakistani authorities, a test run of loaded trucks
under TIR System was planned to be launched along ITI Corridor.
Electronic Data Exchange
In order to eliminate non-physical barriers and enhance the efficiency of customs control of
goods and vehicles moved between the States, Turkey ran significant projects on electronic data
exchange.
Within the frame of transit data exchange, Turkey had projects with Georgia, Iran and
Azerbaijan.
Within the frame of export data exchange, Turkey had projects with Russian Federation, Belarus
and Kazakhstan.
Simplified Customs Corridor
The Project was carried out between Turkish and Russian Customs. The Protocol was signed in
September 2008 in Moscow.
The aim of the "Simplified Customs Corridor Project" was to provide simplified custom
procedures to exporters providing the preliminary information of the goods, including their
classification and value.
The preliminary information was being sent electronically. This system is applied to the Turkish
and Russian companies on a voluntary basis.
One Stop Shop
One-Stop-Shop Project referred to combined performance of customs controls and other
authorities’ controls so that the goods were controlled by related authorities at the same time and
at the same point in order to optimize time and personnel costs.
Once the project would be accomplished, customs clearance at land border gates would be
expected to be completed faster and more efficiently.
One-Stop-Shop Project’s pilot scheme began to be implemented on 14 January 2014 at Kapıkule
(Border Gate between Turkey and Bulgaria) Customs Office and feedback evaluation process
was in progress by the time this report was written.
Silk Road Customs Cooperation Initiative Caravanserai Project
Turkish Customs Administration launched Silk Road Customs Initiative among the Silk Road
Customs Administrations. The main purpose of the initiative was to revitalize ancient Silk Road,
turn it into a preferable route and to increase the trade and transportation volume between Europe
and China and among the countries on this route through harmonization, facilitation and
acceleration of border crossing procedures among Silk Road Countries.
163
Aiming at intensified cooperation between the One Belt and Road Project of China and
Caravanserai Project, Presidents of Turkey and China signed a Memorandum of Understanding
at the occasion G20 summit held in Antalya, Turkey in 2015.
- Other Important Projects
Lapis Lazuli Project
Besides the technical and administrative regulations made by the Caspian region countries, it
was also found necessary to create a contractual basis on combined transportation in order to
maintain transnational co-operation.
Within this context, the proposed Lapis Lazuli Corridor was an international transit route
(highway and railway) project that was expected to contribute to the revival of the ancient Silk
Road and to the development of the transportation, transit passage, economy, commercial
relationships and transportation connection between Afghanistan, Turkmenistan, Azerbaijan,
Georgia and Turkey.
The negotiations on the contract regarding the aforementioned project were completed and the
contract was sigend on 15 November 2017.
Silk Wind Project
Within the scope of the project "Logistics Centres and Maritime Highways II" under the scope of
the TRACECA Program, a block train project started with the initiative of Kazakhstan, named as
"Silk Wind", The route starts from the Chinese border with Kazakhstan and runs via Kazakhstan,
Azerbaijan, Georgia to Turkey via TRACECA corridor.
The most important phase of the project was realized with the finalization of the Baku-Kars-
Tbilisi line.
Viking Train
The "Viking Train" was a combined transportation project that connects the Baltic Sea with the
Black Sea via Klaipeda, Odessa and İliçevski sea ports by rail.
Lithuania, Belarus and Ukraine were participating in the project and with the train operated by
Lithuanian Railways (LG), Ukrainian Nationalized Transportation Company (LISKI) and
Belirtertrans (Belarus National Contracting Company).
An agreement was reached on 12 September 2013 that the project would be fully supported,
according to the "Memorandum of Understanding on Cooperation" signed between the
Lithuanian Railway Company EU "Lietuvos Gelezinkeliai-LG" and Turkish State Railways in
Ankara.
Railway Projects
In 2017, there were 14 international and 157 block container train operations of Turkish State
Railways.
These operations were between Turkey and Slovakia, Germany, France, Hungary, Romania,
Austria, Bulgaria, Greece, Kazakhstan, Iran and Pakistan.
164
Turkey constructed and put in operation High Speed Railway Line as follows: Ankara-Eskişehir
(13 March 2009), Ankara-Konya (24 August 2011), Eskişehir-Konya (24 March 2013), Ankara-
İstanbul (25 July 2014) and Konya-Istanbul High Speed Railway Line (18 December 2014).
Several other lines were under construction:
High Speed Railway Lines:
• Ankara –İzmir HSR (Completion Date: Polatlı-Afyonkarahisar-Uşak: 2019, Uşak-
Manisa-İzmir: 2020)
• Ankara – Sivas HSR (Completion Date: 2018)
Conventional Lines
• Kars-Tiflis-Baku Railway Line (Completion Date: 2018)
• Gebze-Söğütlüçeşme/Kazlıçeşme-Halkalı (Completion Date: 2018)
Uzbekistan
Uzbekistan successfully completed a first stage of an infrastructure project electrifying 140.8 km
Marakand – Karshi railway section. The Uzbekistan Railways modernized 55 locomotives and
1,258 freight wagons and purchased 11 new freight electric locomotives and 650 freight wagons.
Ukraine
The Ukrainian Railway established in cooperation with partner railways new container train
lines: European countries – Ukraine (Chop), Batevo/Izov – Ilyichyevsk-Paromnaya – Georgia
(Poti/ Batumi – Gardabani) – Azerbaijan – (Bejuk- Kjasik – Alyat) – Kazakhstan (Aktau-Port –
Dostyk) – China through ferry crossing Ilyichyevsk – Poti/Batumi and Alyat – Aktau – Aktau-
Port.
Ukraine introduced the principle of the “single window” at border stations and checkpoints. The
country also adopted the use of unified CIM/SMGS consignment and saw an increasing
application of the document in carriage operation.
National Ukrainian railways company “Ukrzaliznytsia” adopted31
in 2017 its five-year
development strategy for 2017-2021. It included investment of 130 to 150 billion Hryvna, and
the formation of five business sectors: freight transport and logistics, passenger transport,
infrastructure, traction services, manufacturing and services.
In the freight sector, “Ukrzaliznytsia” planned to invest in the creation of intermodal terminals
and logistics services with a target of growing its share of the container market from 29 to 45 per
cent in 2021. The planned traction services company would be tasked with purchasing 250 new
locomotives and modernising the fleet.
The 2017-2021 rolling stock investment plan was calculated at 108 billion Hryvna, 36 billion for
262 locomotives, 31 billion for some 35 thousand wagons, 9 billion for 440 coaches and 11
billion for 46 diesel and electric multiple-units. The remaining 22 billion would be used for the
modernisation of 403 freight, 212 passenger and 283 shunting locomotives as well as some 57
31
http://www.railwaygazette.com/news/policy/single-view/view/ukrainian-railways-plans-five-year-investment-
programme.html
165
thousand wagons, 696 coaches and 430 multiple units. This would mean at least half of the
“Ukrzaliznytsia” fleet would be new or modernised with the implementation of the investment
plan.

166
PART III. MAIN OBSTACLES HAMPERING THE EURO-ASIAN
TRANSPORT LINKS DEVELOPMENT
III.1. General overview
Globalization together with introduction of logistics principles into production, trade and
distribution had dramatically changed the way cargo was moved in the world at the time this
report was prepared. According to Martin Christopher – one of the authorities in logistics and
supply chain management – supply chains and not enterprises compete. If so, developments in
managing a supply chain and in making it more competitive to others were what predetermined
the requirements for transport routes and services used within supply chains.
The EATL inland routes had to meet the requirements of modern supply chains in order to be
considered by supply chain managers and be used as tradelanes. It was necessary therefore that
proper business environment and logistics services as well as stable, predictable and business-
friendly administrative procedures were offered along these routes. There must have also been
flexibility offered among the intermediate points of the routes for changing the flow of the cargo,
if demanded. With other words, the routes had to provide proper connectivity, capacity and
flexibility translating into necessary economic efficiency of the routes for them to be used within
supply chains.
If the connectivity or capacity of a route or a network of routes made them uncompetitive within
a supply chain, it was necessary to identify causes for such a situation. In particular under
capacity, there can be technical or technological shortcomings along the route such as poor
infrastructure at route sections or missing links, lack of logistics hubs or nodes or lack of
logistics services that can undermine the capacity of the route. Such shortcomings created what
was called physical barriers to the development of routes. There can be however shortcomings of
the type of lack of proper policies, poor or business-unfriendly administrative regulations,
frequently changing or instable procedures in countries along the route or lack of administrative
interoperability between neighbouring countries along the routes, which can undermine the
connectivity or directly the economic efficiency of the route. These shortcomings were the non-
physical barriers to the development of routes.
This chapter looks at discussing and identifying both the physical and non-physical barriers of
EATL inland routes. In particular, it discusses border crossings, road transport, rail transport,
intermodal transport and public and private interests and cross-country cooperation along EATL
inland routes to articulate the barriers that existed at the time this report was prepared.
III.2 Border crossings on EATL inland routes
Various studies issued between 2013 and 2016 showed that the time lost at border crossings on
EATL routes was significant. In particular studies made for Central Asia showed that the
stopping time exceeded the UNECE recommended 60 minutes for international shuttle trains and
30 minutes for combined transport32
.
According to Corridor Performance Measurement and Monitoring (CPMM) data by the Asian
Development Bank the time spent on specific rail border crossing could take as much as 6 hours
(Alat Farap between Turkmenistan and Uzbekistan) to over 65 hours (Dostyk between China and
Kazakhstan). Figure 3.1 and 3.2 show CPMM data for various border crossing points in Central
Asia.
32
UNECE (2000) Report of the Informal Meeting on Rail Transport. Doc. TRANS/SC.2/2000/18

167
Figure 3.1
Average border crossing times, Uzbekistan road BSP, 2013
Figure 3.2
Average border crossing times for selected BCP, 2013
The border crossing delays added significantly to the overall time needed to transport of goods
on EATL inland routes. A route analysis undertaken by UNESCAP from Almaty (Kazakhstan)
to Berlin (Germany) through the Russian Federation, Belarus and Poland, had showed that 50
per cent of the transit time had been spent at border crossing points between Kazakhstan and the
Russian Federation (3-4 days) and between the Russian Federation and Belarus (4-7days).
168
Therefore a trip that should have taken 6 days assuming a border crossing time of 5 hours33
doubled in time to as many as 10-13 days due to the time lost at border crossings.
As studies showed it, the delays at border crossings were mainly caused by inadequate
infrastructure at border crossing points, hence a physical barrier, and process inefficiencies,
hence a non-physical barrier.
III.2.1 Border crossing infrastructure
Underdeveloped or inadequate infrastructure was recorded at many border crossing points along
EATL routes. Many of these points had been designed and built at some points in the past for
lesser cargo volumes and often the infrastructure was not developed further to meet the growing
volumes. For road transport that would mean not enough lanes or no proper waiting area to
manage peak transport flows. For rail infrastructure it would mean not enough tracks for cargo
transfer, in particular at border crossing points between countries using different standard of rail
gauge. Such points were often underequipped with facilities for trans-loading.
The border crossing points often lacked equipment for non-intrusive controls, such as devices for
scanning or weighing of trucks, wagons and containers.
In a number of countries along the EATL inland routes border crossing points were equipped
with electronic systems and computers that failed to provide data on cargo in a timely manner.
Often integrated information systems or information exchange systems were not used.
III.2.2 Border crossing processes and procedures
Uncoordinated and repetitive interventions of numerous inspection and border crossing
administrations working in isolation on the same cargo were recorded at many border crossing
points along the EATL inland routes. Each administration would require its own set of
documents to be cleared separately from others, which was considered a duplication. The
problem often remained with the organisation of custom procedures with each clearance
procedure established separately by a responsible administration in isolation from others. Any
optimisation of those procedures from the perspective of a faster border crossing clearance, in
particular through joint interventions and sharing of data and information, remained to be
undertaken. The procedures were thus quite unfriendly from the perspective of transport
operators.
Physical inspection were also done as customs authorities would often not trust documents
cleared by custom authorities of neighbouring country and would therefore physically inspected
cargo to match the document information with the actual cargo count.
III.3 Road transport
Reviews showed that the transit countries along the EATL inland routes had established more
than 300 bilateral agreements on international road transport with countries in Europe and Asia,
of which some 286 agreements were established to govern transport between two transit states34
.
33
UNECE (2015) Identification of cargo flows on the Euro-Asian transport links. Informal doc. WP.5/GE.2 (2015)
No. 1 34
IRU (2016) An analysis of international road transport permit systems in Eurasia: current practices and prospects
169
Although these bilateral agreements should normally aim at “facilitating trade” and at “balancing
bilateral road transport markets”, due to the bilateral nature and the number of these agreements,
they complicated instead of facilitating a transport undertaking, if cargo was transported across
several countries or when the vehicle and driver came from different countries.
These complications could be associated with the following aspects:
- Varying legal conditions laid down in agreements for undertaking cargo shipments
between pairs of individual countries regarding taxes, levies and permits,
- Limited choice of transport routes for operators from foreign countries if specific routes
and border crossings were defined in the bilateral agreements (in particular, for all
bilateral agreements involving China), and
- Restricted number of bilateral quotas agreed and the necessity of usage of highly-priced
occasional permits.
Assessments also showed that systems for distribution of permits to hauliers were not transparent
in some countries. There had been also cases of discrimination of hauliers noted, e.g. Chinese
truckers arriving at the Khorgos border crossing point needed to go to Almaty to obtain the
permit required.
Furthermore, international road transport was hampered by high transit fees, e.g. transit fees in
some EATL countries were not a charge for infrastructure use but rather a charge on access to
the market. The system of transit fees was not transparent and so was used to discriminate
between operators from different countries, between permit and non-permit holders, and between
domestic and foreign operators. In addition, the fees were often changed without notice.
International road transport was also affected by visa procedures for truckers along EATL inland
routes. Reviews showed some difficulties faced by truckers as follows:
- Non-existence of long-term multi-entry visas in some EATL countries requiring a trucker
to apply for new visa for each trip,
- Non-issuance of visas at border crossing points by some EATL countries requiring a
trucker to apply for visa at embassies in his or her country of residence and so be on hold
from driving for the time of processing of visa application,
- Long-processing times and high consular charges, e.g. a processing time could take up to
two weeks for a transit visa valid for a maximum of 10 days, and
- Lack of synchronisation of visa procedures in EATL transit countries whether with
regard to documents required as part of the visa application, charges or processing times.
In addition, hauliers or truckers complained about the lack of transparency in the system for visa
issuance. They reported about discrimination faced in some EATL countries where truckers of
some nationalities were able to receive visa with fewer formalities and shorter processing time.
Extortion and other illegal actions by officials were another barrier for road transport operations
along EATL routes. Road transport operations between Europe and Asia met with numerous
examples of extortion when crossing state borders, as well as en route. The principal source of
this extortion was the prejudice or the open corruption of customs or other regulatory bodies
170
when passing through vehicle border crossing points35
. Conspiracies between representatives of
state bodies responsible for customs, frontier, sanitary, veterinary and plant control were report
to not be uncommon. At a number of customs posts the levels of bribes required to pass through
the border quickly and without undue hassle were even unofficially published.
The levels of corruption varied significantly from country to country and in general rose when
moving from West to East (corruption was unknown on the borders of Georgia, Poland and
Belarus, whereas on the borders of Central Asian states the unofficial levies imposed and the
levels of extortion were reported by hauliers sometimes to exceed official tariffs twenty-fold)36
.
Last but not least, hauliers were also complaining about several other issues impeding road
haulage, among them:
- Geographical restrictions of TIR system of customs transit in some EATL countries (in
particular strictly limited number of border crossing points for TIR operations),
- Absence of fully digital transit, transport and customs documents in most EATL countries
(like e-CMR consignment note and e-TIR carnet),
- Local collection of charges and fees often introduced without prior notice,
- Requirements for simplified border procedures that could not be met by hauliers due to
unpredictable arrival times at borders (declaration was required within hours of arrival),
or
- Intransparent requirements for convoy or escort allowing the authorities to assign convoy
or escort at their discretion (also to safe and sealed cargo in regular size containers).
III.3 Rail transport
Assessment showed that international rail transport on EATL rail routes was hindered by
differences in railway systems adopted in various EATL countries translating into difference in
requirements for access to rail transport operation market for foreign rolling stock and transport
services providers:
- Use of foreign locomotives, wagons and crews,
- Liability,
- Security (placement of armed officers on trains, e.g. in China),
- Different consignment notes and bills.
Such differences resulted in checks or action at border crossing points that were time consuming
and caused delays, e.g.:
- Technical inspection of rolling stock,
- Document checks to verify and match content of consignment notes, wagon lists and
other cargo documents,
35
UN Global Compact (2014) GLOBAL ANTI-CORRUPTION INITIATIVE. Cases of Bribery and Extortion аlong
Major Transport Corridors and their Impact on Sustainable Transport Development 36
NEA (2009) NELTI Final Report. Analysis of monitoring data collected on NELTI Project Routes in 2008-2009
171
- Preparation of rail transfer documents,
- Exchange of locomotives and crews,
- Replacement of wagons and additional delays caused by unavailability of replacement
wagons, and
- Splitting of trains.
At the same time, supply chain managers informed that railways operators in a number of EATL
countries often failed to offer good quality service that would meet the requirements of modern
logistic market and supply chains. The quality of service was often assessed as poor and
transport would rarely be made on time (delays from 40 to as many as 90 days were reported on
certain transit routes, thus considerably exceeding the scheduled transit time). The tariffs did not
respond to market conditions and there was little flexibility of rail operators to adjusting their
services. The tariffs were also changing unexpectedly.
In addition, in the number of countries block trains transporting containers had to give priority to
trains transporting raw commodities.
III.4 Intermodal transport
The intermodal transport, as the reviews showed it, was not much developed across EATL
countries. Operation such as sea crossing used to be difficult on EATL routes. There were not
enough logistics centres including intermodal terminals that could serve well and promote the
intermodal transport. There were also services missing in local markets to help develop
intermodal transport.
With regard to difficulties on sea crossing – in particular Caspian Sea – truckers used to face
complications to use ferry services due to reasons such as:
- Ferry schedules were not available, and
- Small quotas for trucks were offered on ferries.
Combining the poor ferry service, one that would not respond to market situation, with visa
formalities, where a trucker due to a delay on sea crossing could see his or her visa expiring for a
next transit country before reaching it – Turkmenistan was offering only short validity transit
visas – was not encouraging for undertaking any transport activities on such a sea crossing route.
The intermodal centres had still to be developed at the time when this report was prepared. The
progress in their development was expected to be seen with the conclusion in 2013 of the
Intergovernmental Agreement on Dry Ports under the auspices of the United Nations Economic
and Social Commission for Asia and the Pacific (it entered into force on 23 April 2016). This
Agreement identifies a number of existing and potential dry port locations that were expected to
be the basis of a coordinated effort to create nodes along an international integrated intermodal
transport and logistics system. Some EATL countries, once becoming a Contracting Party to the
Agreement, actively started to develop dry ports network in accordance with it. Among these
countries were Azerbaijan, China, Kazakhstan or Mongolia.
At the same time, a number of EATL countries failed to establish polices that would create
conditions for private sector to develop logistics services locally forming an integral part of
interregional intermodal services.
172
III.5 Public and private interests, cross-country cooperation
While public and private interests should both be aimed at ensuring competitive transport
services facilitating trade, this objective was often missed by public authorities in some EATL
countries. The non-physical barriers articulated in other sections of this chapter, that were
present in EATL countries, show that the principle objective of trade facilitation was not
adequately supported by the public authorities when executing their primary functions related to
safety, security or revenue collection from international transport.
Certain difficulties faced by private sector when delivering transport services could have been
avoided or addressed long time ago if EATL countries would have worked closer together and
followed a more integrated approach to international transport and trade facilitation. Instead
often a disintegrated approach was followed with numerous initiatives overlapping involving
different groups of EATL countries. This resulted in the fragmentation of tradelanes.
III.6. Conclusions
There were many barriers, especially the non-physical ones, existing in EATL countries that
made rail, road and intermodal transport rather difficult or underdeveloped. Removal of these
barriers would often be achieved by improving policies and their implementation at a country
level and by ensuring certain mid-term stability and unchanging conditions for transport
operation. Other barriers, especially those on lack of administrative interoperability between
countries along the transit routes require joint effort and coordination. Without the latter the
fragmentation of tradelanes could be difficult to overcome.

173
PART IV. EATL: LOOKING INTO THE FUTURE
As noted in the Joint Statement on Future Development of Euro-Asian Transport Links (EATL)
signed in Geneva, on 26 February 2013, by ministers of transport from EATL countries, there
was a great potential to diversify freight transport routes between Europe and Asia and increase
the use of existing and projected inland transport capacities.
The development of efficient, economically justified, safe and more secure EATL inland routes
could provide alternative or complementary transport connections to the maritime transport,
facilitate existing and future trade and cargo flows between Europe and Asia, and facilitate
integration of national economies in the global economy37
.
Development of EATL could play a significant role in achieving the Sustainable Development
Goals (SDG). EATL inland routes can facilitate access to markets, economic opportunities and
social services to a number of countries spanning these routes, including landlocked and transit
developing countries, in a manner that could significantly contribute to economic development,
reduction of poverty and increase in the stability of economic prospects in these states.
The initial SWOT-analysis that had been developed during phase II of the EATL project gave
the overall picture of the status of EATL. It helped to understand maximum benefits from
strengths, to outline the ways to compensate weaknesses, to minimize threats and take the
greatest possible advantage of opportunities.
The current section of the report contains the upgraded version of the SWOT analysis of the
EATL project reflecting the changes and trends identified in the course of the phase III of the
project.
The following were identified as strengths of EATL inland routes:
(a) Faster delivery on EATL inland routes than on maritime routes for the
transport of goods between Europe and the Asia-Pacific;
(b) Important transport option for landlocked developing countries (LLDCs) lying
on EATL inland routes;
(c) Unutilized existing capacities along some parts of the EATL road and railway
routes running East-West and North-South;
(d) Preferred transport option for countries along the EATL inland routes to reach
their major trade partners (countries of Central Asia, Afghanistan and
Mongolia);
(e) Integral part and physical extensions of Pan-European Corridors, AGR, AGC,
AGTC, the Trans-European Transport Networks (TEN-T), Asian Highway
(AH) network, Trans-Asian Railway (TAR), Trans-European Motorway
(TEM), Trans-European Railway (TER), TRACECA, International Transport
Corridor North-South and International OSJD Rail Corridors, International
Transport Corridor Via-Carpatia, International Road Corridor Europe –
37UNECE. Joint Statement on Future Development of Euro-Asian Transport Links, 26 February 2013. Available:
www.unece.org/fileadmin/DAM/trans/doc/2013/itc/Joint_Declaration_on_EATL.pdf

174
Western China and other related corridors and networks of high significance
to transport between Europe and Asia;
(f) Political commitment to the development of EATL inland routes expressed by
concerned governments and various international and subregional
governmental and non-governmental organizations promoting related
initiatives and projects in the area of transport;
(g) Availability of Public-Private Partnerships (PPPs) for the implementation of
projects and initiatives aimed at EATL inland routes development (in addition
to traditional PPPs, new institutional forms of global partnerships, in
particular the Global Partnership for Sustainable Transport (GPST),
involvement of international financial institutions, was expected to contribute
to improvement of cooperation between different transport businesses and the
United Nations, its specialized and regional agencies in the area of transport
facilitation, harmonization of transport law and other issues essential to
EATL); and
(h) Availability of best available technological and environmental standards and
best practices for planning and construction of missing links.
10. The following were considered to be general weaknesses observed on EATL inland
routes (not necessarily present in all EATL countries):
(a) Comparably too high costs of goods transport on EATL inland routes vis-à-vis
the maritime routes across the Indian Ocean and the Suez Canal due to:
(i) Limited competition on EATL inland routes versus high competition
between liner shipping companies leading to low freight rates;
(ii) (sometimes) Unreasonably high transit tariffs, fees and charges pursuing,
primarily, the fiscal objectives; and
(iii) Challenges in harmonizing tariff rates between rail operators for cargo
delivery between Europe and Asia;
(b) Slowly developing transport and logistic services along the EATL inland
routes;
(c) Insufficient development of intermodal transport across the EATL region,
mainly in the Central-Asian region (few intermodal services provided on the
continental Euro-Asian market; insufficient number of logistic centres along
the routes);
(d) Existing physical and non-physical barriers along the EATL inland routes
hampering transport operations, in particular:
(i) Missing links on road and railway networks;
(ii) Time-consuming control procedures leading to delays at border crossing
points;
(iii) Absence of ‘single window’ procedures at border crossing points;
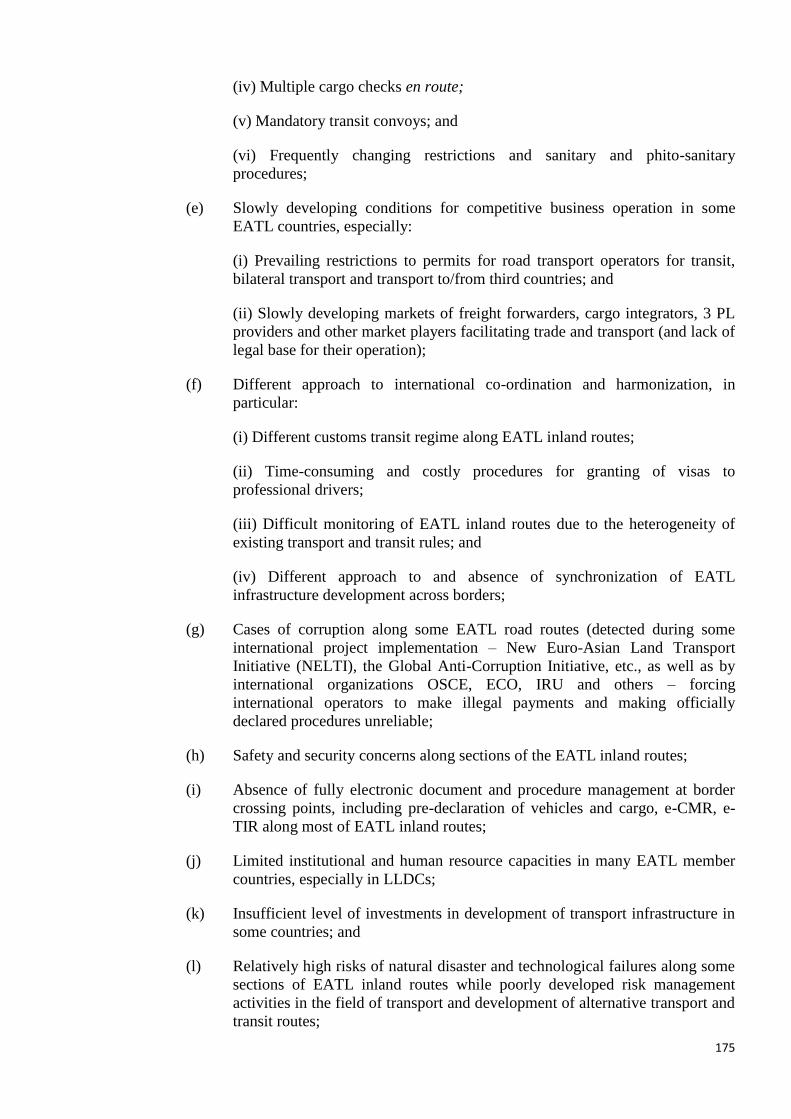
175
(iv) Multiple cargo checks en route;
(v) Mandatory transit convoys; and
(vi) Frequently changing restrictions and sanitary and phito-sanitary
procedures;
(e) Slowly developing conditions for competitive business operation in some
EATL countries, especially:
(i) Prevailing restrictions to permits for road transport operators for transit,
bilateral transport and transport to/from third countries; and
(ii) Slowly developing markets of freight forwarders, cargo integrators, 3 PL
providers and other market players facilitating trade and transport (and lack of
legal base for their operation);
(f) Different approach to international co-ordination and harmonization, in
particular:
(i) Different customs transit regime along EATL inland routes;
(ii) Time-consuming and costly procedures for granting of visas to
professional drivers;
(iii) Difficult monitoring of EATL inland routes due to the heterogeneity of
existing transport and transit rules; and
(iv) Different approach to and absence of synchronization of EATL
infrastructure development across borders;
(g) Cases of corruption along some EATL road routes (detected during some
international project implementation – New Euro-Asian Land Transport
Initiative (NELTI), the Global Anti-Corruption Initiative, etc., as well as by
international organizations OSCE, ECO, IRU and others – forcing
international operators to make illegal payments and making officially
declared procedures unreliable;
(h) Safety and security concerns along sections of the EATL inland routes;
(i) Absence of fully electronic document and procedure management at border
crossing points, including pre-declaration of vehicles and cargo, e-CMR, e-
TIR along most of EATL inland routes;
(j) Limited institutional and human resource capacities in many EATL member
countries, especially in LLDCs;
(k) Insufficient level of investments in development of transport infrastructure in
some countries; and
(l) Relatively high risks of natural disaster and technological failures along some
sections of EATL inland routes while poorly developed risk management
activities in the field of transport and development of alternative transport and
transit routes;

176
11. The following were considered to be EATL inland routes opportunities:
(a) Increasing long-term transport flow of goods between Europe and Asia due to
continuous globalization;
(b) Rapid growth of China and India and some other Asian countries generating
greater transport demand and thus new opportunities for EATL inland routes;
(c) Adoption during 2014-2015 by UN General Assembly and the ongoing
implementation of United Nations Resolutions 70/1 "Transforming our world:
the 2030 Agenda for Sustainable Development", 69/213 "The Role of
Transport and Transit Corridors in Ensuring International Cooperation for
Sustainable Development", 70/197 "Towards comprehensive cooperation
among all modes of transport for promoting sustainable multimodal transit
corridors";
(d) Launch of “The Ashgabat Process" on Sustainable Transport Development
based on the results of the First Global United Nations Conference on
Sustainable Transport (November 26-27, 2016, Ashgabat, Turkmenistan);
(e) The adoption of Ministerial Declaration on Sustainable Transport
Connectivity in Asia and the Pacific and the Regional Action Programme for
Sustainable Transport Connectivity in Asia and the Pacific, phase III (2017-
2021) during the Third Session of the UNESCAP Ministerial Conference on
Transport (5-9 December 2016, Moscow, Russian Federation);
(f) Ongoing implementation of the Vienna Programme of Action for Landlocked
Developing Countries for the Decade 2014-2024;
(g) Establishment of the Eurasian Economic Union (EAEU) in 2014 and
implementation of coordinated (agreed) transport policies among its member
States with gradual creation of a single transport space and common market of
transport services;
(h) The start of “One Belt - One Road” (OBOR) Initiative by China;
(i) Creation of the Global Partnership for Sustainable Transport (GPST) and
launch of its work on key transport issues related to the development of
EATL, for example its proposal to develop a Global Transit Document
(GTrD) to facilitate inter-modal transit of goods across multiple jurisdictions
taking into account related legal and insurance issues during the transit of
goods;
(j) Accession of EATL countries to the WTO (Russian Federation (2012),
Tajikistan (2013) and Kazakhstan (2015));
(k) Entry into force of the WTO Trade Facilitation Agreement (TFA) in 2017;
(l) Economic reforms in certain EATL countries improving the business climate
and transparency of procedures as evidenced by the growth indices of
competitiveness and LPI in those countries;
(m) Developing trade among EATL countries, in particular between LLDCs in
Central Asia and their transit developing neighbours;
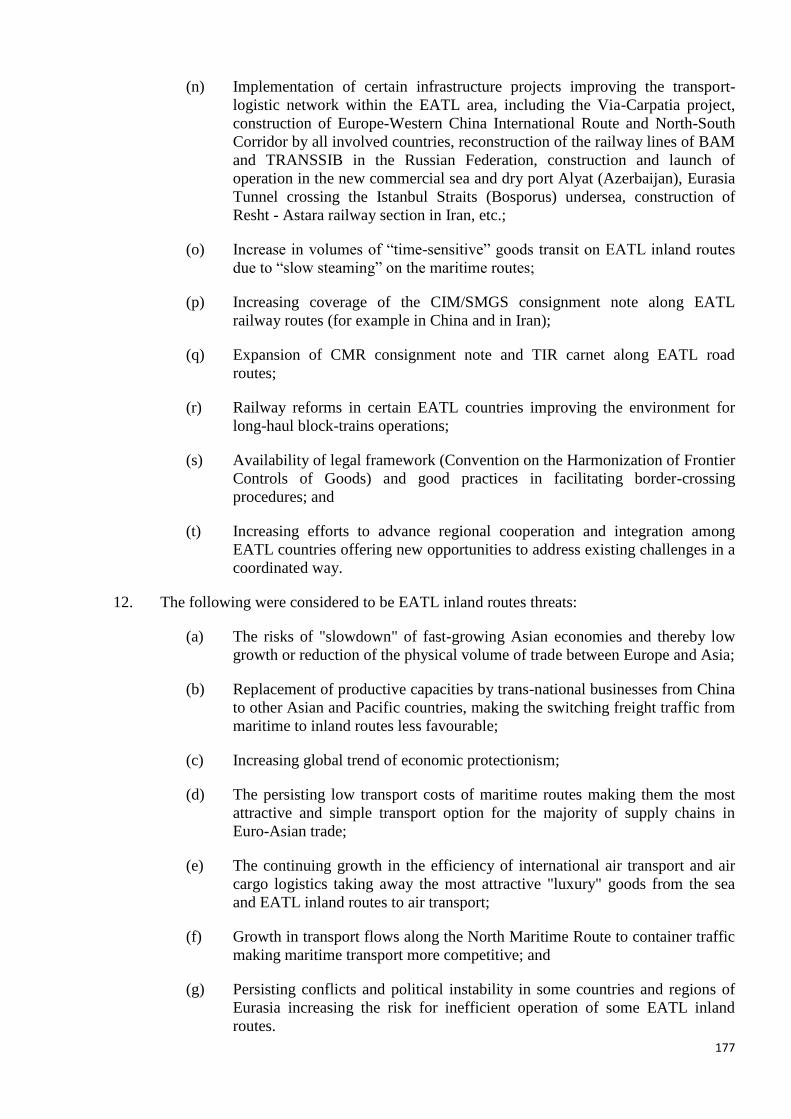
177
(n) Implementation of certain infrastructure projects improving the transport-
logistic network within the EATL area, including the Via-Carpatia project,
construction of Europe-Western China International Route and North-South
Corridor by all involved countries, reconstruction of the railway lines of BAM
and TRANSSIB in the Russian Federation, construction and launch of
operation in the new commercial sea and dry port Alyat (Azerbaijan), Eurasia
Tunnel crossing the Istanbul Straits (Bosporus) undersea, construction of
Resht - Astara railway section in Iran, etc.;
(o) Increase in volumes of “time-sensitive” goods transit on EATL inland routes
due to “slow steaming” on the maritime routes;
(p) Increasing coverage of the CIM/SMGS consignment note along EATL
railway routes (for example in China and in Iran);
(q) Expansion of CMR consignment note and TIR carnet along EATL road
routes;
(r) Railway reforms in certain EATL countries improving the environment for
long-haul block-trains operations;
(s) Availability of legal framework (Convention on the Harmonization of Frontier
Controls of Goods) and good practices in facilitating border-crossing
procedures; and
(t) Increasing efforts to advance regional cooperation and integration among
EATL countries offering new opportunities to address existing challenges in a
coordinated way.
12. The following were considered to be EATL inland routes threats:
(a) The risks of "slowdown" of fast-growing Asian economies and thereby low
growth or reduction of the physical volume of trade between Europe and Asia;
(b) Replacement of productive capacities by trans-national businesses from China
to other Asian and Pacific countries, making the switching freight traffic from
maritime to inland routes less favourable;
(c) Increasing global trend of economic protectionism;
(d) The persisting low transport costs of maritime routes making them the most
attractive and simple transport option for the majority of supply chains in
Euro-Asian trade;
(e) The continuing growth in the efficiency of international air transport and air
cargo logistics taking away the most attractive "luxury" goods from the sea
and EATL inland routes to air transport;
(f) Growth in transport flows along the North Maritime Route to container traffic
making maritime transport more competitive; and
(g) Persisting conflicts and political instability in some countries and regions of
Eurasia increasing the risk for inefficient operation of some EATL inland
routes.
178
EATL Roadmap to 2030 (“Strengths - Weaknesses - Opportunities - Threats” matrix).
The main goal of the phase III of the EATL project was to identify the measures that would
make the EATL routes operational.
In fact, these links had already been functioning accumulating the everyday experience of trade
and transport. In this context, the task was rather to generalize this experience and formulate the
coordinated measures that could facilitate the further growth in transport flows on EATL routes.
Table 1 lists strengths, weaknesses, opportunities and threats for several issues recognized as
important to the development and further operationalization of EATL inland routes such as: (i)
SDG implementation, (ii) LLDCs improved access to markets, (iii) Inland transport and
international trade between Europe and Asia, (iv) EATL infrastructure, (v) Harmonization and
facilitation of procedures along EATL inland routes, (vi) Container block trains, (vii) Road
transport and Euro-Asian connectivity, (viii) Universal legal regimes, and (ix) Railway reforms
in certain EATL countries. By grouping strengths, weaknesses, opportunities and threats in that
way, the table shows in clear way which are the strengths to build on, weaknesses to address,
opportunities to seize and threats to minimize for each of the nine issues of importance. Hence,
the table can serve as an effective tool for different actors in formulating adequate action under
each of the nine issues of importance.
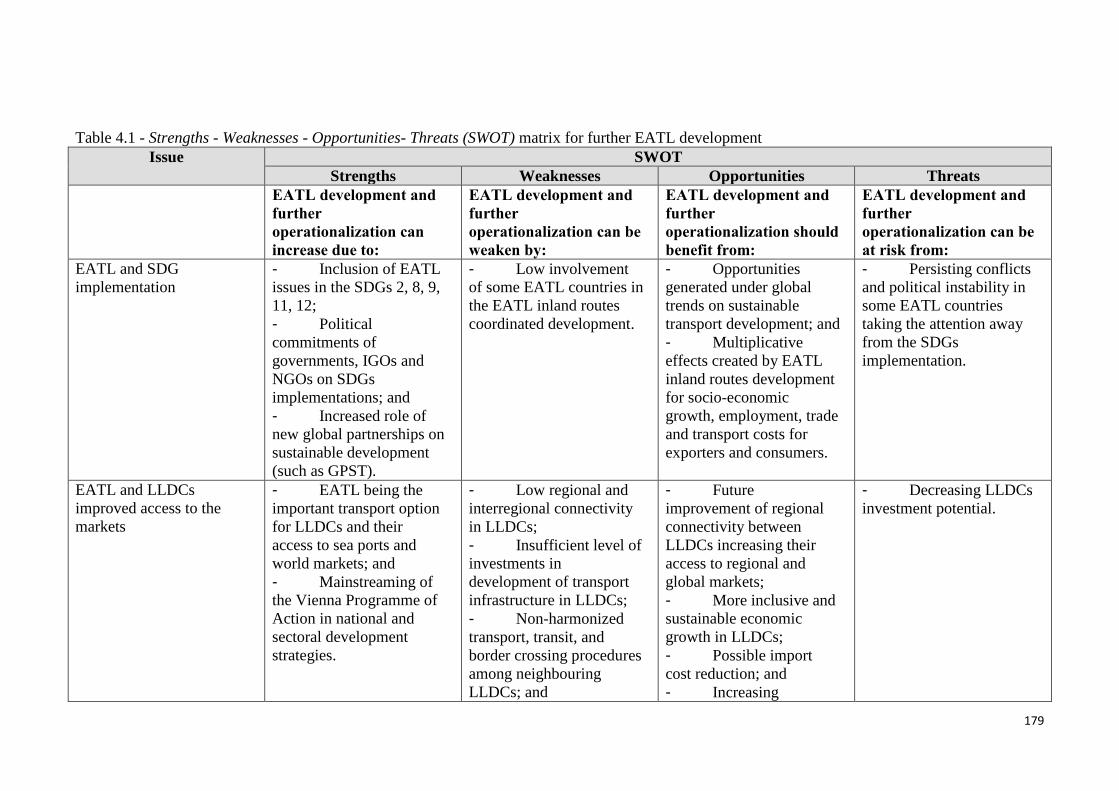
179
Table 4.1 - Strengths - Weaknesses - Opportunities- Threats (SWOT) matrix for further EATL development
Issue SWOT
Strengths Weaknesses Opportunities Threats
EATL development and
further
operationalization can
increase due to:
EATL development and
further
operationalization can be
weaken by:
EATL development and
further
operationalization should
benefit from:
EATL development and
further
operationalization can be
at risk from:
EATL and SDG
implementation
- Inclusion of EATL
issues in the SDGs 2, 8, 9,
11, 12;
- Political
commitments of
governments, IGOs and
NGOs on SDGs
implementations; and
- Increased role of
new global partnerships on
sustainable development
(such as GPST).
- Low involvement
of some EATL countries in
the EATL inland routes
coordinated development.
- Opportunities
generated under global
trends on sustainable
transport development; and
- Multiplicative
effects created by EATL
inland routes development
for socio-economic
growth, employment, trade
and transport costs for
exporters and consumers.
- Persisting conflicts
and political instability in
some EATL countries
taking the attention away
from the SDGs
implementation.
EATL and LLDCs
improved access to the
markets
- EATL being the
important transport option
for LLDCs and their
access to sea ports and
world markets; and
- Mainstreaming of
the Vienna Programme of
Action in national and
sectoral development
strategies.
- Low regional and
interregional connectivity
in LLDCs;
- Insufficient level of
investments in
development of transport
infrastructure in LLDCs;
- Non-harmonized
transport, transit, and
border crossing procedures
among neighbouring
LLDCs; and
- Future
improvement of regional
connectivity between
LLDCs increasing their
access to regional and
global markets;
- More inclusive and
sustainable economic
growth in LLDCs;
- Possible import
cost reduction; and
- Increasing
- Decreasing LLDCs
investment potential.
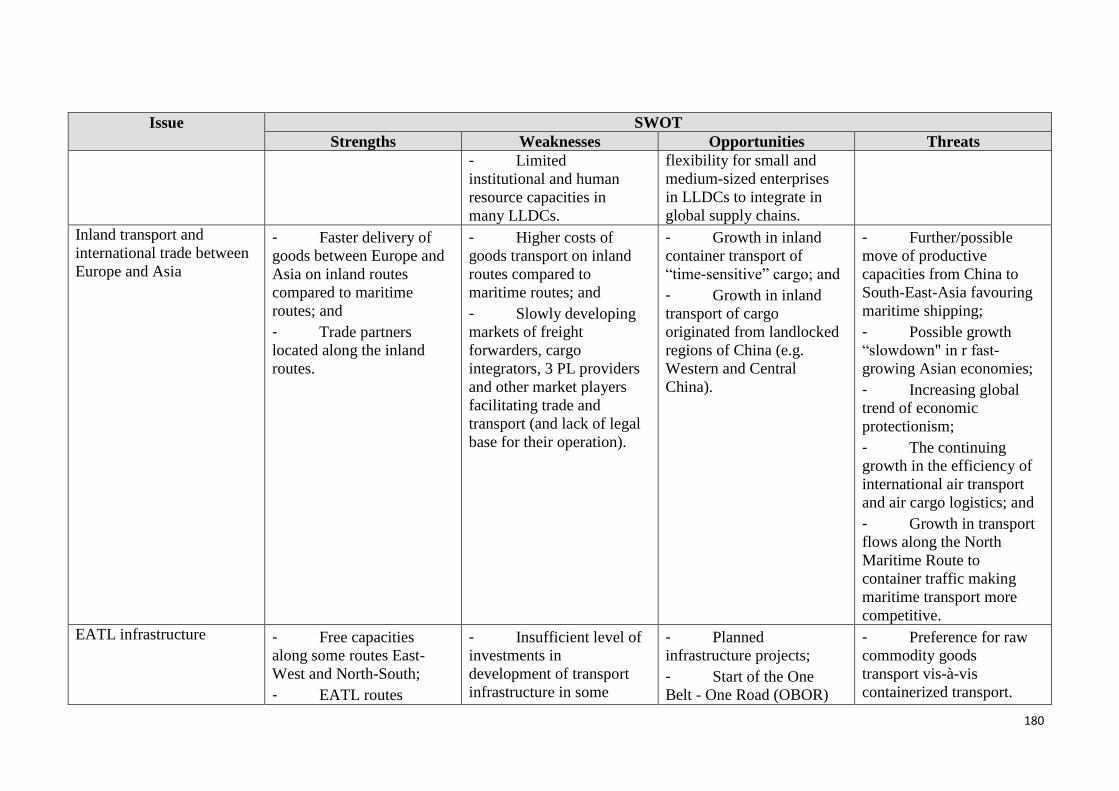
180
Issue SWOT
Strengths Weaknesses Opportunities Threats
- Limited
institutional and human
resource capacities in
many LLDCs.
flexibility for small and
medium-sized enterprises
in LLDCs to integrate in
global supply chains.
Inland transport and
international trade between
Europe and Asia
- Faster delivery of
goods between Europe and
Asia on inland routes
compared to maritime
routes; and
- Trade partners
located along the inland
routes.
- Higher costs of
goods transport on inland
routes compared to
maritime routes; and
- Slowly developing
markets of freight
forwarders, cargo
integrators, 3 PL providers
and other market players
facilitating trade and
transport (and lack of legal
base for their operation).
- Growth in inland
container transport of
“time-sensitive” cargo; and
- Growth in inland
transport of cargo
originated from landlocked
regions of China (e.g.
Western and Central
China).
- Further/possible
move of productive
capacities from China to
South-East-Asia favouring
maritime shipping;
- Possible growth
“slowdown" in r fast-
growing Asian economies;
- Increasing global
trend of economic
protectionism;
- The continuing
growth in the efficiency of
international air transport
and air cargo logistics; and
- Growth in transport
flows along the North
Maritime Route to
container traffic making
maritime transport more
competitive.
EATL infrastructure - Free capacities
along some routes East-
West and North-South;
- EATL routes
- Insufficient level of
investments in
development of transport
infrastructure in some
- Planned
infrastructure projects;
- Start of the One
Belt - One Road (OBOR)
- Preference for raw
commodity goods
transport vis-à-vis
containerized transport.
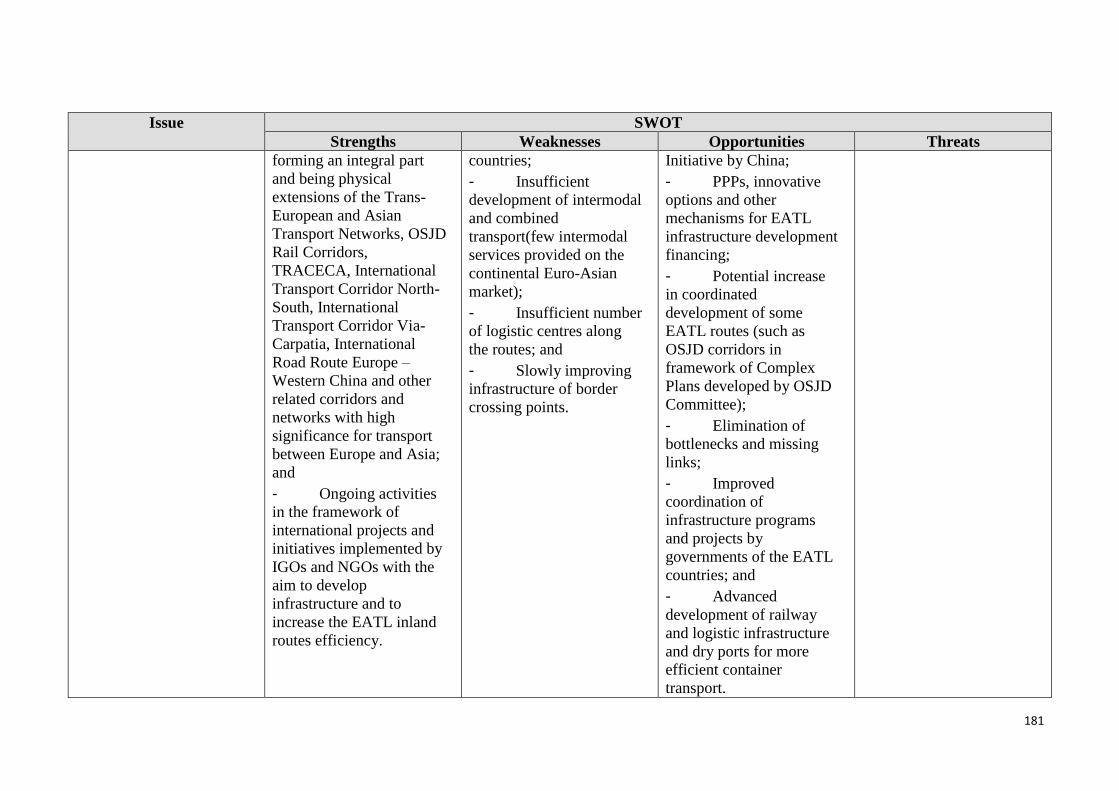
181
Issue SWOT
Strengths Weaknesses Opportunities Threats
forming an integral part
and being physical
extensions of the Trans-
European and Asian
Transport Networks, OSJD
Rail Corridors,
TRACECA, International
Transport Corridor North-
South, International
Transport Corridor Via-
Carpatia, International
Road Route Europe –
Western China and other
related corridors and
networks with high
significance for transport
between Europe and Asia;
and
- Ongoing activities
in the framework of
international projects and
initiatives implemented by
IGOs and NGOs with the
aim to develop
infrastructure and to
increase the EATL inland
routes efficiency.
countries;
- Insufficient
development of intermodal
and combined
transport(few intermodal
services provided on the
continental Euro-Asian
market);
- Insufficient number
of logistic centres along
the routes; and
- Slowly improving
infrastructure of border
crossing points.
Initiative by China;
- PPPs, innovative
options and other
mechanisms for EATL
infrastructure development
financing;
- Potential increase
in coordinated
development of some
EATL routes (such as
OSJD corridors in
framework of Complex
Plans developed by OSJD
Committee);
- Elimination of
bottlenecks and missing
links;
- Improved
coordination of
infrastructure programs
and projects by
governments of the EATL
countries; and
- Advanced
development of railway
and logistic infrastructure
and dry ports for more
efficient container
transport.

182
Issue SWOT
Strengths Weaknesses Opportunities Threats
Harmonization and
facilitation of procedures
along EATL routes
- Participation of
most of EATL countries in
key international
agreements and United
Nations conventions, such
as CMR, TIR,
Harmonisation Convention
as well as in WTO TFA.
- Lack of accession
by some EATL countries
to international
conventions and United
Nations agreements;
- Insufficient level of
international co-ordination
and harmonization of
border crossing
procedures;
- Cases of corruption
along some EATL road
routes;
- Absence of fully
electronic transport and
customs documents/
procedures, including
electronic pre-declaration
systems; and
- Limited
institutional and human
resource capacities.
- Entry into force of
the WTO Trade
Facilitation Agreement
(TFA) in 2017;
- Start of TIR carnets
in Pakistan;
- China accession to
the TIR Convention;
- Entry into force
and implementation of
new regional transport
agreements (SCO
Agreement,
Intergovernmental
Agreement on road
transport along Asian
Highway Network, etc.);
- Establishment of
the Eurasian Economic
Union (EAEU) in 2014
and implementation of
coordinated (agreed)
transport policies among
its member States with
gradual creation of a single
transport space and
common market of
transport services;
- Dissemination of
- Continuing low
level of implementation in
some EATL countries of
international programs and
initiatives related to
facilitation and
harmonization of transport,
transit and border crossing
procedures.

183
Issue SWOT
Strengths Weaknesses Opportunities Threats
best decisions and models
in the area of international
trade, transport and border
crossing (UN ECE –
OSCE Handbook of best
practices at border
crossings, WCO standards,
Safe-TIR, TIR-EPD etc.);
- Further
development of bilateral
and multilateral forms of
cooperation in the field of
transport between EATL
countries; and
- Enhanced
development of the
freight-forwarding and
high level logistic
providers segment (3PL
and higher).
Container block trains - Container block
train in regular services.
- High competition
between liner shipping
companies and the
associated low freight
rates;
- Challenges in tariff
harmonization for
container transport
between Europe and Asia
- Increasing capacity
for operating container
block trains between
Europe and Asia due to
efforts of IGOs, NGOs (in
particular OSJD,
Coordinating Council on
Trans-Siberian
Transportation
International Association,
- Persisting
preference for raw
commodity transport vis-à-
vis containerized transport;
- Continuing growth
in the efficiency of
international air transport
and air cargo logistics;
- Conservation of
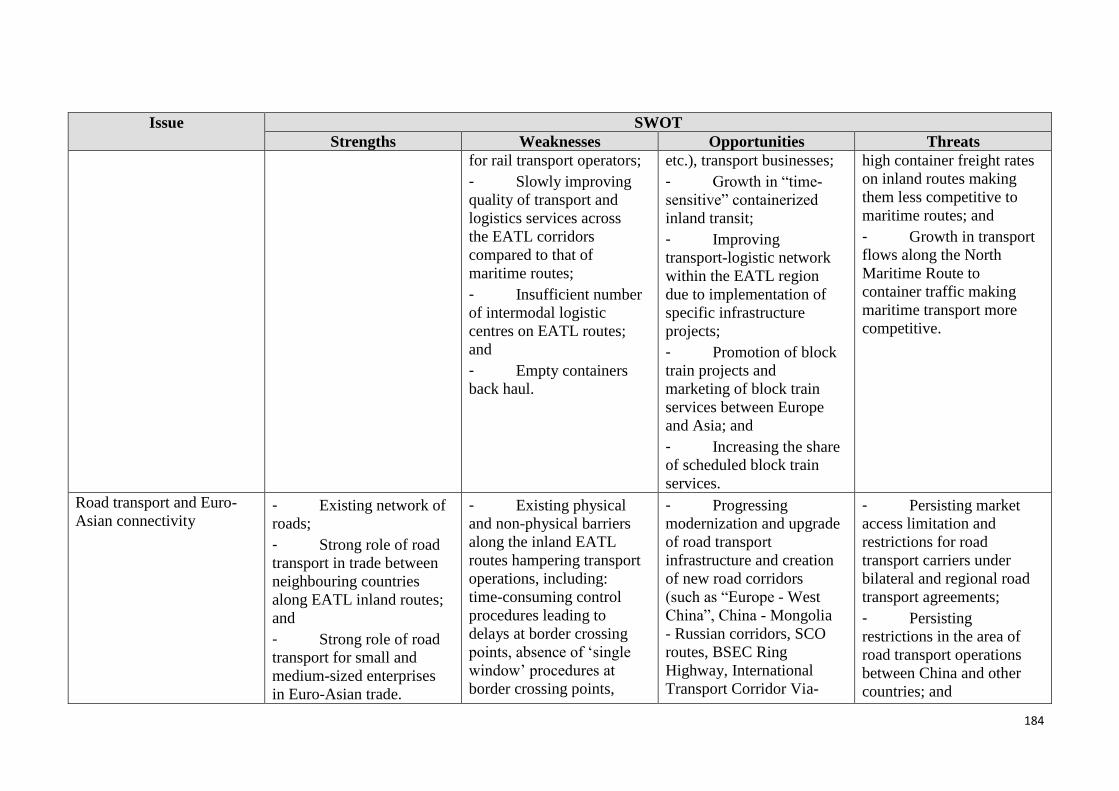
184
Issue SWOT
Strengths Weaknesses Opportunities Threats
for rail transport operators;
- Slowly improving
quality of transport and
logistics services across
the EATL corridors
compared to that of
maritime routes;
- Insufficient number
of intermodal logistic
centres on EATL routes;
and
- Empty containers
back haul.
etc.), transport businesses;
- Growth in “time-
sensitive” containerized
inland transit;
- Improving
transport-logistic network
within the EATL region
due to implementation of
specific infrastructure
projects;
- Promotion of block
train projects and
marketing of block train
services between Europe
and Asia; and
- Increasing the share
of scheduled block train
services.
high container freight rates
on inland routes making
them less competitive to
maritime routes; and
- Growth in transport
flows along the North
Maritime Route to
container traffic making
maritime transport more
competitive.
Road transport and Euro-
Asian connectivity - Existing network of
roads;
- Strong role of road
transport in trade between
neighbouring countries
along EATL inland routes;
and
- Strong role of road
transport for small and
medium-sized enterprises
in Euro-Asian trade.
- Existing physical
and non-physical barriers
along the inland EATL
routes hampering transport
operations, including:
time-consuming control
procedures leading to
delays at border crossing
points, absence of ‘single
window’ procedures at
border crossing points,
- Progressing
modernization and upgrade
of road transport
infrastructure and creation
of new road corridors
(such as “Europe - West
China”, China - Mongolia
- Russian corridors, SCO
routes, BSEC Ring
Highway, International
Transport Corridor Via-
- Persisting market
access limitation and
restrictions for road
transport carriers under
bilateral and regional road
transport agreements;
- Persisting
restrictions in the area of
road transport operations
between China and other
countries; and
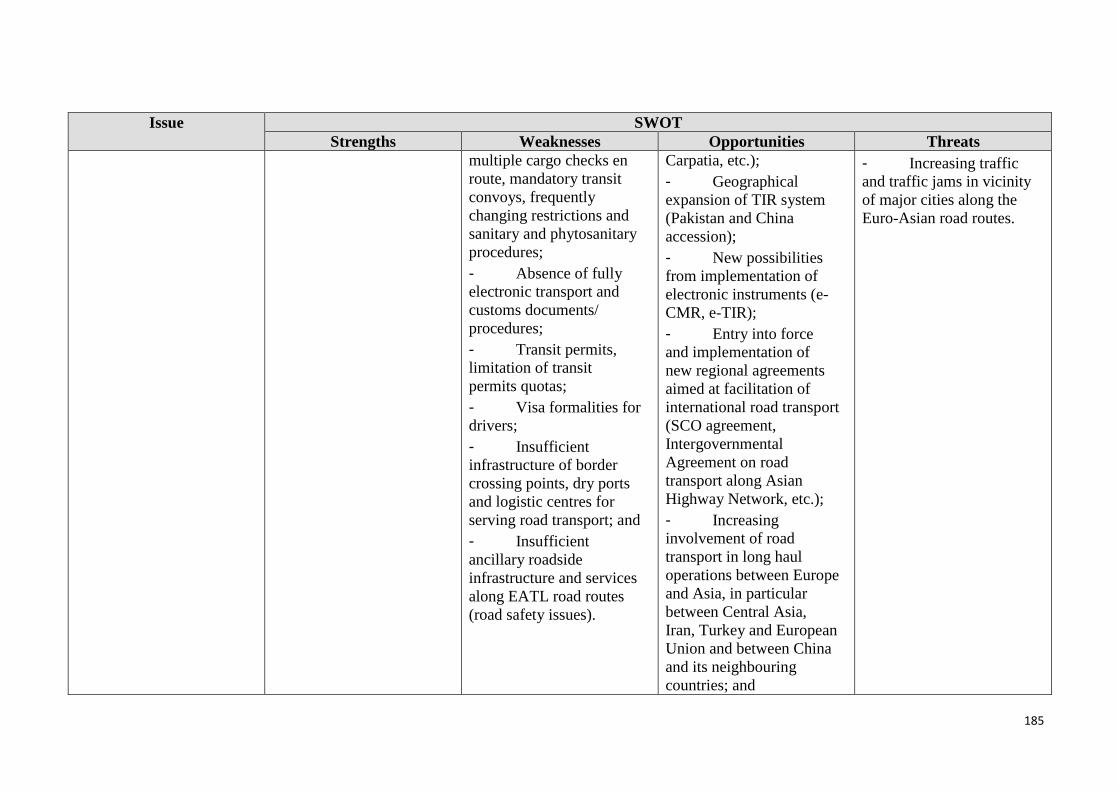
185
Issue SWOT
Strengths Weaknesses Opportunities Threats
multiple cargo checks en
route, mandatory transit
convoys, frequently
changing restrictions and
sanitary and phytosanitary
procedures;
- Absence of fully
electronic transport and
customs documents/
procedures;
- Transit permits,
limitation of transit
permits quotas;
- Visa formalities for
drivers;
- Insufficient
infrastructure of border
crossing points, dry ports
and logistic centres for
serving road transport; and
- Insufficient
ancillary roadside
infrastructure and services
along EATL road routes
(road safety issues).
Carpatia, etc.);
- Geographical
expansion of TIR system
(Pakistan and China
accession);
- New possibilities
from implementation of
electronic instruments (e-
CMR, e-TIR);
- Entry into force
and implementation of
new regional agreements
aimed at facilitation of
international road transport
(SCO agreement,
Intergovernmental
Agreement on road
transport along Asian
Highway Network, etc.);
- Increasing
involvement of road
transport in long haul
operations between Europe
and Asia, in particular
between Central Asia,
Iran, Turkey and European
Union and between China
and its neighbouring
countries; and
- Increasing traffic
and traffic jams in vicinity
of major cities along the
Euro-Asian road routes.
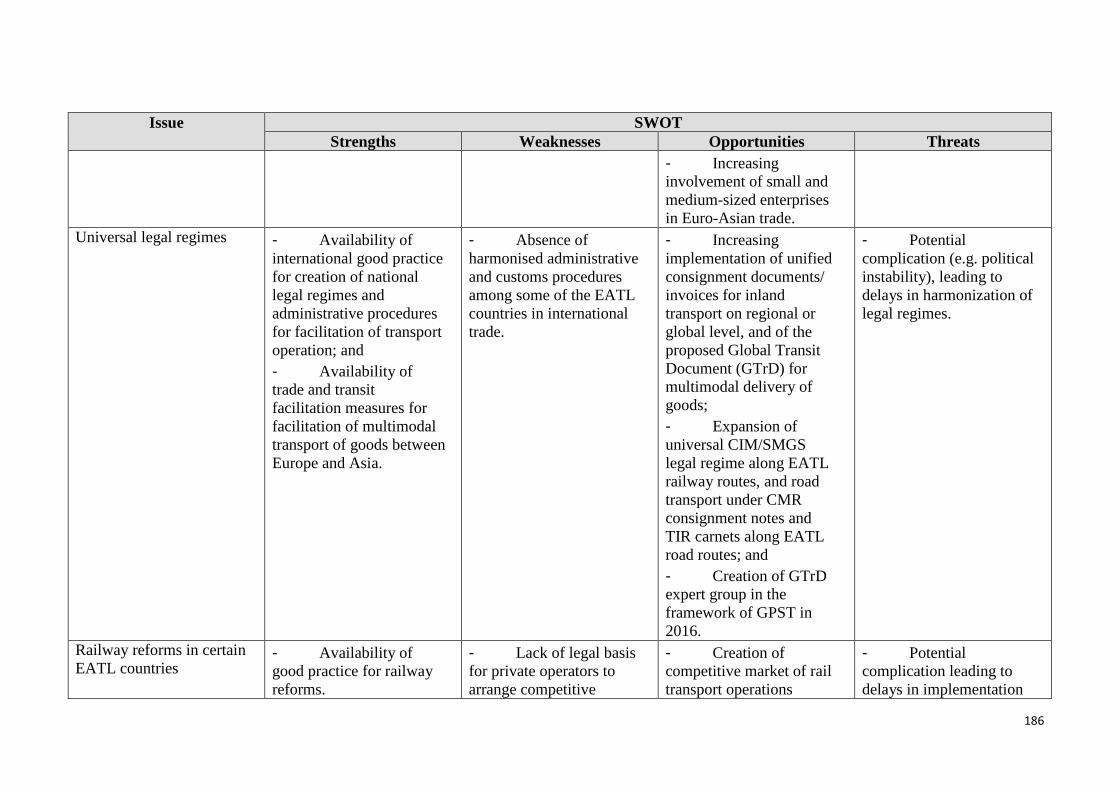
186
Issue SWOT
Strengths Weaknesses Opportunities Threats
- Increasing
involvement of small and
medium-sized enterprises
in Euro-Asian trade.
Universal legal regimes - Availability of
international good practice
for creation of national
legal regimes and
administrative procedures
for facilitation of transport
operation; and
- Availability of
trade and transit
facilitation measures for
facilitation of multimodal
transport of goods between
Europe and Asia.
- Absence of
harmonised administrative
and customs procedures
among some of the EATL
countries in international
trade.
- Increasing
implementation of unified
consignment documents/
invoices for inland
transport on regional or
global level, and of the
proposed Global Transit
Document (GTrD) for
multimodal delivery of
goods;
- Expansion of
universal CIM/SMGS
legal regime along EATL
railway routes, and road
transport under CMR
consignment notes and
TIR carnets along EATL
road routes; and
- Creation of GTrD
expert group in the
framework of GPST in
2016.
- Potential
complication (e.g. political
instability), leading to
delays in harmonization of
legal regimes.
Railway reforms in certain
EATL countries - Availability of
good practice for railway
reforms.
- Lack of legal basis
for private operators to
arrange competitive
- Creation of
competitive market of rail
transport operations
- Potential
complication leading to
delays in implementation
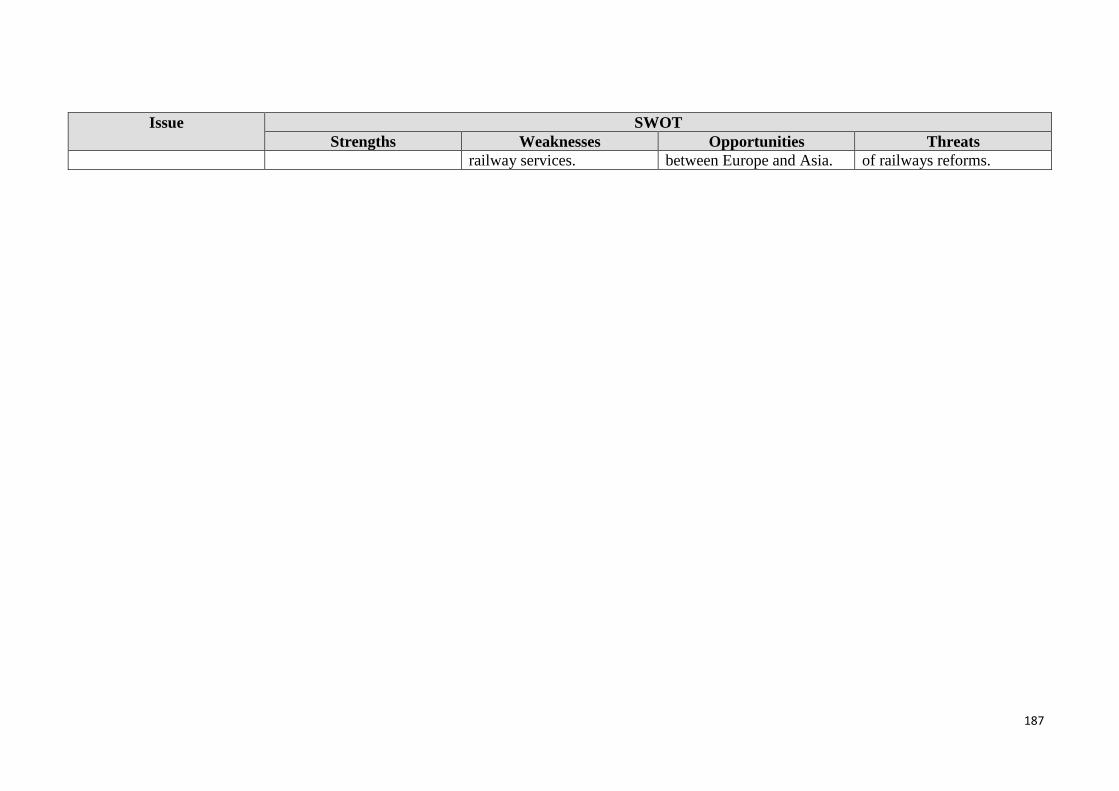
187
Issue SWOT
Strengths Weaknesses Opportunities Threats
railway services. between Europe and Asia. of railways reforms.

PART V. CONCLUSIONS AND RECOMMENDATIONS
In the context of above mentioned SWOT Matrix, it was relevant to identify the best options and
mechanisms for further EATL development by governments, international intergovernmental
and non-governmental organizations and the business community. These recommendations have
been prepared in recognition of the fact that conditions in which transport systems develop differ
among countries and regions along the EATL inland routes.
These recommendations seek to propose options on how to most effectively develop EATL
inland routes at national, international and business levels by “translating” the policy language
into potentially actionable initiatives that governments, IGOs, NGOs and businesses could
undertake in order to reap the benefits of these important policy instruments.
A. Transport policy
Establishing of transport policies based on good practice available internationally and developing
bilateral and international forms of cooperation should be a priority to help further operationalize
the EATL inland routes.
Recommendations:
For governments and IGOs
1. Continue the activities within the EATL project in co-ordination with other similarly
focused initiatives (UNECE, UNESCAP, SPECA, OSJD, ECO, CCTT, UIC, IRU, GPST etc.)
with the aim to increase the EATL efficiency:
Implement at the national level the provisions of United Nations Resolutions 69/213
"The Role of Transport and Transit Corridors in Ensuring International Cooperation for
Sustainable Development" and 70/197 "Towards comprehensive cooperation among all
modes of transport for promoting sustainable multimodal transit corridors";
Implement the provisions of Ministerial Declaration on Sustainable Transport
Connectivity in Asia and the Pacific and the Regional Action Programme for
Sustainable Transport Connectivity in Asia and the Pacific, phase III (2017-2021) by
Asian EATL countries;
Participate in the regional and international projects and initiatives implemented by
IGOs and NGOs in the area of EATL, trade, transport and transit facilitation (UNECE,
UNESCAP, SPECA, OSCE, OSJD, ECO, CAREC, CCTT, UIC, IRU, GPST etc.);
Develop solutions for improving national transport policies including transit and border
crossing provisions with the participation of all relevant stakeholders; and
Integrate EATL achievements in national transport plans and programs.
2. Analyse and disseminate best practices and models in the sphere of international trade
and transport (UNECE – OSCE Handbook of best practices at border crossings, WCO
standards, etc.):
Carry out studies on transport-logistical competitiveness based on internationally
recognized methodologies;
Promote policies helping national businesses, especially small and medium-sized
enterprises, to participate wider in international trade and transport; and
Simplify and synchronize visa issuing procedures and introduce long-term multi-entry
visas where possible.
3. Develop bilateral and multilateral forms of cooperation in the field of transport between
EATL countries:
Improve the monitoring of infrastructure developments, the execution of transport
facilitation plans, and the functioning of transport corridors;
Improve collection and dissemination of transport and trade statistics and other relevant
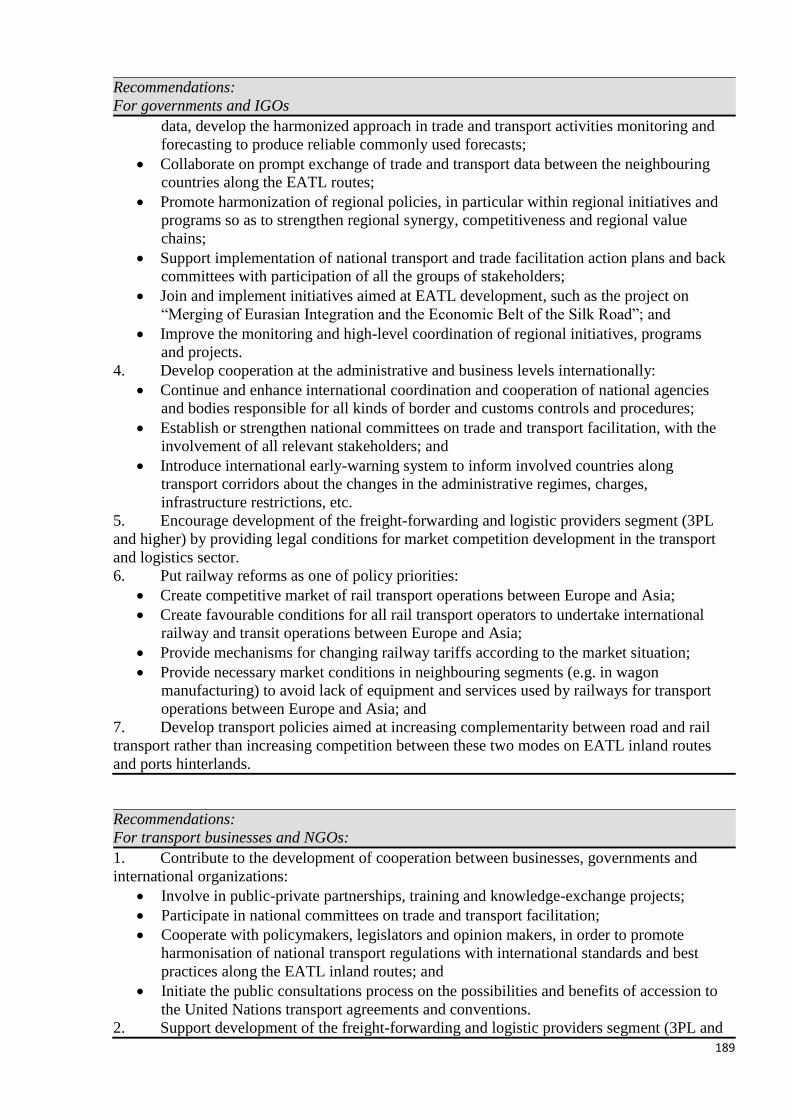
189
Recommendations:
For governments and IGOs
data, develop the harmonized approach in trade and transport activities monitoring and
forecasting to produce reliable commonly used forecasts;
Collaborate on prompt exchange of trade and transport data between the neighbouring
countries along the EATL routes;
Promote harmonization of regional policies, in particular within regional initiatives and
programs so as to strengthen regional synergy, competitiveness and regional value
chains;
Support implementation of national transport and trade facilitation action plans and back
committees with participation of all the groups of stakeholders;
Join and implement initiatives aimed at EATL development, such as the project on
“Merging of Eurasian Integration and the Economic Belt of the Silk Road”; and
Improve the monitoring and high-level coordination of regional initiatives, programs
and projects.
4. Develop cooperation at the administrative and business levels internationally:
Continue and enhance international coordination and cooperation of national agencies
and bodies responsible for all kinds of border and customs controls and procedures;
Establish or strengthen national committees on trade and transport facilitation, with the
involvement of all relevant stakeholders; and
Introduce international early-warning system to inform involved countries along
transport corridors about the changes in the administrative regimes, charges,
infrastructure restrictions, etc.
5. Encourage development of the freight-forwarding and logistic providers segment (3PL
and higher) by providing legal conditions for market competition development in the transport
and logistics sector.
6. Put railway reforms as one of policy priorities:
Create competitive market of rail transport operations between Europe and Asia;
Create favourable conditions for all rail transport operators to undertake international
railway and transit operations between Europe and Asia;
Provide mechanisms for changing railway tariffs according to the market situation;
Provide necessary market conditions in neighbouring segments (e.g. in wagon
manufacturing) to avoid lack of equipment and services used by railways for transport
operations between Europe and Asia; and
7. Develop transport policies aimed at increasing complementarity between road and rail
transport rather than increasing competition between these two modes on EATL inland routes
and ports hinterlands.
Recommendations:
For transport businesses and NGOs:
1. Contribute to the development of cooperation between businesses, governments and
international organizations:
Involve in public-private partnerships, training and knowledge-exchange projects;
Participate in national committees on trade and transport facilitation;
Cooperate with policymakers, legislators and opinion makers, in order to promote
harmonisation of national transport regulations with international standards and best
practices along the EATL inland routes; and
Initiate the public consultations process on the possibilities and benefits of accession to
the United Nations transport agreements and conventions.
2. Support development of the freight-forwarding and logistic providers segment (3PL and
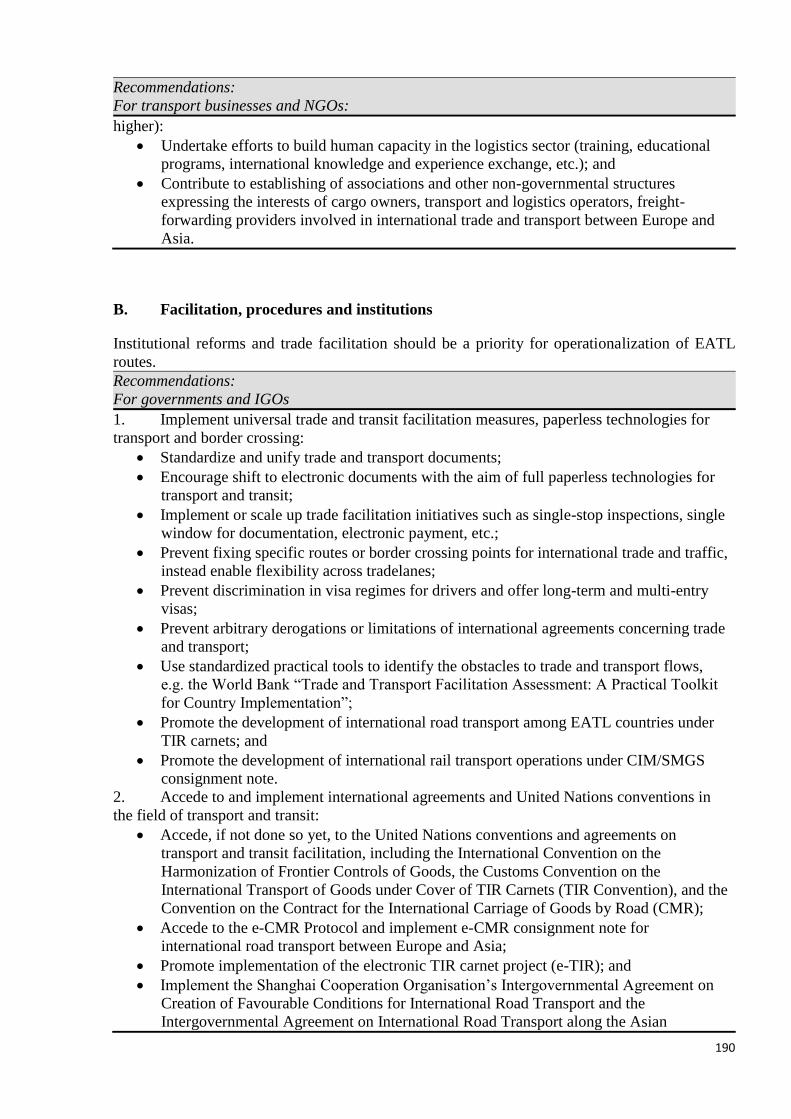
190
Recommendations:
For transport businesses and NGOs:
higher):
Undertake efforts to build human capacity in the logistics sector (training, educational
programs, international knowledge and experience exchange, etc.); and
Contribute to establishing of associations and other non-governmental structures
expressing the interests of cargo owners, transport and logistics operators, freight-
forwarding providers involved in international trade and transport between Europe and
Asia.
B. Facilitation, procedures and institutions
Institutional reforms and trade facilitation should be a priority for operationalization of EATL
routes.
Recommendations:
For governments and IGOs
1. Implement universal trade and transit facilitation measures, paperless technologies for
transport and border crossing:
Standardize and unify trade and transport documents;
Encourage shift to electronic documents with the aim of full paperless technologies for
transport and transit;
Implement or scale up trade facilitation initiatives such as single-stop inspections, single
window for documentation, electronic payment, etc.;
Prevent fixing specific routes or border crossing points for international trade and traffic,
instead enable flexibility across tradelanes;
Prevent discrimination in visa regimes for drivers and offer long-term and multi-entry
visas;
Prevent arbitrary derogations or limitations of international agreements concerning trade
and transport;
Use standardized practical tools to identify the obstacles to trade and transport flows,
e.g. the World Bank “Trade and Transport Facilitation Assessment: A Practical Toolkit
for Country Implementation”;
Promote the development of international road transport among EATL countries under
TIR carnets; and
Promote the development of international rail transport operations under CIM/SMGS
consignment note.
2. Accede to and implement international agreements and United Nations conventions in
the field of transport and transit:
Accede, if not done so yet, to the United Nations conventions and agreements on
transport and transit facilitation, including the International Convention on the
Harmonization of Frontier Controls of Goods, the Customs Convention on the
International Transport of Goods under Cover of TIR Carnets (TIR Convention), and the
Convention on the Contract for the International Carriage of Goods by Road (CMR);
Accede to the e-CMR Protocol and implement e-CMR consignment note for
international road transport between Europe and Asia;
Promote implementation of the electronic TIR carnet project (e-TIR); and
Implement the Shanghai Cooperation Organisation’s Intergovernmental Agreement on
Creation of Favourable Conditions for International Road Transport and the
Intergovernmental Agreement on International Road Transport along the Asian
191
Recommendations:
For governments and IGOs
Highway Network signed in 2016 by China, Mongolia and the Russian Federation.
3. Implement best practices and standards adopted internationally:
Implement best practices at border crossings recommended by UNECE and OSCE in
their Joint Handbook; and
Implement the WCO standards and best practices in accordance with the Handbook on
Transit adopted in 2017.
4. Harmonize legal provisions on transport, trade and transit facilitation in the framework
of regional and bilateral agreements:
Introduce solutions based on best international practices in bilateral and regional
cooperation as well as introduce them into trade and transport national legislation;
Harmonize procedures in the international road transport and introduce permits-free
system of transit road transport;
Introduce the rule of obligatory “early warning” about changes in rules, tariffs, and
procedures related to international trade and transport;
Provide special simplified control procedures for cargo owners and transport operators
with good reputation;
Limit compulsory convoy or escort to high risk commodities only;
Implement legislation allowing the operation of long-and-heavy road vehicles across the
main trade corridors and in the hinterland of logistic centres; and
Promote multilateral and regional permit systems for road transport aimed at eliminating
quantitative limits and focus on provision of quality and safety for road transport
services.
5. Develop institutions and procedures facilitating the long-haul container block train
operation and related services and activities by promoting a better business environment so as
to assist all the interested parties to organize and operate long-haul container trains.
6. Implement procedures for facilitating transit, border crossing and enabling paperless
technologies accelerating trade and transport operations:
Identify non-physical barriers and evaluate their influence according to agreed common
benchmarking procedures;
Simplify visa requirements and formalities for personnel involved in international
transport;
Remove internal checkpoints, as possible;
Record and analyse the reasons for border-crossing point congestion, queuing and time
delays;
Develop and implement the system of border-crossing point performance indicators to
evaluate the results of investment projects and changes in procedures;
Decrease the number of documents necessary for export, import and transit procedures;
Introduce optimization of border crossing procedures on the basis of joint operations and
data sharing; and
Evaluate the possibility to introduce the unified format of data exchange (e.g.
EDIFACT).
7. Introduce best international practice when amending railway legislation:
Follow the provisions of the Joint Declaration expressing willingness to create a
common legal regime for rail traffic across Asia and Europe of 2013;
Cooperate in the development of general conditions for Euro-Asian rail transport;
Introduce competition within the railway sector using the most effective international
models; and
Envisage elaboration of legal conditions for the access of foreign rail operators to the
192
Recommendations:
For governments and IGOs
national network, at least, in container train operations.
Recommendations:
For transport businesses and NGOs:
1. Support governments in implementation of international agreements and United Nations
conventions in the field of transport and transit:
Formulate recommendations for governments or regional cooperation authorities on how
to create favourable conditions for regional transport and transit operations (including
accession to international agreements and United Nations conventions, conclusion of
new regional agreements to promote trade, transport and transit facilitation; and
Participate in the implementation of activities under the Vienna Programme of Action.
2. Contribute to developing the container block train operations and related services and
activities:
Establish container pools;
Organizing training programs and inter-railway staff exchange programs in the area of
organization and promotion of container block trains;
Issue research work analysing the successful cases and the failures in inland container
train operations;
Analyse the possibility of developing “Terminal services standard minimum” for use by
the terminal staff across the EATL inland corridors - in a form of recommendations or
“Best practices manual”; and
Improve the quality of transport and logistics services, punctuality and cargo safety
conditions.
3. Assist in implementing procedures and paperless technologies accelerating trade and
transport operations:
Help identifying non-physical barriers and evaluating their influence according to
agreed common benchmarking procedures;
Provide data and analysis on the reasons for border-crossing point congestion, queuing
and time delays; and
Assist in developing single transit document for multimodal transport.
C. Infrastructure
The EATL transport network was nearly formed by the time this report was written and proved
its efficiency for certain tradelanes and commodities. Numerous initiatives, programmes and
projects were undertaken to improve the infrastructure in the EATL region. Therefore, it seemed
reasonable that efforts should focus on coordination, standardization of infrastructure parameters
and implementation of the most effective “point-focused” projects.
Recommendations:
For governments and IGOs
1. Eliminate bottlenecks and missing links on the potentially most effective inland transit
routes and tradelanes in the EATL area:
Focus at identifying and removing obvious physical bottlenecks;
Develop logistics centres and hubs as well as dry ports at the nodes of the EATL routes;
and
Modernize the infrastructure of border crossing points.
193
Recommendations:
For governments and IGOs
2. Encourage introduction of public-private cooperation and other market-oriented and
innovative forms for infrastructure project financing:
Develop the necessary policies and regulatory frameworks to promote private sector
involvement in infrastructure development;
Promote enabling environment to attract foreign direct infrastructure investments; and
Encourage the PPPs for development of EATL inland routes infrastructure.
3. Coordinate infrastructure programs and projects using the “system approach” to
infrastructure programs on development of the transport and logistics infrastructure in the
framework of regional cooperation and unions of economic integration:
Encourage creating transport-logistics and industrial clusters in order to foster
knowledge networks and links among enterprises;
Promote economies of scale for transport systems through intermodal transport
development, creation of dry ports, logistic centres, etc.;
Provide development of sea ports coordinated with the development of port hinterland
connections and the infrastructural objects located in the hinterland and directly linked
to sea ports;
Motivate the developers and operators to cooperate in creation of high-scale
multipurpose logistic sites serving domestic, international trade, transport and transit;
Create logistic centres and dry ports as market-oriented nodes of supply chains
improving the competitiveness of the entire EATL system;
Work towards harmonization of the total vehicle weight, dimensions and axle weight
limits along the main EATL road routes to provide effective road transport; and
Further improve GIS and GNSS applications and develop tools to support “smart”
decisions in transport and supply chains.
4. Advance development of railway and logistic infrastructure providing effective
container transport, in particular, by promoting the cross-border cooperation of railway
infrastructure administrations to provide the harmonized technologies for block train border
crossing.
5. Prioritize infrastructure projects providing time-effective transport:
Ensure technical and operational interoperability of railway and road systems of
neighbouring countries;
Encourage harmonization of railway technological standards and road axle load limits to
facilitate regional connectivity, where feasible;
Implement IT-systems to ensure transparency in border crossing procedures, customs
and transit transport rules, regulations, fees and charges;
Upgrade border crossing points equipping them with modern surveillance methods for
security (vehicle scanning equipment, etc.), as well as the necessary IT infrastructure
and supportive systems; and
Develop a Border-Crossing Point Design Guide for border crossing points of different
types and scales based on BCP best-practice examples.
6. Introduce effective mechanisms of railway infrastructure development in reform
programs:
Implementing the best practices in the area of infrastructure management and
development;
Introduce adequate infrastructure fees within the railway industry paying special
attention to intermodal transport; and
Encourage private participation in development and operation of certain infrastructure
objects (terminals, railway logistic centres, railway sections built and operated by
private companies).
194
Recommendations:
For transport businesses and NGOs:
1. Involve in public-private cooperation and other market-oriented and innovative forms of
infrastructure projects financing by intensifying participation in national and international
programmes that propose financial and technical assistance in the area of transport
infrastructure development.
2. Contribute to the development of railway and logistics infrastructure providing effective
transport for containers:
Involve in development of multi-purpose logistics centres with intermodal terminals;
Develop effective reloading capacities for containers and other intermodal units in the
gauge-changing points;
Engage in replacing where possible the boogie change procedures for block trains by
effective container transhipment on railway gauge changing stations; and
Expand marketing and promotion of EATL inland routes and block train services.
3. Get involved in infrastructure projects providing time-effective transport:
Invest in projects aimed at improvement of sea-rail interoperability to ensure the
synergy between these two modes;
Help design border-crossing points of different types and scales based on BCP best-
practice examples; and
Adopt modern and innovative transport systems, including Intelligent Transport Systems
(ITS).
195
REFERENCES
1. World Air Cargo Forecast 2014–2015. Boeing, Seattle, 2014
2. UNCTAD, 2015. Trade and development report
3. Rastogi, Cordula, and Jean-François Arvis. 2014. The Eurasian Connection: Supply-Chain Efficiency along
the Modern Silk Route through Central Asia. Directions in Development. Washington, DC: World Bank
4. John Arnold. 2005. Best Practices in Corridor Management. Washington, DC: World Bank
5. Kunaka, Charles, and Robin Carruthers (2014). Trade and Transport Corridor Management Toolkit.
Washington, DC: World Bank. doi: 10.1596/978-1-4648-0143-3. License: Creative Commons Attribution
CC BY 3.0 IGO
6. Informal document WP.5/GE.2, 2015. No 5// Information from participants on recent developments in
transport infrastructure priority projects on EATL routes
7. Informal document WP.5/GE.2, 2015 No 1// Identification of cargo flows on the Euro-Asian transport
links. Euro Asian Transport Links. Transport flows and non-physical barriers
8. AGTC (2003), cited in UNESCAP Transit Transport Issues in Landlocked and Developing Transit
Countries. Landlocked Developing Countries Series No1, (New York 2003), p. 35
9. TRACECA Project (2003): Harmonization of Border Crossing Procedures, Recommendation of Border
Harmonization Evaluation Workshop, cited in UNESCAP Transit Transport Issues in Landlocked and
Developing Transit Countries. Landlocked Developing Countries Series No1, (New York 2003), p. 35
10. CAREC (2013) CARECCPMM Corridor Performance Measurement and Monitoring Annual Report, 2013
11. UNESCAP Transit Transport Issues in Landlocked and Developing Transit Countries. Landlocked
Developing Countries Series No1, (New York 2003)
12. Linn, Johannes. 2012. “Central Asian Regional Integration and Cooperation: Realityor Mirage?” In
Eurasian Integration Yearbook 2012, 96–117. Almaty: Eurasian Development Bank
13. Euro-Asian transport: maritime ports - challenges and opportunities. Informal document WP.5/GE.2 (2015)
No. 1.
14. Informal document WP.5/GE.2 (2015) No. 2 Сопоставительный анализ продолжительности и
издержек железнодорожных и морских перевозок между Европой и Азией по выбранным
маршрутам евро-азиатских транспортных связей
15. European Parliament. THE EVOLVING ROLE OF EU SEAPORTSIN GLOBAL MARITIME
LOGISTICS –CAPACITIES, CHALLENGES ANDSTRATEGIES. STUDY. 2009
16. UNECE. Hinterland connections of Seaports. 2010
17. CEFIR study
18. EvgenyVinokurov, Director, Centre for Integration Studies, Eurasian Development Bank Transport
Corridors of the Silk Road Economic Belt across the Eurasian Economic Union: Preliminary Estimates for
Transportation Capacity and Investment Needs (Working paper)
19. Saroj Kumar Jha, Regional Country Director for Central Asia, Word Bank. Presentation at Third China
Round Table on WTO Accessions. Post Accession “Maximizing the Benefits of WTO Membership and
Global Economic Integration”, Dushanbe, Tajikistan, June 2-4, 2015
20. Hubay Government official site. http://en.hubei.gov.cn/news/newslist/201601/t20160106_773725.shtml

196
21. Europlatforms. European Logistic Platforms Association. Official site http://www.europlatforms.eu/
22. EvgenyVinokurov, Director, Centre for Integration Studies, Eurasian Development Bank. Working Paper
Transport Corridors of the Silk Road Economic Belt across the Eurasian Economic Union: Preliminary
Estimates for Transportation Capacity and Investment Needs. – 2016. -
http://papers.ssrn.com/sol3/papers.cfm?abstract_id=2771587
23. INTERGOVERNMENTAL ORGANISATION FOR INTER-NATIONAL CARRIAGE BY RAIL (OTIF).
25th Session. Work on the unification of Euro-Asian rail freight transport law. Point of information.
http://www.otif.org/fileadmin/user_upload/otif_verlinkte_files/04_recht/03_CR/03_CR_25_2014/CR_25_5
-1_e_Information_Unification_Eurasian_freight_railway_law.pdf
24. COMMISSION STAFF WORKING DOCUMENT. BOSNIA AND HERZEGOVINA 2015 REPORT.
Brussels, 10.11.2015 - SWD(2015) 214 final
25. COMMISSION STAFF WORKING DOCUMENT. MONTENEGRO 2015 REPORT. Brussels,
10.11.2015 - SWD(2015) 210 final
26. COMMISSION STAFF WORKING DOCUMENT. SERBIA 2015 REPORT. Brussels, 10.11.2015 -
SWD(2015) 211 final
27. COMMISSION STAFF WORKING DOCUMENT. THE FORMER YUGOSLAV REPUBLIC OF
MACEDONIA 2015 REPORT. Brussels, 10.11.2015 - SWD(2015) 212 final
28. COMMISSION STAFF WORKING DOCUMENT. TURKEY 2015 REPORT. Brussels, 10.11.2015 -
SWD(2015) 216 final
29. Railway Reform in South East Europe and Turkey. On the Right Track? Document of the World Bank.
Report No. 60223-ECA - March 2011
30. Hong Ju. Railway Sector Reform in China: controversy and problems. Journal of Contemporary China.
Volume 24, 2015 - Issue 96
http://www.tandfonline.com/doi/abs/10.1080/10670564.2015.1030957?journalCode=cjcc20
31. Report on the activities of the Organisation for Cooperation between Railways (OSJD) in 2015. Warsaw,
2016
32. Draft Report on Documentation and Procedures for the Development of Seamless Rail-Based Intermodal
Transport Services in Northeast and Central Asia. UNESCAP, 2016
33. Information on container trains operating with regular itineraries between Europe and Asia. Transmitted by
the Organization for Cooperation between Railways (OSJD). Informal document WP.5/GE.2 (2015) No.
3/Rev.1, 17 May 2016
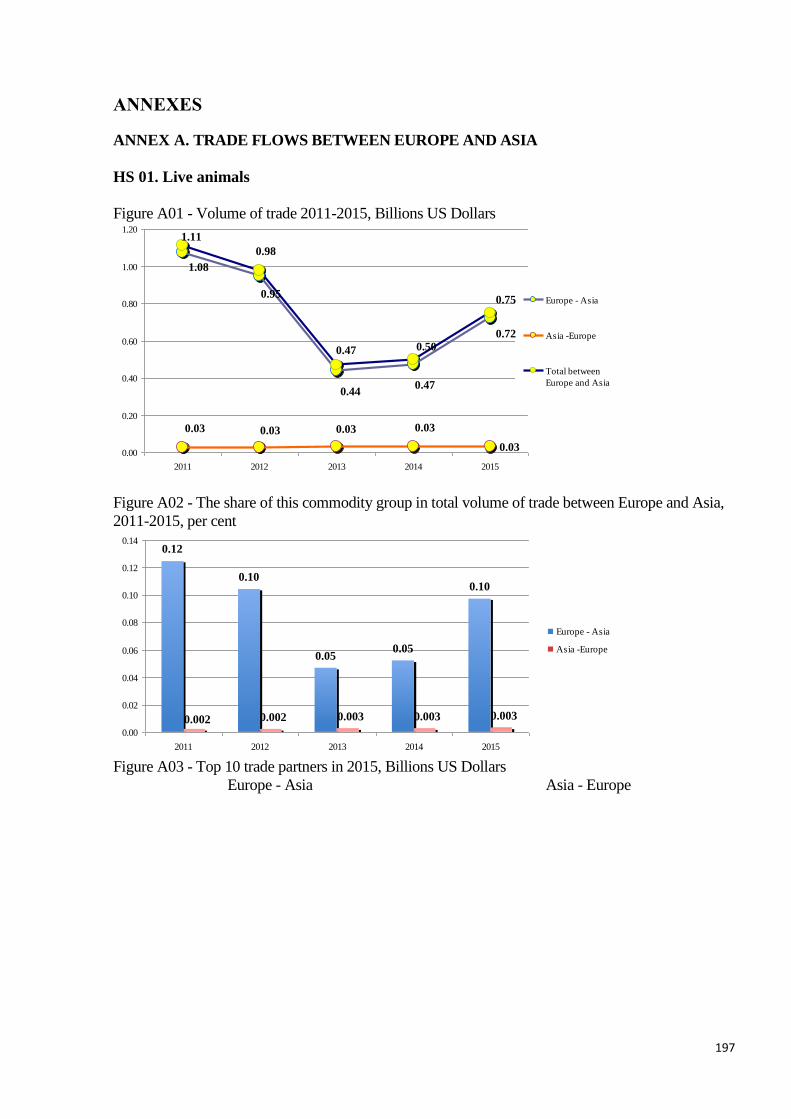
197
ANNEXES
ANNEX A. TRADE FLOWS BETWEEN EUROPE AND ASIA
HS 01. Live animals
Figure A01 - Volume of trade 2011-2015, Billions US Dollars
0.03
1.08
0.95
0.440.47
0.72
0.03 0.03 0.03 0.03
1.11
0.98
0.47 0.50
0.75
0.00
0.20
0.40
0.60
0.80
1.00
1.20
2011 2012 2013 2014 2015
Europe - Asia
Asia -Europe
Total between
Europe and Asia
Figure A02 - The share of this commodity group in total volume of trade between Europe and Asia,
2011-2015, per cent
0.12
0.10
0.050.05
0.10
0.002 0.002 0.003 0.003 0.003
0.00
0.02
0.04
0.06
0.08
0.10
0.12
0.14
2011 2012 2013 2014 2015
Europe - Asia
Asia -Europe
Figure A03 - Top 10 trade partners in 2015, Billions US Dollars
Europe - Asia Asia - Europe

198

HS 02. Meat and edible meat offal
Figure A04 - Volume of trade 2011-2015, Billions US Dollars
0.14
6.4 6.5 6.5
5.45.0
0.10 0.03 0.12 0.18
6.5 6.5 6.7
5.6
5.2
0.0
1.0
2.0
3.0
4.0
5.0
6.0
7.0
2011 2012 2013 2014 2015
Europe - Asia
Asia -Europe
Total between
Europe and Asia
Figure A05 - The share of this commodity group in total volume of trade between Europe and Asia,
2011-2015, per cent
0.74 0.72 0.70
0.60
0.68
0.01 0.00 0.01 0.02 0.01
0.00
0.10
0.20
0.30
0.40
0.50
0.60
0.70
0.80
2011 2012 2013 2014 2015
Europe - Asia
Asia -Europe
Figure A06 - Top 10 trade partners in 2015, Billions US Dollars
Europe - Asia Asia - Europe
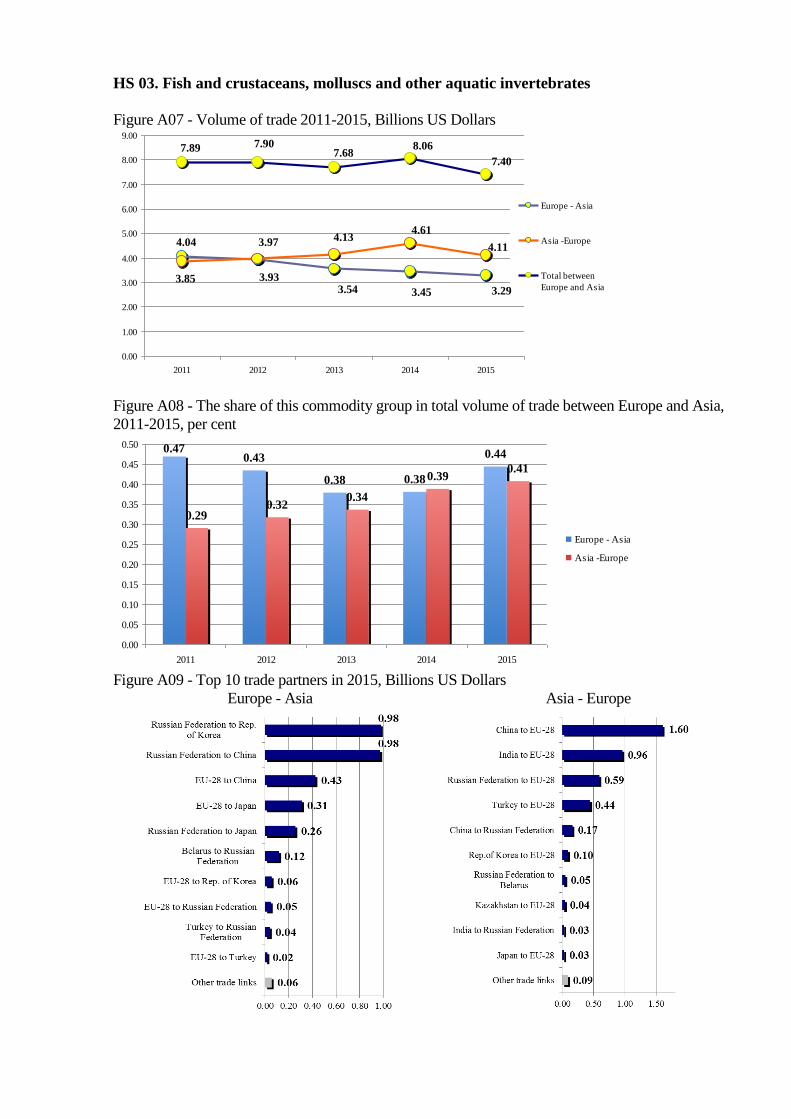
HS 03. Fish and crustaceans, molluscs and other aquatic invertebrates
Figure A07 - Volume of trade 2011-2015, Billions US Dollars
4.04
3.933.54 3.45 3.29
4.11
3.85
3.97 4.134.61
7.89 7.907.68
8.06
7.40
0.00
1.00
2.00
3.00
4.00
5.00
6.00
7.00
8.00
9.00
2011 2012 2013 2014 2015
Europe - Asia
Asia -Europe
Total between
Europe and Asia
Figure A08 - The share of this commodity group in total volume of trade between Europe and Asia,
2011-2015, per cent
0.470.43
0.38 0.38
0.44
0.290.32
0.34
0.390.41
0.00
0.05
0.10
0.15
0.20
0.25
0.30
0.35
0.40
0.45
0.50
2011 2012 2013 2014 2015
Europe - Asia
Asia -Europe
Figure A09 - Top 10 trade partners in 2015, Billions US Dollars
Europe - Asia Asia - Europe
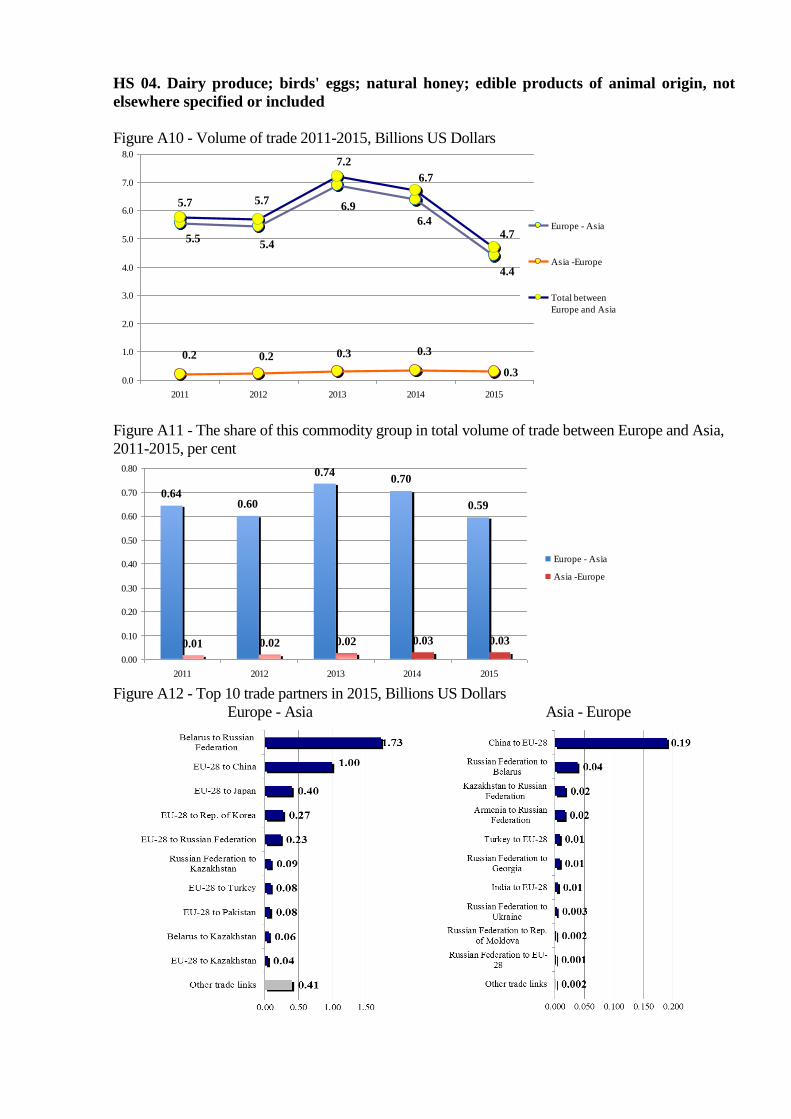
HS 04. Dairy produce; birds' eggs; natural honey; edible products of animal origin, not
elsewhere specified or included
Figure A10 - Volume of trade 2011-2015, Billions US Dollars
0.3
5.55.4
6.9
6.4
4.4
0.2 0.2 0.3 0.3
5.7 5.7
7.2
6.7
4.7
0.0
1.0
2.0
3.0
4.0
5.0
6.0
7.0
8.0
2011 2012 2013 2014 2015
Europe - Asia
Asia -Europe
Total between
Europe and Asia
Figure A11 - The share of this commodity group in total volume of trade between Europe and Asia,
2011-2015, per cent
0.640.60
0.740.70
0.59
0.01 0.02 0.02 0.03 0.03
0.00
0.10
0.20
0.30
0.40
0.50
0.60
0.70
0.80
2011 2012 2013 2014 2015
Europe - Asia
Asia -Europe
Figure A12 - Top 10 trade partners in 2015, Billions US Dollars
Europe - Asia Asia - Europe
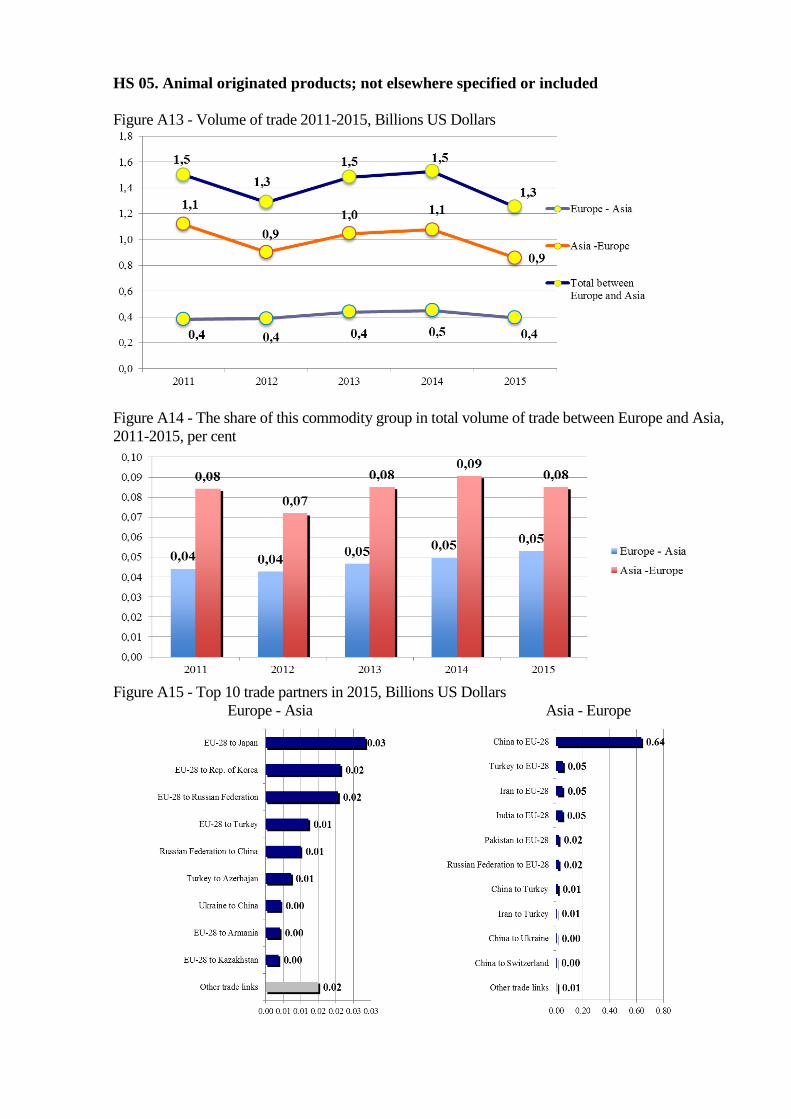
HS 05. Animal originated products; not elsewhere specified or included
Figure A13 - Volume of trade 2011-2015, Billions US Dollars
Figure A14 - The share of this commodity group in total volume of trade between Europe and Asia,
2011-2015, per cent
Figure A15 - Top 10 trade partners in 2015, Billions US Dollars
Europe - Asia Asia - Europe

HS 06. Trees and other plants, live; bulbs, roots and the like; cut flowers and ornamental
foliage
Figure A16 - Volume of trade 2011-2015, Billions US Dollars
0.15
0.86
0.971.04
0.970.87
0.16 0.17 0.17 0.16
1.02
1.141.21
1.14
1.02
0.00
0.20
0.40
0.60
0.80
1.00
1.20
1.40
2011 2012 2013 2014 2015
Europe - Asia
Asia -Europe
Total between
Europe and Asia
Figure A17 - The share of this commodity group in total volume of trade between Europe and Asia,
2011-2015, per cent
0.100.11
0.110.11
0.12
0.00 0.00 0.00 0.00 0.000.00
0.02
0.04
0.06
0.08
0.10
0.12
0.14
2011 2012 2013 2014 2015
Europe - Asia
Asia -Europe
Figure A18 - Top 10 trade partners in 2015, Billions US Dollars
Europe - Asia Asia - Europe
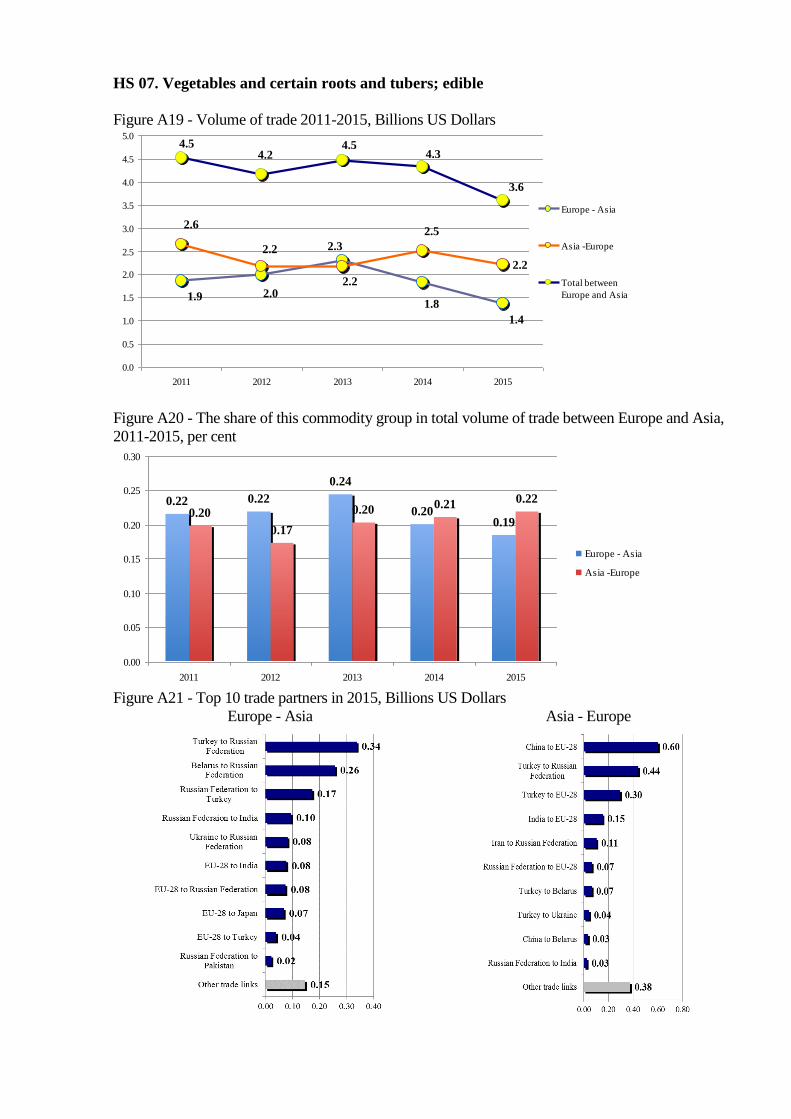
HS 07. Vegetables and certain roots and tubers; edible
Figure A19 - Volume of trade 2011-2015, Billions US Dollars
2.2
1.9 2.0
2.3
1.8
1.4
2.6
2.2
2.2
2.5
4.54.2
4.54.3
3.6
0.0
0.5
1.0
1.5
2.0
2.5
3.0
3.5
4.0
4.5
5.0
2011 2012 2013 2014 2015
Europe - Asia
Asia -Europe
Total between
Europe and Asia
Figure A20 - The share of this commodity group in total volume of trade between Europe and Asia,
2011-2015, per cent
0.22 0.22
0.24
0.200.19
0.20
0.17
0.20 0.21 0.22
0.00
0.05
0.10
0.15
0.20
0.25
0.30
2011 2012 2013 2014 2015
Europe - Asia
Asia -Europe
Figure A21 - Top 10 trade partners in 2015, Billions US Dollars
Europe - Asia Asia - Europe
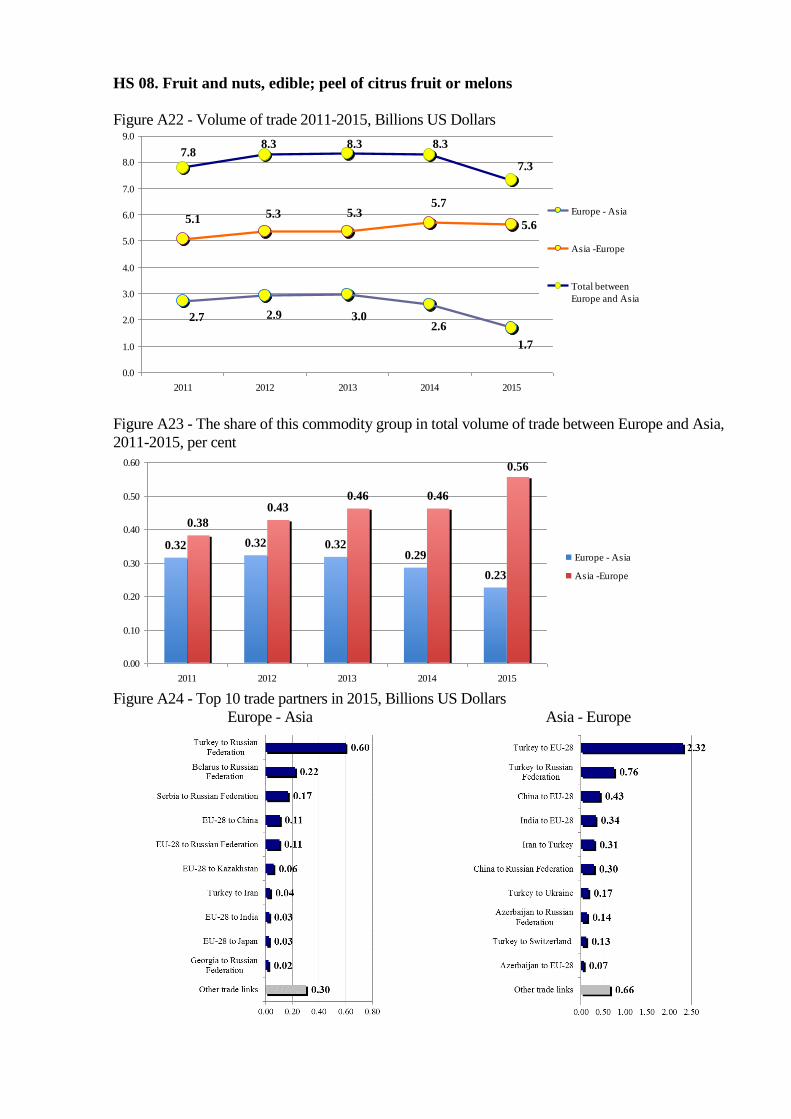
HS 08. Fruit and nuts, edible; peel of citrus fruit or melons
Figure A22 - Volume of trade 2011-2015, Billions US Dollars
5.6
2.7 2.9 3.02.6
1.7
5.1 5.3 5.35.7
7.88.3 8.3 8.3
7.3
0.0
1.0
2.0
3.0
4.0
5.0
6.0
7.0
8.0
9.0
2011 2012 2013 2014 2015
Europe - Asia
Asia -Europe
Total between
Europe and Asia
Figure A23 - The share of this commodity group in total volume of trade between Europe and Asia,
2011-2015, per cent
0.32 0.32 0.320.29
0.23
0.38
0.430.46 0.46
0.56
0.00
0.10
0.20
0.30
0.40
0.50
0.60
2011 2012 2013 2014 2015
Europe - Asia
Asia -Europe
Figure A24 - Top 10 trade partners in 2015, Billions US Dollars
Europe - Asia Asia - Europe

HS 09. Coffee, tea, mate and spices
Figure A25 - Volume of trade 2011-2015, Billions US Dollars
Figure A26 - The share of this commodity group in total volume of trade between Europe and Asia,
2011-2015, per cent
Figure A27 - Top 10 trade partners in 2015, Billions US Dollars
Europe - Asia Asia - Europe
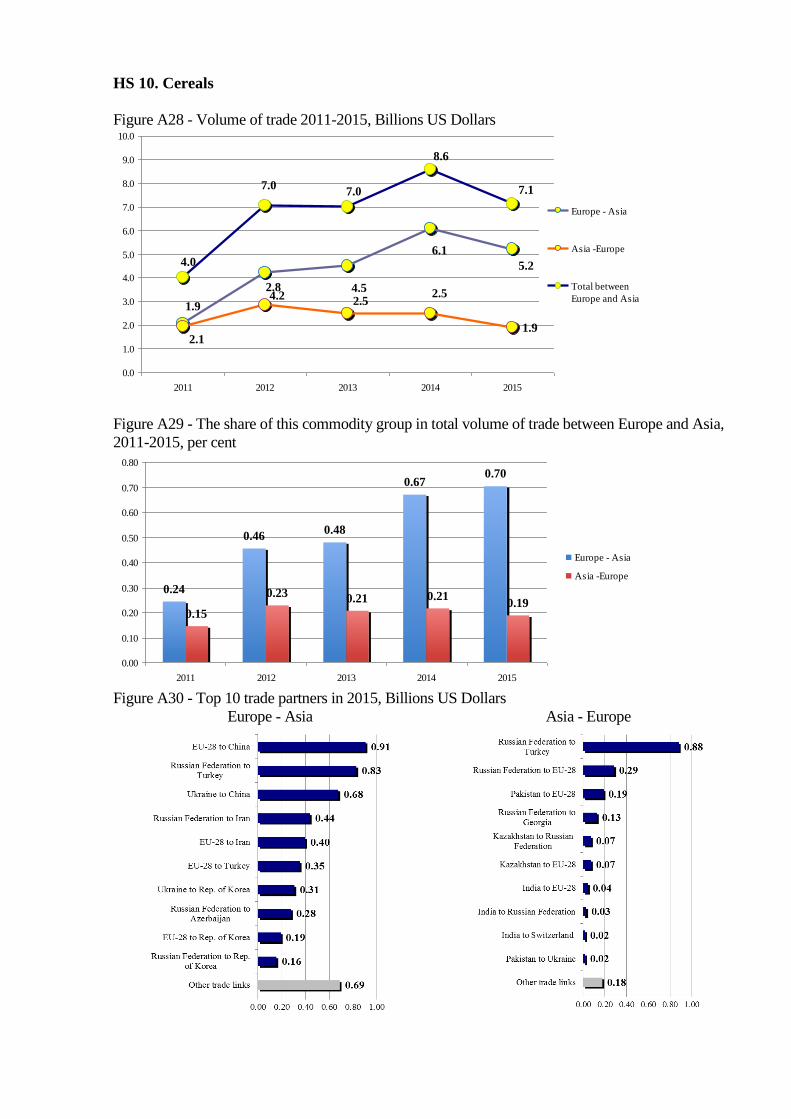
HS 10. Cereals
Figure A28 - Volume of trade 2011-2015, Billions US Dollars
1.92.1
4.24.5
6.1
5.2
1.9
2.8
2.52.5
4.0
7.07.0
8.6
7.1
0.0
1.0
2.0
3.0
4.0
5.0
6.0
7.0
8.0
9.0
10.0
2011 2012 2013 2014 2015
Europe - Asia
Asia -Europe
Total between
Europe and Asia
Figure A29 - The share of this commodity group in total volume of trade between Europe and Asia,
2011-2015, per cent
0.24
0.460.48
0.670.70
0.15
0.23 0.21 0.210.19
0.00
0.10
0.20
0.30
0.40
0.50
0.60
0.70
0.80
2011 2012 2013 2014 2015
Europe - Asia
Asia -Europe
Figure A30 - Top 10 trade partners in 2015, Billions US Dollars
Europe - Asia Asia - Europe

HS 11. Products of the milling industry; malt, starches, inulin, wheat gluten
Figure A31 - Volume of trade 2011-2015, Billions US Dollars
0.13
0.65 0.67 0.69 0.700.64
0.130.12 0.12 0.13
0.780.79 0.81 0.83
0.77
0.00
0.10
0.20
0.30
0.40
0.50
0.60
0.70
0.80
0.90
2011 2012 2013 2014 2015
Europe - Asia
Asia -Europe
Total between
Europe and Asia
Figure A32 - The share of this commodity group in total volume of trade between Europe and Asia,
2011-2015, per cent
0.07 0.07 0.070.08
0.09
0.01 0.01 0.01 0.01 0.01
0.00
0.01
0.02
0.03
0.04
0.05
0.06
0.07
0.08
0.09
0.10
2011 2012 2013 2014 2015
Europe - Asia
Asia -Europe
Figure A33 - Top 10 trade partners in 2015, Billions US Dollars
Europe - Asia Asia - Europe

HS 12. Oil seeds and oleaginous fruits; miscellaneous grains, seeds and fruit, industrial or
medicinal plants; straw and fodder
Figure A34 - Volume of trade 2011-2015, Billions US Dollars
1.7
1.6 1.6 1.71.8 1.8
1.5
1.9
2.8
2.0
3.2
3.5
4.5
3.83.5
0.0
0.5
1.0
1.5
2.0
2.5
3.0
3.5
4.0
4.5
5.0
2011 2012 2013 2014 2015
Europe - Asia
Asia -Europe
Total between
Europe and Asia
Figure A35 - The share of this commodity group in total volume of trade between Europe and Asia,
2011-2015, per cent
0.190.18 0.18
0.20
0.24
0.12
0.15
0.22
0.17 0.17
0.00
0.05
0.10
0.15
0.20
0.25
0.30
2011 2012 2013 2014 2015
Europe - Asia
Asia -Europe
Figure A36 - Top 10 trade partners in 2015, Billions US Dollars
Europe - Asia Asia - Europe

HS 13. Lac; gums, resins and other vegetable saps and extracts
Figure A37 - Volume of trade 2011-2015, Billions US Dollars
0.50
0.390.37
0.36 0.38 0.36
0.42
0.59 0.56 0.54
0.81
0.960.92 0.92
0.86
0.00
0.20
0.40
0.60
0.80
1.00
1.20
2011 2012 2013 2014 2015
Europe - Asia
Asia -Europe
Total between
Europe and Asia
Figure A38 - The share of this commodity group in total volume of trade between Europe and Asia,
2011-2015, per cent
0.050.04
0.040.04
0.050.05 0.05 0.05
0.03
0.05
0.00
0.01
0.02
0.03
0.04
0.05
0.06
2011 2012 2013 2014 2015
Europe - Asia
Asia -Europe
Figure A39 - Top 10 trade partners in 2015, Billions US Dollars
Europe - Asia Asia - Europe
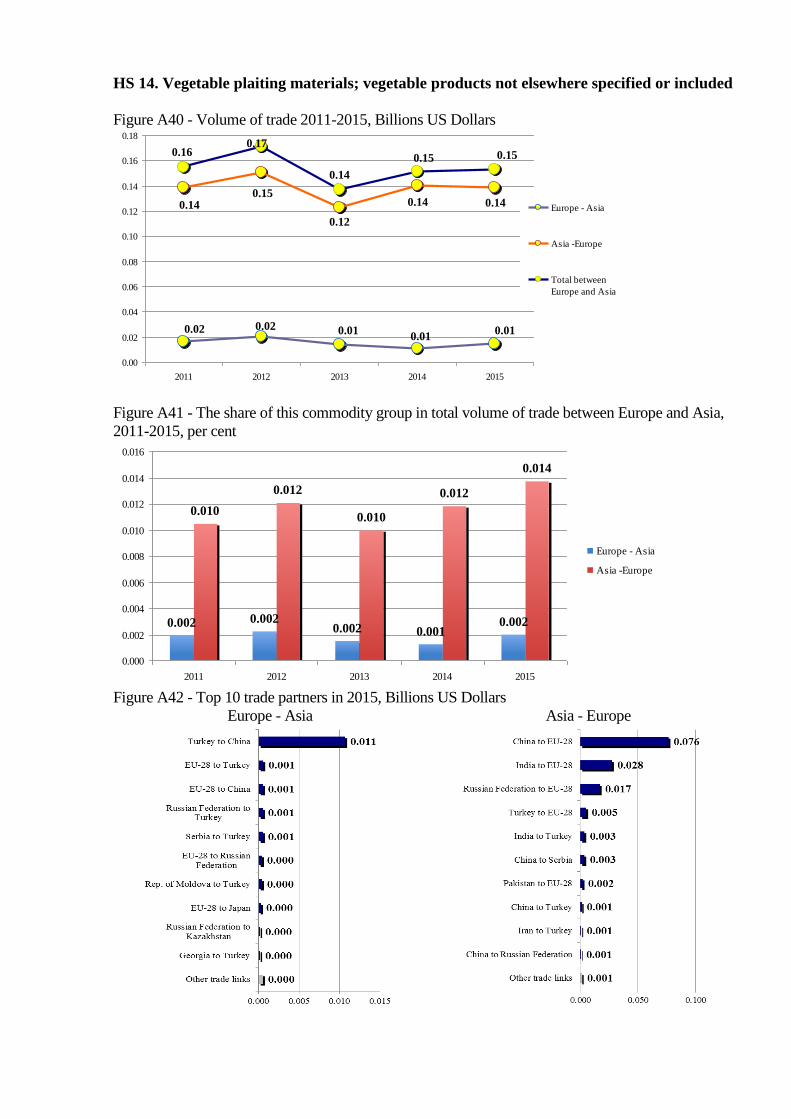
HS 14. Vegetable plaiting materials; vegetable products not elsewhere specified or included
Figure A40 - Volume of trade 2011-2015, Billions US Dollars
0.02 0.02 0.010.01
0.01
0.140.15
0.12
0.14 0.14
0.160.17
0.14
0.15 0.15
0.00
0.02
0.04
0.06
0.08
0.10
0.12
0.14
0.16
0.18
2011 2012 2013 2014 2015
Europe - Asia
Asia -Europe
Total between
Europe and Asia
Figure A41 - The share of this commodity group in total volume of trade between Europe and Asia,
2011-2015, per cent
0.002 0.0020.002 0.001
0.002
0.010
0.012
0.010
0.012
0.014
0.000
0.002
0.004
0.006
0.008
0.010
0.012
0.014
0.016
2011 2012 2013 2014 2015
Europe - Asia
Asia -Europe
Figure A42 - Top 10 trade partners in 2015, Billions US Dollars
Europe - Asia Asia - Europe
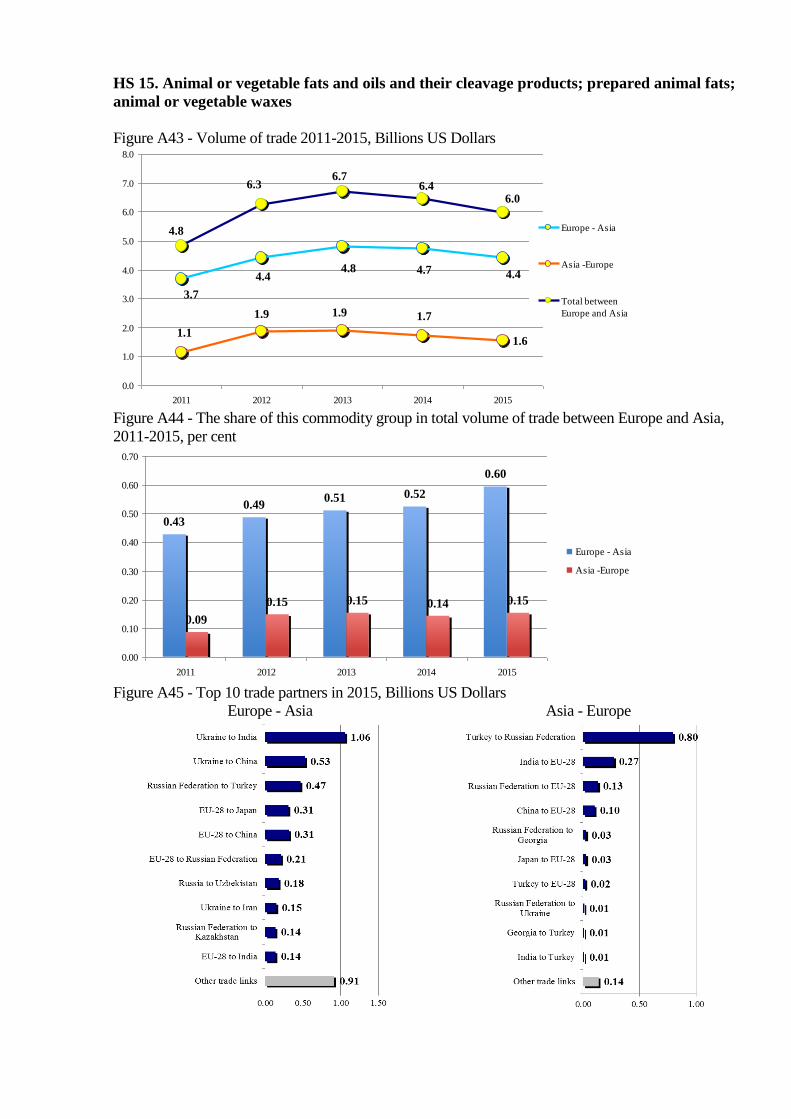
HS 15. Animal or vegetable fats and oils and their cleavage products; prepared animal fats;
animal or vegetable waxes
Figure A43 - Volume of trade 2011-2015, Billions US Dollars
1.6
3.7
4.44.8 4.7 4.4
1.1
1.9 1.9 1.7
4.8
6.36.7
6.46.0
0.0
1.0
2.0
3.0
4.0
5.0
6.0
7.0
8.0
2011 2012 2013 2014 2015
Europe - Asia
Asia -Europe
Total between
Europe and Asia
Figure A44 - The share of this commodity group in total volume of trade between Europe and Asia,
2011-2015, per cent
0.43
0.490.51 0.52
0.60
0.09
0.15 0.15 0.14 0.15
0.00
0.10
0.20
0.30
0.40
0.50
0.60
0.70
2011 2012 2013 2014 2015
Europe - Asia
Asia -Europe
Figure A45 - Top 10 trade partners in 2015, Billions US Dollars
Europe - Asia Asia - Europe
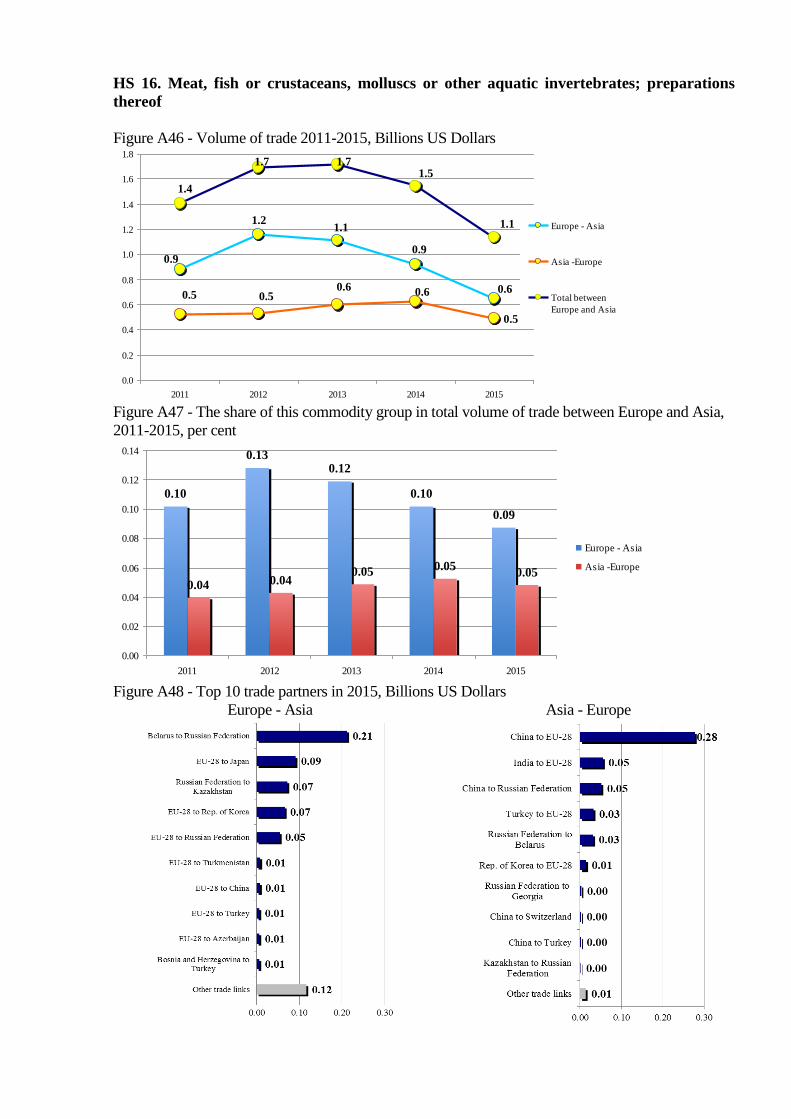
HS 16. Meat, fish or crustaceans, molluscs or other aquatic invertebrates; preparations
thereof
Figure A46 - Volume of trade 2011-2015, Billions US Dollars
0.5
0.9
1.21.1
0.9
0.60.5 0.5
0.6 0.6
1.4
1.7 1.71.5
1.1
0.0
0.2
0.4
0.6
0.8
1.0
1.2
1.4
1.6
1.8
2011 2012 2013 2014 2015
Europe - Asia
Asia -Europe
Total between
Europe and Asia
Figure A47 - The share of this commodity group in total volume of trade between Europe and Asia,
2011-2015, per cent
0.10
0.130.12
0.10
0.09
0.04 0.040.05 0.05
0.05
0.00
0.02
0.04
0.06
0.08
0.10
0.12
0.14
2011 2012 2013 2014 2015
Europe - Asia
Asia -Europe
Figure A48 - Top 10 trade partners in 2015, Billions US Dollars
Europe - Asia Asia - Europe
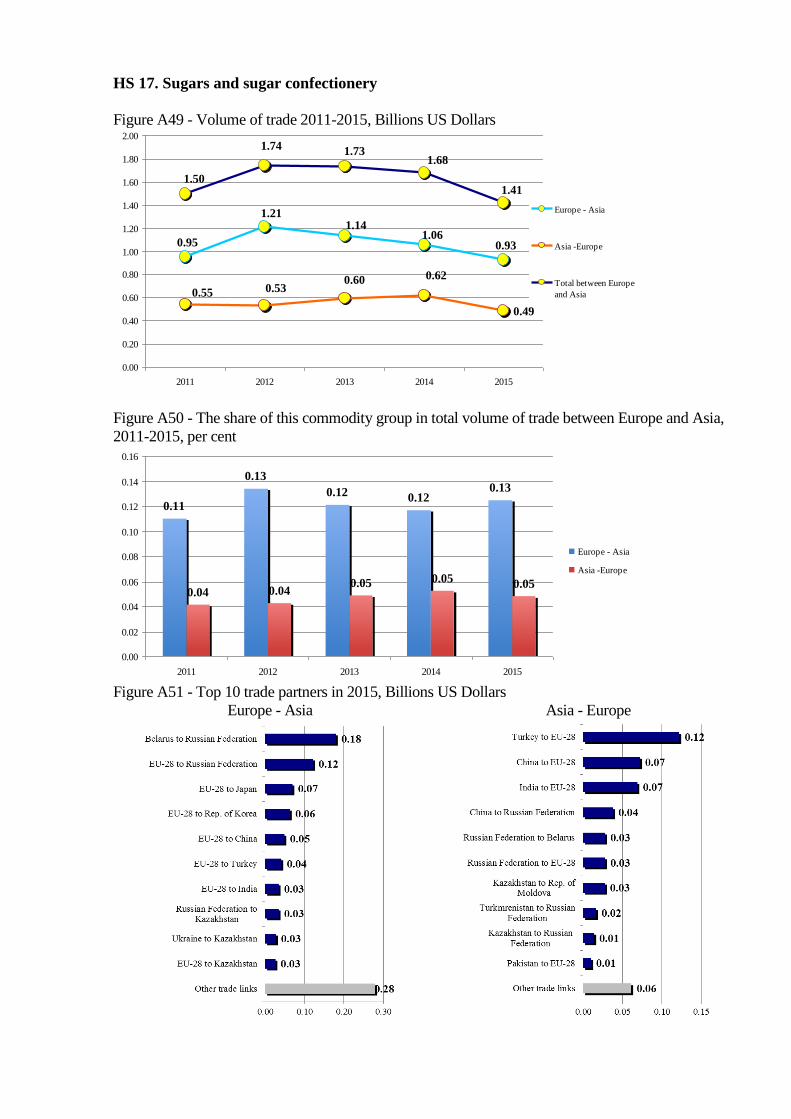
HS 17. Sugars and sugar confectionery
Figure A49 - Volume of trade 2011-2015, Billions US Dollars
0.49
0.95
1.211.14
1.060.93
0.55 0.530.60 0.62
1.50
1.74 1.731.68
1.41
0.00
0.20
0.40
0.60
0.80
1.00
1.20
1.40
1.60
1.80
2.00
2011 2012 2013 2014 2015
Europe - Asia
Asia -Europe
Total between Europe
and Asia
Figure A50 - The share of this commodity group in total volume of trade between Europe and Asia,
2011-2015, per cent
0.11
0.13
0.12 0.120.13
0.04 0.040.05 0.05 0.05
0.00
0.02
0.04
0.06
0.08
0.10
0.12
0.14
0.16
2011 2012 2013 2014 2015
Europe - Asia
Asia -Europe
Figure A51 - Top 10 trade partners in 2015, Billions US Dollars
Europe - Asia Asia - Europe

HS 18. Cocoa and cocoa preparations
Figure A52 - Volume of trade 2011-2015, Billions US Dollars
Figure A53 - The share of this commodity group in total volume of trade between Europe and Asia,
2011-2015, per cent
Figure A54 - Top 10 trade partners in 2015, Billions US Dollars
Europe - Asia Asia - Europe
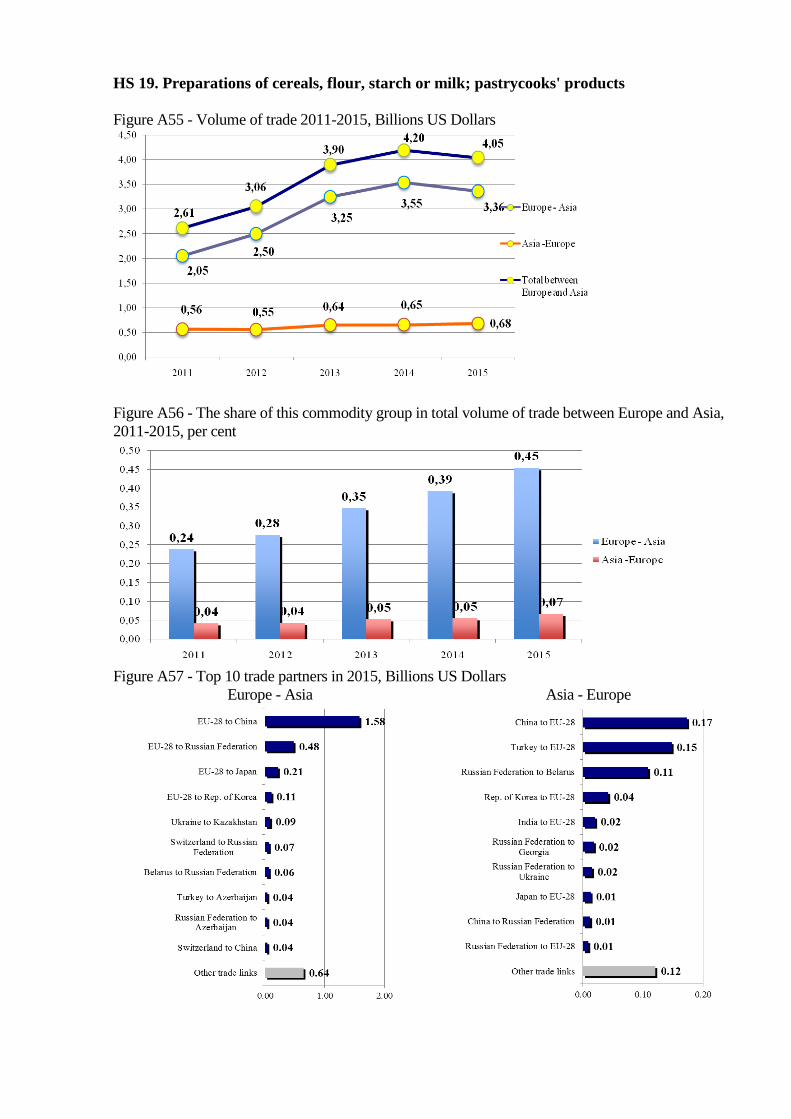
HS 19. Preparations of cereals, flour, starch or milk; pastrycooks' products
Figure A55 - Volume of trade 2011-2015, Billions US Dollars
Figure A56 - The share of this commodity group in total volume of trade between Europe and Asia,
2011-2015, per cent
Figure A57 - Top 10 trade partners in 2015, Billions US Dollars
Europe - Asia Asia - Europe

HS 20. Preparations of vegetables, fruit, nuts or other parts of plants
Figure A58 - Volume of trade 2011-2015, Billions US Dollars
Figure A59 - The share of this commodity group in total volume of trade between Europe and Asia,
2011-2015, per cent
Figure A60 - Top 10 trade partners in 2015, Billions US Dollars
Europe - Asia Asia - Europe
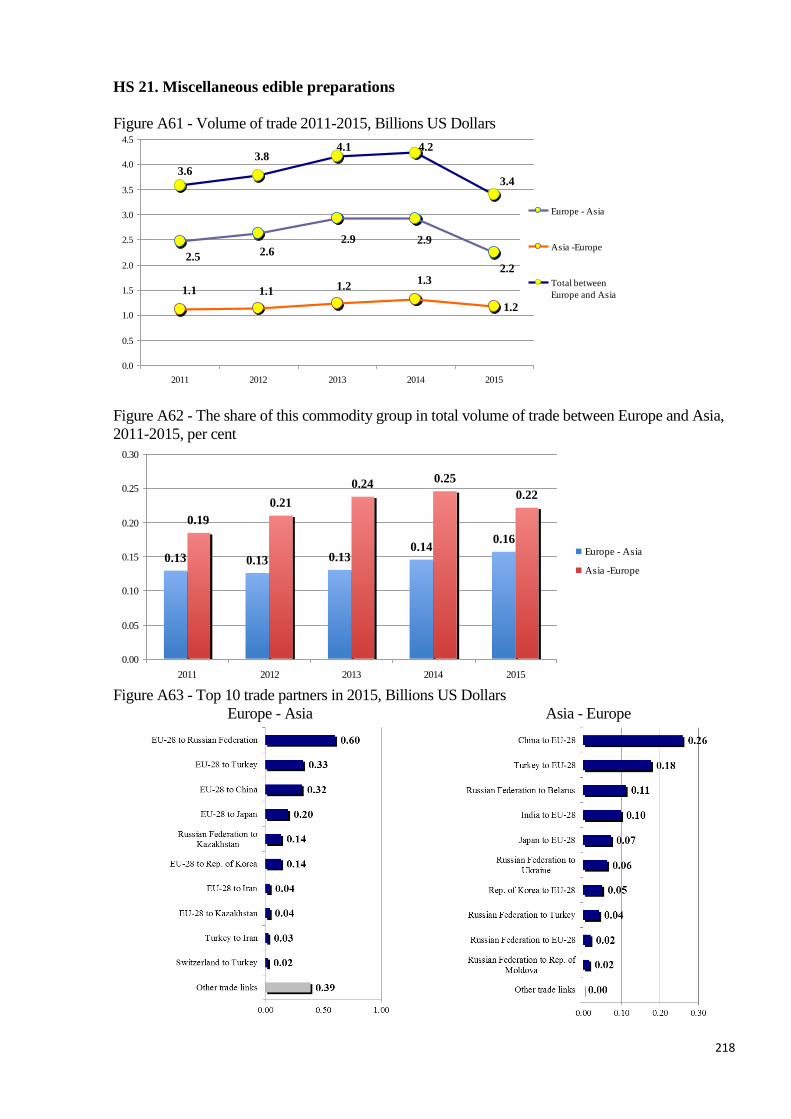
218
HS 21. Miscellaneous edible preparations
Figure A61 - Volume of trade 2011-2015, Billions US Dollars
1.2
2.5 2.62.9 2.9
2.2
1.1 1.1 1.21.3
3.6
3.84.1 4.2
3.4
0.0
0.5
1.0
1.5
2.0
2.5
3.0
3.5
4.0
4.5
2011 2012 2013 2014 2015
Europe - Asia
Asia -Europe
Total between
Europe and Asia
Figure A62 - The share of this commodity group in total volume of trade between Europe and Asia,
2011-2015, per cent
0.13 0.13 0.130.14
0.16
0.19
0.21
0.24 0.25
0.22
0.00
0.05
0.10
0.15
0.20
0.25
0.30
2011 2012 2013 2014 2015
Europe - Asia
Asia -Europe
Figure A63 - Top 10 trade partners in 2015, Billions US Dollars
Europe - Asia Asia - Europe

219
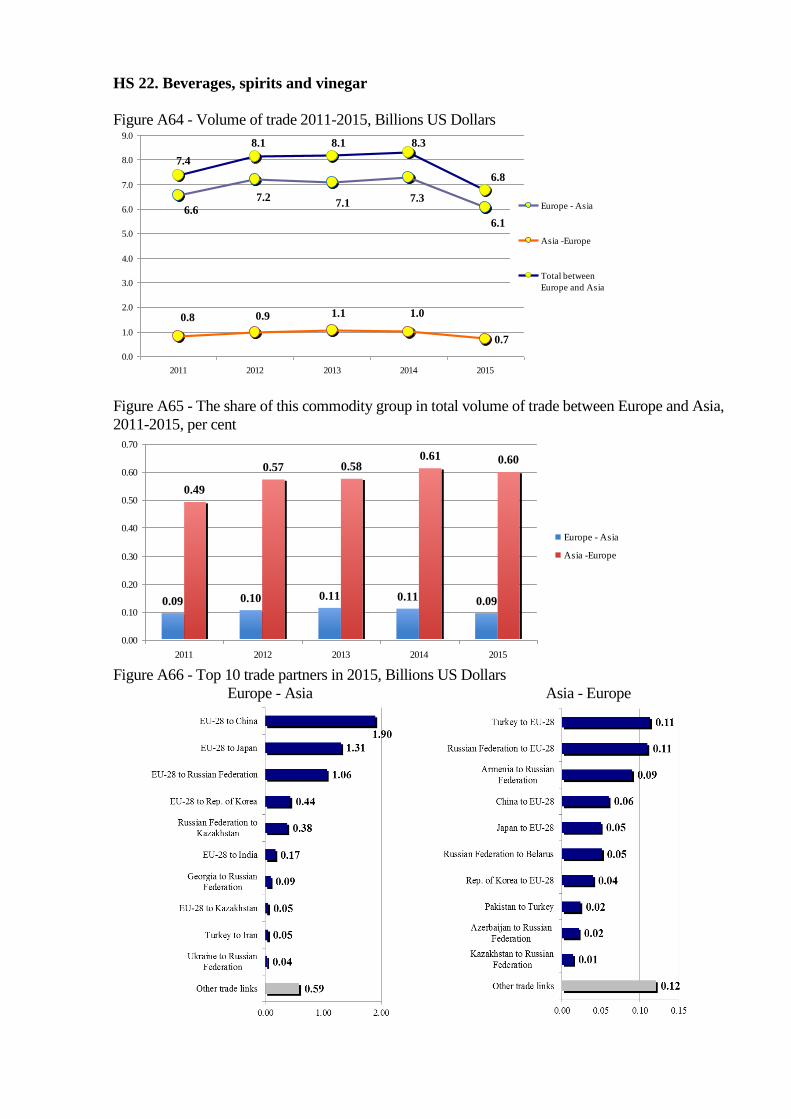
HS 22. Beverages, spirits and vinegar
Figure A64 - Volume of trade 2011-2015, Billions US Dollars
0.7
6.6
7.27.1 7.3
6.1
0.8 0.9 1.1 1.0
7.4
8.1 8.1 8.3
6.8
0.0
1.0
2.0
3.0
4.0
5.0
6.0
7.0
8.0
9.0
2011 2012 2013 2014 2015
Europe - Asia
Asia -Europe
Total between
Europe and Asia
Figure A65 - The share of this commodity group in total volume of trade between Europe and Asia,
2011-2015, per cent
0.09 0.10 0.11 0.11 0.09
0.49
0.57 0.580.61 0.60
0.00
0.10
0.20
0.30
0.40
0.50
0.60
0.70
2011 2012 2013 2014 2015
Europe - Asia
Asia -Europe
Figure A66 - Top 10 trade partners in 2015, Billions US Dollars
Europe - Asia Asia - Europe
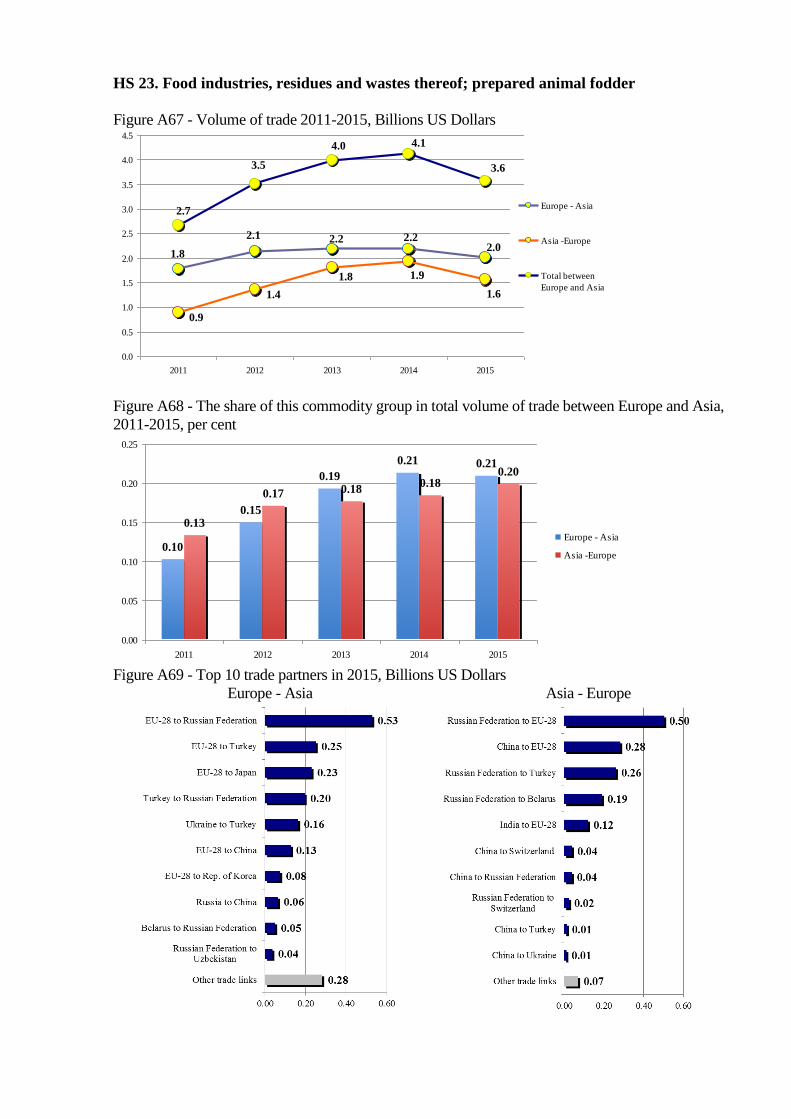
HS 23. Food industries, residues and wastes thereof; prepared animal fodder
Figure A67 - Volume of trade 2011-2015, Billions US Dollars
1.8
2.1 2.2 2.22.0
1.6
0.9
1.4
1.8 1.9
2.7
3.5
4.0 4.1
3.6
0.0
0.5
1.0
1.5
2.0
2.5
3.0
3.5
4.0
4.5
2011 2012 2013 2014 2015
Europe - Asia
Asia -Europe
Total between
Europe and Asia
Figure A68 - The share of this commodity group in total volume of trade between Europe and Asia,
2011-2015, per cent
0.10
0.15
0.19
0.21 0.21
0.13
0.17 0.180.18
0.20
0.00
0.05
0.10
0.15
0.20
0.25
2011 2012 2013 2014 2015
Europe - Asia
Asia -Europe
Figure A69 - Top 10 trade partners in 2015, Billions US Dollars
Europe - Asia Asia - Europe
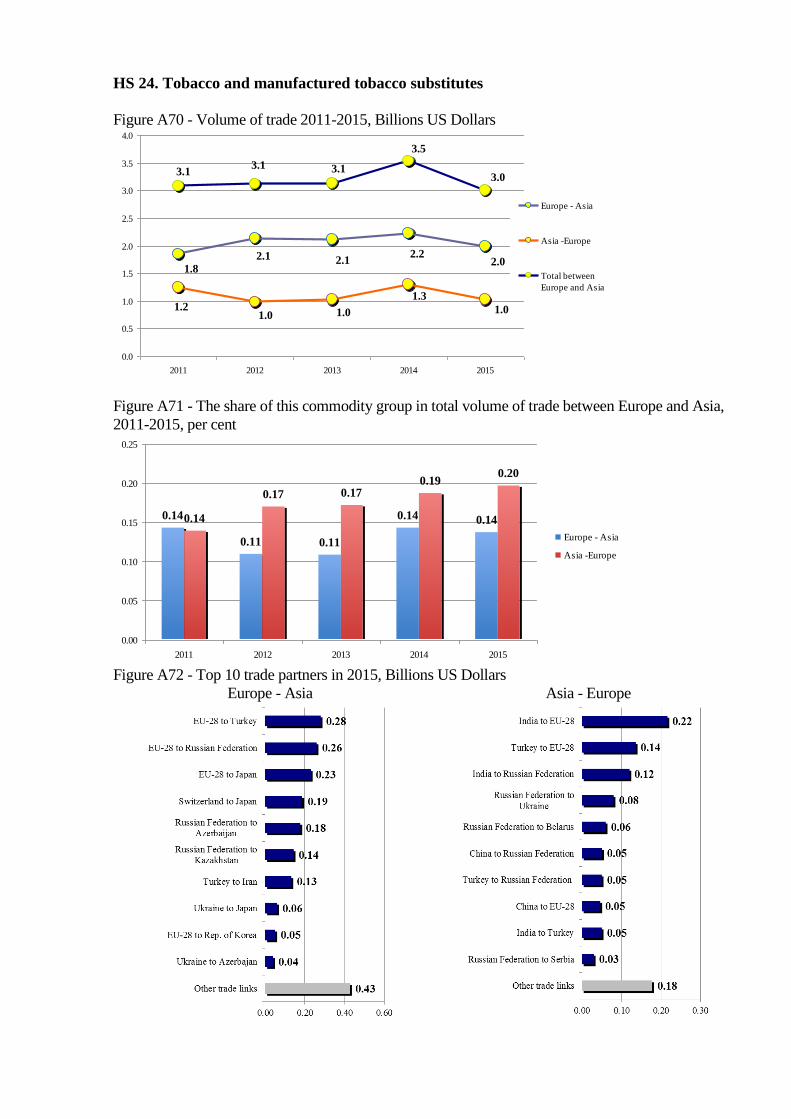
HS 24. Tobacco and manufactured tobacco substitutes
Figure A70 - Volume of trade 2011-2015, Billions US Dollars
1.8
2.1 2.12.2
2.0
1.01.21.0 1.0
1.3
3.13.1 3.1
3.5
3.0
0.0
0.5
1.0
1.5
2.0
2.5
3.0
3.5
4.0
2011 2012 2013 2014 2015
Europe - Asia
Asia -Europe
Total between
Europe and Asia
Figure A71 - The share of this commodity group in total volume of trade between Europe and Asia,
2011-2015, per cent
0.14
0.11 0.11
0.14 0.140.14
0.17 0.170.19
0.20
0.00
0.05
0.10
0.15
0.20
0.25
2011 2012 2013 2014 2015
Europe - Asia
Asia -Europe
Figure A72 - Top 10 trade partners in 2015, Billions US Dollars
Europe - Asia Asia - Europe
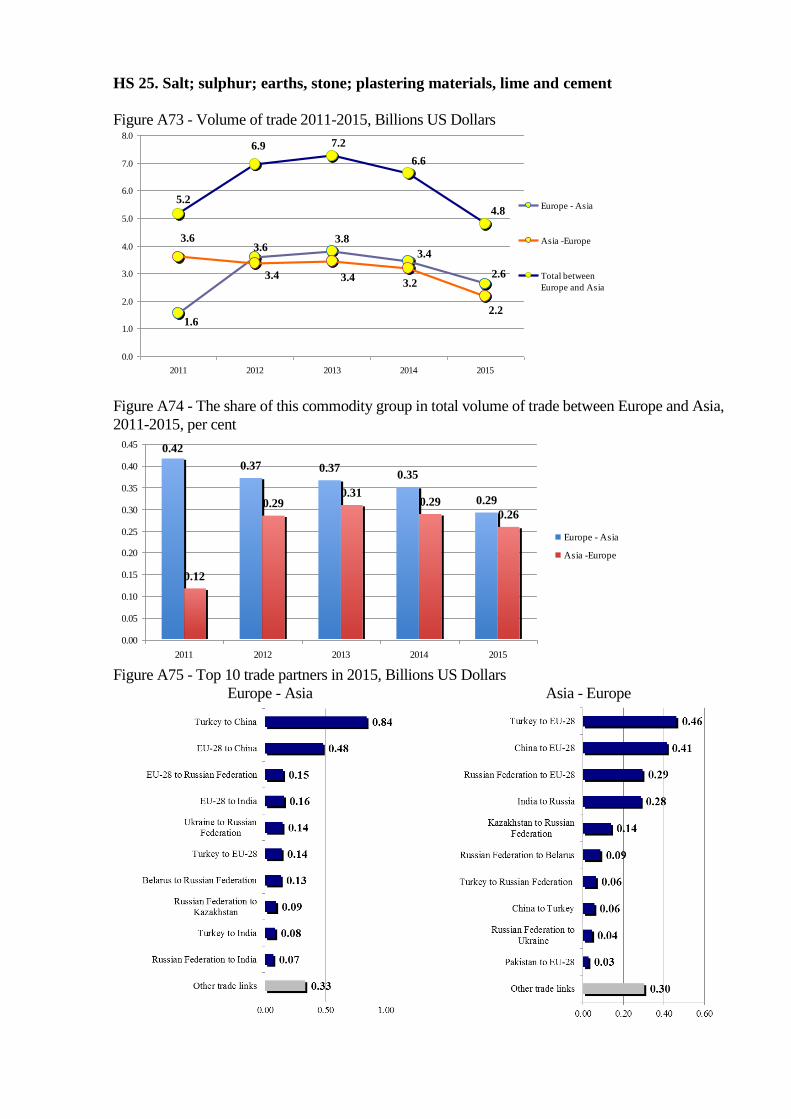
HS 25. Salt; sulphur; earths, stone; plastering materials, lime and cement
Figure A73 - Volume of trade 2011-2015, Billions US Dollars
1.6
3.63.8
3.4
2.6
2.2
3.6
3.4 3.43.2
5.2
6.9 7.2
6.6
4.8
0.0
1.0
2.0
3.0
4.0
5.0
6.0
7.0
8.0
2011 2012 2013 2014 2015
Europe - Asia
Asia -Europe
Total between
Europe and Asia
Figure A74 - The share of this commodity group in total volume of trade between Europe and Asia,
2011-2015, per cent
0.42
0.37 0.370.35
0.29
0.12
0.290.31
0.290.26
0.00
0.05
0.10
0.15
0.20
0.25
0.30
0.35
0.40
0.45
2011 2012 2013 2014 2015
Europe - Asia
Asia -Europe
Figure A75 - Top 10 trade partners in 2015, Billions US Dollars
Europe - Asia Asia - Europe

HS 26. Ores, slag and ash
Figure A76 - Volume of trade 2011-2015, Billions US Dollars
2.4
6.76.2
6.8
5.7
3.7
2.7 3.9 3.7 4.0
9.4
10.0 10.5
9.6
6.1
0.0
2.0
4.0
6.0
8.0
10.0
12.0
2011 2012 2013 2014 2015
Europe - Asia
Asia -Europe
Total between
Europe and Asia
Figure A77 - The share of this commodity group in total volume of trade between Europe and Asia,
2011-2015, per cent
0.78
0.680.72
0.62
0.51
0.20
0.31 0.300.33
0.24
0.00
0.10
0.20
0.30
0.40
0.50
0.60
0.70
0.80
0.90
2011 2012 2013 2014 2015
Europe - Asia
Asia -Europe
Figure A78 - Top 10 trade partners in 2015, Billions US Dollars
Europe - Asia Asia - Europe
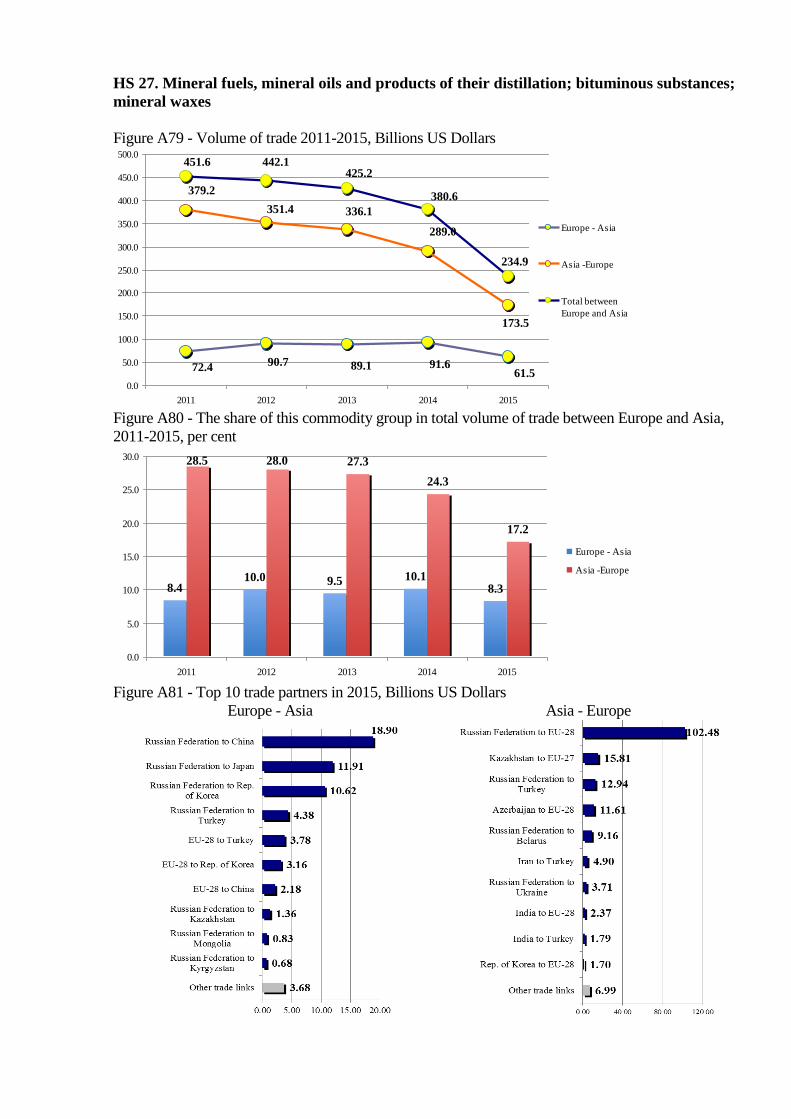
HS 27. Mineral fuels, mineral oils and products of their distillation; bituminous substances;
mineral waxes
Figure A79 - Volume of trade 2011-2015, Billions US Dollars
72.4 90.7 89.1 91.661.5
173.5
379.2
351.4 336.1
289.0
451.6 442.1425.2
380.6
234.9
0.0
50.0
100.0
150.0
200.0
250.0
300.0
350.0
400.0
450.0
500.0
2011 2012 2013 2014 2015
Europe - Asia
Asia -Europe
Total between
Europe and Asia
Figure A80 - The share of this commodity group in total volume of trade between Europe and Asia,
2011-2015, per cent
8.410.0 9.5 10.1
8.3
28.5 28.0 27.3
24.3
17.2
0.0
5.0
10.0
15.0
20.0
25.0
30.0
2011 2012 2013 2014 2015
Europe - Asia
Asia -Europe
Figure A81 - Top 10 trade partners in 2015, Billions US Dollars
Europe - Asia Asia - Europe
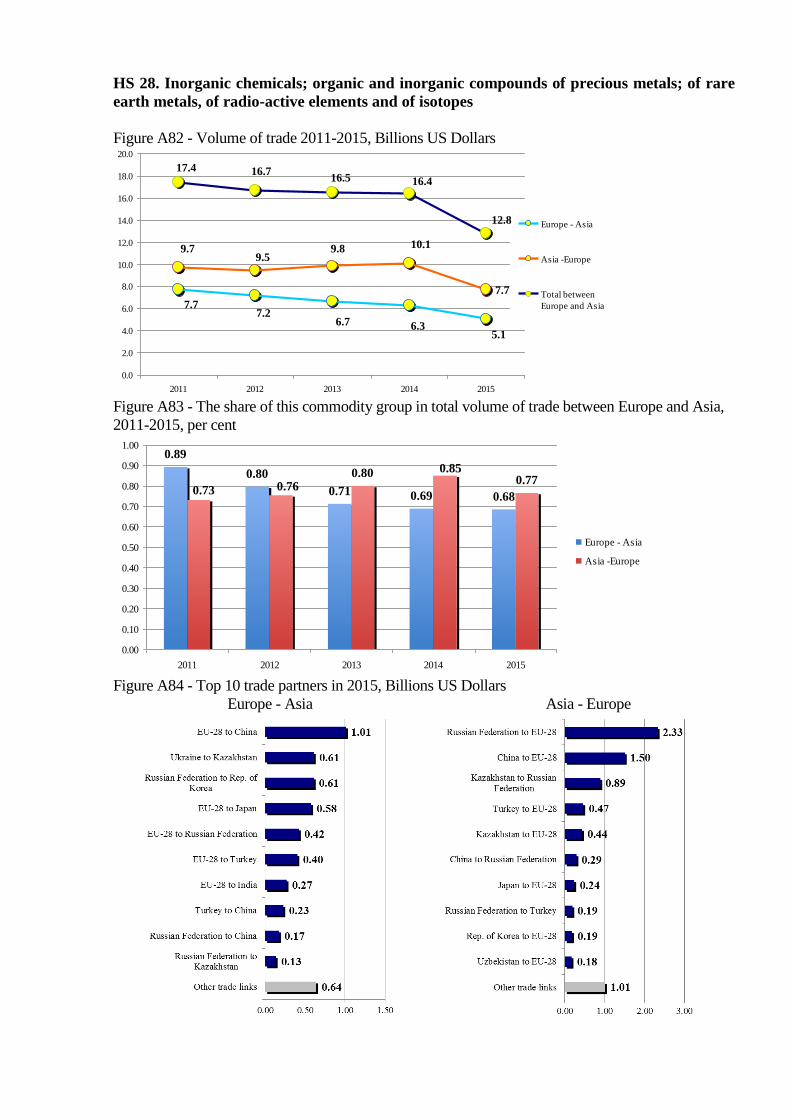
HS 28. Inorganic chemicals; organic and inorganic compounds of precious metals; of rare
earth metals, of radio-active elements and of isotopes
Figure A82 - Volume of trade 2011-2015, Billions US Dollars
7.7
7.77.2
6.7 6.35.1
9.79.5
9.8 10.1
17.4 16.716.5 16.4
12.8
0.0
2.0
4.0
6.0
8.0
10.0
12.0
14.0
16.0
18.0
20.0
2011 2012 2013 2014 2015
Europe - Asia
Asia -Europe
Total between
Europe and Asia
Figure A83 - The share of this commodity group in total volume of trade between Europe and Asia,
2011-2015, per cent
0.89
0.80
0.71 0.69 0.68
0.800.77
0.85
0.760.73
0.00
0.10
0.20
0.30
0.40
0.50
0.60
0.70
0.80
0.90
1.00
2011 2012 2013 2014 2015
Europe - Asia
Asia -Europe
Figure A84 - Top 10 trade partners in 2015, Billions US Dollars
Europe - Asia Asia - Europe
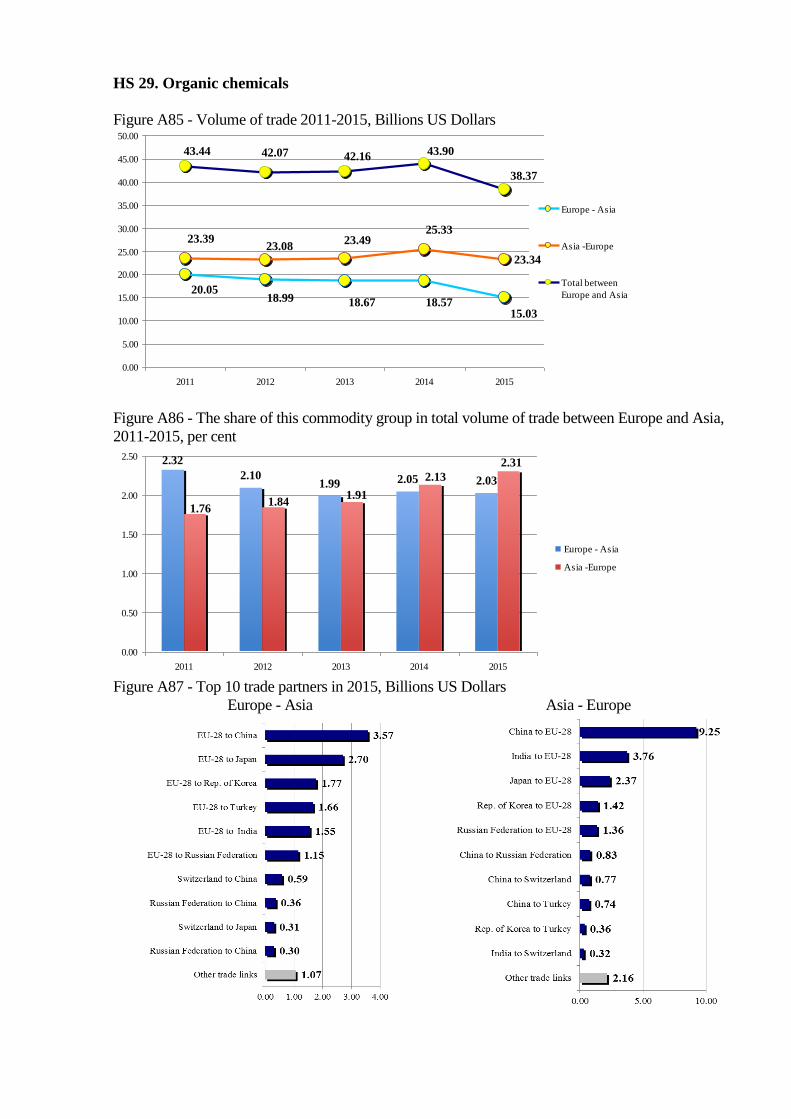
HS 29. Organic chemicals
Figure A85 - Volume of trade 2011-2015, Billions US Dollars
23.34
20.0518.99 18.67 18.57
15.03
23.3923.08
23.4925.33
43.44 42.07 42.16 43.90
38.37
0.00
5.00
10.00
15.00
20.00
25.00
30.00
35.00
40.00
45.00
50.00
2011 2012 2013 2014 2015
Europe - Asia
Asia -Europe
Total between
Europe and Asia
Figure A86 - The share of this commodity group in total volume of trade between Europe and Asia,
2011-2015, per cent
2.32
2.101.99 2.05 2.03
2.31
2.13
1.911.84
1.76
0.00
0.50
1.00
1.50
2.00
2.50
2011 2012 2013 2014 2015
Europe - Asia
Asia -Europe
Figure A87 - Top 10 trade partners in 2015, Billions US Dollars
Europe - Asia Asia - Europe
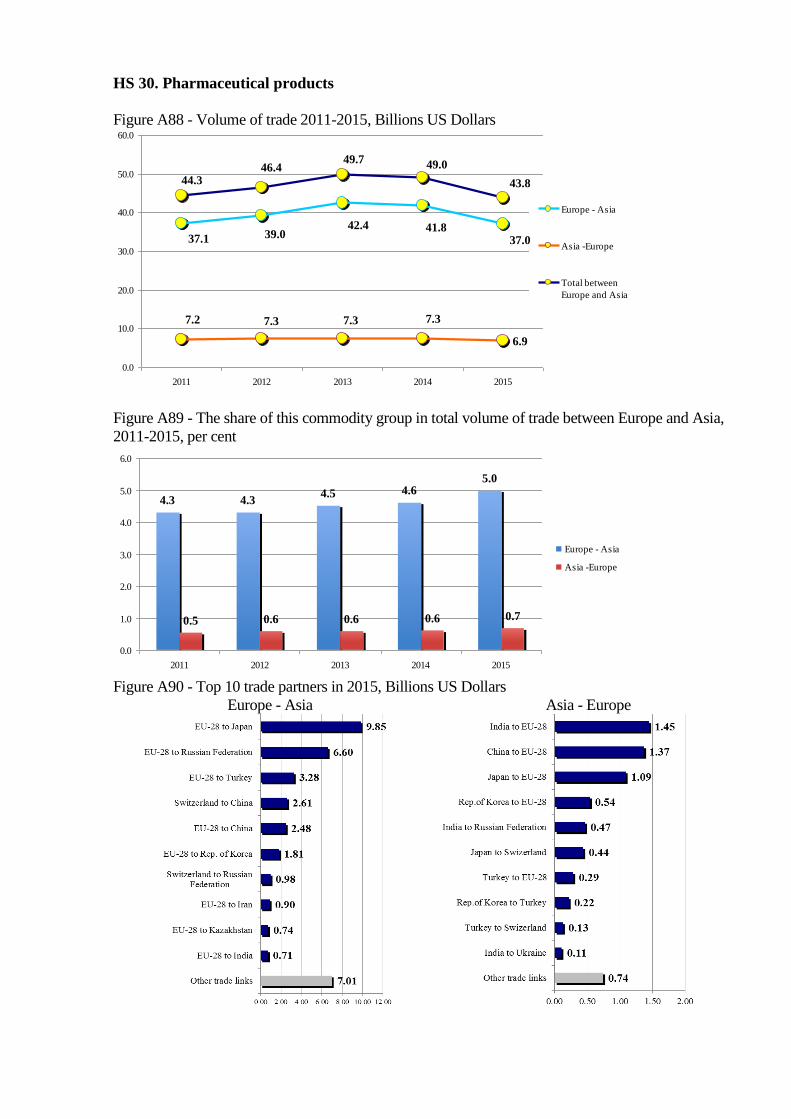
HS 30. Pharmaceutical products
Figure A88 - Volume of trade 2011-2015, Billions US Dollars
6.9
37.1 39.042.4 41.8
37.0
7.2 7.3 7.3 7.3
44.346.4
49.7 49.0
43.8
0.0
10.0
20.0
30.0
40.0
50.0
60.0
2011 2012 2013 2014 2015
Europe - Asia
Asia -Europe
Total between
Europe and Asia
Figure A89 - The share of this commodity group in total volume of trade between Europe and Asia,
2011-2015, per cent
4.3 4.34.5 4.6
5.0
0.5 0.6 0.6 0.6 0.7
0.0
1.0
2.0
3.0
4.0
5.0
6.0
2011 2012 2013 2014 2015
Europe - Asia
Asia -Europe
Figure A90 - Top 10 trade partners in 2015, Billions US Dollars
Europe - Asia Asia - Europe
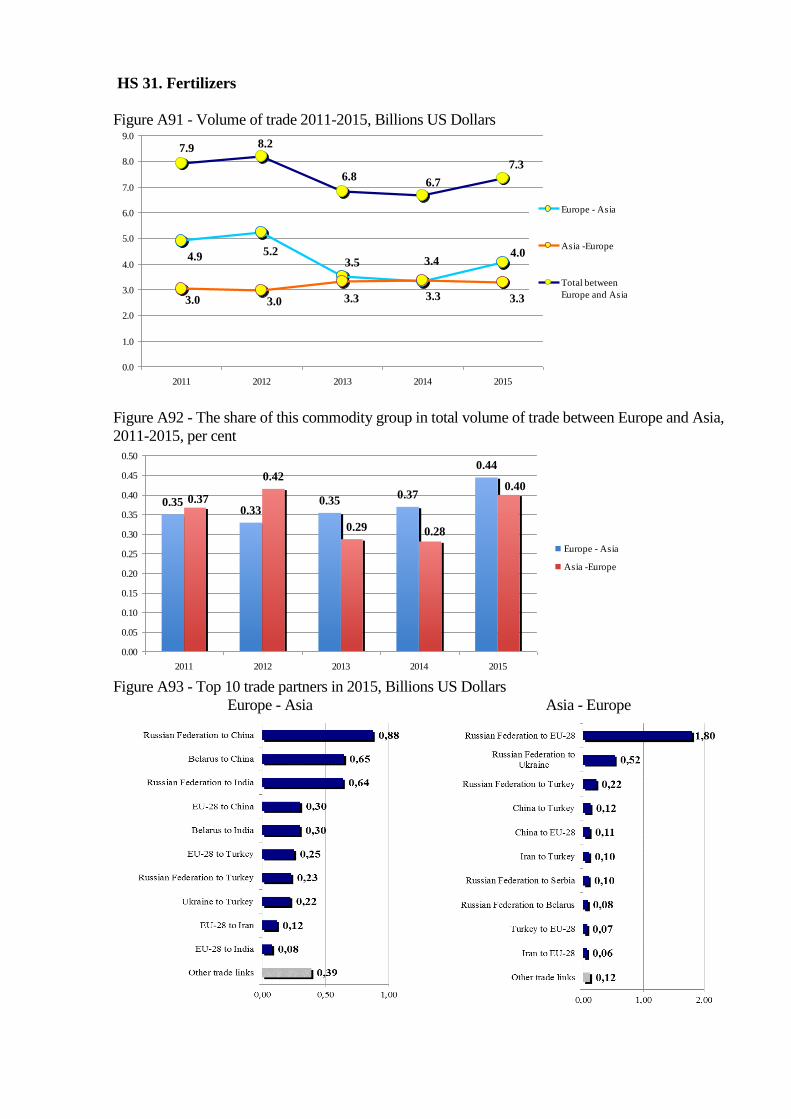
HS 31. Fertilizers
Figure A91 - Volume of trade 2011-2015, Billions US Dollars
4.9 5.23.5
3.3
4.0
3.33.0 3.0 3.3
3.4
7.9 8.2
6.86.7
7.3
0.0
1.0
2.0
3.0
4.0
5.0
6.0
7.0
8.0
9.0
2011 2012 2013 2014 2015
Europe - Asia
Asia -Europe
Total between
Europe and Asia
Figure A92 - The share of this commodity group in total volume of trade between Europe and Asia,
2011-2015, per cent
0.350.33
0.350.37
0.440.42
0.40
0.280.29
0.37
0.00
0.05
0.10
0.15
0.20
0.25
0.30
0.35
0.40
0.45
0.50
2011 2012 2013 2014 2015
Europe - Asia
Asia -Europe
Figure A93 - Top 10 trade partners in 2015, Billions US Dollars
Europe - Asia Asia - Europe
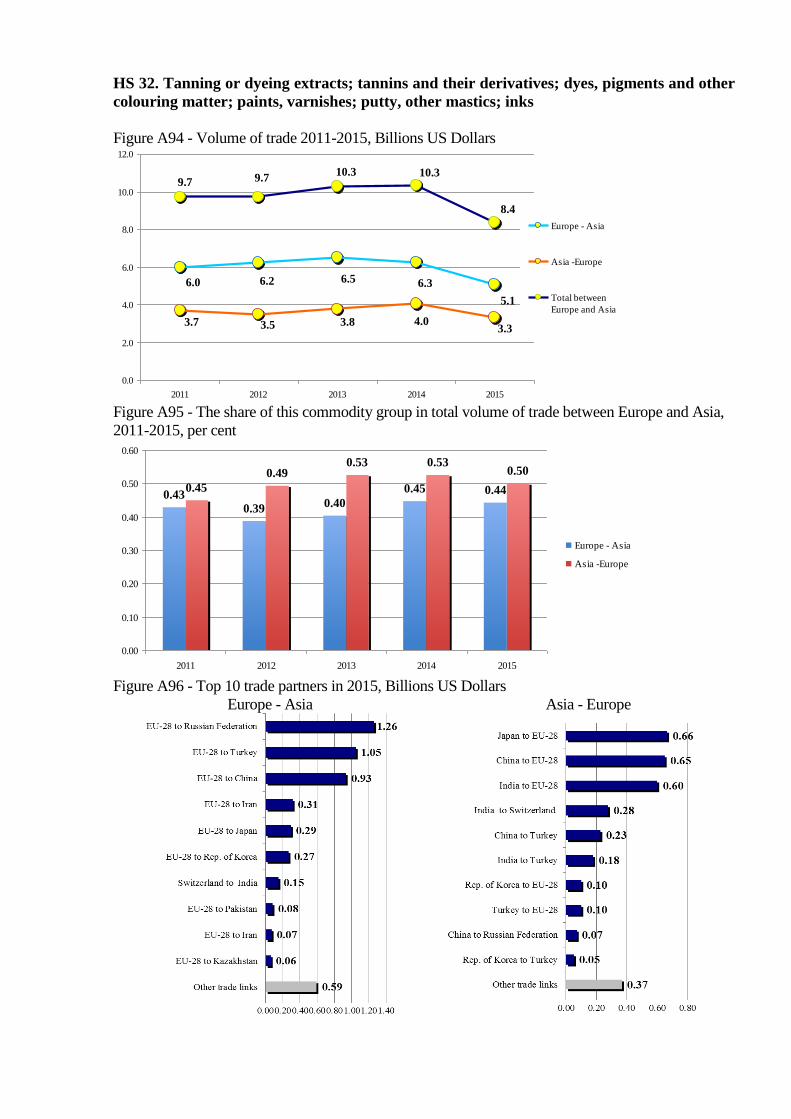
HS 32. Tanning or dyeing extracts; tannins and their derivatives; dyes, pigments and other
colouring matter; paints, varnishes; putty, other mastics; inks
Figure A94 - Volume of trade 2011-2015, Billions US Dollars
6.0 6.2 6.5 6.3
5.1
3.33.7 3.5 3.8 4.0
9.7 9.710.3 10.3
8.4
0.0
2.0
4.0
6.0
8.0
10.0
12.0
2011 2012 2013 2014 2015
Europe - Asia
Asia -Europe
Total between
Europe and Asia
Figure A95 - The share of this commodity group in total volume of trade between Europe and Asia,
2011-2015, per cent
0.43
0.39 0.40
0.45 0.440.45
0.490.53 0.53
0.50
0.00
0.10
0.20
0.30
0.40
0.50
0.60
2011 2012 2013 2014 2015
Europe - Asia
Asia -Europe
Figure A96 - Top 10 trade partners in 2015, Billions US Dollars
Europe - Asia Asia - Europe
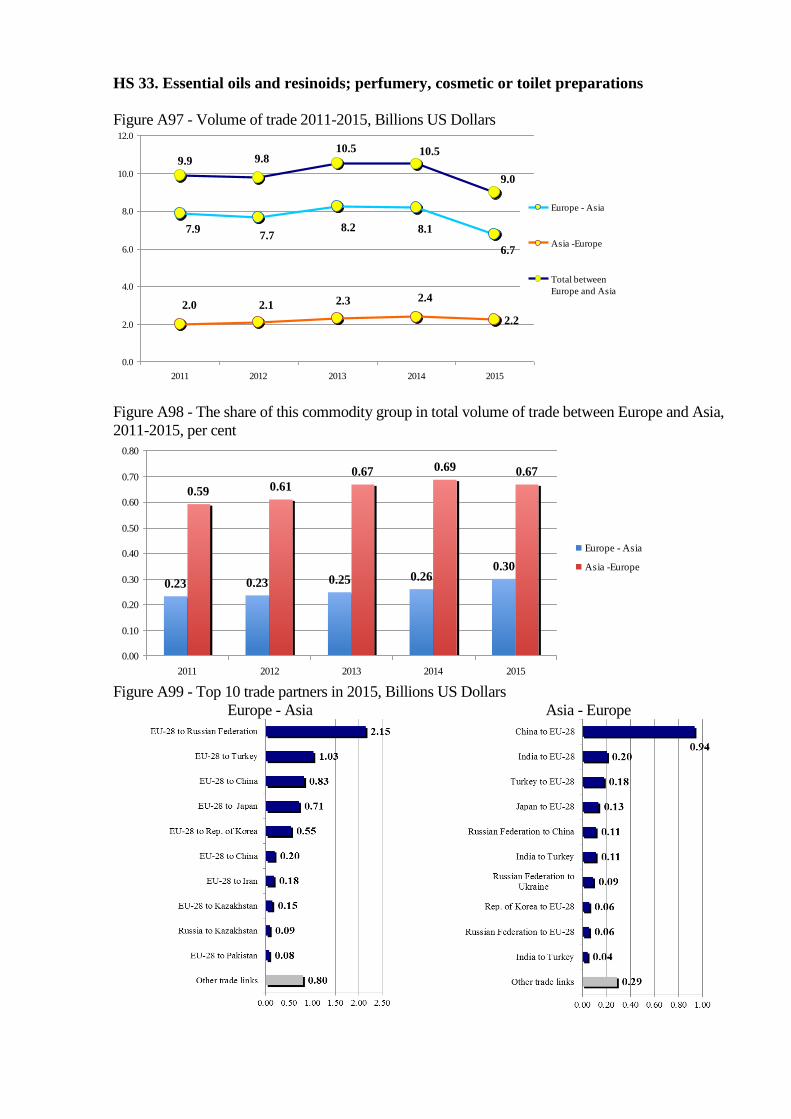
HS 33. Essential oils and resinoids; perfumery, cosmetic or toilet preparations
Figure A97 - Volume of trade 2011-2015, Billions US Dollars
2.2
7.97.7
8.2 8.1
6.7
2.0 2.1 2.3 2.4
9.9 9.810.5 10.5
9.0
0.0
2.0
4.0
6.0
8.0
10.0
12.0
2011 2012 2013 2014 2015
Europe - Asia
Asia -Europe
Total between
Europe and Asia
Figure A98 - The share of this commodity group in total volume of trade between Europe and Asia,
2011-2015, per cent
0.23 0.23 0.25 0.260.30
0.59 0.61
0.67 0.69 0.67
0.00
0.10
0.20
0.30
0.40
0.50
0.60
0.70
0.80
2011 2012 2013 2014 2015
Europe - Asia
Asia -Europe
Figure A99 - Top 10 trade partners in 2015, Billions US Dollars
Europe - Asia Asia - Europe
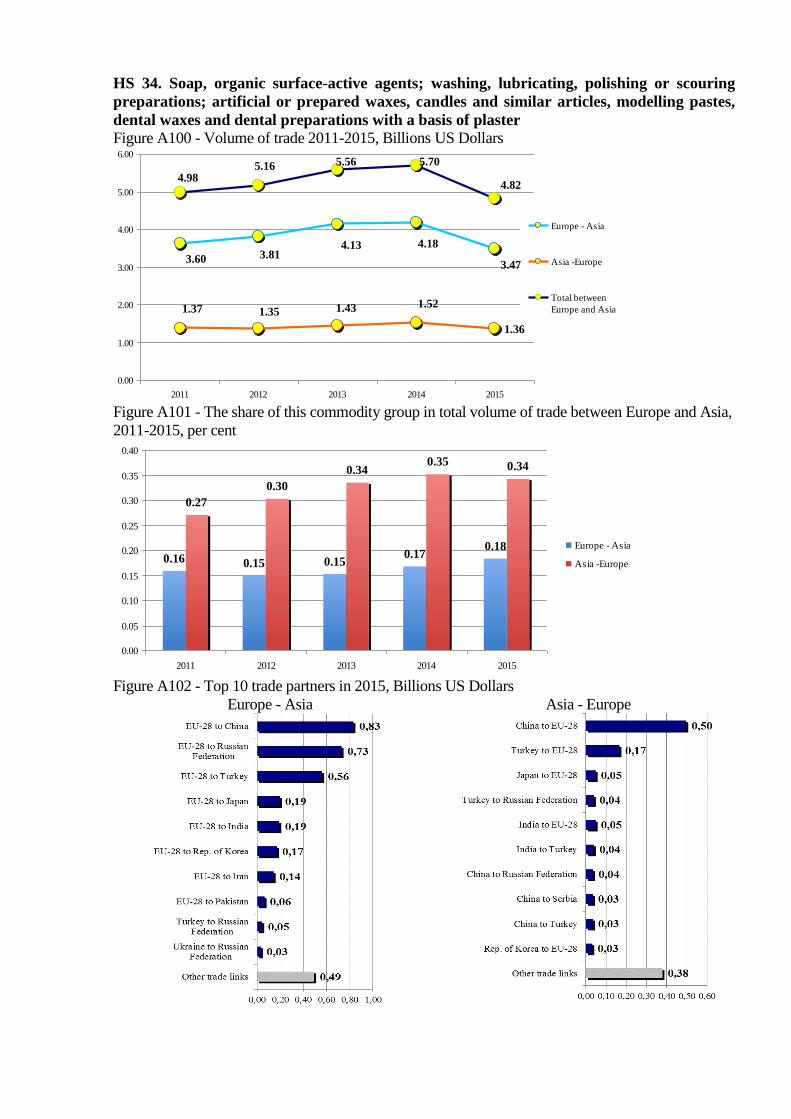
HS 34. Soap, organic surface-active agents; washing, lubricating, polishing or scouring
preparations; artificial or prepared waxes, candles and similar articles, modelling pastes,
dental waxes and dental preparations with a basis of plaster
Figure A100 - Volume of trade 2011-2015, Billions US Dollars
1.36
3.60 3.814.13 4.18
3.47
1.37 1.35 1.43 1.52
4.985.16 5.56 5.70
4.82
0.00
1.00
2.00
3.00
4.00
5.00
6.00
2011 2012 2013 2014 2015
Europe - Asia
Asia -Europe
Total between
Europe and Asia
Figure A101 - The share of this commodity group in total volume of trade between Europe and Asia,
2011-2015, per cent
0.16 0.15 0.150.17
0.18
0.27
0.30
0.340.35 0.34
0.00
0.05
0.10
0.15
0.20
0.25
0.30
0.35
0.40
2011 2012 2013 2014 2015
Europe - Asia
Asia -Europe
Figure A102 - Top 10 trade partners in 2015, Billions US Dollars
Europe - Asia Asia - Europe
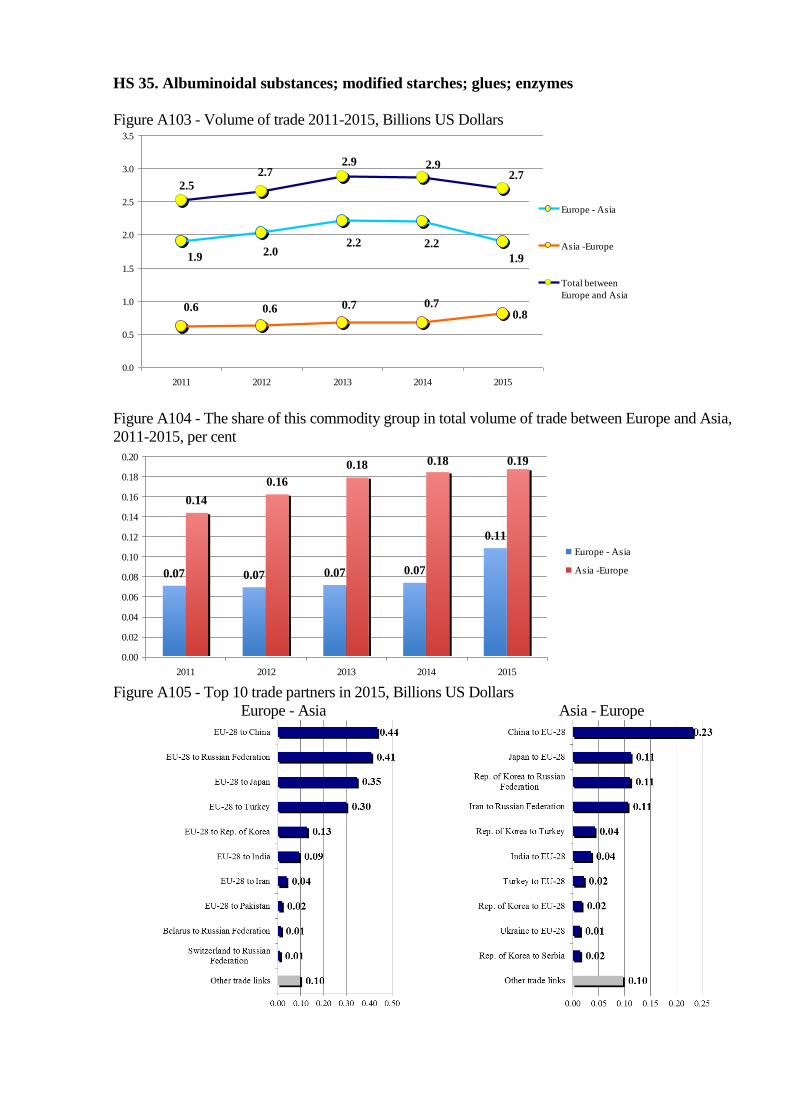
HS 35. Albuminoidal substances; modified starches; glues; enzymes
Figure A103 - Volume of trade 2011-2015, Billions US Dollars
0.8
1.9 2.02.2 2.2
1.9
0.6 0.6 0.7 0.7
2.5
2.72.9 2.9
2.7
0.0
0.5
1.0
1.5
2.0
2.5
3.0
3.5
2011 2012 2013 2014 2015
Europe - Asia
Asia -Europe
Total between
Europe and Asia
Figure A104 - The share of this commodity group in total volume of trade between Europe and Asia,
2011-2015, per cent
0.07 0.07 0.07 0.07
0.11
0.14
0.16
0.18 0.18 0.19
0.00
0.02
0.04
0.06
0.08
0.10
0.12
0.14
0.16
0.18
0.20
2011 2012 2013 2014 2015
Europe - Asia
Asia -Europe
Figure A105 - Top 10 trade partners in 2015, Billions US Dollars
Europe - Asia Asia - Europe
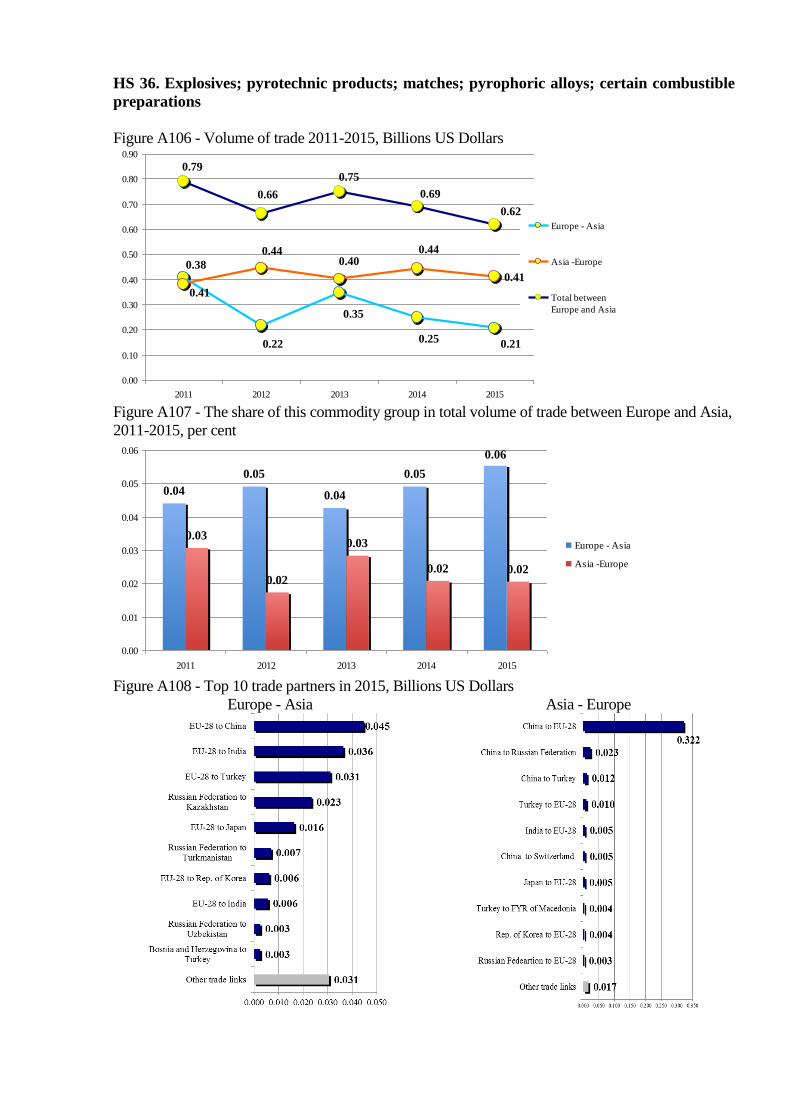
HS 36. Explosives; pyrotechnic products; matches; pyrophoric alloys; certain combustible
preparations
Figure A106 - Volume of trade 2011-2015, Billions US Dollars
0.41
0.41
0.22
0.35
0.25 0.21
0.38
0.440.40
0.44
0.79
0.66
0.75
0.69
0.62
0.00
0.10
0.20
0.30
0.40
0.50
0.60
0.70
0.80
0.90
2011 2012 2013 2014 2015
Europe - Asia
Asia -Europe
Total between
Europe and Asia
Figure A107 - The share of this commodity group in total volume of trade between Europe and Asia,
2011-2015, per cent
0.04
0.05
0.04
0.05
0.06
0.03
0.02
0.03
0.02 0.02
0.00
0.01
0.02
0.03
0.04
0.05
0.06
2011 2012 2013 2014 2015
Europe - Asia
Asia -Europe
Figure A108 - Top 10 trade partners in 2015, Billions US Dollars
Europe - Asia Asia - Europe
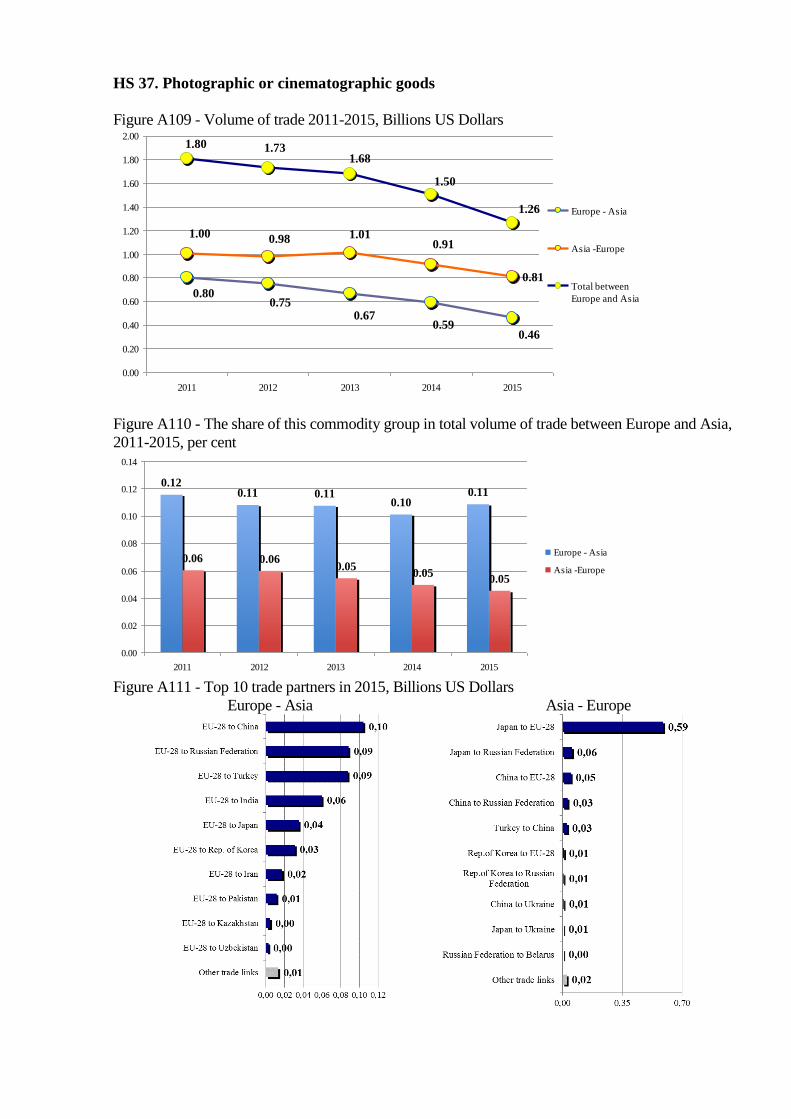
HS 37. Photographic or cinematographic goods
Figure A109 - Volume of trade 2011-2015, Billions US Dollars
0.81
0.800.75
0.670.59
0.46
1.00 0.98 1.010.91
1.80 1.731.68
1.50
1.26
0.00
0.20
0.40
0.60
0.80
1.00
1.20
1.40
1.60
1.80
2.00
2011 2012 2013 2014 2015
Europe - Asia
Asia -Europe
Total between
Europe and Asia
Figure A110 - The share of this commodity group in total volume of trade between Europe and Asia,
2011-2015, per cent
0.120.11 0.11
0.100.11
0.06 0.060.05
0.050.05
0.00
0.02
0.04
0.06
0.08
0.10
0.12
0.14
2011 2012 2013 2014 2015
Europe - Asia
Asia -Europe
Figure A111 - Top 10 trade partners in 2015, Billions US Dollars
Europe - Asia Asia - Europe
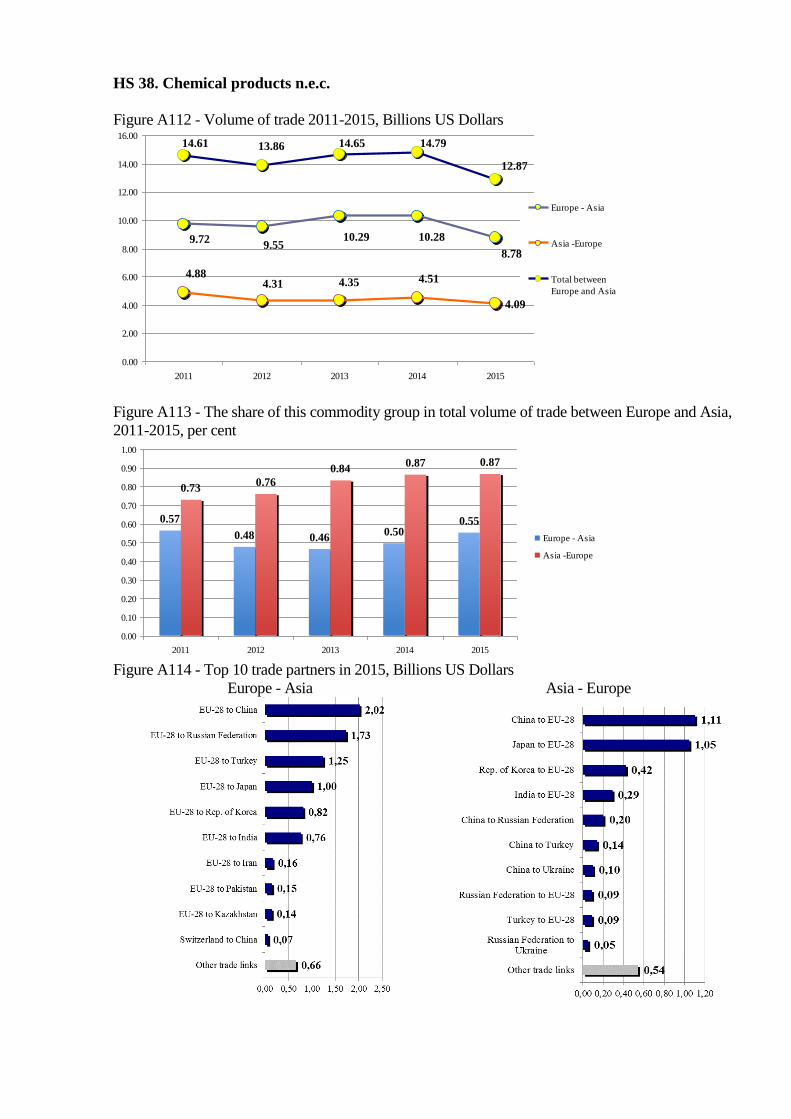
HS 38. Chemical products n.e.c.
Figure A112 - Volume of trade 2011-2015, Billions US Dollars
4.09
9.729.55
10.29 10.28
8.78
4.884.31 4.35 4.51
14.61 13.86 14.65 14.79
12.87
0.00
2.00
4.00
6.00
8.00
10.00
12.00
14.00
16.00
2011 2012 2013 2014 2015
Europe - Asia
Asia -Europe
Total between
Europe and Asia
Figure A113 - The share of this commodity group in total volume of trade between Europe and Asia,
2011-2015, per cent
0.57
0.48 0.460.50
0.55
0.730.76
0.840.87 0.87
0.00
0.10
0.20
0.30
0.40
0.50
0.60
0.70
0.80
0.90
1.00
2011 2012 2013 2014 2015
Europe - Asia
Asia -Europe
Figure A114 - Top 10 trade partners in 2015, Billions US Dollars
Europe - Asia Asia - Europe

HS 39. Plastics and articles thereof
Figure A115 - Volume of trade 2011-2015, Billions US Dollars
25.0
26.4
23.5
28.0
28.624.1
24.4
24.1
26.8
28.8
50.947.6
54.857.4
49.1
0.0
10.0
20.0
30.0
40.0
50.0
60.0
70.0
2011 2012 2013 2014 2015
Europe - Asia
Asia -Europe
Total between
Europe and Asia
Figure A116 - The share of this commodity group in total volume of trade between Europe and Asia,
2011-2015, per cent
2.832.66
2.86
3.183.37
1.99 1.88
2.282.41 2.38
0.00
0.50
1.00
1.50
2.00
2.50
3.00
3.50
4.00
2011 2012 2013 2014 2015
Europe - Asia
Asia -Europe
Figure A117 - Top 10 trade partners in 2015, Billions US Dollars
Europe - Asia Asia - Europe
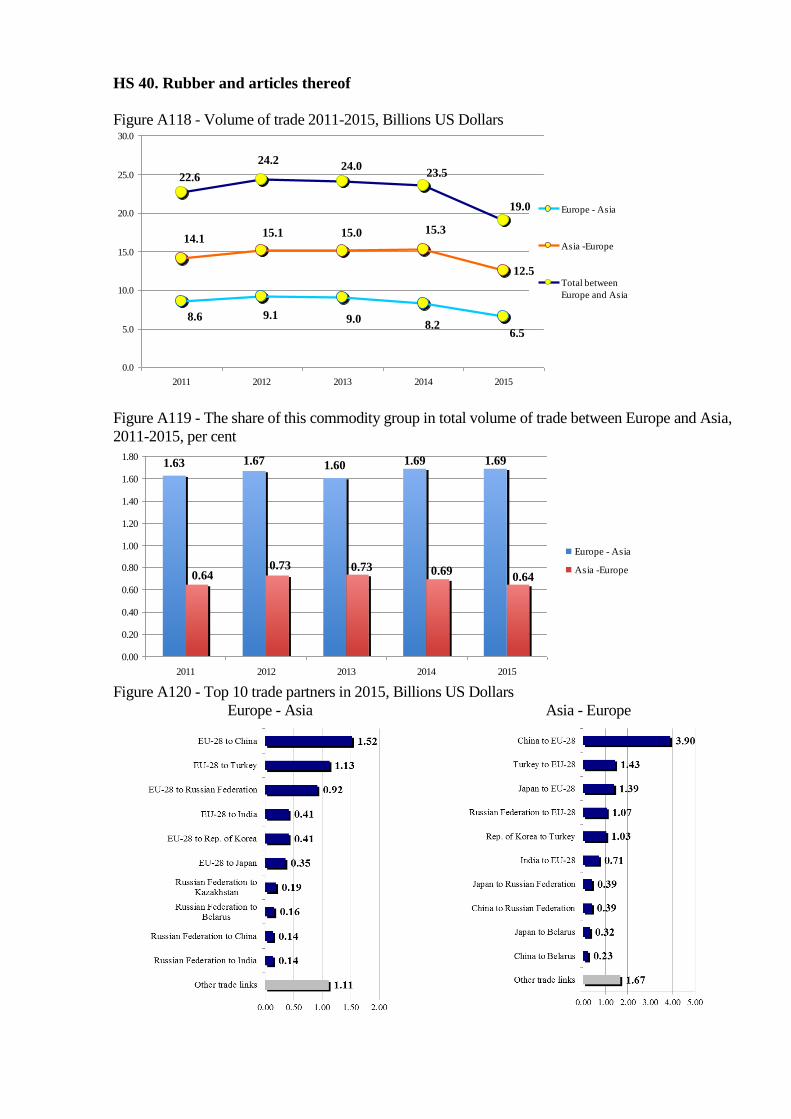
HS 40. Rubber and articles thereof
Figure A118 - Volume of trade 2011-2015, Billions US Dollars
12.5
8.6 9.1 9.08.2
6.5
14.115.1 15.0 15.3
22.6
24.224.0
23.5
19.0
0.0
5.0
10.0
15.0
20.0
25.0
30.0
2011 2012 2013 2014 2015
Europe - Asia
Asia -Europe
Total between
Europe and Asia
Figure A119 - The share of this commodity group in total volume of trade between Europe and Asia,
2011-2015, per cent
1.63 1.67 1.60 1.69 1.69
0.640.73 0.73
0.640.69
0.00
0.20
0.40
0.60
0.80
1.00
1.20
1.40
1.60
1.80
2011 2012 2013 2014 2015
Europe - Asia
Asia -Europe
Figure A120 - Top 10 trade partners in 2015, Billions US Dollars
Europe - Asia Asia - Europe
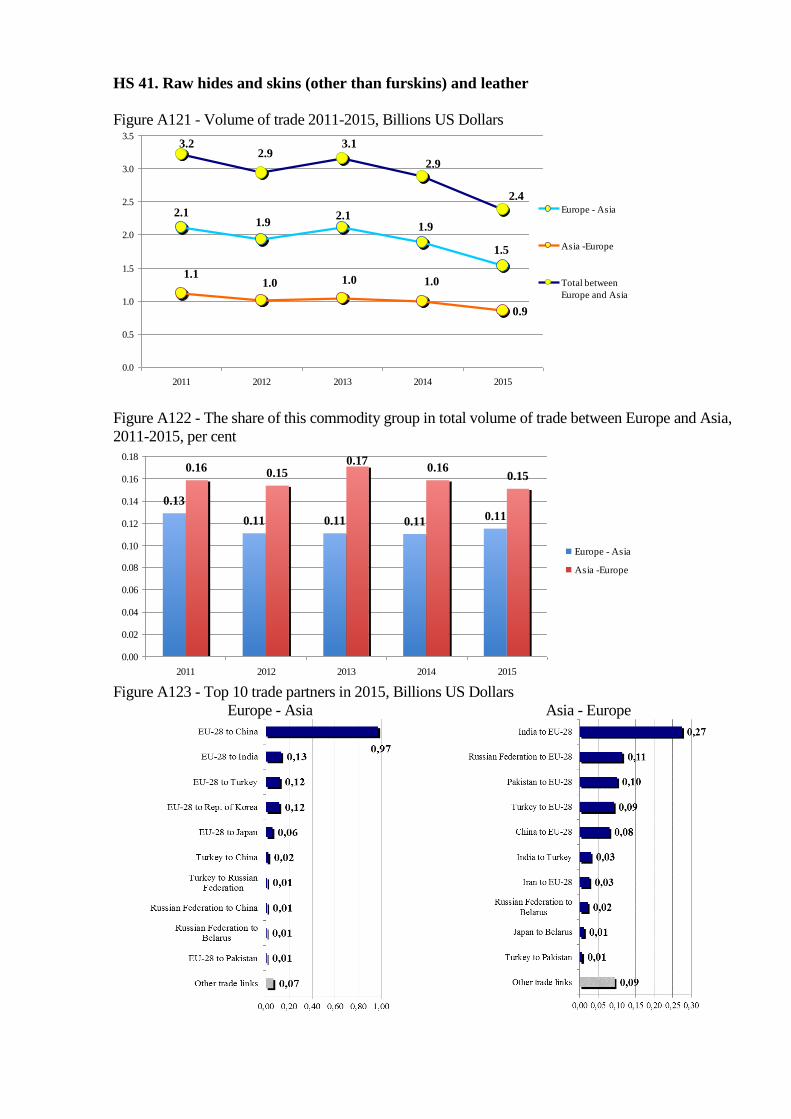
HS 41. Raw hides and skins (other than furskins) and leather
Figure A121 - Volume of trade 2011-2015, Billions US Dollars
0.9
2.11.9
2.11.9
1.5
1.11.0 1.0 1.0
3.22.9
3.1
2.9
2.4
0.0
0.5
1.0
1.5
2.0
2.5
3.0
3.5
2011 2012 2013 2014 2015
Europe - Asia
Asia -Europe
Total between
Europe and Asia
Figure A122 - The share of this commodity group in total volume of trade between Europe and Asia,
2011-2015, per cent
0.13
0.11 0.11 0.11 0.11
0.16 0.150.17
0.160.15
0.00
0.02
0.04
0.06
0.08
0.10
0.12
0.14
0.16
0.18
2011 2012 2013 2014 2015
Europe - Asia
Asia -Europe
Figure A123 - Top 10 trade partners in 2015, Billions US Dollars
Europe - Asia Asia - Europe
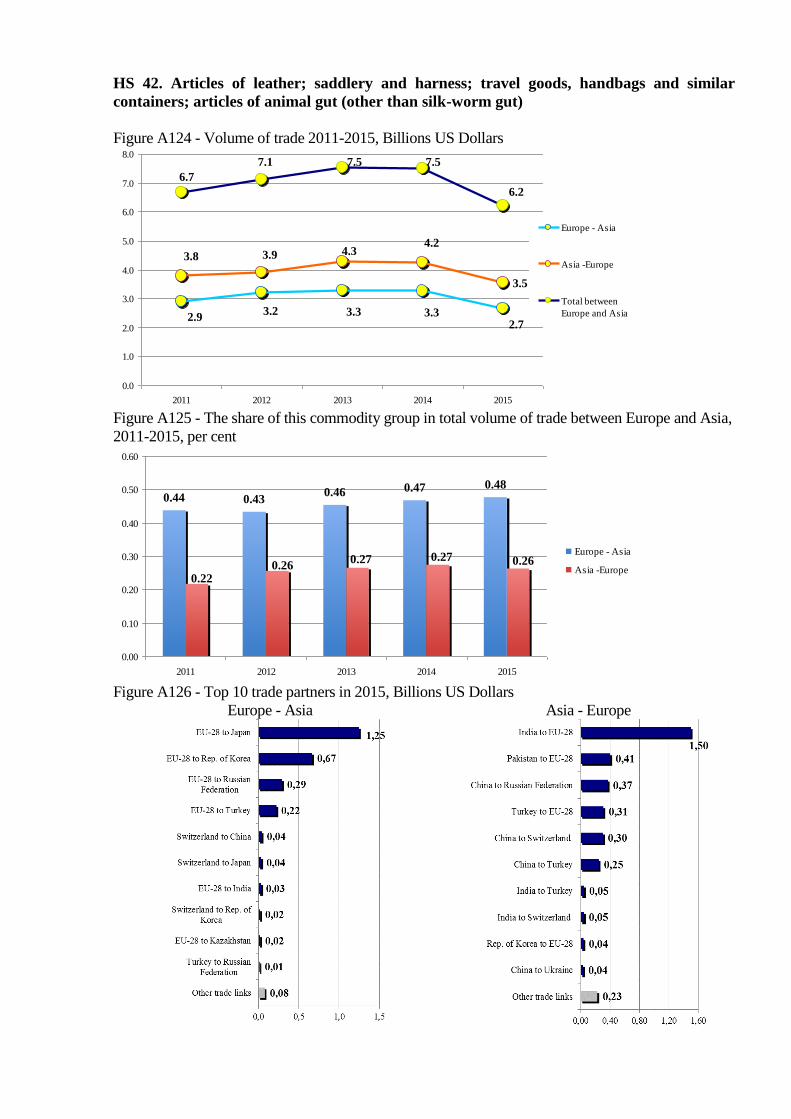
HS 42. Articles of leather; saddlery and harness; travel goods, handbags and similar
containers; articles of animal gut (other than silk-worm gut)
Figure A124 - Volume of trade 2011-2015, Billions US Dollars
3.5
2.93.2 3.3 3.3
2.7
3.8 3.9 4.34.2
6.7
7.1 7.5 7.5
6.2
0.0
1.0
2.0
3.0
4.0
5.0
6.0
7.0
8.0
2011 2012 2013 2014 2015
Europe - Asia
Asia -Europe
Total between
Europe and Asia
Figure A125 - The share of this commodity group in total volume of trade between Europe and Asia,
2011-2015, per cent
0.44 0.430.46 0.47 0.48
0.220.26
0.27 0.27 0.26
0.00
0.10
0.20
0.30
0.40
0.50
0.60
2011 2012 2013 2014 2015
Europe - Asia
Asia -Europe
Figure A126 - Top 10 trade partners in 2015, Billions US Dollars
Europe - Asia Asia - Europe

241
HS 43. Furskins and artificial fur; manufactures thereof
Figure A127 - Volume of trade 2011-2015, Billions US Dollars
0.5
1.3
1.5
1.9
1.4
1.2
0.8
1.00.9
0.7
2.0
2.52.7
2.0
1.7
0.0
0.5
1.0
1.5
2.0
2.5
3.0
2011 2012 2013 2014 2015
Europe - Asia
Asia -Europe
Total between
Europe and Asia
Figure A128 - The share of this commodity group in total volume of trade between Europe and Asia,
2011-2015, per cent
Figure A129 - Top 10 trade partners in 2015, Billions US Dollars
Europe - Asia Asia - Europe
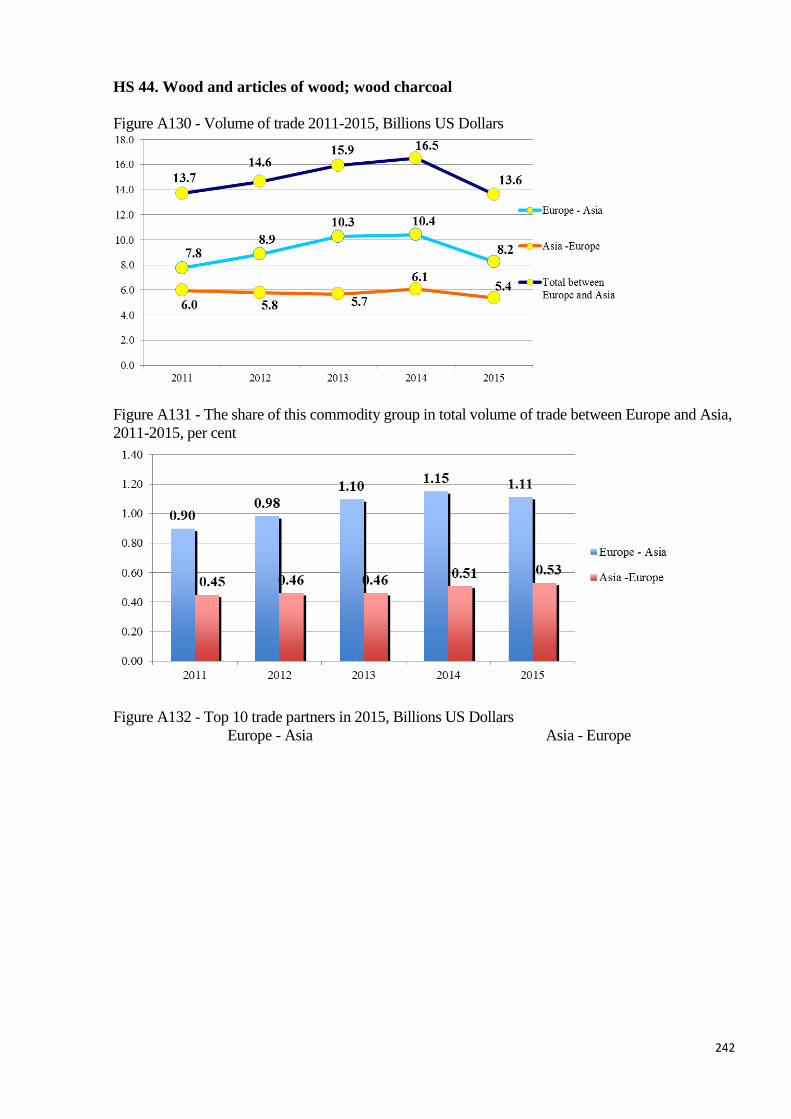
242
HS 44. Wood and articles of wood; wood charcoal
Figure A130 - Volume of trade 2011-2015, Billions US Dollars
Figure A131 - The share of this commodity group in total volume of trade between Europe and Asia,
2011-2015, per cent
Figure A132 - Top 10 trade partners in 2015, Billions US Dollars
Europe - Asia Asia - Europe
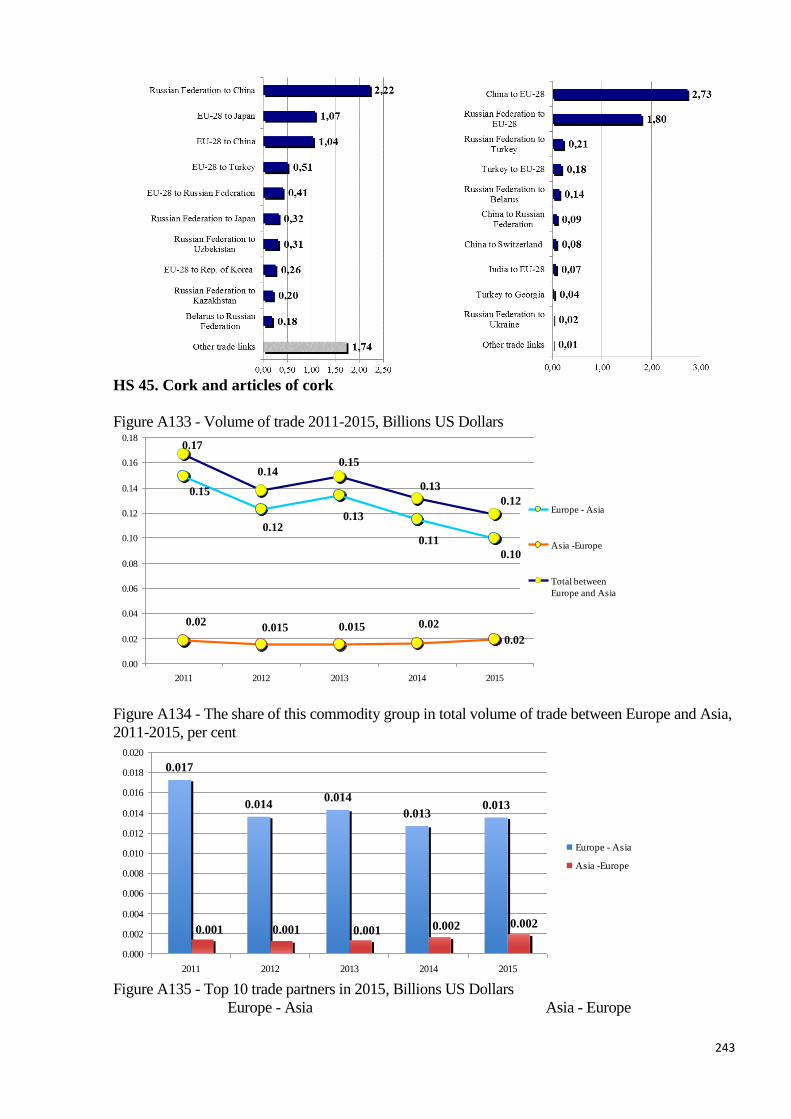
243
HS 45. Cork and articles of cork
Figure A133 - Volume of trade 2011-2015, Billions US Dollars
0.02
0.15
0.120.13
0.11
0.10
0.020.015 0.015 0.02
0.17
0.140.15
0.13
0.12
0.00
0.02
0.04
0.06
0.08
0.10
0.12
0.14
0.16
0.18
2011 2012 2013 2014 2015
Europe - Asia
Asia -Europe
Total between
Europe and Asia
Figure A134 - The share of this commodity group in total volume of trade between Europe and Asia,
2011-2015, per cent
0.017
0.0140.014
0.0130.013
0.001 0.001 0.001 0.002 0.002
0.000
0.002
0.004
0.006
0.008
0.010
0.012
0.014
0.016
0.018
0.020
2011 2012 2013 2014 2015
Europe - Asia
Asia -Europe
Figure A135 - Top 10 trade partners in 2015, Billions US Dollars
Europe - Asia Asia - Europe
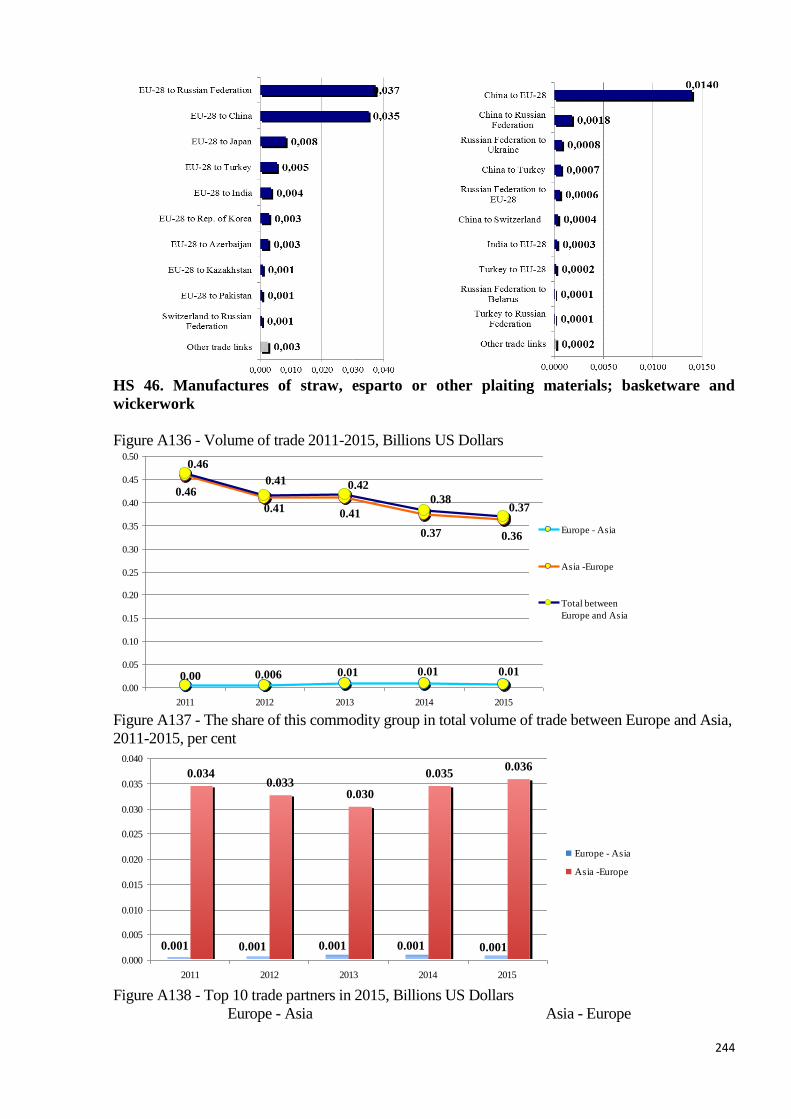
244
HS 46. Manufactures of straw, esparto or other plaiting materials; basketware and
wickerwork
Figure A136 - Volume of trade 2011-2015, Billions US Dollars
0.010.010.010.0060.00
0.37
0.41
0.41
0.46
0.36
0.370.38
0.42
0.41
0.46
0.00
0.05
0.10
0.15
0.20
0.25
0.30
0.35
0.40
0.45
0.50
2011 2012 2013 2014 2015
Europe - Asia
Asia -Europe
Total between
Europe and Asia
Figure A137 - The share of this commodity group in total volume of trade between Europe and Asia,
2011-2015, per cent
0.0340.033
0.030
0.0350.036
0.0010.0010.0010.0010.001
0.000
0.005
0.010
0.015
0.020
0.025
0.030
0.035
0.040
2011 2012 2013 2014 2015
Europe - Asia
Asia -Europe
Figure A138 - Top 10 trade partners in 2015, Billions US Dollars
Europe - Asia Asia - Europe

245
HS 47. Pulp of wood or other fibrous cellulosic material; recovered (waste and scrap)
paper or paperboard
Figure A139 - Volume of trade 2011-2015, Billions US Dollars
4.5
4.1
4.5
4.0 3.9
0.3
0.5 0.4 0.4 0.4
5.0
4.5
4.9
4.44.2
0.0
1.0
2.0
3.0
4.0
5.0
6.0
2011 2012 2013 2014 2015
Europe - Asia
Asia -Europe
Total between
Europe and Asia
Figure A140 - The share of this commodity group in total volume of trade between Europe and Asia,
2011-2015, per cent
0.450.48
0.45
0.53 0.53
0.030.030.030.030.04
0.00
0.10
0.20
0.30
0.40
0.50
0.60
2011 2012 2013 2014 2015
Europe - Asia
Asia -Europe
Figure A141 - Top 10 trade partners in 2015, Billions US Dollars
Europe - Asia Asia - Europe
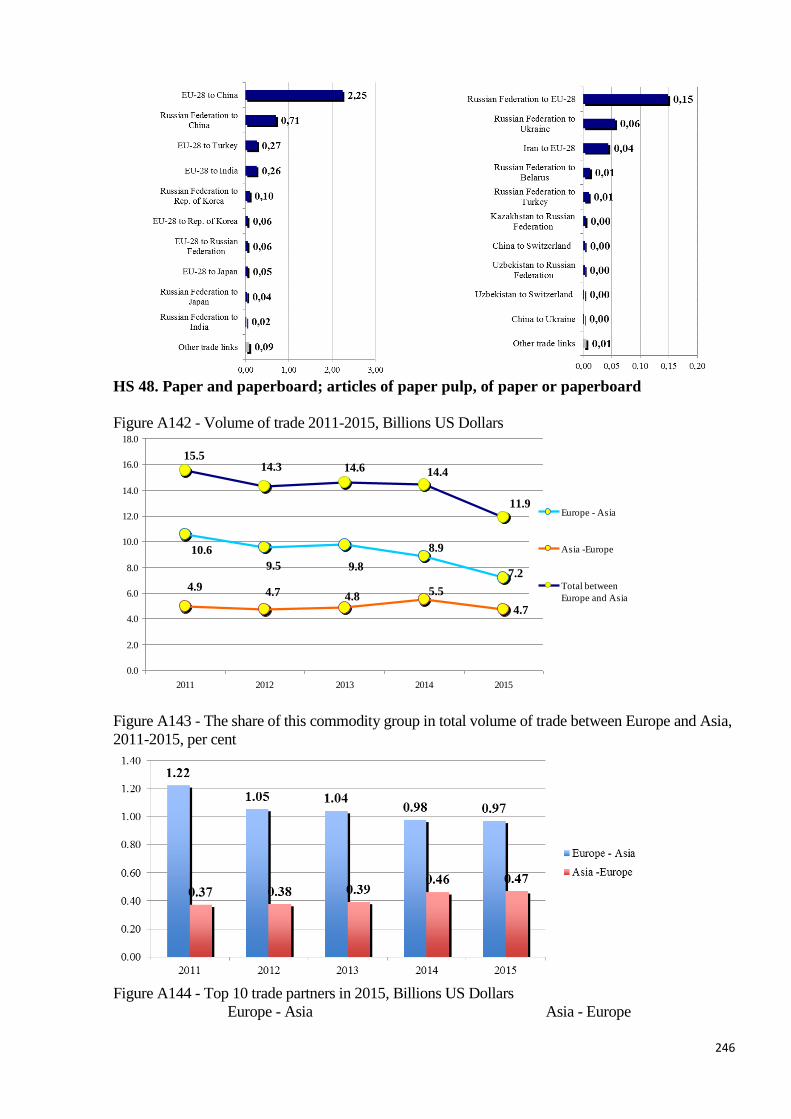
246
HS 48. Paper and paperboard; articles of paper pulp, of paper or paperboard
Figure A142 - Volume of trade 2011-2015, Billions US Dollars
4.7
10.6
9.5 9.8
8.9
7.2
4.9 4.7 4.8 5.5
15.514.3 14.6 14.4
11.9
0.0
2.0
4.0
6.0
8.0
10.0
12.0
14.0
16.0
18.0
2011 2012 2013 2014 2015
Europe - Asia
Asia -Europe
Total between
Europe and Asia
Figure A143 - The share of this commodity group in total volume of trade between Europe and Asia,
2011-2015, per cent
Figure A144 - Top 10 trade partners in 2015, Billions US Dollars
Europe - Asia Asia - Europe
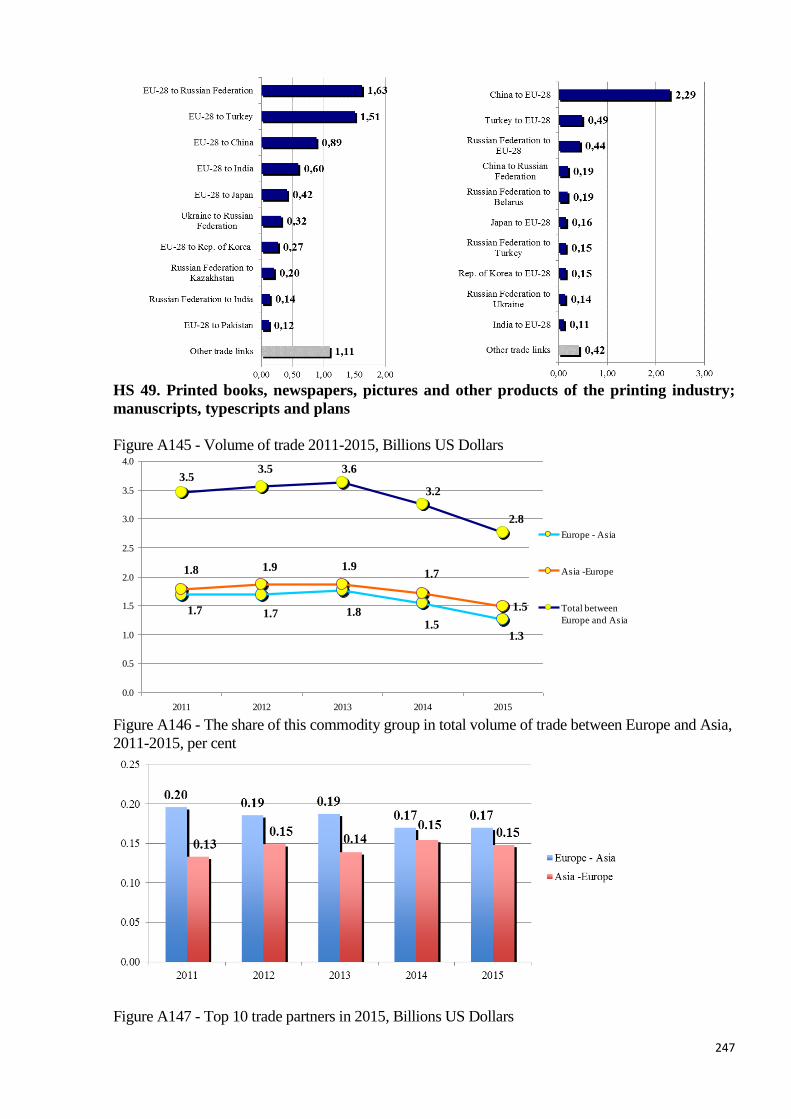
247
HS 49. Printed books, newspapers, pictures and other products of the printing industry;
manuscripts, typescripts and plans
Figure A145 - Volume of trade 2011-2015, Billions US Dollars
1.51.7 1.7 1.81.5
1.3
1.8 1.9 1.91.7
3.53.5 3.6
3.2
2.8
0.0
0.5
1.0
1.5
2.0
2.5
3.0
3.5
4.0
2011 2012 2013 2014 2015
Europe - Asia
Asia -Europe
Total between
Europe and Asia
Figure A146 - The share of this commodity group in total volume of trade between Europe and Asia,
2011-2015, per cent
Figure A147 - Top 10 trade partners in 2015, Billions US Dollars

248
Europe - Asia Asia - Europe
HS 50. Silk
Figure A148 - Volume of trade 2011-2015, Billions US Dollars
0.06 0.06 0.060.05
0.04
0.41
0.56
0.490.52 0.52
0.62
0.560.59
0.57
0.45
0.00
0.10
0.20
0.30
0.40
0.50
0.60
0.70
2011 2012 2013 2014 2015
Europe - Asia
Asia -Europe
Total between
Europe and Asia
Figure A149 - The share of this commodity group in total volume of trade between Europe and Asia,
2011-2015, per cent
Figure A150 - Top 10 trade partners in 2015, Billions US Dollars

249
Europe - Asia Asia - Europe
HS 51. Wool, fine or coarse animal hair; horsehair yarn and woven fabric
Figure A151 - Volume of trade 2011-2015, Billions US Dollars
Figure A152 - The share of this commodity group in total volume of trade between Europe and Asia,
2011-2015, per cent
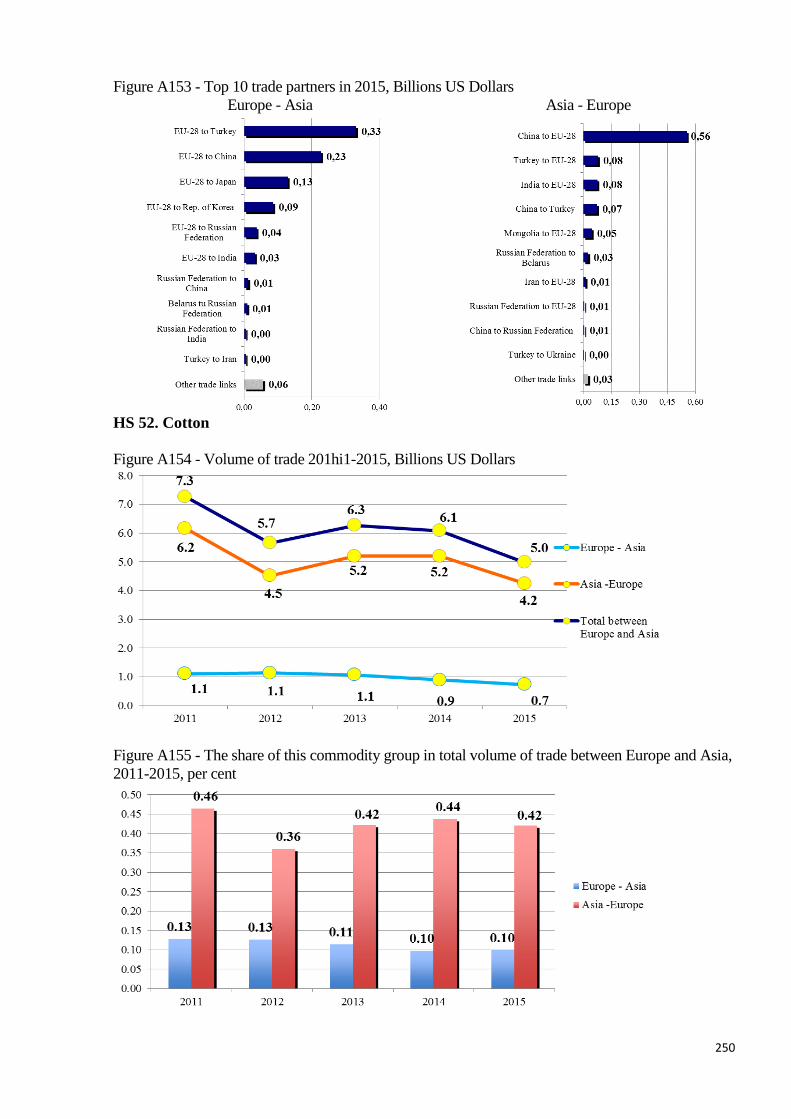
250
Figure A153 - Top 10 trade partners in 2015, Billions US Dollars
Europe - Asia Asia - Europe
HS 52. Cotton
Figure A154 - Volume of trade 201hi1-2015, Billions US Dollars
Figure A155 - The share of this commodity group in total volume of trade between Europe and Asia,
2011-2015, per cent

251
Figure A156 - Top 10 trade partners in 2015, Billions US Dollars
Europe - Asia Asia - Europe
HS 53. Vegetable textile fibres; paper yarn and woven fabrics of paper yarn
Figure A157 - Volume of trade 2011-2015, Billions US Dollars
Figure A158 - The share of this commodity group in total volume of trade between Europe and Asia,
2011-2015, per cent
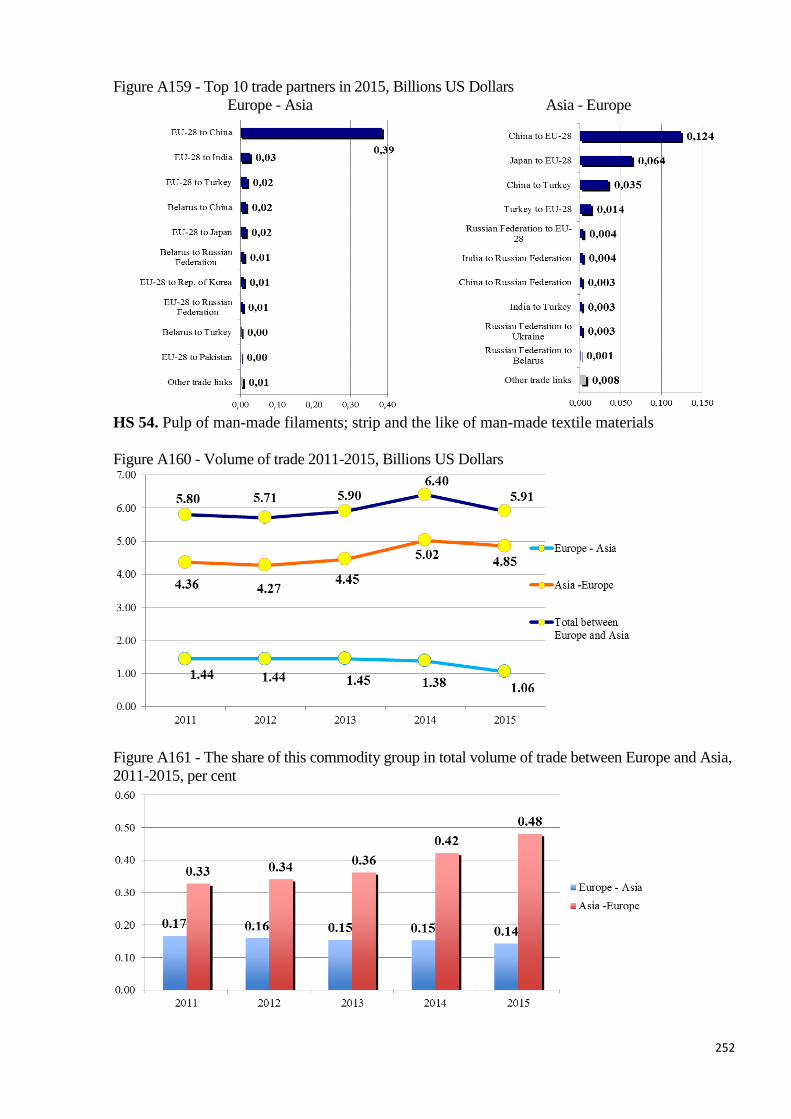
252
Figure A159 - Top 10 trade partners in 2015, Billions US Dollars
Europe - Asia Asia - Europe
HS 54. Pulp of man-made filaments; strip and the like of man-made textile materials
Figure A160 - Volume of trade 2011-2015, Billions US Dollars
Figure A161 - The share of this commodity group in total volume of trade between Europe and Asia,
2011-2015, per cent
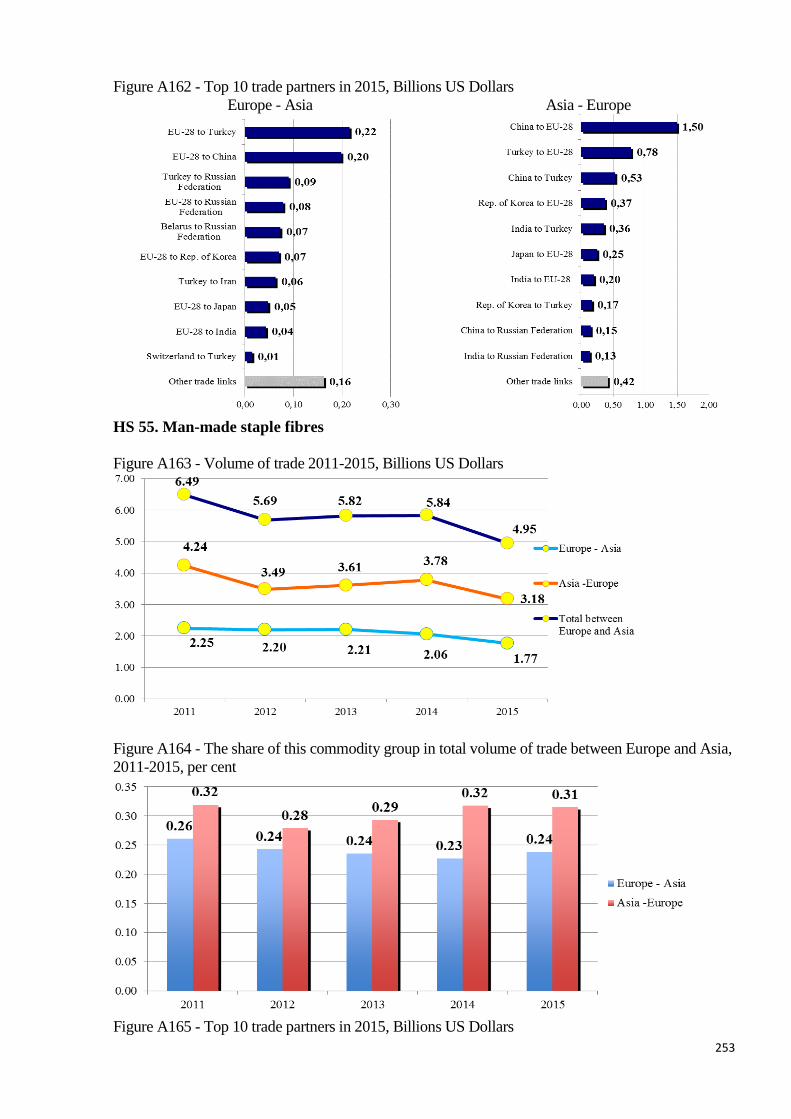
253
Figure A162 - Top 10 trade partners in 2015, Billions US Dollars
Europe - Asia Asia - Europe
HS 55. Man-made staple fibres
Figure A163 - Volume of trade 2011-2015, Billions US Dollars
Figure A164 - The share of this commodity group in total volume of trade between Europe and Asia,
2011-2015, per cent
Figure A165 - Top 10 trade partners in 2015, Billions US Dollars
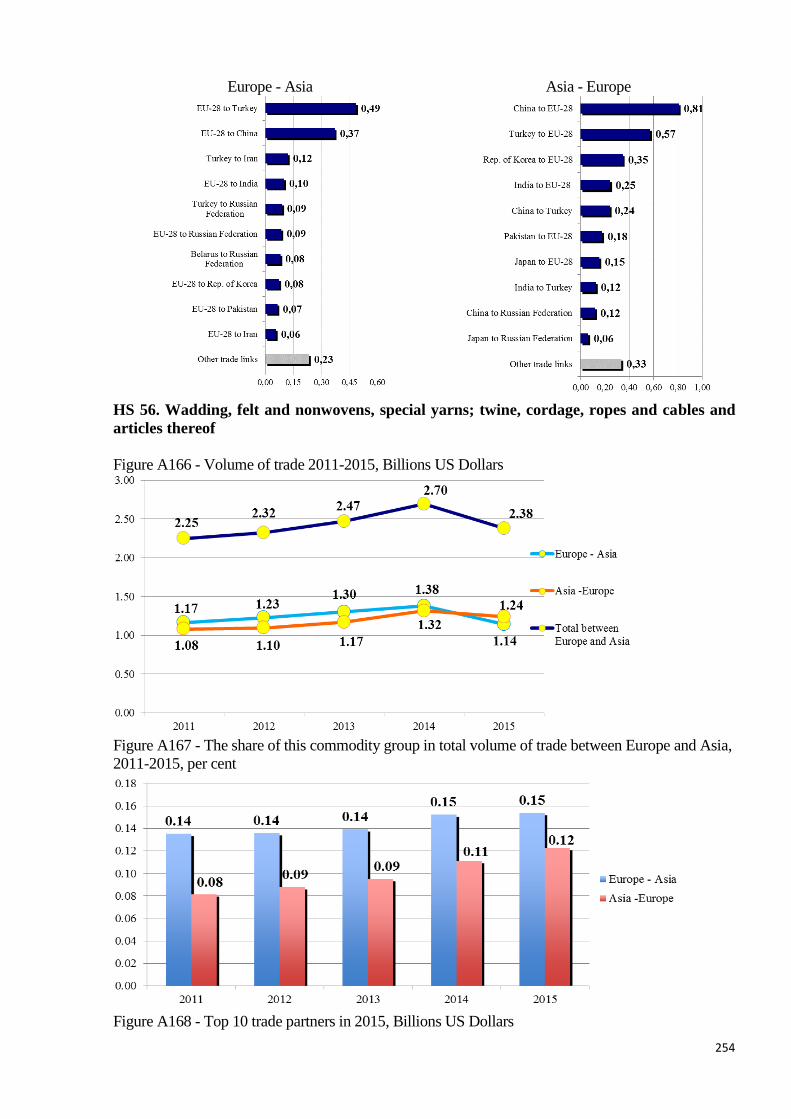
254
Europe - Asia Asia - Europe
HS 56. Wadding, felt and nonwovens, special yarns; twine, cordage, ropes and cables and
articles thereof
Figure A166 - Volume of trade 2011-2015, Billions US Dollars
Figure A167 - The share of this commodity group in total volume of trade between Europe and Asia,
2011-2015, per cent
Figure A168 - Top 10 trade partners in 2015, Billions US Dollars

255
Europe - Asia Asia - Europe
HS 57. Carpets and other textile floor coverings
Figure A169 - Volume of trade 2011-2015, Billions US Dollars
Figure A170 - The share of this commodity group in total volume of trade between Europe and Asia,
2011-2015, per cent
Figure A171 - Top 10 trade partners in 2015, Billions US Dollars
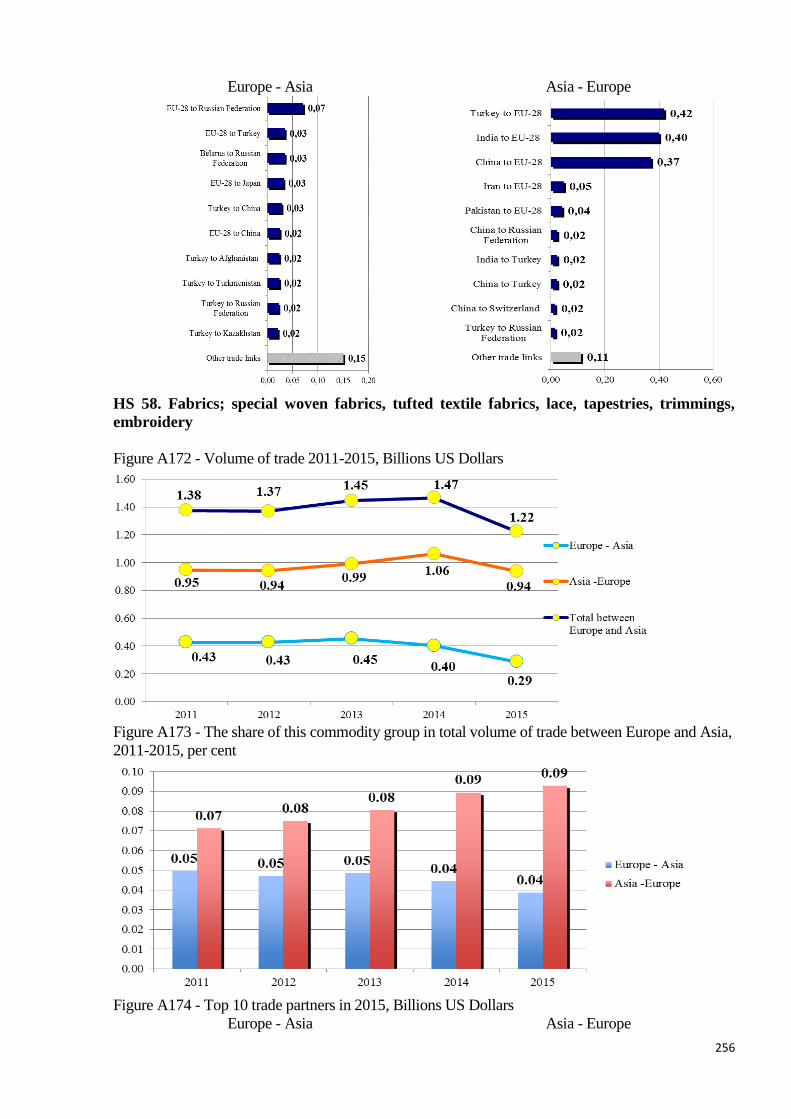
256
Europe - Asia Asia - Europe
HS 58. Fabrics; special woven fabrics, tufted textile fabrics, lace, tapestries, trimmings,
embroidery
Figure A172 - Volume of trade 2011-2015, Billions US Dollars
Figure A173 - The share of this commodity group in total volume of trade between Europe and Asia,
2011-2015, per cent
Figure A174 - Top 10 trade partners in 2015, Billions US Dollars
Europe - Asia Asia - Europe
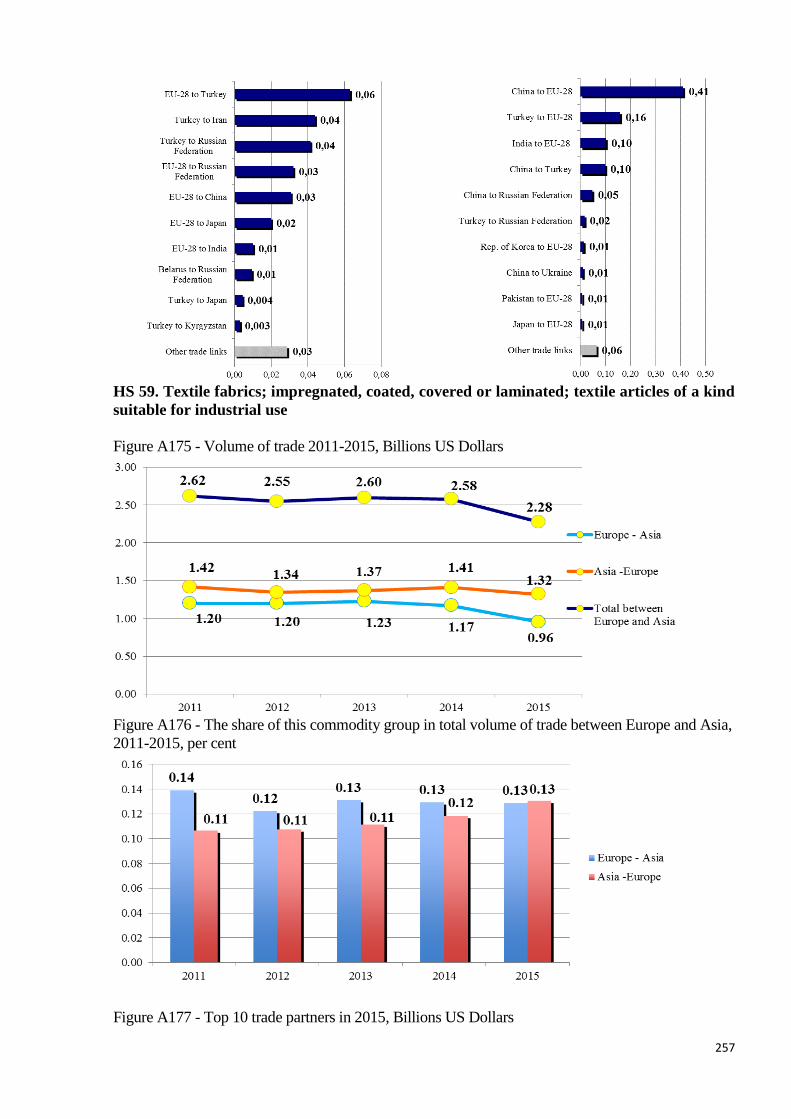
257
HS 59. Textile fabrics; impregnated, coated, covered or laminated; textile articles of a kind
suitable for industrial use
Figure A175 - Volume of trade 2011-2015, Billions US Dollars
Figure A176 - The share of this commodity group in total volume of trade between Europe and Asia,
2011-2015, per cent
Figure A177 - Top 10 trade partners in 2015, Billions US Dollars
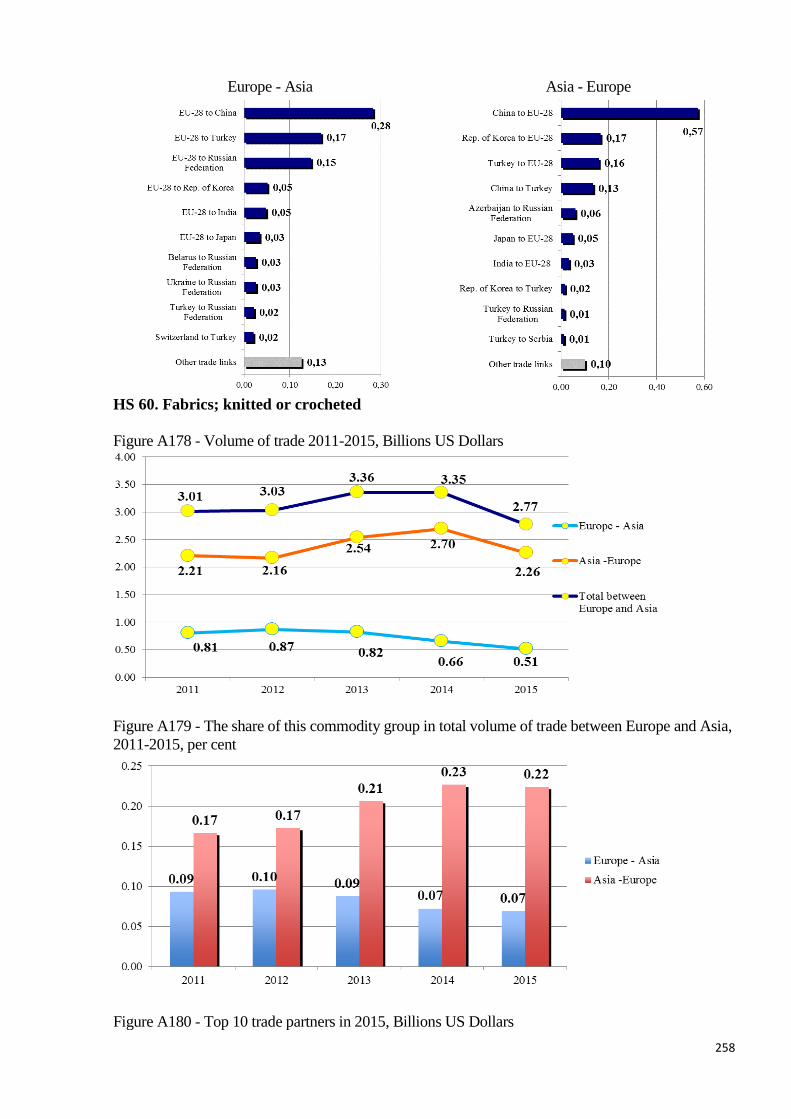
258
Europe - Asia Asia - Europe
HS 60. Fabrics; knitted or crocheted
Figure A178 - Volume of trade 2011-2015, Billions US Dollars
Figure A179 - The share of this commodity group in total volume of trade between Europe and Asia,
2011-2015, per cent
Figure A180 - Top 10 trade partners in 2015, Billions US Dollars
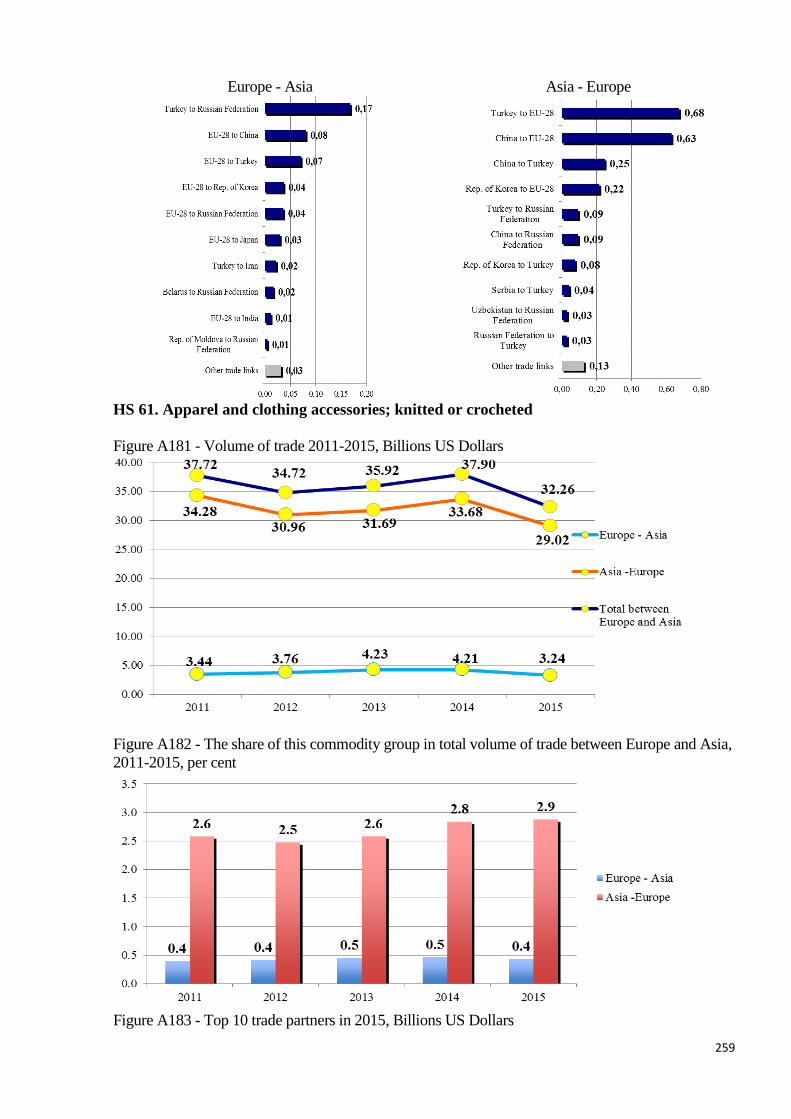
259
Europe - Asia Asia - Europe
HS 61. Apparel and clothing accessories; knitted or crocheted
Figure A181 - Volume of trade 2011-2015, Billions US Dollars
Figure A182 - The share of this commodity group in total volume of trade between Europe and Asia,
2011-2015, per cent
Figure A183 - Top 10 trade partners in 2015, Billions US Dollars
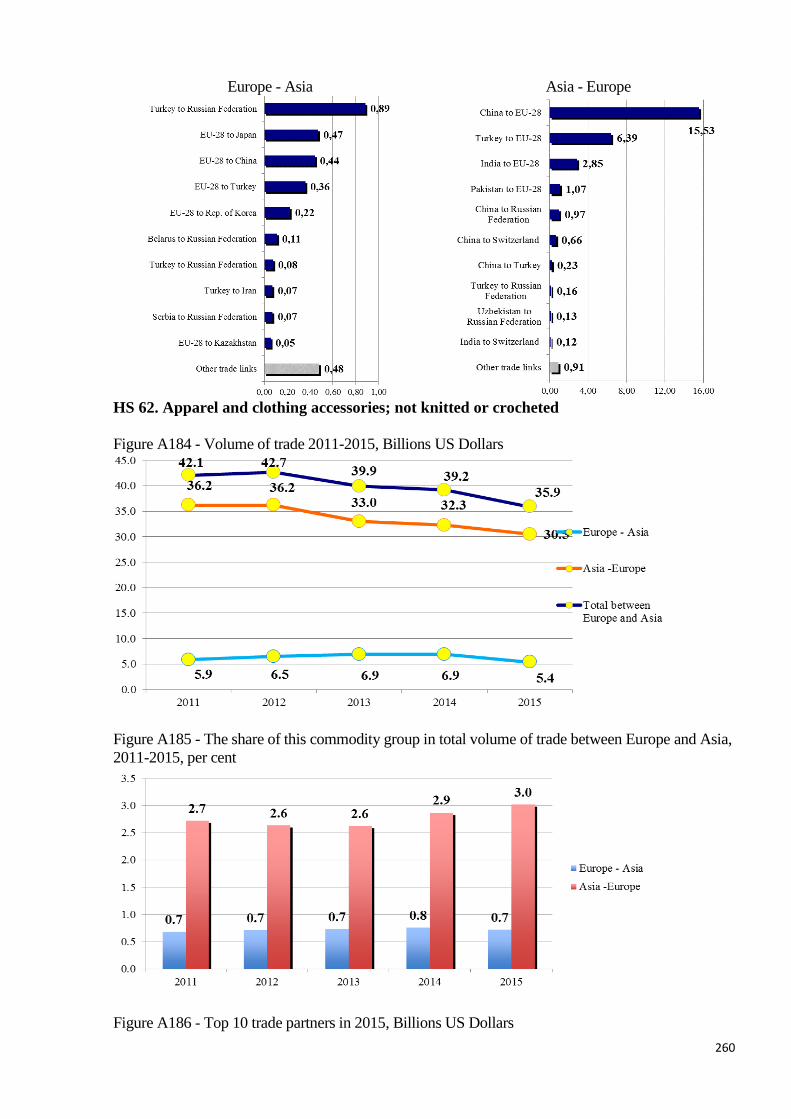
260
Europe - Asia Asia - Europe
HS 62. Apparel and clothing accessories; not knitted or crocheted
Figure A184 - Volume of trade 2011-2015, Billions US Dollars
Figure A185 - The share of this commodity group in total volume of trade between Europe and Asia,
2011-2015, per cent
Figure A186 - Top 10 trade partners in 2015, Billions US Dollars
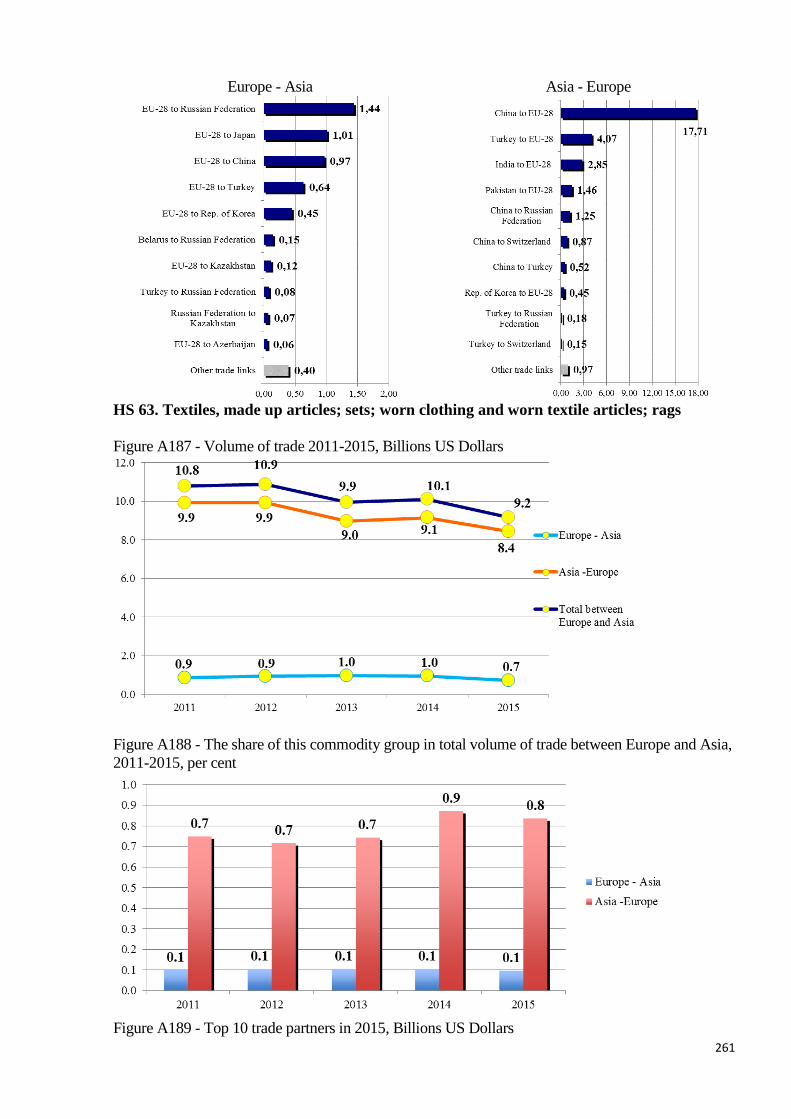
261
Europe - Asia Asia - Europe
HS 63. Textiles, made up articles; sets; worn clothing and worn textile articles; rags
Figure A187 - Volume of trade 2011-2015, Billions US Dollars
Figure A188 - The share of this commodity group in total volume of trade between Europe and Asia,
2011-2015, per cent
Figure A189 - Top 10 trade partners in 2015, Billions US Dollars
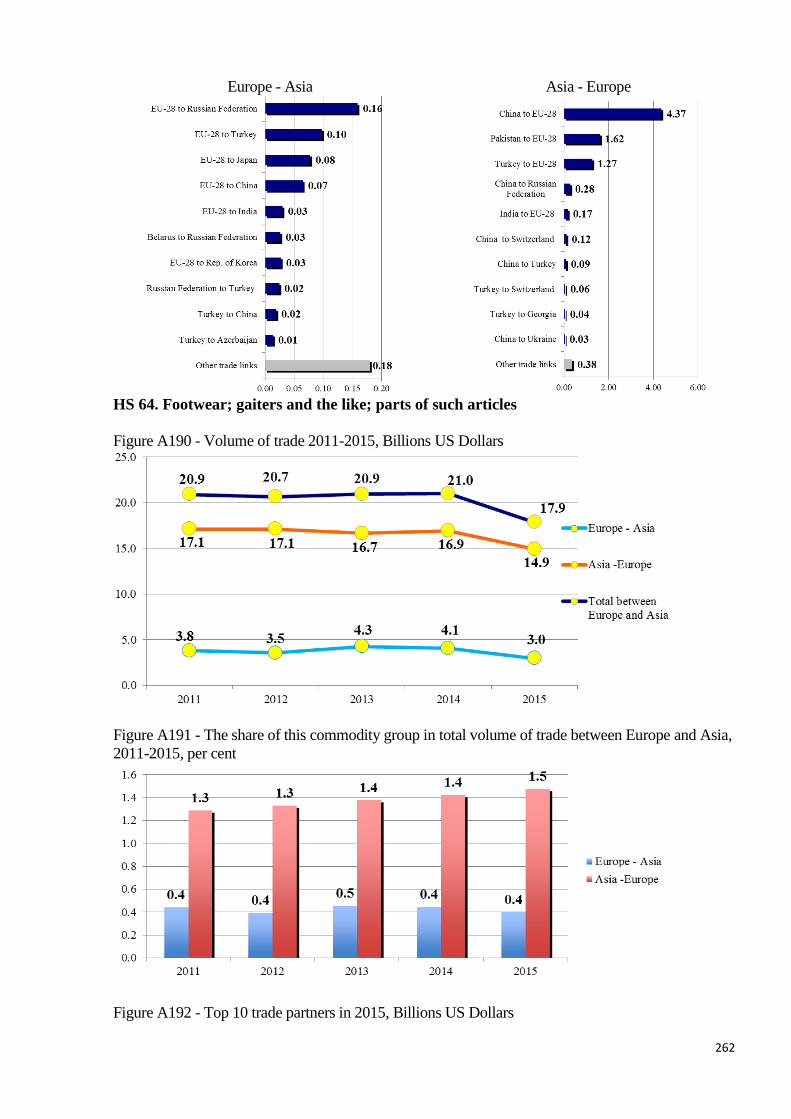
262
Europe - Asia Asia - Europe
HS 64. Footwear; gaiters and the like; parts of such articles
Figure A190 - Volume of trade 2011-2015, Billions US Dollars
Figure A191 - The share of this commodity group in total volume of trade between Europe and Asia,
2011-2015, per cent
Figure A192 - Top 10 trade partners in 2015, Billions US Dollars
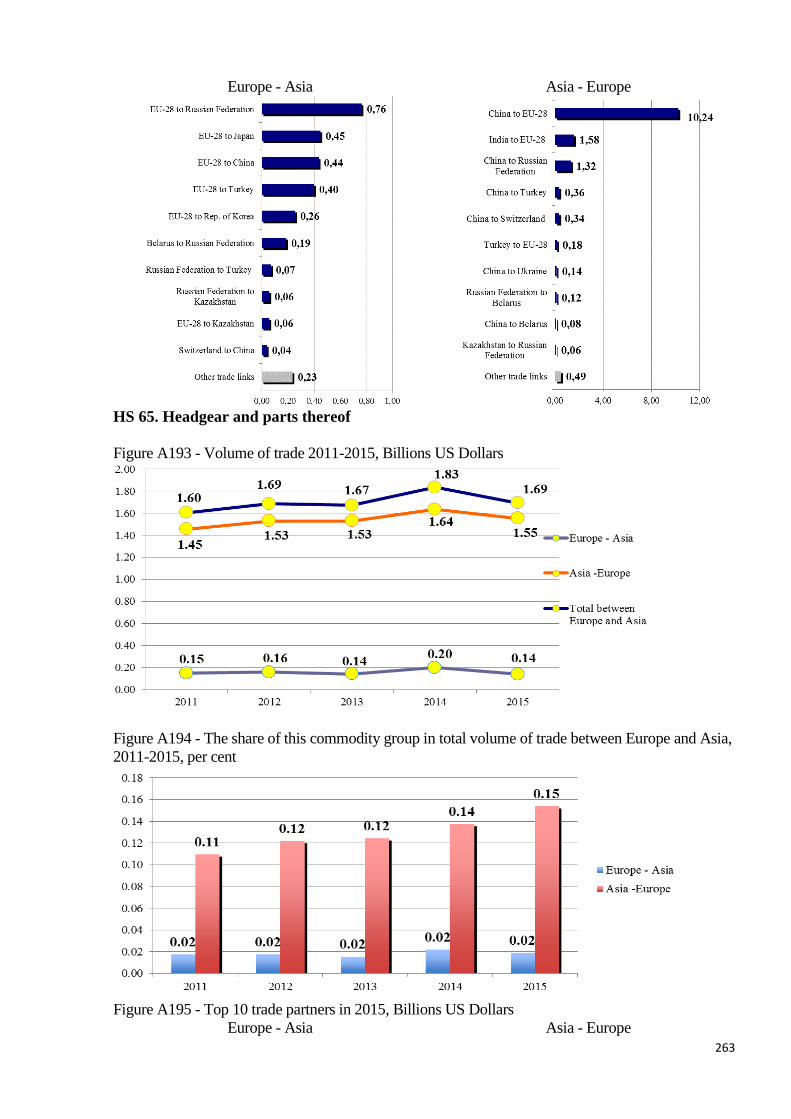
263
Europe - Asia Asia - Europe
HS 65. Headgear and parts thereof
Figure A193 - Volume of trade 2011-2015, Billions US Dollars
Figure A194 - The share of this commodity group in total volume of trade between Europe and Asia,
2011-2015, per cent
Figure A195 - Top 10 trade partners in 2015, Billions US Dollars
Europe - Asia Asia - Europe
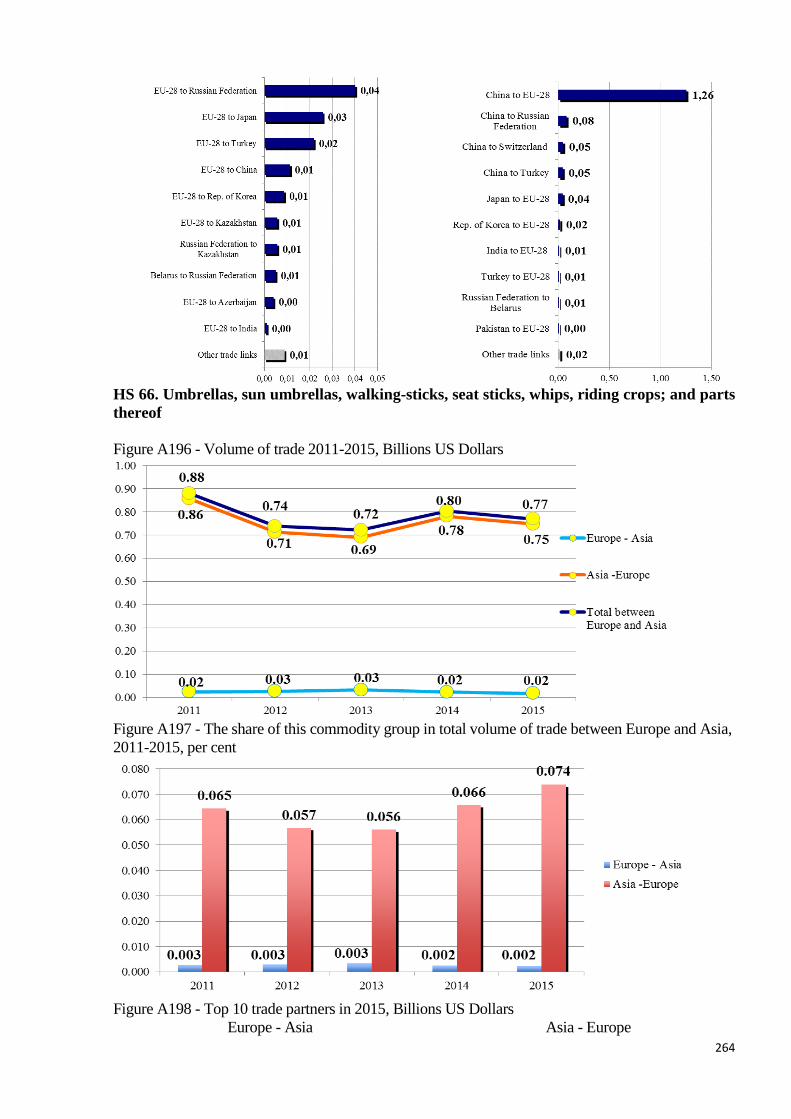
264
HS 66. Umbrellas, sun umbrellas, walking-sticks, seat sticks, whips, riding crops; and parts
thereof
Figure A196 - Volume of trade 2011-2015, Billions US Dollars
Figure A197 - The share of this commodity group in total volume of trade between Europe and Asia,
2011-2015, per cent
Figure A198 - Top 10 trade partners in 2015, Billions US Dollars
Europe - Asia Asia - Europe
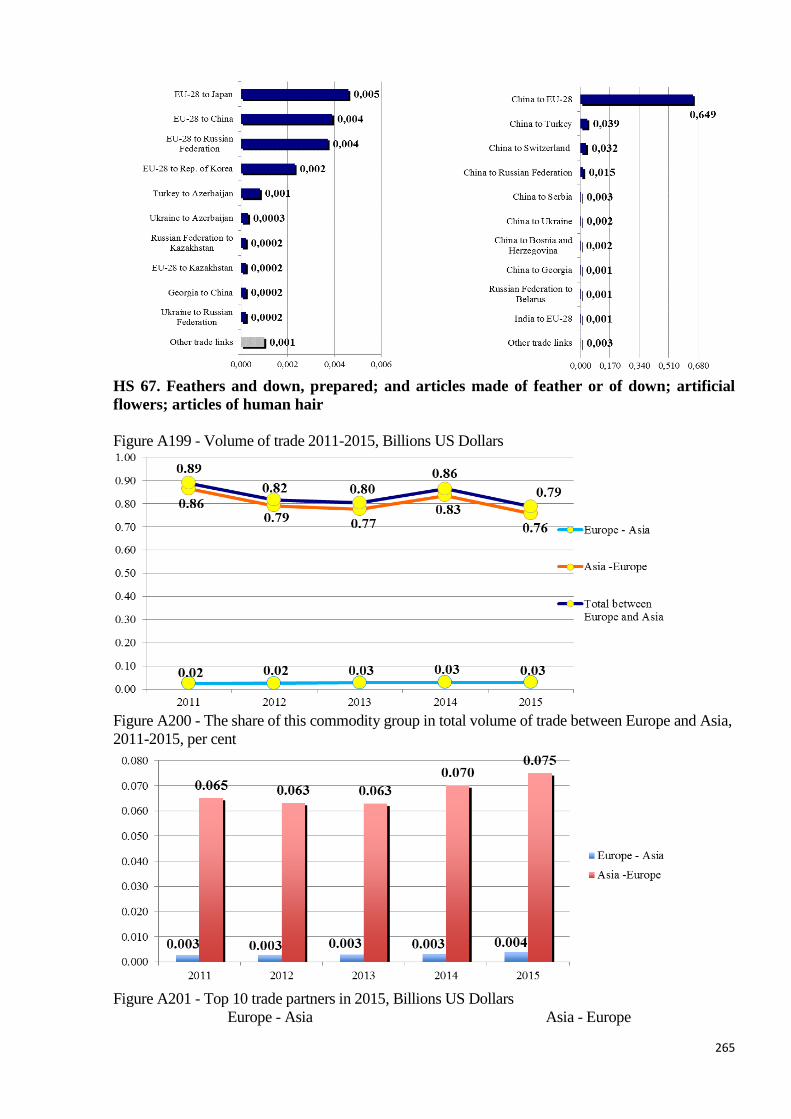
265
HS 67. Feathers and down, prepared; and articles made of feather or of down; artificial
flowers; articles of human hair
Figure A199 - Volume of trade 2011-2015, Billions US Dollars
Figure A200 - The share of this commodity group in total volume of trade between Europe and Asia,
2011-2015, per cent
Figure A201 - Top 10 trade partners in 2015, Billions US Dollars
Europe - Asia Asia - Europe
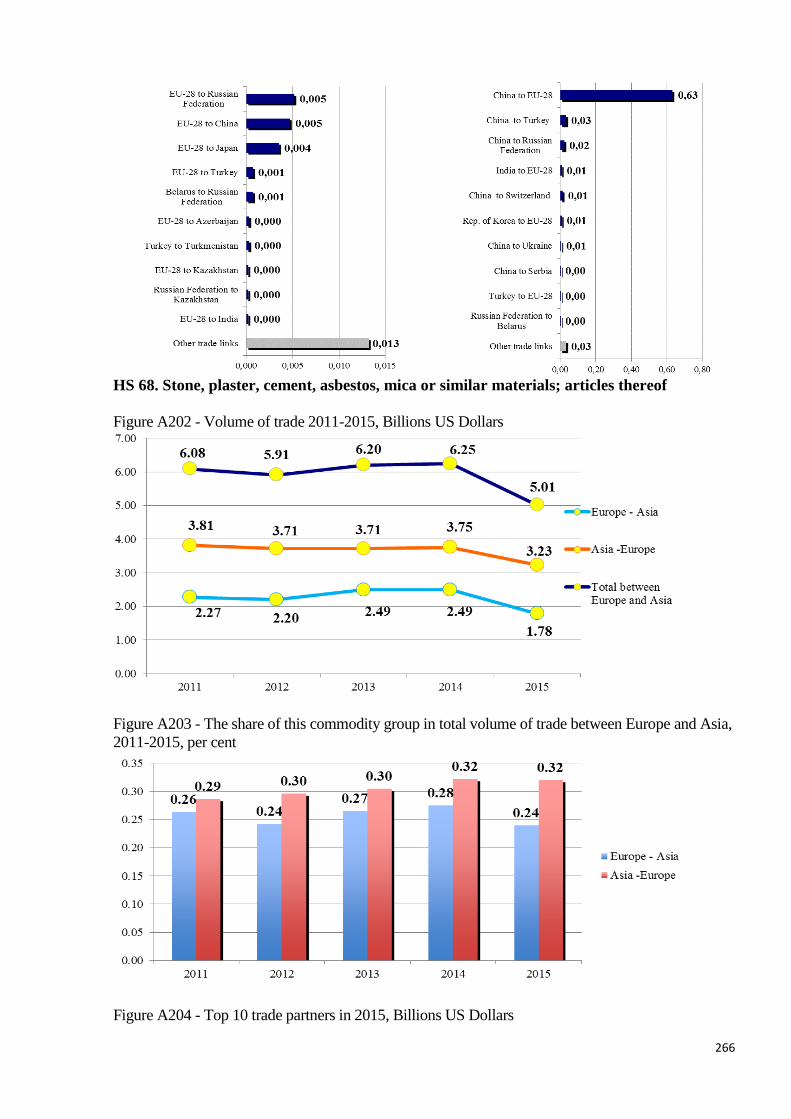
266
HS 68. Stone, plaster, cement, asbestos, mica or similar materials; articles thereof
Figure A202 - Volume of trade 2011-2015, Billions US Dollars
Figure A203 - The share of this commodity group in total volume of trade between Europe and Asia,
2011-2015, per cent
Figure A204 - Top 10 trade partners in 2015, Billions US Dollars

267
Europe - Asia Asia - Europe
HS 69. Ceramic products
Figure A205 - Volume of trade 2011-2015, Billions US Dollars
Figure A206 - The share of this commodity group in total volume of trade between Europe and Asia,
2011-2015, per cent
Figure A207 - Top 10 trade partners in 2015, Billions US Dollars

268
Europe - Asia Asia - Europe
HS 70. Glass and glassware
Figure A208 - Volume of trade 2011-2015, Billions US Dollars
0.03
1.08
0.95
0.440.47
0.72
0.03 0.03 0.03 0.03
1.11
0.98
0.47 0.50
0.75
0.00
0.20
0.40
0.60
0.80
1.00
1.20
2011 2012 2013 2014 2015
Europe - Asia
Asia -Europe
Total between
Europe and Asia
Figure A209 - The share of this commodity group in total volume of trade between Europe and Asia,
2011-2015, per cent
0.12
0.10
0.050.05
0.10
0.002 0.002 0.003 0.003 0.003
0.00
0.02
0.04
0.06
0.08
0.10
0.12
0.14
2011 2012 2013 2014 2015
Europe - Asia
Asia -Europe
Figure A210 - Top 10 trade partners in 2015, Billions US Dollars
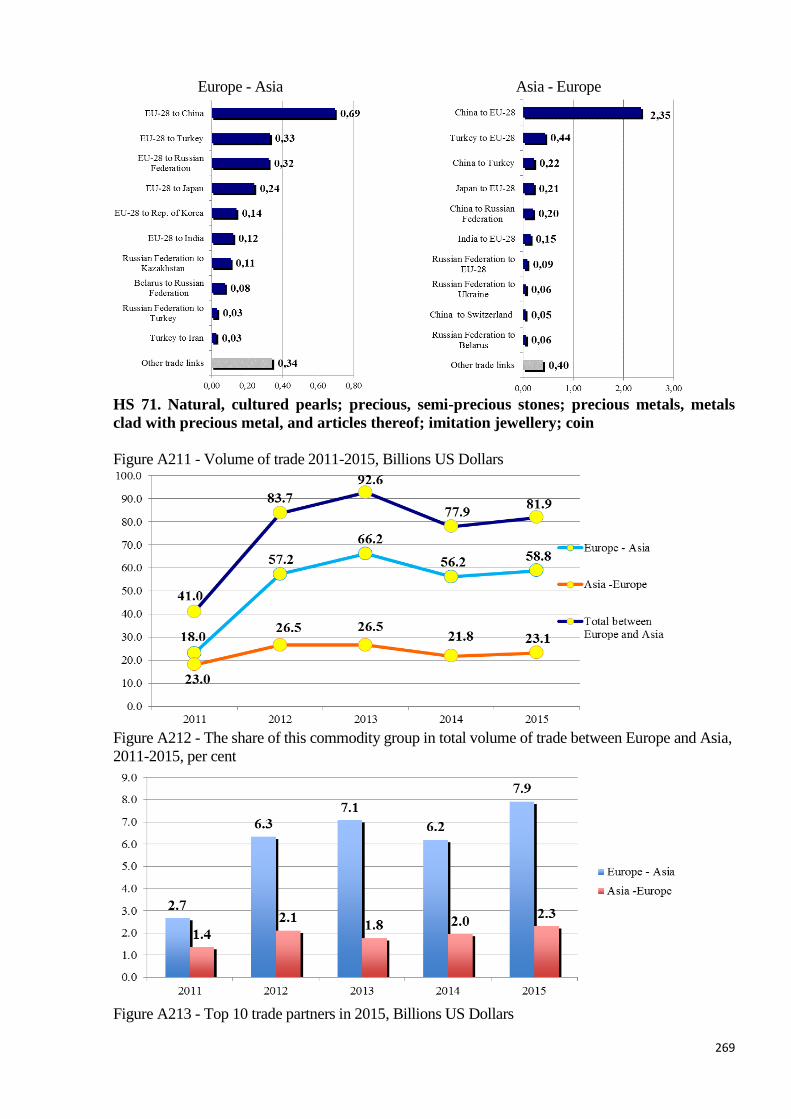
269
Europe - Asia Asia - Europe
HS 71. Natural, cultured pearls; precious, semi-precious stones; precious metals, metals
clad with precious metal, and articles thereof; imitation jewellery; coin
Figure A211 - Volume of trade 2011-2015, Billions US Dollars
Figure A212 - The share of this commodity group in total volume of trade between Europe and Asia,
2011-2015, per cent
Figure A213 - Top 10 trade partners in 2015, Billions US Dollars

270
Europe - Asia Asia - Europe
HS 72. Iron and steel
Figure A214 - Volume of trade 2011-2015, Billions US Dollars
Figure A215 - The share of this commodity group in total volume of trade between Europe and Asia,
2011-2015, per cent
Figure A216 - Top 10 trade partners in 2015, Billions US Dollars

271
Europe - Asia Asia - Europe
HS 73. Iron or steel articles
Figure A217 - Volume of trade 2011-2015, Billions US Dollars
Figure A218 - The share of this commodity group in total volume of trade between Europe and Asia,
2011-2015, per cent
Figure A219 - Top 10 trade partners in 2015, Billions US Dollars
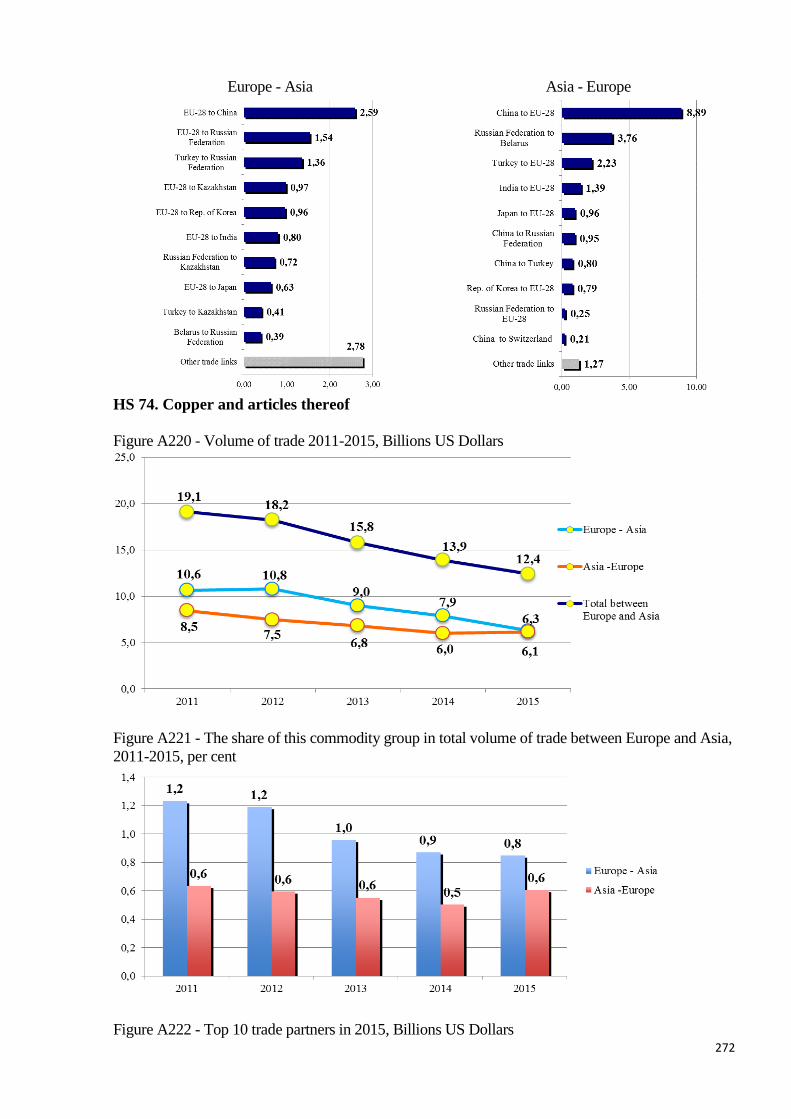
272
Europe - Asia Asia - Europe
HS 74. Copper and articles thereof
Figure A220 - Volume of trade 2011-2015, Billions US Dollars
Figure A221 - The share of this commodity group in total volume of trade between Europe and Asia,
2011-2015, per cent
Figure A222 - Top 10 trade partners in 2015, Billions US Dollars
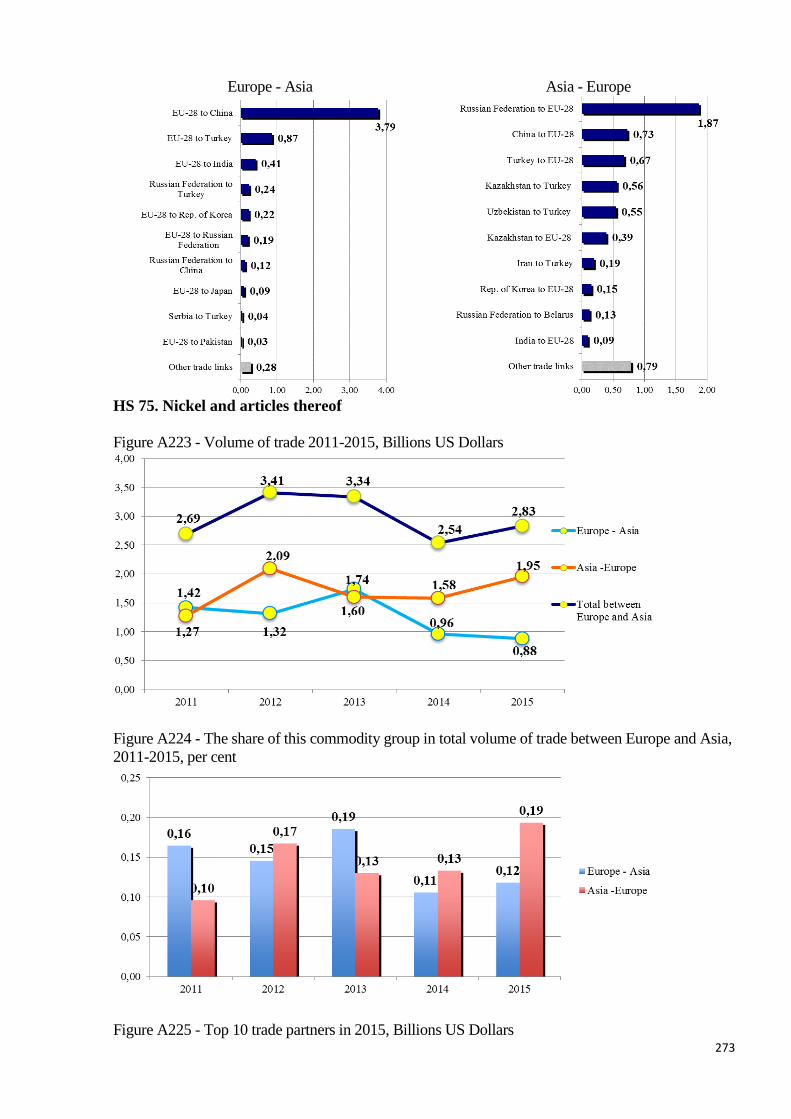
273
Europe - Asia Asia - Europe
HS 75. Nickel and articles thereof
Figure A223 - Volume of trade 2011-2015, Billions US Dollars
Figure A224 - The share of this commodity group in total volume of trade between Europe and Asia,
2011-2015, per cent
Figure A225 - Top 10 trade partners in 2015, Billions US Dollars

274
Europe - Asia Asia - Europe
HS 76. Aluminium and articles thereof
Figure A226 - Volume of trade 2011-2015, Billions US Dollars
Figure A227 - The share of this commodity group in total volume of trade between Europe and Asia,
2011-2015, per cent
Figure A228 - Top 10 trade partners in 2015, Billions US Dollars

275
Europe - Asia Asia - Europe
HS 78. Lead and articles thereof
Figure A229 - Volume of trade 2011-2015, Billions US Dollars
Figure A230 - The share of this commodity group in total volume of trade between Europe and Asia,
2011-2015, per cent
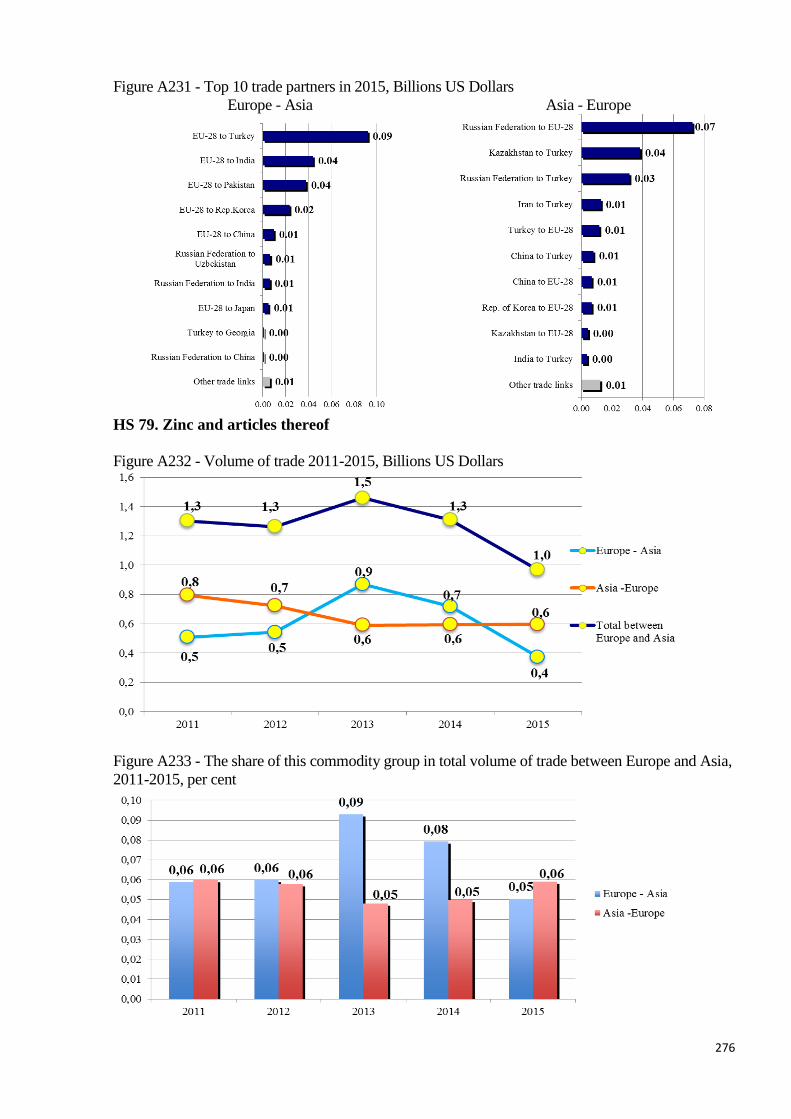
276
Figure A231 - Top 10 trade partners in 2015, Billions US Dollars
Europe - Asia Asia - Europe
HS 79. Zinc and articles thereof
Figure A232 - Volume of trade 2011-2015, Billions US Dollars
Figure A233 - The share of this commodity group in total volume of trade between Europe and Asia,
2011-2015, per cent

277
Figure A234 - Top 10 trade partners in 2015, Billions US Dollars
Europe - Asia Asia - Europe
HS 80. Tin; articles thereof
Figure A235 - Volume of trade 2011-2015, Billions US Dollars
Figure A236 - The share of this commodity group in total volume of trade between Europe and Asia,
2011-2015, per cent
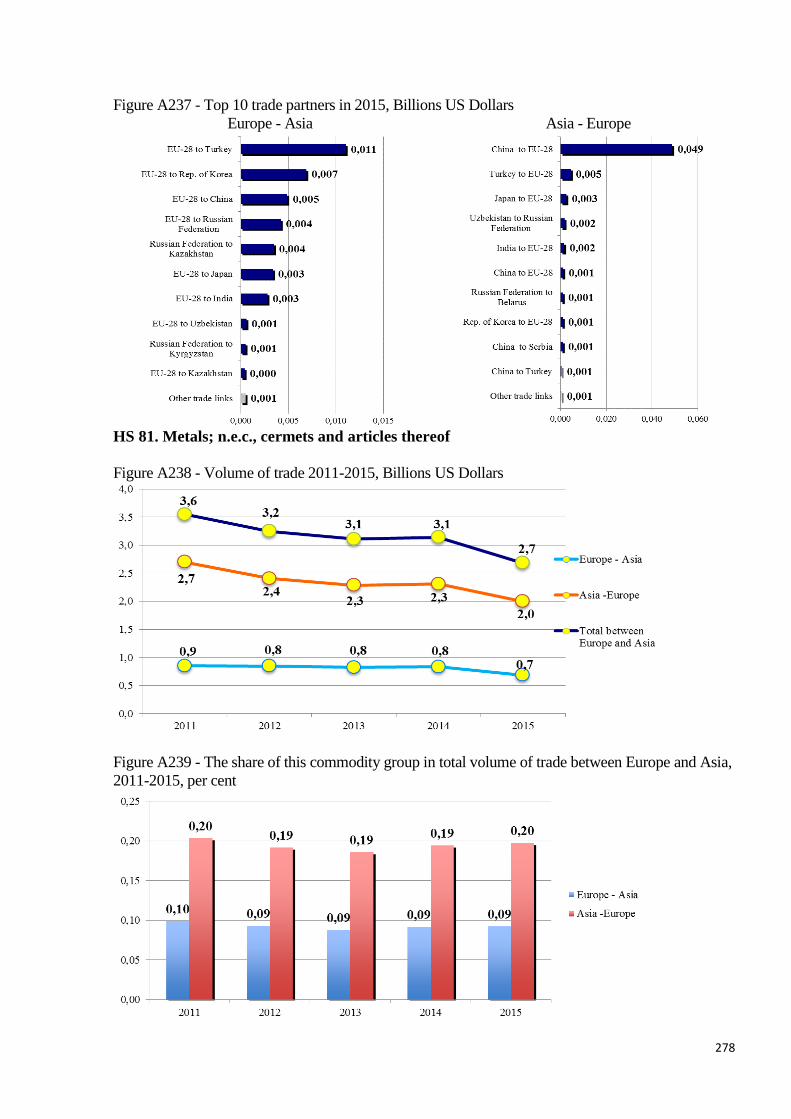
278
Figure A237 - Top 10 trade partners in 2015, Billions US Dollars
Europe - Asia Asia - Europe
HS 81. Metals; n.e.c., cermets and articles thereof
Figure A238 - Volume of trade 2011-2015, Billions US Dollars
Figure A239 - The share of this commodity group in total volume of trade between Europe and Asia,
2011-2015, per cent

279
Figure A240 - Top 10 trade partners in 2015, Billions US Dollars
Europe - Asia Asia - Europe
HS 82. Tools, implements, cutlery, spoons and forks, of base metal; parts thereof, of base
metal
Figure A241 - Volume of trade 2011-2015, Billions US Dollars
Figure A242 - The share of this commodity group in total volume of trade between Europe and Asia,
2011-2015, per cent
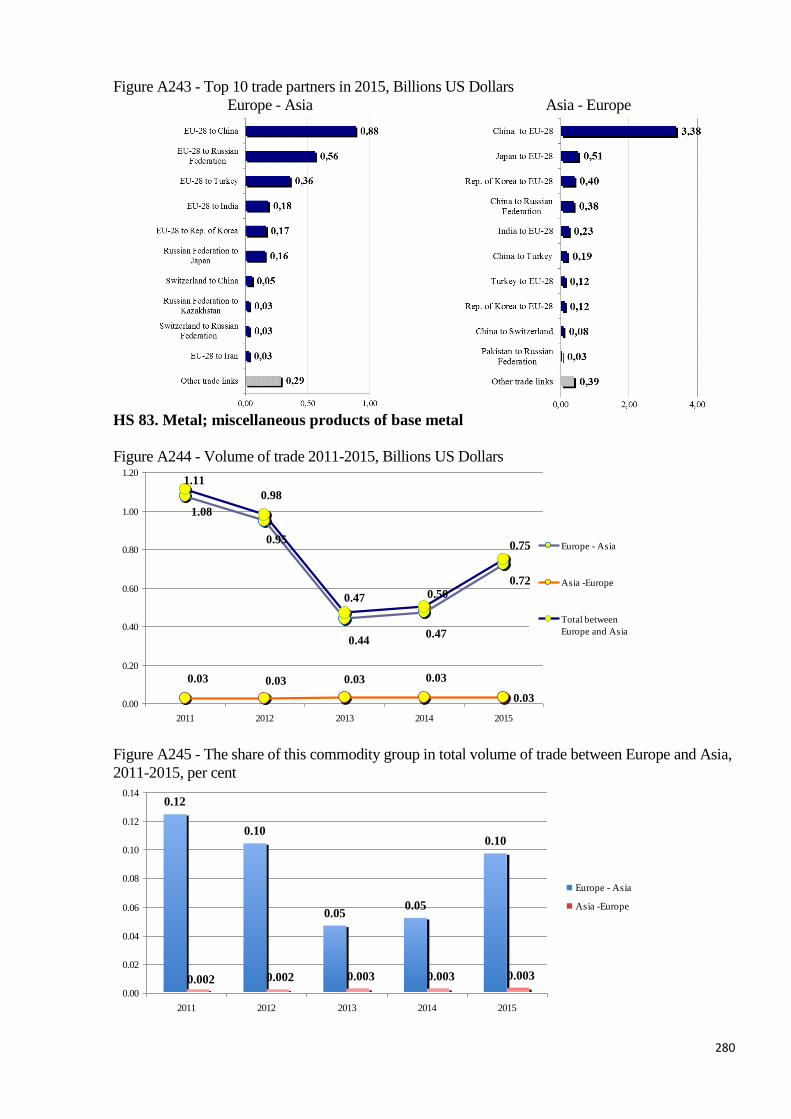
280
Figure A243 - Top 10 trade partners in 2015, Billions US Dollars
Europe - Asia Asia - Europe
HS 83. Metal; miscellaneous products of base metal
Figure A244 - Volume of trade 2011-2015, Billions US Dollars
0.03
1.08
0.95
0.440.47
0.72
0.03 0.03 0.03 0.03
1.11
0.98
0.47 0.50
0.75
0.00
0.20
0.40
0.60
0.80
1.00
1.20
2011 2012 2013 2014 2015
Europe - Asia
Asia -Europe
Total between
Europe and Asia
Figure A245 - The share of this commodity group in total volume of trade between Europe and Asia,
2011-2015, per cent
0.12
0.10
0.050.05
0.10
0.002 0.002 0.003 0.003 0.003
0.00
0.02
0.04
0.06
0.08
0.10
0.12
0.14
2011 2012 2013 2014 2015
Europe - Asia
Asia -Europe
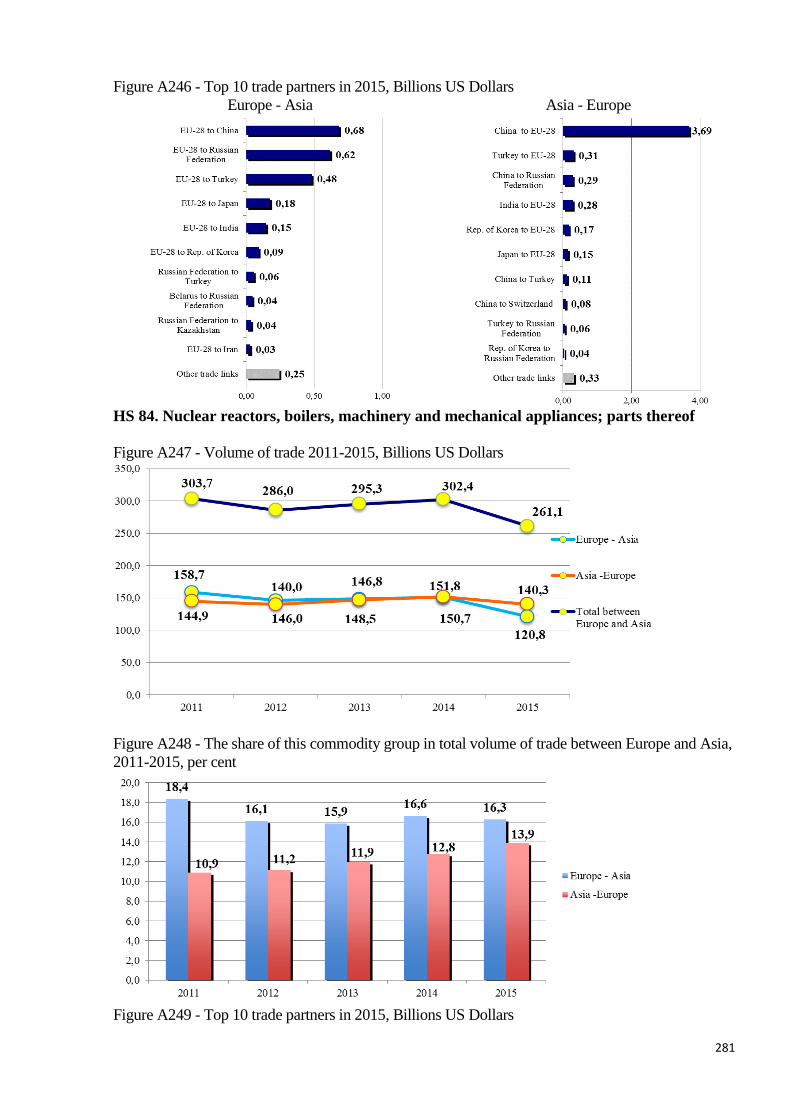
281
Figure A246 - Top 10 trade partners in 2015, Billions US Dollars
Europe - Asia Asia - Europe
HS 84. Nuclear reactors, boilers, machinery and mechanical appliances; parts thereof
Figure A247 - Volume of trade 2011-2015, Billions US Dollars
Figure A248 - The share of this commodity group in total volume of trade between Europe and Asia,
2011-2015, per cent
Figure A249 - Top 10 trade partners in 2015, Billions US Dollars
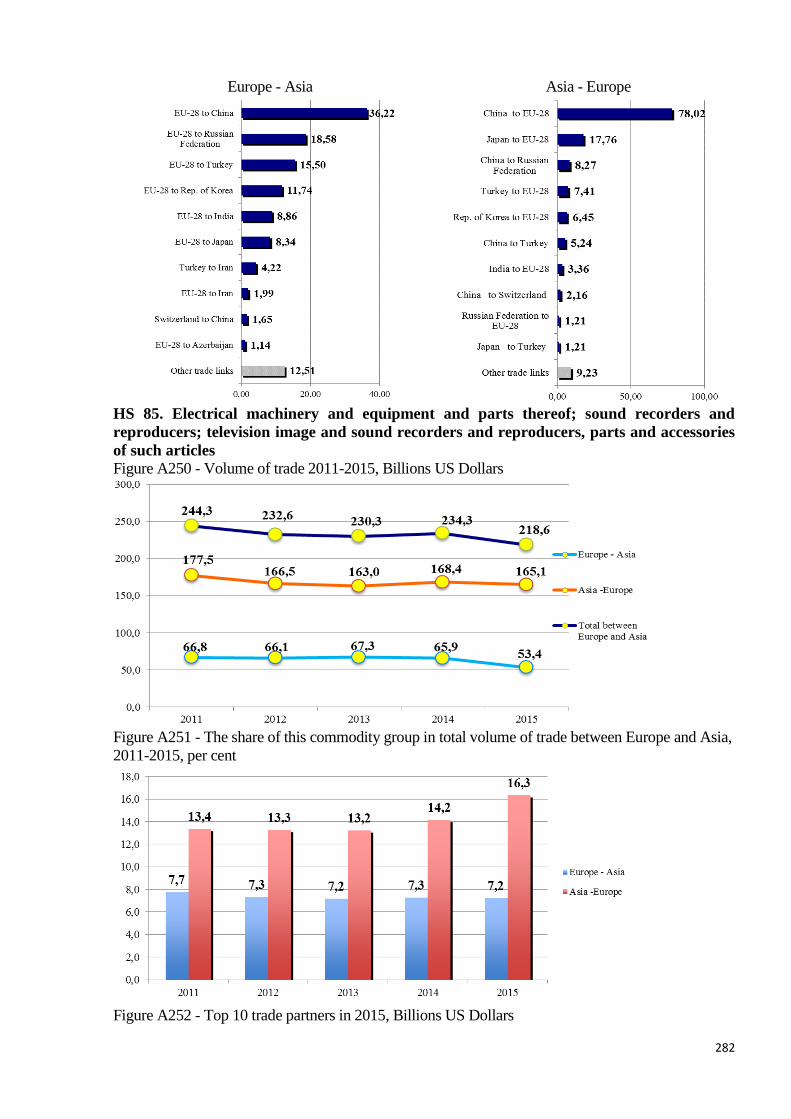
282
Europe - Asia Asia - Europe
HS 85. Electrical machinery and equipment and parts thereof; sound recorders and
reproducers; television image and sound recorders and reproducers, parts and accessories
of such articles
Figure A250 - Volume of trade 2011-2015, Billions US Dollars
Figure A251 - The share of this commodity group in total volume of trade between Europe and Asia,
2011-2015, per cent
Figure A252 - Top 10 trade partners in 2015, Billions US Dollars
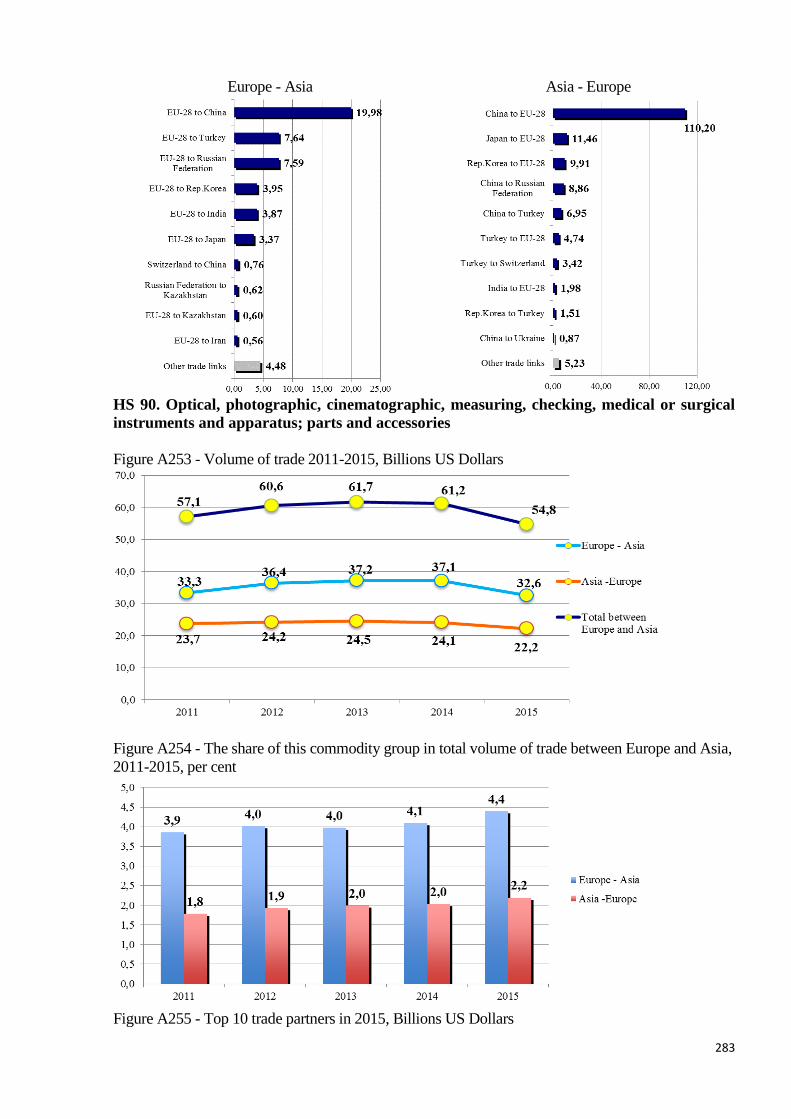
283
Europe - Asia Asia - Europe
HS 90. Optical, photographic, cinematographic, measuring, checking, medical or surgical
instruments and apparatus; parts and accessories
Figure A253 - Volume of trade 2011-2015, Billions US Dollars
Figure A254 - The share of this commodity group in total volume of trade between Europe and Asia,
2011-2015, per cent
Figure A255 - Top 10 trade partners in 2015, Billions US Dollars
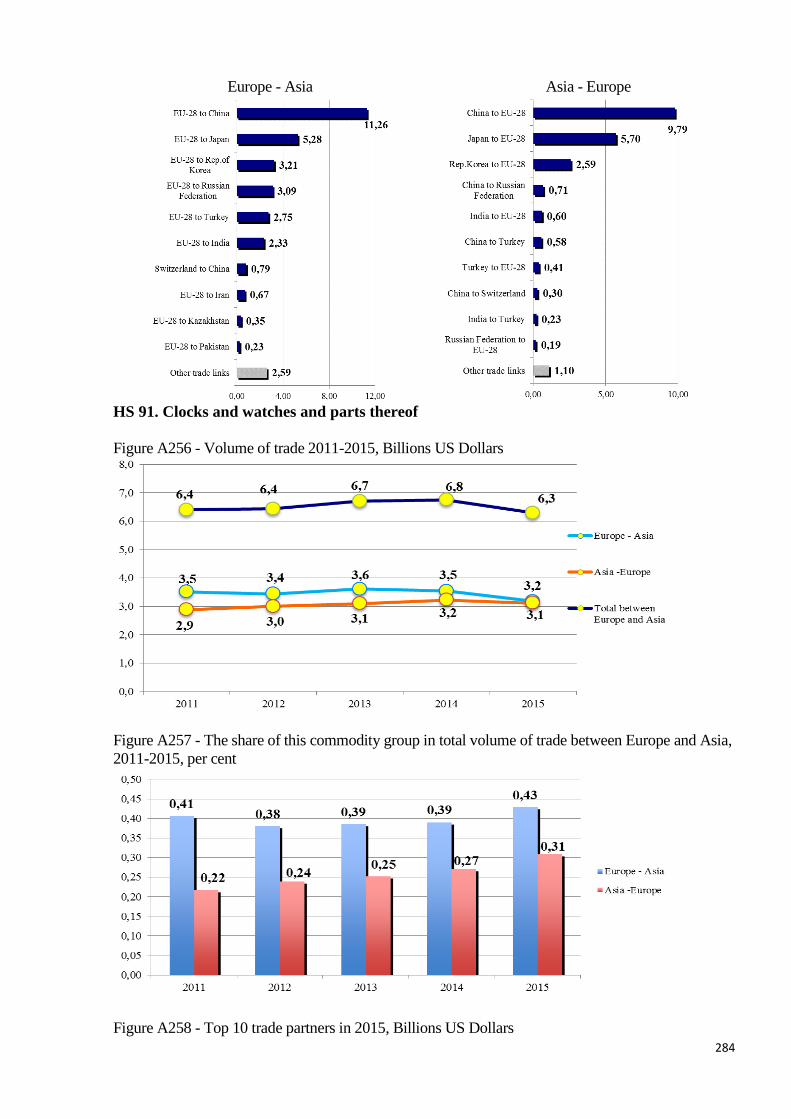
284
Europe - Asia Asia - Europe
HS 91. Clocks and watches and parts thereof
Figure A256 - Volume of trade 2011-2015, Billions US Dollars
Figure A257 - The share of this commodity group in total volume of trade between Europe and Asia,
2011-2015, per cent
Figure A258 - Top 10 trade partners in 2015, Billions US Dollars
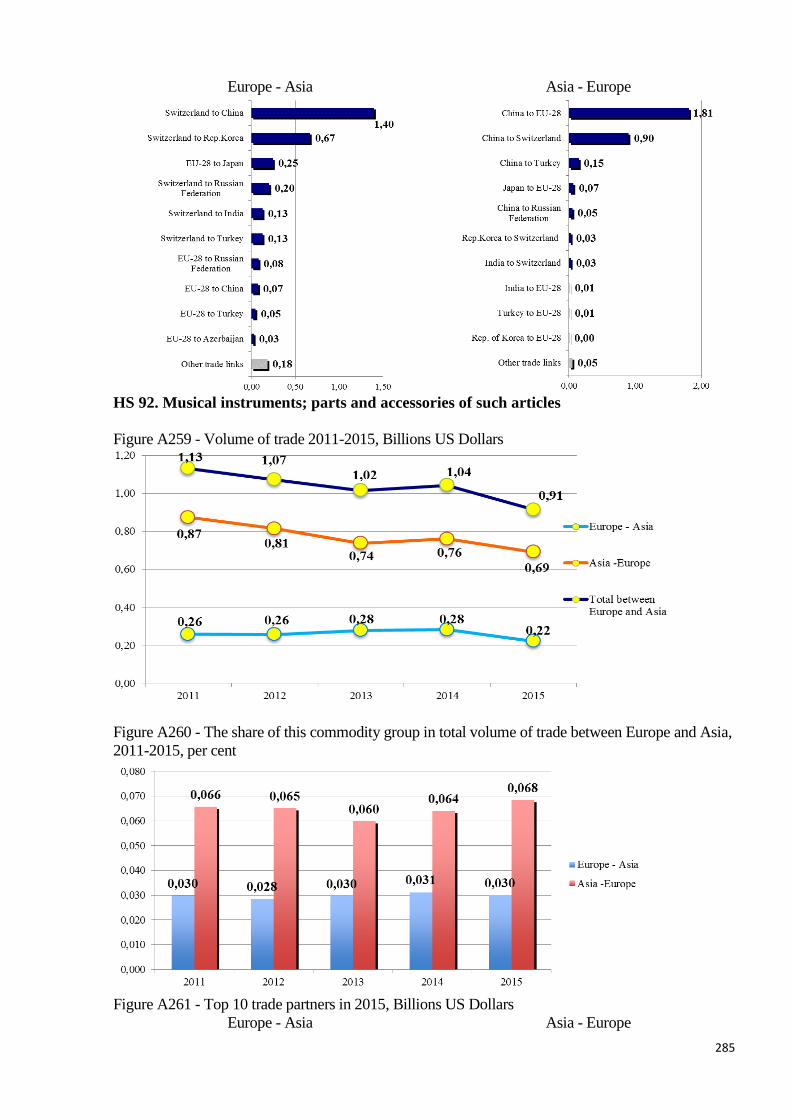
285
Europe - Asia Asia - Europe
HS 92. Musical instruments; parts and accessories of such articles
Figure A259 - Volume of trade 2011-2015, Billions US Dollars
Figure A260 - The share of this commodity group in total volume of trade between Europe and Asia,
2011-2015, per cent
Figure A261 - Top 10 trade partners in 2015, Billions US Dollars
Europe - Asia Asia - Europe

286
HS 94. Furniture; bedding, mattresses, mattress supports, cushions and similar stuffed
furnishings; lamps and lighting fittings, n.e.c.; illuminated signs, illuminated name-plates
and the like; prefabricated buildings
Figure A262 - Volume of trade 2011-2015, Billions US Dollars
Figure A263 - The share of this commodity group in total volume of trade between Europe and Asia,
2011-2015, per cent
Figure A264 - Top 10 trade partners in 2015, Billions US Dollars
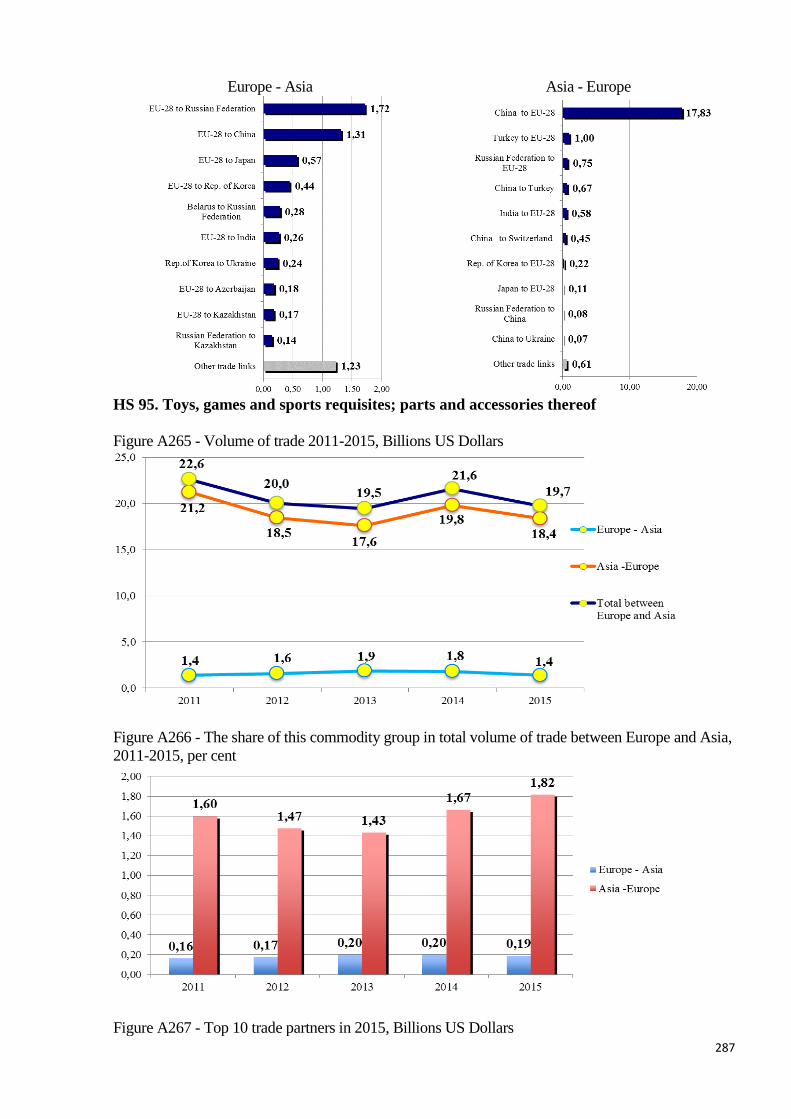
287
Europe - Asia Asia - Europe
HS 95. Toys, games and sports requisites; parts and accessories thereof
Figure A265 - Volume of trade 2011-2015, Billions US Dollars
Figure A266 - The share of this commodity group in total volume of trade between Europe and Asia,
2011-2015, per cent
Figure A267 - Top 10 trade partners in 2015, Billions US Dollars

288
Europe - Asia Asia - Europe
HS 96. Miscellaneous manufactured articles
Figure A268 - Volume of trade 2011-2015, Billions US Dollars
Figure A269 - The share of this commodity group in total volume of trade between Europe and Asia,
2011-2015, per cent
Figure A270 - Top 10 trade partners in 2015, Billions US Dollars

289
Europe - Asia Asia - Europe