emerging market multinationals report (emr) 2019
TRANSCRIPT
i
Fcom
EMERGING MARKETS INSTITUTE
EMERGING MARKET MULTINATIONALS REPORT (EMR) 2019
EMERGING MARKETS: BUILDING CONSTRUCTIVE ENGAGEMENT
Emerging Markets Institute Cornell S.C. Johnson College of Business, Cornell University
Lourdes Casanova, Senior Lecturer, Director Anne Miroux, Visiting Fellow
Cornell SC Johnson College of Business
ii
©Cornell University
©Lourdes Casanova
©Anne Miroux 2019.
All right reserved.
ISBN-13: 978-1-7328042-3-4 ISSN 2689-0127 No part of this publication may be reproduced or transmitted in any form or by any means, including photocopying and
recording, or by any information storage and retrieval system without prior permission of the copyright owners.
iii
Authors Lourdes Casanova is the Senior Lecturer and Director of the Emerging Markets Institute in the Johnson School of Management, at Cornell University. Formerly at INSEAD, she specializes in international business with focus on emerging market multinationals. In 2014 and 2015, she was named one of the 50 most influential Iberoamerican intellectuals by Esglobal. She has also been a Faculty Fellow at the Atkinson Center for a Sustainable Future and was a Fulbright Scholar, earning her Master degree from the University of Southern
California and her PhD from the University of Barcelona. She has been a visiting professor at the Haas School of Business, University of California at Berkeley; Judge Business School, University of Cambridge and Latin American Centre, University of Oxford; University of Zurich and Universidad Autónoma de Barcelona. She was a consultant with the Inter-American Development Bank and directed executive programs at INSEAD for senior managers including Telefónica, BBVA, Cemex and the Brazilian Confederation of Industries. Lourdes Casanova’s publications include: Entrepreneurship and the Finance of Innovation in Emerging Markets, Elsevier, 2017, co-authored with P. Cornelius and S. Dutta; the Emerging Market Multinationals Report 2016: The China Surge, co-authored with A. Miroux; The Political Economy of an Emerging Global Power: In Search of the Brazil Dream, Palgrave Macmillan 2014, co-authored with J. Kassum; and ‘Global Latinas: Latin America’s emerging multinationals’ Palgrave Macmillan 2009. She also co-authored ‘Innovalatina, Fostering Innovation in Latin America’, Ariel 2011, and has contributed articles in journals including Beijing Business Review, International Journal of Human Resource Management, Business and Politics and Foreign Affairs Latinoamérica. She is a member of Latin America Global Agenda Council and the Competitiveness in Latin America taskforce of the World Economic Forum, the B20 Task Force on ICT and Innovation in G20 summit, Los Cabos (2012), and at INSEAD was responsible for the Goldman Sachs 10,000 women initiative. She is a board member of Boyce Tompson Institute, start-up Documenta. She is a founding Board Member of the Societé des Amis du Chateau de Fontainebleau and a member of the Advisory Council of the Tompkins Public Library. She is a founding board member of the Emerging Multinationals Research Network and co-founder of the Ithaca Hub of Global Shapers. Writer of an op-ed at Latin Trade and regular contributor to CNN en español http://cnnespanol.cnn.com/.
Anne Miroux is a Faculty Fellow at the Emerging Markets Institute, Johnson School of Management at Cornell University. She has over 30 years of experience in international trade and finance. She began her career in the United Nations Centre on Transnational Corporations in New-York, and later joined the United Nations Conference on Trade and Development (UNCTAD) where she specialized on developing country debt, foreign direct investment and transnational corporations, and technology and innovation policies. For several years
she headed the Investment Analysis Branch in UNCTAD and directed the World Investment Reports (WIR), the United Nations flagship report on FDI and transnational corporations and served as the Editor of the UN Transnational Corporations Journal. She published a number of papers and articles and led research projects and technical assistance activities in developing countries on debt, FDI and development. Until late 2015 Anne Miroux was the Director of the Division on Technology and Logistics in UNCTAD, and Head of the Secretariat of the UN Commission on Science and Technology for Development (CSTD). She is a member of the Advisory Board of the Technology and Management Center of the Department of International Development at Oxford University. She is also a member of the Board of NetExplo. Anne Miroux has an MBA from HEC, Ecole des Hautes Etudes Commerciales, and a diploma from IEP (Institut d'Etudes Politiques – Paris). She holds a PHD in Economics from University of Paris I - Sorbonne.
iv
Contributors Veneta Andonova is Associate Professor of Business Strategy at Universidad de los Andes School of Management, Colombia. She obtained her Ph.D. degree from Universitat Pompeu Fabra, Spain. Previously, she worked at Universidad Pompeu Fabra, ITAM (Mexico) and the American University in Bulgaria. Her research stands at the intersection of business strategy, entrepreneurship and economic development in the context of emerging and transition economies. Her most recent books are on the internationalization of Latin American corporations, the multilatinas, and the birth of entrepreneurial ecosystems in unexpected places. She has been extensively engaged in executive training, consulting and mentoring on
a range of topics related to strategy, internationalization and innovation-driven entrepreneurship.
Limin Chen is a professor in the School of Economics & Management at Wuhan University. She is also the director of Centre for Global Strategy at Wuhan University. She received her Ph.D. from Wuhan University in China, and was once a visiting professor at the Stern Business School of New York University in 2008. Her research interests are global strategy and institutional complexity, especially for Chinese multinationals.
Maria Emilia Correa co-founded Sistema B and was a 2019 Fellow in the Advanced Leadership Initiative at Harvard University. Correa served as the first board chair of Sistema B, a Latin American enterprise promoting new economies and B Corporations. Ms. Correa also headed social and environmental responsibility for Latin American GrupoNueva, directed sustainability at Brazilian cosmetics company Natura Cosmeticos, and led biodiversity conservation in Colombia for The
Nature Conservancy. Correa serves as a board member of for-profit companies—Colbún, Córpora, and Explora in Chile—and non-for-profit Fundación Bancolombia and Fundación Gaia in Colombia.
Juana García Duque is Visiting Scholar at the David Rockefeller Center for Latin American Studies at Harvard University and Associate Professor at the Business School from Universidad de los Andes, Colombia. Her research activity in international development includes: (i) the role of international cooperation and the private sector in the peacebuilding process, and the study of (ii) internationalization and emerging economies. She is part of the academic committee of the Masters degree in Peacebuilding and coordinates
several of university projects regarding peace, such as the research for Peace Portfolio. Her book Peacebuilding: the role of companies in the reintegration of ex-combatants gathers the learnings and challenges of Colombian companies working with ex-combatants. She has been working on new blended courses and MOOCs in emerging markets, exploring new education methodologies.
Evodio Kaltenecker — Assistant Professor at EGADE Business School/Escuela de Negócios (México), the Samuel C. Johnson Graduate School of Management at Cornell University (USA), The Management Center Innsbruck (Austria), and Professor-in-Residence at Austral Education Group. Focus on strategy, Latin America, emerging market multinationals and international business. B.S. in Metallurgy by the Military Institute of Technology (IME), M.Sc in Industrial Engineering by the Federal University of Rio de Janeiro
(UFRJ/Coppe), MBA by Harvard University (Harvard Business School) and Ph.D. in internationalization strategy by the Polytechnic School at University of São Paulo (POLI/USP).
Jahir Lombana-Coy — Associate Professor of the Business School, Universidad del Norte, Colombia. He holds a Ph.D. in Economics from the University of Goettingen (Germany), and a Masters in International Studies from the Universidad de Chile. He is also an International Relations Specialist from the Universidad de Chile with an undergraduate degree in Economics from the Universidad del Rosario in Bogotá (Colombia). He has worked as a specialized professional in the Ministry of Foreign Trade in Colombia, and
was the Director/Editor of the websites www.freshplaza.es and www.freshplaza.com, which features specialized information in the foreign trade of fresh fruits and vegetables. He is also a project consultant in Europe and Latin America in entities such as the Friedrich Ebert Foundation (Germany), United Nations Food and Agriculture Organization (FAO), the
Jahir Lombana-Coy — Associate Professor of the Business School, Universidad del Norte, Colombia. He holds a Ph.D. in Economics from the University of Goettingen (Germany), and a Masters in International Studies from the Universidad de Chile. He is also an International Relations Specialist from the Universidad de Chile with an undergraduate degree in Economics from the Universidad del Rosario in Bogotá (Colombia). He has worked as a specialized professional in the Ministry of Foreign Trade in Colombia, and was the Director/Editor of the websites www.freshplaza.es and www.freshplaza.com, which features specialized information in the foreign trade of fresh fruits and vegetables. He is also a project consultant in Europe and Latin America in entities such as the Friedrich Ebert Foundation (Germany), United Nations Food and Agriculture Organization (FAO), the Institute of Agronomic Studies INRA (France), Association of Bananeros of Colombia AUGURA (Colombia), Association of Farmers of the North ASOGANORTE (Colombia). In research and teaching, his areas of interest are competitiveness, strategy, international trade, management skills and agribusiness. Additionally, he has supported regional projects promoting research financed by the National Planning Department and Colciencias in Colombia, among others.
v
Institute of Agronomic Studies INRA (France), Association of Bananeros of Colombia AUGURA (Colombia), Association of Farmers of the North ASOGANORTE (Colombia). In research and teaching, his areas of interest are competitiveness, strategy, international trade, management skills and agribusiness. Additionally, he has supported regional projects promoting research financed by the National Planning Department and Colciencias in Colombia, among others.
Miguel A. Montoya — Full Professor and Researcher at the School of Business of the Tecnológico de Monterrey campus Guadalajara since 1996. His Ph.D. is in Applied Economics from the Autonomous University of Barcelona (Cum Laude, 2007). He teaches at the Professional, Postgraduate and Executive Education levels at Tec de Monterrey on the Guadalajara campus and in other locations, receiving different awards from students and alumni for their teaching quality. Since 2009, he has been a member of the National System of Researchers of the National Council of Science and Technology (CONACYT — Mexico).
He has published more than 30 research papers in journals and books on multinational companies, businesses at the base of the pyramid and regulatory. He is the editor of books with Cambridge University Press and Fudan Development Institute Press. He participates in the editorial board of Competition and Regulation in Network Industries and Harvard Deusto Business Research Journal. He has presented more than 40 research papers in international conferences in different countries. He has research residencies with Northeastern University (Boston, USA) and CEIBS (Shanghai, China).
Lorena A. Palacios-Chacon — Full Time Assistant Professor of International Business at Instituto Tecnológico y de Estudios Superiores de Monterrey (ITESM) and Universidad del Norte in Barranquilla, Colombia. Dr. Palacios-Chacon earned her Ph.D. in management from the University of Puerto Rico, and her two bachelors in economics and finance and international trade from the Sergio Arboleda University. One of her main interests is the writing of teaching cases; she has participated in a number of conferences, having won multiple best case awards. She is member of the Board of Directors of the Latin American Case
Association (ALAC). Dr. Palacios-Chacon has written books and articles in the areas of internationalization of the firm, financial deepening in Colombia, the processes of offshore and outsourcing of companies and international economic integration between countries. She is initiating a line of research in multinationals from emerging markets, especially Multilatinas.
EMI Research Team, Cornell University Daniel dos Anjos – Holds a bachelor’s degree in Economics Science from Universidade Federal de Viçosa, Brazil. Daniel has worked on data analysis since 2012, performed on Finance Planning strategies and Risk Management reports for multinational companies.
Eudes Lopes — Cultural anthropology PhD student at Cornell University. Eudes holds a bachelor’s degree in anthropology and public policy from Princeton University. His research interests focus on the cultural relevance of economic thought and its embeddedness in the financial markets.
Jennifer Wholey — Writer and editor. She earned her bachelor's degree in Communication from Cornell University, and a master's degree in magazine writing and editing from Northwestern University's Medill School of Journalism. She has performed copy editing and substantive editing on books and reports produced by Cornell's Emerging Markets Institute since 2017.
vi
Preface The 2019 edition of The Emerging Market Multinational Report affirms its place as mandatory reading for those
who watch and need to understand the ever-shifting landscape in emerging markets. The report is laser-focused on the rise of multinationals from Asia, Latin America and Africa and how they exert their economic muscle in trade and in financial markets. The importance of this focus is as great as it has ever been.
This year’s theme – Building Constructive Engagement – has been very strategically chosen by the lead authors, Drs. Lourdes Casanova and Anne Miroux. While it continues to press the distinctive theme of our EMI research program about the rise of emerging multinationals, this year’s theme lowers the microscope on what we are calling the era of Chinese multinationals. Indeed, nearly 120 companies in the 2019 Fortune Global 500 – nearly 25% - are domiciled in China. The report does a deep-dive into understanding the influence of Chinese financial institutions, the transformation of traditional financial services by Chinese FinTech companies, noting that many global leaders in Fintech are from China. The lead authors and the teams of corresponding authors ask how much they foster greater financial inclusion for those underserved in the world by traditional financial services and how much they are building out infrastructure in Latin America and Africa. I found especially illuminating the chapter on state capitalism and how Chinese multinationals are imprinting the institutions and resources from home on their targets of opportunity as their pace of cross-border acquisitions continues. The report ultimately pursues the big question to which we all seek the answer: are Chinese multinationals disrupting the incumbents in the countries they enter as much as they are engaging constructively with them? Of course, readers will have a chance to delve into other important themes across all EMs, including the mission critical role of innovation and entrepreneurship, including with a broad social or sustainable mandate, in spawning the emerging multinationals of tomorrow.
I cannot imagine a more timely and relevant theme for the report given the ongoing turbulence in global trade and in international capital markets. I know the Report will force you to reflect again on emerging markets as the “underfunded growth opportunities with problems” – which is my consistent working definition of EMs and, as always, with emphasis on “problems.”
I congratulate the EMI and Drs. Casanova and Miroux for their dedicated and ongoing thought leadership!.
Andrew Karolyi Deputy Dean and College Dean for Academic Affairs Professor of Finance and Harold Bierman Jr. Distinguished Professor of Management Founding Co-Academic Director, Emerging Markets Institute Cornell S.C. Johnson College of Business Cornell University Ithaca, NY 14853 U.S.A.
vii
Acknowledgements The Emerging Market Multinationals Report (EMR) 2019 was authored by Lourdes Casanova, Senior Lecturer,
EMI Director, and Anne Miroux, EMI Visiting Fellow, at the Emerging Markets Institute (EMI), Cornell S.C. Johnson College of Business, Cornell University.
The authors are grateful to Jennifer Wholey and Daniel Ribeiro dos Anjos for their contributions as the leading Research Assistants to the report, and to, Julian Díaz Acosta, Mariana Rodríguez Díaz, Jorge Forero Fajardo, Carlos Delgado López, Vineetha Pachava, Abdellah Bouhamidi for their input. The authors would also like to thanks Eudes Lopes and Klaudia Kokoszka for editing, and Samanta Pinheiro da Fonseca for her administrative and organizational support to EMI. And also to Ritika Tiwari and David Kobuladze for their support.
The report benefited from comments and discussions with Andrew Karolyi, Deputy Dean and Dean of Academic Affairs. Cornell S.C. Johnson College of Business and Harold Bierman, Jr. Distinguished Professor of Management; Ravi Ramamurti, Distinguished Professor of International Business and Director of the Center for Emerging Markets, Northeastern University; and Subramanian Rangan, Professor of Strategy and Management, INSEAD.
As last year, members of the Emerging Market Research Network participated in the preparation of the Report: Limin Chen, professor from the School of Economics & Management at Wuhan University, for her research on state capitalism and technology influencing the growth of Chinese multinationals; Veneta Andonova, Associate Professor of Business, and Juana Catalina García Duque, Associate Professor, all from the School of Management, Universidad de los Andes, Colombia, contributed the chapter on social innovation in Latin America; Evodio Kaltenecker, Assistant Professor at EGADE Business School/Escuela de Negócios, and Miguel A. Montoya, Professor and Researcher at the School of Business of the Tecnológico de Monterrey, for their chapter on Mexican multinationals.
Finally, our special thanks go to the EMnet team at the OECD Development Center, a close partner of EMI for several years now, which has contributed to the present report.
viii
Table of Contents Preface .................................................................................................................................................... vi Acknowledgements................................................................................................................................. vii Table of Contents ................................................................................................................................... viii Abbreviations and Acronyms .................................................................................................................... x Executive Summary .................................................................................................................................. xi Chapter 1 The era of Chinese multinationals ............................................................................................ 1
1.1. The rise of Chinese multinationals ................................................................................................. 1 1.2. Greenfield investments ................................................................................................................. 6 1.3. Innovation leadership from emerging markets .............................................................................. 9 1.4. Case Study: Huawei, a 5G champion .............................................................................................12
Chapter 2 Revisiting China and the E20 ...................................................................................................24 2.1. Revisiting the E20 .........................................................................................................................24 2.2. Economic slowdown in emerging markets ....................................................................................25 2.3. Investments in and from emerging economies continue ...............................................................28
A. Stability in E20 investment ..........................................................................................................28 B. A new era? Overseas investments decline in 2018 .......................................................................28
2.4. International trade: doubts and uncertainties ..............................................................................29 Chapter 3 The Global South: Chinese investments in Latin America and Africa ........................................34
3.1. Introduction .................................................................................................................................34 3.2. China’s economic engagement in Latin America ...........................................................................35
A. A new era? Overseas investments decline in 2018 .......................................................................35 B. Chinese lending to Latin America .................................................................................................37
3.3. China’s economic engagement in Africa .......................................................................................39 3.4. Global south linkages: Belt and Road Initiative..............................................................................43 3.5. Ten years that changed global trade and realigned investment ....................................................43
Special contributions ..............................................................................................................................45 Chapter 4 State capitalism or technology springboard: Chinese multinationals influenced by both institutions and resources .........................................................................................................................................46
4.1. Theory and hypotheses ................................................................................................................47 A. Connecting internationalization to performance requires moderating factors .............................47 B. Influence of resources on international strategy and its performance .........................................48 C. Influence by institutions on international strategy and its performance.......................................48 D. Internationalization-performance relation of latecomers from emerging economies ..................48
4.2. Method and models .....................................................................................................................49 A. Data Collection ............................................................................................................................49 B. Variables .....................................................................................................................................49
4.3. Results .........................................................................................................................................50 4.4. Conclusion and Discussion ............................................................................................................51
A. Contributions ..............................................................................................................................51 B. Limitations and Future Research .................................................................................................51
Chapter 5 Mexican multinationals ..........................................................................................................61 5.1. GDP growth ..................................................................................................................................61
A. GDP per capita ............................................................................................................................62
ix
B. Inbound foreign direct investment (FDI) ......................................................................................62 C. Foreign Direct Investment Regulatory Restrictiveness Investment (FDI RRI) .................................62 D. Outbound Foreign Direct Investment (OFDI) ...............................................................................63
5.2. Role of the Mexican government ..................................................................................................63 A. Impact of USMCA versus NAFTA ..................................................................................................63 B. The U.S.-China trade war and the impacts on the Mexican economy ...........................................64
5.3. Mexican multinationals (MultiMex) ..............................................................................................64 A. Five selected Mexican multinationals ..........................................................................................65
5.4. Lessons from the international expansion of Mexican multinationals ...........................................70 Chapter 6 Social innovation in Latin America ..........................................................................................73
6.1. Context ........................................................................................................................................73 6.2. Social Innovation ..........................................................................................................................74 6.3. Countries and Cases .....................................................................................................................75
A. Natura Brazil ...............................................................................................................................75 B. CEMEX - Mexico ..........................................................................................................................75 C. Bancolombia - Colombia ..............................................................................................................76 D. Pacari — Ecuador ........................................................................................................................77 E. Intercorp — Peru .........................................................................................................................78
6.4. Conclusions ..................................................................................................................................78 Chapter 7 Korean multinationals, a value-added industries case approach .............................................81
7.1. Introduction .................................................................................................................................81 7.2. Korean Outward Investment ........................................................................................................82 7.3. Korean Multinationals in International Rankings ...........................................................................84 7.4. Cases: Five Korean Multinationals ................................................................................................85
A. SAMSUNG ...................................................................................................................................85 B. SK HOLDINGS ..............................................................................................................................87 C. HYUNDAI MOTOR GROUP ...........................................................................................................88 D. POSCO METALS ...........................................................................................................................90 E. KEPCO .........................................................................................................................................91 F. SUMMARY ...................................................................................................................................92
7.5. Final Remarks ...............................................................................................................................93 Chapter 8 Better business for 2030 – Putting the SDGs at the core .........................................................95
8.1. Introduction .................................................................................................................................95 8.2. Opportunities for the private sector .............................................................................................96 8.3. Challenges for businesses .............................................................................................................99 8.4. Conclusion ..................................................................................................................................101
x
Abbreviations and Acronyms AACSB Association to Advance Collegiate Schools of Business AMBA Association of MBAs BPM Business Process Management BRI Belt and Road Initiative BRICS Brazil, Russia, India, China and South Africa CARI China-Africa Research Initiative CDB China Development Bank CDEEE Dominican Republic State Electric Utility Chaebol Korean family-run conglomerate CNCPC National Petroleum Corporation DOI Degree of Internationalization DRAM Dynamic Random Access Memor EBITDA Earnings Before Interest, Taxes, Depreciation, and Amortization ECLAC United Nations Economic Commission for Latin America and the Caribbean EQUIS European Quality Improvement System EMI Emerging Markets Institute eMNC Emerging Multinationals EMNET OECD Development Centre’s Emerging Markets Network EMR Emerging Markets Report ESG Environmental, Social and Governance requirements FATA Foreign Assets to Total Assets FDI Foreign Direct Investment FDI RRI Foreign Direct Investment Regulatory Restrictiveness Investment FERE Foreign Employees to Total Employees FSTS Foreign Sales to Total Sales FTAs Free Trade Agreements GDP Gross Domestic Product GDPR General Data Protection Regulation GEIDCO Global Energy Interconnection Development and Cooperation Organization GEGI Global Economic Governance Initiative GFC Global Financial Crisis GII Global Innovation Index GICS Global Industry Classification Standard GSM Global System for Mobile Communications GVCs Global Value Chains HACCP Hazard Analysis and Critical Control Points HCBM Human-Centered Business Model HMETC Hyundai Motor Europe Technical Center IB International Business
ICT Information & Communication Technology IDB Inter-American Development Bank IEA International Energy Agency IMF International Monetary Fund INST-OUT Outer institutions KEPCO Korea Electric Power Corporation LAC Latin America and the Caribbean M&As Mergers and Acquisitions MDGs Millennium Development Goals MNE Multinational Enterprise NAFTA North American Free Trade Agreement NOC Number of countries hosting overseas subsidiaries NOS Number of overseas subsidiaries OECD Organisation for the Economic Cooperation and Development OFDI Outward Foreign Direct Investment OSTS Overseas Subsidiaries to Total Subsidiaries PBX Private Branch Exchanges PPP Purchasing Power Parity RBC Responsible Business Conduct RES-IN Inner Resources RES-OUT Outer Resources RES-OUT-RAW Raw material-seeking RES-OUT-TECH Technology-seeking outer resources ROA Return on Assets ROE Return on Equity ROS Return on Sales S&T Science and Technology SAIS Johns Hopkins University School of Advanced International Studies SDGs (United Nations) Sustainable Development Goals SKMS SK Management System SOE State-Owned Enterprise SMEs Small and Medium-size Enterprises STEM Science, Technology, Engineering & Mathematics TPA Trade Promotion Authority UN United Nations UNCTAD United Nations Conference on Trade and Development USMCA United States-Mexico-Canada trade agreement VCR Video Cassette Recorders WB World Bank WCDMA Wide-Band Code Division Multiple Access WEF World Economic Forum WTO World Trade Organization
xi
Executive Summary Chapter 1—The era of Chinese multinationals
This chapter documents the rise of Chinese multinationals as measured by their presence on the 2019 Fortune Global 500 rankings. With 119 companies in the 2019 Fortune Global 500, China is almost at par with the U.S., which has 121 companies on the list. This is a show of force for the Chinese domestic market and the ecosystem it has spawned. South Korean companies have also shown great success, but the rest of emerging market multinationals (eMNCs) have grown less impressively. We explore the specific firms which drive foreign direct investments (FDI) from emerging market countries and compare them to developed markets such as the U.S. and Japan. The chapter also describes innovation leadership from emerging markets. Companies from several emerging markets, including China and India, are now becoming formidable competitors on the global stage. We conclude the chapter by honing in on Huawei, one of the most innovative Chinese companies.
Chapter 2—Revisiting China and the E20 Chapter 2 examines trends in emerging economies as illustrated by the E20—a group composed of 20 top
emerging economies that EMI established in its first Emerging Market Multinationals Report (EMR) to illustrate the emerging market phenomenon. In 2018, global growth recovery did not live up to expectations. Among a global slowdown, largely reflecting poor performance in advanced economies, the E20 as a whole also registered a small decline in its growth rate. As well, outward FDI from the E20 registered a slight decline while inward FDI remained relatively stable. The chapter highlights the pervasive uncertainty resulting from trade tensions that have continued virtually unabated since early 2018, and their major destabilizing impact on the global economy. As mentioned in the EMR last year, in the long term, the sustained loss of confidence in the rule-based global trade system stemming from the trade war is even more damaging than the economic losses by themselves.
Chapter 3—The Global South: Chinese Investments in Latin America and Africa Chapter 3 explores the rise of the global South through the rising economic engagement of China in Latin America
and Africa. The rise of Chinese FDI on both continents is particularly illustrative of this trend. While almost two thirds of China’s outward foreign direct investment (FDI) stock is still invested in Asia alone, Latin America and Africa have provided fertile ground for the significant overseas expansion of Chinese multinationals. The chapter highlights the data challenges inherent to Chinese OFDI and overseas lending. Based on a variety of sources, it examines trends in China’s outward FDI and lending to these regions. Overall, in Latin America and the Caribbean, Chinese OFDI has come to play a major role, being at par or even exceeding Chinese lending to the continent on several occasions. Though lending does not dominate the picture as it does in Africa, in some years China has been the largest source of development finance for Latin America, even surpassing that of major development banks. In Africa, lending remains the most important mode of finance from China; yet, for Africa, China is also a key investment partner.
Chapter 4—State capitalism or technology springboard: Chinese multinationals influenced by both institutions and resources
As Chinese outward direct investment (OFDI) has increased for 16 consecutive years, analysts have sought to determine the driving factors behind this massive growth. The stock of Chinese OFDI ranked No. 2 in 2017, behind only the U.S. This paper integrates an institution-based view and a resource-based view to investigate the impacts on Chinese multinationals from four aspects: Inner resources (firms’ resource and capability), outer resources (resource-seeking motivation), inner institutions (ownership of firms), and outer institutions (sub-national institutional environment). We analyzed data from Chinese listed firms from 2009-2017 and obtained the following results: (1) Inner resources, outer resources, and outer institutions all have positive impacts on the internationalization of Chinese firms. However, inner institutions have a negative effect, i.e., state-owned enterprises (SOEs) have a lower percentage of internationalization and lower mean degree of internationalization (DOI) than private firms. (2) Institutions and resources not only have a direct impact on internationalization and performance, but also significantly moderate their relationship. Though private firms performed better than SOEs, SOEs’ performance improved with higher DOI. This paper found that expanding internationally can help firms improve performance despite institutional flaws in the home country. Some research has asserted that institutional factors caused this phenomenon, and that it is the result of state capitalism, reflecting the will
xii
of the Chinese government. Other research points to resource factors: Internationalization is a springboard for Chinese firms to satisfy their technology-seeking motivations (Luo & Tung, 2007, 2018). With China’s rapid development in recent years, overseas acquisitions have become increasingly necessary to meet the raw material needs of Chinese enterprises.
Chapter 5—Mexican multinationals Mexico is the second-largest economy in Latin America. In 2018, Mexico’s population peaked at 125.929 million
people (Mexico, n.d.), the 11th most populous country in the world (The World Factbook, 2018). Its 2018 nominal Gross Domestic Product (GDP) and Purchasing Power Parity (PPP) reached $1.15 trillion and $2.45 trillion respectively (Silver, 2019), with a projected real GDP change of 0.9% (Mexico GDP Annual Growth Rate, n.d.). Among its many particularities, two-thirds of Mexico’s exports are manufactured, totaling $419 billion (Mexico Total Exports, n.d.), with much of Mexico’s industrial base firmly connected to the U.S.-based manufacturing value chains (Kaltenecker, 2018).
Chapter 6—Social innovation in Latin America Latin American countries, like many other emerging economies, face serious challenges. Climate change, as well
as persistent inequality and violence force millions of people and businesses throughout the region to live in a constant state of uncertainty. Consequently, private firms from the region have taken the initiative to experiment with business models that create value beyond the economic dimension, producing a positive social and environmental impact. In this chapter, we provide an overview of the concept of social innovation, highlight its increasing relevance for businesses in Latin America and we provide an overview of five significant regional case studies.
Chapter 7—Korean multinationals, a value-added industries case approach In this chapter we study some features of South Korea’s internationalization process. Focusing on the cases of
five Korean multinationals—Samsung, SK Holding, Hyundai, POSCO and KEPCO—from five different industries, we explain the influence of the government in their expansion and their strategies to conquer increasingly distant markets. All five companies featured in the chapter use internationalization as the most effective way to expand their businesses given the small size of their domestic market. Since the 1960s, the government of South Korea had a development strategy based on high value-added industries that includes steel, energy, communications and consumer goods that provided those firms with financial support and other benefits. All companies included in the cases come from the country’s chaebol family-run conglomerates, which guarantees continuity in goals, processes and reforms. Altogether, those elements comprise the South Korea multinationals’ formula of success.
Chapter 8— Better business for 2030— Putting the SDGs at the core An increasing number of firms recognize that making sense of the Sustainable Development Goals (SDGs) makes
business sense. The Organisation for Economic Co-operation and Development (OECD) is committed to leveraging its capacity and expertise in a wide range of areas, from data collection to dialogue and peer-learning. This chapter explores ways in which the private sector can contribute to the SDGs by putting them at the center of decision-making. The analysis builds on the work of the OECD Development Centre’s business platform Emerging Markets Network (EMnet).
1
Chapter 1 The era of Chinese multinationals 1.1. The rise of Chinese multinationals
1.2. Greenfield investments
1.3. Innovation leadership from emerging markets
1.4. Case Study: Huawei, a 5G champion
Executive Summary
This chapter documents the rise of Chinese multinationals as measured by their presence on the 2019 Fortune Global 500 rankings. With 119 companies in the 2019 Fortune Global 500, China is almost at par with the U.S., which has 121 companies on the list. This is a show of force for the Chinese domestic market and the ecosystem it has spawned. South Korean companies have also shown great success, but the rest of emerging market multinationals (eMNCs) have grown less impressively. We explore the specific firms which drive foreign direct investments (FDI) from emerging market countries and compare them to developed markets such as the U.S. and Japan. The chapter also describes innovation leadership from emerging markets. Companies from several emerging markets, including China and India, are now becoming formidable competitors on the global stage. We conclude the chapter by honing in on Huawei, one of the most innovative Chinese companies.
Chinese companies taking the lead1 Emerging market multinational corporations (eMNCs) are companies headquartered in an emerging market and
operating in another country in addition to its own, as defined by UNCTAD and in previous reports. In this chapter, we use the Fortune Global 500 rankings (started in 1990) to compare the performance of eMNCs with their peers from developed countries. The richness of the longitudinal data contained within the Fortune Global 500 dataset allows us to compare firms along a number of dimensions including revenues, profits, assets, equity and number of employees.
Similar to the analysis in prior EMI Reports (Casanova and Miroux, 2016, 2017, and 2018), this chapter focuses on the largest eMNCs, as they have a disproportionately high impact on their economies. We contend that a diversified local private sector, committed to the development of its home country, drives much of the growth behind the success of emerging markets. These companies fuel the creation of more stable and better-paid jobs, provide resources to conduct research and foster innovation, as well as contribute to the development of small- and medium- sized companies.
This chapter first describes the rise of Chinese multinationals as measured by their presence on the 2019 Fortune Global 500 rankings. It explores the specific firms that turbocharge FDI from emerging market countries and compares them to developed markets such as the U.S. and Japan. The chapter concludes with a description of innovation leadership from emerging markets, in particular the case of Huawei, the most emblematic of Chinese firms in innovation, global reach, and impact, as demonstrated by its visibility in the press.
1.1. The rise of Chinese multinationals
In 2019, the Fortune Global 500 comprised companies from 34 countries with revenues of $32.7 trillion and profits of $2.15 trillion generated by 69.3 million employees. Only 21 countries had more than one company listed in this important ranking.
Nearly half of the companies in the list were headquartered in either the U.S. or China: the former hosted 121 companies, followed closely by the latter with 119 companies, 24.2% and 23.8% of the Fortune Global 500 respectively.
1 We gratefully acknowledge the help of Daniel dos Anjos for assistance with data analytics.
2
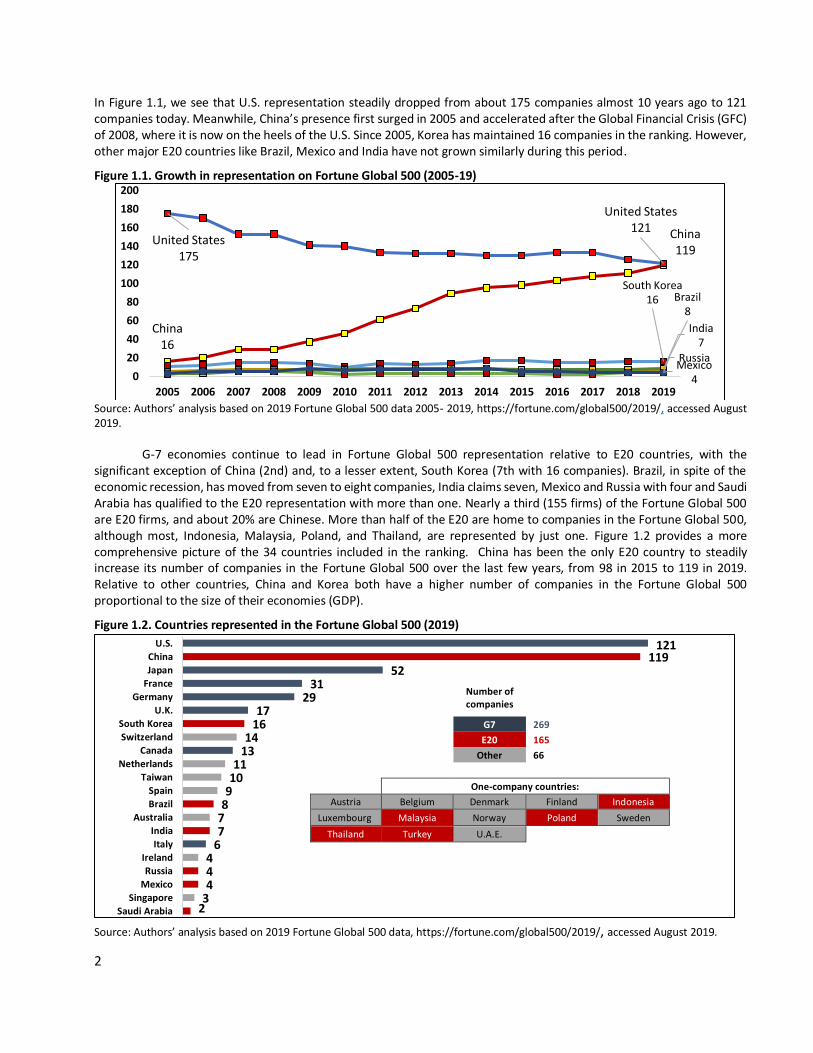
In Figure 1.1, we see that U.S. representation steadily dropped from about 175 companies almost 10 years ago to 121 companies today. Meanwhile, China’s presence first surged in 2005 and accelerated after the Global Financial Crisis (GFC) of 2008, where it is now on the heels of the U.S. Since 2005, Korea has maintained 16 companies in the ranking. However, other major E20 countries like Brazil, Mexico and India have not grown similarly during this period.
Figure 1.1. Growth in representation on Fortune Global 500 (2005-19)
Source: Authors’ analysis based on 2019 Fortune Global 500 data 2005- 2019, https://fortune.com/global500/2019/, accessed August 2019.
G-7 economies continue to lead in Fortune Global 500 representation relative to E20 countries, with the significant exception of China (2nd) and, to a lesser extent, South Korea (7th with 16 companies). Brazil, in spite of the economic recession, has moved from seven to eight companies, India claims seven, Mexico and Russia with four and Saudi Arabia has qualified to the E20 representation with more than one. Nearly a third (155 firms) of the Fortune Global 500 are E20 firms, and about 20% are Chinese. More than half of the E20 are home to companies in the Fortune Global 500, although most, Indonesia, Malaysia, Poland, and Thailand, are represented by just one. Figure 1.2 provides a more comprehensive picture of the 34 countries included in the ranking. China has been the only E20 country to steadily increase its number of companies in the Fortune Global 500 over the last few years, from 98 in 2015 to 119 in 2019. Relative to other countries, China and Korea both have a higher number of companies in the Fortune Global 500 proportional to the size of their economies (GDP).
Figure 1.2. Countries represented in the Fortune Global 500 (2019)
Source: Authors’ analysis based on 2019 Fortune Global 500 data, https://fortune.com/global500/2019/, accessed August 2019.
China16
China119
South Korea16
India7
Brazil8
Mexico4
United States175
United States121
Russia
0
20
40
60
80
100
120
140
160
180
200
2005 2006 2007 2008 2009 2010 2011 2012 2013 2014 2015 2016 2017 2018 2019
Number of companies
G7 269
E20 165
Other 66
One-company countries:
Austria Belgium Denmark Finland Indonesia
Luxembourg Malaysia Norway Poland Sweden
Thailand Turkey U.A.E.
23444
677891011
1314
1617
2931
52119
121
Saudi Arabia
Singapore
Mexico
Russia
Ireland
Italy
India
Australia
Brazil
Spain
Taiwan
Netherlands
Canada
Switzerland
South Korea
U.K.
Germany
France
Japan
China
U.S.
3
Compared to last year, six Chinese companies have risen in the rankings, six have dropped and four held their positions. Two Russian companies, Gazprom and Lukoil, and Brazil’s Petrobras have all improved their rankings, despite both countries having suffered currency devaluations with respect to the dollar; Korea’s Samsung also improved its rank. Of the 50 biggest emerging markets multinationals (see Appendix 1.1), 70% are headquartered in China, 8% in South Korea, 6% in India, 5% in Brazil, 4% in Russia, 2% in Mexico and Saudi Arabia, and 1% in each of Indonesia, Malaysia and Thailand.
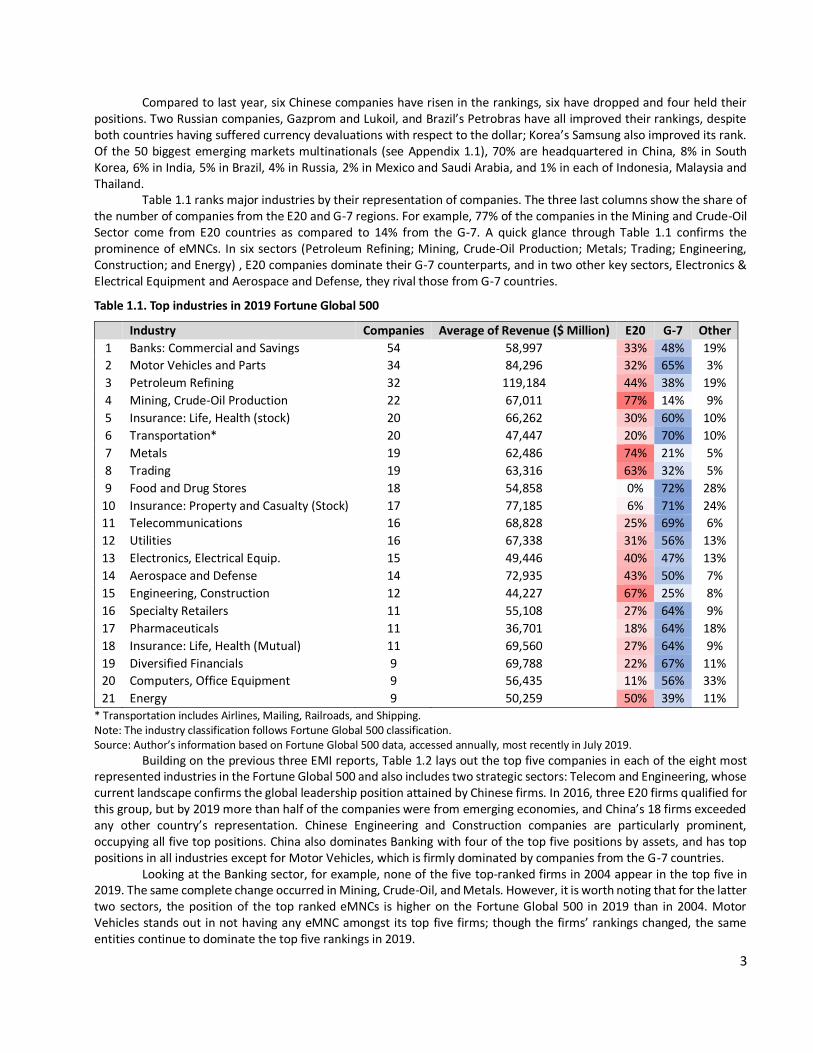
Table 1.1 ranks major industries by their representation of companies. The three last columns show the share of the number of companies from the E20 and G-7 regions. For example, 77% of the companies in the Mining and Crude-Oil Sector come from E20 countries as compared to 14% from the G-7. A quick glance through Table 1.1 confirms the prominence of eMNCs. In six sectors (Petroleum Refining; Mining, Crude-Oil Production; Metals; Trading; Engineering, Construction; and Energy) , E20 companies dominate their G-7 counterparts, and in two other key sectors, Electronics & Electrical Equipment and Aerospace and Defense, they rival those from G-7 countries.
Table 1.1. Top industries in 2019 Fortune Global 500
Industry Companies Average of Revenue ($ Million) E20 G-7 Other
1 Banks: Commercial and Savings 54 58,997 33% 48% 19%
2 Motor Vehicles and Parts 34 84,296 32% 65% 3%
3 Petroleum Refining 32 119,184 44% 38% 19%
4 Mining, Crude-Oil Production 22 67,011 77% 14% 9%
5 Insurance: Life, Health (stock) 20 66,262 30% 60% 10%
6 Transportation* 20 47,447 20% 70% 10%
7 Metals 19 62,486 74% 21% 5%
8 Trading 19 63,316 63% 32% 5%
9 Food and Drug Stores 18 54,858 0% 72% 28%
10 Insurance: Property and Casualty (Stock) 17 77,185 6% 71% 24%
11 Telecommunications 16 68,828 25% 69% 6%
12 Utilities 16 67,338 31% 56% 13%
13 Electronics, Electrical Equip. 15 49,446 40% 47% 13%
14 Aerospace and Defense 14 72,935 43% 50% 7%
15 Engineering, Construction 12 44,227 67% 25% 8%
16 Specialty Retailers 11 55,108 27% 64% 9%
17 Pharmaceuticals 11 36,701 18% 64% 18%
18 Insurance: Life, Health (Mutual) 11 69,560 27% 64% 9%
19 Diversified Financials 9 69,788 22% 67% 11%
20 Computers, Office Equipment 9 56,435 11% 56% 33%
21 Energy 9 50,259 50% 39% 11%
* Transportation includes Airlines, Mailing, Railroads, and Shipping. Note: The industry classification follows Fortune Global 500 classification. Source: Author’s information based on Fortune Global 500 data, accessed annually, most recently in July 2019.
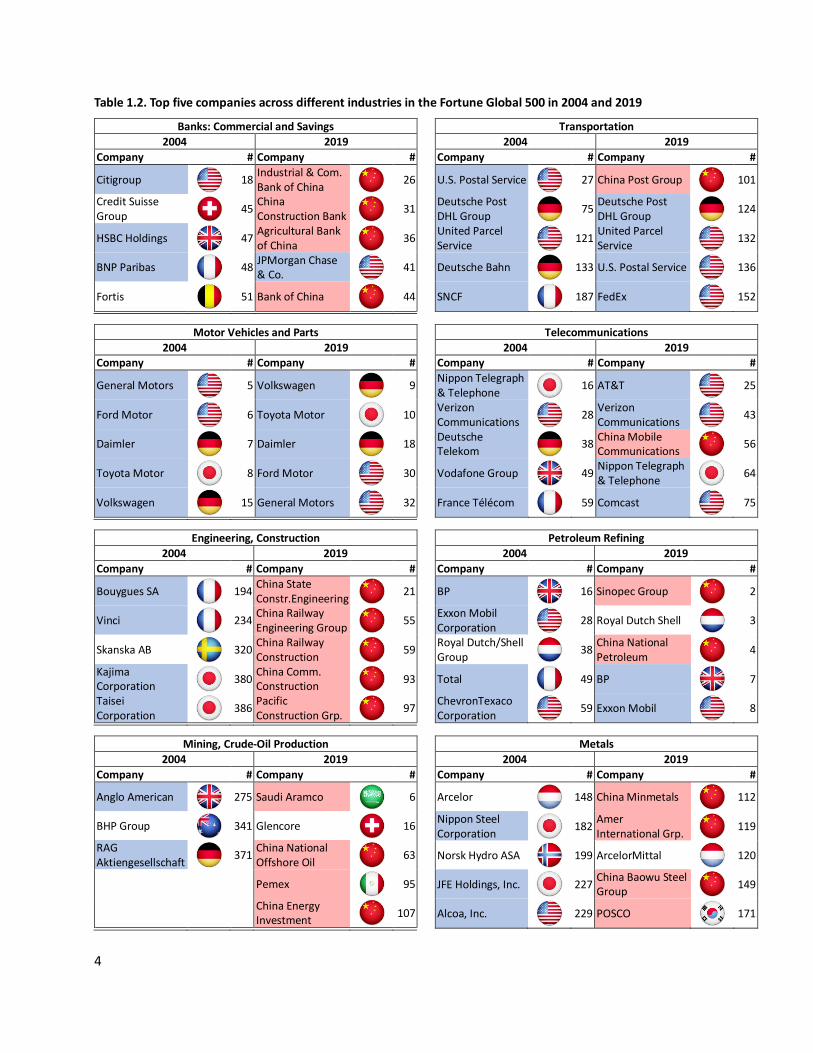
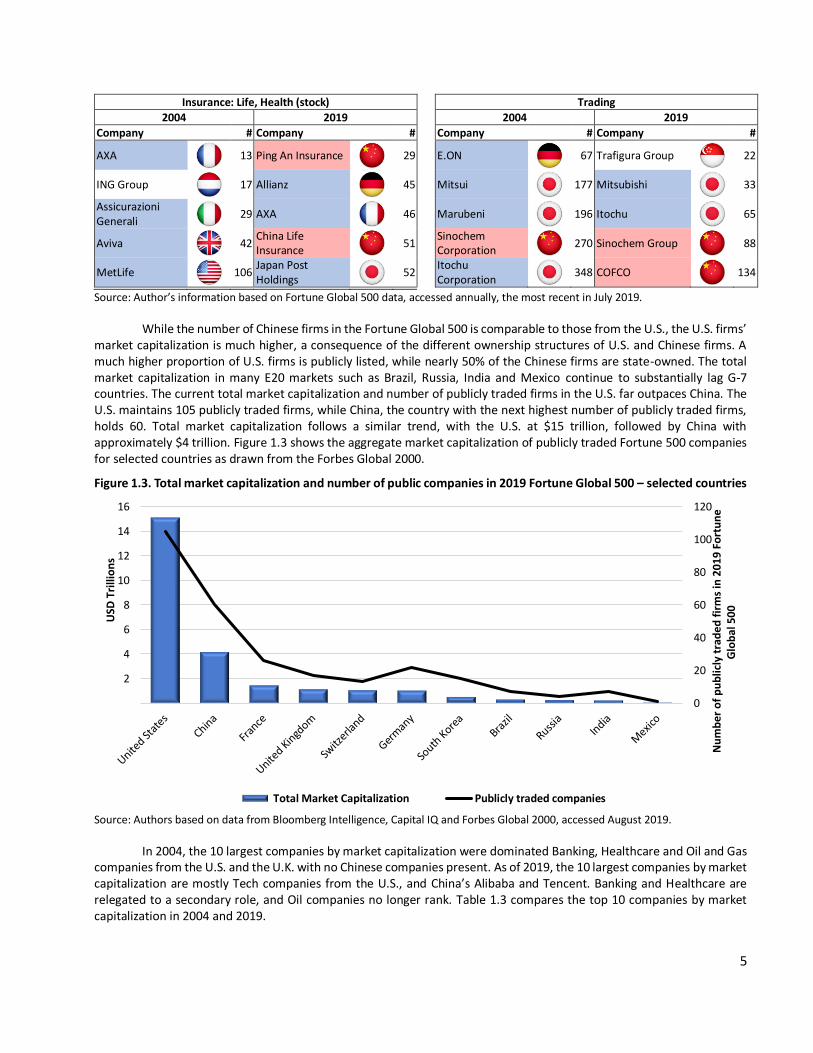
Building on the previous three EMI reports, Table 1.2 lays out the top five companies in each of the eight most represented industries in the Fortune Global 500 and also includes two strategic sectors: Telecom and Engineering, whose current landscape confirms the global leadership position attained by Chinese firms. In 2016, three E20 firms qualified for this group, but by 2019 more than half of the companies were from emerging economies, and China’s 18 firms exceeded any other country’s representation. Chinese Engineering and Construction companies are particularly prominent, occupying all five top positions. China also dominates Banking with four of the top five positions by assets, and has top positions in all industries except for Motor Vehicles, which is firmly dominated by companies from the G-7 countries.
Looking at the Banking sector, for example, none of the five top-ranked firms in 2004 appear in the top five in 2019. The same complete change occurred in Mining, Crude-Oil, and Metals. However, it is worth noting that for the latter two sectors, the position of the top ranked eMNCs is higher on the Fortune Global 500 in 2019 than in 2004. Motor Vehicles stands out in not having any eMNC amongst its top five firms; though the firms’ rankings changed, the same entities continue to dominate the top five rankings in 2019.
4
Table 1.2. Top five companies across different industries in the Fortune Global 500 in 2004 and 2019
Banks: Commercial and Savings
2004 2019
Company # Company #
Citigroup
18 Industrial & Com. Bank of China
26
Credit Suisse Group
45 China Construction Bank
31
HSBC Holdings
47 Agricultural Bank of China
36
BNP Paribas
48 JPMorgan Chase & Co.
41
Fortis
51 Bank of China
44
Transportation
2004 2019
Company # Company #
U.S. Postal Service
27 China Post Group
101
Deutsche Post DHL Group
75 Deutsche Post DHL Group
124
United Parcel Service
121 United Parcel Service
132
Deutsche Bahn
133 U.S. Postal Service
136
SNCF
187 FedEx
152
Motor Vehicles and Parts
2004 2019 Company # Company #
General Motors
5 Volkswagen
9
Ford Motor
6 Toyota Motor
10
Daimler
7 Daimler
18
Toyota Motor
8 Ford Motor
30
Volkswagen
15 General Motors
32
Telecommunications
2004 2019 Company # Company #
Nippon Telegraph & Telephone
16 AT&T
25
Verizon Communications
28 Verizon Communications
43
Deutsche Telekom
38 China Mobile Communications
56
Vodafone Group
49 Nippon Telegraph & Telephone
64
France Télécom
59 Comcast
75
Engineering, Construction
2004 2019
Company # Company #
Bouygues SA
194 China State Constr.Engineering
21
Vinci
234 China Railway Engineering Group
55
Skanska AB
320 China Railway Construction
59
Kajima Corporation
380 China Comm. Construction
93
Taisei Corporation
386 Pacific Construction Grp.
97
Petroleum Refining
2004 2019
Company # Company #
BP
16 Sinopec Group
2
Exxon Mobil Corporation
28 Royal Dutch Shell
3
Royal Dutch/Shell Group
38 China National Petroleum
4
Total
49 BP
7
ChevronTexaco Corporation
59 Exxon Mobil
8
Mining, Crude-Oil Production
2004 2019
Company # Company #
Anglo American
275 Saudi Aramco
6
BHP Group
341 Glencore
16
RAG Aktiengesellschaft
371 China National Offshore Oil
63
Pemex
95
China Energy Investment
107
Metals
2004 2019
Company # Company #
Arcelor
148 China Minmetals
112
Nippon Steel Corporation
182 Amer International Grp.
119
Norsk Hydro ASA
199 ArcelorMittal
120
JFE Holdings, Inc.
227 China Baowu Steel Group
149
Alcoa, Inc.
229 POSCO
171
2019
5
Insurance: Life, Health (stock)
2004 2019
Company # Company #
AXA
13 Ping An Insurance
29
ING Group
17 Allianz
45
Assicurazioni Generali
29 AXA
46
Aviva
42 China Life Insurance
51
MetLife
106 Japan Post Holdings
52
Trading
2004 2019
Company # Company #
E.ON
67 Trafigura Group
22
Mitsui
177 Mitsubishi
33
Marubeni
196 Itochu
65
Sinochem Corporation
270 Sinochem Group
88
Itochu Corporation
348 COFCO
134
Source: Author’s information based on Fortune Global 500 data, accessed annually, the most recent in July 2019.
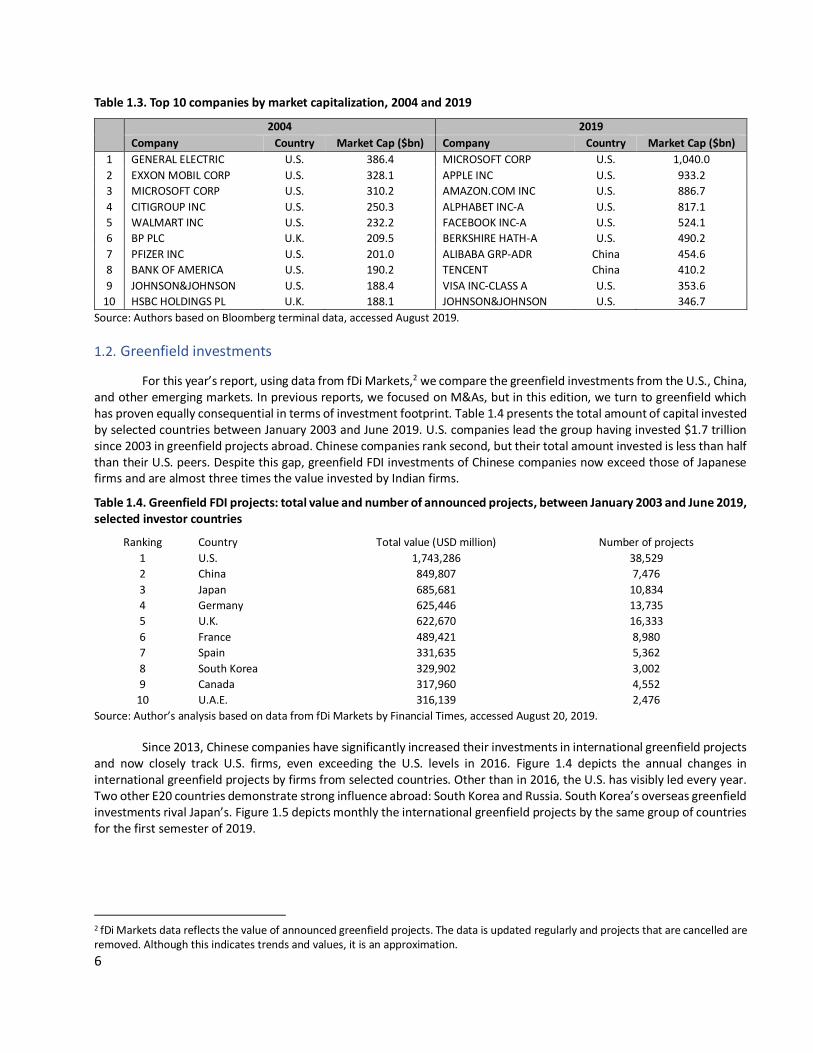
While the number of Chinese firms in the Fortune Global 500 is comparable to those from the U.S., the U.S. firms’ market capitalization is much higher, a consequence of the different ownership structures of U.S. and Chinese firms. A much higher proportion of U.S. firms is publicly listed, while nearly 50% of the Chinese firms are state-owned. The total market capitalization in many E20 markets such as Brazil, Russia, India and Mexico continue to substantially lag G-7 countries. The current total market capitalization and number of publicly traded firms in the U.S. far outpaces China. The U.S. maintains 105 publicly traded firms, while China, the country with the next highest number of publicly traded firms, holds 60. Total market capitalization follows a similar trend, with the U.S. at $15 trillion, followed by China with approximately $4 trillion. Figure 1.3 shows the aggregate market capitalization of publicly traded Fortune 500 companies for selected countries as drawn from the Forbes Global 2000.
Figure 1.3. Total market capitalization and number of public companies in 2019 Fortune Global 500 – selected countries
Source: Authors based on data from Bloomberg Intelligence, Capital IQ and Forbes Global 2000, accessed August 2019.
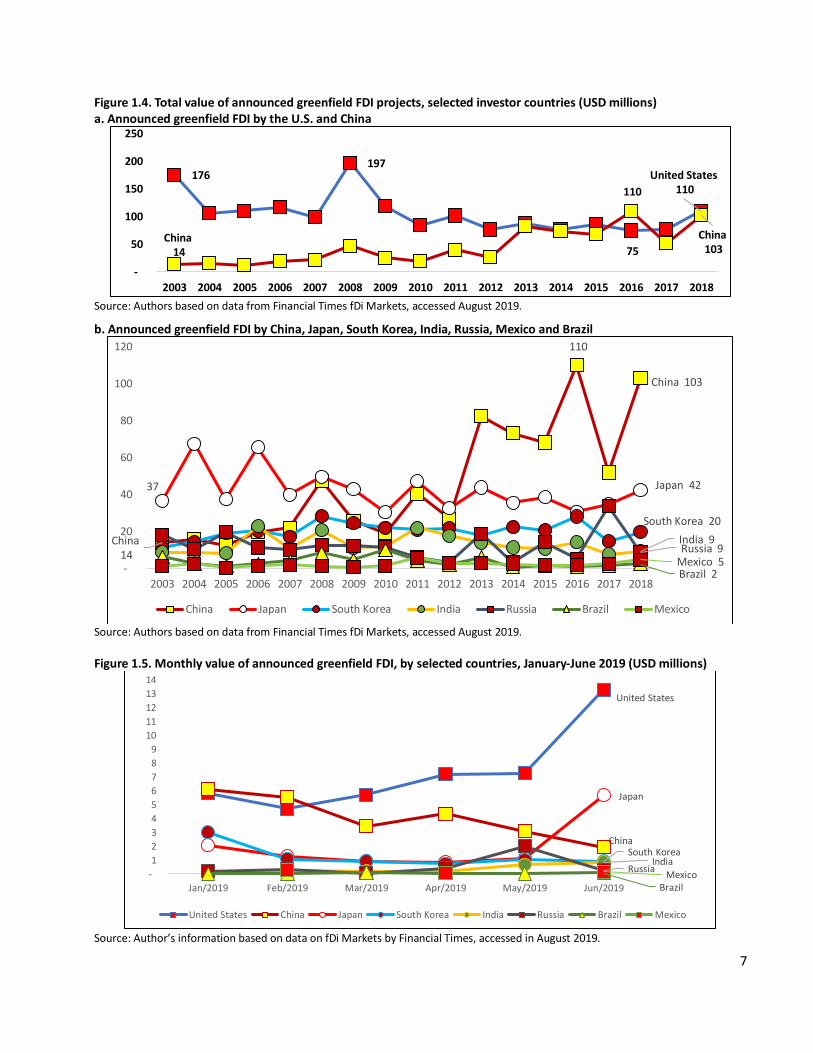
In 2004, the 10 largest companies by market capitalization were dominated Banking, Healthcare and Oil and Gas companies from the U.S. and the U.K. with no Chinese companies present. As of 2019, the 10 largest companies by market capitalization are mostly Tech companies from the U.S., and China’s Alibaba and Tencent. Banking and Healthcare are relegated to a secondary role, and Oil companies no longer rank. Table 1.3 compares the top 10 companies by market capitalization in 2004 and 2019.
0
20
40
60
80
100
120
2
4
6
8
10
12
14
16
Nu
mb
er o
f p
ub
licly
tra
ded
fir
ms
in 2
019
Fort
un
e G
lob
al 5
00USD
Tri
llio
ns
Total Market Capitalization Publicly traded companies
6
Table 1.3. Top 10 companies by market capitalization, 2004 and 2019
2004 2019
Company Country Market Cap ($bn) Company Country Market Cap ($bn)
1 GENERAL ELECTRIC U.S. 386.4 MICROSOFT CORP U.S. 1,040.0
2 EXXON MOBIL CORP U.S. 328.1 APPLE INC U.S. 933.2
3 MICROSOFT CORP U.S. 310.2 AMAZON.COM INC U.S. 886.7
4 CITIGROUP INC U.S. 250.3 ALPHABET INC-A U.S. 817.1
5 WALMART INC U.S. 232.2 FACEBOOK INC-A U.S. 524.1
6 BP PLC U.K. 209.5 BERKSHIRE HATH-A U.S. 490.2
7 PFIZER INC U.S. 201.0 ALIBABA GRP-ADR China 454.6
8 BANK OF AMERICA U.S. 190.2 TENCENT China 410.2
9 JOHNSON&JOHNSON U.S. 188.4 VISA INC-CLASS A U.S. 353.6
10 HSBC HOLDINGS PL U.K. 188.1 JOHNSON&JOHNSON U.S. 346.7
Source: Authors based on Bloomberg terminal data, accessed August 2019.
1.2. Greenfield investments
For this year’s report, using data from fDi Markets,2 we compare the greenfield investments from the U.S., China, and other emerging markets. In previous reports, we focused on M&As, but in this edition, we turn to greenfield which has proven equally consequential in terms of investment footprint. Table 1.4 presents the total amount of capital invested by selected countries between January 2003 and June 2019. U.S. companies lead the group having invested $1.7 trillion since 2003 in greenfield projects abroad. Chinese companies rank second, but their total amount invested is less than half than their U.S. peers. Despite this gap, greenfield FDI investments of Chinese companies now exceed those of Japanese firms and are almost three times the value invested by Indian firms.
Table 1.4. Greenfield FDI projects: total value and number of announced projects, between January 2003 and June 2019, selected investor countries
Source: Author’s analysis based on data from fDi Markets by Financial Times, accessed August 20, 2019.
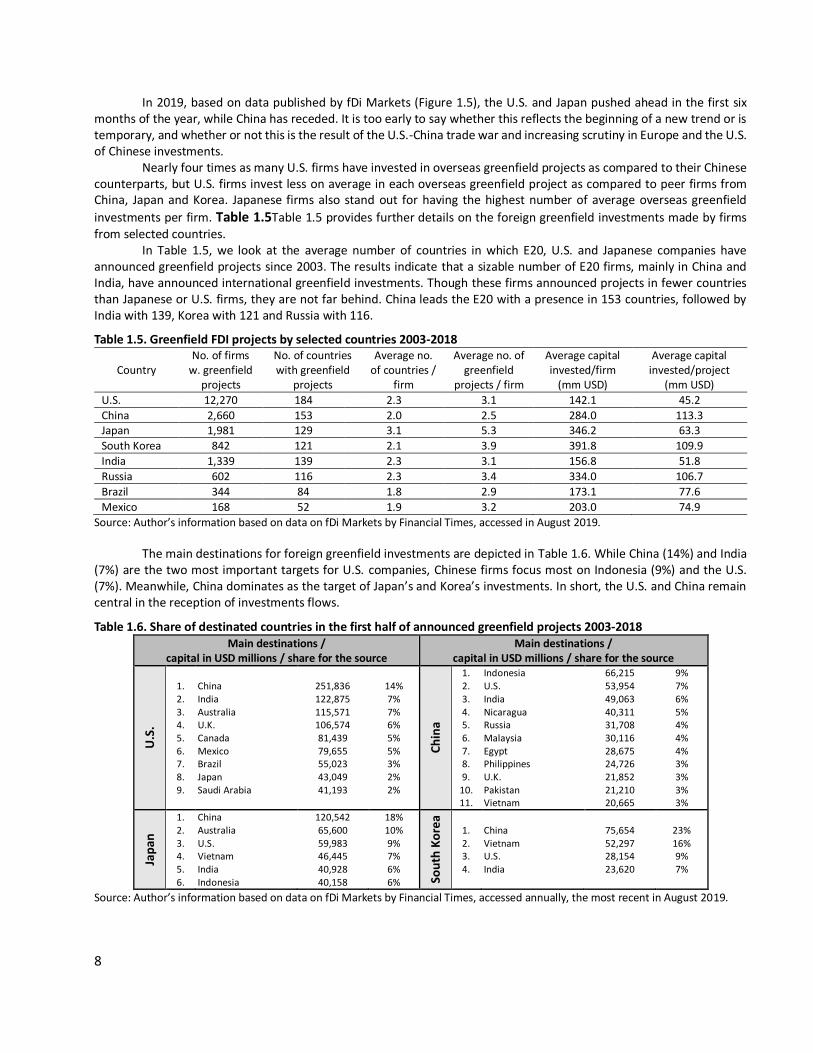
Since 2013, Chinese companies have significantly increased their investments in international greenfield projects and now closely track U.S. firms, even exceeding the U.S. levels in 2016. Figure 1.4 depicts the annual changes in international greenfield projects by firms from selected countries. Other than in 2016, the U.S. has visibly led every year. Two other E20 countries demonstrate strong influence abroad: South Korea and Russia. South Korea’s overseas greenfield investments rival Japan’s. Figure 1.5 depicts monthly the international greenfield projects by the same group of countries for the first semester of 2019.
2 fDi Markets data reflects the value of announced greenfield projects. The data is updated regularly and projects that are cancelled are removed. Although this indicates trends and values, it is an approximation.
Ranking Country Total value (USD million) Number of projects
1 U.S. 1,743,286 38,529
2 China 849,807 7,476
3 Japan 685,681 10,834
4 Germany 625,446 13,735
5 U.K. 622,670 16,333
6 France 489,421 8,980
7 Spain 331,635 5,362
8 South Korea 329,902 3,002
9 Canada 317,960 4,552
10 U.A.E. 316,139 2,476
7
Figure 1.4. Total value of announced greenfield FDI projects, selected investor countries (USD millions) a. Announced greenfield FDI by the U.S. and China
Source: Authors based on data from Financial Times fDi Markets, accessed August 2019.
b. Announced greenfield FDI by China, Japan, South Korea, India, Russia, Mexico and Brazil
Source: Authors based on data from Financial Times fDi Markets, accessed August 2019.
Figure 1.5. Monthly value of announced greenfield FDI, by selected countries, January-June 2019 (USD millions)
Source: Author’s information based on data on fDi Markets by Financial Times, accessed in August 2019.
176 197
75
United States110
China14
110
China103
-
50
100
150
200
250
2003 2004 2005 2006 2007 2008 2009 2010 2011 2012 2013 2014 2015 2016 2017 2018
China14
110
China 103
37 Japan 42
South Korea 20
India 9 Russia 9
Brazil 2 Mexico 5
-
20
40
60
80
100
120
2003 2004 2005 2006 2007 2008 2009 2010 2011 2012 2013 2014 2015 2016 2017 2018
China Japan South Korea India Russia Brazil Mexico
United States
China
Japan
South KoreaIndia
Russia
BrazilMexico -
1
2
3
4
5
6
7
8
9
10
11
12
13
14
Jan/2019 Feb/2019 Mar/2019 Apr/2019 May/2019 Jun/2019
United States China Japan South Korea India Russia Brazil Mexico
8
In 2019, based on data published by fDi Markets (Figure 1.5), the U.S. and Japan pushed ahead in the first six months of the year, while China has receded. It is too early to say whether this reflects the beginning of a new trend or is temporary, and whether or not this is the result of the U.S.-China trade war and increasing scrutiny in Europe and the U.S. of Chinese investments.
Nearly four times as many U.S. firms have invested in overseas greenfield projects as compared to their Chinese counterparts, but U.S. firms invest less on average in each overseas greenfield project as compared to peer firms from China, Japan and Korea. Japanese firms also stand out for having the highest number of average overseas greenfield
investments per firm. Table 1.5Table 1.5 provides further details on the foreign greenfield investments made by firms from selected countries.
In Table 1.5, we look at the average number of countries in which E20, U.S. and Japanese companies have announced greenfield projects since 2003. The results indicate that a sizable number of E20 firms, mainly in China and India, have announced international greenfield investments. Though these firms announced projects in fewer countries than Japanese or U.S. firms, they are not far behind. China leads the E20 with a presence in 153 countries, followed by India with 139, Korea with 121 and Russia with 116.
Table 1.5. Greenfield FDI projects by selected countries 2003-2018
Country No. of firms
w. greenfield projects
No. of countries with greenfield
projects
Average no. of countries /
firm
Average no. of greenfield
projects / firm
Average capital invested/firm
(mm USD)
Average capital invested/project
(mm USD)
U.S. 12,270 184 2.3 3.1 142.1 45.2
China 2,660 153 2.0 2.5 284.0 113.3 Japan 1,981 129 3.1 5.3 346.2 63.3
South Korea 842 121 2.1 3.9 391.8 109.9
India 1,339 139 2.3 3.1 156.8 51.8
Russia 602 116 2.3 3.4 334.0 106.7
Brazil 344 84 1.8 2.9 173.1 77.6
Mexico 168 52 1.9 3.2 203.0 74.9
Source: Author’s information based on data on fDi Markets by Financial Times, accessed in August 2019.
The main destinations for foreign greenfield investments are depicted in Table 1.6. While China (14%) and India (7%) are the two most important targets for U.S. companies, Chinese firms focus most on Indonesia (9%) and the U.S. (7%). Meanwhile, China dominates as the target of Japan’s and Korea’s investments. In short, the U.S. and China remain central in the reception of investments flows.
Table 1.6. Share of destinated countries in the first half of announced greenfield projects 2003-2018 Main destinations /
capital in USD millions / share for the source Main destinations /
capital in USD millions / share for the source
U.S
.
1. 2. 3. 4. 5. 6. 7. 8. 9.
China India Australia U.K. Canada Mexico Brazil Japan Saudi Arabia
251,836 122,875 115,571 106,574 81,439 79,655 55,023 43,049 41,193
14% 7% 7% 6% 5% 5% 3% 2% 2%
Ch
ina
1. 2. 3. 4. 5. 6. 7. 8. 9.
10. 11.
Indonesia U.S. India Nicaragua Russia Malaysia Egypt Philippines U.K. Pakistan Vietnam
66,215 53,954 49,063 40,311 31,708 30,116 28,675 24,726 21,852 21,210 20,665
9% 7% 6% 5% 4% 4% 4% 3% 3% 3% 3%
Jap
an
1. 2. 3. 4. 5. 6.
China Australia U.S. Vietnam India Indonesia
120,542 65,600 59,983 46,445 40,928 40,158
18% 10% 9% 7% 6% 6% So
uth
Ko
rea
1. 2. 3. 4.
China Vietnam U.S. India
75,654 52,297 28,154 23,620
23% 16% 9% 7%
Source: Author’s information based on data on fDi Markets by Financial Times, accessed annually, the most recent in August 2019.
Main destinations / capital in USD millions / share for the source
9
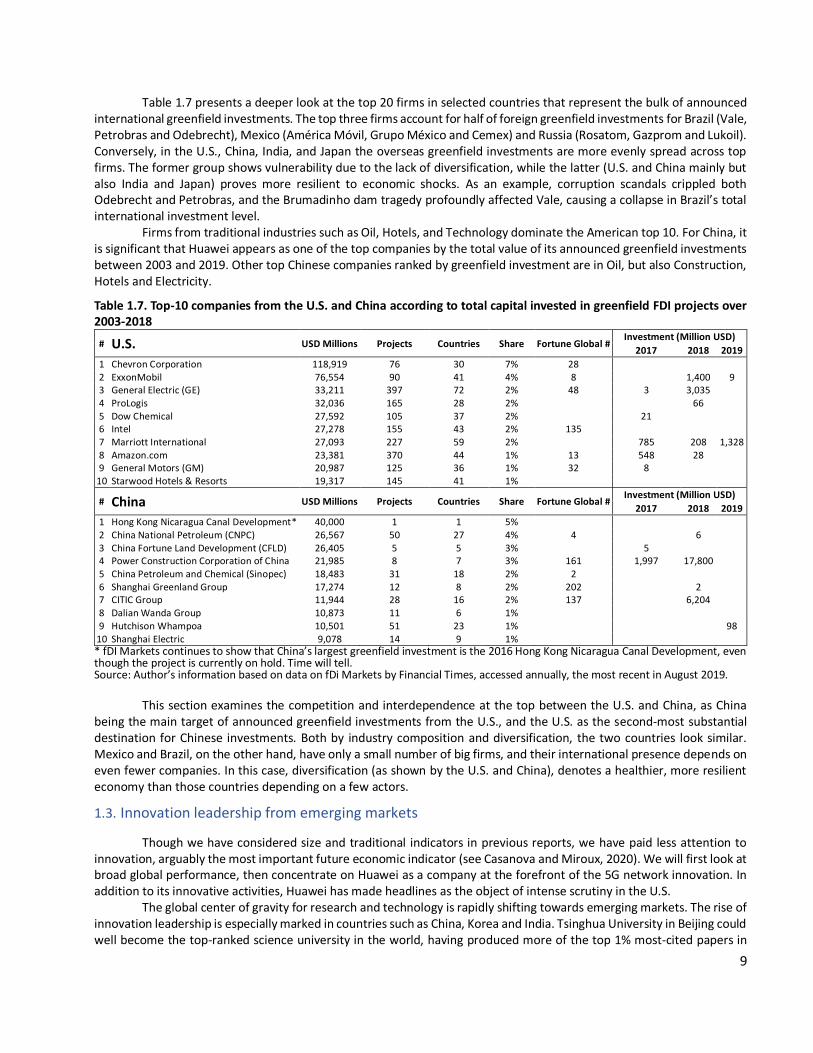
Table 1.7 presents a deeper look at the top 20 firms in selected countries that represent the bulk of announced international greenfield investments. The top three firms account for half of foreign greenfield investments for Brazil (Vale, Petrobras and Odebrecht), Mexico (América Móvil, Grupo México and Cemex) and Russia (Rosatom, Gazprom and Lukoil). Conversely, in the U.S., China, India, and Japan the overseas greenfield investments are more evenly spread across top firms. The former group shows vulnerability due to the lack of diversification, while the latter (U.S. and China mainly but also India and Japan) proves more resilient to economic shocks. As an example, corruption scandals crippled both Odebrecht and Petrobras, and the Brumadinho dam tragedy profoundly affected Vale, causing a collapse in Brazil’s total international investment level.
Firms from traditional industries such as Oil, Hotels, and Technology dominate the American top 10. For China, it is significant that Huawei appears as one of the top companies by the total value of its announced greenfield investments between 2003 and 2019. Other top Chinese companies ranked by greenfield investment are in Oil, but also Construction, Hotels and Electricity.
Table 1.7. Top-10 companies from the U.S. and China according to total capital invested in greenfield FDI projects over 2003-2018
# U.S. USD Millions Projects Countries Share Fortune Global # Investment (Million USD)
2017 2018 2019
1 Chevron Corporation 118,919 76 30 7% 28 2 ExxonMobil 76,554 90 41 4% 8 1,400 9 3 General Electric (GE) 33,211 397 72 2% 48 3 3,035 4 ProLogis 32,036 165 28 2% 66 5 Dow Chemical 27,592 105 37 2% 21 6 Intel 27,278 155 43 2% 135 7 Marriott International 27,093 227 59 2% 785 208 1,328 8 Amazon.com 23,381 370 44 1% 13 548 28 9 General Motors (GM) 20,987 125 36 1% 32 8
10 Starwood Hotels & Resorts 19,317 145 41 1%
# China USD Millions Projects Countries Share Fortune Global # Investment (Million USD)
2017 2018 2019
1 Hong Kong Nicaragua Canal Development* 40,000 1 1 5% 2 China National Petroleum (CNPC) 26,567 50 27 4% 4 6 3 China Fortune Land Development (CFLD) 26,405 5 5 3% 5 4 Power Construction Corporation of China 21,985 8 7 3% 161 1,997 17,800 5 China Petroleum and Chemical (Sinopec) 18,483 31 18 2% 2 6 Shanghai Greenland Group 17,274 12 8 2% 202 2 7 CITIC Group 11,944 28 16 2% 137 6,204 8 Dalian Wanda Group 10,873 11 6 1% 9 Hutchison Whampoa 10,501 51 23 1% 98
10 Shanghai Electric 9,078 14 9 1% * fDI Markets continues to show that China’s largest greenfield investment is the 2016 Hong Kong Nicaragua Canal Development, even though the project is currently on hold. Time will tell. Source: Author’s information based on data on fDi Markets by Financial Times, accessed annually, the most recent in August 2019.
This section examines the competition and interdependence at the top between the U.S. and China, as China being the main target of announced greenfield investments from the U.S., and the U.S. as the second-most substantial destination for Chinese investments. Both by industry composition and diversification, the two countries look similar. Mexico and Brazil, on the other hand, have only a small number of big firms, and their international presence depends on even fewer companies. In this case, diversification (as shown by the U.S. and China), denotes a healthier, more resilient economy than those countries depending on a few actors.
1.3. Innovation leadership from emerging markets
Though we have considered size and traditional indicators in previous reports, we have paid less attention to innovation, arguably the most important future economic indicator (see Casanova and Miroux, 2020). We will first look at broad global performance, then concentrate on Huawei as a company at the forefront of the 5G network innovation. In addition to its innovative activities, Huawei has made headlines as the object of intense scrutiny in the U.S.
The global center of gravity for research and technology is rapidly shifting towards emerging markets. The rise of innovation leadership is especially marked in countries such as China, Korea and India. Tsinghua University in Beijing could well become the top-ranked science university in the world, having produced more of the top 1% most-cited papers in
10
mathematics and computing, as well as a greater share of the 10% most-cited papers in Science, Technology, Engineering and Mathematics (STEM) than any other university in the world (Marginson, 2019).
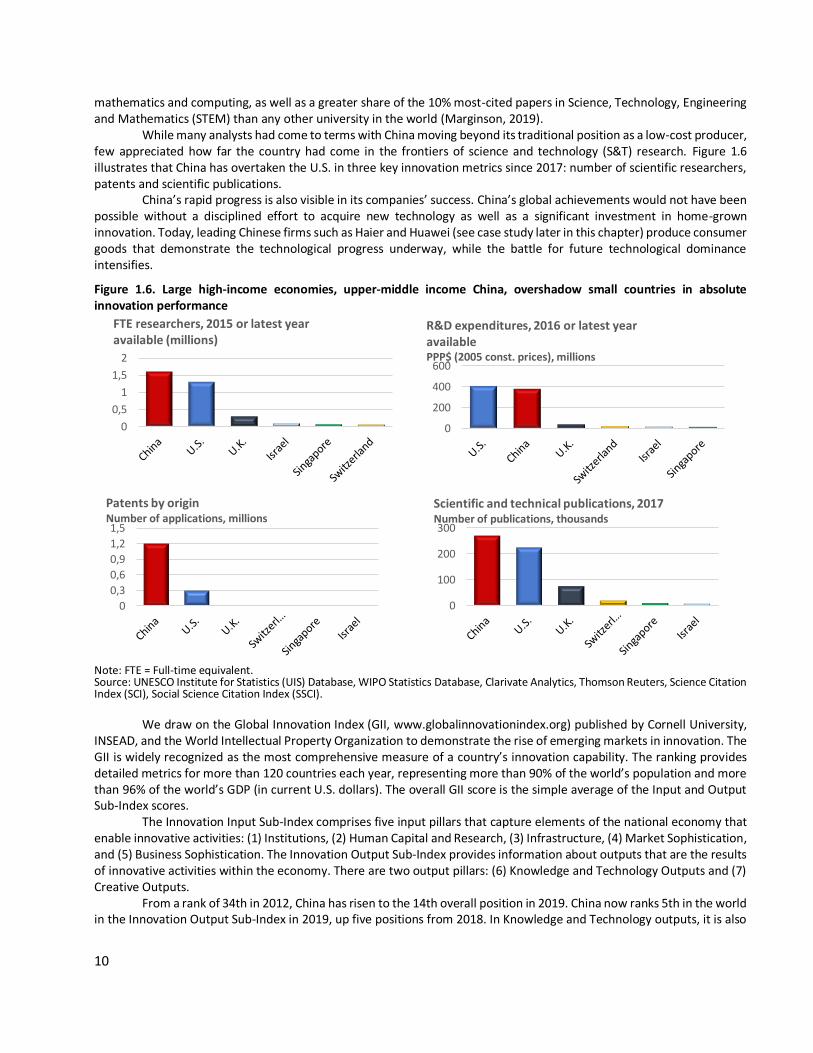
While many analysts had come to terms with China moving beyond its traditional position as a low-cost producer, few appreciated how far the country had come in the frontiers of science and technology (S&T) research. Figure 1.6 illustrates that China has overtaken the U.S. in three key innovation metrics since 2017: number of scientific researchers, patents and scientific publications.
China’s rapid progress is also visible in its companies’ success. China’s global achievements would not have been possible without a disciplined effort to acquire new technology as well as a significant investment in home-grown innovation. Today, leading Chinese firms such as Haier and Huawei (see case study later in this chapter) produce consumer goods that demonstrate the technological progress underway, while the battle for future technological dominance intensifies.
Figure 1.6. Large high-income economies, upper-middle income China, overshadow small countries in absolute innovation performance
Note: FTE = Full-time equivalent. Source: UNESCO Institute for Statistics (UIS) Database, WIPO Statistics Database, Clarivate Analytics, Thomson Reuters, Science Citation Index (SCI), Social Science Citation Index (SSCI).
We draw on the Global Innovation Index (GII, www.globalinnovationindex.org) published by Cornell University, INSEAD, and the World Intellectual Property Organization to demonstrate the rise of emerging markets in innovation. The GII is widely recognized as the most comprehensive measure of a country’s innovation capability. The ranking provides detailed metrics for more than 120 countries each year, representing more than 90% of the world’s population and more than 96% of the world’s GDP (in current U.S. dollars). The overall GII score is the simple average of the Input and Output Sub-Index scores.
The Innovation Input Sub-Index comprises five input pillars that capture elements of the national economy that enable innovative activities: (1) Institutions, (2) Human Capital and Research, (3) Infrastructure, (4) Market Sophistication, and (5) Business Sophistication. The Innovation Output Sub-Index provides information about outputs that are the results of innovative activities within the economy. There are two output pillars: (6) Knowledge and Technology Outputs and (7) Creative Outputs.
From a rank of 34th in 2012, China has risen to the 14th overall position in 2019. China now ranks 5th in the world in the Innovation Output Sub-Index in 2019, up five positions from 2018. In Knowledge and Technology outputs, it is also
0
0,5
1
1,5
2
FTE researchers, 2015 or latest year available (millions)
0
200
400
600
R&D expenditures, 2016 or latest year available PPP$ (2005 const. prices), millions
0
0,3
0,6
0,9
1,2
1,5
Patents by originNumber of applications, millions
0
100
200
300
Scientific and technical publications, 2017Number of publications, thousands
11
5th in the world, while in Creative Outputs it ranks 12th. It performs at an impressive level on many of the input dimensions as well, ranking 14th on Business Sophistication and 21st on Market Sophistication.
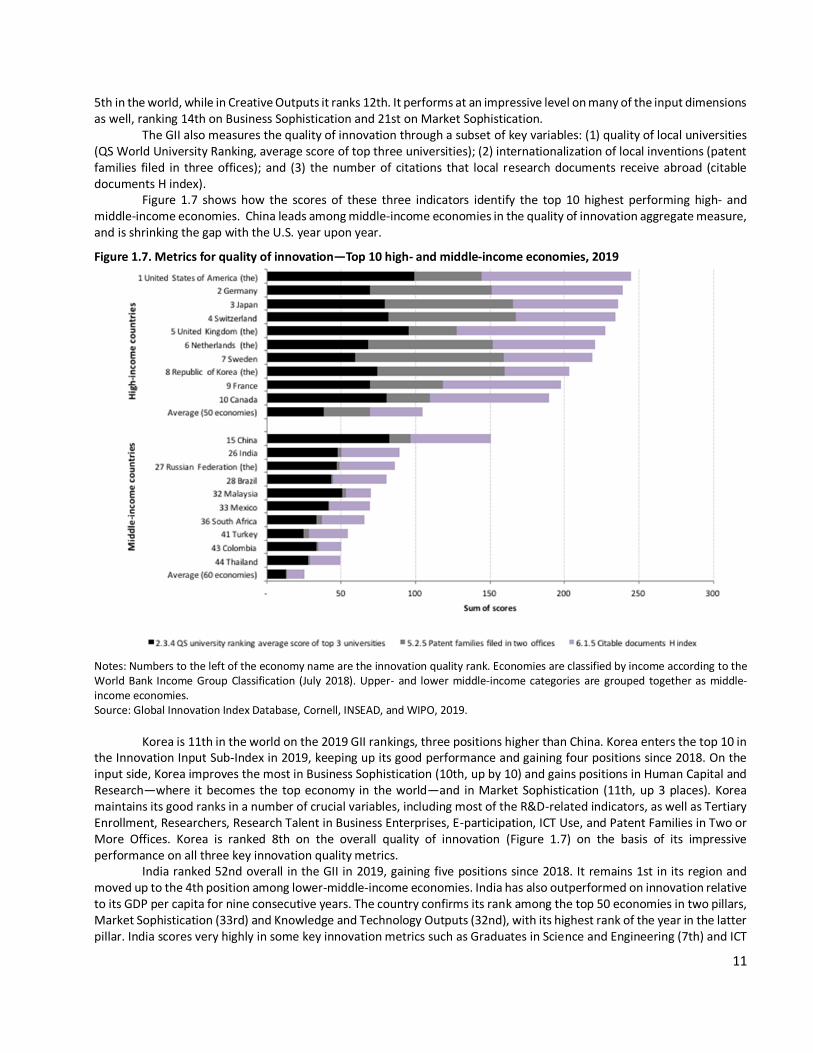
The GII also measures the quality of innovation through a subset of key variables: (1) quality of local universities (QS World University Ranking, average score of top three universities); (2) internationalization of local inventions (patent families filed in three offices); and (3) the number of citations that local research documents receive abroad (citable documents H index).
Figure 1.7 shows how the scores of these three indicators identify the top 10 highest performing high- and middle-income economies. China leads among middle-income economies in the quality of innovation aggregate measure, and is shrinking the gap with the U.S. year upon year.
Figure 1.7. Metrics for quality of innovation—Top 10 high- and middle-income economies, 2019
Notes: Numbers to the left of the economy name are the innovation quality rank. Economies are classified by income according to the World Bank Income Group Classification (July 2018). Upper- and lower middle-income categories are grouped together as middle-income economies. Source: Global Innovation Index Database, Cornell, INSEAD, and WIPO, 2019.
Korea is 11th in the world on the 2019 GII rankings, three positions higher than China. Korea enters the top 10 in the Innovation Input Sub-Index in 2019, keeping up its good performance and gaining four positions since 2018. On the input side, Korea improves the most in Business Sophistication (10th, up by 10) and gains positions in Human Capital and Research—where it becomes the top economy in the world—and in Market Sophistication (11th, up 3 places). Korea maintains its good ranks in a number of crucial variables, including most of the R&D-related indicators, as well as Tertiary Enrollment, Researchers, Research Talent in Business Enterprises, E-participation, ICT Use, and Patent Families in Two or More Offices. Korea is ranked 8th on the overall quality of innovation (Figure 1.7) on the basis of its impressive performance on all three key innovation quality metrics.
India ranked 52nd overall in the GII in 2019, gaining five positions since 2018. It remains 1st in its region and moved up to the 4th position among lower-middle-income economies. India has also outperformed on innovation relative to its GDP per capita for nine consecutive years. The country confirms its rank among the top 50 economies in two pillars, Market Sophistication (33rd) and Knowledge and Technology Outputs (32nd), with its highest rank of the year in the latter pillar. India scores very highly in some key innovation metrics such as Graduates in Science and Engineering (7th) and ICT
12
Services Exports (as % of total trade) (1st). India ranks 2nd in Quality of Innovation (see Figure 1.7) among middle-income economies for the fourth consecutive year, with particular strength in Quality of Scientific Publications (2nd) and in the Quality of Universities (3rd), notably due to the performance of its top three universities: the Indian Institute of Technology (Delhi and Bombay) and the Indian Institute of Science Bangalore. Brazil retains its 4th place among middle-income countries, and 28th globally.
The GII presents a detailed analysis of the innovation performance of more than 120 nations around the world, most of them emerging markets. From the selected results described above, it is evident that emerging markets are increasingly leading on innovation. While China’s and Korea’s innovation leadership have been exemplary in recent years, similar trends are visible in many of the other E20 nations. We now present a short case study on one of the most innovative companies from China, Huawei.
1.4. Case Study: Huawei, a 5G champion3
In this last section, we take a deeper look at one of the companies at the heart of the U.S.-China trade dispute, Huawei. Headquartered in Shenzhen, China, Huawei Investment & Holding Co., Ltd. was founded in 1987 by Ren Zhengfei. It provides solutions in information and communication technology (ICT) for telecom carriers, companies and consumers. With sales of $105.2 billion and gross profits of $40.4 billion in 2018. Huawei is the No. 2 Global Communications Equipment company by sales, ranking highly in each of its component industries of data networking equipment, mobile phones and telecommunication equipment, (4th, 1st, and 3rd respectively). The company now ranks fifth globally in the 2018 EU Industrial R&D Investment Scoreboard by total investments in R&D after Samsung, Alphabet, Volkswagen and Microsoft, but ahead of Intel and Apple. Huawei entered the Fortune Global 500 in 2009 in the 397th position and in 2019 was number 61. Huawei's strategy relies heavily on internationalization of R&D (Casanova and Miroux, OECD Business Insights, 2017). The company opened its first international R&D center in 1999 in Bengaluru, India, and has grown to 21 centers established in the U.S., Canada, Japan, and Western Europe. Huawei is now a major supplier for most of the 35 biggest telecom operators.
Huawei currently provides products and services in Business to Consumer (B2C) and Business to Business (B2B) models. B2C covers production of devices like smartphones, tablets, home gadgets, and wearable devices; as well as application development. Their B2B model supplies structure and network technologies, and support. According to S&P Capital IQ (2019), in the last 10 years (2009-2018) the company has almost doubled its number of employees and increased its assets and revenues almost five times. In 2009, the company maintained 95,000 employees and held $20 billion worth of assets. As of 2018, this figure has jumped to 180,000 employees and $97 billion worth of assets (S&P Capital IQ).
Huawei has a presence in more than 170 countries and regions. According to the company’s 2018 annual report, 24.3% of its revenues come from Europe, Middle East and Africa. Some reports state that Huawei has built 70 of African’s 4G networks and is about to build a 5G one in South Africa. Total net revenue in 2018 was over $104 trillion, while net income was slightly over $8.6 trillion. Compared to 2009 figures, this is a significant increase from $21 trillion in revenue and $2.6 trillion in net income, respectively (S&P Capital IQ).
Unusually, the firm is owned by its 188,000 employees.4 The 115 representatives who form the Representatives’ Commission are elected by shareholding employees, who in turn are responsible for choosing the Chairman of the Board and the remaining 16 board directors. This Board of Directors elects three executive directors and four deputy chairmen, three of whom take turns serving as the company's rotating chairman. Forty percent of the employees are in R&D activities.
Company history and internationalization Huawei began as a seller of private branch exchanges (PBX) and evolved into a global giant in telecommunications
equipment and smartphones. The firm’s history can be divided into three stages (Muralidhara and Faheem, 2019 & Li Sun, 2009). The first stage, from 1987 to 1992, marks its consolidation in, and dominance of, the Chinese market for low-cost PBX products and motherboards. Unlike other potential rival companies, which focused their business in urban markets,
3 The contributions of Mariana Rodríguez Díaz, Julián Díaz Costa, interns at EMI during the summer of 2019 and students at Universidad de los Andes in Colombia is gratefully acknowledged. 4 Employees own a kind of virtual Huawei stock, which they cannot transfer to others. If the employee leaves the
company when she has not reached the necessary seniority level to keep the shares, Huawei buys them back (Zhong, R.
2019).
1.4. Case Study: Huawei, a 5G champion
13
Huawei started in the periphery of China focused on rural areas where it faced little competition. Once it had secured its business in the Chinese countryside and learnt by doing, the company expanded into cities and, only then, the entire country. Unlike other Chinese telecom firms, which typically acted as agents of Western companies, Huawei invested heavily in its own R&D from the beginning, distributing its products into the growing Chinese market. These novel strategies combined with intelligent marketing campaigns gave Huawei a dominant position at home within a short period of time, overtaking leading competitors such as French Alcatel and Chinese Shanghai Bell.
During the second stage, from 1993 to 2000, Huawei experienced significant economic growth alongside the growth of the Chinese economy. China was liberalizing its economic policy, and the Chinese government’s demand for electronic products was increasing. This environment, combined with significant R&D investments, enabled Huawei to solidify its dominance beyond its earliest market segment of selling telecom products in Chinese rural areas at low cost. For instance, in 1997, Huawei took advantage of China’s booming mobile cellular network and launched wireless Global System for Mobile Communications (GSM)-based solutions, which significantly drove down the sales price of GSM equipment in China.
During this period, Huawei began to expand internationally. In 1997, it signed its first contract with the Hong Kong-based firm Hutchison Telecommunications. Huawei won the contract by offering Hutchison faster and cheaper implementation of number portability than established suppliers could offer.
That same year, Huawei formed a joint venture with Beto Corporation, a Russian manufacturer of telecommunication equipment, to assemble Huawei’s switches in Russia. This partnership enabled Huawei to benefit from Beto’s assets, such as its sales force in the Russian market and its relationships with government officials. When expanding to international markets, Huawei followed a similar approach to its domestic strategy, targeting markets with high demand for low-cost products and limited competition. After entering Hong Kong and neighboring Russia, the company expanded into emerging economies such as Algeria, India, Vietnam, as well as setting up an R&D center in Bengaluru, India in 1999. Notwithstanding these forays abroad, Huawei’s expansion still relied on strong growth in China. For instance, in 1999 the company launched its first digital product, access servers. In only one year, the company supplied 70% of all newly installed access servers in China.
Later, the expansion moved to more competitive markets such as Europe and Australia. By 2001, the third stage of the company’s globalization process had begun, as China gained access to the World Trade Organization (WTO) and Huawei entered the U.S. Following its “continuous customer-centric innovation and win-win cooperation” strategy, Huawei expanded its research centers to the U.S., Canada, Japan, and Western Europe, establishing 21 R&D centers and 36 joint innovation centers worldwide.
By 2004, Huawei’s low prices and high-end innovations had proved attractive in Europe. The Dutch firm Telfort wanted to deploy a 3G network but lacked the space to house the necessary equipment at its base stations. Huawei created a new base station that could be extended in two parts, needed little space to install, and was cheaper to run than existing alternatives. In just a few months, the companies sealed a 10-year contract worth 230 million euros. This was Huawei’s entry point into Europe, followed by additional contracts in Germany and France.
The company also entered the U.S. in 2001, pricing its products in the U.S. market 30% lower than Cisco’s. As major U.S. firms recognized the threat that Huawei posed to their business, they fought back, limiting Huawei’s expansion in the market (see Box 1.1).
Despite the complications in entering the U.S., Huawei made inroads in the 3G market. In 2002, the company reached cross-licensing agreements with Ericsson and Nokia, the main patent holders of Wide-Band Code Division Multiple Access (WCDMA). However, it was not until 2004 that Huawei entered the cell phone business with its first 3G mobile phone.
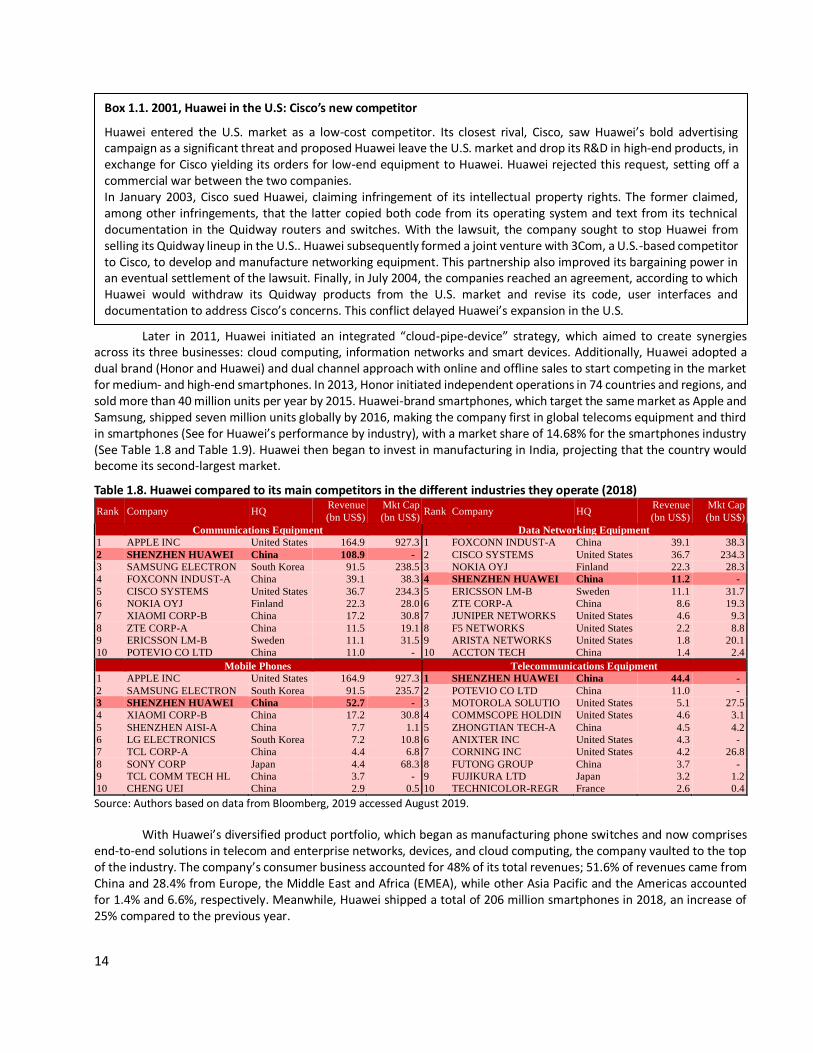
14
Later in 2011, Huawei initiated an integrated “cloud-pipe-device” strategy, which aimed to create synergies
across its three businesses: cloud computing, information networks and smart devices. Additionally, Huawei adopted a dual brand (Honor and Huawei) and dual channel approach with online and offline sales to start competing in the market for medium- and high-end smartphones. In 2013, Honor initiated independent operations in 74 countries and regions, and sold more than 40 million units per year by 2015. Huawei-brand smartphones, which target the same market as Apple and Samsung, shipped seven million units globally by 2016, making the company first in global telecoms equipment and third in smartphones (See for Huawei’s performance by industry), with a market share of 14.68% for the smartphones industry (See Table 1.8 and Table 1.9). Huawei then began to invest in manufacturing in India, projecting that the country would become its second-largest market.
Table 1.8. Huawei compared to its main competitors in the different industries they operate (2018)
Rank Company HQ Revenue
(bn US$)
Mkt Cap
(bn US$) Rank Company HQ
Revenue
(bn US$)
Mkt Cap
(bn US$)
Communications Equipment Data Networking Equipment
1 APPLE INC United States 164.9 927.3 1 FOXCONN INDUST-A China 39.1 38.3
2 SHENZHEN HUAWEI China 108.9 - 2 CISCO SYSTEMS United States 36.7 234.3
3 SAMSUNG ELECTRON South Korea 91.5 238.5 3 NOKIA OYJ Finland 22.3 28.3
4 FOXCONN INDUST-A China 39.1 38.3 4 SHENZHEN HUAWEI China 11.2 -
5 CISCO SYSTEMS United States 36.7 234.3 5 ERICSSON LM-B Sweden 11.1 31.7
6 NOKIA OYJ Finland 22.3 28.0 6 ZTE CORP-A China 8.6 19.3
7 XIAOMI CORP-B China 17.2 30.8 7 JUNIPER NETWORKS United States 4.6 9.3
8 ZTE CORP-A China 11.5 19.1 8 F5 NETWORKS United States 2.2 8.8
9 ERICSSON LM-B Sweden 11.1 31.5 9 ARISTA NETWORKS United States 1.8 20.1
10 POTEVIO CO LTD China 11.0 - 10 ACCTON TECH China 1.4 2.4
Mobile Phones Telecommunications Equipment
1 APPLE INC United States 164.9 927.3 1 SHENZHEN HUAWEI China 44.4 -
2 SAMSUNG ELECTRON South Korea 91.5 235.7 2 POTEVIO CO LTD China 11.0 -
3 SHENZHEN HUAWEI China 52.7 - 3 MOTOROLA SOLUTIO United States 5.1 27.5
4 XIAOMI CORP-B China 17.2 30.8 4 COMMSCOPE HOLDIN United States 4.6 3.1
5 SHENZHEN AISI-A China 7.7 1.1 5 ZHONGTIAN TECH-A China 4.5 4.2
6 LG ELECTRONICS South Korea 7.2 10.8 6 ANIXTER INC United States 4.3 -
7 TCL CORP-A China 4.4 6.8 7 CORNING INC United States 4.2 26.8
8 SONY CORP Japan 4.4 68.3 8 FUTONG GROUP China 3.7 -
9 TCL COMM TECH HL China 3.7 - 9 FUJIKURA LTD Japan 3.2 1.2
10 CHENG UEI China 2.9 0.5 10 TECHNICOLOR-REGR France 2.6 0.4
Source: Authors based on data from Bloomberg, 2019 accessed August 2019.
With Huawei’s diversified product portfolio, which began as manufacturing phone switches and now comprises end-to-end solutions in telecom and enterprise networks, devices, and cloud computing, the company vaulted to the top of the industry. The company’s consumer business accounted for 48% of its total revenues; 51.6% of revenues came from China and 28.4% from Europe, the Middle East and Africa (EMEA), while other Asia Pacific and the Americas accounted for 1.4% and 6.6%, respectively. Meanwhile, Huawei shipped a total of 206 million smartphones in 2018, an increase of 25% compared to the previous year.
Box 1.1. 2001, Huawei in the U.S: Cisco’s new competitor
Huawei entered the U.S. market as a low-cost competitor. Its closest rival, Cisco, saw Huawei’s bold advertising campaign as a significant threat and proposed Huawei leave the U.S. market and drop its R&D in high-end products, in exchange for Cisco yielding its orders for low-end equipment to Huawei. Huawei rejected this request, setting off a commercial war between the two companies. In January 2003, Cisco sued Huawei, claiming infringement of its intellectual property rights. The former claimed, among other infringements, that the latter copied both code from its operating system and text from its technical documentation in the Quidway routers and switches. With the lawsuit, the company sought to stop Huawei from selling its Quidway lineup in the U.S.. Huawei subsequently formed a joint venture with 3Com, a U.S.-based competitor to Cisco, to develop and manufacture networking equipment. This partnership also improved its bargaining power in an eventual settlement of the lawsuit. Finally, in July 2004, the companies reached an agreement, according to which Huawei would withdraw its Quidway products from the U.S. market and revise its code, user interfaces and documentation to address Cisco’s concerns. This conflict delayed Huawei’s expansion in the U.S.
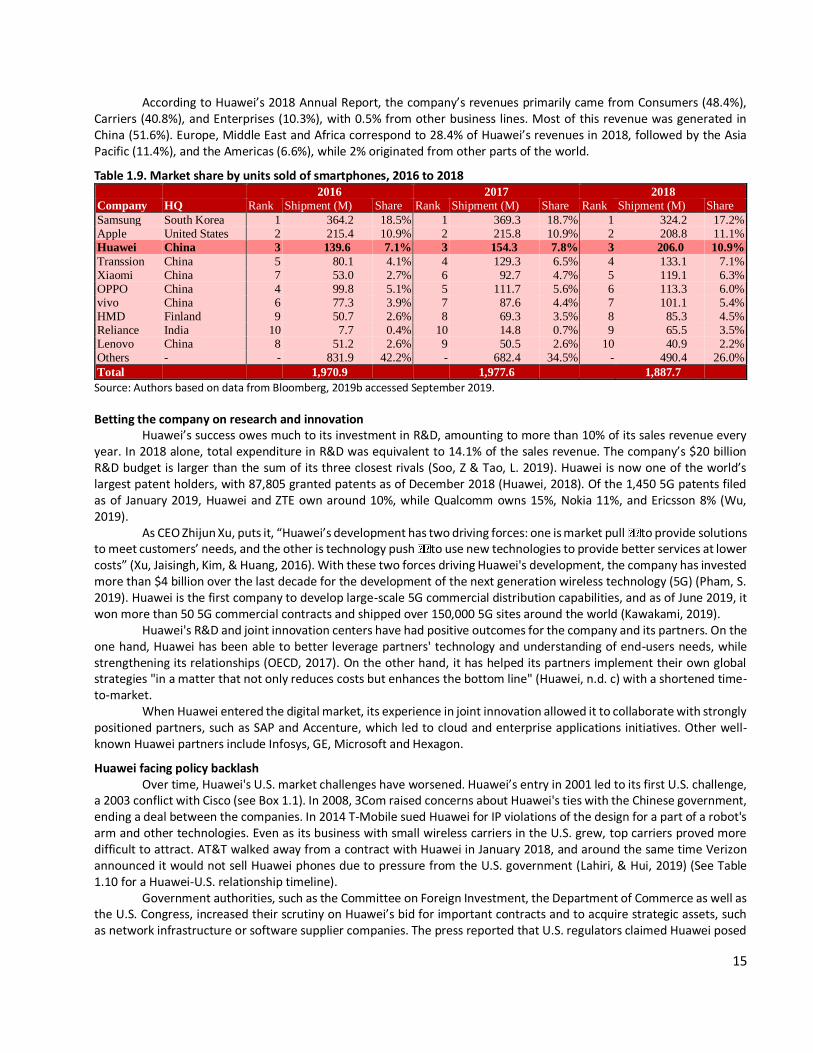
15
According to Huawei’s 2018 Annual Report, the company’s revenues primarily came from Consumers (48.4%), Carriers (40.8%), and Enterprises (10.3%), with 0.5% from other business lines. Most of this revenue was generated in China (51.6%). Europe, Middle East and Africa correspond to 28.4% of Huawei’s revenues in 2018, followed by the Asia Pacific (11.4%), and the Americas (6.6%), while 2% originated from other parts of the world.
Table 1.9. Market share by units sold of smartphones, 2016 to 2018 2016 2017 2018
Company HQ Rank Shipment (M) Share Rank Shipment (M) Share Rank Shipment (M) Share
Samsung South Korea 1 364.2 18.5% 1 369.3 18.7% 1 324.2 17.2% Apple United States 2 215.4 10.9% 2 215.8 10.9% 2 208.8 11.1% Huawei China 3 139.6 7.1% 3 154.3 7.8% 3 206.0 10.9%
Transsion China 5 80.1 4.1% 4 129.3 6.5% 4 133.1 7.1% Xiaomi China 7 53.0 2.7% 6 92.7 4.7% 5 119.1 6.3% OPPO China 4 99.8 5.1% 5 111.7 5.6% 6 113.3 6.0% vivo China 6 77.3 3.9% 7 87.6 4.4% 7 101.1 5.4% HMD Finland 9 50.7 2.6% 8 69.3 3.5% 8 85.3 4.5% Reliance India 10 7.7 0.4% 10 14.8 0.7% 9 65.5 3.5% Lenovo China 8 51.2 2.6% 9 50.5 2.6% 10 40.9 2.2% Others - - 831.9 42.2% - 682.4 34.5% - 490.4 26.0%
Total 1,970.9 1,977.6 1,887.7
Source: Authors based on data from Bloomberg, 2019b accessed September 2019.
Betting the company on research and innovation Huawei’s success owes much to its investment in R&D, amounting to more than 10% of its sales revenue every
year. In 2018 alone, total expenditure in R&D was equivalent to 14.1% of the sales revenue. The company’s $20 billion R&D budget is larger than the sum of its three closest rivals (Soo, Z & Tao, L. 2019). Huawei is now one of the world’s largest patent holders, with 87,805 granted patents as of December 2018 (Huawei, 2018). Of the 1,450 5G patents filed as of January 2019, Huawei and ZTE own around 10%, while Qualcomm owns 15%, Nokia 11%, and Ericsson 8% (Wu, 2019).
As CEO Zhijun Xu, puts it, “Huawei’s development has two driving forces: one is market pull to provide solutions to meet customers’ needs, and the other is technology push to use new technologies to provide better services at lower costs” (Xu, Jaisingh, Kim, & Huang, 2016). With these two forces driving Huawei's development, the company has invested more than $4 billion over the last decade for the development of the next generation wireless technology (5G) (Pham, S. 2019). Huawei is the first company to develop large-scale 5G commercial distribution capabilities, and as of June 2019, it won more than 50 5G commercial contracts and shipped over 150,000 5G sites around the world (Kawakami, 2019).
Huawei's R&D and joint innovation centers have had positive outcomes for the company and its partners. On the one hand, Huawei has been able to better leverage partners' technology and understanding of end-users needs, while strengthening its relationships (OECD, 2017). On the other hand, it has helped its partners implement their own global strategies "in a matter that not only reduces costs but enhances the bottom line" (Huawei, n.d. c) with a shortened time-to-market.
When Huawei entered the digital market, its experience in joint innovation allowed it to collaborate with strongly positioned partners, such as SAP and Accenture, which led to cloud and enterprise applications initiatives. Other well-known Huawei partners include Infosys, GE, Microsoft and Hexagon.
Huawei facing policy backlash Over time, Huawei's U.S. market challenges have worsened. Huawei’s entry in 2001 led to its first U.S. challenge,
a 2003 conflict with Cisco (see Box 1.1). In 2008, 3Com raised concerns about Huawei's ties with the Chinese government, ending a deal between the companies. In 2014 T-Mobile sued Huawei for IP violations of the design for a part of a robot's arm and other technologies. Even as its business with small wireless carriers in the U.S. grew, top carriers proved more difficult to attract. AT&T walked away from a contract with Huawei in January 2018, and around the same time Verizon announced it would not sell Huawei phones due to pressure from the U.S. government (Lahiri, & Hui, 2019) (See Table 1.10 for a Huawei-U.S. relationship timeline).
Government authorities, such as the Committee on Foreign Investment, the Department of Commerce as well as the U.S. Congress, increased their scrutiny on Huawei’s bid for important contracts and to acquire strategic assets, such as network infrastructure or software supplier companies. The press reported that U.S. regulators claimed Huawei posed
Government authorities, such as the Committee on Foreign Investment, the Department of Commerce as well as the U.S. Congress, increased their scrutiny on Huawei’s bid for important contracts and to acquire strategic assets, such as network infrastructure or software supplier companies. The press reported that U.S. regulators claimed Huawei posed a national security risk, arguing the company’s operations in the U.S. could be used for espionage by the Chinese government.
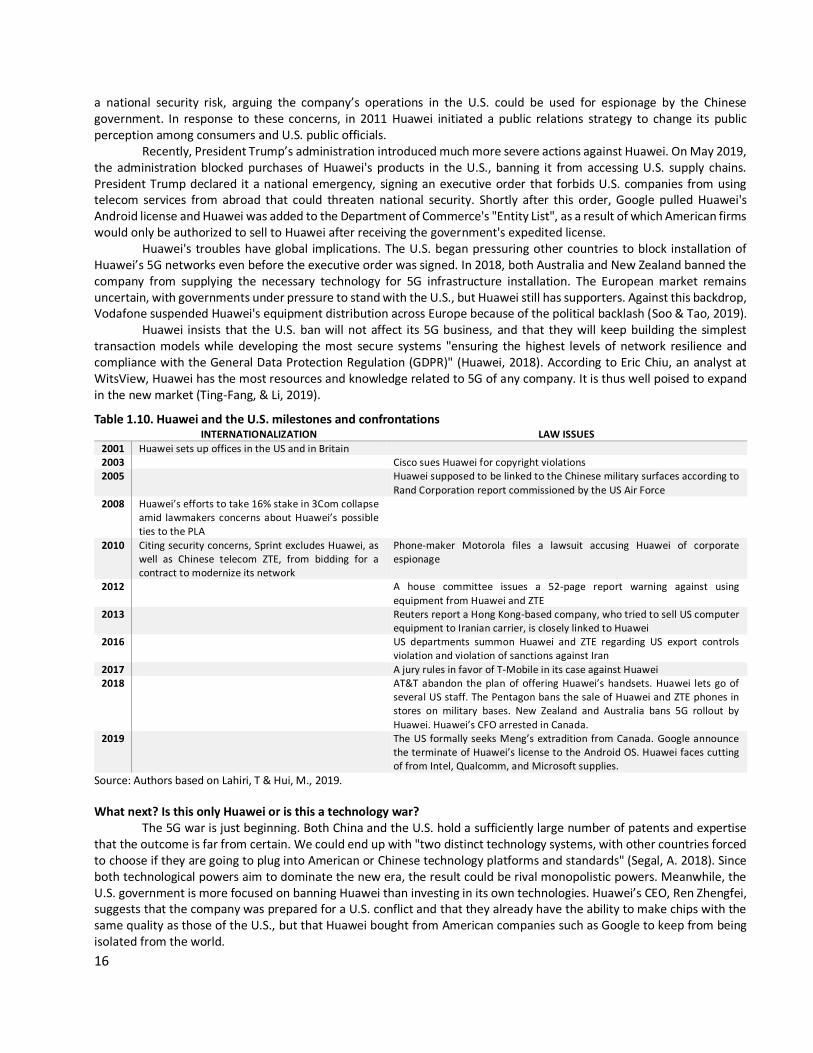
16
a national security risk, arguing the company’s operations in the U.S. could be used for espionage by the Chinese government. In response to these concerns, in 2011 Huawei initiated a public relations strategy to change its public perception among consumers and U.S. public officials.
Recently, President Trump’s administration introduced much more severe actions against Huawei. On May 2019, the administration blocked purchases of Huawei's products in the U.S., banning it from accessing U.S. supply chains. President Trump declared it a national emergency, signing an executive order that forbids U.S. companies from using telecom services from abroad that could threaten national security. Shortly after this order, Google pulled Huawei's Android license and Huawei was added to the Department of Commerce's "Entity List", as a result of which American firms would only be authorized to sell to Huawei after receiving the government's expedited license.
Huawei's troubles have global implications. The U.S. began pressuring other countries to block installation of Huawei’s 5G networks even before the executive order was signed. In 2018, both Australia and New Zealand banned the company from supplying the necessary technology for 5G infrastructure installation. The European market remains uncertain, with governments under pressure to stand with the U.S., but Huawei still has supporters. Against this backdrop, Vodafone suspended Huawei's equipment distribution across Europe because of the political backlash (Soo & Tao, 2019).
Huawei insists that the U.S. ban will not affect its 5G business, and that they will keep building the simplest transaction models while developing the most secure systems "ensuring the highest levels of network resilience and compliance with the General Data Protection Regulation (GDPR)" (Huawei, 2018). According to Eric Chiu, an analyst at WitsView, Huawei has the most resources and knowledge related to 5G of any company. It is thus well poised to expand in the new market (Ting-Fang, & Li, 2019).
Table 1.10. Huawei and the U.S. milestones and confrontations INTERNATIONALIZATION LAW ISSUES
2001 Huawei sets up offices in the US and in Britain 2003 Cisco sues Huawei for copyright violations 2005 Huawei supposed to be linked to the Chinese military surfaces according to
Rand Corporation report commissioned by the US Air Force 2008 Huawei’s efforts to take 16% stake in 3Com collapse
amid lawmakers concerns about Huawei’s possible ties to the PLA
2010 Citing security concerns, Sprint excludes Huawei, as well as Chinese telecom ZTE, from bidding for a contract to modernize its network
Phone-maker Motorola files a lawsuit accusing Huawei of corporate espionage
2012 A house committee issues a 52-page report warning against using
equipment from Huawei and ZTE 2013 Reuters report a Hong Kong-based company, who tried to sell US computer
equipment to Iranian carrier, is closely linked to Huawei 2016 US departments summon Huawei and ZTE regarding US export controls
violation and violation of sanctions against Iran
2017 A jury rules in favor of T-Mobile in its case against Huawei 2018 AT&T abandon the plan of offering Huawei’s handsets. Huawei lets go of
several US staff. The Pentagon bans the sale of Huawei and ZTE phones in stores on military bases. New Zealand and Australia bans 5G rollout by
Huawei. Huawei’s CFO arrested in Canada. 2019 The US formally seeks Meng’s extradition from Canada. Google announce
the terminate of Huawei’s license to the Android OS. Huawei faces cutting of from Intel, Qualcomm, and Microsoft supplies.
Source: Authors based on Lahiri, T & Hui, M., 2019.
What next? Is this only Huawei or is this a technology war? The 5G war is just beginning. Both China and the U.S. hold a sufficiently large number of patents and expertise
that the outcome is far from certain. We could end up with "two distinct technology systems, with other countries forced to choose if they are going to plug into American or Chinese technology platforms and standards" (Segal, A. 2018). Since both technological powers aim to dominate the new era, the result could be rival monopolistic powers. Meanwhile, the U.S. government is more focused on banning Huawei than investing in its own technologies. Huawei’s CEO, Ren Zhengfei, suggests that the company was prepared for a U.S. conflict and that they already have the ability to make chips with the same quality as those of the U.S., but that Huawei bought from American companies such as Google to keep from being isolated from the world.
17
Though significant challenges loom over Huawei in 2019, the crisis will not keep the giant from growing. The company is the target of much scrutiny by Western governments but may stay the course and, as a result, strengthen its homemade ecosystem while continuing to innovate in technology and promote social progress.
Will Chinese and emerging multinationals continue to grow? Huawei epitomizes the outburst of eMNCs more broadly across the global stage. Chinese firms have led the
charge, increasingly reaching the top ranks (by size) in many sectors and parity with U.S. companies. While it is too early to say how this rivalry will unfold, from trade wars to increased scrutiny of federal investments, we confirm the resilience of Chinese companies, as they continue to grow domestically and internationally, with increased representation in the Fortune Global 500.
REFERENCES
Bloomberg, L.P. (2019a) Company Classification. 2019. Accessed June 28, 2019. Bloomberg, L.P. (2019b) Market Share by Shipments. 2016-2018. Accessed June 28, 2019 Capital IQ. (2019). Accessed June 28, 2019. Casanova, L.; Miroux, A. (2016). Emerging Market Multinationals Report: The China Surge. Emerging Markets Institute.
S.C. Johnson School of Management. Cornell University. ISSN 2689-0127. https://hdl.handle.net/1813/66976. Casanova, L.; Miroux, A. (2017). Emerging Market Multinationals Report: Emerging Multinationals in a Changing World.
Emerging Markets Institute. S.C. Johnson School of Management. Cornell University. ISSN 2689-0127 http://bit.ly/eMNCreport. https://hdl.handle.net/1813/66977.
Casanova, L.; Miroux, A. (2018). Emerging Market Multinationals Report: Emerging Markets Reshaping Globalization. Emerging Markets Institute. S.C. Johnson School of Management. Cornell University. ISSN 2689-0127 http://bit.ly/eMNCreport https://hdl.handle.net/1813/66978.
Casanova, L.; Miroux, A. forthcoming 2020. The Era of Chinese Multinationals: How Chinese Companies Are Conquering the World. Elsevier. Cuervo-Cazurra, A. (2012), “Extending theory by analyzing developing country multinational companies: Solving the Goldilocks debate”, Global Strategy Journal, Vol. 2/3, Strategic Management Society, Chicago, pp. 153-167.
Cuervo-Cazurra, A. and R. Ramamurti (eds.) (2015), Understanding Multinationals from Emerging Markets, Cambridge University Press, Cambridge.
Dunning, J.H. (2005), “The evolving world scenario “in S. Passow and M. Runnbeck (eds.), in What’s Next? Strategic Views on Foreign Direct Investment, Invest in Sweden Agency, Stockholm, pp. 12-17.
ECLAC (2013), Foreign Direct Investment in Latin America and the Caribbean 2012, United Nations Economic Commission for Latin America and the Caribbean, Santiago de Chile.
Fortune 500 Directory website, http://fortune.com/fortune500/ (accessed August 2019). Fleury, A. and Fleury, M.T. L. (2012), Brazilian Multinationals: Competences for Internationalization, Cambridge
University Press, Cambridge. Guillén, M.F. and E. García-Canal (2009), “The American Model of the Multinational Firm and the ‘New’ Multinationals
from Emerging Economies”, Academy of Management Perspectives, Vol. 23/2, Briarcliff Manor, NY, pp. 23-35, www-management.wharton.upenn.edu/guillen/PDF-Documents/New_MNEs_Acad_Mgmt_Perspectives-2009.pdf.
Huawei Investment & Holding Co., Ltd. (n.d. a). About Huawei: Our Mission, Vision, and Strategy. <https://www.huawei.com/en/about-huawei/corporate-information/value-propositions> Accessed June 28, 2019.
Huawei Investment & Holding Co., Ltd. (n.d. b). About Huawei: Corporate Governance. <https://www.huawei.com/en/about-huawei/corporate-information/value-propositions> and <https://www.huawei.com/en/about-huawei/corporate-governance> Accessed June 28, 2019.
Huawei Investment & Holding Co., Ltd. (2018). 2018 Annual Report. Huawei. (n.d. c). Industry Insights: Joint Innovation Centers. <https://www.huawei.com/en/industry-
insights/innovation/joint-innovations/hw_u_167825> Accessed July 17, 2019 INSEAD. (2017). A Dark Horse in the Global Smartphone Market: Huawei's Smartphone Strategy.
18
Kawakami, T. (2019). Huawei's 5G business 'unaffected' by US sanctions: chairman. Nikkei: Asian review. <https://asia.nikkei.com/Spotlight/Huawei-crackdown/Huawei-s-5G-business-unaffected-by-US-sanctions-chairman> Accessed July 11, 2019.
Lahiri, T. & Hui, M. (2019). How Huawei became America’s tech enemy No. 1. Quartz. <https://qz.com/1627149/huaweis-journey-to-becoming-us-tech-enemy-no-1/> Accessed July 1, 2019.
Lall, S. (1984), New Multinationals: Spread of Third World Enterprises, Wiley/IRM Series on Multinationals, John Wiley & Sons Ltd, New York.
Li Sun, S. (2009). Internationalization strategy of MNEs from emerging economies: The case of Huawei. Multinational Business Review, 17(2), 129-156.
Marginson, S. (2019). Oxford University, Centre for Science and Technology Studies, Leiden University. Muralidhara G.V., Faheem H. (2019) Huawei’s Quest for Global Markets. In: China Europe International Business School
(eds) China-Focused Cases. Springer, Singapore OECD Development Centre. (2017). BUSINESS INSIGHTS ON EMERGING MARKETS 2017. 13-27. Pham, S. (2019). Huawei is still signing up 5G customers despite US pressure. CNN Business.
<https://www.cnn.com/2019/06/26/tech/huawei-ken-hu-mwc/index.html> Accessed July 11, 2019. Soo, Z & Tao,L. (2019). How Huawei went from small-time trader in Shenzhen to world’s biggest telecoms equipment
supplier. South China Morning Post. <https://www.scmp.com/tech/big-tech/article/2186494/how-huawei-went-small-time-trader-shenzhen-worlds-biggest-telecoms> Accessed June 28, 2019.
Segal, A. (2018). Year in Review: Huawei and the Technology Cold War. Council on Foreign Relations. <https://www.cfr.org/blog/year-review-huawei-and-technology-cold-war> Accessed June 28, 2019.
Spencer, M. (2019). Huawei is the Rising Dragon of 5G: Europe refuses to blanket-ban Huawei in spite of security risks. Medium. <https://medium.com/futuresin/huawei-is-rising-dragon-of-5g-5fa9931cc167> Accessed July 17, .201
Soo, Z & Tao,L. (2019). Open Innovation at Huawei. Hkust Business School: Thompson Center for Business Case Studies. Standard &Poor’s. Capital IQ. Database. Accessed through Johnson Library. Cornell University. Ting-Fang, C. & Li, L. (2019). Huawei to enter high-end electronics with world's first 5G TV. Nikkei: Asian review.
<https://asia.nikkei.com/Business/China-tech/Huawei-to-enter-high-end-electronics-with-world-s-first-5G-TV> Accessed July 11, 2019.
UNCTAD (2016), “FDI Recovery Is Unexpectedly Strong, but Lacks Productive Impact”, Global Investment Trends Monitor No. 22, United Nations Conference on Trade and Development, 20 January, http://unctad.org/en/PublicationsLibrary/webdiaeia2016d1_en.pdf.
UNCTAD (2015b), UNCTADStats, United Nations Conference on Trade and Development, http://unctadstat.unctad.org/EN/Index.html (accessed 15 December 2015).
UNCTAD (2006), “World Investment Report. FDI from developing and transition economies; Implications for development”, United Nations Conference on Trade and Development, Geneva.
Wu, A. (2019). Huawei’s 5G Patent Race. The Epoch Times. <https://www.theepochtimes.com/huaweis-5g-patent-race_2782903.html>Accesed July 17, 2019
Zhong, R. (2019). Who Owns Huawei? The Company Tried to Explain. It Got Complicated. The New York Times. <https://www.nytimes.com/2019/04/25/technology/who-owns-huawei.html> Accessed July 17, 2019
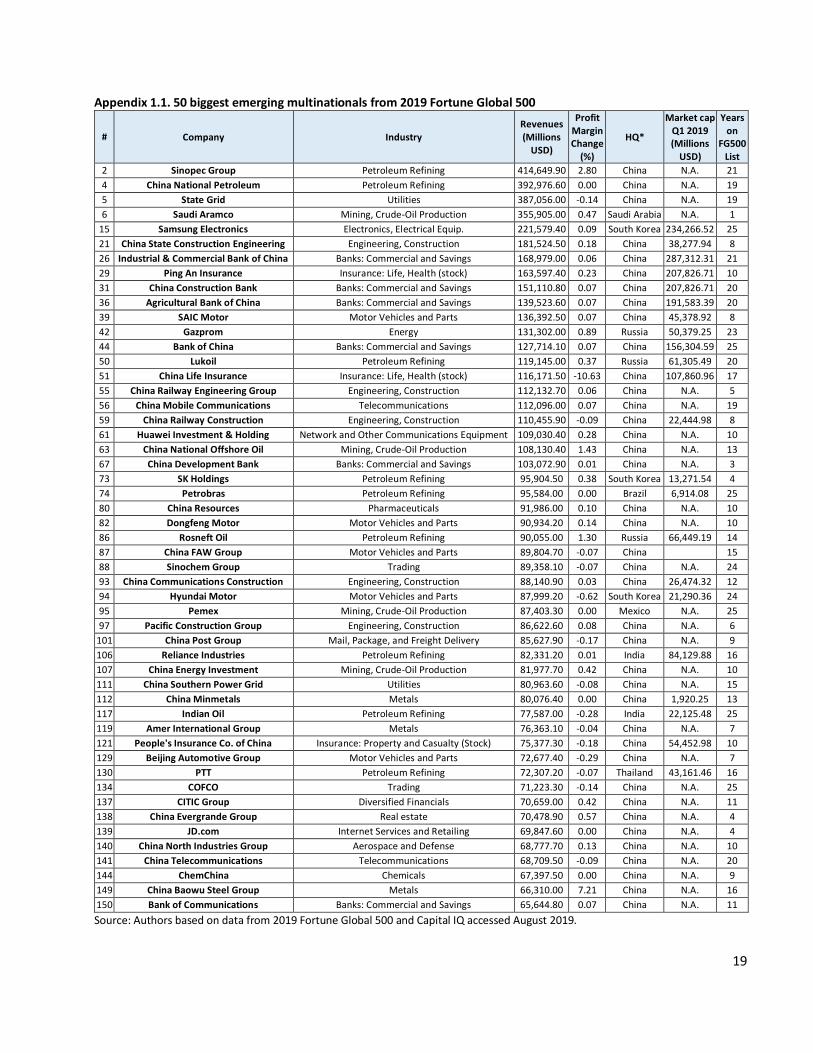
19
Appendix 1.1. 50 biggest emerging multinationals from 2019 Fortune Global 500
# Company Industry Revenues (Millions
USD)
Profit Margin Change
(%)
HQ*
Market cap Q1 2019 (Millions
USD)
Years on
FG500 List
2 Sinopec Group Petroleum Refining 414,649.90 2.80 China N.A. 21
4 China National Petroleum Petroleum Refining 392,976.60 0.00 China N.A. 19
5 State Grid Utilities 387,056.00 -0.14 China N.A. 19
6 Saudi Aramco Mining, Crude-Oil Production 355,905.00 0.47 Saudi Arabia N.A. 1
15 Samsung Electronics Electronics, Electrical Equip. 221,579.40 0.09 South Korea 234,266.52 25
21 China State Construction Engineering Engineering, Construction 181,524.50 0.18 China 38,277.94 8
26 Industrial & Commercial Bank of China Banks: Commercial and Savings 168,979.00 0.06 China 287,312.31 21
29 Ping An Insurance Insurance: Life, Health (stock) 163,597.40 0.23 China 207,826.71 10
31 China Construction Bank Banks: Commercial and Savings 151,110.80 0.07 China 207,826.71 20
36 Agricultural Bank of China Banks: Commercial and Savings 139,523.60 0.07 China 191,583.39 20
39 SAIC Motor Motor Vehicles and Parts 136,392.50 0.07 China 45,378.92 8
42 Gazprom Energy 131,302.00 0.89 Russia 50,379.25 23
44 Bank of China Banks: Commercial and Savings 127,714.10 0.07 China 156,304.59 25
50 Lukoil Petroleum Refining 119,145.00 0.37 Russia 61,305.49 20
51 China Life Insurance Insurance: Life, Health (stock) 116,171.50 -10.63 China 107,860.96 17
55 China Railway Engineering Group Engineering, Construction 112,132.70 0.06 China N.A. 5
56 China Mobile Communications Telecommunications 112,096.00 0.07 China N.A. 19
59 China Railway Construction Engineering, Construction 110,455.90 -0.09 China 22,444.98 8
61 Huawei Investment & Holding Network and Other Communications Equipment 109,030.40 0.28 China N.A. 10
63 China National Offshore Oil Mining, Crude-Oil Production 108,130.40 1.43 China N.A. 13
67 China Development Bank Banks: Commercial and Savings 103,072.90 0.01 China N.A. 3
73 SK Holdings Petroleum Refining 95,904.50 0.38 South Korea 13,271.54 4
74 Petrobras Petroleum Refining 95,584.00 0.00 Brazil 6,914.08 25
80 China Resources Pharmaceuticals 91,986.00 0.10 China N.A. 10
82 Dongfeng Motor Motor Vehicles and Parts 90,934.20 0.14 China N.A. 10
86 Rosneft Oil Petroleum Refining 90,055.00 1.30 Russia 66,449.19 14
87 China FAW Group Motor Vehicles and Parts 89,804.70 -0.07 China 15
88 Sinochem Group Trading 89,358.10 -0.07 China N.A. 24
93 China Communications Construction Engineering, Construction 88,140.90 0.03 China 26,474.32 12
94 Hyundai Motor Motor Vehicles and Parts 87,999.20 -0.62 South Korea 21,290.36 24
95 Pemex Mining, Crude-Oil Production 87,403.30 0.00 Mexico N.A. 25
97 Pacific Construction Group Engineering, Construction 86,622.60 0.08 China N.A. 6
101 China Post Group Mail, Package, and Freight Delivery 85,627.90 -0.17 China N.A. 9
106 Reliance Industries Petroleum Refining 82,331.20 0.01 India 84,129.88 16
107 China Energy Investment Mining, Crude-Oil Production 81,977.70 0.42 China N.A. 10
111 China Southern Power Grid Utilities 80,963.60 -0.08 China N.A. 15
112 China Minmetals Metals 80,076.40 0.00 China 1,920.25 13
117 Indian Oil Petroleum Refining 77,587.00 -0.28 India 22,125.48 25
119 Amer International Group Metals 76,363.10 -0.04 China N.A. 7
121 People's Insurance Co. of China Insurance: Property and Casualty (Stock) 75,377.30 -0.18 China 54,452.98 10
129 Beijing Automotive Group Motor Vehicles and Parts 72,677.40 -0.29 China N.A. 7
130 PTT Petroleum Refining 72,307.20 -0.07 Thailand 43,161.46 16
134 COFCO Trading 71,223.30 -0.14 China N.A. 25
137 CITIC Group Diversified Financials 70,659.00 0.42 China N.A. 11
138 China Evergrande Group Real estate 70,478.90 0.57 China N.A. 4
139 JD.com Internet Services and Retailing 69,847.60 0.00 China N.A. 4
140 China North Industries Group Aerospace and Defense 68,777.70 0.13 China N.A. 10
141 China Telecommunications Telecommunications 68,709.50 -0.09 China N.A. 20
144 ChemChina Chemicals 67,397.50 0.00 China N.A. 9
149 China Baowu Steel Group Metals 66,310.00 7.21 China N.A. 16
150 Bank of Communications Banks: Commercial and Savings 65,644.80 0.07 China N.A. 11
Source: Authors based on data from 2019 Fortune Global 500 and Capital IQ accessed August 2019.
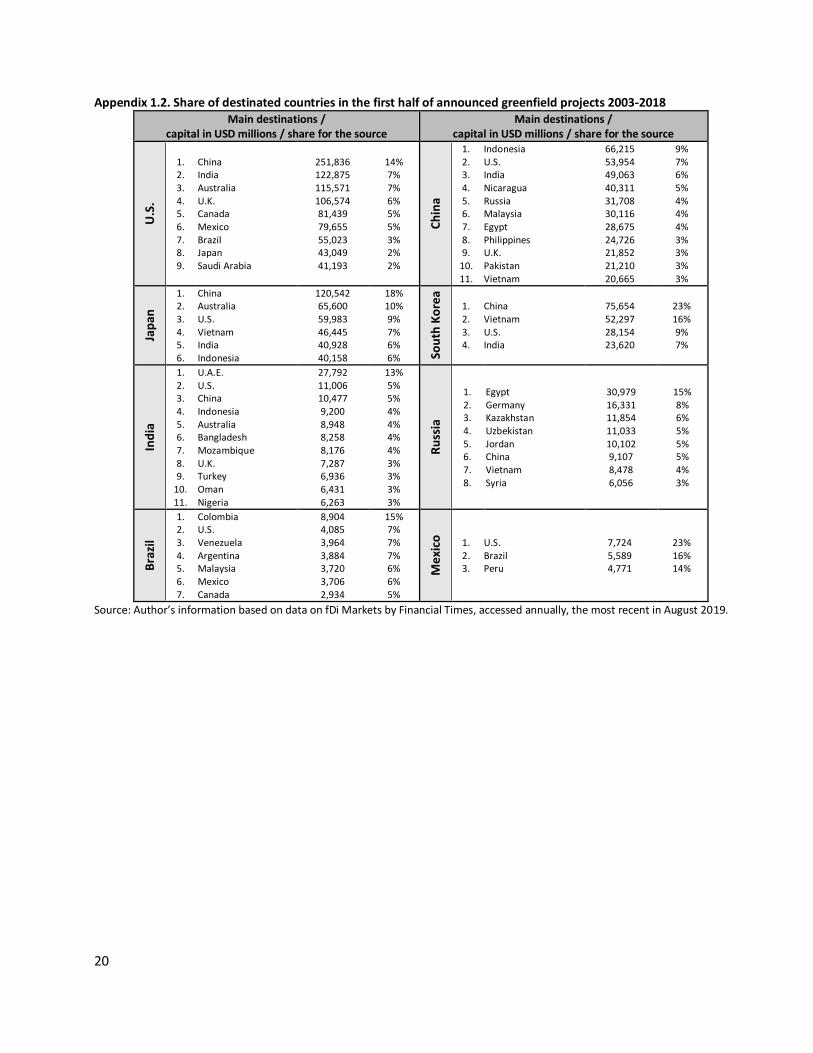
20
Appendix 1.2. Share of destinated countries in the first half of announced greenfield projects 2003-2018 Main destinations /
capital in USD millions / share for the source Main destinations /
capital in USD millions / share for the source
U.S
. 1. 2. 3. 4. 5. 6. 7. 8. 9.
China India Australia U.K. Canada Mexico Brazil Japan Saudi Arabia
251,836 122,875 115,571 106,574 81,439 79,655 55,023 43,049 41,193
14% 7% 7% 6% 5% 5% 3% 2% 2%
Ch
ina
1. 2. 3. 4. 5. 6. 7. 8. 9.
10. 11.
Indonesia U.S. India Nicaragua Russia Malaysia Egypt Philippines U.K. Pakistan Vietnam
66,215 53,954 49,063 40,311 31,708 30,116 28,675 24,726 21,852 21,210 20,665
9% 7% 6% 5% 4% 4% 4% 3% 3% 3% 3%
Jap
an
1. 2. 3. 4. 5. 6.
China Australia U.S. Vietnam India Indonesia
120,542 65,600 59,983 46,445 40,928 40,158
18% 10% 9% 7% 6% 6% So
uth
Ko
rea
1. 2. 3. 4.
China Vietnam U.S. India
75,654 52,297 28,154 23,620
23% 16% 9% 7%
Ind
ia
1. 2. 3. 4. 5. 6. 7. 8. 9.
10. 11.
U.A.E. U.S. China Indonesia Australia Bangladesh Mozambique U.K. Turkey Oman Nigeria
27,792 11,006 10,477 9,200 8,948 8,258 8,176 7,287 6,936 6,431 6,263
13% 5% 5% 4% 4% 4% 4% 3% 3% 3% 3%
Ru
ssia
1. 2. 3. 4. 5. 6. 7. 8.
Egypt Germany Kazakhstan Uzbekistan Jordan China Vietnam Syria
30,979 16,331 11,854 11,033 10,102 9,107 8,478 6,056
15% 8% 6% 5% 5% 5% 4% 3%
Bra
zil
1. 2. 3. 4. 5. 6. 7.
Colombia U.S. Venezuela Argentina Malaysia Mexico Canada
8,904 4,085 3,964 3,884 3,720 3,706 2,934
15% 7% 7% 7% 6% 6% 5%
Mex
ico
1. 2. 3.
U.S. Brazil Peru
7,724 5,589 4,771
23% 16% 14%
Source: Author’s information based on data on fDi Markets by Financial Times, accessed annually, the most recent in August 2019.
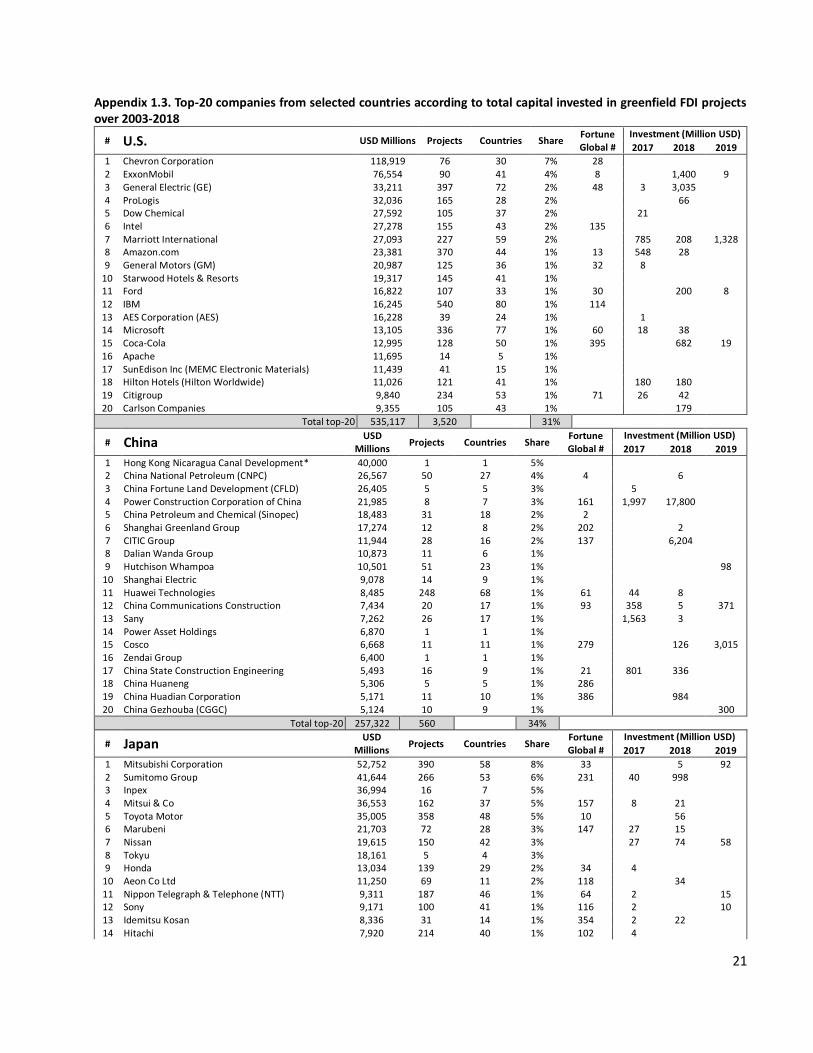
21
Appendix 1.3. Top-20 companies from selected countries according to total capital invested in greenfield FDI projects over 2003-2018
# U.S. USD Millions Projects Countries Share Fortune Global #
Investment (Million USD)
2017 2018 2019
1 Chevron Corporation 118,919 76 30 7% 28 2 ExxonMobil 76,554 90 41 4% 8 1,400 9 3 General Electric (GE) 33,211 397 72 2% 48 3 3,035 4 ProLogis 32,036 165 28 2% 66 5 Dow Chemical 27,592 105 37 2% 21 6 Intel 27,278 155 43 2% 135 7 Marriott International 27,093 227 59 2% 785 208 1,328 8 Amazon.com 23,381 370 44 1% 13 548 28 9 General Motors (GM) 20,987 125 36 1% 32 8
10 Starwood Hotels & Resorts 19,317 145 41 1% 11 Ford 16,822 107 33 1% 30 200 8 12 IBM 16,245 540 80 1% 114 13 AES Corporation (AES) 16,228 39 24 1% 1 14 Microsoft 13,105 336 77 1% 60 18 38 15 Coca-Cola 12,995 128 50 1% 395 682 19 16 Apache 11,695 14 5 1% 17 SunEdison Inc (MEMC Electronic Materials) 11,439 41 15 1% 18 Hilton Hotels (Hilton Worldwide) 11,026 121 41 1% 180 180 19 Citigroup 9,840 234 53 1% 71 26 42 20 Carlson Companies 9,355 105 43 1% 179
Total top-20 535,117 3,520 31%
# China USD
Millions Projects Countries Share
Fortune Global #
Investment (Million USD)
2017 2018 2019
1 Hong Kong Nicaragua Canal Development* 40,000 1 1 5% 2 China National Petroleum (CNPC) 26,567 50 27 4% 4 6 3 China Fortune Land Development (CFLD) 26,405 5 5 3% 5 4 Power Construction Corporation of China 21,985 8 7 3% 161 1,997 17,800 5 China Petroleum and Chemical (Sinopec) 18,483 31 18 2% 2 6 Shanghai Greenland Group 17,274 12 8 2% 202 2 7 CITIC Group 11,944 28 16 2% 137 6,204 8 Dalian Wanda Group 10,873 11 6 1% 9 Hutchison Whampoa 10,501 51 23 1% 98
10 Shanghai Electric 9,078 14 9 1% 11 Huawei Technologies 8,485 248 68 1% 61 44 8 12 China Communications Construction 7,434 20 17 1% 93 358 5 371 13 Sany 7,262 26 17 1% 1,563 3 14 Power Asset Holdings 6,870 1 1 1% 15 Cosco 6,668 11 11 1% 279 126 3,015 16 Zendai Group 6,400 1 1 1% 17 China State Construction Engineering 5,493 16 9 1% 21 801 336 18 China Huaneng 5,306 5 5 1% 286 19 China Huadian Corporation 5,171 11 10 1% 386 984 20 China Gezhouba (CGGC) 5,124 10 9 1% 300
Total top-20 257,322 560 34%
# Japan USD
Millions Projects Countries Share
Fortune Global #
Investment (Million USD)
2017 2018 2019
1 Mitsubishi Corporation 52,752 390 58 8% 33 5 92 2 Sumitomo Group 41,644 266 53 6% 231 40 998 3 Inpex 36,994 16 7 5% 4 Mitsui & Co 36,553 162 37 5% 157 8 21 5 Toyota Motor 35,005 358 48 5% 10 56 6 Marubeni 21,703 72 28 3% 147 27 15 7 Nissan 19,615 150 42 3% 27 74 58 8 Tokyu 18,161 5 4 3% 9 Honda 13,034 139 29 2% 34 4
10 Aeon Co Ltd 11,250 69 11 2% 118 34 11 Nippon Telegraph & Telephone (NTT) 9,311 187 46 1% 64 2 15 12 Sony 9,171 100 41 1% 116 2 10 13 Idemitsu Kosan 8,336 31 14 1% 354 2 22 14 Hitachi 7,920 214 40 1% 102 4
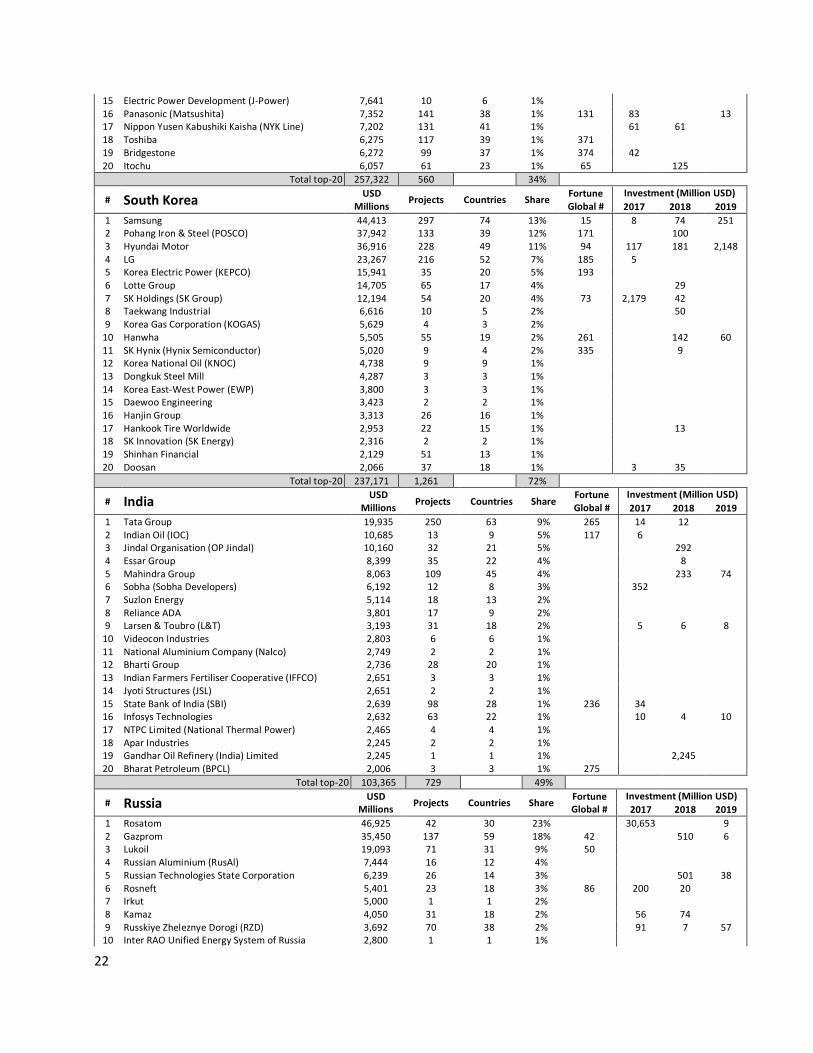
22
15 Electric Power Development (J-Power) 7,641 10 6 1% 16 Panasonic (Matsushita) 7,352 141 38 1% 131 83 13 17 Nippon Yusen Kabushiki Kaisha (NYK Line) 7,202 131 41 1% 61 61 18 Toshiba 6,275 117 39 1% 371 19 Bridgestone 6,272 99 37 1% 374 42 20 Itochu 6,057 61 23 1% 65 125
Total top-20 257,322 560 34%
# South Korea USD
Millions Projects Countries Share
Fortune Global #
Investment (Million USD)
2017 2018 2019
1 Samsung 44,413 297 74 13% 15 8 74 251 2 Pohang Iron & Steel (POSCO) 37,942 133 39 12% 171 100 3 Hyundai Motor 36,916 228 49 11% 94 117 181 2,148 4 LG 23,267 216 52 7% 185 5 5 Korea Electric Power (KEPCO) 15,941 35 20 5% 193 6 Lotte Group 14,705 65 17 4% 29 7 SK Holdings (SK Group) 12,194 54 20 4% 73 2,179 42 8 Taekwang Industrial 6,616 10 5 2% 50 9 Korea Gas Corporation (KOGAS) 5,629 4 3 2%
10 Hanwha 5,505 55 19 2% 261 142 60 11 SK Hynix (Hynix Semiconductor) 5,020 9 4 2% 335 9 12 Korea National Oil (KNOC) 4,738 9 9 1% 13 Dongkuk Steel Mill 4,287 3 3 1% 14 Korea East-West Power (EWP) 3,800 3 3 1% 15 Daewoo Engineering 3,423 2 2 1% 16 Hanjin Group 3,313 26 16 1% 17 Hankook Tire Worldwide 2,953 22 15 1% 13 18 SK Innovation (SK Energy) 2,316 2 2 1% 19 Shinhan Financial 2,129 51 13 1% 20 Doosan 2,066 37 18 1% 3 35
Total top-20 237,171 1,261 72%
# India USD
Millions Projects Countries Share
Fortune Global #
Investment (Million USD)
2017 2018 2019
1 Tata Group 19,935 250 63 9% 265 14 12 2 Indian Oil (IOC) 10,685 13 9 5% 117 6 3 Jindal Organisation (OP Jindal) 10,160 32 21 5% 292 4 Essar Group 8,399 35 22 4% 8 5 Mahindra Group 8,063 109 45 4% 233 74 6 Sobha (Sobha Developers) 6,192 12 8 3% 352 7 Suzlon Energy 5,114 18 13 2% 8 Reliance ADA 3,801 17 9 2% 9 Larsen & Toubro (L&T) 3,193 31 18 2% 5 6 8
10 Videocon Industries 2,803 6 6 1% 11 National Aluminium Company (Nalco) 2,749 2 2 1% 12 Bharti Group 2,736 28 20 1% 13 Indian Farmers Fertiliser Cooperative (IFFCO) 2,651 3 3 1% 14 Jyoti Structures (JSL) 2,651 2 2 1% 15 State Bank of India (SBI) 2,639 98 28 1% 236 34 16 Infosys Technologies 2,632 63 22 1% 10 4 10 17 NTPC Limited (National Thermal Power) 2,465 4 4 1% 18 Apar Industries 2,245 2 2 1% 19 Gandhar Oil Refinery (India) Limited 2,245 1 1 1% 2,245 20 Bharat Petroleum (BPCL) 2,006 3 3 1% 275
Total top-20 103,365 729 49%
# Russia USD
Millions Projects Countries Share
Fortune Global #
Investment (Million USD)
2017 2018 2019
1 Rosatom 46,925 42 30 23% 30,653 9 2 Gazprom 35,450 137 59 18% 42 510 6 3 Lukoil 19,093 71 31 9% 50 4 Russian Aluminium (RusAl) 7,444 16 12 4% 5 Russian Technologies State Corporation 6,239 26 14 3% 501 38 6 Rosneft 5,401 23 18 3% 86 200 20 7 Irkut 5,000 1 1 2% 8 Kamaz 4,050 31 18 2% 56 74 9 Russkiye Zheleznye Dorogi (RZD) 3,692 70 38 2% 91 7 57
10 Inter RAO Unified Energy System of Russia 2,800 1 1 1%
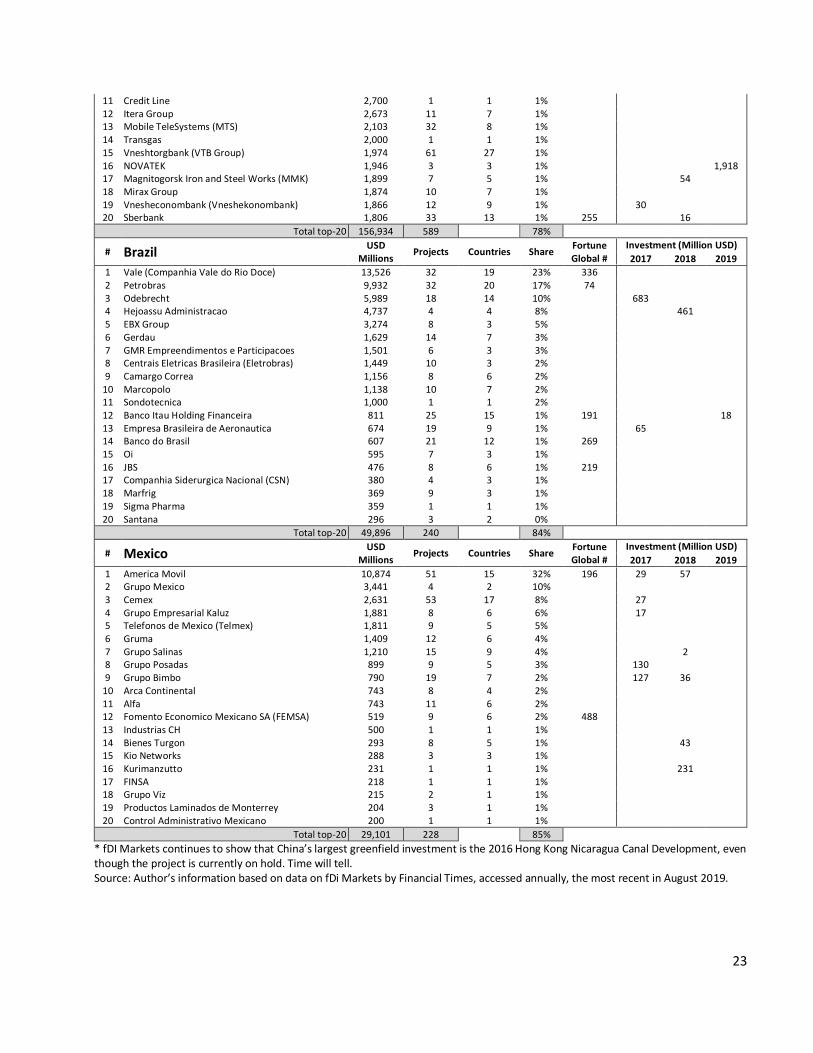
23
11 Credit Line 2,700 1 1 1% 12 Itera Group 2,673 11 7 1% 13 Mobile TeleSystems (MTS) 2,103 32 8 1% 14 Transgas 2,000 1 1 1% 15 Vneshtorgbank (VTB Group) 1,974 61 27 1% 16 NOVATEK 1,946 3 3 1% 1,918 17 Magnitogorsk Iron and Steel Works (MMK) 1,899 7 5 1% 54 18 Mirax Group 1,874 10 7 1% 19 Vnesheconombank (Vneshekonombank) 1,866 12 9 1% 30 20 Sberbank 1,806 33 13 1% 255 16
Total top-20 156,934 589 78%
# Brazil USD
Millions Projects Countries Share
Fortune Global #
Investment (Million USD)
2017 2018 2019
1 Vale (Companhia Vale do Rio Doce) 13,526 32 19 23% 336 2 Petrobras 9,932 32 20 17% 74 3 Odebrecht 5,989 18 14 10% 683 4 Hejoassu Administracao 4,737 4 4 8% 461 5 EBX Group 3,274 8 3 5% 6 Gerdau 1,629 14 7 3% 7 GMR Empreendimentos e Participacoes 1,501 6 3 3% 8 Centrais Eletricas Brasileira (Eletrobras) 1,449 10 3 2% 9 Camargo Correa 1,156 8 6 2%
10 Marcopolo 1,138 10 7 2% 11 Sondotecnica 1,000 1 1 2% 12 Banco Itau Holding Financeira 811 25 15 1% 191 18 13 Empresa Brasileira de Aeronautica 674 19 9 1% 65 14 Banco do Brasil 607 21 12 1% 269 15 Oi 595 7 3 1% 16 JBS 476 8 6 1% 219 17 Companhia Siderurgica Nacional (CSN) 380 4 3 1% 18 Marfrig 369 9 3 1% 19 Sigma Pharma 359 1 1 1% 20 Santana 296 3 2 0%
Total top-20 49,896 240 84%
# Mexico USD
Millions Projects Countries Share
Fortune Global #
Investment (Million USD)
2017 2018 2019
1 America Movil 10,874 51 15 32% 196 29 57 2 Grupo Mexico 3,441 4 2 10% 3 Cemex 2,631 53 17 8% 27 4 Grupo Empresarial Kaluz 1,881 8 6 6% 17 5 Telefonos de Mexico (Telmex) 1,811 9 5 5% 6 Gruma 1,409 12 6 4% 7 Grupo Salinas 1,210 15 9 4% 2 8 Grupo Posadas 899 9 5 3% 130 9 Grupo Bimbo 790 19 7 2% 127 36
10 Arca Continental 743 8 4 2% 11 Alfa 743 11 6 2% 12 Fomento Economico Mexicano SA (FEMSA) 519 9 6 2% 488 13 Industrias CH 500 1 1 1% 14 Bienes Turgon 293 8 5 1% 43 15 Kio Networks 288 3 3 1% 16 Kurimanzutto 231 1 1 1% 231 17 FINSA 218 1 1 1% 18 Grupo Viz 215 2 1 1% 19 Productos Laminados de Monterrey 204 3 1 1% 20 Control Administrativo Mexicano 200 1 1 1%
Total top-20 29,101 228 85% * fDI Markets continues to show that China’s largest greenfield investment is the 2016 Hong Kong Nicaragua Canal Development, even though the project is currently on hold. Time will tell. Source: Author’s information based on data on fDi Markets by Financial Times, accessed annually, the most recent in August 2019.
24
Chapter 2
Revisiting China and the E20
2.1. Revisiting the E20
2.2. Economic slowdown in emerging markets
2.3. Trends in emerging economy investments
A. Stability in E20 investment
B. A new era? Overseas investments decline in 2018
2.4. International trade doubts and uncertainties
Executive Summary
Chapter 2 examines trends in emerging economies as illustrated by the E20 - a group composed of 20 top emerging economies that EMI established in its first Emerging Market Multinationals Report (EMR) to illustrate the emerging market phenomenon and that we reexamine this year. In 2018, global growth recovery did not live up to expectations. Among a global slowdown, largely reflecting poor performance in advanced economies, the E20 as a whole also registered a small decline in its growth rate. As well, outward FDI from the E20 registered a slight decline while inward FDI remained relatively stable. Among the factors affecting the growth performance of emerging markets the chapter highlights the pervasive uncertainty resulting from the trade tensions that have continued virtually unabated since early 2018, and their major destabilizing impact on the global economy. As mentioned in the EMR last year, in the long term, the sustained loss of confidence in the rule-based global trade system stemming from the trade war is even more damaging than the economic losses by themselves.
2.1. Revisiting the E20
The Emerging Markets Institute (EMI) coined the term E20 in 2016 to refer a list of top 20 emerging economies in the first issue of its Emerging Markets Report (EMR), an annual publication that illustrates the evolving role and importance of emerging market companies and countries on the world stage. As a basis to establish this list, we considered the emerging economy groupings of major international organizations (the International Monetary Fund (IMF) and the United Nations (UN)) as well as those from think tanks and research institutes. To formally define the E20 for our purposes, we considered the size (as measured by nominal gross domestic product (GDP)) and weight (in terms of demography) of each economy (Figure 2.1). To be included, we determined that economies must meet a threshold population size,1 and be classified as emerging by at least one major international organization.2
Since its first inclusion in the EMR, the makeup of the E20 has remained largely the same. Only one country, Egypt, has left the list, and Pakistan entered to replace it. Pakistan enjoyed relatively high growth during the last five years, averaging close to 5% between 2014 and 2018 (World Bank, n.d.a). In 2016, managing director of the IMF Christine Lagarde highlighted the country’s promising future: “This is an important time—'a moment of opportunity’—for Pakistan, a country undergoing an economic transformation that can place it well among the ranks of emerging market economies,” (Lagarde, 2016). Higher demand in consumption and imports, in turn fostered by public spending, drove the initial boost to Pakistan’s economy. With growth rates from 2016-2018 surpassing those of Egypt, Pakistan’s nominal GDP in 2018
1 Based on the small size of its populations, Qatar and the UAE did not make the list. 2 From the 2016 EMR to the present edition, we referred to the lists of the IMF, the United Nations Conference on Trade and Development (UNCTAD) and the United Nations Industrial Development Organization (UNIDO).
2.4. International trade doubts and uncertainties
The Emerging Markets Institute (EMI) coined the term E20 in 2016 to refer a list of top 20 emerging economies in the first issue of its Emerging Markets Report (EMR), an annual publication that illustrates the evolving role and importance of emerging market companies and countries on the world stage. As a basis to establish this list, we considered the emerging economy groupings of major international organizations (the International Monetary Fund (IMF) and the United Nations (UN)) as well as those from think tanks and research institutes. To formally define the E20 for our purposes, we considered the size (as measured by nominal gross domestic product (GDP)) and weight (in terms of demography) of each economy (Figure 2.1). To be included, we determined that economies must meet a threshold population size,1 and be classified as emerging by at least one major international organization.2 Since its first inclusion in the EMR, the makeup of the E20 has remained largely the same. Only one country, Egypt, has left the list, and Pakistan entered to replace it. Pakistan enjoyed relatively high growth during the last five years, averaging close to 5% between 2014 and 2018 (World Bank, n.d.a). In 2016, managing director of the IMF Christine Lagarde highlighted the country’s promising future: “This is an important time—'a moment of opportunity’—for Pakistan, a country undergoing an economic transformation that can place it well among the ranks of emerging market economies,” (Lagarde, 2016). Higher demand in consumption and imports, in turn fostered by public spending, drove the initial boost to Pakistan’s economy. With growth rates from 2016-2018 surpassing those of Egypt, Pakistan’s nominal GDP in 2018 ($313 billion) exceeded Egypt’s GDP ($250 billion)
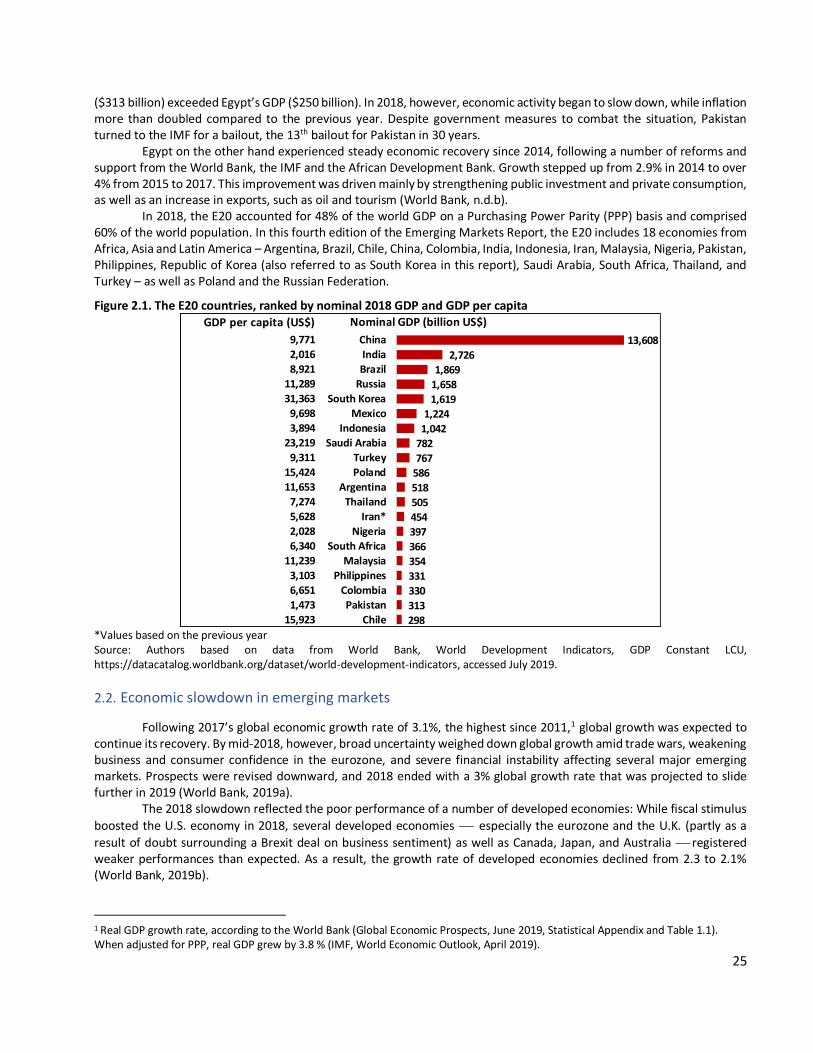
25
($313 billion) exceeded Egypt’s GDP ($250 billion). In 2018, however, economic activity began to slow down, while inflation more than doubled compared to the previous year. Despite government measures to combat the situation, Pakistan turned to the IMF for a bailout, the 13th bailout for Pakistan in 30 years.
Egypt on the other hand experienced steady economic recovery since 2014, following a number of reforms and support from the World Bank, the IMF and the African Development Bank. Growth stepped up from 2.9% in 2014 to over 4% from 2015 to 2017. This improvement was driven mainly by strengthening public investment and private consumption, as well as an increase in exports, such as oil and tourism (World Bank, n.d.b).
In 2018, the E20 accounted for 48% of the world GDP on a Purchasing Power Parity (PPP) basis and comprised 60% of the world population. In this fourth edition of the Emerging Markets Report, the E20 includes 18 economies from Africa, Asia and Latin America – Argentina, Brazil, Chile, China, Colombia, India, Indonesia, Iran, Malaysia, Nigeria, Pakistan, Philippines, Republic of Korea (also referred to as South Korea in this report), Saudi Arabia, South Africa, Thailand, and Turkey – as well as Poland and the Russian Federation.
Figure 2.1. The E20 countries, ranked by nominal 2018 GDP and GDP per capita
*Values based on the previous year Source: Authors based on data from World Bank, World Development Indicators, GDP Constant LCU, https://datacatalog.worldbank.org/dataset/world-development-indicators, accessed July 2019.
2.2. Economic slowdown in emerging markets
Following 2017’s global economic growth rate of 3.1%, the highest since 2011,1 global growth was expected to continue its recovery. By mid-2018, however, broad uncertainty weighed down global growth amid trade wars, weakening business and consumer confidence in the eurozone, and severe financial instability affecting several major emerging markets. Prospects were revised downward, and 2018 ended with a 3% global growth rate that was projected to slide further in 2019 (World Bank, 2019a).
The 2018 slowdown reflected the poor performance of a number of developed economies: While fiscal stimulus
boosted the U.S. economy in 2018, several developed economies ⎯ especially the eurozone and the U.K. (partly as a
result of doubt surrounding a Brexit deal on business sentiment) as well as Canada, Japan, and Australia ⎯ registered weaker performances than expected. As a result, the growth rate of developed economies declined from 2.3 to 2.1% (World Bank, 2019b).
1 Real GDP growth rate, according to the World Bank (Global Economic Prospects, June 2019, Statistical Appendix and Table 1.1). When adjusted for PPP, real GDP grew by 3.8 % (IMF, World Economic Outlook, April 2019).
9,771
2,016
8,921
11,289
31,363
9,698
3,894
23,219
9,311
15,424
11,653
7,274
5,628
2,028
6,340
11,239
3,103
6,651
1,473
15,923
GDP per capita (US$)
13,608
2,726
1,869
1,658
1,619
1,224
1,042
782
767
586
518
505
454
397
366
354
331
330
313
298
China
India
Brazil
Russia
South Korea
Mexico
Indonesia
Saudi Arabia
Turkey
Poland
Argentina
Thailand
Iran*
Nigeria
South Africa
Malaysia
Philippines
Colombia
Pakistan
Chile
Nominal GDP (billion US$)
In 2018, however, economic activity began to slow down, while inflation more than doubled compared to the previous year. Despite government measures to combat the situation, Pakistan turned to the IMF for a bailout, the 13th bailout for Pakistan in 30 years. Egypt on the other hand experienced steady economic recovery since 2014, following a number of reforms and support from the World Bank, the IMF and the African Development Bank. Growth stepped up from 2.9% in 2014 to over 4% from 2015 to 2017. This improvement was driven mainly by strengthening public investment and private consumption, as well as an increase in exports, such as oil and tourism (World Bank, n.d.b). In 2018, the E20 accounted for 48% of the world GDP on a Purchasing Power Parity (PPP) basis and comprised 60% of the world population. In this fourth edition of the Emerging Markets Report, the E20 includes 18 economies from Africa, Asia and Latin America – Argentina, Brazil, Chile, China, Colombia, India, Indonesia, Iran, Malaysia, Nigeria, Pakistan, Philippines, Republic of Korea (also referred to as South Korea in this report), Saudi Arabia, South Africa, Thailand, and Turkey – as well as Poland and the Russian Federation.
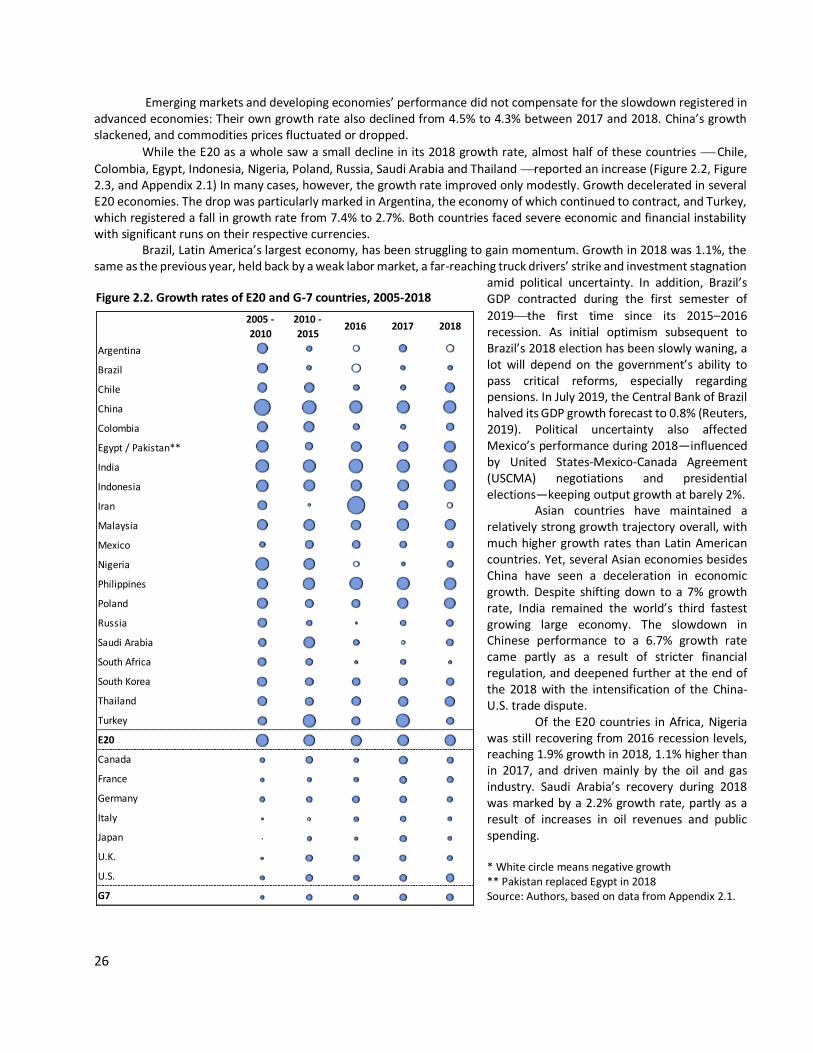
26
Emerging markets and developing economies’ performance did not compensate for the slowdown registered in advanced economies: Their own growth rate also declined from 4.5% to 4.3% between 2017 and 2018. China’s growth slackened, and commodities prices fluctuated or dropped.
While the E20 as a whole saw a small decline in its 2018 growth rate, almost half of these countries ⎯ Chile,
Colombia, Egypt, Indonesia, Nigeria, Poland, Russia, Saudi Arabia and Thailand ⎯reported an increase (Figure 2.2, Figure 2.3, and Appendix 2.1) In many cases, however, the growth rate improved only modestly. Growth decelerated in several E20 economies. The drop was particularly marked in Argentina, the economy of which continued to contract, and Turkey, which registered a fall in growth rate from 7.4% to 2.7%. Both countries faced severe economic and financial instability with significant runs on their respective currencies.
Brazil, Latin America’s largest economy, has been struggling to gain momentum. Growth in 2018 was 1.1%, the same as the previous year, held back by a weak labor market, a far-reaching truck drivers’ strike and investment stagnation
amid political uncertainty. In addition, Brazil’s GDP contracted during the first semester of
2019⎯the first time since its 2015–2016 recession. As initial optimism subsequent to Brazil’s 2018 election has been slowly waning, a lot will depend on the government’s ability to pass critical reforms, especially regarding pensions. In July 2019, the Central Bank of Brazil halved its GDP growth forecast to 0.8% (Reuters, 2019). Political uncertainty also affected Mexico’s performance during 2018—influenced by United States-Mexico-Canada Agreement (USCMA) negotiations and presidential elections—keeping output growth at barely 2%.
Asian countries have maintained a relatively strong growth trajectory overall, with much higher growth rates than Latin American countries. Yet, several Asian economies besides China have seen a deceleration in economic growth. Despite shifting down to a 7% growth rate, India remained the world’s third fastest growing large economy. The slowdown in Chinese performance to a 6.7% growth rate came partly as a result of stricter financial regulation, and deepened further at the end of the 2018 with the intensification of the China-U.S. trade dispute.
Of the E20 countries in Africa, Nigeria was still recovering from 2016 recession levels, reaching 1.9% growth in 2018, 1.1% higher than in 2017, and driven mainly by the oil and gas industry. Saudi Arabia’s recovery during 2018 was marked by a 2.2% growth rate, partly as a result of increases in oil revenues and public spending.
* White circle means negative growth ** Pakistan replaced Egypt in 2018 Source: Authors, based on data from Appendix 2.1.
0.00%2005 -
2010
2010 -
20152016 2017 2018
Argentina
Brazil
Chile
China
Colombia
Egypt / Pakistan**
India
Indonesia
Iran
Malaysia
Mexico
Nigeria
Philippines
Poland
Russia
Saudi Arabia
South Africa
South Korea
Thailand
Turkey
E20
Canada
France
Germany
Italy
Japan
U.K.
U.S.
G7
Figure 2.2. Growth rates of E20 and G-7 countries, 2005-2018
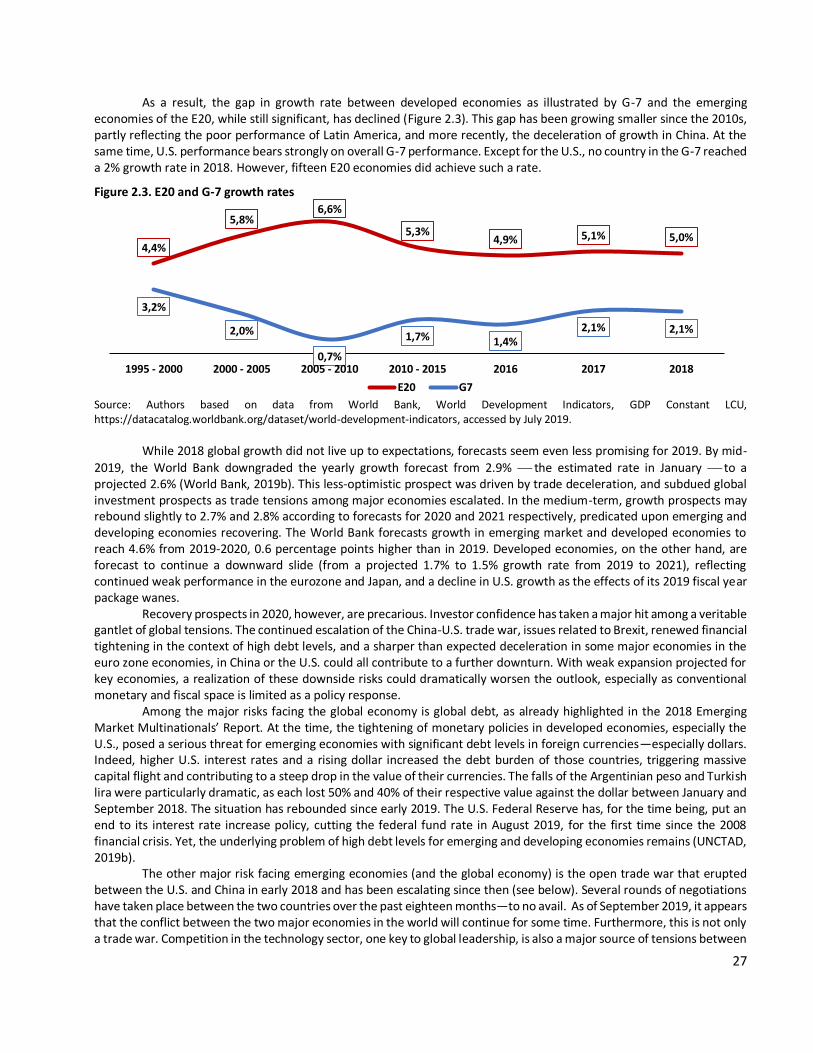
27
As a result, the gap in growth rate between developed economies as illustrated by G-7 and the emerging economies of the E20, while still significant, has declined (Figure 2.3). This gap has been growing smaller since the 2010s, partly reflecting the poor performance of Latin America, and more recently, the deceleration of growth in China. At the same time, U.S. performance bears strongly on overall G-7 performance. Except for the U.S., no country in the G-7 reached a 2% growth rate in 2018. However, fifteen E20 economies did achieve such a rate.
Figure 2.3. E20 and G-7 growth rates
Source: Authors based on data from World Bank, World Development Indicators, GDP Constant LCU, https://datacatalog.worldbank.org/dataset/world-development-indicators, accessed by July 2019.
While 2018 global growth did not live up to expectations, forecasts seem even less promising for 2019. By mid-
2019, the World Bank downgraded the yearly growth forecast from 2.9% ⎯ the estimated rate in January ⎯ to a projected 2.6% (World Bank, 2019b). This less-optimistic prospect was driven by trade deceleration, and subdued global investment prospects as trade tensions among major economies escalated. In the medium-term, growth prospects may rebound slightly to 2.7% and 2.8% according to forecasts for 2020 and 2021 respectively, predicated upon emerging and developing economies recovering. The World Bank forecasts growth in emerging market and developed economies to reach 4.6% from 2019-2020, 0.6 percentage points higher than in 2019. Developed economies, on the other hand, are forecast to continue a downward slide (from a projected 1.7% to 1.5% growth rate from 2019 to 2021), reflecting continued weak performance in the eurozone and Japan, and a decline in U.S. growth as the effects of its 2019 fiscal year package wanes.
Recovery prospects in 2020, however, are precarious. Investor confidence has taken a major hit among a veritable gantlet of global tensions. The continued escalation of the China-U.S. trade war, issues related to Brexit, renewed financial tightening in the context of high debt levels, and a sharper than expected deceleration in some major economies in the euro zone economies, in China or the U.S. could all contribute to a further downturn. With weak expansion projected for key economies, a realization of these downside risks could dramatically worsen the outlook, especially as conventional monetary and fiscal space is limited as a policy response.
Among the major risks facing the global economy is global debt, as already highlighted in the 2018 Emerging Market Multinationals’ Report. At the time, the tightening of monetary policies in developed economies, especially the U.S., posed a serious threat for emerging economies with significant debt levels in foreign currencies—especially dollars. Indeed, higher U.S. interest rates and a rising dollar increased the debt burden of those countries, triggering massive capital flight and contributing to a steep drop in the value of their currencies. The falls of the Argentinian peso and Turkish lira were particularly dramatic, as each lost 50% and 40% of their respective value against the dollar between January and September 2018. The situation has rebounded since early 2019. The U.S. Federal Reserve has, for the time being, put an end to its interest rate increase policy, cutting the federal fund rate in August 2019, for the first time since the 2008 financial crisis. Yet, the underlying problem of high debt levels for emerging and developing economies remains (UNCTAD, 2019b).
The other major risk facing emerging economies (and the global economy) is the open trade war that erupted between the U.S. and China in early 2018 and has been escalating since then (see below). Several rounds of negotiations have taken place between the two countries over the past eighteen months—to no avail. As of September 2019, it appears that the conflict between the two major economies in the world will continue for some time. Furthermore, this is not only a trade war. Competition in the technology sector, one key to global leadership, is also a major source of tensions between
4,4%
5,8%6,6%
5,3%4,9% 5,1% 5,0%
3,2%
2,0%
0,7%
1,7% 1,4%2,1% 2,1%
1995 - 2000 2000 - 2005 2005 - 2010 2010 - 2015 2016 2017 2018
E20 G7
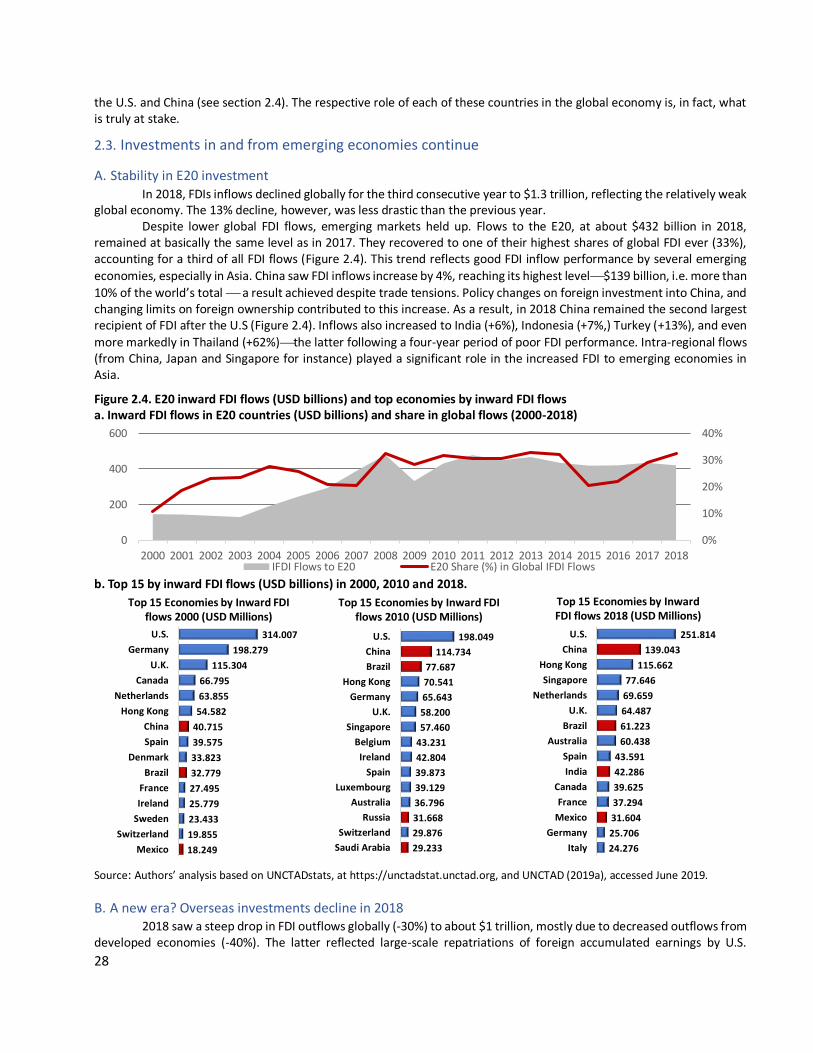
28
the U.S. and China (see section 2.4). The respective role of each of these countries in the global economy is, in fact, what is truly at stake.
2.3. Investments in and from emerging economies continue
A. Stability in E20 investment In 2018, FDIs inflows declined globally for the third consecutive year to $1.3 trillion, reflecting the relatively weak
global economy. The 13% decline, however, was less drastic than the previous year. Despite lower global FDI flows, emerging markets held up. Flows to the E20, at about $432 billion in 2018,
remained at basically the same level as in 2017. They recovered to one of their highest shares of global FDI ever (33%), accounting for a third of all FDI flows (Figure 2.4). This trend reflects good FDI inflow performance by several emerging
economies, especially in Asia. China saw FDI inflows increase by 4%, reaching its highest level⎯$139 billion, i.e. more than
10% of the world’s total ⎯ a result achieved despite trade tensions. Policy changes on foreign investment into China, and changing limits on foreign ownership contributed to this increase. As a result, in 2018 China remained the second largest recipient of FDI after the U.S (Figure 2.4). Inflows also increased to India (+6%), Indonesia (+7%,) Turkey (+13%), and even
more markedly in Thailand (+62%)⎯the latter following a four-year period of poor FDI performance. Intra-regional flows (from China, Japan and Singapore for instance) played a significant role in the increased FDI to emerging economies in Asia.
Figure 2.4. E20 inward FDI flows (USD billions) and top economies by inward FDI flows a. Inward FDI flows in E20 countries (USD billions) and share in global flows (2000-2018)
b. Top 15 by inward FDI flows (USD billions) in 2000, 2010 and 2018.
Source: Authors’ analysis based on UNCTADstats, at https://unctadstat.unctad.org, and UNCTAD (2019a), accessed June 2019.
B. A new era? Overseas investments decline in 2018 2018 saw a steep drop in FDI outflows globally (-30%) to about $1 trillion, mostly due to decreased outflows from
developed economies (-40%). The latter reflected large-scale repatriations of foreign accumulated earnings by U.S.
0%
10%
20%
30%
40%
0
200
400
600
2000 2001 2002 2003 2004 2005 2006 2007 2008 2009 2010 2011 2012 2013 2014 2015 2016 2017 2018IFDI Flows to E20 E20 Share (%) in Global IFDI Flows
314.007
198.279
115.304
66.795
63.855
54.582
40.715
39.575
33.823
32.779
27.495
25.779
23.433
19.855
18.249
U.S.
Germany
U.K.
Canada
Netherlands
Hong Kong
China
Spain
Denmark
Brazil
France
Ireland
Sweden
Switzerland
Mexico
Top 15 Economies by Inward FDI flows 2000 (USD Millions)
198.049
114.734
77.687
70.541
65.643
58.200
57.460
43.231
42.804
39.873
39.129
36.796
31.668
29.876
29.233
U.S.
China
Brazil
Hong Kong
Germany
U.K.
Singapore
Belgium
Ireland
Spain
Luxembourg
Australia
Russia
Switzerland
Saudi Arabia
Top 15 Economies by Inward FDI flows 2010 (USD Millions)
251.814
139.043
115.662
77.646
69.659
64.487
61.223
60.438
43.591
42.286
39.625
37.294
31.604
25.706
24.276
U.S.
China
Hong Kong
Singapore
Netherlands
U.K.
Brazil
Australia
Spain
India
Canada
France
Mexico
Germany
Italy
Top 15 Economies by Inward FDI flows 2018 (USD Millions)
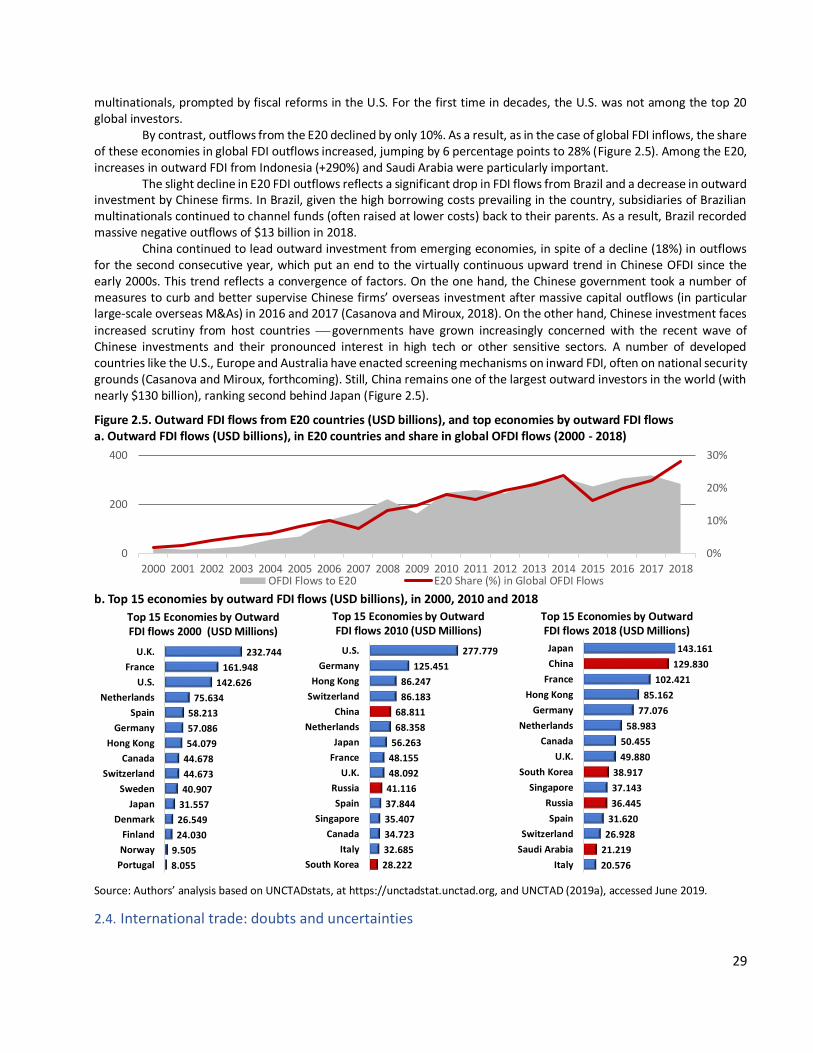
29
multinationals, prompted by fiscal reforms in the U.S. For the first time in decades, the U.S. was not among the top 20 global investors.
By contrast, outflows from the E20 declined by only 10%. As a result, as in the case of global FDI inflows, the share of these economies in global FDI outflows increased, jumping by 6 percentage points to 28% (Figure 2.5). Among the E20, increases in outward FDI from Indonesia (+290%) and Saudi Arabia were particularly important.
The slight decline in E20 FDI outflows reflects a significant drop in FDI flows from Brazil and a decrease in outward investment by Chinese firms. In Brazil, given the high borrowing costs prevailing in the country, subsidiaries of Brazilian multinationals continued to channel funds (often raised at lower costs) back to their parents. As a result, Brazil recorded massive negative outflows of $13 billion in 2018.
China continued to lead outward investment from emerging economies, in spite of a decline (18%) in outflows for the second consecutive year, which put an end to the virtually continuous upward trend in Chinese OFDI since the early 2000s. This trend reflects a convergence of factors. On the one hand, the Chinese government took a number of measures to curb and better supervise Chinese firms’ overseas investment after massive capital outflows (in particular large-scale overseas M&As) in 2016 and 2017 (Casanova and Miroux, 2018). On the other hand, Chinese investment faces
increased scrutiny from host countries ⎯ governments have grown increasingly concerned with the recent wave of Chinese investments and their pronounced interest in high tech or other sensitive sectors. A number of developed countries like the U.S., Europe and Australia have enacted screening mechanisms on inward FDI, often on national security grounds (Casanova and Miroux, forthcoming). Still, China remains one of the largest outward investors in the world (with nearly $130 billion), ranking second behind Japan (Figure 2.5).
Figure 2.5. Outward FDI flows from E20 countries (USD billions), and top economies by outward FDI flows a. Outward FDI flows (USD billions), in E20 countries and share in global OFDI flows (2000 - 2018)
b. Top 15 economies by outward FDI flows (USD billions), in 2000, 2010 and 2018
Source: Authors’ analysis based on UNCTADstats, at https://unctadstat.unctad.org, and UNCTAD (2019a), accessed June 2019.
2.4. International trade: doubts and uncertainties
0%
10%
20%
30%
0
200
400
2000 2001 2002 2003 2004 2005 2006 2007 2008 2009 2010 2011 2012 2013 2014 2015 2016 2017 2018OFDI Flows to E20 E20 Share (%) in Global OFDI Flows
232.744
161.948
142.626
75.634
58.213
57.086
54.079
44.678
44.673
40.907
31.557
26.549
24.030
9.505
8.055
U.K.
France
U.S.
Netherlands
Spain
Germany
Hong Kong
Canada
Switzerland
Sweden
Japan
Denmark
Finland
Norway
Portugal
Top 15 Economies by Outward FDI flows 2000 (USD Millions)
277.779
125.451
86.247
86.183
68.811
68.358
56.263
48.155
48.092
41.116
37.844
35.407
34.723
32.685
28.222
U.S.
Germany
Hong Kong
Switzerland
China
Netherlands
Japan
France
U.K.
Russia
Spain
Singapore
Canada
Italy
South Korea
Top 15 Economies by Outward FDI flows 2010 (USD Millions)
143.161
129.830
102.421
85.162
77.076
58.983
50.455
49.880
38.917
37.143
36.445
31.620
26.928
21.219
20.576
Japan
China
France
Hong Kong
Germany
Netherlands
Canada
U.K.
South Korea
Singapore
Russia
Spain
Switzerland
Saudi Arabia
Italy
Top 15 Economies by Outward FDI flows 2018 (USD Millions)
30
Trade tensions between the U.S. and China erupted openly in early 2018. That March, the U.S. announced that it would impose a 25% tariff on steel imports and a 10% tariff on aluminum imports. These tariffs affected products coming from many countries—most notably China. In April, the Chinese government indicated that, should the U.S. actually impose its new tariffs on steel and aluminum, China would respond with tariffs ranging from 15% to 25% on 128 goods, including soybeans, automobiles and chemicals imports, which amounted to nearly $3 billion. A period of negotiations ensued, with no result. Both the U.S., then Chinese, tariffs went into effect.
In April 2018, the U.S. also published lists of Chinese products that could be subject to 25% tariffs. The tariffs focused on industries targeted by the Made in China 2025 plan and included products from high tech industries such as aerospace, ICT, robotics, electrical equipment and medical equipment among others. Again, both countries attempted and failed at negotiations, and the proposed tariffs took effect: In July 2018, on a list amounting to $34 billion, and then in August with a list amounting $16 billion. China parried each thrust, retaliating by imposing a 25% tariff on U.S. goods worth $34 billion and then around $16 billion, including U.S. agricultural products, automobiles and aquatic products. The U.S. government also announced a third list of products worth $200 billion in August 2018. The tariff of 10% on these products went into effect in September 2018. As a response, China implemented tariffs on $60 billion worth of U.S. products.
During the G20 summit in Buenos Aires in December 2018, the U.S. and China agreed to a temporary three-month truce before escalating tariffs any further and announced the beginning of a round of trade talks. In spite of the tense atmosphere that surrounded the talks, the U.S. government postponed tariff hikes by the end of February 2019. The talks between U.S. and Chinese officials continued, and an agreement was expected by May. Nevertheless, in June, the U.S. government raised its tariffs on the third list of products, worth $200 billion, from 10% to 25%. In addition, U.S. officials promised to establish a 25% tariff on all Chinese imports, estimated to amount to an additional $325 billion, if China did not comply with U.S. terms to reach an agreement. China reciprocated by announcing new 25% tariffs on $60 billion worth of U.S. products. During the G20 summit in Japan in June 2019, U.S. President Donald Trump and Chinese President Xi Jinping agreed to carry on with the negotiations and announced they did not plan to impose new tariffs for the time being (Rosenfeld, 2019). Negotiations resumed. In early August, however, the U.S. announced it would impose a tariff of 10% on the remaining $300 billion of Chinese imports of goods and products beginning in September. If applied, this would mean that all of Chinese imports to the U.S. would be subject to new tariffs. By mid-August, the U.S. announced these new tariffs would be delayed until the end of 2019 and removed some items from the list. In September, some of the earlier announced U.S. tariffs went into effect, activating the retaliatory tariffs China had promised. That same month, both countries agreed to hold a new round of negotiations, the 13th since early 2018.
As of September 2019, no breakthrough was in sight. As noted by Eswar Prasad, former Head of the IMF’s China Division and Senior Professor of Trade Policy at Cornell University, in an August 2019 New York Times article: “Both sides now seem to be settling in for a broad and unremitting trade war that will last at least through this term of Trump’s presidency.” (Rappeport, 2019).
Several multilateral organizations have called for an end to the trade war. According to the IMF, the tariffs have reduced trade between the U.S. and China, but the trade deficit has remained stable. While the trade war has had modest impact on global growth, it could potentially disrupt global supply chains and significantly alter economic performance in the future. IMF calculations suggest tariffs would cut global GDP by 0.3% in 2020 and cost $455 billion in lost output, i.e., a loss larger than the size of South Africa’s GDP (IMF 2019b). OECD estimations point in the same direction, suggesting that an intensification of China-U.S. trade tensions could undercut global output by 0.7% (OECD Economic Outlook, May 2019).
In addition, trade tensions are not limited to U.S.-China trade relations. The U.S. has had other challenges with some of its traditional ‘closer’ trade partners, as illustrated by NAFTA renegotiations between the U.S., Canada and Mexico. The new USMCA, intended to replace NAFTA, was concluded in November 2018 (see Box 2.1).
Tensions between the U.S. and China have also risen over each country’s presence in the technology sector. Tariff hikes, export restrictions, increased control and limitations to inward investment, including restrictions on business acquisitions by foreigners all deeply affect technology-related sectors (Casanova and Miroux, 2018 and forthcoming). The case of telecoms is particularly illustrative, with the U.S. adopting several measures on national security grounds de facto targeting Chinese firms such as Huawei, which effectively prevented them from accessing the U.S. market or acquiring technology equipment from U.S. firms. In May 2019, for instance, U.S. President Donald Trump declared a national emergency, signing an executive order forbidding U.S. companies from using foreign telecom services that could pose a national security threat. The executive order applies to all, but Chinese multinationals such as Huawei, the world leader
31
in telecommunications equipment (see Chapter 1), will likely bear the brunt of the effects. The U.S. is encouraging other countries to adopt similar restrictions. As noted in the previous chapter, Huawei was also put on the U.S. “Entity List” in May 2019, and five other Chinese companies were added to the list in August 2019. Inclusion on the list makes it
mandatory for U.S. firms to receive a government authorization before selling equipment to the listed company ⎯ which can prove quite difficult if relations with the buyer’s home country are tense. The U.S. President eased the bans on Huawei during the G20 Summit in June 2019: some American companies would still be allowed to sell their products to Huawei, but the company would remain on the U.S. trade blacklist. Yet, the extent of this exemption remained relatively unclear and in the following weeks, there was no clear indication of the reversal of Huawei’s ban (Boxall, 2019 & Duffy, 2019). As in trade, China retaliated, announcing in May 2019 that it would establish its very own list of unreliable entities to include foreign enterprises, organizations, and individuals that do not obey market rules, violate contracts, and block, cut off supply for non-commercial reasons, or severely damage the legitimate interests of Chinese companies (Bloomberg News, 2019). In June, the National Development and Reform Commission, together with other state ministries, announced that it was in the process of enacting its own national security management list (Yang, 2019).
Are the days of the rule-based global trade system over?
The factors in the global environment that encouraged significant growth for a number of emerging economies has dramatically changed. In addition, 2018-2019 has seen a new slowdown in the global economy. While the IMF and World Bank expect some improvement in the medium-term, downside risks still firmly loom. As noted by the IMF, the global economy is more fragile than it was (Gopinath, 2019). One of the key reasons for this fragility is the trade war
Box 2.1. The United States-Mexico-Canada Agreement (USMCA)
The United States-Mexico-Canada Agreement (USMCA) is the result of the renegotiation of the 1994 North American Free Trade Agreement (NAFTA). Among the biggest changes it includes, are stricter labor and environmental regulations, intellectual property protections, and digital trade provisions. The agreement opens the Canadian dairy market to U.S. farmers, and extends the period that a pharmaceutical company can be protected from generic competition, which has become a sticking point while the agreement is being approved by the U.S. Congress. Among its requirements, USMCA establishes a 16-year expiration clause (a “sunset clause”) for the agreement, and requires that 40 to 45% of auto components be manufactured by workers who earn a minimum of $16 an hour; it also increases the proportion of components that must be produced in North America for tariff reductions to apply, from 62.5% under NAFTA to 75%. In addition, the agreement also includes a clause (Section 32.10) that states that a USMCA country must give three months' notice to the other two parties before negotiating a free trade agreement with any country considered a "non-market" USMCA partner. Many experts have taken this to be a direct reference to China. Under USMCA's Section 32, USMCA nations will be given the opportunity to review the text of any trade deal between an USMCA partner and a non-market country before it is signed, and would retain the option of pulling out of the North American trade pact in response. The agreement, signed by the three parties in November 2018, must be ratified following the appropriate domestic procedures before it comes into force. Until that moment, NAFTA will remain in place. In May 2019, the U.S. administration struck a deal to end steel and aluminum tariffs on Canada and Mexico, something both countries demanded if they were to pass the USMCA, clearing a major hurdle to ratification in both countries. In June 2019, the Mexican senate approved the agreement with an overwhelming congressional majority. Canada has not yet approved the agreement, but it is expected to pass the approval process in parliament. By contrast, political division in the U.S. Congress might prove to be problematic for U.S. approval. Democrats find that the labor rule enforcement provisions and environmental protections included in the agreement are not sufficiently strong. Some Republicans have argued that the agreement limits trade opportunities, while others have blasted its sections aimed at preventing discrimination on the basis of sex, including sexual orientation and gender identity. Congresspeople have pressed the U.S. trade representative to take concrete steps to reopen negotiations with Mexico and Canada before a vote on the agreement takes place. In spite of the concerns espoused by many legislators, the White House still planned to send the agreement to Congress by July 2019 for it to be voted on by the end of the year, without any major modification. In the meantime, political negotiations seem to be moving forward. Although U.S. President Donald Trump has threatened to withdraw from NAFTA in an effort to pressure Democrats to approve the USMCA, several Canadian and U.S. trade experts believe a withdrawal from the agreement is unlikely. As of September 2019, approval in the U.S. Congress was still pending.
32
between the U.S. and China; the pervasive uncertainty that it creates has a major destabilizing impact on the global economy. As mentioned in the 2018 EMR, the authors are of the view that, in the long term, the sustained loss of confidence in the rule-based global trade system is even more damaging than the economic losses by themselves.
REFERENCES
Bloomberg News, (2019). “What We Know About China’s ‘Unreliable Entities’ Blacklist”, June 2019, <https://www.bloomberg.com/news/articles/2019-06-04/understanding-china-s-unreliable-entities-blacklist-quicktake>.
Boxall, A. (2019). “Huawei ban partially lifted, but situation remains as confused as ever”, Digital Trends, July 2019, <https://www.digitaltrends.com/mobile/huawei-us-ban-partially-lifted-news/>.
Casanova, L. and Miroux A., (2018), Emerging Market Multinationals Report 2018, Emerging Markets Reshaping Globalization, SC Johnson College of Business, Cornell University, <https://www.johnson.cornell.edu/wp-content/uploads/sites/3/2019/04/EMR2018_V3_FIN-11Jan.pdf>.
Casanova, L. and Miroux, A., The Era of Chinese Multinationals – Competing for Global Dominance, Academic Press, Elsevier, Forthcoming.
Duffy, C. (2019). “Trump said he’d ease up on Huawei. Questions remain about what that means”, CNN Business, July 2019, <e>.
Gopinath, G., (2019), “The Global Economy: A Delicate Moment”, April 2019, IMF blog, at <https://blogs.imf.org/2019/04/09/the-global-economy-a-delicate-moment/>.
International Monetary Fund (2019b), “World Economic Outlook”, April 2019. International Monetary Fund (2019a), “How to help, not to hinder growth”, June 2019,
<https://blogs.imf.org/2019/06/05/how-to-help-not-hinder-global-growth/#more-26509>. Lagarde, C. 2016, Pakistan and Emerging Markets in the World Economy,
<https://www.imf.org/en/News/Articles/2016/10/24/SP102416-Pakistan-Emerging-Markets-in-the-World-Economy>.
OECD (2019), OECD Economic Outlook, Volume 2019 Issue 1, OECD Publishing, Paris, <https://doi.org/10.1787/b2e897b0-en>.
Rappeport, A. (2019) “China Reacts to Trade Tariffs and Hong Kong Protests by Blaming U.S.”, The New York Times, August 2019, <https://www.nytimes.com/2019/08/01/us/politics/trump-tariffs-china.html>.
Reuters, (2019). <https://www.reuters.com/article/us-brazil-economy-survey/economists-trim-brazil-2019-growth-forecasts-again-but-signs-of-stability-emerge-survey-idUSKCN1U31GD>.
Rosenfeld, E. (2019). “Trumps says he agreed with Xi to hold off on new tariffs and to let Huawei buy US products”, <https://www.cnbc.com/2019/06/29/us-china-trade-war-trump-and-xi-meet-at-g-20-summit-in-osaka.html>, CNBC World Economy, June 2019.
UNCTAD. (2019). World Investment Report: Special Economic Zones. United Nations: New York and Geneva. UNCTAD, (2019b), Current challenges to developing country debt sustainability. World Bank (2019a), “Global Economic Prospects”, January 2019. World Bank (2019b), “Global Economic Prospects – Heightened tensions, Subdued Investment”, June 2019. World Bank (n.d.a), Pakistan Overview, <https://www.worldbank.org/en/country/pakistan/overview>. World Bank (n.d.b), Arab Republic of Egypt, <http://pubdocs.worldbank.org/en/736931553672509905/Egypt-MEU-April-
2019-Eng.pdf>. Yang, Y. (2019) “Companies in the Crosshairs? China to Enact its own Export Controls”, China Business Review, August
2019, < https://www.chinabusinessreview.com/companies-in-the-crosshairs-china-to-enact-its-own-export-controls/>.
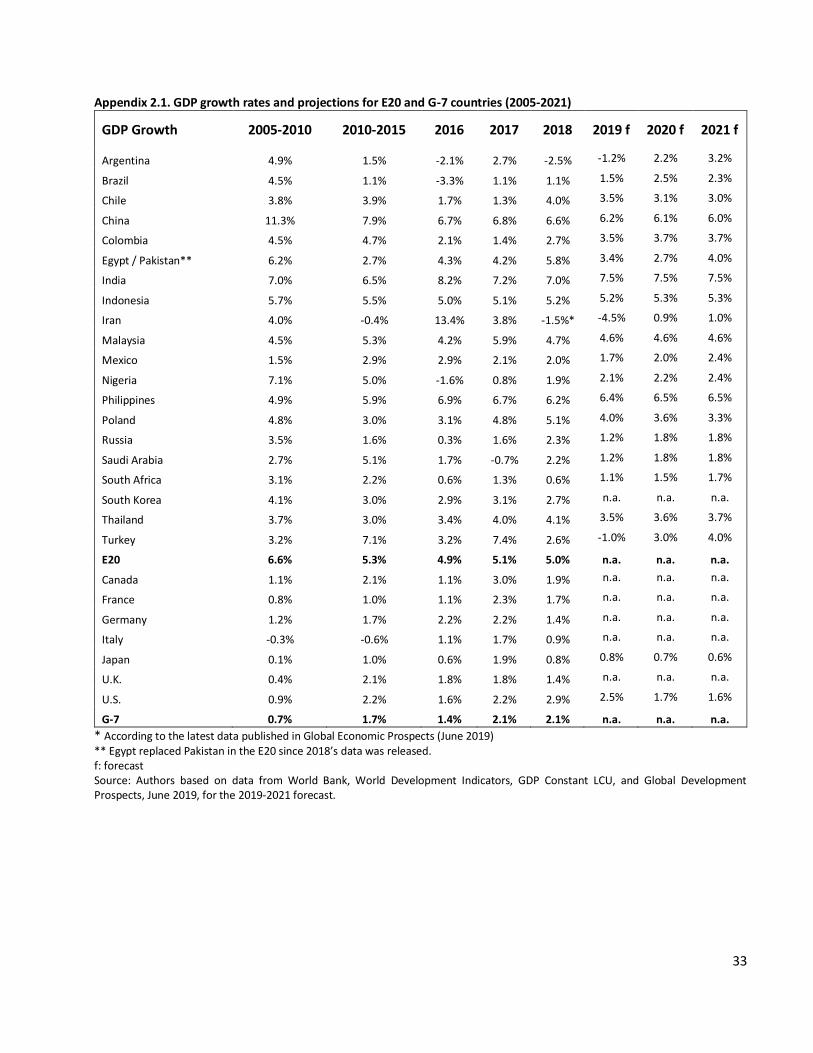
33
Appendix 2.1. GDP growth rates and projections for E20 and G-7 countries (2005-2021)
GDP Growth 2005-2010 2010-2015 2016 2017 2018 2019 f 2020 f 2021 f
Argentina 4.9% 1.5% -2.1% 2.7% -2.5% -1.2% 2.2% 3.2%
Brazil 4.5% 1.1% -3.3% 1.1% 1.1% 1.5% 2.5% 2.3%
Chile 3.8% 3.9% 1.7% 1.3% 4.0% 3.5% 3.1% 3.0%
China 11.3% 7.9% 6.7% 6.8% 6.6% 6.2% 6.1% 6.0%
Colombia 4.5% 4.7% 2.1% 1.4% 2.7% 3.5% 3.7% 3.7%
Egypt / Pakistan** 6.2% 2.7% 4.3% 4.2% 5.8% 3.4% 2.7% 4.0%
India 7.0% 6.5% 8.2% 7.2% 7.0% 7.5% 7.5% 7.5%
Indonesia 5.7% 5.5% 5.0% 5.1% 5.2% 5.2% 5.3% 5.3%
Iran 4.0% -0.4% 13.4% 3.8% -1.5%* -4.5% 0.9% 1.0%
Malaysia 4.5% 5.3% 4.2% 5.9% 4.7% 4.6% 4.6% 4.6%
Mexico 1.5% 2.9% 2.9% 2.1% 2.0% 1.7% 2.0% 2.4%
Nigeria 7.1% 5.0% -1.6% 0.8% 1.9% 2.1% 2.2% 2.4%
Philippines 4.9% 5.9% 6.9% 6.7% 6.2% 6.4% 6.5% 6.5%
Poland 4.8% 3.0% 3.1% 4.8% 5.1% 4.0% 3.6% 3.3%
Russia 3.5% 1.6% 0.3% 1.6% 2.3% 1.2% 1.8% 1.8%
Saudi Arabia 2.7% 5.1% 1.7% -0.7% 2.2% 1.2% 1.8% 1.8%
South Africa 3.1% 2.2% 0.6% 1.3% 0.6% 1.1% 1.5% 1.7%
South Korea 4.1% 3.0% 2.9% 3.1% 2.7% n.a. n.a. n.a.
Thailand 3.7% 3.0% 3.4% 4.0% 4.1% 3.5% 3.6% 3.7%
Turkey 3.2% 7.1% 3.2% 7.4% 2.6% -1.0% 3.0% 4.0%
E20 6.6% 5.3% 4.9% 5.1% 5.0% n.a. n.a. n.a.
Canada 1.1% 2.1% 1.1% 3.0% 1.9% n.a. n.a. n.a.
France 0.8% 1.0% 1.1% 2.3% 1.7% n.a. n.a. n.a.
Germany 1.2% 1.7% 2.2% 2.2% 1.4% n.a. n.a. n.a.
Italy -0.3% -0.6% 1.1% 1.7% 0.9% n.a. n.a. n.a.
Japan 0.1% 1.0% 0.6% 1.9% 0.8% 0.8% 0.7% 0.6%
U.K. 0.4% 2.1% 1.8% 1.8% 1.4% n.a. n.a. n.a.
U.S. 0.9% 2.2% 1.6% 2.2% 2.9% 2.5% 1.7% 1.6%
G-7 0.7% 1.7% 1.4% 2.1% 2.1% n.a. n.a. n.a.
* According to the latest data published in Global Economic Prospects (June 2019) ** Egypt replaced Pakistan in the E20 since 2018’s data was released. f: forecast Source: Authors based on data from World Bank, World Development Indicators, GDP Constant LCU, and Global Development Prospects, June 2019, for the 2019-2021 forecast.
34
Chapter 3
The Global South: Chinese
investments in Latin America and
Africa 3.1. Introduction
3.2. China’s economic engagement in Latin America
A. A new era? Overseas investments decline in 2018
B. Chinese lending to Latin America
3.3. China’s economic engagement in Africa
3.4. Global south linkages: Belt and Road Initiative
3.5. Ten years that changed global trade and realigned investment
Executive Summary
Chapter 3 explores the rise of the global South through the rising economic engagement of China in Latin America and Africa. The rise of Chinese FDI on both continents is particularly illustrative of this trend. Indeed, while almost two third of China’s outward foreign direct investment (FDI) stock is still invested in Asia alone, Latin America and Africa have provided fertile ground for the significant overseas expansion of Chinese multinationals. The chapter highlights the data challenges as regards Chinese OFDI and overseas lending. Based on a variety of sources it examines trends in China’s outward FDI in and lending to these regions. Overall, in Latin America and the Caribbean Chinese OFDI has come to play a major role, being at par or even exceeding Chinese lending to the continent on several occasions. Though lending does not dominate the picture as it does in Africa, in some years China has been the largest source of development finance for Latin America, even surpassing that of major development banks. In Africa, lending remains the most important mode of finance from China; yet, for Africa, China is a key investment partner, the second one in term of Greenfield projects for instance.
3.1. Introduction
China’s internationalization has focused on emerging markets: first, in its natural market, Asia, but also in the broader global south, Africa and Latin America. While 63% of China’s outward foreign direct investment (FDI) stock is invested in Asia alone, Latin America (21.4%) and Africa (2.4%) have provided fertile ground for Chinese multinationals to expand overseas. This chapter examines this FDI trend in the context of the growing influx of Chinese investment on these two continents.
Page 34
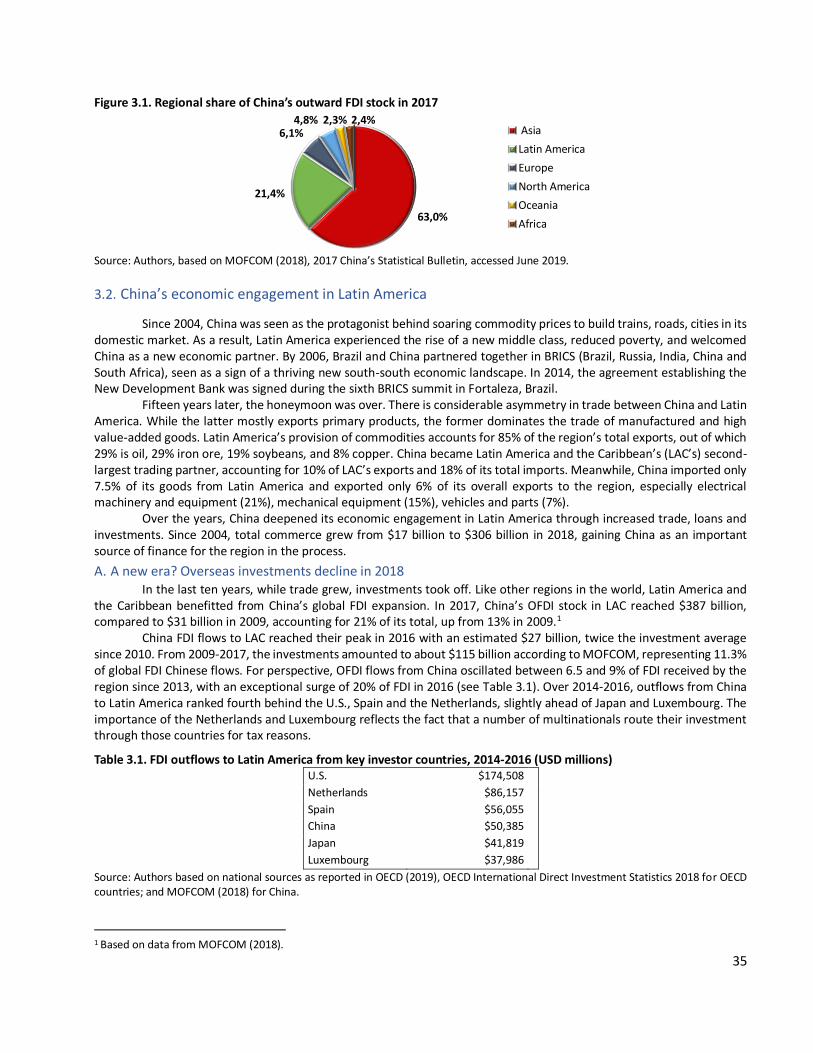
35
Figure 3.1. Regional share of China’s outward FDI stock in 2017
Source: Authors, based on MOFCOM (2018), 2017 China’s Statistical Bulletin, accessed June 2019.
3.2. China’s economic engagement in Latin America
Since 2004, China was seen as the protagonist behind soaring commodity prices to build trains, roads, cities in its domestic market. As a result, Latin America experienced the rise of a new middle class, reduced poverty, and welcomed China as a new economic partner. By 2006, Brazil and China partnered together in BRICS (Brazil, Russia, India, China and South Africa), seen as a sign of a thriving new south-south economic landscape. In 2014, the agreement establishing the New Development Bank was signed during the sixth BRICS summit in Fortaleza, Brazil.
Fifteen years later, the honeymoon was over. There is considerable asymmetry in trade between China and Latin America. While the latter mostly exports primary products, the former dominates the trade of manufactured and high value-added goods. Latin America’s provision of commodities accounts for 85% of the region’s total exports, out of which 29% is oil, 29% iron ore, 19% soybeans, and 8% copper. China became Latin America and the Caribbean’s (LAC’s) second-largest trading partner, accounting for 10% of LAC’s exports and 18% of its total imports. Meanwhile, China imported only 7.5% of its goods from Latin America and exported only 6% of its overall exports to the region, especially electrical machinery and equipment (21%), mechanical equipment (15%), vehicles and parts (7%).
Over the years, China deepened its economic engagement in Latin America through increased trade, loans and investments. Since 2004, total commerce grew from $17 billion to $306 billion in 2018, gaining China as an important source of finance for the region in the process.
A. A new era? Overseas investments decline in 2018 In the last ten years, while trade grew, investments took off. Like other regions in the world, Latin America and
the Caribbean benefitted from China’s global FDI expansion. In 2017, China’s OFDI stock in LAC reached $387 billion, compared to $31 billion in 2009, accounting for 21% of its total, up from 13% in 2009.1
China FDI flows to LAC reached their peak in 2016 with an estimated $27 billion, twice the investment average since 2010. From 2009-2017, the investments amounted to about $115 billion according to MOFCOM, representing 11.3% of global FDI Chinese flows. For perspective, OFDI flows from China oscillated between 6.5 and 9% of FDI received by the region since 2013, with an exceptional surge of 20% of FDI in 2016 (see Table 3.1). Over 2014-2016, outflows from China to Latin America ranked fourth behind the U.S., Spain and the Netherlands, slightly ahead of Japan and Luxembourg. The importance of the Netherlands and Luxembourg reflects the fact that a number of multinationals route their investment through those countries for tax reasons.
Table 3.1. FDI outflows to Latin America from key investor countries, 2014-2016 (USD millions) U.S. $174,508 Netherlands $86,157 Spain $56,055 China $50,385 Japan $41,819 Luxembourg $37,986
Source: Authors based on national sources as reported in OECD (2019), OECD International Direct Investment Statistics 2018 for OECD countries; and MOFCOM (2018) for China.
1 Based on data from MOFCOM (2018).
63,0%
21,4%
6,1%4,8% 2,3% 2,4%
Asia
Latin America
Europe
North America
Oceania
Africa
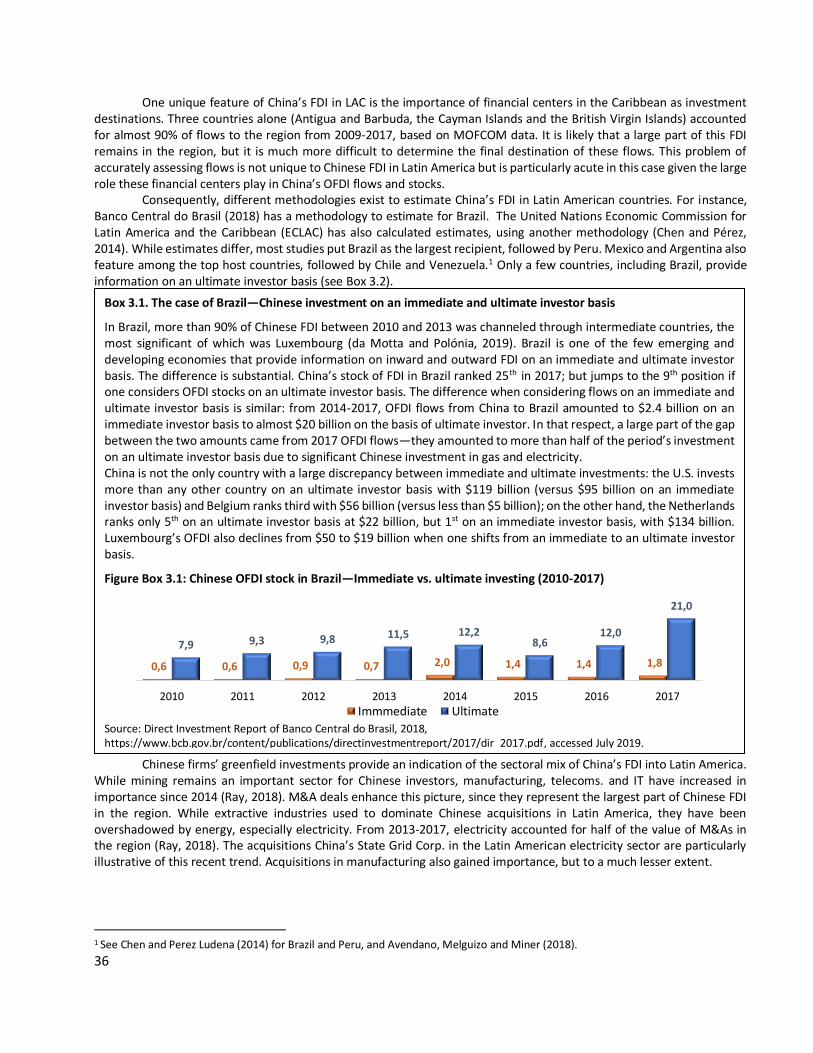
36
One unique feature of China’s FDI in LAC is the importance of financial centers in the Caribbean as investment destinations. Three countries alone (Antigua and Barbuda, the Cayman Islands and the British Virgin Islands) accounted for almost 90% of flows to the region from 2009-2017, based on MOFCOM data. It is likely that a large part of this FDI remains in the region, but it is much more difficult to determine the final destination of these flows. This problem of accurately assessing flows is not unique to Chinese FDI in Latin America but is particularly acute in this case given the large role these financial centers play in China’s OFDI flows and stocks.
Consequently, different methodologies exist to estimate China’s FDI in Latin American countries. For instance, Banco Central do Brasil (2018) has a methodology to estimate for Brazil. The United Nations Economic Commission for Latin America and the Caribbean (ECLAC) has also calculated estimates, using another methodology (Chen and Pérez, 2014). While estimates differ, most studies put Brazil as the largest recipient, followed by Peru. Mexico and Argentina also feature among the top host countries, followed by Chile and Venezuela.1 Only a few countries, including Brazil, provide information on an ultimate investor basis (see Box 3.2).
Chinese firms’ greenfield investments provide an indication of the sectoral mix of China’s FDI into Latin America.
While mining remains an important sector for Chinese investors, manufacturing, telecoms. and IT have increased in importance since 2014 (Ray, 2018). M&A deals enhance this picture, since they represent the largest part of Chinese FDI in the region. While extractive industries used to dominate Chinese acquisitions in Latin America, they have been overshadowed by energy, especially electricity. From 2013-2017, electricity accounted for half of the value of M&As in the region (Ray, 2018). The acquisitions China’s State Grid Corp. in the Latin American electricity sector are particularly illustrative of this recent trend. Acquisitions in manufacturing also gained importance, but to a much lesser extent.
1 See Chen and Perez Ludena (2014) for Brazil and Peru, and Avendano, Melguizo and Miner (2018).
Box 3.1. The case of Brazil—Chinese investment on an immediate and ultimate investor basis
In Brazil, more than 90% of Chinese FDI between 2010 and 2013 was channeled through intermediate countries, the most significant of which was Luxembourg (da Motta and Polónia, 2019). Brazil is one of the few emerging and developing economies that provide information on inward and outward FDI on an immediate and ultimate investor basis. The difference is substantial. China’s stock of FDI in Brazil ranked 25th in 2017; but jumps to the 9th position if one considers OFDI stocks on an ultimate investor basis. The difference when considering flows on an immediate and ultimate investor basis is similar: from 2014-2017, OFDI flows from China to Brazil amounted to $2.4 billion on an immediate investor basis to almost $20 billion on the basis of ultimate investor. In that respect, a large part of the gap between the two amounts came from 2017 OFDI flows—they amounted to more than half of the period’s investment on an ultimate investor basis due to significant Chinese investment in gas and electricity. China is not the only country with a large discrepancy between immediate and ultimate investments: the U.S. invests more than any other country on an ultimate investor basis with $119 billion (versus $95 billion on an immediate investor basis) and Belgium ranks third with $56 billion (versus less than $5 billion); on the other hand, the Netherlands ranks only 5th on an ultimate investor basis at $22 billion, but 1st on an immediate investor basis, with $134 billion. Luxembourg’s OFDI also declines from $50 to $19 billion when one shifts from an immediate to an ultimate investor basis.
Figure Box 3.1: Chinese OFDI stock in Brazil—Immediate vs. ultimate investing (2010-2017)
Source: Direct Investment Report of Banco Central do Brasil, 2018, https://www.bcb.gov.br/content/publications/directinvestmentreport/2017/dir_2017.pdf, accessed July 2019.
0,6 0,6 0,9 0,7 2,0 1,4 1,4 1,8
7,9 9,3 9,8 11,5 12,28,6
12,0
21,0
2010 2011 2012 2013 2014 2015 2016 2017
Immmediate Ultimate
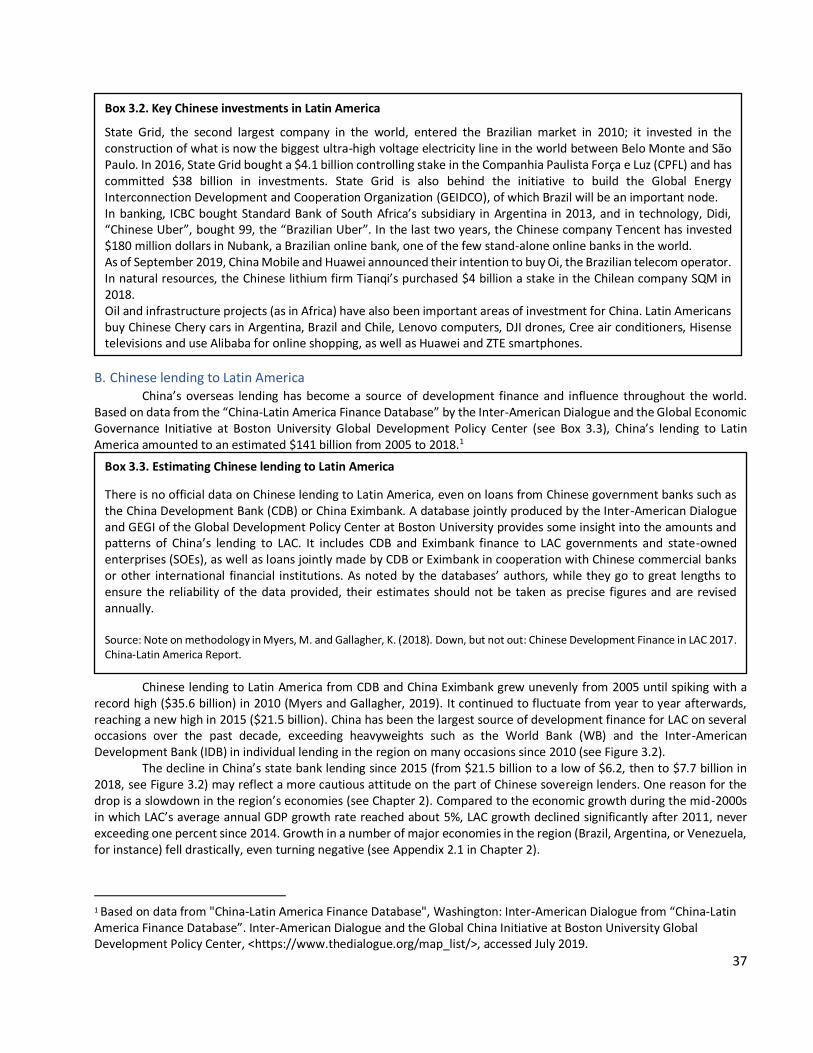
37
B. Chinese lending to Latin America China’s overseas lending has become a source of development finance and influence throughout the world.
Based on data from the “China-Latin America Finance Database” by the Inter-American Dialogue and the Global Economic Governance Initiative at Boston University Global Development Policy Center (see Box 3.3), China’s lending to Latin America amounted to an estimated $141 billion from 2005 to 2018.1
Chinese lending to Latin America from CDB and China Eximbank grew unevenly from 2005 until spiking with a
record high ($35.6 billion) in 2010 (Myers and Gallagher, 2019). It continued to fluctuate from year to year afterwards, reaching a new high in 2015 ($21.5 billion). China has been the largest source of development finance for LAC on several occasions over the past decade, exceeding heavyweights such as the World Bank (WB) and the Inter-American Development Bank (IDB) in individual lending in the region on many occasions since 2010 (see Figure 3.2).
The decline in China’s state bank lending since 2015 (from $21.5 billion to a low of $6.2, then to $7.7 billion in 2018, see Figure 3.2) may reflect a more cautious attitude on the part of Chinese sovereign lenders. One reason for the drop is a slowdown in the region’s economies (see Chapter 2). Compared to the economic growth during the mid-2000s in which LAC’s average annual GDP growth rate reached about 5%, LAC growth declined significantly after 2011, never exceeding one percent since 2014. Growth in a number of major economies in the region (Brazil, Argentina, or Venezuela, for instance) fell drastically, even turning negative (see Appendix 2.1 in Chapter 2).
1 Based on data from "China-Latin America Finance Database", Washington: Inter-American Dialogue from “China-Latin America Finance Database”. Inter-American Dialogue and the Global China Initiative at Boston University Global Development Policy Center, <https://www.thedialogue.org/map_list/>, accessed July 2019.
Box 3.2. Key Chinese investments in Latin America
State Grid, the second largest company in the world, entered the Brazilian market in 2010; it invested in the construction of what is now the biggest ultra-high voltage electricity line in the world between Belo Monte and São Paulo. In 2016, State Grid bought a $4.1 billion controlling stake in the Companhia Paulista Força e Luz (CPFL) and has committed $38 billion in investments. State Grid is also behind the initiative to build the Global Energy Interconnection Development and Cooperation Organization (GEIDCO), of which Brazil will be an important node. In banking, ICBC bought Standard Bank of South Africa’s subsidiary in Argentina in 2013, and in technology, Didi, “Chinese Uber”, bought 99, the “Brazilian Uber”. In the last two years, the Chinese company Tencent has invested $180 million dollars in Nubank, a Brazilian online bank, one of the few stand-alone online banks in the world. As of September 2019, China Mobile and Huawei announced their intention to buy Oi, the Brazilian telecom operator. In natural resources, the Chinese lithium firm Tianqi’s purchased $4 billion a stake in the Chilean company SQM in 2018. Oil and infrastructure projects (as in Africa) have also been important areas of investment for China. Latin Americans buy Chinese Chery cars in Argentina, Brazil and Chile, Lenovo computers, DJI drones, Cree air conditioners, Hisense televisions and use Alibaba for online shopping, as well as Huawei and ZTE smartphones.
Box 3.3. Estimating Chinese lending to Latin America
There is no official data on Chinese lending to Latin America, even on loans from Chinese government banks such as the China Development Bank (CDB) or China Eximbank. A database jointly produced by the Inter-American Dialogue and GEGI of the Global Development Policy Center at Boston University provides some insight into the amounts and patterns of China’s lending to LAC. It includes CDB and Eximbank finance to LAC governments and state-owned enterprises (SOEs), as well as loans jointly made by CDB or Eximbank in cooperation with Chinese commercial banks or other international financial institutions. As noted by the databases’ authors, while they go to great lengths to ensure the reliability of the data provided, their estimates should not be taken as precise figures and are revised annually. Source: Note on methodology in Myers, M. and Gallagher, K. (2018). Down, but not out: Chinese Development Finance in LAC 2017. China-Latin America Report.
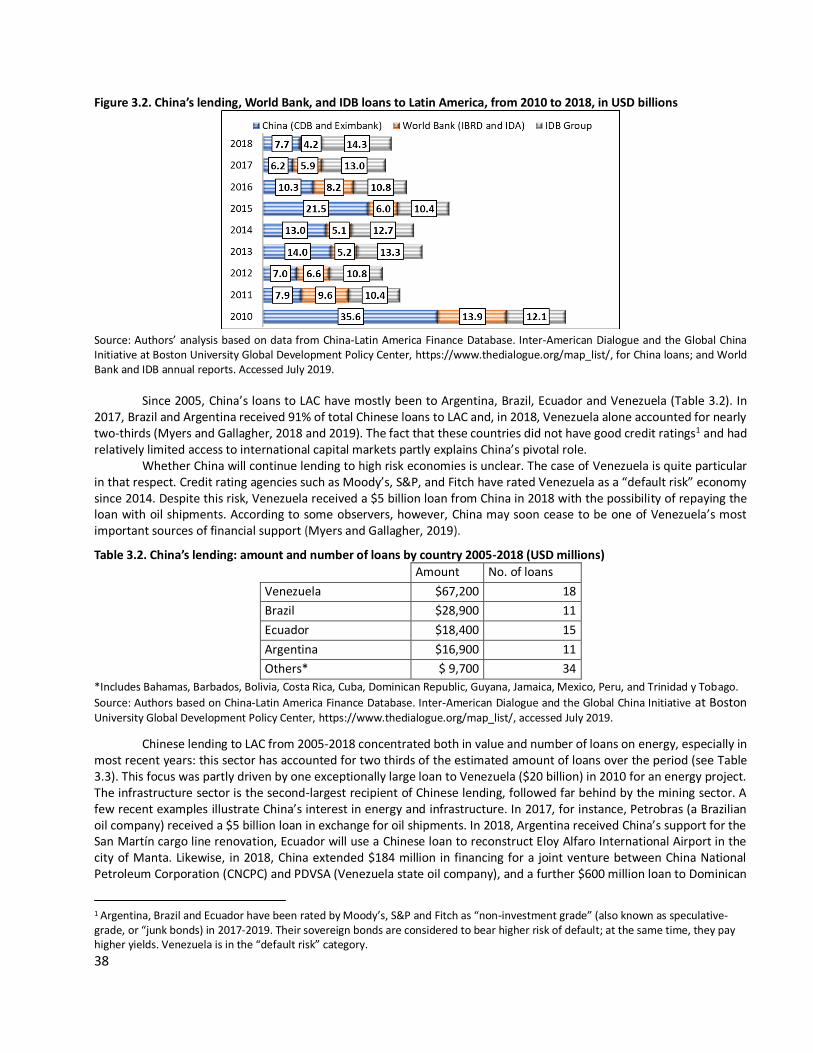
38
Figure 3.2. China’s lending, World Bank, and IDB loans to Latin America, from 2010 to 2018, in USD billions
Source: Authors’ analysis based on data from China-Latin America Finance Database. Inter-American Dialogue and the Global China Initiative at Boston University Global Development Policy Center, https://www.thedialogue.org/map_list/, for China loans; and World Bank and IDB annual reports. Accessed July 2019.
Since 2005, China’s loans to LAC have mostly been to Argentina, Brazil, Ecuador and Venezuela (Table 3.2). In 2017, Brazil and Argentina received 91% of total Chinese loans to LAC and, in 2018, Venezuela alone accounted for nearly two-thirds (Myers and Gallagher, 2018 and 2019). The fact that these countries did not have good credit ratings1 and had relatively limited access to international capital markets partly explains China’s pivotal role.
Whether China will continue lending to high risk economies is unclear. The case of Venezuela is quite particular in that respect. Credit rating agencies such as Moody’s, S&P, and Fitch have rated Venezuela as a “default risk” economy since 2014. Despite this risk, Venezuela received a $5 billion loan from China in 2018 with the possibility of repaying the loan with oil shipments. According to some observers, however, China may soon cease to be one of Venezuela’s most important sources of financial support (Myers and Gallagher, 2019).
Table 3.2. China’s lending: amount and number of loans by country 2005-2018 (USD millions)
Amount No. of loans
Venezuela $67,200 18
Brazil $28,900 11
Ecuador $18,400 15
Argentina $16,900 11
Others* $ 9,700 34
*Includes Bahamas, Barbados, Bolivia, Costa Rica, Cuba, Dominican Republic, Guyana, Jamaica, Mexico, Peru, and Trinidad y Tobago.
Source: Authors based on China-Latin America Finance Database. Inter-American Dialogue and the Global China Initiative at Boston University Global Development Policy Center, https://www.thedialogue.org/map_list/, accessed July 2019.
Chinese lending to LAC from 2005-2018 concentrated both in value and number of loans on energy, especially in most recent years: this sector has accounted for two thirds of the estimated amount of loans over the period (see Table 3.3). This focus was partly driven by one exceptionally large loan to Venezuela ($20 billion) in 2010 for an energy project. The infrastructure sector is the second-largest recipient of Chinese lending, followed far behind by the mining sector. A few recent examples illustrate China’s interest in energy and infrastructure. In 2017, for instance, Petrobras (a Brazilian oil company) received a $5 billion loan in exchange for oil shipments. In 2018, Argentina received China’s support for the San Martín cargo line renovation, Ecuador will use a Chinese loan to reconstruct Eloy Alfaro International Airport in the city of Manta. Likewise, in 2018, China extended $184 million in financing for a joint venture between China National Petroleum Corporation (CNCPC) and PDVSA (Venezuela state oil company), and a further $600 million loan to Dominican
1 Argentina, Brazil and Ecuador have been rated by Moody’s, S&P and Fitch as “non-investment grade” (also known as speculative-grade, or “junk bonds) in 2017-2019. Their sovereign bonds are considered to bear higher risk of default; at the same time, they pay higher yields. Venezuela is in the “default risk” category.
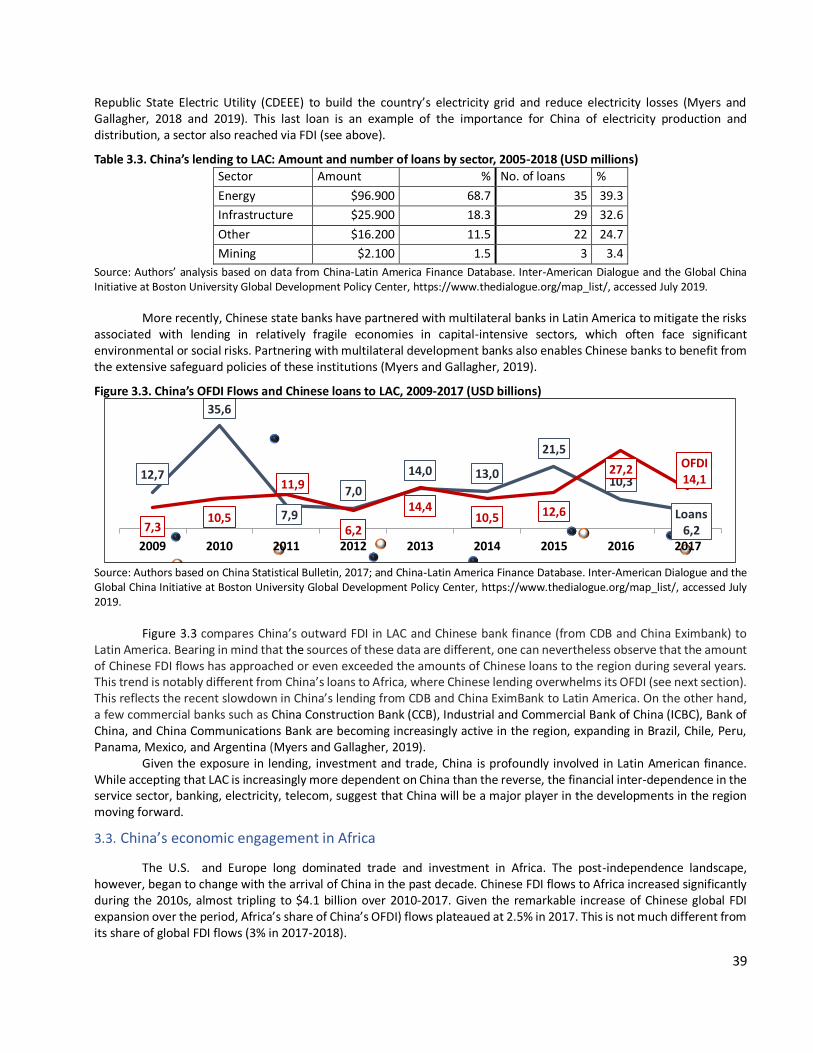
39
Republic State Electric Utility (CDEEE) to build the country’s electricity grid and reduce electricity losses (Myers and Gallagher, 2018 and 2019). This last loan is an example of the importance for China of electricity production and distribution, a sector also reached via FDI (see above).
Table 3.3. China’s lending to LAC: Amount and number of loans by sector, 2005-2018 (USD millions)
Sector Amount % No. of loans %
Energy $96.900 68.7 35 39.3
Infrastructure $25.900 18.3 29 32.6
Other $16.200 11.5 22 24.7
Mining $2.100 1.5 3 3.4
Source: Authors’ analysis based on data from China-Latin America Finance Database. Inter-American Dialogue and the Global China Initiative at Boston University Global Development Policy Center, https://www.thedialogue.org/map_list/, accessed July 2019.
More recently, Chinese state banks have partnered with multilateral banks in Latin America to mitigate the risks associated with lending in relatively fragile economies in capital-intensive sectors, which often face significant environmental or social risks. Partnering with multilateral development banks also enables Chinese banks to benefit from the extensive safeguard policies of these institutions (Myers and Gallagher, 2019).
Figure 3.3. China’s OFDI Flows and Chinese loans to LAC, 2009-2017 (USD billions)
Source: Authors based on China Statistical Bulletin, 2017; and China-Latin America Finance Database. Inter-American Dialogue and the Global China Initiative at Boston University Global Development Policy Center, https://www.thedialogue.org/map_list/, accessed July 2019.
Figure 3.3 compares China’s outward FDI in LAC and Chinese bank finance (from CDB and China Eximbank) to Latin America. Bearing in mind that the sources of these data are different, one can nevertheless observe that the amount of Chinese FDI flows has approached or even exceeded the amounts of Chinese loans to the region during several years. This trend is notably different from China’s loans to Africa, where Chinese lending overwhelms its OFDI (see next section). This reflects the recent slowdown in China’s lending from CDB and China EximBank to Latin America. On the other hand, a few commercial banks such as China Construction Bank (CCB), Industrial and Commercial Bank of China (ICBC), Bank of China, and China Communications Bank are becoming increasingly active in the region, expanding in Brazil, Chile, Peru, Panama, Mexico, and Argentina (Myers and Gallagher, 2019).
Given the exposure in lending, investment and trade, China is profoundly involved in Latin American finance. While accepting that LAC is increasingly more dependent on China than the reverse, the financial inter-dependence in the service sector, banking, electricity, telecom, suggest that China will be a major player in the developments in the region moving forward.
3.3. China’s economic engagement in Africa
The U.S. and Europe long dominated trade and investment in Africa. The post-independence landscape, however, began to change with the arrival of China in the past decade. Chinese FDI flows to Africa increased significantly during the 2010s, almost tripling to $4.1 billion over 2010-2017. Given the remarkable increase of Chinese global FDI expansion over the period, Africa’s share of China’s OFDI) flows plateaued at 2.5% in 2017. This is not much different from its share of global FDI flows (3% in 2017-2018).
12,7
35,6
7,9
7,0
14,0 13,0
21,5
10,3
Loans6,27,3
10,5
11,9
6,2
14,410,5 12,6
27,2 OFDI14,1
2009 2010 2011 2012 2013 2014 2015 2016 2017
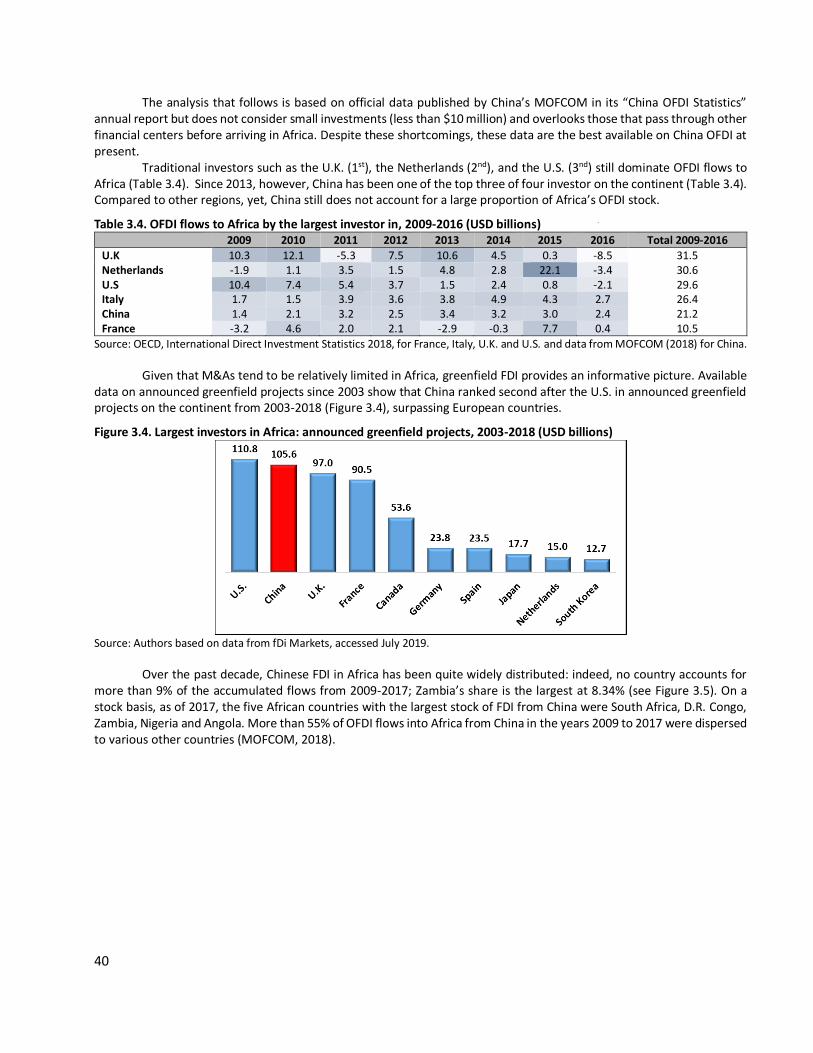
40
The analysis that follows is based on official data published by China’s MOFCOM in its “China OFDI Statistics” annual report but does not consider small investments (less than $10 million) and overlooks those that pass through other financial centers before arriving in Africa. Despite these shortcomings, these data are the best available on China OFDI at present.
Traditional investors such as the U.K. (1st), the Netherlands (2nd), and the U.S. (3nd) still dominate OFDI flows to Africa (Table 3.4). Since 2013, however, China has been one of the top three of four investor on the continent (Table 3.4). Compared to other regions, yet, China still does not account for a large proportion of Africa’s OFDI stock.
Table 3.4. OFDI flows to Africa by the largest investor in, 2009-2016 (USD billions) 2009 2010 2011 2012 2013 2014 2015 2016 Total 2009-2016
U.K 10.3 12.1 -5.3 7.5 10.6 4.5 0.3 -8.5 31.5 Netherlands -1.9 1.1 3.5 1.5 4.8 2.8 22.1 -3.4 30.6 U.S 10.4 7.4 5.4 3.7 1.5 2.4 0.8 -2.1 29.6 Italy 1.7 1.5 3.9 3.6 3.8 4.9 4.3 2.7 26.4 China 1.4 2.1 3.2 2.5 3.4 3.2 3.0 2.4 21.2 France -3.2 4.6 2.0 2.1 -2.9 -0.3 7.7 0.4 10.5
Source: OECD, International Direct Investment Statistics 2018, for France, Italy, U.K. and U.S. and data from MOFCOM (2018) for China.
Given that M&As tend to be relatively limited in Africa, greenfield FDI provides an informative picture. Available data on announced greenfield projects since 2003 show that China ranked second after the U.S. in announced greenfield projects on the continent from 2003-2018 (Figure 3.4), surpassing European countries.
Figure 3.4. Largest investors in Africa: announced greenfield projects, 2003-2018 (USD billions)
Source: Authors based on data from fDi Markets, accessed July 2019.
Over the past decade, Chinese FDI in Africa has been quite widely distributed: indeed, no country accounts for more than 9% of the accumulated flows from 2009-2017; Zambia’s share is the largest at 8.34% (see Figure 3.5). On a stock basis, as of 2017, the five African countries with the largest stock of FDI from China were South Africa, D.R. Congo, Zambia, Nigeria and Angola. More than 55% of OFDI flows into Africa from China in the years 2009 to 2017 were dispersed to various other countries (MOFCOM, 2018).
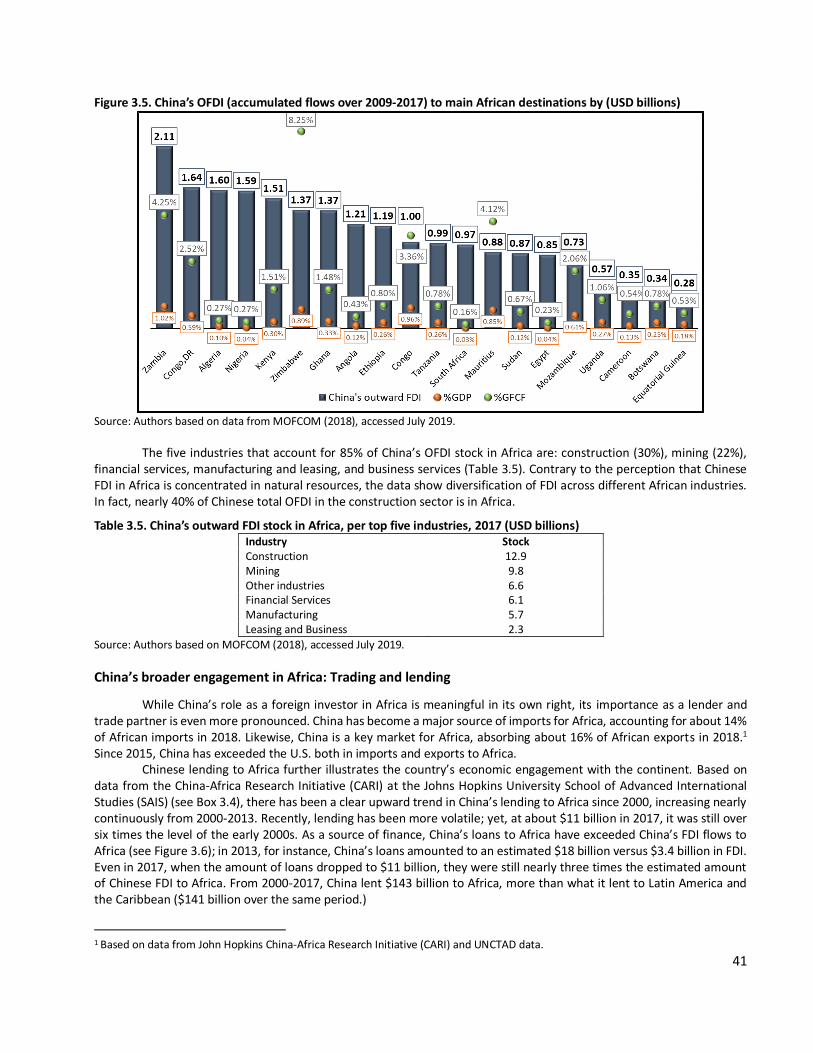
41
Figure 3.5. China’s OFDI (accumulated flows over 2009-2017) to main African destinations by (USD billions)
Source: Authors based on data from MOFCOM (2018), accessed July 2019.
The five industries that account for 85% of China’s OFDI stock in Africa are: construction (30%), mining (22%), financial services, manufacturing and leasing, and business services (Table 3.5). Contrary to the perception that Chinese FDI in Africa is concentrated in natural resources, the data show diversification of FDI across different African industries. In fact, nearly 40% of Chinese total OFDI in the construction sector is in Africa.
Table 3.5. China’s outward FDI stock in Africa, per top five industries, 2017 (USD billions) Industry Stock Construction 12.9 Mining 9.8 Other industries 6.6 Financial Services 6.1 Manufacturing 5.7 Leasing and Business 2.3
Source: Authors based on MOFCOM (2018), accessed July 2019.
China’s broader engagement in Africa: Trading and lending
While China’s role as a foreign investor in Africa is meaningful in its own right, its importance as a lender and trade partner is even more pronounced. China has become a major source of imports for Africa, accounting for about 14% of African imports in 2018. Likewise, China is a key market for Africa, absorbing about 16% of African exports in 2018.1 Since 2015, China has exceeded the U.S. both in imports and exports to Africa.
Chinese lending to Africa further illustrates the country’s economic engagement with the continent. Based on data from the China-Africa Research Initiative (CARI) at the Johns Hopkins University School of Advanced International Studies (SAIS) (see Box 3.4), there has been a clear upward trend in China’s lending to Africa since 2000, increasing nearly continuously from 2000-2013. Recently, lending has been more volatile; yet, at about $11 billion in 2017, it was still over six times the level of the early 2000s. As a source of finance, China’s loans to Africa have exceeded China’s FDI flows to Africa (see Figure 3.6); in 2013, for instance, China’s loans amounted to an estimated $18 billion versus $3.4 billion in FDI. Even in 2017, when the amount of loans dropped to $11 billion, they were still nearly three times the estimated amount of Chinese FDI to Africa. From 2000-2017, China lent $143 billion to Africa, more than what it lent to Latin America and the Caribbean ($141 billion over the same period.)
1 Based on data from John Hopkins China-Africa Research Initiative (CARI) and UNCTAD data.
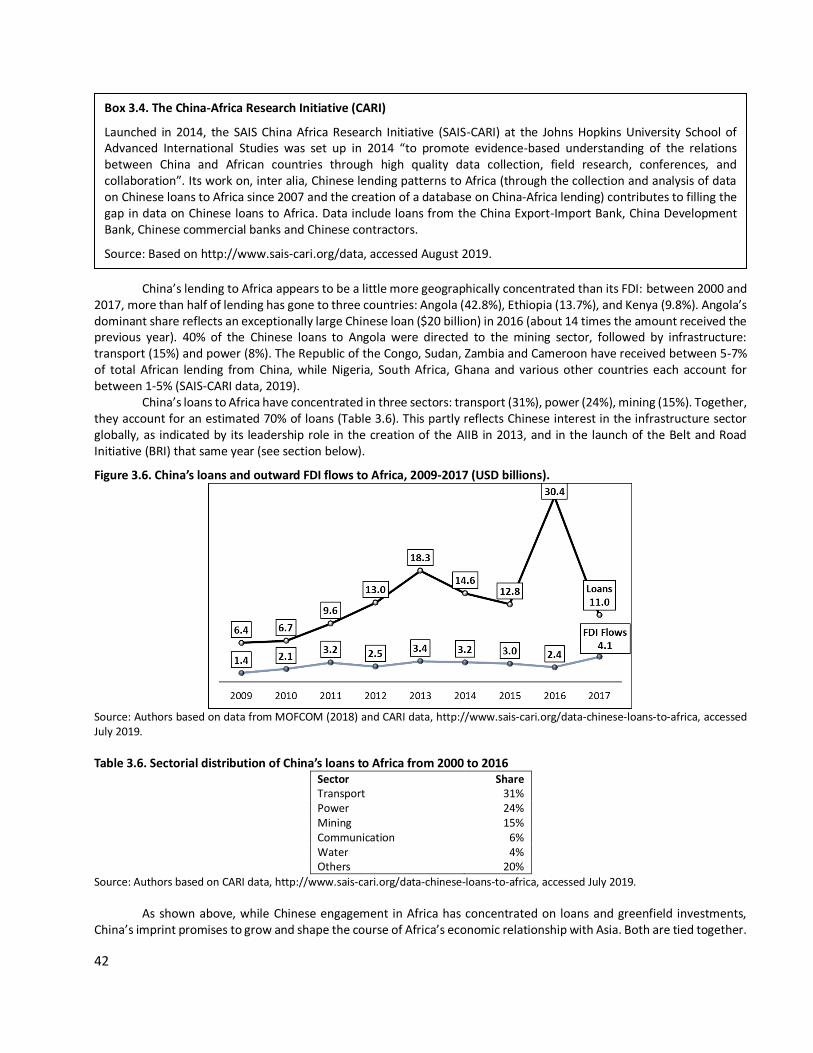
42
China’s lending to Africa appears to be a little more geographically concentrated than its FDI: between 2000 and 2017, more than half of lending has gone to three countries: Angola (42.8%), Ethiopia (13.7%), and Kenya (9.8%). Angola’s dominant share reflects an exceptionally large Chinese loan ($20 billion) in 2016 (about 14 times the amount received the previous year). 40% of the Chinese loans to Angola were directed to the mining sector, followed by infrastructure: transport (15%) and power (8%). The Republic of the Congo, Sudan, Zambia and Cameroon have received between 5-7% of total African lending from China, while Nigeria, South Africa, Ghana and various other countries each account for between 1-5% (SAIS-CARI data, 2019).
China’s loans to Africa have concentrated in three sectors: transport (31%), power (24%), mining (15%). Together, they account for an estimated 70% of loans (Table 3.6). This partly reflects Chinese interest in the infrastructure sector globally, as indicated by its leadership role in the creation of the AIIB in 2013, and in the launch of the Belt and Road Initiative (BRI) that same year (see section below).
Figure 3.6. China’s loans and outward FDI flows to Africa, 2009-2017 (USD billions).
Source: Authors based on data from MOFCOM (2018) and CARI data, http://www.sais-cari.org/data-chinese-loans-to-africa, accessed July 2019.
Table 3.6. Sectorial distribution of China’s loans to Africa from 2000 to 2016 Sector Share Transport 31% Power 24% Mining 15% Communication 6% Water 4% Others 20%
Source: Authors based on CARI data, http://www.sais-cari.org/data-chinese-loans-to-africa, accessed July 2019.
As shown above, while Chinese engagement in Africa has concentrated on loans and greenfield investments, China’s imprint promises to grow and shape the course of Africa’s economic relationship with Asia. Both are tied together.
Box 3.4. The China-Africa Research Initiative (CARI)
Launched in 2014, the SAIS China Africa Research Initiative (SAIS-CARI) at the Johns Hopkins University School of Advanced International Studies was set up in 2014 “to promote evidence-based understanding of the relations between China and African countries through high quality data collection, field research, conferences, and collaboration”. Its work on, inter alia, Chinese lending patterns to Africa (through the collection and analysis of data on Chinese loans to Africa since 2007 and the creation of a database on China-Africa lending) contributes to filling the gap in data on Chinese loans to Africa. Data include loans from the China Export-Import Bank, China Development Bank, Chinese commercial banks and Chinese contractors.
Source: Based on http://www.sais-cari.org/data, accessed August 2019.
43
3.4. Global south linkages: Belt and Road Initiative
China’s broad economic engagement with Africa and LAC is also reflected in the expansion of the BRI, the largest infrastructure development plan in history, launched in 2013 by China’s president Xi Jinping. It involves land and maritime corridors (the Belt and Road, and the Maritime Road) across Asia, Eurasia and the eastern coast of Africa (Casanova and Miroux, 2018). The initial vision of the BRI has expanded progressively to include connections to West and Central Africa as well as to Latin America and the Caribbean.
In Africa, in addition to the key BRI partners on the direct path of the Maritime Silk Road (such as Djibouti, Egypt, Ethiopia, Tanzania and Zambia), about 30 countries have signed memorandums of understanding with China to join the initiative (as of March 2019, according to the Belt and Road Portal). A number of these agreements were concluded following visits by Chinese President Xi Jinping during China-Africa Cooperation Forums. A limited number of projects are in place (such as the flagship railway line from Addis Ababa to Djibouti, or the port facilities in Djibouti, Lagos, Lomé and Abidjan), but there are several important projects planned or under construction according to three main priority areas: 1) railway lines 2) pipelines and 3) ports. Several of these projects will connect Africa’s hinterland to key ports on the eastern and western coasts of the continent.
Meanwhile, in Latin America, the BRI increased its footprint in the region. Panama paved the way when it signed a memorandum of understanding in December 2017, with agreements including investment in the Colón mega-port for containers and rail. Since then, eighteen LAC members have joined the initiative, including 10 countries from Central America and Caribbean region alone (Belt and Road Portal). Though the size of many of these investments is relatively small in some of the countries involved (such as the Bahamas, Barbados, Antigua and Barbuda), these investments have had a significant impact on local economies in the Caribbean.
3.5. Ten years that changed global trade and realigned investment
As explored in the sections above, south-south trade and investment relations have taken off, albeit unevenly. China is now leading investment, lending and trade to the global south. A rebalancing is in order, but the trendlines suggest that the asymmetry promises to continue in the years ahead.
In Latin America, lending does not dominate the Chinese financing picture as it does in Africa: FDI flows from China have on several occasions been at par or even exceeded China’s state lending. Yet, Chinese lending plays an important role: in some years, China has been the largest source of development finance for the region, even surpassing that of major development banks such as the World Bank and IDB combined.
China’s lending declined in Latin America in recent years, partly as a result of slowing economies in some of its major borrowers and a more cautious attitude in view of increased risks. In both continents, extractive industries continue to be an important sector for Chinese investors (whether through loans or FDI). However, the picture is changing. In Africa, construction dominates the FDI picture while energy and infrastructure lead in loans. In Latin America, by contrast, FDI has diversified towards energy (electricity), manufacturing, and IT and telecoms while China’s lending focuses on energy and infrastructure.
We believe that China will continue playing an important role as a trade partner, lender and investor in both Africa and Latin America.
REFERENCES
Avendano R, R. Mezguizo and Sean Miner (2018), Chinese FDI in Latin America: new trends with global implications, Atlantic Council of the United States and OECD.
Banco Central do Brasil. (2018). Direct Investment Report. <https://www.bcb.gov.br/content/publications/directinvestmentreport/2017/dir_2017.pdf>. Accessed July 2019
Casanova, L and Miroux A (2018), Emerging Market Multinationals Report, Emerging Markets Reshaping Globalization, https://www.johnson.cornell.edu/wp-content/uploads/sites/3/2019/04/EMR2018_V3_FIN-11Jan.pdf
44
China-Africa Research Initiative (CARI), John Hopkins University, at http://www.sais-cari.org/data Da Motta, P. and Polónia, S. (2019). China FDI in Brazil: recent trends and policy debates. Policy Center for the new
south. PB-19/20. Chen, T and Pérez Ludena, M. (2014). Chinese foreign direct investment in Latin America and the Caribbean. ECLAC. Financial Times. “fDiMarkets.” Online database. <http://www.fdimarkets.com>. Accessed July 2019. Gallagher, Kevin P. and Margaret Myers (2019) "China-Latin America Finance Database," Washington: Inter-American
Dialogue. <https://www.thedialogue.org/map_list/>. Accessed July 2019 González, A. (2018). Latin America – China Trade and Investment Amid Global Tensions A need to upgrade and diversify.
Atlantic Council. Latin America Economic Outlook. (2019). Socio-economic risks and challenges: A macro-perspective. <
http://www.oecd.org/dev/americas/LEO-2019-Chapter-1.pdf>. Accessed July 2019 MOFCOM, (2018). 2017 Statistical Bulletin of China’s Outward Foreign Direct Investment Myers, M., Gallagher, K. and Yuan, F. (2016). China Finance to LAC in 2015: Doubling Down. China-Latin America Report. Myers, M. and Gallagher, K. (2017). China Finance to LAC in 2016. China-Latin America Report. Myers, M. and Gallagher, K. (2018). Down, but not out: Chinese Development Finance in LAC 2017. China-Latin America
Report. Myers, M. and Gallagher, K. (2019). Cautious Capital: Chinese Development Finance in LAC 2018. China-Latin America
Report. SAIS. CARI data. Online Database. <http://www.sais-cari.org/data-chinese-loans-to-africa> Accessed July 2019. Ray, R. (2018). China-Latin America Economic Bulletin 2018 Edition. Global development policy center Global Economic
Governance Initiative. <https://www.bu.edu/gdp/files/2018/04/C-LAC-Bulletin-2018.pdf>. Accessed July 2019 Timini, J. and Sánchez-Albornoz, A. (2019). El impacto de China sobre América Latina: los canales comerciales y de
inversión extranjera directa. Bulletin 2. Banco de España. World Bank. “World Bank Open Data.” Online database. <https://data.worldbank.org/> Accessed July 2019.
Special contributions
In collaboration with
• Limin Chen SCHOOL OF ECONOMICS AND MANAGEMENT, WUHAN UNIVERSITY, CHINA
• Evodio Kaltenecker and Miguel A. Montoya
EGADE/TECNOLOGICO DE MONTERREY, GUADALAJARA, MEXICO
• Veneta Andonova, Juana García Duque and Maria Emilia Correa
SCHOOL OF MANAGEMENT, UNIVERSIDAD DE LOS ANDES, COLOMBIA
• Lorena Palacios-Chacon, Jahir Lombana-Coy
BUSINESS SCHOOL, UNIVERSIDAD DEL NORTE, COLOMBIA
AND
• EMERGING MARKETS RESEARCH NETWORK
46
Chapter 4
State capitalism or technology
springboard: Chinese
multinationals influenced by both
institutions and resources By Limin Chen, Wuhan University
This work was supported by the National Natural Science Foundation of China [grant number 71372123], and
the National Social Science Foundation of China [grant number 15ZDA061]. The most thanks to Jiaqi ZHANG
from Tsinghua University for his excellent work on data processing
4.1. Theory and hypotheses
A. Complicated internationalization-performance relation needs moderating mechanism
B. Influence by resources on international strategy and its performance
C. Influence by institutions on international strategy and its performance
D. Internationalization-performance relation of latecomers from emerging economies
4.2. Methods and models
A. Data collection
B. Variables
4.3. Results
4.4. Conclusion and discussion
A. Contributions
B. Limitations and further research
Executive Summary
As Chinese outward direct investment (OFDI) has increased for 16 consecutive years, analysts have sought to determine the driving factors behind this massive growth. The stock of Chinese OFDI ranked No. 2 in 2017, behind only the U.S. This paper integrates an institution-based view and a resource-based view to investigate the impacts on Chinese multinationals from four aspects: Inner resources (firms’ resource and capability), outer resources (resource-seeking motivation), inner institutions (ownership of firms), and outer institutions (sub-national institutional environment). We analyzed data from Chinese listed firms from 2009-2017 and obtained the following results: (1) Inner resources, outer resources, and outer institutions all have positive impacts on the internationalization of Chinese firms. However, inner
As Chinese outward direct investment (OFDI) has increased for 16 consecutive years, analysts have sought to determine the driving factors behind this massive growth. The stock of Chinese OFDI ranked No. 2 in 2017, behind only the U.S. This paper integrates an institution-based view and a resource-based view to investigate the impacts on Chinese multinationals from four aspects: Inner resources (firms’ resource and capability), outer resources (resource-seeking motivation), inner institutions (ownership of firms), and outer institutions (sub-national institutional environment). We analyzed data from Chinese listed firms from 2009-2017 and obtained the following results: (1) Inner resources, outer resources, and outer institutions all have positive impacts on the internationalization of Chinese firms. However, inner institutions have a negative effect, i.e., state-owned enterprises (SOEs) have a lower percentage of internationalization and lower mean degree of internationalization (DOI) than private firms. (2) Institutions and resources not only have a direct impact on internationalization and performance, but also significantly moderate their relationship. Though private firms performed better than SOEs, SOEs’ performance improved with higher DOI. This paper found that expanding internationally can help firms improve performance despite institutional flaws in the home country. Some research has asserted that institutional factors caused this phenomenon, and that it is the result of state capitalism, reflecting the will of the Chinese government. Other research points to resource factors: Internationalization is a springboard for Chinese firms to satisfy their technology-seeking motivations (Luo & Tung, 2007, 2018). With China’s rapid development in recent years, overseas acquisitions have become increasingly necessary to meet the raw material needs of Chinese enterprises.1
47
institutions have a negative effect, i.e., state-owned enterprises (SOEs) have a lower percentage of internationalization and lower mean degree of internationalization (DOI) than private firms. (2) Institutions and resources not only have a direct impact on internationalization and performance, but also significantly moderate their relationship. Though private firms performed better than SOEs, SOEs’ performance improved with higher DOI. This paper found that expanding internationally can help firms improve performance despite institutional flaws in the home country. Some research has asserted that institutional factors caused this phenomenon, and that it is the result of state capitalism, reflecting the will of the Chinese government. Other research points to resource factors: Internationalization is a springboard for Chinese firms to satisfy their technology-seeking motivations (Luo & Tung, 2007, 2018). With China’s rapid development in recent years, overseas acquisitions have become increasingly necessary to meet the raw material needs of Chinese enterprises.1
Finding the true driving factors behind Chinese international expansion is of theoretical importance, as international strategy is one of the most fundamental corporate strategies. If strategic management theory’s paradigm shift (Kuhn, 1962) in the last decade of the 20th century was from the industry-based view to the resource-based view, then the institution-based view is the most prominent paradigm to emerge in the 21st century (Peng, Wang, & Jiang, 2008).
The industry-based view investigates the opportunities and threats affecting firms from the outside (Porter, 1980, 1985). The resource-based view on the other hand places more emphasis on the strengths and weaknesses inside the firms. It proposes that the valuable, rare, inimitable resources which have been integrated into the organization are the source of sustainable competitive advantage (VRIO framework, Barney, 1991). However, the institution-based view asserts that besides industry-level and firm-level factors, institutional factors are important for strategy formulation. Institutions are much more than background conditions; they directly determine strategy formulation and competitive advantage (Meyer, Estrin, Bhaumik, & Peng, 2009). Institutional factors are likely to have a strong influence on emerging economy firms, since most emerging economies are simultaneously transition economies.
This paper will study the following two questions through a theoretic perspective integrating both an institution-based view and resource-based view: (1) Why have so many Chinese firms adopted strategic global expansion? Is the reason so-called state capitalism, or technology acting as a springboard? In other words, how do institutions and resources influence Chinese firms to expand abroad? We investigated the impacts of four aspects on Chinese multinationals: Inner resources (firms’ resource and capability), outer resources (resource-seeking motivation), inner institutions (ownership of firms), outer institutions (sub-national institutional environment). (2) What is the relation between internationalization and performance of Chinese enterprises? Will the relation be negative linear, the same as firms in the initial phase of internationalization; or U-shaped, the same as firms with some international experience; or reach a horizontal S-shape, the same as firms with high DOI in developed economies? How will institutions and resources affect this relationship? We studied these two questions by analyzing data from China-listed firms from 2009-2017.
4.1. Theory and hypotheses
A. Connecting internationalization to performance requires moderating factors The relation between internationalization and performance is not only a central topic (Li & Tallman, 2011) and a
key element (Goerzen & Beamish, 2003) in global strategy research, but also a subject for significant debate (Qian, Khoury, Peng, & Qian, 2010). Although classical multinational enterprise (MNE) theory considers that internationalization has a consistently positive and promotional impact on firm performance (Dunning, 1980), a large number of empirical studies have produced diversified results. These results make the research “mixed” (Hennart, 2007), “contradictory” (Geringer,
Tallman, & Olsen,2000), “inconclusive and contradictory” (Tallman & Li, 1996), or “fragmented and contradictory” (Bausch & Krist, 2007). As Glaum & Oesterle (2007) summarized, there are more questions than answers after 40 years of research on internationalization and firm performance.
We must account for key moderating factors is to better explain the various results. For example, the relation of internationalization and performance may be phase-dependent; if firms are in different internationalization phases, the
1 According to the Notice on the 2018 announcement of 100 largest multinational corporations and transnational index of China which was released by the China Enterprise Confederation and the China Enterprise Directors Association, there are six energy/material enterprises among the top 10 largest multinationals (ranked by the size of their overseas assets): No. 1 China National Petroleum Corporation, $132 billion, No. 2 Sinopec Group, $97 billion, No. 3 CHEMCHINA, $96 billion, No. 6 China National Offshore Oil Corporation, $70 billion, No. 8 Sinochem Group, $52 billion, No. 10 China Minmetals Corporation, $34 billion.
We must account for key moderating factors is to better explain the various results. For example, the relation of internationalization and performance may be phase-dependent; if firms are in different internationalization phases, the positive or negative impacts on performance of internationalization are different (Lu & Beamish, 2004). In addition, the relation of internationalization and performance may be institution-dependent, that is to say, if host countries have different institutional arrangements, the impacts on performance by internationalization will change (Dau, 2013). Furthermore, the relation of internationalization and performance may be industry-dependent. If firms are in different industries, internationalization will affect performance differently (Capar & Kotabe, 2003). Finally, the relation of internationalization and performance may be location-dependent. In other words, if location choices of OFDI are different, the impacts of internationalization will also differ (Vachani, 1991): if host countries’ environments are similar to those of the home countries, performance will be enhanced, but unrelated geographic diversification will diminish performance.
48
positive or negative impacts on performance of internationalization are different (Lu & Beamish, 2004). In addition, the relation of internationalization and performance may be institution-dependent, that is to say, if host countries have different institutional arrangements, the impacts on performance by internationalization will change (Dau, 2013). Furthermore, the relation of internationalization and performance may be industry-dependent. If firms are in different industries, internationalization will affect performance differently (Capar & Kotabe, 2003). Finally, the relation of internationalization and performance may be location-dependent. In other words, if location choices of OFDI are different, the impacts of internationalization will also differ (Vachani, 1991): if host countries’ environments are similar to those of the home countries, performance will be enhanced, but unrelated geographic diversification will diminish performance.
To take these factors into account, we established a binary moderating model of internationalization to study the impacts on international strategy of Chinese multinationals across the two key dimensions.
B. Influence of resources on international strategy and its performance Seen from the resource-based view, a firm is a bundle of resources in a highly imperfect market. A firm’s
resources at a given time could be defined as those assets that are tied semi-permanently to the firm (Wernerfelt, 1984). Here “semi-permanently” means that these assets are neither totally mobile nor totally fixed. When a firm’s resources coincide with the VRIO framework (Barney, 1991), the firm will have a sustainable competitive advantage.
We investigated both the inner resources and outer resources that may impact Chinese multinationals. Inner resources refer to a firm’s resources and capabilities. Our analysis uses the quality of top management as the proxy variable for a firm’s core resource and competence. Outer resources refer to the influences of resource-seeking motivation on firm’s OFDI. We classify these motivations into technology-seeking and raw material-seeking. The first group of hypotheses are as follows:
Hypothesis 1a: Inner resources positively push international strategy. The more qualified resources and capabilities Chinese enterprises have, the higher DOI and the better performance they have.
Hypothesis 1b: Outer resources positively pull international strategy. The stronger the resource-seeking motivations for Chinese enterprises are, the higher their DOI is and the better their performance.
C. Influence by institutions on international strategy and its performance Only considering the influences of resources is inadequate. The institution-based view asserts that additional and
broader institutional factors should be considered for strategy formulation (North, 1990). Combining the institution-based view with industry- and resource-based views can answer questions such as: What drives firm strategy in IB (international business)? What determines the success and failure of firms around the world (Peng, Wang, & Jiang, 2008)? In fact, institutions are much more than background conditions, they directly determine strategy formulation and competitive advantage (Meyer, Estrin, Bhaumik, & Peng, 2009). Firms in emerging economies are apt to be influenced by institutional factors, since most emerging economies are simultaneously transition economies.
We also classified institutions into two types. Inner institutions are measured by the ownership forms of listed firms: SOEs or private enterprises. As for outer institutions, Ma, Tong, & Fitza (2013) assume that the sub-national region in a country matters to the heterogeneity of foreign subsidiary performance. We measured outer institutions by the marketization degree of 31 provinces released by the Marketization Index of China’s Provinces: National Economic Research Institute Report 2018 (Wang, Fan, & Hu, 2018). The second group of hypotheses are as follows:
Hypothesis 2a: Inner institutions have a significant impact on international strategy. State-owned enterprises supported by China government have higher DOI and better performance than private enterprises.
Hypothesis 2b: Outer institutions have a significant impact on international strategy. Chinese listed firms from provinces with higher marketization degree have a correspondingly higher DOI and better performance.
D. Internationalization-performance relation of latecomers from emerging economies A large number of empirical studies about internationalization and performance relation have produced
diversified results: Positive linear (Grant, 1987; Kirca, Fernandez, & Kundu, 2016), negative linear (Geringer, Tallman, & Olsen, 2000; Dau, 2013), inverted U-shaped (Hitt, Hoskission, & Kim, 1997; Chao & Kumar, 2010), U-shaped (Lu & Beamish, 2001; Kim, Hoskisson, & Lee, 2015), horizontal S-shaped (Lu & Beamish, 2004; Chang & Wang, 2007), N-shaped (Contractor, Kundu, & Hsu, 2003; Powell, 2014), or even irrelevant (Morck & Yeung, 1991; Berry & Kaul, 2016). Different sample firms in different international periods may account for the incredibly varied results.
Early on in internationalization, firms often suffer from the liabilities of newness and foreignness (Hymer, 1960; Zaheer, 1995), therefore internationalization can have a negative impact on performance. As the firm becomes more of an insider in a particular host society, developing linkages and aligning its values and actions to the institutional
Early on in internationalization, firms often suffer from the liabilities of newness and foreignness (Hymer, 1960; Zaheer, 1995), therefore internationalization can have a negative impact on performance. As the firm becomes more of an insider in a particular host society, developing linkages and aligning its values and actions to the institutional requirements of the host environment, these liabilities should decline and perhaps even disappear (Zaheer, 2002). The accumulations of international experience make returns change from negative to positive gradually, so the internationalization-performance relation appears U-shaped. However, when some firms continue expanding geographically and exceed an optimal degree, they will suffer disadvantages such as organizational complexity, coordination costs, administrative difficulties, burden of information processing, inefficiency of resource allocation, etc. All these factors turn the net gains from internationalization negative again, and the internationalization-performance relation takes on a horizontal S-shape.
49
requirements of the host environment, these liabilities should decline and perhaps even disappear (Zaheer, 2002). The accumulations of international experience make returns change from negative to positive gradually, so the internationalization-performance relation appears U-shaped. However, when some firms continue expanding geographically and exceed an optimal degree, they will suffer disadvantages such as organizational complexity, coordination costs, administrative difficulties, burden of information processing, inefficiency of resource allocation, etc. All these factors turn the net gains from internationalization negative again, and the internationalization-performance relation takes on a horizontal S-shape.
Chinese firms are mostly at the early or mid-period of internationalization. We assume the relation of internationalization and performance for Chinese firms is now U-shaped, and that resources and institutions will both have significant impacts on their performance. We present the third group of hypotheses as follows:
Hypothesis 3a: The internationalization-performance relation of Chinese firms appears to be U-shaped, which means a negative correlation with low DOI and a positive correlation with high DOI.
Hypothesis 3b: Resources significantly moderate the internationalization-performance relation. Both inner resources (firm’s resources and capabilities) and outer resources (resource-seeking motivations) have positive impacts on this relation.
Hypothesis 3c: Institutions significantly moderate the internationalization-performance relation. Both inner institutions (state-owned enterprises) and outer institutions (sub-national marketization degree) have positive impacts on this relation.
4.2. Method and models
A. Data Collection We derived our samples of Chinese firms from those that were listed on the Shanghai and Shenzhen Stock
Exchange from 2009 to 2017. There are 1683 enterprises listed on the Shanghai and Shenzhen Stock Exchange that continuously operated from 2009-2017, and we screened out some of the samples based on the following considerations: (1) we removed the 56 firms that were suspended in listings for any year during 2009-2017, leaving 1,627 firms; (2) we ignored 222 firms that were faced with special treatment during any year between 2009-2017; (3) 90 firms that had a back door listing; (4) 435 firms that were missing variable data, leaving 880 firms. Finally, we have a nine-year balanced panel data yielding 7,920 observations during the period from 2009 to 2017.
B. Variables Dependent variable: performance. We adopted Tobin’s Q to measure performance on account of the following
reasons: Tobin’s Q is widely recognized as the most suitable indicator in the internationalization performance field. Tobin’s Q is a future-oriented and risk-adjusted capital-market measure of performance that reflects both current and anticipated profitability (Li & Tallman, 2011). Additionally, Tobin’s Q shows a firm’s value and long-term performance (Yang & Driffield, 2012), which are better indicators for this study rather than accounting indicators that reflect the size and short-term performance of a firm. Tobin’s Q is also better than the Cumulative Abnormal Return indicator, which reveals a firm’s short-term performance. The third reason is that accounting indicators from Chinese firms such as return on sales (ROS), return on equity (ROE), and return on assets (ROA) can sometimes be difficult to interpret, as they may have been adjusted by the firms themselves. In comparison, the stock market is a more perfectly competitive market and the market price is relatively difficult to manipulate. The stock price can reflect the firm’s performance more objectively and more truthfully. We obtained the data for Tobin’s Q from the CSMAR database.
Independent variable: DOI. The most representative indicators that measure internationalization are: measures for international depth such as FSTS (foreign sales to total sales), FATA (foreign assets to total assets), and FETE (foreign employees to total employees); measures for international breadth such as OSTS (overseas subsidiaries to total subsidiaries), NOS (number of overseas subsidiaries), and NOC (number of countries hosting overseas subsidiaries); and finally, synthetic measures by multiple indices. In this paper, we chose FSTS as the indicator of internationalization, not only because it is the most commonly used indicator, but also because of the availability of that data. Most listed firms disclose their export and foreign sales information, but do not reveal the detailed information of overseas subsidiaries. As such, we cannot calculate the above-mentioned indicators of internationalization, except for FSTS. The data of foreign sales and total sales we used to calculate FSTS came from the WIND database.
Moderators: (1) Inner resources (RES-IN), referring to a firm’s resources and capabilities, measured by the percentage of top management with overseas education or overseas working experience. (2) Outer resources (RES-OUT),
Moderators: (1) Inner resources (RES-IN), referring to a firm’s resources and capabilities, measured by the percentage of top management with overseas education or overseas working experience. (2) Outer resources (RES-OUT), referring to the technology-seeking (RES-OUT-TECH) or raw material-seeking (RES-OUT-RAW) motivation in firm’s OFDI. The measurement indicates whether the firm belongs to the technology industry (GICS No. 35 and 45) or raw material and energy industry (GICS No. 10 and 15)1. (3) Inner institutions (INST-IN), referring to the ownership form of listed firms. We assigned 1 to this variable when firms are national state-owned or province-owned, and 0 when firms are private, foreign, public or other enterprises. (4) Outer institutions (INST-OUT), referring to the sub-national institutional environment, measured by the marketization degree of 31 provinces released by Marketization Index of China’s Provinces: NERI Report 2018.
50
referring to the technology-seeking (RES-OUT-TECH) or raw material-seeking (RES-OUT-RAW) motivation in firm’s OFDI. The measurement indicates whether the firm belongs to the technology industry (GICS No. 35 and 45) or raw material and energy industry (GICS No. 10 and 15)1. (3) Inner institutions (INST-IN), referring to the ownership form of listed firms. We assigned 1 to this variable when firms are national state-owned or province-owned, and 0 when firms are private, foreign, public or other enterprises. (4) Outer institutions (INST-OUT), referring to the sub-national institutional environment, measured by the marketization degree of 31 provinces released by Marketization Index of China’s Provinces: NERI Report 2018.
Control variables. We chose the following four control variables: (1) firm age (AGE), is the year the firm was established; (2) firm size (SIZE), is measured by the annual total assets and uses the logarithmic form; (3) capital structure (DEBT), is an important financial indicator that can affect international performance, that we use to control for variables in firm performance studies as measured by debt-to-assets ratio; (4) year effect (YEAR), is assigned on the basis of the sample period, nine years from 2009 to 2017. We controlled for the year by fixed-effect to reduce this influence. See the modeling equations and Table 4.1 in the Appendix.
4.3. Results
Descriptive Statistics We found that: (1) The maximum of DOI is 0.853, suggesting that foreign sales revenue accounts for 85.3% of
total sales. The minimum of DOI is 0, suggesting no foreign sales at all. The mean of DOI is 0.104, suggesting that foreign sales revenue accounts for 10.4% of the total sales revenue. The cross-sectional data from 2017 show similar distributions: Among 880 firms, there are 472 firms with foreign sales, and 408 firms without foreign sallies. There are 334 firms whose foreign sales account for at least 5% of their total sales, and 274 firms whose foreign sales account for 10% and above. (2) Raw material-seeking firms account for 21.2% of the total samples, and technology-seeking firms account for 18.8%. SOEs account for 54.7%, while private enterprises account for 45.3%, a nearly even split. (3) The correlations of control variables with DOI and performance are all significant, so it is reasonable to introduce them into analysis. Meanwhile, the Pearson correlation coefficients are all less than 0.55, showing that there is no multicollinearity. (4) The maximum of DEBT is 1.004, showing that the total debt of a particular enterprise is larger than its total assets. This is the result after 1% winsor2, meaning that 0.5% or 38 firms have total debt that exceeds their total assets. (5) The three correlation coefficients larger than 0.4 all indicate interesting results: rDEBT-PERF=-0.434, suggesting that more debt indicates poorer performance, in accordance with our expectation. However, rSIZE-PERF=-0.525, suggests that larger firms have poor performance,. Finally, rSIZE-DEBT=0.440, suggests that larger firms have more debt, which is logically consistent with above two correlations. See Table 4.2 in the Appendix for the full descriptive statistics and correlation matrix of all the variables for the full sample.
We calculated further descriptive statistics for the three 0/1 variables: raw material-seeking, technology-seeking, and SOEs. Shown in Figure 4.1: (1) The mean FSTS of raw material-seeking firms is 11%, which is similar to the mean FSTS of firms without material-seeking motivations (10.3%). However, the percentage of internationalized samples whose FSTS is larger than zero in firms with raw material-seeking motivations is 63%, which is much larger than the percentage of FSTS>0 in firms without raw material-seeking motivations (47.4%). Thus, the raw material-seeking motivation has a positive impact on firm’s internationalization. (2) The mean FSTS of technology-seeking firms is 13.7%, which is much larger than the mean FSTS of firms without technology-seeking motivations (9.67%). Moreover, the percentage of internationalized samples whose FSTS is larger than zero in firms with technology-seeking motivations is 61.6%, much larger than the percentage of FSTS>0 in firms without technology-seeking motivations (48.2%). Therefore, the technology-seeking motivation also has a positive impact on firm’s internationalization. (3) The mean FSTS of SOEs is 9.05%, which is even lower than the mean FSTS of private firms (12.1%). Moreover, the percentage of internationalized samples whose
1 The Global Industry Classification Standard (GICS) is an industry taxonomy developed in 1999 by MSCI and Standard & Poor's (S&P). The GICS structure consists of 11 sectors. No. 10 “Energy” includes energy equipment & services; oil, gas & consumable fuels. No. 15 “Materials” includes chemicals; construction materials; containers & packaging; metals & mining; paper & forest products. No. 35 “Medical & Health” includes health care equipment & services; pharmaceuticals, biotechnology & life sciences. No. 45 “Information technology” includes software & services; technology hardware & equipment; semiconductors & semiconductor equipment. 2 Besides DEBT, we winsorize PERF and DOI at the 1% level, so as to avoid too much impact on the regression results by outliers.
We calculated further descriptive statistics for the three 0/1 variables: raw material-seeking, technology-seeking, and SOEs. Shown in Figure 4.1: (1) The mean FSTS of raw material-seeking firms is 11%, which is similar to the mean FSTS of firms without material-seeking motivations (10.3%). However, the percentage of internationalized samples whose FSTS is larger than zero in firms with raw material-seeking motivations is 63%, which is much larger than the percentage of FSTS>0 in firms without raw material-seeking motivations (47.4%). Thus, the raw material-seeking motivation has a positive impact on firm’s internationalization. (2) The mean FSTS of technology-seeking firms is 13.7%, which is much larger than the mean FSTS of firms without technology-seeking motivations (9.67%). Moreover, the percentage of internationalized samples whose FSTS is larger than zero in firms with technology-seeking motivations is 61.6%, much larger than the percentage of FSTS>0 in firms without technology-seeking motivations (48.2%). Therefore, the technology- seeking motivation also has a positive impact on firm’s internationalization. (3) The mean FSTS of SOEs is 9.05%, which is even lower than the mean FSTS of private firms (12.1%). Moreover, the percentage of internationalized samples whose FSTS larger than zero in SOEs is 47.2%, which is also lower than the percentage of FSTS>0 in private firms (55%). Hence, the state-ownership has negative impact on firm’s internationalization.
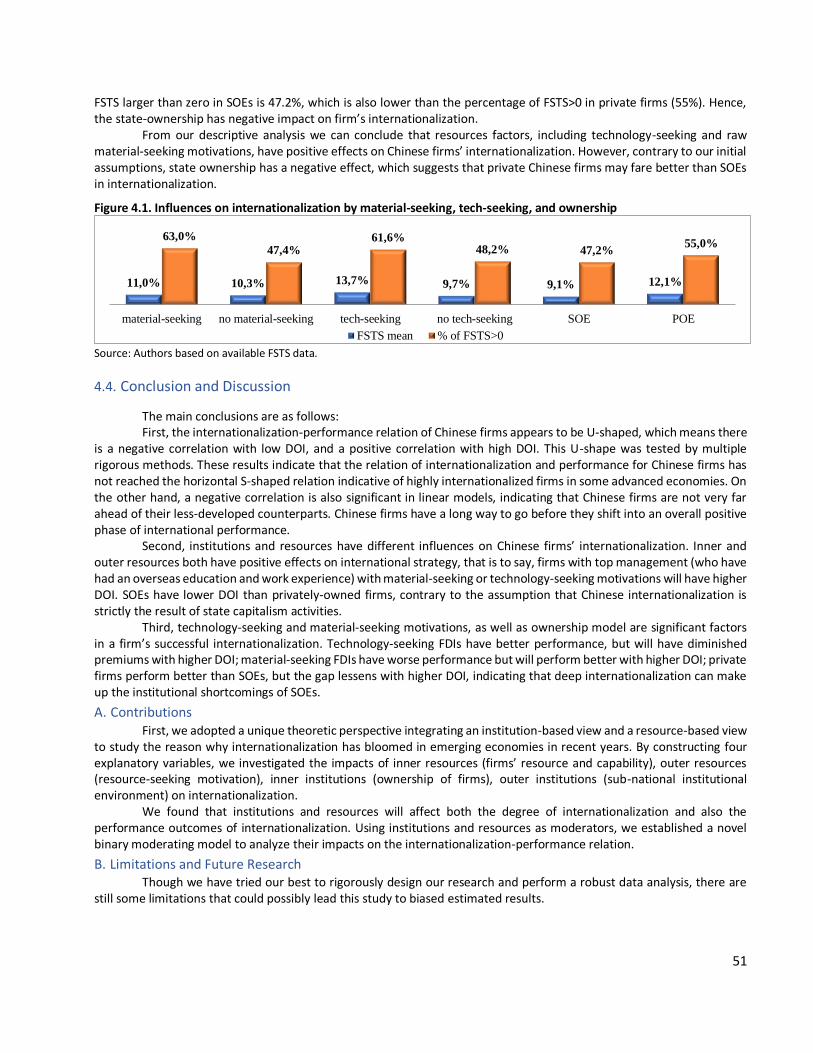
51
FSTS larger than zero in SOEs is 47.2%, which is also lower than the percentage of FSTS>0 in private firms (55%). Hence, the state-ownership has negative impact on firm’s internationalization.
From our descriptive analysis we can conclude that resources factors, including technology-seeking and raw material-seeking motivations, have positive effects on Chinese firms’ internationalization. However, contrary to our initial assumptions, state ownership has a negative effect, which suggests that private Chinese firms may fare better than SOEs in internationalization.
Figure 4.1. Influences on internationalization by material-seeking, tech-seeking, and ownership
Source: Authors based on available FSTS data.
4.4. Conclusion and Discussion
The main conclusions are as follows: First, the internationalization-performance relation of Chinese firms appears to be U-shaped, which means there
is a negative correlation with low DOI, and a positive correlation with high DOI. This U-shape was tested by multiple rigorous methods. These results indicate that the relation of internationalization and performance for Chinese firms has not reached the horizontal S-shaped relation indicative of highly internationalized firms in some advanced economies. On the other hand, a negative correlation is also significant in linear models, indicating that Chinese firms are not very far ahead of their less-developed counterparts. Chinese firms have a long way to go before they shift into an overall positive phase of international performance.
Second, institutions and resources have different influences on Chinese firms’ internationalization. Inner and outer resources both have positive effects on international strategy, that is to say, firms with top management (who have had an overseas education and work experience) with material-seeking or technology-seeking motivations will have higher DOI. SOEs have lower DOI than privately-owned firms, contrary to the assumption that Chinese internationalization is strictly the result of state capitalism activities.
Third, technology-seeking and material-seeking motivations, as well as ownership model are significant factors in a firm’s successful internationalization. Technology-seeking FDIs have better performance, but will have diminished premiums with higher DOI; material-seeking FDIs have worse performance but will perform better with higher DOI; private firms perform better than SOEs, but the gap lessens with higher DOI, indicating that deep internationalization can make up the institutional shortcomings of SOEs.
A. Contributions First, we adopted a unique theoretic perspective integrating an institution-based view and a resource-based view
to study the reason why internationalization has bloomed in emerging economies in recent years. By constructing four explanatory variables, we investigated the impacts of inner resources (firms’ resource and capability), outer resources (resource-seeking motivation), inner institutions (ownership of firms), outer institutions (sub-national institutional environment) on internationalization.
We found that institutions and resources will affect both the degree of internationalization and also the performance outcomes of internationalization. Using institutions and resources as moderators, we established a novel binary moderating model to analyze their impacts on the internationalization-performance relation.
B. Limitations and Future Research Though we have tried our best to rigorously design our research and perform a robust data analysis, there are
still some limitations that could possibly lead this study to biased estimated results.
11,0% 10,3% 13,7% 9,7% 9,1% 12,1%
63,0%
47,4%61,6%
48,2% 47,2%55,0%
material-seeking no material-seeking tech-seeking no tech-seeking SOE POE
FSTS mean % of FSTS>0
52
First, we drew conclusions based on data for Chinese firms from 2009-2017. To what degree may these conclusions apply to firms in other emerging economies? A universal conclusion can only be drawn after analyzing data from additional countries.
Next, due to data availability, we chose Chinese listed firms as sample data. In fact, many “Going Abroad” firms are not listed firms, including some influential enterprises, such as Huawei. Hence, extending the empirical study to include non-listed firms would probably reach different results from this study.
Finally, though international breadth indicators are very important and commonly used in studies, we only adopted international depth indicators to measure DOI. Furthermore, we only used one depth DOI indicator — FSTS. Though FSTS is the most commonly used indicator to reflect international operations of firms, we also adopted it because of the availability of data. Most listed firms in China disclose their information about export and foreign sales, which allowed us to calculate FSTS accurately, but did not reveal other overseas details.
Given these limitations, future research can be developed in the following directions: (1) Expanding the research to more latecomer firms from other emerging economies in order to gain more universal conclusions; (2) Expanding the research to non-listed firms to avoid potential bias; (3) Expanding the indicators of DOI, combining international breadth measurement with international depth measurement. Of course, these works may need to explore new database sources or use questionnaires, surveys, and other approaches to collect sample data.
The inner institutional factor was the only one among the four explanatory variables that was not verified by the empirical tests. How can we explain the lower degree of internationalization and worse performance of Chinese SOEs compared with private firms? First, Chinese SOEs have lots of domestic resources and support. With many opportunities to expand within China, many SOEs do not have strong motivations to go abroad for international business. Second, SOEs have specific decision principles that can delay the process of internationalization and lower operating efficiency compared to private firms. Third, the direct government involvement can actually decrease a firm’s legitimacy and identity in host countries, and may become a liability. All these are harmful to the SOEs’ international operations. We think that investigation of the above-mentioned considerations could generate interesting studies in the future.
REFERENCES
Barney J. 1991. Firm resources and sustained competitive advantage. Journal of Management, 17(1): 99-120. Bausch, A., & Krist, M. 2007. The effect of context-related moderators on the internationalization performance
relationship: Evidence from meta-analysis. Management International Review, 47(3): 319-347. Berry, H., & Kaul, A. 2016. Replicating the multinationality–performance relationship: Is there an S-curve? Strategic
Management Journal, 37(11): 2275-2290. Capar, N., & Kotabe, M. 2003. The relationship between international diversification and performance in service firms.
Journal of International Business Studies, 34(4): 345-355. Chang, S. C., & Wang, C. F. 2007. The effect of product diversification strategies on the relationship between
international diversification and firm performance. Journal of World Business, 42(1): 61-79. Chao, C. H., & Kumar, V. 2010. The impact of institutional distance on the international diversity–performance
relationship. Journal of World Business, 45(1): 93-103. China Ministry of Commerce, China National Bureau of Statistics, & China State Administration of Foreign Exchange.
2018. Statistical bulletin of China’s outward foreign direct investment. Beijing: China Statistical Press. Contractor, F. J., Kundu, S. K., & Hsu, C. C. 2003. A three-stage theory of international expansion: The link between
multinationality and performance in the service sector. Journal of International Business Studies, 34(1): 5-18. Dau, L. A. 2013. Learning across geographic space: Pro-market reforms, multinationalization strategy, and profitability.
Journal of International Business Studies, 44(3): 235-262. Dunning, J. H. 1980. Toward an eclectic theory of international production: Some empirical tests. Journal of International
Business Studies, 11(1): 9-31. Geringer, M. J, Tallman, S., & Olsen, D. M. 2000. Product and international diversification among Japanese multinational
firms. Strategic Management Journal, 21(1): 51-80.
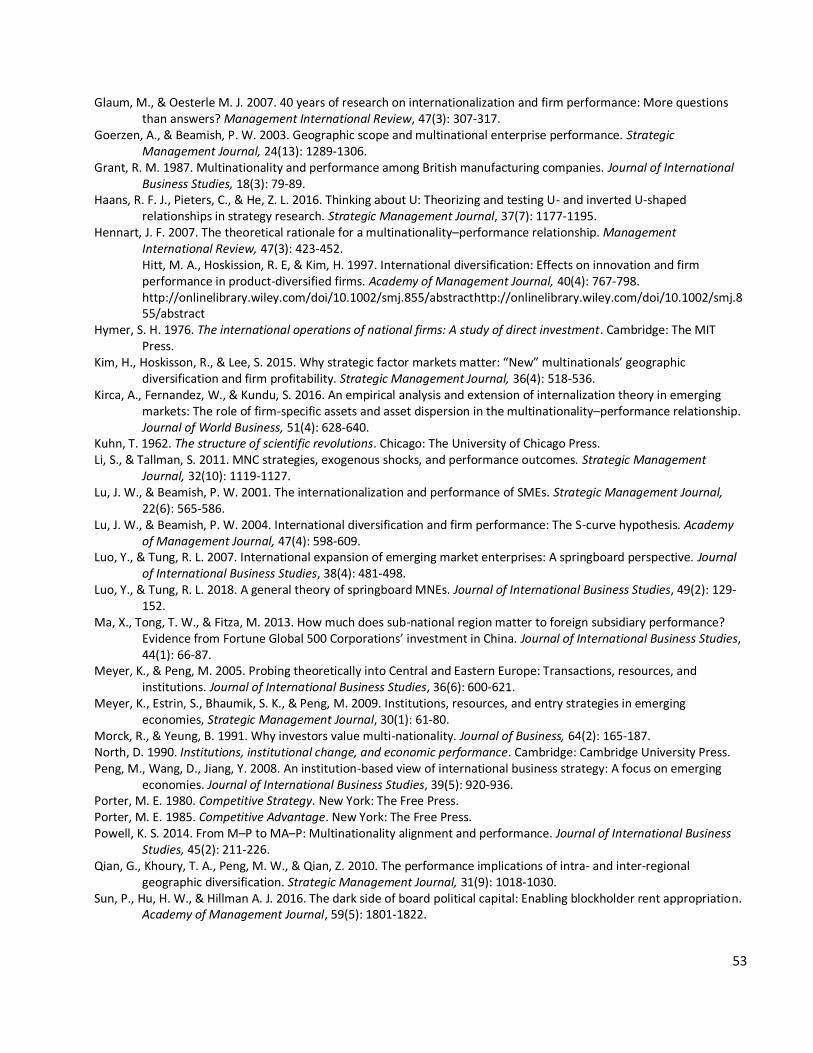
53
Glaum, M., & Oesterle M. J. 2007. 40 years of research on internationalization and firm performance: More questions than answers? Management International Review, 47(3): 307-317.
Goerzen, A., & Beamish, P. W. 2003. Geographic scope and multinational enterprise performance. Strategic Management Journal, 24(13): 1289-1306.
Grant, R. M. 1987. Multinationality and performance among British manufacturing companies. Journal of International Business Studies, 18(3): 79-89.
Haans, R. F. J., Pieters, C., & He, Z. L. 2016. Thinking about U: Theorizing and testing U- and inverted U-shaped relationships in strategy research. Strategic Management Journal, 37(7): 1177-1195.
Hennart, J. F. 2007. The theoretical rationale for a multinationality–performance relationship. Management International Review, 47(3): 423-452. Hitt, M. A., Hoskission, R. E, & Kim, H. 1997. International diversification: Effects on innovation and firm performance in product-diversified firms. Academy of Management Journal, 40(4): 767-798. http://onlinelibrary.wiley.com/doi/10.1002/smj.855/abstracthttp://onlinelibrary.wiley.com/doi/10.1002/smj.855/abstract
Hymer, S. H. 1976. The international operations of national firms: A study of direct investment. Cambridge: The MIT Press.
Kim, H., Hoskisson, R., & Lee, S. 2015. Why strategic factor markets matter: “New” multinationals’ geographic diversification and firm profitability. Strategic Management Journal, 36(4): 518-536.
Kirca, A., Fernandez, W., & Kundu, S. 2016. An empirical analysis and extension of internalization theory in emerging markets: The role of firm-specific assets and asset dispersion in the multinationality–performance relationship. Journal of World Business, 51(4): 628-640.
Kuhn, T. 1962. The structure of scientific revolutions. Chicago: The University of Chicago Press. Li, S., & Tallman, S. 2011. MNC strategies, exogenous shocks, and performance outcomes. Strategic Management
Journal, 32(10): 1119-1127. Lu, J. W., & Beamish, P. W. 2001. The internationalization and performance of SMEs. Strategic Management Journal,
22(6): 565-586. Lu, J. W., & Beamish, P. W. 2004. International diversification and firm performance: The S-curve hypothesis. Academy
of Management Journal, 47(4): 598-609. Luo, Y., & Tung, R. L. 2007. International expansion of emerging market enterprises: A springboard perspective. Journal
of International Business Studies, 38(4): 481-498. Luo, Y., & Tung, R. L. 2018. A general theory of springboard MNEs. Journal of International Business Studies, 49(2): 129-
152. Ma, X., Tong, T. W., & Fitza, M. 2013. How much does sub-national region matter to foreign subsidiary performance?
Evidence from Fortune Global 500 Corporations’ investment in China. Journal of International Business Studies, 44(1): 66-87.
Meyer, K., & Peng, M. 2005. Probing theoretically into Central and Eastern Europe: Transactions, resources, and institutions. Journal of International Business Studies, 36(6): 600-621.
Meyer, K., Estrin, S., Bhaumik, S. K., & Peng, M. 2009. Institutions, resources, and entry strategies in emerging economies, Strategic Management Journal, 30(1): 61-80.
Morck, R., & Yeung, B. 1991. Why investors value multi-nationality. Journal of Business, 64(2): 165-187. North, D. 1990. Institutions, institutional change, and economic performance. Cambridge: Cambridge University Press. Peng, M., Wang, D., Jiang, Y. 2008. An institution-based view of international business strategy: A focus on emerging
economies. Journal of International Business Studies, 39(5): 920-936. Porter, M. E. 1980. Competitive Strategy. New York: The Free Press. Porter, M. E. 1985. Competitive Advantage. New York: The Free Press. Powell, K. S. 2014. From M–P to MA–P: Multinationality alignment and performance. Journal of International Business
Studies, 45(2): 211-226. Qian, G., Khoury, T. A., Peng, M. W., & Qian, Z. 2010. The performance implications of intra- and inter-regional
geographic diversification. Strategic Management Journal, 31(9): 1018-1030. Sun, P., Hu, H. W., & Hillman A. J. 2016. The dark side of board political capital: Enabling blockholder rent appropriation.
Academy of Management Journal, 59(5): 1801-1822.
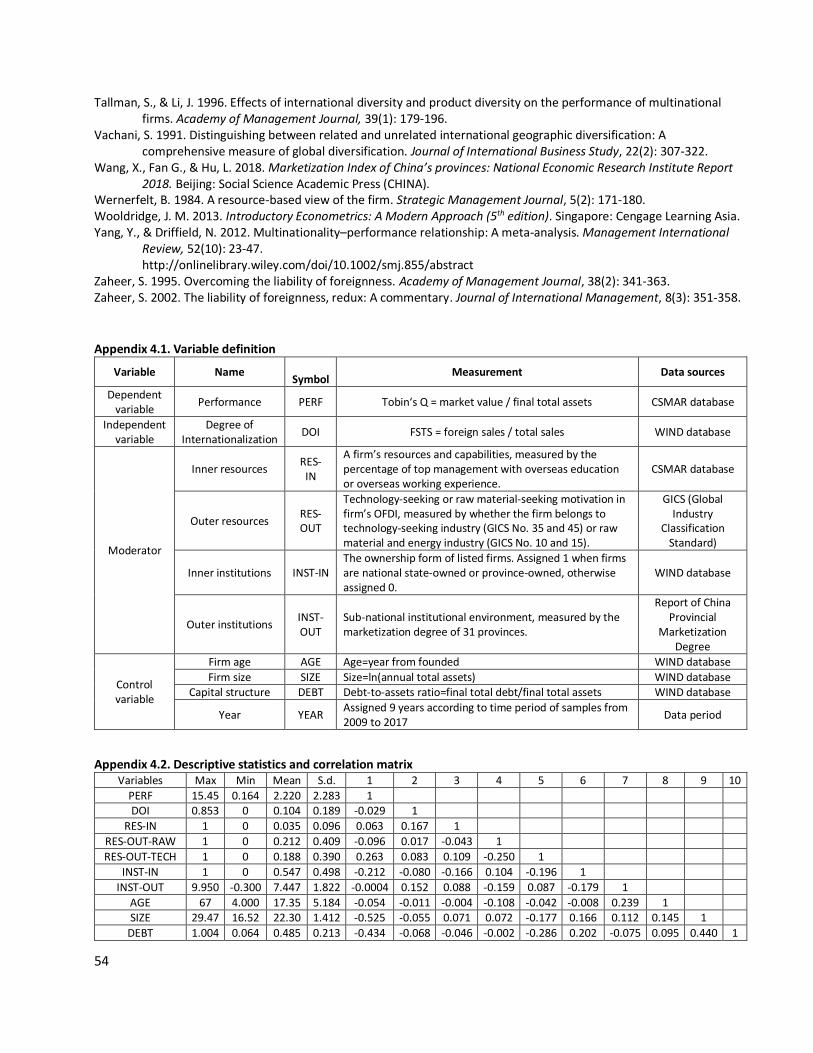
54
Tallman, S., & Li, J. 1996. Effects of international diversity and product diversity on the performance of multinational firms. Academy of Management Journal, 39(1): 179-196.
Vachani, S. 1991. Distinguishing between related and unrelated international geographic diversification: A comprehensive measure of global diversification. Journal of International Business Study, 22(2): 307-322.
Wang, X., Fan G., & Hu, L. 2018. Marketization Index of China’s provinces: National Economic Research Institute Report 2018. Beijing: Social Science Academic Press (CHINA).
Wernerfelt, B. 1984. A resource-based view of the firm. Strategic Management Journal, 5(2): 171-180. Wooldridge, J. M. 2013. Introductory Econometrics: A Modern Approach (5th edition). Singapore: Cengage Learning Asia. Yang, Y., & Driffield, N. 2012. Multinationality–performance relationship: A meta-analysis. Management International
Review, 52(10): 23-47. http://onlinelibrary.wiley.com/doi/10.1002/smj.855/abstract
Zaheer, S. 1995. Overcoming the liability of foreignness. Academy of Management Journal, 38(2): 341-363. Zaheer, S. 2002. The liability of foreignness, redux: A commentary. Journal of International Management, 8(3): 351-358.
Appendix 4.1. Variable definition
Variable Name
Symbol Measurement Data sources
Dependent variable
Performance PERF Tobin‘s Q = market value / final total assets CSMAR database
Independent variable
Degree of Internationalization
DOI FSTS = foreign sales / total sales WIND database
Moderator
Inner resources RES- IN
A firm’s resources and capabilities, measured by the percentage of top management with overseas education or overseas working experience.
CSMAR database
Outer resources RES- OUT
Technology-seeking or raw material-seeking motivation in firm’s OFDI, measured by whether the firm belongs to technology-seeking industry (GICS No. 35 and 45) or raw material and energy industry (GICS No. 10 and 15).
GICS (Global Industry
Classification Standard)
Inner institutions INST-IN The ownership form of listed firms. Assigned 1 when firms are national state-owned or province-owned, otherwise assigned 0.
WIND database
Outer institutions INST-OUT
Sub-national institutional environment, measured by the marketization degree of 31 provinces.
Report of China Provincial
Marketization Degree
Control variable
Firm age AGE Age=year from founded WIND database
Firm size SIZE Size=ln(annual total assets) WIND database Capital structure DEBT Debt-to-assets ratio=final total debt/final total assets WIND database
Year YEAR Assigned 9 years according to time period of samples from 2009 to 2017
Data period
Appendix 4.2. Descriptive statistics and correlation matrix Variables Max Min Mean S.d. 1 2 3 4 5 6 7 8 9 10
PERF 15.45 0.164 2.220 2.283 1 DOI 0.853 0 0.104 0.189 -0.029 1
RES-IN 1 0 0.035 0.096 0.063 0.167 1
RES-OUT-RAW 1 0 0.212 0.409 -0.096 0.017 -0.043 1
RES-OUT-TECH 1 0 0.188 0.390 0.263 0.083 0.109 -0.250 1
INST-IN 1 0 0.547 0.498 -0.212 -0.080 -0.166 0.104 -0.196 1
INST-OUT 9.950 -0.300 7.447 1.822 -0.0004 0.152 0.088 -0.159 0.087 -0.179 1
AGE 67 4.000 17.35 5.184 -0.054 -0.011 -0.004 -0.108 -0.042 -0.008 0.239 1 SIZE 29.47 16.52 22.30 1.412 -0.525 -0.055 0.071 0.072 -0.177 0.166 0.112 0.145 1
DEBT 1.004 0.064 0.485 0.213 -0.434 -0.068 -0.046 -0.002 -0.286 0.202 -0.075 0.095 0.440 1
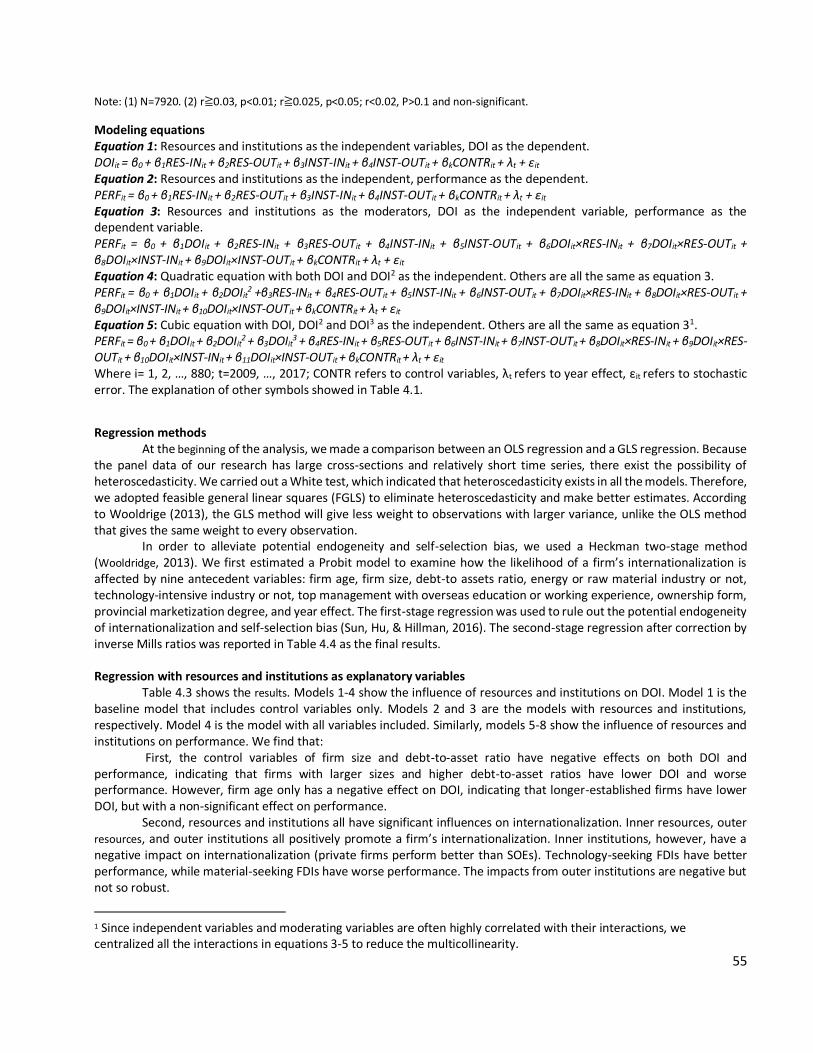
55
Note: (1) N=7920. (2) r≧0.03, p<0.01; r≧0.025, p<0.05; r<0.02, P>0.1 and non-significant.
Modeling equations Equation 1: Resources and institutions as the independent variables, DOI as the dependent. DOIit = β0 + β1RES-INit + β2RES-OUTit + β3INST-INit + β4INST-OUTit + βkCONTRit + λt + εit
Equation 2: Resources and institutions as the independent, performance as the dependent.
PERFit = β0 + β1RES-INit + β2RES-OUTit + β3INST-INit + β4INST-OUTit + βkCONTRit + λt + εit
Equation 3: Resources and institutions as the moderators, DOI as the independent variable, performance as the dependent variable.
PERFit = β0 + β1DOIit + β2RES-INit + β3RES-OUTit + β4INST-INit + β5INST-OUTit + β6DOIit×RES-INit + β7DOIit×RES-OUTit + β8DOIit×INST-INit + β9DOIit×INST-OUTit + βkCONTRit + λt + εit Equation 4: Quadratic equation with both DOI and DOI2 as the independent. Others are all the same as equation 3. PERFit = β0 + β1DOIit + β2DOIit
2 +β3RES-INit + β4RES-OUTit + β5INST-INit + β6INST-OUTit + β7DOIit×RES-INit + β8DOIit×RES-OUTit + β9DOIit×INST-INit + β10DOIit×INST-OUTit + βkCONTRit + λt + εit Equation 5: Cubic equation with DOI, DOI2 and DOI3 as the independent. Others are all the same as equation 31. PERFit = β0 + β1DOIit + β2DOIit
2 + β3DOIit3 + β4RES-INit + β5RES-OUTit + β6INST-INit + β7INST-OUTit + β8DOIit×RES-INit + β9DOIit×RES-
OUTit + β10DOIit×INST-INit + β11DOIit×INST-OUTit + βkCONTRit + λt + εit Where i= 1, 2, …, 880; t=2009, …, 2017; CONTR refers to control variables, λt refers to year effect, εit refers to stochastic error. The explanation of other symbols showed in Table 4.1.
Regression methods At the beginning of the analysis, we made a comparison between an OLS regression and a GLS regression. Because
the panel data of our research has large cross-sections and relatively short time series, there exist the possibility of heteroscedasticity. We carried out a White test, which indicated that heteroscedasticity exists in all the models. Therefore, we adopted feasible general linear squares (FGLS) to eliminate heteroscedasticity and make better estimates. According to Wooldrige (2013), the GLS method will give less weight to observations with larger variance, unlike the OLS method that gives the same weight to every observation.
In order to alleviate potential endogeneity and self-selection bias, we used a Heckman two-stage method (Wooldridge, 2013). We first estimated a Probit model to examine how the likelihood of a firm’s internationalization is affected by nine antecedent variables: firm age, firm size, debt-to assets ratio, energy or raw material industry or not, technology-intensive industry or not, top management with overseas education or working experience, ownership form, provincial marketization degree, and year effect. The first-stage regression was used to rule out the potential endogeneity of internationalization and self-selection bias (Sun, Hu, & Hillman, 2016). The second-stage regression after correction by inverse Mills ratios was reported in Table 4.4 as the final results.
Regression with resources and institutions as explanatory variables
Table 4.3 shows the results. Models 1-4 show the influence of resources and institutions on DOI. Model 1 is the baseline model that includes control variables only. Models 2 and 3 are the models with resources and institutions, respectively. Model 4 is the model with all variables included. Similarly, models 5-8 show the influence of resources and institutions on performance. We find that:
First, the control variables of firm size and debt-to-asset ratio have negative effects on both DOI and performance, indicating that firms with larger sizes and higher debt-to-asset ratios have lower DOI and worse performance. However, firm age only has a negative effect on DOI, indicating that longer-established firms have lower DOI, but with a non-significant effect on performance.
Second, resources and institutions all have significant influences on internationalization. Inner resources, outer resources, and outer institutions all positively promote a firm’s internationalization. Inner institutions, however, have a negative impact on internationalization (private firms perform better than SOEs). Technology-seeking FDIs have better performance, while material-seeking FDIs have worse performance. The impacts from outer institutions are negative but not so robust.
1 Since independent variables and moderating variables are often highly correlated with their interactions, we centralized all the interactions in equations 3-5 to reduce the multicollinearity.
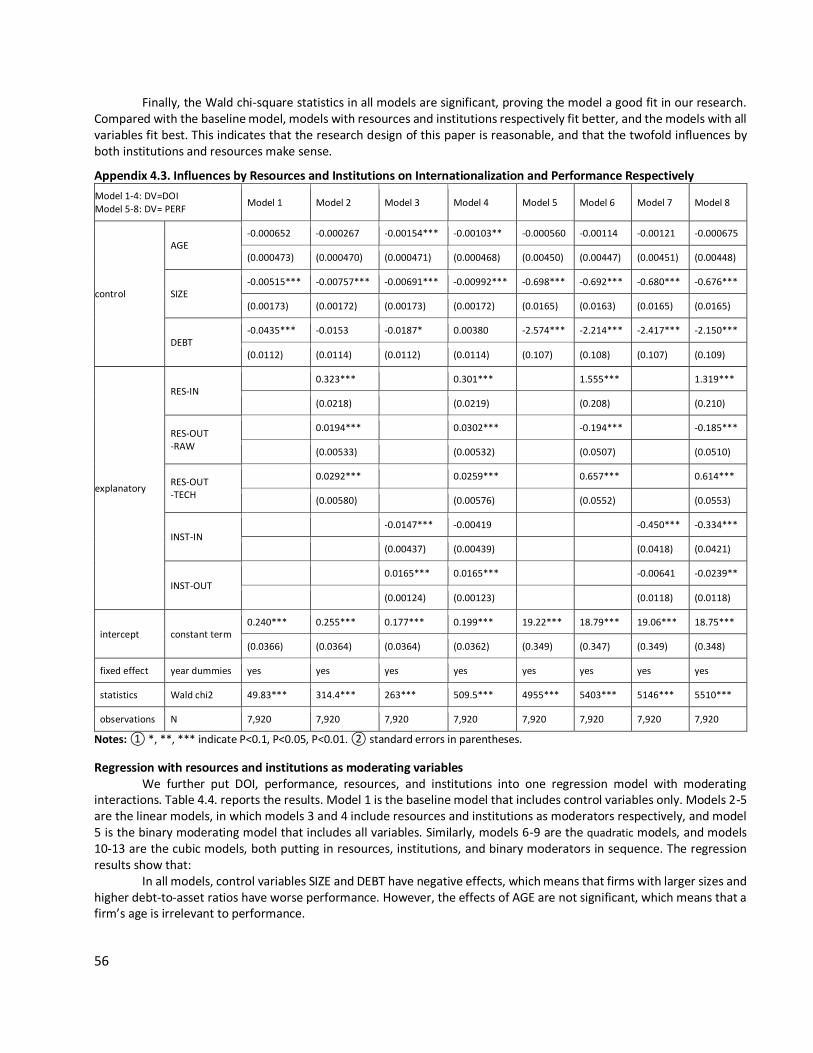
56
Finally, the Wald chi-square statistics in all models are significant, proving the model a good fit in our research. Compared with the baseline model, models with resources and institutions respectively fit better, and the models with all variables fit best. This indicates that the research design of this paper is reasonable, and that the twofold influences by both institutions and resources make sense.
Appendix 4.3. Influences by Resources and Institutions on Internationalization and Performance Respectively
Model 1-4: DV=DOI Model 5-8: DV= PERF
Model 1 Model 2 Model 3 Model 4 Model 5 Model 6 Model 7 Model 8
control
AGE -0.000652 -0.000267 -0.00154*** -0.00103** -0.000560 -0.00114 -0.00121 -0.000675
(0.000473) (0.000470) (0.000471) (0.000468) (0.00450) (0.00447) (0.00451) (0.00448)
SIZE -0.00515*** -0.00757*** -0.00691*** -0.00992*** -0.698*** -0.692*** -0.680*** -0.676***
(0.00173) (0.00172) (0.00173) (0.00172) (0.0165) (0.0163) (0.0165) (0.0165)
DEBT -0.0435*** -0.0153 -0.0187* 0.00380 -2.574*** -2.214*** -2.417*** -2.150***
(0.0112) (0.0114) (0.0112) (0.0114) (0.107) (0.108) (0.107) (0.109)
explanatory
RES-IN 0.323*** 0.301*** 1.555*** 1.319***
(0.0218) (0.0219) (0.208) (0.210)
RES-OUT -RAW
0.0194*** 0.0302*** -0.194*** -0.185***
(0.00533) (0.00532) (0.0507) (0.0510)
RES-OUT -TECH
0.0292*** 0.0259*** 0.657*** 0.614***
(0.00580) (0.00576) (0.0552) (0.0553)
INST-IN -0.0147*** -0.00419 -0.450*** -0.334***
(0.00437) (0.00439) (0.0418) (0.0421)
INST-OUT 0.0165*** 0.0165*** -0.00641 -0.0239**
(0.00124) (0.00123) (0.0118) (0.0118)
intercept constant term 0.240*** 0.255*** 0.177*** 0.199*** 19.22*** 18.79*** 19.06*** 18.75***
(0.0366) (0.0364) (0.0364) (0.0362) (0.349) (0.347) (0.349) (0.348)
fixed effect year dummies yes yes yes yes yes yes yes yes
statistics Wald chi2 49.83*** 314.4*** 263*** 509.5*** 4955*** 5403*** 5146*** 5510***
observations N 7,920 7,920 7,920 7,920 7,920 7,920 7,920 7,920
Notes: ① *, **, *** indicate P<0.1, P<0.05, P<0.01. ② standard errors in parentheses.
Regression with resources and institutions as moderating variables
We further put DOI, performance, resources, and institutions into one regression model with moderating interactions. Table 4.4. reports the results. Model 1 is the baseline model that includes control variables only. Models 2-5 are the linear models, in which models 3 and 4 include resources and institutions as moderators respectively, and model 5 is the binary moderating model that includes all variables. Similarly, models 6-9 are the quadratic models, and models 10-13 are the cubic models, both putting in resources, institutions, and binary moderators in sequence. The regression results show that:
In all models, control variables SIZE and DEBT have negative effects, which means that firms with larger sizes and higher debt-to-asset ratios have worse performance. However, the effects of AGE are not significant, which means that a firm’s age is irrelevant to performance.
57
Second, linear models and quadratic models are all significant, however, cubic models are not significant. These results indicate that though the relation of internationalization and performance for Chinese firms are U-shaped, they indeed have not reached the horizontal S-shaped relation period.
Third, the three 0/1 variables are significant: raw material-seeking, technology-seeking, and SOEs. RES-OUT-RAW is negative in moderator. but positive in interaction, suggesting that raw material-seeking FDIs have worse performance but will grow with higher DOI. RES-OUT-TECH is positive in moderator but negative in interaction, suggesting that technology-seeking FDIs have better performance but will decline and approach an average level along with higher DOI. INST-IN is negative in moderator but positive in interaction, suggesting that SOEs perform worse than private firms but will grow better along with higher DOI. That is to say, intensive internationalization will improve the unhealthy performance of SOEs.
Finally, the Wald chi-square statistics in all models are significant, proving the model a good fit and meaningful research results. Compared with the baseline model, models with resources and institutions respectively fit better, and the models with all variables fit best. This indicates that our research design is reasonable and valuable, the binary moderating
mechanism is a good match.
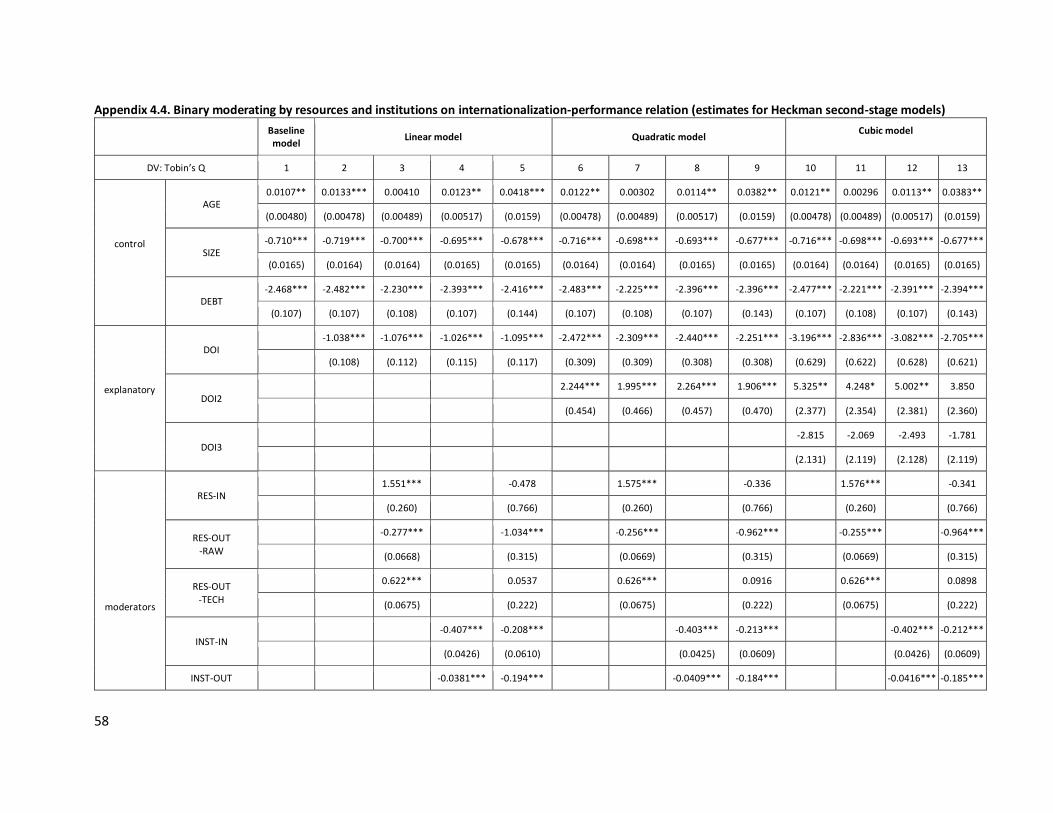
58
Appendix 4.4. Binary moderating by resources and institutions on internationalization-performance relation (estimates for Heckman second-stage models)
Baseline model
Linear model Quadratic model Cubic model
DV: Tobin’s Q 1 2 3 4 5 6 7 8 9 10 11 12 13
control
AGE 0.0107** 0.0133*** 0.00410 0.0123** 0.0418*** 0.0122** 0.00302 0.0114** 0.0382** 0.0121** 0.00296 0.0113** 0.0383**
(0.00480) (0.00478) (0.00489) (0.00517) (0.0159) (0.00478) (0.00489) (0.00517) (0.0159) (0.00478) (0.00489) (0.00517) (0.0159)
SIZE -0.710*** -0.719*** -0.700*** -0.695*** -0.678*** -0.716*** -0.698*** -0.693*** -0.677*** -0.716*** -0.698*** -0.693*** -0.677***
(0.0165) (0.0164) (0.0164) (0.0165) (0.0165) (0.0164) (0.0164) (0.0165) (0.0165) (0.0164) (0.0164) (0.0165) (0.0165)
DEBT -2.468*** -2.482*** -2.230*** -2.393*** -2.416*** -2.483*** -2.225*** -2.396*** -2.396*** -2.477*** -2.221*** -2.391*** -2.394***
(0.107) (0.107) (0.108) (0.107) (0.144) (0.107) (0.108) (0.107) (0.143) (0.107) (0.108) (0.107) (0.143)
explanatory
DOI -1.038*** -1.076*** -1.026*** -1.095*** -2.472*** -2.309*** -2.440*** -2.251*** -3.196*** -2.836*** -3.082*** -2.705***
(0.108) (0.112) (0.115) (0.117) (0.309) (0.309) (0.308) (0.308) (0.629) (0.622) (0.628) (0.621)
DOI2 2.244*** 1.995*** 2.264*** 1.906*** 5.325** 4.248* 5.002** 3.850
(0.454) (0.466) (0.457) (0.470) (2.377) (2.354) (2.381) (2.360)
DOI3 -2.815 -2.069 -2.493 -1.781
(2.131) (2.119) (2.128) (2.119)
moderators
RES-IN 1.551*** -0.478 1.575*** -0.336 1.576*** -0.341
(0.260) (0.766) (0.260) (0.766) (0.260) (0.766)
RES-OUT -RAW
-0.277*** -1.034*** -0.256*** -0.962*** -0.255*** -0.964***
(0.0668) (0.315) (0.0669) (0.315) (0.0669) (0.315)
RES-OUT -TECH
0.622*** 0.0537 0.626*** 0.0916 0.626*** 0.0898
(0.0675) (0.222) (0.0675) (0.222) (0.0675) (0.222)
INST-IN -0.407*** -0.208*** -0.403*** -0.213*** -0.402*** -0.212***
(0.0426) (0.0610) (0.0425) (0.0609) (0.0426) (0.0609)
INST-OUT -0.0381*** -0.194*** -0.0409*** -0.184*** -0.0416*** -0.185***
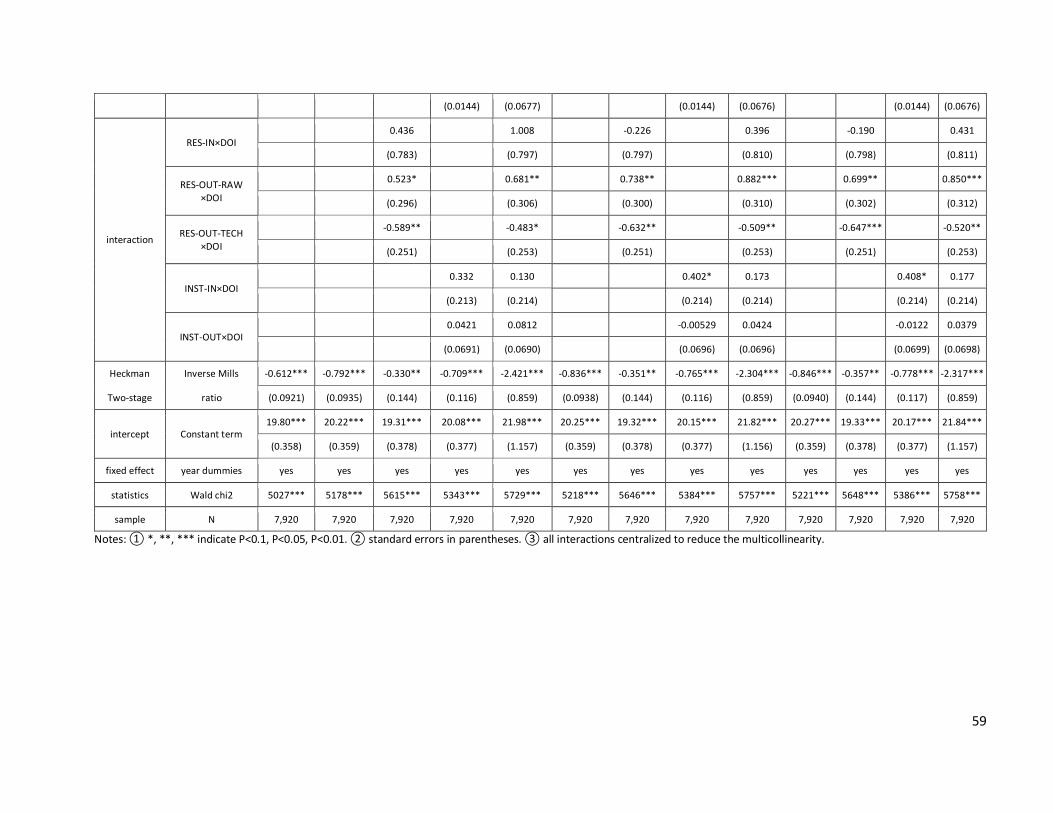
59
(0.0144) (0.0677) (0.0144) (0.0676) (0.0144) (0.0676)
interaction
RES-IN×DOI 0.436 1.008 -0.226 0.396 -0.190 0.431
(0.783) (0.797) (0.797) (0.810) (0.798) (0.811)
RES-OUT-RAW ×DOI
0.523* 0.681** 0.738** 0.882*** 0.699** 0.850***
(0.296) (0.306) (0.300) (0.310) (0.302) (0.312)
RES-OUT-TECH ×DOI
-0.589** -0.483* -0.632** -0.509** -0.647*** -0.520**
(0.251) (0.253) (0.251) (0.253) (0.251) (0.253)
INST-IN×DOI 0.332 0.130 0.402* 0.173 0.408* 0.177
(0.213) (0.214) (0.214) (0.214) (0.214) (0.214)
INST-OUT×DOI 0.0421 0.0812 -0.00529 0.0424 -0.0122 0.0379
(0.0691) (0.0690) (0.0696) (0.0696) (0.0699) (0.0698)
Heckman Inverse Mills -0.612*** -0.792*** -0.330** -0.709*** -2.421*** -0.836*** -0.351** -0.765*** -2.304*** -0.846*** -0.357** -0.778*** -2.317***
Two-stage ratio (0.0921) (0.0935) (0.144) (0.116) (0.859) (0.0938) (0.144) (0.116) (0.859) (0.0940) (0.144) (0.117) (0.859)
intercept Constant term 19.80*** 20.22*** 19.31*** 20.08*** 21.98*** 20.25*** 19.32*** 20.15*** 21.82*** 20.27*** 19.33*** 20.17*** 21.84***
(0.358) (0.359) (0.378) (0.377) (1.157) (0.359) (0.378) (0.377) (1.156) (0.359) (0.378) (0.377) (1.157)
fixed effect year dummies yes yes yes yes yes yes yes yes yes yes yes yes yes
statistics Wald chi2 5027*** 5178*** 5615*** 5343*** 5729*** 5218*** 5646*** 5384*** 5757*** 5221*** 5648*** 5386*** 5758***
sample N 7,920 7,920 7,920 7,920 7,920 7,920 7,920 7,920 7,920 7,920 7,920 7,920 7,920
Notes: ① *, **, *** indicate P<0.1, P<0.05, P<0.01. ② standard errors in parentheses. ③ all interactions centralized to reduce the multicollinearity.
moderators INST-OUT
60
Robustness analysis We ensure the robustness of our analysis from following several aspects: First, though we use feasible general
linear squares (FGLS) to get a better estimate under heteroscedasticity, we also conduct the OLS regression. The results indicate that all the coefficients from OLS are in the same direction and significance as from FGLS. The coefficients from the two methods only have little difference in magnitude. Therefore, the regression results of this paper are robust. According to Wooldrige (2013), if the results from the two regression methods are very different, then the function forms are probably set incorrectly. On the contrary, if the results from the two regression methods are similar to each other, no proof indicates that the function forms are problematic.
Second, the four models of the S-shaped relation can be seen as the robustness check to the U-shaped relation. Adding a cubic term (X3) in the equation can test whether the relation is S-shaped rather than U-shaped. If the finding is that the cubic term does not improve model fit, it provides stronger support for a quadratic relation (Hanns, Pieters, & He, 2016). In our test, the cubic models 10-13 in Table 4.4 are all not significant, so the horizontal S-shape or N-shape are both excluded.
Finally, we draw figures to illustrate the U-shaped relation between internationalization and performance, because a rigorous U-shape needs figure verification (Hanns, Pieters, & He, 2016): Only the curve with the inflection point in the first quadrant is a true U-shape. Otherwise it will be a pseudo U-shape, since the inflection point in the second or third quadrant is impossible in reality. This kind of pseudo U-shape is in fact a positive linear correlation in the first quadrant.
On account of this consideration, we drew the figures of models with significant moderating effects: models 7 & 8 in Figure 4.3a and model 9 in Figure 4.3b. (1) All five U-shaped curves have inflection points in the first quadrant, so they are all true U-shape instead of pseudo U-shape which are impossible in reality. (2) Figure 4.3a indicates that material-seeking FDIs have worse performance but will grow better with higher DOI, and will soon outperform others. This reveals that deep internationalization will improve the performance of material-seeking FDIs. Meanwhile, technology-seeking FDIs have better performance but will decline with higher DOI. This illustrates that after deep internationalization the tech-seeking FDIs will no longer obtain premiums. (3) Figure 4.3b indicates that SOEs have worse international performance than private firms, but the gap will become less along with higher DOI. This proves
that the institutional shortcomings of SOEs will be overcome by deep internationalization.
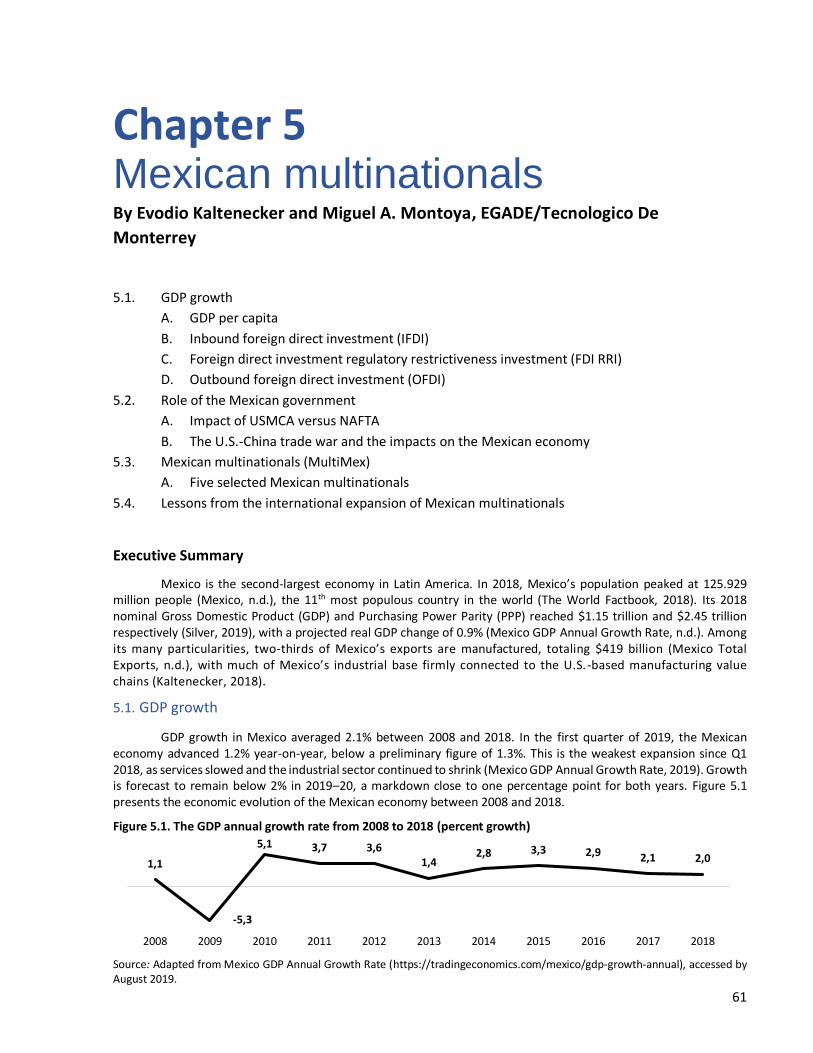
61
Chapter 5
Mexican multinationals By Evodio Kaltenecker and Miguel A. Montoya, EGADE/Tecnologico De
Monterrey
5.1. GDP growth
A. GDP per capita
B. Inbound foreign direct investment (IFDI)
C. Foreign direct investment regulatory restrictiveness investment (FDI RRI)
D. Outbound foreign direct investment (OFDI)
5.2. Role of the Mexican government
A. Impact of USMCA versus NAFTA
B. The U.S.-China trade war and the impacts on the Mexican economy
5.3. Mexican multinationals (MultiMex)
A. Five selected Mexican multinationals
5.4. Lessons from the international expansion of Mexican multinationals
Executive Summary
Mexico is the second-largest economy in Latin America. In 2018, Mexico’s population peaked at 125.929 million people (Mexico, n.d.), the 11th most populous country in the world (The World Factbook, 2018). Its 2018 nominal Gross Domestic Product (GDP) and Purchasing Power Parity (PPP) reached $1.15 trillion and $2.45 trillion respectively (Silver, 2019), with a projected real GDP change of 0.9% (Mexico GDP Annual Growth Rate, n.d.). Among its many particularities, two-thirds of Mexico’s exports are manufactured, totaling $419 billion (Mexico Total Exports, n.d.), with much of Mexico’s industrial base firmly connected to the U.S. -based manufacturing value chains (Kaltenecker, 2018).
5.1. GDP growth
GDP growth in Mexico averaged 2.1% between 2008 and 2018. In the first quarter of 2019, the Mexican economy advanced 1.2% year-on-year, below a preliminary figure of 1.3%. This is the weakest expansion since Q1 2018, as services slowed and the industrial sector continued to shrink (Mexico GDP Annual Growth Rate, 2019). Growth is forecast to remain below 2% in 2019–20, a markdown close to one percentage point for both years. Figure 5.1 presents the economic evolution of the Mexican economy between 2008 and 2018.
Figure 5.1. The GDP annual growth rate from 2008 to 2018 (percent growth)
Source: Adapted from Mexico GDP Annual Growth Rate (https://tradingeconomics.com/mexico/gdp-growth-annual), accessed by August 2019.
1,1
-5,3
5,1 3,7 3,61,4
2,8 3,3 2,9 2,1 2,0
2008 2009 2010 2011 2012 2013 2014 2015 2016 2017 2018
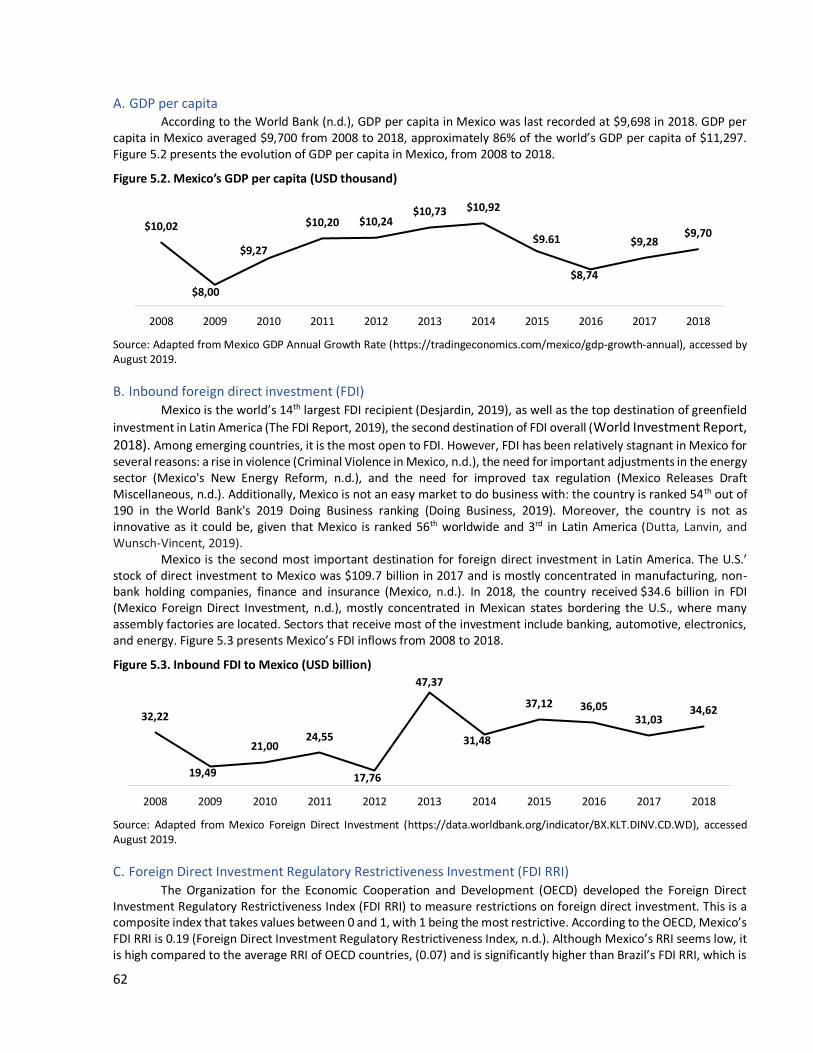
62
A. GDP per capita According to the World Bank (n.d.), GDP per capita in Mexico was last recorded at $9,698 in 2018. GDP per
capita in Mexico averaged $9,700 from 2008 to 2018, approximately 86% of the world’s GDP per capita of $11,297. Figure 5.2 presents the evolution of GDP per capita in Mexico, from 2008 to 2018.
Figure 5.2. Mexico’s GDP per capita (USD thousand)
Source: Adapted from Mexico GDP Annual Growth Rate (https://tradingeconomics.com/mexico/gdp-growth-annual), accessed by August 2019.
B. Inbound foreign direct investment (FDI) Mexico is the world’s 14th largest FDI recipient (Desjardin, 2019), as well as the top destination of greenfield
investment in Latin America (The FDI Report, 2019), the second destination of FDI overall (World Investment Report, 2018). Among emerging countries, it is the most open to FDI. However, FDI has been relatively stagnant in Mexico for several reasons: a rise in violence (Criminal Violence in Mexico, n.d.), the need for important adjustments in the energy sector (Mexico's New Energy Reform, n.d.), and the need for improved tax regulation (Mexico Releases Draft Miscellaneous, n.d.). Additionally, Mexico is not an easy market to do business with: the country is ranked 54th out of 190 in the World Bank's 2019 Doing Business ranking (Doing Business, 2019). Moreover, the country is not as innovative as it could be, given that Mexico is ranked 56th worldwide and 3rd in Latin America (Dutta, Lanvin, and Wunsch-Vincent, 2019).
Mexico is the second most important destination for foreign direct investment in Latin America. The U.S.’ stock of direct investment to Mexico was $109.7 billion in 2017 and is mostly concentrated in manufacturing, non-bank holding companies, finance and insurance (Mexico, n.d.). In 2018, the country received $34.6 billion in FDI (Mexico Foreign Direct Investment, n.d.), mostly concentrated in Mexican states bordering the U.S., where many assembly factories are located. Sectors that receive most of the investment include banking, automotive, electronics, and energy. Figure 5.3 presents Mexico’s FDI inflows from 2008 to 2018.
Figure 5.3. Inbound FDI to Mexico (USD billion)
Source: Adapted from Mexico Foreign Direct Investment (https://data.worldbank.org/indicator/BX.KLT.DINV.CD.WD), accessed August 2019.
C. Foreign Direct Investment Regulatory Restrictiveness Investment (FDI RRI) The Organization for the Economic Cooperation and Development (OECD) developed the Foreign Direct
Investment Regulatory Restrictiveness Index (FDI RRI) to measure restrictions on foreign direct investment. This is a composite index that takes values between 0 and 1, with 1 being the most restrictive. According to the OECD, Mexico’s FDI RRI is 0.19 (Foreign Direct Investment Regulatory Restrictiveness Index, n.d.). Although Mexico’s RRI seems low, it is high compared to the average RRI of OECD countries, (0.07) and is significantly higher than Brazil’s FDI RRI, which is
$10,02
$8,00
$9,27
$10,20 $10,24$10,73 $10,92
$9,61
$8,74
$9,28$9,70
2008 2009 2010 2011 2012 2013 2014 2015 2016 2017 2018
32,22
19,49
21,0024,55
17,76
47,37
31,48
37,12 36,0531,03
34,62
2008 2009 2010 2011 2012 2013 2014 2015 2016 2017 2018
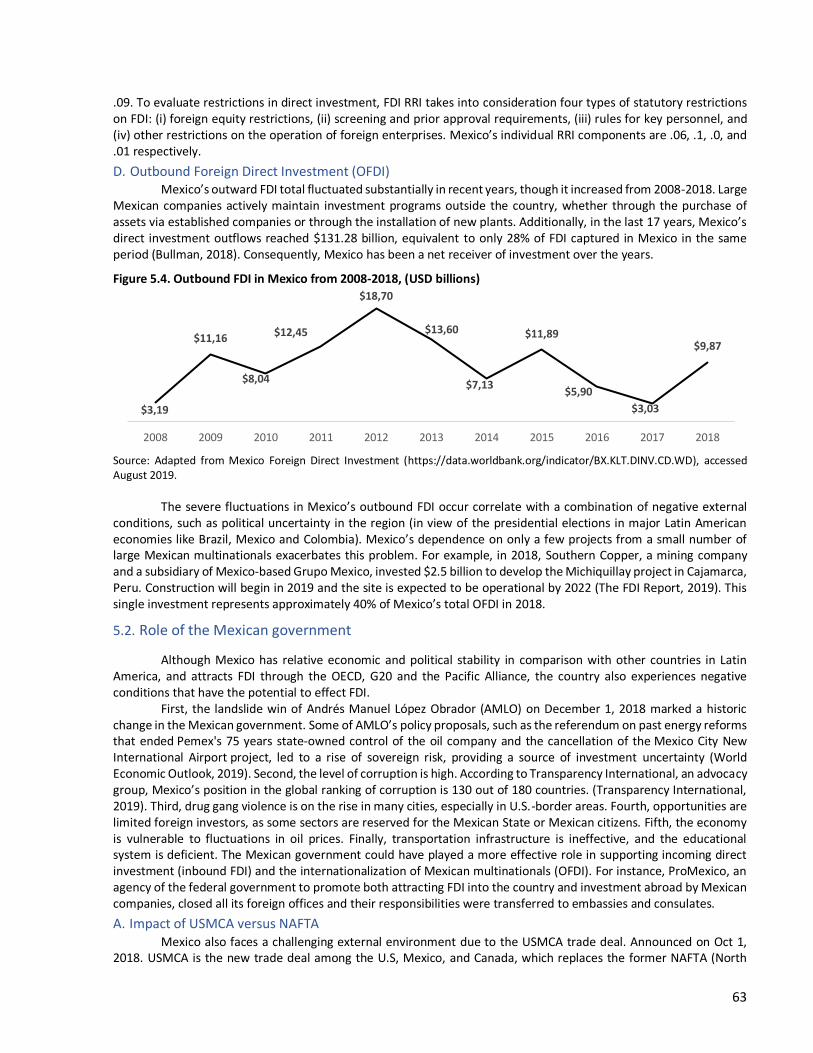
63
.09. To evaluate restrictions in direct investment, FDI RRI takes into consideration four types of statutory restrictions on FDI: (i) foreign equity restrictions, (ii) screening and prior approval requirements, (iii) rules for key personnel, and (iv) other restrictions on the operation of foreign enterprises. Mexico’s individual RRI components are .06, .1, .0, and .01 respectively.
D. Outbound Foreign Direct Investment (OFDI) Mexico’s outward FDI total fluctuated substantially in recent years, though it increased from 2008-2018. Large
Mexican companies actively maintain investment programs outside the country, whether through the purchase of assets via established companies or through the installation of new plants. Additionally, in the last 17 years, Mexico’s direct investment outflows reached $131.28 billion, equivalent to only 28% of FDI captured in Mexico in the same period (Bullman, 2018). Consequently, Mexico has been a net receiver of investment over the years.
Figure 5.4. Outbound FDI in Mexico from 2008-2018, (USD billions)
Source: Adapted from Mexico Foreign Direct Investment (https://data.worldbank.org/indicator/BX.KLT.DINV.CD.WD), accessed August 2019.
The severe fluctuations in Mexico’s outbound FDI occur correlate with a combination of negative external conditions, such as political uncertainty in the region (in view of the presidential elections in major Latin American economies like Brazil, Mexico and Colombia). Mexico’s dependence on only a few projects from a small number of large Mexican multinationals exacerbates this problem. For example, in 2018, Southern Copper, a mining company and a subsidiary of Mexico-based Grupo Mexico, invested $2.5 billion to develop the Michiquillay project in Cajamarca, Peru. Construction will begin in 2019 and the site is expected to be operational by 2022 (The FDI Report, 2019). This single investment represents approximately 40% of Mexico’s total OFDI in 2018.
5.2. Role of the Mexican government
Although Mexico has relative economic and political stability in comparison with other countries in Latin America, and attracts FDI through the OECD, G20 and the Pacific Alliance, the country also experiences negative conditions that have the potential to effect FDI.
First, the landslide win of Andrés Manuel López Obrador (AMLO) on December 1, 2018 marked a historic change in the Mexican government. Some of AMLO’s policy proposals, such as the referendum on past energy reforms that ended Pemex's 75 years state-owned control of the oil company and the cancellation of the Mexico City New International Airport project, led to a rise of sovereign risk, providing a source of investment uncertainty (World Economic Outlook, 2019). Second, the level of corruption is high. According to Transparency International, an advocacy group, Mexico’s position in the global ranking of corruption is 130 out of 180 countries. (Transparency International, 2019). Third, drug gang violence is on the rise in many cities, especially in U.S.-border areas. Fourth, opportunities are limited foreign investors, as some sectors are reserved for the Mexican State or Mexican citizens. Fifth, the economy is vulnerable to fluctuations in oil prices. Finally, transportation infrastructure is ineffective, and the educational system is deficient. The Mexican government could have played a more effective role in supporting incoming direct investment (inbound FDI) and the internationalization of Mexican multinationals (OFDI). For instance, ProMexico, an agency of the federal government to promote both attracting FDI into the country and investment abroad by Mexican companies, closed all its foreign offices and their responsibilities were transferred to embassies and consulates.
A. Impact of USMCA versus NAFTA Mexico also faces a challenging external environment due to the USMCA trade deal. Announced on Oct 1,
2018. USMCA is the new trade deal among the U.S, Mexico, and Canada, which replaces the former NAFTA (North
$3,19
$11,16
$8,04
$12,45
$18,70
$13,60
$7,13
$11,89
$5,90
$3,03
$9,87
2008 2009 2010 2011 2012 2013 2014 2015 2016 2017 2018
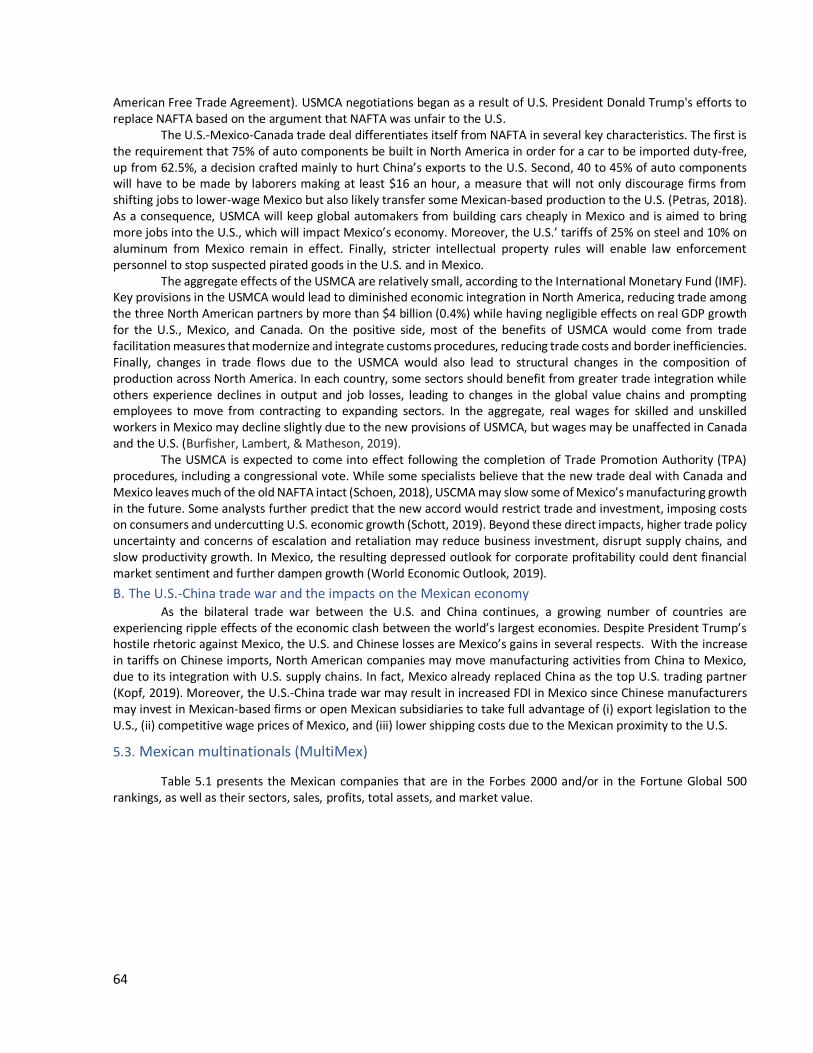
64
American Free Trade Agreement). USMCA negotiations began as a result of U.S. President Donald Trump's efforts to replace NAFTA based on the argument that NAFTA was unfair to the U.S.
The U.S.-Mexico-Canada trade deal differentiates itself from NAFTA in several key characteristics. The first is the requirement that 75% of auto components be built in North America in order for a car to be imported duty-free, up from 62.5%, a decision crafted mainly to hurt China’s exports to the U.S. Second, 40 to 45% of auto components will have to be made by laborers making at least $16 an hour, a measure that will not only discourage firms from shifting jobs to lower-wage Mexico but also likely transfer some Mexican-based production to the U.S. (Petras, 2018). As a consequence, USMCA will keep global automakers from building cars cheaply in Mexico and is aimed to bring more jobs into the U.S., which will impact Mexico’s economy. Moreover, the U.S.’ tariffs of 25% on steel and 10% on aluminum from Mexico remain in effect. Finally, stricter intellectual property rules will enable law enforcement personnel to stop suspected pirated goods in the U.S. and in Mexico.
The aggregate effects of the USMCA are relatively small, according to the International Monetary Fund (IMF). Key provisions in the USMCA would lead to diminished economic integration in North America, reducing trade among the three North American partners by more than $4 billion (0.4%) while having negligible effects on real GDP growth for the U.S., Mexico, and Canada. On the positive side, most of the benefits of USMCA would come from trade facilitation measures that modernize and integrate customs procedures, reducing trade costs and border inefficiencies. Finally, changes in trade flows due to the USMCA would also lead to structural changes in the composition of production across North America. In each country, some sectors should benefit from greater trade integration while others experience declines in output and job losses, leading to changes in the global value chains and prompting employees to move from contracting to expanding sectors. In the aggregate, real wages for skilled and unskilled workers in Mexico may decline slightly due to the new provisions of USMCA, but wages may be unaffected in Canada and the U.S. (Burfisher, Lambert, & Matheson, 2019).
The USMCA is expected to come into effect following the completion of Trade Promotion Authority (TPA) procedures, including a congressional vote. While some specialists believe that the new trade deal with Canada and Mexico leaves much of the old NAFTA intact (Schoen, 2018), USCMA may slow some of Mexico’s manufacturing growth in the future. Some analysts further predict that the new accord would restrict trade and investment, imposing costs on consumers and undercutting U.S. economic growth (Schott, 2019). Beyond these direct impacts, higher trade policy uncertainty and concerns of escalation and retaliation may reduce business investment, disrupt supply chains, and slow productivity growth. In Mexico, the resulting depressed outlook for corporate profitability could dent financial market sentiment and further dampen growth (World Economic Outlook, 2019).
B. The U.S.-China trade war and the impacts on the Mexican economy As the bilateral trade war between the U.S. and China continues, a growing number of countries are
experiencing ripple effects of the economic clash between the world’s largest economies. Despite President Trump’s hostile rhetoric against Mexico, the U.S. and Chinese losses are Mexico’s gains in several respects. With the increase in tariffs on Chinese imports, North American companies may move manufacturing activities from China to Mexico, due to its integration with U.S. supply chains. In fact, Mexico already replaced China as the top U.S. trading partner (Kopf, 2019). Moreover, the U.S.-China trade war may result in increased FDI in Mexico since Chinese manufacturers may invest in Mexican-based firms or open Mexican subsidiaries to take full advantage of (i) export legislation to the U.S., (ii) competitive wage prices of Mexico, and (iii) lower shipping costs due to the Mexican proximity to the U.S.
5.3. Mexican multinationals (MultiMex)
Table 5.1 presents the Mexican companies that are in the Forbes 2000 and/or in the Fortune Global 500 rankings, as well as their sectors, sales, profits, total assets, and market value.
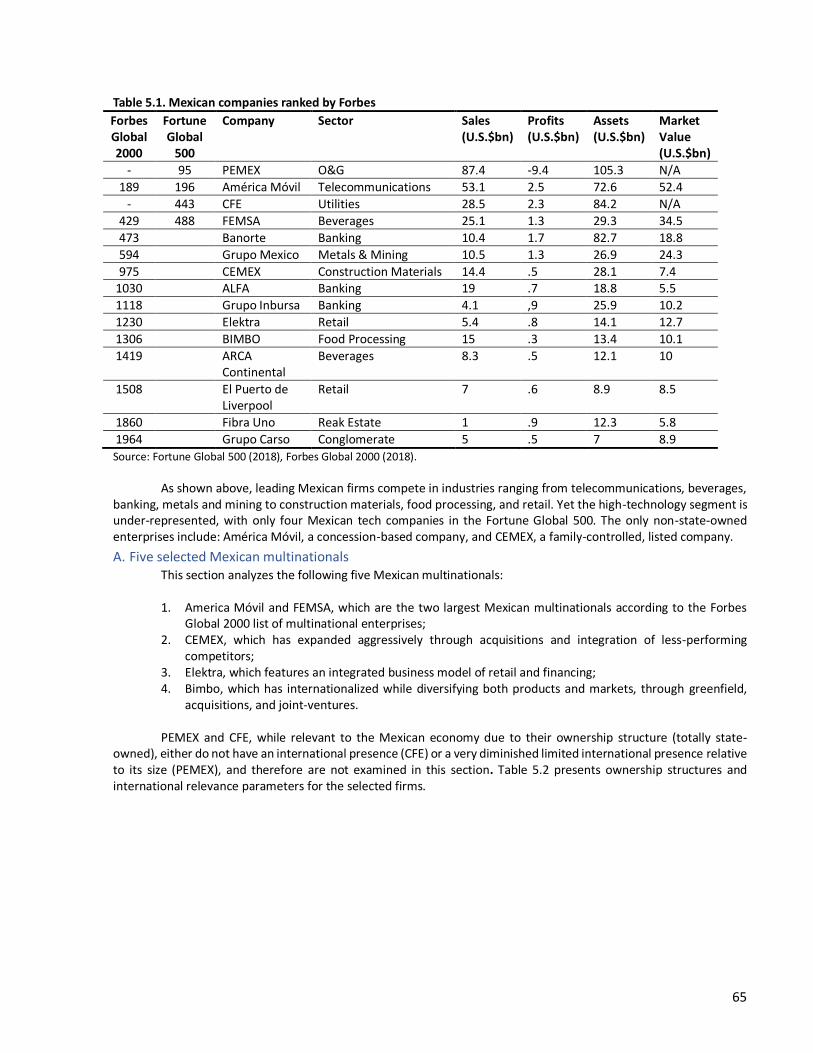
65
Table 5.1. Mexican companies ranked by Forbes
Forbes Global 2000
Fortune Global
500
Company Sector Sales (U.S.$bn)
Profits (U.S.$bn)
Assets (U.S.$bn)
Market Value (U.S.$bn)
- 95 PEMEX O&G 87.4 -9.4 105.3 N/A
189 196 América Móvil Telecommunications 53.1 2.5 72.6 52.4
- 443 CFE Utilities 28.5 2.3 84.2 N/A
429 488 FEMSA Beverages 25.1 1.3 29.3 34.5
473 Banorte Banking 10.4 1.7 82.7 18.8
594 Grupo Mexico Metals & Mining 10.5 1.3 26.9 24.3
975 CEMEX Construction Materials 14.4 .5 28.1 7.4 1030 ALFA Banking 19 .7 18.8 5.5
1118 Grupo Inbursa Banking 4.1 ,9 25.9 10.2
1230 Elektra Retail 5.4 .8 14.1 12.7
1306 BIMBO Food Processing 15 .3 13.4 10.1
1419 ARCA Continental
Beverages 8.3 .5 12.1 10
1508 El Puerto de Liverpool
Retail 7 .6 8.9 8.5
1860 Fibra Uno Reak Estate 1 .9 12.3 5.8
1964 Grupo Carso Conglomerate 5 .5 7 8.9
Source: Fortune Global 500 (2018), Forbes Global 2000 (2018).
As shown above, leading Mexican firms compete in industries ranging from telecommunications, beverages, banking, metals and mining to construction materials, food processing, and retail. Yet the high-technology segment is under-represented, with only four Mexican tech companies in the Fortune Global 500. The only non-state-owned enterprises include: América Móvil, a concession-based company, and CEMEX, a family-controlled, listed company.
A. Five selected Mexican multinationals This section analyzes the following five Mexican multinationals: 1. America Móvil and FEMSA, which are the two largest Mexican multinationals according to the Forbes
Global 2000 list of multinational enterprises; 2. CEMEX, which has expanded aggressively through acquisitions and integration of less-performing
competitors; 3. Elektra, which features an integrated business model of retail and financing; 4. Bimbo, which has internationalized while diversifying both products and markets, through greenfield,
acquisitions, and joint-ventures. PEMEX and CFE, while relevant to the Mexican economy due to their ownership structure (totally state-
owned), either do not have an international presence (CFE) or a very diminished limited international presence relative to its size (PEMEX), and therefore are not examined in this section. Table 5.2 presents ownership structures and international relevance parameters for the selected firms.
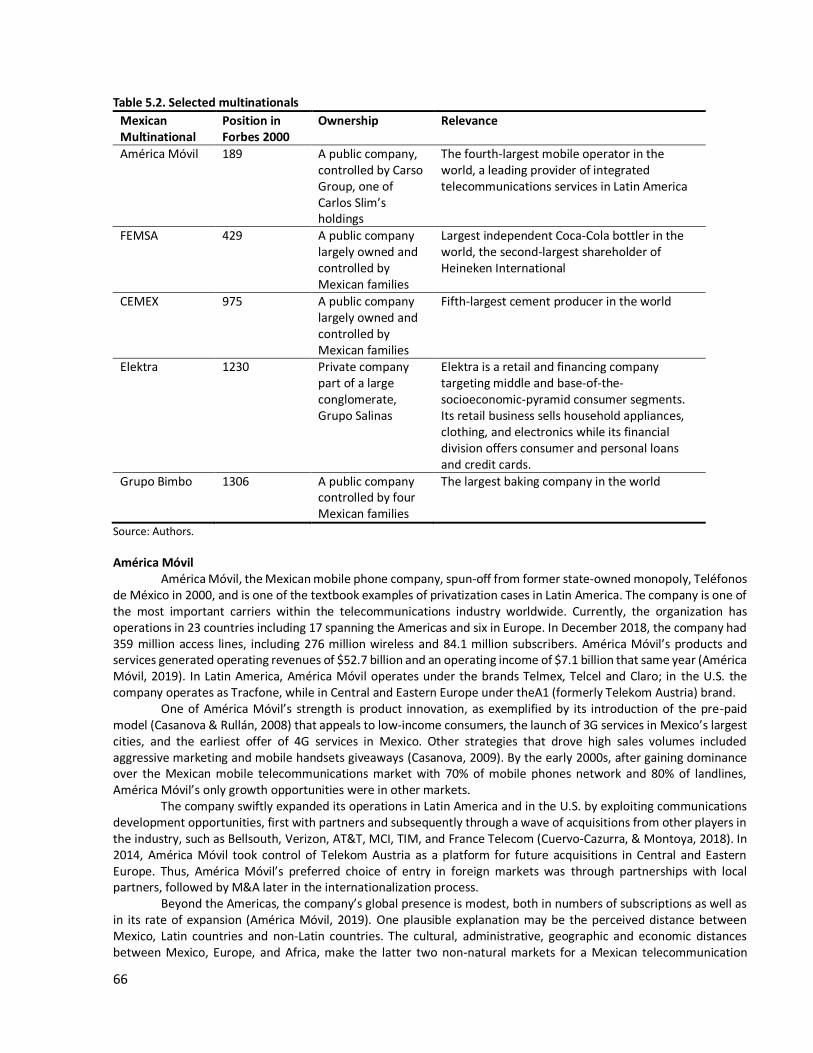
66
Table 5.2. Selected multinationals
Mexican Multinational
Position in Forbes 2000
Ownership Relevance
América Móvil 189 A public company, controlled by Carso Group, one of Carlos Slim’s holdings
The fourth-largest mobile operator in the world, a leading provider of integrated telecommunications services in Latin America
FEMSA 429 A public company largely owned and controlled by Mexican families
Largest independent Coca-Cola bottler in the world, the second-largest shareholder of Heineken International
CEMEX 975 A public company largely owned and controlled by Mexican families
Fifth-largest cement producer in the world
Elektra 1230 Private company part of a large conglomerate, Grupo Salinas
Elektra is a retail and financing company targeting middle and base-of-the-socioeconomic-pyramid consumer segments. Its retail business sells household appliances, clothing, and electronics while its financial division offers consumer and personal loans and credit cards.
Grupo Bimbo 1306 A public company controlled by four Mexican families
The largest baking company in the world
Source: Authors.
América Móvil América Móvil, the Mexican mobile phone company, spun-off from former state-owned monopoly, Teléfonos
de México in 2000, and is one of the textbook examples of privatization cases in Latin America. The company is one of the most important carriers within the telecommunications industry worldwide. Currently, the organization has operations in 23 countries including 17 spanning the Americas and six in Europe. In December 2018, the company had 359 million access lines, including 276 million wireless and 84.1 million subscribers. América Móvil’s products and services generated operating revenues of $52.7 billion and an operating income of $7.1 billion that same year (América Móvil, 2019). In Latin America, América Móvil operates under the brands Telmex, Telcel and Claro; in the U.S. the company operates as Tracfone, while in Central and Eastern Europe under theA1 (formerly Telekom Austria) brand.
One of América Móvil’s strength is product innovation, as exemplified by its introduction of the pre-paid model (Casanova & Rullán, 2008) that appeals to low-income consumers, the launch of 3G services in Mexico’s largest cities, and the earliest offer of 4G services in Mexico. Other strategies that drove high sales volumes included aggressive marketing and mobile handsets giveaways (Casanova, 2009). By the early 2000s, after gaining dominance over the Mexican mobile telecommunications market with 70% of mobile phones network and 80% of landlines, América Móvil’s only growth opportunities were in other markets.
The company swiftly expanded its operations in Latin America and in the U.S. by exploiting communications development opportunities, first with partners and subsequently through a wave of acquisitions from other players in the industry, such as Bellsouth, Verizon, AT&T, MCI, TIM, and France Telecom (Cuervo-Cazurra, & Montoya, 2018). In 2014, América Móvil took control of Telekom Austria as a platform for future acquisitions in Central and Eastern Europe. Thus, América Móvil’s preferred choice of entry in foreign markets was through partnerships with local partners, followed by M&A later in the internationalization process.
Beyond the Americas, the company’s global presence is modest, both in numbers of subscriptions as well as in its rate of expansion (América Móvil, 2019). One plausible explanation may be the perceived distance between Mexico, Latin countries and non-Latin countries. The cultural, administrative, geographic and economic distances between Mexico, Europe, and Africa, make the latter two non-natural markets for a Mexican telecommunication
Beyond the Americas, the company’s global presence is modest, both in numbers of subscriptions as well as in its rate of expansion (América Móvil, 2019). One plausible explanation may be the perceived distance between Mexico, Latin countries and non-Latin countries. The cultural, administrative, geographic and economic distances between Mexico, Europe, and Africa, make the latter two non-natural markets for a Mexican telecommunication company (Casanova & Rullán, 2008), and may be responsible for America Móvil’s slow expansion into those regions.
Page 66
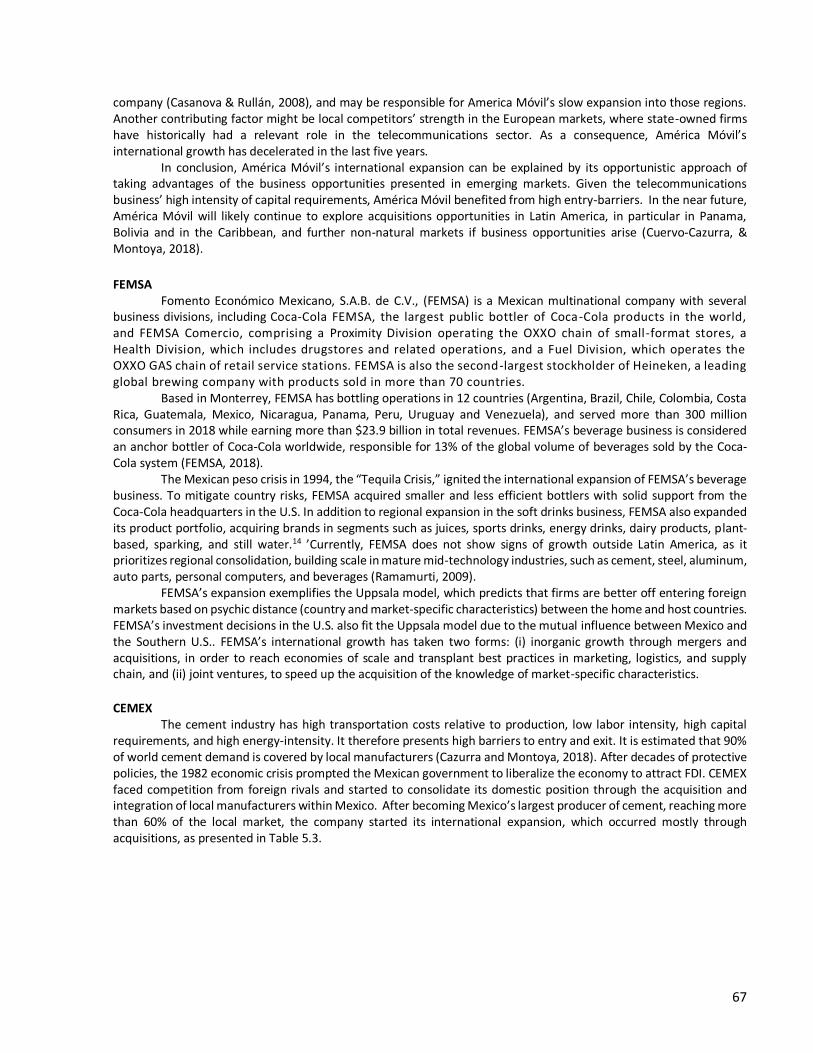
67
company (Casanova & Rullán, 2008), and may be responsible for America Móvil’s slow expansion into those regions. Another contributing factor might be local competitors’ strength in the European markets, where state-owned firms have historically had a relevant role in the telecommunications sector. As a consequence, América Móvil’s international growth has decelerated in the last five years.
In conclusion, América Móvil’s international expansion can be explained by its opportunistic approach of taking advantages of the business opportunities presented in emerging markets. Given the telecommunications business’ high intensity of capital requirements, América Móvil benefited from high entry-barriers. In the near future, América Móvil will likely continue to explore acquisitions opportunities in Latin America, in particular in Panama, Bolivia and in the Caribbean, and further non-natural markets if business opportunities arise (Cuervo-Cazurra, & Montoya, 2018).
FEMSA
Fomento Económico Mexicano, S.A.B. de C.V., (FEMSA) is a Mexican multinational company with several business divisions, including Coca-Cola FEMSA, the largest public bottler of Coca-Cola products in the world, and FEMSA Comercio, comprising a Proximity Division operating the OXXO chain of small-format stores, a Health Division, which includes drugstores and related operations, and a Fuel Division, which operates the OXXO GAS chain of retail service stations. FEMSA is also the second-largest stockholder of Heineken, a leading global brewing company with products sold in more than 70 countries.
Based in Monterrey, FEMSA has bottling operations in 12 countries (Argentina, Brazil, Chile, Colombia, Costa Rica, Guatemala, Mexico, Nicaragua, Panama, Peru, Uruguay and Venezuela), and served more than 300 million consumers in 2018 while earning more than $23.9 billion in total revenues. FEMSA’s beverage business is considered an anchor bottler of Coca-Cola worldwide, responsible for 13% of the global volume of beverages sold by the Coca-Cola system (FEMSA, 2018).
The Mexican peso crisis in 1994, the “Tequila Crisis,” ignited the international expansion of FEMSA’s beverage business. To mitigate country risks, FEMSA acquired smaller and less efficient bottlers with solid support from the Coca-Cola headquarters in the U.S. In addition to regional expansion in the soft drinks business, FEMSA also expanded its product portfolio, acquiring brands in segments such as juices, sports drinks, energy drinks, dairy products, plant-based, sparking, and still water.14 ’Currently, FEMSA does not show signs of growth outside Latin America, as it prioritizes regional consolidation, building scale in mature mid-technology industries, such as cement, steel, aluminum, auto parts, personal computers, and beverages (Ramamurti, 2009).
FEMSA’s expansion exemplifies the Uppsala model, which predicts that firms are better off entering foreign markets based on psychic distance (country and market-specific characteristics) between the home and host countries. FEMSA’s investment decisions in the U.S. also fit the Uppsala model due to the mutual influence between Mexico and the Southern U.S.. FEMSA’s international growth has taken two forms: (i) inorganic growth through mergers and acquisitions, in order to reach economies of scale and transplant best practices in marketing, logistics, and supply chain, and (ii) joint ventures, to speed up the acquisition of the knowledge of market-specific characteristics.
CEMEX
The cement industry has high transportation costs relative to production, low labor intensity, high capital requirements, and high energy-intensity. It therefore presents high barriers to entry and exit. It is estimated that 90% of world cement demand is covered by local manufacturers (Cazurra and Montoya, 2018). After decades of protective policies, the 1982 economic crisis prompted the Mexican government to liberalize the economy to attract FDI. CEMEX faced competition from foreign rivals and started to consolidate its domestic position through the acquisition and integration of local manufacturers within Mexico. After becoming Mexico’s largest producer of cement, reaching more than 60% of the local market, the company started its international expansion, which occurred mostly through acquisitions, as presented in Table 5.3.
Another contributing factor might be local competitors’ strength in the European markets, where state-owned firms have historically had a relevant role in the telecommunications sector. As a consequence, América Móvil’s international growth has decelerated in the last five years. In conclusion, América Móvil’s international expansion can be explained by its opportunistic approach of
Page 67
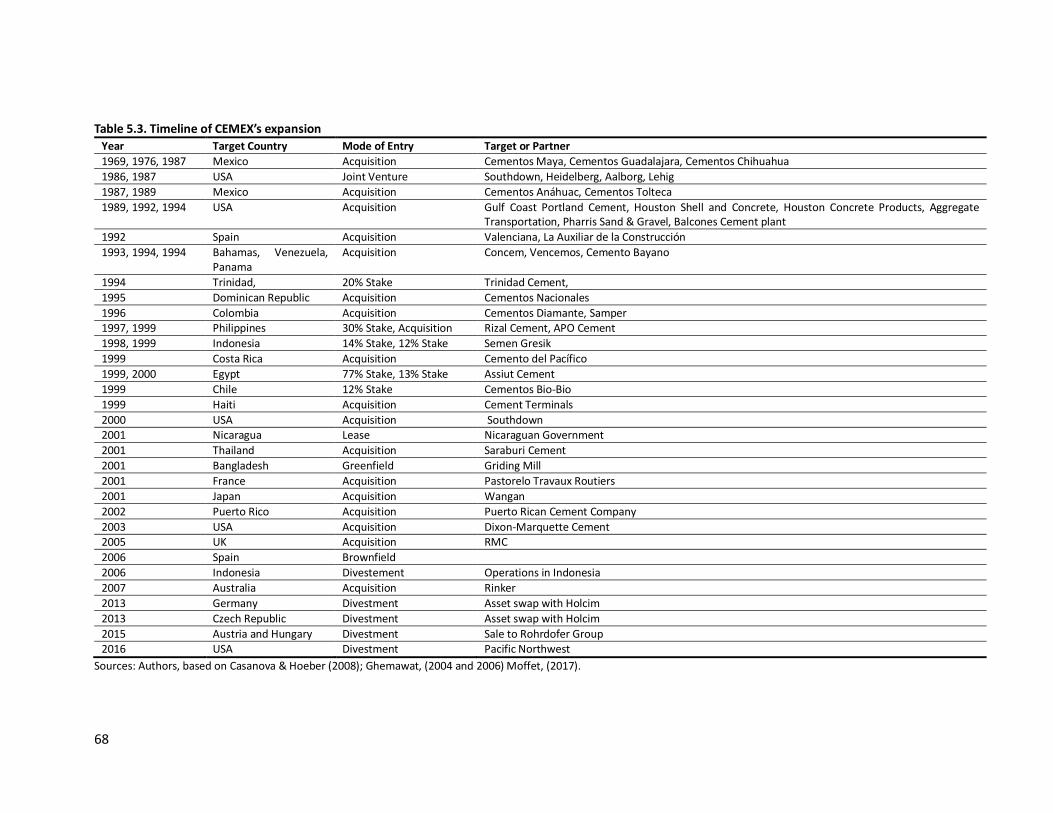
68
Table 5.3. Timeline of CEMEX’s expansion
Year Target Country Mode of Entry Target or Partner
1969, 1976, 1987 Mexico Acquisition Cementos Maya, Cementos Guadalajara, Cementos Chihuahua
1986, 1987 USA Joint Venture Southdown, Heidelberg, Aalborg, Lehig
1987, 1989 Mexico Acquisition Cementos Anáhuac, Cementos Tolteca
1989, 1992, 1994 USA Acquisition Gulf Coast Portland Cement, Houston Shell and Concrete, Houston Concrete Products, Aggregate Transportation, Pharris Sand & Gravel, Balcones Cement plant
1992 Spain Acquisition Valenciana, La Auxiliar de la Construcción
1993, 1994, 1994 Bahamas, Venezuela, Panama
Acquisition Concem, Vencemos, Cemento Bayano
1994 Trinidad, 20% Stake Trinidad Cement,
1995 Dominican Republic Acquisition Cementos Nacionales
1996 Colombia Acquisition Cementos Diamante, Samper 1997, 1999 Philippines 30% Stake, Acquisition Rizal Cement, APO Cement
1998, 1999 Indonesia 14% Stake, 12% Stake Semen Gresik
1999 Costa Rica Acquisition Cemento del Pacífico
1999, 2000 Egypt 77% Stake, 13% Stake Assiut Cement
1999 Chile 12% Stake Cementos Bio-Bio
1999 Haiti Acquisition Cement Terminals
2000 USA Acquisition Southdown 2001 Nicaragua Lease Nicaraguan Government
2001 Thailand Acquisition Saraburi Cement
2001 Bangladesh Greenfield Griding Mill
2001 France Acquisition Pastorelo Travaux Routiers
2001 Japan Acquisition Wangan
2002 Puerto Rico Acquisition Puerto Rican Cement Company
2003 USA Acquisition Dixon-Marquette Cement 2005 UK Acquisition RMC
2006 Spain Brownfield
2006 Indonesia Divestement Operations in Indonesia
2007 Australia Acquisition Rinker
2013 Germany Divestment Asset swap with Holcim
2013 Czech Republic Divestment Asset swap with Holcim
2015 Austria and Hungary Divestment Sale to Rohrdofer Group 2016 USA Divestment Pacific Northwest
Sources: Authors, based on Casanova & Hoeber (2008); Ghemawat, (2004 and 2006) Moffet, (2017).
Page 68
69
As a result, CEMEX became a global building materials company providing products and services in more than 50 countries. CEMEX cherry-picked structurally attractive markets to mitigate risk through risk-pooling while pursuing vertical integration of assets in the production of cement, aggregates, and ready-mix concrete.
Operationally, CEMEX is known for its extensive due diligence process in selecting M&A targets, a fast merger/post-merger integration process, and the use of information systems and product delivery tools to maintain a competitive cost structure and leverage organizational knowledge (Cazurra and Montoya, 2018). Consequently, its subsidiaries focus on making and selling cement while the parent company develops the corporate strategy.
Despite its expertise in the acquisition and integration of target companies, CEMEX was severely hit by two events: the acquisition of Rinker (which was financed with $14.2 billion of new debt on top of Rinker’s $1.3 billion existing debt) and the 2008 housing crisis in the U.S., which led to the Global Financial Crisis (GFC) in 2008-2009. The timing of the acquisition proved unfortunate as the construction sector halted investment and demand for cement decreased worldwide. Both the Rinker acquisition and the GFC damaged CEMEX’s credit profile, prompting it to divest assets in Germany, Austria, Hungary, the Czech Republic and in the U.S. to appease creditors (Moffet, 2017). CEMEX’s approach like FEMSA’s, also displays both inorganic growth and joint ventures.
Elektra
Grupo Elektra is the leading retailer and financial services company in Latin America, the second-largest bank in Mexico (by number of branches) and the largest non-bank provider of cash advance services in the U.S. The company operates 7,269 points of contact (stores and financial services units) in North, Central, and South Americas. It has used its Mexican business model of blending retail and financial services to expand internationally into countries and regions with similar economic characteristics in the Americas (Elektra, 2019).
Elektra’s specific advantages are: (i) its blend of retail and financial services, which deepens its reach to low-income customers without access to traditional banking systems, (ii) its credit evaluation capabilities, (iii) its marketing capabilities to customers in middle and low segments, (iv) its merchandise mix, which includes appliances, clothing, and electronics, and (v) its expertise in retail logistics. This model enables consumers at the bottom of the socio-economic pyramid to access the credit they need to purchase products. Elektra’s standardized practices in each of its markets suggest that the company strategically searches for efficiency and services tailored to the needs of middle and lower-middle segments. It has also followed the Uppsala model of international expansions to incrementally expand into other markets with low psychological distance.
Elektra’s international expansion began in 1996 after a foreign competitor (the Dutch-owned chain Le Curacao) decided to enter the Mexican market. Feeling threatened at home, the Elektra decided to strike back abroad inn 1997 and opened stores in Guatemala, Honduras, and other Central American countries. Elektra adopted organic growth through greenfield investment as its entry mode of choice in foreign countries, even though economies of scale can present significant barriers in retail.
Grupo Bimbo Grupo Bimbo is a Mexican multinational in the food processing sector. The company is ranked 1,306 in the Forbes
2000 and is the largest baking company in the world, with operations in 32 countries. Bimbo’s profits reached $310 million from revenues of $15 billion as of May 15th, 2019 (Fortune Global 2000, 2019).
Bimbo’s international expansion began in the 1980s with its entry into the U.S. market, mainly to market its products to Hispanic immigrants. Since that time, most of its internationalization has occurred through acquisitions. Bimbo’s strengths lie in its excellence in production, branding, distribution, innovation and packaging, key drivers of success in the consumer goods industry. As of today, Grupo Bimbo’s worldwide presence includes plants in the U.S. (83), Mexico (38), Latin America (33), Europe (24), Asia (14), and Africa (5) (BIMBO, n.d). Table 5.4 presents the international expansion of Grupo Bimbo, with its acquisition targets.
Page 69
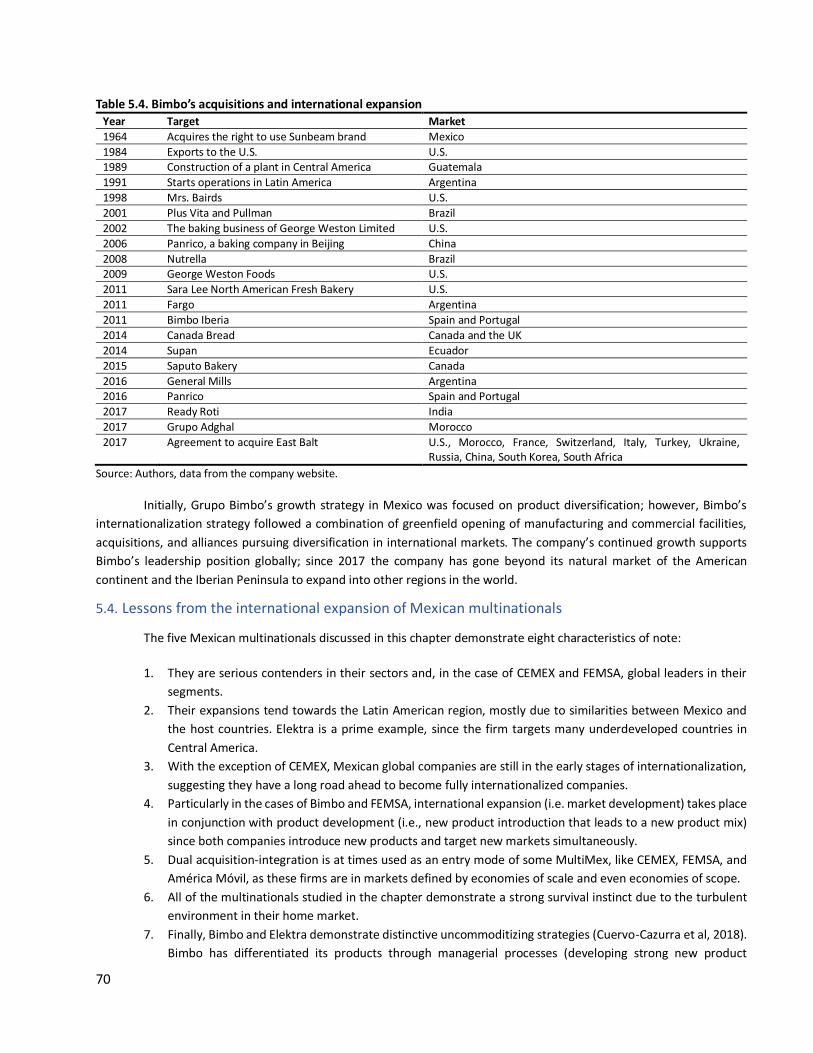
70
Table 5.4. Bimbo’s acquisitions and international expansion
Year Target Market
1964 Acquires the right to use Sunbeam brand Mexico
1984 Exports to the U.S. U.S. 1989 Construction of a plant in Central America Guatemala
1991 Starts operations in Latin America Argentina
1998 Mrs. Bairds U.S.
2001 Plus Vita and Pullman Brazil
2002 The baking business of George Weston Limited U.S.
2006 Panrico, a baking company in Beijing China
2008 Nutrella Brazil 2009 George Weston Foods U.S.
2011 Sara Lee North American Fresh Bakery U.S.
2011 Fargo Argentina
2011 Bimbo Iberia Spain and Portugal
2014 Canada Bread Canada and the UK
2014 Supan Ecuador
2015 Saputo Bakery Canada
2016 General Mills Argentina 2016 Panrico Spain and Portugal
2017 Ready Roti India
2017 Grupo Adghal Morocco
2017 Agreement to acquire East Balt U.S., Morocco, France, Switzerland, Italy, Turkey, Ukraine, Russia, China, South Korea, South Africa
Source: Authors, data from the company website.
Initially, Grupo Bimbo’s growth strategy in Mexico was focused on product diversification; however, Bimbo’s
internationalization strategy followed a combination of greenfield opening of manufacturing and commercial facilities,
acquisitions, and alliances pursuing diversification in international markets. The company’s continued growth supports
Bimbo’s leadership position globally; since 2017 the company has gone beyond its natural market of the American
continent and the Iberian Peninsula to expand into other regions in the world.
5.4. Lessons from the international expansion of Mexican multinationals
The five Mexican multinationals discussed in this chapter demonstrate eight characteristics of note:
1. They are serious contenders in their sectors and, in the case of CEMEX and FEMSA, global leaders in their
segments.
2. Their expansions tend towards the Latin American region, mostly due to similarities between Mexico and
the host countries. Elektra is a prime example, since the firm targets many underdeveloped countries in
Central America.
3. With the exception of CEMEX, Mexican global companies are still in the early stages of internationalization,
suggesting they have a long road ahead to become fully internationalized companies.
4. Particularly in the cases of Bimbo and FEMSA, international expansion (i.e. market development) takes place
in conjunction with product development (i.e., new product introduction that leads to a new product mix)
since both companies introduce new products and target new markets simultaneously.
5. Dual acquisition-integration is at times used as an entry mode of some MultiMex, like CEMEX, FEMSA, and
América Móvil, as these firms are in markets defined by economies of scale and even economies of scope.
6. All of the multinationals studied in the chapter demonstrate a strong survival instinct due to the turbulent
environment in their home market.
7. Finally, Bimbo and Elektra demonstrate distinctive uncommoditizing strategies (Cuervo-Cazurra et al, 2018).
Bimbo has differentiated its products through managerial processes (developing strong new product
Finally, Bimbo and Elektra demonstrate distinctive uncommoditizing strategies (Cuervo-Cazurra et al, 2018). Bimbo has differentiated its products through managerial processes (developing strong new product leveraging cross-border capabilities), while Elektra has avoided the commodity trap through the addition of services to its product mix.
Page 70
71
leveraging cross-border capabilities), while Elektra has avoided the commodity trap through the addition of
services to its product mix.
Although some of the international ventures of the five multinationals presented in this chapter were not successful, such as Elektra’s entry into the Dominican Republic and Brazil, America Móvil’s movement into Europe, and CEMEX’s acquisition of Rinker in Australia, the five MultiMex exemplify the internationalization of multinational companies from an emerging market. Even as Mexican multinationals face more daunting challenges relative to their advanced economy counterparts, these five MultiMex prove that global dominance is not limited to multinationals from rich countries.
REFERENCES
América Móvil (2019). <https://s22.q4cdn.com/604986553/files/doc_financials/quarterly/2019/Q2/updated/2Q19.pdf> BIMBO. <https://www.grupobimbo.com/en/grupo-bimbo-today> Bullman, E. (2018). Mexico’s outward foreign investment tripled in 2017.
<http://www.mexiconewsnetwork.com/en/news/mexicos-outward-foreign-investment-tripled-in-2017/> Burfisher, M. E., Lambert, F., & Matheson, M. T. D. (2019). NAFTA to USMCA: What is Gained? International Monetary
Fund. Casanova, L. Hoeber, H. (2008). CEMEX (A) Building a Global Latina. INSEAD Case 308-380-1 Casanova, L. (2009). Global latinas: Latin America's emerging multinationals. Springer. Casanova, L., Rhullán, S. (2008) América Móvil: The Making of a Mexican Global Latina INSEAD Case INS038 Criminal Violence in Mexico. <https://www.cfr.org/interactive/global-conflict-tracker/conflict/criminal-violence-
mexico> Cuervo-Cazurra, A., & Montoya, M. A. (Eds.). (2018). Mexican Multinationals: Building Multinationals in Emerging
Markets. Cambridge University Press. Cuervo-Cazurra, A., Carneiro, J., Finchelstein, D., Duran, P., Gonzalez-Perez, M. A., Montoya, M. A., ... & Newburry, W.
(2018). Uncommoditizing strategies by emerging market firms. Multinational Business Review. Desjardin, J. (2019) Mapped: Foreign Direct Investment by Country. < https://www.visualcapitalist.com/mapped-foreign-direct-investment-by-country/>
Doing Business (2019). World Bank. <https://www.doingbusiness.org/content/dam/doingBusiness/media/Annual-Reports/English/DB2019-report_web-version.pdf>
Dutta, S., Lanvin, B., & Wunsch-Vincent, S. (2019). The global innovation index 2019. WIPO. ELEKTRA (2019). <http://www.grupoelektra.com.mx/es/presentaciones> FEMSA (2018). Annual Report. < http://www.annualreport.femsa.com/2018/> Forbes Global 2000 (2018). The World’s Largest Public Companies. <
https://www.forbes.com/global2000/list/#country:Mexico> Foreign Direct Investment, Mexico. World Bank.
<https://data.worldbank.org/indicator/BM.KLT.DINV.CD.WD?end=2018&locations=MX&start=2008&view=chart>
Foreign Direct Investment Regulatory Restrictiveness Index. < https://goingdigital.oecd.org/en/indicator/74/> Foreign Direct Investment Statistics: Data, Analysis, and Forecasts. <http://www.oecd.org/investment/statistics.htm> Fortune Global 500 (2018) <https://fortune.com/global500/2019/search/?hqcountry=Mexico> Ghemawat, P., & Matthews, J. L. (2000). The globalization of CEMEX. Harvard Business School.. Global 2000 (2019). The World’s Largest Public Companies. <
https://www.forbes.com/global2000/list/#country:Mexico> Johanson, J., & Vahlne, J. E. (2009). The Uppsala internationalization process model revisited: From liability of
foreignness to liability of outsidership. Journal of international business studies, 40(9), 1411-1431.
Page 71
72
Kaltenecker, E. (2018) The MultiMex: The Multinational Companies from Mexico. <https://evodiokaltenecker.com/the-multimex-the-multinational-companies-from-mexico/>
Kopf, D (2019) Mexico is finally the US’s number-one trading partner. <https://qz.com/1682861/mexico-is-now-americas-number-one-trading-partner/>
Las 500 Empresas Más Importantes de México (2019). <https://expansion.mx/las-500-2019> MexicoOffice of the U.S. Trade Representative. <https://ustr.gov/countries-regions/americas/mexico> Mexico Foreign Direct Investment <https://data.worldbank.org/indicator/BX.KLT.DINV.CD.WD> Mexico GDP Annual Growth Rate. <https://tradingeconomics.com/mexico/gdp-growth-annual> Mexico GDP Per capita <https://data.worldbank.org/indicator/NY.GDP.PCAP.CD?locations=MX> Mexico <http://www.imf.org/en/Countries/MEX#featured> Mexico's New Energy Reform, <https://www.wilsoncenter.org/publication/mexicos-new-energy-reform> Mexico Releases Draft Miscellaneous <E> Mexico Total Exports. <https://data.worldbank.org/indicator/BX.GSR.TOTL.CD?locations=MX> Moffet, M.H. (2017) CEMEX and the Rinker Acquisition (B) Thunderbird case A02-17-0008 Petras, G. (2018) From NAFTA to USMCA: Key changes on the trilateral trade pact. <
https://www.usatoday.com/story/news/2018/10/01/comparison-nafta-and-usmca-trade-agreements/1487163002/>
Ramamurti, R. (2009). 13 What have we learned about emerging—market MNEs?. Emerging multinationals in emerging markets, 399..
Schoen, J.W. (2018), Here are the key changes between the old NAFTA and the new one. <https://www.cnbc.com/2018/10/01/new-trump-trade-deal-leaves-nafta-largely-intact.html>
Schott, J.J. (2019) Just Say No to the New Nafta <https://www.piie.com/commentary/op-eds/just-say-no-new-nafta> Silver, C. (2019, June 07). Top 20 Economies in the World. < https://www.investopedia.com/insights/worlds-top-
economies/> The FDI Report (2019). Global Greenfield Investments trends. FDi Markets. The World Factbook. (2018). <https://www.cia.gov/library/publications/the-world-factbook/fields/335rank.html#MX> Transparency International, (2019). Mexico. <https://www.transparency.org/country/MEX> World Investment Report (2018). <https://unctad.org/en/PublicationsLibrary/wir2018_en.pdf> World Economic Outlook (2019)) International Monetary Fund
<https://www.imf.org/external/pubs/ft/weo/2019/01/weodata/index.aspx> World’s GDP Per capita (Current US$), <https://data.worldbank.org/indicator/ny.gdp.pcap.cd>
Page 72
73
Chapter 6 Social innovation in Latin America By Veneta Andonova, Juana García Duque and Maria Emilia Correa, Universidad de
los Andes
6.1. Context
6.2. Social innovation
6.3. Countries and cases
A. Natura — Brazil
B. CEMEX — Mexico
C. Bancolombia — Colombia
D. Pacari — Ecuador
E. Intercorp — Peru
6.4. Conclusions
Executive Summary
Latin American countries, like many other emerging economies, face serious challenges. Climate change, as well as persistent inequality and violence force millions of people and businesses throughout the region to live in a constant state of uncertainty. Consequently, private firms from the region have taken the initiative to experiment with business models that create value beyond the economic dimension, producing a positive social and environmental impact. In this chapter, we provide an overview of the concept of social innovation, highlight its increasing relevance for businesses in Latin America and we provide an overview of five significant regional case studies.
6.1. Context
Latin America is rich in culture, biodiversity, natural and energy resources but it is also characterized by high rates of inequality and violence. As a result, citizens and the business community are becoming increasingly aware of the need to redefine business and business success to include the well-being of people, societies, and nature in the present and in the future.
Globally, more and more longstanding businesses and new entrepreneurial ventures have committed to the concept of a regenerative economy that seeks to recover and restore value for both degraded ecosystems and society. B Corporations are on the rise—the number of certified companies grew from 82 certifications in 2007 to 2,933 as of July 2019 worldwide (B Corporation, n.d.-a). Certified B Corporations are for-profit businesses that meet the highest standards of verified social and environmental performance and public transparency. To obtain the certification, Certified B Corporations must commit to having a positive impact on nature and society in their bylaws, therefore assuming a legally binding duty to accountability and to balance profit and purpose (B Corporation, n.d.-b).
Latin American companies began joining the B Corp movement in 2012. As of July 2019, there are 540 certified firms in the region, some 20% of all Certified B Corporations in the world. In addition, around 4,000 companies in the region use B Impact Assessment tools to manage their social and environmental impacts, indicating that Latin American companies are showing a growing interest in these values and causes.
Page 73
74
In 2018, by the Dow Jones Sustainability Index added the Mercado Integrado Latinoamericano (MILA) Pacific Alliance Index, with 41 companies.17 There are 14 companies from Latin America in the Dow Jones Sustainability World Index, including one new addition in 2018 (S&P Dow Jones Indices; RobecoSAM, 2018b). Moreover, 26 of the 94 companies in the Dow Jones Sustainability Emerging Markets Index are from Latin America (S&P Dow Jones Indices; RobecoSAM, 2018a). Of the 61 industries in the 2018 Industry Leaders classification, two are from Latin America (RobecoSAM, 2018). Finally, in the FTSE4Good Index for emerging economies, 98 of 541 companies are from the region (FTSE Russell, 2019).
In Latin America, social innovation initiatives have risen as a response to acute and diverse social problems rampant in the region. For example, between 2004 and 2010 the Social Development Division of the Economic Commission for Latin America and the Caribbean (ECLAC), with the support of W.K. Kellogg Foundation, developed a program to promote 4,800 social innovation initiatives related to community health, basic education, youth, food security and nutrition, income generation, rural development, social responsibility and volunteering (ECLAC, n.d.). All these domains represent huge areas for advancement in the region and require substantial efforts. Since then, many more actors are involved in social innovation initiatives, including the private sector. Businesses have become more aware of opportunities to overcome the aforementioned challenges, and as a result, multilatinas, multinational companies from Latin America, are among the global leaders in social innovation and sustainable practices.
6.2. Social Innovation
In a recent statement about the purpose of the corporation, the Business Roundtable, an organization that represents the chief executives of 192 large U.S. companies, declared that business leaders should commit to balancing the needs of shareholders with customers, employees, suppliers and local communities (The Washington Post, 2019). The need to reinvent 21st century capitalism resonates well with the notion of social innovation. Peter Drucker and Michael Young18 first articulated the concept of social innovation in the 1960s, and the approach has since gained relevance at par with the rising awareness of problems related to poverty and inequality, access to good quality healthcare and education, pollution, and biodiversity conservation.
Even though many analysts share a common understanding of social innovation, there is no single and widely accepted definition. In general, social innovation relates to actions that solve social problems. However, there is no consensus about what actions trigger social innovation, how social impact is created and measured, or which actors are called upon to create social innovation.
For example, some authors argue that civil society, with the support of other organizations and the government, are actors that support social innovation.19 Others claim that it is not only civil society, but any actor whose primary purpose is social.20 In the same way, the International Handbook of Social Innovation (2013) restricts social innovation to projects and international networks. However, we see these views as unnecessarily restrictive. We subscribe to the understanding that social innovation can be fostered by any actor—civil society, private sector, government, or any kind of organization.21
Relatedly, the object of social innovation is almost always understood in broad terms. In other words, the innovation could be in terms of products, services, instruments, models, and processes, among others, even though some authors focus more on activities, social relations, and services.22
There is complete agreement about the fact that social innovation has a positive impact on society, whether in terms of poverty, social inclusion, equality, human rights, environment or any other way that improves the wellbeing of a group of people. However, there is debate around the question of whether social benefit should be the root and the reason for a particular innovation, or whether it could also be a consequence while serving to other purposes.23
In this chapter, we adopt the more general approach to social innovation, understanding it as any new way of doing things that contributes to solving social and environmental problems. Therefore, we define social innovation as new
17 This index does not include Brazil. 18 Abreu Quintero, José Luis (2011) Innovación social: Conceptos y etapas. Daena: International journal of good conscience, 6 (2). pp. 134-138. ISSN 1870-557X 19 Cecchini & Bernal, 2018; Latin American Social Innovation Network, 2018; Rodríguez Herrera, Adolfo - Alvarado, 2008. 20 Mulgan, Tucker, Ali, & Sanders, 2007. 21 Dawson & Daniel, 2010; Kanter, 1999; Martinez, O’Sullivan, Smith, & Esposito, 2017; Mcelroy, 2002. 22 Franz, Hochgerner, & Howaldt, 2012; Moulaert, MacCallum, Mehmood, & Hamdouch, 2013; Mulgan et al., 2007. 23 Martínez et al., 2017.
In this chapter, we adopt the more general approach to social innovation, understanding it as any new way of doing things that contributes to solving social and environmental problems. Therefore, we define social innovation as new products, services, models, processes, or new ways of using already existing ideas by companies, organizations, civil society, government or any other actor, that tackles social or environmental issues and enhances community agency, whether as the main motivation and core value of the initiative or as a consequence in the pursuit of other goals.
Page 74
75
products, services, models, processes, or new ways of using already existing ideas by companies, organizations, civil society, government or any other actor, that tackles social or environmental issues and enhances community agency, whether as the main motivation and core value of the initiative or as a consequence in the pursuit of other goals.
Despite the fact that the vast majority of authors focus on initiatives from NGOs or civil society and, in some cases, from social entrepreneurs, we emphasize that the private sector, including big multinational corporations, can play a key role in the development of social innovation, especially in a region that has so many pressing social issues such as Latin America. Since large companies have the capacity and scope to solve social issues, while they continue to fulfil the other stakeholders’ expectations—by expanding to new markets or launching new products or services—the social and environmental impact holds promise to transform and improve the company’s relations with customers and communities. Companies can achieve this as part of their core business, by aligning business strategy to specific social and environmental goals. During the process, they can arguably become more resilient and perform better in the long term. To testify to this possibility, we present the experience of five multinational companies from Brazil, Chile, Colombia, Ecuador and México that are changing their business models in response to the social context of their countries, and, consequently, engage in social innovation in the communities in which they operate.
6.3. Countries and Cases
A. Natura Brazil Natura is the largest Brazilian multinational by revenue in the cosmetic industry. Founded in 1969, Natura now
comprises Natura Cosmetics, Aesop, acquired in 2012, and The Body Shop, acquired in 2017. Moreover, it was the first publicly listed company to become a B Corp, and the biggest certified B Corp in the world (Natura&Co, 2018a). By 2018, it employed more than 18,000 people, reported $3,460.7 million in revenues and $141.7 million in net income, with operations in 73 countries on five continents (Natura, 2018).
The mission of Natura Cosmetics is to contribute to a better world “through commitment to transparency, sustainability, and well-being” (Natura, n.d.). Its value proposition focuses on a sustainable practice related to the use of natural ingredients from the Amazon rainforest, local communities and their ecosystems. Natura has developed multiple programs to fulfill these objectives. It is certified by the Union for Ethical BioTrade for sustainable supply chains for all-natural ingredients, including the maintenance of ecosystems, fair trade and benefit sharing (Natura&Co, 2018a; Natura, 2018). One example is its sustainable packaging policy: Natura utilizes 100% post-consumption recycled raw material for packaging its product line Ekos (Natura&Co, 2018b). The firm sells non-cosmetic products (backpacks, mugs, notepads, among others) through its “Creer Para Ver” program, to fund initiatives that promote education. In 2018, sales through this program reached more than $10 million in Latin America, exceeding their goal for 2020. All their products have the Leaping Bunny seal, which guarantees that the brand does not test on animals in any stage of the production chain (Natura&Co, 2018a).
The core initiative of the Natura Amazônia Program has been to create sustainable supply chains in the Amazon, since 18% of its raw materials come from this region. On the one hand, it builds strong relations with ancestral Amazon communities in order to learn from their traditional use of biodiversity, and develop sustainable production, agriculture and agroforestry systems. On the other hand, the company guarantees fair trade practices and supports projects that contribute to the communities’ social progress. The company also invests 2.2% of net revenues in research and development, including investment in the Natural Innovation Center in Manaus, Amazon, dedicated to developing sustainable natural products and protect and regenerate Amazon biodiversity. As a result, as of 2018, the program has contributed to the preservation of 257,000 hectares of forestland, to the immediate benefit of 4,636 families, and represents an investment of $3.5 million in local communities (Natura, 2018).
In essence, Natura efforts were able to integrate innovative solutions and models that fulfill its value proposition and economic objectives, but at the same time tackle social and environmental problems. In this way, Natura’s business model embraces the concept of social innovation in a significant way.
B. CEMEX - Mexico CEMEX is a Mexican multinational dedicated to building materials and complementary products. It operates in
more than 50 countries in the Americas, Europe, the Caribbean, Asia, the Middle East and Africa. It was founded in 1906 and it is publicly listed on the New York Stock Exchange and the Mexican Stock Exchange. The company’s mission is “to create sustainable value by providing industry-leading products and solutions to satisfy the construction needs of customers around the world” (CEMEX, 2018). Since 2015, the firm has committed to aligning its strategy with the United Nations Sustainable Development Goals (SDGs), while still generating value for its shareholders. In 2018, it reported
CEMEX is a Mexican multinational dedicated to building materials and complementary products. It operates in more than 50 countries in the Americas, Europe, the Caribbean, Asia, the Middle East and Africa. It was founded in 1906 and it is publicly listed on the New York Stock Exchange and the Mexican Stock Exchange. The company’s mission is “to create sustainable value by providing industry-leading products and solutions to satisfy the construction needs of customers around the world” (CEMEX, 2018). Since 2015, the firm has committed to aligning its strategy with the United Nations Sustainable Development Goals (SDGs), while still generating value for its shareholders.
Page 75
76
$14,089 million in revenue, an EBITDA of $2,453.8 million and a net profit of $532.7 million.24 As of 2018, CEMEX had more than $28,122.8 million in assets and employed more than 42,000 people.25
In order to implement the SDGs, the company prioritized five objectives based on CEMEX’s core activities: decent work and economic growth, industry innovation and infrastructure, sustainable cities and communities, climate action, and environmental conservation. CEMEX changed its production process to save water and other resources, it became more energy efficient and increased the use of alternative fuels and raw materials, using clinker substitutes, among other alternatives (CEMEX, 2018). In 2018, 43% of its cement and ready-mix concrete had sustainable attributes. The company aims to have more than 50% sustainable products by 2030.
Since 2010, CEMEX has worked to implement sustainable standards and responsible practices through its whole value chain, including human rights, labor, antitrust and sustainability clauses in their contracts with suppliers. Each year the company evaluates and acknowledges the best-performing suppliers in the Supplier Sustainability Program.
The company has also emphasized reducing emissions, especially CO2, dust, NOx, and SOx. As of December 31, 2018, CEMEX reduced CO2 emissions by 8 million tons compared with its practices in 1990. The company is close to completing the installation of Continuous Emissions Monitoring Systems in 100% of its kilns. In addition, CEMEX is developing a circular economy system, through the conversion of non-recyclable waste to alternative fuels and raw materials for the cement process, using residues and by-products as substitutes for cement and natural aggregates. One of its 2030 goals is to introduce recycled concrete after the demolition of infrastructure as an alternative to other aggregates.
With the ambition to create a positive impact on the communities in which it operates, CEMEX has launched initiatives that both inside and outside its core capabilities. Examples of the former are Patrimonio Hoy, Construyo Contigo, Yo Construyo, and ConstruApoyo. Their purposes are to help areas affected by natural disasters in Mexico recover, finance construction materials to low income sectors, and train construction workers. Examples of the latter are investments in education and the development of capabilities for employability, community centers, women’s economic empowerment, and other Community Engagement Plans that are contingent on the meetings with local communities, which allows CEMEX to identify specific needs and expectations and support community progress accordingly. These are integrated into the company’s Corporate Social Responsibility strategy.
Moreover, CEMEX invests in innovative productive activities and new entrepreneurial ventures that focus on creating solutions to social and environmental issues. In 2010, the company created the CEMEX-Tec Center for Sustainable Development that researches and collaborates with other actors from academia, civil society, and the public and private sectors, to contribute to sustainable communities with a good quality of life. Additionally, the company has implemented initiatives to protect biodiversity and water resources through Biodiversity Action Plans and water management plans in areas of operation with scarce water resources.
As a large multinational in an industry with high environmental impact, CEMEX has been changing the understanding of its core business to adapt to environmental concerns; as a result, it has become a more sustainable company. Subsequently, CEMEX has been included in many indexes and rankings related to sustainability.26 To achieve this, the company has incorporated innovative sustainable practices in its core processes, even while it is the seventh largest company in the global industry by revenues, reporting an annual average revenue growth of over 7.5%.27
C. Bancolombia - Colombia As the largest Colombian financial institution, Bancolombia is part of the financial group Grupo Bancolombia,
which offers different banking services and products. The bank is an outstanding multilatina and has subsidiaries in six other countries in the region. It is listed on the New York and Colombian Stock Exchange (Bloomberg, n.d.). Bancolombia supports and promotes the Sistema B Movement in Latin America. In 2018, Bancolombia was ranked in the Dow Jones Sustainability Report as the most sustainable bank in the world (Dinero, 2018).
The Bancolombia Foundation, part of the financial group, is in charge of sustainability and inclusivity initiatives, both in territories affected by Colombian armed conflict, and in areas with vulnerable populations. Its goals include
24 With historical exchange rates. All data reported in US dollars. Source: Capital IQ, accessed August 31, 2019. 25 Source: Capital IQ, accessed August 31, 2019 and CEMEX’s 2018 Integrated Report. 26 Dow Jones Sustainability MILA Pacific Alliance Index, FTSE4Good Index Series, MSCI ESG Leaders Index, Mexican Stock Exchange Sustainability Index, the Carbon Disclosure Project, and Vigeo Eiris Best Emerging Markets Performers Ranking. 27 Source: Capital IQ, accessed August 31, 2019.
In 2018, it reported $14,089 million in revenue, an EBITDA of $2,453.8 million and a net profit of $532.7 million.24 As of 2018, CEMEX had more than $28,122.8 million in assets and employed more than 42,000 people.25
The Bancolombia Foundation, part of the financial group, is in charge of sustainability and inclusivity initiatives, both in territories affected by Colombian armed conflict, and in areas with vulnerable populations.
Page 76
77
creating programs for unbanked communities in remote parts of the country, and closing multiple development gaps between the rural and urban areas, for the agricultural sector, and for young people (Grupo Bancolombia, 2018).
For example, in order to improve the economic conditions of small farmers in rural areas, Bancolombia adopted an innovative risk management strategy to reach a population previously unattended by the financial sector. The impressive business transformation of small farmers in the program goes beyond traditional static and anecdotal social impact measurements.
In 2016, a large Colombian packaging company, Compañía de Empaques, that produces packages from fique natural fiber, realized the need to increase the supply of the company’s raw material to attend the growing demand. While fique plant growers were willing to increase their production, they faced economic and structural challenges that prevented them from doing so. These small farmers were in Antioquia, a region severely affected by armed conflict during the last 55 years. They lacked access to credit to purchase and modernize their machinery, a sustainable means to cover their living expenses until harvest, and collateral to cover the risk and attract investors or financial institutions. Understanding these problems, the packaging company went to Bancolombia to propose a credit risk diversification model that spanned the entire value chain and that could benefit the fique growers.
The packaging company proposed that Bancolombia grant loans to small farmers, and pledged to support the payment of these credits by buying all the fique produced by the farmers above the market price. Loans would also allow farmers to both alleviate the costs associated with the crop and their living expenses until harvest. The loan moratorium period was two years. After this period, the bank would begin to receive the loan payments with their respective interests, creating a win-win relationship—Bancolombia had created a new line of business within its core activities. The bank and its Foundation decided to join forces to consolidate this new business model, following a process of continuous learning that promotes agricultural development and entrepreneurship while benefitting both organizations.
This is a case of a large multinational company with more than 100 years of experience that understands its edifying role in a society that needs drivers of progress and optimism. The ultimate business model that embeds social innovation mitigates the causes of conflict, such as the exclusion of financial and commercial systems, unemployment, and poverty. Consequently, it positively impacts the socioeconomic conditions of small farmers, their families and former combatants by establishing social cohesion through commercial activity. Moreover, the business model is aligned with peacebuilding initiatives that resonate with one of the most critical negotiating points of the peace agreement in Colombia: the ultimate goal of the “Integral Rural Reform” that seeks to return land to the displaced and encourage agricultural productivity by restoring peace in Colombia (Alto Comisionado para la Paz, 2016).
Bancolombia’s inclusive model shows that business innovation is needed to generate wealth, while closing
inequality gaps and respecting nature’s boundaries. So far, transformations like this one have proved beneficial and
successful, promising an ongoing source of economic and social progress and replicability.
D. Pacari — Ecuador Pacari is a chocolate producer from Ecuador. Founded in 2002 by Carla Barboto and Santiago Peralta, Pacari had
one main objective: to produce one of the highest-quality cocoas historically exported to Europe and manufacture chocolate locally with top quality standards. Barboto and Peralta decided to challenge the status quo in the chocolate value chain. They committed to a state-of–the-art production process combined with the objective of helping small producers in rural areas and low-income families to overcome long-lasting socio-economic barriers. Since then, they have certified more than 3,500 small-scale farmers in good practices related to crop management, ensuring fine flavor cocoa from an organic, sustainable and environmentally-friendly production process. They treat these small-scale farmers as their allies; the farmers’ relationship to nature and its equilibrium are an indispensable element of the product’s value, which contributes to a win-win transaction. Pacari pays a fair price, allowing farmer families to increase their knowledge of land protection and make them part of a human and social process of producing the highest quality chocolate (Pacari n.d.). The result of this production process is a chocolate bar well-known for its premium quality and organic and biodynamic production process. The biodynamic process at Pacari is defined as an agricultural practice where a crop, farm or land is considered a single complex organism with all its components working together for its own success.
One of Pacari’s most significant innovations with great social impact was the redesign of the size of its traditional cocoa bags. Although cocoa production relies on a significant share of female workers, the heavy weight of the most common bags gave obvious advantages to men, who earned much higher income. Pacari decided to adopt smaller and lighter bags for women to carry more easily. The redesign of the bag allowed women to become active merchants and receive the corresponding share of payment without the intermediation of men. This innovation had a profound impact on the education and health of the farmer communities (CAF, 2019). In addition to this, Pacari managed to establish
Its goals include creating programs for unbanked communities in remote parts of the country, and closing multiple development gaps between the rural and urban areas, for the agricultural sector, and for young people (Grupo Bancolombia, 2018).
One of Pacari’s most significant innovations with great social impact was the redesign of the size of its traditional cocoa bags. Although cocoa production relies on a significant share of female workers, the heavy weight of the most common bags gave obvious advantages to men, who earned much higher income. Pacari decided to adopt smaller and lighter bags for women to carry more easily. The redesign of the bag allowed women to become active merchants and receive the corresponding share of payment without the intermediation of men. This innovation had a profound impact on the education and health of the farmer communities (CAF, 2019).
Page 77
78
sustainable tourism experiences integrated in the cocoa value chain in the region of Santa Rita, where guided tours serve as an extra source of income for villagers. These tours emphasize the importance of processes and products that enable sustainable production practices and increased market value (Pacari, n.d.).
To sum up, Pacari has redefined the chocolate production value chain embracing sustainable policies. As a result, small-scale farmers overcome socio-economic barriers when the chocolate produced from their cocoa is sold world-wide as earnings reach small farmers’ pockets. Pacari decided to build strong relationships with their suppliers by buying their product at fair prices, and by helping them to establish standards required to produce award-winning chocolate bars. Honoring the heritage of Ecuador’s small cocoa producers, Pacari won the title of “Gold product” in the International Chocolate Awards (CAF, 2019) for six years running.
E. Intercorp — Peru Intercorp is one of the largest business groups in Peru, a top player in financial services, retailing, tourism, real
state, healthcare, and education. By the end of 2016, the 30 companies in the holding had $4.8 billion in revenues; EBITDA of $894 million; 60,000 employees; and more than 10 million customers (Porter & Ramirez & Merino, 2017). Intercorp defines itself as a business group committed to the development and welfare of Peruvian families that focuses on the growing Peruvian middle class by trying to combine profitability with the social mission of elevating and improving the lives of Peruvians (Porter & Ramirez & Merino, 2017).
Intercorp’s largest business unit is that of its financial services, which includes corporate, and retail banking, insurance, retirement plans and brokerage services. The focus is on increasing banking inclusion for the middle class. To effectively accomplish this, Intercorp uses local mom-and-pop stores as the promoters of money withdrawal and payment services (Porter & Ramirez & Merino, 2017).
Intercorp owns Supermercados Peruanos, the largest supermarket chain in the country. Without losing market share and leadership, the company cooperated with the government to train farmers and small manufacturers in best practices so that they could raise quality and food safety standards as well as efficiency levels. In addition to this, the company joined the Peru Food Bank on its mission to collect and distribute food that was close to reaching its expiration date but still had optimal nutritional conditions, so that it could be served to lower income families through NGOs.
Casa Andina, a national hotel chain, is also part of Intercorp. It followed the same strategy as Supermercados Peruanos, training suppliers in worldwide quality assurance programs, such as Business Process Management (BPM) and Hazard Analysis and Critical Control Points (HACCP), so that their own businesses could grow (Porter & Ramirez & Merino, 2017).
Real Plaza, the largest shopping mall in the country, is Intercorp’s real estate presence. Its growth strategy included opening smaller shopping malls in secondary cities, which in turn increased the commercial value of businesses located nearby, created new jobs, and enhanced the city’s reputation.
With Inkafarma, Intercorp reaches remote locations to offer low price medicine. By opening branches in such locations, new job opportunities are created, and pharmacists can act as medicine advisors to counsel low income families.
Intercorp’s education strategy focuses on strengthening primary and secondary schools as well as technical schools and universities for middle- and lower-income families. By combining technology with innovative teaching methods, Innova Schools’ value proposition is based on four pillars: high-quality education, scalability, affordability, and profitability. It has managed to improve average test scores for its students, reach revenues of $38 million, employ more than 1,300 teachers and serve 31,000 students (Porter & Ramirez & Merino, 2017).
In sum, Intercorp is an example of how a diversified business group can use social innovation to improve the conditions of middle- and low-income families. When social innovation forms part of the purpose of a corporation or a business group, and is well defined and driven by strong leadership, both strategic initiatives and daily activities of the company can lead to great social and economic results.
6.4. Conclusions
The business sector in Latin America has become increasingly aware of the importance of generating a positive impact on society and the environment as part of its core activities. The risk conditions as well as economic and social challenges have led companies to engage in social innovation not only as part of their Corporate Social Responsibilities, but as an indispensable element in their overall business strategies.
The business sector is innovating in business models, practices and products to offer solutions to the region’s social and environmental problems. The cases described in this chapter show that for-profit companies can operate successfully in the market, not only reducing their negative impacts, but actively working to have positive social impact.
In addition to this, Pacari managed to establish sustainable tourism experiences integrated in the cocoa value chain in the region of Santa Rita, where guided tours serve as an extra source of income for villagers. These tours emphasize the importance of processes and products that enable sustainable production practices and increased market value (Pacari, n.d.).
Page 78
79
Working in collaboration with civil society and governments, business actors can be active agents of positive change in society and nature.
REFERENCES
Abreu Quintero, José Luis (2011) Innovación social: Conceptos y etapas. Daena: International journal of good conscience, 6 (2). pp. 134-138. ISSN 1870-557X
B Corporation. (n.d.-a). A Global Community of Leaders. Retrieved July 20, 2019, from https://bcorporation.net/ B Corporation. (n.d.-b). About B Corps. Retrieved July 20, 2019, from https://bcorporation.net/about-b-corps Correa, M. E., (2019). Sistema B y las empresas B en América Latina: Un movimiento social que cambia el sentido del
éxito empresarial. CAF. E, Flynn, Sharon, Amit, Alon. Responsabilidad social corporativa en América Latina: una visión empresarial. CEPAL abril
2004. https://repositorio.cepal.org/bitstream/handle/11362/5621/S044214_es.pdf?sequence=1&isAllowed=y Cecchini, S., & Bernal, M. E. (2018). Social Innovation in Latin America and the Caribbean. In J. Howaldt, C. Kaletka, A.
Schröder, & M. Zirngiebl (Eds.), Atlas of Social Innovation: New Practices for a Better Future (pp. 127–129). Dortmund: Sozialforschungsstelle, TU Dortmund University.
CEMEX. (2018). 2018 Integrated Report. Retrieved from https://www.cemex.com/documents/45903740/47790802/IntegratedReport2018.pdf/a147346a-339e-a49b-7d3f-fb53be8e46c9
Dawson, P., & Daniel, L. (2010). Understanding social innovation: a provisional framework. International Journal of Technology Management, 51(1), 9–21. https://doi.org/10.1504/IJTM.2010.033125
ECLAC. (n.d.). Experiences in Social Innovation in Latin America and the Caribbean ECLAC-Kellogg. Retrieved July 15, 2019, from https://www.cepal.org/en/topics/innovacion-social/experiences-social-innovation-latin-america-and-caribbean-eclac-kellogg
Franz, H. W., Hochgerner, J., & Howaldt, J. (2012). Challenge social innovation: Potentials for business, social entrepreneurship, welfare and civil society. In Challenge Social Innovation: Potentials for Business, Social Entrepreneurship, Welfare and Civil Society. https://doi.org/10.1007/978-3-642-32879-4
FTSE Russell. (2019). FTSE4Good Emerging Indexes. Retrieved from https://research.ftserussell.com/Analytics/FactSheets/temp/66b38e05-d4a6-4519-bded-e6c5ca4ad44d.pdf
Kanter, R. M. (1999). From spare change to real change. The social sector as beta site for business innovation. Harvard Business Review.
Latin American Social Innovation Network. (2018). LASIN Results and reflections (M. Majewsky, S. Puerta, & C. Cipolla, Eds.).
Martinez, F., O’Sullivan, P., Smith, M., & Esposito, M. (2017). Perspectives on the role of business in social innovation. Journal of Management Development, 36(5), 681–695. https://doi.org/10.1108/JMD-10-2016-0212
Mcelroy, M. W. (2002). Social innovation capital. Journal of Intellectual Capital, 3(1), 30–39. https://doi.org/10.1108/14691930210412827
Moulaert, F., MacCallum, D., Mehmood, A., & Hamdouch, A. (2013). The International Handbook on Social Innovation. In the International Handbook on Social Innovation. https://doi.org/10.4337/9781849809993
Mulgan, G., Tucker, S., Ali, R., & Sanders, B. (2007). Social Innovation. What it is, why it matters and how can it be accelerated. https://doi.org/10.1515/zna-1967-1247
Natura&Co. (2018a). 2018 Report. Retrieved from https://naturaeco.com/report_2018_en.pdf Natura&Co. (2018b, December). Facts & Figures. Retrieved August 19, 2019, from https://naturaeco.com/facts.html Natura (n.d.) E Natura (2018). 2018 Annual Report. Retrieved from https://natu.infoinvest.com.br/enu/7116/Natura Annual Report
2018.pdf Pacari (n.d.). Promoviendo una cultura ancestral. Retrieved on September 5, 2019, from
https://www.pacari.com/comunidad-cacao-sostenible/ Porter, M. E. & Ramirez Vallejo, J. & Merino Dominguez, M. Intercorp. Harvard Business School. November 15, 2017
Page 79
80
RobecoSAM. (2018, September 13). Industry Leaders 2018. Retrieved July 25, 2019, from https://www.robecosam.com/csa/csa-resources/industry-leaders.html
Rodríguez Herrera, Adolfo - Alvarado, H. (2008). Claves de la innovacion en america latina y el caribe. S&P Dow Jones Indices; RobecoSAM. (2018a, September 24). Dow Jones Sustainability Emerging Markets Index.
Retrieved from https://www.robecosam.com/media/4/5/6/456641f9fb5255ac5147c30712076680_djsi-2018-componentlist-emergingmarkets_tcm1016-15773.pdf
S&P Dow Jones Indices; RobecoSAM. (2018b, September 28). Dow Jones Sustainability World Index. Retrieved from https://www.robecosam.com/media/c/7/e/c7e87c9963866ed03a3057155d6a69c0_djsi-2018-componentlist-world_tcm1016-15777.pdf
Sistema B. (n.d.). Sumate al movimiento B. Retrieved July 21, 2019, from https://sistemab.org/ The Washington Post, August 19, 2020, Group of top CEOs says maximizing shareholder profits no longer can be the
primary goal of corporations, By Jena McGregor, Available at https://www.washingtonpost.com/business/2019/08/19/lobbying-group-powerful-ceos-is-rethinking-how-it-defines-corporations-purpose/?noredirect=on
Page 80
81
Chapter 7 Korean multinationals, a value-
added industries case approach By Lorena Palacios-Chacon and Jahir Lombana-Coy, Universidad del Norte
7.1. Introduction
7.2. Korean Outward Investment
7.3. Korean Multinationals in International Rankings
7.4. Cases: Five Korean Multinationals
A. SAMSUNG
B. SK HOLDINGS
C. HYUNDAI MOTOR GROUP
D. POSCO METALS
E. KEPCO
F. SUMMARY
7.5. Final Remarks
Executive Summary
In this chapter we study some features of South Korea’s internationalization process. Focusing on the cases of five Korean multinationals—Samsung, SK Holding, Hyundai, POSCO and KEPCO—from five different industries, we explain the influence of the government in their expansion and their strategies to conquer increasingly distant markets. All five companies featured in the chapter use internationalization as the most effective way to expand their businesses given the small size of their domestic market. Since the 1960s, the government of South Korea had a development strategy based on high value-added industries that includes steel, energy, communications and consumer goods that provided those firms with financial support and other benefits. All companies included in the cases come from the country’s chaebol family-run conglomerates, which guarantees continuity in goals, processes and reforms. Altogether, those elements comprise the South Korea multinationals’ formula of success.
7.1. Introduction
By definition, an emerging economy is a country with rapid economic growth because of changes in markets, technology, business culture and social practices, but does not satisfy standards to be termed a developed market (Wharton, 2011); those standards include good infrastructure, a stable economy, open financial markets and high per capita income. The case of South Korea is particular in the way that some sources list it as an emerging economy, while others insist that it is a developed one. The reasons for that disagreement include, on the one hand, that South Korea exhibits signals of being a highly developed economy: the fact that South Korea is the 14th largest economy by nominal GDP, the 5th largest exporter and the 9th largest importer. South Korea has the world’s second-best healthcare system, and it has been named the world’s most innovative country by the Bloomberg Innovation Index (CIA World Factbook, 2019). On the other hand, South Korea also exhibits some characteristics that place it in the category of an emerging
By definition, an emerging economy is a country with rapid economic growth because of changes in markets, technology, business culture and social practices, but does not satisfy standards to be termed a developed market (Wharton, 2011); those standards include good infrastructure, a stable economy, open financial markets and high per capita income. The case of South Korea is particular in the way that some sources list it as an emerging economy, while others insist that it is a developed one. The reasons for that disagreement include, on the one hand, that South Korea exhibits signals of being a highly developed economy: the fact that South Korea is the 14th largest economy by nominal GDP, the 5th largest exporter and the 9th largest importer. South Korea has the world’s second-best healthcare system, and it has been named the world’s most innovative country by the Bloomberg Innovation Index (CIA World Factbook, 2019).
Page 81
82
country: the lack of convertibility of the national currency, which forces international investors and local counterparties to use the Korean won in all transactions and only during business hours, further limiting businesses and compromising market liquidity; furthermore, South Korea prohibits in-kind transfers of securities
After the end of the Korean War in 1953, the economy of South Korea began to soar. The country witnessed a period of rapid export-led economic growth that began in the 1960s, accompanied by massive investment in education, which provided the country with a highly skilled workforce (CIA World Factbook, 2019). Those characteristics combined with strong government involvement in all sectors and strong regulatory oversight defined South Korea as a mixed economy. Moreover, South Korea’s chaebols, or powerfully family-run conglomerates, operate the most important companies in different industries.
By 2018, the World Competitiveness Report of the World Economic Forum (WEF) named South Korea the 15th economy in the general ranking and the 5th in Asia, just behind of Singapore, Japan, Hong Kong SAR and Taiwan, province of China. The report highlights South Korea as “the world’s champion in terms of broad-based ICT adoption” (p. viii). Korea’s two weakest pillars within the 12 in the ranking are “Product Market” (67th) due to the low or inexistence local competition, and “Labor Market” (48th) due to the rigidity of the domestic market and sub-optimal utilization of human capital.
Given the small size of its domestic market, South Korea has depended strongly on international markets, which is reflected in its high share of trade and FDI worldwide flows. Ranked by the Global Investment Report of 2019, South Korea was the 19th host economy for FDI inflows in 2018, gaining one place in the ranking from 2017. Despite South Korea’s improvement, most countries (within the top 20) experienced a contraction in their FDI values from 2017 to 2018; South Korea reached $14 billion in FDI. In terms of outflows, South Korea was 9th in 2018, showing an improvement of four places in the ranking compared to the previous year. Moreover, it is the 4th most important home country in Asia after Japan, China and Hong Kong (China). South Korea’s FDI outflows were around $39 billion, almost three times bigger than the inflows. FDI from Asia represented 40% of global outflows with South Korea representing almost 10% of the Asian total investment.
7.2. Korean Outward Investment
While the U.S. and Japan have the most companies ranked in Euromonitor International’s 2019 top 100 manufacturing companies in the world, emerging markets such as China and South Korea are catching up. Rapid economic growth and the gradual expansion of B2B demand are two of the main drivers behind this improvement from emerging economies. Emerging economies are able to hold onto their gains due to the strong domestic B2B demand, highly efficient production processes, and strong R&D capabilities.
South Korea’s amazing increases in outward FDI (OFDI) flows are evidenced by data from OECD and UNCTAD from 2008 onwards (see Table 7.1). Total FDI flows over time increased by 144.6%, from $20.867 million in 2008 to $51.044 million in 2017. The four principal FDI destinations, namely the U.S., ASEAN, EU28 and China, accounted for 73.7% of the total investment in 2017. OFDI in those markets experienced 189.1% growth. The largest rise during those years was in the EU28 (287.4%), followed by the U.S. (242.3%) and ASEAN (175.6%). Oceania represents the only exception to this trend: the region presented outward foreign direct divestment of $1.279 million. South Korean investments in the U.S. go towards production plants for the elaboration of high value-added/technological products, while investment in China is more related to procuring lower labor production costs (OECES, 2019).
On the other hand, South Korea also exhibits some characteristics that place it in the category of an emerging country: the lack of convertibility of the national currency, which forces international investors and local counterparties to use the Korean won in all transactions and only during business hours, further limiting businesses and compromising market liquidity; furthermore, South Korea prohibits in-kind transfers of securities
Page 82

83
Table 7.1. Korean OFDI flows by country (USD millions) 2008 2009 2010 2011 2012 2013 2014 2015 2016 2017
U.S. 4,756 3,016 3,137 6,213 4,979 4,129 5,345 4,264 9,100 16,280 Canada 149 2,420 838 1,214 -71 -872 137 -1,355 294 437
Mexico 305 53 63 113 430 618 -326 220 -66 638
Brazil 635 131 1,050 390 917 1,145 1,021 -1,315 1,308 1,566
Other Latin-American Countries 301 320 166 324 263 498 421 269 210 351
China 3,418 1,715 2,809 4,977 5,406 10,936 4,337 3,726 6,271 6,008
Japan 388 363 292 130 -130 850 506 1,469 181 1,181
India 181 225 170 505 657 -121 485 664 612 1,043 Russia 257 420 324 89 650 311 -858 18 687 686
ASEAN 3,048 1,866 3,957 4,614 4,041 3,421 3,818 3,859 5,854 8,401
Other Asian Countries 2,011 1,163 874 1,639 1,799 704 1,511 1,577 -406 1,536
Germany 632 139 755 359 364 349 71 154 280 544
France 29 264 337 44 185 63 0 924 -21 136
U.K. 3 1,703 3,279 1,384 232 531 -397 -1,402 688 2,005
Other EU 28 1,109 2,045 1,067 2,158 3,636 3,405 939 2,444 861 4,183 Other European Countries 512 97 15 334 -30 1,228 -709 323 1,540 2,011
Africa 314 359 287 314 298 256 85 -539 -454 324
Oceania 157 242 176 18 -66 2,716 1,633 934 971 -1,279
World 20,867 18,139 21,464 26,989 27,354 31,488 19,994 18,490 30,508 51,044 Source: Authors’ own elaboration with data from UNCTAD and OECD.
Complementarily, Figure 7.1 depicts the values for the four main Korean investment recipient countries. In the International Investment Report of UNCTAD (2019), the international activities of Samsung Electronics and LG are mentioned as responsible for the extraordinary peaks observed since 2008. Furthermore, Free Trade Agreements (FTAs) between South Korea and its four main recipients have exerted additional influence on OFDI.
The top six industry sectors by number of announced South Korean FDI projects in the U.S. are auto components, industrial equipment, consumer electronics, software and IT services, automotive OEM and electronic components (selectusa.gov, 2019), which consolidates South Korean participation in Global Value Chains (GVCs) of high value-added products.
Figure 7.1. Korean OFDI by main destination countries
Source: Authors’ own elaboration with data from UNCTAD and OECD.
In terms of main activities, the most important sectors in South Korea’s outward investment are services and manufacturing. Services accounted for 65.3% of the country’s total OFDI flows in 2017 and manufacturing represented 36.1% that the same year. Motor vehicles products play an important role in both services and manufacturing OFDI for
0
2.000
4.000
6.000
8.000
10.000
12.000
14.000
16.000
18.000
2008 2009 2010 2011 2012 2013 2014 2015 2016 2017
United States ASEAN EU28 China
In terms of main activities, the most important sectors in South Korea’s outward investment are services and manufacturing. Services accounted for 65.3% of the country’s total OFDI flows in 2017 and manufacturing represented 36.1% that the same year.
Page 83
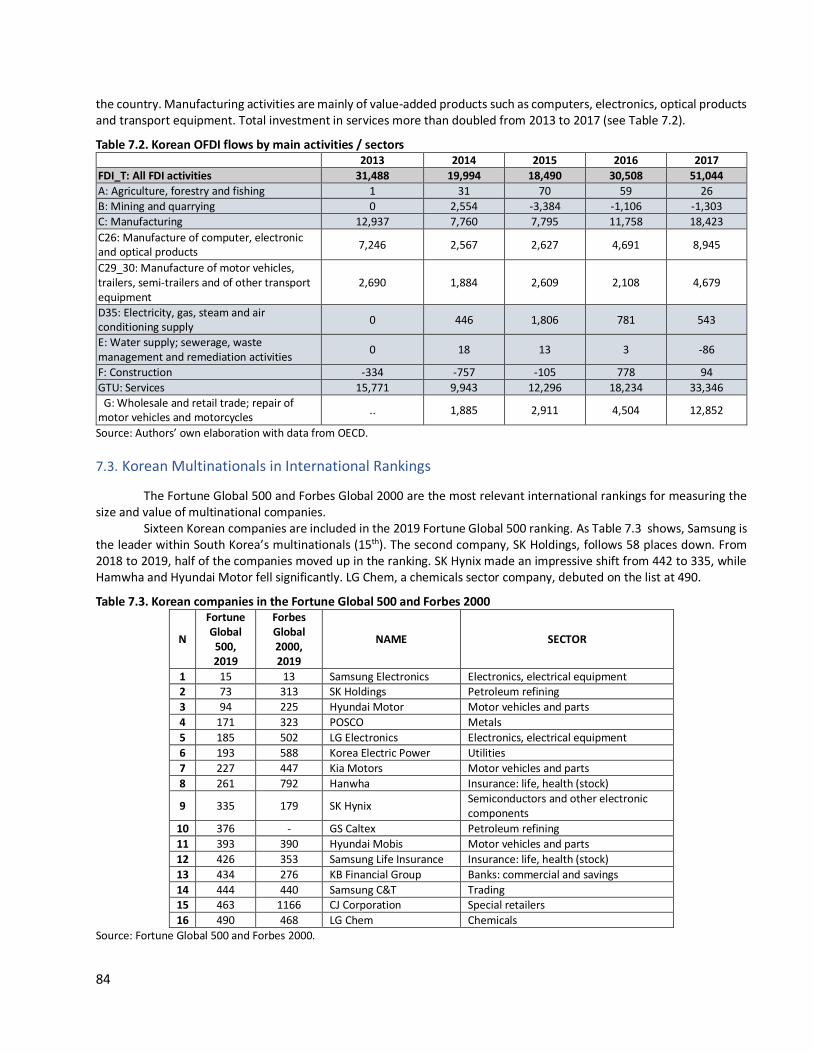
84
the country. Manufacturing activities are mainly of value-added products such as computers, electronics, optical products and transport equipment. Total investment in services more than doubled from 2013 to 2017 (see Table 7.2).
Table 7.2. Korean OFDI flows by main activities / sectors 2013 2014 2015 2016 2017
FDI_T: All FDI activities 31,488 19,994 18,490 30,508 51,044
A: Agriculture, forestry and fishing 1 31 70 59 26
B: Mining and quarrying 0 2,554 -3,384 -1,106 -1,303
C: Manufacturing 12,937 7,760 7,795 11,758 18,423
C26: Manufacture of computer, electronic and optical products
7,246 2,567 2,627 4,691 8,945
C29_30: Manufacture of motor vehicles, trailers, semi-trailers and of other transport equipment
2,690 1,884 2,609 2,108 4,679
D35: Electricity, gas, steam and air conditioning supply
0 446 1,806 781 543
E: Water supply; sewerage, waste management and remediation activities
0 18 13 3 -86
F: Construction -334 -757 -105 778 94
GTU: Services 15,771 9,943 12,296 18,234 33,346
G: Wholesale and retail trade; repair of motor vehicles and motorcycles
.. 1,885 2,911 4,504 12,852
Source: Authors’ own elaboration with data from OECD.
7.3. Korean Multinationals in International Rankings
The Fortune Global 500 and Forbes Global 2000 are the most relevant international rankings for measuring the size and value of multinational companies.
Sixteen Korean companies are included in the 2019 Fortune Global 500 ranking. As Table 7.3 shows, Samsung is the leader within South Korea’s multinationals (15th). The second company, SK Holdings, follows 58 places down. From 2018 to 2019, half of the companies moved up in the ranking. SK Hynix made an impressive shift from 442 to 335, while Hamwha and Hyundai Motor fell significantly. LG Chem, a chemicals sector company, debuted on the list at 490.
Table 7.3. Korean companies in the Fortune Global 500 and Forbes 2000
N
Fortune Global 500, 2019
Forbes Global 2000, 2019
NAME SECTOR
1 15 13 Samsung Electronics Electronics, electrical equipment 2 73 313 SK Holdings Petroleum refining
3 94 225 Hyundai Motor Motor vehicles and parts
4 171 323 POSCO Metals
5 185 502 LG Electronics Electronics, electrical equipment
6 193 588 Korea Electric Power Utilities
7 227 447 Kia Motors Motor vehicles and parts
8 261 792 Hanwha Insurance: life, health (stock)
9 335 179 SK Hynix Semiconductors and other electronic components
10 376 - GS Caltex Petroleum refining
11 393 390 Hyundai Mobis Motor vehicles and parts
12 426 353 Samsung Life Insurance Insurance: life, health (stock)
13 434 276 KB Financial Group Banks: commercial and savings
14 444 440 Samsung C&T Trading 15 463 1166 CJ Corporation Special retailers
16 490 468 LG Chem Chemicals
Source: Fortune Global 500 and Forbes 2000.
Motor vehicles products play an important role in both services and manufacturing OFDI for the country. Manufacturing activities are mainly of value-added products such as computers, electronics, optical products and transport equipment. Total investment in services more than doubled from 2013 to 2017 (see Table 7.2).
Page 84
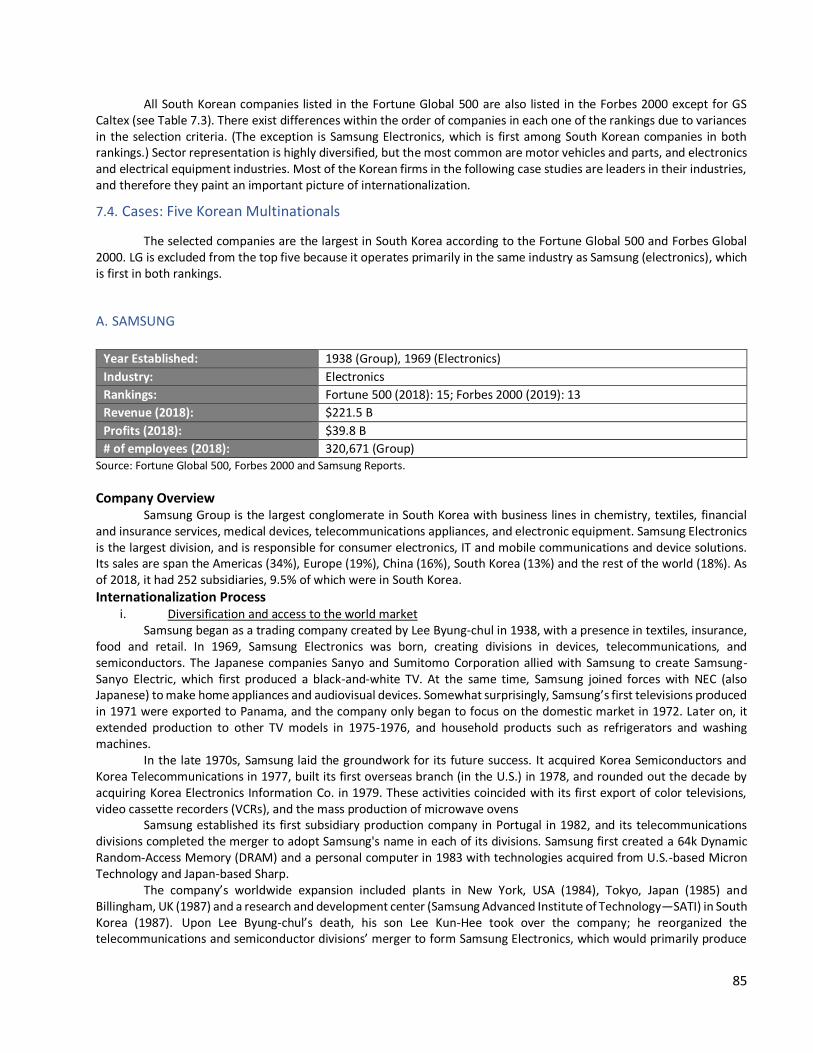
85
All South Korean companies listed in the Fortune Global 500 are also listed in the Forbes 2000 except for GS Caltex (see Table 7.3). There exist differences within the order of companies in each one of the rankings due to variances in the selection criteria. (The exception is Samsung Electronics, which is first among South Korean companies in both rankings.) Sector representation is highly diversified, but the most common are motor vehicles and parts, and electronics and electrical equipment industries. Most of the Korean firms in the following case studies are leaders in their industries, and therefore they paint an important picture of internationalization.
7.4. Cases: Five Korean Multinationals
The selected companies are the largest in South Korea according to the Fortune Global 500 and Forbes Global 2000. LG is excluded from the top five because it operates primarily in the same industry as Samsung (electronics), which is first in both rankings.
A. SAMSUNG
Year Established: 1938 (Group), 1969 (Electronics)
Industry: Electronics
Rankings: Fortune 500 (2018): 15; Forbes 2000 (2019): 13
Revenue (2018): $221.5 B
Profits (2018): $39.8 B
# of employees (2018): 320,671 (Group) Source: Fortune Global 500, Forbes 2000 and Samsung Reports.
Company Overview Samsung Group is the largest conglomerate in South Korea with business lines in chemistry, textiles, financial
and insurance services, medical devices, telecommunications appliances, and electronic equipment. Samsung Electronics is the largest division, and is responsible for consumer electronics, IT and mobile communications and device solutions. Its sales are span the Americas (34%), Europe (19%), China (16%), South Korea (13%) and the rest of the world (18%). As of 2018, it had 252 subsidiaries, 9.5% of which were in South Korea.
Internationalization Process i. Diversification and access to the world market
Samsung began as a trading company created by Lee Byung-chul in 1938, with a presence in textiles, insurance, food and retail. In 1969, Samsung Electronics was born, creating divisions in devices, telecommunications, and semiconductors. The Japanese companies Sanyo and Sumitomo Corporation allied with Samsung to create Samsung-Sanyo Electric, which first produced a black-and-white TV. At the same time, Samsung joined forces with NEC (also Japanese) to make home appliances and audiovisual devices. Somewhat surprisingly, Samsung’s first televisions produced in 1971 were exported to Panama, and the company only began to focus on the domestic market in 1972. Later on, it extended production to other TV models in 1975-1976, and household products such as refrigerators and washing machines.
In the late 1970s, Samsung laid the groundwork for its future success. It acquired Korea Semiconductors and Korea Telecommunications in 1977, built its first overseas branch (in the U.S.) in 1978, and rounded out the decade by acquiring Korea Electronics Information Co. in 1979. These activities coincided with its first export of color televisions, video cassette recorders (VCRs), and the mass production of microwave ovens
Samsung established its first subsidiary production company in Portugal in 1982, and its telecommunications divisions completed the merger to adopt Samsung's name in each of its divisions. Samsung first created a 64k Dynamic Random-Access Memory (DRAM) and a personal computer in 1983 with technologies acquired from U.S.-based Micron Technology and Japan-based Sharp.
The company’s worldwide expansion included plants in New York, USA (1984), Tokyo, Japan (1985) and Billingham, UK (1987) and a research and development center (Samsung Advanced Institute of Technology—SATI) in South Korea (1987). Upon Lee Byung-chul’s death, his son Lee Kun-Hee took over the company; he reorganized the telecommunications and semiconductor divisions’ merger to form Samsung Electronics, which would primarily produce
The company’s worldwide expansion included plants in New York, USA (1984), Tokyo, Japan (1985) and Billingham, UK (1987) and a research and development center (Samsung Advanced Institute of Technology—SATI) in South Korea (1987). Upon Lee Byung-chul’s death, his son Lee Kun-Hee took over the company; he reorganized the telecommunications and semiconductor divisions’ merger to form Samsung Electronics, which would primarily produce semiconductors, telecommunications and home appliances. Samsung’s retail, chemicals, food, and paper businesses were separated into independent groups.
Page 85
86
semiconductors, telecommunications and home appliances. Samsung’s retail, chemicals, food, and paper businesses were separated into independent groups.
ii. Industrial reorganization, concentration in core businesses and vertical integration Samsung retained interests in construction, winning important projects in Malaysia, Taiwan and the United Arab
Emirates (UAE) in 1990. It continued to develop new electronics and launched its first cellphone, the first 64 megabyte DRAM, and mass production of industry robots in 1991. In 1992, it opened a production center in China. In 1993, Lee Kun-Hee concentrated the Samsung Group's business in engineering, chemistry and electronics and transferred and divested some of its non-core subsidiaries in accordance with his strategy of “New Management, New Identity”.
In data processing technologies, Samsung went from developing DRAM of 256 megabytes to 1 gigabyte in just three years, becoming a main participant in the microprocessor business and not surpassed by Intel for several years. Samsung was also the first company to develop the liquid crystal display (1995). All of these innovations were part of a strategy of vertical integration of components. Rather than moving Samsung away from consumer markets, this integration gave it the strength to obtain positive results years later. At the end of the 1990s, Samsung became the global market leader in many of these product categories, (e.g. semiconductors, PC monitors, LCD screens). Samsung’s products derived from LCD screens such as TVs and 3D TVs become world leaders, all backed by a strong worldwide marketing promotion that has included the Olympic Games since 1998. At the end of the decade, Samsung developed phones with MP3 technology included, the first so-called smartphones, and digital TVs.
The 1997 Asian financial crisis had no major impact on Samsung except in its non-strategic, automotive area,
which was mostly acquired by France's Renault.
iii. First place in several products but commercial struggles The 21st century opened with the creation of a Samsung R&D Institute in Poland and improvements in flash
memory capacity from 512 M (2001), to 8GB (2004) and to 32GB (2006), making Samsung the world leader in the category. The decade also saw increased partnership: Samsung licensed joint patents with IBM (2002), formed a strategic alliance with Sony to provide LCD screens to both companies under the new S-LCD company mostly owned by Samsung (2003), and signed a contract with Apple to supply microchips (2005). Notwithstanding this outreach, Samsung continued to expand internally, opening manufacturing plants in Slovakia (2003), Russia (2008), and a research center in China (2004).
By 2005, Samsung was already considered the global leader in consumer electronics (surpassing Japan's Sony). In 2008, it debuted the Solstice mobile phone line, which was later rebranded to Galaxy in the 2010s.
The group began reconfiguring in the new decade with a new emphasis on sectors such as medical-pharmaceuticals with the 2010 acquisition of the medical machine company Medison and the merger with Samsung Imaging followed by the 2011 acquisition of U.S.-based Nexus and the 2013 acquisition of Novaled, a German company that develops organic materials and LED technologies.
In 2012, Samsung became embroiled in an intellectual property and patent infringement legal claim with Apple, its rival but also main client. Although Samsung was forced to pay to Apple (according to a U.S. court), in South Korea and Germany, the dispute between the two companies was declared bilateral infringement. In 2014, Samsung opened a new semiconductor production plant in China that mainly produces phones, processors/memory and screens.
Samsung continued to expand in 2016 and 2017 when it completed the purchase of U.S.-based Dacor (home appliances), Joyent (software and services), Viv Labs (artificial intelligence assistant), AdGear (Advertising technology) and Harman (connectivity with appliances).
In 2017, a trio of CEOs—Ki Nam Kim, Hyun Suk Kim, and Dong Jin Koh—replaced the company's CEO since 2012, Kwon Oh-hyun. This change implied an important restructuring of leadership in a quite competitive environment, particularly up against the strong Chinese presence in a growing consumer electronics market.
iv. Competitive advantages In conclusion, three competitive advantages are at the heart of Samsung’s success. Samsung continues to create
new products to face the challenges of old and new market segments, providing it with a first-mover advantage. Secondly, Samsung has developed its brand, giving it worldwide consumer recognition as a high quality company in the electronic products sector. Finally, extensive product differentiation allows Samsung to reach a variety of consumers.
Page 86
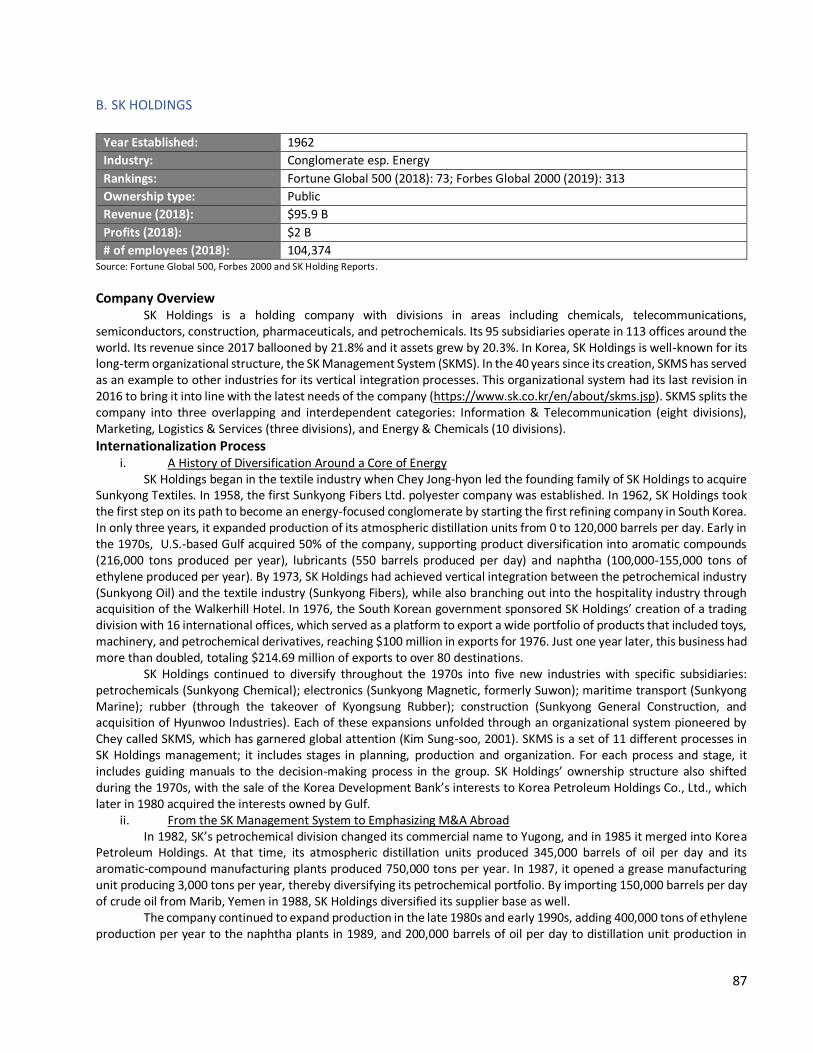
87
B. SK HOLDINGS
Year Established: 1962
Industry: Conglomerate esp. Energy
Rankings: Fortune Global 500 (2018): 73; Forbes Global 2000 (2019): 313
Ownership type: Public
Revenue (2018): $95.9 B
Profits (2018): $2 B
# of employees (2018): 104,374
Source: Fortune Global 500, Forbes 2000 and SK Holding Reports.
Company Overview SK Holdings is a holding company with divisions in areas including chemicals, telecommunications,
semiconductors, construction, pharmaceuticals, and petrochemicals. Its 95 subsidiaries operate in 113 offices around the world. Its revenue since 2017 ballooned by 21.8% and it assets grew by 20.3%. In Korea, SK Holdings is well-known for its long-term organizational structure, the SK Management System (SKMS). In the 40 years since its creation, SKMS has served as an example to other industries for its vertical integration processes. This organizational system had its last revision in 2016 to bring it into line with the latest needs of the company (https://www.sk.co.kr/en/about/skms.jsp). SKMS splits the company into three overlapping and interdependent categories: Information & Telecommunication (eight divisions), Marketing, Logistics & Services (three divisions), and Energy & Chemicals (10 divisions).
Internationalization Process i. A History of Diversification Around a Core of Energy
SK Holdings began in the textile industry when Chey Jong-hyon led the founding family of SK Holdings to acquire Sunkyong Textiles. In 1958, the first Sunkyong Fibers Ltd. polyester company was established. In 1962, SK Holdings took the first step on its path to become an energy-focused conglomerate by starting the first refining company in South Korea. In only three years, it expanded production of its atmospheric distillation units from 0 to 120,000 barrels per day. Early in the 1970s, U.S.-based Gulf acquired 50% of the company, supporting product diversification into aromatic compounds (216,000 tons produced per year), lubricants (550 barrels produced per day) and naphtha (100,000-155,000 tons of ethylene produced per year). By 1973, SK Holdings had achieved vertical integration between the petrochemical industry (Sunkyong Oil) and the textile industry (Sunkyong Fibers), while also branching out into the hospitality industry through acquisition of the Walkerhill Hotel. In 1976, the South Korean government sponsored SK Holdings’ creation of a trading division with 16 international offices, which served as a platform to export a wide portfolio of products that included toys, machinery, and petrochemical derivatives, reaching $100 million in exports for 1976. Just one year later, this business had more than doubled, totaling $214.69 million of exports to over 80 destinations.
SK Holdings continued to diversify throughout the 1970s into five new industries with specific subsidiaries: petrochemicals (Sunkyong Chemical); electronics (Sunkyong Magnetic, formerly Suwon); maritime transport (Sunkyong Marine); rubber (through the takeover of Kyongsung Rubber); construction (Sunkyong General Construction, and acquisition of Hyunwoo Industries). Each of these expansions unfolded through an organizational system pioneered by Chey called SKMS, which has garnered global attention (Kim Sung-soo, 2001). SKMS is a set of 11 different processes in SK Holdings management; it includes stages in planning, production and organization. For each process and stage, it includes guiding manuals to the decision-making process in the group. SK Holdings’ ownership structure also shifted during the 1970s, with the sale of the Korea Development Bank’s interests to Korea Petroleum Holdings Co., Ltd., which later in 1980 acquired the interests owned by Gulf.
ii. From the SK Management System to Emphasizing M&A Abroad In 1982, SK’s petrochemical division changed its commercial name to Yugong, and in 1985 it merged into Korea
Petroleum Holdings. At that time, its atmospheric distillation units produced 345,000 barrels of oil per day and its aromatic-compound manufacturing plants produced 750,000 tons per year. In 1987, it opened a grease manufacturing unit producing 3,000 tons per year, thereby diversifying its petrochemical portfolio. By importing 150,000 barrels per day of crude oil from Marib, Yemen in 1988, SK Holdings diversified its supplier base as well.
The company continued to expand production in the late 1980s and early 1990s, adding 400,000 tons of ethylene production per year to the naphtha plants in 1989, and 200,000 barrels of oil per day to distillation unit production in
Page 87
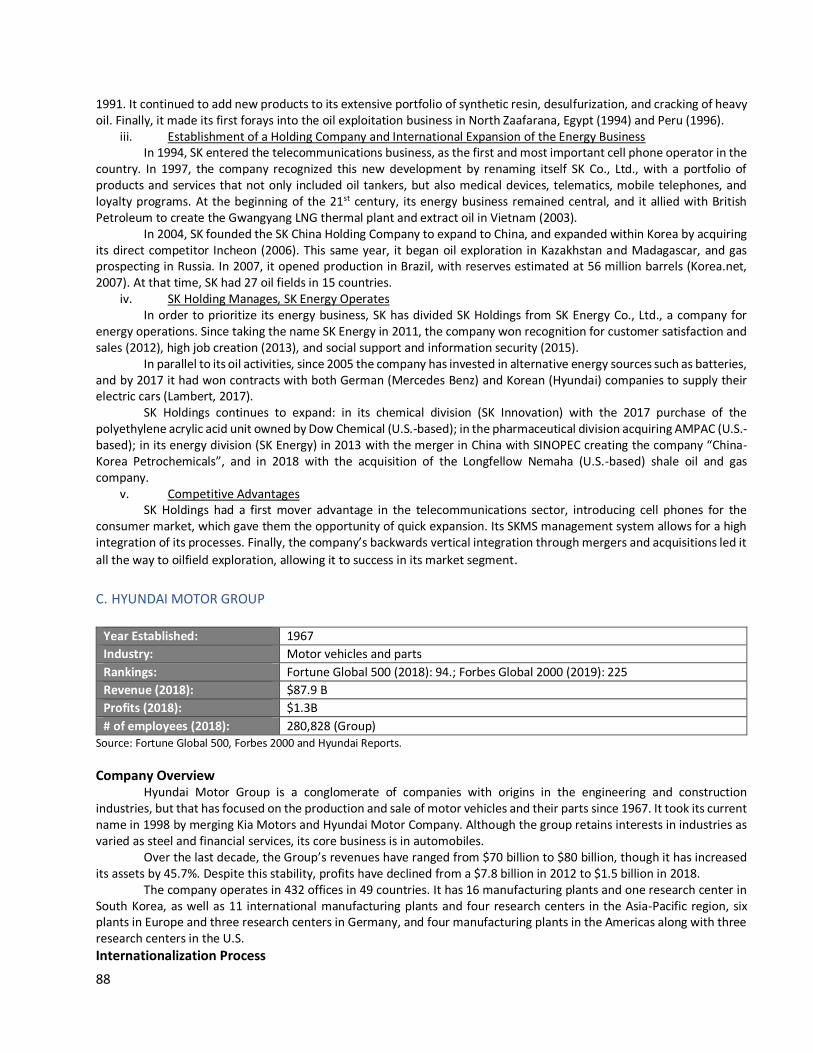
88
1991. It continued to add new products to its extensive portfolio of synthetic resin, desulfurization, and cracking of heavy oil. Finally, it made its first forays into the oil exploitation business in North Zaafarana, Egypt (1994) and Peru (1996).
iii. Establishment of a Holding Company and International Expansion of the Energy Business In 1994, SK entered the telecommunications business, as the first and most important cell phone operator in the
country. In 1997, the company recognized this new development by renaming itself SK Co., Ltd., with a portfolio of products and services that not only included oil tankers, but also medical devices, telematics, mobile telephones, and loyalty programs. At the beginning of the 21st century, its energy business remained central, and it allied with British Petroleum to create the Gwangyang LNG thermal plant and extract oil in Vietnam (2003).
In 2004, SK founded the SK China Holding Company to expand to China, and expanded within Korea by acquiring its direct competitor Incheon (2006). This same year, it began oil exploration in Kazakhstan and Madagascar, and gas prospecting in Russia. In 2007, it opened production in Brazil, with reserves estimated at 56 million barrels (Korea.net, 2007). At that time, SK had 27 oil fields in 15 countries.
iv. SK Holding Manages, SK Energy Operates In order to prioritize its energy business, SK has divided SK Holdings from SK Energy Co., Ltd., a company for
energy operations. Since taking the name SK Energy in 2011, the company won recognition for customer satisfaction and sales (2012), high job creation (2013), and social support and information security (2015).
In parallel to its oil activities, since 2005 the company has invested in alternative energy sources such as batteries, and by 2017 it had won contracts with both German (Mercedes Benz) and Korean (Hyundai) companies to supply their electric cars (Lambert, 2017).
SK Holdings continues to expand: in its chemical division (SK Innovation) with the 2017 purchase of the polyethylene acrylic acid unit owned by Dow Chemical (U.S.-based); in the pharmaceutical division acquiring AMPAC (U.S.-based); in its energy division (SK Energy) in 2013 with the merger in China with SINOPEC creating the company “China-Korea Petrochemicals”, and in 2018 with the acquisition of the Longfellow Nemaha (U.S.-based) shale oil and gas company.
v. Competitive Advantages SK Holdings had a first mover advantage in the telecommunications sector, introducing cell phones for the
consumer market, which gave them the opportunity of quick expansion. Its SKMS management system allows for a high integration of its processes. Finally, the company’s backwards vertical integration through mergers and acquisitions led it
all the way to oilfield exploration, allowing it to success in its market segment.
C. HYUNDAI MOTOR GROUP
Year Established: 1967
Industry: Motor vehicles and parts
Rankings: Fortune Global 500 (2018): 94.; Forbes Global 2000 (2019): 225
Revenue (2018): $87.9 B
Profits (2018): $1.3B
# of employees (2018): 280,828 (Group) Source: Fortune Global 500, Forbes 2000 and Hyundai Reports.
Company Overview Hyundai Motor Group is a conglomerate of companies with origins in the engineering and construction
industries, but that has focused on the production and sale of motor vehicles and their parts since 1967. It took its current name in 1998 by merging Kia Motors and Hyundai Motor Company. Although the group retains interests in industries as varied as steel and financial services, its core business is in automobiles.
Over the last decade, the Group’s revenues have ranged from $70 billion to $80 billion, though it has increased its assets by 45.7%. Despite this stability, profits have declined from a $7.8 billion in 2012 to $1.5 billion in 2018.
The company operates in 432 offices in 49 countries. It has 16 manufacturing plants and one research center in South Korea, as well as 11 international manufacturing plants and four research centers in the Asia-Pacific region, six plants in Europe and three research centers in Germany, and four manufacturing plants in the Americas along with three research centers in the U.S.
Internationalization Process
The company continued to expand production in the late 1980s and early 1990s, adding 400,000 tons of ethylene production per year to the naphtha plants in 1989, and 200,000 barrels of oil per day to distillation unit production in 1991. It continued to add new products to its extensive portfolio of synthetic resin, desulfurization, and cracking of heavy oil. Finally, it made its first forays into the oil exploitation business in North Zaafarana, Egypt (1994) and Peru (1996).
Page 88
89
i. South Korean Expansion on Foreign Technologies The company began as the Hyundai Engineering and Construction Company under the guidance of Chung Ju-
Yung, who in 1967 established the Hyundai Motor Company as a subsidiary. The company made its first vehicle, the Cortina, in cooperation with the Ford Motor Company, in 1968 at the recently completed Ulsan plant. By 1975, Hyundai had produced its first independent car, the Pony, with the support of British management and engineering personnel, Italian design and a Japanese engine. While early production runs were exported to Ecuador and Belgium, the Netherlands and Luxembourg (Benelux), by 1982 the Pony was brought to the British market.
One of Hyundai’s first subsidiaries opened in 1983 in Canada (Canada HMC). Its sales exceeded expectations, and by 1986 Hyundai had opened its U.S. subsidiary and turned the Excel model into the best-selling Imported car in the U.S.
ii. Increasing Autonomy in Engineering and Parts for Self-production In 1988, Hyundai’s automobile production was based on Korean technology (e.g., Sonata), reaching one million
units exported by 1989, and Hyundai continued to reduce its dependence on foreign technology into the 1990s. In 1992, Hyundai showed off its technological prowess with the introduction of its first concept car, the HCD-I. It continued to increase capacity, and by 1995, its production line reached one million units per year, enhanced by its new plant in Jeonju. That same year, Hyundai Motor Europe Technical Center (HMETC) opened with the aim of evaluating the company's production against European standards and guaranteeing quality to its customers.
In 1997 and 1998, Hyundai opened new production plants in Turkey and India, respectively, as well as assemblers in Botswana and Egypt. This era featured ongoing production decentralization that was reflected in new models, technological independence and innovation (hybrid vehicles and solar between 1994-1998). In 1998, Hyundai acquired the majority of Kia Motors (its main rival in Korea), with the new entity known as the Hyundai Motor Group. Hyundai Motors and Kia Motors become the core businesses, configuring themselves as subsidiaries, alongside other divisions in auto parts, steel, construction and finance.
iii. Organizational Renewal with Global Objectives At the turn of the millennium, Chung Ju-Yung handed over the reins to his son Chung Mon Koo. The new CEO
built his global strategy around four objectives: to strengthen management’s capabilities, to develop strategic car types by region, to increase brand value through sponsorship of sporting events and teams, and to differentiate its local offers (e.g. extension of guarantees). Chung Mon Koo pursued this strategy with substantial investments in design centers in Europe (2001) and the U.S. (2002), manufacturing plants in China (2002), and technical centers in Europe (2003) and the U.S. (2005).
By 2004, the company's accumulated exports reached 10 million units, of which Africa and the Middle East contributed 1 million, demonstrating the importance of emerging markets as destinations. Hyundai continued to expand into attractive markets, inaugurating the CKD plant in Brazil in 2007 and opening second plants in India and China in 2008. This emerging market theme continued in 2009, with the establishment of plants in the Czech Republic and Russia. By 2011, other emerging countries in South and Central America reached the milestone of the 2 million units sold, encouraging Hyundai to open another Brazilian plant in 2012.
From 2013 to 2015 Hyundai released new models and brands and ascended to new heights in production, exports and awards. One of its signature accomplishments was the launch of the luxury brand Genesis as an independent mark, from a model within the Hyundai brand since 2004. While the design and technical innovations used in the brand are the results of a collaborative effort from teams in South Korea, Germany and the U.S., the manufacturing is 100% Korean. By 2016, China was recognized not only as a production subsidiary, but also as a support for the new strategy of data analysis technology, connectivity and driving autonomy in automobiles, leading Hyundai to construct a big data center in Guizhou Province.
iv. Competitive Advantages One of Hyundai’s key elements of success has been its strong participation in GVCs; the company has specialized
partners all around the world providing it with advantages in cost, location, quality and technology. As we have mentioned, the consumers in emerging markets have specific tastes and needs, and Hyundai has excelled at meeting those needs and taking care of those customers. Finally, the acquisition of Kia contributed to Hyundai’s strong performance and market expansion as it solidified its leadership position in South Korea.
Page 89
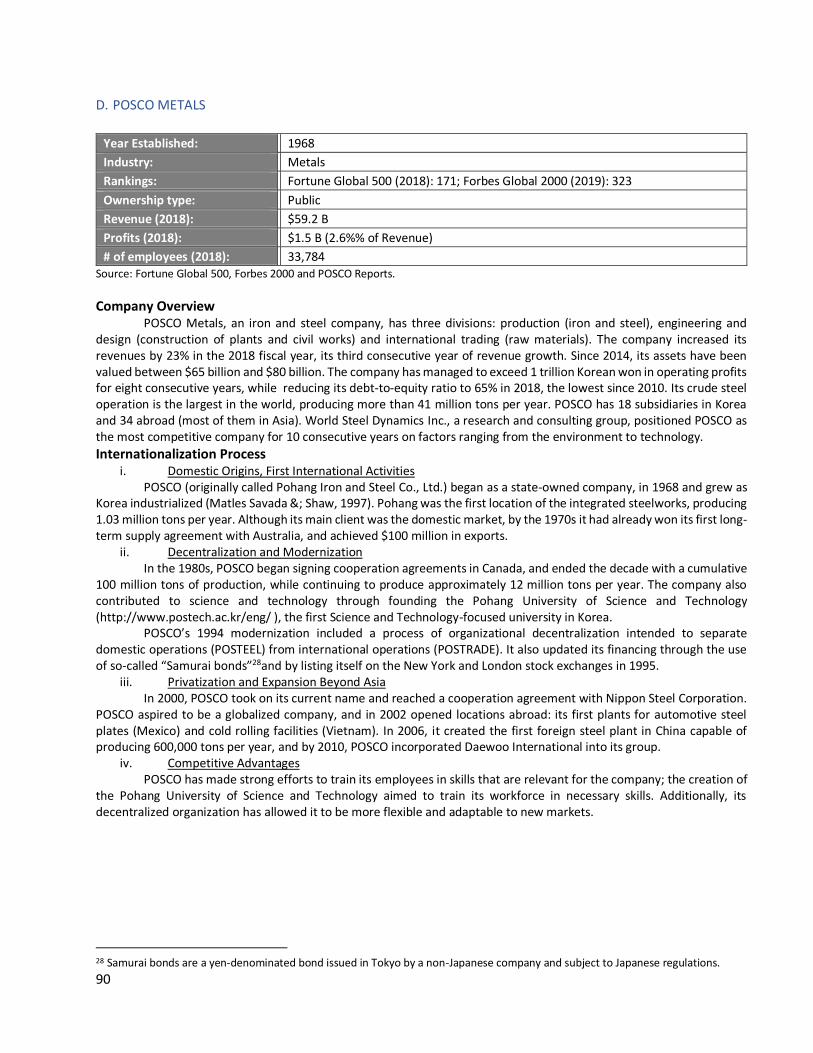
90
D. POSCO METALS
Year Established: 1968
Industry: Metals
Rankings: Fortune Global 500 (2018): 171; Forbes Global 2000 (2019): 323
Ownership type: Public
Revenue (2018): $59.2 B
Profits (2018): $1.5 B (2.6%% of Revenue)
# of employees (2018): 33,784
Source: Fortune Global 500, Forbes 2000 and POSCO Reports.
Company Overview POSCO Metals, an iron and steel company, has three divisions: production (iron and steel), engineering and
design (construction of plants and civil works) and international trading (raw materials). The company increased its revenues by 23% in the 2018 fiscal year, its third consecutive year of revenue growth. Since 2014, its assets have been valued between $65 billion and $80 billion. The company has managed to exceed 1 trillion Korean won in operating profits for eight consecutive years, while reducing its debt-to-equity ratio to 65% in 2018, the lowest since 2010. Its crude steel operation is the largest in the world, producing more than 41 million tons per year. POSCO has 18 subsidiaries in Korea and 34 abroad (most of them in Asia). World Steel Dynamics Inc., a research and consulting group, positioned POSCO as the most competitive company for 10 consecutive years on factors ranging from the environment to technology.
Internationalization Process i. Domestic Origins, First International Activities
POSCO (originally called Pohang Iron and Steel Co., Ltd.) began as a state-owned company, in 1968 and grew as Korea industrialized (Matles Savada &; Shaw, 1997). Pohang was the first location of the integrated steelworks, producing 1.03 million tons per year. Although its main client was the domestic market, by the 1970s it had already won its first long-term supply agreement with Australia, and achieved $100 million in exports.
ii. Decentralization and Modernization In the 1980s, POSCO began signing cooperation agreements in Canada, and ended the decade with a cumulative
100 million tons of production, while continuing to produce approximately 12 million tons per year. The company also contributed to science and technology through founding the Pohang University of Science and Technology (http://www.postech.ac.kr/eng/ ), the first Science and Technology-focused university in Korea.
POSCO’s 1994 modernization included a process of organizational decentralization intended to separate domestic operations (POSTEEL) from international operations (POSTRADE). It also updated its financing through the use of so-called “Samurai bonds”28and by listing itself on the New York and London stock exchanges in 1995.
iii. Privatization and Expansion Beyond Asia In 2000, POSCO took on its current name and reached a cooperation agreement with Nippon Steel Corporation.
POSCO aspired to be a globalized company, and in 2002 opened locations abroad: its first plants for automotive steel plates (Mexico) and cold rolling facilities (Vietnam). In 2006, it created the first foreign steel plant in China capable of producing 600,000 tons per year, and by 2010, POSCO incorporated Daewoo International into its group.
iv. Competitive Advantages POSCO has made strong efforts to train its employees in skills that are relevant for the company; the creation of
the Pohang University of Science and Technology aimed to train its workforce in necessary skills. Additionally, its decentralized organization has allowed it to be more flexible and adaptable to new markets.
28 Samurai bonds are a yen-denominated bond issued in Tokyo by a non-Japanese company and subject to Japanese regulations.
Page 90
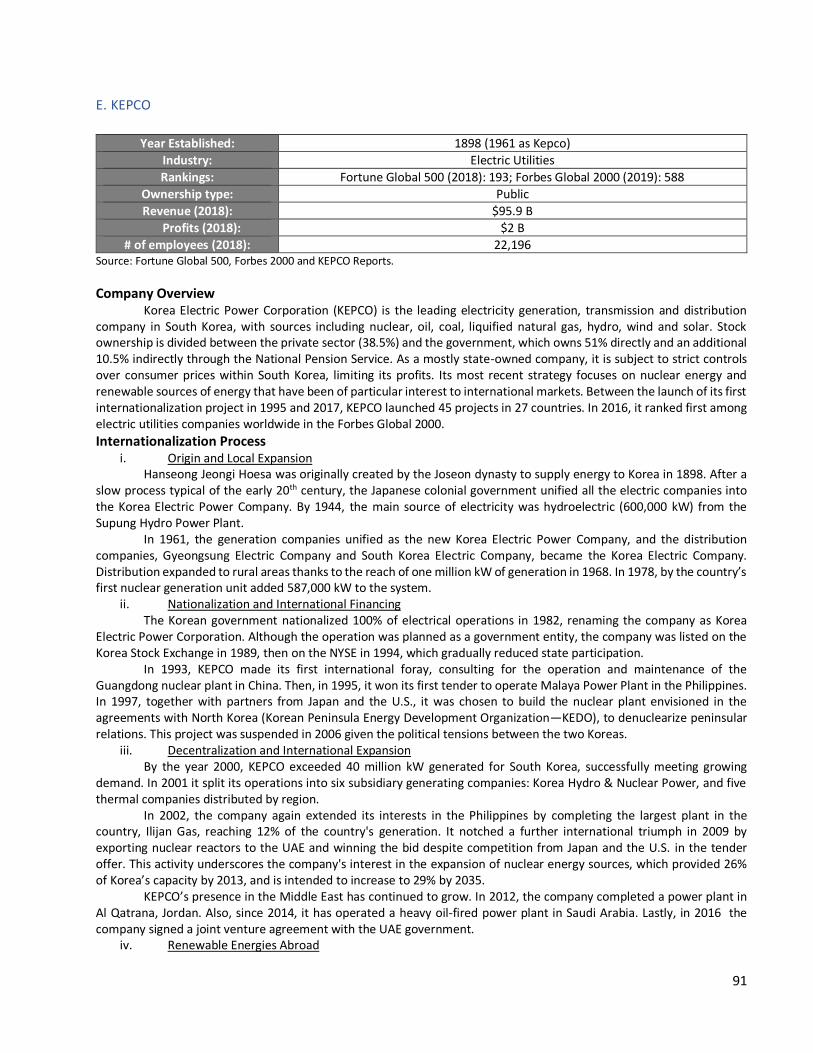
91
E. KEPCO
Year Established: 1898 (1961 as Kepco)
Industry: Electric Utilities
Rankings: Fortune Global 500 (2018): 193; Forbes Global 2000 (2019): 588
Ownership type: Public
Revenue (2018): $95.9 B
Profits (2018): $2 B
# of employees (2018): 22,196 Source: Fortune Global 500, Forbes 2000 and KEPCO Reports.
Company Overview Korea Electric Power Corporation (KEPCO) is the leading electricity generation, transmission and distribution
company in South Korea, with sources including nuclear, oil, coal, liquified natural gas, hydro, wind and solar. Stock ownership is divided between the private sector (38.5%) and the government, which owns 51% directly and an additional 10.5% indirectly through the National Pension Service. As a mostly state-owned company, it is subject to strict controls over consumer prices within South Korea, limiting its profits. Its most recent strategy focuses on nuclear energy and renewable sources of energy that have been of particular interest to international markets. Between the launch of its first internationalization project in 1995 and 2017, KEPCO launched 45 projects in 27 countries. In 2016, it ranked first among electric utilities companies worldwide in the Forbes Global 2000.
Internationalization Process i. Origin and Local Expansion
Hanseong Jeongi Hoesa was originally created by the Joseon dynasty to supply energy to Korea in 1898. After a slow process typical of the early 20th century, the Japanese colonial government unified all the electric companies into the Korea Electric Power Company. By 1944, the main source of electricity was hydroelectric (600,000 kW) from the Supung Hydro Power Plant.
In 1961, the generation companies unified as the new Korea Electric Power Company, and the distribution companies, Gyeongsung Electric Company and South Korea Electric Company, became the Korea Electric Company. Distribution expanded to rural areas thanks to the reach of one million kW of generation in 1968. In 1978, by the country’s first nuclear generation unit added 587,000 kW to the system.
ii. Nationalization and International Financing The Korean government nationalized 100% of electrical operations in 1982, renaming the company as Korea
Electric Power Corporation. Although the operation was planned as a government entity, the company was listed on the Korea Stock Exchange in 1989, then on the NYSE in 1994, which gradually reduced state participation.
In 1993, KEPCO made its first international foray, consulting for the operation and maintenance of the Guangdong nuclear plant in China. Then, in 1995, it won its first tender to operate Malaya Power Plant in the Philippines. In 1997, together with partners from Japan and the U.S., it was chosen to build the nuclear plant envisioned in the agreements with North Korea (Korean Peninsula Energy Development Organization—KEDO), to denuclearize peninsular relations. This project was suspended in 2006 given the political tensions between the two Koreas.
iii. Decentralization and International Expansion By the year 2000, KEPCO exceeded 40 million kW generated for South Korea, successfully meeting growing
demand. In 2001 it split its operations into six subsidiary generating companies: Korea Hydro & Nuclear Power, and five thermal companies distributed by region.
In 2002, the company again extended its interests in the Philippines by completing the largest plant in the country, Ilijan Gas, reaching 12% of the country's generation. It notched a further international triumph in 2009 by exporting nuclear reactors to the UAE and winning the bid despite competition from Japan and the U.S. in the tender offer. This activity underscores the company's interest in the expansion of nuclear energy sources, which provided 26% of Korea’s capacity by 2013, and is intended to increase to 29% by 2035.
KEPCO’s presence in the Middle East has continued to grow. In 2012, the company completed a power plant in Al Qatrana, Jordan. Also, since 2014, it has operated a heavy oil-fired power plant in Saudi Arabia. Lastly, in 2016 the company signed a joint venture agreement with the UAE government.
iv. Renewable Energies Abroad
Page 91
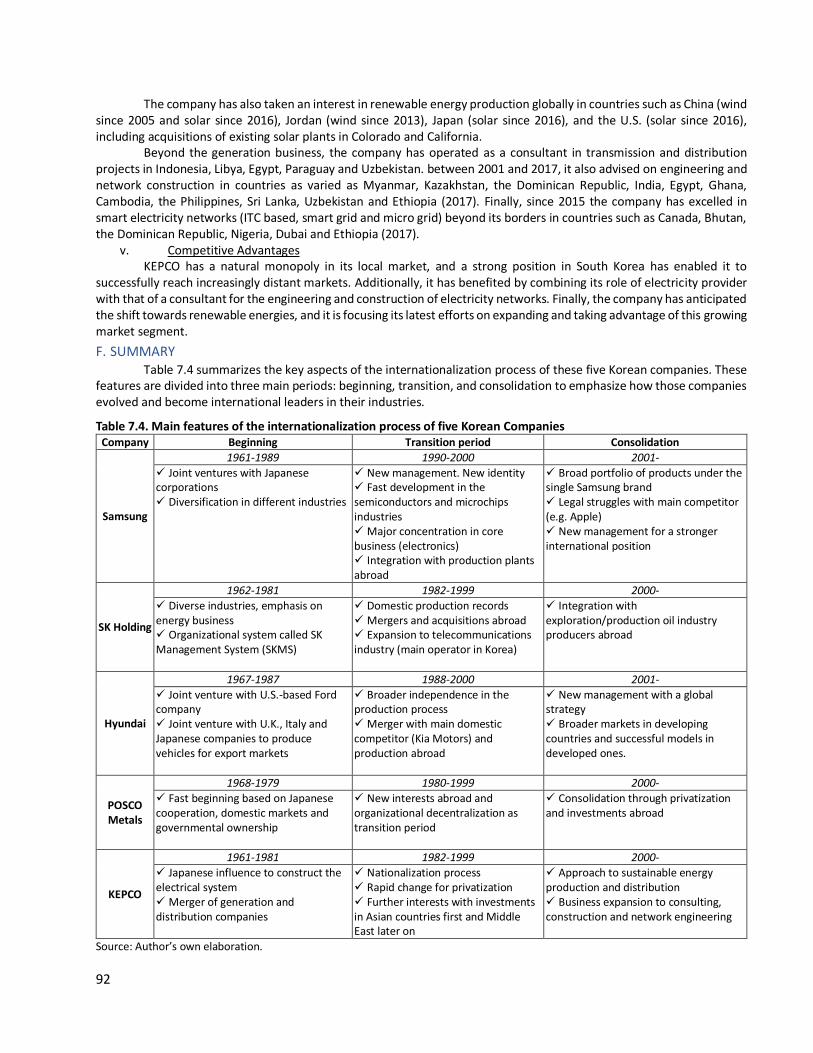
92
The company has also taken an interest in renewable energy production globally in countries such as China (wind since 2005 and solar since 2016), Jordan (wind since 2013), Japan (solar since 2016), and the U.S. (solar since 2016), including acquisitions of existing solar plants in Colorado and California.
Beyond the generation business, the company has operated as a consultant in transmission and distribution projects in Indonesia, Libya, Egypt, Paraguay and Uzbekistan. between 2001 and 2017, it also advised on engineering and network construction in countries as varied as Myanmar, Kazakhstan, the Dominican Republic, India, Egypt, Ghana, Cambodia, the Philippines, Sri Lanka, Uzbekistan and Ethiopia (2017). Finally, since 2015 the company has excelled in smart electricity networks (ITC based, smart grid and micro grid) beyond its borders in countries such as Canada, Bhutan, the Dominican Republic, Nigeria, Dubai and Ethiopia (2017).
v. Competitive Advantages KEPCO has a natural monopoly in its local market, and a strong position in South Korea has enabled it to
successfully reach increasingly distant markets. Additionally, it has benefited by combining its role of electricity provider with that of a consultant for the engineering and construction of electricity networks. Finally, the company has anticipated the shift towards renewable energies, and it is focusing its latest efforts on expanding and taking advantage of this growing market segment.
F. SUMMARY Table 7.4 summarizes the key aspects of the internationalization process of these five Korean companies. These
features are divided into three main periods: beginning, transition, and consolidation to emphasize how those companies evolved and become international leaders in their industries.
Table 7.4. Main features of the internationalization process of five Korean Companies Company Beginning Transition period Consolidation
Samsung
1961-1989 1990-2000 2001-
✓ Joint ventures with Japanese corporations ✓ Diversification in different industries
✓ New management. New identity ✓ Fast development in the semiconductors and microchips industries ✓ Major concentration in core business (electronics) ✓ Integration with production plants abroad
✓ Broad portfolio of products under the single Samsung brand ✓ Legal struggles with main competitor (e.g. Apple) ✓ New management for a stronger international position
SK Holding
1962-1981 1982-1999 2000-
✓ Diverse industries, emphasis on energy business ✓ Organizational system called SK Management System (SKMS)
✓ Domestic production records ✓ Mergers and acquisitions abroad ✓ Expansion to telecommunications industry (main operator in Korea)
✓ Integration with exploration/production oil industry producers abroad
Hyundai
1967-1987 1988-2000 2001-
✓ Joint venture with U.S.-based Ford company ✓ Joint venture with U.K., Italy and Japanese companies to produce vehicles for export markets
✓ Broader independence in the production process ✓ Merger with main domestic competitor (Kia Motors) and production abroad
✓ New management with a global strategy ✓ Broader markets in developing countries and successful models in developed ones.
POSCO Metals
1968-1979 1980-1999 2000-
✓ Fast beginning based on Japanese cooperation, domestic markets and governmental ownership
✓ New interests abroad and organizational decentralization as transition period
✓ Consolidation through privatization and investments abroad
KEPCO
1961-1981 1982-1999 2000-
✓ Japanese influence to construct the electrical system ✓ Merger of generation and distribution companies
✓ Nationalization process ✓ Rapid change for privatization ✓ Further interests with investments in Asian countries first and Middle East later on
✓ Approach to sustainable energy production and distribution ✓ Business expansion to consulting, construction and network engineering
Source: Author’s own elaboration.
Page 92
93
7.5. Final Remarks
Family-run conglomerates known as chaebol first surfaced in the 1960s at the end of the Korean War as a government development strategy in high value-added industries including steel, energy, communications and consumer goods. The initial characteristics of these companies combined broad diversification with a focus on a main business as well as the unrestricted political, fiscal and financial support of the government, which guaranteed sustained business growth. Organizationally, the Korean family social system also permeated the structure of the companies, so the leadership positions were occupied by entire families, who also sought to ensure the continuity for generations.
In addition to government support, transnational companies from the U.S. and Japan provided FDI. Countries that already had industrialization experiences wanted to take advantage of the particular governmental impulse and the advantage in productive factors (mainly labor) of Korea. Given the small size of the Korean market, it was not necessarily the primary opportunity for these firms, leading them to enter international markets to export products.
The second generation of these businesses’ leaders tended to increase product diversification, but not far from central business. Likewise, what had begun as an export business evolved into other forms of market entry with greater control, such as FDI, first in neighboring markets and then to more distant markets. Thus, as Korean companies joined international markets they first took advantage of reduced costs or the manufacturing and/or assembly phases in less-developed countries, and then capitalized on more developed countries’ strengths in research and development for the stages of design and development of new products, always under the control and supervision from the Korean parent company.
The Korean miracle begins with the idea of a government that leverages the development of industries that already had private support, but that required additional financial muscle to survive beyond their borders. Although the family organizational system can be criticized as autocratic, this system has provided these companies with continuity that would otherwise be difficult to achieve. Additionally, even in the aftermath of the Global Financial Crisis (GFC), Korea continued its development and its main multinationals are powerful leaders in different sectors worldwide.
REFERENCES
CIA World Factbook (2019). East Asia/Southeast Asia: Korea, South. Website: https://www.cia.gov/library/publications/the-world-factbook/geos/ks.html
Euromonitor International. (2018). Top 100 Global Manufacturing Companies 2018. Website: https://www.euromonitor.com/top-100-global-manufacturing-companies-2018/report
Forbes. (2019). #13 Samsung Electronics. Website: https://www.forbes.com/companies/samsung- electronics/?list=global2000#31f9e35a2450
Forbes. (2019). #252 Hyundai Motors. Website: https://www.forbes.com/companies/hyundai-motor/?list=global2000#7ba58e8eff3a
Forbes. (2019). #313 SK Holdings. Website: https://www.forbes.com/companies/samsung- electronics/?list=global2000#31f9e35a2450
Forbes. (2019). #323 Posco. Website: https://www.forbes.com/companies/posco/#52f47bf7a6ab Forbes. (2019). #588 Korea Electric Power. Website: https://www.forbes.com/companies/korea-electric-
power/#2f6b4d922698 Fortune. (2019). Hyundai Motors. Global 500. Website: https://fortune.com/global500/2019/hyundai-motor Fortune. (2019). Korea Electric Power. Global 500. Website: https://fortune.com/global500/korea-electric-power Fortune. (2019). Posco. Global 500. Website: https://fortune.com/global500/posco/ Fortune. (2019). Samsung Electronics. Global 500 Sitio web: https://fortune.com/global500/2019/samsung-electronics Fortune. (2019). SK Holdings. Global 500. Website: https://fortune.com/global500/2019/sk-holdings Hyundai. (2019). History. Website: https://www.hyundai.com/worldwide/en/company/corporate/information/history Hyundai Motor Group. (2019). Main Website: https://www.hyundaimotorgroup.com/ Kepco. (2019). About us. Website: http://home.kepco.co.kr/kepco/main.do
http://home.kepco.co.kr/kepco/EN/A/htmlView/ENAAHP001.do?menuCd=EN010101
Page 93
94
Kepco. (2019). Main Website: http://home.kepco.co.kr/kepco/main.do Kim Sung-soo (2001) Diversifying Into the Global Marketplace. Korea Times. Website
https://web.archive.org/web/20080311012550/http://www.kinds.or.kr/main/search/searchcontent.php?docid=03100201.20010830KTM0007
Korea.net (2007) SK Energy acquires oil production rights in Brazil. Korea Times. https://web.archive.org/web/20080310212841/http://korea.net/news/news/NewsView.asp?serial_no=20070730019&part=107&SearchDay=
Lambert, F. (2017) SK Innovation is doubling its battery production for electric vehicles to 4GWh/year to support demand from Mercedes and others. Elektrek. Website: https://electrek.co/2017/03/06/sk-innovation-expanding-battery/
Nikkei Inc. (2019). Hyundai Motor Co. Ltd. Nikkei Assian Review, Website: https://asia.nikkei.com/Companies/Hyundai-Motor-Co.-Ltd2
Nikkei Inc. (2019). Korea Electric Power Corp. Nikkei Assian Review, Website: https://asia.nikkei.com/Companies/Korea-Electric-Power-Corp.
OECES, 2019. Oficina Económica y Comercial de España en Seúl. Informe Económico y Comercial de Corea del Sur. Website: https://www.icex.es/icex/wcm/idc/groups/public/documents/documento/mde5/ode3/~edisp/doc2019817592.pdf?utm_source=RSS&utm_medium=ICEX.es&utm_content=27-03-2019&utm_campaign=Informe%20Econ%C3%B3mico%20y%20Comercial.%20Corea%20del%20Sur%202019
Posco. (2019). Main Website: http://www.posco.com Samsung Electronics Co., Ltd. (2018). Notes to the Consolidated Financial Statements.
Website: https://images.samsung.com/is/content/samsung/p5/global/ir/docs/2018_con_quarter04_note.pdf Samsung Electronics Co., Ltd. (2018) Economic Performance Report.
Website: https://images.samsung.com/is/content/samsung/p5/co/aboutsamsung/about_us/Economic_Performance_Report.pdf
Savada, A.M., & Shaw, W. (Eds.). (1997). South Korea: A country study (Vol. 550, No. 41). Diane Publishing. Selectusa.gov (2019). Foreign Direct Investment (FDI): South Korea. Website:
https://www.selectusa.gov/servlet/servlet.FileDownload?file=015t0000000LKNs SK Group. (2019). Main Website: https://www.sk.co.kr/en/about/skms.jsp UNCTAD (2019). World Investment Report 2019. Website:
https://unctad.org/en/pages/PublicationWebflyer.aspx?publicationid=2460 U.S. Securities and Exchange Commission. (2016). List of Subsidiaries of Posco. Website:
https://www.sec.gov/Archives/edgar/data/889132/000114554907001133/h01304exv8w1.htm Wharton (2011). Emerging Economy. Website: https://kwhs.wharton.upenn.edu/term/emerging-economy/ World Economic Forum. (2018). The Global Competitiveness Report 2018. Website:
https://es.weforum.org/reports/the-global-competitveness-report-2018
Page 94
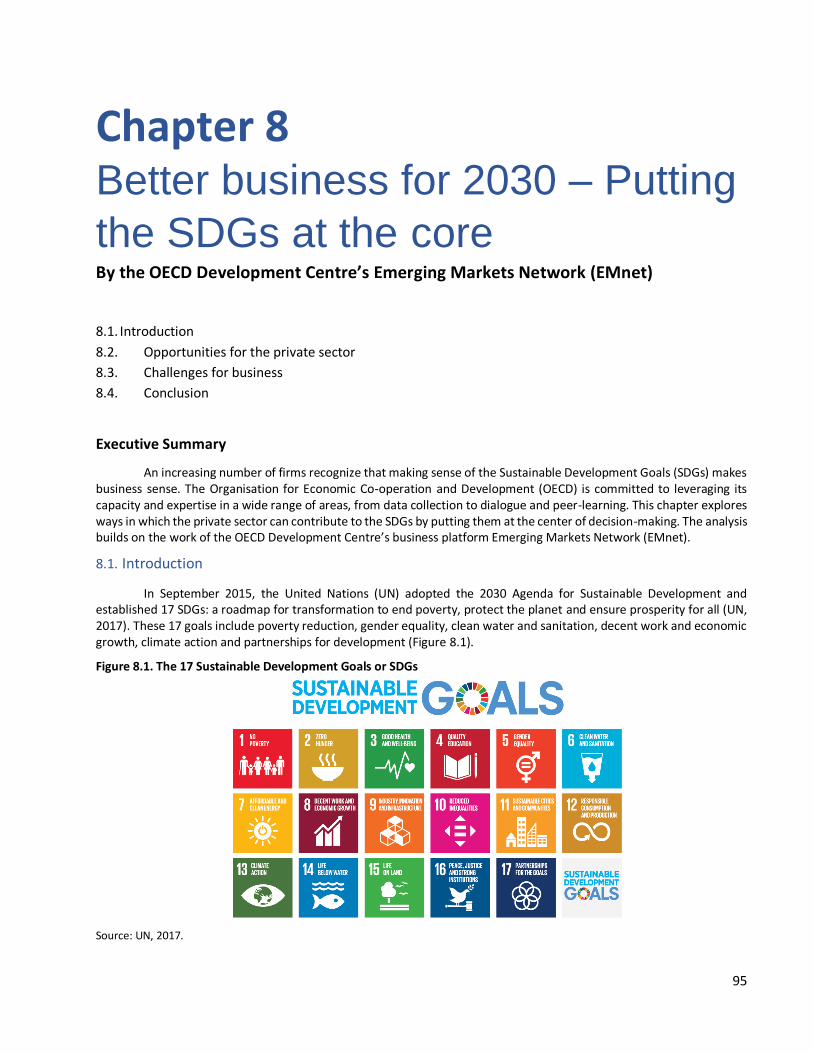
95
Chapter 8 Better business for 2030 – Putting
the SDGs at the core By the OECD Development Centre’s Emerging Markets Network (EMnet)
8.1. Introduction
8.2. Opportunities for the private sector
8.3. Challenges for business
8.4. Conclusion
Executive Summary
An increasing number of firms recognize that making sense of the Sustainable Development Goals (SDGs) makes business sense. The Organisation for Economic Co-operation and Development (OECD) is committed to leveraging its capacity and expertise in a wide range of areas, from data collection to dialogue and peer-learning. This chapter explores ways in which the private sector can contribute to the SDGs by putting them at the center of decision-making. The analysis builds on the work of the OECD Development Centre’s business platform Emerging Markets Network (EMnet).
8.1. Introduction
In September 2015, the United Nations (UN) adopted the 2030 Agenda for Sustainable Development and established 17 SDGs: a roadmap for transformation to end poverty, protect the planet and ensure prosperity for all (UN, 2017). These 17 goals include poverty reduction, gender equality, clean water and sanitation, decent work and economic growth, climate action and partnerships for development (Figure 8.1).
Figure 8.1. The 17 Sustainable Development Goals or SDGs
Source: UN, 2017.
Page 95
96
Unlike the Millennium Development Goals (MDGs), which were launched in 2000 and aimed to address basic human needs throughout the developing world, this new set of goals actively involves diverse actors across society including the private sector, whose collective efforts outweigh what they could deliver individually (UN, 2000; UNIDO and UN Global Compact, 2014).
Achieving the SDGs will require a whole of society approach and “partnerships between governments, the private sector and civil society” (UN, 2017). Indeed, business-led initiatives, such as research and development partnerships, knowledge-sharing platforms, technology and skills transfer, together with infrastructure investment have the potential to optimize development outcomes, enable productivity gains, generate better quality jobs, strengthen skills and promote technological progress. In addition, the private sector is the premier agent of job creation, which contributes to development by boosting living standards, raising productivity, and fostering social cohesion (IFC, 2013; World Bank, 2013).
The private sector is considered essential to delivering sustainable development worldwide (OECD, 2016a). Achieving the SDGs will require a drastic rethinking of how to do business throughout the supply chain and how to engage in coalitions with other companies and with the public sector, in order to generate profit while having a positive social, environmental and economic impact. Over 1,500 companies participated in the UN’s Global Compact and stated that a strategic approach to sustainability can drive long-term financial value while improving productivity and growth today (UN Global Compact, 2018). However, even for businesses that value the relevance of the sustainability agenda, actively putting the SDGs at the core of their strategies remains a challenge, in particular when balancing sustainable development objectives with profitability (OECD, 2017a).
Some efforts to combine business and sustainability pre-date the adoption of the SDGs. Adhering to more responsible business conduct (RBC29) was pivotal in encouraging companies to proactively minimize negative impacts of their operations, especially in supply chains. Beyond operations, issues of social justice, community dialogue and the restoration of trust between citizens, institutions and the private sector have become an essential part of the equation. Furthermore, increasing inequalities in society over the last 30 years have contributed to mounting discontent and a fragmented social contract, highlighting the need for more inclusive growth and inclusive business (OECD, 2017b).
In this context, EMnet launched a thematic Working Group on Business and Sustainability in Emerging Markets in 2017 and hosted roundtable discussions with companies operating in emerging markets as well as in OECD countries. These discussions explored how businesses can take additional action to place the SDGs at the core of their activities, act responsibly in line with their RBC commitments, and balance the demands of their shareholders. Building on the outcomes of the meetings, this chapter provides an overview of current perceptions, ongoing strategies and suggestions to further optimize the private sector’s contribution to the SDGs.
8.2. Opportunities for the private sector
Businesses increasingly see investments in sustainability as business opportunities despite the challenges involved (OECD, 2016a). There is a growing consensus that sustainability can enable companies to acquire new clients, penetrate new markets, promote innovation, explore new business models and both attract and retain talent. Individual companies recognize that achieving the SDGs creates market opportunities, even though the SDG agenda has unevenly been mainstreamed by Multinational Enterprises (MNEs) and does not form an integral plan of strategic planning across industry (Business & Sustainable Development Commission, 2017). There are nonetheless powerful incentives for doing so. Companies that are more sustainable are more competitive
Evidence suggests that the business case for placing the SDGs at the core of companies’ strategies is getting stronger. The Business and Sustainable Development Commission estimates that the SDGs will open up $12 trillion of market opportunities by 2030 in areas ranging from food and agriculture, cities, energy and materials, and health and well-being (Business & Sustainable Development Commission, 2017). Indeed, companies adopting sound environmental, social and governance practices toward clients, suppliers, employees and the environment may be more competitive in the long run (Benhamou and Diaye, 2016), create more jobs, and employ more skilled, and female, workers (ILO, 2017).
29 Above all, responsible business conduct (RBC) entails compliance with laws, including human rights, environmental protection, labor relations and financial accountability, even in countries where these are poorly enforced. It also involves responding to societal expectations communicated by channels other than the law, e.g. inter-governmental organizations, within the workplace, by local communities and trade unions, or via the press. Private voluntary initiatives addressing this latter aspect of RBC are often referred to as corporate social responsibility (CSR).
Page 96
97
Evidence suggests that productivity gains generated by sustainable business conducts can outweigh the additional costs and in turn reduce overall unit labor costs. Employers that provide formal training for their employees, for example, pay 14% higher wages, yet are also 20% more productive.
A sustainable reputation can help companies attract and retain clients. In addition to being more competitive, there is evidence that firms can capitalize on their sustainability image through their pricing structure (WBCSD, 2017). A Nielson study shows that the large majority of respondents were willing to pay a premium for products and services offered by sustainable businesses: up to 66% of customers, and 73% in the case of global millennials, are willing to pay more for a more sustainable brand (Nielsen, 2015). The analysis is based on a survey involving 30,000 respondents from 60 countries, and shows that consumers across regions, income levels and categories prefer businesses that remain loyal to their values. The report also mentions that consumers in emerging markets, such as in Latin America, Asia, Middle East and Africa, are almost 30% more willing to pay a premium for sustainable offerings than consumers in developed economies. The reason, according to researchers, is that consumers in developing markets are physically closer to surrounding communities and more aware of the daily challenges. Other research has shown that customers are willing to pay more for a greener product with similar performance standards: 70% would pay a 5% premium in industries such as automotive, building, electronics, furniture and packaging, according to a survey assessing the sustainability of industry value chains (Miremadi, Musso and Weihe, 2012). Access to new markets and opportunities
The SDG agenda has created a framework for researchers, entrepreneurs, and creative minds to work toward a more sustainable world. CEOs believe that the 2030 Agenda provides an essential window of opportunity to rethink and test approaches to sustainability; when surveyed, 89% of them said that commitment to sustainability is translating into real impact in their own industries (Accenture, 2016). In its Global Opportunity Explorer, for example, the UN Global Compact and partners took a systematic approach and closely studied the intersections between the fields of health, food, water, and energy, and, in turn, the intersection of these fields with technology, and mapped out new markets and new opportunities for business. Following consultations with 17,000 business leaders, they identified some 55 specific market opportunities (Connect4Climate, 2018).
In their Global Opportunity Report, the UN Global Compact and the project partners were able to match specific opportunities to lagging SDGs (DNV GL, 2018). The report highlights that reduced inequalities (SDG 10), responsible consumption and production (SDG 12), climate action (SDG 13), and life below water (SDG 14) have the biggest lag. For each of these SDGs, the report highlighted new potential business opportunities that may help to address these gaps. Some examples include:
Reducing inequalities through blockchain technology. Thanks to its secure encryption, blockchain is useful for securing land titles, which is essential for many small rural and urban entrepreneurs in countries with unclear land registries. Moreover, digitalizing supply chains using blockchain and smart contracts30 can increase their transparency and promote a more even distribution of value added throughout the chain. Fuller transparency can also help customers know the origins and history of a product or its components. In Africa, where only about 30% of land has been fully surveyed, drones are making information on land ownership more readily available. Clear and transparent land titles enable access to finance with the land as collateral while allowing governments to levy property taxes more accurately to raise general revenue.
Innovation and responsible food supply sources can mitigate greenhouse gas emissions. The OECD Taxing Energy Use report states that putting a price on emissions and pollution through carbon pricing tools such as energy taxes and tradeable permits is an essential part of climate change mitigation strategies (OECD, 2018; OECD 2016c). In advance of legislation, multinational firms such as Mahindra & Mahindra have adopted internal carbon prices, often known as “shadow prices”, which put a financial value on carbon emissions (OECD, 2017c). Using these prices as a metric, Mahindra is able to make investment decisions that take emissions into account, leading to less-carbon intensive projects (WRI India and Shakti Sustainable Energy Foundation, 2018) and a corporate commitment to carbon neutrality by 2040 (Mahindra, 2018).
Sustainable construction techniques are reducing the construction sector’s carbon footprint. The industry accounts for a large percentage of carbon emissions (25-40% globally) and of solid waste (up to 40% in the U.S.). Innovative building techniques leverage prefabricated blocks that can be taken apart easily and re-used as well as construction waste that can be transformed into new materials. 3D-printing can also mitigate the use of superfluous materials and reduce
30 Smart contracts are trusted transactions directly between parties without the need for a central authority, registry, legal system, or enforcement mechanism. The contract is written in lines code and distributed over a decentralized network accessible via the web. The term was first coined in 1997 by the American computer scientist Nick Szabo.
98
transport costs. Increasingly, architects and developers are seeking carbon neutrality standards for new buildings. Non-profits such as the World Green Building Council (WorldGBC) work with corporations to reduce energy and carbon emissions as well as water consumption (WorldGBC, 2018). Some companies have joined the cause: in 2017, JP Morgan Chase announced it would source 100% of global energy needs from renewable resources by 2020. The company has since worked to retrofit all its buildings with LED lighting to cut energy consumption by 50%, in line with the WorldGBC’s goal of moving to net zero carbon (JP Morgan Chase, 2017). Major emerging market multinationals in the sector are increasingly adopting sustainable practices in their processes. Dangote Cement, the construction branch of the Nigerian conglomerate Dangote Group, highlighted its sustainability approach in its recent sustainability report (Dangote Cement, 2018). The “Dangote Way”, operationalized in in Africa, includes salient sustainable initiatives that reduce carbon emissions and water usage, set specific emission targets and report publicly on them, while promoting principles of a circular economy across the value chain (Dangote Cement, 2018).
Ocean resources represent an “asset” worth $2.5 trillion per year (WWF, 2015), currently threatened by the incidence of waste. Some estimates indicate that the ocean will count more plastic than sea by 2050 (MacArthur Foundation, 2016). Consumers’ preferences are increasingly driving sustainable packaging solutions. Global consumer goods companies are closely monitoring this trend. For instance, Unilever pledged in 2017 that 100% of its packaging was to be made out of recyclable plastics by 2025 (Unilever, 2017). Surging demand for fish, coinciding with the world’s population growth, put pressure on fisheries. Aquaculture and ocean farming hold the potential to feed a growing population without further impairing the world’s wild fish stocks. The total market for aquaculture is worth $176 billion and is expected to grow at 4.6%, making it the fastest growing food industry (DNV GL, 2018). Companies are already applying aquaculture solutions to produce ocean foods at a commercial scale, thus moving towards the realization of SDG 14.
Other SDGs also provide significant opportunities. The International Energy Agency (IEA) describes opportunities that exist in energy-related aspects of the SDG 7 on affordable and clean energy (IEA, 2017a). In its sustainable development policy scenario, the IEA describes the policies necessary to achieve the objective of universal clean energy access, including capping levels of emissions as soon as possible, to be followed by a substantial decline, and a large reduction of energy-related pollutants. Without policy intervention, 700 million people will still lack energy access by 2030, and 2.3 billion people will still rely on polluting fuels for their basic needs (IEA, 2017b).
The investments associated with the IEA’s Sustainable Development Scenario offer opportunities to the private sector. Examples include companies active in delivering energy solutions in decentralized systems far from the main grid (“micro grids”), firms active in the electrical vehicle industry and its supply chain, and businesses operating in energy transmission and distribution (IEA, 2017a). Companies such as Huawei have seized green energy solutions as a means to bring solar energy to rural and remote areas, while providing digital connectivity to the same areas (Huawei, 2018a). Its “PowerCube 1,000” solution combines AI and enhanced digital technologies to provide a stable power supply in a green, intelligent, and cost-effective manner (Huawei, 2018a), while its reliance on solar energy makes it ideal for emerging markets endowed with ample solar energy, for example in Africa. By the end of 2018, the hybrid green energy solution had reached 170 countries and regions and more than 310 carriers and operators including MTN, Zain, Airtel, Vimpelcom, Telefónica and Vodafone (Huawei, 2018b; GSMA, 2013). African multinationals, such as Samba Bathily’s Groupe ADS or Infinity Solar in Egypt, are also capitalizing on opportunities in the sector. Through Solektra International, a part of Groupe ADS’ portfolio, Groupe ADS has been able to provide access to clean energy across 15 African countries, particularly in rural areas, using solar energy (Groupe ADS, 2019). Sustainability leads to technological innovation
New technologies are enabling companies to integrate sustainability more easily into their operations. According to a UN Global Compact study, 75% of CEOs in over 100 countries stated that digital technologies are facilitating the adoption of sustainable practices (UN Global Compact, 2017). Mahindra & Mahindra, an Indian multinational automobile manufacturing company, invested in an agriculture-focused venture dedicated to enhancing farmers’ productivity and ethical sourcing of food products through an extensive use of innovative technologies (MASL, 2018). This initiative is supporting the goal set by the Indian Council of Food and Agriculture of doubling farmers’ income by 2022 (Indian Council of Food and Agriculture, 2016).
The OCP Group, the Moroccan multinational phosphate company, has a specific “Agribooster” program that enables African farmers to use digital technology to have a more successful growing season (OCP, 2018). The program’s mobile platform is accessible in remote parts of Africa and boasts a variety of features including access to financing, a platform to sell and buy crops, agricultural support and counselling, and harvest history (OCP, 2018). The program has equipped 55,000 farmers since 2016, including 51,000 farmers in 2018 with knowledge and digital tools across Burkina
Increasingly, architects and developers are seeking carbon neutrality standards for new buildings. Non- profits such as the World Green Building Council (WorldGBC) work with corporations to reduce energy and carbon emissions as well as water consumption (WorldGBC, 2018). Some companies have joined the cause: in 2017, JP Morgan Chase announced it would source 100% of global energy needs from renewable resources by 2020. The company has since worked to retrofit all its buildings with LED lighting to cut energy consumption by 50%, in line with the WorldGBC’s goal of moving to net zero carbon (JP Morgan Chase, 2017). Major emerging market multinationals in the sector are increasingly adopting sustainable practices in their processes. Dangote Cement, the construction branch of the Nigerian conglomerate Dangote Group, highlighted its sustainability approach in its recent sustainability report (Dangote Cement, 2018). The “Dangote Way”, operationalized in in Africa, includes salient sustainable initiatives that reduce carbon emissions and water usage, set specific emission targets and report publicly on them, while promoting principles of a circular economy across the value chain (Dangote Cement, 2018).
The OCP Group, the Moroccan multinational phosphate company, has a specific “Agribooster” program that enables African farmers to use digital technology to have a more successful growing season (OCP, 2018). The program’s mobile platform is accessible in remote parts of Africa and boasts a variety of features including access to financing, a platform to sell and buy crops, agricultural support and counselling, and harvest history (OCP, 2018). The program has equipped 55,000 farmers since 2016, including 51,000 farmers in 2018 with knowledge and digital tools across Burkina Faso, Côte d'Ivoire, Guinea, Ghana, Kenya, Nigeria and Togo (OCP, 2018).
Page 98
99
Faso, Côte d'Ivoire, Guinea, Ghana, Kenya, Nigeria and Togo (OCP, 2018). Farmers involved became more competitive and increased their production volumes without having to travel long distances for access to agricultural resources (OCP, 2017). Sustainable companies attract talent
The generation born between 1980 and 2000, also called “millennials”, is characterized by a lower level of loyalty to their employers than previous generations, and higher attention to aligning employment with personal and ethical values. This phenomenon is redefining the employer-employee relationship. A ManpowerGroup study highlights that the majority of people currently entering the workforce say that purpose is a priority in their choice of work (ManpowerGroup, 2016).
With increasing job mobility, only one in five millennials is expected to stay in the same field and progress with one employer; 75% of millennials, interviewed in 2008, said that they expected to have two to five employers throughout their lifetime (PwC, 2011). It is also important to notice that 86% of respondents would consider leaving an employer whose values no longer met their expectations (PwC, 2011). Considering this, companies should be more inclined to improve their employees’ working experience and offer fair benefits. Companies that invest in social responsibility and sustainability can potentially create a sense of belonging and be more likely to retain talents, keep employees motivated and improve productivity.
8.3. Challenges for businesses
Despite generating significant opportunities, challenges remain in actively putting sustainability at the core of business strategies and in balancing sustainable development objectives with profitability. Achieving the SDGs will require a drastic rethinking of doing business throughout and beyond the value chain. The SDGs’ awareness gap
While the private sector is expected to play a major role in achieving the 2030 Agenda for Sustainable Development, businesses have expressed that this major shift will not happen without a higher level of global SDG awareness among all relevant stakeholders. As the public’s awareness increases, companies will be able to conduct sustainable business more effectively and attract and retain better-informed customers. Evidence shows that SDG awareness is increasing, but significant hurdles remain.
As described above, evidence shows that customers are more likely to buy goods and services from companies that endorse RBC (PwC, 2015). Increasing sustainability awareness can therefore be a way to incentivize a positive relationship between customers and businesses, in which the importance of the SDGs is recognized and more companies are encouraged to follow the example of industry leaders. According to a large, nearly 1,000-firm global survey conducted by PwC, 71% of business respondents said they had started planning how they will engage with the SDGs, 13% had identified the tools they needed to assess their impact against the SDGs, while 41% said they would embed the SDGs into their strategy within five years (PwC, 2016). The dilemma of reconciling profitability, risk management and sustainability
In spite of clear incentives to further invest and act sustainably, many operational challenges remain. Businesses in developing countries often work in risky environments, where corruption is widespread, the rule of law is not enforced, and infrastructure and services are poor. Maintaining profitability and navigating these challenges thus become first order priorities, often at the expense of sustainability, which is seen as a sunk cost. In addition, some companies have had difficulty keeping up with their commitments to RBC. The OECD reports that 34 new violation instances were submitted against individual businesses in 2016 under the OECD Guidelines for Multinational Enterprises (OECD, 2016b). Alleged violations span across several sectors and involve human rights, due diligence, supply chains, stakeholder engagement and the environment. In a 2017 case, a Dutch bank was required to publish specific, intermediate targets to reach the Paris Agreement (UN, 2015), in order to prove observance of the OECD guidelines to which this company had committed, in a case submitted by NGOs to the guidelines’ national contact point (OECD, 2019). The case shows that sustainable and fair business practices have become important to civil society and are both valued and closely examined.
A number of initiatives have attempted to resolve this dilemma, and support the private sector in reconciling profitability, risk management and sustainability. One such initiative is the Human-Centered Business Model (HCBM31).
31 The HCBM project originated in 2015 within the World Bank’s Global Forum on Law, Justice and Development and is now based at the OECD’s Development Centre. It underpins an innovative ecosystem of sustainable business based on six pillars. First, a set of principles that give a new purpose to corporations. Second, updated legal frameworks and corporate governance coherent with those
Farmers involved became more competitive and increased their production volumes without having to travel long distances for access to agricultural resources (OCP, 2017).
31 The HCBM project originated in 2015 within the World Bank’s Global Forum on Law, Justice and Development and is now based at the OECD’s Development Centre. It underpins an innovative ecosystem of sustainable business based on six pillars. First, a set of principles that give a new purpose to corporations. Second, updated legal frameworks and corporate governance coherent with those principles. Third, the alignment of business goals and practices with environmental, social and governance (ESG) requirements set by responsible financiers and shareholders. Fourth, good practices of public and private procurement that encourage, for example, green, social and sustainable procurement. Fifth, effective tax systems that incentivize/penalize the positive/negative social and environmental impact of businesses. Sixth, and final, a change of business paradigm from shareholders to stakeholders’ primacy.
Page 99
100
The HCBM seeks to balance profitability with social and environmental sustainability as well as ethical and integrity principles. Enterprises volunteer to adopt and embed certain principles and values into their bylaws as goals and to establish performance indicators to assess and measure how they are reaching those goals. Because the model takes a bottom-up approach and pays special attention to micro, small and medium-enterprises, it has the potential to address the challenges of many countries, including developing countries, in some cases with weak legal frameworks, where enterprises seek ways to sustainably position themselves within global markets. (Bonaglia and Nicoli, 2019). Challenge of seeing sustainability as an integral dimension of core business
Participants in EMnet meetings highlighted the importance of integrating sustainability into their core business. They use the SDG framework to describe efforts in a common language and as a way to track and communicate them, aligning with the global sustainability agenda. This requires a major shift towards a more strategic approach, a step away from picking a few selected SDGs only, and instead focusing on horizontal issues and their link to sustainability strategies. Whereas only 1% of companies planned to assess their impact on all 17 SDGs, 34% indicated they were planning to select specific targets, according to a survey by PwC on businesses and the SDGs (PwC, 2015). By integrating the SDGs into their core strategy and taking a systemic approach to sustainability in the actual implementation of these strategic guidelines, MNEs could work towards enhancing their contribution to the 2030 agenda.
Siemens, a German industrial manufacturing company, uses a methodology called “Business to Society”. It entails an objective measurement of the impact of operations on local societies (Siemens, “Business-to-Society”) in which the firm operates. The “outside-in” approach focuses on the needs of society and the environment, using the SDGs as a roadmap. The “inside-out” approach analyses how their operations contribute to and add value to those needs. Through this methodology, Siemens considers all of the broader needs of society, including the ones that may not appear to be relevant to the company’s immediate operational goals at first glance (Siemens, n.d.). Importance of including sustainability in management education
Discussions in the EMnet meetings highlighted the importance of including responsible business practices and sustainability into management education. Business schools are the primary source of management education for future corporate leaders. However, even though the number of courses offered on corporate social responsibility and sustainability has increased over the years, they are still very detached from core management disciplines (Kolb, Fröhlich and Schmidpeter, 2017). Furthermore, there is evidence that while senior management is well aware of the importance of sustainability, middle management and employees in general do not know the SDGs or do not actively engage with them on a frequent basis (CSR Europe, 2017). In response, some universities have begun to incorporate sustainability as part of the core discipline of their programs. The CFA Institute, which trains chartered financial analysts, also has taken note of this trend, and reviewed its curriculum to include sustainability at the core of its curriculum (CFA Institute, 2017). Some have furthermore argued that “sustainability” has actually become a selling point for Master of Business Administration (MBA) programs. MBA accreditation commissions such as the European Quality Improvement System (EQUIS), the Association of MBAs (AMBA), and the Association to Advance Collegiate Schools of Business (AACSB) all added to their criteria that a business program should contain sustainability as a component of the syllabus (Scott, 2015). Lack of coordination across supply chains
During the EMnet meetings, companies discussed the challenge of coordinating sustainability efforts within their respective internal operations, particularly throughout their supply chains. According to RBC principles of “do good” while “doing no harm”, companies are also required to look at their suppliers and buyers, and take responsibility for their actions as partners in the value creation process (OECD, n.d.). High-profile cases have shown that non-compliance with RBC standards can have negative effects on the reputation of certain brands. Through these discussions, companies agreed that embedding sustainability and accountability throughout supply chains is essential to achieving the SDGs. The OECD has been supporting these efforts for a long time through the OECD Guidelines for Multinational Enterprises. The guidelines promote RBC for MNEs, not only in the way they conduct themselves, but also by avoiding harmful impacts caused by their supply chains (Nieuwenkamp, 2014).
The supply chains of a multinational company can be diversified and widespread. For example, approximately 50 different suppliers produce the components for a Dell Computer (WTO, 2013). Monitoring these complex supply chains can be cumbersome and difficult. During discussions, EMnet members noted that the SDGs could also serve as a roadmap for suppliers and buyers, considering that 75% of the world’s poorest population live in the same rural areas where many
principles. Third, the alignment of business goals and practices with environmental, social and governance (ESG) requirements set by responsible financiers and shareholders. Fourth, good practices of public and private procurement that encourage, for example, green, social and sustainable procurement. Fifth, effective tax systems that incentivize/penalize the positive/negative social and environmental impact of businesses. Sixth, and final, a change of business paradigm from shareholders to stakeholders’ primacy.
The supply chains of a multinational company can be diversified and widespread. For example, approximately 50 different suppliers produce the components for a Dell Computer (WTO, 2013). Monitoring these complex supply chains can be cumbersome and difficult. During discussions, EMnet members noted that the SDGs could also serve as a roadmap for suppliers and buyers, considering that 75% of the world’s poorest population live in the same rural areas where many supply chains begin (Business & Sustainable Development Commission, 2017).
Page 100
101
supply chains begin (Business & Sustainable Development Commission, 2017). By integrating sustainability across supply chains, companies can protect and create value at the same time (GRI, UN Global Compact and WBCSD, 2015). Many companies have formalized demands on sustainability in specific terms and conditions in contracts with suppliers. A company such as Siemens-Gamesa, for example, organized supplier events to share the company’s challenges and goals with respect to sustainability. Siemens-Gamesa has also audited of all of its key suppliers in order to align its supply chain with its CSR Master Plan (Siemens-Gamesa, 2018). Addressing SMEs’ engagement with SDGs through multinational corporations
Small and medium-sized enterprises (SMEs) account for more than half of formal employment worldwide and can play a significant role in achieving the SDGs. In emerging economies, SMEs account for 43% of jobs, an estimate that increases to 90% when considering the informal sector (Kamal-Chaoui, 2017). However, SMEs can often lack the capacity, capital and incentives to incorporate sustainable practices in their business operations (OECD, 2017d). Multinational enterprises can and should play a role by incentivizing SMEs in their value chains so that they incorporate an SDGs approach into their operations. MNEs can also lead by example through their market power: by supporting a critical consumer mass that validates a sustainability premium (i.e. a higher price for a product produced in a sustainable manner), MNEs can thus establish an environment that encourages other firms to focus on sustainability.
EMnet discussions also highlighted successful MNE and SME partnerships. Larger enterprises can benefit from investing in SMEs and getting access to new markets. The French multinational energy company ENGIE, for example, has set up a corporate impact venture fund that invests in social enterprises that aim to provide sustainable energy access for vulnerable population groups around the world (ENGIE, 2016a and 2016b). Through these investments, ENGIE offers finance to SMEs in the energy sector, whilst gaining access to a new market that it could not reach before. Internal and external accountability – measuring progress against the SDGs
To achieve the SDGs by 2030, businesses stressed the importance of establishing clear internal and external accountability benchmarks. This can provide MNEs with mechanisms to monitor their progress towards meeting the SDGs. An Accenture survey found that 86% of CEOs believe that standardized impact metrics will be important in unlocking the potential of business on the SDGs. Furthermore, 73% of respondents believe that business should develop common indicators to measure and communicate impact on the SDGs (Accenture, 2016; WBCSD, 2016).
Discussions during the EMnet meetings suggested sustainability evaluations should be considered part of the overall business performance assessment. There was, however, agreement that there is no simple way to measure sustainability and compare results. In this regard, Danone, a French multinational food-products company, has designed a program called “Danone Way”. Danone Way uses a set of guidelines to implement and monitor sustainability in each business unit (Danone, 2017). Through these guidelines, Danone can measure the company’s overall progress towards the SDGs through each business unit’s performance. Each unit is therefore internally accountable and responsible for helping the company integrate sustainability goals into its business operations.
As a general approach, businesses touched on how MNEs need to be accountable to their clients and to the public on the actions they take, as they work towards becoming more sustainable. In this context, adopting an overall corporate strategy on RBC is essential to mitigate reputational risks. As sustainability becomes more mainstream, various countries have started publishing information on specific carbon emissions or climate risk by individual companies (EY 2013). “Virtual whistle-blowing” can damage a firm’s reputation, especially when its commitment to sustainability is seen as superficial or disingenuous. Recent examples demonstrate how discovering potentially unlawful working conditions in the value chains can damage the reputation of specific industries, such as the case of the garment industry (Moulds, 2015).
8.4. Conclusion
The SDGs provide an opportunity to rethink approaches to sustainable value creation. It has therefore become increasingly relevant for businesses to adhere to the SDGs and to the sustainability agenda set out in Agenda 2030. There are many ways in which companies can integrate sustainability into their operations. Having companies’ leadership prioritize the SDGs can help ensure that sustainability is built into the underlying corporate culture and that efforts towards achieving SDGs take root over time, across value chains and within all layers of the company.
Focusing on sustainability also makes business sense, allowing companies to achieve higher levels of labor productivity over the long run and enabling multinational enterprises to remain more competitive to meet the needs of their client base while creating a sense of shared value.
It is therefore not surprising that there is a growing dynamism to sustainability initiatives under the umbrella of the SDGs. More specifically for multinationals based in emerging markets, efforts in support of the 2030 Sustainable Development agenda are increasing and intensifying. From Latin America to Africa and Asia, corporations are
By integrating sustainability across supply chains, companies can protect and create value at the same time (GRI, UN Global Compact and WBCSD, 2015). Many companies have formalized demands on sustainability in specific terms and conditions in contracts with suppliers. A company such as Siemens-Gamesa, for example, organized supplier events to share the company’s challenges and goals with respect to sustainability. Siemens-Gamesa has also audited of all of its key suppliers in order to align its supply chain with its CSR Master Plan (Siemens-Gamesa, 2018).
It is therefore not surprising that there is a growing dynamism to sustainability initiatives under the umbrella of the SDGs. More specifically for multinationals based in emerging markets, efforts in support of the 2030 Sustainable Development agenda are increasing and intensifying.
Page 101
102
implementing strategies and defining projects to reduce carbon emissions, save water, and create circular economy concepts. Although progress is not still heterogeneous across companies or industries and while it is still hard to measure and compare, the momentum towards more sustainable production and more responsible business conduct has found fertile ground in emerging markets.
At a time when frameworks to encourage this transition struggle to keep pace, EMnet through its Working Group aims to create a convening space to support the private sector in addressing the challenges identified in this chapter.
REFERENCES
Accenture (2016), Agenda 2030: A Window of Opportunity, UN Global Compact Accenture Strategy, https://www.accenture.com/t20161216t041642z__w__/us-en/_acnmedia/accenture/next-gen-2/insight-ungc-ceo-study-page/accenture-un-global-compact-accenture-strategy-ceo-study-2016.pdf
Benhamou, S. and M. Diaye (2016), Corporate Social Responsibility and Competitiveness, France Stratégie, Paris, www.strategie.gouv.fr/sites/strategie.gouv.fr/files/atoms/files/synthese-rse_en.pdf.
Bonaglia and Nicoli (2019), Human-Centred Business Model: an innovative business ecosystem for sustainable development, (Forthcoming on https://oecd-development-matters.org/)
Business and Sustainable Development Commission (2017), Better Business, Better World, London, http://report.businesscommission.org/uploads/BetterBiz-BetterWorld_170215_012417.pdf.
CFA Institute (2017), On Sustainability, https://www.cfapubs.org/doi/pdf/10.2469/cfm.v28.n2.1. Connect4Climate (2018), Ten New Markets earmarked as opportunities to boost lagging Sustainable Development
Goals, https://www.connect4climate.org/article/ten-new-markets-earmarked-opportunities-boost-lagging-sustainable-development-goals.
CSR Europe (2017), The Sustainable Development Goals (SDGs): The Value for Europe, https://www.csreurope.org/sites/default/files/uploads/FS_WP_Sustainable%20Development%20Goals_05112017_RD_0.pdf.
Dangote Cement (2018), Annual Report 2018, http://www.dangotecement.com/wp-content/uploads/reports/2019/Q1/DangoteCementPlc_2018_AnnualReport.pdf.
Danone (2017), Danone Way, Paris, https://www.danone.com/content/dam/danone-corp/danone-com/about-us-impact/publications/en/2018/Danone-RA2017-EN-PDF-e-accessible_03.pdf.
DNV GL, Sustainia, UN Global Compact (2018), Global Opportunity Report 2018, https://issuu.com/sustainia/docs/ global_opportunity_report_2018_1a5a0c3de3371d.
ENGIE (2016a), Rassembleurs d’Energies initiative, https://www.engie.com/en/commitments/providing-sustainable-energy-access-for-all/rassembleurs-denergies/.
ENGIE (2016b), Rassembleurs d’Energies, 2016 Progress Report, http://library.engie.com/uid_2351b0d7-7021-4398-a0d3-d185fd027370/beevirtua/beevirtua.html?#app=3d20&ccb3-pageId=0&adf3-lang=en&9557-source=xmlConfs/init.xml.
European Union (2018), Novel foods regulation, http://eur-lex.europa.eu/legal-content/EN/TXT/PDF/?uri=CELEX :32015R2283&from=EN.
EY (2013), Sustainability reporting - the time is now, e. GRI, UN Global Compact and WBCSD (2015), SDG Compass: the Guide for Business Action on the SDGs, SDG Compass,
https://www.globalreporting.org/resourcelibrary/GSSB-Item-29-SDG-Compass-Meeting5Nov15.pdf. Groupe ADS (2019), The Founder, http://adsglobalcorp.com/en/the-founder/, (accessed on 5 September 2019). GSMA (2013), Telecoms Renewable Energy Vendors/ESCOs Landscape in Bangladesh,
https://www.gsma.com/mobilefordevelopment/wp-content/uploads/2013/04/GSM_Vendor_040413_Bangladesh.pdf.
Huawei (2018a), Sustainability Report 2018, https://www-file.huawei.com/-/media/corporate/pdf/sustainability/2018/2018-csr-report-en.pdf?la=en.
Huawei Corporate (2018b), Huawei launches PowerCube 1000 Advanced Diesel Hybrid Power solution at AfricaCom, https://www.itweb.co.za/office/huaweicorporate/content/dgp45MaGWKrvX9l8.
From Latin America to Africa and Asia, corporations are implementing strategies and defining projects to reduce carbon emissions, save water, and create circular economy concepts. Although progress is not still heterogeneous across companies or industries and while it is still hard to measure and compare, the momentum towards more sustainable production and more responsible business conduct has found fertile ground in emerging markets.
Page 102
103
International Energy Agency (2017a), World Energy Outlook 2017, http://www.iea.org/bookshop/750-World_Energy_Outlook_2017.
International Energy Agency (2017b), Energy Access Outlook 2017, https://www.iea.org/publications/freepublications/ publication/weo-2017-special-report-energy-access-outlook.html.
International Labor Organization (2017), World Employment and Social Outlook 2017 – Sustainable Enterprises and Jobs: Formal Enterprises and Decent Work, International Labour Organization, Geneva, http://www.ilo.org/global/publications/books/WCMS_579893/lang--en/index.htm.
Indian Council of Food and Agriculture (2016), Report on Doubling Farmer’s Income by 2022: Farm Crisis and Farmers’ Distress, India International Centre, New Delhi, India, http://www.icfa.org.in/assets/doc/reports/6202513-doubling-farmers-income.pdf.
International Finance Corporation (2013), IFC Jobs Study: Assessing Private Sector Contributions to Job Creation and Poverty Reduction, World Bank, Washington, DC, https://www.ifc.org/wps/wcm/connect/0fe6e2804e2c0a8f8d3bad 7a9dd66321/IFC_FULL+JOB+STUDY+REPORT_JAN2013_FINAL.pdf?MOD=AJPERES.
JP Morgan Chase (2017), “JPMorgan Chase commits to 100% renewables & greater building energy efficiency”, http://www.worldgbc.org/news-media/jpmorgan-chase-commits-100-renewables-greater-building-energy-efficiency.
Kamal-Chaoui, L. (2017). “Unlocking the potential of SMEs for the SDGs”, OECD Development Matters, OECD Publishing, Paris, https://oecd-development-matters.org/2017/04/03/unlocking-the-potential-of-smes-for-the-sdgs/.
Kolb, M., L. Fröhlich and R. Schmidpeter (2017), “Implementing sustainability as the new normal: Responsible management education – From a private business school's perspective”, International Journal of Management Education, Cologne Business School, Germany, http://www.sciencedirect.com/science/article/pii/S147281171730099X.
MacArthur Foundation, The New Plastics Economy, e. Mahindra (2018), Mahindra Group To Go Carbon Neutral by 2040 Focus on Energy Efficiency and Renewable Power,
https://www.mahindra.com/news-room/press-release/mahindra-group-to-go-carbon-neutral-by-2040-focus-on-energy-efficiency-and-renewable-power
MASL (2018), Mahindra Agri Solutions, https://www.mahindraagri.com. ManpowerGroup (2016), Millennial Careers: 2020 Vision, www.manpowergroup.com/millennials. Miremadi, M., C. Musso and U. Weihe (2012), How much will consumers pay to go green?, McKinsey Quarterly,
October, https://www.mckinsey.com/business-functions/sustainability-and-resource-productivity/our-insights/how-much-will-consumers-pay-to-go-green.
Moulds, J. (2015), Child labour in the fashion supply chain: Where, why and what can be done. The Guardian, January 2015, https://labs.theguardian.com/unicef-child-labour/ (accessed on 28 February 2018)
Nielsen Company (2015), Consumer Goods’ Brands that Demonstrate Commitment to Sustainability Outperform Those that Don’t, e.
Nieuwenkamp, R. (2014), Corporate leaders: Your supply chain is your responsibility, OECD Observer, http://oecdobserver.org/news/fullstory.php/aid/4366/Corporate_leaders:_Your_supply_chain_is_your_responsibility.html.
OCP Group (2018), Sustainability Report 2018, https://www.ocpgroup.ma/sites/default/files/2019-07/Sustainability%20report%202018%20OCP.pdf.
OCP Group (2017), #Switch to Digital, Sustainability Report 2017, https://www.ocpgroup.ma/sites/default/files/2019-05/RA%20OCP%202017%20VUK.pdf.
OECD (n.d.), Responsible business conduct and human rights, http://www.oecd.org/industry/inv/responsible-business-conduct-and-human-rights.htm
OECD (2019), ING Bank and NGOs concerning climate policy, http://mneguidelines.oecd.org/database/instances/nl0029.htm.
OECD (2018), Taxing Energy Use 2018: Companion to the Taxing Energy Use Database, OECD Publishing, Paris. http://dx.doi.org/10.1787/9789264289635-en.
OECD (2017a), Business Insights on Emerging Markets 2017, http://www.oecd.org/dev/oecdemnet.htm. OECD (2017b), Bridging the Gap: Inclusive Growth 2017 update report, http://www.oecd.org/inclusive-
growth/Bridging_the_Gap.pdf.
Page 103
104
OECD (2017c), Policy Note on Green Investment, Energy Investment and Carbon Pricing in Emerging Markets, OECD Publishing, Paris, http://www.oecd.org/dev/Energy_Investment_Carbon_Pricing_Note_EMnet.pdf.
OECD (2017d), Enhancing the Contributions of SMEs in a Global and Digitalised Economy, https://www.oecd.org/ mcm/documents/C-MIN-2017-8-EN.pdf.
OECD (2016a), Development Co-operation Report 2016: The Sustainable Development Goals as Business Opportunities, http://dx.doi.org/10.1787/dcr-2016-en.
OECD (2016b), Annual Report on the OECD Guidelines for Multinational Enterprises 2016, http://www.oecd.org/ daf/inv/mne/2016-Annual-Report-MNE-Guidelines-EN.pdf.
OECD (2016c), Effective Carbon Rates: Pricing CO2 through Taxes and Emissions Trading Systems, e. PwC (2016), Make it your business: Engaging with the Sustainable Development Goals, https://www.pwc.com/gx/en/
sustainability/SDG/SDG%20Research_FINAL.pdf. PwC (2015), Make it your Business: Engaging with the Sustainable Development Goals, PricewaterhouseCoopers,
www.pwc.com/sdg. PwC (2011), Millennials at Work: Reshaping the Workplace, PricewaterhouseCoopers, https://www.pwc.de/
de/prozessoptimierung/assets/millennials-at-work-2011.pdf. Scott, Mike (2015), Sustainability now key selling point for business schools attracting students, The Guardian,
https://www.theguardian.com/sustainable-business/2015/feb/09/are-business-schools-taking-sustainability-seriously.
Siemens (n.d.), Business-to-Society, Why contributing to sustainable development matters, www.siemens.com/global/en/home/company/sustainability/business-to-society.html.
Siemens-Gamesa (2018), Sustainability – Commitments – Suppliers – Responsible Supply Chain Development, http://www.siemensgamesa.com/en/sustainability-commitments-suppliers-responsi.html.
UN (2017), Sustainable Development Goals, United Nations, http://www.un.org/sustainabledevelopment/sustainable-development-goals/#.
UN (2015), Paris Agreement, http://unfccc.int/files/essential_background/convention/application/pdf/english_paris_agreement.pdf.
UN (2000), Millennium Development Goals, United Nations, http://www.un.org/millenniumgoals/. UN Global Compact (2018), Roadmap for Integrated Sustainability, United Nations Global Compact,
www.unglobalcompact.org/take-action/leadership/integrate-sustainability/roadmap. UN Global Compact and BSR (2017), Supply Chain Sustainability – A Practical Guide for Continuous Improvement, United
Nations Global Compact and BSR, https://www.unglobalcompact.org/docs/issues_doc/supply_chain/ SupplyChainRep_spread.pdf.
UNIDO, UN Global Compact (2014), Engaging with the Private Sector in the Post-2015 Agenda, United Nations Industrial Development Organization and United Nations Global Compact, https://www.unido.org/fileadmin/ user_media_upgrade/Resources/Publications/Final_Consultation_Report_Engaging_with_the_Private_Sector.pdf.
Unilever (2017), Unilever commits to 100% recyclable plastic packaging by 2025, https://www.unilever.com/news/ Press-releases/2017/Unilever-commits-to-100-percent-recyclable-plastic.html.
World Bank (2013), World Development Report on Jobs 2013, http://siteresources.worldbank.org/EXTNWDR2013 /Resources/8258024-1320950747192/8260293-1322665883147/WDR_2013_Report.pdf.
WorldGBC (2018), About Green Building, http://www.worldgbc.org/benefits-green-buildings. WBCSD (2017), World Business Council on Sustainable Development, CEO Guide to the Sustainable Development Goals,
http://www.wbcsd.org/Overview/Resources/General/CEO-Guide-to-the-SDGs. WRI India and Shakti Sustainable Energy Foundation (2018), Internal Carbon Pricing Primer Case Studies, “Mahindra &
Mahindra: Drives investment with hybrid carbon pricing scheme”, https://shaktifoundation.in/wp-content/uploads/2018/03/Internal-Carbon-Pricing-Primer-Case-Study.pdf.
WTO (2013), Views of GVC operators, in Global Value Chains in a Changing World, World Trade Organization, Geneva, Switzerland, www.wto.org/english/res_e/booksp_e/aid4tradeglobalvalue13_e.pdf.
WWF (2015), Reviving the Oceans Economy: The Case for Action, https://c402277.ssl.cf1.rackcdn.com/publications/ 790/files/original/Reviving_Ocean_Economy_REPORT_low_res.pdf?1429717323
Page 104
In collaboration with
SCHOOL OF ECONOMICS AND MANAGEMENT, WUHAN UNIVERSITY, CHINA
SCHOOL OF MANAGEMENT, UNIVERSIDAD DE LOS ANDES, COLOMBIA
EGADE/TECNOLOGICO DE MONTERREY, GUADALAJARA, MEXICO
BUSINESS SCHOOL, UNIVERSIDAD DEL NORTE, COLOMBIA
AND
EMERGING MARKETS RESEARCH NETWORK
www.johnson.cornell.edu/Emerging-Markets-Institute
ISBN-13: 978-1-7328042- 3-4
ISSN 2689-0127
https://hdl.handle.net/1813/66978
facebook.com/CornellEMI/ @lourdescasanova