the role of technological catch up and domestic market growth in the genesis of emerging country...
TRANSCRIPT

1
The role of technological catch up and domestic market growth in the
genesis of emerging country based multinationals
Abstract The paper presents a model that evaluates how upgraded technological capabilities of emerging
country based multinationals (EMNCs) and an increase in the domestic market size of large emerging
countries affect value chain location choices and the competitiveness of emerging country based firms
versus advanced country based ones. The model shows that, even without possessing a competitive
advantage in terms of technology and/or brands, EMNCs from large or rapidly technologically
advancing countries can become dominant players in the global system. The model highlights the
central role of firm level technological intensity and product differentiation in determining the location
of value chain activities as well as defining organizational boundaries. Empirical analysis of the
location choices of the world's top multinationals from large advanced and emerging countries in 2010
supports the model's predictions.
Key words: Emerging country based MNCs, Technological catch up, Domestic market growth, Global
system view, Location choice.

2
1. Introduction
Post World War II globalization, in terms of Foreign Direct Investment (FDI) and international trade,
has been dominated by large advanced country based multinationals (AMNCs). Such hegemony was
facilitated by technological advantages, well recognized brands, superior managerial practices and
production efficiency, coupled with the existence of large domestic markets as a major source of
demand for products and services (Dunning, 1988, 1993; Vernon, 1966, 1971).
However, the accelerated development of countries such as Brazil, India, China and Russia has
resulted in a growing number of emerging country based multinationals (EMNCs) beginning to play
an important role in today's global system. The increased salience of EMNCs has been widely
documented in the extant literature (e.g. Bonaglia, Goldstein and Mathews, 2007; Buckley, Clegg,
Cross, Zheng, Voss and Liu, 2007; Dunning, 2006; Duysters, Jacob, Lemmens and Jintian, 2009;
Goldstein, 2007; Lall, 1983; Luo and Tang, 2007; Matthews, 2002, 2006; Niosi and Tschang, 2009;
Ramamurti and Singh, 2009; Sauvant, 2008; Wells, 1983).
A recurring question in this stream of literature is how can one explain the rise of EMNCs, and
especially their ability to engage in FDI in advanced countries, given that many emerging country
based firms lack firm-specific competitive advantages? (Amsden and Chu, 2003; Goldstein, 2007;
Mathews, 2006; Nolan, 2004; Ramamurti, 2009a; Rugman, 2009). According to Dunning's
Ownership-Location-Internalization paradigm (Dunning, 1977; 1988) the possession of firm specific
advantages, mainly in technological advance and brands, is a necessary condition for the emergence of
the multinational corporation (MNC). This is because such advantages are needed to compensate for
the liabilities of foreignness (Hymer, 1976), which imply a higher cost of doing business abroad for
foreign firms. Hence, in the absence of such advantages, the rise of EMNCs seems to contradict extant
explanations for the existence of MNCs.
Several answers were provided to this question, including: the superior ability of EMNCs to operate in
harsh institutional environments in other developing countries (Cuervo-Cazzura and Genc, 2008;
Dunning and Lundan, 2008), greater capability to adapt products to the specific demands of import
protected developing markets (Lall, 1983; Wells, 1983), the leverage of home country advantages such
as natural resources and cheap labor (Rugman, 2009; Cantwell and Barnard, 2008; Williamson and

3
Zeng, 2009), access to cheap capital because of imperfections in the domestic capital market (Buckley,
et al., 2007) and the desire to engage in "knowledge asset seeking" in foreign markets (Dunning, 2006;
Dunning, Kim and Park, 2008; Goldstein, 2007; Hoskisson et al, 2000; Luo and Tang, 2007;
Matthews, 2002). Yet, it still remains unclear if and under what conditions EMNCs are likely to
compete successfully with AMNCs on a global scale (Ramamurti, 2009b).
The current paper utilises the global system view model (Buckley and Hashai, 2004; Casson, 2000) to
postulate the conditions under which EMNCs will close the gap vis-à-vis AMNCs in terms of
dominance in serving global markets and foreign direct investment. More specifically, the model
formally analyzes how upgrading the technological capabilities of EMNCs and a substantial increase
in domestic market size of emerging countries, are likely to project EMNCs versus AMNCs in terms
of the worldwide location and ownership of Research and Development (R&D), production and
marketing activities. The model specifically highlights the role of technology intensity and product
differentiation in the comparative statics of a global system comprised of EMNCs and AMNCs.
The model predicts a novel phase of globalization where EMNCs from countries where lower
production costs are maintained, and that encounter rapid technological progress or possess a large and
growing domestic market become dominant competitors for AMNCs. It shows that value chain
location for AMNCs and EMNCs is likely to be quite different, where AMNCs are expected to locate
R&D and marketing activities primarily in advanced countries, EMNCs are expected to locate R&D
and production activities primarily in emerging countries. The model further shows that greater
technological intensity increases the propensity of AMNCs to locate production in advanced countries,
while increasing the propensity of EMNCs to locate marketing activities in emerging countries.
Greater technology intensity and product differentiation further increase the propensity of both
AMNCs and EMNCs to integrate activities in-house, rather than outsource them. Empirical analysis of
the location choices of the world's top MNCs from large developed and developing countries in 2010
(in Gross Domestic Product terms) supports these value chain location and integration predictions.
A key insight of the model is that even without possessing firm specific advantages in R&D and
marketing, EMNCs from large and rapidly technology advancing countries may become dominant
players in the global system. Once emerging country based firms catch up on technology (while not

4
achieving a competitive advantage) and once their domestic market size increases sufficiently (making
the interaction with consumers less costly) they become able to successfully compete with advanced
country based firms.
In the next section we briefly present the literature on the rise of EMNCs. In section 3 we build on the
"global system view" perspective and present a simple model that predicts the outcome of EMNCs
versus AMNCs competition in terms of value chain location and integration. Section 4 presents our
data, measures and methods, and results in section 5. Insights from the model and the structure of the
resulting emergent global system are discussed in the concluding sections.
2. The globalization of EMNCs
The global system at the end of the 20th century started to emerge after the Second World War
(Obstfeld and Taylor, 2002).1 This system has been characterized by the dominance of the US, Europe
and Japan in terms of military power, political influence and technological advance. Foreign
investments were the engine of this globalization phase where integrated capital markets absorbed FDI
outflows led by AMNCs, reaching a peak of over $US 2 Trillion in 2007 (UNCTAD, 2009).
Yet, already 30 years ago a new type of multinational had emerged: emerging country based
multinationals2. The rise of this type of multinational initially was explained by their superior ability to
substitute imports in protected emerging countries in terms of scale, labor costs, skill and adapted
materials (Wells, 1983). It was further argued that EMNCs often use outdated and simpler adapted
technology in other emerging countries going down the ladder of the product life cycle to even less
advanced countries (Ghymn, 1980; Lall, 1983). In many aspect EMNCs are still believed to enjoy the
1 Of course this process is not unique as the following quotation about ancient Rome illustrates. “….trading with
Empires, picking up new farming techniques from them, receiving their diplomatic subsidies, copying their
weaponry and ideologies, and organising yourself to fend off the worst excesses of domination, all pushed
forward the sequential emergence of more developed economies and larger state structures in the Germanic and
Slavic worlds in the two halves of the first millennium…. particular groups in the periphery are able to take
advantage of the opportunities opened up by the range of new contracts with an imperial neighbor, and this is
precisely what we now call a globalization” (Heather 2013: 294).
2 The exact definition of EMNCs is not trivial (Goldstein, 2007, section 2.1). In this paper we refer to multinationals that are managed from an emerging country headquarters as "EMNCs". We acknowledge the fact that this definition may not include all multinationals originating in emerging countries yet it captures the vast majority of such multinationals.

5
advantages of experience of operating in harsh institutional environments (Cuervo-Cazurra and Genc,
2008; Dunning and Lundan, 2008) and data indeed shows that such firms mainly establish foreign
operations in other emerging countries, most often in their home region (Rugman, 2008, 2009). All in
all this pattern of EMNCs investing in other emerging countries seemed to fall within the boundaries
of extant FDI theories (Dunning, et al., 2008).
Yet, as Figure 1 illustrates, the outward FDI stock from large emerging countries such as Brazil,
Russia, India and China (BRIC) into major advanced countries, such as Germany, Japan, the US and
the UK, has increased almost tenfold in the last decade. While in terms of share out of inward FDI,
FDI from emerging countries into advanced ones is still modest (about 1.2% in 2010) it is clear that a
growing number of EMNCs are establishing operations in advanced countries. Multiple pieces of
anecdotal evidence such as Lenovo's takeover of IBM's PC business, Tata Steel's takeover of the
Anglo-Dutch Corus Steel, Jaguar, Land Rover and Tetley Tea, Cemex's takeover of large cement
companies in Australia, the UK and the US provide further evidence for the growing dominance of
EMNCs vis-à-vis AMNCs.
[Insert Figure 1 about here]
The fact that many EMNCs establish foreign operations in advanced countries seems to contradict
extant international business theories. One would expect EMNCs to possess competitive advantages in
terms of technology, brands or superior managerial practices (Dunning, 1977, 1988) that will
compensate for their liability of foreignness (Hymer, 1976) when operating in more advanced
countries. Given that many EMNCs often lack firm specific competitive advantages (Amsden and
Chu, 2003; Goldstein, 2007; Nolan, 2004; Mathews, 2006; Ramamurti, 2009a,b; Rugman, 2009)
alternative explanations to the rise of EMNCs were sought.
One important explanation refers to the establishment of foreign operations in advanced countries as a
vehicle for knowledge asset seeking (Buckley et al., 2007; Cantwell and Barnard, 2008; Dunning,
2006; Dunning et al., 2008; Goldsterin, 2007; Luo and Tang, 2007; Matthews, 2002). In other words,
EMNCs do not go abroad to exploit existing firm specific advantages but rather to explore new ones
(Hoskisson, et al., 2000). By establishing a presence in advanced countries, EMNCs gain greater
proximity to advanced country firms as means to facilitate the acquisition of superior technological

6
knowledge, marketing advances, or managerial practices. Yet, given the inherent assumption that
EMNCs are disadvantaged relative to AMNCs, this explanation falls short in explaining exactly how
EMNCs suddenly become able to efficiently absorb the superior capabilities of AMNCs, acquire and
in some instances outcompete them.
Other scholars argue that EMNCs build on their country specific advantages such as natural resources
or cheap labor. Since access to such production factors in emerging countries is often limited and
controlled, EMNCs that are granted privileged access to these factors may build on such resources to
create a competitive advantage (Cantwell and Barnard, 2008; Dunning, et al., 2009; Rugman, 2009;
Williamson and Zeng, 2009). Access to cheap capital because of subsidies, deficiencies in the
domestic banking system, family finance or conglomerate cross-subsidisation may also enable the
internationalization of EMNCs (Buckley et al., 2007). While this argument is plausible it has more to
do with the ability of EMNCs to compete with AMNCs in emerging markets rather than in advanced
ones, and is much less applicable to industries where technology and marketing brands are dominant
determinants of competitive advantage.
Other explanations for the rise of EMNCs include: the fact that international operations provide an
opportunity to diversify risks and improve flexibility especially in the case of emerging country based
business groups (Amsden and Hikino, 1994; Lawrence, 1993; Ramamurti, 2009a), the greater
entrepreneurial spirit of EMNCs as compared to more bureaucratic management practices of AMNCs
(Amsden, 2009) and late mover advantages when operating in mature mid-tech industries (Ramamurti,
2009b). These explanations, while probably making a good case for specific EMNCs, are hardly
generalizable to capture the phenomenon of increased EMNC growth in the advanced country
markets.
It follows therefore that the plethora of explanations for the rise of EMNCs does not provide an
adequate answer to the questions: To what extent EMNCs are able to successfully compete with
AMNCs?; and under which conditions are they able to do that? In order to answer these questions one
has to take into account two major phenomena that have been observed in some of the emerging
countries in the recent decade: technological catch up (Perez, 2002) and the growth of domestic
markets.
7
2.1 Technological catch up and domestic market growth in large emerging countries
The accelerated globalization of the last half century in terms of FDI and foreign trade coincided with
a technological revolution: the "information revolution" (Perez, 2002). This revolution was led, from
its emergence in the early 1970s, by the United States (Perez, 2002). However, in the last decade some
emerging countries, such as Brazil, India, China and Russia, have gone through a rapid process of
catching up in terms of their share in the world's high technology production and technological
advance (Borensztein and Ostry, 1996; Mahmood and Singh, 2003; Naughton, 2007). This has not
only resulted from intensive efforts for technology assimilation (Nelson and Pack, 1999) but also from
innovation by EMNCs themselves and the establishment of R&D sites in these countries (Athreye and
Cantwell, 2007). Large governmental spending on higher education, coupled with legal and economic
reforms aimed at increasing competition and securing an effective system of property rights (Peng,
Wang and Jiang, 2008; Yang, 2003; Yang, Fryxell and Sie, 2008) are some of the prominent reasons
for this catching up process. In many cases, it was the improved technological and macro-economic
infrastructure led by the incoming FDI of AMNCs that facilitated this technological catch up (Amsden
and Hikino, 1994; Cantwell and Barnard, 2008; Goldstein, 2007; Khanna and Palepu, 2006; Rugman
and Doh, 2008).
Table 1 lists the global capabilities (GloCap) index of technological advance (Filippetti and Peyrache,
2011) for selected emerging and advanced countries. The GloCap index is comprised of various
technological indicators including: business innovation (patents, business R&D expenditures),
knowledge and skills (number of researches, scientific articles published, public R&D expenditures)
and infrastructure (number of PCs, internet users, broadband subscribers)3. The Index relates to the
year 2007 and the table also reports its growth rate between 1995 and 2007. Table 1 clearly reveals
that while the GloCap index is lower for the selected emerging countries, its average annual growth
3 The GloCap index is based on the principles guiding the construction of the ArCo index (Archibugi and Coco,
2004, 2005) but is updated.

8
rate in the 1995-2007 period is significantly higher than that of advanced countries4. Indeed, recent
data (National Science Board, 2012) reveal that the rate of real growth in R&D expenditures is the
highest for Asian countries, headed by China. Asian countries have actually matched the level of R&D
expenditures of the US, with overall annual expenditures of about $US 400 Billion.
[Insert Table 1 about here]
This catching up process is also one of the triggers for the rapid increase in the income per capita of
several large emerging countries, making their domestic markets central in the world's goods markets
(Tolentino, 2000; Cantwell and Barnard, 2008). Indeed, the differences in income per capita between
advanced and emerging countries remain significant (World Bank, 2012), yet the increase in income
per capita in large population countries, such as China or India, results in an overall significant
increase in such countries Gross Domestic Product (GDP). Table 1 further lists 2010 GDP data (in
absolute terms) and GDP growth between 2000 to 2010 for selected advanced and emerging countries.
China's Gross Domestic Product (GDP) is second to the US reaching over $US 5.9 Trillion, Brazil is
seventh in its ranking with a GDP of over $US 1.7 Trillion (World Bank, 2010)5.
This trend implies that several emerging economies became attractive for foreign and local investors
not only due to their relatively cheap resources but also due to their growing domestic markets. This
trend has intensified following the recent financial crisis that virtually led to a halt in GDP growth in
advanced countries, while only marginally slowing down the growth rate of emerging countries such
as China and India (UNCTAD, 2009). Just as the large domestic markets of advanced countries have
been one of the sources for the dominance of such countries' multinationals in the last half century,
larger domestic markets are becoming a source of growth to EMNCs. In fact, some scholars predict
that Asia's share of the world's total GDP will increase from about 23% in 1970 to 50% in 2050
(Sachs, 2008).
4 In fact, assuming that the average annual growth rates of the listed emerging and advanced countries do not
change, one can estimate the time period by which the gap in the GloCap index is to be closed, via the equation: 0.117*(1+0.354)n= 0.604*(1+0.069)n. In this case n=7 (years) represents the timeframe where the GloCap index of the BRIC countries surpasses that of advanced countries, indicating technological catch up. 5 Assuming that the average annual rates of GDP growth will be retained, the equation 1.7*(1+0.074)n=
2.2*(1+0.017)n reveals that the domestic market size of India, for instance, will surpass that of the UK in 5 years.

9
Given the technological catch up of large emerging countries and the growth of domestic markets, a
potentially important question is therefore to what extent these factors can explain the rapid
development of EMNCs from large emerging countries in the last two decades (Ramamurti and Singh,
2009; Sauvant, 2008) and how it affects their global value chain location and organizational
boundaries.
3. Theoretical framework - global system evolution
The potential outcome and characteristics of globalization led by EMNCs because of their
technological catch up and increase in domestic market size are next demonstrated by introducing a
simple model of an economic system producing products that differ in their technological intensity and
differentiation. The model builds on the "global system view" perspective (Buckley and Hashai, 2004,
2009; Casson, 2000, chapter 3) and predicts the evolving dominance of advanced versus emerging
country origin multinationals as well as the shifting location of R&D, marketing and production
activities. Applying a global system view to the theory of internationalization, the world is modelled
as a grid of locations for value chain activities (e.g. R&D, production, and marketing) that are
interconnected through knowledge flows. The basic notion of the global system view dates back to
Coase’s (1937) transaction cost theory. Essentially, each value adding activity can be located in any
location and coordinated within a firm or through a market exchange. The number of firms that
eventually exist, their location and their organizational boundaries (in terms of value chain activities)
is expected to minimize the overall cost of the system as well as the cost for each firm. Equilibrium
will not be achieved as long as there is a profit opportunity somewhere in the system that enables
actors within it to reduce costs. At one extreme there would be as many firms as the number of
potential locations multiplied by the number of relevant value chain activities. At the other extreme, a
single multinational would exist and would internalize the whole world system.
The global system model, presented below, analyzes optimal location and internalization choices in
the global system before and after technological catch up and a substantial increase in the domestic
market size of emerging countries. It enables the prediction of the outcome in the changing dominance

10
of advanced versus emerging country multinationals and their location and internalization choices
across the value chain.
3.1 Specification of the model
Consider an economic system that produces consumer goods. The system is comprised of an advanced
country (AD) and an emerging country (EM). Four types of value chain activities are involved:
Headquarters (HQ), R&D (R), Production (P)6 and Marketing (M). AD is assumed to be
comparatively abundant with skilled labor; and hence according to the Hecksher-Ohlin-Samuelson (H-
O-S) theory it is expected to have a comparative advantage in value chain activities that are "skilled
labor" intensive. EM is comparatively abundant with unskilled (or cheap) labor and hence has a
comparative advantage in value chain activities that are "unskilled labor" intensive7 (Ramamurti,
2009b).
The value chain activities are linked to one another by flows of knowledge (denoted by K). Four main
types of linkage are identified: KHQ-R – flow of knowledge between the firm's headquarters and R&D,
reflecting the role of managerial discretion. KR-P - flow of know-how between R&D and production,
KM-R - flow of knowledge between marketing and R&D and KM-C - flow of knowledge between the
marketing entity and customers (C). All knowledge flows are two-way. This is because there is always
feedback in knowledge flows between different value adding activities. Consistently with extant
global system view models (Buckley and Hashai, 2004, Casson, 2000, chapter 3) the flow of
knowledge between headquarters, production and marketing is entirely intermediated by R&D.
The location of headquarters (either in AD or EM) represents the origin of the firm (Goldstein, 2007).
Each of the other value chain activities (R, P and M) can be located either in AD or EM, hence may be
thought of as representing the major bulk of R&D, production or marketing activity taking place in the
system. This implies 16 (24) alternative location options that are depicted in Figure 2. Each location
option (hereinafter – location configuration) represents a potentially optimal system that includes
6 Production costs may be considered as "operation" costs making the model also suitable to relate to service (rather than product) providers. 7 Labor is assumed to be internationally immobile whereas capital is assumed to be internationally mobile and thus has little or no impact on comparative advantage (Casson, 1985).

11
headquarters, R&D, production and marketing activities, connected via knowledge flows (marked in
arrows), that can be located either in AD or EM. Each location configuration may include a maximum
of four firms (assuming each activity is performed by an independent firm) and a minimum of one
firm (assuming one multinational internalizes all value chain activities).
[Insert Figure 2 about here]
The various cost components of the model are as follows:
R&D Costs
The output of an R&D laboratory is an intangible good (such as a patent or technological
specification) that can be transferred via KR-P to production sites around the globe. Following Buckley
and Hashai (2004) and Adler and Hashai (2007), R&D activities are assumed to incur only a fixed
cost. In addition since AD is comparatively abundant with skilled labor it is expected to have a
comparative advantage in high value adding activity such as R&D (Mudambi, 2008). Hence, we
assume that for a given level of technological output CR,AD< CR,EM (CR=R&D cost)8. This assumption
is consistent with recent findings on R&D location choices in advanced and emerging countries
(Demirbag and Glaister, 2010).
Production costs
Production cost is made up of variable production cost, that is determined by the variable cost of
producing and shipping one product unit to end customers (Vi, i= AD, EM), and fixed production costs
(F). More specifically, one can determine that: CP,i= Fi+Vi*x; (CP= cost of production, i= AD, EM,
x=number of produced units). Since EM is comparatively abundant with unskilled labor it has a
comparative advantage in low value adding activities such as production (relative to R&D, for
instance) indicating that: CP,EM< CP,AD (Mudambi, 2008). This implies that, by and large, the cost of
producing at EM and shipping products from EM to AD is expected to be lower than the cost of
producing at AD and shipping products domestically (Hirsch, 1976). The latter assumption stems from
the large production cost differences between AD and EM countries coupled with the sharp decline in
8 Formally, comparative advantage in this case implies that, for instance, relative to production: CR,AD / CP,AD < CR,EM/ CP,EM (CR=R&D cost; CP=production cost).

12
international transportation costs and tariff barriers in the few last decades (Adler and Hashai, 2007;
Aulakh, Kotabe and Teegan, 2000; Hummels, 2007).
Marketing Costs
The cost of marketing is specifically defined as the costs of the interface between the marketing
personnel and consumers as well as the cost of supplying post-sale services (including travelling costs
and on-going market research cost). Like production costs, marketing costs are a function of fixed and
variable costs, as: CM,i = F'i+V'i*x' (CM= cost of marketing, F' – fixed costs, V' – variable costs, i=AD,
EM, x'=number of units sold) where fixed costs include the baseline costs of operating sales offices
and customer support centers, while the variable costs represent the fact that the larger the sales
volume, the larger the number of employees that will be enrolled in marketing activities. As in the
case of R&D, the fact that AD is comparatively abundant with skilled labor indicates that AD has a
comparative advantage in high value adding activity such as marketing (Mudambi, 2008). Hence, we
assume that CM,AD< CM,EM (CM= marketing cost). This assumption is consistent with classic views of
the comparative advantage of developed countries in the international business and economics
literatures (Dunning, 1988, 1993; Flam and Helpman, 1987; Matsuyama, 2000; Volrath, 1991).
Costs of knowledge flows
Geographic boundaries. Knowledge flow costs include communication costs and transaction costs,
thus they might be viewed as fixed costs that are higher within the advanced (or emerging) country
than across them (Casson, 2000: 67-70; Teece, 1977) because of the effect of liability of foreignness
and cultural differences between countries (Contractor, 1990; Hofstede, 1980; Hymer, 1976; Kogut
and Singh, 1988). Hence, if we let α denote within country knowledge flow cost and β denote across
country knowledge flow cost, we assume that α<β.
Organizational boundaries. Where firm boundaries are concerned we follow Kogut and Zander
(1993), Martin and Salomon (2003) and many others to assume that the more complex products are,
the greater the difference between intra-firm and inter-firm knowledge transfer costs. Transaction
costs are further likely to increase inter-firm knowledge transfer costs the more technology intensive
and differentiated products are due to frequency and specificity effects (Williamson, 1985). On the
other hand, specialization of firms in specific value adding activities as well as the reduction of agency

13
costs through externalization may reduce inter-firm knowledge transfer costs for low-technology
intensive and non-differentiated products (Buckley and Casson, 1976, 1998; Casson, 1994, 2000;
Williamson, 1985). Letting, γ denote intra-firm knowledge flow cost and δ denote inter-firm
knowledge flow cost, it therefore follows that γ<δ for knowledge flows related to high technology
intensive and/or differentiated products and γ>δ for knowledge flow costs related to low-technology
intensive and/or non-differentiated products.
3.2 Optimal location and control configurations
3.2.1 Initial global system
A global system is determined by the location of value adding activities (location configuration) and
the combination of internalized or externalized activities comprising it (referred to as the control
configuration). An optimal global system is one that minimizes the cost of operations and knowledge
flows relative to all other potential systems (Casson, 2000: 65). This view corresponds with the
'economic school' view of internationalization, explaining patterns of investment in foreign markets is
explained by rational economic analysis, according to which firms choose their optimal structure by
evaluating the cost of economic transactions (e.g. Buckley and Casson, 1976; Dunning, 1977, 1988,
1993; Hirsch, 1976; Morck and Yeung, 1992; Rugman, 1986), but also extends it to a global system
where cost minimization pertains to the whole system and not to a single firm (Casson, 2000: 62-63,
Buckley and Hashai, 2004, 2009).
According to the above assumptions, the global system is comprised of sixteen alternative location
configurations (labelled configuration 1-16 in Figure 2)9. Consistently with Figure 2, configurations 1-
8 include headquarters in AD while configurations 9-16 include headquarters in EM.
The total cost of each location configuration can be calculated by summing up the relevant costs of
operation (for R, P and M activities) in AD or EM and the relevant knowledge flows between value
chain activities and to customers. The configuration(s) with the lowest operation and knowledge flow
costs represents the solution of the global system in terms of location optimality. Once the location
9 Knowledge flows to customers in AD and EM are not shown in Figure 2.

14
configuration is determined, the appropriate firm boundaries (or control configuration) may also be
determined according to the difference between intra- and inter-firm knowledge flow costs for high
and low technologically and differentiated/non-differentiated products (Casson, 2000: 62-63, Buckley
and Hashai, 2004). The origin of each firm in the system is mostly determined based on the location of
headquarters (either in AD or EM). Yet, possible solutions of the system allow the separation of
headquarters from value chain activities, reflecting externalization (or outsourcing) of specific
activities. In this case the location of such value chain activities identifies their home origin.
The easiest way to understand the general properties of the solution is to eliminate the configurations
that are dominated by others (i.e. involve higher costs). Initially, we identify the optimal
configurations for a global system where a preponderance of the world's market is assumed to be
located in AD (as a base case). Taking the year 2000 as our point of departure, and given the sharp
differences in GDP between advanced in emerging countries in this point of time (World Bank, 2000)
the market in AD can be assumed to be considerably larger than that of EM10. In the next subsection
we compare these configurations to the optimal configurations emerging after a technological catch up
on behalf of EM and a substantial increase in its domestic market size have occurred. Appendix Table
1 spells out the costs of all operation and knowledge flow costs. Specifically, given that in the initial
global system the market in AD is substantially larger than that of EM, in the last column of Appendix
Table 1 we distinguish between knowledge flow between marketing to customers in the AD larger
market (denoted by α or β) and similar knowledge flows to customers in the EM smaller market
(denoted by α' or β'). Due to the substantial differences in market size it is taken that in the initial stage
significantly less knowledge needs to be transferred to EM, implying that: α'<< α and β'<< β.
Based on the assumptions made earlier on operation and knowledge flow costs, we can calculate
which configurations dominate other configurations. This domination can be easily calculated from
Appendix Table 1. For instance, the total cost of configuration 1 equals: CR,AD+ CP,AD+CM,AD+4α+β'.
The total cost of configuration 4 equals: CR,AD+ CP,AD+CM,EM+ 2α+2β+α'. Given that CM,AD<CM,EM and
given that α<β and that α'<<α and β'<<β, the total cost of configuration 1 is lower than that of
10 Take for instance the US economy in 2000 with a GDP of 10 $US Trillion, relative to the Chinese economy in that year with a GDP of 1 $US Trillion.

15
configuration 4, which in turn implies that configuration 1 dominates configuration 4. The total costs
of all the configurations are calculated in a similar fashion revealing that configurations 4, 5, 8, 9, 12,
13, 14 and 16 are dominated by configuration 1, and that configurations 3, 6 7, 10, 11 and 16 are
dominated by configuration 2. Thus, we are left with configurations 1 and 2 as two dominant solutions
of the initial global system.
The levels of technological intensity and product differentiation determine the organizational
boundaries for these location configurations in terms of internalization and externalization due to their
effect on the relative magnitude of γ and δ as discussed above. For products that are high technology
intensive either a domestic AD firm with boundaries spanning {HQAD, RAD, PAD, MAD} for
configuration 1 or an AMNC with production activities in EM for configuration 2 {HQAD, RAD, PEM,
MAD} emerge as optimal solutions of the system. For products that are differentiated (but low
technology intensive) three AD originating firms emerge, with the following boundaries: firm i:
{HQAD}, firm ii: {RAD, MAD}, and firm iii which can be either {PAD} for configuration 1 or {PEM} for
configuration 2. Finally for products that are both low-technologically intensive and non-differentiated
four AD originating firms, each conducting only a single activity, emerge. These firms have the
following boundaries: firm i: {HQAD}, firm ii: {RAD}, firm iii which can be either {PAD} for
configuration 1 {PEM} for configuration 2 and firm iv:{MAD}. The latter configurations represent AD
entrepreneur(s) coordinating three different value adding activities where firm ii supplies technology
to an independent producer (firm iii) and firm iv markets the product. In all cases, the global system
solutions imply that AD based firms translate the comparative advantage of AD in high technology
intensive and/or differentiated products into competitive advantages (Mudambi, 2008; Porter, 1990)
thus outcompeting EM based firm across the board.
3.2.2 Newly emerging global system
As discussed above two fundamental shifts are likely to change the initial global system. One is the
technological catch up on behalf of EMNCs and the other is the increase in the domestic market size
of large emerging countries, as a result of the increase in the standard of living in such countries

16
coupled with their large population. In terms of our model, the significant development of
technological capabilities in EM implies that EM neutralizes AD's comparative advantage in R&D,
hence we assume that: CR,EM=CR,AD. This assumption is supported by the literature documenting the
vast increase in R&D activities in emerging countries in the recent decade (Demirbag and Glaister,
2010; Lewin, Massini and Peeters, 2009). Yet, it is noteworthy that this technological catch up does
not imply that EM has a comparative advantage in R&D activities nor do EM based firms possess a
competitive advantage in product development.
The increase in the relative size of the market in EM relative to that in AD, implies that we can no
longer assume that α'<< α and β'<< β. This implies that the knowledge flow costs, of both AMNCs and
EMNCs, with consumers in EM, become similar to the knowledge flow costs to AD consumers.
While in the longer term the increase in the standard of living in emerging countries may also affect
the comparative advantage of AD in marketing and that of EM in production, we maintain that these
effects are currently still less substantial, as evident from the sharp differences in the income per capita
of emerging and advanced countries (World Bank, 2012) and the much larger number of brands
possessed by advanced country based firms (Brandz, 2010; WIPO, 2012). We therefore keep our
baseline assumptions regarding these value chain activities.
Repeating the comparison of total costs of all configurations, as above, one can note that, in the newly
emerging global system, the following configurations are dominated by others: Configurations 3, 6, 10
and 11 (by configuration 2), configurations 4, 5, 8, 9, 12 and 13 (by configuration 1) and
configurations 7 and 16 (by configuration 15). Thus, we are left with configurations 1, 2, 14 and 15 as
optimal solutions of the global system.
The organizational boundaries of configurations 1 and 2 remain identical to those in the initial global
system. For the EMNCs (configurations 14 and 15) the levels of technological intensity and product
differentiation determine organizational boundaries. For products that are high technologically
intensive an EMNC with the following value chain activities: {HQEM, REM, PEM, MAD} for
configuration 14 (where the firm is engaged in FDI in marketing) emerge as the optimal solution of
the global system. Alternatively, a domestic EM firm with boundaries spanning {HQEM, REM, PEM,
MEM} for configuration 15, may also emerge as the optimal solution of the system. For products that

17
are differentiated (but low technology intensive) three EM originating firms emerge, with the
following boundaries: firm i: {HQEM}, firm ii: {PEM} and firm iii which can be either {REM, MAD}11 for
configuration 14, or {REM, MEM} for configuration 15. Finally, for products that are both low-
technologically intensive and non-differentiated four EM originating firms emerge, each conducting
only a single activity emerge, with the following boundaries: firm i: {HQEM}, firm ii: {REM}, firm iii:
{PEM} and firm iv which can be either {MAD} for configuration 14, or {MEM} for configuration 15. In
all cases, the global system solutions imply that EM based firms serve their domestic markets as well
as export to the AD countries as competition to the AD based firms FDI in EM. All in all, the global
system that emerges, due to the change in relative market size of EM and AD and in the comparative
advantage in R&D, is mainly characterized by the addition of EM based firms to the optimal solutions
for the global system that was previously relatively more dominated by AD based firms.
3.2.3 Value chain location and control characteristics in the new global system
Our model is quite specific in its predictions regarding the location and control configurations in the
newly emerging global system. In terms of value chain location, the prediction is that very specific
location configurations will dominate others, where AMNCs and EMNCS are expect to differ in their
configurations. For AMNCs, the model predicts a continuous dominancy in the location of R&D and
marketing activities in advanced countries. In addition, our model predicts that high technological
intensity (increasing KR-P) increases the propensity of locating production activities in advanced
countries as means to reduce these costs. The main idea here is that AMNCs are likely to face lower
liabilities of foreignness due to lower cultural distance and lower differences in technological advance
when operating in advanced countries (Hofstede, 1980; Hymer, 1976; Kogut and Singh, 1988; Teece,
1977). This implies that the more technology intensive AMNCs are, the more likely they are to prefer
configuration 1 over configuration 2.
For EMNCs our model predicts dominancy in the location of R&D and production activities in
emerging countries. In addition, high technological intensity increases the propensity of locating
11 It is noteworthy that this in the only configuration for which the model cannot predict the firm's origin.

18
marketing activities in emerging countries, as means to reduce R&D-marketing knowledge transfer
costs. The lower liabilities of foreignness EMNCs are expected to face when operating in other
emerging countries are likely to drive this prediction. This implies that the more technology intensive
EMNCs are, the more likely they are to prefer configuration 15 over configuration 14.
Technology intensity and product differentiation are further expected to substantially impact the
control configuration (or organizational boundaries) of both AD and EM based firms. Greater
technology intensity is expected to lead to fully integrated firms conducting R&D, production and
marketing activities in house. Greater product differentiation is expected to increase the propensity for
the emergence of firms with integrated R&D and marketing activities and outsourced production
activities.
4. Empirical analysis
4.1 Data
We test the predictions for location and control configuration on data pertaining to the world's largest
MNCs from large advanced and large emerging countries for the year 2010 (UNCTAD, 2011). This
source contains two separate lists of the top 100 largest MNCs in general and the 100 largest TNCs
originating in emerging countries. Given that a central feature of our model relates to domestic market
size, we have first screened out from the two lists all MNCs that originate from countries that are not
included in the world's top 15 countries in terms of GDP (World Bank, 2012). This has resulted with a
list of 139 firms, 79 from advanced countries and 60 from emerging countries.
For these firms, UNCTAD (2011) includes data on total and foreign assets, total and foreign sales and
total and foreign employees. We have collected additional data from multiple secondary sources,
including: the DataStream and WorldScope databases, web pages and financial reports of the firms,
press announcements from Lexis Nexis academics (pertaining to outsourcing and alliance
announcements for the time period 2005-2010), United States Patent and Trademark Office (USPTO)
(for patent data) and WIPO Global Brands database.
These sources enable us to get detailed data at the MNC level regarding: the prime locations of R&D,
production and marketing activities, the extent of outsourcing R&D, production and marketing

19
activities, R&D expenses and number of patents (as two alternative proxies for technological
intensity), selling, general and administrative costs and number of brands (as two alternative proxies
for product differentiation) and firm age.
4.2 Measures
Dependent variables: In testing predictions regarding location configurations, we use dummy
variables for each MNC's main R&D facility, the location of the main production site and the main
location of marketing activities. Each such variable receives a value of "0" if it represents location in
an advanced country and "1" if it represents location in an emerging country.12 For testing hypotheses
regarding the location of all three value chain activities we use a three cell vector which combines the
three variables.
In testing predictions regarding the externalization or outsourcing of value chain activities, we also use
a set of dummy variables for R&D, production and marketing activities. Each dummy variable
receives the value "0" if a specific value chain activity (R&D, production or marketing) is mostly
conducted in house and "1" if there is an extensive outsourcing or alliance activity in this value chain.
Extensive outsourcing and alliance activity is defined as cases where MNCs conduct major parts of a
specific value chain activity with a significant partner and/or where MNCs have at least three partners
with which they are conducting their activities in a specific value chain activity.
Independent variables: Given the focus of the study on advanced versus emerging country MNCs, we
use a dummy measure to indicate whether a given firm originates from an emerging country (receiving
the value "0") or an advanced country (receiving the value "1"). The origin of each MNC was
determined based on UNCTAD (2011) classifications cross checked against the location of the MNC
headquarters to be consistent with our theoretical model.
Our main measure for technological intensity is the total number of patents of each firm. The main
measure for product differentiation is the number of brands it possesses. We further use GDP (2010
data) as a rough proxy for domestic market size.
12 Generally speaking the locations of main value chain activities were determined based on the firms' own
reports and represent the locations where the largest number of employees and/or assets exist. Clearly, both AMNCs and EMNCs usually have multiple sites for each value chain activity.

20
Control variables: We use three control variables that may affect firms' location and control
configurations. The first is firm size, for which our main measure is the overall assets of the MNCs.
The second control variable is firm level of internationalization, as reflected by the level of foreign
assets and the third control variable is firm age.
4.3 Analysis
In order to test the predictions of our model we conduct several analyzes. First we compare the
unconditional probabilities for occurrence of configurations 1 and 2 for the AMNCs and
configurations 14 and 15 for the EMNCs. Next, we conduct a Probit analysis to determine whether the
choice of different locations for R&D, production and marketing activities is correlated with the MNC
origin (advanced or emerging country). We further test whether technological intensity and domestic
market size affect such locations, as per our predictions. Finally, we conduct a separate Probit analysis
to determine the correlation between technological intensity and the probability of MNCs to have fully
integrated operations (i.e. internalizing R&D, production and marketing) as well as the correlation
between product differentiation on the probability of MNCs to internalize R&D and marketing
activities, but outsource production.
5. Results
Table 2 presents descriptive statistics of the advanced country- and emerging country MNCs. The
table reveals that AMNCs are, on average larger and more international than EMNCs in terms of
assets, sales and employees. Further, AMNCs are more technology intensive and more product
differentiated than EMNCs and are also older.
[Insert Table 2 about here]
Table 3 reports the propensity of the analyzed AMNCs and EMNCs to choose specific location
configuration from the 16 possible configurations detailed in Figure 2. In order to do so, we have
looked separately on the advanced- and emerging country MNCs. The table indicates that the vast
majority of AMNCs choose configuration 1 (73%), while the second largest group of firms chooses
configuration 2 (10%). Table 3 further indicates that the vast majority of EMNCs choose configuration
21
15 (66%), while the second largest group of firms chooses configuration 14 (12%). Taken together
these results show support to the predictions of the model that configurations 1 and 2 are the most
likely to be chosen for AMNCs whereas configurations 14 and 15 are the most likely to be chosen for
EMNCs. Appendix Table 2 details the breakdown of our MNCs sample based on their chosen location
configuration.
[Insert Table 3 about here]
To further test the propensity of MNCs to locate their value chain activities according to the
predictions of our model, Table 4 analyzes the factors affecting the choice of each location
configuration for AMNCs relative to EMNCs while also taking into account technological intensity,
domestic market size and product differentiation and controlling for firm size, level of
internationalizations and age. The eight models in Table 4 represent the 23 possibilities for locating
R&D, production and marketing activities in advanced versus emerging countries. The AMNC
dummy represents the location of these firm's headquarters and tests it against the probability to
choose a specific location configuration for R&D, production and marketing. Models 1 and 2 in Table
4 support our prediction that AMNCs are more likely than EMNCs to locate their R&D and marketing
activities in advanced countries while locating their production activities either in advanced or
emerging countries more than EMNCs. This can be observed by the positive and significant
coefficient of the AMNC dummy variable and implies that AMNCs are significantly more likely to
choose location configuration 1 or 2. Models 6 and 7 in Table 4 support the view that EMNCs are
more likely than AMNCs to locate their R&D and production activities in emerging countries while
locating their marketing activities either in advanced or emerging countries (i.e. choose location
configuration 14 or 15), as indicated by the negative and significant sign of the AMNC dummy for
these models. We did not find any significant differences between location configurations of AMNCs
and EMNCs for any of the other configurations.
Models 1 and 2 in Table 4 further show that technological intensity (as measured by the number of
patents) is positively and significantly correlated with production location in advanced countries
(model 1) and negatively correlated with production location in emerging countries (model 2). Taken
together with our previous observations, these results imply that technology intensive AMNCs are the

22
more likely to locate their production activities in advanced countries, as per our predictions. A similar
analysis of models 6 and 7 (where firms differ only in the location of their marketing activities) shows
that greater technological intensity is expected to lead to the location of marketing activities in
emerging countries, while less technological intensity increases the probability of locating marketing
activities in advanced countries. Together with the previous result that EMNCs are more likely to
choose the relevant location configurations that these models represent, it follows that knowledge
intensive EMNCs are more likely to locate their marketing activities in emerging countries than other
EMNCs. In addition, models 1, 2 and 7 show that domestic market size is positively associated with
the probability of choosing the respective configurations. Given that AMNCs are more likely to
choose the location configurations represented by models 1 and 2 and that EMNCs are more likely to
choose the configuration represented by model 7, we can see the domestic market size is important for
the emergence of MNCs, even within a sample consisting of large countries at the first place. It is
noteworthy that domestic market size is insignificant for the second largest group of EMNCs
(represented by model 6). EMNCs belonging to this group apparently rely more on export markets,
making domestic market size less significant for them. These results are consistent with our
predictions showing that both technological intensity and domestic market size are positively affecting
the probability of firms from emerging countries to become MNCs. In terms of the control measures
Table 4 shows that the firm size, level of internationalization and firm age are correlated with the
probability to choose some location configurations. Overall, all the models presented in Table 4 are
highly significant in terms of their log likelihood (p<.1%).
[Insert Table 4 about here]
Finally, Table 5 tests our predictions regarding the outsourcing of value chain activities. Models 1-3
in Table 5 show that technological intensity significantly decreases the probability of externalizing
R&D, production and marketing activities while product differentiation (measured through the number
of brands each firm possesses) significantly decreases the probability of externalizing R&D and
marketing activities. In contrast to the case of value chain activity location, domestic market size does
not have a significant effect on the internalization decision of the analyzed MNCs. These results are
once again consistent with our predictions. In terms of the control measures, Table 5 shows that the

23
firm size and the level of internationality generally decrease the probability of externalizing value
chain activities. All three models presented in Table 5 are highly significant in terms of their log
likelihood (p<.1%).
[Insert Table 5 about here]
We have conducted several robustness tests to the analyzes above. First, we have used R&D
expenditures as an alternative proxy for technological intensity. Second, we have used sales, general
and administration costs as an alternative proxy for product differentiation. We have further used
MNC sales volume and the number of employees as alternative proxies for firm size. Foreign sales
and the number of foreign employees were likewise used as alternative internationalization measures.
In all cases results remained unchanged in terms of the factors affecting MNCs' location and control
configurations.
6. Discussion
The study analyzes the impact of technological catch up on behalf of large emerging countries and an
increase in the domestic market of such countries on the relative dominance of EMNCs versus
AMNCs. This analysis is based on the observation that the global system is currently in the midst of a
technological revolution - the information revolution, where large emerging countries are closing the
technological gap with more advanced countries while rapidly increasing their domestic market
growth. This phase is particularly interesting given that, despite these changes, emerging countries are
still far behind advanced ones in terms of their income levels, hence allegedly preserving their cost
based comparative advantages in production.
To present this point of view, we introduce a model, which is empirically tested and verified, that
predicts the location of value adding activities and their organizational boundaries in a world
comprised of advanced and emerging countries, where the latter experience technological catch up and
substantial growth of their domestic market. Essentially, the model predicts that technological catch up
and/or an increase in emerging country domestic market size leads to more intensive competition for
AMNCs from emerging country based firms. Overall, technological catch up and increase in the
domestic market size of emerging countries result in the emergence of quite a different global system

24
than the global system that has dominated since the Second World War - where advanced country
based firms had clear hegemony. This system is jointly shared by AMNCs and EMNCs, where the
latter mostly cater other advanced and emerging countries through exports.
Given this rise of EMNCs, the model predicts a greater probability of locating R&D and marketing
activities in emerging market countries. In this respect, our model supports recent observations that the
world's production is gradually moving to emerging countries at the expense of more advanced
countries. Yet, the model further shows that an even more important trend might be the greater
propensity of locating high value adding activities such as R&D and marketing in emerging countries
(Gassmann and Han, 2004; Li and Zhong, 2003; Von Zedtwitz, 2004).
In terms of firm boundaries, the model predicts that technological intensive firms are likely to choose
more internalized configurations, whereas product differentiated firms will prefer to integrate R&D
and marketing activities while outsourcing production. This is why we predict that that the newly
emergent global system will be centered on focal brand owners that may be termed "the global
factory" (Buckley, 2009; Buckley and Ghauri, 2004). Such brand owners will either originate in
advanced countries which are expected to preserve their comparative advantage in marketing
differentiated products, with strong, familiar brands or they may originate in emerging countries that
will enjoy advantages in the marketing of "weaker" brands.
Main contributions of the model
While the model presented in this paper is extremely simple, it is rich in its predictions regarding the
newly emergent global system. In industrial organization terms, the model allows for the emergence of
monopolies (single firm configurations) and competition (multiple firm configurations). In terms of
value chain activities the model allows for fully integrated firms (conducting all value chain
activities), partially integrated firms (conducting some of the value adding activities) and specializing
firms (conducting only a single value adding activity). The model further acknowledges the existence
of multiple types of domestic and foreign operations, including: domestic firms serving their own
markets and export markets (e.g. configurations 1 and 15 for integrated firms), FDI in production
activities (e.g. configuration 2 for an integrated MNC), FDI in marketing activities (e.g. configuration

25
14 for an integrated MNC), as well as domestic and foreign outsourcing and licensing of technology to
third parties (for instance, in control configuration where each value chain activity is conducted
separately).
An important insight stemming from our results is that the predicted increased dominance of emerging
country based firms in the global system is achieved neither with the possession of a competitive
advantage in R&D nor in marketing. This insight implies that even without gaining a competitive (or
ownership) advantage (Dunning, 1988, 1993; Porter, 1990) based on technology or brands, firms from
large emerging countries where technological catch-up takes place can successfully compete with
advanced country based firms. This is an important observation given the fact that many scholars are
sceptical regarding the ability of emerging country firms to outcompete advanced country ones
because of their lack of ownership advantages (Amsden and Chu, 2003; Cuervo-Cazzura and Genc,
2008; Goldstein, 2007; Nolan, 2004; Ramamurti, 2009a; Rugman, 2009). In practical terms, our model
implies that emerging country based firms become able to compete successfully with advanced
country based firms when they reach a similar level of technological capability or when their domestic
market size increases sufficiently and becomes another important growth source for such firms. Both
phenomena do not imply a competitive advantage on behalf of emerging country based firms. Yet, as
our results show, this will lead to a global system with an increased dominance of emerging country
based firms.
The model presented in this paper demonstrates that while the cost advantages existing in different
locations are available to domestic and foreign firms, the difference between international and
domestic knowledge transfer costs and that between intra- and inter-firm knowledge transfer costs is
the main factor that shapes the organizational and geographical boundaries of firms. Once emerging
country based firms catch up on technology (while not achieving a competitive advantage) and once
their domestic market size increases sufficiently, making the knowledge transfer from marketing
activities located in emerging countries to consumers less costly, they are much better able to compete
with advanced country firms. The centrality of knowledge flow costs in determining firm boundaries
and competitive advantage is consistent with the view of the internalization school (Buckley and
Casson, 1976; Rugman, 1986), the view of firms as entities that are more efficient in the transfer of

26
complex knowledge (Kogut and Zander, 1993; Martin and Salomon, 2003) and observations regarding
the costly cross border flow of knowledge (e.g. Adler and Hashai, 2007; Casson, 2000: 67-70; Fisch,
2004; Hirsch, 1976; Teece, 1977).
In a broader sense, the privileged access that EMNCs have to their home markets relative to AMNCs
is also consistent with the predictions of Teece (1986) who, among other things, addressed privileged
market access as a central pre-condition for gaining competitive advantage. In fact, to the extent that
specific industrial policy measures in emerging countries, such as high tariffs, local content
requirements or any other discriminatory measure in favor of EMNCs, are in force, we expect EMNCs
originating from emerging countries with large domestic markets to be even more likely to emerge and
gain dominancy when competing with AMNCs.
In that respect it is noteworthy that one can reasonably argue that EMNCs may build on their
technological catch up to successfully compete with AMNCs, even in cases where their domestic
markets are small, by serving foreign markets through exports. Indeed, Lee, Kim, Park, and Sanidas
(2013) show that small-size markets (e.g. Taiwan) may also grow successful MNCs. In terms of our
model and empirics, we essentially argue that the ability to cater large domestic markets is
complementary to firms' level of technological advance and is not a necessary condition for the
emergence of EMNCs. EMNCs from smaller domestic markets will likely require the possession
competitive advantages in terms of technology or brands to outcompete AMNCs. On the other hand,
EMNCs originating in countries with larger markets may not require possessing such advantages, in
order to outcompete AMNCs, due to their relatively more privileged access (e.g. in terms of
knowledge exchange with local consumers) to their home markets.
The originality of this modelling as compared to other global system view models is twofold. First, by
adding the headquarters function, the current modelling attributes specific origins to firms (in our case
advanced versus emerging countries). This allows us to be more specific in our predictions regarding
their relative dominance as well as empirically test these predictions. Second, the model goes beyond
previous models of the global system (Buckley and Hashai 2004, 2009, Casson 2000) by adopting
improved predictions on technological intensity and differentiation of products and their comparative
statics in terms of location and control configurations.

27
Given that three out of the four dominant location configurations that the model identifies as dominant
configurations indicate serving markets via exports13, our model further implies that the emerging
global system is likely to be mostly based on foreign trade where exports from emerging country firms
are likely to replace or compete with current FDI activities of AMNCs. This insight is important as it
indicates a dramatic change in two central global phenomena: 1) the trade balance of advanced
countries with emerging ones is likely to become more negative; 2) outgoing FDI from advanced
countries to emerging ones is expected to significantly reduce. Taken together the two phenomena
may indicate the emergence of a new equilibrium where foreign trade rather than FDI dominates.
The predicted global system is expected to be the basis for a new wave of emerging countries-led
globalization. In order to evaluate which emerging countries are likely to become the leaders, several
factors should be considered. One important factor is the institutional environment in such countries.
In this respect we expect that emerging countries' institutional environments that promote
technological advance and intellectual property rights will be more likely to achieve accelerated
technological catch up (Peng et al., 2008; Perez, 2002; Yang, 2003; Yang, Fryxell and Sie, 2008). In
addition, countries that promote economic reforms that will lead to an increase in the purchasing
power of consumers in such countries (Peng et al., 2008) are more likely to be the source for global
firms that become dominant players in the newly emergent global system. Importantly, is its
noteworthy that a key argument here is that large domestic market size of emerging countries is a
fundamental condition for these countries' EMNCs to become dominant players in the newly emerging
global system.
Finally, it should be noted that the current model is limited in its key assumptions. When using the
global system view, the model does not take into account possible institutional hurdles to the
development of EMNCs such as the need to develop a welfare system, build a stronger intellectual
property protection system and be more environmentally friendly (Dunning, 2006; Naughton, 2007).
These challenges may well affect the relative costs of conducting R&D, production and marketing in
emerging versus advanced countries and hence may affect the predictions of our model. Furthermore,
13 Note that only configuration 2 indicates FDI in production.

28
our model assumes that since the costs of cross border transportation and tariff barriers have been
reduced significantly relative to the cost of production, in the vast majority of products the cost of
production in emerging countries remains lower than the cost of production in advanced countries
even after overseas transportation costs and tariff barriers are taken into account. To the extent that
this assumption does not hold for specific product categories the predictions of our model should be
taken with caution. Our model is also limited in its predictions to firms where R&D activities are
central in the intermediation of knowledge between production and marketing activities. This view is
perfectly consistent with the extant global system modelling literature (Buckley and Hashai, 2004;
Casson, 2000), and further acknowledges the importance of R&D activities in a high technology
economy. However, it is noteworthy that different location and control configurations are likely to
emerge for firms with no R&D activities or for firms where either production or marketing activities
serve as such intermediators.14 The model and empirical analysis also do not take into account the
"knowledge asset seeking" activities of many EMNCs, that locate some of their R&D activities in
advanced countries as means to absorb knowledge there (Buckley et al., 2007; Cantwell and Barnard,
2008; Dunning, 2006; Dunning et al., 2008; Goldstein, 2007; Luo and Tang, 2007; Matthews, 2002).
While many EMNCs are likely to retain their main R&D activities at home, future studies may expand
the current model and take into account new knowledge acquisition in advanced countries as means to
gain a more fine grained picture of the global dispersion of R&D (and other value chain activities) of
EMNCs.
7. Conclusion
Casual empiricism suggests that emerging countries are beginning to approach advanced countries in
terms of shares of world trade, FDI and technological dominance. This paper models the effects of
upgraded technology and increases in relative market size of large emerging countries on the
emergence of dominant MNCs based in emerging countries. The global system view is shown to be
an excellent framework for the analysis of these potentially radical changes in the world economy.
14 We wish to thank an anonymous reviewer for raising this point.

29
This application of model has profound implications for policy in both emerging and advanced
countries. As long as emerging countries enjoy comparative advantages in production AMNCs need
to specialize more in technologically intensive and highly differentiated products in order to compete
with the newly powerful EMNCs. Emerging countries should work to attract R&D and seek to
upgrade their marketing capabilities to further increase their global dominance. This paper has utilized
the global system view model to trace the impact of upgrading of technological competence and
increased market size in large emerging economies on ownership and location in the future global
economy. Such a model enables us to take a nuanced and differentiated view of the impact of rising
firms from emerging countries in contrast to straight line projections of their growth and potential
power. It explains how, even without obtaining a competitive advantage in R&D and marketing, such
firms are likely to become dominant players in the global system.
Acknowledgments
We wish to thank Mark Casson, Editor Keun Lee and two anonymous reviewers for
comments on earlier drafts.

30
References
Adler, N., Hashai, N. 2007. Knowledge flows and the modelling of the multinational enterprise.
Journal of International Business Studies, 38(4): 639-657.
Amsden, A.H. 2009. Does firm ownership matter? In Ramamurti, R. & Singh, V.S. 2009. (Eds.)
Emerging multinationals in emerging markets. Cambridge University Press, Cambridge, UK.
Amsden, A.H., Hikino, T. 1994. Project execution capability, organizational know-how and
conglomerate corporate growth in late industrialization. Industrial and Corporate Change, 3(1): 111-
147.
Amsden, A.H., Chu, W.W. 2003. Beyond late development: Taiwan's upgrading policies. MIT Press,
Cambridge, MA.
Asmussen, C.G., Benito, G.R.G., Petersen, B. “Organizing foreign market activities: from entry mode
choice to configuration decisions”. International Business Review, 18(2): 145-155.
Archibugi, D., Coco, A., 2004. A new indicator of technological capabilities for developed and
emerging countries (ArCo).World Development. 32(4): 629–654.
Archibugi, D., Coco, A. 2005 Measuring technological capabilities at the country level: A survey and
a menu for choice. Research Policy 34: 175–194
Athreye S., Cantwell, J.A. 2007. Creating competition? Globalization and the emergence of new
technology producers. Research Policy, 36(2): 209-226.
Aulakh, P.S., Kotabe M. Teegan, H. 2000. Export strategies and the performance of firms from
emerging economies, Academy of Management Journal, 43(3): 342-361.
Bonaglia, F., Goldstein A., Mathews, J.A. 2007. Accelerated internationalization by emerging
markets’ multinationals: The case of the white goods sector, Journal of World Business, 42(4): 369-
383.
Borensztein, E., Ostry, J.D. 1996. Accounting for China's growth performance, American Economics
Review, 86(2): 224-228.

31
Brandz, 2010. Top 100 most valuable global brands 2010. Millward, Brown, Optimer.
Buckley, P.J. 2009. The impact of the global factory on economic development. Journal of World
Business, 44(2): 131 – 143.
Buckley, P. J., Casson, M. 1976. The future of the multinational enterprise. London, Macmillan.
Buckley, P. J., Casson, M. C. 1998. Models of the multinational enterprise. Journal of International
Business Studies, 29(1): 21-44.
Buckley, P.J., Clegg, L. J., Cross, A. R., Zheng, P., Voss, H., Liu, X. 2007. The determinants of
Chinese outward foreign direct investment. Journal of International Business Studies, 38(4): 499–518.
Buckley, P.J., Ghauri, P. N. 2004. Globalisation, economic geography and the strategy of
multinational enterprises. Journal of International Business Studies, 35(2): 81-98.
Buckley, P. J., Hashai, N. 2004. A global system view of firm boundaries. Journal of International
Business Studies, 35(1): 33-45.
Buckley, P.J., Hashai, N. 2009. Formalizing internationalization in the eclectic paradigm. Journal of
International Business Studies, 40(1): 58-70.
Cantwell, J., Barnard, H. 2008. Do firms from emerging markets have to invest abroad? Outward FDI
and the competitiveness of firms. In Sauvant, K.P. 2008. (Ed.) The rise of transnational corporations
from emerging countries- threat or opportunity?. Edward Elgar, Cheltenham, UK.
Casson, M.C. 1985. Multinational monopolies and international cartels. In P.J. Buckley and M.
Casson, The economic theory of the multinational enterprise. London: Macmillan.
Casson, M. C. 1994. Why are firms hierarchical. Journal of the Economics of Business, 1(1): 47-76.
Casson, M. C. 2000. Enterprise and leadership: Studies on firms, networks and institutions.
Cheltenham: Edward Elgar.
Coase, R.H. 1937. The nature of the firm. Economica, 4: 386 – 405.
Contractor, F. J. 1990. Ownership patterns of US joint ventures abroad and the liberalization of
foreign government regulations in the 1980s: Evidence from the benchmark surveys. Journal of

32
International Business Studies, 21(1): 55 – 73.
Cuervo-Cazzura, A., Genc, M. 2008. Transforming disadvantages into advantages: emerging countries
MNEs in the least developed countries. Journal of International Business Studies, 39: 957 – 979.
Demirbag M., Glaister, K.W. 2010. Factors Determining Offshore Location Choice for R&D
Projects: A Comparative Study of Developed and Emerging Regions. Journal of Management Studies.
47(8): 1534-1560.
Dunning, J. H. 1977. Trade, location of economic activity and the multinationals. In B. Ohlin, P.
Hesselborn and P. Wijkman (Eds.), The International Allocation of Economic Activity, Macmillan.
Dunning, J. H. 1981. Explaining the international direct position of countries: towards a dynamic or
developmental approach. Weltwirtschaftliches Archiv, 117: 30-64.
Dunning, J. H. 1988. Changes in the level and structure of international production: The Last One
Hundred Years. In J. H. Dunning, Exploring International Production, London: Unwin Hyman: 71-
119.
Dunning, J. H. 1993. Multinational enterprises and the global economy. Wokingham, Addison
Wesley.
Dunning, J. H. 2006. Comment on dragon multinationals: new players in 21st century globalisation.
Asia Pacific Journal of Management, 23: 139-141.
Dunning, J.H., Kim, C., Park, D. 2008. Old wine in new bottles: a comparison of emerging-market
TNCs today and developed-country TNCs thirty years ago. In Sauvant, K.P. 2008. (Ed.) The rise of
transnational corporations from emerging countries- threat or opportunity?. Edward Elgar,
Cheltenham, UK.
Dunning, J. H., Lundan, S. M. (2008) Multinational Enterprises and the Global Economy, 2nd Edition.
Cheltenham: Edward Elgar.
Duysters, G., Jacob, J., Lemmens C., Jintian, Y. 2009. Internationalization and technological catching
up of emerging multinationals: a comparative case study of China's Haier group. Industrial and
Corporate Change, 18: 325-349.

33
Filippetti, A., Peyrache, A. 2011. The Patterns of Technological Capabilities of Countries: A Dual
Approach using Composite Indicators and Data Envelopment Analysis, World Development, 39(7):
1108-1121.
Fisch, J.H. 2004. Allocating innovative activities in international R&D with fuzzy logic. Management
International Review, 44(3): 147-166.
Flam, H., Helpman, E. 1987. Vertical Product Differentiation and North-South Trade. American
Economic Review, 77(5): 810-822.
Gassmann, O., Hann Z. 2004. Motivations and barriers of foreign R&D activities in China. R&D
Management. 34(4): 423-437.
Ghymn, K.L. 1980. Multinational enterprises from the third world. Journal of International Business
Studies, 11: 118-122.
Goldstein, A. 2007. Multinational Companies from Emerging Economies. Palgrave Macmillan:
London.
Heather, P. 2013. The Restoration of Rome: Barbarian Popes and Imperial Pretenders. London:
Macmillan.
Hirsch, S. 1976. An international trade and investment theory of the firm, Oxford Economic Papers,
28: 258- 270.
Hofstede, G. 1980. Culture’s consequences: International Differences in Work Related Values.
Beverly Hills: Sage Publications.
Hoskisson, R.E., Eden, L., Lau, C.M., Wright, M. 2000. Strategy in Emerging Economies. Academy
of Management Journal, 43: 249-267.
Hummels, D. 2007. Transportation costs and international trade in the second era of globalization.
Journal of Economic Perspectives, 21(3): 131-154.
Hymer, S. 1976. The International Operations of National Firms: A Study of Direct Foreign
Investment. Cambridge, Mass: MIT Press.

34
Khanna, T., Palepu, K. 2006. Emerging giants: building world class companies in emerging countries.
Harvard Business Review, 84(1): 60-69.
Kogut, B., Singh, H. 1988. The effect of national culture on the choice of entry mode. Journal of
International Business Studies, 19(3): 411-432.
Kogut, B., Zander, U. 1993. Knowledge of the firm and the evolutionary theory of the multinational
corporation. Journal of International Business Studies, 4: 625-45.
Kumar, N. 2001. Determinants of location of overseas R&D activity of multinational enterprises: the
case of US and Japanese corporations. Research Policy, 30: 159–174.
Lall, S. 1983. (Ed.) The new multinationals: the spread of third world enterprises. John Wiley,
Chinchester, UK and New York.
Lawrence, R.Z. 1993. Japan's low levels of inward investment: the role of inhibitions on acquisitions.
In Froot, K. (Ed.), Foreign Direct Investment, University of Chicago for NBER, Chicago.
Lee, K., Kim, B.Y., Park, Y.Y., Sanidas, E. 2013. Big businesses and economic growth: Identifying a
binding constraint for growth with country panel analysis, Journal of Comparative Economics, 31:
561-582.
Lewin, A., Massini S., Peeters, C. 2009. Why are companies offshoring innovation? The emerging
global race for talent, Journal of International Business Studies, 40 : 901-925.
Luo, Y., Tang, R.L. 2007. International expansion of emerging countries enterprises: A springboard
perspective. Journal of International Business Studies, 38: 481-498.
Li, J., Zhong J. 2003. Explaining the growth of R&D alliances in China. Managerial and Decision
Economics, 24: 101-105.
Mahmood I.P., Singh, J. 2003. Technological dynamism in Asia, Research Policy, 32(6): 1032-1054.
Martin, X., Salomon, R. 2003. Knowledge transfer capacity and its implications for the theory of the
multinational corporation, Journal of International Business Studies, 34(4): 356-373.

35
Mathews, J.A. 2002. Dragon multinational: A new model for global growth. Oxford University Press:
Oxford and New York.
Mathews, J.A. 2006. Dragon multinationals: new players in 21st century globalisation, Asia Pacific
Journal of Management 23: 5-27.
Matsuyama, K. 2000. A Ricardian Model with a Continuum of Goods under Nonhomothetic
Preferences: Demand Complementarities, Income Distribution, and North‐South Trade. Journal of
Political Economy, 108(6): 1093-1120.
Morck, R., Yeung, B. 1992. Internalization: an event study test. Journal of International Economics,
33(1-2): 41-56.
Mudambi, R. 2008. Location, control and innovation in knowledge-intensive industries, Journal of
Economic Geography, 8(5): 699 – 725.
Naughton, B. 2007. The Chinese economy: transitions and growth. MIT Press Book.
Nelson, R.R., Pack, H. 1999. The Asian miracle and modern growth theory. The Economic Journal,
109: 416-436.
Niosi, J., Tschang, F.T. 2009. The strategies of Chinese and Indian software multinationals:
implications for internationalization theory, Industrial and Corporate Change, 18(2): 269-284.
Nolan, P. 2004. China at the crossroads. Polity Press: Cambridge, UK.
Obstfeld M., Taylor, A.M. 2002. Globalization and capital markets. NBER working paper 8846,
National Bureau of Economic Research, Cambridge, MA.
Peng, M.W., Wang, D.Y.L., Jiang, Y. 2008. An institution-based view of international business
strategy: a focus on emerging economies, Journal of International Business Studies, 39(5): 920-935.
Perez C. 2002. Technological revolutions and financial capital, The dynamics of bubbles and golden
ages, Edward Elgar, Cheltenham, UK.
Porter, M.W. 1990. The competitive advantage of nations. Free Press, New York.

36
Ramamurti, R. 2009a. Why study emerging country multinationals? In Ramamurti, R. & Singh, V.S.
2009. (Eds.) Emerging multinationals in emerging markets. Cambridge University Press, Cambridge,
UK.
Ramamurti, R. 2009b. What have we learned about emerging market MNEs? In Ramamurti, R. &
Singh, V.S. 2009. (Eds.) Emerging multinationals in emerging markets. Cambridge University Press,
Cambridge, UK.
Ramamurti, R., Singh, V.S. 2009. (Eds.) Emerging multinationals in emerging markets. Cambridge
University Press, Cambridge, UK.
Rugman, A.M. 1986. New theories of the multinational enterprise: An assessment of internalization
theory, Bulletin of Economic Research, 38(2): 101-119.
Rugman, A.M. 2008. Theoretical aspects of MNEs from emerging economies. In Ramamurti, R. &
Singh, V.S. 2009. (Eds.) Emerging multinationals in emerging markets. Cambridge University Press,
Cambridge, UK.
Rugman, A. 2009. How global are TNCs from emerging countries? In Sauvant, K.P. 2008. (Ed.) The
rise of transnational corporations from emerging countries- threat or opportunity?. Edward Elgar,
Cheltenham, UK.
Rugman, A.M., Doh, J. 2008. Multinationals and development. Yale University Press, New Haven,
CT.
Sachs, J.D. 2008. The rise of TNCs from emerging markets: the global context. In Sauvant, K.P. 2008.
(Ed.) The rise of transnational corporations from emerging countries- threat or opportunity?. Edward
Elgar, Cheltenham, UK.
Sauvant, K.P. 2008. (Ed.) The rise of transnational corporations from emerging countries- threat or
opportunity?. Edward Elgar, Cheltenham, UK.
Shimizutani, S., Todo, Y. 2007. What determines overseas R&D activities? The case of Japanese
multinational firms. Research Policy, 37: 530–544.

37
Teece, D.J 1977. Technology transfer by multinational corporations: the resource cost of transferring
technological know-how, Economic Journal, 87:242-261.
Teece, D.J. 1986. Profiting from technological innovation: Implications for integration, collaboration,
licensing and public policy. Research Policy, 15, 285-305.
UNCTAD, 2011 World Investment Report. Geneva.
UNCTAD, 2009. Assessing the impact of the current financial and economic crisis on global FDI
flows, United Nations publication. New York and Geneva.
Vernon, R. 1966. International investment and international trade in the product cycle. Quarterly
Journal of Economics, 80: 190-207.
Vernon, R. 1971. Sovereignty at bay, Basic Books, New York.
Volrath, T.L. 1991. A Theoretical Evaluation of Alternative Trade Intensity Measures of Revealed
Comparative Advantage. Weltwirtschaftliches Archiv, 130, 265–279,
Von Zedtwitz, M. 2004. Managing foreign R&D laboratories in China, R&D Management, 34(4):
439-452.
Wells, L.T. 1983. Third world multinationals- The rise of foreign investment from emerging countries.
MIT Press: Cambridge, MA and London.
Williamson, O. E. 1985. The economic institutions of capitalism. New York: The Free Press.
Williamson P.J., Zeng, M. 2009. Chinese multinationals: emerging through new global gateways. In
Ramamurti, R., Singh, V.S. 2009. (Eds.) Emerging multinationals in emerging markets. Cambridge
University Press, Cambridge, UK.
WIPO, 2012, Global Brands Database.
World Bank, 2000, 2010, 2012. World development indicators database: Washington, DC.
Yang, D. 2003. The development of intellectual property in China. World Patent Information,
25(2):131-42.

38
Yang, D., Fryxell, G., Sie, A. K. Y. 2008. Anti-piracy effectiveness and managerial confidence:
Insights from MNCs in China, Journal of World Business, 43(3): 321-339.

39
Table 1 – Technological capabilities and Gross Domestic Product (GDP) for BRIC and advanced countries
Sources: Filippetti and Peyrache, 2011; World Bank, 2010.
GloCap Index
(2007)
Average annual
change in GloCap Index
(1995-2007)
GDP
$US Trillions
(2010)
Average annual GDP growth rate
(2000-2010)
BRIC countries
Brazil 0.130 30.3% 2.1 3.7%
Russia 0.182 9.5% 1.5 5.3%
India 0.039 38.1% 1.7 7.4%
China 0. 078 63.8% 5.9 10.3%
Average 0.117 35.4% 2.8 6.7%
Advanced countries
US 0.632 6.2% 14.6 1.8%
Japan 0.659 5.8% 5.5 0.9%
Germany 0.605 7.1% 3.3 1.2%
United Kingdom 0.520 8.3% 2.2 1.7%
Average 0.604 6.9% 6.4 1.4%

40
Table 2 – Descriptive statistics - top AMNCs and EMNCs, 2010 ($US Million)
AMNCs Mean (SD)
EMNCs Mean (SD)
N 79 60 Assets 126,855
(104, 570) 48,304
(90, 369) Foreign Assets 79,952
(76, 345) 12,562
(13, 747) Sales 85,311
(78, 258) 29,113
(42, 850) Foreign Sales 52,956
(48, 187) 13,500
(19, 384) Employees (number) 167,125
(254, 096) 102,998
(207, 189) Foreign Employees (number) 91,361
(103, 015) 32,254
(56, 015) Average GDP ($ Billions)
4,084 (4460)
2,101 (1,711)
R&D expenses 1,888 (2, 479)
269 (1, 077)
Patents granted in the US (number)
18,504 (43, 949)
3,727 (13, 995)
Sales, general and administration and expenses
14,082 (12, 535)
2,833 (4, 827)
Brands (number) 1,896 (2, 925)
97 (300)
Age (years) 81 (58)
53 (43)
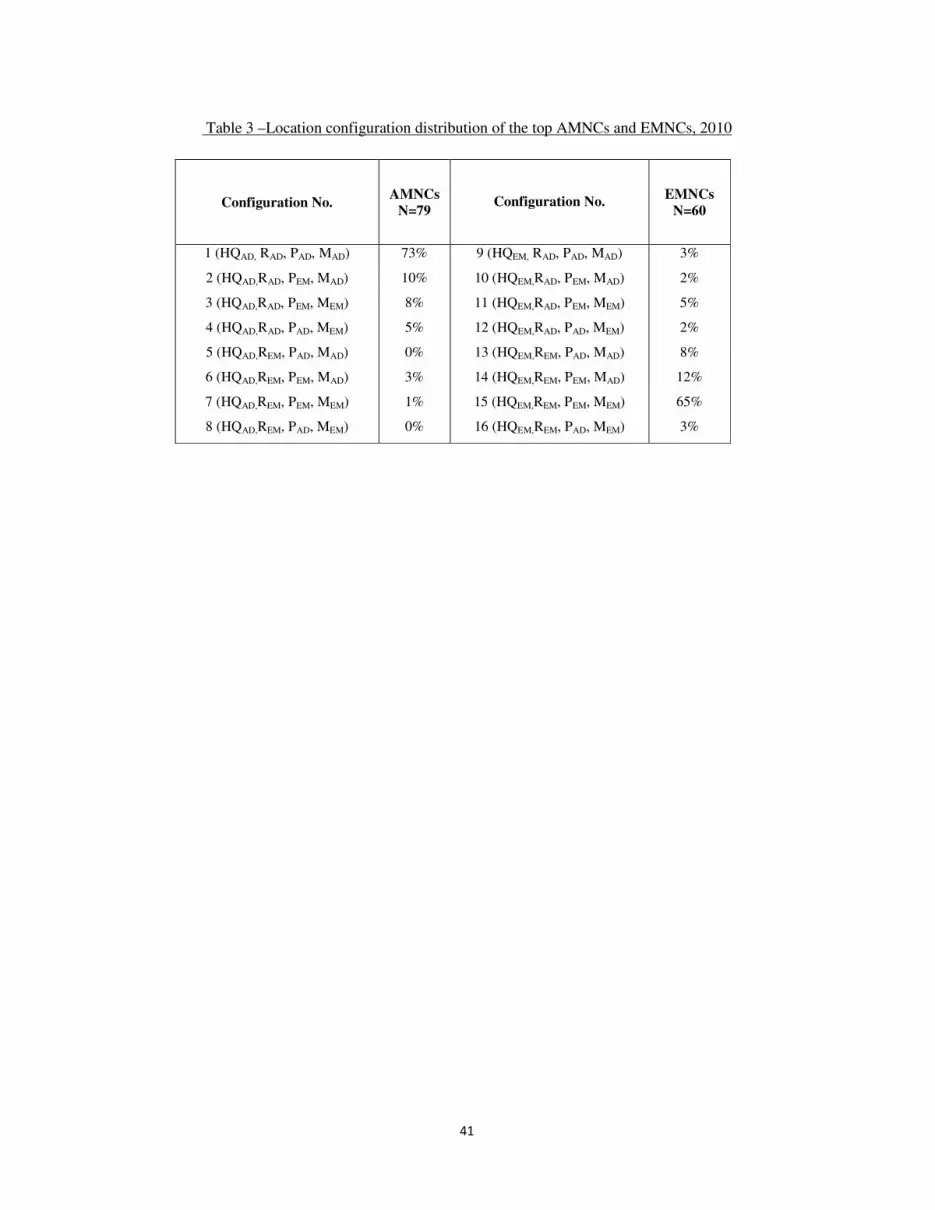
41
Table 3 –Location configuration distribution of the top AMNCs and EMNCs, 2010
Configuration No. AMNCs
N=79
Configuration No. EMNCs
N=60
1 (HQAD, RAD, PAD, MAD) 73% 9 (HQEM, RAD, PAD, MAD) 3%
2 (HQAD,RAD, PEM, MAD) 10% 10 (HQEM,RAD, PEM, MAD) 2%
3 (HQAD,RAD, PEM, MEM) 8% 11 (HQEM,RAD, PEM, MEM) 5%
4 (HQAD,RAD, PAD, MEM) 5% 12 (HQEM,RAD, PAD, MEM) 2%
5 (HQAD,REM, PAD, MAD) 0% 13 (HQEM,REM, PAD, MAD) 8%
6 (HQAD,REM, PEM, MAD) 3% 14 (HQEM,REM, PEM, MAD) 12%
7 (HQAD,REM, PEM, MEM) 1% 15 (HQEM,REM, PEM, MEM) 65%
8 (HQAD,REM, PAD, MEM) 0% 16 (HQEM,REM, PAD, MEM) 3%

42
Table 4 – Probit Analyzes for value chain location configurations (N=139)
Legend: ** = significant at 1%; * = significant at 5%. R=R&D, P= production, M=marketing, AD=location in advanced country, EM=location in emerging country. n.a. – variable unavailable (no AMNCs with this configuration)
Table 5 – Probit Analyzes for control configurations (N=139)
Legend: *** = significant at 0.1%; ** = significant at 1%; * = significant at 5%.
Probability of: {RAD,
PAD,
MAD}
Model
1
{RAD,
PEM,
MAD}
Model
2
{RAD,
PEM,
MEM}
Model
3
{RAD,
PAD,
MEM}
Model
4
{REM,
PAD,
MAD}
Model
5
{REM,
PEM,
MAD}
Model
6
{REM,
PEM,
MEM}
Model
7
REM,
PAD,
MEM}
Model
8
AMNC .290** .074** .185 .012 n.a. -.057** -.173** n.a.
Number of patents .011* -.021* -.032 .120 .008 -.014* .084** -.075
Number of brands .064 .009 .012 .192 .312 .415 -.022 -.081
Domestic market size .125** .011* .003 .005 .061 .012 .134* .004
Assets .212* .018 .005* .128* .025* .052* .112* 018*
Foreign Assets .013 .200* .101* .079* .163* .130 .046 .010*
Age .016 .022* .003* .013* .020* .024 .013 .022*
Log likelihood -71.33 -75.25 -57.76 -59.11 -58.19 -72.66 -77.33 -58.20
Dependent variable= probability of:
R&D externalization
(Model 1)
Production externalization
(Model 2)
Marketing externalization
(Model 3) AMNC .012 .167 .115
Number of patents -.325** -.121** -.215**
Number of brands -.101** -.022 -.089**
Domestic market size .011 .017 .015
Assets -.139** -.225** -.009*
Foreign Assets -.067* -.035* -.012*
Age -.023 -.005* -.031
Log likelihood -82.11*** -79.17*** -80.23***

43
Appendix Table 1 – Costs of alternative location configurations
Configuration No.
Knowledge flow HQ-R&D
R&D
Production
Knowledge flow R&D-Production
Marketing
Knowledge flow R&D-marketing
Knowledge flow Marketing –customers
1 α CR,AD CP,AD α CM,AD α α+β'
2 α CR,AD CP, EM β CM,AD α α+β'
3 α CR,AD CP, EM β CM, EM β β+α'
4 α CR,AD CP,AD α CM, EM β β+α'
5 β CR,EM CP,AD β CM,AD β α+β'
6 β CR, EM CP, EM α CM,AD β α+β'
7 β CR, EM CP, EM α CM, EM α β+α'
8 β CR, EM CP,AD β CM, EM α β+α'
9 β CR,AD CP,AD α CM,AD α α+β'
10 β CR,AD CP, EM β CM,AD α α+β'
11 β CR,AD CP, EM β CM, EM β β+α'
12 β CR,AD CP,AD α CM, EM β β+α'
13 α CR, EM CP,AD β CM,AD β α+β'
14 α CR, EM CP, EM α CM,AD β α+β'
15 α CR, EM CP, EM α CM, EM α β+α'
16 α CR, EM CP,AD β CM, EM α β+α'

44
Appendix Table 2 – Classification of MNCs into location configurations
Configuration 1 (HQAD, RAD, PAD, MAD)
Configuration 2 (HQAD,RAD, PEM, MAD)
Configuration 15 (HQEM,REM, PEM, MEM)
General Electric Co Royal Dutch Shell plc Vale SA
BP plc Exxon Mobil Corporation Hyundai Motor Company
Vodafone Group Plc Total SA China Ocean Shipping (Group) Company e
Toyota Motor Corporation GDF Suez América Móvil SAB de CV
Volkswagen Group Chevron Corporation Tata Steel Ltd
EDF SA Eni SpA Jardine Matheson Holdings Ltd
E.ON AG Schlumberger Ltd Noble Group Ltd
Enel SpA Alcoa Inc Petroleo Brasileiro SA
Siemens AG Configuration 3 (HQAD,RAD, PEM, MEM)
Gerdau SA
Deutsche Telekom AG SABMiller PLC China National Petroleum Corporation
Honda Motor Co Ltd Telefonica SA Tata Motors Ltd
Iberdrola SA Lafarge SA New World Development Ltd
Pfizer Inc British American Tobacco PLC Hindalco Industries Ltd
ConocoPhillips Caterpillar Inc First Pacific Company Ltd
Daimler AG AES Corporation Sinochem Group
Ford Motor Company Configuration 4 (HQAD,RAD, PAD, MEM)
CLP Holdings Ltd
Johnson & Johnson Rio Tinto PLC Axiata Group Bhd
Mitsubishi Corporation Unilever PLC Fomento Economico Mexicano SAB
Sony Corporation BHP Billiton Group Ltd POSCO
Wal-Mart Stores Inc Japan Tobacco Inc China Resources Enterprises Ltd
EADS N.V. Configuration 6 (HQAD,REM, PEM, MAD)
Severstal Group Holdings
General Motors Co Linde AG China National Offshore Oil Corp
Nissan Motor Co Ltd BG Group plc Sun Hung Kai Properties Ltd
France Telecom S.A. Configuration 7 (HQAD,REM, PEM, MEM)
VimpelCom Ltd
BMW AG Anglo American plc Swire Pacific Ltd
RWE AG Configuration 9 (HQEM, RAD, PAD, MAD)
Mechel OAO
Mitsui & Co Ltd Suzlon Energy Ltd Lenovo Group Ltd
Procter & Gamble Co Techtronic Industries Co Ltd Sime Darby Bhd
International Business Machines Corporation
Configuration 10 (HQEM,RAD, PEM, MAD)
MMC Norilsk Nickel
Hewlett-Packard Co Hutchison Whampoa Limited China Railway Construction Corporation Ltd
Kraft Foods Inc Configuration 11 (HQEM,RAD, PEM, MEM)
ZTE Corp
GlaxoSmithKline PLC Petronas - Petroliam Nasional Bhd Galaxy Entertainment Group Ltd
Veolia Environnement SA Evraz Group SA Mobile TeleSystems OJSC
BASF SE Skyworth Digital Holdings Ltd Reliance Communications Ltd
Ferrovial SA Configuration 12 (HQEM,RAD, PAD, MEM)
Lee & Man Paper Manufacturing Ltd
Compagnie de Saint-Gobain SA Cemex S.A.B. de C.V. TMK OAO
Carrefour SA Configuration 13 (HQEM,REM, PAD, MAD)
Tata Chemicals Ltd
Deutsche Post AG Li & Fung Ltd Sistema JSFC
AstraZeneca PLC Ternium SA Oil and Natural Gas Corp Ltd
ThyssenKrupp AG Tata Consultancy Services Configuration 16 (HQEM,REM, PAD, MEM)
Fiat S.p.A. Esprit Holdings Ltd Genting Bhd
Vivendi SA Doosan Corp Grupo Bimbo SAB de CV

45
Tesco PLC
National Grid PLC Configuration 14 (HQEM,REM, PEM, MAD)
Merck & Co Lukoil OAO
Schneider Electric SA Samsung Electronics Co., Ltd.
Dow Chemical Company Yue Yuen Industrial Holdings Ltd
Repsol YPF SA Rusal
Sanofi-Aventis SA TPV Technology Limited
Liberty Global Inc CITIC Group
WPP PLC Shangri-La Asia Ltd
Hitachi Ltd
Renault SA
The Coca-Cola Company
Alstom S.A.
Barrick Gold Corporation
BAE Systems plc
Pernod-Ricard SA

46
Figure 1 – Outward FDI from the BRIC countries to advanced economies*
0
5000
10000
15000
20000
25000
30000
35000
40000
45000
50000
2000 2001 2002 2003 2004 2005 2006 2007 2008 2009 2010
FD
I sto
ck (
in $
US
M)
Source: OECD.Stat. * - United States, Japan, Germany and the United Kingdom.

47
Figure 2 – Alternative location configuration
[See separate document]

48