in situ erosion measurements on fine-grained sediments from the bay of fundy
TRANSCRIPT

Marine Geology, 108 (1992) 175-196 175 Elsevier Science Publishers B.V., Amsterdam
In situ erosion measurements on fine-grained sediments from the Bay of Fundy
C a r l L. A m o s a, G . R . D a b o r n b, H . A . C h r i s t i a n a, A. A t k i n s o n a a n d A. R o b e r t s o n b
aGeological Survey of Canada, P.O. Box 1006, Dartmouth, NS B2 Y 4A2, Canada bAcadia Centre for Estuarine Research, Acadia University, Wolfville, NS, Canada
(Received October 31, 1991; revision accepted May 7, 1992)
ABSTRACT
Amos, C.L., Daborn, G.R., Christian, H.A., Atkinson, A. and Robertson, A., 1992. In situ erosion measurements on fine- grained sediments from the Bay of Fundy. Mar. Geol., 108: 175-196.
In situ measurements of the erodibility of fine-grained sediments have been made in two regions of the Bay of Fundy using the benthic annular flume, Sea Carousel. The regions were markedly different in benthic biology, atmospheric exposure, ice loading and wave effects. Nevertheless, remarkable similarities were found in erosion character. Three patterns of erosion were detected. "Type Ia" erosion is characterized by an asymptotically decreasing erosion rate with time. It is a surface phenomenon associated with the erosion of. 1 mm organic pellets formed by the browsing amphipod Corophium volutator, and was found in regions of high benthic activity only. Onset of this erosion type is equated with z0~ of Otsubo and Muraoka (1988). "Type Ib" erosion also showed asymptotically decreasing erosion with time, but erosion generated rip-up clasts and aggregates up to 7 mm in diameter. "Type Ib" erosion occurred at all locations at imposed bed stresses between 1.0 and 4.4 Pa. Peak erosion lasted only 1-3 minutes at any imposed stress level and thereafter ceased. This pattern of erosion is the result of a linearly increasing sediment shear strength with depth with an internal friction angle circa 70 ° . Onset of this erosion is equated with To2 of Otsubo and Muraoka (1988). "Type I" erosion occurred only in the uppermost 0.5 mm of the bed: below, "Type II" erosion was dominant. "Type II" erosion was constant with time and, over the time-scales of our experiments, was independent of changes in bulk bed shear strength with depth. It was found at all locations and was produced by bed shear stresses between 2 and 10 Pa. "Type II" erosion succeeded "Type Ib"erosion. Video observations show that "Type II" erosion is characterized by failure along fine planes of weakness within the sediment, probably related to the sediment microfabric generated after deposition. A relationship (r 2 = 0.65; n = 72) was found between peak erosion rate (E) of all types and excess bed shear stress of the form proposed by Parchure and Mehta (1985): Ln(E/E r ) = ~(z~ - zs(z)) °'5 kg/m~/s where Ef = 5.1 X 10- S kg/m2/s and ~t = 1.62 m/N °'s. This relationship held for all data irrespective of exposure, sediment texture or benthic activity. Notwithstanding similar erosion rates, changes in erosion type will have a profound impact on net erosion. Given its relationship to microfabric, erosion type is not predictable using standard laboratory measurements.
Introduction
The erodibil i ty of f ine-grained sediments is typi-
cally defined on the basis of two principle parame-
ters: the erosion threshold and the erosion rate.
These parameters are inherent ly difficult to predict
on the basis of the physical properties of the
sediment due to a wide variety of biogeophysical
influences that occur dur ing and subsequent to
sediment deposi t ion (Postma, 1967; Lick, 1982;
Correspondence to: C.L. Amos, Geological Survey of Canada, P.O. Box 1006, Dartmouth, NS B2Y 4A2, Canada.
Yingst and Rhoads , 1978; Dyer, 1989). The thresh-
old for erosion appears no t to be a cons tan t value, bu t changes bo th with time (Amos et al., 1988;
Christ ian, 1990; Paterson et al., 1990) and depth within a sediment. Nei ther is erosion rate a simple
funct ion of time. Mehta and Par theniades (1982) classified erosion rate as either exponent ia l ly
decaying with t ime ("Type I") or cons tan t with
time ("Type II"). There are no clear reasons for the differences in the two erosion trends. N or is it clear that the erosion types are mutua l ly exclusive in a given sediment. Parchure and Mehta (1985) and later Sheng and Villaret (1989) explained
Elsevier Science Publishers B.V.

176 C.L. A M O S ET A L
"Type I" erosion as "floc" erosion; i.e. the bed fails through breakdown of the bonds that bind together flocculated particles. As flocs are eroded, so a deeper and more consolidated substrate is exposed that possesses a higher yield strength and a greater resistance to erosion. At a constant flow, erosion ceases when the exposed yield strength of the bed is equal to the applied bed stress:
dM/dt = E = Erexp{ct[r b - "rs(z)] °'5 } (1)
Here, bed erosion rate (E) under an applied fluid bed stress (rb) is eventually balanced by the increas- ing bed shear strength (rs) with depth (z) as erosion takes place (Parchure and Mehta, 1985). Bed shear strength is equated with the threshold stress for erosion (re) as E approaches zero. This process is independent of particle settling rate or mass depos- ition and implies a time-variable erosion rate. Lick (1982), on the other hand, explained "Type I" erosion as a balance between the upward flux of eroded suspended particles (E) which remains con- stant and the downward particle flux through settling (D) which increases through time in pro- portion to suspended sediment concentration (SSC). Laboratory results of Parchure and Mehta (1985) disprove this argument and show that in a closed system SSC is largely the result of variations in E with time, Many other laboratory observa- tions of bed erosion show an exponentially- decaying rate of bed erosion under conditions of constant discharge (Thorn and Parsons, 1980; Mehta and Parthenaides, 1982; Amos and Mosher, 1984; Parchure and Mehta, 1985; Ockenden and Delo, 1991). As far as we were aware, no-one at the time of this study had observed this type of erosion in nature. The first objective of this study was to do so. Thereafter to evaluate the applicabil- ity of Eq. l to natural marine settings.
Erosion rate is expressed by Villaret and Paulic (1986), Owen (1975) and Sheng and Lick (1979) in the form of:
dM/dt = E = Ct(rb-- Zc) ~ (2)
where rb is the applied bed shear stress. Here the threshold stress for bed erosion (r~) remains con- stant with time irrespective of hydrodynamic con- ditions or erosion history. Furthermore, erosion rate is a constant (q) function of excess bed stress.
Ariathurai and Arulanandan (1978) and Ariath- urai and Krone (1976) also subscribe to this type of erosion, but of the probabilistic form:
dM/dt = E = ~ ( T b / T c - - 1 ) (3)
In all cases c~ and ~/are determined by experimenta- tion and so are site and experiment specific. Equa- tions 2 and 3 imply that one set of constants is enough to define the erosion character of the sediment in time. That is, erosion, once failure has taken place, is continuous. This type of erosion rate has also been observed in flume experimenta- tion, and is equivalent to the "Type II" erosion of Mehta and Partheniades (1982). Parchure and Mehta (1985) propose that "Type II" erosion is solely the result of remoulding otherwise stratified, consolidated sediment. Thus they have abandoned the distinction in erosion types under the assump- tion that they are end members of a continuum of bed strength profiles. As their work was carried out under laboratory conditions on pure kaolinite can their conclusions be directly applied to nature?
Biological attributes of a natural sediment strongly influence its stability (Parchure and Mehta, 1985). Purple sulphur bacteria (Grant and Gust, 1987), chlorophyll (Grant et al., 1986b), macroalgae (Neumann et al., 1970; Oppenheim and Paterson, 1990), sea grasses (Fonseca, 1989), benthic diatoms (Grant et al., 1986a; Paterson, 1989; Paterson et al., 1990) and animal tracking and pelletization (Nowell et al., 1981; Jumars et al., 1981) have documented effects on sediment sta- bility. Furthermore, bioturbation and remoulding should reduce sediment stability for reasons described above (Nowell et al., 1981; Grant et al., 1982; Grant, 1983; Zeman, 1983; and Jumars and Nowell, 1984 for reviews). Furthermore, anteced- ent stresses due to sub-aerial exposure (Anderson and Howell, 1984; Amos et al., 1988), wave load- ing, and ice loading (Gordon and Desplanque, 1983) can significantly alter the dynamic properties of an adhesive/cohesive sediment. Biological influ- ences or antecedent bed stresses cannot be fully simulated in a laboratory, yet field measures of bed erodibility are rare. Therefore, the second purpose of this study was to verify the existence of Type II erosion in nature and the animal/ sediment characteristics that control it. Our study

EROSION ON FINE-GRAINED SEDIMENTS 177
was in the Bay of Fundy where a wide range of hydrodynamic, sedimentary, and biological condi- tions exists.
System configuration and method of deployment
The measurement of sediment erodibility was carried out in situ on natural, undisturbed sediment using the benthic, annular f lume--Sea Carousel. The details of the flume geometry (Fig. 1), its calibration, and operation are given in Amos et al. (1992). In brief, the annulus is 2 m in diameter, 0.3 m high and 0.15 m wide. It is lowered to the seabed from a floating pontoon and operated in a submarine setting. Flow is generated by rota- tion of a lid equipped with eight paddles. Mean
(radially-averaged) bed stress is determined from measures of azimuthal and vertical velocity made mid-channel at a height of 0.15 m above the bed using a laboratory produced algorithm (Amos et al., 1992).
Sea Carousel is deployed during tidal inundation to minimize sediment disturbance. Each site is initially selected to ensure a suitably fiat bed. Flow during deployment is typically increased at 10 minute intervals up to an azimuthal velocity of 1.0 m / s .
Bed erosion rate is defined on the rate of change in SSC, detected within the annulus using three optical backscatter sensors (OBS) (Downing, 1983). The sensors are calibrated in situ using approximately ten 100 ml water samples pumped
Fig. 1. A photograph of the benthic annular flume--Sea Carousel, used in this study to induce seabed erosion. The flume is deployed in a submarine setting. Erosion is detected by changes in suspended sediment concentration within the annulus, and by a video camera that monitors the seabed through a window in the annulus wall. Flow is induced by lid rotation, and is detected by an electro-magnetic current meter. All sensors are logged at 1 Hz and stored for post-processing.

178 C.L. A M O S E I A L
to the surface and filtered. The OBS, flow and lid rotation measurements are logged at 1 Hz and stored on an underwater storage module. Data are continuously monitored via a RS232 link and are intermittently downloaded to a surface computer. Typical experiments last 1 to 2 hours. Each time series is filtered and time-averaged. Time-averaging the bed stress eliminated macroturbulent fluctua- tions that may have been important particularly close to an erosion threshold (Lavelle and Mofjeld, 1987). The significance of these macroturbulent events in relation to total flow is discussed. Runn- ing-totals of eroded mass and eroded depth are computed for each time-averaged value (the latter based on bulk density measurements made by Christian, 1991). The effect of SSC on bed stress (derived from velocity profiles made in Annapolis Basin) appears minimal (Amos et al., 1992). A clear-water friction factor, relating velocity to bed stress, is therefore used throughout. Results of all variables are plotted as time-series for evaluation. Some losses of SSC occur by water exchanges across the lid during operation. These losses are evaluated in a series of experiments reported in Amos et al. (1992) and are accounted for in the computation of eroded mass. Such losses prevent the SSC inside the flume from exceeding approxi- mately 500 mg/l.
The depth of erosion within the annulus is computed assuming equal erosion over the area of the flume foot-print; this was qualitatively con- firmed by visual observations. "Type I" and "Type II" erosion are defined on the basis of trends in SSC over a 10 minute increment of constant current speed. The threshold stresses for erosion are determined by equating them to the fluid stress at which erosion ceased under "Type I" erosion: Zb = "~s = "ge' Regression of each value against esti- mated depth of erosion (z) yields the profiles of rs(z) and zc(z ). The surface intercept of these profiles (z= 0) is the surface threshold stress for sediment erosion (rso of Parchure and Mehta, 1985).
Video photography of the natural bed and of the lower 0.10 m of the flume water column was obtained at station 2 in Minas Basin and stations 6 and 7 in Annapolis Basin (see Fig. 2). Images recorded at 100 frames per second are suitable for
freeze-flaming for analysis of particle size and trajectory. Particle trajectory is measured at several heights above the bed in order to examine the nature of the benthic boundary layer, the thickness of the viscous sub-layer, and the distribution of aggregates within the water column. These obser- vations help evaluate the impact of SSC on the thickness of the benthic boundary layer, which according to Gust (1988) can lead to reductions in bed shear stress and consequently bed erosion. Finally, the nature of bed failure (floc, aggregate, or rip-up clast release) and the diameter of sus- pended particles is determined from the video imagery in order to help interpret measured trends in SSC.
Data base and regional descriptions
Sea Carousel was deployed on the tidal mudflats of two sub-estuaries in the Bay of Fundy: Minas Basin and Annapolis Basin (Fig. 2D). These sub- estuaries were chosen as they are geographically adjacent yet subject to differing wave climatology, tidal range, subaerial exposure, biological diver- sity, and benthic productivity. So, significant differences in the character of bed erosion type were anticipated.
Minas Basin
Repetitive measurements of sediment erodibility were made during July and August, 1989 and July, 1990 at three stations along a transect of a littoral mudflat in the Southern Bight of Minas Basin (Fig. 2A and B). Minas Basin is strongly macro- tidal (semi-diurnal mean tides of 11.5 m tidal range), is subject to intermediate wave activity and ice cover, and has a wide variety of sediment sources principally through the erosion of seabed glacial and post-glacial material (Amos and Long, 1980).
The physiography of the mudflats and the physi- cal and mineralogical properties of deposited sedi- ment are given in Amos et al. (1988), Christian (1991) and Faas (in prep.). The mudflat is largely composed of inorganic silt (40-60%) of low plas- ticity, and very fine sand (30-40%) with smaller amounts of clay (10-20%). The clay mineralogy

EROSION ON F I N E - G R A I N E D SEDIMENTS 179
.,~Fj \ANNAPOLIS
44 @~~(~ ESTUARY h OVA SCOT i
~ i i I
• li
CAU
(A)
• / /; , /
x y
IS)
~,-4 1 2 .
12 m
Dts~e (m)
Fig. 2. (A) Minas Basin, (B) Minas Basin transect, (C) Annapolis Basin, and (D) location of the two studied sub-estuaries in the Bay of Fundy.
is typical of glaciated marine environments: high in illites and chlorites, low in smectites and kaolin- ite (Amos and Mosher, 1984). Resistance to ero- sion is therefore due to adhesion (biological binding of inorganic particles) rather than cohe- sion. The bulk density of the sediment is 1820 kg/ m a (Christian, 1991) and the water content is 30-40%. Average organic content is between 2 and 3%. The mudflat is generated by tidal depos-
ition during spring periods of high turbidity (Amos and Long, 1980). Deposition throughout the sum- mer is low (G. Yeo, pers. commun., 1990). As a result surface sediments consolidate and increase in shear strength with time. The mechanism for this strengthening is strongly linked to biological activity and is described by Daborn and others (1991).
Surface sediments are biologically active and the
180 c i . AMOS ET AL
pelletization process is high. The most significant species on the mudflat is the tubicolous amphipod Corophium volutator that reaches numbers in excess of 10,000/m 2 during summer. Adhesion is largely provided by polysaccharide mucilage generated by surface diatoms that the amphipods feed on (Daborn and others, 1991; Paterson, in prep). Each winter, ice removes the surface 0.10 m of the mudflat and consolidates a perennial substrate of clean silt beneath that has a shear strength in excess of 200 kPa. Thus the surface layer that we studied is regenerated through tidal sedimentation each spring. Deposition occurs at concentrations below 50 mg/l (Daborn and others, 1991) and in the form of floccules 20 gm in diameter (Hilde- brand et al., 1980; Amos and Mosher, 1984). Nearbed water temperature at the time varied between 15 ° and 18°C, while interstitial and water column salinity was between 27 and 30 ppt.
Annapolis Basin
Annapolis Basin is situated close to the mouth of the Bay of Fundy. It is the site of the only operating tidal power plant in North America (Baker and Daborn, 1990). The results of three experiments are reported from the strongly stra- tified headpond of the tidal power plant (Fig. 2C). This headpond has a restricted tidal range (ca. 1 m), limited wave activity, and a limited sediment source (erosion of the adjacent marsh bluffs, Mar- tec Limited, 1980). The seabed sediments are described by Daborn et al. (1982) as a fine aerobic mud. The headpond region differs from other studied sites because it is not sub-aerially exposed at low water, experiences only low wave influences, and is not subject to ice loading. The limnology and oceanography of the region is described by Daborn et al. (1979a,b) and Daborn (1986). The bottom sediments comprise 20% sand, 60% silt and 20% clay. The sediments had a bulk density of only 1500 kg/m 3, and a water content of approx- imately 70%. The clay mineralogy is similar to that of Minas Basin. Because of water column stratification, benthic activity is low. Consequently these sediments are biologically undisturbed and organic content varies between 2 and 3%. Thus the main differences between the two studied
regions were in tidal exposure, winter ice erosion, wave climate, and benthic tracking. Finally, the nearbed water temperature during our visit was between 15 ° and 20°C and salinity was between 27 and 30 ppt.
Results
Minas Basin
Nineteen successful deployments of Sea Carousel were undertaken at three stations (1-3) in Minas Basin (Fig. 2A and B). Although the sites reflect differing grain sizes, clay content, and sub- aerial exposure they exhibited marked similarities in results. For example, when horizontal current speed was increased incrementally to 0.6 m/s over a period of 1.3 hours, both "Type I" and "Type II" erosion were evident in the SSC time-series (Fig. 3B and C). "Type I" erosion is characterized by a rapid onset of erosion to a maximum rate immediately after the current speed is increased, followed by a smooth exponential decay to zero within 3 minutes of this increase (Fig. 3C; 12.05 and 12.25 Atlantic Daylight T ime- -ADT) . Peak erosion rate occurs within 40 seconds of onset of the increased flow and is maintained for 20--40 s only. Peak erosion rates are between 0.8x 10 4 and 3.5 x 10 -4 kg/m2/s (Table 1).
"'Type I" erosion is herein subdivided into "Type la'" and "Type Ib" based on the variance in the time-series of SSC. "Type Ia" erosion shows a low signal variance (< 0.021), with no evidence of bed erosion after 3 minutes of onset of the threshold stress (i.e. Ef = 0 kg/m2/s). "Type Ib" erosion, by contrast, shows a higher signal variance and evi- dence of intermittent periods of bed erosion events after the initial maximum (i.e. E l > 0 kg/m2/s). Are these latter periods of erosion correlated with flow?
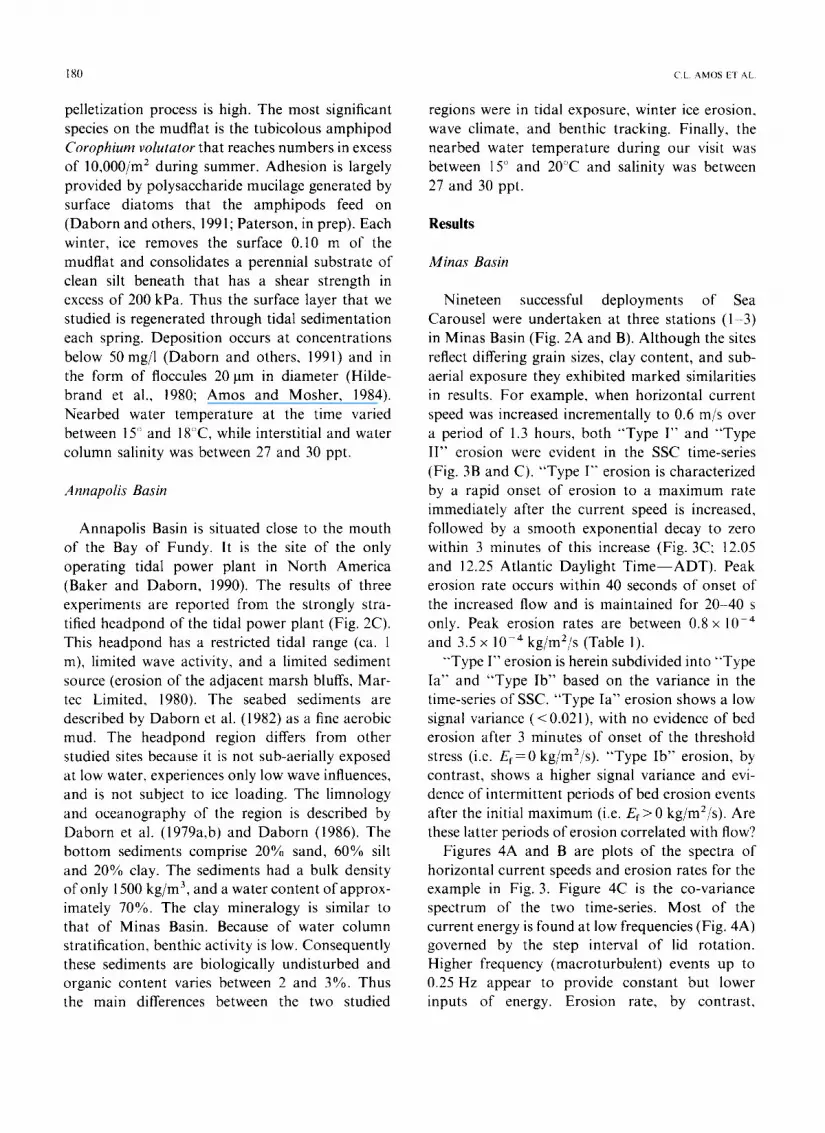
Figures 4A and B are plots of the spectra of horizontal current speeds and erosion rates for the example in Fig. 3. Figure 4C is the co-variance spectrum of the two time-series. Most of the current energy is found at low frequencies (Fig. 4A) governed by the step interval of lid rotation. Higher frequency (macroturbulent) events up to 0.25 Hz appear to provide constant but lower inputs of energy. Erosion rate, by contrast,

E R O S I O N O N F I N E - G R A I N E D S E D I M E N T S
1.0
0.8
0.6
0.4
0.2
0.0
-0.2
1.5
DATE: 2 AUGUST, 1989 MINAS BASIN - STATION 2
- - - * LID ROTATION 2 - - , , , , ~ ,~ ~"
r-- ......... ..--:.I m I .~o. f h,'-,-~..,-4 " "
H . . . . . . . / ,*'.~.v.~o~*~Z" "" o - * VERT. VELY tn
• - - * HORIZ. VE
" ' ' I ' ' I ' '
12.0 12.5
HOURS(ADT)
181
1000
900
8 0 0
7 0 0
6 0 0
500
400
300
2 0 0
100
0 11.5
i I I I 1
* - - ° SSCI (UPPER)
. - - " SSC2 (AMBIENT)
*--- SSC3 (LOWER)
I I I
12.0 12.5 HOURS(ADT)
Z
M
z
m 6O
:. m
4 . 0 E - 4
3.0E-4
2.0E-4
1 . 0 E - 4
0.0
' ' I ~ ' I
~o°° **o L 9 ~,
' I
12.0
- 1.0E-4 ~ i j 6 1
11.5 12.5 HOURS(ADT)
(x/
~0
v
f-d
z O
o
Fig. 3. A time-series of a deployment of Sea Carousel at station 2, Minas Basin, during 2 August , 1989: (A) azimuthal (tangential) and vertical current speed measured 0.15 m above the bed in the annulus, and lid rotation; (B) suspended sediment concentration (SSC) measured by the three OBS's, 1 and 3 are inside the annulus, 2 is outside the annulus; and (C) erosion rate, based on the rate of change of SSC.

182 (.L. AMOS ET AL
TABLE 1
Erosion results from Sea Carousel. A synthesis of bed shear stress (ATAU; PaL excess shear stress (ETAU; Pa), erosion rate (E; kg/ mZ/s), erosion type (ETYPE), internal friction angle (FRIC AGL; degrees), and adhesion (ADH; Pa) for the Minas Basin and Annapolis Basin deployments
Date ATAU ETAU E ETYPE FRIC AGL ADH
Minas Basin 15/07/89 2 0.32 0.00012 IA 49 1.5 ST I 2.56 0.56 0.00018 IB
3.08 0.52 0.00015 IB 3.76 0.68 0.00017 IB 4.25 0.49 0.00021 IB 4.91 0.66 0.00027 IB 5.61 0.7 0.00035 II 6.21 0.6 0.0004 II
16/07/89 I 0.17 0.00012 IB 81 0.2 ST 3 0.83 0.24 0.0001 IB
0.17 0.17 5e-005 IA 0.59 0.24 0.00013 IA 1.42 0.28 0.00011 IB 1.56 0.14 0.00013 IB 1.89 0.33 0.00018 IB
17/07/89 1.69 1.69 0.00035 IB 75 1 ST 2 2.19 0.5 0.00026 IB 20/07/89 0.79 0.45 0.00049 IA 73 0.9 ST 3 1.14 0.35 0.00032 IB
1.35 0.2 0.00016 1B 21/07/89 1.3 0.6 3e-005 IB 85 0.5 ST 2 1.52 0.22 6e-005 IB
2.8 0.76 8e-005 IB 3.41 I. 13 6e-005 I B
22/07/89 0.96 0.62 0.0002 IA 69 1.3 ST 1 1.34 0.38 0.00036 IA
1.79 0.45 0.00023 IA 2.14 0.35 11.00027 IB
23/07/89 1.47 0.33 0.0003 IA ST 2 1.89 0.42 0.00029 IB 24/07/89 6.8 0.1)032 lI ST 3 4 0.0012 lI 25/07/89 0.89 0.54 0.00061 IA 68 1.5 ST 2 1.3 0.41 0.00063 IA
1.65 0.35 0.00055 IB 2.09 0.44 0.00037 IB 2.41 0.32 0.00038 IB
26/07/89 0.96 0.45 0.00034 1A 76 0.2 ST 1 1.38 0.46 0.00038 IB
1.79 0.41 0.00031 IB 27/07/89 1.3 0.38 0.0002 IA 37 2.5 Poisoned 2.28 0.98 0.00028 I1
3.08 0.8 0.00128 II 30/07/89 0.79 0.46 0.00012 IA 43 2 ST 1 I. 18 0.39 t).0003 [ IA
I. 7 0.52 0.00068 1A 2.09 0.39 0.00082 IA

EROSION ON FINE-GRAINED SEDIMENTS
TABLE I (continued)
183
Date ATAU ETAU E ETYPE FRIC AGL ADH
31/07/89 IB 71 1.9 ST 2 01/08/89 1.68 0.76 0.0003 IA 73 1.2 ST 2 3.08 1.4 0.0004 IB
3.88 0.8 0.00045 IB 4.77 0.89 0.00035 IB 5.61 0.84 0.0004 II
02/08/89 0.61 0.32 8e-005 I 64 1.6 ST 2 1 0.39 0.00022 IB
1.39 0.39 0.00024 IB 1.84 0.45 0.00035 IB 2.14 0.3 0.00025 IB 2.41 0.27 0.00033 IB 1.75 1.78 0.0012 IB 3.47 1.69 0.00075 IB 4.2 0.73 0.00035 IB 5.43 1.23 0.0005 IB 6.18 0.75 0.00045 IB 7.46 1.29 0.0004 IB
31/07/90 73 1 ST 2
Annapolis Basin 17/07/90 ST 3
19/07/90 ST 6 19/07/90 ST 7
1.05 0.7 0.0009 IB 48 0.5 2.04 0.99 0.0007 IB 3.71 1.67 0.0013 IB 4.08 0.38 0.0006 II 4.73 0.65 0.0008 II 2.1 I 0.00035 IB 73 2.2 3.1 1 0.00065 IB 5 5 0.0035 IB 71 0.3 5.5 5.5 0.0031 IB 3.7 3.7 0.0023 IB
increases monotonically with frequency (Fig. 4B). A significant correlation (coherence > 0.9) between current speed and erosion rate is found near the steady current end of the spectrum (Fig. 4C). The higher frequency erosion events, by contrast, appears to be unrelated to macroturbulence (low coherence). Thus more than 90% of the explained bed erosion is by the accelerations of flow imposed at each change in lid rotation. These accelerations are controllable: less than 10% may be attributed to macroturbulent events that are not.
"Type I" erosion characterizes initial bed failure in all experiments. "Type Ia" is a surface phenome- non, restricted to depths of 1 pellet (unconfined) diameter (,-~ 100 gm based on video observations), and is not always detectible. It has a mean peak erosion rate of 2.7_+ 1.6 x 10 -4 kg/mE/s and exhib-
its an exponential decay in this rate over a period of 1-3 min after onset of erosion.
"Type Ib" erosion is ubiquitous and is apparent as a linearly increasing shear strength with depth (solid lines Fig. 5A-D). It is also a surface phenom- enon, as the depth eroded in this manner is only 160 gm. The mean peak erosion rate for "Type Ib" erosion is 4.5_+2.5x 10⁻⁴kg/m2/s. Erosion rate decays asymptotically to random erosion events within 1-3 min with a remnant erosion rate ( E l ) o f 5.1 x l0 -5 kg /mE/s . Th i s t ype o f e r o s i o n
occurs between bed stresses of 1.0 and 4.4 Pa. The mean slope of the equilibrium stress line (equal to the arctangent of the internal friction angle of the sediment; see discussion) is 68 _+ 14 ° (Table 1). The "loops" in the stress/depth plots (best seen in Fig. 5D) trace the increase in applied stress above
1 8 4 C . L . A M O S E T A L
10-z
10-3
10 ~
lO-S
10 ~
E
10-7 0
lffS
10 ~
10-7
1 0 - 8
10-9
1 0 lo
Pxx - X Power Spectral Density
A
!
\ " , / .
0.05 0.1 0.15 0.2 0.25
Frequency
. . . . . . . T . . . . . . . . . . . . . . . . . . ~ . . . . . . . . . . . . . . . . . . . . . . . . . . . . . T
i j j j j .
j j . z - J "
1 _ n
0.05 0.1 0.15 0.2 0.25
Frequency
! 0.9
0.8
0.7
0.6
0.5
0.4
0.3
0.2
0.1
06
C
\
0.05 0.1 0.15 0.2 0,25
Frequency

E R O S I O N ON F I N E - G R A I N E D S E D I M E N T S 185
the threshold value for that depth and the subse- quent erosion to the equilibrium line (the failure envelope of the M o h r - C o u l o m b diagram, Fig. 5D; Bowles, 1979). Erosion takes place through ripping-up of clasts.
"Type I I " erosion is evident at depths greater than 80 ~tm and at measured bed stresses between 3.2 and 7.0 Pa. "Type I I " initial peak erosion rate is 3 .1+ 1.7 x 10 -4 kg/m2/s. This erosion, once begun, continued unabated over the t ime-frame of our experiments. Note that these erosion rates overlap those of the "Type Ib" cases.
In all tests, a threshold for erosion of surface sediment (Zso) exists that varies up to 2.5 Pa. The threshold shows no clear trends across the littoral mudflat (i.e. with exposure), but station 2 shows a general increase in strength with time through the 19 days of the survey from a minimum of 0.5 Pa to a maximum of 2.5 Pa (Fig. 6). The seaward station (3) appears to yield the lowest sediment stability, but results are inconclusive. The factors affecting this trend are discussed by Daborn and others (1991).
Annapolis Royal
Three successful deployments of Sea Carousel were carried out in Annapolis Basin headpond (Table 1). Figures 7 and 8 illustrate examples of deployments near the tidal power plant (stations 6 and 7, respectively). Although "Type Ia" erosion is not detected, "Type Ib" erosion consistently occurs. A measurable surface critical bed shear stress of between 0.2 and 2.2 Pa is detected for "Type Ib" erosion, and this erosion takes place to a maximum depth of 0.45 mm. Peak erosion rate is higher than in Minas Basin (Table 1) and varies up to 3.5 x 10 -3 kg/m2/s. It correlates with rapid resuspension of sediment aggregates up to 7.5 mm in diameter from the bed (observed in video records). The linear increase in the critical stress
with depth (diagnostic of "Type I" erosion) is evident in Fig. 9. The characteristic " loops" of the data above the equilibrium stress are also evident here. The friction angles for these two stations (6 and 7) were 73 ° and 71 °, respectively. These angles are similar to those measured in Minas Basin.
"Type I I " erosion occurs at bed stresses above 4.1 Pa. Onset of this erosion corresponds to a depth range of 0.1 to 0 .2mm, and erosion is measured to a maximum depth of 0.8 mm. Video observations, made at stations 6 and 7, show the nature of bed erosion and the size, mode of transport, and number of clasts in transport (Figs. 7 and 8). The large variance in erosion rate (Fig. 7B) is observed in video records to be quantum releases of sediment in the form of aggre- gates 4 to 6 m m in diameter (Fig. 7C). Notice that for station 6, the clast size increases rapidly with the onset of erosion to a maximum of 6.5 mm (Fig. 7C). The trend in size follows closely that of erosion rate (Fig 7B). Larger clasts are observed to be ripped from the seabed and thereafter roll or bounce along the bed; smaller ones move in suspension. The decrease in size with time is due to clast breakup during transport. The number of clasts in transport corresponds closely to erosion events. The peak of 400 clasts/min correlates with a peak erosion rate of 6.5 x 10 -4 kg/m2/s (Fig. 7B). Note that at this time the clast size is at a local minimum of 3 mm. The number and size of eroded clasts stabilizes at intermediate values under "Type I I " erosion.
The size and number of clasts at station 7 shows trends that are inversely related. Clast size (Fig. 8C) systematically increases to a maximum of 7.5 mm throughout the deployment which is dominated by "Type Ib" erosion. The initial increase corresponds to the onset of erosion, although there is no clear correspondence between clast size and erosion rate (Fig. 8B). Moreover, the
Fig. 4. Spectral plots of the time-series illustrated in Fig. 3. The analysis is based on 2048 samples recorded at I Hz, and uses a 128-point spectral window: (A) the spectral density of azimuthal current. It shows that the greatest input of energy results from steady flow and that energy input is evenly distributed across the macroturbulent frequency range (0.I-0.5 Hz); (B) the spectral density of erosion rate; and (C) a coherence spectrum between azimuthal current and erosion rate. Erosion is clearly related to the low-frequency changes in current speed. Peaks in the macroturbulent range are inconsistent between experiments and are not significant.

186 C.L. A M O S ET A L
0.00
- 0.05
t ±
4 - 0 . 1 0 +
0.15
r ~ rm
- 0 2 0
- 0 . 2 5
0.00
0.05
- 0 . 1 0
- 0 1 5
2~
- 0 2 0
- - 0 2 5
MINAS BASIN STATION 1
DATE: 15 JULY, 1 9 8 9
,.O o i
0 ~ 2vD O~
@:
0 1 2 3 4 5 6 7 8
BED SHEAR STRENGTH (Pa)
MINAS BASIN STATION 2
DATE: 31 JULY, 1990
m
4 I ~ ~ °
~ ° °
° ~ e o
t +
0 2 4 6 8 ]0
BED SHEAR STRENGTH (Pa)
E
O~
0.05 I [ ~ ~ ~ ~
0 1 0
MINAS BASIN STATION £
DATE: 2 AUGUST 1 9 8 9
0 0 0 ~ ~ + ~ + , : 1 4 - ,,," ...... BI .... i 4 ~ +
• -
4
0 1 5
0 20
0 1 'd 3 4 5 6 7 8
BED SHEAR STRENGTH (Pa)
MINAS BASIN STATION 2
DATE: 30 JULY, 1 9 9 0
o o o . . . . . . . . .
• f
0 2 5
0 15 - -- --~ o£~
0 2 0
0 2 5
£L OO P • II,
g • +
• • . . * "
\ . ~ 1 . " + \
3 I 6 8 10
BED SHEAR STRENGTH (Pa)
Fig. 5. Plots of imposed bed shear strength versus eroded depth for a series of deployments in Minas Basin. (A) station l, 15 July, 1989; (B) station 2, 2 August, 1989; (C) station 2, 31 July, 1991; and (D) station 2, 30 July, 1990. Notice that "Type Ia" erosion is restricted to the very surface of the sediment. "Type Ib" erosion is also a surface phenomenon and defines a normal (linear) consolidation profile with depth. "Type II" erosion shows no depth dependency.
p e a k in the n u m b e r o f c la s t s ( 4 0 0 / m i n u t e ; F ig . 8 D )
o c c u r s at i n t e r m e d i a t e bed s tresses a n d corres -
p o n d e d to o n l y a s m a l l rise in the e r o s i o n rate (2 .5 x 10 4 kg /mZ/s ) .
D i s c u s s i o n
W e h a v e t r a n s f o r m e d s e d i m e n t d e p t h s ( in Figs .
5 a n d 9) to e f fec t ive ver t i ca l s tress (a ' ) w i t h the
EROSION ON F I N E - G R A I N E D SEDIMENTS 187
3.0
2.5
2.0
1.5
1.0
0.5
0.0
LISP STUDY - MINAS BASIN 1989
I I I I I I I I I
[] STATION 1 I
I I I I I I I I I
2 4 6 8 10 12 14 16 18 20
TIME (DAb(S)
Q., v
Z
GO
t~ .<
(/3
~.) .<
O3
.< o
h m ~D
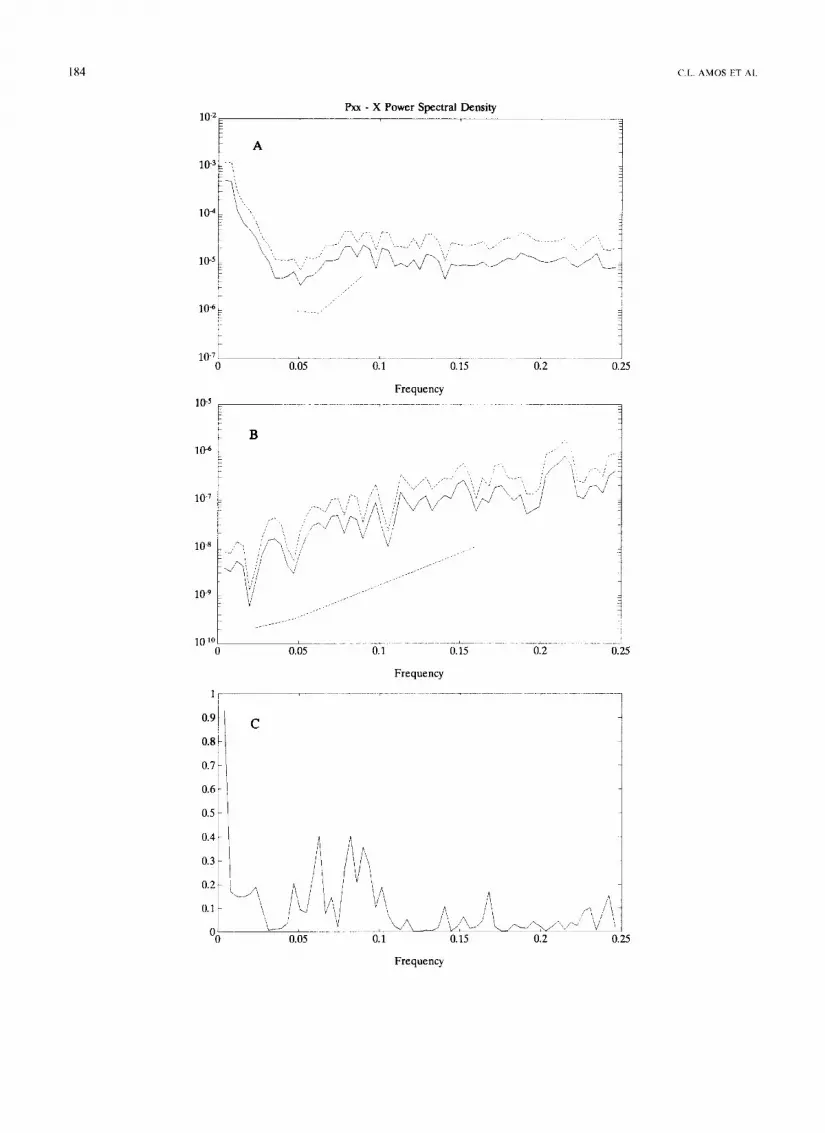
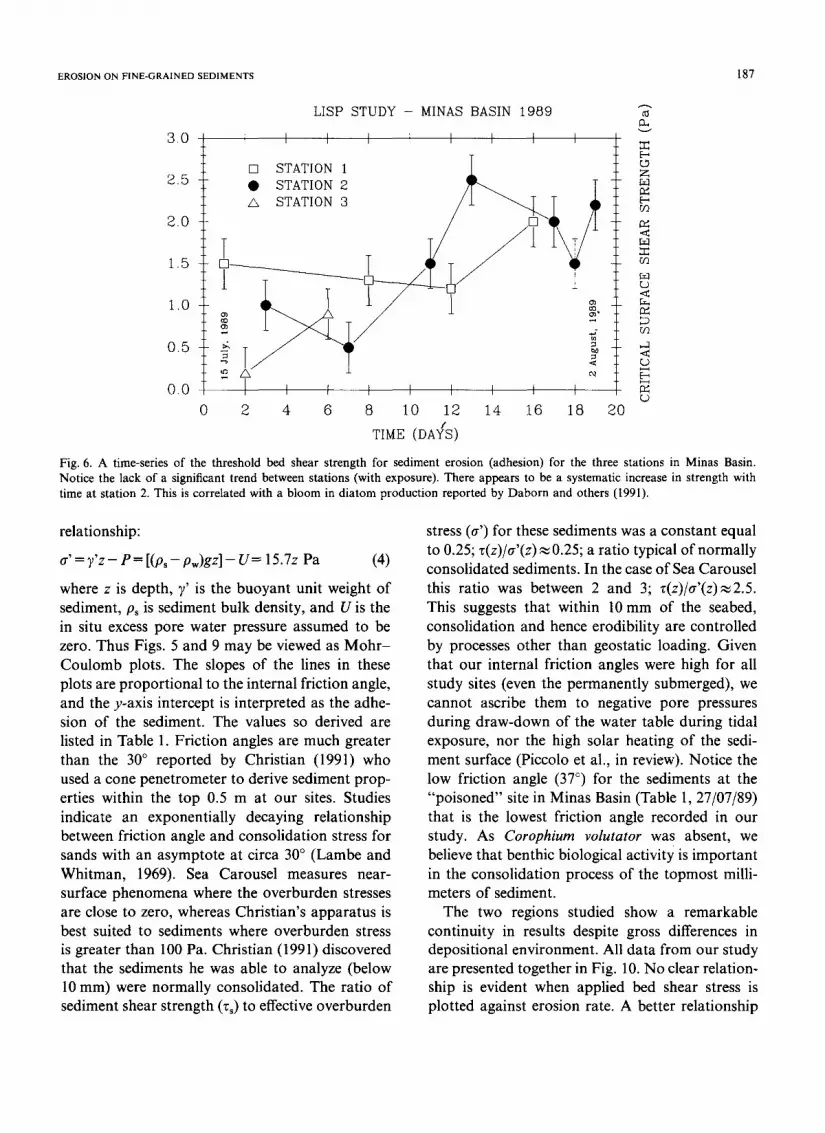
Fig. 6. A time-series of the threshold bed shear strength for sediment erosion (adhesion) for the three stations in Minas Basin. Notice the lack of a significant trend between stations (with exposure). There appears to be a systematic increase in strength with time at station 2. This is correlated with a bloom in diatom production reported by Daborn and others (1991).
relationship:
a' = ),'z - e = [(Ps - pw)gz] - U-- 15.7z Pa (4)
where z is depth, 7' is the buoyant unit weight of sediment, Ps is sediment bulk density, and U is the in situ excess pore water pressure assumed to be zero. Thus Figs. 5 and 9 may be viewed as M o h r - Coulomb plots. The slopes of the lines in these plots are proportional to the internal friction angle, and the y-axis intercept is interpreted as the adhe- sion of the sediment. The values so derived are listed in Table 1. Friction angles are much greater than the 30 ° reported by Christian (1991) who used a cone penetrometer to derive sediment prop- erties within the top 0.5 m at our sites. Studies indicate an exponentially decaying relationship between friction angle and consolidation stress for sands with an asymptote at circa 30 ° (Lambe and Whitman, 1969). Sea Carousel measures near- surface phenomena where the overburden stresses are close to zero, whereas Christian's apparatus is best suited to sediments where overburden stress is greater than 100 Pa. Christian (1991) discovered that the sediments he was able to analyze (below 10 mm) were normally consolidated. The ratio of sediment shear strength (vs) to effective overburden
stress (a') for these sediments was a constant equal to 0.25; z(z)/a'(z)~ 0.25; a ratio typical of normally consolidated sediments. In the case of Sea Carousel this ratio was between 2 and 3; z(z)/a'(z),,~2.5. This suggests that within 10 mm of the seabed, consolidation and hence erodibility are controlled by processes other than geostatic loading. Given that our internal friction angles were high for all study sites (even the permanently submerged), we cannot ascribe them to negative pore pressures during draw-down of the water table during tidal exposure, nor the high solar heating of the sedi- ment surface (Piccolo et al., in review). Notice the low friction angle (37 ° ) for the sediments at the "poisoned" site in Minas Basin (Table 1, 27/07/89) that is the lowest friction angle recorded in our study. As Corophium volutator was absent, we believe that benthic biological activity is important in the consolidation process of the topmost milli- meters of sediment.
The two regions studied show a remarkable continuity in results despite gross differences in depositional environment. All data from our study are presented together in Fig. 10. No clear relation- ship is evident when applied bed shear stress is plotted against erosion rate. A better relationship

188 C . L A M O S E T A L
1.0
0.9
0.8
0.7
0.6
0.5
0 4
0.3
0.2
0.1
0.0
0.1 10 .5
ANNAPOLIS ROYAL STATION 6
/ D A T E I9 JULY, 1 9 9 0 4-
o ....... o VERT. VELY i z
~ " - - " AZIMUTHAL VELY ; .
1 0 . 7 1 0 . 9 1 1 . 1 1 1 . 3 11 5 1 1 . 7
'rIME (ADT)
6.0E 4
4.0E 4
2.0E 4
0.0
2 . 0 E - 4 I . . . . 10.5
i i i 1 ~
B
o o o
I 0o0 o o
,, i - ~ - . . . . . I . . . . . ~ . . . . . ~ . . . . . J . . . . . . . lit 10.7 10.9 11.1 11.3 11.5 11.7
TIME (ADT)
2~
rm
Z O U~ o r~ gTq
emerges, however, when excess bed shear stress is regressed against erosion rate (Fig. 10A):
E = 4.9 x 10⁻⁴(~" b - - zs(z))°'81kg/m2/s (5) (r = 0.65,n = 72)
At the limit when (~b-z~(z))--*O,E--*Ef~4.9x 10 -4 kg/m2/s. This is two orders o f magnitude higher than those values reported by Parchure and Mehta (1985). It is also much larger than the minimum erosion rate o f 3 . 5 x l 0 - S k g / m Z / s adopted by Otsubo and M u r a o k a (1988) indicating that Eq. 5 overpredicts near the threshold. By
t ransformat ion of Eq. 1 we arrive at the expression:
Ln(E/Ef ) = e(~b -- rs(z)) °'s (6)
where Ef is the remnant (floc) erosion of material that takes place below the threshold stress, and is a erosion coefficient listed by Parchure and Mehta (1985, p. 1322) between 4.2 and 25.6. In Fig. 10B we plot our data in a fashion similar to that o f Parchure and Mehta (1985, their fig. 13). Ef and ~ are subsequently derived f rom a least squares regression that yields a variance (r 2) = 0.65 (n--72), and are 5.1 x 10 -5 and 1.62, respectively.

EROSION ON FINE-GRAINED SEDIMENTS 189
10
4
2-
10.5
, , : l ; ; : ; : l : ; : : : l : : : + : l ' ~ q ' ~ l ' ' ' , ' l '
i n I i : ~ ~ : : I : : : ~ : I : * : : : I ; : ; ; ; ] t q i ~ n E I
10.7 10.9 11.1 11.3 11.5 11.7
TIME (ADT)
fi B
.<
[-~ U~ ,<
L)
5 0 0 ' ' ' ' , , , , , I , , , , , I , , , , I , , , , , I , , , , , I , ,
400 D
300
lOO s
I I
0 , , , , , : ~ ; I , , , , , I , , , , ', '. , ', : '. ', : ; : : : ', : ' .
10.5 10.7 10.9 11.1 11.3 11.5 11.7
TIME (ADT)
Fig. 7. A time-series of Sea Carousel deployed at station 6 in the headpond of the Annapolis Basin tidal power plant, during 19 July, 1990: (A) azimuthal and vertical current speed measured 0.15 m above the bed in the annulus; (B) erosion rate, based on the rate of change of SSC; (C) diameter of clasts eroded from the seabed observed in video; and (D) number of clasts in transport. This pattern of erosion is typical of "Type Ib" and "Type II" (see Fig. 9A).
Thus:
Ln(E/5.1 x 10- 5) = 1.62{%- vs(z)} °'5 (7)
Note that Er is now similar to the values reported by Parchure and Mehta (1985). By contrast, our erosion constant (~) is significantly lower than any laboratory-derived values reported above. This we consider to be a reflection of higher consolidation gradients and greater shear strengths in our natural sediments. We conclude, therefore, that many labo- ratory results reflect a higher susceptibility to
erosion than would occur on the mudflats of the Bay of Fundy.
Equation 7 incorporates data for the three types of erosion and at all monitoring sites. No improve- ment in correlation results by regressing each erosion type separately. This suggests that, from the standpoint of erosion rate;, all three types of erosion follow the relationship defined by Eq. 7. Therefore, the distinction in erosion type is signifi- cant not in erosion rate, but in the estimation of the net erosion with time. Under Type I erosion

190 C.L. AMOS ET AL.
1.0
0.9
0.8
0.7
0.6
0.5
0.4
0.3
0.2
0.1
0.0
0.1 13.4
ANNAPOLIS BASIN - STATION 7
J l * l l i J ~ l l l l l q l ~ l l q l J l l l J l l l J l t l ~ l e - - ' < - - ~ l * l l ~ - + - ~ , l l ~
A DATE: 19 JULY, 1990
o--o VERT VELY ~WI~
• --. HORIZ VELY L~
, 50
13.5 13.6 13.7 13.8 13.9 14.0 14.1 14.2
TIME (ADT)
1 .0E-3
8 .0E-4
6 .0E-4
4 .0E-4
2 .0E-4
0.0
B
~ o
v
/
i I
.<
Z 0 U?. 0 C~
- 2 . 0 E - 4 13.4 13.5 13.6 13.7 13.8 13.9 14.0 14 l 14.2
TIME (ADT)
the release of bed material ceases within minutes; under Type II erosion it does not.
The continuity of results between Minas Basin and Annapolis Basin is clear and suggests that Eq. 7 is spatially and long-time (days) independent. Erosion is, however, short-time (throughout the erosion process) dependent. This time-dependency is manifested as increases in the term zs through the progressive exposure of deeper material during an erosion event. Such an increase with depth is illustrated schematically in Fig. 1 I. "Type Ia" ero- sion is interpreted to occur by suspension of lO0 ~tm sized low density flocs or pellets on the seabed.
We correlate onset of this type of erosion with r¢1 of Otsubo and Muraoka (1988). Pellets are formed by benthic animals especially the amphipod Coro- phium volutator and the polychaete Heteromastus filiformis. The sparse benthic fauna in Annapolis Basin undoubtedly accounts for the lack of loose pellets at the seabed and the absence of Type Ia erosion.
"Type Ib" erosion represents the intermittent failure of the bed as rip-up clasts in the form of large irregular aggregates (up to 7 mm in diameter). Erosion occurs through excavation of small irregu- larities in the bed that become enlarged through

EROSION ON FINE-GRAINED SEDIMENTS 191
: : : : : : : : : : : : : : : : : : : : : : : : : : : : : : : : : : : : : : : : : : : : : : : : : : : : : : : :
c
/\ / \
: : : : : : : : : : : : : : : : : : : : : : : : : : : : : : : : : : : : : : : : : : : : : : : : : : : : : : : : : :
13.4 13.5 13.6 13.7 13.8 13.9 14.0 14.1 14,2
[-.,
.<
rJ~ .<
r..)
TIME (ADT)
500 : : : : : : : : : : : : : : : : : : : : : : : : : : : : : : : : : : : : : : : : : : : : : : : : : : : : : : :
D 400 o,O
300 ~' • / • 0 • • T • 0 , / , O / \ • Z
• O 2oo
0
l O ° I . •
: : : : : : : : : : : : : : : : : : : : : : : : : : : : : : : : : : : : : : : : : : : : : : : P ~ I ~
13.4 13.5 13.6 13.7 13.8 13.9 14.0 14.1 14.2
TIME (ADT)
Fig. 8. A time-series of Sea Carousel deployed at station 7 in the headpond of the Annapolis Basin tidal power plant, during 19 July, 1990: (A) azimuthal and vertical current speed measured 0.15 m above the bed in the annulus; (B) erosion rate, based on the rate of change of SSC; (C) diameter of clasts eroded from the seabed observed in video; and (D) number of clasts in transport. This pattern of erosion is typical of "Type Ib" (see Fig. 9B).
randomly-oriented bed failures. Release of aggre- gates to the water column appears episodic and is not related to macroturbulence in the flume (Fig. 4C). Particles are rapidly abraded, suggesting that the aggregate structure has not totally col- lapsed by the process of consolidation or compac- tion (cf. Parthenaides, 1965). Thus the strength of the sediment in this zone is limited by weaknesses related to its open microfabric. Typical sediment strengths vary f rom 1.0 to 1.5 Pa, which is an order of magnitude lower than aggregate strengths reported by Krone (1984, p. 73). Thus failure is
presumed to take place between aggregates not across them.
Eroded particle density is presumed to be larger than those suspended under "Type Ia" erosion as they tend to move by saltation close to the bed rather than in suspension. The environmental con- sequences of "Type I" erosion are interpreted to be low because the sediment is self-armouring and erosion quickly ceases. "Type I I " erosion, by contrast, exhibits a continuous release of sediment to the water column once a critical stress (re2 of Otsubo and Muraoka, 1988) has been exceeded.

192 C.L. A M O S E 1 AL .
ANNAPOLIS BASIN STATION 6 ANNAPOI,[G BASIN STATION T
DATE: 19 JULY, 1 9 9 0 DATE: 19 JUI,Y. 1 9 9 0
t : -,o 2 V4 h
4 0.05 : ~, 005 j
Z= 0 1 0 o ~ ~- 0 1 0 i ..
"3. TYPE II 0 15 , ~ 0 1 !3 '
!
- 02.0 0 2 0 + , , , i ,+~++-~+~+~+~+*-+-+-f
0 :2 4 6 8 10 () 2 t 6 8 10
BED SHEAR STRENGTH (Pa) BED SHEAR STRENGTH (Pa)
Fig. 9, Plots of imposed bed shear stress versus eroded depth for a series of deployments in the Annapolis Basin tidal power plant headpond: (A) station 6; (B) station 7. The solid line in the figure is related to the failure envelope of the Mohr Coulomb diagram.
"Type II" erosion is observed to result from failure of the bed along planes of weakness parallel to the sediment surface (zsi, in Fig. 11). Elongate clasts are lifted from the seabed whereupon they are rapidly corraded. These aggregates are slightly smaller and of more uniform size than those eroded under "Type I" erosion. We postulate that the planes of weakness are controlled by the microfab- ric of the sediment because erosion continues at bed shear stresses below values predicted by a normal consolidation profile. According to Bowles et al. (1969) this fabric will be ordered and aligned normal to the major principle overburden stress (i.e. horizontal) with the associated development of planes of weakness.
There appears to be no way to determine a priori which type of erosion will take place. We tentative conclude that "Type I" erosion will pre- dominate where the sediment microfabric is uni- form, and "Type II" erosion will predominate where the microfabric exhibits laminated planes of weakness. Peculiarly, this is quite opposite to the observations of Parchure and Mehta (1985).
Our observations show that clast size is related neither to erosion type nor to absolute bed stress.
This leads us to believe that sediment microfabric and associated planes of weakness control aggre- gate size. The tripartite division illustrated in Fig. 11 adequately explains observed sizes of aggre- gates released from the bed and the process of erosion. This division looks remarkable similar to that of Parchure and Mehta (1988; their fig. 5) and follows closely the progression of aggregate col- lapse upon burial defined by Bowles et al. (1969).
Conclusions
In this paper we have attempted to classify and interpret measurements of the induced erosion of fine-grained sediments obtained in two sub- estuaries of the Bay of Fundy, and to relate these patterns to published results from conventional laboratory studies. Our conclusions are the following.
(1) Measured bed erosion can be classified into either "Type I" (asymptotically decreasing with time) or "Type II" (constant with time) erosion patterns proposed by Mehta and Parthenaides (1982). "Type I" erosion may be sub-divided into: "Type Ia"--diagnost ic of floc or pellet resuspen-

E R O S I O N O N F I N E - G R A I N E D S E D I M E N T S 193
0.01
0.001
0.0001
0.00001 0.1
0.01
0.001
0 1 0 0 0 1
0.00001
A
• %
0 V v •
• "..
++ "+ S °%°°°
i L , , , , I i
1
EXCESS BED STRESS (Pa)
~7 V
~7
E
v
< f'r"
Z 0 CO 0 n-" L,J
B ~ V
V
o " ? , ' im~. ~ MINAS BASIN ~ o q, o STATION 1
~ i a ~ o • STATION 2 a STATION 3
Z~o o ANNAPOLIS BASIN
• • • STATION 3 z~
• o STATION 6
v STATION 7
. . . . . t . . . . . . . i I i i i i i i i i I i i i i i i i i
1 2 3
SRT EXCESS STRESS (Pa)
t ~
E
<
Z ©
c f l ©
w
Fig. 10. Summary plots for all data in this study: (A) sediment erosion rate plotted against excess stress (%-zs(z)) Pa. A good correlation exists in the form E = 0.00049(%-z,(z)) ° 8 ' kg/m2/s; (B) the natural logarithm of erosion rate plotted against the square root of the excess stress (after Parchure and Mehta, 1985). A better fit is derived following the form E = 5.1 x 10 - 5exp{ 1.621% - z,(z)] °'m] kg/m2/s.
sion from the seabed at low stresses; and "Type Ib"--diagnostic of bed failure occurring as rip-up clasts (aggregates) but which is constrained in depth by a higher-than-normal consolidation pro- file in the sediment. Surface threshold stresses (Zso) for erosion varies between 0.2 and 2.5 Pa. In the intertidal sediment, variations in zs are probably related to changes in biological activity, particu- larly benthic diatom production.
(2) "Type II" erosion is not constrained by the consolidation profile, but appears to take place along silt-rich laminae that comprise the corn-
pacted microfabric of the sediment developed upon burial. The critical bed shear stress for "Type II" erosion is greater than 4.1 Pa.
(3) Co-variance spectra of azimuthal velocity and suspended sediment concentration indicate that erosion rate is largely controlled by incremen- tal changes in current speed imposed during the experiments. Coherence between flow macroturbu- lence and erosion rate was low.
(4) Eroded aggregate size is greatest at the onset of erosion (up to 7 mm) and decreases rapidly through corrasion. The largest aggregates are asso-

194
SUSPENSION
C . L . A M O S ET A L .
BED
T ........... 4 DIATOM MUSCILLAGE
PELLETIZED LAYER (Type la erosion)
COLLAPSE ZONE (Type 1 b erosion)
LAMINATED BED (Type 2 erosion)
S I L t R I C . LAMINAE
CLAY RICH LAMINAE
STRENGTH
"~b '~silt 1;clay
Fig. 11. A summary diagram of a type section of the erosion properties of fine-grained sediment from the Bay of Fundy. The profile comprises a surface layer of unconsolidated pellets that erode with a "'Type Ia" trend. An intermediate collapse zone is present that is typified by "Type Ib" erosion and wherein the ratio z(z)/a'(z)~2.5. Below is found a normally consolidated region typified by "Type lI" erosion wherein z(z)/a'(z)~0.25.
ciated with "Type Ib" erosion. Eroded aggregate
size is more closely related to microfabric than
erosion rate. (5) Peak erosion rate showed no obvious rela-
t ionship to the absolute bed shear stress. It is
significantly related to the excess bed stress in the
exponent ial form Ln(E/5.1 × 10-5) = 1.62(z b -
%(z)) ° s kg/m2/s. This relationship holds for all
sites and all erosion types. (6) Near surface internal friction angles derived
from our study were circa 70°; those deeper in the
sediment were circa 30 ° . This supports the argu-
ment that friction angle and overburden stress are
inversely related within the upper few millimeters.
Acknowledgements
The authors wish to express thanks to Dr. R.W.
Faas, Ms G. Bishop, R. Vine, J. Arango, R. Murphy, F. Jodrey, K. Black and B. Ts inman.
The study was funded by Depar tmen t of Supply
and Services grant ) UP-008. This is Geological
Survey of Canada con t r ibu t ion No. 21892.
References
Abdel-Rahman, N.M., 1962. The effect of flowing water on cohesive beds. Ph.D. Thesis presented to Lab. for Hydraul. Res. and Soil Mechanics, Swiss Federal Inst. Technol., Zurich, Switzerland.
Amos, C.L. and Long, B.F.N., 1980. The sedimentary character of Minas Basin, Bay of Fundy. In: S.B. McCann (Editor), The Coastline of Canada. Geol. Surv. Can. Pap., 80-10: 123-152.
Amos, C.L. and Mosher, D.C., 1984. Erosion and deposition of fine-grained sediments from the Bay of Fundy. Sedi- mentology, 32: 815-832.
Amos, C.L., Van Wagoner, N.A. and Daborn, G.R., 1988. The influence of subaerial exposure on the bulk properties of fine-grained intertidal sediment from Minas Basin, Bay of Fundy. Estuarine Coastal Shelf Sci., 27: 1-13.
Amos, C.L., Grant, J., Daborn, G.R. and Black, K., 1992. Sea Carousel--A benthic, annular flume. Estuarine, Coastal Shelf Sci., 34: 557-577.
Amos, C.L., Christian, H.A., Grant, J. and Paterson, D.M., 1992. A comparison of four methods to measure the erodibil-

EROSION ON FINE-GRAINED SEDIMENTS 195
ity of fine-grained sediment, Minas Basin, Bay of Fundy. Proc. 2nd Int. Conf. on Hydraul. and Environ. Modelling of Coastal, Estuarine and River Waters, Bradford, UK.
Anderson, F.E. and Howell, B.A., 1984. Dewatering of an unvegetated muddy tidal fiat during exposure--desiccation or drainage? Estuaries, 7(3): 225-232.
Ariathurai, R. and Arulanandan, K., 1978. Erosion of cohesive soils. Proc. Am. Soc. Civil Eng., J. Hydraul. Div., 104: 279-283.
Ariathurai, R. and Krone, R.B., 1976. Finite element model for cohesive sediment transport. Proc. Am. Soc. Civil Eng., J. Hydraul. Div., 102: 323-338.
Baker, G.C. and Daborn, G.R., 1990. Fisheries-related impacts of the Annapolis Tidal generating station. In: C.E. Delisle and M.A. Bouchard (Editors), Collection Environnement et Geologie. Publ. Can. Soc. Environ. Biol., 9: 539-554.
Bowles, F.A., Bryant, W.R. and Wallin, C., 1969. Microstruc- ture of unconsolidated and consolidated marine sediments. J. Sediment. Petrol., 39(4): 1546-1551.
Bowles, J.E., 1979. Physical and Geotechnical Properties of Soils. McGraw-Hill, New York, 478 pp.
Christian, H.A., 1991. Geomechanics. In: G.R. Daborn (Edi- tor), Littoral Investigation of Sediment Properties. Acadia Cent. Estuarine Res., Rep., 17:113-144.
Christian, H.A., Gillespie, D., and Amos, C.L., 1990. Results of a new device to measure the in-situ shear strength of cohesive sediments, Minas Basin, Bay of Fundy. Abstr. 13th Int. Sedimentol. Congr., Nottingham, U.K., p. 91.
Daborn, G.R., 1986. Effects of tidal mixing on the plankton and benthos of estuarine regions of the Bay of Fundy. In: J. Bowman, M. Yentsch and W.T. Peterson (Editors), Tidal Mixing and Plankton Dynamics. Springer, Berlin, pp. 390-413.
Daborn, G.R., O'Neill, J.T. and Williams, R.R.G., 1979a. Limnology of the Annapolis River and estuary II. Fish distribution in the estuary, 1976 and 1977. Proc. N.S. Inst. Sci., 29: 173-183.
Daborn, G.R., Williams, R.G., Boates, J.S. and Smith, P.S., 1979b. Limnology of the Annapolis River and estuary I. Physical and chemical features. Proc. N.S. Inst. Sci., 29: 153-172.
Daborn, G.R., Redden, A.M. and Gregory, R.S., 1982. Ecolog- ical studies of the Annapolis estuary. Acadia Univ. Inst., Wolfville, 29:
Daborn, G.R. and others., 1991. Littoral investigation of sediment properties (LISP) report. Acadia Cent. Estuarine Res., Rep., 17, 239 pp.
Delo, E.A., 1988. Estuarine muds manual. Hydraulics Research Limited, Wallingford Rep. SR164.
Downing, J.P., 1983. An optical instrument for monitoring suspended particulates in ocean and laboratory. In: Proceed- ings of Oceans'83. IEEE, pp. 199-202.
Dyer, K.R., 1986. Coastal and Estuarine Sediment Dynamics. Wiley, Chichester, 342 pp.
Dyer, K.R., 1989. Sediment processes in estuaries: future research requirements. J. Geophys. Res., 94(C10): 14,327- 14,339.
Faas, R.W., in prep. Interaction between adjacent sedimentary environments in a high macrotidal situation, Minas Basin, Bay of Fundy.
Fonseca, M.S., 1989. Sediment stabilization by Halophila deci- piens in comparison to other seagrasses. Estuarine Coastal Shelf Sci., 29: 501-507.
Gordon, D.C. and Desplanque, C., 1983. Dynamics and envi- ronmental effects of ice in the Cumberland Basin of the Bay of Fundy. Can. J. Fish. Aquat. Sci., 40(9): 1331-1342.
Grant, J., 1983. The relative magnitude of biological and physical sediment reworking in an intertidal community. J. Mar. Res., 41: 673-689.
Grant, J. and Gust, G., 1987. Prediction of coastal sediment stability from photopigment content of mats of purple sul- phur bacteria. Nature, 330(6145): 244-246.
Grant, J., Bathmann, U.V. and Mills, E.L., 1986a. The inter- action between benthic diatom films and sediment transport. Estuarine Coastal Shelf Sci., 23: 225-238.
Grant, J., Mills, E.L. and Hopper, C.M., 1986b. A chlorophyll budget of the sediment-water interface and the effect of stabilizing biofilms on particle fluxes. Ophelia, 26: 207-219.
Grant, W.D., Boyer, L.F. and Sanford, L.P., 1982. The effects of bioturbation on the initiation of motion of intertidal sands. J. Mar. Res., 40(3): 659-677.
Gust, G., 1988. Skin friction probes for field applications. J. Geophys. Res., 93: 14,121-14,132.
Hill, P.S., Nowell, A.R.M. and Jumars, P.A., 1988. Flume evaluation of the relationship between suspended sediment concentration and excess boundary shear stress. J. Geophys. Res., 93(C10): 12,499-12,509.
Hildebrand, L.P., MacDormand, E.B., Nelson, D.R., Powell, C.G., Rodgers, N.A. and Walker, J.A., 1980. Activities of the Job Cops Program, Fundy tidal power development. Natl. Res. Counc. Can., Halifax, N.S., Project 16-01-002N, 176 pp.
Jumars, P.A. and Nowell, A.R.M., 1984. Effects of benthos on sediment transport: difficulties with functional grouping. Continental Shelf Res., 3(2): 115-130.
Jumars, P.A. Nowell, A.R.M. and Self, R.F.L., 1981. A simple model of flow-sediment-organism interaction. Mar. Geol., 42(1/4): 155-172.
Krone, R.B., 1984. The significance of aggregate properties to transport processes. In: A.J. Mehta (Editor), Estuarine Cohe- sive Sediment Dynamics. Springer, Berlin, pp. 66-84.
Lambe, T.W. and Whitman, R.V., 1969. Soil Mechanics. Wiley, New York, 553 pp.
Lavelle, J.W. and Mofjeld, H.O., 1987. Do critical stresses for incipient motion and erosion really exist? J. Hydraul. Eng., 113(3): 370-393.
Lick, W., 1982. Entrainment, deposition, and transport of fine- grained sediments in lakes. Hydrobiologia, 91: 31-40.
Martec Limited., 1980. Annapolis tidal power project basin water level study. Report Submitted to Tidal Power Corpora- tion, Halifax, N.S., 4.4 pp. (Unpubl.)
Mehta, A.J. and Partheniades, E., 1982. Resuspension of deposited cohesive sediment beds. Eighteenth Conf. Coastal Eng., pp. 1569-1588.
Miller, D.C., Jumars, P.A. and Nowell, A.R.M., 1984. Effects of sediment transport on deposit feeding: scale arguments. Limnol. Oceanogr., 29(6): 1202-1217.
Neumann, A.C., Gebelein, C.D. and Scoffin, T.P., 1970. The composition, structure and erodibility of subtidal mats, Abaco, Bahamas. J. Sediment. Petrol., 40(1): 274-297.

196 CL. AMOS ET AL
Nowell, A.R.M., Jumars, P.A. and Eckman, J.E., 1981. Effects of biological activity on the entrainment of marine sediments. Mar. Geol., 42(1/4): 133-153.
Ockenden, M.C. and Delo, E.A., 1991. Laboratory testing of muds. Geo-Mar. Lett., 11: 138-142.
Oppenheim, D.R. and Paterson, D.M., 1990. The fine structure of an algal mat from a freshwater maritime antarctic lake. Can. J. Bot., 68: 174-183.
Owen, M.W., 1975. Erosion of Avonmouth Mud. Hydraulics Research Station, Report INT 150, 17 pp.
Otsubo, K. and Muraoka, K., 1988. Critical shear stress of cohesive bottom sediments. J. Hydraul. Eng., 114(10): 1241 1255.
Parchure, T.M. and Mehta, A.J., 1985. Erosion of soft cohesive sediment deposits. J. Hydraul. Eng., 111(I0) 1308-1326.
Parthenaides, E., 1965. Erosion and deposition of cohesive soils. J. Hydraul. Div. Am. Soc. Civil Eng., 91(HY1): 105-139.
Paterson, D.M., 1989. Short-term changes in the erodibility of intertidal cohesive sediments related to the migratory beha- vior of epipelic diatoms. Limnol. Oceanogr., 34( l): 223-234.
Paterson, D.M., in prep. Biological influence of the cohesion on littoral sediments in the Bay of Fundy, Nova Scotia.
Paterson, D.M., Crawford, R.M. and Little, C., 1990. Subaerial exposure and changes in the stability of intertidal estuarine sediments. Estuarine Coastal Shelf Sci., 30:541 556.
Picollo, C., Perillo, G.E., and Daborn, G.R., in review. Temper-
ature characteristics of the intertidal sediments of Starrs Point mudflat, Minas Basin, Bay of Fundy. Estuarine Coastal Shelf Sci.
Postma, H., 1967. Sediment transport and sedimentation in the estuarine environment. In: G.M. Lauff (Editor), Estuar- ies. Am. Assoc. Adv. Sci., 83:158 179.
Sheng, Y.P. and Lick, W., 1979. The transport and resuspension of sediments in a shallow lake. J. Geophys. Res., 84: 1809- 1826.
Sheng, Y.P. and Villaret, C., 1989. Modeling the effect of suspended sediment stratification on bottom exchange pro- cesses. J. Geophys. Res., 94(C10): 14,429-14,444.
Thorn, M.F.C. and Parsons, J.G., 1980. Erosion of cohesive sediments in estuaries: an engineering guide. In: Third Int. Symp. Dredging Technol. (Bordeaux) pp. 349-358.
Villaret, C. and Paulic, M., 1986. Experiments on the erosion of deposited and placed cohesive sediments in an annular flume and a rocking flume. Report to Coastal and Oceanogr. Eng. Dep., Univ. Florida, Gainesville.
Yingst, J.Y. and Rhoads, D.C., 1978. Seafloor stability in central Long Island Sound: Part lI. Biological Interactions and their potential importance for seafloor erodibility. In: M.L. Wiley (Editor), Estuarine Interactions. Academic Press, New York, pp. 245 260.
Zeman, A.J., 1983. Erosion of cohesive sediments; bibliography and annotated abstracts. Inland Waters Directorate, Burl- ington, Inter. Rep., 354, 93 pp.