identifying isi-indexed articles by their lexical usage: a text analysis approach
TRANSCRIPT

Identifying ISI-Indexed Articles by Their Lexical Usage:A Text Analysis Approach
Mohammadreza Moohebat, Ram Gopal Raj, Sameem Binti Abdul KareemFaculty of Computer Science and Information Technology, Department of Artificial Intelligence,University of Malaya, 50603, Kuala Lumpur, Federal Territory of Kuala Lumpur, Malaysia.E-mail: [email protected]; [email protected]; [email protected]
Dirk ThorleuchterFraunhofer INT, Appelsgarten 2, Euskirchen D-53879, Germany. E-mail: [email protected]
This research creates an architecture for investigatingthe existence of probable lexical divergences betweenarticles, categorized as Institute for Scientific Informa-tion (ISI) and non-ISI, and consequently, if such a differ-ence is discovered, to propose the best availableclassification method. Based on a collection of ISI- andnon-ISI-indexed articles in the areas of business andcomputer science, three classification models aretrained. A sensitivity analysis is applied to demonstratethe impact of words in different syntactical forms on theclassification decision. The results demonstrate that thelexical domains of ISI and non-ISI articles are distin-guishable by machine learning techniques. Our findingsindicate that the support vector machine identifies ISI-indexed articles in both disciplines with higher precisionthan do the Naïve Bayesian and K-Nearest Neighborstechniques.
Introduction
Getting one’s work published, especially in an ISI-indexed journal, is a complex endeavor. A novel methodand solid findings are often mandatory for article accep-tance. However, other aspects are also important, includingthe style of writing. The writing style needs to be clear,concise, and comprehensible to the reader. It has been
demonstrated that using an inappropriate writing style isthe most common reason for rejection in scientific journalsbecause it creates barriers in the transmission of theauthors’ intentions (Bornmann, Weymuth, & Daniel, 2009;Meneghini & Packer, 2007).
Currently, several organizations index scientific jour-nals. However, the most reliable and prominent organiza-tion is the Thomson Reuters. As of October 2012, morethan 13,000 journals in the fields of science, art, and socialscience are indexed in Thomson Reuters (Thomson, 2012).Undoubtedly, publishing a paper in ISI-indexed journals issignificant (Chang, McAleer, & Oxley, 2011). The rejec-tion rate of ISI journals is also high. According toBornmann et al. (2009), the most common reason forrejection is language.
Consistent with the evolution of machine learning,new possibilities have arisen in text analysis studies. Suchendeavors have led to text summarization, opinion mining,and innovative algorithms and techniques. Text miningextracts interesting patterns from various texts. Existingmethods are able to analyze the contents and thestructure of texts. Thus, they can be used to identify anISI-indexed article’s lexical domain theoretically as asubset of the writing style. Appropriate vocabulary usage isone of the indicators of suitable writing style in the scien-tific world.
In this article, a new method and application are proposedfor text classification. In contrast to related research, thisapproach focuses on the vocabulary usage of authors in thescientific domain and assigns them to classes, as defined bythe scientific vocabulary used in ISI-indexed journals andnon-ISI-indexed journals in business and computer science.
Received September 20, 2013; revised November 18, 2013; accepted
November 25, 2013
© 2014 ASIS&T • Published online 19 May 2014 in Wiley Online Library(wileyonlinelibrary.com). DOI: 10.1002/asi.23194
JOURNAL OF THE ASSOCIATION FOR INFORMATION SCIENCE AND TECHNOLOGY, 66(3):501–511, 2015
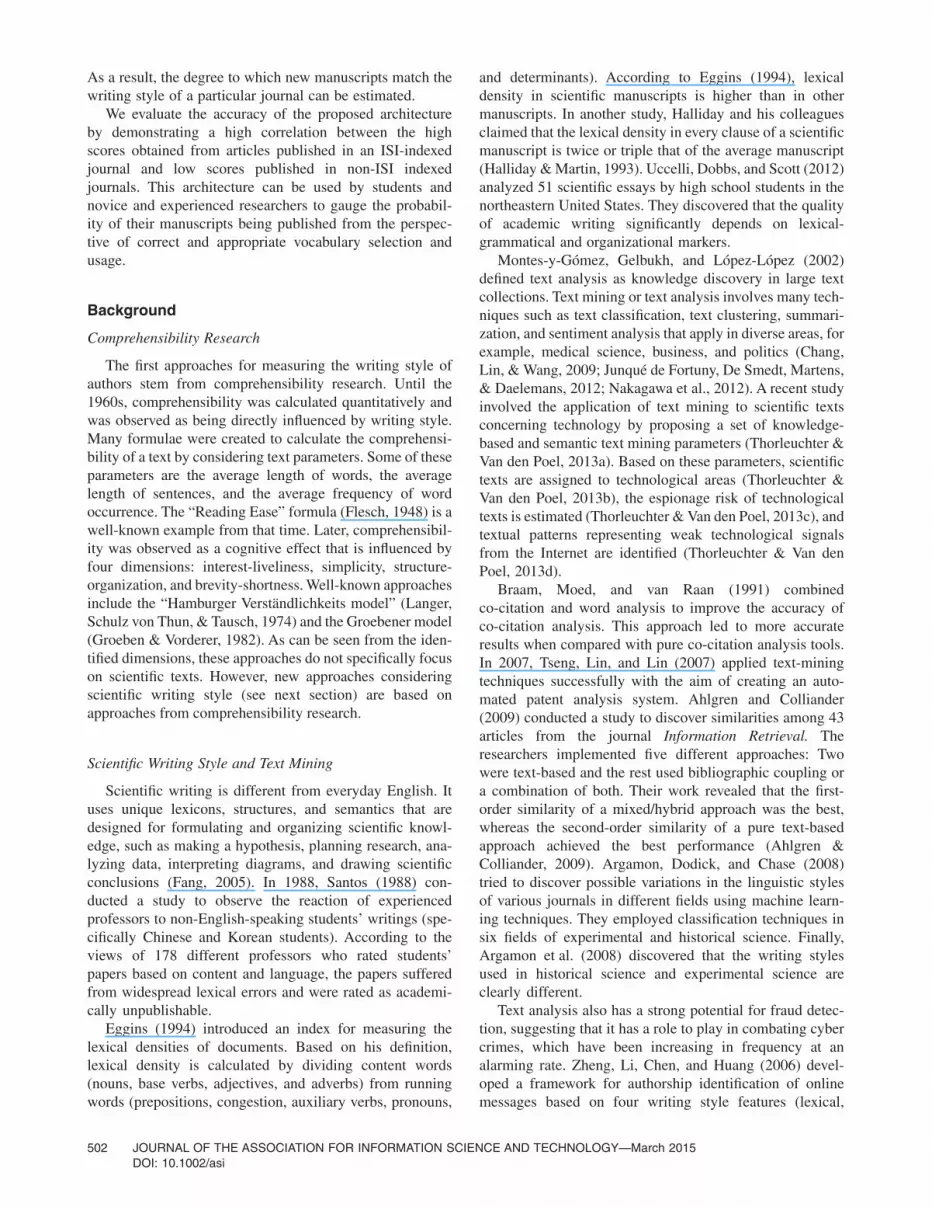
As a result, the degree to which new manuscripts match thewriting style of a particular journal can be estimated.
We evaluate the accuracy of the proposed architectureby demonstrating a high correlation between the highscores obtained from articles published in an ISI-indexedjournal and low scores published in non-ISI indexedjournals. This architecture can be used by students andnovice and experienced researchers to gauge the probabil-ity of their manuscripts being published from the perspec-tive of correct and appropriate vocabulary selection andusage.
Background
Comprehensibility Research
The first approaches for measuring the writing style ofauthors stem from comprehensibility research. Until the1960s, comprehensibility was calculated quantitatively andwas observed as being directly influenced by writing style.Many formulae were created to calculate the comprehensi-bility of a text by considering text parameters. Some of theseparameters are the average length of words, the averagelength of sentences, and the average frequency of wordoccurrence. The “Reading Ease” formula (Flesch, 1948) is awell-known example from that time. Later, comprehensibil-ity was observed as a cognitive effect that is influenced byfour dimensions: interest-liveliness, simplicity, structure-organization, and brevity-shortness. Well-known approachesinclude the “Hamburger Verständlichkeits model” (Langer,Schulz von Thun, & Tausch, 1974) and the Groebener model(Groeben & Vorderer, 1982). As can be seen from the iden-tified dimensions, these approaches do not specifically focuson scientific texts. However, new approaches consideringscientific writing style (see next section) are based onapproaches from comprehensibility research.
Scientific Writing Style and Text Mining
Scientific writing is different from everyday English. Ituses unique lexicons, structures, and semantics that aredesigned for formulating and organizing scientific knowl-edge, such as making a hypothesis, planning research, ana-lyzing data, interpreting diagrams, and drawing scientificconclusions (Fang, 2005). In 1988, Santos (1988) con-ducted a study to observe the reaction of experiencedprofessors to non-English-speaking students’ writings (spe-cifically Chinese and Korean students). According to theviews of 178 different professors who rated students’papers based on content and language, the papers sufferedfrom widespread lexical errors and were rated as academi-cally unpublishable.
Eggins (1994) introduced an index for measuring thelexical densities of documents. Based on his definition,lexical density is calculated by dividing content words(nouns, base verbs, adjectives, and adverbs) from runningwords (prepositions, congestion, auxiliary verbs, pronouns,
and determinants). According to Eggins (1994), lexicaldensity in scientific manuscripts is higher than in othermanuscripts. In another study, Halliday and his colleaguesclaimed that the lexical density in every clause of a scientificmanuscript is twice or triple that of the average manuscript(Halliday & Martin, 1993). Uccelli, Dobbs, and Scott (2012)analyzed 51 scientific essays by high school students in thenortheastern United States. They discovered that the qualityof academic writing significantly depends on lexical-grammatical and organizational markers.
Montes-y-Gómez, Gelbukh, and López-López (2002)defined text analysis as knowledge discovery in large textcollections. Text mining or text analysis involves many tech-niques such as text classification, text clustering, summari-zation, and sentiment analysis that apply in diverse areas, forexample, medical science, business, and politics (Chang,Lin, & Wang, 2009; Junqué de Fortuny, De Smedt, Martens,& Daelemans, 2012; Nakagawa et al., 2012). A recent studyinvolved the application of text mining to scientific textsconcerning technology by proposing a set of knowledge-based and semantic text mining parameters (Thorleuchter &Van den Poel, 2013a). Based on these parameters, scientifictexts are assigned to technological areas (Thorleuchter &Van den Poel, 2013b), the espionage risk of technologicaltexts is estimated (Thorleuchter & Van den Poel, 2013c), andtextual patterns representing weak technological signalsfrom the Internet are identified (Thorleuchter & Van denPoel, 2013d).
Braam, Moed, and van Raan (1991) combinedco-citation and word analysis to improve the accuracy ofco-citation analysis. This approach led to more accurateresults when compared with pure co-citation analysis tools.In 2007, Tseng, Lin, and Lin (2007) applied text-miningtechniques successfully with the aim of creating an auto-mated patent analysis system. Ahlgren and Colliander(2009) conducted a study to discover similarities among 43articles from the journal Information Retrieval. Theresearchers implemented five different approaches: Twowere text-based and the rest used bibliographic coupling ora combination of both. Their work revealed that the first-order similarity of a mixed/hybrid approach was the best,whereas the second-order similarity of a pure text-basedapproach achieved the best performance (Ahlgren &Colliander, 2009). Argamon, Dodick, and Chase (2008)tried to discover possible variations in the linguistic stylesof various journals in different fields using machine learn-ing techniques. They employed classification techniques insix fields of experimental and historical science. Finally,Argamon et al. (2008) discovered that the writing stylesused in historical science and experimental science areclearly different.
Text analysis also has a strong potential for fraud detec-tion, suggesting that it has a role to play in combating cybercrimes, which have been increasing in frequency at analarming rate. Zheng, Li, Chen, and Huang (2006) devel-oped a framework for authorship identification of onlinemessages based on four writing style features (lexical,
502 JOURNAL OF THE ASSOCIATION FOR INFORMATION SCIENCE AND TECHNOLOGY—March 2015DOI: 10.1002/asi
syntactic, structural, and content-specific features). Theyapplied three classification algorithms (decision trees, back-propagation neural network, and support vector machine(SVM)) on English and Chinese writing. Based on Zheng’swork, a 70 to 90% satisfactory accuracy was reported(Zheng et al., 2006). In 2012, North (2012) demonstratedhow classification techniques can detect and classify thewriting of three American authors successfully and effi-ciently based on their writing structure and vocabularyusage. Recently, Koppel and Winter (2014) detectedauthors’ identities in different scripts with high accuracywith the help of a new semisupervised classificationmethod.
Text Classification and Machine-Based Learning
Text classification assigns classes to textual documents.These classes generally must be predefined (Finzen, Kintz,& Kaufmann, 2012; Ko & Seo, 2009; Lin & Hong, 2011;Sudhamathy & Jothi Venkateswaran, 2012; Thorleuchter,Van den Poel, & Prinzie, 2010). Two sample classes, asintroduced in the case study discussed in this article, areISI-indexed journals and non-ISI-indexed journals. A classcan be interpreted as a textual pattern that represents thecharacteristics of a given set, for example, ISI-indexedjournals.
Classification in machine learning is similar to that inhuman learning, that is, learning based on experiences forknowledge acquisition. In the same way, computers learnfrom text data to gain new knowledge. Generally, a data setis divided into two sets: a training set and a test set. Thetraining set is used to train the system, and the test set is usedto evaluate the accuracy of the generated trained model. Across-validation procedure exchanges the test and trainingsets, which is useful for machine learning because it avoidsoverfitting.
In text classification, several well-known and basicapproaches exist. Three basic and popular algorithmsinclude K-Nearest Neighbors (K-NN), Naïve Bayes, andSVM. These algorithms are selected because of theirimportance and popularity among researchers. K-NN isrepresentative of instance-based learning algorithms. More-over, Naïve Bayes is a simple and well-known probabilisticalgorithm. Finally, SVM algorithms are known to exhibitgood performance in text classification. Many researchershave created new hybrid algorithms to increase the accu-racy of these basic algorithms (Feng, Guo, Jing, & Hao,2012a; Ko & Seo, 2009; Yoon & Lee, 2013). However,their main structures and platforms are overlaid onto tradi-tional classification algorithms. These three commonapproaches are described in detail next.
Naïve Bayesian
The Naïve Bayesian model is a probabilistic classifier.The probability of the existence of a term is calculated basedon the following formula:
P c d P c P t ckk nd
( ) ( ) ( | )| ∝≤ ≤∏
1
In this model, nd represents the number of tokens, P(c) is theprobability of every class, which is estimated by dividing thedocument number of that class by the total number ofclasses. P(tk|c) is the likelihood of the existence of term tk inthat class. The Naïve Bayesian model calculates the prob-ability of locating a new document in different classes overa test period and assigns the document to the class in whichit earns the highest probability. This classification techniquehas been applied in several studies (Feng, Guo, Jing, & Hao,2012b; Wong, 2012a, 2012b; Zeng & Yan, 2008).
K-Nearest Neighbors (K-NN) Classification
The K-NN classification model follows the simple andeffective idea of classification by testing each document in agiven vector space against the majority class of its K nearestneighbors. K is the only parameter of this algorithm and canhave different values. However, the K-NN algorithm doesnot often lead to good results. Frequently, K is chosen to bebetween three and five to obtain the best outcome. The mainadvantages of K-NN are its ease of implementation, highexecution speed, and generally acceptable performance. Asuccessful application of K-NN has been reported by Kwonand Lee (2003) for Korean website classification.
Support Vector Machine (SVM)
The SVM model was introduced as a linear supervisedlearning classification model by Vapnik and Lerner (1963).Since 1963, many studies have been involved in the testing,implementation, and development of this algorithm for dif-ferent applications (Kim & Lee, 2014; Liu, Yu, Huang, &An, 2011; Orrù, Pettersson-Yeo, Marquand, Sartori, &Mechelli, 2012). This model attempts to classify itemswithin each training set by calculating the optimal hyper-plane between two different classes. The optimal hyperplaneis one that has the maximum distance between the twosample classes. In 1992, Vapnik proposed a nonlinear SVMmodel (Boser, Guyon, & Vapnik, 1992) and subsequently anSVM model using a soft margin algorithm (Vapnik &Cortes, 1995). Based on Meyer’s work, SVM has demon-strated acceptable performance when compared with othermethods, especially when used for classification (Meyer,Leisch, & Hornik, 2003).
Method
Our method consists of five steps: corpus collection,pre-processing, term vector creation, classification, andevaluation.
Corpus Collection
The method uses two corpora as input data to enablebinary classification with the classification algorithms
JOURNAL OF THE ASSOCIATION FOR INFORMATION SCIENCE AND TECHNOLOGY—March 2015 503DOI: 10.1002/asi

tested. Each corpus contains a set of textual documents. Thedocuments in both corpora should be written in a commonlanguage, thus enabling the original writing style of anarticle to be retained because translation may alter the intrin-sic writing style. Furthermore, using the same language fordocuments in both corpora enables the proposed approach toassign the texts based on authors’ writing styles and notlanguage.
Pre-Processing
The first step in most text analysis approaches is textpre-processing. This stage is important for two reasons:First, because proper text pre-processing minimizes the sizeof the term-frequency matrix that models various terms inour documents and, second, because the result qualitystrongly depends on our input terms and pre-processing hasan undeniable effect in this respect point.
Pre-processing starts with raw text cleaning. The aim is touse the main text of articles. Thus, we discard figures, tables,and formula captions from the collected articles. As a result,a raw text-based corpus is created for every set.
The next step in pre-processing is the removal of stopwords, a basic technique in pre-processing. According to Liu(2006), stop words are words that frequently occur in anycontext that do not represent any content, for instance,prepositions, articles, conjunctions, and pronouns. Gener-ally, writing style is influenced by the ratio of the number ofstop words to the total number of words. An author whowrites in a “flowery” style generally uses more stop wordsthan an author who is concise. Thus, approaches that esti-mate the writing style of authors use the frequency of stopwords as an indicator. However, in this article, we areattempting to quantify authors’ scientific writing style and,thus, the removal of stop words was deemed necessary.
The removal of stop words is usually followed by stem-ming to convert words (usually verbs) to their stems (rootforms). However, we have chosen not to apply stemmingbecause applying the different syntactical forms of wordscan change the writing quality and, in the English language,every term has different syntactical forms based on its roleand usage in different contexts. For example, the use of nounphrases is more prevalent in academic manuscripts than inothers (Biber & Gray, 2010; Cortes, 2004; Fang, 2005). Asapplying stemming to an academic text influences its per-ceived scientific writing style, we do not implement anystemming techniques to maintain the original forms ofwords in both corpora.
Creating Term Vectors
The first step after pre-processing is to create a termvector based on the vector space model. To create a termvector for each document, we use the Term Frequency-Inverse Document Frequency (TF-IDF) weighting scheme,which is defined in Formula 1
tf idf tf logN
dft d t d
t
− = ×, , (1)
where tft,d is the term frequency of term t in document d, Nindicates the total number of documents, and dft representsthe number of documents that contain term t. The advantageof using TF-IDF is that it balances moderate frequencyterms that are repeated in many documents by assigningthem a decent score while assigning a higher score to thoseterms with large frequencies in a few documents (Manning,Raghavan, & Schütze, 2008). The term vectors can thenform a term-document matrix by using the training set. Therows and the columns represent terms and documents,respectively, and each component of the matrix is repre-sented by the weighted frequency of terms in documents ascalculated by TF-IDF.
Text Classification
The term set vectors are assigned to the classes usingclassification algorithms, machine-based learning, andn-fold cross validation. The three most popular classificationalgorithms, SVM, Naïve Bayesian, and K-NN, are imple-mented to determine the one that classifies with the highestprecision.
Results
Based on the classification models created using thethree algorithms, the scientific vocabulary is used by thealgorithms to distinguish between ISI-indexed journals andnon-ISI-indexed journals. A part-of-speech tagger isapplied to identify the different syntactical forms of wordsin the document collection. We select these words in a spe-cific syntactical form for which the corresponding termweights are above a specific threshold. A sensitivity analy-sis based on the three classification models is processed toidentify the impact of the selected words on the classifi-cation decision. The three trained classification models areapplied to the selected test documents. The results are anassignment probability to a class (in the case of NaïveBayesian), an assignment function to a class that dependson the number of K (in case of K-NN), and a distance tothe hyperplane (in the case of SVM). In a manual process,test documents are modified by adding words at randomlyselected positions or by changing the syntactical forms ofwords. Then, the three classification models are applied tothe modified documents. Changes in the assignment prob-ability (Naïve Bayesian), the assignment function (K-NN),and the distance (SVM) are used to estimate the impact ofthe document changes on the classification decision.
Evaluation
Precision and recall indicators are commonly used toevaluate the accuracy of classification algorithms. These
504 JOURNAL OF THE ASSOCIATION FOR INFORMATION SCIENCE AND TECHNOLOGY—March 2015DOI: 10.1002/asi

indexes are calculated based on the formulae below and areobtained from a confusion matrix (Table 1).
PrecisionTP
TP FP=
+(1)
RecallTP
TP FN=
+(2)
The sensitivity shows the ability of the test set to identifypositive results. It equals the recall value. The specificityshows the ability of the test set to identify negative results.
SpecificityTN
TN FP=
+(3)
Case Study
Corpus Collection
The corpus is created from scientific articles. We limitthe corpus to English journals because most of the relevantscientific journals use English as the standard language.Two different corpora that contain articles from ISI-indexed journals and from non-ISI-indexed journals arecreated. We hypothesize that articles in ISI-indexed jour-nals use a different vocabulary domain than articles in non-ISI-indexed journals. To reduce the possible discrepanciesamong collected articles and to have a solid corpus, all ofthe articles are gathered from the same discipline (com-puter science). Additionally, we select articles with similarsubjects because the computer science has a wide scope,and thus, it could not be guaranteed that articles belong toa common vocabulary domain. However, using specifickeywords identifies articles from a small technological areaand decreases biases. We suppose that the lexical domainwithin a small area of the science world is similar. Thus,an assignment of articles to the ISI-indexed journal class orto the non-ISI-indexed journal class only considers the dif-ferent vocabulary usage and not the writing style of thetechnological area.
To verify the accuracy of our model and reduce theeffects of chance, another corpus is created from asignificantly different area (business). Each collectionincludes 100 articles consisting of ISI and non-ISI articlesselected based on a random sampling from scientific data-bases (50 articles each).
We select all ISI articles from the Web of Science data-base, whereas the non-ISI articles are extracted from theEmerald database because we can extract the full text of thearticle in the HTML format directly. To create a solid corpusand reduce the possible diversity of the technical vocabulary,article searches are performed in a subdomain of theselected scientific areas. Computer science articles are elic-ited using the keyword “Wireless Network,” and businessarticles are extracted using the keyword “ERP implementa-tion.” The selection of these keywords is random, with nospecific intention in choosing them.
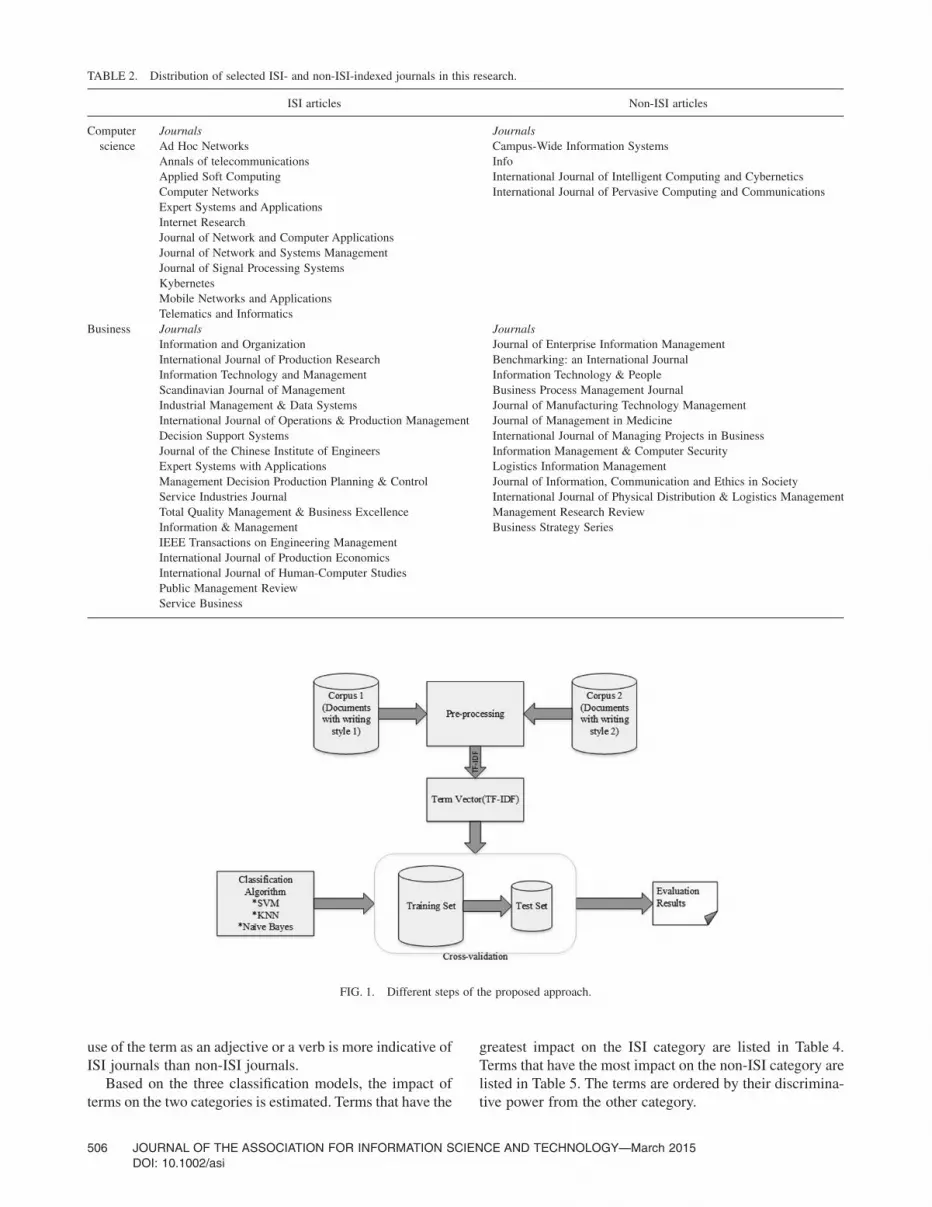
Table 2 shows the variety of scientific journals used forthis research.
Pre-Processing, Term Vector Creation, and TextClassification
Pre-processing is applied as described, and a term vectorof weighted components is created for each scientific articleas described in the Creating Term Vector section.
For machine learning, we use a fivefold cross validation.Thus, 80% of our corpora are assigned for training and20% for testing. Text classification is applied as describedpreviously.
For text classification, the threshold that is used to clas-sify a document into ISI versus non-ISI is a 50% probabilityin case of Naïve Bayesian. In the case of K-NN, K is set tothree as is commonly used. This determines the assignmentto the classes. The distance of each document to the hyper-plane as calculated by SVM is transformed to a class prob-ability using Platt’s method (Platt, 1999). Documents areassigned to the class based on a 50% threshold.
For SVM, a linear discriminant function is used (linearkernel). We are aware that nonlinear functions are possiblybetter, however, the linear kernel is selected because of tworeasons: First, the use of a linear kernel avoids the highercomplexity of a nonlinear kernel and make the results moretransparent. Second, we have seen that compared to K-NNand Naïve Bayesian, linear kernel works well using thedocument collection in this case study (Figure 1).
Results
The impact of the syntactical form of a word can beillustrated by considering the word “compromise,” whichoften occurs in several variations in the documentcollection, especially in computer science journals (seeTable 3). Compromise has three syntactical forms, and itsimpact on the two categories is estimated based on the threeforms. For each form, term co-occurrences are groupedtogether. These terms often occur together with the syntac-tical form of the term. The three text classification modelsare used to assign the different groups to the two categories.As a result, the use of compromise or compromises as a nounin a scientific article indicates that this article is published ina non-ISI journal rather than an ISI journal. Furthermore, the
TABLE 1. Confusion matrix.
Predicted positive Predicted negative
Actual positive TP FNActual negative FP TN
JOURNAL OF THE ASSOCIATION FOR INFORMATION SCIENCE AND TECHNOLOGY—March 2015 505DOI: 10.1002/asi
use of the term as an adjective or a verb is more indicative ofISI journals than non-ISI journals.
Based on the three classification models, the impact ofterms on the two categories is estimated. Terms that have the
greatest impact on the ISI category are listed in Table 4.Terms that have the most impact on the non-ISI category arelisted in Table 5. The terms are ordered by their discrimina-tive power from the other category.
TABLE 2. Distribution of selected ISI- and non-ISI-indexed journals in this research.
ISI articles Non-ISI articles
Computerscience
Journals JournalsAd Hoc NetworksAnnals of telecommunicationsApplied Soft ComputingComputer NetworksExpert Systems and ApplicationsInternet ResearchJournal of Network and Computer ApplicationsJournal of Network and Systems ManagementJournal of Signal Processing SystemsKybernetesMobile Networks and ApplicationsTelematics and Informatics
Campus-Wide Information SystemsInfoInternational Journal of Intelligent Computing and CyberneticsInternational Journal of Pervasive Computing and Communications
Business Journals JournalsInformation and OrganizationInternational Journal of Production ResearchInformation Technology and ManagementScandinavian Journal of ManagementIndustrial Management & Data SystemsInternational Journal of Operations & Production ManagementDecision Support SystemsJournal of the Chinese Institute of EngineersExpert Systems with ApplicationsManagement Decision Production Planning & ControlService Industries JournalTotal Quality Management & Business ExcellenceInformation & ManagementIEEE Transactions on Engineering ManagementInternational Journal of Production EconomicsInternational Journal of Human-Computer StudiesPublic Management ReviewService Business
Journal of Enterprise Information ManagementBenchmarking: an International JournalInformation Technology & PeopleBusiness Process Management JournalJournal of Manufacturing Technology ManagementJournal of Management in MedicineInternational Journal of Managing Projects in BusinessInformation Management & Computer SecurityLogistics Information ManagementJournal of Information, Communication and Ethics in SocietyInternational Journal of Physical Distribution & Logistics ManagementManagement Research ReviewBusiness Strategy Series
FIG. 1. Different steps of the proposed approach.
506 JOURNAL OF THE ASSOCIATION FOR INFORMATION SCIENCE AND TECHNOLOGY—March 2015DOI: 10.1002/asi

TABLE 3. Different forms of “compromise” in the articles considered and corresponding data characteristics.
Term Form Frequency Number of documents Term weight Impact
Compromised Adj 25 5 0,80978063 ISI journalCompromise Verb 12 6 0,52897939 ISI journalCompromise Noun 6 5 0,58332783 non-ISI journalCompromised Verb 24 9 0,52897939 ISI journalCompromises Verb 3 3 0,52897939 ISI journalCompromises Noun 2 2 0,58332783 non-ISI journalCompromising Verb 1 1 0,52897939 ISI journal
TABLE 4. Terms that are representative of ISI articles.
Term Form Frequency Number of documents Term weight
Attack Noun 180 17 0,564544632Threat Noun 70 12 0.678503167Round Noun 163 22 0.585392887Border Noun 116 16 0.654948247Intrusion Noun 68 14 0.651882707Integrity Noun 61 11 0.603684910Convex Adj 75 11 0.669876606Count Noun 202 23 0.561031918Boundary Noun 58 16 0.642057156Reactive Adj 57 14 0.567038890Intelligence Noun 28 11 0.607418617Validity Noun 40 13 0.602537225Engineering Noun 28 11 0.625278106Protection Noun 71 11 0.593749309Terminal Noun 119 17 0.631870531Segment Noun 259 23 0.639303594Multicast Noun 645 16 0.680987931Competition Noun 108 15 0.572637586Mutual Adj 33 11 0.563163683Combined Adj 41 13 0.597358012Surveillance Noun 105 14 0.602676287Digital Adj 121 23 0.617149495Angle Noun 46 12 0.588853120Shape Noun 56 14 0.629737135Pick Verb 36 12 0.574390079Population Noun 105 13 0.662339451Multihop Noun 70 12 0.584015055Immediate Adj 32 11 0.583601775Market Noun 383 25 0.573118209Classical Adj 47 15 0.598253224Complementary Adj 46 12 0.608545877Cable Noun 85 11 0.729276153Spread Noun 26 11 0.561080569Individual Noun 53 13 0.597673221Subscriber Noun 179 15 0.592452695Replacement Noun 37 11 0.685865325Government Noun 51 11 0.627153570Broadcasting Adj 47 12 0.583294312Ground Noun 33 12 0.637279435Positioning Noun 34 12 0.627855039Penetration Noun 54 11 0.652329000Dominant Adj 40 11 0.580405794Regulation Noun 65 11 0.564541141Route Noun 268 40 0,341767492Tier Noun 23 3 0,897209689Protect Verb 74 24 0,414816839
JOURNAL OF THE ASSOCIATION FOR INFORMATION SCIENCE AND TECHNOLOGY—March 2015 507DOI: 10.1002/asi

The results show that the word form of characteristicterms for the non-ISI category is often noun. Nouns have animpact on the ISI category, too. However, adjectives andverbs have a large impact on the ISI category but not on the
non-ISI category. This shows different formulations used inboth categories. It is interesting to see that “government”and “protection” are two terms with high impact in bothcategories.
Figure 2 compares the frequencies of different grammati-cal forms that have been repeated at least 10 times invarious articles in each category (ISI and non-ISI). Ourfindings show that there are some terms that are morecommonly used in ISI articles. For instance, the word“complementary” as an adjective has been used 46 times in12 ISI articles. As shown in Figure 2, there is a meaningfuldiscrepancy between ISI and non-ISI articles from this per-spective. Some of the most popular terms in each of thegrammatical groups are presented in Appendix A.
Evaluation
The evaluation results obtained by applying three differ-ent classification algorithms on our two corpora are summa-rized in Table 6. The best recall is obtained using the SVMalgorithm, with 94% recall for the computer science ISI-indexed journals, and interestingly, the lowest recall isobtained by SVM in the classification of non-ISI businessarticles. However, the SVM outcome for the classification ofISI articles in both computer science and business is quitegood (above 90%). Surprisingly, the Naïve Bayes algorithmperforms better than the other algorithms in the classifica-tion of non-ISI articles. It even shows acceptable perfor-mance in detecting ISI articles. The K-NN algorithm (withthree neighbors) also shows moderate performance and isable to successfully differentiate between ISI and non-ISIarticles.
Another indicator for evaluating the classification resultsis the F-Score. The “F-Score is the harmonic mean of pre-cision and recall” (Yang, Lin, & Wu, 2009, p. 2231) and iscalculated based on following formula:
F-Score =+
2pr
p r(4)
Based on the F-Scores, we confirm our findings that theSVM classifies ISI articles better than the other two algo-rithms (F-Score higher than 70%). However, the SVM’sF-score for detecting non-ISI articles is not notably high.
TABLE 5. Terms that are representative of non-ISI articles.
Term Form Frequency Number of documents Term weight
Content Noun 67 13 0.600147801Participant Noun 63 11 0.645078756European Adj 66 12 0.597903441Country Noun 116 11 0.590865531Regulation Noun 65 11 0.564541141Subscription Noun 223 12 0.749502859Industry Noun 79 16 0.570120278Organizer Noun 2 2 0,848482848Government Noun 51 11 0.627153570Penetration Noun 54 11 0.652329000Party Noun 64 13 0.635102165Privacy Noun 128 15 0.596193808Market Noun 383 25 0.573118209Competition Noun 108 15 0.572637586Subscriber Noun 179 15 0.592452695Language Noun 76 13 0.613734845Road Noun 33 11 0.592292554Person Noun 93 17 0.602803723Protection Noun 71 11 0.593749309
FIG. 2. Comparing various grammatical forms’ frequencies in ISI andnon-ISI article (Number of document > 10).
TABLE 6. Evaluation of SVM, K-NN, and Naïve Bayes.
Algorithms Area Specificity Precision Recall/Sensitivity F-Score
SVM Business 38 59.21 90 71.42819Computer 56 68.12 94 78.99433
K-NN Business 68 63.64 56 59.57606Computer 54 65.15 86 74.13695
Naïve Bayes Business 76 73.33 66 69.47219Computer 58 63.16 72 67.29091
508 JOURNAL OF THE ASSOCIATION FOR INFORMATION SCIENCE AND TECHNOLOGY—March 2015DOI: 10.1002/asi

Conclusions
This study confirms the findings of other scholars thatmachine learning techniques can be employed to demonstratethat ISI and non-ISI articles have different academic writingstyles (Argamon et al., 2008; Eggins, 1994; Halliday &Martin, 1993; Santos, 1988). Our proposed model allows forthe classification of ISI and non-ISI articles with high preci-sion. Among the three different classification algorithms thatwere tested, SVM categorizes ISI articles the most effec-tively. However, SVM exhibits a lower performance in clas-sifying non-ISI articles. This finding may have been observedbecause many non-ISI articles actually conform to theEnglish writing styles of ISI journals. Nevertheless, using theappropriate writing style is only one criterion for obtainingacceptance from high-quality journals. Other factors, such asresearch quality, novelty, and methodology, also play impor-tant roles. We also observed that in most cases, the classifi-cation results for computer science articles were slightlybetter than those for business articles. This difference mightbe related to the characteristics of these corpora. Computerscience articles were collected from a limited number ofjournals, whereas business articles were selected frombroader collections. Naturally, the frequencies of some spe-cific journal articles were greater than those of other articles,which could have affected our results.
In summary, this research demonstrates that text classifi-cation is a viable technique for comparing the writing stylesof articles indexed or not indexed by ISI. Although thecurrent results are sufficient to produce a commercialsystem, other untested classification algorithms or hybridclassification techniques could produce improved results, asPrabowo and Thelwall (2009) have proposed. Additionally,we only created two corpora in two disciplines (computerscience and business). A greatly expanded corpora and testson articles from other fields could shed more light on theproblem of estimating the probability that a article will bepublished.
A further avenue of future research is to consider tree-based methods for text classification. Random Forest orAdaBoost could be a nice addition to the benchmark sincethey are very robust against overfitting which is importantwhen using flat datasets (as is often the case in text mining).A further addition could be the use of Kernel Factory(Ballings & Van den Poel, 2013) as an interesting algorithm,which combines kernels and trees.
A 5 × 2-fold cross validation (Demšar, 2006) often out-performs standard n-fold cross validation. To improve sig-nificance of the results, 5 × 2-fold cross validation should beconsidered in future works.
Acknowledgments
We completed this project using the open source softwareMySQL 5.5 and RapidMiner 5. this project was supportedby a grant from the University of Malaya (FL012–2011).
References
Ahlgren, P., & Colliander, C. (2009). Document-document similarityapproaches and science mapping: Experimental comparison of fiveapproaches. Journal of Informetrics, 3(1), 49–63. doi: 10.1016/j.joi.2008.11.003
Argamon, S., Dodick, J., & Chase, P. (2008). Language use reflects scien-tific methodology: A corpus-based study of peer-reviewed journalarticles. Scientometrics, 75(2), 203–238. doi: 10.1007/s11192-007-1768-y
Ballings, M., & Van den Poel, D. (2013). Kernel factory: An ensemble ofkernel machines. Expert Systems with Applications, 40(8), 2904–2913.doi: http://dx.doi.org/10.1016/j.eswa.2012.12.007
Biber, D., & Gray, B. (2010). Challenging stereotypes about academicwriting: Complexity, elaboration, explicitness. Journal of Englishfor Academic Purposes, 9(1), 2–20. doi: 10.1016/j.jeap.2010.01.001
Bornmann, L., Weymuth, C., & Daniel, H.-D. (2009). A content analysis ofreferees’ comments: How do comments on manuscripts rejected by ahigh-impact journal and later published in either a low- or high-impactjournal differ? Scientometrics, 83(2), 493–506. doi: 10.1007/s11192-009-0011-4
Boser, B.E., Guyon, I.M., & Vapnik, V.N. (1992). A training algorithm foroptimal margin classifiers. Proceedings of the Fifth Annual Workshop onComputational Learning Theory (pp. 144–152). Pittsburgh, PA: ACM.doi:10.1145/130385.130401
Braam, R.R., Moed, H.F., & van Raan, A.F.J. (1991). Mapping of scienceby combined co-citation and word analysis. II: Dynamical aspects.Journal of the American Society for Information Science, 42(4), 252–266. doi: 10.1002/(SICI)1097-4571(199105)42:4<252::AID-ASI2>3.0.CO;2-G
Chang, C.-L., McAleer, M., & Oxley, L. (2011). What makes a greatjournal great in the sciences? Which came first, the chicken or the egg?Scientometrics, 87(1), 17–40. doi: 10.1007/s11192-010-0335-0
Chang, C.-W., Lin, C.-T., & Wang, L.-Q. (2009). Mining the text informa-tion to optimizing the customer relationship management. ExpertSystems with Applications, 36(2), 1433–1443. doi: 10.1016/j.eswa.2007.11.027
Cortes, V. (2004). Lexical bundles in published and student disciplinarywriting: Examples from history and biology. English for Specific Pur-poses, 23(4), 397–423. doi: 10.1016/j.esp.2003.12.001
Demšar, J. (2006). Statistical comparisons of classifiers over multiple datasets. Journal of Machine Learning Research, 7, 1–30. Retrieved fromhttp://dl.acm.org/citation.cfm?id=1248547.1248548
Eggins, S. (1994). Introduction to systemic functional linguistics. London,NY: Pinter.
Fang, Z. (2005). Scientific literacy: A systemic functional linguisticsperspective. Science Education, 89(2), 335–347. doi: 10.1002/sce.20050
Feng, G., Guo, J., Jing, B.-Y., & Hao, L. (2012a). A Bayesian featureselection paradigm for text classification. Information Processing &Management, 48(2), 283–302. doi: http://dx.doi.org/10.1016/j.ipm.2011.08.002
Feng, G., Guo, J., Jing, B.-Y., & Hao, L. (2012b). A Bayesian featureselection paradigm for text classification. Information Processing &Management, 48(2), 283–302. doi: 10.1016/j.ipm.2011.08.002
Finzen, J., Kintz, M., & Kaufmann, S. (2012). Aggregating web-basedideation platforms. International Journal of Technology Intelligence andPlanning, 8(1), 32–46. doi: 10.1504/IJTIP.2012.047376
Flesch, R. (1948). A new readability yardstick. The Journal of AppliedPsychology, 32(3), 221–232.
Groeben, N., & Vorderer, P. (1982). Leserpsychologie: Textverständnis—Textverständlichkeit. Münster, Germany: Aschendorff.
Halliday, M.A.K., & Martin, J.R. (1993). Grammatical problems in scien-tific english. In M.A.K. Halliday & J.R. Martin (Eds.), Writing science:Literacy and discursive power (pp. 76–94). London, NY: Routledge.Retrieved from http://www.scribd.com/doc/16929396/HALLIDAY-Some-Grammatical-Problems-in-Scientific-English-c-4
JOURNAL OF THE ASSOCIATION FOR INFORMATION SCIENCE AND TECHNOLOGY—March 2015 509DOI: 10.1002/asi

Junqué de Fortuny, E., De Smedt, T., Martens, D., & Daelemans, W. (2012).Media coverage in times of political crisis: A text mining approach.Expert Systems with Applications, 39(14), 11616–11622. doi: 10.1016/j.eswa.2012.04.013
Kim, K., & Lee, D. (2014). Inductive manifold learning using structuredsupport vector machine. Pattern Recognition, 47(1), 470–479.doi:10.1016/j.patcog.2013.07.011
Ko, Y., & Seo, J. (2009). Text classification from unlabeled documents withbootstrapping and feature projection techniques. Information Processing& Management, 45(1), 70–83. doi: 10.1016/j.ipm.2008.07.004
Koppel, M., & Winter, Y. (2014). Determining if two documents are writtenby the same author. Journal of the Association for Information Scienceand Technology, 65(1), 178–187. doi:10.1002/asi.22954
Kwon, O.-W., & Lee, J.-H. (2003). Text categorization based on k-nearestneighbor approach for web site classification. Information Processing &Management, 39(1), 25–44. doi: 10.1016/S0306-4573(02)00022-5
Langer, I., Schulz von Thun, F., & Tausch, R. (1974). Verständlichkeitin schule und verwaltung. Ernst Reinhardt. Munich, Germany: ErnstReinhardt.
Lin, M.-H., & Hong, C.-F. (2011). Opportunities for crossing the chasmbetween early adopters and the early majority through new uses ofinnovative products. The Review of Socionetwork Strategies, 5(2),27–42. doi: 10.1007/s12626-011-0019-0
Liu, B. (2006). Web data mining: Exploring hyperlinks, contents, and usagedata (Data-centric systems and applications). Secaucus, NJ: Springer-Verlag New York, Inc.
Liu, Y., Yu, X., Huang, J.X., & An, A. (2011). Combining integratedsampling with SVM ensembles for learning from imbalanced datasets.Information Processing & Management, 47(4), 617–631. doi: 10.1016/j.ipm.2010.11.007
Manning, C.D., Raghavan, P., & Schütze, H. (2008). Introduction to infor-mation retrieval. New York, NY: Cambridge University Press.
Meneghini, R., & Packer, A.L. (2007). Is there science beyond English?Initiatives to increase the quality and visibility of non-English publica-tions might help to break down language barriers in scientific commu-nication. EMBO Reports, 8(2), 112–116. doi: 10.1038/sj.embor.7400906
Meyer, D., Leisch, F., & Hornik, K. (2003). The support vector machineunder test. Neurocomputing, 55(1), 169–186.
Montes-y-Gómez, M., Gelbukh, A., & López-López, A. (2002). Textmining at detail level using conceptual graphs. In D. Corbett, G.Angelova, & U. Priss (Eds.), Conceptual structures: Integration andinterfaces (Vol. 2393, pp. 122–136). Berlin Heidelberg, NY: Springer.doi: 10.1007/3-540-45483-7_10
Nakagawa, K., Asakawa, Y., Yamada, K., Ushikubo, M., Yoshida, T., &Yamaguchi, H. (2012). Benefits of off-campus education for students inthe health sciences: A text-mining analysis. BMC Medical Education, 12,84–91. doi: 10.1186/1472-6920-12-84
North, M. (2012). Data mining for the masses. Athens: Global Text Project.Retrieved from http://dl.dropbox.com/u/31779972/DataMiningForTheMasses.pdf
Orrù, G., Pettersson-Yeo, W., Marquand, A.F., Sartori, G., & Mechelli, A.(2012). Using support vector machine to identify imaging biomarkers ofneurological and psychiatric disease: A critical review. Neuroscience andBiobehavioral Reviews, 36(4), 1140–1152. doi: 10.1016/j.neubiorev.2012.01.004
Platt, J. (1999). Probabilistic outputs for support vector machines andcomparisons to regularized likelihood methods. Advances in LargeMargin Classifiers, 10(3), 61–74. Retrieved from http://www.researchgate.net/publication/2594015_Probabilistic_Outputs_for_Support_Vector_Machines_and_Comparisons_to_Regularized_Likelihood_Methods/file/504635154cff5262d6.pdf
Prabowo, R., & Thelwall, M. (2009). Sentiment analysis: A combinedapproach. Journal of Informetrics, 3(2), 143–157. doi: 10.1016/j.joi.2009.01.003
Santos, T. (1988). Professors’ reactions to the Academic Writing ofNonnative-Speaking Students. TESOL Quarterly, 22(1), 69–90. doi:10.2307/3587062
Sudhamathy, G., & Jothi Venkateswaran, C. (2012). Fuzzy temporal clus-tering approach for e-commerce websites. International Journal of Engi-neering and Technology, 4(3), 119–132.
Thomson, R. (2012). Master journal list. Thomson Reuters. Retrieved fromhttp://ip-science.thomsonreuters.com/mjl/
Thorleuchter, D., & Van den Poel, D. (2013a). Web mining based extractionof problem solution ideas. Expert Systems with Applications, 40(10),3961–3969. doi. http://dx.doi.org/10.1016/j.eswa.2013.01.013
Thorleuchter, D., & Van den Poel, D. (2013b). Technology classificationwith latent semantic indexing. Expert Systems with Applications, 40(5),1786–1795. doi. http://dx.doi.org/10.1016/j.eswa.2012.09.023
Thorleuchter, D., & Van den Poel, D. (2013c). Protecting research andtechnology from espionage. Expert Systems with Applications, 40(9),3432–3440. doi. http://dx.doi.org/10.1016/j.eswa.2012.12.051
Thorleuchter, D., & Van den Poel, D. (2013d). Weak signal identificationwith semantic web mining. Expert Systems with Applications, 40(12),4978–4985. doi. http://dx.doi.org/10.1016/j.eswa.2013.03.002
Thorleuchter, D., Van den Poel, D., & Prinzie, A. (2010). Mining ideasfrom textual information. Expert Systems with Applications, 37(10),7182–7188. doi: 10.1016/j.eswa.2010.04.013
Tseng, Y.-H., Lin, C.-J., & Lin, Y.-I. (2007). Text mining techniques forpatent analysis. Information Processing & Management, 43(5), 1216–1247. doi: 10.1016/j.ipm.2006.11.011
Uccelli, P., Dobbs, C.L., & Scott, J. (2012). Mastering academic language:Organization and stance in the persuasive writing of high schoolstudents. Written Communication, 30(1), 36–62. doi: 10.1177/0741088312469013
Vapnik, V., & Cortes, C. (1995). Support-vector networks. Machine Learn-ing, 20(3), 273–297.
Vapnik, V., & Lerner, A. (1963). Generalized portrait method for patternrecognition. Automation and Remote Control, 24(6), 774–780.
Wong, T.-T. (2012a). A hybrid discretization method for Naïve Bayesianclassifiers. Pattern Recognition, 45(6), 2321–2325. doi: 10.1016/j.patcog.2011.12.014
Wong, T.-T. (2012b). Generalized Dirichlet priors for Naïve Bayesian clas-sifiers with multinomial models in document classification. Data Miningand Knowledge Discovery, 28(1), 123–144. doi:10.1007/s10618-012-0296-4
Yang, Z., Lin, H., & Wu, B. (2009). BioPPIExtractor: A proteinâ–proteininteraction extraction system for biomedical literature. Expert Systemswith Applications, 36(2 Pt 1), 2228–2233. doi: 10.1016/j.eswa.2007.12.014
Yoon, Y., & Lee, G.G. (2013). Two scalable algorithms for associative textclassification. Information Processing & Management, 49(2), 484–496.doi: http://dx.doi.org/10.1016/j.ipm.2012.09.003
Zeng, Z., & Yan, H. (2008). Supervised classification of share price trends.Information Sciences, 178(20), 3943–3956. doi: 10.1016/j.ins.2008.06.002
Zheng, R., Li, J., Chen, H., & Huang, Z. (2006). A framework for author-ship identification of online messages: Writing-style features and classi-fication techniques. Journal of the American Society for InformationScience and Technology, 57(3), 378–393. doi: 10.1002/asi.20316
510 JOURNAL OF THE ASSOCIATION FOR INFORMATION SCIENCE AND TECHNOLOGY—March 2015DOI: 10.1002/asi
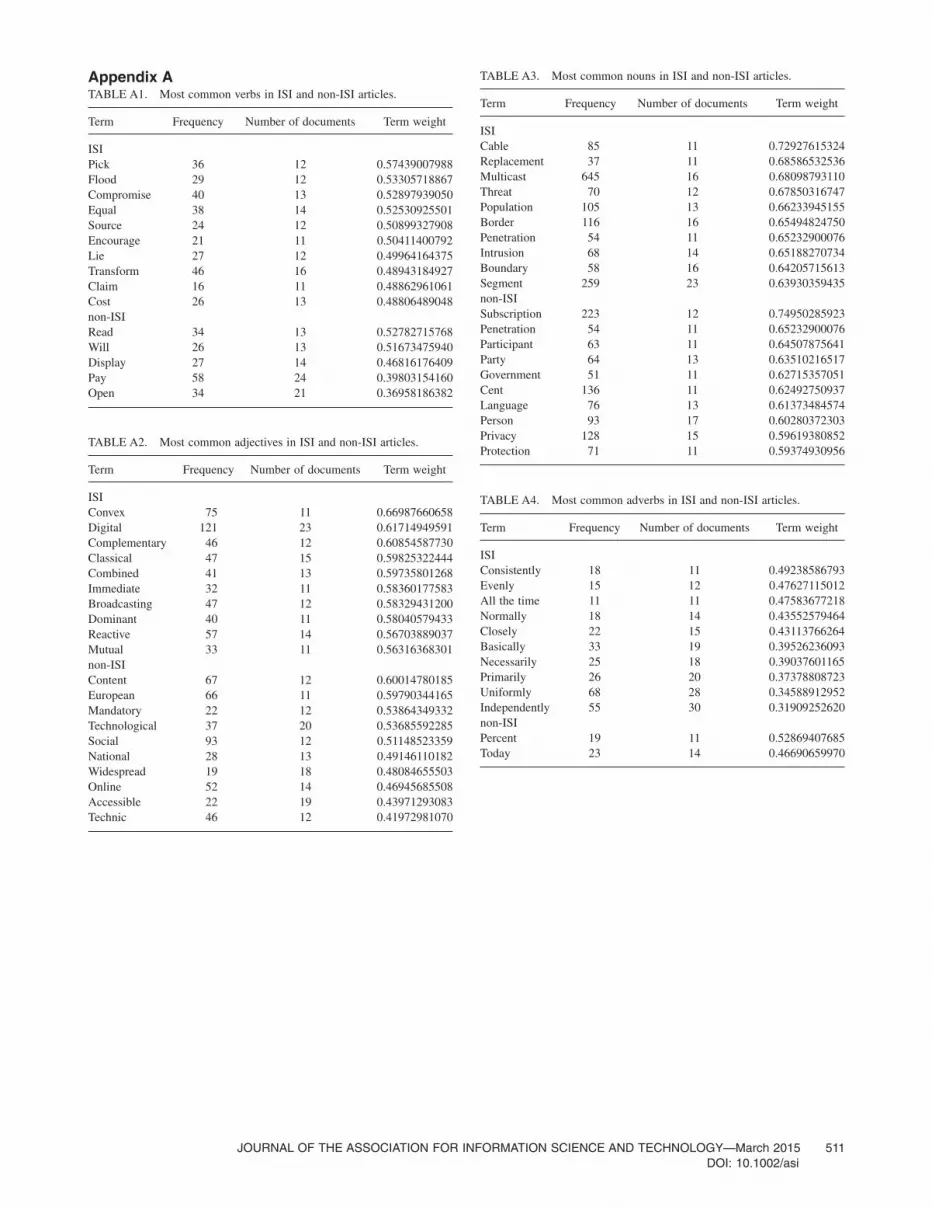
Appendix ATABLE A1. Most common verbs in ISI and non-ISI articles.
Term Frequency Number of documents Term weight
ISIPick 36 12 0.57439007988Flood 29 12 0.53305718867Compromise 40 13 0.52897939050Equal 38 14 0.52530925501Source 24 12 0.50899327908Encourage 21 11 0.50411400792Lie 27 12 0.49964164375Transform 46 16 0.48943184927Claim 16 11 0.48862961061Cost 26 13 0.48806489048non-ISIRead 34 13 0.52782715768Will 26 13 0.51673475940Display 27 14 0.46816176409Pay 58 24 0.39803154160Open 34 21 0.36958186382
TABLE A2. Most common adjectives in ISI and non-ISI articles.
Term Frequency Number of documents Term weight
ISIConvex 75 11 0.66987660658Digital 121 23 0.61714949591Complementary 46 12 0.60854587730Classical 47 15 0.59825322444Combined 41 13 0.59735801268Immediate 32 11 0.58360177583Broadcasting 47 12 0.58329431200Dominant 40 11 0.58040579433Reactive 57 14 0.56703889037Mutual 33 11 0.56316368301non-ISIContent 67 12 0.60014780185European 66 11 0.59790344165Mandatory 22 12 0.53864349332Technological 37 20 0.53685592285Social 93 12 0.51148523359National 28 13 0.49146110182Widespread 19 18 0.48084655503Online 52 14 0.46945685508Accessible 22 19 0.43971293083Technic 46 12 0.41972981070
TABLE A3. Most common nouns in ISI and non-ISI articles.
Term Frequency Number of documents Term weight
ISICable 85 11 0.72927615324Replacement 37 11 0.68586532536Multicast 645 16 0.68098793110Threat 70 12 0.67850316747Population 105 13 0.66233945155Border 116 16 0.65494824750Penetration 54 11 0.65232900076Intrusion 68 14 0.65188270734Boundary 58 16 0.64205715613Segment 259 23 0.63930359435non-ISISubscription 223 12 0.74950285923Penetration 54 11 0.65232900076Participant 63 11 0.64507875641Party 64 13 0.63510216517Government 51 11 0.62715357051Cent 136 11 0.62492750937Language 76 13 0.61373484574Person 93 17 0.60280372303Privacy 128 15 0.59619380852Protection 71 11 0.59374930956
TABLE A4. Most common adverbs in ISI and non-ISI articles.
Term Frequency Number of documents Term weight
ISIConsistently 18 11 0.49238586793Evenly 15 12 0.47627115012All the time 11 11 0.47583677218Normally 18 14 0.43552579464Closely 22 15 0.43113766264Basically 33 19 0.39526236093Necessarily 25 18 0.39037601165Primarily 26 20 0.37378808723Uniformly 68 28 0.34588912952Independently 55 30 0.31909252620non-ISIPercent 19 11 0.52869407685Today 23 14 0.46690659970
JOURNAL OF THE ASSOCIATION FOR INFORMATION SCIENCE AND TECHNOLOGY—March 2015 511DOI: 10.1002/asi