community exposure to tsunami hazards in california
TRANSCRIPT
U.S. Department of the InteriorU.S. Geological Survey
Scientific Investigations Report 2012–5222
Community Exposure to Tsunami Hazards in California
Prepared in cooperation with the California Emergency Management Agency and the California Geological Survey
FRONT COVERPhotographs of Crescent City (upper left), Huntington Beach (upper right), Alameda (lower left) and the Port of Long Beach (lower right) on the California coast shown with the internationally adopted tsunami-evacuation sign (Intergovernmental Oceanographic Commission, 2002). Photographs of the Port of Long Beach and Crescent City are reprinted with permission from Adelman and Adelman (2010). Aerial photograph of Alameda Island (image ID: AHLB3931) is courtesy of aerialarchives.com. Huntington Beach is from the City of Huntington Beach (2012), which states that all of its Web site content is public information.
Community Exposure to Tsunami Hazards in California
By Nathan J. Wood, Jamie Ratliff, and Jeff Peters
Prepared in cooperation with the California Emergency Management Agency and the California Geological Survey
Scientific Investigations Report 2012–5222
U.S. Department of the InteriorU.S. Geological Survey
U.S. Department of the InteriorKEN SALAZAR, Secretary
U.S. Geological SurveySuzette M. Kimball, Acting Director
U.S. Geological Survey, Reston, Virginia: 2013
For more information on the USGS—the Federal source for science about the Earth, its natural and living resources, natural hazards, and the environment—visit http://www.usgs.gov or call 1–888–ASK–USGS For an overview of USGS information products, including maps, imagery, and publications, visit http://www.usgs.gov/pubprod
Suggested citation:Wood, N., Ratliff, J., and Peters, J., 2013, Community exposure to tsunami hazards in California: U.S. Geological Survey Scientific Investigations Report 2012–5222, 49 p.
Any use of trade, product, or firm names is for descriptive purposes only and does not imply endorsement by the U.S. Government. Although this information product, for the most part, is in the public domain, it also may contain copyrighted materials as noted in the text. Permission to reproduce copyrighted items must be secured from the copyright owner.
iii
Contents
Abstract ...........................................................................................................................................................1Introduction.....................................................................................................................................................1Purpose and Scope ......................................................................................................................................4Study Area.......................................................................................................................................................4Variations in Community Exposure .............................................................................................................6
Land Cover .............................................................................................................................................7Residents ................................................................................................................................................9Employees ............................................................................................................................................21Community-Support Businesses ......................................................................................................30Dependent-Care Facilities ................................................................................................................31Public Venues ......................................................................................................................................34Park and Beach Visitors ....................................................................................................................34
Composite Indices of Community Exposure ............................................................................................38Conclusions...................................................................................................................................................43Acknowledgments .......................................................................................................................................43References Cited..........................................................................................................................................44Appendixes ...................................................................................................................................................47
Figures 1. Photographs of tsunami-prone areas of California ........................................................................3 2. Map of counties and incorporated cities with land in the California tsunami-inundation
zone and coastline segments with mapped tsunami-inundation zones ..............................4 3. Maps of the tsunami-inundation zone and land-cover data from the 2006 National Land
Cover Database for the communities of Crescent City, Eureka, Belvedere, Alameda, and Long Beach, California .........................................................................................................8
4. Pie chart showing distribution of National Land Cover Database classes (by area) in the California tsunami-inundation zone ...............................................................................9
5. Plot showing amount of land by National Land Cover Database class in the tsunami-inundation zone of California coastal counties. ............................................9
6. Plots showing amount and percentage of developed land in the California tsunami-inundation zone ..............................................................................10
7. Plots showing number and percentage of residents in the California tsunami-inundation zone ..............................................................................12
8. Plot showing percentage of residents in the California tsunami-inundation zone that identify themselves as Hispanic or Latino ......................................................................15
9. Plot showing percentage of residents in the California tsunami-inundation zone that identify themselves as Asian ............................................................................................17
10. Plot showing percentage of residents in the California tsunami-inundation zone that are less than 5 years in age ..............................................................................................18
11. Plot showing percentage of residents in the California tsunami-inundation zone
iv
that are more than 65 years in age ..........................................................................................1912. Plot showing percentage of occupied households in the California
tsunami-inundation zone that are renter occupied ........................................................................ 2013. Plot showing percentage of occupied households in the California
tsunami-inundation zone that are headed by females with children less than 18 years in age and no spouse present .................................................................22
14. Photographs of examples of group quarters .................................................................................2315. Plot showing percentage of residents in the California tsunami-inundation zone
that are in institutionalized group quarters ............................................................................................. 2416. Plot showing percentage of residents in the California tsunami-inundation zone
that are in noninstitutionalized group quarters ....................................................................................... 2517. Plots showing number and percentage of employees
in the California tsunami-inundation zone ..............................................................................2618. Plot showing percentage of employees, by business sector,
in the California tsunami-inundation zone ..............................................................................2819. Plot showing percentage of employees at businesses
in the California tsunami-inundation zone with low and high visitor potential ................2920. Plot showing number of community-support businesses and organizations
in the California tsunami-inundation zone .............................................................................3221. Plot showing number of dependent-population facilities
in the California tsunami-inundation zone ..............................................................................3322. Plot showing number of public venues in the California tsunami-inundation zone ................3523. Photograph of Avalon Harbor on Catalina Island, California ......................................................3624. Photographs of recreationists in tsunami-hazard zones .............................................................3625. Plot showing annual average number of visitors (in millions) to coastal California
city and county beaches, State parks, and National Park Service locations grouped by city and county jurisdictions ................................................................................37
26. Plot comparing normalized indices for the amount and percentage of community assets for communities with land in the California tsunami-inundation zone ................... 39
27. Frequency histogram of the sum of normalized exposure indices for communities in the California tsunami-inundation zone....................................................................................40
28. Plot showing sum of normalized amount and percentage indices for communities with land in the California tsunami-inundation zone ............................................................41
29. Photographs of communities considered to have high relative exposure to tsunamis .........42
Tables1. Block-level demographic characteristics for residential populations in the California
tsunami-inundation zone, based on the 2010 U.S. Census ..................................................142. Amount and percentage of businesses in the tsunami-inundation zone of California. ............31Appendix 1. Table of predicted tsunami run-up heights and primary sources for
selected locations on the California coast .............................................................................48Appendix 2. Attendance for various city and county, State,
and national beaches and parks ..............................................................................................49
Community Exposure to Tsunami Hazards in California
By Nathan Wood, Jamie Ratliff, and Jeff Peters
AbstractEvidence of past events and modeling of potential events
suggest that tsunamis are significant threats to low-lying communities on the California coast. To reduce potential impacts of future tsunamis, officials need to understand how communities are vulnerable to tsunamis and where targeted outreach, preparedness, and mitigation efforts may be warranted. Although a maximum tsunami-inundation zone based on multiple sources has been developed for the California coast, the populations and businesses in this zone have not been documented in a comprehensive way. To support tsunami preparedness and risk-reduction planning in California, this study documents the variations among coastal communities in the amounts, types, and percentages of developed land, human populations, and businesses in the maximum tsunami-inundation zone.
The tsunami-inundation zone includes land in 94 incorporated cities, 83 unincorporated communities, and 20 counties on the California coast. According to 2010 U.S. Census Bureau data, this tsunami-inundation zone contains 267,347 residents (1 percent of the 20-county resident population), of which 13 percent identify themselves as Hispanic or Latino, 14 percent identify themselves as Asian, 16 percent are more than 65 years in age, 12 percent live in unincorporated areas, and 51 percent of the households are renter occupied. Demographic attributes related to age, race, ethnicity, and household status of residents in tsunami-prone areas demonstrate substantial range among communities that exceed these regional averages. The tsunami-inundation zone in several communities also has high numbers of residents in institutionalized and noninstitutionalized group quarters (for example, correctional facilities and military housing, respectively). Communities with relatively high values in the various demographic categories are identified throughout the report.
The tsunami-inundation zone contains significant nonresidential populations based on 2011 economic data from Infogroup (2011), including 168,565 employees (2 percent of the 20-county labor force) at 15,335 businesses that generate approximately $30 billion in annual sales. Although the regional percentage of at-risk employees is low, certain communities, such as Belvedere, Alameda, and Crescent City, have high percentages of their local workforce in the tsunami-inundation zone. Employees in the tsunami-inundation zone are primarily in businesses associated with tourism (for example, accommodations, food services, and retail trade)
and shipping (for example, transportation and warehousing, manufacturing, and wholesale trade), although the dominance of these sectors varies substantially among the 94 cities.
Although the number of occupants is not known for each site, the tsunami-inundation zone contains numerous dependent-population facilities, such as schools and child daycare centers, which may have individuals with limited mobility. The tsunami-inundation zone includes a substantial number of facilities that provide community services, such as banks, religious organizations, and grocery stores, where local residents may be unaware of evacuation procedures if previous awareness efforts focused on home preparedness. There are also numerous recreational areas in the tsunami-inundation zone, such as amusement parks, marinas, city and county beaches, and State and national parks, which attract visitors who may not be aware of tsunami hazards or evacuation procedures. During peak summer months, estimated daily attendance at city and county beaches can be approximately six times larger than the total number of residents in the tsunami-inundation zone.
Community exposure to tsunamis in California varies considerably—some communities may experience great losses that reflect only a small part of their community and others may experience relatively small losses that devastate them. Among 94 incorporated communities and the remaining unincorporated areas of the 20 coastal counties, the communities of Alameda, Oakland, Long Beach, Los Angeles, Huntington Beach, and San Diego have the highest number of people and businesses in the tsunami-inundation zone. The communities of Belvedere, Alameda, Crescent City, Emeryville, Seal Beach, and Sausalito have the highest percentages of people and businesses in this zone. On the basis of a composite index, the cities of Alameda, Belvedere, Crescent City, Emeryville, Oakland, and Long Beach have the highest combinations of the number and percentage of people and businesses in tsunami-prone areas.
IntroductionThe tragic loss of life and property damage associated
with recent catastrophic tsunamis (for example, 2004 Indian Ocean, 2009 Samoa, 2010 Chile, 2010 Sumatra, and 2011 Japan) has raised global awareness of tsunami hazards. Historical and geologic evidence indicate that the California coast has experienced similar large-magnitude tsunamis
2 Community Exposure to Tsunami Hazards in California
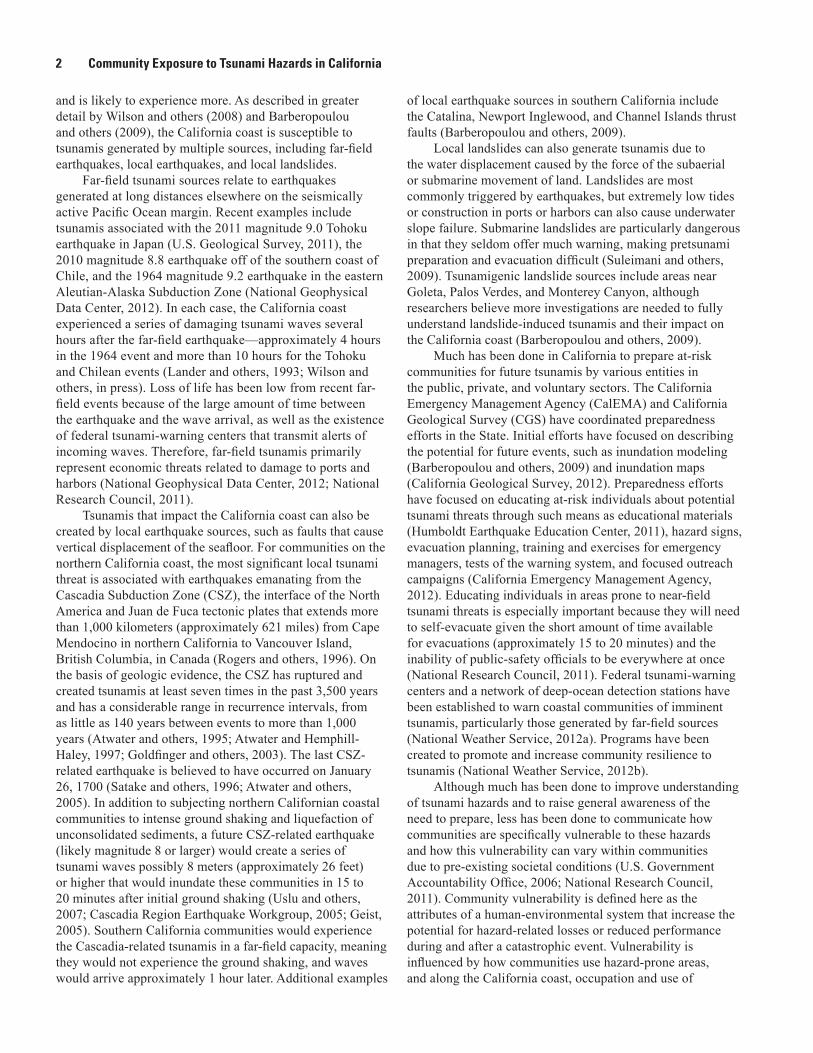
and is likely to experience more. As described in greater detail by Wilson and others (2008) and Barberopoulou and others (2009), the California coast is susceptible to tsunamis generated by multiple sources, including far-field earthquakes, local earthquakes, and local landslides.
Far-field tsunami sources relate to earthquakes generated at long distances elsewhere on the seismically active Pacific Ocean margin. Recent examples include tsunamis associated with the 2011 magnitude 9.0 Tohoku earthquake in Japan (U.S. Geological Survey, 2011), the 2010 magnitude 8.8 earthquake off of the southern coast of Chile, and the 1964 magnitude 9.2 earthquake in the eastern Aleutian-Alaska Subduction Zone (National Geophysical Data Center, 2012). In each case, the California coast experienced a series of damaging tsunami waves several hours after the far-field earthquake—approximately 4 hours in the 1964 event and more than 10 hours for the Tohoku and Chilean events (Lander and others, 1993; Wilson and others, in press). Loss of life has been low from recent far-field events because of the large amount of time between the earthquake and the wave arrival, as well as the existence of federal tsunami-warning centers that transmit alerts of incoming waves. Therefore, far-field tsunamis primarily represent economic threats related to damage to ports and harbors (National Geophysical Data Center, 2012; National Research Council, 2011).
Tsunamis that impact the California coast can also be created by local earthquake sources, such as faults that cause vertical displacement of the seafloor. For communities on the northern California coast, the most significant local tsunami threat is associated with earthquakes emanating from the Cascadia Subduction Zone (CSZ), the interface of the North America and Juan de Fuca tectonic plates that extends more than 1,000 kilometers (approximately 621 miles) from Cape Mendocino in northern California to Vancouver Island, British Columbia, in Canada (Rogers and others, 1996). On the basis of geologic evidence, the CSZ has ruptured and created tsunamis at least seven times in the past 3,500 years and has a considerable range in recurrence intervals, from as little as 140 years between events to more than 1,000 years (Atwater and others, 1995; Atwater and Hemphill-Haley, 1997; Goldfinger and others, 2003). The last CSZ-related earthquake is believed to have occurred on January 26, 1700 (Satake and others, 1996; Atwater and others, 2005). In addition to subjecting northern Californian coastal communities to intense ground shaking and liquefaction of unconsolidated sediments, a future CSZ-related earthquake (likely magnitude 8 or larger) would create a series of tsunami waves possibly 8 meters (approximately 26 feet) or higher that would inundate these communities in 15 to 20 minutes after initial ground shaking (Uslu and others, 2007; Cascadia Region Earthquake Workgroup, 2005; Geist, 2005). Southern California communities would experience the Cascadia-related tsunamis in a far-field capacity, meaning they would not experience the ground shaking, and waves would arrive approximately 1 hour later. Additional examples
of local earthquake sources in southern California include the Catalina, Newport Inglewood, and Channel Islands thrust faults (Barberopoulou and others, 2009).
Local landslides can also generate tsunamis due to the water displacement caused by the force of the subaerial or submarine movement of land. Landslides are most commonly triggered by earthquakes, but extremely low tides or construction in ports or harbors can also cause underwater slope failure. Submarine landslides are particularly dangerous in that they seldom offer much warning, making pretsunami preparation and evacuation difficult (Suleimani and others, 2009). Tsunamigenic landslide sources include areas near Goleta, Palos Verdes, and Monterey Canyon, although researchers believe more investigations are needed to fully understand landslide-induced tsunamis and their impact on the California coast (Barberopoulou and others, 2009).
Much has been done in California to prepare at-risk communities for future tsunamis by various entities in the public, private, and voluntary sectors. The California Emergency Management Agency (CalEMA) and California Geological Survey (CGS) have coordinated preparedness efforts in the State. Initial efforts have focused on describing the potential for future events, such as inundation modeling (Barberopoulou and others, 2009) and inundation maps (California Geological Survey, 2012). Preparedness efforts have focused on educating at-risk individuals about potential tsunami threats through such means as educational materials (Humboldt Earthquake Education Center, 2011), hazard signs, evacuation planning, training and exercises for emergency managers, tests of the warning system, and focused outreach campaigns (California Emergency Management Agency, 2012). Educating individuals in areas prone to near-field tsunami threats is especially important because they will need to self-evacuate given the short amount of time available for evacuations (approximately 15 to 20 minutes) and the inability of public-safety officials to be everywhere at once (National Research Council, 2011). Federal tsunami-warning centers and a network of deep-ocean detection stations have been established to warn coastal communities of imminent tsunamis, particularly those generated by far-field sources (National Weather Service, 2012a). Programs have been created to promote and increase community resilience to tsunamis (National Weather Service, 2012b).
Although much has been done to improve understanding of tsunami hazards and to raise general awareness of the need to prepare, less has been done to communicate how communities are specifically vulnerable to these hazards and how this vulnerability can vary within communities due to pre-existing societal conditions (U.S. Government Accountability Office, 2006; National Research Council, 2011). Community vulnerability is defined here as the attributes of a human-environmental system that increase the potential for hazard-related losses or reduced performance during and after a catastrophic event. Vulnerability is influenced by how communities use hazard-prone areas, and along the California coast, occupation and use of
Introduction 3
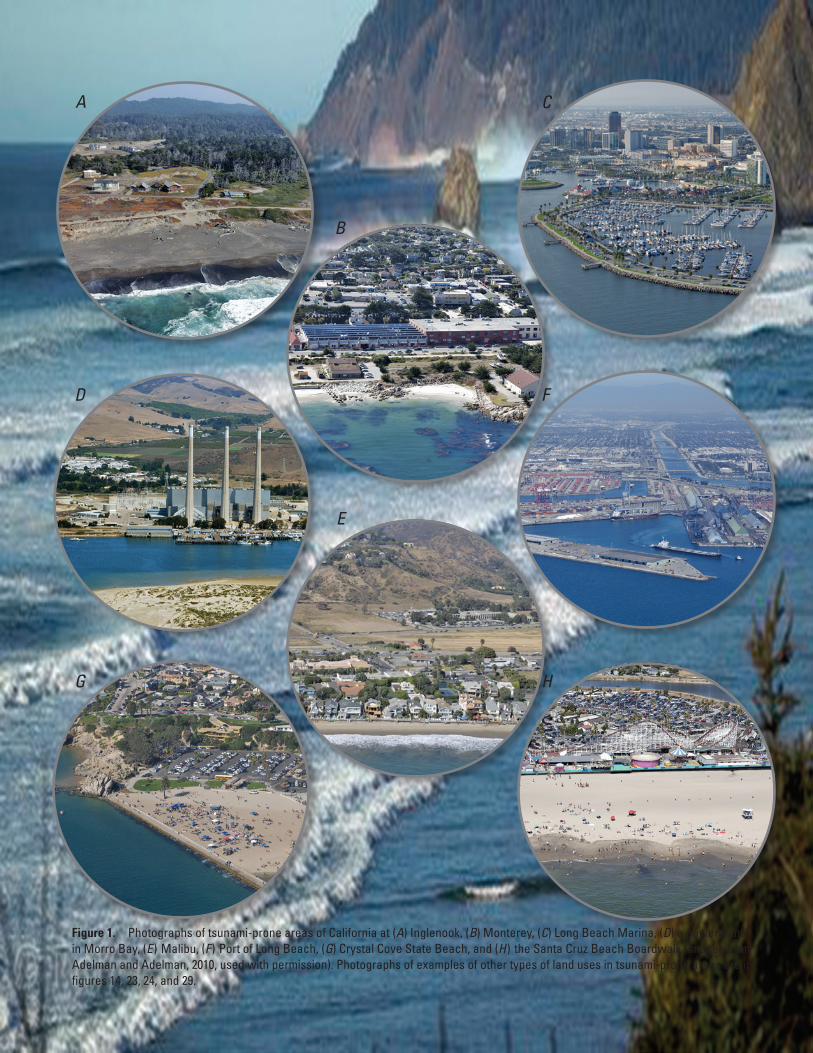
Figure 1. Photographs of tsunami-prone areas of California at (A) Inglenook, (B) Monterey, (C) Long Beach Marina, (D) a powerplant in Morro Bay, (E) Malibu, (F) Port of Long Beach, (G) Crystal Cove State Beach, and (H) the Santa Cruz Beach Boardwalk (images from Adelman and Adelman, 2010, used with permission). Photographs of examples of other types of land uses in tsunami-prone areas are in figures 14, 23, 24, and 29.
A
D
E
G
C
F
B
H
4 Community Exposure to Tsunami Hazards in California
tsunami-prone areas varies considerably, such as rural residential development (fig. 1A), mixed commercial and residential (fig. 1B), marinas (fig. 1C), industrial sites (fig. 1D), high-density residential development (fig. 1E), commercial ports (fig. 1F), recreational beaches (fig. 1G), and high-volume tourist boardwalks (fig. 1H). These land-use variations influence each community’s vulnerability, typically characterized by the exposure, sensitivity, and adaptive capacity of a community and its assets in relation to potential tsunamis (Turner and others, 2003). Exposure is a function of the proximity of populations and assets to hazards, whereas sensitivity and adaptive capacity are internal characteristics of an individual, group, or socioeconomic system that influence their ability to reduce their vulnerability. A tsunami may cause damage to buildings or injure people, but the cumulative choices a community makes with regards to its use of hazard-prone areas and its willingness to develop risk-reduction strategies (for example, education programs and evacuation training) before an extreme event occurs set the stage for and will determine the extent of these losses (Mileti, 1999; Wisner and others, 2004).
To better understand societal vulnerability to California tsunami hazards, the California Emergency Management Agency (CalEMA) and California Geological Survey (CGS) sought assistance from the U.S. Geological Survey (USGS) to determine the number and type of people and businesses that are in tsunami-prone areas and how communities vary in their exposure to tsunami hazards. A maximum tsunami-inundation zone has been developed based on data from multiple sources (Barberopoulou and others, 2009), and CalEMA and CGS were interested in knowing what populations and businesses were in these areas. Understanding how communities vary in their exposure to tsunamis helps emergency managers, land-use planners, public works managers, and the maritime community understand potential tsunami impacts and to determine where to complement regional risk-reduction strategies with site-specific efforts that are tailored to local conditions and needs (for example, targeted education programs and evacuation procedures for specific schools or assisted-living facilities). Results can also be used to help prioritize preparedness funding, sites or sectors for mitigation cost-benefit analysis, and locations to develop next-generation hazard modeling, such as probabilistic tsunami hazard analysis.
Purpose and Scope This report documents geographic variations in
community exposure to tsunami hazards in California. Community exposure is described by the amount and relative percentage of various populations and population-related indicators in tsunami-prone areas as defined by a maximum tsunami-inundation zone. Variations in community exposure to tsunamis are based on the presence of populations and
businesses in tsunami-prone areas using regional datasets and tallied using geographic-information-system (GIS) tools; results are not engineering-based loss estimates for any particular facility. These inventories cannot be considered estimates of potential losses because aspects of individual perceptions and preparedness levels before a tsunami, adaptive capacity of a community during a response, and long-term resilience of individuals and communities after an event are excluded from this analysis (Pelling, 2002; Turner and others, 2003). Potential losses would only match reported inventories if all residents, employees, and visitors in tsunami-prone areas were unaware of tsunami risks, were unaware of what to do if warned of an imminent threat (either by natural cues or official announcements), and failed to take protective measures to evacuate. This assumption is unrealistic, given the current level of tsunami-awareness efforts in California (California Emergency Management Agency, 2012; National Weather Service, 2012b). Finally, the primary purpose of this population-exposure inventory is to support preparedness and education efforts; therefore, it does not include analysis of direct or indirect economic losses to individuals, businesses, communities, or to the regional economy (for example, lost revenues for a manufacturer because a supplier’s facilities were destroyed by a tsunami). This analysis is intended to serve as a foundation for additional risk-related studies and to help community members and local, State, and Federal policymakers (for example, in the emergency-management or land-use arenas) in their efforts to develop and prioritize preparedness and risk-reduction strategies that are tailored to local needs.
Study AreaThis study of community exposure to tsunami hazards
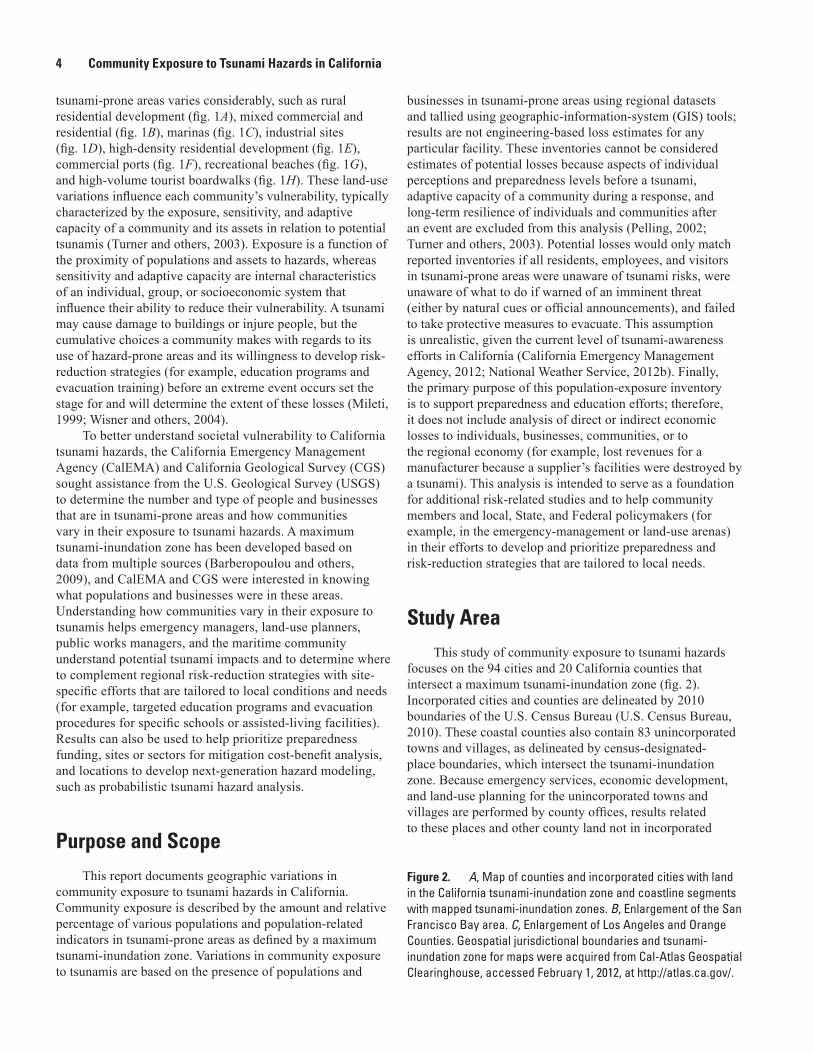
focuses on the 94 cities and 20 California counties that intersect a maximum tsunami-inundation zone (fig. 2). Incorporated cities and counties are delineated by 2010 boundaries of the U.S. Census Bureau (U.S. Census Bureau, 2010). These coastal counties also contain 83 unincorporated towns and villages, as delineated by census-designated-place boundaries, which intersect the tsunami-inundation zone. Because emergency services, economic development, and land-use planning for the unincorporated towns and villages are performed by county offices, results related to these places and other county land not in incorporated
Figure 2. A, Map of counties and incorporated cities with land in the California tsunami-inundation zone and coastline segments with mapped tsunami-inundation zones. B, Enlargement of the San Francisco Bay area. C, Enlargement of Los Angeles and Orange Counties. Geospatial jurisdictional boundaries and tsunami-inundation zone for maps were acquired from Cal-Atlas Geospatial Clearinghouse, accessed February 1, 2012, at http://atlas.ca.gov/.
Study Area 5
Monterey
Los AngelesVentura
San Diego
Santa Barbara
Orange
San LuisObispo
1. San Diego2. Coronado3. National City4. Chula Vista5. Imperial Beach
Oxnard
Carlsbad
Santa Barbara
Malibu
Encinitas
1. Marina2. Sand City3. Seaside4. Monterey5. Pacific Grove6. Carmel-by-the-Sea
Pismo Beach
Goleta
36°0' N
35°0' N
34°0' N
33°0' N
NEVADACALIFORNIA
123
465
Morro Bay
Grover Beach
Carpinteria
Oceanside
Solana BeachDel Mar
1
23
45
San Buenaventura (Ventura)Port Hueneme
Humboldt
Mendocino
Sonoma
Napa
Marin
Del Norte
Santa Cruz
EurekaArcata
Fort Bragg
Point Arena
Ferndale
Trinidad
Crescent City
117°0' W118°0' W119°0' W121°0' W122°0' W 120°0' W123°0' W124°0' W
Capitola
42°0' N
41°0' N
39°0' N
38°0' N
37°0' N
40°0' N
0 20 KILOMETERS
0 20 MILES
Santa Clara
P a c i f i cO c e a n
Santa Cruz
Incoporated city with landin tsunami-inundation zone
County with landin tsunami-inundation zone
Other California counties
Coastline with mappedtsunami-inundation zone
Avalon
OREGONCALIFORNIA
San Francisco
San Mateo
Solano
Alameda
Contra Costa
MEXICO
Los Angeles
Newport Beach
Dana Point
Torrance
Huntington BeachCosta Mesa
Seal Beach
Westminster
Laguna Beach
Rancho Palos Verdes
Santa Monica
El Segundo
Redondo Beach
Palos VerdesEstates
Manhattan Beach
Los Angeles
OrangeHermosa Beach
San Clemente
0 10 KILOMETERS
0 10 MILES
Long Beach
Brisbane
Benicia
Foster City
South SF
Marin
Alameda
Santa Clara
Contra Costa
Fremont
San Jose
Oakland
Hayward
Vallejo
Richmond
Novato
Redwood City
Alameda
Sunnyvale
San Rafael Hercules
Union City
Pinole
NewarkSan Mateo
Pacifica
Menlo Park
Martinez
San Leandro
Mountain View
Daly City
Burlingame
San CarlosHalf Moon
Bay
Larkspur
Palo AltoEast Palo Alto
Solano
BerkeleyAlbany
Emeryville
San Francisco
Mill Valley
Sausalito
San Francisco (SF)
Millbrae
0 10 KILOMETERS
0 10 MILES
San Mateo
Belvedere
ABA
C
B
C
6 Community Exposure to Tsunami Hazards in California
cities or unincorporated places are aggregated and reported at the county level as “remaining land” for a given county throughout the report.
The tsunami-inundation zone used in this study is based on cumulative modeling efforts that incorporate a variety of far-field, local earthquake, and local landslide sources. It was created for 35 separate regions covering the most significant population and economic centers along the California coast and does not represent potential inundation along the entire coastline (fig. 2). Local fault sources include the Cascadia Subduction Zone (for northern coastal communities) and other local faults in the Santa Barbara Channel (Anacapa-Dume and Channel Islands thrust faults, 1927 Point Arguello earthquake), between Santa Monica and San Diego Bay (Catalina Fault, Newport Inglewood Fault, Oceanside thrust fault, San Clemente Fault, and San Mateo thrust fault), and around the San Francisco Bay area (San Gregorio, Hayward-Rodgers Creek, and Point Reyes Faults). Landslide sources include submarine scenario landslides within or near Goleta, Palos Verdes, Coronado Canyon, and Monterey Canyon. Far-field tsunamigenic earthquake sources include several subduction zones—Alaska-Aleutian, Kuril-Japan, Chilean, Marianna-Izu-Bonin, and Cascadia (distant source for central and southern California communities). Descriptions of each tsunami source, such as the length, width, depth, slip and magnitudes for earthquake scenarios can be found in Wilson and others (2010).
The tsunami-inundation zone was generated at 3 arc-second (75-to-90 meter) resolution grids for all areas and then enhanced with 1 arc-second (25-to-30 meter) resolution grids in the major port areas (Los Angeles, Long Beach, San Francisco, and San Diego). The final tsunami-inundation zone represents the maximum inundation in each of the areas from the various tsunami sources and is refined to a higher level of accuracy using high-resolution elevation data (3 to 5 meters) onshore. The delineation of the inundation zone also included field verification by geologists and local emergency planners for their specific jurisdictions (Barberopoulou and others, 2009). In most areas, potential tsunami inundation is dominated by one or two scenarios, primarily the Cascadia Subduction Zone, local submarine faults or landslides, or a magnitude 9.2 earthquake from the eastern Aleutian Islands (appendix 1; Wilson and others, 2010).
Because the tsunami-inundation zone identifies the maximum areas of inundation from various earthquake and landslide sources, it is not meant to imply that all delineated areas would be inundated by a single future tsunami. Also, the areas in the identified tsunami-inundation zone are not equally at risk from inundation; areas closer to the shoreline are more likely to be affected than areas on the landward edge of the zone because of a presumed greater flooding depth and stronger currents. Finally, the tsunami-inundation zone does not provide any indicator of the probability of specific earthquake or landslide scenarios. The tsunami-inundation zone used in this study is a guide for emergency planning and is not a prediction for a future event, because the actual
inundation extent, depth, speed, and impact forces of a future tsunami will be determined by specific aspects of the source (for example, the location, depth, and magnitude of an earthquake), the ocean conditions through which it travels, and the topography over which it moves (for example, the influence of vegetation and human structures on changing flow dynamics).
Variations in Community ExposureWe use the amount and percentage of 7 population-
related variables—developed land, residents, employees, public venues, dependent-population facilities, community-support businesses, and beach and park attendance—to describe the variation in community exposure to tsunami hazards among the 94 communities and 20 counties. We chose these variables because they are all indicators of human occupation and land use in tsunami-prone areas. They are also data that U.S. jurisdictions are encouraged to collect as they develop hazard-mitigation plans (Federal Emergency Management Agency, 2001) to qualify for funds under the U.S. Hazard Mitigation Grant Program in accordance with the Disaster Mitigation Act of 2000, Public Law 106-390.
Calculating the number and distribution of individuals and businesses in tsunami-prone areas shows emergency managers and community planners where risk and warning education may be most needed. Calculating the percentage of community assets in tsunami-prone areas provides insight about the relative impact of losses to an entire community. For example, two coastal communities (one small and one large) both may have 100 homes and businesses in a tsunami-inundation zone; however, this may only represent 5 percent of total assets in the larger community and 100 percent in the smaller community. As such, the smaller community may have greater difficulty responding to and recovering from the same event, given that every structure in their community could be damaged or destroyed. The relative exposure of a community’s urban footprint to a predicted threat may influence their overall sensitivity and adaptive capacity to the threat.
Analyses were completed using geographic-information-system (GIS) software to overlay geospatial data representing population counts, land-cover classification, administrative boundaries, and tsunami-inundation zones. Before analysis, we transformed all geospatial data to share the same projection and datum, specifically the 1983 North American Datum (NAD83) enhanced by the High Accuracy Reference Network (HARN) for State Plane California Zone I, which uses Lambert Conformal Conic as its base projection. Spatial analysis of vector data (for example, business points and census-block polygons) focused on determining if points or polygons are inside the tsunami-inundation-zone polygons. If GIS-based population polygons overlapped hazard polygons, final population values were adjusted proportionately using the spatial ratio of each sliver within or outside of the tsunami-inundation zone.
Variations in Community Exposure 7
Land Cover
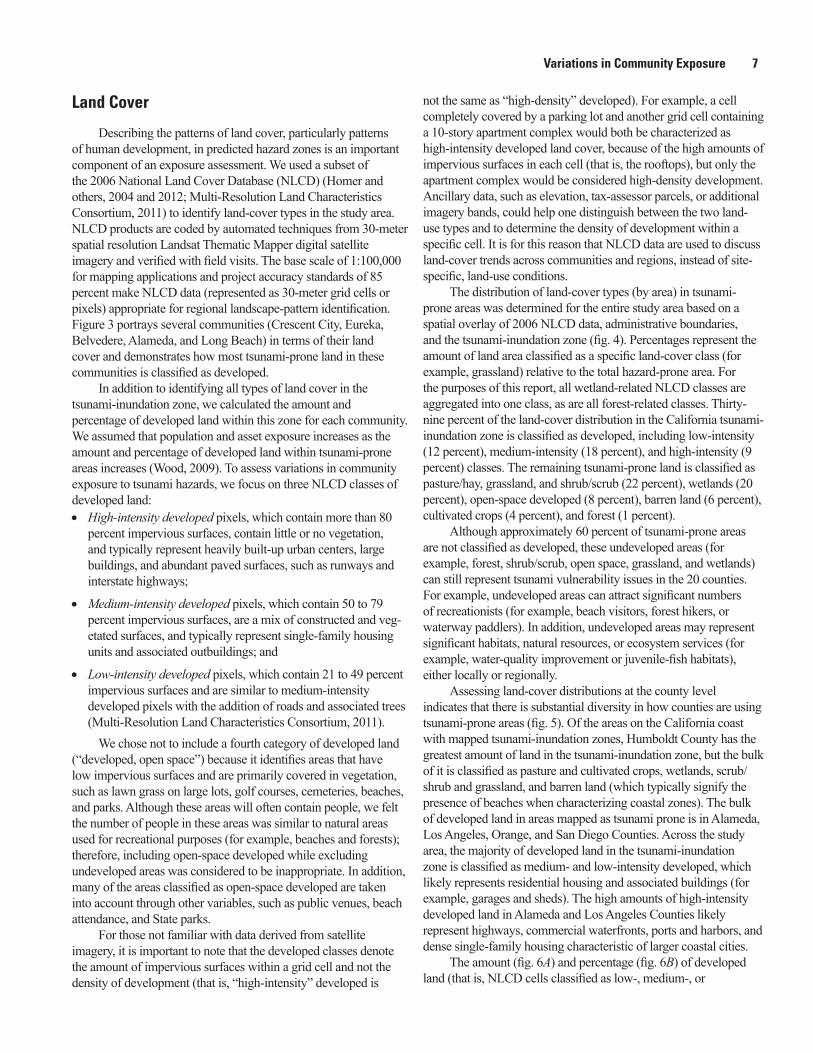
Describing the patterns of land cover, particularly patterns of human development, in predicted hazard zones is an important component of an exposure assessment. We used a subset of the 2006 National Land Cover Database (NLCD) (Homer and others, 2004 and 2012; Multi-Resolution Land Characteristics Consortium, 2011) to identify land-cover types in the study area. NLCD products are coded by automated techniques from 30-meter spatial resolution Landsat Thematic Mapper digital satellite imagery and verified with field visits. The base scale of 1:100,000 for mapping applications and project accuracy standards of 85 percent make NLCD data (represented as 30-meter grid cells or pixels) appropriate for regional landscape-pattern identification. Figure 3 portrays several communities (Crescent City, Eureka, Belvedere, Alameda, and Long Beach) in terms of their land cover and demonstrates how most tsunami-prone land in these communities is classified as developed.
In addition to identifying all types of land cover in the tsunami-inundation zone, we calculated the amount and percentage of developed land within this zone for each community. We assumed that population and asset exposure increases as the amount and percentage of developed land within tsunami-prone areas increases (Wood, 2009). To assess variations in community exposure to tsunami hazards, we focus on three NLCD classes of developed land: • High-intensity developed pixels, which contain more than 80
percent impervious surfaces, contain little or no vegetation, and typically represent heavily built-up urban centers, large buildings, and abundant paved surfaces, such as runways and interstate highways;
• Medium-intensity developed pixels, which contain 50 to 79 percent impervious surfaces, are a mix of constructed and veg-etated surfaces, and typically represent single-family housing units and associated outbuildings; and
• Low-intensity developed pixels, which contain 21 to 49 percent impervious surfaces and are similar to medium-intensity developed pixels with the addition of roads and associated trees (Multi-Resolution Land Characteristics Consortium, 2011).
We chose not to include a fourth category of developed land (“developed, open space”) because it identifies areas that have low impervious surfaces and are primarily covered in vegetation, such as lawn grass on large lots, golf courses, cemeteries, beaches, and parks. Although these areas will often contain people, we felt the number of people in these areas was similar to natural areas used for recreational purposes (for example, beaches and forests); therefore, including open-space developed while excluding undeveloped areas was considered to be inappropriate. In addition, many of the areas classified as open-space developed are taken into account through other variables, such as public venues, beach attendance, and State parks.
For those not familiar with data derived from satellite imagery, it is important to note that the developed classes denote the amount of impervious surfaces within a grid cell and not the density of development (that is, “high-intensity” developed is
not the same as “high-density” developed). For example, a cell completely covered by a parking lot and another grid cell containing a 10-story apartment complex would both be characterized as high-intensity developed land cover, because of the high amounts of impervious surfaces in each cell (that is, the rooftops), but only the apartment complex would be considered high-density development. Ancillary data, such as elevation, tax-assessor parcels, or additional imagery bands, could help one distinguish between the two land-use types and to determine the density of development within a specific cell. It is for this reason that NLCD data are used to discuss land-cover trends across communities and regions, instead of site-specific, land-use conditions.
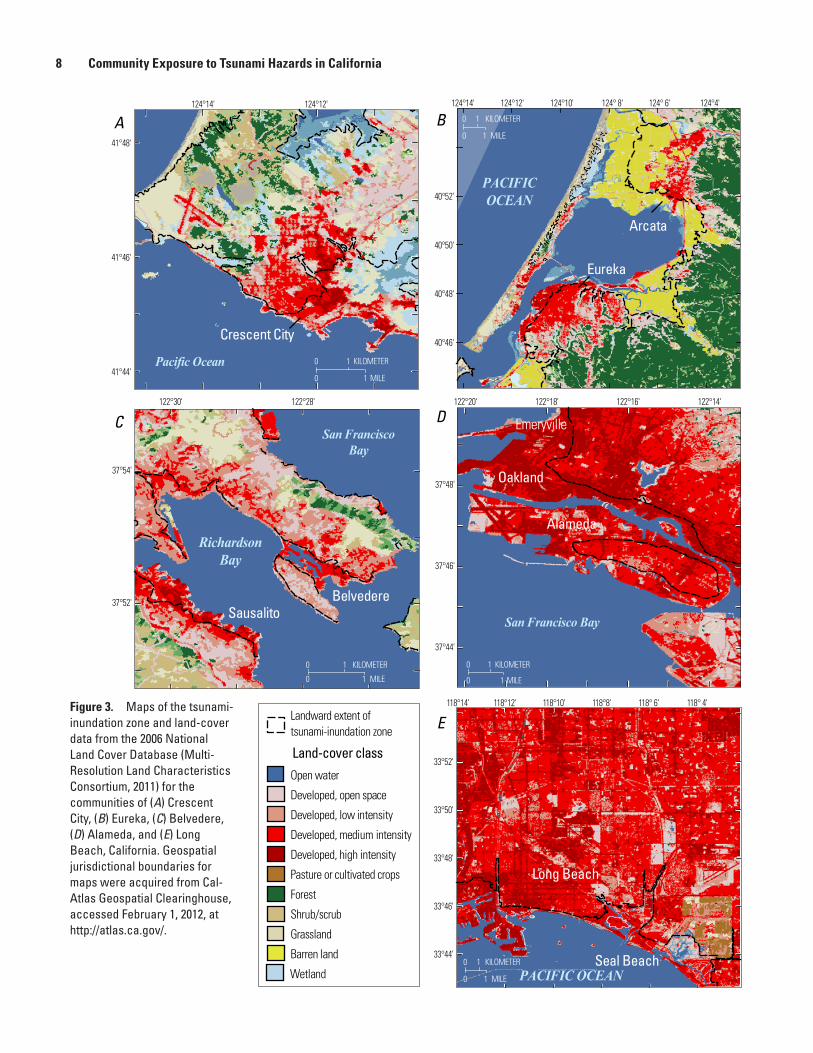
The distribution of land-cover types (by area) in tsunami-prone areas was determined for the entire study area based on a spatial overlay of 2006 NLCD data, administrative boundaries, and the tsunami-inundation zone (fig. 4). Percentages represent the amount of land area classified as a specific land-cover class (for example, grassland) relative to the total hazard-prone area. For the purposes of this report, all wetland-related NLCD classes are aggregated into one class, as are all forest-related classes. Thirty-nine percent of the land-cover distribution in the California tsunami-inundation zone is classified as developed, including low-intensity (12 percent), medium-intensity (18 percent), and high-intensity (9 percent) classes. The remaining tsunami-prone land is classified as pasture/hay, grassland, and shrub/scrub (22 percent), wetlands (20 percent), open-space developed (8 percent), barren land (6 percent), cultivated crops (4 percent), and forest (1 percent).
Although approximately 60 percent of tsunami-prone areas are not classified as developed, these undeveloped areas (for example, forest, shrub/scrub, open space, grassland, and wetlands) can still represent tsunami vulnerability issues in the 20 counties. For example, undeveloped areas can attract significant numbers of recreationists (for example, beach visitors, forest hikers, or waterway paddlers). In addition, undeveloped areas may represent significant habitats, natural resources, or ecosystem services (for example, water-quality improvement or juvenile-fish habitats), either locally or regionally.
Assessing land-cover distributions at the county level indicates that there is substantial diversity in how counties are using tsunami-prone areas (fig. 5). Of the areas on the California coast with mapped tsunami-inundation zones, Humboldt County has the greatest amount of land in the tsunami-inundation zone, but the bulk of it is classified as pasture and cultivated crops, wetlands, scrub/shrub and grassland, and barren land (which typically signify the presence of beaches when characterizing coastal zones). The bulk of developed land in areas mapped as tsunami prone is in Alameda, Los Angeles, Orange, and San Diego Counties. Across the study area, the majority of developed land in the tsunami-inundation zone is classified as medium- and low-intensity developed, which likely represents residential housing and associated buildings (for example, garages and sheds). The high amounts of high-intensity developed land in Alameda and Los Angeles Counties likely represent highways, commercial waterfronts, ports and harbors, and dense single-family housing characteristic of larger coastal cities.
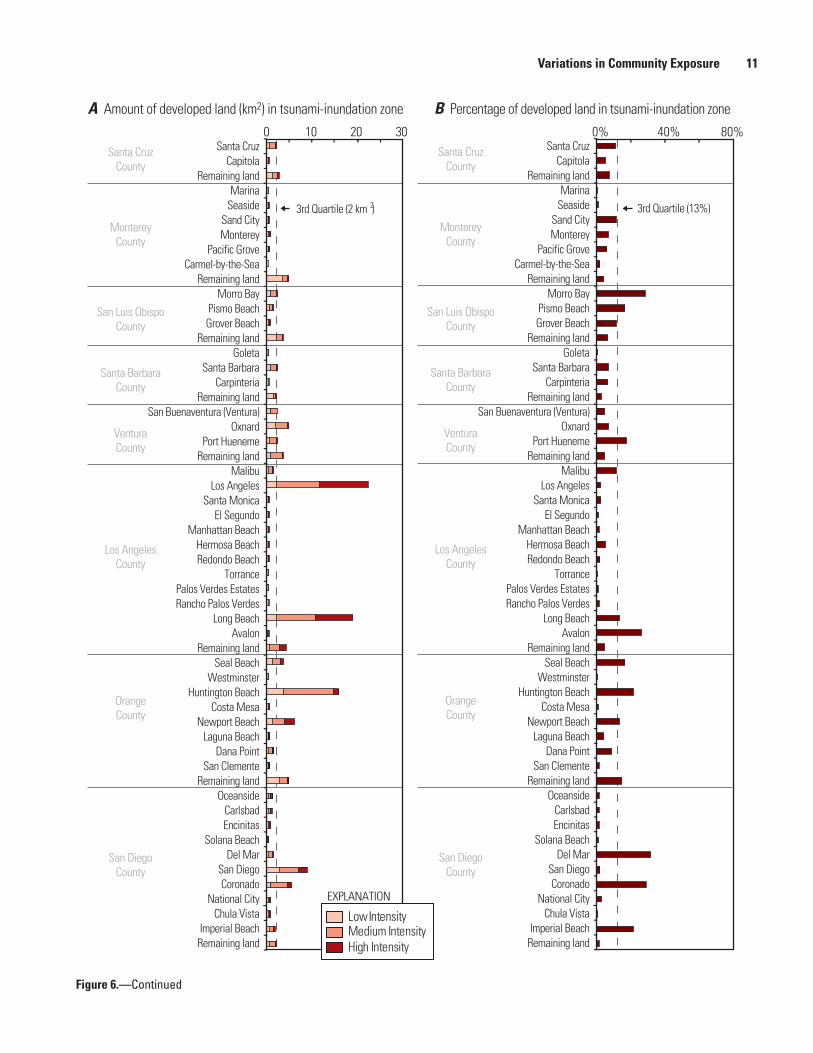
The amount (fig. 6A) and percentage (fig. 6B) of developed land (that is, NLCD cells classified as low-, medium-, or
8 Community Exposure to Tsunami Hazards in California
Shrub/scrub
Grassland
Barren land
Forest
Landward extent of tsunami-inundation zone
Land-cover classOpen water
Developed, open space
Developed, low intensity
Developed, medium intensity
Developed, high intensity
Pasture or cultivated crops
Crescent City
41°48'
41°46'
41°44'
SausalitoBelvedere
37°54'
37°52'
Alameda
Oakland
Emeryville
122°28'122°30' 122°14'122°16'122°20' 122°18'
37°48'
37°46'
37°44'
Eureka
Arcata
124°12'124°14' 124°14' 124°4'124° 6'124° 8'124°10'124°12'
40°52'
40°50'
40°48'
40°46'
Long Beach
Seal Beach
118° 4'118°14' 118° 6'118°8'118°10' 118°12'
33°52'
33°50'
33°48'
33°46'
33°44'
0 1 KILOMETER
0 1 MILE
0 1 KILOMETER
0 1 MILE
0 1 KILOMETER
0 1 MILE
0 1 KILOMETER
0 1 MILE
0 1 KILOMETER
0 1 MILE
Pacific Ocean
PACIFICOCEAN
San Francisco Bay
RichardsonBay
San FranciscoBay
PACIFIC OCEANWetland
A B
C D
EFigure 3. Maps of the tsunami-inundation zone and land-cover data from the 2006 National Land Cover Database (Multi-Resolution Land Characteristics Consortium, 2011) for the communities of (A) Crescent City, (B) Eureka, (C) Belvedere, (D) Alameda, and (E) Long Beach, California. Geospatial jurisdictional boundaries for maps were acquired from Cal-Atlas Geospatial Clearinghouse, accessed February 1, 2012, at http://atlas.ca.gov/.
Variations in Community Exposure 9
Del NorteCounty name
HumboldtMendocino
SonomaMarinNapa
SolanoContra Costa
AlamedaSanta ClaraSan Mateo
San FranciscoSanta CruzMonterey
San Luis ObispoSanta Barbara
VenturaLos Angeles
OrangeSan Diego
Developed, open space
Barren land ForestShrub/scrub or grasslandPasture or cultivated crops Wetland
Developed, low intensityDeveloped, medium intensityDeveloped, high intensity
Amount of land, by type, in tsunami-inundation zone,in square kilometers
0 40 80 160120Developed,open space
(8%)Developed, low intensity
(12%)
Developed,mediumintensity(18%)
Developed,high
intensity(9%)
Barren land(6%)Pasture
or cultivated crops (4%)
Forest (1%)
Shrub/scrub orgrassland (22%)
Wetland (20%)
Figure 4. Pie chart showing distribution of National Land Cover Database classes (by area) in the California tsunami-inundation zone. %, percent.
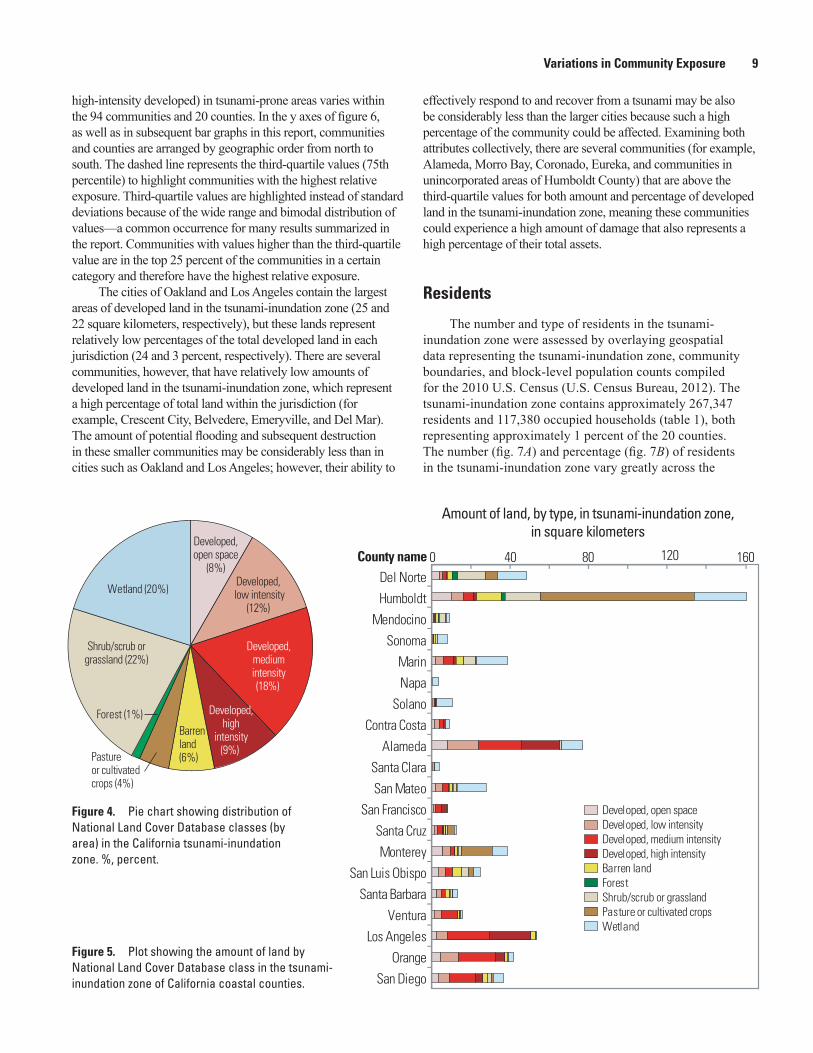
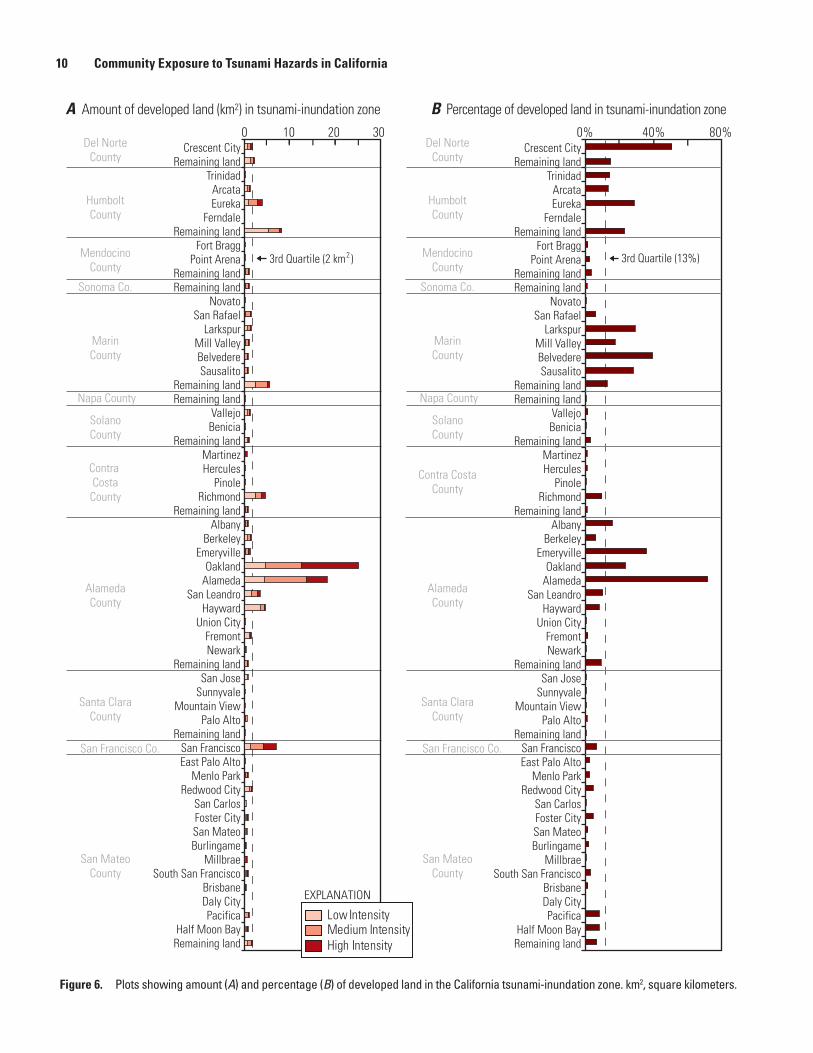
high-intensity developed) in tsunami-prone areas varies within the 94 communities and 20 counties. In the y axes of figure 6, as well as in subsequent bar graphs in this report, communities and counties are arranged by geographic order from north to south. The dashed line represents the third-quartile values (75th percentile) to highlight communities with the highest relative exposure. Third-quartile values are highlighted instead of standard deviations because of the wide range and bimodal distribution of values—a common occurrence for many results summarized in the report. Communities with values higher than the third-quartile value are in the top 25 percent of the communities in a certain category and therefore have the highest relative exposure.
The cities of Oakland and Los Angeles contain the largest areas of developed land in the tsunami-inundation zone (25 and 22 square kilometers, respectively), but these lands represent relatively low percentages of the total developed land in each jurisdiction (24 and 3 percent, respectively). There are several communities, however, that have relatively low amounts of developed land in the tsunami-inundation zone, which represent a high percentage of total land within the jurisdiction (for example, Crescent City, Belvedere, Emeryville, and Del Mar). The amount of potential flooding and subsequent destruction in these smaller communities may be considerably less than in cities such as Oakland and Los Angeles; however, their ability to
effectively respond to and recover from a tsunami may be also be considerably less than the larger cities because such a high percentage of the community could be affected. Examining both attributes collectively, there are several communities (for example, Alameda, Morro Bay, Coronado, Eureka, and communities in unincorporated areas of Humboldt County) that are above the third-quartile values for both amount and percentage of developed land in the tsunami-inundation zone, meaning these communities could experience a high amount of damage that also represents a high percentage of their total assets.
Residents
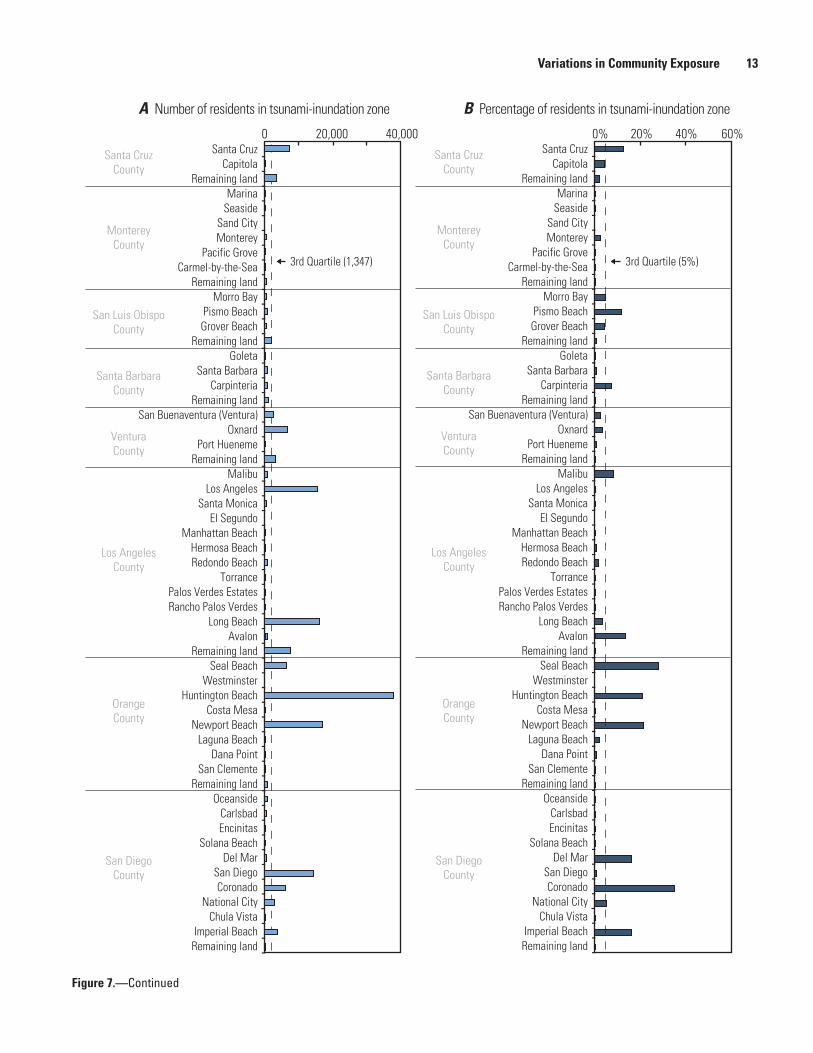
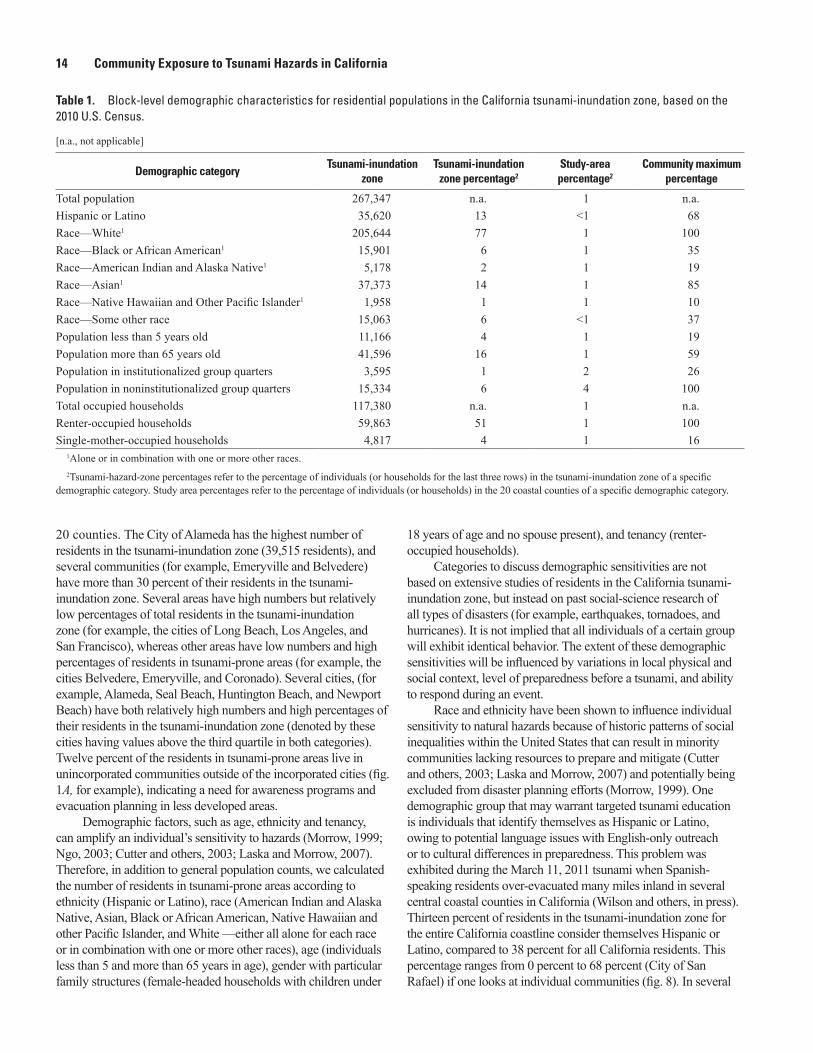
The number and type of residents in the tsunami-inundation zone were assessed by overlaying geospatial data representing the tsunami-inundation zone, community boundaries, and block-level population counts compiled for the 2010 U.S. Census (U.S. Census Bureau, 2012). The tsunami-inundation zone contains approximately 267,347 residents and 117,380 occupied households (table 1), both representing approximately 1 percent of the 20 counties. The number (fig. 7A) and percentage (fig. 7B) of residents in the tsunami-inundation zone vary greatly across the
Figure 5. Plot showing the amount of land by National Land Cover Database class in the tsunami-inundation zone of California coastal counties.
10 Community Exposure to Tsunami Hazards in California
Figure 6. Plots showing amount (A) and percentage (B) of developed land in the California tsunami-inundation zone. km2, square kilometers.
B Percentage of developed land in tsunami-inundation zoneA Amount of developed land (km2) in tsunami-inundation zone
3rd Quartile (13%)
Sonoma Co.
Napa County
San Francisco Co.
San MateoCounty
Contra CostaCounty
HumboltCounty
Santa ClaraCounty
MendocinoCounty
Del NorteCounty
MarinCounty
AlamedaCounty
SolanoCounty
Sonoma Co.
Napa County
San Francisco Co.
San MateoCounty
Contra CostaCounty
HumboltCounty
Santa ClaraCounty
MendocinoCounty
Del NorteCounty
MarinCounty
AlamedaCounty
SolanoCounty
0 10 20 30 0% 40% 80%
Low IntensityMedium IntensityHigh Intensity
Crescent CityRemaining land
TrinidadArcataEureka
FerndaleRemaining land
Fort BraggPoint Arena
Remaining landRemaining land
NovatoSan Rafael
LarkspurMill ValleyBelvedereSausalito
Remaining landRemaining land
VallejoBenicia
Remaining landMartinezHercules
PinoleRichmond
Remaining landAlbany
BerkeleyEmeryville
OaklandAlameda
San LeandroHayward
Union CityFremontNewark
Remaining landSan Jose
SunnyvaleMountain View
Palo AltoRemaining land
San FranciscoEast Palo Alto
Menlo ParkRedwood City
San CarlosFoster CitySan MateoBurlingame
MillbraeSouth San Francisco
BrisbaneDaly CityPacifica
Half Moon BayRemaining land
3rd Quartile (2 km )2
EXPLANATION
Variations in Community Exposure 11
Figure 6.—Continued
0 10 20 30 0% 40% 80%
San DiegoCounty
VenturaCounty
OrangeCounty
MontereyCounty
Santa CruzCounty
Santa BarbaraCounty
Los AngelesCounty
San Luis ObispoCounty
Santa CruzCapitola
Remaining landMarina
SeasideSand CityMonterey
Pacific GroveCarmel-by-the-Sea
Remaining landMorro Bay
Pismo BeachGrover Beach
Remaining landGoleta
Santa BarbaraCarpinteria
Remaining landSan Buenaventura (Ventura)
OxnardPort Hueneme
Remaining landMalibu
Los AngelesSanta Monica
El SegundoManhattan Beach
Hermosa BeachRedondo Beach
TorrancePalos Verdes EstatesRancho Palos Verdes
Long BeachAvalon
Remaining landSeal Beach
WestminsterHuntington Beach
Costa MesaNewport Beach
Laguna BeachDana Point
San ClementeRemaining land
OceansideCarlsbadEncinitas
Solana BeachDel Mar
San DiegoCoronado
National CityChula Vista
Imperial BeachRemaining land
Low IntensityMedium IntensityHigh Intensity
3rd Quartile (13%)3rd Quartile (2 km )2
B Percentage of developed land in tsunami-inundation zoneA Amount of developed land (km2) in tsunami-inundation zone
EXPLANATION

12 Community Exposure to Tsunami Hazards in California
0 20,000 40,000 0% 20% 40% 60%
3rd Quartile (5%)
Sonoma Co.
Napa County
San Francisco Co.
San MateoCounty
Contra Costa
County
HumboltCounty
Santa ClaraCounty
MendocinoCounty
Del NorteCounty
MarinCounty
AlamedaCounty
SolanoCounty
Sonoma Co.
Napa County
San Francisco Co.
San MateoCounty
Contra CostaCounty
HumboltCounty
Santa ClaraCounty
MendocinoCounty
Del NorteCounty
MarinCounty
AlamedaCounty
SolanoCounty
Crescent CityRemaining land
TrinidadArcataEureka
FerndaleRemaining land
Fort BraggPoint Arena
Remaining landRemaining land
NovatoSan Rafael
LarkspurMill ValleyBelvedereSausalito
Remaining landRemaining land
VallejoBenicia
Remaining landMartinezHercules
PinoleRichmond
Remaining landAlbany
BerkeleyEmeryville
OaklandAlameda
San LeandroHayward
Union CityFremontNewark
Remaining landSan Jose
SunnyvaleMountain View
Palo AltoRemaining land
San FranciscoEast Palo Alto
Menlo ParkRedwood City
San CarlosFoster CitySan MateoBurlingame
MillbraeSouth San Francisco
BrisbaneDaly CityPacifica
Half Moon BayRemaining land
3rd Quartile (1,347)
B Percentage of residents in tsunami-inundation zoneA Number of residents in tsunami-inundation zone
Figure 7. Plots showing number (A) and percentage (B) of residents in the California tsunami-inundation zone. %, percent.
Variations in Community Exposure 13
San DiegoCounty
VenturaCounty
OrangeCounty
MontereyCounty
Santa CruzCounty
Santa BarbaraCounty
Los AngelesCounty
San Luis ObispoCounty
Santa CruzCapitola
Remaining landMarina
SeasideSand CityMonterey
Pacific GroveCarmel-by-the-Sea
Remaining landMorro Bay
Pismo BeachGrover Beach
Remaining landGoleta
Santa BarbaraCarpinteria
Remaining landSan Buenaventura (Ventura)
OxnardPort Hueneme
Remaining landMalibu
Los AngelesSanta Monica
El SegundoManhattan Beach
Hermosa BeachRedondo Beach
TorrancePalos Verdes EstatesRancho Palos Verdes
Long BeachAvalon
Remaining landSeal Beach
WestminsterHuntington Beach
Costa MesaNewport Beach
Laguna BeachDana Point
San ClementeRemaining land
OceansideCarlsbadEncinitas
Solana BeachDel Mar
San DiegoCoronado
National CityChula Vista
Imperial BeachRemaining land
0 20,000 40,000 0% 20% 40% 60%
B Percentage of residents in tsunami-inundation zoneA Number of residents in tsunami-inundation zone
3rd Quartile (5%)3rd Quartile (1,347)
Figure 7.—Continued
14 Community Exposure to Tsunami Hazards in California
20 counties. The City of Alameda has the highest number of residents in the tsunami-inundation zone (39,515 residents), and several communities (for example, Emeryville and Belvedere) have more than 30 percent of their residents in the tsunami-inundation zone. Several areas have high numbers but relatively low percentages of total residents in the tsunami-inundation zone (for example, the cities of Long Beach, Los Angeles, and San Francisco), whereas other areas have low numbers and high percentages of residents in tsunami-prone areas (for example, the cities Belvedere, Emeryville, and Coronado). Several cities, (for example, Alameda, Seal Beach, Huntington Beach, and Newport Beach) have both relatively high numbers and high percentages of their residents in the tsunami-inundation zone (denoted by these cities having values above the third quartile in both categories). Twelve percent of the residents in tsunami-prone areas live in unincorporated communities outside of the incorporated cities (fig. 1A, for example), indicating a need for awareness programs and evacuation planning in less developed areas.
Demographic factors, such as age, ethnicity and tenancy, can amplify an individual’s sensitivity to hazards (Morrow, 1999; Ngo, 2003; Cutter and others, 2003; Laska and Morrow, 2007). Therefore, in addition to general population counts, we calculated the number of residents in tsunami-prone areas according to ethnicity (Hispanic or Latino), race (American Indian and Alaska Native, Asian, Black or African American, Native Hawaiian and other Pacific Islander, and White —either all alone for each race or in combination with one or more other races), age (individuals less than 5 and more than 65 years in age), gender with particular family structures (female-headed households with children under
Table 1. Block-level demographic characteristics for residential populations in the California tsunami-inundation zone, based on the 2010 U.S. Census.
[n.a., not applicable]
Demographic categoryTsunami-inundation
zoneTsunami-inundation
zone percentage2
Study-area percentage2
Community maximum percentage
Total population 267,347 n.a. 1 n.a.Hispanic or Latino 35,620 13 <1 68Race—White1 205,644 77 1 100Race—Black or African American1 15,901 6 1 35Race—American Indian and Alaska Native1 5,178 2 1 19Race—Asian1 37,373 14 1 85Race—Native Hawaiian and Other Pacific Islander1 1,958 1 1 10Race—Some other race 15,063 6 <1 37Population less than 5 years old 11,166 4 1 19Population more than 65 years old 41,596 16 1 59Population in institutionalized group quarters 3,595 1 2 26Population in noninstitutionalized group quarters 15,334 6 4 100Total occupied households 117,380 n.a. 1 n.a.Renter-occupied households 59,863 51 1 100Single-mother-occupied households 4,817 4 1 16
1Alone or in combination with one or more other races.2Tsunami-hazard-zone percentages refer to the percentage of individuals (or households for the last three rows) in the tsunami-inundation zone of a specific
demographic category. Study area percentages refer to the percentage of individuals (or households) in the 20 coastal counties of a specific demographic category.
18 years of age and no spouse present), and tenancy (renter-occupied households).
Categories to discuss demographic sensitivities are not based on extensive studies of residents in the California tsunami-inundation zone, but instead on past social-science research of all types of disasters (for example, earthquakes, tornadoes, and hurricanes). It is not implied that all individuals of a certain group will exhibit identical behavior. The extent of these demographic sensitivities will be influenced by variations in local physical and social context, level of preparedness before a tsunami, and ability to respond during an event.
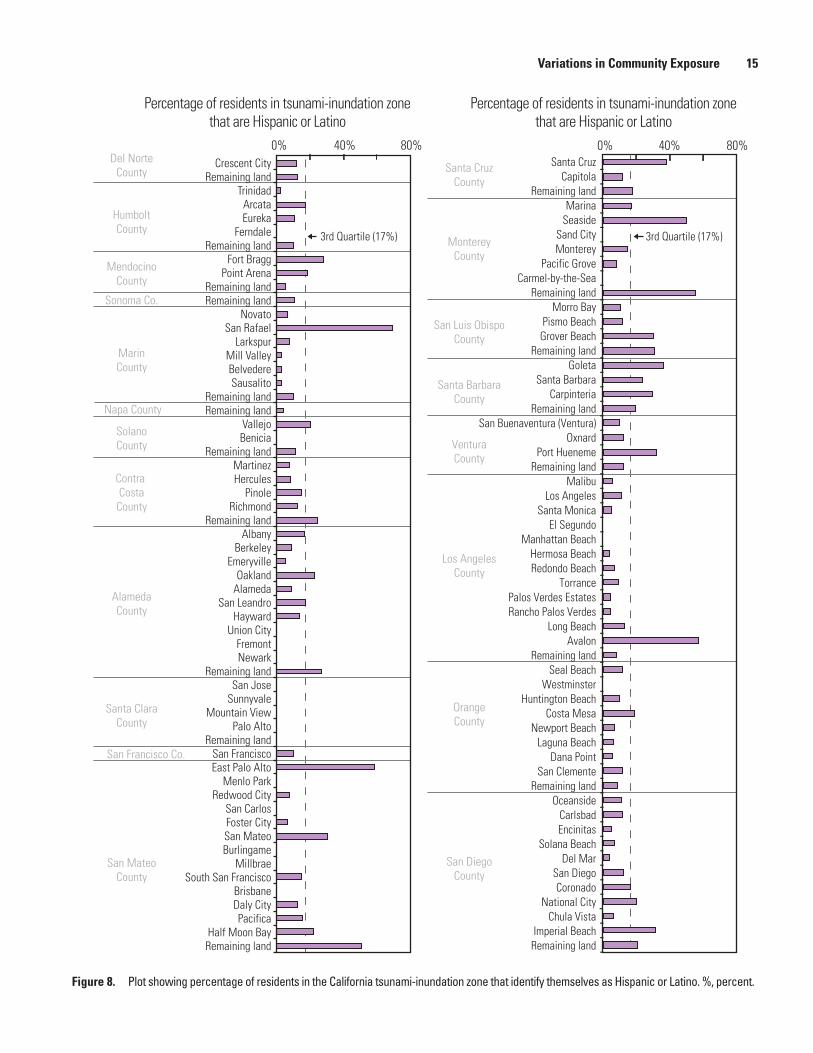
Race and ethnicity have been shown to influence individual sensitivity to natural hazards because of historic patterns of social inequalities within the United States that can result in minority communities lacking resources to prepare and mitigate (Cutter and others, 2003; Laska and Morrow, 2007) and potentially being excluded from disaster planning efforts (Morrow, 1999). One demographic group that may warrant targeted tsunami education is individuals that identify themselves as Hispanic or Latino, owing to potential language issues with English-only outreach or to cultural differences in preparedness. This problem was exhibited during the March 11, 2011 tsunami when Spanish-speaking residents over-evacuated many miles inland in several central coastal counties in California (Wilson and others, in press). Thirteen percent of residents in the tsunami-inundation zone for the entire California coastline consider themselves Hispanic or Latino, compared to 38 percent for all California residents. This percentage ranges from 0 percent to 68 percent (City of San Rafael) if one looks at individual communities (fig. 8). In several
Variations in Community Exposure 15
Percentage of residents in tsunami-inundation zonethat are Hispanic or Latino
0% 40% 80%
Percentage of residents in tsunami-inundation zonethat are Hispanic or Latino
0% 40% 80%
Sonoma Co.
Napa County
San Francisco Co.
San MateoCounty
Contra CostaCounty
HumboltCounty
Santa ClaraCounty
MendocinoCounty
Del NorteCounty
MarinCounty
AlamedaCounty
SolanoCounty
Crescent CityRemaining land
TrinidadArcataEureka
FerndaleRemaining land
Fort BraggPoint Arena
Remaining landRemaining land
NovatoSan Rafael
LarkspurMill ValleyBelvedereSausalito
Remaining landRemaining land
VallejoBenicia
Remaining landMartinezHercules
PinoleRichmond
Remaining landAlbany
BerkeleyEmeryville
OaklandAlameda
San LeandroHayward
Union CityFremontNewark
Remaining landSan Jose
SunnyvaleMountain View
Palo AltoRemaining land
San FranciscoEast Palo Alto
Menlo ParkRedwood City
San CarlosFoster CitySan MateoBurlingame
MillbraeSouth San Francisco
BrisbaneDaly CityPacifica
Half Moon BayRemaining land
3rd Quartile (17%)
San DiegoCounty
VenturaCounty
OrangeCounty
MontereyCounty
Santa CruzCounty
Santa BarbaraCounty
Los AngelesCounty
San Luis ObispoCounty
Santa CruzCapitola
Remaining landMarina
SeasideSand CityMonterey
Pacific GroveCarmel-by-the-Sea
Remaining landMorro Bay
Pismo BeachGrover Beach
Remaining landGoleta
Santa BarbaraCarpinteria
Remaining landSan Buenaventura (Ventura)
OxnardPort Hueneme
Remaining landMalibu
Los AngelesSanta Monica
El SegundoManhattan Beach
Hermosa BeachRedondo Beach
TorrancePalos Verdes EstatesRancho Palos Verdes
Long BeachAvalon
Remaining landSeal Beach
WestminsterHuntington Beach
Costa MesaNewport Beach
Laguna BeachDana Point
San ClementeRemaining land
OceansideCarlsbadEncinitas
Solana BeachDel Mar
San DiegoCoronado
National CityChula Vista
Imperial BeachRemaining land
3rd Quartile (17%)
Figure 8. Plot showing percentage of residents in the California tsunami-inundation zone that identify themselves as Hispanic or Latino. %, percent.
16 Community Exposure to Tsunami Hazards in California
communities, the majority of individuals in the tsunami-inundation zone identify themselves as Hispanic or Latino, including San Rafael, East Palo Alto, Seaside, Avalon, and communities in the unincorporated parts of Monterey and San Mateo Counties.
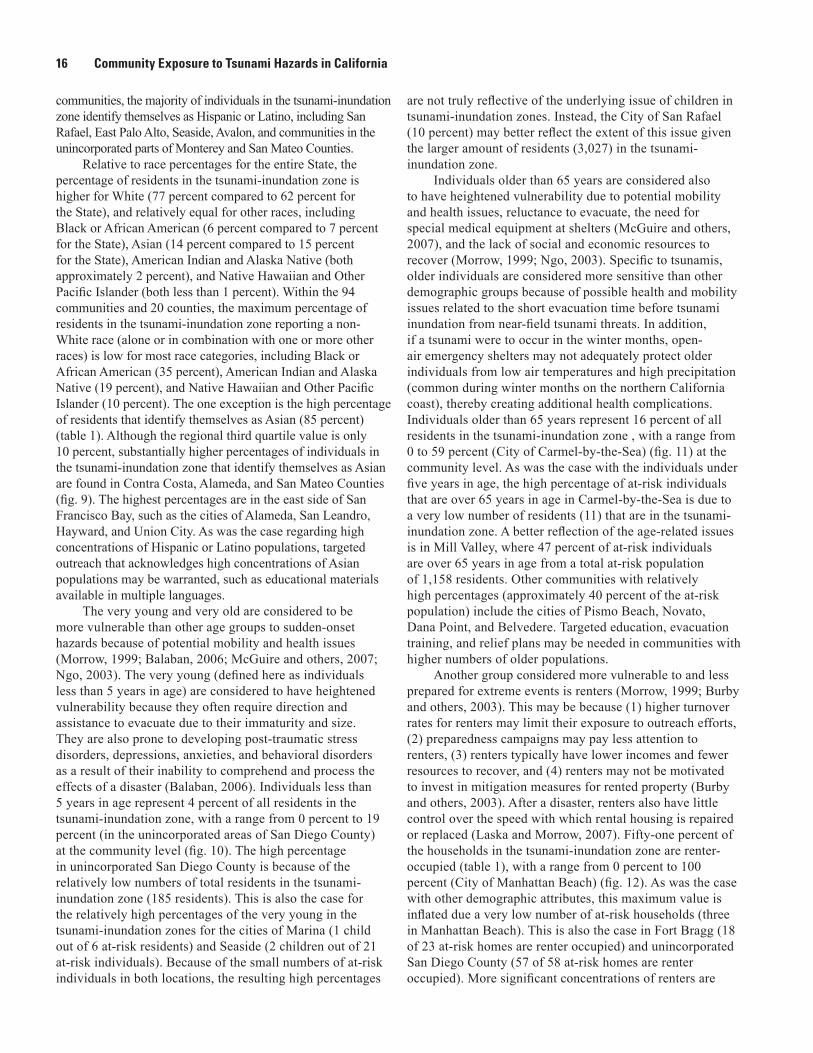
Relative to race percentages for the entire State, the percentage of residents in the tsunami-inundation zone is higher for White (77 percent compared to 62 percent for the State), and relatively equal for other races, including Black or African American (6 percent compared to 7 percent for the State), Asian (14 percent compared to 15 percent for the State), American Indian and Alaska Native (both approximately 2 percent), and Native Hawaiian and Other Pacific Islander (both less than 1 percent). Within the 94 communities and 20 counties, the maximum percentage of residents in the tsunami-inundation zone reporting a non-White race (alone or in combination with one or more other races) is low for most race categories, including Black or African American (35 percent), American Indian and Alaska Native (19 percent), and Native Hawaiian and Other Pacific Islander (10 percent). The one exception is the high percentage of residents that identify themselves as Asian (85 percent) (table 1). Although the regional third quartile value is only 10 percent, substantially higher percentages of individuals in the tsunami-inundation zone that identify themselves as Asian are found in Contra Costa, Alameda, and San Mateo Counties (fig. 9). The highest percentages are in the east side of San Francisco Bay, such as the cities of Alameda, San Leandro, Hayward, and Union City. As was the case regarding high concentrations of Hispanic or Latino populations, targeted outreach that acknowledges high concentrations of Asian populations may be warranted, such as educational materials available in multiple languages.
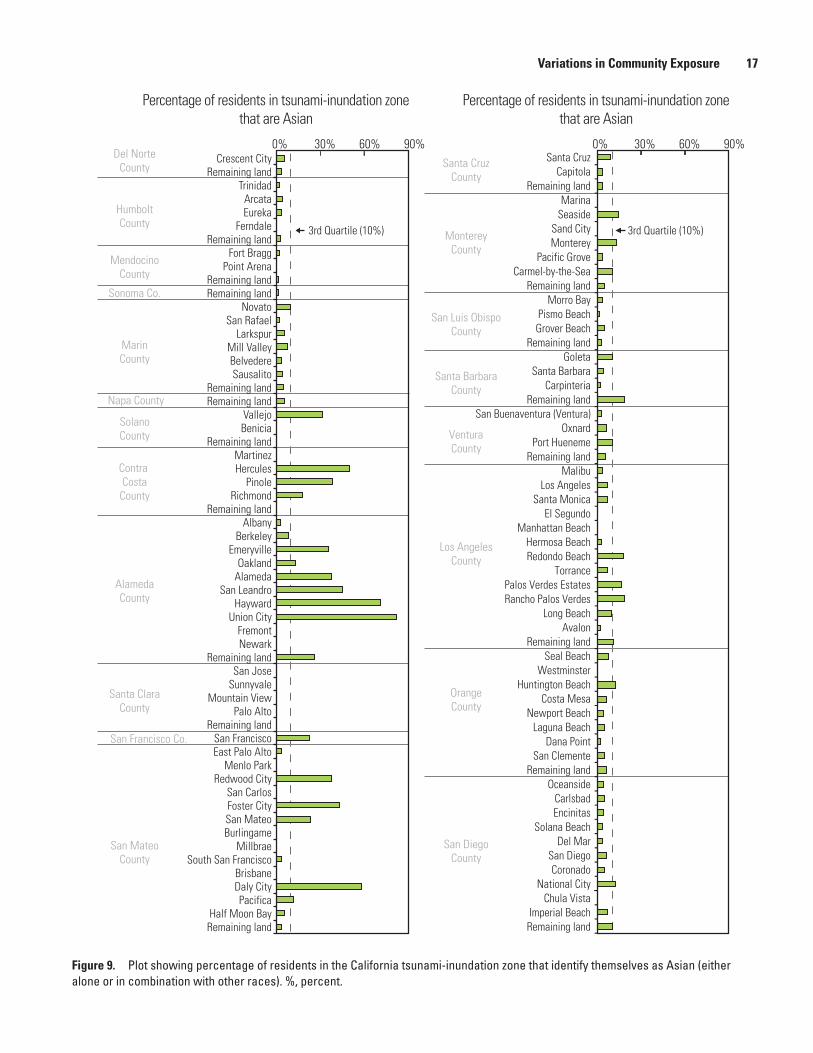
The very young and very old are considered to be more vulnerable than other age groups to sudden-onset hazards because of potential mobility and health issues (Morrow, 1999; Balaban, 2006; McGuire and others, 2007; Ngo, 2003). The very young (defined here as individuals less than 5 years in age) are considered to have heightened vulnerability because they often require direction and assistance to evacuate due to their immaturity and size. They are also prone to developing post-traumatic stress disorders, depressions, anxieties, and behavioral disorders as a result of their inability to comprehend and process the effects of a disaster (Balaban, 2006). Individuals less than 5 years in age represent 4 percent of all residents in the tsunami-inundation zone, with a range from 0 percent to 19 percent (in the unincorporated areas of San Diego County) at the community level (fig. 10). The high percentage in unincorporated San Diego County is because of the relatively low numbers of total residents in the tsunami-inundation zone (185 residents). This is also the case for the relatively high percentages of the very young in the tsunami-inundation zones for the cities of Marina (1 child out of 6 at-risk residents) and Seaside (2 children out of 21 at-risk individuals). Because of the small numbers of at-risk individuals in both locations, the resulting high percentages
are not truly reflective of the underlying issue of children in tsunami-inundation zones. Instead, the City of San Rafael (10 percent) may better reflect the extent of this issue given the larger amount of residents (3,027) in the tsunami-inundation zone.
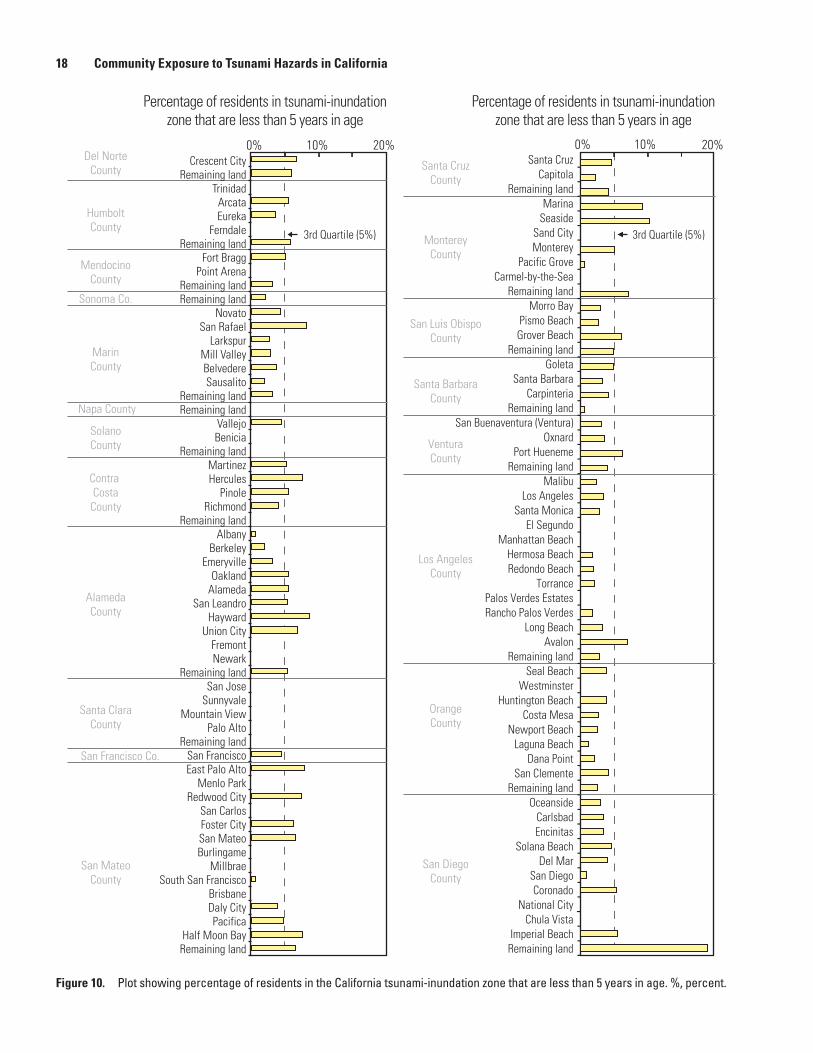
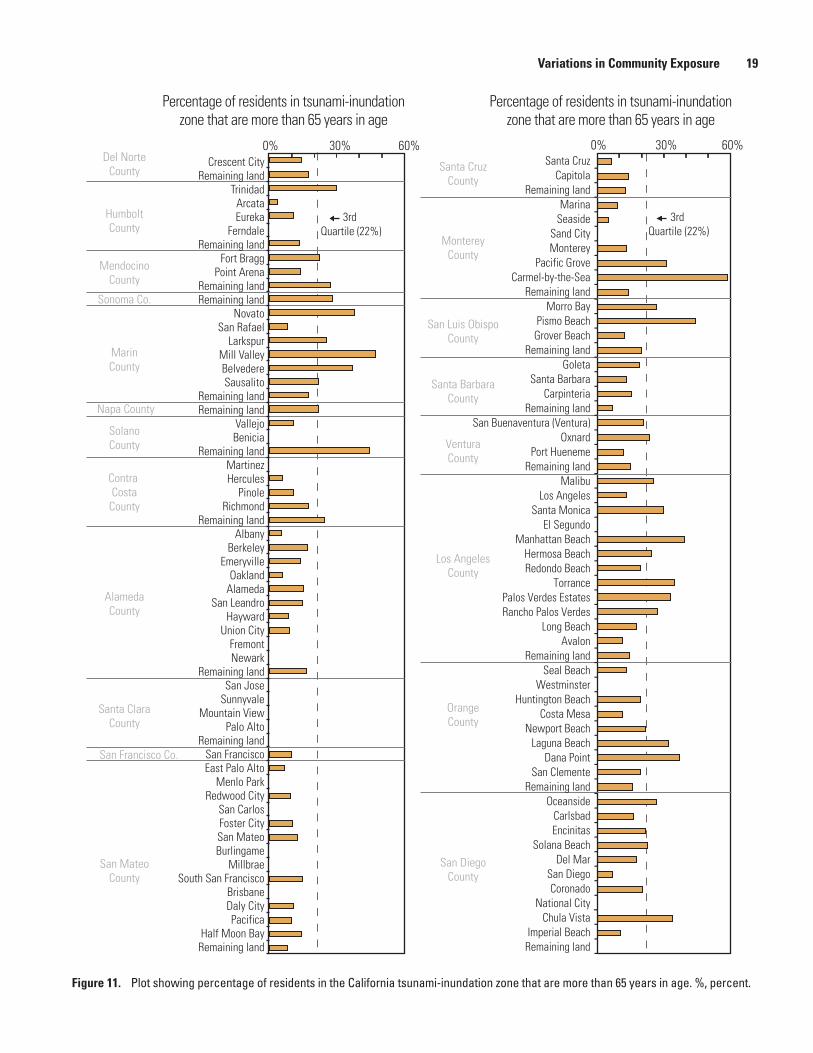
Individuals older than 65 years are considered also to have heightened vulnerability due to potential mobility and health issues, reluctance to evacuate, the need for special medical equipment at shelters (McGuire and others, 2007), and the lack of social and economic resources to recover (Morrow, 1999; Ngo, 2003). Specific to tsunamis, older individuals are considered more sensitive than other demographic groups because of possible health and mobility issues related to the short evacuation time before tsunami inundation from near-field tsunami threats. In addition, if a tsunami were to occur in the winter months, open-air emergency shelters may not adequately protect older individuals from low air temperatures and high precipitation (common during winter months on the northern California coast), thereby creating additional health complications. Individuals older than 65 years represent 16 percent of all residents in the tsunami-inundation zone , with a range from 0 to 59 percent (City of Carmel-by-the-Sea) (fig. 11) at the community level. As was the case with the individuals under five years in age, the high percentage of at-risk individuals that are over 65 years in age in Carmel-by-the-Sea is due to a very low number of residents (11) that are in the tsunami-inundation zone. A better reflection of the age-related issues is in Mill Valley, where 47 percent of at-risk individuals are over 65 years in age from a total at-risk population of 1,158 residents. Other communities with relatively high percentages (approximately 40 percent of the at-risk population) include the cities of Pismo Beach, Novato, Dana Point, and Belvedere. Targeted education, evacuation training, and relief plans may be needed in communities with higher numbers of older populations.
Another group considered more vulnerable to and less prepared for extreme events is renters (Morrow, 1999; Burby and others, 2003). This may be because (1) higher turnover rates for renters may limit their exposure to outreach efforts, (2) preparedness campaigns may pay less attention to renters, (3) renters typically have lower incomes and fewer resources to recover, and (4) renters may not be motivated to invest in mitigation measures for rented property (Burby and others, 2003). After a disaster, renters also have little control over the speed with which rental housing is repaired or replaced (Laska and Morrow, 2007). Fifty-one percent of the households in the tsunami-inundation zone are renter-occupied (table 1), with a range from 0 percent to 100 percent (City of Manhattan Beach) (fig. 12). As was the case with other demographic attributes, this maximum value is inflated due a very low number of at-risk households (three in Manhattan Beach). This is also the case in Fort Bragg (18 of 23 at-risk homes are renter occupied) and unincorporated San Diego County (57 of 58 at-risk homes are renter occupied). More significant concentrations of renters are
Variations in Community Exposure 17
0% 30% 60% 90% 0% 30% 60% 90%
Percentage of residents in tsunami-inundation zonethat are Asian
Percentage of residents in tsunami-inundation zonethat are Asian
Sonoma Co.
Napa County
San Francisco Co.
San MateoCounty
Contra CostaCounty
HumboltCounty
Santa ClaraCounty
MendocinoCounty
Del NorteCounty
MarinCounty
AlamedaCounty
SolanoCounty
Crescent CityRemaining land
TrinidadArcataEureka
FerndaleRemaining land
Fort BraggPoint Arena
Remaining landRemaining land
NovatoSan Rafael
LarkspurMill ValleyBelvedereSausalito
Remaining landRemaining land
VallejoBenicia
Remaining landMartinezHercules
PinoleRichmond
Remaining landAlbany
BerkeleyEmeryville
OaklandAlameda
San LeandroHayward
Union CityFremontNewark
Remaining landSan Jose
SunnyvaleMountain View
Palo AltoRemaining land
San FranciscoEast Palo Alto
Menlo ParkRedwood City
San CarlosFoster CitySan MateoBurlingame
MillbraeSouth San Francisco
BrisbaneDaly CityPacifica
Half Moon BayRemaining land
3rd Quartile (10%)
San DiegoCounty
VenturaCounty
OrangeCounty
MontereyCounty
Santa CruzCounty
Santa BarbaraCounty
Los AngelesCounty
San Luis ObispoCounty
Santa CruzCapitola
Remaining landMarina
SeasideSand CityMonterey
Pacific GroveCarmel-by-the-Sea
Remaining landMorro Bay
Pismo BeachGrover Beach
Remaining landGoleta
Santa BarbaraCarpinteria
Remaining landSan Buenaventura (Ventura)
OxnardPort Hueneme
Remaining landMalibu
Los AngelesSanta Monica
El SegundoManhattan Beach
Hermosa BeachRedondo Beach
TorrancePalos Verdes EstatesRancho Palos Verdes
Long BeachAvalon
Remaining landSeal Beach
WestminsterHuntington Beach
Costa MesaNewport Beach
Laguna BeachDana Point
San ClementeRemaining land
OceansideCarlsbadEncinitas
Solana BeachDel Mar
San DiegoCoronado
National CityChula Vista
Imperial BeachRemaining land
3rd Quartile (10%)
Figure 9. Plot showing percentage of residents in the California tsunami-inundation zone that identify themselves as Asian (either alone or in combination with other races). %, percent.
18 Community Exposure to Tsunami Hazards in California
0% 10% 20% 0% 10% 20%
Percentage of residents in tsunami-inundationzone that are less than 5 years in age
Percentage of residents in tsunami-inundationzone that are less than 5 years in age
Sonoma Co.
Napa County
San Francisco Co.
San MateoCounty
Contra Costa
County
HumboltCounty
Santa ClaraCounty
MendocinoCounty
Del NorteCounty
MarinCounty
AlamedaCounty
SolanoCounty
Crescent CityRemaining land
TrinidadArcataEureka
FerndaleRemaining land
Fort BraggPoint Arena
Remaining landRemaining land
NovatoSan Rafael
LarkspurMill ValleyBelvedereSausalito
Remaining landRemaining land
VallejoBenicia
Remaining landMartinezHercules
PinoleRichmond
Remaining landAlbany
BerkeleyEmeryville
OaklandAlameda
San LeandroHayward
Union CityFremontNewark
Remaining landSan Jose
SunnyvaleMountain View
Palo AltoRemaining land
San FranciscoEast Palo Alto
Menlo ParkRedwood City
San CarlosFoster CitySan MateoBurlingame
MillbraeSouth San Francisco
BrisbaneDaly CityPacifica
Half Moon BayRemaining land
3rd Quartile (5%)
San DiegoCounty
VenturaCounty
OrangeCounty
MontereyCounty
Santa CruzCounty
Santa BarbaraCounty
Los AngelesCounty
San Luis ObispoCounty
Santa CruzCapitola
Remaining landMarina
SeasideSand CityMonterey
Pacific GroveCarmel-by-the-Sea
Remaining landMorro Bay
Pismo BeachGrover Beach
Remaining landGoleta
Santa BarbaraCarpinteria
Remaining landSan Buenaventura (Ventura)
OxnardPort Hueneme
Remaining landMalibu
Los AngelesSanta Monica
El SegundoManhattan Beach
Hermosa BeachRedondo Beach
TorrancePalos Verdes EstatesRancho Palos Verdes
Long BeachAvalon
Remaining landSeal Beach
WestminsterHuntington Beach
Costa MesaNewport Beach
Laguna BeachDana Point
San ClementeRemaining land
OceansideCarlsbadEncinitas
Solana BeachDel Mar
San DiegoCoronado
National CityChula Vista
Imperial BeachRemaining land
3rd Quartile (5%)
Figure 10. Plot showing percentage of residents in the California tsunami-inundation zone that are less than 5 years in age. %, percent.
Variations in Community Exposure 19
0% 30% 60%0% 30% 60%
Percentage of residents in tsunami-inundationzone that are more than 65 years in age
Percentage of residents in tsunami-inundationzone that are more than 65 years in age
Sonoma Co.
Napa County
San Francisco Co.
San MateoCounty
Contra Costa
County
HumboltCounty
Santa ClaraCounty
MendocinoCounty
Del NorteCounty
MarinCounty
AlamedaCounty
SolanoCounty
Crescent CityRemaining land
TrinidadArcataEureka
FerndaleRemaining land
Fort BraggPoint Arena
Remaining landRemaining land
NovatoSan Rafael
LarkspurMill ValleyBelvedereSausalito
Remaining landRemaining land
VallejoBenicia
Remaining landMartinezHercules
PinoleRichmond
Remaining landAlbany
BerkeleyEmeryville
OaklandAlameda
San LeandroHayward
Union CityFremontNewark
Remaining landSan Jose
SunnyvaleMountain View
Palo AltoRemaining land
San FranciscoEast Palo Alto
Menlo ParkRedwood City
San CarlosFoster CitySan MateoBurlingame
MillbraeSouth San Francisco
BrisbaneDaly CityPacifica
Half Moon BayRemaining land
3rd Quartile (22%)
San DiegoCounty
VenturaCounty
OrangeCounty
MontereyCounty
Santa CruzCounty
Santa BarbaraCounty
Los AngelesCounty
San Luis ObispoCounty
Santa CruzCapitola
Remaining landMarina
SeasideSand CityMonterey
Pacific GroveCarmel-by-the-Sea
Remaining landMorro Bay
Pismo BeachGrover Beach
Remaining landGoleta
Santa BarbaraCarpinteria
Remaining landSan Buenaventura (Ventura)
OxnardPort Hueneme
Remaining landMalibu
Los AngelesSanta Monica
El SegundoManhattan Beach
Hermosa BeachRedondo Beach
TorrancePalos Verdes EstatesRancho Palos Verdes
Long BeachAvalon
Remaining landSeal Beach
WestminsterHuntington Beach
Costa MesaNewport Beach
Laguna BeachDana Point
San ClementeRemaining land
OceansideCarlsbadEncinitas
Solana BeachDel Mar
San DiegoCoronado
National CityChula Vista
Imperial BeachRemaining land
3rd Quartile (22%)
Figure 11. Plot showing percentage of residents in the California tsunami-inundation zone that are more than 65 years in age. %, percent.
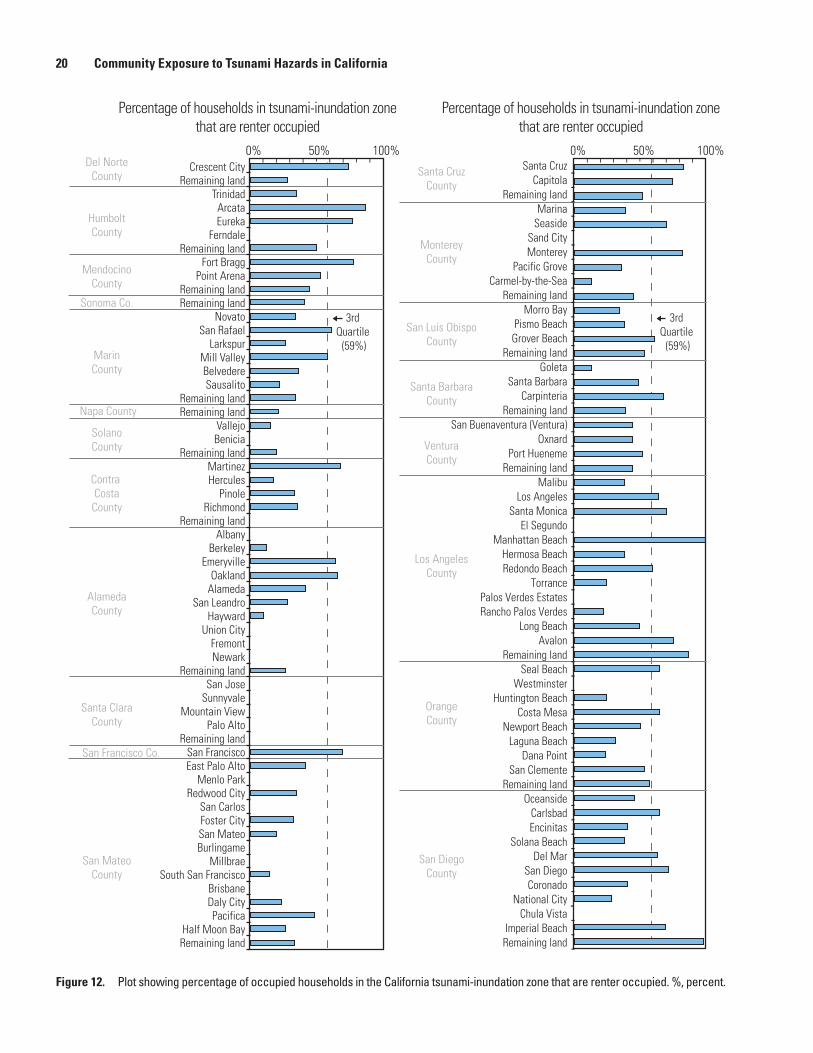
20 Community Exposure to Tsunami Hazards in California
Percentage of households in tsunami-inundation zonethat are renter occupied
Percentage of households in tsunami-inundation zonethat are renter occupied
Sonoma Co.
Napa County
San Francisco Co.
San MateoCounty
Contra Costa
County
HumboltCounty
Santa ClaraCounty
MendocinoCounty
Del NorteCounty
MarinCounty
AlamedaCounty
SolanoCounty
Crescent CityRemaining land
TrinidadArcataEureka
FerndaleRemaining land
Fort BraggPoint Arena
Remaining landRemaining land
NovatoSan Rafael
LarkspurMill ValleyBelvedereSausalito
Remaining landRemaining land
VallejoBenicia
Remaining landMartinezHercules
PinoleRichmond
Remaining landAlbany
BerkeleyEmeryville
OaklandAlameda
San LeandroHayward
Union CityFremontNewark
Remaining landSan Jose
SunnyvaleMountain View
Palo AltoRemaining land
San FranciscoEast Palo Alto
Menlo ParkRedwood City
San CarlosFoster CitySan MateoBurlingame
MillbraeSouth San Francisco
BrisbaneDaly CityPacifica
Half Moon BayRemaining land
3rd Quartile
(59%)
San DiegoCounty
VenturaCounty
OrangeCounty
MontereyCounty
Santa CruzCounty
Santa BarbaraCounty
Los AngelesCounty
San Luis ObispoCounty
Santa CruzCapitola
Remaining landMarina
SeasideSand CityMonterey
Pacific GroveCarmel-by-the-Sea
Remaining landMorro Bay
Pismo BeachGrover Beach
Remaining landGoleta
Santa BarbaraCarpinteria
Remaining landSan Buenaventura (Ventura)
OxnardPort Hueneme
Remaining landMalibu
Los AngelesSanta Monica
El SegundoManhattan Beach
Hermosa BeachRedondo Beach
TorrancePalos Verdes EstatesRancho Palos Verdes
Long BeachAvalon
Remaining landSeal Beach
WestminsterHuntington Beach
Costa MesaNewport Beach
Laguna BeachDana Point
San ClementeRemaining land
OceansideCarlsbadEncinitas
Solana BeachDel Mar
San DiegoCoronado
National CityChula Vista
Imperial BeachRemaining land
3rd Quartile
(59%)
0% 50% 100% 0% 50% 100%
Figure 12. Plot showing percentage of occupied households in the California tsunami-inundation zone that are renter occupied. %, percent.
Variations in Community Exposure 21
found in the unincorporated portions of Los Angeles County (87 percent of 4,149 at-risk homes) and the City of Santa Cruz (86 percent of 2,634 at-risk homes).
Households that are female-headed with children under the age of 18, and no spouse present (that is, single-mother households) may also be more vulnerable to extreme events. Four percent of households in the tsunami-inundation zone are single-mother households, which are more likely to have limited mobility during an evacuation from a sudden-onset hazard and fewer financial resources to draw on to prepare for natural hazards and to recover from a disaster (Enarson and Morrow, 1998; Laska and Morrow, 2007). The highest percentages of households in the tsunami-inundation zone that are female-headed, with children under the age of 18, and no spouse present are in the City of East Palo Alto (16 percent), Berkeley (15 percent), and Crescent City (11 percent) (fig. 13).
Another group of residents who will require special attention during and before a tsunami are those in group quarters, either institutionalized (for example, adult correctional, juvenile, and nursing facilities) or noninstitutionalized (for example, college/university student housing and military quarters) (fig. 14). The unincorporated areas of Marin County and the City of Crescent City have relatively high percentages of residents in the tsunami-inundation zone that are institutionalized (26 and 8 percent, respectively) because of the large correctional facilities in those areas (fig. 15). San Quentin State Prison is located in unincorporated land of Marin County (fig. 14A), and parts of it are in the tsunami-inundation zone (representing 1,591 of the 6,107 at-risk individuals), as is the Del Norte County Jail located in Crescent City. Los Angeles and Mill Valley also have relatively high percentages of institutionalized residents in group quarters (6 percent each) located in the tsunami-prone area. This population is a concern during a tsunami because they will require a structured evacuation and continued supervision to ensure the safety of both the institutionalized populace and the neighboring communities.
As for noninstitutionalized residents in group quarters, the cities of Albany and National City have the highest percentage (100 and 99 percent, respectively) in the tsunami-inundation zone (fig. 16). The high percentage in Albany reflects a very small number (36 people) in the zone residing in this type of group quarters, whereas the high percentage in National City is due to more than 3,000 people residing in military housing at Naval Base San Diego that may be in tsunami-prone areas. Significant noninstitutionalized populations in other communities likely reflect military housing (for example, Eureka and Seaside) or university dormitories (for example, Santa Barbara; fig. 14B). Much of San Francisco’s noninstitutionalized population, which makes up 8 percent (and 834 people) of its total exposed population, likely resides in housing for participants in government-based education programs (for example, Job Corps on Treasure Island, a part of San Francisco completely within the tsunami-inundation zone). Noninstitutionalized,
group-quarters-based populations represent a vulnerable population because they are likely to be unfamiliar with local hazard issues, may not remember past disasters in the area, and may not have been exposed to tsunami-awareness efforts if such efforts are geared for homeowners.
Employees
The number and types of employees in tsunami-prone areas are based on an overlay of the tsunami-inundation zone and the 2011 Infogroup Employer Database (Infogroup, 2011). Our counts serve as approximations because we were unable to field-verify locational data (that is, latitude and longitude coordinates) for each of the 1,014,765 businesses within the 20 counties of the study area. We used the North American Industry Classification System (NAICS) codes (U.S. Census Bureau, 2007; see appendix A of Wood, 2007, for codes) and the number of employees associated with each business to identify the primary business sectors in tsunami-prone areas, an indicator routinely used to evaluate economic health and market trends (Bureau of Labor Statistics, 2010).
The tsunami-inundation zone contains approximately 168,565 employees at 15,335 businesses, both representing approximately 2 percent of the businesses and employees in the 20 counties. The 15,335 businesses in the tsunami-inundation zone generated approximately $29.8 billion in sales in 2010 (2 percent of the study-area total). As with residential populations, the number (fig. 17A) and percentage (fig. 17B) of employees in tsunami-inundation zones vary considerably in the study area. The highest numbers of employees working within the tsunami-inundation zone are in the cities of Oakland (22,176), Long Beach (16,506), Alameda (15,441), and Los Angeles (9,581), reflecting the active ports in each city (fig. 1F, for example). The related ports of Oakland and Alameda have greater numbers of employees in the maximum-tsunami zone than the related ports of Los Angeles and Long Beach (37,617 and 26,087, respectively). Some communities have high numbers but low percentages of employees in the tsunami-inundation zone (for example, San Francisco), whereas other communities have low numbers of employees that represent a high percentage of the city’s workforce in these areas (for example, Crescent City, Pacifica, and Belvedere). Communities that have both relatively high numbers and high percentages of its employees in the tsunami-inundation zone include Alameda, Eureka, Sausalito, Emeryville, Santa Cruz, Monterey, Seal Beach, and Newport Beach.
High percentages of employees in the tsunami-inundation zone represent not only public-safety issues in the event of an imminent tsunami but also economic fragility for a community, as unemployment could increase dramatically overnight if a tsunami injures employees or if it damages or destroys businesses. Even if a business escapes damage or physical disruption from an extreme event, it may still experience significant customer and revenue loss
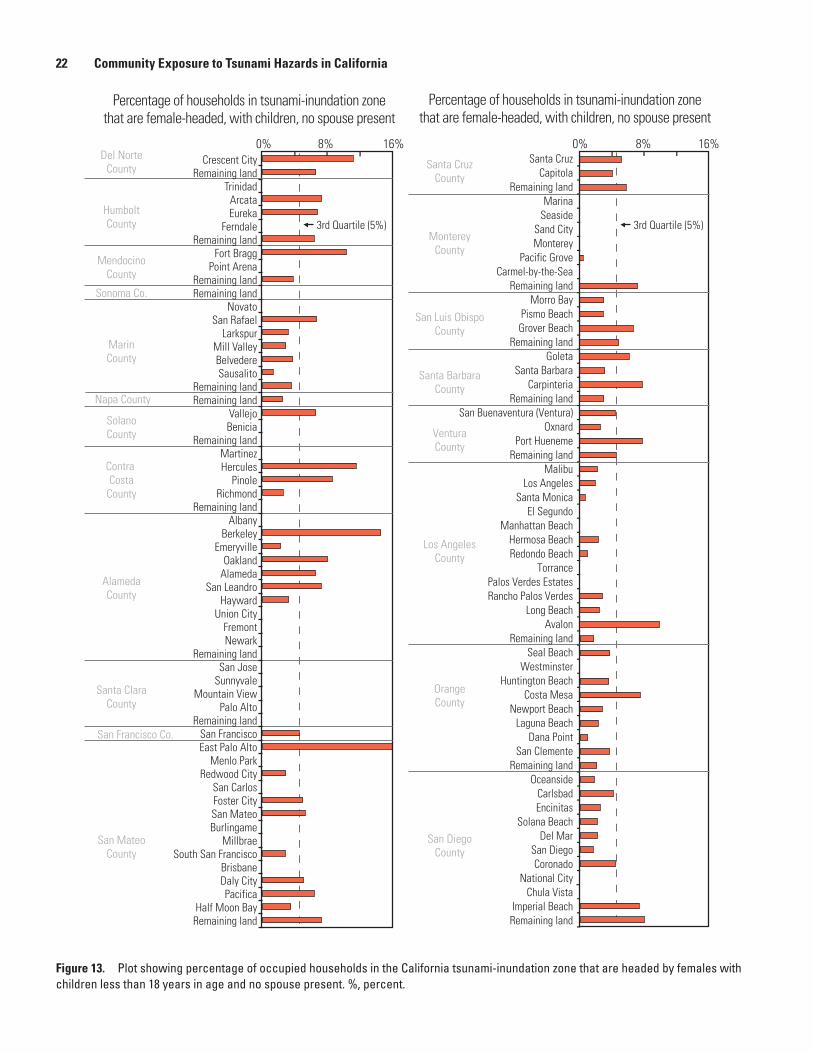
22 Community Exposure to Tsunami Hazards in California
0% 8% 16% 0% 8% 16%
Percentage of households in tsunami-inundation zonethat are female-headed, with children, no spouse present
Percentage of households in tsunami-inundation zonethat are female-headed, with children, no spouse present
Sonoma Co.
Napa County
San Francisco Co.
San MateoCounty
Contra CostaCounty
HumboltCounty
Santa ClaraCounty
MendocinoCounty
Del NorteCounty
MarinCounty
AlamedaCounty
SolanoCounty
Crescent CityRemaining land
TrinidadArcataEureka
FerndaleRemaining land
Fort BraggPoint Arena
Remaining landRemaining land
NovatoSan Rafael
LarkspurMill ValleyBelvedereSausalito
Remaining landRemaining land
VallejoBenicia
Remaining landMartinezHercules
PinoleRichmond
Remaining landAlbany
BerkeleyEmeryville
OaklandAlameda
San LeandroHayward
Union CityFremontNewark
Remaining landSan Jose
SunnyvaleMountain View
Palo AltoRemaining land
San FranciscoEast Palo Alto
Menlo ParkRedwood City
San CarlosFoster CitySan MateoBurlingame
MillbraeSouth San Francisco
BrisbaneDaly CityPacifica
Half Moon BayRemaining land
3rd Quartile (5%)
San DiegoCounty
VenturaCounty
OrangeCounty
MontereyCounty
Santa CruzCounty
Santa BarbaraCounty
Los AngelesCounty
San Luis ObispoCounty
Santa CruzCapitola
Remaining landMarina
SeasideSand CityMonterey
Pacific GroveCarmel-by-the-Sea
Remaining landMorro Bay
Pismo BeachGrover Beach
Remaining landGoleta
Santa BarbaraCarpinteria
Remaining landSan Buenaventura (Ventura)
OxnardPort Hueneme
Remaining landMalibu
Los AngelesSanta Monica
El SegundoManhattan Beach
Hermosa BeachRedondo Beach
TorrancePalos Verdes EstatesRancho Palos Verdes
Long BeachAvalon
Remaining landSeal Beach
WestminsterHuntington Beach
Costa MesaNewport Beach
Laguna BeachDana Point
San ClementeRemaining land
OceansideCarlsbadEncinitas
Solana BeachDel Mar
San DiegoCoronado
National CityChula Vista
Imperial BeachRemaining land
3rd Quartile (5%)
Figure 13. Plot showing percentage of occupied households in the California tsunami-inundation zone that are headed by females with children less than 18 years in age and no spouse present. %, percent.
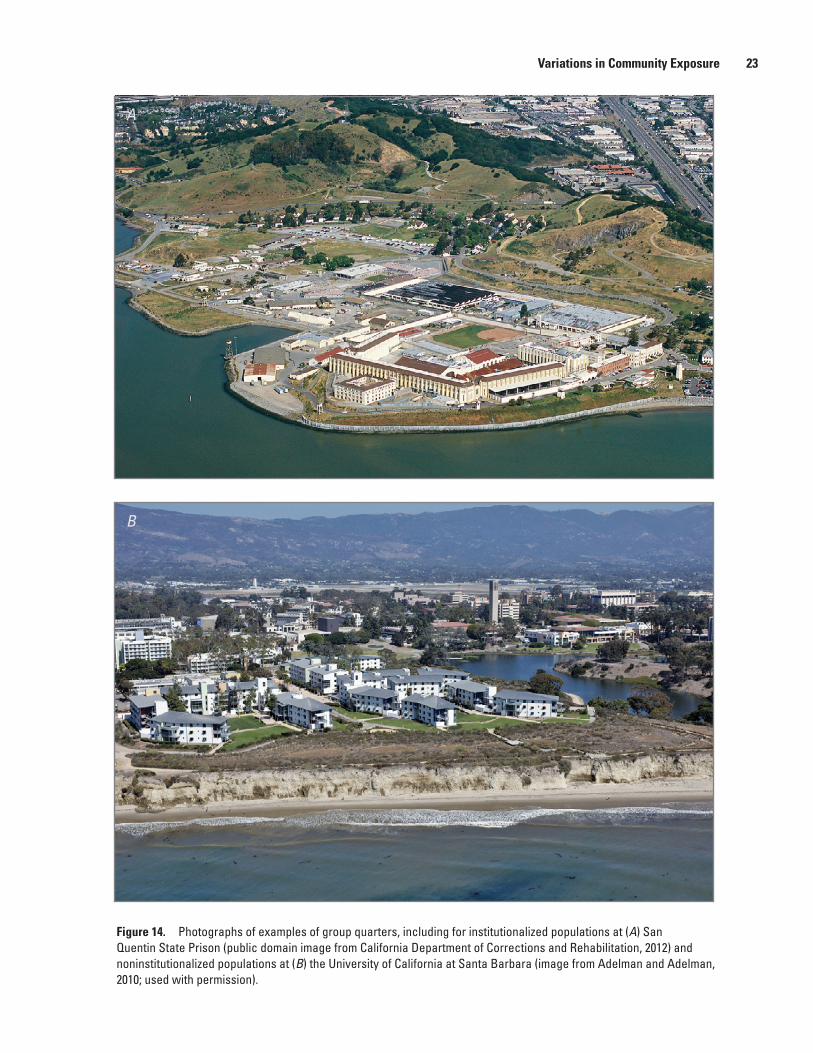
Variations in Community Exposure 23
Figure 14. Photographs of examples of group quarters, including for institutionalized populations at (A) San Quentin State Prison (public domain image from California Department of Corrections and Rehabilitation, 2012) and noninstitutionalized populations at (B) the University of California at Santa Barbara (image from Adelman and Adelman, 2010; used with permission).
A
B

24 Community Exposure to Tsunami Hazards in California
Figure 15. Plot showing percentage of residents in the California tsunami-inundation zone that are in institutionalized group quarters. %, percent.
0% 15% 30% 0% 15% 30%
Percentage of residents in the tsunami-inundation zonethat are in institutionalized group quarters
Sonoma Co.
Napa County
San Francisco Co.
San MateoCounty
Contra Costa
County
HumboltCounty
Santa ClaraCounty
MendocinoCounty
Del NorteCounty
MarinCounty
AlamedaCounty
SolanoCounty
Crescent CityRemaining land
TrinidadArcataEureka
FerndaleRemaining land
Fort BraggPoint Arena
Remaining landRemaining land
NovatoSan Rafael
LarkspurMill ValleyBelvedereSausalito
Remaining landRemaining land
VallejoBenicia
Remaining landMartinezHercules
PinoleRichmond
Remaining landAlbany
BerkeleyEmeryville
OaklandAlameda
San LeandroHayward
Union CityFremontNewark
Remaining landSan Jose
SunnyvaleMountain View
Palo AltoRemaining land
San FranciscoEast Palo Alto
Menlo ParkRedwood City
San CarlosFoster CitySan MateoBurlingame
MillbraeSouth San Francisco
BrisbaneDaly CityPacifica
Half Moon BayRemaining land
3rd Quartile (0%)
San DiegoCounty
VenturaCounty
OrangeCounty
MontereyCounty
Santa CruzCounty
Santa BarbaraCounty
Los AngelesCounty
San Luis ObispoCounty
Santa CruzCapitola
Remaining landMarina
SeasideSand CityMonterey
Pacific GroveCarmel-by-the-Sea
Remaining landMorro Bay
Pismo BeachGrover Beach
Remaining landGoleta
Santa BarbaraCarpinteria
Remaining landSan Buenaventura (Ventura)
OxnardPort Hueneme
Remaining landMalibu
Los AngelesSanta Monica
El SegundoManhattan Beach
Hermosa BeachRedondo Beach
TorrancePalos Verdes EstatesRancho Palos Verdes
Long BeachAvalon
Remaining landSeal Beach
WestminsterHuntington Beach
Costa MesaNewport Beach
Laguna BeachDana Point
San ClementeRemaining land
OceansideCarlsbadEncinitas
Solana BeachDel Mar
San DiegoCoronado
National CityChula Vista
Imperial BeachRemaining land
3rd Quartile (0%)
Percentage of residents in the tsunami-inundation zonethat are in institutionalized group quarters
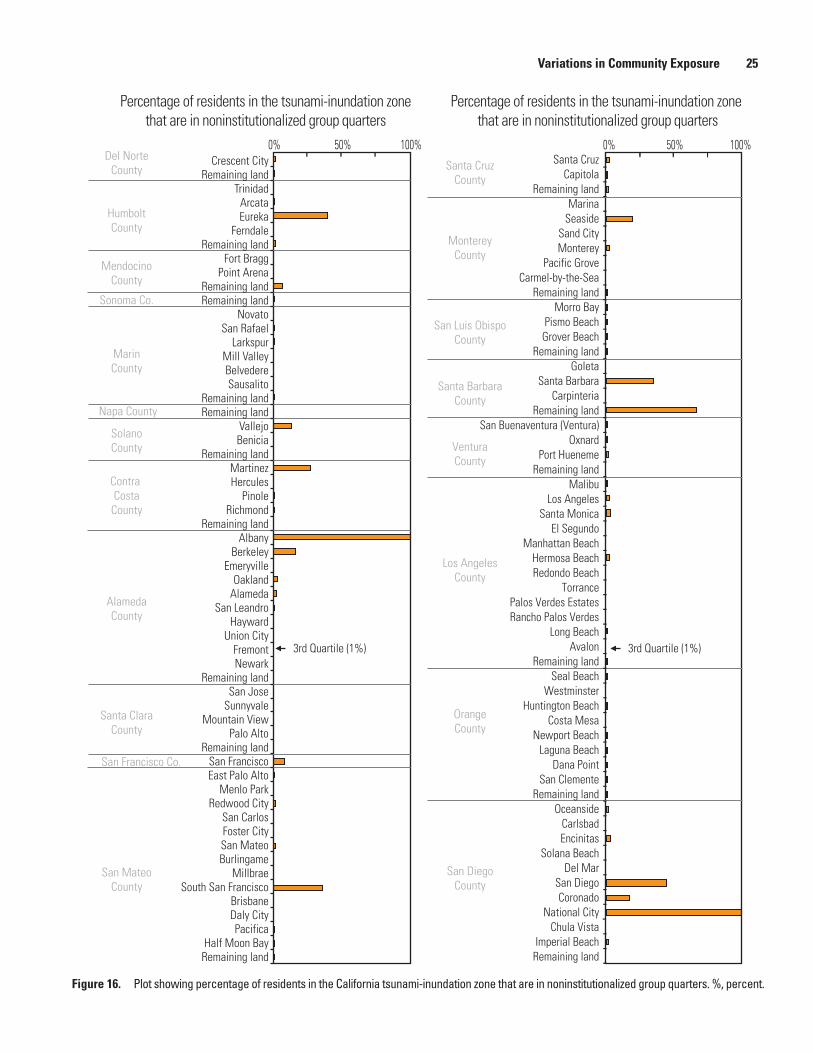
Variations in Community Exposure 25
Figure 16. Plot showing percentage of residents in the California tsunami-inundation zone that are in noninstitutionalized group quarters. %, percent.
0% 50% 100%0% 50% 100%
Sonoma Co.
Napa County
San Francisco Co.
San MateoCounty
Contra Costa
County
HumboltCounty
Santa ClaraCounty
MendocinoCounty
Del NorteCounty
MarinCounty
AlamedaCounty
SolanoCounty
Crescent CityRemaining land
TrinidadArcataEureka
FerndaleRemaining land
Fort BraggPoint Arena
Remaining landRemaining land
NovatoSan Rafael
LarkspurMill ValleyBelvedereSausalito
Remaining landRemaining land
VallejoBenicia
Remaining landMartinezHercules
PinoleRichmond
Remaining landAlbany
BerkeleyEmeryville
OaklandAlameda
San LeandroHayward
Union CityFremontNewark
Remaining landSan Jose
SunnyvaleMountain View
Palo AltoRemaining land
San FranciscoEast Palo Alto
Menlo ParkRedwood City
San CarlosFoster CitySan MateoBurlingame
MillbraeSouth San Francisco
BrisbaneDaly CityPacifica
Half Moon BayRemaining land
3rd Quartile (1%)
San DiegoCounty
VenturaCounty
OrangeCounty
MontereyCounty
Santa CruzCounty
Santa BarbaraCounty
Los AngelesCounty
San Luis ObispoCounty
Santa CruzCapitola
Remaining landMarina
SeasideSand CityMonterey
Pacific GroveCarmel-by-the-Sea
Remaining landMorro Bay
Pismo BeachGrover Beach
Remaining landGoleta
Santa BarbaraCarpinteria
Remaining landSan Buenaventura (Ventura)
OxnardPort Hueneme
Remaining landMalibu
Los AngelesSanta Monica
El SegundoManhattan Beach
Hermosa BeachRedondo Beach
TorrancePalos Verdes EstatesRancho Palos Verdes
Long BeachAvalon
Remaining landSeal Beach
WestminsterHuntington Beach
Costa MesaNewport Beach
Laguna BeachDana Point
San ClementeRemaining land
OceansideCarlsbadEncinitas
Solana BeachDel Mar
San DiegoCoronado
National CityChula Vista
Imperial BeachRemaining land
3rd Quartile (1%)
Percentage of residents in the tsunami-inundation zone that are in noninstitutionalized group quarters
Percentage of residents in the tsunami-inundation zone that are in noninstitutionalized group quarters
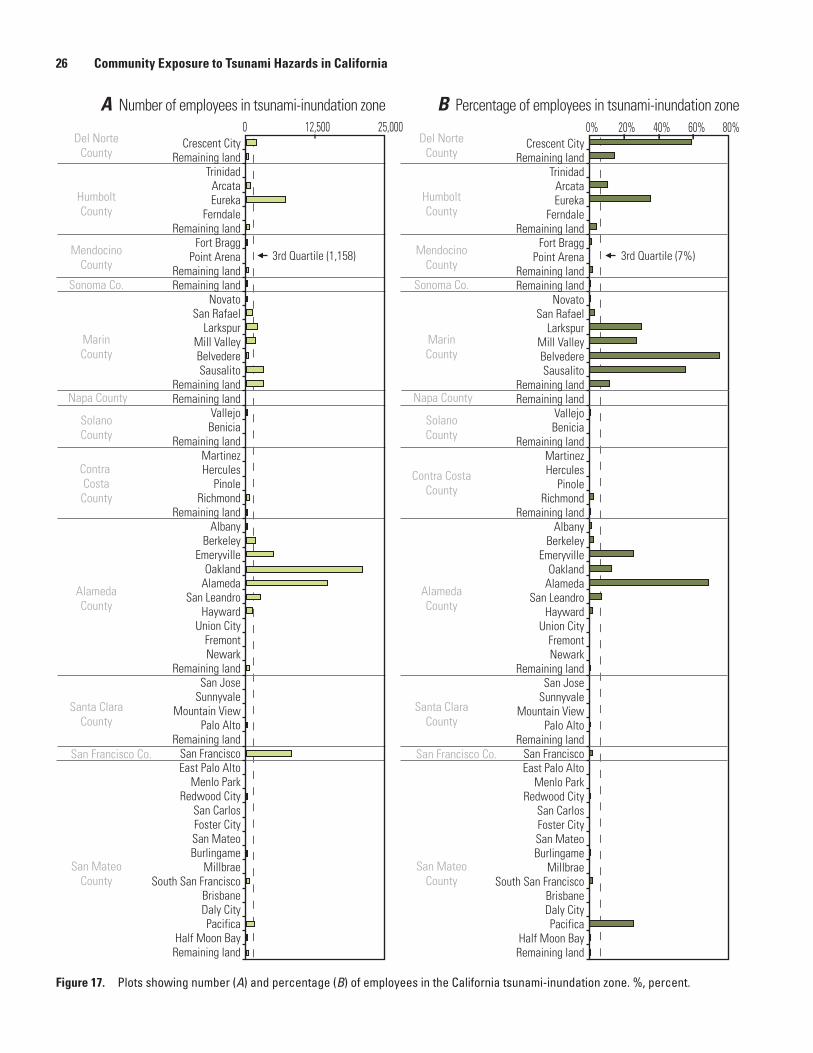
26 Community Exposure to Tsunami Hazards in California
0 12,500 25,000 0% 20% 40% 60% 80%
B Percentage of employees in tsunami-inundation zoneA Number of employees in tsunami-inundation zone
3rd Quartile (7%)
Sonoma Co.
Napa County
San Francisco Co.
San MateoCounty
Contra CostaCounty
HumboltCounty
Santa ClaraCounty
MendocinoCounty
Del NorteCounty
MarinCounty
AlamedaCounty
SolanoCounty
Sonoma Co.
Napa County
San Francisco Co.
San MateoCounty
Contra CostaCounty
HumboltCounty
Santa ClaraCounty
MendocinoCounty
Del NorteCounty
MarinCounty
AlamedaCounty
SolanoCounty
Crescent CityRemaining land
TrinidadArcataEureka
FerndaleRemaining land
Fort BraggPoint Arena
Remaining landRemaining land
NovatoSan Rafael
LarkspurMill ValleyBelvedereSausalito
Remaining landRemaining land
VallejoBenicia
Remaining landMartinezHercules
PinoleRichmond
Remaining landAlbany
BerkeleyEmeryville
OaklandAlameda
San LeandroHayward
Union CityFremontNewark
Remaining landSan Jose
SunnyvaleMountain View
Palo AltoRemaining land
San FranciscoEast Palo Alto
Menlo ParkRedwood City
San CarlosFoster CitySan MateoBurlingame
MillbraeSouth San Francisco
BrisbaneDaly CityPacifica
Half Moon BayRemaining land
3rd Quartile (1,158)
Figure 17. Plots showing number (A) and percentage (B) of employees in the California tsunami-inundation zone. %, percent.

Variations in Community Exposure 27
0 12,500 25,000 0% 20% 40% 60% 80%
B Percentage of employees in tsunami-inundation zoneA Number of employees in tsunami-inundation zone
San DiegoCounty
VenturaCounty
OrangeCounty
MontereyCounty
Santa CruzCounty
Santa BarbaraCounty
Los AngelesCounty
San Luis ObispoCounty
Santa CruzCapitola
Remaining landMarina
SeasideSand CityMonterey
Pacific GroveCarmel-by-the-Sea
Remaining landMorro Bay
Pismo BeachGrover Beach
Remaining landGoleta
Santa BarbaraCarpinteria
Remaining landSan Buenaventura (Ventura)
OxnardPort Hueneme
Remaining landMalibu
Los AngelesSanta Monica
El SegundoManhattan Beach
Hermosa BeachRedondo Beach
TorrancePalos Verdes EstatesRancho Palos Verdes
Long BeachAvalon
Remaining landSeal Beach
WestminsterHuntington Beach
Costa MesaNewport Beach
Laguna BeachDana Point
San ClementeRemaining land
OceansideCarlsbadEncinitas
Solana BeachDel Mar
San DiegoCoronado
National CityChula Vista
Imperial BeachRemaining land
3rd Quartile (7%)3rd Quartile (1,158)
Figure 17.—Continued

28 Community Exposure to Tsunami Hazards in California
if the neighborhood and other businesses around it are damaged, leading customers to shop elsewhere. Neighborhood effects have been found to be especially important for retailers that rely on foot traffic (Chang and Falit-Baiamonte, 2002), a potentially significant issue for tourism-related retail and food services within California coastal communities.
Societal vulnerability is also influenced by the types of businesses in the tsunami-inundation zone. On the basis of employee distributions, the primary business sectors in the tsunami-inundation zone are in accommodation and food services; retail trade; manufacturing; professional, technical and scientific services; and construction (fig. 18). Tourism-related businesses (for example, accommodations, food services, and retail trade) attract local customers and tourists and therefore could contain significant numbers of people with little awareness of tsunami hazards or of how to evacuate from that location. Employees also may be unaware of tsunami hazards or proper evacuation strategies, especially if they do not live in tsunami-prone areas themselves, are not well connected to the community, and are reliant on business owners for information. Nontourism businesses (for example, manufacturing and warehousing) tend to involve high numbers of employees, low numbers of tourists, heavy machinery that may obstruct evacuations, raw materials that could be scattered across an area by a tsunami (for example, timber) and possibly hazardous materials that require unique storage and response plans.
To better understand the distribution of business types in the tsunami-inundation zone at the community level, the multiple NAICS classes have been generalized into two groups based on the potential for visitors (high and low). Developing the two groups, as well as determining which group the various business
0% 10%
Percentage of employees, by sector, in tsunami-inundation zone30%
Management of companies and enterprises
Agriculture, forestry, fishing, and huntingMiningUtilities
ConstructionManufacturing
Wholesale tradeRetail trade
Transportation and warehousingInformation
Finance and insuranceReal estate and rental and leasing
Professional, scientific, and technical services
Administrative and support and waste managementEducational services
Health care and social assistanceArts, entertainment, and recreationAccommodation and food services
Other services (except public administrationion)Public administration
Unnamed
20%
Tsunami-inundation zoneCalif. coastal counties
EXPLANATION
types fall within, was a subjective process. It is meant to only help in discussing the types of businesses and population groups that frequent them across the study area and provide additional insight for the development of targeted tsunami preparedness and outreach efforts. Businesses with low visitor potential include NAICS classes for administrative support and waste management; agriculture, forestry, fishing and hunting; construction; finance and insurance; information; management of companies; manufacturing; mining; professional, scientific, and technical services; public administration; real-estate rental and leasing; transportation and warehousing utilities; and wholesale trade and other, nonclassified businesses. Businesses with high visitor potential include NAICS classes for accommodation and food services; arts, entertainment and recreation; educational services; health care and social assistance; and retail trade.
Across the entire study area, the distribution of employees in these two business groupings is approximately equal at 50 percent in each group (fig. 19). The vertical dotted line in figure 19 denotes this 50:50 distribution in employee percentages. Several communities have similar percentages as the regional trend (for example, Eureka and San Francisco). Other communities, as well as the unincorporated county lands, have different distributions of relative percentage of employees for the two business groupings. The stacked bar graphs in figure 19 reflect only the relative percentage of employees among the two business groups and not the absolute number of employees in the various groups. The lack of a stacked bar graph for a community (for example, Trinidad, Benicia, and Hercules) indicates that there are no employees, according to our regional economic data, in the tsunami-inundation zone of these communities.
Figure 18. Plot showing percentage of employees, by business sector, in the California (Calif.) tsunami-inundation zone. %, percent.
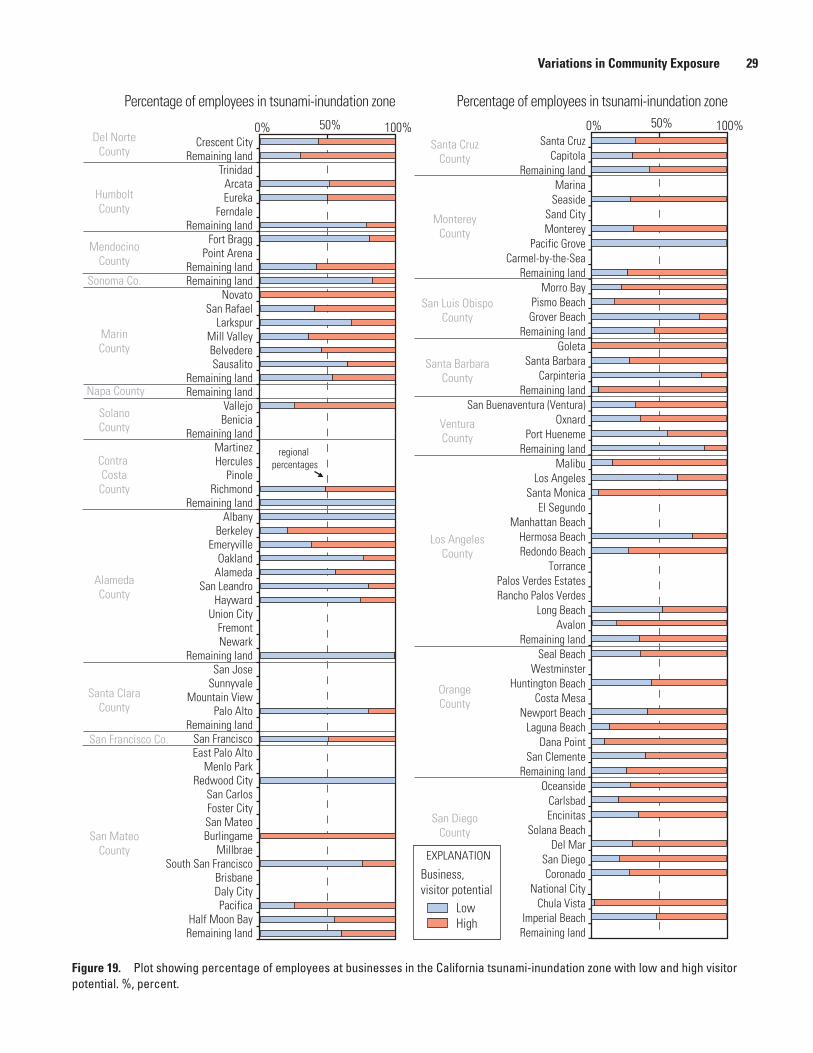
Variations in Community Exposure 29
0% 50% 100% 0% 50% 100%
Percentage of employees in tsunami-inundation zonePercentage of employees in tsunami-inundation zone
Sonoma Co.
Napa County
San Francisco Co.
San MateoCounty
Contra CostaCounty
HumboltCounty
Santa ClaraCounty
MendocinoCounty
Del NorteCounty
MarinCounty
AlamedaCounty
SolanoCounty
Crescent CityRemaining land
TrinidadArcataEureka
FerndaleRemaining land
Fort BraggPoint Arena
Remaining landRemaining land
NovatoSan Rafael
LarkspurMill ValleyBelvedereSausalito
Remaining landRemaining land
VallejoBenicia
Remaining landMartinezHercules
PinoleRichmond
Remaining landAlbany
BerkeleyEmeryville
OaklandAlameda
San LeandroHayward
Union CityFremontNewark
Remaining landSan Jose
SunnyvaleMountain View
Palo AltoRemaining land
San FranciscoEast Palo Alto
Menlo ParkRedwood City
San CarlosFoster CitySan MateoBurlingame
MillbraeSouth San Francisco
BrisbaneDaly CityPacifica
Half Moon BayRemaining land
San DiegoCounty
VenturaCounty
OrangeCounty
MontereyCounty
Santa CruzCounty
Santa BarbaraCounty
Los AngelesCounty
San Luis ObispoCounty
Santa CruzCapitola
Remaining landMarina
SeasideSand CityMonterey
Pacific GroveCarmel-by-the-Sea
Remaining landMorro Bay
Pismo BeachGrover Beach
Remaining landGoleta
Santa BarbaraCarpinteria
Remaining landSan Buenaventura (Ventura)
OxnardPort Hueneme
Remaining landMalibu
Los AngelesSanta Monica
El SegundoManhattan Beach
Hermosa BeachRedondo Beach
TorrancePalos Verdes EstatesRancho Palos Verdes
Long BeachAvalon
Remaining landSeal Beach
WestminsterHuntington Beach
Costa MesaNewport Beach
Laguna BeachDana Point
San ClementeRemaining land
OceansideCarlsbadEncinitas
Solana BeachDel Mar
San DiegoCoronado
National CityChula Vista
Imperial BeachRemaining land
regional percentages
Business, visitor potential
LowHigh
EXPLANATION
Figure 19. Plot showing percentage of employees at businesses in the California tsunami-inundation zone with low and high visitor potential. %, percent.
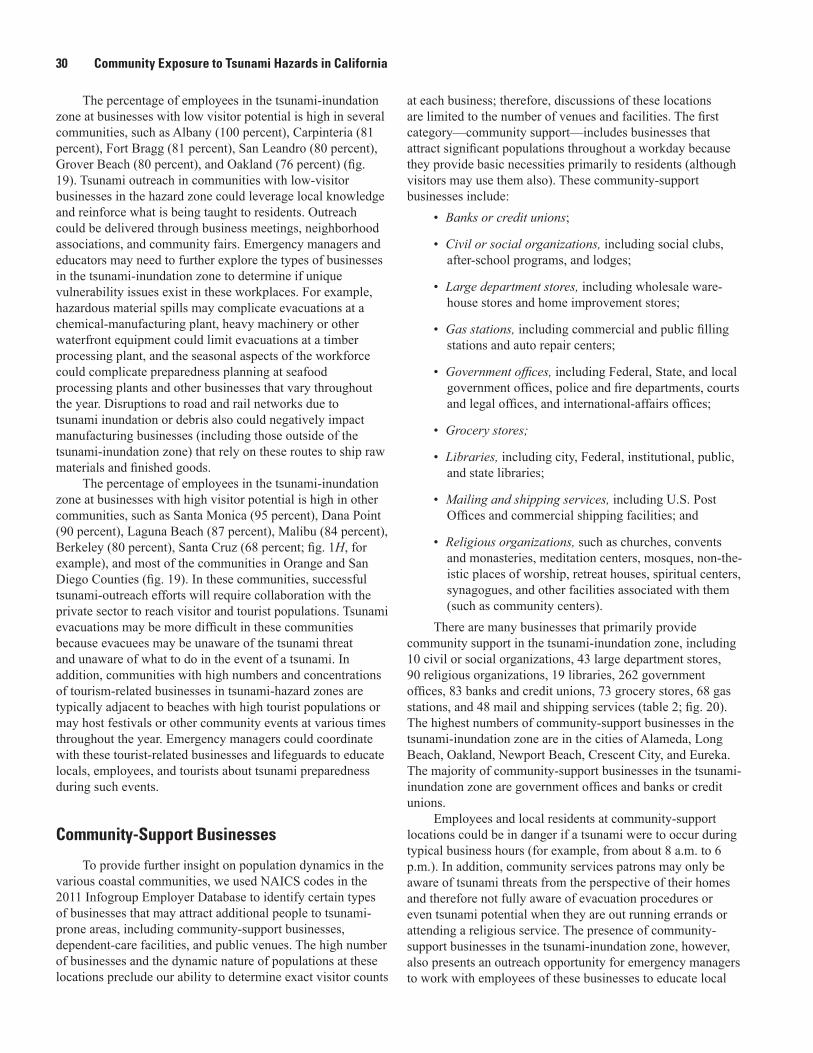
30 Community Exposure to Tsunami Hazards in California
The percentage of employees in the tsunami-inundation zone at businesses with low visitor potential is high in several communities, such as Albany (100 percent), Carpinteria (81 percent), Fort Bragg (81 percent), San Leandro (80 percent), Grover Beach (80 percent), and Oakland (76 percent) (fig. 19). Tsunami outreach in communities with low-visitor businesses in the hazard zone could leverage local knowledge and reinforce what is being taught to residents. Outreach could be delivered through business meetings, neighborhood associations, and community fairs. Emergency managers and educators may need to further explore the types of businesses in the tsunami-inundation zone to determine if unique vulnerability issues exist in these workplaces. For example, hazardous material spills may complicate evacuations at a chemical-manufacturing plant, heavy machinery or other waterfront equipment could limit evacuations at a timber processing plant, and the seasonal aspects of the workforce could complicate preparedness planning at seafood processing plants and other businesses that vary throughout the year. Disruptions to road and rail networks due to tsunami inundation or debris also could negatively impact manufacturing businesses (including those outside of the tsunami-inundation zone) that rely on these routes to ship raw materials and finished goods.
The percentage of employees in the tsunami-inundation zone at businesses with high visitor potential is high in other communities, such as Santa Monica (95 percent), Dana Point (90 percent), Laguna Beach (87 percent), Malibu (84 percent), Berkeley (80 percent), Santa Cruz (68 percent; fig. 1H, for example), and most of the communities in Orange and San Diego Counties (fig. 19). In these communities, successful tsunami-outreach efforts will require collaboration with the private sector to reach visitor and tourist populations. Tsunami evacuations may be more difficult in these communities because evacuees may be unaware of the tsunami threat and unaware of what to do in the event of a tsunami. In addition, communities with high numbers and concentrations of tourism-related businesses in tsunami-hazard zones are typically adjacent to beaches with high tourist populations or may host festivals or other community events at various times throughout the year. Emergency managers could coordinate with these tourist-related businesses and lifeguards to educate locals, employees, and tourists about tsunami preparedness during such events.
Community-Support Businesses
To provide further insight on population dynamics in the various coastal communities, we used NAICS codes in the 2011 Infogroup Employer Database to identify certain types of businesses that may attract additional people to tsunami-prone areas, including community-support businesses, dependent-care facilities, and public venues. The high number of businesses and the dynamic nature of populations at these locations preclude our ability to determine exact visitor counts
at each business; therefore, discussions of these locations are limited to the number of venues and facilities. The first category—community support—includes businesses that attract significant populations throughout a workday because they provide basic necessities primarily to residents (although visitors may use them also). These community-support businesses include:
• Banks or credit unions;
• Civil or social organizations, including social clubs, after-school programs, and lodges;
• Large department stores, including wholesale ware-house stores and home improvement stores;
• Gas stations, including commercial and public filling stations and auto repair centers;
• Government offices, including Federal, State, and local government offices, police and fire departments, courts and legal offices, and international-affairs offices;
• Grocery stores;
• Libraries, including city, Federal, institutional, public, and state libraries;
• Mailing and shipping services, including U.S. Post Offices and commercial shipping facilities; and
• Religious organizations, such as churches, convents and monasteries, meditation centers, mosques, non-the-istic places of worship, retreat houses, spiritual centers, synagogues, and other facilities associated with them (such as community centers).
There are many businesses that primarily provide community support in the tsunami-inundation zone, including 10 civil or social organizations, 43 large department stores, 90 religious organizations, 19 libraries, 262 government offices, 83 banks and credit unions, 73 grocery stores, 68 gas stations, and 48 mail and shipping services (table 2; fig. 20). The highest numbers of community-support businesses in the tsunami-inundation zone are in the cities of Alameda, Long Beach, Oakland, Newport Beach, Crescent City, and Eureka. The majority of community-support businesses in the tsunami-inundation zone are government offices and banks or credit unions.
Employees and local residents at community-support locations could be in danger if a tsunami were to occur during typical business hours (for example, from about 8 a.m. to 6 p.m.). In addition, community services patrons may only be aware of tsunami threats from the perspective of their homes and therefore not fully aware of evacuation procedures or even tsunami potential when they are out running errands or attending a religious service. The presence of community-support businesses in the tsunami-inundation zone, however, also presents an outreach opportunity for emergency managers to work with employees of these businesses to educate local
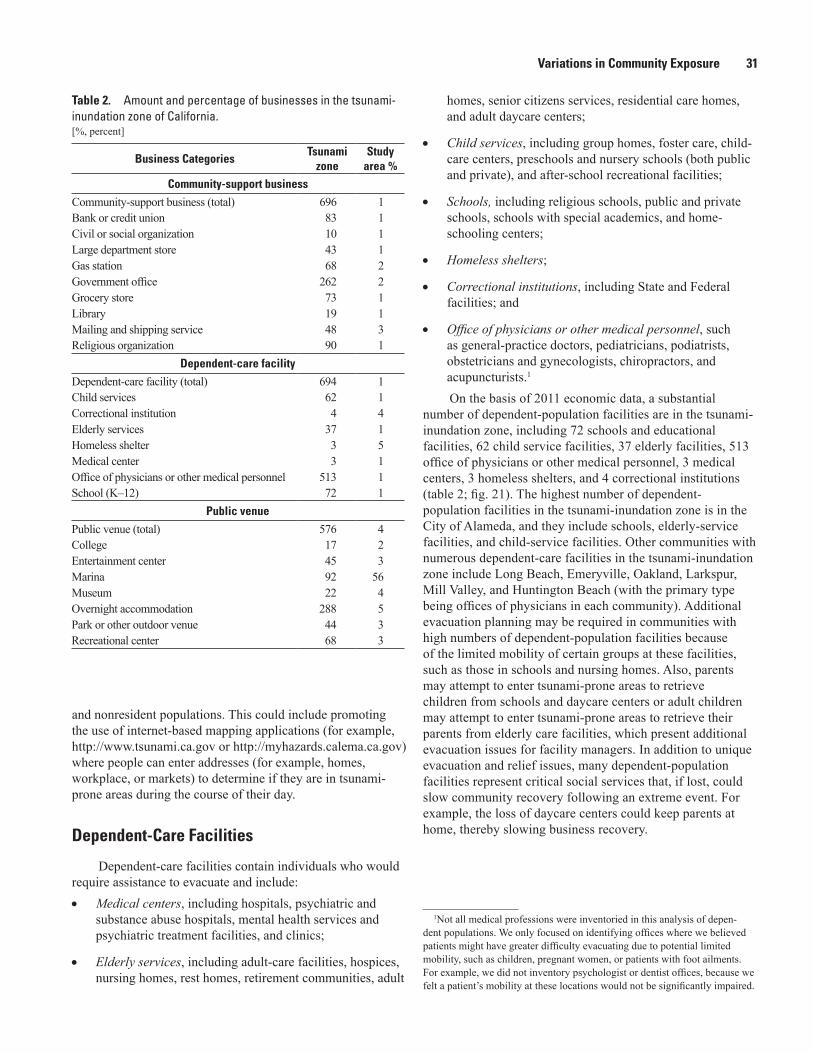
Variations in Community Exposure 31
Table 2. Amount and percentage of businesses in the tsunami-inundation zone of California.[%, percent]
Business CategoriesTsunami
zoneStudy
area %Community-support business
Community-support business (total) 696 1Bank or credit union 83 1Civil or social organization 10 1Large department store 43 1Gas station 68 2Government office 262 2Grocery store 73 1Library 19 1Mailing and shipping service 48 3Religious organization 90 1
Dependent-care facilityDependent-care facility (total) 694 1Child services 62 1Correctional institution 4 4Elderly services 37 1Homeless shelter 3 5Medical center 3 1Office of physicians or other medical personnel 513 1School (K–12) 72 1
Public venuePublic venue (total) 576 4College 17 2Entertainment center 45 3Marina 92 56Museum 22 4Overnight accommodation 288 5Park or other outdoor venue 44 3Recreational center 68 3
and nonresident populations. This could include promoting the use of internet-based mapping applications (for example, http://www.tsunami.ca.gov or http://myhazards.calema.ca.gov) where people can enter addresses (for example, homes, workplace, or markets) to determine if they are in tsunami-prone areas during the course of their day.
Dependent-Care Facilities
Dependent-care facilities contain individuals who would require assistance to evacuate and include:• Medical centers, including hospitals, psychiatric and
substance abuse hospitals, mental health services and psychiatric treatment facilities, and clinics;
• Elderly services, including adult-care facilities, hospices, nursing homes, rest homes, retirement communities, adult
homes, senior citizens services, residential care homes, and adult daycare centers;
• Child services, including group homes, foster care, child-care centers, preschools and nursery schools (both public and private), and after-school recreational facilities;
• Schools, including religious schools, public and private schools, schools with special academics, and home-schooling centers;
• Homeless shelters;
• Correctional institutions, including State and Federal facilities; and
• Office of physicians or other medical personnel, such as general-practice doctors, pediatricians, podiatrists, obstetricians and gynecologists, chiropractors, and acupuncturists.1
On the basis of 2011 economic data, a substantial number of dependent-population facilities are in the tsunami-inundation zone, including 72 schools and educational facilities, 62 child service facilities, 37 elderly facilities, 513 office of physicians or other medical personnel, 3 medical centers, 3 homeless shelters, and 4 correctional institutions (table 2; fig. 21). The highest number of dependent-population facilities in the tsunami-inundation zone is in the City of Alameda, and they include schools, elderly-service facilities, and child-service facilities. Other communities with numerous dependent-care facilities in the tsunami-inundation zone include Long Beach, Emeryville, Oakland, Larkspur, Mill Valley, and Huntington Beach (with the primary type being offices of physicians in each community). Additional evacuation planning may be required in communities with high numbers of dependent-population facilities because of the limited mobility of certain groups at these facilities, such as those in schools and nursing homes. Also, parents may attempt to enter tsunami-prone areas to retrieve children from schools and daycare centers or adult children may attempt to enter tsunami-prone areas to retrieve their parents from elderly care facilities, which present additional evacuation issues for facility managers. In addition to unique evacuation and relief issues, many dependent-population facilities represent critical social services that, if lost, could slow community recovery following an extreme event. For example, the loss of daycare centers could keep parents at home, thereby slowing business recovery.
1Not all medical professions were inventoried in this analysis of depen-dent populations. We only focused on identifying offices where we believed patients might have greater difficulty evacuating due to potential limited mobility, such as children, pregnant women, or patients with foot ailments. For example, we did not inventory psychologist or dentist offices, because we felt a patient’s mobility at these locations would not be significantly impaired.
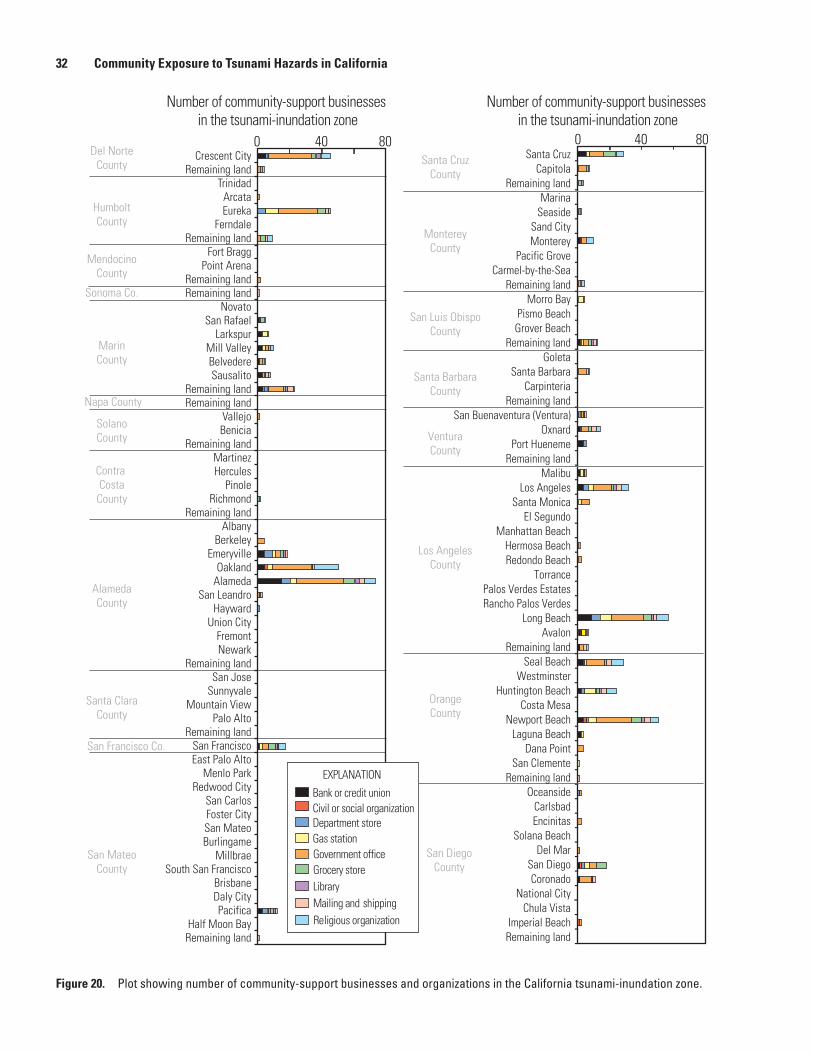
32 Community Exposure to Tsunami Hazards in California
Number of community-support businesses in the tsunami-inundation zone
0 40 80
Number of community-support businesses in the tsunami-inundation zone
Sonoma Co.
Napa County
San Francisco Co.
San MateoCounty
Contra CostaCounty
HumboltCounty
Santa ClaraCounty
MendocinoCounty
Del NorteCounty
MarinCounty
AlamedaCounty
SolanoCounty
Crescent CityRemaining land
TrinidadArcataEureka
FerndaleRemaining land
Fort BraggPoint Arena
Remaining landRemaining land
NovatoSan Rafael
LarkspurMill ValleyBelvedereSausalito
Remaining landRemaining land
VallejoBenicia
Remaining landMartinezHercules
PinoleRichmond
Remaining landAlbany
BerkeleyEmeryville
OaklandAlameda
San LeandroHayward
Union CityFremontNewark
Remaining landSan Jose
SunnyvaleMountain View
Palo AltoRemaining land
San FranciscoEast Palo Alto
Menlo ParkRedwood City
San CarlosFoster CitySan MateoBurlingame
MillbraeSouth San Francisco
BrisbaneDaly CityPacifica
Half Moon BayRemaining land
San DiegoCounty
VenturaCounty
OrangeCounty
MontereyCounty
Santa CruzCounty
Santa BarbaraCounty
Los AngelesCounty
San Luis ObispoCounty
Santa CruzCapitola
Remaining landMarina
SeasideSand CityMonterey
Pacific GroveCarmel-by-the-Sea
Remaining landMorro Bay
Pismo BeachGrover Beach
Remaining landGoleta
Santa BarbaraCarpinteria
Remaining landSan Buenaventura (Ventura)
OxnardPort Hueneme
Remaining landMalibu
Los AngelesSanta Monica
El SegundoManhattan Beach
Hermosa BeachRedondo Beach
TorrancePalos Verdes EstatesRancho Palos Verdes
Long BeachAvalon
Remaining landSeal Beach
WestminsterHuntington Beach
Costa MesaNewport Beach
Laguna BeachDana Point
San ClementeRemaining land
OceansideCarlsbadEncinitas
Solana BeachDel Mar
San DiegoCoronado
National CityChula Vista
Imperial BeachRemaining land
0 40 80
LibraryGrocery storeGovernment officeGas stationDepartment storeCivil or social organizationBank or credit union
Mailing and shippingReligious organization
EXPLANATION
Figure 20. Plot showing number of community-support businesses and organizations in the California tsunami-inundation zone.

Variations in Community Exposure 33
Number of dependent-care facilities in tsunami-inundation zone Number of dependent-care facilities in tsunami-inundation zone
0 50 100 150
SchoolOffice of physiciansMedical centerHomeless shelterElderly serviceCorrectional institutionChild service
0 50 100 150
Sonoma Co.
Napa County
San Francisco Co.
San MateoCounty
Contra CostaCounty
HumboltCounty
Santa ClaraCounty
MendocinoCounty
Del NorteCounty
MarinCounty
AlamedaCounty
SolanoCounty
Crescent CityRemaining land
TrinidadArcataEureka
FerndaleRemaining land
Fort BraggPoint Arena
Remaining landRemaining land
NovatoSan Rafael
LarkspurMill ValleyBelvedereSausalito
Remaining landRemaining land
VallejoBenicia
Remaining landMartinezHercules
PinoleRichmond
Remaining landAlbany
BerkeleyEmeryville
OaklandAlameda
San LeandroHayward
Union CityFremontNewark
Remaining landSan Jose
SunnyvaleMountain View
Palo AltoRemaining land
San FranciscoEast Palo Alto
Menlo ParkRedwood City
San CarlosFoster CitySan MateoBurlingame
MillbraeSouth San Francisco
BrisbaneDaly CityPacifica
Half Moon BayRemaining land
San DiegoCounty
VenturaCounty
OrangeCounty
MontereyCounty
Santa CruzCounty
Santa BarbaraCounty
Los AngelesCounty
San Luis ObispoCounty
Santa CruzCapitola
Remaining landMarina
SeasideSand CityMonterey
Pacific GroveCarmel-by-the-Sea
Remaining landMorro Bay
Pismo BeachGrover Beach
Remaining landGoleta
Santa BarbaraCarpinteria
Remaining landSan Buenaventura (Ventura)
OxnardPort Hueneme
Remaining landMalibu
Los AngelesSanta Monica
El SegundoManhattan Beach
Hermosa BeachRedondo Beach
TorrancePalos Verdes EstatesRancho Palos Verdes
Long BeachAvalon
Remaining landSeal Beach
WestminsterHuntington Beach
Costa MesaNewport Beach
Laguna BeachDana Point
San ClementeRemaining land
OceansideCarlsbadEncinitas
Solana BeachDel Mar
San DiegoCoronado
National CityChula Vista
Imperial BeachRemaining land
EXPLANATION
Figure 21. Plot showing number of dependent-population facilities in the California tsunami-inundation zone.
34 Community Exposure to Tsunami Hazards in California
Public Venues
Tourists are another significant population in coastal communities and can often outnumber residents and employees in tsunami-prone areas (Wood and Good, 2004). No consistent census count for tourists exists; therefore, the locations of public venues are used as an indicator of tourist populations, while acknowledging that local residents are also present at public venues. Businesses that likely attract both residents and nonresidents are considered public venues and are identified using NAICS codes in the 2011 Infogroup Employer Database. Public venues include:• Entertainment centers, including aquariums, botanical
gardens, casinos, theaters (including live and cinematic), and amusement parks (fig. 1H, for example);
• Colleges, including community colleges, private universi-ties, and public universities (fig. 14B, for example);
• Marinas, including recreational and fishing, vessel repair and storage, and yacht clubs (fig. 1C, for example);
• Museums, including art, history, and technology muse-ums;
• Overnight accommodations, including hotels, inns, resorts, hostels, cabin rentals, bed and breakfasts, and student housing;
• Park or other outdoor venues, including parks (fig. 1G, for example), amphitheaters, race tracks, sports stadiums, zoos, and fairgrounds; and
• Recreational centers, including sports parks, gyms, golf courses, and family fun centers.Many public venues are in the tsunami-inundation zone,
including 288 overnight-tourist accommodations, 44 parks or other outdoor venues, 22 museums, 17 colleges, 92 marinas, 68 recreational centers, and 45 entertainment centers (table 2; fig. 22). The highest numbers of public venues in the tsunami-inundation zone are in the cities of San Diego, Los Angeles, Oakland, Eureka, and Santa Cruz. The majority of public venues in the tsunami-inundation zone are overnight accommodations. Large numbers of visitors could be in danger if a tsunami were to occur during a high-occupancy time (for example, holidays or weekends). Visitors may not be fully aware of evacuation procedures or even the potential for tsunamis if they are coming from areas with no history of tsunamis. In addition, public servants, such as emergency managers, might not be working on weekends and holidays, further complicating emergency-response activities at these times. The presence of public venues in the tsunami-inundation zone, however, also presents an outreach opportunity for emergency managers to work with owners and employees of these public venues to educate local and tourist populations.
The number of public venues and facilities in tsunami-prone areas of each community provides some insight about dynamic populations but does not capture the range in magnitudes of populations at these sites. Therefore, these counts should serve
as starting points for discussion and further studies about high-occupancy public venues. Examples of high-occupancy public venues in the tsunami-inundation zone include: • Monterey Bay Aquarium, where daily visitor attendance
can exceed 4,931 people (Jeffries, 2011);
• Santa Cruz Beach Boardwalk which attracts approxi-mately three million visitors each year (fig. 1H) (Season Pass/Group Sales Office, oral commun., January 30, 2012);
• Public piers with high-volume tourist populations in Santa Monica, Redondo Beach, Santa Barbara, and Pismo Beach;
• The Catalina Casino in Avalon, which includes a 1,184-seat theater and a ballroom with a capacity of 1,400 people (Visit Catalina Island, 2012; fig. 23);
• Waterfronts that serve as ports of call for cruises, such as the City of Avalon on Catalina Island that receives tourists from five international cruise lines, including as many as 2,000 passengers on a weekly basis from one ship (Cata-lina Island Chamber of Commerce and Visitors Bureau, 2012; fig. 23); and
• Terminals for cruise ships, including the World Cruise Center at the Port of Los Angeles that serves 12 different cruise lines (Pacific Cruise Ship Terminals, 2012) and the Long Beach Cruise Terminal that primarily serves Carnival cruises, that together see more than 300 cruise departures every year (Cruisetimetables.com, 2012).
Park and Beach Visitors
In addition to public venues, residents and tourists are drawn to tsunami-prone areas by the multiple recreational opportunities along the 1,200-mile California coastline (Visit California, 2012). Substantial numbers of visitors are attracted to city, county, State, and national beaches and coastal parks, especially in summer months (fig. 24A, for example). The coast is also a gateway to boating activities, such as sailing in San Francisco Bay (fig. 24B) or anchoring in Avalon Bay (fig. 23). Estimating the magnitude of population exposure to tsunamis for these groups is difficult given their dynamic nature. The boating community is especially difficult given the large range in their locations throughout the day and the uncertainty in their points of entry to and departure from waterways. For example, sailboats in San Francisco Bay could have originated from nearby marinas in the bay or from marinas elsewhere, such as Half Moon Bay or other points on the U.S. West Coast. Because the California maritime community is vulnerable to even minor tsunamis, the State tsunami program has an active boater-preparedness program (California Geological Survey, 2012). Gauging the extent of maritime activity in coastal California waters is beyond the scope of this assessment, and subsequent discussion is limited to visitors to beaches and parks.
Analysis of visitor data from State of California parks (California State Parks, 2010) and national parks (National
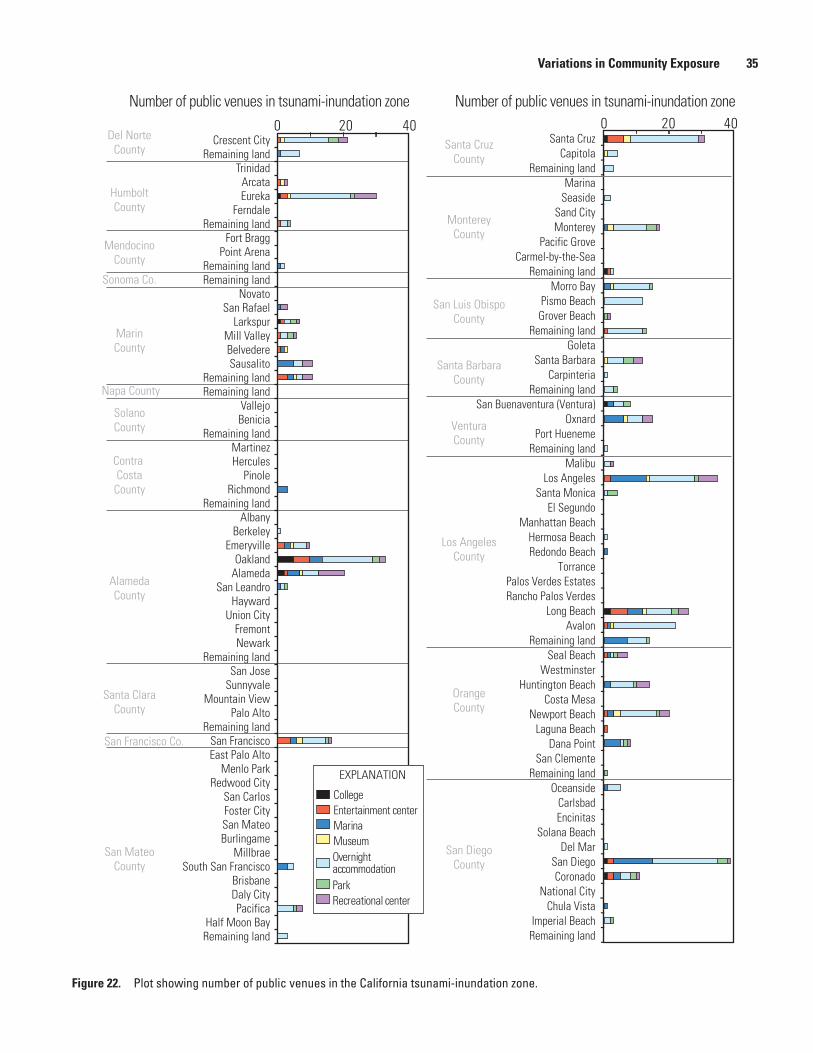
Variations in Community Exposure 35
Number of public venues in tsunami-inundation zone0 20 40
Number of public venues in tsunami-inundation zone
Sonoma Co.
Napa County
San Francisco Co.
San MateoCounty
Contra Costa
County
HumboltCounty
Santa ClaraCounty
MendocinoCounty
Del NorteCounty
MarinCounty
AlamedaCounty
SolanoCounty
Crescent CityRemaining land
TrinidadArcataEureka
FerndaleRemaining land
Fort BraggPoint Arena
Remaining landRemaining land
NovatoSan Rafael
LarkspurMill ValleyBelvedereSausalito
Remaining landRemaining land
VallejoBenicia
Remaining landMartinezHercules
PinoleRichmond
Remaining landAlbany
BerkeleyEmeryville
OaklandAlameda
San LeandroHayward
Union CityFremontNewark
Remaining landSan Jose
SunnyvaleMountain View
Palo AltoRemaining land
San FranciscoEast Palo Alto
Menlo ParkRedwood City
San CarlosFoster CitySan MateoBurlingame
MillbraeSouth San Francisco
BrisbaneDaly CityPacifica
Half Moon BayRemaining land
San DiegoCounty
VenturaCounty
OrangeCounty
MontereyCounty
Santa CruzCounty
Santa BarbaraCounty
Los AngelesCounty
San Luis ObispoCounty
Santa CruzCapitola
Remaining landMarina
SeasideSand CityMonterey
Pacific GroveCarmel-by-the-Sea
Remaining landMorro Bay
Pismo BeachGrover Beach
Remaining landGoleta
Santa BarbaraCarpinteria
Remaining landSan Buenaventura (Ventura)
OxnardPort Hueneme
Remaining landMalibu
Los AngelesSanta Monica
El SegundoManhattan Beach
Hermosa BeachRedondo Beach
TorrancePalos Verdes EstatesRancho Palos Verdes
Long BeachAvalon
Remaining landSeal Beach
WestminsterHuntington Beach
Costa MesaNewport Beach
Laguna BeachDana Point
San ClementeRemaining land
OceansideCarlsbadEncinitas
Solana BeachDel Mar
San DiegoCoronado
National CityChula Vista
Imperial BeachRemaining land
0 20 40
CollegeEntertainment centerMarinaMuseumOvernight accommodationParkRecreational center
EXPLANATION
Figure 22. Plot showing number of public venues in the California tsunami-inundation zone.
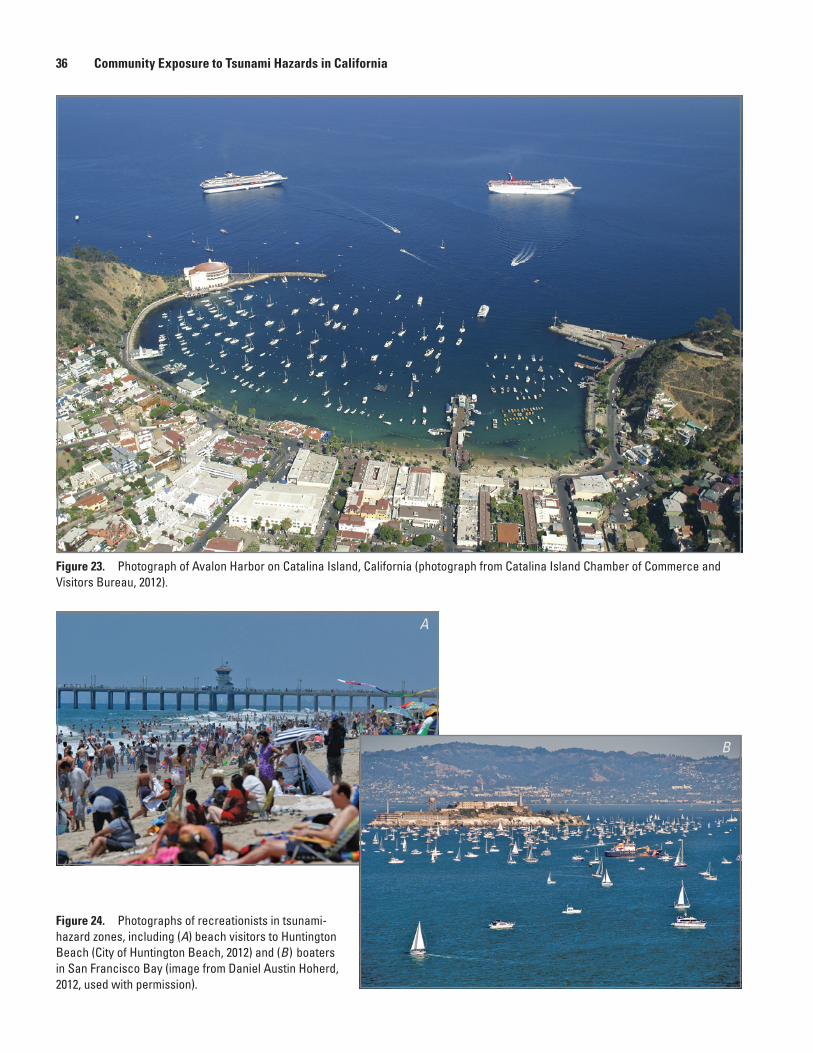
36 Community Exposure to Tsunami Hazards in California
Figure 23. Photograph of Avalon Harbor on Catalina Island, California (photograph from Catalina Island Chamber of Commerce and Visitors Bureau, 2012).
Figure 24. Photographs of recreationists in tsunami-hazard zones, including (A) beach visitors to Huntington Beach (City of Huntington Beach, 2012) and (B) boaters in San Francisco Bay (image from Daniel Austin Hoherd, 2012, used with permission).
A
B
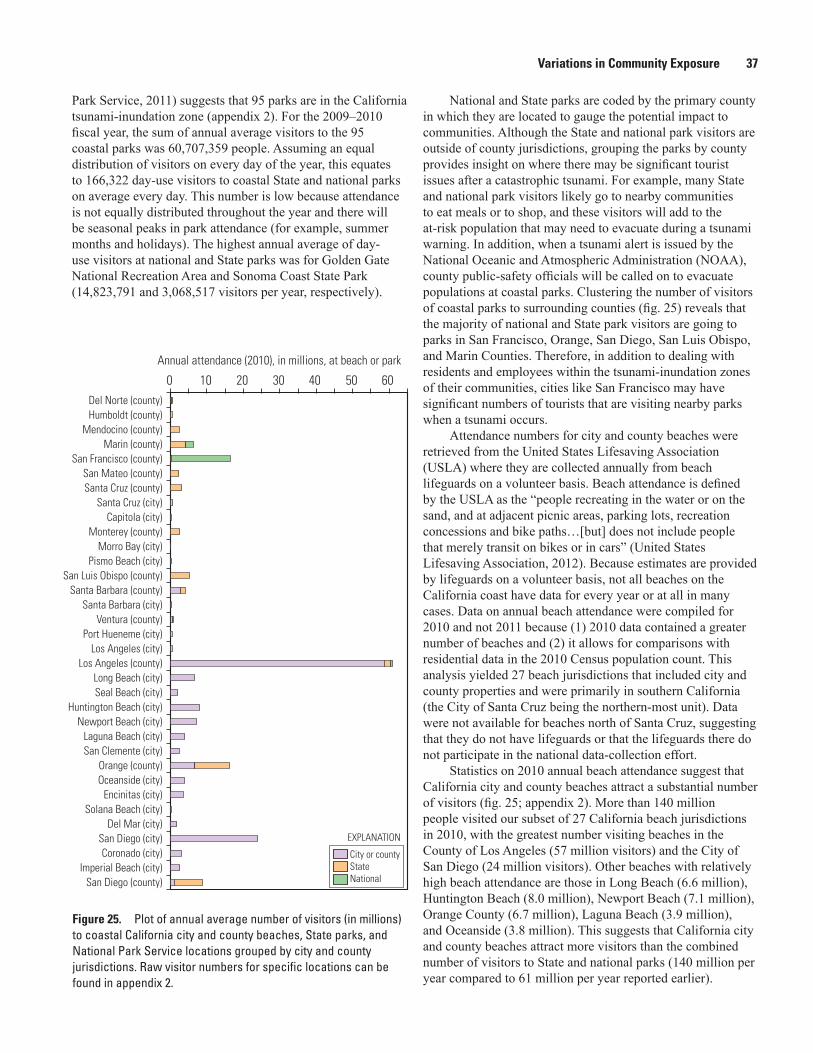
Variations in Community Exposure 37
Park Service, 2011) suggests that 95 parks are in the California tsunami-inundation zone (appendix 2). For the 2009–2010 fiscal year, the sum of annual average visitors to the 95 coastal parks was 60,707,359 people. Assuming an equal distribution of visitors on every day of the year, this equates to 166,322 day-use visitors to coastal State and national parks on average every day. This number is low because attendance is not equally distributed throughout the year and there will be seasonal peaks in park attendance (for example, summer months and holidays). The highest annual average of day-use visitors at national and State parks was for Golden Gate National Recreation Area and Sonoma Coast State Park (14,823,791 and 3,068,517 visitors per year, respectively).
0 10 50Del Norte (county)Humboldt (county)
Mendocino (county)Marin (county)
San Francisco (county)San Mateo (county)Santa Cruz (county)
Santa Cruz (city)Capitola (city)
Monterey (county)Morro Bay (city)
Pismo Beach (city)San Luis Obispo (county)
Santa Barbara (county)Santa Barbara (city)
Ventura (county)Port Hueneme (city)
Los Angeles (city)Los Angeles (county)
Long Beach (city)Seal Beach (city)
Huntington Beach (city)Newport Beach (city)
Laguna Beach (city)San Clemente (city)
Orange (county)Oceanside (city)
Encinitas (city)Solana Beach (city)
Del Mar (city)San Diego (city)Coronado (city)
Imperial Beach (city)San Diego (county)
Annual attendance (2010), in millions, at beach or park
20 30 40 60
City or countyStateNational
EXPLANATION
Figure 25. Plot of annual average number of visitors (in millions) to coastal California city and county beaches, State parks, and National Park Service locations grouped by city and county jurisdictions. Raw visitor numbers for specific locations can be found in appendix 2.
National and State parks are coded by the primary county in which they are located to gauge the potential impact to communities. Although the State and national park visitors are outside of county jurisdictions, grouping the parks by county provides insight on where there may be significant tourist issues after a catastrophic tsunami. For example, many State and national park visitors likely go to nearby communities to eat meals or to shop, and these visitors will add to the at-risk population that may need to evacuate during a tsunami warning. In addition, when a tsunami alert is issued by the National Oceanic and Atmospheric Administration (NOAA), county public-safety officials will be called on to evacuate populations at coastal parks. Clustering the number of visitors of coastal parks to surrounding counties (fig. 25) reveals that the majority of national and State park visitors are going to parks in San Francisco, Orange, San Diego, San Luis Obispo, and Marin Counties. Therefore, in addition to dealing with residents and employees within the tsunami-inundation zones of their communities, cities like San Francisco may have significant numbers of tourists that are visiting nearby parks when a tsunami occurs.
Attendance numbers for city and county beaches were retrieved from the United States Lifesaving Association (USLA) where they are collected annually from beach lifeguards on a volunteer basis. Beach attendance is defined by the USLA as the “people recreating in the water or on the sand, and at adjacent picnic areas, parking lots, recreation concessions and bike paths…[but] does not include people that merely transit on bikes or in cars” (United States Lifesaving Association, 2012). Because estimates are provided by lifeguards on a volunteer basis, not all beaches on the California coast have data for every year or at all in many cases. Data on annual beach attendance were compiled for 2010 and not 2011 because (1) 2010 data contained a greater number of beaches and (2) it allows for comparisons with residential data in the 2010 Census population count. This analysis yielded 27 beach jurisdictions that included city and county properties and were primarily in southern California (the City of Santa Cruz being the northern-most unit). Data were not available for beaches north of Santa Cruz, suggesting that they do not have lifeguards or that the lifeguards there do not participate in the national data-collection effort.
Statistics on 2010 annual beach attendance suggest that California city and county beaches attract a substantial number of visitors (fig. 25; appendix 2). More than 140 million people visited our subset of 27 California beach jurisdictions in 2010, with the greatest number visiting beaches in the County of Los Angeles (57 million visitors) and the City of San Diego (24 million visitors). Other beaches with relatively high beach attendance are those in Long Beach (6.6 million), Huntington Beach (8.0 million), Newport Beach (7.1 million), Orange County (6.7 million), Laguna Beach (3.9 million), and Oceanside (3.8 million). This suggests that California city and county beaches attract more visitors than the combined number of visitors to State and national parks (140 million per year compared to 61 million per year reported earlier).

38 Community Exposure to Tsunami Hazards in California
Assuming an equal distribution of visitors on every day of the year, an annual attendance of 140,452,280 visitors translates to 384,801 day-use visitors to city and county beaches in southern California on average every day. This annual average is greater than the total number of residents in the tsunami-inundation zone for the entire State (267,347 residents). Actual daily attendance at city and county beaches is even greater because beach attendance is not uniform throughout the year or among the various beaches. In a study of annual beach attendance of 75 southern California beaches in 2007, Dwight and others (2007) conclude that 53 percent of all visits occurred in summer months and that 48 percent of all visits throughout the year occurred on weekends (27 percent on Saturdays and 21 percent on Sundays). Therefore, after accounting for this variability in beach attendance and using these percentages, the number of people on city and county beaches in southern California is estimated to range from 92,699 visitors on a Tuesday in February to 1,660,989 visitors on a Saturday in July2.
Peak attendance on holiday weekends can be even higher than the daily beach estimates. For example, beach attendance on Sunday, July 4, 2010, was 584,750 people for City of San Diego beaches (City of San Diego Lifeguard Services, oral commun., June 21, 2012) and 1,165,550 people for Los Angeles County beaches (Los Angeles County Fire Department, Lifeguard Division, oral commun., June 21, 2012). Using annual attendance values from USLA (2012) and percentages described earlier in Dwight and others (2007), daily attendance in 2010 would be estimated to be 275,587 people on San Diego beaches and 656,167 people on Los Angeles County beaches, which is approximately 47 percent and 56 percent, respectively, of the actual attendance estimated by lifeguards on that day. Therefore, peak beach attendance on high-volume holidays like July 4th weekend could be higher than the 1.7 million estimated earlier for city and county beaches. If we assume the actual peak daily attendance on other beaches was also 1.8 times higher than estimated attendance (as was the case with Los Angeles County beaches for July 4th weekend in 2010), then an estimate of 2.9 million people on southern California beaches on a day during a summer holiday is plausible.
Regardless if daily beach attendance is 2 or 3 million people on peak holidays, both values are substantially greater than the total number of residents in the tsunami-inundation zone. Beach visitors may be residents and double counting is sure to exist. However, even with the potential for some double counting, data suggest beach visitors substantially exceed residential populations in the tsunami-inundation zone, particularly during summer months.
2This is based on the 2010 annual beach attendance total of 140,452,280 visitors for the 27 beaches in our analysis. The low estimate is based on 3.3 percent of visitors attending in February, 8 percent are on Tuesdays, and there being 4 Tuesdays in February in 2010. The upper estimate is based on 21.9 percent of visitors attending in July, 27 percent of these visitors are associated with Saturdays, and there being five Saturdays in July of 2010.
Composite Indices of Community Exposure
We developed two composite indices to compare community exposure from tsunamis for the 114 geographic units (94 incorporated cities, and the remaining land in the 20 counties). An amount index was derived for each geographic unit from the amount of developed land and the number of residents, employees, public venues, dependent-population facilities, community-support businesses, and beach and park visitors. A percentage index was derived for each geographic unit from the percentage of the same categories relative to the total amount of each within a community, except for the percentage of total beach visitors within a community, which was excluded because it was not applicable. Therefore, the amount index includes seven variables and the percentage index includes six variables.
Each composite index was created by normalizing values to the maximum value found within a category. Normalizing data to maximum values creates a common data range of zero to one for all categories and is a simple approach for comparing disparate datasets. The normalized values in each community were added, resulting in scores from zero to seven for the amount index and from zero to six for the percentage index (fig. 26). The two unitless indices allow us to compare the relative exposure levels for the 114 geographic units at regional or State levels. Because they are relative metrics, the numbers do not provide much meaning for individual communities. Understanding tsunami exposure within an individual community is better served by looking at the actual data for a jurisdiction.
Figure 26 illustrates the two composite indices for the 114 areas, where higher values indicate higher amounts or percentages. The bar graph representing the amount of assets is reversed on the vertical axis in figure 26 to facilitate easier comparisons of the two values in individual communities. Values for both indices increase as the bar extends away from the central line. For example, the City of Alameda has the highest composite amount value (4.95), indicating that this community consistently has one of the highest number of populations in the tsunami-inundation zone. The community of Belvedere has the highest composite percentage value (5.19), indicating it has the highest percentage of populations in the tsunami-inundation zone for each of the six categories. Only the City of Alameda has high composite values for both the amount and percentage of populations in tsunami-prone areas. Other communities with fairly equal (but much lower than Alameda) amount and percentage values include Eureka, Santa Cruz, Oxnard, and Newport Beach. The remaining communities either have high amount but low percentage values (for example, Oakland, Los Angeles, Long Beach, Huntington Beach, San Francisco, and San Diego) or low amount but high percentage values (for example, Crescent City, Belvedere, Sausalito, Emeryville, Seal Beach, and Coronado).
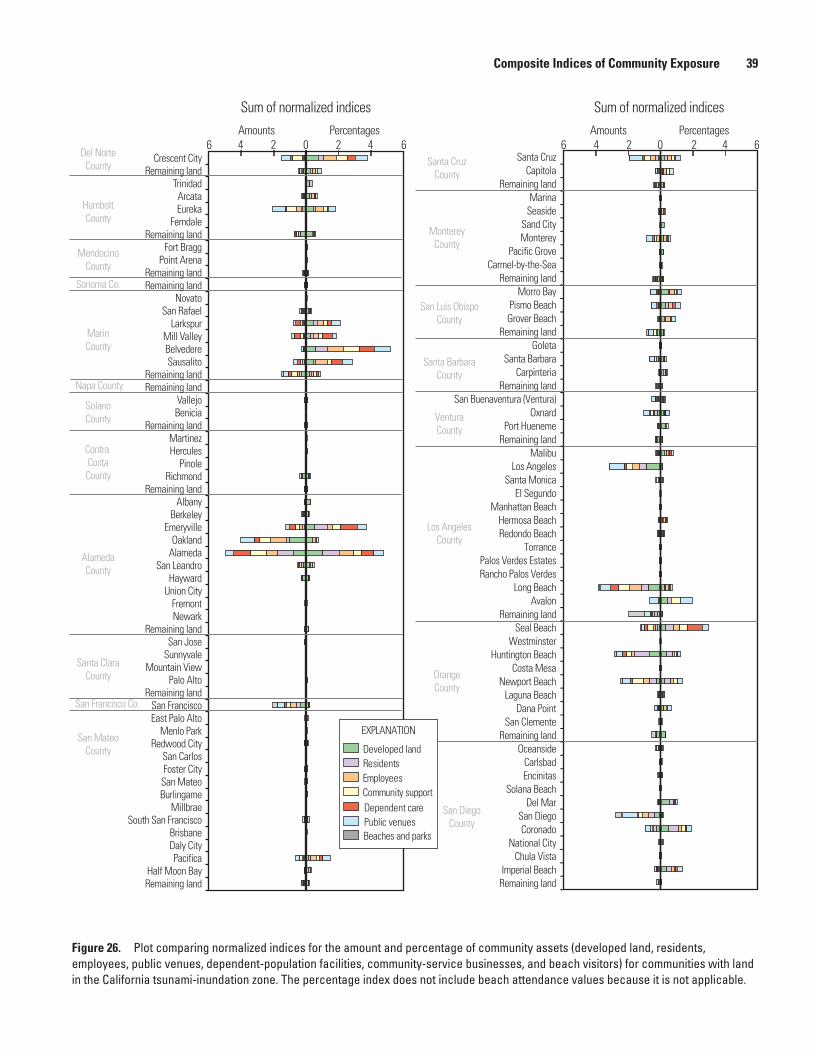
Composite Indices of Community Exposure 39
Figure 26. Plot comparing normalized indices for the amount and percentage of community assets (developed land, residents, employees, public venues, dependent-population facilities, community-service businesses, and beach visitors) for communities with land in the California tsunami-inundation zone. The percentage index does not include beach attendance values because it is not applicable.
Sum of normalized indices Sum of normalized indicesAmounts Percentages
0 2 4 6246Amounts Percentages
0 2 4 6246
Sonoma Co.
Napa County
San Francisco Co.
San MateoCounty
Contra CostaCounty
HumboltCounty
Santa ClaraCounty
MendocinoCounty
Del NorteCounty
MarinCounty
AlamedaCounty
SolanoCounty
Crescent CityRemaining land
TrinidadArcataEureka
FerndaleRemaining land
Fort BraggPoint Arena
Remaining landRemaining land
NovatoSan Rafael
LarkspurMill ValleyBelvedereSausalito
Remaining landRemaining land
VallejoBenicia
Remaining landMartinezHercules
PinoleRichmond
Remaining landAlbany
BerkeleyEmeryville
OaklandAlameda
San LeandroHayward
Union CityFremontNewark
Remaining landSan Jose
SunnyvaleMountain View
Palo AltoRemaining land
San FranciscoEast Palo Alto
Menlo ParkRedwood City
San CarlosFoster CitySan MateoBurlingame
MillbraeSouth San Francisco
BrisbaneDaly CityPacifica
Half Moon BayRemaining land
San DiegoCounty
VenturaCounty
OrangeCounty
MontereyCounty
Santa CruzCounty
Santa BarbaraCounty
Los AngelesCounty
San Luis ObispoCounty
Santa CruzCapitola
Remaining landMarina
SeasideSand CityMonterey
Pacific GroveCarmel-by-the-Sea
Remaining landMorro Bay
Pismo BeachGrover Beach
Remaining landGoleta
Santa BarbaraCarpinteria
Remaining landSan Buenaventura (Ventura)
OxnardPort Hueneme
Remaining landMalibu
Los AngelesSanta Monica
El SegundoManhattan Beach
Hermosa BeachRedondo Beach
TorrancePalos Verdes EstatesRancho Palos Verdes
Long BeachAvalon
Remaining landSeal Beach
WestminsterHuntington Beach
Costa MesaNewport Beach
Laguna BeachDana Point
San ClementeRemaining land
OceansideCarlsbadEncinitas
Solana BeachDel Mar
San DiegoCoronado
National CityChula Vista
Imperial BeachRemaining land
Developed landResidentsEmployeesCommunity supportDependent carePublic venuesBeaches and parks
EXPLANATION
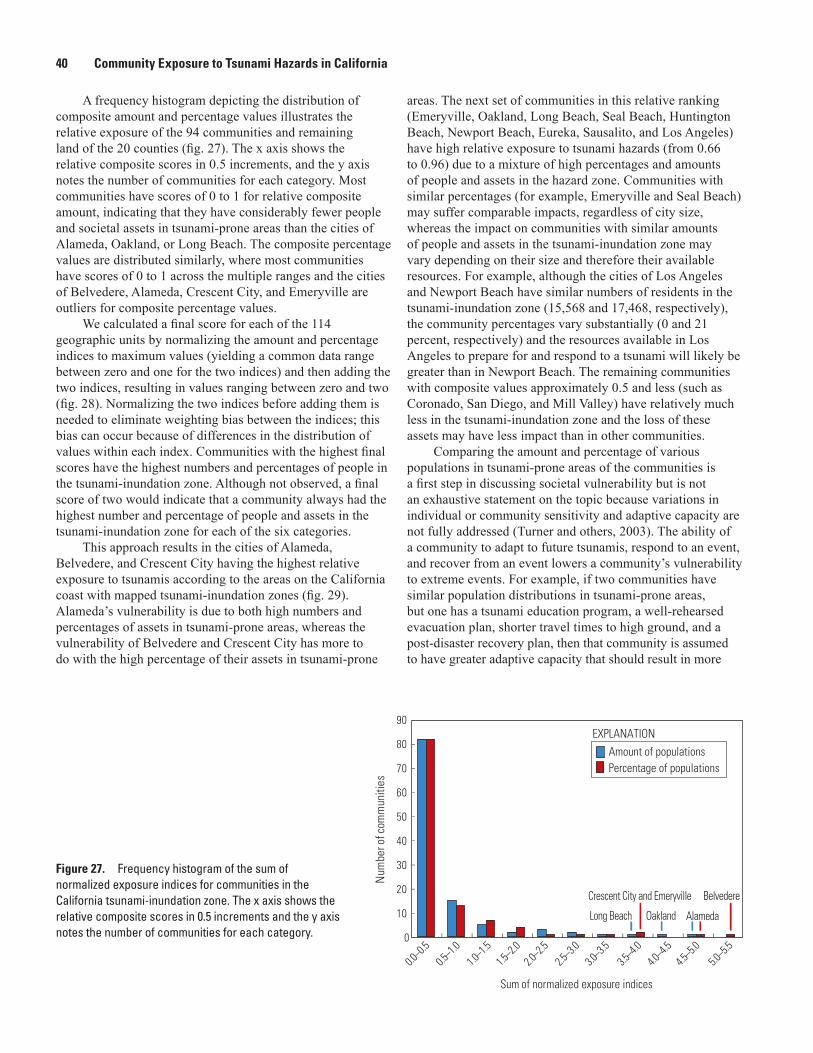
40 Community Exposure to Tsunami Hazards in California
A frequency histogram depicting the distribution of composite amount and percentage values illustrates the relative exposure of the 94 communities and remaining land of the 20 counties (fig. 27). The x axis shows the relative composite scores in 0.5 increments, and the y axis notes the number of communities for each category. Most communities have scores of 0 to 1 for relative composite amount, indicating that they have considerably fewer people and societal assets in tsunami-prone areas than the cities of Alameda, Oakland, or Long Beach. The composite percentage values are distributed similarly, where most communities have scores of 0 to 1 across the multiple ranges and the cities of Belvedere, Alameda, Crescent City, and Emeryville are outliers for composite percentage values.
We calculated a final score for each of the 114 geographic units by normalizing the amount and percentage indices to maximum values (yielding a common data range between zero and one for the two indices) and then adding the two indices, resulting in values ranging between zero and two (fig. 28). Normalizing the two indices before adding them is needed to eliminate weighting bias between the indices; this bias can occur because of differences in the distribution of values within each index. Communities with the highest final scores have the highest numbers and percentages of people in the tsunami-inundation zone. Although not observed, a final score of two would indicate that a community always had the highest number and percentage of people and assets in the tsunami-inundation zone for each of the six categories.
This approach results in the cities of Alameda, Belvedere, and Crescent City having the highest relative exposure to tsunamis according to the areas on the California coast with mapped tsunami-inundation zones (fig. 29). Alameda’s vulnerability is due to both high numbers and percentages of assets in tsunami-prone areas, whereas the vulnerability of Belvedere and Crescent City has more to do with the high percentage of their assets in tsunami-prone
0
10
20
30
40
50
60
70
80
90
Num
ber o
f com
mun
ities
Sum of normalized exposure indices
0.0–0.5
1.0–1.5
2.0–2.5
3.0–3.5
4.0–4.5
5.0–5.5
0.5–1.0
1.5–2.0
2.5–3.0
3.5–4.0
4.5–5.0
Amount of populationsPercentage of populations
EXPLANATION
Oakland Alameda
Belvedere
Long Beach
Crescent City and Emeryville
Figure 27. Frequency histogram of the sum of normalized exposure indices for communities in the California tsunami-inundation zone. The x axis shows the relative composite scores in 0.5 increments and the y axis notes the number of communities for each category.
areas. The next set of communities in this relative ranking (Emeryville, Oakland, Long Beach, Seal Beach, Huntington Beach, Newport Beach, Eureka, Sausalito, and Los Angeles) have high relative exposure to tsunami hazards (from 0.66 to 0.96) due to a mixture of high percentages and amounts of people and assets in the hazard zone. Communities with similar percentages (for example, Emeryville and Seal Beach) may suffer comparable impacts, regardless of city size, whereas the impact on communities with similar amounts of people and assets in the tsunami-inundation zone may vary depending on their size and therefore their available resources. For example, although the cities of Los Angeles and Newport Beach have similar numbers of residents in the tsunami-inundation zone (15,568 and 17,468, respectively), the community percentages vary substantially (0 and 21 percent, respectively) and the resources available in Los Angeles to prepare for and respond to a tsunami will likely be greater than in Newport Beach. The remaining communities with composite values approximately 0.5 and less (such as Coronado, San Diego, and Mill Valley) have relatively much less in the tsunami-inundation zone and the loss of these assets may have less impact than in other communities.
Comparing the amount and percentage of various populations in tsunami-prone areas of the communities is a first step in discussing societal vulnerability but is not an exhaustive statement on the topic because variations in individual or community sensitivity and adaptive capacity are not fully addressed (Turner and others, 2003). The ability of a community to adapt to future tsunamis, respond to an event, and recover from an event lowers a community’s vulnerability to extreme events. For example, if two communities have similar population distributions in tsunami-prone areas, but one has a tsunami education program, a well-rehearsed evacuation plan, shorter travel times to high ground, and a post-disaster recovery plan, then that community is assumed to have greater adaptive capacity that should result in more
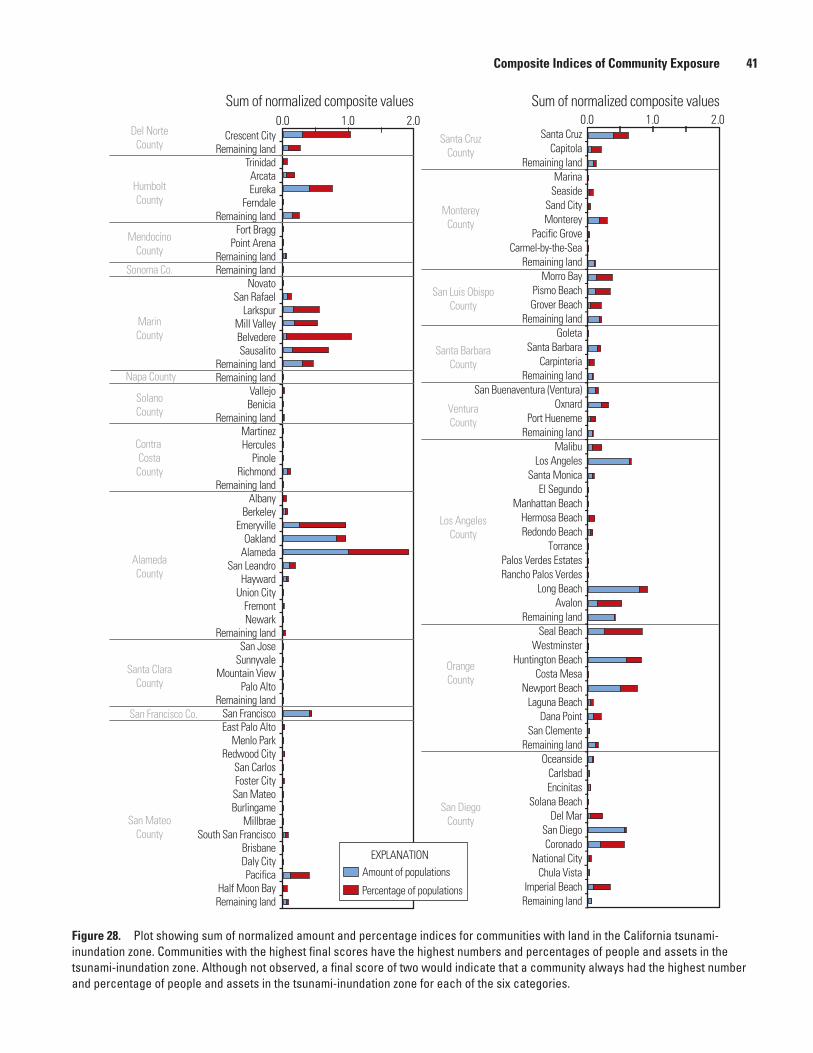
Composite Indices of Community Exposure 41
Sum of normalized composite values0.0 1.0 2.0 0.0 1.0 2.0
Sum of normalized composite values
Sonoma Co.
Napa County
San Francisco Co.
San MateoCounty
Contra CostaCounty
HumboltCounty
Santa ClaraCounty
MendocinoCounty
Del NorteCounty
MarinCounty
AlamedaCounty
SolanoCounty
Crescent CityRemaining land
TrinidadArcataEureka
FerndaleRemaining land
Fort BraggPoint Arena
Remaining landRemaining land
NovatoSan Rafael
LarkspurMill ValleyBelvedereSausalito
Remaining landRemaining land
VallejoBenicia
Remaining landMartinezHercules
PinoleRichmond
Remaining landAlbany
BerkeleyEmeryville
OaklandAlameda
San LeandroHayward
Union CityFremontNewark
Remaining landSan Jose
SunnyvaleMountain View
Palo AltoRemaining land
San FranciscoEast Palo Alto
Menlo ParkRedwood City
San CarlosFoster CitySan MateoBurlingame
MillbraeSouth San Francisco
BrisbaneDaly CityPacifica
Half Moon BayRemaining land
San DiegoCounty
VenturaCounty
OrangeCounty
MontereyCounty
Santa CruzCounty
Santa BarbaraCounty
Los AngelesCounty
San Luis ObispoCounty
Santa CruzCapitola
Remaining landMarina
SeasideSand CityMonterey
Pacific GroveCarmel-by-the-Sea
Remaining landMorro Bay
Pismo BeachGrover Beach
Remaining landGoleta
Santa BarbaraCarpinteria
Remaining landSan Buenaventura (Ventura)
OxnardPort Hueneme
Remaining landMalibu
Los AngelesSanta Monica
El SegundoManhattan Beach
Hermosa BeachRedondo Beach
TorrancePalos Verdes EstatesRancho Palos Verdes
Long BeachAvalon
Remaining landSeal Beach
WestminsterHuntington Beach
Costa MesaNewport Beach
Laguna BeachDana Point
San ClementeRemaining land
OceansideCarlsbadEncinitas
Solana BeachDel Mar
San DiegoCoronado
National CityChula Vista
Imperial BeachRemaining land
EXPLANATIONAmount of populations
Percentage of populations
Figure 28. Plot showing sum of normalized amount and percentage indices for communities with land in the California tsunami-inundation zone. Communities with the highest final scores have the highest numbers and percentages of people and assets in the tsunami-inundation zone. Although not observed, a final score of two would indicate that a community always had the highest number and percentage of people and assets in the tsunami-inundation zone for each of the six categories.
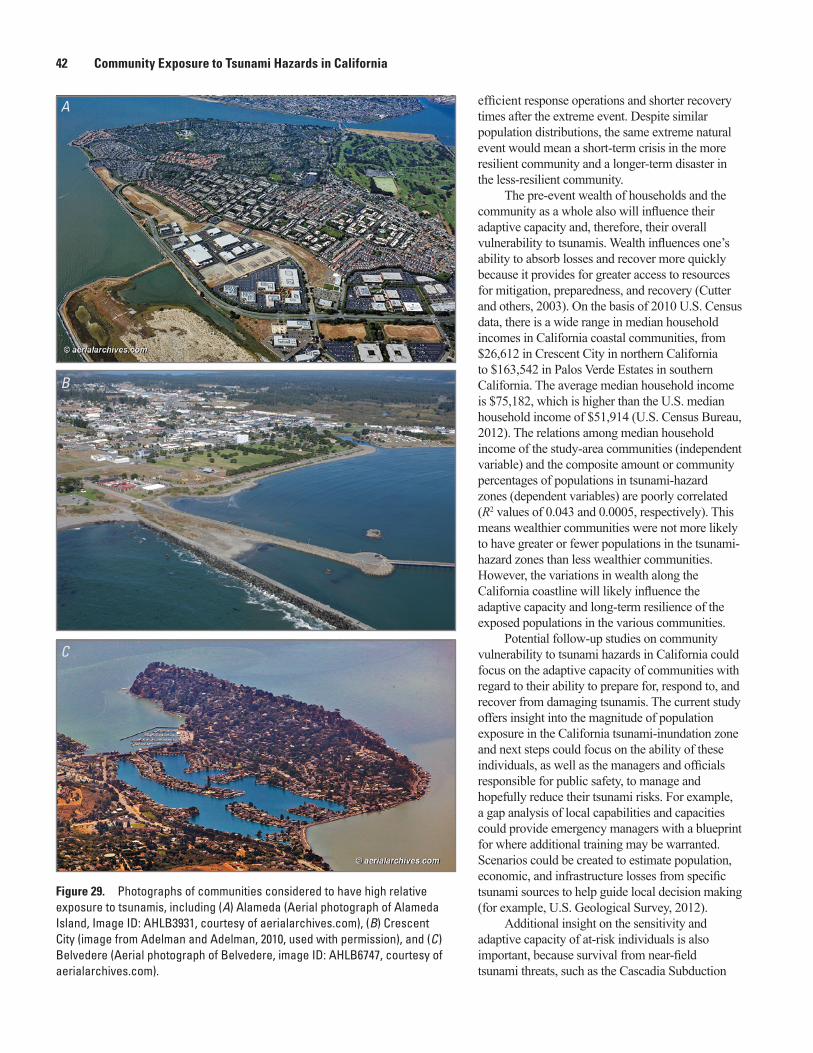
42 Community Exposure to Tsunami Hazards in California
Figure 29. Photographs of communities considered to have high relative exposure to tsunamis, including (A) Alameda (Aerial photograph of Alameda Island, Image ID: AHLB3931, courtesy of aerialarchives.com), (B) Crescent City (image from Adelman and Adelman, 2010, used with permission), and (C) Belvedere (Aerial photograph of Belvedere, image ID: AHLB6747, courtesy of aerialarchives.com).
efficient response operations and shorter recovery times after the extreme event. Despite similar population distributions, the same extreme natural event would mean a short-term crisis in the more resilient community and a longer-term disaster in the less-resilient community.
The pre-event wealth of households and the community as a whole also will influence their adaptive capacity and, therefore, their overall vulnerability to tsunamis. Wealth influences one’s ability to absorb losses and recover more quickly because it provides for greater access to resources for mitigation, preparedness, and recovery (Cutter and others, 2003). On the basis of 2010 U.S. Census data, there is a wide range in median household incomes in California coastal communities, from $26,612 in Crescent City in northern California to $163,542 in Palos Verde Estates in southern California. The average median household income is $75,182, which is higher than the U.S. median household income of $51,914 (U.S. Census Bureau, 2012). The relations among median household income of the study-area communities (independent variable) and the composite amount or community percentages of populations in tsunami-hazard zones (dependent variables) are poorly correlated (R2 values of 0.043 and 0.0005, respectively). This means wealthier communities were not more likely to have greater or fewer populations in the tsunami-hazard zones than less wealthier communities. However, the variations in wealth along the California coastline will likely influence the adaptive capacity and long-term resilience of the exposed populations in the various communities.
Potential follow-up studies on community vulnerability to tsunami hazards in California could focus on the adaptive capacity of communities with regard to their ability to prepare for, respond to, and recover from damaging tsunamis. The current study offers insight into the magnitude of population exposure in the California tsunami-inundation zone and next steps could focus on the ability of these individuals, as well as the managers and officials responsible for public safety, to manage and hopefully reduce their tsunami risks. For example, a gap analysis of local capabilities and capacities could provide emergency managers with a blueprint for where additional training may be warranted. Scenarios could be created to estimate population, economic, and infrastructure losses from specific tsunami sources to help guide local decision making (for example, U.S. Geological Survey, 2012).
Additional insight on the sensitivity and adaptive capacity of at-risk individuals is also important, because survival from near-field tsunami threats, such as the Cascadia Subduction
A
B
C
Acknowledgments 43
Zone in northern California or local landslides in southern California, is largely a function of individuals educating and preparing themselves to recognize natural cues and self-evacuate to higher ground. Perception studies and evacuation drills could be conducted to determine if at-risk individuals are able to recognize natural cues of tsunamis and self-evacuate. Evacuation modeling could be performed to assess the likelihood of successful evacuations to naturally occurring high ground (National Research Council, 2011). Evaluation of the vulnerability and preparedness of the coastal communities would also help determine the overall readiness and resilience of the California coast to tsunamis.
ConclusionsTsunamis are credible threats to California coastal
communities. Understanding how communities are specifically vulnerable to tsunamis will help local and State officials develop and target realistic preparedness and education efforts. The California maximum tsunami-inundation zone, on the basis of a suite of sources, contains 267,347 residents, 168,565 employees, and numerous public venues, dependent-population facilities, community-support businesses, and high-volume beaches. Certain communities have high percentages of groups that may need targeted outreach and preparedness training, such as renters, the very young and very old, institutionalized and noninstitutionalized group quarters (for example, military housing, correctional facilities, and university dormitories), and individuals where English may be a second language. Sustained education is also important at several high-occupancy public venues in the tsunami-inundation zone (for example, city and county beaches, State or national parks, and amusement parks), where daily visitor attendance at one county’s beaches on a single day may be four times greater than the number of residents in the tsunami-inundation zone for the entire State.
Communities vary in the types of people that are in tsunami-prone areas. Although the communities of Santa Cruz and Pacifica have highly mixed populations, the exposed populations in other communities are dominated by certain subgroups, such as residents in Oxnard, employees in Oakland, tourists at public venues in Avalon, and beach visitors in Los Angeles County and San Diego. Education efforts will vary for these different audiences. Sustained education for residents could be implemented through existing social networks (for example, neighborhood groups, church groups, and parent-teacher associations) and could capitalize on residents’ familiarity with their surroundings. Sustained education for employees cannot assume this familiarity with surroundings or with tsunami hazards. For industry-related businesses, education efforts may address the potential for hazardous materials or heavy equipment to hinder an individual’s ability to evacuate. For tourism-related businesses, employees would ideally be trained in crowd control. Although tourists at public venues and beaches likely make up the highest number of people in the tsunami-inundation zone, they are also likely to
be the hardest to reach. Newer social-media technologies may be needed to reach tourist populations that are not exposed to community-outreach efforts.
Community exposure to tsunamis in California varies considerably among 94 communities and 20 counties—some may experience great losses that nevertheless affect a small part of their community, and others may experience relatively small losses that devastate them. The cities of Alameda, Oakland, and Long Beach have the highest amounts of people and related businesses in the tsunami-inundation zone, whereas the cities of Belvedere, Alameda, and Crescent City have the highest percentages of people and related businesses in the tsunami-inundation zone. Communities with more people in the tsunami-inundation zone may end up having higher losses from a tsunami, but communities with high percentages of their people in the tsunami-inundation zone may experience greater relative impacts and social disruption and have fewer internal resources available during recovery. A difficult policy question for managers is how to allocate limited risk-reduction resources––to the communities with potentially high losses, to the communities that may be incapable of adapting to the loss of significant percentages of their community, or to a specific demographic or economic sector. The cities of Alameda, Belvedere, and Crescent City (fig. 28) have the highest community exposure to tsunami hazards, on the basis of composite indices that compare the relative number and percentage of people and businesses in the tsunami-inundation zone.
This report was developed to support collaboration between the California Emergency Management Agency, California Geological Survey, and the U.S. Geological Survey that focuses on improving our understanding of community vulnerability to tsunamis. Information presented in this report will hopefully support emergency, land-use, and resource managers, as well as the coastal communities, in their efforts to identify where additional preparedness, mitigation, recovery planning, and outreach activities may be needed to manage risks associated with California tsunamis.
AcknowledgmentsThis study was supported by the USGS Geographic
Analysis and Monitoring (GAM) Program and the USGS National Geospatial Program (NGP). We specifically thank Julia Fields of the NGP and Jonathan Smith of GAM for their support of this project. We also thank Lucy Jones for creating a collaborative environment with State agencies through the USGS Science Application for Risk Reduction (SAFRR) project that made this study possible. Finally, we thank Kevin Miller of the California Emergency Management Agency, Rick Wilson of the California Geological Survey, Matt Schmidtlein of Sacramento State University, and Susan Benjamin, Ron Kirby, and Mara Tongue of the USGS for their insightful reviews of the manuscript.
44 Community Exposure to Tsunami Hazards in California
References Cited
Adelman, K., and Adelman, G., 2010, California Coastal Records Project: California Coastal Records Project Web site, accessed March 14, 2012, at http://www.californiacoastline.org.
Atwater, B.F., and Hemphill-Haley, E., 1997, Recurrence intervals for great earthquakes of the past 3,500 years at northeastern Willapa Bay, Washington: Reston, Va., U.S. Geological Survey Professional Paper 1576, 108 p.
Atwater, B., Nelson A., Clague, J., Carver, G., Yamaguchi, D., Bobrowsky, P., Bourgeois, J., Darienzo, M., Grant, W., Hemphill-Haley, E., Kelsey, H., Jacoby, G., Nishenko, S., Palmer, S., Peterson, C., and Reinhart, M., 1995, Summary of geologic evidence for past great earthquakes at the Cascadia Subduction Zone: Earthquake Spectra, v. 11, no. 1, p. 1–18.
Atwater, B., Satoko, M., Satake, K., Yoshinobu, T., Kazue, U., and Yamaguchi, D., 2005, The orphan tsunami of 1700—Japanese clues to a parent earthquake in North America: Reston, Va., U.S. Geological Survey Professional Paper 1707. (Also available at http://pubs.usgs.gov/pp/pp1707/.)
Balaban, V., 2006, Psychological assessment of children in disasters and emergencies: Disasters, v. 30, no. 2, p. 178–198.
Barberopoulou, A., Burak, U., Borrero, J., and Synolakis, C., 2009, Tsunami inundation mapping for the State of California: unpublished technical report to California Emergency Management Agency, , 40 p.
Burby, R., Steinberg, L., and Basolo, V., 2003, The tenure trap—The vulnerability of renters to joint natural and technological disasters: Urban Affairs Review, v. 39, no. 1, p. 32–58.
Bureau of Labor Statistics, 2010, United States economy at a glance: Bureau of Labor Statistics, U.S. Department of Labor, Web site, accessed December 13, 2010, at http://www.bls.gov/oes.
California Department of Corrections and Rehabilitation, 2012, CDCR—San Quentin State Prison Web site, accessed September 14, 2012, at http://www.cdcr.ca.gov/Facilities_Locator/SQ.html.
California Emergency Management Agency, 2012, Tsunami preparedness: California Emergency Management Agency Web site, accessed on March 9, 2012, at http://www.calema.ca.gov/PlanningandPreparedness/Pages/Tsunami-Preparedness.aspx.
California Geological Survey, 2012, CGS Tsunami Web site: California Geological Survey Web site, accessed on March 1, 2012, at http://www.conservation.ca.gov/cgs/geologic_hazards/Tsunami/Inundation_Maps/Pages/Index.aspx.
California State Parks, 2010, Statistical report—2009/10 fiscal year: Statewide Planning Unit, Planning Division, California State Parks, accessed on December 14, 2011, at http://www.parks.ca.gov/pages/795/files/09-10%20statistical%20report%20final%20online.pdf.
Cascadia Region Earthquake Workgroup, 2005, Cascadia Subduction Zone earthquakes—A magnitude 9.0 earthquake scenario: Portland, Oreg., Oregon Department of Geology and Mineral Industries Report O-05-05, 22 p.
Catalina Island Chamber of Commerce and Visitors Bureau, 2012, Avalon Bay with cruise ships, Catalina Island Image Library, Catalina Island Chamber of Commerce and Visitors Bureau, Web site, accessed June 21, 2012, at http://www.catalinachamber.com/mediafilming/image-library.
Chang, S., and Falit-Baiamonte, A., 2002, Disaster vulnerability of businesses in the 2001 Nisqually earthquake: Environmental Hazards, v. 4, p. 59–71.
City of Huntington Beach, 2012, Residents: City of Huntington Beach Website, accessed June 5, 2012, at http://www.huntingtonbeachca.gov/residents/.
Cruisetimetables.com, 2012, Cruises from Los Angeles, California, accessed September 13, 2012, at http://www.cruisetimetables.com/cruises-from-los-angeles-california.html/.
Cutter, S., Boruff, B., and Shirley, W., 2003, Social vulnerability to environmental hazards: Social Science Quarterly, v. 84, no. 2, p. 242–261.
Dwight, R., Brinks, M., SharavanaKumar, G., Semenza, J., 2007, Beach attendance and bathing rates for Southern California beaches: Ocean and Coastal Management, v. 50, no. 10, p. 847–858.
Enarson, E., and Morrow, B., 1998, The gendered terrain of disaster: Westport, Connecticut, Praeger, 275 p.
Federal Emergency Management Agency, 2001, State and local mitigation planning how-to guide No. 2—Understanding your risks: Federal Emergency Management Agency Report no. 386-2, accessed August 21, 2007, at http://www.fema.gov/library/viewRecord.do?id=1880.
Geist, E., 2005, Local tsunami hazards in the Pacific Northwest from Cascadia Subduction Zone earthquakes: Reston, Va., U.S. Geological Survey Professional Paper 1661–B, 17 p. (Available at http://pubs.usgs.gov/pp/pp1661b/.)
Goldfinger, C., Nelson, C., and Johnson, J., 2003, Holocene earthquake records from the Cascadia Subduction Zone and northern San Andreas Fault based on precise dating of offshore turbidites: Annual Review of Earth and Planetary Sciences, v. 31, p. 555–577.
References Cited 45
Hoherd, D.A., 2012, Alcatraz with boats: Flickr Web site, accessed September 14, 2012, at http://www.flickr.com/photos/warzauwynn/2961971672/.
Homer, C., Huang, C., Yang, L., Wylie, B., and Coan, M., 2004, Development of a 2001 National Landcover Database for the United States: Photogrammetric Engineering and Remote Sensing, v. 70, no. 7, p. 829–840.
Homer, C.H., Fry, J.A., and Barnes C.A., 2012, The National Land Cover Database: U.S. Geological Survey Fact Sheet 2012–3020, 4 p. (Available at http://pubs.usgs.gov/fs/2012/3020/.)
Humboldt Earthquake Education Center, 2011, Living on shaky ground—How to survive earthquakes and tsunamis in northern California: Humboldt State University, 32 p.
Infogroup, 2011, Employer database: Infogroup online dataset, accessed October 20, 2011, at http://referenceusagov.com/Static/Home.
Intergovernmental Oceanographic Commission, 2002, Progress report of ad hoc working group on international tsunami signs and symbols: United Nations Educational, Scientific and Cultural Organization, IOC/ITSU-ON-2003/9, 7 p.
Jeffries, K., 2011, Monterey Bay Aquarium 2010 Annual Review: Monterey Bay Aquarium, 24 p., accessed March 1, 2012, at http://www.montereybayaquarium.org/PDF_files/aa/financials/aquarium_annualreview_10.pdf.
Lander, J., Lockridge, P.A., and Kozuch, J., 1993, Tsunamis affecting the west coast of the United States 1806–1992: Boulder, Colo., National Oceanic and Atmospheric Administration, National Geophysical Data Center, NGDC Key to Geophysical Research Documentation No. 29, USDOC/NOAA/NESDIS/NGDC, 242 p.
Laska, S., and Morrow, B., 2007, Social vulnerabilities and Hurricane Katrina—An unnatural disaster in New Orleans: Marine Technology Society Journal, v. 40, no. 4, p. 16–26.
McGuire, L., Ford, E., and Okoro, C., 2007, Natural disasters and older US adults with disabilities—Implications for evacuation: Disasters, v. 31, no. 1, p. 49–56.
Mileti, D., 1999. Disasters by design—A reassessment of natural hazards in the United States: Washington, D.C., Joseph Henry Press, 376 p.
Morrow, B., 1999, Identifying and mapping community vulnerability: Disasters, v. 23, no. 1, p. 1–18.
Multi-Resolution Land Characteristics Consortium, 2011, National Land Cover Database 2006 (NLCD2006): Multi-Resolution Land Characteristics Consortium Web site, accessed March 14, 2012, at http://www.mrlc.gov/nlcd06_data.php.
National Geophysical Data Center/World Data Center, 2012, National Geophysical Data Center/World Data Center (NGDC/WDC) global historical tsunami database: National Oceanic and Atmospheric Administration, National Geophysical Data Center, Web site, accessed March 1, 2012, at http://www.ngdc.noaa.gov/hazard/tsu_db.shtml.
National Park Service, 2011, National Park Service Public Use Office. National Park Service Web site accessed December 14, 2011, at http://www.nature.nps.gov/stats/park.cfm.
National Research Council, 2011, Tsunami warning and preparedness—an assessment of the U.S. Tsunami Program and the nation’s preparedness efforts, Committee on the Review of the Tsunami Warning and Forecast System and Overview of the Nation’s Tsunami Preparedness, Ocean Studies Board, National Research Council, 296 p.
National Weather Service, 2012a, West Coast and Alaska tsunami information: National Oceanic and Atmospheric Administration, National Weather Service, Web site, accessed March 9, 2012, at http://wcatwc.arh.noaa.gov/.
National Weather Service, 2012b, TsunamiReady: National Oceanic and Atmospheric Administration, National Weather Service, Web site, accessed March 9, 2012, at http://www.tsunamiready.noaa.gov/.
Ngo, E., 2003, When disasters and age collide—reviewing vulnerability of the elderly: Natural Hazards Review, v. 2, no. 2, p. 80–89.
Pacific Cruise Ship Terminals, 2012, Cruise links, accessed September 13, 2012, at http://www.pcsterminals.com/.
Pelling, M., 2002, Assessing urban vulnerability and social adaptation to risk: International Development Planning Review, v. 24, no. 1, p. 59–76.
Rogers, A., Walsh, T., Kockelman, W., and Priest, G., 1996, Earthquake hazards in the Pacific Northwest—An overview, in Rogers, A., Walsh, T., Kockelman, W., and Priest, G., eds., Assessing earthquake hazards and reducing risk in the Pacific Northwest: U.S. Geological Survey Professional Paper 1560, p. 1–54.
Satake, K., Shimazaki, K., Tsuji, Y., and Ueda, K., 1996, Time and size of a giant earthquake in Cascadia inferred from Japanese tsunami records of January 1700: Nature, v. 379, p. 246–249.
Suleimani, E., Hansen, R., and Hueussler, P., 2009, Numerical Study of tsunami generated by multiple submarine slope failures in Resurrection Bay, Alaska, during the Mw 9.2 1964 Earthquake, Pure and Applied Geophysics, v. 166, p. 131–152.

46 Community Exposure to Tsunami Hazards in California
Turner, B.L., Kasperson, R.E., Matson, P.A., McCarthy, J.L., Corell, R.W., Christensen, L., Eckley, N., Kasperson, J.X., Luers, A., Martello, M.L., Polsky, C., Pulsipher, A., and Schiller, A., 2003, A framework for vulnerability analysis in sustainability science: Proceedings of the National Academy of Sciences, v. 100, no. 14, p. 8074–8079.
United States Lifesaving Association, 2012, Statistics: United States Lifesaving Association Web site, accessed May 18, 2012, at http://arc.usla.org/Statistics/public.asp.
U.S. Census Bureau, 2007, North American Industry Classification System: U.S. Census Bureau Web site, accessed April 1, 2007, at http://www.census.gov/epcd/www/naics.html.
U.S. Census Bureau, 2010, 2010 TIGER/Line® Shapefiles: U.S. Census Bureau Web site, accessed January 26, 2012, at http://www.census.gov/cgi-bin/geo/shapefiles2010/main/.
U.S. Census Bureau, 2012, American FactFinder: U.S. Census Bureau Web site, accessed June 3, 2012, at http://factfinder2.census.gov/faces/nav/jsf/pages/index.xhtml.
U.S. Government Accountability Office, 2006, U.S. Tsunami preparedness—Federal and State partners collaborate to help communities reduce potential impacts, but significant challenges remain: Washington, D.C., U.S. Government Accountability Office report no. GAO-06-519, 61 p.
U.S. Geological Survey, 2011, Magnitude 9.0 Near the Coast of Honshu, Japan: U.S. Geological Survey Web site, accessed January 24, 2012, at http://earthquake.usgs.gov/earthquakes/eqinthenews/2011/usc0001xgp/#summary/.
U.S. Geological Survey, 2012, Tsunami—USGS Science Application for Risk Reduction (SAFRR) Tsunami Scenario: U.S. Geological Survey Multihazards Demonstration Project Web site, accessed May 22, 2012, at http://urbanearth.gps.caltech.edu/tsunami/.
Uslu, B., Borrero, J. C., Dengler, L. A., and Synolakis, C. E., 2007, Tsunami inundation at Crescent City, California generated by earthquakes along the Cascadia Subduction Zone: Geophysical Research Letters, v. 34, p. 1–5.
Visit California, 2012, Media center—The facts: Visit California Web site, accessed May 18, 2012, at http://media.visitcalifornia.com/Facts-Learning/The-Facts/.
Wilson, R.I., Barberopoulou, A., Miller, K.M., Goltz, J.D., and Synolakis, C.E., 2008, New maximum tsunami inundation maps for use by local emergency planners in the State of California, USA: EOS, Transactions of the American Geophysical Union, v. 89, no. 53, Fall Meeting Supplement, Abstract OS43D-1343.
Wilson, R.I, Barberopoulou, A., Borrero, J.C, Bryant, W.A, Dengler, L.A., Goltz, J.D., Legg, M.R., McGuire, T., Miller, K.M., Real, C.R., and Synolakis, C.E., 2010, Development of new databases for tsunami hazard analysis in California, in Lee, W.H.K., Kirby, S.H., and Diggles, M.F., compilers, 2010, Program and abstracts of the Second Tsunami Source Workshop; July 19–20, 2010: U.S. Geological Survey Open-File Report 2010–1152, 33 p. (Available at http://pubs.usgs.gov/of/2010/1152/.)
Wilson, R.I., Admire, A.R., Borrero, J.C., Dengler, L.A., Legg, M.R., Lynett, P., Miller, K.M., Ritchie, A., Sterling, K., McCrink, T.P., and Whitmore, P.M., in press, Observations and impacts from the 2010 Chilean and 2011 Japanese tsunami in California (USA): Pure and Applied Geophysics.
Wisner, B. Blaikie, P., Cannon, T., and Davis, I., 2004, At risk—Natural hazards, people’s vulnerability and disasters, 2nd ed.: New York, Routledge, 471 p.
Wood, N., 2007, Variations in city exposure and sensitivity to tsunami hazards in Oregon: U.S. Geological Survey Scientific Investigations Report 2007–5283, 37 p. (Available at http://pubs.usgs.gov/sir/2007/5283/.)
Wood, N., 2009, Tsunami exposure estimation with land-cover data—Oregon and the Cascadia Subduction Zone: Applied Geography, v. 29, p. 158–170.
Wood, N., and Good, J., 2004, Vulnerability of a port and harbor community to earthquake and tsunami hazards—The use of GIS in community hazard planning: Coastal Management, v. 32, no. 3, p. 243–269.
Appendixes 47
Appendixes
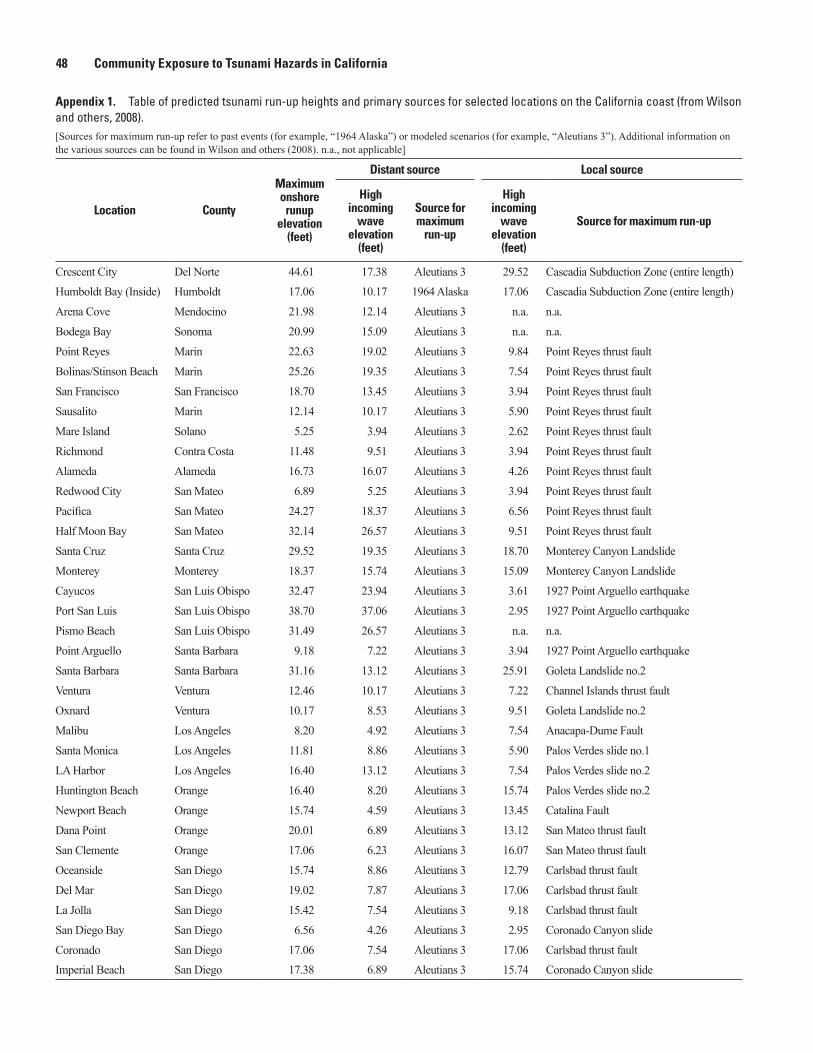
48 Community Exposure to Tsunami Hazards in California
Appendix 1. Table of predicted tsunami run-up heights and primary sources for selected locations on the California coast (from Wilson and others, 2008). [Sources for maximum run-up refer to past events (for example, “1964 Alaska”) or modeled scenarios (for example, “Aleutians 3”). Additional information on the various sources can be found in Wilson and others (2008). n.a., not applicable]
Location County
Maximum onshore
runup elevation
(feet)
Distant source Local source
High incoming
wave elevation
(feet)
Source for maximum
run-up
High incoming
wave elevation
(feet)
Source for maximum run-up
Crescent City Del Norte 44.61 17.38 Aleutians 3 29.52 Cascadia Subduction Zone (entire length)
Humboldt Bay (Inside) Humboldt 17.06 10.17 1964 Alaska 17.06 Cascadia Subduction Zone (entire length)
Arena Cove Mendocino 21.98 12.14 Aleutians 3 n.a. n.a.
Bodega Bay Sonoma 20.99 15.09 Aleutians 3 n.a. n.a.
Point Reyes Marin 22.63 19.02 Aleutians 3 9.84 Point Reyes thrust fault
Bolinas/Stinson Beach Marin 25.26 19.35 Aleutians 3 7.54 Point Reyes thrust fault
San Francisco San Francisco 18.70 13.45 Aleutians 3 3.94 Point Reyes thrust fault
Sausalito Marin 12.14 10.17 Aleutians 3 5.90 Point Reyes thrust fault
Mare Island Solano 5.25 3.94 Aleutians 3 2.62 Point Reyes thrust fault
Richmond Contra Costa 11.48 9.51 Aleutians 3 3.94 Point Reyes thrust fault
Alameda Alameda 16.73 16.07 Aleutians 3 4.26 Point Reyes thrust fault
Redwood City San Mateo 6.89 5.25 Aleutians 3 3.94 Point Reyes thrust fault
Pacifica San Mateo 24.27 18.37 Aleutians 3 6.56 Point Reyes thrust fault
Half Moon Bay San Mateo 32.14 26.57 Aleutians 3 9.51 Point Reyes thrust fault
Santa Cruz Santa Cruz 29.52 19.35 Aleutians 3 18.70 Monterey Canyon Landslide
Monterey Monterey 18.37 15.74 Aleutians 3 15.09 Monterey Canyon Landslide
Cayucos San Luis Obispo 32.47 23.94 Aleutians 3 3.61 1927 Point Arguello earthquake
Port San Luis San Luis Obispo 38.70 37.06 Aleutians 3 2.95 1927 Point Arguello earthquake
Pismo Beach San Luis Obispo 31.49 26.57 Aleutians 3 n.a. n.a.
Point Arguello Santa Barbara 9.18 7.22 Aleutians 3 3.94 1927 Point Arguello earthquake
Santa Barbara Santa Barbara 31.16 13.12 Aleutians 3 25.91 Goleta Landslide no.2
Ventura Ventura 12.46 10.17 Aleutians 3 7.22 Channel Islands thrust fault
Oxnard Ventura 10.17 8.53 Aleutians 3 9.51 Goleta Landslide no.2
Malibu Los Angeles 8.20 4.92 Aleutians 3 7.54 Anacapa-Dume Fault
Santa Monica Los Angeles 11.81 8.86 Aleutians 3 5.90 Palos Verdes slide no.1
LA Harbor Los Angeles 16.40 13.12 Aleutians 3 7.54 Palos Verdes slide no.2
Huntington Beach Orange 16.40 8.20 Aleutians 3 15.74 Palos Verdes slide no.2
Newport Beach Orange 15.74 4.59 Aleutians 3 13.45 Catalina Fault
Dana Point Orange 20.01 6.89 Aleutians 3 13.12 San Mateo thrust fault
San Clemente Orange 17.06 6.23 Aleutians 3 16.07 San Mateo thrust fault
Oceanside San Diego 15.74 8.86 Aleutians 3 12.79 Carlsbad thrust fault
Del Mar San Diego 19.02 7.87 Aleutians 3 17.06 Carlsbad thrust fault
La Jolla San Diego 15.42 7.54 Aleutians 3 9.18 Carlsbad thrust fault
San Diego Bay San Diego 6.56 4.26 Aleutians 3 2.95 Coronado Canyon slide
Coronado San Diego 17.06 7.54 Aleutians 3 17.06 Carlsbad thrust fault
Imperial Beach San Diego 17.38 6.89 Aleutians 3 15.74 Coronado Canyon slide
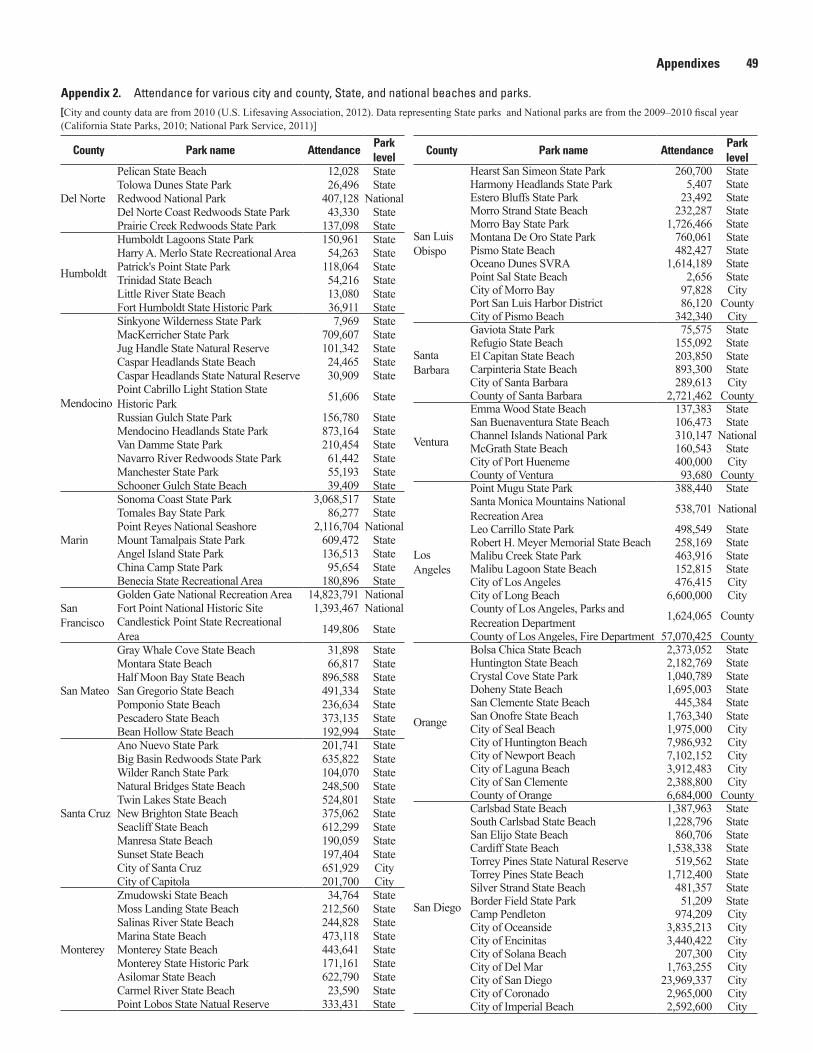
Appendixes 49
County Park name AttendancePark level
Del Norte
Pelican State Beach 12,028 StateTolowa Dunes State Park 26,496 StateRedwood National Park 407,128 NationalDel Norte Coast Redwoods State Park 43,330 StatePrairie Creek Redwoods State Park 137,098 State
Humboldt
Humboldt Lagoons State Park 150,961 StateHarry A. Merlo State Recreational Area 54,263 StatePatrick's Point State Park 118,064 StateTrinidad State Beach 54,216 StateLittle River State Beach 13,080 StateFort Humboldt State Historic Park 36,911 State
Mendocino
Sinkyone Wilderness State Park 7,969 StateMacKerricher State Park 709,607 StateJug Handle State Natural Reserve 101,342 StateCaspar Headlands State Beach 24,465 StateCaspar Headlands State Natural Reserve 30,909 StatePoint Cabrillo Light Station State Historic Park 51,606 State
Russian Gulch State Park 156,780 StateMendocino Headlands State Park 873,164 StateVan Damme State Park 210,454 StateNavarro River Redwoods State Park 61,442 StateManchester State Park 55,193 StateSchooner Gulch State Beach 39,409 State
Marin
Sonoma Coast State Park 3,068,517 StateTomales Bay State Park 86,277 StatePoint Reyes National Seashore 2,116,704 NationalMount Tamalpais State Park 609,472 StateAngel Island State Park 136,513 StateChina Camp State Park 95,654 StateBenecia State Recreational Area 180,896 State
San Francisco
Golden Gate National Recreation Area 14,823,791 NationalFort Point National Historic Site 1,393,467 NationalCandlestick Point State Recreational Area 149,806 State
San Mateo
Gray Whale Cove State Beach 31,898 StateMontara State Beach 66,817 StateHalf Moon Bay State Beach 896,588 StateSan Gregorio State Beach 491,334 StatePomponio State Beach 236,634 StatePescadero State Beach 373,135 StateBean Hollow State Beach 192,994 State
Santa Cruz
Ano Nuevo State Park 201,741 StateBig Basin Redwoods State Park 635,822 StateWilder Ranch State Park 104,070 StateNatural Bridges State Beach 248,500 StateTwin Lakes State Beach 524,801 StateNew Brighton State Beach 375,062 StateSeacliff State Beach 612,299 StateManresa State Beach 190,059 StateSunset State Beach 197,404 StateCity of Santa Cruz 651,929 City City of Capitola 201,700 City
Monterey
Zmudowski State Beach 34,764 StateMoss Landing State Beach 212,560 StateSalinas River State Beach 244,828 StateMarina State Beach 473,118 StateMonterey State Beach 443,641 StateMonterey State Historic Park 171,161 StateAsilomar State Beach 622,790 StateCarmel River State Beach 23,590 StatePoint Lobos State Natual Reserve 333,431 State
County Park name AttendancePark level
San Luis Obispo
Hearst San Simeon State Park 260,700 StateHarmony Headlands State Park 5,407 StateEstero Bluffs State Park 23,492 StateMorro Strand State Beach 232,287 StateMorro Bay State Park 1,726,466 StateMontana De Oro State Park 760,061 StatePismo State Beach 482,427 StateOceano Dunes SVRA 1,614,189 StatePoint Sal State Beach 2,656 StateCity of Morro Bay 97,828 City Port San Luis Harbor District 86,120 CountyCity of Pismo Beach 342,340 City
Santa Barbara
Gaviota State Park 75,575 StateRefugio State Beach 155,092 StateEl Capitan State Beach 203,850 StateCarpinteria State Beach 893,300 StateCity of Santa Barbara 289,613 City County of Santa Barbara 2,721,462 County
Ventura
Emma Wood State Beach 137,383 StateSan Buenaventura State Beach 106,473 StateChannel Islands National Park 310,147 NationalMcGrath State Beach 160,543 StateCity of Port Hueneme 400,000 City County of Ventura 93,680 County
Los Angeles
Point Mugu State Park 388,440 StateSanta Monica Mountains National Recreation Area 538,701 National
Leo Carrillo State Park 498,549 StateRobert H. Meyer Memorial State Beach 258,169 StateMalibu Creek State Park 463,916 StateMalibu Lagoon State Beach 152,815 StateCity of Los Angeles 476,415 City City of Long Beach 6,600,000 City County of Los Angeles, Parks and Recreation Department 1,624,065 County
County of Los Angeles, Fire Department 57,070,425 County
Orange
Bolsa Chica State Beach 2,373,052 StateHuntington State Beach 2,182,769 StateCrystal Cove State Park 1,040,789 StateDoheny State Beach 1,695,003 StateSan Clemente State Beach 445,384 StateSan Onofre State Beach 1,763,340 StateCity of Seal Beach 1,975,000 City City of Huntington Beach 7,986,932 City City of Newport Beach 7,102,152 City City of Laguna Beach 3,912,483 City City of San Clemente 2,388,800 CityCounty of Orange 6,684,000 County
San Diego
Carlsbad State Beach 1,387,963 StateSouth Carlsbad State Beach 1,228,796 StateSan Elijo State Beach 860,706 StateCardiff State Beach 1,538,338 StateTorrey Pines State Natural Reserve 519,562 StateTorrey Pines State Beach 1,712,400 StateSilver Strand State Beach 481,357 StateBorder Field State Park 51,209 StateCamp Pendleton 974,209 City City of Oceanside 3,835,213 CityCity of Encinitas 3,440,422 CityCity of Solana Beach 207,300 CityCity of Del Mar 1,763,255 CityCity of San Diego 23,969,337 CityCity of Coronado 2,965,000 CityCity of Imperial Beach 2,592,600 City
Appendix 2. Attendance for various city and county, State, and national beaches and parks.[City and county data are from 2010 (U.S. Lifesaving Association, 2012). Data representing State parks and National parks are from the 2009–2010 fiscal year (California State Parks, 2010; National Park Service, 2011)]


Produced in the Menlo Park Publishing Service Center, CaliforniaManuscript approved for publication, September 30, 2012Edited by James H. Hendley IILayout and design by Jeanne S. DiLeo
Wood and others—
Comm
unity Exposure to Tsunami H
azards in California—Scientific Investigations Report 2012–5222