a second generation of tsunami inundation maps for the state of california
TRANSCRIPT
A Second Generation of Tsunami Inundation Maps for the State of California
A. BARBEROPOULOU,1 J. C. BORRERO,1,2 B. USLU,3 M. R. LEGG,4 and C. E. SYNOLAKIS1,5
Abstract—A new generation of tsunami inundation maps is
now available for 20 coastal counties in California. These maps
represent an improvement over previous efforts, as they are based
on the most recent descriptions of potential tsunami sources, apply
recently updated numerical modeling techniques, and cover pre-
viously unmapped regions of the State. Since the maps are based on
deterministic rather than probabilistic modeling, they are only
intended for emergency preparedness and evacuation planning and
are not to be used in engineering siting studies. The California
maps cover a greater coastal area than any other US State. To be
helpful, the maps need to be integrated into a consistent statewide
hazard-planning framework. Indeed, tsunami preparedness in Cal-
ifornia was tested on several occasions over the past 5 years, i.e.,
during the 14 June 2005 event, about 90 miles SW of Crescent
City, the 15 November 2006 Kuril Islands, and the 27 February
2010 Chile earthquake. We discuss briefly the State’s response as
these events unfolded.
Key words: California, Tsunami, inundation, inundation
maps, mitigation, coastal, evacuation, natural hazards.
1. Introduction
Since the early 1990s, steady progress has been
made in understanding and mitigating tsunami haz-
ards in California. In response to tsunami events that
have highlighted previously unrecognized threats,
scientists and federal and state policy-makers have
undertaken a comprehensive effort to produce evac-
uation maps showing areas of possible tsunami
inundation. Advances in tsunami modeling, source
characterization, computational resources, and social
science studies have allowed better identification of
high-risk areas and have made this information
available to the public.
Prior to the early 1990s, California was thought to
be primarily vulnerable to teletsunamis caused by
large earthquakes in the subduction zones around the
Pacific Rim (HOUSTON and GARCIA, 1978; MCCULLOCH,
1985). The State was generally thought to be at lesser
risk from local or regional tsunamis. However,
identification of the Cascadia Subduction Zone (CSZ)
as a tsunami source (CLARKE and CARVER, 1992) and
the 1992 Cape Mendocino earthquake and tsunami
demonstrated otherwise (MCCARTHY and BERNARD,
1993; SYNOLAKIS et al., 1997; GONZALEZ et al., 1995).
Post-tsunami field surveys (SYNOLAKIS and OKAL,
2005; SYNOLAKIS and KONG, 2006) have provided a
wealth of field observations that have increased
awareness of tsunami hazards (SYNOLAKIS et al., 2002;
BARDET et al., 2003). Three recent events have further
reinforced the need for continued vigilance (e.g.,
SYNOLAKIS and BERNARD, 2006). Although the first of
these, the June 14, 2005 earthquake offshore of
Northern California, did not generate a significant
tsunami, it presented a challenging tsunami-warning
situation and highlighted shortcomings in the existing
response system (GIBBONS, 2005; MURPHY, 2005). The
November 15, 2006 earthquake in the Kuril Islands
generated a teletsunami that caused US $10 million
damage to Crescent City Harbor (DENGLER, 2008;
DENGLER et al., 2009). The Chilean earthquake of
February 27, 2010 produced a similar teletsunami in
California, which nonetheless caused substantial
currents in California ports and damage estimated at
US $10 million.
1 Tsunami Research Center, University of Southern California,
3620 S. Vermont Avenue, Los Angeles, CA 90089, USA.
E-mail: [email protected]; [email protected] ASR Limited, Marine Consulting and Research, 1 Wainui
Road, Raglan 3225, New Zealand.3 Pacific Marine Environmental Laboratory, NOAA, 7600
Sand Point Way NE, Seattle, WA 98115, USA. E-mail:
[email protected] Legg Geophysical, 16541 Gothard St # 107, Huntington
Beach, CA 92647-4472, USA. E-mail: [email protected] Laboratory of Natural Hazards, Technical University of
Crete, 73100 Chanea, Greece.
Pure Appl. Geophys. 168 (2011), 2133–2146
� 2011 Springer Basel AG
DOI 10.1007/s00024-011-0293-3 Pure and Applied Geophysics
With more than 2,000 km of coastline, California
has a large at-risk population and several economically
vital ports and harbors. The vulnerability is high, and,
to increase resilience, advances in tsunami planning,
hazard mitigation, and warning need to be utilized.
California faces additional challenges such as a very
short historical record of tsunamis and a long history of
geologic studies that have focused on inland faults,
while generally ignoring offshore fault zones
(SYNOLAKIS et al., 1997). Several of these fault zones lie
only a few kilometers from the coast, yet seismometer
coverage of offshore areas is inadequate, leading to
inaccurate determination of epicenter locations and
focal mechanisms (LEGG and BARBEROPOULOU, 2007).
Not surprisingly, the frequency of occurrence for
locally generated tsunamis is not much better known
today than it was in the early 1980s.
The tsunami hazard in Northern California is
dominated by the CSZ and can be inferred from
GONZALEZ et al. (1995). Further south, the 1927 Point
Arguello earthquake (Ms 7.3) is to date the best-
documented locally generated tsunami in Southern
California (SATAKE and SOMERVILLE, 1992; LANDER
et al., 1993); however, its occurrence in a sparsely
populated area minimized the impact. Prior to 1927,
historical accounts of 19th century events describe
waves that would be damaging today, due to
increased coastal populations and higher building
density, particularly in the Santa Barbara Channel
region (MCCULLOCH, 1985; LANDER et al., 1993;
BORRERO et al., 2001) and in San Diego Bay (LEGG
and KENNEDY, 1979). Confirmation of prehistoric
tsunami deposits in the Southern California coastal
area remains to be established, although candidate
sites have been identified (e.g., G. KUHN, pers. com-
munication, 2003; GOYA, 2005).
2. Previous Efforts to Quantify Tsunami Hazards
in California
HOUSTON and GARCIA (1974) and HOUSTON and
GARCIA (1978) used a combination of finite-difference
computations, one-dimensional analytical results
for periodic waves, and finite-element models to
estimate offshore wave heights caused by far-field
hypothetical scenarios designed to resemble the 1960
Chile and 1964 Aleutian Island earthquakes. Their
numerical computations, while groundbreaking at the
time (SYNOLAKIS et al., 1997), did not include inun-
dation. Their 100- and 500-year recurrence rates for
offshore tsunami heights were used in the Flood
Insurance Rate Maps (FIRM) for the National Flood
Insurance program. MCCULLOCH (1985) considered
far-field and near-field tsunami hazards as part of an
evaluation of the earthquake hazard in the Los
Angeles region. However, due to an arithmetic error,
his estimate of tsunami wave heights caused by near-
shore submarine landslides was deficient by nearly
two orders of magnitude (BORRERO, 2002), leading to
the earlier significant underestimation of this hazard.
MCCARTHY and BERNARD (1993) qualitatively
assessed the tsunami hazard for the entire state fol-
lowing the 1992 Cape Mendocino earthquake
(OPPENHEIMER et al., 1993). They considered local and
regional sources and offshore slumping and were the
first to consider the tsunami hazard from earthquakes
along the CSZ. They proposed that the coastal areas
north of Cape Mendocino and south of the Monterey
Peninsula to Palos Verdes (Los Angeles County) are
high risk, and the remaining coastlines ‘‘moderate’’
risk.
The first quantitative study of tsunami inundation
due to a near-source event was that of BERNARD et al.
(1994). This study was motivated during discussions
between the Federal Emergency Management Agency
(FEMA) and the scientific community in the aftermath
of the 1992 Cape Mendocino earthquake and tsunami.
While BERNARD et al. (1994) presented careful seis-
mological inferences for possible CSZ events, the
characterization of the wave itself was less rigorous.
The tsunami from the Mw 8.4 tremor was modeled as a
sinusoid with 10 m amplitude and 33.3 min period at
50 m depth. The model used was untested in terms of
the veracity of inundation predictions, and likely it
stopped computations at some threshold location. The
results were published as part of an earthquake plan-
ning scenario produced by the California Division of
Mines and Geology, now known as the California
Geological Survey (CGS) (TOPPOZADA et al., 1995).
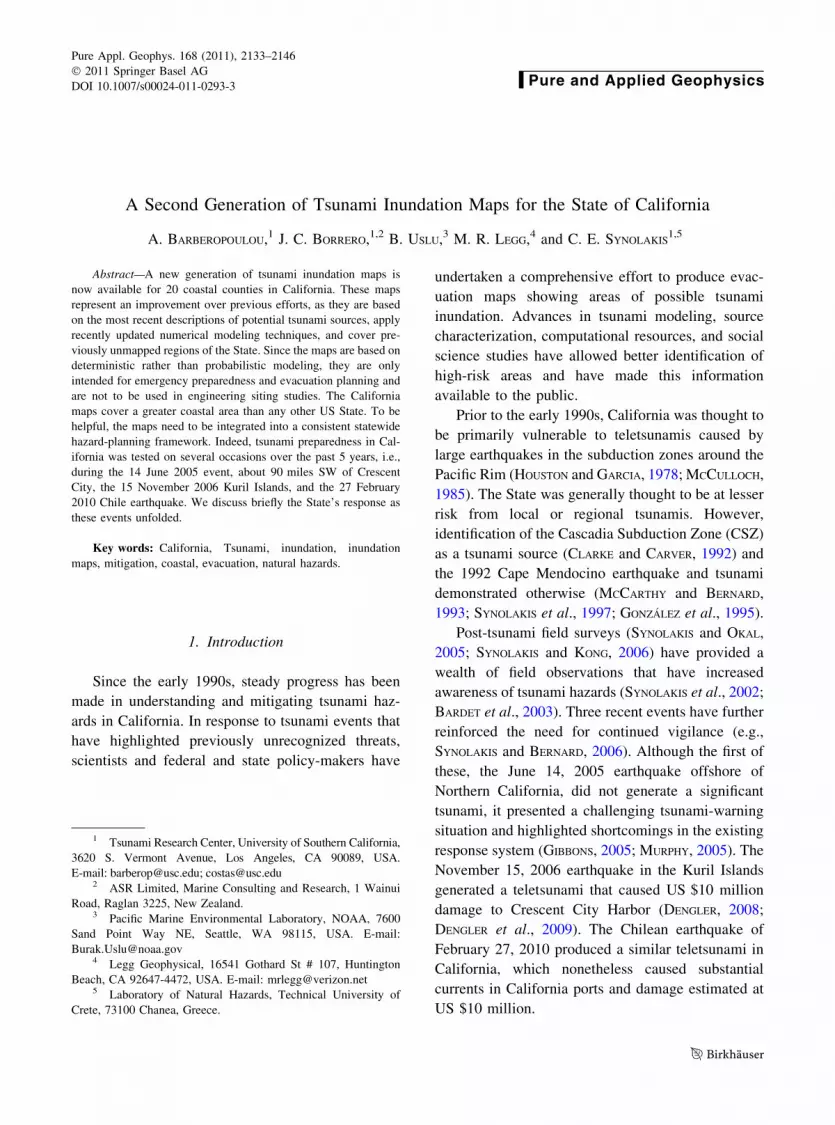
Since then, the Redwood Coast Tsunami Working
Group (RCTWG), a consortium of private, academic,
and government scientists and planners, has developed
a more detailed set of tsunami hazard maps for the
2134 A. Barberopoulou et al. Pure Appl. Geophys.
same area in Northern California (e.g., Fig. 1;
DENGLER, 2006).
In 1995, the US Congress created the National
Tsunami Hazard Mitigation Program (NTHMP) and
directed the National Oceanic and Atmospheric
Administration (NOAA) to form working groups at
the federal and state levels charged with addressing
tsunami hazard assessment, mitigation, and response
issues (BERNARD and GONZALEZ, 1994). In 1996, this
group submitted a report recommending the prepa-
ration of tsunami inundation maps for the five Pacific
states of Alaska, Washington, Oregon, California,
and Hawaii (EISNER et al., 2001). By 1997, a series of
local tsunamis (Nicaragua, 1992; Flores, Indonesia,
1992; Okushiri, Japan, 1993; East Java, Indonesia,
1994; Mindoro, Philippines, 1994; Shitokan, Russia,
1994; Manzanillo, Mexico, 1995; Biak, Indonesia,
1996; Sulawesi, Indonesia, 1996; Chimbote, Peru,
1996) further focused attention on hazards associated
with locally generated tsunamis. Based on MCCARTHY
and BERNARD (1993), SYNOLAKIS et al. (1997) con-
sidered a possible rupture of the San Clemente Fault
in Southern California and found that, using inunda-
tion models that had just started to become available
(TITOV and SYNOLAKIS, 1998), runup predictions ran-
ged up to two times greater than results obtained
using 1980s-type threshold computations (see
SYNOLAKIS and KANOGLU, 2009, for definitions). In the
immediate aftermath of the 1998 Papua New Guinea
landslide tsunami, a series of workshops combined
with a reassessment of the tsunami hazard led the
California Office of Emergency Services [now known
as the California Emergency Management Agency
(CalEMA)] to collaborate with the University of
Southern California-Tsunami Research Center (USC-
TRC) for the development of a first generation of
inundation maps for the State’s coastlines using funds
provided by the NTHMP and the California Seismic
Safety Commission.
Because the HOUSTON and GARCIA (1974) study
considered only distant events, this early effort
focused on locally generated tsunamis. Limited
resources and a large at-risk population spread along
2,000 km of coast meant that difficult decisions had
Figure 1Example of an inundation and evacuation map for Crescent City, CA produced by the Redwood Coast Tsunami Working Group
Vol. 168, (2011) A Second Generation of Tsunami Inundation Maps 2135
to be made regarding mapping priorities and meth-
odology. The first-generation maps were produced
with priority given to coastal areas of high population
density, numerical grid resolution of 250 m (com-
pared with an average 1.7–2.0 km spacing used by
HOUSTON and GARCIA, 1974), and emphasis on near-
shore earthquake and landslide sources over distant
events. The State’s strategy is discussed in EISNER
et al. (2001) and BORRERO et al. (2003), while the
methodology and computational details are discussed
in BORRERO (2002).
Based on feedback from the emergency manage-
ment community, these maps reflected a single runup
value for each modeled region, derived from com-
putations of wave evolution and inundation from
extreme but plausible tsunamigenic scenarios. The
inundation line on each map corresponded to the
highest modeled tsunami runup along the modeled
coast, among the scenarios. As they were completed,
the first-generation maps were ‘‘ground-truthed’’
through field surveys conducted by the USC-TRC
team and State officials. The purpose of these field
surveys was to compare the model results to physical
reality and to familiarize both parties with areas of
particular vulnerability.
The California practice differs from that in other
Pacific states. For example, the Oregon Department
of Mineral and Industry’s tsunami inundation maps
included two lines, one for a locally generated tsu-
nami from the CSZ, and another for far-field
tsunamis, leaving the final choice of which map’s
projection to use with emergency managers. The
reasoning behind California’s single inundation line
was to facilitate communication to the public with a
clear message: if you are at a location situated below
the inundation line, you should evacuate to high
ground in the event a tsunami warning is issued or if
you feel an earthquake lasting longer than 30 s, or if
you see any unusual water motions near shore.
Another difference was that the computational suite
used by California was the only one benchmarked
with both laboratory and field data. At the time of this
writing, the five Pacific states are planning a code
benchmarking workshop, and it remains to be seen
which state models comply with the recently adopted
standards and guidelines for numerical models (SYN-
OLAKIS et al., 2008).
While groundbreaking as compared with maps
available in other states (for example, maps in Hawaii
until recently relied on 1970s-type modeling with
one-dimensional propagation results), California’s
early mapping effort had limitations. First, the maps
were based only on computations of tsunami evolu-
tion from local sources. Second, the relatively coarse
grid resolution of 250 m was difficult to transfer to
the onshore land surface. At the time, it was difficult
to register on-land topographic grids and offshore
bathymetric grids to the same datum. Third, the
inclusion of submarine landslide scenarios—events
that are plausible but with unknown return periods—
resulted in inundation distances that would make an
orderly evacuation nearly impossible, particularly on
a summer afternoon when there may be hundreds of
thousands in beach areas. Last, while the maps cov-
ered all densely populated areas, vast areas of the
State remained unmapped. These constraints moti-
vated the development of a new set of inundation
maps for California.
For the record, the first study of probabilistic
hazard assessment since HOUSTON and GARCIA (1974)
is that of USLU (2008), where both time-dependent
and time-independent methods were used to assess
the tsunami risk. In the latter, slip rates were obtained
from global positioning system (GPS) measurements
of tectonic motions and then used as a basis to esti-
mate the return period of possible earthquakes. The
resulting tsunami heights from these earthquakes
were computed at selected locations offshore ports
and harbors in California, and then return periods
were estimated to provide a total probability of
exceedance of given wave heights. In the time-inde-
pendent method, return periods of candidate
earthquakes were estimated using Gutenberg–Rich-
ter-type relationships. For Crescent City Harbor, a
full inundation computation was performed so that
recurrence estimates were provided at the location of
the tide gage, for comparison with earlier events.
The USLU (2008) analysis found that San Fran-
cisco Bay and Central California are most sensitive to
tsunamis originating from the Alaska and Aleutian
Subduction Zone (AASZ). Using an earthquake
source of magnitude comparable to the 1964 Great
Alaska Earthquake located on the central AASZ
resulted in twice the wave height as experienced in
2136 A. Barberopoulou et al. Pure Appl. Geophys.
1964 in San Francisco Bay. Detailed inundation
modeling is currently underway to evaluate whether
this doubling of offshore heights results in double the
flooding distances. Both time-dependent and time-
independent methods showed that Central California
and San Francisco Bay receive more frequent tsuna-
mis from the AASZ, while Southern California is
mostly impacted by tsunamis generated on Chile and
Central American Subduction Zone, as well as the
AASZ.
3. New Tsunami Inundation Maps
On December 26, 2004, the second largest
instrumentally recorded earthquake in history (second
only to the 1960 Chilean Earthquake, Mw = 9.5)
occurred off of the west coast of Sumatra, Indonesia
(i.e. GEIST et al., 2006; OKAL and STEIN, 2005). The
aftermath of the subsequent tsunami prompted gov-
ernments worldwide to reassess coastal vulnerability.
The US Congress supplemented funding in 2005 and
2006 to support the expansion of the tsunami warning
system, additional Deep-Ocean Assessment Report-
ing of Tsunamis (DART) tsunameters in the Pacific
the development of the infrastructure for producing
real-time forecasts (WEI et al., 2008), and accelerated
production of inundation maps for at-risk or previ-
ously unmapped areas.
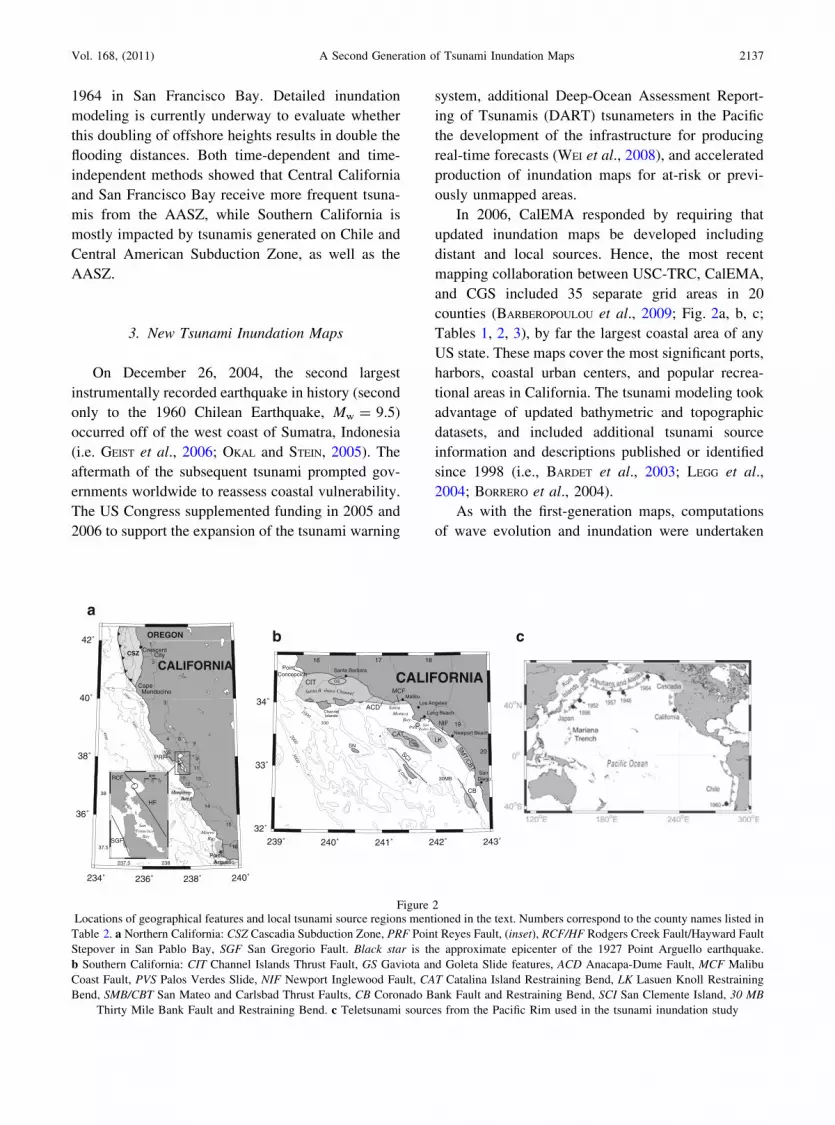
In 2006, CalEMA responded by requiring that
updated inundation maps be developed including
distant and local sources. Hence, the most recent
mapping collaboration between USC-TRC, CalEMA,
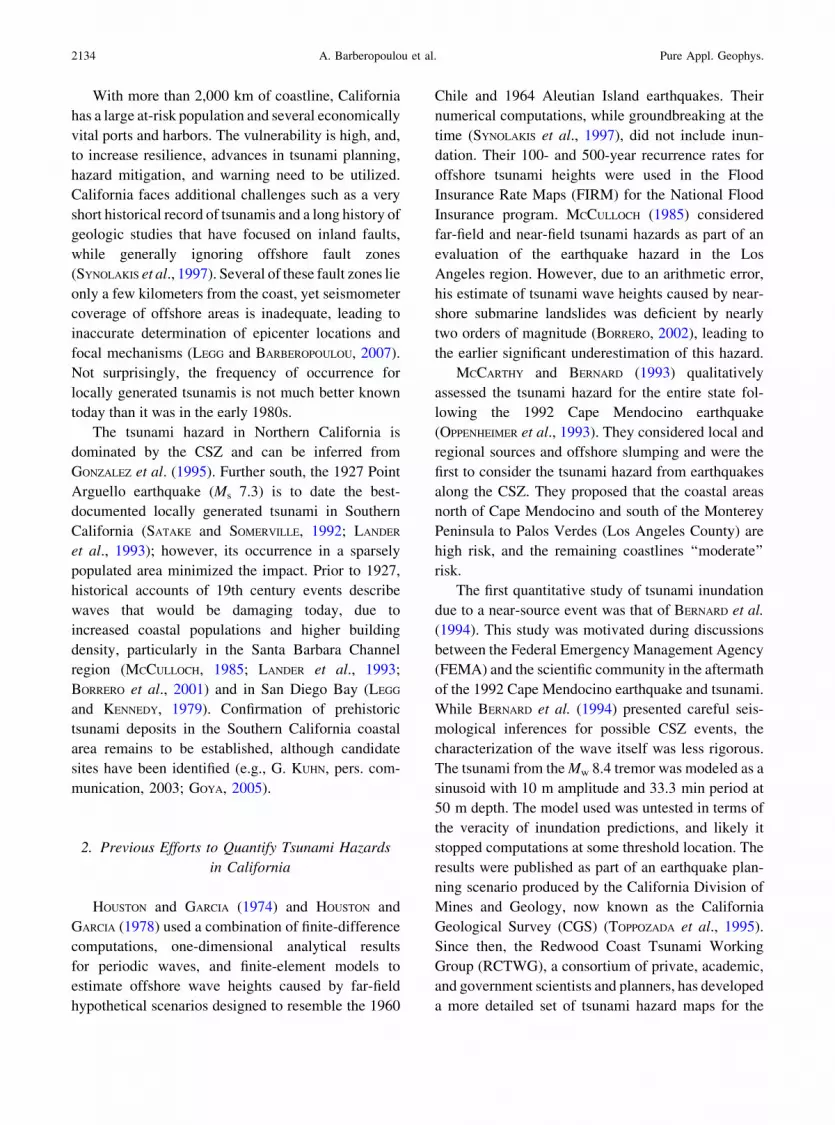
and CGS included 35 separate grid areas in 20
counties (BARBEROPOULOU et al., 2009; Fig. 2a, b, c;
Tables 1, 2, 3), by far the largest coastal area of any
US state. These maps cover the most significant ports,
harbors, coastal urban centers, and popular recrea-
tional areas in California. The tsunami modeling took
advantage of updated bathymetric and topographic
datasets, and included additional tsunami source
information and descriptions published or identified
since 1998 (i.e., BARDET et al., 2003; LEGG et al.,
2004; BORRERO et al., 2004).
As with the first-generation maps, computations
of wave evolution and inundation were undertaken
234˚ 236˚ 238˚ 240˚
36˚
38˚
40˚
42˚
237.5 238
37.5
38
SanFrancisco Bay
RCF
SGF
0 10 20
km
HF
OREGON
Morro Bay
Crescent City
Cape Mendocino
1
2
3
4
5
67
8
9
10
11
1213
14
15
16
Monterey Bay
Point Arguello
CALIFORNIACSZ
PRF
50010002000
3000
4000
239˚ 240˚ 241˚ 242˚ 243˚32˚
33˚
34˚
CALIFORNIA
Cata.
Los Angeles
Long Beach
SanPedro Bay
SanDiego
Malibu
Santa Barbara
SN
Newport Beach
16 17 18
19
20
LKCAT
SCI
Santa B
a
rbara Channel
500
1000
20003000
Santa Monica Bay
SMT/C
BT
CIT
30MB
GS
NIFPVS
S.Clem. Is.
PointConcepcion
ACD
MCF
CB
ChannelIslands
a
b c
Figure 2Locations of geographical features and local tsunami source regions mentioned in the text. Numbers correspond to the county names listed in
Table 2. a Northern California: CSZ Cascadia Subduction Zone, PRF Point Reyes Fault, (inset), RCF/HF Rodgers Creek Fault/Hayward Fault
Stepover in San Pablo Bay, SGF San Gregorio Fault. Black star is the approximate epicenter of the 1927 Point Arguello earthquake.
b Southern California: CIT Channel Islands Thrust Fault, GS Gaviota and Goleta Slide features, ACD Anacapa-Dume Fault, MCF Malibu
Coast Fault, PVS Palos Verdes Slide, NIF Newport Inglewood Fault, CAT Catalina Island Restraining Bend, LK Lasuen Knoll Restraining
Bend, SMB/CBT San Mateo and Carlsbad Thrust Faults, CB Coronado Bank Fault and Restraining Bend, SCI San Clemente Island, 30 MB
Thirty Mile Bank Fault and Restraining Bend. c Teletsunami sources from the Pacific Rim used in the tsunami inundation study
Vol. 168, (2011) A Second Generation of Tsunami Inundation Maps 2137
with MOST (TITOV and GONZALEZ, 1997). Originally
developed at the USC-TRC (TITOV and SYNOLAKIS,
1998) prior to its adoption by NOAA, MOST solves
the nonlinear two-dimensional shallow-water wave
equations and allows for calculations of the wave
evolution over complex bathymetry and overland
flooding. Inundation computations are notoriously
temperamental, as solving the overland flow involves
nontrivial interactions of the incident wave with the
shoreline (LIU et al., 1991). MOST has been validated
repeatedly at benchmark workshops funded by the
National Science Foundation (YEH et al., 1996; LIU
et al., 2005; LIU et al., 2008), through the steps out-
lined in SYNOLAKIS et al. (2008). MOST is the
computational suite used for the official tsunami
forecasts in the USA. It was most recently used to
accurately predict the far-field wave evolution of the
2010 Chilean tsunami, as well as the extent of
flooding in Hawaii and California, faster than real
time.
In terms of maps, most of California’s coastline
was modeled with grid resolution of 3 arcsec,
(approximately 75–90 m). The three major ports, Los
Angeles/Long Beach, San Francisco, and San Diego,
were modeled with 1 arcsec resolution (*25–30 m).
The numerical grids were adjusted to mean high
water (MHW) conditions to represent a conservative
sea level for tsunami inundation. We note that only
maximum inundation was computed in the ports;
computations for currents and assessment of the
impact of harbor resonance possible in narrow
channels need even higher resolution and far longer
computational times.
Both local (BORRERO et al., 2001; BORRERO et al.,
2004; USLU et al., 2007) and far-field (OKAL et al.,
2003; DENGLER et al., 2008) tsunami sources were
considered in this effort. Local tsunami sources
included offshore reverse and thrust faults, major
restraining bends on strike-slip fault zones, and large
submarine landslides capable of significant seafloor
displacement and tsunami generation. Far-field tsu-
nami sources included historical great subduction
zone events such as the 1700 Cascadia, 1952 Kurile
Island, 1960 Chile, and 1964 Alaska earthquakes, as
well as a suite of plausible large-scale events occur-
ring around the Pacific Rim.
To create overland flooding projections, the
computed inundation from each of the sources in a
given region was combined to create a dataset
showing the area of potential flooding from all
sources considered. The location of the final inun-
dation line was determined with the benefit of a
ground-truth survey to check the preliminary pre-
dictions against a high-resolution (3–10 m)
topographic dataset and compare them with the actual
coastal conditions in terms of sand dunes, river
mouths, wetlands, and coastal structures that may
interfere with the advancing tsunami. These surveys
were coordinated with local emergency managers,
and considered historic inundation information, when
available (Fig. 3). As opposed to the first generation
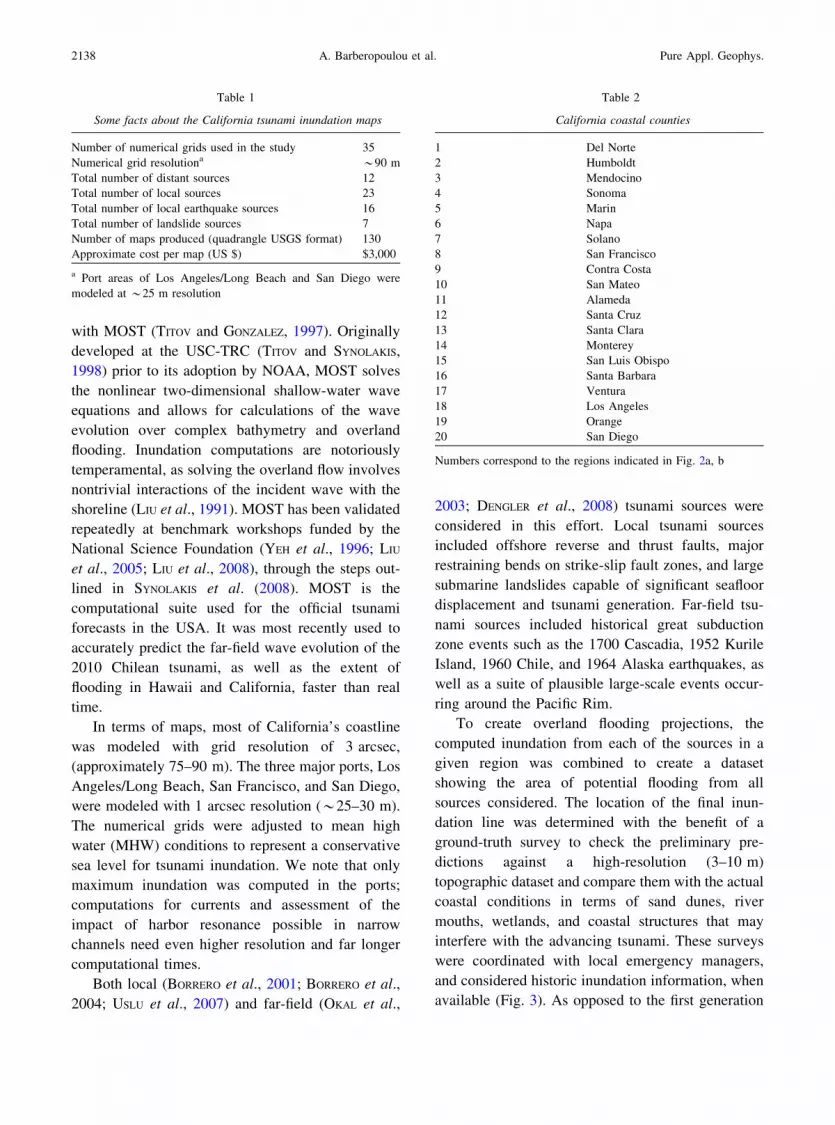
Table 1
Some facts about the California tsunami inundation maps
Number of numerical grids used in the study 35
Numerical grid resolutiona *90 m
Total number of distant sources 12
Total number of local sources 23
Total number of local earthquake sources 16
Total number of landslide sources 7
Number of maps produced (quadrangle USGS format) 130
Approximate cost per map (US $) $3,000
a Port areas of Los Angeles/Long Beach and San Diego were
modeled at *25 m resolution
Table 2
California coastal counties
1 Del Norte
2 Humboldt
3 Mendocino
4 Sonoma
5 Marin
6 Napa
7 Solano
8 San Francisco
9 Contra Costa
10 San Mateo
11 Alameda
12 Santa Cruz
13 Santa Clara
14 Monterey
15 San Luis Obispo
16 Santa Barbara
17 Ventura
18 Los Angeles
19 Orange
20 San Diego
Numbers correspond to the regions indicated in Fig. 2a, b
2138 A. Barberopoulou et al. Pure Appl. Geophys.
of maps (whose inundation line represented one
global maximum over the entire map), each point on
the second-generation maps reflected the extreme
inundation at that particular point, among different
scenarios at that point, therefore a local maximum.
California completed its second generation of
inundation maps, as planned, by the fifth anniversary
of the 2004 Sumatra tsunami. They were presented at
a joint CalEMA, USGS, and USC-TRC press con-
ference at the 2009 Fall Meeting of the American
Geophysical Union. These maps are a significant
improvement over the earlier generation, as they are
of higher resolution, are based on more recent geo-
logic investigations, and cover areas not previously
mapped. Once implemented in local tsunami hazard
mitigation and response planning, the maps will
provide an additional level of confidence for visitors
and residents of coastal locales.
4. Discussion of the Second-Generation Maps
4.1. Deterministic versus Probabilistic
For these maps, a deterministic approach was
used. Probabilistic maps are more appropriate for
land use planning and zoning, but deterministic maps
are more common for evacuation planning. The latter
are less expensive to produce than the former, and
often there is simply not enough information to
warrant the production of probabilistic maps, even if
resources exist. This happens when there are insuf-
ficient historical records or geological and
seismological data available for meaningful estimates
of tsunami recurrence rates.
While specific scenarios used to develop deter-
ministic maps do, in general, have quantified return
periods, for many scenarios used in this study, the
return periods are poorly known, especially for
submarine landslide sources. For example, the repeat
time of the Palos Verdes debris avalanche, a feature
believed to be capable of generating a significant
tsunami off the Ports of Los Angeles/Long Beach,
has been estimated to 3,000–7,500 years (e.g., LEE
et al., 2009), with the last event estimated to have
taken place over 2,000 years ago.
The inundation mapping effort discussed here
included submarine landslide sources placed at various
likely locations along the coast. Indeed, these submarine
landslide sources dominated the runup predictions for
most cases in Southern California. The relatively long
expected recurrence frequencies for these large coastal
submarine landslides—up to 10,000 years—are roughly
one order of magnitude lower than the frequency of large
(M [ 7.0) offshore earthquakes on active offshore faults
with recurrence rates of 150–3,500 years (150 years for
the offshore San Andreas in Northern California,
3,500 years for the less active faults along the coast
such as the Newport-Inglewood-Rose Canyon Fault
Zone). Reconciling this disparity is an issue that will be
revisited in future studies.
4.2. Numerical Grid Resolution
California, with its complex offshore and near-
shore bathymetry, offers a challenging hydrodynamic
setting for numerical simulations. While flat and
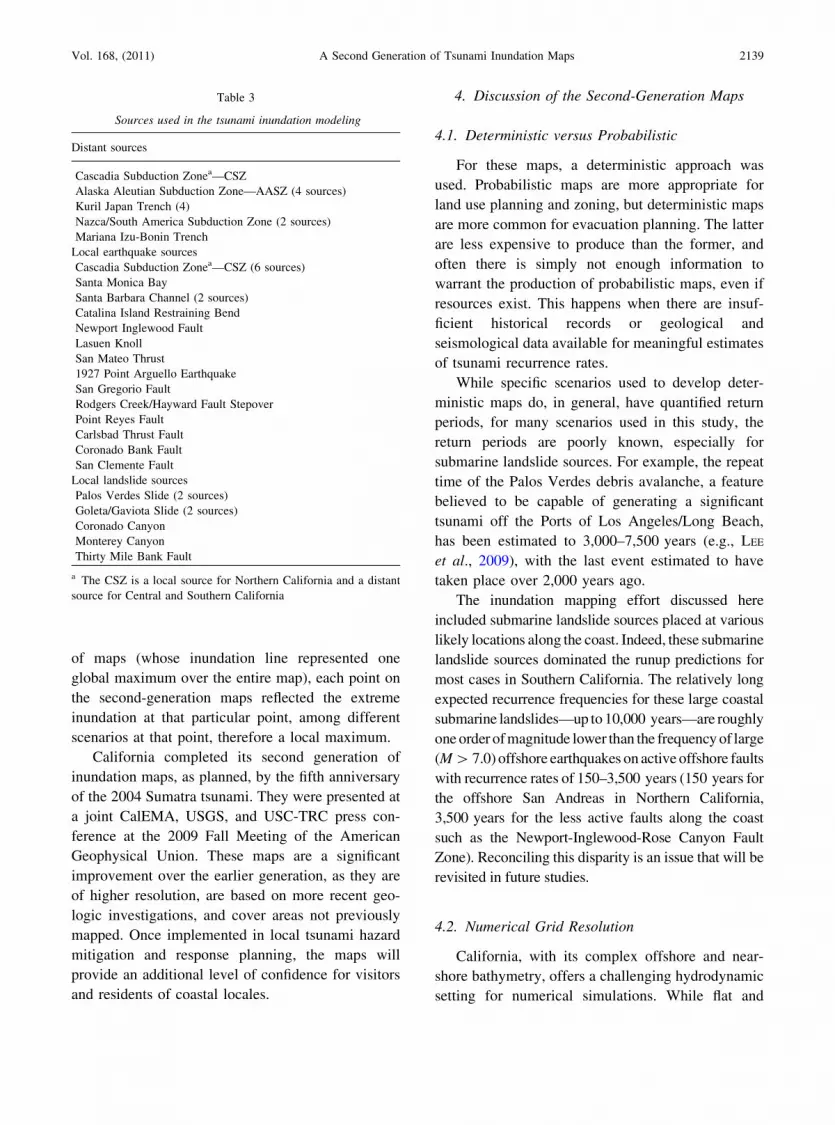
Table 3
Sources used in the tsunami inundation modeling
Distant sources
Cascadia Subduction Zonea—CSZ
Alaska Aleutian Subduction Zone—AASZ (4 sources)
Kuril Japan Trench (4)
Nazca/South America Subduction Zone (2 sources)
Mariana Izu-Bonin Trench
Local earthquake sources
Cascadia Subduction Zonea—CSZ (6 sources)
Santa Monica Bay
Santa Barbara Channel (2 sources)
Catalina Island Restraining Bend
Newport Inglewood Fault
Lasuen Knoll
San Mateo Thrust
1927 Point Arguello Earthquake
San Gregorio Fault
Rodgers Creek/Hayward Fault Stepover
Point Reyes Fault
Carlsbad Thrust Fault
Coronado Bank Fault
San Clemente Fault
Local landslide sources
Palos Verdes Slide (2 sources)
Goleta/Gaviota Slide (2 sources)
Coronado Canyon
Monterey Canyon
Thirty Mile Bank Fault
a The CSZ is a local source for Northern California and a distant
source for Central and Southern California
Vol. 168, (2011) A Second Generation of Tsunami Inundation Maps 2139
planar beaches can be realistically modeled using
90 m numerical grids, more complex ports and harbors
require higher-resolution grids to resolve complex
wave dynamics and possible seiching (i.e. BARBERO-
POULOU, 2008). For example, in the Ports of Los
Angeles and Long Beach, the breakwater is not well
represented with a 90 m grid. Using a 25–30 m grid,
the breakwater is better resolved, resulting in more
accurate hydrodynamic simulations. Furthermore, as
well documented in previous inundation modeling
studies, coarse numerical grid resolution leads to
underprediction of tsunami inundation and runup
(TITOV and SYNOLAKIS, 1998; TITOV and GONZALEZ,
1997). The issue of modeled inundation approaching
its physical asymptotic value with increasing grid
resolution has been addressed by TITOV and SYNOLAKIS
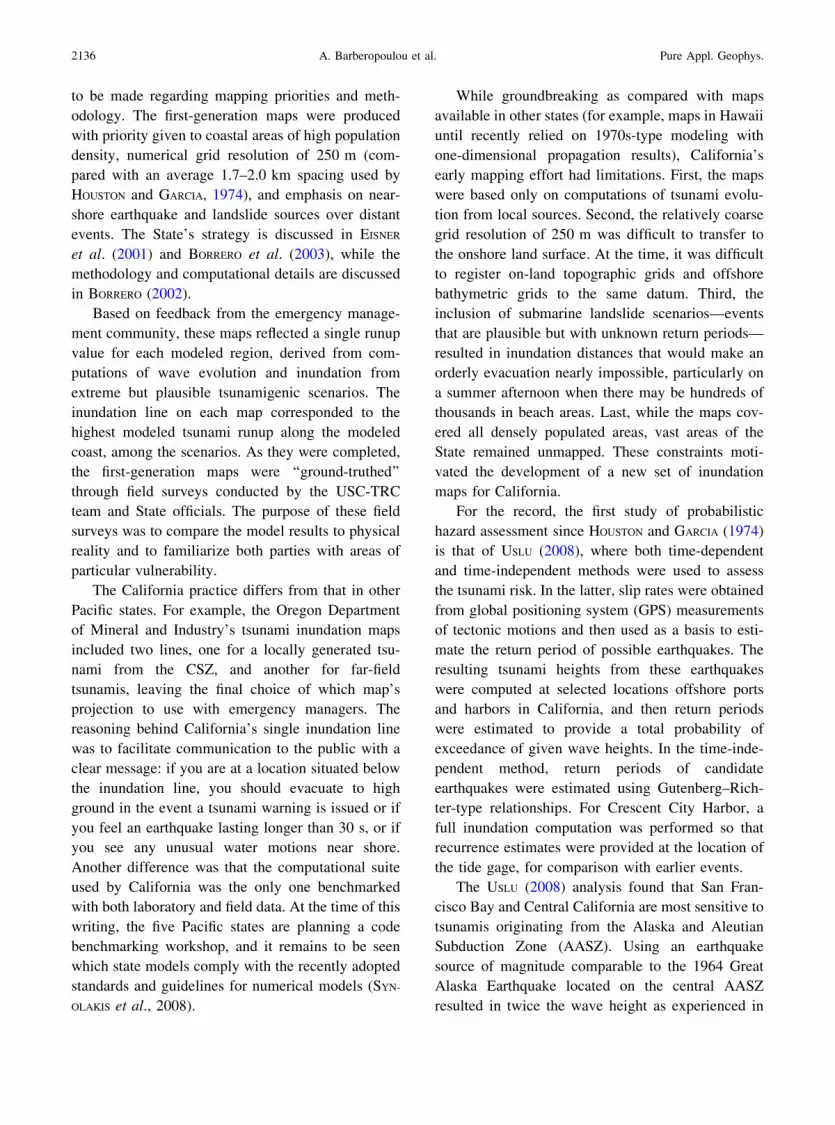
(1998) and PEDERSEN (2008) and is illustrated in Fig. 4,
which compares inundation projections in San Diego
Bay using 3-arcsec and 1-arcsec resolution grids.
The issue of the appropriate grid resolution for
numerical prediction of tsunami inundation in com-
plex bays and harbors was raised as recently as April
2009, during a meeting of the NTHMP Mapping and
Modeling Subcommittee (MMS). Minimum require-
ments were placed for the inundation map production,
wherever the quality of available data permits. As
SYNOLAKIS et al. (2002) have argued, while higher
numerical resolution may improve computational
accuracy, it does not improve physical realism if not
based on equivalent or higher resolution in measured
bathymetry and topography. If one interpolates
numerically in a given coarse grid, features present
in the prototype landforms may be missed and the
fine-resolution computation may provide a false sense
of confidence. In California, where most of the
inundation maps relied on a 90 m resolution grid,
field surveys attempted to improve the maps by
carefully checking the actual terrain against the digital
elevation model used in the computations. This
approach has merit in terms of finding out if on-land
features are reflected in the topographic grids, but it
does not improve computational accuracy.
4.3. Bathymetry and Topography Data
The bathymetric and topographic data used in
California’s maps originate from the National
Geophysical Data Center (NGDC). The NGDC is
the primary developer of registered bathymetry and
topography datasets in the USA. Grids are produced
at cost—a grid with 30 m resolution for a 40 km
length of coastline is valued at approximately
US $45,000. The NGDC produces datasets in a
format readily usable by MOST, thus allowing for
considerable time-saving in the production of maps.
Grids are subsectioned as appropriate for site-specific
scenario modeling.
4.4. Tsunami Sources
Initial conditions for local and distant sources
were implemented differently in the computations.
For distant events, we relied on the National Oceanic
and Atmospheric Administration Pacific Marine
Environmental Laboratory (NOAA–PMEL) database,
which subdivides the major subduction zones of the
Pacific Rim into discrete 50-km-wide by 100-km-
long fault segments. The rupture along each segment
is modeled as a low-angle, pure thrust mechanism
with a uniform 1 m of co-seismic slip, equivalent to
an earthquake of Mw = 7.5. The resulting sea-floor
deformation is then used as an initial condition for
MOST, and the numerical results stored in a database.
More complex rupture scenarios are created through
linear superposition and scaling of these individual
scenarios into larger events of the desired earthquake
magnitude. The resulting composite wave field is
used to calculate boundary conditions for subsequent
computations in the high-resolution grids for the
region of interest. In this manner, it is not necessary
to compute the wave evolution over large transoce-
anic distances for every scenario, since it is supplied
by the database, and the computational effort is
limited to solving the nonlinear near-shore evolution
problem. It is possibly for this reason, that the cost of
the California maps is the lowest among the five
Pacific states.
Note that, in this methodology of unit sources,
geometric parameters describing each unit fault
segment cannot be modified. However, the NOAA/
PMEL database is expanding and now covers every
major subduction and faulting zone in the Pacific,
Atlantic, and Indian Oceans, and most known earth-
quakes can be described through combination of
2140 A. Barberopoulou et al. Pure Appl. Geophys.
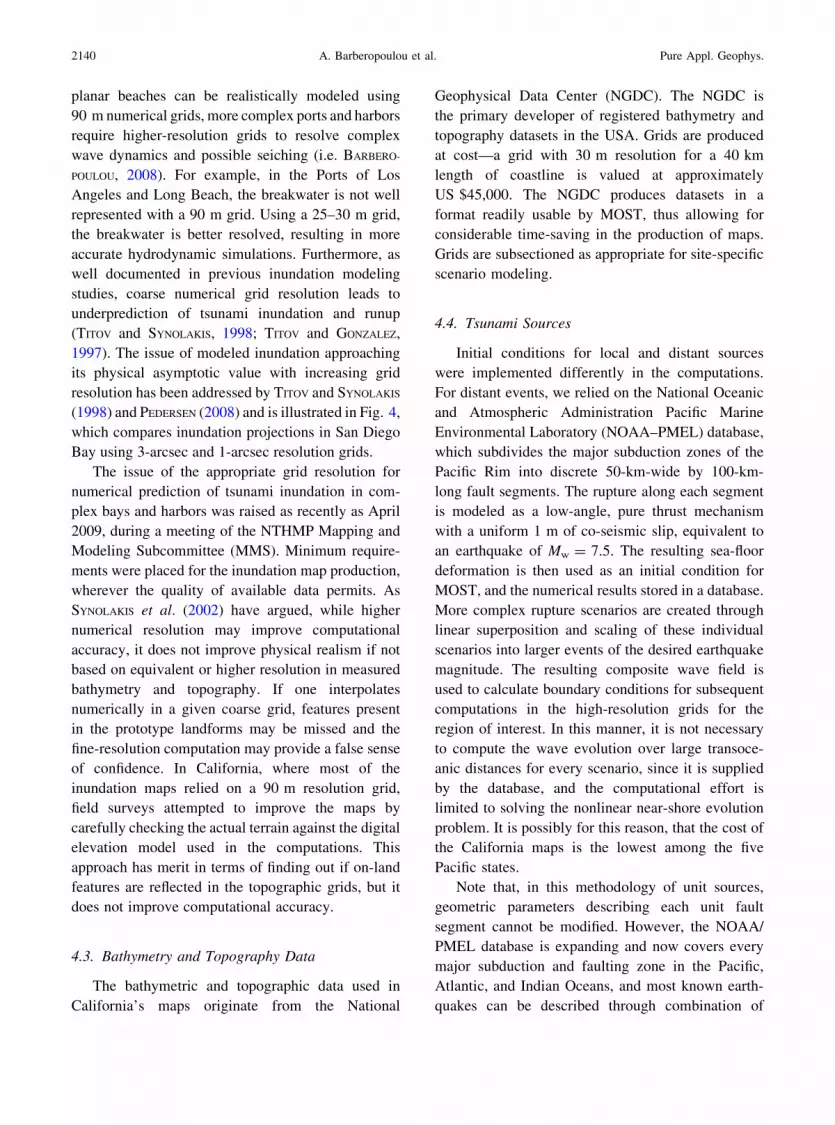
117°22'30"W
117°22'30"W
33°15'0"N
33°7'30"N
33°7'30"N
117°22'30"W
117°22'30"W
33°15'0"N
33°7'30"N
33°7'30"N
TSUNAMI INUNDATION MAPFOR EMERGENCY PLANNING
0.5 0 0.5 10.25
Miles
SCALE 1:24,000
1,000 0 1,000 2,000 3,000 4,000 5,000500
Feet
0.5 0 0.5 10.25
Kilometers
State of CaliforniaCounty of San Diego
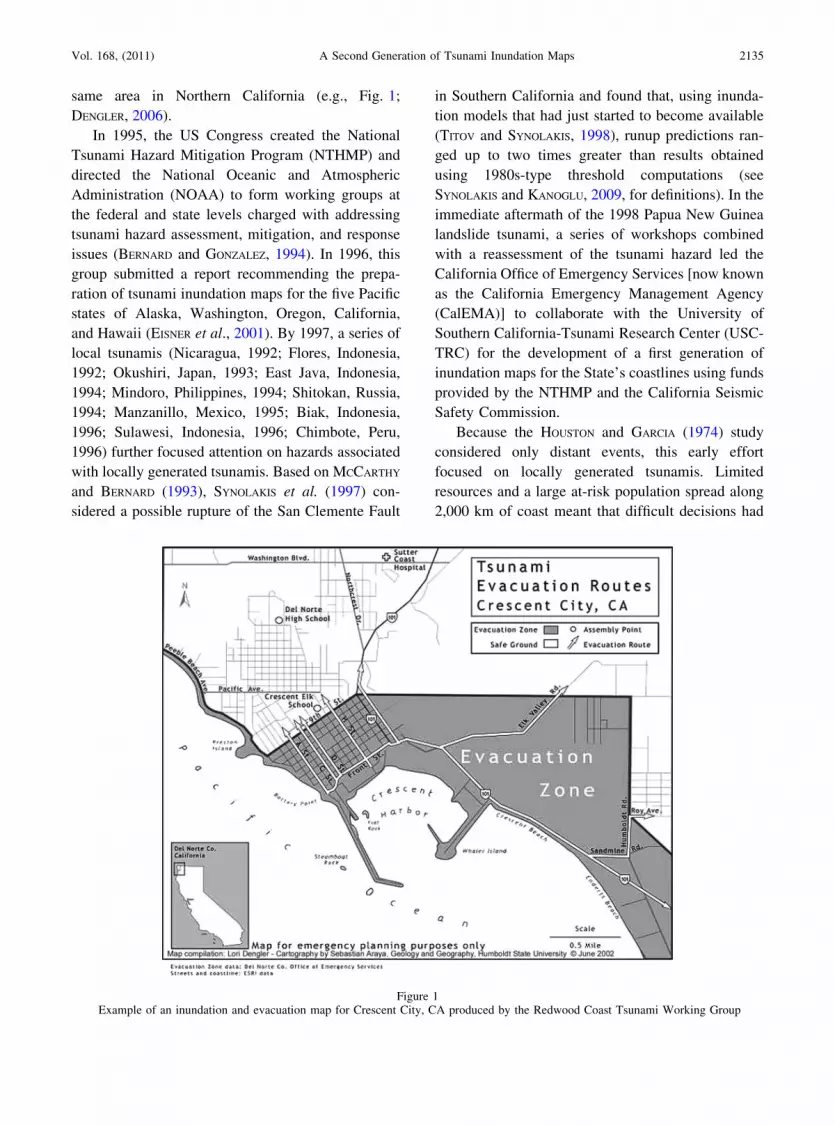
Initial tsunami modeling was performed by the University of Southern California (USC)Tsunami Research Center funded through the California Emergency Management Agency(CalEMA) by the National Tsunami Hazard Mitigation Program. The tsunami modelingprocess utilized the MOST (Method of Splitting Tsunamis) computational program(Version 0), which allows for wave evolution over a variable bathymetry and topographyused for the inundation mapping (Titov and Gonzalez, 1997; Titov and Synolakis, 1998).
The bathymetric/topographic data that were used in the tsunami models consist of aseries of nested grids. Near-shore grids with a 3 arc-second (75- to 90-meters)resolution or higher, were adjusted to “Mean High Water” sea-level conditions,representing a conservative sea level for the intended use of the tsunami modelingand mapping.
A suite of tsunami source events was selected for modeling, representing realisticlocal and distant earthquakes and hypothetical extreme undersea, near-shore landslides(Table 1). Local tsunami sources that were considered include offshore reverse-thrustfaults, restraining bends on strike-slip fault zones and large submarine landslidescapable of significant seafloor displacement and tsunami generation. Distant tsunamisources that were considered include great subduction zone events that are known tohave occurred historically (1960 Chile and 1964 Alaska earthquakes) and others whichcan occur around the Pacific Ocean “Ring of Fire.”
In order to enhance the result from the 75- to 90-meter inundation grid data, a methodwas developed utilizing higher-resolution digital topographic data (3- to 10-metersresolution) that better defines the location of the maximum inundation line (U.S.Geological Survey, 1993; Intermap, 2003; NOAA, 2004). The location of the enhancedinundation line was determined by using digital imagery and terrain data on a GISplatform with consideration given to historic inundation information (Lander, et al.,1993). This information was verified, where possible, by field work coordinated withlocal county personnel.
The accuracy of the inundation line shown on these maps is subject to limitations inthe accuracy and completeness of available terrain and tsunami source information, andthe current understanding of tsunami generation and propagation phenomena as expressedin the models. Thus, although an attempt has been made to identify a credible upperbound to inundation at any location along the coastline, it remains possible that actualinundation could be greater in a major tsunami event.
This map does not represent inundation from a single scenario event. It was created bycombining inundation results for an ensemble of source events affecting a given region(Table 1). For this reason, all of the inundation region in a particular area will not likelybe inundated during a single tsunami event.
Tsunami Inundation Line
Tsunami Inundation Area
MAP EXPLANATIONMETHOD OF PREPARATION
References:
Intermap Technologies, Inc., 2003, Intermap product handbook and quick start guide:Intermap NEXTmap document on 5-meter resolution data, 112 p.
Lander, J.F., Lockridge, P.A., and Kozuch, M.J., 1993, Tsunamis Affecting the West Coastof the United States 1806-1992: National Geophysical Data Center Key to GeophysicalRecord Documentation No. 29, NOAA, NESDIS, NGDC, 242 p.
National Atmospheric and Oceanic Administration (NOAA), 2004, InterferometricSynthetic Aperture Radar (IfSAR) Digital Elevation Models from GeoSAR platform (EarthData):3-meter resolution data.
Titov, V.V., and Gonzalez, F.I., 1997, Implementation and Testing of the Method of TsunamiSplitting (MOST): NOAA Technical Memorandum ERL PMEL – 112, 11 p.
Titov, V.V., and Synolakis, C.E., 1998, Numerical modeling of tidal wave runup:Journal of Waterways, Port, Coastal and Ocean Engineering, ASCE, 124 (4), pp 157-171.
U.S. Geological Survey, 1993, Digital Elevation Models: National Mapping Program,Technical Instructions, Data Users Guide 5, 48 p.
California Emergency Management AgencyCalifornia Geological SurveyUniversity of Southern California
Tsunami Inundation Map for Emergency PlanningOceanside Quadrangle/San Luis Rey Quadrangle
State of California ~ County of San Diego
OCEANSIDE QUADRANGLESAN LUIS REY QUADRANGLE
June 1, 2009This tsunami inundation map was prepared to assist cities and counties in identifyingtheir tsunami hazard. It is intended for local jurisdictional, coastal evacuationplanning uses only. This map, and the information presented herein, is not a legaldocument and does not meet disclosure requirements for real estate transactionsnor for any other regulatory purpose.
The inundation map has been compiled with best currently available scientificinformation. The inundation line represents the maximum considered tsunami runupfrom a number of extreme, yet realistic, tsunami sources. Tsunamis are rare events;due to a lack of known occurrences in the historical record, this map includes noinformation about the probability of any tsunami affecting any area within a specificperiod of time.
Please refer to the following websites for additional information on the constructionand/or intended use of the tsunami inundation map:
State of California Emergency Management Agency, Earthquake and Tsunami Program:http://www.oes.ca.gov/WebPage/oeswebsite.nsf/Content/B1EC51BA215931768825741F005E8D80?OpenDocument
University of Southern California – Tsunami Research Center:http://www.usc.edu/dept/tsunamis/2005/index.php
State of California Geological Survey Tsunami Information:http://www.conservation.ca.gov/cgs/geologic_hazards/Tsunami/index.htm
National Oceanic and Atmospheric Agency Center for Tsunami Research (MOST model):http://nctr.pmel.noaa.gov/time/background/models.html
The California Emergency Management Agency (CalEMA), the University of SouthernCalifornia (USC), and the California Geological Survey (CGS) make no representationor warranties regarding the accuracy of this inundation map nor the data from whichthe map was derived. Neither the State of California nor USC shall be liable under anycircumstances for any direct, indirect, special, incidental or consequential damageswith respect to any claim by any user or any third party on account of or arising fromthe use of this map.
Topographic base maps prepared by U.S. Geological Survey as part of the 7.5-minuteQuadrangle Map Series (originally 1:24,000 scale). Tsunami inundation lineboundaries may reflect updated digital orthophotographic and topographic data thatcan differ significantly from contours shown on the base map.
PURPOSE OF THIS MAP
MAP BASE
DISCLAIMER
Table 1: Tsunami sources modeled for the San Diego County coastline.
Areas of Inundation Map Coverageand Sources UsedSources (M = moment magnitude used in modeled
event) DanaPoint
Oceanside San Diego
Carlsbad Thrust Fault X XCatalina Fault X X XCoronado Bank Fault XLasuen Knoll Fault X XSan Clemente Fault Bend Region XSan Clemente Island Fault XSan Mateo Thrust Fault X X
LocalSources
Coronado Canyon Landslide #1 XCascadia Subduction Zone #3 (M9.2) X XCentral Aleutians Subduction Zone#1(M8.9) X X XCentral Aleutians Subduction Zone#2(M8.9) X XCentral Aleutians Subduction Zone#3(M9.2) X X XChile North Subduction Zone (M9.4) X X1960 Chile Earthquake (M9.3) X X1952 Kamchatka Earthquake (M9.0) X1964 Alaska Earthquake (M9.2) X X XJapan Subduction Zone #2 (M8.8) X XKuril Islands Subduction Zone #2 (M8.8) X XKuril Islands Subduction Zone #3 (M8.8) X X
DistantSources
Kuril Islands Subduction Zone #4 (M8.8) X X
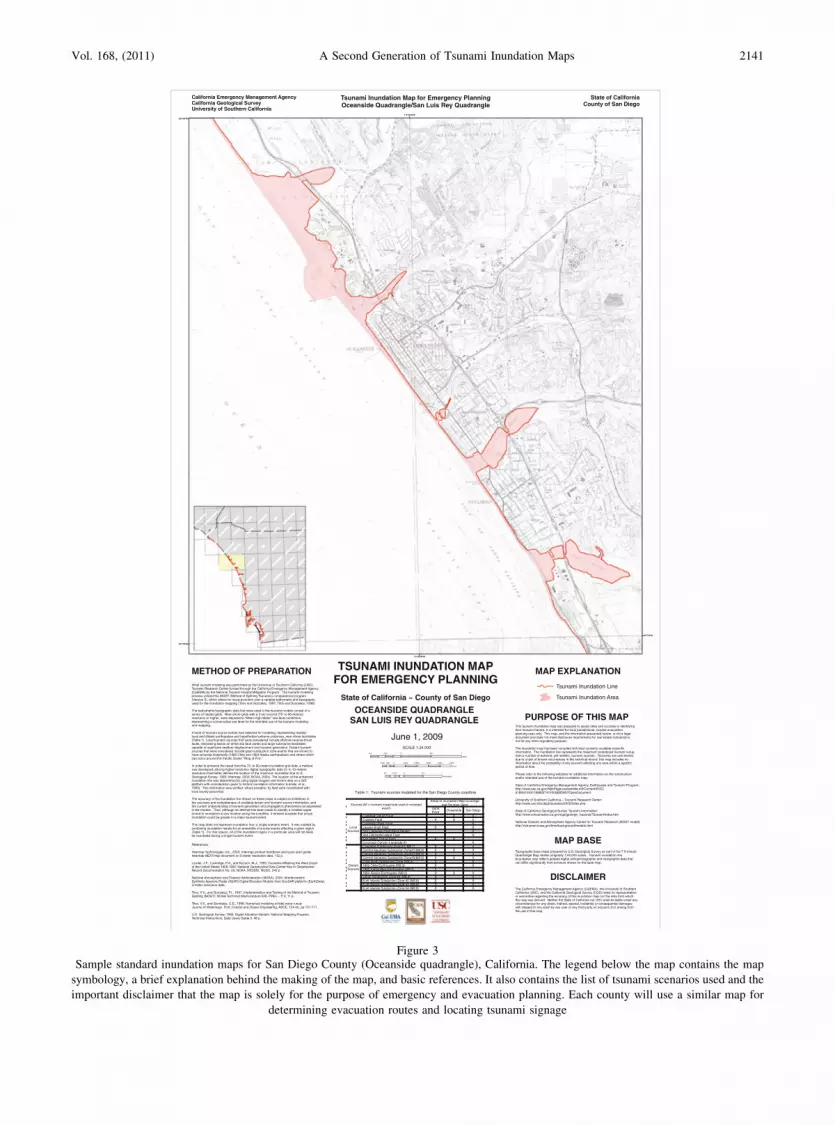
Figure 3Sample standard inundation maps for San Diego County (Oceanside quadrangle), California. The legend below the map contains the map
symbology, a brief explanation behind the making of the map, and basic references. It also contains the list of tsunami scenarios used and the
important disclaimer that the map is solely for the purpose of emergency and evacuation planning. Each county will use a similar map for
determining evacuation routes and locating tsunami signage
Vol. 168, (2011) A Second Generation of Tsunami Inundation Maps 2141
faults in the expanded database (GICA et al., 2008).
When complex local faulting and/or sources occur
within the computational areas, we devise more
realistic faulting scenarios that incorporate variable
slip distributions and alternate fault geometries, i.e.,
we do not use the database. Tsunami inundation
calculations in the Southern California Bight
(BORRERO et al., 2004; LEGG et al., 2004) and near-
field effects of ruptures along the CSZ (USLU, 2008)
were modeled from the epicenter to the maximum
inundation point, without using precomputed data.
4.5. Applicability and Use of the California Maps
The primary use of the new inundation maps is for
evacuation planning, increasing awareness, and pub-
lic education. The latter is believed the weakest link
in the chain. The maps are not appropriate for use in
calculating local effects at power plants, utilities or
vital coastal infrastructure. For example, when con-
sidering whether a near-shore structure will be
overtopped, the information on the maps is of little
use, particularly for marginal events, which may be
the most common. The overland flow depths of
smaller tsunamis may be of the same size as the
height of the structure, hence computations at high
resolution with at least two grid points in the tank are
needed for any meaningful inferences as to the
hazard. Hence, extreme caution needs to be exercised
when using the inundation maps for any engineering
study, which by definition involves analysis of risk at
the level of particular structures. For such needs, a
detailed site-specific study should be undertaken
using state-of-the-art numerical modeling techniques.
4.6. Recent Tsunami Events in California
Inundation maps are but one link in hazard
mitigation planning and emergency response. In an
actual event, State officials (hopefully with the
benefit of the knowledge of tsunami researchers)
decide whether to proceed with a local or regional
evacuation after a tsunami message (watch, advisory
or warning) is issued. Here, we will discuss briefly
how the system worked during three recent events.
The earthquake of 14 June 2005 (MW = 7.2)
occurred on the Gorda Plate near the Mendocino
Triple Junction offshore of Northern California
(OPPENHEIMER et al., 1993). This event was particularly
worrisome, since it occurred near the southern end of
the CSZ and immediately raised the possibility of a
destructive local tsunami. Fortunately, the generated
waves were only a few centimeters high, due primarily
to the strike-slip motion of the source. While strike-
slip faults are not usually thought of as tsunamigenic,
there are examples where strike-slip faults may have
triggered significant tsunamis (IMAMURA et al., 1995).
Also, there is speculation that restraining bends
associated with strike-slip faulting are possible tsu-
nami sources, particularly in Southern California
(LEGG et al., 2004). During the 2005 event, residents
of Crescent City were successfully warned about a
possible tsunami; however, this message failed to
reach residents in other areas on time (GIBBONS, 2005).
On November 15, 2006 an earthquake in the Kuril
Islands produced a tsunami that affected parts of
California (DENGLER et al., 2009). The distance from
the epicenter allowed time for officials to respond.
Once a relatively small tsunami was detected on
deep-ocean tsunameters, the warning was lifted for
the US West Coast, approximately 3.5 h after the
event (DENGLER et al., 2009). At the time, warning
center protocols and procedures did not allow for a
localized watch or warning to be issued for specific
areas of Northern California, such as Crescent City,
which, despite the small tsunami amplitude, remained
vulnerable to damaging currents and surges.
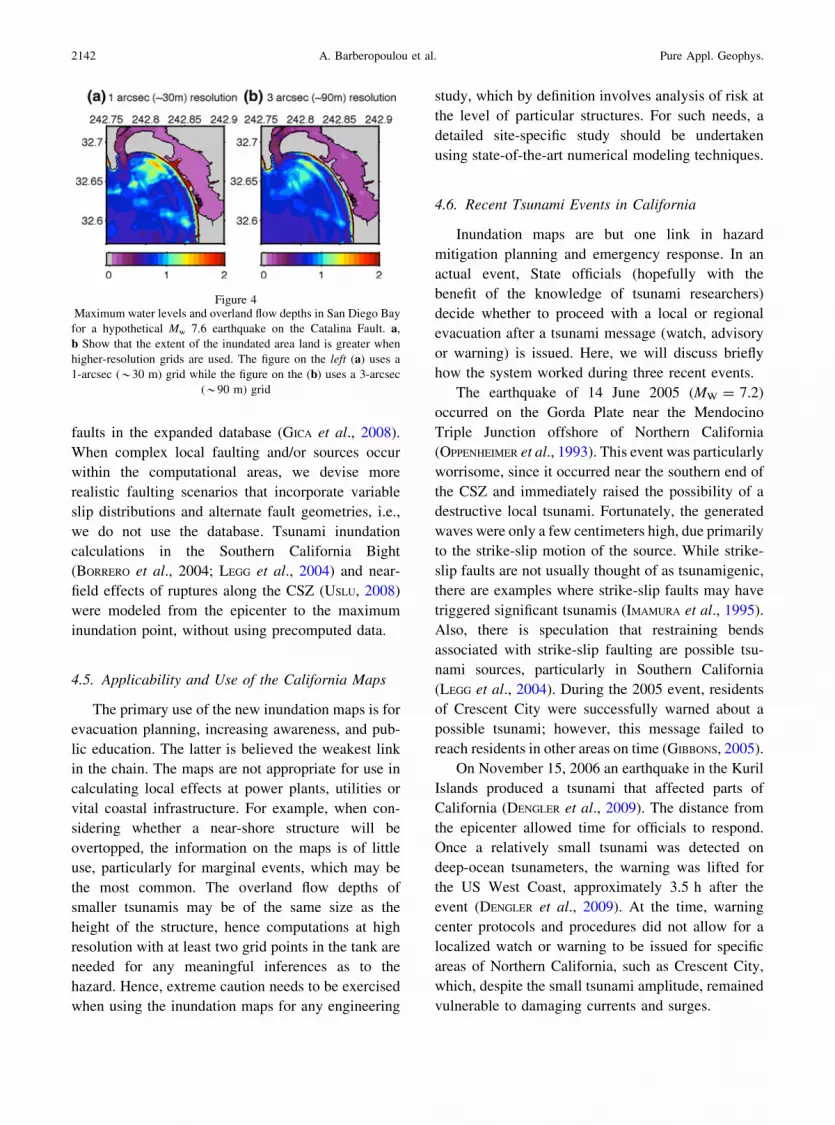
Figure 4Maximum water levels and overland flow depths in San Diego Bay
for a hypothetical Mw 7.6 earthquake on the Catalina Fault. a,
b Show that the extent of the inundated area land is greater when
higher-resolution grids are used. The figure on the left (a) uses a
1-arcsec (*30 m) grid while the figure on the (b) uses a 3-arcsec
(*90 m) grid
2142 A. Barberopoulou et al. Pure Appl. Geophys.
The lines of communication between local
experts, emergency management, and the warning
centers remained open, despite the cancelation of the
official warning. Hence, certain low-lying areas were
evacuated, despite the warning cancelation. The
tsunami arrived at Crescent City at 11:30 a.m. local
time and caused approximately US $10 million in
damage. Most of it was confined to the harbor area
and caused primarily by strong currents generated by
the rapid rise and fall of the water levels. It is
important to note that the damaging surges occurred
11 h after the predicted first wave arrival, by which
time many evacuees had returned to low-lying
waterfront areas. While local officials and experts
were prepared and handled the situation appropri-
ately, they were not aware of the possibility of the
delayed response in Crescent City, and the evacuation
order was lifted too soon (BARBEROPOULOU et al.,
2008).
The Chilean earthquake of 27 February 2010
generated a trans-Pacific tsunami that had small
impact in Japan and minimal effects in Hawaii and
the Marquesas Islands, as predicted by NOAA–
PMEL approximately 8 h before the first wave
arrival. While Hawaii opted for a full evacuation as
per their inundation maps, California, which had a
shorter time window, remained at the advisory level.
Several municipalities evacuated local beaches only,
others not at all. What is relevant is that the tsunami
did cause strong and damaging currents in San Diego,
Los Angeles, Long Beach, and Ventura Harbors, but
otherwise had even less impact than in Hawaii.
The tsunami tested the level of education among
managers and first-responders, such as firefighters,
coastguard, and police. In the ports, emergency boats
sailed offshore, to depths that were greater than
150 m, under the impression that this was the
threshold of safety. One co-author (C.E.S.) observed
the response from a Los Angeles County Fire
Department boat in the Port of Los Angeles through-
out the day of 28 February, and was astounded to find
that, once the expected ‘‘landfall’’ time had passed,
the flotilla of boats started heading back to the harbor.
There was no understanding that tsunamis are long-
duration events and that more often than not the
waves following the first one are larger. In fact, at
1:00 p.m., about 45 min after the forecast time for the
first arrival, another Fire Department vessel encoun-
tered strong currents while attempting to reenter the
harbor, which for a few moments, made the vessel
difficult to steer.
On the same morning (28 February), the US
Coastguard continuously broadcasted every 10 min
over emergency radio channels that 6–8 ft (2–2.5 m)
surges were expected in Southern California, but did
not specify where. Many assumed that this meant
walls of water, and having not noticed even a 1 ft
surge, they believed the tsunami was a ‘‘no show.’’
Later in the day, after receiving reports of strong
currents, the Coast Guard decided to stop the
boarding of passengers onto a cruise ship. This
caused a number of heated arguments, with people
questioning why boarding was being stopped at that
time, since the threat was believed to be long over.
Even emergency personnel had difficulty identifying
the rapid 2 ft drop in water level near their station as
being the tsunami; they instead assumed it was the
tide, not noticing that the water level change took
place in less than 30 min.
A follow-up meeting was organized on 4 March
2010 to discuss California’s response to the Chile
tsunami with first-responders and emergency manage-
ment. Key issues identified as problematic were
uncertainty as to the duration of the event, the number
of waves, and the confusion as to what the tsunami
forecasts referred to in terms of heights or amplitudes.
There was no question that, for port operations,
information about the sequence of waves is essential
to allow rescue operations to proceed ‘‘safely,’’ but
along the open coastlines a flooding forecast would
have been more useful than vague announcements
about tsunami heights or amplitudes, which can change
depending on the offshore location they refer to.
The three described earthquakes challenged
assumptions of what tsunamis look like upon reach-
ing the coast, illustrated the extended duration of the
hazard, and tested the readiness of California’s
tsunami response plan. It is quite clear that what
the science community believes is common knowl-
edge is not so for emergency management or the
general public, particularly in terms of the extended
duration of the hazard, which persists well beyond the
first wave arrival, and inferences about tsunami
‘‘heights’’ and ‘‘amplitudes.’’
Vol. 168, (2011) A Second Generation of Tsunami Inundation Maps 2143
It is here that inundation maps are very impor-
tant. The maps depict flooding zones, just as the
NOAA–PMEL forecasts are designed to do. What
emergency managers need to know is whether a full
or partial evacuation is warranted, and they can do
that with estimates of offshore heights, even when
there is ample time for decision-making. In the
recent event, Hawaii and California each had over
12 h to prepare. Ports need estimates of currents,
duration, and the possibility of seiche, in real time.
Inundation maps provide estimates of flooding and
can provide maximal currents and serve to plan
evacuations in advance, in terms of routes and
resources, particularly important for near-field
events, when there is a short warning window. By
2012, it is expected that in an actual emergency
there will be real-time flooding forecasts from
NOAA–PMEL including margins of error, and
evacuation decisions will be somewhat easier. Even
then, if emergency management, first-responders,
and the public do not become better informed as to
how to interpret forecasts, the useless evacuation in
Hawaii during the 2010 tsunami may be repeated. In
terms of California, one wonders what will happen
in heavily populated southern beaches after a
moderate to large local offshore earthquake.
5. Conclusions
A new set of inundation maps has been developed
for California. These maps cover the largest coastal
area of any US state. They are deterministic, and their
primary use is for evacuation planning. The release of
these maps offers an opportunity to develop a con-
sistent, statewide tsunami preparedness plan for all
coastal communities in California.
These new products are a result of a multiyear
collaboration between CalEMA, CGS, and USC-
TRC. Because planning for a natural disaster is an
ongoing process, the release of these maps is both a
milestone and a call for improvements in tsunami
preparedness.
For more information regarding tsunami hazards
in California and the new tsunami inundation maps
please visit the following websites:
New statewide inundation maps:
http://www.conservation.ca.gov/cgs/geologic_hazards/
Tsunami/Inundation_Maps/Pages/Statewide_Maps.aspx
University of Southern California—Tsunami
Research Center:
http://www.usc.edu/dept/tsunamis
Acknowledgments
We would like to thank the National Tsunami
Hazards Mitigation Program (NTHMP) for providing
the funds for developing the first and second gener-
ation of maps, and particularly our collaborators at
CalEMA (Jim Goltz, Kevin Miller, Johana Fenton)
and at CGS (Rick Wilson) for their contributions in
the implementation of the inundation into evacuation
maps. We thank Dick McCarthy and Jim Anderson
from the California Seismic Safety Commission for
many interesting suggestions and for providing travel
funds in transition periods. We thank the National
Science Foundation for providing grant support for
Burak Uslu’s PhD thesis.
REFERENCES
BARBEROPOULOU, A. (2008) ‘‘A seiche hazard study for Lake Union,
Seattle, Washington’’, Bulletin of the Seismological Society of
America 98 (4), 1837–1848.
BARBEROPOULOU A., DENGLER L., and USLU B. (2008), Lessons for
California from the November 2006 tsunami in Crescent City,
California, in Solutions to Coastal Disasters, Proc. ASCE,
192-203, doi:10.1061/40978(313)18.
BARBEROPOULOU, A., BORRERO J.C., USLU, B., KALLIGERIS N., GOLTZ
J.D., WILSON R.I. and SYNOLAKIS C.E. (2009), New maps of
California to improve tsunami preparedness, Cover article, EOS
Trans. AGU, 90 (16), 137-138.
BARDET, J.-P., SYNOLAKIS, C.E., DAVIES, H.L., IMAMURA, F. and
OKAL, E.A. (2003), Landslide tsunamis: Recent findings and
research directions, Pure and Applied Geophysics, 160, (10/11),
179–1809.
BERNARD, E.N., and GONZALEZ F.I. (1994), Tsunami Inundation
Modeling Workshop Report (November 16–18, 1993), NOAA
Tech. Memo, ERL PMEL-100 (PB94-143377), 139 pp.
BERNARD, E., MADER, C., CURTIS, G., SATAKE, K. (1994), Tsunami
inundation model study of Eureka and Crescent City, California,
NOAA Tech. Memo, ERL PMEL-103, 80 pp.
BORRERO, J.C. (2002), Tsunami Hazards in Southern California,
Ph.D. Thesis, University of Southern California, Los Angeles,
California, 262 pp.
2144 A. Barberopoulou et al. Pure Appl. Geophys.
BORRERO J, YALCINER AC, KANOGLU U, TITOV V, MCCARTHY D,
SYNOLAKIS CE, (2003), Producing tsunami inundation maps: The
California experience in Submarine Landslides and Tsunamis,
NATO Science Series IV Earth and Environmental Sciences, 21,
315-326, IDS Number: BY68 ISBN: 1-4020-1348-5.
BORRERO J.C., LEGG M.R., SYNOLAKIS, C.E. (2004), Tsunami Sour-
ces in the Southern California Bight, Geophysical Research
Letters, 28 (4) 643-646.
BORRERO, J. C., DOLAN, J. F., and SYNOLAKIS, C. E. (2001), Tsunamis
within the eastern Santa Barbara Channel, Geophysical
Research Letters, 28, 643-646.
CLARKE, S. H., and CARVER, G. A. (1992), Late holocene tectonics
and paleo- seismicity, southern Cascadia Subduction Zone,
Science, 255, 188 – 192, doi:10.1126/science.255.5041.188.
DENGLER, L., USLU B., BARBEROPOULOU A., BORRERO J. and SYN-
OLAKIS C. (2008), The vulnerability of Crescent City, California
to tsunamis generated by earthquakes in the Kuril Islands region
of the northwestern Pacific Seismological Research Letters.
DENGLER, L. (2006), Cascadia earthquake and tsunami scenario for
California’s North Coast: Eos, Transactions, American Geo-
physical Union 87(52), Fall Meeting Supplement, Abstract
GC43A-03.
DENGLER, L., USLU B., BARBEROPOULOU, A., YIM S. C. and KELLY A.
(2009), The November 15, 2006 of Crescent City, Kuril Island
generated tsunami in Crescent City, California. Pure and appl.
Geophys., 166 (2009),37-53.
EISNER, R., BORRERO, C., SYNOLAKIS, C.E. (2001), Inundation Maps
for the State of California, International Tsunami Symposium,
ITS 2001. In: Proceedings of the International Tsunami Sympo-
sium 2001 (ITS 2001), NTHMP Review Session, R-2, Seattle,
WA, 7–10 August 2001, 67-81.
GEIST, E.L., TITOV, V.V., and Synolakis, C.E., 2006. Tsunami: wave
of change, Scientific American, 294, 56{63.
GIBBONS, H. (2005), Brief tsunami warning startles US West coast,
reveals strengths and weaknesses in tsunami preparedness, Sound
Waves monthly newsletter, United States Geolog. Survey, July
2005.
GICA, E., SpILLANE, M., TITOV, V., CHAMBERLIN, C., and NEWMAN,
J. (2008), Development of the forecast propagation database
for NOAA’s Short–term Inundation Forecast for Tsunamis
(SIFT). Tech. Memo. OAR PMEL–139 NTIS: PBB2008-
109391, NOAA/Pacific Marine Environmental Laboratory,
Seattle, WA.
GONZALEZ, F.I., BERNARD E.N., and SATAKE K. (1995), The Cape
Mendocino tsunami, 25 April 1992. In Tsunami: Progress in
Prediction, Disaster Prevention and Warning, Y. Tsuchiya and
N. Shuto (eds.), Series of Advances in Natural and Technological
Hazards Research, Kluwer Academic Publishers, 151–158.
GONZALEZ, F.I., SATAKE, K., BOSS, E.F., and MOFJELD, H.O. (1995),
Edge wave and non-trapped modes of the 25 April 1992 Cape
Mendocino tsunami. Pure and Appl. Geophys, 144 (3/4), 409–426.
GOYA, H. (2005), Stratigraphic and lithologic characteristics of
tsunami deposits and an evaluation of possible paleo-tsunami
deposits in southern California: M.S. Thesis, California State
University, Los Angeles, California.
HOUSTON, J. R. and GARCIA, A. W. (1974), Tsunami runup predic-
tions for southern California coastal communities, U. S. Army
Corps of Engineers, Waterways Experimental Station, 17 p.
HOUSTON, J.R. and GARCIA, A.W. (1978), Type-16 flood insurance
study: tsunami predictions for the west coast of the continental
United States, Waterways Experiment Station, Technical Report
H-78-26, Vicksburg, MS.
IMAMURA, F., SYNOLAKIS, C.E., GICA, E., TITOV, V., LISTANCO E. and
LEE, H.J. (1995), Field survey of the 1994 Mindoro Island,
Philippines tsunami, Pure and Applied Geophysics, doi:
10.1007/BF00874399, V.144,No 3-4.
LANDER,J.F, LOCKRIDGE, P.A., KOZUCH, M.J. (1993), Tsunamis
affecting the West Coast of the United States 1806-1992, NOAA
report.
LEE, H.J., GREENE, G.H., EDWARDS, B.D., FISCHER, M.A. and NOR-
MACK, W.R. (2009),Submarine landslides of the Southern
California Borderland, GSA special papers, V.454,251-269 doi:
10.1130/2009.2454(4.3).
LEGG, M.R., and KENNEDY, M.P. (1979), Faulting offshore San
Diego and northern Baja California. in Abbott, P.L., and W.J.
Elliott, eds., Earthquakes and other perils, San Diego region. San
Diego Assoc. of Geologists, 29-46.
LEGG, M.R., and BARBEROPOULOU, A., (2007), Complex faulting in
the Pacific-North America transform offshore southern Califor-
nia and implications for plate boundary tectonics and
tsunamigenesis: Eos, Transactions, American Geophysical
Union, Fall Meeting, Abstract.
LEGG, M.R., BORRERO, J.C., SYNOLAKIS, C.E. (2004), Tsunami
Hazards from the Catalina Fault Offshore Southern California,
Earthquake Spectra, Vol. 20, No. 3, p. 917 – 950.
LIU, P.L.-F., SYNOLAKIS, C.E. and YEH, H. (1991) Report on the
International Workshop on Long Wave Runup, Journal of Fluid
Mechanics, vol 229, 675-688.
LIU, P.L.-F., WU, T.-R., RAICHLEN, F., SYNOLAKIS, C.E., and BOR-
RERO J. (2005) Runup and rundown generated by three-
dimensional sliding masses, J. Fluid Mech., 536, 107–144.
LIU, P.L.-F., YEH, H. and SYNOLAKIS, C.E. (2008), Benchmark
Problems, in Advanced numerical models for simulating tsunami
waves and runup (ed. Liu, P.L-F.,Yeh H. and Synolakis C.E.),
World Scientific,, pp.3-42.
MCCARTHY, R.J., BERNARD, E.N. and LEGG M.R. (1993), The Cape
Mendocino Earthquake: A local tsunami wakeup call?, Pro-
ceedings of the Eighth Symposium on Coastal and Ocean
Management, Vol. III, 2812–2828.
MCCULLOCH, D. S. (1985), Evaluating tsunami potential, Evaluat-
ing Earthquake Hazards in the Los Angeles Region-An Earth
Science Perspective, USGS Prof. Paper 1360, 375-413.
MURPHY, K. (2005), West Coast Tsunami Warning June 14 2005,
After action report, Oregon Emergency Management, August
2005.
OKAL, E. A., STEIN, S. (2005), Seismology: Speed and size of the
Sumatra earthquake, Nature 434, 581–582, doi:10.1038/434581a.
OKAL, E.A., PLAFKER, G., SYNOLAKIS, C.E. and BORRERO, J.C.
(2003), Near-field survey of the 1946 Aleutian tsunami on Uni-
mak and Sanak Islands, Bull. Seismol. Soc. Amer., V. 93, No. 3,
pp. 1226 – 1234.
OPPENHEIMER, J. EATON 1, JAYKO, A., LISOWSKI, M., MARSHALL, G.,
MURRAY, M., SIMPSON, R., STEIN, R., BEROZA, G., MAGEE, M.,
CARVER, G., DENGLER, L., MCPHERSON, R., GEE, L., ROMANOWICZ,
B., GONZALEZ, F., LI, W. H., SATAKE, K., SOMERVILLE, P., and
VALENTINE D. (1993), The Cape Mendocino, California, Earth-
quakes of April 1992: Subduction at the Triple Junction, Science,
Vol. 261. no. 5120, 433 – 438.
PEDERSEN, G. (2008), A lagrangian model applied to runup prob-
lems, In Advanced numerical models for simulating tsunami
Vol. 168, (2011) A Second Generation of Tsunami Inundation Maps 2145
waves and runup (ed. Liu, P.L-F.,Yeh H. and Synolakis C.E.),
World Scientific, 2008, pp. 311-318.
SATAKE, K. and SOMERVILLE, P.G. (1992), Location and size of the
1927 Lompoc, California, earthquake from tsunami data, Bull.
Seismol.Soc.Amer., V82,(4), 1710-1725.
SYNOLAKIS CE, MCCARTHY D, TITOV V.V. (1997), Evaluating the
tsunami risk in California and the World Ocean ‘97 –Conference
Proceedings, Editors Magoon OT et al., San Diego, California,
IDS Number BL35F, ISBN 0-7844-0297-3, 1225-1236.
SYNOLAKIS, C.E., and OKAL, E. A. (2005), 1992 – 2002: Perspective
on a decade of post-tsunami surveys, in Tsunamis: Case Studies
and Recent Developments, K. Satake (ed), Adv. Nat. Technol.
Hazards, 23, 1 – 30.
SYNOLAKIS, C.E., BARDET, J.-P., BORRERO, J.C., DAVIES, H.L., OKAL,
E.A., SILVER, E.A., SWEET, S. and TAPPIN D.R. (2002), The slump
origin of the 1998 Papua New Guinea tsunami, Proceedings of
the Royal Society (London), Ser. A, 458, 763-789.
SYNOLAKIS, C.E., and BERNARD, E.N. (2006), Tsunami science
before and beyond Boxing Day 2004. Philisophical Transactions,
364 (1845),, 2231–2265, doi:10.1098/rsta.2006.1824.
SYNOLAKIS, C.E., and KONG, L., 2006, Runup measurements of the
December 26, 2004 tsunami, Earthquake Spectra 22 (S3),
S67S91, doi:10.1193/1.2218371,6, 2006.
Synolakis, C.E., Bernard, E.N., Titov V.V., Kanoglu, U. and
Gonzalez, F. I. (2008), Validation and Verification of Tsunami
Numerical Models, Pure and Applied Geophysics, V. 165(11/12),
2197-2228, doi:10.1007/s00024-004-0427-y.
SYNOLAKIS, C.E.and KANOGLU, U., (2009) Tsunami modeling,
development of benchmarked models, The Sea (Bernard, E.N &
Robinson, A.R., eds), V. 15, Harvard University Press, Cam-
bridge, Massachussetts, ISBN 0674031733.
TITOV V.V. and GONZALEZ, F. I. (1997), Implementation and Testing
of the Method of Tsunami Splitting (MOST). NOAA Technical
Memorandum ERL PMEL – 112. November.
TITOV, V.V. and SYNOLAKIS, C.E. (1998), Numerical modeling of
tidal wave runup, Journal of Waterways, Port, Coastal and Ocean
Engineering, ASCE, 124 (4), 157-171.
TOPPOZADA, T., BORCHARDT, G., HAYDON, W., PETERSEN, M., OLSON,
R., LAGORIO, H., and ANVIK, T. (1995), Planning Scenario in
Humboldt and Del Norte counties, California, for a great
earthquake on the Cascadia subduction zone, California Division
of Mines and Geology Special Publication 115, 157 p.
USLU, B., BORRERO, J.C., DENGLER, L., and SYNOLAKIS, C.E. (2007),
Tsunami Inundation at Crescent City, California generated by
earthquakes on the Cascadia Subduction Zone. Geophysical
Research Letters, Vol. 34, L20601.
USLU, B. (2008) Deterministic and probabilistic tsunami studies in
California from near and farfield sources, Ph.D. Thesis, Uni-
versity of Southern California, Los Angeles, California, 208 pp,
publication number 3341809.
WEI, Y., BERNARD, E., TANG, L., WEISS, R., TITOV, V., MOORE, C.,
SPILLANE, M., HOPKINS, M., and KANOGLU U. (2008) Real-time
experimental forecast of the Peruvian tsunami of August 2007 for
U.S. coastlines. Geophys. Res. Lett., 35, L04609, doi:
10.1029/2007GL032250.
YEH, H., LIU, P., and SYNOLAKIS, C. (eds.). (1996) Long-wave runup
models. World Scientific, Singapore.
(Received January 4, 2010, revised October 16, 2010, accepted October 19, 2010, Published online February 27, 2011)
2146 A. Barberopoulou et al. Pure Appl. Geophys.