bearing capacity of drilled shaft in intermediate geomaterials
TRANSCRIPT

Magazine of Civil Engineering. 2020. 99(7). Article No. 9908
Lan, C.N., Nguyen, M.H., Thanh, B.T., Long, N.N., Tien, L.D., Ho, L.S. Bearing capacity of drilled shaft in
intermediate geomaterials. Magazine of Civil Engineering. 2020. 99(7). Article No. 9908. DOI: 10.18720/MCE.99.8
This work is licensed under a CC BY-NC 4.0
ISSN 2712-8172
Magazine of Civil Engineering
journal homepage: http://engstroy.spbstu.ru/
DOI: 10.18720/MCE.99.8
Bearing capacity of drilled shaft in intermediate geomaterials C.N. Lana, M.H. Nguyenb, B.T. Thanha, N.N. Longa, L.D. Tiena, L.S. Hob,c* a University of Transport and Communications, Vietnam b University of Transport Technology, Vietnam c Civil and Environmental Engineering Program, Graduate School of Advanced Science and Engineering, Hiroshima University, Higashi-Hiroshima, Hiroshima, Japan * E-mail: [email protected]
Keywords: drilled shaft, weathered rock, intermediate geomaterials, bearing capacity, static loading test, FEM, FB-MultiPier
Abstract. Weathered rock or IGMs (Intermediate Geomaterials) is still a controversy in designing the bearing capacity of the drilled shaft. At present, Vietnamese standards separately defined the load capacity of the pile in soils and rocks. That leads to both underestimation and overestimation in case IGMs assumed to be soil and rock, respectively. In this paper, a case study of a project in central Vietnam basing on experienced equations, finite element method (FEM), and field measurement was conducted. The static loading and pull-out tests were conducted for drilled shaft with 0.8 m in diameter installing in the weathered rock. In these tests, instruments were installed including the displacement device, strain gage, and extensometers, which were distributed along the drilled shaft to measure the side and tip bearing capacity of the piles. In addition, FEM was employed to simulate the static loading and pull-out tests of the piles. The obtained results indicated that FEM had a similar behavior at the medium loading stage compared to the field tests (static loading and pull-out tests). Thus, FEM could be a potential method that can be used for calculating and estimating the bearing capacity of the drilled shaft in the IGMs layer. An empirical equation was proposed for computing the side resistance of the pile in the IGMs layer. Finally, this study could help to choose properly the pile length in the design of the pile placed on IGMs layer so that the safety and cost-effective problems can be optimized.
1. Introduction
At present, estimation of the bearing capacity for a drilled shaft is divided into two cases. For the first case, when the pile is placed in the soil, the formulas related to the resistance of the ground are used, such
as the internal friction angle of loose soil and unconfined compressive strength in the undrained condition qu
for cohesive soil, based on the field test results such as Cone Penetration Test (CPT), Standard Penetration Test (SPT). For the second case, when the pile is placed on the rock, the formula is used based on the
compressive strength qu of the rock. However, for some cases, the pile tip of the drilled shaft located in a
strong weathered rock that has the strength is smaller than that of rock but much larger than that of soil. This leads to difficulties in using the equation specified in standards as well as monitoring and acceptance. In order to address these issues, several researchers have introduced the concept of Intermediate Geomaterials (IGMs) into the design [1–4]. The results of SPT-N experiment or unconfined compression test can be used to determine the bearing capacity of the pile in this case [5–8]. Several authors have proposed some methods to compute the bearing capacity of the drilled shaft that placed into the IGMs layer [4, 7, 9, 10].
It is known that load-bearing capacity and settlement of drilled shaft affected by axial compressive load and depended on many different factors such as physic-mechanical properties of soil, characteristics of piles, mechanism load distribution in piles, and interaction between pile and soil [1, 7, 11–17] These mentioned factors cannot be completely simulated in the calculation formula, thus the best method to predict the load-settlement relationship of the drilled shaft is to use the static loading test and pull-out tests. In general, the bearing capacity of the drilled shaft is determined through the static loading and pull-out tests on site. The static loading test for measuring axial displacement along the pile has been applied since 1969 for precast reinforced concrete piles. It was then applied in many countries around the world to determine the level of

Magazine of Civil Engineering, 99(7), 2020
Lan, C.N., Nguyen, M.H., Thanh, B.T., Long, N.N., Tien, L.D., Ho, L.S.
friction mobilization along with the pile [1]. In the 1980s, experimental studies on the drilled shaft were also carried out in order to propose inverse analysis methods for determining the loading transfer line in the pile, thereby determining the side resistance as well as the tip resistance of the single pile [1, 11, 18, 19]. However, many case studies in the United States showed the static loading test can only determine the bearing capacity of the entire pile rather than determining the side resistance and tip resistance of the pile. It means that this test is not enough to evaluate the behavior of the pile [19, 20].
It is noted that the pile resistance in the rock is mobilized at a displacement of less than 13 mm and the shear strength will mobilize residual and strain-hardening to the maximum value of displacement exceeding 38 mm [21]. Thus, it is needed to consider the side resistance of the pile in this case. In addition, there are several studies on the bearing capacity of the drilled shaft with the measurement of pile deformation were conducted [8, 11, 13]. In Vietnam, for many central regions, drilled shaft constructed in the IGMs layer (see Appendix 1). However, there are almost no studies concerning bearing capacity of the pile that has the pile tip located in IGMs layer. In general, in Vietnam the calculation of the pile placed into the IGMs layer employed the formula used for soil or rock. This calculation method caused underestimated bearing capacity for the case of the pile located into rock layer and overestimated bearing capacity for the case of the pile placed into soil (i.e. clay or soil). As a result, the pile length will be too short and too long, which leads to both safety and cost-effective problems. A proper calculation for the pile place into this IGMs layer must be done to have a suitable design. Thus, it is necessary to study the bearing capacity of drilled shaft constructed on the weathered rock layer (IGMs) in Vietnam with different and specific geological conditions.
Therefore, this study aims to investigate the bearing capacity of the drilled shaft on weathered rock layers through the static loading and pull-out tests for a case study in Vietnam (i.e. Quang Tri province); in which deformation devices attached at the side and tip of the pile to determine stresses and strain. From the obtained deformation values along the side of the pile during the static loading and pull-out test and some hypotheses, it is possible to determine not only the load distribution in the pile, the side friction distribution, unit friction resistance, pile tip resistance, but also the relationship curves between displacement/pile diameter and side friction/maximum side friction (t-z curve). Simultaneously, this study also simulated the static loading and pull-out tests using the finite element method (FB-MultiPier software) for the piles those having the pile tip placed in the weathered rock layer (IGM) for comparison. Finally, a comparison between the results obtained from actual tests and modeling was done to evaluate the feasibility application of FEM model. Based on the results of this study, an empirical formula was proposed for calculating the bearing capacity of the pile in the IGMs layer in geological of Vietnam. As a result, the pile length will be determined properly so that the safety and cost-effective of projects will be well designed.
2. Materials and methods
2.1. Geological condition
The case study is conducted for the drilled shaft with a diameter of 0.8 m belonging to the construction project of a reinforced concrete bridge (bridge length is 36.2 m). The geological condition consists of three layers: layers 1 to 3 are sandy clay and layer 4 is claystone (strongly weathered rock). Their thickness and other properties can be found in Table 1 and Fig. 1.
Table 1. Geological conditions and soil parameters.
Layer Thickness (m) Undrained strength
Su (kPa)
Unit weight (kN/m3)
Unconfined compressive
Strength for rock layer (kPa)
1. Sandy clay 2.2 24 18 -
2. Soft clay mixed with sand 1.3 36 18 -
3. Sandy clay mixed gravel 8.1 180 18 -
4. Claystone, strong weathered
(RQD = 20 %) 5.6 - 19 4800
2.2. Static loading test and pull-out test
To estimate the strength of the pile and bearing capacity of the weathered rock layer, static loading and pull-out tests were conducted. The deformation, as well as strain, were measured using the devices attached along the pile to assess the results.

Magazine of Civil Engineering, 99(7), 2020
Lan, C.N., Nguyen, M.H., Thanh, B.T., Long, N.N., Tien, L.D., Ho, L.S.
2.2.1. Static loading test
The static loading test was conducted for a drilled shaft according to ASTM D1143 standard [22]. The diameter and length of the pile are 0.8 m and 14.5 m, respectively. The load was applied to the pile head. The design load for the drilled shaft is 153 tons calculated according to AASHTO LRFD 2010 standard [23]. The maximum load for the static loading test is 150 % of the design load. The instruments for both static loading and pull out the tests are installed along with the pile. For each pile, measuring devices including pile head displacement, loadcell, pile deformation measurement, extensometers are shown in Fig. 1.
Figure 1. Soil profile and installation of instruments along with the drilled shaft.
a. Displacement
Displacement measuring device (DT-100A; KYOWA, JAPAN) with an accuracy of 0.01 mm and maximum displacement of 10 cm, is connected to the data logger system and fixed to the standard beam. There are 4 displacement measuring devices installing around the top of the pile (Fig. 2). Displacement devices were used for measuring the displacement of the pile head.
Figure 2. Pile head displacement measuring device.
b. Extensometer
In order to measure the displacement of the pile at a different depth, the extensometer was employed. Extensometers were steel bars and were installed at the top, center, and tip of the pile (Fig. 3). These instruments were used for measuring the displacement of the pile along the pile’s length.
Figure 3. Extensometer equipment for measuring the displacement of pile.

Magazine of Civil Engineering, 99(7), 2020
Lan, C.N., Nguyen, M.H., Thanh, B.T., Long, N.N., Tien, L.D., Ho, L.S.
c. Strain gage
In the static loading test, the displacement of concrete was measured using strain gage (GT-VG4200 GEOTECH, Taiwan). The strain gage is usually used for monitoring the change of strain in either reinforced concrete or mass concrete structure during the construction period. This strain gage is high accuracy and good precision with a measurement range up to ±3000 µε. For the drilled shaft, strain gages were arranged at 4 different depths and 2 strain gauges were attached to each depth. A total of 8 strain gages were used for measuring the displacement of concrete. Strain gage was attached to the main reinforced bar as shown in Fig. 4.
Figure 4. Strain gage for measuring concrete displacement.
2.2.2. Pullout test
The pull-out test was conducted according to ASTM D1143 standard to determine the bearing capacity at the pile body under tension condition [24]. This experiment will be analyzed in conjunction with the static loading test to be able to evaluate and provide the bearing capacity of the pile in accordance with the actual condition. Fig. 5 shows an overview of the pull-out test at the site condition and the schematic of the pull-out test for 0.8 m in diameter of the drilled shaft.
Figure 5. Overview (left) and a schematic (right) of the pull-out test.
2.2.3. Analysis data from static test and pull out test
The deformation of concrete and displacement of the pile at loading stages can be used for analyzing side resistance and tip resistance. The applied force at each depth is calculated according to the formula:
P=c Ec Ac (1)
where, Ac is the cross-section area of the pile and the area of reinforcement, Ec is the elastic modulus of
concrete, and c is the deformation of concrete at each depth is determined by the sensor (strain gage).
Based on the correlation between Ec and the deformation of concrete at each depth (at each loading
level), the stress of the pile at each loading stage is calculated. The side resistance fi (of pile segment i) is
calculated according to the following equation:
2 steel I900,
L = 10m
steel plate
1200x1200x100
Hydraulic
jact 500T
Load cell
4800 4800
Bar 16Ø25
Drilled shaft
Measuring
system 10
00
10
00
90
01
16
0
41
10
800
Concrete
Magazine of Civil Engineering, 99(7), 2020
Lan, C.N., Nguyen, M.H., Thanh, B.T., Long, N.N., Tien, L.D., Ho, L.S.
1 1P P P Pi i i i
fi A D L
i i i
(2)
where, Pi and Pi-1 are the applied forces at the depth of ith and i-1th and are calculated by E.q (1). Ai is the
surface area of pile side (m2), Di is the diameter of the pile (m), and Li is the distance between two strain gage
mounting positions (m).
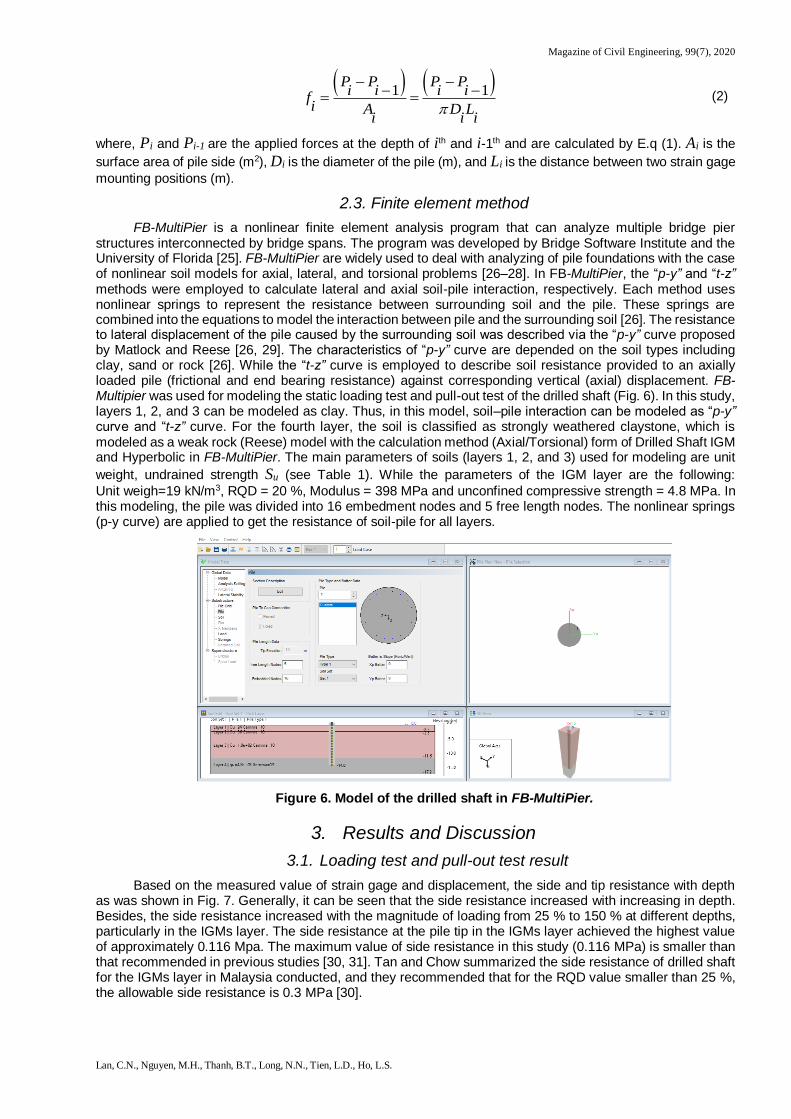
2.3. Finite element method
FB-MultiPier is a nonlinear finite element analysis program that can analyze multiple bridge pier structures interconnected by bridge spans. The program was developed by Bridge Software Institute and the University of Florida [25]. FB-MultiPier are widely used to deal with analyzing of pile foundations with the case of nonlinear soil models for axial, lateral, and torsional problems [26–28]. In FB-MultiPier, the “p-y” and “t-z” methods were employed to calculate lateral and axial soil-pile interaction, respectively. Each method uses nonlinear springs to represent the resistance between surrounding soil and the pile. These springs are combined into the equations to model the interaction between pile and the surrounding soil [26]. The resistance to lateral displacement of the pile caused by the surrounding soil was described via the “p-y” curve proposed by Matlock and Reese [26, 29]. The characteristics of “p-y” curve are depended on the soil types including clay, sand or rock [26]. While the “t-z” curve is employed to describe soil resistance provided to an axially loaded pile (frictional and end bearing resistance) against corresponding vertical (axial) displacement. FB-Multipier was used for modeling the static loading test and pull-out test of the drilled shaft (Fig. 6). In this study, layers 1, 2, and 3 can be modeled as clay. Thus, in this model, soil–pile interaction can be modeled as “p-y” curve and “t-z” curve. For the fourth layer, the soil is classified as strongly weathered claystone, which is modeled as a weak rock (Reese) model with the calculation method (Axial/Torsional) form of Drilled Shaft IGM and Hyperbolic in FB-MultiPier. The main parameters of soils (layers 1, 2, and 3) used for modeling are unit
weight, undrained strength Su (see Table 1). While the parameters of the IGM layer are the following:
Unit weigh=19 kN/m3, RQD = 20 %, Modulus = 398 MPa and unconfined compressive strength = 4.8 MPa. In this modeling, the pile was divided into 16 embedment nodes and 5 free length nodes. The nonlinear springs (p-y curve) are applied to get the resistance of soil-pile for all layers.
Figure 6. Model of the drilled shaft in FB-MultiPier.
3. Results and Discussion
3.1. Loading test and pull-out test result
Based on the measured value of strain gage and displacement, the side and tip resistance with depth as was shown in Fig. 7. Generally, it can be seen that the side resistance increased with increasing in depth. Besides, the side resistance increased with the magnitude of loading from 25 % to 150 % at different depths, particularly in the IGMs layer. The side resistance at the pile tip in the IGMs layer achieved the highest value of approximately 0.116 Mpa. The maximum value of side resistance in this study (0.116 MPa) is smaller than that recommended in previous studies [30, 31]. Tan and Chow summarized the side resistance of drilled shaft for the IGMs layer in Malaysia conducted, and they recommended that for the RQD value smaller than 25 %, the allowable side resistance is 0.3 MPa [30].

Magazine of Civil Engineering, 99(7), 2020
Lan, C.N., Nguyen, M.H., Thanh, B.T., Long, N.N., Tien, L.D., Ho, L.S.
0.00 0.02 0.04 0.06 0.08 0.10 0.12
2
4
6
8
10
12
14
25%
50%
75%
100%
125%
150%
Depth
(m)
Side resistance qs (Mpa)
Figure 7. Side resistance versus depth for static loading test.
Similar to the case of the static loading test, the side resistance in the pull-out test is calculated based on the measured value of strain gauge and displacement, the side resistance with the depth of the pile in the pull-out test is depicted in Fig. 8. The side resistance was almost stable or slightly increased from 3 m to around 7.5 m for all loading conditions because the soil from 3 to 7.5 m is the soft clay and sandy clay. However, at the tip of the pile, the side resistance increased significantly even from 25 % of loading to 200 % of loading. Because the tip of the pile was placed in the IGMs layer. The maximum value of side resistance was approximately 0.17 MPa for the cases of 175 % and 200 % loading. From the results of Figs. 7 and 8, it is clear that for the load level from 25 % to 75 % of the design load, the side resistance at the pile tip of the pull-out test was almost the same as that of static loading test. The results of this study agreed well with previous studies [2, 32–34]. However, for the case of the load from 100 % to 150 % of design load, it can be seen that the side resistance at the pile tip of the pull-out test was higher than that of the loading test, this is different from with the case of the load level from 25 % to 75 % of design load and the previous study [33]. The difference may be explained as follows. In the previous study, the final layer is gravelly soil that has lower unconfined compressive strength as well as modulus compared to the IGMs layer in this study.
0.00 0.02 0.04 0.06 0.08 0.10 0.12 0.14 0.16 0.18
2
4
6
8
10
12
14
25%50%75%100%150%175%200%
Side resistance qs (MPa)
Depth
(m)
Figure 8. Side resistance versus depth for pull out test.
Fig. 9 shows the load versus settlement curve of the static loading test. It can be seen that there is no settlement at the tip of the pile. The maximum of settlement in the center of the pile was approximately 0.5 mm at the loading of 250 tons. This result of the pile head in this study agreed well with the results of the previous study of drilled shaft placed in the IGMs layer, which had the displacement of pile head was smaller than the allowable value [6, 35]. Fig. 10 presents the load versus displacement curve of the pull-out test at the pile head, center, and tip. For the maximum pull-out load of 260 tons, the displacement was approximately 2.0 mm, 5.8 mm, and 11.3 mm for the bottom, center, and head of the pile, respectively.

Magazine of Civil Engineering, 99(7), 2020
Lan, C.N., Nguyen, M.H., Thanh, B.T., Long, N.N., Tien, L.D., Ho, L.S.
0 50 100 150 200 250 300
2.0
1.5
1.0
0.5
0.00 50 100 150 200 250 300
Se
ttle
me
nt
(mm
)
Top of pile
Center of pile
Pile tip
Load (ton)
0 50 100 150 200 250 300
12
10
8
6
4
2
00 50 100 150 200 250 300
Load (ton)
Dis
pla
ce
me
nt
(mm
)
Top of pile
Center of pile
Pile tip
Figure 9. The load-settlement curve for static loading test.
Figure 10. Load-displacement for pull-out test.
3.2. FEM method results and comparison with measured results
From FEM results, load and displacement curves for static loading and pull-out test are presented in Fig. 11 and Fig. 12, respectively. For the case of the static loading test, at the pile tip, the maximum value of the settlement was approximately 0.75 mm; and the center of the pile was around 1.25 mm, while the pile head achieved the biggest value of 2.1 mm. Compared to the results of the actual test (field test), the model results give a greater value of settlement than the actual results at the final load level (Fig. 11). The difference might be related to the degraded and reworked geomaterial on the borehole wall, which decreased the modulus of geomaterial mass, as indicated in a previous study [36]. However, these values are not much different, thus, the calculation model can be considered acceptable. Fig. 12 shows the load-displacement relationship in the pull-out test. The displacement of the pile tip was approximately 1.2 mm for the maximum load, while it was around 1.7 mm for the center of the pile. The biggest displacement was observed for the case of displacement of the pile head, the displacement value was 4.5 mm for the maximum load condition. From Fig. 12, we can observe that the settlement values of the pull-out tests in the modeling were similar to that of the actual field test for the cases of small and medium load conditions.
The results of actual and modeling show that the results of the settlement and the load of the pile are quite similar to that of small and medium loads. However, for the case of the pile head, there was a big gap between the actual value and model value, the displacement of the actual value was much bigger than that of the modeled one. In summary, we can see that both static loading and pullout tests showed that the values of the settlement and displacement of the pile into the cracking weathered rock (IGMs) were quite small, indicating that the strength of IGMs layer is quite large. Thus, when designing the load capacity of piles in many cases, if it is considered that the weathered stone layer (IGMs) as a sand layer and using the formula of the sand layer to calculate the load-bearing capacity as current will lead to underestimating the bearing capacity of the pile that prone too safety and also causing the difficulty to drill deep into the weathered rock fractured in the field.
0 50 100 150 200 250 300
4.0
3.5
3.0
2.5
2.0
1.5
1.0
0.5
0.0
0 50 100 150 200 250 300
Load (ton)
Se
ttle
me
nt
(mm
)
Top of pile (measured)
Ceter of pile (measured)
Pile tip (measured)
Top of pile (modeled)
Ceter of pile (modeled)
Pile tip (modeled)
0 50 100 150 200 250 300
12
10
8
6
4
2
00 50 100 150 200 250 300
Load (ton)
Dis
pla
ce
me
nt
(mm
)
Top of pile (measured)
Center of pile (measured)
Pile tip (measured)
Top of pile (modeled)
Center of pile (modeled)
Pile tip (modeled)
Figure 11. Comparison between the results of FB-MultiPier software and actual results
for static loading experiments.
Figure 12. Comparison between the results of FB-MultiPier software and actual results
for the pull-out test.

Magazine of Civil Engineering, 99(7), 2020
Lan, C.N., Nguyen, M.H., Thanh, B.T., Long, N.N., Tien, L.D., Ho, L.S.
Table 2 shows the comparison between the results of the static loading test calculated by FEM (FB-MultiPier) and actual results measured on-site. It is obvious that for the IGM layer 4, the results of side resistance and tip resistance of the pile calculated using FB-MultiPier was almost similar to that measured on-site. This indicates that FEM (FB-MultiPier) can be used to calculate the bearing capacity of the pile in the IGM layer with high accuracy. The table also shows the comparison results of the pull-out test; it is clear that for IGM layer 4, the side resistance of the pile is consistent for 3 methods, whereas the tip resistance for the LRFD method is higher compared to other methods. From Table 2, we can also observe that the tip resistance results for the pull-out test of the LRFD method also was higher than that of the measured value and FEM method. However, static loading and pull out the tests showed that the value of the settlement and displacement of the pile into the weathered rock is quite small.
Table 2. Comparison results between modeled and for the static loading and pull-out tests.
Resistance for layer 4
(IGM)
Static loading test Pull-out test
LRFD method Measured
value FEM result
LRFD method
Measured value
FEM result
Side resistance
𝑞𝑠 = 𝑓𝑠 (MPa)
0.1728 0.1096 0.1118 - - -
Tip resistance qp (MPa)
0.7094 0.48 0.5542 0.1728 0.1662 0.1511
3.3. Side resistance correlation
According to AASHTO standard, side resistance of pile in IGM layer can be calculated as the following equation.
qs = qu (3)
where qu is unconfined compression strength of IGM Several correlations have been developed by various
authors for estimating unit side resistance in IGM layer and relationships to unconfined compressive strength
qu as well as SPT N blow count. The methods adopted by AASHTO using qu as the main design parameter
as shown in equation 3. Base on the testing result from static load test (Fig. 6), qs can be corrected to qu as
equation below:
qs (correction) = 0.81 qu (4)
4. Conclusions
Based on the obtained results of the static loading test and the piling test with the measuring devices attached along with the pile and the FB-MultiPier pile testing model, some main conclusions can be drawn as follows:
1. The results of the experiment and modeling showed that side resistance is similar for all methods. However, the LRFD method provided a higher value of side and tip resistance.
2. The static loading and pull-out tests with strain gauge along with the pile body could produce a more accurate calculation of the bearing capacity of the drilled shaft into the weathered rock layer.
3. FEM method using FB-MultiPier software can be used to estimate the load capacity, the result of FEM is quite similar to the actual static loading and pull-out tests when the load applied at small and medium levels.
4. A correction value for drilled shaft into the weathered rock layer (IGMs) in a case study in Vietnam is proposed. However, more field tests should be conducted to provide a precise result for practical design as well as validate the results of simulation using FEM software.
5. Based on the results of this study, the pile length placed into the IGMs layer in Vietnam geological condition can be designed properly so that the safety and cost-effective problems can be optimized.
This study investigated the bearing capacity of drilled shaft placed into the IGMs layer, the side and tip resistance of the pile could be obtained using the deformation devices attached to the pile. The finding of this
Magazine of Civil Engineering, 99(7), 2020
Lan, C.N., Nguyen, M.H., Thanh, B.T., Long, N.N., Tien, L.D., Ho, L.S.
study indicated that FEM (FB-MultiPier) could be used to estimate the bearing capacity of the drilled shaft placed into the IGMs layer. In addition, this study also proposed an empirical formula to calculate the side resistance of the pile in this case. However, this study only conducted for a case study, thus, it is needed to extend this study for many projects as well as different geological conditions to validate the application of FEM method as well as the proposed equation.
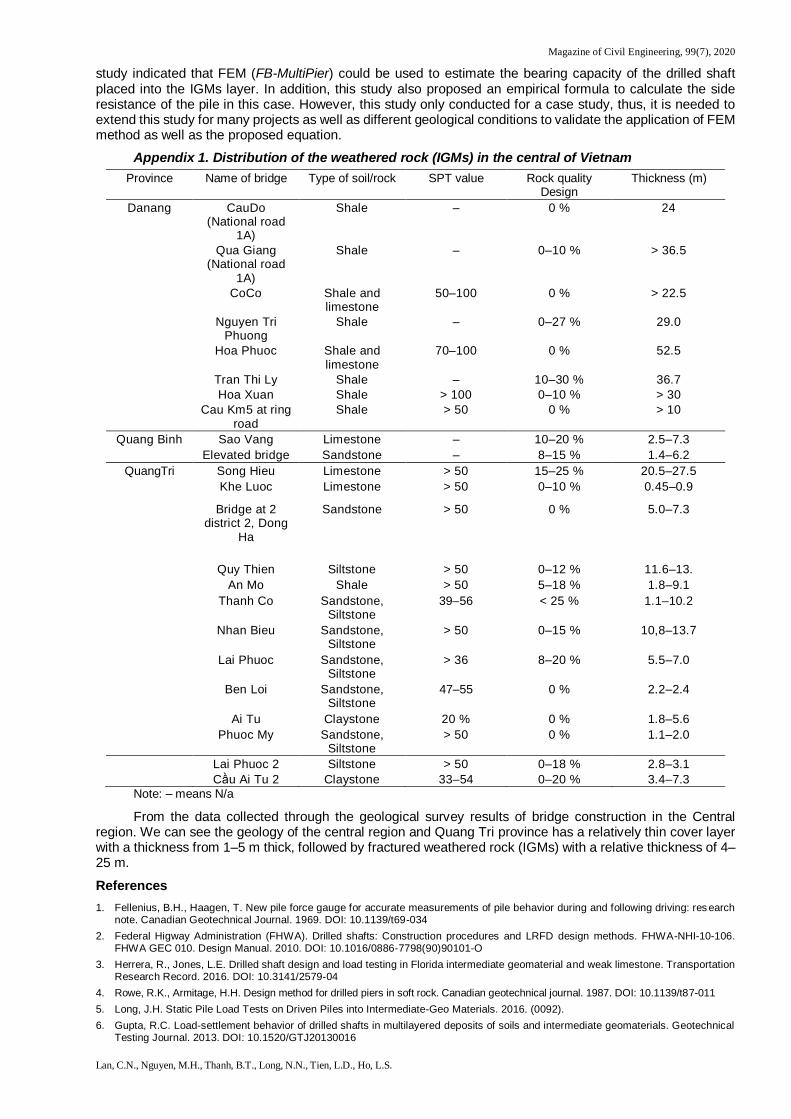
Appendix 1. Distribution of the weathered rock (IGMs) in the central of Vietnam
Province Name of bridge Type of soil/rock SPT value Rock quality Design
Thickness (m)
Danang CauDo (National road
1A)
Shale – 0 % 24
Qua Giang (National road
1A)
Shale – 0–10 % > 36.5
CoCo Shale and limestone
50–100 0 % > 22.5
Nguyen Tri Phuong
Shale – 0–27 % 29.0
Hoa Phuoc Shale and limestone
70–100 0 % 52.5
Tran Thi Ly Shale – 10–30 % 36.7
Hoa Xuan Shale > 100 0–10 % > 30
Cau Km5 at ring road
Shale > 50 0 % > 10
Quang Binh Sao Vang Limestone – 10–20 % 2.5–7.3
Elevated bridge Sandstone – 8–15 % 1.4–6.2
QuangTri Song Hieu Limestone > 50 15–25 % 20.5–27.5
Khe Luoc Limestone > 50 0–10 % 0.45–0.9
Bridge at 2 district 2, Dong
Ha
Sandstone > 50 0 % 5.0–7.3
Quy Thien Siltstone > 50 0–12 % 11.6–13.
An Mo Shale > 50 5–18 % 1.8–9.1
Thanh Co Sandstone, Siltstone
39–56 < 25 % 1.1–10.2
Nhan Bieu Sandstone, Siltstone
> 50 0–15 % 10,8–13.7
Lai Phuoc Sandstone, Siltstone
> 36 8–20 % 5.5–7.0
Ben Loi Sandstone, Siltstone
47–55 0 % 2.2–2.4
Ai Tu Claystone 20 % 0 % 1.8–5.6
Phuoc My Sandstone, Siltstone
> 50 0 % 1.1–2.0
Lai Phuoc 2 Siltstone > 50 0–18 % 2.8–3.1
Cầu Ai Tu 2 Claystone 33–54 0–20 % 3.4–7.3
Note: – means N/a
From the data collected through the geological survey results of bridge construction in the Central region. We can see the geology of the central region and Quang Tri province has a relatively thin cover layer with a thickness from 1–5 m thick, followed by fractured weathered rock (IGMs) with a relative thickness of 4–25 m.
References
1. Fellenius, B.H., Haagen, T. New pile force gauge for accurate measurements of pile behavior during and following driving: res earch note. Canadian Geotechnical Journal. 1969. DOI: 10.1139/t69-034
2. Federal Higway Administration (FHWA). Drilled shafts: Construction procedures and LRFD design methods. FHWA-NHI-10-106. FHWA GEC 010. Design Manual. 2010. DOI: 10.1016/0886-7798(90)90101-O
3. Herrera, R., Jones, L.E. Drilled shaft design and load testing in Florida intermediate geomaterial and weak limestone. Transportation Research Record. 2016. DOI: 10.3141/2579-04
4. Rowe, R.K., Armitage, H.H. Design method for drilled piers in soft rock. Canadian geotechnical journal. 1987. DOI: 10.1139/t87-011
5. Long, J.H. Static Pile Load Tests on Driven Piles into Intermediate-Geo Materials. 2016. (0092).
6. Gupta, R.C. Load-settlement behavior of drilled shafts in multilayered deposits of soils and intermediate geomaterials. Geotechnical Testing Journal. 2013. DOI: 10.1520/GTJ20130016
Magazine of Civil Engineering, 99(7), 2020
Lan, C.N., Nguyen, M.H., Thanh, B.T., Long, N.N., Tien, L.D., Ho, L.S.
7. Gupta, R.C. Hyperbolic model for load tests on instrumented drilled shafts in intermediate geomaterials and rock. Journal of Geotechnical and Geoenvironmental Engineering. 2012. DOI: 10.1061/(ASCE)GT.1943-5606.0000697
8. Hayes, J., Simmonds, T. Interpreting strain measurements from load tests in bored piles. Proc., 9th International Conference on Piling
and Deep Foundations. 2002.
9. Lianyang Zhang, Einstein, H.H. End bearing capacity of drilled shafts in rock. Journal of Geotechnical and Geoenvironmental
Engineering. 1998. DOI: 10.1061/(ASCE)1090-0241(1998)124:7(574)
10. Carter, J.P., Kulhawy, F.H. Analysis and Design of Foundations Socketed into Rock. Electric Power Research Institute. 1988.
11. Fellenius, B.H. Capacity versus deformation analysis for design of footings and piled foundations. Geotechnical Engineering. 2011.
42(2). Pp. 70–77.
12. Brown, M.J., Hyde, A.F.L., Anderson, W.F. Analysis of a rapid load test on an instrumented bored pile in clay. Geotechnique. 2006. DOI: 10.1680/geot.2006.56.9.627
13. Lee, J.S., Park, Y.H. Equivalent pile load-head settlement curve using a bi-directional pile load test. Computers and Geotechnics. 2008. DOI: 10.1016/j.compgeo.2007.06.008
14. Kim, U.G., Zhuang, L., Kim, D., Lee, J. Evaluation of cyclic shear strength of mixtures with sand and different types of f ines. Marine Georesources and Geotechnology. 2017. DOI: 10.1080/1064119X.2014.987891
15. Nam, M.S., Vipulanandan, C. Roughness and unit side resistances of drilled shafts socketed in clay shale and limestone. Journal of Geotechnical and Geoenvironmental Engineering. 2008. DOI: 10.1061/(ASCE)1090-0241(2008)134:9(1272)
16. Pipinato, A. Innovative bridge design handbook: Construction, rehabilitation and maintenance 2015.
17. Ma, M., Liu, J., Ke, Z., Gao, Y. Bearing Capacity Estimation of Bridge Piles Using the Impulse Transient Response Method. hindawi.com. 2016. DOI: 10.1155/2016/4187026
18. Bica, A. V.D., Prezzi, M., Seo, H., Salgado, R., Kim, D. Instrumentation and axial load testing of displacement piles. Proceedings of the Institution of Civil Engineers: Geotechnical Engineering. 2014. DOI: 10.1680/geng.12.00080
19. Fellenius, B.H., Harris, D.E., Anderson, D.G. Static loading test on a 45 m long pipe pile in Sandpoint, Idaho. Canadian Geotechnical
Journal. 2004. DOI: 10.1139/T04-012
20. Nguyen, T., McVay, M., Song, X., Herrera, R., Wasman, S., Wang, K. Strength Envelopes of Florida Carbonate Rocks near Ground
Surface. Journal of Geotechnical and Geoenvironmental Engineering. 2019. DOI: 10.1061/(ASCE)GT.1943-5606.0002069
21. Officials, T. AASHTO guide specifications for LRFD seismic bridge design 2011.
22. ASTM. Standard Test Methods for Deep Foundations Under Static Axial Compressive Load. Astm D1143/D1143M-07. 2013.
DOI: 10.1520/D1143
23. Aashto. AASHTO LRFD Bridge Design Specifications 2010.
24. ASTM D3689. Standard Test Methods for Deep Foundations Under Static Axial Tensile Load. Annual Book of ASTM Standards. 2013.
DOI: 10.1520/D3689
25. Chan, C.L., & Low, B.K. (2012). Probabilistic analysis of laterally loaded piles using response surface and neural network approaches. Computers and Geotechnics, 43, 101–110. doi.org/10.1016/j.compgeo.2012.03.001
26. Lin, C., Bennett, C., Han, J., Parsons, R.L. Integrated analysis of the performance of pile-supported bridges under scoured conditions. Engineering Structures. 2012. 36. Pp. 27–38. DOI: 10.1016/j.engstruct.2011.11.015
27. Zhang, L., McVay, M.C., Lai, P. Numerical analysis of laterally loaded 3 x 3 to 7 x 3 pile groups in sands. Journal of Geotechnical and Geoenvironmental Engineering. 1999. 125(11). Pp. 936–946. DOI: 10.1061/(ASCE)1090-0241(1999)125:11(936)
28. Ruesta, P.F., Townsend, F.C. Evaluation of laterally loaded pile group at Roosevelt Bridge. Journal of Geotechnical Engineering. 1997. 123(12). Pp. 1153–1161. DOI: 10.1061/(ASCE)1090-0241(1997)123:12(1153)
29. Matlock, H., & Reese, L.C. (1962). Generalized solutions for laterally loaded piles. Transactions of the American Society of Civil
Engineers, 127(1), 1220–1247.
30. Tan, Y.C., Chow, C.M. Foundation Design and Construction Practice in Limestone Area in Malaysia. Proceedings of Seminar on
Geotechnical Works in Karst in South-East Asia. 2006.
31. Li, W.W., Wong, C.T., Yim, K.P., Leung, M.K. Shaft friction between marble and concretein rock-socketted large diameter bored pile: A review of state of art. Procedia Engineering. 2011. DOI: 10.1016/j.proeng.2011.07.220
32. Chen, Y.J., Kulhawy, F.H. Evaluation of drained axial capacity for drilled shafts. Geotechnical Special Publication. 2002. DOI: 10.1061/40601(256)86
33. Kulhawy, F.H. Drilled Shaft Foundations. Foundation Engineering Handbook 1991.
34. Rollins, K.M., Clayton, R.J., Mikesell, R.C., Blaise, B.C. Drilled shaft side friction in gravelly soils. Journal of Geotechnical and Geoenvironmental Engineering. 2005. DOI: 10.1061/(ASCE)1090-0241(2005)131:8(987)
35. Ke, T.N., Khanh, H.N.P. Determine load capacity of pressed piles using ζ method. Procedia Engineering. 2016. DOI: 10.1016/j.proeng.2016.02.054
36. Hassan, K.M., O’Neill, M.W., Sheikh, S.A., Ealy, C.D. Design method for drilled shafts in soft argillaceous rock. Journal of Geotechnical Engineering. 1997. DOI: 10.1061/(ASCE)1090-0241(1997)123:3(272)
Contacts: Nguyen Chau Lan, [email protected]
May Huu Nguyen, [email protected]
Bui Tien Thanh, [email protected]
Nguyen Ngoc Long, [email protected]
Le Duc Tien, [email protected]
Lanh Si Ho, [email protected]
© Lan, C.N., Nguyen, M.H., Thanh, B.T., Long, N.N., Tien, L.D., Ho, L.S., 2020