bangladesh demographic and health survey 2011
TRANSCRIPT
Bangladesh Demographic
and Health Survey
2011
Preliminary Report
National Institute of Population Research and Training Dhaka, Bangladesh
Mitra and Associates
Dhaka, Bangladesh
MEASURE DHS, ICF International Calverton, Maryland, USA

BANGLADESH DEMOGRAPHIC AND HEALTH SURVEY
2011
PRELIMINARY REPORT
National Institute of Population Research and Training Dhaka, Bangladesh
Mitra and Associates Dhaka, Bangladesh
MEASURE DHS ICF International
Calverton, Maryland, U.S.A.
April 2012

Cover motif: A tapestry by Rashid Chowdhury, 1984 The 2011 Bangladesh Demographic and Health Survey (BDHS) is part of the worldwide Demographic and Health Surveys program (MEASURE DHS). Information about the BDHS may be obtained from the National Institute of Population Research and Training (NIPORT), Azimpur, Dhaka, Bangladesh (Telephone: 862-5251 and Fax: 861-3362) or from Mitra and Associates, 2/17 Iqbal Road, Mohammadpur, Dhaka, Bangladesh (Telephone: 911-5503; Fax: 912-6806). Additional information about the DHS program may also be obtained from MEASURE DHS, ICF International, 11785 Beltsville Drive, Suite 300, Calverton, MD 20705 (Telephone: 301-572-0200 and Fax: 301-572-0999).
iii
CONTENTS
TABLES AND FIGURES ...................................................................................................................................... v
FOREWORD ........................................................................................................................................................ vii
1 INTRODUCTION .................................................................................................................................... 1
2 SURVEY IMPLEMENTATION .............................................................................................................. 2 2.1 Sample Design ........................................................................................................................... 2 2.2 Questionnaires ............................................................................................................................ 2 2.3 Training and Fieldwork .............................................................................................................. 3 2.4 Data Processing .......................................................................................................................... 4 2.5 Coverage of the Sample ............................................................................................................. 4
3 KEY FINDINGS FROM THE 2011 BDHS ............................................................................................. 5 3.1 Background Characteristics........................................................................................................ 5 3.2 Fertility ....................................................................................................................................... 6 3.3 Family Planning ......................................................................................................................... 9 3.4 Fertility Preferences ................................................................................................................. 16 3.5 Maternal Health ........................................................................................................................ 19 3.6 Postnatal Care .......................................................................................................................... 23 3.7 Child Health ............................................................................................................................. 24 3.8 Knowledge of HIV/AIDS and Ways to Avoid AIDS ............................................................... 36
REFERENCES ..................................................................................................................................................... 41
APPENDIX I ........................................................................................................................................................ 43
APPENDIX II ....................................................................................................................................................... 45

v
TABLES AND FIGURES
Table 1 Results of the household and individual interviews .......................................................................... 4 Table 2 Background characteristics of respondents ....................................................................................... 6 Table 3 Current fertility .................................................................................................................................. 7 Table 4 Trends in current fertility rates .......................................................................................................... 8 Table 5 Current use of contraception by background characteristics ........................................................... 10 Table 6 Trends in current use of contraceptive methods .............................................................................. 11 Table 7 Contraceptive discontinuation rates ................................................................................................ 13 Table 8 Source of supply of specific modern methods ................................................................................. 15 Table 9 Contact with fieldworkers ............................................................................................................... 16 Table 10 Fertility preferences by number of living children .......................................................................... 16 Table 11 Need and demand for family planning among currently married women ....................................... 18 Table 12 Antenatal care .................................................................................................................................. 20 Table 13 Number of antenatal care visits ....................................................................................................... 20 Table 14 Place of delivery .............................................................................................................................. 22 Table 15 Assistance during delivery .............................................................................................................. 23 Table 16 Postnatal care for mothers and children .......................................................................................... 24 Table 17 Early childhood mortality rates ....................................................................................................... 25 Table 18 Trend in early childhood mortality .................................................................................................. 25 Table 19 Vaccinations by source of information ............................................................................................ 27 Table 20 Vaccinations by background characteristics .................................................................................... 27 Table 21 Prevalence and treatment of symptoms of ARI ............................................................................... 29 Table 22 Treatment for diarrhoea ................................................................................................................... 30 Table 23 Nutritional status of children ........................................................................................................... 32 Table 24 Breastfeeding status by age ............................................................................................................. 34 Table 25 Infant and young child feeding (IYCF) practices ............................................................................ 35 Table 26 Vitamin A supplementation ............................................................................................................. 36 Table 27 Knowledge of AIDS ........................................................................................................................ 37 Table 28 Knowledge of HIV prevention methods .......................................................................................... 38 Figure 1 Trends in Age-Specific Fertility Rates .............................................................................................. 7 Figure 2 Trends in Total Fertility Rates by Division, 2007 and 2011.............................................................. 8 Figure 3 Trends in Total Fertility Rates, 1975-2011 ....................................................................................... 9 Figure 4 Contraceptive Use by Background Characteristics ......................................................................... 11 Figure 5 Trends in Contraceptive Use among Currently Married Women Age 10-49, 1975-2011 ............... 12 Figure 6 Trends in All Methods Contraceptive Discontinuation Rates, 1993/94-2011 ................................. 14 Figure 7 Fertility Preferences among Currently Married Women Age 15-49 ............................................... 17 Figure 8 Trends in Unmet Need for Family Planning among Currently Married Women Age 15-49 by
Division, 2007 and 2011 ................................................................................................................. 19 Figure 9 Utilization of Maternal Health Services, 2004-2011 ....................................................................... 21 Figure 10 Trends in Childhood Mortality, 1989-2011 ..................................................................................... 25 Figure 11 Trends in Nutritional Status of Children Under Five, 2004-2011 ................................................... 33 Figure 12 Percentage of Ever-Married Women and Men Who Have Heard of AIDS, by Background
Characteristics ................................................................................................................................. 37

vii
Director GeneralNational Institute of Population Research and Training
Ministry of Health and Family Welfare
FOREWORD
Bangladesh Demographic and Health Survey (BDHS) 2011 is a nationwide sample survey of men and women of reproductive age designed to provide information on fertility and childhood mortality levels; fertility preferences; use of family planning methods; maternal, child and newborn health, including breastfeeding practices, nutrition levels including anemia and presence of iodine in cooking salt; knowledge and attitudes toward HIV/AIDS and other sexually transmitted infections (STI); and community-level data on accessibility and availability of health and family planning services. BDHS 2011 is the sixth survey of its kind conducted in Bangladesh. The special feature of this survey is to provide biomarker indices of adult male and female population which is instrumental in determining increasing risk of non-communicable diseases.
The wealth of demographic and health data that BDHS 2011 provides is essential and instrumental in monitoring and evaluating the performance of Health Population Nutrition Sector Development Programme (HPNSDP). BDHS 2011 presents estimates for 18 indicators of result framework of HPNSDP and is considered as baseline for the programme to be implemented during 2011-2016. We hope this information will assist policymakers and programme managers in monitoring and designing programmes and strategies for improving health and family planning services in the country.
This report presents the preliminary results for the major findings of the survey. A more comprehensive and detailed report is scheduled to be published later in 2012.
The survey could be successfully conducted due to the dedicated support and involvement of a large number of institutions and individuals. I am deeply indebted and grateful to all those who contributed to BDHS 2011. Because of their efforts, data could be made available in a timely fashion. I would like to put on record my sincere appreciation for the Technical Working Group members, representatives on the Technical Review Committee, field staff, the data processing team, and particularly the survey respondents. I am thankful to Research Unit of NIPORT, Mitra and Associates and ICF International for completing the task in time. USAID, Bangladesh deserves special thanks for providing financial support for the survey.

1
1 INTRODUCTION
The 2011 Bangladesh Demographic and Health Survey (BDHS) was the sixth national-level demographic and health survey designed to provide information on demographic and maternal and child health in Bangladesh. The BDHS included a household survey of ever-married women age 12-49 and ever-married men age 15-54. The BDHS also included a community questionnaire administered during the listing of households to informants in communities around the sample points from which the households were selected. This report presents major findings from data collected in the household survey using the Household Questionnaire, the Women’s Questionnaire and the Men’s Questionnaire. A more comprehensive and detailed report is scheduled to be released later in 2012. The data in the final report are not expected to differ substantially from the findings presented in this preliminary report; however, the results presented here should be regarded as provisional and may be subject to modification. In order to examine trends, the findings from the 2011 survey have been compared with findings from the 1993-1994 BDHS, the 1996-1997 BDHS, the 1999-2000 BDHS, the 2004 BDHS, and the 2007 BDHS.
The 2011 BDHS was conducted under the authority of the National Institute of Population Research and Training (NIPORT) of the Ministry of Health and Family Welfare. The survey was implemented by Mitra and Associates, a Bangladeshi research firm located in Dhaka. ICF International of Calverton, Maryland, USA provided technical assistance to the project as part of its international Demographic and Health Surveys program (MEASURE DHS), and financial assistance was provided by the U.S. Agency for International Development (USAID).
As with prior Bangladesh DHS surveys, the main objective of the 2011 BDHS is to provide up-to- date information on fertility and childhood mortality levels; fertility preferences; awareness, approval, and use of family planning methods; maternal and child health, including breastfeeding practices, nutrition levels and newborn care; knowledge and attitudes toward HIV/AIDS and other sexually transmitted infections (STI); and community-level data on accessibility and availability of health and family planning services. This information is intended to assist policymakers and program managers in evaluating and designing programs and strategies for improving health and family planning services in the country.
The 2011 BDHS included height and weight measurements from ever-married women age 12-49 and children under 6 years (born after January 2006) in all households. In the one-third of the households selected for the men’s survey; ever married women age 50 and older, never-married women age 35 and older, ever-married men age 15-34 and all men age 35 and older were weighed and measured. In these same households, anaemia testing was conducted for all consenting children age 6-59 months and ever-married women age 12-49. Finally, in the households eligible for the men’s survey, all consenting adults age 35 and over, regardless of their marital status, were voluntarily tested for blood glucose and their blood pressure was measured.
2
2 SURVEY IMPLEMENTATION
2.1 Sample Design
The sample for the 2011 BDHS is nationally representative and covers the entire population residing in non-institutional dwelling units in the country. The survey used as a sampling frame the list of enumeration areas (EAs) prepared for the 2011 population census of the People’s Republic of Bangladesh (PCPRB 2011), provided by the Bangladesh Bureau of Statistics (BBS). The primary sampling unit (PSU) for the survey is an EA created to have an average of about 100 households.
Bangladesh is divided into seven administrative divisions: Barisal, Chittagong, Dhaka, Khulna, Rajshahi, Rangpur, and Sylhet. Each division is divided into zilas, and each zila into upazilas. Each urban area in an upazila is divided into wards, and into mohallas within a ward; a rural area in the upazila is divided into union parishads (UP) and mouzas within an UP. These divisions allow the country as a whole to be easily separated into rural and urban areas.
The survey is based on a two-stage stratified sample of households. In the first stage, 600 EAs were selected with probability proportional to the EA size, with 207 clusters in urban areas and 393 in rural areas. A complete household listing operation was then carried out in all the selected EAs to provide a sampling frame for the second stage selection of households. In the second stage of sampling, a systematic sample of 30 households on average was selected per EA to provide statistically reliable estimates of key demographic and health variables for the country as a whole, for urban and rural areas separately, and for each of the seven divisions. With this design, the survey selected 18,000 residential households, and was expected to result in completed interviews with about 18,000 ever-married women. In addition, ever-married men age 15-54 in every third household were eligible for the male survey.
A household listing operation was carried out in all selected EAs from 22 May to 5 October, 2011 in four phases of about 3 weeks each. Initially, 19 teams of two persons each were deployed to carry out the listing of households and administer the Community Questionnaires. The number of teams was reduced to 15 in the second and third phases and to six in the final phase. In addition, 6 supervisors were deployed to check and verify the work of the listing teams.
2.2 Questionnaires
The 2011 BDHS used five types of questionnaires: a Household Questionnaire, a Woman’s Questionnaire, a Man’s Questionnaire, a Community Questionnaire, and two questionnaires to collect data on causes of death among children under age 5. The contents of the household and individual questionnaires were based on the MEASURE DHS Model Questionnaires. These model questionnaires were adapted for use in Bangladesh during a series of meetings with a Technical Working Group (TWG) that consisted of representatives from NIPORT, Mitra and Associates, ICDDR,B, USAID/Dhaka, and MEASURE DHS (see Appendix-I for a list of members). Draft questionnaires were then circulated to other interested groups and were reviewed by the BDHS Technical Review Committee (see Appendix I). The questionnaires were developed in English and then translated and printed into Bangla.
The verbal autopsy module was replicated from the questionnaires used in the 2004 BDHS for the same objective.
The Household Questionnaire was used to list all the usual members and visitors in the selected households. Some basic information was collected on the characteristics of each person listed, including age, sex, education, and relationship to the head of the household. The main purpose of the Household Questionnaire was to identify women and men who were eligible for the individual interview. In addition, information was collected about the dwelling unit, such as the source of water, type of toilet facilities, materials used to construct the floor and walls, and ownership of various consumer goods. In the one in three households selected for the Men’s survey, the Household Questionnaire was also used to record:
3
• Height and weight measurements for children and women • Anemia test results for women and children • Measurement of blood pressure and blood glucose for men and women 35 years and older
The Woman’s Questionnaire was used to collect information from ever-married women age 12-49. Women were asked questions on the following topics:
• Background characteristics (e.g., age, education, religion, media exposure), • Reproductive history, • Use and source of family planning methods, • Antenatal, delivery, postnatal and newborn care, • Breastfeeding and infant feeding practices, • Child immunizations and childhood illnesses, • Marriage, • Fertility preferences, • Husband’s background and respondent’s work, • Awareness of AIDS and other sexually transmitted infections, and • Food security.
The Man’s Questionnaire was used to collect information from ever-married men age 15-54. Men were asked questions on the following topics:
• Background characteristics (including respondent’s work), • Marriage, • Fertility preferences, • Participation in reproductive health care, and • Awareness of AIDS and other sexually transmitted infections.
The Community Questionnaire was administered in each selected cluster during the household listing operation, and included questions about the existence of development organizations in the community and the availability and accessibility of health services and other facilities. During the household listing operation, the geographic coordinates and altitude of each cluster were also recorded. The information obtained in these questionnaires was also used to verify information gathered in the Women’s and Men’s Questionnaires on the types of facilities accessed and health services personnel seen.
The Verbal Autopsy Questionnaires were used to collect information related to the causes of death among young children—one for neonatal deaths (deaths 0-28 days) and one for other under-five deaths. These questionnaires were administered to mothers who reported the death of a child under five in the five-year period prior to the BDHS.
2.3 Training and Fieldwork
The Household, Woman’s and Man’s Questionnaires were pre-tested in March 2011. Four supervisors, 10 interviewers, and 4 biomarker staff were trained for the pretest. The questionnaires were pre-tested on 100 households, 100 women and 70 men in one urban and one rural cluster in Comilla District and one urban and one rural cluster in Dhaka. Based on observations in the field and suggestions made by the pretest teams, revisions were made in the wording and translations of the questionnaires.
Training of the 2011 BDHS field workers took place from 6 June to 5 July, 2011. A total of 173 field staff were recruited based on their educational level, prior experience with surveys, maturity, and willingness to spend up to six months on the project. Training included lectures on how to complete the questionnaires, mock interviews between participants, and field practice.
4
Fieldwork for the BDHS was carried out by 16 interviewing teams, each consisting of one male supervisor, one female field editor, five female interviewers, two male interviewers, and one logistics staff. Data collection was implemented in five phases, starting on 8 July, 2011 and ending on 27 December, 2011 except for re-visits during 2-19 January 2012 to collect blood samples from respondents interviewed during Ramadan. Data quality was ensured through four quality control teams each comprised of one male and one female staff. In addition, NIPORT monitored fieldwork by using additional quality control teams. Data quality was also monitored through field check tables generated concurrently with data processing. This was an advantage since the quality control teams were able to advise field teams of problems detected during data entry. In particular, tables were generated to check various data quality parameters. Fieldwork was also monitored through visits by representatives from USAID, MEASURE DHS and NIPORT.
2.4 Data Processing
Questionnaires for the BDHS were periodically returned to Dhaka for data processing at Mitra and Associates. The data processing began shortly after fieldwork commenced. Data processing consisted of office editing, coding of open-ended questions, data entry, and editing of inconsistencies found by the computer program. The data were processed by 16 data entry operators and two data entry supervisors. Data processing commenced on 23 July, 2011and ended on 15 January, 2012. Data processing was carried out using CSPro, a joint software product of the U.S. Census Bureau, Macro International, and Serpro S.A.
2.5 Coverage of the Sample
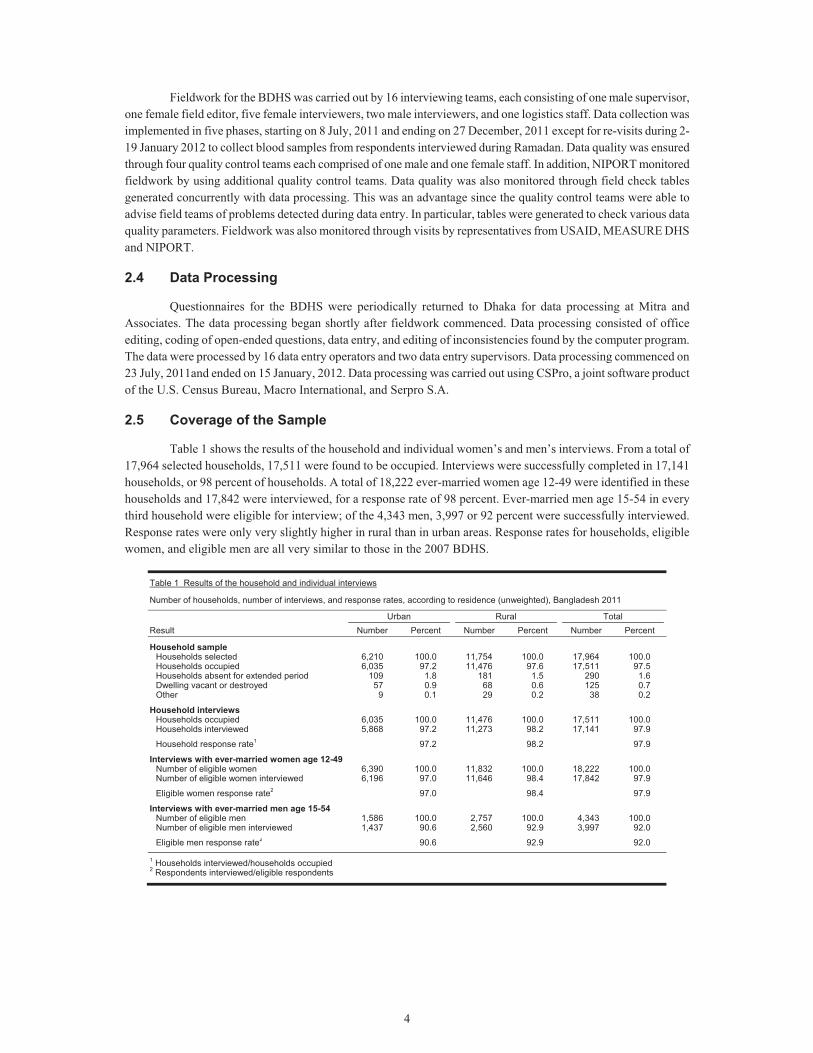
Table 1 shows the results of the household and individual women’s and men’s interviews. From a total of 17,964 selected households, 17,511 were found to be occupied. Interviews were successfully completed in 17,141 households, or 98 percent of households. A total of 18,222 ever-married women age 12-49 were identified in these households and 17,842 were interviewed, for a response rate of 98 percent. Ever-married men age 15-54 in every third household were eligible for interview; of the 4,343 men, 3,997 or 92 percent were successfully interviewed. Response rates were only very slightly higher in rural than in urban areas. Response rates for households, eligible women, and eligible men are all very similar to those in the 2007 BDHS.
Table 1 Results of the household and individual interviews
Number of households, number of interviews, and response rates, according to residence (unweighted), Bangladesh 2011
Result Urban Rural Total
Number Percent Number Percent Number Percent
Household sample Households selected 6,210 100.0 11,754 100.0 17,964 100.0Households occupied 6,035 97.2 11,476 97.6 17,511 97.5Households absent for extended period 109 1.8 181 1.5 290 1.6Dwelling vacant or destroyed 57 0.9 68 0.6 125 0.7Other 9 0.1 29 0.2 38 0.2
Household interviews Households occupied 6,035 100.0 11,476 100.0 17,511 100.0Households interviewed 5,868 97.2 11,273 98.2 17,141 97.9
Household response rate1 97.2 98.2 97.9
Interviews with ever-married women age 12-49 Number of eligible women 6,390 100.0 11,832 100.0 18,222 100.0Number of eligible women interviewed 6,196 97.0 11,646 98.4 17,842 97.9
Eligible women response rate2 97.0 98.4 97.9
Interviews with ever-married men age 15-54 Number of eligible men 1,586 100.0 2,757 100.0 4,343 100.0Number of eligible men interviewed 1,437 90.6 2,560 92.9 3,997 92.0
Eligible men response rate2 90.6 92.9 92.0 1 Households interviewed/households occupied 2 Respondents interviewed/eligible respondents
5
3 KEY FINDINGS FROM THE 2011 BDHS
3.1 Background Characteristics
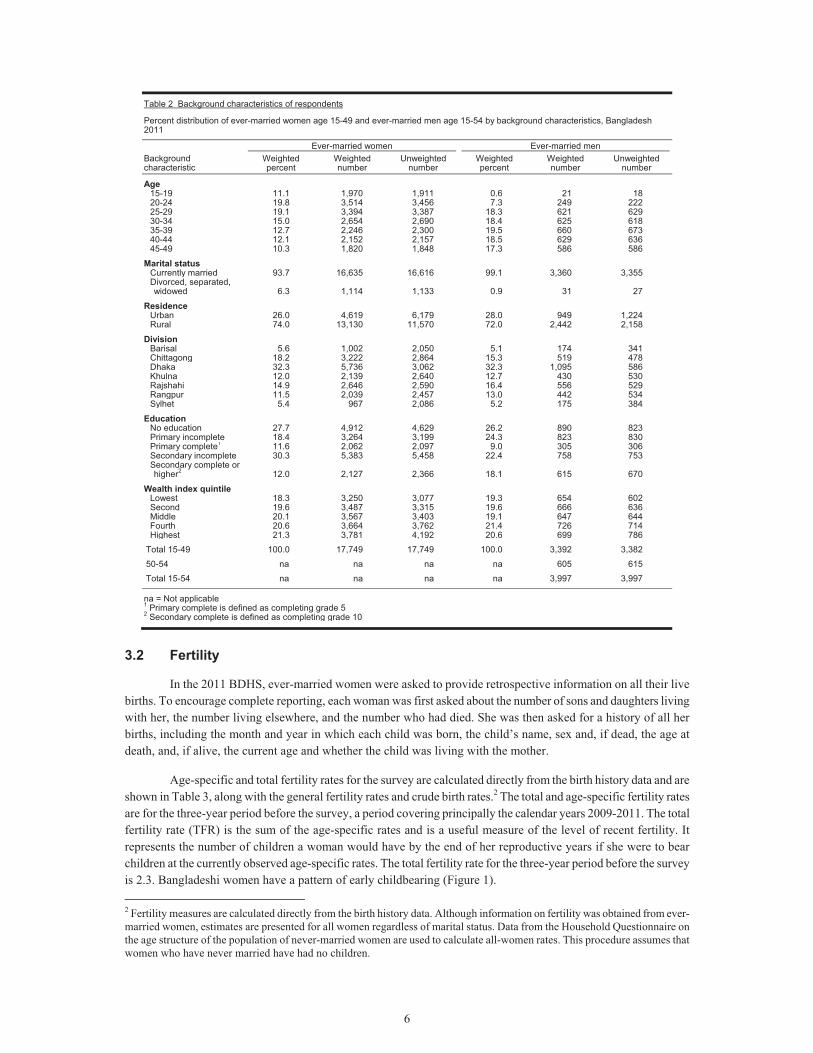
Table 2 shows the distributions of ever-married women age 15-491 and ever-married men age 15-54 interviewed in the 2011 BDHS by selected background characteristics. Half of the ever-married women (50 percent) are under age 30, compared with 26 percent of ever-married men. As might be expected, the majority of ever-married women (94 percent) are currently married, while 6 percent are divorced, separated, or widowed. Nearly all ever-married men (99 percent) are currently married, with just 1 percent divorced, separated, or widowed.
Twenty-six percent of women and 28 percent of men live in urban areas. Almost one-third of respondents live in Dhaka and about one-sixth each live in Chittagong and Rajshahi. In 2011, the latter division was split into two divisions, Rajshahi and Rangpur. Rangpur has 12 percent of women and 13 percent of men, very similar to the size of Khulna division. Sylhet and Barisal are the smallest divisions, accounting for only about five percent of respondents each.
There has been a slight shift in the population distribution by division since 2007, including small increases in Dhaka and what used to be Rajshahi (now Rajshahi and Rangpur) and a slight decrease in Khulna. The proportion of respondents in other divisions remains very similar to 2007.
Twenty-eight percent of ever-married women and 26 percent of ever-married men age 15-49 have no education, while 12 percent of women and 18 percent of men have completed secondary or higher education. Compared with data from the 2007 BDHS, these results show that there has been a decline in the proportion of women who have never attended school from 34 to 28 percent and for men from 30 to 26 percent.
In addition to standard background characteristics, most of the results in this report are shown by wealth quintiles, an indicator of the economic status of households. Although surveys under the DHS program do not collect data on consumption or income, they do collect detailed information on dwelling and household characteristics and access to a variety of consumer goods and services, and assets which are used as a measure of economic status. The wealth index is a measure that has been used in many DHS and other country-level surveys to indicate inequalities in household characteristics, in the use of health and other services, and in health outcomes. The resulting wealth index is an indicator of the level of wealth that is consistent with expenditure and income measures.
The wealth index was constructed using household asset data via principal components analysis. In its current form, which takes better account of urban-rural differences in the stores and indicators of wealth, the wealth index is created in three steps. In the first step, a subset of indicators common to both urban and rural areas is used to create wealth scores for households in both areas. Categorical variables to be used are transformed into separate dichotomous (0-1) indicators. These indicators and those that are continuous are then analyzed using principal components analysis to produce a common factor score for each household. In a second step, separate factor scores are produced for households in urban and in rural areas using area-specific indicators. The third step combines the separate area-specific factor scores to produce a nationally applicable combined wealth index by adjusting the area-specific score through regression on the common factor scores. This three-step procedure permits greater adaptability of the wealth index in both urban and rural areas. The resulting combined wealth index has a mean of zero and a standard deviation of one, and once it is obtained, national-level wealth quintiles are obtained by assigning the household score to each de jure household member, ranking each person in the population by their score and then dividing the ranking into five equal parts, from quintile one (lowest-poorest) to quintile five (highest-wealthiest), each having approximately 20 percent of the population. The distribution of women and men by quintiles is by definition, close to 20 percent in each category.
1 The survey sampled ever-married women age 12-49. However, very few ever-married women were in the age group 10-14 (90 unweighted cases or less than one percent). These women have been removed from the data set and the weights recalculated for the 15-49 age group. The tables in this report discuss only women age 15-49.
6
Table 2 Background characteristics of respondents
Percent distribution of ever-married women age 15-49 and ever-married men age 15-54 by background characteristics, Bangladesh 2011
Background characteristic
Ever-married women Ever-married men Weighted percent
Weighted number
Unweighted number
Weighted percent
Weighted number
Unweighted number
Age 15-19 11.1 1,970 1,911 0.6 21 18 20-24 19.8 3,514 3,456 7.3 249 222 25-29 19.1 3,394 3,387 18.3 621 629 30-34 15.0 2,654 2,690 18.4 625 618 35-39 12.7 2,246 2,300 19.5 660 673 40-44 12.1 2,152 2,157 18.5 629 636 45-49 10.3 1,820 1,848 17.3 586 586
Marital status Currently married 93.7 16,635 16,616 99.1 3,360 3,355 Divorced, separated, widowed 6.3 1,114 1,133 0.9 31 27
Residence Urban 26.0 4,619 6,179 28.0 949 1,224 Rural 74.0 13,130 11,570 72.0 2,442 2,158
Division Barisal 5.6 1,002 2,050 5.1 174 341 Chittagong 18.2 3,222 2,864 15.3 519 478 Dhaka 32.3 5,736 3,062 32.3 1,095 586 Khulna 12.0 2,139 2,640 12.7 430 530 Rajshahi 14.9 2,646 2,590 16.4 556 529 Rangpur 11.5 2,039 2,457 13.0 442 534 Sylhet 5.4 967 2,086 5.2 175 384
Education No education 27.7 4,912 4,629 26.2 890 823 Primary incomplete 18.4 3,264 3,199 24.3 823 830 Primary complete1 11.6 2,062 2,097 9.0 305 306 Secondary incomplete 30.3 5,383 5,458 22.4 758 753 Secondary complete or higher2 12.0 2,127 2,366 18.1 615 670
Wealth index quintile Lowest 18.3 3,250 3,077 19.3 654 602 Second 19.6 3,487 3,315 19.6 666 636 Middle 20.1 3,567 3,403 19.1 647 644 Fourth 20.6 3,664 3,762 21.4 726 714 Highest 21.3 3,781 4,192 20.6 699 786
Total 15-49 100.0 17,749 17,749 100.0 3,392 3,382
50-54 na na na na 605 615
Total 15-54 na na na na 3,997 3,997
na = Not applicable 1 Primary complete is defined as completing grade 5 2 Secondary complete is defined as completing grade 10
3.2 Fertility
In the 2011 BDHS, ever-married women were asked to provide retrospective information on all their live births. To encourage complete reporting, each woman was first asked about the number of sons and daughters living with her, the number living elsewhere, and the number who had died. She was then asked for a history of all her births, including the month and year in which each child was born, the child’s name, sex and, if dead, the age at death, and, if alive, the current age and whether the child was living with the mother.
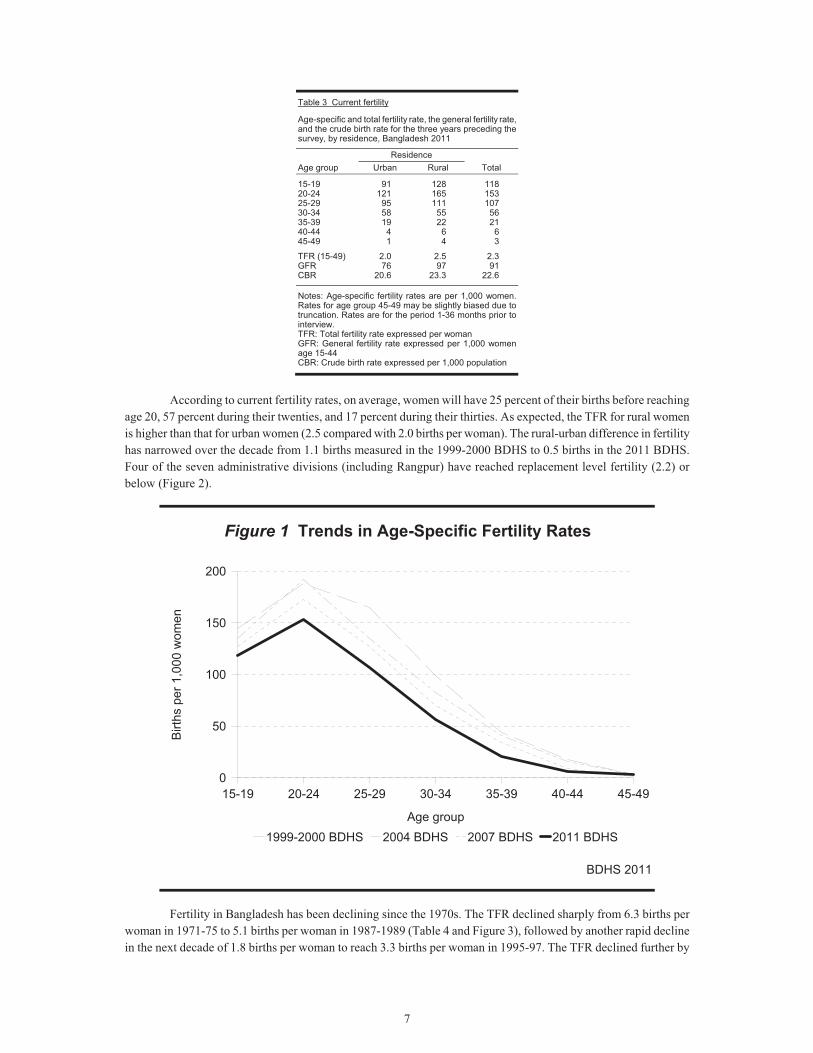
Age-specific and total fertility rates for the survey are calculated directly from the birth history data and are shown in Table 3, along with the general fertility rates and crude birth rates.2 The total and age-specific fertility rates are for the three-year period before the survey, a period covering principally the calendar years 2009-2011. The total fertility rate (TFR) is the sum of the age-specific rates and is a useful measure of the level of recent fertility. It represents the number of children a woman would have by the end of her reproductive years if she were to bear children at the currently observed age-specific rates. The total fertility rate for the three-year period before the survey is 2.3. Bangladeshi women have a pattern of early childbearing (Figure 1). 2 Fertility measures are calculated directly from the birth history data. Although information on fertility was obtained from ever-married women, estimates are presented for all women regardless of marital status. Data from the Household Questionnaire on the age structure of the population of never-married women are used to calculate all-women rates. This procedure assumes that women who have never married have had no children.
7
Table 3 Current fertility
Age-specific and total fertility rate, the general fertility rate, and the crude birth rate for the three years preceding the survey, by residence, Bangladesh 2011
Age group Residence
Total Urban Rural
15-19 91 128 11820-24 121 165 15325-29 95 111 10730-34 58 55 5635-39 19 22 2140-44 4 6 645-49 1 4 3
TFR (15-49) 2.0 2.5 2.3GFR 76 97 91CBR 20.6 23.3 22.6
Notes: Age-specific fertility rates are per 1,000 women. Rates for age group 45-49 may be slightly biased due to truncation. Rates are for the period 1-36 months prior to interview. TFR: Total fertility rate expressed per woman GFR: General fertility rate expressed per 1,000 women age 15-44 CBR: Crude birth rate expressed per 1,000 population
According to current fertility rates, on average, women will have 25 percent of their births before reaching
age 20, 57 percent during their twenties, and 17 percent during their thirties. As expected, the TFR for rural women is higher than that for urban women (2.5 compared with 2.0 births per woman). The rural-urban difference in fertility has narrowed over the decade from 1.1 births measured in the 1999-2000 BDHS to 0.5 births in the 2011 BDHS. Four of the seven administrative divisions (including Rangpur) have reached replacement level fertility (2.2) or below (Figure 2).
Figure 1 Trends in Age-Specific Fertility Rates
BDHS 2011
15-19 20-24 25-29 30-34 35-39 40-44 45-49
Age group
0
50
100
150
200
Birt
hs p
er 1
,00 0
wom
e n
1999-2000 BDHS 2004 BDHS 2007 BDHS 2011 BDHS
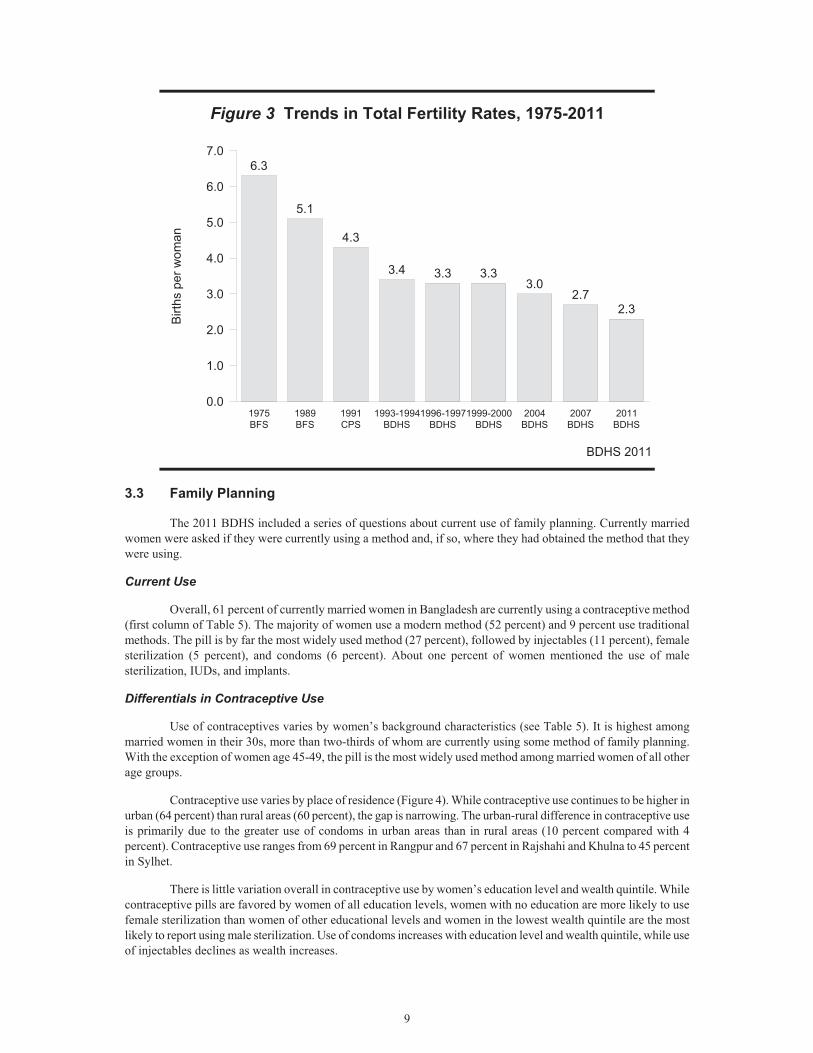
Fertility in Bangladesh has been declining since the 1970s. The TFR declined sharply from 6.3 births per woman in 1971-75 to 5.1 births per woman in 1987-1989 (Table 4 and Figure 3), followed by another rapid decline in the next decade of 1.8 births per woman to reach 3.3 births per woman in 1995-97. The TFR declined further by
8
one child per woman during the current decade to reach 2.3 births per woman. So, following a decade long plateau in fertility (1993-94 to 2004) at around 3.3, there has been a steady and encouraging decline in each subsequent DHS (9 percent between 1999-2000 to 2004; 10 percent between 2004 and 2007 and almost 15 percent between 2007 to 2011). Between 2007 and 2011 the decline in fertility was greater in urban areas (17 percent) compared to the rural areas (11 percent).
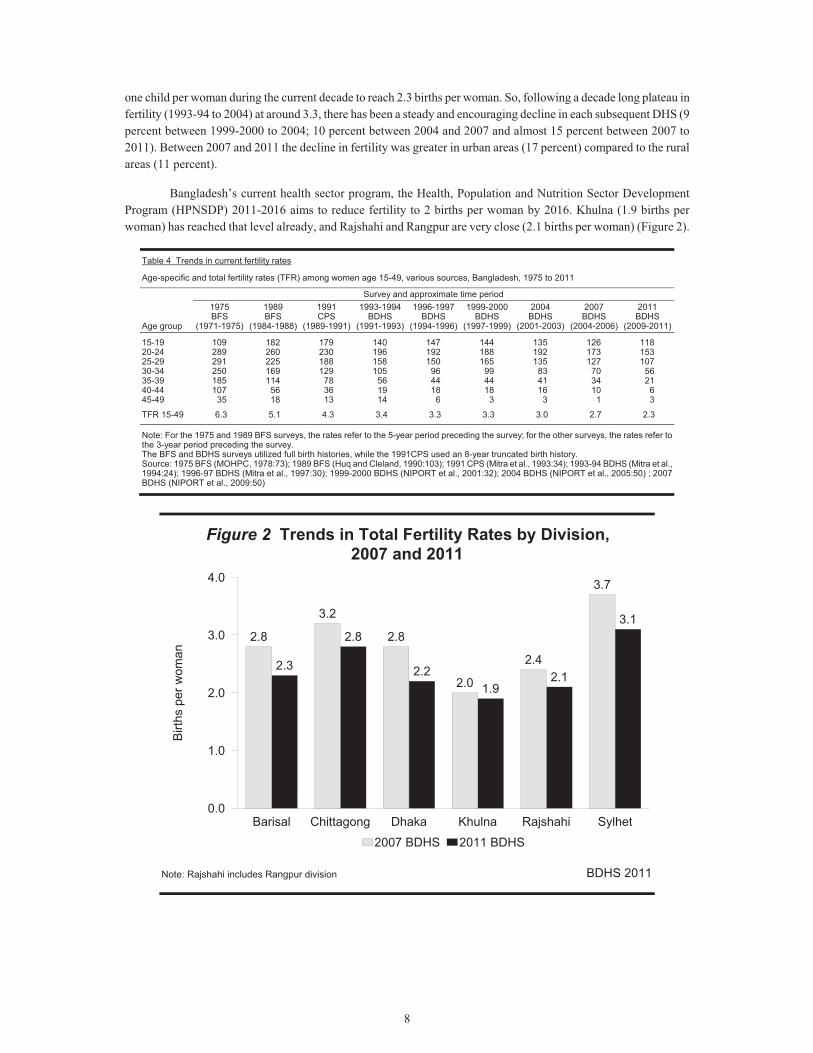
Bangladesh’s current health sector program, the Health, Population and Nutrition Sector Development Program (HPNSDP) 2011-2016 aims to reduce fertility to 2 births per woman by 2016. Khulna (1.9 births per woman) has reached that level already, and Rajshahi and Rangpur are very close (2.1 births per woman) (Figure 2).
Table 4 Trends in current fertility rates
Age-specific and total fertility rates (TFR) among women age 15-49, various sources, Bangladesh, 1975 to 2011
Age group
Survey and approximate time period 1975 BFS
(1971-1975)
1989 BFS
(1984-1988)
1991 CPS
(1989-1991)
1993-1994BDHS
(1991-1993)
1996-1997BDHS
(1994-1996)
1999-2000BDHS
(1997-1999)
2004 BDHS
(2001-2003)
2007 BDHS
(2004-2006)
2011 BDHS
(2009-2011)
15-19 109 182 179 140 147 144 135 126 11820-24 289 260 230 196 192 188 192 173 15325-29 291 225 188 158 150 165 135 127 10730-34 250 169 129 105 96 99 83 70 5635-39 185 114 78 56 44 44 41 34 2140-44 107 56 36 19 18 18 16 10 645-49 35 18 13 14 6 3 3 1 3
TFR 15-49 6.3 5.1 4.3 3.4 3.3 3.3 3.0 2.7 2.3
Note: For the 1975 and 1989 BFS surveys, the rates refer to the 5-year period preceding the survey; for the other surveys, the rates refer to the 3-year period preceding the survey. The BFS and BDHS surveys utilized full birth histories, while the 1991CPS used an 8-year truncated birth history. Source: 1975 BFS (MOHPC, 1978:73); 1989 BFS (Huq and Cleland, 1990:103); 1991 CPS (Mitra et al., 1993:34); 1993-94 BDHS (Mitra et al., 1994:24); 1996-97 BDHS (Mitra et al., 1997:30); 1999-2000 BDHS (NIPORT et al., 2001:32); 2004 BDHS (NIPORT et al., 2005:50) ; 2007 BDHS (NIPORT et al., 2009:50)
Figure 2 Trends in Total Fertility Rates by Division,2007 and 2011
BDHS 2011
2.8
3.2
2.8
2.0
2.4
3.7
2.3
2.8
2.21.9
2.1
3.1
Barisal Chittagong Dhaka Khulna Rajshahi Sylhet0.0
1.0
2.0
3.0
4.0
Birt
hs p
er w
oman
2007 BDHS 2011 BDHS
Note: Rajshahi includes Rangpur division
9
Figure 3 Trends in Total Fertility Rates, 1975-2011
BDHS 2011
6.3
5.1
4.3
3.4 3.3 3.33.0
2.72.3
1975BFS
1989BFS
1991CPS
1993-1994BDHS
1996-1997BDHS
1999-2000BDHS
2004BDHS
2007BDHS
2011BDHS
0.0
1.0
2.0
3.0
4.0
5.0
6.0
7.0
Birt
hs p
er w
oman
3.3 Family Planning
The 2011 BDHS included a series of questions about current use of family planning. Currently married women were asked if they were currently using a method and, if so, where they had obtained the method that they were using.
Current Use
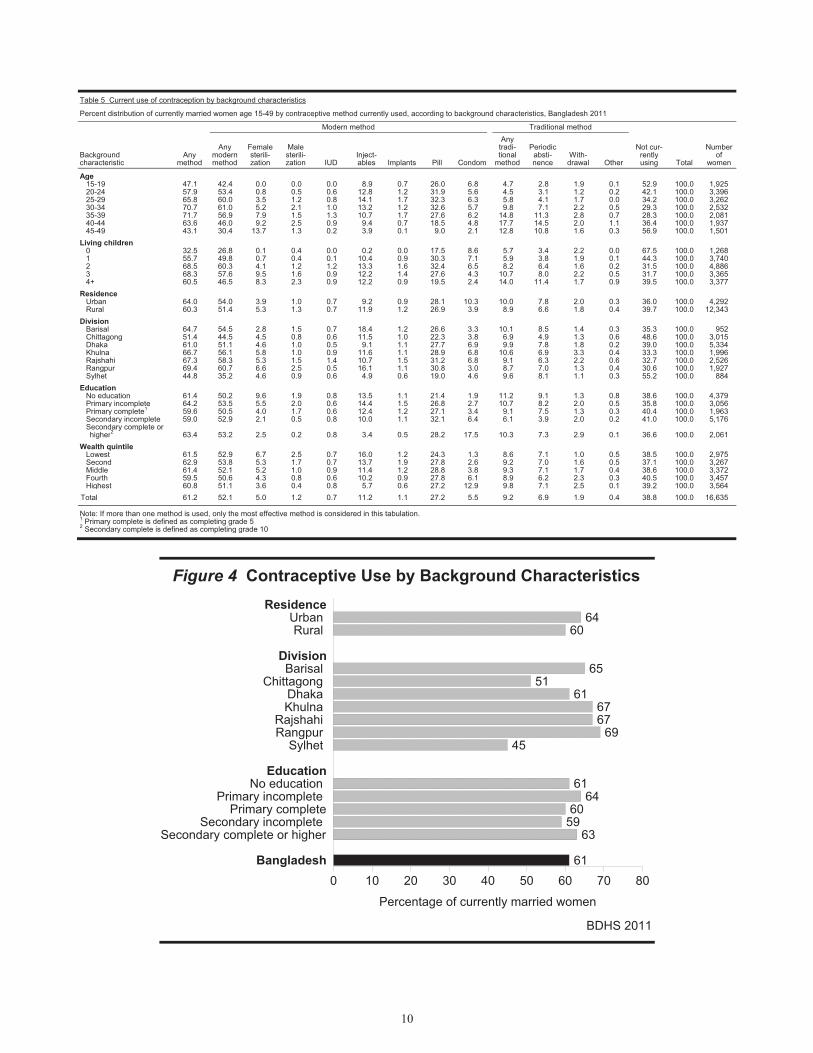
Overall, 61 percent of currently married women in Bangladesh are currently using a contraceptive method (first column of Table 5). The majority of women use a modern method (52 percent) and 9 percent use traditional methods. The pill is by far the most widely used method (27 percent), followed by injectables (11 percent), female sterilization (5 percent), and condoms (6 percent). About one percent of women mentioned the use of male sterilization, IUDs, and implants.
Differentials in Contraceptive Use
Use of contraceptives varies by women’s background characteristics (see Table 5). It is highest among married women in their 30s, more than two-thirds of whom are currently using some method of family planning. With the exception of women age 45-49, the pill is the most widely used method among married women of all other age groups.
Contraceptive use varies by place of residence (Figure 4). While contraceptive use continues to be higher in urban (64 percent) than rural areas (60 percent), the gap is narrowing. The urban-rural difference in contraceptive use is primarily due to the greater use of condoms in urban areas than in rural areas (10 percent compared with 4 percent). Contraceptive use ranges from 69 percent in Rangpur and 67 percent in Rajshahi and Khulna to 45 percent in Sylhet.
There is little variation overall in contraceptive use by women’s education level and wealth quintile. While contraceptive pills are favored by women of all education levels, women with no education are more likely to use female sterilization than women of other educational levels and women in the lowest wealth quintile are the most likely to report using male sterilization. Use of condoms increases with education level and wealth quintile, while use of injectables declines as wealth increases.
10
Table 5 Current use of contraception by background characteristics
Percent distribution of currently married women age 15-49 by contraceptive method currently used, according to background characteristics, Bangladesh 2011
Background characteristic
Any method
Modern method Traditional method
Not cur-rently using Total
Number of
women
Any modern method
Female sterili-zation
Male sterili-zation IUD
Inject-ables Implants Pill Condom
Any tradi-tional
method
Periodic absti-nence
With-drawal Other
Age 15-19 47.1 42.4 0.0 0.0 0.0 8.9 0.7 26.0 6.8 4.7 2.8 1.9 0.1 52.9 100.0 1,92520-24 57.9 53.4 0.8 0.5 0.6 12.8 1.2 31.9 5.6 4.5 3.1 1.2 0.2 42.1 100.0 3,39625-29 65.8 60.0 3.5 1.2 0.8 14.1 1.7 32.3 6.3 5.8 4.1 1.7 0.0 34.2 100.0 3,26230-34 70.7 61.0 5.2 2.1 1.0 13.2 1.2 32.6 5.7 9.8 7.1 2.2 0.5 29.3 100.0 2,53235-39 71.7 56.9 7.9 1.5 1.3 10.7 1.7 27.6 6.2 14.8 11.3 2.8 0.7 28.3 100.0 2,08140-44 63.6 46.0 9.2 2.5 0.9 9.4 0.7 18.5 4.8 17.7 14.5 2.0 1.1 36.4 100.0 1,93745-49 43.1 30.4 13.7 1.3 0.2 3.9 0.1 9.0 2.1 12.8 10.8 1.6 0.3 56.9 100.0 1,501
Living children 0 32.5 26.8 0.1 0.4 0.0 0.2 0.0 17.5 8.6 5.7 3.4 2.2 0.0 67.5 100.0 1,2681 55.7 49.8 0.7 0.4 0.1 10.4 0.9 30.3 7.1 5.9 3.8 1.9 0.1 44.3 100.0 3,7402 68.5 60.3 4.1 1.2 1.2 13.3 1.6 32.4 6.5 8.2 6.4 1.6 0.2 31.5 100.0 4,8863 68.3 57.6 9.5 1.6 0.9 12.2 1.4 27.6 4.3 10.7 8.0 2.2 0.5 31.7 100.0 3,3654+ 60.5 46.5 8.3 2.3 0.9 12.2 0.9 19.5 2.4 14.0 11.4 1.7 0.9 39.5 100.0 3,377
Residence Urban 64.0 54.0 3.9 1.0 0.7 9.2 0.9 28.1 10.3 10.0 7.8 2.0 0.3 36.0 100.0 4,292Rural 60.3 51.4 5.3 1.3 0.7 11.9 1.2 26.9 3.9 8.9 6.6 1.8 0.4 39.7 100.0 12,343
Division Barisal 64.7 54.5 2.8 1.5 0.7 18.4 1.2 26.6 3.3 10.1 8.5 1.4 0.3 35.3 100.0 952Chittagong 51.4 44.5 4.5 0.8 0.6 11.5 1.0 22.3 3.8 6.9 4.9 1.3 0.6 48.6 100.0 3,015Dhaka 61.0 51.1 4.6 1.0 0.5 9.1 1.1 27.7 6.9 9.9 7.8 1.8 0.2 39.0 100.0 5,334Khulna 66.7 56.1 5.8 1.0 0.9 11.6 1.1 28.9 6.8 10.6 6.9 3.3 0.4 33.3 100.0 1,996Rajshahi 67.3 58.3 5.3 1.5 1.4 10.7 1.5 31.2 6.8 9.1 6.3 2.2 0.6 32.7 100.0 2,526Rangpur 69.4 60.7 6.6 2.5 0.5 16.1 1.1 30.8 3.0 8.7 7.0 1.3 0.4 30.6 100.0 1,927Sylhet 44.8 35.2 4.6 0.9 0.6 4.9 0.6 19.0 4.6 9.6 8.1 1.1 0.3 55.2 100.0 884
Education No education 61.4 50.2 9.6 1.9 0.8 13.5 1.1 21.4 1.9 11.2 9.1 1.3 0.8 38.6 100.0 4,379Primary incomplete 64.2 53.5 5.5 2.0 0.6 14.4 1.5 26.8 2.7 10.7 8.2 2.0 0.5 35.8 100.0 3,056Primary complete1 59.6 50.5 4.0 1.7 0.6 12.4 1.2 27.1 3.4 9.1 7.5 1.3 0.3 40.4 100.0 1,963Secondary incomplete 59.0 52.9 2.1 0.5 0.8 10.0 1.1 32.1 6.4 6.1 3.9 2.0 0.2 41.0 100.0 5,176Secondary complete or higher2 63.4 53.2 2.5 0.2 0.8 3.4 0.5 28.2 17.5 10.3 7.3 2.9 0.1 36.6 100.0 2,061
Wealth quintile Lowest 61.5 52.9 6.7 2.5 0.7 16.0 1.2 24.3 1.3 8.6 7.1 1.0 0.5 38.5 100.0 2,975Second 62.9 53.8 5.3 1.7 0.7 13.7 1.9 27.8 2.6 9.2 7.0 1.6 0.5 37.1 100.0 3,267Middle 61.4 52.1 5.2 1.0 0.9 11.4 1.2 28.8 3.8 9.3 7.1 1.7 0.4 38.6 100.0 3,372Fourth 59.5 50.6 4.3 0.8 0.6 10.2 0.9 27.8 6.1 8.9 6.2 2.3 0.3 40.5 100.0 3,457Highest 60.8 51.1 3.6 0.4 0.8 5.7 0.6 27.2 12.9 9.8 7.1 2.5 0.1 39.2 100.0 3,564
Total 61.2 52.1 5.0 1.2 0.7 11.2 1.1 27.2 5.5 9.2 6.9 1.9 0.4 38.8 100.0 16,635
Note: If more than one method is used, only the most effective method is considered in this tabulation.1 Primary complete is defined as completing grade 5 2 Secondary complete is defined as completing grade 10
Figure 4 Contraceptive Use by Background Characteristics
BDHS 2011
6460
6551
616767
6945
6164
6059
63
61
ResidenceUrban Rural
DivisionBarisal
Chittagong Dhaka Khulna
Rajshahi Rangpur
Sylhet
EducationNo education
Primary incomplete Primary complete
Secondary incomplete Secondary complete or higher
Bangladesh0 10 20 30 40 50 60 70 80
Percentage of currently married women
11
Trends in Contraceptive Use
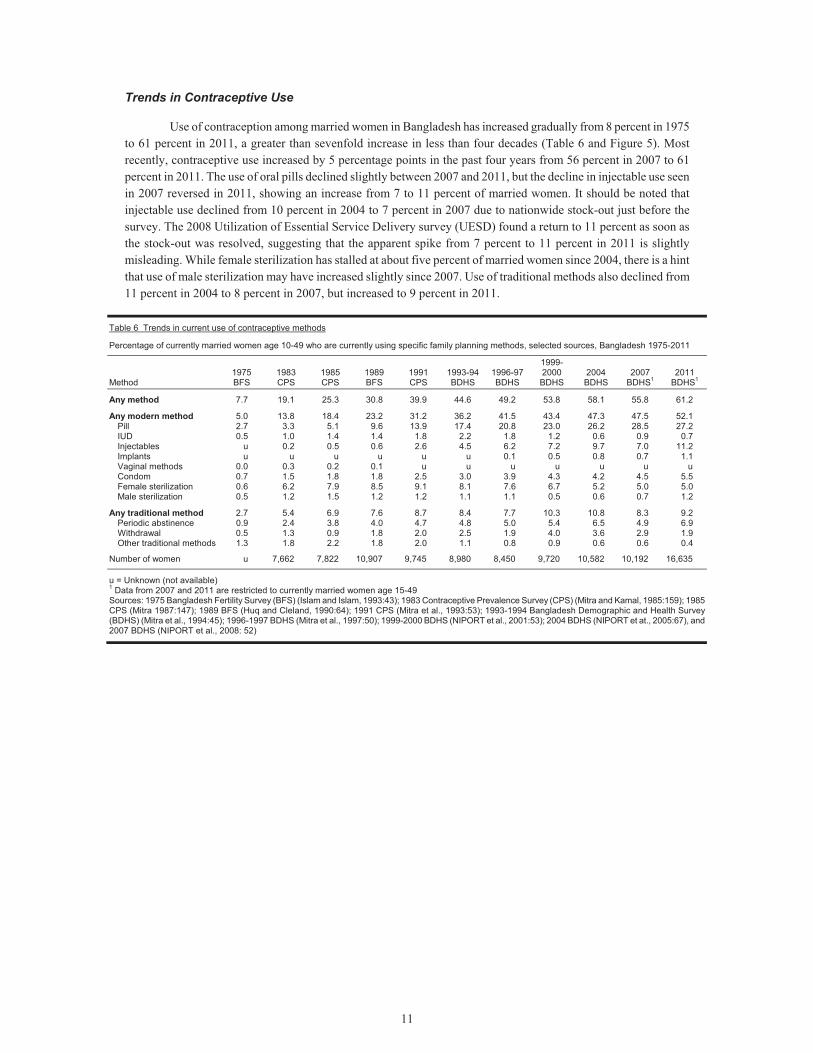
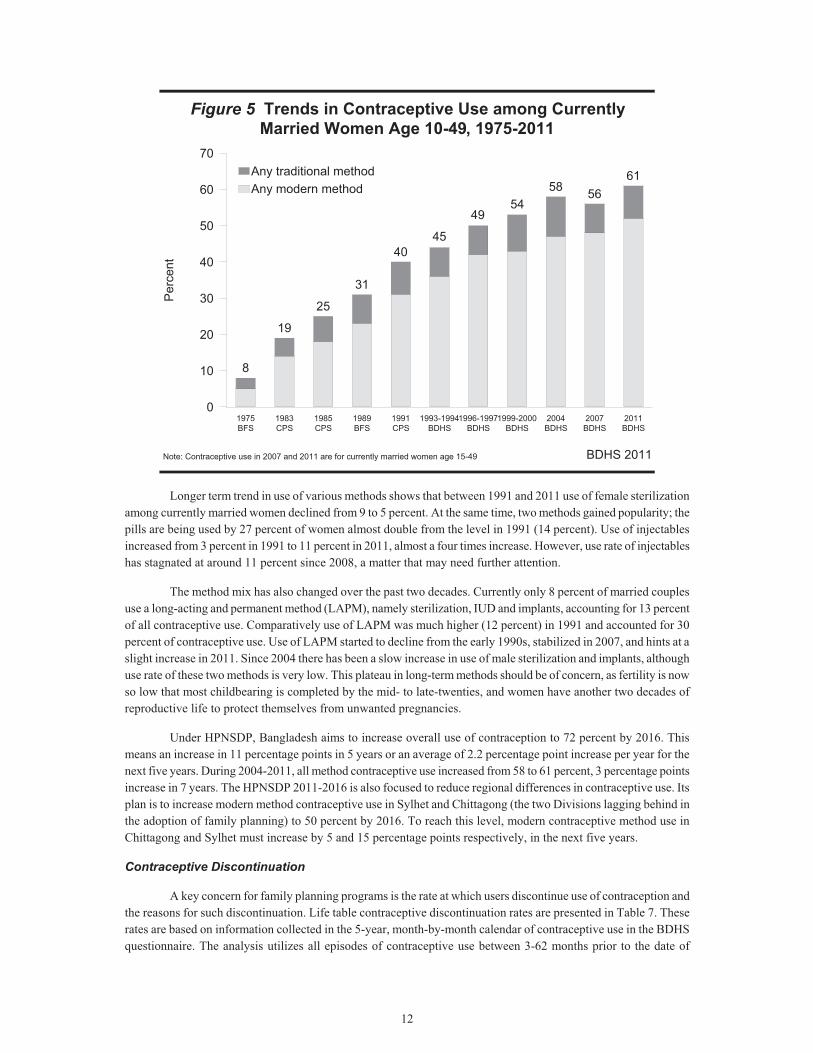
Use of contraception among married women in Bangladesh has increased gradually from 8 percent in 1975 to 61 percent in 2011, a greater than sevenfold increase in less than four decades (Table 6 and Figure 5). Most recently, contraceptive use increased by 5 percentage points in the past four years from 56 percent in 2007 to 61 percent in 2011. The use of oral pills declined slightly between 2007 and 2011, but the decline in injectable use seen in 2007 reversed in 2011, showing an increase from 7 to 11 percent of married women. It should be noted that injectable use declined from 10 percent in 2004 to 7 percent in 2007 due to nationwide stock-out just before the survey. The 2008 Utilization of Essential Service Delivery survey (UESD) found a return to 11 percent as soon as the stock-out was resolved, suggesting that the apparent spike from 7 percent to 11 percent in 2011 is slightly misleading. While female sterilization has stalled at about five percent of married women since 2004, there is a hint that use of male sterilization may have increased slightly since 2007. Use of traditional methods also declined from 11 percent in 2004 to 8 percent in 2007, but increased to 9 percent in 2011.
Table 6 Trends in current use of contraceptive methods
Percentage of currently married women age 10-49 who are currently using specific family planning methods, selected sources, Bangladesh 1975-2011
Method 1975 BFS
1983 CPS
1985 CPS
1989 BFS
1991 CPS
1993-94BDHS
1996-97BDHS
1999-2000 BDHS
2004 BDHS
2007 BDHS1
2011 BDHS1
Any method 7.7 19.1 25.3 30.8 39.9 44.6 49.2 53.8 58.1 55.8 61.2
Any modern method 5.0 13.8 18.4 23.2 31.2 36.2 41.5 43.4 47.3 47.5 52.1 Pill 2.7 3.3 5.1 9.6 13.9 17.4 20.8 23.0 26.2 28.5 27.2 IUD 0.5 1.0 1.4 1.4 1.8 2.2 1.8 1.2 0.6 0.9 0.7 Injectables u 0.2 0.5 0.6 2.6 4.5 6.2 7.2 9.7 7.0 11.2 Implants u u u u u u 0.1 0.5 0.8 0.7 1.1 Vaginal methods 0.0 0.3 0.2 0.1 u u u u u u u Condom 0.7 1.5 1.8 1.8 2.5 3.0 3.9 4.3 4.2 4.5 5.5 Female sterilization 0.6 6.2 7.9 8.5 9.1 8.1 7.6 6.7 5.2 5.0 5.0 Male sterilization 0.5 1.2 1.5 1.2 1.2 1.1 1.1 0.5 0.6 0.7 1.2
Any traditional method 2.7 5.4 6.9 7.6 8.7 8.4 7.7 10.3 10.8 8.3 9.2 Periodic abstinence 0.9 2.4 3.8 4.0 4.7 4.8 5.0 5.4 6.5 4.9 6.9 Withdrawal 0.5 1.3 0.9 1.8 2.0 2.5 1.9 4.0 3.6 2.9 1.9 Other traditional methods 1.3 1.8 2.2 1.8 2.0 1.1 0.8 0.9 0.6 0.6 0.4
Number of women u 7,662 7,822 10,907 9,745 8,980 8,450 9,720 10,582 10,192 16,635
u = Unknown (not available) 1 Data from 2007 and 2011 are restricted to currently married women age 15-49 Sources: 1975 Bangladesh Fertility Survey (BFS) (Islam and Islam, 1993:43); 1983 Contraceptive Prevalence Survey (CPS) (Mitra and Kamal, 1985:159); 1985 CPS (Mitra 1987:147); 1989 BFS (Huq and Cleland, 1990:64); 1991 CPS (Mitra et al., 1993:53); 1993-1994 Bangladesh Demographic and Health Survey (BDHS) (Mitra et al., 1994:45); 1996-1997 BDHS (Mitra et al., 1997:50); 1999-2000 BDHS (NIPORT et al., 2001:53); 2004 BDHS (NIPORT et at., 2005:67), and 2007 BDHS (NIPORT et al., 2008: 52)
12
Figure 5 Trends in Contraceptive Use among Currently Married Women Age 10-49, 1975-2011
BDHS 2011
8
19
25
31
4044
5053
58 5661
1975BFS
1983CPS
1985CPS
1989BFS
1991CPS
1993-1994BDHS
1996-1997BDHS
1999-2000BDHS
2004BDHS
2007BDHS
2011BDHS
0
10
20
30
40
50
60
70P
erce
n tAny modern methodAny traditional method
Note: Contraceptive use in 2007 and 2011 are for currently married women age 15-49
45
4954
Longer term trend in use of various methods shows that between 1991 and 2011 use of female sterilization among currently married women declined from 9 to 5 percent. At the same time, two methods gained popularity; the pills are being used by 27 percent of women almost double from the level in 1991 (14 percent). Use of injectables increased from 3 percent in 1991 to 11 percent in 2011, almost a four times increase. However, use rate of injectables has stagnated at around 11 percent since 2008, a matter that may need further attention.
The method mix has also changed over the past two decades. Currently only 8 percent of married couples use a long-acting and permanent method (LAPM), namely sterilization, IUD and implants, accounting for 13 percent of all contraceptive use. Comparatively use of LAPM was much higher (12 percent) in 1991 and accounted for 30 percent of contraceptive use. Use of LAPM started to decline from the early 1990s, stabilized in 2007, and hints at a slight increase in 2011. Since 2004 there has been a slow increase in use of male sterilization and implants, although use rate of these two methods is very low. This plateau in long-term methods should be of concern, as fertility is now so low that most childbearing is completed by the mid- to late-twenties, and women have another two decades of reproductive life to protect themselves from unwanted pregnancies.
Under HPNSDP, Bangladesh aims to increase overall use of contraception to 72 percent by 2016. This means an increase in 11 percentage points in 5 years or an average of 2.2 percentage point increase per year for the next five years. During 2004-2011, all method contraceptive use increased from 58 to 61 percent, 3 percentage points increase in 7 years. The HPNSDP 2011-2016 is also focused to reduce regional differences in contraceptive use. Its plan is to increase modern method contraceptive use in Sylhet and Chittagong (the two Divisions lagging behind in the adoption of family planning) to 50 percent by 2016. To reach this level, modern contraceptive method use in Chittagong and Sylhet must increase by 5 and 15 percentage points respectively, in the next five years.
Contraceptive Discontinuation
A key concern for family planning programs is the rate at which users discontinue use of contraception and the reasons for such discontinuation. Life table contraceptive discontinuation rates are presented in Table 7. These rates are based on information collected in the 5-year, month-by-month calendar of contraceptive use in the BDHS questionnaire. The analysis utilizes all episodes of contraceptive use between 3-62 months prior to the date of
13
interview. The month of interview and the two preceding months are ignored to avoid the bias that might be introduced by an unrecognized pregnancy.
The rates presented in Table 7 are cumulative one-year discontinuation rates and represent the proportion of users who discontinue using a method within 12 months after starting. The rates are calculated by dividing the number of discontinuations at each duration of use in single months, by the number of months of exposure for that duration. The single-month rates are then cumulated to produce a one-year rate.
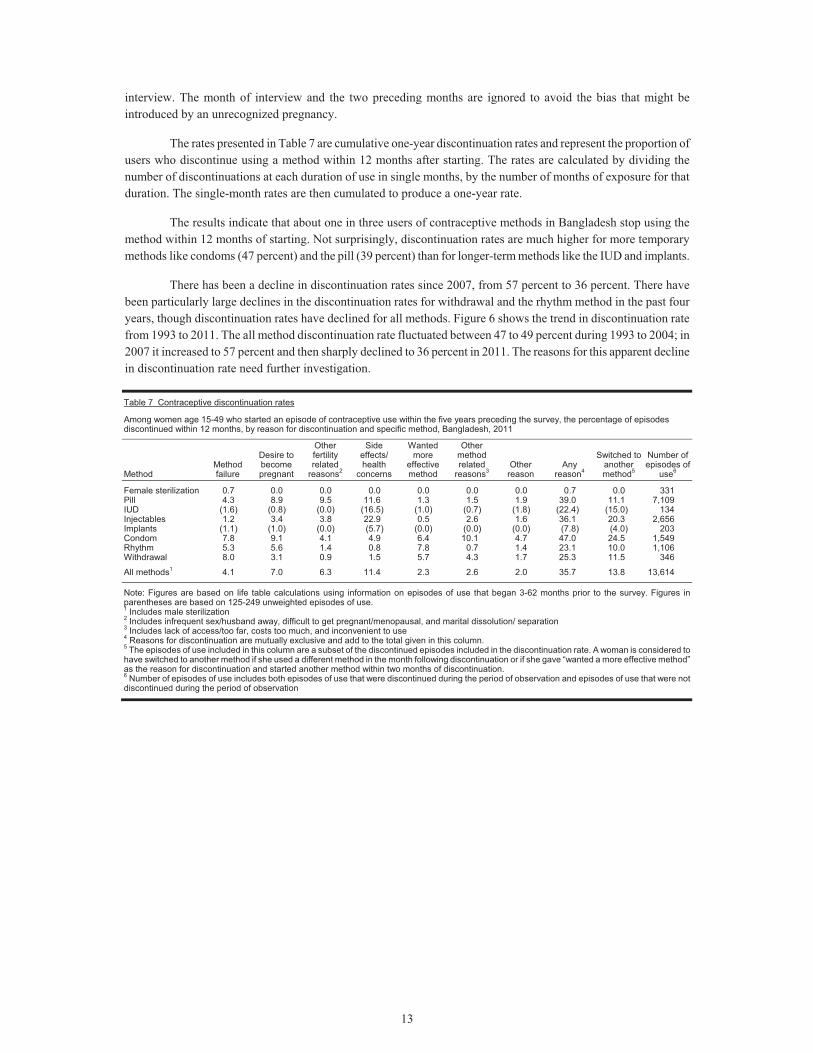
The results indicate that about one in three users of contraceptive methods in Bangladesh stop using the method within 12 months of starting. Not surprisingly, discontinuation rates are much higher for more temporary methods like condoms (47 percent) and the pill (39 percent) than for longer-term methods like the IUD and implants.
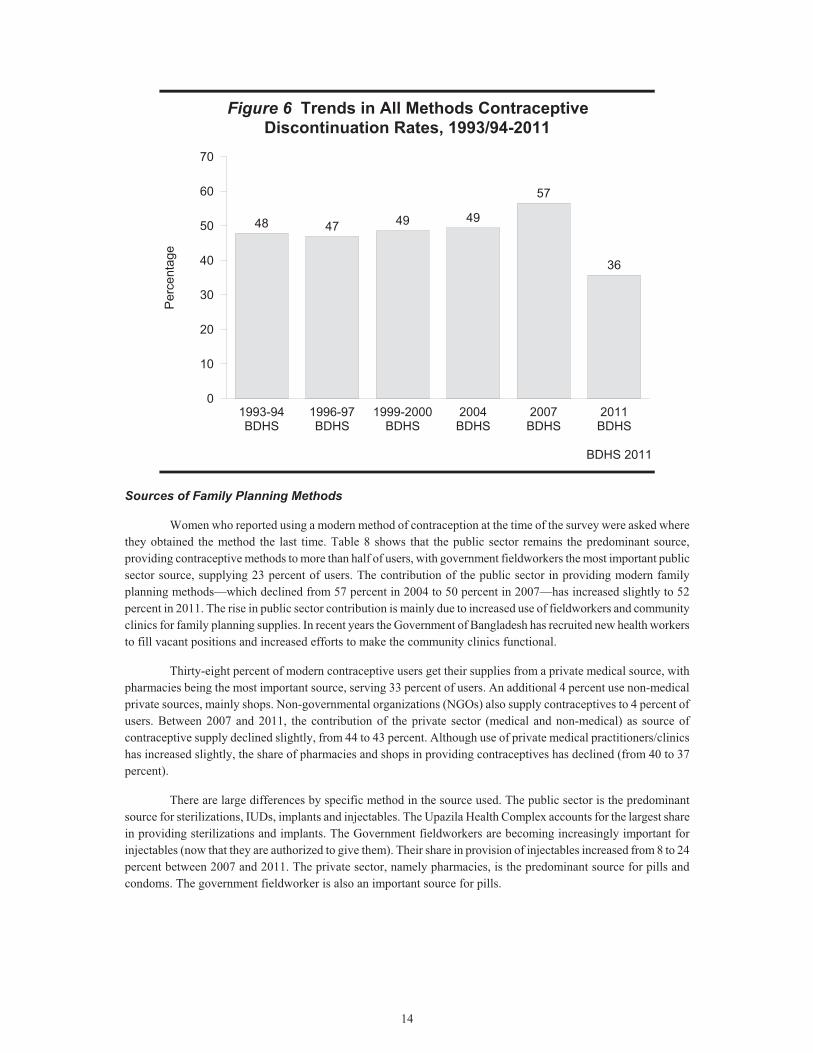
There has been a decline in discontinuation rates since 2007, from 57 percent to 36 percent. There have been particularly large declines in the discontinuation rates for withdrawal and the rhythm method in the past four years, though discontinuation rates have declined for all methods. Figure 6 shows the trend in discontinuation rate from 1993 to 2011. The all method discontinuation rate fluctuated between 47 to 49 percent during 1993 to 2004; in 2007 it increased to 57 percent and then sharply declined to 36 percent in 2011. The reasons for this apparent decline in discontinuation rate need further investigation.
Table 7 Contraceptive discontinuation rates
Among women age 15-49 who started an episode of contraceptive use within the five years preceding the survey, the percentage of episodes discontinued within 12 months, by reason for discontinuation and specific method, Bangladesh, 2011
Method Method failure
Desire to become pregnant
Other fertility related
reasons2
Side effects/ health
concerns
Wanted more
effective method
Other method related
reasons3 Other
reason Any
reason4
Switched to another method5
Number of episodes of
use6
Female sterilization 0.7 0.0 0.0 0.0 0.0 0.0 0.0 0.7 0.0 331Pill 4.3 8.9 9.5 11.6 1.3 1.5 1.9 39.0 11.1 7,109IUD (1.6) (0.8) (0.0) (16.5) (1.0) (0.7) (1.8) (22.4) (15.0) 134Injectables 1.2 3.4 3.8 22.9 0.5 2.6 1.6 36.1 20.3 2,656Implants (1.1) (1.0) (0.0) (5.7) (0.0) (0.0) (0.0) (7.8) (4.0) 203Condom 7.8 9.1 4.1 4.9 6.4 10.1 4.7 47.0 24.5 1,549Rhythm 5.3 5.6 1.4 0.8 7.8 0.7 1.4 23.1 10.0 1,106Withdrawal 8.0 3.1 0.9 1.5 5.7 4.3 1.7 25.3 11.5 346
All methods1 4.1 7.0 6.3 11.4 2.3 2.6 2.0 35.7 13.8 13,614
Note: Figures are based on life table calculations using information on episodes of use that began 3-62 months prior to the survey. Figures in parentheses are based on 125-249 unweighted episodes of use. 1 Includes male sterilization 2 Includes infrequent sex/husband away, difficult to get pregnant/menopausal, and marital dissolution/ separation 3 Includes lack of access/too far, costs too much, and inconvenient to use 4 Reasons for discontinuation are mutually exclusive and add to the total given in this column. 5 The episodes of use included in this column are a subset of the discontinued episodes included in the discontinuation rate. A woman is considered to have switched to another method if she used a different method in the month following discontinuation or if she gave “wanted a more effective method” as the reason for discontinuation and started another method within two months of discontinuation. 6 Number of episodes of use includes both episodes of use that were discontinued during the period of observation and episodes of use that were not discontinued during the period of observation
14
Figure 6 Trends in All Methods Contraceptive Discontinuation Rates, 1993/94-2011
BDHS 2011
48 47 49 49
57
36
1993-94BDHS
1996-97BDHS
1999-2000BDHS
2004BDHS
2007BDHS
2011BDHS
0
10
20
30
40
50
60
70P
erce
ntag
e
Sources of Family Planning Methods
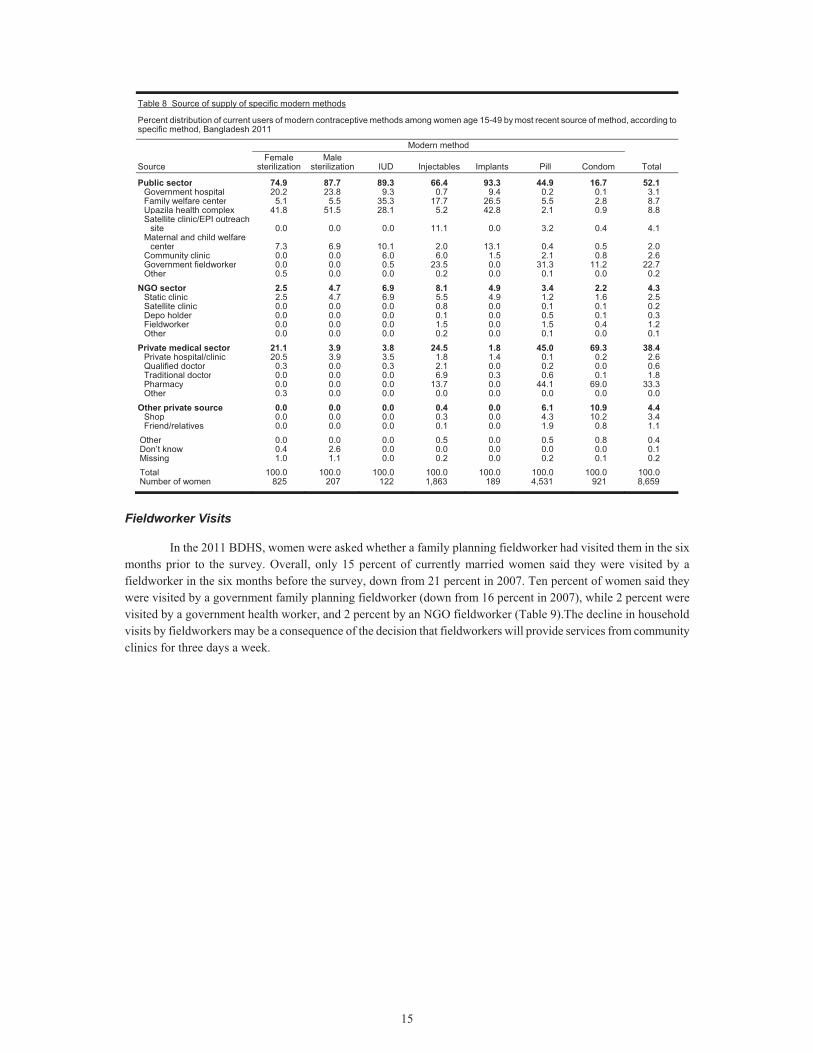
Women who reported using a modern method of contraception at the time of the survey were asked where they obtained the method the last time. Table 8 shows that the public sector remains the predominant source, providing contraceptive methods to more than half of users, with government fieldworkers the most important public sector source, supplying 23 percent of users. The contribution of the public sector in providing modern family planning methods—which declined from 57 percent in 2004 to 50 percent in 2007—has increased slightly to 52 percent in 2011. The rise in public sector contribution is mainly due to increased use of fieldworkers and community clinics for family planning supplies. In recent years the Government of Bangladesh has recruited new health workers to fill vacant positions and increased efforts to make the community clinics functional.
Thirty-eight percent of modern contraceptive users get their supplies from a private medical source, with pharmacies being the most important source, serving 33 percent of users. An additional 4 percent use non-medical private sources, mainly shops. Non-governmental organizations (NGOs) also supply contraceptives to 4 percent of users. Between 2007 and 2011, the contribution of the private sector (medical and non-medical) as source of contraceptive supply declined slightly, from 44 to 43 percent. Although use of private medical practitioners/clinics has increased slightly, the share of pharmacies and shops in providing contraceptives has declined (from 40 to 37 percent).
There are large differences by specific method in the source used. The public sector is the predominant source for sterilizations, IUDs, implants and injectables. The Upazila Health Complex accounts for the largest share in providing sterilizations and implants. The Government fieldworkers are becoming increasingly important for injectables (now that they are authorized to give them). Their share in provision of injectables increased from 8 to 24 percent between 2007 and 2011. The private sector, namely pharmacies, is the predominant source for pills and condoms. The government fieldworker is also an important source for pills.
15
Table 8 Source of supply of specific modern methods
Percent distribution of current users of modern contraceptive methods among women age 15-49 by most recent source of method, according to specific method, Bangladesh 2011
Source
Modern method
Total Female
sterilization Male
sterilization IUD Injectables Implants Pill Condom
Public sector 74.9 87.7 89.3 66.4 93.3 44.9 16.7 52.1Government hospital 20.2 23.8 9.3 0.7 9.4 0.2 0.1 3.1Family welfare center 5.1 5.5 35.3 17.7 26.5 5.5 2.8 8.7Upazila health complex 41.8 51.5 28.1 5.2 42.8 2.1 0.9 8.8Satellite clinic/EPI outreach
site 0.0 0.0 0.0 11.1 0.0 3.2 0.4 4.1Maternal and child welfare
center 7.3 6.9 10.1 2.0 13.1 0.4 0.5 2.0Community clinic 0.0 0.0 6.0 6.0 1.5 2.1 0.8 2.6Government fieldworker 0.0 0.0 0.5 23.5 0.0 31.3 11.2 22.7Other 0.5 0.0 0.0 0.2 0.0 0.1 0.0 0.2
NGO sector 2.5 4.7 6.9 8.1 4.9 3.4 2.2 4.3Static clinic 2.5 4.7 6.9 5.5 4.9 1.2 1.6 2.5Satellite clinic 0.0 0.0 0.0 0.8 0.0 0.1 0.1 0.2Depo holder 0.0 0.0 0.0 0.1 0.0 0.5 0.1 0.3Fieldworker 0.0 0.0 0.0 1.5 0.0 1.5 0.4 1.2Other 0.0 0.0 0.0 0.2 0.0 0.1 0.0 0.1
Private medical sector 21.1 3.9 3.8 24.5 1.8 45.0 69.3 38.4Private hospital/clinic 20.5 3.9 3.5 1.8 1.4 0.1 0.2 2.6Qualified doctor 0.3 0.0 0.3 2.1 0.0 0.2 0.0 0.6Traditional doctor 0.0 0.0 0.0 6.9 0.3 0.6 0.1 1.8Pharmacy 0.0 0.0 0.0 13.7 0.0 44.1 69.0 33.3Other 0.3 0.0 0.0 0.0 0.0 0.0 0.0 0.0
Other private source 0.0 0.0 0.0 0.4 0.0 6.1 10.9 4.4Shop 0.0 0.0 0.0 0.3 0.0 4.3 10.2 3.4Friend/relatives 0.0 0.0 0.0 0.1 0.0 1.9 0.8 1.1
Other 0.0 0.0 0.0 0.5 0.0 0.5 0.8 0.4Don’t know 0.4 2.6 0.0 0.0 0.0 0.0 0.0 0.1Missing 1.0 1.1 0.0 0.2 0.0 0.2 0.1 0.2
Total 100.0 100.0 100.0 100.0 100.0 100.0 100.0 100.0Number of women 825 207 122 1,863 189 4,531 921 8,659
Fieldworker Visits
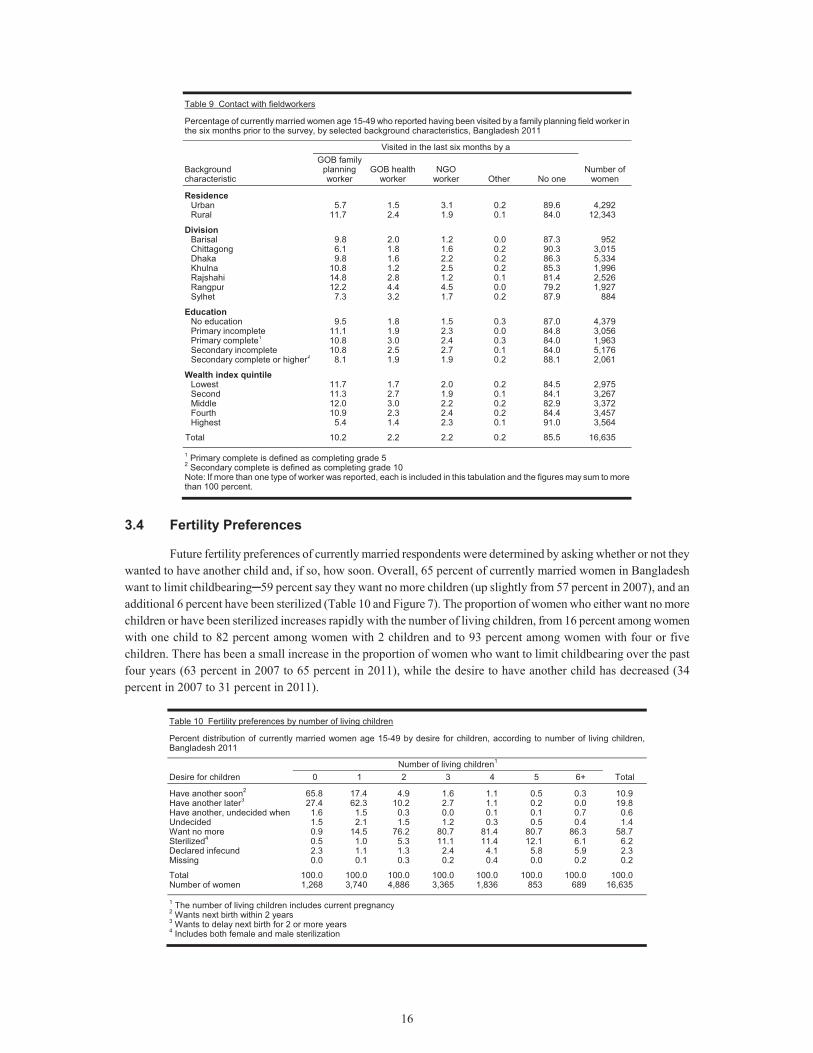
In the 2011 BDHS, women were asked whether a family planning fieldworker had visited them in the six months prior to the survey. Overall, only 15 percent of currently married women said they were visited by a fieldworker in the six months before the survey, down from 21 percent in 2007. Ten percent of women said they were visited by a government family planning fieldworker (down from 16 percent in 2007), while 2 percent were visited by a government health worker, and 2 percent by an NGO fieldworker (Table 9).The decline in household visits by fieldworkers may be a consequence of the decision that fieldworkers will provide services from community clinics for three days a week.
16
Table 9 Contact with fieldworkers
Percentage of currently married women age 15-49 who reported having been visited by a family planning field worker in the six months prior to the survey, by selected background characteristics, Bangladesh 2011
Background characteristic
Visited in the last six months by a
Number of women
GOB family planning worker
GOB health worker
NGO worker Other No one
Residence Urban 5.7 1.5 3.1 0.2 89.6 4,292 Rural 11.7 2.4 1.9 0.1 84.0 12,343
Division Barisal 9.8 2.0 1.2 0.0 87.3 952 Chittagong 6.1 1.8 1.6 0.2 90.3 3,015 Dhaka 9.8 1.6 2.2 0.2 86.3 5,334 Khulna 10.8 1.2 2.5 0.2 85.3 1,996 Rajshahi 14.8 2.8 1.2 0.1 81.4 2,526 Rangpur 12.2 4.4 4.5 0.0 79.2 1,927 Sylhet 7.3 3.2 1.7 0.2 87.9 884
Education No education 9.5 1.8 1.5 0.3 87.0 4,379 Primary incomplete 11.1 1.9 2.3 0.0 84.8 3,056 Primary complete1 10.8 3.0 2.4 0.3 84.0 1,963 Secondary incomplete 10.8 2.5 2.7 0.1 84.0 5,176 Secondary complete or higher2 8.1 1.9 1.9 0.2 88.1 2,061
Wealth index quintile Lowest 11.7 1.7 2.0 0.2 84.5 2,975 Second 11.3 2.7 1.9 0.1 84.1 3,267 Middle 12.0 3.0 2.2 0.2 82.9 3,372 Fourth 10.9 2.3 2.4 0.2 84.4 3,457 Highest 5.4 1.4 2.3 0.1 91.0 3,564
Total 10.2 2.2 2.2 0.2 85.5 16,635 1 Primary complete is defined as completing grade 52 Secondary complete is defined as completing grade 10 Note: If more than one type of worker was reported, each is included in this tabulation and the figures may sum to more than 100 percent.
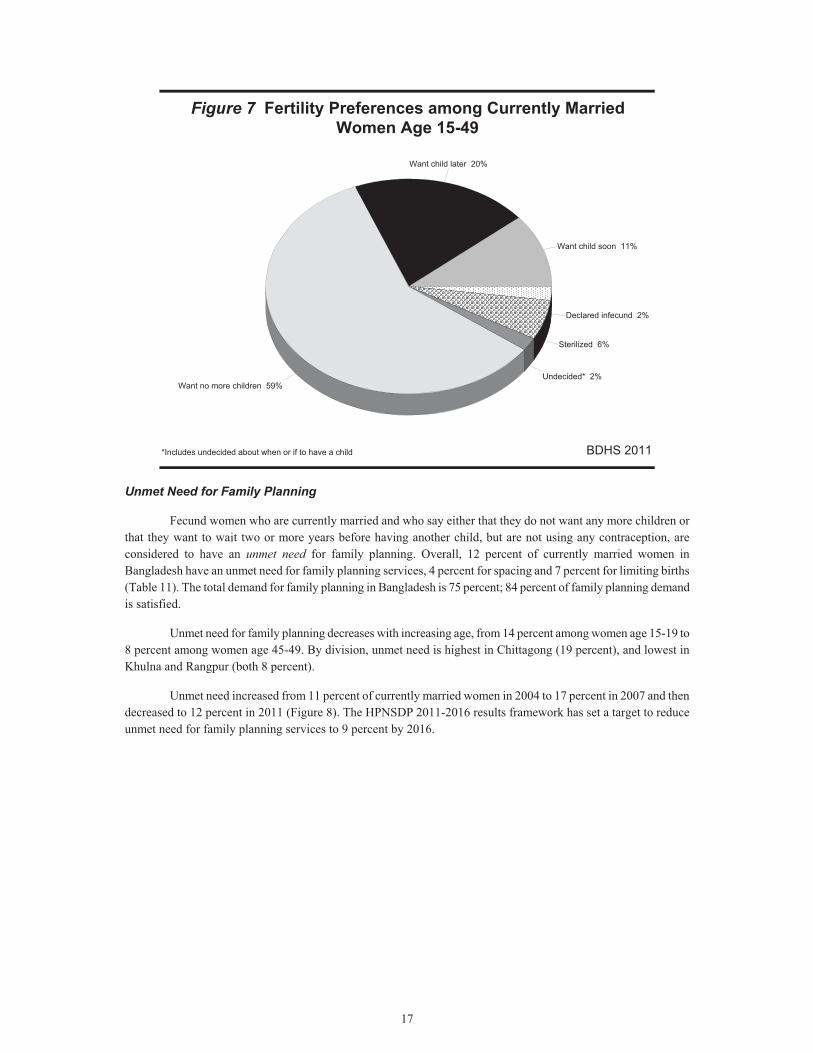
3.4 Fertility Preferences
Future fertility preferences of currently married respondents were determined by asking whether or not they wanted to have another child and, if so, how soon. Overall, 65 percent of currently married women in Bangladesh want to limit childbearing�59 percent say they want no more children (up slightly from 57 percent in 2007), and an additional 6 percent have been sterilized (Table 10 and Figure 7). The proportion of women who either want no more children or have been sterilized increases rapidly with the number of living children, from 16 percent among women with one child to 82 percent among women with 2 children and to 93 percent among women with four or five children. There has been a small increase in the proportion of women who want to limit childbearing over the past four years (63 percent in 2007 to 65 percent in 2011), while the desire to have another child has decreased (34 percent in 2007 to 31 percent in 2011).
Table 10 Fertility preferences by number of living children
Percent distribution of currently married women age 15-49 by desire for children, according to number of living children, Bangladesh 2011
Desire for children Number of living children1
Total 0 1 2 3 4 5 6+
Have another soon2 65.8 17.4 4.9 1.6 1.1 0.5 0.3 10.9 Have another later3 27.4 62.3 10.2 2.7 1.1 0.2 0.0 19.8 Have another, undecided when 1.6 1.5 0.3 0.0 0.1 0.1 0.7 0.6 Undecided 1.5 2.1 1.5 1.2 0.3 0.5 0.4 1.4 Want no more 0.9 14.5 76.2 80.7 81.4 80.7 86.3 58.7 Sterilized4 0.5 1.0 5.3 11.1 11.4 12.1 6.1 6.2 Declared infecund 2.3 1.1 1.3 2.4 4.1 5.8 5.9 2.3 Missing 0.0 0.1 0.3 0.2 0.4 0.0 0.2 0.2
Total 100.0 100.0 100.0 100.0 100.0 100.0 100.0 100.0 Number of women 1,268 3,740 4,886 3,365 1,836 853 689 16,635 1 The number of living children includes current pregnancy2 Wants next birth within 2 years 3 Wants to delay next birth for 2 or more years 4 Includes both female and male sterilization
17
Figure 7 Fertility Preferences among Currently Married Women Age 15-49
BDHS 2011
Want child soon 11%
Want child later 20%
Want no more children 59%Undecided* 2%
Sterilized 6%
Declared infecund 2%
*Includes undecided about when or if to have a child
Unmet Need for Family Planning
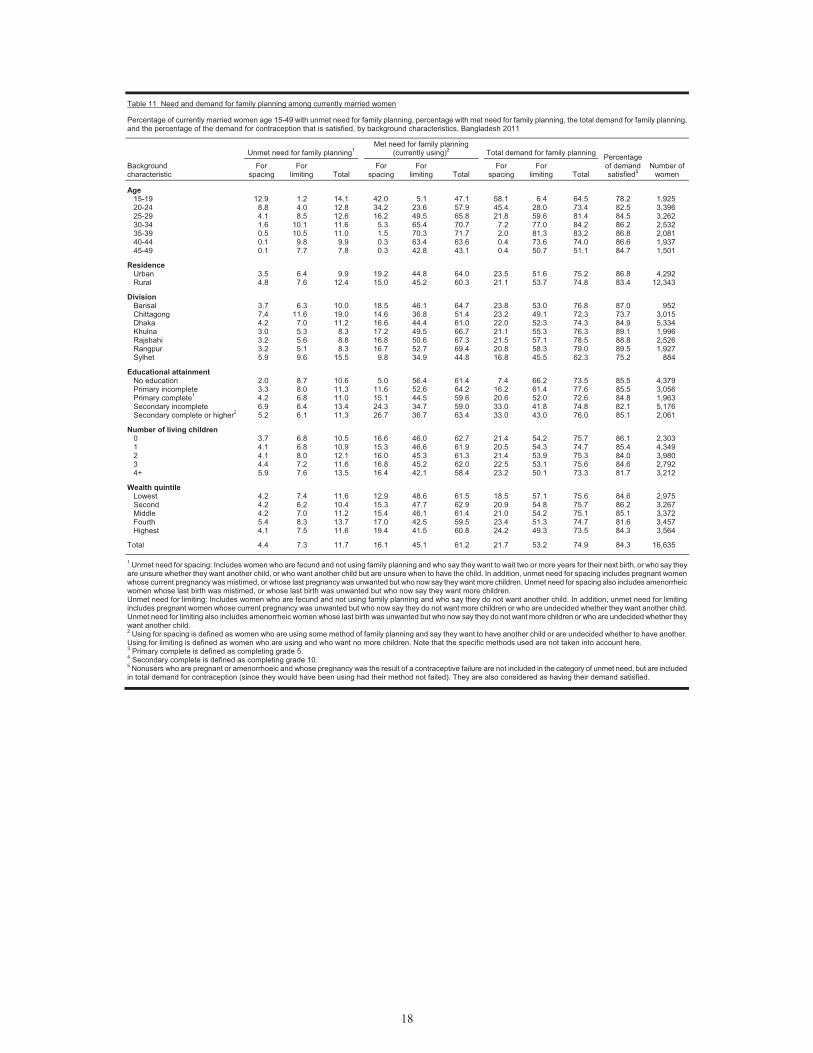
Fecund women who are currently married and who say either that they do not want any more children or that they want to wait two or more years before having another child, but are not using any contraception, are considered to have an unmet need for family planning. Overall, 12 percent of currently married women in Bangladesh have an unmet need for family planning services, 4 percent for spacing and 7 percent for limiting births (Table 11). The total demand for family planning in Bangladesh is 75 percent; 84 percent of family planning demand is satisfied.
Unmet need for family planning decreases with increasing age, from 14 percent among women age 15-19 to 8 percent among women age 45-49. By division, unmet need is highest in Chittagong (19 percent), and lowest in Khulna and Rangpur (both 8 percent).
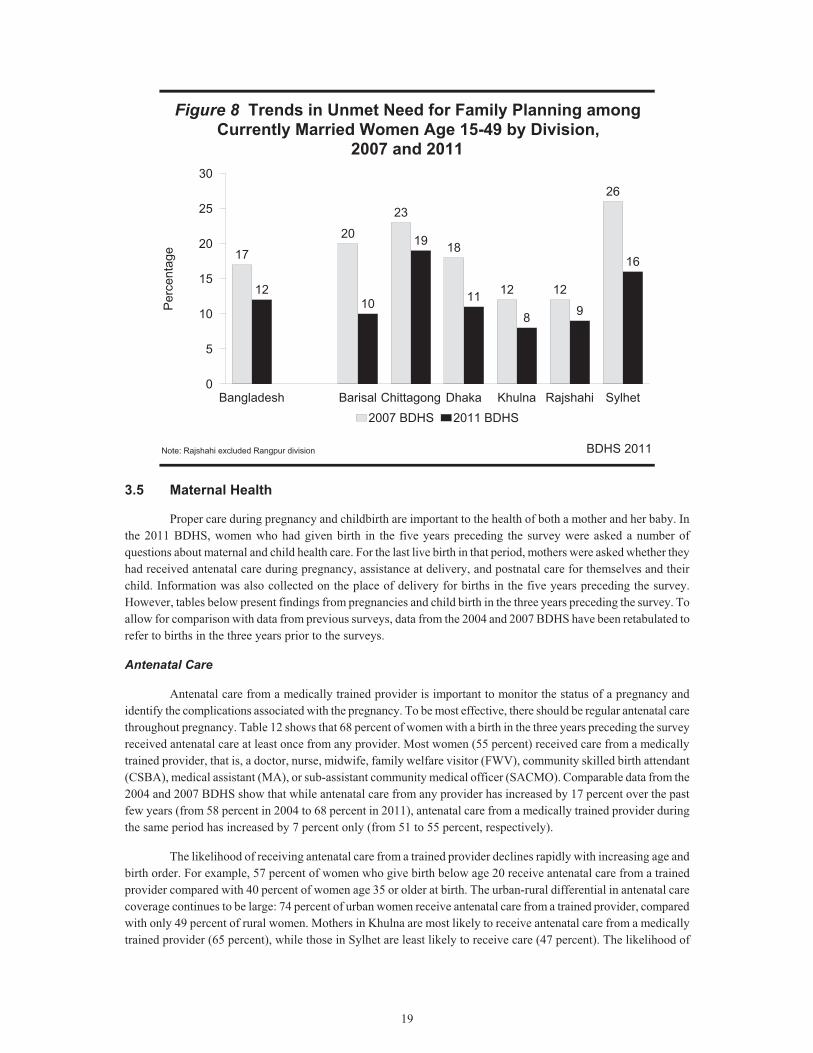
Unmet need increased from 11 percent of currently married women in 2004 to 17 percent in 2007 and then decreased to 12 percent in 2011 (Figure 8). The HPNSDP 2011-2016 results framework has set a target to reduce unmet need for family planning services to 9 percent by 2016.
18
Table 11 Need and demand for family planning among currently married women
Percentage of currently married women age 15-49 with unmet need for family planning, percentage with met need for family planning, the total demand for family planning, and the percentage of the demand for contraception that is satisfied, by background characteristics, Bangladesh 2011
Background characteristic
Unmet need for family planning1 Met need for family planning
(currently using)2 Total demand for family planning Percentage of demand satisfied5
Number of women
For spacing
For limiting Total
For spacing
For limiting Total
For spacing
For limiting Total
Age 15-19 12.9 1.2 14.1 42.0 5.1 47.1 58.1 6.4 64.5 78.2 1,925 20-24 8.8 4.0 12.8 34.2 23.6 57.9 45.4 28.0 73.4 82.5 3,396 25-29 4.1 8.5 12.6 16.2 49.5 65.8 21.8 59.6 81.4 84.5 3,262 30-34 1.6 10.1 11.6 5.3 65.4 70.7 7.2 77.0 84.2 86.2 2,532 35-39 0.5 10.5 11.0 1.5 70.3 71.7 2.0 81.3 83.2 86.8 2,081 40-44 0.1 9.8 9.9 0.3 63.4 63.6 0.4 73.6 74.0 86.6 1,937 45-49 0.1 7.7 7.8 0.3 42.8 43.1 0.4 50.7 51.1 84.7 1,501
Residence Urban 3.5 6.4 9.9 19.2 44.8 64.0 23.5 51.6 75.2 86.8 4,292 Rural 4.8 7.6 12.4 15.0 45.2 60.3 21.1 53.7 74.8 83.4 12,343
Division Barisal 3.7 6.3 10.0 18.5 46.1 64.7 23.8 53.0 76.8 87.0 952 Chittagong 7.4 11.6 19.0 14.6 36.8 51.4 23.2 49.1 72.3 73.7 3,015 Dhaka 4.2 7.0 11.2 16.6 44.4 61.0 22.0 52.3 74.3 84.9 5,334 Khulna 3.0 5.3 8.3 17.2 49.5 66.7 21.1 55.3 76.3 89.1 1,996 Rajshahi 3.2 5.6 8.8 16.8 50.6 67.3 21.5 57.1 78.5 88.8 2,526 Rangpur 3.2 5.1 8.3 16.7 52.7 69.4 20.8 58.3 79.0 89.5 1,927 Sylhet 5.9 9.6 15.5 9.8 34.9 44.8 16.8 45.5 62.3 75.2 884
Educational attainment No education 2.0 8.7 10.6 5.0 56.4 61.4 7.4 66.2 73.5 85.5 4,379 Primary incomplete 3.3 8.0 11.3 11.6 52.6 64.2 16.2 61.4 77.6 85.5 3,056 Primary complete1 4.2 6.8 11.0 15.1 44.5 59.6 20.6 52.0 72.6 84.8 1,963 Secondary incomplete 6.9 6.4 13.4 24.3 34.7 59.0 33.0 41.8 74.8 82.1 5,176 Secondary complete or higher2 5.2 6.1 11.3 26.7 36.7 63.4 33.0 43.0 76.0 85.1 2,061
Number of living children 0 3.7 6.8 10.5 16.6 46.0 62.7 21.4 54.2 75.7 86.1 2,303 1 4.1 6.8 10.9 15.3 46.6 61.9 20.5 54.3 74.7 85.4 4,349 2 4.1 8.0 12.1 16.0 45.3 61.3 21.4 53.9 75.3 84.0 3,980 3 4.4 7.2 11.6 16.8 45.2 62.0 22.5 53.1 75.6 84.6 2,792 4+ 5.9 7.6 13.5 16.4 42.1 58.4 23.2 50.1 73.3 81.7 3,212
Wealth quintile Lowest 4.2 7.4 11.6 12.9 48.6 61.5 18.5 57.1 75.6 84.6 2,975 Second 4.2 6.2 10.4 15.3 47.7 62.9 20.9 54.8 75.7 86.2 3,267 Middle 4.2 7.0 11.2 15.4 46.1 61.4 21.0 54.2 75.1 85.1 3,372 Fourth 5.4 8.3 13.7 17.0 42.5 59.5 23.4 51.3 74.7 81.6 3,457 Highest 4.1 7.5 11.6 19.4 41.5 60.8 24.2 49.3 73.5 84.3 3,564
Total 4.4 7.3 11.7 16.1 45.1 61.2 21.7 53.2 74.9 84.3 16,635 1 Unmet need for spacing: Includes women who are fecund and not using family planning and who say they want to wait two or more years for their next birth, or who say they are unsure whether they want another child, or who want another child but are unsure when to have the child. In addition, unmet need for spacing includes pregnant women whose current pregnancy was mistimed, or whose last pregnancy was unwanted but who now say they want more children. Unmet need for spacing also includes amenorrheicwomen whose last birth was mistimed, or whose last birth was unwanted but who now say they want more children. Unmet need for limiting: Includes women who are fecund and not using family planning and who say they do not want another child. In addition, unmet need for limiting includes pregnant women whose current pregnancy was unwanted but who now say they do not want more children or who are undecided whether they want another child. Unmet need for limiting also includes amenorrheic women whose last birth was unwanted but who now say they do not want more children or who are undecided whether they want another child. 2 Using for spacing is defined as women who are using some method of family planning and say they want to have another child or are undecided whether to have another. Using for limiting is defined as women who are using and who want no more children. Note that the specific methods used are not taken into account here. 3 Primary complete is defined as completing grade 5. 4 Secondary complete is defined as completing grade 10. 5 Nonusers who are pregnant or amenorrhoeic and whose pregnancy was the result of a contraceptive failure are not included in the category of unmet need, but are included in total demand for contraception (since they would have been using had their method not failed). They are also considered as having their demand satisfied.
19
Figure 8 Trends in Unmet Need for Family Planning among Currently Married Women Age 15-49 by Division,
2007 and 2011
BDHS 2011
17
20
23
18
12 12
26
1210
19
11
8 9
16
Bangladesh Barisal Chittagong Dhaka Khulna Rajshahi Sylhet0
5
10
15
20
25
30Pe
rcen
tag e
2007 BDHS 2011 BDHS
Note: Rajshahi excluded Rangpur division
3.5 Maternal Health
Proper care during pregnancy and childbirth are important to the health of both a mother and her baby. In the 2011 BDHS, women who had given birth in the five years preceding the survey were asked a number of questions about maternal and child health care. For the last live birth in that period, mothers were asked whether they had received antenatal care during pregnancy, assistance at delivery, and postnatal care for themselves and their child. Information was also collected on the place of delivery for births in the five years preceding the survey. However, tables below present findings from pregnancies and child birth in the three years preceding the survey. To allow for comparison with data from previous surveys, data from the 2004 and 2007 BDHS have been retabulated to refer to births in the three years prior to the surveys.
Antenatal Care
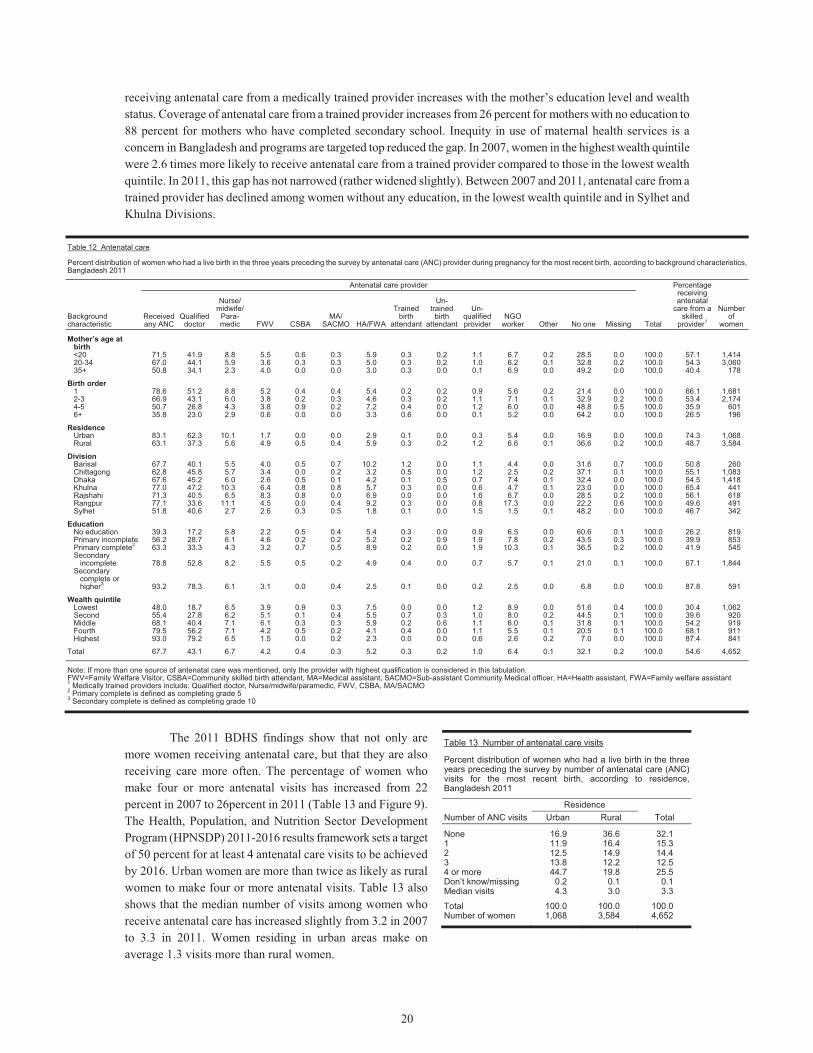
Antenatal care from a medically trained provider is important to monitor the status of a pregnancy and identify the complications associated with the pregnancy. To be most effective, there should be regular antenatal care throughout pregnancy. Table 12 shows that 68 percent of women with a birth in the three years preceding the survey received antenatal care at least once from any provider. Most women (55 percent) received care from a medically trained provider, that is, a doctor, nurse, midwife, family welfare visitor (FWV), community skilled birth attendant (CSBA), medical assistant (MA), or sub-assistant community medical officer (SACMO). Comparable data from the 2004 and 2007 BDHS show that while antenatal care from any provider has increased by 17 percent over the past few years (from 58 percent in 2004 to 68 percent in 2011), antenatal care from a medically trained provider during the same period has increased by 7 percent only (from 51 to 55 percent, respectively).
The likelihood of receiving antenatal care from a trained provider declines rapidly with increasing age and birth order. For example, 57 percent of women who give birth below age 20 receive antenatal care from a trained provider compared with 40 percent of women age 35 or older at birth. The urban-rural differential in antenatal care coverage continues to be large: 74 percent of urban women receive antenatal care from a trained provider, compared with only 49 percent of rural women. Mothers in Khulna are most likely to receive antenatal care from a medically trained provider (65 percent), while those in Sylhet are least likely to receive care (47 percent). The likelihood of
20
receiving antenatal care from a medically trained provider increases with the mother’s education level and wealth status. Coverage of antenatal care from a trained provider increases from 26 percent for mothers with no education to 88 percent for mothers who have completed secondary school. Inequity in use of maternal health services is a concern in Bangladesh and programs are targeted top reduced the gap. In 2007, women in the highest wealth quintile were 2.6 times more likely to receive antenatal care from a trained provider compared to those in the lowest wealth quintile. In 2011, this gap has not narrowed (rather widened slightly). Between 2007 and 2011, antenatal care from a trained provider has declined among women without any education, in the lowest wealth quintile and in Sylhet and Khulna Divisions.
Table 12 Antenatal care
Percent distribution of women who had a live birth in the three years preceding the survey by antenatal care (ANC) provider during pregnancy for the most recent birth, according to background characteristics, Bangladesh 2011
Background characteristic
Antenatal care provider
Total
Percentage receiving antenatal
care from a skilled
provider1
Number of
women Received any ANC
Qualified doctor
Nurse/ midwife/
Para-medic FWV CSBA
MA/ SACMO HA/FWA
Trained birth
attendant
Un-trained
birth attendant
Un-qualified provider
NGO worker Other No one Missing
Mother’s age at birth <20 71.5 41.9 8.8 5.5 0.6 0.3 5.9 0.3 0.2 1.1 6.7 0.2 28.5 0.0 100.0 57.1 1,41420-34 67.0 44.1 5.9 3.6 0.3 0.3 5.0 0.3 0.2 1.0 6.2 0.1 32.8 0.2 100.0 54.3 3,06035+ 50.8 34.1 2.3 4.0 0.0 0.0 3.0 0.3 0.0 0.1 6.9 0.0 49.2 0.0 100.0 40.4 178
Birth order 1 78.6 51.2 8.8 5.2 0.4 0.4 5.4 0.2 0.2 0.9 5.6 0.2 21.4 0.0 100.0 66.1 1,6812-3 66.9 43.1 6.0 3.8 0.2 0.3 4.6 0.3 0.2 1.1 7.1 0.1 32.9 0.2 100.0 53.4 2,1744-5 50.7 26.8 4.3 3.8 0.9 0.2 7.2 0.4 0.0 1.2 6.0 0.0 48.8 0.5 100.0 35.9 6016+ 35.8 23.0 2.9 0.6 0.0 0.0 3.3 0.6 0.0 0.1 5.2 0.0 64.2 0.0 100.0 26.5 196
Residence Urban 83.1 62.3 10.1 1.7 0.0 0.0 2.9 0.1 0.0 0.3 5.4 0.0 16.9 0.0 100.0 74.3 1,068Rural 63.1 37.3 5.6 4.9 0.5 0.4 5.9 0.3 0.2 1.2 6.6 0.1 36.6 0.2 100.0 48.7 3,584
Division Barisal 67.7 40.1 5.5 4.0 0.5 0.7 10.2 1.2 0.0 1.1 4.4 0.0 31.6 0.7 100.0 50.8 260Chittagong 62.8 45.8 5.7 3.4 0.0 0.2 3.2 0.5 0.0 1.2 2.5 0.2 37.1 0.1 100.0 55.1 1,083Dhaka 67.6 45.2 6.0 2.6 0.5 0.1 4.2 0.1 0.5 0.7 7.4 0.1 32.4 0.0 100.0 54.5 1,418Khulna 77.0 47.2 10.3 6.4 0.8 0.8 5.7 0.3 0.0 0.6 4.7 0.1 23.0 0.0 100.0 65.4 441Rajshahi 71.3 40.5 6.5 8.3 0.8 0.0 6.9 0.0 0.0 1.6 6.7 0.0 28.5 0.2 100.0 56.1 618Rangpur 77.1 33.6 11.1 4.5 0.0 0.4 9.2 0.3 0.0 0.8 17.3 0.0 22.2 0.6 100.0 49.6 491Sylhet 51.8 40.6 2.7 2.6 0.3 0.5 1.8 0.1 0.0 1.5 1.5 0.1 48.2 0.0 100.0 46.7 342
Education No education 39.3 17.2 5.8 2.2 0.5 0.4 5.4 0.3 0.0 0.9 6.5 0.0 60.6 0.1 100.0 26.2 819Primary incomplete 56.2 28.7 6.1 4.6 0.2 0.2 5.2 0.2 0.9 1.9 7.8 0.2 43.5 0.3 100.0 39.9 853Primary complete2 63.3 33.3 4.3 3.2 0.7 0.5 8.9 0.2 0.0 1.9 10.3 0.1 36.5 0.2 100.0 41.9 545Secondary
incomplete 78.8 52.8 8.2 5.5 0.5 0.2 4.9 0.4 0.0 0.7 5.7 0.1 21.0 0.1 100.0 67.1 1,844Secondary
complete or higher3 93.2 78.3 6.1 3.1 0.0 0.4 2.5 0.1 0.0 0.2 2.5 0.0 6.8 0.0 100.0 87.8 591
Wealth quintile
Lowest 48.0 18.7 6.5 3.9 0.9 0.3 7.5 0.0 0.0 1.2 8.9 0.0 51.6 0.4 100.0 30.4 1,062Second 55.4 27.8 6.2 5.1 0.1 0.4 5.5 0.7 0.3 1.0 8.0 0.2 44.5 0.1 100.0 39.6 920Middle 68.1 40.4 7.1 6.1 0.3 0.3 5.9 0.2 0.6 1.1 6.0 0.1 31.8 0.1 100.0 54.2 919Fourth 79.5 56.2 7.1 4.2 0.5 0.2 4.1 0.4 0.0 1.1 5.5 0.1 20.5 0.1 100.0 68.1 911Highest 93.0 79.2 6.5 1.5 0.0 0.2 2.3 0.0 0.0 0.6 2.6 0.2 7.0 0.0 100.0 87.4 841
Total 67.7 43.1 6.7 4.2 0.4 0.3 5.2 0.3 0.2 1.0 6.4 0.1 32.1 0.2 100.0 54.6 4,652 Note: If more than one source of antenatal care was mentioned, only the provider with highest qualification is considered in this tabulation.FWV=Family Welfare Visitor, CSBA=Community skilled birth attendant, MA=Medical assistant, SACMO=Sub-assistant Community Medical officer, HA=Health assistant, FWA=Family welfare assistant 1 Medically trained providers include: Qualified doctor, Nurse/midwife/paramedic, FWV, CSBA, MA/SACMO 2 Primary complete is defined as completing grade 5 3 Secondary complete is defined as completing grade 10
The 2011 BDHS findings show that not only are
more women receiving antenatal care, but that they are also receiving care more often. The percentage of women who make four or more antenatal visits has increased from 22 percent in 2007 to 26percent in 2011 (Table 13 and Figure 9). The Health, Population, and Nutrition Sector Development Program (HPNSDP) 2011-2016 results framework sets a target of 50 percent for at least 4 antenatal care visits to be achieved by 2016. Urban women are more than twice as likely as rural women to make four or more antenatal visits. Table 13 also shows that the median number of visits among women who receive antenatal care has increased slightly from 3.2 in 2007 to 3.3 in 2011. Women residing in urban areas make on average 1.3 visits more than rural women.
Table 13 Number of antenatal care visits
Percent distribution of women who had a live birth in the three years preceding the survey by number of antenatal care (ANC) visits for the most recent birth, according to residence, Bangladesh 2011
Number of ANC visitsResidence
Total Urban Rural
None 16.9 36.6 32.11 11.9 16.4 15.32 12.5 14.9 14.43 13.8 12.2 12.54 or more 44.7 19.8 25.5Don’t know/missing 0.2 0.1 0.1Median visits 4.3 3.0 3.3
Total 100.0 100.0 100.0Number of women 1,068 3,584 4,652
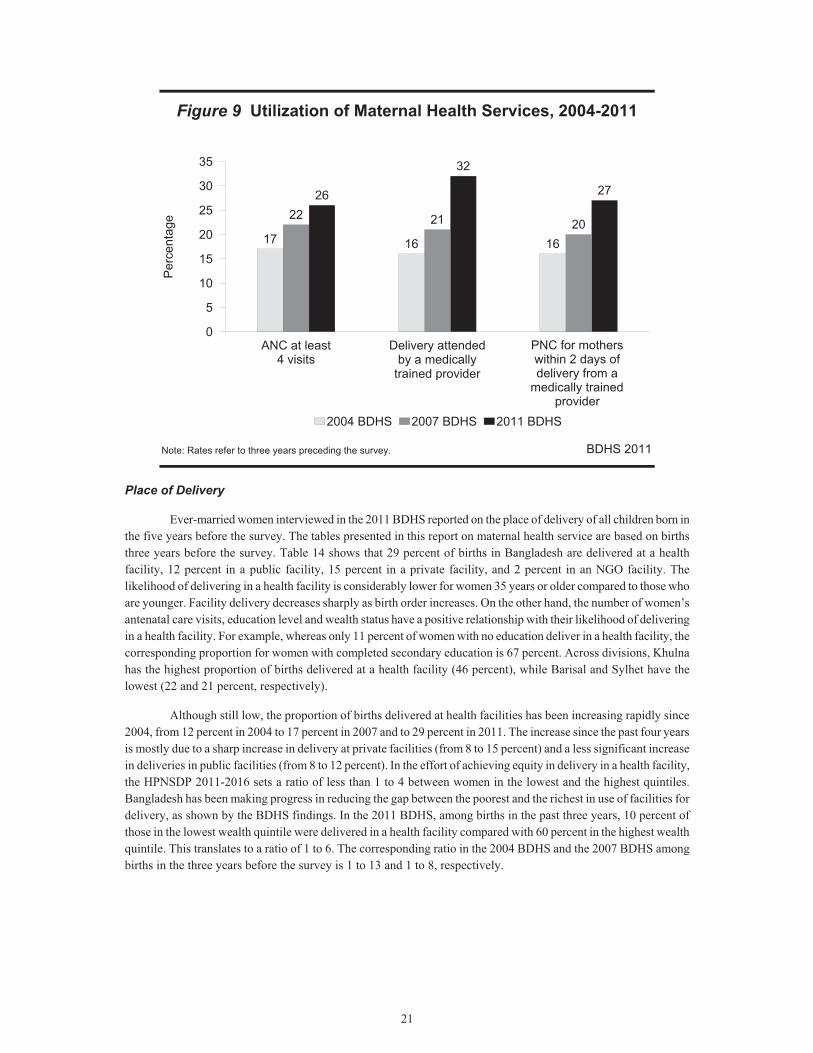
21
Figure 9 Utilization of Maternal Health Services, 2004-2011
BDHS 2011
17 16 16
22 21 20
26
32
27
ANC at least4 visits
Delivery attendedby a medically
trained provider
PNC for motherswithin 2 days ofdelivery from a
m
0
5
10
15
20
25
30
35P
erce
ntag
e
2004 BDHS 2007 BDHS 2011 BDHS
Note: Rates refer to three years preceding the survey.
PNC for mothers within 2 days of delivery from a
medically trained provider
Place of Delivery
Ever-married women interviewed in the 2011 BDHS reported on the place of delivery of all children born in the five years before the survey. The tables presented in this report on maternal health service are based on births three years before the survey. Table 14 shows that 29 percent of births in Bangladesh are delivered at a health facility, 12 percent in a public facility, 15 percent in a private facility, and 2 percent in an NGO facility. The likelihood of delivering in a health facility is considerably lower for women 35 years or older compared to those who are younger. Facility delivery decreases sharply as birth order increases. On the other hand, the number of women’s antenatal care visits, education level and wealth status have a positive relationship with their likelihood of delivering in a health facility. For example, whereas only 11 percent of women with no education deliver in a health facility, the corresponding proportion for women with completed secondary education is 67 percent. Across divisions, Khulna has the highest proportion of births delivered at a health facility (46 percent), while Barisal and Sylhet have the lowest (22 and 21 percent, respectively).
Although still low, the proportion of births delivered at health facilities has been increasing rapidly since 2004, from 12 percent in 2004 to 17 percent in 2007 and to 29 percent in 2011. The increase since the past four years is mostly due to a sharp increase in delivery at private facilities (from 8 to 15 percent) and a less significant increase in deliveries in public facilities (from 8 to 12 percent). In the effort of achieving equity in delivery in a health facility, the HPNSDP 2011-2016 sets a ratio of less than 1 to 4 between women in the lowest and the highest quintiles. Bangladesh has been making progress in reducing the gap between the poorest and the richest in use of facilities for delivery, as shown by the BDHS findings. In the 2011 BDHS, among births in the past three years, 10 percent of those in the lowest wealth quintile were delivered in a health facility compared with 60 percent in the highest wealth quintile. This translates to a ratio of 1 to 6. The corresponding ratio in the 2004 BDHS and the 2007 BDHS among births in the three years before the survey is 1 to 13 and 1 to 8, respectively.
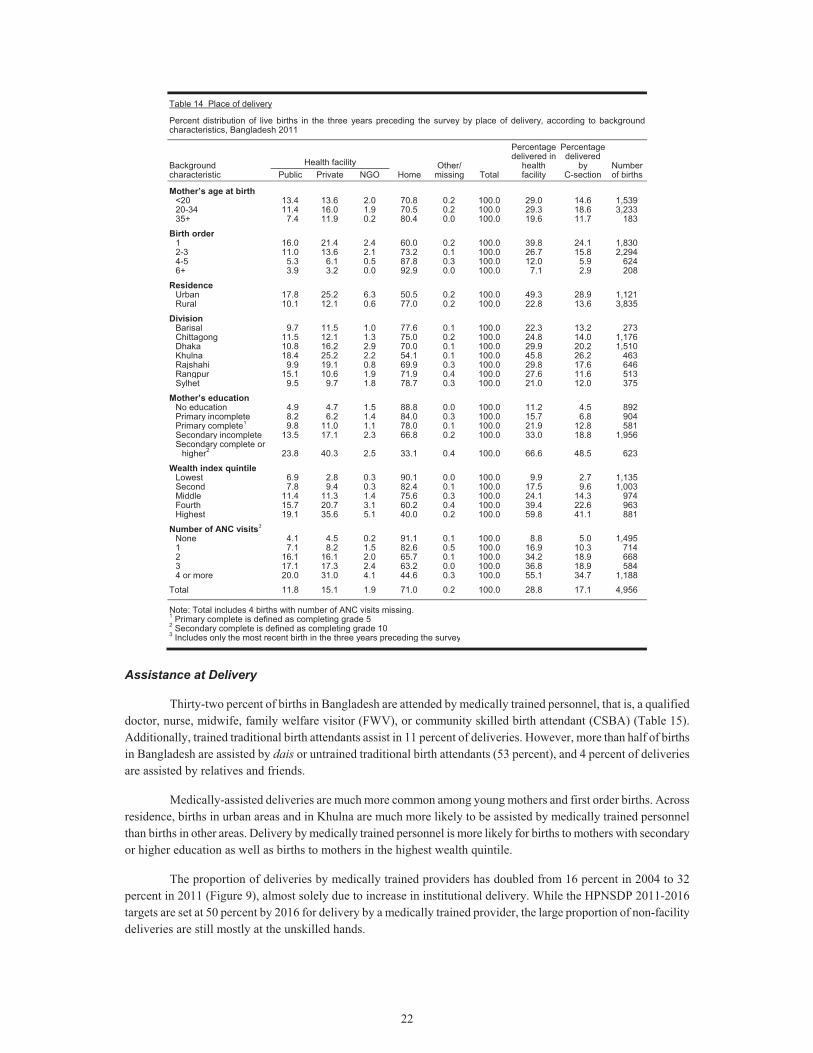
22
Table 14 Place of delivery
Percent distribution of live births in the three years preceding the survey by place of delivery, according to background characteristics, Bangladesh 2011
Background characteristic
Health facility Home
Other/ missing Total
Percentage delivered in
health facility
Percentage delivered
by C-section
Number of births Public Private NGO
Mother’s age at birth <20 13.4 13.6 2.0 70.8 0.2 100.0 29.0 14.6 1,539 20-34 11.4 16.0 1.9 70.5 0.2 100.0 29.3 18.6 3,233 35+ 7.4 11.9 0.2 80.4 0.0 100.0 19.6 11.7 183
Birth order 1 16.0 21.4 2.4 60.0 0.2 100.0 39.8 24.1 1,830 2-3 11.0 13.6 2.1 73.2 0.1 100.0 26.7 15.8 2,294 4-5 5.3 6.1 0.5 87.8 0.3 100.0 12.0 5.9 624 6+ 3.9 3.2 0.0 92.9 0.0 100.0 7.1 2.9 208
Residence Urban 17.8 25.2 6.3 50.5 0.2 100.0 49.3 28.9 1,121 Rural 10.1 12.1 0.6 77.0 0.2 100.0 22.8 13.6 3,835
Division Barisal 9.7 11.5 1.0 77.6 0.1 100.0 22.3 13.2 273 Chittagong 11.5 12.1 1.3 75.0 0.2 100.0 24.8 14.0 1,176 Dhaka 10.8 16.2 2.9 70.0 0.1 100.0 29.9 20.2 1,510 Khulna 18.4 25.2 2.2 54.1 0.1 100.0 45.8 26.2 463 Rajshahi 9.9 19.1 0.8 69.9 0.3 100.0 29.8 17.6 646 Rangpur 15.1 10.6 1.9 71.9 0.4 100.0 27.6 11.6 513 Sylhet 9.5 9.7 1.8 78.7 0.3 100.0 21.0 12.0 375
Mother’s education No education 4.9 4.7 1.5 88.8 0.0 100.0 11.2 4.5 892 Primary incomplete 8.2 6.2 1.4 84.0 0.3 100.0 15.7 6.8 904 Primary complete1 9.8 11.0 1.1 78.0 0.1 100.0 21.9 12.8 581 Secondary incomplete 13.5 17.1 2.3 66.8 0.2 100.0 33.0 18.8 1,956 Secondary complete or
higher2 23.8 40.3 2.5 33.1 0.4 100.0 66.6 48.5 623
Wealth index quintile Lowest 6.9 2.8 0.3 90.1 0.0 100.0 9.9 2.7 1,135 Second 7.8 9.4 0.3 82.4 0.1 100.0 17.5 9.6 1,003 Middle 11.4 11.3 1.4 75.6 0.3 100.0 24.1 14.3 974 Fourth 15.7 20.7 3.1 60.2 0.4 100.0 39.4 22.6 963 Highest 19.1 35.6 5.1 40.0 0.2 100.0 59.8 41.1 881
Number of ANC visits3 None 4.1 4.5 0.2 91.1 0.1 100.0 8.8 5.0 1,495 1 7.1 8.2 1.5 82.6 0.5 100.0 16.9 10.3 714 2 16.1 16.1 2.0 65.7 0.1 100.0 34.2 18.9 668 3 17.1 17.3 2.4 63.2 0.0 100.0 36.8 18.9 584 4 or more 20.0 31.0 4.1 44.6 0.3 100.0 55.1 34.7 1,188
Total 11.8 15.1 1.9 71.0 0.2 100.0 28.8 17.1 4,956
Note: Total includes 4 births with number of ANC visits missing.1 Primary complete is defined as completing grade 5 2 Secondary complete is defined as completing grade 10 3 Includes only the most recent birth in the three years preceding the survey
Assistance at Delivery
Thirty-two percent of births in Bangladesh are attended by medically trained personnel, that is, a qualified doctor, nurse, midwife, family welfare visitor (FWV), or community skilled birth attendant (CSBA) (Table 15). Additionally, trained traditional birth attendants assist in 11 percent of deliveries. However, more than half of births in Bangladesh are assisted by dais or untrained traditional birth attendants (53 percent), and 4 percent of deliveries are assisted by relatives and friends.
Medically-assisted deliveries are much more common among young mothers and first order births. Across residence, births in urban areas and in Khulna are much more likely to be assisted by medically trained personnel than births in other areas. Delivery by medically trained personnel is more likely for births to mothers with secondary or higher education as well as births to mothers in the highest wealth quintile.
The proportion of deliveries by medically trained providers has doubled from 16 percent in 2004 to 32 percent in 2011 (Figure 9), almost solely due to increase in institutional delivery. While the HPNSDP 2011-2016 targets are set at 50 percent by 2016 for delivery by a medically trained provider, the large proportion of non-facility deliveries are still mostly at the unskilled hands.
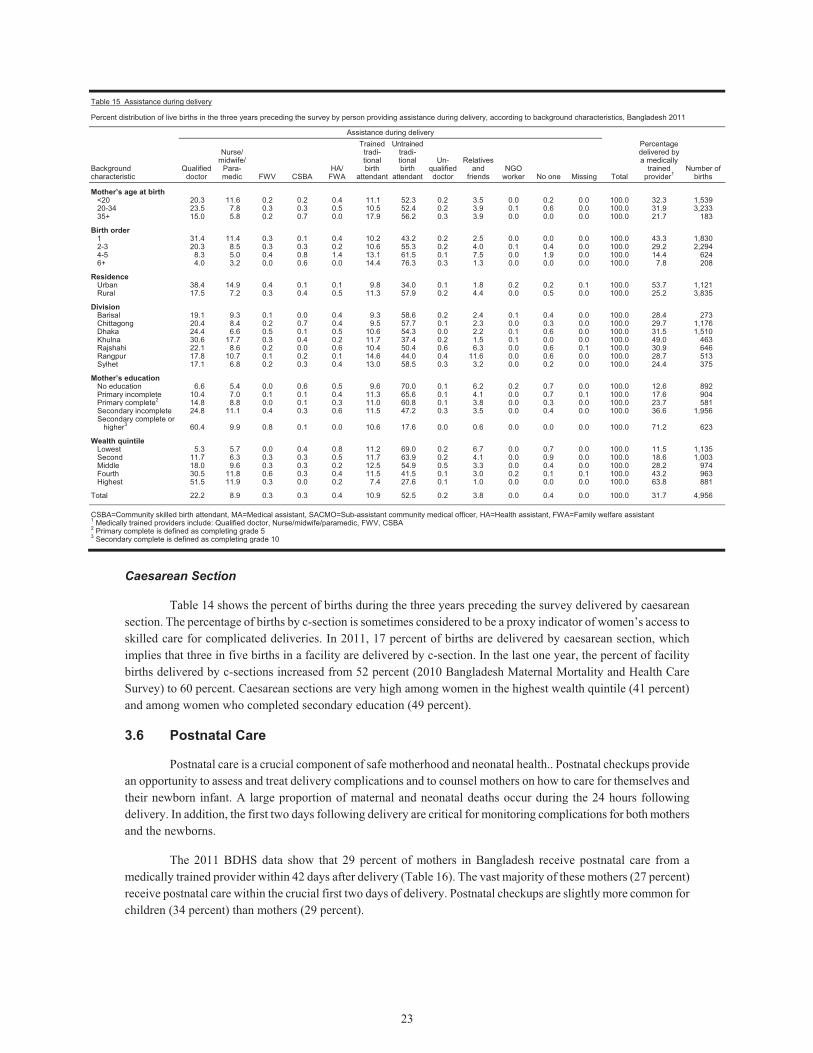
23
Table 15 Assistance during delivery
Percent distribution of live births in the three years preceding the survey by person providing assistance during delivery, according to background characteristics, Bangladesh 2011
Background characteristic
Assistance during delivery
Total
Percentage delivered by a medically
trained provider1
Number of births
Qualified doctor
Nurse/ midwife/
Para-medic FWV CSBA
HA/ FWA
Trained tradi-tional birth
attendant
Untrained tradi-tional birth
attendant
Un-qualified doctor
Relatives and
friends NGO
worker No one Missing
Mother’s age at birth <20 20.3 11.6 0.2 0.2 0.4 11.1 52.3 0.2 3.5 0.0 0.2 0.0 100.0 32.3 1,53920-34 23.5 7.8 0.3 0.3 0.5 10.5 52.4 0.2 3.9 0.1 0.6 0.0 100.0 31.9 3,23335+ 15.0 5.8 0.2 0.7 0.0 17.9 56.2 0.3 3.9 0.0 0.0 0.0 100.0 21.7 183
Birth order 1 31.4 11.4 0.3 0.1 0.4 10.2 43.2 0.2 2.5 0.0 0.0 0.0 100.0 43.3 1,8302-3 20.3 8.5 0.3 0.3 0.2 10.6 55.3 0.2 4.0 0.1 0.4 0.0 100.0 29.2 2,2944-5 8.3 5.0 0.4 0.8 1.4 13.1 61.5 0.1 7.5 0.0 1.9 0.0 100.0 14.4 6246+ 4.0 3.2 0.0 0.6 0.0 14.4 76.3 0.3 1.3 0.0 0.0 0.0 100.0 7.8 208
Residence Urban 38.4 14.9 0.4 0.1 0.1 9.8 34.0 0.1 1.8 0.2 0.2 0.1 100.0 53.7 1,121Rural 17.5 7.2 0.3 0.4 0.5 11.3 57.9 0.2 4.4 0.0 0.5 0.0 100.0 25.2 3,835
Division Barisal 19.1 9.3 0.1 0.0 0.4 9.3 58.6 0.2 2.4 0.1 0.4 0.0 100.0 28.4 273Chittagong 20.4 8.4 0.2 0.7 0.4 9.5 57.7 0.1 2.3 0.0 0.3 0.0 100.0 29.7 1,176Dhaka 24.4 6.6 0.5 0.1 0.5 10.6 54.3 0.0 2.2 0.1 0.6 0.0 100.0 31.5 1,510Khulna 30.6 17.7 0.3 0.4 0.2 11.7 37.4 0.2 1.5 0.1 0.0 0.0 100.0 49.0 463Rajshahi 22.1 8.6 0.2 0.0 0.6 10.4 50.4 0.6 6.3 0.0 0.6 0.1 100.0 30.9 646Rangpur 17.8 10.7 0.1 0.2 0.1 14.6 44.0 0.4 11.6 0.0 0.6 0.0 100.0 28.7 513Sylhet 17.1 6.8 0.2 0.3 0.4 13.0 58.5 0.3 3.2 0.0 0.2 0.0 100.0 24.4 375
Mother’s education No education 6.6 5.4 0.0 0.6 0.5 9.6 70.0 0.1 6.2 0.2 0.7 0.0 100.0 12.6 892Primary incomplete 10.4 7.0 0.1 0.1 0.4 11.3 65.6 0.1 4.1 0.0 0.7 0.1 100.0 17.6 904Primary complete2 14.8 8.8 0.0 0.1 0.3 11.0 60.8 0.1 3.8 0.0 0.3 0.0 100.0 23.7 581Secondary incomplete 24.8 11.1 0.4 0.3 0.6 11.5 47.2 0.3 3.5 0.0 0.4 0.0 100.0 36.6 1,956Secondary complete or
higher3 60.4 9.9 0.8 0.1 0.0 10.6 17.6 0.0 0.6 0.0 0.0 0.0 100.0 71.2 623
Wealth quintile Lowest 5.3 5.7 0.0 0.4 0.8 11.2 69.0 0.2 6.7 0.0 0.7 0.0 100.0 11.5 1,135Second 11.7 6.3 0.3 0.3 0.5 11.7 63.9 0.2 4.1 0.0 0.9 0.0 100.0 18.6 1,003Middle 18.0 9.6 0.3 0.3 0.2 12.5 54.9 0.5 3.3 0.0 0.4 0.0 100.0 28.2 974Fourth 30.5 11.8 0.6 0.3 0.4 11.5 41.5 0.1 3.0 0.2 0.1 0.1 100.0 43.2 963Highest 51.5 11.9 0.3 0.0 0.2 7.4 27.6 0.1 1.0 0.0 0.0 0.0 100.0 63.8 881
Total 22.2 8.9 0.3 0.3 0.4 10.9 52.5 0.2 3.8 0.0 0.4 0.0 100.0 31.7 4,956 CSBA=Community skilled birth attendant, MA=Medical assistant, SACMO=Sub-assistant community medical officer, HA=Health assistant, FWA=Family welfare assistant1 Medically trained providers include: Qualified doctor, Nurse/midwife/paramedic, FWV, CSBA 2 Primary complete is defined as completing grade 5 3 Secondary complete is defined as completing grade 10
Caesarean Section
Table 14 shows the percent of births during the three years preceding the survey delivered by caesarean section. The percentage of births by c-section is sometimes considered to be a proxy indicator of women’s access to skilled care for complicated deliveries. In 2011, 17 percent of births are delivered by caesarean section, which implies that three in five births in a facility are delivered by c-section. In the last one year, the percent of facility births delivered by c-sections increased from 52 percent (2010 Bangladesh Maternal Mortality and Health Care Survey) to 60 percent. Caesarean sections are very high among women in the highest wealth quintile (41 percent) and among women who completed secondary education (49 percent).
3.6 Postnatal Care
Postnatal care is a crucial component of safe motherhood and neonatal health.. Postnatal checkups provide an opportunity to assess and treat delivery complications and to counsel mothers on how to care for themselves and their newborn infant. A large proportion of maternal and neonatal deaths occur during the 24 hours following delivery. In addition, the first two days following delivery are critical for monitoring complications for both mothers and the newborns.
The 2011 BDHS data show that 29 percent of mothers in Bangladesh receive postnatal care from a medically trained provider within 42 days after delivery (Table 16). The vast majority of these mothers (27 percent) receive postnatal care within the crucial first two days of delivery. Postnatal checkups are slightly more common for children (34 percent) than mothers (29 percent).
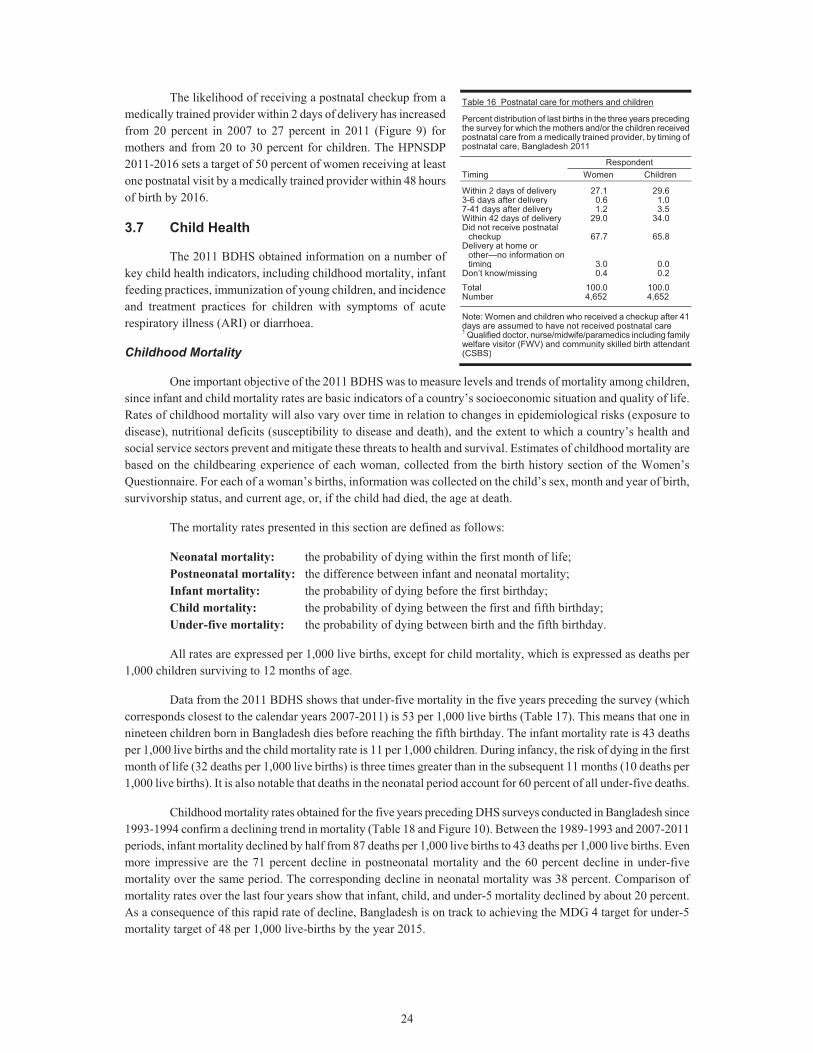
24
The likelihood of receiving a postnatal checkup from a medically trained provider within 2 days of delivery has increased from 20 percent in 2007 to 27 percent in 2011 (Figure 9) for mothers and from 20 to 30 percent for children. The HPNSDP 2011-2016 sets a target of 50 percent of women receiving at least one postnatal visit by a medically trained provider within 48 hours of birth by 2016.
3.7 Child Health
The 2011 BDHS obtained information on a number of key child health indicators, including childhood mortality, infant feeding practices, immunization of young children, and incidence and treatment practices for children with symptoms of acute respiratory illness (ARI) or diarrhoea.
Childhood Mortality
One important objective of the 2011 BDHS was to measure levels and trends of mortality among children, since infant and child mortality rates are basic indicators of a country’s socioeconomic situation and quality of life. Rates of childhood mortality will also vary over time in relation to changes in epidemiological risks (exposure to disease), nutritional deficits (susceptibility to disease and death), and the extent to which a country’s health and social service sectors prevent and mitigate these threats to health and survival. Estimates of childhood mortality are based on the childbearing experience of each woman, collected from the birth history section of the Women’s Questionnaire. For each of a woman’s births, information was collected on the child’s sex, month and year of birth, survivorship status, and current age, or, if the child had died, the age at death.
The mortality rates presented in this section are defined as follows:
Neonatal mortality: the probability of dying within the first month of life; Postneonatal mortality: the difference between infant and neonatal mortality; Infant mortality: the probability of dying before the first birthday; Child mortality: the probability of dying between the first and fifth birthday; Under-five mortality: the probability of dying between birth and the fifth birthday.
All rates are expressed per 1,000 live births, except for child mortality, which is expressed as deaths per 1,000 children surviving to 12 months of age.
Data from the 2011 BDHS shows that under-five mortality in the five years preceding the survey (which corresponds closest to the calendar years 2007-2011) is 53 per 1,000 live births (Table 17). This means that one in nineteen children born in Bangladesh dies before reaching the fifth birthday. The infant mortality rate is 43 deaths per 1,000 live births and the child mortality rate is 11 per 1,000 children. During infancy, the risk of dying in the first month of life (32 deaths per 1,000 live births) is three times greater than in the subsequent 11 months (10 deaths per 1,000 live births). It is also notable that deaths in the neonatal period account for 60 percent of all under-five deaths.
Childhood mortality rates obtained for the five years preceding DHS surveys conducted in Bangladesh since 1993-1994 confirm a declining trend in mortality (Table 18 and Figure 10). Between the 1989-1993 and 2007-2011 periods, infant mortality declined by half from 87 deaths per 1,000 live births to 43 deaths per 1,000 live births. Even more impressive are the 71 percent decline in postneonatal mortality and the 60 percent decline in under-five mortality over the same period. The corresponding decline in neonatal mortality was 38 percent. Comparison of mortality rates over the last four years show that infant, child, and under-5 mortality declined by about 20 percent. As a consequence of this rapid rate of decline, Bangladesh is on track to achieving the MDG 4 target for under-5 mortality target of 48 per 1,000 live-births by the year 2015.
Table 16 Postnatal care for mothers and children
Percent distribution of last births in the three years preceding the survey for which the mothers and/or the children received postnatal care from a medically trained provider, by timing of postnatal care, Bangladesh 2011
Timing Respondent
Women Children
Within 2 days of delivery 27.1 29.63-6 days after delivery 0.6 1.07-41 days after delivery 1.2 3.5Within 42 days of delivery 29.0 34.0Did not receive postnatal
checkup 67.7 65.8Delivery at home or
other—no information on timing 3.0 0.0
Don’t know/missing 0.4 0.2
Total 100.0 100.0Number 4,652 4,652
Note: Women and children who received a checkup after 41 days are assumed to have not received postnatal care 1 Qualified doctor, nurse/midwife/paramedics including family welfare visitor (FWV) and community skilled birth attendant (CSBS)
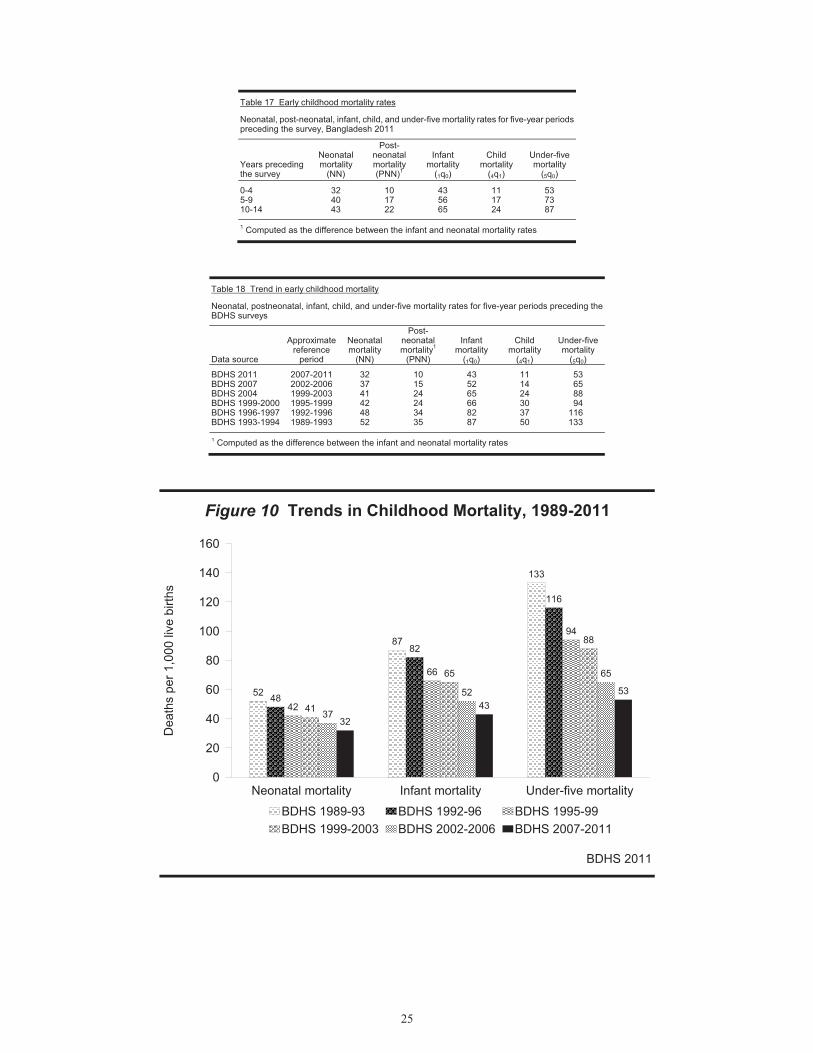
25
Table 17 Early childhood mortality rates
Neonatal, post-neonatal, infant, child, and under-five mortality rates for five-year periods preceding the survey, Bangladesh 2011
Years preceding the survey
Neonatalmortality
(NN)
Post-neonatal mortality (PNN)1
Infant mortality
(1q0)
Child mortality
(4q1)
Under-five mortality
(5q0)
0-4 32 10 43 11 535-9 40 17 56 17 7310-14 43 22 65 24 87 1 Computed as the difference between the infant and neonatal mortality rates
Table 18 Trend in early childhood mortality
Neonatal, postneonatal, infant, child, and under-five mortality rates for five-year periods preceding the BDHS surveys
Data source
Approximate reference
period
Neonatalmortality
(NN)
Post-neonatal mortality1
(PNN)
Infant mortality
(1q0)
Child mortality
(4q1)
Under-five mortality
(5q0)
BDHS 2011 2007-2011 32 10 43 11 53 BDHS 2007 2002-2006 37 15 52 14 65 BDHS 2004 1999-2003 41 24 65 24 88 BDHS 1999-2000 1995-1999 42 24 66 30 94 BDHS 1996-1997 1992-1996 48 34 82 37 116 BDHS 1993-1994 1989-1993 52 35 87 50 133 1 Computed as the difference between the infant and neonatal mortality rates
Figure 10 Trends in Childhood Mortality, 1989-2011
BDHS 2011
52
87
133
48
82
116
42
66
94
41
65
88
37
52
65
3243
53
Neonatal mortality Infant mortality Under-five mortality0
20
40
60
80
100
120
140
160
Dea
ths
per 1
,000
live
birt
h s
BDHS 1989-93 BDHS 1992-96 BDHS 1995-99BDHS 1999-2003 BDHS 2002-2006 BDHS 2007-2011
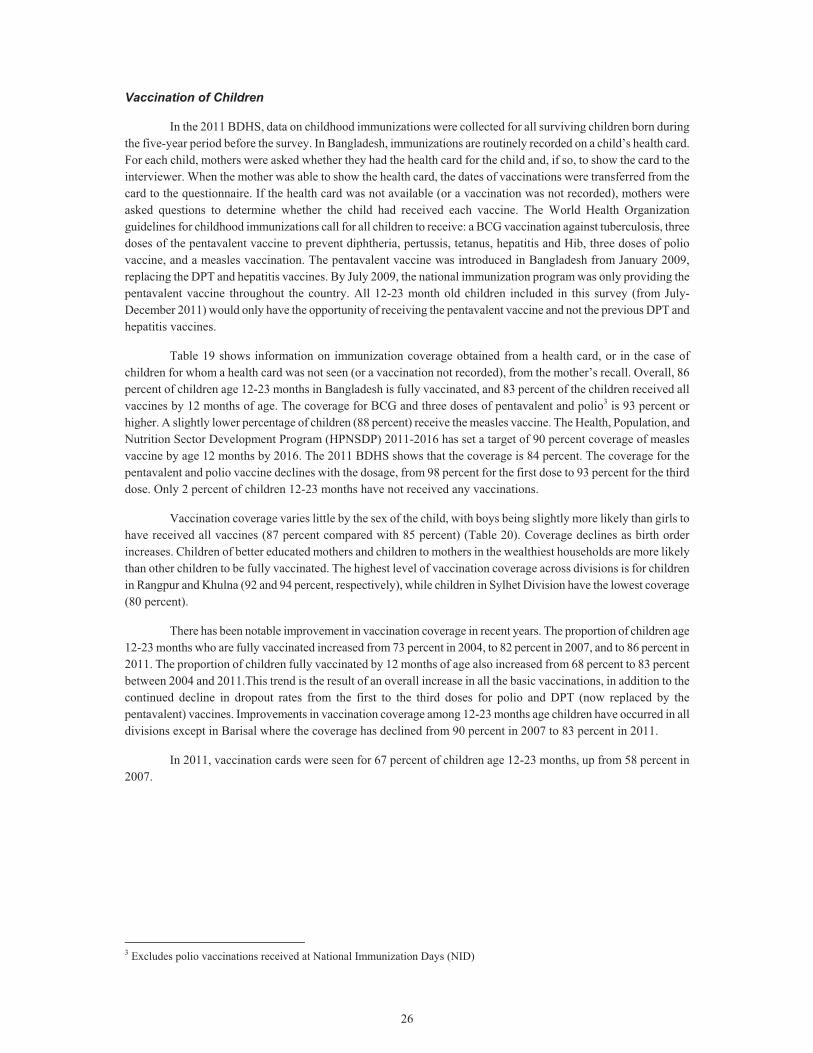
26
Vaccination of Children
In the 2011 BDHS, data on childhood immunizations were collected for all surviving children born during the five-year period before the survey. In Bangladesh, immunizations are routinely recorded on a child’s health card. For each child, mothers were asked whether they had the health card for the child and, if so, to show the card to the interviewer. When the mother was able to show the health card, the dates of vaccinations were transferred from the card to the questionnaire. If the health card was not available (or a vaccination was not recorded), mothers were asked questions to determine whether the child had received each vaccine. The World Health Organization guidelines for childhood immunizations call for all children to receive: a BCG vaccination against tuberculosis, three doses of the pentavalent vaccine to prevent diphtheria, pertussis, tetanus, hepatitis and Hib, three doses of polio vaccine, and a measles vaccination. The pentavalent vaccine was introduced in Bangladesh from January 2009, replacing the DPT and hepatitis vaccines. By July 2009, the national immunization program was only providing the pentavalent vaccine throughout the country. All 12-23 month old children included in this survey (from July-December 2011) would only have the opportunity of receiving the pentavalent vaccine and not the previous DPT and hepatitis vaccines.
Table 19 shows information on immunization coverage obtained from a health card, or in the case of children for whom a health card was not seen (or a vaccination not recorded), from the mother’s recall. Overall, 86 percent of children age 12-23 months in Bangladesh is fully vaccinated, and 83 percent of the children received all vaccines by 12 months of age. The coverage for BCG and three doses of pentavalent and polio3 is 93 percent or higher. A slightly lower percentage of children (88 percent) receive the measles vaccine. The Health, Population, and Nutrition Sector Development Program (HPNSDP) 2011-2016 has set a target of 90 percent coverage of measles vaccine by age 12 months by 2016. The 2011 BDHS shows that the coverage is 84 percent. The coverage for the pentavalent and polio vaccine declines with the dosage, from 98 percent for the first dose to 93 percent for the third dose. Only 2 percent of children 12-23 months have not received any vaccinations.
Vaccination coverage varies little by the sex of the child, with boys being slightly more likely than girls to have received all vaccines (87 percent compared with 85 percent) (Table 20). Coverage declines as birth order increases. Children of better educated mothers and children to mothers in the wealthiest households are more likely than other children to be fully vaccinated. The highest level of vaccination coverage across divisions is for children in Rangpur and Khulna (92 and 94 percent, respectively), while children in Sylhet Division have the lowest coverage (80 percent).
There has been notable improvement in vaccination coverage in recent years. The proportion of children age 12-23 months who are fully vaccinated increased from 73 percent in 2004, to 82 percent in 2007, and to 86 percent in 2011. The proportion of children fully vaccinated by 12 months of age also increased from 68 percent to 83 percent between 2004 and 2011.This trend is the result of an overall increase in all the basic vaccinations, in addition to the continued decline in dropout rates from the first to the third doses for polio and DPT (now replaced by the pentavalent) vaccines. Improvements in vaccination coverage among 12-23 months age children have occurred in all divisions except in Barisal where the coverage has declined from 90 percent in 2007 to 83 percent in 2011.
In 2011, vaccination cards were seen for 67 percent of children age 12-23 months, up from 58 percent in 2007.
3 Excludes polio vaccinations received at National Immunization Days (NID)
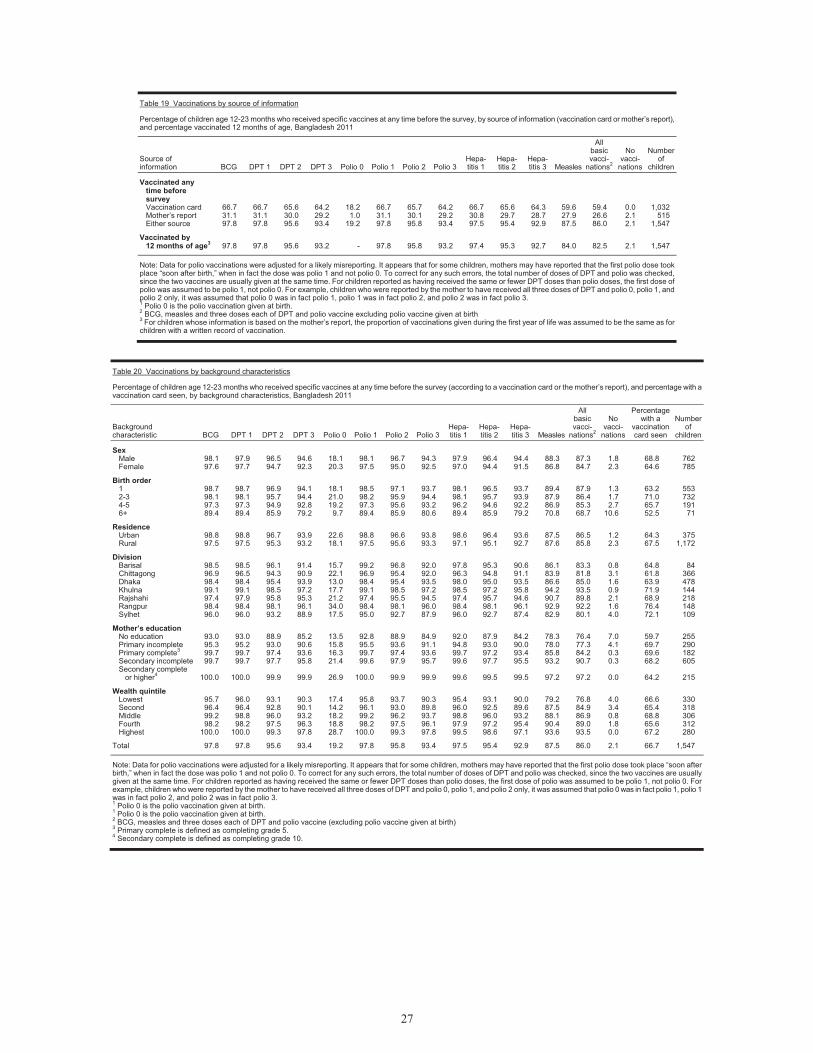
27
Table 19 Vaccinations by source of information
Percentage of children age 12-23 months who received specific vaccines at any time before the survey, by source of information (vaccination card or mother’s report), and percentage vaccinated 12 months of age, Bangladesh 2011
Source of information BCG DPT 1 DPT 2 DPT 3 Polio 0 Polio 1 Polio 2 Polio 3
Hepa-titis 1
Hepa-titis 2
Hepa-titis 3 Measles
All basic vacci-
nations2
No vacci-
nations
Number of
children
Vaccinated any time before survey Vaccination card 66.7 66.7 65.6 64.2 18.2 66.7 65.7 64.2 66.7 65.6 64.3 59.6 59.4 0.0 1,032Mother’s report 31.1 31.1 30.0 29.2 1.0 31.1 30.1 29.2 30.8 29.7 28.7 27.9 26.6 2.1 515Either source 97.8 97.8 95.6 93.4 19.2 97.8 95.8 93.4 97.5 95.4 92.9 87.5 86.0 2.1 1,547
Vaccinated by 12 months of age3 97.8 97.8 95.6 93.2 - 97.8 95.8 93.2 97.4 95.3 92.7 84.0 82.5 2.1 1,547
Note: Data for polio vaccinations were adjusted for a likely misreporting. It appears that for some children, mothers may have reported that the first polio dose took place “soon after birth,” when in fact the dose was polio 1 and not polio 0. To correct for any such errors, the total number of doses of DPT and polio was checked, since the two vaccines are usually given at the same time. For children reported as having received the same or fewer DPT doses than polio doses, the first dose of polio was assumed to be polio 1, not polio 0. For example, children who were reported by the mother to have received all three doses of DPT and polio 0, polio 1, and polio 2 only, it was assumed that polio 0 was in fact polio 1, polio 1 was in fact polio 2, and polio 2 was in fact polio 3. 1 Polio 0 is the polio vaccination given at birth. 2 BCG, measles and three doses each of DPT and polio vaccine excluding polio vaccine given at birth 3 For children whose information is based on the mother’s report, the proportion of vaccinations given during the first year of life was assumed to be the same as for children with a written record of vaccination.
Table 20 Vaccinations by background characteristics
Percentage of children age 12-23 months who received specific vaccines at any time before the survey (according to a vaccination card or the mother’s report), and percentage with a vaccination card seen, by background characteristics, Bangladesh 2011
Background characteristic BCG DPT 1 DPT 2 DPT 3 Polio 0 Polio 1 Polio 2 Polio 3
Hepa-titis 1
Hepa-titis 2
Hepa-titis 3 Measles
All basic vacci-
nations2
No vacci-
nations
Percentage with a
vaccination card seen
Number of
children
Sex Male 98.1 97.9 96.5 94.6 18.1 98.1 96.7 94.3 97.9 96.4 94.4 88.3 87.3 1.8 68.8 762Female 97.6 97.7 94.7 92.3 20.3 97.5 95.0 92.5 97.0 94.4 91.5 86.8 84.7 2.3 64.6 785
Birth order 1 98.7 98.7 96.9 94.1 18.1 98.5 97.1 93.7 98.1 96.5 93.7 89.4 87.9 1.3 63.2 5532-3 98.1 98.1 95.7 94.4 21.0 98.2 95.9 94.4 98.1 95.7 93.9 87.9 86.4 1.7 71.0 7324-5 97.3 97.3 94.9 92.8 19.2 97.3 95.6 93.2 96.2 94.6 92.2 86.9 85.3 2.7 65.7 1916+ 89.4 89.4 85.9 79.2 9.7 89.4 85.9 80.6 89.4 85.9 79.2 70.8 68.7 10.6 52.5 71
Residence Urban 98.8 98.8 96.7 93.9 22.6 98.8 96.6 93.8 98.6 96.4 93.6 87.5 86.5 1.2 64.3 375Rural 97.5 97.5 95.3 93.2 18.1 97.5 95.6 93.3 97.1 95.1 92.7 87.6 85.8 2.3 67.5 1,172
Division Barisal 98.5 98.5 96.1 91.4 15.7 99.2 96.8 92.0 97.8 95.3 90.6 86.1 83.3 0.8 64.8 84Chittagong 96.9 96.5 94.3 90.9 22.1 96.9 95.4 92.0 96.3 94.8 91.1 83.9 81.8 3.1 61.8 366Dhaka 98.4 98.4 95.4 93.9 13.0 98.4 95.4 93.5 98.0 95.0 93.5 86.6 85.0 1.6 63.9 478Khulna 99.1 99.1 98.5 97.2 17.7 99.1 98.5 97.2 98.5 97.2 95.8 94.2 93.5 0.9 71.9 144Rajshahi 97.4 97.9 95.8 95.3 21.2 97.4 95.5 94.5 97.4 95.7 94.6 90.7 89.8 2.1 68.9 218Rangpur 98.4 98.4 98.1 96.1 34.0 98.4 98.1 96.0 98.4 98.1 96.1 92.9 92.2 1.6 76.4 148Sylhet 96.0 96.0 93.2 88.9 17.5 95.0 92.7 87.9 96.0 92.7 87.4 82.9 80.1 4.0 72.1 109
Mother’s education No education 93.0 93.0 88.9 85.2 13.5 92.8 88.9 84.9 92.0 87.9 84.2 78.3 76.4 7.0 59.7 255Primary incomplete 95.3 95.2 93.0 90.6 15.8 95.5 93.6 91.1 94.8 93.0 90.0 78.0 77.3 4.1 69.7 290Primary complete3 99.7 99.7 97.4 93.6 16.3 99.7 97.4 93.6 99.7 97.2 93.4 85.8 84.2 0.3 69.6 182Secondary incomplete 99.7 99.7 97.7 95.8 21.4 99.6 97.9 95.7 99.6 97.7 95.5 93.2 90.7 0.3 68.2 605Secondary complete
or higher4 100.0 100.0 99.9 99.9 26.9 100.0 99.9 99.9 99.6 99.5 99.5 97.2 97.2 0.0 64.2 215
Wealth quintile Lowest 95.7 96.0 93.1 90.3 17.4 95.8 93.7 90.3 95.4 93.1 90.0 79.2 76.8 4.0 66.6 330Second 96.4 96.4 92.8 90.1 14.2 96.1 93.0 89.8 96.0 92.5 89.6 87.5 84.9 3.4 65.4 318Middle 99.2 98.8 96.0 93.2 18.2 99.2 96.2 93.7 98.8 96.0 93.2 88.1 86.9 0.8 68.8 306Fourth 98.2 98.2 97.5 96.3 18.8 98.2 97.5 96.1 97.9 97.2 95.4 90.4 89.0 1.8 65.6 312Highest 100.0 100.0 99.3 97.8 28.7 100.0 99.3 97.8 99.5 98.6 97.1 93.6 93.5 0.0 67.2 280
Total 97.8 97.8 95.6 93.4 19.2 97.8 95.8 93.4 97.5 95.4 92.9 87.5 86.0 2.1 66.7 1,547 Note: Data for polio vaccinations were adjusted for a likely misreporting. It appears that for some children, mothers may have reported that the first polio dose took place “soon after birth,” when in fact the dose was polio 1 and not polio 0. To correct for any such errors, the total number of doses of DPT and polio was checked, since the two vaccines are usually given at the same time. For children reported as having received the same or fewer DPT doses than polio doses, the first dose of polio was assumed to be polio 1, not polio 0. For example, children who were reported by the mother to have received all three doses of DPT and polio 0, polio 1, and polio 2 only, it was assumed that polio 0 was in fact polio 1, polio 1 was in fact polio 2, and polio 2 was in fact polio 3. 1 Polio 0 is the polio vaccination given at birth. 1 Polio 0 is the polio vaccination given at birth. 2 BCG, measles and three doses each of DPT and polio vaccine (excluding polio vaccine given at birth) 3 Primary complete is defined as completing grade 5. 4 Secondary complete is defined as completing grade 10.
28
Treatment of Childhood Respiratory Illness and Diarrhoea
Acute respiratory infections (ARI) are a leading cause of childhood illness and death. Early diagnosis and treatment with antibiotics can reduce the number of deaths caused by ARIs, particularly deaths resulting from pneumonia. Dehydration from diarrhoea is an important contributing cause of childhood mortality. The administration of oral dehydration therapy (ORT) is a simple means of countering the effects of dehydration. During diarrhoea, the child is given a solution prepared either by mixing water with the salts in a commercially prepared oral rehydration packet (ORS)—also called khabar or packet saline in Bangladesh—or by making a homemade solution of sugar, salt and water, also called labon gur. Oral rehydration therapy has a long history of use in Bangladesh because it was developed some 30 years ago by the International Centre for Diarrhoeal Disease Research, Bangladesh (ICDDR,B). Currently, ORS packets are available through health facilities and at shops and pharmacies, many of which are marketed by the Social Marketing Company and other pharmaceutical companies.
In the 2011 BDHS, mothers were asked if their children under age five had experienced symptoms of ARI or an episode of diarrhoea in the two weeks before the survey. Overall, 6 percent of children under age 5 had symptoms of ARI in the two weeks preceding the survey and 5 percent had diarrhoea (data not shown).
The 2011 BDHS shows that 35 percent of children who were reported by their mother as showing symptoms of ARI were taken to a health facility or provider for treatment and 71 percent of children received antibiotics (Table 21). This already far exceeds the HPNSDP 2011-2016 target of 50 percent of children (0-59 months) with pneumonia receiving antibiotics. While 17 percent of the children with ARI received no care, 22 percent received care from pharmacies and another 24 percent from traditional doctors. The least likely to be taken to a health facility or provider for treatment are children age 48-59 months, female children, children residing in rural areas, children from Chittagong, children of mothers with no education, and those from the lowest wealth quintile. The proportion of children with ARI symptoms who were taken to a health facility or trained provider is 35 percent in 2011, slightly lower than the 37 percent in 2007. ARI is seasonal, particularly in terms of etiology and severity, so this small reduction in care-seeking from health facilities or trained providers is difficult to interpret.
For children with diarrhoea in the two weeks before the survey, the mother was asked what she did to treat the diarrhoea. Because the prevalence of diarrhoea varies seasonally, the survey results pertain only to the period July to December, when the fieldwork took place. Table 22 shows that one in four children under five with diarrhoea in the two-week period before the survey was taken to a health facility or provider for treatment and 78 percent were given fluid made from an ORS packet, a small increase from 77 percent in 2007. Eighty-one percent of children with diarrhoea were given oral rehydration therapy (ORT), that is, either a solution made from oral rehydration salt (ORS) packets or a homemade sugar-salt solution. Use of ORT was exactly the same (81 percent) in 2007.
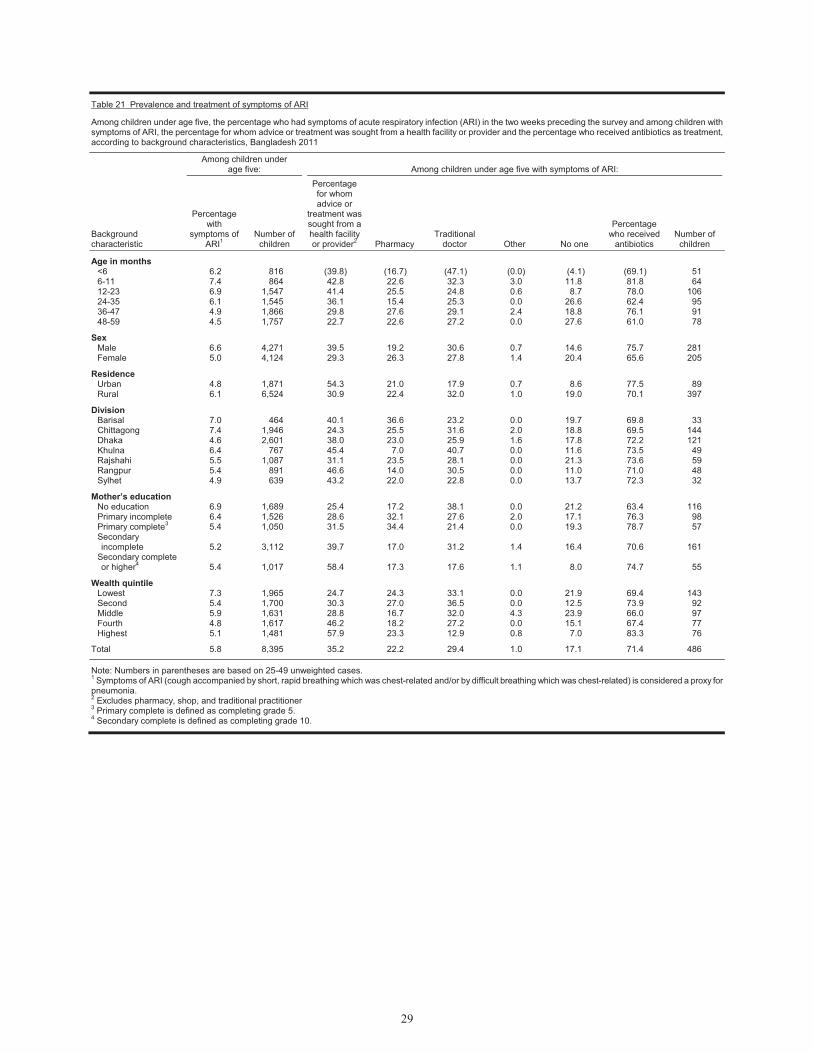
29
Table 21 Prevalence and treatment of symptoms of ARI
Among children under age five, the percentage who had symptoms of acute respiratory infection (ARI) in the two weeks preceding the survey and among children with symptoms of ARI, the percentage for whom advice or treatment was sought from a health facility or provider and the percentage who received antibiotics as treatment, according to background characteristics, Bangladesh 2011
Background characteristic
Among children under age five: Among children under age five with symptoms of ARI:
Percentage with
symptoms of ARI1
Number of children
Percentage for whom advice or
treatment was sought from a health facility or provider2 Pharmacy
Traditional doctor Other No one
Percentage who received
antibiotics Number of
children
Age in months <6 6.2 816 (39.8) (16.7) (47.1) (0.0) (4.1) (69.1) 51 6-11 7.4 864 42.8 22.6 32.3 3.0 11.8 81.8 64 12-23 6.9 1,547 41.4 25.5 24.8 0.6 8.7 78.0 106 24-35 6.1 1,545 36.1 15.4 25.3 0.0 26.6 62.4 95 36-47 4.9 1,866 29.8 27.6 29.1 2.4 18.8 76.1 91 48-59 4.5 1,757 22.7 22.6 27.2 0.0 27.6 61.0 78
Sex Male 6.6 4,271 39.5 19.2 30.6 0.7 14.6 75.7 281 Female 5.0 4,124 29.3 26.3 27.8 1.4 20.4 65.6 205
Residence Urban 4.8 1,871 54.3 21.0 17.9 0.7 8.6 77.5 89 Rural 6.1 6,524 30.9 22.4 32.0 1.0 19.0 70.1 397
Division Barisal 7.0 464 40.1 36.6 23.2 0.0 19.7 69.8 33 Chittagong 7.4 1,946 24.3 25.5 31.6 2.0 18.8 69.5 144 Dhaka 4.6 2,601 38.0 23.0 25.9 1.6 17.8 72.2 121 Khulna 6.4 767 45.4 7.0 40.7 0.0 11.6 73.5 49 Rajshahi 5.5 1,087 31.1 23.5 28.1 0.0 21.3 73.6 59 Rangpur 5.4 891 46.6 14.0 30.5 0.0 11.0 71.0 48 Sylhet 4.9 639 43.2 22.0 22.8 0.0 13.7 72.3 32
Mother’s education No education 6.9 1,689 25.4 17.2 38.1 0.0 21.2 63.4 116 Primary incomplete 6.4 1,526 28.6 32.1 27.6 2.0 17.1 76.3 98 Primary complete3 5.4 1,050 31.5 34.4 21.4 0.0 19.3 78.7 57 Secondary incomplete 5.2 3,112 39.7 17.0 31.2 1.4 16.4 70.6 161
Secondary complete or higher4 5.4 1,017 58.4 17.3 17.6 1.1 8.0 74.7 55
Wealth quintile Lowest 7.3 1,965 24.7 24.3 33.1 0.0 21.9 69.4 143 Second 5.4 1,700 30.3 27.0 36.5 0.0 12.5 73.9 92 Middle 5.9 1,631 28.8 16.7 32.0 4.3 23.9 66.0 97 Fourth 4.8 1,617 46.2 18.2 27.2 0.0 15.1 67.4 77 Highest 5.1 1,481 57.9 23.3 12.9 0.8 7.0 83.3 76
Total 5.8 8,395 35.2 22.2 29.4 1.0 17.1 71.4 486
Note: Numbers in parentheses are based on 25-49 unweighted cases. 1 Symptoms of ARI (cough accompanied by short, rapid breathing which was chest-related and/or by difficult breathing which was chest-related) is considered a proxy for pneumonia. 2 Excludes pharmacy, shop, and traditional practitioner 3 Primary complete is defined as completing grade 5. 4 Secondary complete is defined as completing grade 10.
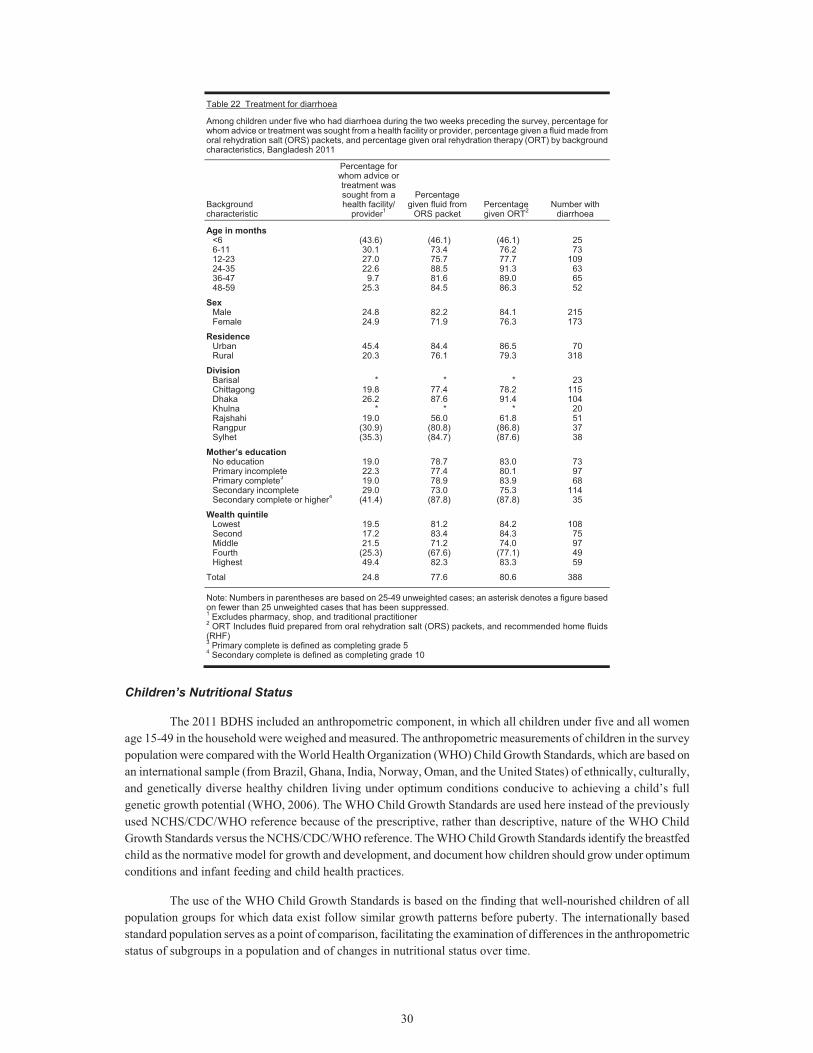
30
Table 22 Treatment for diarrhoea
Among children under five who had diarrhoea during the two weeks preceding the survey, percentage for whom advice or treatment was sought from a health facility or provider, percentage given a fluid made from oral rehydration salt (ORS) packets, and percentage given oral rehydration therapy (ORT) by background characteristics, Bangladesh 2011
Background characteristic
Percentage for whom advice or treatment was sought from a health facility/
provider1
Percentage given fluid from
ORS packet Percentage given ORT2
Number with diarrhoea
Age in months <6 (43.6) (46.1) (46.1) 25 6-11 30.1 73.4 76.2 73 12-23 27.0 75.7 77.7 109 24-35 22.6 88.5 91.3 63 36-47 9.7 81.6 89.0 65 48-59 25.3 84.5 86.3 52
Sex Male 24.8 82.2 84.1 215 Female 24.9 71.9 76.3 173
Residence Urban 45.4 84.4 86.5 70 Rural 20.3 76.1 79.3 318
Division Barisal * * * 23 Chittagong 19.8 77.4 78.2 115 Dhaka 26.2 87.6 91.4 104 Khulna * * * 20 Rajshahi 19.0 56.0 61.8 51 Rangpur (30.9) (80.8) (86.8) 37 Sylhet (35.3) (84.7) (87.6) 38
Mother’s education No education 19.0 78.7 83.0 73 Primary incomplete 22.3 77.4 80.1 97 Primary complete3 19.0 78.9 83.9 68 Secondary incomplete 29.0 73.0 75.3 114 Secondary complete or higher4 (41.4) (87.8) (87.8) 35
Wealth quintile Lowest 19.5 81.2 84.2 108 Second 17.2 83.4 84.3 75 Middle 21.5 71.2 74.0 97 Fourth (25.3) (67.6) (77.1) 49 Highest 49.4 82.3 83.3 59
Total 24.8 77.6 80.6 388
Note: Numbers in parentheses are based on 25-49 unweighted cases; an asterisk denotes a figure based on fewer than 25 unweighted cases that has been suppressed. 1 Excludes pharmacy, shop, and traditional practitioner 2 ORT Includes fluid prepared from oral rehydration salt (ORS) packets, and recommended home fluids (RHF) 3 Primary complete is defined as completing grade 5 4 Secondary complete is defined as completing grade 10
Children’s Nutritional Status
The 2011 BDHS included an anthropometric component, in which all children under five and all women age 15-49 in the household were weighed and measured. The anthropometric measurements of children in the survey population were compared with the World Health Organization (WHO) Child Growth Standards, which are based on an international sample (from Brazil, Ghana, India, Norway, Oman, and the United States) of ethnically, culturally, and genetically diverse healthy children living under optimum conditions conducive to achieving a child’s full genetic growth potential (WHO, 2006). The WHO Child Growth Standards are used here instead of the previously used NCHS/CDC/WHO reference because of the prescriptive, rather than descriptive, nature of the WHO Child Growth Standards versus the NCHS/CDC/WHO reference. The WHO Child Growth Standards identify the breastfed child as the normative model for growth and development, and document how children should grow under optimum conditions and infant feeding and child health practices.
The use of the WHO Child Growth Standards is based on the finding that well-nourished children of all population groups for which data exist follow similar growth patterns before puberty. The internationally based standard population serves as a point of comparison, facilitating the examination of differences in the anthropometric status of subgroups in a population and of changes in nutritional status over time.
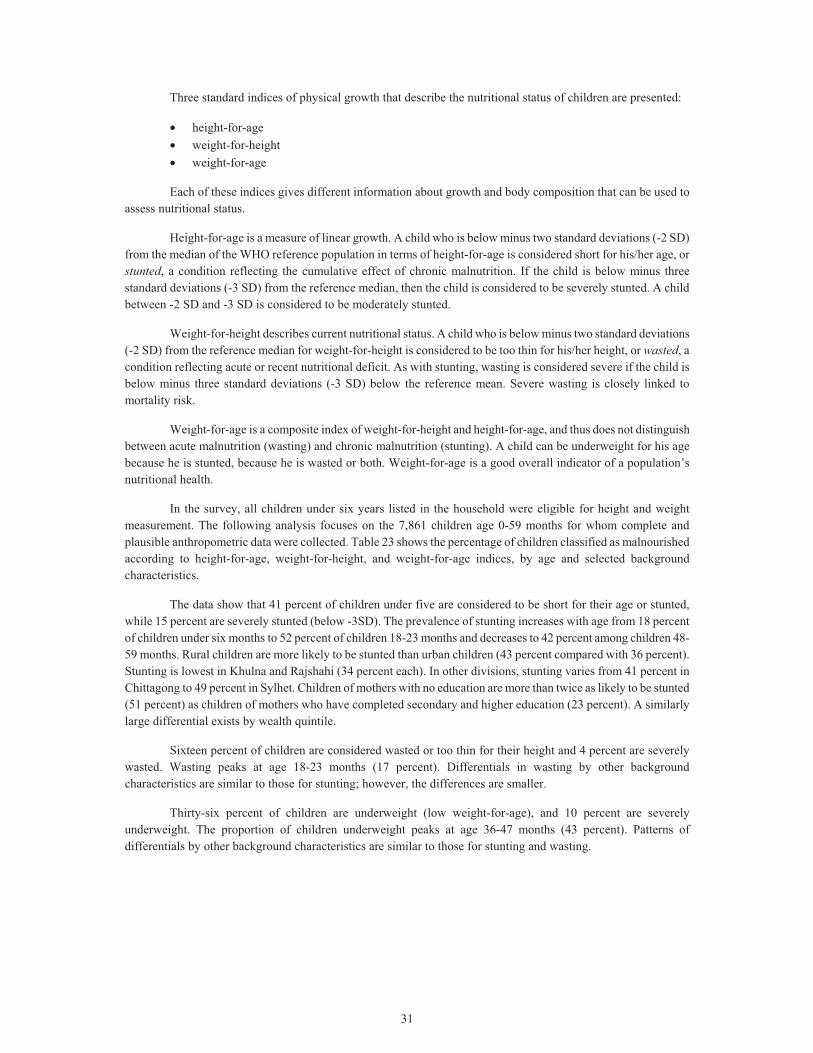
31
Three standard indices of physical growth that describe the nutritional status of children are presented:
• height-for-age • weight-for-height • weight-for-age
Each of these indices gives different information about growth and body composition that can be used to assess nutritional status.
Height-for-age is a measure of linear growth. A child who is below minus two standard deviations (-2 SD) from the median of the WHO reference population in terms of height-for-age is considered short for his/her age, or stunted, a condition reflecting the cumulative effect of chronic malnutrition. If the child is below minus three standard deviations (-3 SD) from the reference median, then the child is considered to be severely stunted. A child between -2 SD and -3 SD is considered to be moderately stunted.
Weight-for-height describes current nutritional status. A child who is below minus two standard deviations (-2 SD) from the reference median for weight-for-height is considered to be too thin for his/her height, or wasted, a condition reflecting acute or recent nutritional deficit. As with stunting, wasting is considered severe if the child is below minus three standard deviations (-3 SD) below the reference mean. Severe wasting is closely linked to mortality risk.
Weight-for-age is a composite index of weight-for-height and height-for-age, and thus does not distinguish between acute malnutrition (wasting) and chronic malnutrition (stunting). A child can be underweight for his age because he is stunted, because he is wasted or both. Weight-for-age is a good overall indicator of a population’s nutritional health.
In the survey, all children under six years listed in the household were eligible for height and weight measurement. The following analysis focuses on the 7,861 children age 0-59 months for whom complete and plausible anthropometric data were collected. Table 23 shows the percentage of children classified as malnourished according to height-for-age, weight-for-height, and weight-for-age indices, by age and selected background characteristics.
The data show that 41 percent of children under five are considered to be short for their age or stunted, while 15 percent are severely stunted (below -3SD). The prevalence of stunting increases with age from 18 percent of children under six months to 52 percent of children 18-23 months and decreases to 42 percent among children 48-59 months. Rural children are more likely to be stunted than urban children (43 percent compared with 36 percent). Stunting is lowest in Khulna and Rajshahi (34 percent each). In other divisions, stunting varies from 41 percent in Chittagong to 49 percent in Sylhet. Children of mothers with no education are more than twice as likely to be stunted (51 percent) as children of mothers who have completed secondary and higher education (23 percent). A similarly large differential exists by wealth quintile.
Sixteen percent of children are considered wasted or too thin for their height and 4 percent are severely wasted. Wasting peaks at age 18-23 months (17 percent). Differentials in wasting by other background characteristics are similar to those for stunting; however, the differences are smaller.
Thirty-six percent of children are underweight (low weight-for-age), and 10 percent are severely underweight. The proportion of children underweight peaks at age 36-47 months (43 percent). Patterns of differentials by other background characteristics are similar to those for stunting and wasting.
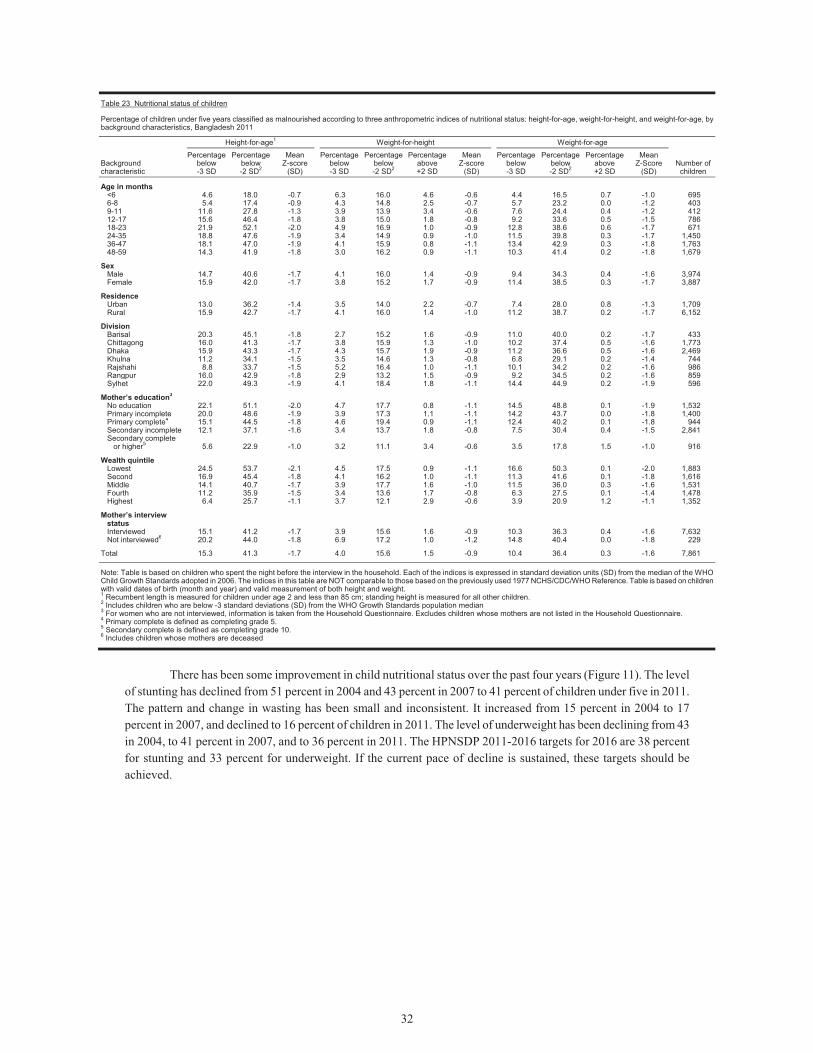
32
Table 23 Nutritional status of children
Percentage of children under five years classified as malnourished according to three anthropometric indices of nutritional status: height-for-age, weight-for-height, and weight-for-age, bybackground characteristics, Bangladesh 2011
Background characteristic
Height-for-age1 Weight-for-height Weight-for-age
Number of children
Percentage below -3 SD
Percentage below -2 SD2
Mean Z-score
(SD)
Percentage below -3 SD
Percentage below -2 SD2
Percentage above +2 SD
Mean Z-score
(SD)
Percentage below -3 SD
Percentage below -2 SD2
Percentage above +2 SD
Mean Z-Score
(SD)
Age in months <6 4.6 18.0 -0.7 6.3 16.0 4.6 -0.6 4.4 16.5 0.7 -1.0 6956-8 5.4 17.4 -0.9 4.3 14.8 2.5 -0.7 5.7 23.2 0.0 -1.2 4039-11 11.6 27.8 -1.3 3.9 13.9 3.4 -0.6 7.6 24.4 0.4 -1.2 41212-17 15.6 46.4 -1.8 3.8 15.0 1.8 -0.8 9.2 33.6 0.5 -1.5 78618-23 21.9 52.1 -2.0 4.9 16.9 1.0 -0.9 12.8 38.6 0.6 -1.7 67124-35 18.8 47.6 -1.9 3.4 14.9 0.9 -1.0 11.5 39.8 0.3 -1.7 1,45036-47 18.1 47.0 -1.9 4.1 15.9 0.8 -1.1 13.4 42.9 0.3 -1.8 1,76348-59 14.3 41.9 -1.8 3.0 16.2 0.9 -1.1 10.3 41.4 0.2 -1.8 1,679
Sex Male 14.7 40.6 -1.7 4.1 16.0 1.4 -0.9 9.4 34.3 0.4 -1.6 3,974Female 15.9 42.0 -1.7 3.8 15.2 1.7 -0.9 11.4 38.5 0.3 -1.7 3,887
Residence Urban 13.0 36.2 -1.4 3.5 14.0 2.2 -0.7 7.4 28.0 0.8 -1.3 1,709Rural 15.9 42.7 -1.7 4.1 16.0 1.4 -1.0 11.2 38.7 0.2 -1.7 6,152
Division Barisal 20.3 45.1 -1.8 2.7 15.2 1.6 -0.9 11.0 40.0 0.2 -1.7 433Chittagong 16.0 41.3 -1.7 3.8 15.9 1.3 -1.0 10.2 37.4 0.5 -1.6 1,773Dhaka 15.9 43.3 -1.7 4.3 15.7 1.9 -0.9 11.2 36.6 0.5 -1.6 2,469Khulna 11.2 34.1 -1.5 3.5 14.6 1.3 -0.8 6.8 29.1 0.2 -1.4 744Rajshahi 8.8 33.7 -1.5 5.2 16.4 1.0 -1.1 10.1 34.2 0.2 -1.6 986Rangpur 16.0 42.9 -1.8 2.9 13.2 1.5 -0.9 9.2 34.5 0.2 -1.6 859Sylhet 22.0 49.3 -1.9 4.1 18.4 1.8 -1.1 14.4 44.9 0.2 -1.9 596
Mother’s education3 No education 22.1 51.1 -2.0 4.7 17.7 0.8 -1.1 14.5 48.8 0.1 -1.9 1,532Primary incomplete 20.0 48.6 -1.9 3.9 17.3 1.1 -1.1 14.2 43.7 0.0 -1.8 1,400Primary complete4 15.1 44.5 -1.8 4.6 19.4 0.9 -1.1 12.4 40.2 0.1 -1.8 944Secondary incomplete 12.1 37.1 -1.6 3.4 13.7 1.8 -0.8 7.5 30.4 0.4 -1.5 2,841Secondary complete
or higher5 5.6 22.9 -1.0 3.2 11.1 3.4 -0.6 3.5 17.8 1.5 -1.0 916
Wealth quintile Lowest 24.5 53.7 -2.1 4.5 17.5 0.9 -1.1 16.6 50.3 0.1 -2.0 1,883Second 16.9 45.4 -1.8 4.1 16.2 1.0 -1.1 11.3 41.6 0.1 -1.8 1,616Middle 14.1 40.7 -1.7 3.9 17.7 1.6 -1.0 11.5 36.0 0.3 -1.6 1,531Fourth 11.2 35.9 -1.5 3.4 13.6 1.7 -0.8 6.3 27.5 0.1 -1.4 1,478Highest 6.4 25.7 -1.1 3.7 12.1 2.9 -0.6 3.9 20.9 1.2 -1.1 1,352
Mother’s interview status Interviewed 15.1 41.2 -1.7 3.9 15.6 1.6 -0.9 10.3 36.3 0.4 -1.6 7,632Not interviewed6 20.2 44.0 -1.8 6.9 17.2 1.0 -1.2 14.8 40.4 0.0 -1.8 229
Total 15.3 41.3 -1.7 4.0 15.6 1.5 -0.9 10.4 36.4 0.3 -1.6 7,861 Note: Table is based on children who spent the night before the interview in the household. Each of the indices is expressed in standard deviation units (SD) from the median of the WHO Child Growth Standards adopted in 2006. The indices in this table are NOT comparable to those based on the previously used 1977 NCHS/CDC/WHO Reference. Table is based on children with valid dates of birth (month and year) and valid measurement of both height and weight. 1 Recumbent length is measured for children under age 2 and less than 85 cm; standing height is measured for all other children. 2 Includes children who are below -3 standard deviations (SD) from the WHO Growth Standards population median 3 For women who are not interviewed, information is taken from the Household Questionnaire. Excludes children whose mothers are not listed in the Household Questionnaire. 4 Primary complete is defined as completing grade 5. 5 Secondary complete is defined as completing grade 10. 6 Includes children whose mothers are deceased
There has been some improvement in child nutritional status over the past four years (Figure 11). The level
of stunting has declined from 51 percent in 2004 and 43 percent in 2007 to 41 percent of children under five in 2011. The pattern and change in wasting has been small and inconsistent. It increased from 15 percent in 2004 to 17 percent in 2007, and declined to 16 percent of children in 2011. The level of underweight has been declining from 43 in 2004, to 41 percent in 2007, and to 36 percent in 2011. The HPNSDP 2011-2016 targets for 2016 are 38 percent for stunting and 33 percent for underweight. If the current pace of decline is sustained, these targets should be achieved.
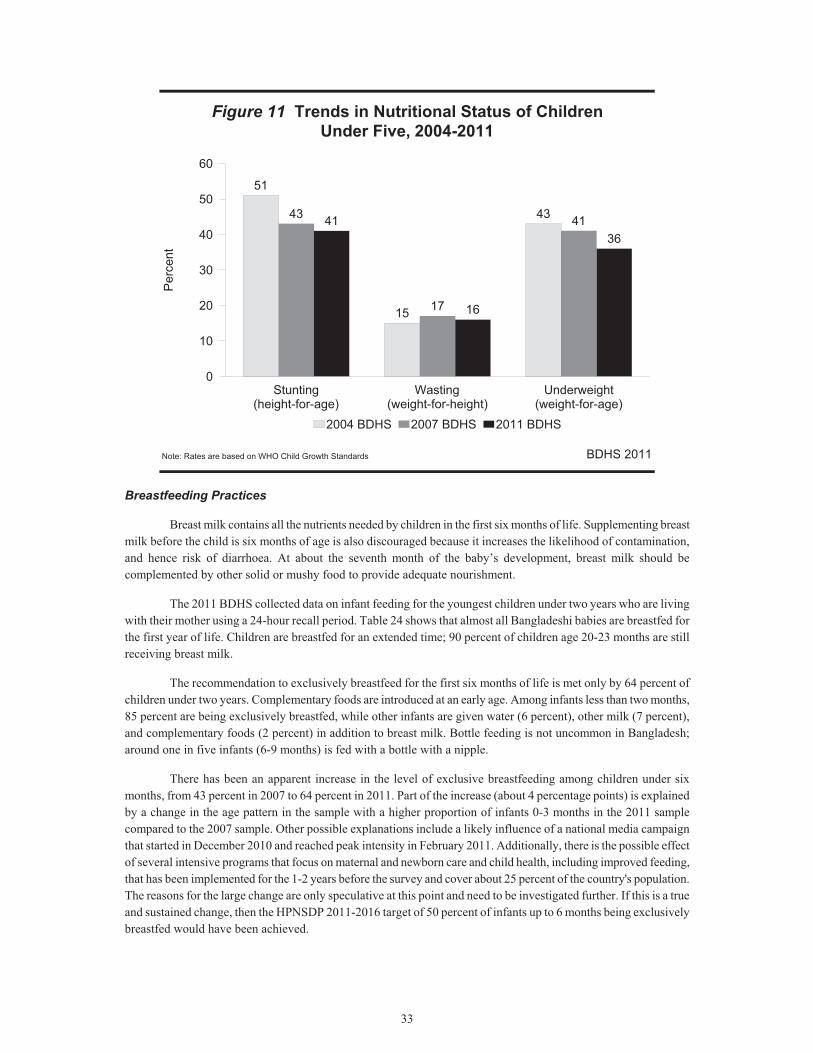
33
Figure 11 Trends in Nutritional Status of ChildrenUnder Five, 2004-2011
BDHS 2011
51
15
4343
17
4141
16
36
Stunting(height-for-age)
Wasting(weight-for-height)
Underweight(weight-for-age)
0
10
20
30
40
50
60P
erce
nt
2004 BDHS 2007 BDHS 2011 BDHS
Note: Rates are based on WHO Child Growth Standards
Breastfeeding Practices
Breast milk contains all the nutrients needed by children in the first six months of life. Supplementing breast milk before the child is six months of age is also discouraged because it increases the likelihood of contamination, and hence risk of diarrhoea. At about the seventh month of the baby’s development, breast milk should be complemented by other solid or mushy food to provide adequate nourishment.
The 2011 BDHS collected data on infant feeding for the youngest children under two years who are living with their mother using a 24-hour recall period. Table 24 shows that almost all Bangladeshi babies are breastfed for the first year of life. Children are breastfed for an extended time; 90 percent of children age 20-23 months are still receiving breast milk.
The recommendation to exclusively breastfeed for the first six months of life is met only by 64 percent of children under two years. Complementary foods are introduced at an early age. Among infants less than two months, 85 percent are being exclusively breastfed, while other infants are given water (6 percent), other milk (7 percent), and complementary foods (2 percent) in addition to breast milk. Bottle feeding is not uncommon in Bangladesh; around one in five infants (6-9 months) is fed with a bottle with a nipple.
There has been an apparent increase in the level of exclusive breastfeeding among children under six months, from 43 percent in 2007 to 64 percent in 2011. Part of the increase (about 4 percentage points) is explained by a change in the age pattern in the sample with a higher proportion of infants 0-3 months in the 2011 sample compared to the 2007 sample. Other possible explanations include a likely influence of a national media campaign that started in December 2010 and reached peak intensity in February 2011. Additionally, there is the possible effect of several intensive programs that focus on maternal and newborn care and child health, including improved feeding, that has been implemented for the 1-2 years before the survey and cover about 25 percent of the country's population. The reasons for the large change are only speculative at this point and need to be investigated further. If this is a true and sustained change, then the HPNSDP 2011-2016 target of 50 percent of infants up to 6 months being exclusively breastfed would have been achieved.
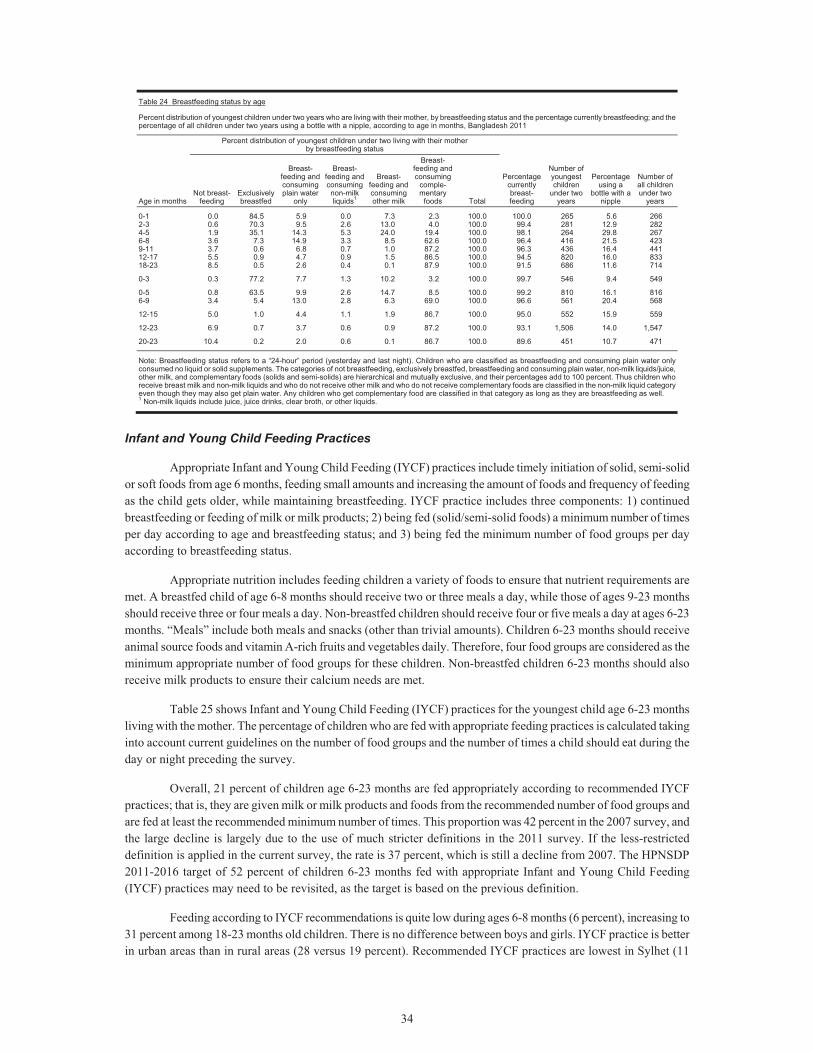
34
Table 24 Breastfeeding status by age
Percent distribution of youngest children under two years who are living with their mother, by breastfeeding status and the percentage currently breastfeeding; and the percentage of all children under two years using a bottle with a nipple, according to age in months, Bangladesh 2011
Age in months
Percent distribution of youngest children under two living with their mother by breastfeeding status
Percentage currently breast-feeding
Number of youngest children
under two years
Percentage using a
bottle with a nipple
Number of all children under two
years Not breast-
feeding Exclusively breastfed
Breast-feeding and consuming plain water
only
Breast-feeding and consuming non-milk liquids1
Breast-feeding and consuming other milk
Breast-feeding and consuming
comple-mentary
foods Total
0-1 0.0 84.5 5.9 0.0 7.3 2.3 100.0 100.0 265 5.6 2662-3 0.6 70.3 9.5 2.6 13.0 4.0 100.0 99.4 281 12.9 2824-5 1.9 35.1 14.3 5.3 24.0 19.4 100.0 98.1 264 29.8 2676-8 3.6 7.3 14.9 3.3 8.5 62.6 100.0 96.4 416 21.5 4239-11 3.7 0.6 6.8 0.7 1.0 87.2 100.0 96.3 436 16.4 44112-17 5.5 0.9 4.7 0.9 1.5 86.5 100.0 94.5 820 16.0 83318-23 8.5 0.5 2.6 0.4 0.1 87.9 100.0 91.5 686 11.6 714 0-3 0.3 77.2 7.7 1.3 10.2 3.2 100.0 99.7 546 9.4 549 0-5 0.8 63.5 9.9 2.6 14.7 8.5 100.0 99.2 810 16.1 8166-9 3.4 5.4 13.0 2.8 6.3 69.0 100.0 96.6 561 20.4 568 12-15 5.0 1.0 4.4 1.1 1.9 86.7 100.0 95.0 552 15.9 559 12-23 6.9 0.7 3.7 0.6 0.9 87.2 100.0 93.1 1,506 14.0 1,547 20-23 10.4 0.2 2.0 0.6 0.1 86.7 100.0 89.6 451 10.7 471 Note: Breastfeeding status refers to a “24-hour” period (yesterday and last night). Children who are classified as breastfeeding and consuming plain water only consumed no liquid or solid supplements. The categories of not breastfeeding, exclusively breastfed, breastfeeding and consuming plain water, non-milk liquids/juice, other milk, and complementary foods (solids and semi-solids) are hierarchical and mutually exclusive, and their percentages add to 100 percent. Thus children who receive breast milk and non-milk liquids and who do not receive other milk and who do not receive complementary foods are classified in the non-milk liquid category even though they may also get plain water. Any children who get complementary food are classified in that category as long as they are breastfeeding as well. 1 Non-milk liquids include juice, juice drinks, clear broth, or other liquids.
Infant and Young Child Feeding Practices
Appropriate Infant and Young Child Feeding (IYCF) practices include timely initiation of solid, semi-solid or soft foods from age 6 months, feeding small amounts and increasing the amount of foods and frequency of feeding as the child gets older, while maintaining breastfeeding. IYCF practice includes three components: 1) continued breastfeeding or feeding of milk or milk products; 2) being fed (solid/semi-solid foods) a minimum number of times per day according to age and breastfeeding status; and 3) being fed the minimum number of food groups per day according to breastfeeding status.
Appropriate nutrition includes feeding children a variety of foods to ensure that nutrient requirements are met. A breastfed child of age 6-8 months should receive two or three meals a day, while those of ages 9-23 months should receive three or four meals a day. Non-breastfed children should receive four or five meals a day at ages 6-23 months. “Meals” include both meals and snacks (other than trivial amounts). Children 6-23 months should receive animal source foods and vitamin A-rich fruits and vegetables daily. Therefore, four food groups are considered as the minimum appropriate number of food groups for these children. Non-breastfed children 6-23 months should also receive milk products to ensure their calcium needs are met.
Table 25 shows Infant and Young Child Feeding (IYCF) practices for the youngest child age 6-23 months living with the mother. The percentage of children who are fed with appropriate feeding practices is calculated taking into account current guidelines on the number of food groups and the number of times a child should eat during the day or night preceding the survey.
Overall, 21 percent of children age 6-23 months are fed appropriately according to recommended IYCF practices; that is, they are given milk or milk products and foods from the recommended number of food groups and are fed at least the recommended minimum number of times. This proportion was 42 percent in the 2007 survey, and the large decline is largely due to the use of much stricter definitions in the 2011 survey. If the less-restricted definition is applied in the current survey, the rate is 37 percent, which is still a decline from 2007. The HPNSDP 2011-2016 target of 52 percent of children 6-23 months fed with appropriate Infant and Young Child Feeding (IYCF) practices may need to be revisited, as the target is based on the previous definition.
Feeding according to IYCF recommendations is quite low during ages 6-8 months (6 percent), increasing to 31 percent among 18-23 months old children. There is no difference between boys and girls. IYCF practice is better in urban areas than in rural areas (28 versus 19 percent). Recommended IYCF practices are lowest in Sylhet (11
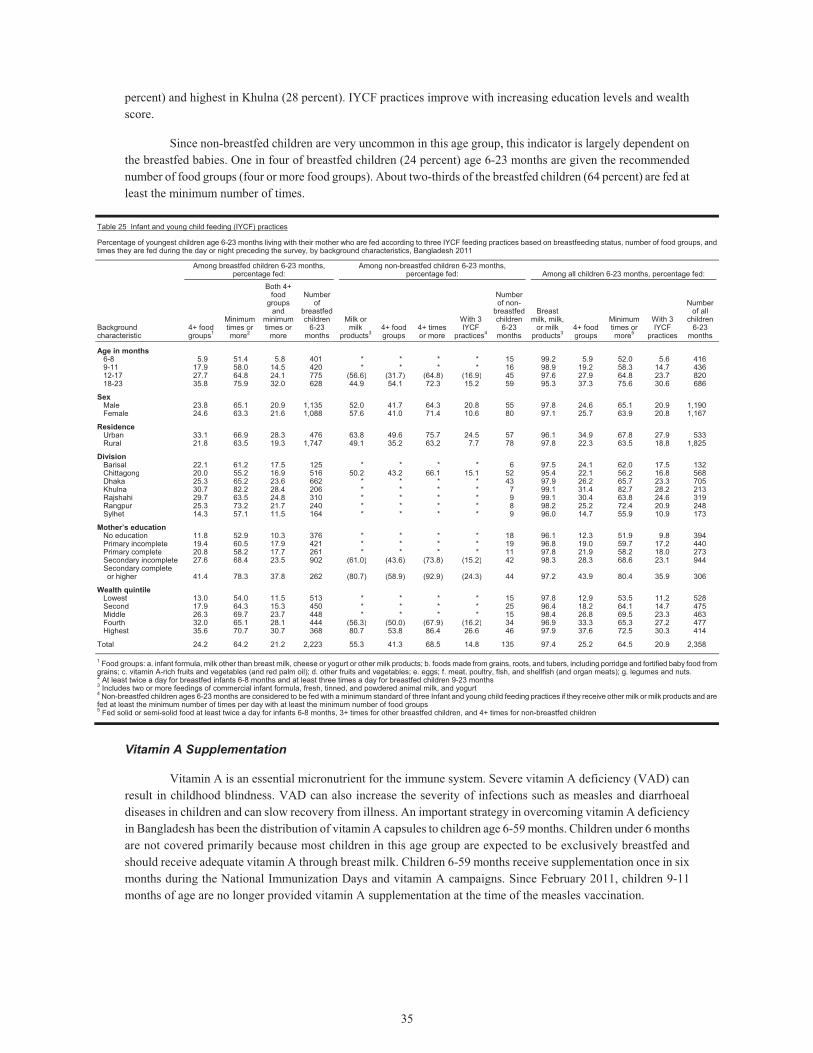
35
percent) and highest in Khulna (28 percent). IYCF practices improve with increasing education levels and wealth score.
Since non-breastfed children are very uncommon in this age group, this indicator is largely dependent on the breastfed babies. One in four of breastfed children (24 percent) age 6-23 months are given the recommended number of food groups (four or more food groups). About two-thirds of the breastfed children (64 percent) are fed at least the minimum number of times.
Table 25 Infant and young child feeding (IYCF) practices
Percentage of youngest children age 6-23 months living with their mother who are fed according to three IYCF feeding practices based on breastfeeding status, number of food groups, and times they are fed during the day or night preceding the survey, by background characteristics, Bangladesh 2011
Background characteristic
Among breastfed children 6-23 months, percentage fed:
Among non-breastfed children 6-23 months, percentage fed: Among all children 6-23 months, percentage fed:
4+ food groups1
Minimum times or more2
Both 4+ food
groups and
minimum times or
more
Number of
breastfed children
6-23 months
Milk or milk
products34+ food groups
4+ times or more
With 3 IYCF
practices4
Number of non-
breastfed children
6-23 months
Breast milk, milk,
or milk products3
4+ food groups
Minimum times or more5
With 3 IYCF
practices
Number of all
children 6-23
months
Age in months 6-8 5.9 51.4 5.8 401 * * * * 15 99.2 5.9 52.0 5.6 4169-11 17.9 58.0 14.5 420 * * * * 16 98.9 19.2 58.3 14.7 43612-17 27.7 64.8 24.1 775 (56.6) (31.7) (64.8) (16.9) 45 97.6 27.9 64.8 23.7 82018-23 35.8 75.9 32.0 628 44.9 54.1 72.3 15.2 59 95.3 37.3 75.6 30.6 686
Sex Male 23.8 65.1 20.9 1,135 52.0 41.7 64.3 20.8 55 97.8 24.6 65.1 20.9 1,190Female 24.6 63.3 21.6 1,088 57.6 41.0 71.4 10.6 80 97.1 25.7 63.9 20.8 1,167
Residence Urban 33.1 66.9 28.3 476 63.8 49.6 75.7 24.5 57 96.1 34.9 67.8 27.9 533Rural 21.8 63.5 19.3 1,747 49.1 35.2 63.2 7.7 78 97.8 22.3 63.5 18.8 1,825
Division Barisal 22.1 61.2 17.5 125 * * * * 6 97.5 24.1 62.0 17.5 132Chittagong 20.0 55.2 16.9 516 50.2 43.2 66.1 15.1 52 95.4 22.1 56.2 16.8 568Dhaka 25.3 65.2 23.6 662 * * * * 43 97.9 26.2 65.7 23.3 705Khulna 30.7 82.2 28.4 206 * * * * 7 99.1 31.4 82.7 28.2 213Rajshahi 29.7 63.5 24.8 310 * * * * 9 99.1 30.4 63.8 24.6 319Rangpur 25.3 73.2 21.7 240 * * * * 8 98.2 25.2 72.4 20.9 248Sylhet 14.3 57.1 11.5 164 * * * * 9 96.0 14.7 55.9 10.9 173
Mother’s education No education 11.8 52.9 10.3 376 * * * * 18 96.1 12.3 51.9 9.8 394Primary incomplete 19.4 60.5 17.9 421 * * * * 19 96.8 19.0 59.7 17.2 440Primary complete 20.8 58.2 17.7 261 * * * * 11 97.8 21.9 58.2 18.0 273Secondary incomplete 27.6 68.4 23.5 902 (61.0) (43.6) (73.8) (15.2) 42 98.3 28.3 68.6 23.1 944Secondary complete or higher 41.4 78.3 37.8 262 (80.7) (58.9) (92.9) (24.3) 44 97.2 43.9 80.4 35.9 306
Wealth quintile Lowest 13.0 54.0 11.5 513 * * * * 15 97.8 12.9 53.5 11.2 528Second 17.9 64.3 15.3 450 * * * * 25 96.4 18.2 64.1 14.7 475Middle 26.3 69.7 23.7 448 * * * * 15 98.4 26.8 69.5 23.3 463Fourth 32.0 65.1 28.1 444 (56.3) (50.0) (67.9) (16.2) 34 96.9 33.3 65.3 27.2 477Highest 35.6 70.7 30.7 368 80.7 53.8 86.4 26.6 46 97.9 37.6 72.5 30.3 414
Total 24.2 64.2 21.2 2,223 55.3 41.3 68.5 14.8 135 97.4 25.2 64.5 20.9 2,358 1 Food groups: a. infant formula, milk other than breast milk, cheese or yogurt or other milk products; b. foods made from grains, roots, and tubers, including porridge and fortified baby food from grains; c. vitamin A-rich fruits and vegetables (and red palm oil); d. other fruits and vegetables; e. eggs; f. meat, poultry, fish, and shellfish (and organ meats); g. legumes and nuts. 2 At least twice a day for breastfed infants 6-8 months and at least three times a day for breastfed children 9-23 months 3 Includes two or more feedings of commercial infant formula, fresh, tinned, and powdered animal milk, and yogurt 4 Non-breastfed children ages 6-23 months are considered to be fed with a minimum standard of three Infant and young child feeding practices if they receive other milk or milk products and are fed at least the minimum number of times per day with at least the minimum number of food groups 5 Fed solid or semi-solid food at least twice a day for infants 6-8 months, 3+ times for other breastfed children, and 4+ times for non-breastfed children
Vitamin A Supplementation
Vitamin A is an essential micronutrient for the immune system. Severe vitamin A deficiency (VAD) can result in childhood blindness. VAD can also increase the severity of infections such as measles and diarrhoeal diseases in children and can slow recovery from illness. An important strategy in overcoming vitamin A deficiency in Bangladesh has been the distribution of vitamin A capsules to children age 6-59 months. Children under 6 months are not covered primarily because most children in this age group are expected to be exclusively breastfed and should receive adequate vitamin A through breast milk. Children 6-59 months receive supplementation once in six months during the National Immunization Days and vitamin A campaigns. Since February 2011, children 9-11 months of age are no longer provided vitamin A supplementation at the time of the measles vaccination.
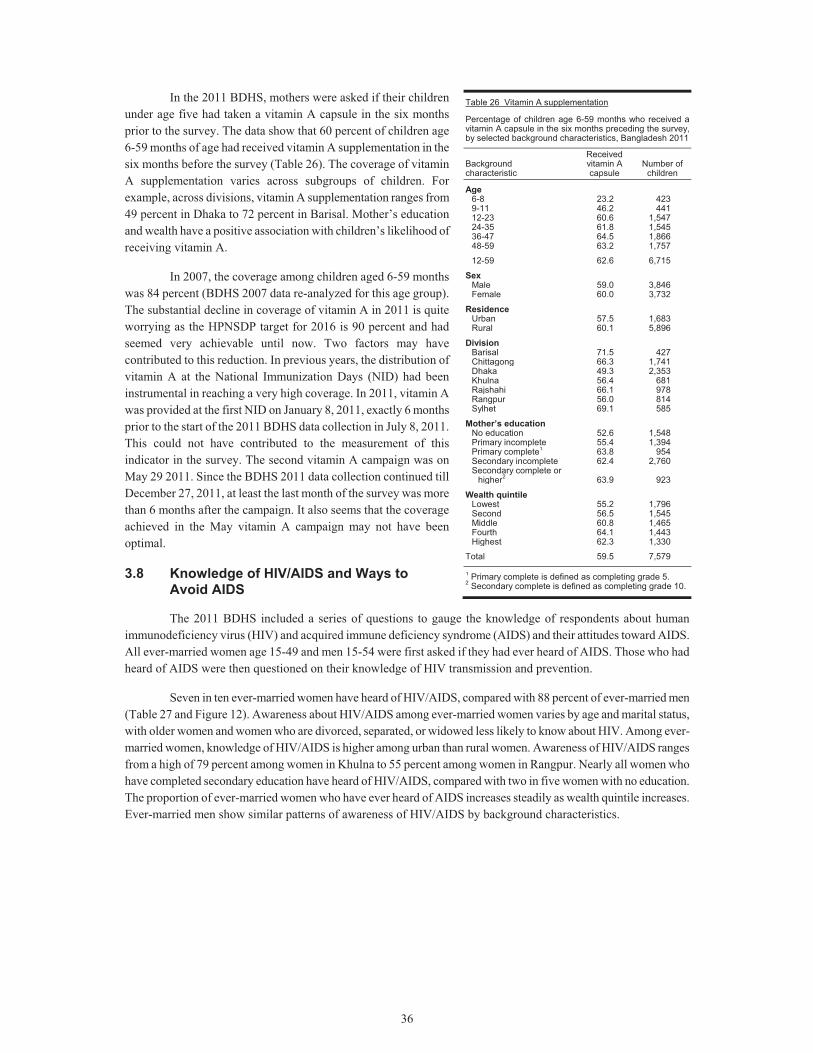
36
In the 2011 BDHS, mothers were asked if their children under age five had taken a vitamin A capsule in the six months prior to the survey. The data show that 60 percent of children age 6-59 months of age had received vitamin A supplementation in the six months before the survey (Table 26). The coverage of vitamin A supplementation varies across subgroups of children. For example, across divisions, vitamin A supplementation ranges from 49 percent in Dhaka to 72 percent in Barisal. Mother’s education and wealth have a positive association with children’s likelihood of receiving vitamin A.
In 2007, the coverage among children aged 6-59 months was 84 percent (BDHS 2007 data re-analyzed for this age group). The substantial decline in coverage of vitamin A in 2011 is quite worrying as the HPNSDP target for 2016 is 90 percent and had seemed very achievable until now. Two factors may have contributed to this reduction. In previous years, the distribution of vitamin A at the National Immunization Days (NID) had been instrumental in reaching a very high coverage. In 2011, vitamin A was provided at the first NID on January 8, 2011, exactly 6 months prior to the start of the 2011 BDHS data collection in July 8, 2011. This could not have contributed to the measurement of this indicator in the survey. The second vitamin A campaign was on May 29 2011. Since the BDHS 2011 data collection continued till December 27, 2011, at least the last month of the survey was more than 6 months after the campaign. It also seems that the coverage achieved in the May vitamin A campaign may not have been optimal.
3.8 Knowledge of HIV/AIDS and Ways to Avoid AIDS
The 2011 BDHS included a series of questions to gauge the knowledge of respondents about human immunodeficiency virus (HIV) and acquired immune deficiency syndrome (AIDS) and their attitudes toward AIDS. All ever-married women age 15-49 and men 15-54 were first asked if they had ever heard of AIDS. Those who had heard of AIDS were then questioned on their knowledge of HIV transmission and prevention.
Seven in ten ever-married women have heard of HIV/AIDS, compared with 88 percent of ever-married men (Table 27 and Figure 12). Awareness about HIV/AIDS among ever-married women varies by age and marital status, with older women and women who are divorced, separated, or widowed less likely to know about HIV. Among ever-married women, knowledge of HIV/AIDS is higher among urban than rural women. Awareness of HIV/AIDS ranges from a high of 79 percent among women in Khulna to 55 percent among women in Rangpur. Nearly all women who have completed secondary education have heard of HIV/AIDS, compared with two in five women with no education. The proportion of ever-married women who have ever heard of AIDS increases steadily as wealth quintile increases. Ever-married men show similar patterns of awareness of HIV/AIDS by background characteristics.
Table 26 Vitamin A supplementation
Percentage of children age 6-59 months who received a vitamin A capsule in the six months preceding the survey, by selected background characteristics, Bangladesh 2011
Background characteristic
Received vitamin A capsule
Number of children
Age 6-8 23.2 4239-11 46.2 44112-23 60.6 1,54724-35 61.8 1,54536-47 64.5 1,86648-59 63.2 1,757
12-59 62.6 6,715
Sex Male 59.0 3,846Female 60.0 3,732
Residence Urban 57.5 1,683Rural 60.1 5,896
Division Barisal 71.5 427Chittagong 66.3 1,741Dhaka 49.3 2,353Khulna 56.4 681Rajshahi 66.1 978Rangpur 56.0 814Sylhet 69.1 585
Mother’s education No education 52.6 1,548Primary incomplete 55.4 1,394Primary complete1 63.8 954Secondary incomplete 62.4 2,760Secondary complete or
higher2 63.9 923
Wealth quintile Lowest 55.2 1,796Second 56.5 1,545Middle 60.8 1,465Fourth 64.1 1,443Highest 62.3 1,330
Total 59.5 7,579
1 Primary complete is defined as completing grade 5.2 Secondary complete is defined as completing grade 10.
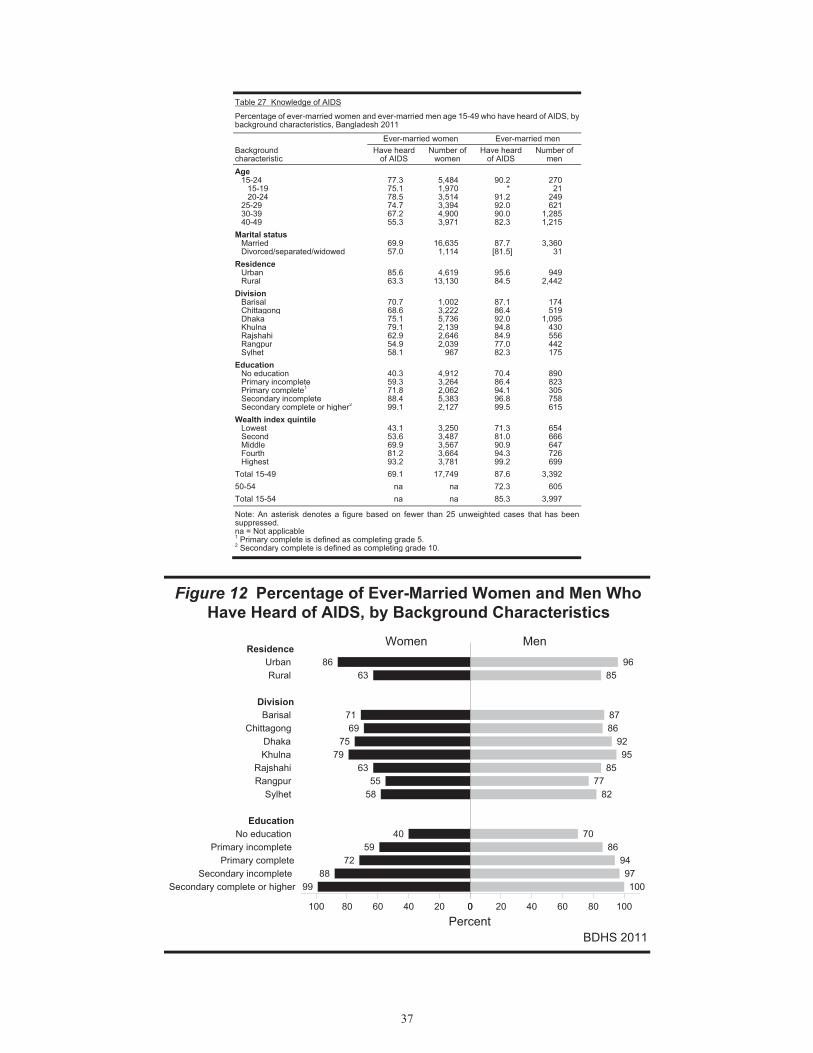
37
Table 27 Knowledge of AIDS
Percentage of ever-married women and ever-married men age 15-49 who have heard of AIDS, by background characteristics, Bangladesh 2011
Background characteristic
Ever-married women Ever-married men Have heard
of AIDS Number of
women Have heard
of AIDS Number of
men Age
15-24 77.3 5,484 90.2 270 15-19 75.1 1,970 * 21 20-24 78.5 3,514 91.2 249
25-29 74.7 3,394 92.0 621 30-39 67.2 4,900 90.0 1,285 40-49 55.3 3,971 82.3 1,215
Marital status Married 69.9 16,635 87.7 3,360 Divorced/separated/widowed 57.0 1,114 [81.5] 31
Residence Urban 85.6 4,619 95.6 949 Rural 63.3 13,130 84.5 2,442
Division Barisal 70.7 1,002 87.1 174 Chittagong 68.6 3,222 86.4 519 Dhaka 75.1 5,736 92.0 1,095 Khulna 79.1 2,139 94.8 430 Rajshahi 62.9 2,646 84.9 556 Rangpur 54.9 2,039 77.0 442 Sylhet 58.1 967 82.3 175
Education No education 40.3 4,912 70.4 890 Primary incomplete 59.3 3,264 86.4 823 Primary complete1 71.8 2,062 94.1 305 Secondary incomplete 88.4 5,383 96.8 758 Secondary complete or higher2 99.1 2,127 99.5 615
Wealth index quintile Lowest 43.1 3,250 71.3 654 Second 53.6 3,487 81.0 666 Middle 69.9 3,567 90.9 647 Fourth 81.2 3,664 94.3 726 Highest 93.2 3,781 99.2 699
Total 15-49 69.1 17,749 87.6 3,392
50-54 na na 72.3 605
Total 15-54 na na 85.3 3,997
Note: An asterisk denotes a figure based on fewer than 25 unweighted cases that has been suppressed. na = Not applicable 1 Primary complete is defined as completing grade 5. 2 Secondary complete is defined as completing grade 10.
Figure 12 Percentage of Ever-Married Women and Men Who Have Heard of AIDS, by Background Characteristics
BDHS 2011
8663
7169
7579
6355
58
4059
7288
99
9685
8786
9295
8577
82
7086
9497100
ResidenceUrban Rural
DivisionBarisal
Chittagong Dhaka Khulna
Rajshahi Rangpur
Sylhet
EducationNo education
Primary incomplete Primary complete
Secondary incomplete Secondary complete or higher
020406080100 0 20 40 60 80 100
Percent
MenWomen
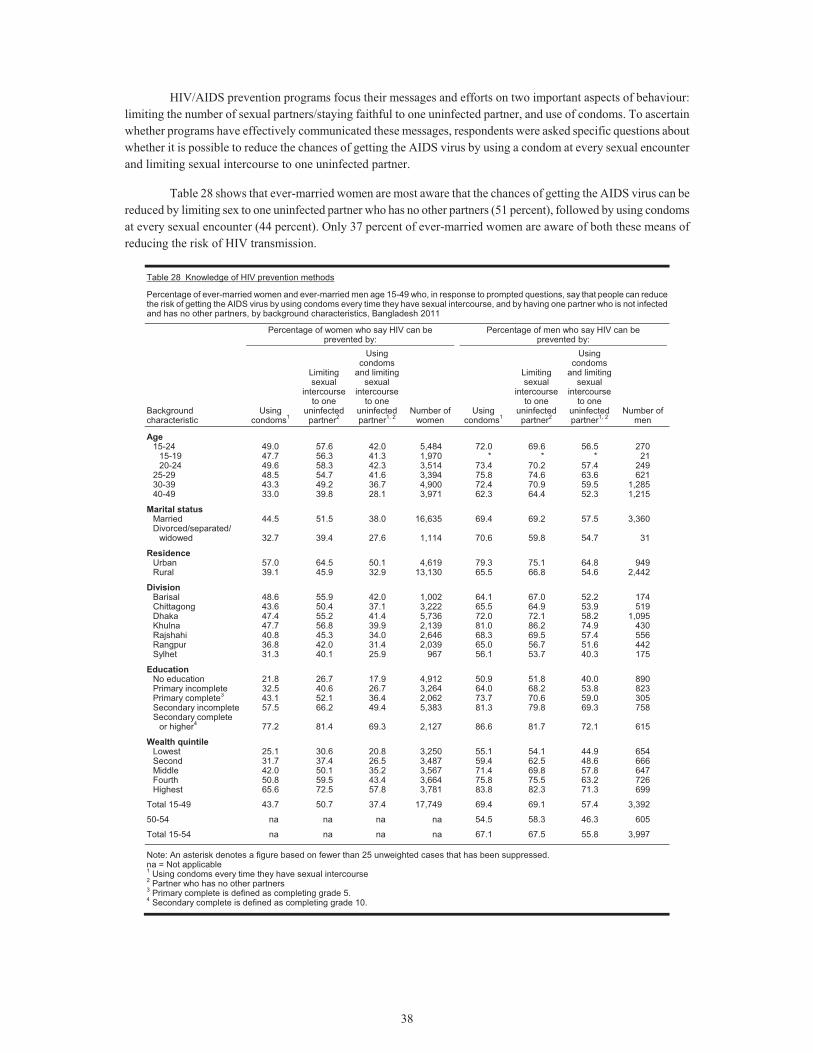
38
HIV/AIDS prevention programs focus their messages and efforts on two important aspects of behaviour: limiting the number of sexual partners/staying faithful to one uninfected partner, and use of condoms. To ascertain whether programs have effectively communicated these messages, respondents were asked specific questions about whether it is possible to reduce the chances of getting the AIDS virus by using a condom at every sexual encounter and limiting sexual intercourse to one uninfected partner.
Table 28 shows that ever-married women are most aware that the chances of getting the AIDS virus can be reduced by limiting sex to one uninfected partner who has no other partners (51 percent), followed by using condoms at every sexual encounter (44 percent). Only 37 percent of ever-married women are aware of both these means of reducing the risk of HIV transmission.
Table 28 Knowledge of HIV prevention methods
Percentage of ever-married women and ever-married men age 15-49 who, in response to prompted questions, say that people can reduce the risk of getting the AIDS virus by using condoms every time they have sexual intercourse, and by having one partner who is not infected and has no other partners, by background characteristics, Bangladesh 2011
Background characteristic
Percentage of women who say HIV can be prevented by:
Percentage of men who say HIV can be prevented by:
Using condoms1
Limiting sexual
intercourse to one
uninfected partner2
Using condoms
and limiting sexual
intercourse to one
uninfected partner1, 2
Number of women
Using condoms1
Limiting sexual
intercourse to one
uninfected partner2
Using condoms
and limiting sexual
intercourse to one
uninfected partner1, 2
Number of men
Age 15-24 49.0 57.6 42.0 5,484 72.0 69.6 56.5 270
15-19 47.7 56.3 41.3 1,970 * * * 2120-24 49.6 58.3 42.3 3,514 73.4 70.2 57.4 249
25-29 48.5 54.7 41.6 3,394 75.8 74.6 63.6 62130-39 43.3 49.2 36.7 4,900 72.4 70.9 59.5 1,28540-49 33.0 39.8 28.1 3,971 62.3 64.4 52.3 1,215
Marital status Married 44.5 51.5 38.0 16,635 69.4 69.2 57.5 3,360Divorced/separated/
widowed 32.7 39.4 27.6 1,114 70.6 59.8 54.7 31
Residence Urban 57.0 64.5 50.1 4,619 79.3 75.1 64.8 949Rural 39.1 45.9 32.9 13,130 65.5 66.8 54.6 2,442
Division Barisal 48.6 55.9 42.0 1,002 64.1 67.0 52.2 174Chittagong 43.6 50.4 37.1 3,222 65.5 64.9 53.9 519Dhaka 47.4 55.2 41.4 5,736 72.0 72.1 58.2 1,095Khulna 47.7 56.8 39.9 2,139 81.0 86.2 74.9 430Rajshahi 40.8 45.3 34.0 2,646 68.3 69.5 57.4 556Rangpur 36.8 42.0 31.4 2,039 65.0 56.7 51.6 442Sylhet 31.3 40.1 25.9 967 56.1 53.7 40.3 175
Education No education 21.8 26.7 17.9 4,912 50.9 51.8 40.0 890Primary incomplete 32.5 40.6 26.7 3,264 64.0 68.2 53.8 823Primary complete3 43.1 52.1 36.4 2,062 73.7 70.6 59.0 305Secondary incomplete 57.5 66.2 49.4 5,383 81.3 79.8 69.3 758Secondary complete
or higher4 77.2 81.4 69.3 2,127 86.6 81.7 72.1 615
Wealth quintile Lowest 25.1 30.6 20.8 3,250 55.1 54.1 44.9 654Second 31.7 37.4 26.5 3,487 59.4 62.5 48.6 666Middle 42.0 50.1 35.2 3,567 71.4 69.8 57.8 647Fourth 50.8 59.5 43.4 3,664 75.8 75.5 63.2 726Highest 65.6 72.5 57.8 3,781 83.8 82.3 71.3 699
Total 15-49 43.7 50.7 37.4 17,749 69.4 69.1 57.4 3,392
50-54 na na na na 54.5 58.3 46.3 605
Total 15-54 na na na na 67.1 67.5 55.8 3,997
Note: An asterisk denotes a figure based on fewer than 25 unweighted cases that has been suppressed.na = Not applicable 1 Using condoms every time they have sexual intercourse 2 Partner who has no other partners 3 Primary complete is defined as completing grade 5. 4 Secondary complete is defined as completing grade 10.

39
Ever-married men age 15-49 are equally as likely to know that the risk of transmitting HIV can be reduced by using condoms and by limiting sexual intercourse to one uninfected partner (69 percent for both). Over half of men age 15-49 are aware of both means of reducing transmission (57 percent). Much larger proportions of men are knowledgeable about the ways HIV is transmitted than women.
Women and men age 15-24 are more knowledgeable about the various modes of HIV/AIDS prevention than older respondents. Knowledge of HIV/AIDS prevention methods among both women and men is higher in urban than in rural areas, among those with the highest education, and among those from the wealthiest households.

41
REFERENCES
Al-Sabir, Ahmed, Shahin Sultana, Subrata K. Bhadra, and Mohammed Ahsanul Alam. 2009. Utilization of Essential Service Delivery (UESD) Survey 2008. Dhaka: National Institute of Population Research and Training (NIPORT).
Huq, M.N., and J. Cleland. 1990. Bangladesh Fertility Survey 1989: Main report. Dhaka, Bangladesh: National Institute of Population Research and Training (NIPORT).
Islam, M.N. and M.M. Islam. 1993. Biological and behavioral determinants of fertility in Bangladesh: 1975-1989. In Bangladesh Fertility Survey, 1989: Secondary analysis, 29-72. Dhaka: National Institute of Population Research and Training (NIPORT).
National Institute of Population Research and Training (NIPORT), Mitra and Associate, and ORC Macro. 2001. Bangladesh Demographic and Health Survey 1999-2000. Dhaka, Bangladesh and Calverton, Maryland [USA]: National Institute of Population Research and Training (NIPORT), Mitra and Associates, and ORC Macro.
National Institute of Population Research and Training (NIPORT), ORC Macro, Johns Hopkins University and ICDDR,B. 2003. Bangladesh Maternal Health Services and Maternal Mortality Survey 2001. Dhaka, Bangladesh and Calverton, Maryland (USA): NIPORT, ORC Macro, Johns Hopkins University, and ICDDR,B.
National Institute of Population Research and Training (NIPORT), Mitra and Associates, and ORC Macro. 2005. Bangladesh Demographic and Health Survey 2004. Dhaka, Bangladesh and Calverton, Maryland [USA]: National Institute of Population Research and Training, Mitra and Associates, and ORC Macro.
National Institute of Population Research and Training (NIPORT), Mitra and Associates, and Macro International. 2009. Bangladesh Demographic and Health Survey 2007. Dhaka, Bangladesh and Calverton, Maryland, USA: National Institute of Population Research and Training, Mitra and Associates, and Macro International.
National Institute of Population Research and Training (NIPORT), MEASURE Evaluation, and ICDDR,B. 2011. Bangladesh Maternal Mortality and Health Care Survey 2010: Preliminary Results. Dhaka: National Institute of Population Research and Training, MEASURE Evaluation, and ICDDR,B.
Ministry of Health and Population Control (MHPC). 1978. Bangladesh Fertility Survey, 1975-76: First Country Report. Dhaka: Government of the People’s Republic of Bangladesh and the World Fertility Survey.
Mitra, S.N. and G.M. Kamal. 1985. Bangladesh Contraceptive Prevalence Survey - 1983: Final report. Dhaka: Mitra and Associates.
Mitra, S.N. 1987. Bangladesh Contraceptive Prevalence Survey-1985: Final report. Dhaka: Mitra and Associates.
Mitra, S.N., M. Nawab Ali, Shahidul Islam, Anne R. Cross, and Tulshi Saha. 1994. Bangladesh Demographic and Health Survey 1993-94. Calverton, Maryland: National Institute for Population Research and Training (NIPORT), Mitra and Associates, and Macro International Inc.
Mitra, S.N., Ann Larson, Gillian Foo, and Shahidul Islam. 1990. Bangladesh Contraceptive Survey-1989: Final report. Dhaka: Mitra and Associates.
Mitra, S.N., Charles Lerman, and Shahidul Islam. 1993. Bangladesh Contraceptive Survey -1991: Final report. Dhaka: Mitra and Associates.
Mitra, S.N., Ahmed Al-Sabir, Anne R. Cross, and Kanta Jamil. 1997. Bangladesh Demographic and Health Survey 1996-97. Dhaka, Bangladesh and Calverton, Maryland [USA]: National Institute for Population Research and Training (NIPORT), Mitra and Associates, and Macro International Inc.
World Health Organization (WHO) Multicentre Growth Reference Study Group. 2006. WHO child growth standards: Length/height-for-age, weight-for-age, weight-for-length, weight-for-height and body mass index-for-age: Methods and development. Geneva: World Health Organization.

43
APPENDIX I
Members of the Technical Review Committee and the Technical Working Group
Technical Review Committee (TRC) Dr. Shelina Afroza, Director General, NIPORT Chairman Deputy Secretary (Program), Ministry of Health and Family Welfare Member Deputy Chief (Health), Ministry of Health and Family Welfare Member Deputy Chief (Family Welfare), Ministry of Health and Family Welfare Member Deputy Chief, Population Planning Wing, Planning Commission Member Director (Planning and Research), Directorate General of Health Services Member Director (MIS), Directorate General of Health Services Member Director, National AIDS/STD Program (NASP), Directorate General of Health Services Member Line Director (MC-RH), Directorate General of Family Planning Member Director (Planning), Directorate General of Family Planning Member Director (MIS), Directorate General of Family Planning Member Director, Census Wing, Bangladesh Bureau of Statistics Member Prof. M. Kabir, Department of Statistics, Jahangeernagar University Member Prof. Sekandar Hayat Khan, ISRT, Dhaka University Member Prof. A.K.M. Nurun Nabi, Department of Population Sciences, Dhaka University Member Prof. Nitai Chakraborty, Department of Statistics, University of Dhaka Member Representative, WHO, Dhaka Member Representative, UNFPA, Dhaka Member Health Manager, UKAID, British High Commission, Dhaka Member Representative, World Bank, Dhaka Member Representative, GIZ, Dhaka Member Representative, JICA, Dhaka Member Chief, Health and Nutrition, UNICEF Member Dr. Kanta Jamil, Monitoring and Evaluation Advisor, Office of Population, Health,
Nutrition and Education, USAID, Bangladesh Member Dr. Ahmed Al-Sabir, Representative, MEASURE Evaluation Member Chief of Party, Smiling Sun Franchise Program (SSFP) Member Dr. Ishtiaq Mannan, Chief of Party, MCHIP Member Mr. Toslim Uddin Khan, General Manager (Program), Social Marketing Company (SMC) Member Dr. Laura Reichenbach, Sr. Scientist & Head, RH Unit, ICDDR,B Member Dr. Peter Kim Streatfield, Director, CPUCC, ICDDR,B Member Dr. Shams El Arifeen, Director, CCAH, ICDDR,B Member Representative, ICF International, USA Member Mr. S.N. Mitra, Executive Director, Mitra and Associates Member Mrs. Shahin Sultana, Sr. Research Associate, NIPORT Member Mr. Subrata K. Bhadra, Sr. Research Associate, NIPORT Member Mr. Md. Rafiqul Islam Sarker, Director (Research), NIPORT Member-Secretary Technical Working Group (TWG) Dr. Shelina Afroza, Director General, NIPORT Chairman Mr. Md. Rafiqul Islam Sarker, Director (Research), NIPORT Member Dr. Peter Kim Streatfield, Director, CPUCC, ICDDR,B Member Dr. Shams El Arifeen, Director, CCAH, ICDDR,B Member Dr. Laura Reichenbach, Sr. Scientist & Head, RH Unit, ICDDR,B Member Dr. Kanta Jamil, Monitoring and Evaluation Advisor, Office of Population, Health,
Nutrition and Education, USAID, Bangladesh Member Dr. Ahmed Al-Sabir, Representative, MEASURE Evaluation Member Representative, ICF International, USA Member Mr. S.N. Mitra, Executive Director, Mitra and Associates Member Mr. Subrata K. Bhadra, Sr. Research Associate, NIPORT Member- Secretary

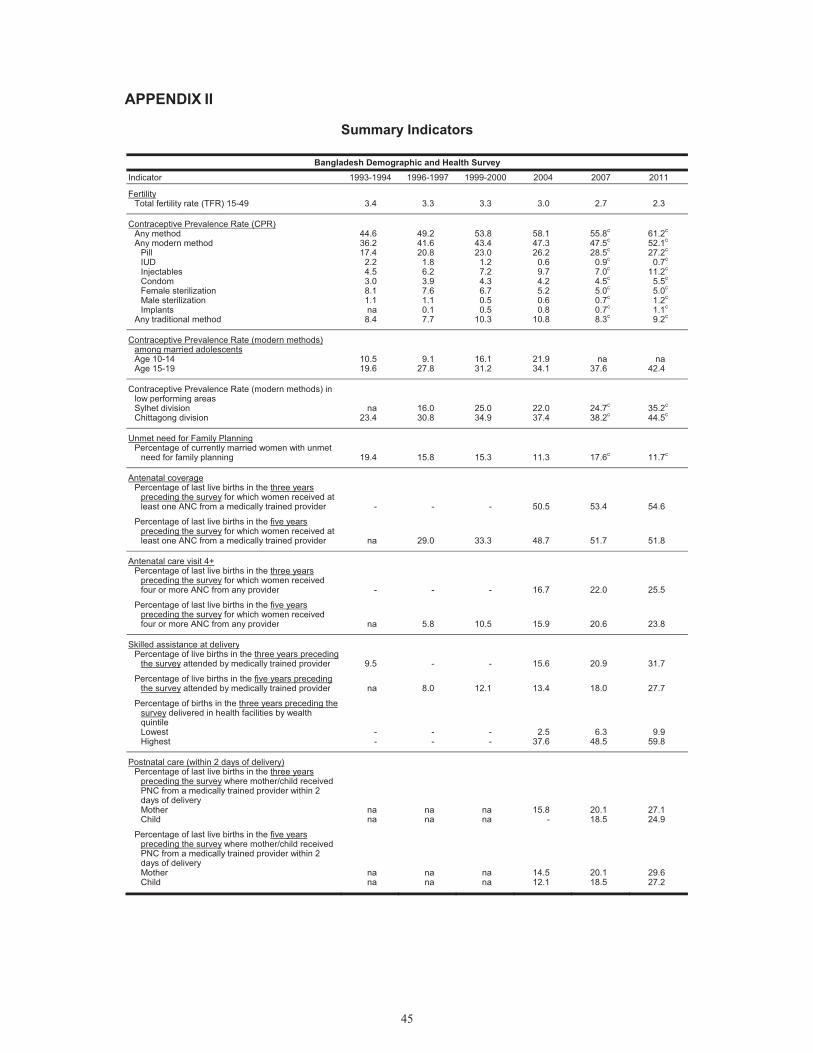
45
APPENDIX II
Summary Indicators
Bangladesh Demographic and Health Survey Indicator 1993-1994 1996-1997 1999-2000 2004 2007 2011
Fertility Total fertility rate (TFR) 15-49 3.4 3.3 3.3 3.0 2.7 2.3
Contraceptive Prevalence Rate (CPR) Any method Any modern method
Pill IUD Injectables Condom Female sterilization Male sterilization Implants
Any traditional method
44.636.2 17.4
2.2 4.5 3.0 8.1 1.1 na
8.4
49.241.6 20.8
1.8 6.2 3.9 7.6 1.1 0.1 7.7
53.843.4 23.0
1.2 7.2 4.3 6.7 0.5 0.5
10.3
58.147.3 26.2
0.6 9.7 4.2 5.2 0.6 0.8
10.8
55.8c 47.5c 28.5c
0.9c 7.0c 4.5c 5.0c 0.7c 0.7c 8.3c
61.2c
52.1c 27.2c
0.7c 11.2c
5.5c 5.0c 1.2c 1.1c 9.2c
Contraceptive Prevalence Rate (modern methods) among married adolescents Age 10-14 Age 15-19
10.519.6
9.127.8
16.131.2
21.934.1
na 37.6
na42.4
Contraceptive Prevalence Rate (modern methods) in low performing areas Sylhet division Chittagong division
na23.4
16.030.8
25.034.9
22.037.4
24.7c 38.2c
35.2c
44.5c
Unmet need for Family Planning Percentage of currently married women with unmet
need for family planning 19.4 15.8 15.3 11.3 17.6c 11.7c
Antenatal coverage Percentage of last live births in the three years
preceding the survey for which women received at least one ANC from a medically trained provider - - - 50.5 53.4 54.6
Percentage of last live births in the five years preceding the survey for which women received at least one ANC from a medically trained provider na 29.0 33.3 48.7 51.7 51.8
Antenatal care visit 4+ Percentage of last live births in the three years
preceding the survey for which women received four or more ANC from any provider - - - 16.7 22.0 25.5
Percentage of last live births in the five years preceding the survey for which women received four or more ANC from any provider na 5.8 10.5 15.9 20.6 23.8
Skilled assistance at delivery Percentage of live births in the three years preceding
the survey attended by medically trained provider 9.5 - - 15.6 20.9 31.7
Percentage of live births in the five years preceding the survey attended by medically trained provider na 8.0 12.1 13.4 18.0 27.7
Percentage of births in the three years preceding the survey delivered in health facilities by wealth quintile Lowest Highest
--
--
--
2.537.6
6.3 48.5
9.959.8
Postnatal care (within 2 days of delivery) Percentage of last live births in the three years
preceding the survey where mother/child received PNC from a medically trained provider within 2 days of delivery Mother Child
nana
nana
nana
15.8-
20.1 18.5
27.124.9
Percentage of last live births in the five years preceding the survey where mother/child received PNC from a medically trained provider within 2 days of delivery Mother Child
nana
nana
nana
14.512.1
20.1 18.5
29.627.2
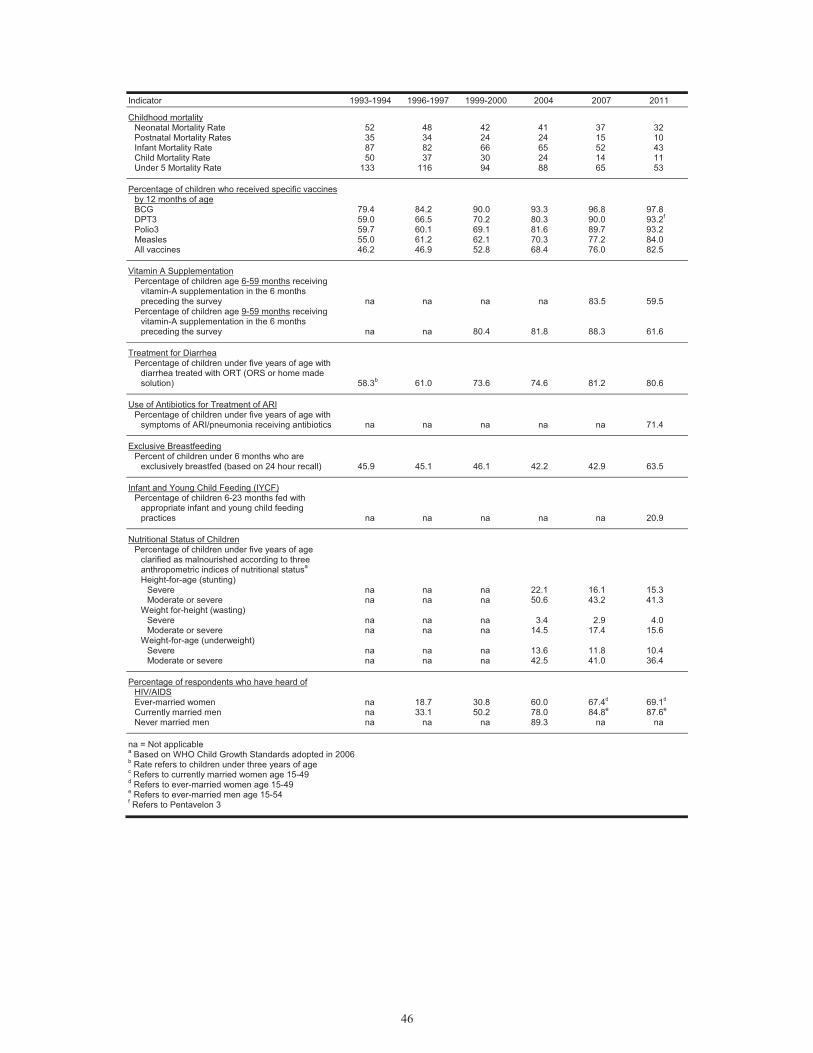
46
Indicator 1993-1994 1996-1997 1999-2000 2004 2007 2011
Childhood mortality Neonatal Mortality Rate Postnatal Mortality Rates Infant Mortality Rate Child Mortality Rate Under 5 Mortality Rate
52 35 87 50
133
48 34 82 37
116
42 24 66 30 94
41 24 65 24 88
37 15 52 14 65
32 10 43 11 53
Percentage of children who received specific vaccines by 12 months of age BCG DPT3 Polio3 Measles All vaccines
79.4 59.0 59.7 55.0 46.2
84.2 66.5 60.1 61.2 46.9
90.0 70.2 69.1 62.1 52.8
93.3 80.3 81.6 70.3 68.4
96.8 90.0 89.7 77.2 76.0
97.8 93.2f 93.2 84.0 82.5
Vitamin A Supplementation Percentage of children age 6-59 months receiving
vitamin-A supplementation in the 6 months preceding the survey na na na na 83.5 59.5
Percentage of children age 9-59 months receiving vitamin-A supplementation in the 6 months preceding the survey na na 80.4 81.8 88.3 61.6
Treatment for Diarrhea Percentage of children under five years of age with
diarrhea treated with ORT (ORS or home made solution) 58.3b 61.0 73.6 74.6 81.2 80.6
Use of Antibiotics for Treatment of ARI Percentage of children under five years of age with
symptoms of ARI/pneumonia receiving antibiotics na na na na na 71.4
Exclusive Breastfeeding Percent of children under 6 months who are
exclusively breastfed (based on 24 hour recall) 45.9 45.1 46.1 42.2 42.9 63.5
Infant and Young Child Feeding (IYCF) Percentage of children 6-23 months fed with
appropriate infant and young child feeding practices na na na na na 20.9
Nutritional Status of Children Percentage of children under five years of age
clarified as malnourished according to three anthropometric indices of nutritional statusa Height-for-age (stunting)
Severe Moderate or severe
na na
na na
na na
22.1 50.6
16.1 43.2
15.3 41.3
Weight for-height (wasting) Severe Moderate or severe
na na
na na
na na
3.4 14.5
2.9 17.4
4.0 15.6
Weight-for-age (underweight) Severe Moderate or severe
na na
na na
na na
13.6 42.5
11.8 41.0
10.4 36.4
Percentage of respondents who have heard of HIV/AIDS Ever-married women Currently married men Never married men
na na na
18.7 33.1
na
30.8 50.2
na
60.0 78.0 89.3
67.4d 84.8e
na
69.1d 87.6e
na
na = Not applicable a Based on WHO Child Growth Standards adopted in 2006 b Rate refers to children under three years of age c Refers to currently married women age 15-49 d Refers to ever-married women age 15-49 e Refers to ever-married men age 15-54 f Refers to Pentavelon 3