demographic characteristics and differential item functioning
TRANSCRIPT
KIU Journal of Humanities
53
KIU Journal of Humanities Copyright©2019
Kampala International University ISSN: 2415-0843; 4(2): 53-69
Demographic Characteristics and Differential Item Functioning of Economics
Achievement Test in Plateau State, Nigeria
JOSEPH JOHN MAWAK , ABBAS Y. MUSTAPHA, SAYITA. S.G. WAKJISSA
University of Jos, Nigeria
Abstract. The study investigated the
demographic characteristics of students and
differential item functioning of economics
achievement test items for SSII students in
Plateau State, Nigeria. The motivation of the
study was the persistent poor performance of
students in external examinations in the subject
which could be attributed to the quality of test
items used by teachers in assessing students’
achievement in the subject. Again, some of the
test items used in assessing students function
differentially based on students’ gender, school
location and school type, which have resulted in
students with the same ability performing
differently. Furthermore, the teachers use the
same test items to measure secondary issues
above primary issues. Again there are no
existing developed tests in economics in the
study area that can be used in assessing students
in the subject within the study area. The research
design used for the study was instrumentation
and cross-sectional survey research designs. The
population of the study consisted of all the
23712 SS2 economics students in Plateau State
whereby a sample of 1454 SSII students were
selected and used for the study. Multistage
sampling technique was used to ensure that
adequate number of students were selected from
each zone, local government, schools and
students. A sample of 134 schools made up of
74 private schools and 60 public schools with 68
from rural and 66 from urban; 720 males and
734 females were used for the study. The
instrument for data collection was an Economics
Achievement Test (EAT) developed and
calibrated by the researcher. One research
question and three hypotheses were formulated
to guide the study. The research question was
answered using the Kaiser-Meyer Olkim (kmo)
and scree plot while the hypotheses were tested
using structural equation modelling of the
IRTPRO. The validity of the instrument was
established using a test blue print and experts’
judgments. The reliability of the instrument was
estimated using Omega reliability procedure and
coefficient of 0.83 was obtained for the EAT
items. The results of the analysis revealed that
some of the items functioned differently for the
testees based on gender, school type and school
location. It was recommended among others that
teachers should determine the differential
functioning of test items before using the tests
for conducting continuous assessments on
students.
Keywords: Demographic characteristics,
Differential item functioning.
1. Introduction
Differential item functioning is one of the test
development process that is used in test
development to ensure that items in a test are
free from bias. It is usually carried out to
KIU Journal of Humanities
54
determine if examinees of equal ability from
different background such as students’ gender,
school type and school location have an unequal
probability of answering an item correctly
(Obinne & Amali, 2013) it is a condition where
items in a test function differently for respondent
with the same level of ability who are from
different background. For example one could
investigate whether a test functions differentially
for male/female students, urban/rural schools
and private/public schools. Hence, test-fairness
is a moral imperative for both the makers and
users of a test to make sure that test items do not
function differently for test takers. However,
studies have shown that some test items that
functioned differently for respondents have been
used in determining the ability of testees at
different level.
1.1 Research Question
What are the dimensions underlying students’
performance in the Economics Achievement
Test?
1.2 Hypotheses
- The items of the economics achievement
test will not functioned differentially
based on students gender in Plateau
State
- The items of the economics achievement
test will not functioned differentially
based on school location in Plateau State
- The items of the economics achievement
test will not functioned differentially
due to school type in Plateau State
2. Literature Review
2.1 Students Gender and Differential Item
Functioning
Gender is a set of characteristics that
distinguished between male and female
(Bolarinwa, Hammed & Barrah, 2013). It is the
biological and psychological characteristics that
defined men and women. Okon and Archibong
(2015) observed that it is a social attitude and
opportunities associated with being male and
female concerns about differential item
functioning with respect to male and female
have generated a considerable interest in the
field of educational testing over the years.
Differential item functioning have been among
the contemporary issues in current academic
debate all over the world. Differences in the way
test items functioned based on gender is likely to
contribute disparities in the allocation of
cognitive roles in the world.
Similarly different studies have been conducted
to investigate the presence or absence of DIF in
test items with regards to gender with diverse
findings. For instance, Ogbebor and Onuka
(2013) in their study found that some NECO test
items functioned differently based on students
gender. Also Enetairo and Akoredo (2010) in
their study found that some economics test items
used by NECO in 2013 functioned differently
based on students’ gender. Furthermore Obinne
and Amali (2014) found that biology questions
paper used by West African Examination
Council NECO functioned differently in favour
of males.
On the contrary, Khairani and Nordin (2011)
found that there was no evidence of DIF in test
items that were used in assessing 14-year old
students in mathematics. From the review, it is
evident that some examinations contain items
that functioned differentially against students’
gender thereby enabling the items to measure
different things for testees with same ability.
However, most of the studies used WAEC and
NECO questions papers or existing instrument
while the present study seeks to develop an
economics achievement test after which DIF
was detected so as to see whether some items
functioned differently for testees based on male
or female. Hence, the need to conduct the
present study.
2.2 School Type and Differential Item
Functioning
Ownership of schools in Nigeria could be
viewed from two categories of ownership of
schools which could be public ownership and
private ownership. According to Oderinde
(2016) and Olubunmi (2016) schools that are
established and run by government are called
public schools while those established by
KIU Journal of Humanities
55
individuals, organisations and missionary bodies
are referred to as private schools. Public schools
are schools that are controlled by the federal,
state or local government, while individual
groups or missionary institutions control private
schools. Researchers have not come to
consensus over the way test items function in
schools based on school type. While some found
that differential items functioning exist, in test
items that are developed for the purpose of
assessment. Others found that there was no
evidence of DIF in test items based on school
type, for example Abedalaziz (2009) in his study
in mathematics found that mathematics test
items functioned differentially based on school
type in favour of private schools. Agbebor and
Onuka (2013) in their study in economics found
that 10 items out of the 60 items that were used
by NECO functioning differently based on
school type.
Similarly, Nhuan (2016) in his study, found that
history achievement test items used by National
Examination Council Service NECS showed
evidence of item bias in favour of school type.
Again Ebesine (2016) in his study on culture and
differential item functioning in National Council
Senior School Certificate Mathematics Multiple-
choice test items found that NECO 2012
multiple-choice test items function differentially
based on school type in favour of public schools.
Hence, the examination test items contain items
that measures different things for testees of the
same ability, but came from private and public
schools. Furthermore Ageigbe and Afolabi
(2014) in their study found that both
mathematics and English test items had items
that functioned differentially for respondents
based on school type of public and private
schools.
From the foregoing it is evident that test items
that function differently based on school type
have been used in assessing students in schools,
hence, the need to investigate if the items in the
EAT functioned differently based on school type
and hence the need for the present study.
2.3 School Location and Differential Item
Functioning
School location refers to where a school is sited.
While some schools are sited in towns, and
cities, others are sited in rural areas or villages.
Esomonu (2002) states that urban areas are those
with high population density, high variety and
beautiful environment while rural areas are those
with low population and subsistence mode of
life. Hence, parents in rural areas are poor and
less exposed than those in urban areas. Madu
(2012) found that test items functioned
differently for candidates from rural and urban
schools. Therefore students of the same ability
level performed differently in a test while
Khairani and Nordin (2011) found that
differential item functioning does not exist in a
test that was used in assessing students. Ageigbe
and Afolabi (2014) and Obesine (2016) in their
separate studies found that test items developed
by WAEC and NECO in mathematics contain
items that functioned differently for students
who had the same ability level but came from
different schools classified by school location of
urban and rural.
Again studies by Amuche and Fan (2016) on
assessment of item bias using differential item
functioning techniques, found that 10 items
functional differentially for students who were
of the same ability but are classified based on
school location. While some researchers found
that some tests items functioned differently for
students from urban and rural schools, others
found that DIF does not exist based on school
location. From the foregoing, there is the need
for teachers to investigate if test items used in
conducting continuous assessment of students
contain items that functioned differentially for
testees who are of the same ability but classified
by school location of urban and rural schools.
The review of literature shows that most of the
studies that were conducted were in
mathematics, English language and biology
while the present study is in economics.
Furthermore, the studies were conducted in
Enugu State, Delta State and Taraba State while
the present is in Plateau State. Similarly, must of
the studies used WAEC and NECO examination
papers while the present study developed and
calibrated the Economics Achievement Test
KIU Journal of Humanities
56
(EAT) and therefore the need for the present
study.
Available evidence from the review shows that
some examination items that have been used in
examining students have been found to be bias
in favour of either male or female, private and
public schools and urban and rural schools
which have violate the principles of test fairness
and therefore this study set out to investigate if
the economics achievement test (EAT) contain
items that are bias based on students
demographic characteristics. The broad question
to this study therefore is; to what extend do the
test items functioned differently across the
different subgroup classified by gender, school
type and school location.
3. Methodology
The study used instrumentation and cross-
sectional survey research designs.
Instrumentation research design refers to the tool
or means by which an investigator attempt to
measure the variables or items of interest in a
data collection process. It was used in
developing and certifying the validity and
reliability of the economics achievement test.
Cross-sectional survey requires that data are
collected once at a particular time from a sample
for the purpose of describing the population
using the sample at that particular time. Cross-
sectional survey design was applied in collecting
data using the economics achievement test from
the sample schools based on subgroups of male,
female, urban/rural and private/public schools.
The designs were used because the study aims at
development and calibration of an economics
achievement test. The result obtained was
generalized on the entire SSII students in the
study area.
The population of the study consisted of all the
23712 SSII students in Plateau State made up of
male and females, urban/rural and private/public
schools while a sample of 1454 SSII students
made up of 720 males and 734 females, 729
students drawn from urban and 725 from rural
schools were used. The decision to use 1454 as a
sample study is because adequate sample for
item-response theory should not be less than
1000. Multistage sampling and proportional
stratified sampling were used for the study.
Multistage and proportional stratified samplings
are sampling method in which different strata in
a population are identified and which the
number of elements are drawn from each strata
proportionate to the relative number of elements
in each stratum (Nwana, 2007). The instrument
used for data collection was the economics
achievement test developed and calibrated by
the researcher.
The content validity of the EAT was established
using table of specifications and the economic
curriculum of SSII the validity of the instrument
was further established by subjecting the
instrument to expect judgment from economics
education and research, measurement and
evaluation. The reliability of the instrument was
established using omega reliability procedure.
Descriptive statistics was used in answering the
research questions and structural equation
modelling was used to test the hypotheses that
were formulated to guide the study at 0.05 level
of significance.
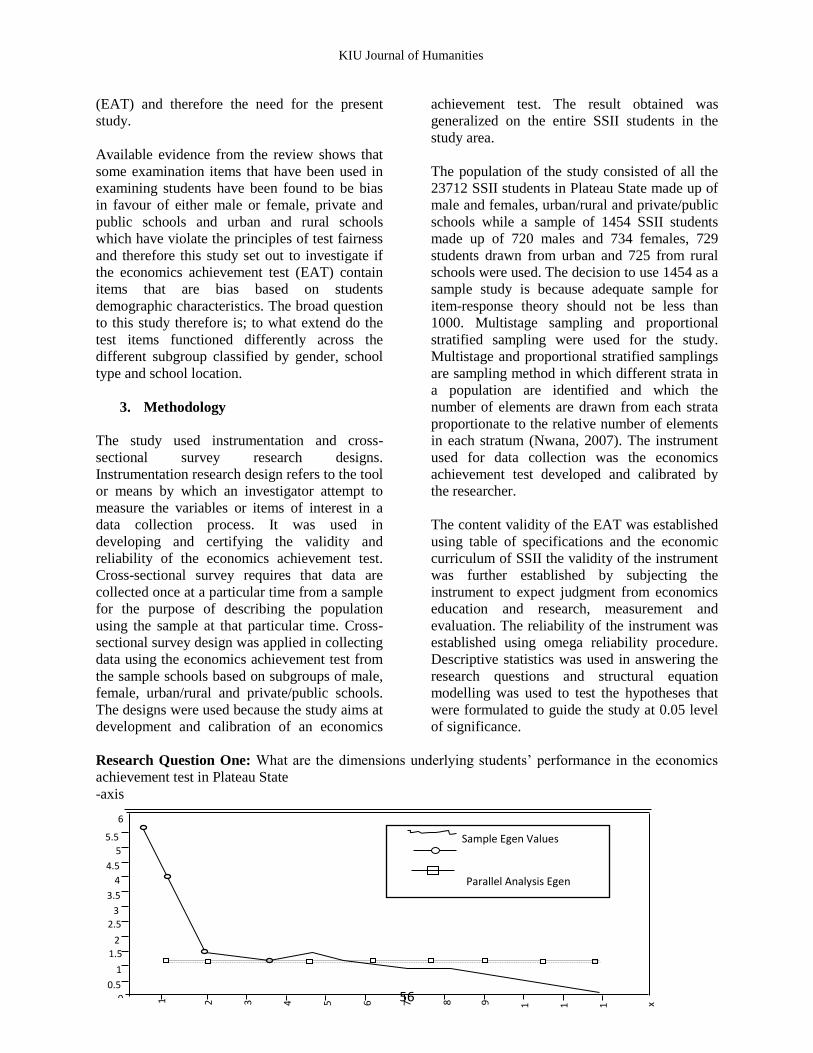
Research Question One: What are the dimensions underlying students’ performance in the economics
achievement test in Plateau State
-axis
1
2
3
4
5
6
7 8
9
1 0
1 1
1 2 x -0
1.5
0.5
1
2
2.5
3
3.5
4
4.5
5
5.5
6
Sample Egen Values
Parallel Analysis Egen
KIU Journal of Humanities
57
Figure 1: Result of Parallel Analysis of the Dichotomously Scored EAT Items
Figure 1 shows the results of the parallel analysis of the EAT items. From the Figure, it show that the
EAT had three component within the sharp descent before Eigen values trail off. This result shows that
there were three dimensions or trait underlying the dichotomously scored EAT items, therefore three
dimension was used to calibrate the test items.
Hypotheses
Hypothesis One
The items of the EAT do not function differentially based on students’ gender in Plateau State.
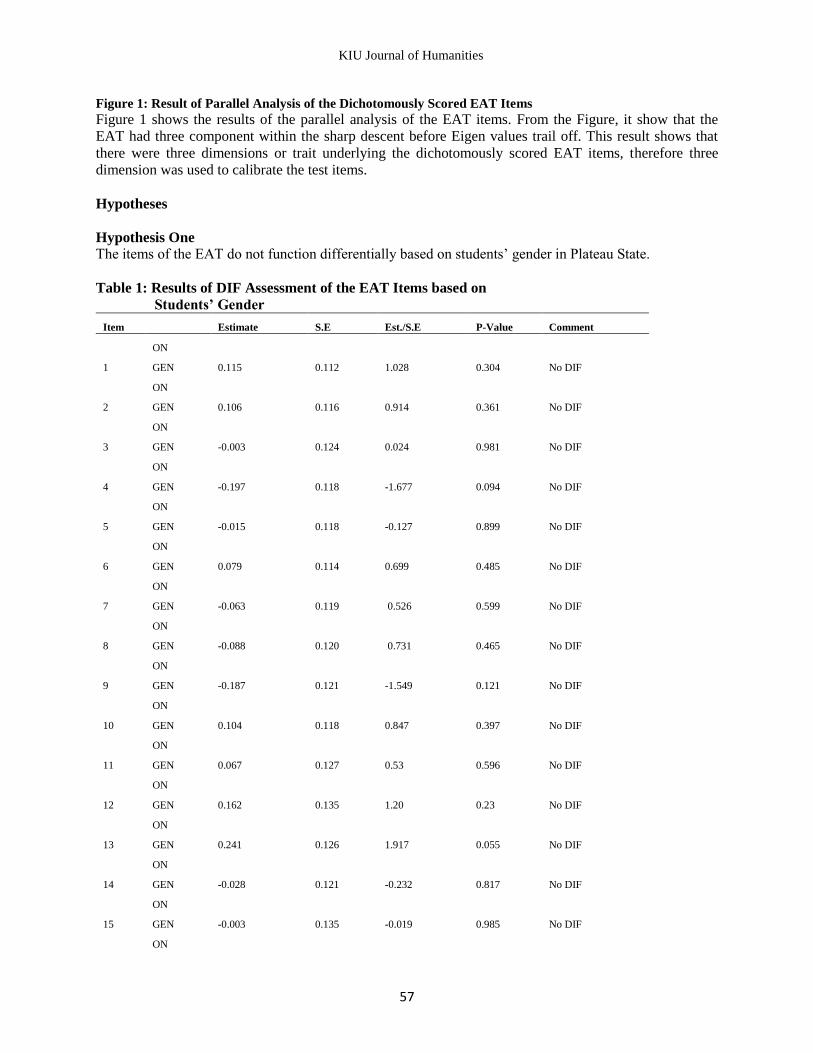
Table 1: Results of DIF Assessment of the EAT Items based on
Students’ Gender
Item Estimate S.E Est./S.E P-Value Comment
ON
1 GEN 0.115 0.112 1.028 0.304 No DIF
ON
2 GEN 0.106 0.116 0.914 0.361 No DIF
ON
3 GEN -0.003 0.124 0.024 0.981 No DIF
ON
4 GEN -0.197 0.118 -1.677 0.094 No DIF
ON
5 GEN -0.015 0.118 -0.127 0.899 No DIF
ON
6 GEN 0.079 0.114 0.699 0.485 No DIF
ON
7 GEN -0.063 0.119 0.526 0.599 No DIF
ON
8 GEN -0.088 0.120 0.731 0.465 No DIF
ON
9 GEN -0.187 0.121 -1.549 0.121 No DIF
ON
10 GEN 0.104 0.118 0.847 0.397 No DIF
ON
11 GEN 0.067 0.127 0.53 0.596 No DIF
ON
12 GEN 0.162 0.135 1.20 0.23 No DIF
ON
13 GEN 0.241 0.126 1.917 0.055 No DIF
ON
14 GEN -0.028 0.121 -0.232 0.817 No DIF
ON
15 GEN -0.003 0.135 -0.019 0.985 No DIF
ON
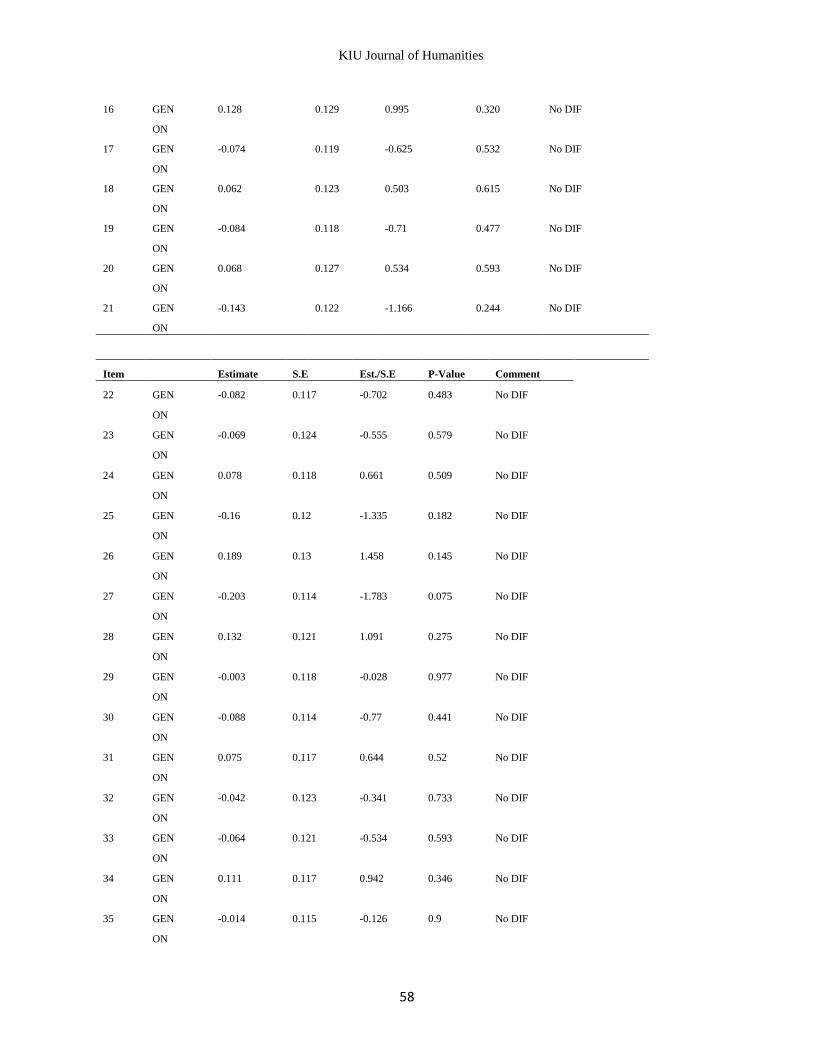
KIU Journal of Humanities
58
16 GEN 0.128 0.129 0.995 0.320 No DIF
ON
17 GEN -0.074 0.119 -0.625 0.532 No DIF
ON
18 GEN 0.062 0.123 0.503 0.615 No DIF
ON
19 GEN -0.084 0.118 -0.71 0.477 No DIF
ON
20 GEN 0.068 0.127 0.534 0.593 No DIF
ON
21 GEN -0.143 0.122 -1.166 0.244 No DIF
ON
Item Estimate S.E Est./S.E P-Value Comment
22 GEN -0.082 0.117 -0.702 0.483 No DIF
ON
23 GEN -0.069 0.124 -0.555 0.579 No DIF
ON
24 GEN 0.078 0.118 0.661 0.509 No DIF
ON
25 GEN -0.16 0.12 -1.335 0.182 No DIF
ON
26 GEN 0.189 0.13 1.458 0.145 No DIF
ON
27 GEN -0.203 0.114 -1.783 0.075 No DIF
ON
28 GEN 0.132 0.121 1.091 0.275 No DIF
ON
29 GEN -0.003 0.118 -0.028 0.977 No DIF
ON
30 GEN -0.088 0.114 -0.77 0.441 No DIF
ON
31 GEN 0.075 0.117 0.644 0.52 No DIF
ON
32 GEN -0.042 0.123 -0.341 0.733 No DIF
ON
33 GEN -0.064 0.121 -0.534 0.593 No DIF
ON
34 GEN 0.111 0.117 0.942 0.346 No DIF
ON
35 GEN -0.014 0.115 -0.126 0.9 No DIF
ON
KIU Journal of Humanities
59
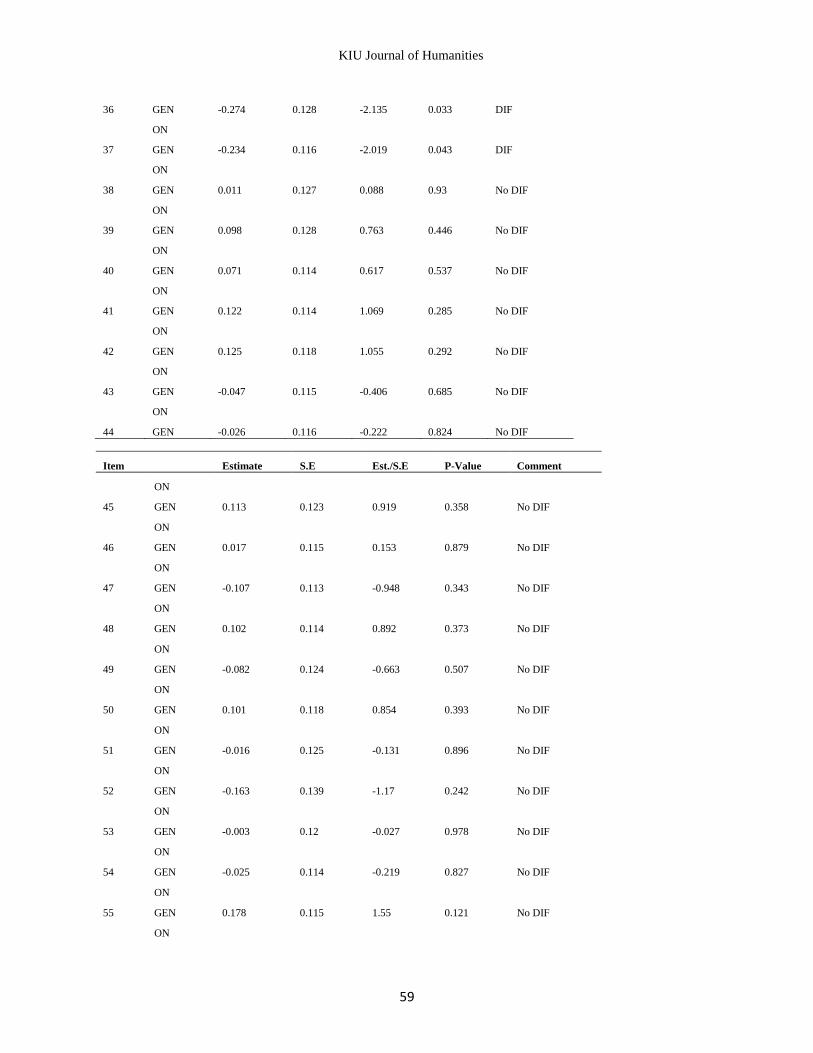
36 GEN -0.274 0.128 -2.135 0.033 DIF
ON
37 GEN -0.234 0.116 -2.019 0.043 DIF
ON
38 GEN 0.011 0.127 0.088 0.93 No DIF
ON
39 GEN 0.098 0.128 0.763 0.446 No DIF
ON
40 GEN 0.071 0.114 0.617 0.537 No DIF
ON
41 GEN 0.122 0.114 1.069 0.285 No DIF
ON
42 GEN 0.125 0.118 1.055 0.292 No DIF
ON
43 GEN -0.047 0.115 -0.406 0.685 No DIF
ON
44 GEN -0.026 0.116 -0.222 0.824 No DIF
Item Estimate S.E Est./S.E P-Value Comment
ON
45 GEN 0.113 0.123 0.919 0.358 No DIF
ON
46 GEN 0.017 0.115 0.153 0.879 No DIF
ON
47 GEN -0.107 0.113 -0.948 0.343 No DIF
ON
48 GEN 0.102 0.114 0.892 0.373 No DIF
ON
49 GEN -0.082 0.124 -0.663 0.507 No DIF
ON
50 GEN 0.101 0.118 0.854 0.393 No DIF
ON
51 GEN -0.016 0.125 -0.131 0.896 No DIF
ON
52 GEN -0.163 0.139 -1.17 0.242 No DIF
ON
53 GEN -0.003 0.12 -0.027 0.978 No DIF
ON
54 GEN -0.025 0.114 -0.219 0.827 No DIF
ON
55 GEN 0.178 0.115 1.55 0.121 No DIF
ON
KIU Journal of Humanities
60
56 GEN -0.003 0.129 -0.022 0.983 No DIF
ON
57 GEN -0.121 0.124 -0.979 0.328 No DIF
ON
58 GEN 0.129 0.135 0.956 0.339 No DIF
ON
59 GEN -0.098 0.119 -0.821 0.412 No DIF
ON
60 GEN 0.054 0.118 0.457 0.647 No DIF
ON
61 GEN -0.045 0.149 -0.302 0.763 No DIF
ON
62 GEN 0.13 0.12 1.08 0.28 No DIF
ON
63 GEN 0.03 0.116 0.255 0.799 No DIF
ON
64 GEN -0.068 0.123 -0.549 0.583 No DIF
ON
65 GEN -0.237 0.126 -1.874 0.061 No DIF
ON
The results of the analysis in Table 1 shows the assessment of the EAT. Structural equation modeling
(SEM) with covariate was used. The analysis was done using MPLUS 7.4. The results show that item 36,
37 showed evidence of differential item functioning while there was no direct effect of the covariate on
the remaining items which shows that the items did not display DIF at 0.05 level of significant. Hence,
the two items that shows evidence of DIF were removed from the test.
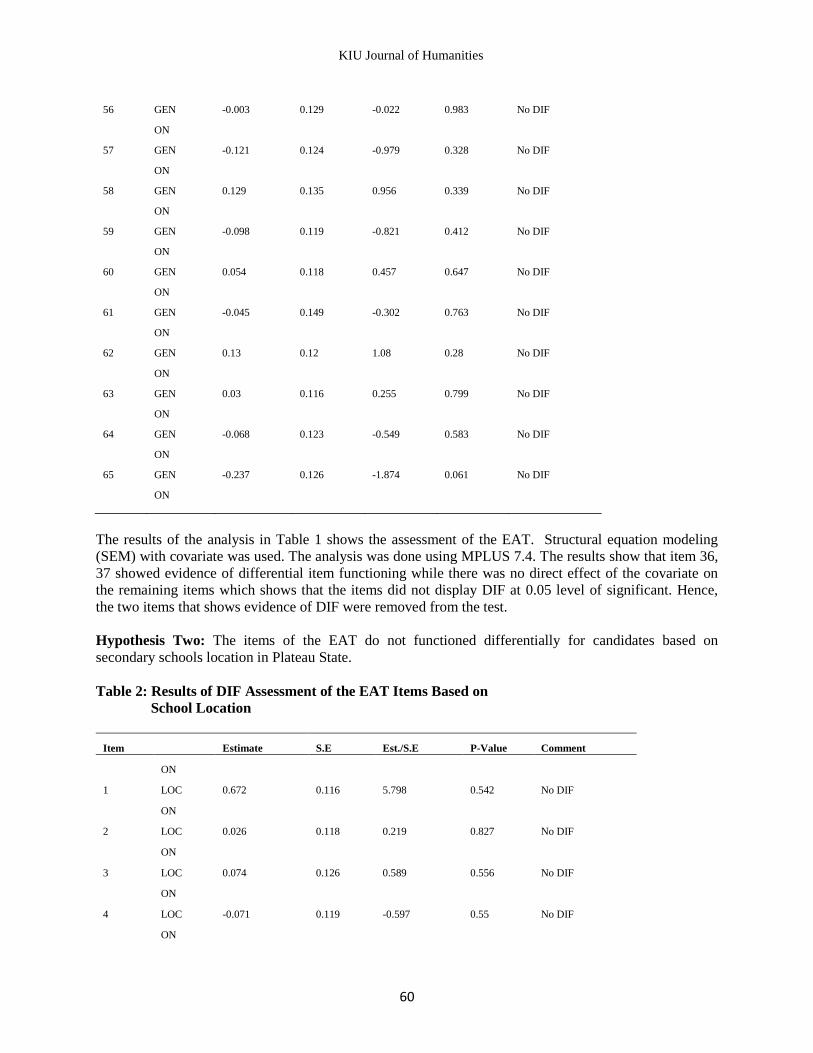
Hypothesis Two: The items of the EAT do not functioned differentially for candidates based on
secondary schools location in Plateau State.
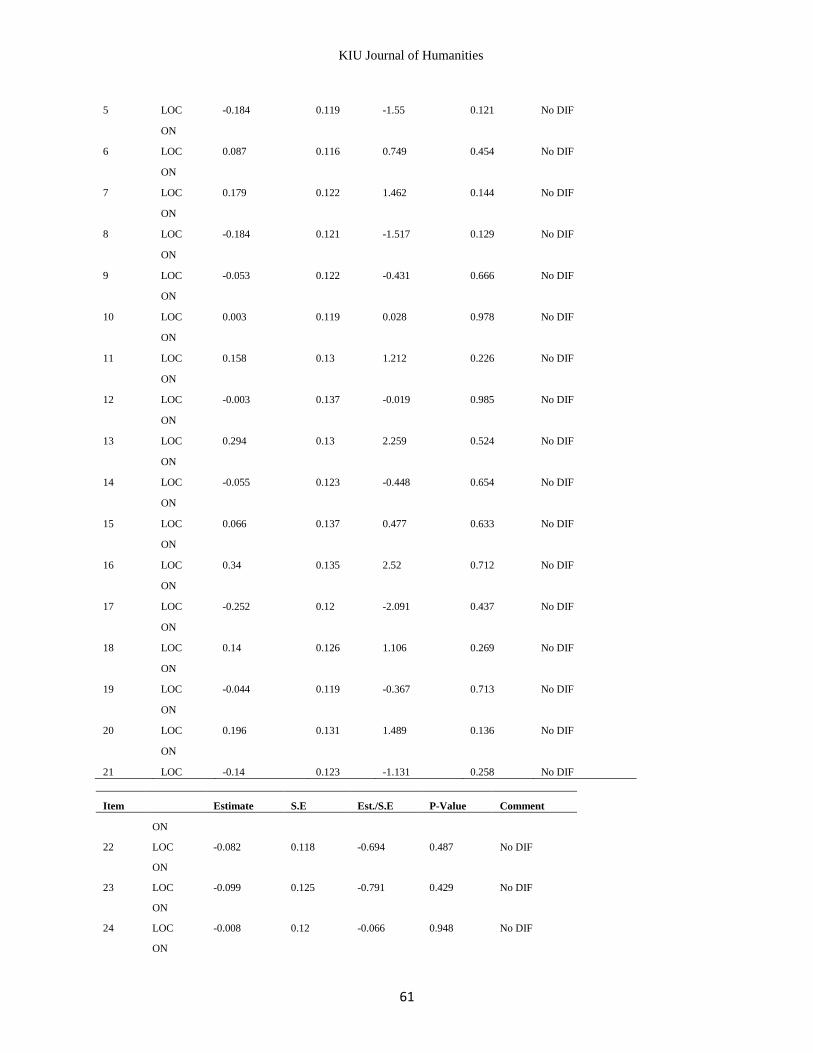
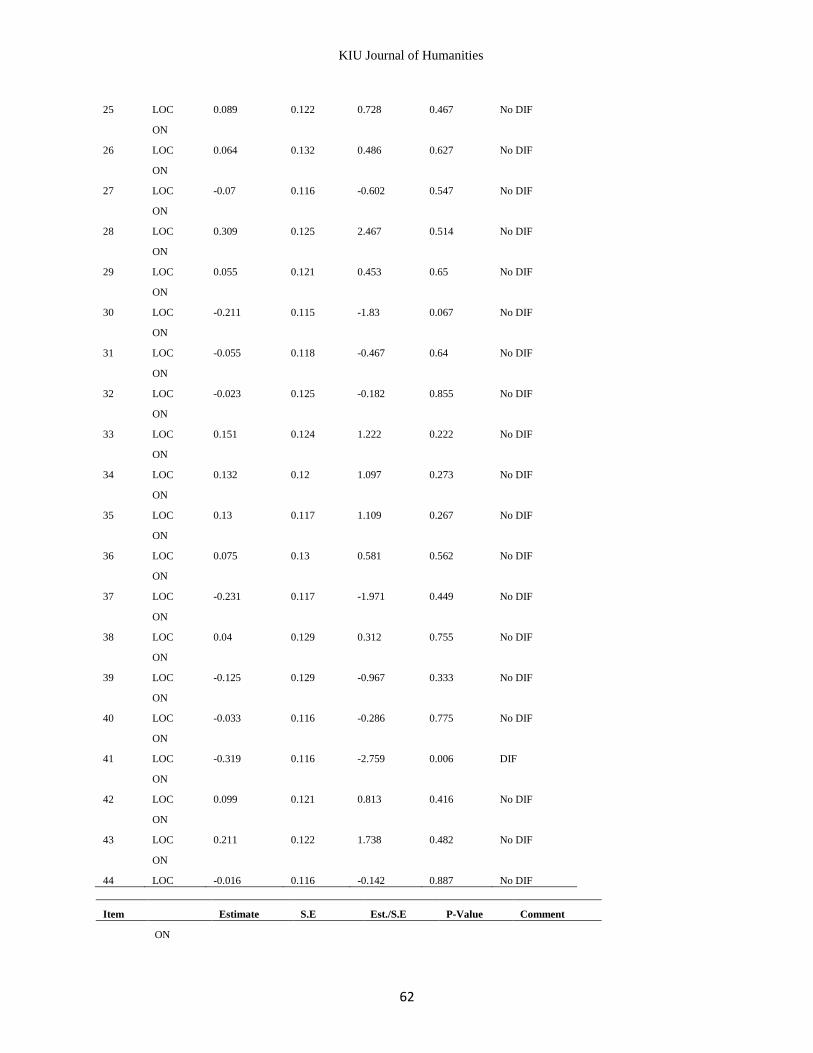
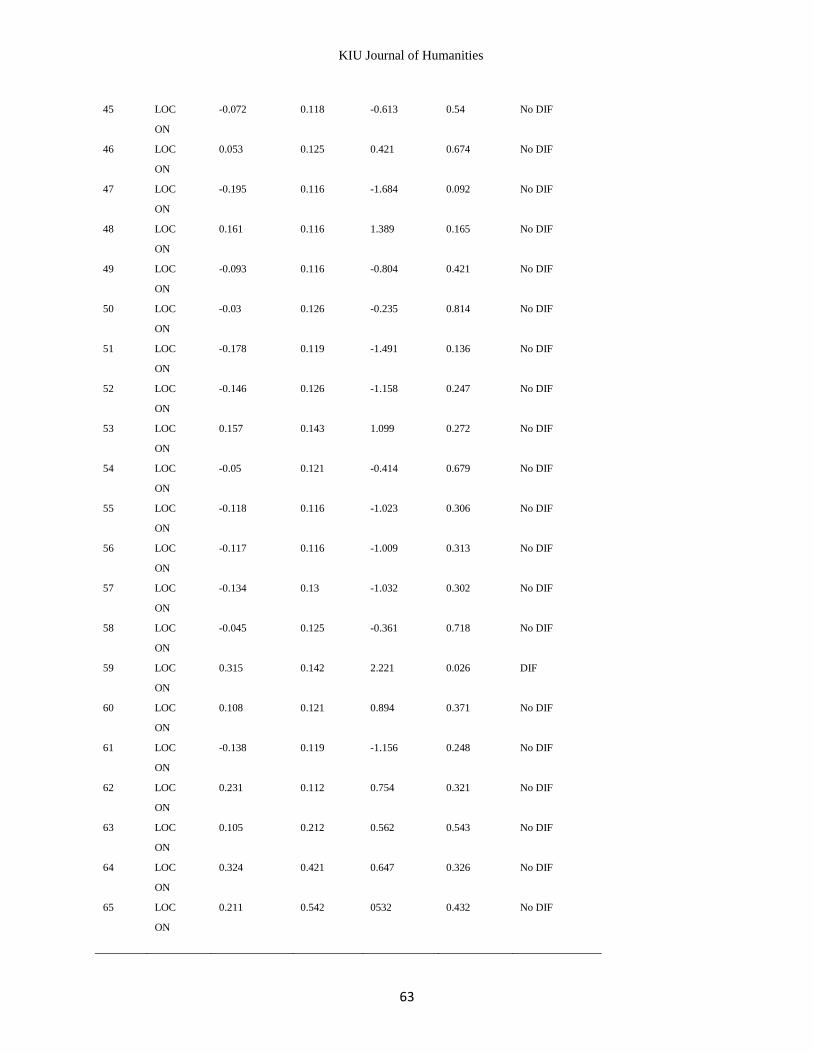
Table 2: Results of DIF Assessment of the EAT Items Based on
School Location
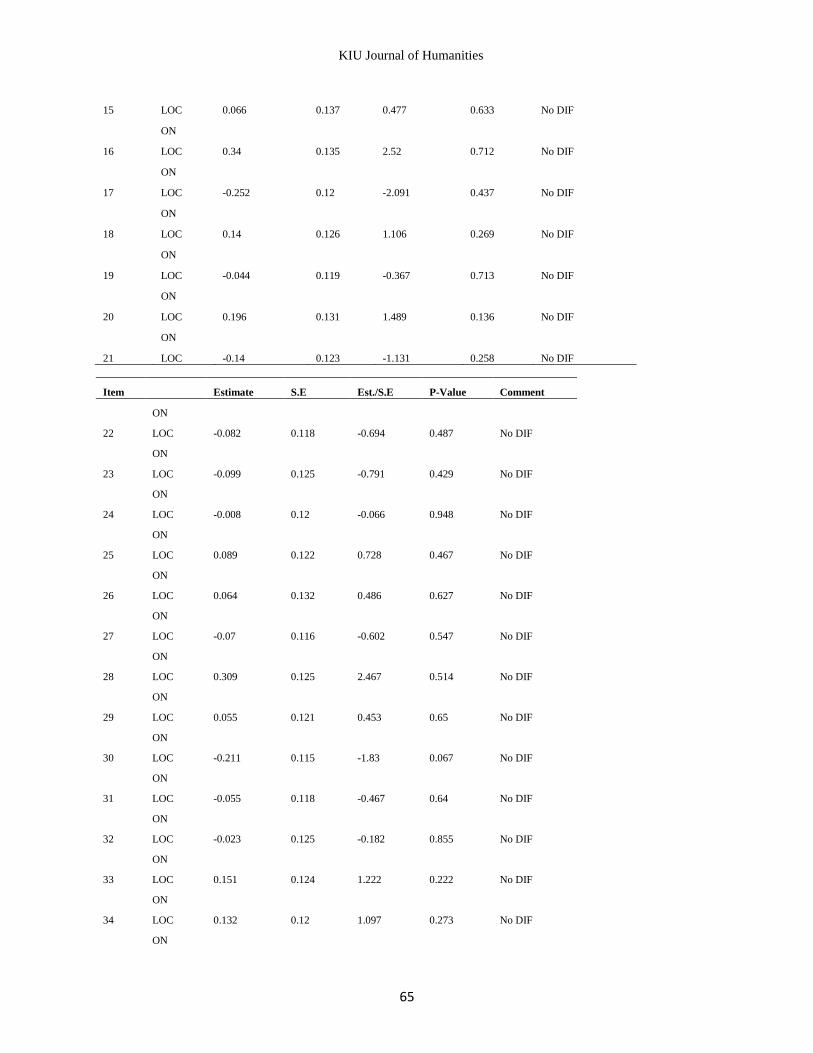
Item Estimate S.E Est./S.E P-Value Comment
ON
1 LOC 0.672 0.116 5.798 0.542 No DIF
ON
2 LOC 0.026 0.118 0.219 0.827 No DIF
ON
3 LOC 0.074 0.126 0.589 0.556 No DIF
ON
4 LOC -0.071 0.119 -0.597 0.55 No DIF
ON
KIU Journal of Humanities
61
5 LOC -0.184 0.119 -1.55 0.121 No DIF
ON
6 LOC 0.087 0.116 0.749 0.454 No DIF
ON
7 LOC 0.179 0.122 1.462 0.144 No DIF
ON
8 LOC -0.184 0.121 -1.517 0.129 No DIF
ON
9 LOC -0.053 0.122 -0.431 0.666 No DIF
ON
10 LOC 0.003 0.119 0.028 0.978 No DIF
ON
11 LOC 0.158 0.13 1.212 0.226 No DIF
ON
12 LOC -0.003 0.137 -0.019 0.985 No DIF
ON
13 LOC 0.294 0.13 2.259 0.524 No DIF
ON
14 LOC -0.055 0.123 -0.448 0.654 No DIF
ON
15 LOC 0.066 0.137 0.477 0.633 No DIF
ON
16 LOC 0.34 0.135 2.52 0.712 No DIF
ON
17 LOC -0.252 0.12 -2.091 0.437 No DIF
ON
18 LOC 0.14 0.126 1.106 0.269 No DIF
ON
19 LOC -0.044 0.119 -0.367 0.713 No DIF
ON
20 LOC 0.196 0.131 1.489 0.136 No DIF
ON
21 LOC -0.14 0.123 -1.131 0.258 No DIF
Item Estimate S.E Est./S.E P-Value Comment
ON
22 LOC -0.082 0.118 -0.694 0.487 No DIF
ON
23 LOC -0.099 0.125 -0.791 0.429 No DIF
ON
24 LOC -0.008 0.12 -0.066 0.948 No DIF
ON
KIU Journal of Humanities
62
25 LOC 0.089 0.122 0.728 0.467 No DIF
ON
26 LOC 0.064 0.132 0.486 0.627 No DIF
ON
27 LOC -0.07 0.116 -0.602 0.547 No DIF
ON
28 LOC 0.309 0.125 2.467 0.514 No DIF
ON
29 LOC 0.055 0.121 0.453 0.65 No DIF
ON
30 LOC -0.211 0.115 -1.83 0.067 No DIF
ON
31 LOC -0.055 0.118 -0.467 0.64 No DIF
ON
32 LOC -0.023 0.125 -0.182 0.855 No DIF
ON
33 LOC 0.151 0.124 1.222 0.222 No DIF
ON
34 LOC 0.132 0.12 1.097 0.273 No DIF
ON
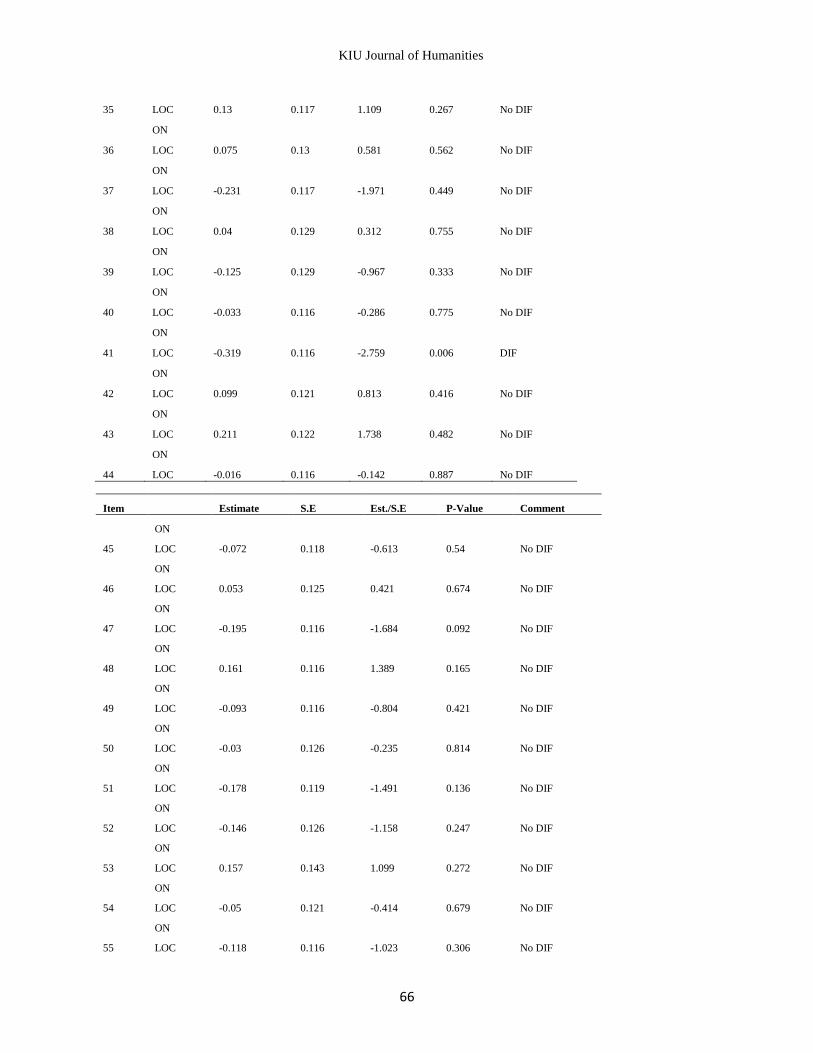
35 LOC 0.13 0.117 1.109 0.267 No DIF
ON
36 LOC 0.075 0.13 0.581 0.562 No DIF
ON
37 LOC -0.231 0.117 -1.971 0.449 No DIF
ON
38 LOC 0.04 0.129 0.312 0.755 No DIF
ON
39 LOC -0.125 0.129 -0.967 0.333 No DIF
ON
40 LOC -0.033 0.116 -0.286 0.775 No DIF
ON
41 LOC -0.319 0.116 -2.759 0.006 DIF
ON
42 LOC 0.099 0.121 0.813 0.416 No DIF
ON
43 LOC 0.211 0.122 1.738 0.482 No DIF
ON
44 LOC -0.016 0.116 -0.142 0.887 No DIF
Item Estimate S.E Est./S.E P-Value Comment
ON
KIU Journal of Humanities
63
45 LOC -0.072 0.118 -0.613 0.54 No DIF
ON
46 LOC 0.053 0.125 0.421 0.674 No DIF
ON
47 LOC -0.195 0.116 -1.684 0.092 No DIF
ON
48 LOC 0.161 0.116 1.389 0.165 No DIF
ON
49 LOC -0.093 0.116 -0.804 0.421 No DIF
ON
50 LOC -0.03 0.126 -0.235 0.814 No DIF
ON
51 LOC -0.178 0.119 -1.491 0.136 No DIF
ON
52 LOC -0.146 0.126 -1.158 0.247 No DIF
ON
53 LOC 0.157 0.143 1.099 0.272 No DIF
ON
54 LOC -0.05 0.121 -0.414 0.679 No DIF
ON
55 LOC -0.118 0.116 -1.023 0.306 No DIF
ON
56 LOC -0.117 0.116 -1.009 0.313 No DIF
ON
57 LOC -0.134 0.13 -1.032 0.302 No DIF
ON
58 LOC -0.045 0.125 -0.361 0.718 No DIF
ON
59 LOC 0.315 0.142 2.221 0.026 DIF
ON
60 LOC 0.108 0.121 0.894 0.371 No DIF
ON
61 LOC -0.138 0.119 -1.156 0.248 No DIF
ON
62 LOC 0.231 0.112 0.754 0.321 No DIF
ON
63 LOC 0.105 0.212 0.562 0.543 No DIF
ON
64 LOC 0.324 0.421 0.647 0.326 No DIF
ON
65 LOC 0.211 0.542 0532 0.432 No DIF
ON
KIU Journal of Humanities
64
The results of the analysis in Table 2 shows the assessment of the EAT. Structural equation modelling
(SEM) with covariate was used to assess DIF of the items based on school location at 0.05 level of
significance. The result shows that item 41and 59 shows evidence of differential item functioning based
on school location and there was no significant direct effect of the covariate on the remaining items
which means that the remaining items did not display DIF based on school location. The items that show
evidences of DIF were removed from the test.
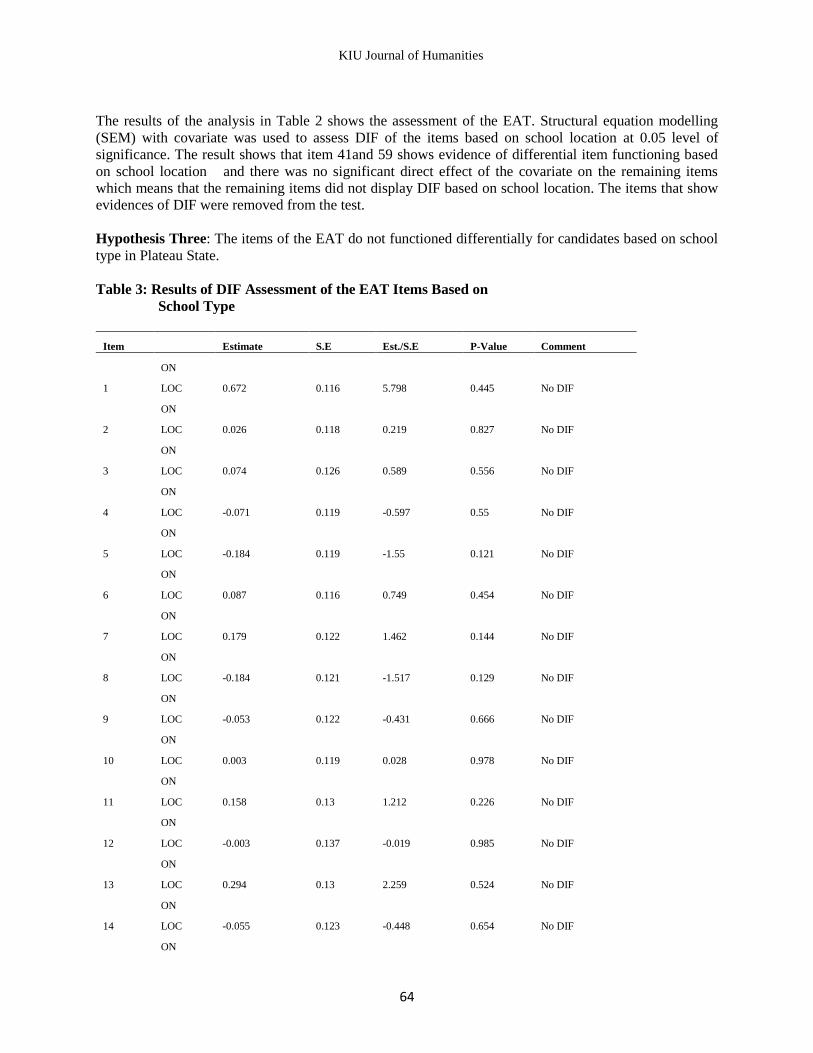
Hypothesis Three: The items of the EAT do not functioned differentially for candidates based on school
type in Plateau State.
Table 3: Results of DIF Assessment of the EAT Items Based on
School Type
Item Estimate S.E Est./S.E P-Value Comment
ON
1 LOC 0.672 0.116 5.798 0.445 No DIF
ON
2 LOC 0.026 0.118 0.219 0.827 No DIF
ON
3 LOC 0.074 0.126 0.589 0.556 No DIF
ON
4 LOC -0.071 0.119 -0.597 0.55 No DIF
ON
5 LOC -0.184 0.119 -1.55 0.121 No DIF
ON
6 LOC 0.087 0.116 0.749 0.454 No DIF
ON
7 LOC 0.179 0.122 1.462 0.144 No DIF
ON
8 LOC -0.184 0.121 -1.517 0.129 No DIF
ON
9 LOC -0.053 0.122 -0.431 0.666 No DIF
ON
10 LOC 0.003 0.119 0.028 0.978 No DIF
ON
11 LOC 0.158 0.13 1.212 0.226 No DIF
ON
12 LOC -0.003 0.137 -0.019 0.985 No DIF
ON
13 LOC 0.294 0.13 2.259 0.524 No DIF
ON
14 LOC -0.055 0.123 -0.448 0.654 No DIF
ON
KIU Journal of Humanities
65
15 LOC 0.066 0.137 0.477 0.633 No DIF
ON
16 LOC 0.34 0.135 2.52 0.712 No DIF
ON
17 LOC -0.252 0.12 -2.091 0.437 No DIF
ON
18 LOC 0.14 0.126 1.106 0.269 No DIF
ON
19 LOC -0.044 0.119 -0.367 0.713 No DIF
ON
20 LOC 0.196 0.131 1.489 0.136 No DIF
ON
21 LOC -0.14 0.123 -1.131 0.258 No DIF
Item Estimate S.E Est./S.E P-Value Comment
ON
22 LOC -0.082 0.118 -0.694 0.487 No DIF
ON
23 LOC -0.099 0.125 -0.791 0.429 No DIF
ON
24 LOC -0.008 0.12 -0.066 0.948 No DIF
ON
25 LOC 0.089 0.122 0.728 0.467 No DIF
ON
26 LOC 0.064 0.132 0.486 0.627 No DIF
ON
27 LOC -0.07 0.116 -0.602 0.547 No DIF
ON
28 LOC 0.309 0.125 2.467 0.514 No DIF
ON
29 LOC 0.055 0.121 0.453 0.65 No DIF
ON
30 LOC -0.211 0.115 -1.83 0.067 No DIF
ON
31 LOC -0.055 0.118 -0.467 0.64 No DIF
ON
32 LOC -0.023 0.125 -0.182 0.855 No DIF
ON
33 LOC 0.151 0.124 1.222 0.222 No DIF
ON
34 LOC 0.132 0.12 1.097 0.273 No DIF
ON
KIU Journal of Humanities
66
35 LOC 0.13 0.117 1.109 0.267 No DIF
ON
36 LOC 0.075 0.13 0.581 0.562 No DIF
ON
37 LOC -0.231 0.117 -1.971 0.449 No DIF
ON
38 LOC 0.04 0.129 0.312 0.755 No DIF
ON
39 LOC -0.125 0.129 -0.967 0.333 No DIF
ON
40 LOC -0.033 0.116 -0.286 0.775 No DIF
ON
41 LOC -0.319 0.116 -2.759 0.006 DIF
ON
42 LOC 0.099 0.121 0.813 0.416 No DIF
ON
43 LOC 0.211 0.122 1.738 0.482 No DIF
ON
44 LOC -0.016 0.116 -0.142 0.887 No DIF
Item Estimate S.E Est./S.E P-Value Comment
ON
45 LOC -0.072 0.118 -0.613 0.54 No DIF
ON
46 LOC 0.053 0.125 0.421 0.674 No DIF
ON
47 LOC -0.195 0.116 -1.684 0.092 No DIF
ON
48 LOC 0.161 0.116 1.389 0.165 No DIF
ON
49 LOC -0.093 0.116 -0.804 0.421 No DIF
ON
50 LOC -0.03 0.126 -0.235 0.814 No DIF
ON
51 LOC -0.178 0.119 -1.491 0.136 No DIF
ON
52 LOC -0.146 0.126 -1.158 0.247 No DIF
ON
53 LOC 0.157 0.143 1.099 0.272 No DIF
ON
54 LOC -0.05 0.121 -0.414 0.679 No DIF
ON
55 LOC -0.118 0.116 -1.023 0.306 No DIF
KIU Journal of Humanities
67
ON
56 LOC -0.117 0.116 -1.009 0.313 No DIF
ON
57 LOC -0.134 0.13 -1.032 0.302 No DIF
ON
58 LOC -0.045 0.125 -0.361 0.718 No DIF
ON
59 LOC 0.315 0.142 2.221 0.026 DIF
ON
60 LOC 0.108 0.121 0.894 0.371 No DIF
ON
61 LOC -0.138 0.119 -1.156 0.248 No DIF
ON
62 LOC 0.233 0.432 0.512 0.543 No DIF
ON
63 LOC 0.211 0.115 0.006 0.063
No DIF
No DIF
64 LOC 0.332 0.117 0.100 0.526 No DIF
65 LOC 0.245 0.302 0.435 0.534 No DIF
The result of the analysis in Table 3 shows the
assessment of the EAT. Structural equation
modelling (SEM) with covariate was used to
assess DIF based on school type at 0.05 level of
significance. The results showed that items 41
and 59 show evidence of DIF based on school
type because the items had p-value that is less
than 0.05 at o.05 level of significance and there
was no significant direct effect of the covariate
on the remaining items which means that the
other items did not display DIF because the
items had p-value that is equal or higher than
0.05.
4. Discussion of Findings
The need for teachers to use test items that do
not function differently for testees of the same
ability is an important component in teaching
and learning. The results of the analysis showed
that the EAT data had three Eigen value that
were respectively greater than the Eigen value of
the mean at 95th percentile of the randomly
general data. This result showed that there were
three dimensions or trait underlying EAT.
Therefore multidimensional procedure was used
in calibrating the test item. This is in agreement
with the findings by Ackerman (2013) that a test
that has more than one dimension should be
calibrated using multidimensional method of
analysis. Structure equation modelling with
covariate was used to test for differential item
functioning of the EAT. The findings shows that
items 36 and 37 showed evidence of DIF based
on students’ gender at 0.05 level of significance
this findings is in conformity with the findings
by Abedalaziz (2009), Madu (2012) and
Ogbebor and Onuka (2013) who find that there
was the presence of DIF in WAEC questions
that were used in conducting certificate
examination of students in 2010 based on
students gender but the findings is contrary to
the study conducted by Ndifon (2014) and
Adedoyin and Makabi (2014) who found that
there was no evidence of DIF in junior
secondary school certificate mathematics
examination in southern educational zones,
Cross River State. The findings further showed
that item 41 and 59 showed evidence of DIF
based on school type at 0.05 level of
significance. The findings is in agreement with
the findings of Ajeigbe and Afolabi (2014) who
found that test items for qualifying examination
KIU Journal of Humanities
68
for senior secondary school students in Osun
State and junior secondary school certificate
mathematics examination in southern
educational zone of Cross River State function
differently for students who had the same ability
but who were differentiated based on school
type at 0.05 level of significance.
The findings further show that item 41 and 59
show evidence of DIF based on school location
because the items had p-value that is less than
0.05 at 0.05 level of significance. This also
confirm the findings by Madu (2014) who found
that mathematics test items used in conducting
WAECSSEE were found to display evidence of
differential item functioning with respect to
school location.
5. Conclusion
Based on the findings of the study, it was
concluded that teachers need to determine the
differential item functioning of test items before
using the test items in examining students. This
is to avoid using items that functioned
differently for testees of the same ability but
who are classified based on gender school type
and school location.
6. Recommendations
Based on the findings of the study, the following
recommendations are made:
- Teachers should investigate for DIF of
test items before using the test items in
conducting continuous assessment of
students in schools.
- Software for DIF should be made
available to teachers to enable the
teachers use the software in detecting
items that functioned differently for
testees from different background.
- Teachers should be trained on how to
determine differential item functioning
of test items that are developed by the
teachers.
- Teachers should be sensitized on the
need to know that test that are developed
for use in conducting continuous
assessment of students could be
multidimensional or unidimensional in
nature.
References
Abedelaziz, N. (2009). A gender-related
differential item functioning
Mathematics test items. Retrieved 19
May 2017 from:
http://www/researchgate.net/.126688//.
Ackerman, T. A. (2012). Using
Multidimensional Item Response
Theory to evaluate educational test.
Journal of Applied and Educational
Measurement, 8(17), 255-278.
Ajeigbe, T. O., & Afolabi, E. F. (2014).
Assessing unidimentionality and
differential item functioning in
Qualifying Examinations for Senior
Secondary School Students, Osun State,
Nigeria. World Journal of Education,
4(4), 23 – 34. Retrieved 16 November
2017 from: www.sciedu.ca/wje.world
Journal of Education.
Amuche, C. I., & Fan, A. F. (2016). An
Assessment of item bias using
differential item functioning technique
in NECO biology conducted
examination in Taraba State Nigeria.
American International Journal of
Research in Humanities, Arts and Social
Science, ISSN (print), 2328 – 3734.
Bolarinwa, A., Hammed, B., & Barrah, J.
(2013). Empirical Analysis on Gender
Disparity towards their Performance in
Business Mathematics Examination in
Tertiary Institutions in Lagos. Retrieved
16 March 2016 from:
www.voced.edu.au/...Ngv%3A52627.
Ebesine, S. S. (2016). Culture and differential
item functioning in National
Examination Council Senior School
Certificates Mathematics Multiple-
Choice Test in Nigeria. International
Journal of Scientific Research, 9(1), 29
– 40
Enetairo, B., & Akorede, F. S. (2010).
Differential items functioning
techniques for detection of items bias in
economics among secondary schools
students in Abuja metropolis. Nigerian
KIU Journal of Humanities
69
Journal of Educational Research and
Evaluation, 9(1), 29 – 40.
Esomonu, N. P. (2002). Assessment of One-
Cognitive Behaviours in Secondary
Schools for National Development. In
R.C. Ebenebe, & Akudolu L.R. (Eds.)
Education for National Development
and Integration (pp.78 –100). Awka:
John Best Publishers.
Khairani, .Z. A., & Nordin, M. S. (2011). The
Development and Construct Validation
of Mathematics Proficiency test for 14-
year-old students. Asia Pacific Journal
of Educators and Education, 26(1), 33 –
50
Madu, B. C. (2012) using transformed item
difficulty procedure to assess gender
related differential item functioning of
multiple-choice mathematics items
administered in Nigeria. Journal of
Humanities and Social Science, 2 (6), 22
– 34
Nhuan, L. V. (2016). Differential item
functioning on the NEL: 88 history
achievement test. Retrieved 16 March
2017 from:
crest.org/wp.content/…/TECH5112.pdf.
Nwana, O. C. (2007). Introduction to
Educational Research. Ibadan: HEBN
Publishers Plc.
Obinne, A. D., & Amali, A. O. (2014).
Differential item functioning: The
Implication for Educational Testing in
Nigeria. International Review of Social
Science and Humanities, 7(1), 52 – 65.
Oderinde, O. (2016). Effect of School Variables
on Students’ Academic Performance in
Calabar Municipal Area of Cross River
State. Retrieved 15 June 2017 from: file:
http//www.
Ogbebor, U., & Onuka, A. (2013). Differential
item functioning method as an item bias
indicator. International Journal
Research, 4(4), 367 – 373.
Okon, C. E., & Archibong, U. I. (2015). School
Type and Students’ Academic
Performance in Social Studies in Junior
Secondary Certificate Examination
JSCE. Academic Journal of
Interdisciplinary Studies, 4 (2), 24 – 35.
Publishing Rome Italy.
Olubunmi, A. G. (2016). The Impact of School
Type, School Population and Socio-
Economics Status of Students’ Academic
Performance. Retrieved 19 November,
2017 from: www.covenanun
iversity.edu.ng.