demographic and socio-economic analysis - cganga
TRANSCRIPT

Report Coad: 048_GBP_IIT_SEC_ANL_10_Ver 1_Dec 2013
Demographic and Socio-Economic
Analysis in Lower Ganga Basin
GRBMP: Ganga River Basin Management Plan
by
IIT
Bombay
IIT
Delhi
IIT
Guwahati
IIT
Kanpur
IIT
Kharagpur
IIT
Madras
IIT
Roorkee
Indian Institutes of Technology

Report Code: 048_GBP_IIT_SEC_ANL_10_Ver 1_Dec 2013
2 | P a g e

Report Code: 048_GBP_IIT_SEC_ANL_10_Ver 1_Dec 2013
3 | P a g e
Preface
In exercise of the powers conferred by sub-sections (1) and (3) of Section 3 of the Environment
(Protection) Act, 1986 (29 of 1986), the Central Government has constituted National Ganga River
Basin Authority (NGRBA) as a planning, financing, monitoring and coordinating authority for
strengthening the collective efforts of the Central and State Government for effective abatement
of pollution and conservation of the river Ganga. One of the important functions of the NGRBA is to
prepare and implement a Ganga River Basin Management Plan (GRBMP).
A Consortium of 7 Indian Institute of Technology (IIT) has been given the responsibility of preparing
Ganga River Basin Management Plan (GRBMP) by the Ministry of Environment and Forests (MoEF),
GOI, New Delhi. Memorandum of Agreement (MoA) has been signed between 7 IITs (Bombay,
Delhi, Guwahati, Kanpur, Kharagpur, Madras and Roorkee) and MoEF for this purpose on July 6,
2010.
This report is one of the many reports prepared by IITs to describe the strategy, information,
methodology, analysis and suggestions and recommendations in developing Ganga River Basin
Management Plan (GRBMP). The overall Framework for documentation of GRBMP and Indexing of
Reports is presented on the inside cover page.
There are two aspects to the development of GRBMP. Dedicated people spent hours discussing
concerns, issues and potential solutions to problems. This dedication leads to the preparation of
reports that hope to articulate the outcome of the dialogue in a way that is useful. Many people
contributed to the preparation of this report directly or indirectly. This report is therefore truly a
collective effort that reflects the cooperation of many, particularly those who are members of the
IIT Team. A list of persons who have contributed directly and names of those who have taken lead
in preparing this report is given on the reverse side.
Dr Vinod Tare
Professor and Coordinator
Development of GRBMP
IITKanpur

Report Code: 048_GBP_IIT_SEC_ANL_10_Ver 1_Dec 2013
4 | P a g e
The Team 1. D K Nauriyal, IIT Roorkee [email protected] 2. N C Nayak, IIT Kharagpur [email protected] 3. P M Prasad, IIT Kanpur [email protected], [email protected] 4. Pulak Mishra, IIT Kharagpur [email protected] 5. Pushpa Trivedi, IIT Bombay [email protected] 6. Rajat Agrawal, IIT Roorkee [email protected] 7. S P Singh, IIT Roorkee [email protected] 8. Seema Sharma, IIT Delhi [email protected] 9. V B Upadhyay, IIT Delhi [email protected] 10. Vinay Sharma, IIT Roorkee [email protected] 11. C Kumar, IIT Roorkee [email protected]
Authors
Seema Sharma [email protected]
V Upadhyay [email protected]

Report Code: 048_GBP_IIT_SEC_ANL_10_Ver 1_Dec 2013
5 | P a g e
Contents S No
Page
No.
1 Introduction 7
2 Lower Ganga Basin: State of Bihar 8
3 Demographic Characteristics 9
3.1 Trends in Population Growth 9
3.2 Trends in Natural Growth Rate 11
3.3 Distribution of Population 12
3.4 Population Concentration 13
3.5 Population Composition 14
4 Economic Indicators 17
4.1 Gross State Domestic Product 17
4.2 Per Capita Gross Domestic Product 19
4.3 Sectoral Composition of GSDP 20
4.4 Trends in Occupational Structure 23
4.5 Population Below Poverty Line 26
4.6 Trends and Pattern in Banking 28
5 Social and Health Components 33
5.1 Literacy 33
5.2 Education 35
5.3 Drinking Water and Sanitation 37
5.4 Health Indicators 39
6 Conclusions and Policy Implications 41
References 43
Appendix 44

Report Code: 048_GBP_IIT_SEC_ANL_10_Ver 1_Dec 2013
6 | P a g e

Report Code: 048_GBP_IIT_SEC_ANL_10_Ver 1_Dec 2013
7 | P a g e
1. Introduction The Ganga Basin constitutes 26 percent of the country's land mass and supports about 43 percent
of population (448.3 million as per 2001 census).Livelihoods of a large number of people directly or
indirectly depend on the resources of the river Ganga. In the backdrop of a very intense and
perennial interrelationship between the river Ganga and its population base, it is important to
dissect the components of population living in Ganga basin, their pattern of growth, composition,
concentration, level of education, economic activities, health constraints etc. in order to prepare a
holistic GRBMP.
There are many links between population growth and environmental degradation, in part, because
an ever-increasing number of people depend on a fixed natural resource base for their livelihood.
Demographic influences are one of many factors that affect water resource management and
increase pressure on the water resource base.
For the effective and sustainable management of the basin, an understanding of growth and
composition of population, sectoral composition of workforce, change in land use patterns,
settlement patterns, health indicators livelihood patterns and their possible impact on the river
water resources, inter alia, is imperative. Management of the basin is required to be viewed as a
part of the broader environment and in relation to socio-economic demands and potentials,
acknowledging the political and cultural context, as water is not only an economic resource but also
a socio-cultural and environmental resource. Keeping these aspects in view, this report
concentrates on the pattern of demographic and socio-economic status of people in the basin area
and its implications for the river basin management. A comprehensive report based on the
demographic and socio-economic status of population in the basin area is divided into four parts as
per the location of the river Ganga and the administrative setup. These are namely, pattern of
demographic and socio-economic status of people in the Upper Ganga Basin (Uttarakhand), Middle
Ganga Basin (Uttar Pradesh), and Lower Ganga Basin comprising separately for the states of Bihar
and West Bengal respectively. This part of the report corresponds to the Lower Ganga Basin and
discuses the pattern of demographic and socio-economic status of people in the state of Bihar.
The specific objectives of this report are as follows:
1. To conduct the demographic and socio-economic analysis of the Ganga Basin.
2. To study the implications of demographic and socio-economic trends in Bihar for the Ganga
Basin.
The data sources, figures and facts documented and analyzed in the report are based on secondary
data retrieved from various issues of Economic Survey reports, published by the Finance
Department of Bihar, Statistical Handbook of Bihar published by the Directorate Of Economics &
Statistics,
The Ganga river basin area (as the term used in the report) is limited to four states i.e. Uttarakhand, Uttar Pradesh, Bihar, and West Bengal for the study purpose, as most of the activities related to the river Ganga are performed widely in these states.

Report Code: 048_GBP_IIT_SEC_ANL_10_Ver 1_Dec 2013
8 | P a g e
Department of Planning & Development, Bihar, Patna, Annual Health Survey 2010 and the Census
data published by Government of India, 2001 and also including the recent Census 2011 data.
This study deals with the overall socio-economic development of Bihar. The crucial indicators for the
study of socio-economic development have been identified and a thorough study of their changing
trends over the years has been done followed by graphical presentations of the indicators. The
analysis has been done at two levels viz., the state level and the district level. Further, on the basis
of their proximity to River Ganga, the districts have been divided, into two categories viz. ‘bank
districts’ and ‘non-bank districts’. The analysis focuses on the post-bifurcation period of Bihar i.e.
from year 2000 and onwards. However, it may be noted that the analysis is limited to the availability
of data for the select variables from 2000 to 2011. All the district level information is presented in
tabular form in the Appendix attached to this report.
2. Lower Ganga Basin: State of Bihar
Bihar occupies a significant place in the history of India for being the birth place of religions like
Jainism and Buddhism. It is located between 21°-58'-10" N ~ 27°-31'-15" N latitude and between
82°-19'-50" E ~ 88°-17'-40" E longitude. Bihar is one of the oldest occupied places in the world, with
a history spanning 3,000 years. There are numerous monuments spread throughout the state which
depict the rich culture and heritage. Bihar is also known as the land of Nirvana. It witnessed the
evolution of both the Buddha and the 24 Jain Tirthankaras. In Indian history, Bihar has seen the rise
and fall of major empires. It has many tourist destinations, especially pilgrim centers like Patna,
Bodhgaya, Rajgir, Vaishali and ruins of the world famous ancient university of Nalanda.
Bihar is situated in the eastern part of India. The city of Patna which is located on the banks of the
holy Ganga, is the capital of Bihar. Bihar is the ninth largest state of India in terms of area (94,163
sq. km) and the third largest in terms of population (10.38 crores) in the country (Census of India,
2011). Bihar is bordered by Nepal in the north, West Bengal in the east, Uttar Pradesh in the west
and Jharkhand in the south. The Bihar plain is divided into two parts by the river Ganga, which flows
through the middle from west to east. The state has some of the most fertile lands of India. Central
Bihar, south of the Ganga, is a region with rich agricultural resources. Most of North and Central
Bihar is a plain.
Bihar falls in the Lower Gangetic plains. As per Planning Commission classification the state is
divided into three geographic regions i.e. North Bihar Plains, South Bihar Plains and part of the
Chhotanagpur Plateau. Approximately 76 percent of North Bihar Plains and 53 percent of South
Bihar Plains are flood-prone while regions falling under Chhotanagpur Plateau are drought prone
(Tankha,2009).
Bihar has 38 districts and 9 sub-divisions and these are shown in the map presented in Figure 1..
The state is well linked by roads, state highways, national highways, rural and district roads. The
state has fairly good railway network connecting to almost all cities in India. There are airports at
Data for Arwal district was unavailable for some variables as it was created in Sept.2001

Report Code: 048_GBP_IIT_SEC_ANL_10_Ver 1_Dec 2013
9 | P a g e
Patna and Gaya besides landing grounds in all major districts of the state. After the division of Bihar
in the year 2000, most of the industries were left in mineral-rich Jharkhand. The state retained
almost 75 percent of the population, while it was left with only 54 percent of the land (Government
of India and Government of Bihar, 2007).
INSTEAD OF THIS MAP, BETTER IF WE PRESENT A PHYSIOGRAPHIC MAP SHOWING THE GANGA
AND OTHER FEATURES.
Figure 1: Map of Bihar Note: Red marks indicate that the district is situated along river Ganga (bank districts).
Source: Developed from the map available at www.mapsofindia.com
From human and economic development perspective, Bihar lags behind other states in India. In
terms of human development index, Bihar is at the lowest position amongst all Indian states. The
state is ranked as the 7th poorest state with 42.56 percent of population below poverty line
(Economic Survey Report, Government of Bihar, 2010-11). The total literacy rate of 64 percent for
the state is much below the national rate of 74 percent. Overall male and female literacy rates in
2011 were 73 percent and 53 percent respectively (Census Data 2011). Other demographic
indicators like high birth rate and population growth rate are discussed later in the report.
3. Demographic Characteristics 3.1. Trends in Population Growth Demography is the study of various characteristics of human populations, such as size, growth
density, birth rate, sex ratio, etc. Demographic analysis provides insights into the links between
these characteristics and the cultural, economic, geographic and other social attributes present in a
given area.
Report Code: 048_GBP_IIT_SEC_ANL_10_Ver 1_Dec 2013
10 | P a g e
According to Census 2001, Bihar has a population density of 880 persons per sq. km, with 14 of its
38 districts having population densities higher than 1000 persons per sq. km. More than 90 percent
of the people in 25 out of the 38 districts of Bihar lives in rural areas, making the state the least
urbanized among all the major states in India. The population of Bihar has increased from about 82
million in 2001 to 104 million in 2011.
Table 1 shows an increasing trend in population of Bihar for the period 2001 to 2011. The
population increased from 83 million in 2001 to 104 million in 2011. The decadal growth rate of
populations however has fallen from 28% during 1991-01 to 25% during 2001-11.
Table 1: Population of Bihar (2001-2011)
Year Total
Population
Decadal growth
rate, %
2001 82,998,509 28.43
2011 103,804,637 25.1
Source: Census of India 2001-2011
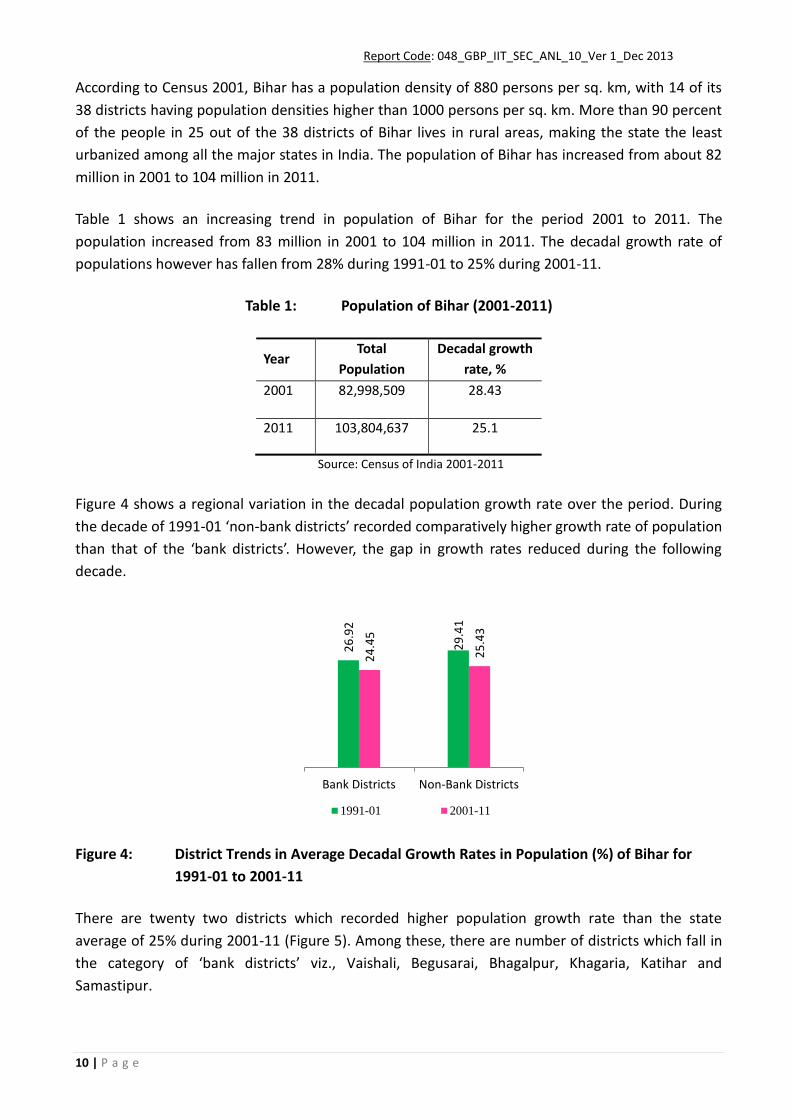
Figure 4 shows a regional variation in the decadal population growth rate over the period. During
the decade of 1991-01 ‘non-bank districts’ recorded comparatively higher growth rate of population
than that of the ‘bank districts’. However, the gap in growth rates reduced during the following
decade.
Figure 4: District Trends in Average Decadal Growth Rates in Population (%) of Bihar for
1991-01 to 2001-11
There are twenty two districts which recorded higher population growth rate than the state
average of 25% during 2001-11 (Figure 5). Among these, there are number of districts which fall in
the category of ‘bank districts’ viz., Vaishali, Begusarai, Bhagalpur, Khagaria, Katihar and
Samastipur.
26
.92
29
.41
24
.45
25
.43
Bank Districts Non-Bank Districts
1991-01 2001-11

Report Code: 048_GBP_IIT_SEC_ANL_10_Ver 1_Dec 2013
11 | P a g e
Figure 5: Decadal Population Growth Rate (%) across Districts of Bihar, 2001-11
3.2. Trends in Natural Growth Rate Birth rate indicates the number of live births per 1,000 population in a reference period.
Subtracting the death rate from the birth rate provides the rate of natural increase, which is equal
to the rate of population change in the absence of migration. As shown in Figure 6, it is interesting
to note that while the birth rate was showing declining trend, the death rate in the state fluctuated
from 2000 till 2006 and then declined subsequently. This is reflected in the declining trend with the
same pace for the natural growth rate ranging between 23 and 19 per 1000 population during
2000-2010. Since 2000-2002, the natural growth rate of population in the state was almost stable
at 23 per 1000 population. It indicates that the consequent decline in natural growth rate since
2003 must have manifested into a sharp decline in the decadal growth rate during 2001-11.
Figure 6: Birth, Death, and Natural Growth Rate (per 1000 population), Bihar, 2000-2010 (Source: The data was obtained from Bihar Statistical Handbook 2012 for the state of Bihar)
31.9 31.2 30.9 30.7 30.2 30.4 29.9 29.4 28.9 28.5 28.1
8.8 8.2 7.9 7.9 8.1 8.1 7.7 7.5 7.3 7 6.8
23.1 23 23 22.8 22.1 22.3 22.2 21.9 21.6 21.5 21.3
0
5
10
15
20
25
30
35
Rat
e (p
er 1
00
0 p
op
ula
tio
n)
Birth Rate
Death Rate
Report Code: 048_GBP_IIT_SEC_ANL_10_Ver 1_Dec 2013
12 | P a g e
Figure 7 presents the birth, death, and the natural growth rates across the bank districts and non-
bank districts of Bihar. Information on district wise birth and death rates were made available in
Annual Heath Survey, 2010. During 2010-11, there was hardly any remarkable difference in
indicators across the districts. However, the non-bank districts accounted for the highest birth and
the death rates and accordingly the natural growth rates.
Figure 7: Birth, Death, and Natural Growth Rate (per 1000 population) across Districts of
Bihar, 2010-11
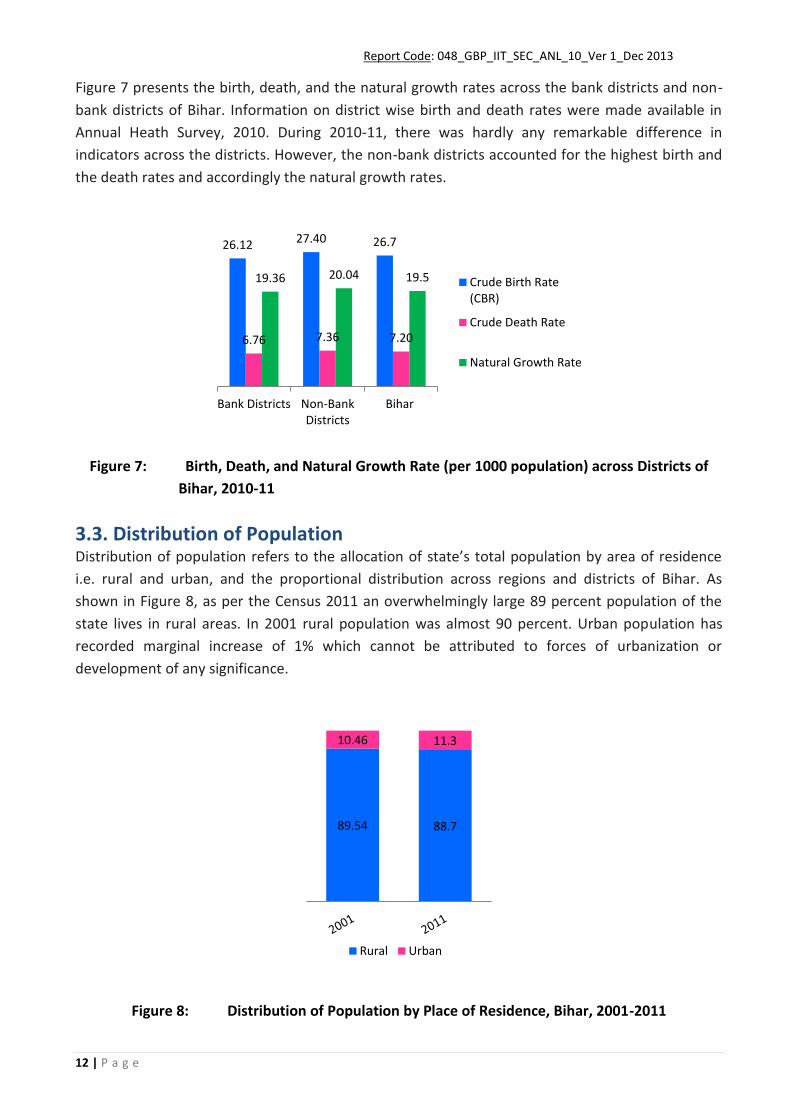
3.3. Distribution of Population Distribution of population refers to the allocation of state’s total population by area of residence
i.e. rural and urban, and the proportional distribution across regions and districts of Bihar. As
shown in Figure 8, as per the Census 2011 an overwhelmingly large 89 percent population of the
state lives in rural areas. In 2001 rural population was almost 90 percent. Urban population has
recorded marginal increase of 1% which cannot be attributed to forces of urbanization or
development of any significance.
Figure 8: Distribution of Population by Place of Residence, Bihar, 2001-2011
26.12 27.40 26.7
6.76 7.36 7.20
19.36 20.04 19.5
Bank Districts Non-BankDistricts
Bihar
Crude Birth Rate(CBR)
Crude Death Rate
Natural Growth Rate
89.54 88.7
10.46 11.3
Rural Urban

Report Code: 048_GBP_IIT_SEC_ANL_10_Ver 1_Dec 2013
13 | P a g e
3.4. Population Concentration Population concentration characterizes the pattern of population distribution in an area. This is
represented by the density of population in particular region, and is calculated in terms of persons
per unit area. Density of population suggests clustering, scattering, randomness or uniformity in
the distribution of population, which further helps to assess the population pressure on particular
area or resources.
As per Census 2011 Bihar with 1102 persons/sq km is the most densely populated state in the
country. The second most densely populated state which is West Bengal is also in the Lower Ganga
basin where the population density is 1029 persons/sq km. In comparison, the national average
population density is only 382 persons/sq km. The significantly higher population densities signify
severe pressure on the land and water resources in the Lower Ganga basin.
Figure 9 shows that in general the population density in ‘bank’ districts of Bihar is significantly
higher than that in the ‘non-bank’ districts. There are 10 districts along river Ganga (namely Patna,
Vaishali, Saran, Begusarai, Buxar, Bhagalpur, Khagaria, Katihar, Bhojpur and Samastipur) where
population density is more than 1001 persons/sq. km. (Figure10). This signifies that, among others,
more people are attracted to the ‘bank districts’ in search of livelihood. However, this may not be
necessarily so in the case of Bihar as there are also several districts in the ‘non-bank’ category
where population density in excess of 1001 persons per sq. km. has been recorded.
Figure 9: Average Population Density (persons/sq. km.) across Districts of Bihar, 2001-2011
1019.75
856.38
1269.08
1084.35
Bank Districts Non-Bank Districts
2001 2011

Report Code: 048_GBP_IIT_SEC_ANL_10_Ver 1_Dec 2013
14 | P a g e
Figure 10: Population Density (Persons/sq. km.) across Districts of Bihar, 2011
3.5. Population Composition Population composition refers to the demographic and the social composition of the population,
which includes population in different age-groups, sex-groups, social groups, and the religious
groups.
Figure 11 shows the percentage of population in various age groups with respect to males and
females which are estimated based on data from the Sample Registration System for 2010. The
Figure indicates that the age group of 15-59, which is considered to be the working age group had
55 percent females and 54 percent males. The age group of 60 and above had 6 percent males as
well as 6 percent females.
Figure 11: Population distribution by age and gender, Bihar, 2010
Figure 12 shows the sex ratio (number of females per 1000 males) in Bihar for the years 2001 and
2011. The sex ratio at 919 in 2001 was significantly higher than that in 2011. This indicates that
13.7
39.8
53.8
6.4 13.4
39
54.8
6.3
0-4 0-14 15-59 60 & aboveMale Female

Report Code: 048_GBP_IIT_SEC_ANL_10_Ver 1_Dec 2013
15 | P a g e
proportion of females has fallen substantially in 2011. In comparison to the national average sex
ratio at 940 in the Census 2011, the state average is recorded at 916.
Figure 12: Trends in Sex Ratio (Female/1000 Male), Bihar, 2001-2011
Figure 13 shows regional difference in sex ratio for bank and non-bank districts. It is noted that sex
ratio in non-bank districts is higher as compared to the bank districts. In absence of migration data
this is difficult to explain, but could possibly be due to more livelihood opportunities in the bank
districts.
Figure 13: Average Sex Ratio (Female/1000 Male) across Districts of Bihar, 2001-2011
919
916
2001 2011
906
925
901
923
Bank Districts Non-Bank Districts
2001 2011

Report Code: 048_GBP_IIT_SEC_ANL_10_Ver 1_Dec 2013
16 | P a g e
Figure 14: Sex Ratio (Female/1000 Male) across Districts of Bihar, 2011
Majority of the population in the state belongs to two main religious groups i.e. Hindu and
Muslims. Figure 15 presents the proportion of population in different social group across regions of
Bihar which is estimated from the 66th round of National Sample Survey (NSS) data. The bank
districts reported 34 percent of the state’s OBCs (Other Backward Castes) population, 34% of ST
(Schedule Tribes) population and 32% of SC (Schedule Castes) population. Majority of SC population
lives in non-bank districts (68%). Overall a majority of all three social groups is found to be residing
in non-bank districts compared to bank districts.
Figure 15: Proportion (%) of Population by Social Group, Bihar, 2009-10
34.25 32.05 34.46
65.75 67.95 65.54
STs SCs OBCs
Non- Bank Districts Bank Districts

Report Code: 048_GBP_IIT_SEC_ANL_10_Ver 1_Dec 2013
17 | P a g e
4. Economic Indicators
4.1. Gross State Domestic Product Bihar's per capita income, which was about 60 per cent of the Indian average during early 1960s,
declined to about 40 per cent in 1993-94 and further to 34 per cent in 1997-98. The GDP growth
rate during the 1990s had been very low. The state was ranked among the slowest growing regions
of India. The overall impact of the demographic situation along with slow growth led to the
economic retrogression of the state (Sharma 2005).
However with the change of political alignments, in the recent past, the economy of Bihar has
improved significantly. According to the Economic Survey of Bihar, 2010, the main growth sectors
were construction, communication and trade/hotels/restaurants. The share of construction and
trade/hotels/restaurants in Bihar’s GSDP (Gross State Domestic Product) has gone up remarkably
from 3.31% and 14.94% respectively in 2000-01 to 12.15% and 25.24% respectively in 2008-09.
However, the share of agriculture went down during the same period from 35.83% to 23.58%. The
contribution of manufacturing too recorded a slight drop from 5.67% in 2001-02 to 4.69% in 2008-
09. The main reason behind the steady decline of agriculture lies in constant lack of investment and
the prevalence of old agrarian practices.
Since Bihar is part of the Ganga Plains, the state has rich soil and abundant water resources.
However, with the bifurcation of the state in November 2000, the newly created Jharkhand state
took away the mineral rich part of the state and the present Bihar was left with its agro-based
economy. During the first five years since 1999-2000, the economy grew at an annual rate of 3.50
percent. With the economic policies pursued by the new state government since 2005-06
which included higher levels of plan outlays, the economy has grown at an annual rate of 10.93
percent during 2004-05 to 2010-11 (Economic Survey 2010-11, Govt. of Bihar).
Figure 17 shows GSDP of Bihar over the 7 year period from 2004 to 2011. There has been a
continuous high growth of GSDP for the state since 2004-05. From 2004-05, there has been no
looking back for Bihar as the GSDP grew higher and higher, reaching Rs. 163.4 (‘000 cores) in 2011-
12, adding Rs. 85.6 thousand crore in eight years, with an average increase of approximately Rs.11
thousand crore every year.

Report Code: 048_GBP_IIT_SEC_ANL_10_Ver 1_Dec 2013
18 | P a g e
Figure 17: Gross State Domestic Product (Rs. ‘000 Crores), Bihar, 2004-2011 at Constant Prices
(2004-05) Note: P -Provisional, Q – Quick
Figure 18: Average GDDP (Rs. Crore) across Districts of Bihar, 2006-2008 at 2004-05 Prices
Figure 19: Region-wise CAGR (%) of GSDP and GDDP in Bihar, 2006-2007 to 2007-08
77.8 78.5
92.4 99.5
114.0 125.9
144.5
163.4
3819.0
1802.6
4300.0
1880.4
Bank Districts Non-Bank Districts
2006-07 2007-08
7.64
12.59
4.32
Bihar Bank Districts Non Bank Districts

Report Code: 048_GBP_IIT_SEC_ANL_10_Ver 1_Dec 2013
19 | P a g e
To sum up, the GSDP of Bihar grew with a rate of 7.64 percent during 2006-07 and 2007-08 (Figure
19). The average GDDP in bank districts appears to have recorded the highest annual growth rate of
12.59 percent during the same period, followed by the non-bank districts (4.32 percent).
4.2. Per Capita Gross Domestic Product Figure 20 presents the trends in per capita GSDP of Bihar during 2004-05 to 2008-9. Over the
period under consideration there has been an increase of around 40%.. Evidently this continuously
rising trend represents positive momentum for the state economy.
Figure 20: Per Capita GSDP (Rs.) of Bihar, 2004-2008 at 2004-05 Constant Prices
Figure 21: Average per Capita GDDP (Rs.) across Districts of Bihar, 2006-2008
In sync with the pattern of growth as observed in case of average GDDP across regions, the growth
rate of per capita GDDP in the bank districts registered was much higher at 10.26 percent during
the same period (Figure 22), compared to the non-bank districts (4.02 percent). Bihar’s per capita
GSDP recorded a growth rate of 6.80 percent.
8,7
73
8,7
06
10
,08
7
10
,69
0
12
,06
6
2004–05 2005–06 2006–07 2007–08 2008–09
12,137.7
7,301.1
13,383.6
7,594.4
Bank Districts Non-Bank Districts
2006-07 2007-08

Report Code: 048_GBP_IIT_SEC_ANL_10_Ver 1_Dec 2013
20 | P a g e
Figure 22: Growth Rate (%) of Per Capita GSDP and GDDP, 2006-07 to 2007-08 As illustrated in Figure 23, per capita GDDP is highest in Patna (Rs. 49,765) which is followed by
Munger (Rs. 16,154) and Begusarai (Rs. 13,245). Except for Bhagalpur and Pashchim Champaran,
per capita GDDP in the rest of the districts was less than Rs.10,000.
Figure 23: Per Capita GDDP (Rs.) across Districts of Bihar, 2007-08
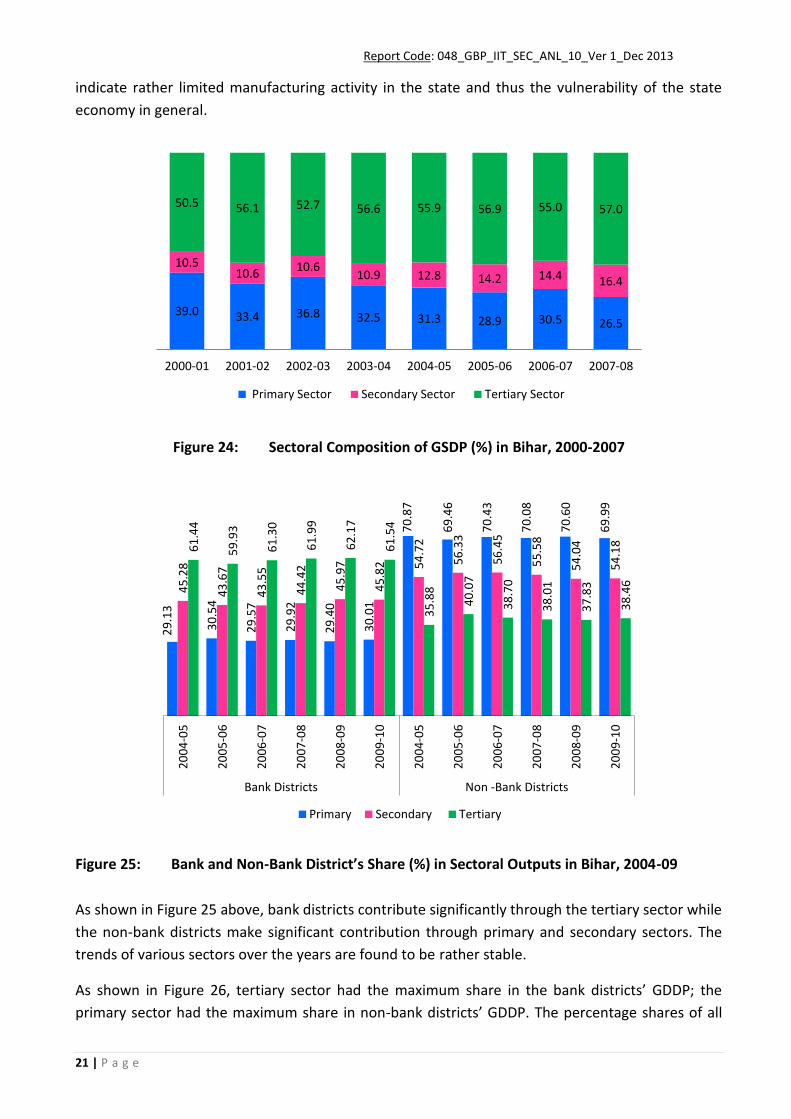
4.3. Sectoral Composition of GSDP Figure 24 presents the trend in the sectoral composition of GSDP of Bihar during 2000-01 to 2007-
08. It is noted that the maximum contribution to GSDP was made by the tertiary sector and which
has been rather stable throughout the period in the range of 50-57 percent. Primary sector was the
second highest contributor to GSDP, though varying in a wide range and registering a significant
decline from 39 percent in 2000-01 to 26 percent in 2007-08. Contribution of secondary sector also
varied significantly from 10 percent in 2000-01 to 16 percent in 2007-08, however low values
6.80
10.26
4.02
Bihar Bank Districts Non Bank Districts
Report Code: 048_GBP_IIT_SEC_ANL_10_Ver 1_Dec 2013
21 | P a g e
indicate rather limited manufacturing activity in the state and thus the vulnerability of the state
economy in general.
Figure 24: Sectoral Composition of GSDP (%) in Bihar, 2000-2007
Figure 25: Bank and Non-Bank District’s Share (%) in Sectoral Outputs in Bihar, 2004-09
As shown in Figure 25 above, bank districts contribute significantly through the tertiary sector while
the non-bank districts make significant contribution through primary and secondary sectors. The
trends of various sectors over the years are found to be rather stable.
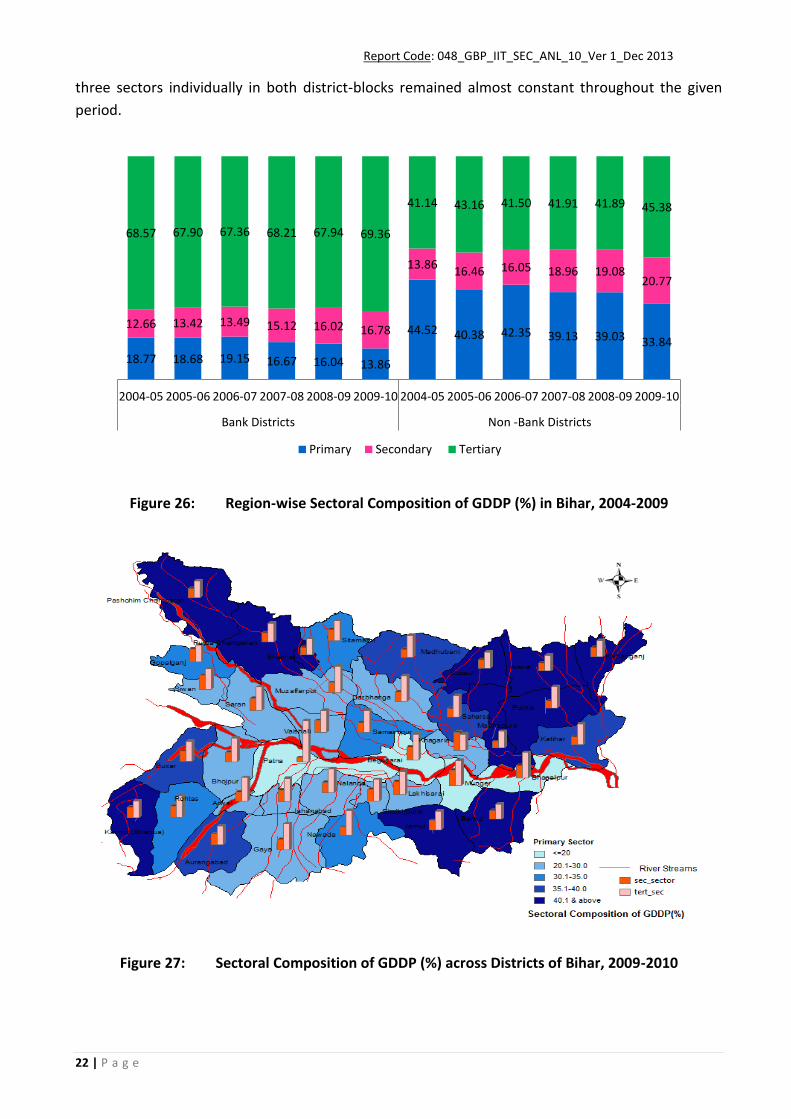
As shown in Figure 26, tertiary sector had the maximum share in the bank districts’ GDDP; the
primary sector had the maximum share in non-bank districts’ GDDP. The percentage shares of all
39.0 33.4 36.8 32.5 31.3 28.9 30.5 26.5
10.5 10.6
10.6 10.9 12.8 14.2 14.4 16.4
50.5 56.1 52.7 56.6 55.9 56.9 55.0 57.0
2000-01 2001-02 2002-03 2003-04 2004-05 2005-06 2006-07 2007-08
Primary Sector Secondary Sector Tertiary Sector
29
.13
30
.54
29
.57
29
.92
29
.40
30
.01
70
.87
69
.46
70
.43
70
.08
70
.60
69
.99
45
.28
43
.67
43
.55
44
.42
45
.97
45
.82
54
.72
56
.33
56
.45
55
.58
54
.04
54
.18
61
.44
59
.93
61
.30
61
.99
62
.17
61
.54
35
.88
40
.07
38
.70
38
.01
37
.83
38
.46
20
04
-05
20
05
-06
20
06
-07
20
07
-08
20
08
-09
20
09
-10
20
04
-05
20
05
-06
20
06
-07
20
07
-08
20
08
-09
20
09
-10
Bank Districts Non -Bank Districts
Primary Secondary Tertiary
Report Code: 048_GBP_IIT_SEC_ANL_10_Ver 1_Dec 2013
22 | P a g e
three sectors individually in both district-blocks remained almost constant throughout the given
period.
Figure 26: Region-wise Sectoral Composition of GDDP (%) in Bihar, 2004-2009
Figure 27: Sectoral Composition of GDDP (%) across Districts of Bihar, 2009-2010
18.77 18.68 19.15 16.67 16.04 13.86
44.52 40.38 42.35 39.13 39.03 33.84
12.66 13.42 13.49 15.12 16.02 16.78
13.86 16.46 16.05 18.96 19.08
20.77
68.57 67.90 67.36 68.21 67.94 69.36
41.14 43.16 41.50 41.91 41.89 45.38
2004-05 2005-06 2006-07 2007-08 2008-09 2009-10 2004-05 2005-06 2006-07 2007-08 2008-09 2009-10
Bank Districts Non -Bank Districts
Primary Secondary Tertiary

Report Code: 048_GBP_IIT_SEC_ANL_10_Ver 1_Dec 2013
23 | P a g e
Figure 27 presents the spatial distribution in sectoral composition of GDDP across districts of Bihar
during 2009-10. The share of tertiary sector in comparison to other sectors in the GDDP appeared
to be the maximum in all districts of the state. There were 4 districts which had recorded more
than 55 percent share of tertiary sector in GDDP viz., Patna, Dharbhanga, Muzaffarpur and Gaya.
On the other hand, Khagaria and Munger showed higher share of secondary sector in the GDDP
between 33-39%.
4.4. Trends in Occupational Structure Expansion in non-farm sector is one of the major ways of diversification of the rural economies. It is
important due to inability of the agriculture sector to absorb the unemployed rural people. If we
look at the economy of Bihar, agriculture is seen as the main source of livelihood. However, the
cultivation at subsistence level is not able to provide sufficient income to the rural people and
therefore they participate in other activities or migrate to other states. Non-farm sector constitutes
of a whole range of activities from collecting tree twigs which is used as tooth brush to teaching in
schools. However, most of the activities are traditional and low technology based. They have very
poor linkage with agriculture or manufacturing in the urban areas. The tables 2 and 3 below
present data on employment for 2004-05 and 2009-10 which are based on the NSSO reports.
Table 2: Per 1000 Distribution of Usually Working Persons in the Principal Status and Subsidiary
Status taken together by Broad Industry Division (NIC 1998) for each state/union territory for the
year 2004-05
Agricultur
e
Mining
and
quarrying
Manufactu
ring
Electricity
and water.
Constr
uction
Trade,
Hotel
and
restaura
nt
Transp
ort
Fin.
inter,
busin
ess
act,
etc.
Pub
Admin
educn
comm
serv.
etc
Total
Rural Male
Bihar 758 1 50 1 32 87 28 3 40 1000
All-India 665 6 79 2 68 83 38 7 52 1000
Rural
Female
Bihar 864 0 81 0 0 26 0 0 28 1000
All- India 833 3 84 0 15 25 2 1 38 1000
Urban Male
Bihar 172 2 112 3 78 355 78 55 145 1000
All- India 61 9 235 8 92 280 107 59 149 1000
Urban
Female
Bihar 467 0 148 0 0 120 1 4 259 1000
All- India 181 2 282 2 38 122 14 32 327 1000
Source:Employment Situation in India,NSSO 61st
round 2004-05
From Table 2 it is noted that in 2004-05 most of the rural males and females are employed in
agriculture sector. In rural areas the second highest area of livelihood for males is ‘trade, hotel and

Report Code: 048_GBP_IIT_SEC_ANL_10_Ver 1_Dec 2013
24 | P a g e
restaurant’ while for the females interestingly it is ‘manufacturing’. In the urban areas, the area
offering highest livelihood opportunity for males is ‘trade, hotel and restaurant’ while agriculture is
second and manufacturing is a distant fourth. Among urban females the agriculture offers the
highest opportunities which is followed by ‘public administration education, etc.’
Table 3 below shows that in 2009-10, agriculture offered most livelihood opportunities for
both male and female rural populations. In urban areas, construction sector offered most
opportunities for male workers followed by ‘transport and communication’. A good sign is that a
large number of urban females are moving towards education sector. This implies that female
literacy has improved over the years in Bihar as a large number of females are opting to teach.
Interestingly, among the rural females besides agriculture, manufacturing continues to be a popular
livelihood options.

Report Code: 048_GBP_IIT_SEC_ANL_10_Ver 1_Dec 2013
25 | P a g e
Table 3: Distribution (per 1000) of workers according to usual status approach by industry sections of NIC-2004 for 2009-10
Agricul
ture,
huntin
g and
forestr
y
Fishi
ng
Mini
ng
and
quarr
ying
Manuf
acturin
g
Elect
ricity
, gas
and
wate
r
suppl
y
Con
str
ucti
on
Whol
esale,
retail
trade
, etc.
Hot
els
and
rest
aur
ant
s
Transport
, storage
and
communi
cations
Fin
anc
ial
inte
rm
edi
atio
n
Real
estate,
renting
and
business
activities
Public
adminis
tration,
defence
, etc.
Educ
atio
n
Health
and
social
work
Other
commu
nity,
social
and
person
al
service
activiti
es
Activiti
es of
private
househ
olds
Extrate
rritorial
organiz
ations
and
bodies
All
Rural
Male
Bihar 649 0 0 48 1 117 84 3 40 4 3 4 15 2 30 0 0 1000
All-India 623 5 8 70 2 113 72 10 41 3 4 12 15 3 15 3 0 1000
Rural Female
Bihar 830 0 0 82 0 5 19 2 10 0 0 0 26 0 25 1 0 1000
All-India 792 1 3 75 0 52 23 5 2 1 1 5 20 5 9 5 0 1000
Urban
Male
Bihar 126 0 0 118 0 135 312 27 102 18 19 34 67 14 25 4 0 1000
All-India 57 3 7 218 7 114 239 31 104 27 45 57 36 15 30 9 0 1000
Urban Female
Bihar 352 0 0 105 47 0 119 71 0 1 0 56 109 12 35 93 0 1000
all-India 139 0 3 279 4 47 99 22 14 21 26 39 130 42 64 71 0 1000
Source: Key Indicators of Employment and Unemployment Situation in India, NSSO 66th Round, 2009-1

Report Code: 048_GBP_IIT_SEC_ANL_10_Ver 1_Dec 2013
26 | P a g e
4.5. Population Below Poverty Line The Figure 28 shows state population below poverty line for the year 2009-10. In general
non-bank districts have higher fraction of people living below the poverty line compared to
the bank districts. In both the regions, the fraction of BPL population in rural areas is higher
than that in the urban areas.
*Rural Poverty Line: Rs. 655.6 per month Urban Poverty Line: Rs.775.3 per month
Figure 28: Average Population below Poverty Line (%) across Districts of Bihar,2009-10
48.90% 53.98%
43.82% 45.37%
Bank Districts Non-Bank Districts
Rural Urban

Report Code: 048_GBP_IIT_SEC_ANL_10_Ver 1_Dec 2013
27 | P a g e
Figure 29: Population below Poverty Line (%) in Rural Areas across Districts of Bihar,2009-2010 Figure 29 shows the proportion of population living below poverty line in rural areas. The
poverty line in rural areas was set at Rs. 655.6 per month. The Figure depicts that most
districts suffer from the incidence of severe poverty. Khagaria was the only district which
had poverty of 10.68 percent, which was the minimum. The top five districts with the
highest proportion of population below poverty line were Nalanda (82%), Sitamarhi (76%),
Pashchim Champaran (74%), Bhagalpur (72%) and Purba Champaran (68%).

Report Code: 048_GBP_IIT_SEC_ANL_10_Ver 1_Dec 2013
28 | P a g e
Figure 30: Population below Poverty Line (%) in Urban Areas across Districts of Bihar, 2009-2010 Figure 30 shows the proportion of population living below poverty line in urban areas. The
poverty line in urban areas was set at Rs.775.3 per month. The Figure depicts that most
parts of the state suffered from poverty. The top five districts with the highest proportion of
population below poverty line were Bhojpur (81%), Siwan (75%), Sheohar (69%0, Nawada
(65%) and Munger (63). Least proportion of urban population below poverty line is reported
in Begusarai (11%) and Jehanabad (18%) respectively (data for Arwal and Araria were not
available).
4.6. Trends and Pattern in Banking In Bihar banking services are very limited and per capita availability of financial services is
considered to be the lowest in the country. For uniform economic development across the
state, there is an urgent need to expand the base of financial services with a particular focus
on the rural economy and the small and medium enterprises. The expanded financial
services must be cost effective and their delivery should be of high quality. The following
banking facilities with the number of branches for each have been analyzed below.
Commercial Banks (3942)
Co-operative Banks (293)
Regional Rural Banks (1451)
Microfinance

Report Code: 048_GBP_IIT_SEC_ANL_10_Ver 1_Dec 2013
29 | P a g e
1) Commercial Banks A commercial bank (or business bank) is a type of financial institution and intermediary. It is
a bank that provides transactional, savings and money market accounts and accepts time
deposits.
At the end of March 2010, 57.7 percent of the total 4156 branches of commercial banks in
Bihar were located in rural areas, 22.45 percent in semi-urban and 19.83 percent in urban
areas (Economic Survey of Bihar 2012). The total number of branches increased substantially
(5.43 percent) during 2010. This expansion has been a welcome break from the stagnation
noticed till 2007 in the state. However, out of 214 new branches, all but 44 were opened in
either urban (90 branches) or semi-urban areas (102 branches) and most of these were
opened by private non-nationalized banks. Over the years urban branches have been
consistently increasing their share from 15.13 percent in 2005 to 19.83 percent in 2010;
likewise share of semi-urban branches has also increased from 20 percent to 22.45 percent
during the same period (Economic Survey of Bihar, 2010).
Figure 31 shows distribution of urban, semi-urban and rural commercial banks for the period
2001-2010. Since 2001, the number of rural banks has declined, although the total number
of branches has increased in the 10 years period. In the year 2010, the number of
commercial banks in the rural areas declined while that in the semi-urban and the urban
areas increased. These changes are attributed to the impetus to the state economy after the
new political establishment which is giving significant thrust to overall development.
Figure 31: Distribution of Number of Urban, Semi-urban and Rural Commercial Banks
in Bihar
As regards the credit to deposit ratio, it is noted from Table 4 that in non-bank districts
there is comparatively higher credit demand than in the bank districts. However, the CD
ratio is by and large in the range of 29-36%.
69.3 69.1 69.1 68.7 64.8 63.59 62.8 61.63 59.72 57.72
18.5 18.5 18.6 18.9 20.07 20.6 20.66 20.97 21.66 22.45
12.2 12.4 12.3 12.4 15.13 15.81 16.54 17.41 18.62 19.83
2001 2002 2003 2004 2005 2006 2007 2008 2009 2010
Urban (%) Semi- urban (%) Rural share (%)

Report Code: 048_GBP_IIT_SEC_ANL_10_Ver 1_Dec 2013
30 | P a g e
Table 4: Credit Deposit (CD) Ratio of Commercial Banks, Bihar, 2005-2011
Region District wise CD Ratio
2005-
06
2006-
07
2007-
08 2008-09
2009-
10
2010-
11
2011-12
(Sep, 11)
Bank
Districts 32.9 34.3 32.2 29.0 31.0 32.1 31.4
Non-Bank
Districts 34.6 35.7 34.7 31.7 34.5 36.6 36.0
Note: Figures for the regions represent the average value of districts in that particular region.
Source: Economic Survey of Bihar, 2011-12
An analysis of district-wise pattern of credit-deposit ratio (CDR) during 2011-12 reveals that
Kishanganj (53%) and Purnia (50%) recorded the highest, followed by Kaimur (49%) and
Araria (49%). On the other hand lowest CDR was recorded in Siwan (21%), followed by
Lakhisarai (23%), Bhojpur (23%) and Saran (23%).
Figure 32: Credit Deposit Ratio (%) across Districts of Bihar, 2011-12

Report Code: 048_GBP_IIT_SEC_ANL_10_Ver 1_Dec 2013
31 | P a g e
2) Cooperative Banks
Co-operative banks are small sized units organized in the co-operative sector which operate
both in urban and non-urban centers. These banks are traditionally centered on
communities, localities and work place groups and they lend to small borrowers and
businessmen.
Co-operative banks function on the basis of 'no-profit no-loss' and therefore do not pursue
the paradigm of profit maximization. As a result such banks do not focus on offering more
than the basic banking services. Co-operative banks finance small borrowers in industrial
and trade sectors, besides the professional and salaried classes. During 2008-09 there were
only 14 state co-operative banks and 279 district central cooperative banks across the state.
respectively.
3) Regional Rural Banks (RRBs) The rural deposits of the scheduled commercial banks constituted only 24 percent of the
total bank deposits in Bihar in 2007-2008. The deposits of RRBs were about 28 percent of
the total rural deposits of all scheduled commercial banks in India as on December 2009, but
in Bihar these were nearly 43 percent. Bihar accounted for about 6 percent of all rural
deposits of the scheduled commercial banks in the country in 2009-10 and the total amount
of rural deposits of such banks in Bihar amounted to Rs. 24,192 crore. While the number of
RRB branches increased from 1429 in 2007 to 1451 in 2009, the growth in their deposits has
slowed down in 2009-10 (17 percent) compared to that in 2008-09 (23 percent) (Economic
Survey of Bihar 2011, GOB).
Figure 34: Branches and Deposits of Regional Rural Banks in Bihar
4) Microfinance Microfinance is a type of financial service which provides banking and related services to the
persons who have low income. The main objective of microfinance is to provide appropriate
and high range of financial services such as credit, savings, and insurance and fund transfer
to the poor people to help them to come out from poverty. In Bihar, a large segment of the
population is under poverty line and microfinance is considered to be a good tool for
7245
8917
10426
3027 3661
4612
0
2000
4000
6000
8000
10000
12000
2007 2008 2009
Total Deposits (cr) Total Credits (cr)

Report Code: 048_GBP_IIT_SEC_ANL_10_Ver 1_Dec 2013
32 | P a g e
removing poverty. Through microfinance the weaker sections can easily access loans at an
affordable rate which ultimately helps in the overall economic development of the society.
The self help groups (SHGS) and SHG-bank linkage programme implemented by the
commercial banks, RRB's, co-operative banks are considered as the major microfinance
programme in the country. Bihar is gradually catching up with other states in SHG bank
linkages.
The year-wise distribution of the number of SHGs and the amount of credit for the period
2004-2011 across Bihar is shown in Figure 35. In 2004, there were 16,246 SHGs with bank
linkage which increased 49,738 in 2007-2008, however in 2011 the number registered a
significant decline and fell down to 7,287. Likewise the amount of credit in 2004 was
Rs. 5,200 lakh which increased till 2009-2010 and then in 2011 it declined to Rs. 5,300 lakh.
Till June 30, 2010, about 1,85,600 SHGs were credit-linked to various banks and the total
credit flow to them was Rs. 1,003 crore.
Figure 35: Year-wise Distribution of No. of SHGs & Amount of Credit Compared to other states of India, the penetration of microfinance is insignificant in Bihar.
This is attributed to, among others, skewed distribution of SHGs across the districts, weak
infrastructure, increasing costs, low efficiency of operations, lack of experience and capacity
among NGOs, conservative attitude of banks towards SHGs and fund constraints for start-
ups, etc. If SHG movement has to reach out a larger section of the rural population then the
above issues need to be addressed on priority.
16,246
11,769
18,206
26,417
49,738
25,696
30,241
7,287 5,200 3,700 3,100
8,300
24,100 21,100
29,500
5,300.00
No. of SHGs with Bank Linkage Amount of Credit (Rs Lakhs)

Report Code: 048_GBP_IIT_SEC_ANL_10_Ver 1_Dec 2013
33 | P a g e
5. Social and Health Components
5.1. Literacy
Bihar is characterized by comparatively lower level of literacy. For instance as per the Census
2011, against the national average of 74%, Bihar with 63.8% stands lowest among all the 28
states in the country. Present rate of literacy among male and female population is recorded
to be 73 percent and 53 percent respectively. Figure 36 presents literacy rate of Bihar for
2001 and 2011 which brings out a gradual rise for the toal, male and female population.
Female literacy rate which was very low in 2001 has reached respectable level of 53 % in
2011, however the gender gap is still quite significant. Interestingly, as shown in Figure 37
and 38 bank districts have fared better on literacy rate compared to the whole state as well
as the non-bank districts. Further as illustrated in Figure 38, districts in south Bihar have
recorded better literacy rates while those in the north are found to be lagging behind.
Figure 36: Literacy Rate (%), Bihar, 2001 and 2011
Figure 37: Literacy Rate (%) across Districts of Bihar, 2011
47.53
63.82 60.32
73.39
33.57
53.33
2001 2011
Total Males Females
57.07 51.42
75.60 72.46
Bank Districts Non-Bank Districts
Female Male

Report Code: 048_GBP_IIT_SEC_ANL_10_Ver 1_Dec 2013
34 | P a g e
Figure 38: Literacy (Person) Rate (%) across Districts of Bihar, 2011
Figure 9: Literacy (Male) Rate (%) across Districts of Bihar, 2011
Male literacy almost follows the same pattern as the previous map for the combined
population. Literacy rates among male population are found to be quite significant – above

Report Code: 048_GBP_IIT_SEC_ANL_10_Ver 1_Dec 2013
35 | P a g e
60% for majority of districts. In some districts e.g., Rhotas, Bhojpur, Buxar, Siwan,
Aurangabad, etc. this is as high as 80 percent. However there are lagging districts in the
north and the eastern part of the state. However, as shown in Figure 40, female literacy
rates across the state are not significant.
Figure 40: Literacy (Female) Rate (%) across Districts of Bihar, 2011
5.2. Education In the backdrop of the low literacy rates, as shown in Figure 41, it is interesting to note that
over the year enrolment in primary education for both boys and girls has increased.
However, given the growth in population and high population density, the accumulated
deficits, it is recognized that massive efforts need to be made to improve education scenario
across the state Bihar. It’s a fact that prosperity would not come without education.
Figure 41: Enrolment in Primary Schools in Bihar, 2002-2008
5.30 6.14
8.80 7.43
3.93 4.78
3.75
5.77
9.23
10.92
12.55 13.20
0
2
4
6
8
10
12
14
2002 2004 2006 2008
In M
illi
on
s
Boys Girls Total

Report Code: 048_GBP_IIT_SEC_ANL_10_Ver 1_Dec 2013
36 | P a g e
Figure 42 shows upper primary enrolment in the state for 2002-2008. While there has been
a rising trend until 2006, it is intriguing to note steep fall in the subsequent years. Reasons
for this decline are not available.
Figure 42: Upper Primary School Enrolment
Figure 43: No. of Schools across Districts of Bihar, 2009-10
The levels of education and literacy very much depend on the education infrastructure and
facilities available for the population in the state. Figures 43 and 44 present district-wise
0.75
1.21
3.19
2.07
0.42 0.73
2.18
1.46 1.17
1.94
5.37
3.52
0
1
2
3
4
5
6
2002 2004 2006 2008
In M
illi
on
s
Boys Girls Total
Report Code: 048_GBP_IIT_SEC_ANL_10_Ver 1_Dec 2013
37 | P a g e
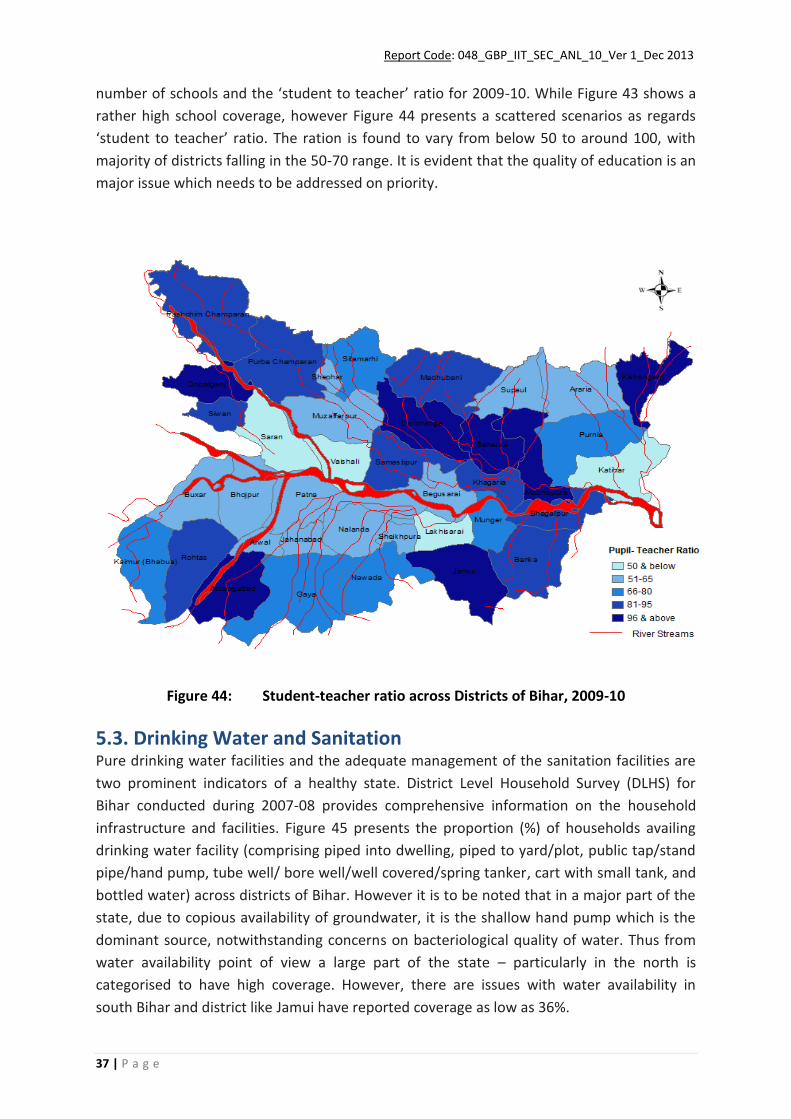
number of schools and the ‘student to teacher’ ratio for 2009-10. While Figure 43 shows a
rather high school coverage, however Figure 44 presents a scattered scenarios as regards
‘student to teacher’ ratio. The ration is found to vary from below 50 to around 100, with
majority of districts falling in the 50-70 range. It is evident that the quality of education is an
major issue which needs to be addressed on priority.
Figure 44: Student-teacher ratio across Districts of Bihar, 2009-10
5.3. Drinking Water and Sanitation Pure drinking water facilities and the adequate management of the sanitation facilities are
two prominent indicators of a healthy state. District Level Household Survey (DLHS) for
Bihar conducted during 2007-08 provides comprehensive information on the household
infrastructure and facilities. Figure 45 presents the proportion (%) of households availing
drinking water facility (comprising piped into dwelling, piped to yard/plot, public tap/stand
pipe/hand pump, tube well/ bore well/well covered/spring tanker, cart with small tank, and
bottled water) across districts of Bihar. However it is to be noted that in a major part of the
state, due to copious availability of groundwater, it is the shallow hand pump which is the
dominant source, notwithstanding concerns on bacteriological quality of water. Thus from
water availability point of view a large part of the state – particularly in the north is
categorised to have high coverage. However, there are issues with water availability in
south Bihar and district like Jamui have reported coverage as low as 36%.

Report Code: 048_GBP_IIT_SEC_ANL_10_Ver 1_Dec 2013
38 | P a g e
Figure 45: Households availing Drinking Water (%) across Districts of Bihar, 2007-08
Figure 46 shows proportion of households having access to toilet facility across districts of
Bihar during 2007-08. Evidently the coverage is very low and this is a major issue which has
potential to adversely affect environment and public health both in the urban and rural
areas.

Report Code: 048_GBP_IIT_SEC_ANL_10_Ver 1_Dec 2013
39 | P a g e
Figure 46: Households having Toilet Facility (%) across Districts of Bihar, 2007-08
5.4. Health Indicators The health status of its population reflects the socio-economic development of a state.
Health status is shaped by a variety of factors — level of income and standard of living,
housing, sanitation, water supply, education, employment, health consciousness and
personal hygiene and the coverage, availability, accessibility, acceptability and affordability
of health services. The poor health status of the citizens of a state is a product of inadequate
nutrition, lack of protected water supply and overcrowded and insanitary housing
conditions. These conditions are conducive to spread of diseases related to water and air
contamination, nutritional deficiency, fecal related and waterborne diseases, which typically
dominate morbidity and mortality pattern in under developed regions.
Infant Mortality Rate (IMR)
IMR, considered to be one of the most sensitive indicators of health and development is
defined as number of infant (under age one) deaths per thousand live births in a given year.
The Table 5 presents latest available IMR data for Bihar.

Report Code: 048_GBP_IIT_SEC_ANL_10_Ver 1_Dec 2013
40 | P a g e
Table5: Health and Mortality Indicators, Bihar, 2010-11
Particulars Total Rural Urban
Infant Mortality Rate
Total 55 56 44
Male 53 54 43
Female 56 58 46
Neo-natal Mortality Rate 35 36 27
Post Neo-natal Mortality Rate 19 19 17
Under-5 Mortality Rate
Total 77 80 57
Male 74 76 53
Female 81 83 60
Source: Annual Health Survey, 2011, Bihar
Notes: 1.Infant mortality rate is calculated as annual deaths of infants (D) between birth and
one year, divided by the annual number of births (B), all multiplied by 1000.
2.Neo-natal deaths: Infant dying before age of 29 days.
3.Post Neo-natal deaths: Infant dying during age of 29 days to < 1 year.
4.The under-five mortality is the probability that a child born in a specific year or
time period will die before reaching the age of five, subject to current age specific
mortality rates. It is expressed as a rate per 1,000 live births.
Figure 47: Infant Mortality Rate (per 1000 live births), Bihar, 2000-2005
62 62 61 60 61 61
63 63 62 62 63 62
53 52 50 49 47 47
0
10
20
30
40
50
60
70
2000 2001 2002 2003 2004 2005
Infa
nt
mo
rtal
ity R
ate
(per
10
00
liv
e
bir
ths)
IMR(Total)
IMR (Rural)
IMR (Urban)

Report Code: 048_GBP_IIT_SEC_ANL_10_Ver 1_Dec 2013
41 | P a g e
It is seen that IMR in the state fluctuated over the years with a fall after 2001 and with a
slight increase after 2003. Urban IMR was lower compared to rural IMR. This could be due to
poor health facilities and lack of proper infrastructure development in rural areas of the
state.
6. Conclusion and Policy Implications Following conclusions emerge from the preceding discussion:
The population of Bihar has increased substantially from 2001 to 2011 (@25.1%) in
both the regions. This signifies that there are more people to be taken care of from,
among others, the available water and other natural resources in the bank districts
and hence more pressure on river Ganga.
It is interesting to note that there is sustained declining trend in birth rates, leading
to almost stable natural growth rate of population in the recent years.
An overwhelming 90% of the state population resides in rural areas, giving the entire
state the character of a ‘rural state’ and the general development deficit.
Bihar is characterized as the most densely inhabited state with population density of
1102 persons/ sq.km. Density is reported to be higher in bank districts compared to
the non-bank districts.
Average statewide sex ratio at 916 in 2011 is below the national average which is
940. During the last decade there has been a drop in the sex ratio.
Since 2004-05 the state has recorded high to very high growth in GSDP which is
above the national growth rate.
Bank districts in general have recorded higher growth in district domestic product
compared to the non-bank districts. Likewise maximum increase in average per
capita GDDP was recorded in bank districts.
The maximum contribution in GSDP was made by the tertiary sector. This was
followed by the primary sector. Contribution from secondary sector is around 16%
which indicates poor manufacturing activity and availability of supporting
infrastructure.
The bank districts had the maximum share in tertiary sector; the non-bank districts
had the maximum share in primary sector.

Report Code: 048_GBP_IIT_SEC_ANL_10_Ver 1_Dec 2013
42 | P a g e
Farm sector provides the maximum number of employment opportunities in both
rural and urban Bihar. In non-farm sector, trade and education provide large
employment.
For bank districts proportion of rural population below poverty line was higher
compared to urban areas. In non-bank districts the percentage of population below
poverty line for both rural and urban area was higher as compared to bank districts.
The amount of deposits in all banks in Bihar has increased but this is not translated
into higher credits/ loans. This indicates business environment is still not conducive.
Male and female literacy rates have increased significantly but the gender gap is
quite significant.
Overall the total primary enrolment shows a rising trend however, enrolment post
2006 have registered an inexplicable sharp decline.
State IMR is way above the national average. Likewise state rural IMR is significantly
higher than that for the urban areas. Although health infrastructure in the state has
improved however there is still considerable deficit to be addressed.
As the focus of this report is on the implications of the rise in population, economic growth
and social changes on the Ganga basin in the state of Bihar, the discussion on the policy
implications should focus on the efficient use of resources to ensure their sustainability and
economic development. However it is evident that the state has not taken advantage of its
share of the available resources and is characterized by significant development deficit in all
respects. Given the low social indicators, high population densities, poor infrastructure and
industrial base, the state needs to imbibe policies for sustained rapid growth. It is not
surprising that the current establishment is therefore seeking ‘special area’ status from the
central government so as to be able to leverage larger share of plan funds.
While the state is endowed with copious water resources, there are issues with quality and
sustainability. At the same time there are major issues with the aggregate sanitation deficit
both in the rural and urban areas. Bihar as recorded significant increase in the ‘census
towns’ i.e., small villages which have taken urban character and which are emerging as
concentrated sources of sewage and solid waste. Therefore the deficit in sanitation
infrastructure particular is posing major threat to the surface and groundwater resources in
the state and undermining efforts in restoring water quality or River Ganga. It is therefore
imperative that the state receives adequate resources and technical assistance to
undertakes concerted and sustained programme for urban infrastructure.

Report Code: 048_GBP_IIT_SEC_ANL_10_Ver 1_Dec 2013
43 | P a g e
References
1. Annual Health Survey, 2010, Registrar General of India. http://censusindia.gov.in/
2. Bihar Statistical Handbook 2010 and 2012
3. Bihar Through Figures 2011
4. Census of India 1991
5. Census of India 2001
6. Census of India 2011
7. Directorate of Economics and Statistics, Department of Planning and Development,
Government of Bihar. http://dse.bih.nic.in/
8. District Level Household and Facility Survey-III, 2007-08
9. Economic Survey Reports of Bihar 2006-07, 2010-11 and 2011-12
10. NSSO 61st and 66th rounds, Government of India
11. Sample Registration System (SRS), Registrar General of India, 2010.
12. Sharma, Alakh N (2005): ‘Agrarian Relations and Socio-Economic Change in Bihar',
Economic and Political Weekly, Vol. 40, No. 10, Mar. 5-11, 2005.
13. Tankha, Ajay (2009) Bihar: Empowering the Poor through Microfinance, Vision 2013-
An ACCESS Initiative

Report Code: 048_GBP_IIT_SEC_ANL_10_Ver 1_Dec 2013
44 | P a g e
Appendix Table 9: District-wise Total Population of Bihar
Districts Years
2001 2011
Patna 4718592 5772804
Vaishali 2718421 3495249
Saran 3248701 3943098
Begusarai 2349366 2954367
Buxar 1402396 1707643
Munger 1137797 1359054
Bhagalpur 2423172 3032226
Khagaria 1280354 1657599
Katihar 2392638 3068149
Lakhisarai 802225 1000717
Bhojpur 2243144 2720155
Samastipur 3394793 4254782
Average for Bank
Districts 2342633.25 2913820.25
Nalanda 2370528 2872523
Rohtas 2450748 2962593
Aurangabad 2013055 2511243
Jehanabad 1514315 1124176
Gaya 3473428 4379383
Nawada 1809696 2216653
Siwan 2714349 3318176
Gopalganj 2152638 2558037
Pashchim champaran 3043466 3922780
Purba champaran 3939773 5082868
Sitamarhi 2682720 3419622
Muzaffarpur 3746714 4778610
Darbhanga 3295789 3921971
Madhubani 3575281 4476044
Saharsa 1508182 1897102
Madhepura 1526646 1994618
Araria 2158608 2806200
Kishanganj 1296348 1690948
Sheohar 515961 656916
Supaul 1732578 2228397
Banka 1608773 2029339
Kaimur 1289074 1626900
Jamui 1398796 1756078
Arwal
699563
Purnia 2543942 3273127
Sheikhpura 525502 634927
Average for Non-
Bank Districts 2195476.4 2647645.9
Source: Census of India 2001, 2011

Report Code: 048_GBP_IIT_SEC_ANL_10_Ver 1_Dec 2013
45 | P a g e
Table 10: District-wise Distribution of Percentage Decadal Variation in Total
Population (1991-2011)
District Years
1991-01 2001-11
Patna 30.17 22.34
Vaishali 26.39 28.58
Saran 26.37 21.37
Begusarai 29.11 25.75
Buxar 29.03 21.77
Munger 20.34 19.45
Bhagalpur 27.24 25.13
Khagaria 29.32 29.46
Katihar 30.91 28.23
Lakhisarai 23.94 24.74
Bhojpur 24.58 21.27
Samastipur 25.63 25.33
Average for Bank Districts 26.92 24.45
West Champaran 30.40 28.89
East Champaran 29.27 29.01
Sheohar 36.16 27.32
Madhubani 26.08 25.19
Supaul 29.95 28.62
Araria 31.84 30.00
Kishanganj 31.50 30.44
Madhepura 29.45 30.65
Saharsa 33.03 25.79
Darbhanga 30.85 19.00
Muzaffarpur 26.74 27.54
Gopalganj 26.11 18.83
Siwan 24.78 22.25
Banka 24.47 26.14
Nalanda 18.64 21.18
Kaimur 30.64 27.54
Rohtas 27.71 20.22
Jehanabad 28.64 21.34
Aurangabad 30.19 24.75
Gaya 30.03 26.08
Nawada 33.08 22.49
Jamui 32.90 25.54
Sitamarhi 32.58 27.47
Purnia 35.23 28.66
Sheikhpura 24.96 20.82
Average for Non-Bank Districts 29.41 25.43
Source: Census of India 2001, 2011

Report Code: 048_GBP_IIT_SEC_ANL_10_Ver 1_Dec 2013
46 | P a g e
Table 11: District-wise Percentage Birth, Death and Natural Growth Rate (2010-2011)
Districts Crude Birth
Rate (CBR)
Crude
Death
Rate
Natural
Growth
Rate
Patna 21.8 5.2 16.6
Vaishali 27.3 7.6 19.7
Saran 24.5 7.7 16.7
Begusarai 26.6 6.5 20.1
Buxar 25.1 6.8 18.3
Munger 25 6.7 18.3
Bhagalpur 26.3 5.5 20.9
Khagaria 30.7 9.4 21.3
Katihar 28.8 6.5 22.3
Lakhisarai 24 6.5 17.5
Bhojpur 24.6 5.8 18.8
Samastipur 28.7 6.9 21.8
Average for Bank Districts 26.12 6.76 19.36
West Champaran 28.6 8.9 19.7
East Champaran 30.4 8.1 22.3
Sheohar 31.2 7.6 23.6
Madhubani 24.7 7.4 17.3
Supaul 28.5 6.5 22
Araria 30.9 7.8 23.1
Kishanganj 30.5 6.5 24.1
Madhepura 30.1 7.5 22.7
Saharsa 32.1 7.8 24.2
Darbhanga 26.5 8.8 17.7
Muzaffarpur 25.5 8.6 16.9
Gopalganj 25.7 6.5 19.2
Siwan 26.1 7.5 18.6
Banka 25.8 6.1 19.7
Nalanda 26.3 8 18.2
Kaimur 25 6 19
Rohtas 25.9 7 18.9
Jehanabad 24.9 6.2 18.7
Aurangabad 25.6 6.4 19.3
Gaya 24.9 7.4 17.5
Nawada 25 5.9 19
Jamui 26.4 6.7 19.7
Sitamarhi 28 9.6 18.4
Purnia 27.6 7.2 20.4
Sheikhpura 28.9 8.1 20.8
Average for Non-Bank Districts 27.40 7.36 20.04
Source: Annual Health Survey 2010-11

Report Code: 048_GBP_IIT_SEC_ANL_10_Ver 1_Dec 2013
47 | P a g e
Table 12: District-wise Density of Population (per sq. km) in Bihar (2001-2011)
District Years
2001 2011
Patna 1471 1803
Vaishali 1332 1717
Saran 1231 1493
Begusarai 1222 1540
Buxar 864 1003
Munger 800 958
Bhagalpur 946 1180
Khagaria 859 1115
Katihar 782 1004
Lakhisarai 652 815
Bhojpur 903 1136
Samastipur 1175 1465
Average for Bank Districts 1020 1269.08
Nalanda 1006 1220
Rohtas 636 763
Kaimur(Bhabhua) 382 488
Gaya 696 880
Jahanabad 992 1206
Arawal 925 1099
Nawada 726 889
Aurangabad 607 760
Siwan 1221 1495
Gopalganj 1052 1258
Muzaffarpur 1180 1506
E.Champaran 991 1281
W.Champaran 582 750
Sitamarhi 1214 1491
Sheohar 1161 1882
Darbhanga 1442 1721
Madhubani 1020 1279
Jamui 451 567
Banka 533 672
Saharsa 885 1125
Supaul 724 919
Madhepura 853 1116
Kishanganj 687 898
Araria 751 992
Purnea 787 1014
Shekhapura 762 922
Average for Non-Bank Districts 856.384615 1084.346154
Source: Census of India 2001, 2011

Report Code: 048_GBP_IIT_SEC_ANL_10_Ver 1_Dec 2013
48 | P a g e
Table 13: District-wise Sex Ratio in Bihar (2001-2011)
District Years
2001 2011
Patna 873 892
Vaishali 920 892
Saran 966 949
Begusarai 912 894
Buxar 899 922
Munger 872 879
Bhagalpur 876 879
Khagaria 885 883
Katihar 919 916
Lakhisarai 921 900
Bhojpur 902 900
Samastipur 928 909
Average for Bank Districts 906.08 901.25
Nalanda 914 921
Rohtas 909 914
Kaimur 902 919
Gaya 938 932
Jahanabad 927 918
Arawal 931 927
Nawada 946 936
Aurangabad 934 916
Siwan 1031 984
Gopalganj 1001 1015
Muzaffarpur 920 898
E.Champaran 897 901
W.Champaran 901 906
Sitamarhi 892 899
Sheohar 885 890
Darbhanga 914 910
Madhubani 942 925
Jamui 918 921
Banka 908 907
Saharsa 910 906
Supaul 920 925
Madhepura 915 914
Kishanganj 936 946
Araria 913 921
Purnia 915 930
Shekhapura 918 926
Average for Non-Bank Districts 924.50 923.35
Source: Census of India 2001& 2011

Report Code: 048_GBP_IIT_SEC_ANL_10_Ver 1_Dec 2013
49 | P a g e
Table 14: District-wise Proportion of Population by Social Groups in Bihar (2009-2010)
Districts STs SCs OBCs
Valid Percent Valid Percent Valid Percent
Patna 2.09 6.19 6.06
Vaishali N.A. 5.94 3.03
Saran 2.49 2.77 4.67
Begusarai N.A. 3.06 2.73
Buxar 9.21 2.06 1.29
Munger 0.01 1.10 1.53
Bhagalpur 0.46 1.09 3.12
Khagaria N.A. 1.48 1.24
Katihar 17.85 1.86 1.65
Lakhisarai 0.47 1.00 0.97
Bhojpur N.A. 3.32 2.28
Samstipur 1.65 2.20 5.89
Bank Districts 34.25 32.05 34.46
West Champaran 0.14 1.43 4.78
East Champaran 0.53 5.15 5.17
Sheohar N.A. 0.27 0.64
Madhubani N.A. 2.49 5.30
Supaul 2.70 1.37 2.52
Araria 10.63 3.87 1.55
Kishangang 0.33 1.01 1.54
Madhepura 7.97 2.09 1.55
Saharsa 3.82 2.11 0.91
Darbhanga N.A. 1.72 4.88
Muzaffarpur N.A. 5.41 4.91
Gopalgang 12.49 3.42 2.88
Siwan 0.90 2.34 2.90
Banka 7.40 2.10 2.27
Nalanda N.A. 3.57 3.12
Bhabhua 7.26 2.20 1.17
Rohtas 1.16 3.68 2.77
Jehanabad N.A. 1.59 0.79
Aurangabad 2.24 2.29 1.57
Gaya 1.74 5.78 3.79
Nawada 0.62 2.39 1.44
Jamui 5.12 1.50 1.69
Sitamarhi N.A. 6.35 3.69
Purnea 0.69 2.42 2.87
Shekhpura N.A. 0.13 0.52
Arwal N.A. 1.26 0.34
Non- Bank Districts 65.75 67.95 65.54
Source: NSS 66th
round, 2009-10

Report Code: 048_GBP_IIT_SEC_ANL_10_Ver 1_Dec 2013
50 | P a g e
Table 15: District-wise Proportion of Population by Religious Groups in Bihar
(2009-2010)
Districts Hindus (Valid
Percent)
Muslims (Valid
Percent)
Patna 6.43 3.87
Vaishali 3.58 1.67
Saran 4.48 2.54
Begusarai 2.63 2.60
Buxar 1.93 0.18
Munger 1.53 0.15
Bhagalpur 2.75 4.39
Khagaria 1.49 0.77
Katihar 1.16 8.02
Lakhisarai 1.12 N.A.
Bhojpur 3.07 1.53
Samstipur 3.91 5.39
Bank Districts 34.08 31.10
West Champaran 4.15 5.04
East Champaran 5.20 3.47
Sheohar 0.39 1.21
Madhubani 3.93 4.48
Supaul 1.78 4.19
Araria 2.10 6.87
Kishangang 0.56 6.20
Madhepura 1.79 0.34
Saharsa 1.49 0.50
Darbhanga 3.68 4.69
Muzaffarpur 4.95 2.32
Gopalgang 2.45 8.31
Siwan 2.98 2.55
Banka 2.29 0.50
Nalanda 3.32 0.42
Bhabhua 1.89 0.05
Rohtas 2.79 1.97
Jehanabad 1.46 0.32
Aurangabad 2.55 0.51
Gaya 4.61 2.37
Nawada 1.94 1.01
Jamui 2.03 1.80
Sitamarhi 4.29 1.81
Purnea 1.98 7.63
Shekhpura 0.54 0.04
Arwal 0.77 0.30
Non- Bank Districts 65.92 68.90
Source: NSS 66th
round, 2009-10

Report Code: 048_GBP_IIT_SEC_ANL_10_Ver 1_Dec 2013
51 | P a g e
Table 16: Gross State Domestic Product (Rs. ‘000 Crores), Bihar, 2004-2011 at constant
prices (2004-05)
Year GSDP
2004–05 77781.2
2005–06 78494
2006–07 92427
2007–08 99492
2008–09 113994
2009–10 (P) 125875
2010–11 (Q) 144472
2011–12 (Adv.) 163439
Source: Economic Survey of Bihar, 2012
Table 17: GDDP (Rs. Lakh) across Districts of Bihar, 2006-2008 at 2004-05 prices
Districts 2006-07 2007-08
Patna 22659.3 26560.4
Vaishali 2391 2390.5
Saran 2463.7 2765.4
Begusarai 3068.6 3502.6
Buxar 1221.7 1373.6
Munger 1648.8 1974.3
Bhagalpur 3095.8 3393.7
Khagaria 1217.9 1343
Katihar 2184.8 2343.6
Lakhisarai 770.5 838.3
Bhojpur 2055.8 2235.1
Samastipur 3050.1 2879.1
Bank Districts 3819 4299.967
West Champaran 3946.3 4185
East Champaran 3008.5 2795.5
Sheohar 288.8 339.8
Madhubani 2608.8 2507.8
Supaul 1260.2 1289.6
Araria 1528.8 1715.2
Kishanganj 1108 1127.2
Madhepura 1104.2 1195.2
Saharsa 1369.8 1466.2
Darbhanga 2702.3 2922.3
Muzaffarpur 2799.2 2677
Gopalganj 1736.4 1821.4
Siwan 2389.7 2243.1
Banka 1184 1252.1
Nalanda 1948.5 2142.2

Report Code: 048_GBP_IIT_SEC_ANL_10_Ver 1_Dec 2013
52 | P a g e
Kaimur 1053.2 1166.7
Rohtas 2505.9 2692.3
Jehanabad 742.1 801.3
Aurangabad 1667.8 1803.6
Gaya 3246.1 3532.6
Nawada 1317 1443.7
Jamui 1122.3 1275.6
Sitamarhi 1906.5 1884
Purnia 2127.3 2286.2
Sheikhpura 394.3 445.5
Non-Bank Districts 1802.64 1880.444
Source: Economic Survey of Bihar, 2012
Table 18: Per Capita GSDP (Rs.) in Bihar, 2004-2008 at 2004-05 constant prices
Year Per Capita GSDP
2004–05 8,773
2005–06 8,706
2006–07 10,087
2007–08 10,690
2008–09 12,066
Source: Statistical Handbook of Bihar, 2012

Report Code: 048_GBP_IIT_SEC_ANL_10_Ver 1_Dec 2013
53 | P a g e
Table 19: Average Per Capita GDDP (Rs.) across Districts of Bihar, 2006-2008 at 2004-
05 prices
Districts 2006-07 2007-08
Patna 43177 49765
Vaishali 8038 7925
Saran 6943 7688
Begusarai 11792 13245
Buxar 7882 8725
Munger 13612 16154
Bhagalpur 11665 12609
Khagaria 8579 9307
Katihar 8187 8631
Lakhisarai 9070 9789
Bhojpur 8433 9053
Samastipur 8274 7712
Average for Bank Districts 12137.67 13383.58
West Champaran 9618 10058
East Champaran 6894 6303
Sheohar 4903 5647
Madhubani 6681 6335
Supaul 6579 6627
Araria 6274 6903
Kishanganj 7642 7637
Madhepura 6525 6949
Saharsa 8071 8476
Darbhanga 7346 7806
Muzaffarpur 8270 7776
Gopalganj 7383 7640
Siwan 8105 7512
Banka 6792 7095
Nalanda 7792 8503
Kaimur 7324 7974
Rohtas 9297 9842
Jehanabad 7251 7707
Aurangabad 7439 7909
Gaya 8405 8995
Nawada 6469 6959
Jamui 7135 7957
Sitamarhi 6314 6122
Purnia 7363 7751
Sheikhpura 6655 7376
Average for Non-Bank Districts 7301.08 7594.36
Source: Economic Survey of Bihar, 2012

Report Code: 048_GBP_IIT_SEC_ANL_10_Ver 1_Dec 2013
54 | P a g e
Table 20: GDDP in Primary Sector (at 2004-05 Constant Prices), Bihar 2004-05 to 2007-08
(Rs. in Lakh)
Region 2004-05 2005-06 2006-07 2007-08 2008-09 2009-10
Bank Districts 715690 709292 839348 795129 862724 811658
Non-Bank
Districts 1741500 1613112 1999121 1862043 2071765 1892793
Source: Directorate of Economics and Statistics, Department of Planning and Development, Government of
Bihar.
Table 21: GDDP in Secondary Sector (at 2004-05 Constant Prices), Bihar 2004-05 to2007-08
(Rs. in Lakh)
Region 2004-05 2005-06 2006-07 2007-08 2008-09 2009-10
Bank Districts 482818 509540 591327 721099 861639 982531
Non-Bank
Districts 583562 657287 766486 902400 1012913 1161849
Source: Directorate of Economics and Statistics, Department of Planning and Development, Government of
Bihar.
Table 22: GDDP in Tertiary Sector (at 2004-05 Constant Prices), Bihar 2004-05 to 2007-08
(Rs. in Lakh)
Region 2004-05 2005-06 2006-07 2007-08 2008-09 2009-10
Bank Districts 2614174 2578010 2953092 3253421 3654858 4060915
Non-Bank
Districts 1526666 1723966 1864077 1994590 2223842 2538284
Source: Directorate of Economics and Statistics, Department of Planning and Development, Government of
Bihar.

Report Code: 048_GBP_IIT_SEC_ANL_10_Ver 1_Dec 2013
55 | P a g e
Table 23: Percentage share of Bank Districts in Total GDDP of the State by Economic
Activity
Economic Activity 2004-05 2005-06 2006-07 2007-08 2008-09 2009-10
Agriculture 29.17 30.82 29.60 30.02 29.46 30.28
Forestry & Logging 27.27 27.16 27.05 26.95 26.80 26.65
Fishing 32.02 32.89 33.66 34.30 34.07 32.50
Mining & quarrying 48.78 42.82 51.52 34.60 22.10 18.39
Primary 29.13 30.54 29.57 29.92 29.40 30.01
Manufacturing MFG 45.73 41.34 40.74 43.50 47.98 47.98
Electricity, Gas & W.Supply 52.55 52.67 52.62 52.55 52.56 52.58
Construction 43.27 43.49 43.67 43.79 43.84 43.99
Secondary 45.28 43.67 43.55 44.42 45.97 45.82
Trade, Hotel & Restaurants 86.46 86.54 86.72 86.71 86.76 86.30
Railways 64.50 64.50 64.50 64.50 64.50 64.50
Transport by other means 55.31 55.21 54.87 53.73 52.72 51.78
Storage 51.47 51.49 51.47 51.48 51.47 51.47
Communication 44.22 44.22 44.22 44.22 44.22 44.22
Banking & Insurance 48.34 48.34 48.34 48.34 48.34 48.34
Real, Ownership of Dwel., B.ser. & Legal 45.66 45.82 45.99 46.13 46.28 46.42
Public Adminis 47.40 47.40 47.40 47.40 47.40 47.40
Other Services 40.15 40.02 40.11 40.15 40.22 40.35
Tertiary 61.44 59.93 61.30 61.99 62.17 61.54
GDDP 49.0181 48.73239 48.63582 50.05572 50.33074 51.1451
Source: Directorate of Economics and Statistics, Department of Planning and Development, Government of
Bihar.

Report Code: 048_GBP_IIT_SEC_ANL_10_Ver 1_Dec 2013
56 | P a g e
Table 24: Percentage share of Non- Bank Districts in Total GDDP of the State by
Economic Activity
Economic Activity 2004-06 2006-07 2006-07 2007-08 2008-09 2009-10
Non -bank
districts
Non -bank
districts
Non -bank
districts
Non -bank
districts
Non -bank
districts
Non -bank
districts
Agriculture 70.83 69.18 70.40 69.98 70.54 69.72
Forestry & Logging 72.73 72.84 72.95 73.05 73.21 73.35
Fishing 67.98 67.10 66.34 65.70 65.92 67.50
Mining & quarrying 51.22 57.18 48.49 65.39 77.90 81.61
Primary 70.87 69.46 70.43 70.08 70.60 69.99
Manufacturing MFG 48.42 58.66 51.83 56.50 52.02 52.02
Electricity, Gas & W.Supply 47.86 47.33 48.67 47.45 47.44 47.42
Construction 55.03 56.51 53.75 56.21 56.16 56.01
Secondary 54.72 56.33 56.45 55.58 54.04 54.18
Trade, Hotel & Restaurants 12.57 13.46 12.44 13.29 13.24 13.70
Railways 53.98 35.50 58.45 35.50 35.50 35.50
Transport by other means 52.56 44.80 51.82 46.27 47.28 48.22
Storage 48.53 48.55 48.55 48.52 48.56 48.53
Communication 55.78 55.78 55.78 55.78 55.78 55.78
Banking & Insurance 51.66 51.66 51.66 51.66 51.66 51.66
Real, Ownership of Dwel., B.ser. & Legal 54.34 54.18 54.01 53.87 53.72 53.58
Public Adminis 52.60 52.60 52.60 52.60 52.60 52.60
Other Services 55.01 59.98 59.89 59.85 59.78 59.65
Tertiary 35.88 40.07 38.70 38.01 37.83 38.46
GDDP 44.28472 51.26758 51.36421 49.94426 49.66926 48.85489
Source: Directorate of Economics and Statistics, Department of Planning and Development, Government of Bihar.

Report Code: 048_GBP_IIT_SEC_ANL_10_Ver 1_Dec 2013
57 | P a g e
Table 25: Percentage share of different Activities in total GDDP in Bank Districts of Bihar
Economic Activity 2004-05 2005-06 2006-07 2007-08 2008-09 2009-10
Agriculture 15.82 15.67 16.62 14.33 13.93 12.01
Forestry & Logging 1.95 1.91 1.61 1.45 1.25 1.12
Fishing 0.95 1.03 0.85 0.85 0.81 0.70
Mining & quarrying 0.05 0.08 0.07 0.04 0.05 0.03
Primary 18.77 18.68 19.15 16.67 16.04 13.86
Manufacturing MFG 5.25 4.47 4.06 4.97 5.83 5.14
Electricity, Gas & W.Supply 1.58 1.65 1.50 1.48 1.43 1.49
Construction 5.83 7.30 7.93 8.67 8.76 10.15
Secondary 12.66 13.42 13.49 15.12 16.02 16.78
Trade, Hotel & Restaurants 36.93 33.87 35.67 37.26 37.47 37.46
Railways 2.45 2.73 2.71 2.73 2.45 2.42
Transport by other means 2.90 3.01 2.82 2.73 2.67 2.56
Storage 0.08 0.08 0.08 0.08 0.08 0.08
Communication 1.28 1.60 1.63 1.69 1.75 2.71
Banking & Insurance 3.28 3.74 3.87 3.97 3.78 4.35
Real, Ownership of Dwel., B.ser.
& Legal 4.84 5.31 5.06 5.10 4.98 5.05
Public Adminis 6.44 6.38 5.57 5.25 5.75 5.56
Other Services 10.36 11.17 9.95 9.41 9.02 9.16
Tertiary 68.57 67.90 67.36 68.21 67.94 69.36
GDDP 100.00 100.00 100.00 100.00 100.00 100.00
Source: Directorate of Economics and Statistics, Department of Planning and Development, Government of
Bihar.

Report Code: 048_GBP_IIT_SEC_ANL_10_Ver 1_Dec 2013
58 | P a g e
Table 26: Percentage share of different Activities in Total GDDP in Non-Bank Districts of
Bihar
Economic Activity 2004-05 2005-06 2006-07 2007-08 2008-09 2009-10
Agriculture 37.53 33.43 37.42 33.48 33.80 28.96
Forestry & Logging 5.00 4.87 4.12 3.93 3.46 3.23
Fishing 1.94 1.99 1.58 1.64 1.58 1.52
Mining & quarrying 0.05 0.10 0.06 0.08 0.19 0.13
Primary 44.52 40.38 42.35 39.13 39.03 33.84
Manufacturing MFG 5.35 6.03 4.89 6.47 6.40 5.83
Electricity, Gas &
W.Supply 1.38 1.41 1.31 1.34 1.31 1.40
Construction 7.13 9.02 9.24 11.16 11.37 13.53
Secondary 13.86 16.46 16.05 18.96 19.08 20.77
Trade, Hotel &
Restaurants 5.16 5.01 16.56 5.72 5.79 6.22
Railways 1.97 1.43 2.33 1.50 1.37 1.40
Transport by other means 2.65 2.32 2.52 2.35 2.42 2.49
Storage 0.08 0.07 0.07 0.08 0.07 0.08
Communication 1.55 1.91 1.95 2.14 2.24 3.58
Banking & Insurance 3.37 3.80 3.92 4.25 4.09 4.86
Real, Ownership of Dwel.,
B.ser. & Legal 5.54 5.97 5.62 5.97 5.86 6.10
Public Adminis 6.87 6.72 5.85 5.84 6.46 6.46
Other Services 13.95 15.91 14.06 14.06 13.58 14.18
Tertiary 41.14 43.16 41.50 41.91 41.89 45.38
GDDP 100 100.00 100.00 100.00 100.00 100.00
Source: Directorate of Economics and Statistics, Department of Planning and Development, Government of
Bihar.

Report Code: 048_GBP_IIT_SEC_ANL_10_Ver 1_Dec 2013
59 | P a g e
Table 27: Population Below Poverty Line in Districts of Bihar, 2009-10
District Rural (% of BPL) Urban (% of BPL)
Poverty
Line:Rs.655.6 per
day
Poverty
Line:Rs.775.3
per day
Patna 65.83% 20.65%
Vaishali 64.49% 52.43%
Saran 61.80% 42.43%
Begusarai 46.40% 11.32%
Buxar 50.81% 19.71%
Munger 38.91% 63.64%
Bhagalpur 72.20% 43.42%
Khagaria 10.68% 43.43%
Katihar 47.12% 41.20%
Lakhisarai 62.13% 59.52%
Bhojpur 43.49% 80.92%
Samstipur 22.89% 47.20%
Bank Districts 48.90% 43.82%
West Champaran 74.56% 55.46%
East Champaran 68.65% 34.64%
Sheohar 40.42% 68.69%
Madhubani 59.98% 48.48%
Supaul 63.11% 58.64%
Araria 35.81% 0.00%
Kishangang 57.40% 43.81%
Madhepura 67.75% 38.27%
Saharsa 43.15% 24.94%
Darbhanga 49.97% 45.35%
Muzaffarpur 67.57% 44.80%
Gopalgang 52.05% 46.21%
Siwan 54.89% 74.84%
Banka 59.62% 51.56%
Nalanda 82.16% 50.72%
Kaimur 54.65% 62.46%
Rohtas 23.12% 51.16%
Jehanabad 43.06% 18.37%
Aurangabad 39.56% 42.99%
Gaya 62.90% 33.99%
Nawada 49.74% 65.22%
Jamui 66.68% 45.05%
Sitamarhi 76.17% 62.80%
Purnea 36.83% 19.74%
Shekhpura 44.40% 46.12%
Arwal 29.39% -
Non-Bank Districts 53.98% 45.37%
Source: NSS 66th
Round, 2009-10
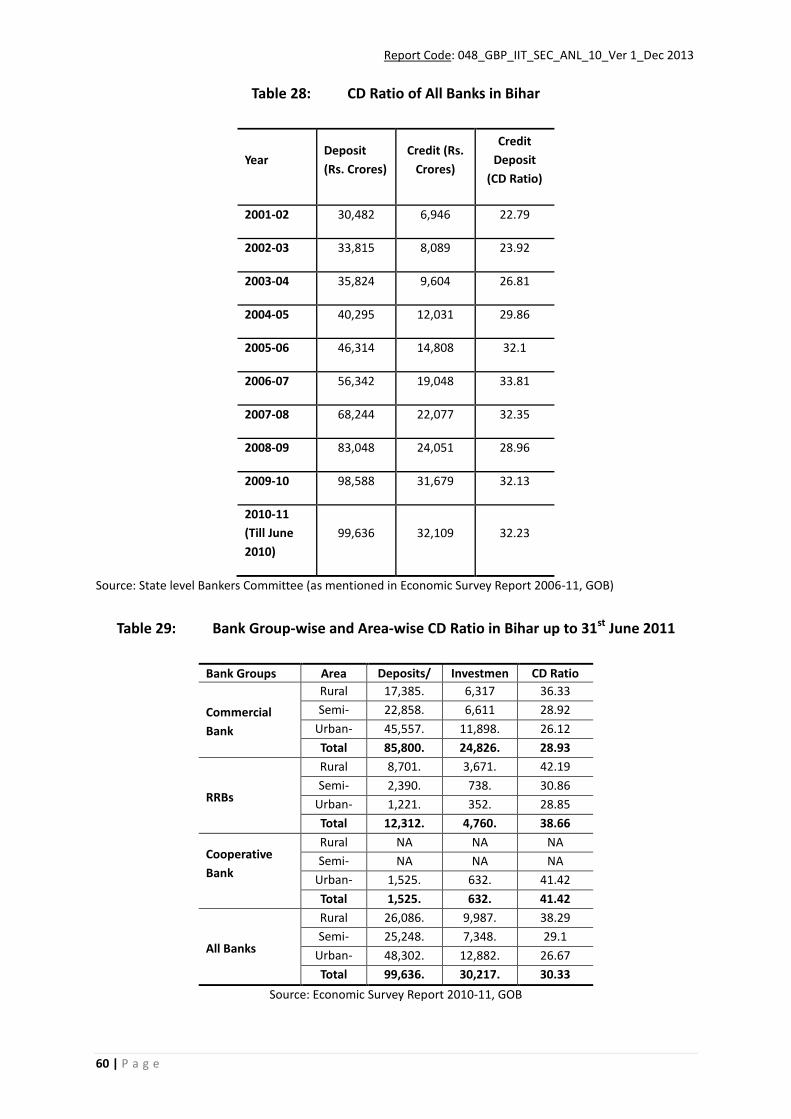
Report Code: 048_GBP_IIT_SEC_ANL_10_Ver 1_Dec 2013
60 | P a g e
Table 28: CD Ratio of All Banks in Bihar
Year Deposit
(Rs. Crores)
Credit (Rs.
Crores)
Credit
Deposit
(CD Ratio)
2001-02 30,482 6,946 22.79
2002-03 33,815 8,089 23.92
2003-04 35,824 9,604 26.81
2004-05 40,295 12,031 29.86
2005-06 46,314 14,808 32.1
2006-07 56,342 19,048 33.81
2007-08 68,244 22,077 32.35
2008-09 83,048 24,051 28.96
2009-10 98,588 31,679 32.13
2010-11
(Till June
2010)
99,636 32,109 32.23
Source: State level Bankers Committee (as mentioned in Economic Survey Report 2006-11, GOB)
Table 29: Bank Group-wise and Area-wise CD Ratio in Bihar up to 31st June 2011
Bank Groups Area Deposits/
Advances
(Rs. crore)
Investmen
t (Rs.
crore)
CD Ratio
(%)
Commercial
Bank
Rural 17,385. 6,317 36.33
Semi-
Urban
22,858. 6,611 28.92
Urban-
Metro
45,557. 11,898. 26.12
Total 85,800. 24,826. 28.93
RRBs
Rural 8,701. 3,671. 42.19
Semi-
Urban
2,390. 738. 30.86
Urban-
Metro
1,221. 352. 28.85
Total 12,312. 4,760. 38.66
Cooperative
Bank
Rural NA NA NA
Semi-
Urban
NA NA NA
Urban-
Metro
1,525. 632. 41.42
Total 1,525. 632. 41.42
All Banks
Rural 26,086. 9,987. 38.29
Semi-
Urban
25,248. 7,348. 29.1
Urban-
Metro
48,302. 12,882. 26.67
Total 99,636. 30,217. 30.33
Source: Economic Survey Report 2010-11, GOB

Report Code: 048_GBP_IIT_SEC_ANL_10_Ver 1_Dec 2013
61 | P a g e
Table 30: District-Wise CD ratio of Commercial Banks
District 2005-06 2006-07 2007-08 2008-09 2009-10 2010-11 2011-12
Patna 29.64 32.18 27.64 25.11 24.18 26.53 28.07
Vaishali 29.7 31.9 32.17 28.45 30.72 29.9 29.33
Nalanda 26.99 27.44 25.77 24.59 27.13 29.75 29.41
Bhojpur 23.61 24.95 24.51 20.74 24.5 23.9 23.12
Buxar 28.39 31.08 30.99 24.17 31.48 31.56 29.49
Rohtas 35.24 39.79 40.5 36.24 36.02 38.37 39.93
Kaimur 44.65 46.06 43.04 47.13 48.16 52.16 49.54
Gaya 25.89 28.37 28.46 28.67 31.45 32.07 31.84
Jehanabad 21.71 23.62 25.28 23.78 28.84 29.98 31.08
Arawal 23.51 26.66 26.8 26.35 32.06 45.38 32.26
Nawada 24.38 27.16 26.06 22.91 31.66 34.44 37.11
Aurangabad 28.31 26.65 23.76 23.22 27.95 31.82 32.7
Saran 23.73 26.18 23.12 23.85 26.25 24.35 23.12
Siwan 20.1 22.07 20.68 18.78 20.08 21.63 21.18
Gopalganj 27.45 29.12 30.19 25.68 25.65 28.66 28.97
West
Champaran 56.85 51.69 48.99 47.31 47.12 45.69 48.77
East Champaran 40.63 43.68 42.34 36.87 38.94 44.07 44.7
Muzaffarpur 33.84 36.21 34.29 43.33 45.34 35.69 36.99
Sitamarhi 40.39 40.24 35.16 32.23 32.91 34 35.83
Sheohar 28.05 30.06 29.44 38.29 42.31 34.09 39.4
Darbhanga 28.82 29.31 26.45 22.99 26.4 28.54 25.47
Madhubani 33.25 32.68 30.32 25.55 28.32 29.4 28.95
Samastipur 37.65 38.5 36.05 37.09 39.69 44.36 43.96
Begusarai 43.72 44.95 40.32 35.59 37.83 39.63 43.06
Munger 21.34 23.35 23.17 23.28 21.02 29.64 26.66
Sheikhpura 27.04 27.61 26.72 24.94 29.77 28.6 27.9
Lakhisarai 25.88 24.4 24.23 22.83 24.26 24.95 22.98
Jamui 28.63 29.18 28.3 25.61 25.85 26.79 27.81
Khagaria 38.57 38.34 32.7 32.37 36.55 36.05 37.5
Bhagalpur 32.98 37.77 35.79 30.98 30.09 28.97 26.14
Banka 39.97 44.62 40.55 33.86 35.83 35.15 33.29
Saharsa 37.1 33.9 36.31 29.03 37.52 34.53 33.87
Supaul 34.84 32.38 35.66 28.16 31.99 36.1 37.21
Madhepura 44.59 42.63 42.29 26.43 28.06 43.39 30.79
Purnea 41.62 51.33 51.53 45.09 49.79 53.12 50.01
Kishanganj 51.66 53.17 52.77 49.1 49.85 53.34 53.15
Araria 54.26 51.69 50.72 38.03 38.57 45.84 48.95
Katihar 59.85 58.19 55.59 43.98 45.59 44.92 43.01
Source: Economic Survey 2012-13

Report Code: 048_GBP_IIT_SEC_ANL_10_Ver 1_Dec 2013
62 | P a g e
Table 31: Distribution of Commercial Bank Branches in Bihar and their Growth Rate
Year Total
Branches
Growth
Rate
Rural
share (%)
Semi-
urban
(%)
Urban
(%)
2001 3620 1.49 69.3 18.5 12.2
2002 3616 -0.11 69.1 18.5 12.4
2003 3609 -0.19 69.1 18.6 12.3
2004 3618 0.25 68.7 18.9 12.4
2005 3648 0.77 64.8 20.07 15.13
2006 3675 0.74 63.59 20.6 15.81
2007 3712 1.01 62.8 20.66 16.54
2008 3792 2.16 61.63 20.97 17.41
2009 3942 3.96 59.72 21.66 18.62
2010 4156 5.43 57.72 22.45 19.83
Source: Economic Survey of Bihar 2006-07 and 2010-11, GOB
Table 32: Micro Finance in Bihar
Year
No. of
SHGs with
Bank
Linkage
Amount of
Credit (Rs
Lakhs)
Upto 2004 16,246 5,200
2004-05 11,769 3,700
2005-06 18,206 3,100
2006-07 26,417 8,300
2007-08 49,738 24,100
2008-09 25,696 21,100
2009-10 30,241 29,500
2010-11 7,287 5,300.
Total 1,85,600. 1,003.
Source: State Level Bankers Committee (as mentioned in the Economic Survey Report 2010-11, GOB)

Report Code: 048_GBP_IIT_SEC_ANL_10_Ver 1_Dec 2013
63 | P a g e
Table 33: District-wise Average Literacy Rate
District Years
2001 2011
Patna 63.82 72.47
Vaishali 51.63 68.56
Saran 52.01 68.57
Begusarai 48.55 66.23
Buxar 57.49 71.77
Munger 60.11 73.3
Bhagalpur 50.28 64.96
Khagaria 41.56 60.87
Katihar 35.29 53.56
Lakhisarai 48.21 64.95
Samastipur 45.76 63.81
Bhojpur 59.71 72.79
Average for Bank Districts 51.20 66.82
Pashchim champaran 39.63 58.06
Purba champaran 38.14 58.26
Sheohar 37.01 56
Sitamarhi 39.38 53.53
Madhubani 42.35 60.9
Supaul 37.8 59.65
Araria 34.94 55.1
Kishnganj 31.02 57.04
Madhepura 36.19 53.78
Saharse 39.28 54.57
Darbhanga 44.32 58.26
Muzaffarpur 48.15 65.68
Gopalganj 48.19 67.04
Siwan 52.01 71.59
Banka 43.4 60.12
Nalanda 53.64 66.41
Kimur 55.57 71.01
Rhotas 62.36 75.59
Aurangabad 56.03 72.77
Gaya 57.5 66.35
Nawada 51.07 61.63
Jamui 47.36 62.16
Jehanabad 42.74 68.27
Arwal N.A. 69.54
Purnia 35.51 52.49
Sheikhpura 49.01 65.96
Average For Non – Bank
Districts 44.9 62.38
Source: Census Data 2001-2011

Report Code: 048_GBP_IIT_SEC_ANL_10_Ver 1_Dec 2013
64 | P a g e
Table 34: District-wise Male Literacy Rate
District Years
2001 2011
Patna 73.81 80.28
Vaishali 64 77
Saran 67.81 79.71
Begusarai 59.71 74.36
Buxar 72.82 82.78
Munger 70.68 80.06
Bhagalpur 60.11 72.3
Khagaria 52.02 68.51
Katihar 45.51 60.99
Lakhisarai 60.97 73.98
Samastipur 57.83 73.09
Bhojpur 74.78 84.08
Average For Bank Districts 63.34 75.60
Pashchim champaran 51.91 68.16
Purba champaran 50.14 68.02
Sheohar 45.54 63.72
Sitamarhi 51.02 62.56
Madhubani 57.26 72.53
Supaul 53.23 71.65
Araria 46.5 64.15
Kishnganj 42.8 65.56
Madhepura 48.87 63.82
Saharse 52.04 65.22
Darbhanga 57.18 68.58
Muzaffarpur 60.19 73.61
Gopalganj 63.81 78.38
Siwan 67.67 82.77
Banka 56.28 69.76
Nalanda 66.94 77.11
Kimur 70.57 81.49
Rhotas 76.54 85.29
Aurangabad 70.9 82.52
Gaya 71.99 76.02
Nawada 63.81 71.4
Jamui 61.22 73.77
Jehanabad 57.1 79.3
Arwal N.A. 81.27
Purnia 46.16 61.09
Sheikhpura 62.56 76.14
Average For Non-Bank Districts 58.09 72.46
Source: Census Data 2001- 2011

Report Code: 048_GBP_IIT_SEC_ANL_10_Ver 1_Dec 2013
65 | P a g e
Table 35: District-wise Female Literacy Rate
District Years
2001 2011
Patna 52.17 63.72
Vaishali 38.14 59.1
Saran 35.74 56.89
Begusarai 36.21 57.1
Buxar 40.36 59.84
Munger 47.97 65.53
Bhagalpur 38.83 56.49
Khagaria 29.62 52.16
Katihar 24.03 45.37
Lakhisarai 34.26 54.89
Samastipur 32.69 53.52
Bhojpur 42.81 60.2
Average For Bank Districts 37.74 57.07
Pashchim Champaran 25.85 46.79
Purba Champaran 24.65 47.36
Sheohar 27.43 47.25
Sitamarhi 26.35 43.4
Madhubani 26.56 48.3
Supaul 21.02 46.63
Araria 22.14 45.18
Kishnganj 18.49 47.98
Madhepura 22.31 42.75
Saharse 25.31 42.73
Darbhanga 30.35 46.88
Muzaffarpur 35.2 56.82
Gopalganj 32.81 56.03
Siwan 37.26 60.35
Banka 29.1 49.4
Nalanda 39.03 54.76
Kimur 38.9 59.56
Rhotas 46.62 64.95
Aurangabad 40.08 62.05
Gaya 42.04 55.9
Nawada 37.4 51.09
Jamui 32.64 49.44
Jehanabad 26.92 56.24
Arwal N.A. 56.85
Purnia 23.72 43.19
Sheikhpura 34.13 54.93
Average For Non-Bank Districts 30.65 51.42
Source: Census Data 2001-2011

Report Code: 048_GBP_IIT_SEC_ANL_10_Ver 1_Dec 2013
66 | P a g e
Table 36: Infant Mortality Rate in Bihar and All Over India (2000-2005)
Year Bihar (Infant Mortality Rate) India (Infant Mortality Rate)
Total Rural Urban Total Rural Urban
2000 62 63 53 68 74 44
2001 62 63 52 66 72 42
2002 61 62 50 63 69 40
2003 60 62 49 60 66 38
2004 61 63 47 58 64 40
2005 61 62 47 58 64 40
Source: Population Foundation of India, 2007