socio-economic factors influencing household dependency
TRANSCRIPT
SOCIO-ECONOMIC FACTORS INFLUENCING HOUSEHOLD DEPENDENCY
ON FOREST IN MASIDA COMMUNITY FOREST,
ZAMBEZI REGION, NAMIBIA
ROMANUS MPASI KARUPU
A DISSERTATION SUBMITTED IN PARTIAL FULFILMENT OF THE
REQUIREMENTS FOR THE DEGREE OF MASTER OF SCIENCE IN
FORESTRY OF SOKOINE UNIVERSITY OF AGRICULTURE.
MOROGORO, TANZANIA.
2019
ii
ABSTRACT
The purpose of this study was to provide a better understanding of the drivers and effects
of dependency on forest resources in Masida community forest in Zambezi region,
Namibia. Specifically, the study assessed the livelihood strategies and contribution of
forest resources to household incomes, assessed socio-economic determinants of
households‟ dependency, determined extent and consequences of dependency and
examined the people‟s perception on forest dependency. A cross-sectional study was
conducted from December 2018 to April 2019. For primary data collection, a semi-
structured questionnaire was administered to 185 randomly selected household heads for
quantitative data, while qualitative data was collected using key informants‟ interviews
and focus group discussion. Secondary data was obtained from office permit system.
Multiple response analysis was used to summarise livelihood strategies and reasons for
household dependence. Multiple comparisons using ANOVA analysed the contributions
of various income sources to household income. Logistic regression model was used to
determine the effect of household‟s socio-economic characteristics on forest dependence.
Descriptive statistics were used to summarise the extent and consequences of dependency,
while people‟s perceptions were assessed using the Likert scale. The study revealed that
farming, piecework and social grants are the livelihood strategies and the forest‟s natural
ablution function, provision of free medicine, easy access of forest, cheap acquisition of
forest resources, inability to pay for other alternatives and unemployment were motives
influencing household forest dependency. The household socio-economic characteristics
such as Age, Education of respondents and Hectares of land owned significantly
influences forest dependency (P<0.05). Moreover, the study showed that species such as
Colophospermum mopane, Terminalia sericea and Dichrostachys cinerea are endangered.
In conclusion, the study revealed that local people‟s perceptions forms a basis for

iii
monitoring the sustainability of forest resources. Lastly, the study recommends that
agroforestry, brickmaking and apiculture are appropriate alternatives to lessen reliance on
forest.
iv
DECLARATION
I, ROMANUS MPASI KARUPU, do hereby declare to the Senate of Sokoine University
of Agriculture that this dissertation is my own work done within the period of registration
and that it has neither been submitted nor being concurrently submitted for degree award
in any other institution.
____________________ ____________________
Romanus Mpasi Karupu Date
(MSc. Candidate)
The above declaration is confirmed by;
____________________ ____________________
Prof. S.M.S Maliondo Date
(Supervisor)

v
COPYRIGHT
No part of this dissertation may be reproduced, stored in any retrieval system, or
transmitted in any form or by any means without prior written permission of the author or
Sokoine University of Agriculture in that behalf.

vi
ACKNOWLEDGEMENT
I would like to express my hand of appreciation to the Ministry of Agriculture, Water and ,
Namibia for their financial support that have taken me up to this level to be able to
produce this document. I would like to extend my thanks to the support received from the
staffs of the Directorate of Forestry, especially the Sibbinda Forestry office, under the
leadership of Ms. Tabo Vivian, for hosting me at their station and accommodated my
research activities into their busy schedule. Similarly, to Masida community forest
management committee, all sampled households and other stakeholders who availed time
for me to collect primary data and organizations for opening doors for me to collect
secondary data for this research.
Furthermore, I extend my thanks to the Sokoine University of Agriculture Postgraduate
Studies, Research, Technology Transfer & Consultancy in general, and specifically, the
Department of Ecosystems and Conservation under the College of Forestry, Wildlife and
Tourism for assigning an Academic Advisor and a Supervisor Professor Salim M.
Maliondo who stood firm and eager to read my work from the development of the research
study up to the write-up stage. Special gratitude goes to Dr. Samora, Head of Ecosystems
and Conservation for assigning the discussants who shaped the final structure of this
document.
Lastly, to my fellow students and the Sokoine National Agricultural Library (SNAL) staffs
for assistance during data analysis and in the searching of relevant journals and books, to
ensure that my work comply with the University guidelines.

vii
DEDICATION
This work is entirely devoted to the Grace of the Almighty God for protecting, guiding
and keeping me safe and healthily to reach this milestone. I also dedicate this study to my
wife, Karupu Ruth N. for finding time to encourage me to work hard and stood firm in my
absence to take care of my family responsibilities of school children, relatives and other
social obligations, also to my siblings although it took them time to communicate with me,
but the little you did, gave me strength to fight hard.
Lastly, to my mother, Widow Karupu Regina Runguro, the single role you took after our
father passed on few months before I departed for study was a path that we should follow,
to be determined and have faith in God that all is possible and achievable in the name of
God.

viii
TABLE OF CONTENTS
ABSTRACT ....................................................................................................................ii
DECLARATION ........................................................................................................... iv
COPYRIGHT.................................................................................................................. v
ACKNOWLEDGEMENT ............................................................................................. vi
DEDICATION .............................................................................................................. vii
TABLE OF CONTENTS .............................................................................................viii
LIST OF TABLES ........................................................................................................ xii
LIST OF FIGURES .....................................................................................................xiii
LIST OF APPENDICES .............................................................................................. xiv
LIST OF ACRONYMS AND SYMBOLS ................................................................... xv
CHAPTER ONE ............................................................................................................. 1
1.0 INTRODUCTION ..................................................................................................... 1
1.1 Background Information ............................................................................................. 1
1.2 Problem Statement ...................................................................................................... 2
1.3 Justification of the Study ............................................................................................. 4
1.4 Objectives ................................................................................................................... 5
1.4.1 Overall objective ................................................................................................ 5
1.4.2 Specific objectives .............................................................................................. 5
1.5 Research Questions ..................................................................................................... 5
1.6 Conceptual Framework of the Study ........................................................................... 6
CHAPTER TWO ............................................................................................................ 9
2.0 LITERATURE REVIEW ......................................................................................... 9
2.1 Forest Dependency in General ..................................................................................... 9
2.2 Community Forest Livelihoods ................................................................................. 10
2.2.1 Types of livelihood benefits.............................................................................. 10
ix
2.2.2 Types of livelihood assets ................................................................................. 11
2.3 Forest dependency in Namibia .................................................................................. 12
2.4 Contribution of Forest Resources to Household‟s Total Income ................................ 13
2.5 Socio - economic Factors of Household Dependency on Forest ................................. 14
2.6 Consequences of Forest Dependency......................................................................... 15
2.7 Forest Dependency Perceptions of Forest Users ........................................................ 17
2.8 Resource Users‟ Perceptions on Natural Resource Management ................................ 17
CHAPTER THREE ...................................................................................................... 20
3.0 MATERIALS AND METHODS ............................................................................ 20
3.1 Description of the Study Area ................................................................................... 20
3.1.1 Location and size .............................................................................................. 20
3.1.2 Climate ............................................................................................................. 21
3.1.3 Soils and agricultural potential ......................................................................... 21
3.1.4 Land types, natural vegetation, and forest resources .......................................... 21
3.1.5 Inhabitants, administration and services ............................................................ 22
3.1.5.1 Organizational set up of the community ................................................ 23
3.1.5.2 The management body and benefit distribution in Masida
community forest ................................................................................. 24
3.2 Research Design........................................................................................................ 25
3.2.1 Sampling design ............................................................................................... 25
3.2.2 Sample size determination ................................................................................ 26
3.3 Data Collection ......................................................................................................... 27
3.3.1 Primary data ..................................................................................................... 27
3.3.1.1 Households‟ livelihood strategies, perceptions and dependency of
household on the forest ........................................................................ 27
3.3.1.2 Household survey ................................................................................. 28
3.3.1.3 Focus group discussions ........................................................................ 29

x
3.3.1.4 Key informants‟ interviews ................................................................... 29
3.3.2 Secondary data ................................................................................................. 30
3.4 Data Analysis ............................................................................................................ 30
3.4.1 Household dependency on the forest, livelihoods and the extent of
dependency on forest and perceptions ............................................................. 30
3.4.2 Analytical Model for determining the socio-economic factors of forest
dependency ..................................................................................................... 33
3.4.3 Description of the variables used in the model .................................................. 34
CHAPTER FOUR......................................................................................................... 38
4.0 RESULTS AND DISCUSSIONS ............................................................................ 38
4.1 Livelihood Strategies and Contribution of Forest Resources to Household Income .... 38
4.1.1 Household livelihoods activities ....................................................................... 38
4.1.2 Livelihood assets .............................................................................................. 38
4.1.2.1 Social assets .......................................................................................... 39
4.1.2.2 Physical assets ...................................................................................... 39
4.1.2.3 Natural assets ........................................................................................ 40
4.1.2.4 Financial assets ..................................................................................... 41
4.1.2.5 Human assets ........................................................................................ 41
4.1.3 Linking forest livelihoods benefits to forest dependence ................................... 41
4.1.3.1 Direct livelihoods benefits .................................................................... 42
4.1.3.2 Indirect livelihoods benefits .................................................................. 44
4.1.4 Contribution of forest resources to total household income ............................... 45
4.1.4.1 Forest resources income and forest dependency .................................... 45
4.1.4.2 Contribution of forest resources to total households income .................. 47
4.2 Socio-economic Factors Influencing Household Dependency on Forest .................... 49
4.2.1 Socio-economic characteristics of respondents ................................................. 49
4.2.2 Socio-economic factors influencing households dependency on forest .............. 51
xi
4.2.3 Reasons influencing household to depend on the forest..................................... 54
4.3 Extent and Consequences of Forest Dependency on Forest Resources ....................... 55
4.3.1 Purposes of forest resource collection from the forest ....................................... 56
4.3.2 Extent of use and consequences of dependency to forest resources ................... 57
4.3.2.1 Firewood .............................................................................................. 57
4.3.2.2 Thatch grass .......................................................................................... 59
4.3.2.3 Wild fruits ............................................................................................ 60
4.3.2.4 Poles ..................................................................................................... 61
4.3.2.5 Droppers ............................................................................................... 63
4.3.2.6 Timber .................................................................................................. 63
4.3.2.7 Medicinal plants ................................................................................... 64
4.4 People‟s Perception to Forest Dependence in Relation to the Sustainability of
Forest Resources ....................................................................................................... 66
4.4.1 People‟s perception on forest resources importance .......................................... 66
4.4.2 People‟s perception on the availability of forest resources ................................ 67
4.4.3 People‟s perception on forest resources collection ............................................ 68
4.4.4 Peoples‟ perceptions on the level of dependency to forest resources ................. 69
4.4.5 Alternative interventions to support forest resource conservation ...................... 70
CHAPTER FIVE .......................................................................................................... 72
5.0 CONCLUSIONS AND RECOMMENDATIONS .................................................. 72
5.1 Conclusions .............................................................................................................. 72
5.2 Recommendations ..................................................................................................... 73
REFERENCES ............................................................................................................. 74
APPENDICES ............................................................................................................... 87
xii
LIST OF TABLES
Table 1: Sampling frame and sampling size of Masida community ................................. 27
Table 2: Livelihood strategies that influences household forest dependency .................... 39
Table 3: Multiple comparison of sources of incomes in Masida CF ................................ 48
Table 4: Socio-economic characteristics of respondents in Masida community ............... 50
Table 5: Socio-economic factors influencing household‟s dependency on forest ............. 52
Table 6: Reasons for depending on Masida community forest ......................................... 55
Table 7: Purposes of forest resources collection by Masida community ........................... 57
Table 8: Sources of energy for cooking in Masida CF ..................................................... 57
Table 9: Harvested species for firewood in Masida CF .................................................... 57
Table 10: Frequencies and quantity of firewood harvested by households ....................... 58
Table 11: Species harvested for commercial firewood in Masida CF ............................... 59
Table 12: Frequencies and quantities of thatch grass collected in Masida CF................... 60
Table 13: Preferred species for poles in Masida CF ......................................................... 61
Table 14: Frequencies and quantities of poles collected by households ........................... 62
Table 15: Tree species harvested for poles from 2008 - 2017 .......................................... 62
Table 16: Species harvested for droppers from 2009 - 2014 ............................................ 63
Table 17: Forest resources harvested for various purposes from 2009 - 2014 .................. 64
Table 18: People‟s perception on the importance of forest products ................................ 67
Table 19: People‟s perception on helpfulness of forest products ...................................... 67
Table 20: Perceptions on forest resource availability in Masida CF ................................. 68
Table 21: The peoples‟ perceptions on forest resource collection in Masida CF .............. 69
Table 22: People‟s perception on the level of forest dependence ..................................... 69
Table 23: Interventions suggested by households towards forest conservation ................. 71

xiii
LIST OF FIGURES
Figure 1: Conceptual framework of the study .................................................................... 8
Figure 2: The location of Masida community forest ........................................................ 20
Figure 3: The main villages of Masida community forest ................................................ 22
Figure 4: The Sampled households distribution of Masida community ............................ 28
Figure 5: Forest benefits mean ranks in Masida CF ......................................................... 42
Figure 6: Pairwise comparisons of the direct livelihoods benefit in Masida CF................ 43
Figure 7: Indirect livelihoods benefits of Masida CF ....................................................... 45
Figure 8: Forest dependency ratio in the villages of Masida CF ....................................... 46
Figure 9: Percentage contribution of forest resources, non-farm resources and
Agriculture income to the total household income ............................................ 47
Figure 10: The reasons for the disappearance of some forest resources............................ 56
Figure 11: Thatch grass species used in Masida CF ......................................................... 60
Figure 12: Species of wild fruits collected in Masida CF ................................................. 61
Figure 13: Medicinal plant species in Masida CF ............................................................ 65

xiv
LIST OF APPENDICES
Appendix 1: Community forest benefit distribution plan ................................................. 87
Appendix 2: Household questionnaire ............................................................................. 88
Appendix 3: Focus group discussion checklist ................................................................ 95
Appendix 4: Checklist for key informant interviews (traditional leader) .......................... 96
Appendix 5: Checklist for key informant interviews (community forestry officer) .......... 97
Appendix 6: Checklist for key informant interviews (conservancy officer) ...................... 98
Appendix 7: Checklist for key informant interviews (constituency development
committee) ................................................................................................. 99
Appendix 8: Checklist for key informant interviews (forestry government official) ....... 100
Appendix 9: Checklist for key informant interviews (Linyanti constituency office) ....... 101
Appendix 10: Checklist for key informant interviews (DAPEES government
official) ................................................................................................... 102
Appendix 11: Data record form for the permits acquired by the community
from 2007 - 2017 ..................................................................................... 103
Appendix 12: Cochran‟s Q test statistics of mean ranks ................................................ 104
Appendix 13: The description of pairwise comparisons of benefits in Masida CF ......... 104
Appendix 14: Sources of income in monetary term in Masida CF ................................. 105
Appendix 15: Sources of income by response in Masida CF communities ..................... 105
Appendix 16: ANOVA of the various income sources in Masida CF............................. 105
Appendix 17: Household income categories of Masida CF communities ....................... 106
Appendix 18: Model coefficient, Summary and Hosmer & Lemeshow test ................... 106
Appendix 19: Percentage of accurate classifications ...................................................... 107
Appendix 20: Factors influencing household dependence on Forest .............................. 108
xv
LIST OF ACRONYMS AND SYMBOLS
0C Degree Celsius
ADC Agricultural Development Centre
AMTA Agro-Marketing and Trade Agency
CBFM Community Based Forest Management
CF Community Forest
CFN Community Forest Namibia
CIFOR Center for International Forestry Research
DAPEES Directorate of Agricultural Production Extensions and Engineering Services
DBH Diameter at Breast Height
DOF Directorate of Forestry
FAO Food and Agricultural Organization
FMC Forest Management Committee
GDP Gross Domestic Products
ICF International Climate Fund
Kg Kilogram
M3 Cubic meters
MAWF Ministry of Agriculture, Water and Forestry
MM Millimeters
N$ Namibian Dollar
NAFOLA Namibia‟s Forested Lands
NGO Non-Governmental Organization
NPC National Planning Commission
NRC National Research Consortium
NTFP Non-Timber Forest Product
SSA Sub-Saharan Africa

1
CHAPTER ONE
1.0 INTRODUCTION
1.1 Background Information
Forests provide a wide range of goods and services to sustain livelihoods for forest-
dependent communities prone to abject poverty (Bwalya, 2013; Schaafsma et al., 2014;
Rahman et al., 2017). Globally, it is estimated that more than 350 million people around
the world depend on forests for their livelihoods. The majority of these are rural people
who live within or adjacent to dense forests on which they depend for their subsistence
and income (Abdullah et al., 2016; Fikir et al., 2016; Ojea et al., 2016). In Sub-Saharan
Africa, more than 70 % of the population depends on forests and woodlands for their
livelihoods. The forests and woodlands supply approximately 60% of all energy
(Mohammed et al., 2015; Odunwole et al., 2015; Fikir et al., 2016). In Namibia, about
62% of the population live in rural areas and depend on natural resources for their
livelihoods (Riehl et al., 2015; Krug, 2017; Vrabcová et al., 2019). Several studies have
been conducted in Sub-Saharan countries on local community dependency on forest and
related socio-economic factors. A study by Ofoegbu et al. (2017) in South Africa
elucidated that the purposes for which forest resources are utilized and the extent to which
they are harnessed, are dictated by the households‟ socio-economic characteristics which
if well managed, are an effective and sustainable way of promoting forest-based climate
change initiatives.
Elsewhere, Bwalya (2013) estimated 30% of total household incomes of rural households
in Zambia was earned from harvesting and selling forest products. Garekae et al. (2017)
assessed household forest dependency from a forest reserve in Botswana. Recently,
Mukete et al. (2018) estimated that forest resources contributed 34.1% of the average total
2
rural household income compared to 36% from agriculture. Vedeld et al. (2007), based on
51 case studies across 17 developing countries, revealed that forest income accounted for
about 22% of the total household income. These studies on forest-dependent households
have inspired some of the policymakers in many developing countries including Namibia,
to decentralize forest management by adopting Community Forest Management strategy
(Rai et al., 2016).
Although forest dependency is a common phenomenon, the drivers of the household‟s
dependency on forest resources vary across households depending on their demographic
and socio-economic characteristics (Adam and Tayeb, 2014; Jain and Sajjad, 2016).
Various studies on factors influencing household forest dependency have found that
factors differ in the degree of dependency geographically, over time and across
communities, in different countries. These differences are largely due to disparities in the
socio-economic conditions, values, beliefs, goals, and preferences of that community.
However, the differences will not be static over time, resulting in changing forest resource
dependency over time (Bwalya, 2013; Misbahuzzaman and Smith-Hall, 2015; Bhandari
and Jianhua, 2017; Garekae et al., 2017).
Therefore, given the context-specific realities, there is a need for developing countries
such as Namibia to better understand how household dependency on the forest resources is
associated with different socio-economic factors. In particular, there is a need for a study
to identify socio-economic determinants of household dependency on forests in the
Zambezi region, Namibia.
1.2 Problem Statement
Sustainable forest management has been a challenge experienced in most sub-Saharan
Africa (SSA) countries, due to rising challenges and pressures (Odera, 2004).

3
This emanated from the failure of the centralized management system to decrease resource
use pressure through enforcement, due to insufficient resources for forest services and the
people-state conflicts on forest ownership, management and controls. As such
encroachment and conversion of forest to agriculture and settlements has taken place
especially in forest areas close to human settlements (Brown and Schrenkenberg, 2001).
However, in many SSA countries it was realized that the exclusion of communities‟ right
to natural resources and the forest has made the forest policies, legislation and tenure
operations to be incapable of lessening the degradation and loss of forests. In recent times,
SSA countries have adapted the Community Based Forest Management (CBFM) of
different types in different countries, and new ones continue to emerge in many countries.
The concept has now turned from state-people collaboration to people-state where the
state supports the efforts of the people (Wily, 2002). Thus, many developing countries
both rich in forest and those with only woodland savannahs such as Namibia are
implementing CBFM as an effective approach of managing the forest resources. The
CBFM is an initiative whereby communities are empowered with responsibilities and
legally secured rights to manage the resources and have received benefits which have
improved the forest cover and reduced the forest degradations (Kajembe et al., 2003). The
CBFM idea has created a favorable environment within a short time and many developing
countries in SSA forest service departments including Namibia are in the process of
establishing CBFM, backed up with bilateral or international Non-governmental
Organization (NGO) support. The only hindrance in the concept is the formulation of costs
and benefit sharing mechanisms/formula. Although Namibia is not a forest-rich country,
the woodland savannah plays an important ecological and socio-economic role, supplying
wood and timber for a variety of uses, as well as non-timber forest products (Mbongo et
al., 2014; Suleiman et al., 2017; Jannat et al., 2018; Vrabcova et al., 2019). Given the
wide range of services provided by the forest, often, people tend to exploit the forest
4
resources in an unsustainable manner, leading to the depletion of the resource base
(Pokharel et al., 2013; Nelson et al., 2015). This is a common problem facing most
developing countries, including Namibia where, due to poverty, high pressure is exerted
on the remaining forest resources (Pokharel et al., 2015; Jain and Sajjad, 2016; Awono
and Levang, 2018). However, little is known and documented about the specific socio-
economic factors that influence community dependency on forest resources in the
Zambezi region, Namibia. This study is therefore intended to fill this knowledge gap by
providing a better understanding of the socio-economic factors that influence household
dependency on forest resources and their effects on the availability of forest resources in
Zambezi region, Namibia.
1.3 Justification of the Study
The findings of this study will provide specific recommendations to enhance the
sustainable utilization and management of the forest resource by the forest management
body in the Zambezi region, Namibia. Zambezi region is most wooded and favourable for
agriculture (Kamwi et al., 2015). Conducting a study in this region will help the relevant
authorities to formulate policies that are beneficial for equitable, sustainable resource
management and conservation of biodiversity that may help to reduce dependency or
pressure on forest resources. The findings will further shed more light on possible
alternative approaches for communities to embark on instead of mainly relying on forest
products alone. The study synopsis is in line with the Strategic research areas of the
Directorate of Forestry (DoF) number two on Forest product (value-added) research and
number six on Economic, policy and sociological research. The study will also address the
strategic objectives of economically sustainable utilization in a relatively scarce resources
in the northern part of Namibia and provide an understanding of the economic, policy and
sociological aspects of forest management and utilization of forest products for

5
development in Community forests (Government Gazette of the Republic of Namibia
2001, 2005). The outcome of this study is therefore intended to inform the policy makers
at local level up to national level on the status of resource utilization and will lay a bench
mark of a holistic approach development.
1.4 Objectives
1.4.1 Overall objective
The overall objective was to provide a better understanding of the drivers of household
forest dependence and their effects on forest resources in the Zambezi region, Namibia.
1.4.2 Specific objectives
The specific objectives were to:
i. Assess household livelihood strategies and contribution of forest resources to the
total household income in the study area.
ii. Assess socio-economic determinants of household dependency on forest resources
in the study area.
iii. Determine the extent and consequences of forest dependency on forest resources in
the study area.
iv. Examine the people‟s perceptions of forest dependency in relation to forest
resource sustainability in the study area.
1.5 Research Questions
The study strives to answer the following questions:
i. What are the livelihood strategies that household embark on and what is the
proportion of forest income to the total household income in the study area?

6
ii. What are the determinants of household‟s dependence on forest resources in the
study area?
iii. What are the effects of forest dependency on the forest resources in the study area?
iv. What are the people‟s perceptions of the dependency on the sustainability of forest
resource in the study area?
1.6 Conceptual Framework of the Study
Conceptual framework has been used by several studies as a systematic approach to assess
the relationship between people and forest (Newton et al., 2016; Mananura et al., 2014;
Kamwi et al., 2018; Suleimann et al., 2017). In this study the theory by Adam and Tayeb
(2014) was adapted to be used as a conceptual framework to guide this study.
The theory was used to identify the relationship between forest, people and dependency
aspects that focus on defining the socio-economic determinants of households‟
dependence on forest of Masida community forest in Zambezi region. The Conceptual
framework comprises of three different connections namely; socio-economic
determinants, forest dependence and attitudes towards conservation (Adam and
Tayeb, 2014).
These aspects are used to outline the mutual benefits of each dimension to each other.
Since forest dependence is a multifaceted phenomenon, the characterization of forest-
dependent people varies considerably in terms of its contribution to people‟s livelihoods
(Munanura et al., 2014). In this framework the forest is defined as source of products and
services. Livelihoods in this context is used to define a means of making a living,
comprised of capabilities, assets, and resources used in daily activities
(Mananura et al., 2014; Kamwi et al., 2018).

7
Interrelated models are contained in this frame work. The households‟ socio-economic
characteristics of household influences forest dependency, the forest resources determines
the livelihood strategies and activities that communities will pursue and the attitudes
towards forest management (conservation and utilization) will determine whether the
forest use is sustainable or unsustainable and call for conservation interventions.
The institutions (Forest Management body, Directorate of forestry, and other stakeholders)
play a role in designing the conservation intervention and regulate the access to resources
in a community forest. The processes within the Institutions such as forest Acts, policies
and legislations will be used to guide the implementation of interventions through the
permit system, and law enforcement to ensure that forest users adhere to the set laws
towards the sustainability of resources. The framework information is vital for
understanding the relationship of livelihoods assets and forest dependence, and
understands people – forest relationship for resource sustainability and conservation of
biodiversity.

8
Figure 1: Conceptual framework of the study
Source: (Adapted from Adam and Tayeb, 2014)
Institutions (Forestry
departments, FMC)
Processes (Forest Acts,
Legislations etc.)
Socio-economic characteristics of the Households
Age
Level of formal education
Marital status
Household size
Hectares of land owned
Gender
Years of residence etc.
Forest dependency
Timber and non - timber forest products
Poles, thatch grass, hunting, droppers,
Tourism services/recreation
Ecological, Cultural services etc
Livelihood strategy
Livelihood activities
Farming, Piecework
Household maintenance
Commercial & Subsistence use of
products etc.
Attitudes towards natural forest Management
Conservation and Utilization of resources
Unsustainable utilization of forest resources
Conservation interventions (outcome)
9
CHAPTER TWO
2.0 LITERATURE REVIEW
2.1 Forest Dependency in General
Several studies have reported that forest provide goods and service to over 800 million up
to 1.6 billion people globally. Majority (70%) of this are in sub-Saharan countries where
they live in rural areas and depend heavily on natural resources for food and income,
where the forests supply about 60% of their daily energy (Mohammed et al., 2015;
Odunwole et al., 2015; Fikir et al., 2016). The forest resources serve as a safety net in time
of economic crisis thus helps in poverty alleviation (Schaafma et al., 2014;
Abdullah et al., 2016). In developing countries conservation of the biodiversity has been a
challenge due to human dependence for both direct and indirect benefits derived from the
forest such as collection of non-timber forest products and service it renders such as
provisional, regulation, cultural, and ecological services (Adam and Tayeb, 2014).
Forest dependency is variously defined by different authors and mainly refers to forest-
dependent people in various contexts (Miah, 2014; Larson et al., 2017; Newton et al.,
2016). In most of the literature, the term was used to refer to forest-people interaction and
its definition and description was brought to relate to specific aspects of looking into the
relationship between forests and people‟s livelihoods (ICF, 2014). In this study, the term
dependency was used to agree with other authors that focus on the context of people and
forest use inferring that forest-dependent people‟s livelihood are reliant on forests to some
degree, and is conditional on forest-derived benefits (Belcher et al., 2015; Newton et al.,
2016). Several studies consider people-forest dependency based on their subsistence and
commercial livelihoods derived from forest products and services (Timko et al., 2010;
Tieguhong and Nkamgnia, 2012; Timko and Kozak, 2014; Schaafsma et al., 2014;
10
Teshome et al., 2015; Newton et al., 2016; Fikir et al., 2016). The dependency is then
ranked from high to low, based on the benefits and use pattern (subsistence or
commercial) indicated by a household as derived from the forest for their livelihoods.
2.2 Community Forest Livelihoods
Community forest concept is a strategy that most of the policy makers in the developing
countries are striving to adopt (Rai et al., 2016). The declaration of a community forest is
a devolution strategy that involves a shift of authority and control from the state to local
communities to manage the area for their own benefits (Thoms, 2008; Schusser, 2013,
Vrabcova et al., 2019). This devolution entails handing over the accountability,
responsibility and costs of management of the area to the established management body.
2.2.1 Types of livelihood benefits
In developing countries, community forest plays a vital role that involves provision of
both direct and indirect livelihoods benefits to the rural inhabitants. These benefits include
forest products, services and capabilities. The direct livelihoods include construction
materials, timber, foods, fuels, medicines, natural ablution and many more. The indirect
livelihoods benefits are obtained through the forest provision of ecological services such
as improvement of soil fertility, fodder, windbreaks on farmlands watershed protection
and erosion control (Thoms, 2008; Vrabcova et al., 2019).
The establishment of a community forest offers the capability benefits such as opening
opportunities for skill developments and social networks to the beneficiaries especially
when the management body establishes income generation activities that are used to
support schools, construction of community building, village electrification, community
fire breaks, and home improvements through salaries. Shackleton et al. (2007) reported in
11
their study on forests and livelihoods in South Africa that one-sixth to one quarter of total
commercial livelihoods is contributed by forest resources. In another study Mahanty et al.
(2006) described three provisioning benefits derived from the forest by households
ranging from forest playing an important role as safety net function for communities to
troubled or lean times, secondly, the acquisition of basic needs supplied by forest such as
weaving fibers, firewood, medicinal plants etc. Lastly, the utilization of forest becomes a
mean to save scarce cash resources. The safety-net function of the forests occurs through
(a) the generation of temporal cash in local or regional markets through selling of forest
resources, (b) utilizing of lesser- known forest resources and (c) substitute purchased
commodities through increased consumption of the already used forest resources
(Shackleton et al., 2007).
2.2.2 Types of livelihood assets
The community forest direct and indirect livelihoods have impacts on different livelihood
assets. These assets are; natural, human, capital, physical and social assets. When
community forests are managed collectively, the livelihoods contribution of forest
becomes more reliable and stable. The community forest indirect livelihoods impacts are
by improvement of natural assets through effective forest resource protection and
regulations for it to be able to regenerate and increases in forest products volume that
increases the benefits. On the other hand, the indirect livelihoods impact includes
opportunities for other livelihoods diversifications as well as improvements in all other
remaining four assets (Dev et al., 2003; Kamwi et al., 2015). Some of the improvement in
human assets are through assistance of projects such as German funded Community Forest
Namibia (CFN), government DoF, World Bank and NAFOLA (Namiba Forested Lands)
through skills training, literacy and empowering craft centre‟s management body.
The financial asset is improved through the sale of forest products and collection of

12
membership fees, while the physical assets are improved through the development
activities and upgrading of community infrastructures. The social assets are enhanced
through the income generation opportunities and diversification of household livelihoods,
when marketable products and their markets are accessible (Thoms, 2008).
2.3 Forest dependency in Namibia
Studies conducted in Namibia, reveals that about 62 % of the country‟s population lives in
the north west and north east regions and they depend on forest resources and agriculture
for their livelihoods sustenance (Mbongo et al., 2014; Riehl et al., 2015; Kamwi et al.,
2015; Krug, 2017; Vrabcova et al., 2019). However, Namibia like any other developing
countries, has experienced challenges in applying traditional centrally - controlled forest
management approaches because local people rely heavily on forest resources for their
livelihoods (Pokharel et al., 2015). Namibia has also faced forest degradation resulting
from high dependency on forest resources for the majority of rural people and this has led
to challenges in forest management efforts, and this has motivated a shift in the forestry
legal framework towards participatory resource management and access rights from the
state to the local community. The new trend in forest resource management acknowledges
the direct dependence on natural environmental resources by the majority of the
population that live in rural areas in Namibia (Mogotsi et al., 2016; Vrabcova et al., 2019).
According to NNRC (2002), the household dependence on wild forest products were
mostly in the northern regions of the country in the Kavango, Ohangwena, Oshikoto and
Omusati region. About 33% of total household consumption in rural areas was estimated
at the national level to have come from the wild forest food and products. In the Zambezi
region, it was estimated that about 50% of the rural communities rely on wild forest food
for their sustenance. The harvested forest resources include bush meat (from game and
fish), poles for constructions and woodcarvings, thatching grasses, firewood (as a primary
13
source of energy, were about 93 % of use in rural households) and medicinal products and
wild fruits (nuts, fruits, leaves, roots and barks). The same study reported that the indirect
use of natural ecosystem is of greater value to survival, and the direct use of natural
ecosystem contributes over 30% to the Gross Domestic Products (GDP) of Namibia.
Several studies conducted in Namibia have demonstrated the role of forest resources in the
economy of forest inhabitants in the North West and North East regions of the country.
Study by Mbongo et al. (2014), revealed that socio-economic benefits of community
forests lie primarily on provision of forest products that enhance rural livelihoods and
study by Kamwi et al. (2015) on livelihood, land use and land cover change in Zambezi
region indicated that illegal logging is one of the drivers of land use and land cover
change, while the collection of non-timber forest products is one of the livelihood coping
strategy. Parviainen (2012) assessed the role of community forestry in rural livelihood and
poverty alleviation, focusing on net benefit generation in community forest and comparing
cost and benefit analysis. However, the socio-economic determinants of forest dependency
and its impact on forest resources in the Zambezi region, Namibia is not so far
documented. Therefore, this information gap necessitates the need for such a study in the
region.
2.4 Contribution of Forest Resources to Household’s Total Income
Many development countries has been encountering poor yields from agriculture and high
unemployment rate and this has brought an increasing demand for forest resources to
provide cash income generation (Steele et al., 2015). Forest resources are considered to be
a source of cash income by most rural households in developing countries. In Sub-Saharan
Africa forest-related enterprises generate cash income to more than 15 million people from
resources such as charcoal sales, small-scale saw milling, fuel wood, handicraft and

14
commercial hunting (Mwera, 2017). Study by Malleson et al. (2014) in Cameroun and
Nigeria reported that communities who lives in rural areas generated high income from
non- timber forest resources and farming than those living in towns. In another study by
Suleiman et al. (2017) revealed that forest resources contribution to household income is
of paramount important as they provide a safe net to households living within or closer to
forest and forest resources contributed about 40% to their total household income.
This entails that it is not appropriate to restrict access to forests, but rather decentralise the
management of forests in rural areas to the local communities under a concept of
Community forest.
2.5 Socio - economic Factors of Household Dependency on Forest
The household‟s reliance on forest resources in developing countries has been widely
discussed (Adam and Tayeb, 2014; Malleson et al., 2014; Sunderland et al., 2014;
Mananura et al., 2014; Kamwi et al., 2015; Ojea et al., 2016; Endamana et al., 2016;
Jannat et al., 2018; Vrabcova et al., 2019). This has increased the interest of creating
alternative policy, monitoring and maintenance of the forest and its resources
(Van Laerhoven, 2010). There are several factors that contribute towards the household‟s
forest dependency including land ownership, household distance to forest, nature, and
extent of forest resource utilization and related income and expenditure (Nelson et al.,
2015). Jain and Sajjad (2016) reported that socio-economic factors such as household size,
land holding size, education, age, livestock populations and market access influenced
household dependency, while Ofoegbu et al. (2017) find length of residency and gender in
addition to what was reported by Jain and Sajjad (2016). In another study Suleiman et al.
(2017) found farm size, household income and occupation to influence household‟s
dependency on forest resources. The roles of the forest towards the community‟s
livelihoods have created an important relationship or mutual dependence between the

15
forest and the communities, and this relationship is hard to be separated (Adlina et al.,
2013). However, Lepetu et al. (2009) and Muhammed et al. (2010) suggested that the
dependency of the household‟s towards forests is highly problematic but they did not
relate or analyse the effect of the household‟s livelihood pattern and dependency towards
the forests comprehensively. The forest dependency is also considered problematic when
the forest resources are used commercially (Jannat et al., 2018). Newton et al. (2016)
reviewed 155 different characterizations of forest-dependent people, and further
characterized the relationships between people and the forest into different dimensions.
This study used the taxonomy of relationships between forest and people as suggested by
various authors. Components of the dimension comprised of a) dimension that focus on
„forest‟ b) dimension that focus on „dependent‟ and c) dimension that focus on „people‟.
2.6 Consequences of Forest Dependency
Namibia‟s important source of energy, food for people and livestock and medicine are
located in the north and northeastern woodlands of the country. About 64% of the total
land cover of the country is covered by wooded savannah and 20% is dry woodlands.
Namibia „s socio-economic activities in the northern part such as shifting agriculture based
on slash and burn, cutting of construction poles and harvesting of fuel woods are the main
causes of deforestation and forest resource degradation. Back dated to 1996 by
Mendelsohn and Roberts (1997) study, the Zambezi region was estimated to clear a total
land area of 20 000 square kilometers for agriculture alone and this was on the riverine
woodlands. The fuel wood annual consumption was estimated at 672 331 metric tons. In
another study in Namibia, NPC (2001) estimated the fuel consumption in the Zambezi
region to reach 1.1 million metric tons a year by 2006. Vigne (2000) revealed that in
Zambezi region, excessive forest fire is a problem and it disturbs forest ecology, destroyed
trees, retards tree growth and hinders seedling regeneration.

16
In Namibia there is a dearth of information on the contribution of forest resources to GDP,
However, estimation of annual values is used. For example, Vigne (2000) estimated that
forest resources contributed 7.9 % to total GDP at market prices. This was summed up
from the contributions from construction of poles, tourism, fences for crop protections and
firewood harvesting. Although these estimates were made, it is difficult to put the real
contribution of these products to the rural livelihood of Namibia by economists.
Thus, NPC (2001) concluded that while it is difficult to quantify the contribution in
economic terms, Namibia‟s northern woodland and savannah ecosystems support the
majority of the people through the provision of many essential ecological services to the
health of the environment and supply of energy, construction materials, wild fruits,
medicine, browse and grazing. In Namibia, on both freehold and communal rangeland,
bush encroachment is a phenomenon linked to overgrazing, and loss of productive grazing
land causes huge losses in the livestock industry.
The extent of the community‟s forest resource utilization can be identified through the
different forest-based activities that are being carried out by the community members
(Muhammed et al., 2010). Forest resource utilization can further be identified based on
types of forest resources being exploited. More often, the unsustainable forest
management and utilization of forest resources has led to an increase in deforestation rate,
and potential loss of water catchment areas (Nelson et al., 2015). In addition, heavy
dependence on forest resources often contributes to the increased rate of soil erosion,
landslides, deforestation, and forest degradation, thus endangering the forest ecosystem
integrity and biodiversity value (Pandit and Bevilacqua, 2011; Mujawamariya and
Karimov, 2014).
Forests are being exploited for various activities, creating worries on sustainable
management. In fact, forests adjacent to community settlements are exploited by different
17
companies and agro-industries without any consideration for local peoples‟ needs, hence
degrading their natural potential along the line (Awono and Levang, 2018). Consequently,
there is a strong need to promote a sustainable management plan for the community‟s
forest resource utilization and establish a constructive relationship between the community
and the forests.
2.7 Forest Dependency Perceptions of Forest Users
Better knowledge of dependency on forest products provides empirical support for further
forest policy orientation towards rural livelihoods improvement based on forest
dependency especially non-timber forest products valuation. Increasingly, the majority of
rural households, especially women and children, extract NTFPs to generate additional
income (Angelsen et al., 2014; Awono and Levang, 2018) and that the harvest of forest
products especially NTFPs is an ancient activity mainly controlled by women (Awono and
Levang, 2018). Assessing how men and women access, manage and use different forest
products in the world tropical forests, the study found that Africa was the only region in
the world where women dominated the NTFPs sector. In contrast, the energetic nature of
the young people propels them to indulge in forest extraction activities which are often
labour intensive and require physical strength; this has been validated by various studies
elsewhere (Fonta and Ayuk, 2013; Adam and Tayeb, 2014; Thondhlana and
Muchapondwa, 2014; Ahmad and Stacey, 2016).
2.8 Resource Users’ Perceptions on Natural Resource Management
Understanding the behavior of the community towards the use of resources in their daily
lives is of utmost importance to consider the perception of local people towards the
changes in resource availability. Thus, in monitoring the changes in common-pool stocks
(natural resources used by majority of people) availability, local perceptions of the small-

18
scale societies form a basis. McCarthy et al. (2014) reported that in designing successful
sustainable management of natural resources, the local perception has been considered by
the small - scale societies as critical. Other author contend that decisions regarding
governance and management of natural resources are not based on scientific knowledge in
many parts of the world because such knowledge is often absent (Fernández-Llamazares et
al., 2015). Leclerc et al. (2013) stated that the perceptual information about environmental
change is directly acquired through local perceptions and encompasses embodied
experience. It is in view of this that to date, it is still debated whether the experience of
local people on environmental changes can be considered as perception or knowledge,
since the perceptions are inherently not articulated in a form that is easily accessible to
others (Yeh, 2016).
However, these terms are used interchangeably, one author used knowledge (Riseth et al.,
2011), while Oldekop et al. (2012) used perception to refer to accounts of environmental
changes as reported by local societies. The study by Fernández-Llamazares et al. (2016)
used the term „change perception‟ and „availability perception‟ to define the individual
evaluation of the changes in the stock of a given resource over time and to define the
individual‟s evaluation of the available stock of a given resource at the present moment
respectively. Chimello de Oliveira (2018) remarked that perception gives a better
reflection of the historical environmental status rather than the ecological dimension of the
changes undergone. The study further narrated that perception might fall short in precision
from an ecological standpoint, but it is important in informing the sustainable management
of resources.
In Namibia, there is an effort to take NTFPs from woodlands and savannahs as a potential
to increase its economic contributions. The value and use of NTFPs has increased in
19
pharmaceuticals, cosmetics and beverage industries. This initiative has been taken up by
the government through the Ministry of Agriculture, Water and Forestry, where women
co-operatives are organized and it has shown that NTFPs has potentials for exploitation.
The initiative has led to the formation of task teams to promote indigenous plants that will
contribute to higher household food security, income and employment creation. Statistics
from NRC (2000) and NPC (2001) is that Directorate of Forestry (DoF) in its value
addition strategy has enabled households to gain some income from the sale of wild fruits
and sale of alcoholic drinks in north-central and Kavango regions and established
international market for Harpagophytum procumbens sales.

20
CHAPTER THREE
3.0 MATERIALS AND METHODS
3.1 Description of the Study Area
3.1.1 Location and size
The study was conducted in Masida Community Forest in Linyanti Constituency, Zambezi
region. This is an area amongst the first 13 community forests that were declared in 2006
by the Government. This is an area where local communities in the communal lands of
Namibia have obtained the rights to manage forests, woodlands and other types of natural
vegetation according to the provisions of the Forest Act No. 12 of 2001(Schusser, 2013).
Masida community forest is located approximately 70 km west of Katima Mulilo town
and 40 km east of Kongola along the Trans Caprivi Highway. The study area (Figure 2)
comprises of 6 villages of Kapani, Kansoko, Sabelo, Masida, Taulo, and Sitanta. It covers
an area of 19 325ha. The study area has a population size of 343 households. It borders
Mudumu National park (South), Makanga Village (East), Zambezi State forest (North) and
the Community forest of Lubuta (West).
#
#
#
#
#
#
#
#
A
B
C
D
E
F
G
H
12.7 k
m
6 k
m
9.5
km
2.6km
3.9
km
12.3km
8.1
km
5km
S
N
EW
MAP FOR MASIDA COMMUNITY FOREST
2 0 2 4 Kilometers
NAMIBIA
Caprivi region
Boundary
# Corner points
Shape Name East-coord South-coord
Point A 23.70897 -17.75427
Point B 23.71978 -17.83629
Point C 23.72665 -17.87951
Point D 23.72960 -17.95219
Point E 23.61370 -17.94188
Point F 23.61370 -17.90750
Point G 23.61517 -17.88491
Point H 23.61615 -17.83236
Projection: Geographic
Datum: W GS 84
Degree Decimals
Figure 2: The location of Masida community forest
21
3.1.2 Climate
The area receives a mean annual rainfall between 550 to 650 mm with a variation of 34 to
36%. The rainy season starts in November and ends in April, with the major rainfall
occurring in February (Environmental profile of Zambezi”, Mendelsohn et al., 2002).
The mean temperature is 220C and a maximum of 34
0C to 36
0C with a minimum between
20C and 4
0C (Jones, 2015; Krug, 2017).
3.1.3 Soils and agricultural potential
The soil type is sand north of the Trans-Caprivi Highway and clay-loam south of the main
road. There is a great deal of small scale or local variation. Cropping potential is indicated
as being poor; the crop fields are covering an area of 1 300 ha. Crop farming occurs on
both sides of the tarred road and stretches south to the old gravel road.
The main crops are maize, millet, and sorghum complemented by pumpkins, groundnuts
and beans. The grazing potential is moderate and grazing pressure is medium, with higher
pressure around water points and cattle posts.
3.1.4 Land types, natural vegetation, and forest resources
The two land types are Mopane woodlands with pockets of Kalahari woodlands south of
the Trans-Caprivi Highway and pure Kalahari woodlands north of the highway.
The mopane woodlands are dominated by Colophospermum mopane – Aristida congesta
(13 787 ha) and Colophospermum mopane – Burkea africana woodlands (64 ha). In the
Kalahari woodlands, Burkea africana – Pterocarpus angolensis – Guibortia coleosperma
woodlands are found in pockets south of the road (2346 ha). The vegetation north of the
road is dominated by Baikieae plurijuga savannah- shrubland (2546 ha) and woodland
(583 ha). The most dominant tree species are Colophospermum mopane, Terminalia
22
sericea, Burkea africana, Guibortia coleosperma, Baikieae plurijuga, and Pterocarpus
angolensis. The woodlands are patched by the Aristida congesta, Cymbopogon excavatus
and many different grass species (Giess, 1998; Kamwi et al., 2015, 2018).
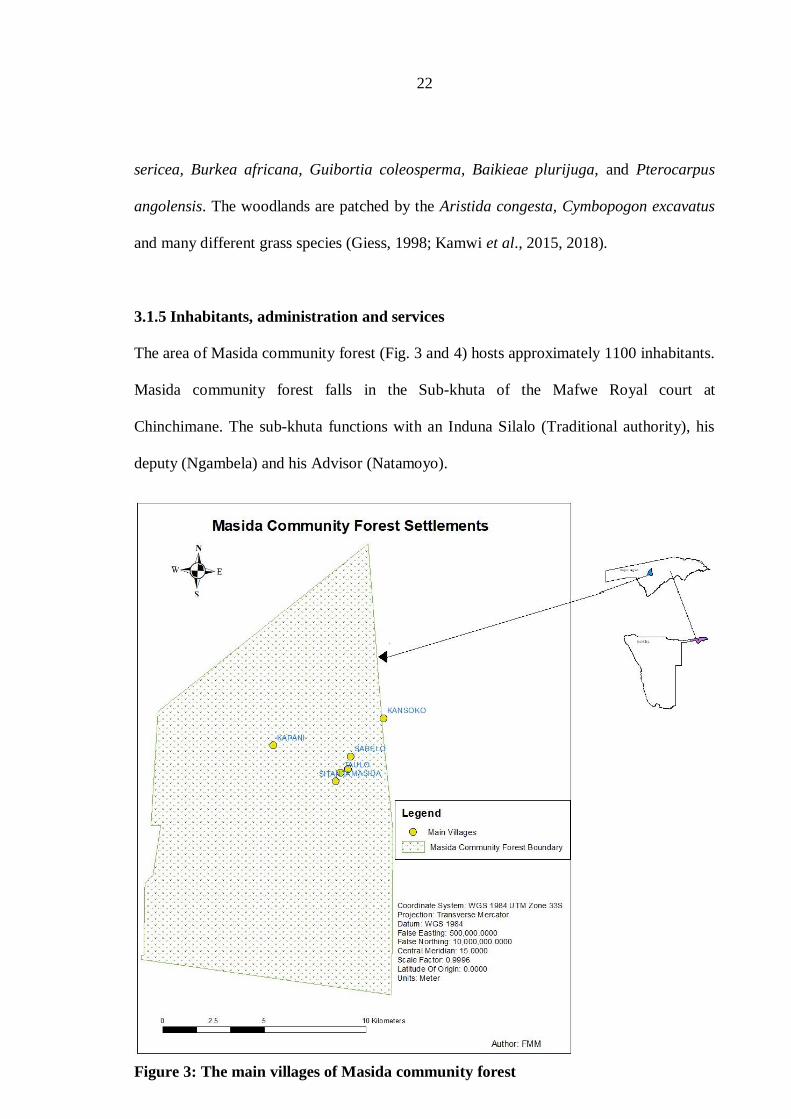
3.1.5 Inhabitants, administration and services
The area of Masida community forest (Fig. 3 and 4) hosts approximately 1100 inhabitants.
Masida community forest falls in the Sub-khuta of the Mafwe Royal court at
Chinchimane. The sub-khuta functions with an Induna Silalo (Traditional authority), his
deputy (Ngambela) and his Advisor (Natamoyo).
Figure 3: The main villages of Masida community forest
23
According to the Community Forest management body, most of the disputes and cases are
settled at the Sub-khuta level. Royal Khuta handles cases related to land – issues, and
assaults. Masida CF area forms north-eastern community of the Linyanti constituency. The
head quarter is situated at Kapani. Masida CF residents go to the nearest health care centre
at Sibbinda for health care or sometimes to the primary health care clinic located west of
the area at Sachona.
There is a combined school building within the community forest. The telephone services
and electricity are currently (2018/2019) being installed. The responsible Agricultural
Development Centre (ADC) and the sub-station of the Directorate of Forestry (DoF) are
located at Sibbinda.
3.1.5.1 Organizational set up of the community
In Masida CF area, there are different types or categories of inhabitants, ranging from
Farmers i.e. - Households who owns pieces of land for agricultural crop cultivation and
sell surplus for income. Pastoralists, are households who own livestock (cattle and goats)
that they graze freely in the forest, and get income from the sale of livestock and from
renting them to others who own agricultural fields to use animal draught power for
ploughing their field at an agreed fee to be paid to the owner. Businessmen/women are
households who own shebeens and cuca shops in the area that get income from sales of
basic necessities including forest products. Under the Civil servants category, are
households with people who are employed in private companies and government workers,
and are the main suppliers of piecework job to others and they have secured salaried job.
The unemployed; are household members without any kind of job, but depend on
piecework job and some on remittances from relatives who are working in different parts
of the region or country. All this mentioned organizational set up relies on forest at

24
different levels in the study area. However, one household might fall in one or all
categories.
3.1.5.2 The management body and benefit distribution in Masida community forest
Community forests in Namibia are established under the provision of the Forest Act of
2001(as amended 2005) after meeting certain conditions prescribed by the legislation and
declared by the Minister of Agriculture, Water and Forestry. The community forest is
managed by the management authority referred to as Forest Management Committee
(FMC) on behalf of the community forest members as per provision from the forestry
legislation. All the benefits derived in the community forest by the FMC are distributed
according to the benefit distribution plan as set in Section 15 (2) (g) of the Forest Act of
2001 that states that “The Community Forest Management agreement must provide for the
adequate reinvestment of the revenues of the Community forest and the equitable use or
distribution of the surplus.” The plan identifies how any surplus incomes are to be used to
provide benefits equitably meaning “fairly” rather than “equally” (Government Gazette of
the Republic of Namibia 2001, 2005). The distribution matrix is set up for all community
forests that cover the benefits (Appendix 1).
25
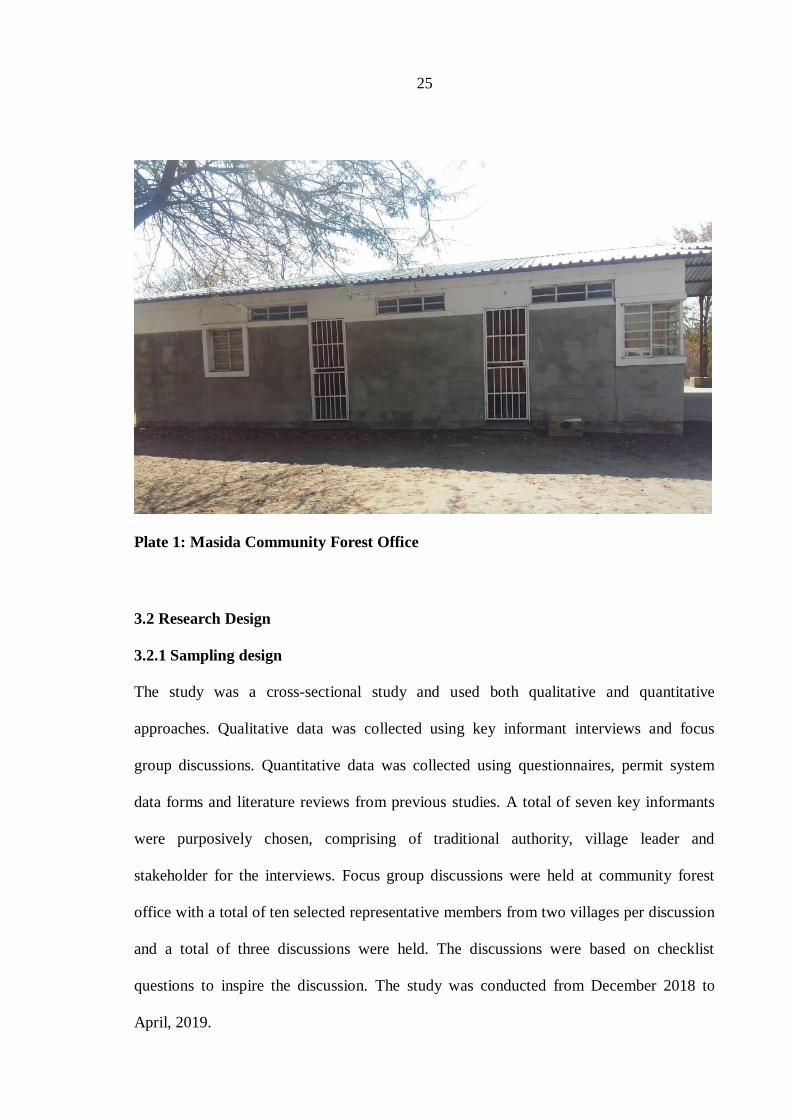
Plate 1: Masida Community Forest Office
3.2 Research Design
3.2.1 Sampling design
The study was a cross-sectional study and used both qualitative and quantitative
approaches. Qualitative data was collected using key informant interviews and focus
group discussions. Quantitative data was collected using questionnaires, permit system
data forms and literature reviews from previous studies. A total of seven key informants
were purposively chosen, comprising of traditional authority, village leader and
stakeholder for the interviews. Focus group discussions were held at community forest
office with a total of ten selected representative members from two villages per discussion
and a total of three discussions were held. The discussions were based on checklist
questions to inspire the discussion. The study was conducted from December 2018 to
April, 2019.
26
The study used households as sampling unit and the head of the households as
observational units. The study sampled households from all six villages in the area.
A simple random sampling technique using computer random numbers was used to select
households to be included in the sample. The village households were taken as a
proportion of the total area households. This gave each household in the area an equal
chance of being selected in the sample and all choices were independent of one another
(Kothari and Garg, 2014).
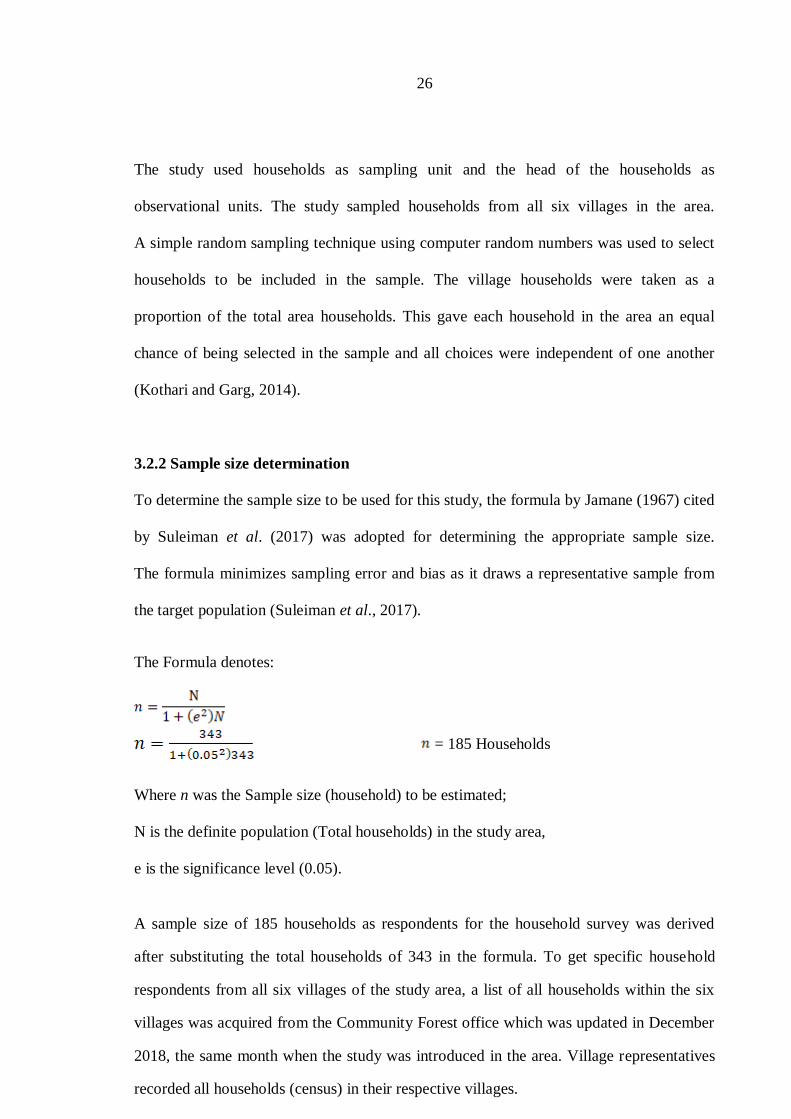
3.2.2 Sample size determination
To determine the sample size to be used for this study, the formula by Jamane (1967) cited
by Suleiman et al. (2017) was adopted for determining the appropriate sample size.
The formula minimizes sampling error and bias as it draws a representative sample from
the target population (Suleiman et al., 2017).
The Formula denotes:
= 185 Households
Where n was the Sample size (household) to be estimated;
N is the definite population (Total households) in the study area,
e is the significance level (0.05).
A sample size of 185 households as respondents for the household survey was derived
after substituting the total households of 343 in the formula. To get specific household
respondents from all six villages of the study area, a list of all households within the six
villages was acquired from the Community Forest office which was updated in December
2018, the same month when the study was introduced in the area. Village representatives
recorded all households (census) in their respective villages.

27
The total number of households per village was used as a proportion of the study
population to the derived total area sample size to get the sample size in each village
(Table 1). This was done to get a representative sample to be included in the study total
sample size (185). Simple random sampling technique was applied to select households to
be interviewed from the total village households. For example, in Table 1 Kansoko village
had 64 total households, we take the 64 as a proportion of the 343 study population to the
study sample size 185 as; 64/343*185 this gives 34 households as a proportional sample
size of Kansoko village to the total 185 households to be interviewed in the whole study
area (Suleiman et al., 2017). The observational unit was the household head independent
of his/her gender status, who is 18 or above years old or a representative in the case of the
head of the household being absent during the time of the interview. This member of the
household had to be able to narrate the household socio-economic status.
Table 1: Sampling frame and sampling size of Masida community
S/N Village Sampling frame Proportion Sampling size
1 Kansoko 64 64/343*185 34
2 Sabelo 67 67/343*185 36
3 Masida 30 30/343*185 17
4 Taulo 87 87/343*185 47
5 Sitanta 51 51/343*185 27
6 Kapani 44 44/343*185 24
Total 343 185
3.3 Data Collection
3.3.1 Primary data
3.3.1.1 Households’ livelihood strategies, perceptions and dependency of household
on the forest
Primary data was collected from the field (Fig. 4), through a semi-structured questionnaire
(Appendix 2) administered to the respondents through face to face interviews.
The household questionnaires comprised of sections that inquired data related to socio
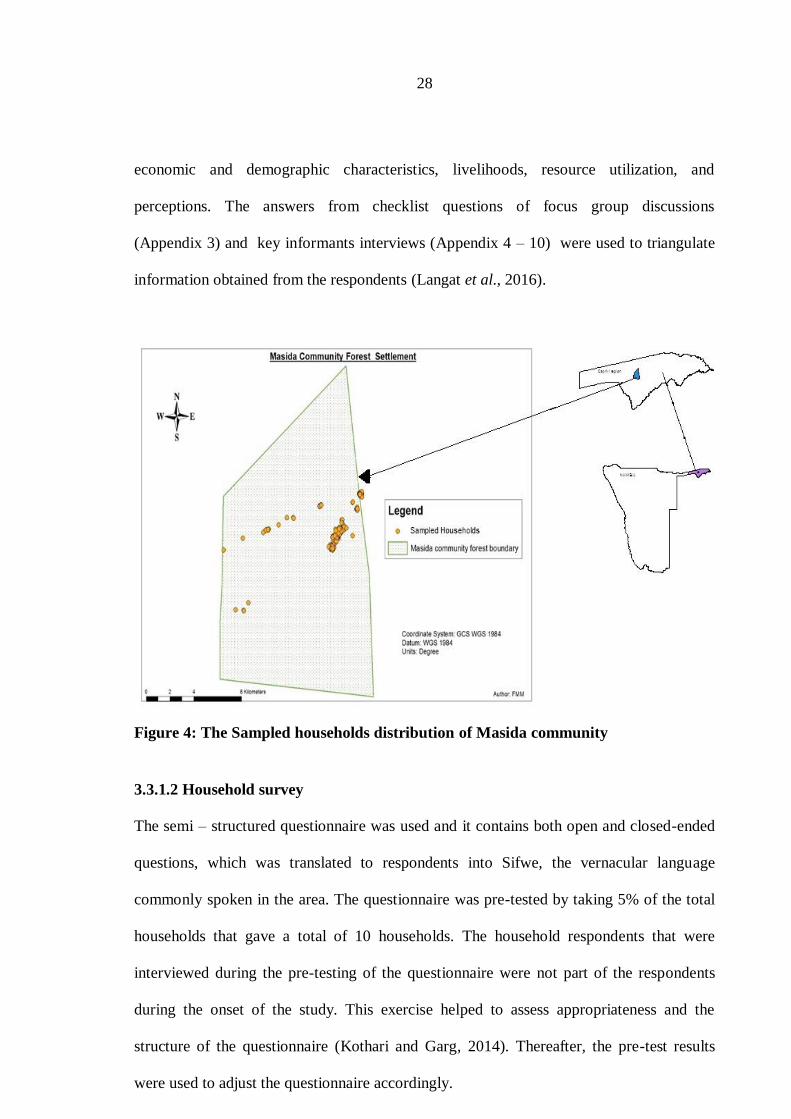
28
economic and demographic characteristics, livelihoods, resource utilization, and
perceptions. The answers from checklist questions of focus group discussions
(Appendix 3) and key informants interviews (Appendix 4 – 10) were used to triangulate
information obtained from the respondents (Langat et al., 2016).
Figure 4: The Sampled households distribution of Masida community
3.3.1.2 Household survey
The semi – structured questionnaire was used and it contains both open and closed-ended
questions, which was translated to respondents into Sifwe, the vernacular language
commonly spoken in the area. The questionnaire was pre-tested by taking 5% of the total
households that gave a total of 10 households. The household respondents that were
interviewed during the pre-testing of the questionnaire were not part of the respondents
during the onset of the study. This exercise helped to assess appropriateness and the
structure of the questionnaire (Kothari and Garg, 2014). Thereafter, the pre-test results
were used to adjust the questionnaire accordingly.

29
To assess people‟s perceptions on forest importance, the forest resource availability and
extractions, a Likert type scale questions was used (Jannat et al., 2018). The Likert scale
on the perception of the level of dependence on the benefits from the forest was recorded
as; Low (1), Medium (2), High (3), and Very high (4). The referred period of the forest
resource availability and the resource extraction (collection) was based on before the area
was gazetted (given the user right by the government) 2007, and after the area was
gazetted up to 2018 when the study commenced in the area.
3.3.1.3 Focus group discussions
The discussions with community members were held at the community forest office
considering gender representation after the household survey to discuss in-depth of the
pertinent information collected from the household surveys. A checklist with detailed
questions on dependency and resource availability was used to inspire the discussion.
This enabled a researcher to get some information that was not revealed during the
household interviews. This also acted as a means of verifying the data and helps to qualify,
strengthen and amend areas that were not clear during household surveys.
A representative number of five members from each of the two villages arranged at a time
were considered for the discussions. Discussions comprised of ten members per discussion
and a total of three meetings were held in the whole study area. The group discussion
members were limited to less than 12 members because more than that might be difficult
to control and causes disintegration (Nyumba et al., 2018).
3.3.1.4 Key informants’ interviews
These were interviews with purposively selected individuals who are more familiar with
the contents of forest resources dependency in the area. This included people from
Community forest office, Directorate of forestry staff responsible for the area, village
leaders and stakeholders from different ministries identified in the area. The eligible

30
members selected were those with representative position in the area. Amongst the criteria
of eligibility used was that a chosen member has to be a person who demonstrate
collective role in conservation of the forest by showing knowledge, communication skills,
willingness, and impartiality. This was aimed at ensuring that the key informant would be
able to communicate his/her knowledge on forest dependency willingly in a
comprehensible manner and known to be unbiased and subjective in the society (Marshall,
1996). A checklist of detailed questions with subjects covered in the focus group
discussions was used to obtain detailed information on the extent and consequences of
dependency on forest resources. Some of the members with these characteristics were
selected during the household interviews based on the observed knowledge by the
Researcher during the household surveys. A total of seven interviews were conducted
across the study area.
3.3.2 Secondary data
Secondary data were obtained from literature such as journals articles, books, reports, and
from the respective government offices responsible for the study area. The data from the
questionnaire was complemented with the official data on forest resources permits issued
between 2007 to 2017 for resources recorded as harvested during the said period
(Appendix 11). This data mostly complemented specific objective number 3 on the extent
and consequences of forest dependency on forest resources in the area. This gave an
overview of the forest resources used and species preferences in the study area.
3.4 Data Analysis
3.4.1 Household dependency on the forest, livelihoods and the extent of dependency
on forest and perceptions
Data collected during fieldwork was compiled, coded, and analysed using IBM Statistical
Packages for Social Sciences (SPSS) at 20 version and Microsoft Office Excel 2010.
Qualitative data (interviews and discussions) were recorded on a digital camera and was
31
transcribed immediately after the fieldwork. These data was transformed into text and
summarized into contents that were used to triangulate the data collected during the
household interviews. Descriptive statistics including frequencies, proportions, measures
of central tendency and dispersion were used to summarise the extent of dependency on
forest resources use and the socio-demographic data. Pearson‟s chi-square test was used to
analyse the associations of socio-economic characteristics, livelihoods and factors that
influence forest dependence (Langat et al., 2016). A binary logistic regression model was
used (Jannat et al., 2018; Hosmer et al., 2013) to determine the effect of socio-economic
factors influencing households‟ forest dependency. In estimating the forest dependency of
the households, forest dependency was the dependent variable and independent variables
were the socio-economic factors. The cross-tabulation was used in the analysis of
perceptions on the importance of forest resources, the trend of availability and extractions
of forest resources between villages of the study area and a Pearson chi-square test was
used to predict the differences. A multiple response analysis was used to analyses open
ended questions and multiple comparisons of various sources of income contributions was
analysed using ANOVA to distinguish the differences. Multiple response analysis was
further used to summarise the repeated responses of respondents on benefits acquired,
factors influencing forest dependency and the alternative interventions required to lessen
the burden of reliance on forest resources.
When referring to forest resource benefits in this study, resources were grouped into broad
categories rather than defining it individually (Timko and Kozak, 2014). Categories were
Building materials (poles, rafters, droppers, thatch grass, mud pits) both for own use and
for sale; Medicinal (parts of the tree, shrubs, lianas, herbs collected for curing an ailment
in the household); Food (collected wild fruits, tubers, bush meat, mushrooms) and Fodder
(freely grazing and browsing of livestock).

32
The data on items collected from the forest was verified from each household during the
face to face interviews. The forest dependency of households in Masida community forest
was calculated as the proportion of annual income earned from forests resources to the
total annual household income (Adam and Tayeb, 2014; Jain and Sajjad, 2016; Langat et
al., 2016). The total annual household income was calculated as the sum of all forest
products income, agricultural income, salary or wage income, and remittances. Forest
product income was computed from the sales of firewood, wild fruits, devil‟s claw, poles
and droppers which were done by multiplying each product by its market price obtained
from the community forest office. Since measuring forest dependency is core in this study,
the forest dependence was computed by adapting a formula from Adam and Tayeb, 2014;
Langat et al. (2016) and derive it as;
FI = TFI/ TI……………………………………………………………………………….(1)
Where FI is the Forest Income, TFI is the Total Forest Income and TI is Total Household
Income. The Agricultural income was calculated from the sales of the surplus sold to
Agricultural Agencies of AMTA and Kamunu. The market price of crops and other
agricultural products was obtained from the local agencies and representative office of
Directorate of Agricultural Production Extensions and Engineering Services (DAPEES)
based at Sibbinda. To determine the level of forest dependence on households, the
sampled households were categorized into 3 income groups based on their level of total
household income in Namibian dollars (N$). The Poor group (0 – 1500 N$), the Moderate
group (1501 – 3000N$) and the Rich group (>3001 N$). The categories were set by the
researcher examining the local condition of income distribution in the area, but do not
reflect the general poverty levels in the study area or in Namibia as a country (Langat et
al., 2016; Adam and Tayeb, 2014).

33
The study adapted the strategies used by Jannat et al. (2018) by taking the average value
across the villages as the cut-off threshold of forest dependency. Household lying below
0.2, that is a household whose income from the forest products accounts for less than 20%
of the total annual household income was categorized as “Low forest dependency” and
households lying at 0.2 and above whose income from the forest products accounts for
more than 20% were identified as “High Forest dependency”. In a logistic regression
binomial probability theory, the dependency variable in this study was assigned a value of
1 (one) if the household dependency is greater than or equal to 0.2 and a value of 0 (zero)
if the value is less than 0.2.
3.4.2 Analytical Model for determining the socio-economic factors of forest
dependency
In this study, the Binary logistic regression model was conducted to identify the socio-
economic variables influencing household to depend on forest. Other studies identified the
significance of this model to deal with dependency (Jannat et al., 2018; Jain and Sajjad,
2016; Tieguhong and Nkamgnia, 2012; Lepetu et al., 2009). The analysis of this model,
projected odds ratios (Y), to determine effects of the independent variables on forest
dependence of the respondents. The association between two binary data values was
measured using odds ratios. In this case it was hypothesized that the forest dependency of
the households was influenced by all the socio-economic characteristics of the households
in Masida community forest.
The estimation of forest dependency formula was adapted from Adam and Tayeb (2014);
[Pi/(1-Pi)] = β0 + β1X1i + β2X2i + ... + βkXki ……………………………….……(2)
Thus, Yi = [Pi/(1-Pi)]
Where:
Yi is the dependent variable that takes a value of 1 for the subscript i denoting the i-th
household who depend on forest in Masida CF.
34
β0 is the intercept term; and β1, β2,…, βk are the coefficients of the explanatory variables to
be estimated,
X1, X2,…, Xk. are a matrix of independent variables which are related to forest dependency.
3.4.3 Description of the variables used in the model
In the logistic regression, the dependent variable Y takes a value of 1 if the respondents
are high dependent on forest and 0 if otherwise. The chi-square test was used to assess the
goodness of fit of the model at 5% level of significance.
Categorical independent variables, assumptions, and their justification are explained
below:
(a) Gender
Gender is a dummy variable that indexes the sex of the respondent; it carries a value of 1
for men and 2 for women. On the part of dependence to forest, as expected in a socio-
cultural setting both are expected to collect forest resources for subsistence and
commercial livelihoods. It only differs in the type of products and the role each will play
(Endamana et al., 2016). For example, the harvest of forest products especially NTFPs is
an ancient activity mainly controlled by women (Awono and Levang, 2018). Others
studies argue that in most part of Africa including Namibia both men and women collects
medicinal plants and firewood (Angelsen et al., 2014; Kamwi et al., 2018). It was
therefore hypothesized that the female headed household are less likely to be dependent on
forest resources than a male-headed households (Suleiman et al., 2017).
(b) Age
The age was recorded in categories where the actual age of the respondent falls in. People
of different age group depend on forest for different purpose in Masida CF. As expected,
those in younger age are active and can access the forest and extract forest resource for

35
both subsistence and commercial purposes while as a person gets older his tendency
decreases.
The energetic nature of the young people propels them to indulge in forest extraction
activities which are often labour intensive and require physical strength; and this has been
validated by various studies elsewhere (Fonta and Ayuk, 2013; Adam and Tayeb, 2014;
Thondhlana and Muchapondwa, 2014).
(c) Years of residence
This independent variable was recorded as a binary outcome in the years category in
which a head of the household falls in. It is assumed that the years of residence is
positively related to forest dependence, due to experience of the person to forest resources
in the area (Ofoegbu et al., 2017). The forest tends to support the livelihood strategies of
the communities who have lived long in the area and have livestock.
(d) Household size
The size of the households was collected in categories, and it is assumed that the larger the
family size the more labour and the more mouth to feed (Jain and Sajjad, 2016.
This entails that the large household has more labour availability in extraction of forest
resources around them and move to larger forest areas (Mujawamariya and Karimov,
2014). Thus it is hypothesized that household size is positively related to forest
dependency (Ofoegbu et al., 2017, Suleiman et al., 2017).
(e) Level of formal education
This was recorded in category of the level of formal education attained by the head of the
household. It is expected that the level of formal education influences the person‟s
36
economic activities. The level of education exposes the understanding of the nature thus
negatively related. This is assumed that the higher the level of formal education will
reduce his reliance on forest as education increases prospects of diverse employment
opportunities (Newton et al., 2016; Jain and Sajjad, 2016).
(f) Occupation status
This was the categories of economic activities a particular head of the household is
engaged into for both subsistence and commercial livelihoods. It is assumed that in rural
areas people rely more on forest resources because there are few livelihoods options to
supplement household food deficit and household income (Suleiman et al., 2017).
Thus, the households in formal employment are less likely to depend on forest.
(g) Marital status
This was recorded in categories of the status of the head of the household. It is assumed in
rural livelihoods that married or cohabitants and unemployed women are found in the rural
areas and they dependent on forest while their married man counterparts they depend less
on forest as they go out to urban areas for employment opportunities (Kamwi et al., 2015).
(h) Hectares of agricultural land owned
This was recorded on categories of farm size owned by the households in hectares.
The hectares of land owned both already cleared for agricultural crop production or still in
it is forested state. Household with less hectares of land rely more on forest for food. It is
hypothesized that land holding size is inversely related to forest dependency as they
possess alternative means to maintain their livelihood through agriculture (Jain and Sajjad,
2016; Suleiman et al., 2017).

37
(i) Household category
Households levels of income were collected and set the households into income groups
based on their level of total household income. It is hypothesized that rich group
households depends less on forest than the poor household group (Langat et al., 2016).
38
CHAPTER FOUR
4.0 RESULTS AND DISCUSSIONS
4.1 Livelihood Strategies and Contribution of Forest Resources to Household Income
4.1.1 Household livelihoods activities
During this study the livelihoods activities was compiled and resulted that; 60% of the
households interviewed indicated that they are unemployed (n =110), relying mostly on
piecework (32%), and government social grants for their children (23%). Other livelihoods
activities were farming (30%), relying on rain-fed agriculture and few others who are
involved in livestock keeping (43%), wage employment (31%), small-scale business (6%).
4.1.2 Livelihood assets
The ecological endowment and the entitlement at the households‟ disposal entail the
choice of strategy that the household will embark upon (Kamwi et al., 2015). This was
also observed to affect the type of livelihoods the communities of Masida community
forest are comprised of (Table 2).
There is a diverse of capabilities, assets and activities that are facilitated by both social
relations and institutional arrangements in the area, thus summarizes their livelihoods
differently.
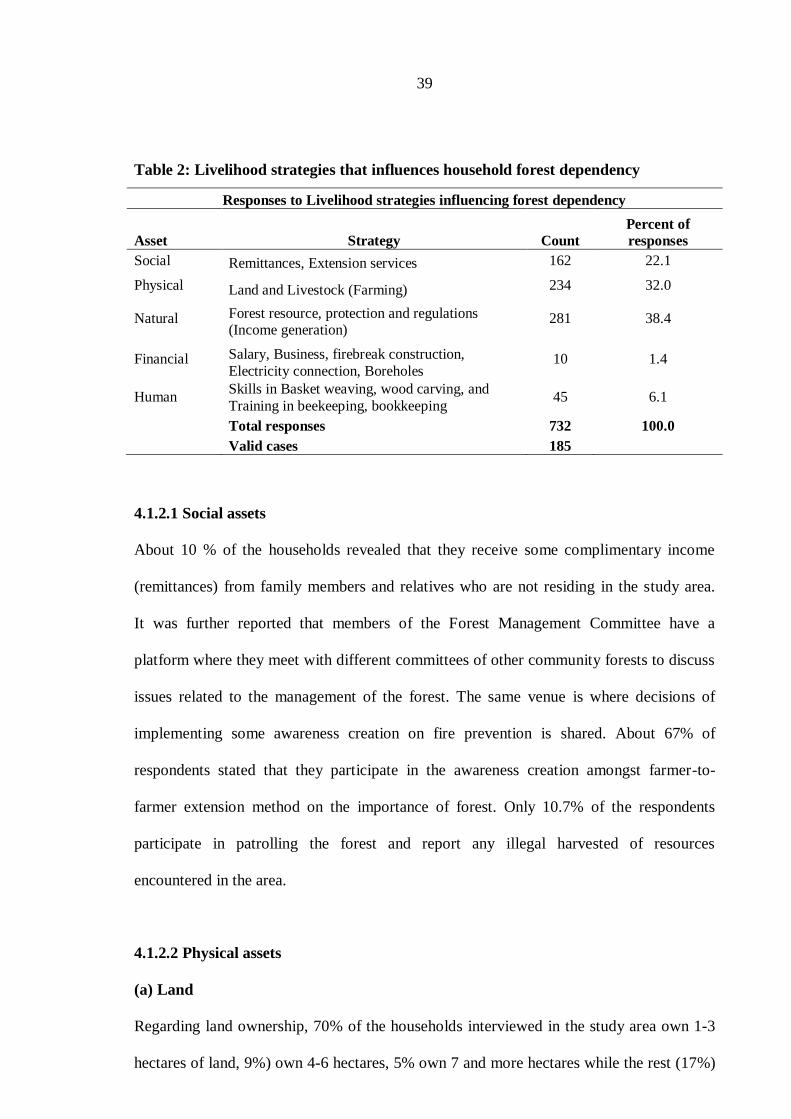
39
Table 2: Livelihood strategies that influences household forest dependency
Responses to Livelihood strategies influencing forest dependency
Asset Strategy Count
Percent of
responses
Social Remittances, Extension services 162 22.1
Physical Land and Livestock (Farming) 234 32.0
Natural Forest resource, protection and regulations (Income generation)
281 38.4
Financial Salary, Business, firebreak construction,
Electricity connection, Boreholes 10 1.4
Human Skills in Basket weaving, wood carving, and
Training in beekeeping, bookkeeping 45 6.1
Total responses 732 100.0
Valid cases 185
4.1.2.1 Social assets
About 10 % of the households revealed that they receive some complimentary income
(remittances) from family members and relatives who are not residing in the study area.
It was further reported that members of the Forest Management Committee have a
platform where they meet with different committees of other community forests to discuss
issues related to the management of the forest. The same venue is where decisions of
implementing some awareness creation on fire prevention is shared. About 67% of
respondents stated that they participate in the awareness creation amongst farmer-to-
farmer extension method on the importance of forest. Only 10.7% of the respondents
participate in patrolling the forest and report any illegal harvested of resources
encountered in the area.
4.1.2.2 Physical assets
(a) Land
Regarding land ownership, 70% of the households interviewed in the study area own 1-3
hectares of land, 9%) own 4-6 hectares, 5% own 7 and more hectares while the rest (17%)
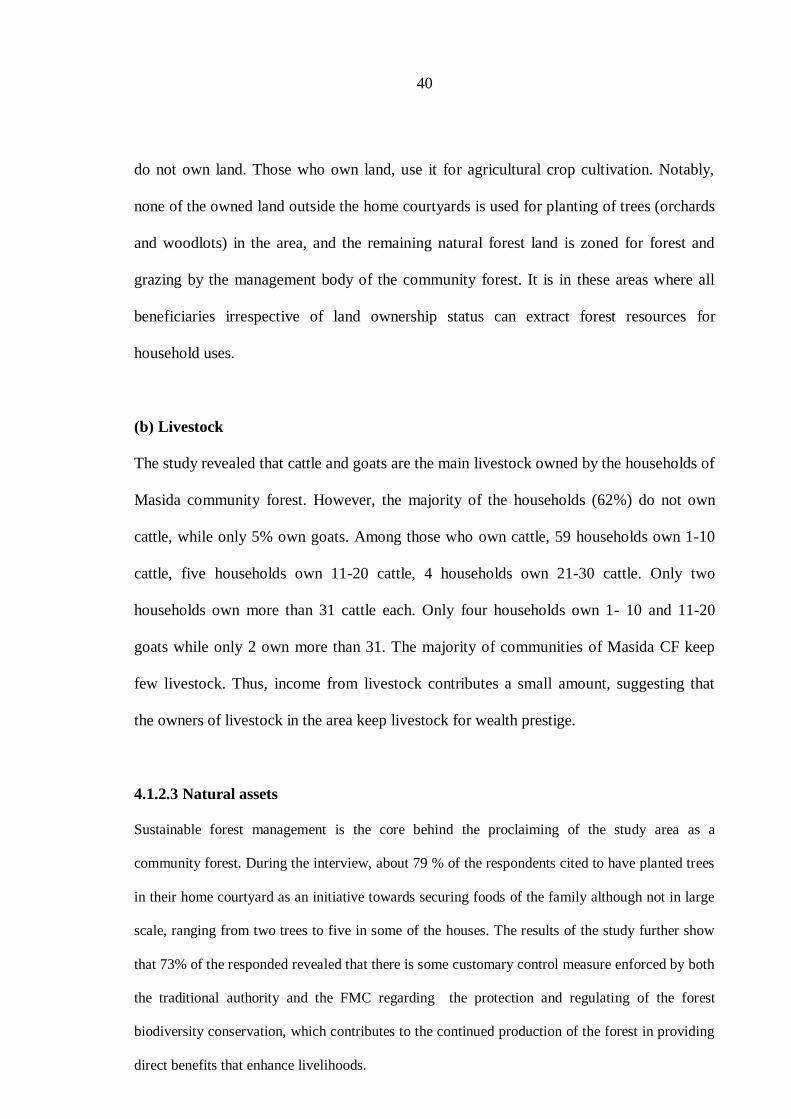
40
do not own land. Those who own land, use it for agricultural crop cultivation. Notably,
none of the owned land outside the home courtyards is used for planting of trees (orchards
and woodlots) in the area, and the remaining natural forest land is zoned for forest and
grazing by the management body of the community forest. It is in these areas where all
beneficiaries irrespective of land ownership status can extract forest resources for
household uses.
(b) Livestock
The study revealed that cattle and goats are the main livestock owned by the households of
Masida community forest. However, the majority of the households (62%) do not own
cattle, while only 5% own goats. Among those who own cattle, 59 households own 1-10
cattle, five households own 11-20 cattle, 4 households own 21-30 cattle. Only two
households own more than 31 cattle each. Only four households own 1- 10 and 11-20
goats while only 2 own more than 31. The majority of communities of Masida CF keep
few livestock. Thus, income from livestock contributes a small amount, suggesting that
the owners of livestock in the area keep livestock for wealth prestige.
4.1.2.3 Natural assets
Sustainable forest management is the core behind the proclaiming of the study area as a
community forest. During the interview, about 79 % of the respondents cited to have planted trees
in their home courtyard as an initiative towards securing foods of the family although not in large
scale, ranging from two trees to five in some of the houses. The results of the study further show
that 73% of the responded revealed that there is some customary control measure enforced by both
the traditional authority and the FMC regarding the protection and regulating of the forest
biodiversity conservation, which contributes to the continued production of the forest in providing
direct benefits that enhance livelihoods.

41
4.1.2.4 Financial assets
The results of the study show that 5.4% of the respondents reported that the community
forest establishment has contributed to the livelihoods of the communities. It was further
observed that during the benefit distribution, the FMC and the Traditional authority are
paid a honorarium for managing of the forest. The development fund share has been used
to pay for community borehole water fees and the supporting of the vulnerable children
with school uniforms.
4.1.2.5 Human assets
It was reported during the Focus group discussions and key informant interviews that
FMC executive members on behalf of the communities are supported by different NGO to
undergo training in leadership‟s skills and bookkeeping. However, due to economic
instability, most of the trained members vacate the area after acquiring the relevant skills
in search of jobs in urban areas. About 24% of the responded revealed that they have
acquired skills through the organized short courses in the community forest to harvest
forest products and carve woods into different tools that is sold for income generation.
It was further reported that the beneficiaries of the community forest resources differ in
their entitlements.
The findings of this study show that the community forest is a natural asset that is an
endowment. Similar findings have been reported from various studies elsewhere on how
different livelihood assets benefit from community forests (Dev et al.,2003; Mahanty et
al., 2006; Shackleton et al., 2007; Kamwi et al., 2015; Vrabcova et al., 2019).
4.1.3 Linking forest livelihoods benefits to forest dependence
During the face-to-face interviews, the respondents mentioned various benefits derived
from the forest as part of the contributing factor to their dependence on forest.

42
The respondents revealed that the forest play a major role in providing direct and indirect
livelihood benefits. Direct livelihood benefits refer to forest ecosystem services under
Provisional services (food, medicine, and building materials). Indirect livelihoods benefits
refer to forest ecosystem services under regulatory, ecological and cultural services.
4.1.3.1 Direct livelihoods benefits
Respondents were asked to rank the direct livelihoods benefits based on their value to the
household. They ranked the benefits to the household on a scale of 1 (most important) to 5
(least important). Figure 5 shows that forest medicinal value is least important (3.86)
followed by food (3.11). Supply of forest based building materials (1.34) considered the
most important benefit.
3.86
3.11
1.34
0.00
0.50
1.00
1.50
2.00
2.50
3.00
3.50
4.00
4.50
Medicinal Food Building Materials
Me
an
ra
nks
Forest benefits
Figure 5: Forest benefits mean ranks in Masida CF
The forest benefits were then subjected to cross tabulation to determine the benefit
distribution relationship across the villages using the Chi-square test at 5% level of
significance. The results showed that the distribution of food and medicinal benefits
differed significantly (p< 0.05) across all villages while building materials was not
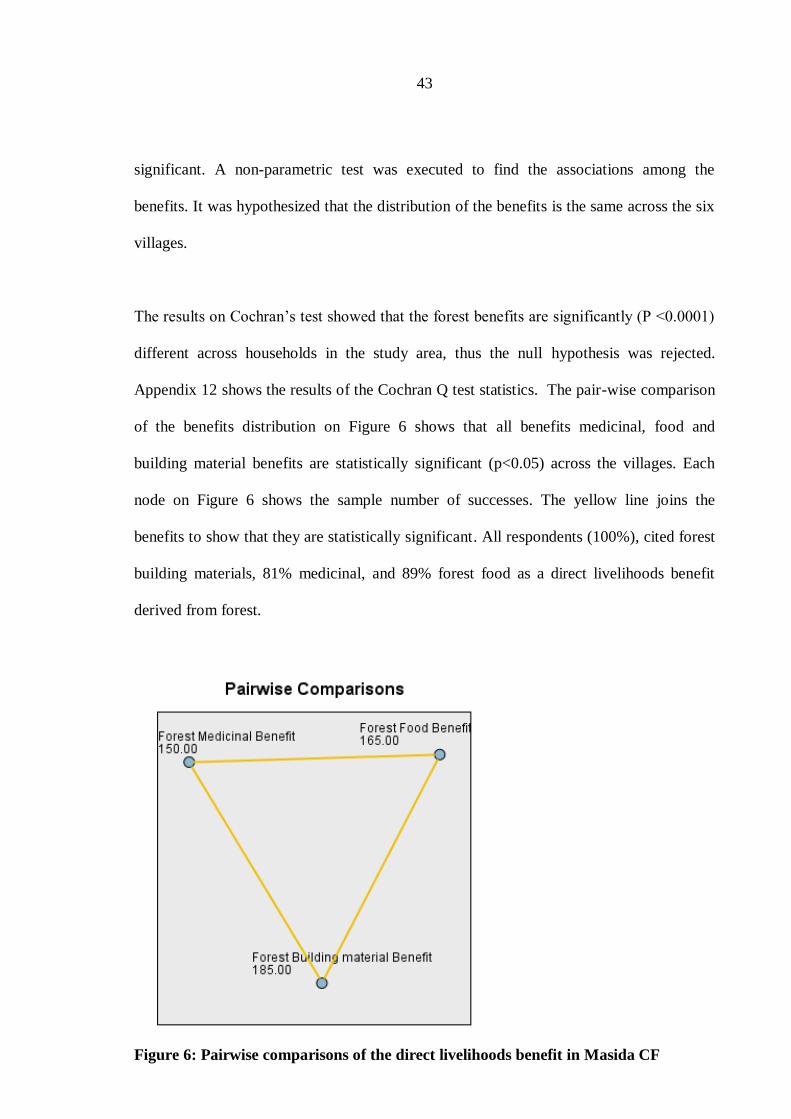
43
significant. A non-parametric test was executed to find the associations among the
benefits. It was hypothesized that the distribution of the benefits is the same across the six
villages.
The results on Cochran‟s test showed that the forest benefits are significantly (P <0.0001)
different across households in the study area, thus the null hypothesis was rejected.
Appendix 12 shows the results of the Cochran Q test statistics. The pair-wise comparison
of the benefits distribution on Figure 6 shows that all benefits medicinal, food and
building material benefits are statistically significant (p<0.05) across the villages. Each
node on Figure 6 shows the sample number of successes. The yellow line joins the
benefits to show that they are statistically significant. All respondents (100%), cited forest
building materials, 81% medicinal, and 89% forest food as a direct livelihoods benefit
derived from forest.
Figure 6: Pairwise comparisons of the direct livelihoods benefit in Masida CF
44
The mean rank results (Fig. 5) imply that provision of building materials (100%) was
highly ranked while medicinal value was the least ranked. Building materials are used by
every household in the study area. This result concurs with findings of other studies in
Namibia by Kamwi et al. (2015) and elsewhere (Fikir et al., 2016; Jannat et al., 2018;
Langat et al., 2016; Newton et al., 2016). Further test results (Appendix 12) were carried
out to examine the influence of benefits to household forest dependency. The relationship
between the all the three benefits was positive and highly significant (p<0.05) (Appendix
13).
These findings agree with studies elsewhere, reporting that forest dependency is diverse
and reliance on the forest can be interpreted differently (Newton et al., 2016; Tieguhong
and Nkamgnia, 2012; Timko et al., 2010; Timko and Kozak, 2014).
4.1.3.2 Indirect livelihoods benefits
During the household interviews, respondents listed various roles that the forest play into
their livelihoods ranging from forest acting as windbreak, enabling gaseous exchange
(provides oxygen and absorb carbon dioxide) and regulate the temperature. In addition,
respondents further cited other benefits such as provision of shelter to their domestic
animals, leguminous plant species such as Colophospermum mopane and Dichrostachys
cinerea enhance soil fertility for agricultural crops, forest hosts their cemetery and sacred
places for religious and cultural festivals, and educational and tourism attractions that
brings in incomes. After analysis, these responses were categorized into forest ecosystem
services. Figure 7 shows that 44% of the respondents revealed that ecological services are
the highest indirect livelihoods benefits followed by regulatory service (32%) and cultural
benefits (24%) being the least. The findings of this study correspond with study by Thoms
(2008) in Nepal and Vrabcova et al. (2019) in Namibia, who reported similar indirect
livelihoods benefits.
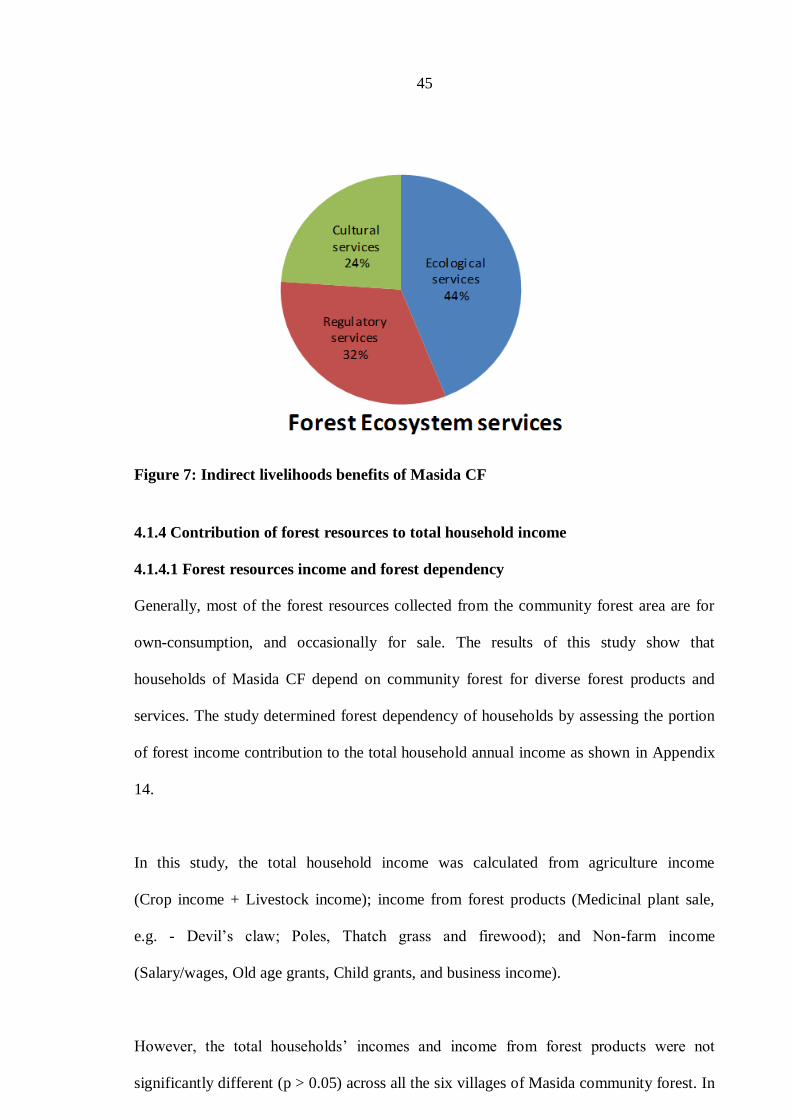
45
Figure 7: Indirect livelihoods benefits of Masida CF
4.1.4 Contribution of forest resources to total household income
4.1.4.1 Forest resources income and forest dependency
Generally, most of the forest resources collected from the community forest area are for
own-consumption, and occasionally for sale. The results of this study show that
households of Masida CF depend on community forest for diverse forest products and
services. The study determined forest dependency of households by assessing the portion
of forest income contribution to the total household annual income as shown in Appendix
14.
In this study, the total household income was calculated from agriculture income
(Crop income + Livestock income); income from forest products (Medicinal plant sale,
e.g. - Devil‟s claw; Poles, Thatch grass and firewood); and Non-farm income
(Salary/wages, Old age grants, Child grants, and business income).
However, the total households‟ incomes and income from forest products were not
significantly different (p > 0.05) across all the six villages of Masida community forest. In

46
contrast, the agricultural income differed significantly (p < 0.05) across the six villages of
Masida community forest. It further observed that farmers in the study area are adopting
the innovations of the mixed cropping and rotational cropping to boost their yield, use
inorganic fertilizer e.g. NPK, use of improved crop varieties.
Their source of income is mainly from forest products, although only 16% of the
households actively participating in harvesting and sale of devil‟s claw, poles and other
forest products constituting a significant quota. Figure 8 presents the average forest
dependency ratio of all households in each villages, showing the Forest dependency ratio
varied from 0.05 to 0.3, and Taulo and Sabelo villages had highest dependency.
0.29
0.25
0.130.12
0.110.10
0.00
0.05
0.10
0.15
0.20
0.25
0.30
0.35
Taulo Sabelo Sitanta Kansoko Kapani Masida
Dep
end
ency
ind
ex
Name of the Village
Figure 8: Forest dependency ratio in the villages of Masida CF
Other villages are less dependent on forest resources e.g. Masida, the central village,
where most of the development is taking place, and people are less dependent on forest
resources as they have other sources of income including salaries, child grant, old age
grants. The findings of this study concur with other studies from India and Bangladesh
that reported forest dependency in terms of derived income (Jain and Sajjad, 2016;
Jannat et al., 2018).

47
4.1.4.2 Contribution of forest resources to total households income
The results of the contributions of various sources of income provide interesting outcomes.
For example, Appendix 15 shows that the forest resources have the highest households‟
response frequency as the main source of incomes perceived by household heads, but in
monetary terms it only contributes 16% to the average annual household income. The
other non-forest incomes contribute up to 84% to the respondent‟s livelihoods (Fig. 9).
The results as shown in Appendix 16 further indicates that the contribution of the various
sources of households‟ income to the Masida CF communities are statistically different
(p<0.05).
For instance, the average annual income contribution of forest resources per household is
N$ 606.36 as compared to N$ 421.32 and N$ 1178.24 per household from Agriculture and
non-farm income, respectively. This indicates that the forest dependency of Masida CF
residents is categorized as low, suggesting that income is not a good measure of
livelihoods dependency in Masida community forest area.
Figure 9: Percentage contribution of forest resources, non-farm resources and
Agriculture income to the total household income

48
Table 3 presents the multiple comparisons of the contributions of different sources of
income using ANOVA. The result reveals that the average annual contribution of the
non-farm income to the household was significantly (p<0.05) higher than that from Forest
resources and Agriculture. However, the annual contributions of income from the sale of
forest resources are significantly higher than that of the Agriculture incomes.
Table 3: Multiple comparison of sources of incomes in Masida CF
Comparison Household Sources of Income
Mean
Difference
Std.
Error Sig.
Agriculture income Non-farm Income -1461.405 59.298 .000
Forest Income -153.297 59.298 .026
Non-farm Income Agriculture income 1461.405 59.298 .000
Forest Income 1308.108 59.298 .000
Forest Income Agriculture income 153.297 59.298 .026
Non-farm Income -1308.108 59.298 .000
This finding reflects that the sale of extracted forest resources and produce from
agriculture is limited. One of the contributing factors to this could be related to the
remoteness of the area, and the free accessibility to forest resources and unemployment,
meaning that everyone is collecting the same resources from the forest and even trying to
sell it, and there are few individuals who will buy it in the area. The same implies to
agricultural produce. The contribution of non-farm incomes is high because people who
are employed gets salary every month and others get remittances from their relatives
outside the study area. This finding of this study concurs with the findings of Suleiman et
al. (2019) who reported that rural people in remote areas tend to utilize forest resources for
subsistence rather than for cash income. In contrast, other studies have reported that
agricultural income and forest resources are the most contributing to the total household
49
income (Mallesson et al., 2014; Ojea et al., 2016; Endamana et al., 2016; Jain and Sajjad,
2016).
The results on household levels of income categories show that the 70% of households are
in the Poor group category, 20% are in the Moderate category while only 10% were in the
Rich group (Appendix 17). Therefore, the dependency on forest in Masida CF may be
interpreted in terms of the dimensions that focus on “people” by looking at the people‟s
strong spatial relationship with forest (Newton et al., 2016) since the people of Masida CF
live within or in proximate to the forest (Belcher et al., 2015). Figure 3 shows that most
people of Masida CF live within a certain distance to the forest edge. Although the
commercial livelihoods of people are not forest-based, their proximity and access to forest
resources shows that they depend on the forest as a source of food, firewood and
supporting environmental services as reported from other studies (Bose et al., 2012;
UNECE, 2014; Timko and Kozak, 2014).
The findings of this study further confirm that household in the lower-income (poor)
category are highly dependent on the forest than the higher income category (rich group).
This finding is in agreement with results from other studies (Fikir et al., 2016; Teshome et
al., 2015).
4.2 Socio-economic Factors Influencing Household Dependency on Forest
4.2.1 Socio-economic characteristics of respondents
The socio-economic characteristics of respondents are shown in Table 4. The average
household size per households in the study area is dominantly 3-5 people, comprising
45.9% of the occupants. About 71.4% of the respondents were head of the households and
only 28.6% were represented in their absence by their children, wife or husbands and
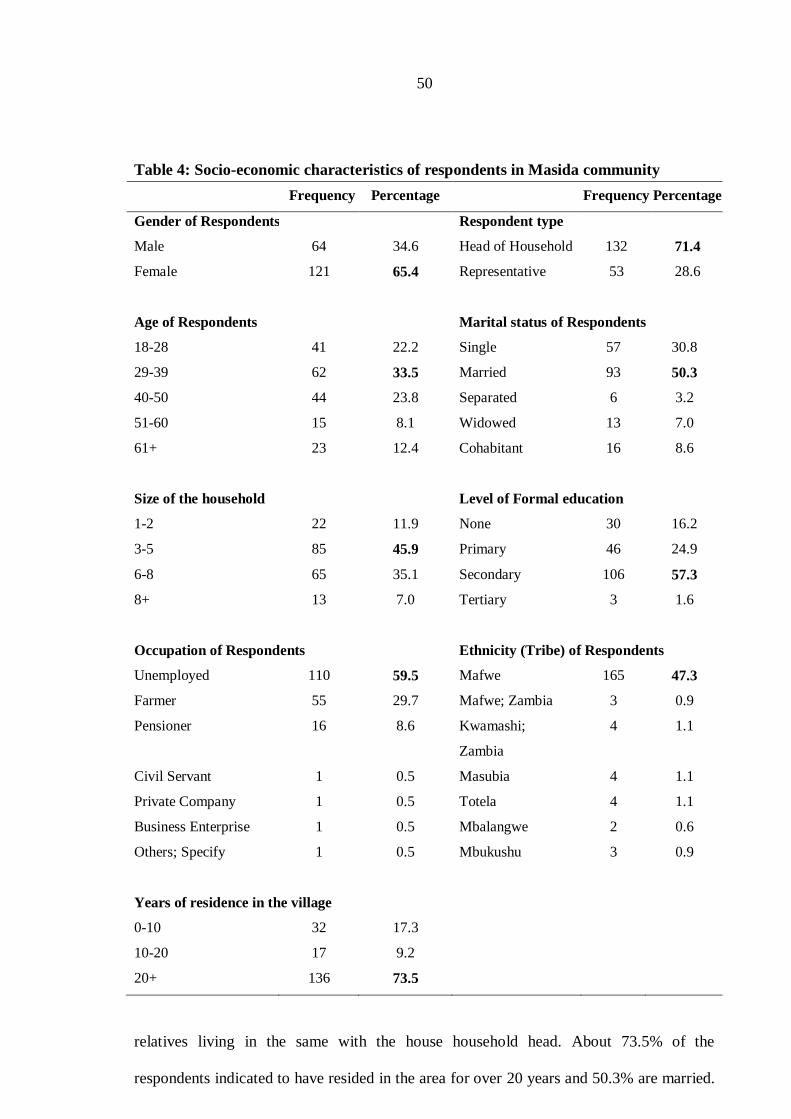
50
Table 4: Socio-economic characteristics of respondents in Masida community
Frequency Percentage Frequency Percentage
Gender of Respondents
Male
64
34.6
Respondent type
Head of Household
132
71.4
Female 121 65.4 Representative 53 28.6
Age of Respondents Marital status of Respondents
18-28 41 22.2 Single 57 30.8
29-39 62 33.5 Married 93 50.3
40-50 44 23.8 Separated 6 3.2
51-60 15 8.1 Widowed 13 7.0
61+ 23 12.4 Cohabitant 16 8.6
Size of the household Level of Formal education
1-2 22 11.9 None 30 16.2
3-5 85 45.9 Primary 46 24.9
6-8 65 35.1 Secondary 106 57.3
8+ 13 7.0 Tertiary 3 1.6
Occupation of Respondents Ethnicity (Tribe) of Respondents
Unemployed 110 59.5 Mafwe 165 47.3
Farmer 55 29.7 Mafwe; Zambia 3 0.9
Pensioner 16 8.6 Kwamashi;
Zambia
4 1.1
Civil Servant 1 0.5 Masubia 4 1.1
Private Company 1 0.5 Totela 4 1.1
Business Enterprise 1 0.5 Mbalangwe 2 0.6
Others; Specify 1 0.5 Mbukushu 3 0.9
Years of residence in the village
0-10 32 17.3
10-20 17 9.2
20+ 136 73.5
relatives living in the same with the house household head. About 73.5% of the
respondents indicated to have resided in the area for over 20 years and 50.3% are married.
51
Majority of the respondents (89.2%) belong to the Mafwe tribe. Females constituted
65.4% of the respondents interviewed and the majority of respondents were in the 29 – 39
age groups (33.5%). Although the majority of these respondents (57.3%), indicated to
have attended formal education up to secondary level, 59.5% of these were unemployed.
4.2.2 Socio-economic factors influencing households dependency on forest
Socio-economic factors that influence households‟ dependence on forest are presented in
Table 5. Results of the Likelihood ratio test (207) of the regression model is significant
(p<0.05), the logistic regression model has an explanatory power that explained the total
variation in the dependent variable with an overall fitness of (x2 value of 48.132,
P< 0.05). Indicating a significant relationship between the independent variables and
forest dependency. The logistic regression model likelihood test ratio, model coefficient,
model summary and Hosmer and Lemeshow (H-L) test are shown in Appendix 18.
The model predicted forest dependency with 70 % accuracy (Appendix 19). The pseudo
R2 (0.31) indicating that the independent variables fitted in the model explained 31% of
the total variation in the dependent variable. Therefore, these variables can be used as
explanatory variables for further studies on forest dependency elsewhere.
The Age of respondents (40 – 50) have a positive coefficient and significant (p < 0.05)
influence on forest dependency. The upper to tertiary education level also had negative
relations and significant (p<0.05). Furthermore, the area of land owned have positive
coefficient and significant (p<0.05). The remaining variables did not significantly explain
forest dependency, thus the null hypothesis was rejected.
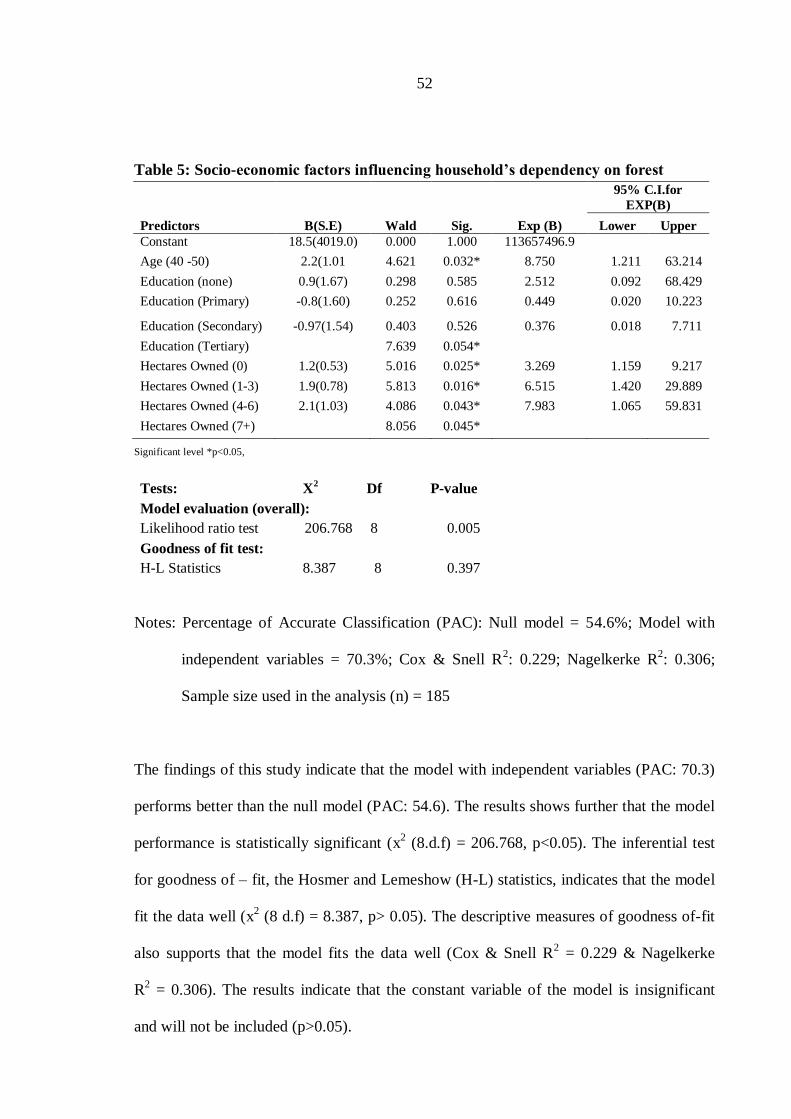
52
Table 5: Socio-economic factors influencing household’s dependency on forest
Predictors B(S.E) Wald Sig. Exp (B)
95% C.I.for
EXP(B)
Lower Upper
Constant 18.5(4019.0) 0.000 1.000 113657496.9
Age (40 -50) 2.2(1.01 4.621 0.032* 8.750 1.211 63.214
Education (none) 0.9(1.67) 0.298 0.585 2.512 0.092 68.429
Education (Primary) -0.8(1.60) 0.252 0.616 0.449 0.020 10.223
Education (Secondary) -0.97(1.54) 0.403 0.526 0.376 0.018 7.711
Education (Tertiary) 7.639 0.054*
Hectares Owned (0) 1.2(0.53) 5.016 0.025* 3.269 1.159 9.217
Hectares Owned (1-3) 1.9(0.78) 5.813 0.016* 6.515 1.420 29.889
Hectares Owned (4-6) 2.1(1.03) 4.086 0.043* 7.983 1.065 59.831
Hectares Owned (7+) 8.056 0.045*
Significant level *p<0.05,
Tests: X2 Df P-value
Model evaluation (overall):
Likelihood ratio test 206.768 8 0.005
Goodness of fit test:
H-L Statistics 8.387 8 0.397
Notes: Percentage of Accurate Classification (PAC): Null model = 54.6%; Model with
independent variables = 70.3%; Cox & Snell R2: 0.229; Nagelkerke R
2: 0.306;
Sample size used in the analysis (n) = 185
The findings of this study indicate that the model with independent variables (PAC: 70.3)
performs better than the null model (PAC: 54.6). The results shows further that the model
performance is statistically significant (x2 (8.d.f) = 206.768, p<0.05). The inferential test
for goodness of – fit, the Hosmer and Lemeshow (H-L) statistics, indicates that the model
fit the data well (x2 (8 d.f) = 8.387, p> 0.05). The descriptive measures of goodness of-fit
also supports that the model fits the data well (Cox & Snell R2 = 0.229 & Nagelkerke
R2 = 0.306). The results indicate that the constant variable of the model is insignificant
and will not be included (p>0.05).
53
The positive relation of age in the households (aged 40 - 50) to forest dependency in
Masida CF was attributed to the fact that at this age, the head of households build houses
using materials collected from the forest and use forest resources both for subsistence and
for commercial purposes. Similarly, those aged 40 - 50 are people with experience of the
forest in identifying forest resources for various uses. Furthermore, the influence of age
groups (40 – 50) imply that the majority of the respondents were unemployed, and at
active age to get into the forest to harvest forest resources. In contrast, as the age reaches
60 years, the citizens of Namibia are entitled to the old-age social grant and hence their
status of unemployment changes and rely less on forest resources. In a study conducted in
South Africa, Ofoegbu et al. (2017) reported that the age of respondents (≤38–65)
significantly (p < 0.05) influenced use of the forest resources.
The primary to tertiary level of education is negatively related to forest dependency,
showing that an increase in one unit of the education causes a decrease in the odds of
households‟ high dependency on the forest. Hence, the more educated members are the
least found in the area and they have secured employment, and rarely use forest resources
in their households. Furthermore, the negative association with education level indicates
also that as community members get more educated, their understanding of health
vulnerability associated with using the forest as natural ablution facility increases, and
build pit latrines or flush toilets. Similarly, Newton et al. (2016) and Jain and Sajjad
(2016) reported that the higher level of formal education reduces reliance on forest as
education increases prospects of diverse employment opportunities. The positive and
significant (p<0.05) relationship between forest dependency and the size of the area (ha)
owned by Masida CF residents is explained by the fact that households who own larger
areas of land tend to clear the forest for expansion of agricultural activities.
54
4.2.3 Reasons influencing household to depend on the forest
During the pre-testing of the questionnaire to be used for the household interviews, the
respondents revealed that the most socio-economic descriptions for households
dependence on forest in the area was “The forest provides free medicine, is used as natural
ablution (toilet) facility, offers easy accessibility and cheap acquisition of forest resources
in the area with high unemployment and low income, and hence inability to spend on
alternatives such as gas and electricity (Appendix 20).
During the face-to-face household interviews, it was reported that the inability to pay for
alternatives such as electricity and gas was not considered a good reason for dependence
to forest resources, especially in the villages of Masida (0%), Kansoko (11.8%) and
Sabelo (16.7%). However, this reason was more important in Sitanta (70.4%) and Taulo
(68.1%) villages. This result implies that residents in these two villages rely more on
forest resources for energy, whereas residents in the other villages can afford to use
electricity and gas in their household instead of relying on forest resources.
The relationship between the reasons influencing households and forest dependency status
was explored using multiple response analysis. The results (Table 6), show that the
majority of respondents cited factors that influence their dependency on forest resource as
(a) Forest use as natural toilet facility, (b) Provision of free medicine from the forest,
(c) Easy access to the forest without any harvesting restriction (d) Forest resources are
cheap to get, (e) The forest provides some income to the unemployed and (f) Use of forest
resources because they cannot afford to pay for alternatives such as electricity and gas.
The influence of each of these reasons in all six villages was tested using the Pearson chi-
square test and was significant (p < 0.05). The results show that provision of medicine
(19.3%) by the forest is a strong motive that makes household to depend on forest,
followed by natural ablution function of the forest with affordability to pay for alternative

55
being the least mentioned. This finding can be explained by the fact that Masida CF is a
remote area, and residents encounter transport problems to reach the nearest health center
located at Sibbinda, 25 km away. This makes people to use forest as a first aid before a
patient is taken to the hospital. The ablution facility function is observed in the study area
that only houses with an old aged or senior citizen had Pit latrines built by the government
in a campaign for the healthcare and reduction of the diseases.
Affordability to pay the utility of electricity and gas was higher in some households where
the Northern Region Electricity Supplier (NORED) has installed electricity lines in
villages and is continuing to erect poles across all villages, expecting the household to buy
the electricity prepaid meter box to install in their houses. However, in the sampled
households, only a few (8.7%) have managed to pay for the service and those who afford
to be connected majority are using it only for light in the houses, but for cooking and
heating, they still use the firewood.
Table 6: Reasons for depending on Masida community forest
Motives contributing to dependence on Forest
Reasons for Dependence Code Count Percent of
responses (%)
Forest provide free medicine 1 150 19.3
Forest serve natural ablution 2 147 18.9
Forest is easily accessed 3 144 18.5
Forest products cheap acquisition 4 140 18.0
Unemployment 5 129 16.6
Cannot afford to pay alternatives 6 68 8.7
Total responses 778 100
Valid cases 185
4.3 Extent and Consequences of Forest Dependency on Forest Resources
The causes of scarcity of forest resources in Masida CF are shown in Figure 10.
The majority of the respondents (74%) attributed the scarcity of forest resources to man-
made activities (e.g. overharvesting) and natural causes (e.g. climate change).

56
60
50
13 11
3
0
10
20
30
40
50
60
70
Overharvesting by
humans
Climatechange
Over grazing No earlyburningpractice
Uncontrolledforest fire
Freq
uen
cies
of
Res
po
nse
s
Causes of scarcity of forest resources
Figure 10: The reasons for the disappearance of some forest resources
A quarter of the respondents reported to have no idea on scarcity or any reason in mind of
what could have caused the scarcity of forest resources but these was assumed that these
were mainly community members who are involved in the illegal harvesting of resources,
but feared prosecution for contravening the law as they harvest forest resources without
the required permits. This finding is supported by the study of Kamwi et al. (2015) in the
same region, that community members fail to disclose their use of the forest for fear of
prosecution according to the Forest Amendment Act 2005 (Act no.13 of 2005) for the
harvesting of trees in a community forest.
4.3.1 Purposes of forest resource collection from the forest
Table 7 shows that most of the collected forest resources are used for own consumption
with firewood and poles and little were collected for sale. This was observed in the study
area that no household collects any forest products strictly for sale.
The small portion of the extracted forest resources is sold to the surrounding village
markets or shebeens for cash income. Similar findings have been reported in other studies
(Jain and Sajjad, 2016; Suleiman et al., 2017; Jannat et al., 2018).

57
Table 7: Purposes of forest resources collection by Masida community
Collected resources Own use (%)
(n = 185)
Both (Sale and Own use) (%)
(n = 185)
Poles 83 17
Timber 2 0
Wild fruits 65 22
Thatch grass 62 28
Firewood 98 2
Medicinal plants 61 25
4.3.2 Extent of use and consequences of dependency to forest resources
4.3.2.1 Firewood
(a) Firewood for own consumption purpose
Use of firewood as a source of energy for cooking was cited by 98% of the households
(Table 8).
Table 8: Sources of energy for cooking in Masida CF
Table 9 shows that 96% of the households across the villages cited Colophospermum
mopane as the highest targeted tree species for firewood in the area, followed by
Terminalia sericea (47%). Acacia fleckii was the least (0.5%) targeted species.
Table 9: Harvested species for firewood in Masida CF
Product(s) Used Number of households
Firewood only 182
Firewood and Gas 1
Firewood and Electricity 2
Total 185
Species Number of households’ response(s)
Colophospermum mopane 178
Terminalia sericea 84
Combretum collinum 24
Baikiaea plurijuga 22
Dichrostachys cinerea 17
Acacia erioloba 15
Combretum imberbe 5
Combretum engleri 4
Acacia fleckii 1

58
The respondents revealed the number of times they visit the forest to collect firewood and
the quantity collected (Table 10). The results show that 44% of the households collected
firewood in 1 – 2 days, collecting 83 bundles of firewood.
Table 10: Frequencies and quantity of firewood harvested by households
Frequency
Total Households
(n =185) Quantities collected
1-2 days 82 (44%) 83 bundles
3-4 days 44 (23.8%) 84 bundles and 2 bakkies load
Once a week 44 (23.8%) 95 bundles
Once in 2 weeks 8 (4.3%) 5 bundles, 4 sledges and 3bakkies loads
Once a month 7(3.8%) 10 bundles, 6 sledges
Table 10 further shows that beneficiaries of Masida CF extract a total of 277 bundles of
firewood (the assumed weight is 20kg/bundle and 5 bakkies load (it is assumed to carry
1 000 kg or 1 ton/bakkie) and 10 sledges (assumed to carry 500kg/sledge) per month for
own consumption from the forest. This is equivalent to 15 540 tons (1ton = 0.001m3) or
15.540 m3
of firewood removed from forest.
(b) Firewood for commercial purpose
According to the Forest Act, 2001(Act no. 12 of 2001, as Amended in Forest Amendment
Act 2005 (Act no.13 of 2005) under Forest license for Harvesting (section 22, 23, 24, 27
and 33/ regulation 8 and 12), the Community Forest Office, is given user right to use
resources for commercial purposes. This study obtained data recorded on the permit
system at the office, focusing mainly on the species use and quantities harvested over a
ten-year period (2007 to 2017). Data from the office showed that the Management body
issued harvesting permission to individuals from within or outside the area to harvest
firewood for commercial purposes to different destinations. A compilation of all permits
revealed that majority of harvesting permits issued for firewood from 2008 to 2016, was
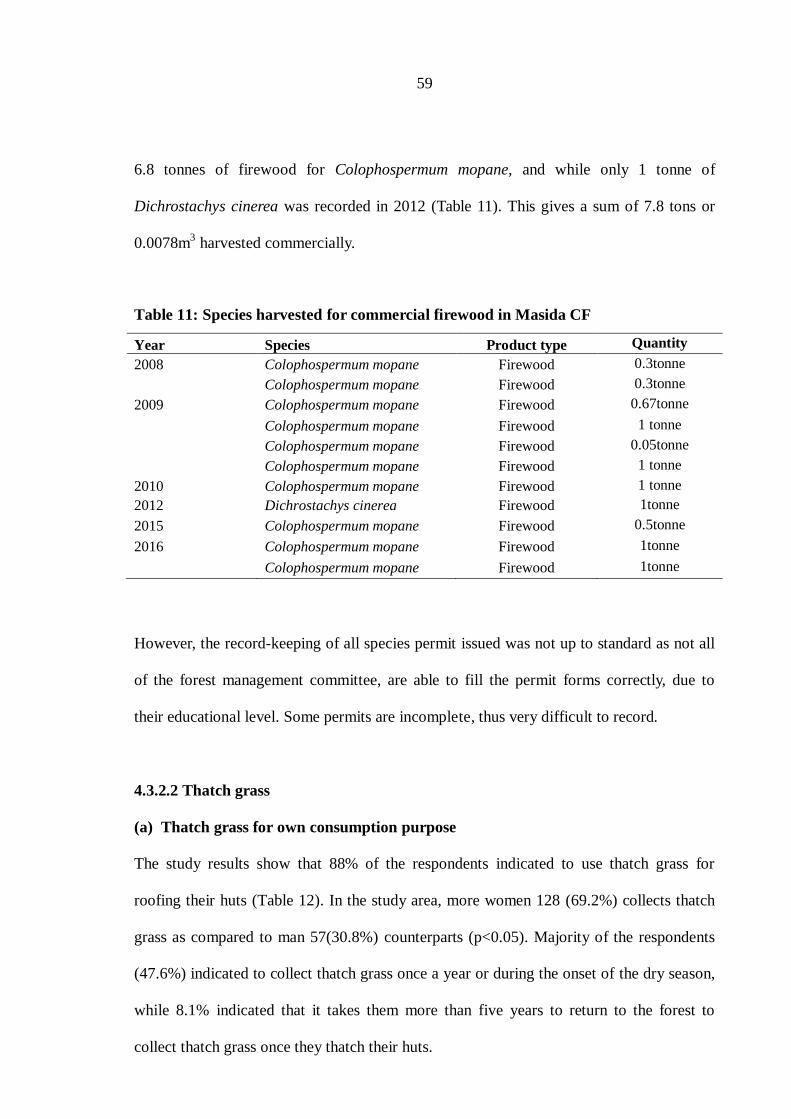
59
6.8 tonnes of firewood for Colophospermum mopane, and while only 1 tonne of
Dichrostachys cinerea was recorded in 2012 (Table 11). This gives a sum of 7.8 tons or
0.0078m3 harvested commercially.
Table 11: Species harvested for commercial firewood in Masida CF
Year Species Product type Quantity
2008 Colophospermum mopane Firewood 0.3tonne
Colophospermum mopane Firewood 0.3tonne
2009 Colophospermum mopane Firewood 0.67tonne
Colophospermum mopane Firewood 1 tonne
Colophospermum mopane Firewood 0.05tonne
Colophospermum mopane Firewood 1 tonne
2010 Colophospermum mopane Firewood 1 tonne
2012 Dichrostachys cinerea Firewood 1tonne
2015 Colophospermum mopane Firewood 0.5tonne
2016 Colophospermum mopane Firewood 1tonne
Colophospermum mopane Firewood 1tonne
However, the record-keeping of all species permit issued was not up to standard as not all
of the forest management committee, are able to fill the permit forms correctly, due to
their educational level. Some permits are incomplete, thus very difficult to record.
4.3.2.2 Thatch grass
(a) Thatch grass for own consumption purpose
The study results show that 88% of the respondents indicated to use thatch grass for
roofing their huts (Table 12). In the study area, more women 128 (69.2%) collects thatch
grass as compared to man 57(30.8%) counterparts (p<0.05). Majority of the respondents
(47.6%) indicated to collect thatch grass once a year or during the onset of the dry season,
while 8.1% indicated that it takes them more than five years to return to the forest to
collect thatch grass once they thatch their huts.
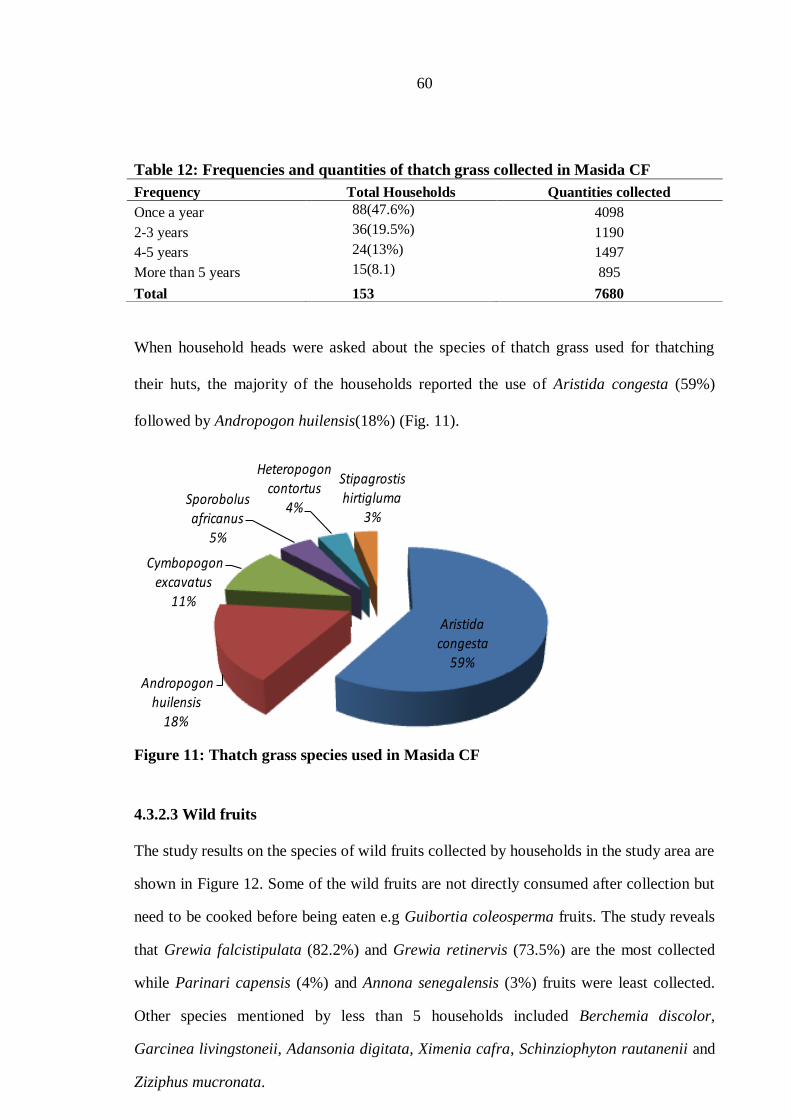
60
Table 12: Frequencies and quantities of thatch grass collected in Masida CF
When household heads were asked about the species of thatch grass used for thatching
their huts, the majority of the households reported the use of Aristida congesta (59%)
followed by Andropogon huilensis(18%) (Fig. 11).
Aristida congesta
59%
Andropogon huilensis
18%
Cymbopogon excavatus
11%
Sporobolus africanus
5%
Heteropogon contortus
4%
Stipagrostis hirtigluma
3%
Thatch grass species used in the study area
Figure 11: Thatch grass species used in Masida CF
4.3.2.3 Wild fruits
The study results on the species of wild fruits collected by households in the study area are
shown in Figure 12. Some of the wild fruits are not directly consumed after collection but
need to be cooked before being eaten e.g Guibortia coleosperma fruits. The study reveals
that Grewia falcistipulata (82.2%) and Grewia retinervis (73.5%) are the most collected
while Parinari capensis (4%) and Annona senegalensis (3%) fruits were least collected.
Other species mentioned by less than 5 households included Berchemia discolor,
Garcinea livingstoneii, Adansonia digitata, Ximenia cafra, Schinziophyton rautanenii and
Ziziphus mucronata.
Frequency Total Households Quantities collected
Once a year 88(47.6%) 4098
2-3 years 36(19.5%) 1190
4-5 years 24(13%) 1497
More than 5 years 15(8.1) 895
Total 153 7680

61
152136
5633 33 25 21
9 8 6
020406080
100120140160
Fre
qu
en
cy o
f re
spo
nse
s
Species preffered for Wildfruit
Figure 12: Species of wild fruits collected in Masida CF
Regarding gender roles in the households, the majority (65.9%) collecting wild fruits as
food were females.
4.3.2.4 Poles
(a) Poles for own consumption
During the interviews, respondents listed the species targeted for different household -
own consumption benefits including species used for poles to construct their houses
(Table 13). Colophospermum mopane is the most preferred and harvested species for poles
(98%) in all the villages, followed by Terminalia sericea (65.9%).
Table 13: Preferred species for poles in Masida CF
Species
Total Households response(s)
(n = 185)
Colophospermum mopane 182
Terminalia sericea 122
Dichrostachys cinerea 64
Acacia erioloba 9
Baikiaea plurijuga 9
Combretum collinum 4 Combretum imberbe 2
Lonchocarpus nelsii 2
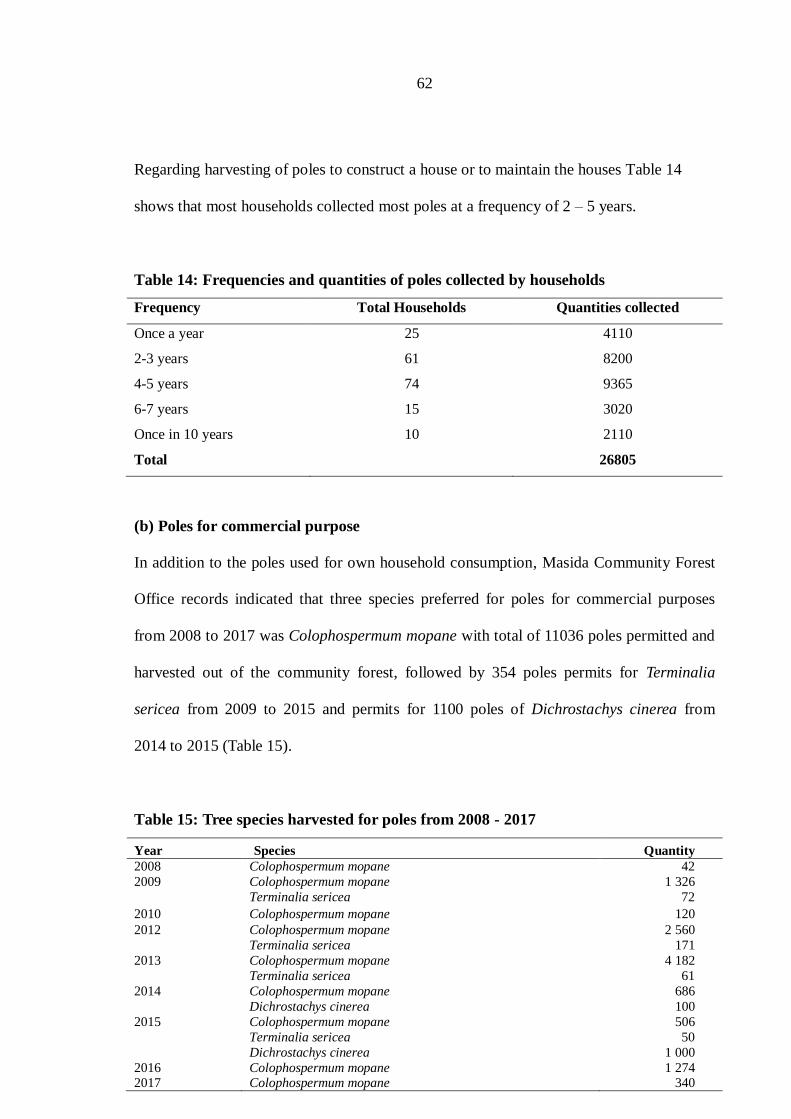
62
Regarding harvesting of poles to construct a house or to maintain the houses Table 14
shows that most households collected most poles at a frequency of 2 – 5 years.
Table 14: Frequencies and quantities of poles collected by households
Frequency Total Households Quantities collected
Once a year 25 4110
2-3 years 61 8200
4-5 years 74 9365
6-7 years 15 3020
Once in 10 years 10 2110
Total 26805
(b) Poles for commercial purpose
In addition to the poles used for own household consumption, Masida Community Forest
Office records indicated that three species preferred for poles for commercial purposes
from 2008 to 2017 was Colophospermum mopane with total of 11036 poles permitted and
harvested out of the community forest, followed by 354 poles permits for Terminalia
sericea from 2009 to 2015 and permits for 1100 poles of Dichrostachys cinerea from
2014 to 2015 (Table 15).
Table 15: Tree species harvested for poles from 2008 - 2017
Year Species Quantity
2008 Colophospermum mopane 42
2009 Colophospermum mopane 1 326
Terminalia sericea 72
2010 Colophospermum mopane 120
2012 Colophospermum mopane 2 560
Terminalia sericea 171
2013 Colophospermum mopane 4 182
Terminalia sericea 61
2014 Colophospermum mopane 686
Dichrostachys cinerea 100
2015 Colophospermum mopane 506
Terminalia sericea 50
Dichrostachys cinerea 1 000
2016 Colophospermum mopane 1 274 2017 Colophospermum mopane 340

63
4.3.2.5 Droppers
(a) Droppers for commercial purposes
The official data further show that Colophospermum mopane species is among the three
highest preferred species for droppers followed by Terminalia sericea (Table 16). During
2009 to 2013, a total of 30150 droppers of Colophospermum mopane were harvested,
while from 2013 to 2014 a total of 14980 droppers of Terminalia sericea was harvested.
Table 16: Species harvested for droppers from 2009 - 2014
Year Species Quantity
2009 Colophospermum mopane 500
2012 Colophospermum mopane 26 000
Dichrostachys cinerea 400
2013 Colophospermum mopane 3 650
Terminalia sericea 13 330
Dichrostachys cinerea 500
2014 Terminalia sericea 1 650
4.3.2.6 Timber
(a) Timber harvested for commercial purpose
Despite the fact that the filing of permit system at Masida CF office was not up to date,
there were records of different species permitted to be harvested for timber from the area
from 2009 to 2014 (Table 17). These products were harvested and processed in the forest
and transported out as finished and semi-finished products such as finished planks. A total
of 150 planks from Pterocarpus angolensis were processed, while a total of 183 finished
planks and 82 semi-finished cants for Baikieae plurijuga were permitted and transported
out of Masida CF to other destinations (Table 17).
Other products recorded were tree harvesting for different purposes such as sledge and
canoe carvings. As per stipulated Forest Act 2001, all the harvested resources have to be
deducted from the Annual Allowable Cut, as set in the management plan and an annual
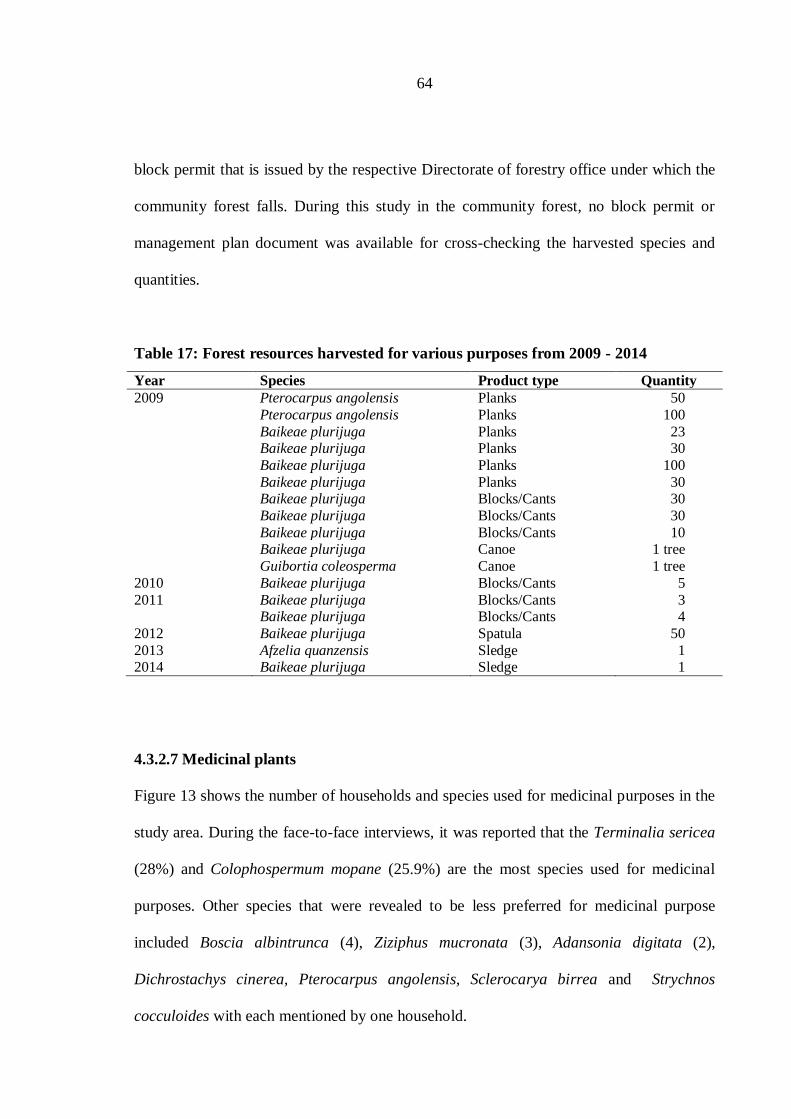
64
block permit that is issued by the respective Directorate of forestry office under which the
community forest falls. During this study in the community forest, no block permit or
management plan document was available for cross-checking the harvested species and
quantities.
Table 17: Forest resources harvested for various purposes from 2009 - 2014
Year Species Product type Quantity
2009 Pterocarpus angolensis Planks 50
Pterocarpus angolensis Planks 100
Baikeae plurijuga Planks 23
Baikeae plurijuga Planks 30
Baikeae plurijuga Planks 100
Baikeae plurijuga Planks 30
Baikeae plurijuga Blocks/Cants 30
Baikeae plurijuga Blocks/Cants 30
Baikeae plurijuga Blocks/Cants 10
Baikeae plurijuga Canoe 1 tree
Guibortia coleosperma Canoe 1 tree
2010 Baikeae plurijuga Blocks/Cants 5
2011 Baikeae plurijuga Blocks/Cants 3
Baikeae plurijuga Blocks/Cants 4
2012 Baikeae plurijuga Spatula 50
2013 Afzelia quanzensis Sledge 1 2014 Baikeae plurijuga Sledge 1
4.3.2.7 Medicinal plants
Figure 13 shows the number of households and species used for medicinal purposes in the
study area. During the face-to-face interviews, it was reported that the Terminalia sericea
(28%) and Colophospermum mopane (25.9%) are the most species used for medicinal
purposes. Other species that were revealed to be less preferred for medicinal purpose
included Boscia albintrunca (4), Ziziphus mucronata (3), Adansonia digitata (2),
Dichrostachys cinerea, Pterocarpus angolensis, Sclerocarya birrea and Strychnos
cocculoides with each mentioned by one household.
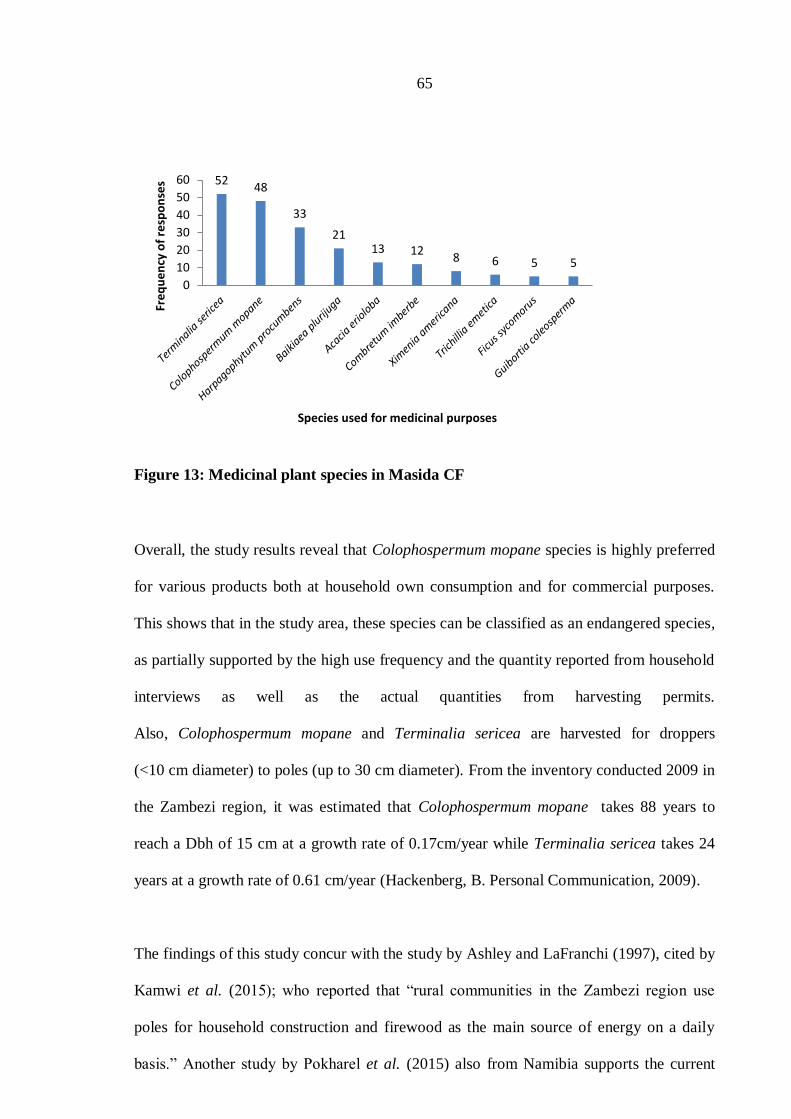
65
5248
33
2113 12
8 6 5 5
0
10
20
30
40
50
60
Fre
qu
en
cy o
f re
spo
nse
s
Species used for medicinal purposes
Figure 13: Medicinal plant species in Masida CF
Overall, the study results reveal that Colophospermum mopane species is highly preferred
for various products both at household own consumption and for commercial purposes.
This shows that in the study area, these species can be classified as an endangered species,
as partially supported by the high use frequency and the quantity reported from household
interviews as well as the actual quantities from harvesting permits.
Also, Colophospermum mopane and Terminalia sericea are harvested for droppers
(<10 cm diameter) to poles (up to 30 cm diameter). From the inventory conducted 2009 in
the Zambezi region, it was estimated that Colophospermum mopane takes 88 years to
reach a Dbh of 15 cm at a growth rate of 0.17cm/year while Terminalia sericea takes 24
years at a growth rate of 0.61 cm/year (Hackenberg, B. Personal Communication, 2009).
The findings of this study concur with the study by Ashley and LaFranchi (1997), cited by
Kamwi et al. (2015); who reported that “rural communities in the Zambezi region use
poles for household construction and firewood as the main source of energy on a daily
basis.” Another study by Pokharel et al. (2015) also from Namibia supports the current

66
findings revealing that management of forests in Namibia experiences challenges in
applying traditional centrally-controlled forest management approaches because local
people rely heavily on forest resources for their livelihoods.
The results of the current study are also similar to the findings of other studies; including
Awono and Levang (2018) in Cameroon, that revealed that community forests are
exploited for various activities creating worries on sustainable management and that
forests are exploited by outsiders or companies without considering local people‟s needs,
hence degrading forest‟s natural potential. Likewise, Jannat et al. (2018) in Bangladesh
revealed that forest dependency is considered problematic when the forest resources are
used commercially.
Mohammed et al. (2010) also reported that the extent of forest resource utilization by
communities can be identified through the different forest-based activities that are being
carried out by the community members. Ahmad and Stacey (2016) also found that in rural
households, firewood, medicine, building materials and wild fruits are common uses of
forest resources. The findings on permit-issuing correspond with the findings by Vrabcová
et al. (2019) in Namibia that illiteracy among the community forest management body is a
major challenge in commercializing of forest resources.
4.4 People’s Perception to Forest Dependence in Relation to the Sustainability of
Forest Resources
4.4.1 People’s perception on forest resources importance
During the face to face household interviews, the Likert type questions were used to assess
the household forest importance and usefulness to their livelihoods. The results were
subjected to the Pearson‟s chi-square test which showed that all these four-scaling differed

67
significantly (p < 0.001) across the six villages for household forest importance (Table 18)
and helpfulness (Table 19).
The majority of the households interviewed perceive the forest as very highly important
especially at Kapani; Sabelo and Kansoko villages ranking the forest importance as high
(Table 18). On the other hand, two households in Taulo (1) and Sitanta (1) villages ranked
forest to be of low importance and not helpful.
Table 18: People’s perception on the importance of forest products
Village name
Importance of forest products to household
Very high High Medium Low
Kapani (n = 24) 15 6 3 0
Kansoko (n = 34) 4 28 2 0
Sabelo (n = 36) 0 36 0 0 Masida (n = 17) 3 14 0 0
Taulo (n = 47) 3 37 6 1
Sitanta (n = 27) 3 17 6 1
Regarding the usefulness of the forest, most village households ranked the forest as highly
useful except one household who found forest to be of no use in Taulo (Table 19).
Table 19: People’s perception on helpfulness of forest products
Village name Very helpful Helpful Not helpful
Kapani (n= 24) 15 9 0
Kansoko (n = 34) 4 30 0
Sabelo (n = 36) 0 36 0
Masida (n = 17) 2 15 0
Taulo (n = 47) 2 44 1
Sitanta (n = 27) 2 25 0
4.4.2 People’s perception on the availability of forest resources
The study disclosed that the availability of forest resources varies. Majority (85%) of
respondents reported that medicinal plants are currently the same as in earlier periods

68
(Table 20); thatch grasses are decreasing (74%), while firewood is slightly increasing
(36%).
Table 20: Perceptions on forest resource availability in Masida CF
Name of resource Increase (%) Decrease (%) Same as before (%)
Poles 35 36 19
Thatch grass 12 74 15
Fodder 32 42 32
Firewood 36 28 37
Medicinal plants 5 10 85
Wild fruits 26 32 40
This is in contrary to the study by Jannat et al. (2018) who reported that the all resources
were decreasing due to dependency although small portions of fuel wood, poles and
medicinal plants remained as before.
This result reflects the current situation of Masida CF that more people are building their
roofs using thatched grass and frequent droughts make it hard for grass to reach
harvestable size. Kamwi et al. (2015) working in the same region reported that drought
spells are causing more tree species to dry out and turn into firewood thus firewood
availability turns to increase. Similar findings were reported by Ahmad and Stacey (2016).
4.4.3 People’s perception on forest resources collection
Respondents were asked to rate the collection of forest resources as to whether they have
decreased, increased or remained the same as before. According to the respondents, forest
resources collected by the communities in the area tend to vary per forest resources
(Table 21). Collection of thatch grass was reported by 63% of the respondents as
decreasing; in contrast, 55% of the respondents reported increasing pole harvesting; while
79% and 56% of the respondents respectively, reported collection of firewood and
medicinal plants not to have changed.

69
Table 21: The peoples’ perceptions on forest resource collection in Masida CF
Name of resource
Increase (%)
(n = 185)
Decrease (%)
(n = 185)
Same as before (%)
(n = 185)
Poles 55 28 17
Thatch grass 26 63 11
Fodder 25 40 34
Firewood 16 5 79
Medicinal plants 4 40 56
Wild fruits 56 8 37
Above findings were supported by the Pearson chi-square test showing that collection of
all five forest resources was significantly (p < 0.001) different across all villages; only
fodder collection was insignificant. These results reveal that the collection of fodder by
villagers who own cattle in the area has not changed. A similar finding was reported by
Jain and Sajjad (2016) that families who own more cattle mostly depend on the forest for
fodder, and further supported by Ofoegbu et al. (2017) that households that possess
animals and have lived long in a community tend to depend more on the forest because it‟s
relatively low cost in supporting their livelihood strategies.
4.4.4 Peoples’ perceptions on the level of dependency to forest resources
The study revealed that all beneficiaries of Masida community forest tend to use forest
resources for building materials such as thatch grass, poles, rafters, droppers for roofing
and surrounding the courtyard (Table 22).
Table 22: People’s perception on the level of forest dependence
Forest dependence
Low (%)
(n = 185)
Medium (%)
(n = 185)
High (%)
(n = 185)
Very high (%)
(n = 185)
Income 14.1 13.5 69.7 2.7
Food supply 10.8 46.5 42.7 0.0 medicinal plants 37.3 58.4 4.3 0.0
Fodder 36.2 12.4 43.8 7.6
Building materials 0.0 0.5 82.2 17.3
The Likert scale assessment on the level of dependence per benefit revealed that building
materials, income and fodder benefits are scaled as high, the food supply and medicinal

70
plant scaled medium. The high income dependency perception on forest resources is
caused by the single high income derived by beneficiaries of the community forest during
a seasonal sale of Harpagophytum procumbens (devil‟s claw) facilitated by the
community forest committee and is important to households who participate in harvesting
and selling devil‟s claw. Building materials and fodder was scaled high since all of the
household uses forest resources for building their dwellings whereas the high in fodder is
brought by the availability of unused fodder due to limited number of livestock in the area
that graze freely. However, the community forest is a source of medicine as people
initially prepare different forest products concoctions as first aid before being taken to the
nearby hospital that is 25 km away at Sibbinda. The Pearson chi-square test results
showed that the relationship of the benefits among the villages was significantly
(p < 0.001) different between villages in their level of dependence to forest resources.
The results of this study on people‟s perception shows an individual‟s evaluation of the
changes in the stock of the resources referred to, as whether it was increasing, decreasing
or the same as before. The results from the current study shows that people‟s perception
are in agreement with the study by Chimello de Oliveira (2018) indicating that people‟s
perceptions give a better reflection of the history of the environmental status rather than
the ecological dimension of the changes. Moreover, results of this study are similar to
Fernández-Llamazares et al. (2016) who reported that the local people‟s perception forms
a basis for monitoring the changes in availability and utilization of common pool stock of
natural resources.
4.4.5 Alternative interventions to support forest resource conservation
At the end of every interview, the respondents were asked to give their views on possible
interventions that could reduce their dependence on the natural forest alone as a source of

71
livelihood supplier, hence promote natural resource conservation. The responses of
respondents are shown in Table 23. About 56% of the respondents suggested adoption of
Agroforestry followed by Brickmaking (20.4%) and micro projects (19.2%). This will
enable people to use their own planted trees in household orchards as supplements of food
and make bricks instead of cutting trees for building materials.
Table 23: Interventions suggested by households towards forest conservation
Appropriate interventions to conserve the forest
Alternative measures Code Count Percent of
Responses (%)
Agro forestry 1 93 55.7
Brickmaking 2 34 20.4
Micro projects(Basketry, Poultry, Bakery) 3 32 19.2
Woodlot nursery 4 7 4.2
Beekeeping 5 1 0.6
Total responses 167
Valid cases 185

72
CHAPTER FIVE
5.0 CONCLUSIONS AND RECOMMENDATIONS
5.1 Conclusions
This study has shown that the household‟s forest dependency and forest income vary with
households‟ characteristics and that households in the lower income category are highly
forest-dependent than the high-income categories. The study has shown that forest
resource collection, remittances, piecework, farming, social grants, and wages are the
livelihood strategies and forest resources contribute 16% to the total annual household
incomes in the study area. The study further reveals that the socio-economic factors such
as age of respondents, education and hectares of land owned significantly (p<0.05)
influence forest dependency. Natural ablution facility, provision of free medicine, cheap
acquisition of forest resources, easy accessibility to the forest, and unemployment were
found to be significant factors influencing households‟ forest dependency in the study
area.
The extraction of forest resources for both own consumption and for commercial purposes
through permit system is not well documented, which may not give accurate figures on
utilities of forest resources in the area. In addition, bookkeeping at the community forest
office is not up to date, thus forest permission issued and quantity it contained could not
be traced during the study period. Illiteracy among the community forest management
body is one of the major challenges. However, certain species were highly targeted for
multiple uses e.g. Colophospermum mopane and Terminalia sericea. Firewood is the most
frequently collected resources and is used as a supplement in households that have access
to electricity and gas, whereby it is used for heating or cooking. This study further reveals
that local people‟s perception forms a basis of monitoring the sustainability of common

73
pool natural resource stock. Agroforestry, brickmaking and beekeeping are appropriate
alternatives to embark upon instead of relying on forest resources alone.
5.2 Recommendations
The study has the following to recommend;
(i) An in-depth study and forest resource inventory should be carried out to
determine the intensity of resource consumption in the area.
(ii) The in-service training in bookkeeping should be conducted to the management
body of the community forest.
(iii) Conduct awareness creation on lesser-known tree species to lessen the burden on
the targeted species.
(iv) The Community Forest management body to set up agroforestry trial orchards as
an alternative to using the natural forest alone.
(v) The development and promotion of fuel-efficient stoves to reduce the high
consumption of firewood.
(vi) Directorate of Forestry and stakeholders should provide seedlings of fast-growing
species for planting in home gardens, fruit orchards or on common lands.
(vii) Strengthen management body to reinforce the practice of early burning in the
area.
74
REFERENCES
Abdullah, A. N. M., Stacey, N., Garnett, S. T. and Myers, B. (2016). Economic
dependence on mangrove forest resources for livelihoods in the Sundarbans,
Bangladesh. Forest Policy and Economics 64: 15 – 24.
Adam, Y. O. and EL Tayeb, M. A. (2014). Forest dependency and its effect on
conservation in Sudan: a case of Sarf-Saaid Reserved Forest in Gadarif State.
Agriculture and Forestry 60(3): 107–121.
Adlina, A. H., Jawan, J. A., Sri Rahayu, I., Normala, O. and Mohd Hadzrul, M. (2013).
Traditional knowledge and environmental conservation among indigenous
people in Ranau, Sabah. Global Journals Incorporated 13(3): 4–12.
Ahammad, R. and Stacey, N. (2016). Forest and Agrarian Change in the Chittagong Hill
Tracts Region of Bangladesh. Agrarian Change in Tropical Landscapes.
Center for International Forestry Research, Bogor, Indonesia. 233pp.
Angelsen, A., Jagger, P., Babigumira, R., Belcher, B., Hogarth, N. J., Bauch, S. and
Wunder, S. (2014). Environmental income and rural livelihoods: A global-
comparative analysis. World Development 64: 12 – 28.
Awono, A. and Levang, P. (2018). Contribution of environmental products to the
household economy in cameroon: essential, complementary or trivial?, Forest
Research and Engineering: International Journal 2(1): 1–14.
Belcher, B., Achdiawan, R. and Dewi, S. (2015). Forest-based livelihoods strategies
conditioned by market remoteness and forest proximity in Jharkhand, India.
World Development 66: 269 – 279.
75
Bhandari, D. and Jianhua, Z. (2017). household dependency on buffer zone community
forest and its implication for management of Chitwan National Park, Nepal.
International Journal of Sciences 3(3): 68 – 80.
Bose, P., Arts, B. and van Dijk, H. (2012). „Forest governmentality‟: A genealogy of
subject-making of forest-dependent „scheduled tribes‟ in India. Land Use
Policy 29(3): 664 – 673.
Brown, D. and Schreckenberg, K. (2001). Rural Development Forestry Network:
Community Forestry Facing Up to the Challenge in Cameron. Overseas
Development Institute, London. 14pp.
Bwalya, S. M. (2013). Household dependence on forest income in rural Zambia. Zambia
Social Journal 2(1): 67 – 86.
Chimello de Oliveira, L. E. (2018). The perceptions of social-ecological changes in
Tarituba, a coastal village in Southeastern Brazil. Thesis for Award of PhD
Degree at University of Manitoba, Winnipeg, Brazil, 224pp.
Dev, O. P., Yadav, N. P., Springate-Baginski, O. and Soussan, J. (2003). Impacts of
community forestry on livelihoods in the middle hills of Nepal. Journal of
Forest and Livelihood 3(1): 64 – 77.
Endamana, D., Angu, K. A., Akwah, G. N., Shepherd, G. and Ntumwel, B. C. (2016).
Contribution of non-timber forest products to cash and non-cash income of
remote forest communities in Central Africa. International Forestry Review
18(3): 280 – 295.

76
Fernández-Llamazares, Á., Díaz-Reviriego, I., Guèze, M., Cabeza, M., Pyhälä, A. and
Reyes-García, V. (2016). Local perceptions as a guide for the sustainable
management of natural resources: empirical evidence from a small-scale
society in Bolivian Amazonia. Ecology and Society 21(1): 1 – 2.
Fernández-Llamazares, Á., Méndez-López, M. E., Díaz-Reviriego, I., McBride, M. F.,
Pyhälä, A., Rosell-Melé, A. and Reyes-García, V. (2015). Links between
media communication and local perceptions of climate change in an indigenous
society. Climatic Change 131(2): 307 – 320.
Field, A. (2014). Discovering Statistics Using SPSS. and Sex and Drugs and Rock ‘N’
Roll. (Third Edition), SAGE Publication Ltd., India. 857pp.
Fikir, D., Tadesse, W. and Gure, A. (2016). Economic contribution to local livelihoods
and households dependency on dry land forest products in Hammer District,
Southeastern Ethiopia. International Journal of Forestry Research 2016(12):
1 – 11.
Fonta, W. M. and Ayuk, E. T. (2013). Measuring the role of forest income in mitigating
poverty and inequality: evidence from south-eastern Nigeria. Forests, Trees
and Livelihoods 22(2): 86–105.
Garekae, H., Thakadu, O. T. and Lepetu, J. (2017). Socio-economic factors influencing
household forest dependency in Chobe enclave, Botswana. Ecological
Processes 6(1): 1 – 10.
Giess, W. (1998). A preliminary vegetation map of Namibia. Dinteria 4: 1–112.

77
Government Gazette of the Republic of Namibia (2001). Promulgation of Forest Act, 2001
(Act No. 12 of 2001). Windhoek, Namibia.
Government Gazette of the Republic of Namibia. (2005). Promulgation of Forest Act,
2005 (Act No. 13 of 2005). Windhoek, Namibia.
Hosmer, D., Lemeshow, S. and Sturdivant, R. (2013). Applied Logistic Regression.
(3rd
Ed). John Wiley and Sons, New York. 397pp.
ICF (2014). The UK's international Climate Fund. [http://icai.independent.gov.uk/wp-
content/uploads/2014/01/ICAI-Study-The-UK-International-Climate-Fund-
ToRs.pdf] site visited on 12/07/2019.
Jain, P. and Sajjad, H. (2016). Household dependency on forest resources in the Sariska
Tiger Reserve (STR), India: Implications for management. Journal of
Sustainable Forestry 35(1): 60 – 74.
Jannat, M., Hossain, M. K., Uddin, M. M., Hossain, M. A. and Kamruzzaman, M. (2018).
People‟s dependency on forest resources and contributions of forests to the
livelihoods: A case study in Chittagong Hill Tracts of Bangladesh.
International Journal of Sustainable Development and World Ecology 25(6):
1–8.
Jones, T. B. (2015). A Strategic Forestry Management Plan for the Mudumu Landscape.
Zambezi Region. Republic of Namibia, Namibia. 48pp.
Kajembe, G. C., Monela, G. C. and Mvena, Z. S. K. (2003). Making Community
Management Work: A Case Study of Duru-Haitemba Village Forest Reserve,

78
Babati, Tanzania. Policies and Governance Structures in Woodlands of
Southern Africa. Center for International Forestry Research, Bogor. 12pp.
Kamwi, J. M., Chirwa, P. W. C., Graz, F. P., Manda, S. O. M., Mosimane, A. W. and
Kätsch, C. (2018). Livelihood activities and skills in rural areas of the Zambezi
region, Namibia: Implications for policy and poverty reduction. African
Journal of Food, Agriculture, Nutrition and Development 18(1): 13074 –
13094.
Kamwi, J. M., Chirwa, P. W., Manda, S. O., Graz, P. F. and Kätsch, C. (2015).
Livelihoods, land use and land cover change in the Zambezi Region, Namibia.
Population and Environment 37(2): 207 – 230.
Kothari, C. R. and Garg, G. (2014). Research Methodology: Methods and Techniques.
New Age International (P) Limited, Publishers Nairobi. 418pp.
Krug, J. H. (2017). Adaptation of Colophospermum mopane to extra-seasonal drought
conditions: site-vegetation relations in dry-deciduous forests of Zambezi region
(Namibia). Forest Ecosystems 4(25): 1 – 10.
Langat, D. K., Maranga, E. K., Aboud, A. A. and Cheboiwo, J. K. (2016). Role of forest
resources to local livelihoods: The Case of East Mau Forest Ecosystem, Kenya.
International Journal of Forestry Research 11(12): 1 – 10.
Larson, A. M., Monterroso, I., Banjade, M. R. and Mwangi, E. (2017). Community rights
to forests in the tropics. Comparative Property Law: Global Perspectives
9(12.6): 435 – 442.
79
Leclerc, C., Mwongera, C. N., Camberlin, P. and Boyard-Micheau, J. (2013). Indigenous
past climate knowledge as cultural built-in object and its accuracy. Ecology
and Society 18(4).
Lepetu, J., Alavalapati, J. and Nair, P. K. (2009). Forest dependency and its implication
for protected areas management: A case study from Kasane forest reserve,
Botswana. International Journal of Environmental Research 3(4): 525–536.
Mahanty, S., Gronow, J., Nurse, M. and Malla, Y. (2006). Reducing poverty through
community based forest management in Asia. Journal of Forest and Livelihood
5 (1): 78 – 89.
Malleson, R., Asaha, S., Egot, M., Kshatriya, M., Marshall, E., Obeng-Okrah, K. and
Sunderland, T. (2014). Non-timber forest products income from forest
landscapes of Cameroon, Ghana and Nigeria–an incidental or integral
contribution to sustaining rural livelihoods?. International Forestry Review
16(3): 261 – 277.
Marshall, M. N. (1996). The key informant technique. Family Practice 13(1): 92 – 97.
Mbongo, W., Benkenstein, A. and Hengari, S. (2014). Community Forests in Namibia:
Ensuring Sustainable Local-level Forest Management. Policy Briefing No.
119. governance if African‟s Resources Programme, Namibia. 4pp.
Mccarthy, A., Hepburn, C., Scott, N., Schweikert, K., Turner, R. and Moller, H. (2014).
Local people see and care most? Severe depletion of inshore fisheries and its
consequences for Māori communities in New Zealand. Aquatic Conservation:
Marine and Freshwater Ecosystems 24(3): 369 – 390.

80
Mendelsohn, J., Jarvis, A., Roberts, C. and Robertson, T. (2002). Atlas of Namibia:
A portrait of the land and its people. Cape Town, South Africa.
[https://onlinelibrary.wiley.com/ doi/abs/ 10.../mmnz.20040800111] site visited
on 10/03/2019.
Mendelsohn, M. and Roberts, C. (1997). An Environmental Profile and Atlas of Caprivi.
Directorate of Environmental Affairs, Windhoek. 50pp.
Miah, M. D. (2014). Trade-offs between Forest Conservation and Livelihoods of the
forest-dependent people in the Chittagong Hill tracts: REDD+ Strategy
Development in Bangladesh. The Rufford Small grants fountain, London.
[https://www.researchgate.net/.../Trade-offs-between-forest-conserv] site
visited on 12/04/2019.
Misbahuzzaman, K. and Smith-Hall, C. (2015). Role of forest income in rural household
livelihoods: the case of village common forest communities in the Chittagong
Hill Tracts, Bangladesh. Small-Scale Forest 14(3): 315 – 330.
Mogotsi, I., Lendelvo, S., Angula, M. and Nakanyala, J. (2016). Forest resource
management and utilisation through a gendered lens in Namibia. Environment
and Natural Resources Research 6(4): 79 – 90.
Mohammed, Y. S., Bashir, N. and Mustafa, M. W. (2015). Overuse of wood-based
bioenergy in selected sub-Saharan Africa countries: review of unconstructive
challenges and suggestions. Journal of Cleaner Production 96: 501 – 519.
Muhammed, N., Oesten, G., Von Detten, R., Masum, M. F. H. and Chakma, S. (2010).
Livelihood Pattern and Forest Dependence of the Major Tribes in Rangamati,
Bangladesh. Shinsu University International Symposium, Japan. 58pp.

81
Mujawamariya, G. and Karimov, A. A. (2014). Importance of socioeconomic factors in
the collection of NTFPs: The case of gum Arabic in Kenya. Forest Policy
Economics 42: 24 – 29.
Mukete, B., Yujun, S., Etongo, D. and Ndiaye Georges, N. (2018). Household
characteristics and forest resources dependence in the Rumpi Hills of
Cameroon. Applied Ecology and Environmental Research 16(3): 2755 – 2777.
Munanura, I. E., Backman, K. F., Moore, D. D., Hallo, J. C. and Powell, R. B. (2014).
Household poverty dimensions influencing forest dependence at Volcanoes
National Park, Rwanda: An application of the sustainable livelihoods
framework. Natural Resources 5: 1031 – 1047.
Mwera, D. K., Nyangena, W. and Gathiaka, K. (2017). Contribution of forest resources to
household income and level of dependence by different income groups.
American Journal of Economics 1(1): 66 – 78.
Nelson, J., Muhammed, N. and Rashid, R. A. (2015). Communities forest dependency and
its effects towards the forest resources and wildlife abundances in Sarawak,
Malaysia. International Journal of Sustainable Development and World
Ecology 22(5): 401–412.
Newton, P., Miller, D. C., Byenkya, M. A. A. and Agrawal, A. (2016). Who are forest-
dependent people? A taxonomy to aid livelihood and land-use decision-making
in forested regions. Land Use Policy 57: 388 – 395.
NNRC (2002). Namibia‟s natural resource sector. A contribution to Vision 2030. National
planning commission. Windhoek. [www.the-eis.com/.../Namibias%20natural
82
%20re source%20sector%] site visited on 08/04/2019.
NPC (2001). Second national development plan. National Planning Commission.
Windhoek. [https://www.npc.gov.na/?page_id=206] site visited on 12/04/2019.
NRC (2000). Agriculture and land resources. Directorate of environmental affairs,
Windhoek. [www.the-eis.com/.../Farming%20systems%20in%20Namibia%
20P] site visited on 12/04/2019.
Nyumba, T. O., Wilson, K., Derrick, C. J. and Mukherjee, N. (2018). The use of focus
group discussion methodology: Insights from two decades of application in
conservation. Methods in Ecology and Evolution 9(1): 20 – 32.
Odera, J. (2004). Lessons learnt on community forest management in Africa. A Report
Prepared For The Project ‘Lessons Learnt on Sustainable Forest Management
in Africa’: Royal Swedish Academy of Agriculture and Forestry, African Forest
Research Network. Food and Agriculture Organization of the United Nations,
Rome, Italy. 74pp.
Odunwole, S., Ben, O. O., Oluwayomi, A. and Joseph, O. (2015). Implications of
fuelwood demand on sustainable forest conservation of the Sub-Sahara Africa.
International Journal of Scientific and Technology Research 4(8): 74 – 80.
Ofoegbu, C., Chirwa, P. W., Francis, J. and Babalola, F. D. (2017). Socio-economic
factors influencing household dependence on forests and its implication for
forest-based climate change interventions§. Southern Forests 79(2): 109 –116.
Ojea E., Loureiro, M. L., Alló, M. and Barrio, M. (2016). Ecosystem services and REDD:
estimating the benefits of non-carbon services in worldwide forests. World
Development 78: 246 – 261.
83
Oldekop, J. A., Bebbington, A. J., Truelove, N. K., Holmes, G., Villamarín, S. and
Preziosi, R. F. (2012). Environmental impacts and scarcity perception influence
local institutions in indigenous Amazonian Kichwa communities. Human
Ecology 40(1): 101 – 115.
Pandit, R. and Bevilacqua, E. (2011). Forest users and environmental impacts of
community forestry in the hills of Nepal. Forest Policy and Economics 13(5):
345–352.
Parviainen, T. (2012). Role of Community Forestry in Rural Livelihood and Poverty
Alleviation in Ohangwena and Caprivi Regions in Namibia. University of
Helsinki. 170pp.
Pokharel, R. K., Neupane, P. R., Tiwari, K. R. and Köhl, M. (2015). Assessing the
sustainability in community-based forestry: A case from Nepal. Forest Policy
and Economics 58: 75 – 84.
Rahman, M. M., Mahmud, M. A. A. and Shahidullah, M. (2017). Socioeconomics of
biodiversity conservation in the protected areas: a case study in Bangladesh.
International Journal Sustainable Development and World Ecology 24(1):
65 – 72.
Rai, R. K., Neupane, P. and Dhakal, A. (2016). Is the contribution of community forest
users financially efficient? A household level benefit-cost analysis of
community forest management in Nepal. International Journal of the
Commons 10(1): 142–157.
Riehl, B., Zerriffi, H. and Naidoo, R. (2015). Effects of community-based natural resource
management on household welfare in Namibia. PLoS One 10(5): 1 – 23.

84
Riseth, J. Å., Tømmervik, H., Helander-Renvall, E., Labba, N., Johansson, C., Malnes, E.
and Schanche, A. (2011). Sámi traditional ecological knowledge as a guide to
science: snow, ice and reindeer pasture facing climate change. Polar Record
47(3): 202 – 217.
Schaafsma, M., Morse-Jones, S., Posen, P., Swetnam, R. D., Balmford, A., Bateman, I. J.
and Geofrey, V. (2014). The importance of local forest benefits: economic
valuation of non-timber forest products in the Eastern Arc Mountains in
Tanzania. Global Environmental Change 24: 295 – 305.
Schusser, C. (2013). Who determines biodiversity? An analysis of actors' power and
interests in community forestry in Namibia. Forest Policy and Economics 36:
42 – 51.
Shackleton, C. M., Shackleton, S. E., Buiten, E. and Bird, N. (2007). The importance of
dry woodlands and forests in rural livelihoods and poverty alleviation in South
Africa. Forest Policy and Economics 9(5): 558 – 577.
Steele, M. Z., Shackleton, C. M., Shaanker, R. U., Ganeshaiah, K. N. and Radloff, S.
(2015). The influence of livelihood dependency, local ecological knowledge
and market proximity on the ecological impacts of harvesting non-timber forest
products. Forest Policy and Economics 50: 285 – 291.
Suleiman, M. S., Wasonga, V. O., Mbau, J. S., Suleiman, A. and Elhadi, Y. A. (2017).
Non-timber forest products and their contribution to households‟ income
around Falgore Game Reserve in Kano, Nigeria. Ecological Processes 6(1):
1 – 14.
85
Sunderland, T., Achdiawan, R., Angelsen, A., Babigumira, R., Ickowitz, A., Paumgarten,
F., Shively, G. (2014). Challenging perceptions about men, women, and forest
product use: a global comparative study. World Development 64: 56 – 66
Teshome, B. Kassa, H., Mohammed, Z. and Padoch, C. (2015). Contribution of dry forest
products to household income and determinants of forest income levels in the
Northwestern and Southern Lowlands of Ethiopia. Natural Resources 6(5):
331–338.
Thoms, C. A. (2008). Community control of resources and the challenge of improving
local livelihoods: A critical examination of community forestry in Nepal.
Geoforum 39(3): 1452 – 1465.
Thondhlana, G. and Muchapondwa, E. (2014). Dependence on environmental resources
and implications for household welfare: evidence from the Kalahari drylands,
South Africa. Journal of Ecological Economics 108: 59 – 67.
Tieguhong, J. C. and Nkamgnia, E. M. (2012). Household dependence on forests around
lobeke National Park, Cameroon. International Forestry Review 14(2):
196 – 212.
Timko, J. A. and Kozak, R. A. (2014). Using a gender perspective to explore forest
dependence in rural HIV/AIDS-affected Malawian households. Population and
Environment 35(4): 441 – 454.
Timko, J. A., Waeber, P. O. and Kozak, R. A. (2010). The socio-economic contribution of
non-timber forest products to rural livelihoods in Sub-Saharan Africa:
Knowledge gaps and new directions. International Forestry Review 12(3):
284 – 29.

86
UNECE (2014). We are all forest dependent people. United Nations Economic
Commission for Europe [http://www.unece.org/index.php?id=3564] site visited
on 20/06/2019.
Van Laerhoven, F. (2010). Governing community forests and the challenge of solving
two-level collective action dilemmas-A large-N perspective. Global
Environmental Change 20(3): 539 – 546.
Vedeld, P., Angelsen, A., Bojö, J., Sjaastad, E. and Berg, K. G. (2007). Forest
environmental incomes and the rural poor. Forest Policy Economics 9(7):
869 – 879.
Vigne, P. (2000). Forestry Sector Issues and Options Paper. Natural Resources Cluster
Workshop, May 9, 2000 DEA/DANCED, Windhoek.
Vrabcová, P., Nikodemus, A. and Hájek, M. (2019). Utilization of Forest Resources and
Socio-Economic Development in Uukolonkadhi Community Forest of
Namibia. Acta Universitatis Agriculturae et Silviculturae Mendelianae
Brunensis 67(1): 197 – 206.
Wily, L. A. (2002). The political economy of community forestry in Africa – getting the
power relations right. Forests, Trees and People 46: 4 – 12.
Yeh, E. T. (2016). How can experience of local residents be “knowledge”? „Challenges in
interdisciplinary climate change research. Area 48(1): 34 – 40.

87
APPENDICES
Appendix 1: Community forest benefit distribution plan
……………….Community Forest Benefit Distribution Plan
Benefit Who benefits Method/Rules
10% of surplus
income
Traditional
Authorities (TA) In return the TA supports the aims and objectives of the
Community Forest
Development Fund All members Community decides on what should be funded at the AGM. Proposals to be submitted to the management
authority at least I month before the AGM.
25 % of Surplus
income FMC The Management Authority to cater for running costs
and Honorariums taken quarterly

88
Appendix 2: Household questionnaire
Questionnaire for Household survey (Semi - structured)
Questionnaire No:……...Interview date……………………………………………….
Constituency ……………………………. Region………………………………………
Enumerator‟s name ……………………………………………….…………………….
Name of village …………………………………………………………………………
Household coordinates: S…………………………E…………………………..……….
Respondent: Head of household Representative
Name of Respondent……………………………...........Relation to Head………..............
Section A: Household demographics
1. Gender of the Respondent
2. Age of the Respondent (years)
1. 18 – 28
(2000 - 1990)
2. 29 – 39
(1989 -1979)
3. 40 – 50
(1978 – 1968)
4. 51 – 60
(1967 -1958)
5. 61+
Before 1957
3. Ethnicity:……………………………………………………………
4. Number of years being a resident of this village
1. 0 - 10 years
(2008 -2018)
2. 10 – 20 years
(1998 – 2008)
3. 20+ years
(Before 1998)
5. Size of the Household (Number of people in the household)
Males Females Age Occupation
≥18
19 – 39
40 – 60
61+
6. Level of Formal Education of Respondent
1.None 2. Primary 3. Secondary 4.Tertiary
1. Male 2. Female

89
7. Occupation of the Respondent
1. Unemployed 2.Farmer 3. Pensioner 4. Civil
servant
5. Private
company
6. Business
enterprises…
Others (specify)…………………………………………
8. Marital status of Respondent
1.Single 2. Married 3. Divorced 4.
Separated
5.
Widowed
6.
Cohabitant
9. Sources of Household income
1. Salary 2. Livestock
farming
3.Crop
Farming
4. Old
age
grant
5. Forest
products
6.
Business
Others (specify)……………………………………………………………....................
10. Monthly Income level of household (N$)
1. Below
1500
2. 1501 -
3000
3. 3001 -
5000
4. 5001 -
10000
5. Above
10000
11. Household major source of income…………………………………
12. Livestock size:
1. Cattle……… 2. Goats…… 3. Sheep…… 4.Others…
13. Agricultural land owned ……………………………hectares
14. Skills possess by household head that brings in income
………………………………………………………………………………………
……………………………………………………………………………………….
B. Household benefits from forest and dependence on forest
15. Do you use any of the forest resources to meet your household needs?
(i) Yes
(ii) No

90
16. What are the benefits that you obtain from the forest for your household needs?
(a) Food
(b) Medicinal purposes
(c) Fodder/grazing for livestock
(d) Source of income
(e) Building materials
Others specify………………………………………
17. Among those benefits in 16 above, what are the most important ones; rank by
importance to your household?
Forest Benefit(s) Ranking
Food
Medicinal purpose
Fodder
Income to household
Building materials
Others ……………………………………………………………………………………….
18. Who collects the forest resources from the forest in your household?
Gender of Collector Product/Resource(s) Collected
19. Can you list the types of forest products you get from forest and their uses in your
household?
Forest product (s) Species (Local name) Use Frequency Quantity
Poles
Timber
Wild Fruits
Thatch grass
Firewood
Medicinal plants
Others……………..
91
20. How far is the forest from where you collect the resources from the house?
(i) 1 km
(ii) 2 km
(iii) 3 km
21. Which mode of transport do you use to transport your products from forest?
………………………………………………………………………………………………
22. Have you planted any trees in your farm?
(i) Yes
(ii) No
23 What are the reasons that make you choose to use forest resources in your household?
(i) Forest is easily accessed
(ii) Forest product acquisition is cheaper, they regenerate
naturally
(iii) Cannot afford to pay other alternatives e.g electricity and
gas
(iv) Unemployed, no reliable source of income
(v) Supplements crop field during drought season poor harvest
Others (Specify)………………………………………………………………….......
C. Extent and consequences of forest dependence on forest resources
22. Which forest products are mostly used for your house hold requirements?
………………………………………………………………………………………………
………………………………………………………………………………………………
25 What do you use as energy for cooking?
(a) Firewood
(b) Gas
(c) Electricity

92
26 Amongst the resources that you collect, state the purposes it is used in your
household?
Collected resources Household use Sale Both purposes
Poles
Timber
Wild Fruits
Thatch grass
Firewood
Medicinal plants
27 Have you observed any scarcity of forest products that you usually collect?
(i) Yes
(ii) No
28 If Yes, What do you think could be the cause of scarcity of these products?
…………………………………………………………………………………………………
…………………………………………………………………………………………………
29 If No sale go to question 34, if Sale continue with question 29. What do you look at
when you set the price of the products?
………………………………………………………………………………………………
………………………………………………………………………………………………
Who are the customers and where do you sell the products?
………………………………………………………………………………………………
………………………………………………………………………………………………
30 When selling, which products is mostly sold or of high demand?
Forest product (s) Ranking
Poles
Timber
Wild Fruits
Thatch grass
Firewood
Medicinal plants
Others…………
31 Has the number of Customers changed over years?
(i) Yes
(ii) No
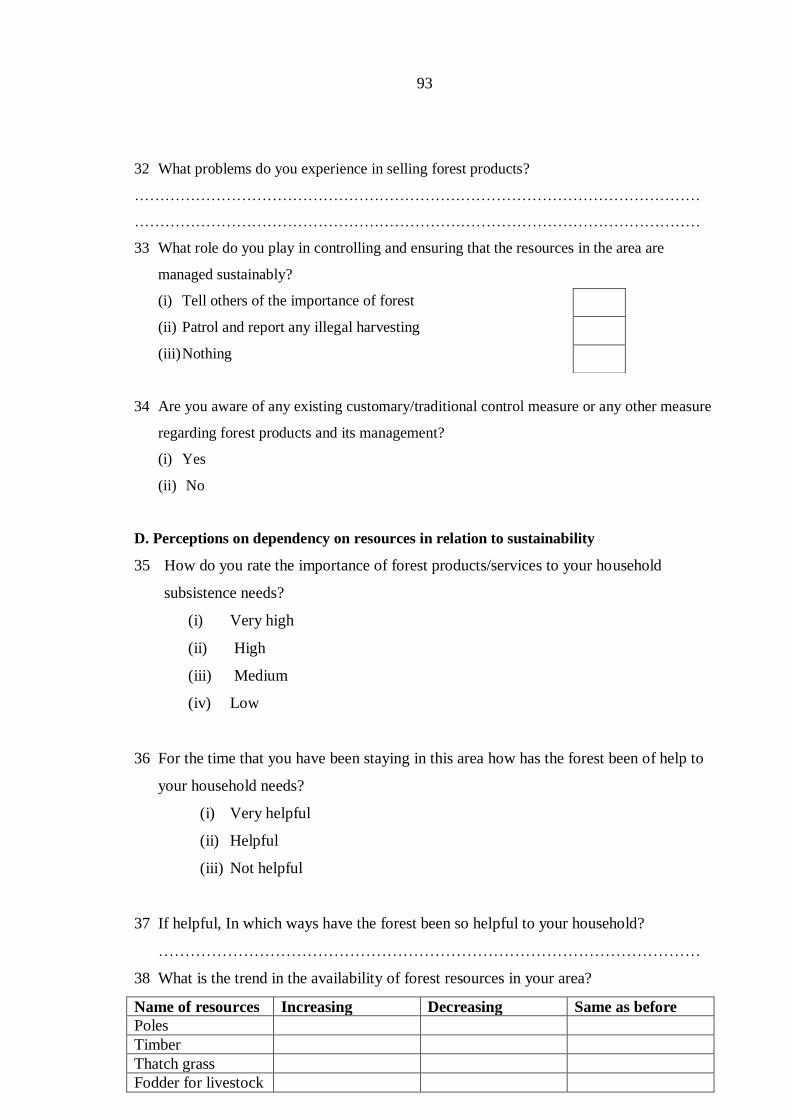
93
32 What problems do you experience in selling forest products?
…………………………………………………………………………………………………
…………………………………………………………………………………………………
33 What role do you play in controlling and ensuring that the resources in the area are
managed sustainably?
(i) Tell others of the importance of forest
(ii) Patrol and report any illegal harvesting
(iii) Nothing
34 Are you aware of any existing customary/traditional control measure or any other measure
regarding forest products and its management?
(i) Yes
(ii) No
D. Perceptions on dependency on resources in relation to sustainability
35 How do you rate the importance of forest products/services to your household
subsistence needs?
(i) Very high
(ii) High
(iii) Medium
(iv) Low
36 For the time that you have been staying in this area how has the forest been of help to
your household needs?
(i) Very helpful
(ii) Helpful
(iii) Not helpful
37 If helpful, In which ways have the forest been so helpful to your household?
…………………………………………………………………………………………
38 What is the trend in the availability of forest resources in your area?
Name of resources Increasing Decreasing Same as before
Poles
Timber
Thatch grass
Fodder for livestock
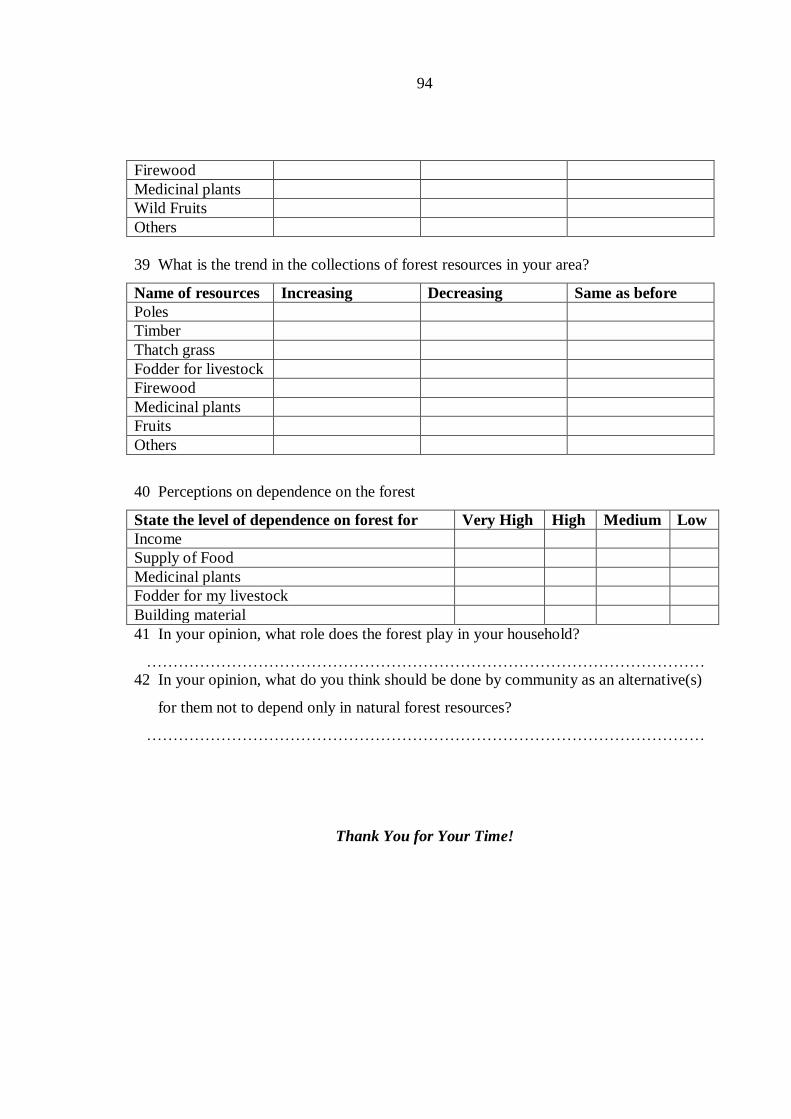
94
Firewood
Medicinal plants
Wild Fruits
Others
39 What is the trend in the collections of forest resources in your area?
Name of resources Increasing Decreasing Same as before
Poles
Timber
Thatch grass
Fodder for livestock
Firewood
Medicinal plants
Fruits
Others
40 Perceptions on dependence on the forest
State the level of dependence on forest for Very High High Medium Low
Income
Supply of Food
Medicinal plants
Fodder for my livestock
Building material
41 In your opinion, what role does the forest play in your household?
……………………………………………………………………………………………
42 In your opinion, what do you think should be done by community as an alternative(s)
for them not to depend only in natural forest resources?
……………………………………………………………………………………………
Thank You for Your Time!
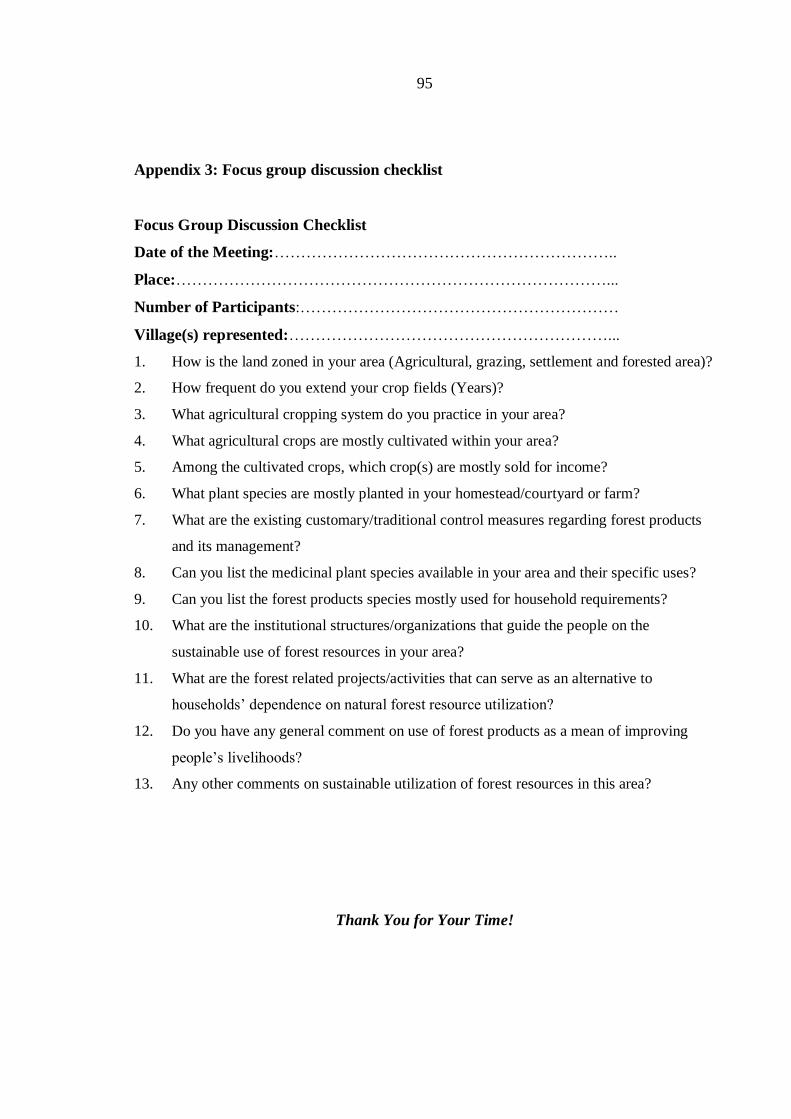
95
Appendix 3: Focus group discussion checklist
Focus Group Discussion Checklist
Date of the Meeting:………………………………………………………..
Place:………………………………………………………………………...
Number of Participants:……………………………………………………
Village(s) represented:……………………………………………………...
1. How is the land zoned in your area (Agricultural, grazing, settlement and forested area)?
2. How frequent do you extend your crop fields (Years)?
3. What agricultural cropping system do you practice in your area?
4. What agricultural crops are mostly cultivated within your area?
5. Among the cultivated crops, which crop(s) are mostly sold for income?
6. What plant species are mostly planted in your homestead/courtyard or farm?
7. What are the existing customary/traditional control measures regarding forest products
and its management?
8. Can you list the medicinal plant species available in your area and their specific uses?
9. Can you list the forest products species mostly used for household requirements?
10. What are the institutional structures/organizations that guide the people on the
sustainable use of forest resources in your area?
11. What are the forest related projects/activities that can serve as an alternative to
households‟ dependence on natural forest resource utilization?
12. Do you have any general comment on use of forest products as a mean of improving
people‟s livelihoods?
13. Any other comments on sustainable utilization of forest resources in this area?
Thank You for Your Time!

96
Appendix 4: Checklist for key informant interviews (traditional leader)
Date of the interview:…………………………………...................................................
Years being a resident in the area:……………………………Sex……………………..
Village of residence in the area:………………………………………………………….
Community Position/Committee representing:………………………….........Age........
1. What role do you play in the management of the Community Forest of Masida?
2. Are there any policies in the traditional authority act governing the use of forest
resources in Community forest?
3. Is there any land use zones in your area with respects to Settlements, Agricultural
fields and forest area?
4. Since establishment of a community forest, how have the forest resources
contributed to changing people‟s livelihood?
5. What could be the factors that influence Households to depend on Forest in your
area?
6. How did the dependency on forest impacted on the forest resources in your area?
7. Comparing to the time you settled here up to now and forecasting on the years to
come, how do you see the resources availability in your area?
8. In your opinion, how is the contribution of forest comparing to other source of
livelihoods of household like Agriculture?
9. Any general comment on the management of forest resources in your area?
Thank You Very Much for Your Cooperation!!!

97
Appendix 5: Checklist for key informant interviews (community forestry officer)
Date of the interview:………………………….........................................................
Years being a resident in the area:……………………………Sex…………….…….
Village of residence in the area:………………………………………………………
Position in the Committee:…………………………………..............Age...................
1. What is the state of community people settlements in Masida Community Forest (CF)?
2. What is the overall contribution of forest resources in Masida CF?
3. Have there been any demands for extension of forest area boundaries?
4. How has the population change affected the availability and utilization of resources?
5. Which amongst the forest resources is in high demand by the community in the area
and how is the availability of it?
6. Are the communities acquiring permission of forest resource only for own
consumption or for commercial purposes as well?
7. How frequent do the communities from this area visit your office for forest resource
use permission?
8. Who amongst the community are the ones regularly coming for forest resources use
permission?
9. How is forest resource utilization regulated in relation to agricultural cultivation?
10. How is your permit system monitored? Who controls your books after you have issued
permissions?
11. To which institutions/ organizations do you report about your activities at the office?
How frequent do you do this?
12. How is the general demand of forest resources and the annual allowable cut(supply)?
13. How frequent do you carry out forest inventory? Who facilitates this activities?
14. Do you receive or attend any in service training about the daily work you carry out at
your office?
Thank You Very Much for Your Cooperation!!!

98
Appendix 6: Checklist for key informant interviews (conservancy officer)
Date of the interview:…………………………………..............................................
Years being a resident in the area:………………………………Sex……………….
Village of residence in the area:………………………………………………………
Position in the Committee:…………………………………..............Age...................
1. Is there any distinction between the boundary of Sobbe Conservancy and Masida
Community Forest (CF)?
2. Is there any platform where the Conservancy committee and Community Forest
committee comes together and plan for your daily activities?
3. Do you have any joint activities such as Patrols in the forest together with Community
forest committee members?
4. To whom do you report your activities of the Conservancy such as your work plans,
achievements, benefit sharing etc.?
5. What could you tell as reasons that keep households of Masida to depend on forest?
6. How would you rate the utilization of forest resources of the area is it sustainable or is
being exploited?
7. Is there an integration of conservancy and community Forest in this area?
8. Any comment on the management of forest resources of Masida Community forest?
Thank You Very Much for Your Cooperation!!!

99
Appendix 7: Checklist for key informant interviews (constituency development
committee)
Date of the interview:…………………………………..............................................
Years being a resident in the area:………………………………Sex……………….
Village of residence in the area:………………………………………………………
Position in the Committee:…………………………………..............Age...................
1. What developmental activities have taken place in Masida area over the past 5 years?
2. How did these developments influence the people‟s mindset on depending on forest
resources for their daily activities?
3. When did the Child social grant came into effect in Masida area?
4. What other developmental activities/ infrastructure is earmarked for Masida villages in
the near future?
5. What forest related project would you recommend that will act as an alternative to
people not to use natural forest resources alone?
6. How would you rate the Contribution of Community forest initiatives to the
conservation of resources in Masida area?
7. Any general comment on the utilization of forest resources by the people of Masida
community forest?
Thank You Very Much for Your Time Availed to this Interview!!!
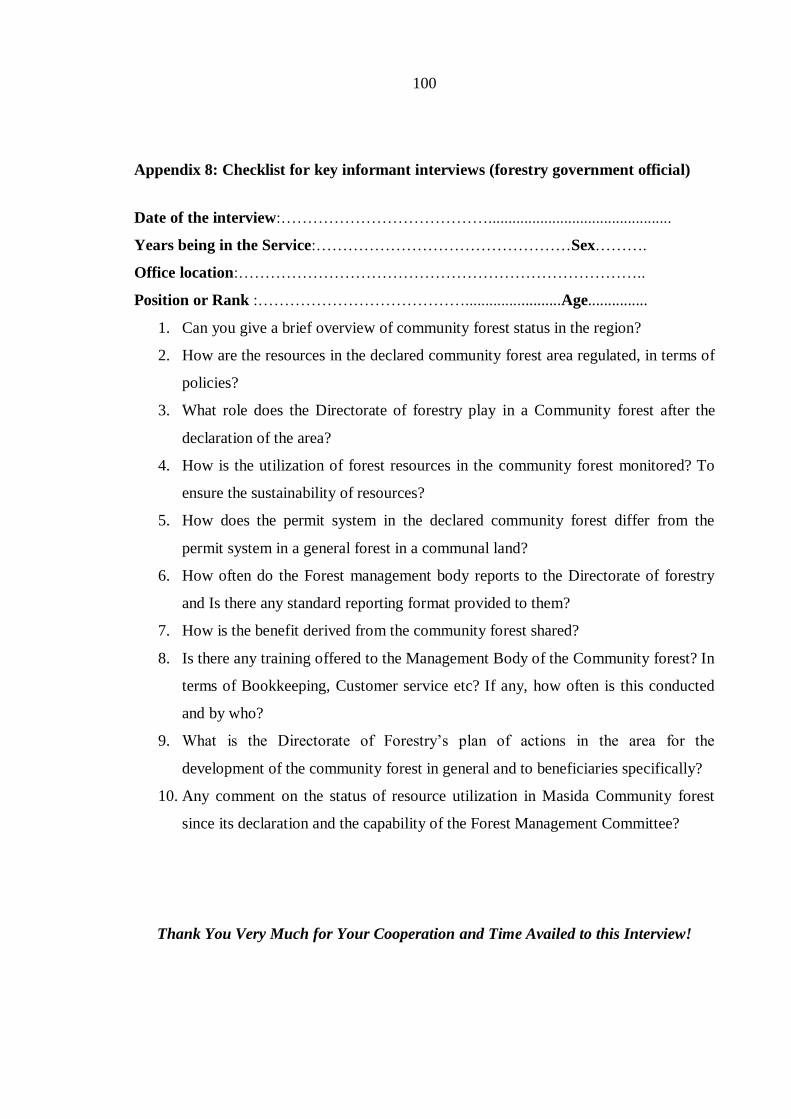
100
Appendix 8: Checklist for key informant interviews (forestry government official)
Date of the interview:…………………………………..............................................
Years being in the Service:…………………………………………Sex……….
Office location:…………………………………………………………………..
Position or Rank :…………………………………........................Age...............
1. Can you give a brief overview of community forest status in the region?
2. How are the resources in the declared community forest area regulated, in terms of
policies?
3. What role does the Directorate of forestry play in a Community forest after the
declaration of the area?
4. How is the utilization of forest resources in the community forest monitored? To
ensure the sustainability of resources?
5. How does the permit system in the declared community forest differ from the
permit system in a general forest in a communal land?
6. How often do the Forest management body reports to the Directorate of forestry
and Is there any standard reporting format provided to them?
7. How is the benefit derived from the community forest shared?
8. Is there any training offered to the Management Body of the Community forest? In
terms of Bookkeeping, Customer service etc? If any, how often is this conducted
and by who?
9. What is the Directorate of Forestry‟s plan of actions in the area for the
development of the community forest in general and to beneficiaries specifically?
10. Any comment on the status of resource utilization in Masida Community forest
since its declaration and the capability of the Forest Management Committee?
Thank You Very Much for Your Cooperation and Time Availed to this Interview!
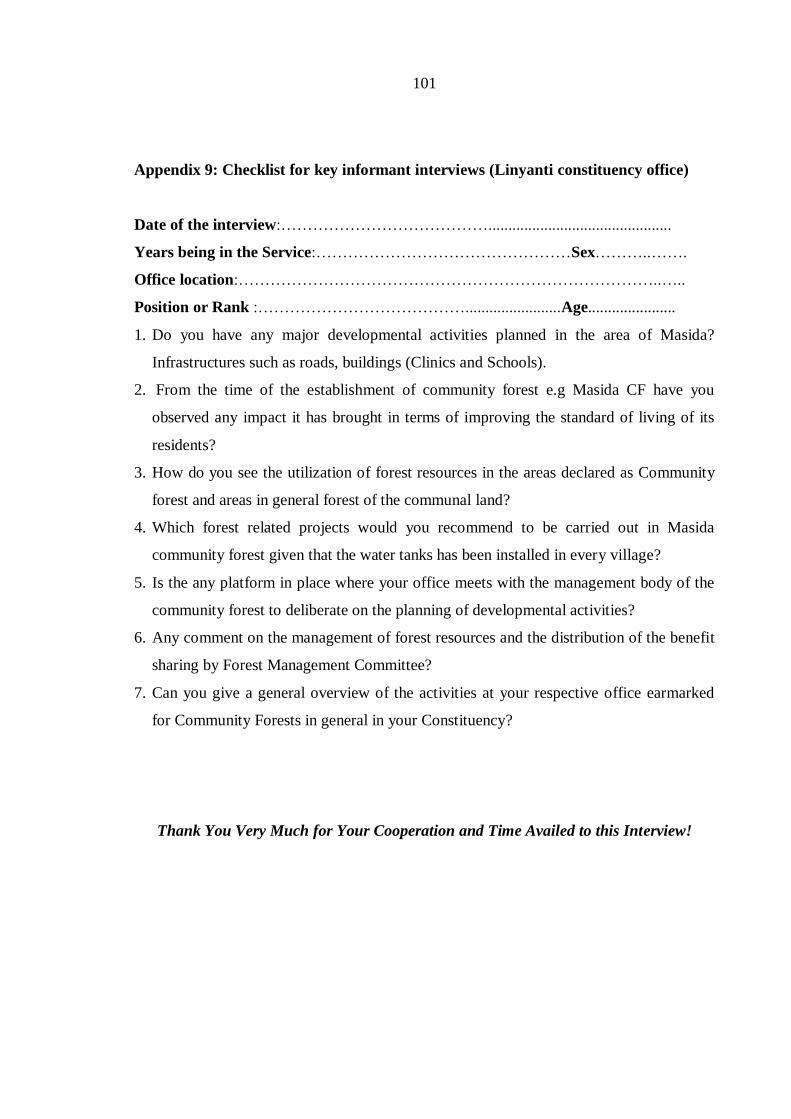
101
Appendix 9: Checklist for key informant interviews (Linyanti constituency office)
Date of the interview:…………………………………..............................................
Years being in the Service:…………………………………………Sex………..…….
Office location:……………………………………………………………………..…..
Position or Rank :…………………………………........................Age......................
1. Do you have any major developmental activities planned in the area of Masida?
Infrastructures such as roads, buildings (Clinics and Schools).
2. From the time of the establishment of community forest e.g Masida CF have you
observed any impact it has brought in terms of improving the standard of living of its
residents?
3. How do you see the utilization of forest resources in the areas declared as Community
forest and areas in general forest of the communal land?
4. Which forest related projects would you recommend to be carried out in Masida
community forest given that the water tanks has been installed in every village?
5. Is the any platform in place where your office meets with the management body of the
community forest to deliberate on the planning of developmental activities?
6. Any comment on the management of forest resources and the distribution of the benefit
sharing by Forest Management Committee?
7. Can you give a general overview of the activities at your respective office earmarked
for Community Forests in general in your Constituency?
Thank You Very Much for Your Cooperation and Time Availed to this Interview!
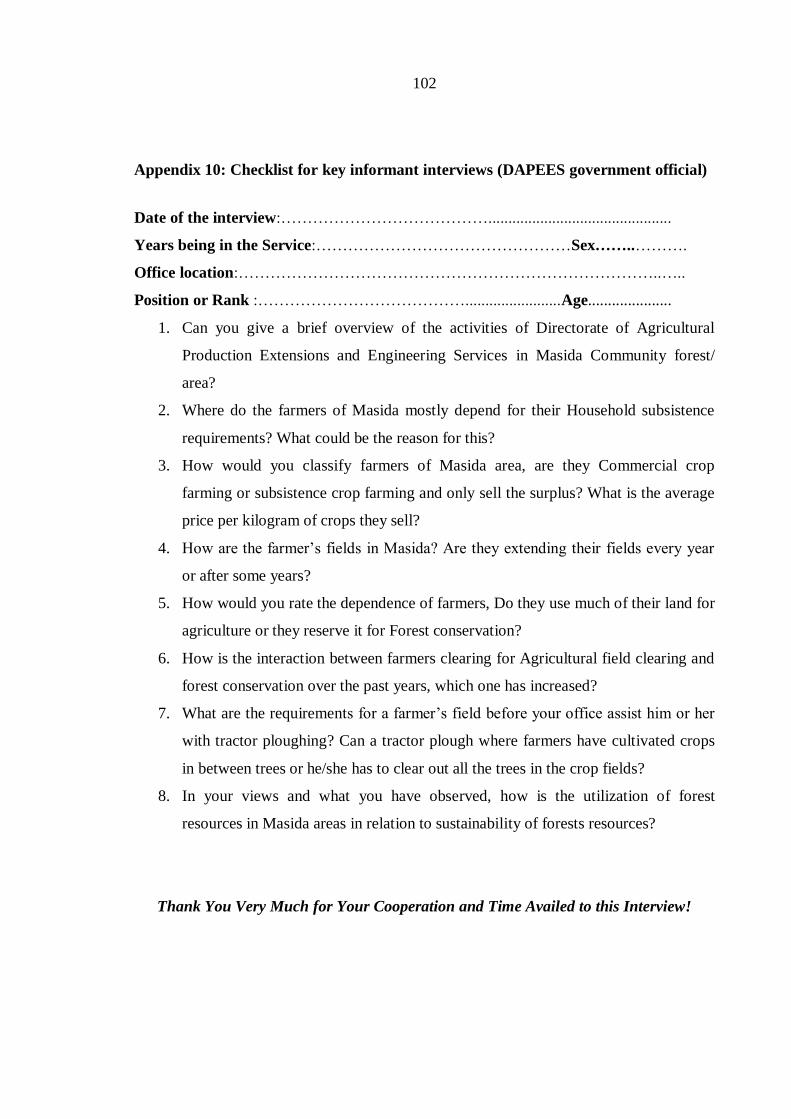
102
Appendix 10: Checklist for key informant interviews (DAPEES government official)
Date of the interview:…………………………………..............................................
Years being in the Service:…………………………………………Sex……..……….
Office location:……………………………………………………………………..…..
Position or Rank :…………………………………........................Age.....................
1. Can you give a brief overview of the activities of Directorate of Agricultural
Production Extensions and Engineering Services in Masida Community forest/
area?
2. Where do the farmers of Masida mostly depend for their Household subsistence
requirements? What could be the reason for this?
3. How would you classify farmers of Masida area, are they Commercial crop
farming or subsistence crop farming and only sell the surplus? What is the average
price per kilogram of crops they sell?
4. How are the farmer‟s fields in Masida? Are they extending their fields every year
or after some years?
5. How would you rate the dependence of farmers, Do they use much of their land for
agriculture or they reserve it for Forest conservation?
6. How is the interaction between farmers clearing for Agricultural field clearing and
forest conservation over the past years, which one has increased?
7. What are the requirements for a farmer‟s field before your office assist him or her
with tractor ploughing? Can a tractor plough where farmers have cultivated crops
in between trees or he/she has to clear out all the trees in the crop fields?
8. In your views and what you have observed, how is the utilization of forest
resources in Masida areas in relation to sustainability of forests resources?
Thank You Very Much for Your Cooperation and Time Availed to this Interview!
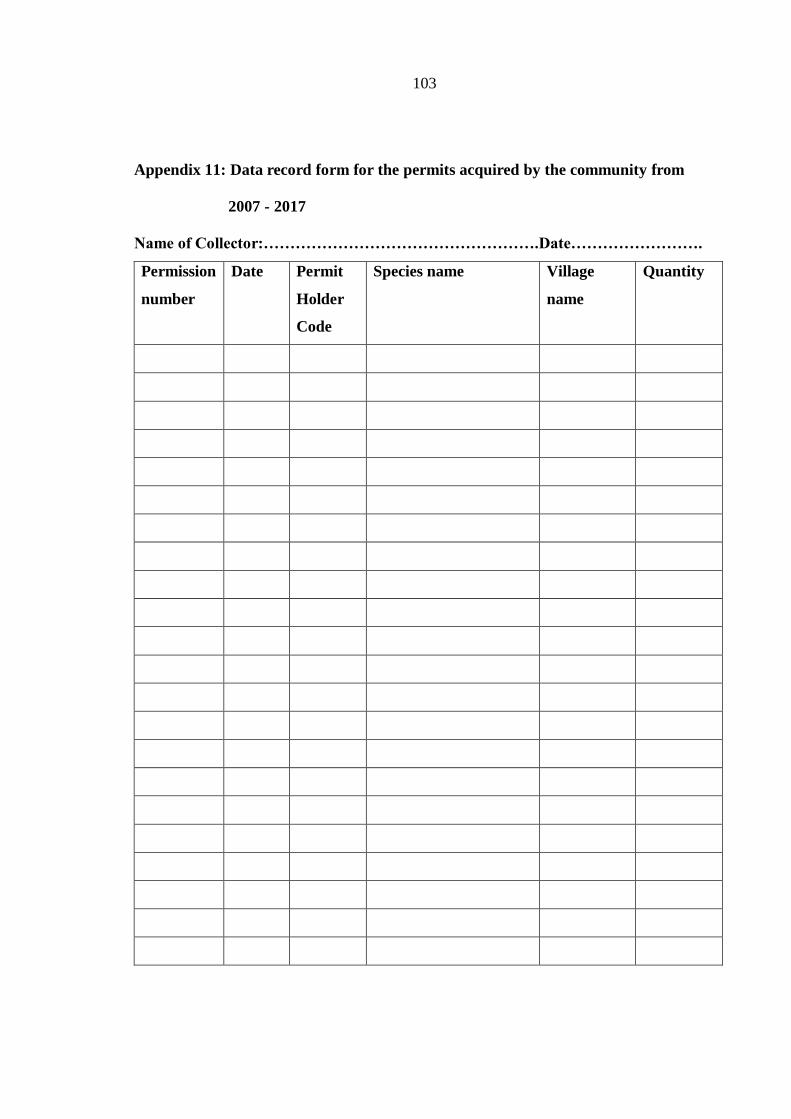
103
Appendix 11: Data record form for the permits acquired by the community from
2007 - 2017
Name of Collector:…………………………………………….Date…………………….
Permission
number
Date
Permit
Holder
Code
Species name
Village
name
Quantity

104
Appendix 12: Cochran’s Q test statistics of mean ranks
Appendix 13: The description of pairwise comparisons of benefits in Masida CF

105
Appendix 14: Sources of income in monetary term in Masida CF
130600
66700
5000044700 44000
3679024650
139002400
0
20000
40000
60000
80000
100000
120000
140000
An
nu
al H
ou
seh
old
Inco
me
(N
$ 0
.00
)
Sources of Household Incomes in Masida CF
Appendix 15: Sources of income by response in Masida CF communities
Appendix 16: ANOVA of the various income sources in Masida CF
Sum of Squares df Mean Square F Sig.
Between Groups 143 203 0477.838 2 716 015 238.919 366.898 .000
Within Groups 6 492 774 012.973 3 327 1 951 540.130
Total 7 924 804 490.811 3 329
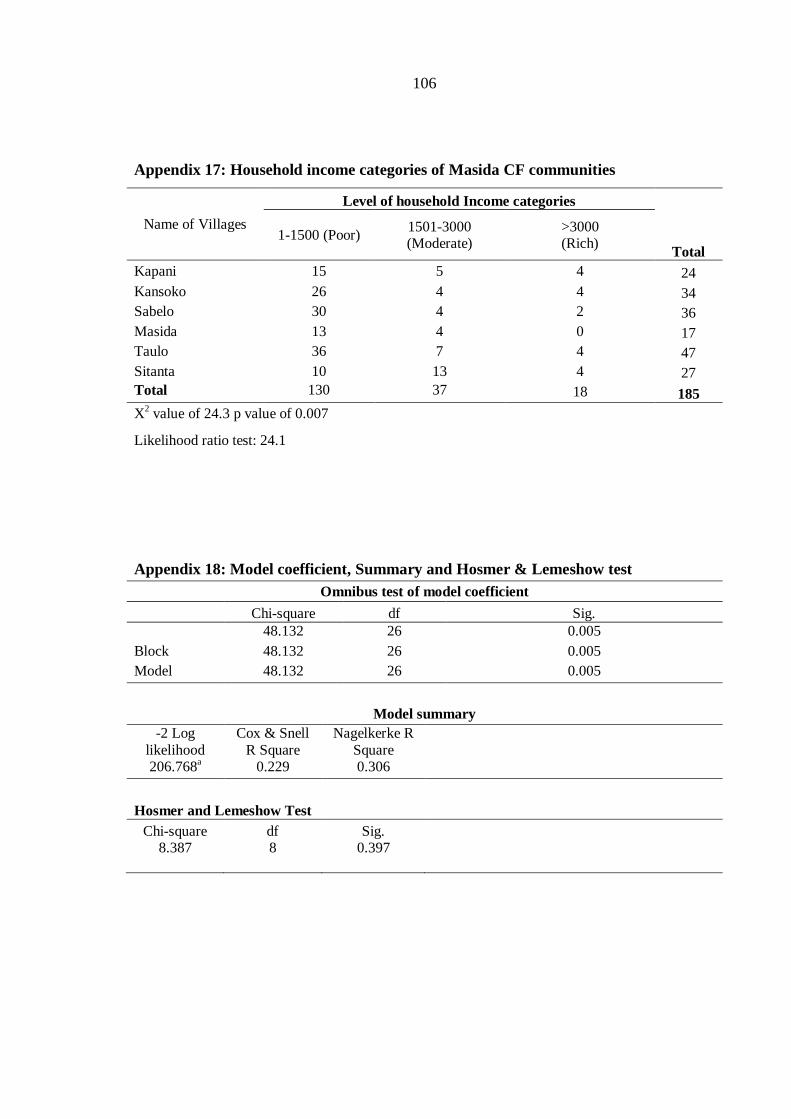
106
Appendix 17: Household income categories of Masida CF communities
Name of Villages
Level of household Income categories
Total
1-1500 (Poor) 1501-3000 (Moderate)
>3000 (Rich)
Kapani 15 5 4 24
Kansoko 26 4 4 34
Sabelo 30 4 2 36
Masida 13 4 0 17
Taulo 36 7 4 47
Sitanta 10 13 4 27
Total 130 37 18 185
X2 value of 24.3 p value of 0.007
Likelihood ratio test: 24.1
Appendix 18: Model coefficient, Summary and Hosmer & Lemeshow test
Omnibus test of model coefficient
Chi-square df Sig.
48.132 26 0.005
Block 48.132 26 0.005
Model 48.132 26 0.005
Model summary
-2 Log
likelihood
Cox & Snell
R Square
Nagelkerke R
Square 206.768
a 0.229 0.306
Hosmer and Lemeshow Test
Chi-square df Sig. 8.387 8 0.397
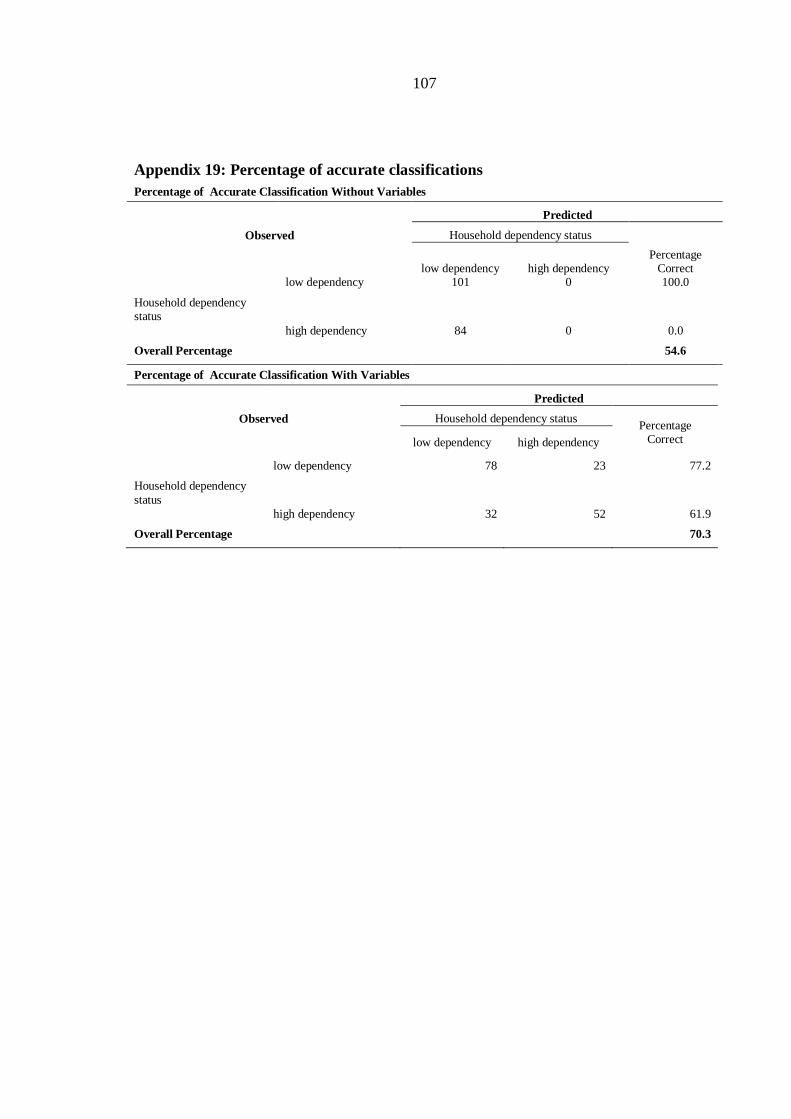
107
Appendix 19: Percentage of accurate classifications
Percentage of Accurate Classification Without Variables
Predicted
Observed Household dependency status
Percentage Correct
low dependency high dependency
Household dependency status
low dependency 101 0 100.0
high dependency 84 0 0.0
Overall Percentage 54.6
Percentage of Accurate Classification With Variables
Predicted
Observed Household dependency status Percentage
Correct
low dependency high dependency
Household dependency
status
low dependency 78 23 77.2
high dependency 32 52 61.9
Overall Percentage 70.3

108
Appendix 20: Factors influencing household dependence on Forest
Proportion of respondents in the Villages (%)
Socioeconomic factor Response
Kapani
n = 24
Kansoko
n = 34
Sabelo
n = 36
Masida
n = 17
Taulo
n= 47
Sitanta
n= 27
Forest easily accessed (3) No 20.8 44.1 27.8 29.4 12.8 0.0
Yes 79.2 55.9 72.2 70.6 87.2 100.0
Forest resources cheap to acquire
(4)
No 29.2 35.3 33.3 11.8 19.1 11.1
Yes 70.8 64.7 66.7 88.2 80.6 88.9
Cannot afford to pay alternatives
(e.g. electricity, gas) (6)
No 70.8 88.2 83.3 100.0 31.9 29.6
Yes 29.2 11.8 16.7 0.0 68.1 70.4
Unemployment (5) No 29,2 17.6 16.7 17.6 38.3 59.3
Yes 70,8 82.4 83.3 82.4 61.2 40.7
Forest resource provide free
medicine (2)
No 37.5 2.9 22.2 11.8 19.1 22.2
Yes 62.5 97.1 77.8 88.2 80.9 77.8
Natural Ablution facility (1) No 25.0 14.7 16.7 17.6 17.0 37.0
Yes 75.0 85.3 83.3 82.4 83.0 63.0