socio-economic impact assessment report jeanette
TRANSCRIPT
Socio-Economic Impact Assessment Report
Jeanette Goldmine, Free State
January 2016
Harmony Gold. File photo; Image by: Reuben Goldberg
PREPARED BY:
An Kritzinger (Economic specialist) (Contact: +27 (0) 82 335 4126)
Johan Oosthuizen (Social specialist) (Contact: +27 (0) 82 557 3947)
For SLR Consulting on behalf of Taung Gold (Free State) (Pty) Ltd
TABLE OF CONTENTS
LIST OF ABBREVIATIONS .......................................................................................................4
DETAILS OF SPECIALISTS.......................................................................................................5
DECLARATION OF INDEPENDENCE ....................................................................................5
0. NEMA CHECKLIST ......................................................................................................6
1. INTRODUCTION ...........................................................................................................7
1.1. PROJECT BACKGROUND ..........................................................................................7
1.2. LEGAL FRAMEWORK FOR SOCIO-ECONOMIC IMPACT
ASSESSMENTS IN THE MINING SECTOR ..............................................................8
1.3. SCOPE OF WORK .......................................................................................................10
1.4. METHODOLOGY AND SOURCES ...........................................................................10
1.5. LIMITATIONS AND ASSUMPTIONS ......................................................................11
2. SOCIO-ECONOMIC BASELINE OF THE LOCAL AREA ....................................11
3. THE POTENTIAL SOCIO-ECONOMIC IMPACTS OF THE PROJECT
AND PROPOSED MANAGEMENT MEASURES ....................................................41
3.1. POTENTIAL IMPACTS DURING THE CONSTRUCTION PHASE ....................41
3.2. POTENTIAL IMPACTS DURING THE OPERATIONAL PHASE .......................54
3.2.17. POTENTIAL SOCIO-ECONOMIC IMPACTS DURING THE
DECOMMISSIONING AND CLOSURE PHASE .....................................................67
3.4. POTENTIAL CUMULATIVE IMPACTS ..................................................................68
4. SOCIO-ECONOMIC IMPACT AND RISK ASSESSMENT
METHODOLOGY ........................................................................................................70
5. SOCIO-ECONOMIC IMPACT AND RISK ASSESSMENT ....................................73
6. POTENTIAL LOCAL SOCIO-ECONOMIC DEVELOPMENT
PROJECTS ....................................................................................................................82
7. RECOMMENDATIONS FOR MANAGING RELATIONSHIPS WITH
COMMUNITIES AND INTEREST GROUPS ...........................................................83
8. SUMMARY AND CONCLUSION ..............................................................................84
9. RESPONSES TO SOCIO-ECONOMIC ISSUES HIGHLIGHTED BY
INTERESTED AND AFFECTED PARTIES .............................................................86
10. REFERENCES ..............................................................................................................87

ANNEXURE 1: LIST OF STAKEHOLDER INTERVIEWS ..................................................90
ANNEXURE 2: CURRICULUM VITAE OF SPECIALISTS .................................................91
4
LIST OF ABBREVIATIONS
Abbreviation Description
AMCU Association of Mineworkers and Construction Union
ANC African National Congress
bn billion
COCTA Department of Co-operative Governance
DEA Department of Environmental Affairs
DMR Department of Mineral Resources
DTI Department of Trade and Industry
EIA Environmental Impact Assessment
EMIS Department of Basic Education
FGF Free State Goldfields Development Centre
GUBICO The Gold and Uranium Belt Impact Censoring Organisation
Ha Hectare
HSRC Human Sciences Research Council
I&AP Interested and Affected Parties
IAIA International Association for Impact Assessment
ICT Information and Communication Technology
IDP Integrated Development Plan
Km2 Square kilometre
LED Local Economic Development
MPRDA The Mineral And Petroleum Resources Development Act
n.a. not available
NDRDLR National Department of Rural Development & Land Reform
NEMA National Environment Management Act
NGO Non-governmental Organisations
nr Number
NUM National Union of Mineworkers
p.a. per annum
SEDA Small Enterprise Development Agency
SEIA Social and Economic Impact Assessment
SMME Small, medium and micro enterprises
UASA United Association of South Africa
5
DETAILS OF SPECIALISTS
An Kritzinger (Masters Economics) has been working as consultant in the economic
development field for the past sixteen years. She has extensive experience in the
economic profiling and economic development plans for local authorities and districts
in South Africa and has designed and implemented a training project for the monitoring
of sustainable local economic development for municipalities throughout South Africa
in collaboration with the Development Bank of Southern Africa. Her work has also
focussed on applied economic modelling in South Africa, Namibia, Botswana and
Mozambique including economic impact analysis, economic cost benefit analysis,
social incidence studies and macroeconomic forecast modelling.
Johan Oosthuizen holds Psychology and Project Management degrees from the
University of Pretoria and is a social specialist with approximately 4 years’ experience
in social impact assessments, including baseline data gathering, sensitivity mapping,
primary and secondary social research to determine the effect (impact) of project
changes on the existing social environment, and detailing mitigation and/or
enhancement measures. Johan works in close coordination with senior specialists as
part of an integrated team of social and environmental specialists.
DECLARATION OF INDEPENDENCE
This report has been prepared as per the requirements of Section 32 of Government
Notice No. R542 dated 18 June 2010 (Environmental Impact Assessment Regulations)
under sections 24(5), 24M and 44 of the National Environmental Management Act,
1998 (Act 107 of 1998). We, Anna Sophia Kritzinger and Johan Oosthuizen declare
that this report has been prepared independently of any influence or prejudice as may be
specified by the Department of Environmental Affairs (DEA).
Anna Sophia Kritzinger Johan Oosthuizen
Signatures of the specialists:
Southern Economic Development
Name of group (trading name):
January 2016
Date:
6
0. NEMA CHECKLIST
NEMA Regulations (2014) Relevant section in report
Details of the specialist who prepared the report Page 5 and Annexure 2
The expertise of that person to compile a specialist report
including a curriculum vitae Page 5 and Annexure 2
A declaration that the person is independent in a form as
may be specified by the competent authority Page 5
An indication of the scope of, and the purpose for which,
the report was prepared Section 1.3
The date and season of the site investigation and the
relevance of the season to the outcome of the assessment Section 1.4 (season not relevant)
A description of the methodology adopted in preparing
the report or carrying out the specialised process Section 1.4
The specific identified sensitivity of the site related to the activity and its associated structures and infrastructure Not applicable
An identification of any areas to be avoided, including buffers Not applicable
A map superimposing the activity including the associated structures and infrastructure on the
environmental sensitivities of the site including areas to
be avoided, including buffers; Not applicable
A description of any assumptions made and any
uncertainties or gaps in knowledge; Section 1.5
A description of the findings and potential implications
of such findings on the impact of the proposed activity,
including identified alternatives, on the environment Section 8
Any mitigation measures for inclusion in the EMPr
Any conditions for inclusion in the environmental authorisation Not applicable
Any monitoring requirements for inclusion in the EMPr or environmental authorisation Section 3
A reasoned opinion as to whether the proposed activity or portions thereof should be authorised and Section 8
If the opinion is that the proposed activity or portions
thereof should be authorised, any avoidance,
management and mitigation measures that should be
included in the EMPr, and where applicable, the closure
plan Section 8
A description of any consultation process that was
undertaken during the course of carrying out the study Section 1.4 and Annexure 1
A summary and copies if any comments that were
received during any consultation process Not applicable
Any other information requested by the competent
authority. Not applicable
7
1. INTRODUCTION
1.1. PROJECT BACKGROUND
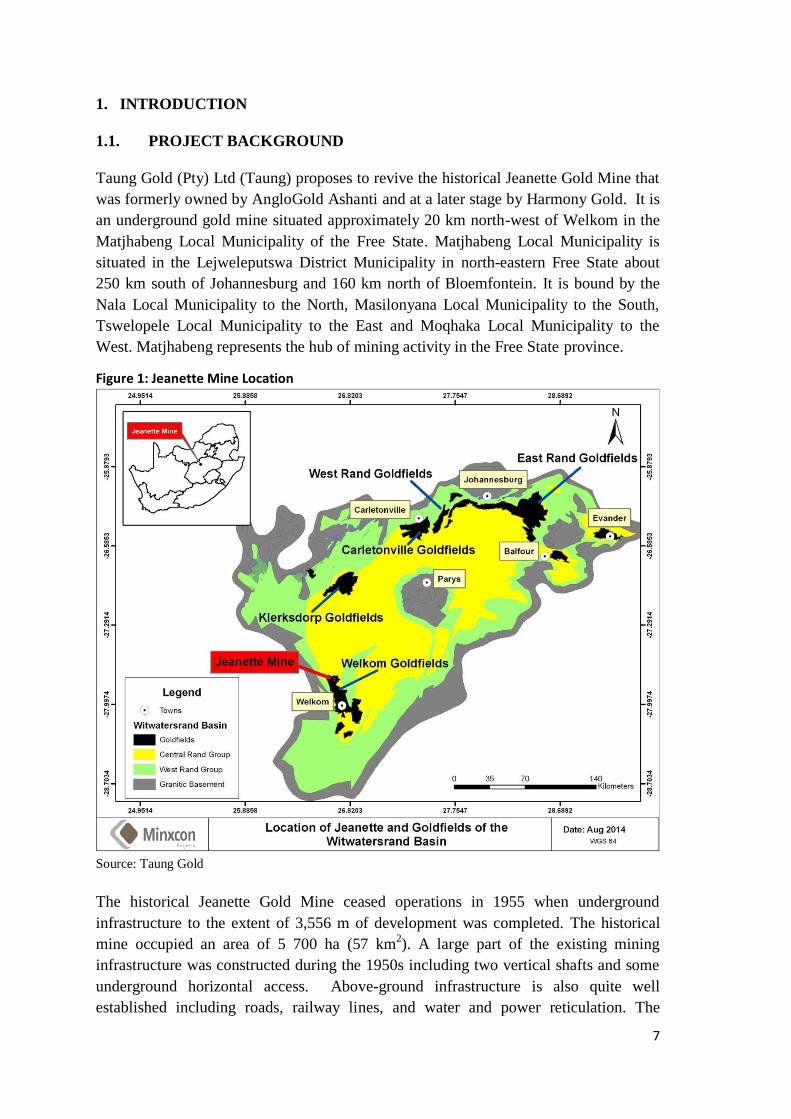
Taung Gold (Pty) Ltd (Taung) proposes to revive the historical Jeanette Gold Mine that
was formerly owned by AngloGold Ashanti and at a later stage by Harmony Gold. It is
an underground gold mine situated approximately 20 km north-west of Welkom in the
Matjhabeng Local Municipality of the Free State. Matjhabeng Local Municipality is
situated in the Lejweleputswa District Municipality in north-eastern Free State about
250 km south of Johannesburg and 160 km north of Bloemfontein. It is bound by the
Nala Local Municipality to the North, Masilonyana Local Municipality to the South,
Tswelopele Local Municipality to the East and Moqhaka Local Municipality to the
West. Matjhabeng represents the hub of mining activity in the Free State province.
Figure 1: Jeanette Mine Location
Source: Taung Gold
The historical Jeanette Gold Mine ceased operations in 1955 when underground
infrastructure to the extent of 3,556 m of development was completed. The historical
mine occupied an area of 5 700 ha (57 km2). A large part of the existing mining
infrastructure was constructed during the 1950s including two vertical shafts and some
underground horizontal access. Above-ground infrastructure is also quite well
established including roads, railway lines, and water and power reticulation. The
8
Jeanette deposit was never fully developed because the prevailing state of the gold
market and high overhead costs made the Jeanette mine uneconomic and its owner at
the time, Anglo American, switched its focus to the higher-grade area closer to
Welkom.
Jeanette was acquired by Taung Gold (Free State) Pty Ltd in 2008. The Hong Kong
listed Taung Gold International owns 69% in the South African operation while a black
economic empowerment company, Sephaku Gold Holdings, has an effective 26% of the
South African projects, making the company fully compliant with mining licence
conditions. Taung Gold is a junior gold operator, founded and incorporated in South
Africa in 2004.
Due to a more complex geology at the Jeanette mine, a highly mechanised method of
gold extraction is the more feasible option for mining production at the mine, in turn,
requiring a skilled labour force. The total labour force for the Project is estimated to
peak at around 1113 employees (including management and all other fixed labour), i.e.
about half of the labour force required for a more labour-intensive gold mining
operation of similar size.
The proposed project will be constructed on land previously used for mining, with an
estimated prospecting right area/proposed mining right area of 9,121ha, an estimated
underground mine area of ~ 5,701ha, and a surface area of disturbance of 250ha.
Proposed surface infrastructure will consist of the following: A single main shaft
complex, a processing plant, a tailings storage facility and a waste rock dump. For
purposes of the SEIA, the Jeanette life of mine is estimated to be between 24 to 29
years.
1.2. LEGAL FRAMEWORK FOR SOCIO-ECONOMIC IMPACT
ASSESSMENTS IN THE MINING SECTOR
Two sets of legislation are relevant for the socio-economic assessment of mining
projects in South Africa:
THE NATIONAL ENVIRONMENTAL MANAGEMENT ACT (NEMA), No. 107
of 1998 and ENVIRONMENTAL IMPACT ASSESSMENT REGULATIONS (GN
No. R. 1159 of 10 December 2010)] provides a suite of principles and tools to guide
South Africa on a path to sustainable development. “Environment’ is defined in holistic
terms and includes biophysical, social and economic components, as well as the
connections within and between these components. While the act does not prescribe a
specific methodology in terms of socio economic impact assessment the following
stipulations highlights the necessity to include socio economic issues in environmental
impact assessments.
The following general principles apply to all identified impacts:
Responsibility for the impact should apply throughout its life cycle.
9
The participation of all interested and affected parties in environmental governance
must be promoted
Decisions must take into account the interests, needs and values of all interested
parties
The costs of remedying pollution, environmental degradation, consequent adverse
health effects and of preventing, controlling or mitigating further pollution,
environmental damage or adverse health effects must be paid for by those
responsible for harming the environment, i.e. the so-called polluter-pay principle.
The regulations also makes provision for cumulative effects assessment identifying and
evaluating the significance of effects from multiple actions representing potential
causes of impacts.
THE MINERAL AND PETROLEUM RESOURCES DEVELOPMENT ACT 28
OF 2002 (MPRDA, No. 28 of 2002). The objectives of the Act are to:
promote equitable access to the nation’s mineral and petroleum resources to all the
people of South Africa;
substantially and meaningfully expand opportunities for historically disadvantaged
persons, including women, to enter the mineral and petroleum industries and to
benefit from the exploitation of the nation’s mineral and petroleum resources;
promote economic growth and mineral and petroleum resources development in the
Republic;
promote employment and advance the social and economic welfare of all South
Africans;
ensure that holders of mining and production rights contribute towards the socio-
economic development of the areas in which they are operating.
In order to fulfil the objectives, chapter 4 of the Act stipulates that any prospecting or
mining operation must be conducted in accordance with generally accepted principles
of sustainable development by integrating social, economic and environmental factors
into the planning and implementation of prospecting and mining projects in order to
ensure that exploitation of mineral resources serves present and future generations. To
this end an applicant has to:
establish baseline information concerning the affected environment to determine
protection, remedial measures and environmental management objectives;
investigate, assess and evaluate the impact of his or her proposed prospecting or
mining operations on the environment and the socio-economic conditions of any
person who might be directly affected by the prospecting or mining operation
The MINERAL AND PETROLEUM RESOURCES DEVELOPMENT
REGULATIONS OF April 2004 (Amended October 2004, November 2006 and April
2011) provide more detail on the implementation of the MPRDA:
10
REGULATION 50 (c): The regulation sets out the requirement for the assessment and
evaluation of the proposed mining operation on the economic conditions of directly
affected persons during the construction, operational, decommissioning phases. This
includes:
The listing of all potential socio-economic impacts
Quantification of the loss of value of property or infrastructural assets due to the
mining activity
Quantification of the net present value of commercial, economic or business
activity that will be impacted on as a result of the mining activity
Identification of cumulative impacts
An impact rating in terms of the listed impacts in terms of its nature, extent,
duration, probability and significance.
REGULATION 50 (e): This regulation requires the applicant to determine the
appropriate mitigation and management measures for each significant impact of the
proposed mining operation.
1.3. SCOPE OF WORK
The scope of work of the socio-economic impact assessment include the following
deliverables:
A socio-economic baseline description of the local area and scoping of potential
impacts
Description of socio-economic impacts during construction, operational,
decommissioning and post-closure
Propose mitigation and management measures to enhance positive social benefits
and reduce negative impacts including:
o The identification of potential opportunities for implementing / assisting
with the implementation of socio-economic development projects
o Recommendations for managing relationships with local groups
1.4. METHODOLOGY AND SOURCES
The economic impact assessment is based on primary as well as secondary resources
including:
Interviews with specialists responsible for different EIA work streams including
groundwater , air quality , social, traffic, biodiversity and visual assessments
Review of specialist reports where available
Interviews with the project developer
Interviews with sector specialists
11
Interviews with key parties that are likely to experience economic impacts related to
the project
International and national literature on the external costs of goldmine activities
Financial information supplied by the developer that is subject to change
The list of references is provided in section 10 of the Report. A list of stakeholders
interviewed is provided in the Annexure to this report.
Economic modeling Input-Output (I/O) modelling is used to assess the project’s
potential impact on employment and output. The I/O analyses is based on i) direct
impacts (income and employment created due to employment by the project itself) ii)
indirect impacts (backward linkages to local suppliers) and iii) induced impacts due
to the overall increase in income levels and increased spending on goods and services
which could lead to a further increase in production and employment in the local area.
The socio- economic team undertook a visit to the site in June 2015 and undertook
personal interviews with local community members. The aim of the site visit was for
the socio- economic specialists to familiarise themselves with the site and the socio-
economic areas surrounding the sites.
1.5. LIMITATIONS AND ASSUMPTIONS
The following assumptions and limitations apply to the socio-economic impact
assessment:
It is assumed that the developer will adhere to legally required and current industry
management principles
The financial information for the mine is obtained from the Pre-Feasibility Study
(PFS) of the mine that still needs to be updated by the Feasibility Study for the mine
The potential external costs associated with the project was based on information
supplied by sub-specialists for the Environmental Impact Assessment of the project
The economic impact model was based on information supplied by the developer
Economic multipliers, average salaries and wages and value added as a percentage
of total income were based on provincial and national averages.
2. SOCIO-ECONOMIC BASELINE OF THE LOCAL AREA
2.1. DEFINING THE LOCAL AREA
The Jeanette mine is situated in the Matjhabeng municipal area close to the national
R30 in the goldfields of the central Free State, north of Bloemfontein and south of
Kroonstad. The mine is surrounded by farming communities as discussed in section 2.3.
below. The closest settlements/towns are Odendaalsrus (about 7km to the south);
Allanridge (about 8km to the north) and Nyakkalong, almost 2km west of the site.
12
For purposes the socio-economic baseline the local communities that are profiled
include the whole of the Matjhabeng municipality. The Matjhabeng municipal area,
previously known as the Free State Goldfields, consists of the following:
Welkom/Thabong/Bronville
Allanridge/Nyakallong
Odendaalsrus/Kutlwanong
Hennenman/Phomolong
Ventersburg/Mmamahabane
Virginia/Meloding
Where data is available, the socio-economic baseline will focus in on the specific wards
where the mine is situated and wards adjacent to the proposed mining area. These
include:
Allanridge (ward 36)
Eerstegeluk rural area to the east (ward 10)
Odendaalsrus to the south (ward 35)
Nyakkalong to the west (ward 19)
Kutlwanong to the south east (wards 18, 20, 21 and 22)
2.2. DEMOGRAPHIC PROFILE OF THE LOCAL AREA
Population and household size and growth:
Matjhaneng is the second largest city in the Free State with a population of 406 000
recorded in the census of 2011. Table 1 below illustrates the negative population growth
in the Matjhabeng municipal area of -1.1% per annum between 1996 and 2011
compared to the positive average annual growth rates of 1.6% and 0.3% of the National
and Free State populations respectively (Stats SA Census 2006 and 2011).
Table 1: Population and household trends, 1996 -2011
Geographic
area
Population (nr) Households (nr) Population
growth
(average
p.a.)
Household
growth
(average
p.a.)
1996 2011 1996 2011 1996-2011 1996-2011
South Africa 40 583 574 51 770 559 9 059 571 14 450 163 1.6% 3.2%
Free State 2 633 505 2 745 591 625 011 823 317 0.3% 1.9%
Matjhabeng 476 745 406 446 110 220 123 195 -1.1% 0.7%
Allanridge 19 887 11 667 3 891 4 011 -3.5% 0.2%
Eerstegeluk rural
7 692 11 937 2 091 3 288 3.0% 3.1%
Odendaals-rus
8 901 11 694 3 336 3 228 1.8% -0.2%
Nyakkalong 13 692 14 259 2 823 2 754 0.3% -0.2%
Kutlwanong 56 181 46 067 14 097 13 413 -1.3% -0.3%
Source: Stats SA (Census 1996 and 2011)
13
Low to negative population growth was recorded in Allanridge and Kutlwanong and
Nyakalong. In Odendaalsrus the population grew at a rate close to the national growth
rate while the high population growth rates in Eerstegeluk rural area suggest some in-
migration at the fringes of the municipal area.
There are signs that the population growth rate of Matjhabeng municipality might be
increasing again after a low point in 2007 - an annual rate close to 1% per annum are
recorded between 2007 and 2013 (IHS Global Insight, 2015). This could be ascribed to
the stabilization of migration rates out of the municipal area also as job opportunities
outside the municipal area become scarcer.
Gender and age distribution:
In 2011, 51% of the national population was 25 years and younger as opposed to 49%
in Mathjabeng municipality. In both cases the population could be described as young.
While the percentage of the young population declined somewhat on a national level
(from 56% in 1996 to 51% in 2011), the portion of the young population in Mathjabeng
increased from 43% in 1996 to 49% in 2011.Considering the negative average
population growth of the municipality this could to a higher birth rate in the area as well
as to older people moving away from the area (based on data from IHS Global Insight,
2015 and Stats SA Census 2006 and 2011).
The male: female ratio for the municipality is above the national average for most of the
period from 1996, with the exception of 2007. These dominant high male:female ratios
indicate a large percentage of single (male) family migrants residing in the area. While
this ratio declined between 2001 and 2007, it increased towards 2011 and is showing
signs of increasing again towards 2013. This confirms the analyses above that
population growth in the area is showing signs of increasing, This could indicate to the
stabilisation of net migration from the municipal area with younger migrants coming
into the area possibly off-setting older migrants moving out of the area (Ibid).
The Eerstegeluk rural area recorded the youngest population (57% in 2011) of the
wards surrounding the mining area. These characteristics, coupled with the high
recorded population growth rates between 1996 and 2011 could signify net migration
into the ward area. The male:female ratio for this area is not significantly above the
national average which could indicate to younger families moving into the ward (Ibid).
Kutlwanong recorded the second youngest population (53% in 2011). The area also
recorded male:female ratios on par with average ratios in South Africa. Coupled with
the negative population growth in the area it could suggest net migration of families
from the area possibly coupled with a high mortality rate of the local population
incidence due to HIV/AIDS or other illnesses.
14
Allanridge recorded the third youngest population (51% in 2011) of the wards
surrounding the mining area. Coupled with the high negative population growth rates
from the area, it could be argued that it is mostly older migrants leaving the area. The
male:female ratio is significantly above the national average since 1996 but it is also
declining, confirming the out-migration of probably older single (male) households
from the ward (Ibid).
The population of Odendaalsrus is older than the populations of the other wards with
only 33% belonging to the age-group 25 years and younger as opposed to 39% in 1996.
This ward showed above-average population growth as well as increasing male:female
ratios since 1996 – well above the national average. This could indicate to the net in-
migration of older single (male households) into the ward, either from inside the
municipality (e.g. Allanridge) or from outside the municipal area (Ibid).
The Nyakkalong ward recorded the oldest population in 1996 with only 34% of its
population being 25 years and younger. But while the population in Odendaalsrus
became older, the Nyakkalong population became younger with 41% being 25 years
and younger in 2011. The male:female ratio also shifted from below the national
average (indicating net out-migration from the area in 1996) on par with the national
average in 2011.
Heads of household:
With relatively high male:female ratios and migrants in the local area it can be expected
that the prevalence of child and female-headed households in the area will be below the
national average.
In Mathjabeng as a whole, 0.2% of household heads are younger than 16 years
compared to 0.3% nationally. In the Allanridge, Kutlwanong andf Eerstegeluk areas
the average was 0.1% in 2011, while negligible in in Odendaalsrus. In Nyakkalong the
percentage of child-headed households is on par (0.3%) with the national average
(based on Stats SA Census 2011). It is estimated that there could have been in the
region of 40 child-headed households in the wards surrounding the mine area in 2011,
the majority residing in Nyakkalong and Kutlwanong.
An estimated 40% of households in Mathjabeng are headed by females compared to
41% nationally. The prevalence is much lower in Allanridge (29%); Odendaalsrus
(29%) and Eerstegeluk rural area ((38%) but higher in Nyakkalong and Kutlwanong
(43%) (Ibid).
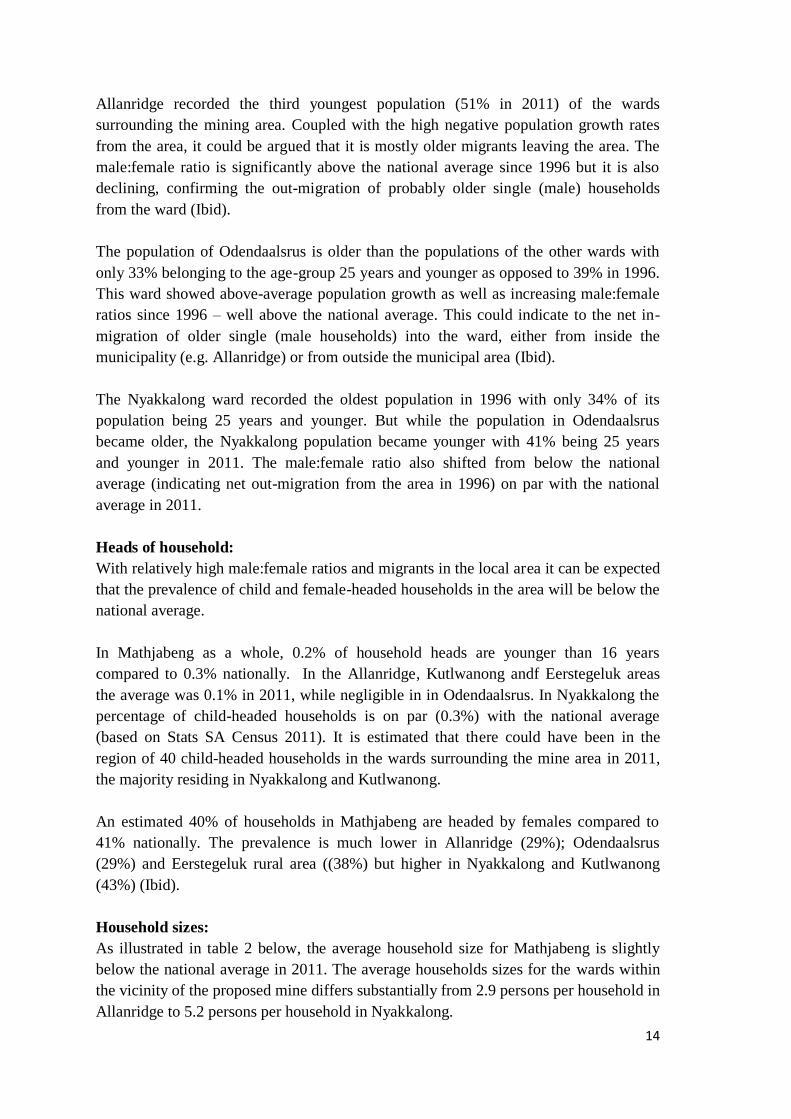
Household sizes:
As illustrated in table 2 below, the average household size for Mathjabeng is slightly
below the national average in 2011. The average households sizes for the wards within
the vicinity of the proposed mine differs substantially from 2.9 persons per household in
Allanridge to 5.2 persons per household in Nyakkalong.
15
Table 2: Average households sizes
Area 1996 2011
National 4.5 3.6
Mathjabeng 4.3 3.3
Allanridge 5.1 2.9
Eerstegeluk 3.7 3.6
Odendaalsrus 2.7 3.6
Nyakkalong 4.9 5.2
Kutlwanong 4.0 3.4
Source: Stats SA (Census 1996 and 2011)
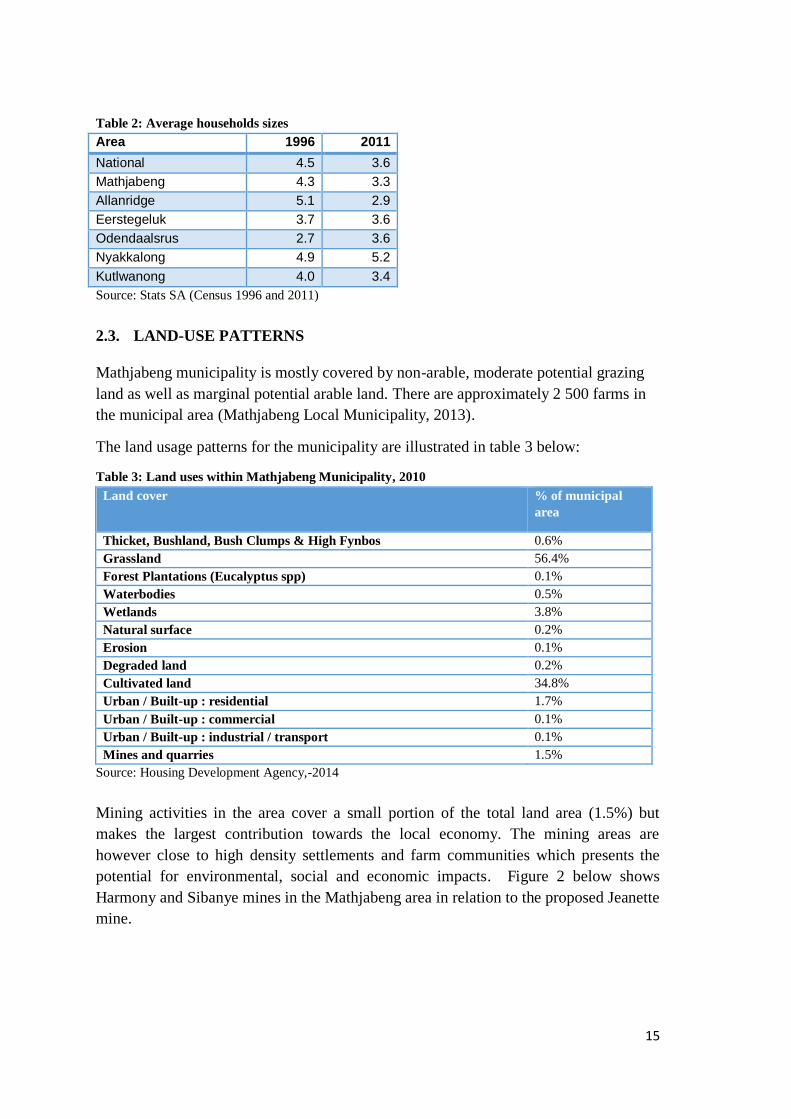
2.3. LAND-USE PATTERNS
Mathjabeng municipality is mostly covered by non-arable, moderate potential grazing
land as well as marginal potential arable land. There are approximately 2 500 farms in
the municipal area (Mathjabeng Local Municipality, 2013).
The land usage patterns for the municipality are illustrated in table 3 below:
Table 3: Land uses within Mathjabeng Municipality, 2010
Land cover % of municipal
area
Thicket, Bushland, Bush Clumps & High Fynbos 0.6%
Grassland 56.4%
Forest Plantations (Eucalyptus spp) 0.1%
Waterbodies 0.5%
Wetlands 3.8%
Natural surface 0.2%
Erosion 0.1%
Degraded land 0.2%
Cultivated land 34.8%
Urban / Built-up : residential 1.7%
Urban / Built-up : commercial 0.1%
Urban / Built-up : industrial / transport 0.1%
Mines and quarries 1.5%
Source: Housing Development Agency,-2014
Mining activities in the area cover a small portion of the total land area (1.5%) but
makes the largest contribution towards the local economy. The mining areas are
however close to high density settlements and farm communities which presents the
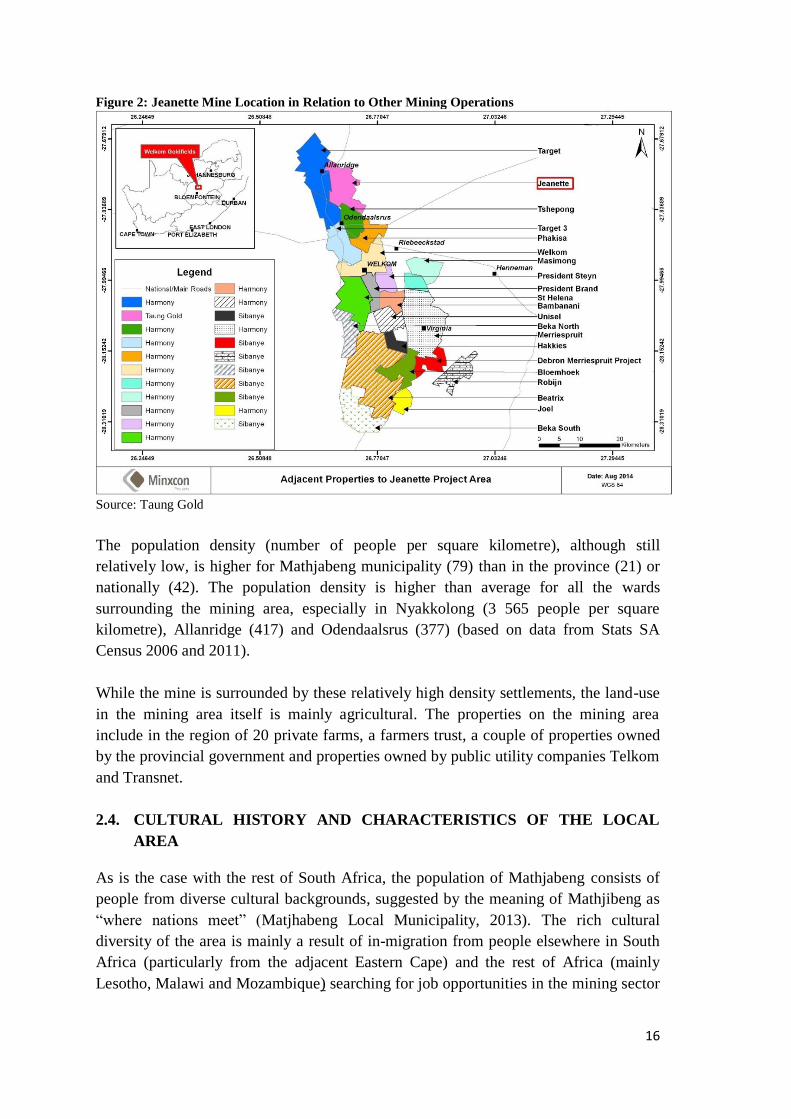
potential for environmental, social and economic impacts. Figure 2 below shows
Harmony and Sibanye mines in the Mathjabeng area in relation to the proposed Jeanette
mine.
16
Figure 2: Jeanette Mine Location in Relation to Other Mining Operations
Source: Taung Gold
The population density (number of people per square kilometre), although still
relatively low, is higher for Mathjabeng municipality (79) than in the province (21) or
nationally (42). The population density is higher than average for all the wards
surrounding the mining area, especially in Nyakkolong (3 565 people per square
kilometre), Allanridge (417) and Odendaalsrus (377) (based on data from Stats SA
Census 2006 and 2011).
While the mine is surrounded by these relatively high density settlements, the land-use
in the mining area itself is mainly agricultural. The properties on the mining area
include in the region of 20 private farms, a farmers trust, a couple of properties owned
by the provincial government and properties owned by public utility companies Telkom
and Transnet.
2.4. CULTURAL HISTORY AND CHARACTERISTICS OF THE LOCAL
AREA
As is the case with the rest of South Africa, the population of Mathjabeng consists of
people from diverse cultural backgrounds, suggested by the meaning of Mathjibeng as
“where nations meet” (Matjhabeng Local Municipality, 2013). The rich cultural
diversity of the area is mainly a result of in-migration from people elsewhere in South
Africa (particularly from the adjacent Eastern Cape) and the rest of Africa (mainly
Lesotho, Malawi and Mozambique) searching for job opportunities in the mining sector
17
– a sector that played a major role in the social life and economy of the Mathjabeng
area since the early twentieth century (Ibid).
In Mathjabeng the cultural profile is similar to the Free State provincial profile with the
Sesotho speaking group currently makes the largest contribution (62%) towards the
municipal population followed by the Afrikaans-speaking group (12%) and the
IsiXhosa-speaking group (12%) (StatsSA 2011).
The early history of the area is associated with the Khoisan hunter-gatherers and Khoi
herders between 2000 -20 000 years ago. Between 150 and 400 years ago that Bantu-
speaking agro pastoralists moved into the region. The Basotho nation is a result of the
diplomacy of King Moshoeshoe I who gathered disparate clans of Sotho-Tswana origin
that had dispersed across Southern Africa in the early 1800s after the political turmoil
that most historians associate with the wars started by Shaka Zulu. In the 1830’s settlers
mainly from Dutch origin (Voortrekkers or Boers) moved away from Cape British
colonial rule to settle in the Free State. On 23 February 1854, the Orange Free State
officially became a republic for the Voortrekkers. Various wars and conflicts took place
between the British, Boers and Basotho in the middle and late 19th century. The
Voortrekkers and Basothos fought two wars that ended in 1868 (Free State Provincial
Government, 2005).
A period of relative peace and steady progress followed until the outbreak of the second
Boer War (Anglo-Boer War) in 1899. The Free State played an important role in the
Anglo-Boer War (1899-1902). Defeated by the British, the Free State ceased to exist
as an independent Boer republic in 1902 and joined the Union of South Africa in
1910 which in turn became the Republic of South Africa in 1961 (Free State
Provincial Government,2005).
The history of the area took a new turn when the first gold was discovered in the early
1940s as part of the broader gold rush in the region of the larger Witwatersrand basin.
The district became predominantly known as the Free State Goldfields. Odendaalsrus
was the first town to be established in the Goldfields in 1912. The town transformed
from a small farming community with only 40 houses and three shops to a major town
after the discovery of the richest gold reef in the world in 1946 (Matjhabeng Local
Municipality, 2013).
Welkom was specifically designed as a major centre for the gold mining community
(planned by Sir Ernest Oppenheimer, Anglo American Chairman at the time) and
development of the city started in 1947. The adjacent mining towns of Allanridge and
Virginia were established soon after as more gold deposits were discovered and mines
opened up. By 1992, some 20 mines were operational in these mining towns (Ibid).
The history of the other two towns (Ventersburg and Hennenman) that presently form
part of the greater Mathjibeng municipality is not as closely related to the gold industry.
18
Ventersburg’s early history (1857) is associated with the history of the Dutch Reformed
Church and the Anglo-Boer War while Hennenman’s history is associated with a
railway station. The growth in both towns after 1950 could be directly attributed to the
discovery of gold in the area (Matjhabeng Local Municipality, 2013).
Following the policy of town development under the apartheids regime of Afrikaner
dominated National Party (since 1948) segregated development resulted in ‘coloured’
townships developing near the centres of the ‘white’ towns. The dominant white towns
with their annexed townships include:
Odendaalsrus (Kutlwanong)
Welkom (Thabong)
Allanridge (Nyakallong)
Virginia (Meloding)
Ventersburg (Mamahabane)
Hennenman (Phomolong emerged from the forcefully removed old location to an
area 6km from the town)
As in other mining towns in South Africa, hostels were used by many mining houses in
the area to accommodate single migrant families. The hostel-system also played an
important part in the role that labour played in the struggle against apartheid. In the
1970s and 1980s Welkom became a major centre in the struggle against apartheid. One
of the most violent labour conflicts occurred near Welkom when least 80 miners were
killed in clashes between strikers and non-strikers initiated by the National Union of
Mineworkers, who aggressively pursued its workers interests and opposed apartheid
(Botes et.al, 2007).
While the ‘white’ towns became more integrated after the end of the apartheid regime
in 1994, the townships are mainly still dominated by Sesotho and IsiXhosa-speaking
groups. In Allanridge, the main groups are the Sesotho (43%) and Afrikaans-speaking
groups (34%) while the Sesotho-speaking group contribute 76% towards the
Nyakkalong population in 2011. In Odendaalsrus the contribution of Afrikaans-
speaking groups’ declined from 57% to 37% between 1996 and 2011 while the share of
Sesotho speakers increased from 28% to 42% in the same period. In Kutlwanong the
share of Sesotho speakers remained close to 80% of the population between 1996 and
2011 (StatsSA 2011).
Since the middle 1990’s the gold boom in Welkom came to an end with the closure of
several mines in the area (discussed in more detail under the discussion of the local
economy below). A media article in 2013 refers to Welkom as “the old oom of the gold
boom” (Steyn, 2013). The once magnificent Ernest Oppenheimer theatre in the middle
of the town stands empty after a devastating fire in 2011 while the once prosperous
municipality “can't afford to pay its electricity bills, let alone restore a theatre.” It is the
19
opinion of many community members that the municipal area is marked by high crimes
and a zero-sum game in the fight for jobs (Ibid).
Since the mid-2000s, amidst declining economic opportunities especially for the youth,
Mathjibeng is characterised as an increasingly fragmented community. For example,
different regions (towns) pitch against each other as is the case with Phomolong and
Virginia that perceived being excluded from economic development initiatives in
Welkom. A number of xenophobic attacks are recorded as part of civil protests against
government as well as mining companies with target groups mainly being Indian and
Bangladeshi businesses. Frustration is also voiced that ‘Lesotho’ people and people
from the Eastern Cape are favoured in recruitment by mining companies at the expense
of ‘locals’ (Botes et.al, 2007, De Wet, 2013, Mokati, 2012, Action Voices, 2012
Gubico, 2015).
Of all the areas close to the proposed mine, Odendaalrus recorded the highest
percentage of foreigners (35%) and people that was born outside the Free State (52%)
in 2011. In Allanridge, 7% of the inhabitants were born outside South Africa and 30%
outside the Free State. In former townships of Nyakkalong and Kutlwanong the
percentage of people that were born outside South Africa was in the region of 3% in
2011 while only 10% were born outside the Free State. In the rural area of Eerstegeluk
the percentages of the population with foreign citizenship was only 2% while 13% was
born outside the Free State (StatsSA, Census 2011). The statistics suggest that
Odendaalsrus and to a lesser extent Allanridge are the most popular host destinations
within the adjacent wards for people moving into the area. Despite the lower
percentage of foreigners present in Nyakkalong, Kutlwanong and Eerstegeluk, the high
unemployment rates in these areas (discussed below) could still indicate a potential for
xenophobic conflict in these areas.
2.5. HEALTH
The morbidity and mortality rates of the Free State Province, as in South Africa, are
dominated by HIV/AIDS. In 2013 the HIV prevalence and AIDS deaths among the
general population in the Free State is higher (12.6%) than the national average
(11.1%). The rate is even higher in Mathjabeng Municipality, i.e. 13% in 2013
compared to 9.6% in 2000 (IHS Global Insight, 2015).
The shortage of skilled health professionals in the public health sector presents a serious
Free State province challenge to attract and retain scarce skills. In 2010, 48.7% of
professional health worker posts in the Free State were vacant compared to 42.5%
nationally. There are particularly acute shortages of doctors (medical practitioners) and
nurses. There were only 24.1 medical practitioners per 100 000 uninsured population in
2010 compared with 27.3 doctors per 100 000 uninsured population nationally
(NDRDLR and Free State Department of COCTA, 2013).
MARCH 2013
20
According to the Matjhabeng IDP (Matjhabeng Local Municipality, 2013) the
objectives of the healthcare system are:
Improvement in environmental health conditions;
Within a broader disaster management response capacity, maintenance of ability to
respond to any and all public health threats;
Massive reduction in HIV/AIDS prevalence or incidence rates and reduced impact
of HIV/AIDS on communities; and
Universal access to a comprehensive basket of health services, especially primary
health care
In the greater Welkom area the following health care facilities are available:
Bongani Regional Hospital (Public)
Ernest Oppenheimer Hospital (Semi-private)
Goudveld Regional Hospital
Mediclinic Welkom (Private)
St Helena Hospital (Private)
Various primary care clinics exist in the former townships.
2.6. EDUCATION
In Mathjabeng, the educational profile improved significantly the past two decades.
Functional literacy (the population 15 years plus with 7 years schooling and higher) has
increased from 69% in 2000 to approximately 85% in 2013 compared to a national
average of 82% in 2013 (IHS Global Insight, 2015). Furthermore the population (aged
20 +) without schooling declined from 11% in 2000 to 6% in 2013.
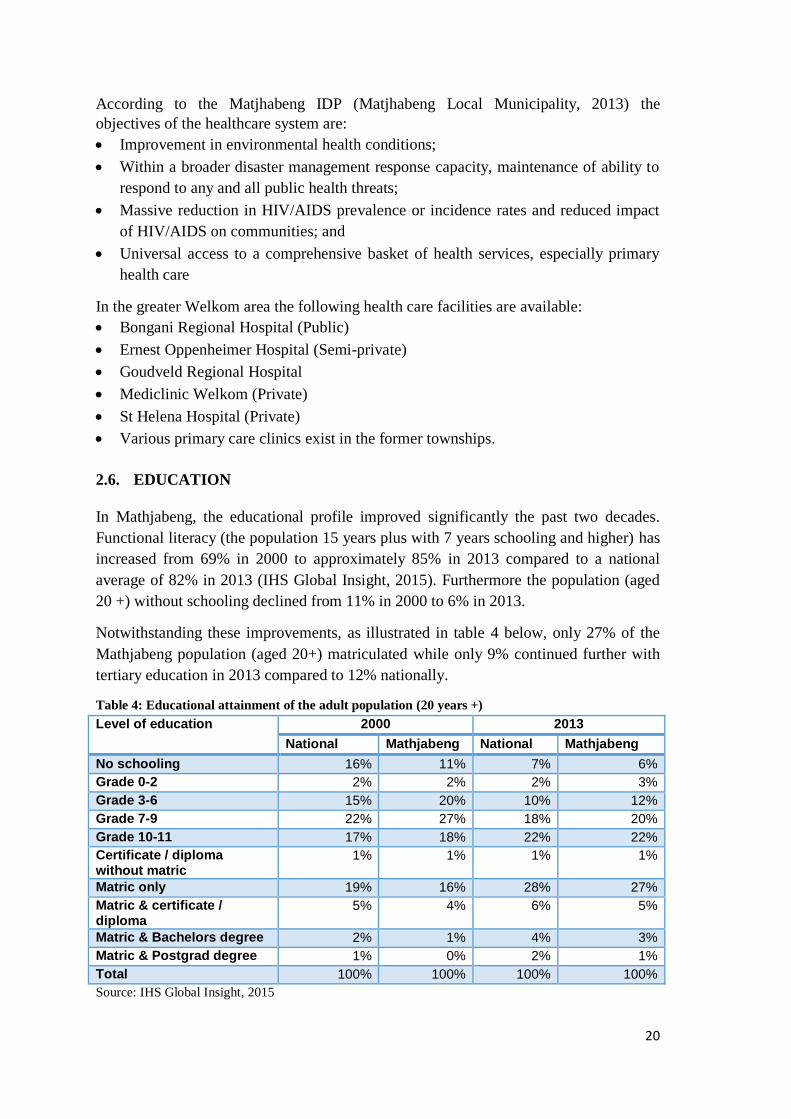
Notwithstanding these improvements, as illustrated in table 4 below, only 27% of the
Mathjabeng population (aged 20+) matriculated while only 9% continued further with
tertiary education in 2013 compared to 12% nationally.
Table 4: Educational attainment of the adult population (20 years +)
Level of education 2000 2013
National Mathjabeng National Mathjabeng
No schooling 16% 11% 7% 6%
Grade 0-2 2% 2% 2% 3%
Grade 3-6 15% 20% 10% 12%
Grade 7-9 22% 27% 18% 20%
Grade 10-11 17% 18% 22% 22%
Certificate / diploma without matric
1% 1% 1% 1%
Matric only 19% 16% 28% 27%
Matric & certificate / diploma
5% 4% 6% 5%
Matric & Bachelors degree 2% 1% 4% 3%
Matric & Postgrad degree 1% 0% 2% 1%
Total 100% 100% 100% 100%
Source: IHS Global Insight, 2015
21
As is the case in the Free State Province in general, there are concerns regarding
support for early childhood development. Although there has been an increase of 40%
in the number of Grade R classes in the Free State between 2004 and 2010, only 58% of
potential Grade R learners at the age of 5 years were enrolled in school in 2010. In
2010 only 50% of the Grade 3 learners achieved a satisfactory level of competency
(NDRDLR and Free State Department of COCTA, 2013). The result is that
approximately 50% of the Free State pupils leave secondary school before
matriculating. While the Grade 12 pass rate for the Free State has increased from 56%
in 1994 to 71% in 2010. However the percentages of learners who complete
matriculation with university exemption, mathematics and physical science remain low
and only 35% of Grade 12’s that pass their exams continue with tertiary education
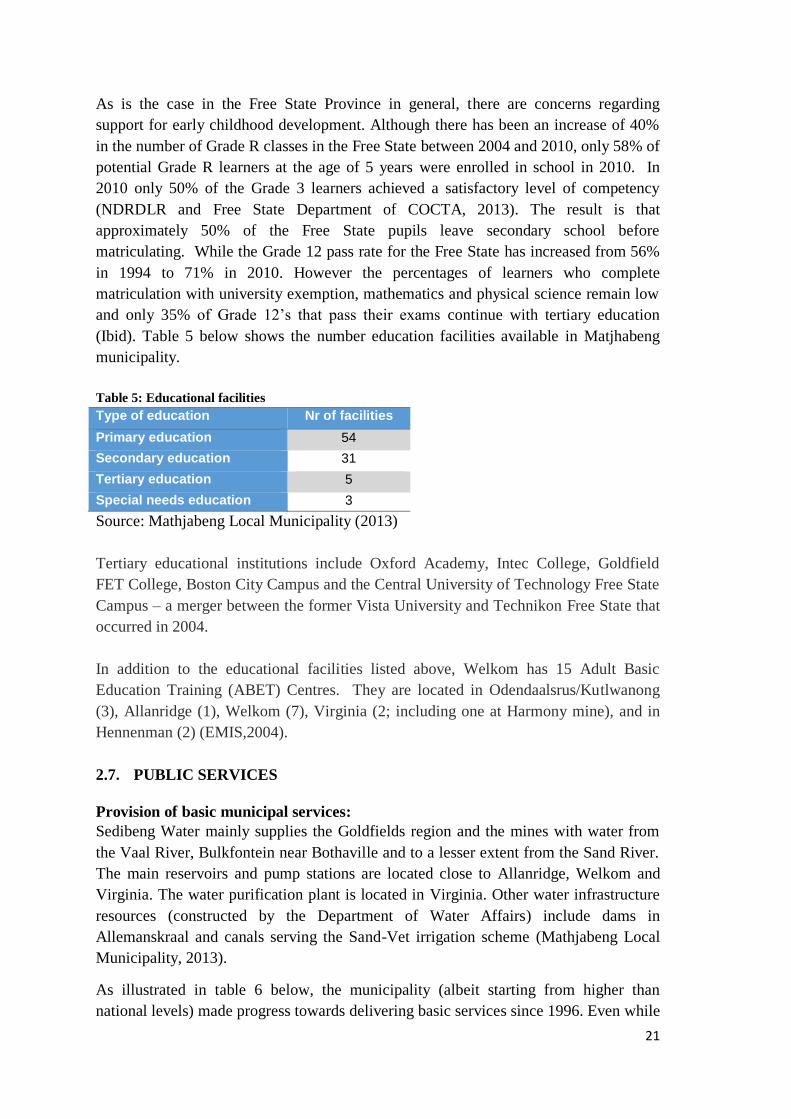
(Ibid). Table 5 below shows the number education facilities available in Matjhabeng
municipality.
Table 5: Educational facilities
Type of education Nr of facilities
Primary education 54
Secondary education 31
Tertiary education 5
Special needs education 3
Source: Mathjabeng Local Municipality (2013)
Tertiary educational institutions include Oxford Academy, Intec College, Goldfield
FET College, Boston City Campus and the Central University of Technology Free State
Campus – a merger between the former Vista University and Technikon Free State that
occurred in 2004.
In addition to the educational facilities listed above, Welkom has 15 Adult Basic
Education Training (ABET) Centres. They are located in Odendaalsrus/Kutlwanong
(3), Allanridge (1), Welkom (7), Virginia (2; including one at Harmony mine), and in
Hennenman (2) (EMIS,2004).
2.7. PUBLIC SERVICES
Provision of basic municipal services:
Sedibeng Water mainly supplies the Goldfields region and the mines with water from
the Vaal River, Bulkfontein near Bothaville and to a lesser extent from the Sand River.
The main reservoirs and pump stations are located close to Allanridge, Welkom and
Virginia. The water purification plant is located in Virginia. Other water infrastructure
resources (constructed by the Department of Water Affairs) include dams in
Allemanskraal and canals serving the Sand-Vet irrigation scheme (Mathjabeng Local
Municipality, 2013).
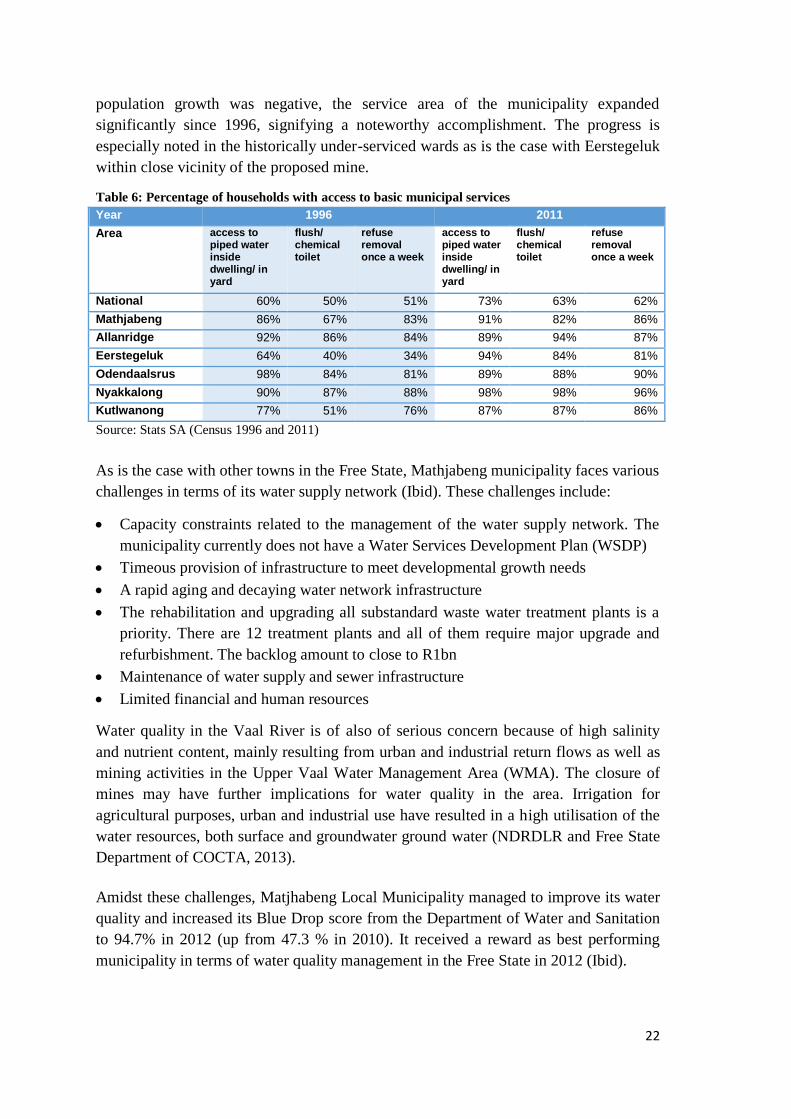
As illustrated in table 6 below, the municipality (albeit starting from higher than
national levels) made progress towards delivering basic services since 1996. Even while
22
population growth was negative, the service area of the municipality expanded
significantly since 1996, signifying a noteworthy accomplishment. The progress is
especially noted in the historically under-serviced wards as is the case with Eerstegeluk
within close vicinity of the proposed mine.
Table 6: Percentage of households with access to basic municipal services Year 1996 2011
Area access to piped water inside dwelling/ in yard
flush/ chemical toilet
refuse removal once a week
access to piped water inside dwelling/ in yard
flush/ chemical toilet
refuse removal once a week
National 60% 50% 51% 73% 63% 62%
Mathjabeng 86% 67% 83% 91% 82% 86%
Allanridge 92% 86% 84% 89% 94% 87%
Eerstegeluk 64% 40% 34% 94% 84% 81%
Odendaalsrus 98% 84% 81% 89% 88% 90%
Nyakkalong 90% 87% 88% 98% 98% 96%
Kutlwanong 77% 51% 76% 87% 87% 86%
Source: Stats SA (Census 1996 and 2011)
As is the case with other towns in the Free State, Mathjabeng municipality faces various
challenges in terms of its water supply network (Ibid). These challenges include:
Capacity constraints related to the management of the water supply network. The
municipality currently does not have a Water Services Development Plan (WSDP)
Timeous provision of infrastructure to meet developmental growth needs
A rapid aging and decaying water network infrastructure
The rehabilitation and upgrading all substandard waste water treatment plants is a
priority. There are 12 treatment plants and all of them require major upgrade and
refurbishment. The backlog amount to close to R1bn
Maintenance of water supply and sewer infrastructure
Limited financial and human resources
Water quality in the Vaal River is of also of serious concern because of high salinity
and nutrient content, mainly resulting from urban and industrial return flows as well as
mining activities in the Upper Vaal Water Management Area (WMA). The closure of
mines may have further implications for water quality in the area. Irrigation for
agricultural purposes, urban and industrial use have resulted in a high utilisation of the
water resources, both surface and groundwater ground water (NDRDLR and Free State
Department of COCTA, 2013).
Amidst these challenges, Matjhabeng Local Municipality managed to improve its water
quality and increased its Blue Drop score from the Department of Water and Sanitation
to 94.7% in 2012 (up from 47.3 % in 2010). It received a reward as best performing
municipality in terms of water quality management in the Free State in 2012 (Ibid).
23
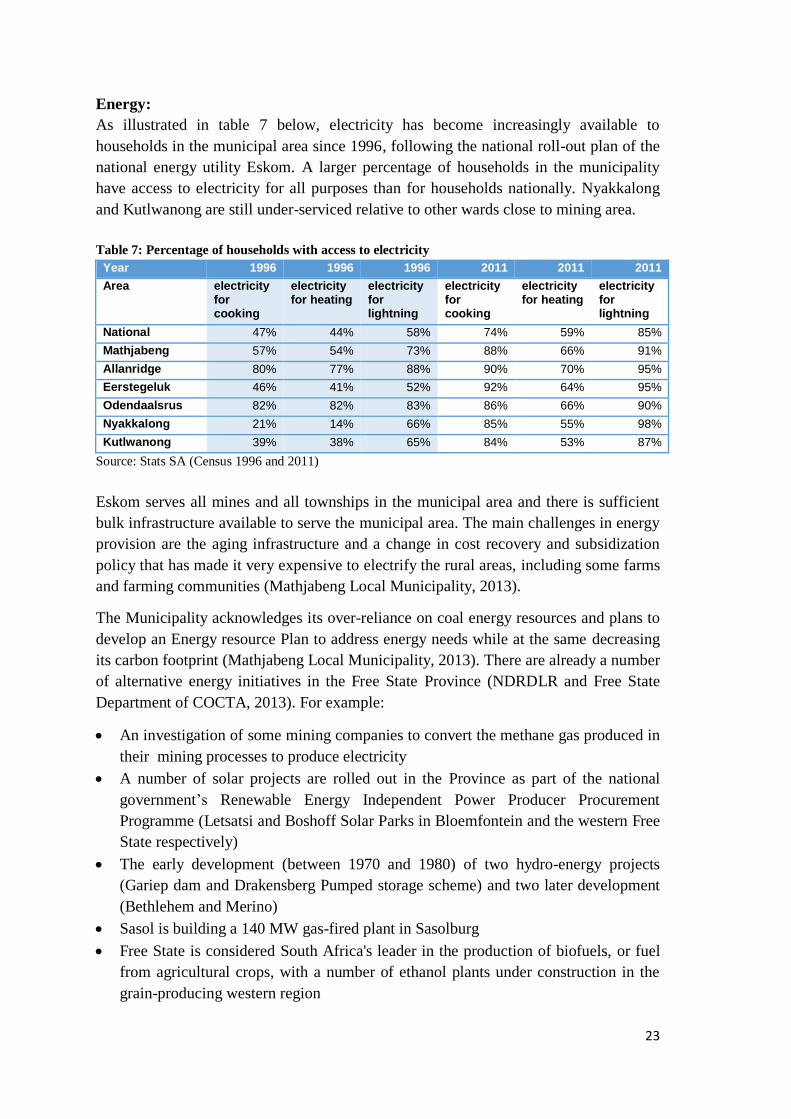
Energy:
As illustrated in table 7 below, electricity has become increasingly available to
households in the municipal area since 1996, following the national roll-out plan of the
national energy utility Eskom. A larger percentage of households in the municipality
have access to electricity for all purposes than for households nationally. Nyakkalong
and Kutlwanong are still under-serviced relative to other wards close to mining area.
Table 7: Percentage of households with access to electricity Year 1996 1996 1996 2011 2011 2011
Area electricity for cooking
electricity for heating
electricity for lightning
electricity for cooking
electricity for heating
electricity for lightning
National 47% 44% 58% 74% 59% 85%
Mathjabeng 57% 54% 73% 88% 66% 91%
Allanridge 80% 77% 88% 90% 70% 95%
Eerstegeluk 46% 41% 52% 92% 64% 95%
Odendaalsrus 82% 82% 83% 86% 66% 90%
Nyakkalong 21% 14% 66% 85% 55% 98%
Kutlwanong 39% 38% 65% 84% 53% 87%
Source: Stats SA (Census 1996 and 2011)
Eskom serves all mines and all townships in the municipal area and there is sufficient
bulk infrastructure available to serve the municipal area. The main challenges in energy
provision are the aging infrastructure and a change in cost recovery and subsidization
policy that has made it very expensive to electrify the rural areas, including some farms
and farming communities (Mathjabeng Local Municipality, 2013).
The Municipality acknowledges its over-reliance on coal energy resources and plans to
develop an Energy resource Plan to address energy needs while at the same decreasing
its carbon footprint (Mathjabeng Local Municipality, 2013). There are already a number
of alternative energy initiatives in the Free State Province (NDRDLR and Free State
Department of COCTA, 2013). For example:
An investigation of some mining companies to convert the methane gas produced in
their mining processes to produce electricity
A number of solar projects are rolled out in the Province as part of the national
government’s Renewable Energy Independent Power Producer Procurement
Programme (Letsatsi and Boshoff Solar Parks in Bloemfontein and the western Free
State respectively)
The early development (between 1970 and 1980) of two hydro-energy projects
(Gariep dam and Drakensberg Pumped storage scheme) and two later development
(Bethlehem and Merino)
Sasol is building a 140 MW gas-fired plant in Sasolburg
Free State is considered South Africa's leader in the production of biofuels, or fuel
from agricultural crops, with a number of ethanol plants under construction in the
grain-producing western region
24
A number of municipalities in the Free State face the threat of being cut-off from
electricity supply because of outstanding Eskom bills. Matjhabeng is one of the
municipalities that had an outstanding electricity bill of more than R 300m in 2014.
According to representatives of the Matjhabeng Ratepayers Association, “the
municipality simply don't know how to handle money”. Eleven businesses have already
closed their doors and “people and businesses are leaving Matjhabeng in droves”
(Moore, 2014).
Road and transport infrastructure:
Of the 3 305 km of main roads that falls under the jurisdiction of Free State Province
less than 50% has been evaluated as being in a fair, good or very good condition. A
total of 1731 km (52%) has been evaluated to be in a poor to very poor condition. The
maintenance and repair cost associated with these roads have been estimated by the
Department of Police, Roads and Transport to be in the order of R11.4 billion. At the
2005 rate of resealing in the Province, resealing will only occur every 40 years, way
below the international norm of resealing roads every 12 years. The state of the Free
State’s road network has resulted in an increase in road accidents (NDRDLR and Free
State Department of COCTA, 2013).
While Mathjabeng municipality has a well-established road and transportation
infrastructure, the main challenge for over the years has been maintenance of such
infrastructure. Due to the large backlogs for the province as a whole, there is
insufficient financial support from the Provincial Departments to eradicate these
backlogs. In 2012 the roads and storm water maintenance backlog for the municipality
is estimated close to be close to R4 billion and new roads backlog at approximately R2
billion. The municipality has a total length of 1 618km of roads of which 40% is gravel
and 60% is surfaced (Mathjabeng Local Municipality,2013).
The public transport system of Matjhabeng mainly consists of privately owned taxis.
Apart from dedicated transport for mine workers, there is no local bus service operating
in Matjhabeng. The rail network passing through Hennenman, and Virginia mainly
services mines (Ibid).
2.8. SAFETY AND SECURITY
Crime:
The level of crime within Mathjabeng municipality is of concern. Close to 177 violent
crimes per 100 000 people were recorded in the municipal area in 2013 compared to 99
nationally and 142 provincially. While violent crimes decreased by 39% nationally
since 2000, it only decreased by 9% in Mathjabeng. In 2013, the property crime index
was also much higher at 263 crimes per 100 000 people compared to the national and
provincial averages of 221 and 245 crimes respectively (IHS Global Insight data, 2015).
25
A number of high profile crimes occurred in the area the last 5 years (Allan, 2011).
Welkom also recently made news headlines in March 2014 when 10 people on separate
incidents were brutally slayed in less than a week (De Klerk, 2014). Farm murders are
reportedly higher in the Free State than in the rest of the country with 42 per 100 000
population recorded in 2014 as opposed to 31 per 100 000 nationally. Dominantly an
urban area in terms of population, the ratio is much lower in Mathjabeng, since it only
presented 7% of the farm murders in the Free State since 2000 compared to its
population contribution of 18% of towards the Free State population (based on data
from Bridges, 2014).
There is a general opinion in the media that the closure of mines and the consequent
economic decline could be one of the reasons behind what is perceived as an escalation
of violent crimes in the area.
Various challenges were identified related to the effective combating of crime within
the municipal area (Mathjabeng Local Municipality, 2013). These include:
Lack of resources within the police service (transport, manpower).
Ineffective functioning of neighbourhood watch organization and community police
forums.
Lack of visible policing.
Lack of accessibility to police stations
According to the latest Integrated Development Plan (IDP) of Mathjabeng more
facilities such as mobile police stations, available transport and accessible
communication systems are required to improve crime prevention and emergency
response (Mathjabeng Local Municipality, 2013).
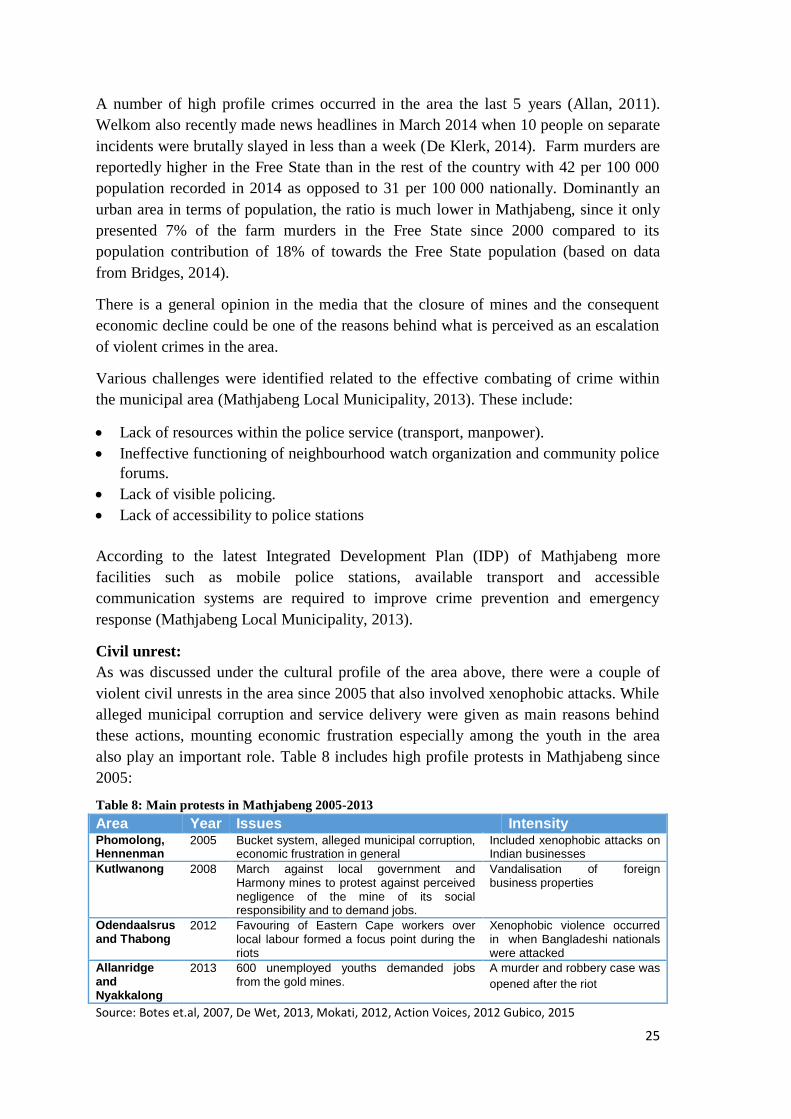
Civil unrest:
As was discussed under the cultural profile of the area above, there were a couple of
violent civil unrests in the area since 2005 that also involved xenophobic attacks. While
alleged municipal corruption and service delivery were given as main reasons behind
these actions, mounting economic frustration especially among the youth in the area
also play an important role. Table 8 includes high profile protests in Mathjabeng since
2005:
Table 8: Main protests in Mathjabeng 2005-2013
Area Year Issues Intensity Phomolong, Hennenman
2005 Bucket system, alleged municipal corruption, economic frustration in general
Included xenophobic attacks on Indian businesses
Kutlwanong
2008 March against local government and Harmony mines to protest against perceived negligence of the mine of its social responsibility and to demand jobs.
Vandalisation of foreign business properties
Odendaalsrus and Thabong
2012 Favouring of Eastern Cape workers over local labour formed a focus point during the riots
Xenophobic violence occurred in when Bangladeshi nationals were attacked
Allanridge and Nyakkalong
2013 600 unemployed youths demanded jobs from the gold mines.
A murder and robbery case was
opened after the riot
Source: Botes et.al, 2007, De Wet, 2013, Mokati, 2012, Action Voices, 2012 Gubico, 2015
26
Service delivery protests and xenophobia in general are on the rise in South Africa with
a record number of protests (174) recorded in the country in 2014 (Municipal IQ, 2014).
Hygiene/ sanitation issues and alleged corruption charges against government officials
in many cases play a catalytic role in service delivery protests. The root cases are
mainly to be found in limited economic opportunities, especially for the youth (Botes
et.al., 2007). Inadequate sewage systems are recorded in many cases in Mathjabeng
townships including sections of Kutlwanong, Thabong and Meloding (Action Voices,
2012). The frustrated economic aspirations of the youth are furthermore well recorded
in Mathjibeng. Against this background it could be expected that civil unrest will most
likely intensify in future.
Labour unrest:
Even as the gold mining sector is declining in Mathjibeng, it is still subject to labour
unrest. Increased labour unrest not only threatens the safety and security of the
labourers but also the safety of the public. In November 2012 Harmony Gold recorded
public violence in Kusasalethu mine near Carletonville (Harmony, 2012). The events
that occurred in Lonmin’s Marikana mine (Rustenburg) in 2012 are considered a
reflection of the growing tensions within the mining sector. The rivalry between the
well-established government-affiliated union the National Union of Mineworkers
(NUM) and AMCU result in each group trying to get the best and most competitive
wage deals for its members. Over the past few years, unprotected strike action in many
cases has escalated into an uncontrolled, violent and unlawful landscape. Analysts
predict that the platinum and gold sectors will be exposed to the risk of high levels of
labour unrest over the next few years (Mavuso, 2013).
Safety aspects related to illegal mining:
Illegal gold mining is a growing concern in the area, as is the case in the West Rand.
Welkom made headlines in 2009 when the bodies of at least 82 illegal miners (zama
zamas) died from inhalation of poisonous gasses created by a fire in the Eland
mineshaft of Harmony Gold near Welkom. Many desperate and unemployed people
venture into illegal gold mining even amidst the danger of the enterprise. A local law
enforcement officer of the area estimates that about 3000 illegal miners work in the
underground mines in Matjhabeng and fears that there may be hundreds more bodies of
"illegals" that could still be left in these mines (Macharia, 2009).
2.9. LOCAL GOVERNMENT STRUCTURE AND CAPACITY
Governance:
Matjhabeng Municipality is a category “B” municipality with a mayoral executive
system combined with a ward participatory system. The ANC has a 72% majority in the
municipal council (Mathjabeng Local Municipality, 2013b).
Poor communication and accountability relationships with communities as well as high
levels of corruption and fraud have been among the focus areas of the Department of
27
Cooperative Government and Traditional Affairs (COGTA) in municipalities in South
Africa since 2009 (Ibid).
The municipality make use of a number of communication channels including a
functional website, notice boards, a monthly community newspaper (Matjhabeng News)
as well as community radio station, The Rock (Mathjabeng Local Municipality,
2013b).
In 2011 Mathjibeng municipality made headlines due to unaccounted spending to the
amount of R2bn. There exists a perception among community members of wasteful
spending and ‘massive’ corruption at municipal level (Africa and Hofstatter, 2011).
Basic service delivery:
As was mentioned under the provision of basic services above, the municipality
managed to extend basic service delivery to a large percentage of households within its
jurisdiction since 1996. It managed to do so despite having to serve a much rather
jurisdiction and while experiencing a declining number of rate-payers and a declining
economy. The municipality followed a pro-poor approach in its focus on basic service
delivery that left little funds available for maintaining infrastructure (e.g. water
infrastructure and roads) needed to support economic growth (Madibeng Local
Municipality, 2013).
Despite the strong focus on basic service delivery, the municipality experienced at least
one recorded violent protest in Phomolong in 2005 (discussed above) that was related to
basic service delivery issues. As is the case with other service delivery protest in South
Africa, dissatisfaction with the lack of basic services related to sanitation (mainly the
bucket system) proved to be the major complaint in the case of the Phomolong unrest.
Issues related to the local clinic also featured among the complaints although health
falls under provincial jurisdiction. Deeper investigation into main drivers behind the
protest however revealed major drivers as the lack of economic opportunities especially
among the youth and perceptions of corruption in the local municipality. While the
municipality bore the brunt of the civil action, protestors also provided the lack of local
jobs created by the mines and preferential appointment of Lesotho people as reasons for
the protest of 2005 (Botes et.al, 2007).
Financial management:
Matjhabeng Local Municipality received a disclaimer audit opinion for the past
financials years. The report of the Auditor-General for the year ended 2013 gave the
following reasons for their audit decision (in Mathjabeng Local Municipality, 2013b):
Fruitless and wasteful expenditure of R 76m due to interest on late payment of
accounts
Irregular expenditure of R 160m due to inadequate procurement processes followed
Insufficient alignment between the Integrated Development Plan and the Municipal
Budget
28
Inadequate performance monitoring of development priorities and objectives against
key indicators
Irregular staff appointments
Lack of signed performance contracts of the municipal manager and senior
management
Lack of stability in senior management positions including the position of the chief
financial officer whose position has been vacant for more than 2 years
Long term development planning:
For an economy that faced severe decline the past decades, long term development
planning is crucial in support of diversification away from the declining mining sector.
The Executive Mayor heads the Integrated Development Plan (IDP) Representative
Forum which consists of the ward committees, sector departments and the business. The
IDP forum improved inter-government collaboration as well as relationships with the
private sector. There is however insufficient alignment between the IDP and the
municipal budget. This could be ascribed to the limited funding to implement
programmes beyond the basic service delivery mandate of the municipality. Local
Economic Programmes in particular face funding constraints although funding from
other spheres became available in recent years. In 2013 no new jobs were created by
LED programmes. A number of short term jobs were however created through the
national-driven Expanded Public Works Programme (Mathjabeng Local Municipality,
2013b). It is also argued that LED has a limited impact on the region’s economic
performance also due to a lack of coordination between municipal initiatives and the
Social and Labour Plans of mines in the area (Nel, 2002).
There appear to be relative consistency in personnel in the planning department with
low staff turnover rates of 6% recorded in 2013 compared to the accepted norm of 15%.
While there are no vacancies on higher management levels in the planning and Local
Economic Development Offices vacancies rates of between 40% -50% at the junior
support level (Ibid).
2.10. LOCAL SOCIAL NETWORKS
Civil society plays an important role in support of vulnerable groups in society and
ideally provides a structured voice to marginalised groups within a local area. More
than 300 non-governmental organisations (NGOs) were recorded in Mathjabeng in
2011. As is the case with in the Free State in general civic society is still under-
represented in Matjhabeng contributing only 0.4% towards the total NGOs operational
in South Africa compared to its 0.8% contribution towards the South African
population (Centre for Development Support, 2013).
Social focus areas:
The majority of NGOs in Mathjabeng focuses on social services including family-
related matters (48%); development issues (18%); health including forums such as the
29
HIV /AIDS Consortium (12%), religion including the Matjhabeng Christian Leaders
Forum (10%) and education (6%).
Environmental and developmental focus areas:
Since 2011 there has been a stronger focus on environmental and developmental issues
of civic organisations in the area, especially behind the background of the declining
mining sector and the long-term economic and environmental impacts of mining on
Mathjabeng. There is also a stronger focus on mobilising the youth of Mathjabeng
around these environmental, economic and human rights related to the mining industry
in the areas.
The most vocal of these groups are the Gold and Uranium Belt Impact Censoring
Organisation (GUBICO) established by a group of young people in Mathjabeng
(GUBICO) in 2011. The organisation utilise community monitors mainly in the former
townships of Meloding, Nyakkalong, Thabong and Masilo that provide regular
feedback to the local communities to issues related to the environment, labour
conditions, safety issues related to mines in the area as well as to municipal service
delivery. The group supports the principles of non-violence, inclusivity, gender parity,
cultural diversity, non-racialism and Anti-Xenophobia. Their communication strategy
includes a regularly updated blog web-site www.goldanduraniumbelt.blogspot.com.
The group is closely associated with the Bench Marks Foundation launched by
Archbishop Desmond Tutu in 2001 as an independent organisation mandated by
churches to monitor the practices of multi-national corporations “to ensure that those
most negatively impacted upon are heard, protected and accommodated within the
business plans of the corporations” (Action Voices, 2012).
Economic focus areas:
Employer organisations: As early as the 1990s, the FGF (Free State Goldfields
Development Centre) was established with the objective to find alternatives to the
declining mining industry in the areas and to drive local economic development (LED)
in the local area. The FGF managed to encourage new reasonably good working
relationships between the municipality and the business sector (HSRC, 2003). The
FGF also works closely with the Free State Goldfields Chamber of Business in
brainstorming ways to promote economic activities in the area that do not depend on the
mines. The Matjhabeng Ratepayers Association (RPA) in turn focuses on tranforming
Matjhabeng into a prosperous business centre.
Labour organisations: The major trade unions operational in the mining industry is
also found in Mathjabeng. These include the ANC-allied National Union of
Mineworkers (NUM), the Association of Mineworkers and Construction Union
(AMCU), the United Association of South Africa (UASA) and Solidarity. NUM still
appear to be the majority union in the area although AMCU is showing fast growth in
the mining sector due to the gains won for its members in platinum negotiations in 2014
(News24, 2015). AMCU was formed in 1998 as an allegedly ‘a-political’ breakaway
30
from NUM and as discussed above is in fierce competition with NUM to recruit
members in the mining industry. UASA and Solidarity are older unions with more
stable membership mainly among medium to higher skilled workers.
Recently a number of forums were established to represent the growing number of
youth that is unemployed in the area, for example the Matjhabeng Mining
Unemployment Community. Development forums in Nyakallong and Kutlwanong
regard themselves as voices of the unemployed in their communities. These
organisations has been associated with unrest in their local areas, inter alia demanding
jobs from the gold mines and protesting over recruitment of outsiders at the expense of
local labour (Action Voices, 2012).
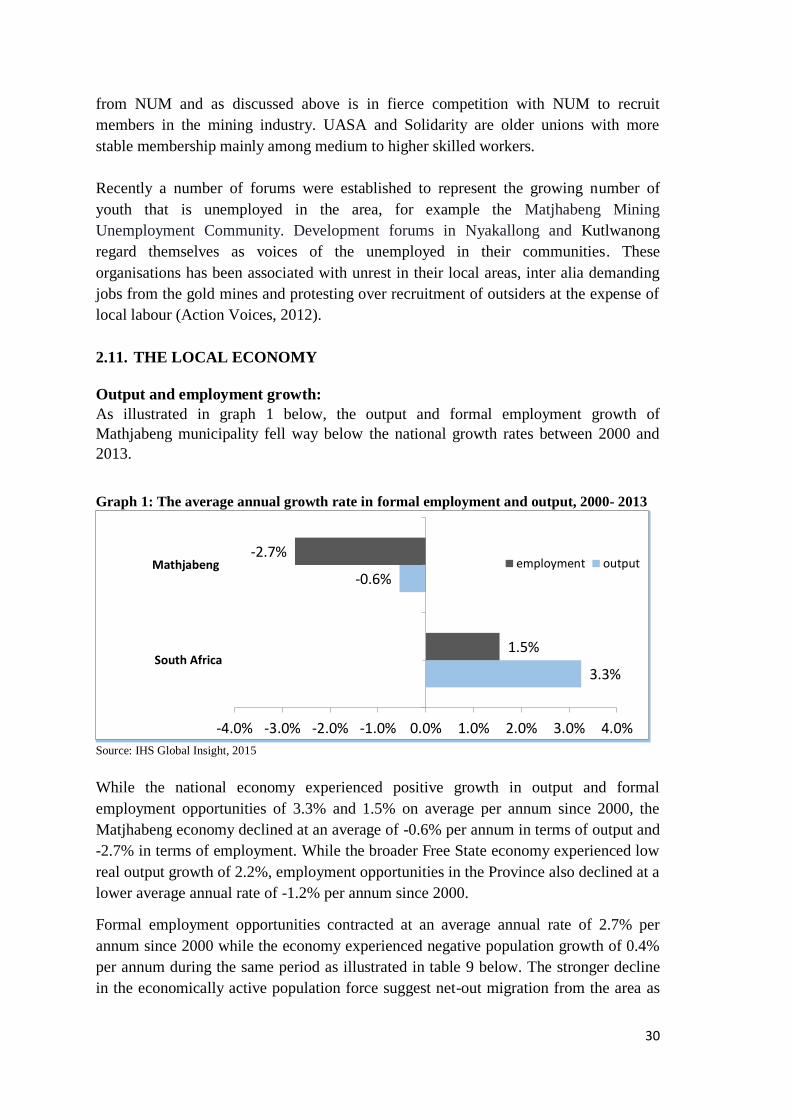
2.11. THE LOCAL ECONOMY
Output and employment growth:
As illustrated in graph 1 below, the output and formal employment growth of
Mathjabeng municipality fell way below the national growth rates between 2000 and
2013.
Graph 1: The average annual growth rate in formal employment and output, 2000- 2013
Source: IHS Global Insight, 2015
While the national economy experienced positive growth in output and formal
employment opportunities of 3.3% and 1.5% on average per annum since 2000, the
Matjhabeng economy declined at an average of -0.6% per annum in terms of output and
-2.7% in terms of employment. While the broader Free State economy experienced low
real output growth of 2.2%, employment opportunities in the Province also declined at a
lower average annual rate of -1.2% per annum since 2000.
Formal employment opportunities contracted at an average annual rate of 2.7% per
annum since 2000 while the economy experienced negative population growth of 0.4%
per annum during the same period as illustrated in table 9 below. The stronger decline
in the economically active population force suggest net-out migration from the area as
3.3%
-0.6%
1.5%
-2.7%
-4.0% -3.0% -2.0% -1.0% 0.0% 1.0% 2.0% 3.0% 4.0%
South Africa
Mathjabeng employment output
31
well as an increase in discouraged job-seekers in response to declining economic
activities.
Table 9: The average annual growth in population, economically active population and labour
force, 2000 - 2013
Area Population Economically active population (15-64 years)
Labour force
Labour force participation rate 2000
Labour force participation rate 2010
South Africa 1.3% 1.4% 1.4% 55.0% 55.2%
Mathjabeng -0.4% -0.7% -1.0% 67.8% 65.3%
Source: IHS Global Insight, 2015
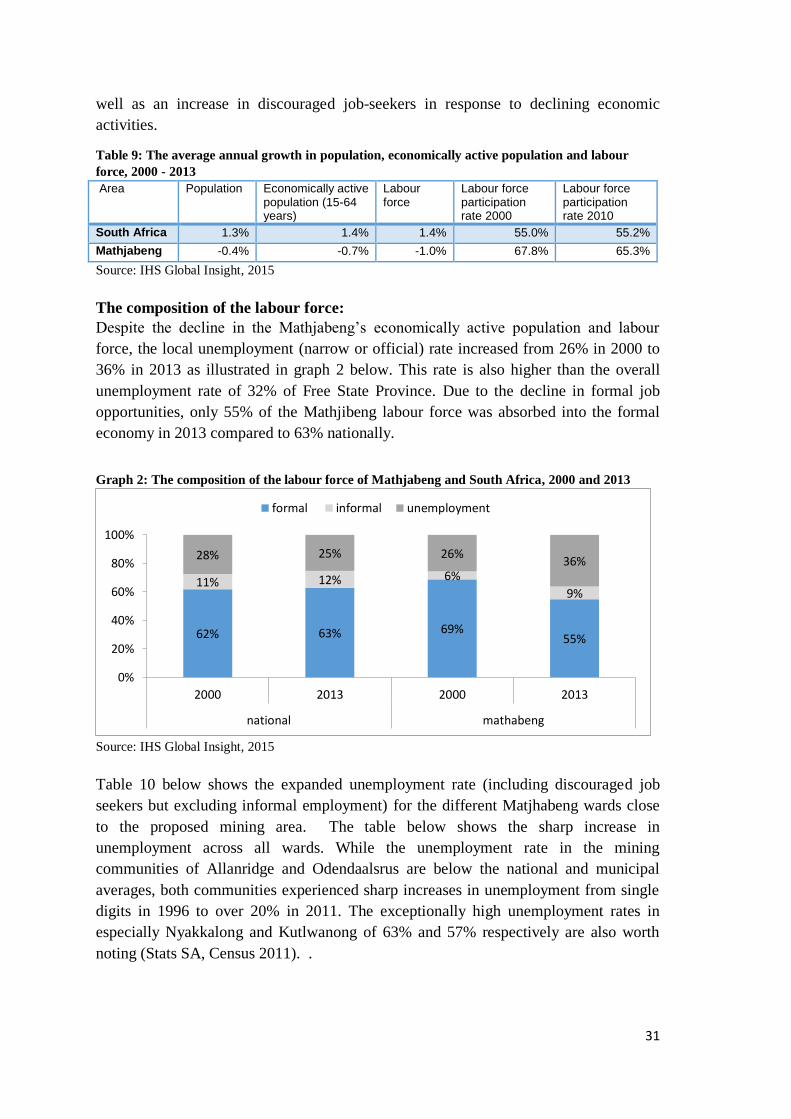
The composition of the labour force:
Despite the decline in the Mathjabeng’s economically active population and labour
force, the local unemployment (narrow or official) rate increased from 26% in 2000 to
36% in 2013 as illustrated in graph 2 below. This rate is also higher than the overall
unemployment rate of 32% of Free State Province. Due to the decline in formal job
opportunities, only 55% of the Mathjibeng labour force was absorbed into the formal
economy in 2013 compared to 63% nationally.
Graph 2: The composition of the labour force of Mathjabeng and South Africa, 2000 and 2013
Source: IHS Global Insight, 2015
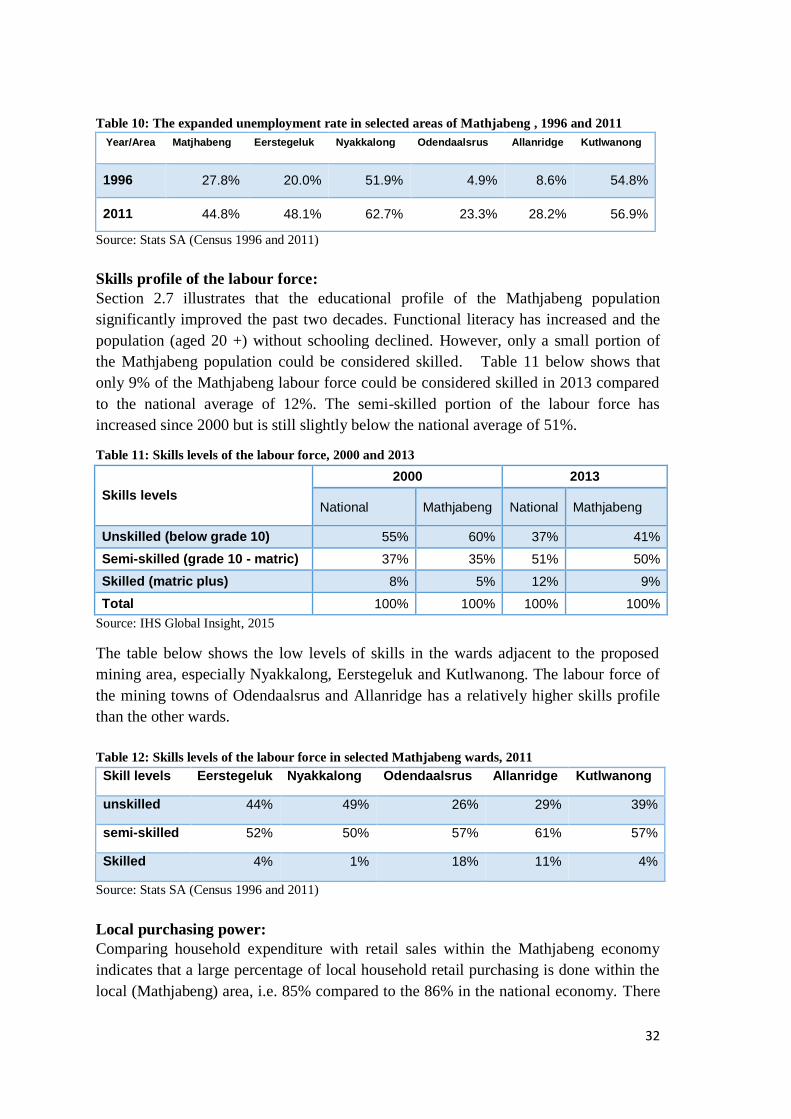
Table 10 below shows the expanded unemployment rate (including discouraged job
seekers but excluding informal employment) for the different Matjhabeng wards close
to the proposed mining area. The table below shows the sharp increase in
unemployment across all wards. While the unemployment rate in the mining
communities of Allanridge and Odendaalsrus are below the national and municipal
averages, both communities experienced sharp increases in unemployment from single
digits in 1996 to over 20% in 2011. The exceptionally high unemployment rates in
especially Nyakkalong and Kutlwanong of 63% and 57% respectively are also worth
noting (Stats SA, Census 2011). .
62% 63% 69% 55%
11% 12% 6%
9%
28% 25% 26% 36%
0%
20%
40%
60%
80%
100%
2000 2013 2000 2013
national mathabeng
formal informal unemployment
32
Table 10: The expanded unemployment rate in selected areas of Mathjabeng , 1996 and 2011
Year/Area Matjhabeng Eerstegeluk Nyakkalong Odendaalsrus Allanridge Kutlwanong
1996 27.8% 20.0% 51.9% 4.9% 8.6% 54.8%
2011 44.8% 48.1% 62.7% 23.3% 28.2% 56.9%
Source: Stats SA (Census 1996 and 2011)
Skills profile of the labour force:
Section 2.7 illustrates that the educational profile of the Mathjabeng population
significantly improved the past two decades. Functional literacy has increased and the
population (aged 20 +) without schooling declined. However, only a small portion of
the Mathjabeng population could be considered skilled. Table 11 below shows that
only 9% of the Mathjabeng labour force could be considered skilled in 2013 compared
to the national average of 12%. The semi-skilled portion of the labour force has
increased since 2000 but is still slightly below the national average of 51%.
Table 11: Skills levels of the labour force, 2000 and 2013
Skills levels
2000 2013
National Mathjabeng National Mathjabeng
Unskilled (below grade 10) 55% 60% 37% 41%
Semi-skilled (grade 10 - matric) 37% 35% 51% 50%
Skilled (matric plus) 8% 5% 12% 9%
Total 100% 100% 100% 100%
Source: IHS Global Insight, 2015
The table below shows the low levels of skills in the wards adjacent to the proposed
mining area, especially Nyakkalong, Eerstegeluk and Kutlwanong. The labour force of
the mining towns of Odendaalsrus and Allanridge has a relatively higher skills profile
than the other wards.
Table 12: Skills levels of the labour force in selected Mathjabeng wards, 2011
Skill levels Eerstegeluk Nyakkalong Odendaalsrus Allanridge Kutlwanong
unskilled 44% 49% 26% 29% 39%
semi-skilled 52% 50% 57% 61% 57%
Skilled 4% 1% 18% 11% 4%
Source: Stats SA (Census 1996 and 2011)
Local purchasing power:
Comparing household expenditure with retail sales within the Mathjabeng economy
indicates that a large percentage of local household retail purchasing is done within the
local (Mathjabeng) area, i.e. 85% compared to the 86% in the national economy. There
33
is therefore no indication of significant spending leaks in the local economy – i.e. local
wages are mainly spent on local goods (based on IHS Global Insight data, 2015).
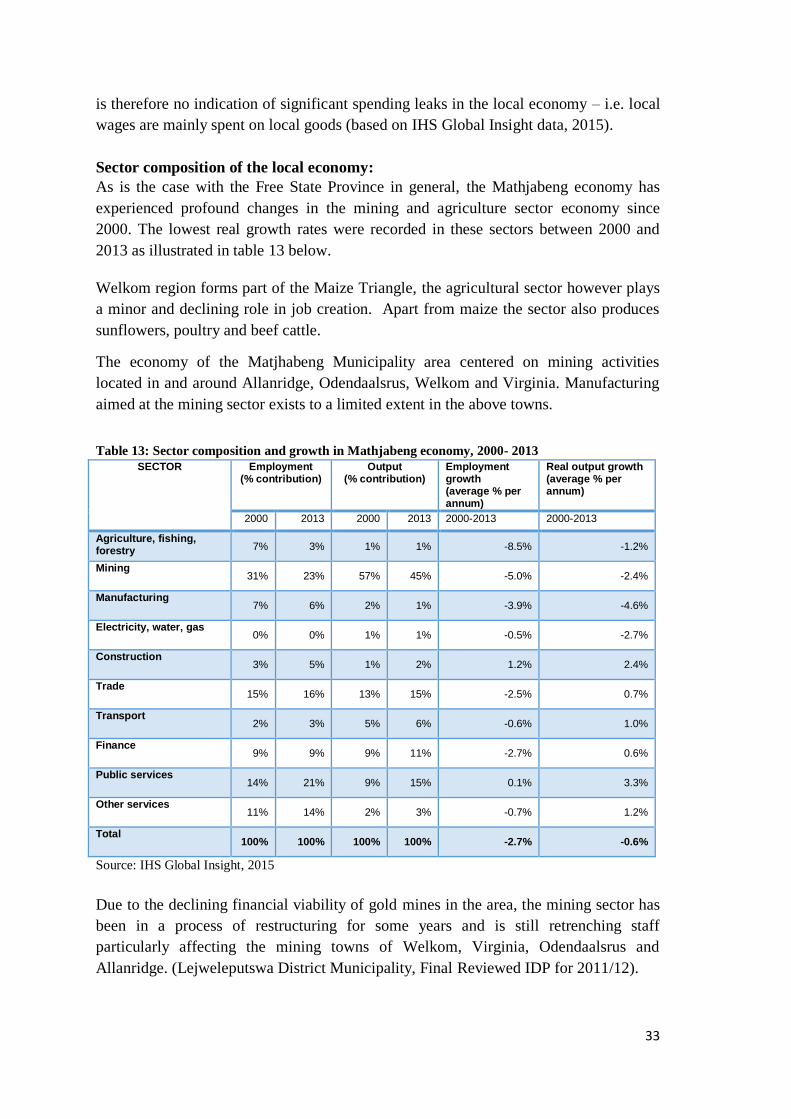
Sector composition of the local economy:
As is the case with the Free State Province in general, the Mathjabeng economy has
experienced profound changes in the mining and agriculture sector economy since
2000. The lowest real growth rates were recorded in these sectors between 2000 and
2013 as illustrated in table 13 below.
Welkom region forms part of the Maize Triangle, the agricultural sector however plays
a minor and declining role in job creation. Apart from maize the sector also produces
sunflowers, poultry and beef cattle.
The economy of the Matjhabeng Municipality area centered on mining activities
located in and around Allanridge, Odendaalsrus, Welkom and Virginia. Manufacturing
aimed at the mining sector exists to a limited extent in the above towns.
Table 13: Sector composition and growth in Mathjabeng economy, 2000- 2013 SECTOR Employment
(% contribution) Output
(% contribution) Employment growth (average % per annum)
Real output growth (average % per annum)
2000 2013 2000 2013 2000-2013 2000-2013
Agriculture, fishing, forestry 7% 3% 1% 1% -8.5% -1.2%
Mining 31% 23% 57% 45% -5.0% -2.4%
Manufacturing 7% 6% 2% 1% -3.9% -4.6%
Electricity, water, gas 0% 0% 1% 1% -0.5% -2.7%
Construction 3% 5% 1% 2% 1.2% 2.4%
Trade 15% 16% 13% 15% -2.5% 0.7%
Transport 2% 3% 5% 6% -0.6% 1.0%
Finance 9% 9% 9% 11% -2.7% 0.6%
Public services 14% 21% 9% 15% 0.1% 3.3%
Other services 11% 14% 2% 3% -0.7% 1.2%
Total 100% 100% 100% 100% -2.7% -0.6%
Source: IHS Global Insight, 2015
Due to the declining financial viability of gold mines in the area, the mining sector has
been in a process of restructuring for some years and is still retrenching staff
particularly affecting the mining towns of Welkom, Virginia, Odendaalsrus and
Allanridge. (Lejweleputswa District Municipality, Final Reviewed IDP for 2011/12).
34
The mining of gold and uranium ore still dominates the Mathjabeng mining, producing
almost 96% of output in 2013. However, real economic output has steadily declined
from R14bn in 2000 to R10bn in 2013, while employment in the sector has almost
halved from 42 000 in 2000 to 22 000 in 2013. The media highlights Welkom as an
“unraveling gold mining city that once employed more than 170 000 people. It also
highlights the high incidence of unemployment under the youth.Those who are
educated, once skilled, go outside [the city] to look for work" (Steyn, 2013). .
The majority of the remaining mining workforce of 22 000 is currently employed by
Harmony Gold and Sibanye Gold. Harmony took over a number of mines that were
going to be closed by AngloGold and Gold Fields in the late 70s up to the early 90s –
thereby extending the sustainability of areas such as Welkom, Virginia and
Odendaalsrus (Ibid). Apart from providing employment for the majority of the mining
workforce, Harmony is also involved in local economic development projects some in
association with the Department of Trade and Industry (DTI). The major projects
include:
A jewelry school as an incubation centre for design and manufacture of precious
metal jewellery (Seccombe, 2014)
A poultry project entailing a co-operatives of small farmers where Harmony would
be the base customer, buying chickens to feed employees living in hostels
A business development project that will include a business incubation and
mentoring programme to foster small black-owned companies. Harmony wants the
incubator programme, which will receive R10m from the DTI over three years, to
include any business that can supply the company with goods and services “ranging
from foodstuffs to welding” (Ibid)
A biofuel project that envisages generating methane from sugar beet grown on rehabilitated mine land (Ibid).
According to table 13 above all sectors (except the construction and public services
sectors) of Mathjabeng experienced decline in terms of employment since 2000. The
low growth in the trade, manufacturing and transport sectors could be directly ascribed
to links with the declining mining sector.
The labour-intensive tourism sector is upheld as a potential growth sector for the
Province and the local economy. Mine tours are offered at Virginia, Welkom,
Allanridge and Odendaalrus which showcase some of the deepest mines in the world.
As is the case in the Free State economy in general, tourism plays a relatively small role
in the Mathjabeng economy contributing around 2% towards total formal employment
in 2013. The sector did experience positive employment growth since 2000 with
employment almost doubling from 1400 in 2000 to 2000 in 2013. However, real output
for the sector also declined by -1% per annum since 2000 (IHS Global Insight, 2015).
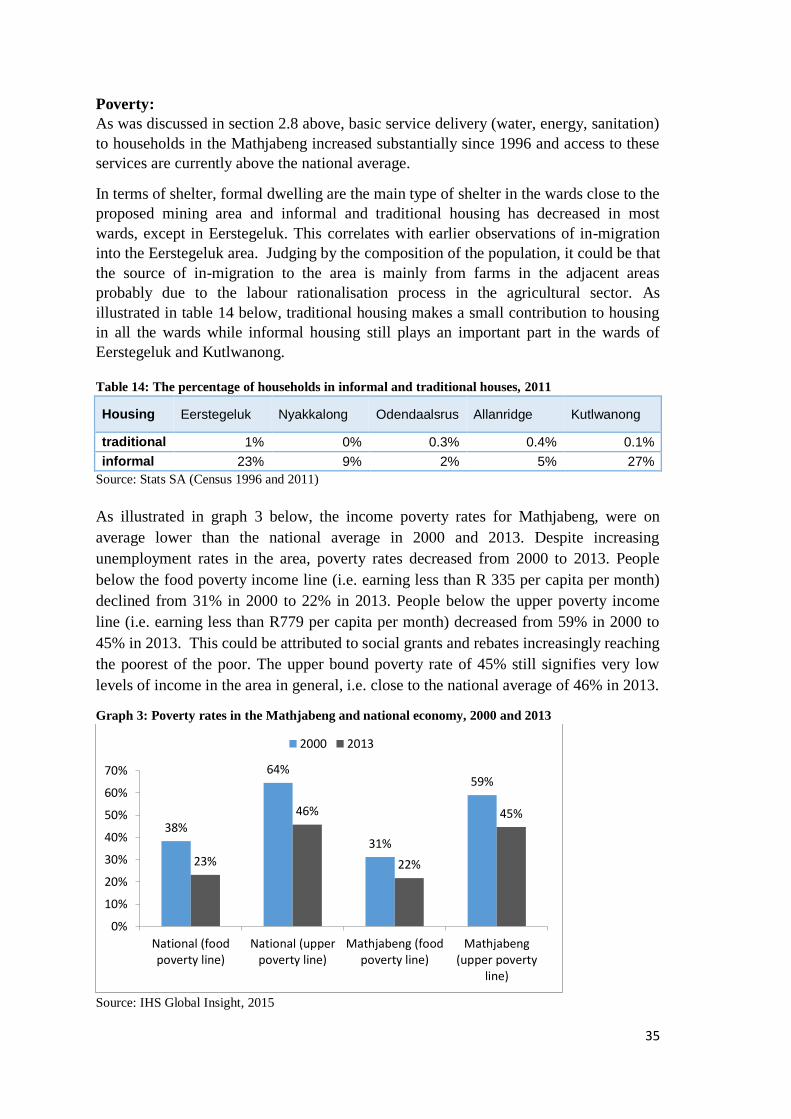
35
Poverty:
As was discussed in section 2.8 above, basic service delivery (water, energy, sanitation)
to households in the Mathjabeng increased substantially since 1996 and access to these
services are currently above the national average.
In terms of shelter, formal dwelling are the main type of shelter in the wards close to the
proposed mining area and informal and traditional housing has decreased in most
wards, except in Eerstegeluk. This correlates with earlier observations of in-migration
into the Eerstegeluk area. Judging by the composition of the population, it could be that
the source of in-migration to the area is mainly from farms in the adjacent areas
probably due to the labour rationalisation process in the agricultural sector. As
illustrated in table 14 below, traditional housing makes a small contribution to housing
in all the wards while informal housing still plays an important part in the wards of
Eerstegeluk and Kutlwanong.
Table 14: The percentage of households in informal and traditional houses, 2011
Housing Eerstegeluk Nyakkalong Odendaalsrus Allanridge Kutlwanong
traditional 1% 0% 0.3% 0.4% 0.1%
informal 23% 9% 2% 5% 27%
Source: Stats SA (Census 1996 and 2011)
As illustrated in graph 3 below, the income poverty rates for Mathjabeng, were on
average lower than the national average in 2000 and 2013. Despite increasing
unemployment rates in the area, poverty rates decreased from 2000 to 2013. People
below the food poverty income line (i.e. earning less than R 335 per capita per month)
declined from 31% in 2000 to 22% in 2013. People below the upper poverty income
line (i.e. earning less than R779 per capita per month) decreased from 59% in 2000 to
45% in 2013. This could be attributed to social grants and rebates increasingly reaching
the poorest of the poor. The upper bound poverty rate of 45% still signifies very low
levels of income in the area in general, i.e. close to the national average of 46% in 2013.
Graph 3: Poverty rates in the Mathjabeng and national economy, 2000 and 2013
Source: IHS Global Insight, 2015
38%
64%
31%
59%
23%
46%
22%
45%
0%
10%
20%
30%
40%
50%
60%
70%
National (foodpoverty line)
National (upperpoverty line)
Mathjabeng (foodpoverty line)
Mathjabeng(upper poverty
line)
2000 2013
36
In 2013, all of the qualifying indigent households (earning less than R 1100 a month)
received free basic services including water, sanitation, refuse removal and electricity.
The number of indigent households were close 20 700 households or 16% of the
households recorded in 2013 (Mathjabeng Local Municipality, 2013b).
Table 14 below shows the percentage of households close to the proposed mining area
that earned R 1600 and less in 2011. This poverty rate roughly equates to the upper
bound poverty income line of R779 per capita in 2011. The table shows that the
Eerstegeluk, Nyakkalong and Kutlwanong areas have poverty rates almost double the
size of the mining towns of Allanridge and Odendaalsrus. The poverty rates below are
closely related to the unemployment rates in table 10 above.
Table 15: Percentage of households earning less than R1600 per month in 2011 Area % of households
Eerstegeluk 49%
Nyakkalong 56%
Odendaalsrus 26%
Allanridge 28%
Kutlwanong 52%
Source: Stats SA (Census 2011)
Inequality:
The Gini-coefficient measures the level of income inequality in an economy with a
coefficient closer to 1 signifying a less equal society; a coefficient closer to 0 a more
equal society.
The Gini coefficient for Mathjabeng was slightly lower (albeit still at a high level) than
the national average of 0.64 at 0.60 in 2013. As is the case in the national economy,
income distribution became slightly less skew since 2000. The Gini coefficient is
however still higher in 2013 than levels recorded in 1996. This is the case for both the
national and local economy that in 1996 recorded Gini coefficients of 0.56 and 0.60
respectively.
Economic stability and sustainability:
The Mathjibeng economy has a relatively high tress index of 66 in 2013 compared to
the national average of 39. This indicates a relatively undiversified economy, mainly
because of the large contribution made by the mining sector. The gold mining sector in
particular is subject to external factors such as the global financial climate. This renders
the local economy vulnerable to fluctuations and the potential down-sizing of one
particular sector, as is evident from the decline in the economy the past 13 years.
The mining sector is furthermore an energy and water intensive sector as illustrated in
the graph below. According to the graph, the value of production per unit energy and
water consumed of the mining sector is low compared to for instance the trade and
services and the construction sectors.
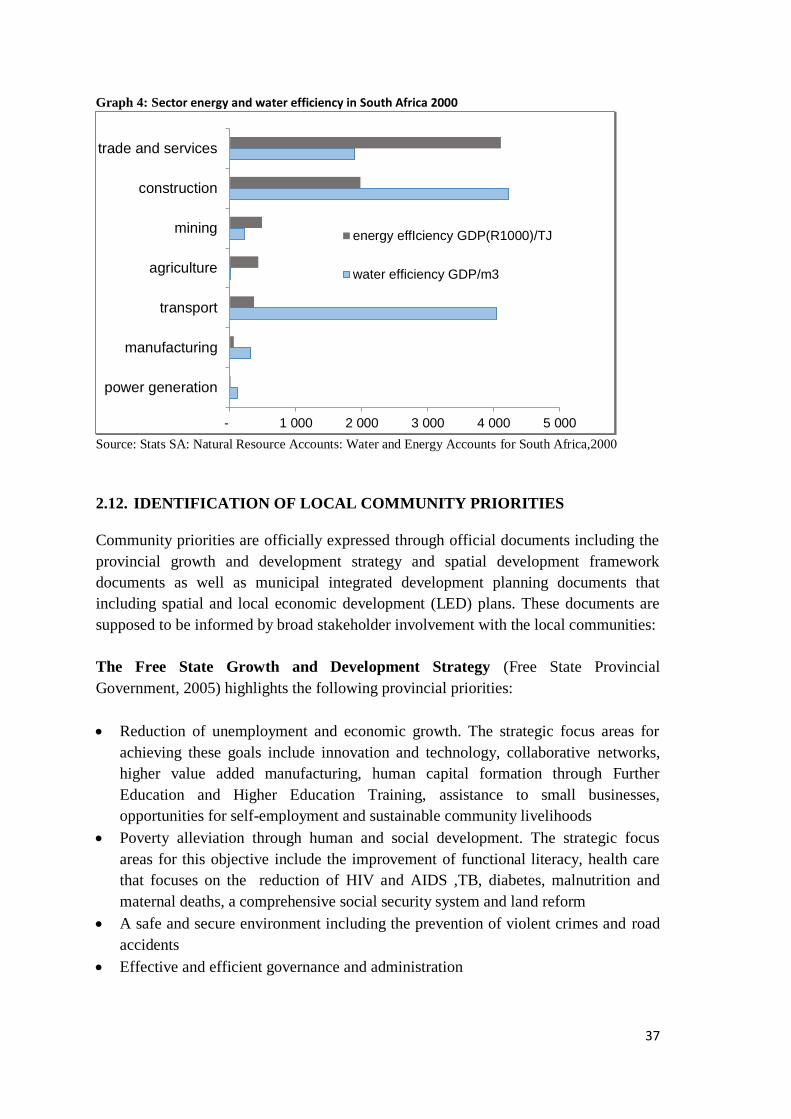
37
Graph 4: Sector energy and water efficiency in South Africa 2000
Source: Stats SA: Natural Resource Accounts: Water and Energy Accounts for South Africa,2000
2.12. IDENTIFICATION OF LOCAL COMMUNITY PRIORITIES
Community priorities are officially expressed through official documents including the
provincial growth and development strategy and spatial development framework
documents as well as municipal integrated development planning documents that
including spatial and local economic development (LED) plans. These documents are
supposed to be informed by broad stakeholder involvement with the local communities:
The Free State Growth and Development Strategy (Free State Provincial
Government, 2005) highlights the following provincial priorities:
Reduction of unemployment and economic growth. The strategic focus areas for
achieving these goals include innovation and technology, collaborative networks,
higher value added manufacturing, human capital formation through Further
Education and Higher Education Training, assistance to small businesses,
opportunities for self-employment and sustainable community livelihoods
Poverty alleviation through human and social development. The strategic focus
areas for this objective include the improvement of functional literacy, health care
that focuses on the reduction of HIV and AIDS ,TB, diabetes, malnutrition and
maternal deaths, a comprehensive social security system and land reform
A safe and secure environment including the prevention of violent crimes and road
accidents
Effective and efficient governance and administration
- 1 000 2 000 3 000 4 000 5 000
power generation
manufacturing
transport
agriculture
mining
construction
trade and services
energy effIciency GDP(R1000)/TJ
water efficiency GDP/m3
38
While the Free State Growth and Development Strategy does not place a large emphasis
on environmental issues, the Provincial Spatial Development Framework (PSDF)
(NDRDLR and Free State Department of COCTA, 2013) makes more explicit reference
to environmental objectives. The following provincial environmental issues and
concerns are listed:
The development of proper municipal waste management plans
Renewable energy is regarded as key focus area for investment
Agricultural land is regarded as a vital resource that should be protected in
accordance with the applicable legislation and policy. However the PSDF also
recognizes the conflict between agriculture and the need for food security versus
biodiversity conservation
There is concern over the environmental and resource degradation caused by the
mining sector in the province. The following issues are highlighted:
o The high utilisation of surface and groundwater
o The impact on water quality in the Vaal River as a result of upstream
activities combined with the impacts of agricultural irrigation return flows
on salinity concentrations
o The insufficient methodologies that are applied for determining the long-
term impacts of mines during the EIA for new mines
o Inadequate strategies to ensure that mining and associated industries result in
a net benefit for both the affected people and the receiving environment
o Inadequate supervision over rehabilitation of closed mine sites
o Insufficient strategies to sustain local communities and economies that have
developed as a result of mining operations after closure of the operations.
The Matjhabeng Integrated Development Plan (Mathjabeng Local Municipality,
2013) highlights the following development priorities:
A diversified economy that is able to meet local needs in terms of job creations,
increased incomes, wealth distribution, and challenges of inequality
A well-governed and pro-poor municipality that maintains quality service delivery
A safe environment in terms of health and crime
Sustainable development and environmental justice
The integration and cohesion across professional circles
The following are some economic key areas that Matjhabeng highlights as potential
strategies to achieve its goals:
Attracting investment to the region as well as focusing on the retention of the
investment already within the area
Developing the infrastructure of the municipality to make it easier for businesses to
operate (i.e. houses, transport, roads, water and electricity etc.).
Creating strong links to the national, regional, and global economy
39
Building capacity and developing human capital including education and skills
development
SMMEs development including facilitation of access to business support services
(management, quality control, financing, technology, operational skills, quality
management, tender skills, legal, IT). The need is highlighted for entrepreneurs to
access opportunities through public and private sector procurement opportunities
SMME development through tourism, especially mine tourism and agricultural
tourism
Typical LED strategies that are in conceptualised for the municipal area include
developing markets for informal traders and the upgrading of taxi ranks, focusing on
emerging farmers and agro-processing opportunities (e.g. construction of a livestock
auction facility and auction centre for local farmers, poultry abattoir , livestock feed
milling), small scale mining projects and gold jewellery production. Some of the
projects are undertaken in collaboration with mining companies such as Harmony as
well as the Free State Goldfields Development Centre.
As mentioned above, environmental issues are also highlighted as one of the goals in
the Integrated Development Plan of Matjhabeng. The environmental focus areas
mainly include:
Sustainable Waste Management
Healthy River eco systems
Biodiversity
Sustainable energy
The reduction of land, air, water noise and light pollution
Outside the formal channels of the IDP and LED, local communities that are
highlighted in the media and via civic organisations such as GUBICO include the
following:
Mining companies should do more to develop job opportunities outside the mining
sector. Focus is also on appropriate opportunities. For example, the Phakisa
Raceway, a world-class racing venue less than 20km out of town was completed in
1999, cost a controversial R97-million, but the venue allegedly remains largely
unutilised for most of the year (Steyn, 2013)
Jobs for local people (Action Voices, 2012)
There are concerns about the large number of abandoned shafts and mining
buildings followed by mine closures. There is a perceived lack of communication
between the mines and the municipality to put these spaces to more constructive use
and secondly to manage the risks of illegal mining (Gubico, 2015)
Illegal mining increased substantially in the area in recent years and while there has
been strict police action against the illegal miners, some community groups such as
Gubico (a community-based body that monitors the impact of mining in the area)
believes that small mining could be development to provide local job opportunities
40
(Ibid.). This view is also expressed in the Integrated Development Plan of
Matjhabeng municipality as mentioned above
There are increased local concerns about the environmental impacts of the mines in
Welkom. The following local environmental concerns were highlighted during a
recent discussion during South Africa Mining Communities and Allies Dialogue
sponsored by International Alliance on Natural Resources in Africa (2013):
o The high level of air pollution in Welkom, high TB infection rates and the
high levels of people with silicosis
o Water pollution that is especially affecting farming sector
o Increased risks related to earthquakes
o The prevalence of high levels of uranium that is toxic to human beings and
animals
o The impact of Acid Mine Drainage
41
3. THE POTENTIAL SOCIO-ECONOMIC IMPACTS OF THE PROJECT
AND PROPOSED MANAGEMENT MEASURES
3.1. POTENTIAL IMPACTS DURING THE CONSTRUCTION PHASE
This section deals with socio-economic impacts that are expected to occur as a result of
construction activities.
The construction activities that will be considered relates to the proposed activities for
which the current environmental authorization applications are made. These activities
are associated with the Proposed Jeanette gold mine and include:
Site establishment of temporary infrastructure/facilities required to support the
construction phase
Clearing of vegetation in accordance with the relevant vegetation management
procedures;
Stripping and stockpiling of soil resources in areas designated for surface
infrastructure in line with a soil conservation procedure to be developed for the
project;
Sourcing of material for construction;
Digging, drilling and/or blasting foundations and trenches;
General construction activities for surface infrastructure;
Shaft dewatering; and
Shaft sinking/widening.
3.1.1. POTENTIAL POPULATION INFLUX
As part of the construction phase the following potential impacts are possible:
Informal Influx of People: Refers to people in the form of job seekers who enter the
area in search of employment. This group of people can consist of locals returning
home and/or people who are new comers to the area who enter the area with the sole
purpose of trying to secure a job. In general it is very difficult to determine what
impact this group will have on the natural growth rate of the area as it is not
possible to accurately predict the number of people (as opposed to the set number of
people who will form part of the construction team).
Formal Influx of People: Refers to those people who will be formally employed by
the project, i.e. the construction team. It is expected that this group of people will
enter and remain in the area for a specific time period (i.e. the duration of the
construction phase), after which they will be demobilised and leave the area.
The proposed Jeanette mine is a mechanised operation and will employ a maximum of
1 113 workers during the operational phase of the mine and 1 400 employees during the
construction phase of the mine, the majority skilled jobs (discussed further in section
3.1.8 below). This is not however how the general public might perceive the proposed
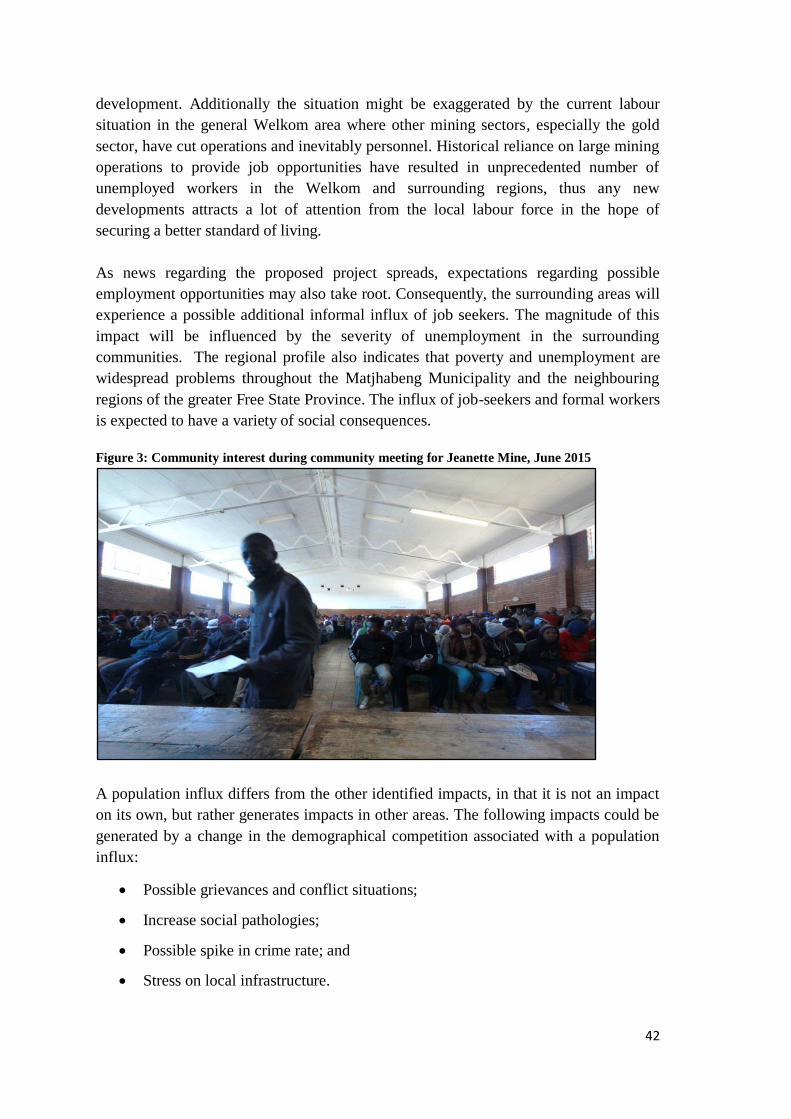
42
development. Additionally the situation might be exaggerated by the current labour
situation in the general Welkom area where other mining sectors, especially the gold
sector, have cut operations and inevitably personnel. Historical reliance on large mining
operations to provide job opportunities have resulted in unprecedented number of
unemployed workers in the Welkom and surrounding regions, thus any new
developments attracts a lot of attention from the local labour force in the hope of
securing a better standard of living.
As news regarding the proposed project spreads, expectations regarding possible
employment opportunities may also take root. Consequently, the surrounding areas will
experience a possible additional informal influx of job seekers. The magnitude of this
impact will be influenced by the severity of unemployment in the surrounding
communities. The regional profile also indicates that poverty and unemployment are
widespread problems throughout the Matjhabeng Municipality and the neighbouring
regions of the greater Free State Province. The influx of job-seekers and formal workers
is expected to have a variety of social consequences.
Figure 3: Community interest during community meeting for Jeanette Mine, June 2015
A population influx differs from the other identified impacts, in that it is not an impact
on its own, but rather generates impacts in other areas. The following impacts could be
generated by a change in the demographical competition associated with a population
influx:
Possible grievances and conflict situations;
Increase social pathologies;
Possible spike in crime rate; and
Stress on local infrastructure.
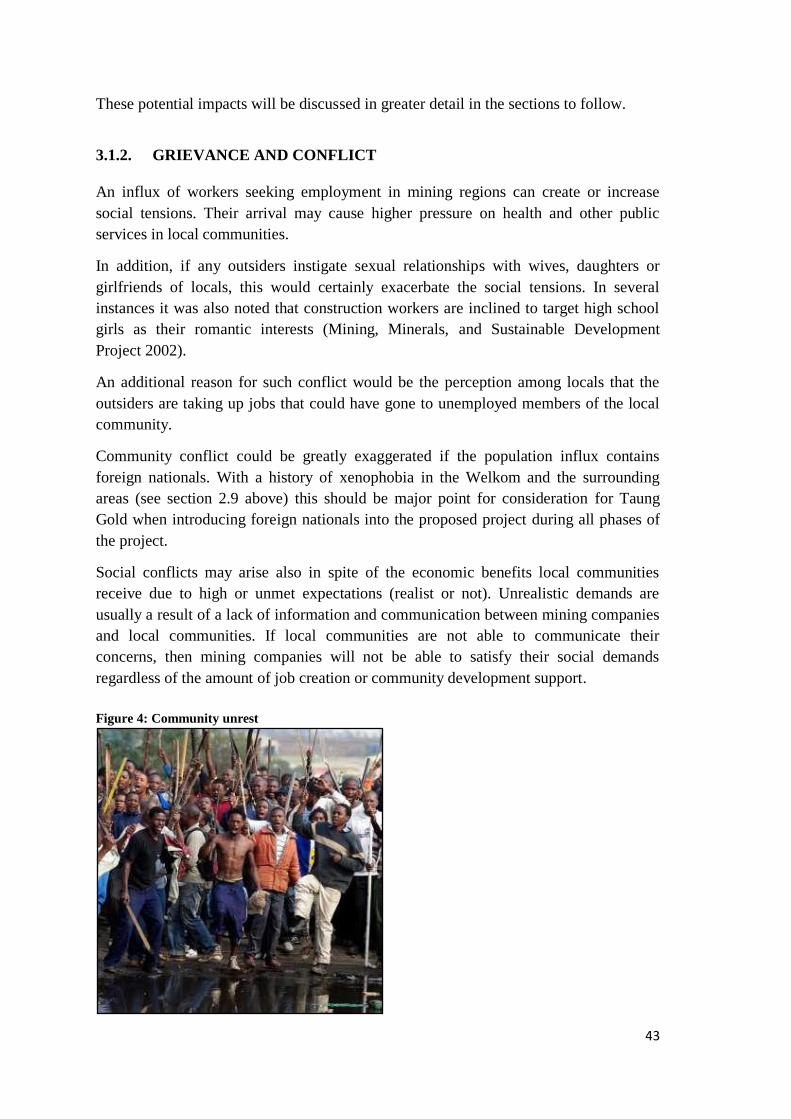
43
These potential impacts will be discussed in greater detail in the sections to follow.
3.1.2. GRIEVANCE AND CONFLICT
An influx of workers seeking employment in mining regions can create or increase
social tensions. Their arrival may cause higher pressure on health and other public
services in local communities.
In addition, if any outsiders instigate sexual relationships with wives, daughters or
girlfriends of locals, this would certainly exacerbate the social tensions. In several
instances it was also noted that construction workers are inclined to target high school
girls as their romantic interests (Mining, Minerals, and Sustainable Development
Project 2002).
An additional reason for such conflict would be the perception among locals that the
outsiders are taking up jobs that could have gone to unemployed members of the local
community.
Community conflict could be greatly exaggerated if the population influx contains
foreign nationals. With a history of xenophobia in the Welkom and the surrounding
areas (see section 2.9 above) this should be major point for consideration for Taung
Gold when introducing foreign nationals into the proposed project during all phases of
the project.
Social conflicts may arise also in spite of the economic benefits local communities
receive due to high or unmet expectations (realist or not). Unrealistic demands are
usually a result of a lack of information and communication between mining companies
and local communities. If local communities are not able to communicate their
concerns, then mining companies will not be able to satisfy their social demands
regardless of the amount of job creation or community development support.
Figure 4: Community unrest
44
Impacts Identified:
Possible conflict between locals and job seekers.
Possible catalyst situation for xenophobia.
Possible conflict between locals and Taung Gold.
Proposed mitigation measures:
Stakeholder meetings should be done beforehand to communicate the exact
implications of the proposed development on job creation.
Problem areas that are brought to the attention of Taung Gold should be
rectified immediately. This should be communicated to the effected parties
along with a plan on how and when the problem will be addressed. The parties
should be given regular feedback on the matter.
The recruitment policy used to employ people on the project must be fair and
transparent (i.e. communicated in clear terms to the local community).
Guidelines for the recruitment policy is discussed in more detail under section
3.18 below)
Ensure that the intention of giving preferential employment to locals is clearly
communicated, so as to discourage in influx of job-seekers from other areas.
Involve local community structures and forums to assist in communicating the
intention of Taung Gold to give preference to local labour, and also to assist by
developing a skills database and residents status for the labour pool in their
community
Optimise the benefits from the mine through enhancement strategies to increase
the impact on local employment, the S&L plan as well as through collaboration
with local economic forums in the area.
Develop a Grievances Register that is easily excisable and regularly monitored
for communities to voice any concerns they might have.
3.1.3. POTENTIAL HEALTH IMPACTS ON THE LOCAL COMMUNITY
The second possible impact arising from an influx of construction workers and job
seekers is that they bring with them changes to local communities, and often have a
negative impact on these communities. Young, poor, rural women who live in close
proximity to construction operations or mine camps are the most vulnerable group of
people as they can be lured into sex work, casual sexual relationships, and other forms
of relationships in the hope of securing financial stability. Compared to the local
communities, construction workers are well paid and often in cash, this makes
socializing and drinking much more prevalent and contributes to more casual sexual
encounters. Furthermore, the transport of building materials via roads is expected to
increase. Truck drivers are often associated with prostitution and this, together with the
45
influx of new work seekers, increases the risk that the prevalence of HIV/AIDS will
further more increase. The same factors apply to TB and other communicable diseases.
During the construction phase there is also a risk associated with hazardous excavations
and infrastructure include all structures into or off which third parties and animals can
fall and be harmed.
Impacts Identified:
Possible increase in sexually transmitted diseases.
Hazardous excavations and infrastructure include all structures into or off which
third parties and animals can fall and be harmed
Proposed mitigation measures:
Implement access control, barriers and warning signs at hazardous areas
In case of injury or death due to hazardous excavations, an emergency response
procedure must be implemented
Develop a Grievances Register that is easily excisable and regularly monitored
for communities to voice any concerns they might have.
3.1.4. POTENTIAL IMPACT ON COMMUNITY SAFETY
The influx of construction workers and job seekers might also be accompanied by an
increase in crime. Even if particular instances of crime are not as a result of the
newcomers, they may still be attributed to them by local communities. There is also the
perception that upgraded roads conditions could lead to easier access to farm properties
and in turn easier access to livestock, equipment and crops that would have been
sheltered by adverse road conditions, thus increasing the likelihood of agricultural
related theft.
In addition to the above mentioned, unauthorised movements of construction workers
and job seekers, during and after working hours could result in trespassing, damage to
local land (e.e. increased risk for fires) and property and create anger amongst local
residents.
Impacts Identified:
Possible increase in crime locally.
Jeanette Gold Mine seen as a possible target for crime.
Possible increase in agricultural related theft
Increase in fire risks
46
Proposed mitigation measures:
The developer should ensure that a contractor management plan is in place and
should monitor adherence to the plan on a regular basis.
Consult with the local police branch to establish standard operating procedures
for the control and/or removal of loiterers.
Liaison structures are to be established with local police to monitor social
changes during the construction and operation phase. Liaison should also be
established with existing crime control organisations
3.1.5. PRESSURE ON LOCAL PUBLIC INFRASTRUCTURE
A population influx will also place more pressure on local infrastructure and services,
such as water, sanitation, electricity, health care and education. The increase in migrants
may result in an increased demand for shelter and possibly exacerbate the existing
housing shortages and poor service delivery (refuse collection, road infrastructure,
sewage and water services, health) especially in Nyakallong and Kutlwanong.
Impact Identified:
Pressure on local infrastructure and services through population influx
Potential increase in informal settlements in the local area
Proposed mitigation measures:
Identify possible institutions that may be at risk of having insufficient
infrastructure before the influx of new members to the community. Working
with local municipalities and other role players in community development, cost
effective ways of upgrading and providing infrastructure.
Work with local authorities and the police to prevent informal settlement
development on private land.
Taung will evaluate the need to assist the community in fund raising to provide
the human resources where necessary.
Develop a Grievances Register that is easily excisable and regularly monitored.
3.1.6. DIRECT IMPACT ON LOCAL INCOME AND EMPLOYMENT
The initial construction phase of the mine is largely related to infrastructure and is
expected to last for six years before operations commence.
As illustrated in graph 5 below, high level estimates of labour requirement (based on
national skills ratios for the construction sector) during the construction phase are an
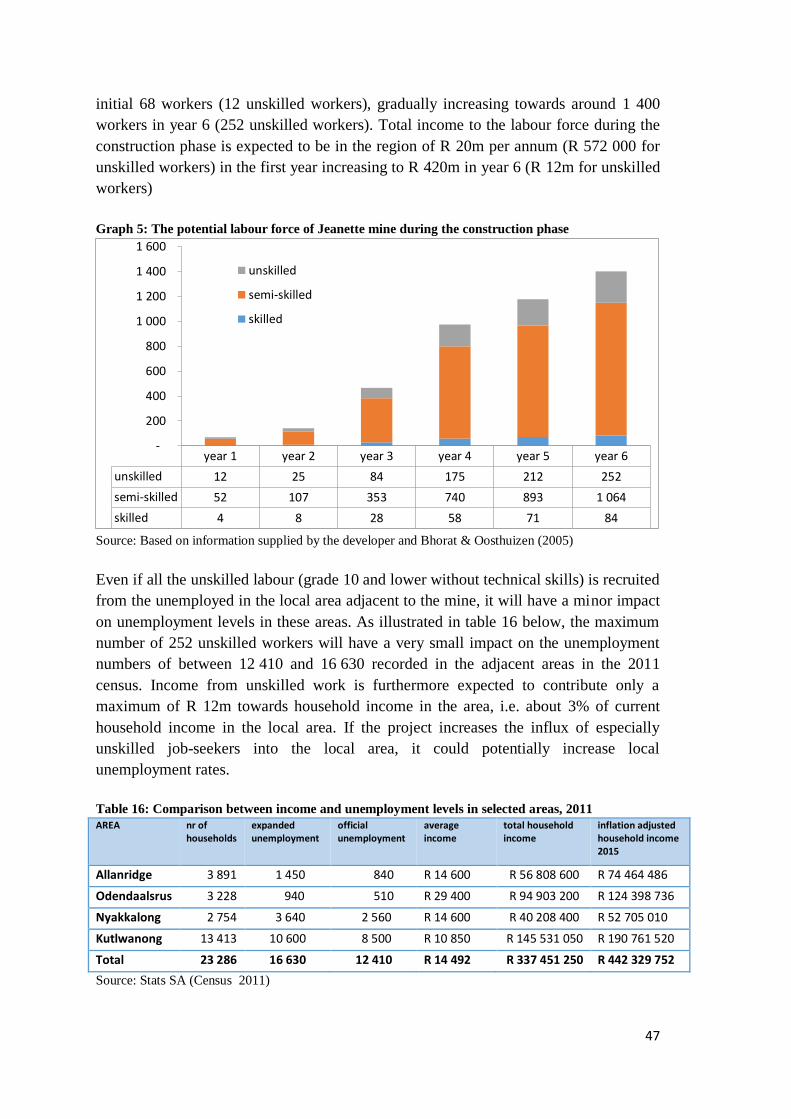
47
initial 68 workers (12 unskilled workers), gradually increasing towards around 1 400
workers in year 6 (252 unskilled workers). Total income to the labour force during the
construction phase is expected to be in the region of R 20m per annum (R 572 000 for
unskilled workers) in the first year increasing to R 420m in year 6 (R 12m for unskilled
workers)
Graph 5: The potential labour force of Jeanette mine during the construction phase
Source: Based on information supplied by the developer and Bhorat & Oosthuizen (2005)
Even if all the unskilled labour (grade 10 and lower without technical skills) is recruited
from the unemployed in the local area adjacent to the mine, it will have a minor impact
on unemployment levels in these areas. As illustrated in table 16 below, the maximum
number of 252 unskilled workers will have a very small impact on the unemployment
numbers of between 12 410 and 16 630 recorded in the adjacent areas in the 2011
census. Income from unskilled work is furthermore expected to contribute only a
maximum of R 12m towards household income in the area, i.e. about 3% of current
household income in the local area. If the project increases the influx of especially
unskilled job-seekers into the local area, it could potentially increase local
unemployment rates.
Table 16: Comparison between income and unemployment levels in selected areas, 2011
AREA nr of households
expanded unemployment
official unemployment
average income
total household income
inflation adjusted household income 2015
Allanridge 3 891 1 450 840 R 14 600 R 56 808 600 R 74 464 486
Odendaalsrus 3 228 940 510 R 29 400 R 94 903 200 R 124 398 736
Nyakkalong 2 754 3 640 2 560 R 14 600 R 40 208 400 R 52 705 010
Kutlwanong 13 413 10 600 8 500 R 10 850 R 145 531 050 R 190 761 520
Total 23 286 16 630 12 410 R 14 492 R 337 451 250 R 442 329 752
Source: Stats SA (Census 2011)
year 1 year 2 year 3 year 4 year 5 year 6
unskilled 12 25 84 175 212 252
semi-skilled 52 107 353 740 893 1 064
skilled 4 8 28 58 71 84
-
200
400
600
800
1 000
1 200
1 400
1 600
unskilled
semi-skilled
skilled
48
The 2011 census figures show an adequate number of semi-skilled labour (grades 10 to
12 with technical training including artisans, technicians etc.) and skilled labour (higher
than grade 12) available in the local area relative to the labour force requirement of the
mine during the construction phase. Whether recruitment of semi-skilled and skilled
labour from the local areas would have a net positive employment impact on the local
areas will largely depend on the unemployment level and employability of the local
semi-skilled and skilled labour force. If local semi-skilled and skilled labour who are
already employed are recruited, it would have no net impact on employment and
income levels in the local areas adjacent to the mine. If new positions for semi-skilled
and skilled labour are created for the local workforce during the construction phase it
could imply a significant inflow of income to the local area. Total income from semi-
skilled and skilled employment from construction activities represents between 4%
(year 1) to 70% (year 6) of current household income levels.
Impacts Identified:
Depending on the levels of influx of unskilled workers into the local area, a
marginal positive impact is foreseen on local unemployment and income levels
due to job opportunities for unskilled workers
Depending on the current unemployment rate of semi-skilled and skilled
workers in the local area as well as the relevant skills and employability of
unemployed semi-skilled and skilled local labour, there is potential for a
marginal increase in the employment of the local semi-skilled and skilled
workforce.
If additional jobs are created for the local semi-skilled and skilled labour force,
the income impact on the local area could be substantial
Proposed enhancement measures:
To deter influx of unskilled workers into the project area, a clear regional
communication strategy well in advance of the project inception is imperative.
The communication strategy should focus identifying the most effective
communication channels on a regional level (e.g. Free State Goldfields Chamber
of business, local economic development forums, newspapers, radio messages).
The basic information that needs to be conveyed include the message that:
o During the construction of the mine offers minimal opportunities for
unskilled workers
o Unskilled labour will be sourced from the local communities adjacent to
the mine where possible.
To manage the expectations of the large local number of unemployed people,
community forums and the recommended Multidirectional Communication
Platform of the S&L Plan for the mine should be used to convey figures related
49
to the limited number of job opportunities for unskilled people during the
construction phase
An employment recruitment strategy for the operator as well as sub-contractors
should be developed during the construction phase to optimize the local
economic impact of the project during its construction phase. This should
include:
o Recruitment of unskilled labour from the local area from the ranks of the
unemployed where possible
o Recruit unskilled labour proportionally from the local areas according to
objective criteria (e.g. the share of each community in total local
unemployment)
o The ranking of priority recruitment of semi-skilled and skilled workers.
According to priority this would be:
Suitably qualified people in Allanridge, Odendaalrus,
Nyakkalong or Kutlwanong who are currently not employed
Suitably qualified people in the larger Mathjibeng area who are
currently not employed
Suitably qualified people from outside Mathjibeng who are
willing to reside in local areas adjacent to the mine
Suitably qualified people within the local communities who
already have employed positions
Suitably qualified people from outside Mathjibeng who will not
reside in any of the local communities adjacent to the mine
Involve local community structures and forums to assist in communicating the
intention to give preference to local labour, and also to assist by developing a
skills database and residents status for the labour pool in their community.
Verify through community networks that unskilled labour to be recruited
inhabited the local area for a specified number of years
Incentives could be provided for semi-skilled and skilled labour to locate in
local areas close to the mine to retain purchasing power within the local areas
close to the mine
Distribute a detailed list of potential positions and requirements related to these
positions available during the construction phase within the local communities
well in advance of the project in order to assist the local community to make
50
preparations (and possibly obtain relevant training) for job applications during
the construction phase
As per the current S&L Plan for the mine (Career build programme), prepare the
youth in the areas adjacent to the mine with the opportunity to take up semi-
skilled and skilled positions in mining construction activities
As per the current S&L Plan for the mine, up-skill unskilled workers during the
construction phase to enable them to find a similar job elsewhere after
construction or that would enable them to be employed in the operational phase
of the mine
Communicate the recruitment strategy of the mine during community meetings
Facilitate community workshops to counter intolerance towards labour recruited
outside the local area
As per the current S&L Plan for the mine, facilitate the roll-out of relevant
training programmes to enable the community to obtain the relevant skills to fill
positions during the construction phase. There are numerous NGOs involved in
training in Mathjibeng. The Free State Chamber of Business and the Black
Management Forum could potentially assist in the facilitation of roll-out of
training programmes
Compile a list of small contractors in the local area and provide them with
information about the tender procedures and other requirements for procurement
of services for construction services at the mine well in advance of the
commencement of construction activities
As per the current S&L Plan for the mine facilitate the roll-out of business
development services to local contractors through the aid of local business
chambers, the LED division of the local and district municipalities and SEDA
3.1.7. POTENTIAL NEGATIVE IMPACTS ON OTHER LOCAL SECTORS
The mine could recruit low skilled workers who already have some entry level skills
obtained from for instance in the agricultural sector (e.g. tractor drivers). This could
impose costs on the sector to recruit and train once again from the unskilled labour
force. Furthermore if the mining sector ‘draws down’ labour from the agriculture sector
there is a chance that the position within the agricultural sector might not be filled again
meaning that employment is only shifted from agriculture to mining with no additional
job created.
Impacts Identified:
51
Diversion/labour ‘draw down; of unskilled and semi-skilled labour of the
adjacent agricultural sector could lead to increased training costs for local
farmers or labour-shedding in the agricultural sector
Proposed mitigation measures:
Avoid recruiting unskilled labour that is already in employment, especially
labour in the adjacent agricultural sector
Minimise recruiting semi-skilled and skilled labour for the adjacent agricultural
sector
Taung will investigate the need to compensate farmers for re-training costs if
labour ‘draw down’ occurs
Meet on a regular basis with adjacent farmers to monitor impact on the local
labour force
3.1.8. INDIRECT AND INDUCED IMPACTS ON INCOME AND
EMPLOYMENT
Apart from direct employment by the operator and its main contractors during the
construction phase of the mine, spending on local suppliers also has the potential to
create local job opportunities. In the initial phases of construction about 10% is
expected to be sourced from the Matjhabeng area, scaling up towards 20% at later
phases. The increased spending on construction supplies within the local area could
potentially lead to between 20 (year 1) to 1 200 (year 6) additional jobs in the local
economy as illustrated in graph 5 below. This could increase local income within
between R10m (year 1) and R 663m (year 6) with a small fraction directed towards
income from unskilled labour , R 300 000 (year 1) and R 16m (year 6). While unskilled
labour income represents only 3% of current total household income (R 440m) in the
adjacent areas to the mine, income from semi-skilled and skilled labour represents a
significant portion of household income.
Graph 6: Potential local employment from local supply-links of construction activities
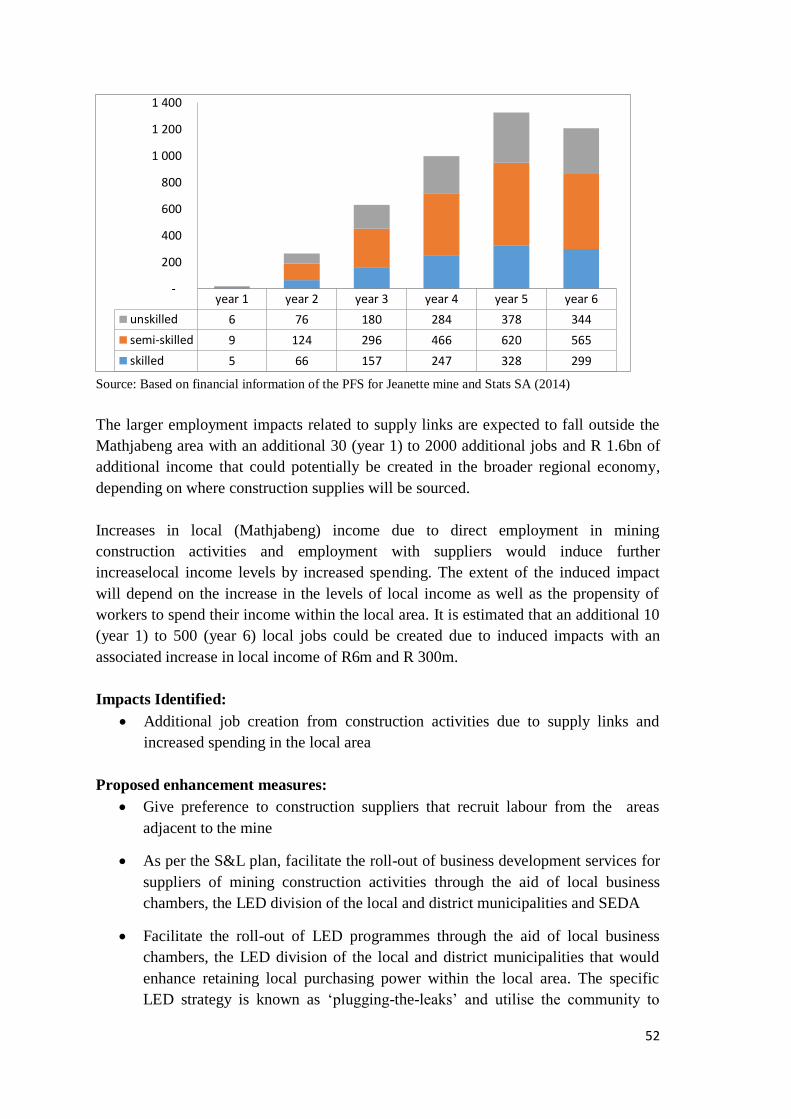
52
Source: Based on financial information of the PFS for Jeanette mine and Stats SA (2014)
The larger employment impacts related to supply links are expected to fall outside the
Mathjabeng area with an additional 30 (year 1) to 2000 additional jobs and R 1.6bn of
additional income that could potentially be created in the broader regional economy,
depending on where construction supplies will be sourced.
Increases in local (Mathjabeng) income due to direct employment in mining
construction activities and employment with suppliers would induce further
increaselocal income levels by increased spending. The extent of the induced impact
will depend on the increase in the levels of local income as well as the propensity of
workers to spend their income within the local area. It is estimated that an additional 10
(year 1) to 500 (year 6) local jobs could be created due to induced impacts with an
associated increase in local income of R6m and R 300m.
Impacts Identified:
Additional job creation from construction activities due to supply links and
increased spending in the local area
Proposed enhancement measures:
Give preference to construction suppliers that recruit labour from the areas
adjacent to the mine
As per the S&L plan, facilitate the roll-out of business development services for
suppliers of mining construction activities through the aid of local business
chambers, the LED division of the local and district municipalities and SEDA
Facilitate the roll-out of LED programmes through the aid of local business
chambers, the LED division of the local and district municipalities that would
enhance retaining local purchasing power within the local area. The specific
LED strategy is known as ‘plugging-the-leaks’ and utilise the community to
year 1 year 2 year 3 year 4 year 5 year 6
unskilled 6 76 180 284 378 344
semi-skilled 9 124 296 466 620 565
skilled 5 66 157 247 328 299
-
200
400
600
800
1 000
1 200
1 400

53
identify local business opportunities within their area based on local spending
patterns
3.1.9. IMPACT ON PHYSICAL ASSETS IN THE LOCAL AREA
Impacts Identified:
No loss of physical structures /disinvestment is foreseen in the area that needs to
be cleared for the surface infrastructure of the mine.
Proposed mitigation measures:
None
54
3.2. POTENTIAL IMPACTS DURING THE OPERATIONAL PHASE
This section deals with socio-economic impacts that are expected to occur during the
operational phase. The operation of the proposed Jeanette Gold Mine is likely to give
rise to numerous socio-economic impacts. The following was assessed to determine
possible impacts:
The Mining Method; and
Surface infrastructure including:
o Vertical shafts and headgear (main shaft, ventilation shaft and fans, and
rock shaft);
o Waste rock dump (WRD);
o Tailings storage facility (TSF);
o ROM stockpile;
o Refrigeration plant;
o Mineral processing plant;
o Access and haul roads;
o Sewerage and waste water treatment plant;
o Generators;
o Proposed consumer sub-stations and generators;
o Change houses;
o Fire detection and fighting facilities;
o Water storage facilities and surface water control measures;
o Lighting and communication infrastructure;
o Fuel storage facilities;
o Waste handling station;
o First aid facility;
o Mine offices;
o Control rooms and mass meeting hall/canteen;
o Bus/taxi rank;
o Parking areas;
o Security access and checkpoints;
o Engineering workshops and stores;
o Winder houses;
o Conveyors from shaft to plant or WRD;
o Possible railway siding;
o Proto room;
o Timber bay (including lay down areas and stock yard); and
o Lamp rooms; and
o Mineral processing plant
55
3.2.1. PERCEPTIONS OF WATER CONTAMINATION AND AVAILABILITY
Perceptions of water quality result from a complex interaction of diverse factors
including water flavour, risk perception, attitudes towards water chemicals, contextual
cues provided by the supply system, familiarity with specific water properties, trust in
suppliers, past problems attributed to water quality and information provided by the
mass media and interpersonal sources.
The perception of water quality and quantity for agricultural use is also of concern
especially in areas directly neighbouring the proposed project site, with comments and
concerns lodged by the community.
Impacts Identified
Negative perceptions by the community of the quality and quantity of their
water for consumption being affected by mining construction and operations.
Negative perceptions regarding the quality and quantity of water being released
back into the environment effecting sensitive ecosystems.
Mitigation measures
Community meetings should be held to educate the local people in the area of
what the mines impact will be. It has shown before that if persons know what to
expect the impact comes as much less of a shock. These meetings should take
place before construction starts.
3.2.2. POTENTIAL INCREASE IN CRIME
As is the case during the construction phase, the movement of job seekers and the
greater access via upgraded roads could lead to increase in crime, trespassing, damage
to local land and property in the areas adjacent to the mine.
Impacts Identified:
Possible increase in crime locally.
Jeanette Gold Mine seen as a possible target for crime.
Possible increase in agricultural related theft.
Proposed mitigation measures:
Mine workers should be clearly identifiable by wearing proper uniforms and
identification tags displaying the logo of the company.
The operator should establish clear rules and regulations for access to the mine
site and offices to control loitering. Consult with the local police branch to
establish standard operating procedures for the control and/or removal of
loiterers.
56
Liaison structures are to be established with local police to monitor social
changes during the construction and operation phase. Liaison should also be
established with existing crime control organisations.
Develop a single transport system for construction workers to avoid numerous
minibuses entering the area
3.2.3. GRIEVANCE AND CONFLICT
As is the case in the construction phase, the influx of workers seeking employment in
mining regions can create or increase social tensions. Community conflict could be
greatly exaggerated if the population influx contains foreign nationals.
Social conflicts may arise also in spite of the economic benefits local communities
receive due to high or unmet expectations (realist or not). Unrealistic demands are
usually a result of a lack of information and communication between mining companies
and local communities. If local communities are not able to communicate their
concerns, then mining companies will not be able to mitigate unrealistic expectations
regardless of the amount of job creation or community development support.
Impacts Identified:
Possible conflict between locals and job seekers.
Possible catalyst situation for xenophobia.
Possible conflict between locals and Taung Gold.
Proposed mitigation measures:
Stakeholder meetings should be done beforehand to communicate the exact
implications of the proposed development on job creation.
Problem areas that are brought under the attention Taung Gold should be
rectified immediately. This should be communicated to the effected parties
along with a plan on how and when the problem will be addressed. The parties
should be given regular feedback on the matter.
The recruitment policy used to employ people on the project must be fair and
transparent.
The adoption of a ‘locals first’ policy (discussed in more detail below), which
gives employment preference to people that have been residing in the local areas
adjacent to the mine for more than a year, could act as a deterrent for accelerated
in-migration of work seekers and xenophobia
Facilitate community workshops to counter intolerance towards people
migrating into the local area
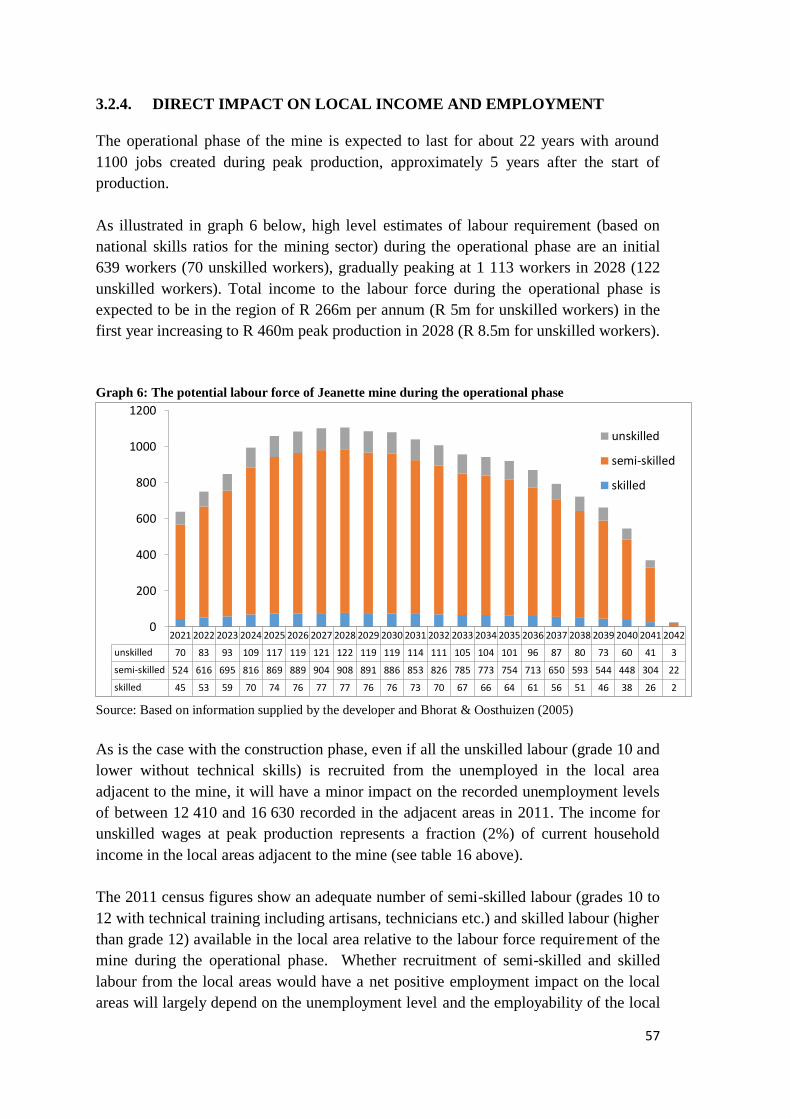
57
3.2.4. DIRECT IMPACT ON LOCAL INCOME AND EMPLOYMENT
The operational phase of the mine is expected to last for about 22 years with around
1100 jobs created during peak production, approximately 5 years after the start of
production.
As illustrated in graph 6 below, high level estimates of labour requirement (based on
national skills ratios for the mining sector) during the operational phase are an initial
639 workers (70 unskilled workers), gradually peaking at 1 113 workers in 2028 (122
unskilled workers). Total income to the labour force during the operational phase is
expected to be in the region of R 266m per annum (R 5m for unskilled workers) in the
first year increasing to R 460m peak production in 2028 (R 8.5m for unskilled workers).
Graph 6: The potential labour force of Jeanette mine during the operational phase
Source: Based on information supplied by the developer and Bhorat & Oosthuizen (2005)
As is the case with the construction phase, even if all the unskilled labour (grade 10 and
lower without technical skills) is recruited from the unemployed in the local area
adjacent to the mine, it will have a minor impact on the recorded unemployment levels
of between 12 410 and 16 630 recorded in the adjacent areas in 2011. The income for
unskilled wages at peak production represents a fraction (2%) of current household
income in the local areas adjacent to the mine (see table 16 above).
The 2011 census figures show an adequate number of semi-skilled labour (grades 10 to
12 with technical training including artisans, technicians etc.) and skilled labour (higher
than grade 12) available in the local area relative to the labour force requirement of the
mine during the operational phase. Whether recruitment of semi-skilled and skilled
labour from the local areas would have a net positive employment impact on the local
areas will largely depend on the unemployment level and the employability of the local
2021 2022 2023 2024 2025 2026 2027 2028 2029 2030 2031 2032 2033 2034 2035 2036 2037 2038 2039 2040 2041 2042
unskilled 70 83 93 109 117 119 121 122 119 119 114 111 105 104 101 96 87 80 73 60 41 3
semi-skilled 524 616 695 816 869 889 904 908 891 886 853 826 785 773 754 713 650 593 544 448 304 22
skilled 45 53 59 70 74 76 77 77 76 76 73 70 67 66 64 61 56 51 46 38 26 2
0
200
400
600
800
1000
1200
unskilled
semi-skilled
skilled
58
semi-skilled and skilled labour force. If local semi-skilled and skilled labour who are
already employed are recruited, it would have no net impact on employment and
income levels in the local areas adjacent to the mine. If new positions for semi-skilled
and skilled labour are created for the local workforce during the operational phase it
could imply a significant inflow of income to the local area. Total income from semi-
skilled and skilled employment from operational activities represents between 58%
(year 1) to 100% (peak production) of current household income generated in the local
areas adjacent to the mine.
Impacts Identified:
Depending on the levels of influx of unskilled workers into the local area, a
marginal positive impact is foreseen on local unemployment and income levels
due to job opportunities for unskilled workers
Depending on the current unemployment rate of semi-skilled and skilled
workers in the local area as well as the relevant skills and employability of the
unemployed semi-skilled and skilled local labour, there is potential for a relative
small increase in the employment of the local semi-skilled and skilled
workforce.
If additional jobs are created for the local semi-skilled and skilled labour force,
the income impact on the local area could be substantial
Proposed enhancement measures:
To deter influx of unskilled workers into the project area, a clear regional
communication strategy well in advance of the project inception is imperative.
The communication strategy should focus identifying the most effective
communication channels on a regional level (e.g. Free State Goldfields Chamber
of business, local economic development forums, newspapers, radio messages).
The basic information that needs to be conveyed include the message that:
o During the operational phase, the mine offers minimal opportunities for
unskilled workers
o Unskilled labour will be sourced from the local communities adjacent to
the mine as far as possible.
To manage the expectations of the large local number of unemployed people,
community forums and the recommended Multidirectional Communication
Platform of the S&L Plan for the mine should be used to convey figures related
to the limited number of job opportunities for unskilled people during the
operational phase
59
An employment recruitment strategy for the operator should be developed
during the operational phase to optimize the local economic impact of the
project during its construction phase. This should include:
o Recruitment of unskilled labour from the local area from the ranks of the
unemployed as far as possible
o Recruit unskilled labour proportionally from the local areas according to
objective criteria (e.g. the share of each community in total local
unemployment)
o The ranking of priority recruitment of semi-skilled and skilled workers.
According to priority this would be:
Suitably qualified people in Allanridge, Odendaalrus,
Nyakkalong or Kutlwanong who are currently not employed
Suitably qualified people in the larger Mathjibeng area who are
currently not employed
Suitably qualified people from outside Mathjibeng who are
willing to reside in local areas adjacent to the mine
Suitably qualified people within the local communities who
already have employed positions
Suitably qualified people from outside Mathjibeng who will not
reside in any of the local communities adjacent to the mine
Involve local community structures and forums to assist in communicating the
intention of relevant companies to give preference to local labour, and also to
assist by developing a skills database and residents status for the labour pool in
their community
Verify through community networks that unskilled labour to be recruited
inhabited the local area for a specified number of years
Incentives could be provided for semi-skilled and skilled labour to locate in
local areas close to the mine to retain purchasing power within the local areas
close to the mine
Distribute a detailed list of potential positions and requirements related to these
positions available during the operational phase within the local communities
well in advance of the project in order to assist the local community to make
preparations (and possibly obtain relevant training) for job applications during
the operational phase
As per the current S&L Plan for the mine (Career build programme), prepare the
youth in the areas adjacent to the mine with the opportunity to take up semi-
skilled and skilled positions in mining operational activities
60
As per the current S&L Plan for the mine, up-skill unskilled workers during the
operational phase
Communicate the recruitment strategy of the mine during community meetings
Facilitate community workshops to counter intolerance towards labour recruited
outside the local area
As per the current S&L Plan for the mine, facilitate the roll-out of relevant
training programmes to enable the community to obtain the relevant skills to fill
positions during the operational. There are numerous NGOs involved in training
in Mathjibeng. The Free State Chamber of Business and the Black Management
Forum could potentially assist in the facilitation of roll-out of training
programmes
3.2.5. POTENTIAL NEGATIVE IMPACTS ON OTHER LOCAL SECTORS
The mine could recruit low skilled workers who already have some entry level skills
obtained from for instance in the agricultural sector (e.g. tractor drivers). This could
impose costs on the sector to recruit and train once again from the unskilled labour
force. Furthermore if the mining sector ‘draws down’ labour from the agriculture sector
there is a chance that the position within the agricultural sector might not be filled again
meaning that employment is only shifted from agriculture to mining with no additional
job created.
Impacts identified:
Diversion/labour ‘draw down; of unskilled and semi-skilled labour of the
adjacent agricultural sector could lead to increased training costs for local
farmers or labour-shedding in the agricultural sector
Proposed mitigation measures:
Avoid recruiting unskilled labour that is already in employment, especially
labour in the adjacent agricultural sector
Minimise recruiting semi-skilled and skilled labour for the adjacent agricultural
sector
Compensate farmers for re-training costs if labour ‘draw down’ occurs
Meet on a regular basis with adjacent farmers to monitor impact on the local
labour force
3.2.6. INDIRECT AND INDUCED IMPACT ON INCOME AND
EMPLOYMENT
Apart from direct employment during the operational of the mine, spending on local
suppliers also has the potential to create local job opportunities. If an estimated 20%
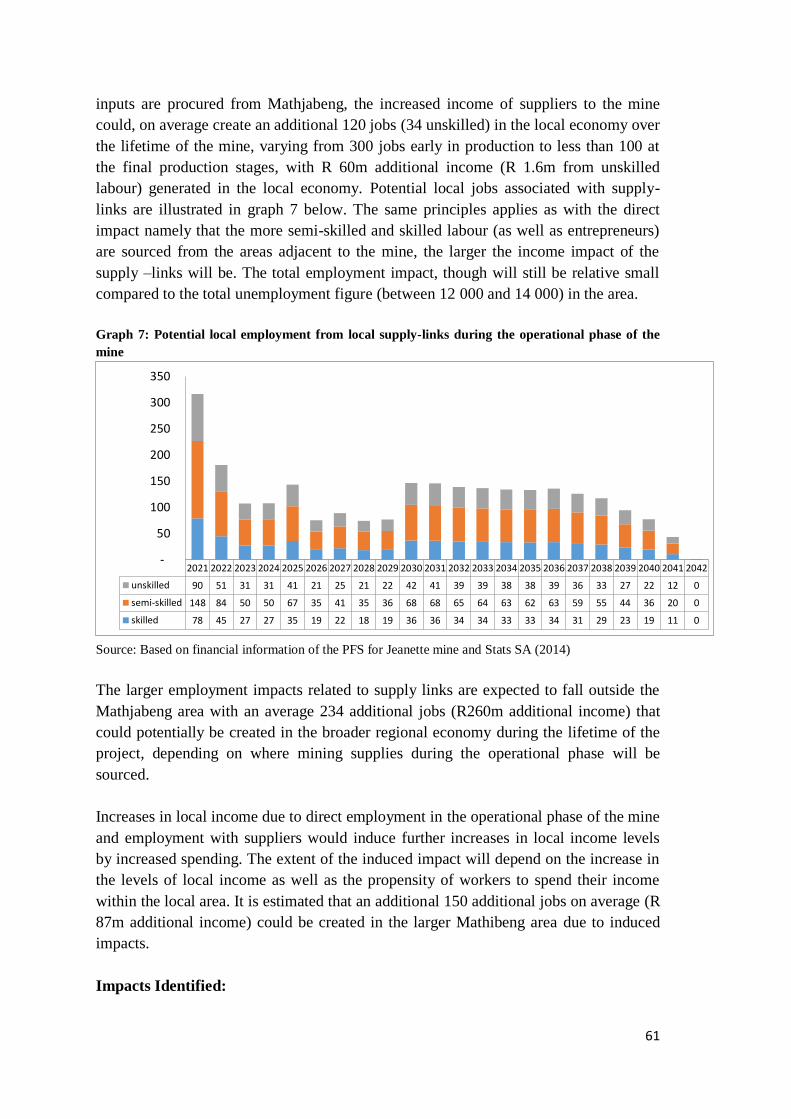
61
inputs are procured from Mathjabeng, the increased income of suppliers to the mine
could, on average create an additional 120 jobs (34 unskilled) in the local economy over
the lifetime of the mine, varying from 300 jobs early in production to less than 100 at
the final production stages, with R 60m additional income (R 1.6m from unskilled
labour) generated in the local economy. Potential local jobs associated with supply-
links are illustrated in graph 7 below. The same principles applies as with the direct
impact namely that the more semi-skilled and skilled labour (as well as entrepreneurs)
are sourced from the areas adjacent to the mine, the larger the income impact of the
supply –links will be. The total employment impact, though will still be relative small
compared to the total unemployment figure (between 12 000 and 14 000) in the area.
Graph 7: Potential local employment from local supply-links during the operational phase of the
mine
Source: Based on financial information of the PFS for Jeanette mine and Stats SA (2014)
The larger employment impacts related to supply links are expected to fall outside the
Mathjabeng area with an average 234 additional jobs (R260m additional income) that
could potentially be created in the broader regional economy during the lifetime of the
project, depending on where mining supplies during the operational phase will be
sourced.
Increases in local income due to direct employment in the operational phase of the mine
and employment with suppliers would induce further increases in local income levels
by increased spending. The extent of the induced impact will depend on the increase in
the levels of local income as well as the propensity of workers to spend their income
within the local area. It is estimated that an additional 150 additional jobs on average (R
87m additional income) could be created in the larger Mathibeng area due to induced
impacts.
Impacts Identified:
2021 2022 2023 2024 2025 2026 2027 2028 2029 2030 2031 2032 2033 2034 2035 2036 2037 2038 2039 2040 2041 2042
unskilled 90 51 31 31 41 21 25 21 22 42 41 39 39 38 38 39 36 33 27 22 12 0
semi-skilled 148 84 50 50 67 35 41 35 36 68 68 65 64 63 62 63 59 55 44 36 20 0
skilled 78 45 27 27 35 19 22 18 19 36 36 34 34 33 33 34 31 29 23 19 11 0
-
50
100
150
200
250
300
350
62
Additional job creation from operational activities due to supply links and
increased spending in the local area
Proposed enhancement measures:
Give preference to suppliers that recruit labour from the areas adjacent to the
mine
As per the S&L Plan, develop a database of potential non-core mining activities
(e.g. catering, accommodation etc.) that could be procured from suppliers in the
areas adjacent to the mine
As per the S&L Plan, facilitate the roll-out of business development services for
suppliers of mining construction activities through the aid of local business
chambers, the LED division of the local and district municipalities and SEDA
Facilitate the roll-out of LED programmes through the aid of local business
chambers, the LED division of the local and district municipalities that would
enhance retaining local purchasing power within the local area. The specific
LED strategy is known as ‘plugging-the-leaks’ and utilise the community to
identify local business opportunities within their area based on local spending
patterns
3.2.7. INCREASE IN LABOUR UNREST
As was mentioned above, the events that occurred in Lonmin’s Marikana mine
(Rustenburg) in 2012 are considered a reflection of the growing tensions within the
mining sector. The rivalry between the well-established government-affiliated union the
National Union of Mineworkers (NUM) and AMCU result in each group trying to get
the best and most competitive wage deals for its members. Over the past few years,
unprotected strike action in many cases has escalated into an uncontrolled, violent and
unlawful landscape. Analysts predict that the platinum and gold sectors will be exposed
to the risk of high levels of labour unrest over the next few years (Mavuso, 2013).
Impacts Identified
Possible labour unrest.
Mitigation measures
Stakeholder meetings should be held on a regular basis to help identify the
possible grievances and mitigation measures.
Ensure that the Jeanette Gold Mine’s Social and Labour Plan is updated
regularly and accommodate employee growth and advancement strategies
Ensure that the basic living conditions (housing and nutrition) of employees are
being addressed according to the current S&L Plan
63
Facilitate the formation of stakeholder forum (including other gold mining
companies in the area, trade unions and local government) to monitor the risk
and identify potential mitigation measures for cases of violent labour unrest in
the larger Mathjabeng area
3.2.8. PRESSURE ON LOCAL PUBLIC INFRASTRUCTURE
In addition to population influx, the mine itself will place pressure on local
infrastructure such as water supply, waste management, roads and energy infrastructure.
Due to capacity constraints at the local sewage treatment plant, the mine will implement
its own sewage management system. The upgrading of access roads to the mine will
also be funded by the project. Outside the mining area provincial funds will need to be
allocated for the maintenance of roads. There already exist financial constraints and
serious backlogs on the maintenance of road infrastructure in the Mathjabeng area.
It could be argued that mining companies as tax payers are entitled to their fair share of
public services, in practice however the major part of the mining sector tax contribution
flows to central government from where it is distributed according to national priorities
and hence does not necessarily flow back to the local area where their impact on public
infrastructure is experienced.
Impacts Identified:
Diversion of scarce public funds for the infrastructure needs of the mine, mainly
energy, water supply and the maintenance of roads used by the mine that falls
outside the mining area
Proposed mitigation measures:
Develop an action plan for the reduction and optimisation of natural resources
(water, energy use, waste management) by the mine. Disclose and discuss the
plan with potentially-affected parties
3.2.9. POTENTIAL IMPACT ON PROPERTY VALUES
Based on interviews with property developers in the area, the mine is not expected to
have a significant impact on the property values of adjacent farms. The perceived water
impacts of mining on water quality and availability are already discounted in current
farm values in the area due the long-term presence of mining activities in the area.
The mine, on the other hand, could have a slight positive impact on middle and higher
income house properties in the local areas close to the mine as well as selected areas in
Welkom, depending on the number of semi-skilled and skilled labour that will be
recruited from areas outside Mathjabeng.
64
Impacts Identified
A potential increase in middle and higher income residential properties in the
local areas close to the mine as well as selected areas in Welkom with a positive
wealth impact on local property owners in these areas
Speculation based on unrealistic expectations of the employment impacts of the
mine could result in an over-valuation of middle- high income residential
properties in the local area
Enhancement measures
Keep local property agents informed through the EIA and related stakeholder
processes of the potential impacts of the mine in terms of the potential for non-local
semi-skilled and skilled labour that could be recruited by the mine
3.2.10. POTENTIAL IMPACT ON POVERTY
The census 2011 figure recorded close to 11 000 below the income poverty line in the
areas adjacent to the mine, the majority (67%) resided in the the Kutlwanong area,
followed by Nyakkalong (15%), Allanridge (10%) and Odendaalsrus (5%).
The mine could potentially have a positive impact on poverty rates in the local areas
through three main channels:
Job creation for low income groups: Being a highly mechanised project the project
will utilise a relatively low number of unskilled workers. During the operational phase
of the mine the total number of unskilled jobs could be on average 93 per annum from
mining operations, 34 from supply-links and 44 from induced impacts. The mine is
expected to create a limited number of unskilled jobs. Even if all the unskilled labour is
recruited from the unemployed in the local area, it will still have a minor impact on
local poverty levels.
Increase in other social funds: The project will set aside social development funds
according to the specifications of the Social and Labour Plan. Apart from workforce
development programmes, the basic approach of the S&L plan towards addressing
poverty in the local area is to provide business training and provide training support for
household food security programme to empower the local community to help
themselves. The mine alone cannot be held responsible for addressing the vast poverty
problem in the adjacent areas to the mine, yet could face unrealistic expectations in
terms of its impact on local poverty. There is a risk that unfilled expectations could
result in civil unrest.
Increase in public funds due to company taxes and royalties as well as increased
taxation from employment: Due to net positive spin-offs on employment and income
65
levels, it is expected that tax revenue to provincial and central government will
increase. The main part of the tax income will be allocated to central government with
no direct impact on local poverty levels.
Impacts Identified
A relatively small impact on local poverty levels is anticipated through the
creation of unskilled jobs. The impact will be enhanced through the poverty
programme of the current S&L plan of the mine. There is a still a risk that
unfilled expectations could result in civil unrest
Enhancement measures
Maximise employment impacts on the local economy through a detailed
recruitment plan as discussed under the enhancement measures for direct
employment, supply-links and induced impacts discussed above.
Up-skill unskilled labour and fill vacant positions once again with unskilled
from the ranks of the unemployed
Make provisions for community investment in the Social and Labour Plan of the
proposed Jeanette Gold Mine expansion and revisit the provisions on a yearly
basis to ensure that they are still relevant and maximise the reach of the
proposed investment as far as reasonable
Effectively communicate to the community that the mine alone is not
responsible for eradicating local poverty
Facilitation of local economic development forums and business organisations
in the local area that draw together the regional business councils, local,
government, other private companies including mining companies in the local
area, NGOs and local community members (discussed in more detail under
section 6 below)
3.2.11. POTENTIAL IMPACT ON INCOME EQUALITY IN THE LOCAL
AREA
Impacts Identified:
The project could improve the income distribution levels in the local area
depending on the extent to which the project up-skill the local workforce and
recruit workers among the unemployed
Enhancement measures:
Up-skill the locally recruited workforce
Recruit workers among the unemployed
66
3.2.12. IMPACT ON THE DIVERSITY OF THE LOCAL ECONOMY
Impacts Identified:
Another mine will increase the concentration of economic activities in the
mining sector and could restrict the local adjustment process towards a post-
mining economy.
Mitigation measures:
As per the current S&L Plan for the mine, focus on the support of non-mining
related activities in community development programmes and business support
programmes
Focus the local procurement programme on non-core mining inputs (e.g.
catering, accommodation)
3.2.13. IMPACT ON NATURAL RESOURCE INTENSITY OF THE LOCAL
ECONOMY
Impact Identified:
The energy and water use of gold mines are high compared to their economic
output. The mine will intensify water and energy consumption in the local area
Mitigation measures:
Develop an action plan for the reduction and optimisation of natural resources
(water, energy use, waste management) by the mine
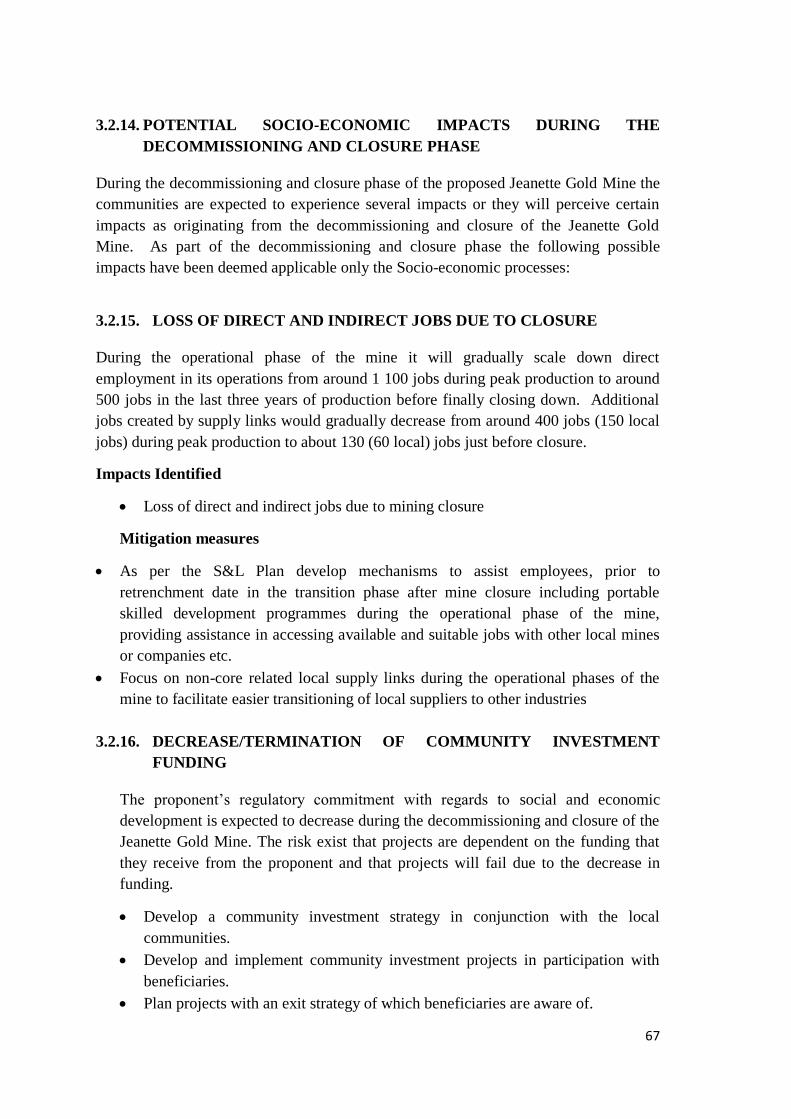
67
3.2.14. POTENTIAL SOCIO-ECONOMIC IMPACTS DURING THE
DECOMMISSIONING AND CLOSURE PHASE
During the decommissioning and closure phase of the proposed Jeanette Gold Mine the
communities are expected to experience several impacts or they will perceive certain
impacts as originating from the decommissioning and closure of the Jeanette Gold
Mine. As part of the decommissioning and closure phase the following possible
impacts have been deemed applicable only the Socio-economic processes:
3.2.15. LOSS OF DIRECT AND INDIRECT JOBS DUE TO CLOSURE
During the operational phase of the mine it will gradually scale down direct
employment in its operations from around 1 100 jobs during peak production to around
500 jobs in the last three years of production before finally closing down. Additional
jobs created by supply links would gradually decrease from around 400 jobs (150 local
jobs) during peak production to about 130 (60 local) jobs just before closure.
Impacts Identified
Loss of direct and indirect jobs due to mining closure
Mitigation measures
As per the S&L Plan develop mechanisms to assist employees, prior to
retrenchment date in the transition phase after mine closure including portable
skilled development programmes during the operational phase of the mine,
providing assistance in accessing available and suitable jobs with other local mines
or companies etc.
Focus on non-core related local supply links during the operational phases of the
mine to facilitate easier transitioning of local suppliers to other industries
3.2.16. DECREASE/TERMINATION OF COMMUNITY INVESTMENT
FUNDING
The proponent’s regulatory commitment with regards to social and economic
development is expected to decrease during the decommissioning and closure of the
Jeanette Gold Mine. The risk exist that projects are dependent on the funding that
they receive from the proponent and that projects will fail due to the decrease in
funding.
Develop a community investment strategy in conjunction with the local
communities.
Develop and implement community investment projects in participation with
beneficiaries.
Plan projects with an exit strategy of which beneficiaries are aware of.
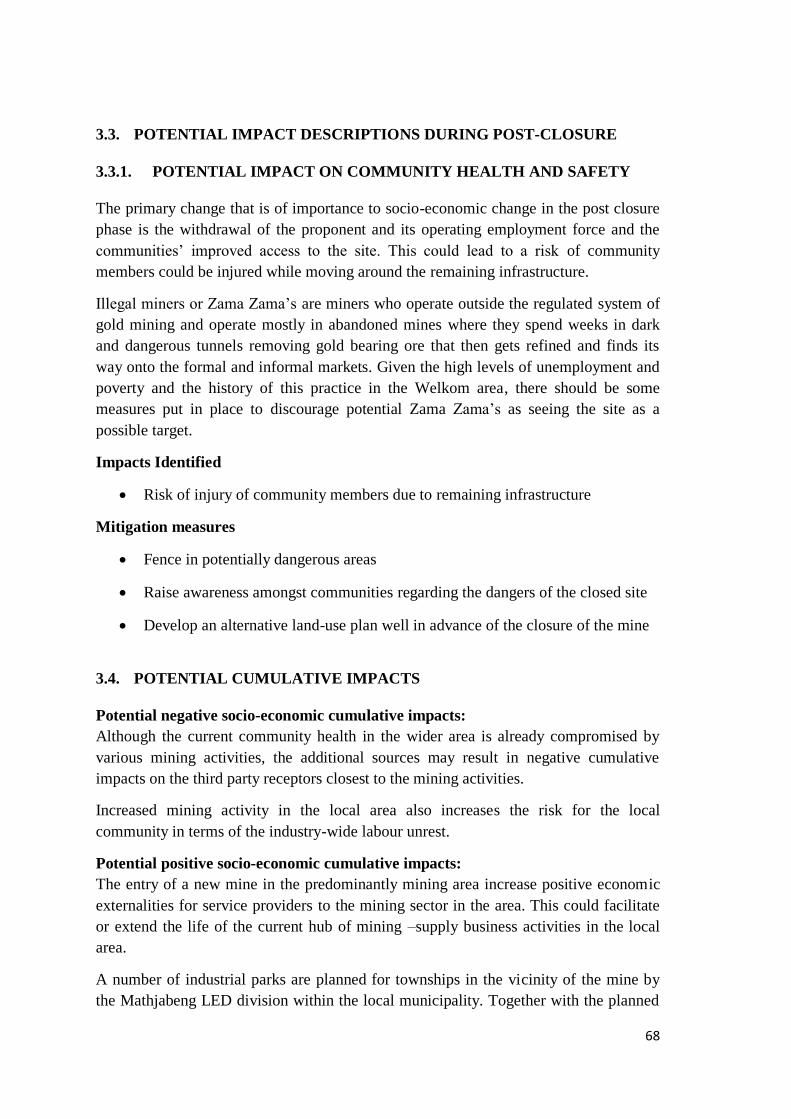
68
3.3. POTENTIAL IMPACT DESCRIPTIONS DURING POST-CLOSURE
3.3.1. POTENTIAL IMPACT ON COMMUNITY HEALTH AND SAFETY
The primary change that is of importance to socio-economic change in the post closure
phase is the withdrawal of the proponent and its operating employment force and the
communities’ improved access to the site. This could lead to a risk of community
members could be injured while moving around the remaining infrastructure.
Illegal miners or Zama Zama’s are miners who operate outside the regulated system of
gold mining and operate mostly in abandoned mines where they spend weeks in dark
and dangerous tunnels removing gold bearing ore that then gets refined and finds its
way onto the formal and informal markets. Given the high levels of unemployment and
poverty and the history of this practice in the Welkom area, there should be some
measures put in place to discourage potential Zama Zama’s as seeing the site as a
possible target.
Impacts Identified
Risk of injury of community members due to remaining infrastructure
Mitigation measures
Fence in potentially dangerous areas
Raise awareness amongst communities regarding the dangers of the closed site
Develop an alternative land-use plan well in advance of the closure of the mine
3.4. POTENTIAL CUMULATIVE IMPACTS
Potential negative socio-economic cumulative impacts:
Although the current community health in the wider area is already compromised by
various mining activities, the additional sources may result in negative cumulative
impacts on the third party receptors closest to the mining activities.
Increased mining activity in the local area also increases the risk for the local
community in terms of the industry-wide labour unrest.
Potential positive socio-economic cumulative impacts:
The entry of a new mine in the predominantly mining area increase positive economic
externalities for service providers to the mining sector in the area. This could facilitate
or extend the life of the current hub of mining –supply business activities in the local
area.
A number of industrial parks are planned for townships in the vicinity of the mine by
the Mathjabeng LED division within the local municipality. Together with the planned
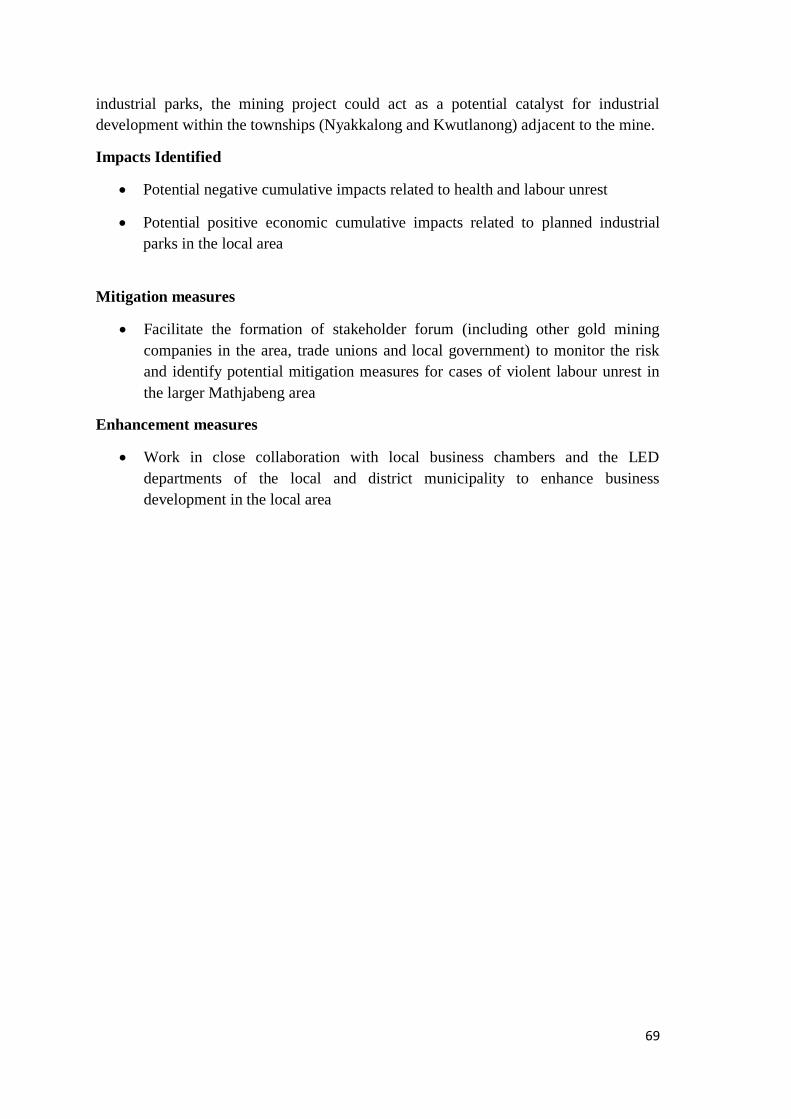
69
industrial parks, the mining project could act as a potential catalyst for industrial
development within the townships (Nyakkalong and Kwutlanong) adjacent to the mine.
Impacts Identified
Potential negative cumulative impacts related to health and labour unrest
Potential positive economic cumulative impacts related to planned industrial
parks in the local area
Mitigation measures
Facilitate the formation of stakeholder forum (including other gold mining
companies in the area, trade unions and local government) to monitor the risk
and identify potential mitigation measures for cases of violent labour unrest in
the larger Mathjabeng area
Enhancement measures
Work in close collaboration with local business chambers and the LED
departments of the local and district municipality to enhance business
development in the local area
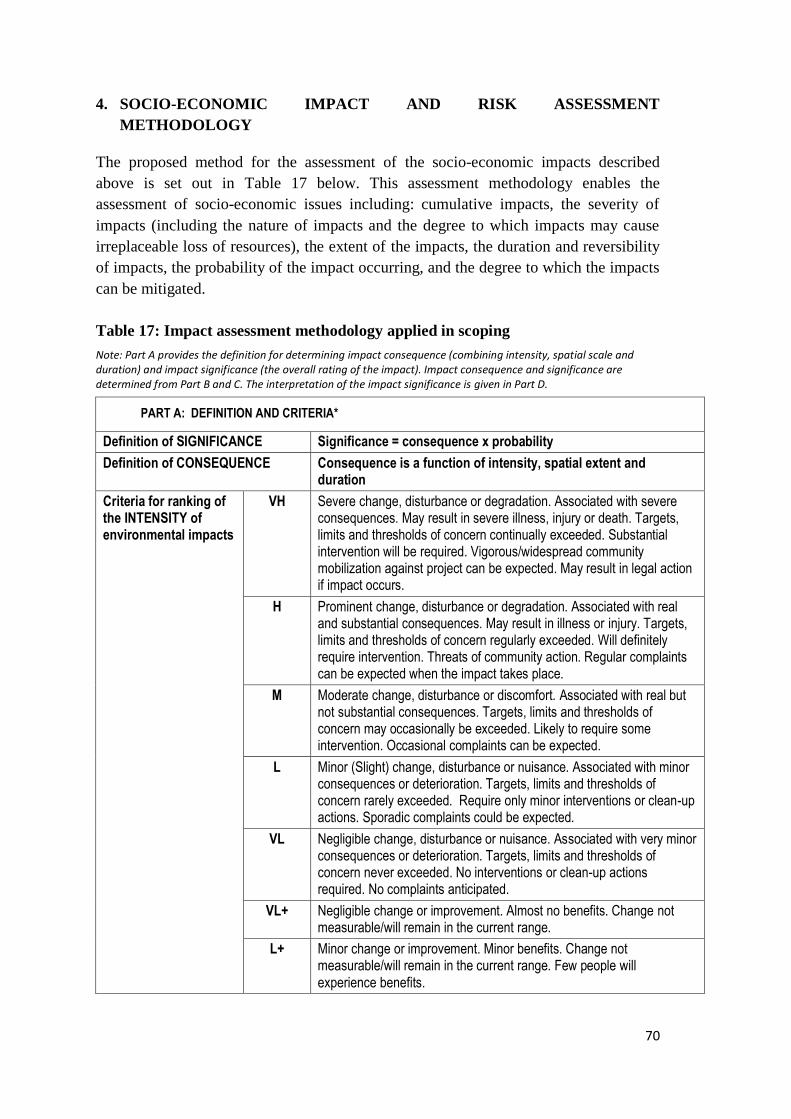
70
4. SOCIO-ECONOMIC IMPACT AND RISK ASSESSMENT
METHODOLOGY
The proposed method for the assessment of the socio-economic impacts described
above is set out in Table 17 below. This assessment methodology enables the
assessment of socio-economic issues including: cumulative impacts, the severity of
impacts (including the nature of impacts and the degree to which impacts may cause
irreplaceable loss of resources), the extent of the impacts, the duration and reversibility
of impacts, the probability of the impact occurring, and the degree to which the impacts
can be mitigated.
Table 17: Impact assessment methodology applied in scoping
Note: Part A provides the definition for determining impact consequence (combining intensity, spatial scale and duration) and impact significance (the overall rating of the impact). Impact consequence and significance are determined from Part B and C. The interpretation of the impact significance is given in Part D.
PART A: DEFINITION AND CRITERIA*
Definition of SIGNIFICANCE Significance = consequence x probability
Definition of CONSEQUENCE Consequence is a function of intensity, spatial extent and duration
Criteria for ranking of the INTENSITY of environmental impacts
VH Severe change, disturbance or degradation. Associated with severe consequences. May result in severe illness, injury or death. Targets, limits and thresholds of concern continually exceeded. Substantial intervention will be required. Vigorous/widespread community mobilization against project can be expected. May result in legal action if impact occurs.
H Prominent change, disturbance or degradation. Associated with real and substantial consequences. May result in illness or injury. Targets, limits and thresholds of concern regularly exceeded. Will definitely require intervention. Threats of community action. Regular complaints can be expected when the impact takes place.
M Moderate change, disturbance or discomfort. Associated with real but not substantial consequences. Targets, limits and thresholds of concern may occasionally be exceeded. Likely to require some intervention. Occasional complaints can be expected.
L Minor (Slight) change, disturbance or nuisance. Associated with minor consequences or deterioration. Targets, limits and thresholds of concern rarely exceeded. Require only minor interventions or clean-up actions. Sporadic complaints could be expected.
VL Negligible change, disturbance or nuisance. Associated with very minor consequences or deterioration. Targets, limits and thresholds of concern never exceeded. No interventions or clean-up actions required. No complaints anticipated.
VL+ Negligible change or improvement. Almost no benefits. Change not measurable/will remain in the current range.
L+ Minor change or improvement. Minor benefits. Change not measurable/will remain in the current range. Few people will experience benefits.
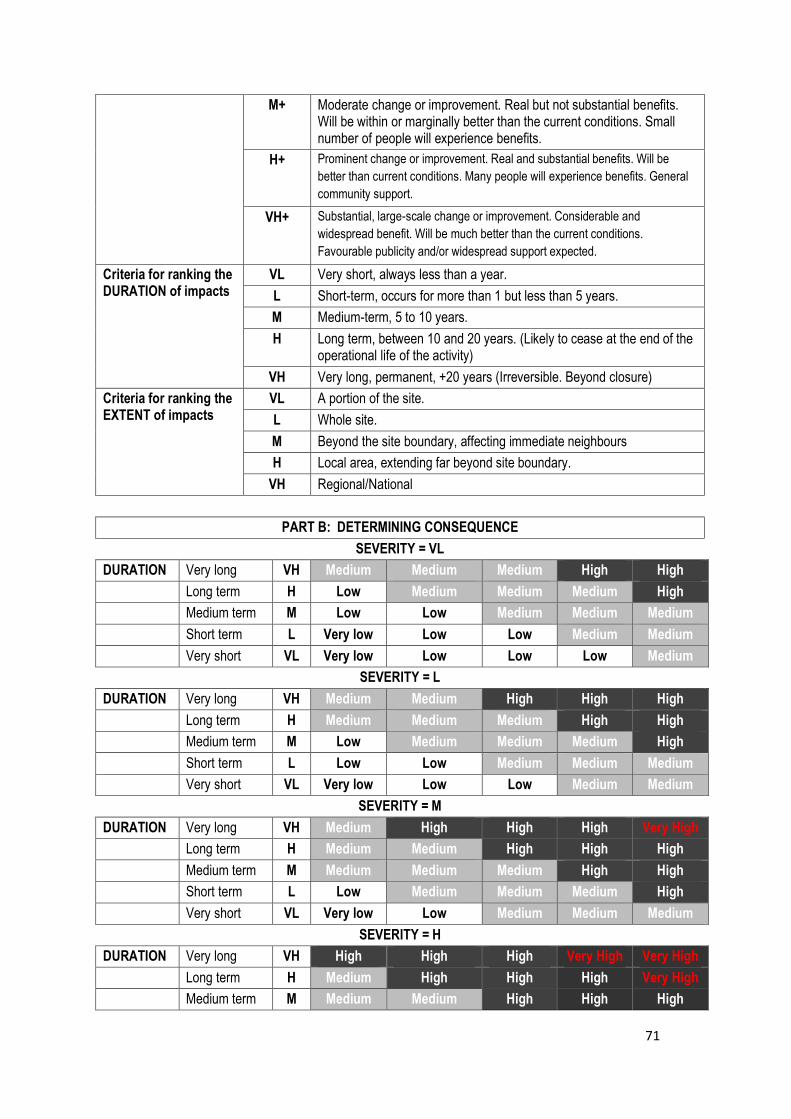
71
M+ Moderate change or improvement. Real but not substantial benefits. Will be within or marginally better than the current conditions. Small number of people will experience benefits.
H+ Prominent change or improvement. Real and substantial benefits. Will be
better than current conditions. Many people will experience benefits. General
community support.
VH+ Substantial, large-scale change or improvement. Considerable and
widespread benefit. Will be much better than the current conditions.
Favourable publicity and/or widespread support expected.
Criteria for ranking the DURATION of impacts
VL Very short, always less than a year.
L Short-term, occurs for more than 1 but less than 5 years.
M Medium-term, 5 to 10 years.
H Long term, between 10 and 20 years. (Likely to cease at the end of the operational life of the activity)
VH Very long, permanent, +20 years (Irreversible. Beyond closure)
Criteria for ranking the EXTENT of impacts
VL A portion of the site.
L Whole site.
M Beyond the site boundary, affecting immediate neighbours
H Local area, extending far beyond site boundary.
VH Regional/National
PART B: DETERMINING CONSEQUENCE
SEVERITY = VL
DURATION Very long VH Medium Medium Medium High High
Long term H Low Medium Medium Medium High
Medium term M Low Low Medium Medium Medium
Short term L Very low Low Low Medium Medium
Very short VL Very low Low Low Low Medium
SEVERITY = L
DURATION Very long VH Medium Medium High High High
Long term H Medium Medium Medium High High
Medium term M Low Medium Medium Medium High
Short term L Low Low Medium Medium Medium
Very short VL Very low Low Low Medium Medium
SEVERITY = M
DURATION Very long VH Medium High High High Very High
Long term H Medium Medium High High High
Medium term M Medium Medium Medium High High
Short term L Low Medium Medium Medium High
Very short VL Very low Low Medium Medium Medium
SEVERITY = H
DURATION Very long VH High High High Very High Very High
Long term H Medium High High High Very High
Medium term M Medium Medium High High High
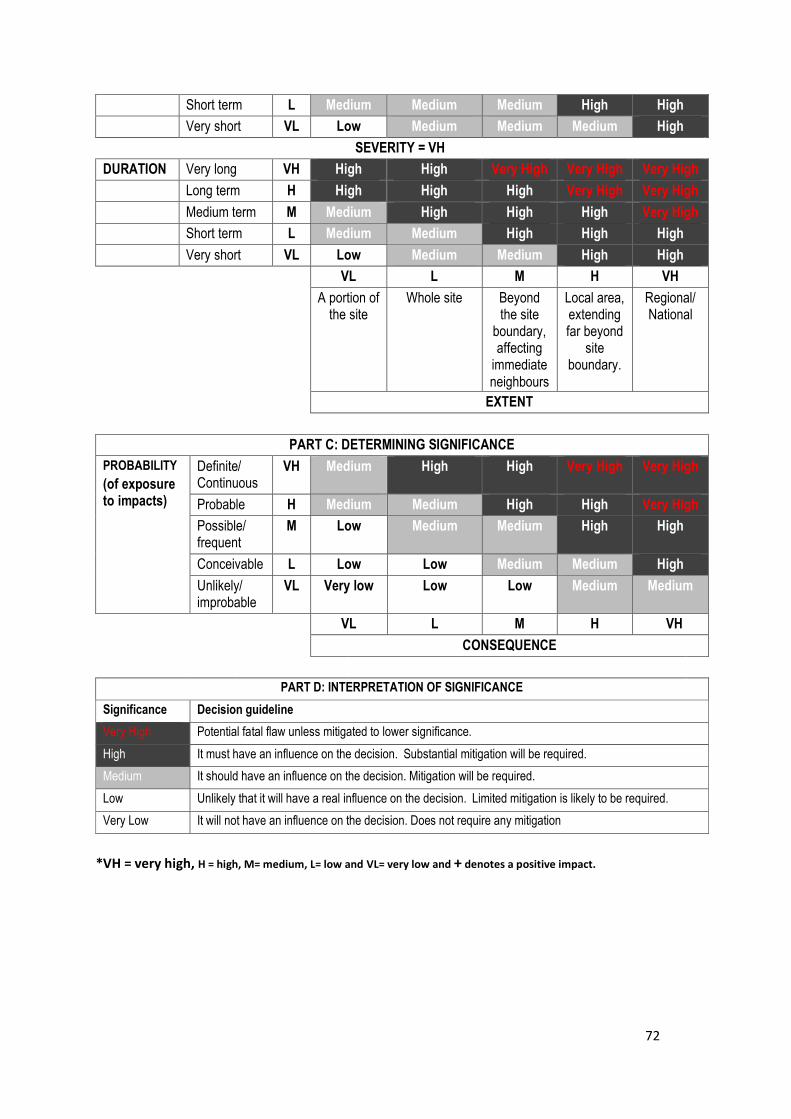
72
Short term L Medium Medium Medium High High
Very short VL Low Medium Medium Medium High
SEVERITY = VH
DURATION Very long VH High High Very High Very High Very High
Long term H High High High Very High Very High
Medium term M Medium High High High Very High
Short term L Medium Medium High High High
Very short VL Low Medium Medium High High
VL L M H VH
A portion of the site
Whole site Beyond the site
boundary, affecting
immediate neighbours
Local area, extending far beyond
site boundary.
Regional/ National
EXTENT
PART C: DETERMINING SIGNIFICANCE
PROBABILITY
(of exposure to impacts)
Definite/ Continuous
VH Medium High High Very High Very High
Probable H Medium Medium High High Very High
Possible/ frequent
M Low Medium Medium High High
Conceivable L Low Low Medium Medium High
Unlikely/ improbable
VL Very low Low Low Medium Medium
VL L M H VVH
CONSEQUENCE
PART D: INTERPRETATION OF SIGNIFICANCE
Significance Decision guideline
Very High Potential fatal flaw unless mitigated to lower significance.
High It must have an influence on the decision. Substantial mitigation will be required.
Medium It should have an influence on the decision. Mitigation will be required.
Low Unlikely that it will have a real influence on the decision. Limited mitigation is likely to be required.
Very Low It will not have an influence on the decision. Does not require any mitigation
*VH = very high, H = high, M= medium, L= low and VL= very low and + denotes a positive impact.
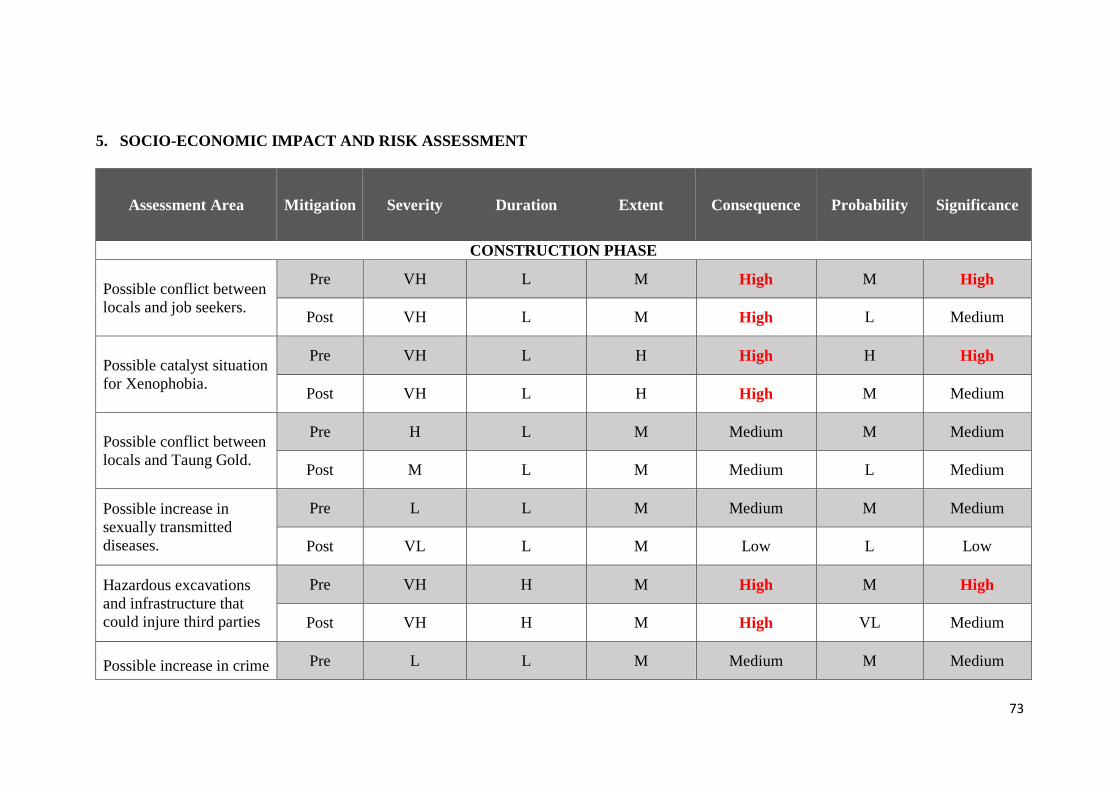
73
5. SOCIO-ECONOMIC IMPACT AND RISK ASSESSMENT
Assessment Area Mitigation Severity Duration Extent Consequence Probability Significance
CONSTRUCTION PHASE
Possible conflict between
locals and job seekers.
Pre VH L M High M High
Post VH L M High L Medium
Possible catalyst situation
for Xenophobia.
Pre VH L H High H High
Post VH L H High M Medium
Possible conflict between
locals and Taung Gold.
Pre H L M Medium M Medium
Post M L M Medium L Medium
Possible increase in
sexually transmitted
diseases.
Pre L L M Medium M Medium
Post VL L M Low L Low
Hazardous excavations
and infrastructure that
could injure third parties
Pre VH H M High M High
Post VH H M High VL Medium
Possible increase in crime Pre L L M Medium M Medium
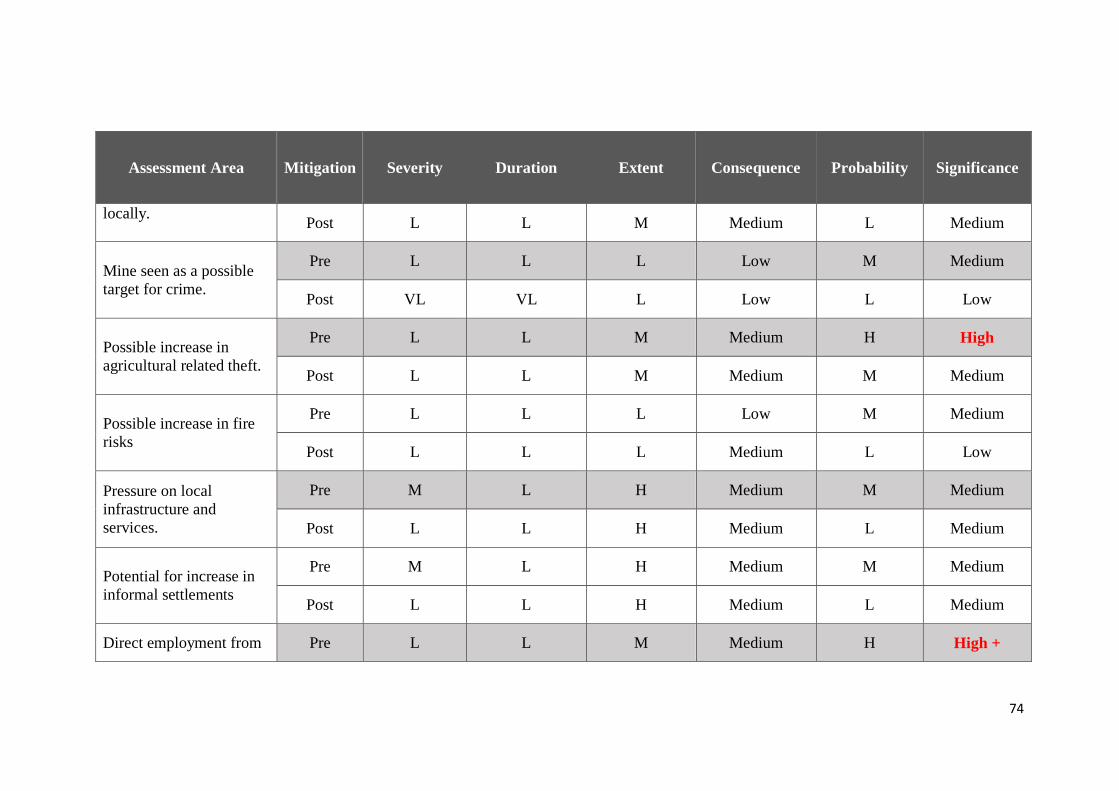
74
Assessment Area Mitigation Severity Duration Extent Consequence Probability Significance
locally. Post L L M Medium L Medium
Mine seen as a possible
target for crime.
Pre L L L Low M Medium
Post VL VL L Low L Low
Possible increase in
agricultural related theft.
Pre L L M Medium H High
Post L L M Medium M Medium
Possible increase in fire
risks
Pre L L L Low M Medium
Post L L L Medium L Low
Pressure on local
infrastructure and
services.
Pre M L H Medium M Medium
Post L L H Medium L Medium
Potential for increase in
informal settlements
Pre M L H Medium M Medium
Post L L H Medium L Medium
Direct employment from Pre L L M Medium H High +
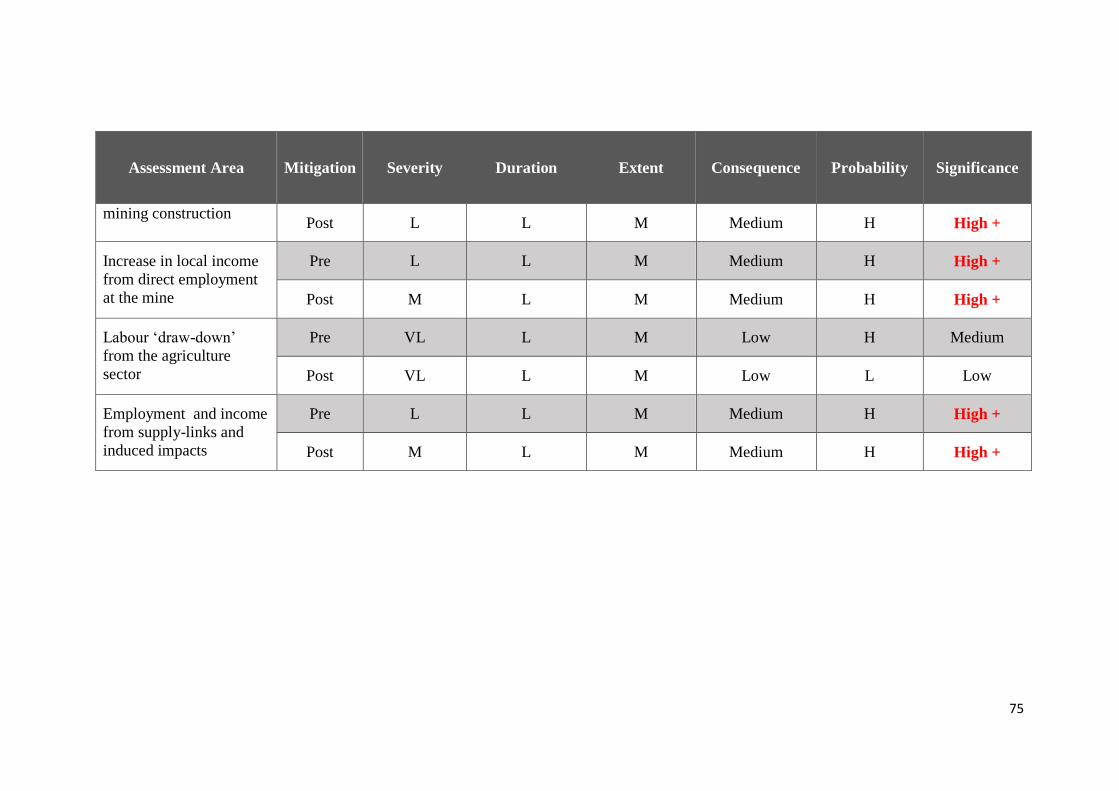
75
Assessment Area Mitigation Severity Duration Extent Consequence Probability Significance
mining construction Post L L M Medium H High +
Increase in local income
from direct employment
at the mine
Pre L L M Medium H High +
Post M L M Medium H High +
Labour ‘draw-down’
from the agriculture
sector
Pre VL L M Low H Medium
Post VL L M Low L Low
Employment and income
from supply-links and
induced impacts
Pre L L M Medium H High +
Post M L M Medium H High +
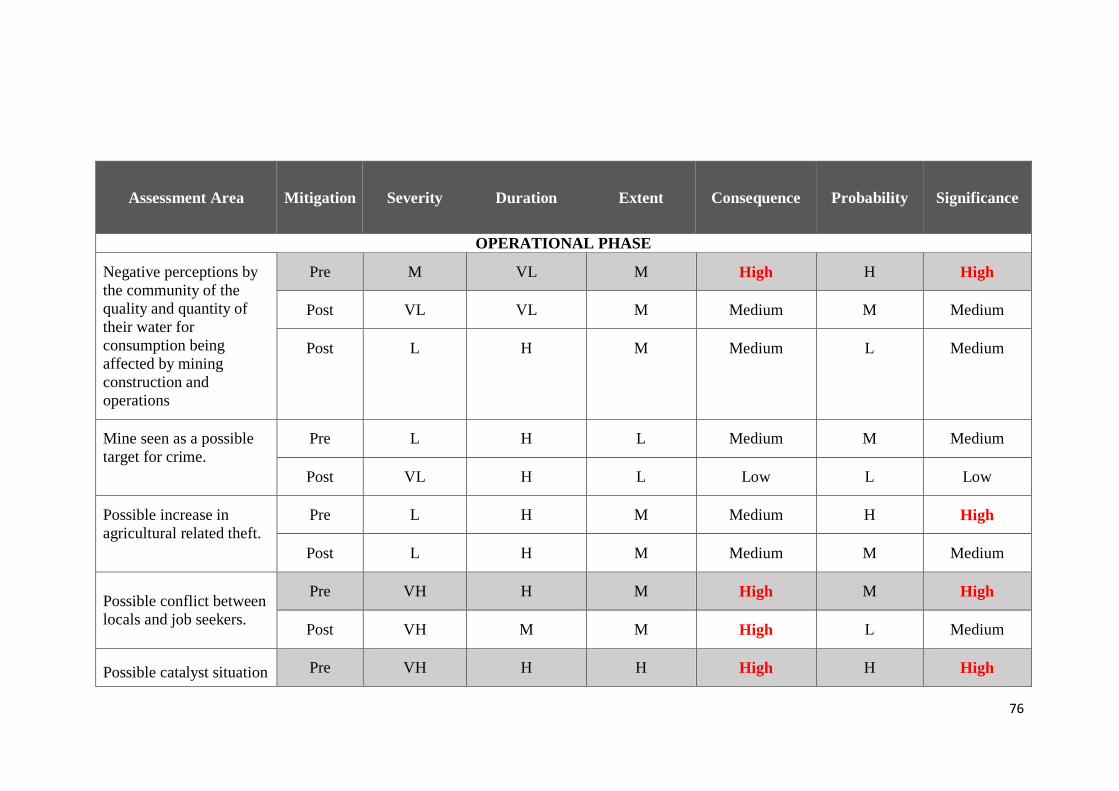
76
Assessment Area Mitigation Severity Duration Extent Consequence Probability Significance
OPERATIONAL PHASE
Negative perceptions by
the community of the
quality and quantity of
their water for
consumption being
affected by mining
construction and
operations
Pre M VL M High H High
Post VL VL M Medium M Medium
Post L H M Medium L Medium
Mine seen as a possible
target for crime.
Pre L H L Medium M Medium
Post VL H L Low L Low
Possible increase in
agricultural related theft.
Pre L H M Medium H High
Post L H M Medium M Medium
Possible conflict between
locals and job seekers.
Pre VH H M High M High
Post VH M M High L Medium
Possible catalyst situation Pre VH H H High H High
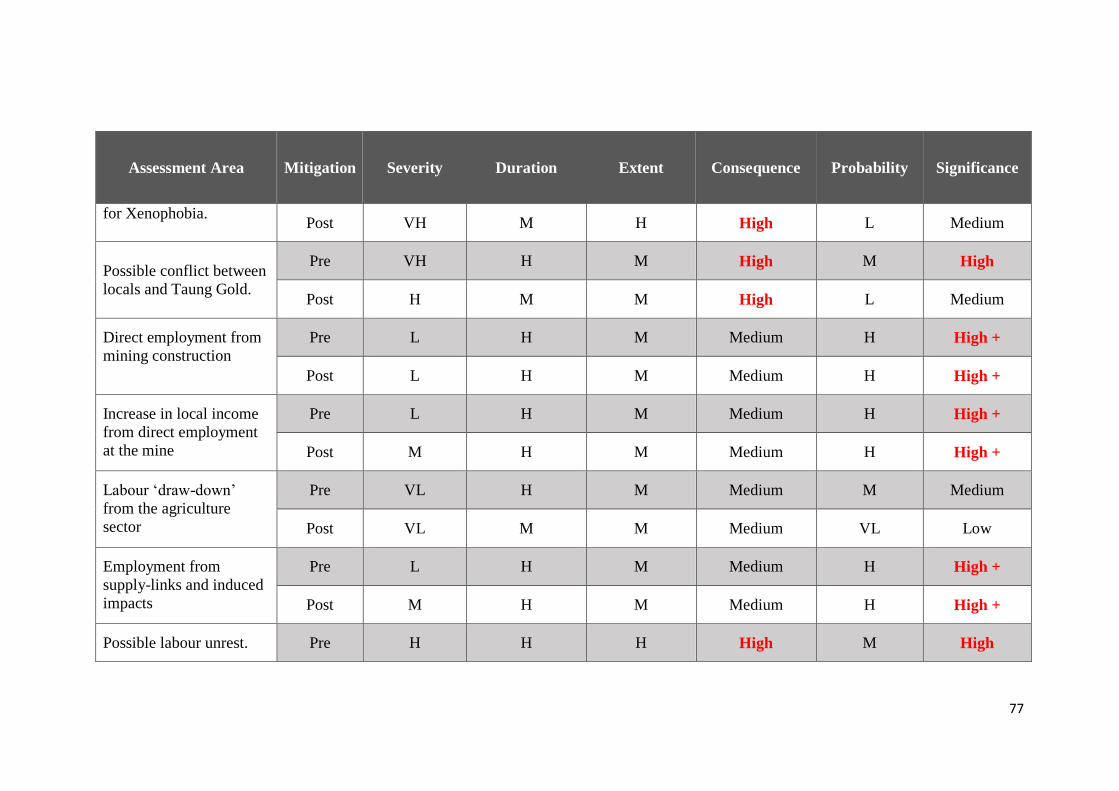
77
Assessment Area Mitigation Severity Duration Extent Consequence Probability Significance
for Xenophobia. Post VH M H High L Medium
Possible conflict between
locals and Taung Gold.
Pre VH H M High M High
Post H M M High L Medium
Direct employment from
mining construction
Pre L H M Medium H High +
Post L H M Medium H High +
Increase in local income
from direct employment
at the mine
Pre L H M Medium H High +
Post M H M Medium H High +
Labour ‘draw-down’
from the agriculture
sector
Pre VL H M Medium M Medium
Post VL M M Medium VL Low
Employment from
supply-links and induced
impacts
Pre L H M Medium H High +
Post M H M Medium H High +
Possible labour unrest. Pre H H H High M High
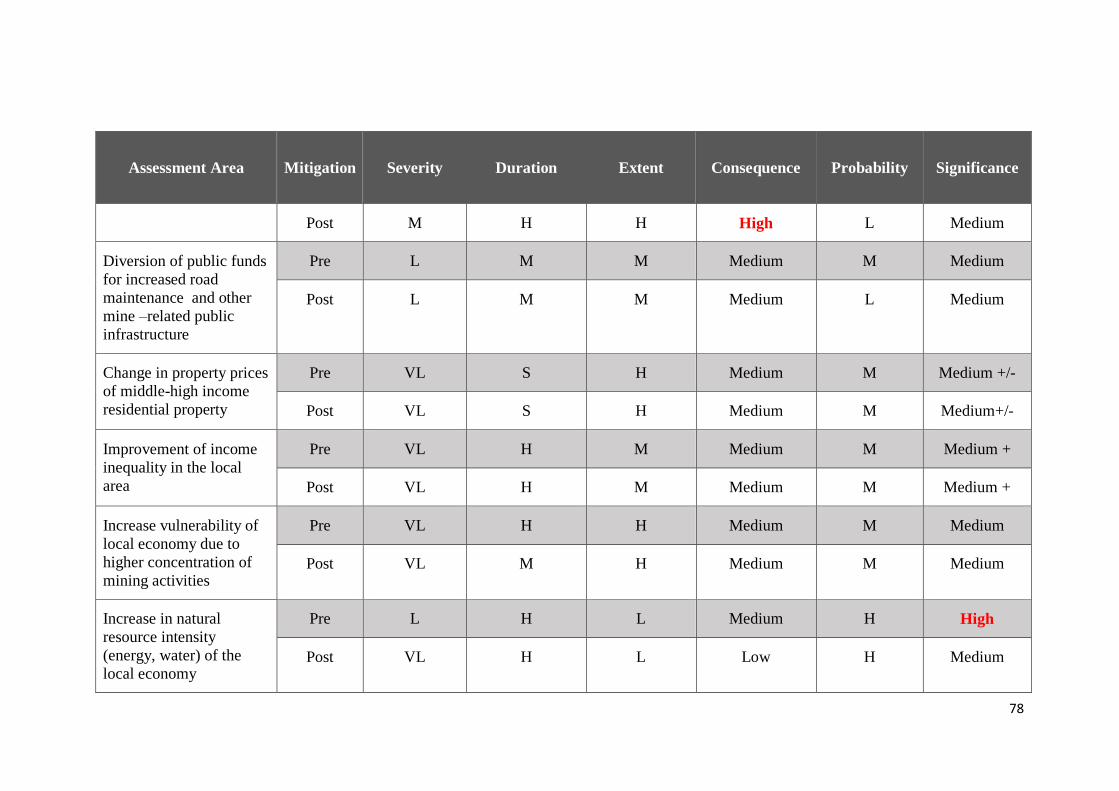
78
Assessment Area Mitigation Severity Duration Extent Consequence Probability Significance
Post M H H High L Medium
Diversion of public funds
for increased road
maintenance and other
mine –related public
infrastructure
Pre L M M Medium M Medium
Post L M M Medium L Medium
Change in property prices
of middle-high income
residential property
Pre VL S H Medium M Medium +/-
Post VL S H Medium M Medium+/-
Improvement of income
inequality in the local
area
Pre VL H M Medium M Medium +
Post VL H M Medium M Medium +
Increase vulnerability of
local economy due to
higher concentration of
mining activities
Pre VL H H Medium M Medium
Post VL M H Medium M Medium
Increase in natural
resource intensity
(energy, water) of the
local economy
Pre L H L Medium H High
Post VL H L Low H Medium
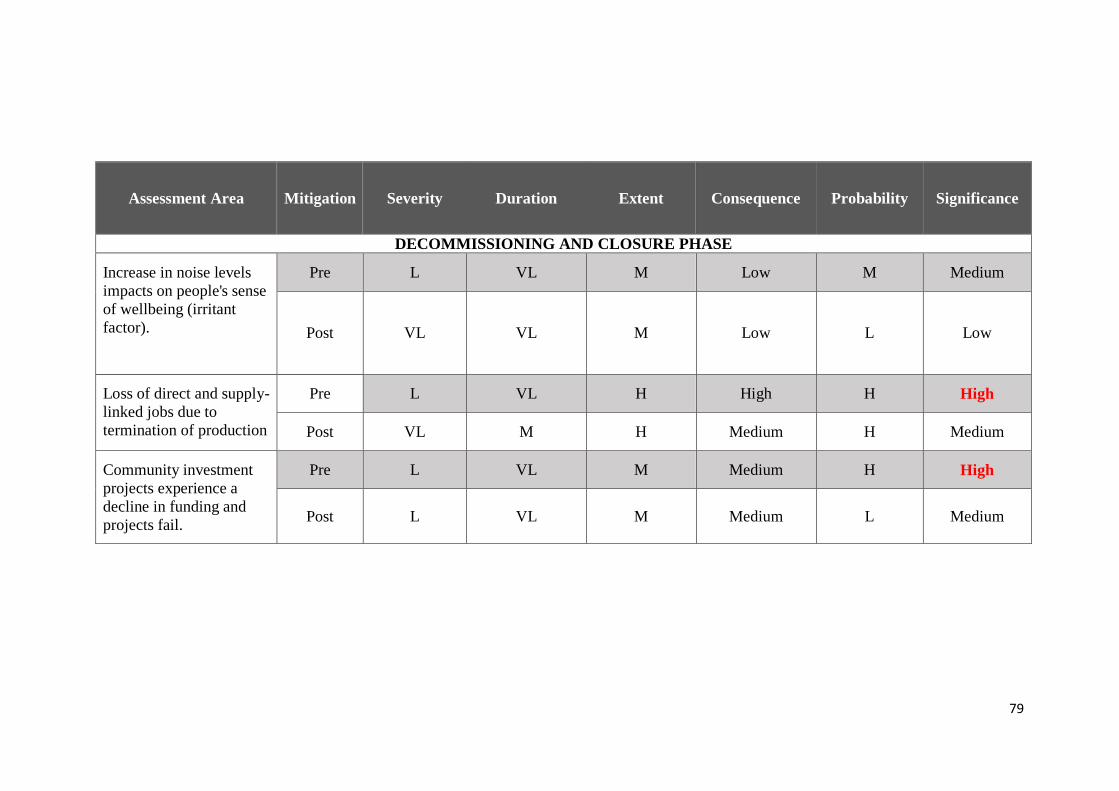
79
Assessment Area Mitigation Severity Duration Extent Consequence Probability Significance
DECOMMISSIONING AND CLOSURE PHASE
Increase in noise levels
impacts on people's sense
of wellbeing (irritant
factor).
Pre L VL M Low M Medium
Post VL VL M Low L Low
Loss of direct and supply-
linked jobs due to
termination of production
Pre L VL H High H High
Post VL M H Medium H Medium
Community investment
projects experience a
decline in funding and
projects fail.
Pre L VL M Medium H High
Post L VL M Medium L Medium
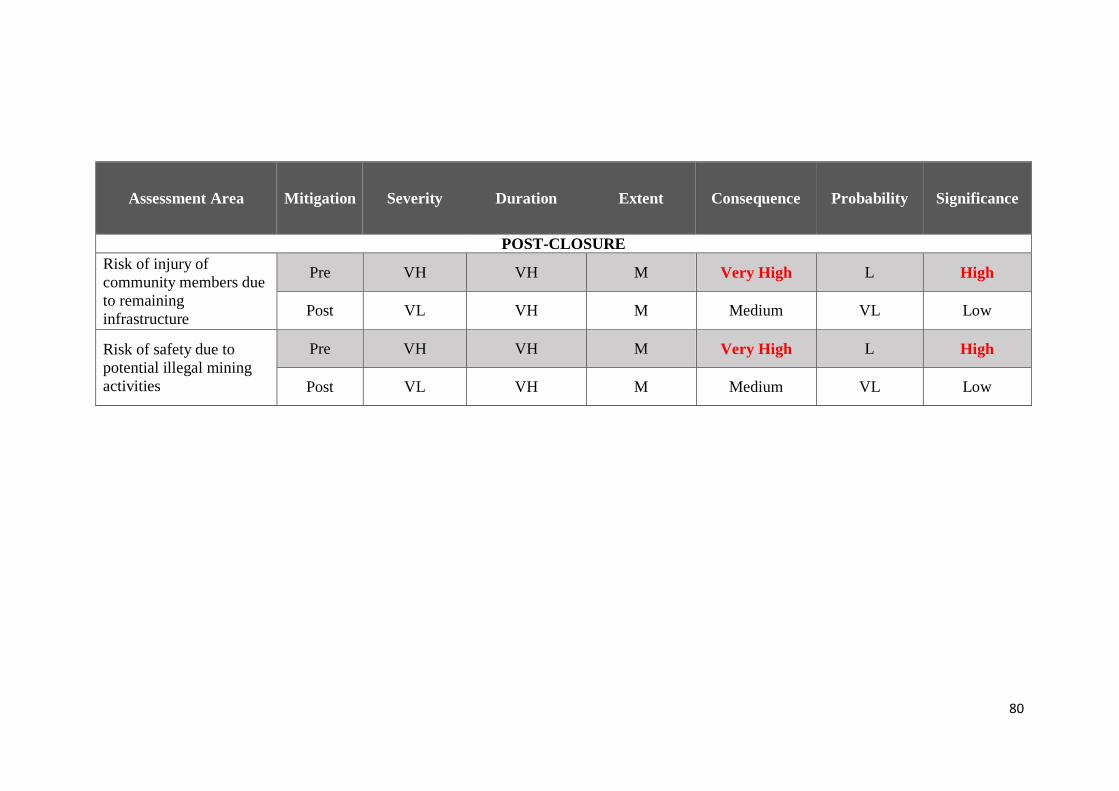
80
Assessment Area Mitigation Severity Duration Extent Consequence Probability Significance
POST-CLOSURE
Risk of injury of
community members due
to remaining
infrastructure
Pre VH VH M Very High L High
Post VL VH M Medium VL Low
Risk of safety due to
potential illegal mining
activities
Pre VH VH M Very High L High
Post VL VH M Medium VL Low
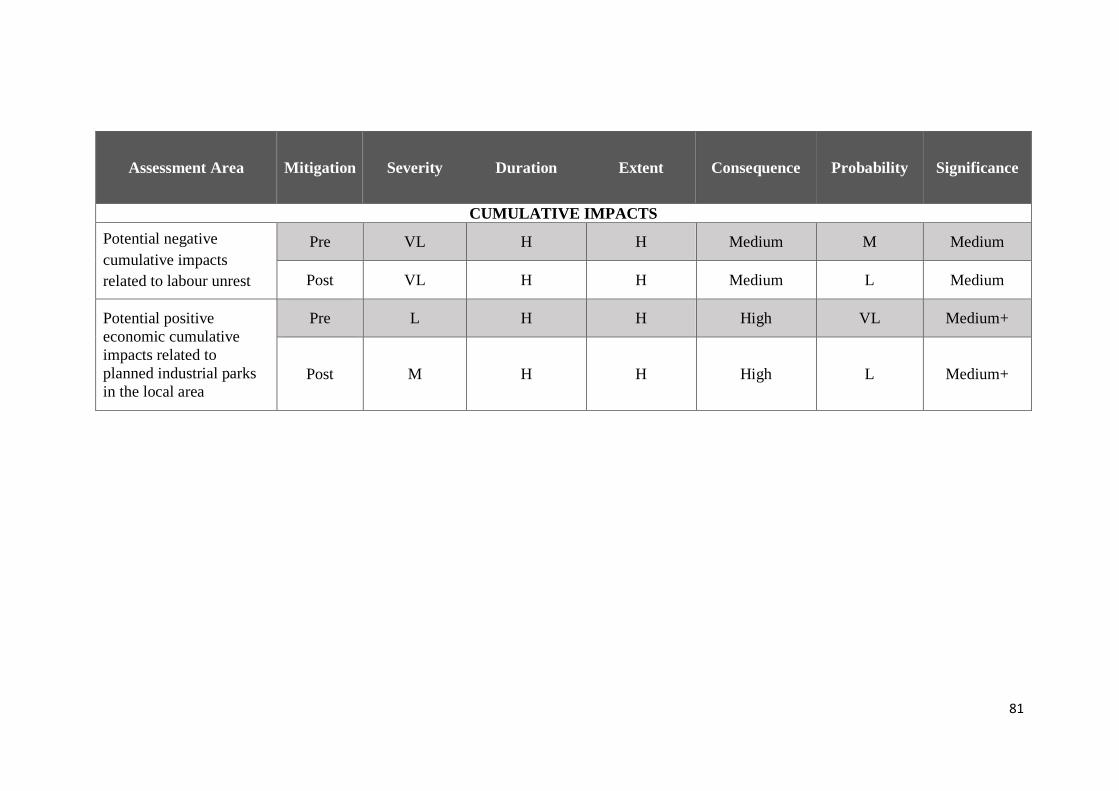
81
Assessment Area Mitigation Severity Duration Extent Consequence Probability Significance
CUMULATIVE IMPACTS
Potential negative
cumulative impacts
related to labour unrest
Pre VL H H Medium M Medium
Post VL H H Medium L Medium
Potential positive
economic cumulative
impacts related to
planned industrial parks
in the local area
Pre L H H High VL Medium+
Post M H H High L Medium+
82
6. POTENTIAL LOCAL SOCIO-ECONOMIC DEVELOPMENT PROJECTS
The most pressing needs in the communities adjacent the mining area are employment
and business opportunities coupled with appropriate skills development for the labour
market. The community is isolated in terms of initiatives in the broader Mathjabeng
municipality. There also appear to be distrust among the local communities towards the
local municipality who are perceived to by-pass their needs in favour of the Welkom
area.
Within this scenario there is a real risk that community needs in terms of social
infrastructure and job creation could be exclusively directed towards the new mine. It is
therefore important to develop social networks within the community that emphasise
the shared responsibility for local economic development between the community
themselves, the private sector (including mines operational in the area) as well as local
government (including both the local and district municipality).
As a first step towards local economic development projects in the area it is therefore
recommended that initiatives should focus on the establishment of LED forums within
the Odendaalsrus/Kwutlanong and Allanridge/Nyakkalong areas that could consist of:
The private business sector (including the Free State Chamber of Business; the
Black Management Forum and other businesses operational in the local area)
NGOs active in training, health and education, community development
Training organisations
Community members
Local government including the LED divisions of Lejweleputswa District
Municipality and Mathjabeng municipalities, SEDA, the DTI
Local economic development projects have a better chance to succeed if it the local
community take ownership of the initiatives. A LED forum provides the opportunity
for the local community to engage in the formulation of development strategies. While
a new mine in the area could act as catalyst for development, a forum decreases the
social risk for the mine related to unrealistic expectations.
LED strategies that are relevant to the local area include:
business development that focus on non-mining activities for sustainable after
mine-closures
the building of social networks and community trust , e.g. through the LED
forum itself and the establishment of local business chambers
structured ‘plugging-the-leaks’ LED strategies that focuses on developing
business opportunities around local spending power
youth skills development (e.g. science and maths programme)
83
7. RECOMMENDATIONS FOR MANAGING RELATIONSHIPS WITH
COMMUNITIES AND INTEREST GROUPS
The following recommendations are made in terms of the mine’s management of
relationships with the adjacent communities and other interest groups:
Quarterly meetings between the mine and local community at large to
communicate employment and business opportunities and address general issues
from the community
Quarterly meetings between the mine and the adjacent farming community to
assess the impact of the mine on the agricultural sector
To mitigate against influx of unskilled workers into the local area a
communication strategy is needed to inform the broader region of the lack of
unskilled job opportunities at the mine well in advance of the project inception.
The strategy could involve the media (local newspapers and radio stations) and
regional business chambers (e.g. Free State Chamber of Business)
As discussed above, facilitate the formation of local LED forums in order to
manage the relationship with the community in terms unrealistic expectations of
the mine role in local economic development
Quarterly meetings with other gold mines in the local area (Harmony and
Sibanye Gold) to monitor industry-related issues such as trade union activity
Join the local community police forum as a member to assess and address safety
issues in the area, specifically related to mining activities
84
8. SUMMARY AND CONCLUSION
The project is expected to have a net positive impact on the local communities close to
the mine due to jobs created by the mine itself, links to local suppliers and social
spending through its S&L plan and taxes and royalties paid by the mine. The extent of
the benefit will largely depend on the level of in-migration of unskilled workers from
outside the local area, the degree to which local labour is up-skilled to fill semi-skilled
and skilled positions at the mine as well as the extent to which the mine source
unskilled employment among the ranks of unemployed.
There are also a number of negative socio-economic impacts that the mine needs to
mitigate also to lessen its own social risks to operate within the local area. Paramount
among the recommended mitigation strategies are:
An effective communication strategy that could convey the message to the
regional community that there are a limited number of unskilled jobs at the mine
to mitigate the influx of unskilled workers into the local area
An effective communication strategy to mitigate against unrealistic expectations
of the local community in terms of the number of local jobs that the mine will
create and its sole responsibility for economic development within the local area
Collaboration with a broader LED network within the local area to illustrate
shared but not sole responsibility of economic development in the local area
Up-skilling of local labour force to enable them to fill semi-skilled and skilled
positions at the mine
Sourcing unskilled labour from the ranks of the unemployed
Participation towards building greater local tolerance for groups outside the
local area
Socio-economic risks that could impose high impacts on the local community during
the different phases for the project and require focused attention in terms of mitigation
include:
Construction Phase:
Possible conflict between locals and job seekers.
Possible catalyst situation for Xenophobia.
Hazardous excavations and infrastructure that could injure third parties
Possible increase in agricultural related theft
Operational Phase:
85
Negative perceptions by the community of the quality and quantity of their
water for consumption being affected by mining construction and operations
Possible conflict between locals and job seekers.
Possible catalyst situation for Xenophobia.
Possible conflict between locals and Taung Gold
Possible increase in agricultural related theft
Increased potential for labour unrest
Increase in natural resource intensity (energy, water) of the local economy
Decommissioning and Closure Phase:
Loss of direct and supply-linked jobs due to termination of production
A decrease in social welfare due to declining funds for community investment
projects or project failure
Post-closure Phase:
Risk of injury of community members due to remaining infrastructure
Risk of safety due to potential illegal mining activities
Permanent loss of income from land that was replaced by mining infrastructure
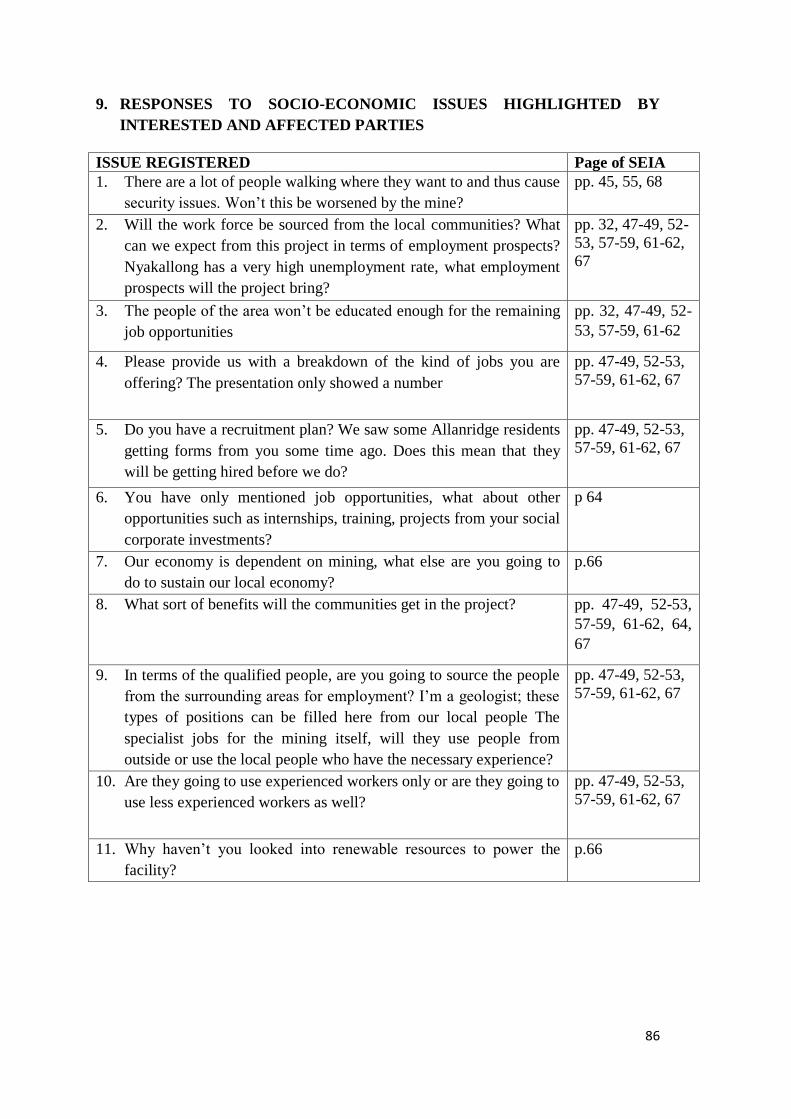
86
9. RESPONSES TO SOCIO-ECONOMIC ISSUES HIGHLIGHTED BY
INTERESTED AND AFFECTED PARTIES
ISSUE REGISTERED Page of SEIA
1. There are a lot of people walking where they want to and thus cause
security issues. Won’t this be worsened by the mine?
pp. 45, 55, 68
2. Will the work force be sourced from the local communities? What
can we expect from this project in terms of employment prospects?
Nyakallong has a very high unemployment rate, what employment
prospects will the project bring?
pp. 32, 47-49, 52-
53, 57-59, 61-62,
67
3. The people of the area won’t be educated enough for the remaining
job opportunities
pp. 32, 47-49, 52-
53, 57-59, 61-62
4. Please provide us with a breakdown of the kind of jobs you are
offering? The presentation only showed a number
pp. 47-49, 52-53,
57-59, 61-62, 67
5. Do you have a recruitment plan? We saw some Allanridge residents
getting forms from you some time ago. Does this mean that they
will be getting hired before we do?
pp. 47-49, 52-53,
57-59, 61-62, 67
6. You have only mentioned job opportunities, what about other
opportunities such as internships, training, projects from your social
corporate investments?
p 64
7. Our economy is dependent on mining, what else are you going to
do to sustain our local economy?
p.66
8. What sort of benefits will the communities get in the project? pp. 47-49, 52-53,
57-59, 61-62, 64,
67
9. In terms of the qualified people, are you going to source the people
from the surrounding areas for employment? I’m a geologist; these
types of positions can be filled here from our local people The
specialist jobs for the mining itself, will they use people from
outside or use the local people who have the necessary experience?
pp. 47-49, 52-53,
57-59, 61-62, 67
10. Are they going to use experienced workers only or are they going to
use less experienced workers as well?
pp. 47-49, 52-53,
57-59, 61-62, 67
11. Why haven’t you looked into renewable resources to power the
facility?
p.66
87
10. REFERENCES
Action Voices (2012). Community Monitoring Project, Bench Marks Foundation.
Johannesburg
Afrika, M.Z. and Hofstatter, S. (2011).How a Small Town Blew R2bn on Dodgy Deals.
http://www.timeslive.co.za/local/2011/06/12/how-a-small-town-blew-r2bn-on-dodgy-deals.
Accessed 21 May 2015
Allan E. (2011). The Killing That Shook Welkom. Eamon Allan
http://mg.co.za/article/2011-07-08-the-killing-that-shook-welkom. Accessed 21 May 2015
Bhorat, H. and M. Oosthuizen (2005). The Post-Apartheid South African Labour Market,
Development Policy Research Unit: University of Cape Town, Cape Town
Botes, L., Lenka, M., Marais, L.,Matebesi, Z., and K. Sigenu (2007). The New Struggle:
Service Delivery-Related Unrest in South Africa, Centre for Development Support:
University of the Free State, Bloemfontein
Bridges, S. (2013). Free State Private Kingdom of Premier Ace Magashule.
http://sunettebridges.co.za/free-state-private-kingdom-of-premier-ace-magashule/. Accessed
5 May 2015
Centre for Development Support South Africa (2013). SME Observatory: The Potential
of Non-Profit Organizations in the Free State Province to Adopt a Social Enterprise
Approach. International Labour Organization, Geneva
Commonwealth of Australia (2005). Socio-economic Impact Assessment Toolkit, Bureau
of Rural Sciences, Canberra
De Klerk, N. (2014). Almost 10 Killed In Welkom In Less Than A
Week.http://www.news24.com/SouthAfrica/News/Almost-10-killed-in-Welkom-in-less-
than-a-week-20141203. Accessed 13 May 2015
De Wet, T. (2013). Moord en Roof ook Ondersoek.
http://152.111.11.6/argief/berigte/volksblad/2013/08/23/VB/4/wetar-V2.html. Accessed 5
May 2015.
Department of Environmental Affairs (2006) Socio-Economic Impact Assessment,
Integrated Environmental Management Information Series 22, Department of Environmental
Affairs and Tourism (DEAT), Pretoria
Department of Environmental Affairs (2012). National Waste Information Baseline
Report. Department of Environmental Affairs, Pretoria, South Africa
Development Bank of South Africa (2012). Social Accounting Matrix of Free State, 2006
prices. DBSA, Midrand
EMIS (2004). Free State Department of Education Address List: ABET Centres, Department
of Basic Education, Pretoria
Free State Provincial Government (2005). Provincial Growth and Development Strategy
(PGDS) (2005 – 2014), Free State Provincial Government, Bloemfontein
Gubico (2015). http://goldanduraniumbelt.blogspot.com/. Accessed 21 April 2015
Harmony (2012). Public Violence in Vicinity of Harmony’s Kusasalethu Mine.
https://www.harmony.co.za/investors/news-and-events/company-announcements-
2/announcements-2012/671-public-violence-in-vicinity-of-harmony-s-kusasalethu-mine.
88
Accessed 21 May 2015
Housing Development Agency (2014). Matjhabeng Local Municipality: Municipal Profile.
Developed by i@Consulting (Pty) Ltd on behalf of the Housing Development Agency,
Johannesburg
Human Sciences Research Council and University of the Free State (2003). Evaluation
Of Local Economic Development (LED) In The Free State Province, Study undertaken for
the Premier’s Economic Advisory Council of the Free State. Rhodes University, Rhodes
IHS Global Insight (2015) Selected Indicators for Mathjabeng Municipality, the Free State
and the National Economy, Unpublished Information
International Alliance on Natural Resources in Africa South Africa (2013). Mining
Communities and Allies Dialogue: Meeting Report.
http://www.fhr.org.za/files/7213/8122/6982/mining-dialogue-report.pdf. Accessed 10 May
2015
International Association for Impact Assessment (2003).Social Impact Assessment:
International Principles Special Publication Series, Fargo
Investissement-Québec (2001) Economic Impact Assessment Method Revised edition –
2001 Commission de la Santé et de la Sécurité du travail (CSST), Bibliothèque Nationale du
Québec, Montreal
Luckow, P., Stanton, E., Biewald, B., Fields, S., Jacksom, S., Fisher, J. and Ackerman,
F. (2014). CO2 Price Report, Spring 2014, Synapse Energy Economists, Massachusetts
Macharia, J. (2009). More Than 60 Illegal Miners Killed at SA Gold Mine
http://mg.co.za/article/2009-06-02-more-than-60-illegal-miners-killed-at-sa-gold-mine.
Accessed 20 May 2015
Mathjabeng Local Municipality (2013). Integrated Development Plan 2014-2015,
Mathjabeng Municipality, Welkom
Mathjabeng Local Municipality (2013b). Annual report 2012/2013, Mathjabeng
Municipality, Welkom
Mavuso, Z. (2013). Labour Unrest Impacts Negatively on South African Gold Miners.
http://www.miningweekly.com/article/labour-unrest-impacts-negatively-on-sa-gold-miners-
2013-06-28. Accessed 21 May 2015
McCrae, M.A. (2015). The Stunning Collapse of Gold Production in South Africa.
http://www.mining.com/the-stunning-collapse-of-gold-production-in-south-
africa/?utm_source=digest-en-mining-150312&utm_medium=email&utm_campaign=digest.
Accessed 15 April 2015
Mokati, N. (2012). Police quell xenophobic violence. http://www.iol.co.za/news/south-
africa/free-state/police-quell-xenophobic-violence-1.1232079?showComments=true#.VV--
Ck2JiM8. Accessed 21 May 2015
Moore, N. (2014). Free State Electricity's Impenetrable Darkness.
http://www.dailymaverick.co.za/article/2014-10-06-free-state-electricitys-impenetrable-
darkness/#.VV8wCE2JiM8. Accessed 21 May 2015
Mudd, G. (2008). Gold mining and sustainability: A critical reflection. Retrieved from
http://www.eoearth.org/view/article/153053
Municipal IQ (2014). Municipal IQ Hotspots Monitor.
89
http://www.municipaliq.co.za/index.php?site_page=press.php. Accessed 18 May 2015
National Department of Rural Development & Land Reform and Free State
Department of Co-operative Governance & Traditional Affairs (2013). Free State
Province Provincial Spatial Development Framework (PSDF) Phase 2, Free State Provincial
Government, Bloemfontein
Nel, E. (2002). Decline and response in South Africa's Free State goldfields: Local economic
development in Matjhabeng in International Development Planning Review Volume 24,
Issue 3, Liverpool University Press, Liverpool
News24 (2015). Sibanye Gold to Recognise Amcu as Majority Trade Union.
http://www.news24.com/Archives/City-Press/Sibanye-Gold-first-to-recognise-Amcu-as-
majority-trade-union-20150430. Accessed 21 April 2015
SABC (2013). Welkom school close over re-admission of Rastafarian girl
http://www.sabc.co.za/news/a/2c1ca3804fba6a9b972df70b5d39e4bb/Welkom-school-close-
over-re-admission-of-Rastafarian-girl--20130523. Accessed 5 May 2015
Seccombe, A. (2014). Virginia and Welkom: A Tale of Two Towns.
http://www.financialmail.co.za/coverstory/2014/11/20/virginia-and-welkom-a-tale-of-two-
towns. Accessed 21 April 2015. Accessed 21 April 2015
South African Reserve Bank (2014). National Accounts: Statistical Annexure, SARB,
Pretoria
Standard Bank (2014). Agribusiness Price Updates. Standard Bank Biz Connect,
Johannesburg
Statistics SA. (2011). Gross Domestic Product, Annual Estimates 2002 – 2010, Annual
Estimates Per Region 2002 – 2010. Third Quarter, StatsSa, Pretoria.
Statistics SA. (2015). Quarterly Employment Statistics, March 2015, StatsSa, Pretoria.
Stats SA (2000). Natural Resource Accounts: Water and Energy Accounts for South Africa,
Stats SA, Pretoria
Stats SA (2015). SuperCross Data for Census 2006 and 2011, Stats SA, Pretoria
Steyn, L. (2013). The Old Oom of The Gold Boom. http://mg.co.za/article/2013-04-12-00-
the-old-oom-of-the-gold-boom Accessed 21 April 2015
Swarts S., King, D., Simpson, Z., Havenga J. and Goedhals-Gerber L. (2012).
Calculation of Freight Externality Costs for South Africa, Journal of Transport and Supply
Chain Management, University of Johannesburg, Johannesburg
Tendai Gwatidzo and Miracle Benhura (2013). Mining Wages in South Africa, Labour
Market Intelligence Partnership (LMIP), Pretoria
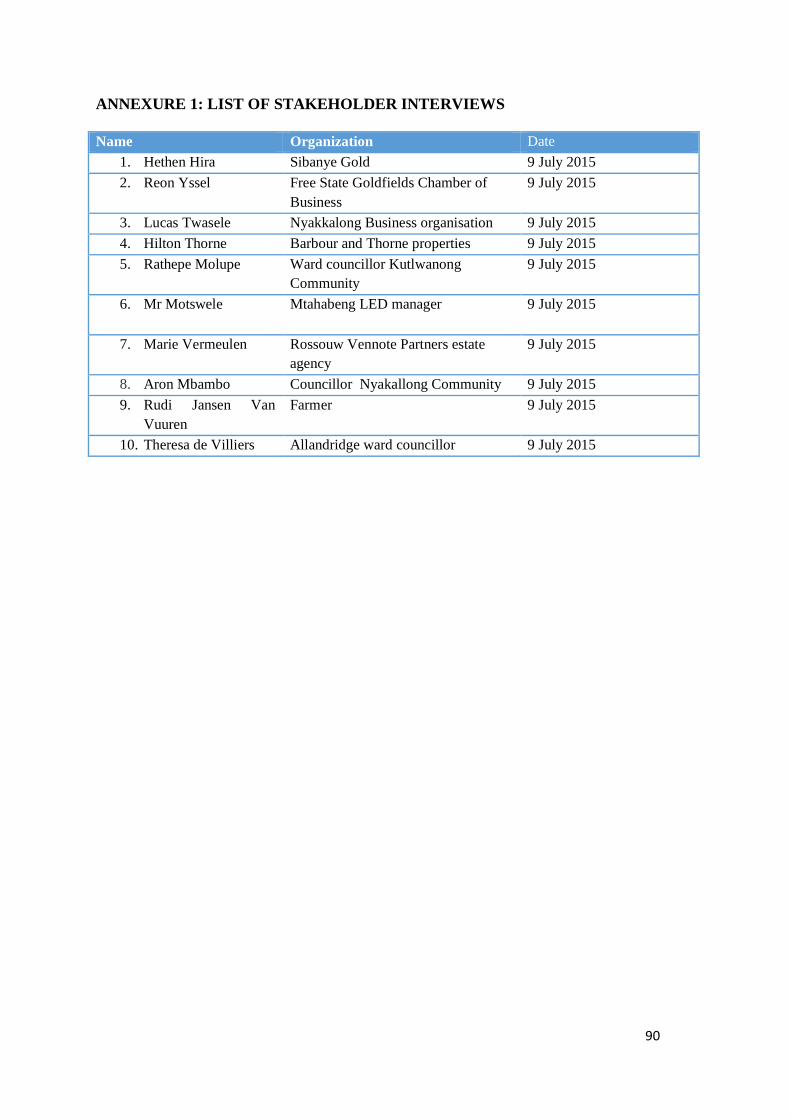
90
ANNEXURE 1: LIST OF STAKEHOLDER INTERVIEWS
Name Organization Date
1. Hethen Hira Sibanye Gold 9 July 2015
2. Reon Yssel Free State Goldfields Chamber of
Business
9 July 2015
3. Lucas Twasele Nyakkalong Business organisation 9 July 2015
4. Hilton Thorne Barbour and Thorne properties 9 July 2015
5. Rathepe Molupe Ward councillor Kutlwanong
Community
9 July 2015
6. Mr Motswele
Mtahabeng LED manager 9 July 2015
7. Marie Vermeulen Rossouw Vennote Partners estate
agency
9 July 2015
8. Aron Mbambo Councillor Nyakallong Community 9 July 2015
9. Rudi Jansen Van
Vuuren
Farmer 9 July 2015
10. Theresa de Villiers Allandridge ward councillor 9 July 2015
91
ANNEXURE 2: CURRICULUM VITAE OF SPECIALISTS
ANNA SOPHIA KRITZINGER
1. Family name: Kritzinger
2. First names: Anna Sophia
3. Date of birth: 17 March 1964
4. Nationality: South African
5. Education:
Institution
[ Date ] Degree(s) or Diploma(s) obtained:
University of Stellenbosch, South Africa (1990-1992) M.Admin (Economics)
University of Pretoria, South Africa (1982-1985) B.Admin (Hons) (Economics)
Language skills: Indicate competence on a scale of 1 to 5 (1 – excellent; 5 – basic)
Language Reading Speaking Writing
English 1 1 1
Afrikaans 1 1 1
Dutch 2 3 3
German 3 3 4
French 4 4 4
6. Membership of professional bodies: -
7. Other skills: (e.g. Computer literacy, etc.) Computer literacy –MS Office, Accredited training
Assessor, Social Accounting Matrix (SAM) literacy
8. Publications: Kritzinger, A. S. (2011) Towards a Conceptual Framework for LED Strategies. Skills @ Work, Volume 4:
67- 79.
Kritzinger, A. S. and Baur P. (2012) Structuring Local Data to Determine LED Strategy Priorities: An
Economic Development Perspective. Skills @ Work, Volume 5: (forthcoming)
9. Present position: Director of Southern Economic Development Services (SED) and freelance-
associate of South African management consultancy Futurelead
10. Years with the firm: 16
11. Areas of specialisation
Economic impact assessments
Applied economics (macro-economic and social impact analysis; economic cost benefit
analysis, economic incidence analysis, scenario planning)
Skills development in development profiling and strategies
Economic databases & economic reviews
Local social and economic development strategies
Industry and market analysis
Analyses of higher education systems in Africa (analyses of demand and supply factors)
Working as a freelance consultant I have developed a strong network with organizations in South
Africa – including my involvement as associate of management consulting firm Futurelead as well
as an extensive network of development and economic consulting groups such as the Development
Bank of Southern Africa, the economic and financial firm Global Insight and Deloitte (Namibia,
92
South Africa and Botswana) the University of Johannesburg (Centre for Local Economic
Development) and the Bureau of Economic Research (University of Stellenbosch).
12. Professional experience:
Date from – Date
to
Company
(position)
Description of activities
(country; year of assignment)
1998 – current Consulting Examples of assignments include:
Economic impact analyses:
Developed economic criteria for the evaluation of projects for the
Strategic Infrastructure Programme (SIP) for the Western Cape
Province( 2005)
Study lead for revenue management study, entailing the identification of
mitigation strategies related to project –related revenues (employment and public revenues) for a large-scale gas project for Anadarko
petroleum in Mozambique (2012-2014)
Socio-economic impact assessment for Jeanette mine, Free State (2015)
Economic study for a waste disposal site in Tshwane, Gauteng (2014)
Economic impact assessment as part of Social Impact Assessment (SIA)
of a Glencore/Xtrata chrome mine in Rustenburg, Mpumalanga (2014)
Economic impact assessment as part of Social Impact Assessment (SIA)
for the extension of a mining right application for Boschmanspoort coal
mine in Mpumalanga (2014)
Economic impact assessment as part of Social Impact Assessment (SIA)
for a casino/retail project in Delmas, Mpumalanga (2014)
Economic study for a private regional landfill in the Ga-Rankuwa area
of City of Tshwane (2014)
Economic impact assessment as part of SIA for a CFB coal plant in
Delmas area, Mpumalanga, South Africa (2013)
Economic impact assessment as part of SIA of a coal mine in
Chrissiesmeer, Mpumalanga, South Africa (2013)
Economic impact assessment as part of SIA for selected wind farms and
solar plants in the Northern Cape (2012)
Economic impact assessment as part of SIA for an existing vanadium
mine in the Brits area (2012)
Economic impact assessment as part of SIA for a diamond mine in
Alexander Bay area, West Coast, South Africa (2012)
Measured the impact of the global financial crisis on the mining industry
of 8 SADC countries including South Africa (SADC countries; 2009);
Conducted an analysis of the economic contribution of state owned
enterprises to the Namibian economy (Namibia; 1999 and 2009).
Conducted a socio economic impact analysis for the development of an
Africa centre and sustainable housing development project in the
Western Cape (South Africa; 2007); (Namibia, South Africa, Botswana;
2005- );
Part of an economic evaluation team for strategic infrastructure projects
(SIP) in the Western Cape (South Africa; (2005);
Conducted the economic evaluation of an infrastructure project in the
Mosselbay area (South Africa;2001);
Economic impact assessment for horse-mackerel industry (Namibia
2003)
Local Economic Development- related work:
Managed and conducted a research project pertaining to Business
Retention and Attraction Strategies to inform strategic inputs to improve
programmes on behalf of Deloitte Nambia for the Local Economic
Development Association (LEDA) of Namibia (Namibia, 2013)
Designed and implemented a training project for capacity training in
sustainable local economic development (including the “green
economy”) monitoring for district municipalities throughout South
Africa. The project was developed in collaboration with Inwent and the
Development Bank of Southern Africa (South Africa; 2008 – 2011). The project has been developed further as one of the courses that forms part
of the University of Johannesburg’s Centre of Local Economic
93
Date from – Date
to
Company
(position)
Description of activities
(country; year of assignment)
Development degree programme;
Evaluated local economic development projects in the Western and
Eastern Cape. These studies involved the evaluation of existing
economic development projects and the identification of LED projects that the NGO-client could potentially get involved in (South Africa,
2002);
Managed a team in conducting a business survey and Local Economic
Development action plan for the eastern parts of Cape Town, including
township areas such as Mfuleni and parts of Macasser. The project included extensive consultation sessions with community organisations
(South Africa; 2007);
Compiled various socio economic development profiles for various
South African local authorities including profiles for George
municipality; Drakenstein municipality, the Overberg region and Oudtshoorn municipality that were used to inform the Local
Development for the towns and district. The profiles and identification
of relevant projects involved community facilitation work (South
Africa;1998-2008);
Developed a socio economic database for the Cape Metropolitan Area.
The study was updated to an extensive economic analysis of the city and
some indicators were extended to include all the different regions of the
Western Cape (South Africa;1998, 2001);
Industry profiles and market analysis:
Conducted research and compiled the synthesis report for geothermal
potential in the African rift valley (2011)
Conducted various research reports on global sectors e.g. the global oil
and gas industry and ship building and repairs (Global, Africa, South Africa; 2003-2007)
Managed the compilation of an “invest in Cape Town report” for
Wesgro (2011)
Managed a sector survey and profile for the Cape Town Boat building
industry (South Africa, 2008);
Compiled an industry profile for the City of Johannesburg. The study
involved a survey of numerous companies and informed the city about the relative importance of the sector for the City of Johannesburg on the
hand of various development criteria (South Africa; 2003).
Higher education analyses in Africa:
Conducted a demand and supply review of the higher education system
of Namibia including a gap analyses of current and forecasted labour
demand and supply of higher education qualifications (Namibia; 2012
and 2014)
Managed a situational analysis and done a market analysis as well as
economic cost benefit analysis for Botswana Export Development Agency with Deloitte SA to investigate the feasibility of a tertiary
education hub to diversify the Botswana economy (Botswana; 2009).
Economic cost benefit analysis:
Conducted a high level economic cost benefit analyses for a regional
landfill project in Ga-Rankuwa, City of Tshwane as extension for an
economic impact assessment (South Africa, 2014)
Conducted an economic cost benefit analyses for a coal mine near
Chrissiesmeer, Mpumalanga as part of alternative land-use study for a mining application study (South Africa, 2013)
Conducted an economic cost benefit analysis for an agricultural
irrigation project in the Pandamatenga area (Botswana, 2010);
Conducted an economic cost benefit analysis for Botswana Export
Development Agency with Deloitte SA to investigate the feasibility of a
tertiary education hub to diversify the Botswana economy (Botswana; 2009)
Other macro-economic modeling:
94
Date from – Date
to
Company
(position)
Description of activities
(country; year of assignment)
Developed an economic forecast model for the City of Cape Town and
the Western Cape economy (City of Cape Town; 2005 updated in 2011,
extended to Western Cape in 2014);
Conducted research to establish the economic contribution of
agricultural research in South Africa to assist the motivation of increased public grants to the main agricultural research body (South
Africa; 2011)
Conducted a comparative economic incidence analysis between fuel
levies and motor vehicle licence fees for the Western Cape (South
Africa; 2007 updated in 2011)
References:
Herman Marais (Strategy Partners Agricultural Venture Capital Fund)
+27 83 377 6234; [email protected]; Johan Hayes, (AECOM: Africa Practice Lead: Impact Assessments; +27
+27 (0) 82 859 1932 [email protected]
1994-1998 Freelance Freelance work in UK, travelling through Europe
1989 -1994 University of Stellenbosch
(lecturer)
Tasks included:
Lecturing first to third year
Marking of papers and assignments
Leading tutorial classes
References:
Professor Phillip Black (University of Stellenbosch) tel: +27 (021)
808-2478; [email protected]
1987-1988
Development
Bank of Southern Africa
(Researcher)
Tasks included:
Profiling of selected development areas in South Africa
Analyses and database development pertaining to key economic indicators.
References:
David Viljoen (Development Bank of Southern Africa) tel: +27 (0) 11 313 3043/3303 ; [email protected]
95
PIETER JOHANNES OOSTHUIZEN
1. Family name: Oosthuizen
2. First names: Pieter Johannes
3. Date of birth: 04 December 1987
4. Nationality: South African
5. Education:
Institution
[ Date ]
Degree(s) or Diploma(s) obtained:
University of Pretoria, South Africa (2006-2010) B.A (Industrial Psychology)
University of Pretoria, South Africa (2010-2012) NQF Level 6 Project Management
6. Language skills: Indicate competence on a scale of 1 to 5 (1 – excellent; 5 – basic)
Language Reading Speaking Writing
English 1 1 1
Afrikaans 1 1 1
7. Membership of professional bodies: - International Association of Impact Assessors, South African
branch (Membership number: 34499)
Project Management Institute, South African branch
8. Other skills: (e.g. Computer literacy, etc.) GIS, MS projects and full computer literacy, Provincial
cricket
9. Publications:
-
10. Present position: Director of Triad Project Solutions and freelance-associate of Southern
Economic Development Services (SED).
11. Years with the firm: 2
12. Areas of specialisation
Leading and supervising fieldwork, resettlement and logistics teams
Collection and processing of raw data
Resettlement action plans
Research for Social Impact Assessments
Writing Social Impact Assessments
Project Management
Social and Labour plans
Human Rights Impact Assessments
Analyses of higher education systems in Africa (analyses of demand and supply factors)
I have been involved and managed numerous projects over the past 6 years. I have accumulated
critical international project experience in the oil and gas as well as the mining sector. I have also
been actively involved in a number of Social and Human Rights Impact Assessments at Digby Wells
Environmental and Continuum (formerly Roos Social Risk Solutions).
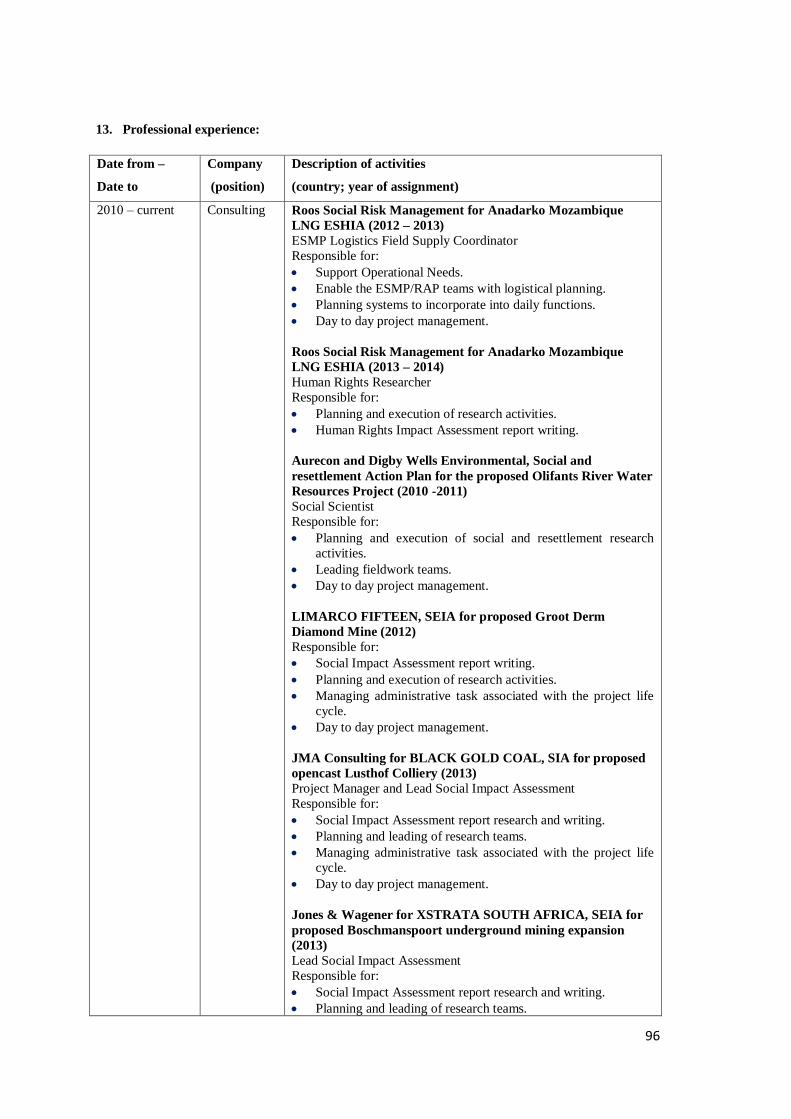
96
13. Professional experience:
Date from –
Date to
Company
(position)
Description of activities
(country; year of assignment)
2010 – current Consulting Roos Social Risk Management for Anadarko Mozambique
LNG ESHIA (2012 – 2013)
ESMP Logistics Field Supply Coordinator
Responsible for:
Support Operational Needs.
Enable the ESMP/RAP teams with logistical planning.
Planning systems to incorporate into daily functions.
Day to day project management.
Roos Social Risk Management for Anadarko Mozambique
LNG ESHIA (2013 – 2014)
Human Rights Researcher
Responsible for:
Planning and execution of research activities.
Human Rights Impact Assessment report writing.
Aurecon and Digby Wells Environmental, Social and
resettlement Action Plan for the proposed Olifants River Water
Resources Project (2010 -2011)
Social Scientist
Responsible for:
Planning and execution of social and resettlement research
activities.
Leading fieldwork teams.
Day to day project management.
LIMARCO FIFTEEN, SEIA for proposed Groot Derm
Diamond Mine (2012)
Responsible for:
Social Impact Assessment report writing.
Planning and execution of research activities.
Managing administrative task associated with the project life
cycle.
Day to day project management.
JMA Consulting for BLACK GOLD COAL, SIA for proposed
opencast Lusthof Colliery (2013)
Project Manager and Lead Social Impact Assessment
Responsible for:
Social Impact Assessment report research and writing.
Planning and leading of research teams.
Managing administrative task associated with the project life
cycle.
Day to day project management.
Jones & Wagener for XSTRATA SOUTH AFRICA, SEIA for
proposed Boschmanspoort underground mining expansion
(2013)
Lead Social Impact Assessment
Responsible for:
Social Impact Assessment report research and writing.
Planning and leading of research teams.
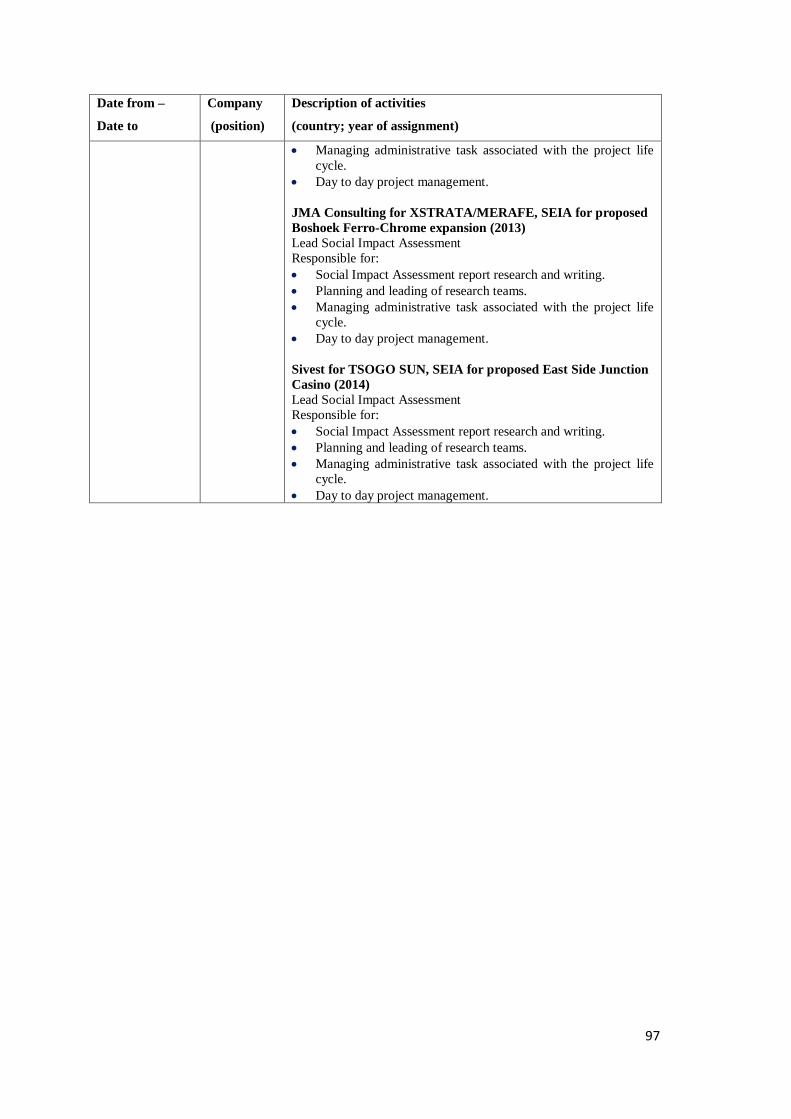
97
Date from –
Date to
Company
(position)
Description of activities
(country; year of assignment)
Managing administrative task associated with the project life
cycle.
Day to day project management.
JMA Consulting for XSTRATA/MERAFE, SEIA for proposed
Boshoek Ferro-Chrome expansion (2013)
Lead Social Impact Assessment
Responsible for:
Social Impact Assessment report research and writing.
Planning and leading of research teams.
Managing administrative task associated with the project life
cycle.
Day to day project management.
Sivest for TSOGO SUN, SEIA for proposed East Side Junction
Casino (2014)
Lead Social Impact Assessment
Responsible for:
Social Impact Assessment report research and writing.
Planning and leading of research teams.
Managing administrative task associated with the project life
cycle.
Day to day project management.