socio-economic review district statistical abstract
TRANSCRIPT
FOR OFFICIAl. miE ONl.T
SOCIO-ECONOMIC REVIEW AND
DISTRICT STATISTICAL ABSTRACT OF
THANA DISTRICT
1972-73
WRZAt1 01' tCONOM:CS AND STAtlSnC! COVERNMENTOFMA.BARASBTRA
BOMBAY
========= ===============
.J.ND
1972-:-73 ============
SOCIO ECONOMIC REVIEW ---- ------ -----.AND --
DISTRICT STATI STICAL ABSTRACT -------- ~---------- --------OF -
THANA
---------------------------------------------------Sr.No. Subject Page No. =======~====:==~===================================
~~~_=_I 1. Thana District at a glance
2. Chapter No. 1 to 4
~~~_=_II
1. Statistical Tables
·1 to 5
1 to 35
1 to 174
====================================================
P.A.RT - I ==========
SOCIO ECONOMIC REVIEW ===== ======== ======
1972-73 =======
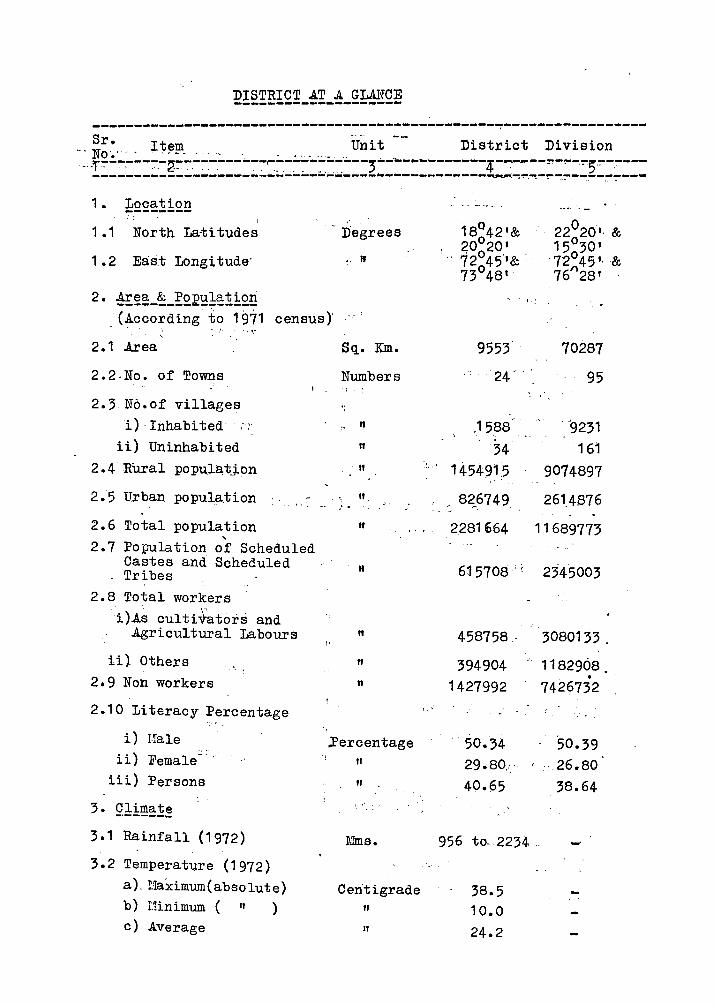
DISTRICT AT A GLMqCE --------------------------------------------------------------------~-----------------
1. ~Q~~!iQ!!
1.1 North Latitudes Degrees
1 .2 Eas,t Longitude' .' "
2. !!~~_~_~QE~1~!iQ!! (Acco~ding ~? 1971 census)'
2.1 Area
2.2·No. of Towns
2.3 No.of villages i) 'Inhabited .\~ ;.
ii) Uninhabited 2.4 Rural po pu.latj. on
2.5 Urban po pula,t ion
2.6 Total population --2.7 Population of Scheduled
Castes and Scheduled Tribes
2.8 Total workers , . \-
i)As cultivators and Agricultural Labours
ii} Others .. 2.9 Non workers
2.10 Literacy Percentage
i) Hale ii) Female
iii) Persons
3.1 Rainfall (1972)
3.2 Temperat'Ure (1972 ) a). Uaximum(absolute) b) Hinimum ( " ) c) Average
..
"
Sq. KIn.
Numbers
'J
i: n
If
If
" . ' . " It
n
" n
.:Percentage
" "
:Mms.
Centigrade
" II
, ,
I,'
, , .
9553 70287
"24' 95
.1588 "
, "9231 , 34 161
1454915 9074897
826749 " '-, .. 261.4876
2281664 11689773
615708' ( 234'5003
458758· 3080133 .
394904 1427992
956
.,
50.34
29.80,: '. 40.65
to. 2234 "
38.5 10.0 24.2
1182908. . 7426732
50.39 '. 26.80
38.64
-
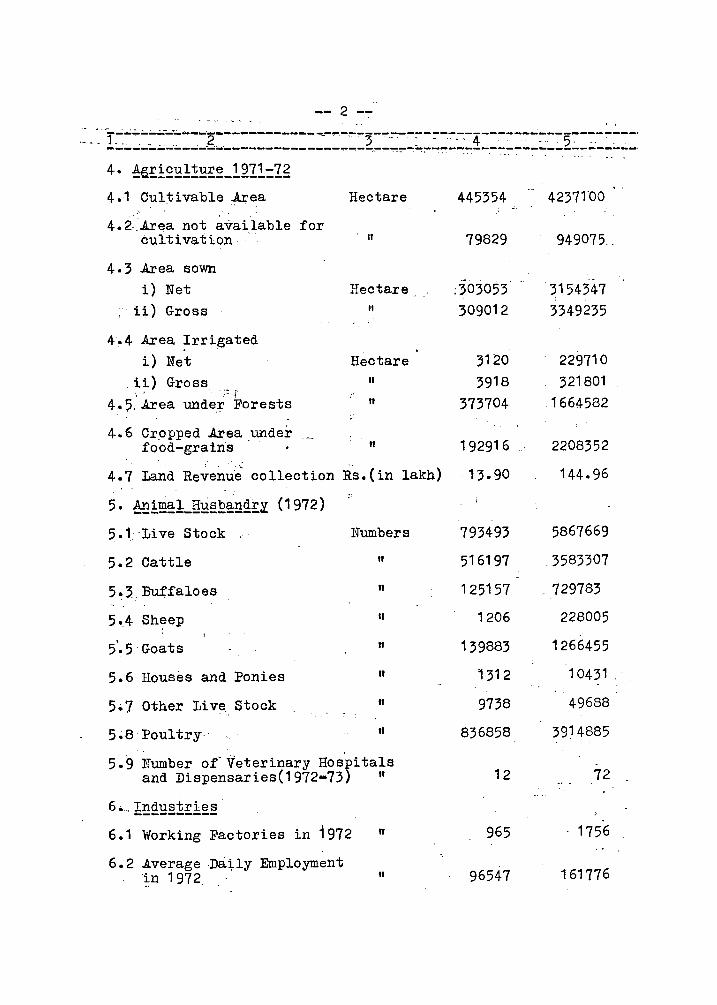
-- 2
' ... r:~~:=:~=:::g:=:::=:::::=-:::::~.::~~:~~~::~·:1=.:~::::~::~::::::::: 4. !~!i£~!!~~_!2I!=Ig
4.1 Cultivable Area . . .' '
4.2· Area not available for cultivation .
4.3 Area sown i) Net
; ii) Gross
4.4 Area ~rrigated i) Net
. ii) Gross . ,0 r 4.5. Area unde,r Forests
4.6 Cropped Area under food-grains .
Hectare
"
Hectare
"
Hectare
" II
" 4.7 Land Re~end~~ collection Rs.(in lakh)
5. !£1~~1_g~~£~~£!~ (1972)
5.1 Live Stock
5.2 Cattle
5.3 Buffaloes
5.4 Sh7ep
5'.5' Goats
5.6 Houses and Ponies
5. 7 Other Live. stock
5.8 Poultry'
::
Uumbers
" " II
II
II
" ,I
5.9 Number of" Veterinary Hos'pi tals and Dispensaries(1972-73) II
6··!!!£~~1!i~~
6.1 Working Factories in 1972 II
6.2 Average ·Datly Employment ~n 1972 II
445354 42371'00
79829 949075 ..
.. :303053 3154347 309012 3349235
3120 229710 3918 321801
373704 .1664582
192916 2208352
·13.90 144.96
793493 5867669
516197 .3583307
125157 _ 729783
1206 228005
139883 1266455
1312 10431 ..
9738 49688
836858 3914885
12 72
965 1756
96547 161776
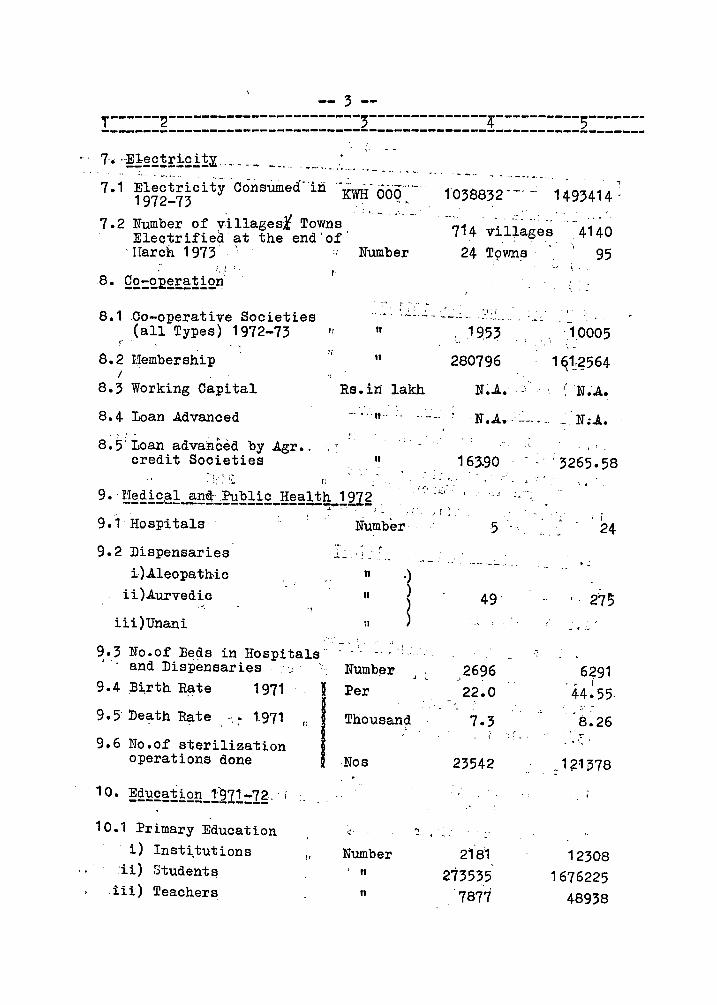
-- 3 -------- -----------------------;--------------4----------5-------T 2 ___________________________________________ _ ---------------------
7-. ·,;m!~£1!:i_£.g~". ,_ _ _ ... ,_ .... _ '. _ ... , ... '. __
' '7.1' Ele~·t~ici ty 'Consumea-'iii '-~- 000'-'-' ...... - '. '-" '". _ ••• 0.- ••
1972-73 " ' . ~ 1038832 - ,_. -. 1493414'
7.2 Number of villagesl Towns ...... ,'. -, , Eleotrifie~ at the end'of' 714 villages 4140
'lIarch 1973 . " Number 24 T9wns 95 , i.,r :,
8. Q£=£E~!~1i2n
8.1 .Co-operative Societies (all Types) 1972-73
" 8.2 Hembership
/
8.3 Working Capital
8.4 Loan .Advanced
8.5: Loan advaEced by Agr., credit Societies
l ... . '.
I'
tj
. 7' ~. :-. ,"" . • j ~ , T ._ ........ - -_. __ . '.'.:
" "
Rs.il1 lakh -.... It ..
It
,19.53
280796
N~.A.'
'N.A.,
163.90
9. I'Iedical and ,Public Health 1972 -~---~----~-------------~~~-~;.
I r.· : . . -~ · ••. r
9.1'Hospitals
9.2 Dispensaries i).Aleopa tholc
ii).Aurvedic
iii)Unani '!
9.3 No.of Beds in Hospitals" , and Dispensar ies ~'
9.4 Bi,rth R~te 1971
1.971
9.6 No.of sterilization operations done
10. Education 1'971-72. ' -----------------10.1 Primary Education
i) Insti,tutions 'ii) Students iii) Teachers
r' ." • ./ I ...
" " II
Numb~r
Per
.) ) ) )
Thousand ,
Nos
t!:
Number
" "
5
49
2696 22.0
7.3 ,.
23542
':'
2181 273535
7877
"; :
, '
.. '-
, -'1.0005
161·2564 \ .. -N~A.
N;J..~
• ,1 ,
0"3265.58
, !
24
. ~
. "
6291 , . I
44.55· .. .. 8.26 '" ... "-
_ 1?~o78
12308 1676225
48938
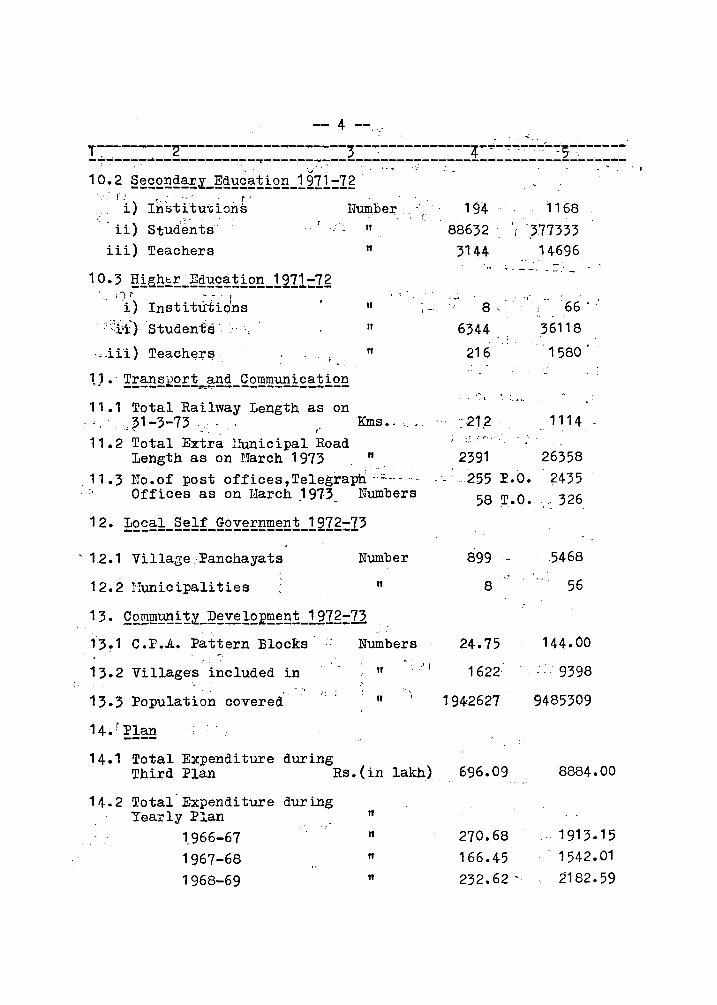
-- 4 --.... - . "'.
T~-. ---:---'2-------------------3---:-----------4-... -":"~---;..-:;."':-------~---------------~~~~------------------------------------------~-,- ", \ - ,::. '.. .,
10.2 §~£2E£~!~_~~~£~!i2E_l21l=lg' r! , ~ -i) Insti tU'Uons Number
ii) 1-:-
Students " iii) Teachers "
. ," j'-,,, .,.., -- J
i) Institu:iio'ns " , -''i;t)Studeni:s . " , .. iii) Teach~:r~, "
1).' !E~§~2E! __ ~E£_Q2~~i£~1i2E 11.1 Total Railway Length as on -,.,~1-3-73 ' . ,. Kms •..
11.2 Total Extra lIunicipal Road Length as on l1:arch 1973 II ,
.11.3 No.of post offices,Telegraptl "'~ ... -.
. :. Offices as on March ,1973 Numbers
, 1.2.1 VillagePanchayats
12.2 l'Tunicipalities
Number
II
13. Q£~~~i!~_~~~1£E~~E!_!21g=~
13~ 1 C.P.A. Pattern Blocks ,.
Numbers ..
13.2 Villages included in " : .J I
J! ; .', 13.3 Population covered "
i -
14.r~1~
14.1 Total Expenditure during Third Plan Rs.(in lakh)
14.2 Total' Expenditure during Yearly Plan "
1,966-67 " 1967-68 II
1968-69 "
194 88632
3144
1168
. )77333
14696
'- .( .. 8 ' 66 . ,
6344 36118
216 '1580 .
:2l2 ' 1114 ..~. f. r. , •.
2391 26358 .. '.255 P.O. g435
58 T.O •. ~ 326
899-
8
24.75
1622
194:2627
696.09
270.68
166.45
232.62 '
5468
56
144.00
9398
9485309
8884.00
1913.15
1542.01
2182.59
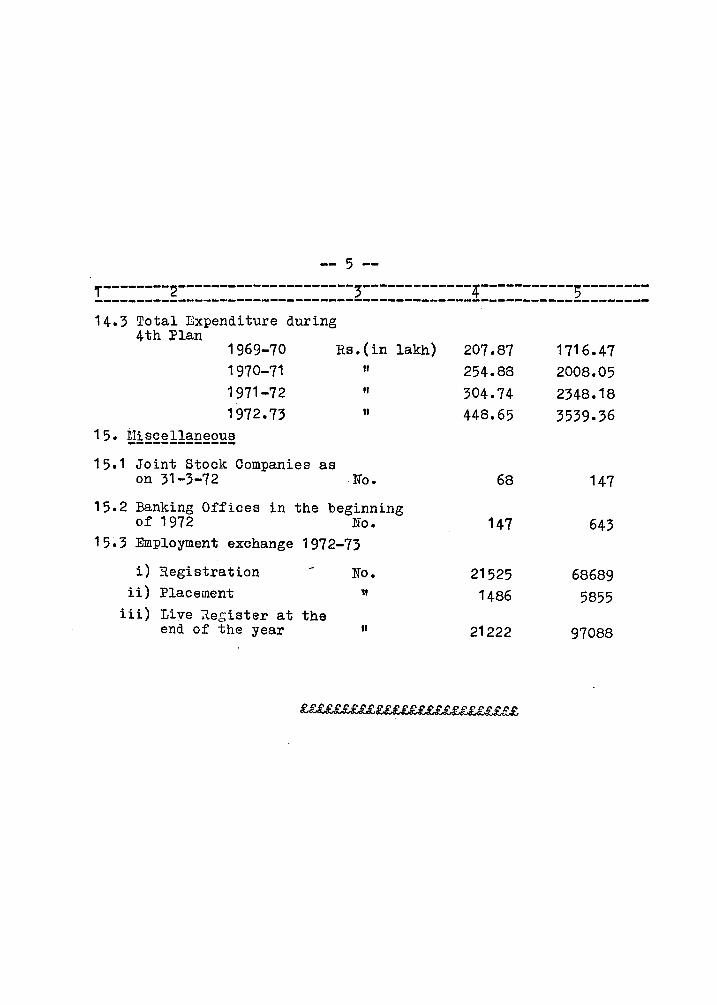
-- 5 -T--------~---------------------;-------------4-----------5-------------------------------------------------------------------------14.3 Total Expenditure during
4th :Plan 1969-70 Rs.(in lakh) 207.87 1716.47 1970-71 If 254.88 2008.05 1971-72 " 304.74 2348.18 1972.73 " 448.65 3539.36
15. ~i~£~11~£~Q~~
15.1 Joint Stock Companies as on 31-3-72 . lifo. 68 147
15.2 Banking Offices in the beginning of 1972 lIo. 147 643
15.3 Employment exchange 1972-73
i) Registration No. 21525 68689 ii) Placement 11 1486 5855
iii) Liye -aegister at the end of the year " 21222 97088
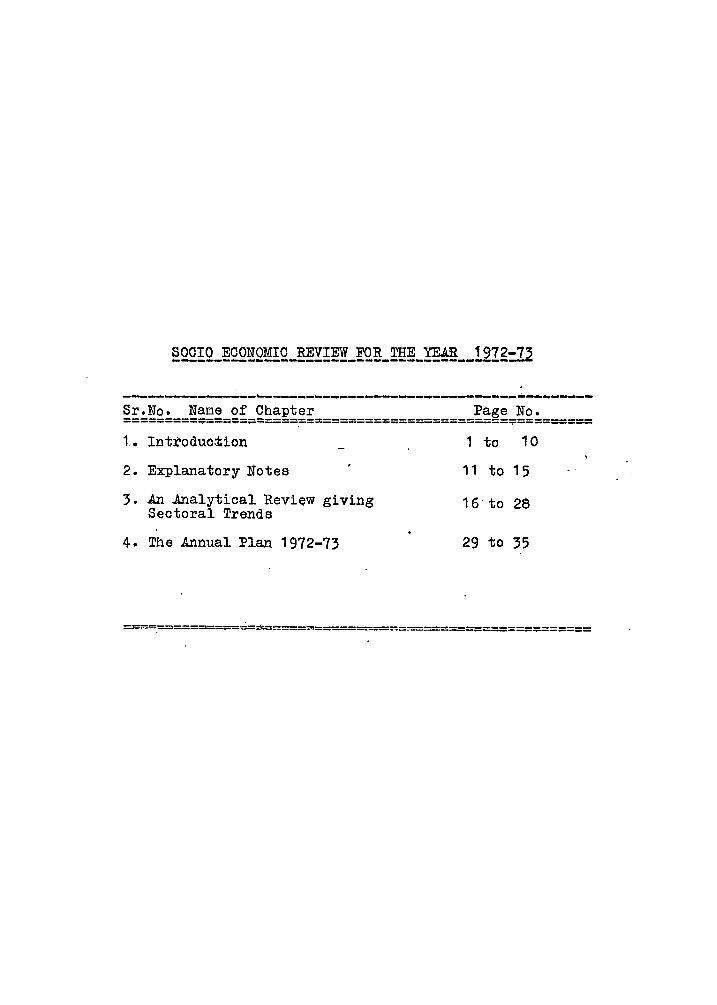
----------~--~-----------------------------.-~~-----Sr.No. Nane of Chapter Page No. =========.===;=~=====~=========~==============~=========
1. Introduction
2. Explanatory Notes
3. An Analytical Review giving Sectoral Trends
4. The Annual Plan 1972-73
1 to 10
11 to 15
16 to 28
29 to 35
==.======::::'=~=='========:;:::===::=====================
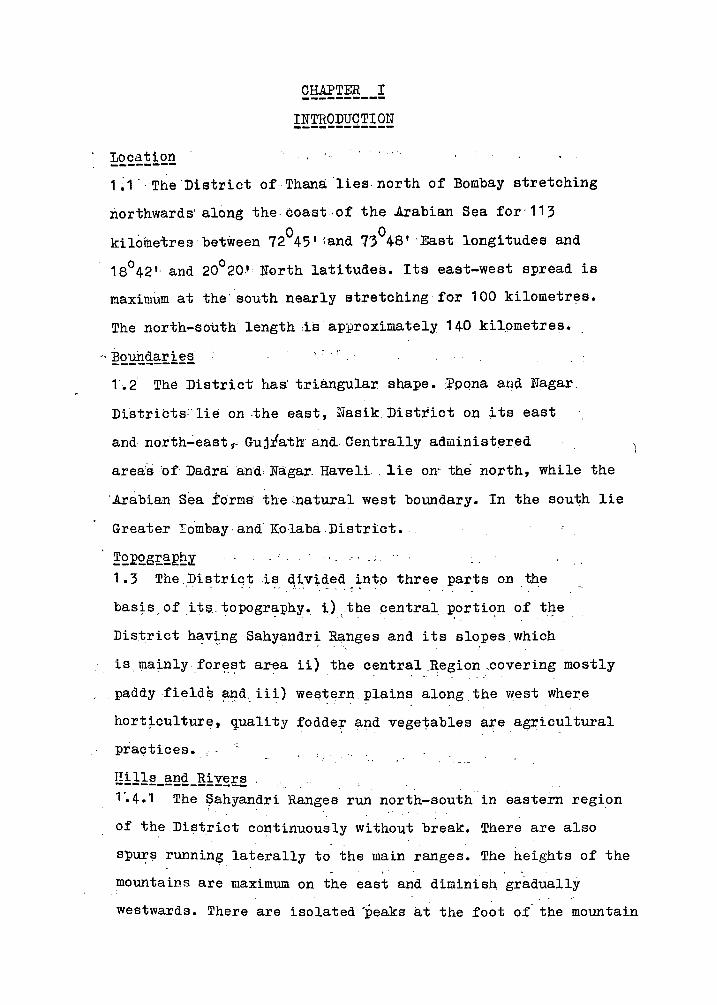
CHAPTER I ----------INTRODUCTION ------------
Location --------1 ~1 . The'District of· Thana lies north of Bombay stretching
northwards' along the coast ,of the .Arabian Sea for' 113
kilometres between 72045' (and 73048' 'East longitudes and
180 42" and 200 20 1 N0rth latitudes. Its east-west spread is
maximum at the'south nearly stretching for 100 kilometres.
The north-south length ;is approximately 140 kilometres.
-. ~2.~£~!'.i~!a
10 i The District has' triangular shape. J?pona and Nagar
Distribt~'lie on ~he east, Nasik.Disttict on its east
and north~east~ GUjtathand,Centrally administered
areas 'of Dadra and Nagar, Haveli . lie on' the north, while the
'.Arabian Sea forms thecnatural west boundary. In the sou~h lie
Greater'rombay.and Kolaba..District •.
~2.E2.g!'.~Eht ' .,' 1 .3 The .District -is d,i.vtded into three parts on the
.. ' . - . - ':" .
basts of ite .. topography. i) ,the central.portion of the _. . - - . ". I
District having Sahyandri Ranges and its slopes which . ..... '.
is mainly .for~~t area ii) the central Region ,covering mostly
paddy<fields ~nd.iii) western plains along the west whe~e
hort~culture, ~uality fodder and vege~ables are agricultural
practices.
Hills and Rivers ----------------1'.4.1 The ~ahyandri Ranges run north-south in eastern regi.on
of the Dil;3trict continuously without break. There are also
sp~~ running laterally to the main ranges. The heights of the . ,
mountains are maximum on the east and diminish gradually
westwards. There are isolated ~eaks at the fo~t of' the mountain
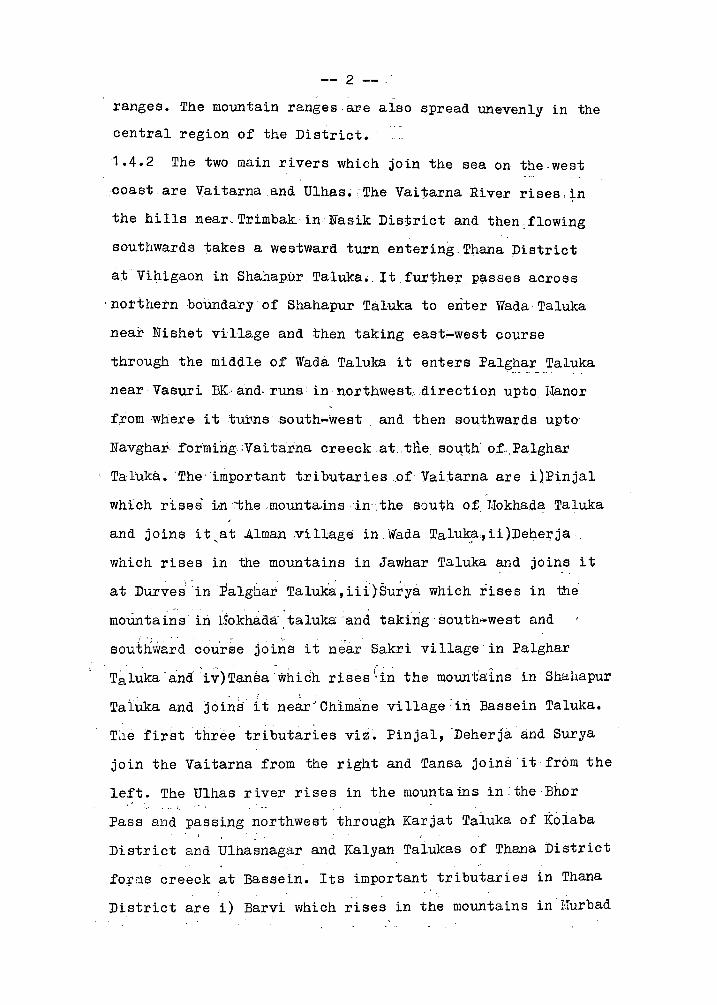
-- 2 -- "
ranges. The mountain ranges ,axe also spread unevenly in the
central region of the District. '
1.4.2 The two main rivers which join the sea on the ,west
,coast are Vaitarnaand Ulhas~ :The Vai1;arna River rises,in
the hills near, Trimbak· in Nasik District and then : flowing . ,
southwards takes a westward turn entering Thana District
at'Vihigaoil in Shahapur Taluka., It fuxthe;r passes across
. northern ,boundary of Shahapur Taluka to enter Wada Taluka
near Nishet village and then taking east;..west course
through the middle of Wada Taluka it enters Palg.~8:r_ .Taluka
near VasuriBK and· runs in: northwest·, direction upto Uanor
from where it twns south-west and then southwards upto
Navghar forming:Vai tarna creeckat,tne. so-qth' of ... Palghar
T"altika.. 'The 'important tributaries of Va ita rna are i)Pinjal
which rises i·n:themounta.,insin-,the south of. Uokhada Taluka
and Joins it,at ..Alman.village in,Wada Taluk~,ii)Deherja
which rises in the mountains in Jawhar Taluka and joins it
at Dur";'es!in :Palgllar Tal~, iii)Surya which :rtses in the'
moUntains in i.Tokha.da.· ·taiukaand. taking' sOuth~west and
southJ'ia.rd cou'r~e joins it near Sakri village' in Palghar -
T~luka andiv)Tansa--which rises I. iIi the mountains -in' Shahapur
Taluka and join~ it ne~r·· Chimane village :in Bassein Taluka.
T;le first three tributaries viz. Pinjal, -Deherjaand Surya
join the Vaitarna from the right and Tansa joins'it from the
left. The Ulhas river rises in the mountains in~theBhor
Pass and passing northwest through Karjat Taiuka of Koiaba . -
District and Ulhasnagar and Kalyan Talukas of Thana District
fO~QS creeck at Bassein. Its important tributaries in Thana
District are i) Barvi which rises in the mountains in Hurbad
-- 3 --, Taluka and joins it at Apti village in Ulhasnagar Taluka
" '", ~ , • " ", " '\ ' : .. , I " " ,
and ii) Bhatsa which rises in the mountains in Shahapur Taluka • : .'. J, ~ • ~ .' ,.' ~ '. : •• \ ': : .•. : :
and joins it at Vadavali in Kalyan Taluka. Kalu 1S an important ~
tributary of Bh~tsa'River: It rises 'in the mo~tains in 'Shahapur " ;.,.. ...
Taluka and joins Bhatsa River near Sangoda in ic,ilyan 'Tal~ka': Both .' . '. ~
these tributaries viz. Barvi and Bhatsa join it from the'right.
'The Vai t~;na is ~~vigabIe' for 25' kiiometres in slde' the Cb8~ and r:" ,- • ::L.~ _ .....
Ulhas is navigable for nearly 40 kilometres from Kalyan. 1 "
,';" I • , _1-4 .,-
The soil' types' or"'Thana' District can be' conveniently divided .. :. :',',.. - ~
., ..... : .... "..!',...
into three categories: i) Black soil cp;ntaining. san.d,~ _ ..... __ .-. -.. . ... , .. _ ... --- -.--- _ ... _.
ii) Red soil in ,the eastern regions mostly on the . "sloPes ,and' ,'.. _ ,,', " .' . I
iii) Broymish black soil in the patches of t~e valleys 1 " flostly :Lying' 'be:tween' the coastal plains:' and' ~the-::
, : hill¥ :sl<?:ves pf Sahyandri. The first" type of 's'oil :Ls' fertile and is useful, for
. ~ . :', ',', ! 't'~. i second type is useful for growing coarse millets like Nagli and
_'. I r-.. . .. ,;",', .' I"': . I
vari. The third type' is useful particularly for 'paddy. First • . r : -'. _ _ . - ;. I -. ( ,-, .' - - ',' t.
type of'soil is found in Dahanu, Palghar, Bassein and Thana ," J : .. ,.'
. -_~ .', , • "\ ,_. - ~ _ • r _ :.- -..,--
the second type (Red soil) is ~sp~cl~lly - ". i.
T~lukas whereas ~
prominent in LIokhada, Ta"lasari ~nd' some partso! other taluk:as
on the eastern slopes. The third t,ype of soil is found in Bhi
wandi, Kalyan and Shahapur Talukas.
, , ... '. ~ '" _ ., <. ... 'r'~" . ".:. " .
, 1. 6 ~he clLma'te 'of' ,the' District is disiinct1y'dLffer'ent',":
'on th~' coastal plains and' oh-the' eastern· siOpE;s.'13elng ,fully
'tropical, ,the ciimateonthecoast (Le.':~he coas-tal strip'"
including Thana, Eassein, Palghar'ahd 'Dahanu Ta-ll1.kas) is:very
humid and warm~' The variations in the-' temperature ~are 'smal!
-- 4 --- "
on this coastal region. On the, ?ther hand" the climate on the
eastern slopes,.and '~n, the Pl~,ins at' t'he foot of ~he sl~pes is \
hot and comparatively less humid. However, the variation in the ',','" {::"" '.i '
temperature on the eastern region is more than that on the • .:. v j .' ": • • r .~ . . .. ~ ..;; .:" 3 j. \
coa~ta:j. E3trtp • • ~ '.: J • .:..
Rainfall ,,~.:-~-::------ , '.r, .
1.7 The District gets assured rainfall of 2000 to 4000 mms , ,',',' " i'"" . :.~ " '. ~ (", ':" '.' . ~', ... ' ~'_' ',r,:
from.~he, ~outh west non~o,~~ ,f~om June to S~Ptelll'!J.~r •. ~ven though
scarcity is a rare phenomenon in this District, the rainfall
rece~yed. throughout the District during 1972 was much less than , " ~ .. -.: ~~: . _.' ... - ,I .l.':.'.1 -';. ~. . .• ~ 1. ~ . :
normal creating scarcity conditions in the District • . ,
. '.- ,-:: I • '.~. .::' ~.. '.. • • . ) , J' ,_,
1.8.1 The total geographical area of the District is 9553 :, r ":.j' : : 1,;'" .;',.",. {- ' •. :;."/ • .' ,: i :.: " _ ; , 'Square.kLlprne.tfe~io·ut.,,6f whd..9h.934~~5,Sq.K1;n is.rural and
203.5 Sq.Km. is urban"Th't.·'Dist~ic:t -con~i~:sts~ of '1622 villages r r ,- ..." r-. ,I ' " , _.': I . :-.' ,'I ~ .
(1588 inhabited and 34 uninhabited villages) and 24 towns as per
1971 .gen~~s. -~ .' '. ~--....' .. ... , .; ; . '.1.
1.8.2 D,uring the period from 1961 to 1971, Kalyan taluka was -;'1' .': .:. j. • "._ ; i ~- ,,,~. . .:. . . '.1 •
split"up into two talukas Kalvan and Ulhasnagar. The total • . , '. 1 ,u, ..'
-'.'.: .l.. . . .' ? 'I • I ': I.
number Of taluka~ ,ip the Di.!3trict therefore incr.eased from 12 to :,.l ~ r· ! : • ' •. ' \ .l.- ..' '\ •• ~ _ .J
13 during th,is period. The head quarter of the newly created. '.. ,", ,"'" ,.1.,.1 ,r ' • '.
Taluka is .Ulhaspagar Town. 'I I' • .:..!. t 1. ':.'
Forest ------ .. 1.9.1 The area covered under Forest in the District is
3,73,704.(197~c72).hectares wp.ich,~·Jorms 39.12 percent of ~he
total geographical a,rea of· the District. Th.e talukas of Mokhada
Jawhar., Dahanu, .Viada,. S)1a: ... apur .. are comparatively thickly wooded .... ". '. . ~ "~ - ,". '., .
whereas, those of Thana, Kalyan, Ulhasnagar, IA:urbad, Bhiwandi, , • , ) .J. ',. • • • •
;Sass~in, Palghar ,and Talasa~i are. thinly ywod~d~~he forests
-- 5 --
in the District fall under the type "~ropical moist (mixed
deciduous forests) II ~Teak is the, i,mpo~tant species in the _ . ... -, .. ,
forests of this District. Besides ,Teak there are other
speci~s viz. Ain, Hed, Shisham, Bibla, Kal~m,.Khair, Sawar,
Kakat, Shemat etc.
:i~h~!:i~~ , ')" '. ,
1.9.2 The coast line extends for 'over' 113 kilometres and ! • • "
marine fishing is practiced allover the 'coast in the District.
Deep sea'fishing is also'qarried on with the help of trawlers. ,T ' '
The fishing trade has floUr islled in the District as there: is
always a demand for fish in the market at'Bombay. The annual
fish landing fluctuates much depending on many fa~tors. The
average fish landing from marilie fi-shery perye?J.r :for the
l~st ten' years (62":63 to 71-72) i'sestiLiated,to be ,67,500 , , • t '
tonnes. Fishing and fishing trade is increasing gradually and
. still has vast potentiall iies~- .,'
!Iinerals -------- ,
1 .10.1 The mining activities are confined to quarrying of
stones ~nd sand. Stone and 'sana.: quarrying. is carried on -: .
. especially at plac~s whiCh" are near urban areas in Kaf.y~, • I· (. .' "
Bhiwandi and Thana Talukas.'
1.10.2 Near Tungar Hills in 13assein Taluka, deposits of
baunxit containing aiu~irfium are found:but,the exploitation
of'the deposits has not been-made. Deposits ,of reddish
laterite clay are also'found'near Gokhivape in BqsseinTaluka.
This clay is used for uaking bricks,' tiles'·and Ch0'lP red
glazec. wares.
1.10.3 '.I:here are' also eprings of mineral waters containing
'traces of sulphur at Kokaner, Sativali, Vajreshwari, Ganesh~uri
-- 6' -
etc. This water has medicinal value.
1.10.4 There'are salt centres on the coasts in Thana and
Bassein TalUkas where salt is produced by direct solar evaporot-
ion of sea wate;t"~ .
~212B1~~12!}
1.11.1 The population of Thana District as per 1971 Census is
22,81,664. The rate o.f increase of population during the decade
1961-71 was 38 percent and that dm;ing the decade 1951-61 was
;~'29 percent. The 'increase. in th.e .growth rate is probably due ,.. , • ! '-. .
tc;f'large' scale m~gration of people from outside the District in '.
search 'of employment to Thand. industria,l complex. The housing
'. problem in. Gr_ea:ter·. BombCly:, is . a~so a reason for large scale
migration of people f,rom Gref;ter Bombay to the areas surrounding - \".. . -
Greater Bombay wnichlies just, adjacent to the District.
1.11.2 JQut o.:C the. total 1971 population of 22,81,664 , " - . . ,~ , . '. :
12,04,855 are males and 10,76,809 are females. The sex ratio in
terms o~ females per 1000 males in this District as per 1971
"jCensus is 894. The sex ratio iI;l the ,District shows a decreasing
trend. It was·940, 920~ 91.9 during the year 1941,1951 and 1961
"respectively,., Th~"percenta3e of urban population in the District
is 36.'23 and that of rural population is 63.77 as per 1971
Census .. The percentage of urban population to the total popula
tion-is highest ,in Ulhasnagar Taluka (82.86%).There is also L .
substantial proportion ,of urban population in Thana (65.63%)
"and Kal~7an, (62.56%) Talukas. Three talukas viz Talasari, Uokhada
and :Iurbad are complet~ly rural and the proportion of urben
populatiGn in other Talukas varies from 5 to 33. The total
working population in the District as per 1971 Census was
-- 7
8,53,672, out of which 2,78,984 (32.68 %,) were cultivators
1,79,784 (21.06 %) were agricultural labo~rers and 3,94,904 '. . ....
(46.26 %) were engaged in other categories. The proport~on of
non-working population among males exclusively during 1971 was
45.78 percent where the corresponding proportion of , non-working
popu+atLm among feooles exclusively was 81.39. The po~lation
of Scheduled Tribes in this District as per 1971 Census was
5,79,538 (25.40 1~) and that of Scheduled Castes was 36,170
(1.59 %). The proportion of Scheduled Tribes in this District
decreased from 30.29 % in 1961 to 25.40 ~ in 1971. The popula
tion of Scheduled Tribes is spread i~ the T~lukas of , Tala sari,
Dahanu, Palghar, iiada, Jawhar and IIokhada. There are also some
pockets of Tribal population in Shahapur, Hurbad" Bhiwandi
and Bassein Talukas.
1.11.3 The overall population density in terms of number of
persons per square kilometre during 1971 was 239. The populatioI
density for urban areas is 4063 whereas'it is 156 in rural
area. There ar~ 24 towns J 8 municipal and 16 non-municipal),
and 1588 inhabited villages in' the District as per 1971 Census. [ - - - "
Two towns of Thana and Ulhasnagar have': population of more' than -
one lakh while the population 'of Kalya~ tovm is little-less
than one lakh.-
1.11.4 The percentage of literacy' (i. e. percentage -or- Ii terat-
es to to'tal popuiation) during 1971 was 40.65 and the- saiJe - -
ratios for ~'161 and 1951'were 30.54 and 24.34 respectively. The
percentage of literacy among.females exclusively hag however
not kept ?A.ce with that among males exclusivAly. The literacy
percentage for females excli.lsively has i:ricre'::'~<~Gi':;:,om ? .58 in
1941 to 14.19 in' 1951 and fClrther to' 19.06 iYl - -;;:: 1 and 29.80
in 1971. The corresponding percentage for males exclusively
-- 8 --
has, however, increased from 25.84 in 1941 to 33.52 in 1951
and furth€r to 41.09 in 1961 and 50.34 in 1971.
·~&!!!iu!~!r~!lY~_~~!=~P
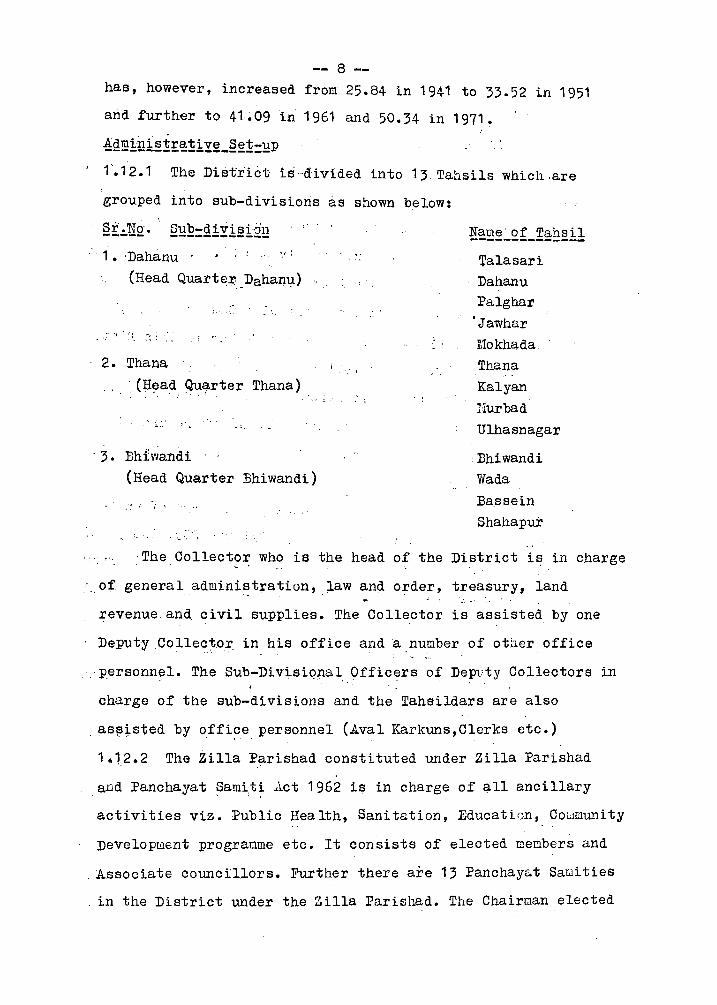
1'.12.1 The District is ·d'ivided into 13 Tahsils which ,are
grouped into sub-divisions as shown below:
§t~IT£· §~£=~lYl~iQll
1 • 'Dahanu - ',' :
(Head Quarte~ Dahan~)
2. Thana
JH~ad Q~~rter Thana) ,. !,. ••
, 3. Bhlwandi
(Head Quarter Bhiwandi)
. ~ ..
• ' .... I
Name' of Tahsil --------------Talasari Dahanu Palghar
" Jawha.r l10khada Thana Kalyan IIurbad Ulhasnagar
. Bhiwandi Wada Bassein Shahapur
'The Collector who is the head of the District is in charge
,',of general admini~tration, law and order, treasury, land
revenue and ?ivil supplies. The Collector is assisted, by one
Deputy Collector, in his office and a ,nut::lber of otLler office
.. "personnel. The Sub-Di visiqnal Officers of Deprty Collectors in
charge of the sub-divisions and the Tahsildars are also
as!?tsted by offi?e, personnel (.A.val Karkuns,Clerks etc.)
1.12.2 The Zilla Parishad constituted under Zilla Parishad
and Panchayat ~ami,t~ Act 1962 is in charge of all ancillary
activities viz. Public Health, Sanita.tion, Educati0n, COWffiilllity
Development programme etc. It consists of elected members and
"Associate councillors. Further there are 13 Panchaya.t Salili ties
in the District under the Zilla Parishad. The Chairman elected
-- 9 ....
by the members of the Panchayat Samiti works as head of the , ., T
Pancha:yat SaIlli tie The -v'illage t Panchayat iff the lowest local
"body in th:e' ~lin'e of local administration. In; Thana' District '. i,. . ... ,. , t " ' t :
there wete 899 village panchayats'as on 31-3-73·~
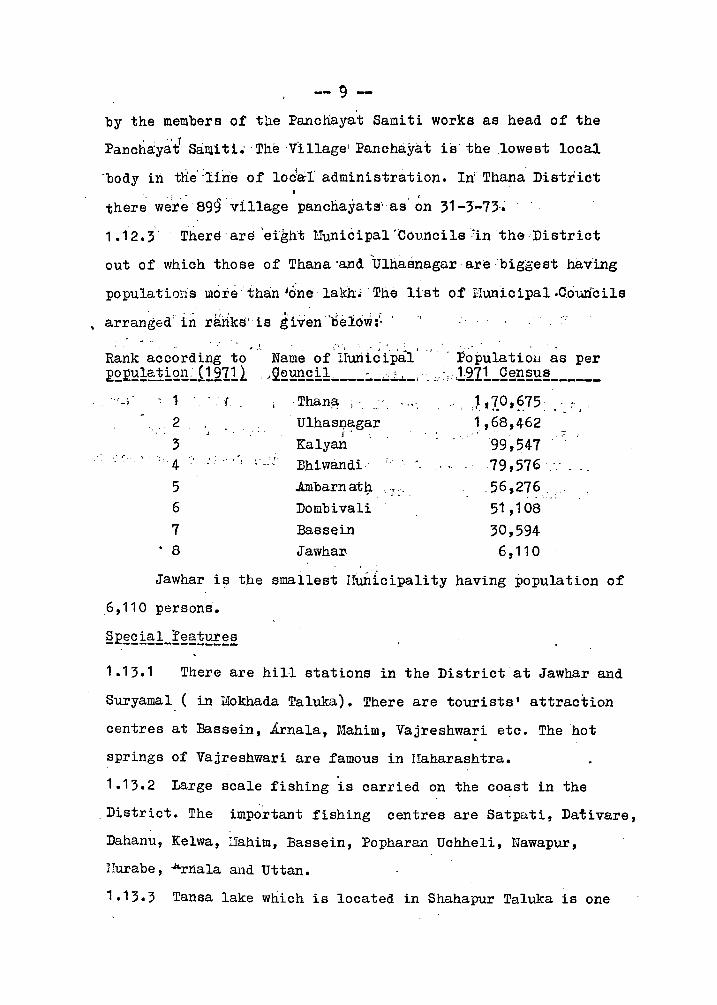
1.12.3' Thers'are 'eight lIunicipal'Councile'in'the,District
out of which those of Thana 'and. 'Ulhasnagar,arebiggest havIng
. populations Ulore"than lo"ne lakh~' The list of ITunicipal.C.6uncila
arranged: in rarlks"is given ''tielow:~ ,
Rank according to .. ', Name oflTuriicipat' E2~~!~~i££~i!2111 "QQ~£i! ____ ~_~l._,
1 f. ,Than~ j ......
2 UlhasI;lagar J f .
3 Kalyan .' r, -; ',:
, " : t, i,' 4 .' ~ J Bhiwandi,
5 .Ambarn at.9. ' J ~" .
6 Dombivali 7 Bassein . 8 Jawhal\
. Po pula t i ~ll' as per . c'~' ·,121!_Q~!!~~!L ____ _
J.Io,?75, ."'.' 1,E)8,462
99,547 79,576
,56,276 , . , 51 ,108
30,594 6,110
Jawhar is the smallest Huntcipality having population of
,6,110 persons.
§E~£i~l_~~~~~!~~
1.13.1 There are hill stations in the District at Jawhar and
Suryamal ( in Mokhada Taluka). There are tourists' attraction
centres at Bassein, Arnala, Mahim, Vajreshwa:i etc. The hot
springs of Vajreshwari are famous in lIaharashtra.
1.13.2 Large scale fishing is carried on the coast in the
,District. The important fishing centres are Satpati, Dativare,
Dahanu, Kelwa, :'iahim, Bassein, Popharan Uchheli, Nawapur,
J'Iurabe, Arnala and Uttan.
1.13.3 Tansa lake which is located in Shahapur Taluka is one
-- 10 --
Of the biggest lake having large catchment area. It is the
major source of water for Bombay city. At present, a Dam is
being constru.cted on Bhatsa River in Shahapur Taluka for
augmentation of Bombay city water supply. This project is
_likely to be completed by-1977.
1.13.4 --.A large dairy project has been started at Dapchari
in Dahanu Taluka in this l?istrict with the purj?oseof
shifting stables from Bombay to Dapchari. This project is ':'.~ . :
-constructed on modern._lines_and deserv-es spec ial mention.
1.13.5 An .Atomic Power Plant has been established at Tarapur
in Palghar. Taluka for generating electricity from nuclear
energy. It is a major achievement in the field of science and
technology in this country.
-- 11 --
Q~~I!11L_!!
~~E!~~~2£~_~2~~~_2~_~g~_~£~E~_~~_!!~!~~~!2~~_~f_~~~~ :e!:£~£!11£~Li~_~~~_II_~~~!!~~!£~!_~12~1!:~£~ \"
2.1 The total number of tables presented ih Part II '-Statistical
Abstract are:'eightiy eight which a~e' classified into 'thir'teen
groups. The: scopela~d limi'iati'ons 'of these 'tab'les, are 'described
in the foregoing paragraphs.
~£~_~!1~_~Q:eB1~!iQ!1
2.'2 There are seven tables ,in this group; out of which s:i,x
tables give 1971 Census data regarding area,houses,and
'population, 'dec~dal' variationdf population, since 1951, "',
classification'of villages'a.ndtowns. according'to population
ranges,-di~tribution of District population according to. workers
an'd non.;.,worke·rs a~ well as Scheduled Castes- and Scheduled,
Tribes for'every TalUka.. Distribution of:District:popu]4tion
as per 1971' C'ensus 'is givEm according to' age groups" and·", , ,
religion in the remaining table.
Q1il!~!£_~!!~_g~i!!f~11 ,'- ,.' .::- -, .. ":,-
monthwi'se ratnfal,i'da.ta oithirteen centres in ,the District~ and . '," ','
temperatutedata of clliiyone: 'centre' (Dahanu) for~ the year 1972. i. .~, : ~: ~-. ~. . -:: ..
,' .... :," , ' , ,
2.4 The first' ~ix tables out of th-e 'tota'l twel~et'ables in
this group P;ovide'aata 'forille yei1r "':, ~7oj~h 'and 1971"':7'2 : ' ''' 2', .. ~ . '.: " . ' ._. '. ~ .; '~" , :
regarding land utilization, cropping pattern, yi'eld rate and . ::" ~ I .
total production', ofllrincipaj. cr~ps, s~urcewise arid cropwise , ,
:-- , r--
area ir'rigated, utilisation J ~f ~ irrigation welis~ Data regarding
yield rate and production is provided for the District asa
,whole'while the data in other tables is given tahsilwise. The
-- 12
next two tables give tahsilwise data ·o:f minor irrigation works
in 1971-72 and major and medium irrigation projects as on
30-6-72 in the District. The remaining :four tables give data
regarding, agricultural wage rates in three selected centres,
tahsil~ise agricultural implements as per 1972 livestock census
scarcity condition and work :for 1972-73 and history o:f sc~rcity
:for last :five years.
~!~~1_g~~2~£~E~~_E£E~~1_~£~_E!~g~E!~~
2.5 There are :five.tables in this group and the :first :four
tables give data.regarding-tahsilwise livestock·as per 1972
livestock census, tahsilwise -veterinary statistics, :for 1972-73
tahsilwise recognised slaughter houses and animal slaughtered
during 72-73 and diseasewilJle J.:l.''I{estock mortality during 72-73,
whereas-the :fi:fthtable is sub-divided into three parts (.A),(B)
and (C) which provide data regarding :forest .areas, major and
minor :ferest product and quantity o:f :fish cured respectively in
the year 1972-73.
~R~£~~~!L_!£~~~!~lL_~~~~~~_~~~_~~~£1E~£~!~
2.6 Out e:f the eleven tables -in ;this group the :first three
tables relate to number o:f :factories and average daily
- empleyment :for the year 1971, . industrywi~e distribution o:f
~working :factories according to. working strength as well as
number e:f days.wcrked. The next table gives Annual Survey c:f
Industries data 1966. Emplcyment Exchange Statistics and relating
data :for the year 1972-73 is giyen in the subsequent three twles.
The next two. tables prcvide data regarding distributicn c:f
Gcvernoent emplcyees as cn 1-7-1966 acccrding to. ranges c:f pay
and emoluments and accerding to. varieus Departments. The last
13 --
two tables give Statistics regarding consumption of electricity "
during 72-73 and villages and towns electrified ,and ~o~ulation • • ~ .. • - • "I, J '
covered at the end of IIarch 61,66,70 and 73 • . :. ; ..
QQ=Q12~!~1i2!!
2.7 There are eight tables in this group, and the ~tatistics
regarding numb~r of Co-operative societies of different types, j . • r .
co-operative Lanks, their membership, share capital,working
'ca~ital,' ioan 'advanced etc. is' ~gtven' in the 'first four tables . _ .' , - , ": .... ' , I ~ '\ ~ I" t'
"and statidtcs r.be1.ating to operationsot Central and Primary
"co-o~erative !lTarlfeting 'Societ"i~s', other 'co~p~ra.ti~e~cieties
and :Regulated j.:Iatkets '\~'" gi ven ill the next three tab'ies.' The . ~ . r '. .. - . . . ........
last table gives data. regarding registered Honey Lender's-. The ,-' •. ~ . !~,~ --\~: J"' '"'1;'
-'data supp'lied 'iri all the tables is for the year 1972-73.
, ~i!!f£~i_~t.~~~!l£Ji'~~!ih ': '~ __ . ~! j' '-'-"~".-;~ I'
2.8 This group includes five tables which give tahsilwise - . --' -
information regarding medical facilities (through public and I , . . ; 1 --,;~ . ; . . , \ -' . !. •
public 'aiued bodies') ,vaccination, family planning an'a. births
"and deaths ill fpur 'separatet'ables, - a.nd informat'ion of the
number of -de~thsdue to different causes' for' the District' as _ .• i" '., . I ~."l ,', .J. " ..'
a 'whole in the remaining table. The data in all these tables
except for that~'relaiing'to famiiy planning'~:i..s given 'rorthe '::- • !'"' ~- . • ',1 ! .'.: -. .
calendar year 1972 and the' data for family" planning is given
for the year· end ing 31 st March 1973.
Education ---------2.9 The first- thr'ee tabies out of seven tables in this group
give'tahsilwise statistics relating to liter~cy, educ~ti6ri 'in . . " .' ' J • ..•. ~,' :
rural and urban areas as per 1971 census. The next table gives
statistics rega~ding -:educatl.~nal iiu3i.'itutions, pupils and
teachers for the year 1972-73. The last three tables provide
-- 14 --
in£ormation regarding Backward Class beneficiaries during 70-71 '.\ , I ' ••
arid 71-72 , Econ'omically BackWard Class concession of Free ~ • I .-. I "I
Educat'ion' during 70-71 and '71-72 and expenditure on primary . - .. )
education by way, of Grant-in-aid to local bodies during 71-72
and 72-73.
2.10 T.b.is group includes seven tables which give Railway ..... , ," ....... " ' ... -
. Ro.utes, .Road kilometreage according to. category and surface . ~ .. ' .' ~. .",. - . .; --' . . .. -' . _.,.: - - ." . .' -.
classification, n.umber of motor vehicles ill ~hana Region, State " • '·1 ",' -. ,,'
Transport actiyities, and traffic intenBity in f.ive dif~er,ent
tables while postal statistics and coverage under rural , J .:..'" • • ~ ~ ! ..... - . . . .f -- . . .-
. broadcasti~g is supplied in the remaining two tables. The data " .j',:,., . . '. .,' \ '- ---' .. .!.
is given for the year endipg 31 st March 19'13 • Exce,pt for traffic .... ~.. -', \ . ' .~ ... , • _ 1 ", • :. l' ~. ',' ! ~ , . ' .'.
intesity (which is for Hay 1971) and pesital data (which is for • • _~ I i _.
the year 1961-62, 1965-66 and 1970-71 to 1~72-73)
~£~!J~£:!i~~
2.11 Statistics for. the year 1972-73 regarding ipcome an~ ;-~ . -'
expenditure of v:illage. panchayats, Zilla :Parishad, l.Iunicipal
Councils is given in four tables, in this group. T4e table
. relating to income and expenditure ,of, Zilla Parishad is, sub-I'. • .:.~ I.
divided into three parts A,. Band C ~or P!esenting data
regarding H~adwise Receipts, Government Grants to Zilla . I .
Parishad and Headwise Expenditure ~espectively. . . I
2.12 Out of five tables .in this group the firl3tt ,two give
expenditure and physical achievements of Distr'1.ct Level Schemes . .
for the year .. 1972-73 and the remaining three tables give stages
and coverage of C.D.Blocks, .their expenditura and physical
-~ .. 15
achievements during the.::Y~~!,'.1~72~?3
Prices ------2.13 : :T~ed~ta .·regarding., ,w}1~lc .. salepriqE;:s. pr~vac.tion i.n 1972
. '. ,". _.' • ... '.. ,.,. ' .•. ~ '. , I • ..
~ .of. certail1' agr,~qu.lturaJ,..coUltp.f?d~ t,t.~S: 'J.a~'.''1e~ec~ed .. ceJ).}~~)~,
averag~ reta~l .. pric.~~,~of ,.,imP9rta.nt .,coI]!moqi ~~es ,.,t;Lt :1ih~. ~ . - -- - - - -- ~ - ~- -, - - : ...
'I ,"
District Head Quarter during 72 and Consumer Price Index during . :' i~' - ':: :) ...... ,!- '.1... ...., I': " " .' . " , ,'._.;.
72-73 at Bombay and Jaiga6ri 'is given in··three :'separats'tables : e -' ~...... f- t~.! ' : .... :" .
in this group • . '-"1 ·r ":;', :'
Ni!!£~!!~~£!!S r' ." .' ~ ~: .. ; I: .
2.~ 14.:, ~l1.e, l~s~ gro:uf". inc~~.~r~.,;~elv~ ta?l~~;; g,~v~ng o::ficial .
. Statistics viz. statistics relating to Police strength,Crime, , '.. . ~ c': • ", .. ' 1" -.' , " 1.. .: '. .' 'J "1:! ~ . " :~.', .~.' i
G.ourts'rCine,!lla.theatres, banking offices and population .-. - . J '. ;. i .J ... ,' , ,;~ .. :._ •. _.~ .,": !.·'.f [.J,' ..... '~ :" ...... :::-:. : . __ '~'. 0' ' ••••••• ~ ••
. covereq. by the banking offices, Joint Stock Companies, ~ ,"' ,' .• - • -L. ',."':Ii .. J ,.', : ... : ~ : " i" " ~ . . ~~~,~(jl~< .. ' ;' .. :~.,J" i. ,:' '. '~"
IBsurance poliCies, Land Revenue, Small Savings, Number of , ,- r "
presses" Journals alId""Gen:.e~al=Elections in eleven tables and (' '.-" ' .. ' ",. "~": ">'. ""'\ .... ~:).:,'.~ "r'.· :',r:- .... ; .. 1\ . '_ '. -~ ._ ,'., • ;,; - r "
important indicators for -the' Dis'trict'-shOwj.:!ig gene.ta.,;t~ trend. " .J .1.. " .... ' '.'. !. '_ , : . .. -'_0 _ .,...._ ••. __ .•. _ .... _ , _________ ... _. _
of-' develoPtne,Il1; ,·in "v~rio.us~:s-e·Qtor-s- over--a: per-loa OI'-1;~()- I-.-.; '. -.. -'.' -. " .J. _.. .. - _
'. ;$$$$$$$$$$$$ ~, • • I _ '
, . , .
16
'Q!!4Eg;:~~ __ 11.1
3.1 l ' In this chapter' some socio economic indicators over a . ' ..
period o:f time are presented showing comparisionamong Tahsils.
!!l£1:£§:iQ.!._liQ.':'..1: :-Percentageo:i: gross cropped area to ,y " net cropped area
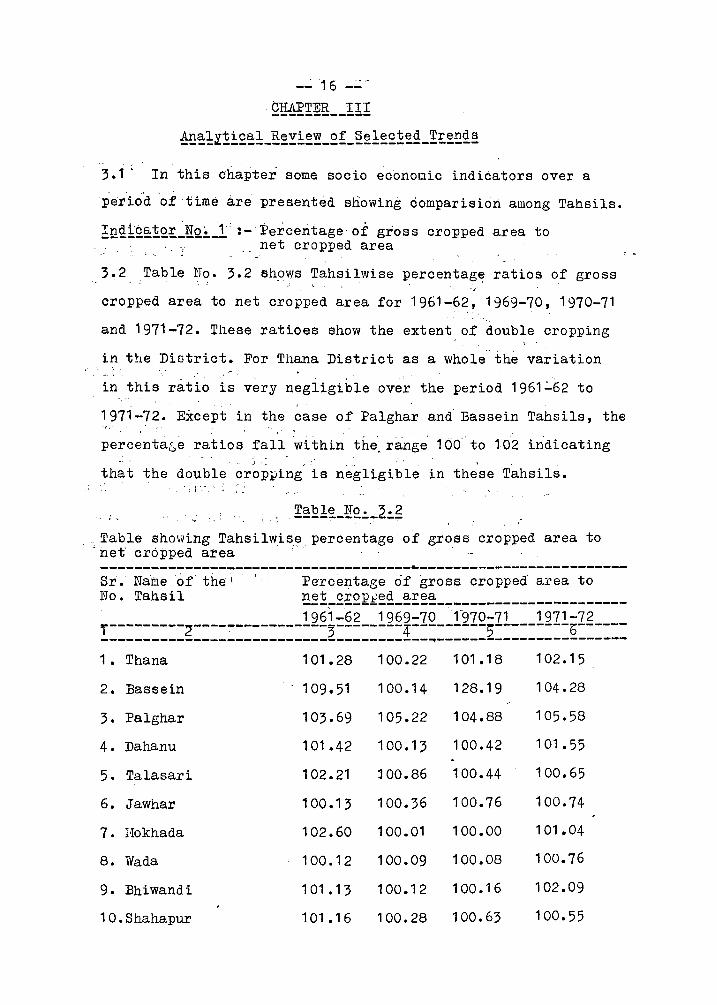
3.2 Table No. 3.2 sh,ows Tahsilwise percentag~ ratios of gross
cropped area to net cropped area for 1961-62, 1969-70, 1970-71
and 1971-72. These ratioes show the extent of double cropping
in the Diotrict. For Thana District as a whole the variation -' -. .. . ~ ,
in this r~tio is v~ry negligi~le ov~r the period 1961~~2 to
1971-72. Except in the case of Palghar and' Bassein Tahsils, the , "
percentage ratios fall 'within the. range 100 to 102 indicating ' .. ,". ,
that the double cropping is negligible in these Tahsils. , ~ 1,
'. : ~
, Table, showing Tahsilwise percentage of gross cropped area to -net cr6pped area '" '
-------------------------------------~-------------------------Sr. Name of the I Pe-rcEmtage of gross cropped' area to No. Tahsil ~~!_£~£R~~£_~~~~ ______________________ _
196'1-62 1969-701"970-71 1971-72 T---------2----~-----------3--------4---------5---------b--------------------------------------------~-----------------------
1. Thana
2. Bassein
3. Palghar
4. Dahanu
5. Talasari
6. Jawhar
7. Hokhada
8. Wada
9. Bhiwandi
10.Shahapur
101 .28
109.51
103.69
101 .42
102.21
100.13
102.60
100.12
1 01 .1 3
101 .16
100.22
100.14
105.22
100.13
l 00.86
100.36
100.01
100.09
100.12
100.28
101 .18
128.19
104.88
100.42
100.44
100.76
100.00
100.08
100.16
100.63
102.15
104.28
105.58
101 .55
100.65
100.74
101.04
100.76
102.09
100.55
-- 17 --
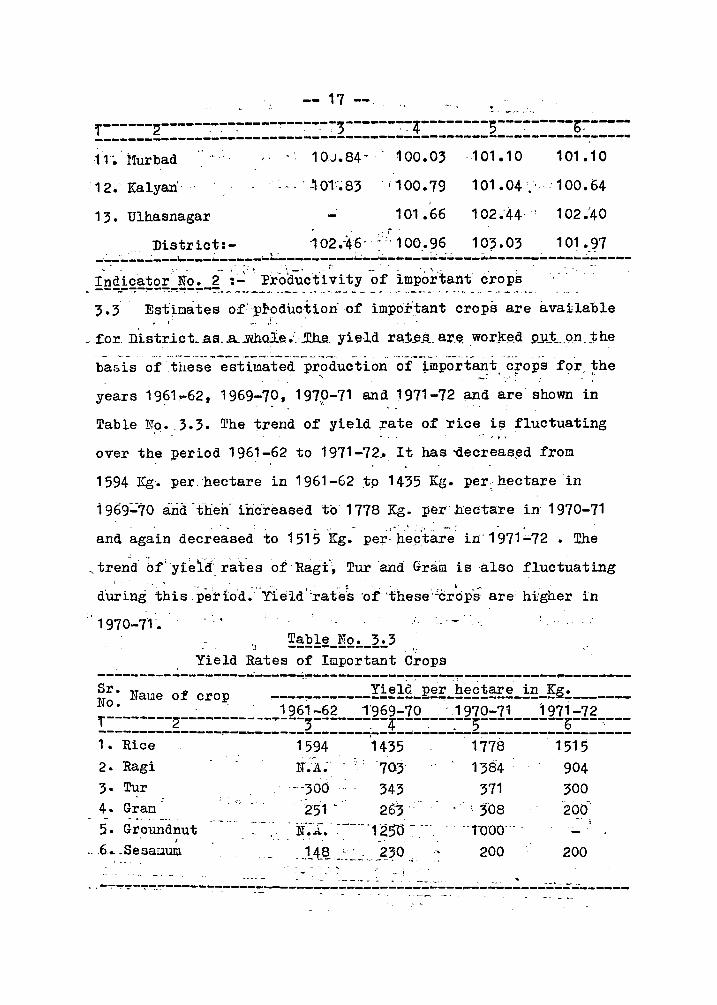
f------2-----~-~-~----~----~-3------~~4--------;---~-----b~--------------------------------------------------------------------11'~ Hurbad .... " 10'J.84·
"
100.03 ,101.10 101.10
12. Kalyan' , ~ , , ' -, Ot'~83 'i 100.79 101.04'.' ' 100.64
13. Ulhasnagar - 101.66 102;44' 102.'40 " t .
District:- '102.-46" ":'100.96 103.03 101.97 -. ..:...:,;..--~-_-\..~.--~-----~------~---.~-... --~:.:-:.;;.---.~----~----~.:..----- " " ,'_" J, \' I • '. '. _ •. ' __"., '.; .!
!~£b£~1Q£_N2~_g:- Productivity of important crops .-.- ......... -.- .. ,-- .... -- ... -~--- .. ~ .. -.-----.- ... ~----.~.- ... - .. - .. --.--.
3.3 Estinates of':production" of important crops are available r .
.... .... - - .- ..... ---- .----- ---.. _- - ..... -- - ~
basis of these estimated production of important crops for the . .' ..... . -~ .. ::' :- . .':'
years 19~h·62, 1969~7?, 197.p-71 and 1971-72 ~d are shown in
Table N~. ,3.3. The trend of yield rate of rice is fluctuating ", "
over the period 1961-62 to 1971-72~ It has ~ecreas~d from
1594 Kg. per, hectare in 1961-62 tp 1435 Kg. per:~ hectare in
; 969::-'10 and 'then' increased to 1778 Kg. per' hectare in 1970-71
and again decrea:sed to 1515 'icg.~ per:'n:~~'tiir~' in' 1'971 '-72 • The , ..
~trend of' "yield', rates of Ragr', Tur 'and Grain is :a:180 fluctuating , ....
. ... ' '.. .. ,' .. :. '.' '., dUring this .period. Y:Leld 'rates 'of ·theseicrcips are higher in
1970-7'1'. '.1
Yield Rates of Important Crops --------------.,.;.----------":.,-----------~--~~----------~-------~r. Nal.1e of crop ___________ !!~!~LE~!:_!!~£!!:!:~_!!!_!~~ ___ _
o. "'1961-621'969~70' 1970-71 1971-72 T--------2-----------~---;------~--4------~--5----------b---~----------------~----------------~-------------------------------1 • Rice 1594 1435 1778' 1515
, ,
2. Ragi If.A: ' ',' 70.3' 1384 904
3· Tur -'-300 ,,343 371 300 4. Gran
. ~:.
251 ' 26-3 ., " ; 308 200-- _ ....
5. Groundnut - N":X.~---'--125rr~ --- .. ' "rooo'" ~ I -'
6, .. _Sesauum. 148 L', 230 ... ___ _ r_~_ .... __ . ..; 200 200
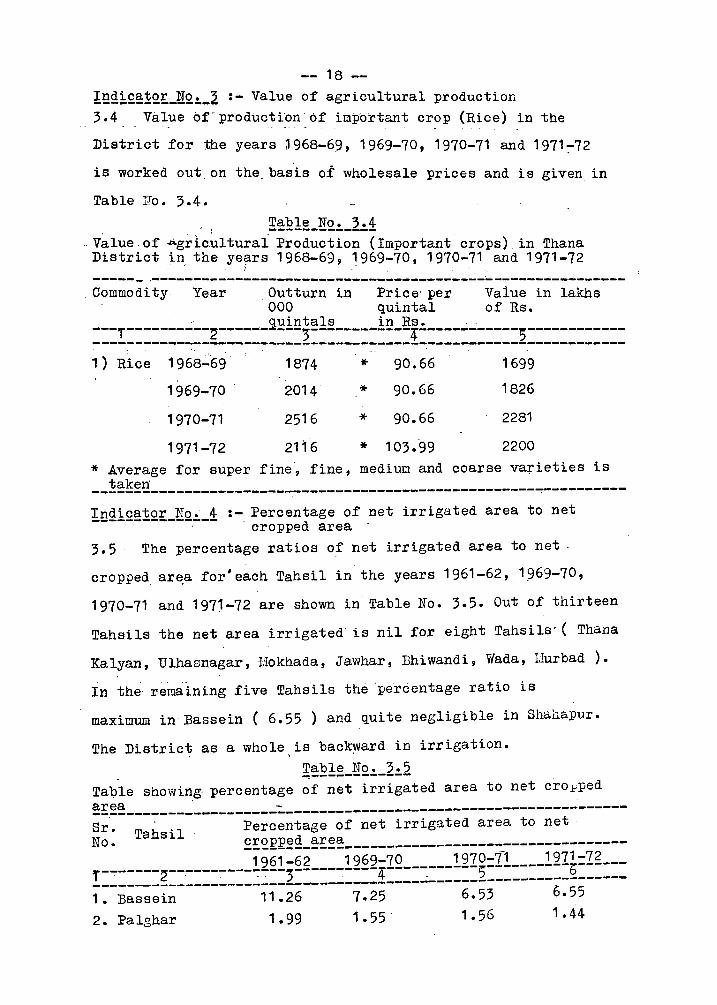
-- 18 --fngi£~~2£_N2~_2 :- Value of agricultural production 3 ~4 . Val?e or- producti:on. of important crop (Rice) in the
District for the years 1968-69, 1969-70, 1970-71 and 1971~72
is worked out on the basis oi wholesale prices and is given in
Table Fo. 3.4.
, ' : ~~£1!L!'!2!._2.:.! .. Value, of ..ti.grl.culturai Production (Important crops) in Thana District in the ye~rs 1968-69, 1969-70, 1970-71 and 1971-72 ------ .--------------------------------------~-.-----------------
. Commodity Year Out turn in Price' per Va1ue in lakhs 000 quintal of Rs.
_ .' , 9,uintals in Rs. ." --r----------2------ ---3------------4------------5-----------~-----~--------------------------------~------------------------1 ) Rice 1968-69 1874 90.66
,
* 1699
1969-70 2014 * 90.66 1826
1970-71 2516 * 90.66 2281
1971-72 2116 * 103.99 2200
* Average for super fine', fine, medium and coarse varieties is taken ----------------------------------------------------------------
In£i£~~Qr_!Q.:._1 :- Percentage of net irrigated area to net , cropped area '
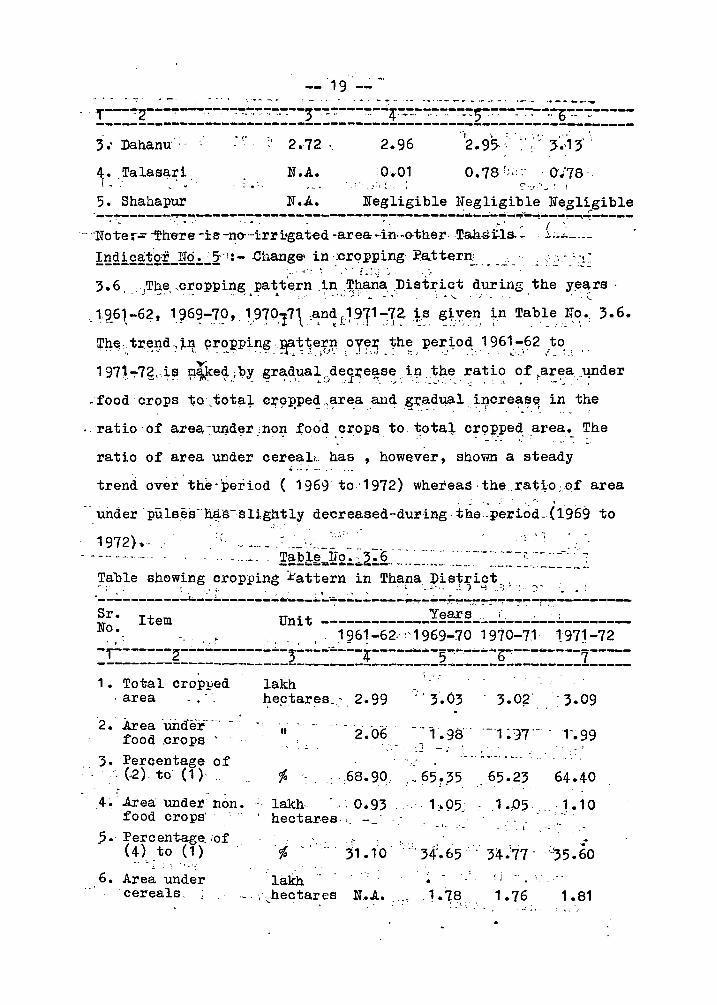
3.5 The percentage ratios of net irrigated area to net,
cropped ar~a for'each Tahsil in the years 1961-62, 1969-70,
1970-71 and 197~-72 are shown in Table No. 3.5. Out of thirteen
Tahsils the net area irrigated' is nil for eight Tahsils-( Thana
Kalyan, Ulhasnagar, IJokhada, Jawhar, Bhiwandi, Wada, I.Iurbad ).
In th~' remaining five Tahsils the 'percentage ratio is
maximum in Bassein ( 6.55 ) and quite negligible in Shahapur.
The District as a whole is backward in irrigation. , .'
~~E1~_!IQ.:._2!.2 Ta~le showing percentage of net irrigated area to net cro~ped ~E~~ __________________ ~ _______________________________ ----------
Sr. Tahsil Percentage of net irrigated area to net No. £E£EE~g_~E~~ _________________________________ _ 1961-62 1969-70 1970-7-1 1971-72
f-~-----2--~-------~~--3-----~---------~------5----------b------__________________________________ 1 ______________________ -------1. Bassein 11.26 7.25 6.53 6.55 2. Palghar 1.99 1.55 1.56 1.44
-- '19 .......... _- .. _-_ .. _ .... - .... ------ ..
,..--~~2---~---~--~~·-:~~~·~--;-~~---~--4~~~-:~~--~-:;-~---:--:-:-~:b~ .. ~-:~---.. ------------------~---------------------------------------------3 .. Dahanu'"
010
2.96
4. Talasari N .A.0.,01 O. 78 ~;;: :" On8' r .. ~: .~ . w • ; .:, •• l' .. ':' ~ ,': t; ":.t .' ... 7 f
5. Shahapur N.A. Negligible Negligible Nezl~gible .--:--:-----~~~~-------------:----------::-~----------~ ... -~~-~~--:~~~-':.---... -
- "Not'e:--- -Th'ere-is -no--irl'i-gat-ed -areao-i~.-().ther, -Tahs.ils.: ,..:.~-.<.----Indicat'or Nd.5"r:--Change- in ':cropping' J:lattern' ',', ,,".,' ' __ t~ --------------- ._ -1': ~ ", ~ • f #> ~~! "; . ,. -- ... - -- -. -" - .. --_.
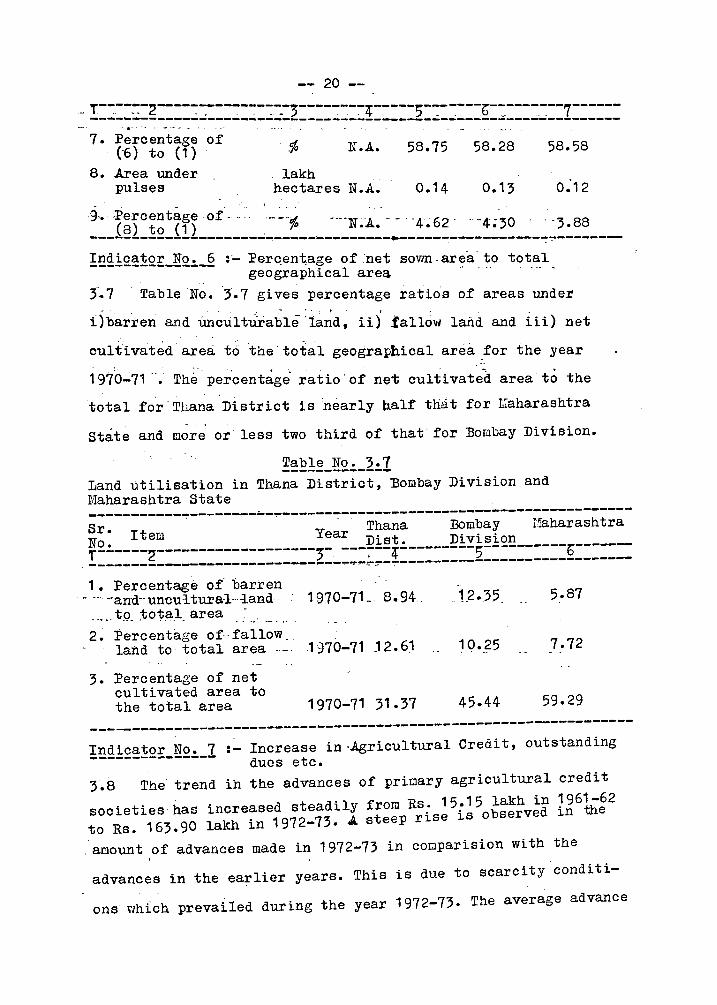
3.6, . ,The, ,cropping patt'ern ,i~~l:lana ,District during the y~~rs . - ... ....... '.. '.... ... ".,' ;, ........... J:" ... 1,.... ; • '... . ,,: . ..' " ~ (.
c 1,~_6l-6~,1;~6~-7~' t970.171 :~n~f1911~1~t~, ~t..~~~; +n Ta,b~~ ;~~.; 3.6.
Th.~::.tr~J)d ~ '-11 ~r~~ptIl~, ~~~~ifP ',oJ~,10 ~h~, lle~,~0~,1,96~--;62 ,r~~ -" .' ~.
197~":"7~~,~~ Fl¥.eg. j by~r~~1?:a~ :ide~fr;e~,s~ ",l,~:~,~e~ ~a~io, ~1' ~a~~aJ~nder
. food crops to." tota~ cropped ~area alld g,t'ad-qal i:t;lcrease. in the • ~. _ J. ...' ....L. .• ..i • ~ ::.. '. ~. _ ':. Fr.... .
o,ratio'of area-under ,non food crops to, total cropped area. The .. .. - - .... . .... . . -: -'" .'- ':. .: ". . -
ratio of area under cereaL.. has , however, shown a steady ..... -" .... - .. -
trend over'the-,:period ( 1969' to'1972) wheteaS·theratto,:of ,area '. ,
0, underpuleeso'h~s-sUghtly decreased-during, the~:p~:r:iod-,(1969 to " '~'. .
o -~:.~~! :': " ' - ','-::~, ... '!~~i~:~'~~~i~~.~"~:.~~',:~~ ,::,~~~,-~'o~=~~~~==-~~= Table sh~wing cropping ~attern in Thana District . ' o~;_~:.. ______ ~_';:.t. _____ .:....;. ... ~ __ .i..:"~_":_":' ___ ~~':'~~~~~~;;~~~':':'~~~.:..:. ___ _
Sr. No. Item U 0 t Years, ;, ' :
nl -------------------------------------, 1961-6~,:·1969-70 1970-7~ 1971-72 -,--------2-.;..--------.:...'--;-.::.-.:....;;;.;:..:.-i-----... --S-... ----b'-----:..--:;,--------------------------------------------------------------------1. Total cropped
. area
2. .Area 'UIufer--' .. food .crops '
, 3. Percentage of ,', (-2). to (1)· "
4~:Axea under'n6n. , food crops' '
.5. Percentage, iof (4) to (1)
6. Area under , cereals,'
"' .'
lakh ~ep:tares_.', 2.99~" 3'.03 '3.0;2' '3.09
It
:..: -' , , ..... - --.- ...... --
.-. ::
65.23 64.40
" lakh, , ~ 0 .. 9'3 hectares,. -
,I '"
lakh ~j --
,~hectar es N • .A. •. " 1.76 1.81 ... :' ..
-- 20 --
- T--,--:-:-2-----:----------:;--------if-----~------b--------7--------__________ -! __ ~..;._..;._~·~ ______ ~ __ :... __ ;..~ __ 2_.;_~ _____ ..;; ____ .~ ________ _
-'7. ~.~)~~~-tff) of '''' .'fa' . . N .A. 58.75' - 58.28 58.58
8. Area under pulses
~akh hectares !'l.A. 0.14 0.13 0.'12
g.. -Percentage of ' . .- --nf (8) to (1) 7D -"'N.A. - -. '4.62 "-4;;0' . -3.88 --------------------...; ... -----~-------..---------------:-:--------!!!!!1£~!Q!:.1!Q.:._2 :'- :per~ent"ageofnet sown ,area. to total
geographical area 3-.. 7 'Table No. 3. 7 gives 'percentage ratios of areas under
," " . . • - • , t· f
i)barren and Unculturable'tand, ii) fall~w land and iii) net
CU1,ti vated a~ea to 'the' total geographical area. ~for the year
1970"':71 ". The' per'centag~' ratio' of net culti vat~-d area to the
total for'Thana District is ;nearly naIf that for llaharashtra
State and more or less two third of that for Eombay Division.
!~E1~_!!£.:._2!.:r Land utilisation in Thana District, Eombay Division and r.Taharashtra State -----------~----------~------~-~---------------------------------Sr. Item y Thana Bombay Haharashtra No. ear Dist. Division T------2-------------------:;- ---~--4---------5----------b-------------------------------------~~~~------------------------------1. Percentage of' barren
- .. ·-and·'uncultura·l· .. ~and· 1970-7L 8.94. __ ... tP. total. area ........ .. 2. Perc entage of .. fallow,
land to total area .... ,1970-71 j 2.61
3. Percentage of net cultivated area to the total area 1970-71 31.37
7.72
59.29
-----------------------------------------------------------------!~~!£~~2!_!!2!._1 :- Increase in'Agricultural Credit, outstanding
dues etc. 3.8 The trend ih the advances of prioary agricultural credit
societies has increased steadily from Rs. 15.15 lakh in ~961-62 to Rs. 163.90 lakh in 1972-73. A steep rise is observed ~n the
. aflount of advances made in 1972-73 in cooparision with the
advances in the earlier years. This is due to scarcity conditi
ons wh:Lch prevailed during the year 1972-73. The average advance
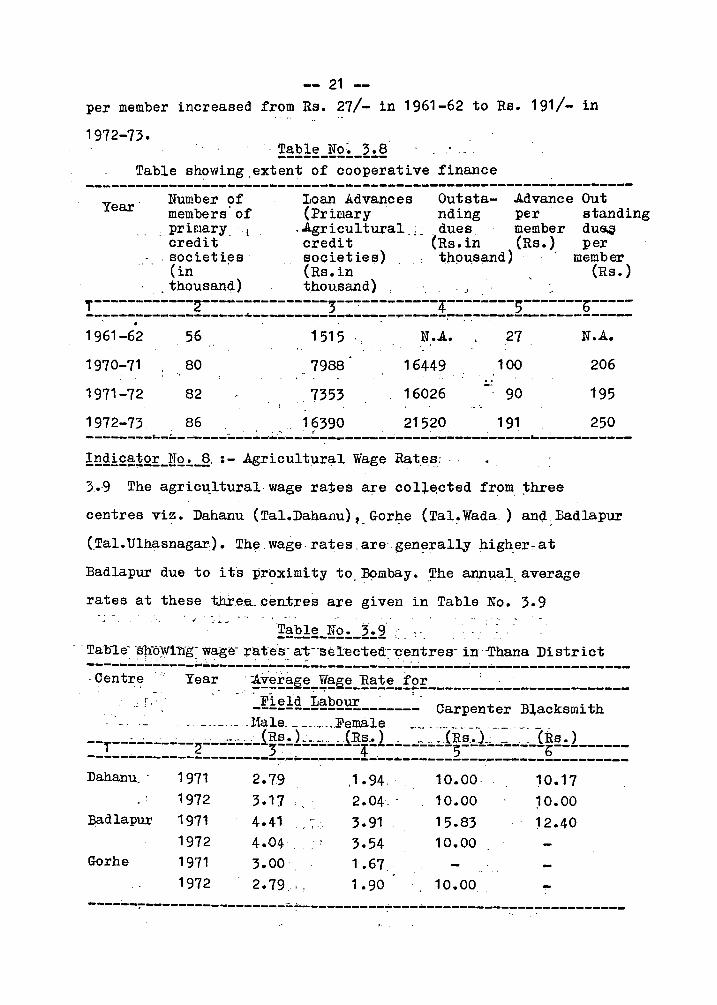
-- 21 --per member increased from Rs. 27/- in 1961-62 to Rs. 191/- in
1972-73. . Table No: 3.8 -------------
Table showing ,extent of cooperative finance -----------------------------------------------------------------
Year' Outsta- Advance Out nding per standing
Number of Loan Advances members' of (Primary' .
dues member du~ (Rs. in (Rs.) per
,priI:lary. l ,Agricultural.,. credit credit
. societies societies) ... (in' (Rs.in
thpu,sand) 'member , (Rs.)
.. thousand) thousand} . J .
T------------2---------------3--~---------4--------;-------b------~--------------------------------~-~-----~---------------------1961-62
1970-71
1971-72
56
80
82
1515 '.
7988
7353
N.A..
16449
16026
27
100
90
N.A.
206
195
1972-73 86 16390 21520 191 250 --------'--~-------:..--~-... ~---~-~----~~----:....:...~-------... -; --------I!l£i£~1Q;L!IQ!....;§, :- Agricultural Wage Rat,es.:· .
3..·9 The agric-qltural· wage ra:j;es are coll~cted from :three
centres vi~. Dahanu (Tal.Dahanu) '- Gorhe (Tal. Wads ) and; Badlapur
(Tal. Ulhasnagar). Th~. wage. rates. are gen~rally high,er- at
Badlapur due to its pr?ximity to. B9mbay. Jhe annllal. average
rates at these t.hr.ee.. . .cen.tres are given in Table No. 3.9 ~ -j " _ ••
. . Tab1.e- 'slfoW11ig~ wage- :ra.t'as: a~-'sel:ected~-c·entres- in-Thana District -------------~~---------------------. -~~~----~--~----------------. Centre ". Year _. ~!~!:~~~-~-!!~~-]!!!~~f~!------:..-----------------
Field Labour' . . ------------------- Carpenter BlacksmLth
r • ...
----------llale. ___ . __ ._.Female ________ . ______ . _. __ '. '. '-.-. (Rs.L __ . __ (Rs.) .. ____ (Rs .• ). _ . _ (Rs.) T----------2-------~3--------~------------5----------b-------------------------------_::-___ ._.-----1-;...-.... ----------:-----___________ _
Dahanu_ . 1971 2.79 ,1.94 .. 10.00 10.17 1972 3.17 2.04, 10.00 ~O.OO
Badlapur 1971 4.41 3.91 15.83 ~ 2.40 1972 4.04 3.54 10.00
Gorhe 1971 3.00 1.67 1972 2.79.· 1.90 10.00,
-----~---------------.-;;..~---------------------------------------. . -. .
22
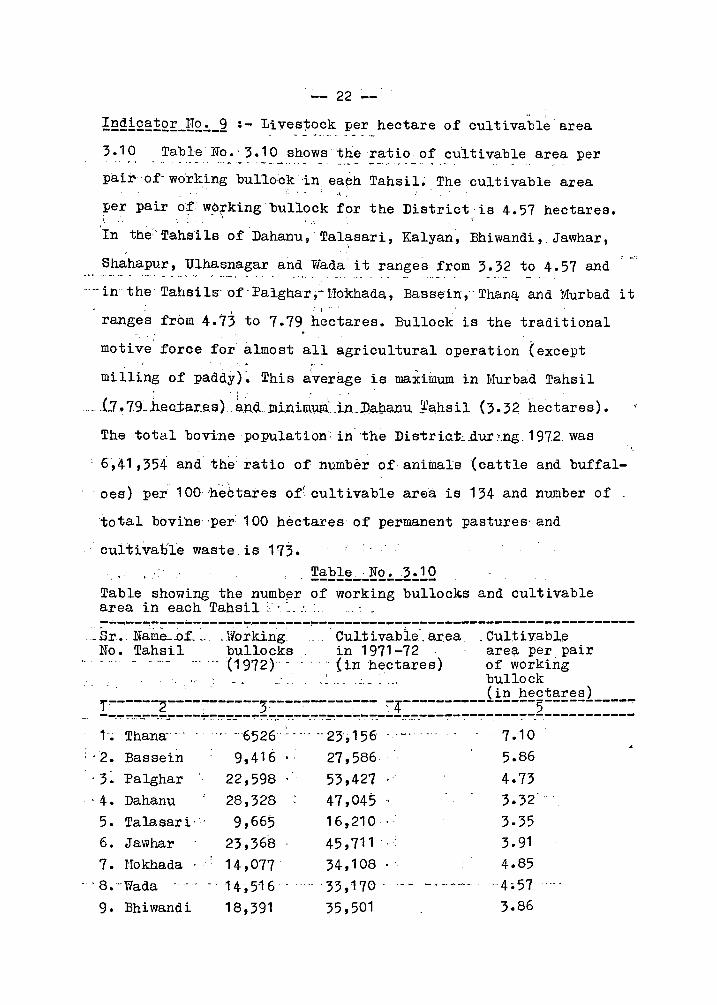
1~£!£~12E_E2~_~ :- Livestock per hectare of cultivable area
3.10 Table No.' 3.10 shows' thera·tio of cultivable area per
pair- of- work,ing bullock'in eaeh TahsiL The cultivable area . " . . ~ . .
per pair of wOrking bullock for the District'is 4.57 hectares. . . ~, . . ..
" ,.' .
'In the'Tahsils ofDahanu, Tal~sari, Kalyan, Bhiwandi, Jawhar,
Shahapur, Ulhasnagar and Wada it ranges from 3.32 to 4.57 and ~.. . .. ~ ... - ~ . - .. - - - - - ~ e_·_. . __ . .. .'_ .. __ . _.. _.. . _.. _ .
-- in the Tahsils' of- Palghar;- Uokhada, Bassein," Thanq. and Murbad it I
ranges from 4.73 to 7.79 hectares. Bullock is the traditional
motive force for almost all agricultural operation (except
miiUng of paddy)~ This average is maximum in Murbad Tahsil
.- .(1 .• 79~1eQtar.es) '. ~.nd.j:rtinim~:.in_l)ap..a.ou Jahsil. (3.32 hectares).
The total bovine population; in the Distric.t~ .dur :I.ng. 1972. was
6,41,354 and the ratio of number ofanitnals (cattle and buffal
oes) per 100hebtares of1cultivable area. is 134 and number of .
total bbvi'ne 'per 100 hectares of per-manent pastures· and
. cultivable waste, is 173.
, !~El:~_:..~2~_~!.!Q Table showing the numb~r of working bullocks and cultivable area in each Tahsil ;' - :._ : .• . ~--.---:~------:------r.-------~--:-------~-~---------------------------
, _Sr. Nam.e-..of_ _ . Working... Cultivable'_area _ Cultiv.able No. Tahsil bullocks _ in 1971-72 area per pair
.- -- '(1972) - . ' .. (in hectares) of working __ . _ '_'" __ . __ .. _ bullock
(in hectares) r~-----2------. -----)~------------ ~4----------------5------------~~-:-:~..:--.~.!"'".~-~.~~~'::'"'-~-"'!""~.~:-."':":----~--:-.--~---.~--~::-=.----=---:--~---:---":"""---.-----------
L Thana;-- -' -'6526':' -'" -- 23'; 156- '7.10 : . 2. Bassein 9,416 27,586 5.86
- 3 ~ Palghar 22,598 53,427 4.73 04. Dahanu 28,328 47,045 3.32 5. Talasari'- 9,66$ 16,210 3.35 6. Jawhar 23,368 45,711 . 3.91
7. r.l[okhada 14,077 34,108 4.85 _ .. 8. "Wada . ---. 14,5-16 - . 33,170 . - ... ~ ..... -- - .- 4.57
9. Bhiwandi 18,391 35,501 3.86
.. --: .. ~3 ~-: ... , ._ , __ .. ~,. _. ,- ·T-----2-------------.:-·----·----·--;---............... ~-,... .... 4 ...... -.,.-------;--------------------~---------------------------------------~-----------I
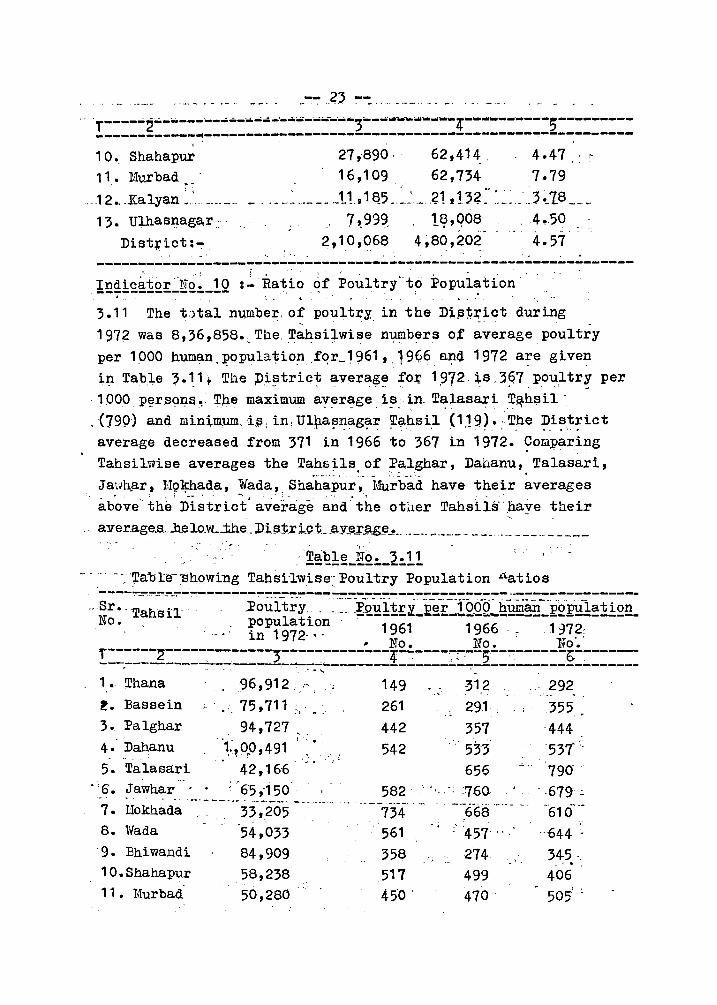
. . 10.: Shahapur 27 ;890· 62,414 . . 4.47.: ~
11. Murbad 16,109 62,734 7.79 !"':""
.. 12 ... Kalyan ~.' ........ ' _ ... _~ .. __ ~.J.1,1&5 .. ~~ .. , .. ~1.13?:~~._ .. · .. 3~_18 __ _ 1 3. Ulhasn.aga,r.:· . .' 7 ~999, 1~,q08 .. 4.50
Dist:J:'ict:~ 2,10,068 4~80,202 4.57 .. ... '. . ----------------------------------------------------------------
Indic~tor~·No·~ 10 :~ Rati~ 6f Poultry' to Popuiation'" . ---------------- .... .. .: . .
3.11 The t.)tal number. of poultry, in the Di~~J;'ict during ....... . '. -' .
1972 was 8,36,858. The. ~a~sq.wise nU'!llbf3rs ot average poultry
per 1000human,popula~io? .fqr_1~61,,1996 a~d 1972 a~e given
in Tab.le 3.11 t The ;o.istrict average foJ;' 1.972 is. 3E?7 poultry per . . ..... .., - . ,- -.' . ~...' - ~
1000, p~rs9I;lS~ The maxim.um average is~. in. Talasari T~hliJil' - . _. - . -. ~ . ~ '. : . .
,(790) and minimum, i§; in, Ul\la!3~?-g?-r ~(ihsil (1.19~. ::T.he ~i~t!ict average decreased from 371 in 1966 to 367 in 1972. ~oL1paring Tahsilwise averages the TahE~ls of ~alghar, Dahanu, Talasari,
•• - -.' -. • ~'P' - " :: _ ••• ' •
JaHhp,r, HQ1plada, Wada, Shahapur, Il,furbad have their averages ab'ove the' Di~trict' ave~'age and" t'he otiler Tahsiis··.~ye their
.. .ayer.age.s.. . .he.lo.vL.:t.he .Dis.:t.ri..ct ... aY.!'l.!'£l.M...! ... ____ . __ . ____ .,. __________ _ "
, " .. !~12!~L~Q!._~:.!! .... -', "1El.ble-:-showing Tahsi·lwise.: Poultry Population ii.atios
··:~~;:~:;~------~~~ill~~=!~mp~~[~~um~~~~;~; ~n 1972· 'hT "':r' "T ..
• J.·lO. 1\;0. J.~o.
f------2-------------~-------------T------~-----~------r--------~--~----------. _~ _____ L _________ ~ ______ ~~~~2--~------~--------, " ... "-
1 •. ~hana 96,912.;,' , ; 149 ' . 31.2 292 . . .,
t. Bassein '. 75 t 711 261 291 .355 .. . . .,
3. Palghar 94,727 .. 442 357 ·444 .. 1:,00,491
, o •
531 537'" 4· Dahanu 542 .. '. ; .. ~ .. ", i 5. Talasa:ri 42,166 656 790 .
. ', 6'. Jawhar '. ~ 65,'150 582 '. , '.'; ~760 , .. 679.:. ., .- . . ..... - ----- '- .--. --~---' .. -~
7. I:1okhada .- "'--- _. __ .. - . '-'-6'68 '-". - -61 O-·~ 33,205 734
8. Wada 54,033 561 ;
" . 457-' . "644-
9. Bhiwandi 84,909 358 274 34;5. '. 10. Shahapur 58,238 517 499 406 11 • Murbad 50,280
."
450 ' , ,
470 505
. '
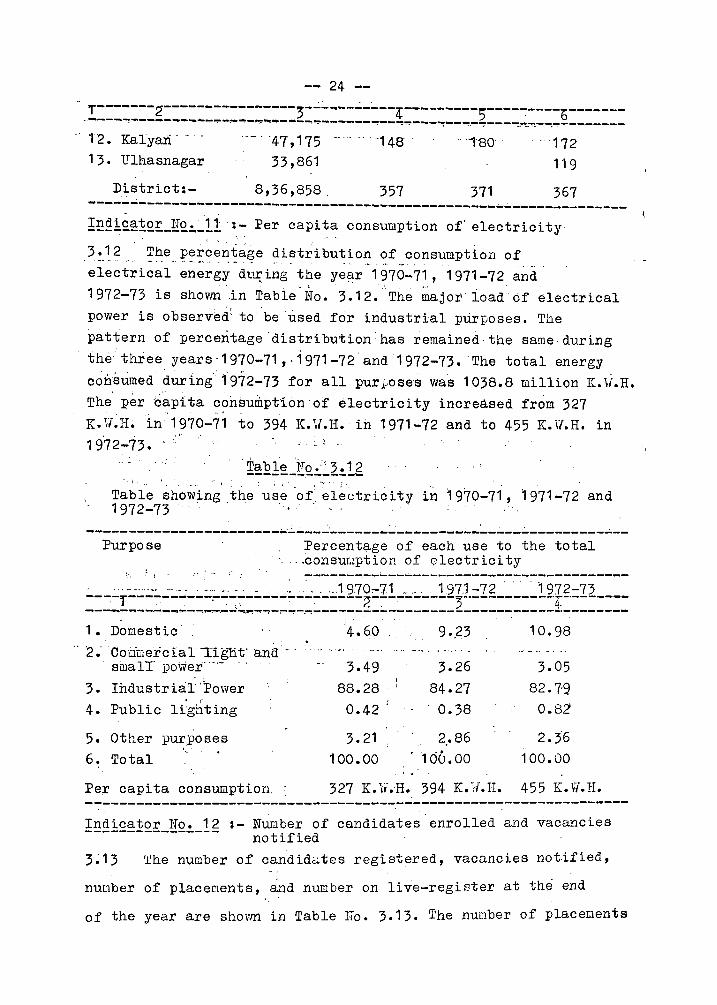
-- 24 --1-------2----------------3-----------4---------5----~----~------. ----'-!.----------""'!""'-:-~-~'""'!!~-~-...,~...,--~--~--~~---~--~.-~---~~-~--.~--------12 • Kalyari' . ._. '47,175 -" ...... -148 "1"80' . 172 13. Ulhasnagar 33,861 119
District:- . 8,36,858. 357 371 367 -------------------------------------------------~---------------!~£i£~!£t_g£~_ll :- Per capita consumption of' electricity
3.12' The percentage distribution of consumption of ,-. -.. .- - -..... , ~ .. -. .-. - - - .-. .•. -.. . ... .
electrical energy dt~ing the ye~r 1970-71, 1971-72 and 1972-73 is shown in Table·lfo. 3.12. 'The ~ajor'ioad6f electrical power is observ~~: to ~erised for industrial ptirposes. The pattern of percentage distribution has remained the same during the three years·1970-71" i 971-72· and 1972-73. 'The total energy consumed during"1972-73 for all pur.f.·oses was 1038.8 million K.li.H. The per b~pita~?nSumptionof electricity increased from 327 K.V.H. in 1970-71 to 394 K.V.H. in 1971-72 and to 455 K.V.H. in 1972-73. . -' .
". T, "
Table sho~ing the use 'oi el~ctricity in 1970-71, 1971-72 and 1972-73 ' ... . .
-----------------------~ . ..:..---~:..------:..----------~----~---------.:.--Purpose
'." . J -
. Percent~ge of each use to the total ' ... consutiption of electricity
--------.---------------------------------.. _ ........... ''''.'''. . ...... 19.70,..71 _.' 197.1-72 '1972,..73
=:=:r:::::::::::::::::::=:.::::==:g:==:==:=:=2===:::::==:1:==:==::: ] .
1. Domestic 4.6.0 9 •. 23 10.98 . 2'- Coclnercial Tignt· ana: ' . -.... - ~ .' ... oW _ ~_ a ..
smaITpo1,ver···-- . 3.49 3.26 3.05 IhdustriaT'Power
I
82·7-9 3. 88.28 .. ! 84.27 • r
0.42 : 0.8Z 4. Public li'ghting 0.38
5. Other purposes 3.21 2.86 2.36 6. - 100.00 106.00 100.00 Total
Per capita consumption. 327 K. lv".H. 394 K.~;{.H. 455 K.W.H. -----------------------------------------------------------------Indicator lifo. 12 :- NUGlber of candidates enrolled and vacancies ---------------- notified
3.13 'rhe number of candide:;.tes registered, vacancies notified,
nuober of placeoents, and number on live-register at the end
of the year are sho1,'m in Table l~o. 3.13. The nunber of placeI:lents
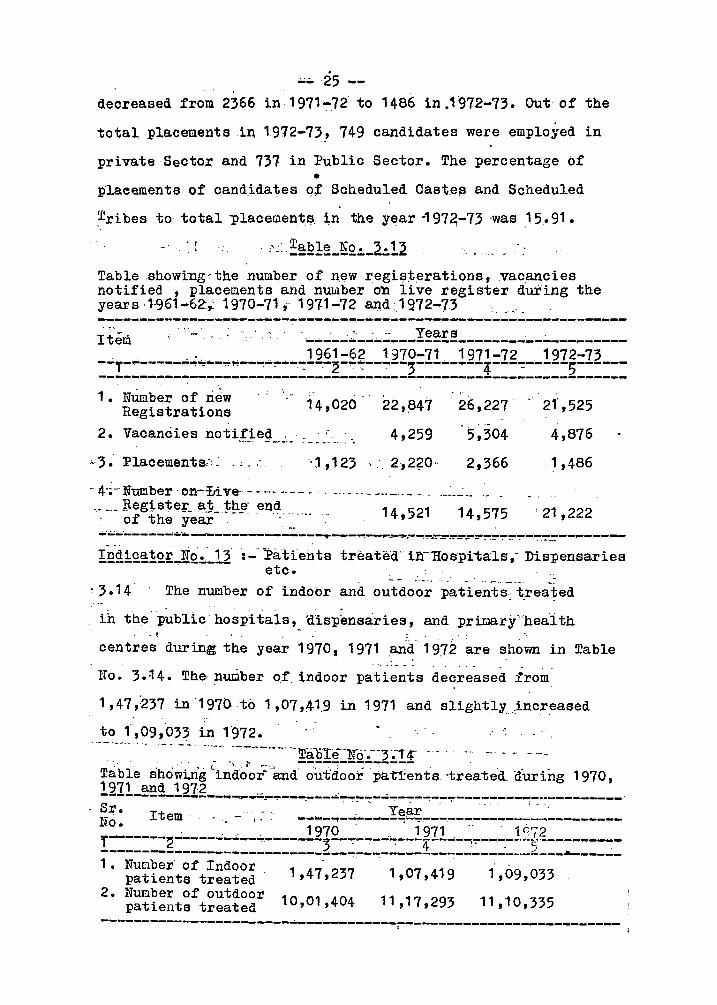
--25 decreased from 2366 in· 1971-:-72· to 1486 in J 972-73. Out of the
total placements ,in 1972-73, 749 candidates were employed in
private·Sector and 731 in Public Sector. The percentage of •
plae~ments of cand.idates qf Scheduled Ca8te~ and Scheduled
Tribes to total ~laceL1ent.s. in the year ·1972,-7} ·was 15.91 •
• t . :' ~: ~~E1:~LliQ!._2!.!2. . . . , Tableshowi:ng~the number of new regis:terations, .vacancies notified , placeraents and nUhlber O'n live register during the years 1-961 ... 62:,' 1970-71; 1911-72 andJ.972-73 ...... .
-. - I .• . Years. . ~-------~----------------------------. . .' .'. . 1961-62 1970-71. 1971-72 1972-73
::!:::::::::::::::::::::::::~::::::::2::::::::i:::~:::::~:::::: 1 • Number of new 14,020 22,847 26,227 21',525 Registrations
2. Vacancies notified . . . 4,259 5,304 4,876 .... -. --_._ ... . .. - .... - .. -. ~
.;.·3. Placements;: .: ... ;.. \. '1,123 , .. 2,2?O,· 2,366 1,486
'·4·;-Number·on-!ri.ve·---···---··· - ..... - ___ .. _ ... _ .. _._ ... '.' -.- !tfegtste!'. aj;_ "!;!l~: .end......... 14,521 14,575 . 21 ,222
: 0 the year . _. . . . .. ,;.,,;-.-------"i&. ___________ -.... __ ~-P-~~~_.!!-_""!'*~~,!'!!_~~~~~_~~-~.~~--,-----Indicator No.· 1"3 :-' Patients treate'd' ii'CHoslfi'tals,' Dispensaries --------------- etc. ..
- .- .-.,--.-~ 3.14· 'The number of indoor and outdoor patients i t.rea~ed
ih the'p~blic hospitals,. 'dis"p~nsa:ries, and priIJB.xY'·hea'ith - ,
centres during the year 1970. 1971 ~nd 1972 are shown in Table . .
. " .. -- - - .. ITo. 3.:t4. The- nuciber o.f, indoor patients decreased :trom
1,47,-237 in '197()to 1,07,41.9 in 1971 and slightly .increased
to 1',09;033 in 1'972 • ... -.-... '-. -- '.--. ·----·--.. ·Tal:ire--lro·.-)~·l4 .-
~ . . ". ~ --------------Table sho~iri'g \ndool'E:md: c:iu:t'dooi ·pat'rents. ·treated. dUring 1970, 1971 and 1972 --------------.... -~.~..!"_~---_----:-~~------~--~---------.-.01----_______ . I~rO·· Item ;. --... --i------!~~~--------------.,---------.~ • __ . ..... 1970' .. 1971." . 1 (";72 f~ ---~--------------~----------------------.--.-----------------~--------_.:.· __ .:. ____ Z __ ~_~ __ ..: ___ 1~--_~~ __ ~ __ ._~ ___ & ____ ..:_
1. NUI:lber' of Indoor . ... patients treated 1,47,237 1,07,419 1,09,033
2. Nunber of outdoor patients treated 10,01,404 11,17,293 11,10,335
-----------------------~----------.--. -------------------------
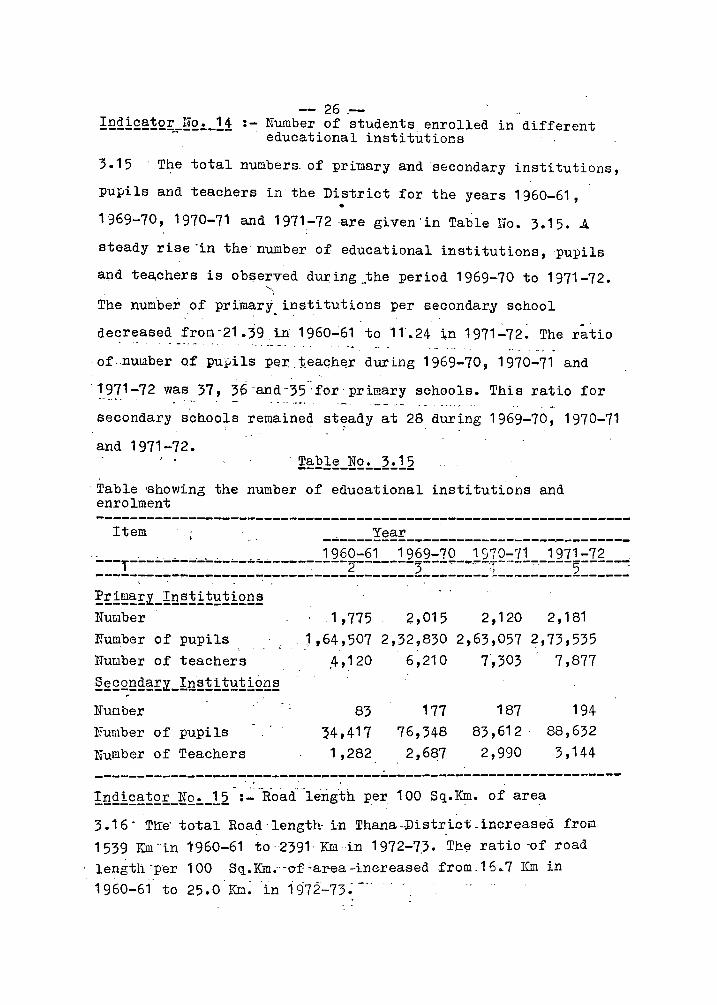
-- 26-~ Indicator lio. 14 :- Number of students enrolled in different --------~------- educational institutions
3.15 The total nuobers_ of primary and secondary institutions,
pupils and teachers in the District for the years 1960-61, •
1969-70,1970-71 and 1971-72-are given-in Table Ho. 3.15 • .A. , -
steady rise-in the number of educational institutions, pupils
and te~chers is observed duringyhe period 1969-70 to 1971-72.
The nuriber of primary institutions per secondary school ,. . . decreased fron-21.~9 in 1960-61 t6 11.24 in 1971-72. The ratio
-of -number Qf pu~ils per.teaGh~r during 1969-70, 1970-71 and . .' .--1971-72 was 37, 36-and-35-forprimary schools. This ratio for
secondary schools remained steady at 28 during 1969-70, 1970-71 , :-
and 1971-72. , .
. Table 'showing the number of educational institutions and enrolment ----------------------------------------------------------------Item _~ ____ X~~! __________________________ _ - _ _ 1960-61 1969-70 1970-71 1971-72 ---,..-----;...----------------------~------3---.,.-... ----T-----.,..----5------: ----------~-----------------------------------------------------
~£!~~£l_f~~~!~~~!£Q~ NULlber 1,775 2,015 2,120 2,181 Number of pupils 1,64,507 2,32,830 2,63,057 2,73,535 NurJber of teachers ,4, ~ 20 6,210 7",303 7,877
2~£2~~~£~_ln~1i1~1!££~ -
Number 83 177 187 194 liumber of pupils 34,417 76,348 83,612- 88,632
Number of Teachers 1,282 2,687 2,990 3,144 - . ---------------------------------------------------------------- . -
In~!£~1£;L~2!.._!2 -:"::--Roaci"-length per 100 Sq.Km. of area
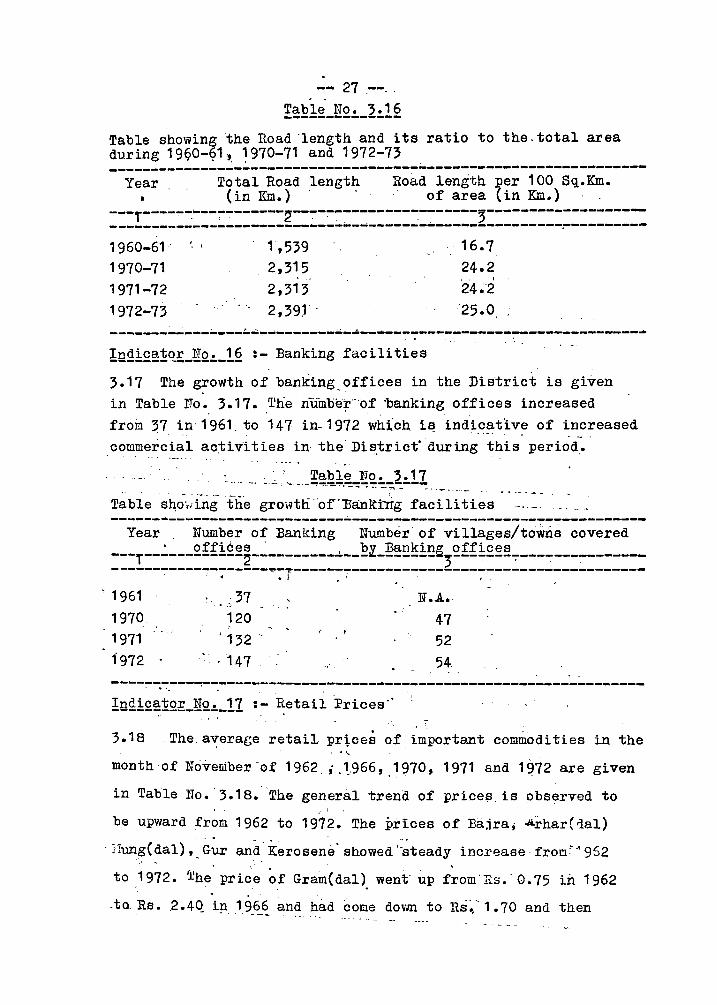
3.16 - Tl:re- total Road -length- in Thana -Distr_ict -increased from
1539 KIn-in 1960-61 to -2391- Killin 1972-7.3. Th~ ratio 'of road length -per 100 Sq.Km.---o-f -area -inereasedfrom _16 .. 7 Km in 1960-61 to 25.0-KI:1~ -ini972-73~---
27--, .
Table No. 3.16 --------------Table showing the Road 'length and its ratio to the. total area during 1990-91~ ~970-71 and 1972-73 --------------------------------------------~-------------------Year Total Road ,lengt~ Road length ~er 100 Sq.Km.
• (in KIn.)' of area {in KIn.} . ,
---r-----~---~-------2--~-~7~-~-----~-------3-------------------------------------------------------------~-----------~---------1960-61' . 1,539 16.7 ' ,
1970-71 2,315 24.2 I
1971-72 2,313 24."2
1972-73 2,39" . 25.0
------------~---~---------------~------------------------------~ , , '
!nQi£~1~!_~Q~_!§ :- Banking facilities
3.17 The growth of banking,offices in the District is given
in Table no., 3.17. ,The numbe:p"'of 'banking offices increased
from 37 in 1961, ·to1-4 7 in- 1972 whfcn i~ indi,c?-tl.ve of increased
commercial activities in the' District" during this period,.
, Table :N'o. 3.17 - _ ... ~ ...• ---, " ___ . _'-'!!"'!'O'.~~.~~~"::'~"':,~--~. _ .. '''_
Table sh,a",,;ingtti'e growtn'or13anknrg facilities - - :~-',~~ ~.-, ' ----------------------------------------------------------------
Year , Number of Banking Number of villages/towns covered
---r--~~--£ff!£~~-~--------~--~~-~~!!£g5£ffi£~~7----------------------------------~--------------------------------------------. .. • f . :. f #
, 1961 " 37 , U.A. . -";. - , ,
1970. 120 47 "
1971 ' 132 .. 52 1972 ·147 54,
----~~~---~-~---------------------------------------------------!n~i£~!Q;£_~~_11 : - ~etail ':Prices"
3.18 Thea~erage retail prtces of important commodities in the , .....
month of Noveniber "of: 1962. ; ,1,966, 1970, 1971 and 1 ~72 are given
in Tahle 110. '3.18. 'The general trend of prices is observed to
be upward from 1962 to 1972. The prices of Bajra; ~rhar(1al)
, lTung(dal), _ G~ and Kerosene' showed '~~teady increase frOl:l'-" 962
to ,1972. ~he' pri~e ~f Gram(dal), went' up f~omRs. '0.75 in 1962
.to, Rs • . 2.4Q ip. .19_6_~ and had come dovm to Rs~-1.70 and then
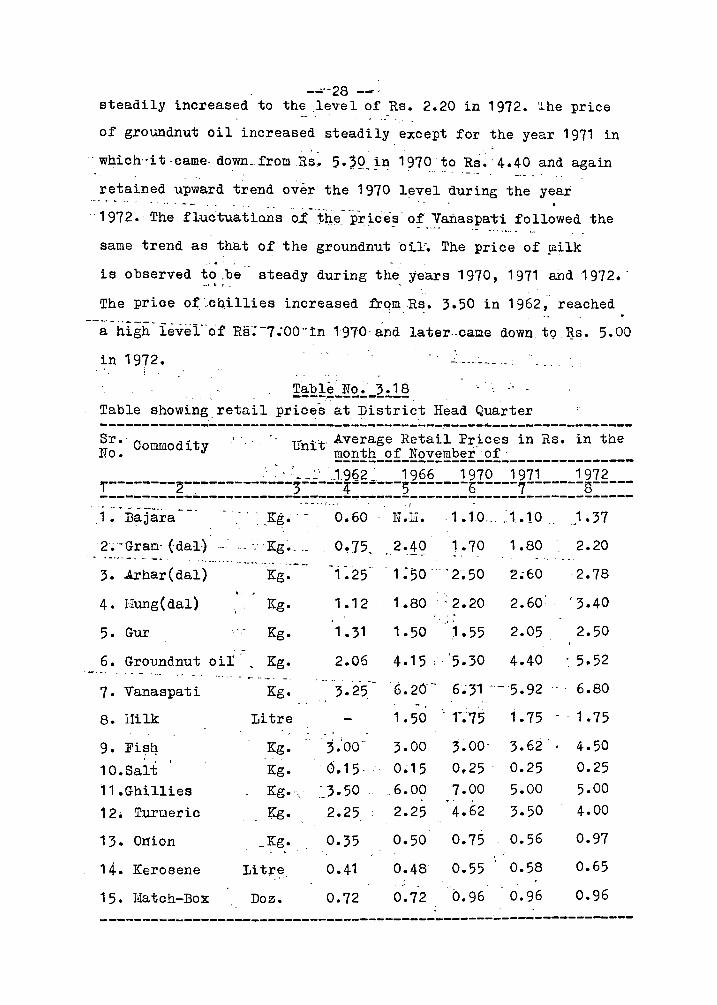
--'-28 steadily increased to the .level of Rs. 2.20 in 1972. 'l.he price
of groundnut oil increased steadily except for the year 1971 in
'which"it',came,dowD_fromRs: 5'2Q_,~~ 197~~0 RS.'4.40 and again
retained upw'ard trend over the 1970 level during the year '~' ..... -.. -' ... --- ',... '-'-'" -- , .. "1972. The fluctuations 01: the price.~ o:t' "yanaspat"i followed the
same trend as that of the groundnut oil". The price of Jililk
is observed to .be _.' b!.
steady during the~ years 1970, 1971 and 1972. -
The price of, .cb,illies increased frqmR~. 3.50 in 1962, reached
---a-iiigh-ievel"of Rs;-7;OO··tn1970·and later"camedown tQ~s. 5.00
in 1972.
Table No. 3.18 ',' I ~·.1
----.---------- .
Table showing retail prices at District Head Quarter --------------------------------~--------~----~-----------------Sr.' COI!lIJlodity No.
, ' u ··t Average Retail Prices in Rs. in the Dl. month of November' of ------------------------------------
" ~ -·--:.' . .1.962~ 1966 1970 1971 1972 r--------2-~-----------)-----4------5-------b-----7-------S-------------------~----~-------------------------------------------.. - - - -.... _-. 1. Bajara
2~ -Grao- (dal) -, .. ,', 'Kg., __ - ._ .... -- .. _ ... -,.- ".- .. _ ....... ~ 3. Arhar(dal)
4. Hung(dal)
5. Gur
Kg.
Kg.
Kg.
6. Groundnut oit', Kg.
7. Vanaspati
8. l1ilk
, 10.Salt 11.Ghillies
12. Turtleric
13. Onion
14. Kerosene
15. Hatch-Box
Kg.
Litre
Kg.
Kg.
Kg.·.,
r~.
_Kg.
Litr~
Doz.
0.60 N.1:i. ,1.10 .... :1.10, ,.1.37
0.75. 2.40 1.70 1.80 2.20
1.25 1:50"'-2~50 2.60
1 • 1 2 1 • 80 ~ 2. 20 2.60
2.78
'3.40
1.31 1.50 1.55 2.05 2.50
2.06 4.15 ;·'5.30 4.40 5.52
3.;00'"
0.15·
.'_3- 50
2.25
0.35
0.41
0.72
3.00
;0~15
.. 6.00
2.25
0.50
0.48
0.72
3.00- 3.62
0.25 0.25
7.00 5.00
4.62 3.50
0.75 0.56
0.55 0.58
0.96 0.96
6.80
4.50
0.25
5.00
4.00
0.97
0.65
0.96
--------------------------------------------_._---------------
-- 29
Qm~~!L..IY
~~~!_~!~~ __ 122g=~ . "
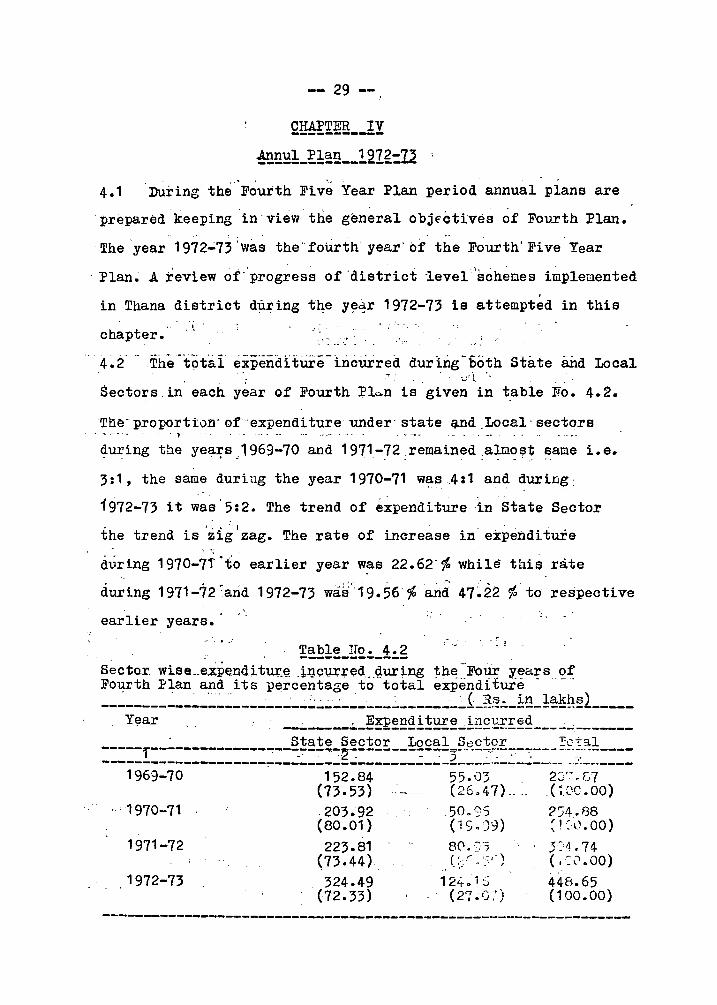
4.1 During the Fourth Five Year Plan period annual plans are , .
prepared keeping in'view'the general objfctives of Fourth Plan.
The 'year 1972':73 '\vas the'fotlrth year' of the Fourth' Five' Year
. Plan • .A teview of··progress of 'district 'level 1scheoes i~plemented
in Thana district during the y~~r 1972-73 is attempted in this
chapter. , t,
I· ',- •
., . . . .. - - .
4~i - .The"totai e~pendlture-bicurred durlrig-bo~h state and Local : . . ·...,:'1 I
Sectors.in'each year of Fourth Plc.n is given in t.able No. 4.2.
Th~-proporti()n'of'expenditureunder'state~nd,Local'sectors "J
~UJ;'ing the yea~s c 1969-70 and 1971-72 .remained .al.Ii1ost same 1. e. . - ~. ," ..
3:1, the same during the yea,r 1970-71 wl!L 13 4:1 and during:
i972-73 it was'5:2. The trend of e~penditurein state Sector w J ~ • • I
the trend is zig zag. The rate of increase in' expenditure
during 1970-7iO
to earlier year w~s 22.62'~ while thiS. rate
during 1971-72 "arid 1972-73 wa:~·:19.56·% a~d' 47~22%' to respective
earlier years. .,' '.: " '~ I
Secto.r. wise .. ei:pend:itu+'~ .tlJ91JI+,ed. .. Q.uring the "FOur years of Fo~th :Plan and its percentage to total expendHuie ._,
.' .. ' ': .. ,.,.. . (. R3. in lakhs) -----------------------------------------------.... _--------_ ... _------Y~ar , . Expenditure .incurred . ------------------------------------------
. State Sector Local Sector ~ot~l
:=::!::::::::::::::~::::::·::g:::::::::::=2=~=~~~==·=::=~.~~;:.~==::: 1969-70
.. ·1970-71
1971-72
1972-73
152.84 (73.53) .203.92 (80.01) 223.81
(73.44) 324.49
(72.33)
55.1)3 (26.47) .... 50.95 ('i S. )9)
800 ",'J (~./,,:/)
12i..1 S (2' '7 ,. ",)
I • ..J I I
2:'~" 07 (~~)C. 00) 2:;4.88 ~ I ~'l). 00) }:1.74 ( .: l"l. 00) 448.65 (100.00)
----------------------------------------------------------------
30 --
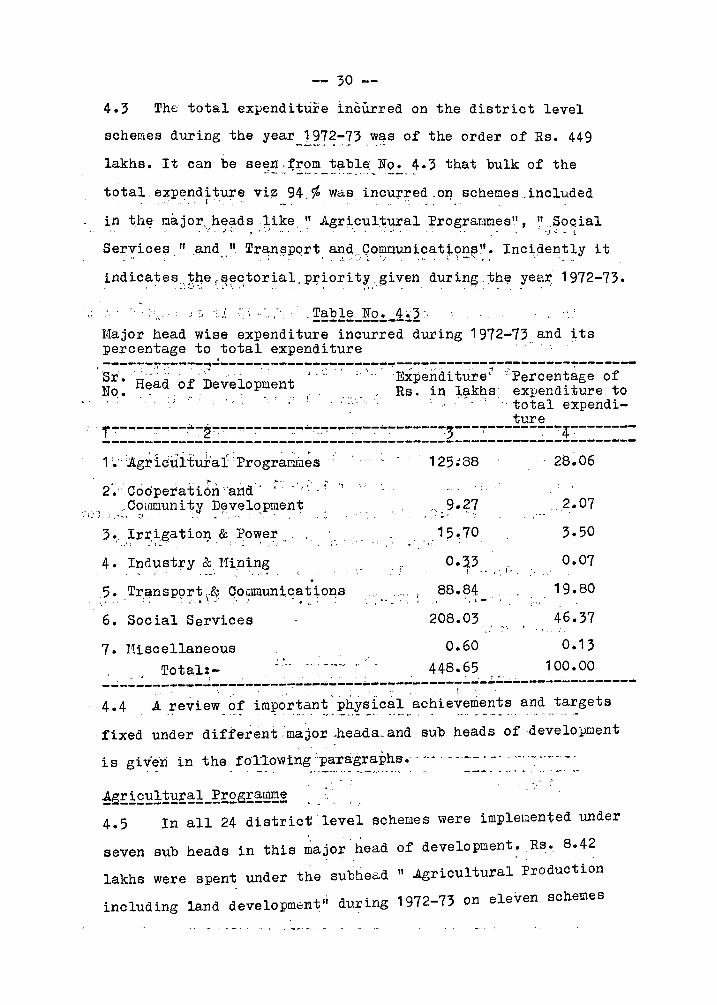
4.3 ThE: total expenditure incUrred on the district level
schemes during the yearJ}?~-:-73 .w.~s of the order of Rs. 449
lakhs. It can be se~I.I.:('rom t~ble No. 4.3 that bulk of the .··_4'~ _.~_ ._ ••... __ ....... __ '_0.
total. expenditure vi~ 94_~ was incurred ,on schet:l.es.included .' , . . l ' " '. . . .' . "':.-' -'. - . '. .
in tb.~ ma.jor,he~ds1,ike. " Agr~cul:t"1-I'al Programt:l.es ll , ".SoQial ,. ,'- .'. J •.. ,',.j ,_. " '. '.' .:.J. ".....' .... 1'-· _ t
Ser",ices," and .. " Tra:nl(mqrt, ~d,Oo~I!lunicat~~!?:~". Incidently it • ~. . ,. .... ... ~ , .". \. ' t \ _ ..:.
indica~es::~~e f~~~tor~al_llr~ori t~.~iven du::d~(;: :t~~ ~ea~ 1972-73.
, '":.:
Major head wise expenditure incurred during 1972-73 and its percentage to total expenditure
I ,--:---:--~~--~-~-----~~------:7-7---:;--:-~~-~~-::-~-~-~-:;--7-------~------
Sr. Head of -Deveiopment "" 'Expe~di ture' CPercert~age of No.. .' ' .. ' ..... " Rs 0 ~n l~khs expendlture to
.,,' : . '. total e:xpendi-~ . ' ture
f~-~--7~-~~-2~~-~-~---~~-~~-~---~-~------3-~-~-------:--~4~-----------------------------------------------------------------------. ' " .' .', i r ' . '. •
1.'·.Ag!:' idtiltur'al ProgramiJes 125~88 28.06
" 9.?7 2.07 " .'
.' . .' 1'- I .,,.. •• , -\ ..,
2." Codperation "and' "' .. ~ .! ,<
."ColJ1t:l.uni ty Development ~. ,.~. 'J . '; .• '. • ;,.:' : . .. r' -,' ~ \:." .' • ~
15~ 70 3.50 ":"
3.; Irr,i.gatiol} & ?owe~ .. ' . ,.' \ ,. I ... '. . _ \ ~ " ...
0.~3 0.07 . . - , i· 4. Industry &, IUn~ng
. I 88.?4 19.80
.' ,\ -5. Transport .. 8; Cowmuni.cations '.' ,.' :, >-', .. \.j '.',.' -. ",; :
6. Social Services 208.03 46.37 ",
7. Hiscellaneous 0.60 0.13
448.65 100.00 Tot~l:-
-~----------~---------~-------------~--~---~--~~----------------·4.4 A .:z;'evie~,o~ impor~an~:~~~~~c~~.ac~ie~~~:~~~.and_t~r.gets fixed under differelltmaJor -heads._ and sub heads ofdevelollIJent
is giv'~-ri in the fo-I-lowtng .. ··_~~::t'.~~~~.~.~ .. · --- . '-'==~.- :,~ ~~ .. ~~~=~:. !e;!.t~~l~~!:§!l_!:!£g!§!~~ ,,'. '.
, .'. ,
4.5 In all 24 district'level schemes were implenented under
seven sub heads in this nia~or head of development. Rs •. 8.42
lakhs were spent under the subhead " .Agricultural Production
including land developm0nt ,i during 1972-73 on eleven schemes
31 --
to achieve ," i) Plantation of fruit trees in 152 hectares (Target 280
hectares) ii) Target of plantatio~,of 40 ~ot~toLplot~
iii) Coverage of 152 ,hectar.es .of l~d upqer .hortictllture, against target of 200 hectares. " ... "" '", '.
i~) Supply of fe~tilizersfor 576 he8ttires'off land (target 600 hectar~s), ',', '"., ')"
v) Supply or-52 ,ducks (target 300 ducks), vi) Construction of sev~n wells u~der ':Page 'Sdie~e:' '(target
nine wells) , , " '
vii) Loans to adivasis ,for construction Qf two wells V'i~i)SUl1Plyof, _1214 he goatsr't~r;get-'2000 goats) ix) Supply of 338 buf'faloes (target '200 bUffaloes). Under,the
'; subhead 'I1inor Irrigation' 'five Schemes were implemented at
the cost of Rs. 46.13 lakns d.nd ten pumps were installed and -,
15 boring operations were'c'arried out in 'addi tton to work of , ,
18 Bandharaf(l in progress • .Anamount of Rs.'26.66 lakhs'was .- .' ~, ' , :' !, '\ ' "
utilised for two schemes under'S6il C6nservation i sub head t-' ~
for (i) t~rracing' 1335'h~~tareS'of'lanci (target '1445 hectares) , .
~ii) tren~hi:ng for pian'tatl.'6ri of;379 hectares' {'target 960 , '
hectares). In addi ti nC'to this', the' tiu-get of" reclaimation of "J j 0_, ~ .~) r _ ~,. • I' : ",' -- - -
Khar,and Khajan land of 405 hectares was'fulfilled. Scheme
under '.Animal HusbandrY'sub head'~as' implemented at the cost , "
of Rs. 0.22 lakh~ for providing basic' ameri'iti'es ;to:the
e~isting Veterinary dispens~ries and aidce;n'tres. Expenditure
of Rs, 18.70 lakhs was incurred during 1971-12-'~or impl~lllenting
three "D~iry DeveloPtlent"Scheui~s' and the important physical
achievements were (i)maintenance~f 650 milking herds and
(ii)handling of 36000 ,litres of milk' per day and (iii) assistan
ce to 5 dairy societies. Under seven "Forest" Schemes Rs.11.24 "
lakhs were utilised to ful fill the target of piantation of 120
-- 32 --" '
hectares of fode: er and plaiitation' of fast grovling species in
610 hectares in addition to errect 859 (big and Small both to • .~ I _.
gether) Cairns. Under II ~isheriesll pr"ogral.l~e, Rs. 14.51 lakhs
were spent for ii:nplein~hti'ng nine' 'schemes and (i) distribution
. of ':20' ~~~'in~~" (target 20 erigines)(ii)imp-roveme'nt of 12 fishing
bQa~~ (targ~t,.; exc~e~~~,,~iii~ st~cking of 10.00 lakhs of carp try ' ..
and netting about 3.00 lakh Kg. of fieh,·in addition to supply
of fishery ~equisites V:lz~"'20000 Kg. nylone, '10000 fish Q,ooks, \. . ,. .' :':. ~. : 'r' • •• ~ _,
500000 litres of H.S.D. Oil was achieved. :.: -
Q.£=£E~!'.~!,i£g~g!!~Q~~9~i!.I~~~Y~1:£;e~~~~ " , 4 •. 6," Se:v:en 'di:a~.;r,iC~ 'lev~~' s'~~eIl,es were 'i~plEHnen'ted under the two
subheads viz. I~, Co-o.peration" an~ II COnLluni ty Development" of this
· Ilajo,rhead •. Out of these ,. five schemes were implemented under the . ".' " .... . ,'", .
' ..
subhea,d n Cooperation li at the cost of Rs. 1.26 lakhs. As regards . ..' . 1! ", '.:
'.f. .
· pQ.ys ical achiever:len ts (i) One market ing soc iety was given finan-- ... ,. , " .. . c. _.. . '. "'1'
· cial assi?ta,nce (j.i) , ,Thre~ f.~rfiling societi~s (target one society) . .... • ·l.. .. ,", ~. " .
were encouf'~ge~:.b~ giving financ~a~,a~sistance. In addition,
~wo cqopera,ti ve consumers stores we~e assisted "( ta~get two t .. .•
. .. - . '
s:t;p;res);.An amount of Rs., 8.011akhs was spent to continue the . .- • • • -. '. ~ .' .:~; ~. ' -j ~ J ~ : .... •
,variou!3 rural, developmen:t' activ.i ties included in' the '''Comtluni ty . ... ". .~.. .'.
.. (' ,
DevelopIlent ,l?rogramtle" in 13 Panchayat Samities and "Applied . ~. --. ....
J . ", Nutritip:n,P;ro.g:r;a.mme" throug~,four blocks under two schemes of
.' _. ... ' '. ,- ."
the subn,ead "ComraunityDevelopment." . . . .... . , i .
1!!:!~~!!~g.:.~ ... ~2~~!:· " . i ~"-
4.7 Only.one distri.ct level sch.eme of IRural Electrification' \. "' v _ . (J.
'wasimpleruented under the sub head" Power Project" through
l~harasht~a St~te Elec~rici.ty Board. 16 villages were supplied ~ , ") .. ".- - :" ..
with electricity and 149 pULlpS were glven'electricity connection
duri.ngthe year under review at the cost of Rs. 15.70 lakhs. ~ _ .. ..i j
- .. 33 --
!!lg!:!~1!~_~_gi!!1!lg ; \ ....
4.8 Three district, level schem~s' Y1ere ~m,plemented under the
only subhead viz,. "Small Scale. ,Industri.es" ,included: in, the
'major head" Ind,us:try & MininK'': Rs. 0.33. ~~hs we,re utilized
and the following a.chieYEiql~nt were made (t)One'in.dustr.ial \ -' ... ' .. ~ :'.. ........" , -
cooperative ,was a~si,steq by ,way of ;Loa.r:t':l :~nd .substdy for .purcha-\ ~ ..
se of tools &equipneI\.t~ ana, (ii)Seven industrial coqperative . ", -' -'
were given managemcn~ !,!ubsidy. ~:'
~!~!!~E£!~..;~!!~.&£!:!£!~!!i£~!i£!l '
,4.9 In a.ll-Rs.88.f34 lakl;1s ,wer~,'"\ltilised for iIiJ.plementing ... . -, -_.. " . . .: ...
fiVe,district level schemes ot~Road Development' under this . . -- . .: -' •. ' • .' '1 .1
major head during 1.972-7,).,Asregards.phy:sical achteve!l1ents
22.95 kilometres of ~Oadswere qonstructed ,as against the target
'of 43.75 kilome·tr.es,~roads. In, addition to ,~his, ,minor remaining
works of'Thana Creek Bridge' .and roads of e.conamic, importance : :
were dnpragress ...
§££i~l_~~EYi£~~ -
4 ~ 10 Thisnajor' head comp:rises; or .. 30 dist~tct levell,schemes
under six sub head,s. An all Rs • .12.37l8:~~s.rwefe ui;~lised for
implementing:sChemes,o:f, 'G~neral Education'.,~heachievements • -", -I "J'"
were (i)appointment of 129f.frirp.ary te~chers(i.i)c;J;'eation of 36 • • '" ..1. • ~ " ' _
Posts.of.flead'Easters (iii)giv~ng grants: to 32 Secondary ~ -, .....' ... - .
, schools(iv)granting loa:tl'sgholarships ... to .10.6 e~.ementary
teachers (v) organi!3,~ng oneschpolcomplex (vi)giving " ..1', .-
connessions to '. 31735 .. economically lJackward class pupils ," -,-' , l' -~ '.
'(vii) giving. e.ducational concessi~ns to 2000 chiJ.:dre'n of primary • , ',' .': r • , ." I '
scho~l,toachers and (Viii) 2000 adults were made literate.
In addition to above (a) Three A.D.E.rs w~re ~pPointed- (target
achieved) (b) Special facilities were provided'fo 64dd'-girl
-- 34- --
students (target achieved) (c)86 school roo,~~,_were_,constructed
(tagget 92 school'l.'ooms) (d)132: students were, granted scholar
ships (target '132' students) .Under IIHealth'. pro'graillle Rs. 4-9.88
lakhs were spent through six' schemes fbr(i)making water supply
arfangenieritin' Primary Health Centre: at I1aswan and_Talasari
=( ii) iii ving-internship training at 4 Primary Health ,Centre and
';(rii)operltng'of'one 'sub centres :of'Primary Health Centre (iv)
implementing scheDe of erradication of malaria and (v) Carrying
out 14-000 vesectomy and 3000 tubec:tQmY,oper?-tions. In·all
R~:. '72.1 0" l~khs ' were' utilised thr{)ugh· three schemes and, works
,'; 'of 13 Go~t. "wa.'ter' s-ctpply - and drainage works and 3 l~unicipal
'water s'u)?ply'~and'dra'ina:ge wo.rks· w'ere -in -progress 'under the sub
head II Wate,J'suppiy and Drainage ll • In add'i tion, construction of
1 O'SOdri1iking water wells (target achieved) was' completed.
Rs.' 1.67' lakhs were spent on only ~sclieiJ.e of Housing to distri bu
te l-oans to 419 beneficiaries for replacing thatched roofs by
tiles. Under the sub head II 'lielfare of Bac:l~~ard ,classes II Rs.
11.16 lakhs'were incurred ,to implement five scheTIes fOI:
(i)grant"of tutions fees, 'examinatfon'fees and scholarships
to 657 students'of sched1iledcaste/Scheduled Tribes/Other
BkckWara.', ci~s'ses'and V.J.' (ii)grants to 20 hostels of B.C.
s'tud:ents' IO~ maintenance (iii), grant ,of financial assistance
to' 60 be.hefici~r'ies ef SC/S1'/OBC'. and (iv)Continuin,; the' welfare I ,
activities in nine Tribal deve lopoent blocks. Under the sub
head lI~bour-' and Labour Vlelfare " Rs. 0.25 lakhs were, spent
on the establishoent of the onlyscherae of craftsnan training
Uiscellal1eous -~-----------
,4.11 Under this major head of developnent ascheDe of 'Rural
J3roadcasting II was iraplemented at the cost of ' as. 0.60 lakhs
-- 35 --
under the sub head" Information and Publicity" and 45 radio sets
were- provided as against the target of 115 radio sets.
PART II ============
3 T.A.TISTICA.L T.A.BLES ~.:..:.:.::=====::~== =====
CONTENTS ~--..---
- -' STATISTrCAL -nSTR..(C·T -FoIi -THE ~riA:R~1-9-i2:ij-..... -::.-=.~~~~~ .............. ~----- ._--- -~ --- ...-----
: '-0' , . ,
------------------------------------------~--------------~ . ~ . r- l ' _ Sr.No. of
. ~ .. Page No.
Table . ',. ". ' ..:' . f----~----~~2---~~~~---~----~--~-------~--~-~~---------------------- -------~------------~-----------~---------
1. Area and Porililat-ion- - - :'., --,.,----------------~------
1. Talukawise area Houses and POpUiation in .. 1971 Census . ,'.' . ' ....... -~ ' ..... , " .. , . ", .
2~ Decadal variation in Population since 19~1 . ",: .,:- ~: - : \ ..
3. Talukawise classification of Villages according to population: ranges in 1971-C"ens:us ". '.
,', .J ....
4. Talukaw:~e classification of Towns ,according. to 1971 CenS~lu ' '-' ',' -., .~ ,-
~.' Nuober of:'''\"iorkers &:' non.;;.workers in each TalUka according to 1971 Census " , '
r ,~ -I ~~. .. .'.. . • -.
1
?
7
. 9 -
6. Distribution of population according to '(~JAge group 13 (B) liother Tongue, & (C) Religion
fl. Scheduled-Ca~t~s=-and'Sche;d';'i~d' Tribes ~ccording to/' 14 1971 Census , , .,', '. -,.' -
,J '
"
8. No. of Rainy days and Total'Rainfall at selected 16 . Centres . - '
9:: 1iaxi~mn,- ~nd 'nlinim~ Temperatur~ 'at selec-ted Centres - 20
·~!._-!g!:!£1a!m!!
v10.' Land UtilisationV'
, . ~ ~ .,",
/11. Area l.lnde.r::different Crops ~n'ea~~ Taluka' . ". : t, .
02. Yield per hsctare and_ out~~n, ?f pr~cipal,:~rop.s , • .. .... I .•.• rO' __ •
• oJ, ~21,
25'
31
v1~._ Area Irrigated by different sources in each Taluka. 32 j • ! ~ ~ ~ Of •••• ;." -: ... ' ,'-:". -
~4. Area Irrigated under different Crops in each Taluka ~34 - . ....! ; .. ' . - '.- . '.. . - .
05. No. of Irrigation and other wells in each Taluka - 40
16. Uinor Irrigation Works
17.Uajor& medium irrigation projects
18. Agricultural wage rates"'-
, 41
42' ..
43
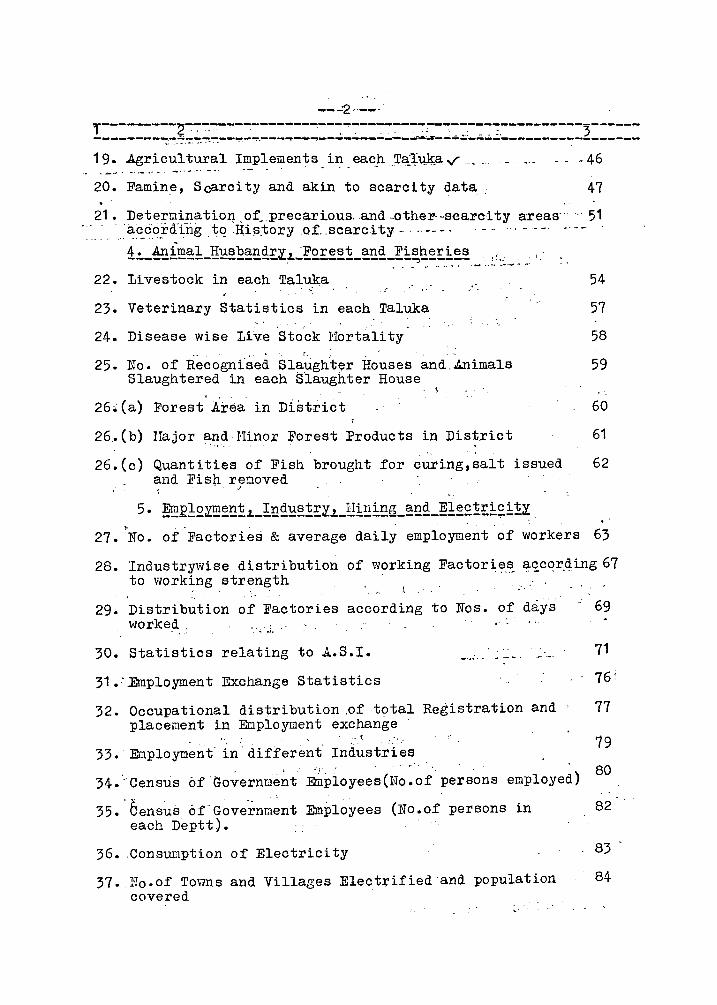
~- --2 _._-- -.
!:::::::~~~~~;=-:::=:::::::::::-~:::--=:::::::=::::::::::::::2:::::: 19. ,Agricultural I~p~eTIlents. iI:1. eaqp. .,Ta;J,:~.a v, .. ,
~ ~- - - .. -. ~ - .-"" -
20. Famin.e, Scarcity and akin to searci ty data ,.
- 46
47
21. Dete:r;m,ip.atiop .o:Cllrecarious,and "otheI'--8caI'c-i ty areas"" 51 ,,~<:,c,0.:rding tqHis,toryo.:Lscarci t.y - ' - -- _. -" '" ,._-
i!._~~~~!_li~~ba~~!:~l.~E£~~:L~~~i~~!:!:~ ,',.' 22. Livestock in each Taluka 54
'. ;~.
23. Veterinary Statistics in each Taluka 57 , ,
24. Disease wise Live Stock l'Iortali ty 58
25. No. of Recogni~ed Sla:Ugh't~r Houses and.J..nimals 59 Slaughtered in each S'laughter House
26~ (a) Forest Area in D:Lst:i-ict 60
26. (b) Uajor an.d, Hinor Forest Products in District 61
26.(c) Quantities of Fish brought for curing,salt issued 62 and Fis~ removed
J
.. 27. ~NO. of 'Factori~s & average daily employment of workers 63
28. Industrywise distribution of working Factorie.~ ~qcqr.ding 67 to working strength
29. Distribution of Factories according to Nos. of day's 69 worked ., ' ..
30. Statistics relating to A.S.I.
31.-.Employment Exchange Statistics
32. Occupational distribution .oftotal Registration and ' placement in Eoployment exchange
, '. ~ '.' .
33.' Employment' in'different Industries
71
76'
77
79
34.:'Census of 'Go~ernme~t ~:ployees(No.of' persons employed) 80
35.' 6ensus 6rGOVe~ntl~nt Employees (No.of persons in 82 each Deptt).
36. ,Consumption of Electricity 83
37. I'To .of Towns and Villages Electrified and population 84-covered
;., ..
,-
3 --
-----------2----------------------------~---~---~--~--;-------!--------------------------------.------------~--- .--.. -, .. ~-------. "
§!._Q.Q.=Q.l?~!:~1i2.!l 38. Number of different types of Co-operativ~ 85
societies
39. Stat~stics relating to Co-operative Banks 86
40. Primary Agricultural credit societies~ '87
41. Other Co-operative Societies of different types 88 , ~'
42. Operation of Central and Primary Co-operative marketing Societies " ,,', - , 89
43. Operation of other Co-operative Societies of' 91 different types ':-
. 44. Operation of regulated marketing "-- 92
45. Number .of Registered 'l'Ianey' Lenders and Loans""'" advanced: b;y, them._ , ' 93
7. Medical and Public Health --------------------------~-
'46. I1edical facilities available thraugh public and 94 pubUe aided bodies in each taluka '
47. No. cf hirths and deaths registered ~ . '.96
48. NQ. af- deaths' 'due ta important causes ' 97
49. Vacination Statistics and Chalera Inoculation 98 . ~. - - .. - ' ..
50. Na.afF~mily Planning Centres operating in District, 99
§!._~g~£~1i£!! ~1. Literacy in each Taluka according to 1971 Census~ 100
. , 52. Education in Rural Areas in each Taluka acc.ording 102
to 1971 Census
53. Educatian in Urban Areas of the Di6tric~ accarding 104 ,:ta 1971 Census, . ;
54. No.af Institutions, pupil~ and Teachers 107
55. No.of 't2.ckward class. Beneficiaries 111
. 56. Econon:lcaliy Backward class Concessions of Free 112 Educ:-:t i c'n
57. Expenditure on primary Education by way of grants 113 in-aids to Local Bodies
•
-- 4 -r--------~---------------------------------------------------------------------------------------------------------------~------- ..
. ______ 2!._!!:~~E£!:~~~~~~~£I1!E~¥~~~i£;!~~, . 58 --(A) Length of Raih"ay"RC>ute'
59. CR?~l:blength according to category & Surface classification" .' '., ' , , .
60. Hptor Vehi.cle~' in" op'~ration' ,
61. Operational StCi-t.is1;ics.of Nationalised Road/ Transport .
..... • )r' ;',
62 •. Traffic 'Census on Important Roads ',1
63. Information of Postal, Telegraph and Tel~phone . Statist ics
64. Rural Broad-Casting Statistics
lQ~_~££~1_~£~i~~
65. Incoue and Expenditure of Local ~odies -
., .'
66. Income and Expenditure of Village Panchayats r,
ja .:.
67. (A) Headwise Receipts of 't:he- "Zill-a- pa.risha~d' ,--'.-. .! '.'
67. (B) Government' grants to Z·i.lla Parishad
67.(C) Headwise Expenditure of Zilla Parisha~
.68. IncoLle and Expenditur~ of 'I~unici,pal Councils, Corporations etc. ' ,
. .' .. ,' .. 11!._PI~n_~Q£gEgrri1l_~~y~1£E~~~! .
- 114
115
. 116
117
'118
121
122
123
124
126 127 128
130
" ., 132 69. Plan Expenditure under different development head/
sub-heads
70. Physicai,·'AchieveLlents under Plan
71'. Statement showing C.D.Programme-, ,
.,
135
140
.7? Expenditure incurred in ,.different ~tages of Blocks 141
73. Physical Achievements on seiected'items in all TIloCks 143
!g!._~!i£~~ . i 74. Wholesale prices of certaih .Agri-coLlLlodities at
selected centres .!. 145
,.
75. 1..verage Retail prices of Important comuodities at v District Head Quarter
76. Consumer Price Index Uumbers(revised series) for Working Class
147
151
-- 5 --r--------2-----------------'-------------------------------;----. --------------------------------------------------------------_.
1~~_Mi~£~11~~~£~~
77. Strength of Police Force Statistics
78. Crime Statistics
79. Work Disposed at in Civil &" Criminal Courts
80. Cinema Statistic's
81. No. of Banking Offices
82. Joint Stock Companies
83. No.of Insurance policies issued and Amount insurd.
84. Collection of Small Savirlgs
85. Land Revenue Collection in each Taluka
86. No.ofPresaes, Newspapers &: Periodicals publis:led
87. Statistics relating to General Election
88. Trends in Selected Indioators
,*************************
153
154
156
157
158
159
160
161
162
163
164
167
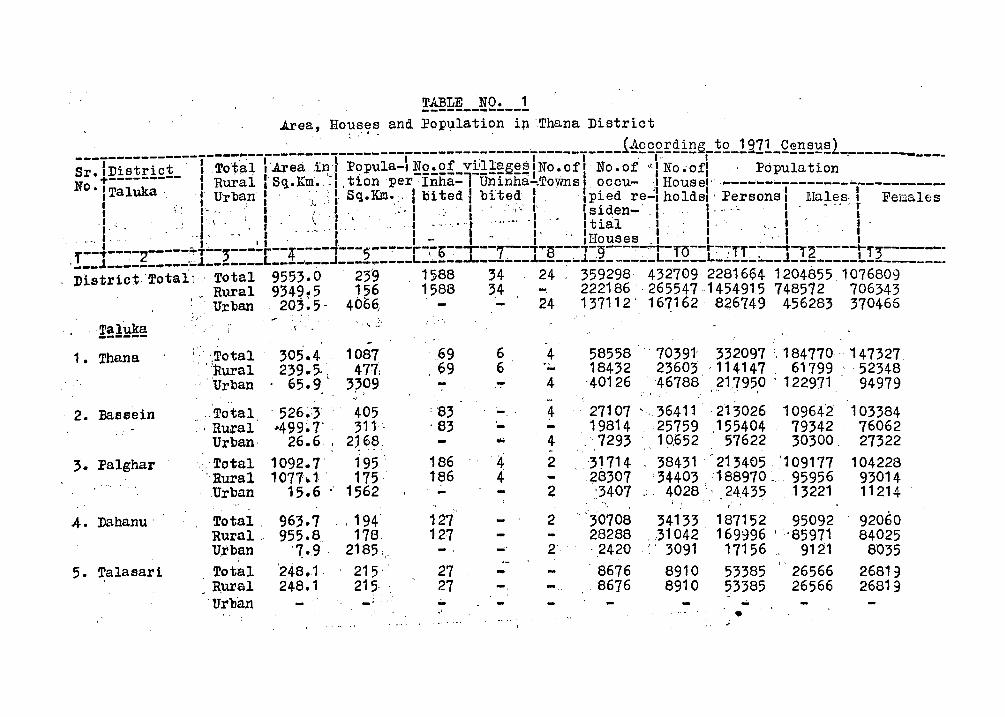
TABLE NO. 1 -------------.Area, Houses and J?opulation ipThana District
____ ~----~---~---~-~~-----------------------------l~£££E~!~~_!£_1211_Q~~~~~1 _____ _ ---------------- .' I . l I . I I . I·· I· ,-----Sr IID1'strict I Total I 'Area in. p. opula-INo.of vHla,O'e~fINo.ofl No.of '''No.ofl ,Pbpulo.tl'on • ,'. . I . '·'1' ------l----Q-- I I I I No. r--
l-uk------ I Rural, Sq.ICm •. 'I· ,tion per Inha- Uninha ... Towns I OCCU-I Housel·---.... --------------------
,Ta a....: Urban r :,;.' ~ tsq.Km •.. I bi ted I bited I . I pied re~1 holdsl 'Personsl Males· I Feoales I . , . , f , 1 I '.. I; I' d . 1 I I - " . r I, '. r'," ; I \,'·1 ',' ·"1';'· I ' .. ,' I _ I S 7 en-' 1 I· .. ··· I' 1 ... : .: I" ,. I..· " .. -I ....... ' I tlal , I I . , ' 1 I .
J .. I . .. I .- . I I , I ' ,I r:r I I . I I ,-, - I' I I I I - .. I I ;iouses ,I I .. I I --~----2------T--j----r--4----'---5-----i-~b--,---7---i~S---,-9-----~r-TO--~-~rr----~_r2---~r)--------,! __ J _______ ----J-------L---~---J---------L-----J-------J _____ ~J ________ L _____ L_~ __ ~~_J ________ L _________ _
DistrictTotall' Total 9553.0 23~ 1588 34 24 359298 432709 2281664 12048551076809 . _ Rural 9349.5 156 1588 34 - 222186··265547·1454915 748572 . 706}43
Urban 203: 5, 4066, 24 137112' 16~162 826749 456283 370466 },'
,TalUka ------ -1. Thana
, ',Total 305.4 1087 . "Rural 239.5.: 477: ., Urban 65.9 '. 3?09 . .,
2. ]3assein . Total ' 526~:3 . 405 .. , Ru:X'al '!499~T 311 .
Urban· 26.E;; , 2~ 6? 3. Palghar .-Total 1092.7' 195 .
-Rural 107'1 .. 1- . 175 Urban 15.6 1562
.4. Dahanu· Total. 963.7 . , 194' Rural,. 955.8. 178. Urban ~.9 2185;"
5. Talasari Total 248.1 215 ; R.ural 248.1 215,
' . . Urban - -'
i.···
69 ,69
:83 , 63
186 186
-. 27 27 -.,'
6 6
... 4 4
-.
4
4
4 4 ~
2
2
2
2
58558 .. 70391- 332097', '184770 ' '147327 18432 23603 ·114147, 61799' 52348 '40.126 '46788' 217950' 122971' 94979
',' .
27107 ", 36411 .. 213026 '109642· 103384 19814 25759 ,155404 : 79342 76062
_'7293 10.652' 57622 30300. 27322 31714 ' 38431 . 213405 '109171 104228 28307 :34403 :188970~. 95956 93014 '3407 ,:. 4028 '" 2443513221 11214
.,
, '30708 34133 28288 . . 31042 ,2420 '3091 8676 8910
.8676 8910
" , 187152 169996 .
17156
53385 53385
.-•
95092 '85971
9121
26566 26566
92060 84025
8035 2681;) 26819
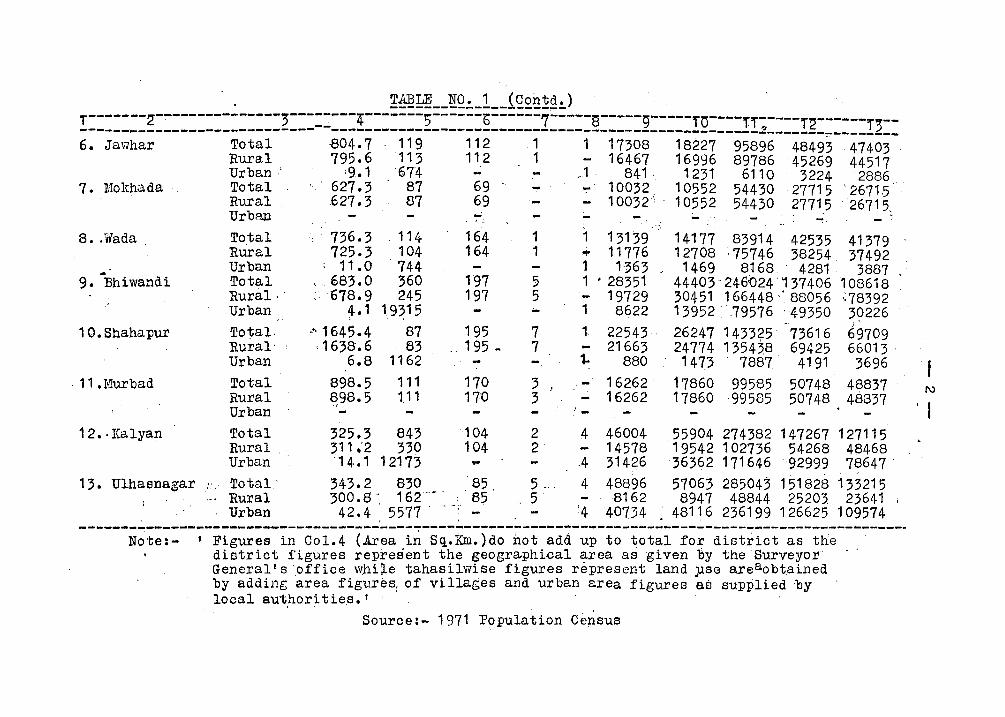
7. 1.!okhada
8 •. Wada .
9. "'Bhiwandi
1 o. Shahapur
. 11 .Murbad
12.· Kalyan
, '
55904 274382 147267 127115 19542 1027~6 54268 4846S 36362 171646 '92999 78647
. ~
57063 285043 151828 133215 8947 48844 25203 23641
48116 236199 126625 109574 ----------------------------------------------------------------------------------------------------
Note:- 'Figures in Col.4 (.Area in Sq.Km.)do not add up to total for district as the district figures repreeient the geographical I?-rea as 'given by the Surveyor General' soffice Whi;Le tahasilvvise figures represent land )lse areaobt.ained by adding area figures: of villages and urban area figures as supplied by local authori tie.s. I .
Source:- 1971 Population Census
, I
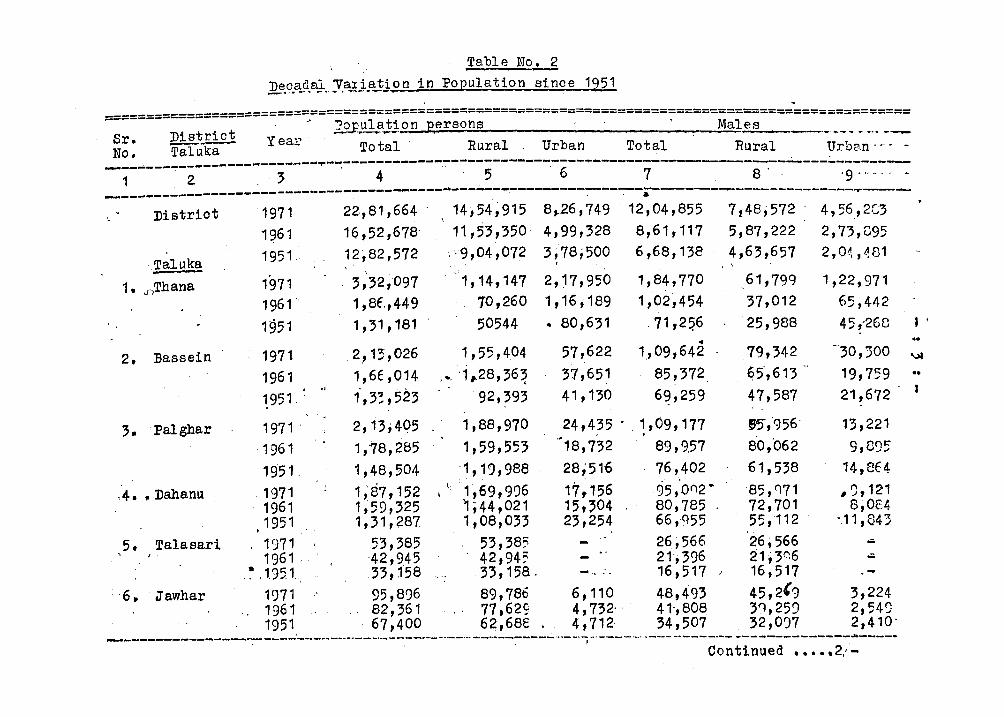
Table No.2
De.9.Et~.a]' __ :V:~;i.~j.on in Population since 1251
=:::====~~:::~::========~===7;~~1~jj~~=g~~~~~~==========~===========~=====M~~~========-~=-=-=~.~=~~ No. Tal~ year Total' Rural Urban Total Rural Urbctn, _. -
------------------~-----.--~-~-----------------------------~-----------------------~----~---------1 . 2 3 4 5 6 7 8 ' . 9- ., - -, -
-----------------------------------------~-------~----------. --~-.------------------------~------Distriot
Taluka
1 • .I,Thana
'1971 1961 1951.
1971 1961'
22.,81,664 16,52,678' 12,82,572
14,54~915 8~26,749
11,53,350 4,99,328 :'9,04,072 3,78;500
1,14,147 2,17,950 10,260 1,16,189
12,04,855 8,61,117 6,68, ne
1,84,770 1,02,454
7 148;572 5,87,222 4,63,657
4,56,2C3 2,73,C95 2, O~ ,481
61,799 1,22,971 37,012 65,442
1951
3,'32,097 1,8f,,449 1,31,181 50544 • 80,631 .71,2~6 25,988 45,-268 I'
2. Bassein
3. 'Palghar
-4 •• Dahanu
,5. Talasari
6. Jawhar
1971 1961 1951 ..
1971 . ·1961 1951. 1971 1961 1951 1971 1961 .
~.1.951.
1971 . 1961
1951
2~13,026
1 ,6E ,014 1', 3~, 523
2,13;405 1,'78,285 1,48,504 1;87,152 1,59,325 1,31,287
53,385 -42,945 33,158 95,896 82,361 67,400
1,55,404 .•. ·11.28,363 .
92,393
1,88,970 1,59,553 '1,19,988
\ 1,69,996 ~;44,021 1,08,033
53,385 42,94~ 33, 15a-89,786 77,629 62,68E
57,622 37,651 41,130
.. 1.,Og,642
85,372 6~,259
24,4~5 .. ~ ,Og, 177 18,732 89,957 28,516 17,156 15,304 23,254
-.....
6,110 4,732, . 4,712
76,402 ,
95,·01")2· 80,785 66,Q55 26,566 21;396 16,517 48,4<)3 41-,808 34,507
79,342 65,613 ..
47,587
e?,"956 .
80;062 61,538 85,071 72,701 55,112 26,566 21~30,6 16,517 45,2(,) 3<),259 32,0')7
-30,300 19,759 21,672
13,221 g,895
14,8E4 ,9,121
8,0£4 -11,843
3,224 2,549 2,410'
_______________________ ._ ........... M-.. ___ • _____ ,, __ ... - __ . ____ ... ________ .. __ ~ __ . ______ ... ___ ._ ... ____ • __ ______________ .a ____ _ , Continued ••••• 2!~
..
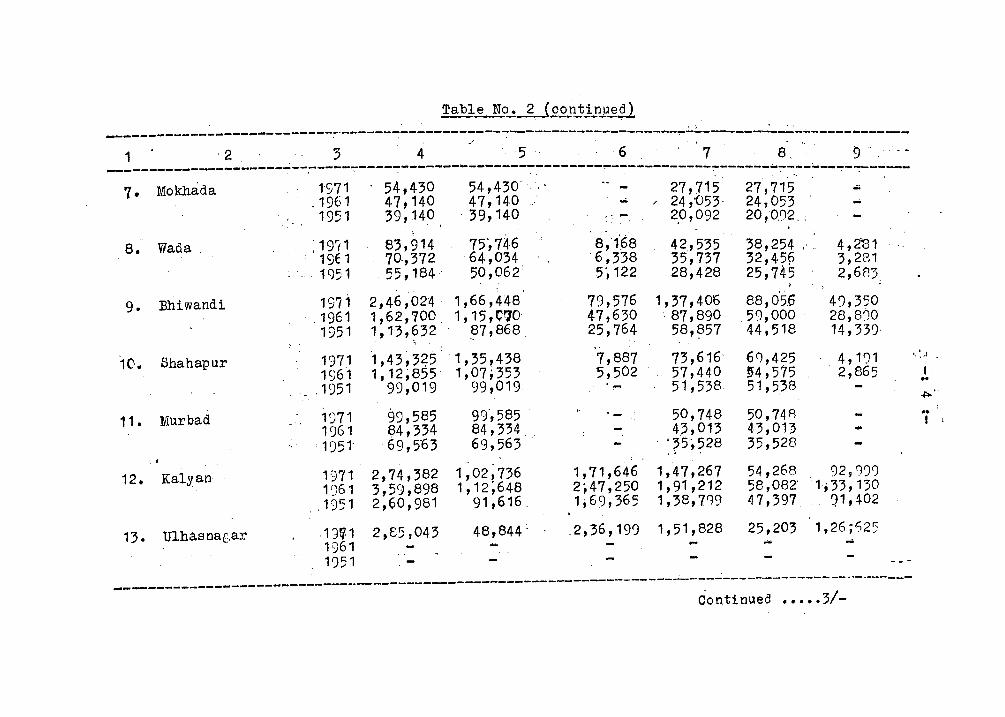
Table No~.J~nJin_p~il
--------------------------- .... --------:'------------~-------------------~..:...~-----~--------------J
1 2 3 4 :
5 6 7 9 8, _____________________ ~--~---_7_---~--_---------------------~------------~~-----~~~~-~--~-~-----7. Mokhada 1571 54,430 54,430' " . 27,715 27,715 -
:1961 47t 14O 47,140 .- 24,053- 24,053 ...;
1951 39,140 - 39,140 ~~. - 2.0,092 20,0,92, ,
8. Wada, , 19/1 83,914 75~746 8,1'68 4~,535 38,254,', 4,281 19E 1 70,,372 64,034 '6,338 35,737 32,456 3,281
-, . 1c)51 55,184 50,062 5', 122 28,428 25,745 2,683
1971 ,
88,0'56 9. Bhiwandi 2,46,024 1,66,448 79,576 1,37,406 49,350 _ 1961 1,62,700 . 1,15,0'10 47,630 87,890 59,000 28,8'")0 1951 1,13,~32 ~7,868_ 25,764 58,?57 44,518 14,339-
"
1,43,3~5 10. Shahapur 1971 1,35,438 7,887 73,616 6O,425 4,11)1 1.:.1 1S61 1,12,855 1,07;353 5,502 57,440 ~4,575 2,865 I.
. ,1951 99,019 99,019 51,538 51,5,38 .. ~.
11. Murbad 1971 99,585 99-,585 '- 50,748 50,748 .. 1 <)61 84,334 84,334. 4,3,013 43,013 I I
1951- -69,5'63 69,563 '35,528 35,528
12. Kalyan 1971 2,74,382 1,02,736 1,71,646 1,47,267 54,268 92,9')9 1961 3,59,898 1,12~648 2;47,250 1,91,212 58,082' 1; 33,130
,1951 2,60,981 91,616, 1;69,365 1,38,71')9 47,397 91,402
13. Ulhasna[,ar -1 )t11 2,65,043 48,844~ _ 2,36,199 1,51,828 25,203 1,2Ei;625 1961 ... ... .-
1951 ... -------------------------_ .... _------------------------------------------------------_._._-----
Continued ••••• 3/-
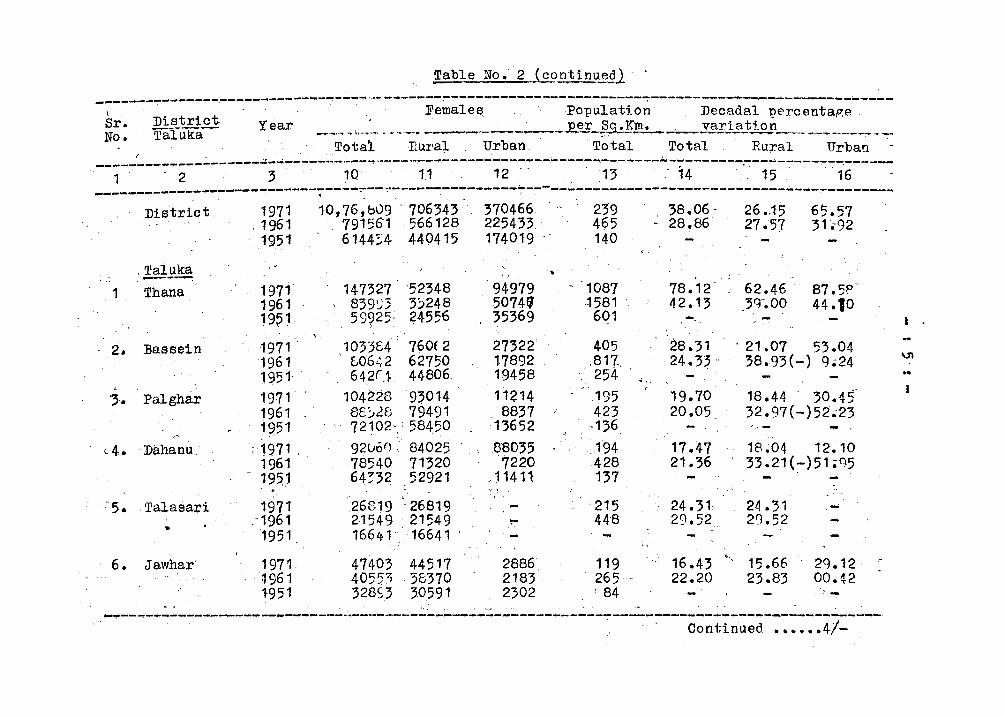
Table No.2 {conttnue.2l·
---------------,--~--------... -~---~.----------~------------------------:"---------------------------\. . . Females. Population Decadal -gercentage ~~: . ~~~_~~~ct . Year __ .~ ~"_~'_' ._._... ~_ ..... per SSt.Km. vari..?J.1.2.E __ ~~ _____ ~~._.
Total ·Rural Urban . Total Total Rural Urban ~----'--------~------..:.;.-------:......- .... --....,~"'--- .... ~-------.------~;..-.---~------..:..----..;;.-----.----.-~------.------
1 - 2 3 . 1Q 1.1 12 ". . .13 .. 14 - 15···· . 16 .. -----------.. ---------~-----;------:-.--'~-------:-.--------~--------,-~--------------------------~---~---
1
2.
, ,-. (4.
.- 5.
6.
" , . District.
. Taluka ............. -Thana'
13assein
Pal ghar
.~
. Dahanu.·
-
,Talasari
Jawhar-
1971 , 1961
1951
1971 1961 19~1,
1971 . 1961 1951 1971 1961 1951
:1971 1961 1951 . ' 1971
:'1961 1951
1971 i
'1961 1951
..
10,76,b09 '706343' , 79156'1 . 566128
6144;;4- 440415
147327 -52348 839~3 3~248 59~25: 24556
103384 . 760£2 606'-:2 62750 642(J 44806
104228 93014 8£;'.28 79491
'. ' 72102" , 58450 92vo() , 84025 78540' 71320 6r~32 52921
26819 -26819 21549 . 21549 1664': ·16641
47403 44517 405~;I ·38370 32853 3.0591
.. ..
370466. 22543} '. 174019" '
,',' ~.
94979 5074£1 35369
27322 ·17892 19458 11214 8837
13652 88035
7220 ~11411' ',' .
-~
2886~ 2183 ' 2302
-
239 465 140
1087 .:J 581
601
405 .811. 254 ,195 423
··136 _194 428 137
'215 44'8
119 265 ' 84
, 38.06-: 28.86-
78.12 42.13 -28.31 24.33 ..
.i •.
19.70 20.05 -
17 .47 21.36
24.31 29.52 ...
"
16.43 <.
22.20
26 •. 15 27.57
62.46 3Q-.OO - ' .
. 21.07 38.93{-)
18.44
65.57 31;92
87.5P' 44.10
53.04 9;24
30.45 32.97(-)52.23'
18.04 12.10 33.21(-)51;05
24.31 -29.52
15.66 2<).12 23.83 00.42
" ~--~---~-----:----.;...----------".~.----.:..~--------------.----------~----------------- .... -,---------...:.--,
•••••• 4/-Continued
I
VI
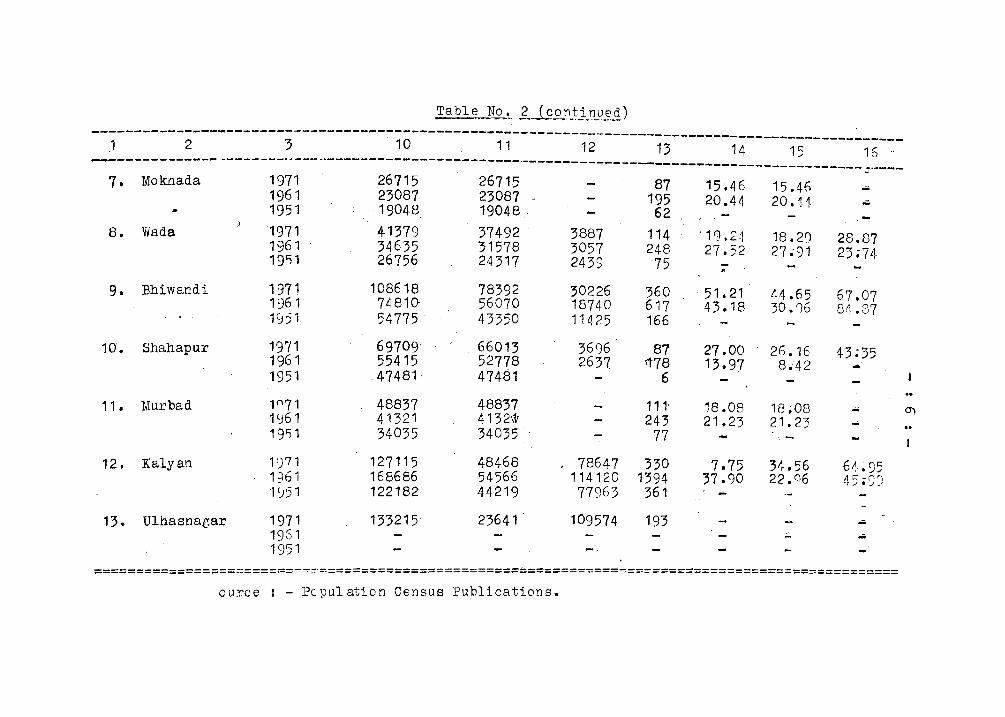
Table No. 2 ( con_~j.}:ly'ed)
~----------------------------------~-------------------------------------------------------------.1 2 3 10 11 12 13 14 15 16 o •••
-------------- -------_ .. -------------------------------------------------------------------- ~ ..• ---7. Moknada 1971 26715 26715 87 15.46 15.46 ...
1961 23087 23087 - 195 20.44 20. t1 ~
1951 ,19048 19048 ' 62 - -8. Wada '1971 41379 37492 3887 114 ' 19.24 18. 2~ 28.87 1961 34635 31578 3057 248 27.52 27.91- 23;74 19'i1 26756 24317 2439 75 :;-
9. Bhiwandi 1971 108618 78392 30226 360 ' 51.21 44.65 67.07 1961 74810 56070 18740 617 43.18 30.1)6 84.87 19;1 54775 ' 43350 11425 166
10'. Shahapur 1971 69709 66013 3696 81 27.00 2fl .16 43;35 1961 55415 52778 2637 178 13.97 8.;42 .... 1951 47481, 47481 6
'0 11. Murbad 1"'71 48837 48837 111' 18.08 18~08 - 0)
1~61 41321 4132\11 243 21.23 21.23 ... '0 19'i 1 34035' 34035 '. 77 ',-
12. Kalyan 197 1 127115 48468 78647 330 7.75 34.56 6~. ~ 95 1~61 168686 54566 114120 1394 37.90 22.Q6 45;99 1~51 122182 44219 77963 361
13. Ulhasnagar 1971 133215' 23641 109574 193 - ... 1961 ... 0:., .-1951
~==========================.==============================================================~=======
ource I - Pc 1,?ul ation Census Publications.
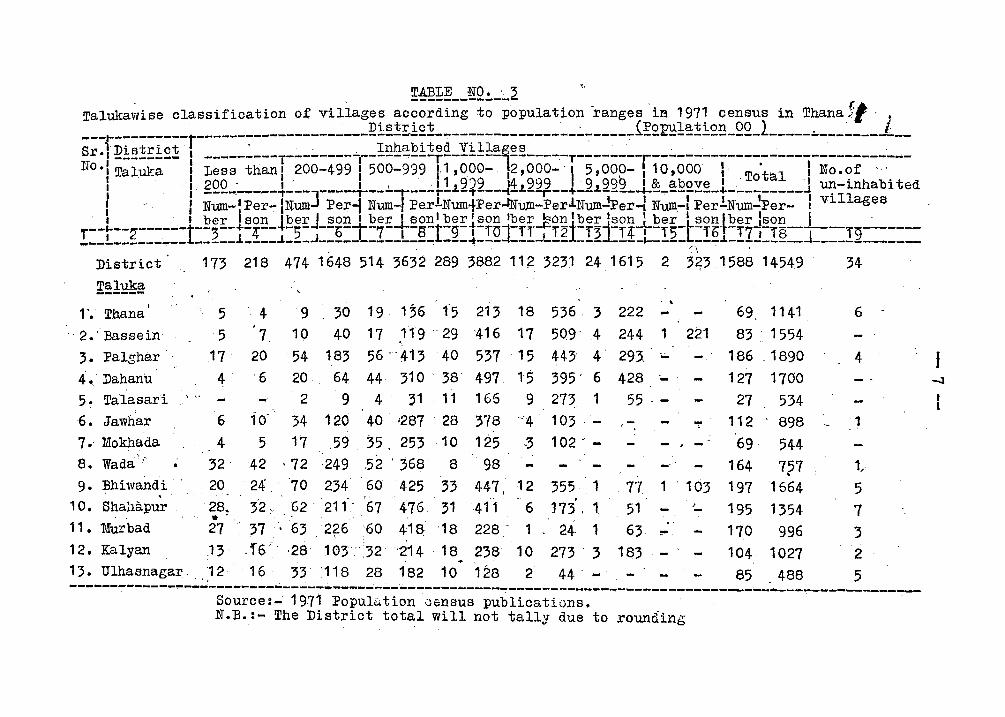
District
Taluka ------1'. Thana I 5
'. 2.I1assein 5 3. Palghar '17'
4~.· Dahanu 4 5. Talasari ":
19 136 . 1"5
17 119 ' .. 29
56 ," 413 40
44 310 38' 4' 31 . 11
213 18 416 17
537 15 .
497. 15 166 9
-4
·3 -.
536 3 509' 4 443- 4 395' 6 273. 1 103 .-102 - -
.. 222 -244 1 291'-428 ._.
55 . -
221
34
69 1141 6
83' 1554 186 .1890 4 127 1700
27 534 112 898 1
69 544 164 757 , 197 1664 195 1354 170 996 104 1027
85 488
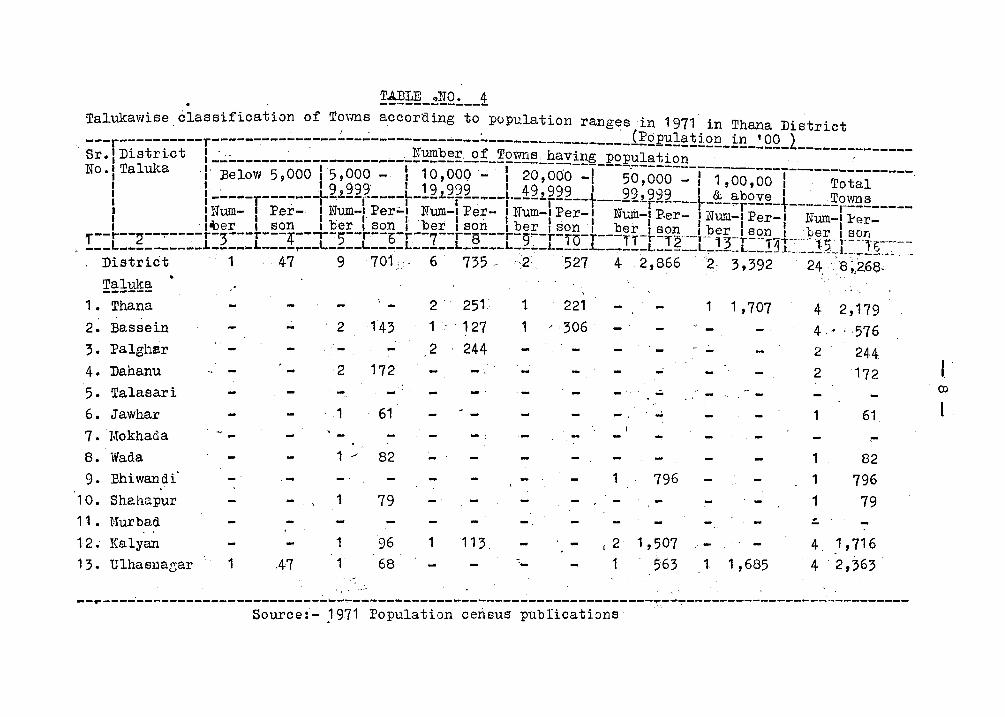
!!§±!~_.!!Q!. __ i Talukawise classification of Torms according to population ranges in 1971 in Thana District
. I.. • . (:p. 1 t· , '00 2 - -r----------------------------------------------- _ ~ onu alan ln ---r--------. - - --~--_____________ _ ____________ _ . Sr. I District 1...:-;,.------~------------...;...;~~E~E~f-'~£!.l!!~_!!~!!~~_R£E~!~1!~!!__ _ . N0.1 Taluka ·1 Below 5,00015,000 - I 10,000- I 20,000 -I 50,000 - 1-1~oo,oo-T----T~t;1-----
I I :...---r-------t2.!.22~----L-!2.z.2_,92- ... --L-12.t222--t'--2~,999 \-1 &; above tl Towns I 1- I· I .. I I I . -,----- ---.,...r---- ------r--------I I Num- • :Per- I Num-I. :Per-I Rum-I :Per- I Hum-I :Per-I Num-I P,er- I Num-I :Per-. Num-Il'er-I I I • b· I I· b · I . I b I· I b I I I I I II~er I son I er I son I er I son I er ,son, er I son Iber Ison I ber I son
T--t---2--.,..----,..-3---,..---4---r-~5--r--6-r--7--r-8---r-g--r-'r"O-T---iT-r-T2--r ' - , ~rr- ·-TilT--····· 'l5 l '--'ir;------_L __________ l _____ L ____ ... __ L ____ L ____ L _____ L ___ --:_L-:-.-: ... _ L--: ___ .L _____ -:L. __ ,-_L,,..-____ L ____ l .... ____ .--; L-:---: __ . _". ._
,District 1 47 9701: 6 735 -:2 527 4 2,8662 3,392 24 '. 8~,2.68, Taluka _ .. ----
1 • Thana 2. Bassein
3. Palglwr
4. Dahanu
5. Talasari 6. Jawhar 7. Mokhada .. 8. Wada 9. Bhiwandi'
10. Shahapur 11. ~·~urbad .. 12. Kalyan 13. Ulhasnar;ar 1 47
1 79
1
1 96 68
2· 251,
1, 127
2 244
1 113,
t
1 /
'-
221 306
~
- .-.,. .....
1 796
,2 1,507 1 '563
" . . '
1 1,707 4 2,179 4, .. ; 576 2 244 2 172
1 61
~
1 82 1 796 1 79 !..
4 1,716 1 1 ,685 4 2,363
--.. ----.----------------------~ ....... ~- .... ~---------------------------------~.--~--------------------------Source: - .1971 Population census pubIicatbns
I, OJ
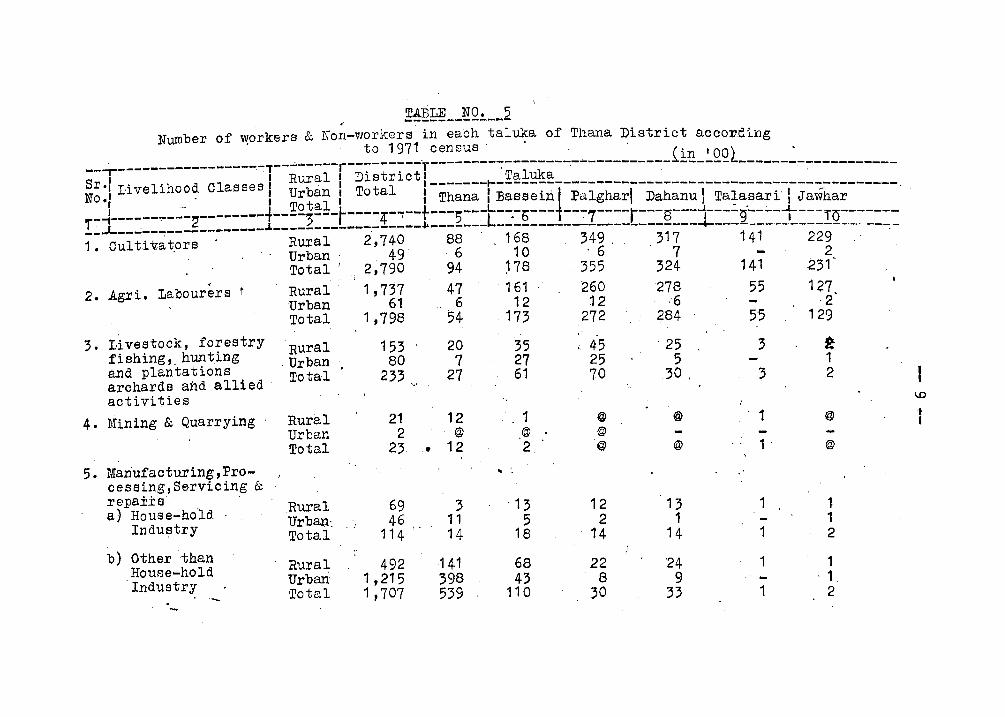
TABLE NO. 5 -------------Number of ~;rkers & No~-workers in each tal~ of Thana District a:cco:t'~ing
---r---------~-------,-T-- ...... ----~--:~-::~:'T::~~~~-----_____ ..:, ___ ---~-----i!:~-~QQl------~-.;.--~ ____ ;,._ S I " Rural I District I 'Taluka . , r., Livelihopd Classes b" Ttl ,-------1-------------------------------------..;.---------,
N0.1 _ ' I ¥r t a~ I 0 al Thana I :Bassein ~ Palgharl Dahanu 1 Ta~asari' I Jawhar .
!:J::::::::::g::::::::i::::z:::t::~:!::::t:::~::Jt::~~:::_:::l::::t:::~:::jt:::g-=~jt:::rQ====:== 1. culti'Viators . Rural' 2,740 88' 168· " 349, 317 141 229 .
. Urban' 49 . 6 10 ' 6 7- 2 Total J 2;790 94 '78 '355 . 324 141 231'
2. Ag.ri. Labourers t Rural'· 1,737 47 '.' . 161 ,_260 '27.8 55127 Urban 61.. 6 . 12 j 2 ,6 ·2"
3. Livestock, forestry fishing" hunting and plantations arohards and allied· activities Mining &. Quarrying
5. Mariufacturing,Pro-ceseing,Servicing & repairs· . a) House-holel
Indu~try
b) Other ·than , House-hol~ Industry
'-
Tot.al . 1 ,798 54 . 173 272 284 55 129
Rural 153 · Urban 80 · Total 233
',J
· Rural 21 Urban 2 Total. 2} ,e,
,Rural 69 Urban·, 46 Total 114 ..
Rural 492 Urban 1,215 Total 1,707
20 ,7 27
12 .@
12
3 11 ·14
·141 398
,539",
. ' ..
35 27 61'
" . 1 ,@ 2,
. ... "
'13 5
,18
68 43
110
, 45 ' 25 3 ~ 25 5 1 70 30. 3 2
,@ '@ 1 @
@ @ @ 1 @
12 13 1 . 1 2 1 1
, 14 14 1 2
22 '24 1 1 8 9 ' 1
30 33 1 2
\0
'1
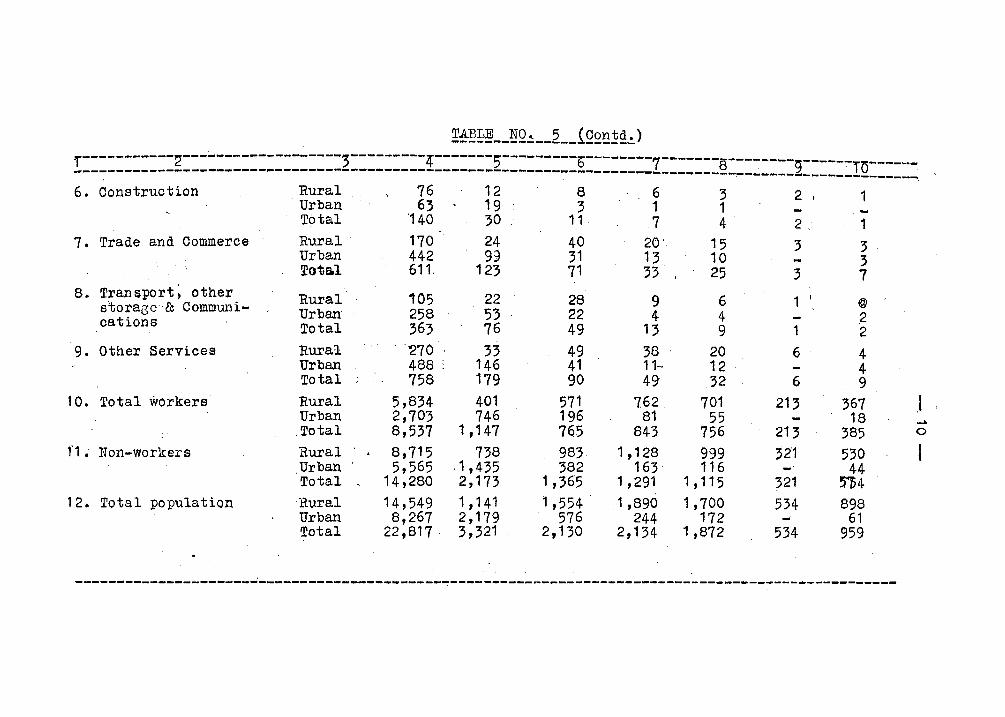
!~~~--~Q~-_2 __ iQ2~~~~) r-----------2-------------------3---------4-------5---------b--------7-~-----S--------g------ ------______________________________________________________ -______________________ _ . T5
\ . - .-------...,j--------------. 6. Construction Rural 76 12 8 6 3 2 1 Urban 63 19 3 1 1
Total '140 30 11 7 4 2 .. · 1 7. Trade and Commerce Rural 170 24 40 20' 15 3 3 Urban 442 99 31 13 10 3 Tota.l 611. 123 71 33 , 25 3 7 8. Transport ~ other Rural 105 22 28 9 6 1 I
@ storaGe & Communi- Urban 258 53 22 4 4 .2 oat ions Total 363 76 49 13 9 1 2 9. Other Services Rural . ''270 33 49 38 20 6 4
Urban 488 : 146 41 11-- 12 4 Total 758 . 179 90 49 32 6 9
10. Total workers Rural 5,834 401 571 762 701 213 367 I Urban 2,703 746 196 81 55 18 -"
. Total 8,537 1,147 7(6 843 756 213 385 0
fL Non-workers Rural 8,715 738 983 1,128 999 32'1 530 I I
Urban 5,565 .1,435 382 163 116 - 44 Total 14,280 2,173 1,365 1,291 1 ,115 321 !n4
12. Total population Rural 14,549 1 ,141 1,554 1,890 1,700 534 898 Urban 8,267 2,179 576 244 172 ... 61 Total 22,817 . 3,321 2,130 2,134 1,872 534 959
--------------------------------------------~------------------------------------------------------
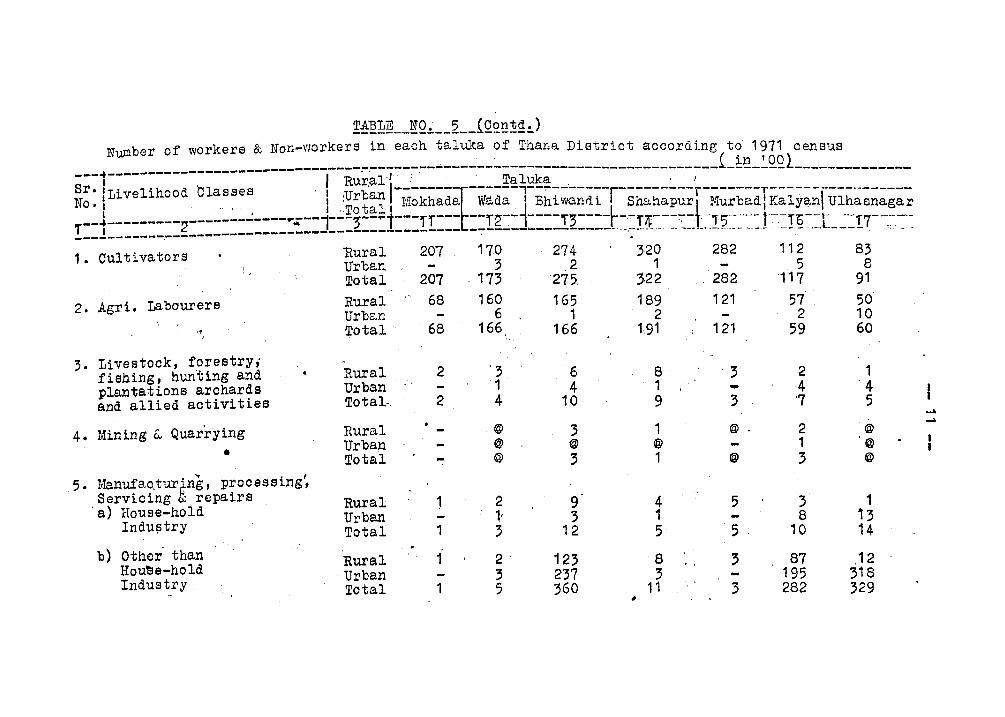
Nwnber of workers & Non-workers in each taluka of Thana. District according to 1971 census ~ _____________________________________ ~ __________ ~ _______________ (_!~_~QQL_________ _ __ _
--- .----------, I Rural" " 'Taluka ' I -
~~: ILivelihood Cl~,s~e~ i I ,:g~:~ !-M~kh;d~-W;d~-l-Bhi~;~di-lsh~h~;~;r-M~;b~dTK~i~;~ruih~~~~~~-;; !::!:::::::,::g:::::::::::::~::j:::2:::1:::11:::t:~I~-:j:::-,-2:::=t=~I~C-=~=t.-.!?,~~"~=.1~,=!§-,=t-~:::I7--,;--=-,~ 1. Cultivators
2. Agri. Labourers r. :
,.;
3. Livestock, forestry; fishing, hunting and plantations archards and allied activities
4. Mining &. Quarrying •
5. Manufao,tu:r~ng, processing', Servicing ~ repairs
'a) House-hold Indu!3t ry
b) Oth~r than Hou~e-hold Industry,
'Rural 207 17,0 274 320 282 11 2 83 Urban 3. 2 1 5 8 Total 207 ,173275, :;22 ' 282117 91 Rural 68 160 165 189 121 57 ' 50 Urban 6 1 2 2 10 ~otal" '68 166 166 191 121 59 60
Rural Urban Total
Rural Urban Tota.l
Rural Urban Total
Rural , Urban Total
2
2
,-
1
1
1
1
'3 1 4
,@
@ @
2 l 3
2' :3 5
6 8' 4 1
10 9
3 1 @ @
; 1
9 4 ; 1
12 5
123 8 237 3 ;60 11
#
'; 2 1 - '4 '4 3 '7 5
@ 2 @
1 @
@ 3 @
5 3 1 8 1;
5 10 14
3 87 ,12 195 318
3 282 ;29
..... .....
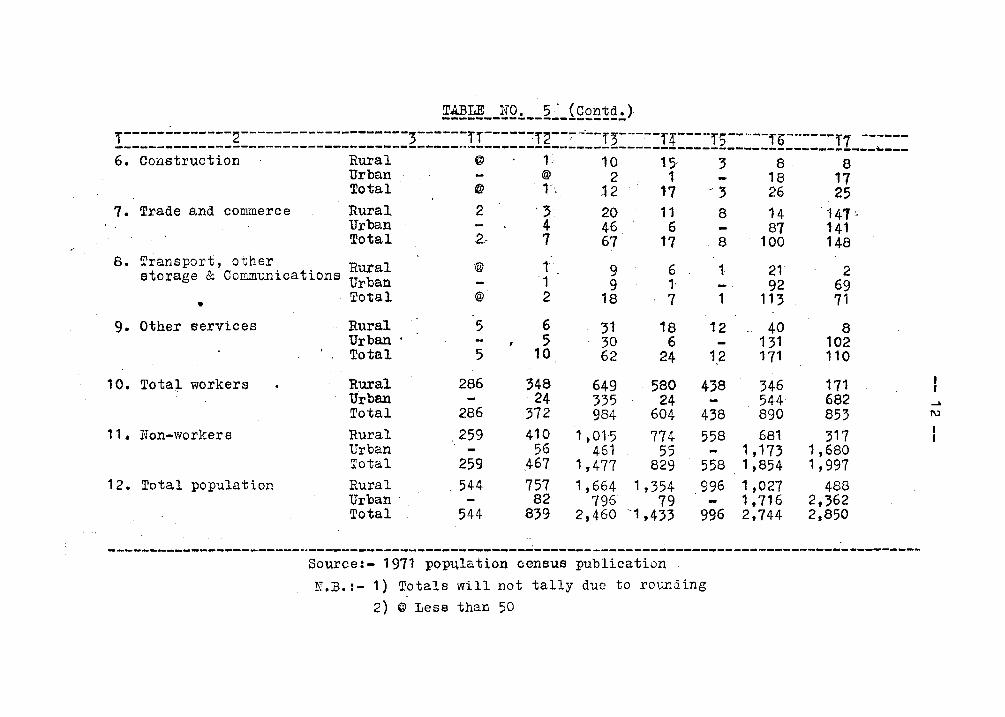
~~ __ !Q:. __ 2~_iQ2!!!g.:.).
T-------------2--------------------,------,.,.----.--:f~--~-... -,.~---:--f4----f:--·---fG------f ------~------------------------------------~-----------------------------__ ~~2-~---_________ 1 ______ ~ 6. Construction Rural @ 1-~ 10 15 :3 8· 8
Urban @ 2 1 18 17 Total @ 1 •. ,12 17 - :3 26 25
7. Tra.de and commeroe Rural 2 ., 20 11 8 14 '141 c
Urban 4 46 6 87 141 Total 2" 7 67 17 .8 100 .148
. 8. Transport, other . Rural @ l' 9 6 1· 2'- 2 storage & Communications Urban '1 9 1- -. 92 69 • .' Total @ 2 18 7 1 . 113 71
9. other services Rural 5 6 31 18 12 .. 40 8 Urban . 5 30 6 131 102 Total 5 10 62 24 1.2 171 110
10. Tota+ workers Rural 286 348 649 ·580 438 346 171 Urban 24 335 24 544 682 ~
Total 286 372 984 604 438 890 853 I\l
11. Non-workers Rural _ 259 410 1,01-5. 774 558 681 317 I I
Urban 56 461 55 1, 1T~ 1,680 Tota.l 259 ,467 1,477 . 829 558 1,854 '1,997
12. Total population . Rural .. 544 757 1,664 1,354 996 1,027 488 Urban' 82 796 79 1,716 2,362 Total 544 839 2,460 -'1,433 996 2,744 2,850
~---~------------------.. --------------------------------------------------------------------------Source:- 1971 pop~lation census publication N .B. r- 1) Totals will not tally due to roUnding
2) @ Less than 50
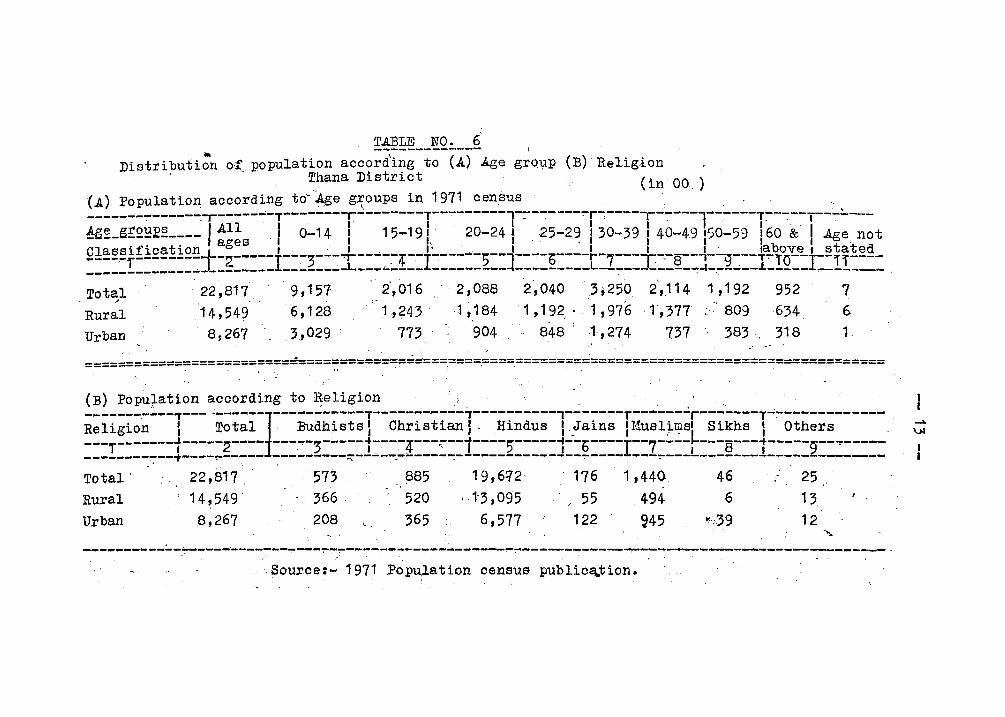
T.A.BLE NO. 6
Distributi~ o-~, population acco;d\i~;-t~-(A)-.Age gro1,lp (B) Thana District
Religi.on
(in 00 ) (A) Population according to- '.Ar,e g~oups in 1971 census . .• . -------~------Jr-------T-------Jr--------T---------l~-~----~r~----Jr-----l------T--~----I --~---~g~_grQ~12~ ____ IAll . ,I 0-14 I 15-191·' 20-241, 25-2.9 III 30-39 I 40-49 150:"'59 1'60 &" I A"'e not acres 1 I, I·. I 1 I 1 -0 . ClassificatiOnt 0 1 . 1 .1'·., I 1 1 I' labove I stated ----·-r-------- -2.-----1---3--~'T'----~4--1------5--1--.,.-b----i-7---I-'-8-~.,-_g~--T.,.-10--,--11----______________________________ .J.. ___ "-____ _ ________ -I __ . _______ L __ -:-__ _ ____ .,.-I-.-----.1-----J.--. ___ _
Total" 22,817 9,157 2',0162,088 2,040.3,250 2,114 1,192 952 7 /
Rural 14, 54~ 6,128 1,243·1 ,184 1 ,192, .. 1 ,97'6 ·1',377 " 809634 6
Urban 8,267 3,029 : 773 904 848'.1-,274 737" 383 318
============================:====:====-:===~;:=========.====.===.=============.============================ . . "
(B) popuJ,ation according to ~eligion .
R;ii;i~'~---T--- -T~t~l-l---B~dhi;t,;I-~ch;i;ti~~I~--Hi~d~;-l~.J~i, ~~-TM~;l~;;r-, sikh;-I-~bth,;;;------, ---r------t-----2---- ---.,.-3-----t----4---::---1----5-----1--b----T--7----~---s---t-----g--..-------------~--T----~--~-- ---------~----~------~---------------~--------~------~------------------Total' 22,817.' 573 885 19,612 0 176 1,440 46 25 Rural 14,549' 366 . 520 1-3,095 ' . , 55 494 6 13,
Urban 8,267 208 \. 365 6,577 122 ~45 "'39 12 ~ , . . . . . .'.
------------~----'----.-:"--~--~~.:----------'--------~'7"'"------------. ----'-----.:..--------------~ -. Source:- 1971 Population census publica.,.tion •.
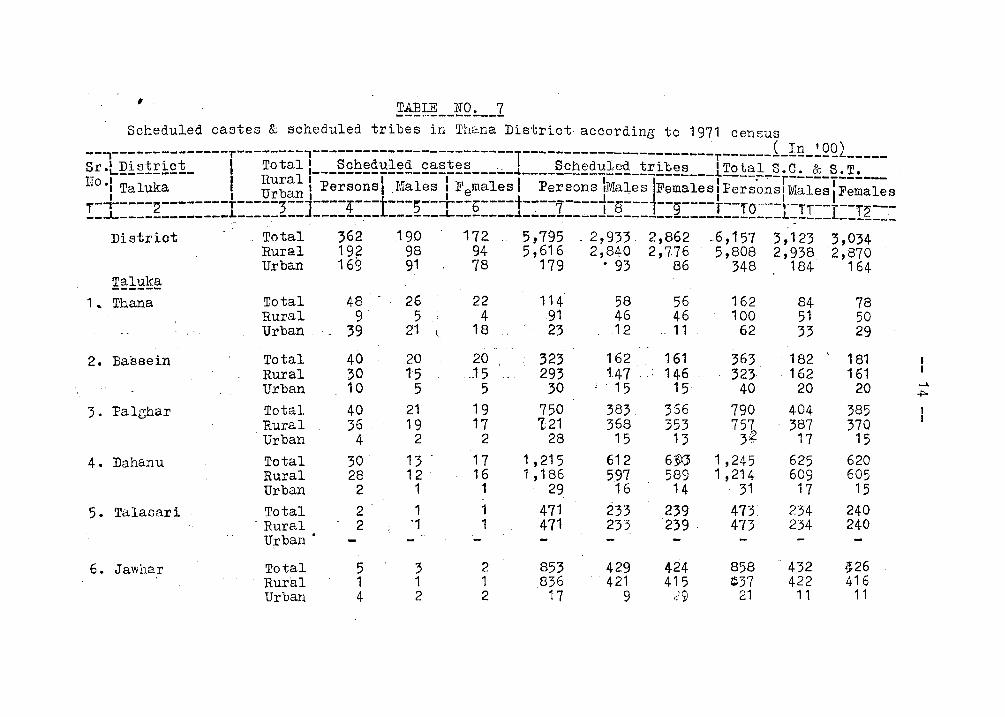
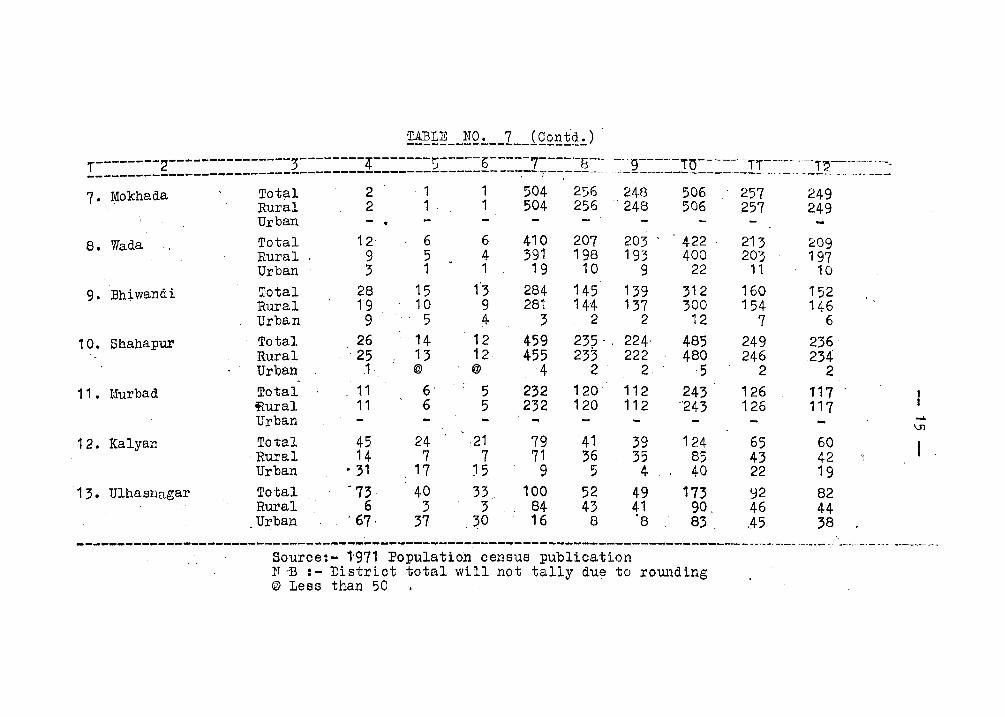
~~~_~!Q~~_I __ {Co~1~~) ,.--------2----------:------j--------4-------!j-----6-----7-----S------9-' ---10----·-TT---- ---T ----.-. '-. __________________________________________________ --~--T--:------····"" -------------------........ -----~ -..
7. Mokhada Tot~l 2 - 1 1 504 256 248 506 257 249 Rural 2 1 ' 1 504 256 ' 248 506 257 249 Urban • ...
8. Wada Total 12' 6 6 410 207 203 422 213 209 , . 5 ,4 391 198 193 Rural . 9 400 203 197
'P'rban 3 1 . .' 1 19 10 9 22 11 10
9. Bh~wandi Total 28 15 1'3 284 145 139 312 160 152 Rural 19 10 9 281 144 137 300 154 146 Urban 9 - . 5 ,4 3 2 2 12 7 6 .
10. Shahapur Total 26 14 12 459 235· , 224· 485 249 236 'Rural ' 25 13 12 455 233 222 480 246 .234 Urban ,1 @ @ 4 2 2 5 2 2 .
11- Murbad Total . 11 6' 5 232 120 112 243 , 26 117 itural 11 6 5 232 120 112 '243 126 ' 117 Urban - -. ....
, \Jl
12. Kaiyan Total 45 24 ·21 79 '41 39 124 65 60- I , Rural 14 7 7 71 36 35 85 43 42 ~.
Urban • 31 17 l5 - 9 5 4 40 22 19 13. Ulhasllagar Total -73 40 33 100 52 49 173 92 82
Rural 6 3 :3 84 43 41 90, 46 44 . Urban ' 67· 37 , ~O 16 8 '8 8:3 . .45 38
------------------------------------------------,-------------------------------------_ .... _ ...... - .. ' ......... .-.-.._- ~.-.. -- .. Source:- 1-971 Population census publication ~~ 13 :- District total will not tally'du~ to rounding
, @ Less than 50
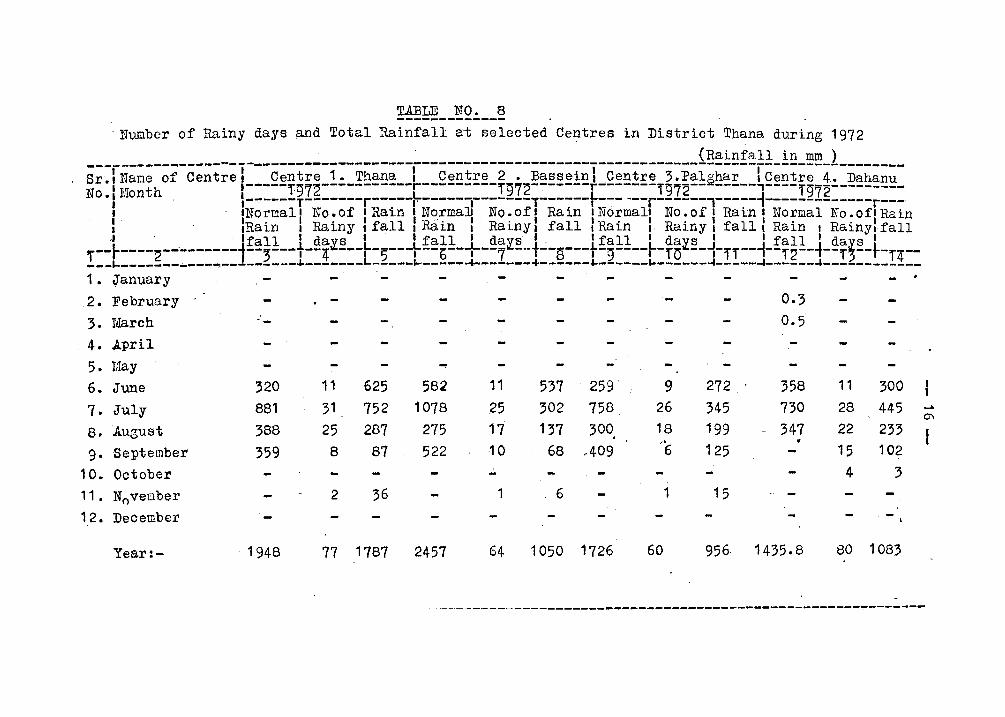
TABLE NO. 8 'Number of Rainy days ~d Total Rainfall at selected Centres in District Thana during 1972
---r------~-------I--------------------I--------------------,------------i~~~~f~f~-~~-~-l--------Sr.,Name of Centre, Centre 1. Thana I Centre 2 • Bassein, Centre 3.Palghar ,Centre 4. Dahanu NO.' Month 1-----'fg72-----------r---------,-972--:----~-r-------rg72-- ... -----'----,-9 2---------
I ,-~----T-------r-----r-----I-------T------t-~-~--r------,-----~------l------r---, ' 'Normal', No .of 'Rain " NormaJJ , No. of' Rain ,Normall No. of , Rain I Normal No .of' Rain I 'R . R" f 11 '0';:' 'R·· 'f 11 I R' I Ra' 'f 111 R . ., , .-, al.n I aLny, a ,.L14l.n I al.ny I a I aln" lny I a I. aln I RalnYlfall ,', 'fall 'da~s I 'fall I da~s I , I fall I da~s I , fall I da s I
!::t::::g:::::::::i::2:::t::!_:::t:~:::t::~::j:::l-::l::~:::t:~::::t:!Q_::j:I!::j::!~::j::!~::t:r1:: 1. ~anuary 2. February
3. March 4. April
5. May 6. June 320 11 625 582 11 537 259' 9 272 358 11 300
7. July 881 31 752 1078 ,25 302 758 26 345 730 28 445 ..... 0'\
8. .August 388 25 287 275 17 137 300. 18 199 ~ 347 22 233 "
9· September 359 8 87 522 10 68 ,409 6 125 15 102
10. October 4 3 11. Nnvet:lber 2 36 1 , 6 1 15
12. December
Year:- 1948 77 1787 2457 64 1050 1726 60 956 1435.8 80 1083
----------------------------------------------------~-------
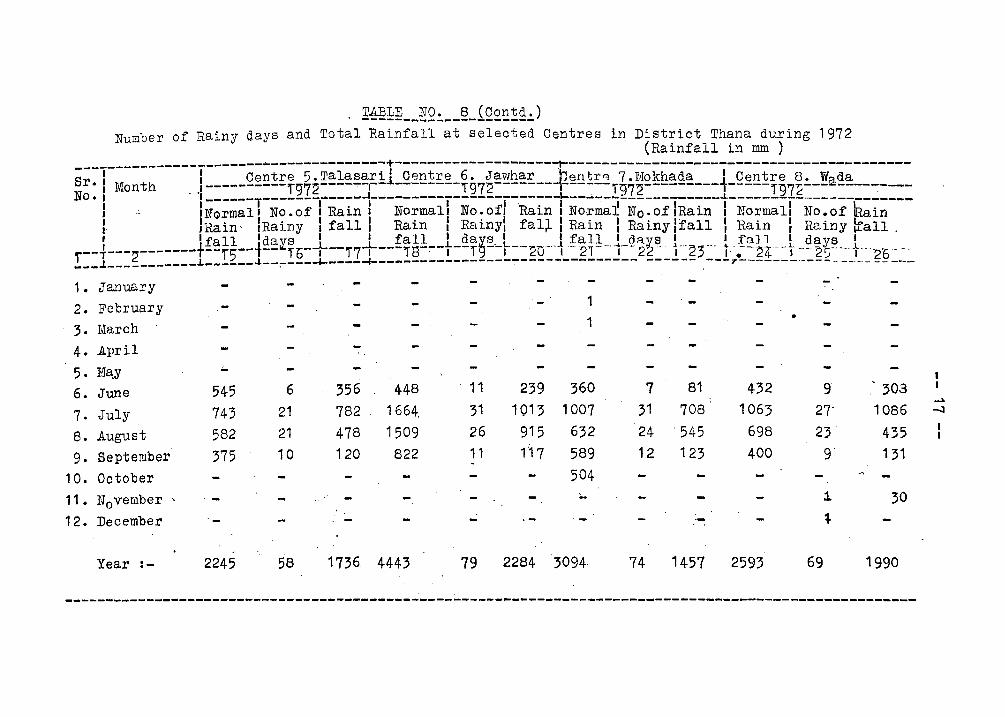
- ~~~~ __ !Q~ __ §_iQ2~!2~) Number of Rainy days B:nd Total,.Rainf'all at selected Centres in. District Thana during 1972
(Rainf'all in mm ) --------------------------------------+-------------------~-------~---------------------------------S I I Centre 5.Talasaril Centre 6. Jawharnentr"'l 7.Mokhada • Centre 8. W da r. I Month , .I----------'r972----"""'-- --------.,.972-------f--~--T'972---------t-----,.'97~---a--------
No. • I------T------------~-----------------------~---~--------------~----------------------I,;. INormal' No .of I Rain I Normall No. of/Rain I Normat No. o.f IRain I Normall No. of' !Rain I h-{ain' IRainy I fall I Rain I Rainyl fal;t I Rain I Rainy Ifall .1 Rain I Rainy ~all _ • • fall 'da~s' I fall • days • • f'a11 • dR.Ys. I I f'all • days I
--~---"'-------+--'r5--+-- 'rl)-+-T7+---T'S-:--t--Tg---r--2U'-'"1'-'21---1-- 22'" 1-"~3 -- j: -.--24"--t --- ~~----t---2"6----'r .1 t:. .L • _ I ____ - .• --------------------------------- ~----- ---T-------~----- ----- ------- ----------- ------.. --~--...... . ..,- .
1 • January -:
2. February
3. Maroh
4. April
5· Ma'y ~
6. June 545 6 356 448 11
7. July 743 21 782 _ 1664_ 31
8. August 582 21 478 1509 26
9. September 375 10' 120 822 11
10. October
11 • November ' .. 12. Deoember
Year :- 2245 58 1736 4443 79
239 1013
915 1'17
2284
... 1
1
360
1007
632
589
504 ~
3094·
7 81
31 708
24 . 545
12 123
.-74 1457
•
432 9' , 303
1063 27" 1086
698 23 435 400 9' 131
1 30 1-
2593 69 1990
------------------------------------------------~-------------------------------------~---------------
...... ~
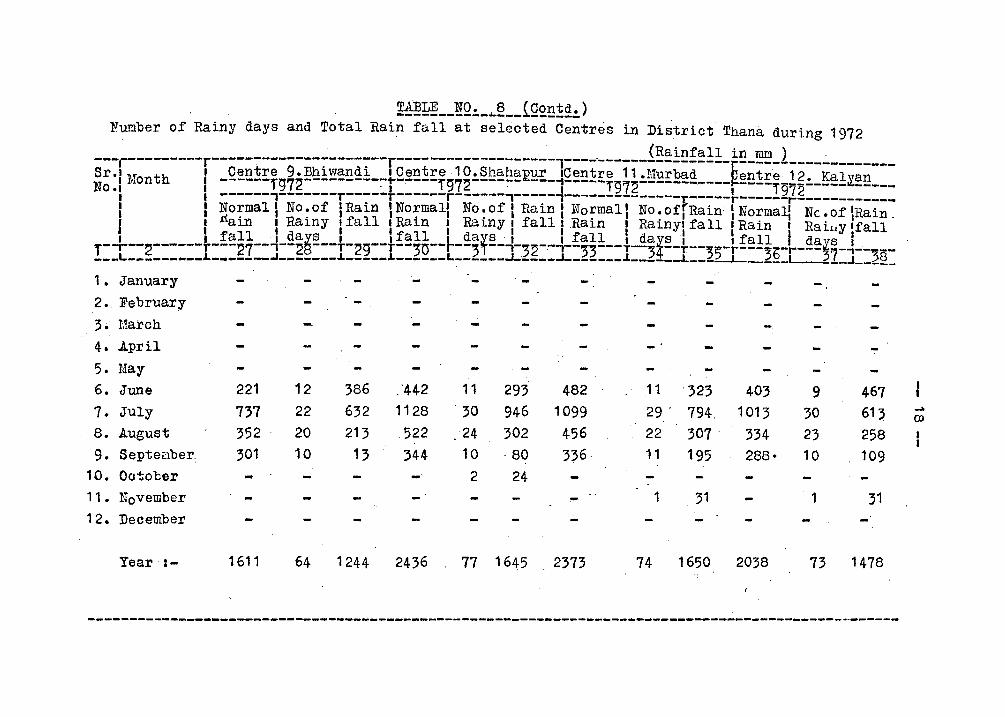
1 • January 2. February
3. l!arch 4. April
5. May 6. June 221 12 386 .'442 11 293 482 11 323 403 9 467 7. July 737 22 632 1128 30 946 1099 29 . 794. 1013 30 613 ....
(l)
8. August 352 20 213 522 .24 302 456 22 307 . 334 23 258 I I
9. Septel:1ber., 301 10 13 344 10 ·80 336· 11 195 288· 10 109 10. Ootober -' 2 24 11. November .- 1 31 1 31 12. December
Year :- 1611 64 1244 2436 77 1645 2373 74 1650 2038 73 1478
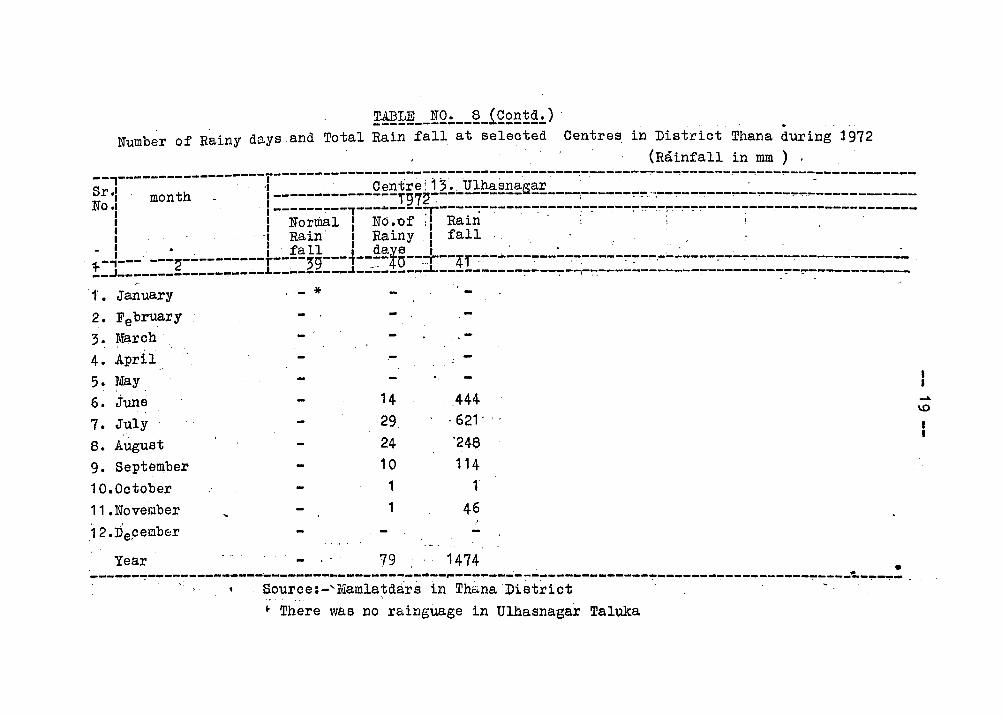
. Number of Rainy days and Total Rain fall at selected Centres in District Thana during 1972
(Rainfall in mm ) , --,------------------r----------------:--~:--~~-·----~--·---~--~.-,------~---~~---~:-'-~~--~----------------Sr , .". . Centre' 13., Ulhasna.Q'ar '
" . month 1---------------,.972-:----------Q------;------~:-::-.---,...--""--""--""---, .,..-----------No 'f , ---------'T----:-----T-----:-------:-----;--:--:-,...:-:---:--·-.,..------:----.-----------------
t 1 Normal I No.of:1 Rain 'i ; , .' 1 . -. '( Rain t Rainy I fall, .' . ,
-, . " I fa 11 1 da*e I ' '. .' , J ' .', •
~ , -- ---"----------T----~"---T---- O--~--Tf-----------------------~-------------------------!_J: ______ = _____ ,... ____ L ____ ~Z ___ ~_~~ _____ ~ __ ~_~ ________ -~~-~_;---~~-~~----,...-~--~~---.,..-.,..---------:::
to January
2. February
3. ~~E!.rch
4. April
5. May
6. June . ,
7. July
8. August
9. September
10.0ctober
11.November
.12.riecemb<::r
*
14
29
24 10
1
1
.444 ,621 '
'248
114 1
46
------,...-~-----------------------------:-~.--~--~-----~~:------------------------.,..-------,...----~----! . ., Source:-.... ruamla~dars in Tho.na District . ,
Year 79 1474
~ There was no rainguage in Ulhasnaga'r Taluka
..... 1.0
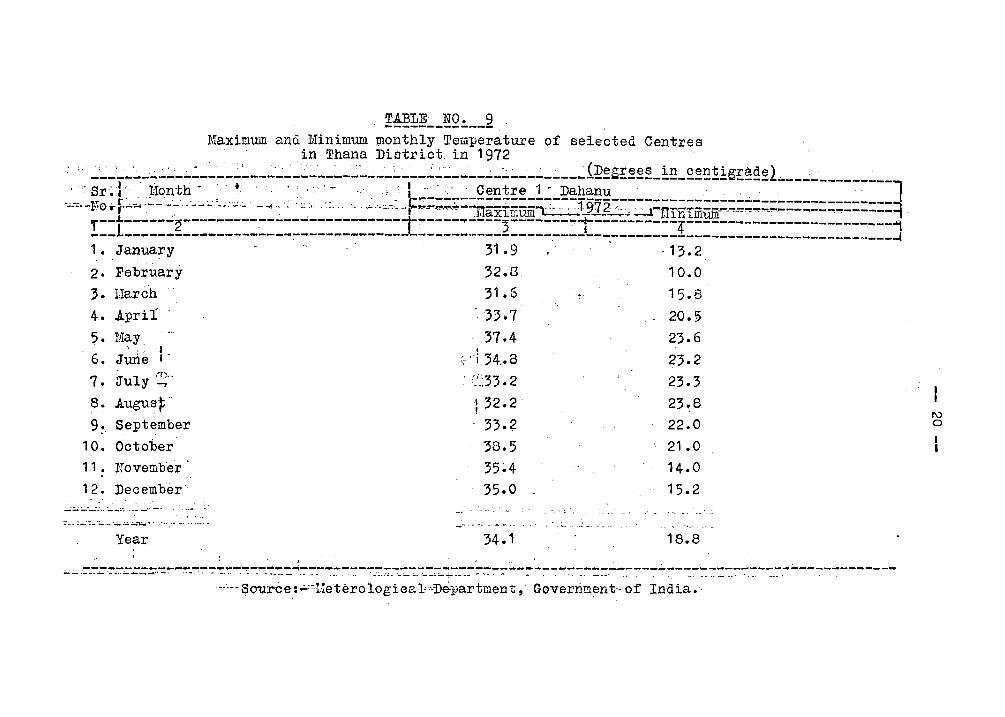
Maximum and Minimum monthly Temperature of selected Centres in Thana District. in 1972
, , ___ ' __ '-_~_;"'_.:..': ____ ~:" __ ":'_~_~';''-_'-_~'-..;._'_:''' ___ ..:...:.:..._ ... __ ..:.':''~.:.-~-_.:. __ ~i;Q~s!:~~~_~~_£~~~~g!:~£~l ... __________ .:. __ .. '_' Sr~ t'._·:·~~~.l'l·~h . __ ,'~'. ' ... ~ :,"~_.- .".'. b,,::....:.-·-:-~-Q~~!!:~-!.::-~~~~~~-------------.:.-.:...;.------------_:.. ___ 1 "-'-:H'OrJ'-- -- ... - - .... - - -"". - . -~ .. -- ... .'-c.::,,"'. -I' ... '""",.· ... ~-J.!axF:iUiii~·972.· .... ...::..rnInImUiii ..... -~-""'"".,..--"..----~---------~ .
,.--J.L-----..;.~---------·~-.:.--...;----------l----- ... ...;.:..--;::.--------t-::.:.·:::::.---.:..-4-------------------------4 --- --------------------------------- -----------------------------------------------------~.---~ 1. January 31.9' . ·13.2
2. February 32.3 10.0 3. Harch 31.6 15.8 4. Apri! . 33~7 20.5 5. May. 37.4 23.6
'\, I 6. June I' 23.2 r~ ,; 34.8
7. iuly~" 23.3 8. August· 9~. September
23~8 I\)
22.0 a
10. October 21.0 11. rovember 14.0 12. December' 15.2
" -.. -" ;'-~.:---:-':"'-''';''''':'':'':-~.' - -..... _.
Year 34.1 18.8 .
~.:....-:---:-=~:":::.====.-=.~-~ .. ~~':~,~~~-:'!--~--:":.~.-:-~--_:=._:_:~_-:-_:7:_~_ .. : .. :.~_:~~_:_:.~:_.:-.~:-=-~:__:--~---------------~':""'':":_::_::~------~------------
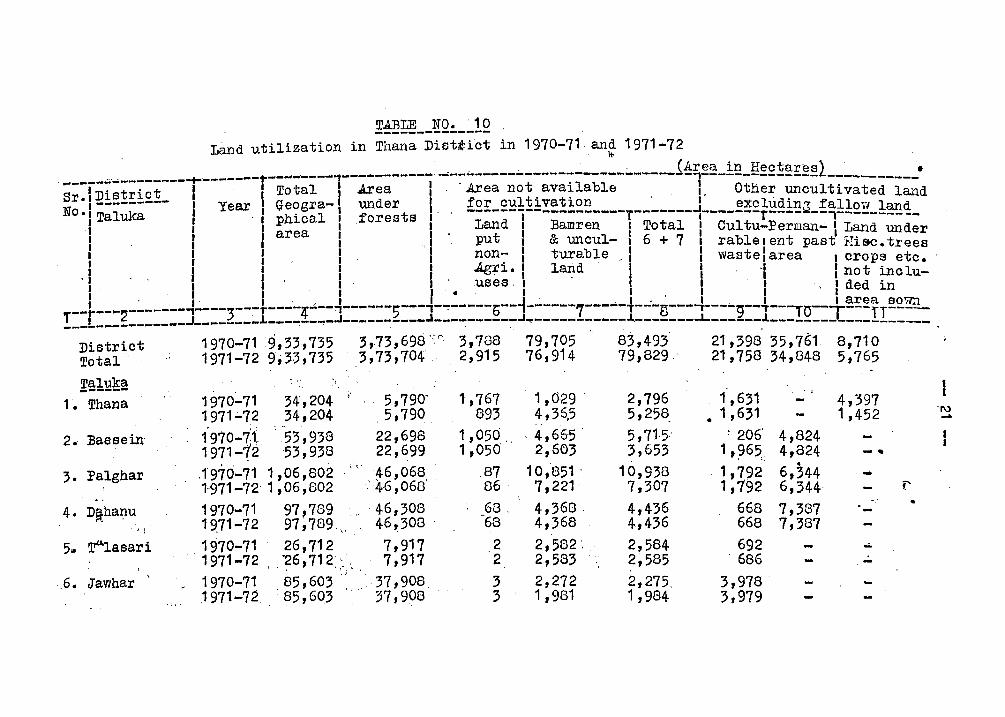
TABLE NO. '1 0 --------------, Land utilization in Thana Disttict in 1970-71 an~ 1971-72
, " '. ' , {Area in Hectaresl ' '. ,-----.;.·----------t-'-------r------... ,-----------,··---------------------------- -1-------------- ----------S 'District . I Total Area ' 'Area not available I. . Other uncultivated land Nro· I --------- Year I Geogra- under for cultivation . ! excludin"" falloYI land
"Taluka ': phical forests ------I------------T-------'"i-------T----~--,----------I , Land, Bamren I Total I Cul tu-Perman..:. I Land under I area tID I I I I pu I CG uncul- I 6 + 7 I rable I ent past Eise. trees
I I non- I turable _ I I waste I area I crops etc . ,I ' .Ag~i.', land' II I -I I no t inc lu: I I ,uses, I tIded ;n
t' • I I It' I ... I. I . , '1 ' 't ,'I I I area sor,m
!::t:::g:::::::J::::2:::I:::~!:::J::::::2:::]:::::::§::~::::::7:::::~:::~:::J[:::~::~:::!Q==][:=:r!:==~_ District 1970-719,33,735 3,.73,698 '~;r 3,788 79,705 83,493 21,398 35,761 8,710 Total"1971-72 9;33,735 3,73,704' " .2,915 76,914 79,829.' 21,758 34,848 5,765
Taluka ~ '" ------1970:"71 1 • Thana 34',204 " 5,790' 1,767 1,029 ' 2,796 1,631 4,397 1971.;.72 34,204 ,5,790 893 4,36,5 ' 5,258, • 1,631 1,452
-I\) .....
2., Bassein l' 970-7:t 53,938 22,698 1,050 '. ' 4,66-5 5,7105- ~ 206' 4,824 1971-12 53,938 22,699 1,050 2,603 3,653 1,965, 4,824 -. ,1970-71 ; "46 068 10851 '
. , ,', . 3. Palghar, 1,06,802 ,-' ,
.87 , " 10,938 1,792 6,344 ... 1971-72 1,06,802 :'4-6,068 86 ' 7,221' 7,307 1,792 6,344 f'
4. D~ha~lU 1970-71 97,789 , .. 46,308 . 68, 4,368 . 4,436 668 7,387 " , 1 ~71-72 97,789, " 46,308 68 4,368 4,436 668 7,387 ...
5~ ~lasari 1970-71 26,712 7,917 2 2,582 " 2,584 692 ~
1971-72 "26 712", " 7,917 2 2,583 2,585 ' 686 ..:. • • " '- ~.; " I
,6. Jawhar 1970-71 85,603 , .' 37,908. 3 2,272 2,275. 3,978 ,1971-72 . 85,603 '.' 37,900 3 1,981 1,984 3,979
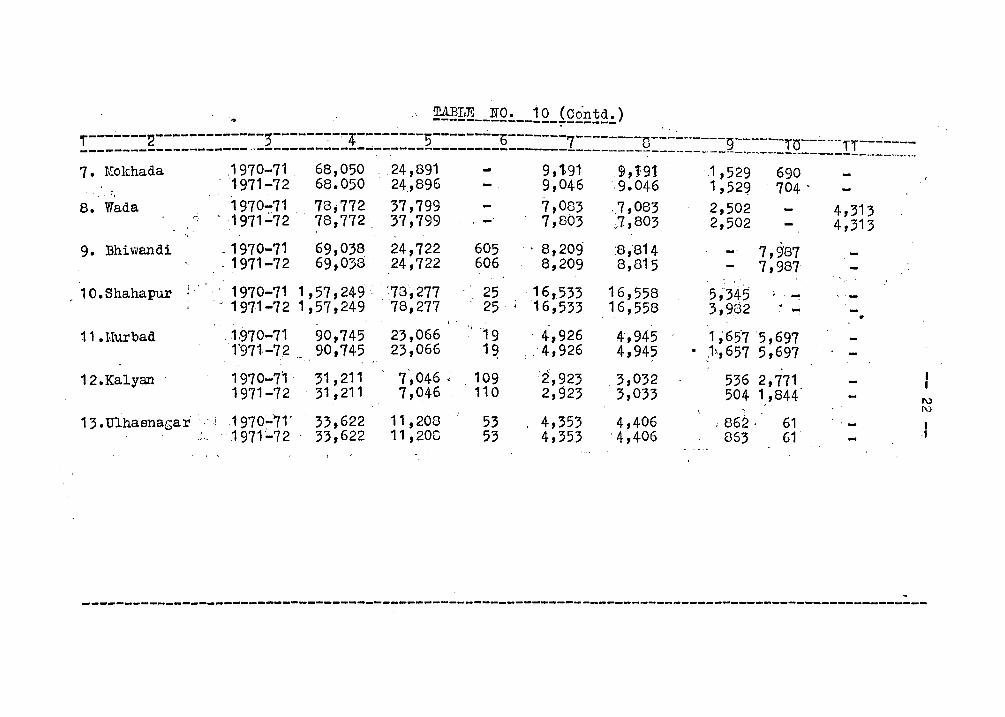
.. ~~~--~Q~--12_~Q2~!~~) r-------2-------------:;------:--'""4--------S------..;.-o-------7-------l"l---:....-----g-----·- ---'-'- -'--------------------- .. ----------------------------------------------~---.-------------_I'Q _____ !I_,_=_=~::: 7. Mokhada 1970-71 68,050 . 24,891 .... 9,1.91 9,191 1,529 690 . 11971-72 68.050 24,896 9,046 ·9.046 1,529 . 704'
"
8. Wada 1970-71 78;772 37,799 7,083 .7,083 2,502 4,313 r. ·1971 ~72 . 78,772 . 37,799 ' - 7,803 ~7 ,803 2,502 4,313
9. 13hiwandi . 1970-71 69,038 24,722 605 . 8,209 .'8,814 7,9'87 , 1971-72 69,038 24,722 606 8,209 8,815 . 7,987
. 10.Shahapur 1970-71 1,57,249 ' . '73,277 25 16,.533 16,558 5;345 ; .... .. 1971-72 1,57,249 78,277 25 16,533 16,558 3,982 -.. , '
11..Uurbad .1,970-71 90,745 23,066 19 4,926 4,945 1 ~ 65'75,697 1'971-72 90,745 23,066 1~ 4,926 4,945 . ,1\,6575,697
12.Kalyan 1970-71 31 ,211 7', 046 ~ . 109 2",923 3,032 536 2,771 1971-72 31,211 7,046 11O 2,923 3,033 504 1,844 I\)
1\)
13.Ulhasnagar .. ,I 1970:-'71 ' 33,622 11,200 53 4,353 4,406 ; 862, 61 . - I .' 1971~72 33,622 11,20C 53 4,353 4,406 853 61
, .~ ',.
-------------------------------------------------------------------------------------------------------
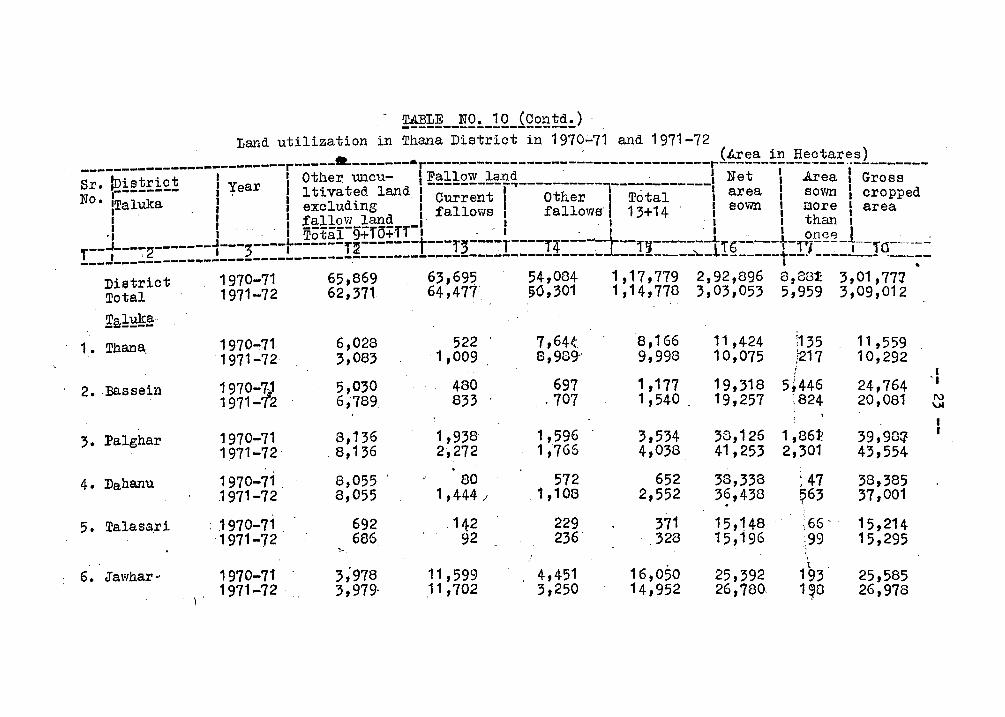
- ~~~~ __ !IQ!._1!L1Q~g~~!.) Land utilization in Thana District in 1970-71 and 1971-72 ______ r _____ ~ _______ Ar------------------~-------------__ ri~~~_!~_~~~~~~~s) ______ _
----;::---t-:---t----.-- , Other Ul1CU- 'Fallow la.nd· , 1 Net 1 bea', Gross Sr. ~~S r~c 1 Year I .' I----------~----------l------------I I No. r------- I' I 1 t~ va t~d l8Jl.d I Current I Other I Total I area I sovm I cropped
,lTaluka ,I I exoludlng I fallows I fallows 13+14 - I so\tm I more I area I I I f~!!9.E_!an!! _I' I ' I . I I th8Jl. I
'I I '.' I Total 9+fo+," I - - I . I . I .. I onc~ I '. J .1 ___ ----L------".~-------t---:r~----T----,..-4---J-:t:-'I"l:f------1.".1'-·---.1.-""------- ... 0· --.. ----- ----I"l------- I ":t I I <f I :J I, I 'J l' 0 I I I I I ! __ J ___ .:.=-----------::!.------------.------------------------------ -------...... - ------t--·, --.;.,---- ._-;-District 1970-71 65,869 63,69' 54,084 1,17,779 2,92,896 8,88t 3,01,771 Total 1971-72 62,371 64,477 ~O,301 1,14,778 3,03,053 5,959 3,09,012
. ~~!~.£!
1 • Thana. 1970-71 6,028 522 7 ,64~. 8,166 11,424 \135 11,559 '1971-72 3,083 '1,009 8,989-' 9,998 10,075 ;217 10,292
i I I
2. Bassein 1970-~ 5,030 480 697 , ,177 19,318 5~446 24,764 . I
1971- 2 6,789 833 , .707 1,540 . 19,257 ;824 20,081 I\) \..N
3. Palghar 1970-71 8,136 1,938- 1,596 3,534 38,126 1,86~ 39,98=1 1971-72' , 8,136 2,272 1,766 4,038 41,253 2,301 43,554
4. Dahanu 1970-71 . 8,055 00 572 652 33,338 ; 47 38,385 ,1971-72 8,055 1,444 ) 1,108 2,552 36,438 ?63 37,001
5. Talasa.ri : ,1970-71 . 692 142 229 371 15,148 .;66' . 15,214 '1971-72 686 92 236 ,328 15,196 ;99 15,295 ,.
1970-71 3;978 11,599 4, l~51 16,050 t
6. Jawhar·· 25,392 193 25,585 1 '
1971-72 . 3,979, ,11 ,702 3,250 14,952 26,780. 1 ~8 26,978
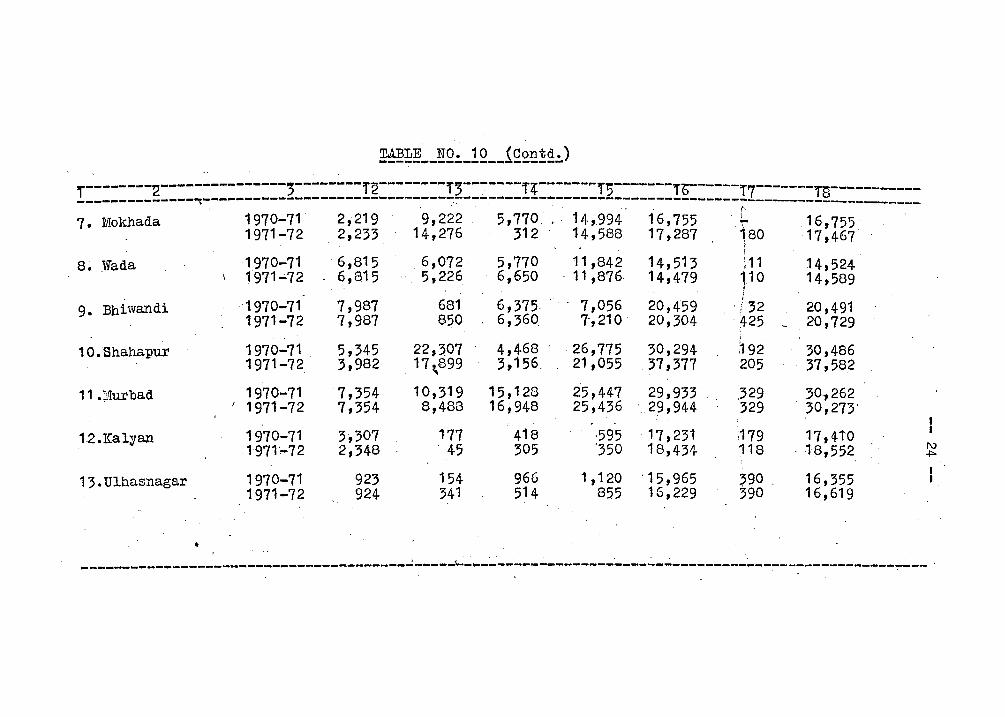
~~~ __ !Q~_!Q __ 1Q£~~g~)
1--------2---------------;--------T~--------T3-------T4------~T5-------T~----T7------- -----------___ -__________ ~-------------------_-----~---~--~-----------------~-------------~--------I~_----------7. Mokhada 1970-71 ' 2,219 9,222 5,770." . 14,.994 16,755 'J... 16,755
1971-72 2,233 14,276 312 14,588 17,287 \80 17,467 1 !
8. Wada 1970-71 6,815 6,072 5,770 11,842 14,513 i 11 14,524 1971 ... 72 6,815 5,226 6,650 ·11,876 14,479 110 14,589
I 1970-71 7,987 681 6,375 ' . 7,056 20,459
, 9. Bhiwandi ,o' 32 20,491
1971-72 7,987 850 6,360. 7',210 20,304 425 20,729 I
10.Shahapur 1970-71 , 5,345 22,3.07 4,468 ·26,775 30,294 ;192 30,486 1971-72 3,982 17 1899 3,156, 21,055 37,377 205 37,582 ..
11 • ~,~urbad 1970-71 7,354 10,319 15,128 25,447 29,933' ,329 30.,262 I 1971-72 7,354 8,488 16,948 25,436 , 29,944 329 30,273'
12.Kalyan 1970-71 3,307 177 418 ·595 17,2;1 ;179 17,4iO .1971',..72 2,348 ' 45 305 '350 18,434 118 .1!3,552 I\)
.p..
13.Ulhasnagar 1970-71 923 154 966 1,120 '15,965 ,90 , 16,355 1971-72 924 341 514 85.5 16,229 390 16,619
• , ~ -'. "' .
----------.----------------------------------~-~---------------~-----------------------------"----~-- '
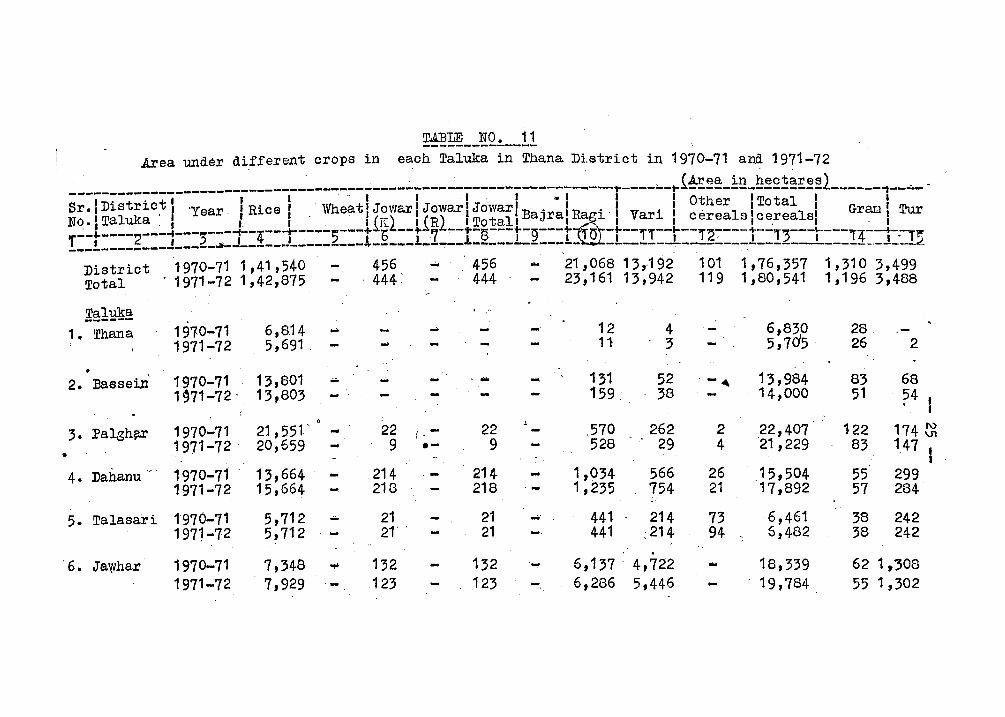
•
~~ __ !~ __ 1! Area under di.fferent crops in each Taluka in Thana Di.strict in 1970-71 and 1971-72
______________ ----------------------..;.---------~-----... --..;.------~--,..----.-t_i~~~-!!Lg~~:!:.~!~~l------"1-----Sr.IDistrict, 'Year I Rice I whe~tlJowarlJowarlJowarl . -I . I . I Other ITotal I Gratl l Tur No. I Taluka : I ' I I',' /'fE:\ liR\ fTotallBaJralRagl.': Varl. : cerealslcerealsl, - I ~-~----2---~---~-~-1i-4--1r----5-... -t~bL--+7L--+-8---t-9---t~-t--rr--~--r~~---t--i~--r---i --j-.-r~ r I I __ 2_~ ________________ ~-----1-----!-------------~------________________________ 1 _____ ~ -------------- ' . '
District 1970-71 1,41,540 Total . 1971-72 1,42,875
Taluka ------1. Thana
2. BasseiXl
3. Palgh?X
1970-71 1971-72
6,814 .... 5,691 ,
1970-71 13,801 1 g71-72' 13,803
1970-71 21 ,551' 1971-72' 20,659' -
4. Dahanu ~ 1970-71 13,664 1971-72 15,664 -
5. Talasar i 1970-71 1971-72
5,712 .... 5,712
456 , 444'
..
22 (.-9 .-
214 218
21 21' .
456 444
...
....
22 9
214 218
21 21
21,068 13,·192 23,161 13,942
12 11
131 159,'
.570 528
1,034 1,235
441 441
4 3
52 38
262 29
566 754
214 ;214 .
101 1,76,357 1,310 3,499 119 1,80,541 1,196 3,488
'-
.-~
6,830 5,7d5
13,984 14,000
28 26
83 51
2
68 54
2 22,407" 122 4 ~1,229 83
174 ~ 147
26 21
73 94
15,504 17,892
6,461 5,482
55 299 57 234
38 242 38 242
'6. Jawhar 1970-71 1971-72
7,348 ... 7,929
132 132 6,137 ' 4,722 18,339 19,784
62 1,'308 55 1,302 123 123 6,286 5,446
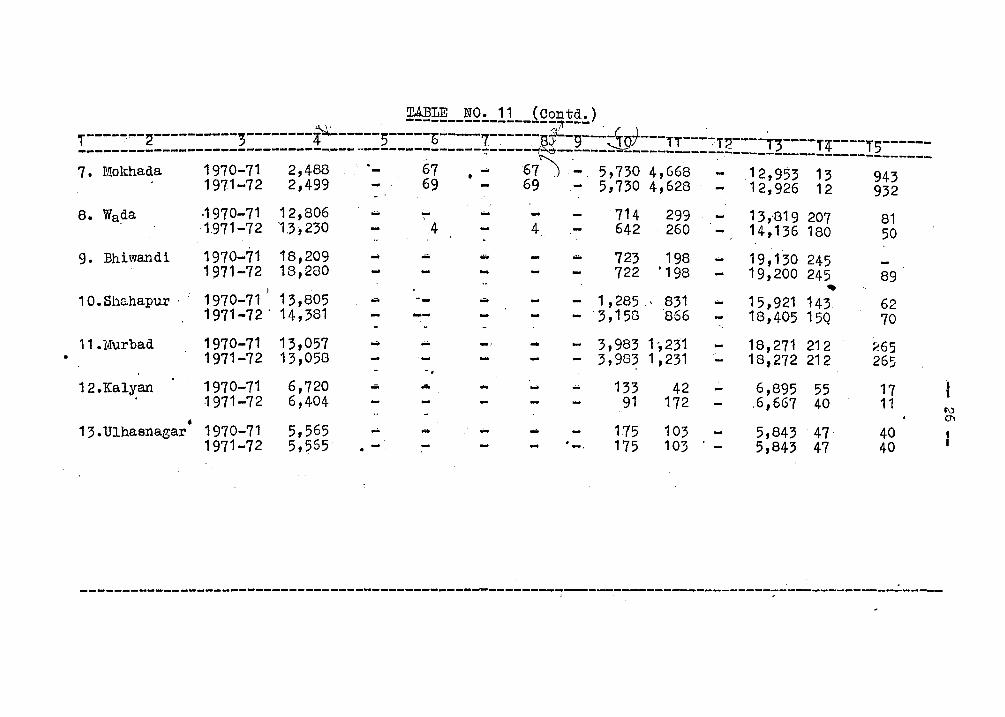
8. Wada
9. Bhiwand1
·1970-71 12,806 1971-72 "13,230
1970-71 18,209 1971-72 13,280
10.ShBhapur'; 1970-71 13,805
11.Murbad
12.Kalyan
1971-72' 14,381
1970-71 13,057 1971-72 13,058
1970-71 6,720 1971-72 6,404
• 13.Ulhasnagar 1970-71 5,565 1971-72 5,565
.... -,4 4
... -
....
..
... ... ....
714 299 642 260
.... 723 198 722 '198
13,.819 207 14,136 180
19,130 245 19,200 245
1,285 . 831 ~ 15,921 143 - '3,158 866 18,405 15Q
- 3,983 1',231 - 3,983 1,231
133 ' 42 91 172
175 103 -, 175 103
18,271212 18,272 212
6,895 55 ,6,667 40
5,843 47 5,843 47
81 50
89
62 70
265 265
17 11
40 40
---------------------------------------------------------~-------------------------~--------------------
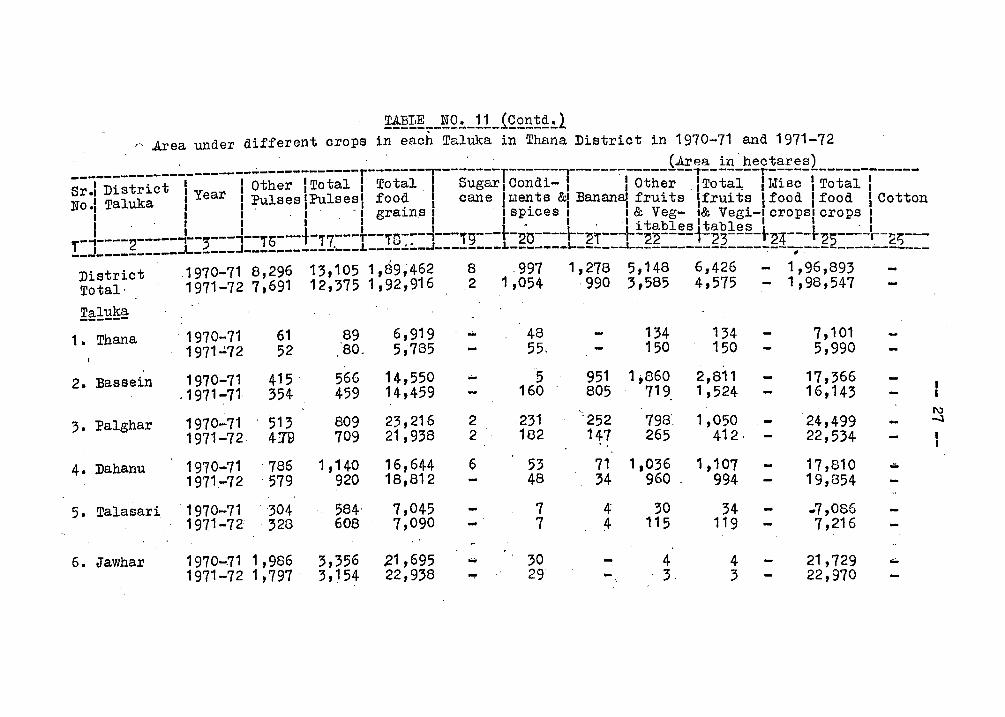
~~~~_~Q~_11_iQ£~1~~1 ."~ .Area under different orops in each Taluka in Thana District in 1970-71 and 1971-72
s;j-Di;t;i~t-~------I-oth;;-TT~t~l-r-T~l-li--s~~~rc~~di:ll-----~-oth;;~l;~~i~~r;~!~}T~t~i-i-----No.' Taluka I Year I PulseslPulsesl food 1 cane Llents &IBanan~ fruits 'fruits Ifood 'food' Cotton
I "" ., . . "' grains, ,spices, , & Veg- 1& Vegi-f cropsl crops I , ".. I I ' I ~ ~.'".I i tables 'tables' , " ,
-~----2-----~--5---'--j6---+-i1---T--jn~~- ---jg--- -20----r-~T---~-~~----i-~3----t~4---t~5----~-~;---!_J __________ ~ _____ J ______________ L _______ ~ ________ L _______ ~---__ _L _______________ ~---,--------~------
District .1970-71 8,296 13,105 1,89~462 8 .997 1,278 5,148 6,426. - 1,96,893 Total" .1971-72 7,691 12,375 1 ,92,916 2 1,054 990 3,585 4,575 - 1,98,547
Taluka ------1 • Thana 1970-71 61 89 6,919 .... 48 134 134 7,101
1971':'72 52 80. 5,785 55, 150 150 5,990
2. Bassein 1970-71 415 566 14,550 ... 5 951 1;860 2,811 17,366 .1971-71. 354 459 14,459 160 805 719 1,524 16,143
Palghar 1970-71 513 809 23,216 2 231 252 798". 1,050 I\)
3. 24,499 -J
1971-72 419 709 21 ,938 2 182 147 265 412· 22,534
4. Dahanu 1970-71 786 1,140 16,644 6 53 71 1,036 1,107 17,810 .-1971.-72 579 920 18,812 48 34 960 994 19,854
5. Talasari 1970-71 ·304 584, 7,045 7 4= 30 34 ... 7,086 1971-72 ·328 608 7,090 7 4 115 119 7,216
6. Jawhar 1970--71 1,986 3,356 .21,695 ... 30 4 4 21,729 .-1971-721,797· 3,154 22,938 ..,. 29 - 3. 3 22,970
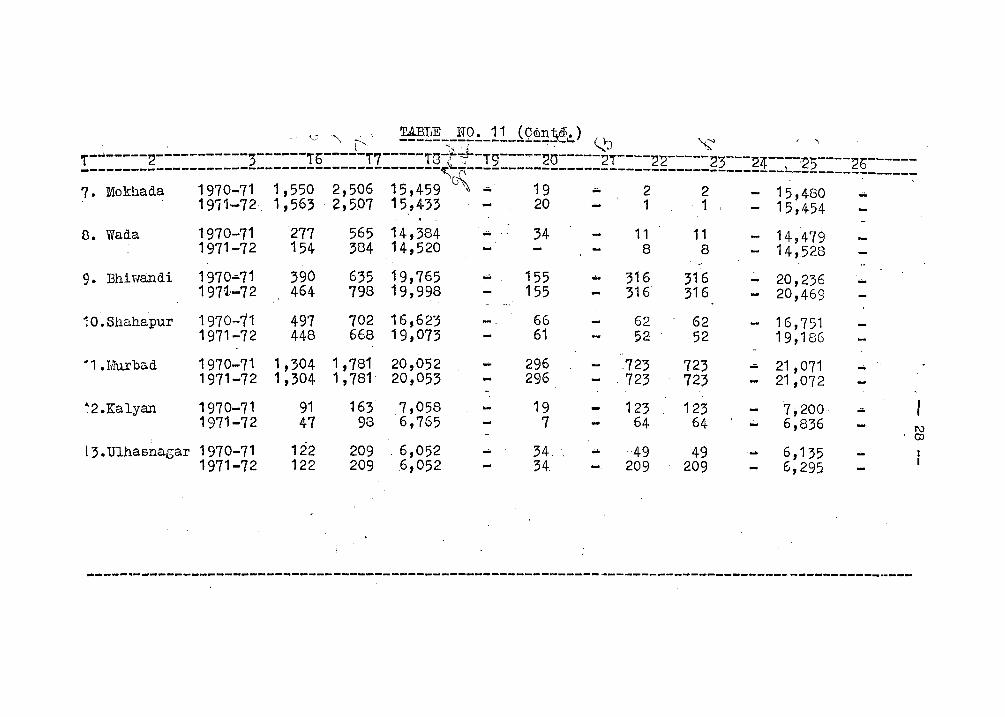
'C '\ ~' ~~~~~!!~!._1.l_£2~!!~) (..'J ~ , . " r-w-----'2-----------3------r6-----r7-----T8-~~-T9-----'20-----2T----'22-----'23---'2 ---~~ ----~ -------------------------------------------------~~n-------------------------------____ 1 __ ~_~2 ____ =~ _____ _ 7. Mokhada 1970-71 1,550 2,506 15,459 G"\... 19 - 2 2 15,480....'
1971,-72 1,563' 2,507 15,433 20 1·1 15,454
8. Wada
9. Ehiwandi
1970-71 1971-72
1970-71 197~/-72
277 154
390 464
565 14,384 384 14,520
635 19,765 798 19,998
10.Shahapur 1970-71 497 448
702 16,623 668 19,073
"1.Murbad
:2.Kalyan
1971-72
1970-71 1,304 1,781 20,052 1971-72 1,304 1,781 20,053
163 7,058
-.
34
155 155
66 61
296 296
11 8
""" 316 316
62 52
.723 723
123
11 8
316 316
62 52
723 723
123
- 14,479 - 14,528
20,236 - 20,469
- 16,751 19,186
... 21,071 - 21,072
1970-71 1971-72
91 47 98 6,765
19 7 64 64
7,200 6,836 I\J
'0)
13.Ulhasnagar 1970-71 1971-72
122 122
209 . 6,052 209 6,052
34 34.
....·49 209
49 209
.... 6,135 ... 6,295
~----~--------------------------------------------------------,--------------------------------------
I I
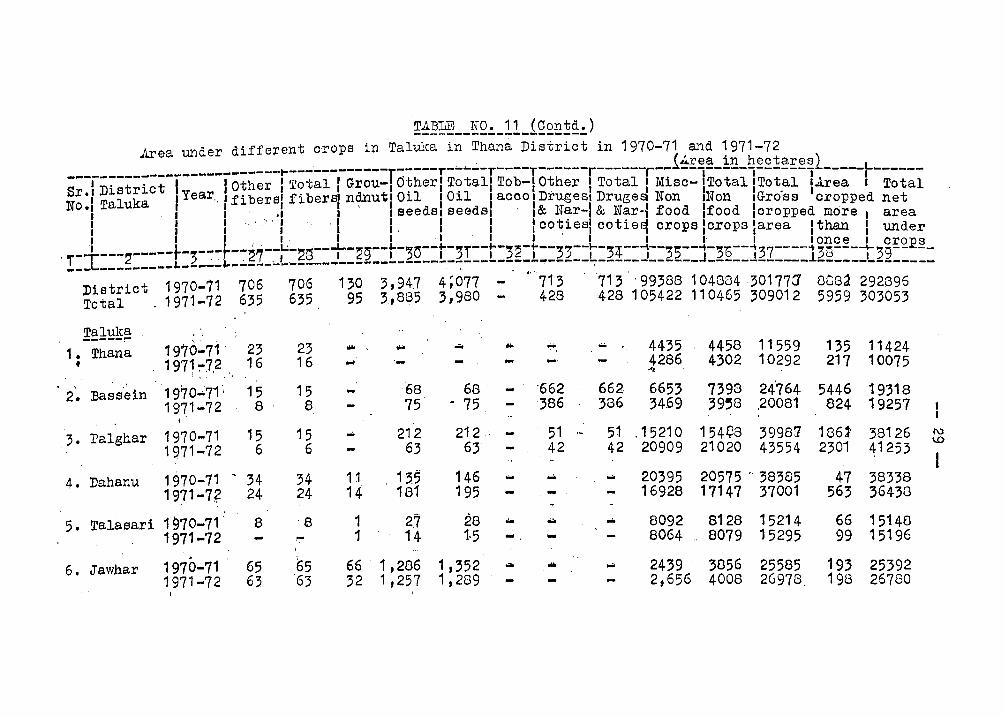
Taluka , , -----~ " ,
1 • Thana 1970-71 2' 23 .... , ... .... ... - ... 4435 4458 11559 135 11424 • 1971-72 ,16 16 ... '- 4286 4302 10292 217 10075
1'\;' ,,' .. "'" , I,)
1970-71 " 15 15 '68 68 '662 662 6653 7398 24'764 2. :Bassein - 5446 19318 1971,-72 8 ' 6 75 • 75 386 386 34.69 39'8 .20081 824 19257 I , ' I
3. Palghar 1970-71 15 '15 .... 212 212,'· 51 ~1 .15210 154Qa 39967 1861 38126 N
19,71-72 6 6 63 63' 42 42 ' 20909 21020 43554 2301 41253 \0
.. I 1970-71 • 34 34 11 1 .. 146 20'95 4. Dahanu 1§~'
... ' - .. 20575 0, 38385 47 38338
1971-7? 24 24 14 195 - 16928 17147 37001 563 364313
5. Talaeari 1970-71 8 e 1 2,7 28 "- .. ... 8092 8128 15214 66 15148 1971-72 - ,. 1 14 1·5 - 8064 8079 15295 99 15196
. ~5 6. Jawhar 1970-71 65 66 1,286 1,352 .. ... ... 2439 3856 25585 193 25392
1971--72 63 '63 32 ,1,257 1,289 2,656 4008 26978, 198 26760 ! '
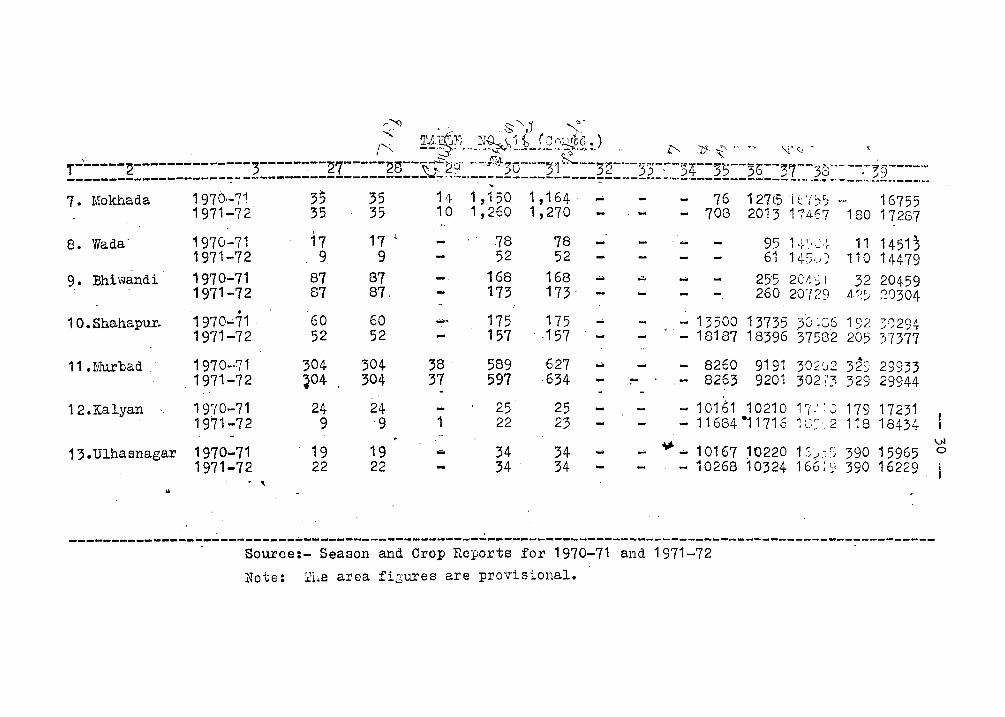
c::' .~, ')' T.Ji~T: N~\J ("n~c) . •. J .• J • V ~ ..
, (':"" --,-, """~'-''''', '-'---'-"'~'()'-'- ,,' t;:-... IJ- ~" ", 'l' '-i - ~
~ - N K ,.-.;.----~--------------3--------'27-----~8--~~9'·'-: ' :;0----)1" '--;2-'--;;:5-:---32J:--3,--Y)--j7--- 3"- --.-..;c----,~ __________________ --:-- ------~--------------- -:" '--.--:------------'::'-----'--' -'~.------------- -'" ,~. '.' __ ~~,!.2 .. ___ ,._ 7. Mokhada 1970.-;1 3~ 35 14 1 ,150 1,164 ... 76 127l5i ChI) ~, 16755
1971-:-72 35 35 10 1,260 1,270 - - 708 2013 174.67 180 17287 , ,
8. Wada' 1970-71 17 17 78 78 95 1 • '" . , 11 14513 ,- .- l ,+ .1,_L j
1971-72 9 9 52 52 - 61 14·5·,;; 110 14479 9. Bhiwandi 1970-71 87 87 168 168 ,;;. ,;:. ... 25'5 2C/~::; I 32 20459
1971-72 87 87, 173 173 260 20'(29 L1~) :; 20304 • 175 30 ;'C6 1 o. Shahapur. 1970~71 60 60 ...... 175 ... - 13500 13735 192 30294
1971-72 52 52 157 ' .157 - 18187 18396 37S82 205 37377
11 .Murbad " 1970~71 304 304 38 589 627 8260 9191 30202 4"
29933 ... - 32~ 1971-72 ~04 304 37 597 634 .... - 8263 9201 302!3 329 29944
12.Kalyan " 1970-71 24 .24 25 25 ..... 10161 10210 1 ?.' ::, 179 17231 1971-72 9 '9 1 22 23 - 11 684 -11 71 6 1 c;~:,. 2 118 18434
~ \>I
1 3. Ulhasnagar 1970 ... 71 19 19 .- 34 34 .... ... 10167 10220 1 :::j/~ 390 15965 0
1971-72 22 22 34 34 - 10268 10324 166::; 390 16229 . , ..
--------------------------------------------------------------------------------------------------------, . Source:- Season and Crop Reports for 1970-71 and 1971-72
Note: :i'ile area figures are provisional.
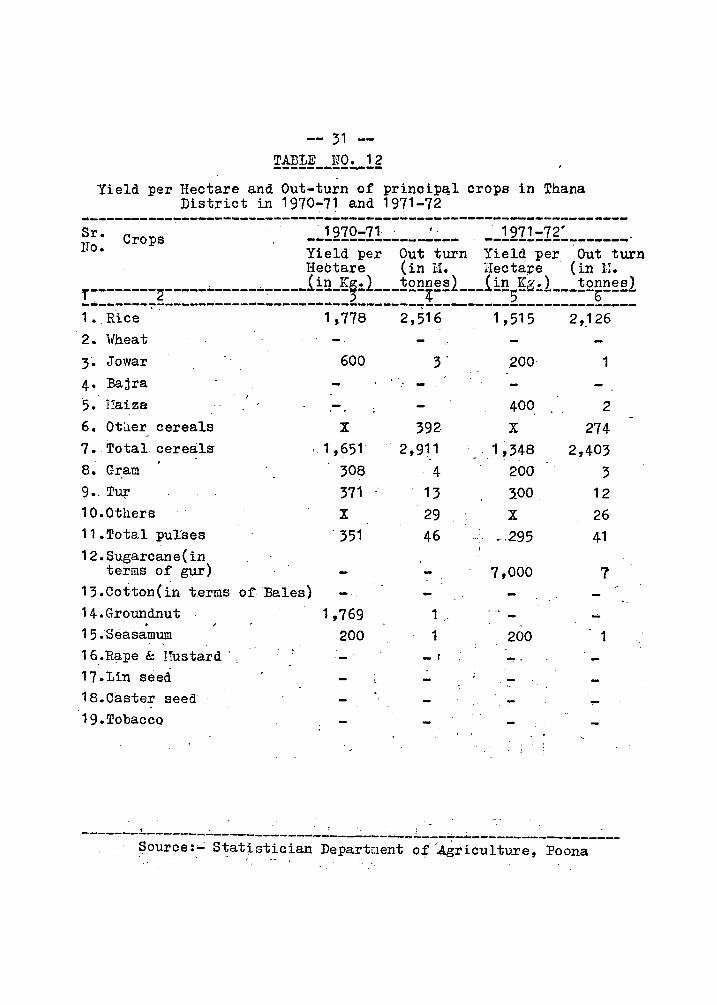
-- 31 -TAIlLE 1W. 1 2 ---------~--
Yield per Hectare and Out-turn of prinoip~l orops in Thana District in 1970-71 and 1971-72
~------------------------------------------------~-~------------Sr. Crops . 1970-7'" . -----------------~
1971-72' ----------------~ lJo. Yield per Out turn Yield per Out turn
Hectare (in li. lIecta~e' (in E. f--------~-----.-----.~---~ii~-!~~1---~£~£~~1---ii~5~~~1 ___ !2~~~~1 --------~~-------------------~----------~-------------------------1. Rice 1,778 2,516· 1,515 2,~26
2. \Yb.eat 3. Jowar
4· Bajra 5. IIaiza 6. OtD.er
-7 • . Tota.l 8. Gram 9 •. Tur 10.0tl1ers
cereals cereals-
11 • Total pul'ses 1 2. Sugarcan e ( in
terms of gur)
13 .Cot·ton( in t.erms of Bales) 14.Groundnut . 15.Seasamum 16.Rape &. I!ustard ' , 17.Lin seed 18.Caster seed 19.Tobacco
600
X
1,651 308 371 X
. 351
1,769 200 .-
.200 1
400 2 392. X 274
2,911 1,348 2,403 4 200 3
13 :i00 12 29 X 26 46 -.295 41
7,000 1
1 1 200 1
-I -. -..
....
, .;-: . . ----------------------------------------~---~--.------------------
Source :,"': S~at.i st.~cian Departuent of :~ricul ture, Poona
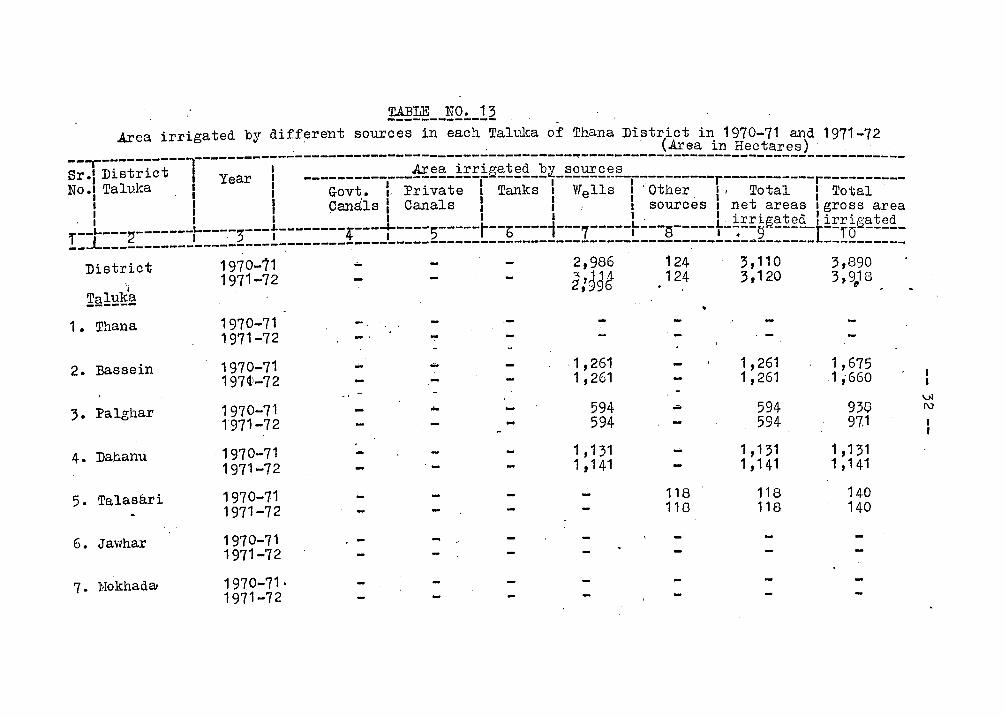
-Axea irrigated by different sources in each Talw{a of Thana District in 1970-71 and 1971-72
. . . (.Area in Hectares) . ---r----------,---------------------------------------------~---------------------------------------Sr·l District I Year I -------------~~~-!EEfg~!~£-E~-~£~£~~-r---------r------~----r----------N0.1 Taluka I I Govt. I. Private I Tanks I Wells I' Other I, Total I Total
I I t Oamils I Canals 1 :, I sources I net areas I gross area . I I I I I I I . I . irrigated I irrir.>·ated ,.--L----2-------t-----,---t--------4'---T----5--·---t---b----1---7-----I----s-----t--: --9 - -----r' --,..d~·-----
__ JL------------------------------------------------------------------------------------- ----------District 1970-11 ~ 2,986 124 3,110 3,890
j 1971-72 ~:~~~ 124 3,120 3~9,18 1:al~fg
1 • Thana 1970-71 1971-72 -
2. Bassein 1970-71 197~)-72
1,261 ... 1,261 1,675 1,261 1,261 1 ;660
.. .. - VI
;. Palghar 1970-71 1971-72
594 "" 594 930 I\)
594 594 97.1
4. Dahanu 1970-71 1971-72 . - 1 , 131 1 ,131 1 , 131
1 t 141 1,141 1 ,141
5. Talasari 1970-71 1971-72
118 118 140 118 118 140
6. Javvhar 1970-71 1971-72
-.-7. I\!okhad81 1970-71.
1971-72
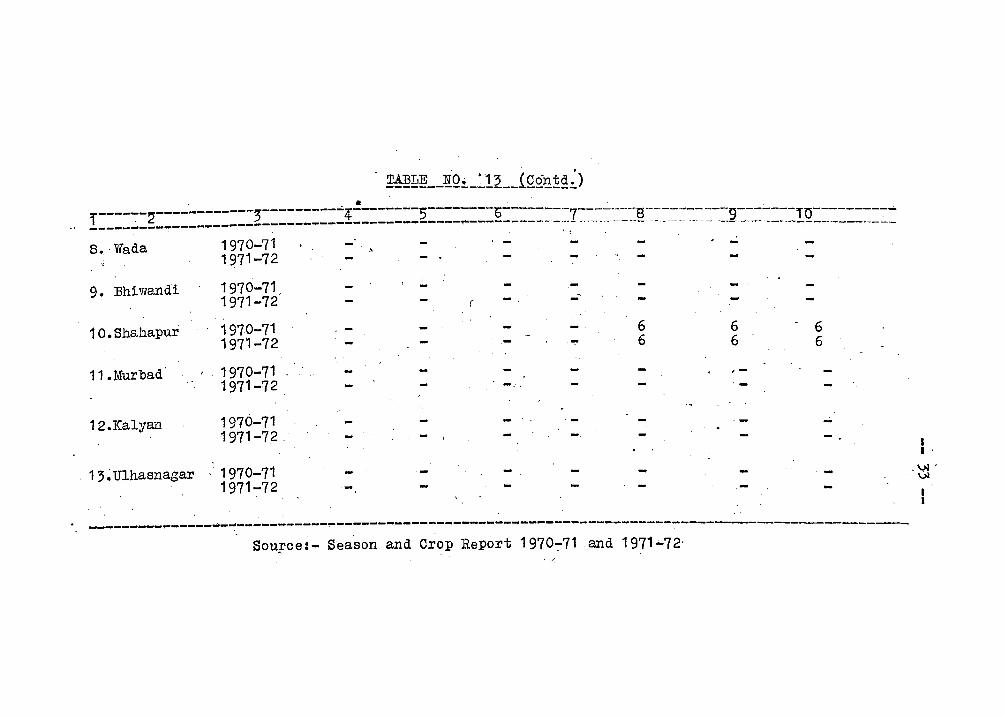
· . . . 1------2------------j----------4--------'5------0------7--------g---------- ---:.....--- --------" -----.:.---------------------------------------... ------------ -'"---------._--- ---. -,-~---- ,---.-!.~----------.:..-
8 •. Wada 1970-71 ',' -~ 1971-72
9. Bhiwandi 1970-71, -1971-72 ( - - -
1 o. Shahapur 1970-71 6 6 - 6 1971-72 - .- 6 6 6
11.Murbad 1970-71 ,-1971-72 '-
12. Kalya.ll 1970-71 1971-72
1 , ~ Ulhasnagar . 1970-71 -1971-72
---------~-------~----------------------------------------------------~---------------------------SouFce:- Season and Crop Report 1970-71 and 1971-72'
I I '
.~' ~
I I
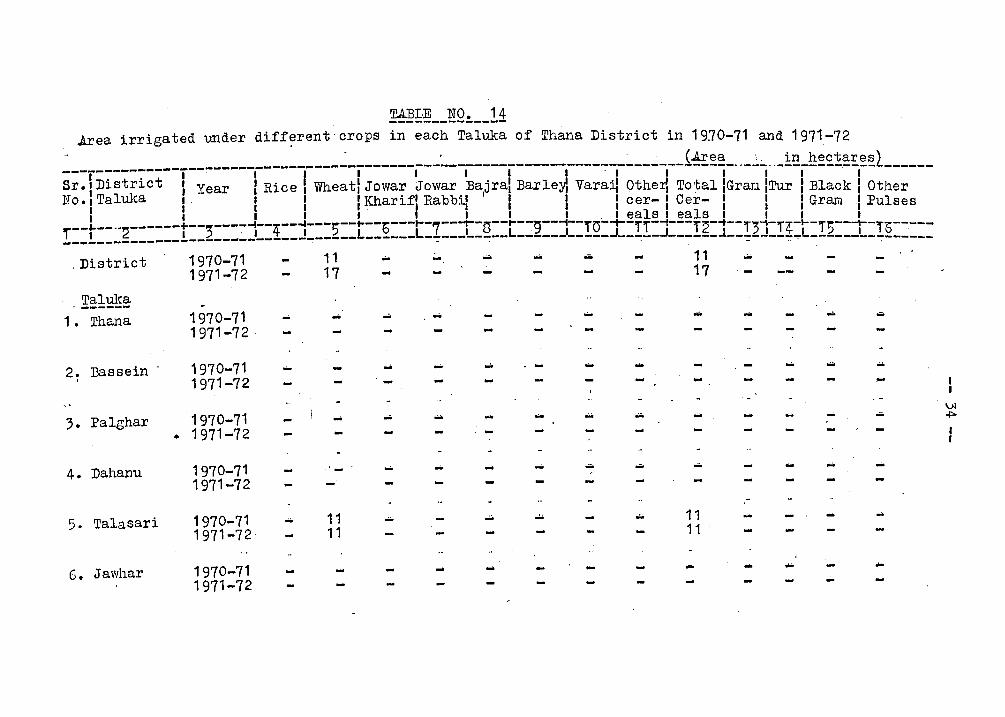
m!:~ __ !!Q!. __ 11 Area irrigated under diff~rent'crops in each Taluka of Thana District in 1910-71 and 1971-72
'. ____________________ ~ ___________ ' __________________________ I£~~_ .. _~;...,_~!!J!~£1~E.~~L _____ _ ---.--:-----:---- , , I ' , I I , ' , , I I' I Sr. I District I Year I Rice, Wheatl Jowar Jowar Ba,jral BarleY, Vara~ Othert Total IGrau ITur I Black I Other })To., Taluka I, I , 'Kharif' Rabbi! , , I cer- 'Cer-' I 'Gram' Pulses , I I , I , .. , I , I , , "
, , I , , , I I ,_ 'eals I eals I 'I , --~--.- ------+-- ---~1--4--1---;--~--6---~-7---r-a--~-~9--~--IO-4--II-~---12-~--i)1-i4-~-15--1r-iG-----! __ L ___ g ______ ! __ 2 ___________ ~-----L--~---L-~-----~--L ______ L ____ J __ ~--J------~--~----~~L----..... --~------, District 1970-71 11... - .... ....... 11.-
1971-72 17 - 17
Taluka . ------1. Thana 1970-71
1971-72 ..... ... ....
2~ Bassein . 1970-71 1971-72
... ..
3. Palghar 1970-71 .. 1971-72
4. Dahanu 1970-71 1971-72
5. Talasari 1970-71 1971-72
.... 11 ... ... - ... 11 "'" 11 11
G. Jawhnr 1970-71 1971-72
- .- -
Vl .p-
I I
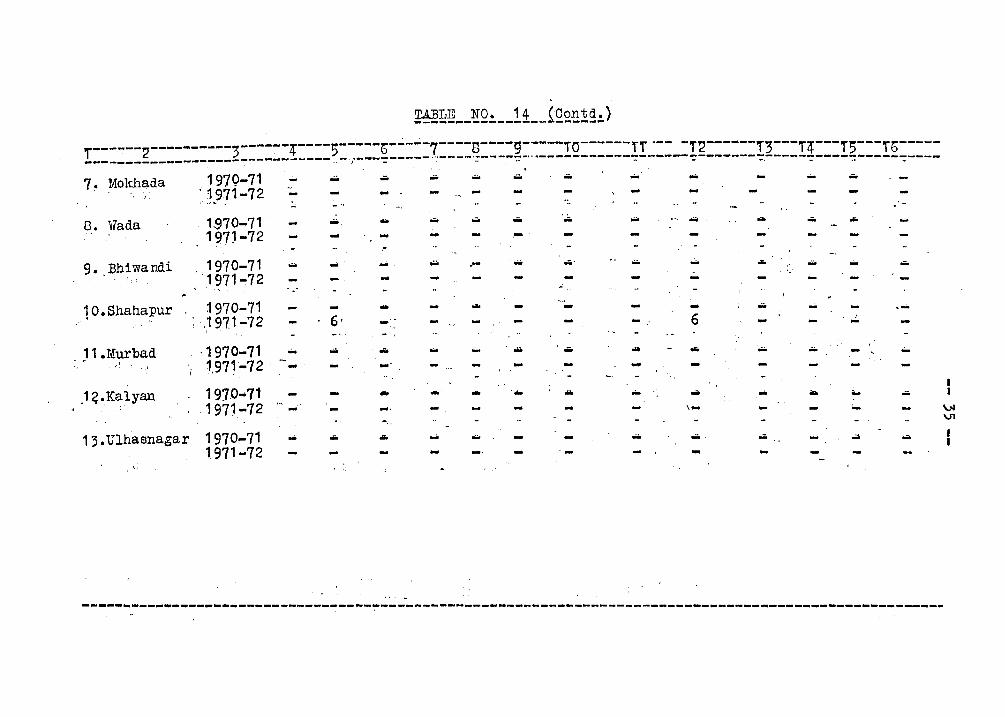
~~~~~_!Q~ __ li __ iQ2~!~~) . ---- -----6-..:.-.:.-7---·-8---9----,.0------,-T .. -- -T2-----,.3---T~---T5---T6-----1------2----------3------; 5
. . ..... ------ .... _--_ ... _----_ ... _-------------------------------------------------------------------~---... ----- .. --/.- -- . - ,- .. - -. - .. -,
7~ Mokhada 197Q-71 ... - ... olio ... ... ... ... ... ... .- ... t971-72 .. .. ..
• :1,1 ,. ..
8. Wada 1,970-71 .. -. .... ... ... ... ... ... ... ... ... ... ... 19.7J -72 - .. .- - - -.,-
9. Blliwandi 1970-71 ... ... ... ... ".. ... ;... .. ... .. "
.- .... .-. .: ".:
~ ':.! 1.1' .. ; '·1971-:72 -. - - -. .. - -'f ,' •• ," • . - ~.
10.Shahapur .3970-71 .... - .. ... ... - ... - .-.j 6 J , 'if '- •• , . 1971-72 6 r • -" - -...
,1.Murbad ·1970-71 ... .- ... .. ... .- ... 0lil .. ... ... ... .' ~ ~ . . J 1971-72 .. .. - .. .. -I •
. 1~~Kalyan 1910-71 ... ... .... .... .... ... .;, - ;;;, ... ... .1971.-72
, - \- - ... VI - - V1 ..
1,. Ulhaanagar 1970-71 .- .... .. ... .. ... olio .... .. ... .. .. 1.971-72 .. - ... - -,; . , i ~:
I.
----~------~----------------~-;--~-~------~-------------------------------------------~----------------
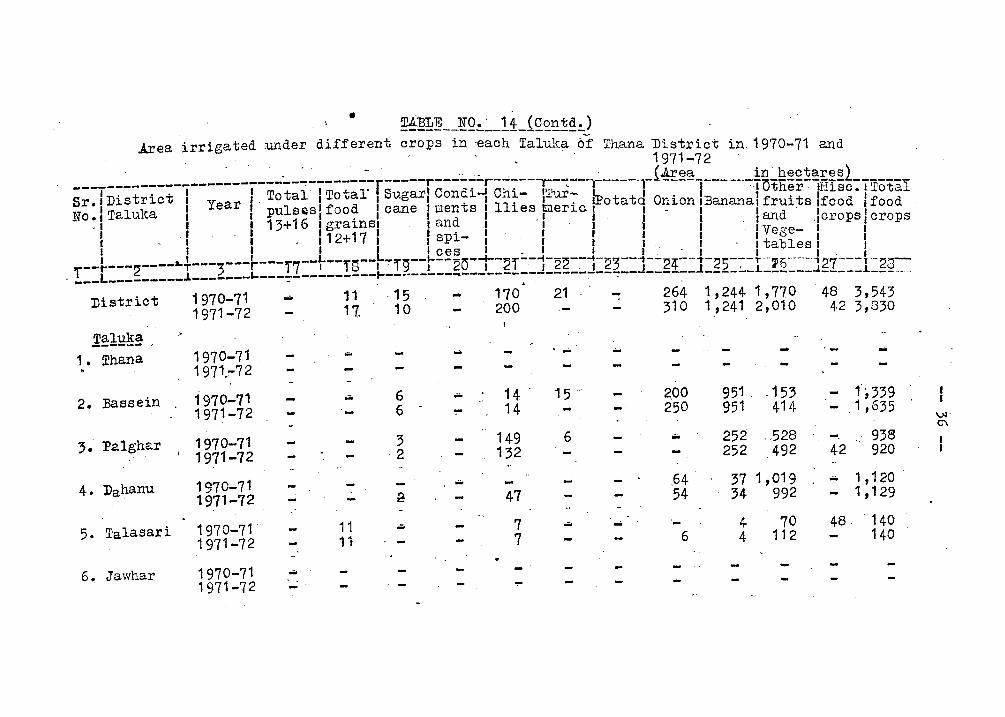
• ~~~~ __ ~Q~~_11_iQ~~!~~) .Area irrigated under different c,rops in 'each Talulca. 61 Thana 'District in 1970-71 and
. _ _ _ . . 1971-72
____ ---------------------~-~-------:r-----r---~~~r-~---Ir-~------ _i~~§____ in hectaresL Sr.l District 1 l. Total I Total' I Sugarl Condi-l Chi- P_1IT- 1; .1 .. I -~·~TOther-lnIsc:ITotaI No.lTaluka I Year I pulsfislfood I cane I Bents I llies Imerici otat9 0l2-1.0nIBanana:fruitslfood Ifood
_: I _ 113+16 I grains, . lal1~ I ., 1 : I land .lcropslcrops , _ I , . 112+17 1 1 SP1- I I I ' I I Vege- I I I I I I I I ces I _, , :..' ., tables I I .-_ -"----~T---~---r---,.7--L--,.~--~-~~--~--~~-~--~--~--~--~-~7----- 1 I I·' ,--- - t:. ..J I 0 I 1:;1 , t:.v I 21 . 12t:. ... t:..J • 22j:"7-·-25--:--'t"'16-------'2 ..... --1·- ~ . ___ L---------.L-------~---':'---------- .... --.------.. -------___________ ~-_J-------.l------J.-~----.l-7---J.-g~-.- ...
District
Taluka ------ .'
1 • Thana
2. Bassein
3. Palghar
4. Dahanu
5. Talasari
6. Jawhar
,
1970-71 1971-72
1970-71 1971.-72
1970-71 1971-72
1970-71 1971-72
1970-71 1-971-72
1970-71' 1971-72
1970-71 1971-72
... -
11 17.
...
. 15 ... 170 10200
6 6
14 -14
3 149 ·2 132
2 47
11 ... 7 11 7
.,..
21
.... ...
15 ..
6
...
... ...
264 310
2.00 250
....
,64 54
-6
1,244 1,770 1,241 2,010
...
951 153 951 414
252 .528 252 492
37 1,019 34 992
4 70 4 112
48 3,543 42 3,330
'- ...
1,339 _1,635
-. 938 42 920
.- 1,120 - 1,129
48 . 140 140
VI' G'\
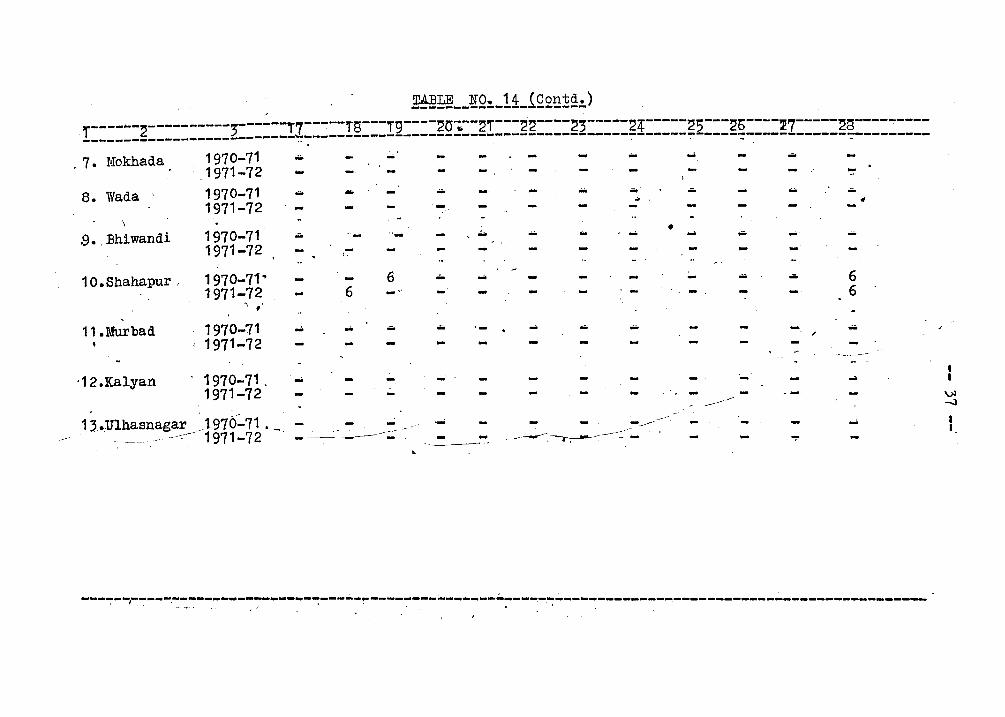
~~ __ ~Q~-11_iQ2~~~~) ----- ----- ---T ----""---"T---""----"~-----"~-----"5---"~----~7-----""----~----,.----.. -"----------~- T7 TS '9 CoV.. Co Cot:. Co.; Co4~ t:. t:.0 L COO £ J _ _ __ ~ __________________________________________________ -------------------------
--------------------- - •• t . • -, - , -
7. Mokhada 1970-71 1971-72
8. Wada 1970-71 1971-72
\
,9. . Bhiwandi 1970-71 1971-72
10.Shahapur 1970-71" 1971-72
", f'
11.Murbad 1970-71 1971-72
·12.Kalyan 1970-71 . 1971-72
13.Ulhasnagar ~197b-71 --:--- 1971-72 - ----
~,.
--~ -------.~-::- -
---~-;-~--~------------~----~---~-~------~-~------~-----~---~-----------------------------------~----• -4.. (' ••
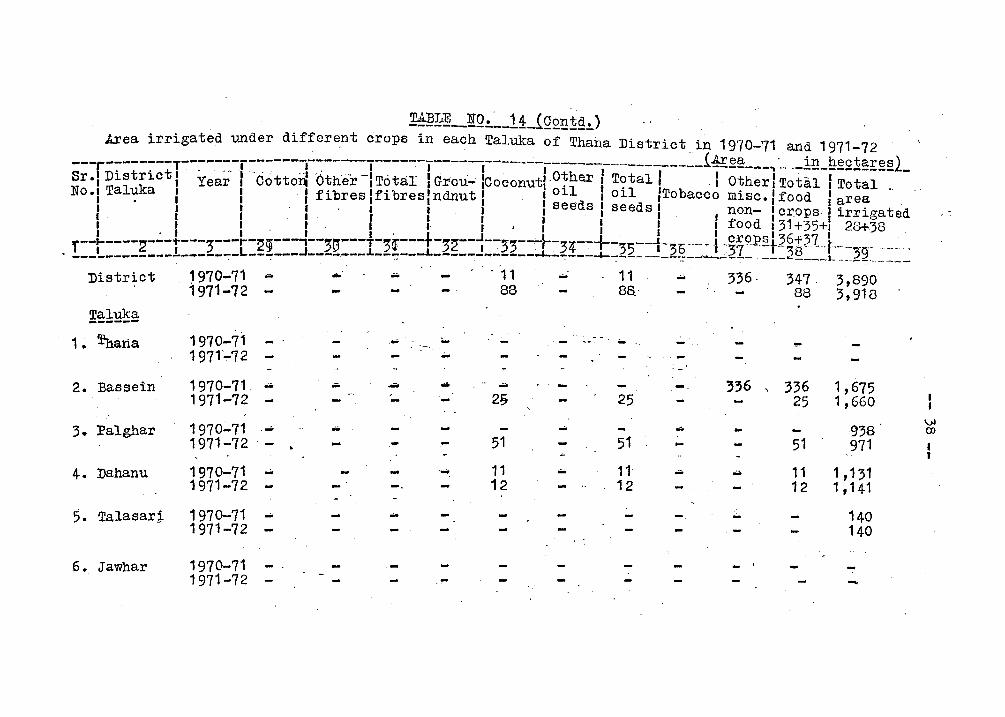
~~--~Q~~_11_iQ£~1Q~) Area irrigated under differe.nt crops in each Taluka of Thana District in 1970-71 and 1971-72
-~.- --------T-------r-------,------"j-----:-.-. ---,-------,----------------__ i!E~§L __ ....... -1!Lh~£:!:§!~~2_ Sr. r District I Yea~' ICottorlOther -I Total I Grou- ICoconuttO~he.r I T?tal f . I O~her I Total_ : Total _. . . NO.ITaluka I I Ifibreslf'ibres'ndnutl. 101.1 ,01.1 ITobaccoIiusC •• 'food ,'area
J • I , I J J I I seeds I s d I . J . I I . I . I I J J ,ee s II non- I crops J irrigated I' I - I I. : : 0 I ': I I I food 131+35+1 23+38 I . I ,. I I' I .J L + . I . J crons I 36+37 I --... ----2---.... ---':r---... -~;---'--3tr---T-;r---T-3~-- J --:-53--'· '--34-~ . -35-1-36 -0_- -1 - 7·:.s:q- 8' -+-- - - --. . ! __ '-________ ! ___ ~_~-L--~---J-_:_-----.L--"::'---J.--------.-----'---:-----'--:-_________ ~__'"2_:_-- .. ___ 2 --__ I.. ___ 2~L ___ _
District 1970-71 "" .... .... - . 11 ,;.; 11 ... 336· 347. 3,890 1971-72 - . 88 88. 88 3,918
Taluka ------1 • ~ana 1970-71 .... ... - ... .- _~ 0 -
1971--72 .- -2. Bassein 1970-71 ....
1971-72 .- .... .. ... . 2Jj - 336 336 1,675
25 25 1,660
3. l'alghar 1970:"'71 .-1971-72 . -
.- -- 51
VI .... .. 938 (X)
51 51 971 I , ,
4- Dahanu 1970-71 ... 1971-72
..... 11 12
... 11 "" ... 11 1,131 12 12 1,141
5. Talasar.i. 1970-71 ... 1971-72
... ..,. - .- 140 140
6. Jawhar 1970-71 ..,. 1971-72 -.
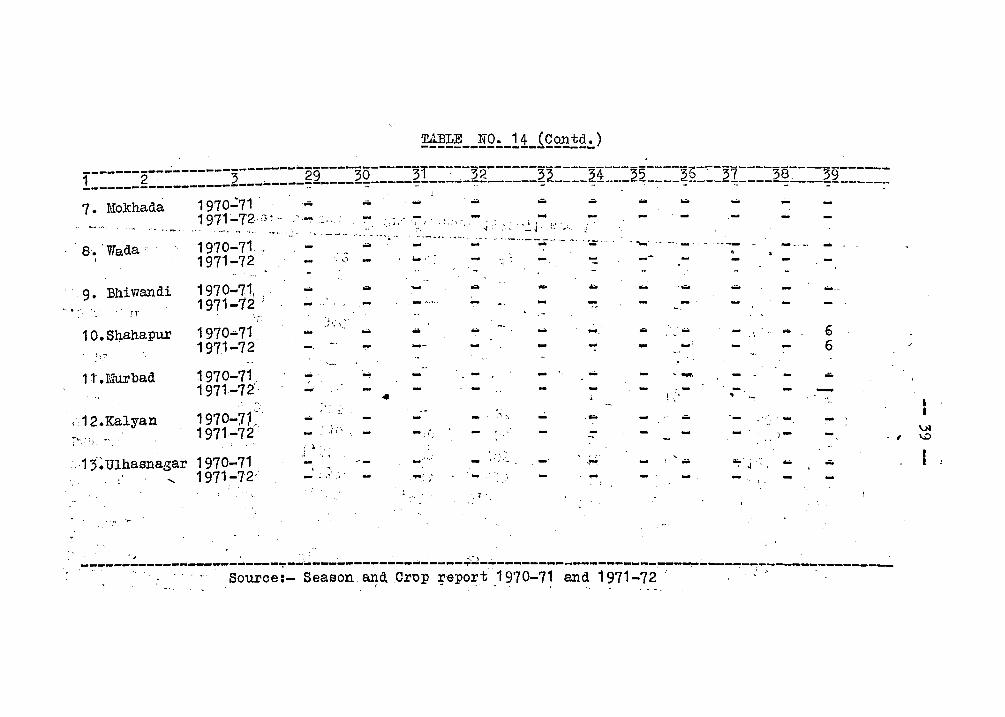
---------~~---------------M29----35-----31-----32------33----34---35-----b-~-37----38~---39------l ______ g __________ ~ ________ ~------~-----~------~-------~-----~---~-~-~--~-----7.-----~----~------~ 7. Mokhada
8. 'Wada"
9. BhiViandi _"11'
1970':71 ' .... 1 971-72' ., ~- '- ,.
1970-71 ,-1971-72 .
.. "."
1970-71, . 1971-12 ..
, ... "; /
~ "
... ,'
.... ,_""0'
... '.:, J. :.:' ." .--~- - , ... -.... .,:; ......... .... --
... --6 6
... "-'-: ..
...
... - , , .
'\ I . " . . . ': . " . ,,0.l . . '
~-~~~~----------~----~--~-------~--~---~------.--~--~----~-----------~~~----~-~--~-------------. , ' Sourc,e:- Season. and Crop report 1970-71 and 1971-72' . j -.. .. ,
VI , \.0
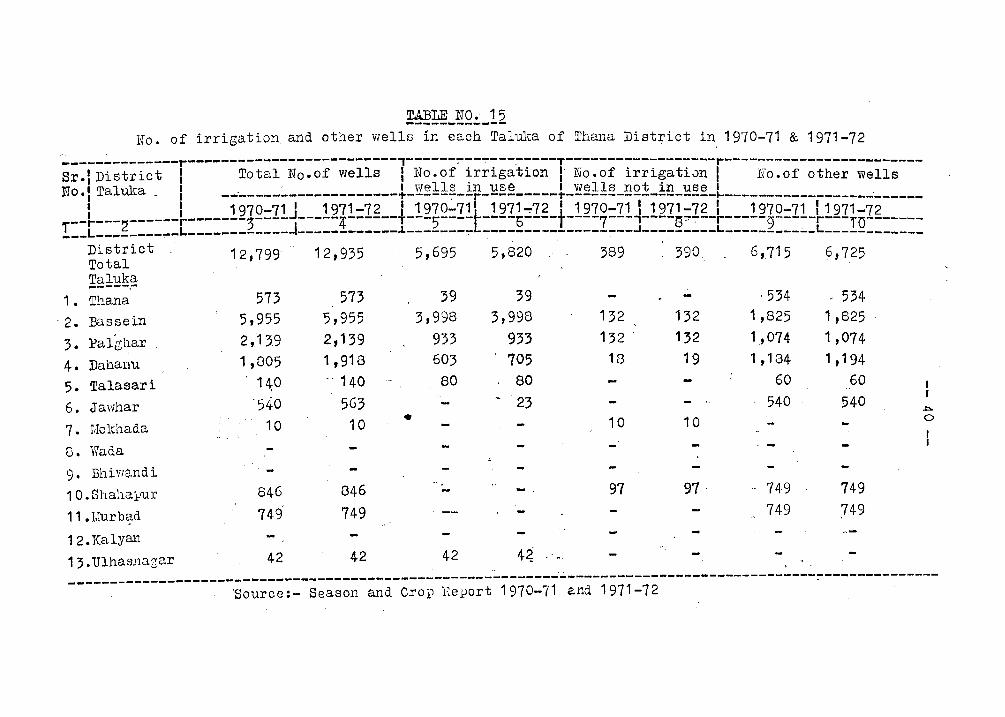
TABLE NO.. '1 5 ------------No. of irrigation, and other wells in each Taluka of Thana District in 1970-71 & 1971-72
r ' '
--------------r-------------------------,------~--~---~----T------------------r------------------------Sr.1 District I Total No.of wells I l~o.of irrigation I No.of irrigation I l~'o.of'other wells N0.1 Taluka - I __ ' _____ :.. _____________ +_!t~11~-ir-'B~~----_~-yy~11!L!!2~-i!L'B~~_L---------------__ ~ _____ _
!::t:::~::::::t:::::::~::~:j:::::~::::::f::~~::~;t::~~§::=:±::~~1:~:j::::~=:::t::::~~=::::t:::rQ:=::::: District - 12,799' 12,935 5,695 '5,820 ,- -389 390 6,715 6 725 To tal ' . . --, - , . Taluka -----.-
1- Thana -2. :Ba.ssein
3. Palgllar
4. Dahal1U
5. Talasari
6. Jawhar
7. Molthada
O. Wada
9· 13hiVl~ndi
10. Shalla1-'ur
11 .1,Turb~d
12. KalY811
13.Ulhasl1ugar
573 5,955 2,,13,9 1,805 . .140 -540
10 .. -
-846 749'
42
573 ·;,955 2,139 1,918
140 5G3 10
046 749
42
39 3,998
933 603 80
•
42
39 3,998
933 ' 705
80 - 23
- .
4~ , ..
132 132 '
18
10
97
-132 132 19
-10
97·
, 534 1,825 1,074-1,184
60 . 540
749 749
' 534 1,825 1,074 1,194
60 540
749 749
~ ·0
----------------------------------------------------------~~-----------------~------------~--------------'Source:- Season and Crop l1eport 1970-71 and 1971-72
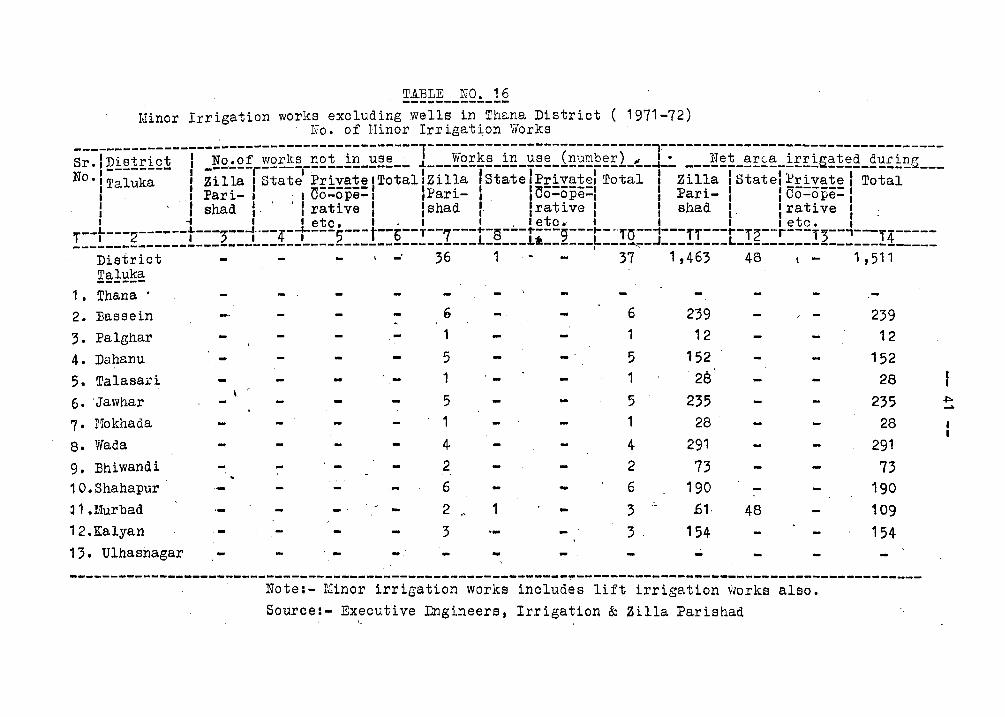
TAJ3LE NO. 1 6 , -------------
Uinor Irrigation works eX9ludingwells in Thana District ( 1971-72) . l~o. of Hinor Irrigat~on Works
-----------------------1---------------------------1----------------------------------s;~r~i;i~!£i--f-=~£~2!r~2£!~i~2!-!~-~~~-- t-~-!2~!~-!~-~~~-i~~~~~~1-~-1~: ---!~f-!~S!-!!!!G~!~~-~~~~~--NO·,Taluka I Zilla State P~!y~!~ITotalIZilla IStatelp~!y!!~1 Total I Zilla IStatelp~!y!!~1 Total
I I Pari- • . I ~o-ope-. .Pari- • I (lo-ope-. . • Pari- I I (lo-ope-I , : shad i· '. '. rative , I shad ,. Irative I I shad t· lrative I . • .... ,1· I etc. • . 1 '. I etc.· I I I I etc. I
r--t---2------t---:;---j··--4'-"t---,---t--6-- T--7---""-g---1"---g---I---'''C--;---ff---r-f~--r---'I';--'--'I'4-----__________________ ~--__ ---_-_---_---_--_--_--_---L-_--_l* ___ ~ __ ~---~-J-----__ -L-_-_---~---_--_--_---_--District -' ,6 1 '7 1,463 48 \ - 1,511 Taluka ------
1. Thana· -2. :Bassein 6 6. 239 239
3. Palghar 1 1 12 12
4. Dahanu 5 5 152 152
5. Talasari - 1 1 28 28
6. 'Jawhar 5 5 235 235 ~ ~
7· }.{okhada 1 1 28 - 28
8. Wada 4 4 291 291
9. :Bhiwandi - ... ... 2 2 . , 73 7'3
10.Shahapur 6 - 6 190 190 l1.Murb.ad 2 1 3 .- .61· 48 109 12.Kalyan ., 3. 154 154 13. Ulhaenagar . - -. - - ..:.
--~------------------~--~---------------~-~~-~----~---------~-----------------------------------------. Note:- Minor irrigation works includes lift irrigation \'1orka also.
Sourcel- Executive Engineers i Irrigation 8: Zilla. Parishad'· L
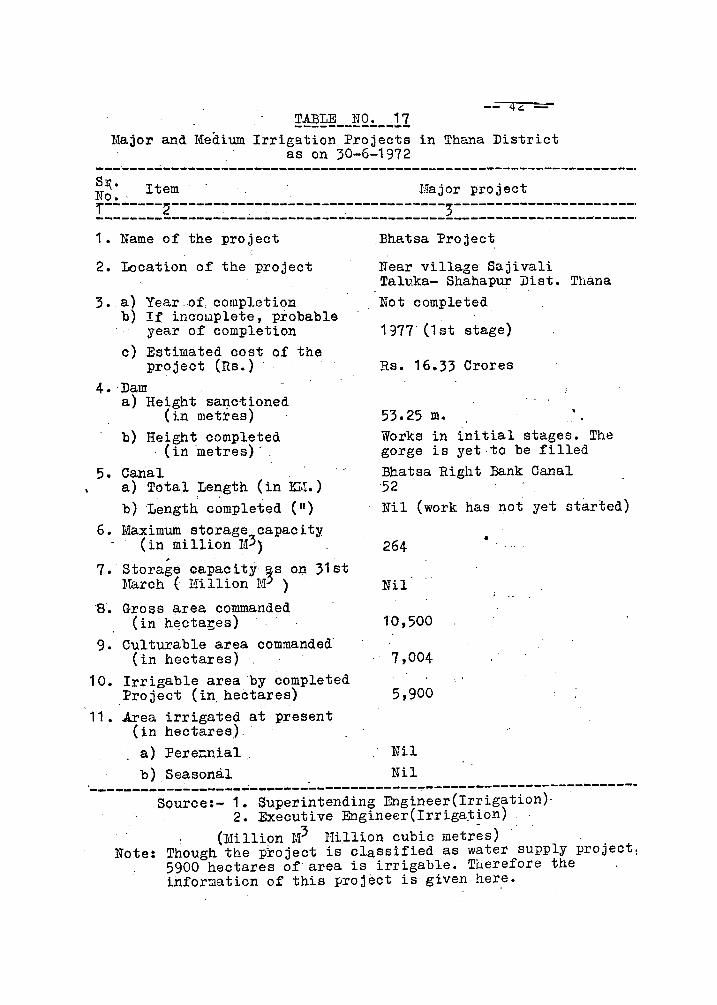
-- 4<:::
Major and Medium Irrig~tion Projects in Thana District as on 30-6-1972
--------...;.---------------------------------------------------------. i~:. Item Hajor project
r=:::::g:::::::::::::::::::::::::::::::::2::::::::::::::::::::::: 1. Name of the project
2. Location of the project
3. a) Year.of. completion b) If incouplete, probable
year of completion c) Estimated cost of the
project. (Rs.) 4. ·Dam
a) Height sa~ctioned (in metres) .
b) Height completed . (in -metres) , .
5. Canal a) Tota). ,Le~gth (in Ki.!.)
b) Length completed (") 6. Maximum storage capacity
. (in mi llion M3)
7. Storage capacitj,~s on 31st ])'Tarch ( Hillion M )
·s. Gross area commanded .(in hecta~es)
9.. CuI tura b le area commanded (in hectares)
10. Irrigable area by completed Project (in, hectares) .
11. Area irrigated at present (in hectares),
, a) Pere~nial b) Seasonal
Bhatsa Project
llear village Saji vali Taluka- Shahapur Dist. Thana Not completed
1977' (1 st stage)
Rs. 16.33 Crores
53.25 m. Works in initial stages. The gorge is yet to be filled Bhatsa Right Bank Canal 52 Nil (work has not yet started)
264
Nil
10,500
7,004
5,900
" Nil Nil
~-----~-----------~--------------------~--------------------------Source:- 1. Superintending Engineer(Irrigation),
2. Executive Engineer(Irriga,tion) . . (Million rJI3 rIillion cubic metr~s)
Note: Though the project is classified as water supply project l
5900 hectares of'area is irrigable. Tuerefore the infor~ation of this project is given here.
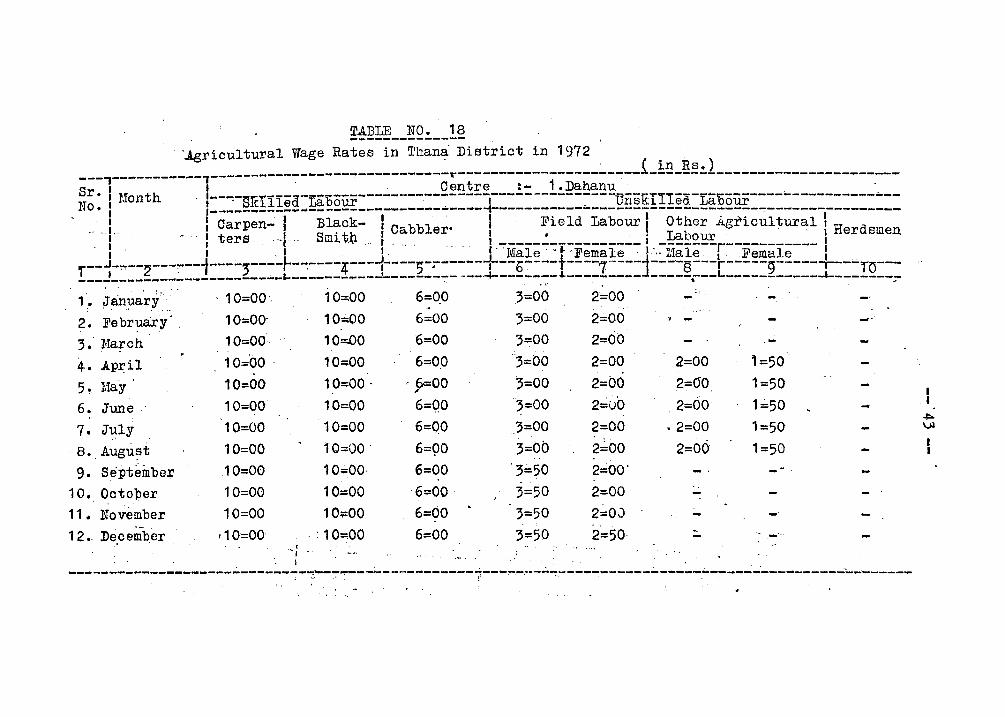
10. Octoper 11. November 120' De,cember
10=00 10=00 10=00 10=00' 10=00 10=00 10=00 10=00 10=00
,10=00
T.AJ3LE NO. 18 --------------
10::.00 6=00 10:::;00 6=00 10=00· ' &=00 ,. 10=00 6=qO 10=00 6=00 10=00 ' 6=90 10=00, 6=00 10.=00 ,6=00 ' 10.;:00 6=00
. : 10=00 6=00 -: -
3=50 3=50 3=50
2=00 2=00 2=00 2";00
2=00 2~00
2";00'
2=00 2=00 2=50·
2=00 2=00 2=00'
.2=00
2=00-
.. ---
I •
1=50"
1=50 1~50
1=50 1=50
.-'.'
--------------------~-------:---: .... -~:--~~-----------~---~-..• ~.:..~~--------..;,-------~ ... ----,..,;.-.-------------------
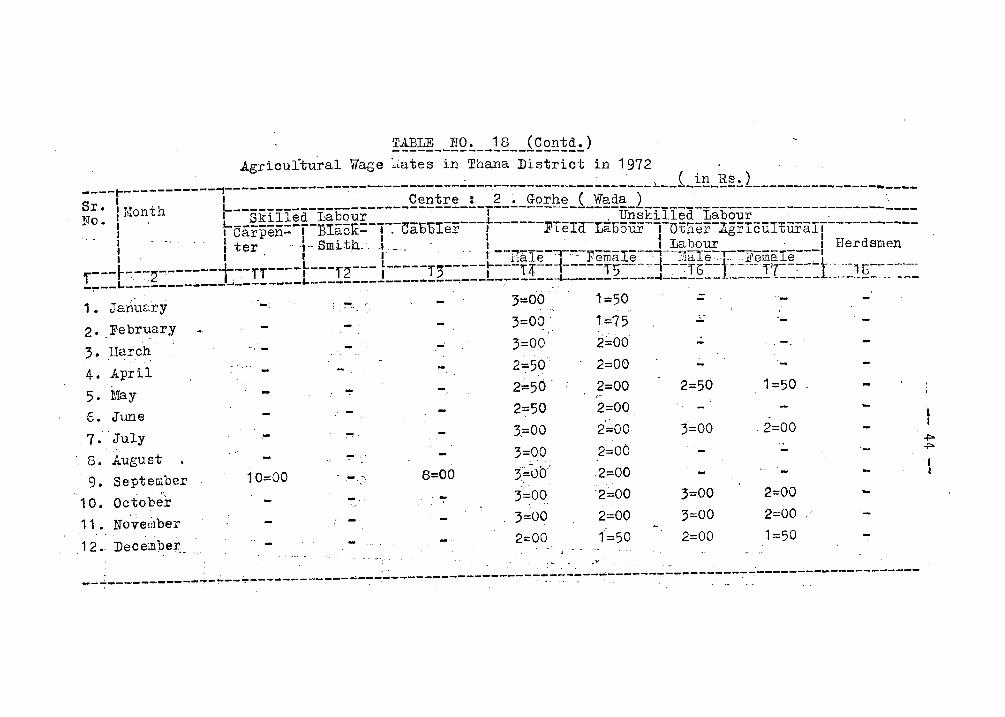
6. June 7:' July
8. August 9. September
. ,}'
10. Octo'ger 11. NO'v~liIber 12.: Decempe~.
',- .. ~
,- "~'
10=00 8=00
, -" -.' .
2:=50 3,=00 '
3=p~ 3';"ob.'
). .;~
3=:oq, 3=00 2=00
.' 2=00 2=00 ,2=00 '2~00
2=00 '1''',;.50
~ _. .' • - ._ "_" ~1t"'.. ..
.. -2=50
3=00
3=00 3~00
2=00
'-.. -.
1=50
. ,2=00
" - '-2=00 -2=00 (' '-l=50 '-
--~-----------';"-~--..,.----~~.------ .... ---.'~----------------..:.~~::~-~------- .... ------------~'-----~------"'-------
I I
.p.
.po.
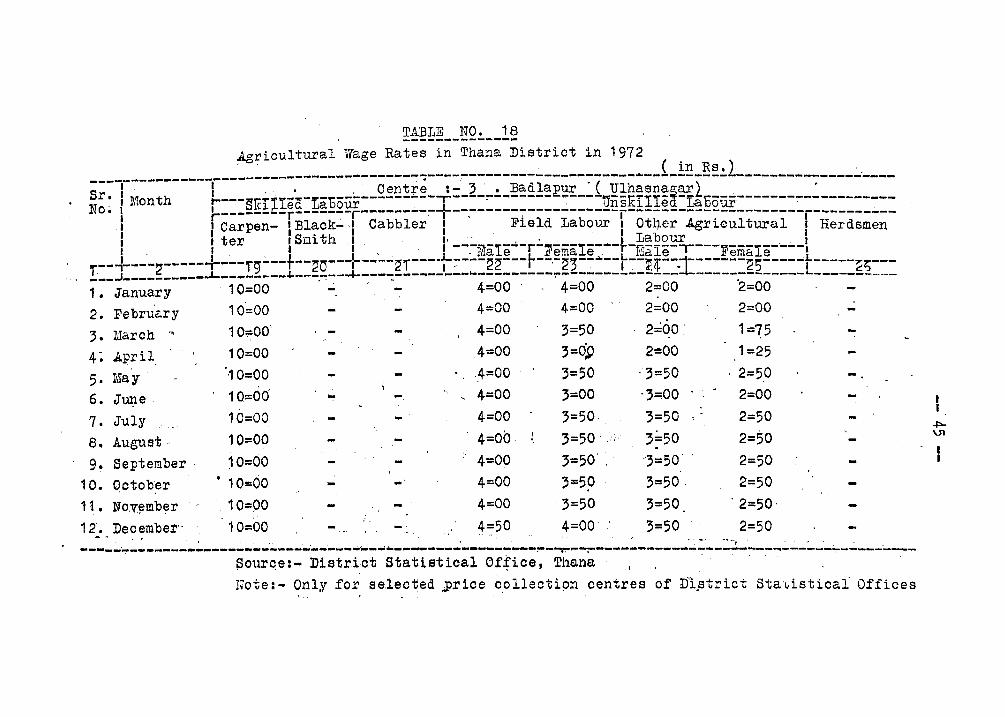
5· May 6. JUl;1e .
7. July
8. August .,
9! September· 10. October 11- Nov:~mber
12. Deoemb'er"
TABLE NO. 18 --------------Agricultural Wage Rates in Thana District in 1972
1Q=00 1.0=00 10=0.0 ,.0=00
• 10=00 10=00 10=00·
_.
.;
_. - '
.4=00 ·4=00 4=00 4=00 4=00 4=00 4=00 4=00 4=50
3=00 :5=50 3=50' ,:,'
3=50' " 3=59
·3=50 4=00' .'
'3=00 3=50 3~50
"3=5.0' ,
3=50. 3=5.0 ;=50
1 =25 , 2=50
2=00 2=50 2=50 2=50 2=50
, 2=50-
2=50 • ~ .:.. . , '. " • ~ ~ '.' .- e'. -~ "'r . . - , ," "
-----'~--.. -------------------... -.-------... ----, .. --------~-.... -~--r.~-:-"'-----.. ----..... -_:"----... --~----;--~-----.---~ourqe:- District Statistical Of;fice, Thana note: - Only for eelected ':price cpllection centres of D'1.strict Sta-~istical Offices
. I
~ \J1
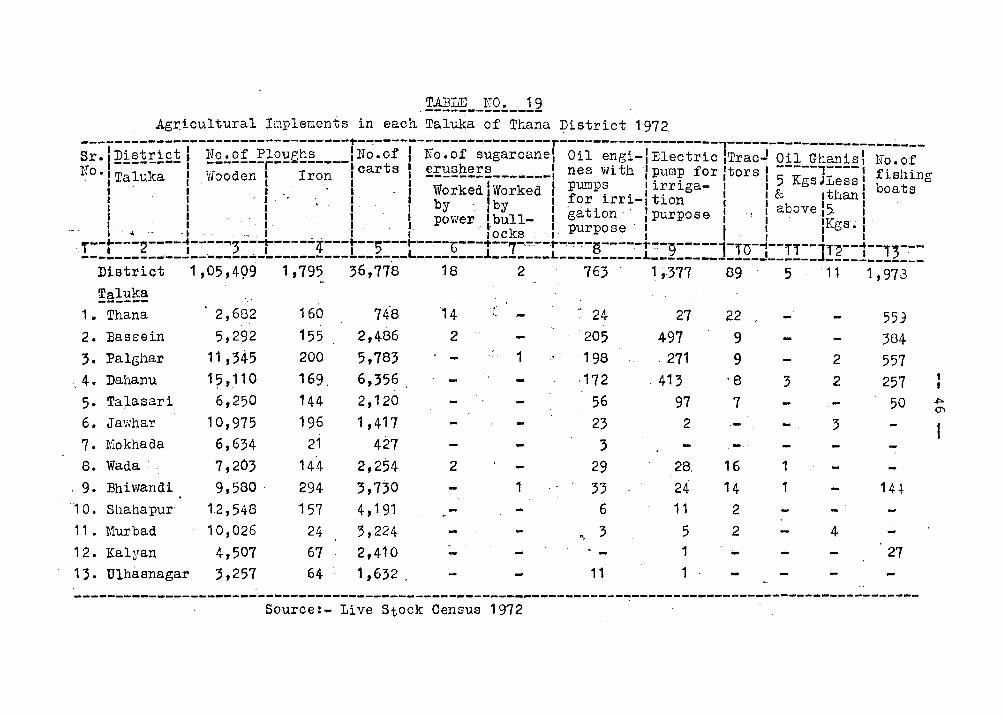
TABLE NO, 1 9 .--------------Agr.icultural Implements in each Taluka of Thana ~istrict 1972
---------------------~---------~~-~---------------------r------------------~l--------------------~---Sr. r~!~!;:!£!! !2:.2:LEF2~~~!! ____ !No,ot f No.of sugarcane! Oil e~gi-IElectric .Traol Q!!_~h~!!!1 l~o.of No '. Taluka • Wooden I Iron I carts. ~!!:!~~~!:!:! _____ ' __ I neB Wl th : :pum:p for Itors I 5 Kgs]Less I fishing
I I ' I I. I Worked IWorked f PfumP~ . I tl.~rl.ga- t ' : &. Ithan I boats I I : f' ".' r ' ·,1· by ~,Iby ,I ,. ~r lrr.~,-I lon" I ".,1 above 15. I ' 1 1 1 1 I power 1 bull- 1 gation . I purpose 1 . 1 . 'Iv,.,. ," I . I. 1 I I, I. "I, k I" purpose 1 I I 1.'68 • 1 I '".. . • .•. '- . I • .. If· 10C a . . I . " I - 1 1 I
T--t---2----1----~3-~-i-----4---f--5---~----b---+--7~~~-~~~--S-----~~-~-----1-TO-~--Tr-- r~--1--r ---____________________ ~-------~--------~-L--------~-------L----------L _____________ J ______ ] ________ 2 __ _ District 1,05,4.99 1,795 36,778 18 2 763 1',:371 89 5 ·11 1,97.3 Taluka ------- .
2,682 1·60 748 1. Thana 14 .'~ ~\ 24 27 22 559 2. ,'J3assein 5,292 155 2,486 2 .. 205 497 9 384 3. Palghar 11 ,345 200 5,783 .. ,r. 1 , ' 198 271 9 2 557
.4. Dahanu 1? ,;11 0 169. 6,356 . .172 ',413 -8 .; 2 257 5· Ta;Lasari 6,250 144 2,120 56 97 7 50 - .p.
0'\
6. Jawhar 10,975 196 1,417 23 2 .. -'. - , 7. Mokhada 6,634 21 427 ; -" -8. Wada, 7,203 144 2,254 2 29 28. 16 . 1 -
\ 9. Bhiwandi 9,580 ' 294 ;,730 1 ;; 24 14 1 14~
'·10. Shahapur' 12,548 157 4,191 6 11 ·2
11 • ]'lurbad 10,026 ·24 3,224 .. ; 5 2 4 12, Kalyan 4,507 67 2,410 1 ... 27 13, Ulhasnagar 3,257 64 1,632 _ 11 1 . . ---------------------------------------------------------------------------~-------~------------------
Source:- Live Stock Census 1972
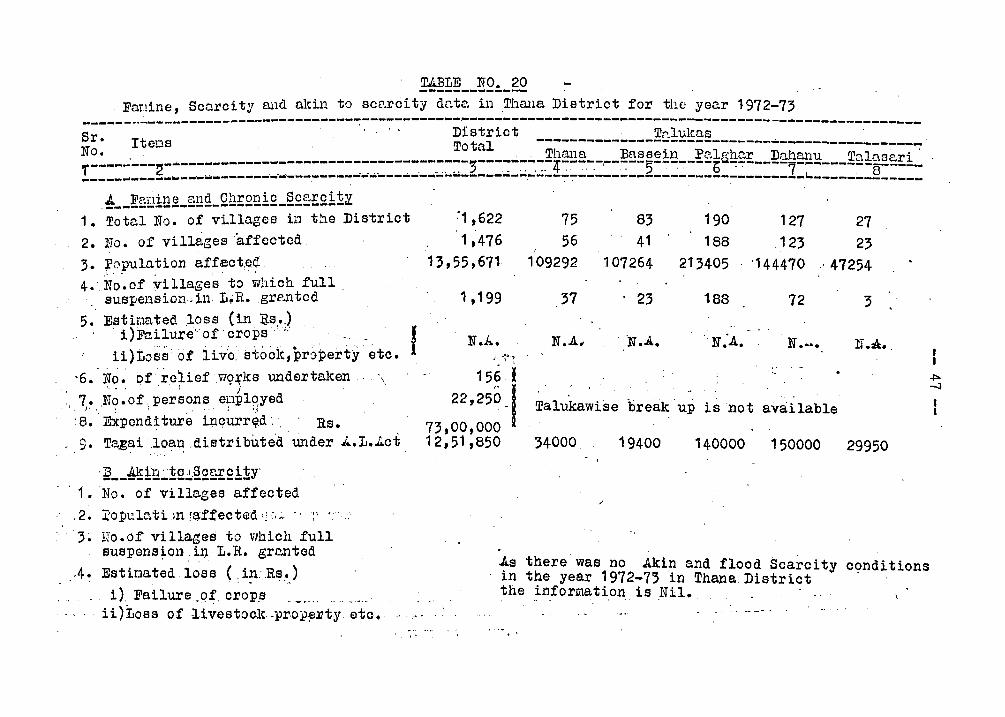
TJ.J3LE NO. 20 ------.-------. Fanine, Scarcity and wein to scnrci ty dcte. il1 Thana District for the year 1972-73
s------·~-------------------------~~----------Di;t;i~t----------------T~i~~;-------------------------r. Iteos . . Total ----------------------------~-----------------No. , . . Thana Bassein P(?,lphc.r Da.hanu Talo.sari . - -----------------------------;---------4------------------bQ -------7---------!::::::::g: .. :::::: ______ -_______ .;.~-.~-.--- ...... ---..; ... ------;.;_~_·..;:.._~~_~_~_~ __ 2 __ ~.;. _____ ~ ________ ~ _____ ;.._§_:=
J;.. Fanine C''.l1d Chronic Sce.rci t;'i -----~-----------------------1. Total No. of vLllages in the District
2. No. of villagesaffectcd 3. Population aff~cte.Q. . . 4 •. N'o'. of :Vi llages to 1t~hich full . . , 8usllension ;).n· L,R.grE'.ntcd
5. Estir.mted .loss (in :as • .) i) Failure' of' ero p8 ';,. I
H)toss of liv'c. stook,pr')~erty etc. I '6.' No.' of·rcliefvlo.r1cs underte.leen .' \.
, " '., . , . ": " j ,
. 7. ,No.of persons eJ]pl()'yed . I ,t·.. , "," ! Ii
'8. 'EXpenditure i:pqurr~d'" '. Rs. . g. TaE~i loe.~ .distri bute'd under ~. L.J..ct
, ~ __ ~!U~!21§££-t2.!:!Y' 1. No. of villages a.ffected
.2. :i:oImla.tilnraffecte:d'.:,:,A' ., :.,
. 3. 11'0. of vi llages to which full suspension i.n. L.R. grc.ntad
, " . . 4. Estioated loss (.~n:Rs~)
i) Failure .qf.crop.s ii)Lo8S of livestoclt.pr.cJ?~rty etc. . ..... ~
'. \'
'-1 ,622 1,476
13,55,671
1,199
N.b.
75 56
/
109292
37
N . .A ..
~. ~ .
83 41
107264
. 23
190 188
213405
188
127 .123
27 23
'144470 .' 47254
72 3
N ....... IT .2i: •.
' .. 156.1
22,250·1 73,00,000 12,51,850
Talukawise 'breakup is not available
34000. 19400 140000 150000 29950
"
As there was no Akin and flood Scarcity c9nditions in the year 1972-73 in Thana District the information is Nil.
. '
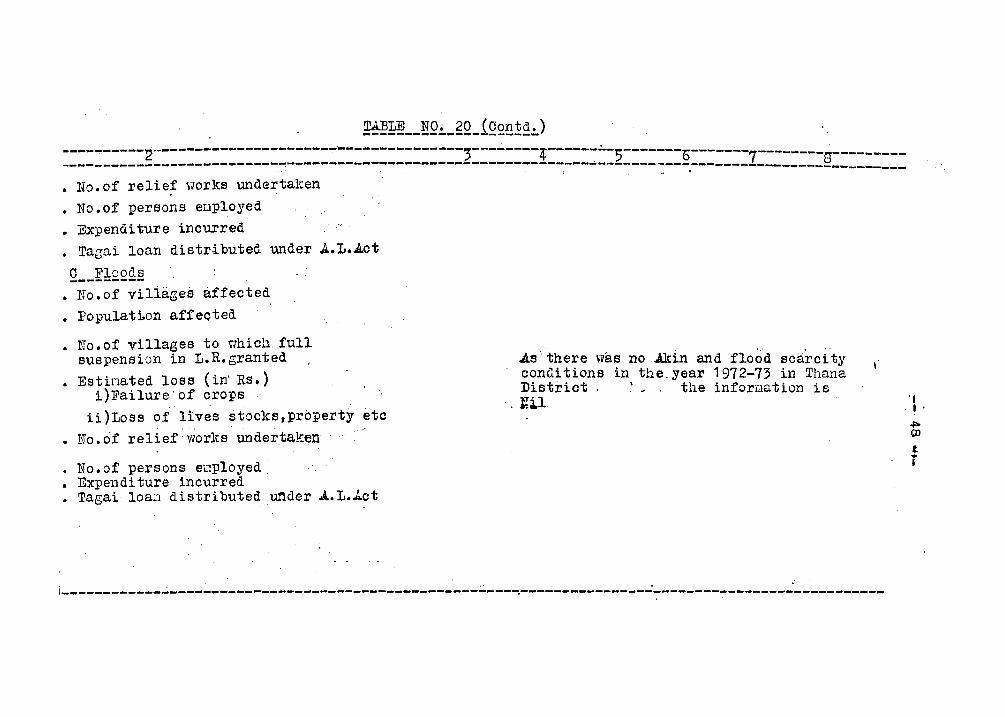
~~~ __ !Q~_gQ_i2~B!~~) ----------2·""---------------------·-------.... -------3-------- - . _________ ~ ________________ ~---------------------------___ i_:::::::2:::::::§:::::::7--------g---------
• .' • .: ...: lo -------------------
• No. of relief YlOrks undertal>:en . '
No.of persons euployed • Expenditure incurred • Tagai loan distributed under A.L.Act C Floods ---------
• No.of viliages affected • Populatton affected
• No.of villages to ilhich full suspension in L.R.granted
• Estinated loss (itt RS.) i)Failure'of crops.
AS" there was no Akin and flo~d scarc1'ty conditions in the. year 1972-73 in Thana District ' the inforwution is
"
ii)Loss oi liv~s stocks,prbpert~ etc ·,lU.l . , .
No.of relief'worlcs underta.ken
• No.of persons e~ployed: • Expenditure incurred .• Tagai loan distributed under A.L.~ct
I, -
. . -..' . .: .
----------------~-------------------------------------~--------------------------------------------
~ 0:> t i
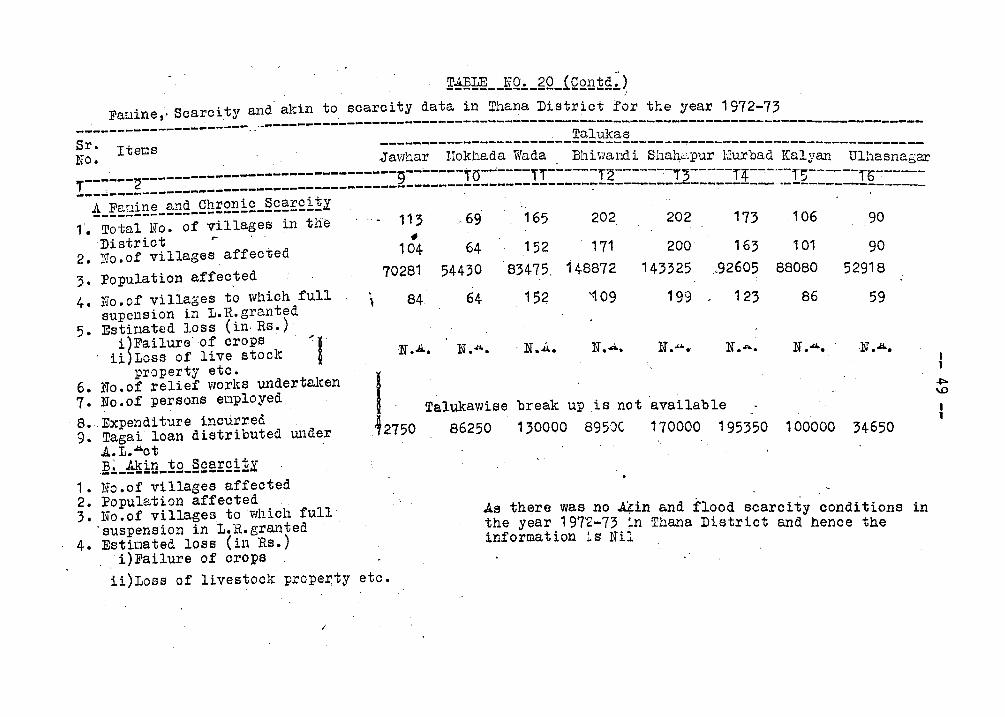
X-!l?I!~L_~Q!._gQ_!.QQll ~g~ ~ Fauine,' Scarcity and akin to scarcity data in Thana District for the year .1972-73
--------------------- . ..... --------------------------------------------------------Sr. I teLls --------------------~--~~~~~~-------. --------=====----------No. . ..' . J'awhar 110khada Wada BhlY/aIn i Shah<".pur llIurbad Kalyan --Ulh;~~gar r------2-------------------------------g-------10------ii------i2-----~_.2:-----i4-~---r~------f6--------~-----------------------------------------~----------------~---------- ---------.--~--------------
A Farrine and Chronic Scarcitl . 1. -T;t~l-N~~-;f-;ill;;~;-i~-the 113·- 69' 165 202 202 173 106 90
fI District r
2. No.of villages affected
3. population affec~ed
4. l~o. of villages to which full supension in L.R.granted
5. Estinated loss (in~ RS.)· i~Failure' ·of crops
ii Loss of live stock ~I property etc.
6. No.of relief works undertalcen enployed 7. No.of persons
8., Expendi ture incurred 9. Tagai loan distributed under
.A.L.~ct ;§~_~ill_~Q_§£~!:£i~.Y
1. No.of villages affected 2. Population affected 3. No.of villages to which full
'suspension in L.R.granted 4. Estiuated loss (in Rs.)
. i)Failure of crops
\
104 64 ,152 171
70281' 54430 83475, 148872
84 64 15~ '109,
N.Ji.. N .I .. . . . N • .iI.. N.A.
I Talukawise break up is not
200 143325
199
If • .L' ....
163 .. 92605
123
N . ..nr...
available
101 90 88080 52918
86 59
N.4. ·N.A.
~2750 86250 130000 8950C 170000 195350 100000 34650
.As there was no ALin and flood scarcity conditions in the year 1972-73 ~n Thana District and hence the information is Nil
1i)Loss of livestock prope~ty etc.
/
""" ..0
I 1
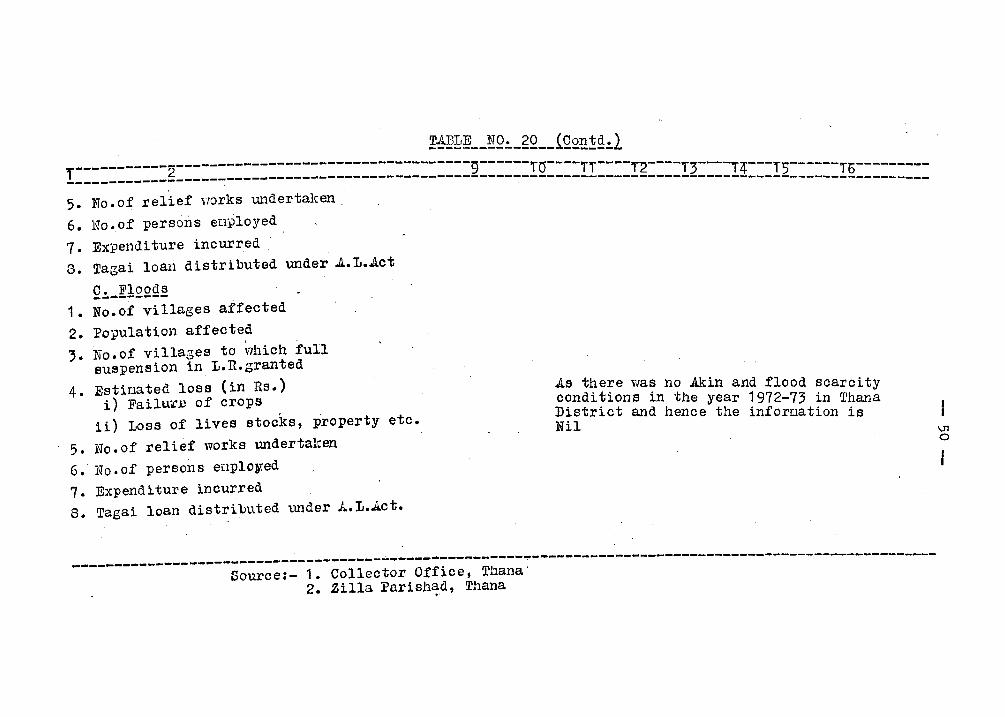
!~E~~ __ ~Q~_gQ __ iQ~~!~~l r-----------2-----------------------------------g------TO----TT----T~----T~---~~--- ------_____________________________________________________ ~ / I~ T5 TE---------
. . --------------------------------------------------5. No.of relief Harks undertaken.
6. No.of persons enployed 7. Expenditure incurred G. Tagai loan distributed 'Wlder ..ll..L • .Act
C. Floods ---------1. No.of villages affected 2. Fopulation affected , '3. No. of villages to '7hich full
suspension in L.R.granted 4. Estinated loss (in Rs.)
i) FailurE of crops ii) Loss of lives stocks, property etc.
5. No. of relief works undertaken 6. No.of persons eoplo,ed 7. Expenditure incurred S. Tagai loan distributed under ~.L • ..ll.ct.
.As there was no .Akin and flood scarcity conditions in the year 1972-73 in Thana District and hence the infornation is Iii I
--------------------------------------------------------------------------------------------------------Source:- 1. Collector Office, Thana'
2. Zilla Fnrishc;d, Thana
\.11 o
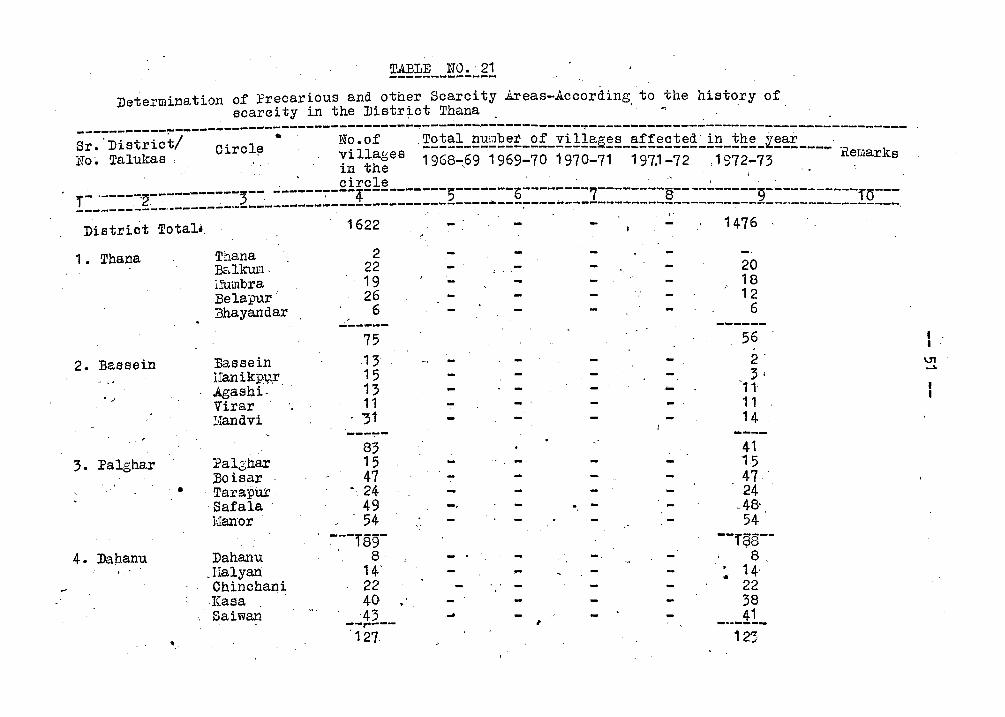
TAJ3LE NO. 21
Determination of Irecarious and other Scarcity Areas-According to the history of scarei ty in the District Thana . .
~;~:-Di;t;i~t/----~~::~;--;-------N~~~f:---~~~~~!=~~2~;!=£~=Yi:ii~~;;=;ff;~~;~=!~=~~;=~~~!====~.-------eo~ Talukas . I~l~~~es 1968~69 1969-70 1970-71 197,1-72 .1972-73 . . R~L1ark6
circle ' . --_.-----.~.--------~--)--. ------7'---4----------5-------b-----:----7--------'8----------'9----------- ---! ______ -____ ..... ______ . _______________________________ .... ___ :-_______________________________________ IQ __ _
District Total;
1. Thana
2. Bassein
. .. '
3. l?alghar
•
4. Dananu
Thana B<;.lkul!1· i.Jumbra Belapur -i3hayandar
Bassein l.Ian ikpV-.r. .AgashiVirar . Nandvi
?al.;har .Boisar Tarapi.u' Safala lIenor
Dahanu J'.Ialyen Chinchani Kasa Saiwan
1622
2 22 19 26
6 ------
75 13 15 13 11
. '31
83 15 47
- 24 49 54
~--189-, 8
14' 22 40 '43 --,----
'127
1476
20 18 12
6 -~----
56
2 3;
.... "11-11 14
41 15 47 24 -. . - .48' 54
--:nm--8 . 14'
22 38
, 41 --.----125
I I
'J1 ~
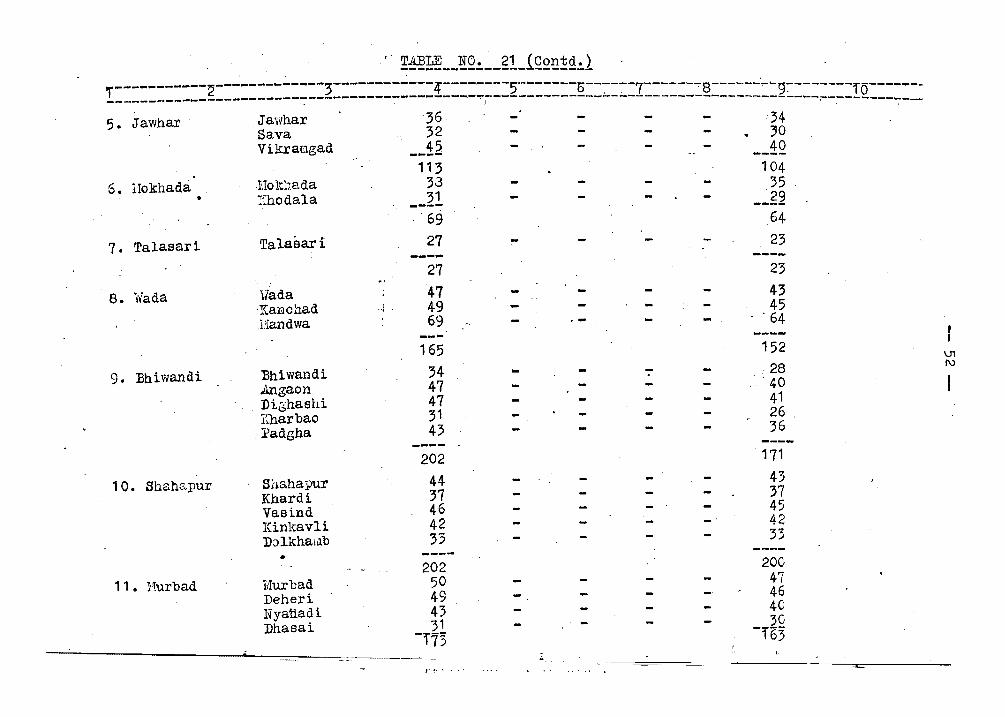
, !~~ __ ~Q~ __ ~!_iQ£g!£~l ,.-----------:2-------------3------------Lf--------5·--------5------7-------:- ------'-~ -------- --------- ... ·--------------------"':'---... ------~.,..-------.-~I---------- .... ---;....-.:....---------§----~---~:--------!Q. , -------5. Jawhar '
6. lIokhada. •
7. Talasari
8. Viada
9. Bhiwandi
10. Shahapur
11. Hurbad
Jawhar Sava Vikraragad
I.1o lC:1ada :~hodala
Talasari
Wada Kanchad ,liiandwa
Bhiwandi .Angaon
, Di6hashi I:harbao
,l'adgha
Shahapur Khardi Vasind Kinkavli DolkhaiJ.b
•
Idurbad Deheri Hyatiadi Dhasai
. J
'36 32 __ 12
113 33 31 ----
'69 27
27
47 49 69
165 34 47 47 31 43
202 44 37 46 42 33
202 50 49 43 31
-;73 'J'~' I, , ., :
104 35 29 ----64 23
23 43 45
. 64
152
':" 28 - ' 40 41 26 36
171
43 37 45 42 33
200 47 46 40 30
-163 -.. -- --..: . ......
(.,' ',.",., - )
\Jl f\.)
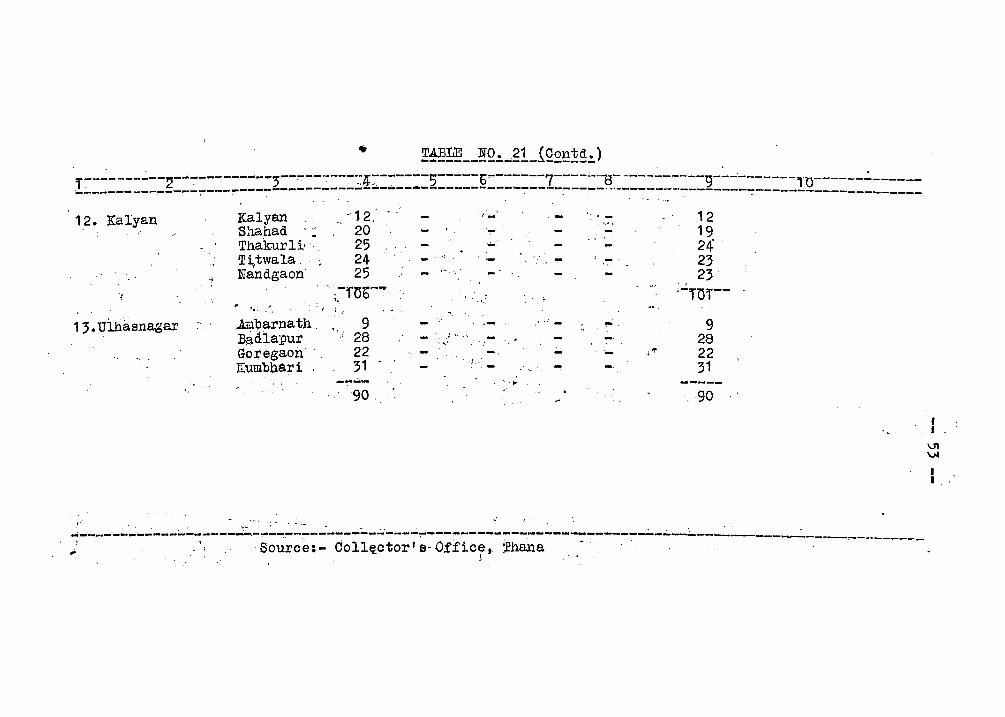
• !~~ __ !Q~_gl_1Q£~!~~) " ' r----------2----------- ... ,--:---'"':"-----lj;'-------5-----'6-------7-----"13-----------9---"-------,-0------..:.----
-.:...--------~-----:--------------------.:.:.-;.;,------------------:-----.-----' ~.---------:---------:---------------------
12. Kalyan Kalyan -12, ,', 12 '- :. -S l1.a. had 20 "'" 19 Thalrurli' '.' 25 ... "" ' ' 24 -Titwala, 24 ; - 23 I .
25 Nandgaon ,- " 23 .. ·-f06~'" ' . ;-TOr--
'. .. r : ,," ,
.ALl1;>arna th ., '. 9 - , 9 Badlapur
". 28 ~ ... ' 28
" "
13.ulhasnagar
Goregaon 22 -. .;.. ... j'!' 22 rrum'qha.r1 31 .J.
31 \ ---- .~ -----
90 90
,f'"
.... --... ---------;....------~- .... --":~------~-:...-.:..---~~------------------------:--.:..-~-~---.:..---~-------'" " , Source:- Coll~ctor' s- Office,. '2hana
l" " •
I " I
VI \.H
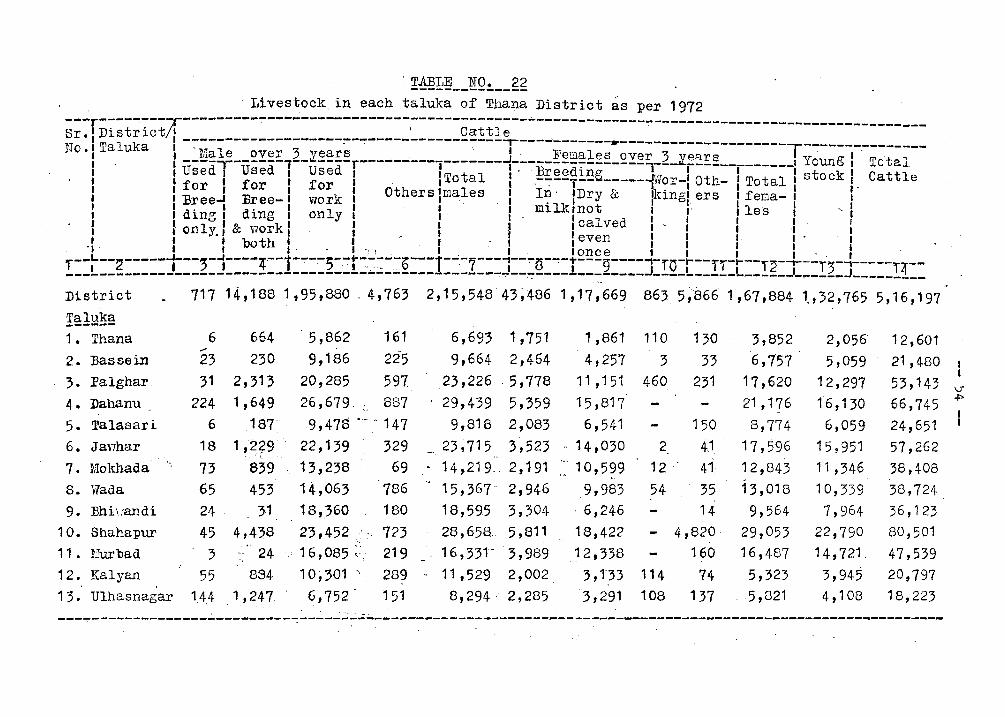
. TABLE NO. 22 --------------Li vest.ock. in each taluka of Thana District as per 1972
---r--------1r--------------------------------~~-------------Sr. District/!' \ Cattle --------~---------------------------------I -------------~------------------------~--~---- _. llo. Taluka I -Male' over 3 vears , . Femai;s ~;;;-;-~;;----------T----------:-----I ----l-------,--~----r---------,-------J------------------~ -!~ ________ J Young Total I Ufsed I vfsed I ufsed I ITotal i' .~~~~~i!!ei-----..korJ Oth- I Total 1 stock Cattle • or I or J or lOth I 1 I ,J:. I I I I :Bree.... Eree- I work I ers .mB:. es I ~. IDry &. Ilnng: ers : fema- I . I dina: ding " onlv.' " . I I:lllktnot I I' ,les, '. l Q " I Ild I I • ,
• f only: I 8: work I. I I I ,ca ve I" I i . I • : bo th I J ' J - I I even' I I I. , .
. ". . I I • . - . I·; ! '. I _ I , onc e t I I I· . r--~--2-----T--)-1----4--1---~5-,-t-:-:-:-,-:-t;--1--,-7---.. r-.,.s.,.~-t---~----1-'J'O-t---l,.-t---,.2-""t---,. --,----- --------------------------------------~------- ------~~--~~------------J----L-----L~----J-~--~-J-____ Ii __ District 717 14,188 1,95,880. 4,763 2,15,54843~486 1,17,66~ 863,5,8661,67,884 1.,32,765 5,16,197 Taluka ------1. Thana 6 664 5,862 161 6,693 1,751 1,861 110 130 3,852 2,056' 12,601
-- 225 2. :Bassein 23 230 9,186 9,664' 2,464 4,257 3 33 6,757 5,059 21,48Q 3. Palghar. 31 2,313 20,285 597 ,23,226 ·5,778 11 ,151 460 . 2:;1 17,620 12,297 53.,143 \J'
1,649 26,679. ' -
1'6,1;0 ~ 4. Dahanu 224 887 . 29,439 5,359 15,817 21,176 66,745 ." I 5. Talasari 6 187:"" 9,478 .-. 147 9,818 2,083 6,541 150 8,774 6,059 24,651
, 6. Ja'i,har 18 1 ;229' . . 22,139 329 ~. 23;715'· 3~523 ~ 14,030 2 4,1 17,596 15,951 57,262
.: .. L .. ' .-
7 ~ , Mokhada .. 73 8:;9 1,3,238 69 14,21 9.. 2,191 .- 10,599 12 .' 41- 12,843 11,346 38,408 8. Wada 65 453 14,063 786 15,367-' 2,946 . 9,983 54 35 13,018 10,339 38,724
9. 13hi\/andi 24 31 18,,360 180 18,595 3,304 ' 6,246 14 9,564 7,964 36,123 ' ,
1O. Shahapur 45 4,43.8 23 ,452 .. ~.:' 723 28,658 .. 5,811 18,422 - 4,820" 29,053 22,790 80,501 '.
11. l!urbad 3 -- ',' 24 : 16,085 ~:,: 219 16,331- 3,989 . ~ 2,338 160 16,487 14,721. 47,539 .)
12. Kalyan 55 884 10,301 ". 289 - 11,529 2,002 3,1"33 114 74 5,323 3,945 20,797 1 3. Ulhasnagar 1.44 1,247. ' ~,752 151 8,294' 2,285 . :; ,291 108 137 ,5,821 4,108 18,223
.. .~ -, ---~------------------------~~--------~--------------~-------------~-----------------------------~---------
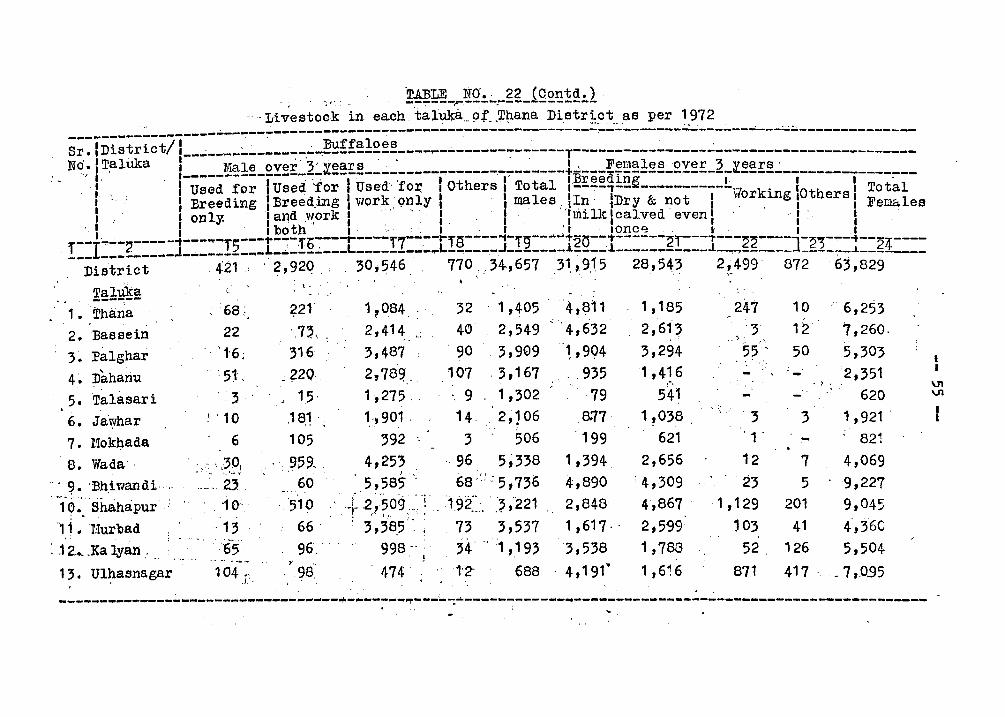
TABLE NO. ·22 (Contd.) I • .,:; t.:: . -,;-,~---r.~---~--~---------
"'Livestock in. each.taluka. .. 9,r.Thana District as per 1972 -s--j"D-:-t-~~til----"'--~--~----~-B;;tf;l~;;-----~-~--------. --...:-...:-:::.::.:--:.:------;.;~-~...;.;..------:;.;.:..--------------_~. I loS. r1.. I--..;---... -------:':"'.--.-.------:---:----,...-..;.------~-_:----T-----------------------------------------No;IT~lUka 1 _____ ~~!~_2Y~!:_2:..~~!:!:~ ___ ~ _____________ ~ __ ~ ___ !...;---E~~!:!~~:...2Y~£_2_il~~!~.:. _______________ _
: I ... I . ; , I " ,I 1 IBreed1.n~ I I I' .: Used for I Used for Used fOI: 1 Others I Total 1---:--,.-- -----------.-, . r I Total , I " , 'Creeding 'Breeding' work only I . 'males lIn' IDry & not I Ilorklng IOthers I F ~ 1 I I .lJ " . - I - " ',I I ' ,I . . 1 . I.. I I ema es , I· . : only... I a~d.vi,ork I . .' I. '1, Im1.lk I calved even I .' : : I .. I I . I both I·"· I . I ' I . lonce. I' .. 1 .1 __ ;.. __ ------t---...... ,.5----t---:-.'fb-:----.-----f7--.--r fS---- ... -rg--...... -t20---t------~r--,. .... --~~---- -~ ----t-- ----. !_-I---g-----J-_--------J.---------L-------.---L------J _____ -:_J.-:----.1-----------.1-_..,.---_-]--2.---;-.1.--gL--
1-
.2.
District 42'1; . 2,92Q:.- .30;546 .. 770.:34-,657 :31. 1 9,15 "28,543 2,499 87263,829 , ,,' ,-
Taluka ., . -----:--
'.
Thana .: 68; '. Bassein
32 '1,405' '4,~11
40 2,549 °'4,632
1,185 . . 2,613
.' 247
3 6,253 '7,260,
3~ l'alghar
22 '1'6;
.. : 51,
?21 '7,-,. 31.6
1 ~084: 2,414.,.: 3,487 : 2, 78~,_ . 1,275 ' 1,.,901 '
. 90 3,9Q9 1,994 3,294
10 12 50 5,303 . I
4'. Dahariu
5. Talasari
6. Jawhar
7. Uokhada
8. Wada,
.. ~ • 'Bhi wan di ·1·9~·."Shaha:pur
·1.i· uurbad
.. ·3
.1 '10
6
',',' ,301 . ...... -.' .. ,:
.- .. 23. , 10-
,1;
: l2. .... Ka 13'an, ' I '.. • ........ .
·65
104 ~; 1:;. Ul~asnagar .1 ..
~ ?2Q,
" 15, .18.1 " 105
.. 95~1 . 60
392 4,25;
) ,
5,585 .
·'519"-f~ 2,J509,:;'! 66 . ' - ; 3,38.5,'~ ; 96:' . 998 ...
'Y "
.. 98. 474
107 ,3,167 .', 935 __ 9 . 1,302
14. 2,106 3 506
. 96 5~338
68 ;(': 5,736
1.92~:;, . ) ,'221
73 3,537
79 .8.77 . '199
1,394. 4,890 2,848 1,617"
1,193 '3,538 688 . 4,191·
1 ,41.6 541
1 ~038 , 621
2,656 ; 4,309
4,867 2,599 1,788
1 ,616
, :~ " 0'
3 , 1 .
12
23 1,129
103 52
871 . ,
2,351 • :0 •
620
3 1,921 '
- 821
7 4,069
5 '9,227 201 9,045
41 4,3-60
126 5,504 417 . . _ 7,0.95
------------------------------..... -----!---....... -~ .. ".------:.--------------------------------------------------------'. .
I
VI VI
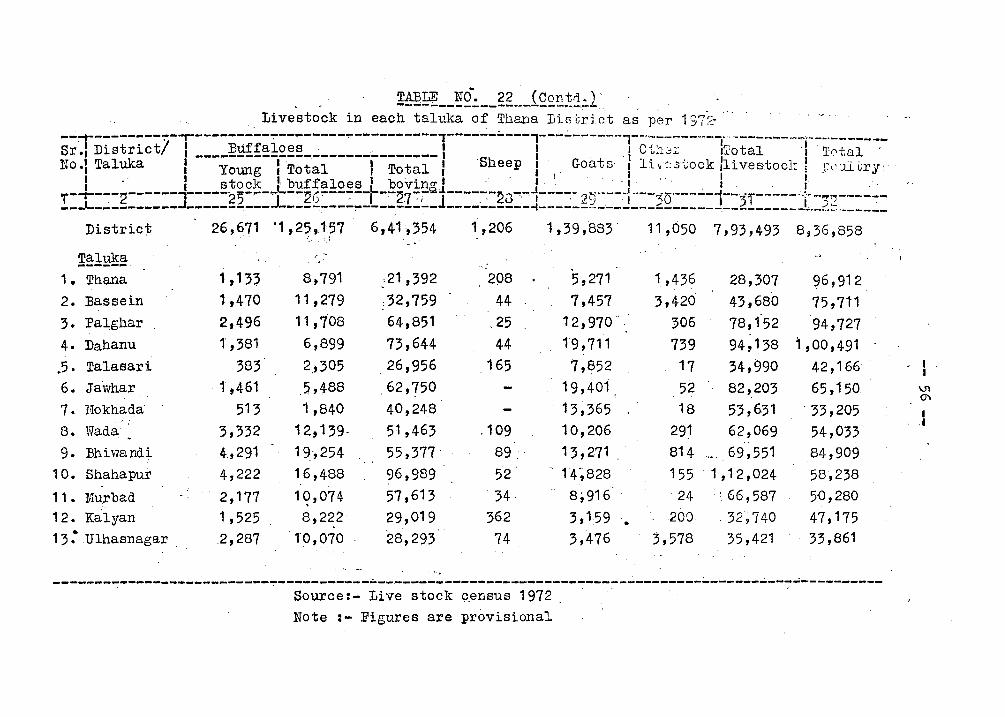
TABLE NO-. 22 (Con trI. ) , ------------------------Livestock in each taluka of Thana IJiE'lGrj ~t as per 1 j7~' --~--------~-T---------":"'--------.,..----------"T----·-·-~---,----------_.,--.. ----------_ .. ----.. ----.,---.-------Sr., ,District! , ____ ;!2~!:~!~~!!_:..:------;..-------1 .. . I . I C~:18:. !T~tal '\ T,~tal . No·1 Taluka : Young I'Total I Total: Sheep I Goats" 1l"~:3-vock Ihves.tocJ: I r"''J.l~ry··
I -' I stock I, buffaloes 1 bo'vinrr 1 ,'I!. . ", I '. I I . T--r---2------'-----25-,..-±--~C.,..--':"--r--277i~j----~-~i3""'..,-1---~- ')t1-·-·--I---~o .. --~-i--3i'-------:·---":,------__ ..J... __________ J ______ ~--- ----:----.,..--------- ---.;.-------f-----=:---------::.-------.---------J._ .. :?::: ..• ____ _
District 26,671 '1,25,157 6,41 ,354 1,206 1,39,883 11,0507,93,4938,36,858 ~_: '. t -
!~l~~ 1 • Thana 1,133 2. :sassein 1,470 3. Palgl1ar 2,496 4. Dahanu l' ,381
.5. Talasari 383 6. Jav~har ' l' ,461 7. l:Iokhada 513 8. Wada 3,332 9. Bhiwandi 4,291
10. Shahapur 4,222 11 • Mu,rbad 2,177 12. Kalyan 1,525 13." .Ulhasnagar . .2,287
," .... , .'
8,791 11,279 11,708
6,899 2,; 305 .5.,488 1,840
12,139-19',254 16,488 19,074 8,222
'1'0,070
_,21,392 )2,759 64,851 73,644 26,956
.62,750 40,248 51,463 55,377 96,989 57,613 29,019 28,293
.109 89 52'
34 362 74
5,271 1, ,436 28,307 ~6,912
7,457 3,420 43,680 75,711 12,970' , 306 78,152 94,727 19,711 739 94,138 1,00,491 7,852 17 34,990 42,166
19,401 52 82,203 65,150 13,365 18 53,631 ' 33,205
, 10,206 291 62,069 54,033 13,271 , 814 69,551 84,909
- 14~828 155 1,12,024 58,238 8;916 24 : 66,587 5{),280 3,159 . 200 . 32'~ 740 47,175 3,476 3,578 35,421 33,861
------------------------------------------------------------------------------~------~~-------------. , Source:- Live stock Qensus 1972 Note :- Figures are provisional
. 1 1
\J1 Cl'
1 .1
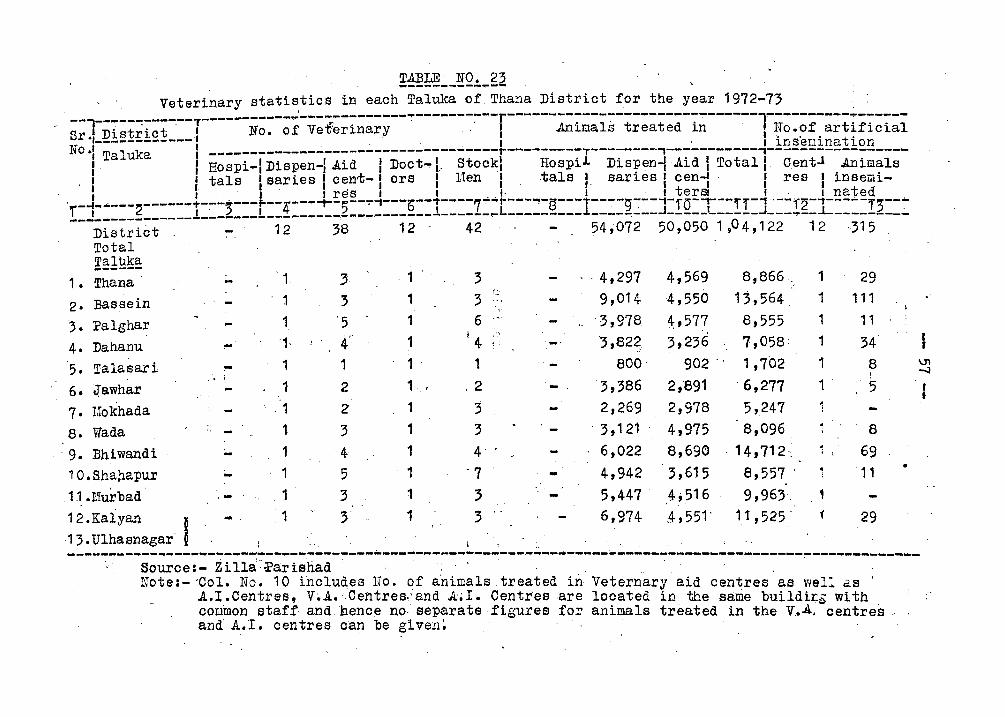
TllBLE ,NO. 23 ----~-----~--
Veterinary ,statistics in each Taluka of, Thana District for the year 1972-73 . " - ----------, --------·----------r------------------------------l------------~------,------------T---- -- -,' " , ' . . > "'r' Distr'ict " No. of Vet'erinary ,I Animals treated in " lifo.of artificial
Ll ·, ____________ 1 _',,' " ins'emination No.: Taluka , ____ - ______________________________ r _________ T ________ ,-----------,-----------------
I 1 Hospi-I Diapen-IAid t Doct-I.. Stockl HospiJ. Dispen-! Aid I Total I Cent.! Animals , 'tals • saries • cenrf;-' ors " Uen.. tale', saries' cen-', 'res , inserai-, , 'I I' . . , I 1 I t ,t' I res . t 1 __ I- , 1 " t terSl· I· I nated
, - ... - .... ---2------... ---5---f---4'·--.,.;--Ij---:--t---b ... --t----7-... r---'"'!-8---1"----g-:-:--;-fO-T--ff-'"I"--n~-'"I-----'f3--· . !_-! ____________ 1 _______ L _________ -----------1------... --:-_______ ! ________ .1 ___________ J ___ ... __ ..1 ________ _
District 12 38 12 - 42 54,072 50,0501,04,122 12 ·315 Total Taluka ------
1 • Thana
2· Bassein
1 3 ' 1 3 ' 4,297 4,569 8,866, 1 29 r,;:
13,564 -,
. 1 3 1 3 9,014 4,550 1 111
3. Palghar
4. Dahanu
1 '5 1 6 3,978 4, 577 8,555 1 11
'1- " 1 ;4 ,':' '3,82~ ;,236 7,058 1 f
4 ! : 34 r
5. Talasari
6. J:awhar
!"'" .". t
1 1 1 1 800' 902 " 1,702 1 8 \Jl
! -.J
1 2 1 ,2 3,;86 2,891 ' 6,277 1 ' 5
7· Uokhada . 1 2 1 3 2,269 2,978 5,247 .. 8. Wada 1 3 1 3 - 3,121 4,975 8,096 8
9. Bhiwandi 1 4 1 4 6,022 8,690 . 14,712· 69
10.Shap,apur 1 5 1 . 7 -' 4,942 3,615 8,557 L 11 •
1.1.llfurbad 1 ; 1 3 5,447 4; 516 9,963.
12.Kalyan I ,1 3 • Ulha snagar
1 3 1 3 - " 6,974 .'1,,551- 11,525' 1 29 - ,
-----~----------~-~---~~-----.---~-------~------~~-~----~------~-----~------------------~-------------Source:- Zilla,~a;rishad Note:- 'Col. No. 10 LncludesHo. of arlimalst,reated in Veternary aid centres as weI:' as .
A,I.Centres, V~.A.Centres,';and .A."I. Centres ·are located itl the same buildir,,s with common staff and hence no- separate figures for animals treated in the V.A., centres and A.I. centres can be given~
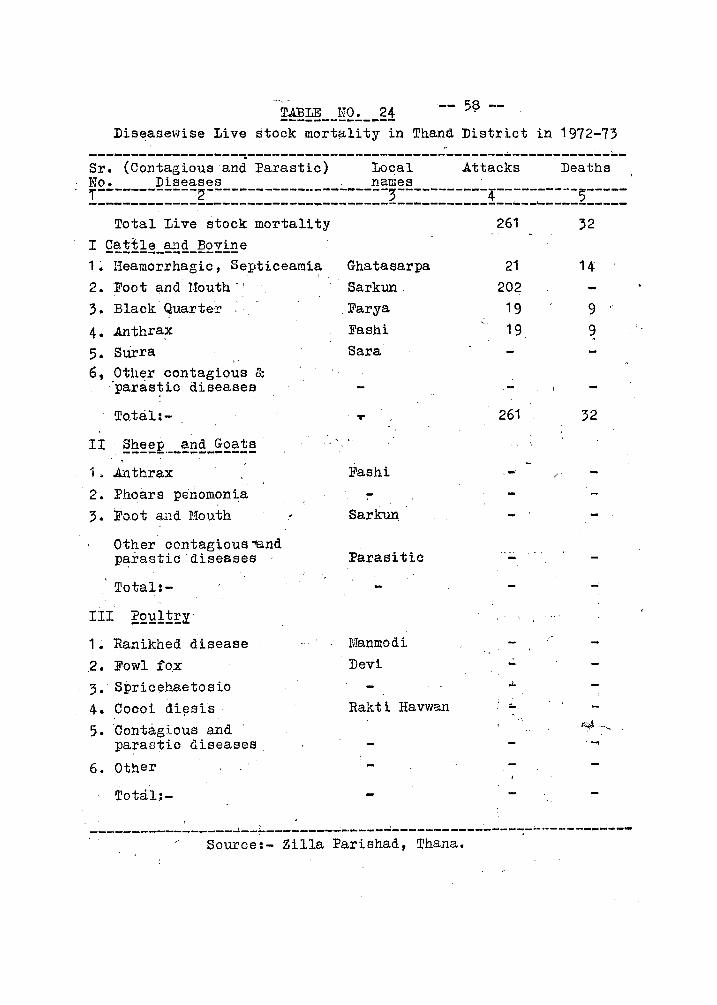
-- 51? --
Diseasewise Live stock mortality in Thana District in 1972-73
S;:-(C~~t;;i~~;-;~d-P~;;~ti~)-----~~;i------Att;~;;-----D~~th;--No. Diseases names r------------2----------------------3-----------~----------5----------------------------------------------------------~----------
Total Live stock mortality
I Q~!i1~_~~£_~£yige 1~ Heamorrhagic, Septiceamia Ghatasarpa 2 • Foot and Houth - , Sarkun . 3. Black· Quarter . Farya
4. Anthrax Fashi 5. Surra Sara 6, Other contagious &
paras~ic diseases
Total:- T
II Sheep and Goats . ----------------
1. Anthrax . 2. :Phoars periomon~a 3. Foot and Mouth
Other contagious~nd p~rasticdises8es
Total:-
III E£1!l!r;y·
1. Ranikhed disease 2. Fowl fox 3. Spricehaetosio 4. Cocoi di~sis . 5. Contagious and
parac.tic diseases.
6. Other .
Totci.l;-
Sarkun
:Parasitic
Manmodi Devi
Rakti Havwan
261
21 202
19
19
261
...
32
14
9 9
32
.....,
, ___________ ~ _____ ..J. __ ;...--------...;-.----~-- ... --.----------_:-~ .... ----------
Source:- Zilla :Parishad, Thana.
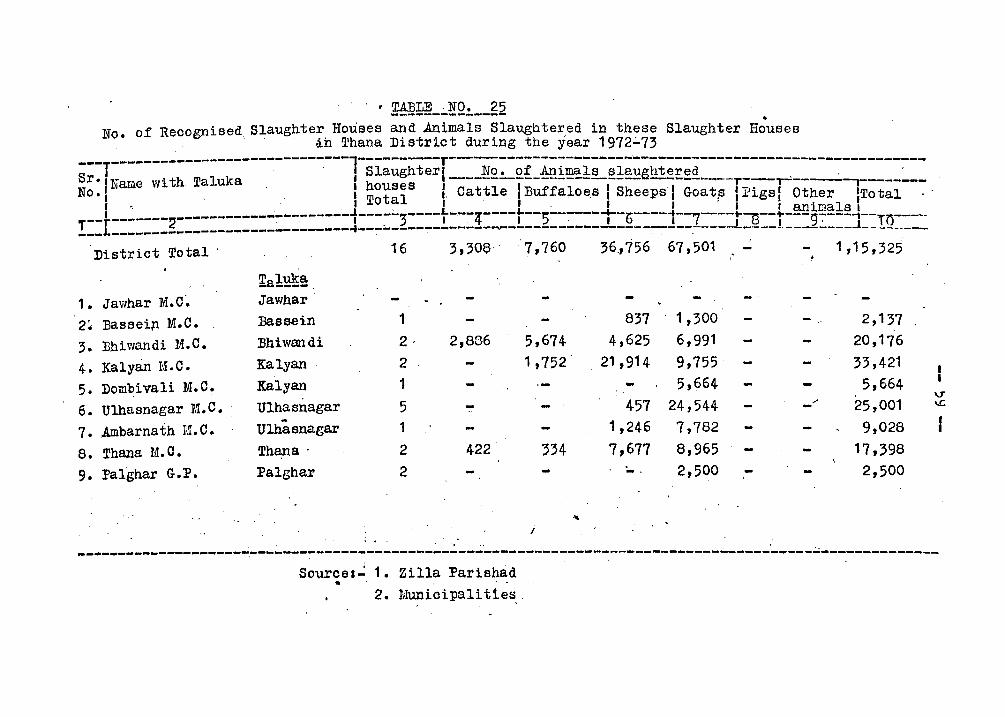
• No. of Recognised, Slaughter Houses and .Animals Slaughtered in these Slaughter Houses
, ah Thana District during the year 1972~73 --- -----------------------------,----------T---------------------~-----------------------------------S T· 'I Slaughter I No. of Animals slaut:l'htered '
r'IName with Taluka . I houses .--------.--------------Q---------. -r----~-----~-,--------No·1 ' . • Total" Cattle I Buffaloe.s I Sheeps I Goat:s I Pigs I Other ITotal."·
I ". . . I, I I. I I I I animals I I " _____________ .. _______ .J _____ o:t ____ L ___ T ____ .... __ ; ____ ._ ...... _ T-----+--1'7--- .... ~--+--- ----.... r--r------- It. . I .J I 't I . I 0 I r r 0 9" . '--Tn-~-___ J. _____________________________ -I __ ~~----_--_----~-_--~------------, , ____ ---------1-------3-------District Total' 16 3, 30a .' 7,760 36.,756 67,501 " 1 ,15,325
:calWf2: 1 • Jawhar :M.C·. Jawhar
2~ Basseill M.C. Bassein 1 837 1,300 2,137
3. Bhiwandi M.C. :Bhiwandi 2· 2,886 5,674 4,625 6,991 20,176
4. Kalyan M.C. Kalyan 2 1,752 . 21,914 9,755 - 33,421
5. Dombivali M.C. Kalyan, 1 5,664 5,664 V'
Ulhasnagar M.C. 6. Ulhasnagar 5 457 24,544 -..- 25,001 \C
7. ~barnath U.C. Ulhasnagar 1 1,246 7,782 9,028
8. Thana M.O. Thana- 2 422 334 7,677 8,965 17,398
9. l'alghar G.P. Palghar 2 - . 2,500 2,500
... /
". . . '
---------------------.-------~-------------------------------------------------------------~~-------------Source:~ 1. Zilla Parishad ..
2. Municipali ttes,.
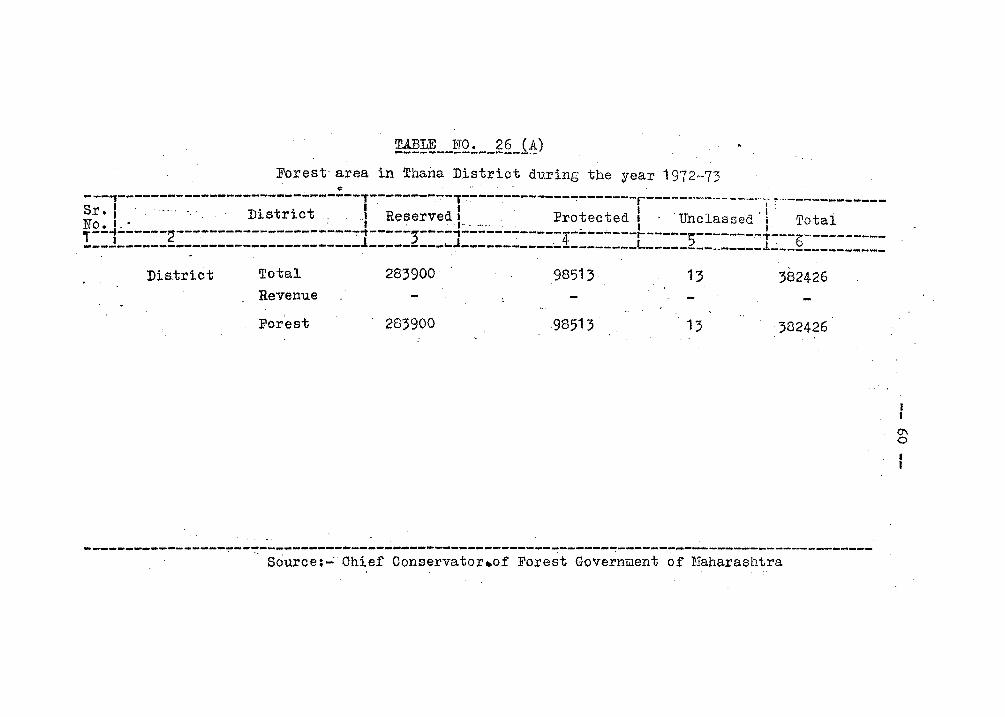
TABLE 1'10. 26 (A) ---------------_ .... Forest area in !Chana District during the year 1972~'73 ..
---.,-----------------------------T----------'1-------------~-------r------·-·-·----'-·---· ~- .. ------------;~: L. -- ~"- ',' - District .-' Reserved L ~'" . _. Pro~ected!' Unclassed' i' Totai ,.---f------2----------------------:--t-----;----;------------4--------r------;-------·-1"--- -.---------___ J _____________________________ J __________ J ______ ~ __ --~---------L ________ .. _____ l~ __ ~ _________ _
District Total Revenue
Forest
283900
283900
98513 13 3824-26
98513 , 13 382426
-----------------~~-~----------~---------~--------------~-------------~------------------------Source;':Ohief Conservator.of Forest Govermilent of 1'1aharaslltra
0\ o
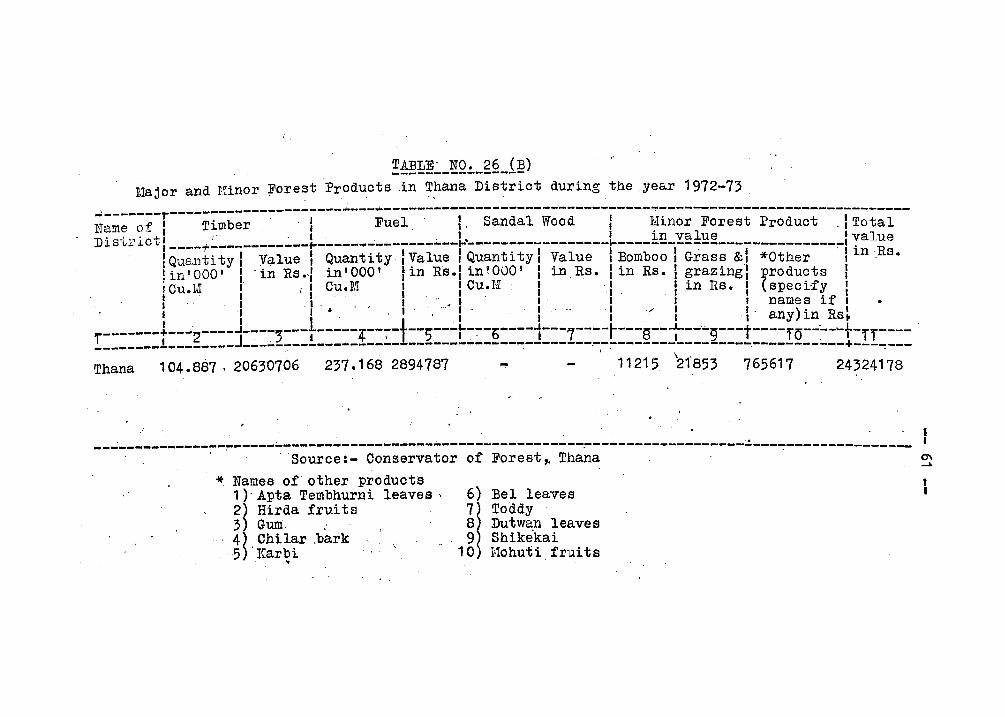
!~~~:_~Q~_g§_i~) I,Iajor and lUnar ;Forest Products ,in Thana District during the yea.r 1972-73 ,
~-------T---------------------·-------------------------'-----------~------------------------------Name of I Timber ' I Fuel, I, Sandal Wood I Minor Forest Product .ITotal Dis-Lrictl ____ +~ ________ ~ __ ~-----.--------~--~~--------________ L ____ ~~_!~~~~ _______________ :~alue
I Qua.nti ty I V~lue I Quantity, 1 Value I Quantity I Value I Bomboo I Grass &1 *Other '\In Rs. !in'OOO' tin RS.,,: in'OOO' tin Rs·1 in'OuO' I in,Rs. I in Rs. I/?razingl ~roducts I
, ICu.ljl I il Cu.~! I, I Cu.!;! I 'I, IlnRs. Ilspeci:fy I " I, " 1 ,I " ". 1 ",". 1 1 ' ,I I 1 name s if 1 •
" 1 'I 1 4 1 " 1 " ' I·.. ·,1/1 I " ) • I 1 1 1 "t' ,I , 1 I' I I any ln Rs~ "
r-------+---2----~-~--;---I-----4--~- --5---t-~-b----1---7----r---s--~--~-g---t----,o--~--t-,,----________ ! ________ J___________________ -------------~--------"-,-:-----------------'-----------+---~---Thana 104.887 ,20630706 237.168 2894787... 11215 21'853 765617 24324178
--------------~-~~----~------------------------------------~------------------~---~---------------'Source: - Conservator of Forest" Thana
* Names of' other products 1)"Apta Tembhurni leaves, 2) Hirda fruits 3) Gum :' 4)" Chilar ,bark 5) Karbi •
6)
ij 10
Bel leaves Toddy Dutwan leaves Shike"kai I'Iohuti, fr'li ts
TABLE NO. 26 (c) ------------------, Quantities of Fish brought for curing salt issued ,and Fish in Thana District during the year 1971-72 and 1972-73 '
\
, ' '.' , ( inM. tonnee) , , ·S;~l-N~;;-;f-th;-fi;h--T~--y;~;---T---Q~;~tit;-;f---T----Q~;~tit;-;f--f.--'-----Q~;~tit;-------No. I curing yard : : fish brought : salt issued I of cured
I . I : for curing I' I. fish removed ,..--J--~--2-------------t----;-----t-------4-----~-- ... r---:-:-----;-------~-----------E)----------___ J _____________ ~_--------~-------------------------------___________ ~ _____________________ _
1971-72 1 1972-73 ,
---------- NIL ----------------------------
-----------------------------------------------------------_._-.. ... _--------------:------------------Source:- Department of Fisheries, Maha.rashtra State
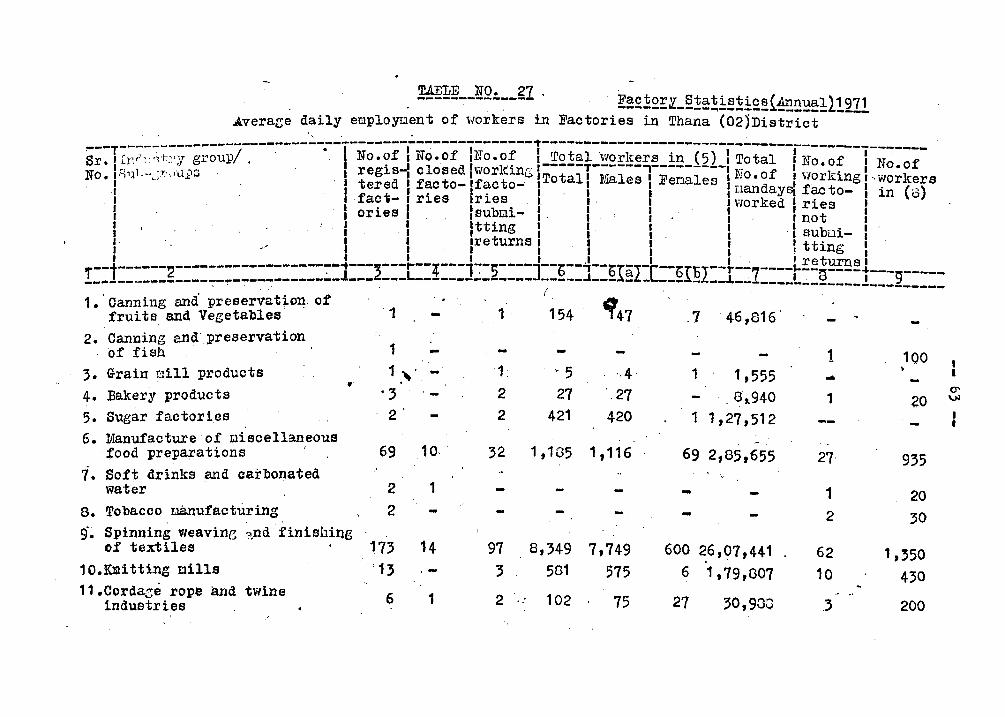
E~£!£E~-~!~~!~!i£~{~~~~111~11 .Average daily employr..1ent of workers in Factories in Thana (021District
, '".. ( - --------------------------------------~-----------~-------------------------------------r--------- -- . I I" I I I S'r ,'·-l,,o,·-i·rc"·'T grou1'/' ,No.of II~o.of INo.of .' Total workers iIi (5) 1 Total No.of No of
• 1.., . . .' ,) J:. ill d ' k' I-----T------,--------- I · No.l·q,;tl ... ~;~·,)U23 . '. , reg f!-I C ose .wor l.nG'Total l Males I Fenales ~jo.of • working .. workers ·1 I tered I f~cto-Ilf~cto- . I I nandayst facto- in (3)
I , fac~- I rles rles , 'I worked I ries I I cries I Isubl~i- I I ,. I not I I I Itting I I ·1 subui-• I I Ireturns I I I. tting" I .," I I I I ,. I I I .I I . , I returns
--t------~--------------------l---~---~--~---l--;----]--b--'--bTaI-[--bTDI--T--7----~--S----~--- -----T . __________ ~ ____ , ___ L _______ ~ ___________ ~ ___ ~ _____ ~_ --~-~-____ L, I 9 -...... ------------'7-.~- , , ( --------________ _ 1. 'Canning and preservation.. of
fruits and Vegetables 1 .. 2. Canning and preservation
of fish 1
:;. Grain r:lill products .. 1." 4. :Bakery products .:; . -5. Sugar factories 2'
6. Manufacture of ~iecellaneous food prepa~ations 69 10 .
i. Soft drinks and oarbonated water 2 1
8. Tobacco Ll8..nufacturing . 2
9'. Spinning weaving ~;,.nd finishing of textiles 173
10.Kmitting Dills '1; 11.Cordaze rope and twine
industries 6
14
, -1
1 154
1: ~ 5
2 27 2 421
:;2 1,105
97 8,349
3 581
2·· 102
'·4' '27
420
1,116
7,749 .
575
75
.7 46,816
1 1,555 ' , 8,,940
1 1,27,512
69 2,85,655
-.
600 26,07,441 . .
6 1,79,007
27 30,900
1 1QO .. 1 ~O
27- 9:;5
1 20 2 :;0
62 1,:550 10 430
.3 200
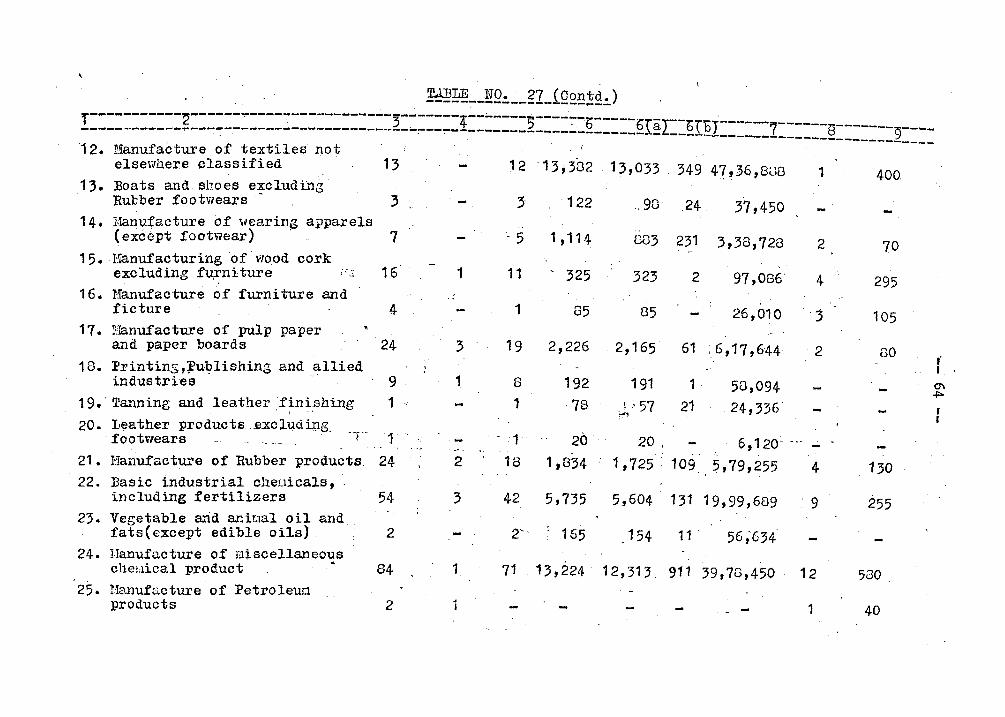
~~--gQ~_~gl_lQ£~!~~) T-----------~---·--~----7------------3-------4--~----5----7-b-----6faI--bfbj------7------,------- ____ ------'----------'7-,----------------------!""---------------------------- -------------------~------_2 ____ 12. l[anufacture of textiles not r
elsewhere classified 13 12 '13,382 ' 13,033 349 47,36,888 1 400 13. :Boats and. shoes e;cluding
Rubber footwears 3 - 3 122 .90 24, 37,450 14. I\fanufacture of wearing apparels
-'
(except footwear) '., 7 -5 1,114 G03 231 3,38,728 2 70 15. " Uanufacturingof' wood cork
excluding f~niture j,o ,~ 16 1 11 "' 325 323 2 97,OG6' 4 295 16. l~anufacture of furniture and
ficture 4 1 85 85 26,010 3 105 17. Hanufacture of pulp paper
and paper boards 24 3 19 2,226 2,165 61 ,6,17,644 2 00 .. 18~ Printins,j.'ul;>lishing and allied I , industries " 9 1 8 192 191 '1 58,094 0'\
-+>0 19.' Tanning and leather 'finishing 1 1 ·78 .!.; 57 21 .24,336 I I •. '
~ I 20. Leather products . .exc lud ipg. 20 'footwears 'T" 1 l' 20 . 6,120- -,.
21. Hanufacture of Rubber products 24 2 18 1,834 1,725 ' 109 5,79,255 4 130 22. :Basic industrial cheDicals,
including :fertilizers 54 :3 42 ?,735 5,604 131 19,99,689 '9 255 23. Vegetable a..'id anitlal oil and
: fats(except edible oils) . 2 2" 165 154 11 . 56;634 24. lIanufacture of Biacellaneo~s
che;;lical product 84 1 71 , 13,224 12,313. 911 39,78,450 12 S30 25. t!8.nuf~,cture of Petroleun
products 2 1 1 40
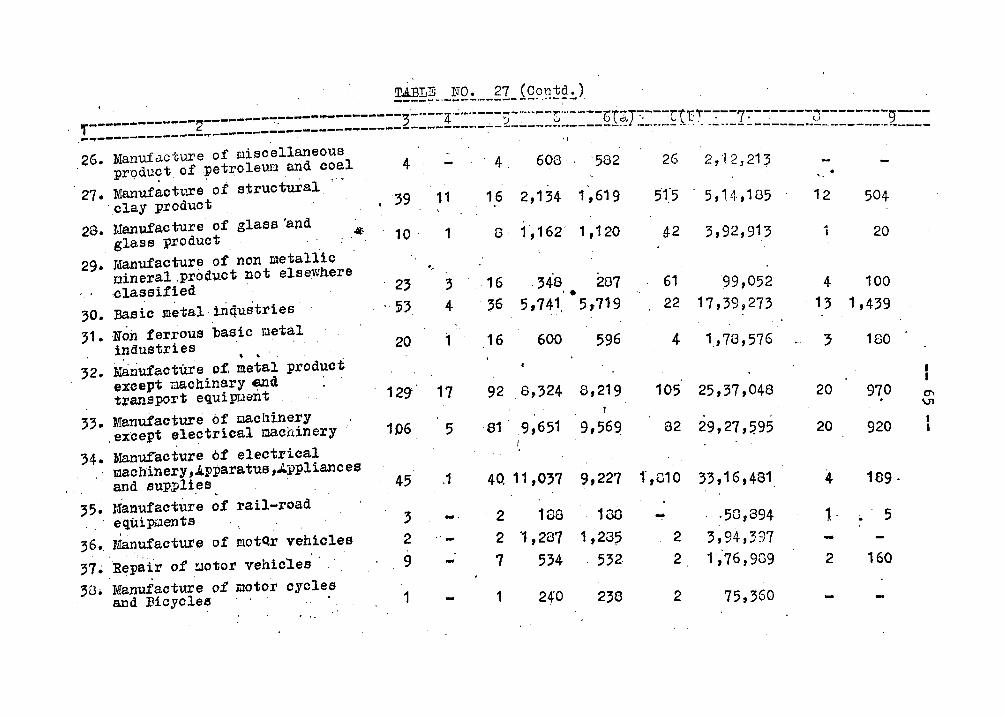
!~!!E1."_~Q!.._'_~:L iQ?!!~~!.) . ,. _____________ 2_.:..-------:'~--------------3-··--4'..;·-·;.---S-:"···,..-0'·· .. ---bt;;,'J~---'C1'r.,.--:---77'-------0--------g---,-.,.----------------------------------------------.-~-------~ ... ----":"-'- ---.-,~.\ .. "'" -- .. _- - -------.:.. ... ------_._._---.,
26. Manufacture of miscellaneous pr'Qdu~t of .petroleUrlarld coal
~., .. 27. Manufact1~e of structural
'clay product IJanufacture of glass 'and glass product Manufacture of non metallic mineral .product not elsewhere Dlassifled .
30. Basic m~talinqustries 31. Non ferrous basic metal
industries , . 32. Jllanufacture of, metal product
except OilS.chinary and transport equi~Jent
33. Manufacture of machinery .excep~ electrical machinery
34. Manufacture of eleotrical ~achineryIA~paratus,~pp11ances and sUPJ)lhs
35. Jianufaoture of rail-road equipLlents , .
36 •. Manufacture of moto,r vehicles
37~ Repair of !lot or vehioles 38. Manufacture of motor cycles
and Bicycles
4
.39 11
10' 1
'.,
23 3 !53 4
20 1
129' 17
106 5
3 2 ."-
9
1
4 608· 582 ."
16 2,134 1,619
8' 1,162' 1,1 20
,16 .348 207 '. 36 5,741. 5,719
16 600 596
92 8,324 8,219
819,651 9,56Q
'2 1CO 2 '1,287 7 534
1 240
100
1,23?
532
230
26
51.'5
~2
61 22
2,'12,213
5,14-,185
3,92,913
99,052 17,39,273
4 1,78,576
105 25,37,048
1,81033,16,481
~ " ·50,394 2 3,94,397 2 1 ;76,9G9
2 75,360
12
1
4 . 13
3
20
20
4
1·
2
504
20
100 1,439
180
970 . 920
189·
• 5
160
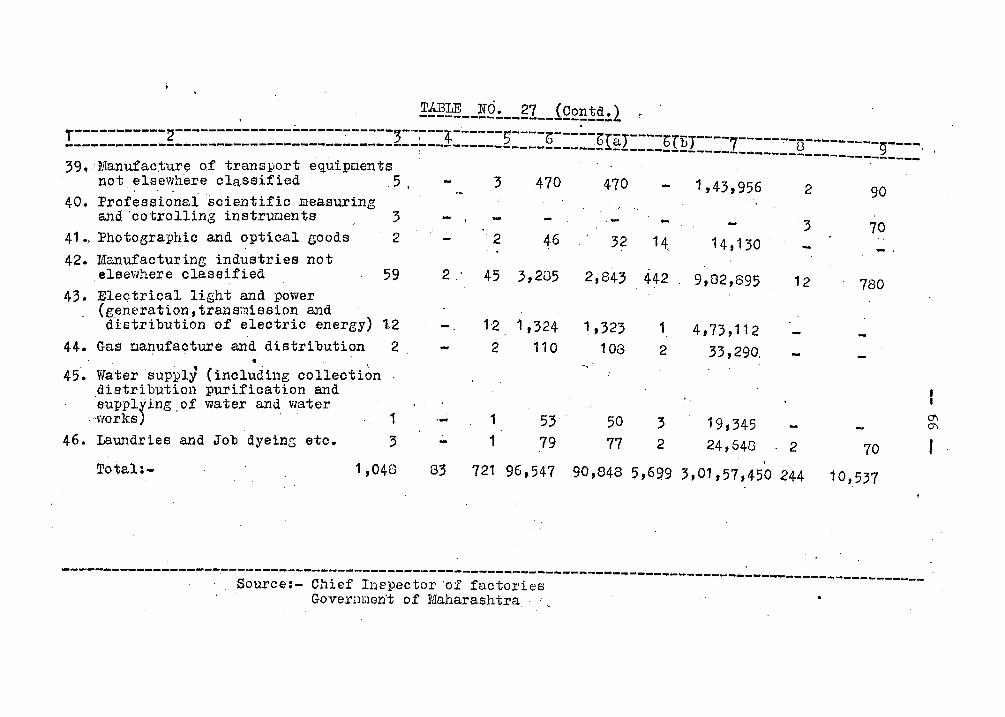
!~~--~Q~--gI __ 1Q2~~~~1 -----------"--------------------------~-----7------~----7-----7 - ----r ~ . J' ~ J 0 Ora) brbr~---7-----~-Q--------- ___ _
~--~----------------------------------------------------------~- ____________________ 0 ~. , -------~---------39~Manufac:tur~ of transportequipments
not .. elsewhere classified 5 . 40. Professional scientific measuring
and 'cotrolling instr"ULlents .'3 41 ., Photographic and optical goods 42. lI'Ianufacturing industries not
elsewhere classified
2
59 43. Electrical light and power
(generation, transmission and distribution of electric energy) 1,2
44. Gas manufacture and distribution 2 • . .. ..,. \
45. Water supply (includil1gcollection distributioll purification and "supplying" of water a.nd water
.-works) 46. Laundri~s and Job dyeing etc.
1
3
3 470
2 46
2.' 45 3,205
1-2 1,324 2 110
1 53 .
1 79
470
32
2,843 442
1, ,323 108
50
77
1
2
3 2
1,43,956
14,130
9,82,895
4,73,112 33,290 .
19,345 24,648
2 90
3 70
12 780
2 70 ,
Total:- 83 721 96,547 90,848 5,699 3,01,51,450 244 10,531
-----~----------~--------------------------------------------------------------------------------------- '. Source:- Chief Il1spector 'of factories Goverllljlen't of Maharashtra .
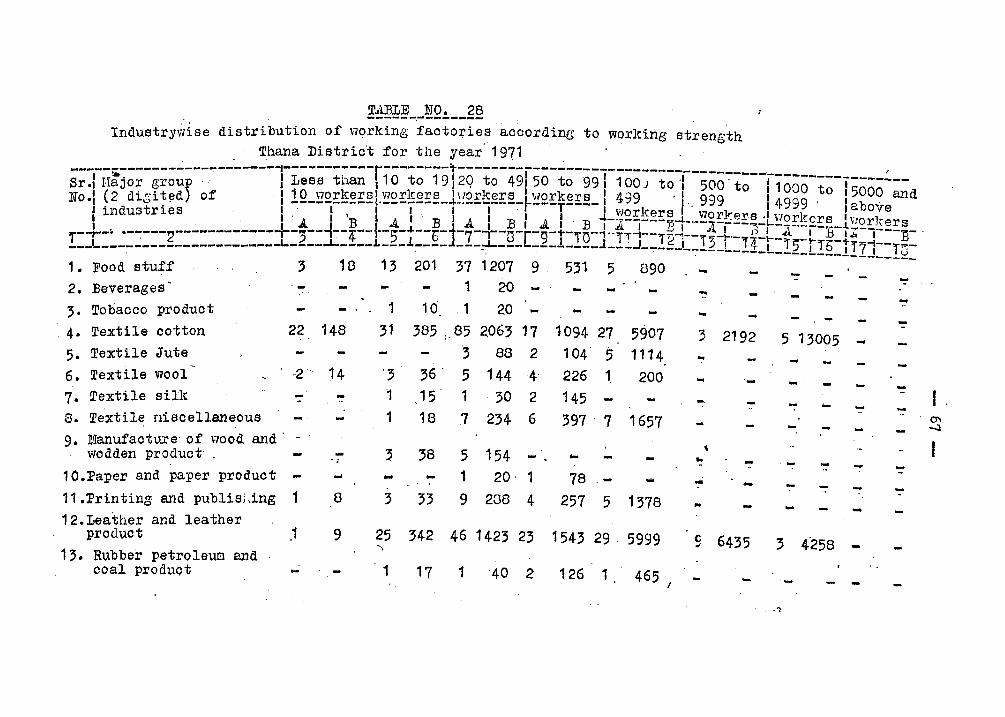
2 • .Beverages ,. Tobacco product -' .
, 4. Textile cotton 22 148
5. Textile Jute 6. Textile limol -2" 14
7. Textile silk 8. Textile uiscellaneous 9. ]~anufacture. of \"Iood and '
wodden product· , 10.Paper and paper product -11.Printing' and pubHs;,ing 1
12.Leather and leather product ~
13. Rubber petroleum and coal product -
... 8
9
TABLE NO., 28 ----- -.--,..-----
1
31
'3 , 1
1
,3
1 20
10', ,1 20-
385 :,85 2063 17
3 88 2
36' 5 144 4' ,15 1 18 7
38 5
'30 2
234 6
154 ... 1 20' 1
3 33 9 238 4
25 342 46 1423 23
1 17 1 '40 2
1094 27 5907 104' 5 1114 226 1, 200 145 -397 ' 7 1657
... 78 - ...
257 5 1378
1543 29 ' 5999
126 1 465
....
... :; 2192 ... ... '-
- -.. ~ 6435
I
5 13005 _
'::' I - "- ':' - 0\ - - -J
- - - ':' ..
- - - -" -
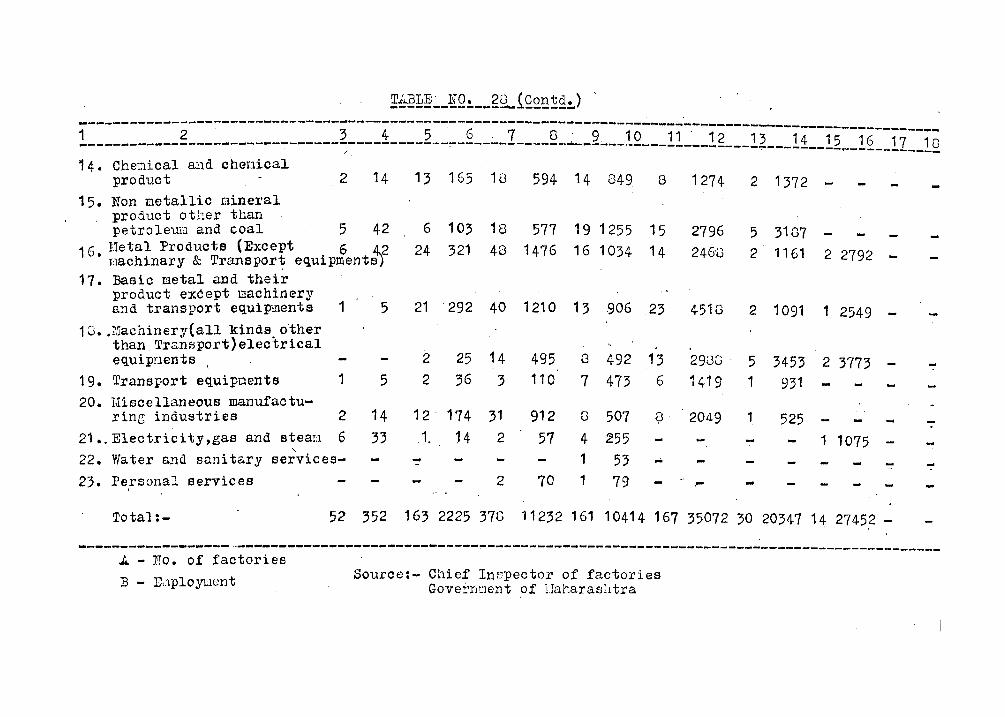
~L~~~~_NQ~~_g~{22~~2~) ,
--------~-----------------~-------------------------------_._------------------!==== _______ g ___ ~ _____ ~~~------~~---1----2--~-§--~-7----Q-~-2---!Q---!!---!g---!~-==11==1~:=1~==li==!~ 14. Chenical and chaLlical
14 13 165 10 1"4 product 2 594 849 8 1274 2 1372 15. Non metallic Dinersl
product other than 5 42 6 103 18 577 19 1255 15 2796 petrolewa and coal 5 ~1G7 - ~
16 lletal :Products (Except 6 ~ 24 321 48 14-76 16 1034 , 14 246'u 2 1161 2 2792 -• machinary & Transport equipments 17. Basic metal and their
product exCept machinery and transport equip-menta 1 5 21 '292 40 1210 13 906 ,23 4518 2 1091 1 2549 -
10 •• iliachinery(all kinds.o'ther than,Transport)electrlcal
14 495 £3 13 equlpnents 2' 25 492 2938 ' 5 3453 2 3773 ":" \
19. Transport equlpoents 1 5 2 36 3 110 7 473 6 1419 1 931 20. lIIiscellaneous manufactu-
ring industries 2 14 12' 174 31 912 0 507 Q 2049 1.- 525 - - ":' 21 •. Electricity,gas and steam 6 33 ,1. 14 2 57 4 ~55 - ~ - 1 1075 - -.-, 22. Water and sanitary services- '":' 1 53 ...
~ '":' ":"
23. Personal services 2 70 t 79 ,.. -Total:- 52 352 163 2225 370 11232 161 104-14 167 35072 30 20347 14 27452 -
------------------ .. -----------------------------~----------~--------------------------------------------. ~ - No. of factories B - E • .1ployment Source:- Chief Inspector of factories
Governcent of lIaharas~ltra
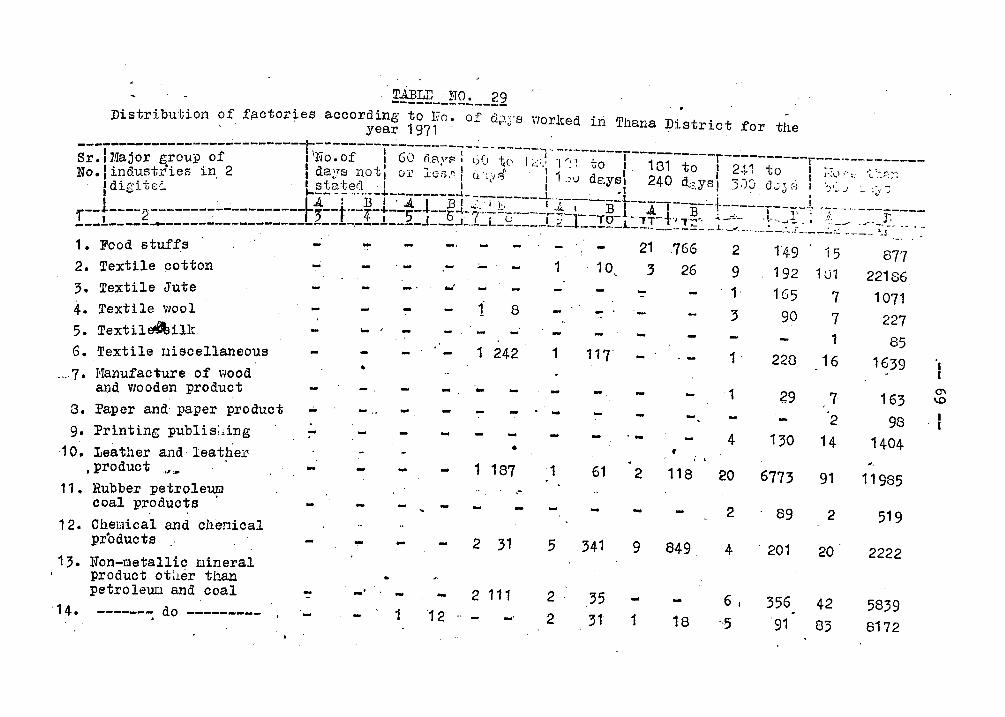
TABLE· NO. 29 --------------Distribu"liion of f;:l.ctories according to Uo. of d,J,j's \"larked iri ~hana District for the
year 1971-------------------~--------T·--------I----------·~-- -----·1 '. ------... ---------- _ Sr.ll'Iajor l!'roup of ,INo.of I GO ~8)TF l 1)(1 to I:::>.' ,/r:.! to I 181 t~- r-2:-;-t~---T-;~·,~~-::-:;:---, t~· . 2 'da'Ts 110t· 0'" .~~I· . .J I" , ,-t I J,\"." l ..... , No. ,indus rles In, I v 1 J. ole,,>.· I U :'~"" I 1.)1.) daysl 240 d;~ YS I 3Xjd, ~ ~~l I '", , ",'" . Idir'jtEJ " 'stated ·1 1 1 .1 -. ~ .. -.; • ,.J ... .)~
lb' - ~~.A--; "··B-t~A.-j'--B-1-~-i :;:------t,---·-j3-t--.:A,-r----:...i·----------l .,---_ .. _______ _ '" ------.:..--------- j--t' '--4-~--5- .... --54- ~/ .. -:::'-----...... ~l\.--To-L + B ." "'J._ .1. r . .:1. r, !::!::::g=: ____ ..:. _______________ ~_.---!----J-_J;,..--L-S:: ___ ~'-d_ _ ____ l._:!:!=_ -:.. !;;~ _ L:'" "._ ~ :'~:r..-..':"_..:.:-:~~: ~j~_: -.. ','
1. Food stuffs ~ - - 21 766 2 1'49 15 87'7
2. Textile potton - ~ 1 10. 3 26 9 192 1U1 22166
3. Textile Jute w '::' 1, 165 .7 1071 4. Textile wool - 1 8 - 3 90 7 227 5. TextilEAilk ... ' 1 85
6. Textile lliscellaneous 1 242 1 111' 1· 228 16 1639 .... 7. I'Tanufaciiure of wood
and wooden product
8. Paper and paper product
9. Printing publis; .. ing
10. Leather and· leathel' ,product "',
11. Rubber petrQleUFl coal products
12. Cheuical and chenical pr'oducts
Non-metallic nineral product ot;ler than petrolSUll and coal
------~ do ---------
•
-.- ..
•
-' 1
-
12
...
• 1 1871
2 31
2 111
-'
.-
5
2
2
61
341
35 31
1 49
. - 4 130 .. ,
2 118 20 6773
9 849
... 1 18
2 89
4 201
6/
'·5 356
91
7 2
14
91
2
20
42
83
163
98 1404
11985
519
2222
5839 8172
I I C'\ 1.0
I I
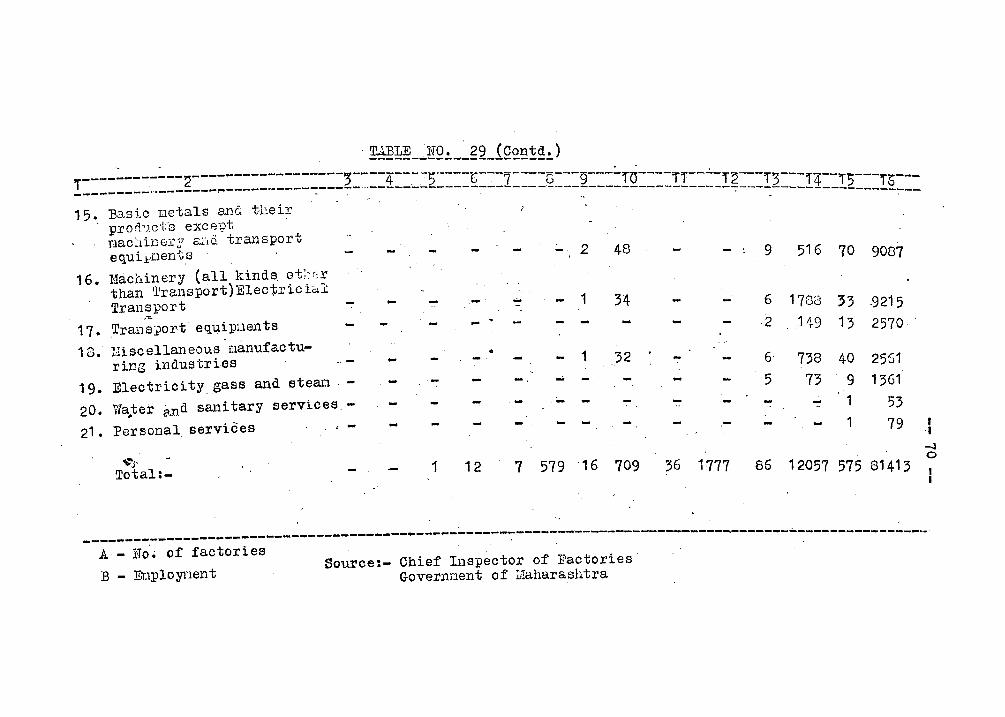
. !~~~~ __ liQ~ __ g2_1Q£~!~~)
T--~---------~------------------;----4--~-5----~-~-7----G---g---~r6----iT--~-l---- ---- --- --- ---_________ ... -------... -----------:----:-- .. ____________________ . ______________________ ~---I2---11 __ 1~ ___ 1~ __ _ ~ ,.- '. - "
15 ",
16.
'Basic metals and their pror1').ci;·s excFn;>t !:lac~linE::CY arlO. tral'1sport equi~ilents . l:1achinery (all kinds. Gt;~(;r than Tral1sport)Eleci;ricia.J: Transport
17 • Tra11 sport equipuel1ts 18. ~:Iiscellaneous . nanufactu
ring industries 19. Electrici ty.gass and stean·, -
20. Wa"ter 8.nd sanitary services-
21. Personal services
~S' Total:-
, -
-
- 2 48
... - 1 34
• 1 32 ... -
1 12· 7 579 ·16 709
- , 9 516 70 9087
6 1788 ~3 .9215 2 1 119 13 2570
6 738 40 2551 - 5 73 9 1361
- - - 1 53 .. .,
- 1 79
36 1777 86 12057 575 81413
, "
-.J o
---------------------------------------~-----------~-------------------------------------------------~ A - N~~ of factories
'B - Er.lployrlent Source:- Chief Inspector of Factories·
Governnent of t!aharashtra
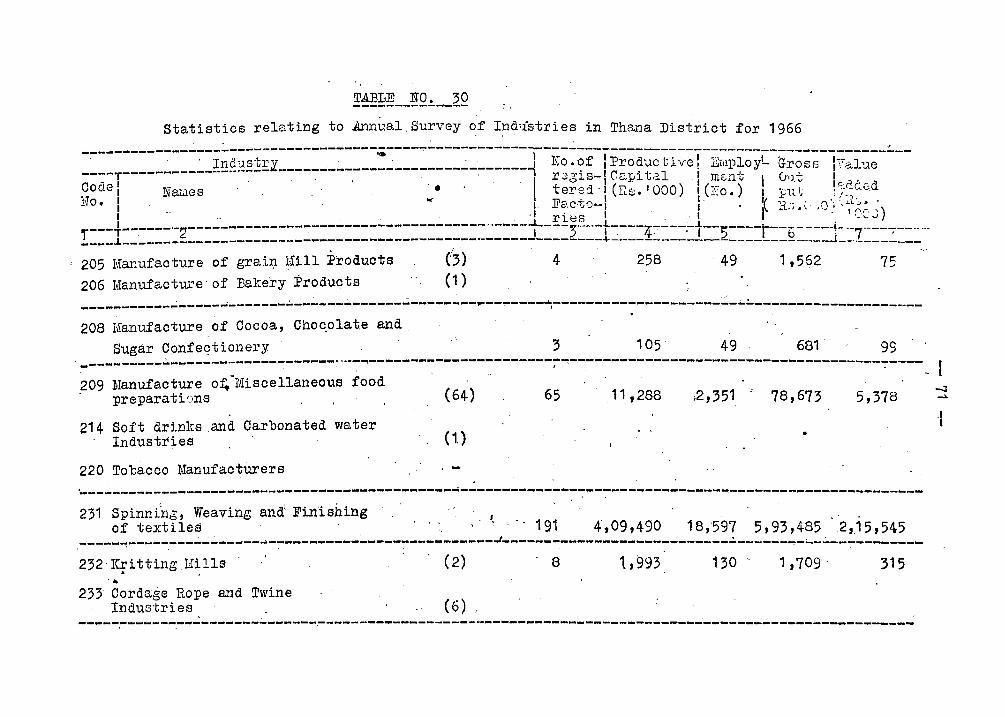
1:~!!~ __ !Q!._2Q
Statistics relating to .Annual, Survey of Ind'lstries in Thana District for 1966
------------------------------------;----~-------------------------------------------------------~--, Industrv "-II No.of lJ?roductivcl ETIlI)loyL G "',' 1':"1' _____ Il.______________________________ , , ro .... s I· d. ile ----T-------------~- " ". r:;gis-l G8..}Ji t,~l I In0,nt I (m.t 'r," Code, NaLles' ." •. I tered.'I(Rs.'OOO) ,(i~o.) I p1. l; l;-:lc:.~d 1,TO , .... F ' , 1 ' (." ~ ,)',' , _'I • I .1 I e.C'tO~ I 1 - .:J ", . (\ i ,_L -" ., ' I *'-u.' ,'.J I ,'v ')
1 • '. . r i es' " I ' '.":,, ,.---+------·-2--------------:-:---------------------··-----t----) .. ···-11..----4~---·-t--5----r--b----+·-7----;-----· ___ •• .L ________ -----------------.,..-----------------.---------______ ...:.----------~. __ •• _________ ___1 ________ _
205 Manufacture of grait;l tUll Products
206 Manufacture' of Bakery Products
I
(3) 4 258 49 1,562 (1)
75
-------------------------~--~----------~--------~-------~---.-----------------~--~-------~------------208 I~anufacture of Cocoa, Choc.olate and
Sugar Confeqtionery 3 105 49 681 9S ----------~~~---~-~------------.. -~~----------------------~~-------------------------~-----------~----.209 ]'Ianufacture o~·liIiscellaneous food
preparati(:Jns
214 Soft drinks and Carbonated water Industries
220 Tobacco ManufactUrers
(64)
(1.)
. -'
65 11,288 ,2,351 ~ 78,673 5,378
~----------------------------------------------------------------------------------------------------231 Spinning, Weaving andl Finishing
of textiles . " ' '. ,'. 191 4,09,490 18,59? 5,93,485, 2,.15,545 _____ ~--_---------------~------------------------_J---_______________________________ ~-~--------____ _ 232' ICri tting lUlls
~ . •
233 Cordage Rope and Twine Industries
( 2)
( 6),
, 8 1,993 130 ' 1 ,709 . 315
-----,-------.--'!"'---------------.-----------------------------------------------------------------------
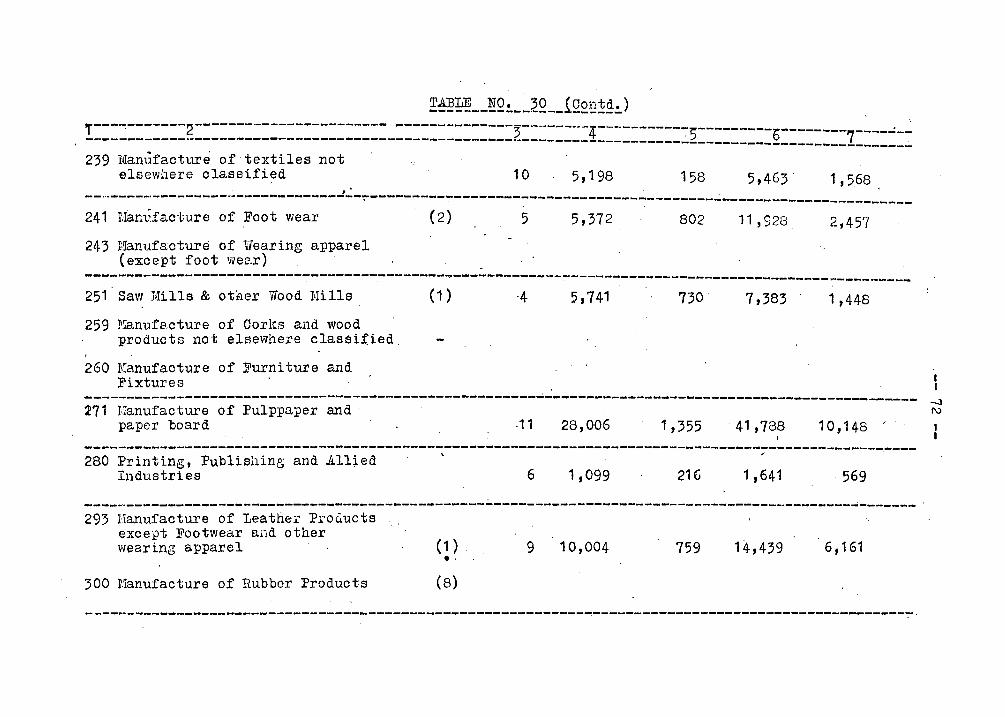
!~~ __ ~Q~ __ 2Q __ iQ~~!~~) T---~-------2----------------------- --------------~--------~-----------5--------- -------- ----~-~ ------------.. -------------------------------------___ -____ . 6 7 ----------------------------------------~ 239 Manufacture of' textiles not
elsewhere classified 10 5,198 158 5,463 1,568 •
---------------------------------~---------~-------------------------------------------------------241 TiIam~facture of Foot wear
243 r,ianufacture of Wearing apparel (except foot wear)
(2) 5 5,372 802 11,928 2,457
-------------------------------------------~------~------~---.--------------------------------------251 Saw Mills & otaer Wood ~!ills
259 ~~anufacture of Corl>;:s and wood products not elsewhere classitied.
260 Manufacture of Furniture and Fixtures
(1) -4 5,741 730 7,383 1,448
---------------------------------------------~--------~--------------------------------------------- ~ :l!71 Manufacture of Pulppaper and f\J
paper board -11 28,006 1,355 41,788 10,148'
-------------------~----~-------------------------------------------------------------------_._------280 Printing, Publisl1inE; and Jl.llted
Industries , '
6 1,099 21(; 1 ,641 ·569
----------------------------------------------------------------------------------------------------- '
293 Hanufacture of Leather ProCiucts except Footwear and other wearing apparel (1 ) .'
300 r1anufacture of Rubber Products (8)
9 10,004 759 14,439 6,161
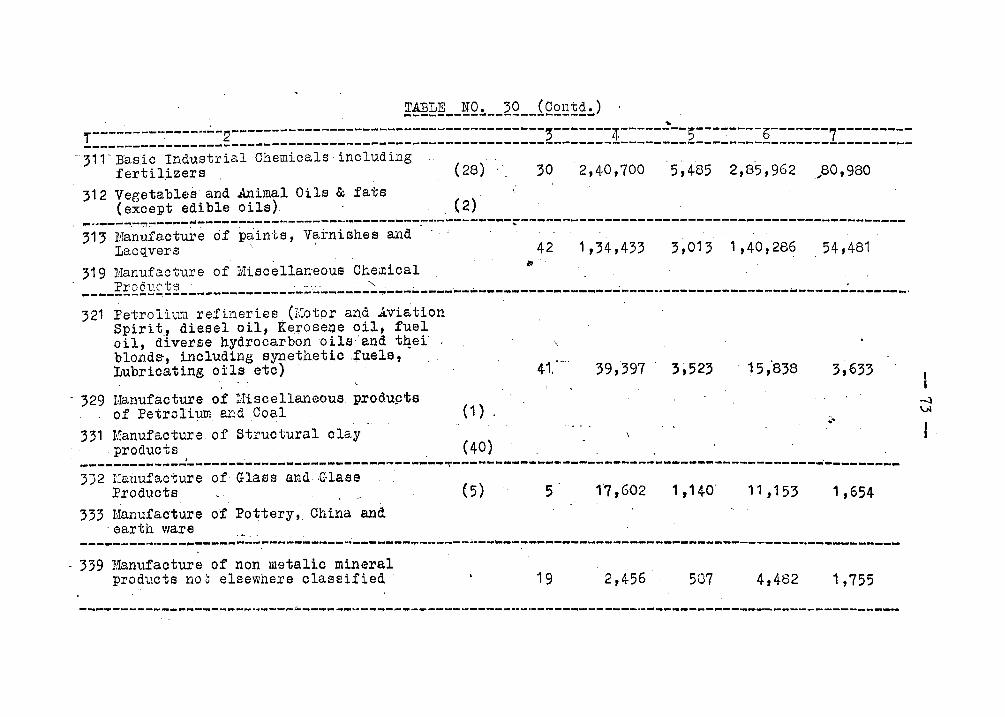
. . ... T--------~--~----2--~-----------------------------------;--~----4--------;--------~-------7----------------~--------------------------------------------------------------------------------------------,11-Baslo Industrial Chemioals·including ..
fertilizers (28) 30 2,40,700 5,485 2,8'5,962 .... 80,980
312 Vegetables and Animal Oils & fats (except edible oils)· . (2)
--.--~-~-----~----------~------~~-~--------~-------------------------------------~------------------,1, Man~fa.cture of paints, Va.rnishes and . . . I,~cqvers \ . 42 1,34,433 3,013 1 ,40,28~ 54,481
319 M~ufactur'e of Miacellan'eo~s Chemica.l . if. .
. PrOducts" ..... ,'. ' ''. .' . . . . ' . ---------~-----------~--------------~----~----~----.----------~------.. -----------~---~-------------. 321 Petrolium refinel'iee (il~o.tor and .Aviation
Spirt t., diesel oil, Ke~osene oil, fuel oil, diverse hydrocarbon oils·'and t4ei blondS', including s~eth,etic .:fuels, Lubrioating oils etc)
- ;2~ Ma.nufacture of I:Tiscellaneou6 produ9ta of Petroli~. and .Coal (1)
'31 Manufacture of Structural clay . products (40)
41:'" 3;523
, ,. I " -... --... --.. --,..-----~-... ------------.... ----,..-,-----.. .,.-.. ----... -------,------------------------------... --------3)2 lillUlUfacture of, Glass and, ·(Haas
Products '3' Ma.nufacture of Po~tery, China and
'earth ware
. (5) . 5 17,602 1 ,140' 11,153 '1,654
--------.•.. ---.. -:---... -.... -... ~~ ... ----.. -... ,. ... ------.,.-.. ----.. --... --~-------..... -... ----------------------.-----------. 339 Manufaoture of non metalio mineral
produ~ts not elsewhere classified' 19 2,456 507 4,482 1,755
------.---... --------_ ... _-_ ... - ..... _--------------------------_._----.... ----... -_ .... -----------....... _-.. ------------
I .
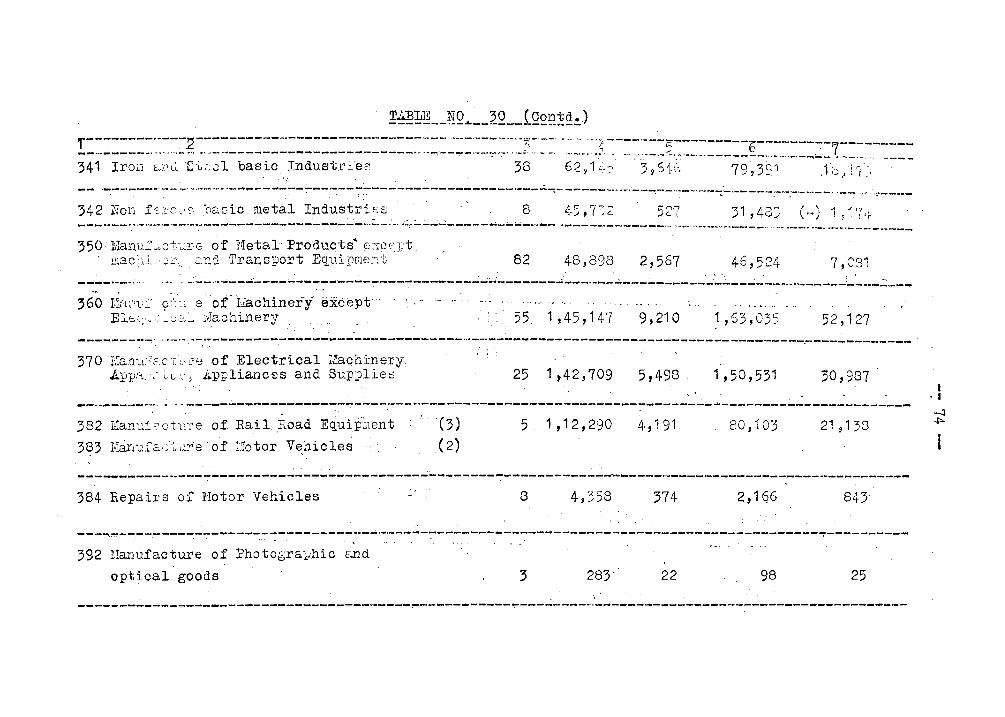
~I:~ __ ~Q.A.~_2.Q..-tQ£t!!£!..) "
!:=:::===.~~==g ~~==::::=:====:=:::=:===:::::~:==:~:=~~~;'(~.'~=:" ·=.~ .. :~}~-=~~.=.==~~====:===£==:==::==7~=~.~~:::= 341 Iron ~.·cl [-~";.Jl ba.sic Industri'es 38 62~ 1~~5 3~61(~ . 79',3~1 .1';.);/[."(:.
-- .-:.----:--_ .. -- '.,. .•. _...; -.... _-;...--,;.::-:--;..:--,--""-:-::--;..;..;-------------_.---.;;-:-;..----... -~.-.,.. . ...,-- ... -.-- ... ,~-----.:-.. ::-.--..;-. ----' .. , .~--.. -342 Non f~2'ov~ .basic metal IndustriF.s 8 45,732 . '7,1 , AS"':. () 1 .. ,-, . .., '1-, ~ ~ I I'~
-------: .... -.--,-,-"7" .. -~ ... -------------------... :..-:.... ..... ~~.:-.:.;......;..:.:----- ....... - ..... -----.----~ ... --------~ ... ~ ..... ' ..................... ---_ .... -...... _-_ .. -.. .. - .. -----.--_
82 48,898 2,567 46,524 ·7,081 _____ -_ ... ; , .. ' , ..... . ... _...,;_ ... ___ .. ;,,:-:-___ ~-~_:_~~--~-R~---":"'------_.;;.-..;..;-I:'-------..i.:.. __ ... _ .... : .. _· __ ,;,.. __ . __ .. _1_.~. __ ....;_:_._ .... _ ..... _____ ;_~~_;: .... __
360' 1.lar·.t<;: ·9:'~·.1. e "o:f 'tlachinet'y" excelyt" . ..-- ". .,,- ...... -... " .. -.. " .... . EIE:;;::; .. i:_oa:t.i~!achinery . : :::..:: 55. 1,45,147 ,9,210 1,63,035 52,127
------..;.-~: ...... -.. ~:~~:---o:----~.---------------------- ..... ~-.~------------------------------:'-------.--:-----------__ 370 l'.ranw?F_C't·Lh'~' ·of .Electrical ~;Iaqh:i:nery;.
.AP1?'·:"-:·'~ i:L;'~' s Appliances and SupplieB
\ .'
.25 1,42,709 5,498 .. 30,987
-- .... ----.- .... :.~ ... -...;..---~-.;..------------:------~------------------.;;..-----...:----------~..:.;----.------~~~-------------382 lJIam~:f2ctt::re of. Rail. Road' Equi:p~ent,: ~ '(3) 5.1,12,290- 4,191 . 80,103 21 ,138
_ . (2)
--------------~-------------------------...;~-------"7----~--------""""------------------------ .... -------... --384 Repairs of ~Iotor Vehicles 8 4,358 374 2,1 ~6 843
/ . ----.;!"'!"!"~~·---~-----:-~-----_:7~----_:---.-..---------:------------:------------------------------------:----------
392 Uanufacture of Photogra:.,;hic and
optioal goods 3 283-." l -,
22 98 25
----------------------------------------~-----------~-----------------------------------------------
. I . I
-.3
"""
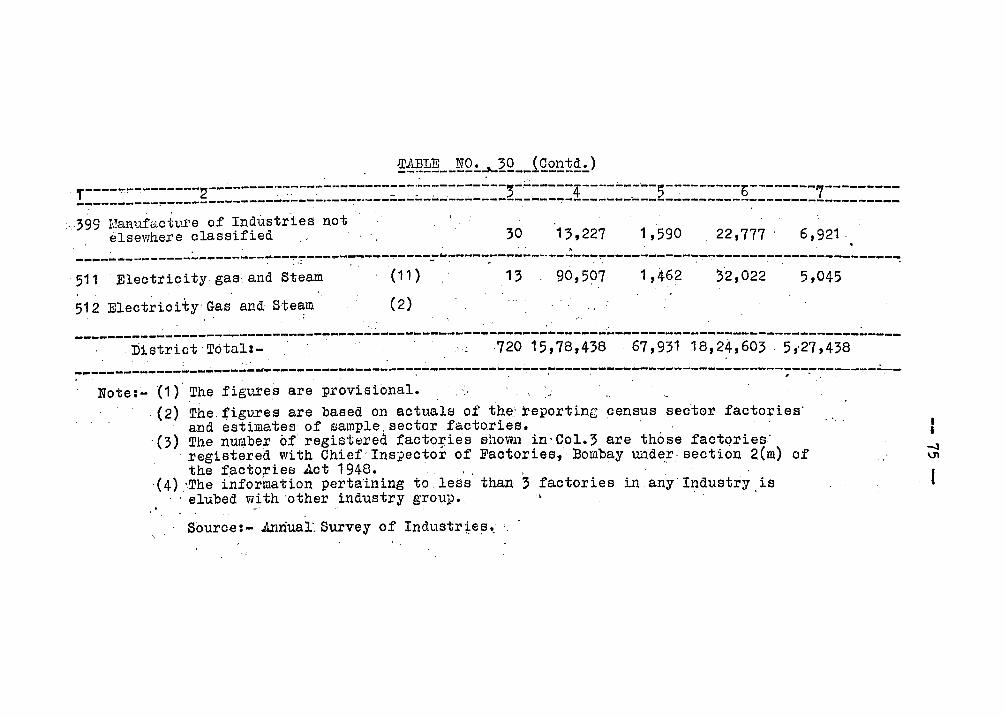
~f~~~ __ ~Q~~~Q __ i~£~1~~) T----":'":---------2--.;..-----'~'::---:--··------:::---:"--:--.-~~---...;3 .... ·;..;---.;..-4----...;--... -5---------6--------7------------------~----------------------~--------------------- .... --~--------~-------------------------------, ,
;. 399 Manufactl,ITe of Industr'tes not' elsewhere classified 30 13,227 1,590 22,777 6,921. . .' ... .
-----------------.---------~,:---~-~----""!"'----:::--~~~--.. ------... -----~~-------------:----------------------~ '511 Eleotticity gas and Stea~
512 Electricity Gas and, Steam
(11 )
(2)
13 90,507 1,462 5,045
, .' .
~--------------------------------------------------------------------------------------------------District Totul:- \ ,~ ,720 15,78,438 ,67,931 18,24,603·5,.27,438
~------------~-----~~~~---------~--------~-~---~------~--;----~----------------------;--~--~-~-""""' -Note,l- (1)' ,The figure~ are provisional. ; '.'
,(2) The. ~igv.res are based on actuals of the' reporting census sec'tor factories' and estimates of sample sector facto,ries.
, (3) The number of registered facto~ies s110vvl1 in' Col. 3 are those factories' registered with Chief' Ins;pector of Factories., Bombay under section 2(m) of the factories .Act 1948. , " '. ..'
(4) 'The information pertatning to less than 3 factories in any'Industry is , elubed wi thother industry group.'
Source:- .Anriua,l', Survey of Industrte!=J._
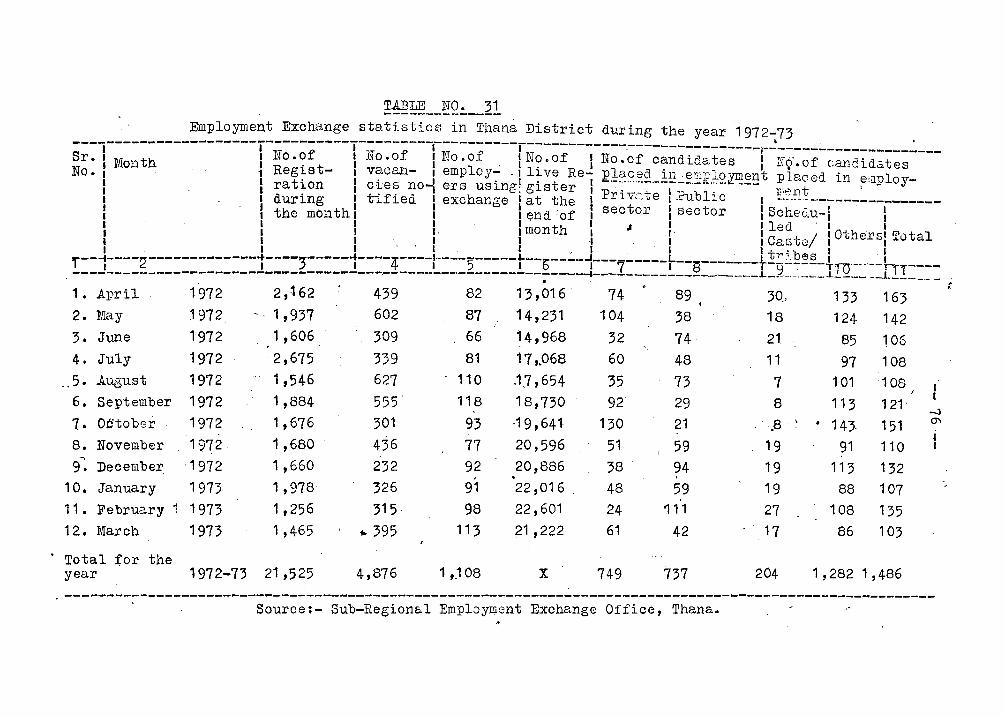
3. June 1972
4. July 1972
_.5. .August 1972 -..
6. September 1972
7.. OC'tober 1972
8. November 1972,
9"'. December -1972
10. January 1973 11 • February I 1973 12. March 1973
. Total ~or the year 1972-73
1,606
2,675
1,546
1,884
1,676 1,680
1,660
1,978
1,256
1,465
21 ,525
627
555 301
436 232
326
315-
10 395
4,876
66
81
110
118
93 77 92 91
98 113
1 ,.1 08
14,968
17,.068
.17,654
18,730 -19,641
20,596 20,886
22,016
22,601
21,222
X
60 48
35 73 92' 29
130 21
51 59 38 94 48 59 24 111
61 42
749 737
11
7 8 .8 - ,
19
19 19
27 17
204
101
113 • 143-
91 113
88
108
86
106 108 108 121 '
151 110
132 107
135 103
1,282 1,486
-J 0"1
---------.----------------------------------------------------------~-------------------------------------Source:- Sub-Region&l Employment Exchange Office, Thana.
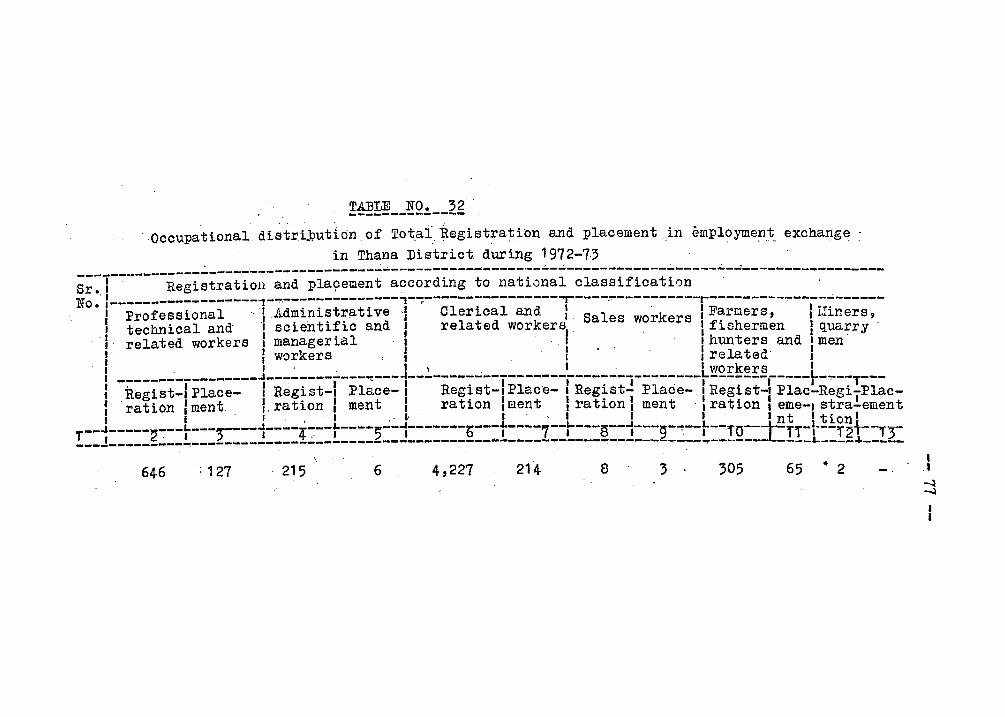
!~!!~LJ,!Q:.--~g
Occupational distri.bution. of TotafRegistration and placement ,in employme!lt_ exchange ~ in Thana District. during 1972-73
s;~1-------R;~i~t;;ti~~-;~d~~i;9;;;~t-;~~~;di~~-t;-~;ti~~;i-~i;;;ifi~;ti;~-----~-----------------No o· ,------------------'1-""'--------------,-~-----------------r----,.,..----------r----------.,..----..;.------
Professional-I i!.dministr;2.tive 'I Clerical and I. Sales o~k I Farmers, I I1iners, technical and' scientific and I related workers, w ers I fishermen f quarry related workers I managerial, . I 1 hunters and ,men'
I workers ,I l I related I . I'. I,,' , workers ' _________________ ... ____________ ~--- .... ----------.-.------__________________ L ____________ L _______ _
, I 1 R . t I "01' , R' t 1"01 I R . t 1 'nl' , . I I' I Regist-I P1ace- 1 egls -, • ace- I egls -I. ace-, egls - • ace- 1 Reglst-I P1ac-Regi-P1ac-, 'ration Iment. l. ration I ment 1 ration lment I ration I ment ·1 ration I eme-, stra'!'ement , 1 , , . . 1 ..' 1 I . , , , , 'nt' tion I
~::~:::::g:::t:::2::::j::::!:::t::::2::j:::::::~:::t::::7::t:::~::j:::~:~--t::!Q:=-t-!!:t=:!gl=:!2_
646 215 6 4,227 214 8 3 305 65 .. 2 I
•• --l ---l
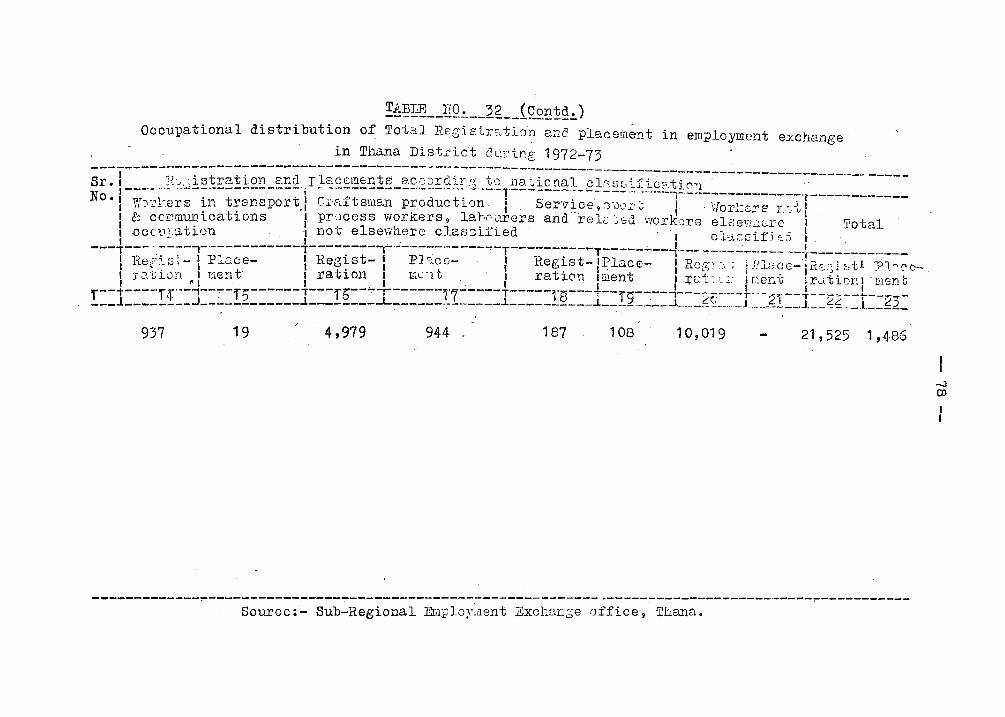
!~~~ __ gQ~ __ 2g __ {Co~~~~) Occupational distribution of Total Reg:i.::: tr?,tion and placem~nt in employment exchange
in Thana District G"l'.ril'g 1972-73 --------_ .... ------------------------------ ---~ ... ------------------:--....:..---------.... ----:-----------------. __ .. -----Sr 1 R~~istration end rlacements accordir~ tonaticnal clsGGifioati0n·. " • \--_ ........ ~---------- _n. --, i ... - ----------.. - .. -.- ....... _-,.---._--.-.. - -_.--- ...... _._..,- --------------.t ___________ _ NO. 1 V{JI'l~ers in transport.! Cr':=dtsman production i SerYi_Ce,T0c.;:-~ I . \{orl:cI'e r .. ~jq
1 e: CCl:'1IDU1'l,lcations I. process workers 9 lat"~'\"U'e:rs and relc >~d Vlork'Jrs elflev!~;.(;;rc I Total \OCCllT8.tioll '..\ not elsewhere classified' ", cls..~:Gifj Ei ~ .
~ I. . I . l ' --- 1--- . -----,-·-----------.--------.,-·--·--~------..,.-T----------.---------,.---. ..,...,.-------- ---r------------1 Ret';;-G~-1 1':;.2.oe- \ Reg~st-I Pl?~o- : Reg~st-I~la.ce- I Reg:;,',;, tJ!la?e-·pts::;~stl.Pl..,C'o-
, J-,"'~:'l'OYt I ment' I rat~ol1 1 IDvl\, 1 rat~0n Ililent· , rat>.':' H:!en-G :r~;,tlor.1 Bent; . _. - •. ~! I I·· I . I I '. I ! . j ,. --+----,-l . --;--";-flj------,.---fE),----r------r7-----,.-----r8---'--r9-~--.,---2 C·- - r'··· 2,--,. - -22 --t---23-___ l _____ I __ .J_-__________ .l _____ .... __ -L_'-____ .:-______ .L ____ -------.1--;:------...L.. __ ._. ___ .... _.1 .... __ . ___ J .•. _. ____ .L ____ _
937 19 4,979 944 . 187 108 10,019 21,525 1,486
-------------~----------------~---------------.--------------- .... -----~---:------------.-----~-----------Source:- Sub-Regional Emplo~'lilent ExchaIl6e office 9 Thana.
-J co
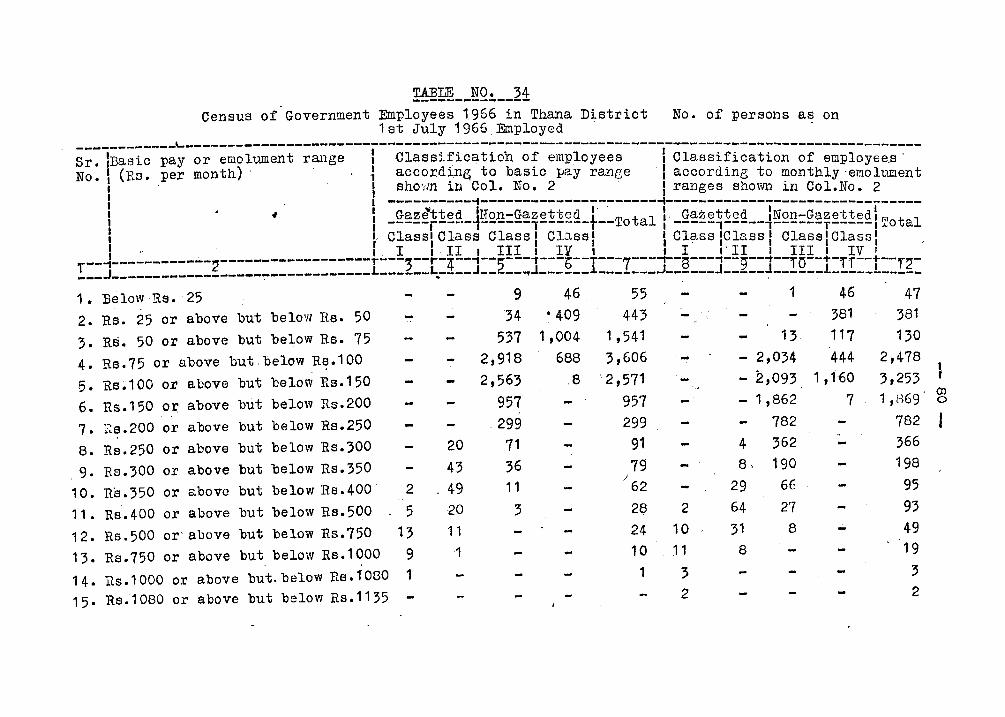
Census of Government Employees 1966 in Thana District No. of persons aE.! on 1st July 1966 Employed
------------~-----------------------.---------------------------------~------------------------------, . 1 t ' Cl . f' t" f 1 ' . Sr. }3as1.c payor erno umen range , aSSl . ~ca Lon 0 .. emp oyees , Classiflcation of employee.s· No. (Rs. per month) . l accord:-.ngj to bas1.c pay range ·1 according to monthly 'emolument
1 sho'lm l.n Col. No. 2 1 ranges shown in ColoNo. 2 , ----------;---------------------~-------------------------------, Gaz?tted JUon-Gazetted tl' . Ttl I· Gazetted INon-Gazetted', , -----r----~------,------ -- 0 a ,-----,-----~------T-----ITotal } ClasslClass Classl CIQSSI 'Class IClass' ClasslClass l
.. .' I. I , . II I III I IV, I I' \. II I III I IV I ' r--4------------2------------------T---;--r-4--~--'---~---b--T---7---~-a---;--g--;--ra--+-rT--+--f2-___ J __________________ ~------------L------~----~-----~J ______ ! _______ J ______ J _____ ~------!-----L-----
1. Be low Re. 25 9 46 . 55 1 46 47
2. Rs. 25 or above but below Re. 50 - 34 • 409 443 381 381
3. Rs. 50 or above but below Rs. 75 537 1,004 1 ,541 13 117 130
4. Rs.75 or above but below R~.100 - 2,918 688 3,606 2,034 444 2,478
B. Rs.100 or above but below R9.150 2,563 .8 '2,571 - 2,093 1,1-60 3,253
6. Rs.150 or above but below Rs.200 957 957 - 1,862 7 1 ,()69 ,
7. 1':'9.200 or above but below Rs.250 299 299 782 782
8. Rs.250 or above but below Rs.300 20 71 91 4 362 366
. 9. Rs.300 or above but below Rs.350 43 36 79 8, 190 198 )
10. Rs.350 or above but below Rs.400 2 49 .11 ·62 29 66 95
11. Rs.400 or above but below Rs.500 5 20 3 28 2 64 27 93
12. Rs.500 or'above but below Rs.750 13 11 24 10 31 8 49
13. Rs.750 or above but below Rs.1000 9 1 10 11 8 19
14. ils.1000 or above but. below Rs.1080 1 ... 1 3 :3
15· Rs.1080 or above but below Rs.1135 2 2
I en 0
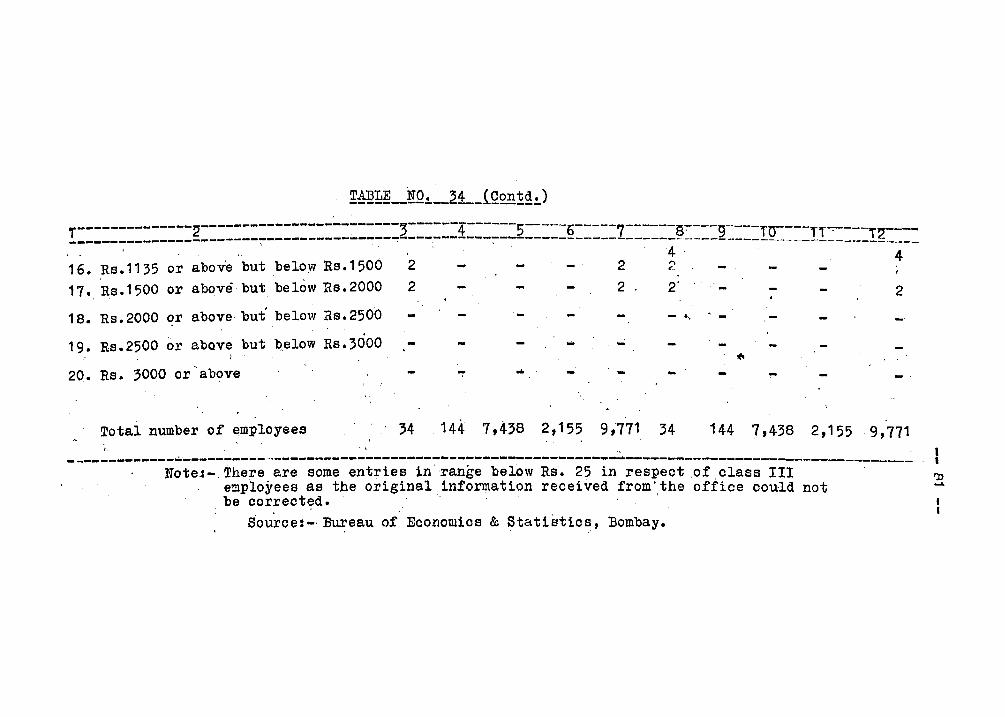
--------------2------------------------2------4------5------6-----7~-----S~--- ----r --- --. --- ---! ______________________ ~----------;..----'":' ---.--------:----------------------.. --__ "2 _____ g:. ___ !I _____ !~ __ _
16. Rs.1135 or above but belo~ Rs.1500 17. Rs.1500 or ab~ve but below Rs.2000
18. Rs.2000 or above· but below, Rs.2500
19. Rs.2500 or above but ~elow Rs.3000 )
20. Ra. 3000 or'above
2
2
. 4 2 " <£.
4
2 2' - 2
- "
..
Total number of employees 34 144 7,438 2,155 9,171 34 144 7,438 2,155 9,771 - . . __ ...... --.. -------.------.. --- >0. _______ .. ___________ ...... ____ .. _ ..... ___ .. _______ ...... _________________________ _
Note':-.There are some ent~iea in'range below Rs. 25 in respeot .of olass III employees as the original information received from'the office could not be corrected.' '
Source:-·Bureau of Economics &. Statistics, Bombay.
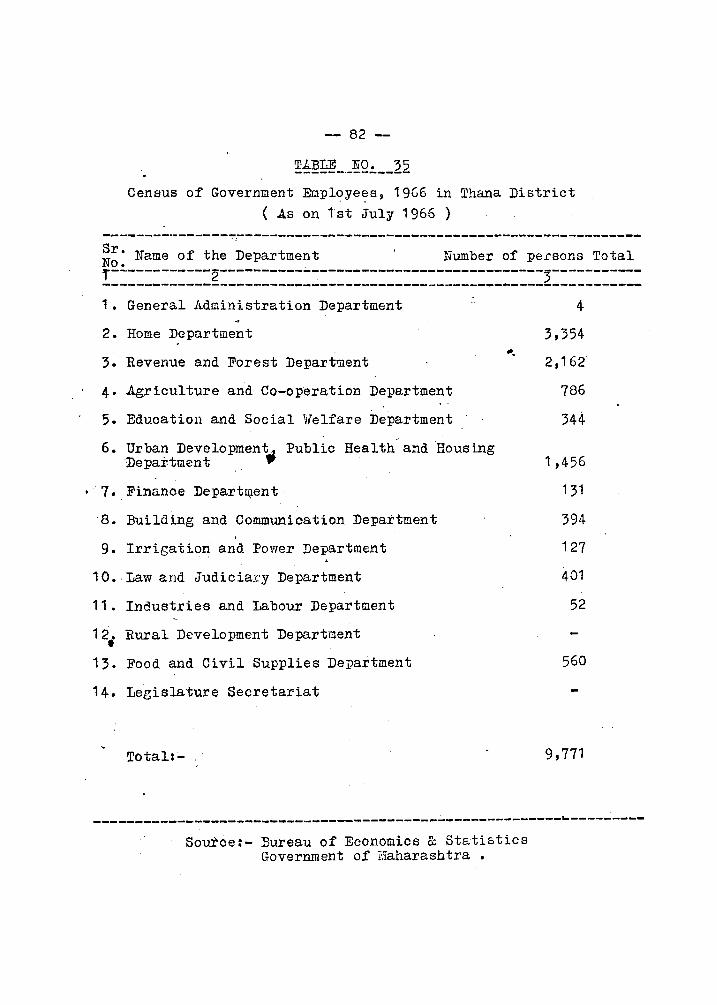
-- 82 -
Census of Government Empl~ye~s~ 19G6 in Thana District ( As on 1st July 1966 )
--------.-------~.-------------------------------------------------
Nsr • Name of the Department Number of persons Total o. !:=::::::::::g:::::::::::::::::::::::::=:::::::::::::~::::::::::: 1. General Administration Department
2. Home Department
3. Revenue and Forest Depart~ent
4. Agriculture and Co-operation Department
5. Education and Social Welfare Department
6. Urban Developmen~ Public Health and Housing Depar.tment ,
. 7. Finanoe Depart~ent
8. Building and Communication Department
9. Irrigatio~ and Power Department
10. Law and Judiciary Department
11. Industries and Labour Department
12. Rural Development Department • 13. Food and Civil Supplies Department
14. Legislature Secretariat
Total:-
.. , 4
3,354
2,162
786
344
1,456
131
394
127
401
52
560
9,771
-------------------------------------------------------~---------
Source:- Bureau of Economics & Statistics Government of r:Taharashtra •
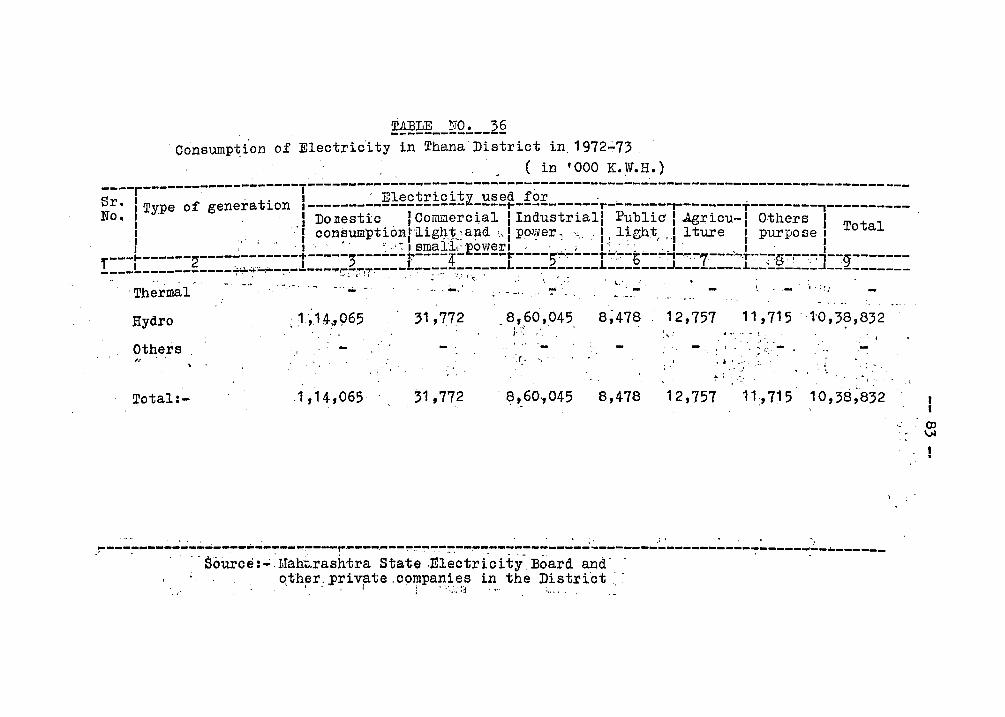
!~~~L_EQ!. __ 2§ Consumption of Electric'i ty in Thana District in, 1972~73 .
( in '000 K.~.H.)
s----r------------~--~---T-------~-El;~t;i~it;-~;;d-f~;-----~-------------------------------------r. 1 Type of generatlon I-------------------~----~----------r-------~-------T--------,----------No~ I . . ' I Donestic ICorm::J.ercial I Industriall PubliC' l.Agricu-1 Others ITt 1 I, i, ·lcon~umpt~o~I·:rr.iglJt:a~~ ',··1 po.\yer ,"-' L lieht .... ll ture I purpose: ° a
. 1 " 1 . " '. ,',I small\'Eowerl. ',0; 1 : : . :, . _I . , I 1 ---1-------2------------+-----';------1:'----4- ----t."----5-,:----'t-·':'"-b--:-~ ... ~~7---.... ·T----:8-r-:-:J--:Ij-------f 1 ~ ............ __ !---... ,..,-_.,.-___ L ___________ L __________ L _______ J ________ .l __ ~_______ _ _______ _ ---------------- •. ~-. • . .. .. ,:., ~. ~ I' • .' -' ~ ,,-, . :.: r~ ..
'Thermal
Hydro
Others
Total:-
..... .. ....... ~
.1,14,065
31,772
- '.
. "
31,772
',' ... 8,60,045
- ;.~; .' ~
'.(. ,,'.
r;1... •• . -
8;478 12,757 11,715 to,38,832 "
8,478
- fl •• ';;.".-:' ...
• 1 •. ' . ..' t ~ ..
, .. 12,757 11·,715 10,38~832
'- Q)
. "' ... . ~---~------.---------...,~-- ... ---:--.... -.---~~~':":-.~-~--.--:--:-.:---:-------------------------~-----.... ---------
.. Source:..; Mah~rash1;raState .Electrici ty Board and - . o,t'her. yrivp,te .companies in the District: -
I. - r I ;' ",:., :.1 .• ,.
VI
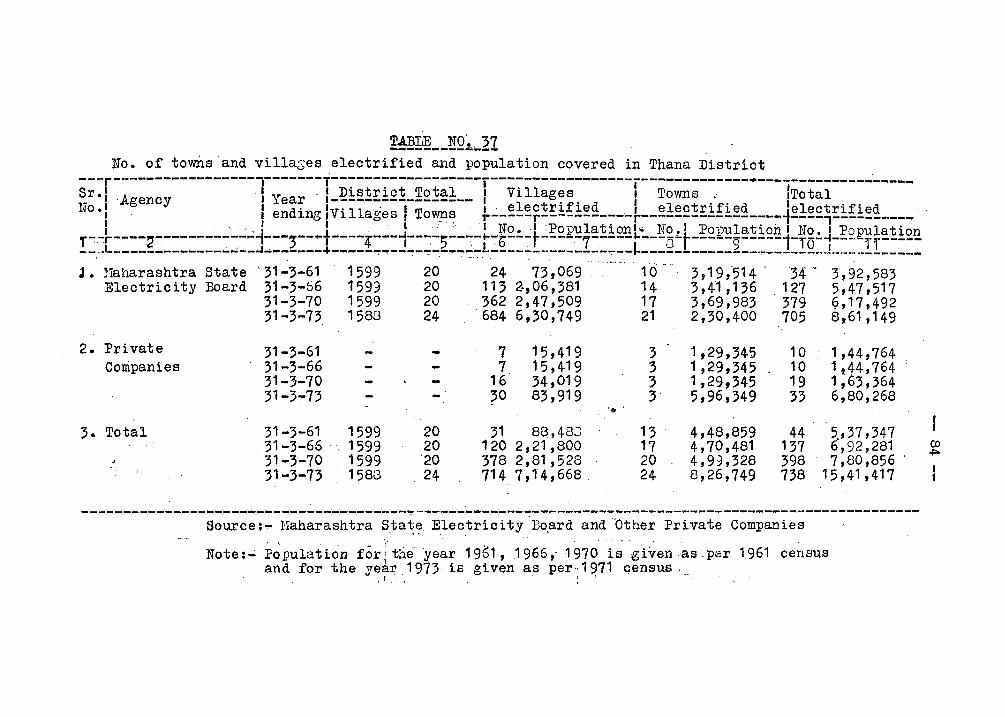
TABLE NO~_ 37 --------_ ... _--No. of towns 'and villases electrified and population covered in Thana District
s;~r~~~:::;----------l-;:::-~l=~i;!E!£!=~~~;!==-r--vill~~?;-------f--;~~;-~-~--~---'T~t;l-~-~------HO.! ' fending IVillages I To~~ ~~-~~~~~!:!~!~!L--_f---~1~£~£!f!~~--_--f~!~£~!:~f~~~ ____ "
I . '"...1 J.1" I,·, " I No. ,I :Population l ,. No.1 Population I NO.1 Population ,.-::-:r----~----------,--.,--~;---I----4----:---:-:-5----i-:-b:---:-t-----7-----*----s ... t-----g-----1-fo-4---·-,,-------.-'-------------------I------+-----..,,""'----~------------__________ .,-__ j.. ______________ . _____________ . _______ _
. . -.,. . '.
l. l!aharashtra State "31-3-61 1599 20 24 73,069 Electricity Board, 31-3-66 1593 20 113 ~,06,381
2. Private Companies
3. Total
31-3-70 1599 20 362 2,47,509 31-3-73 1588 24 684 6,30,749
31-3-61 7 15,419 31-3-66 7 15,419 31-3-70 16 34,019 31-3-73 30 83,919
31-3-61 1599 20 31 88,,483 , 31-3-66 , 1599 20 120 2,21,800 31-3-70 1599 '20 378 2,81 ,528 31-3-73 1588 24 714 7,14, 668 ,
'.
10 14 17 21
3 3 3 3
13 17 20 24
:3 ,19 ;514 - '34-3 ,41 ,1 36 ,1 27 3,69,983 379 2,30,400 705
1,29,345 10 1 ,29,345 10 1,29,345 19 5,96,349 33
4,48,859 44 4,70,481 137 4,93,328 398 8,26,749 738'
3,92,583 ;,47,517 9,17,492 8,61,149
1,44,764 1,,44,764 1,63,364 6,80,268
5.,37,347 6,92,281 7,80,856
15,41,417
-----------------------------~--------.,..-------------------------------------------------------------Source:.- Uaharashtra State Electricity -Bocard and "Other Private Companies
Note:..; :p~pulation for:'th~'ye'ar 1961,1966,. 1 ~no 'i~ 'gi~en ·as .per 1961 census . and for the ye~J;' 1973 is given as per .. 1971 qensus.;.
" ' , '
co ."..
I I
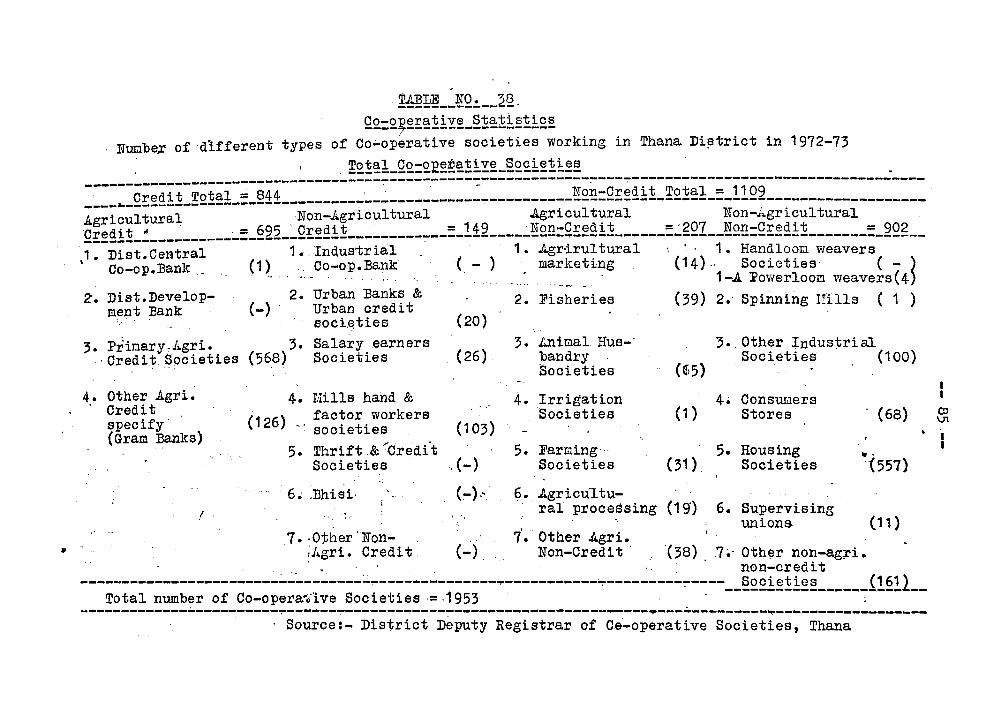
•
Q~=~~~~~!iY~_~1~1iE1i£~ Nucbe~ of different types of Co~operative societies working in Thana Di~trict in 1972-73
, !£1~lJ~.£=£E~!~1i!~-~££!.~1i~!! . --~---------------------------------~------------------------~---~-----------------------------------____ .. _g~~~!]_~21~±_=_§~~ __________ ~ ________ ~ ___ ~ ___________ ~£!!=Q::~~!1_~21~!_=_11Q2 ___________________ ' Agricultural .Non-~ .. gricultural' .Agricult,!,ral ,Non-J .. gri?ul tural Q::~gl]_~ __________ ~=_222 __ Q::~2~] __________ --=-1~2-_-_~~g~:QE~£~] ______ =~gQ1 __ ~2~=Q~~£!] _______ =_2Qg __ ,1. Dist.Centra11 •. Indus'trial 1. J..gr·irultural 1. HandlooIJ. weavers
,Co-op.Bank ,.. (1). ,Co-op.Bank ( - ) marketi-ng (14).. Societies ( - )
z. Diet.Developmept :Bank
... - , '1-.A PowerloOI!l weavers(4) 2. Urban Banks & ()' , (_) , Urban credit 2. Fisheries 39 2.' spinning Uills (1 )
soci~tie~ (20)
3. primary,Agri. 3. Salary earners . Credit ~ocieties (56~) Societies (26)
3. J..nimal Hus-' 3. , Other Industrial ?andry Societies (100)
4,. Other Agri. Credit :, specify' (Gram :Banks)
I
Societies (1!i5)
4. Mills hand & (126) _. fac~or workers (103)
socleties
4~ Irrigation Societies (1)
5. Thrift ,& ~Credft Societies ,(-)
5. Farming" Societies (;1) ,
6. ,Bhisi· (-)" . "
6 • .Agricu'ltu-ral proce~sing (19)
4. Consumers Stores
5. Housing, Societies
6. Supervising unions
. (68)
.. ~557)
(11 ) 7 •. Other 'Non- 7'" Other .Agri.
;.Agri. Credit, (-), Non-Credit '.(;8) .7~' Oth~r non-ag;ri • " . . non-credit
--------------------------------------------------~-----------~---------_---- Societies (1612 Total number of Co-opera~iive Societies .= .1953 ' ,-----------------:--------------------~----------~--~---~------------------------------------~---~---------~------------------, . Source: - District Deputy Registrar of C,a-operative Societies, Thana
co VI
I I
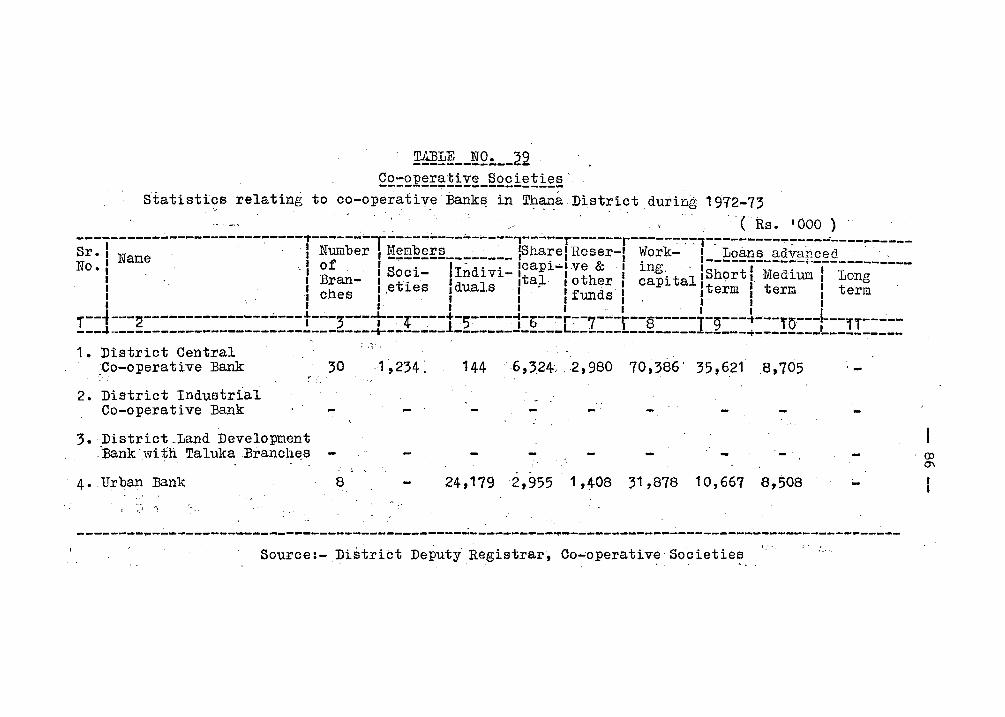
!£~!!~ __ ~Q:. __ ~2 .-Co-operative Societies' -------~--------------
Statistics relating to co-operati v,e :i3ank~ in Th~~ District during 197"2-73
, " /' , ' C Rs • '000 ) , " ----------~----------------~-----~-lr----~~---~-----,--~--r------r--------l----------~---~----------Sr. I ~,T' ' , I Number I ~~~£~!:!L __ :.... __ :.._IShare', Reser-I Work"':'" I . Loans advanced " " no.: J.~ame ,,' of. Is' ' 11 - d' .' Icapi-I.ve & ling ,I-s' h----I------~·-I---- ... -----
I " I Bran- I O~l- I n 1 Vl- Ital I other 1 capi tall 9rt I, Medium I Long 'I' .' ches "etles I duals , . If d' t lterm I term I term ' I • ' I I, I I I un S I, "I I
I , I" , I ' I 1 I .' I "I I I" ,.--~ -·--2-------------------t---;--T-:-~----+:-5--:--:-1-b---r-:--7- .... -r--S-----I-9----t""".,.-ro------,,-----___ ~ ________________________________ ~-------l---------____ L_______________ _ ____ ~--------L ________ _ 1. District Central
,Co-operative Bank
2. District Industrial Co-operative Bank
, .. , "
:3 • District "Land Development .' ,'Bank 'with TalukaBranche.s
30
4- Urban Bank 8
I _.' f\
·1 :,234 ~ 144 '6,324, ,,2,98070,386' 35,6218,705 , -
-'
, '
24,179 "2,955 1,408 31,878 10,667 8,508
----~---~------------------------------------------------~-----------------------------------------Source:- District Deputy Registrar, Co-operative'Societies
'ro 0'\
I
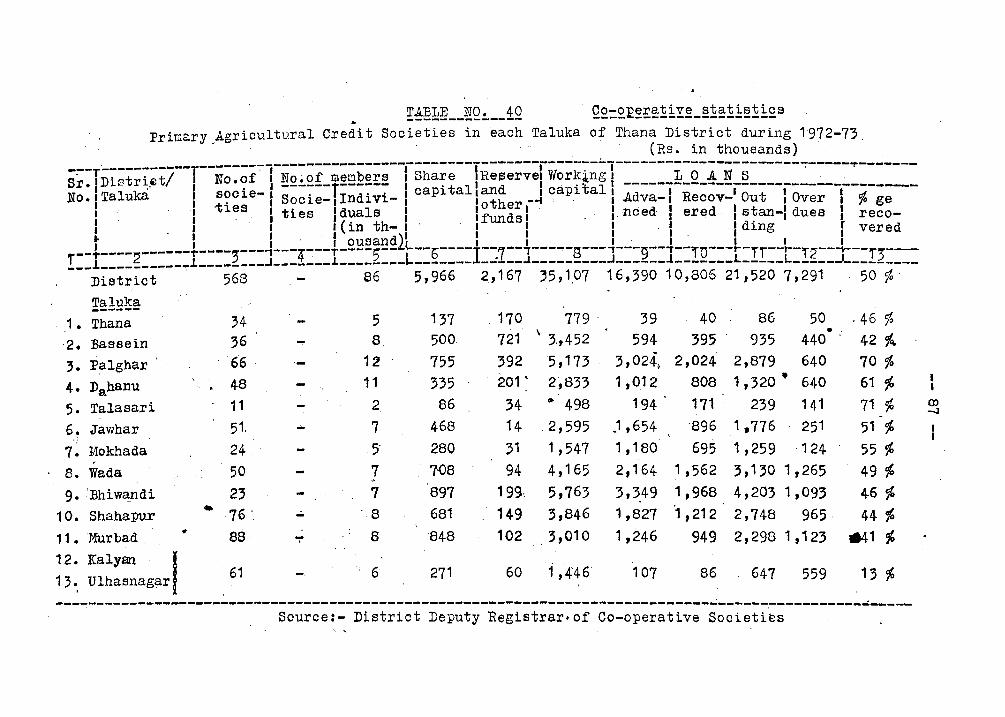
, . ..
Primary.Agricultural Credit Societies ,in each Taluka of Thana District durillg 1972-73, '. (Rs • in thousands) ,
. -- -------------------------------------------1----------------------------~----S-'r--TD--i;tr-i;t/---T--NO.~f' I No.of meubers I Share IReservel Worlr~ng,' L ,0 .A It S ~ , ---• " I ,I ------r------' 't l' d ,,' t l' ------------------------------
No.,Taluka I ~~cle-I Socie-,Indivi-l capl a I~~her.~ cap,l a I .A~va-I Recov-' Out lOver I % ge ", " ~s I ties I duals I 'funds I' , " I,nced' I ered letan-l dues I reco-I " 'I , (in th- I' 'I I 'I' I I ding r vered •.. I I, 'I ousandLL' f I ," I ,
--~~-~- ------~----~---~-~-~~--~----5-- --~---- --~--i---~-S---'---9--'--ln---~-Tf--~-T2--~--f ----f 1 2 L ________ ~ _______ ~ ________ L------- _~L __ ~ _________ ~ ______ ~ _______ L _____ L _____ J ____ 2 ___ _ ---Di;t;i~t---~ , 568 a6 5,966 2,,167' '5,1.07 16,390 10,806 21,520 7,291 50 %'
Taluka -----_. 1. Th8.na, ,2. 13a.seein
3. P~lghar ,
4. Dahanu 5. Talaaari
6,1' Jawhar 7'. J.{okhada
,
~. Wada 9. '13hiwandi
10. Shahapur
11. 'Murbad,
1 2. Kalyan.· I ' 1 3 ~ Ulhaanag~r
.. •
34 36 66 '
48 11 51, 24, '
50 23
,76 " ,
88
61
, , - 5 8
12 11
2
7 5'
7 7
'8
8
, -. 6
137 500
755 335 66
,468
280
" 108 897 681
'848
271
,170 721
392 201'
34 14
31
94 199,
149 102
60
779 ' \ 3.,452 .
'5,173 2,833 ",498
' 2,595 1 ,547 4,165
5,763 3,846 3,010
1,"446'
39 594
3,024, 1,012
194 .
- 40 395
86
935 50
440 2,024 2,879 640
808 1,320· 640
171 239 141 J ,654 '8961 .776 251 1.180 69~ 1,259 ,124 2,164 1,562 3,1,01,?65
3,3,49 1,968 4,203 1,093 1,827 ~,212 2,748 965
1,246 949 2,298 1,123
107 86 .' 647 559
·46 % •
42 %. 70 % 61 % 71 ~ 51 .~
55 ~
49 " 46 % 44 ,t;
1141 "
13 "
---~-------------------~---------------------~--~--~--------------------------~-----------------~-----Source:- District Deputy Regletrar o of,C9-operative Societies
co -J
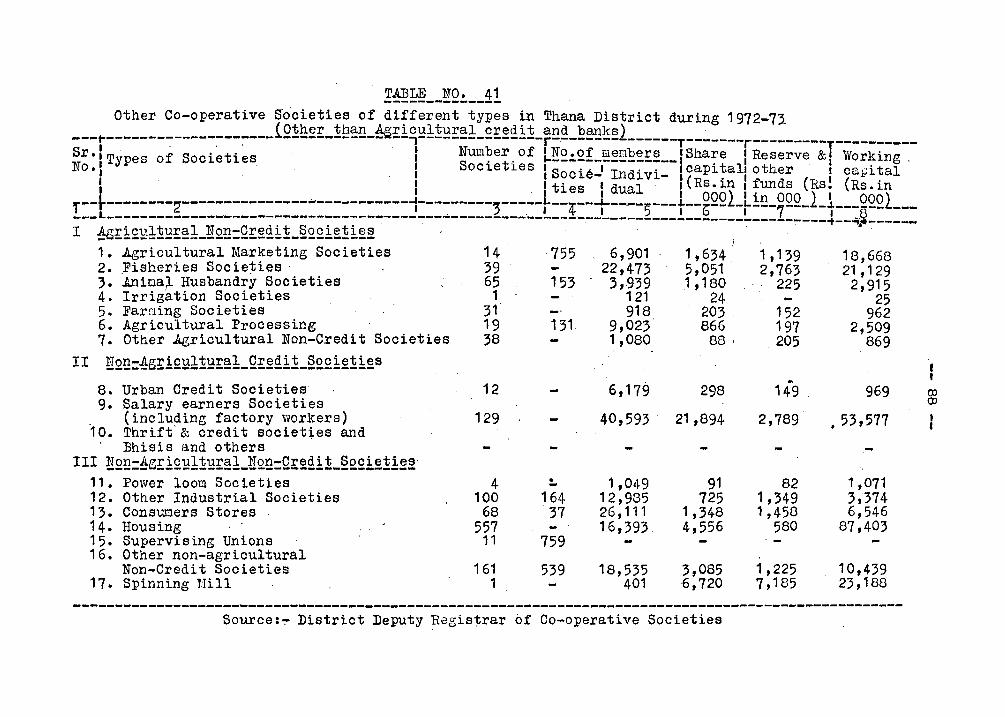
1'~~ __ !Q:. __ 1! Other Co-operative S"ocieties of different types in Thana District during 1972-71
___ ~ ____________________ fQ~h~£_~~~~_~£i,C~!!~£~!-££~~i~_ar~~_E~~~l_ ' i . ," , , ' " -----T-------r---------T----------
Sr.ITypes of Societies , Num~er.0f L!~~2f_~~~~~£~ __ IShare 1 Reserve &1 Working. No. i ". I Socletles I Socie-' Indivi- 1 capi ~all other ' I ca,LJi ~al
I I I ties I dual' I (Rs.ln I funds (RS. (Rs.ln ~-_[--------~,-----------------------_---~---------;---~-L--~--JL----5- ! 0002 1-' in 000 2 ~ 000' I ~ I, ~ --+--b-- - ---7--- -.-----_L __ _ --- --------------'--------------------------... ---------'---------'---------.!.-------!..---------~--..,~------I !g!i£~1!~£~1_NQ~=Q£~£i!_22£i~!i~~ , . . •
1. Agricultural Marketing Societies 14 755 6,901 1,634 1,139 18,668 2. Fisheries Societies' 39 22,473 5,051 2,763 21,129 3. inioa;L Husbandry Societies 65 153 :;,939 ,1,180 225 2,915 4. Irrigation Societies 1 121 24 25 5. Far~ing Societies 31 918 203 152 962 6. Agricultural Processing 19 131 9,023 866 197 2,509 7. Other Agricultural Non-Credit Societies 38 1,080 88 I .205 869
II ~Q~=4g!lQ~11~!~1_Q!~£i!_§2£i~!i~s
8. Urban Credit Societies 9. Salary earners Societies
. (including factory workers) 10. Thrift' & credit societtes and
Bhisis and others I II !!2!3=f!.g!i£g11g!~1_~Q~=Q!~£i:L§2£i~!i~~'
11. Power loom Societies 12. Other Industrial Societies 13. Consuoers Stores 14. Housing 15. Supervising Unions 16. Other non-agricultural
Non-Credit Societies 17. Spinning Mill
12
129
4 100
68 557
11
161 1
!.
164 37
759
539
6,179
40,593
1,049 12,985 26,111 16,393
18,535 401
298
21 ,894
91 725
1,348 4,556
3,085 6,720
149 2,789
82 1,349 1,458
580
1,225 7,185
969
.53,577
1,071 :;,374 6,546
87,403
10,439 23,188
--------------------~-------------------------------------------------------------------------------Source:~ District Deputy Registrar of Co-operative Societies
(Xl (Xl
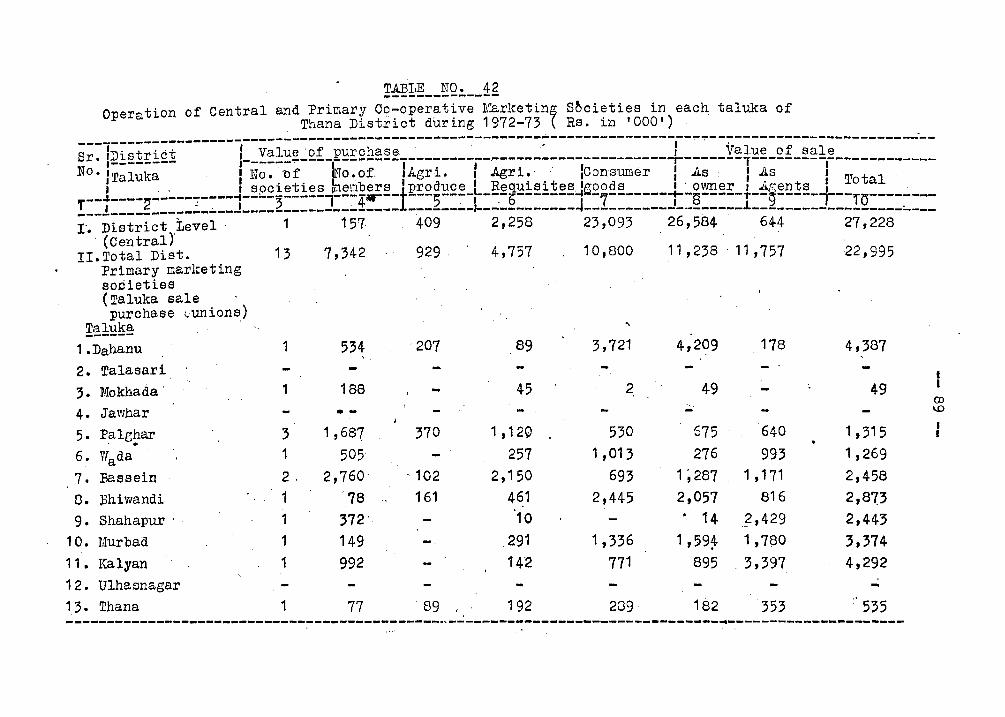
T..ABLE NO. 42 --------------Operation of Central and Primary C9-operative l~rketin~ S~cieties in eac~·taluka of
, Thana District during 1972-73 t Rs. in '000') . ----------------------------------------------------------------------~---~~~------------------------~-IDo t 0 -t I . Value 'of purchase.' ...~ : . Value of sale Sr. I_':!_~!£- I------..---------------------j-----------------:'''':''·-----r-------T---------I------------No. ITaluka II~o.bf ho •. of. IAgrL 1 .Agri.' IConsumer I AS· l.As 1
• . . , 1 societies k1enbers tl nroduce 'L Requisites l1700ds 1 . owner 1 ..t~ents 1 Total , --,,----2-----7.----1--1.o-3-----T-~4 ... -- ~-~.5---:-~ :-...,,~b-------~1ii-7-------i-8-----,.--9-----t_--,.ti------! __ !_~-_-----_----_--~-_-----_------~-- ~~-_---_~----_----_-~_-_-----_----------l----___ ----_-_____ ~ __ _
I~ District tevel 1 157 409. 2,258 23,093 26,584 644 27,228 , (Central)"
II.Total Diet.· . 13 7,342 . ·929, .4,757 10,800 11,238 ·11,75722,995 Primary marketing societies
. . (Taluka· sale . purchase I..,uniona)
Taluka. ' .. ------1.Dahanu 1 534 '207 89 3,721 4,209 .178 4,387
2. Talasari· - - .
3. Mokhada' 1 188 45 2, 49 49 Q) --4. Jawhar - . - - \0
~ . I 5. Palghar 3 1,687 370 1,12" 530 675 640 1,315 • . .. -6. Wada 1 . 505' - 257 1,013 276 993 1,269
7. Bassein 2. 2,760· -102 2,150 693 1 ~287 1 ,17,1 2,458
O. 13hiwandi 1 '78 161 461 2,445 2,057 816 2,873
9. Shahapur .. 1 372' 10 . 14 ..?,429 2,443 1 o. Murbad 1 149 -. .291 1,336 1 , 59~ 1,780 3,374 11 • Kalyan 1 992 14·2 771 895 . 3,397 4,292
'\
12. Ulhasnagar -1.3- Thana 1 77 ·89
" 192 209· 182 '353 . 535
-----------------------------~---------~-----.~-------------------~----------~-~-~--------------------.
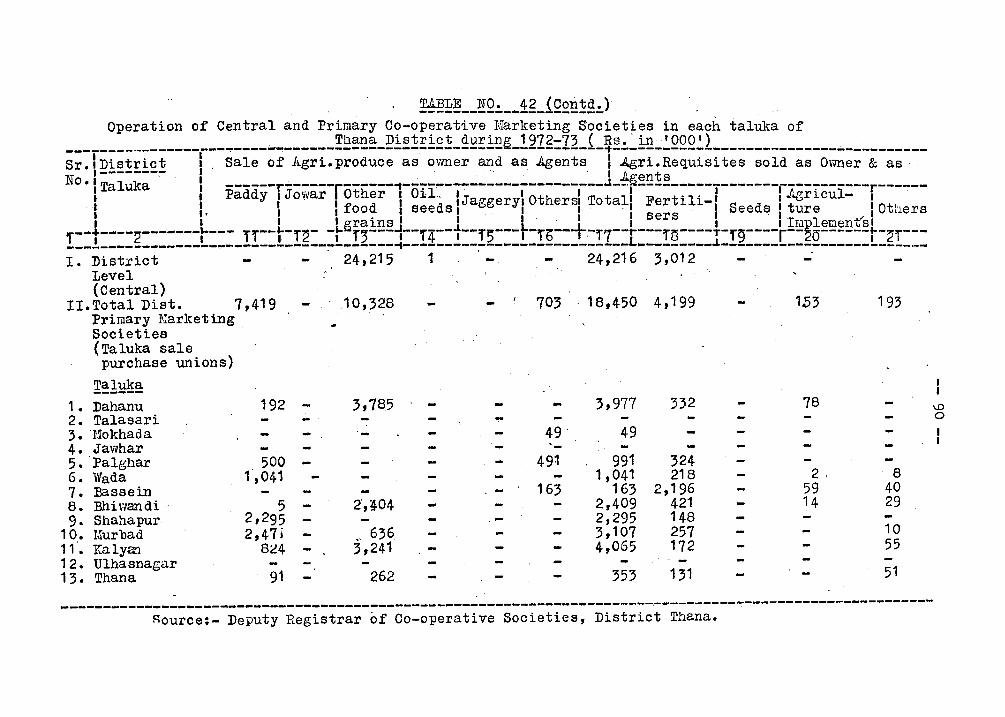
~!?!!~ __ !Q!. __ ig_,{2£!!~~!.) . Operation of Central and Primary Co-operative Marketing Societies in each taluka of
________ . ________ I ___ ------------!~~~~-~!~~E!£!-~~El£~_!21g=12_i_~~!.~~-~QQQ~2----------_----~----------SrolDistrict I. Sale of Agri.produce as ovmer and as Agents I AgrLReq,uisites sold as O'wner & as '.
,-------~ , . I
NOoiTaluka i paddy-rjowar-rOther-,-oii~-j;~;~;;;f~;~;~;I~~~~~;!;;~~~:T-------rJ~ricui:--r---~--I . I. \ I food I seeds I I I" I sers' I Seeds I ture 10tl'lers , , I I p"rains I I I· I I I I Irill?lemen-tsl r--t----2-------r--- TT--t-r~- -r~T;---i--r4--t--r;---t-rb---r~T7--~---r8----T-r9----r--20------t-2'---__________________ ~--------------_-----~--------------_____________ L~-_______ ~ ________________________ _
I. District '24,215 1 . - 24,216 3,012 Level (Central)
II-Total Diet. 7,419 10,328 703 ,18,450 4,199 153 193 PriIilary ~larket ing Societies (Taluka sale purchase unions)
Taluka ------1 ° Dahanu 192 2. Talasari 3. Uokhada 4. Jawhar -5. Palghar 500 6. Wada 1,041 7. })assein 8. Bhir/andi '5 9. Shahapur 2,295
10. Murbad 2,47i 11. lCalyan 8~4 12. Ulhasnagar 13. Thana 91
-
3,785
'-
2',~04
.' 636 3,241
262'
~
49' -491
163
3,977
49
991 1,041
163 2,409 2,295 3,107 4,065
353
332
324 218
2,196 421 148 257 172
131
78
2, 59 14
-8
40 29
10 55
51
-----------------------------------------------------------------------~---~-----~-----------------------Rource:- Deputy Registrar of Co-operative Societies, District Thana.
~ o I I
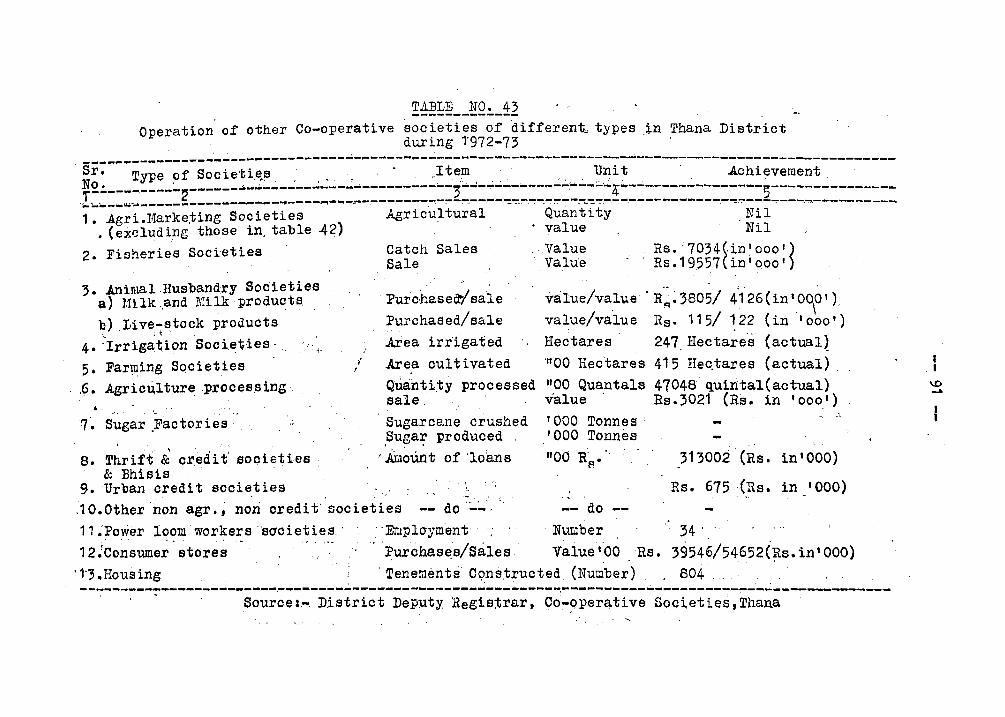
!~;r;~!L.Jf2!._~2 Operation of other Co-operative soc ieties ofdifferent~ types .in Thana District
during 1'972-73
sr-:---;;~;-;;-s~~~;~~,~;--~--~~--~-----'---~It;;~---~------~---Ul!i ~----~----A~i;;;;~t---------¥2!.----'-----2------~-~-------.:..--- .... -----------3~----.... -------: .. --;...·-4 ...... ---------------5--------------.-.----"""'~---------------.--.. ----.-.-...,~.,..-~--.----~-:--~~.-~.---:..~~.~-.~~-.-----:.-~.~---.-~-----~---.--:,-:-----:----.~-~"'!------1. AgrLMarke,tlng Societies
• (excluding those in, table ~2)
2. Fisheries Societies,
3 • .Animal ,Husbandry Societies a) Uilk <and Milk,products, b) Live-stock products
" :, 4. 'Irriga~ion Socie~ies· :: .;.
5. ,Farr.Iing Societ.ies ,6. Agr lcu.l ture ,pro cess ing ,
" .", .
7~ Sugar .Factories' . ,.
8. Thrift & credit' societies, & Bhisis, ",
9. 'Urban credit societies
1 I
Agricultural
Catch Sales Sale
Quantity . value . ,Value
ValUe
Nil , :Nil
Rs.:7034(in f ooo ' ) Rs. 19557 ( in I QOO ' )
Purchased7 sale value/va,lue . R'~ ~ )805/ 4;~' 26 (in I O~O' ) Purchased/sale value/value Rs. 115/ ~22 (in '000') .Area irrigated Hectares 247 Hectare's (actual~
Area cultivated' "'00 Hec'tares 415 Ilec.tares (actual) , Quantity processed "00 Quantals 47048 quirital(actual) sale value Rs. 3021 (Rs .in '000')
Sugarcane crushed .Suga~ produced . '.Am~unt of'loans
'000 Tonnes' '000 Tonnes
"00 Rs." 313002 (Rs. in'OOO)
Rs. 675 (Rs. in r 000) ,1 O.Other 'non agr., non credi t'societies -- do-:-~'-;, " .:- do
11 ~Power l<?~m 'workers 'societies,' "'Emplo-Ynlemt' , . Number 34' "
12 :Consumer stores·'·:Purchas~s/Sa.les Vaiue 1'00 ,Rs. 39546/54652(Rs. in' 000) ~1'; .Housing , Tenements Cc;mstructed, (Nu~ber): . 804 '
--7---~--~----~---------~~------~-----------------------~~-~--------~--------:-~--~--------------Source :~, D,istrict Dep:uty Registrar, Co-operCJ.ti ve Societies, Thana
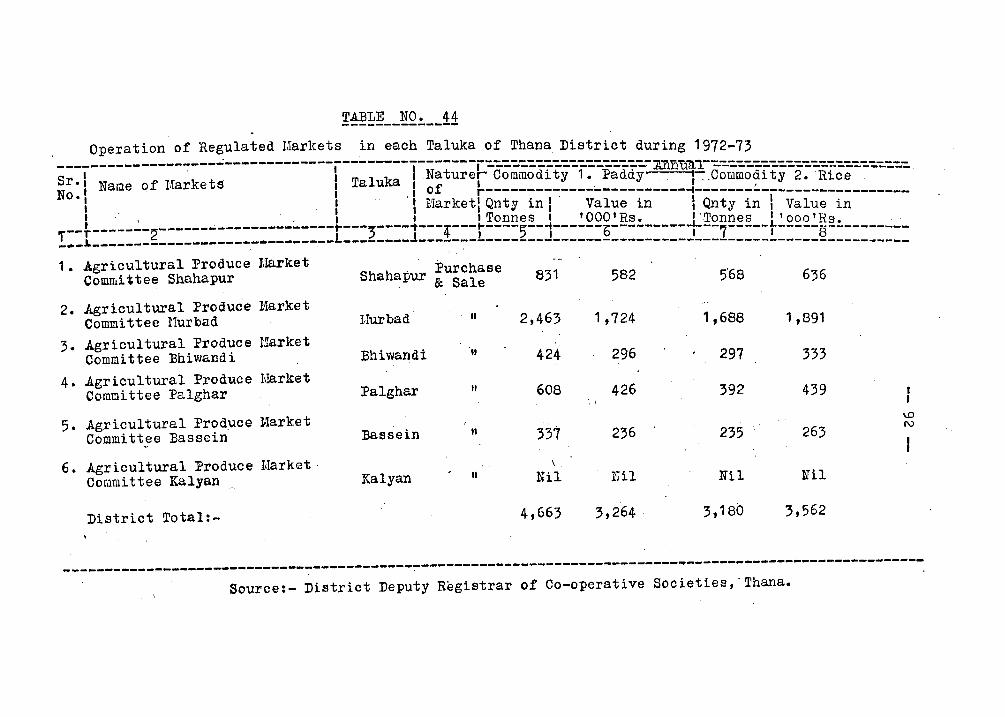
a:~!!~ __ ~Q!. __ !i Operation of Regulated LIarkets in each Taluka of Thana District during 1972-73
---i-----------~---~-------------i--------I-------'~~~~~~~~~~~~~~~~~~-~nu~~~~~~~~~~~~~~~~~~~~~~~~~ Sr. I Name of l,~arkets I Taluka I Naturer Cornmodl ty 1. Paddy .' I· .ComIDodi ty 2. Ric.e . No.1 I I of r-------------:...-----------.-------.:..-
I .' . I . 'I Market\ Qnty in I " Value in I Qnty in l-v~l~;-i~-------,. __ TI _____ .:_1'i ________________ :.. ____ L ___ ~----!---A---~!£~!!~~_J ___ ~Q.Q~~g~!.---- J'Tonnes LI' 000 'Rs.
~ I ~ T ~ I ~' 0 - ~--7-----1----------------__ -~-----------------------------L--------l-----------____ J_________________ 8 . , --------------------------1 • Agricultural Produce },Iarket Purchase
COIDfuittee Shahapur Shahapur & Sale
2. Agricultural Produce r.~rket Committee l.Iur'bad
3. Agricultural Produce Harket Committee Ehiwandi
4. Agricultural Produce 1~rket Committee Palghar
5. Agricultural Prod;uce lIlarket Committee Bassein
6. Agricultural Froduce Market, Committee Kalyan
District Total:-
I,!urbad " Bhiwandi '" Palghar "
:Bassein
Kalyan "
831
2,463
424
608
337
\ . Nil
4,663
582. 5'68 636
1,724 1,688 1,891
296 297 333
426 392 439 w
236 235 263 I\)
Nil Nil lITil
3,264 3,180 ;,562
~---------------------~-----------------------------~---------------------~------~----------------------Source:- District Deputy Registrar of Co-operative Societies,·Thana.
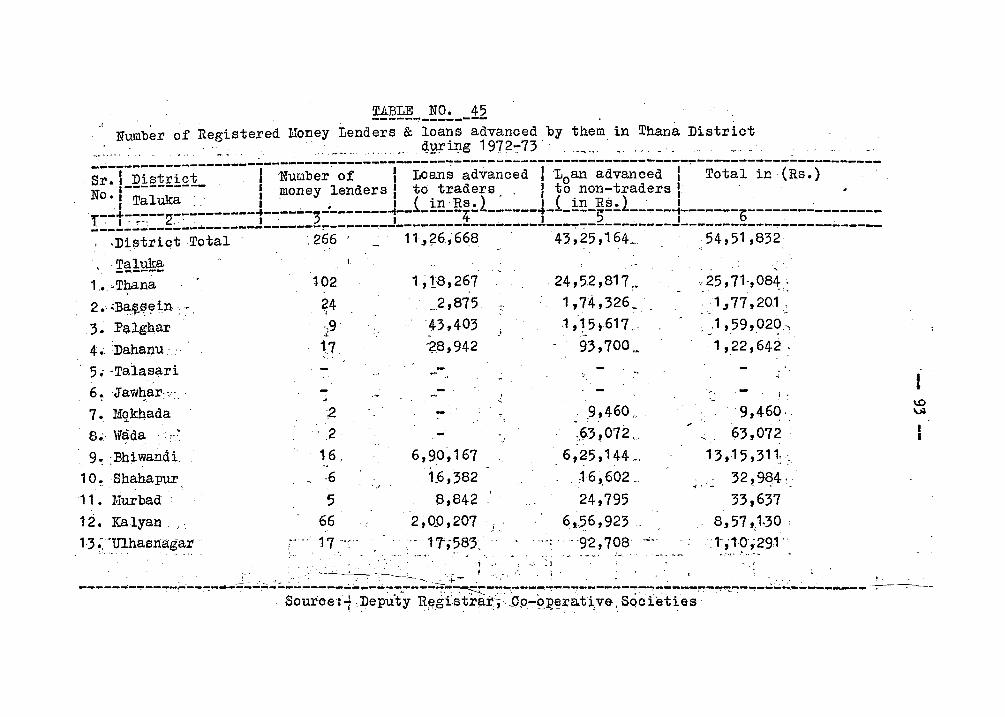
TllBLE NO. 45 -----~--------.(
Number of Registered Mo~ey Lenders &. loans advanced.by them in Thana District . , .... ~. C!~iTlg 1972~73 ...... _._ ..
" . S;~T-Di;t;i~t-------I--N~~b;;~~f----I--L~~~;-~d;~~~;d-I~L~~~-~d;~~;d-I-~-T~t;l-i;'-(R;~)-------No.l-T-i~---:-~ I money lenders I to traders,. I to non-traders I . -~l--:-- ~_~~ ______ J ____ ~_~~ _______ ~_-i-!~~E~~2----_-~-i-!~-E~~2 _____ ~-_-----?----------------'['. I' .,..-: 2.. . I·.J I 9- I 5. I 0 -------------.--------------~-----~-----------------------~~-----------------------~-----------
I ,D~strict ,Total ,266 ' 11.t?6.,668· 43,25,164.. 54,51,832
, ,Taluka - ... ----. 1 •. ·Tbana
2 • .:B~4l.~~tn·; • 3. P~lghar 4 ~Dahanu .', ..
5. 'Talas<?-ri 6. ·Jawhar·", .
• -I.' ...
7., Mqkhada
90;. ::Bhiwandi. 10.Shahapur - . ,-
11. :fIlur bad
12. Kalyan .. '. 1-3:: -.:rnhasnagar ..
102
24 .~
,,9 .t
17
;2
.. 2
. 16,
_ ·6
5 66 17 '--:-
1,18,267
... 2,875 '43,403
---2.8,942
---.-6,90,167
1.6,382
8,842 2,0_0,207
... 1 'f ,583~ "
i
24,5.2,817,... 1,74,326_ .1 , 15 ~617 ._
-93,700 ..
. .9,460, .
~.()3 ~ 072 ,,' 6,25,144_,
16,,602 ..
24,795
i 6,,?6,923 "'"; . --'92,708
... .. .' ' .. :1
~- ... -
- . ~ ,
,25,71-,084: '
. _ 1" 77, 20J .~
; .1',59, 029:, 1,22,642 '
9 ,46q.: 63,072
13,.15,311;:
• _ 32,9~4:,
33,637 8 J 57 ,,1.30 ; ,,.,1~'':291-
t
_____ ...,;_ ... ____ ;.. __ ~--.d.;;;..;;;~..;;;;.~.;...:---.::=--==:.:::::::.;..:.}~..:.::.:.~.--_~--..,.~---.:.-..,.-..,.:...--..:..------.. -~;:",.;,-:;,.~- . .... _t __ ,. __ _
. Source:-t .?epu'tY R~gi.strai'~- ~Cp-oI!~r_a.t~ va, SQcfeties·· . _. . - ,
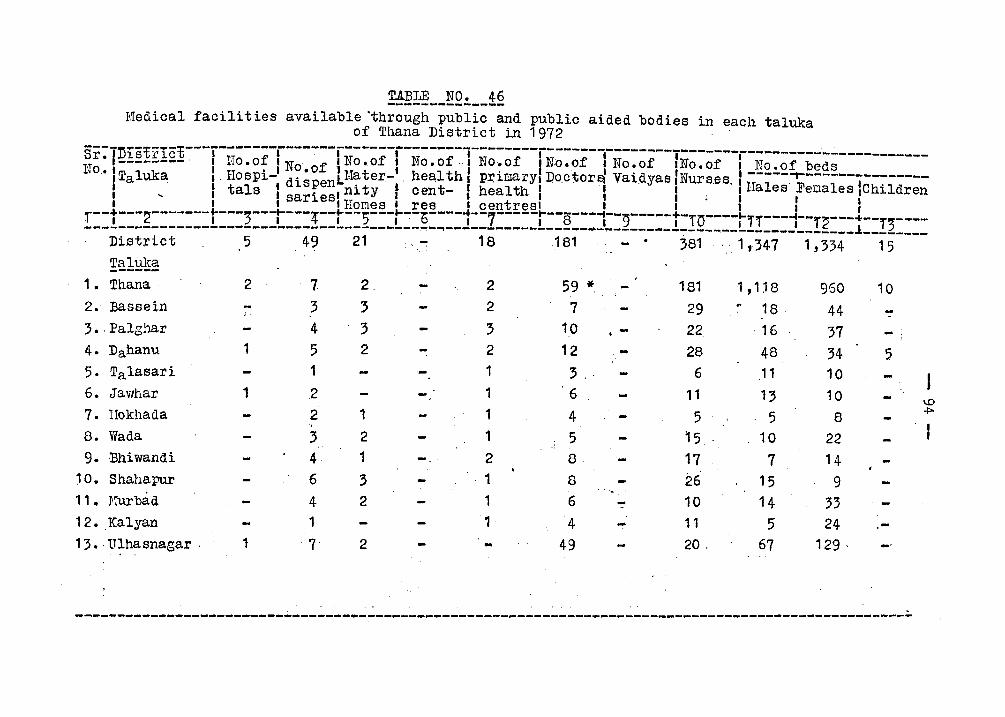
~~--gQ!.--~& Medical facilities available 'through public and public aided bodies in each taluka
of Thana District in 1972 .
sr:T~I~!£!§]~--r-iT~~~f-r;:----rN~:~f-f-N~:~f~.l-N~:~f--fiI.~:~f--rN~:~f--TN~:~f--r-N;:~f-b;d;-----------Ho._, Taluka : . Hospi-' di~ °p!nlMater-t . hea,l th :p~:i.mary: Do.ctorsl Vai.dyas :Nurses, : ;-l--l--.'F----l---j'--:---·---
I I tals ' ni ty I cent- I health I I I I ~ a es e41a es ,Children , ... I I saries l I I I I I; I I I I I I I HOMes I res I centresl , I , I I
r--t---2-------t---)---i---4--t--5---r~-b----1--7-----i--8---1--~-----t-lo----rrl---i--r~---+--r ----------------------------------------~-----~-----------------·--------------~--------------__ l ___ ~ ___ _
Di.strict 5 49 21 ~ 18 181 381 .. 1 ,347 1,334 15
:f~11!l~~ 1. Thana·
2. Bassein
3 •. Palghar
4. Dahanu
5. Talasari
6. Jawhar
7. IIokhada
8. Wada
9. Bhiwandi , o. Shahapur 1,. ~!urbad
12. Kalyan
1 3 •. Ulha snagar .
2
1
7 3 4 5 1
1 2
1
2 , :; 4 6
4 1
'7
2.
3 :; 2
1
2
1
:3 2
2
2
2
3 2
1 1
1 1
2
1 1 , -
59 * 7
10
12
3 .. 6
4 5 8
8
6
4 4-9
181 1 ,118 960 10 29 18 44- --22 16 37 - :
. - 28 48 34 5 6 11 10
11 13 10 5 5 8
'5 10 22 17 7 14 26 15 9
. '- .. 10 14 33 11 5' 24 20. 67 129 .
. - . -------------------------~-------.-------------------------------------------------------------------
I \0 -J:>.
. J
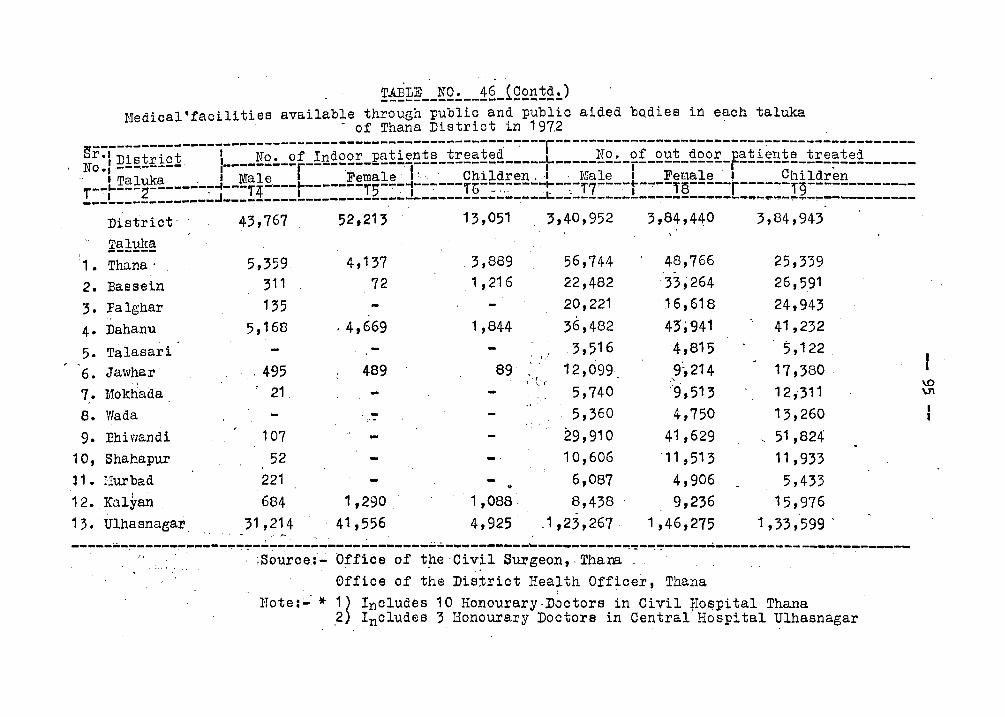
. . , ~~! __ !Q~ __ ~~_iQ2~~~~) ,
Medical-facilities available through public and public aided bQdies in each taluka , . - of Thana District in 197.2 , .
-----------~--------------------------~------------~--lr-~----~--------~--------------~------------g~: I ,~!!!!:!£!,', ! ____ !2~_2fr.-!n~~2;LE~1!.le~!!! ... !!:~~~~~----+--~--!2!.-2f_2!!1_~22!:_~!1!~!!!!_!!~~!~!! _____ _ '. I Taluka . I Male Female' !, '. '. ChIldren," . Male I Female' Children T-~~---2-------:--I---T2j:----r-------T;-~-1--·,:,,---n;.-,:-:-.-:-----':"-~-,.7~---t-"'!'--,.s-----r------,.9-------------___ L __________ -_~ ___ ~----------------~--------------~-__ L~-----------~-_------~~w-p~-~~-~~---------
Dlsirlct' 43,767 52,213 13,051 3,40,952 3,84,440 3,84,943 Talulra . -----I
'1. Thana· 2. :Ba.esein 3. Palgllar .. 4. Dahanu 5. Taiasari 6. Jawhar 7,. Mokha.da. 8. Wada 9. :Bhiwandi
10, Shahapur 11 .- I1urb~d
12. ,Ka;Lyan . 13. ' Ulhaenagar,
5,359, 311 135
5,168
,495 . 21,
107 52
221 684
31 ,214 . ,' ~, , .
4,137 .72
. , 4,669
489
r-
' ...
1,290 41,556
_ 3,889 1,216
1,844
89
.. 1,088, 4,925
( I \.,r
.. :
56,744 22,482 20,221 36,482 3,516
12,099. 5,740
, 5,360 29,910 10,606 '6,087 8,438
.1,23,267
48,766 33;264
. 16,618 43;941 4,815 9~214 ::g,513 4,750
41,629 '11,513
4,906 9,236
1,46,275
25,339 26,5.91 24,943 41,232
5,122 17,380 . 12,311 13,260 51,824 11,933 5,433
15,976 1,33,599 .
'. \ - ""
--~----~----~~-----~-~-~----------~-------~---.-----~-~---------~-~~-~~------------------------~--, ;Source,:- Office oft~e 'Civil' Surgeon,· Thana. _ . aftice of the Dis~rict Health Officer, Thana
lTote:': *.1) Incltide~ 10 HonourarY-Dbctore in CiVil flo~pital Thana , 2) Includes: 3. Honourary Doctors in. Central Hospital ~lhaenagar
... " " ..
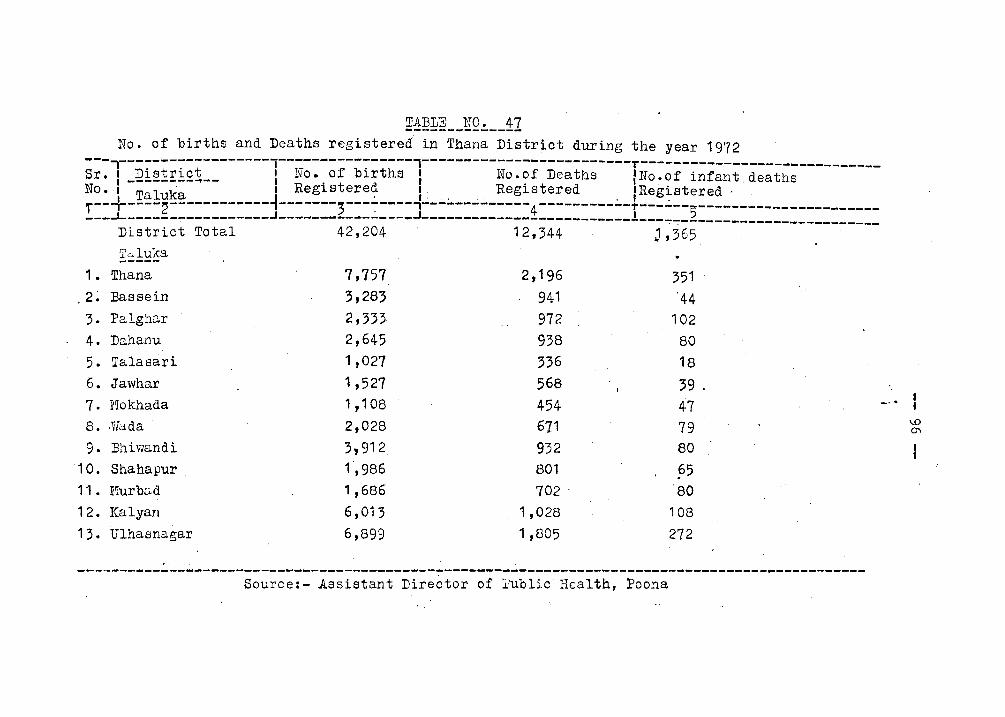
~!~!!!L_!!Q!. __ 1:1 No. of births and Deaths registered in Thana District during the year. 1972
---il-----------------l----------------,-------------~-----------T-----------------------------Sr. I _~i~1!i£1-- I No. of births I No.~f Deaths :No.of infant,deaths No. I Taluka I . Registere~ I.. . .' Reglstered . rReg~stered· . f--~----2------------i-------3--------,-------------4-----------~------;----------------------___ ~ ______ ~_---------~-----------~---~J---__ -----------_________ ! __ ~~~---~-----------------__ _
District Total 42,204 12,344 J,365 . Td.luka -----
1 • Thana 7,757 2,196 351 . 2 ~ Bassein ',283 941 '44 3. Falghar 2,333- 972 102 4. Dahanu 2,645 938 80 5. Talasari 1,027 336 18 6. Jawhar 1,527 568 39 . 7. l'lokhada 1,108 454 47 _.4
8 •. V{ada 2,028 671 .79 1.0 0'1
9. Bhiwandi 3,912, 932 80 '10. Shahapur . 1,986 801 §5 11 • Hurbc.d 1,686 702 . '80
12. Kalyan 6,013 1,028 108 13. Ulhaenagar 6,899 1,805 272
.,. . . ---.----------~-------------------------------------------------~-------------------~-----------Source:- Assistant Director of iublic Health, Poona
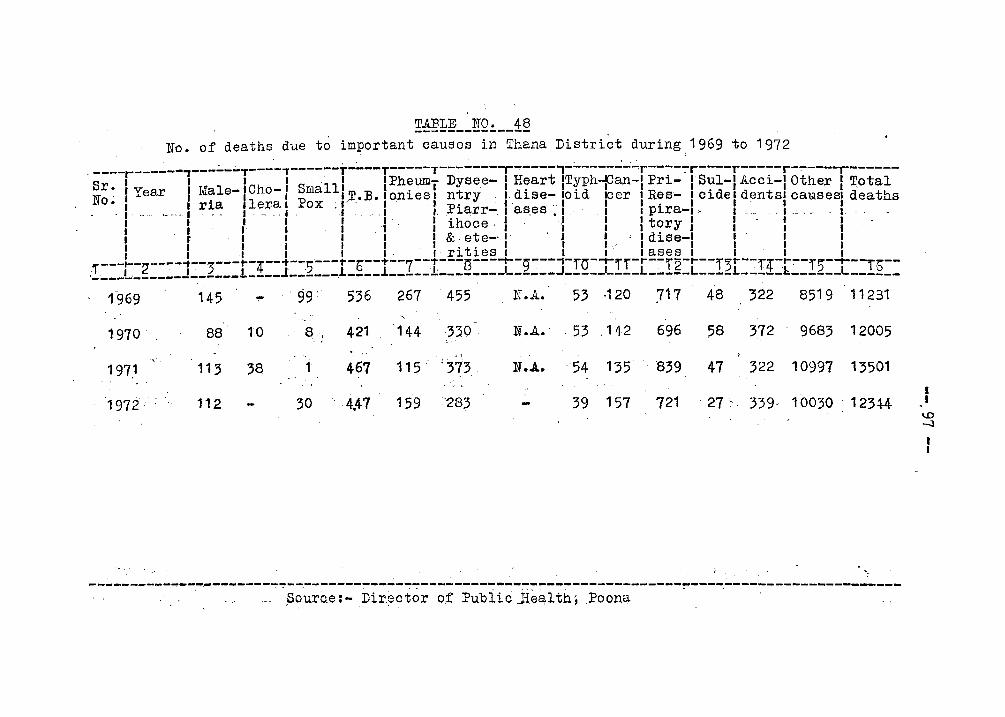
~!!!f __ !Q!,~_~~ ~o. o£ deaths due to important causes in Thana District.during 1969 to 1972
, -~--'----':'--'---~--T----i------T-~--T---,--T-------""'-----,-;..----~-'..;,r----':"r----r-----r-~---_r------Sr I • J ",' 1 IPheum- Dysee- I Heart ITyph-KJan-ll?ri- I Sul-I Acci-I Other 1 Total No ~ I Year : male ... :ClhO-1 ~malll..T.B.' anies I, ntry .1 dise- loid leer '. Res- I eidel dentsl causesl deaths . I • ria I erra I .r;ox : I' 'I ,I Pi 1 .. 1 • • I I' 1 1
. . .•. " .• - .. 1 1 ....... 1 .1 . J . I.. ~rr-. J aS,es . J , 1 1 pJ.ra-1 > 1 . I." . - .. I
I I : 1 I ./ . 1 ihoce· II I I tory 1 I ' I I I r J 1 I' I I &. ete-' I J I J I dise-I J I • I I 1 I I J,. 1 •• J I 1,- 1 1 1 1 1 I' 1 ·1 1 1 1 . I' rJ. tJ.es 1 I I I sses J I . I 1
,f.---t--2--':"--t"':'-3---t--~-""--,5---1"-b--T--7--.":-~-B----r-9'",:,--;-.rO-""t-'I"'I"-t"-~'I"2-t"--'I";t"--::f4-:.t":--'I"5-""t-""lb--.~ ___ L ____ ~_J ______ ~ __ ~_~ __ ~_~_~ __ ~_L _____ ~--_~~ ___ L_~-__ J ____ ~_~_L_--_-L-_--L~~~-~L-----~------
, •. 1'969 l' 45 .... ,:' 9'9':: 536 267 -- 455 '. N .A. 53 ·120' J17 48' '322 851 9 11231 " ' ..
1970 . 88 10 " ~'" 421 144 ':r30, N ~.A.' 53 ,142 696 58 3.72 9683 12005 -.", , , ~ \ .
',,' . 197,1 , 113 35 1 467 115' 1'37'3 N.A. '54 1;5 839 47 322 10997 13501
1972':: : 112 30 ,4.47 15'9 ~28' 3,9 '. 157 721 27::· 33.9- 10030 1234-4 ..0 -J
I I
~:.'" ~ .. ~: . :- '.: ", -: ---~---""-~--~-"'.-----""'!~~-~ .. -~~----~-----:~----------------------------------------------------~---
,', - . . .So.Ul'.ae:- Dir.~ctor ofPubiic.jiea,lth,~,Poon~ - . ,.,
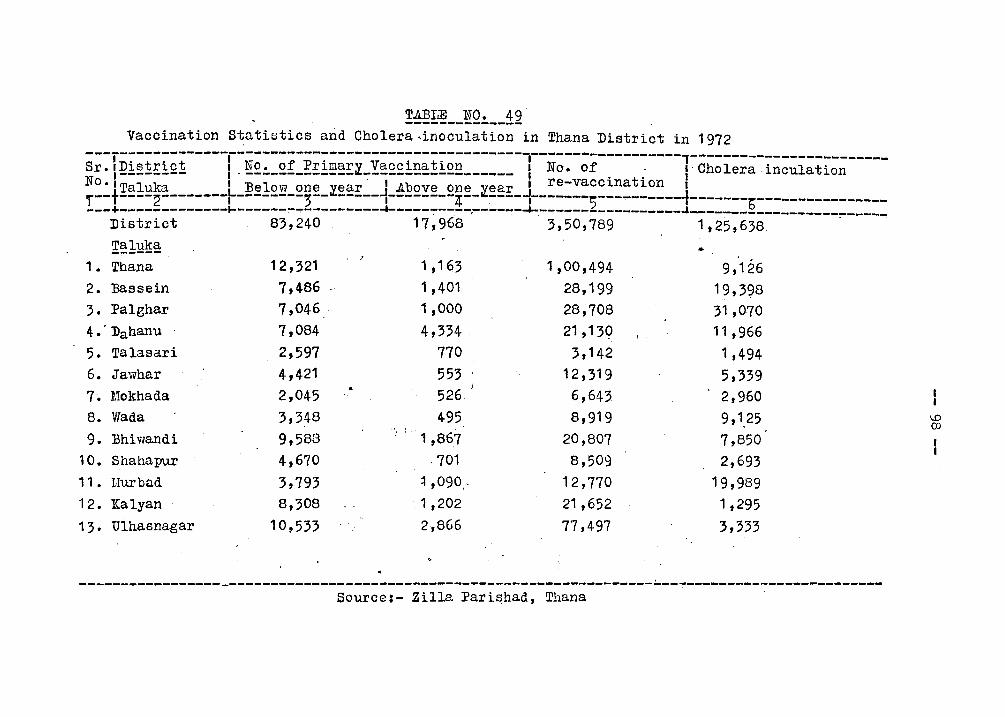
!~~ __ !i!Q!. __ 12 Vaccination Statistics and Cholera ",inoculation in Thana District in 1972
---r-------------r------~---------------------------I------------------1------------------------Sr·I~};~!Ei£! I "li£!._£:L!:E!~~E;y":"y~££};!!~!};££------ I No. of. : I' Cholerainculation
~~:+~~1~~~-------~-~~1£~-£3~-;y~~E--~-~~£Y~-2~~-;y~~E-~--:::~:~:=~:~=~~--1-------b-------------------~-------------~------~~---------~-----~---~----":"-~~-------------____ J _______________________ _
District 83,240 17,968 3,50,789 1,25,638 -Taluka • ------
1. ~hana 12,321 ?
1,163 1,00,494 9,126 2. Bassein 7,486 - 1,401 28,199 19,3~8
3. Palghar 7,046 1,000 28,708 31 ,070 4." Dahanu 7,084 4,334 21,139 11,966 5. Talasari 2,597 770 3,142 1,494 6. Jawhar 4,421 553 12,319 5,339 7. Mokhada 2,045 526 6,643 2,960 8. Wada 3,348 495 8,919 9,1.25 ~
OJ
9. Bhiwandi 9,588 ' " 1,867 20,807 7,850 I
10. Shahapur 4,670 ,701 8,509 2,693 I
11. Uurbad 3,793 ~ ,ogo,- 12,770 19,989 12. Kalyan 8,308 1,202 21 ,652 1,295
13· Ulhasnagar 10,533 2,866 77,497 ;,333
-------------------------------------------------------------------------------------------------Source:- Zilla Parishad, Thana
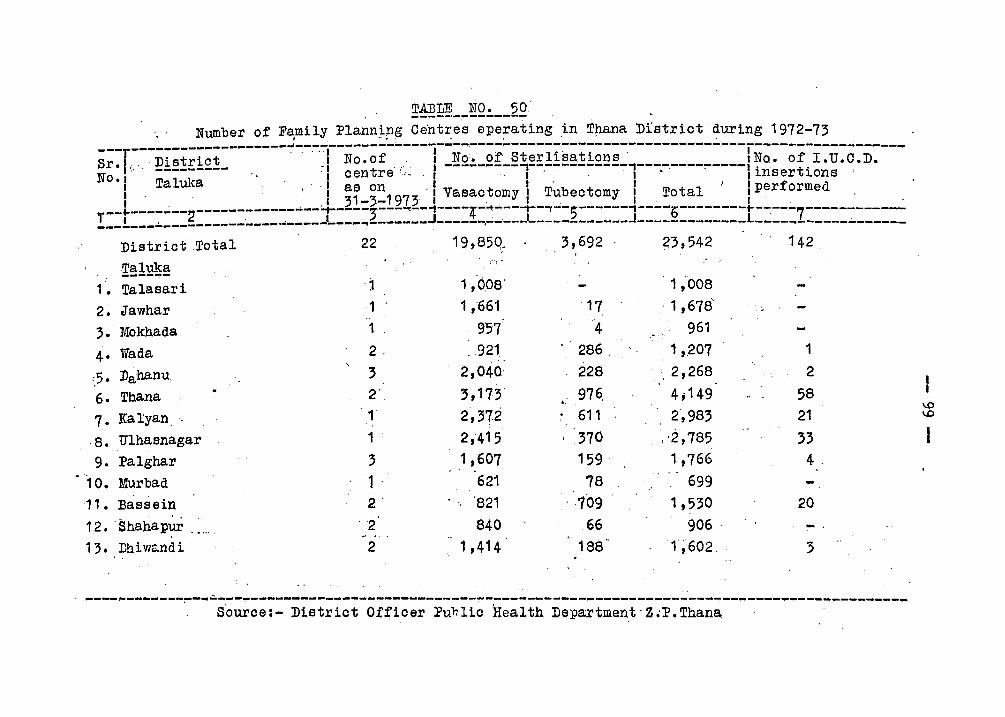
~~~ __ !Q!. __ 2Q , Number of F~mily Plann~ng Centres operating in T~ana Dlstrict~Uring 1972-73
-------------------·----~-~-.------~----I-~--~---~------~---------------------------------~------sr • ./.:, , ~!~!!:!£:L ~ I No. of,. I _!Q!._2f'_~~~E1!~~.!!2~~-_.--------:-----! ~o. of. 1. U.C .D. NO.1 T lul I centre '/" , I ,'. ," I ~nsert~ons '
, a i:a . . I as on' J' I I J P f d J _ " ' J ' J Vasactomy I Tubectomy I Total I er orme , , ' "I 31-3-1973 I . I, ,I I, . ,.,..-... -------2------.---------....... ----3'----.:---1----4-........ --"1---:--:-5-------.----'5--------t---·---7-----------___ i ___ ~ ______________ M ____ J ____ ~-------J-----~-~---L-__________ J _____________ L _____ ------~ _____ _
District Total 22 19,85Q. 3,692 ~3,542 142 " . '
Taluka (":.
------1 • Talasari '1 1 ,0.08' 1,008
2. Jawhar 1 1 ,"661 17 . 1,678' 1 9'57 4 961 . '. 3. Molchada 2 . ,921 286, 1,207 1
, ' 4· Wada
',,5. Da:hanu ,3 2,040 228 . , 2 268 , , 2
2' 3,173 976, 4;149 58 ., 1 2,372 611 2,983 21
\.0 \.0
6. Thana
7. Kalyan,
8. Ulhasnagar 1 2,415 370 ,-2,785 33
9. Palghar 3 1,607 159 1,766 4, . ,
'10. Murbad 1 . 621 78 699 11. Bassein 2' '821 709 1,530 20
12.' Shahapur ,,~,_" , '2 ' 840 ,66 906 . - . ..
13. Dhiwandi 2 1,414 188 .
'1';602 3
. . " . ----,..-------:---~--,-------"""----------------------~--------:----------------------------... --------------Source:- District Officer Public Health Department-Z.P.Thana
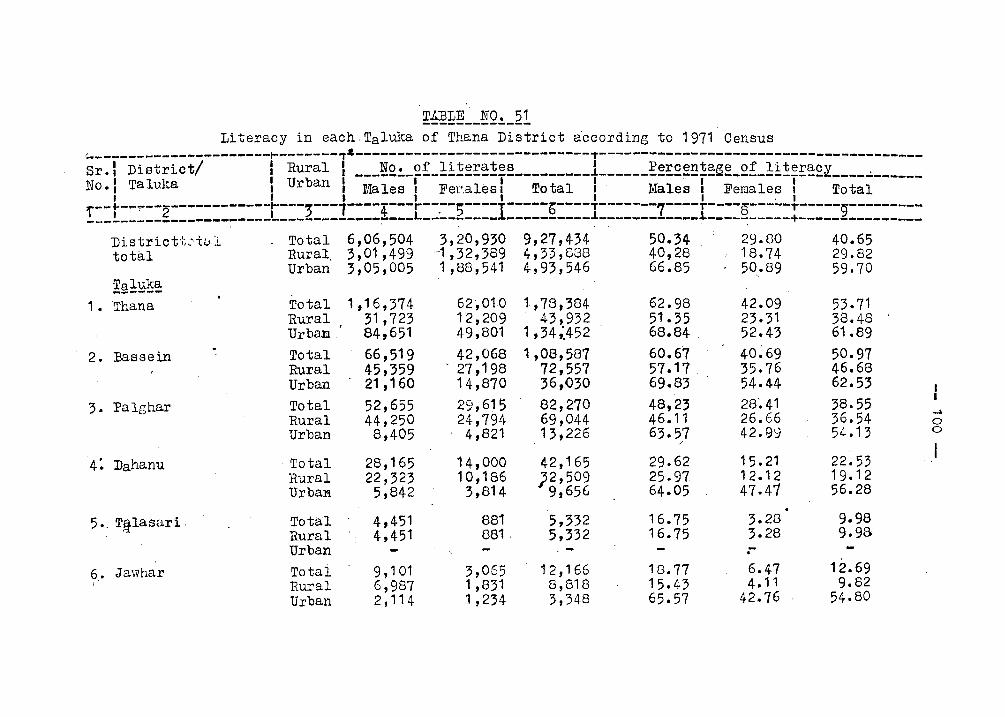
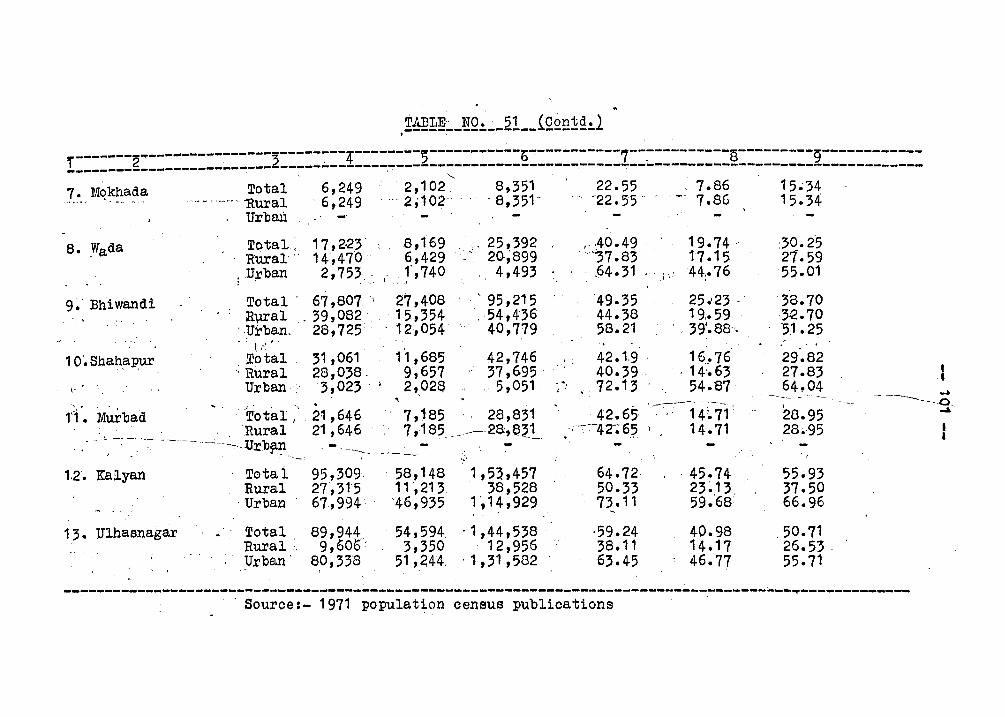
--------~---------------~--------4--------;-----------b~----------7------------8---------9------------f 2 '_~ _____ ~ __ ------------------------------------~-------------------------------------------------------- , . "'-
Total 6,249 2,102 8,351 ,.--.---.- "Rural . 6,249 2;102 " ., '8,351-
UrbaJi
8. :Wada Total. .: 17,2-23 ' 8,169 ' 25,392 Rural" 14,47'0 ' 6,429 ' . - 20;899 .
! ,U,rban 2,753, ' 1',740 4,493 , , "
9.' Bhiwandi Total' 67,807. " 27,408 ' ' 95,215 R'\lXal _ 39,082' 15,354 ,54,436
, ,Ut'ban, 28,725 . 12,054 40,779 I.'
f1,685 10'. Sbanallur , ;Total. 31 ,061 42,746 . Rural 28,038. 9,657 37,695 -~,
22.55 ", '22.5'5'
''',40.49 ' ' ",7.83 , .. ,64.31 ,
49.35 44.38 58.21
42.1.9 ' 40.39 '
. ,', j '"
, 7.86 -, 7.86
19.74 " 17.15 44 .• 76
25.'23 . 19,.59
. 39'.88'"
16,.76 . 14'.63
15~34 15.34
:30.·2'5 21.59 5~.01
38.70 3-2.70 '5,1.25
29.82 27.83
Urban 3,023 .. 2',02S ·5,051 72.13 54.87 64~04 I' ---------.. ~ ~ -- - -" . -----.---~ . -0 .
f1'. " . 42.65
, Murbad Total, 21,646 7,185 28,831 ,. 14;.71' 28.95 ~
, ' Rural 21,646 7, 185 _<~ 28,e~'!. :~T.6? :, 14.71 28.95 , . - -'-,~ ~:~, ·~--------~-.urb?_~
--------- ::1 "----:
1.2. Ka!.lyan Totai 95,309 ' 58,148 1,53,457 64.72 45.74 55.93 Rural 27,315 11 ',213. 38,528 50.33 23~.13_ 37.50
, Urban 67,994 "46,935 1 ',14,929 73.11 59.68 66.96
13. Ulhasnagar Total 89,944 54,594 '1,44,538' ·59.24 40.98 ,50.71 Rural 9,606: 3,350 12,956 38.11 14.17 26.53 ' Urban 80,338 51 , ~44, ' 1,31 ,582 63.45 46.77 55.71
-------------------------------~------------------------------------.-------------------~-------------, Source:- 1971 population census publications
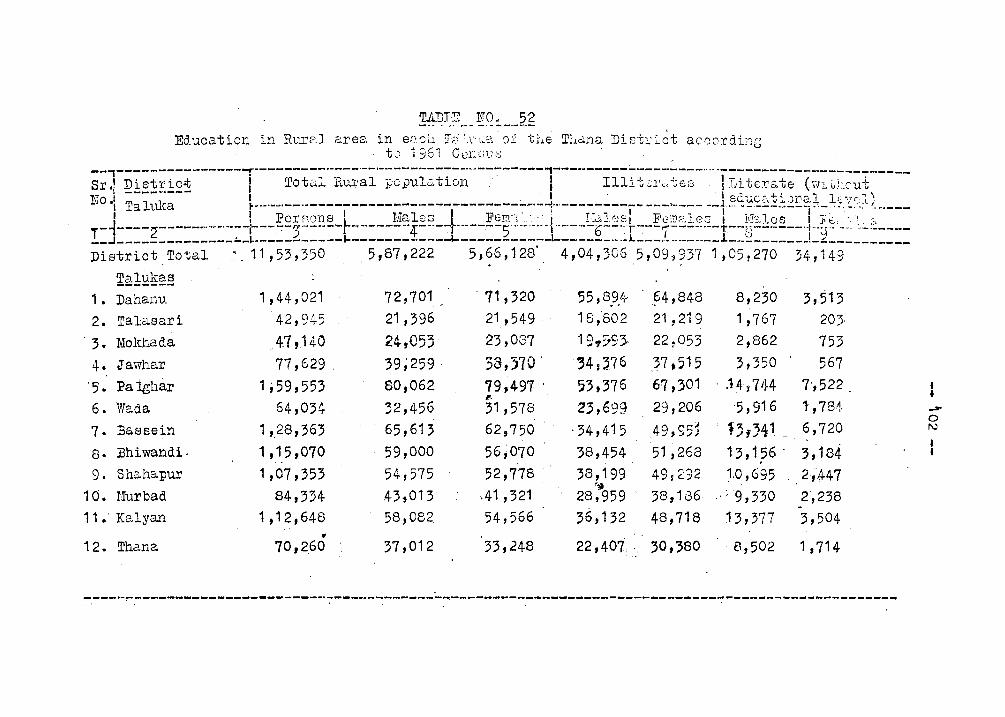
~~"Q~;: .. _ ~q~_._~E~ Ea.ucatiol1 in R1..1XEl area. in e!:.sl.l Tc51x·id or the Thdna Did:c'ict according
to 1961 Gel:,,1);:;
--,---------------..,..._------_._----_._---------_ ... _-------,--_._-----_._------_ ..... _-----------.... _---------Sr.! Distric:t il Totc:;.l P .. u.ral j;;c.t?ulc.tL)l1 " I lIb Lr0:'.::s3 I I~it8:t::o.te (vn. ~).cui
I ----•.• --- -I' . I 0 +-' , No) I' 8QUC&~1)nal level' I Ta luka ~-.-.--.--.--------------------------_:_~-_l ... ---------- ---,---- --1'" --.---... --•.. '- ", . ' .. ", I. -.---
I I Pcr"'OI1S I 1,1a10 8 ~ Fern"! -"c'..1· T,",' '-''''I' Fl:~m::11e'" I l·'r'·' 1 0'" I ~,,~ '.".' _J I. .. L j.L v -' .. f • - - J,.\,A. -- ..... >,., ~-',~ I..... '--' 0 ..r '- . " T-'----2--------"'--r--,-:-3-------r' --.---- -4--·--··----'-5· ..... ' .. - 1··-··----6""-··r-:--7·----··--'t-~·8 -~----'i .. ~ ... ~ _. ~.:..::.----__ .J ______________ .:.._l-___________ I-_____ ---.----'------------.1-------.... L ___ ..... _ .• _ .•. _1_. _________ ._~ _________ _
District,Total ,~.11,53,350 5,87,222 5,~6,128' 4,04,306 5,09,?3'7 1,05,270 34,149
~~1~t~.§ 1 • Dahanu 1,44,021 72,701 71,320 55,8,9J ~4,848 8,230 3,513 :2. Tal:asari 42,945 21,396 ' 21,549 18,802 21,219 1,767 203> 3. Mokhada .47,14-0 24-,055 23,037 19,:;f93- 22:053 2,862 753 4. Jawl1ar 77,629 . 39;259, ,3,:)70 . 34J376 ,37,515 3,350 567
"5. Palghar 1;59,553 60,062 '79,497 . 53,376 67,301 . .14y 7/~4 7',522 . " 6. Wada 64,034- 32,456 31,578, 23,699 29,206 5,916 r ,781·
7. B6.ssein 1,.28,363 65,613 62,750 ·34,415 49,951 'f),)41 _ 6,720 . 8· Bhiwandi- 1,15,070 59,000 56,070 38,454 51 ,268 13,1?6 . 3,184 9. Shahapur 1,07,353 54,575 52,778 38,199 49 s 292 1.0,695 2,447
10. Uurbad 84,334 43,013 ,41 ,321 ..,
28,959 38,186 .' ~9,330 2,238 -11." Kalyan 1,12,646 58,082, 54,566 36,132 48,718 13,377 3,504
• 12. Thana 70,260 37,012 33,248 22,407 .. 30,380 8,502 1,714
-----~-----------------------7----------~---------------------------------------------------------
I • -0 N
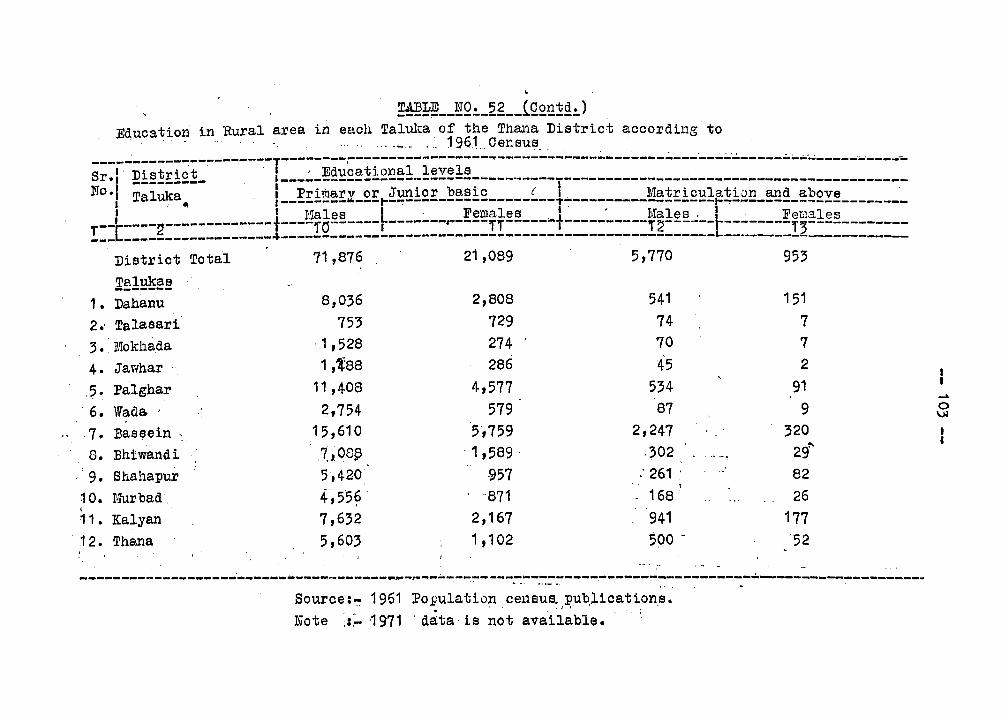
~~ __ ~Q~_2g __ t~£B~2~) , Education in Rural area in each Taluka of the Thana District according to
.... __ .. ~ 1961., Census. ' .. ----...;------~--~-------T--------!------------------,.--------~---~----.;.--.:..------;.:..:.-----.;.----------------Sr .. i ' ~i~!!:l£:L 1 ___ .:._!~~£~!i2B~1._1~Y~!~--___ ·~ ____ T ______________ "; __ ------------------------NO.
1 Taluka., . 1 __ ~!:i!!!!!!:;L2!: .... i[~!2!:-~~~i£-----~--+----------~~!!:i£~!~!i2!L~2_!!:~2Y~ _______ _
I I Males L . Females 1 . , Males. It FeLlales .--1 ----2-------------t----fO------I-------r----rr-----~I----------r2------ --------r~--------------[------------------~--------~------------------------------------------- --.-------~------------
District Total 71,876 21,089 5,770 953 Talukas -------
1 • Dahanu 8,036 2,808 541 151
2.' Talaeari 753 729 74 7
3. Mokhada 1,528 274 70 7
4. Jawhar 1,~88 286 45 2
.5. Palghar 11,408 4,577 534 91 , 6. Wads. ' 2,754 579 87 9 ,7. :Bas~ein , 15,610 5,759 2,247 320 s. Bh1wandi ,7", 08~ . 1,589 . ,302 29~
. 9. Shahapur 5,420 ·957 : 261 ' 82 1O. Murbad. 4, 5'5~ '871 - 168 26 I
11 • Kalyan 7,632 2,167 941 177 12. Thana 5,603 1,102 500 - '52
--------------------------.----------~-~----~~~---~~--~~~----~-----------------~--------------------.. Source:~ 1961 POf,ulation cel1Sus. pub,lications.
4 " , • ,J r , ,
Note ;:~ ,1971 . data is not available.
...... 0 ~
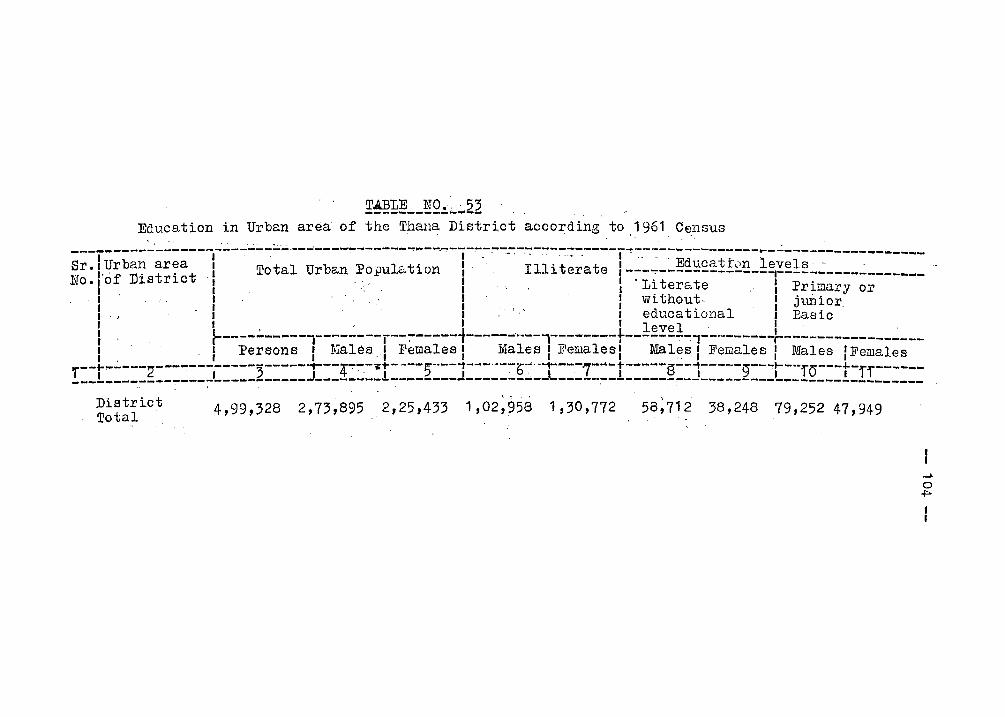
TA:BLE NO.: 53 ----------_ ... _-Education in Urban area of the .Thana District accor;ding to .1961 Census
, . -. ". "-" . ----------------------------------------~,...-~.~---~-~-:---,-----------,~.---------~------~-------------------Sr I Urban area I . I .' .. . . ..... ," ... Educatt,:>n levels' -. ",.. '.' .1 Total Urban Population, Illiterate ,---..,.--------------,---------________ _
N°"l of DlStrlct 1 . .... I I . L~ terate I Primary 01'
'1 I I Wl thout· , j1.U1ior I I . , .. ':' ,educational I Basic , 1, < '. ' leve 1 I' . I·. . 1-----------l--------.--:------1----.,-··---.--------r-------~1--------_r-----------------" .' Persons I Males. Females' Males.I'.Females l, Male.s,'Females', Males ,'Females I , ,. " ...
--f--.:.---2--;..~--------3-----"1---4-:-~-·r-·---;··--1---··--b·--T---7- .... -r-----a--i-----g---j-·-fo---t-ff------! __ L _____________ '-__________ J _________________________ ---------.. ---------------------------------------r " • •
District Total
.. 4,99,328 2,73,8952,25,433 1,02,958 1,30,772 58;712 38,248 79,252 47,949
..... o ~ , ,
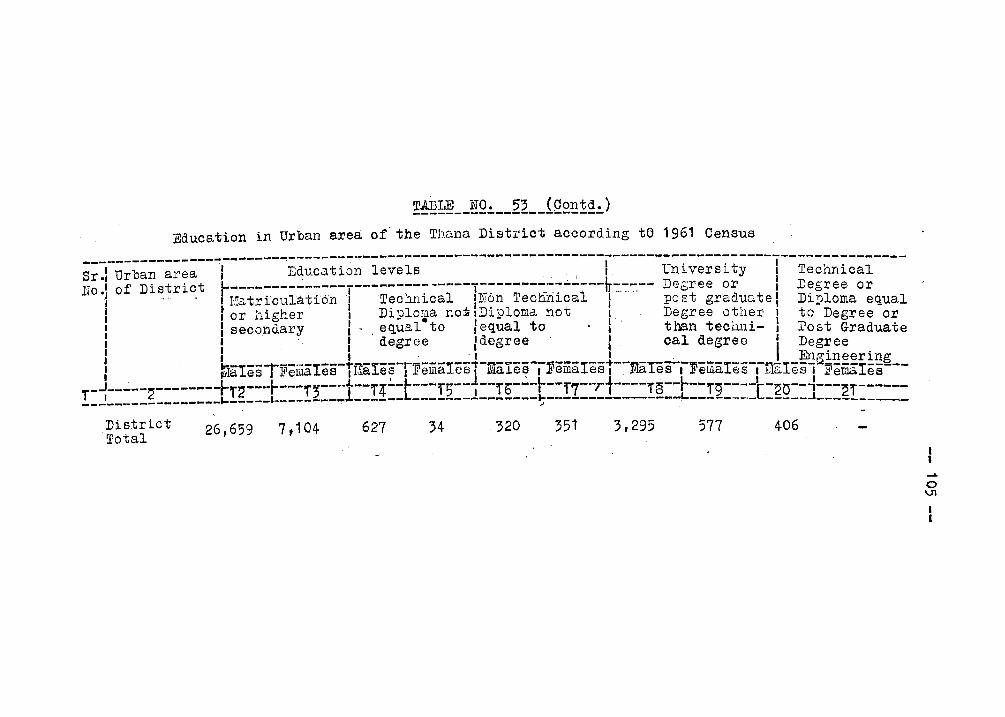
~~HLJ~Q!. __ 2~ __ £Q2~!~!. ) Education in Urban area of' the Th.a.na Dist:rict according te 1961 Census
S;:rU;b~~-;;;;--~'----~--~E~~~~ti~~-i;;;i;--------------~~--~---i.------u~i;;;;it;---l--T;~~i~;i----Iro" of District I------'---... -----T--------:-'-----T-:-:----"':.-::--~---~·:::-::-- J)egree or I Degree, or
J . ", . I }!I.::.trlculati'o'n l 'Tec!:lnJ.cal INon TecMJ.cal I post graduate I Diploma equal I t or 'higher ': Diploma noi IDiploma not I' Degree other I to Degree or I I secondary I . , equal·to Jequal to . than teci.ll1i- I Post Graduate I I ... " I degree Idegree' I cal degreQ I Degree I k- --T--.--I---~n-I---~~---!-~~-n-~----~---I--+--n~~~-~--_I ____ ~I-~~ineering I . ,"yIales Fema es I l,la e~ I .!I'ema es 1 ruaJ.e~ I ieraa es I ,~'J.i:ues I .ceUla. as I J.i.l6. es, Females---
!:j:::::~::::::::t!~:::t:::!2:::1::!!::t:::!2::l::!~:::~::!!::cj::::!~::t::!~::::[:~g::]:=:~!=::::: District Total.
26,659 7,104 627 34 ,320 351 3,295 577 406
I
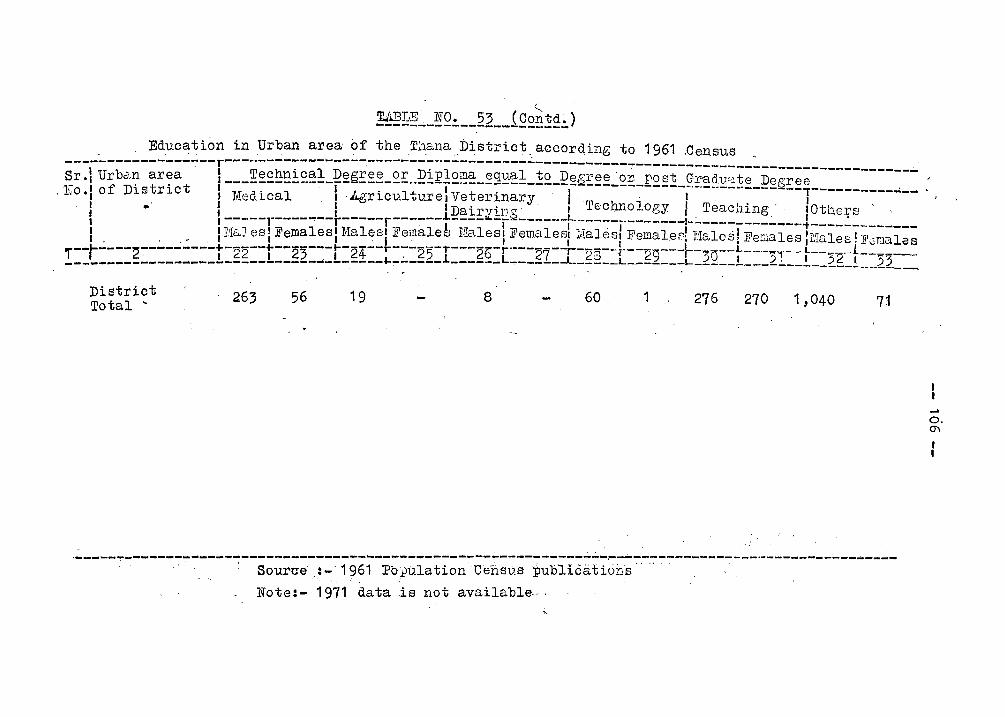
----"--------------r----------------------·------------------------------_______________________________ ,.;., Sr.\ Urba.n area 1---!~~~!!~£~~J~~ff2E~~-~E--;Q~R:!£~~_~9,:!:~~_!£_~~~E~~~£E_R£~!_gE'~~~~~e Degree "
Education in Urban area of the Thana District,according to 1961 ,Census
,l'~o·1 of District I Medical I .Agriculturelveterinary I ' " , ~------1-------~-----, .. ' I ' , IDal.-r'i110" I Technology I Teacill.ng 10thers " , f I l. Y..- '2 /... , • I '-----r-------r-----r------ ---- -r -----~----~---------~-------------~~------------I . _ I !'l£..J.esl Femalesl Malesl Feillale~ IKa.lesl Femalesl Iilales! Female81 dalesl Fenales I 118.1e 6 ! ]';:;nalas
--1-":--- ~---..;----+·-22--+--23---:_-24--~--:--25-1"---2b-r'---27--r-28--r--2g--+·-3D--~-···-3:- -t--32' .. t--=----! __ , _____ g _________ !. _____ L _____ -' _______ '-:-_____ l ______ L-------'--:----L-------:-l---------____________ .... 2.2. __
District Total ~
263 56 19 8 60 1 276 270 1,040
- - ---------~----.;.------------------.-----------------·--------------------~--s~~~;~~:-:-196;--;~~~i~ti~n -Den sus pub 1 ida t i~n:s " " "
Note:- 1971 data ,is not available·,
.... O. 0'\
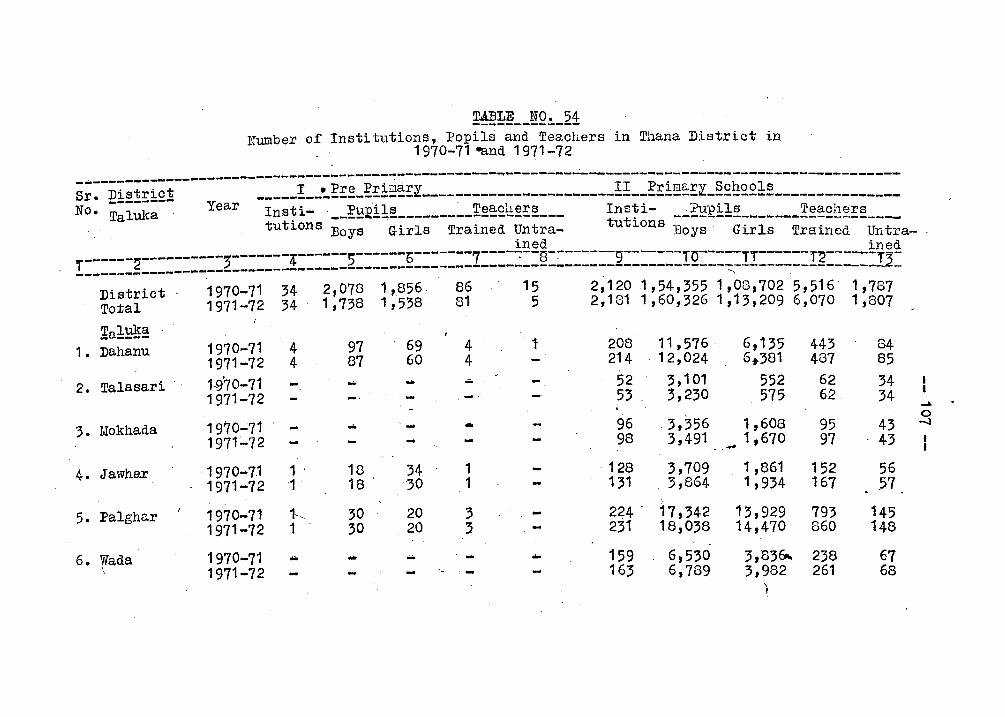
~!!~ __ !!Q!._29; Number of Institutions, Popils and Teachers in Thana District in
1970-71 -and 1971-72
s;:-Di;t;i~i-------~--=====!==~~~;=~!1~~~i======================_!!==~~1;~El=~S~£~!;=============== No. T;i~~~- Year Insti~ __ ~~lii1~ _______ ~-±:~~£~~;:~___ InElti- _~:f!:!p~ls Teachers
t t' . . t t· - -------------~.-----u ~ons Boys Girls Trained Untra- u ~ons Boys' Girls Trained Untra-.
!::::::g:::::::~::2:::::::!::::::2::::::~:::::::7:::=:=:Q::=::===~::==:::IQ:==~=!!:===::I~:::==ir~= District 1970-71 34 2,078 1,856 86 15 2,120 1,54,355 1,08,702 5,516' 1,787 Total 1971-72 34 1,738 1,538' 81 5 2,1811,60,3261,13,209 6,070 1,807
!a1~~ 1 • Dahanu 1970-71 4 97 69 4
1971-72 4 87 60 4 1 208 11,576 6,135 443 84
214 . 12,024 6t 381 487 85
2. Talasari 1-970-71 .... .. ... 1971-72 -
52 3,101 552 62 34 53 ),230 515 62. 34
~
3. lIokl1ada 1970"':71 ... ... .. 1971~72 - 96 . 3,356 1,608
0 95 43 -J
98 3,491 1,670 97 43 I .. ,~ I
4. Jawhar 1970-71 1 ' 18 34 1 1971-72 '1 18 . 30 1
·128 3,709 1 ,861 152 56 131 3,864 1,934 161 ,57
5. Palghar 1970-71 1" 30 20 ; 1971-72 1 ;0 20 ~
224 . 17,342 13,929 793 145 231 18,038 14,470 860 148
6. Wada 1970-71 .... .. .... .... \ 1971-72
159 6,530 3,83&" 238 67 163 6,789 3,982 261 68
.. \ ,
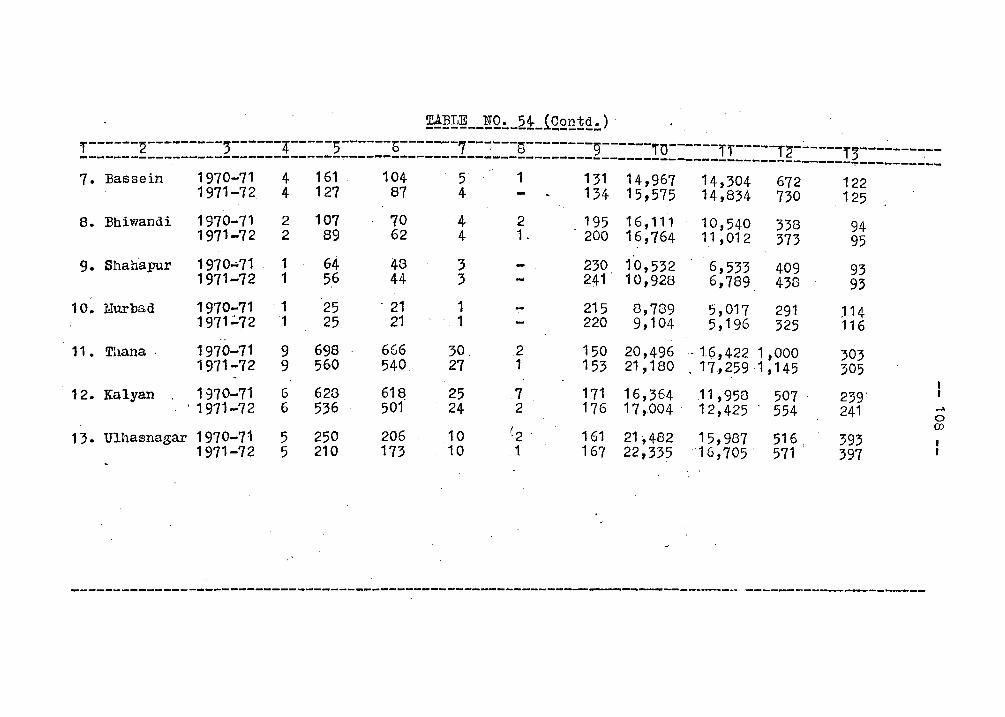
~~m __ ~Q~_21_iQ£~!£~) . r------~---·-----;------4-----5------b-------7------B--------g------ro------;r-----· . . r~------r3-------~-~ -------------------------------~------------------------------------------------------------~----------7. l3assein 1970-71 4 161 104 5 1 131 14,967 14,304 672 122
1971-72 4 127 87 4 134 15,575 14,834 730 125
8. Bhiwandi 1970-71 2 107 70 ,4 2 195 16,111 10,540 338 94 1971-72 2 89 62 4 1. 200 16,764 11 ,012 373 95
9. Shahapur 1970-71 1 64 43 3 230 10,532 6,533 409 93 1971-72 1 56 44 3 - 241 . 10,928 6,.189 438 93
10. l,Iurbad 1970-71 . 1 25 . 21 1 215 8,789 5,017 291 .114 1971'::'72 1 25 21 , 1 220 9,104 5,196 325 116
.,
11 • Thana, 1970-71 9 698 6G6 30, .2 150 20,496 .. t(5,422 1,000 303 1971-72 9 560 540 27 1 153 21,180 . 17,259 1,145 305 ,.
12. Kalyan 1970-71 6 623 61~ 25 7 171 16,364 .11,958 507 ' 239' I 1971-72 6 536 501 24 2 176 17,.004 . 12,425 554 241 ....
0
(2 . en 1 3. Ulhasnagar 1970-71 5 250 206 10 161 21,482 15,987 §~~ I
393 1971-72 5 210 173 10 .1 167 22,335 16,705' 397
-------------------------------------------------------------------------------_._---------------------
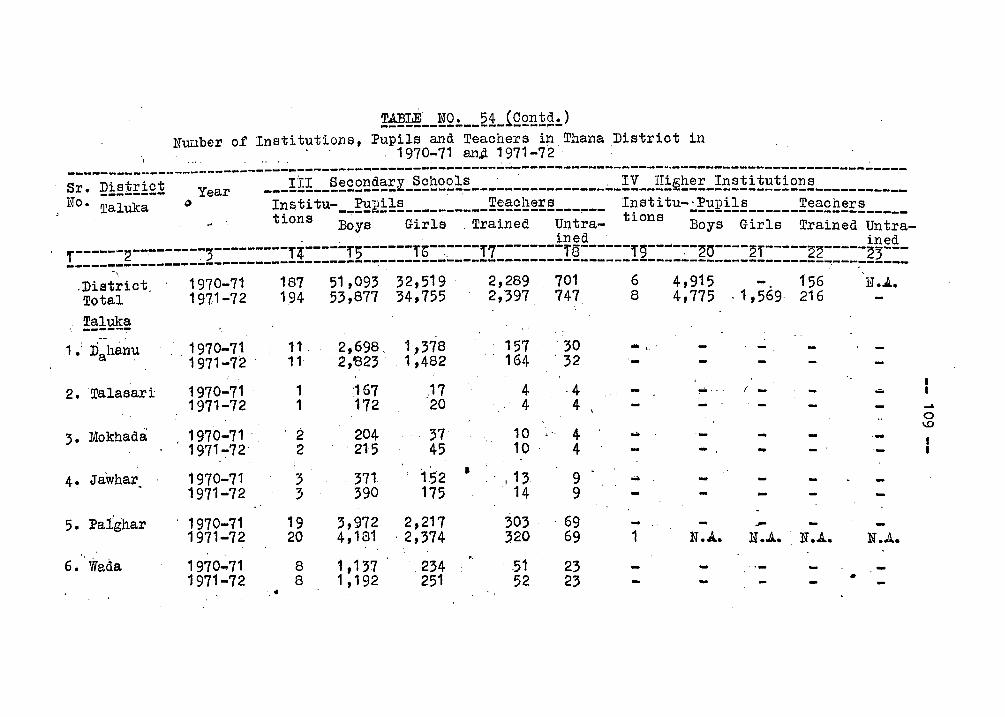
~!!~ __ !,!Q!. __ 2~j.QQ;!~g!. ) NUl:J.ber o:f Institutions, Pupils and Teachers in. Thana District in
1970-71 an~ 1971-72 . .. -------------------------------------------------------------------------.---~------------------------Sr. District Year ___ !~! __ ~~£2~~~~~_~£~22~~ ___ ~_~ __________ ~_!y __ g!~~~~_!~~!!!~!!2~~ __________ _ No. T;itik;-- 0 Institu-__ ~~~!1~ __________ ~~~£~~~~______ Institu-~~~R!1~ ______ !~a_ch_er_s
, t . " t· on -- ------lons Boys Girls. Trained Untra- 1 s Boys Girls Trained Untra-'.' . ined . ined
---~--2-~------~;---------T4-----T;------Tb-~----T7--------T8------T9------~O----2f-----22-----~3---!------------------------------------~-----------------~-----------------------------------~---------'\
.District. 1970-71 187 51,095 32,519 2,289 701 6 4,915 . . 156 N.~. Total 1971-72 194 53,877 34,755 2,397 747 8 4,775 .1,569· 216
, Taluka -----~
1 .' Dahanu 1970-71 11 2,698, 1,378 157 30 ... t..'
1971-72 ' 11 . 2,'823 1,482, 164 . 32 -2. Talasari 1970-71 1 '167 .17 4 ·4 ,... ~ . ...
1971-72 1 172 20 4 4 -Mokhada 1970-71 " 2 204 . 37 10 4 5·
... , 971-:-72 2 ' 215 45 10 4 ..
Jawhar 1970-71 3 371 1,52 • , ' I 13 9 4· .-- 1971-72 3 390 175 14 9
5. Palghar ' 1970-71 19 3,972 2,217 303 ·69 -, .-1971-72 20 4,181 . 2,374 3.20 69 1 N.A. N.J;.. N.A. N.J..
6. Wads. , 970 ... 71 8 1 ,1 ?>7 .:2?>4 .. 51 2?> 1971-72 8 1 ,192 251 52 2?> •
" .
~
0 \.0
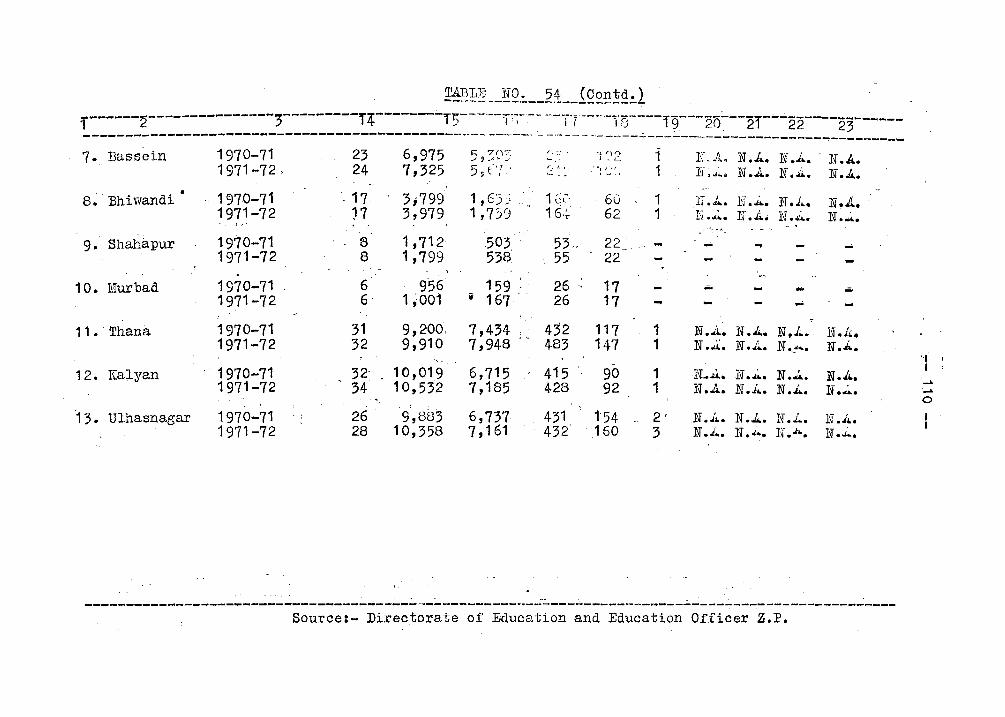
~~~~ --~Q,~ __ 24 __ 129,~~~!.1 f------~---------------j---------,.4-------~'f5---'--'!;~--~ -'-TI-;..-"-T8----1§~--20;..--21- .... -22---23--------------------------------------------------... ~-- -----_. _. -.- - - - --.-.----....:...---------------------...,---------7. Bassein 1970-71 23 6,975 t:; 7(1'-': r, :: 't ~\2 i ILA. N.l... N • .J~. N .A. "'9-·~~_· ~,'
1971-72, 24 7,325 5 ~ f't·· . .: 2 ~ '. ... ~ f~\ :', 1 IL..i... N • .A. N.~. N.J.. • .
8~ Bhiwandi • 1970-71 17 , 3,799 1 ,E).: 1 L;'~' 60 1 IT .1 •• N.A. "- }IT • .i~. N.A. "
16':;" 1971-72 ~7 3,979 1,7)1) 62 1 1J .oIl4. H . .i... N.A. N • ...i... : " ~ .
9· Shahapur 1970-71 8 1,712 503 53. 22 .... .... ... 1971-72 8 1,799 538 55 22
-10. ThIurbad. 1970-71 6 956 159 26 " 17 .- .... ...
1971-72 6 1 ~001 i 167 26 17
11. Thana 1970-71 31 9,200. 7,434 432 117 1 N.,A. N.A. N !i;. •. N .1~. . "
1971-72 32 9,910 7,948 483 147 1 N . .a. N • .I~. lIT ......... N • .k.. '" 'I ,
Kalyan . 1970-71 32 10,019 6,715 415 90 1 ·N .. .u.. 1~.~. N • .J.. N.A. I
12. ,
1971-72 34 10,532 7,185 428 92 1 N.A. -" N .1 ... N • .i... N.'&:\'. . ..... . 0
'13. Ulhasnagar 1970-71 26 9,883 6,737 431 ·1"54 2' N • .1",. N • ..l... If.i.. N • .i~. I
1971-72 28 10,358 7,161 432 160 3 N • .i ... N • .i.~. FA lif • .i... I
~. .
. . . -.. . . . . .. .._. _.... ________________________________________ ~ ___________ .~ ______ M _________________ ~~-~-----------------
Source:- Directorate of Education and Education Officer Z.P.
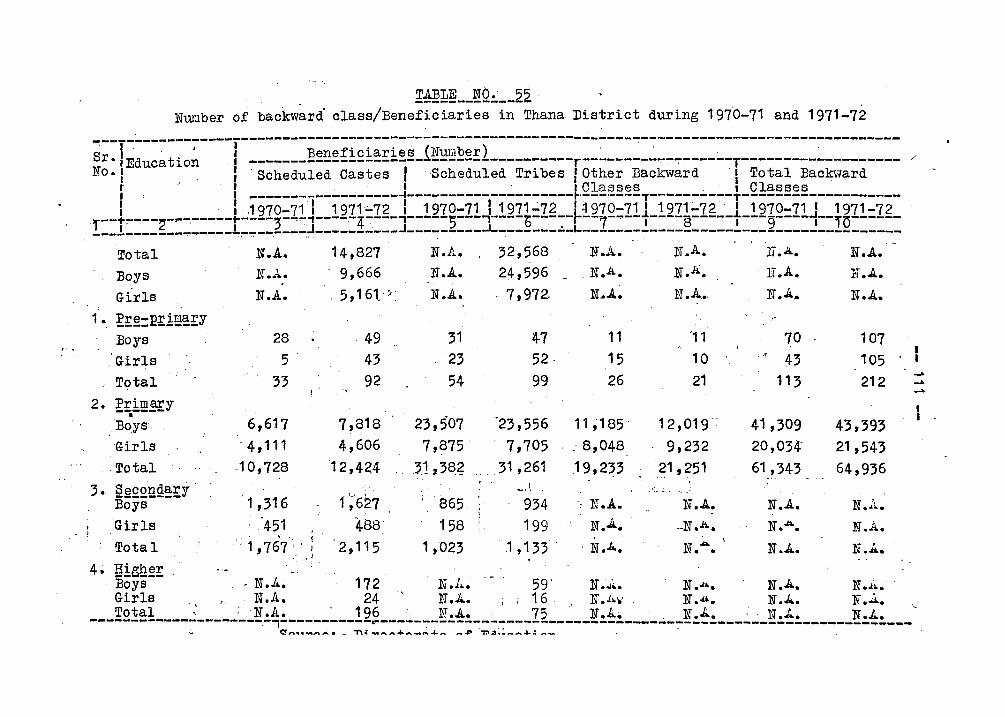
!~H; __ ~Qi __ 22 Nur.tber of backw~rd' class/Beneficiaries in Thana District during 1970-71 and 1971-72
~----~-----~-----r-----------------------------------------------~-------------------------------sr·!Educatio~ , ____ ~--~~£~f!£!~E!~~-l~~~~~El----------r--~-----~~-~------T---------~--------- / NO., I 'Scheduled Castes I ,Scheduled Tribes I Other I3ackward I Total Backward
r I ,I I Classes I Classes I ' I ---------~--------~--------------------~·-------7----------T-------------------, __ !=-___ ~-... -.-----L--121~=Z~~--1~ll=lg-~--121~=:n~.~121t=lg--~:!.2~Q:;11t-121~=lg~-t-12~Q=11i--+511=lg-! __ ! _____________ L=-~-~---~J------~---J---------J-------_~_L _____________________________________ _ Total N.A. 14,827 N.A. 32,568 !-T.A. N.A. Ii.A. U.A. Boys N.A. 9,666 N.A. 24,596 , N.A. N.A. IT.A. i-i • .A..
Girls N.A. . 5,1 61, ;.: N.A. 7,972- N.J. • 1~ • .A. .• N.J.a N.J.. 1. ~;:~=E!lE~!:y
Boys 28 ,49 31 47 11 '11 70 107 , .. , Girls 5 43 23 52· 15 10 .n 43 105
;3 92 54 99 26 21 11; 212 ....
T9tal ..... " .....
2. ~!iE~Y • 23,507 'Boys 6,617 7,818 -2;,556 11 ;185' 12,019 ,. 41,309 43,393 Girls '4,111 4,606 7,875 7,705 : 8,048 9,232 20,034:' 21,543
,Total .10,728 12,424 ,3.1,.38.~ 31,261 19,233 .21,251 61,343 64,936 ;. Secondary' _ • .1 ., -------- 1 , ;1,6 1 ~6~n ; 865 934 N.A. N.J.. N.J.. Boys : N.li..
Girls 451 '488' 158 199 N.J.. .-N .,t;.. N.A. N.A. ':'1,76Y' \
2,115 1,023 .1 ,133 . N.J... N ..... I
Total I N.A. N.J.. . , 4~ g!gh~!:
Boys - N • .t.. 172 N .li-. 59' N • ..t~. N.,h.. N.A. N ... ~. Girls
, . '. N.A. 24 }T .It.. , : 16 N • .Iw N .4 ... N."-.. N • .04. Total ' ; IT.A. - 196 ' l-T • .A.' 75 N.A. ,N • .Ii.. -, N • ..t... N.A.
'-
-------------~------~-I-----------r---------------------------------------------------------------0_ ... _.-...,;.. _ T\': __ ...... __ ...:...l.. __ .s:t '~.3~: __ ..a..: __
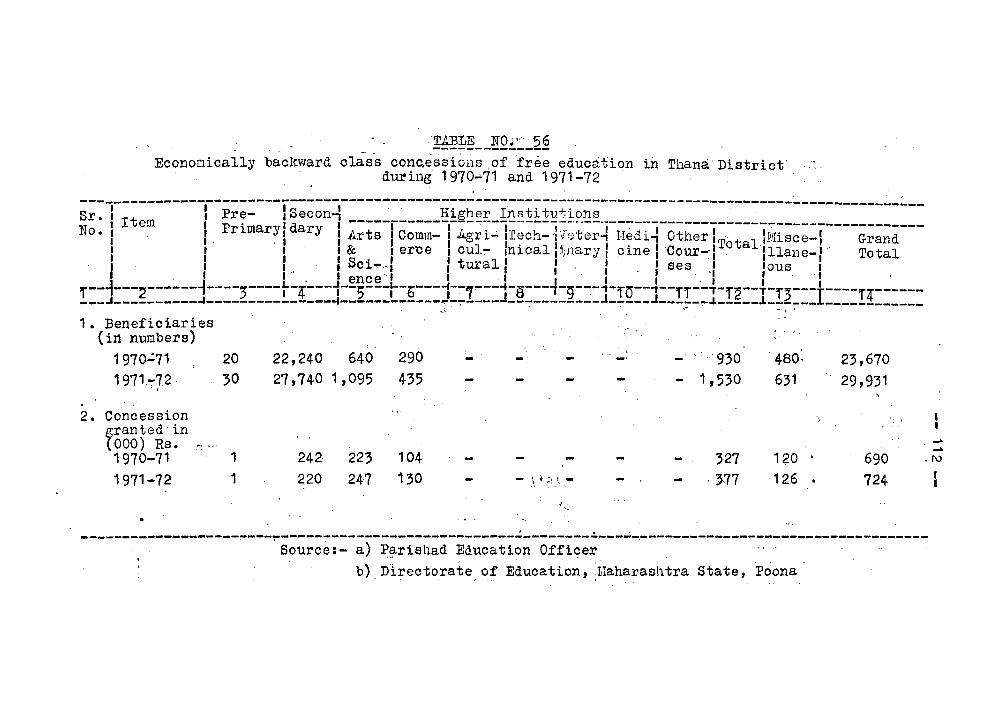
1.
2.
!~~~ __ ~Q~:_2§ Economically backward class conc.essioilsof free education in Thana. District'
during 1970~71 and 1971-72
Beneficiaries (irl numbers)
1970":71 20 22,240 1971-;-7.2, 30 27,740
Concession franted'in
000) Rs. 1970-71 1 242,
1971-72 1 220
640 290 1,095 435
223 104
247 130
-
-, . ;", ~
'\.:
. .'
930 1,530
327 ·317
, 480·
631
1 ~O 126 .
23,670
29,931
; ,
... ... 690 .1\)
724 I I
-------------------~-~~~-----~------------------------------------~-----------------------------------Source:- a) P.?-risllad Education Offiqer b), Directorate. of Education, ;Maharashtra State, Poona
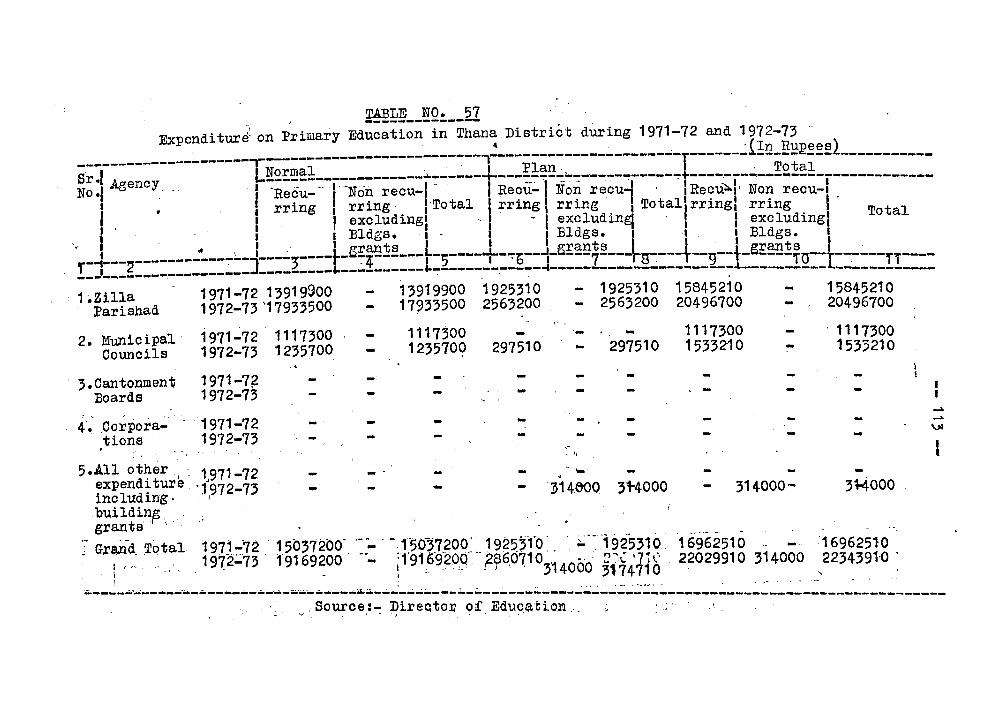
TABLE, NO. 57 Expenditurlon ;rimary Ed~~;ti;;-i;-Th;na District during 1971-72 and 1972-73
---------------------1-------------------------- ~----------------------r------~i!~-E~~~~~l-----------sr.1 A aency !!£!.~~!-------------~------ ----~~~!!-:;;..-:------------t----,---,.;,--~2.!~!--------------No I ~ I· . ". ' -N ' • ' R I N J • I .• .- . I Re?u- I o~ recu-. e~u- o:t;l recu I ' I Re?u"'.::o.l' Non recu-I ,
," I rrlng • rrlng' I'Total rrlng i rrlng I Total l rrlngl rring I • ' I I excluding, - ~ excludinE1 I I excludingl Total 1 'I I Bldgs. I' I BIdgs. -h I I Bldgs. I
. • .. \ I, 1-1 p'rants I I grants I I "'rants I -~---2--------------]----;---- -~~4------L-5----1r-~E--J- ---7--- ----t--g--+-Q----ru--t------r ----!_J __ -_______________ _ ________ ~----------l--------~----~----------------------~ __________ L _______ I ____
: 1~Zilla 1971-72 13919900. 13919900 1925310 - 1925310 15845210 15845210. l'arishad 1.972-73 '1793350.0. 1793350.0. 256320.0 - 2563200. 20.496700. 20496700.
2. Municlpa1.' 1971-72 111730.0. Councils 1972-73 1235700.
3.Cantonment 1971-72 Boards 1972-73
4'.'Corpora-'· "1971-72 tions 1972-73
5 .,All ot~er . I ' 1"971-72 expend7 ture . '1972-73 incIudmg. .!
building '-
1117300. 123570.0. 297510. .. 297510.
,-. '.
, - .. ' . '314,eoO 31-40.00.
1117300 15332"10.
'- 3140.0.0.-
, 1117300 1533210.
3~o.o.o.
grants I
T Gran-d. ~otal 1971-'72 15037200.' '-:,.' - 1"5.0-,720.0.' 192531'0.' '~'-'1925310, 16962510 .. - 16962510. 1972:"'73' 1916920.0. .'- ;f91.b92CQ .. ··~~6(j71o.~~4C' 0..'0.' :?")..: \7~(' 220.29910. ,140.0.0. 2234391,0.'
, ' ' '.I' 3174710. " .---.. -~.-----...... ---.------....... ----------.. .;.-~-'--...;.~---.;...;..:..--.;.---~--- ... ..:.,;.; ......... -.... . . ~- .. -.- _. .
. • C,' " Souroe:~ ~irectol1 of Edu~~'tiQlU,., -:------:-.~--:-------------------------------
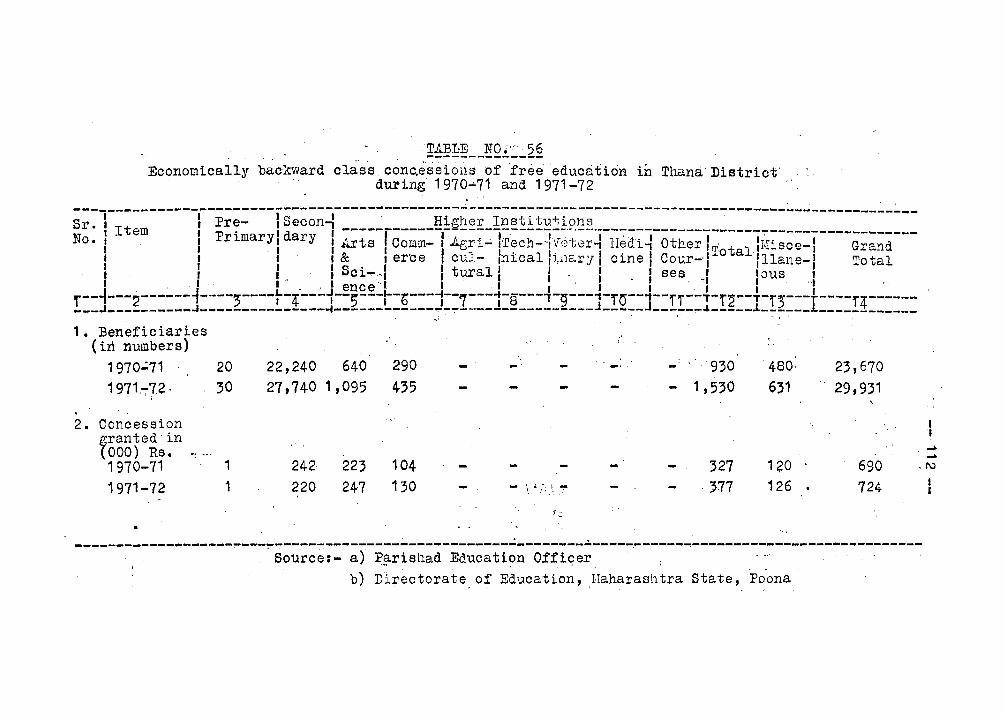
!~I!~ __ ~Qi..:_2§ Economically backward clas's conc.essioils of free education in Thana. District'
during 1970-71 and 1971-72
~;~l-----------f-p;;:---fs;~~~~-----~------Hi~h;;-I~;tit~~i~~;-----------------------~----------~-~--1 Item I . I I -----,------1----,--,----:-----,·,-------:------------------:-------------------
No. I, I :primarYI dary I/..rts I Comm- I 1l.gri':' ,Tech-~ly()ter~ lIedi~ Other I~r t llIVIisce-1 Grand I I I I & I er'Ce I cul- Inical hnary I cine I Cour-' I 0 alllal1e-1 Total
. I· I : " I 8ci-,1 I turall :' I _ I ses _I loua: J .1 I _ ,I ence'l, I ,I I' J I ',I I' 'I '
f--~---2------~--·--3----t-4---~--;---r-b---1--7---1-8---i-9---~-15--~--11--T-r2--T-l;---I----14------___ ~ __________ ~---------------~------------~-":"~-------________ J _____ J ______ ~ _____ ~______ _ __________ _ _ , I· r . ~ , )
1. Beneficiaries (in numbers)
1970':'71 20 22,240 1971~72, 30 27,740
2. Concession franted in
000) Rs. 1970-71 1 242 1971-72 1 220
640 290 1,095 435
223 104 247 130 _ \ ';-:'.-
t..:.
. -'
930 1,530
327 ,377
, 480· 631
120 126 .
23,670 29,931
690 724
. .... .1\)
-------------------~--~~~----~------------------------------------~-----------------------------------Source:- a) P.§l.risllad Education OffiC?er b) ,Directorate of Education, ;Haharashtra State, Poona
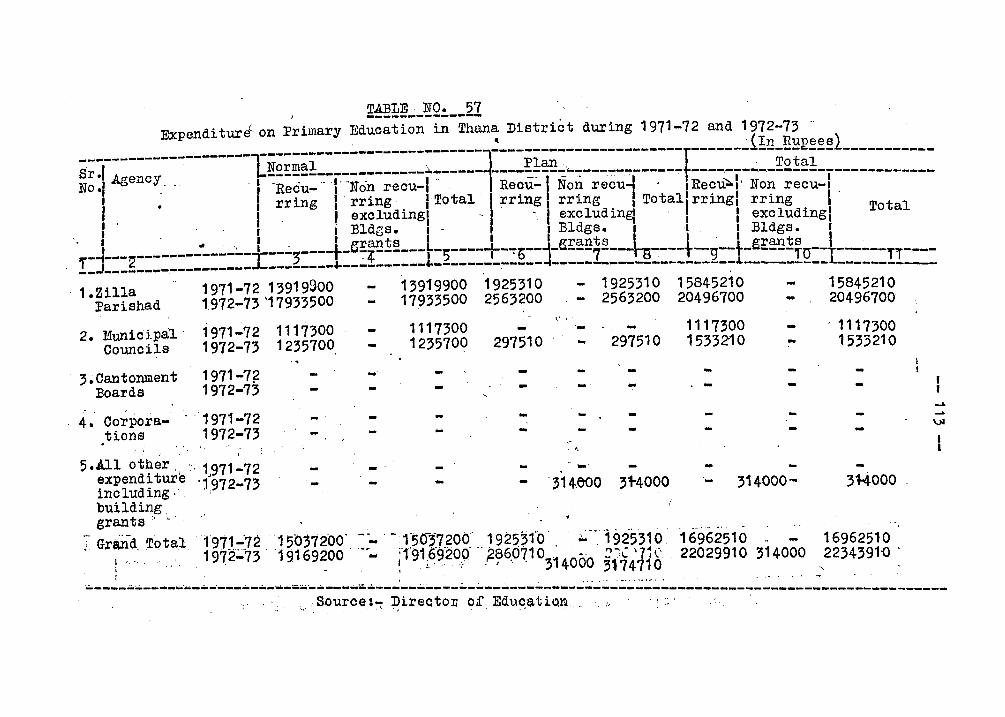
)
Expendi turl on Primary Education in Thana District during 1971-72 and 1972-73 "
-------1--------------------,------ ~--------------------~-T------~~!U-g~E~~~l--- --------------- -- -----Sr .1 Agency !~!:~~!-------------;.,------ ----~~~!!_.:~'7-----~------t----,---~--~21~!--------------No.' .. . 'I 'Recu- ,. I'-No"n recu-I ". ,Recu-l Non recul . IRecu~I' Non recu-!
"
• 'I rring I' rring , I'Total rr1ng rring I Totall'rring! rring I . , ' I, I excluding\ " ~ excludine1 , I excludingl Total I " I I Bldgs.. I - I Bldgs. ~ I I Bldgs. I
, I .. \ I. I rants I I rants I rants I -~---2--------------]----3----t-~-4------LL-;----1r-~b--j-g---7--- ----+--g--+-g----ru--t ------ ----!_J-_---------------- _________ '-__ .:._______ --------,----- ___________________ .L ________ l.. ______ !I __
, 1.Zilla Parishad
, . 1971-72 13919900 13919900 1925310 - 1925310 15845210 15845210 1972-73'17933500 17933500 2563200 - 2563200 20496700 20496700
2. Munic i.pa1.' 1971-72 1117300 Councils 1972-73 1235700
, 3. Cantonment 1971-72 Boards 1972-73
4':Corpora-" "1971-72 tions 1972-73
5 • .4.11 ot~~r I >- 1"971 ~72 expend~ ture '1972 .. 7'3 including,' ' I
building
- '
'-
1117300 1235709 297510 - 297510
" , I.
""",
1117300 15332-10
314000-
, 1117300 1533210
31-4000 '
grants I "
T Gran-d. ,Total I .,," , i I
1971--72 15b372bO' '---' -.1:,03,7,200.: .. 19253fO: . ~:~'1925310 '16962510 .. -. 16962510 1972~'73' 19169200 ". ;191,6920,,~ ,28607103'1400"0" ~X '7i(' 22029910 314000 2234391'0'
• ' J • , 3174710 " .--------~---... --....... -----,-... ----..... --.......... --..;..-'--',.,;.;..;..---.;..-.;..-. . .... " ....... _.... .' . ...- . . ... - -' .
, . " ,Source:- DirectoD of Ed~~;ti~; ... ---------~"':~--------"':'-----------------------~'. . ...... ~ .,' '.
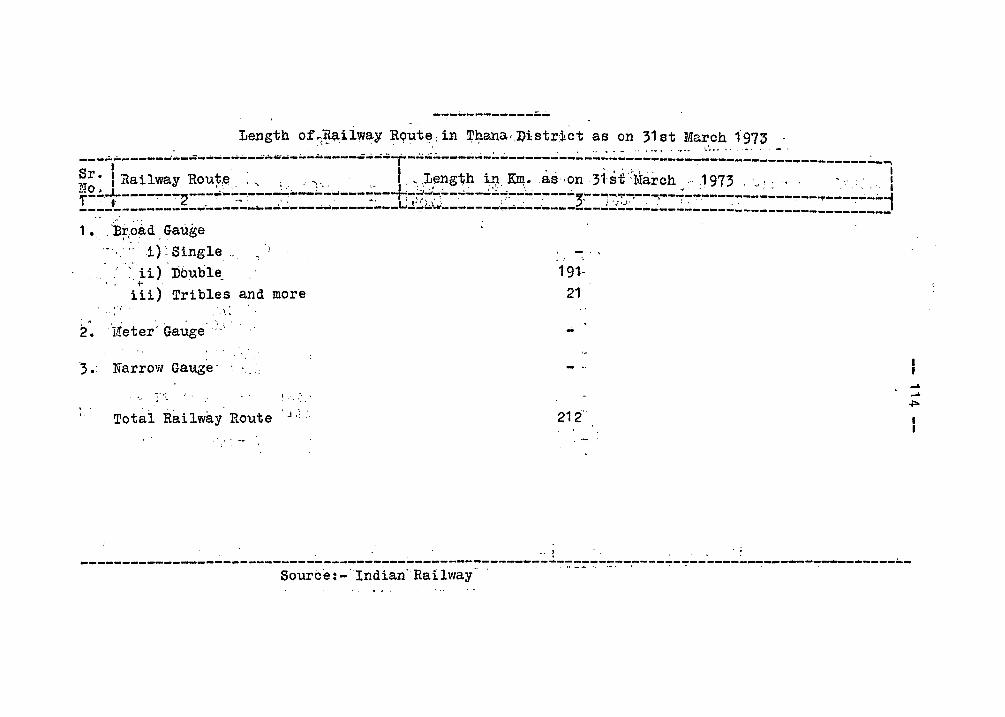
--------------Length of~;~~ilway RQut(il: in 'J:'J:,lana·District as on 31 at March 197:3 , . .... .
---.;..------... :..--......... -.. ---"",..; ...... --.... -----..;.o.; ... -t-.;.;..;;..:.----....;-~..:.--- --...;--:...-::..~.:~"':'::..:.::.-.:: . ..:.-:::.:::-'-.:...:.'-'--:..:.-------_-,;.-... Sr. I· . t' I L th' Km .... 1: •.. ~. . .' •. I ~IO.l.Rallway Rou .. ,e ... ~ i." ',.... ~_,: ;,;.eng ~'. ~~'. ',. as -on 3 st March ,," :1973 . v':-' "', .'. I f--' ----':'"-~·2---':'"-------------... -------r-·· (-~.-------~.~-~-----"' .... -... -":"-.---.-------------------.... ------;..i __ .:.~I~ ______ . ___ ... ~ ___ .::. ____ l~· _______ .:.:.. __ ~.J:~·L~ .... ·-----_.~-..:_-.... - __ 2. .... _.1:.::;.:;,._~..: __ ~.;. ____ ..:.~ ______ .:. ______ ~ ___ _
1. . 'Broad Gauge l l ' .
.. .1): Single
'-:U) Db:ub1e. 191· ;- .
iii) Tribles and more 21 "';
"; .' Narrow Gauge' .
Total Rai lway Route . ~.: .
. :
..... ..... .po
~---------------------------------------------------------":'::-;:-~.:--~:---.----~-~----------------------.;..-Source:- Indian' Railway'
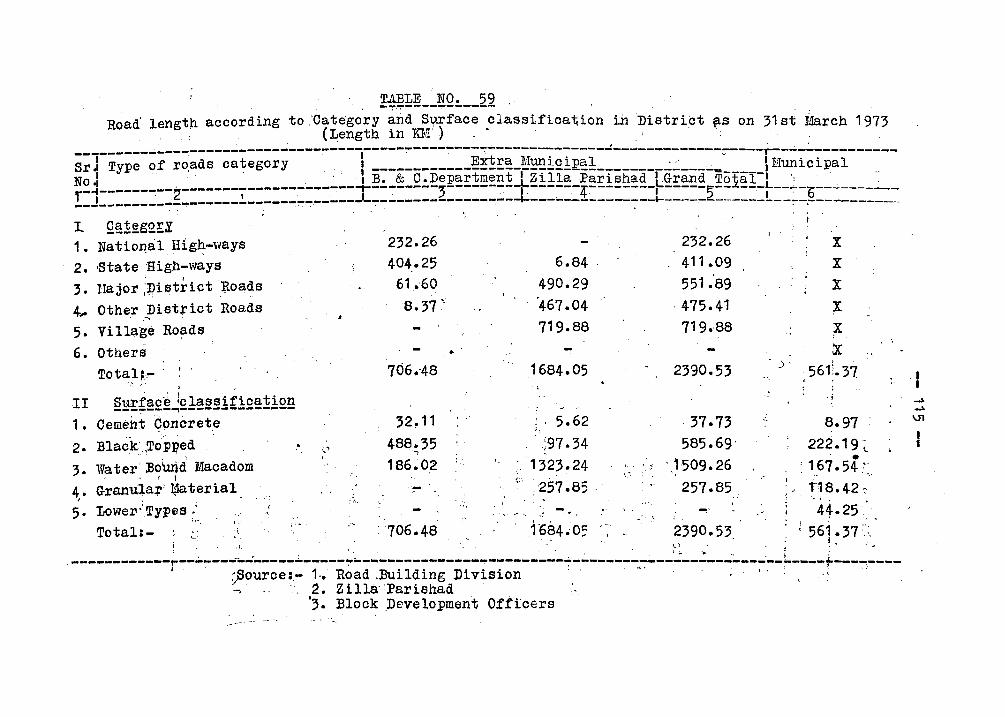
!~!:~ __ :trQ!. __ 2~ , Road' lengt):l according to 'Category and Surface classifica~ion in District (3.6 on 31 st I~rch 1973
( Length in !GIl!: I ) " ,
---------~ ___ ~-----------~--------I--------------~--------------~---------------~----r--~-~----------SrJ Type of rO,ads category '. I ____________ ~?E!!~_~~.i£.iE~±--------~~---~-----J Hunicipal "
~~~---------2-------';"------~---':'--+~.:.-:-~-Q.:.;Q~~~E!!!!~!!,~-~~~!!~":~~Ei~!!~~-~~E~!!~5~£:k~!-~--~-b---~-----' -__ J ________ • _______________ ~~-----J-~---------~------~---------------~---------------~-~--~-------
~ Q@:!~gQ!:~ 1. National Hlg~-ways 2. -State High-ways
3. Uajor ;~if;ltrict Roads
~ Other Disttict Roads . ;'
5. Village Roads
6. others Total~,-
, II Surfac~ lclassification
---~---~--------------1. Ceme~t Qoncrete
2. :Black, ~To':pI?ed 3. Water'Bound Macadom
• i
4. Granula+'~aterial I
5·
232.26 404.25
61.60 8.37 "
706 .. 48
32.11
488.35 ')
186.02
•
6.84 490.29 "467.04 719.88
1684.05
5.62 ;97.34
. 1323~24 ,;, ,257.85
.~. ~
232.26 411.09 551 :89
,475.41 719.88
2390.53
, 37.73 585.69'
, 1509.26
257.85
"
),
x X
X
X X
X 561~. 37
, .j
8.97 222.19~
• , 167.54' t18.42, "- ;
44·25' Lower-'Types ;,':' ", ,-, _ , Total:- :~: i; 706.481684.05 ~ 2390.53 ; ; 561.37::,:.
, ' I, ..
"
: . -..-" - :, {,'. ' . . . " :- ~ .... '. .: :
------------r--------------------~--------~------~---------~------------------------------r--------~ource=- 1.. Road ,Building Division .<
-,.. ',2. ZillaO:Pariehad ' ~. Block pevelopment Officers'
, I I -" -" \1l
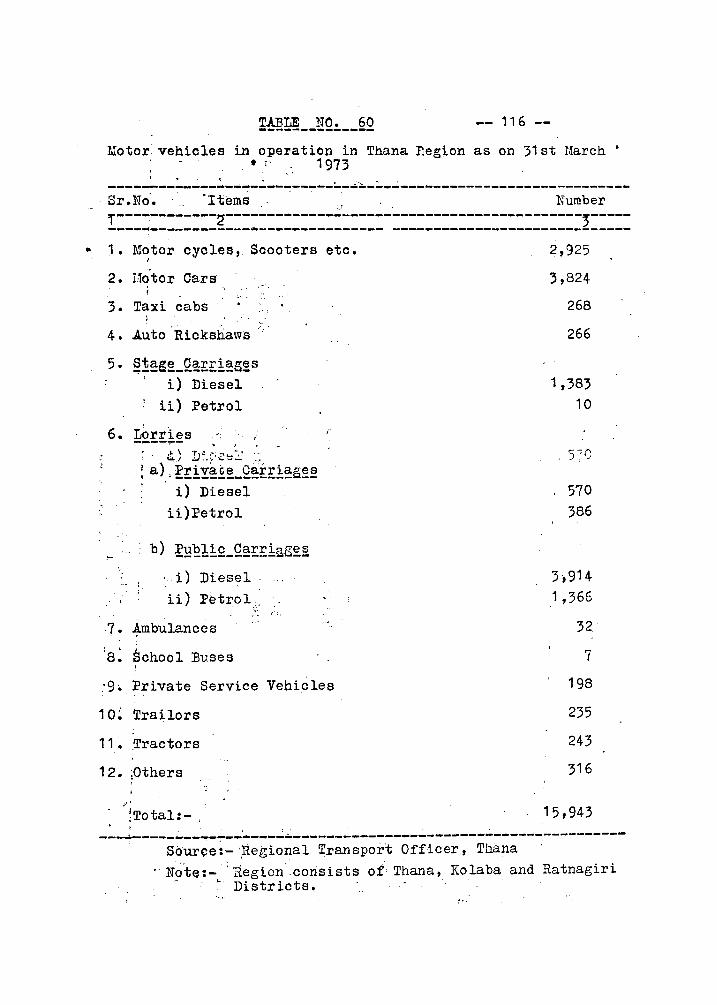
•
-- 116 --
Motor vehicles in operation in Thana. P.egion as on 31 st !.~arch • • , 1973 .. '
----~--~---:----~--------~-.~-~-~----------------------------Sr.No·. "Items Number
r------------~-------------------------------------------,--------------------~--------------- -----------------------------1 • Motor cycles, Scooters
2. Hotor Cars
3. Taxi cabs
4. .A.uto'Rickshaws c.
5. ~!~~~_Q~!ti~g~s i) Diesel
it) Petrol
6. Lorries
7. :8:
-r----:-- ; .' t· ~) D~.:>~~::': ~~ ~ a) , E!iY~E.~_Q~!:!:i~g~§!
i) Diesel
ii)Petrol
.', i) Diesel.
ii) Petrol . ."'
•...
Ambulances . School Buses
etc •
,0. .;1. Private Service Vehi,cles
1 O~ Trailors
11- .Tractors
12. ;Others
?'
;Total:- ,
2,925
3,824
268
266
1,383 10
570 386
3,914 1,366
32
7
198
235
243
316
15,943 --~----~ __ ~~_' ____ ~.,.,:.--------:---------------~------,----------
Source:-'~egional Transport Officer, Tb.8.na 'No'te:- : Region consists of Thana, Kolaba and Ratnagiri
r ." Districts. . :"
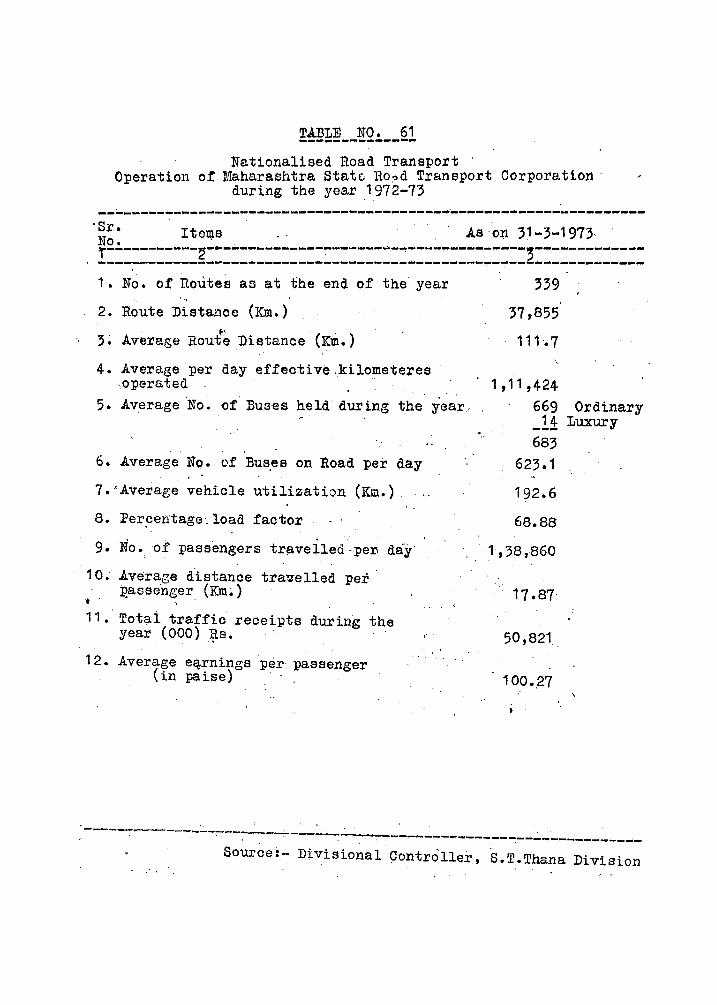
TAJ3LE NO. 61 --------------Nationalised Road Transport
Operation of Maharashtra State llo?d Transport Corporation' during the year ,1972-73
-------------------------------------------'-----------------------·Sr. Items" ' 'As'ol,'l31-3-1973 No. . . . ' i-----------~--------------~-------.,.-'!---------,-----'3---,----------
------------------------------------------~----------------------1. No. of noutes as at the end of the' year
2. Route Distanoe (Km.)
3 ~ Average Route Dista11ce (Km.)
4. Average per day effective,kilometeres .operated
339
37,855
111-.7
5. Av~rageNo 0 of Buses held dur ing the yea.r. , 1 ,11 ,424
669 -!~ 683
6. Average N()o of Buses on Road per day
7 • 'Average vehicle utilization (Km.)
8. Per~en'tage,load factor
9. No. of pass'engers traveiled -per. day'
",
. 623.1
192.6
68.88
. 1,38,860
Ordinary Luxury
10. Average d'istance travelled per' p'asse'nger (Km~)
• 11.' Totai traffic receipts during the
year ( 000) ,?s. ' '
12. Average e~rnings per, passenger . (in paise)
" -----------------. -----------
" . 50,821,
100.,27
------------------------------Source:- Divisional Controller" S.T.Thana Division
.'",
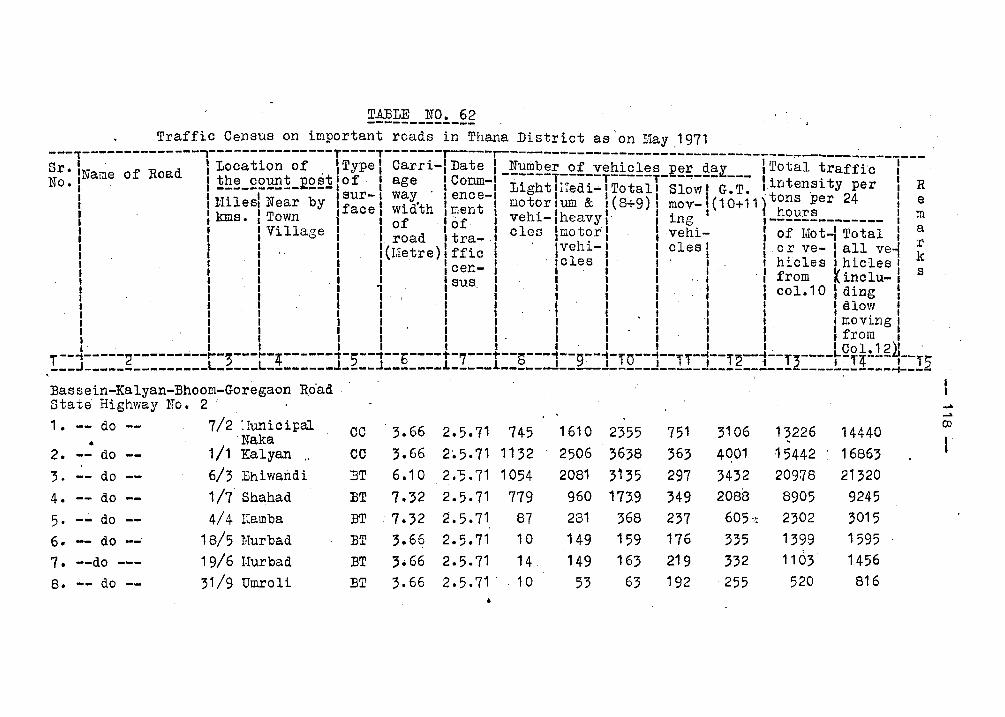
TABLE NO. 62 -------------
Bas sein-Ka lyan-Bhoom-Goregaon Ro-ad state Highway No.2· ...
7/2 :Iunic ipal ->
1. -- do CC 3.66 2.5.71 745 1610 2355 751 3106 13226 14440 (J)
• . Naka J 2. do 1/1 Kalyan .. CC 3.66 2~5.71 1132 2506 3638 363 4Q01 15442 16863 .,
3. -- do 6/3 J3hiwandi BT 6.10 2:5.71 1054 2081 3135 297 3432 209~8 21320
4. -- do 1/7· Shahad BT 7.32 2.5.71 779 960 1739 349 2088 8905 9245
5· -..:.. do 4/4 Kamba BT ·7.32 2.5.71 87 281 368 237 605 ,~ 2302 3015
6. -- do -- 18/5 Nurbad BT 3.66 2.5.71 10 149 159 176 335 1399 1595
7. --do --- 19/6 Uurbad BT 3.66 2.5.71 14 149 163 219 332 1103 1456 8. -- do -- 31/9 Umroli BT 3.66 2.5.71 - . 10 53 63 192 255 520 816
•
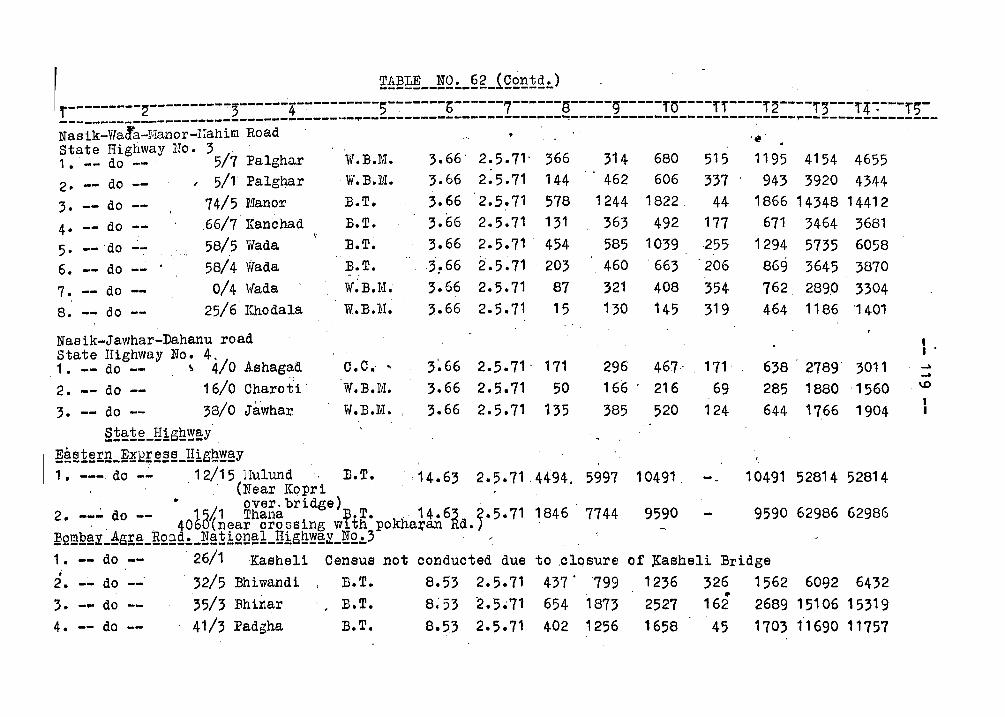
!~~~ __ !Q~_§g_iQ£~1~~) f---------2---------~3------4-~--------5-~-----b------7------8-----9-----fO----ff----f~----f;---f4~---f5-
-------------------------------------.------------------------~---------------------------~----------------Nasik-Wacfa-Manor-!~ahim Road ,~, state Highway Ho. 3 1. -- do -- ' 5/7 l'alghar 2. -- do -- , 5/1 Pelgq.ar 3. -- do -- 74/5 Manor 4. -- do --66/7 Kanchad 5. --'do ~- 58/5 Wada 6. -- do --' 58/4 V{ada 7. -- d'o -- 0/4 Vada 8. -- do -- 25/6 Khodala
Na8ik-Jawhar~Dahanu road State Highway No.4. , 1. -- do -- ~ 4/0 Ashagad 2. -- do -- 16/0 Charot:i' ,. -- do -- 38/0 Jawhar.
§1§!:1!L!:!lga~~y' , ~~~1~~U_~!~f~~~_ll1gh~~y
W.B.M. W.B.M. B.T. B.T. B.T. B.T. W.B.M. W.B.M.
C .C .. ' W.B.M. W.B.liI.
,.66 2.5.71 3.66 2.5.71
144 578
3.66 2.5.71 131 3.66 2.5.71' 454 ~,66 '~.5.71 203 ,.66 ,2.5.71 87 3.66 2.5.71 15
3~66 2.5.71 ' 171 ,.66 2.5.71 50 3.66 2.5.71 135
314 680 462 606
1244 1822 363 492
515 337
44 177
585 1039' -255 460 "663 . 206 321 408 354 130 145319
296 467- 171 166 . 216 69 385 520 124
1195 4154 4655 943 3920 4344
1866 14348 14412 671 3464 3681
1294 5735 6058 869 3645 3870 762, 289.0 3304 464 1186 '1401
638 2789' 3011 285 1880 -1560 644 1766 1904
1. --- do -- 12/15 l:[ulund . D.T. 14.63 2.5.71.4494. 5997 10491, 10491 52814 52814 ' (Near ICopr i
• over. bridge) 2. --..;. do -- 11j/'(1 ~Ihana ~.T.. 14.6'3 2.5.71 1846 7744 9590 ·9590 62986 62986
'. ,4060 near cro s Sing va th pokhaJ;'an Rd.) ~QmE~;Y_~S~~_'BQ::l&.:._li~112U~1_ll1gh~~~_n~h3, ,", 1. -- do -- " 26/1 'Kaeheli Census not conducted due to ,clQsure of ;Kasheli Bridge • 2. -;.. do --' ' 32/5 Bhiwandi I B.T. 8.53 2.5.71 437' '799 1236 326 1562 6092 6432 ;. -~ do -- 35/3 Bhinar B.T. 8~53 ~.5.71 654 1873 2527 162 2689 15106 15319 4. -- do -- 41/3 Padgha B.T. 8.53 2.5.71 402 1256 1658 45 1703 11690 11757
I I ' ...... .... \0
I I
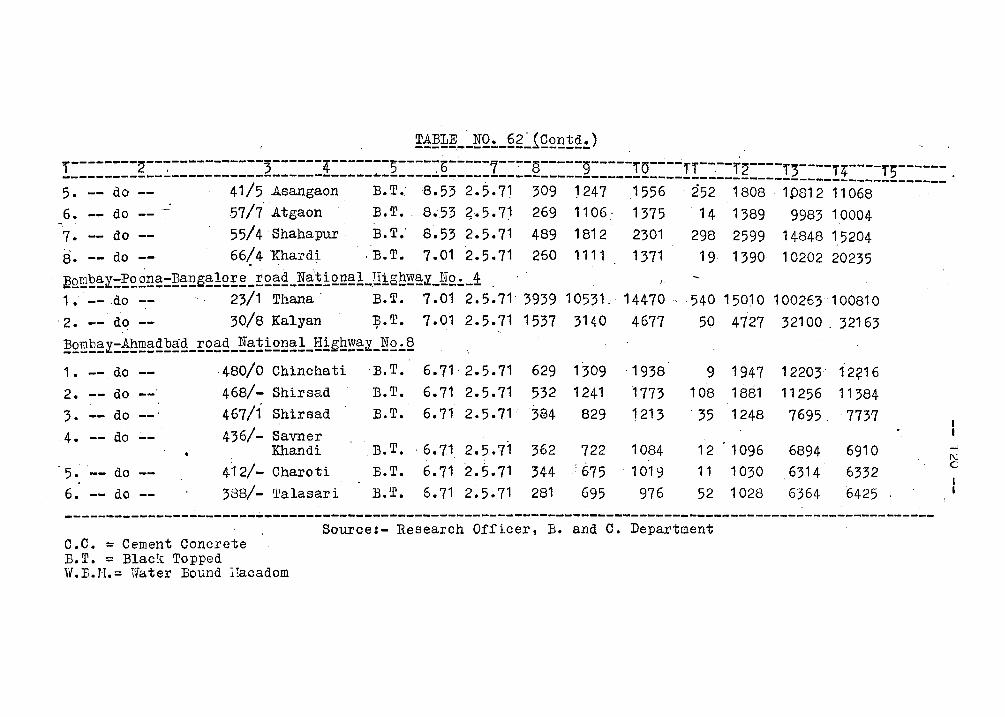
!~~~~~_gQ~_§g~{Q2~!£~)
r--------2--~--------~--3------4-------5----~b-~---7--~-8-----g-----.o-~-~r,-~--r2----. ----I ---- ----------------------------------------------------~----------------------------------------2 _____ ± ____ !2 ______ . 5. -- do -- 41/5.A.sangaon B.T.: 8.53 2.5.71 309 ,247 ,1556 '252 1808,10812 11068
-, 6. -,.. do -57/7--.A.tgaon' B.T., 8 • .53 ?5.71 269 1106- 1375 14 1389 998310004
7. -- do -- 55/4 Shahapur B.T; 8.53 2.5.71 489 1812 2301 298 2599 14848 15204
8. -- do -- 66(4 Xhardi ·B.T. 7.01 2.5 •. 71 260 1111 1371 19 1390 10202 20235
J2Q!2£~:l=~2£!!~:!1~~s;~l£!!:_!2§!;g_g~'!iQ!Hg_nigh~§::L~Q.:._~ . 1. -- .do -- 23/1 Thana' B.T. 7.01 2.5.71 3939 105~1,: 14470" ,·540 15010 100263 100810
2. -- d~ -- 30/8 Kalyan :?T. 7.01 2.5.71 1537 3140 4677 50 4727 32100.32163
~2~E~:i:~!!!§!;gE~~_!£~~_!!~!!£!!~l_!E~h!§!;'J._g2.:.§
1. -- do -- '480/0 Chinchati ·B.T. 6.71, 2.5.71 629 1309 1938 9 1947 12203' 12?16 2. -- do 468/- Shirsad B.T. 6.71 2.5.71 532 1241 1773 108 1881 11256 11384 3. -- do 467/i Shirsad B.T. 6.71 2.5.71' 3@4 829 1213 . 35 1248 7695, 7737 4. -- do 436/- SaYner
Khandi B.T. , 6.71 2.5.71 }62 722 1084 12 1096 6894 6910
5. '-- do -- 412/- Charoti B.T. 6.71 '2.5.71 344 " 675 . 1019 11 1030 6314 6332
6. -- do -- 388/- Talas~ri B.T. 6.71 2.5.71 281 695 976 52 1028 6364 6425
-----------------------~---------------------------------------------------------------------------------
C.C. = Cement Concrete B.T. = Black Topped W.B.II.= Water Bound l!acadom
Source:- Research Officer, B. and C. Departoent
-" I\.: c I I
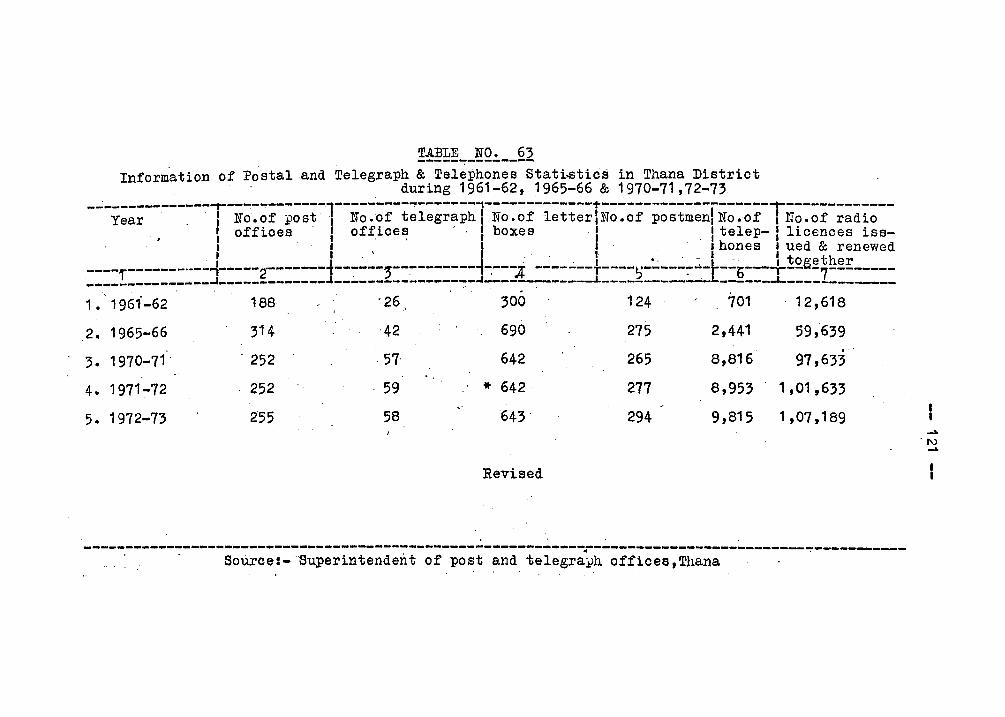
~~~~~~_!Q!. __ 2~ Information of Postal and Telegraph & Telephones Stati~tics in Thana District
during 1961-62,1965-66 & 1970-71,72-73
-~-Y;;;-----~--T-N~~~f-~~;t-l--N~~~f-t;i;~;;~hl-N~~~f-i;tt;;TN~~~f-~~;t;;~fN~~~f-TN~:~f-;;di~--,I I offices ' I office~ , . : boxes 'I I telep- I licences i68-
, I ':, ' :'" I , ' I hones I ued & renewed I -1 _I ' ,I ., - L' I top-ether
----f-------·---,-----Z-------~--~---3--~-------'~---A -------T----,-----~~-I--b----r--Q-7---------~----------~--~-------------~---------------~-~-----~----~-------------------~-------------1. 1961'-62 188 "26 300 124 701 12,618
2. 1965-66 314 42 690 275 2,441 59,639 . " 3. 1970-71 ' ' 252 57, 642 265 8,816 97,633
4. 1971-72 252 59 * 642 277 8,953 1,01,633
5. 1972-73 255 58 643 294 9,815 1,07,189
Revised
- . ----------------------~-------------------------------------r-------------------------~-----------. ' Source:-'Superiritendent of post and telegra~h offices, Thana
-" 'I\) -"
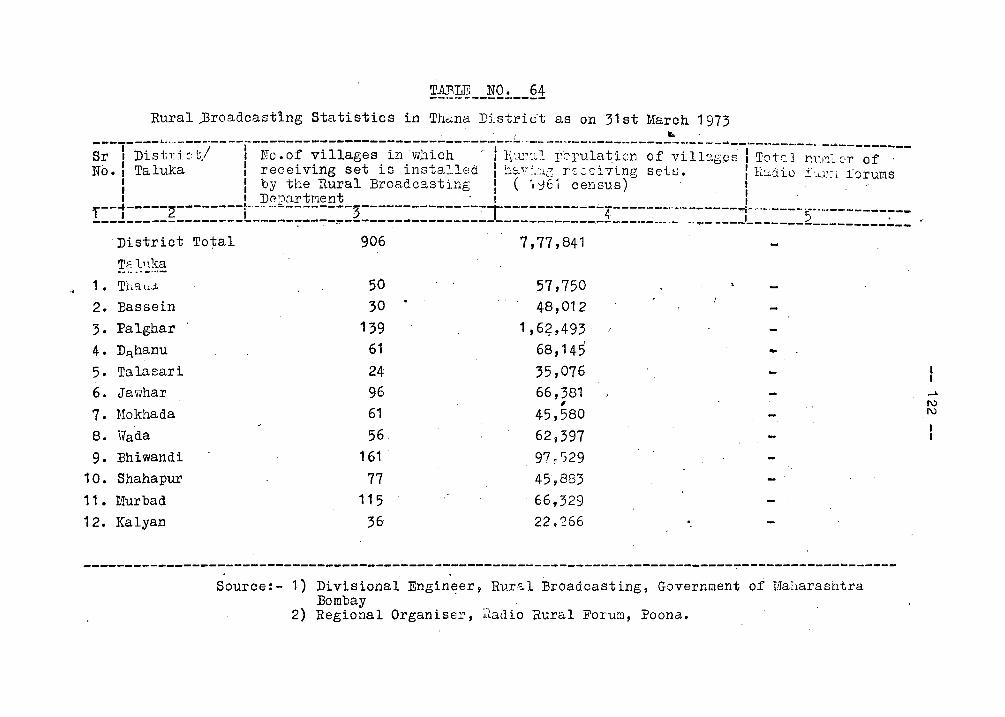
~!:~g; __ !!Q.!. __ §1
Rural )3roadcasting Statistics in Thc.ma J)j,stric't as on 31 st March 1973 - ( ~ -
- ------- .1.. ••.• -----~-- --.---------------------------~----. _ ... _- - - •.•• --.. ---- ... -----.--.- - -- --"""'-..0:----.. ----.----. __________ _ Sr I Distli, c:t/ I No. of villages in which - Ilt~lC~:1,~ fCl'ulaticn of vill?gcs I T('It~] m'r':"":.. c't' of ' No. I Taluka I receiving set io insta2.1eCi I ~J.e"<,:,l0 r::.::ciYltng sei.s. \lLdi0 .!"_,;':i i'nums
I I by the Rural Broadc3.sting I ('I :lEI census) - I I I Del'.:1,rtment ' I \ I
!::1:::::~::::::::t~~=::~::::::2:::::=:::::::::I::::::::::::I:::=:=~:~·-:::~=:=C~~::::~~=:::::::~:: District To~al 906 7,77,841
~~ ~'2~~~ 1 • Ti.a u::i. 50 57,750 2. Bassein 30 48,012 3. Palghar 139 1,6?,493-4. Dqhanu 61 68,145 ... 5. Talasari 24 35,076 6. Jawhar 96 66,381 .... , I\)
7. ~lokhada 61 45,580 f\)
8. i7ada 56 62,397 9. Bhiwandi 161 97~,)29
10. Shahapur 77 45,883 11. Murbad 115 66,329 12. Kalyan 36 22.'266
------------------------------------------------------------------------------~-------------------
Source:- 1) Divisional Engineer, Rurr.:~l Broadcasting, Government of I!Iallarashtra Bombay .
2) Regional Organis€l", i:1adio Rural For-um, Poona.
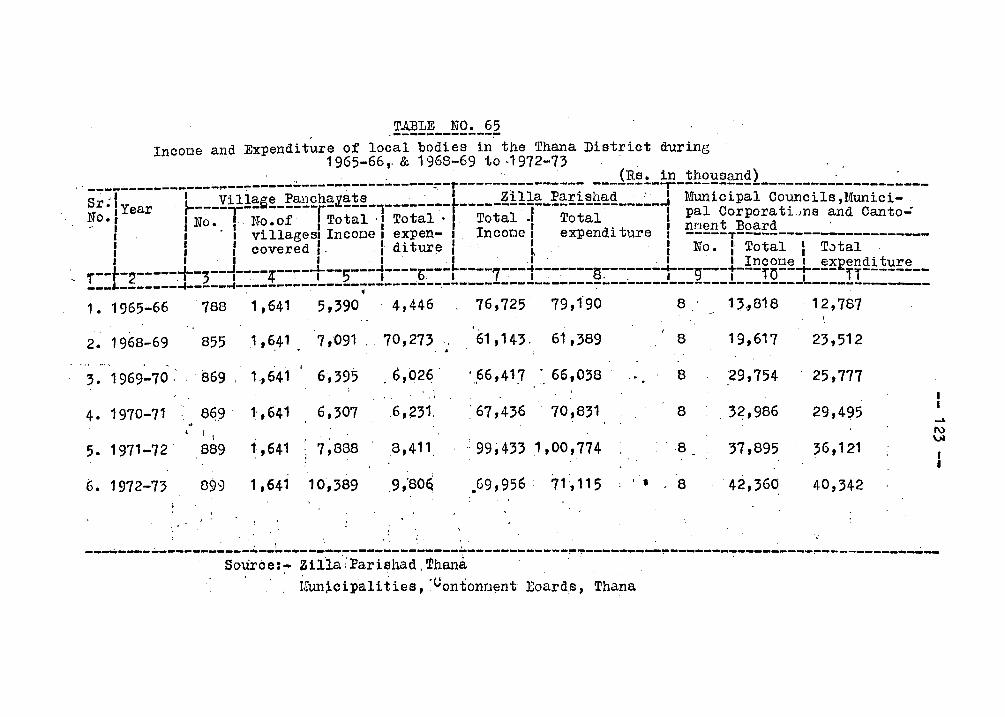
,!~!!~--!Q:.-§~ Incooe and Expenditure of local bodies in the Thana District during
, , 1965-66" & 1968-69 to .1972-73, ' . " . " (Rs. in thousand) . .
's-~":'-I' --------.----viil~;;-p;~~h;~;t;------~-~-rt-----ziii;-l?~;iSh;d---~-T-M~i~i~;i-c~~~ii;-,M~i~i:---N~: : Year rN6~-1~.-N~~~f---rT~t;i-~1-T~t;i-:-I--T~t;1~]---T~t;1~------1 pal ~orBPoradtLns and Canto-=-
:, f • villages. Incooe •. expen- ., Incone 1 expenditure I !l~~!LT-2.~!:--______________ _ I , I : covered:, . f di ture I" l., ,I No. 1 Total I T.)tal ,',
__ i_ _ ____ +1 _~--J----'lr-----L--;--~J----~,--,;.L----7---J-.:.-:----~------.;...L--~_ .. -!_I!!C'f~~~4--~!I!'fen'f~i~~!:~--T r 2 ';J I","t . ., • ,0.' .' 0·. • '::J • v 1 ___ j. _______ ..r _____ -f _________________________ , ___ .--------------------------------------------------
, ' . '
1- 1965-66 788 1,641 5,390 4,446 76,725 79,1'90 8 13.,818 12,787
2. 1968-69 855 ,1,6.41 7,091 .' 70,273 61,143, 61,389 '8 19,617 23,512
3. 1969-70,' 869 1.,641 6,395 ,6,026 '.,66,41} ',66,038 8 '29,754 25,777 , . ,
4. 1.970-71 8~~ 1:.641 6,307 ,6,231, :67,436 70,831 8 . 32,986 29,495 .... • I, 1
t\) VI
5. 1971-72 8a9 1,641 7,888 .8,411. ':99,433 1,00,774 ' ·8 37,895 36,121
6. 1972-73 899 1,641 10,389 ,9 "80~ .69,956 : 71,115 ' . , 8 42,360 40,342
, .
. " I ' ," : . " ----------.. ---------.----------.--------------~-----------..... ~--.. ------~--------.. --------~---------... ~--Sotir6e.:~ Z1lta ;Parishad, ~hal'la. '
ilIun~cipal1 ties, 'UontonrJent Eoards, Thana
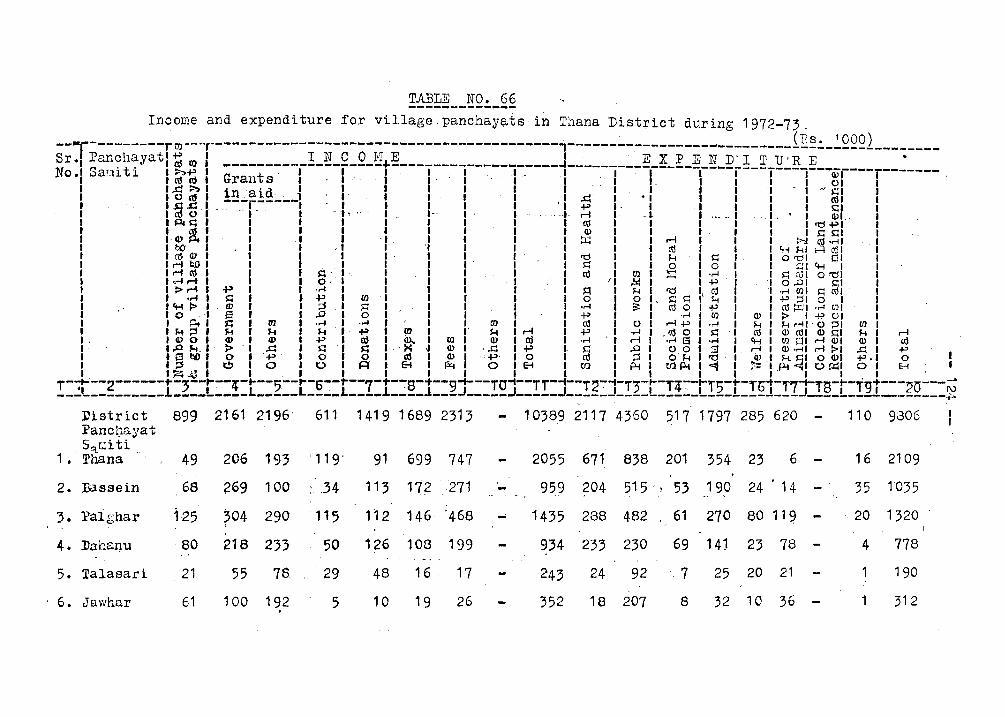
TABLE NO. 66 -------------. ln~ome and expenditure for village, panchaya-ts' in Thana Dist+ict during 1972-73.
--T---------r -.---.------------------------------------------,' ------;,.-------- oJ' . (Rs • ' 000) ~ . . -- ---------------------------Sr., Panchayatl~ rn __________ !_!i!_Q_2J1""~ ___________________ J __ · _____ .:.~~_! ~_E l~ D'l T U'R E ' • No I t:Oani ti ~of'> . I I , 1 .. ' 1 I . I - -I----'---T---l----------------°1 iJ - t1:! m Grants t ,I' I I" 1 1 '. . I 1 1 1 ~I
..c:t ~ in .·aid~ ,I ,I. I , J.... I 1 1 ., J '" j.':ll 1 (J (\J --':'r---;.;..-I I I I 1 J _ • I I I I I t1:!1 1 'S:: ..d '._, 'I I I I • I of'> I . I I 1 I s::ll 1 ~ (J .. t. ". 1 1-" I' ...... -~. 1 • I CIlI I PI j.':l 1 1 1 CIl I I I rO +>1" 1 (\1 I 1 I CIl 1 1 . I s::l j.':ll I (I) PI I. lJ:: I...... I >.I C\1 ..... , I tIO i CIl r fH J..II H CIlI I ~ (I) ~ I J..I I $:I 0 rOl Ell 1 rl bO .... I 0 I 0 $:II fH 1
,.... ~ ,t; -', ell fIl l:q I ,,-I $:I till 0 rOl .,...,.... o· 'I .!lei I I +> ' 0.01 j.':ll :> rl of' ,.-f ~ I J..I I, oQ' I, CIl .,-1 fill j.':l CIlI '
• .-f s:: .... fIl 0 I 0 I. $:I $:I I J..I .p ~I 0 I 'H:> ,OJ ~ s:: • .-f ~ I CIl 0 I .p CIl:rl1 ,,-I rnl o a .... 0 .... I ,,-I I (/J CD:> I +> (I),
Pt s:: fIl ,,-I .,-1 rn ell I (.) I r-I.p I .,-1 ~ r-t .-41 '(J ~I rn F-t ::I r-t J..I '"', +> rn r-t.-4.p 1·,-1 I ,m 0 I s:: CIl CIl CIlI CIl S::I r-t r-I II> 0 (I) Q) of'> CIl iu" rn CIl CIl .,-1' I r-I I • .-1 S 1 • .-1 fH rn SI .-I CIlI CIl CIl
, !. ,D k, I> ..d s:: 'I s:: ,x.. Q) 1 ' .c:.p s:: I,D I (.) 0 ':::1 . r-I Q) ·.-11 .-I 1>1.c: +> ' I o I1D 0 "of'> . 0' 0 ell' I Q) I "+> 0 CIl I ~ 1 0 r-t I rO Cv k $:ll 0 (1)1 +>. 0 ~ t!;I 0 0 I R' E-I I ~ 0 E-I r/l I P-t I tf.l ~ I ..., t:=.P-l ~I 0 ~I 0 E-I' J ~~ . I I 1 I 1 I I' '
T-~--2------~-~--i~-~-~--5--~-6--~--7-~-~8-+--9~~--TO~--TT-~--T2~~-T;-~-T4--iT5-t-r01-T71iTa-r-T9r---20---~ ___ L _________ l _________ l _____ L ____ L ____ ! ____ l ___ J _____ J _____ J _____ J ____ L _________________ J _________________ ~
:District 8992161 2196' 6111419 1689 2313 - 1038,9 2117 4360 ~17' 1797 g85, 62'0 - 110 9806 Paric~yat ,S~rJitl .
1. Thana
2. llassein
3. Pa1shar
4. Dahal)u
5. Talasari
6. Jawhar
49
68
125
80
21
61
206 193 ''''9-
?69 100 : .34
~04. 290 .115
218 2" 50
55 78 29
100 192 5 .
91 699 747 2055
113 11g , ;271 - 959 '
112 146 '468 1435
126 108 199 934
48 16 ' 17 243
10 19 26 352
671 838 201 354 ·23 '6 . 16 2109
204 515 -, 53 190 24 . 14 35 1035
288 482 61 270 80 11~ 20 1320
23; 230 69 14~ 23 78 - 4 778
24 92 ',7 25 20 21 1 190
18 207 8 32 10 36 1 312
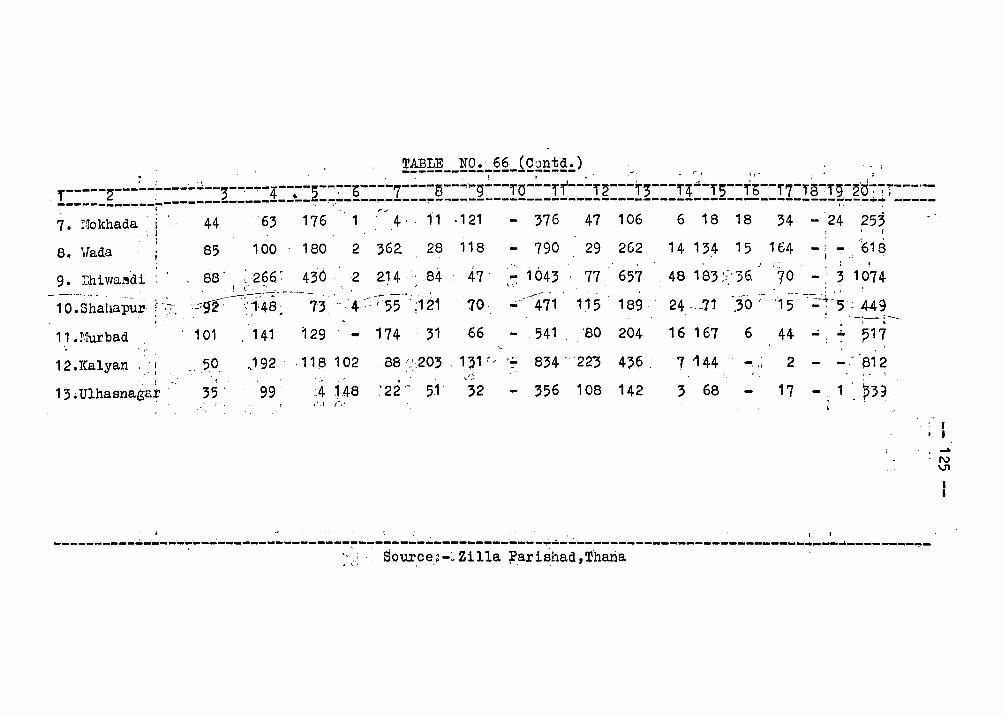
. '. ~~!!~ __ !!Q:.;§§-fQ~£~~:.) ~ . ,-. . r. 'I .
-----2---:...-~----~ ... -;-~-.,.-4--:-5---:-:-b---~7----S--..,l-g..;.--,.o---,.r---"~---'r;---n:--"5--Tb--"7-"8-,.g-2d7-:;---·~-, !-----------r------------------'7-·-:,~_:_---":.-:----------------------------.-------------------------';"--,- ... ~ -----7. Hokhada .:. 44 63 176 1 ' 4,· 11 ·121 376 47 106 6 18 18 34 - '24 253 " . , 8. \{ada 85 100 180 2 362. 28 118 - 790 29 262 14 134 15 164' -: -618
. I . " '
9. Uliwa~df 8S' ,~266: 4302 214· 84 47' ... 1043 77 657 . 48 1~3;:::36' :70 -::3 1074 , ~-----_ _ ~~~_J.~ ,'. ~'.'
.:'9":f- ~. ~'48~ 73 "'4-~~ ('55' ;121 70 -/';-'471' 115 . 189 - 24·.11 jO"';-~-'15 ':'-;:"5"" 449 ---;--;.--
101 141 129 - 174 31 66 541 '80 204 16 167 6 44 ~ ... ~17 : '-.
439 . 7 144 -'oi 2 - -" '812 I· I
142 '3 68 17 - 1 . ~33
12.Kalyan . I 5,0 J92 118 102 88 '..'.20; 1,1 (., '':' 834 '. 22"3 , .. ..
( . .. \.'::
13. Ulhasnagar.· . 35 . 99 A ,,48 :22 ~ 51 32 - 356 108 ,",j ,".'
-. . I I I .. . I\)
V1
t' • • ". • I I .
----------------~-------------------~---~------------------~-------------------------------~--.--------~-.',:' Sour.ce;:-.Zilla ;i?arishad,Tharia '
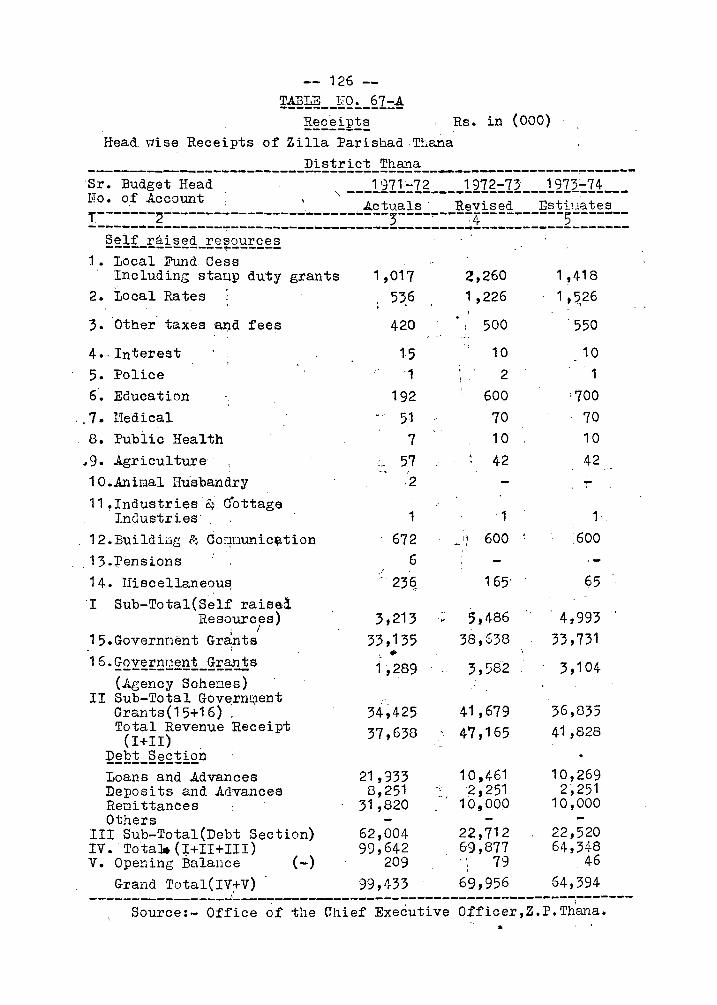
-- 126 -~hl! __ l1Q!._~'I=!
g££~~£!~ Rs. in (000) Head. uise Receipts of Zilla Parishad·T~ana
District Thana --------------------------------------------._-------------~------·Sr. Budget Head 1971-72 1972-73 1973-74 Ho. of Account \ '\ -------------.--:----------:--.-----
. , . Actuals . Revl.sed EstlLlates !:::::=:~:::::::::::::::::::::::::::2:::::::=:±=:=:::::::~:::::::
Self raised resources --------------~------
1. Local Fund Cess Including staup duty grants
2. Local Rates :
3. 'Other' taxes a~d fees
4.· Interest 5. Police 6. Education
.. 7. Uedical 8. Public Health
19. .Agr i cul tur e
10 • .Aninal Husbandry 11 ~ Industries 8;.. c"ottage
Industries' 12.Buildi~lg & Ooqnunic~tion
13.Pensions 14. Iliscellaneou~ '1 Sub-Total(Self raisal
Resources) . /
15.Governnent Gr~nts
16'~2Y~~~8~~1_g~~1s (Agency ScheBes)
II Sub-Total GovernI:lent Grants(15+16): . Total Revenue Receipt
(1+11) ~~!::L~~£th£n Loans and .Advances Deposits and .Advances Renittances Others
1,017 536
420
15 1
192 51
7
-- 57 ·2
~,260
1,226
500
10 2
600
70 10
42
1 . 1
672 II 600 6
- 236, 165'
3,213 '" 5 t 486 33,135 38,638
• 1~289 3,592
34~4i5 41,679 37,638 47,165
21 ,933 8,251
31 ,820
10,461 2,251
10,000
1 ,418 1 ,5
026
. 550
10 1
700 70 10 42
1
600
65
4,993 33,731
. 3,104
36,835 41,828
10,269 2 ~ 251
10,000
III Sub-Total(Debt Section) 62,004 22,712 22,520 IV. Tota1t(++II+III) 99,642 69,877 64,3L~8 V. Opening Balance (-) 209 . \ 79 46
Grand Total(IV+V) . 99,433 69,956 64,394 -----------------~-----------------------------------------------,
Source:- Office of the Chief Executive Otficer,Z.P.Thana.
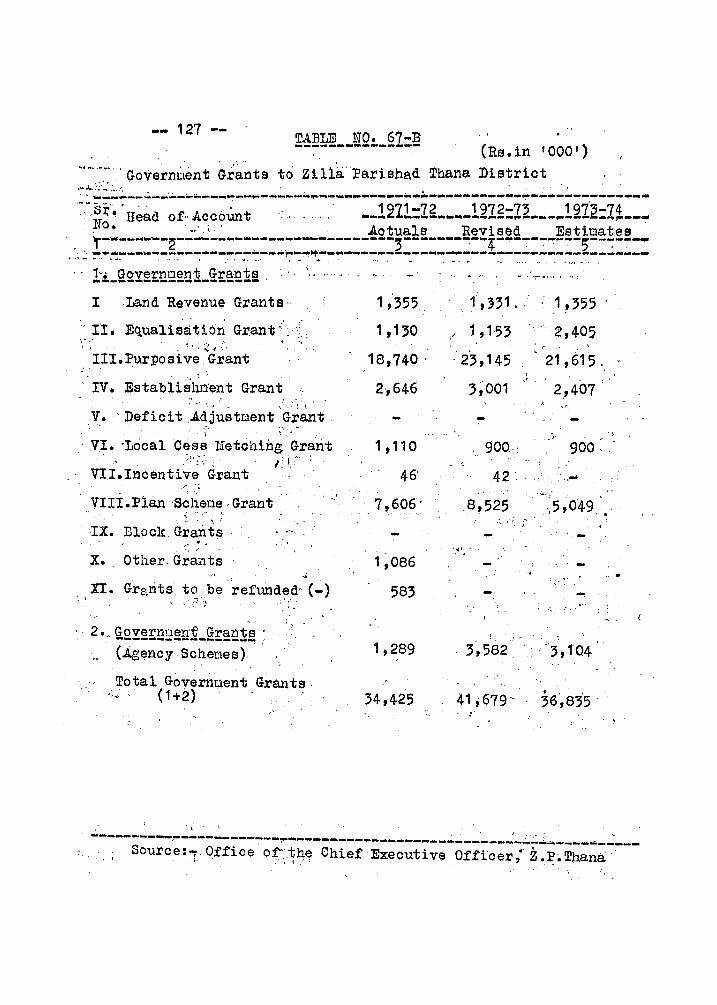
-- 127 --(Rs.in '000')
. GoVe~n~l(mt Grants t6Zi l1iil?arishad Thana District ~~~~~, . . ' , ~ ... -----..:.--'~- ........ ------.... -~-... --~ ... ~--...... --.... -... ----.. --..... ---.. ~-_ .. ---------... -~,~.s~·~ . Head of, AccoUnt '.,. ... . __ 127.1:7.g ....... _122g:Z~ ... __ .. 121~:1~ __ ~ ~o. . _. \ ' . . .Aotuals Revised .Estinatee '. T-~--~~~-~--~--~-----~---~-~--~----~--~~~~---~4-~-~-~~---;--~----", __ IIIiIi ___ a. .. __ .. _____ ... _____ ... ~ ... ~*.---------t!--- .... -....... -------.. --___________ ..,
#-._- .. , ... - . .. "')' . ., .,' .. .. h Governnent Gra·nts -----------~-------- . I ·Land Revenu~ Grants·
.... lIe Equalisatio~ Grant < " ", ~ , • ~ f ',' ,. ". ('
III.Purposlve,Grant , '.
IV. Establisilrlent Grant .' R \ . ': I,
V. 'Deficit Adjustnent Grant I " '
, V.I. 'L.ocalCesB l'Ietching Grant . ;~, ~': , . ,: I:"
VII.Incentive Grant
VIII.Pian ·Schene·Grant ". :
IX. Block. Grants· ...... " ....
x .. Other. Grants . '
XI. Grants, to be refunded·' (-) " } . <·2·~·) .'; .
2., Governnen'-t; Grants . . ------.... ---~-----..,. (
(Agency Scher.1es).
Total Governoent Grants, -:~" (1+2) . . .'. '
"
1,"355
, ,130
18,740 .
2',646
1,110
46'
7,606'
1,086
583
1,289
34,425
..... .,-_.v •• -'1
,/ 1,153
. i3, 145
3~001 .'
. 900,
42' .
.8,525 7, ,"! r
',,,,f, .
.-
',." '2,405 ~ r "
21,615.
2,,407
. ,I
900 :
" ., .... ,
·'5,049 .. . . . . -
....
.'~ " .
. 3, 582. . ~ .. 3, 1 04
' . ... _-------------- ..... ------ . . ",' ,- ;- . .. " Sourc'e: r' Office 0f.~~h;-Chi;f-E;;~~ti;;-Offi~;;;~~:-~~Th~~~~---
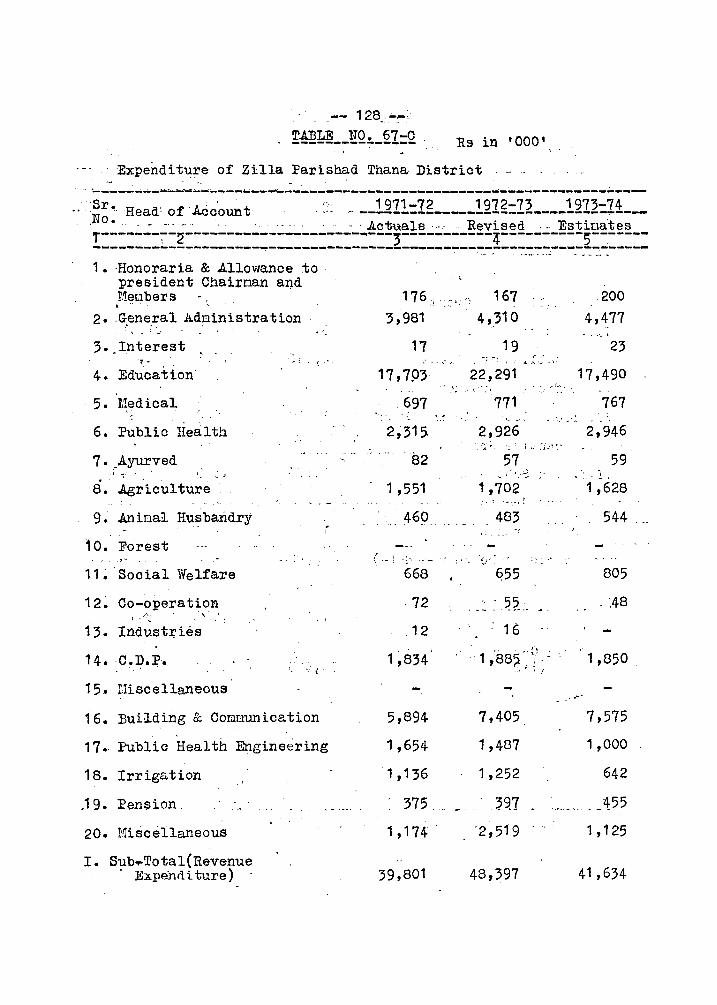
-- 128_ -~~ ~~ __ liQ!.._~I=2 . Rs in '000'
Expenditure of Zilla ~arishad Thana District . -. --------.... ---..~-- ..... -.... ------.......---:-------------------------"------... -----.;..---
Sr~·Head' ofkc'ount .. '-- __ !.21:! .. =lg ___ !.21g=1~ ____ !.21~=11 __ ,No •... - -. -' . . _ . Acwals.. Revised "Estiraates ,..-------~-2-------------------------3-----------4----------5--.----
------------------------------------------------------------~------
1. ·Honoraria & Allowance to president Chairnan and Ueubers
2 •. General Administration· ...., ." " - • .' ~ I.
3 •. Interest .
4. Education
5. l.!edical
6. Public Health
7 •. Ayurved
8 • ./lgricul ture
9 ~ .Aninal Hu~bandry
10. Forest
11~Social Welfare
12~ Co-operation I . "t "
13. Industries
14. ,C~l?P.
15. Uiscellaneous
. : -: . ~ ~
16. Building & Comnunication
17. Public Health Engineering
18. Irriga.tion
. 19. Pension.
20. !'Uscellaneou8
I. Sub~Total(Revenue . Expend i ture ) -
..,
-.-... _ ..
176 _," ,! .. ' .
167 . " 200 4,477 3,981
17 .' ,
17,793
697 .' .
2,31 S-". - ... '82
1 ,551
469
668
72
12
1~834
5,894
1,654
1,136
... ;'J.
..
375 ..
1,174
39,801
4,310
19 . t •
, -4.1.'", .,"
23
17,490
767
22,291
771 '." - . .~' "'"-
2,926 2,946
57
1,702
.483 ,-... "
655
. _:~ '~~2 ___ . : 16
,', - 1 '885"','· ~
, .:, j- : .'
7,405
1,487
1 ,252
. _~9.7
'2,5f9
48,397
.. ,-'
59 . ! .
1,628
.. 544 __
805
.;48
1,850
7,575
1,000
642
._ ... _ ... _ ~55
1,125
41,634
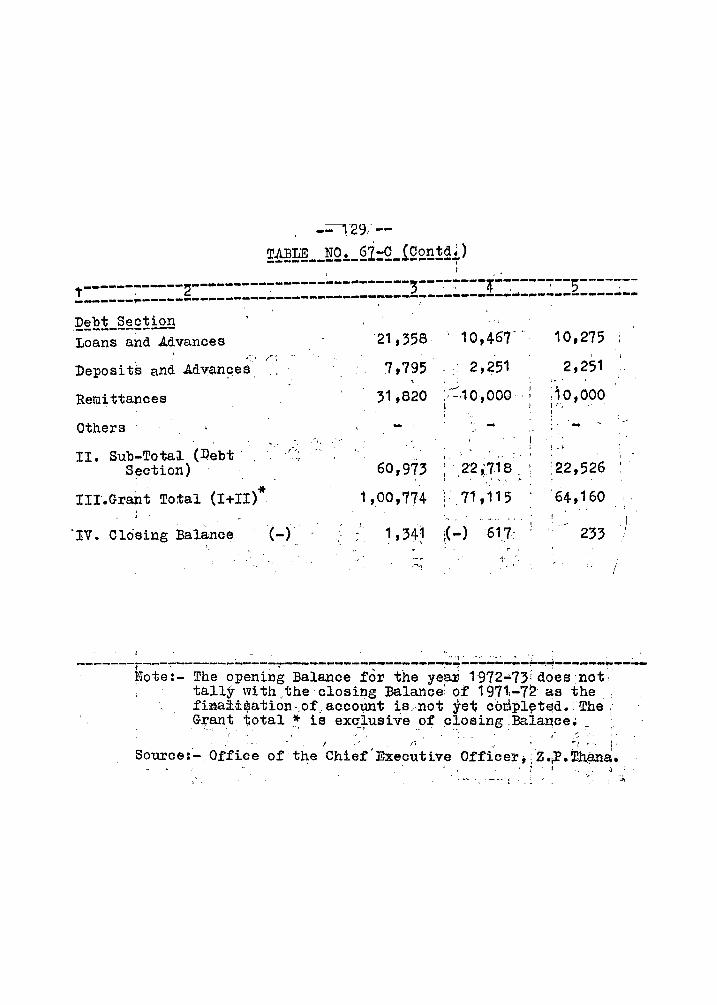
~~~ __ ~Q~_2i:Q_!Q~~!~+) , ' ,
- ---.-------~----~----~---T-------,--5---------... ---------2--..... ---- - :.J . 't ' , t· . ___ _ __ ~ __________ ~ ____ ~~_~-------------~-----~------------------- -- , '
Debt Section ._----------Loans and Advances
Deposits and Advan~es
Remittances
Others'
II. Sub":TotaJ.. (Debt " S~ction)
. * lIT. Grant Total (I+II)
"IV. Closing Balance ,(-) ,
. "'"1' .- - ".' ~. '. I
---~-----------------------------------------------------------~----~ote:- The opening Balance for the yea~ 1972-73 i doesnot , ' tally with, the' closing :Balance~ of 1971.-72 as the"
fi~a~d:$ation-,of, account is.not ye1; c6clpl~te.d.The, G~ant total *: is exqfusive~f c~osing :Balance.; _ '
I' I • f' " ~!. I,
Source:'- Office of the Chief Executive Officel',Z.;P.f~ana.
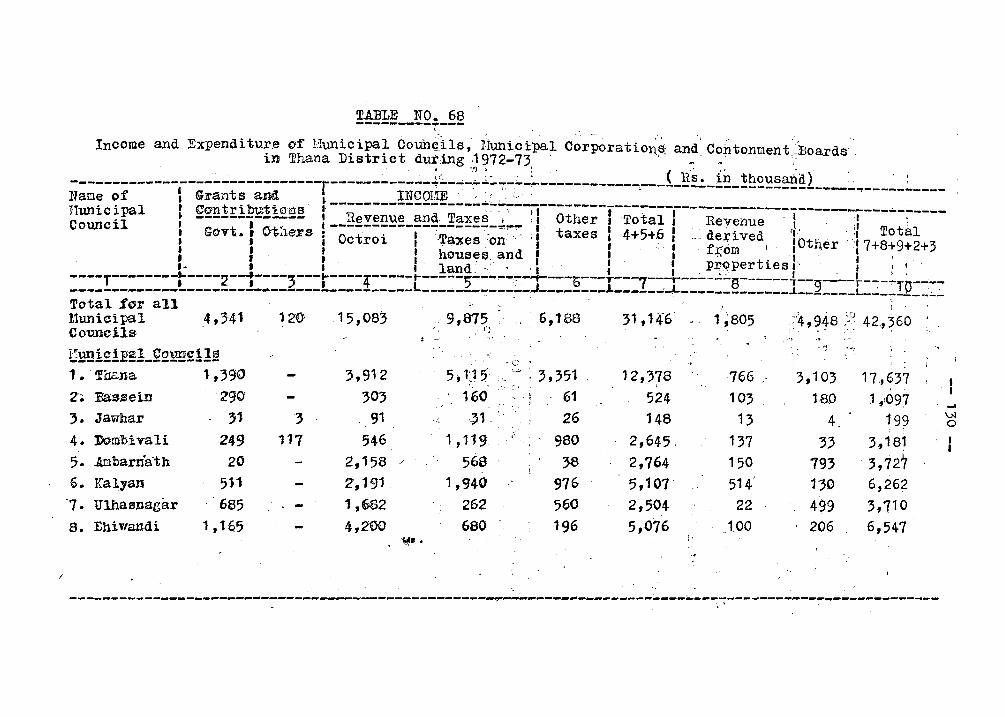
TABLE NO. 68 --------.... --,
Income and Expenditure o:f loIunicipal Couh~'ils, riunici:pal Corporatio~~ and' Contonment'~'Boards in ~hana District dut:ing.1972-73, ' _' ~ ,
, :c. '?:. ': ' ( 11S. in thousahd) " '~ -------------l----------------r---~-------~---~~~;.~--~-----~-----~--------------------------~---~------Name of I Grants a~ "~ ________ !~QQg~_~_.:..;.~~_~~ __________________ _ Hunici~l t ~O'ntrib'Uti0J!l,S I, - 'II I 1 - -------------------.;..-~----
• .l"- • ------------ I Revenue and Taxes l ; I Other I Total I Revenue' 1 , ,I' : CouncIl I • 0-1-< 1 --------------------.",,..- I t I'" l, ,I Total
• Govt. 'Vl.lers: Octroi 1 '.Taxes:on',',;f taxes, 4+5+6 I ,., derived 'lOth' ',:: ' : J I I " f I" 1 f:(om 'I er '17+8+9+2+3 • • 't house l;I , and I I " 1 ' . I. 1 \
, J-' 1 : land ,,'. ,~ : :, pr:~pertles... ' ,I ~ ~ ,
----T--------t'----2---:----;---r----4-----r-----5'---,...-~-"1---:-'6---T---7---r-----8-----{--9--~--:-""TO----_____________ -____ -____ ~ _________________________ ~--_--J--------L-----.~ _____________ ~ _______ L_ __ ~ __ -~~~
Total for all !- , I
J.lunicipll 4,3'41 12'0 ,15,08,,9,675 ,6,168 31,146 1~805 Councils ~.. 'C;
• I "YJ -
~4,948 ,~42,,360 . l', p - ,. •
----~----------------------------------------------~-~----~~---------~-------~--------------------------
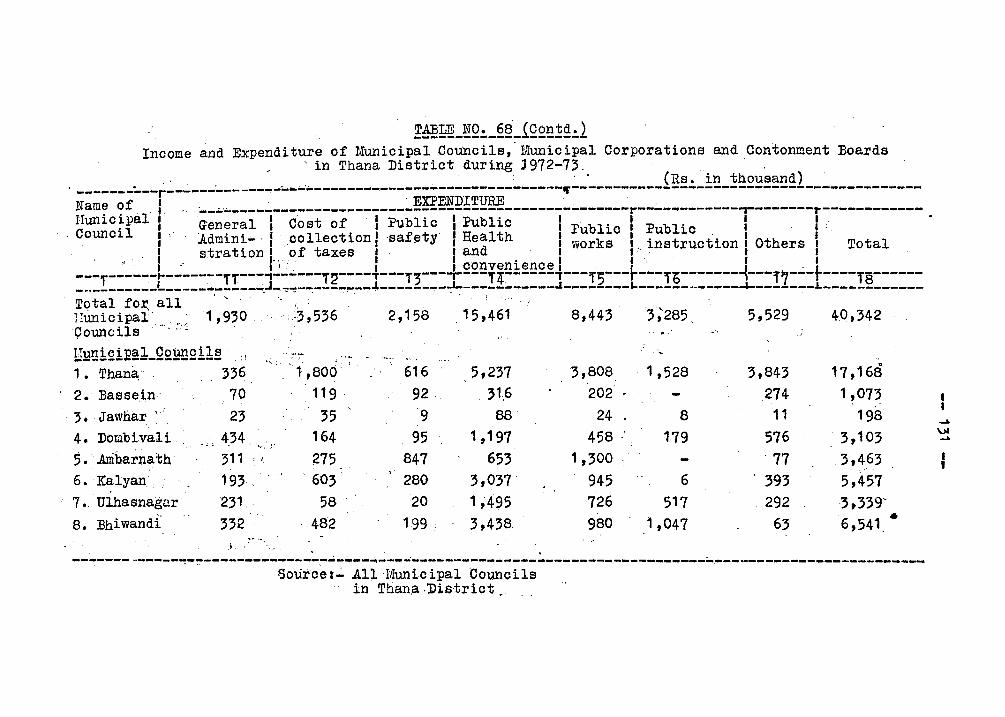
T.AJ3LE NO. 68' (Contd.) ---------------------Income and Expenditure of Municipal Councils," Municipal Corporations and Contonment Boards
, . in Thana District during 3972-73, ' " . . (Rs. in thousand) , . --------:..--r------~-------....... -·---------,----------------------.,------------------------------------------
Nam??! ,t, '" ·---·----------------------~~!!:~~;Q!!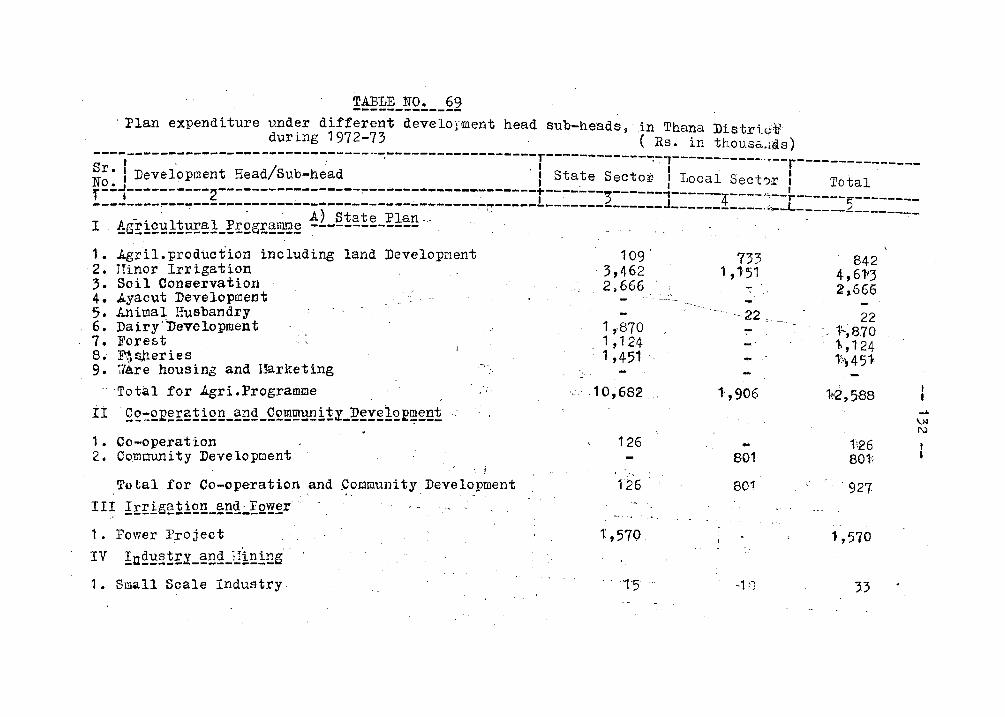
. Plan expenditure under different develol-,ment head sub-he'ads, ,in Thana Distri.Q:1j during 1972-73 ( Ra. in thousa:'~da)
-----------------------------------------------------T--------------,-- . r' ,', " , I " '. I ----:-----·· .... --r---------------~ . I Development Head/Sub-head r State Secto~ I Local Sect!'))!' I Total ,.£~~----------~-----------------~------~-----~-------~----~--;-.-----~------T-- ~I I eo . , I' J <t-' -.. I-------5--------... -----------------------~------~------- .... """"------,..,..~--~-----'----------- -----------~~ . , -.:. 1 p' . , A) State Plan ',' ' '" ---------------I ' ~B!1£gl!~~~ ___ ~£5£~~~ ~------------ ,
1. Agril.production including land Development, ,2. Hinor Irrigation 3. Soil Conservation 4. Ayacut Development 5. Animal Husbandry 6. Dairy'Development 7. Forest
,8.- ~$eries " , 9.·l1ire housin6 and Harketing .-1",
r 'Total for Agri.Frogramme , "
" '
II' Q~~2~2~~!12~_!Bg_Q2~E~i!l_~~!~!2~~~~~
1. Co-operation 2. Community Development
. !
Total for Co-operation and~oJ3Dlunity Development III ' I;r;rlg~:H~!!~~!!!LIQy!!r' .:. 'i. ,
,,'
1 •. Power P;roject
IV !U~~!!!!£:l ... ~!!!!Jli!!!n8" 1. Small Scale Industry,
," . ;: ..
109 . 3,462' 2.666,.' i
, 1,-870 1,124 1,451
~---..
"'''.' ,1 O~682
126
;,
126
- '"
1,570,
'1'5' --
, '
133 1,1'51
~: ..
842 4,61"3 2,666 . ~'-
~"~-22 ~~_ 22 .. -- -~~ f..~ 870
1>,124 , r",45; ...
1',906 "k<2,588
.. 1-;26 801 801.
801 '-of '927-
1,570 .. --..
-1 ;} :n
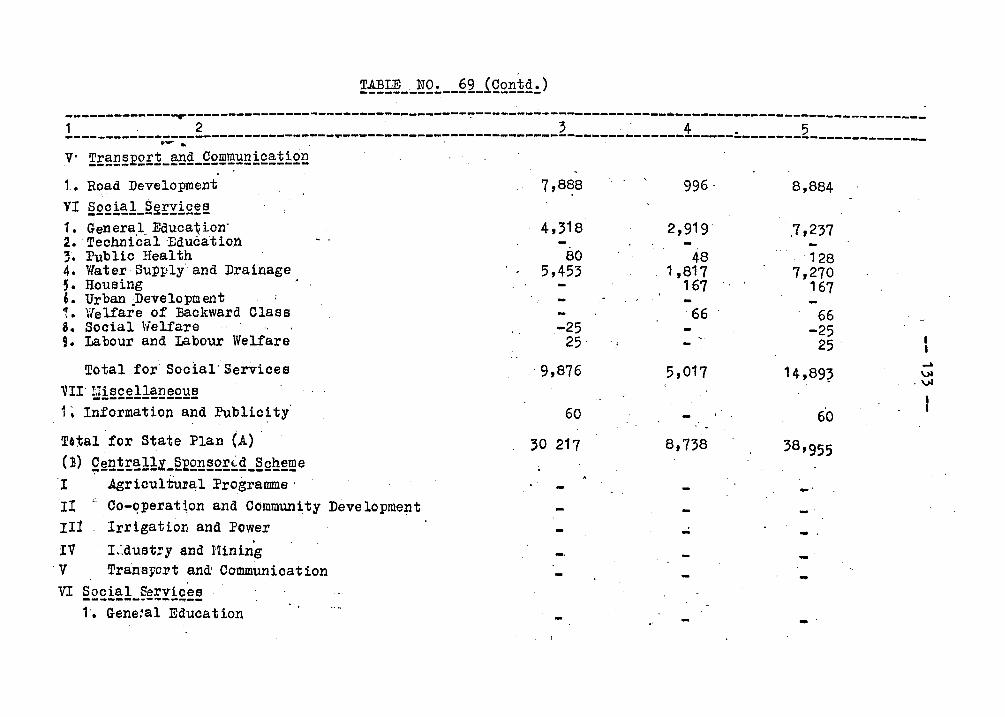
TABLE. NO. 69 (Contd.) ----------------------~------------_r----------------------------------~-----------------------~-----------------------------_ 1 . 2· 3 ... 4 . 5 ---------------------------------.-------------------~--------------~-----------------------------------o~ • "
V' ~r~E~E2r~_~E~_Q2~~BE!£~~!2E
t. Road Development 7,888 996· 8,884 VI Social Services ---------------1. GeneralEduca~ion' 4,318 .2,919 ,7,237 2. Technical ·Education
80 'll Public Health 48 128 ". 4. Water Supply· and Drainage 5,453 1,817 7,270 ,. Housing 167 167 , . Urban .Development .. Welfare of Backward Class 66 66 \ . 8. Social Velfare -25 -25 ,. Labour and Labour Welfare 25 25 .
Total for Soclal·Services . 9,876 5,017 ~
14,89? VI . VI
VII" lIiscellaneous -------------L Information and Public~ty 60 60
T.tal "for State Plan (A) 30 217 8,738 38'955 (:8) Q~E!r~11~_~~2E~2£~~_§Qh~~e I " Agricultur~l Programme' -" "r! ;,:..
Co-~perat~on and Community Development - "
rII Irrigation and Power ..;
IV r:.dustry and Hining V Transfort and' Communi cat ion VI §2£i~!_e~!:Yl£~~
1. Gene:al Education
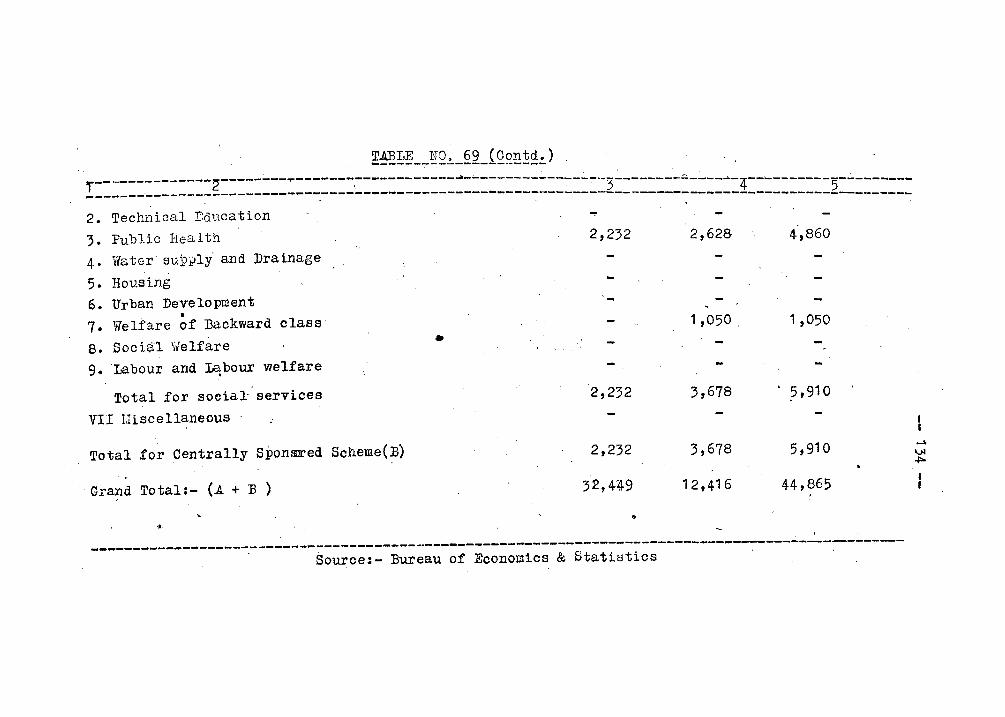
TABLE NO. 69 (Contd.) ---------------------!=============~g=====:=:::::::::.:::==:======~========:==:=:=='-3=:=::==::==:::=!==::===:=:~==:=:::= 2. Technical Baucation
3. Public Health
4· • Water sup~ly' and Drainage
5. Housing 6. Urban Development
• 7. Welfare of Backward class
8. Soci<;[l Welfare 9 .. Labour and Le;bour welfare
Total for socia~ services VII Uiscellaneous .
Total for Centrally SponSlred Scheme(B)
Grand Total:- (A + E )
~ ..
... 2,232 2,628- 4,860
1,050 . 1,050 •
2,232 3,678 ?,910
2,232 3,678 5,910
32,.449 12,416 44,865
--------------------------------------------------------------------------------------------------Source:- Bureau of Economics & Statistics
... 1,.)1 ..p. , I
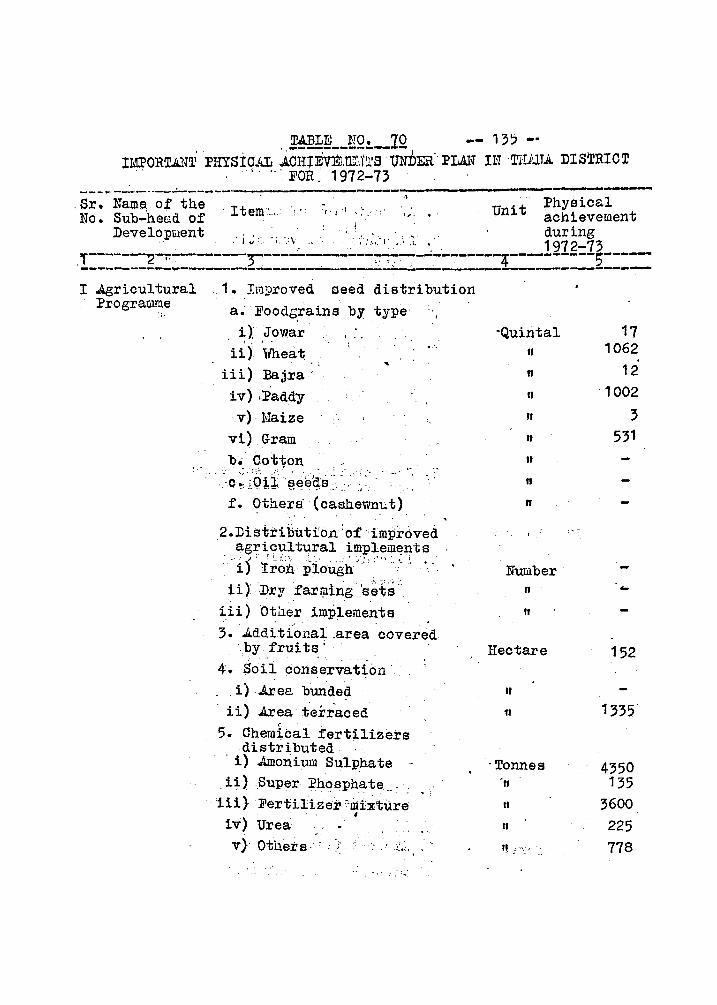
, W~Rl __ !iQ!. __ 1Q -- 1 35 _. • , '. I •
IMPORTAN!l.' PHYSICAL ..A.Cm:EvEl:1E:,)'9.'S ''O'NDER' PLAU nr -THJuTA DIS~ICT , ,-' "'FOR~ 1972-73 '
---~,----"-------..,..,---,-----------------' --_._--,Sr. Nam~ of the It ,,-No. Sub":hee.d of - em'".: '-' ji ':- .• , '" .'
- Physical Unit achievement
, ! Development " '" , " ,,' . , ' " " during - . I" "-' '-_\ _. ' '," ::., I' "I ,t, " ' 1972-73
,T-----~-~---------;------~-----..,..~~~----------4----------5----------------~--------------------- . - . ------------------I .Agricultural
:Prograrume ;.
1~ Im~roved' seed distribution a. 'Foodg,rains by type
i},' Jowa'r t • I ~
ii)- Wheat iii) Bajra"
iv) .Paddy v) Haize
vi) Gram b~ Cotton-
--:Q~-,-'(h(-§ee~s',~<-,'~::" ~- .-f. ~thera (cashewn~t)
_2.nis1;ril>utfon:of -'imprbved agr.icultural implements
: "i) , i~~ti ' ~iOugh ::,. :" .~:~ ,',~ " --it) ·Dryfari!1ing 's~ts-:
iii) Otaer implements " ..,
3 • ..a.dditi'onal ,areacover~d -by- i'rui ts;
4. Soii conservation " _ i)bea bunded
- ii) Area t-e:h'aced
5. Chemical fertilizers distributed -,
- i) Amonium Sulphate . _ ii)Super :Phosphate .. _, iii} FertiliZ~i' ':rili~tur~
I
iv) Urea , v}-Others-' :~: -; x..-;,
-.
-Quintal 17
" 1062
n 12
" -1002
" 3
" 531
" n
" ,
Number' n
" Hectare 152
II
11
'Tonnes 4350 'II 135 It 3600 II 225
'l .' ''-: ': - 778
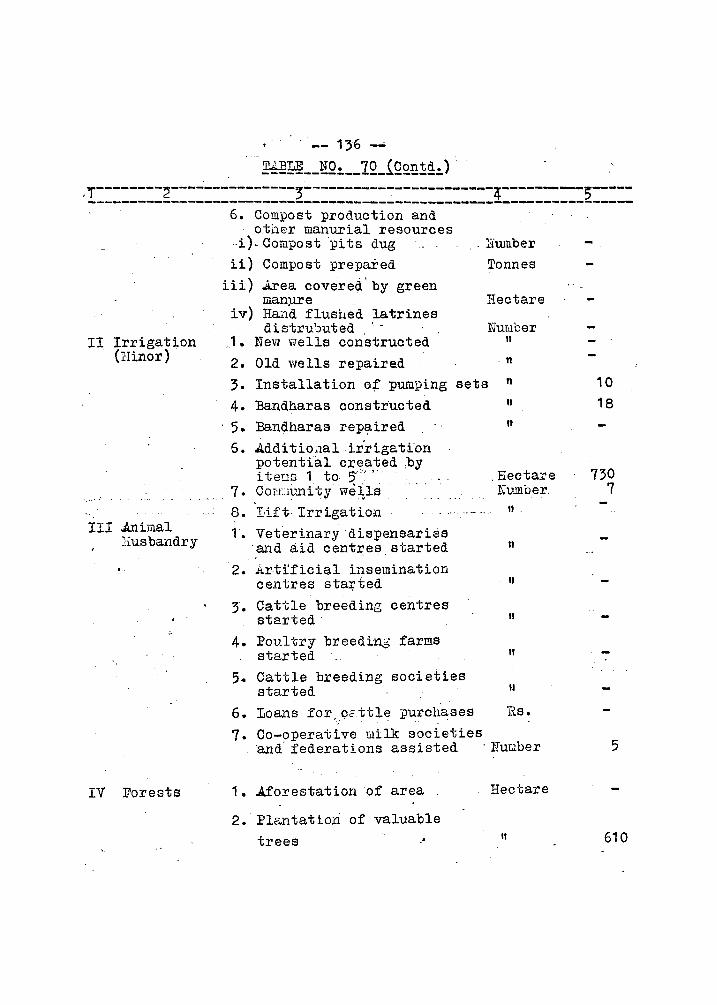
-- 136 --~~~ __ liQ~ __ IQ_iQ£~1~~)
,T--------2---------------~----------~------------4----------;----------------------------------------------------------------------
II Irrigatl,on (Hinor)
III .Animal T:iusbandry
IV Forests
6. Compost production and other manurial resources
.i)- Compost pi ts dug i1) Compos"1i prepared
iii) ~ea covered'by green
. Number Tonnes
manpre _ Hectare iV) Hand flushed latrines
distrubuted " NUMber J. New wells constructed II
2. Old wells repaired . " 3. Installation o~ pumping sets " 4. Bandharas constructed 5. Bandharas rep~ired 5. Additio . ..1al ir'rigatfon
potential c;reated ,by items 1 tG ~~. .
7. COl":L1V.nity we~ls s. Lift·Irrigation 1. Veterinary dispensaries
·and aid centres. started 2. Ar-trficie-l insemination
" "
. Hectare NU.llfoer.
II.
II
centres sta:r;ied II
3. Cattle breeding centres started "
4. Poultry breeding farms started II
5. Cattle breeding societies started II
6. Loans for.ccttle purchases Rs. 7. Co-operative Milk societies
and· federations assisted . ~ruQber
1. Aforestationof area Hectare
2. Plantation of valuable
trees II
10
18
730 7
5
610
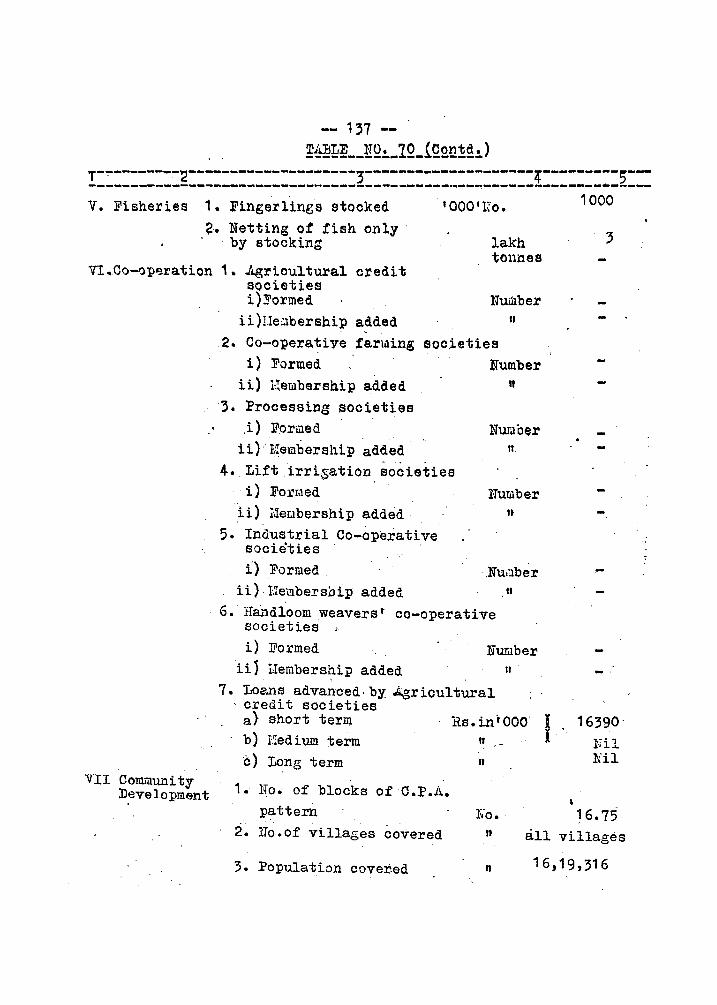
-- 137 -~~~~~ __ llQ~_lQ_!Q~~!~~)
T-~------~~~-~------------------;----~---------------4---------5-------------------------------------~-------.---~--------------------V. Fisheries 1. Fingerllng~ stocked
a. Netting ot !ishonly . by stocking
1000'1<'0.
lakh tOl1l1es
VI,Co-op~ration 1. Agricultural credit societies
VIr Community Development
i)Pormed ii)I.Ie:.1bership added
Number II
2. Co-operative far~ing eoc~eties i) Formed Number
ii) Hemberahip added " 3. Processing societies
.i) Formed ii)'Membersllip added
Number II
4. Lift irrisation societies i). Formed Humber
:U) i.Ieubership added 5. Industrial Co-opexative
societies
ft
1) Formed .NUi1ber ii) l1el!lbersDip added "
6. H~,dloom weavers t co-operative societies • i) Formed Number
ii 1 ilembers~ip added II
7. Loans advanced· by Agricultural credit societies a} short teril). Rs.iniOOO I b) Hedium term "I c) Long term It
1. No. of blocks ofC.l'.i~. pattern
.. l~·o • ,
1000
16390 ij'il ldl
16.75 2. lTo.of villages covered " all villages
3. Population covered n 16,19,316
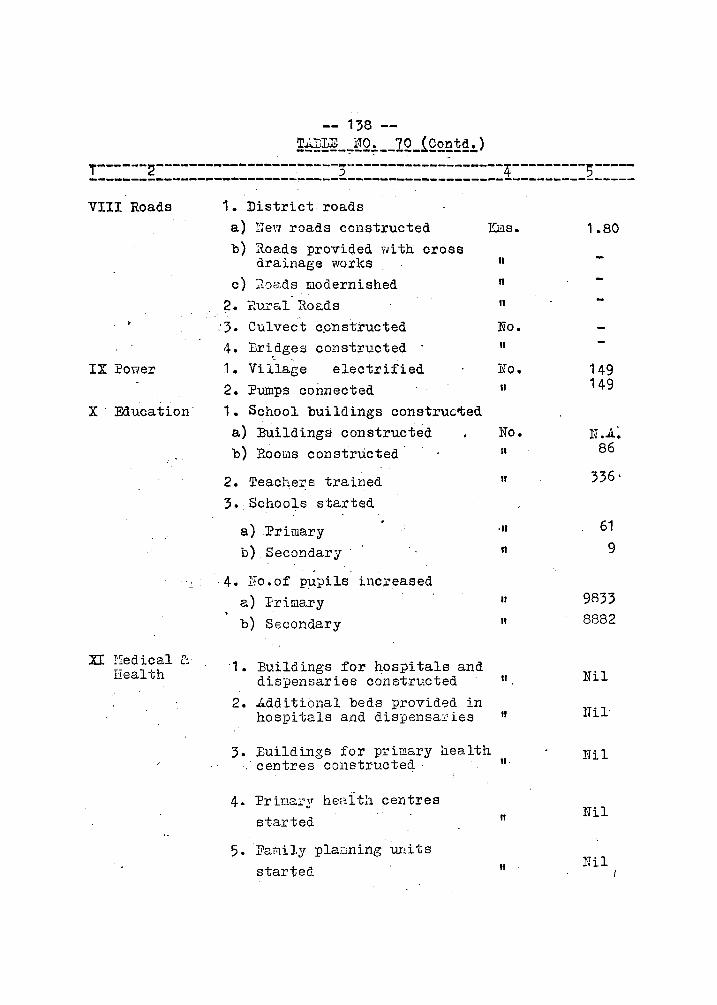
-- 138 -~~~_~~Q~ __ IQ_!2£B~~~)
r------2----------------------)-------------------4---------5----------------------------------------------------------------------VIII Roads
x . Education'
XI ?iedical D:, . Eealth
1. District roads a) New roads constructed b) Roa.ds provided with cross
drainage works c) ~0ads modernished
.. ? r~lli'al Roz.ds '3. Culvect c,onstructed 4. Br\dges constructed 1. Villas~ electrified 2. Pumps connected 1. School buildings construc~ed a) Buildings constructed b) Rooms constructed
2. Teachers trained 3. Schools started
a) Primary b) Secondary
. 4. No.of pupils increased
a) Primary b) Secondary
'1 • Buildings for hospitals and dispensaries constructed
2. J .. ddi tional beds provided in hospitals and dispensa:,:ies
Kills.
II
n
II
No.
" Ho. II
No. II
II
·It
"
" "
"
" 3. Buildings for primary health
, centres constructeD ..
4. Prima~y heaith centres started
5 • Fa8ily pla.Lining imi ts
started.
II,
"
II
1.80
149 149
l~ • .A.: 86
336'
61
9
9833 8882
Nil
Nil'
Nil
Nil
nil f
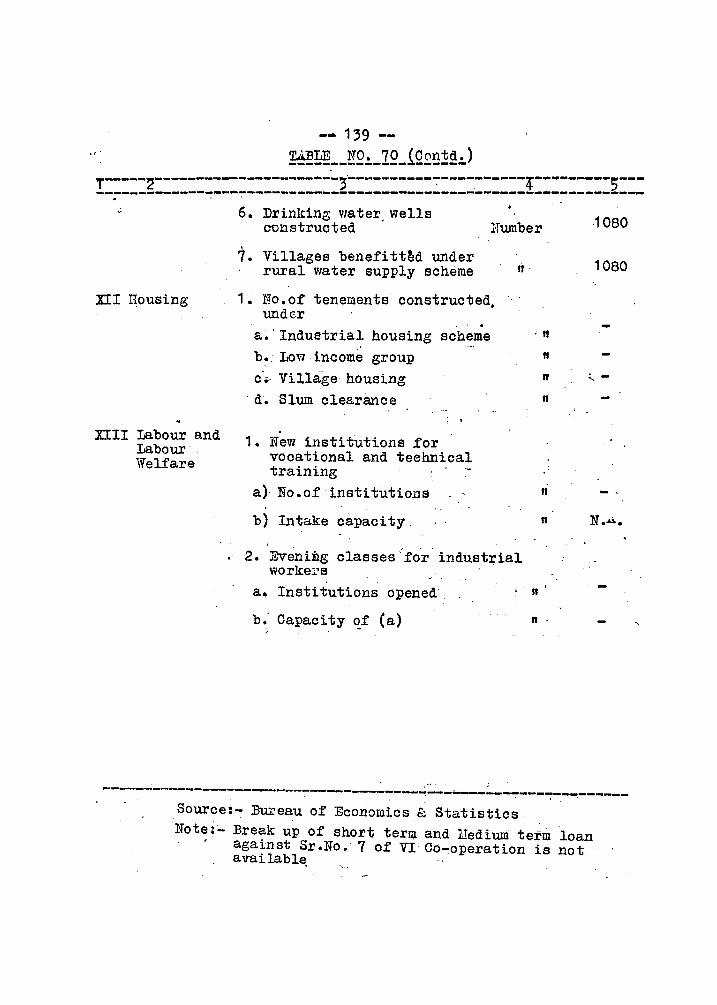
-- 139 --~~~~~ __ ~2~_12_iQ£B~~~)
------------.. ---~--'2'·---------------------T-.. ------5-------- --- ~. ~ T 2 _ ~ ___________________________ ~ __________________ ~ -------------- -. .' . .
XII Rousing
6. Drinking water, wells COllstructed l,Tumber
7. Villages benefitt~d under rural water supply Bcheme
1. No.of tenements constructed. undEr
a~'Industrial housing scheme
Ii'
'It
"
1080
1080
b •. LoVi income group c .. · Village housing
. d. Slum clearance
II :.. -.
XIII Labour and Labour' Welfare
1. l~ew institutions :for vocational and teehnical training
a)· No.of·institutions
b) Intake capacity. , .
. 2. Evening classes 'for industrial wo-rkel's
It
II
a. Institutions opened' •. II
b: Capacity '?,f (a) . n .
N.~.
-----~--------~-------~---;----:------
Source:- J3u:reau of Economics &. Statistics Note:- Break up of short term and hledium term loan
, against Sr.No. 7 of VI· Co~operation is not availabl~
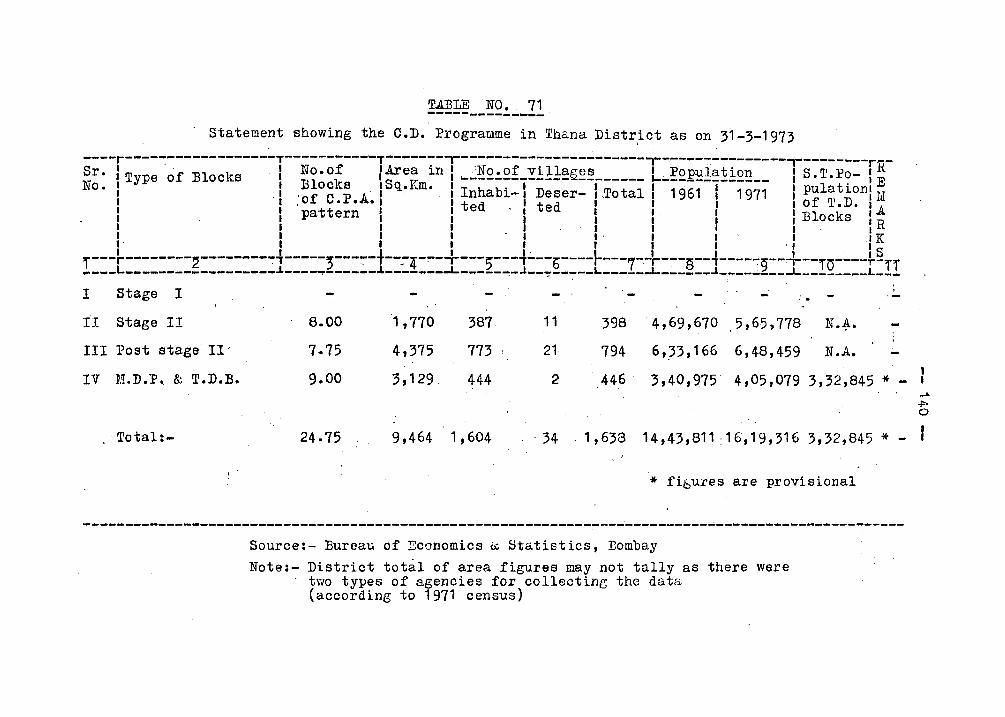
T.ABLE NO. 71 -----------.... _-. Statement showing the C.D. Programme in Thana Distr~ct as on.31-3-1973
----r----~-------------T-----------T-------ir----------------------,-~----~---------,_--------r~-Sr. I' I No.of IArea in I ,'"lifo.of vi~la.cres I ,Population, I S.T.Po- I R I Type of Blocks , I 131 k IS 1r I .... ------------1>1-------- 1-------------- I ' , IE No. I I oc S . I q.\.m. I I hab' I D IT t 11 1961 I 1971 I pulat,LOnl I : I 'of C "D A I I n 1.-1 eser- I, 0 a I I If"' D I It! I I, ..... I ltd ltd I J I I 0 ~ •• I I I pattern I Ie· I e I I . I I Blocks I.A I I I I I I I I I I R I I I I I I I I I I I I I I - I I . I I I ,I K ,. I I I I I I I 'I IS I I + I I . I I I " I . I
,.--~r--------2--------~"T-----;---:-- --':"4-~-ir---5---.,---b----r---7--r-~-s--.,-----:-g--~--,O----r-" ~---L------------------~----~------~--------L-----~-~--~-----L------L------~-~------~--------L---I Stage I
II Stage II
III Post stage II'
IV M.D.P. & T.D.B.
"Total:-
r '
8.00
7.75
9.00
24.75
'1,770 387
4,375 773
3,129. 444
9,464 1,604
----~-----------------------------------------------------------~----------------------------~-----Source:- Bureau of Economics ~ Statistics, Bombay Note:- District total of area figures may not tally as there were
two types of agencies for collecting the data (according to 1971 census)
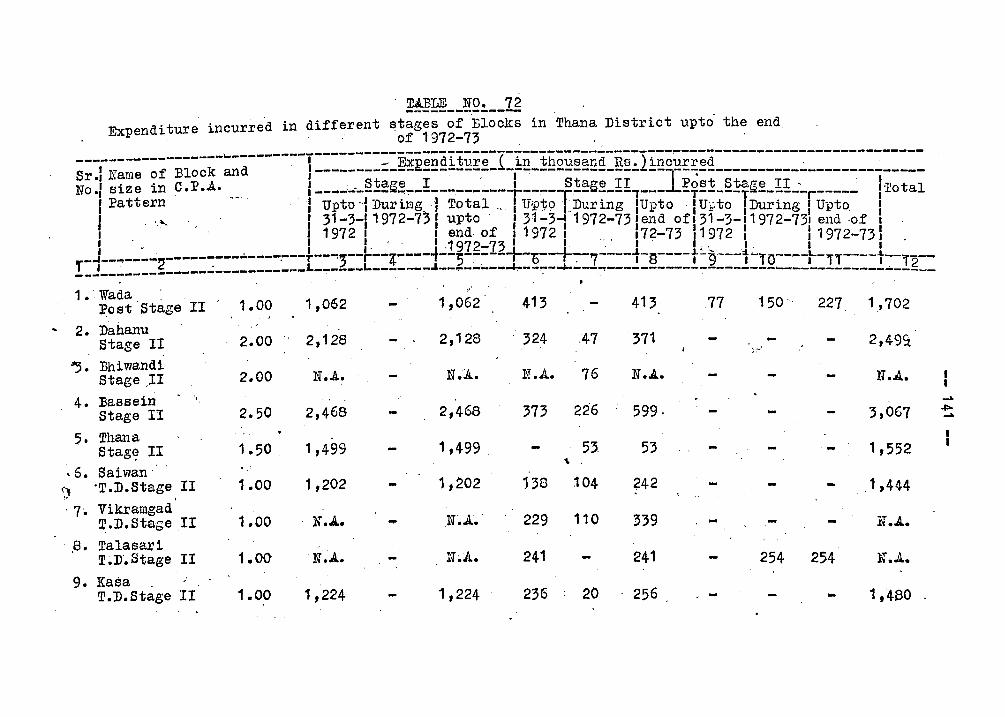
. ~E~ __ ~Q~ __ 1g Expenditure incurred in different stages of Blocks in Thana District upto the end
of 1972-73 ------------------~------------------:-Ei~endit~;e-7-in-th~~;;;d-R;:)i;~~;;~d----------~--------------·Sr.1 Name of Block and ------------ ---:----.--~-,------------------I--:---------------------------No.' s iz e in c. p .,A.. ---..;-·-§~~~~~-!----------l_-----rS~~S~-!!i--- ~~~~-§~~~-f.!-'-r----~ ! Total
, l'attern"- . 'upto "f During r Total .. 1 UPt91.During rUpto -I Uj,lto IDuring I Upto. I
I ":"'..' 31-3-11972-731 upto : 31-3-: 1972-73 1eild ofI31-3-11972-731 end -of 1 1 . 1972 1 1 end· of 11972 I' 172-73 11972 1 11972-731 I . I· " .. 1 1972-73+1 I '.' I' I.,,~ I, I I-. --------~-------T---~--r--T---- --~----- -~--+--7----~-~----~-~---~~~.-- L . ,.-... --... ----2- "J 'I- :; o· 1 0 1 J I 10 --I -jj----j--l---__ l-------------..:-----------L ------L -------... ----.... ---....I-,--.. ,":"--I----...,------------:---------~----------...;,.--g--
1.' Wada 1,062 ' 1,062 Post 'Stage II 1.00 413
2. Dahanu 2,128 Stage II 2.00 2,128 - 324 47
~. Bhiwandi N.A. Stage .II 2.00 N.A. N • .A.. 76
4. :Bassein "
Stage II 2.50 2,468 - 2,468 373 226
5. Thana .. Stag~ II 1.50 1,499 1,499 , 53. ,
·6. Saiwan' I) 'T.D.Stage II 1.00 1,202 1,202 138 104
. T. Vikramgad T.D.Stage II 1.00 l~ .A.. N'.A.. ' 229 110
,a. Talasf:l.ri T ~D·. Stage II 1.00 ·N.A.. U~A. 241
9. Kasa T.D.Stage II 1.00 1,224 1,224 236 20
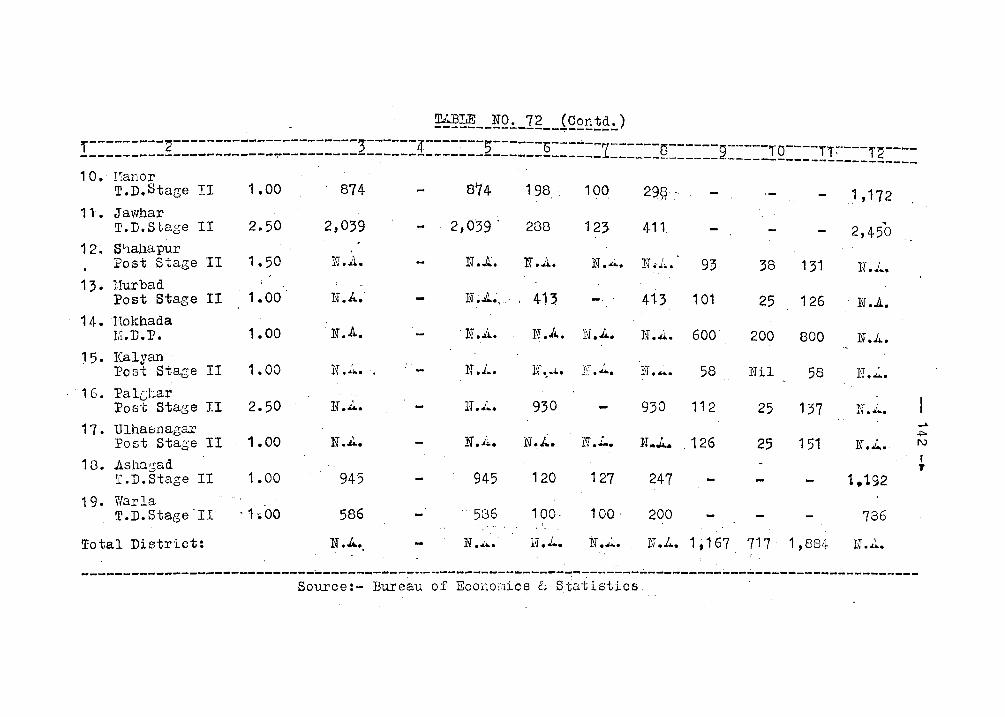
~~ __ ~Q~_lg __ ~Q~~~~~) ~---------~----------------------~------T-------5------r---~--I ~ ~ ~ o· 7------S------~-----~O---- --------------------------~---------------------~-----------------------________ 2 ____ -!_ fT, -,'2----10.' J'Ianor
T.D.Stage II 1.00
11. Jawhar T.D.Stage II 2.50
1 2 ~ Shalla. pur Post Stage II 1.50
1 ,. Uur bad Post stage II 1.00
14. Holchada M.D.P. 1.00
J 5. ICalyan Post Stage II 1.00
,'16. Palchar .. Post Stage II 2.50
17. Ulhaemagar Post Stage II 1.00
1 G. Ashasad T.D.Stage II 1.00
19. Warla T.D.Stage'II -1~00
Total District:
874
2,039
If.A.
N • ./i..'
N .J~.
If .1,. •.
N.A.
945
586
N • .l...
-
. ----------------8'74 198,_ 1 00 2Q~"
2,039 . 2GG 1 23 411.
38 131 U • .i...
, 413 101 25 126 !if .A.
N.A. N.A. N.~. N.~. 600' 200 800
N.1... If~../.I.. l'f .1...., !if • .&.i.. 58 lUI 58 ~ . ...:.. H.J ... 930 930 112 25 137 N.J.. I
N .J.~. N ~.J~. Ft • i.. N.J..., 126 25 151 N.1...
945 120 127 2~7 1.192
1 00 - .1 00 . 200 786 ····536
N~.L.. •.. N.J.. N.~. N.1... 1,167 717· 1,884 N.~.
. ." .
----------------------~----'------..,----- ... -----------.. ------~-""7- .... ----.:.---------;..--.:.--------------------Source:- Bureau of' Economics e:. S.tatistics.
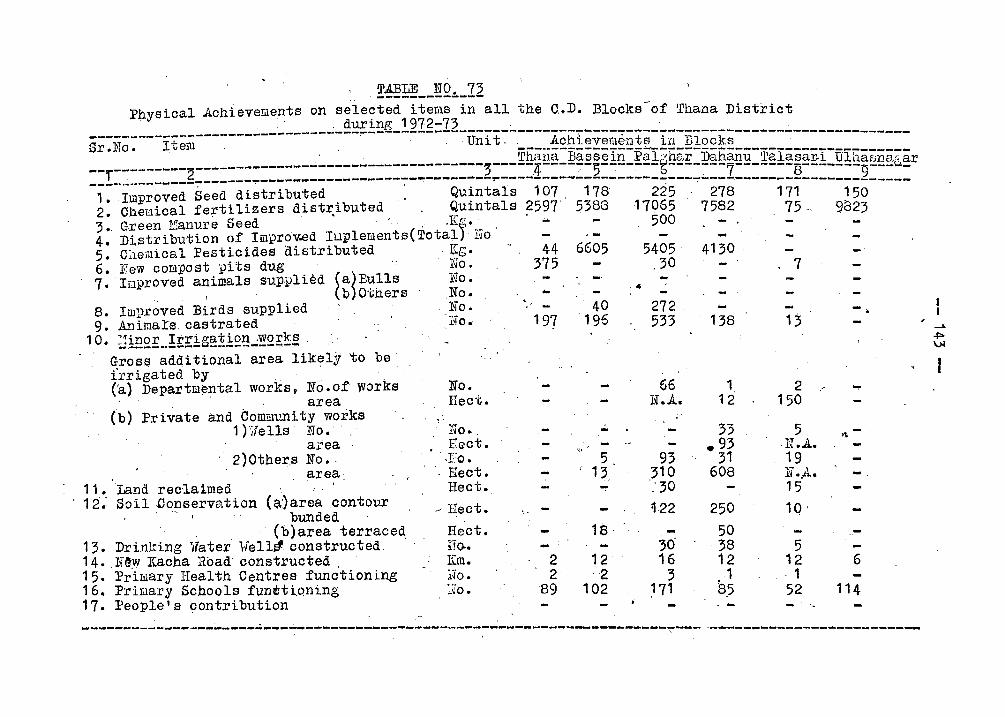
Physical AchievemeI?ts on selected item.s in all the C..D. Blocks-of Thana District during 1972-73 ' "
S;:N;:---It~~---~----------------~------------u~it~-~---A~hI;v;fiI~;t~-i~-Bl;~k~---------------------, ' . Thaiia-BasseIii-:paI~har-Daha:nu-Talasar.I-DI;;a8na-;ar
--'f---------~--------------..;.-----------------.---j-----,4------i:':-------~-------7-------8------~ --...:-;;:.-____ ,~ ________ _:_------.,.-----------------7--:--------... ---________ 2 ____ ... __ -: ___ -:'.:.. ___ .-______________ ~ ____ _
1. Illlproved Seed distributed Quintals 107, 178 225 278 171 150 2. Chemical fertilizers distr,ibuted ' , ~uintals ~59T ~38G17065 7582 75·0 9t:s23 3. Green I:.:ranure Seed " '. .I\.~.' , 500 4. Distribution of Improv.ed Ihlplements(Total}' l~o 5. Cllemical Pesticides distributed Kg. 6. rew compost pits dug No. 7. Iuproved animals suppl ied (a) :Bulls 1\[0.
, (0) Others ,No. 8. Imrroved Birds supplied No. 9. An il1lals, castrated 1;j"o.
10. Hinor Irrip'ation ,works. ----------~---.,.----~--
Gross additional area likely to be frrigated by ..". '
,('a) Departm¢rital works, No. of works , area
(b) Private and Comun.:.ni ty works 1 ) '':fells 'No.' "
atea , 2)Others No. '
area 11 • Land rec1aimed ',,' . . 12: Soil .conservation (a:)areaconto'ur
, " bunded , . . (b)area terrace~ "
13.. Drinting Water 1,/el11# constructed " 14 •. l~'~w Kacha Road constructed ' 15. Pr"tlilary Health Centres func'tioning 16. Primary Schools funmtiQning 17. People's contribution
No. Hect.
No. , E~ct.
, ,Fo. , Reet.
Hect.
../ Hect.
Hect. Eo.. Kill. Ho. l~o.
44 375
.. 197
2 2
89
6605
. 40 "196
~
~;I
5 i 1;
~
18'
12 2
102
.. 5405'
30
272 , 533
66 lif.A..
93 ;10 :30 ~22
30' 16
3 ~ 71
4130 . . 7
138 13
1 2 , .. 12 150
5 ~
,l~ • A.. 19
33 .93
31 608 l:r •. ,A.
15
250 10'
50 38 5 12 12 6
, 1 52 114
1 8,5 - ... - '.
----------------'-----..;.--... ~ .. -----------------... ----~-'---------..... -----.. -.. -~-- .... -------------------------
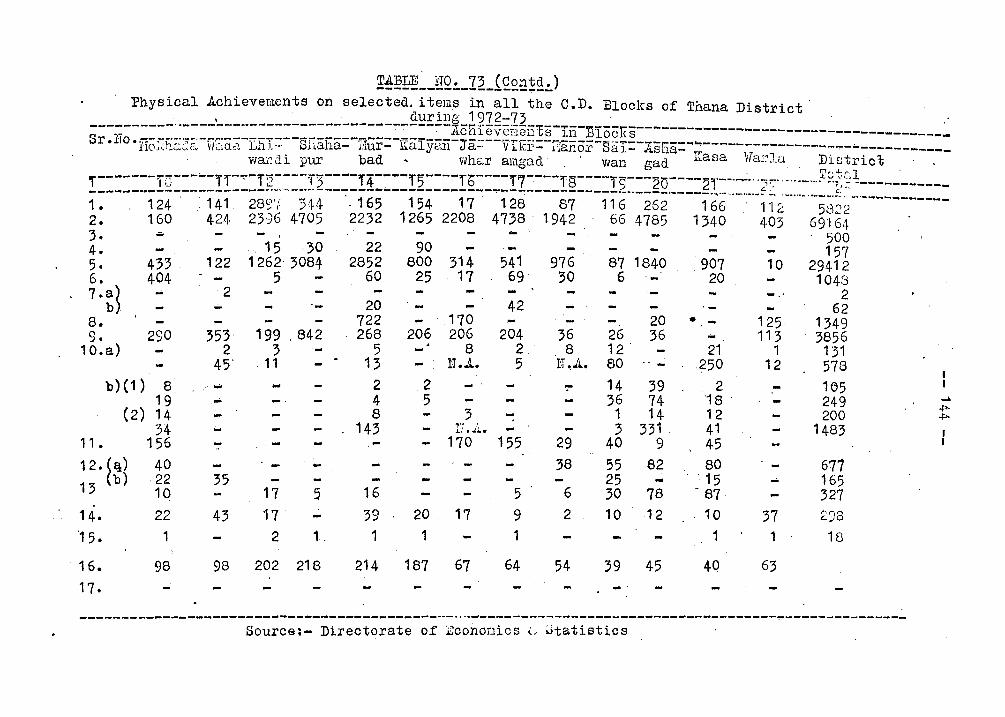
Physical Achievem.ents on selected. itelill3 in all the C.D. Blocks of Thana District , . cluril1g 1972-73 '. . ..
---;------··-------------~------------------Acnreveillen~s-In-BlocK8--------------------------------------Sr. J:I 0 • fiQ~S:Z:~~ r~ -vi'::tda-ZEI:--sIiaha:-fi[ur:-Ralyan-J a::--VTkr :-Dan ox-a 8:1:-1.8n8::""'";-------------------'-----------_
. Wal'Jdi pur bad ~ wh&..r amgad , ' wan gad Lana Va~~llJ.. Dictric1i " , ,.-------'iG-----l1-":".;.12----'13----'rLi----P;---:-lti----'r7----18--.;.-'r9---2D----2r---~~-··2~'·-·'--· .. ~9.~~L----------------•• -----------..... -- ... ~-~.~-- ...... "---:-----------------~--~-----------.- ...... ----.----- .. _t~- -~- ..... _ .. ~ ._ ........... -.. ••• :.:" ...... ______ ... ___ _
1 • 124 1'41 28S'/ 344 . 165 154 17 128 87' 116 262 166 11 ~ 5822 2. 160 424 2396 4705 2232 1265 2208 4738- 1942 66 4785 1340 403 69164 ,. .-;, 500 4. " 15 ·30 22 90 157 5. 433 122 1262' 3084 2852 800 314 541 976 87 1840 907 10 29412 6. 404 5 60 25 17 69 30 6'~ 20 1043
7'~J ~ _2 20 42 -,' 6~ 8. 722 ,170 20 • - 125 1349 9. 290 353 199,842 268 206 206 204 36 26 36 ~ 113 3856
10.a) 2 3 5 8 2, 8 12 ' 21 1 131
b)(1 )
(2)
11.
12.(E!) 13 (b)
14. '15.
. 16.
17.
8 19 14 34
156 40 22 10 22
1
98
45' .11 13 ~r • .!. 5 N.,A. 80 -250 12 578
, ~... 2 2 - ':'" 14 39 2 - 105
35
43
17
17 2
5
t.
98 202 218
45 36 74 '18 249 8 3 - 1 14 1 2 200
143 N.~. 3 331, 41 1483 - 170 155 29 40 9 45
16
39 1
20 1
17
214 187 67
5 9 1
64
38 55 82 80
6
2
54
25 " 15 30 78 - 87 10 12
39 45
-'
10 1
40
37 1
63
671 165 327 2::18
18
-------------------------------------------.... - ..... ~------------------------------------~---------------Source: - Directorate of Econoaics lJ IJtatistics
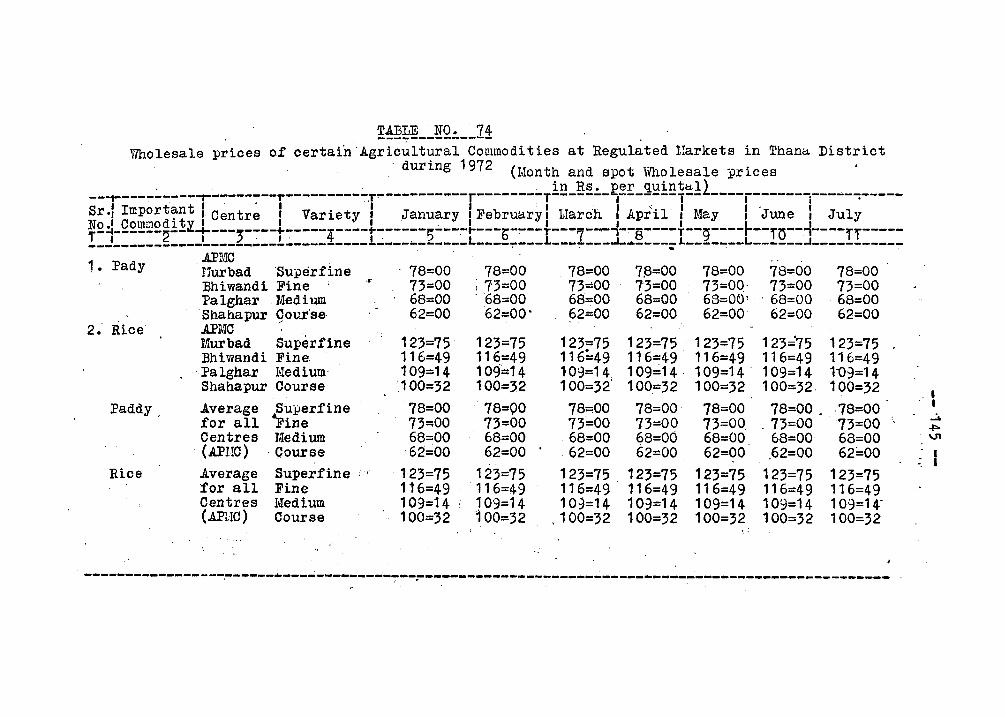
~~I:~!L:"!!Q:. __ 1~ Wholesale prioes of oertain'Agricultural CO[!1modi ties at Regul~ted 1,~arkets in Thana District
.' during 1972 (Month and spot Wholesale prices
--~----~----~--------T---------~T~----------r--------Tl~-g~:.-~~£-~~l£i~!l-~--r------~---~-'-----Sr·1 Impordt~ntt I C~ntr~ I Variety I January I February I March. I April I May I-June! July No I Comwo 1 v I I I . I I I I L. I T-1------2--\L.-:----)-~--t":"----4----t-:-----5---~ ... ---b-~--T---7--'--S----T--9----r--ro--'----rr-----___________________________ ~------------------L----~--_L ___ ~---~.----~L----~--L------~-----------1. Pady
2.- Rice
Paddy,
Rioe
.APMC .' !1urbad 'Sullerfine . 78=00 78=00 78=00 7~=00 78=00 78=00 Bhiwandi Fine' .• 73=00 ; 73=00 73=00 73=00 73=00 0 73=00 Palghar . Medium . 68=00 ' "68=00 68=00 68=00 68=00" 68=00 . Shahapur Cour·se· 62=00 62=00' 62=00 62=00 62=00' 62=00 .APMC / Murbad Sup~rflne 13hiwandi Fine. Palghar Medium· Shahapur Course
Average Superfine for all -'ine Centres Medium (APIre) . Course
.Average Superfine for all Fine Centres IYIedium (.APUC) Course
;. "
'. .
123=75 116=49 .109=14 ,100=32
78=00 73::;00 68=00
·6::!=00 . 123=75 116=49 109=14 ' 100==32
123=75 116=49 1 09~14 100=32 78=00 73=00 68=00 62=00
123=75 116=49 109=14 100=32
123=75 123=75 123=75 123d75 116~49 116~49 116=49 116=49 109=14 109~14' 109=14' 109=14 100=32' 100=32 100=32 100=32. 78~00 73~00 68=00
.62=00 123~75 116=49 10:;)=14
.100=32
78=00 78=00 78=00 . 73=00 73=00 _ 73=00 68=00 68=00 68=00 62=00 62=00 _62=00
123=75 123=75 123=75 116=49 116=49 116=49 10~=14 109=14 109=14 100=32 100=32 100=32
78=00 . 73=00 ·68=00 62=00
123=75 116=49 1"09=14 100=32 ·78=00 73=00-68=00 62=00
123=75 116=49 109=14-100=32
-----------------.---.---... -------------~--:--------------------------------------------------------
. I . I
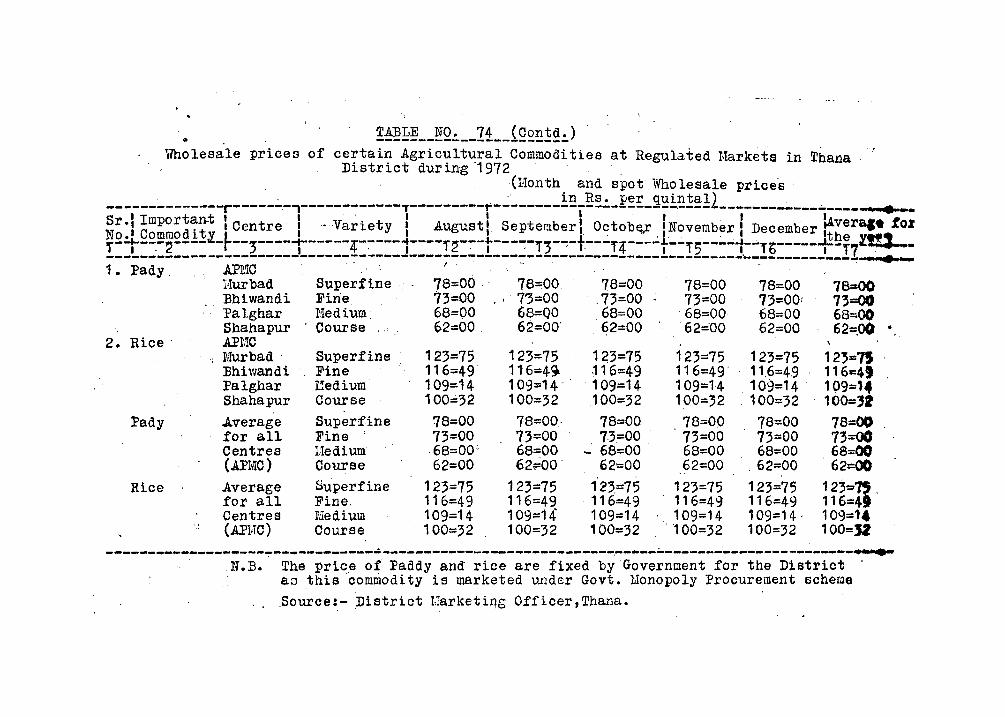
.. Wholesale prices of certain Agricultural Commodities at Regulated Markets in Thana
District during '1972 ' , (Honth and spot Who lesale price's '
---~-------"'.--r-----~-l-------:'~----l---------r--------!~j"g~:.-g~!: ... S~i~~~];2~-i-----~---~--__ , •• -~r.: 6mpor~~~t I Centre l-Varlety, Augustl September t Octobe"r I November I December fA'veraJ. fo! ,.2':'r-2,~22_.L~_~ __ ;----i-----4-~---1---"'T~-:--t----:-'I'3-~-t.---'f4---":f--"5--~-:-i--"b------f~r H!1-. -------------------------------~------------------~----------------~--------~-----_______ i _! • ~. 1. l'ady, "_, AI'~m " " : I' . ' ,-' ,,' , • '
I[uxbad Superfine 78=00 78=00 78=00, 78=00 78=00 78=00 ,Bhiwandi Fine 13=00, 7'3=00 ',73=00 73=00 73=001 73=00 :Palghar ~'Iedium: 68=00 687=00 ,68=00 '68=00 68=00 68=00 Shahapur Course, .. 62=00 , 62=00' 62=00 ' 62=00 62=00 62=.00·
2. Rice' .Al'f;IC Murbad Bhiwandl Palghar Shahapur
Pady Average for all Centres (Al'IYIC)
Rice Average for all Centres (APIITC)
Superfine Fine I.~edium Course
Superfine Fine I.Tedium Course
Superfine Fine, I'Jedium Course
123=75 116=49 109=14 100=32
78::;:00 73=00 68=00: 62=00
123=75 116=49 109=14 100=32
123=75 1 ~3=75 116=4~ ,116=49 109=14' 109=14 100=32 ,100=32 78=00, 78=00 73=00 ,73,=00 , 68=00 - 68=00 62~OO' 62=00
123=75 123,:::75 116=49 ' 116=49 109=14 '109=14 100=32 1,00=32
123=75 123=75 12~=7S 116=49' 11.6=49 116&:4' 109=14 , 109=14 ' 109=14 100=32 ' 100=32 100='2 78=00 78=00 78=00 73=00 73=00 7'3-00 68=00 68=00 66=00 62=00 ,62=00 62=00
123=75 123=75 123""11 116=49 116=49 116=4
, 109=14 109=14' 109=1. ' '100=32 100=32 100=n
-------------------~--------.---------- ... ---------... ------------,-_ .. _-.;.-----------------------....... N.B. The price of :Paddy and rice are fixed by Government for the District .
as this commodity is marketed under Govt. Uonopoly Procurement scheme
.Source:.-District IJarl{etil1tS Officer,Thana.
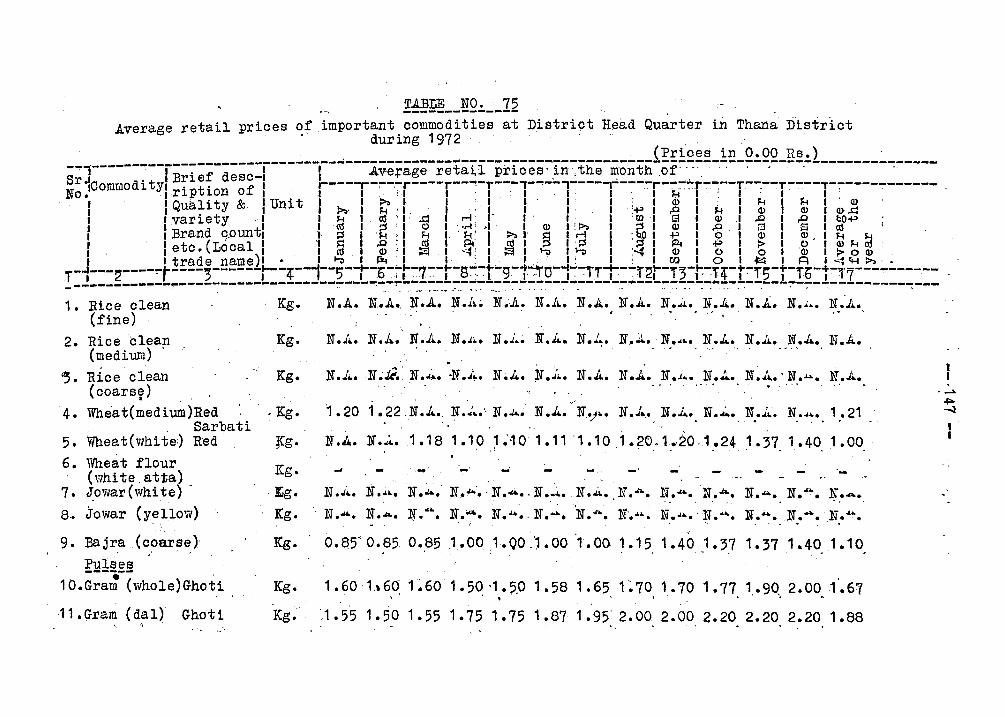
1~~ __ !2.:. __ 12 Average retail prices of important commodities at Distriot Hea.d Quarter in Thana District
during 1972 ' , (Pr(bes in 0.00 Re.)
--I------~-~r--i;f-d;;~:r------r-----Avera:ge-reta:Ii-prices~,in~the-~Qnth~of-'~~--~--~--'----------------:~----Sr .IComrilod 1 tyl B:-, I r----... -:--,-... ----r--"'!-T---'-... --,----,----~ ..... -':':':':r~_:-_:T---_:T----,.-':""----~------No! Irlptlon of I . I I.' I 1 'I, I. I, I' 1 8 I': 1 . 1 1
I f'\ 'l't & 1 U 't 1 1 ~ 1 1 . 1 I· II! 1 <I> 1 . 1 f..I 1 ~ 1 <I> . I 1 ~ua 1 y 1 nl I ~, I f..I' I, I ,I I 1 . I:+" I ..0 I f..I I <I> I <I> 1 <I>.t:l I I variety d I f..I 1 ~, l.t:l • r-I:.- • ' I I rDl S 1 Q) .I ..0 I ..0 1 l:.O+"
I I Brand q..ountl t ~ I ·e :: ~ l. "'~;. ',' ~ I, ~ I'~ I .?o I $ 1 .g' 1 g I ~ I ~ f..I
I ' 1 etc. (Lo cal I 'I § I ~: I :§1 I st; I· ~ I .; I '.; 1 :~ I ~ I t I ~ 1 ,~' I ~ ~ ~ I 1 trade name)l. 1 ~ 1 """ 1 I,' 1 I' I: I: lU)I 0 I ~ I A I "'~ 'H ~, , '
r-1---2----~r_----;------:_--4--1--5--:--b-7":_-7-:-:-r-S~,-:-t-g,-1-:ra-1-:--:rrj--'!'2i-T;-r-:lii-r:-'f5-r-:'fb-t=-17--- ... ------ -_ -----... ------~----_:_------------------~~.~~~.--:~.:-::-::-~.~:-:~~~-~~~-:----:-"'.-----~""---~.~-:~-:-:~-:-_-:-:-:-~---~-r:------------~--1 • Rice clean Kg.
(fine) 2. Rice bleap Kg.
(medium) '5. Rice clean " Kg.
(coars~)
4. Wheat(medium)Red . Kg. Sarbati
5. Wheat (white:) Red f{g. 6. 'Wheat flour Kg. (white.atta) 7. Jowar(whi tel . J[;g.
8. ::rowar (yellow) Kg. . "
9. Bajra ,(coarse )- Kg. Pulses ---.-... ,
10.Gram (whole)Ghoti Kg.
,11.Gram ( dal)' Ghoti Kg.
N.A. N.A., . N.A. N .1\. N .,Jl.. N .IL. N.A. N.,A.. N • .l... N.A. N.i. • N '~'" N .i~. '-
N.J .. N .1 ... N.,a. N .J~. N • .i .. ~ ·N • .i..~ N.l~. N,.~~. N ...... N.J... N.l;... N.J... N.A. ."
N.i ... N~Ji.· N ."j~. -N • .J.~. N.J... N .~4. N.A. N.A. N • .L ... N • .1... N.1A..'N ....... N • .t...
'" 1.20 1 • 22 ,N.A. N • .i ... ', N • .u.~ N.J.. N,.}". N.l ... N • .1... N ••• N .1 .. :. N .4 ... 1.21
.- ..; -' "
N .J"'. N ...... N.J.... N .l. N . N' !' •• .4t... • ..... .N.~. Not>. . . N • ..u.. N • .t... N ...... N ...... N.Ao N.~. N • ..c.. ~.
.... N .... N."' ••. N .... t... N • .n.. N' .... N • .lao.··N .... a... . . . . . N.4 •• N • ...-.. N ....... " .
0.as<0.85 0.851.001.00.'1.00 '1.001.15 1.40 1.37 1.37 1.40 1.10 . -.
1.60h60: L60 1.50,1.5.0 1.58 1.651:70 1.70 1.77 1.90 2.001'.67 . . ~ . . ." . ,'....
.1.55 1..50 1.55 1.75 1.75 1.87 1.95' 2.00 2.00 2.20 2.20 2.20 1.88
. , -" ~ """'I , I
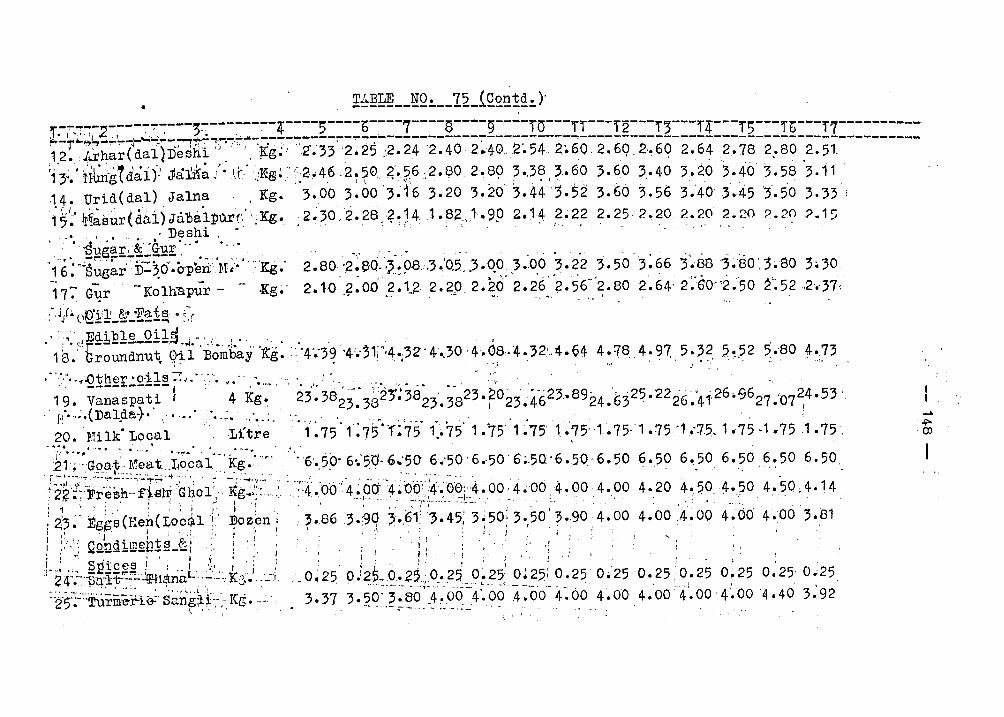
• ~~~~ __ ~Q!. __ 12._i££~!~!.)· r~~;~-2----~~~---;~---~~-~-4----5----b----7----S----9----10---i'i'---i'2---i'~---i'4----rc---i'~---~7----------~-r,-,,~""'~\-~'-~~--.. -~~~:"'.-:'.7""'-:~.-~-~----~-'!""'-:-~~----------_-:-_________ -= __________ 2. _________ 2_.:.. __ ~ ___ .!.. __________ _ 1.2.).xhar(dal)Deshi,J.' ", ;Kg~.' ,2·.332.2.5.~2.242.40 2.402'.54 2~60.2.6Q 2,.6q 2.64 2.78 2.802.51 ~13~: ~.ihng{dai)! Jla~~ /. \f.' .;IEg~,· :::2 .. 46 2~ ?0g",1;6 ,2. f?O 2 ~ 89 3 • .3~ ,3 .. 6,0 3.60 3.403.203.40 3'.58 '3.11 ' ,1.4. Urid(dal)Jaln~ , ,Kg. 3.00 3.00'3~16 3.20 3.203.44~,.52 3.66 3.563.403'.45 '3.503.33: 15~' ~f~sur{dai) Ja.'ba.1P1lrf~";Kg. 2.30 .Z. 28 .?~ ~ 4,1. f'2".l. 99 2.14 2.22 2.25,2.20 2.20 2.20 ? 20~.1 ~
. . . Deshi .' .,' ,.' ,,:' . ', .. : ' "., , '. '.' ,.' ,. .' .
, .. "§Bg~!'~~''':GU! " ..•. ",. , .. ,' ", .. , . . ... '. , '
'16; "~Sugar' ,j):' 3.o"·crpEni ~h· . ":Kg':
177 G~r '-Kolh-apur - - -Kg~'
2'~80.·2-:-~Q."~~;~.,3.·0.5. .. 3.Q6.}.',o'O 3.2'2 3.50'3:66 3'~88 '3~80,,~80 3.30 2 .u) ~~ 00' _? 1.;2 2 ~~.P 2. ~6' 2.2'6·'~. 56-'2.80 2 ~ 64' 2~'60' '2 .'50 f~ 52 ,,2.-37:
. -, .... ~ ..! ~ . . .
. , , ' ,
0.25 0.25,0.25 0.25 0.25' 0~25 4.00 4.00 -4;.00·4~'004.40 3~92 .
\ ~ .
I I, . ..... .po.
,co
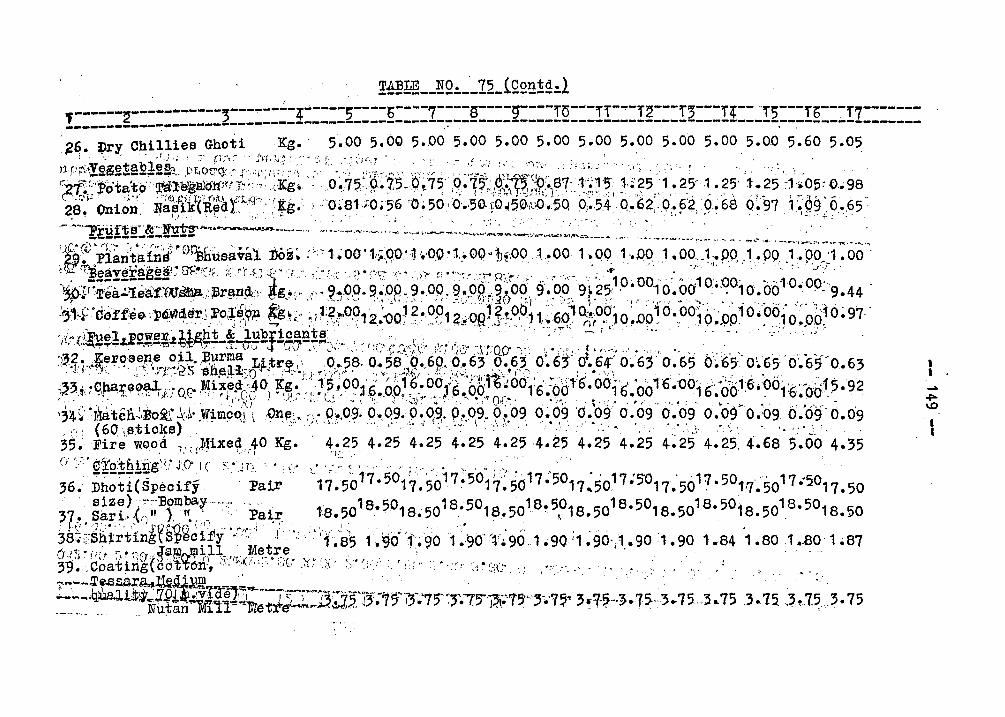
!~~ __ !Q!. __ 12_iQ2!1!2.:.1 ! ------ ----------- ---~----4~----5----6----7----S----~----r5---rr-~-r~---r3---r4--·r5---rb---r7-------1 ~ ; ______________________________________________________ -------------------------__
-----------~ .. ---.. ----- .. .
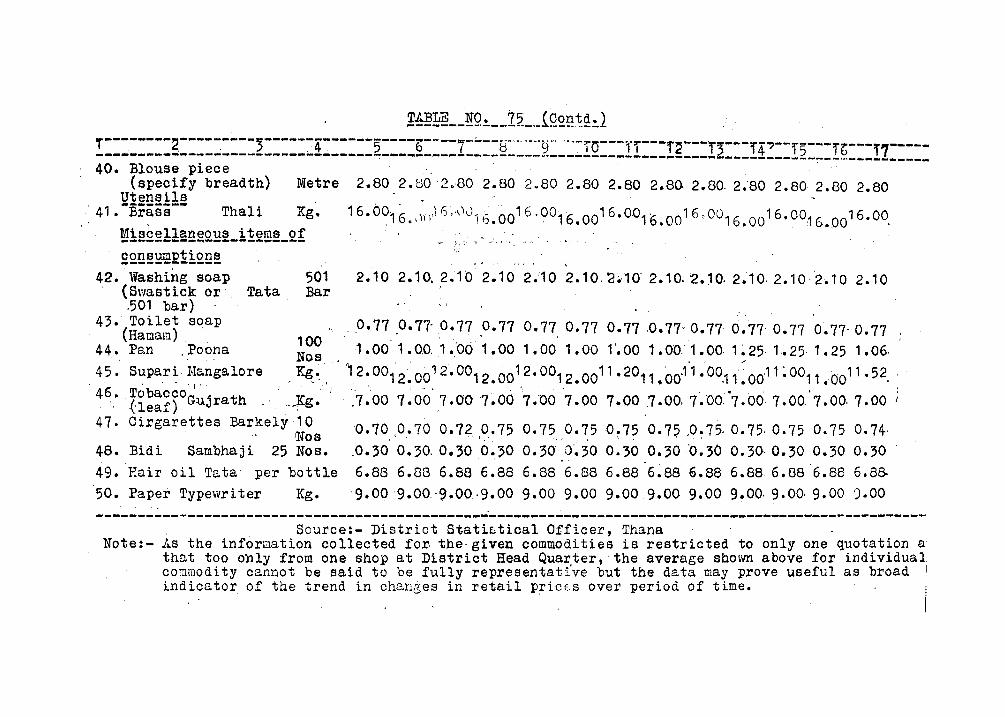
!~~I1~ __ NQ!. __ .7.2_._{QQ.~~~!.1 T---,-----2,-----:----3-----~4-:-----5---..,b----7-;...-':"'H" .. · .. ····9·' ···~rO---ri---i~---i ---i-"-- ---- --- ------------.... ---------------.. --------~--------~----.------ ... ---------------,..--___ 2 ____ ~ ___ r2 ___ r~ ___ !7 ____ _ 40. Blouse piece " '
(specify breadth) Metre 2.80 2.80 2.00 2.80 2.80 2.80 2.80 2.80. 2.80, 2;80 2.80 2.80 2.80 Utensils , , . ..
, 41. -Brass-- Thali Kg. 16.0016. \ )():i I) ~'\h)'i 6.0016 > 0016 • 0016 •0°1 b. 0016,0°16.0016.00,16.0016.00. Mis6ellaneous items of ---------~------------
-, , __ ' ',- 'I . ." ... "
I • • •
£2!2~~E1i~m~ 42. Washing soap 501 , (Swastick or Tat a Bar
501 bar) , ,
l.l
2. 1 0 2.10 .. 2. 1 h 2.10 2.'10 2. 1 0, '2 ~'1 0' 2. 10; 2. ~ O. 2 ~ 10, 2.10 '2 .. 1 0 2. 1 0
, 43. Toilet soap .0.77 .0.77- 0.77 0.77 0.77 0.77 0.77 ,0.77' 0.77 0.'77 0.77 '0.77' 0.77 (Hamam) , 1 ()O" .. " , .
44", Pan .,Poona Nos '. 1.00 1.0.0, ,1 • .-00 1.001.00 1.00 1'.00 1.00,1.00, 1 ~25, 1,.25 1.25 1.06·
, 45. S~pari, ~~galore ~<. )2. 001'2.0012 • 0012. 0012.0°12.0011 .2°11.'00.1'1."00.11: 00,11 : 0011 • 0011 .52. '
46,' 'Z~~:~)oGl,ljrath __ Kg.'.' '.7.00 7.0'0' 7 .00 7~00 '7.06 '7.00 7.00 ,7.00,7.00,'7.00 7.00' 7 .00,7.00 ;
47. Cirgarettes Barkely 10 'Nos
48. Bidi Sambhaji 25 Nos.
49. Hair oil Tata per bottle
50. Paper Typewriter Kg.
0.70,0.70 0.72 0.75 0.75 0.75 0.75 0.75 ,0.75, 0.75· 0.75 0.75 0.74· \ ". I,' ",."
6.8~ 6.88 6.88 6.88 6.88 6.88 6.88-6~886.88 6.8a 6.8S"6.88 6.8S
9.009.00"9.00 ·9.00 9.00 9.00 9.00 9.00 9. 00 9~ 00, 9.00. 9.00 ') .00
--~-------------------------------------------~-----------------------------~-------------------~---Source:- District Statistical Officer, Thana Note:- 1 .. 6 the information collected for the- given commodities is restricted to only one quotation a
tho.t too only from one shop at DiatrictHead Quar.ter,· the average shovm above for individual commodity cannot be said to be fully representative but the data may prove useful as broad indicator of the trend in changes in retailpricE:s over period of time.
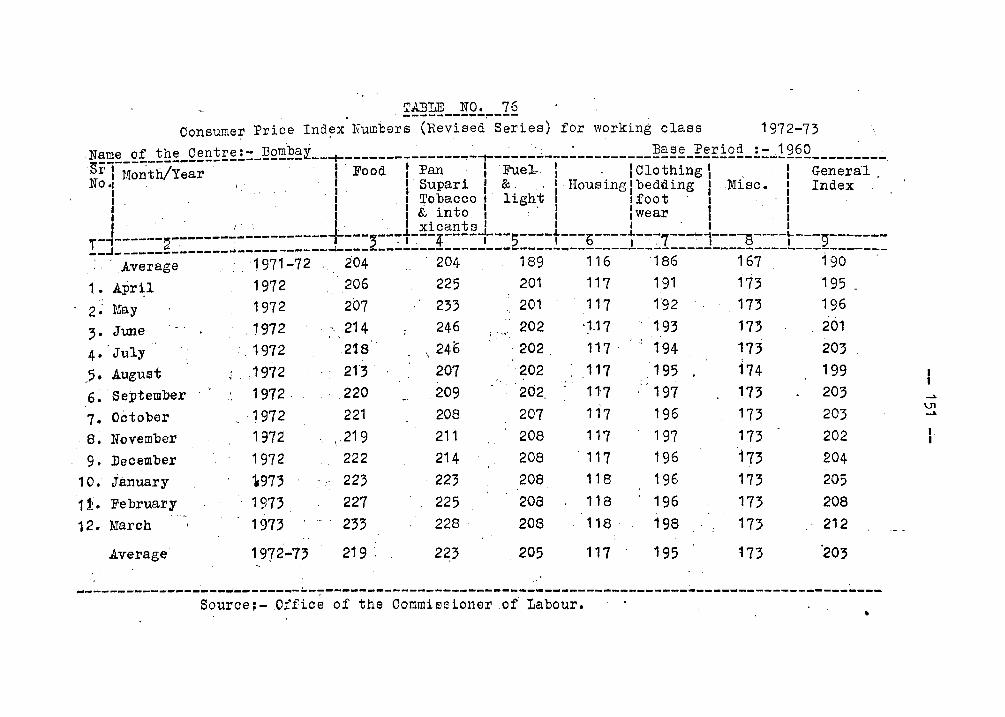
7. October , 8 ~ November
- 9,. December 10.' January 1 f .. Fe bruar y
12. March'
Average .. "
" .
,~"1972
. 1972-
1972
,97' 197'
" '
222
"," 22'
197' I , •.
227 2;;
1972-7' 219 '
\ 24~ 207
.209 202, . 208, 207
211 208 .214 208 , .
. ·22, 208
225 208 228 ' 208
2~' 205
. ,"
'.
" '11'7
"7 117
. 117 . ..
118 118. 118 .
117
196 197
. 196
196 196 198
195
1972-7'3
17' 17' 17'
,,'17' 17' 17' 17'
173
'I
20, 20,
202 204 205 208 212
'203
~--------------~--~------~~--~--~-----~-------------------------~-~------~------------------~---Source;- .Oifice of the Commissioner .of' Labour.
-" U1 .... I,
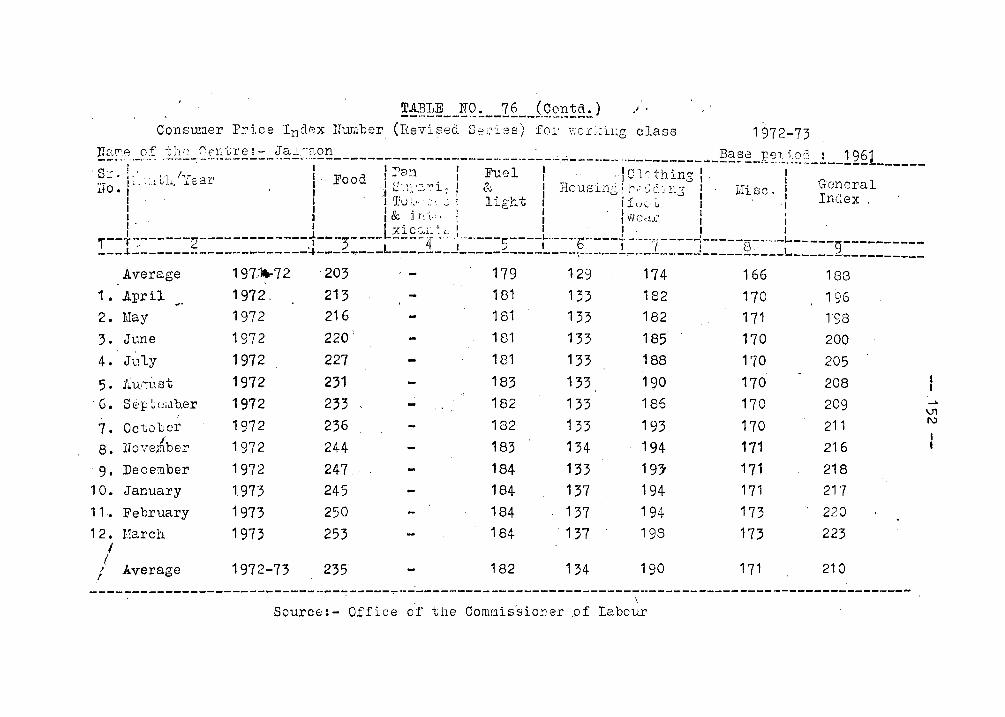
!~!!~ __ .~q!. __ 1§_~f.9.~~!~!.) J .
Consum.er Price Index lJ'umber. (Revised Se:riss) fOl' wc:ckiIlg class "
1972-73 !~r;~.,,~.;r. .1hs_0f~~~!:£!.:_ ~§:d:::~2~L _________ . ______________ :"_.~..: _____ .... _______ ... Basa per. i.ad: 1961
r . . .. - - ------.- ••.••.••••• -------!.------. Sr .' I I 1"8'1 1 FUAl I 1 r' 'Lr- th' ~ 1 , _····' .. tl "rear 1·.Food ,.... '1 :.. I ·1'·,'···· lnol ' ,. ~10. l" ... ! J.,.L II ::':1:~'J,""(, i: I &; I HousinG ~ r(-,3 C 1n3 " 1111 sc" I "General
I . . . ' . '. TOI.,; ::-.. ':' i light I ii.)(. ~ I ,: Illr~ex , I • I D.. .,' I . Iii I., I I~JI','(",! 1 'lwedJ~' I' I ,. Lx;c~""< , ,.. 1 I " , ' • .L '.oJ.. " '-' ' .. r --,T .-------1';-------------.1,---'2'---- ---- if" -", .! ..... ___ .. ____ L.. ___ • ______ -I •. _ •••••. ____ ..!___ I-
" c.. .I '+ ... 1 b I 7 . --8--""- -----9----------___ .L __ .,;. ____________ ~-----~--------!..-.------..J-----i.--------~-- ... ---r-... - ... ----J_-----~---L-------------__ _
AV'erage 197;~-72 '203 ' - 179 ' 129 174 1'66 183 ','
1- April 1972, 213 181 133 182 170 196 ~.
2. l\~ay 1972 216 181 . 133 182 171 1'98 3. Jtme 1972 220) 181 133 185 170 200
4. July 1972 227 181 133 188 170 205
5. l~uc:1.\St 1972 231 183 133 190 170 208 'G. SeptuiJb,er 1972 233 182 133 186, 170 209 ....
\on
7. October 1972 236 182 133 193 170 211 I\)
8. lloyef.{ber 1972 244 183 134 194 171 216
9. December 1972 247, ' 184 133 197 171 218 10. January 1973 245 184 137 . 194 171- 217 11.- February 1973 250 184 . ,137 194 173 '. 220 12. Uarch 1973 253 184 '137 198 173 223
I I
Average 1972-73 235' 182 134 190 171 210 , .' ------------------------------~-----~--------------------------------------------------------------'.
Source:- Office o'f the Commis-sio.r:er .of Labour
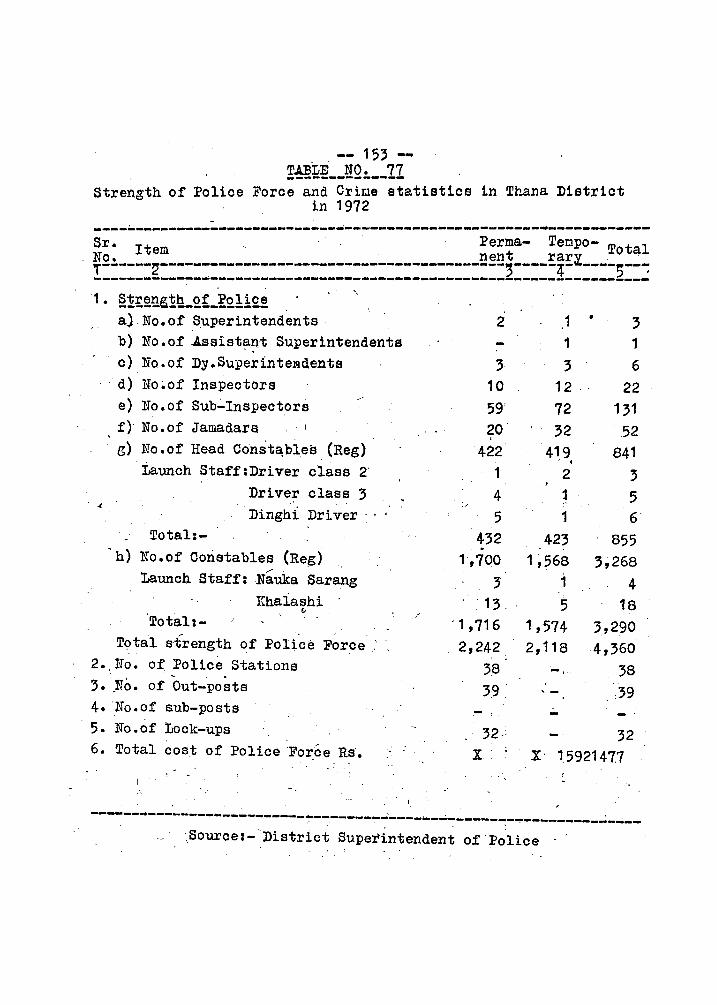
-- 15' -T.ABLE NO. 77 ---------------
Strength of Folice Force and Cri~e statistics in T~~na District in 1972
-----------------------~-----------~---~-------------~--------~---Sr. . , Perma- Tempo- Total
¥2:. __ :~;~------------------------------------~~~~----!:£!:~----5-~-: -----------------------------------------------------------------~ 1. ~!~~~g!h_~~_~~!i£!
'.
a) No.of Superintendents, 2 1 • 3 b) No.of Assist~~t Superintendents - 1 1
. c) No.of Dy.Superlnte~dents , , 6 d) No~of Inspectors 10 12 ' ' 22 e) No.of Sub':"Inspectors 59' 72 131 f)' No.of Jamadars .. 20 32 52 g) No.of Head Consta;bl,ee (Reg) 422 41,9 841
• Launch Staff :Dri ver class 2' 1 2 3 Driver class 3 4 1 5
.( > Dingh1 Driver: .. 5 1 6'
Total1- 432 423 855 . . h) No.of Constables (Reg) 1,700 1,568 ,;268
Launch Staff: /" '
Nauka Sarang 3 1 4 Khalashi '13, 5 18 ~
I' Total:- ' 1 ,716 1,574 3,290 " Total s'trength of Police Force,' 2,242 2,118 4,360
2. Ho. of Police Stations 3~ 38 , ,
3 •. No. of Out-posts 3:9' I
39 4. 'No. of s.ub-po sts 5. No.of Lock-ups 32·: 32 6. Total cost of Police 'Force Rs'. x. x· 15921477
-----.. ------------------~--:.-------.------..;,------~-~-------..:----J30urce:-District Superintendent -o:rPolice
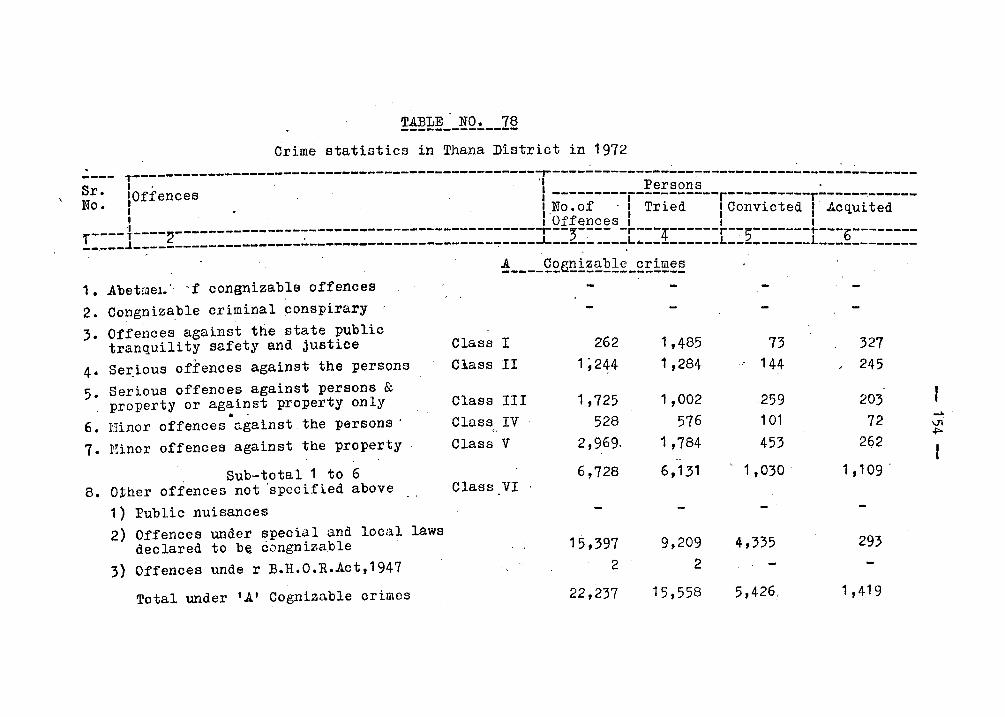
~~~;!?~_!Q!. __ :Z§ Crime statistics in Thana District in 1972
T------------------------------------------------~----~---------~--------------~----~-~-------Sr. IOf~ences' . 'I ---------r-~!E!£~!--r----------r~-----------No. I I.No. of . I Tried I Convicted I .Il.cqui ted
r---- l----2-------------------------------------------~Qf~~~£~s-~---4---~--~----------L--- --------__ , ___ J._-::-__________________ .:. ______ ~--------------_:_~--~_..L ____ :.. ___ -:L ... _________ L_~.2 _______ L ___ § _______ _
! ____ Q£g~~~~£!~_£~i~~! 1 • .Abetmel.' -f congnizable offences
2. Congnizable criminal conspirary ,
3. Offences against the state public tranquility safety and justice Class I 262 1,485 73 327
4· Se~ious offences against the persons Class II 1f 244 1,284 144 245
5. Serious offences against persons & property or against property only Class III 1,725 1,002 259
• 6. Hinor offences against the persons' Class IV 528 576 101
203 72
~ . \..1l .po
7. Ninor offences against the property Class V 2,969. 1,784 453 262
Sub-total 1 to 6 6,728 6,131 1 ,030 ' 1 ,109 .
8. Other ofiences not 'specified above Class VI
1) Public nuisances -2) Offences under special and local laws
declared to b~ congnizable 15,397 9,209 4,335 293
3) Offences unde r B.H.O.R • .Act,1947 2 2
Total under '.A' Cognizable crimes 22,237 15,558 5,426. 1 ,419
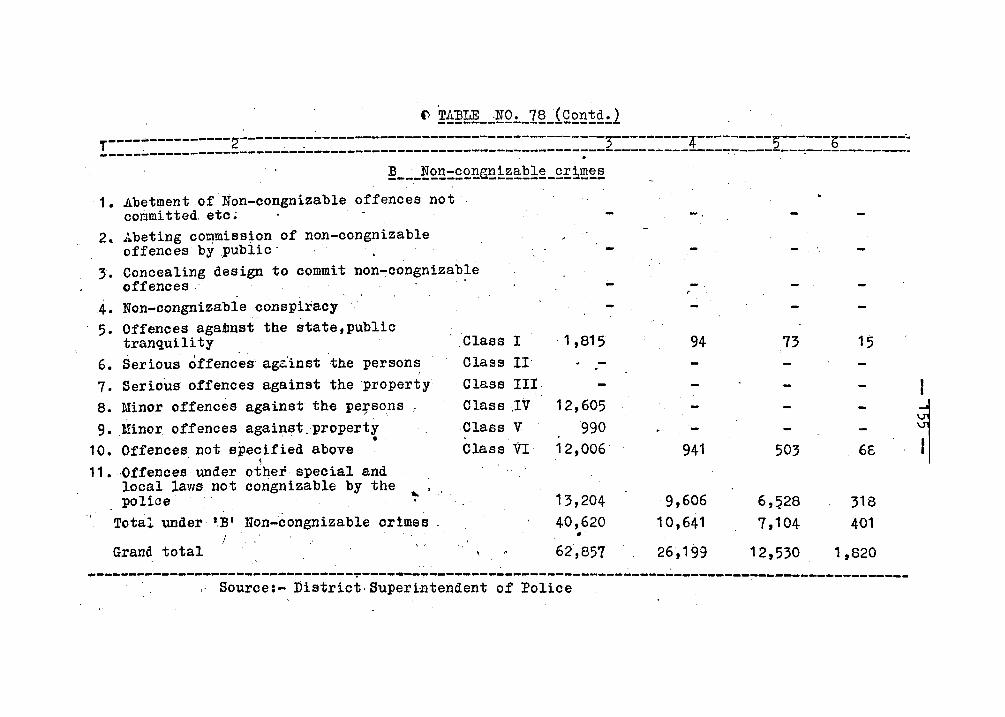
~ !~~~_~~Q~_I§_tQ£B!£~2 T---------------2-----~-~------------------------------------;---------4---------5------b--------~ -----~----------------------------------------------------;----------------~~-------~-------------
~ ___ ~£B=££BgB~~~~1~_£!~~~~
1. Abetment of Non-congnizable offences not coromi tted. etc ~
2. Abeting commission of non-congnizable offences by.public·
3. Concealing design to commit non-congnizable offences
4. Non-congnizable conspiracy 5. Offencesagaimst the state ,public
tranquility 6. Serious offenc~s' agiinst the persons , 7. Serious offence,s against the property 8. Minor offences against the pe~sons 9 •. 1!inor offences against. property
• 10. Offences not specified above . . , 11. ·Offences under other special and
local laws not congnizableby the police
... '. . Total under '.B' Uon-congnizable crtmes
! Grand total
Class I .Class II Class III Class .IV
Class V
Class VI
. 1 ,815
12,605 990
12.006
13,204 40,620
• 62,857
- .
94
941
9,606 10,641
26,199
73
503
6,~28
7,104
12,530
15
6£
318
401
1,820
~-------------------~-----------~----.--~--------------------------------------~------------------Source:- District· Superintendent of Police
I I
~
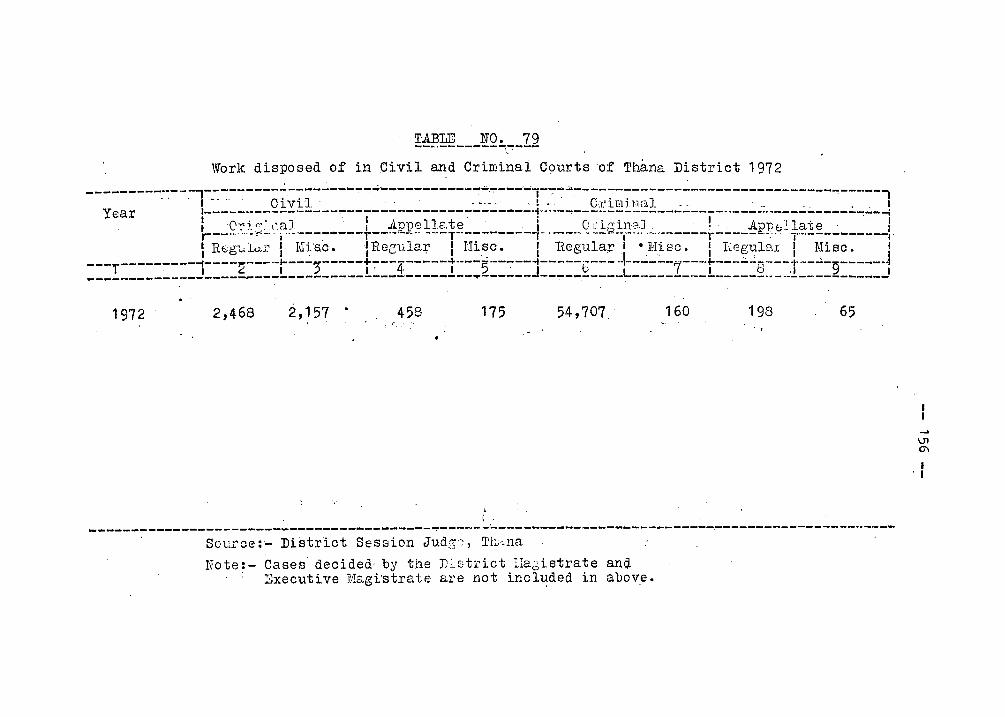
TABLE NO. 79 --.·--------c---Work disposed of in Oivil and Criminal Courts of Thana District 1972
-------------,---_------...:---------~ ... ~----------~-,~---...;i-~------~--------------------------~---... --_. .' . ,- ..... Civil' . .-.- .1.' C:ciminal.- '. _. . 1
Year 1----------------,-----------------------.;····------·---.-----------... ---.... -------------...; ! __ ..:Q~.~~~ ~'~!~---_-----~--~J.2}?~ ~2~~~~--------I--, ._-.-Q ~!G!:2;:l),.--------~-----!;PB-62t.§:!~----~---!-I RE.g'\,tlctJ~ I lI1Tsc·iRcgulaJ;' I Uisc. I 'Regular I eHiec. I I~cgulaI I 11isc. '
---T---------1----2----r---~-----t~--~-----t---~-----~-----C---~------7---t---~~s---r--~-g------1 ___________________ --------------------------... ------J-_________ L ________________ .• _. ____________ _
1972 2,468 2,157 . 458 175 54,707. 160 198 65
, -----------------------------------------~------~-------------------------------------------_ ... ----
Source:- District Session Jud~~~ Thina
Note: - Cases decided by the J):Cst:cict IIa2,istrate and :8xecutive ~·~agi'strate are not included in above.
-> \J1 0"1
I . I
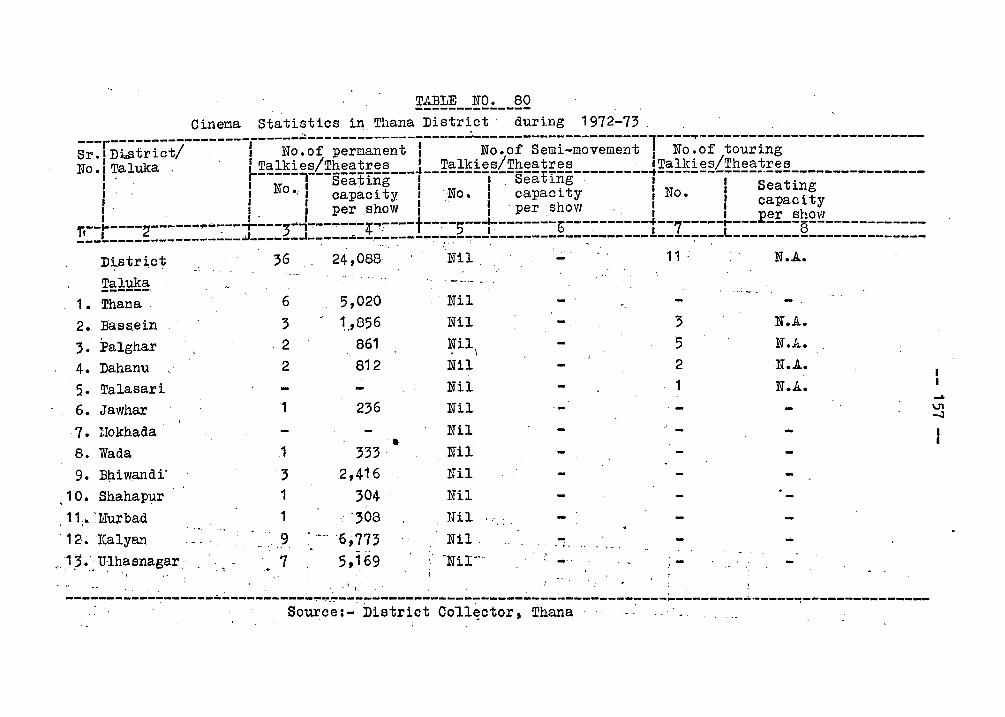
TABLE NO. 80 --------------
Di.strict , ',. -,6 Nil
Taluka ------' 1 • Thana 6 5,020 Nil . .2 •. :Bas s.e in 3 - 1,,856 Nil 3 N.A.
3. Palghar .2 861 ~il\ 5 N.l!..
4. Dahanu 2 812 Nil 2 It.A..
5. Talasari Nil 1 N.A. 6. Jawhar 1 236 Nil
7. IJokhada Nil • 8. Wada 1 333 Nil ...
9. Bp,iwandi' 3 2,416 Nil
10. Shahapur 1 304 Nil
, 11/. 'riIurbad 1 . "308 Nil ' .. . 12:.ICalyan 9 .. , 6;773 Nil -~ . - ..
,13.' U1hasnagar .... ' 7 •• , ~ , , I '
5,169 -Nil-" .' .....
,I'j
---:~----------------------~~.-:--~--~~------------7"---------.----------:----~-.:.--~---~-------:--------------Source: - District Co1.1~ctor·J Thana
..... \J1 -J
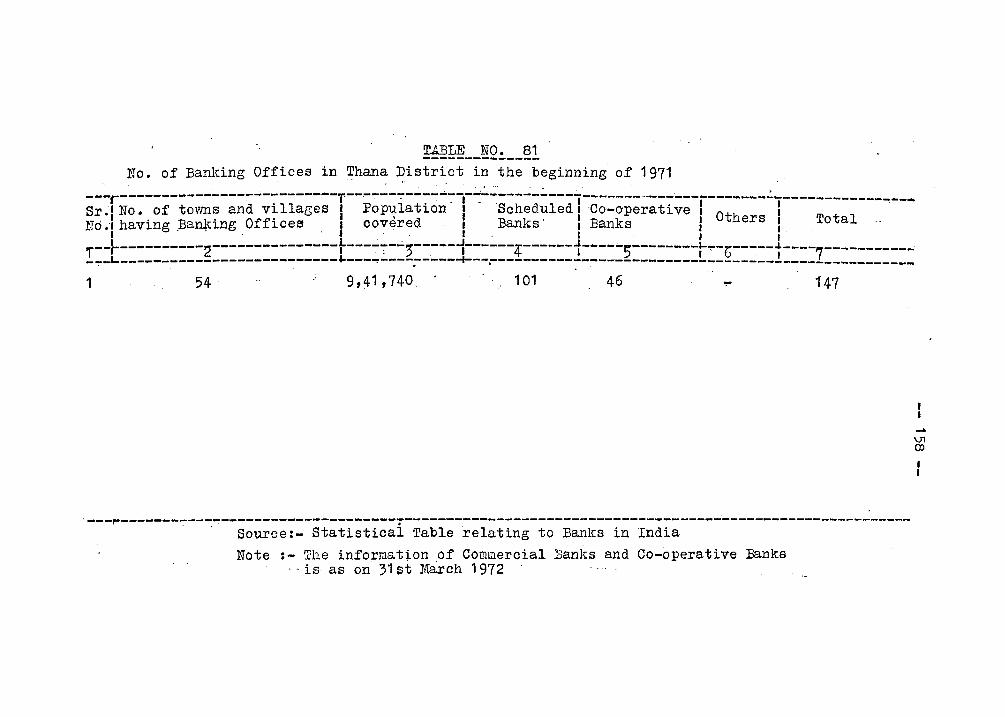
!~!:~ __ gQ!. __ ~l No. of Banking Offices in Thana District in the beginning of 1971
. ..... '.
---r--------------------------T--·-----:----~---I-~-----.;.-----1-------··----~----------.::.-------------~--... Sr.IUo. of towns and villages I Popu,lation I Scheduled, Co-operative I Ot I Total Nd..l having .Banldng Offices I covered I Banks· I Banks I hers I
, . J , , 'I T--~----------2---------------t---~7-~)-----i------4------i-----5--------f~-b-----t----7-----------_~-L--------------------------~---~----~----~--~-------------------------------__________________ _ 1 54 9,41,740 101 46 ':'" 147
.---~-----------~------------------------------------------------------------'-----------------------. . Source:- Statisticai Table relating to Banlcs in India
Note :- The information of Comraercial Banks and Co-operative Banks --is as on 31st March 1972
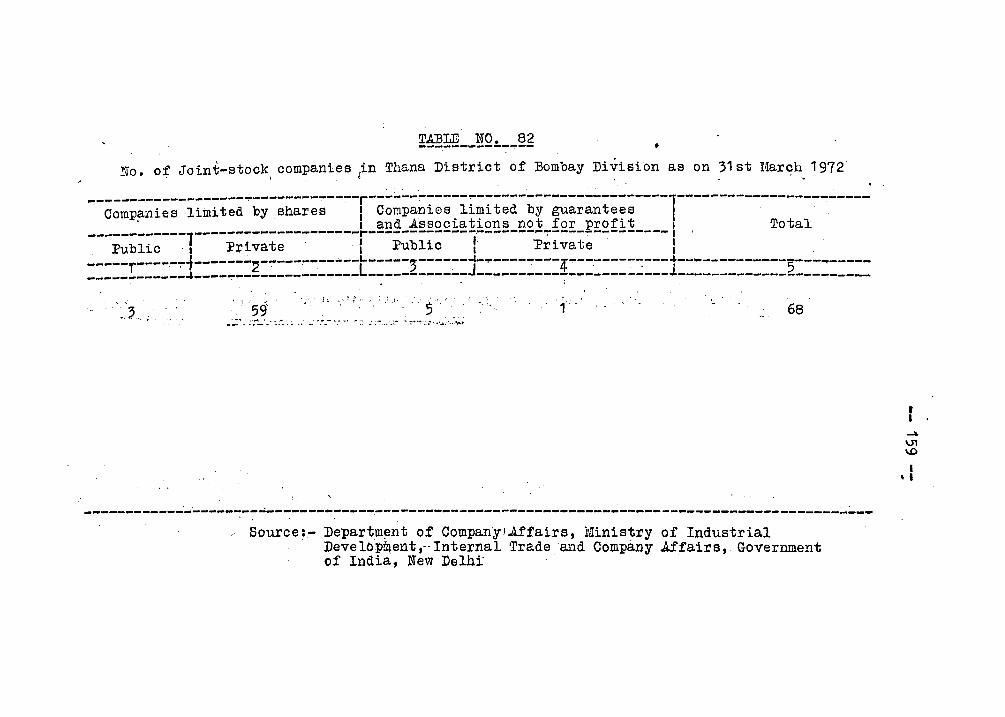
• no. of Joint-stock, companies .in Thana District of Bombay Division as on 31 st I[arch 1972'
~------------------~-------------r~-----------~-----------------------------------------------Companies limited by shares I Companies limited by guarantees I
. I 'and .Associations not for profit I Total ------------l--------------------r--------------·--------~-----:---------- I , Public 'I Private' I Public I 'Private I -----f-----~1-------2------------~-----;------~-~----~---4~-------~---~-------------5---~-----____________ ~ ____________________ L ____________ J _______________________ 1 _____________________ __
, i
, .i,,; 59' ,!. ',': ~,' ,: .. :,:, - -,,~, ..
.. -.::. ... . :'.~' .. ' :,."' .. :::' ,- .. : ' .. --~"': ',-'" -:: ... ,: ....... .:..~' .~ :: ... ~ ......... ,_.".:"",,; l' 68
----------------------------------~-----------------------------------------------------------" '
Source:- Departm~nt of Company I Affairs , Ministry of Industrial Deve lop~ent " Internal 'rradeand Company Mfairs, Government of India, New Delhi'
I I
-" \J1 \0
I • I
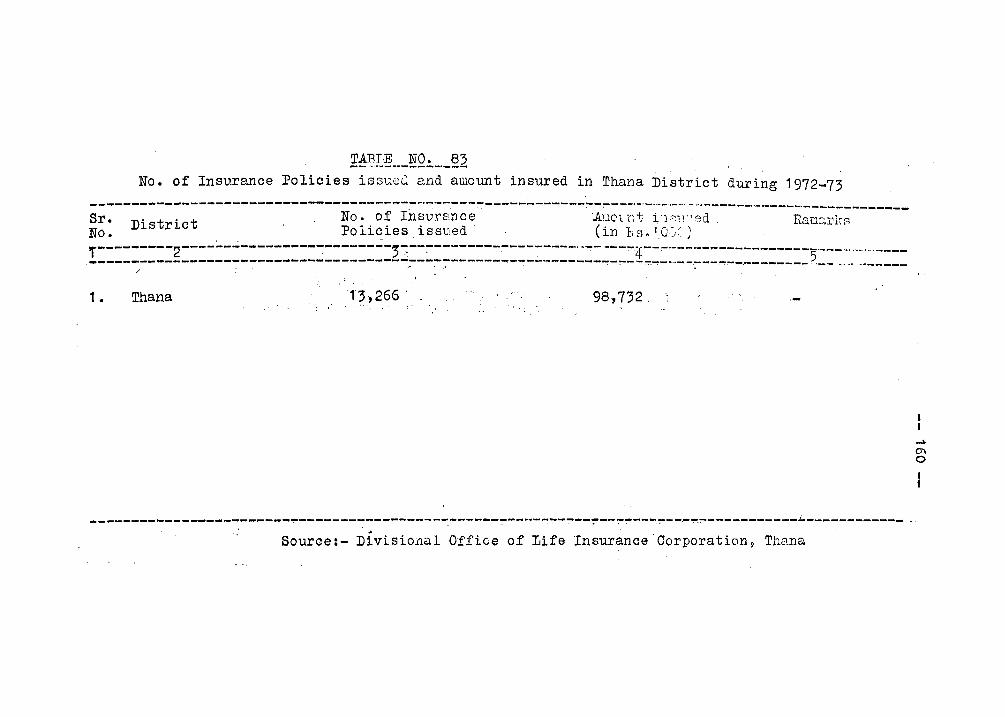
1-!~I:~ __ !Q!. __ ~2 No. of Insurance Policies iss-c;,e<l and amount insured in Thana District during 1972-73
----------------------------------------------~--------------~----.--------------------------------Sr. No. of Insurance ·.A.uC'lnt i'J!'~'.1·'8d Ram:::,:rkA District ( \ No. Policies issued in hs. '0·> I
!:::::::::g:::::::::::=:::=:::::::::2:~:=:;:::::::==::=:::~::~:::!:::~-.:=~::.:::::=::=::5==~:·:~-~~==::: /
1 • Thana 13.,266 98,7'32 .
------------------------~--------------- .... --:-------:---... ----~---:-~--:-~---~--.-~.~-----------.:.------------ _.
Source:- Divisional Office of Life Insurance Corporation, Thana
.... Cl"I o
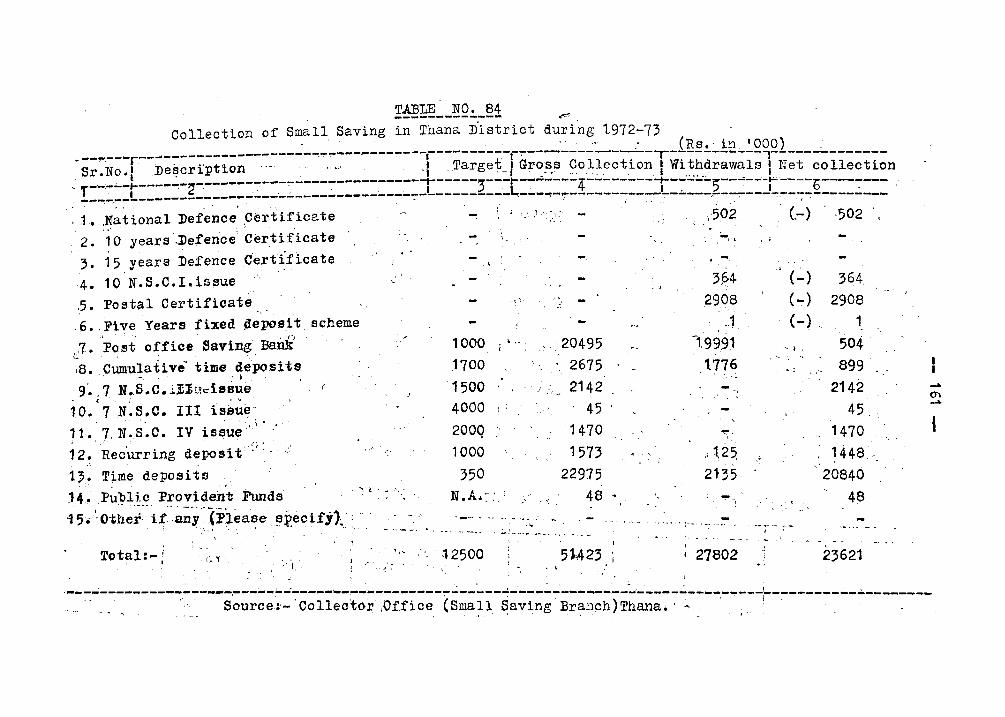
~!!!~_!Q!.~~1 ~ Collection of Small Saving in Thana D'istrict during 1972-73'
. . .'... ' ... ' . . '" " . .: '. . "; ... .': iRs.· in. t 0001 : --~,.,--~r--"'---------------~"--:''''~-'''~---:-''-I--'~-~,-~~~-r~~------~-I- ---------,- -----------Sr.No.t .De~crrption"· '." .' 'f .. Target .. : Gr~.s.s ~o.l~.ect.l~n : Wi~~drawals : Net collection
, f--: ... ·;..·-r----~-2'-·------.':--,-;_:_--- .... --------~-L-----3 .... -·-t--:------4---------:---:----,--... --'j---b----:-- ,-. ~",.-:~.---------------~---.~--~-------------~- --------- .. ---~-'j'----------~~-----.. ~-~---'-=~ ... -;~---------,1. ,National Defence .Certificate -: ':, l,,' .1.>: ". \·502. (-) ·502
,2.'. '1'0 ye~u.s.Detence:Cer.t1f'icate , -, , . ' , , ~ "'" 1. 5 years :Defencece:rt·~iicate . ' . \ ~ ". : -. • '-.. .4,_ .10 ·.·~.S.C.I.1s~ue ' ... :.... . ,-""',; ..... _, :, ,p4.
:,. Post~l.Certiflcate., ... ·: .d' ) 2~:Q,~. 6 •. F1 ve Years fixed jleposJ t. scheme - .. 1
.~ i 't • ,. '0 . ,. . '.
,7. PQ~t office Saving' BaDk 1000 i· .. · .20495 -199.9J 1.: c. , ';'
,S.Cumulative' time de'postts 1700 2675 1776 T " , _,. • i . ,\
g'. 7 N •. S.C • .iJllth:is8ue '1500, ;:,_ 2142 .' 1" '. ; .. ' '" . 10. 7 1l.B,C. III issue- 400q f' ..... ; 1 45' '. ; -
" . ..
·:":'i:) '(-:-)
.' . -<-i' "I,
. '. ", "' . ! --.~
.l·
364 2908
1
504-899
2142
45
..
.' ~. .; ,- I .. ,: ~ ' •• "~ \ 'I
11. ,7,:N.B.C. IV issue .'., :.', 200Q .... '.' '1470· . J •
; ~ ':'. : .• ":" ..' . ' •. (i ~ .' .;. I ",
12. :Recurring deposit' ' ... ' ,:. I .
1000
350
'. "\' .. , 1573 22915
.. -I
.~ ':
1470 "., 14·48~ '. .
~. . .' 1~ .•. T~me deposits '.' . 14~~:·P~bii.c Provideh't FUnds
I .. ~ ••• - ...... -~.-- ..... ~ ..
15'.' Other- if. any . (Please , .. ~~ec ifi/. : .. .. .... '_ ........ - .. ' .,.. ............. .. ': ~'~" r· • • '''- '"(''' ~ "'-'_~',., ....... , ....... .:...: ........ ~~ ........ "" ..... __ .. '.
2135 .... t •. '.'
N.A.~: ; 48. , . " ... \
20840
. .. '. ~} .:. \
48
. ... ..,..- ---~ ~ .
• ~ _._ .... 1
I I
'" "" :'.' .12500 51-.423 i '27802 t 23621 ,'.' ",'. . <" . , , •
. ' ".'., ~ •• ' " I" • ... ,",;.' • •
.~:"'-.--------~_~.~.~:-~--. ...;~-~.~!-~~~-..... --~..:~--------~~~ _____ ~~-...;~~.~:---_-:;..~..;----~---..,-_---i..-----~-~-~-----.. _ ........ ' ~. '. Source.:'''' 'Collectoz,' ,O.fficeCSmall Saving' :Branph)~hana.·'':''..' I .
. . - ';', ..."_.!... .~. ',. . .. .... ~-' ~ -. .
1
Total:- , , . I
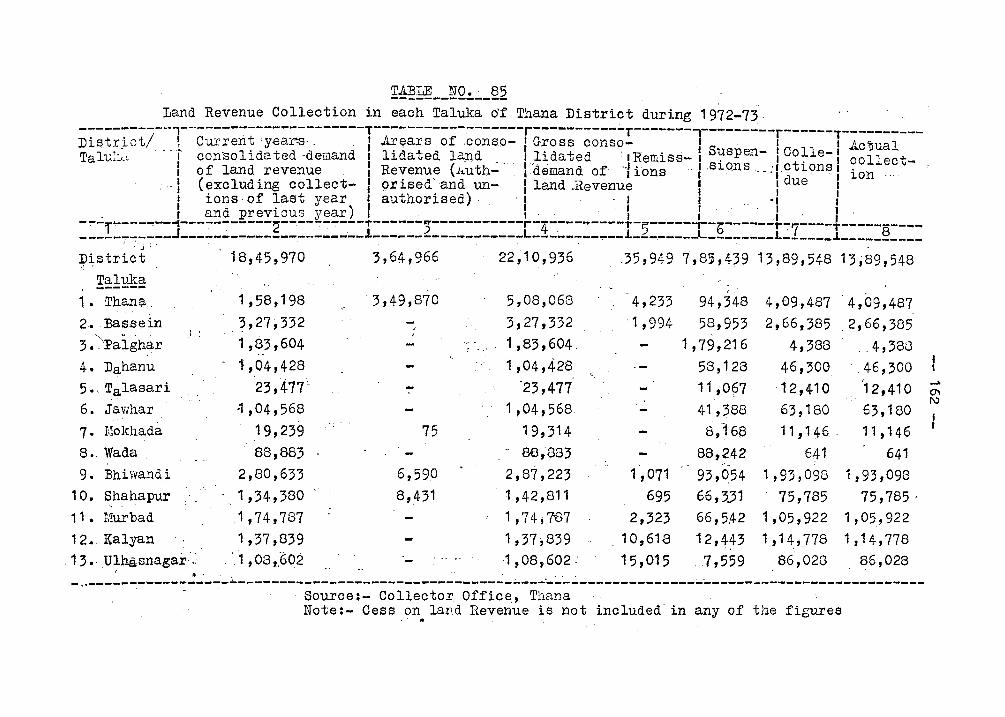
TABLE NO.· 85 -------------- , c
Land Revenue Collection in each Taluka df Thana District during 1972-73 -----------,----------------------T-----------,-----·--r----------.;..T--------.---------r------,.----------Dis,trJ-ct/ ! Current 'y.ea~s-, '. I ArE;lars of ,conso- I Gross conso- I· 1 1 ,ac'!iual Talu~:~~ .. -, con'solidated -deBand 1 lidated land _ _ I.lidated : 1 Remiss- I S1:lspen- I Co~le-l collect-
I of land revenue I Revenue (ii.uth- I demand of "1 ions I·s~ons __ -: l_ctlons I ion , . "I (excluding collect- I orised'and un- I land ,Revenue 1 I due 1
1 ions· of last year I authorised) . . 1 ' I I ..."1 I , I and previous year) I I . . I :... I ' :.
-~-i~------~-----~-----2----------~------)-----------r-4---------T-5-----Ir-b------r~7----T-----8----___________ J ______________________ l __________________ L------__ ~--l--------L------__ L ______ l _________ _ i .:"j I'" .
District 18,45,970 3,64,966 22,10,936 .35,949 7,8~,439 13,89,548 13;89,548 " ,
TaluJm ------1 • Thanl;l.,.
2. Bassein
3.~]?aigha+ .: :
4. Dahanu , 5 •. Talasari
6. Jawhar
7· nlokhada
8. Wada
9. Bhiwandi
1O. Shahapur "
11. Murbad
12. Kalyan
.13. Ulhasnagai<:
1,58,198
3,27;,332 1,83,604
.-
1,04,428
23,477-
:J ,04,568
19,239
88,883
2,80,633
1,34,380
.1,74,787
1,37,839 1,08,,602
,3,49,870
-i
75
6,590
8,431
"
5,08,068
3,27,332
~ .. ' 1,83,604.
1,04,428
'23,477
1,04,568
19,314
00,083 2,87,223 1,42,811
1,74;187
1,37,839 1,08,602.
,
4,233
'1,994
1,071
695
2,323 . 10,618
15,015
, 94,348
58,953 1 ,79,216
58,128
11 ; 067
41,388
8,1'68
88,242
93,Q54 66,3.31
66,542
12,4~3
, 7,559
4,09,487 4,09,487 2,66,385 .2,66,385
4,388 4,388 46,300 ,46,300 12,410 '12,410
63,180 63,180 11,146 11,146
641 641 1,93,098 1,93,098
75,785 75,785,
1,05,922 1,05,922
1,14,778 1,14,778 ,86,020 86,028
.. . . . ~ --.. -----~-----:---~-------------------------------------------------------------------------------------. Source:- Collector Office, Thana Note:- Cess on. land Revenue is not included in any of the fig~es
..... (]'I I\)
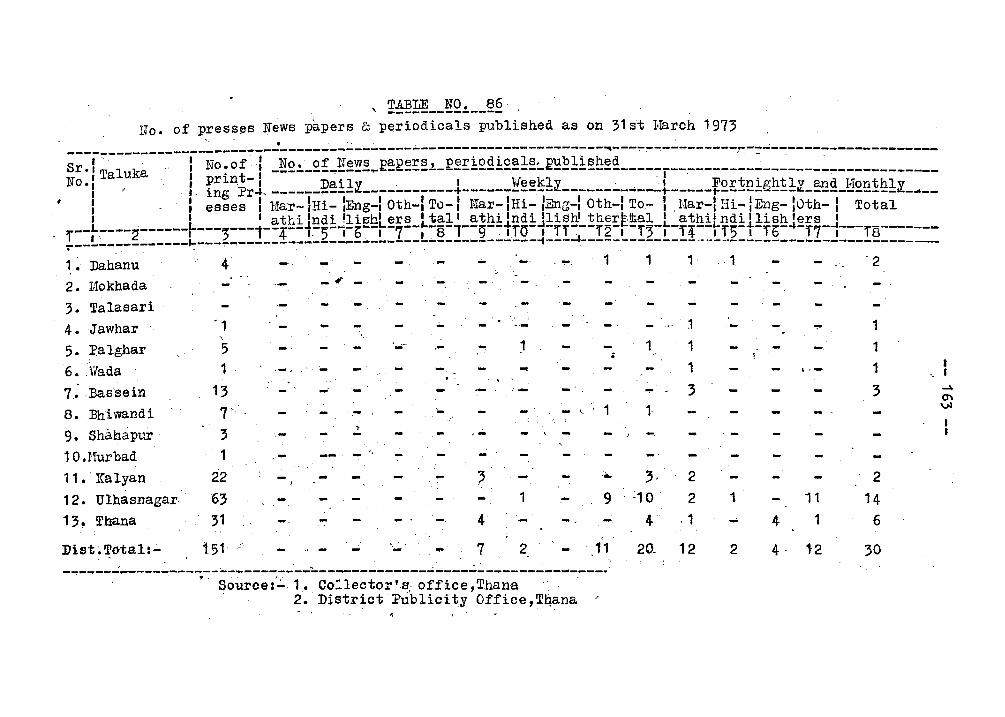
TABLE NO. 86 . , -------------- '
Ho. of presses News pkpers & periodicals published as on 31 st Harch 1973 "- -_________________________ ~ ________ ~ __ ~----~----------------------~---~~~---------r--~--------------------
Sr. 1 Taluka ! no ~ Of! _!':!2!._£f..,!!~~~_l:~g~!:~.l_l:~!:i££i£~!~:...E~~.!:i~!!~~L ____ r--~-------~--------,..-----------NO.! f. f~~n~;J ______ ;Q~!1:l ____ ;,. ______ ~------!!~~!f1:l----~--- ... -...:.~-----~£!:~!!i€i!!~1:l_~!!_!:!£!!~h1~L ... __
I , esses 1 lflar- hu- IEng-1 Oth-l To-: r!!ar-IHi-IEn~-1 otri-I To.- I .li1ar .... II1i-IEng-IOth- 1 Total , I , atr.i 'ndi !lish' ers I tal J athi 'ndi 'liSh' ther\:;!h.al ' athi' ndi 'lish 'ers ,
r--L~---2------~---;---1--4--t~5-,-b--~-7--~-8-1--9-~tru-i-rl~--12-f-13-~-14--rf5-t-lb-4-17-1---,8-------~--~-----------~---~-------------------------------------~---~~------------------------------------------1 ~ Dahanu 4 - , - . - . - 1 1 1 . . 1 . 2
.~
2. Mokhada - # - -
3. Talasari
4. Jawhar
5. Palghar
6 • . \1ada
7.. . Bas-sein
8. Bhiwandi
9. Shahapur·
10.Uurbad
11 •. Kalyan
12. Ulhasnagar
13. Thana
:Dist~Total:':'
"1 , 5 1
13 7····
3 1
22
63 31
151
.. , .-- .-
.... -; -.
-' ",. .... .-> - .-- "
... ? 1
... 4
...; ." . '- ... 7 2
:. 9
-. -11
~ , 'II • ~ ,
-~--------------~~---------------~-------------------------------Source :'':'.1 .•. Co:'lector' s, office ,Thana . 2. District :Publicity Office,Ttlana
,- 2 2 . -10 . 2 1 11 14
4 . 1 .... 4 1 6
20. 12 2 4· 1-2 ;0
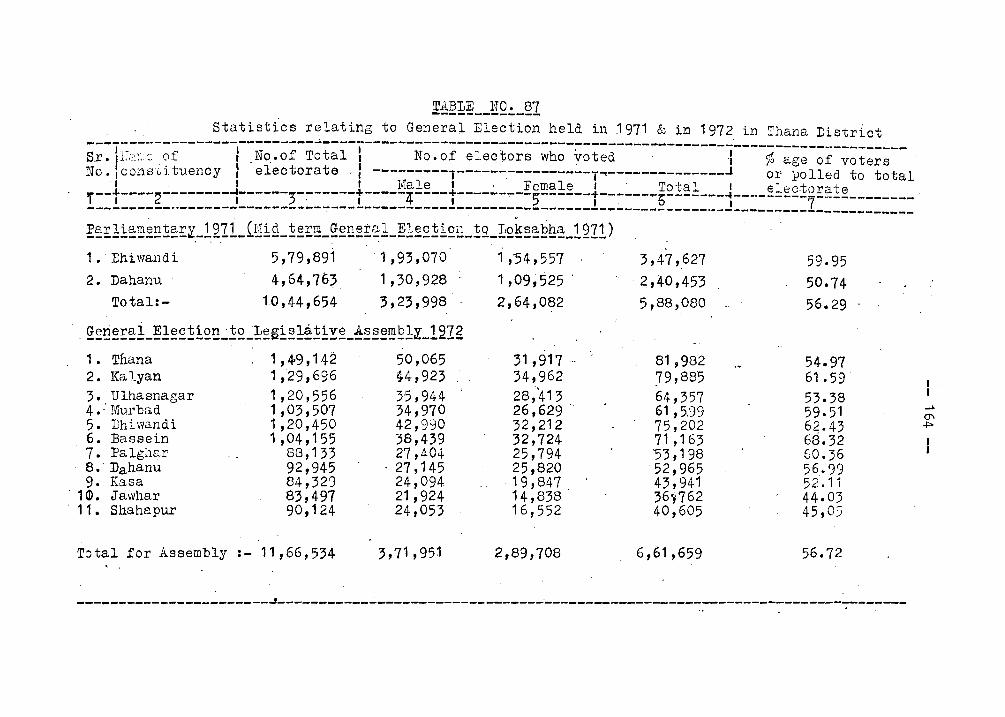
~~~£LJ!Q.:._§1 Statistics 'relating to General Election held in 1971 & in 1972 in Thana District
---------------------.-----._---------------------------------------~-----------------------------I I I :j.' I S,r. ,F;;:;,:::: of , ,No,.of Total I No.of elec"ors who voted .' 'I' % age of voters No ·Icons~i tuency I electorate .,: ---------:T--::----,----------T .... -----~--------.1 or 1Jolled to total
" ' I, I Male I ' Female I " Total "elec-torate ' T--t----2--------1------;-~-----t-----4-~--t---------5------t--~---~5-------1---------7---------------------.. -----------------~------------~----~---------------------------.. ------------------------~~~!1~~~~!~~~_1211_{Y12_~~~~_~~~~~~!_!!~2~i2g_~2_~Q~~~Eh~_1211) 1.'Bhiwandi 5,79,891 '1,93,070 1,54,557 \ 2. Dahanu
Total:-4,64,76~ ..
10,44,654 1,30,928'
'3,23~998' .
.~~~~!~!_~1~2~12~_~2_~~~1~1~!1!~_~~~~~El~_!21g
1 • Thana 1,4-9,142 50,065 2. Kalyan 1,-29,696 §.4,923 3. Ulhasnagar 1,20,556 35,944, 4.: TUUl"bad 1,03,507 34,970 5. Dhiwandi 1,20,450 42,990 6. Bassein 1 ,04,155 38,439 7. Palgll8,r 88,133 27,404 8.' Dahanu 92,945 27,145 9. Kasa 84,32') 24,.094
, 1 Q). Jawhar 83,497 21,924. , 11. Shahapur gO,124 24,053
Total for Assembly :- 11,66,534 :3,71 ,951 . ,
1,09;525'
2,64,0~2
31,917 34,96'2 28,''413 26,629 .. 32,212 32,724 25,794 25,820
,19,847 , 14,838 16,552
2,89,708
"
3,47,.627 ~,40,453
5,88,080
81 ,982 J9,885 64,357 61 ,5,99 75,202 71,163 '53,198
·52,965 . 43,941
36n62 40,605
6,61,659
59.95 50.74 56.29
54.97 61.59 ' 53.38' 59.51 6~.43 68.32 60.36 56.99 52.11 44.03 45,05
56.72
-----------------------~-------------------------------~------------------~.-----------------~------
.... 0"1 ~ , I
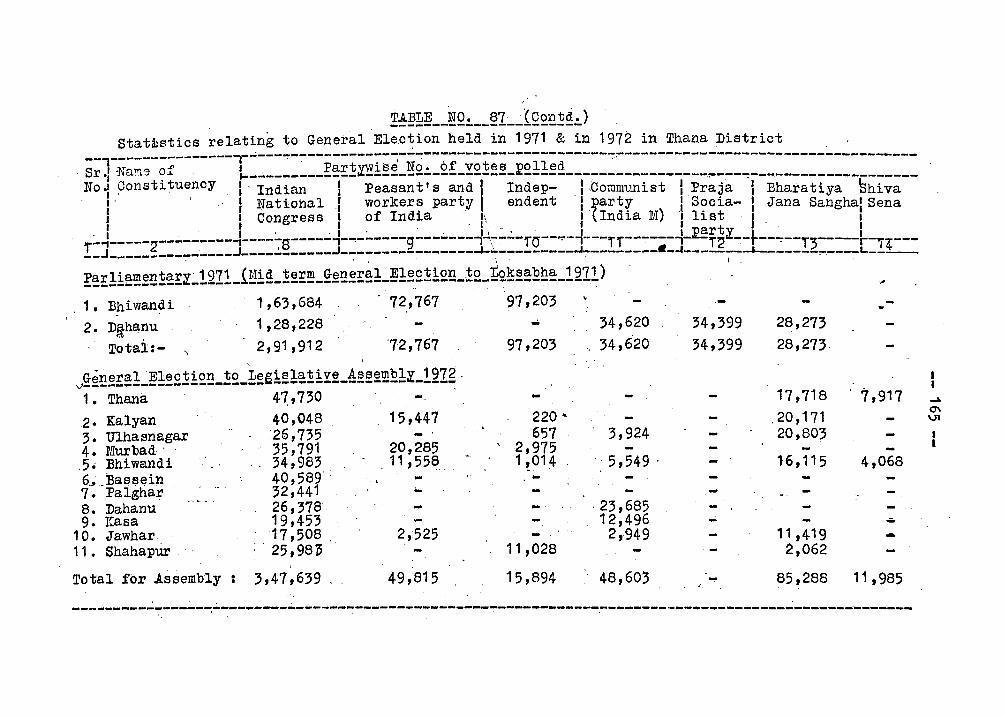
!-!;§!!~ __ ~Q!. __ ~7.~_tQ2.~~~!.) Stata:stics relating to General Election held in 1971 & in 1972 in Thana District .
-- ---------------,--------------------------------------------~------------------------------------sr~ 'Na!!l9 ~f, 1-_..;, ____ ~ __ ~~!:~~:!~~~_~Q.:._2f_Y2~~~_E2.11~~ _______________ -_,.. ___ -= ___________________ _
No": ~onsh tuency I' Indian I peasant.' s and I Indep- I ,Conlnn.:mist I Praja I Bharatiya ~hiva , '. I ~ationa.ll workers party endent' I~arty I Socia- I Jana Sangha' Sena
. I I Congress I of India '. '\ I (Indi~ r,~) "list I. I , I I . I , , 'E§:rt I. I ,. I . ,. ,. ., \ - I I y., ,
,.--1-----~--,;.-------'j----7S-----,-'"'------g-------,-::----1"0--""--'---,-,------,- "''2 --r--~--T3---rl·---__ J _______________ J-_____ -----J----------------~----------~---------.-~---- I ------.~---~--~----
~~~1!~"!!!~~~~!:y.-!27.1_i!:11~L~~!:!!!-~~~~i~1-~1.2,£~i2~-~2~~~!s~~£h~_127.1) i ..
. 1.B?iwandi 1,63,684 '72,767 :~n,203 ~ .. -2. D~h~nu 1,28,228 - 34,620
Totai:- , 2,91,912 '72,767 97,203 34,620 ,
vg;~~.2!:~1_;,E]1~£~1~~_~2_~~fi!21~1iY~_~2~~1Jl1?1y. .. 121g 1. Thana 4 7 , 7 30 '
2. Kalyan 3. Ulhasnagar 4. r/Iurbad' . .5,; Ehiwandi 6 .... 138,s$ein 7. Falghar 8. Dahanu 9. ICasa
10. Jawhar 11. Shahapur
. , Total for Assembly :
40,048 15,447 :26,735 - . 35,791 20,285 34,983 11,558, 40,589' . 32,441 I-
26,378 19,453 17,508 . 2,525
, . 25 ,98~
, 3,47,639 . 49,'815
220 .. . 657 3,924
\ 2,975 1 ~~14 ··5,549· -
,23,685 12,496
2,949 11,028
15,894 48,603
34,399
34,399
...
28,273
28,273
17,718 20,171 20,803
16,115
11,419 2,062
' '7,917
4,068
-85,288 11,985
-----------:-:-------:..;.-:--... ----.;.---~--------------------------... -----.-----------.,.-~--------...:-------.-------
~
0\ VI
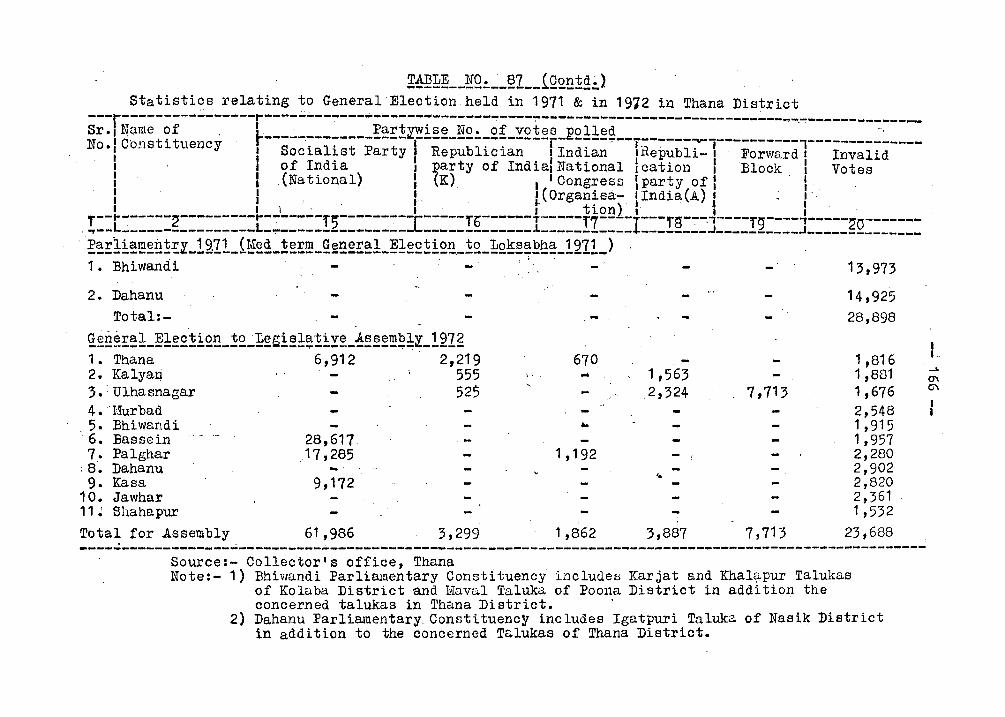
!~~~ __ ~Q~~_~I __ iQ£~!£~) Statisti~s relating to General'Election held in 1971 & in 1912 in Thana District
---r----------------r----~~--~-----------------------~-----------------------------~~---------------i~:I~~~~t~~uenc' , r---~~:_--:_----!:!!E!~i~~-!!~:-:_~~-y~!~r-E£~1~~--T:--~-----1----------,---------:..----
I y 'I Soc~ahst Party I Repubhclan I Ind~an . I Republi- 1 . Forward I Invalid I of India I ~arty of Indial Nationai I cation I Block I Votes I I ,(National) I (K). , I Congress I party of : I I. I." I, I.(Organ~sa- IIndia(A) 1 . /' , I I I '. I' I tlonl I I I . ,
T--r------2---------~-------T;---------[-----rb------T·-----f7---I---fs--~'----rg----'-----2a-------~--L-_--------------L-~------------~--- -____________ ~___________ ------__ ~ __________ J _____________ _
"·!:~E1i!!~~!!~~~_1211_tg~~_~~E!_g;~!!~E!!1_~1~£!i£~_!2_~Q~~~!?!!!!_1211_) . ' 1. Bhiwandi 13,973
2. Dahanu 14,925 Total:- 28,898
~~~~!:~1_~1~£':HQ!!_!2 .. J~~~i~1~!iY~--!~~~!!!E1~-i21g 1. Thana 6,912 2,219 670 1 ,816 2. Kalyan 555 ... 1,563 1,881 '3. : Ulha snagar 525 " 2,324 7,713 1,676
,4. Hurbad 2,548 , 5. Bhiwandi .. 1 ,915
6. Bassein 28,617 1,957 7. Palghar ,17,285 1 ,192 2,280
; S'. Dahanu -' . 2,902
9. Kasa 9,172 '10 2,820
10. Jawhar 2,361 11 ~ Shahapur 1,532 , Total for Assembly 61,986 3,299 1,862 3,887 7,713 23,688 . , ~--~---------------------------------------~----------------------------------------------------------
Source: - Collector's affic.e, Thana Note:- 1) Bhiwandi :Parliamentary Constituency includes Karjat and Khalapur Talukas
of Kolaba District and Maval Taluka of Poona District in addition the concerned talukas in Thana District. .
2) Dahanu :Parliamentary, Constituency includes Igatpuri Taluka of Nasik District in addition to the concerned Talukas of Thana District.
I I,
--" CTI 0\
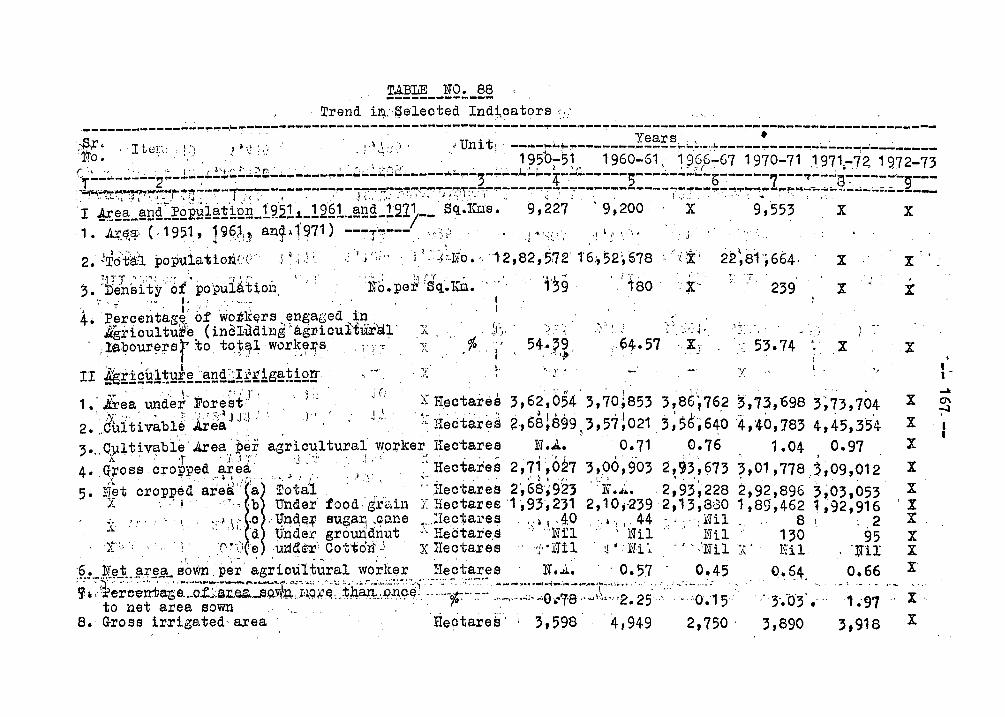
TABLE NO. 88 -------------Trend i~,··Selected Ind~.cators '.:'
2. JTo'tf:!:!J. popuiationt'('j ~j,:". .:"~,,;, j )'''~'~ .. l~o.:. '12,82,572'1'6:,52~678 ; ",:i(' 22~81';664' x X
'l"1"1"'-r .... "1' ..... If , f'~! r, I, . ':' ,',,:'" .,. :~ (H(. ~ "., -./' • i ',- ,"
,. "Den'sit~ot pO:f>uiAtiOl1. . . No. pet' :Sq·.ICLl. 139· 180 . X~ T,
239 • • T . "-'. '1: ."'.' .. ' , 4. ~~rcentagft: of. w~.t:k~rs ,,~n.ga~ed ".i1],:, .
kgricul tute. (~ncl:udillg a.grlculiur~n A: .~t·:" . .~ '.~:~ . . ;lQbour~:rer to tOr~l worlt:,~:r.?s . ;:::r X ~if 54 .. }.~.
II &!:1Q~1!~t!l!.J~ug~!l!!g~:HQrr . X . \ '. J"
1.- j£~a undet' Fore~t.r· 1'~ J (; X HectareS 3,62',054' 3,70;853 2. ',.8'uitiv~blrh~(~J J~! "'. 1"' U. . ';:. Hectare~ ~,68;899:. 3,57 !021
3 .... O'J.lltivable Area. per agricultural worker Hec"tares N.A.. 0.71 4. q~os~ cro~ped ~f~{ .j .. ': .... :, .; :~ I{ectates 2,7f,"027 3,9°,9'03
5. !i~t croPl?~d a;'~~' I"a> T;t'a!l' . ';,'... '--f-Ieota.res 2',68~'923·i"J... ). " j "bl Ulldei' food,gr<:;ll1 ZHectares1',93,231 2,10;-239
• ~.:"." I '.; \,'.0 -qnd,~~ sugar, ·.'GlIlne ,."lIe,c1;ares ',') l .4.0 ,:,~. I' ~4 .\. ' . 'd trnde:.c groundnut "' Hectares ""1'1'11 . ; i'1il :1."-: " :' 0",.'\·e und~" Co'tto'n"-\ :x Hectare's "i'·lal ~ 'lH:"
',9-"._.N~3.~:r~.§i.- e~v{n ,per ag;ictili';'ra1 wo~ker }Ie~tares N • .t..~ , 0.57
,.;. .' ~ I , ,;,.: < • ) ~.
53.74 : X , I .
! 1, .'
3,8G~76~ ~,73,698 3;73,704 3;$t;640 l,~6,'83 4,~5,3~~
0.76 1.04 0.97 2,93~673 2;93~228 2,13,8;)0 -,,, ,lH1 " .1 "l'Ti1
,
~,01,778,'~09,~12 2,92,896 3;03,053 1,89,~62 1,92,916
8 : 2 130 95 Eil . '~nI , , C ,'Nil:;:'
0.45 ().~4. 0.66
X·
x
X
X
X
X
X X
'X X X X X
'9.·:·t~;~:r:~~~~~:ea~~Vf~\?;i,Q~~~~.¥~~~~~~~~e~·:·:-:~:::~%:::~:'~":='~~::~:~~1~:::C':Z~25':' ,~·"~O~:15 __ t ••. ~ .' __ '" •.
8. Gross irrigated' area 'IIeotare~' \ 3,598' '4-,949 2,750 . 3,890 '.-97
3,918
x' X
I , , -~
Ci' ~
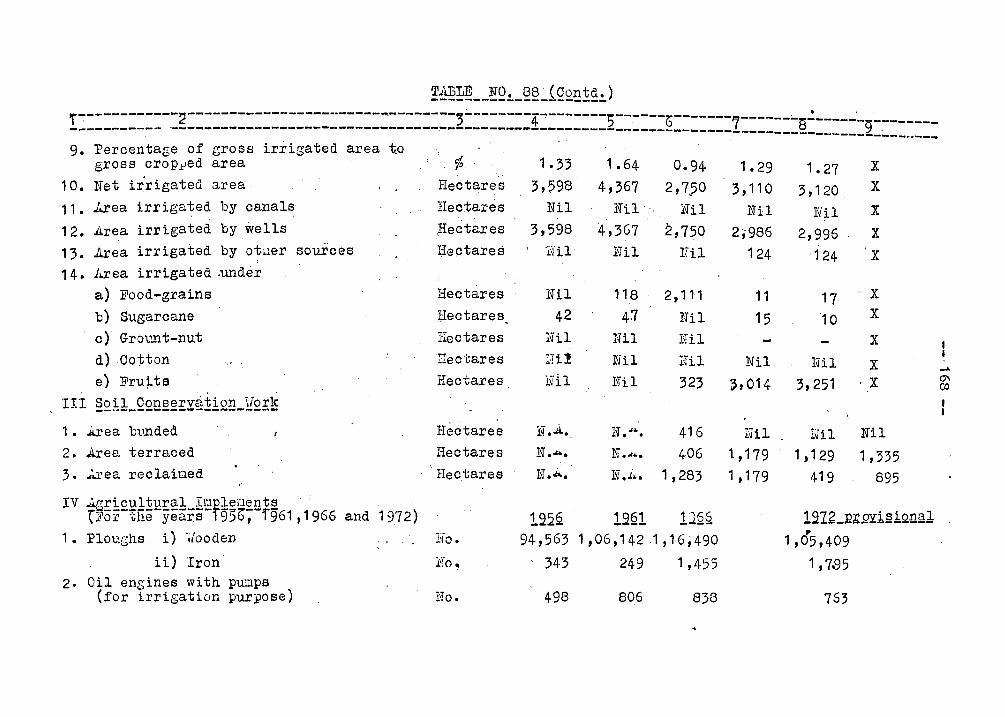
~~~~~ __ !Q~_§§_{Q£g1~~) r------------2--------------------------------3-----------------5------5------- .' . 4 . 7-------8-------9------------------- ---~----------------------~-----~---~~----------------------------- . --------------------_ .. _--9. Percentage of gross irrigated area t.o
gross croPlJed area % 1. 33 1.64 0.94 1.29 1.27 X
10. Net ir'rigated 3.rea Hectares 3,598 4,367 2,7}0 3,110 3,120 . X
11 • .J..rea irrigated by canals Hectares Nil Nil' lifil Nil Nil X
12. Area irrigated by wells ,Hectares 3,598 4,367 2,750 2,986 2,996 X --
13. .Area irrigated by otner sources Ilectares jhl IHl 1;il 124 124 X 14. l~rea irrigated .under
a) Food-grains Hectares Nil 118 2,111 11 17 X
b) Sugarcane Hectares 42 47 Nil 15 10 X
. c)" Grbt'.!l t-nut I-Iectares Nil Nil !Hl X
d) cotton Hectares Hi! Nil JIil Nil IHl X I ..... e) Fruits Hectares lhl Nil 323 ~,014 3,251 'X 0'1
co III Soil Conservation iiork ----------------------1 • Area bvnded. Hectares l~ .'<!.. N". " ... 416 Hil lUl Nil 2. .Area terraced Hectares N.,J.,. N ....... 406 1,179 1,129 1,335 3. ...:..rea reclaiDed
\
Hectares N.J... N • i •• 1,283 1,179 419 895
IV Ag!:i£~1!l!!:@:1_I~tl~rJ~mt~ . tFor tEe years ~5~, f961,1966 and 1972) 1~2§ 1~§1 lJ.§§ 1~12_~rQY1~lQn~1
1 • Ploughs i) "iiooden l~-o • 94,563 1,06,142 1,16;490 r
1,05,409 ii) Iron Fo, 343 249 1,455 1 ,7.95
2. Oil engines with pumps (for irrigation purpose) Ho. 498 806 838 763
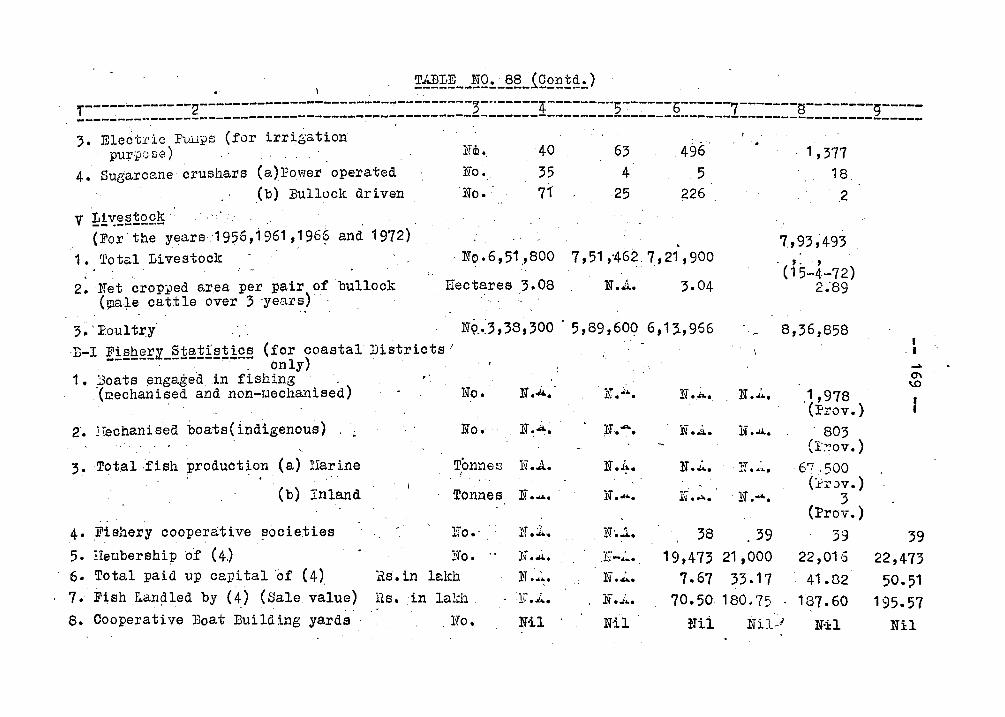
~~~~ __ ~Q~_~§_iQ£~!~~) -------------2---------------------------------,--'-----4--------5~-----b------7-------S--------g----!---~---------------------------------~-----------------------------~---------------------------------. ,
3. Elec-Gl'ic PVlJ.PS (for irrigation pu+,pos~)
. 4. Sugarcane crushars (a)P~wer operated (b) Bullock driven
v ~i ~~§:EQ.9.!!; ..,' , (For'the yearsJ 956,1961 ,196~ and 1972)
1. ~'ot<:lLivestock
2: . :t-Tet ~rop).)ed a~.ea per pair of bullock (~a+e cattle over 3 'years} ,
3;. . Poultry"
;'" "
liJ <h • 40 63 496 Ito •. 35 4 5 No •. 71 25 226
. . No.6,51.,800 7,51,4627,21,900
Hectares 3.08 N • .A..
1~9 .. ,3,38,300 . 5,89,600 6,13.,966
':B-1 E!§h~~I_§~~~f§~l£§ (for coastal Districts/ , . only)
1. Boats ~ngaged in fishing . '(mechanised and non-rJechanised) . l'i .~. No. l~ • .a~' N.~.
2. 2Iechanised boats(indigenous) lilo. lil .~~ . If. ...... l~ • .i •
T,onnes H.,A.. 3. Tot.al,fish production (a) ~rarine • ; r
N.i...
(b) Inland Tonnea N • .:... l~ ..... l~ .....
4· Fishery cooperative societies Ho. ' :H.~. No.1. 38 5. !:Ieubership of (4.) :!'q'o .' .. J~ _..u.. 19,473 6. Total paid up capital 'of ( 4) Rs. in lalrh J)T ... ~. N.':'. 7.67
N.i...
l~ • .<4.
i.T ..... ... ~ . N ......
.39 21,000
33.17 7. Fi8hR.an~ned by (4) (Sale value) Hs. in laldl - 'lC" • .J~. 70.50 180.75
, '
8. Cooperative :Boat Building yards Ho. Nil IHI
1,377 18
2
7.,93;493 . ,. "
(15-4,-72) 2 .. 89
8,36,858 I
. I ..... 0\ \.0
,1,978 (J?:rov. )
, 803 (I":.'ov. )
6'7,,500 (:i:L'.)v. )
3 (Prov. )
39 39 22,016 22,473 41.32 50·51
187.60 195.57 N·i:l Nil
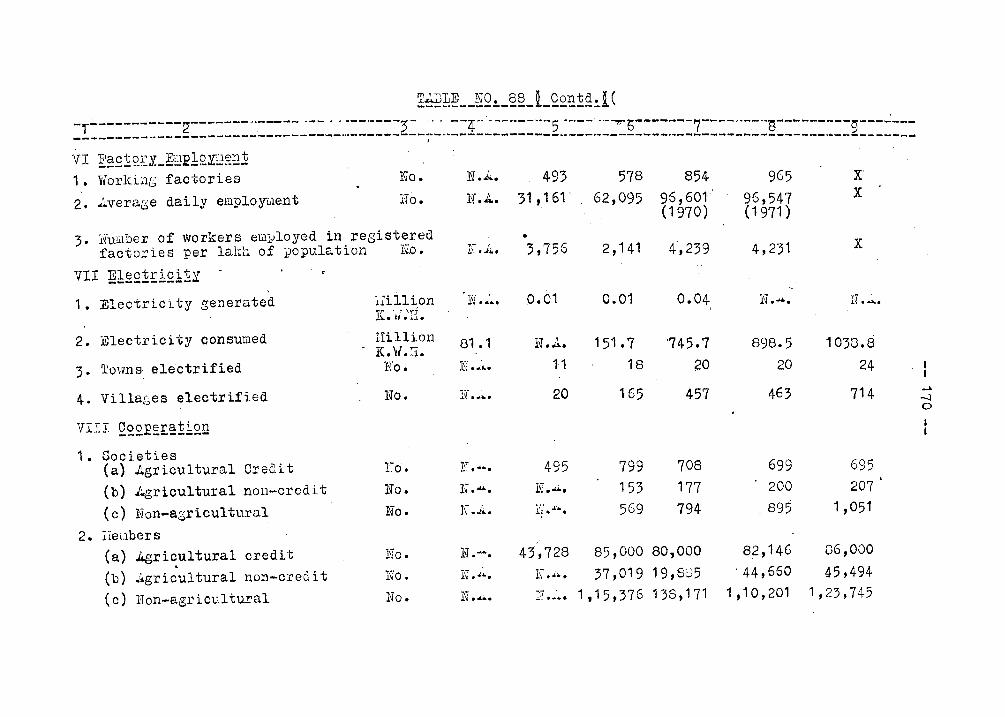
~~~ __ !Q~_~~_l_Q~~~g~l( '. -,.-----------2-------.. ---- ---... -------3' - .... . --~-' ---··----5 ._---, ·-"""!I'""-------7----··----~---------~---...:---_____________________ ~ ______________________ .• ________________________ . 0 ~
" -_ .. _-----------------------------... VI E~£~9.~Y._~}E1QI9~~~ 1. Working factories No.
2. ~verage daily eill~loy~ent ITo.
3. j,ijull1ber of workers em:klloyed in registered factories per lakh of population No.
VII ~!~£~!!2!~I - . 1. Electri~i ty generated
2. Electricity consumed
3. I):owns electrified
4. Villa~es electrified
1. Societies (a) Agricultural Credit (b) ~ricultural non-credit (c) Non-a6ricultural
2. i.ledbers (a)
(b) (c)
.Agricultural credit . ~gricultural non-credit Non-agricultural
:dillion K"li.'II.
iUllion - K.W.:I.
:No.
Ho.
lici •
No. No.
No •
l~o •
No.
N.;'. N."; •.•
493 31 ,161
•
578 62,095
854 96,601 (1970)
N.A. 3,756 2,141 ~.
4,239
81.1
n . .u..
N • ..ti..
u .......
0.01 0.01 0.04
H • .1.
11
20
495 l~ ......
1 51. 7 '745 • 7 18' 20
165 457
799 153 569
708 177 794
43,728 85,000 80,000 N.~. 37,019 19,Bb5 N.~. 1,15,376 138,171
•
965 96,547 (1971 )
4,231
N .....
898.5 20
463
699 200
_ 895
82,146 . 44,660
1 ,10,201
X· X
x
N.~.
1033.8 24
714
695 207
1 ,051
06,000
45,494-1,23,745
.... -l o I I
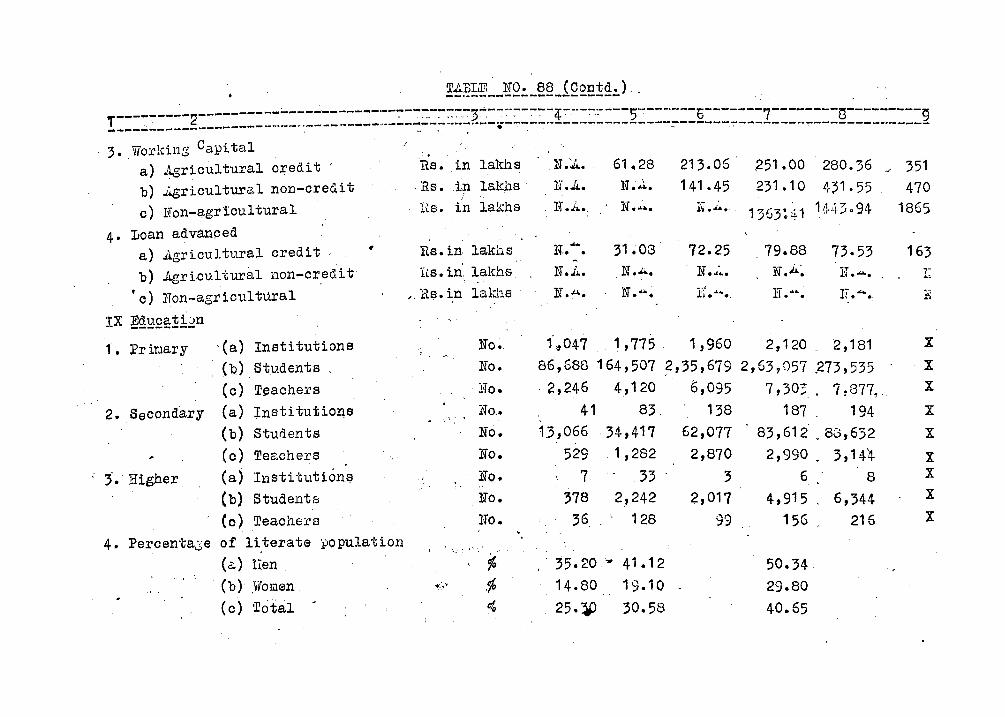
!~?~~--~Q~-~§_£Q£~!~~) -_____ :.. ______________________ o:t..:. _________ ';i _____ ._...: __ !:' ____ -----'6-------7--------1"1"---------
!::::=::::g=::::-----.----... -.--------,,--~- .... ;.;.--:.-:.:~~~~-.:...:...-:..:...-!;..--;..-;..----~----=-----.:..--:--------.-----~----------~ , .... .
3 •. Worldng Capital a} Agricultural credit' b} ~ricultural non-cre&it c) Non-agricultural
4. Loan advanoed a) Jl.gricultural credit b) ..1.grLcultural non-cr.edit
• c) :Hon-agricultural
!X ;mg~£~~.!~n
1. l'r imary , (a) Institutions , {b) Students,
(c) Teachers
2. Secondary (a) Institutiol'.\s (b) Students (0) Tea.chers (a) InstHutions (b) Students (0) Teacher's
4. Percent"a.:;e of literate population (~) lien
(b) .Women (c) Total
.. Rs. in lakhs
. Rs. .in laIchs' Hs. in lakhs
l1s. in· lakl1 s Hs.in.1akhs
,,11s.in 1ak11s
l~o • No.
Ho.
rio.
lifo.
No. l~o • No. lio.
.. , ~
~: ... '" .% %
N \1 .014. 61~28
1~- .lL. 11 • ..l. . H .J.~ •. N .... :...
N .......... 31~08 -N • .J~. N.~.
N ....... N .", ...
1',047 . 1 ,775 . 86,688 164,507
2,246 4,120
41 83 1.3,066 ·34,417
529 1,282
7 .33 378 2,242
36 128
35.20 -- 41.12 14.80 19.10
25.~ 30.58
213.05 ,251 .00 280.36 ,J 351 141 .45 231 .10 ,I1r31 .55 470
K • ..::". 1363::;.1 H+;Ja94 1865
72.25 79.88 73.53 163 N • .J.~. N.A~ l;r • .,.;.l". l~
17 ... .. . N ."' •• 17 .... ,. . J..1
1,960 2,120 2,181 X
~,35,679 2,53,057 .273,535 X
6,095 7,303 _ 7 ~877!. X
138 187 194 X
62,077 83 , 61 2 v 88, 6:; 2 X
2,870 2,990 . 3, 14~ X
3 6 8 X
2,017 4,915 6,344 X
99 156 216 X
50.34· 29.80
40.65
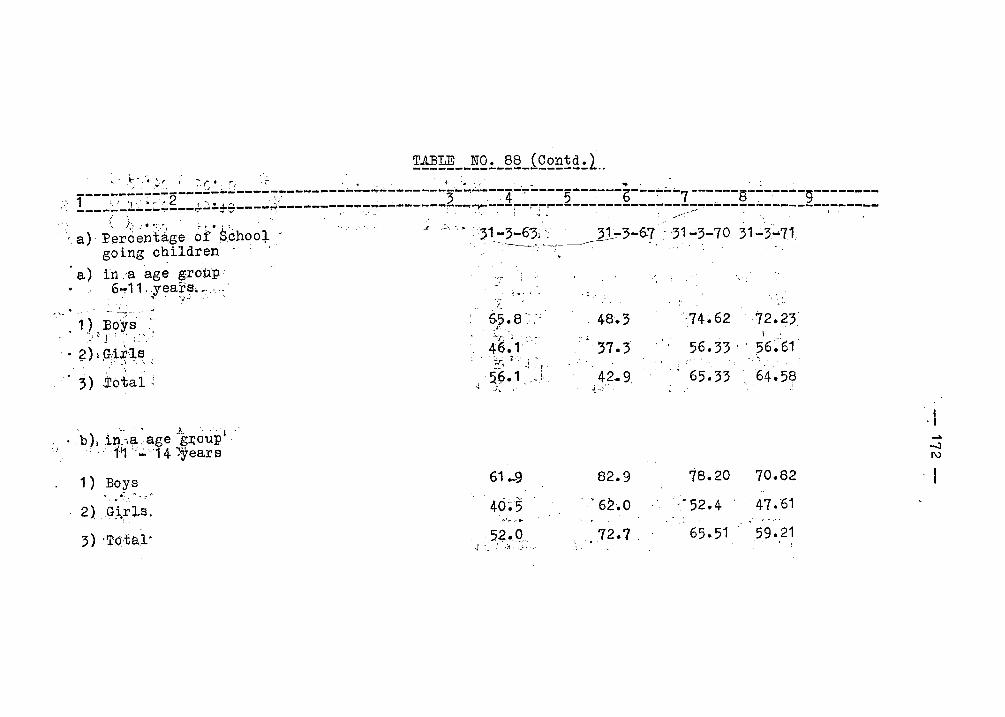
'/
TABLE NO. 88 (Contd.)' ----------------------...
____ ~~:~~~:_~_2~.:.:_,·~;'---··::.--------.:..-..:.-...;.-.:.----~-~·,;.:.~~~--.":-~-----------;-' . --.. : . ',1 '.j',,' ~,r. 2 I',. _. ,':' ,3 . , ,4' 5 0 ---:---7 ------g-------g--------I. -----:----.;..--~---~ .... -t~----.~.-------~-""'!""- .... --------:----:~---:--~:--!!-----------------::--,;,;;.----.:..--------------
( )":. ': ' :- • • . . .... ... <-
"a) :Perc~nt'<'lge ofSdhoo+ .I ':,', "31-3-6)J " 31.-3-6-1' :31 ~3-70 31";'3-:"'71 going children ------..,;~-~ . "
'a) iti.'a age group 6~11, ,years. ,:-,,'
" .,.' ,,~, -' '
• 1) BOYS' ... ;'; ) J ; :' ;~ ", "
) .' ".2 ,G,U"~s ~ '.~. -) " '~ .~
,'3) ±otal:
. '" ' . ).,,' 'I " b), ,i~"~,,age g1;ouP "
, ,: 1"1 "";'-14 3Years
1) Boys ....... ~" .... ;' ,-
2) GJ.rls,
3) 'To:ta,l'
'," ,'-
6.5.8',:' ' _I' •
46.'1" ':",...' ':'\ • '1
~'! .! f
~J).1",l .J .. '
61_9
40;5 .. ',. '.
52.0 j ':. "'.~: .~t." ._
.' :.
, 48.3 - .:..
37.3
42.9 r, '
82.9
. 62.0
72.7
1 '
56.33 ' '56.61 -.'~ .
'65.3364.58 -. . I
78.20 70.82
-' 52.4 47.'61
65.51 59.21 ,
, "
.... -J I\)
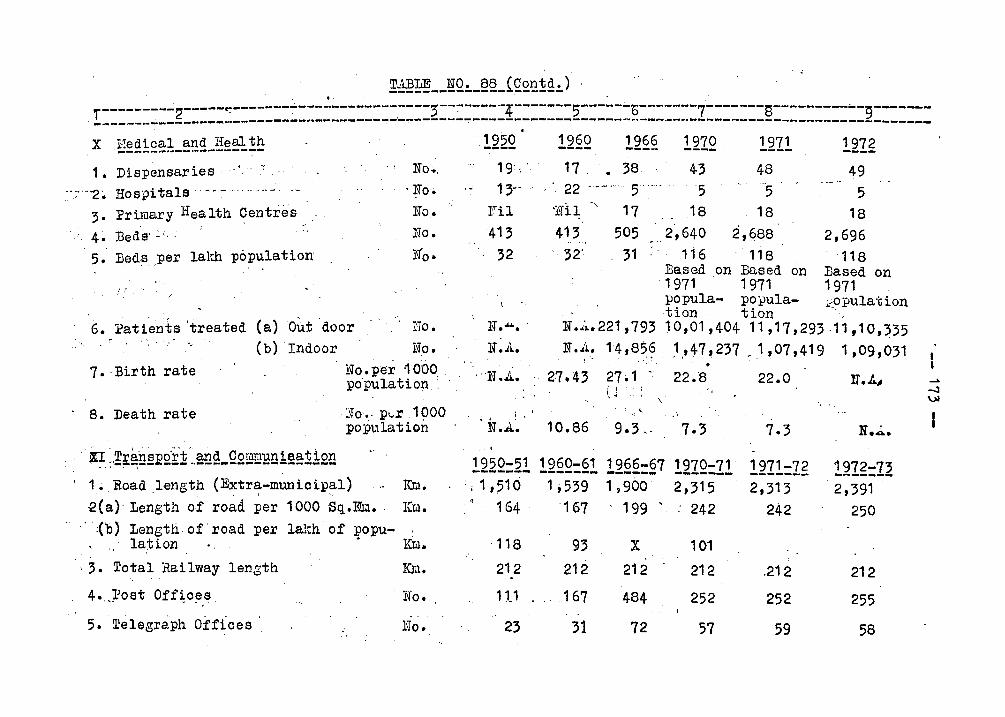
. , 1~~~! __ ~Q~_~~_rQ~~~g~)
-----.:..---:.:...-----------'%'-------.-T-------5-----,;..'I:"-------7·-------l'o;--------... -~-----T---------2-----~-- J' ~ 0 0 ~ . -------.;.--------. .... ------------..... -----~-.-~---- .... -~--------------------,,----------- ----------------------. X I,·~edical and Heal!!! -1222 12§2 1.2§§ ----------------. 1970. . 1.211 121g ----1. DispensaI'ies ..... ";'
:';"-"2~ HOs:i?itals~·-:-'·-····- ". 3. Primary Health Centres
. 4. Beds' ~' .. 5 • .Bed~ ,per lalr..h population
:':., "
No •..
. No.
No. No •
N"o.
'6. l'ati.~nts 'treated (a) Out door lTo. " " (b) Indoor No.
7. ·Birth rate
8. Death rate
, l~o. per 10.00. populatiop.
. :~ 0-., pl.-r 10.0.0. population
. n·,,~;£~U~EQi:f~~E!.LQQj]BBE1~§l:~1QE _,l, • \
1. Road length (Extra-municipal) Km. • • • I ~.
-2(a). Length o·f road per 10.0.0. Sq.I{iin., KLl.
.' . :(b) Length of rO:;l.d per lakh of popu- : lation . Km.
·3. Total Railway length
4 •. ~;Post Cff~o~,s.
5. Telegraph Cff~ces
ICm.
- . 110.
19:: . 13-'
ril
413 32
\
N .... · . . N .J~.
":U .A.
~ , ,
N . .ti.
17 . '. 38 43 48 49 " 22 .. -." 5 .. ··· 5 --5 5 ';:Til" 17 413 32'
50.5 31
18 18 18 __ 2,640. ~,~a8 2,696
116 118 118 Be.sed on Based on Based on
, 1971 1 971 1971 po pula- pOllula- .:::opulation tion tion _
N.~.221,793 10.,01,404 11,17,293.11,1C,~35 N • .A. 14,85? ~.'47~237 r.1 ,07,419 1,0.9,031 . ' , .. ,' . .
2,7.43 27.1 . 22.8 22.0
i! , . " ,
.1
10..86 9.3" li.~ •
1222:21 12§2:§! !2§§:§7 1212:11 !211:7.g 1972-73 -------:; 1 ,510. . • 164
·118
212 . 111
~3
1;539 1,900. 167 199'
93 X
212 212
167 484
31 72
2,315 242
10.1 212
252
57
2,313 242
.212
252
59
2,391 250
212
255
~8
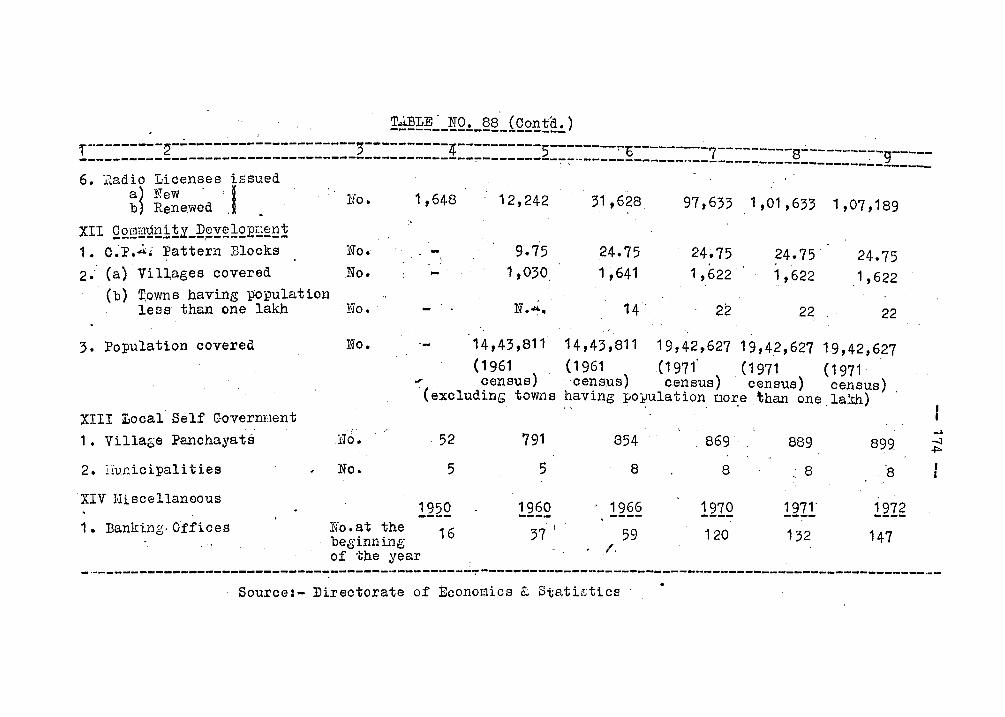
~~~~~-~Q~_§§_£Q~B~£~) ~---------~-~--------------------~----------~----------5---------~--------- . I ~ / ~ . 0 7---------8---------- ----------------------:-------------------------------".---------:::------------------------...,----------___ .:..._2 ___ _ 6. li.adio Licenses issued
~~ l\;ew .1 lifo. 1,648 12,242 31,628 97,633 1,01,633 1 ,07,189 Renewed
QQ.9@1!D1:t~LJ2,~y~1~E8§:D:!! :'
XII 1 • C.P.~" Pattern Blocks lifo. 9.75 24.75 24.75 24.75' 24.75 2'- (a) Villages covered No. 1 ,030. 1 ,641 1 , 622 1 ,622 1 , 622
(b) X.owns having population N.~. 22 less thEm one lakh rio. 14' 22 22
3. population covered No. 14,43,811 14,43,811 19,42,627 19,42,627 19,42,627 (1961 (1961 (1971 (1971 (1971 ., census) 'census) census) census) census)
(excludinG towns having po~ulation llo~e ~han one .lakh) . , XIII Local Self Governuent
1 • Village Panchayats H6. . ·52 791 854 -'
869 889 899 -.J -I>-
2. ~.iunicipali ties No. 5 5 8 8 .: 8. .8
XIV Miscellaneous 222Q 22§2 , 12§§ 2212 2222' 122g
1 • l3anking.Offices liio.at the 16 37' , 59 120 132 147 beginning /. of the year -.. -------.---------------------------------------~-------------------------_ .. _--------------------------._-
Source:- Directorate of Econoaics c;; Stati!;tics