environmental, demographic, and socio-economic
TRANSCRIPT
Environmental, Demographic, and Socio-Economic…| Sri Irianti and Puguh Prasetyoputra
11
Jurnal Kependudukan Indonesia | Vol. 10 No. 1 Juni 2015 | 11-26
JURNAL KEPENDUDUKAN INDONESIA
p-ISSN : 1907-2902 (Print)
e-ISSN : 2502-8537 (Online)
ENVIRONMENTAL, DEMOGRAPHIC, AND SOCIO-ECONOMIC CORRELATES OF
ACCESS TO IMPROVED SANITATION:
EMPIRICAL EVIDENCE FROM PAPUA AND WEST PAPUA PROVINCES
(LINGKUNGAN, DEMOGRAFI, SOSIO-EKONOMI YANG BERKORELASI DENGAN
AKSES KE FASILITAS SANITASI YANG LAYAK:
BUKTI EMPIRIS DARI PROVINSI PAPUA DAN PROVINSI PAPUA BARAT)
Sri Irianti 1 and Puguh Prasetyoputra 2* 1 National Institute of Health Research and Development, Ministry of Health, Republic of Indonesia
2 Research Center for Population, Indonesian Institute of Sciences
* Corresponding author: [email protected]
Abstrak
Provinsi Papua dan Papua Barat adalah dua di antara
provinsi-provinsi di Indonesia yang masih kekurangan
akses terhadap sanitasi yang layak. Oleh karena itu
tulisan ini menyajikan hasil analisis faktor-faktor yang
berhubungan dengan akses sanitasi meliputi
lingkungan, demografi dan sosio-ekonomi di kedua
provinsi tersebut. Data dari Multiple Indicator Cluster
Survey (MICS) 2011 dipakai untuk menentukan faktor-
faktor lingkungan, demografi dan sosio-ekonomi yang
berkorelasi dengan akses ke fasilitas sanitasi yang
layak pada tingkat rumah tangga. Model-model regresi
probit diaplikasikan pada data tersebut. Hasil analisis
menunjukkan bahwa kecamatan, tempat tinggal, jenis
dan lokasi sumber air rumah tangga, jumlah anggota
rumah tangga, umur dan pendidikan kepala rumah
tangga, dan tingkat kekayaan rumah tangga merupakan
faktor-faktor yang berkorelasi secara signifikan dengan
akses sanitasi layak. Hasil dari analisis memperkuat
hasil penelitian sebelumnya dan lebih penting lagi,
dapat dipakai sebagai bahan pembuatan kebijakan
terutama di Provinsi Papua dan Provinsi Papua Barat.
Kata Kunci: Sanitasi Dasar, MICS, Regresi Probit,
Efek Marginal, Disparitas
Abstract
Papua and West Papua provinces are two of many
lagging provinces in Indonesia in terms of access to
adequate sanitation. Hence, this paper aims to reveal
determinants of access to improved sanitation by
investigating the environmental, demographic, and
socio-economic correlation in both provinces. Data
from the 2011 Multiple Indicator Cluster Survey
(MICS) were used to determine the demographic and
socio-economic correlates of households’ access to
improved sanitation facilities. Probit regression models
were fitted to the data. The results suggest that district,
place or residence, type and location of household water
source, household size, age of household head,
education of household head, and household wealth
have significant correlation with access to improved
sanitation. These corroborate previous findings and
more importantly, it can be used to inform policy
makers in Indonesia especially in Papua and West
Papua Provinces.
Keywords: Basic Sanitation, MICS, Probit Regression,
Marginal Effect, Inequality
INTRODUCTION
Access to safe water and sanitation is key determinant
in development outcomes across the life course (The
Lancet, 2014), as lack of which is responsible for many
episodes of diarrhoeal diseases and its subsequent
mortalities (Fuller, Westphal, Kenney, & Eisenberg,
2015; Prüss-Ustün et al., 2014). Therefore, access to
water and sanitation is a human right (Gleick, 1998;
Jurnal Kependudukan Indonesia | Vol. 10, No. ,1 Juni 2015 | 11-26
12
United Nations, 2010), as it significantly contribute to
the development of human health.
It was reported that the world’s target of Millennium
Development Goal (MDG) for drinking water was met
(WHO/UNICEF JMP, 2014). However, having access
to improved water does not guarantee one from
contracting water related diseases for several reasons.
First, sufficient quantity of water is needed to flush
faeces or to wash hands after defecation. Second, there
is a possibility of recontamination by unhygienic
practices (Freeman et al., 2014; Rufener, Mäusezahl,
Mosler, & Weingartner, 2010). Third, lack of access to
improved sanitation also increases the risk of
contamination of drinking-water sources (Bain et al.,
2014).
Globally, 2.5 billion people did not have access to an
improved sanitation facility in 2012, and if the current
trends coverage increase continues, then the MDG
sanitation target will not be achieved (WHO/UNICEF
JMP, 2014). In 2013, two of five Indonesian households
still did not have access to improved sanitation facility,
with varying coverage across provinces (NIHRD, 2013)
owing to slow progress during the past two decades
(Haryanto & Sutomo, 2012). The Government of
Indonesia (GoI) targets acceleration of increasing
coverage to achieve universal access to drinking-water
and sanitation by 2019 through the Presidential
Regulation No. 185 in 2014 (Government of Indonesia,
2014). Inequalities in access to improved sanitation
related to location and socio-economic status of
household in Indonesia (Prasetyoputra & Irianti, 2013)
and increased pressure from increasing population size
and density (Mara, Lane, Scott, & Trouba, 2010) also
can be obstacles in achieving this target.
Many provinces in Eastern Indonesia are still laggards
in development despite considerable progress (Booth,
2004; Hill, Resosudarmo, & Vidyattama, 2008). This is
also true for sanitation coverage where Eastern
Indonesia provinces are among the lowest (Patunru,
2015). This paper takes Papua and West Papua
provinces as examples. Access to improved sanitation
facility in Papua and West Papua in 2013 was still
behind national average of 59.8 % (30.5% and 54.9%)
(NIHRD, 2013). However, little is known about
disparities of access to improved sanitation within those
provinces. Studying the factors behind access to
improved sanitation facilities will help directing
intervention to increase access and alleviate disparities.
Therefore, using the 2011 Indonesia Multiple Cluster
Indicator Survey (henceforth 2011 Indonesia MICS),
this paper addressed the demographic and socio-
economic correlates of access to improved sanitation
facility. In doing so, bivariate and multivariate probit
regression models were fitted to the data.
Globally, this study is not the first to investigate the
demographic and socio-economic correlates of access
to improved sanitation facility (see Blakely, Hales,
Kieft, Wilson, and Woodward (2005); Prasetyoputra
and Irianti (2013); Gross and Günther (2014)).
However, our contribution is threefold: first, an
underutilised regression model in Indonesia is used.
Second, this study focuses on two, relatively lagged in
development provinces, Papua and West Papua. Third,
this study takes advantage of the internationally
standardised MICS dataset. Four, this study also
explored the demographic dimension of access to
improved sanitation facility.
Cross-sectional data from the 2011 Indonesia MICS
from Indonesia collected in 2011 were used for
analysing the socio-demographic and economic
correlates of access to improved sanitation facility in
Papua Province and West Papua Province. The sample
and survey methodology are explained elsewhere
(Statistics Indonesia, 2013a, 2013b, 2014). The dataset
has been de-identified by the UNICEF and Statistics
Indonesia to preserve anonymity of respondents.
Ethical review was not sought as such.
The 2011 Indonesia MICS included responses from
3000 households drawn from Papua Province and 2913
households drawn from West Papua Province. The
surveys collected information on water and sanitation
facilities, housing characteristics, ownership of assets,
and socio-demographic characteristics of household
head which are the main interests this study. A total of
182 households (6.07%) were excluded from the Papua
dataset and 231 households (7.93%) from the West
Papua dataset using list wise deletion (Dong & Peng,
2013).
The only dependent variable in this study is access to
improved sanitation facilities. It is defined as facilities
that prevent contact of human excreta with human
(WHO/UNICEF JMP, 2006). The Joint Monitoring
Programme (JMP) between the World Health
Organization (WHO) and the United Nations Children
Fund proposed a classification of sanitation ladder
based on health outcomes for the purpose of monitoring
(WHO/UNICEF JMP, 2006, 2008).
Environmental, Demographic, and Socio-Economic…| Sri Irianti and Puguh Prasetyoputra
13
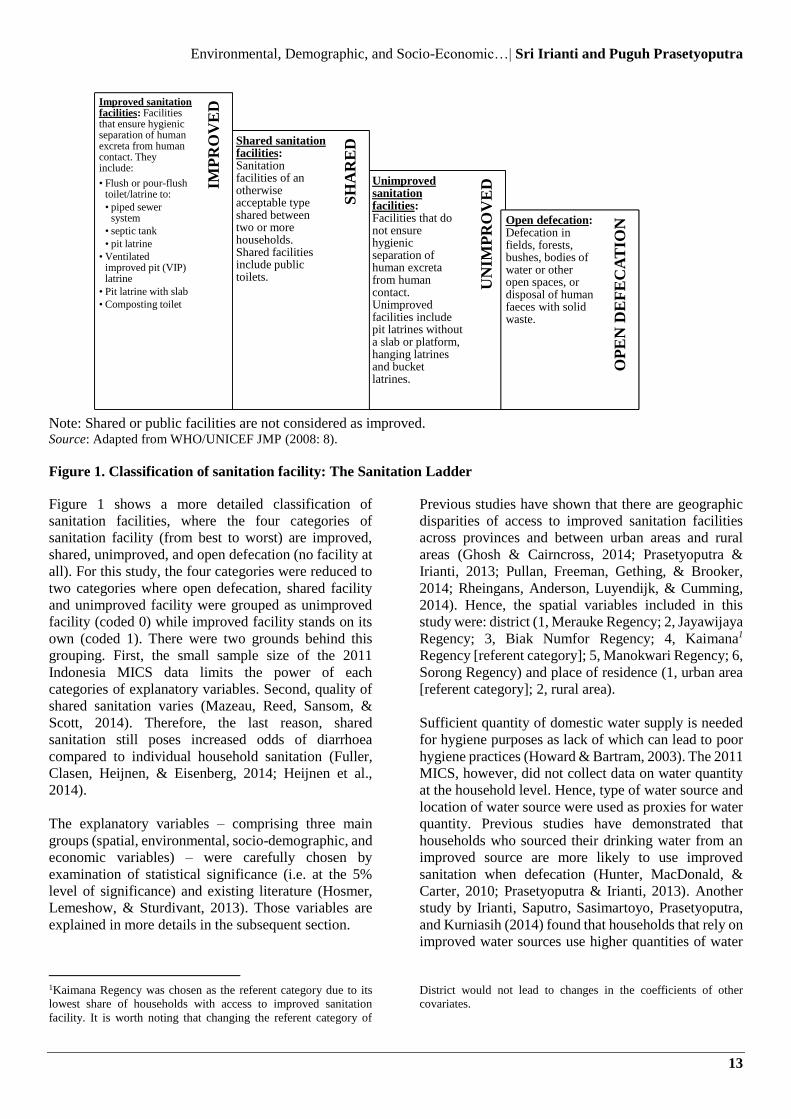
Note: Shared or public facilities are not considered as improved. Source: Adapted from WHO/UNICEF JMP (2008: 8).
Figure 1. Classification of sanitation facility: The Sanitation Ladder
Figure 1 shows a more detailed classification of
sanitation facilities, where the four categories of
sanitation facility (from best to worst) are improved,
shared, unimproved, and open defecation (no facility at
all). For this study, the four categories were reduced to
two categories where open defecation, shared facility
and unimproved facility were grouped as unimproved
facility (coded 0) while improved facility stands on its
own (coded 1). There were two grounds behind this
grouping. First, the small sample size of the 2011
Indonesia MICS data limits the power of each
categories of explanatory variables. Second, quality of
shared sanitation varies (Mazeau, Reed, Sansom, &
Scott, 2014). Therefore, the last reason, shared
sanitation still poses increased odds of diarrhoea
compared to individual household sanitation (Fuller,
Clasen, Heijnen, & Eisenberg, 2014; Heijnen et al.,
2014).
The explanatory variables – comprising three main
groups (spatial, environmental, socio-demographic, and
economic variables) – were carefully chosen by
examination of statistical significance (i.e. at the 5%
level of significance) and existing literature (Hosmer,
Lemeshow, & Sturdivant, 2013). Those variables are
explained in more details in the subsequent section.
1Kaimana Regency was chosen as the referent category due to its
lowest share of households with access to improved sanitation
facility. It is worth noting that changing the referent category of
Previous studies have shown that there are geographic
disparities of access to improved sanitation facilities
across provinces and between urban areas and rural
areas (Ghosh & Cairncross, 2014; Prasetyoputra &
Irianti, 2013; Pullan, Freeman, Gething, & Brooker,
2014; Rheingans, Anderson, Luyendijk, & Cumming,
2014). Hence, the spatial variables included in this
study were: district (1, Merauke Regency; 2, Jayawijaya
Regency; 3, Biak Numfor Regency; 4, Kaimana1
Regency [referent category]; 5, Manokwari Regency; 6,
Sorong Regency) and place of residence (1, urban area
[referent category]; 2, rural area).
Sufficient quantity of domestic water supply is needed
for hygiene purposes as lack of which can lead to poor
hygiene practices (Howard & Bartram, 2003). The 2011
MICS, however, did not collect data on water quantity
at the household level. Hence, type of water source and
location of water source were used as proxies for water
quantity. Previous studies have demonstrated that
households who sourced their drinking water from an
improved source are more likely to use improved
sanitation when defecation (Hunter, MacDonald, &
Carter, 2010; Prasetyoputra & Irianti, 2013). Another
study by Irianti, Saputro, Sasimartoyo, Prasetyoputra,
and Kurniasih (2014) found that households that rely on
improved water sources use higher quantities of water
District would not lead to changes in the coefficients of other
covariates.
UN
IMP
RO
VE
D
SH
AR
ED
OP
EN
DE
FE
CA
TIO
N
IMP
RO
VE
DImproved sanitation facilities: Facilities that ensure hygienic separation of human excreta from human contact. They include:
• Flush or pour-flush toilet/latrine to:
• piped sewer system
• septic tank
• pit latrine
• Ventilated improved pit (VIP) latrine
• Pit latrine with slab
• Composting toilet
Shared sanitation facilities:Sanitation facilities of an otherwise acceptable type shared between two or more households. Shared facilities include public toilets.
Unimproved sanitation facilities:Facilities that do not ensure hygienic separation of human excreta from human contact. Unimproved facilities include pit latrines without a slab or platform, hanging latrines and bucket latrines.
Open defecation: Defecation in fields, forests, bushes, bodies of water or other open spaces, or disposal of human faeces with solid waste.
Jurnal Kependudukan Indonesia | Vol. 10, No. ,1 Juni 2015 | 11-26
14
for all household purposes than those that rely on
unimproved water sources. Moreover, the same study
demonstrated that households that obtain their water
from sources located not in their premises use less
water, on average, compared to those that have water
sources close by, implying a time cost in collecting
water (Irianti, et al., 2014).
For the reasons above, the environmental factors in this
study were main water source for other household
purposes (0, unimproved; 1, improved) and location of
that water source (0, water source located on premises;
1, water source located elsewhere). To prevent perfect
collinearity, those two variables were combined
(interaction) resulting in a four category variable (1,
improved water + on premise; 2, unimproved water +
on premise; 3, improved water + located elsewhere; and
4, unimproved water + located elsewhere).
Demographic factors such as age and household size
have been shown to be associated with water and
sanitation (Francisco, 2014; Gross & Günther, 2014;
Jenkins & Cairncross, 2010; Jenkins & Scott, 2007;
Wright & Gundry, 2009). In this study, variables
intended to represent demographic characteristics of the
households were household size (number of household
members of any age – in discrete form), age of
household head (in years), squared age of household
head, ethnicity of household head (1, Papuan [referent
category]; 2, Javanese; 3, other ethnicity), and
household head is a migrant (0, no [referent category];
1, yes).
Socio-economic position (SEP) of household plays an
important role in household’s ability to achieve better
health status. Poverty hinders access to better sanitation,
while wealth enables it. The higher the affluence of the
household, the more likely it uses improved sanitation
facility (Adams, Boateng, & Amoyaw, 2015; Blakely,
et al., 2005; Prasetyoputra & Irianti, 2013). As such, in
this study, education of household head and wealth of
household were used as indicators of SEP.
The first indicator of SEP in this study is highest
educational attainment of household head (1, no formal
education [referent category]; 2, primary school; 3,
junior high school; 4, senior high school or higher).
Education has been widely used as an indicator of SES
(Oakes & Kaufman, 2006). It has been demonstrated
2 Assets comprise radio, television, fridge, cable television, watch,
mobile phone, motorcycle, land, livestock, mosquito bed net, and
bicycle/cart.
that households headed by a more educated person have
higher odds of accessing improved sanitation facility
(Prasetyoputra & Irianti, 2013). The second indicator of
SES is wealth index in the form of standardised scores.
This indicator has been commonly used in previous
studies (Blakely, et al., 2005; Howe et al., 2012; Vyas
& Kumaranayake, 2006). The details on the
construction of wealth index can be seen in the
Econometric Analyses section.
The data analysis consists of two parts, first,
construction of a new set of wealth index scores, and
second, regression analysis. However, prior to the
aforementioned analyses, a list wise deletion was
performed to handle the missing values (Dong & Peng,
2013). This method was chosen instead of more
sophisticated methods (for instance, multiple
imputation of missing values (see Royston (2004)) due
to presumably insignificant bias emanating from the
small number of missing values in the 2011 Indonesia
MICS datasets.
A new set of wealth index scores was calculated
because the existing wealth index scores in MICS
already included sanitation facility as one of the
components (Statistics Indonesia, 2013a, 2013b) and
therefore such variable must be excluded to prevent
redundancy. The index was constructed from 19
variables categorised into ownership of assets2 and
housing variables3. The standardised scores were
obtained by employing polychoric principal component
analysis (PCA)4 which can take into account ordinal
form of variables (Kolenikov & Angeles, 2004, 2009).
The wealth index had a polychoric correlation
coefficient (ρ) of 0.1697 and the first component
explained 45.73 per cent of the variance.
The outcome variable is in binary form, hence, due to
several violations of using OLS method on a limited
dependent variable (Hill, Griffiths, & Lim, 2011), the
choice of statistical model comes down to probit
regression model (PRM) or logistic regression model
(LRM). In this study, the former is preferred over the
latter for three reasons. First, when the occurrence of the
outcome is rare, the odds ratio (OR) from the LRM
approximates risk. However, as the outcome gets more
common, the OR deviates from risk resulting of an
overestimation of the association between the
explanatory variable and the outcome variable (Sainani,
3 Housing variables are tenure, number of rooms used for sleeping,
occupancy density, material of wall, material of floor, material of
roof, type of cooking fuel, and access to electricity.
4 Polychoric PCA was executed using the ‘POLYCHORICPCA’
command in STATA (Kolenikov & Angeles, 2004).
Environmental, Demographic, and Socio-Economic…| Sri Irianti and Puguh Prasetyoputra
15
2011). In this case, almost half of the household
reported using improved sanitation facility for
defecation. Second, a constant change of in the odds
does not correspond to a constant change in the
probability, and hence the probabilities from probit
regression are more meaningful to interpret (Long &
Freese, 2014). Third, PRM has been widely used in
global literature (see Francisco (2014); Gross and
Günther (2014)).
The probit model specifies the conditional probability
as
P = ϕ(x′β) = ∫ ϕ(z)dz,x′β
−∞
(Eq. 1)
whereϕ(. ) is the standard normal cumulative
distribution function (cdf), with derivativeϕ(z) =
(1
√2π) exp (
−z2
2), which is the standard normal density
function (Cameron & Trivedi, 2005). The probit MLE
first-order conditions are that
∑ wi(yi − ϕ(xi′β))xi = 0,
N
i=1
(Eq. 2)
where, unlike the logit model, the weight wi =
ϕ(xi′)/[ϕ(xi
′β)(1 − ϕ(xi′β))] varies across
observations (Cameron & Trivedi, 2005). Therefore,
the PRM of access to improved sanitation can be
specified as
p = P[IMPSANIT≤ β1 + β2EXPVAR1+ δ1DUMMY1 + ⋯ ]= ϕ(β1 + β2EXPVAR1+ δ1DUMMY1 + ⋯ )
(Eq.3)
where IMPSANIT denotes access to improved
sanitation, EXPVAR denotes continuous/discrete
explanatory variables and DUMMY denotes dummy
explanatory variables.
The first stage of the regression analyses was the
bivariate regression of each potential explanatory
variable. Variables that were statistically significant or
have substantial importance albeit insignificant were
included in the final multivariate PRM. Statistical
significance was evaluated at p< 0.05, but additional
markers were added to variables that are significant at
p< 0.001. Moreover, survey design for the dataset was
declared before the regressions (Kreuter & Valliant,
5 This may cause overrepresentation of rural households. The
authors thank anonymous reviewer for pointing this out.
2007). Also, those variables were examined for severe
collinearity (see Hill et al. (2011) for the impact of
severe collinearity), which is when the value of variance
inflating factor (VIF) exceeds 10 (Chatterjee & Hadi,
2012; Gujarati, 2004). The VIFs were examine using
unweighted regression.
The coefficients from PRM cannot be directly
interpreted. As such, marginal average effects (AME)
were computed using ‘MARGINS’ command (Long &
Freese, 2014) along with their 95 per cent confidence
intervals (95% CI) to obtain the probabilities based on
the explanatory variables. All of the analyses were
performed using Intercooled STATA version 13.1
(StataCorp, 2013).
FACTORS CORRELATES OF ACCESS TO
IMPROVED SANITATION
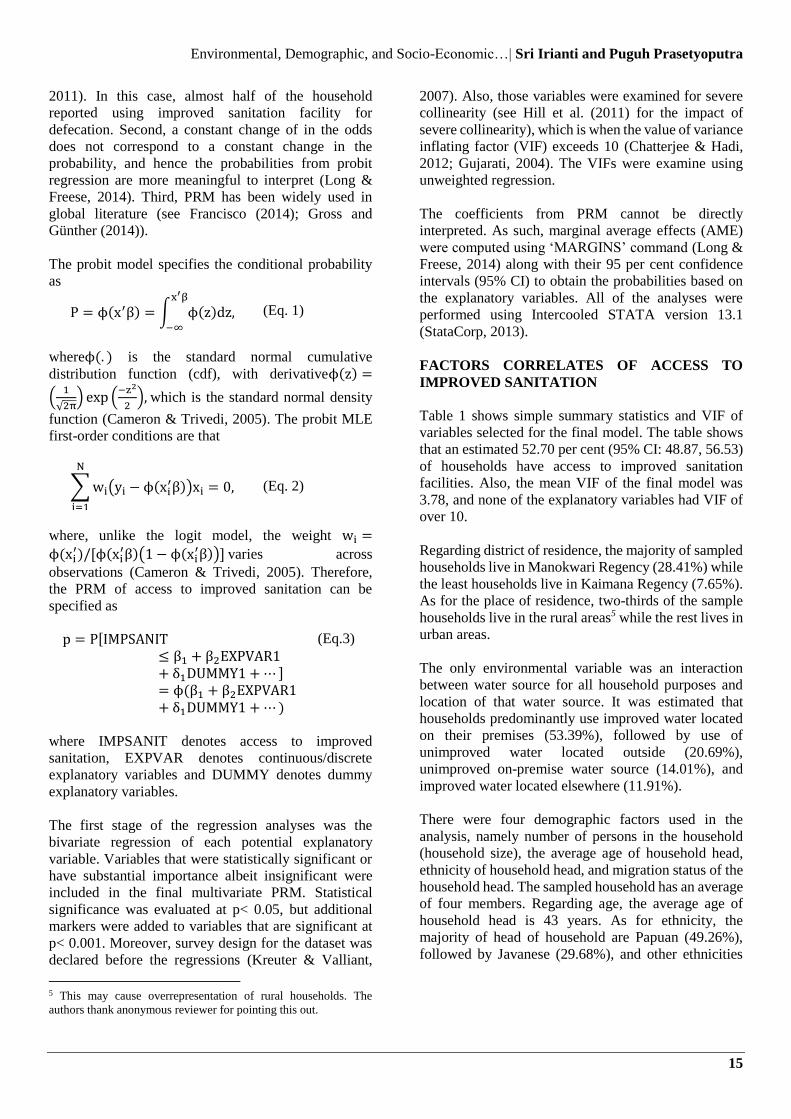
Table 1 shows simple summary statistics and VIF of
variables selected for the final model. The table shows
that an estimated 52.70 per cent (95% CI: 48.87, 56.53)
of households have access to improved sanitation
facilities. Also, the mean VIF of the final model was
3.78, and none of the explanatory variables had VIF of
over 10.
Regarding district of residence, the majority of sampled
households live in Manokwari Regency (28.41%) while
the least households live in Kaimana Regency (7.65%).
As for the place of residence, two-thirds of the sample
households live in the rural areas5 while the rest lives in
urban areas.
The only environmental variable was an interaction
between water source for all household purposes and
location of that water source. It was estimated that
households predominantly use improved water located
on their premises (53.39%), followed by use of
unimproved water located outside (20.69%),
unimproved on-premise water source (14.01%), and
improved water located elsewhere (11.91%).
There were four demographic factors used in the
analysis, namely number of persons in the household
(household size), the average age of household head,
ethnicity of household head, and migration status of the
household head. The sampled household has an average
of four members. Regarding age, the average age of
household head is 43 years. As for ethnicity, the
majority of head of household are Papuan (49.26%),
followed by Javanese (29.68%), and other ethnicities
Jurnal Kependudukan Indonesia | Vol. 10, No. ,1 Juni 2015 | 11-26
16
(21.06%). Lastly, with regard to migration, less than
half of head of household are migrant (45.18%).
The socio-economic factors in this study were
education of household head and household wealth.
With regard to education, more than two fifths of
household heads are junior high school graduates
(42.29%), followed by primary school graduates
(33.23), and senior high school graduates (14.41%).
While one tenth of household heads has no formal
education at all. Wealth index scores used as indicator
of household wealth is averaged at 0.20.
Table 1. Descriptive statistics for selected variables and their VIFs
N = 5500 Categories Weighted
mean/per cent VIF*
Outcome variable
Access to improved sanitation facility No (Ref.) 47.30 N.A.
Yes 52.70 N.A.
Spatial variables
District Kaimana (Ref.) 7.65 N.A.
Jayawijaya 14.38 2.46
Biak Numfor 14.58 2.16
Merauke 22.16 2.16
Manokwari 28.41 2.04
Sorong 12.82 2.38
Place of residence Urban area (Ref.) 32.28 N.A.
Rural area 67.72 4.71
Environmental variables
Interaction variable Improved water + located on premise
(Ref.)
53.39 N.A.
Unimproved water + located on
premise
14.01 1.31
Improved water + located elsewhere 11.91 1.33
Unimproved water + located
elsewhere
20.69 2.33
Demographic factors
Household size (in persons) N.A. 4.17 5.10
Age of household head (in years) N.A. 43.41 8.92
Ethnicity of household head Papuan (Ref.) 49.26 N.A.
Javanese 29.68 6.36
Other ethnicity 21.06 5.08
Household head is a migrant No (Ref.) 54.82 N.A.
Yes 45.18 8.57
Socio-Economic Position
Highest education of household head No formal education (Ref.) 10.06 N.A.
Primary school 33.23 3.46
Junior high school 42.29 4.34
Senior high school or higher 14.41 2.17
Wealth index score N.A. 0.20 3.68
Notes: Ref.: Referent category; N.A.: Not applicable; * From unweighted multivariate probit regression.
Source: Author's calculation of the 2011 Indonesia MICS
Environmental, Demographic, and Socio-Economic…| Sri Irianti and Puguh Prasetyoputra
17
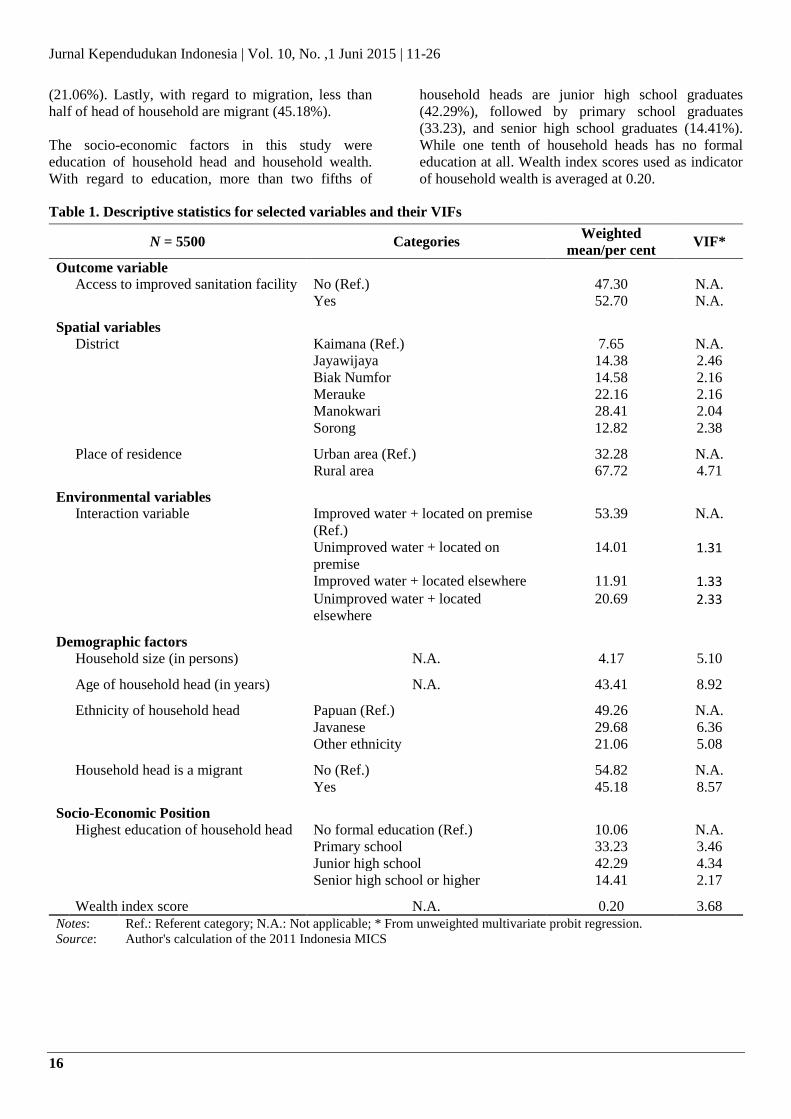
Spatial Correlates
The final model was highly statistically significant
(𝐹(18,199) = 41.20; p< 0.001). Table 2 presents the
probit coefficients from the bivariate and multivariate
probit regressions along with their 95 per cent CI.
The simple relationship between district and access to
improved sanitation facility was statistically significant
(p<0.001) with varying magnitude and direction of the
coefficients. In the multivariate model, district was still
statistically significant (p<0.001). Moreover, the simple
association between being located in a rural area
(compared to living in urban area) and access to
improved sanitation facility was negative and
statistically significant (p<0.001). The direction of this
relationship, however, changed into a positive one and
still statistically significant (p<0.001).
Environmental Correlates
The simple correlation between type of water source for
all household purpose and location and access to
improved sanitation facility was statistically significant
(p<0.001) with all categories statistically different from
the referent category (water source is improved and
located on premise). In the multivariate model, the
association was still statistically significant (p< 0.001).
Compared to referent households, households who
sourced their water from an improved source but
located elsewhere (p = 0.002) and households who
sourced their water from an unimproved source located
elsewhere (p< 0.001) were negatively associated with
access to improved sanitation facility. However, access
to improved sanitation for households who sourced
their water from an unimproved water located on
premise was not statistically different from referent
households (p = 0.235).
Demographic Correlates
The demographic factors in this study were household
size, age of household head, ethnicity of household
head, and migrant status of household head. Household
size was found to be statistically significant (p< 0.001)
and the simple relationship with access to improved
sanitation facility was positive. This was also true for
the adjusted association (p< 0.001). Likewise, age of
household head was also found to be statistically
significant (p< 0.001) and the simple association with
access to improved sanitation was positive. This
relationship holds in when other covariates were
included in the final model (p< 0.001).
Moreover, ethnicity of household head was found to be
statistically associated with differences in access to
improved sanitation facility in the simple regression (p<
0.001), but not in the final multivariate model (p =
0.5692). Lastly, households headed by a migrant were
found to be positively and significantly correlated (p<
0.001) with access to improved sanitation facility. This
correlation, however, became statistically insignificant
when other covariates were taken into account (p =
0.9594).
Socio-Economic Correlates
The socio-economic factors in this study were highest
educational attainment of household head and
household wealth. In the simple regression, compared
to households headed by a non-educated person,
households headed by a primary school graduate (p<
0.001), households headed by junior high school
graduate (p<0.001), and households headed by a senior
high school graduate or higher were found to be
positively associated with access to improved sanitation
facility. There was also a significant and positive
gradient in the probability of access to improved
sanitation facility. In the final multivariate model, the
positive association and gradient remained statistically
significant (p<0.001). Lastly, increases in wealth index
score was found to be statistically related (p<0.001) to
access to improved sanitation facility. This relationship
holds (p<0.001) when other covariates were included in
the final multivariate model.
Jurnal Kependudukan Indonesia | Vol. 10, No. ,1 Juni 2015 | 11-26
18
Table 2. Coefficients from Simple and Multivariate Probit Regressions
Variables Simple Probit Regression Multivariate Probit Regression
β1 95% CI β2 95% CI
Spatial variables
District (Ref.: Kaimana)
Jayawijaya -0.6622 ** -1.0756 , -0.2487 0.0631 -0.2692 , 0.3953
Biak Numfor 0.7988 *** 0.5119 , 1.0858 0.6343 *** 0.3120 , 0.9567
Merauke 0.5176 *** 0.2408 , 0.7945 0.3537 *** 0.0703 , 0.6370
Manokwari 0.2657 -0.0268 , 0.5582 -0.1344 * -0.3931 , 0.1242
Sorong 0.1221 ** -0.1531 , 0.3972 -0.2951 *** -0.5485 , -0.0416
Place of residence (Ref.: Urban area)
Rural area -0.5757 *** -0.7809 , -0.3705 0.3385 *** 0.1468 , 0.5301
Environmental variable
Interaction variable
(Ref.: Improved water + located on premise)
Unimproved water + located on premise -0.3744 *** -0.5623 , -0.1865 -0.1042 -0.2818 , 0.0735
Improved water + located elsewhere -0.8117 *** -1.0107 , -0.6127 -0.3545 *** -0.5590 , -0.1500
Unimproved water + located elsewhere -1.2174 *** -1.4288 , -1.0061 -0.4096 *** -0.6264 , -0.1928
Notes : Ref.: Referent category; N.A.: Not applicable; * p ≤ 0.05; ** p ≤ 0.01; *** p ≤ 0.001; 1 crude coefficients; 2 adjusted coefficients. Source : Author's calculation of the 2011 Indonesia MICS
Environmental, Demographic, and Socio-Economic…| Sri Irianti and Puguh Prasetyoputra
19
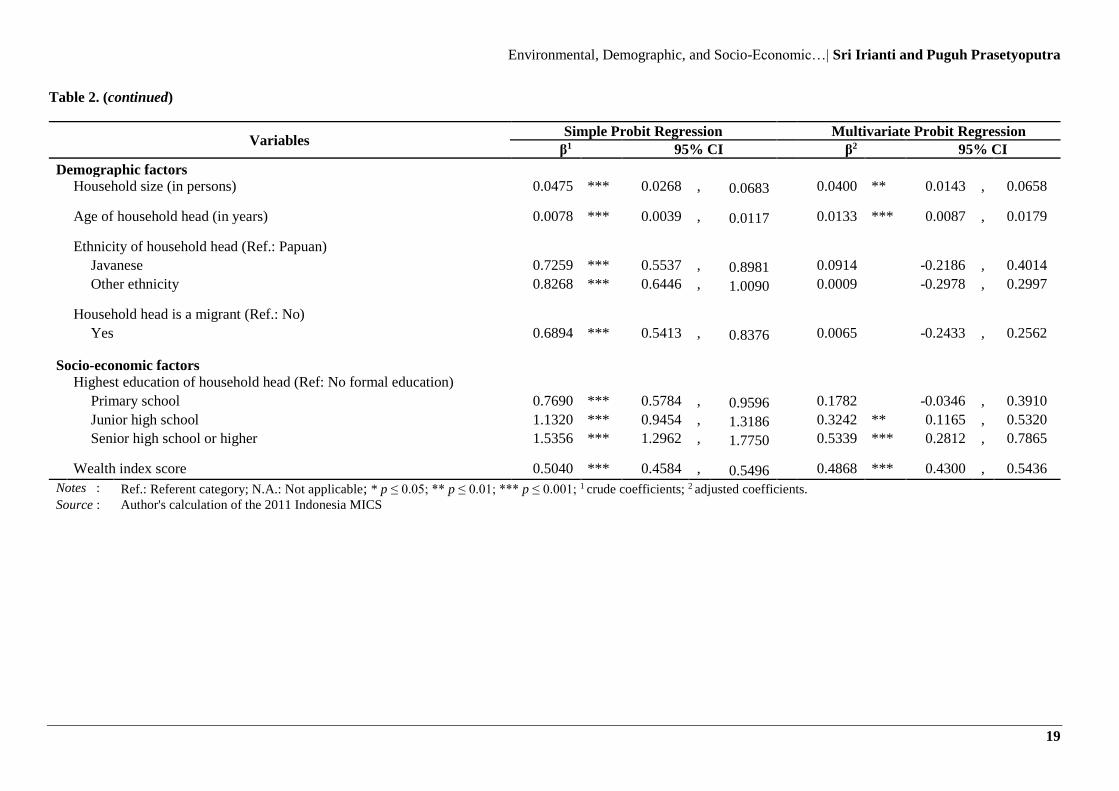
Table 2. (continued)
Variables Simple Probit Regression Multivariate Probit Regression
β1 95% CI β2 95% CI
Demographic factors
Household size (in persons) 0.0475 *** 0.0268 , 0.0683 0.0400 ** 0.0143 , 0.0658
Age of household head (in years) 0.0078 *** 0.0039 , 0.0117 0.0133 *** 0.0087 , 0.0179
Ethnicity of household head (Ref.: Papuan)
Javanese 0.7259 *** 0.5537 , 0.8981 0.0914 -0.2186 , 0.4014
Other ethnicity 0.8268 *** 0.6446 , 1.0090 0.0009 -0.2978 , 0.2997
Household head is a migrant (Ref.: No)
Yes 0.6894 *** 0.5413 , 0.8376 0.0065 -0.2433 , 0.2562
Socio-economic factors
Highest education of household head (Ref: No formal education)
Primary school 0.7690 *** 0.5784 , 0.9596 0.1782 -0.0346 , 0.3910
Junior high school 1.1320 *** 0.9454 , 1.3186 0.3242 ** 0.1165 , 0.5320
Senior high school or higher 1.5356 *** 1.2962 , 1.7750 0.5339 *** 0.2812 , 0.7865
Wealth index score 0.5040 *** 0.4584 , 0.5496 0.4868 *** 0.4300 , 0.5436
Notes : Ref.: Referent category; N.A.: Not applicable; * p ≤ 0.05; ** p ≤ 0.01; *** p ≤ 0.001; 1 crude coefficients; 2 adjusted coefficients. Source : Author's calculation of the 2011 Indonesia MICS
Jurnal Kependudukan Indonesia | Vol. 10, No. ,1 Juni 2015 | 11-26
20
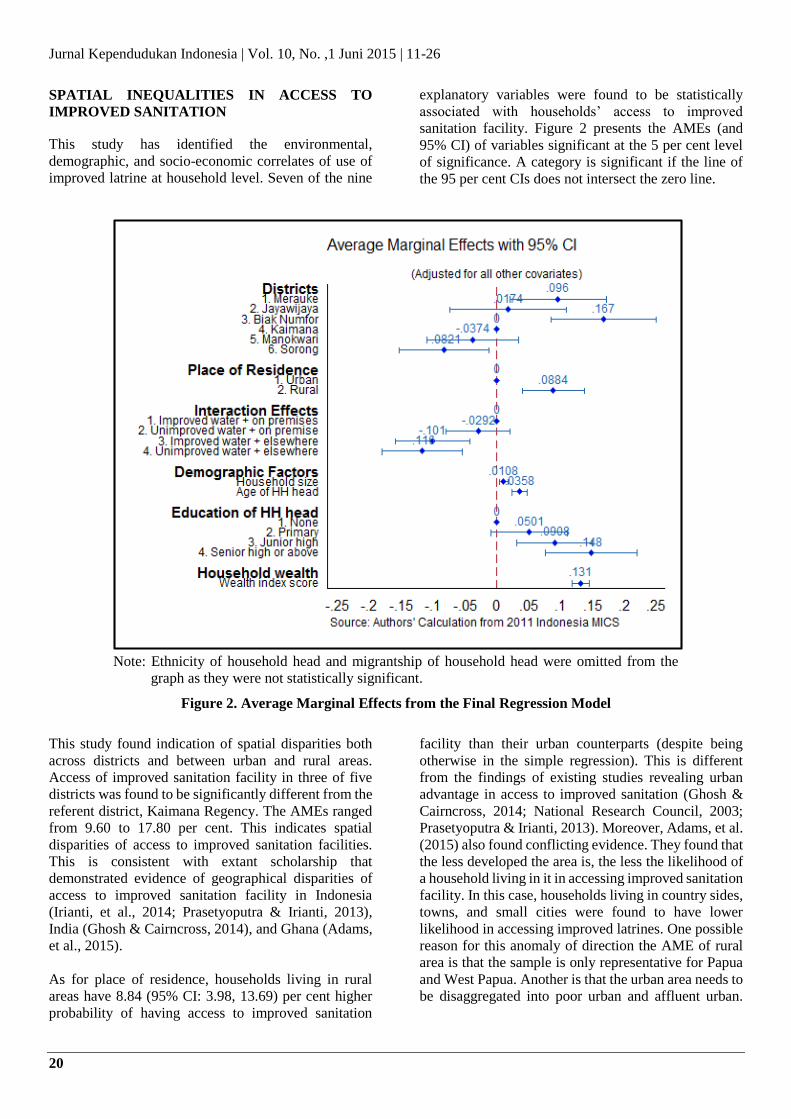
SPATIAL INEQUALITIES IN ACCESS TO
IMPROVED SANITATION
This study has identified the environmental,
demographic, and socio-economic correlates of use of
improved latrine at household level. Seven of the nine
explanatory variables were found to be statistically
associated with households’ access to improved
sanitation facility. Figure 2 presents the AMEs (and
95% CI) of variables significant at the 5 per cent level
of significance. A category is significant if the line of
the 95 per cent CIs does not intersect the zero line.
Note: Ethnicity of household head and migrantship of household head were omitted from the
graph as they were not statistically significant.
Figure 2. Average Marginal Effects from the Final Regression Model
This study found indication of spatial disparities both
across districts and between urban and rural areas.
Access of improved sanitation facility in three of five
districts was found to be significantly different from the
referent district, Kaimana Regency. The AMEs ranged
from 9.60 to 17.80 per cent. This indicates spatial
disparities of access to improved sanitation facilities.
This is consistent with extant scholarship that
demonstrated evidence of geographical disparities of
access to improved sanitation facility in Indonesia
(Irianti, et al., 2014; Prasetyoputra & Irianti, 2013),
India (Ghosh & Cairncross, 2014), and Ghana (Adams,
et al., 2015).
As for place of residence, households living in rural
areas have 8.84 (95% CI: 3.98, 13.69) per cent higher
probability of having access to improved sanitation
facility than their urban counterparts (despite being
otherwise in the simple regression). This is different
from the findings of existing studies revealing urban
advantage in access to improved sanitation (Ghosh &
Cairncross, 2014; National Research Council, 2003;
Prasetyoputra & Irianti, 2013). Moreover, Adams, et al.
(2015) also found conflicting evidence. They found that
the less developed the area is, the less the likelihood of
a household living in it in accessing improved sanitation
facility. In this case, households living in country sides,
towns, and small cities were found to have lower
likelihood in accessing improved latrines. One possible
reason for this anomaly of direction the AME of rural
area is that the sample is only representative for Papua
and West Papua. Another is that the urban area needs to
be disaggregated into poor urban and affluent urban.
Environmental, Demographic, and Socio-Economic…| Sri Irianti and Puguh Prasetyoputra
21
Last reason is that factors other than place of residence
explain access to improved sanitation more.
ENVIRONMENTAL CORRELATES OF ACCESS
TO IMPROVED SANITATION
The referent category for the interaction between water
source of all household purposes and its location was
improved water located on premise. Households with
unimproved water located on premise were found to
have 2.92 per cent (95% CI: -7.93, 2.08) lower
probability of having access to improved sanitation
facility than referent households. This association,
however, was not statistically significant. Moreover,
households with improved water located elsewhere
were found to have 10.10 per cent less (95% CI: 4.20,
15.90) likelihood of having access to improved
sanitation facility than referent households. Lastly,
households with unimproved water located elsewhere
were found to have 11.6 per cent lower (95% CI: 5.36,
17.90) probability of having access to improved
sanitation facility than the referent category.
This confirms previous studies that find a positive
relationship between improved drinking water source
and probability of having access to improved sanitation
facility (Adams, et al., 2015; Jenkins & Cairncross,
2010; Prasetyoputra & Irianti, 2013). Moreover, the
study by Adams, et al. (2015) also found a negative
relationship between time needed to reach water source
and access to improved sanitation facility. The farther
the distance of the water source, the less water one can
fetch, and hence the lower the probability of using
improved sanitation facility for defecation
(Prasetyoputra & Irianti, 2013).
DEMOGRAPHIC CORRELATES OF ACCESS
TO IMPROVED SANITATION
The first of the two demographic factors was household
size. For every 10 person increase in number of
household members, the probability of having access to
improved sanitation facility increases by 1.08 per cent
(95% CI: 0.38, 1.77). This is different from the finding
of the research by Adams, et al. (2015) where number
of household members was found to be negatively
related with access to improved sanitation facility. This
relationship, however, was not statistically significant
when other factors were included in the final model.
The other demographic factor was age of household
head. For every 10-year increase in the age of head of
household, the probability of having access to improved
sanitation facility increases by 3.58 per cent (95% CI:
2.36, 4.81). This is consistent with the study done by
Gross and Günther (2014) where they found a positive
and statistically significant relationship between age of
household head and probability of latrine ownership.
SOCIO-ECONOMIC INEQUALITIES IN
ACCESS TO IMPROVED SANITATION
The findings of this study revealed that households
headed by a person who has primary education have
5.01 per cent (95% CI: -0.97, 10.99) higher probability
compared to referent households. However, this
association was not statistically significant. Moreover,
households headed by a person who has junior high
education have 9.08 per cent (95% CI: 3.19, 14.98)
higher probability compared to referent households.
Furthermore, households headed by a person who has
senior high education or higher have 14.80 per cent
(95% CI: 7.63, 21.94) higher probability compared to
referent households. This shows an increasing
likelihood of accessing improved sanitation facility as
educational attainment of household head gets higher.
This is consistent with studies by Prasetyoputra and
Irianti (2013) and Tiwari and Nayak (2013) that found
positive relationship between education and access to
improved sanitation facility. One possible explanation
for this is that people with higher educational status
have more knowledge of health risks associated with
inadequate sanitation (Adams, et al., 2015; Kirigia &
Kainyu, 2000).
Furthermore, household wealth was found to be
positively associated with ownership of improved
sanitation facility. For every 1 unit increase in wealth
index score, the probability of having access to
improved sanitation facility increases by 13.10 per cent
(95% CI: 11.79, 14.43).
Jurnal Kependudukan Indonesia | Vol. 10, No. ,1 Juni 2015 | 11-26
22
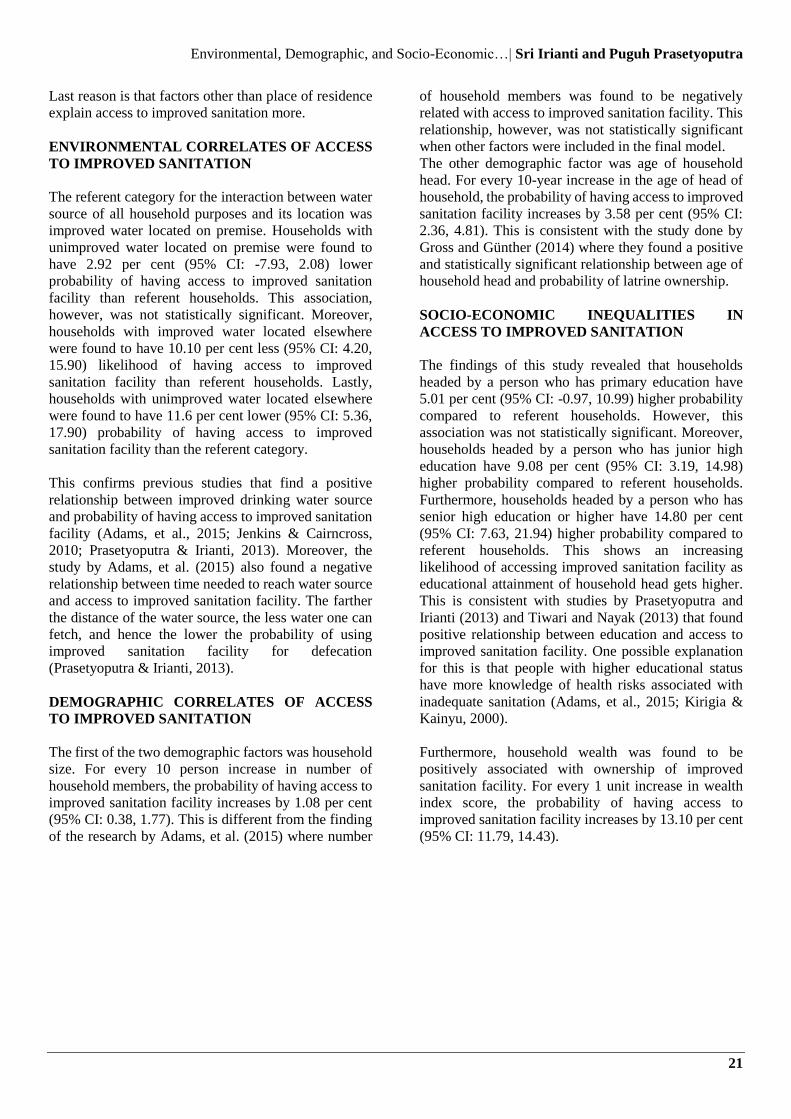
Note: Adjusted for all other covariates.
Figure 3. Household Wealth and Access to Improved Sanitation
Figure 3 shows the relationship between units of wealth
index score and probability of having access to
improved sanitation facility depicting a clearer positive
relationship between those variables. This finding
confirms that of existing scholarship that found positive
relationship between household wealth and ownership
of improved latrine in Indonesia (Irianti, et al., 2014;
Prasetyoputra & Irianti, 2013), Ghana (Adams, et al.,
2015), Benin (Gross & Günther, 2014), and in many
countries (Blakely, et al., 2005).
POLICY IMPLICATIONS
Based on a recent national survey in 2013, Papua
Province had the highest burden of diarrhoea. The
period prevalence rate in that province was 14.3 %,
which is twofold of the national rate (NIHRD, 2013).
Conversely, the period prevalence rate in West Papua
Province is 5.2 % which is lower than the national rate
(NIHRD, 2013). Nonetheless, these burden of diarrhoea
are preventable and increasing access to adequate
sanitation facilities is one way to reduce it.
Educational status of household head was found to be
positively associated with probability of accessing
improved sanitation facility. Hence, improving
educational attainment of the people of West Papua and
Papua Provinces could, in the long run, improve
people’s access to improved sanitation facilities.
Furthermore, wealth status of households was also
found to be positively correlated with probability of
having improved latrines. As such, increasing
employment opportunities also can be done to improve
people’s economic livelihood such that they will be able
to afford better sanitation facilities. These possible
pathways of improving access implies that a concerted
effort from many stakeholders is needed
STUDY LIMITATIONS
There are several limitations to this study. First, there
may still be unobserved confounding due to potential
confounders not collected by the survey. Second, there
is a possibility of overrepresentation of households
living in rural areas. However, the effect of this cannot
be determined in this study. Third, the data are
representative only for Papua Province and West Papua
Province, not Indonesia. These limitations could not be
corrected for in this paper. Future studies using
longitudinal data and experimental designs to examine
changes in demographic characteristics and improved
sanitation facility ownership are recommended.
CONCLUSION
To the best of the authors’ knowledge, this is the first
study that analysed the 2011 Indonesia MICS data to
assess the demographic and socio-economic correlates
of access to improved sanitation facility in Papua
Province and West Papua Province. The results suggest
that the significant demographic correlates were
household size and age of household head. While the
significant socio-economic correlates were highest
education attained by head of household and household
Environmental, Demographic, and Socio-Economic…| Sri Irianti and Puguh Prasetyoputra
23
wealth. The findings also suggest spatial disparities
across districts and in terms of place of residence
showing unusual rural advantage. Furthermore, type of
water source for other household purposes and location
of that water source also determines the probability of
access to improved sanitation facility. These findings
should be taken into account in the policy making
process related to Papua and West Papua Province by
either the national or local government.
Acknowledgements
The authors wish to acknowledge The United Nations
Children’s Fund (UNICEF) for providing the
permission to analyse the 2011 Indonesia MICS
datasets. The authors’ gratitude also goes to two
anonymous reviewers for the constructive comments on
the earlier version of this paper and Tri Prasetyo
Sasimartoyo, M.Sc., Ph.D for his guidance on the
statistical analyses. This study received no external
funding and the authors declare no conflict of interest.
REFERENCES
Adams, E. A., Boateng, G. O., & Amoyaw, J. A. 2015.
Socioeconomic and Demographic Predictors of
Potable Water and Sanitation Access in Ghana.
Social Indicators Research, 1-15. doi:
10.1007/s11205-015-0912-y
Bain, R., Cronk, R., Hossain, R., Bonjour, S., Onda, K.,
Wright, J., . . . Bartram, J. 2014. Global assessment
of exposure to faecal contamination through
drinking water based on a systematic review.
Tropical Medicine & International Health, 19(8),
917–927. doi: 10.1111/tmi.12334
Blakely, T., Hales, S., Kieft, C., Wilson, N., & Woodward,
A. 2005. The global distribution of risk factors by
poverty level. Bulletin of the World Health
Organization, 83(2), 118-126. doi:
10.1590/S0042-96862005000200012.
Booth, A. 2004. Africa in Asia? the development challenges
facing Eastern Indonesia and East Timor. Oxford
Development Studies, 32(1), 19-35. doi:
10.1080/1360081042000184101
Cameron, A. C., & Trivedi, P. K. 2005. Microeconometrics:
methods and applications. New York, NY:
Cambridge University Press.
Chatterjee, S., & Hadi, A. S. 2012. Regression Analysis By
Example (5th ed.). Hoboken, New Jersey: John
Wiley & Sons, Inc.
Dong, Y., & Peng, C.-Y. J. 2013. Principled missing data
methods for researchers. SpringerPlus, 2(1), 222.
doi: 10.1186/2193-1801-2-222
Francisco, J. P. S. 2014. Why households buy bottled water:
a survey of household perceptions in the
Philippines. International Journal of Consumer
Studies, 38(1), 98-103. doi: 10.1111/ijcs.12069
Freeman, M. C., Stocks, M. E., Cumming, O., Jeandron, A.,
Higgins, J. P. T., Wolf, J., . . . Curtis, V. 2014.
Systematic review: Hygiene and health: systematic
review of handwashing practices worldwide and
update of health effects. Tropical Medicine &
International Health, 19(8), 906-916. doi:
10.1111/tmi.12339
Fuller, J. A., Clasen, T., Heijnen, M., & Eisenberg, J. N. S.
2014. Shared Sanitation and the Prevalence of
Diarrhea in Young Children: Evidence from 51
Countries, 2001–2011. The American Journal of
Tropical Medicine and Hygiene, 91(1), 173-180.
doi: 10.4269/ajtmh.13-0503
Fuller, J. A., Westphal, J. A., Kenney, B., & Eisenberg, J. N.
S. 2015. The joint effects of water and sanitation
on diarrhoeal disease: a multicountry analysis of
the Demographic and Health Surveys. Tropical
Medicine & International Health, 20(3), 284-292.
doi: 10.1111/tmi.12441
Ghosh, A., & Cairncross, S. 2014. The uneven progress of
sanitation in India Journal of Water, Sanitation and
Hygiene for Development, 4(1), 15-22. doi:
10.2166/washdev.2013.185
Gleick, P. H. 1998. The human right to water. Water Policy,
1(5), 487-503. doi: 10.1016/S1366-
7017(99)00008-2
Government of Indonesia. 2014. Presidential Regulation of
the Republic of Indonesia Number 185 of 2014 on
the Acceleration of Drinking-Water and Sanitation
Supply. Jakarta: Government of Indonesia,
Republic of Indonesia Retrieved from http://stbm-
indonesia.org/files/PERPRES%20Nomor%20185
%20Tahun%202014.pdf.
Gross, E., & Günther, I. 2014. Why do households invest in
sanitation in rural Benin: Health, wealth, or
prestige?Water Resources Research, 50(10), 8314-
8329. doi: 10.1002/2014wr015899
Gujarati, D. N. 2004. Basic Econometrics (4th ed.). New
York: The McGraw−Hill Companies.
Haryanto, B., & Sutomo, S. 2012. Improving access to
adequate water and basic sanitation services in
Indonesia. 27(4), 159-162. doi: 10.1515/reveh-
2012-0022
Heijnen, M., Cumming, O., Peletz, R., Chan, G. K.-S.,
Brown, J., Baker, K., & Clasen, T. 2014. Shared
Sanitation versus Individual Household Latrines: A
Systematic Review of Health Outcomes. PLoS
ONE, 9(4), e93300. doi:
10.1371/journal.pone.0093300
Jurnal Kependudukan Indonesia | Vol. 10, No. ,1 Juni 2015 | 11-26
24
Hill, H., Resosudarmo, B. P., & Vidyattama, Y. 2008.
Indonesia's changing economic geography.
Bulletin of Indonesian Economic Studies, 44(3),
407-435. doi: 10.1080/00074910802395344
Hill, R. C., Griffiths, W. E., & Lim, G. C. 2011. Principles of
Econometrics (4th ed.). Hoboken: John Wiley &
Sons, Inc.
Hosmer, D. W., Lemeshow, S., & Sturdivant, R. X. 2013.
Applied Logistic Regression (4th ed.). Hoboken,
New Jersey: John Wiley & Sons, Inc.
Howard, G., & Bartram, J. 2003. Domestic Water Quantity,
Service Level and Health. Geneva: World Health
Organization Retrieved from
http://www.who.int/water_sanitation_health/disea
ses/wsh0302/en/index.html.
Howe, L. D., Galobardes, B., Matijasevich, A., Gordon, D.,
Johnston, D., Onwujekwe, O., Hargreaves, J. R.
2012. Measuring socio-economic position for
epidemiological studies in low- and middle-income
countries: a methods of measurement in
epidemiology paper. International Journal of
Epidemiology, 41(3), 871-886. doi:
10.1093/ije/dys037
Hunter, P. R., MacDonald, A. M., & Carter, R. C. 2010.
Water Supply and Health. PLoS Med, 7(11),
e1000361. doi: 10.1371/journal.pmed.1000361
Irianti, S., Saputro, F. E., Sasimartoyo, T. P., Prasetyoputra,
P., & Kurniasih, E. 2014. A Review of Access,
Safety, and Use of Drinking-Water from Various
Sources in Indonesia. Jakarta: National Institute of
Health Research and Development, Ministry of
Health, Republic of Indonesia.
Jenkins, M. W., & Cairncross, S. 2010. Modelling latrine
diffusion in Benin: towards a community typology
of demand for improved sanitation in developing
countries. Journal of Water and Health, 8(1), 166-
183. doi: 10.2166/wh.2009.111
Jenkins, M. W., &Scott, B. 2007. Behavioral indicators of
household decision-making and demand for
sanitation and potential gains from social
marketing in Ghana. Social Science & Medicine,
64, 2427–2442. doi:
10.1016/j.socscimed.2007.03.010
Kirigia, J. M., & Kainyu, L. 2000. Predictors of toilet
ownership in South Africa. East African Medical
Journal, 77(12), 667-672. Retrieved from
http://www.ajol.info/index.php/eamj/article/view/
46767/33157
Kolenikov, S., & Angeles, G. 2004. The use of discrete data
in PCA: Theory, simulations, and applications to
socioeconomic indices. Carolina Population
Center Working Paper No. 04-85. Retrieved from
http://www.cpc.unc.edu/measure/publications/wp-
04-85/at_download/document
Kolenikov, S., & Angeles, G. 2009. Socioeconomic status
measurement with discrete proxy variables: is
principal component analysis a reliable answer?
Review of Income and Wealth, 55(1), 128-165. doi:
10.1111/j.1475-4991.2008.00309.x
Kreuter, F., & Valliant, R. 2007. A survey on survey
statistics: What is done and can be done in Stata.
Stata Journal, 7(1), 1-21.
Long, J. S., & Freese, J. 2014. Regression Models for
Categorical Dependent Variables using Stata (3rd
ed.). College Station, Texas: Stata Press.
Mara, D., Lane, J., Scott, B., & Trouba, D. 2010. Sanitation
and Health. PLoS Med, 7(11), e1000363. doi:
10.1371/journal.pmed.1000363
Mazeau, A., Reed, B., Sansom, K., & Scott, R. 2014.
Emerging categories of urban shared sanitation.
Water and Environment Journal, 28(4), 592-608.
doi: 10.1111/wej.12075
National Research Council. 2003. Cities Transformed:
Demographic Change and Its Implications in the
Developing World. Washington, DC: The National
Academies Press.
NIHRD. 2013. Baseline Health Research Report, 2013
[Laporan Riset Kesehatan Dasar 2013]. Jakarta:
National Institute of Health Research and
Development (NIHRD), Ministry of Health
Indonesia (MoH), Republic of Indonesia.
Oakes, J. M., & Kaufman, J. S. (Eds.). (2006). Methods in
Social Epidemiology. San Francisco, CA: Jossey-
Bass.
Patunru, A. A. 2015. Access to Safe Drinking Water and
Sanitation in Indonesia. Asia & the Pacific Policy
Studies, 2(2), 234-244. doi: 10.1002/app5.81
Prasetyoputra, P., & Irianti, S. 2013. Access to improved
sanitation facilities in Indonesia: An econometric
analysis of geographical and socioeconomic
disparities. Journal of Applied Sciences in
Environmental Sanitation, 8(3), 215-224.
Retrieved from
http://www.trisanita.org/jases/v08n3y2013.html
Prüss-Ustün, A., Bartram, J., Clasen, T., Colford, J. M.,
Cumming, O., Curtis, V., .. Cairncross, S. 2014.
Burden of disease from inadequate water,
sanitation and hygiene in low- and middle-income
settings: a retrospective analysis of data from 145
countries. Tropical Medicine & International
Health, 19(8), 894-905. doi: 10.1111/tmi.12329
Pullan, R. L., Freeman, M. C., Gething, P. W., & Brooker, S.
J. 2014. Geographical Inequalities in Use of
Improved Drinking Water Supply and Sanitation
across Sub-Saharan Africa: Mapping and Spatial
Analysis of Cross-sectional Survey Data. PLoS
Med, 11(4), e1001626. doi:
10.1371/journal.pmed.1001626
Environmental, Demographic, and Socio-Economic…| Sri Irianti and Puguh Prasetyoputra
25
Rheingans, R., Anderson, J. D., Luyendijk, R., & Cumming,
O. 2014. Measuring disparities in sanitation access:
does the measure matter? Tropical Medicine &
International Health, 19(1), 2-13. doi:
10.1111/tmi.12220
Royston, P. 2004. Multiple imputation of missing values.
Stata Journal, 4(3), 227-241. Retrieved from
http://www.stata-
journal.com/article.html?article=st0067
Rufener, S., Mäusezahl, D., Mosler, H.-J., & Weingartner, R.
2010. Quality of drinking-water at source and
point-of-consumption-drinking cup as a high
potential recontamination risk: A field study in
Bolivia. Journal of Health, Population and
Nutrition, 28(1), 34-41.
Sainani, K. L. 2011. Understanding odds ratios. PM&R, 3(3),
263-267. doi: 10.1016/j.pmrj.2011.01.009
StataCorp. 2013. Stata Statistical Software: Release 13.
College Station, TX: StataCorp LP.
Statistics Indonesia. 2013a. The Selected Districts of Papua
Province Multiple Indicator Cluster Survey 2011,
Final Report. Jakarta, Indonesia: Statistics
Indonesia - Badan Pusat Statistik Retrieved from
http://www.childinfo.org/files/MICS4_Indonesia_
Selected_Districts_of_Papua_Province_Final_Rep
ort_2011.pdf.
Statistics Indonesia. 2013b. The Selected Districts of West
Papua Province Multiple Indicator Cluster Survey
2011, Final Report. Jakarta, Indonesia: Statistics
Indonesia - Badan Pusat Statistik Retrieved from
http://www.childinfo.org/files/MICS4_Indonesia_
Selected_Districts_of_West_Papua_Province_Fin
al_Report_2011.pdf.
Statistics Indonesia. 2014. Indonesia - Multiple Indicator
Cluster Survey (MICS) 2011. Jakarta: Statistics
Indonesia - Badan Pusat Statistik, Republic of
Indonesia Retrieved from
http://microdata.bps.go.id/mikrodata/index.php/ca
talog/172/related_materials.
The Lancet. 2014. Water and sanitation: addressing
inequalities. [Editorial]. The Lancet, 383(9926),
1359. doi: 10.1016/S0140-6736(14)60665-6
Tiwari, R., & Nayak, S. 2013. Drinking water and sanitation
in Uttar Pradesh: A regional analysis. Journal of
Rural Development, 32(1), 61-74.
United Nations. 2010. United Nations General Assembly:
Resolution 64/292. New York: United Nations
Retrieved from
http://www.dgvn.de/fileadmin/user_upload/DOK
UMENTE/English_Documents/A-Res-64-
292.pdf.
Vyas, S., & Kumaranayake, L. 2006. Constructing socio-
economic status indices: how to use principal
components analysis. Health Policy and Planning,
21(6), 459-468. doi: 10.1093/heapol/czl029
WHO/UNICEF JMP. 2006. Core Questions on Drinking
Water and Sanitation for Household Surveys.
Geneva: World Health Organization Retrieved
from
http://www.who.int/water_sanitation_health/monit
oring/oms_brochure_core_questionsfinal24608.pd
.
WHO/UNICEF JMP. 2008. Progress on drinking water and
sanitation: Special focus on sanitation. Geneva,
Switzerland: WHO Press Retrieved from
http://www.unicef.org/media/files/Joint_Monitori
ng_Report_-_17_July_2008.pdf.
WHO/UNICEF JMP. 2014. Progress on Sanitation and
Drinking-Water: 2014 Update. Retrieved from
http://www.unwater.org/fileadmin/user_upload/un
water_new/docs/jmp.2014_eng.pdf
Wright, J., & Gundry, S. W. 2009. Household characteristics
associated with home water treatment: an analysis
of the Egyptian Demographic and Health Survey.
Journal of Water and Health, 7(1), 21-29. doi:
10.2166/wh.2009.056
Jurnal Kependudukan Indonesia | Vol. 10, No. ,1 Juni 2015 | 11-26
26