guidance on socio-economic analysis - restrictions - echa
TRANSCRIPT
Guidance on Socio-Economic Analysis –
Restrictions
May 2008
Guidance for the implementation of REACH
LEGAL NOTICE
This document contains guidance on REACH explaining the REACH obligations and how to fulfil them. However, users are reminded that the text of the REACH regulation is the
only authentic legal reference and that the information in this document does not constitute legal advice. The European Chemicals Agency does not accept any liability with
regard to the contents of this document.
© European Chemicals Agency, 2008 Reproduction is authorised provided the source is acknowledged.
2
SOCIO-ECONOMIC ANALYSIS – RESTRICTIONS
3
PREFACE
This document describes the socio-economic analysis under the REACH restriction procedure. It is part of a series of guidance documents that are aimed to help all stakeholders with their preparation for fulfilling their obligations under the REACH regulation. These documents cover detailed guidance for a range of essential REACH processes as well as for some specific scientific and/or technical methods that industry or authorities need to make use of under REACH.
The guidance documents were drafted and discussed within the REACH Implementation Projects (RIPs) led by the European Commission services, involving stakeholders from Member States, industry and non-governmental organisations. These guidance documents can be obtained via the website of the European Chemicals Agency (http://echa.europa.eu/reach_en.asp). Further guidance documents will be published on this website when they are finalised or updated.
This document relates to the REACH Regulation (EC) No 1907/2006 of the European Parliament and of the Council of 18 December 20061
1 Corrigendum to Regulation (EC) No 1907/2006 of the European Parliament and of the Council of 18 December 2006 concerning the Registration, Evaluation, Authorisation and Restriction of Chemicals (REACH), establishing a European Chemicals Agency, amending Directive 1999/45/EC and repealing Council Regulation (EEC) No 793/93 and Commission Regulation (EC) No 1488/94 as well as Council Directive 76/769/EEC and Commission Directives 91/155/EEC, 93/67/EEC, 93/105/EC and 2000/21/EC (OJ L 396, 30.12.2006); amended by Council Regulation (EC) No 1354/2007 of 15 November 2007 adapting Regulation (EC) No 1907/2006 of the European Parliament and of the Council on the Registration, Evaluation, Authorisation and Restriction of Chemicals (REACH) by reason of the accession of Bulgaria and Romania (OJ L 304, 22.11.2007, p. 1).


SOCIO-ECONOMIC ANALYSIS – RESTRICTIONS
CONTENTS
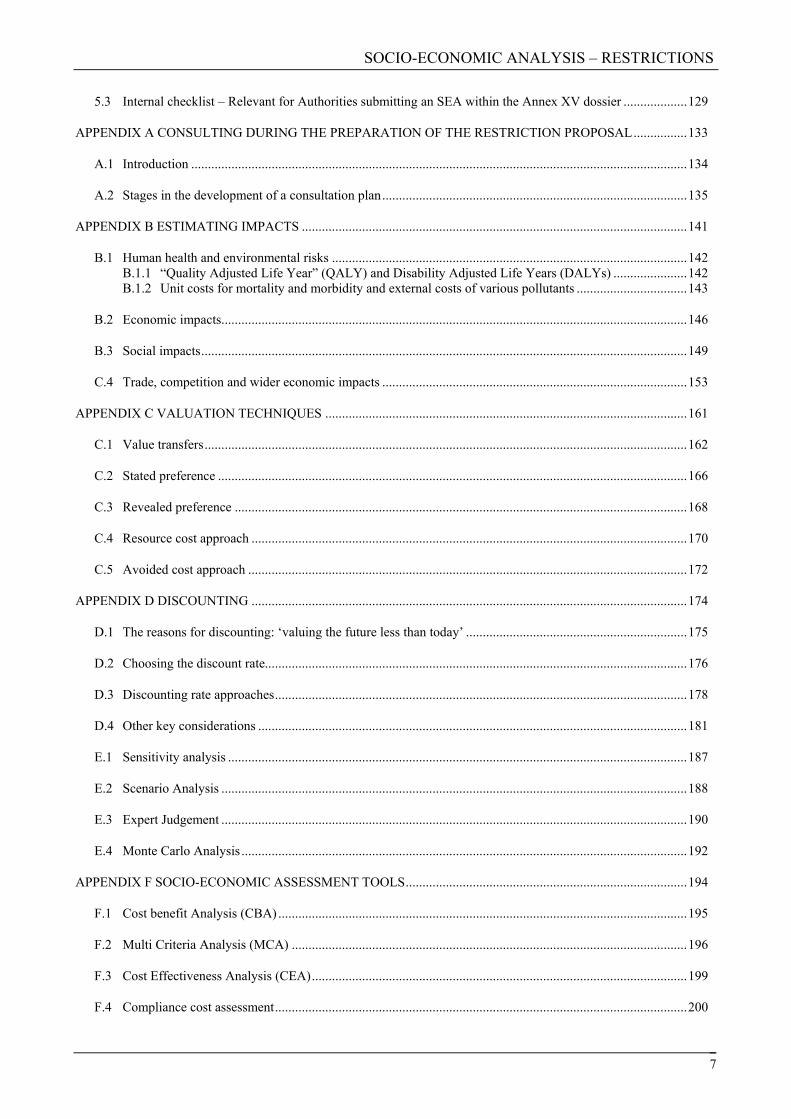
GLOSSARY .................................................................................................................................................................10
ABBREVIATIONS ......................................................................................................................................................18
1 INTRODUCTION TO THE GUIDANCE & THE AIMS OF THE SEA...............................................................20
1.1 Who is the guidance for? ................................................................................................................................21
1.2 The aims of socio-economic analysis (SEA)..................................................................................................25 1.2.1 Why is an SEA important? ..................................................................................................................25 1.2.2 Purpose 1: Justification that Community-wide action is required.......................................................27 1.2.3 Purpose 2: Assessing whether the proposed restriction is the most appropriate Community-wide action
compared to other RMOs ....................................................................................................................27 1.2.4 Purpose 3: Refinement of the restriction proposal ..............................................................................28 1.2.5 Purpose 4: Assessment of the proposed restriction .............................................................................28
1.3 Focus of this guidance ....................................................................................................................................29
1.4 “Quick Guide” - How should the socio-economic analysis (SEA) be undertaken? .......................................30 1.4.1 The overall SEA process .....................................................................................................................30 1.4.2 Stage 1: Setting the aims of the SEA...................................................................................................33 1.4.3 Stage 2: Scoping phase........................................................................................................................35 1.4.4 Stage 3: Identifying and Assessing Impacts ........................................................................................39 1.4.5 Stage 4: Interpretation & conclusion drawing .....................................................................................42 1.4.6 Stage 5: Presenting the results.............................................................................................................44 1.4.7 Pitfalls to avoid....................................................................................................................................46 1.4.8 Overview flow chart ............................................................................................................................46
2 THE SEA PROCESS – STAGE 2: SCOPING PHASE..........................................................................................48
2.1 Introduction to the scoping phase ...................................................................................................................48
2.2 Step 2.1 – Organising the work ......................................................................................................................48
2.3 Step 2.2 – Define the “baseline” scenario.......................................................................................................50
2.4 Step 2.3 – Define the “proposed restriction” scenario ....................................................................................51
2.5 Step 2.4 – Setting the boundaries of the SEA.................................................................................................55 2.5.1 Overview .............................................................................................................................................55 2.5.2 Relevant supply chains........................................................................................................................55 2.5.3 Time period for the SEA .....................................................................................................................57 2.5.4 Geographical area covered by the SEA...............................................................................................58
2.6 Example of Stage 2.........................................................................................................................................58
3 THE SEA PROCESS – STAGE 3: IDENTIFYING AND ASSESSING IMPACTS.............................................61
3.1 Introduction ....................................................................................................................................................61
3.2 Step 3.1 - How to identify the main impacts ..................................................................................................62
3.3 Important considerations when collecting and assessing impacts ..................................................................63 3.3.1 Consider using a stepwise approach....................................................................................................63
5
SOCIO-ECONOMIC ANALYSIS – RESTRICTIONS
3.3.2 Focus on the difference between scenarios rather than the absolute values for each scenario ............64 3.3.3 Minimise key uncertainties that arise in the analysis (if it is feasible to do so)...................................65 3.3.4 Avoid double counting an impact along the supply chain...................................................................65
3.4 Human health and environmental impacts......................................................................................................66 3.4.1 Introduction on human health and environmental impacts..................................................................66 3.4.2 Changes in the manufacture, import and use of substance and alternatives in relevant supply chains and
initial identification of relevant impacts ..............................................................................................70 3.4.3 Changes in emissions and exposure ....................................................................................................74 3.4.4 Changes in health and environmental impacts ....................................................................................77 3.4.5 Valuation of impacts ...........................................................................................................................82 3.4.6 Reporting the results............................................................................................................................85
3.5 Economic impacts...........................................................................................................................................86 3.5.1 Distinction between private costs and social costs ..............................................................................87 3.5.2 Step 3.1 – Identifying economic impacts ............................................................................................88 3.5.3 Step 3.2 – Data collection process.......................................................................................................89 3.5.4 Step 3.3 – Assessing economic impacts ..............................................................................................91
3.6 Social impacts.................................................................................................................................................92 3.6.1 Step 3.1 – Identification of social impacts ..........................................................................................92 3.6.2 Step 3.2 – Data collection process.......................................................................................................93 3.6.3 Step 3.3 – Assessing social impacts ....................................................................................................95
3.7 Trade, competition and economic development (wider economic impacts)...................................................96 3.7.1 Step 3.1 – Identifying trade, competition and economic development impacts ..................................96 3.7.2 Step 3.2 – Data collection process.......................................................................................................96 3.7.3 Step 3.3 – Assessing wider economic impacts ....................................................................................97
3.8 Step 3.4 – Ensuring the consistency of the analysis .......................................................................................98 3.8.1 Exchange rates.....................................................................................................................................99 3.8.2 Inflation ...............................................................................................................................................99 3.8.3 Discounting .........................................................................................................................................100
3.9 Example on how to identify and assess impacts.............................................................................................104
4 THE SEA PROCESS – STAGE 4: INTERPRETATION AND CONCLUSION DRAWING ..............................109
4.1 Introduction ....................................................................................................................................................109
4.2 Step 4.1: Compare the qualitative, quantitative or monetised impacts ...........................................................109
4.3 Step 4.2: Compare distributional impacts.......................................................................................................113 4.3.1 Introduction .........................................................................................................................................113 4.3.2 Approach .............................................................................................................................................114 4.3.3 Presenting distributional analysis ........................................................................................................115
4.4 Step 4.3: Consider how uncertainties in the analysis may alter the outcome of the SEA...............................117 4.4.1 Introduction .........................................................................................................................................117 4.4.2 Approach .............................................................................................................................................117 4.4.3 Presenting uncertainty analysis ...........................................................................................................121
4.5 Step 4.4: Decide whether a conclusion can be reached ..................................................................................123
5 THE SEA PROCESS – STAGE 5: PRESENTING THE RESULTS.....................................................................125
5.1 Introduction ....................................................................................................................................................125
5.2 Reporting format ............................................................................................................................................126 5.2.1 Information on how to fill in the template...........................................................................................127
6
SOCIO-ECONOMIC ANALYSIS – RESTRICTIONS
5.3 Internal checklist – Relevant for Authorities submitting an SEA within the Annex XV dossier ...................129
APPENDIX A CONSULTING DURING THE PREPARATION OF THE RESTRICTION PROPOSAL................133
A.1 Introduction ....................................................................................................................................................134
A.2 Stages in the development of a consultation plan...........................................................................................135
APPENDIX B ESTIMATING IMPACTS ...................................................................................................................141
B.1 Human health and environmental risks ..........................................................................................................142 B.1.1 “Quality Adjusted Life Year” (QALY) and Disability Adjusted Life Years (DALYs) ......................142 B.1.2 Unit costs for mortality and morbidity and external costs of various pollutants .................................143
B.2 Economic impacts...........................................................................................................................................146
B.3 Social impacts.................................................................................................................................................149
C.4 Trade, competition and wider economic impacts ...........................................................................................153
APPENDIX C VALUATION TECHNIQUES ............................................................................................................161
C.1 Value transfers................................................................................................................................................162
C.2 Stated preference ............................................................................................................................................166
C.3 Revealed preference .......................................................................................................................................168
C.4 Resource cost approach ..................................................................................................................................170
C.5 Avoided cost approach ...................................................................................................................................172
APPENDIX D DISCOUNTING ..................................................................................................................................174
D.1 The reasons for discounting: ‘valuing the future less than today’ ..................................................................175
D.2 Choosing the discount rate..............................................................................................................................176
D.3 Discounting rate approaches...........................................................................................................................178
D.4 Other key considerations ................................................................................................................................181
E.1 Sensitivity analysis .........................................................................................................................................187
E.2 Scenario Analysis ...........................................................................................................................................188
E.3 Expert Judgement ...........................................................................................................................................190
E.4 Monte Carlo Analysis .....................................................................................................................................192
APPENDIX F SOCIO-ECONOMIC ASSESSMENT TOOLS....................................................................................194
F.1 Cost benefit Analysis (CBA) ..........................................................................................................................195
F.2 Multi Criteria Analysis (MCA) ......................................................................................................................196
F.3 Cost Effectiveness Analysis (CEA)................................................................................................................199
F.4 Compliance cost assessment...........................................................................................................................200
7
SOCIO-ECONOMIC ANALYSIS – RESTRICTIONS
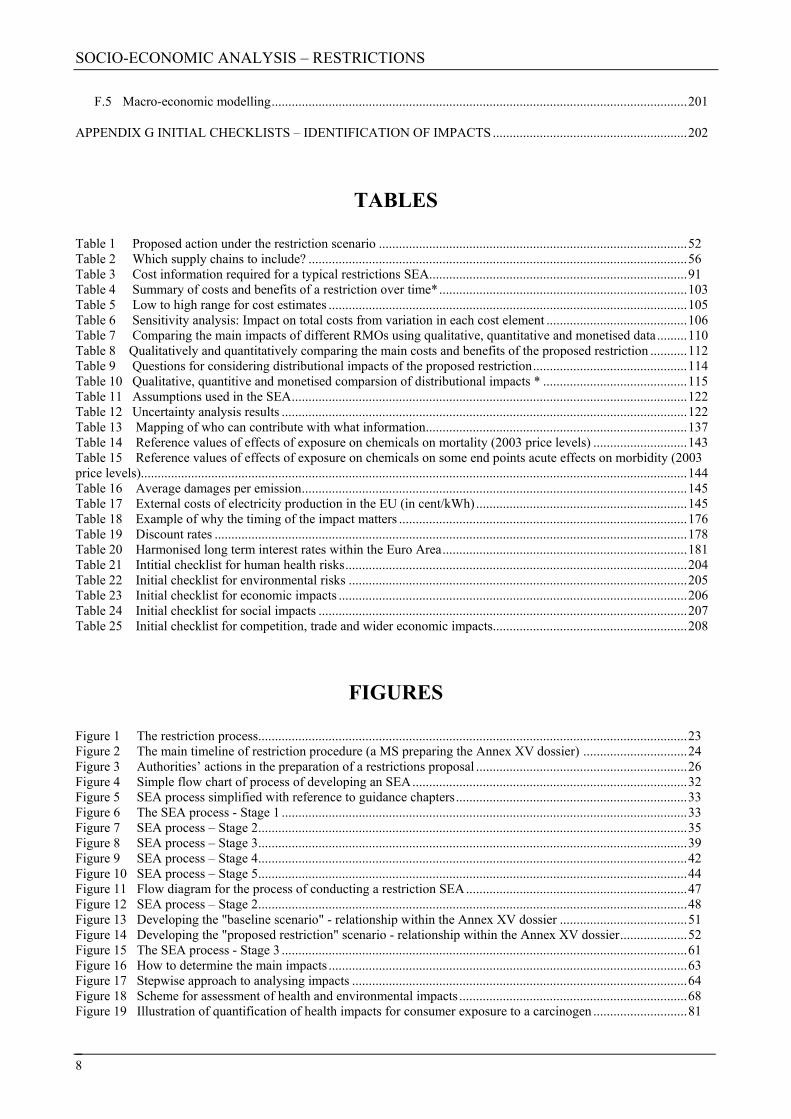
F.5 Macro-economic modelling............................................................................................................................201
APPENDIX G INITIAL CHECKLISTS – IDENTIFICATION OF IMPACTS ..........................................................202
TABLES
Table 1 Proposed action under the restriction scenario ............................................................................................52 Table 2 Which supply chains to include? .................................................................................................................56 Table 3 Cost information required for a typical restrictions SEA.............................................................................91 Table 4 Summary of costs and benefits of a restriction over time*..........................................................................103 Table 5 Low to high range for cost estimates ...........................................................................................................105 Table 6 Sensitivity analysis: Impact on total costs from variation in each cost element ..........................................106 Table 7 Comparing the main impacts of different RMOs using qualitative, quantitative and monetised data.........110 Table 8 Qualitatively and quantitatively comparing the main costs and benefits of the proposed restriction ...........112 Table 9 Questions for considering distributional impacts of the proposed restriction..............................................114 Table 10 Qualitative, quantitive and monetised comparsion of distributional impacts * ...........................................115 Table 11 Assumptions used in the SEA......................................................................................................................122 Table 12 Uncertainty analysis results .........................................................................................................................122 Table 13 Mapping of who can contribute with what information..............................................................................137 Table 14 Reference values of effects of exposure on chemicals on mortality (2003 price levels) ............................143 Table 15 Reference values of effects of exposure on chemicals on some end points acute effects on morbidity (2003 price levels)...................................................................................................................................................................144 Table 16 Average damages per emission...................................................................................................................145 Table 17 External costs of electricity production in the EU (in cent/kWh)...............................................................145 Table 18 Example of why the timing of the impact matters ......................................................................................176 Table 19 Discount rates .............................................................................................................................................178 Table 20 Harmonised long term interest rates within the Euro Area.........................................................................181 Table 21 Intitial checklist for human health risks......................................................................................................204 Table 22 Initial checklist for environmental risks .....................................................................................................205 Table 23 Initial checklist for economic impacts ........................................................................................................206 Table 24 Initial checklist for social impacts ..............................................................................................................207 Table 25 Initial checklist for competition, trade and wider economic impacts..........................................................208
FIGURES
Figure 1 The restriction process................................................................................................................................23 Figure 2 The main timeline of restriction procedure (a MS preparing the Annex XV dossier) ...............................24 Figure 3 Authorities’ actions in the preparation of a restrictions proposal ...............................................................26 Figure 4 Simple flow chart of process of developing an SEA..................................................................................32 Figure 5 SEA process simplified with reference to guidance chapters.....................................................................33 Figure 6 The SEA process - Stage 1 .........................................................................................................................33 Figure 7 SEA process – Stage 2................................................................................................................................35 Figure 8 SEA process – Stage 3................................................................................................................................39 Figure 9 SEA process – Stage 4................................................................................................................................42 Figure 10 SEA process – Stage 5................................................................................................................................44 Figure 11 Flow diagram for the process of conducting a restriction SEA..................................................................47 Figure 12 SEA process – Stage 2................................................................................................................................48 Figure 13 Developing the "baseline scenario" - relationship within the Annex XV dossier ......................................51 Figure 14 Developing the "proposed restriction" scenario - relationship within the Annex XV dossier....................52 Figure 15 The SEA process - Stage 3 .........................................................................................................................61 Figure 16 How to determine the main impacts ...........................................................................................................63 Figure 17 Stepwise approach to analysing impacts ....................................................................................................64 Figure 18 Scheme for assessment of health and environmental impacts ....................................................................68 Figure 19 Illustration of quantification of health impacts for consumer exposure to a carcinogen ............................81
8

SOCIO-ECONOMIC ANALYSIS – RESTRICTIONS
Figure 20 SEA process – Stage 4................................................................................................................................109 Figure 21 Step wise approach to uncertainty analysis ................................................................................................118 Figure 22 Uncertainty analysis process ......................................................................................................................119 Figure 23 Process for deterministic uncertainty analysis............................................................................................121 Figure 24 SEA process -Stage 5 .................................................................................................................................125
9

SOCIO-ECONOMIC ANALYSIS – RESTRICTIONS
GLOSSARY
A glossary of all technical and socio-economic terms used within the guidance is provided below. Any words shown in italics can also be found within this glossary. The European Chemicals Agency (ECHA) also have a glossary of terms relevant to REACH which can be found by using the following link:
http://guidance.echa.europa.eu/public-2/glossary.htm
Actors in the supply chain
All manufacturers and/or importers (M/I) and/or downstream users (DU) in a supply chain (Art 3(17)). Within this guidance, the term is also used to include distributors, consumers and the supply chain for articles. It may additionally refer to actors in the supply chains for alternative substances as well as alternative techniques. See also Supply chain.
Agency European Chemicals Agency (ECHA) as established by the REACH Regulation.
Alternative An alternative is a possible replacement for a substance. The alternative should be able to replace the function that the substance performs. The alternative could be another substance (or several substances) or it could be a technology (e.g. a process, procedure, device, or modification in end product) or a combination of technical and substance alternatives. For example, a technical alternative could be a physical means of achieving the same function that the substance performs or perhaps changes in production, process or product that remove the need for the substance altogether.
Annex XV Annex XV of the REACH regulation lays down general principles for preparing Annex XV dossiers to propose and justify:
(a) harmonised classification and labelling of CMRs, respiratory sensitisers and other effects (b) the identification of a substance as a CMR, PBT, vPvB or a substance of equivalent concern (c) restrictions on the manufacture, placing on the market or use of a substance within the Community.
Further details can be found in the Guidance on Annex XV for restrictions for Member States and the Agency in preparing an Annex XV dossier.
Annex XV dossier
A dossier produced in accordance with Annex XV of the REACH regulation. The dossier consists of two parts: the Annex XV report and an Annex XV technical dossier supporting the Annex XV report.
An Annex XV restrictions dossier proposes and justifies a restriction on the manufacturing, marketing and use of a substance under REACH.
10

SOCIO-ECONOMIC ANALYSIS – RESTRICTIONS
Annex XVII Annex XVII of REACH lists all restricted substances and the conditions of their restrictions under REACH.
Annualised cost Presentation of annualised costs (or equivalent annual costs) is a process whereby non-recurrent (e.g. capital, plant down-time) costs of a measure are equalised over its lifetime using the relevant discount rate. This is presented as a yearly cost (with equal annual payments) assuming that it follows the profile of an annuity. For example if a measure costs €100k to install and it is assumed that the lifetime is ten years and the discount rate is 4% then the annualised costs are around €12k per year. The annualised costs can be calculated as the annualisation factor multiplied by the non-recurrent costs. The annualisation factor is equal to r(l+r)n/((l+r)n –1). In the above example this is: €100k * (0.04(1+0.04)10/((1+0.04) 10-1 ) = €12.3k per year.
(Total) Annual costs
The sum of the annualised non-recurrent costs and the yearly operating costs. Using the example above of a measure that costs €100k to install with a yearly operating cost of €10k over its lifetime, the total annual costs are approximately €22k, which is equal to the sum of annualised capital costs (€12k) plus the operating cost (€10k).
Article Article means an object which during production is given a specific shape, surface or design which determines its function to a greater degree than does its chemical composition.
Benefits The positive implications, both direct and indirect, resulting from some action. This includes both financial and non-financial information.
Chemical safety report (CSR)
The chemical safety report documents the chemical safety assessment for a substance on its own, in a preparation or in an article or a group of substances. Guidance on developing a CSR can be found in Guidance on the Chemical Safety Report
In other words the chemical safety report (CSR) is a document, which details the process and the results of a chemical safety assessment (CSA). Annex I of the REACH Regulation contains general provisions for performing CSAs and preparing CSRs.
Comitology procedure
In accordance with Article 202 of the Treaty establishing the European Community (ECT), it is the task of the Commission to implement legislation at the Community-level. In practice, each legislative instrument specifies the scope of the implementing powers conferred on the Commission by the Council of the European Union. In this context, the Treaty provides for the Commission to be assisted by a committee, in line with the procedure known as "comitology". Further details can be found at:
http://europa.eu/scadplus/glossary/comitology_en.htm
More specifically, restriction proposals under REACH will be adopted in accordance with the regulatory procedure with scrutiny (see description underneath).
11
SOCIO-ECONOMIC ANALYSIS – RESTRICTIONS
Committee for Socio-economic Analysis (SEAC)
The Committee for Socio-economic Analysis (SEAC) is an Agency committee that is responsible for preparing the opinion of the Agency on applications for authorisation, proposals for restrictions, and any other questions that arise from the operation of the REACH Regulation relating to the socio economic impact of possible legislative action on substances. The SEAC consists of at least one but no more than two members from the nominees of each Member State appointed by the Management Board for a renewable term of three years. The Committee members may be accompanied by advisers on scientific, technical or regulatory matters.
Competent Authority
Means the authority or authorities or bodies established by the Member States to carry out the obligations arising from the REACH Regulation.
Costs The negative implications, direct and indirect, resulting from some actions. Includes both financial and non-financial information.
Cost benefit analysis (CBA)
Analysis which quantifies, in monetary terms where possible, costs and benefits of a possible action, including items for which the market does not provide a satisfactory measure of economic value. (See Appendix F.1 for more information).
Cost effectiveness analysis (CEA)
Is widely used (but not restricted to) to determine the least cost means of achieving pre-set targets or goals. CEA can be aimed to identify the least cost option among a set of alternative options that all achieve the targets. In more complicated cases, CEA is used to identify combinations of measures that will achieve the specified target. (See Appendix F.3 for more information).
Damage costs Damage cost is the cost incurred by repercussions (effects) of, for example, environmental impacts (such as effects resulting from the emission of and exposure to pollutants). This could include, for example, the degradation of land or human-made structures and health effects. In environmental accounting, it is part of the costs borne by economic agents.
Discounting A method used to convert future costs or benefits to present values using a discount rate.
Discount rate Used to convert a future income (or expenditure) stream to its present value. It shows the annual percentage rate at which the present value of a future Euro, or other unit of account, is assumed to decrease over time.
Distributional impacts
These show how a proposal may affect different regions, workers, consumers, and industries along the supply chain.
Downstream user Any natural or legal person established within the Community, other than the manufacturer or the importer, who uses a substance, either on its own or in a preparation, in the course of his industrial or professional activities. Article 3(13) of the REACH regulation.
12
SOCIO-ECONOMIC ANALYSIS – RESTRICTIONS
Economic feasibility
Analysis of the economic implications of the adoption of an alternative. Economic feasibility is normally defined as a situation where the economic benefits exceed the economic costs.
Economic impacts
Costs and benefits to manufacturers, importers, downstream users, distributors, consumers and society as a whole. In principle, social and environmental impacts should be included in a truly economic analysis. In much literature, e.g. the EU guidelines for Impact Assessment (European Commission 2005a), a distinction between economic, social and environmental impacts is made – i.e. providing a more narrow interpretation of the term economic. In order to facilitate a comparison with EU literature, we employ this distinction between impact categories in this guidance.
Environmental impacts
Impacts on all environmental compartments. Covers all use and non-use values of the affected environmental compartments.
Existence value The value placed by people on the continued existence of an asset for the benefit of present or future generations. In the case of the latter it is sometimes referred to as bequest value.
Expected value The weighted average of all possible values of a variable, where the weights are the probabilities.
Externalities The non-market impacts of an activity which is not borne by those who generate them.
Financial impact Costs and benefits incurred by identified actors in relevant supply chains. Financial costs will generally include taxes, subsidies, depreciation, capital charges and other transfer payments. NB! Specific terms are explained further in Section 3.4 on Economic impacts.
GDP deflator An index of the general price level in the economy as a whole, measured by the ratio of gross domestic product (GDP) in nominal (i.e. cash) terms to GDP at constant prices.
Health impacts Impacts on human health including morbidity and mortality effects. Covers health related welfare effects, lost production due to workers' sickness and health care costs.
Hedonic pricing Deriving values by decomposing market prices into their constituent characteristics.
13
SOCIO-ECONOMIC ANALYSIS – RESTRICTIONS
Impacts All possible effects –positive or negative - including economic, human health, environmental, social and wider impacts on trade, competition and economic development.
Information on alternatives
Annex XV dossier has to include available information on alternatives, including:
- information on the risks to human health and the environment related to the manufacture and use of the alternatives;
- availability of the alternative, including the time scale; and
- The technical and economical feasibility of using an alternative.
Guidance on gathering information on alternatives can be found in Guidance on Annex XV for restrictions.
Interested party Any organisation, individual, authority or company – other than the Member State Authority that developed an Annex XV dossier – with a potential interest in submitting SEA information on the proposed restriction.
Manufacturer / Importer (M/I)
Any natural or legal person established within the Community who manufactures a substance within the Community (manufacturer) or who is responsible for import (importer) (Art 3(9) and (11)). Within this guidance the term is also used for suppliers of alternatives.
Market value Market Value is the price at which an asset would trade in a competitive market. Market value is different from market price if the market is distorted /inefficient.
Monte Carlo analysis
A technique that allows assessment of the consequences of simultaneous uncertainty about key inputs, taking account of correlations between these inputs.
Multi-criteria analysis (MCA)
A technique that involves assigning weights to criteria, and then scoring options in terms of how well they perform against those weighted criteria. Weighted scores are then summed, and can then be used to rank options.
Net present value (NPV)
Present value is the discounted value of a stream of future costs and/or benefits. Net Present Value (NPV) is the value today of a project, an investment or policy. It is calculated as the sum of discounted streams of costs and benefits related to the activity in question.
Non-threshold substance
A substance for which it is not possible to determine a threshold for effects (DNEL or PNEC) in accordance with Annex I of the REACH Regulation
Persistent Bioaccumulative Toxic (PBT)
The criteria for PBT substances are defined in Annex XIII of the REACH Regulation.
Present Value The future value of an impact expressed in present terms by means of discounting
14
SOCIO-ECONOMIC ANALYSIS – RESTRICTIONS
Price index A measure of the amount by which prices change over time. General price indexes cover a wide range of prices and include the GDP deflator and the Harmonised Index of Consumer Price (HICP). Special price indices apply to individual commodities or types of commodity.
“Proposed restriction” scenario
The likely responses and outcomes of a proposed restriction. If a Risk Management Option (RMO) other than a restriction is considered more appropriate for a particular use of the substance, then this use should not be included in the “proposed restriction” scenario.
Price elasticity A measure of the responsiveness of demand to a change in price. If demand changes proportionally more than the price has changed, the good is “price elastic”. If demand changes proportionally less than the price, it is “price inelastic”.
Pure time preference
Pure time preference is the preference for consumption now, rather than later.
Real price The nominal (i.e. cash) price inflated or deflated by a general price index, e.g. RPI or GDP deflator, relative to a specified base year or base date.
Real terms The value of expenditure at a specified general price level (i.e. a cash price or expenditure divided by a general price index).
Regulatory procedure with scrutiny
Procedure for the adoption of implementing legislation that involves a vote by a Committee composed of representatives of the Member States and which foresees a role for the Council and the European Parliament in accordance with Article 5a of Council Decision 1999/468/EC as amended by Council Decision 2006/512/EC. Restriction proposals under REACH will be adopted in accordance with the regulatory procedure with scrutiny. (See also: comitology procedure)
Relocation of production
Relocation of production is used in a generic manner describing either a situation where the production unit closes down in the EU and a new unit is opened up outside the EU, or where a non-EU supplier increases its production to offset reduced/removed production in the EU.
Response The behavioural response of actors and of the market in relevant supply chains to each RMO scenario.
Restriction Any condition for or prohibition of the manufacture, use or placing on the market of a substance. The substances restricted under REACH and the conditions of their restrictions are included in Annex XVII of the Regulation.
The restrictions procedure is a safety net to address unacceptable risks to human health or the environment, arising from the manufacture, use or placing on the market of substances, which need to be addressed on a Community-wide basis.
15
SOCIO-ECONOMIC ANALYSIS – RESTRICTIONS
16
Restrictions proposal
See Annex XV dossier
Revealed preference
The inference of willingness to pay for something which is not marketed by examining consumer behaviour in a similar or related market.
Risk management measure (RMM) and Operational Conditions (OCs)
These terms are used for concrete risk management measures and operational conditions taken by Industry to control the exposure to the substance of concern. RMMs include e.g. containment of process, local exhaust ventilation, gloves, waste water treatment, exhaust air filters. More generally risk management measures include any action, use of tool, change of parameter state that is introduced during manufacture or use of a substance (either in a pure state or in a preparation) in order to prevent, control, or reduce exposure of humans and/or the environment. OCs include e.g. physical appearance of a preparation, duration and frequency of use/exposure, amount of substance, room size and ventilation rate. More generally the operational conditions include any action, use of tool or parameter state that prevails during manufacture or use of a substance (either in a pure state or in a preparation) that as a side effect might have an impact on exposure of humans and/or the environment. Registrants document, where required, risk management measures and operational conditions in an Exposure Scenario (ES) as a part of their Chemical Safety Report (CSR).
Risk management option (RMO)
This term is used for any possible changes to legislation or other requirements on industry (e.g. in permits) to control identified risks. RMOs may also cover the use of economic instruments and industry’s voluntary commitments.
Sensitivity analysis
A “what-if” type of analysis to determine the sensitivity of the outcomes of an analysis to changes in parameters. If a small change in a parameter results in relatively large changes in the outcomes, the outcomes are said to be sensitive to that parameter.
Socio-economic analysis (SEA)
An approach to analysing all relevant impacts (i.e. both negative and positive changes) of one scenario against another. Relevant impacts include: human health, environmental, economic, social and wider economic. A more detailed definition can be found on ECHA website link below:
http://guidance.echa.europa.eu/socio_economic_en.htm
Social impacts All relevant impacts which may affect: workers, consumers and the general public and are not covered under health, environmental or economic impacts (e.g. employment, working conditions, job satisfaction, education of workers and social security).
Stated preference Willingness to pay for something that is not marketed, as derived from people’s responses to questions about preferences for various combinations of situations and controlled discussion groups. (See Appendix C.2 for more information).
SOCIO-ECONOMIC ANALYSIS – RESTRICTIONS
Suitable alternative
An alternative that is technically and economically feasible for replacement of a substance where transferral to the alternative results in reduced overall risks to human health and the environment taking into account risk management measures. It must also be available (i.e. can be accessed in sufficient quantity and quality) for transferral.
Supply chain In this guidance, the supply chain is the system of organisations, people, activities, information and resources involved in moving a substance from supplier to customer i.e. manufacture/importers (M/I) to downstream users and consumers, including use of articles containing the restricted/alternative substance. It also refers to supply chains for alternative techniques. See also Actors in the supply chain.
Switching point or switching value
The value of an uncertain cost or benefit at which the best way to proceed would switch, for example from approving to not approving a project, or from including or excluding some extra expenditure to preserve some environmental benefit.
Technical feasibility
Relates to an alternative to which it is possible to transfer without compromising the functionality delivered by the substance and its use in the final product.
Transfer payment Transfer payments or ‘transfers’ refer to the transfer of value between sections of society. They do not represent an overall cost to society, simply a redistribution of value. Taxes and subsidies are examples of transfer payments.
Uncertainty This is a state characterising a situation where related parameters are not known or fixed or certain. It stems from a lack of information, scientific knowledge or ignorance and is a characteristic of all predictive assessments. Uncertainty can have a significant effect on the type and amount of evidence that must be collected in undertaking an SEA and taken into account in communicating the outcome.
Very Persistent and very Bioacccumulative (vPvB)
The criteria for vPvB substances are defined in Annex XIII of the REACH regulation.
Wider economic impacts
Impacts that have macro-economic implications. Such impacts may include trade, competition, economic growth, inflation, taxes and other macro-economic effects.
17

SOCIO-ECONOMIC ANALYSIS – RESTRICTIONS
ABBREVIATIONS
CBA Cost Benefit Analysis
CEA Cost Effectiveness Analysis
CMR Carcinogenic Mutagenic or toxic for Reproduction
CPI Consumer Price Index
CSA Chemical Safety Assessment
CSR Chemical Safety Report
DNEL Derived No-Effect Level
DU Downstream User
EC European Commission
ECHA European Chemicals Agency
EU European Union
GDP Gross Domestic Product
HICP Harmonised Index of Consumer Prices
ILO International Labour Organization
MCA Multi-Criteria Analysis
M/I Manufacturer/Importer
MS Member State
PBT Persistent, Bio-accumulative and Toxic
PEC Predicted Environmental Concentration
PED Price Elasticity of Demand
PNEC Predicted No-Effect Concentration
R&D Research and Development
RA Risk Assessment
RAC Risk Assessment Committee
RCR Risk Characterisation Ratio
REACH Registration, Evaluation, Authorisation and restriction of Chemicals
RMM Risk Management Measure
RMO Risk Management Option
18

SOCIO-ECONOMIC ANALYSIS – RESTRICTIONS
RPI Retail Price Index
SEA Socio Economic Analysis
SEAC Socio Economic Analysis Committee
SME Small and Medium-sized Enterprises
SVHC Substance of very high concern
TGD Technical Guidance Document
TtWA Travel to Work Area
VOI Value of Information
vPvB very Persistent and very Bio-accumulative
19

SOCIO-ECONOMIC ANALYSIS – RESTRICTIONS
1 INTRODUCTION TO THE GUIDANCE & THE AIMS OF THE SEA
This document provides technical guidance on how to undertake socio-economic analysis (hereafter called SEA) as part of a proposal to restrict the manufacturing, placing on the market and/or use of a substance in accordance with Article 69 of REACH. Those using this guidance should be familiar with the restriction process and also with the guidance provided on how to prepare a restriction proposal (see Guidance on Annex XV for restrictions).
In the context of REACH, SEA is an approach used to describe and analyse all relevant impacts (i.e. both positive and negative effects) of imposing a restriction compared to continued use. It can also facilitate an assessment of whether the proposed Community-wide restriction is the most appropriate action as compared to other risk management options (RMOs). An SEA included in an Annex XV dossier proposing a restriction and contributions from interested parties is used in the decision-making process (by the SEA Committee of the Agency and the European Commission) to assess the benefits and costs of the proposed restriction.
Annex XVI of the REACH Regulation outlines the information that may be addressed by those conducting a socio-economic analysis (SEA) as a part of an Annex XV dossier suggesting the introduction of a restriction. Annex XVI sets out what an SEA to support a restriction proposal may include:
– Impact of…a proposed restriction on...industry (e.g. manufacturers and importers)
– The impact on all other actors in the supply chain, downstream users and associated businesses in terms of commercial consequences such as impact on investment, research and development, innovation, one-off and operating costs (e.g. compliance, transitional arrangements, changes to existing processes, reporting and monitoring systems, installation of new technology, etc.) taking into account general trends in the market and technology.
– Impacts of a... proposed restriction, on consumers. For example, product prices, changes in composition or quality or performance of products, availability of products, consumer choice, as well as effects on human health and the environment to the extent that these affect consumers.
– Social implications of a… proposed restriction. For example job security and employment.
– Availability, suitability, and technical feasibility of alternative substances and/or technologies, and economic consequences thereof, and information on the rates of, and potential for, technological change in the sector(s) concerned.
– Wider implications on trade, competition and economic development (in particular for SMEs and in relation to third countries) of a… proposed restriction. This may include consideration of local, regional, national or international aspects.
– …proposals for other regulatory or non-regulatory measures that could meet the aim of the proposed restriction (this shall take account of existing legislation). This should include an assessment of the effectiveness and the costs linked to alternative risk management measures.
– …the benefits for human health and the environment as well as the social and economic benefits of the proposed restriction. For example, worker health, environmental performance and the distribution of these benefits, for example, geographically, population groups.
20
SOCIO-ECONOMIC ANALYSIS – RESTRICTIONS
– An SEA may also address any other issue that is considered to be relevant by an interested party.
Annex XVI states that:
“However, the level of detail and scope of the SEA, or contributions to them, shall be the responsibility of the applicant for authorisation, or, in the case of a proposed restriction, the interested party. The information provided can address the socio-economic impacts at any level.”
Annex XV of the REACH Regulation lays down general principles for preparing dossiers to propose and justify restrictions on the manufacture, placing on the market or use of substances within the Community. Agreement on proposed restrictions through a Commission comitology decision, more precisely, the regulatory procedure with scrutiny (see glossary) will lead to the addition of any agreed restrictions to Annex XVII of the Regulation. Any subsequent manufacture, placing on the market or use of the substance has to comply with the conditions of the restrictions. A detailed description of the process is set out in the Guidance on Annex XV for restrictions. The users of this SEA guidance are assumed to be familiar with the Guidance on Annex XV for restrictions.
Within the restriction process (Title VIII of the REACH Regulation), an SEA report may form part of an Annex XV dossier for restriction of a substance. An Annex XV dossier can be submitted by a Member State or the Agency, the latter following a request from the Commission. The Agency will make proposals for restrictions conforming with Annex XV available on its website and will invite interested parties to submit within six months of the date of publication comments on dossiers and the suggested restrictions and/or an SEA or information which can contribute to one {Article 69(6)(b)}. This information will be taken into account in the adoption of an opinion on the suggested restrictions by the Agency’s Committees for Socio-economic Analysis (SEAC) and Risk Assessment (RAC).
1.1 Who is the guidance for?
This guidance is aimed at anyone who is intending to undertake a socio-economic analysis to develop information in support of the restriction proposal or in reaction to the publishing of a restriction proposal. Specifically this includes:
• Member State (MS) Authorities or Agency (the latter on request from the Commission); or
• Interested parties (i.e. not the Authority who submitted the Annex XV dossier suggesting a restriction and not the Agency assessing it) who are either submitting an SEA or information which can contribute to one.
The guidance aims to describe good practice and is therefore also expected to be a useful reference document for the Agency’s SEA committee. This committee is responsible for the review and drafting of opinions on the suggested restrictions and on the related socio-economic impact, on the basis of information submitted in a restriction proposal and any contributions by interested parties. The guidance may also assist the Commission who will make the final decision, in accordance with the regulatory procedure with scrutiny (see glossary), on the inclusion of a restriction for a substance on Annex XVII of the REACH regulation.
Most of this guidance describes what needs to be done from the perspective of the Member State (MS) Authority/Agency developing the restriction proposal. If an interested party wants to submit a
21

SOCIO-ECONOMIC ANALYSIS – RESTRICTIONS
full SEA, they should follow more or less the same approach as the MS Authority/Agency developing the restriction proposal, although the quality and quantity of information available to them may dictate how detailed their SEA will be. If an interested party only wants to contribute information on certain aspects of an SEA it should follow the guidance relevant to those aspects.
Interested parties may submit an SEA report or a contribution to an SEA already included in an Annex XV dossier in response to the proposed restriction (non-confidential parts will be published on the Agency web site, see Figure 1). This information will be taken into consideration by the Agency Committee for SEA in arriving at its opinion on the restriction proposal.
Figure 1 sets out a flow diagram that gives an overview of the restriction procedures and the obligations and opportunities for input into the process by the different actors involved.
22

SOCIO-ECONOMIC ANALYSIS – RESTRICTIONS
Figure 1 The restriction process
In Figure 1 the parts of the restriction process that are relevant to this guidance are highlighted in bold text. Relevant Articles of the REACH Regulation text are indicated.
23
SOCIO-ECONOMIC ANALYSIS – RESTRICTIONS
24
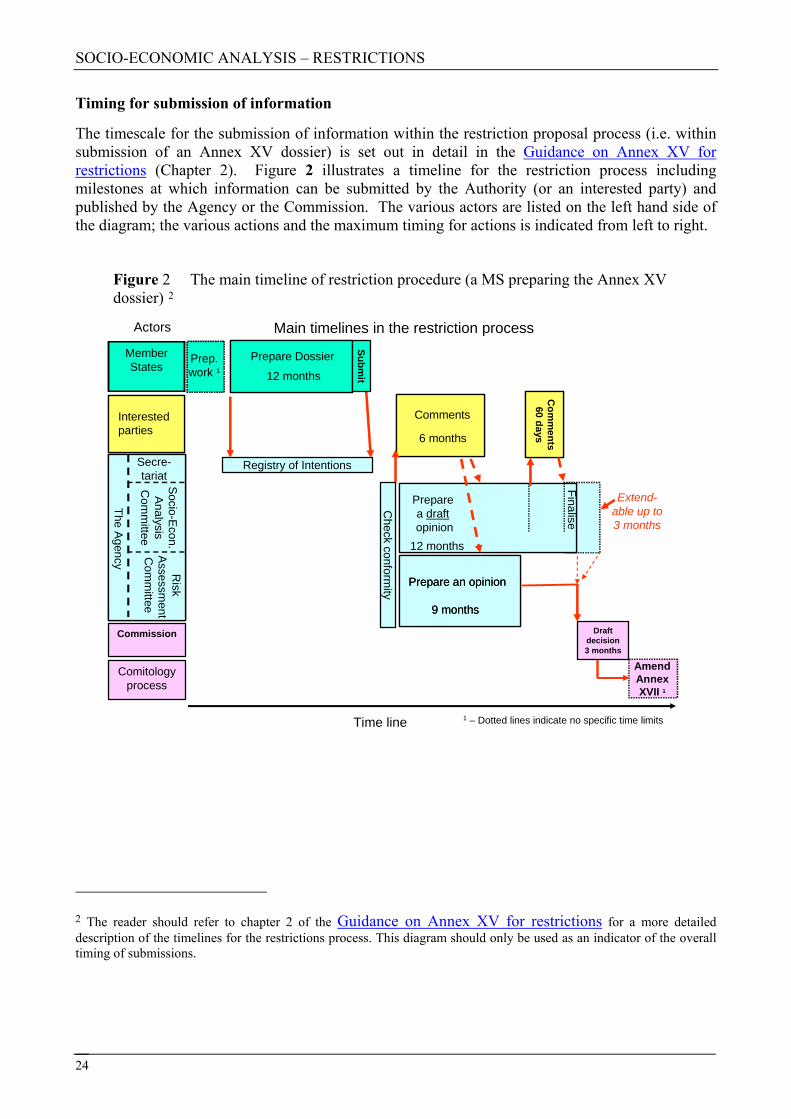
Timing for submission of information
The timescale for the submission of information within the restriction proposal process (i.e. within submission of an Annex XV dossier) is set out in detail in the Guidance on Annex XV for restrictions (Chapter 2). Figure 2 illustrates a timeline for the restriction process including milestones at which information can be submitted by the Authority (or an interested party) and published by the Agency or the Commission. The various actors are listed on the left hand side of the diagram; the various actions and the maximum timing for actions is indicated from left to right.
Figure 2 The main timeline of restriction procedure (a MS preparing the Annex XV dossier) 2
2 The reader should refer to chapter 2 of the Guidance on Annex XV for restrictions for a more detailed description of the timelines for the restrictions process. This diagram should only be used as an indicator of the overall timing of submissions.
MemberStates
Comitologyprocess
Com
ments
60 daysC
omm
ents60 days
Draft decision3 months
Actors Main timelines in the restriction process
Prep. work 1Prep. work 1
Interested parties Interested parties
6 months
Comments
6 months
Comments
Prepare Dossier
12 months
Prepare Dossier
12 months
Registry of Intentions
Prepare an opinion
9 months
Prepare an opinion
9 months
Prepare an opinion
9 months
The Agency
Socio-E
con. A
nalysis C
omm
ittee
Secre-tariat
Risk
Assessm
ent C
omm
ittee
The Agency
Socio-E
con. A
nalysis C
omm
ittee
Secre-tariat
The Agency
Socio-E
con. A
nalysis C
omm
ittee
Secre-tariat
Risk
Assessm
ent C
omm
ittee
Extend-able up to 3 months
12 months
Finalise
Prepare a draftopinion
12 months
Finalise
Prepare a draftopinion
Check conform
ity
Commission
Amend Annex XVII 1
Submit
Time line 1 – Dotted lines indicate no specific time limits
SOCIO-ECONOMIC ANALYSIS – RESTRICTIONS
25
1.2 The aims of socio-economic analysis (SEA)
1.2.1 Why is an SEA important?
Title VIII and Annex XV of the REACH Regulation set out general principles to suggest and justify any restriction on the manufacture, placing on the market or use of a substance within the Community. SEA can be used to provide supporting information on several sections of a restriction proposal as described below (see the Guidance on Annex XV for restrictions for further guidance on what should be included in a restriction proposal).
Member State Authorities and the Agency submitting Annex XV dossiers will want to make sure that the Agency Committees for Risk Assessment and for Socio-Economic Analysis as well as the Commission can act swiftly following their proposal. This can best be done where a good quality Annex XV dossier, including justification for the proposed restriction and a clear view of the costs and benefits of the proposed restriction are provided. The Commission is bound to apply high standards for assessing the consequences of its legislation3. The Commission has a tight deadline of three months to prepare a draft amendment of Annex XVII after receipt of opinions from the SEA and RA Committees and, therefore, relies on the input from the Annex XV dossier, input from interested parties and the Committee opinions in preparing its draft decision. The justification for the restriction should provide sufficient basis for the Commission to conclude that the conditions laid down in Article 68 are fulfilled and by that the Commission has the basis for making a draft amendment of Annex XVII.
Therefore, although not compulsory, Member States or the Agency preparing a restriction proposal should seriously consider analysing the socio-economic impacts to support the restriction proposal. The SEA facilitates a systematic and comprehensive comparison of the different risk management options (RMOs) and/or of the relevant costs/benefits of continuing to use a substance4 compared to the conditions of the proposed restriction. Therefore, it would be advisable to make the SEA as an integral part of the preparation of the Annex XV dossier. An SEA can provide supporting information for the following purposes:
• Purpose 1: Justification that community wide action is required;
• Purpose 2: Assessing whether the proposed restriction is the most appropriate Community-wide action compared to other RMOs;
• Purpose 3: Refining the scope of the proposed restriction;
• Purpose 4: Assessing the proposed restriction in terms of:
o The net benefits to human health and the environment and
o The net costs to manufacturers, importers, downstream users, distributors, consumers and society as a whole.
3 See also Article 68.1 which states that “Any […] decision [to include a substance in Annex XVII] shall take into account the socio-economic impact of the restriction, including the availability of alternatives.".
4 Continued use of the substance without any restriction
SOCIO-ECONOMIC ANALYSIS – RESTRICTIONS
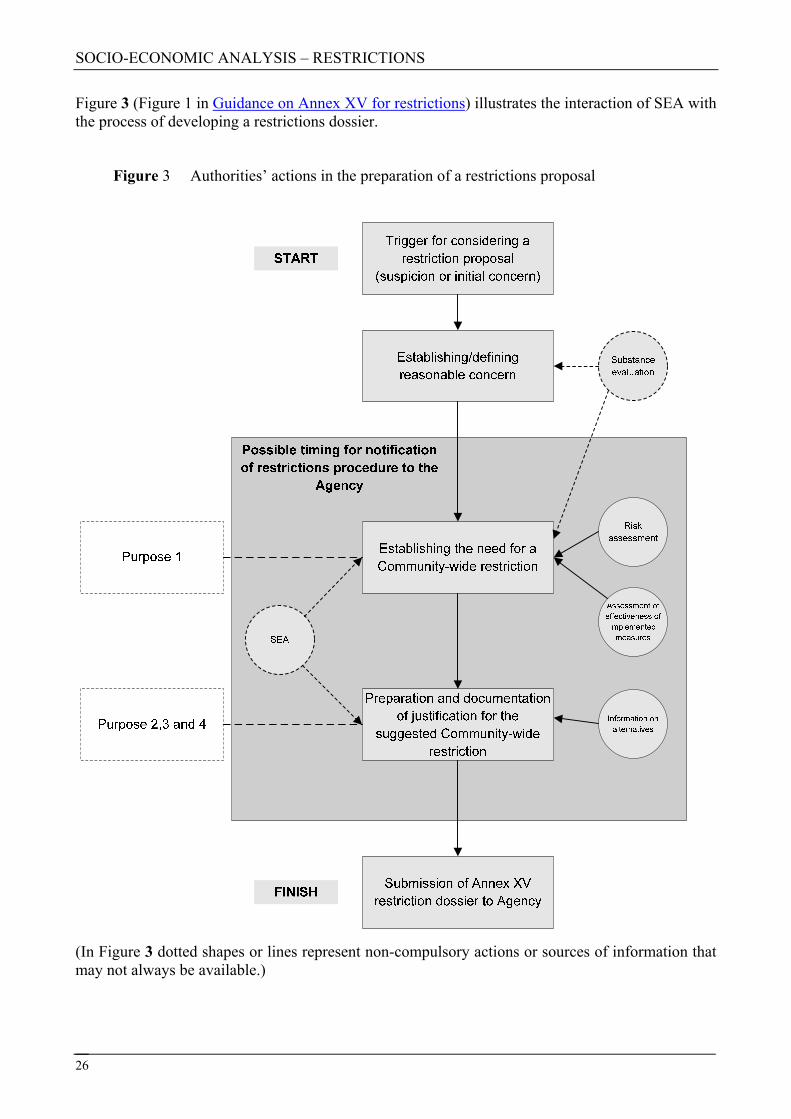
Figure 3 (Figure 1 in Guidance on Annex XV for restrictions) illustrates the interaction of SEA with the process of developing a restrictions dossier.
Figure 3 Authorities’ actions in the preparation of a restrictions proposal
(In Figure 3 dotted shapes or lines represent non-compulsory actions or sources of information that may not always be available.)
26
SOCIO-ECONOMIC ANALYSIS – RESTRICTIONS
1.2.2 Purpose 1: Justification that Community-wide action is required
A restriction proposal needs to justify why the risks identified in the risk assessment should be addressed at a Community-wide level. It needs to show that action on a Community-wide basis is the most appropriate option for reducing the identified risks (see Guidance on Annex XV for restrictions chapter 5.3). It should be noted that as the movement of goods needs to be free in the EU, in most cases it is possible to restrict the marketing and use of a good only at a Community-wide level. In addition, it may be costly to introduce legislation or other actions to control the identified risks caused by the manufacturing or use of substances separately in each Member State. Relevant information on the socio-economic impacts of whether or not action is taken on a Community-wide level can be used to support this justification. An example of a socio-economic argument could be the need to avoid any competition or trade distortions which could occur within the EU under regulations imposed at a national level.
The use of SEA to support this part of the Annex XV dossier could focus on the following aspects:
• Impacts identified in the SEA that would provide supporting information as to whether Community-wide action is required (for example, the SEA could highlight disparities for economic operators in different Member States if national legislation is introduced or information on the extent of possible barriers to trade).
• Whether negative impacts identified could be mitigated/made worse through Community-wide action. For example, imposing national legislation in one Member State (MS) may distort competition compared to other EU MS which could be mitigated if the legislation was imposed at a Community-wide level. This would give equal treatment to MS.
• Whether positive impacts could be improved/lessened through Community-wide action. For example, a Community-wide restriction which reduces greenhouse gas emissions in several MS benefits all EU citizens regardless of where emissions are reduced. Alternatively a Community-wide restriction would not be more effective than a MS restriction when there are geographical restrictions (i.e. accessibility to specific raw materials) which limit manufacturing and production within that MS. In this instance, national legislation would be equally effective, without the need to impose Community-wide action.
However, as this is not considered the main purpose of this guidance, it will not be described further in this guidance document.
1.2.3 Purpose 2: Assessing whether the proposed restriction is the most appropriate Community-wide action compared to other RMOs
A restriction proposal needs to justify why a restriction is the most appropriate Community-wide Risk Management Option (RMO). Information on other possible Community-wide RMOs is described in Section 5.4.4 and Appendix V of the Guidance on Annex XV for restrictions.
The proposed restriction needs to be compared to other RMOs to assess whether a restriction is the most appropriate Community-wide RMO (see Guidance on Annex XV for restrictions section 5.4.5.4) using three criteria as defined in Annex XV (see Guidance on Annex XV for restrictions section 5.4.5):
• Effectiveness: the restriction must be targeted to the effects or exposures that cause the risks identified, capable of reducing these risks to an acceptable level within a reasonable period of time and proportional to the risk;
27
SOCIO-ECONOMIC ANALYSIS – RESTRICTIONS
• Practicality: the restriction must be implementable, enforceable and manageable;
• Monitorability: it must be possible to monitor the results of the implementation of the proposed restriction.
Socio-economic implications are important when comparing the proposed restriction against other Community-wide RMOs. SEA can be used to provide a more systematic and complete picture of the effects of the different Community-wide RMOs to society as a whole enabling a more thorough analysis of the three criteria (effectiveness, practicability and monitorability), thereby encompassing all the relevant aspects. Therefore, an SEA can contribute to a well developed justification of why the proposed restriction would be the most appropriate Community-wide action.
1.2.4 Purpose 3: Refinement of the restriction proposal
A restriction can be any condition for, or prohibition of, the manufacture, use or placing on the market of a substance. The scope of the restriction defines which uses of the substance are covered by the restriction and the extent to which these uses are restricted. Conditions of the restriction may include e.g.:
• timeline(s) from which the restriction applies;
• concentration limits above which the restriction applies; and/or
• definition of the circumstances under which the restriction does not apply (derogations from the restriction).
The scope and conditions of the restriction will determine its effectiveness and proportionality in reducing the identified risks. As part of the development of the restriction proposal, a proposed restriction can be refined (in terms of its scope and/or conditions) using the three criteria indicated above (effectiveness, practicality and monitorability).
Socio-economic implications are important especially for considerations regarding proportionality and in defining an appropriate timetable from which the restriction should apply. SEA can also facilitate in the assessment of the overall effectiveness and the practicality of the various scopes of the proposed restriction.
In practise, the comparison of the restriction to other RMOs (purpose 2) and the refinement of the restriction proposal (purpose 3) could often be done at the same time in one process.
1.2.5 Purpose 4: Assessment of the proposed restriction
A comparison of costs and benefits related to the introduction of the proposed restriction is the fourth use of an SEA in developing a restriction proposal. The focus of this assessment of the proposed restriction should be on:
• The net benefits to human health and the environment; and
• The net costs to manufacturers, importers, downstream users, distributors, consumers and society as a whole.
28
SOCIO-ECONOMIC ANALYSIS – RESTRICTIONS
“Net benefits” should take into account reduced risks due to restriction and possible risks caused by the transfer to alternatives. Similarly, “net costs” should take into account both costs to actors due to restriction and possible cost savings caused by the transfer to alternatives.
Although this assessment of the proposed restriction is not a mandatory part of a restriction proposal, it is in the interest of the Authority to include in the Annex XV dossier an SEA comparing the net benefits and net costs of the proposed restriction. The SEA supports the justification that the proposed restriction is the best way of addressing the identified risks by providing a good overview of its socio-economic consequences to society as a whole.
1.3 Focus of this guidance
As noted this guidance will not focus further on Purpose 1 (Justification that Community-wide action is required). Therefore, given purposes 2, 3 and 4 above, this guidance addresses how SEA can be used to compare one or more RMOs/restriction proposals against the situation where no RMO/restriction is introduced (the so-called baseline situation).
In principle, under purpose 2, the proposed restriction and other RMOs are compared to the baseline and the purpose is to determine whether the proposed restriction is the best situation/gives the highest net benefit to society. Using SEA for comparing the RMOs may include use of cost-effectiveness considerations given that different RMOs may result in different risk reduction levels.
In principle, under purpose 3, different versions of restrictions would be compared to the baseline and the SEA can assist with determining whether the suggested restriction would give the highest net benefit and be the most cost-effective for society.
Under purpose 4, the main aim would be to assess the net benefits and net costs of the proposed restriction.
In other words, if the difference between a RMO/restriction and the baseline (continued use without RMO/restriction) is called Δ (= the difference):
• Purpose 2 aims at determining whether the Δ for the restriction proposal is higher/more effective than Δ for any other considered RMO
• Purpose 3 aims at optimising/maximising the Δ, whereas
• Purpose 4 aims at assessing whether the Δ is positive.
It is obvious that the use of SEA under purposes 2, 3 and 4 will not happen in a linear manner, but may be highly iterative, depending on the case in question. It may also be that some restriction proposals will only use the SEA for one of these purposes. It would be too complicated to describe throughout the guidance all the different iterative processes that could happen in practice. The guidance is therefore focused on the methodology for establishing the difference (i.e. the Δ) under the restriction proposal as compared to the baseline. Therefore, if applying the guidance under purposes 2 and 3, one would basically have to do the same exercise for each of the RMOs/restriction proposals considered, i.e. comparing each of these to the baseline.
Nevertheless, to illustrate how the guidance can be used under purposes 2 and 3, some explanations and examples have been included demonstrating how to analyse and compare different RMOs/different scopes of a restriction proposal.
29
SOCIO-ECONOMIC ANALYSIS – RESTRICTIONS
1.4 “Quick Guide” - How should the socio-economic analysis (SEA) be undertaken?
This section provides a brief overview of the aim of and process for developing and documenting an SEA. Whilst this document is intended to provide guidance (and not a prescribed approach), it is strongly recommended that the users should familiarise themselves with the whole document prior to developing their SEA.
1.4.1 The overall SEA process
The main purpose of the SEA report is to support the basis for decision making on restriction proposals under REACH. The key challenge when developing an SEA is being able to use the information available to identify (and where possible quantify) the impacts that could occur under the proposed restriction in a proportionate and robust way.
The main difficulties encountered when undertaking an SEA is the definition of the “proposed restriction” scenario(s), particularly in relation to what the likely response of relevant actors will be (i.e. manufacturers, downstream users, consumers, suppliers of alternatives, etc.) should the proposed restriction be adopted. A scenario is made up of the likely response for each actor in relevant supply chains. Because there can be multiple responses to a restriction by any actor, it may be necessary to have more than one possible response scenario to a proposed restriction. There is then a further challenge in being able to find and use the right data to estimate the impacts under each of these foreseen responses.
What makes a ‘good’ SEA? - Key features of undertaking an SEA
The following are key features of the SEA approach described in this guidance. The guidance sets out a systematic approach, helping the user to produce a proportionate and unbiased SEA. The Authority or interested party can choose to follow a different approach if they so wish.
• Undertake the SEA as an iterative process. Start with a qualitative assessment based on readily available data and then in additional iterations (if these are considered to be required) aim to provide more detail and a more quantitative assessment until all key impacts are covered in a sufficiently robust way to draw a conclusion.
• Compare socio-economic impacts of proposed restriction with other RMOs if relevant at an early stage of the process (Purpose 2). Where necessary, refine the conditions of the restriction proposal to get a better balance of socio-economic impacts (Purpose 3). It is important to consider all possible types of responses to implementation of the restriction (though those most likely to occur will obviously need most detailed assessment) and this is likely to be best done in consultation with other MS authorities, all relevant supply chains (and in particular the downstream users) and possibly other relevant parties. The scenarios that are considered relevant determine the scope of the SEA regarding the types of impacts to be included and other factors such as time period and geographical coverage.
• Undertake the SEA in five stages:
• Stage 1: Set the aims of the SEA (why is the SEA being developed?)
• Stage 2: Set the scope of the SEA (what is the continued use (“baseline”) scenario and
30
SOCIO-ECONOMIC ANALYSIS – RESTRICTIONS
the “proposed restriction” scenario? Which manufacturing process and whole supply chains are affected in the “proposed” restriction scenario and how are they affected?)
• Stage 3: Identify and assess the impacts (what are the impacts of the proposed restriction compared to the continued use scenario i.e. what are the differences between the two scenarios?)
• Stage 4: Interpretation & conclusion drawing (bring the human health, environmental, economic, social and other impacts together to assess the net benefits and net costs of the proposed restriction)
• Stage 5: Present the results (prepare a report that transparently documents the results and assumptions used in the analysis)
• Remember to consider uncertainties that may arise during the SEA process:
• Consider uncertainties throughout the SEA process (not just at the end of the analysis)
• Minimise uncertainties where possible
• Assess the importance of the uncertainties to the outcome of the SEA. This may be used to decide what further collection of information can best reduce the uncertainties and therefore lead to a robust outcome of the SEA
• Keep track of/document all uncertainties and any decisions/assumptions used during the SEA as well as in the final reporting.
• Transparently present and document the main decisions made during the development of SEA, including ‘negative’ decisions on, e.g. why the scope was restricted to a certain geographical area or to a certain part of the supply chain, why certain impacts have not been considered
• There is no golden rule as to how long the SEA report should be, but the summary of the SEA should in general be restricted to no more than 10 pages.
An illustration of the iterative nature of undertaking an SEA is shown in Figure 4.
31
SOCIO-ECONOMIC ANALYSIS – RESTRICTIONS
Figure 4 Simple flow chart of process of developing an SEA
Figure 4 shows the five proposed stages and the suggested iterative approach whereby an SEA is first undertaken based on available data from the development of the Annex XV dossier and – where considered necessary and proportionate – further qualitative, quantitative and/or monetised assessments are produced. At Stage 4, the evidence is evaluated allowing the Authority to consider whether a robust conclusion can be drawn.
The Authority will need to decide whether it is possible to draw a robust conclusion concerning the proposed restriction when assessing the net benefits to human health and the environment and the net costs to manufacturers, importers, downstream users, distributors, consumers and society as a whole or whether further information generation is needed (i.e. a further iteration of the SEA process). This may involve collecting more data and undertaking more analysis in order to draw a more robust conclusion. As part of stage 5 the Authority should document its conclusion in the relevant parts of the Annex XV dossier and submit this dossier to the Agency (see Guidance on Annex XV for restrictions). Alternatively the Authority may decide to exit from the SEA process. It is recommended that also in this case the findings of any SEA are reported in the Annex XV dossier format and submitted to the Agency in order to avoid duplication of work in case another Authority wishes to investigate the substance (see Guidance on Annex XV for restrictions).
The next sections describe each of the five stages in brief (detailed guidance is provided in Chapters 2 to 5). Throughout the guidance a simple illustration of the five stages is used to indicate where each chapter fits in. This is shown below listing also the chapter number where the detailed guidance on each stage is presented.
32

SOCIO-ECONOMIC ANALYSIS – RESTRICTIONS
Figure 5 SEA process simplified with reference to guidance chapters
1.4.2 Stage 1: Setting the aims of the SEA
Figure 6 The SEA process - Stage 1
What is Stage 1: Setting the aims of the SEA?
The purpose of Stage 1 –“Setting the aims of the SEA” – is to provide the entry point to the SEA. It is where the user answers the question: Why is the SEA or input to one being developed? It will be clear in most cases for an Authority why the SEA is needed or useful but specifically defining the aims early in the restriction proposal process (see Guidance on Annex XV for restrictions section 5.6) will help to focus the SEA as it might contribute to different elements of a restriction proposal as set out in Section 1.2.
Input from an interested party could address any or all aspects. The interested party therefore needs to define specifically what it wants to achieve by providing input. The specific objectives should be clear in terms of defining the supply chain, particular impacts and how they will subsequently affect the analysis.
How is Stage 1 undertaken?
The reasons for conducting an SEA were explained in section 1.2, while the main objectives for the Authority and an interested party are set out below.
33
SOCIO-ECONOMIC ANALYSIS – RESTRICTIONS
MS Authority or the Agency
If the SEA is prepared by a MS Authority or the Agency as part of the development of the restrictions proposal the main aims of the SEA are:
• To assess whether the proposed restriction is the most appropriate RMO to control the risks identified in the risk assessment (Purpose 2)
• To refine the scope of the proposed restriction (Purpose 3)
• To assess the net benefits of the proposed restriction to human health and the environment and the net costs to manufacturers, importers, downstream users, distributors, consumers and society as a whole (Purpose 4).
Interested parties
An interested party can comment on any part of a submitted Annex XV dossier. This could include submitting an SEA or contributing to one regardless of whether or not the Annex XV dossier includes an SEA or SEA considerations.
The aim will be one or more of the following:
• To comment on the justification that the proposed restriction is the most appropriate RMO (Purpose 2)
• To comment on the scope or conditions of the proposed restriction and whether it should be changed on the basis of socio-economic considerations (Purpose 3)
• To comment on and/or assess the net benefits of the proposed restriction to human health and the environment and the net costs to manufacturers, importers, downstream users, distributors, consumers and society as a whole (Purpose 4)
Guidance for interested parties concerning the Annex XV dossier that does not involve any SEA considerations can be found in the Guidance on Annex XV for restrictions.
Further details
Any information submitted will be the formal response of interested parties to the publication on the Agency website of non-confidential parts of Annex XV dossiers for restriction proposals {Article 69(6)}. The information submitted by an interested party will be taken into account by the SEA Committee of the Agency when forming its opinion and by the Commission when making its decision. Information from interested parties may give background and reasons to decide to impose the restriction, modify the scope or conditions of the restriction or reasons to decide not to impose the restriction.
For interested parties intending to submit an SEA report (or contribution to one), the considerations will be similar to those of the Authority in terms of the type of information submitted and the emphasis of the arguments that are presented. An interested party will only be providing information in reaction to the publishing of an Annex XV dossier (which may or may not include an SEA) and therefore may not be able to comment during the preparation of the Authorities SEA for deciding whether restrictions are an appropriate RMO, but may undertake an SEA to support or challenge the conclusion in the Annex XV dossier that the proposed restriction is the most appropriate RMO.
The considerations for an interested party conducting and documenting an SEA will depend on the
34
SOCIO-ECONOMIC ANALYSIS – RESTRICTIONS
35
proposed restriction that the interested party is responding to or what the information request from the Agency relates to. A key consideration for interested parties is that, in general, they will have limited time in which to conduct their analyses. As set out in Article 69(6) and illustrated in Figure 2, interested parties will have 6 months from the time that the Annex XV dossier is published on the Agency’s web site to prepare a submission. Interested parties are therefore likely to submit information that relates to specific aspects of the restriction proposal. Interested parties will also have an opportunity to comment on the draft opinion of the SEA Committee within 60 days of its publication.
1.4.3 Stage 2: Scoping phase
Figure 7 SEA process – Stage 2
What is Stage 2: Scoping phase?
Having set the aims of the SEA, the next step is to define what will happen as a result of the proposed restriction. The information on alternatives collected as part of the development of the restriction proposal will be of value in helping determine what could happen under the proposed restriction. A key question to answer is: how will actors in the relevant supply chains react if they are subjected to the proposed restriction?
The scoping stage involves identifying the likely response(s)5 and first considerations of the related impacts to the proposed restriction. Initial feedback from consultation with the supply chains will be vital to understanding how relevant supply chains will react to the proposed restriction. Following on from the identification of the likely responses, it should be possible to define some of the boundaries of the SEA in terms of the time period covered, the geographical areas and the types of
5 Responses here mean the behavioural responses of actors in the supply chain and of the markets associated with the supply chain.
SOCIO-ECONOMIC ANALYSIS – RESTRICTIONS
impacts to be assessed. When relevant impacts are analysed in more detail (in the next stage) further iterations of the SEA process may be required to adjust the boundaries of the SEA.
Identification of what is most likely to happen under the proposed restriction is an important stage in the SEA process. If there is more than one possible response, and if there are a range of possible impacts (these are both very likely), the Authority should consider the likelihood of each response and the importance of the impacts of those responses in defining the scope. It is important to make sure that all relevant impacts are considered systematically and not omitted without any consideration. Undertaking an SEA has the potential to be much more time and resource intensive (and could include unnecessary data collection and analysis) in cases where the scope is not clearly outlined.
How is Stage 2 undertaken?
There are four proposed steps in the scoping phase. Most, if not all, of the information required should already have been collected during the development of the Annex XV dossier.
• Step 2.1: Organising the work. When preparing to carry out an SEA it may not initially be clear how much work will be involved (this will vary on a case-by-case basis). It is advisable to have an initial kick off meeting or ‘brainstorming’ session with a multidisciplinary team to help decide what is required in order to develop the SEA, how this can be achieved with the resources available and who to consult during the process. The brainstorming session can also consider what type of consultation would be useful for the development of the SEA. In general, such consultation should take place as early as possible. Appendix A provides guidance on how to develop a consultation plan.
• Step 2.2: Define the “baseline” scenario. This scenario is based on the current and predicted future use of the substance in the absence of any further RMOs. This is also known as the “business as usual” scenario.
• Step 2.3: Define the “proposed restriction” scenario: expected responses to the proposed restriction. This is a key element of the SEA. In the event that the restriction proposal is accepted, how will supply chains react? For example, if the substance is banned then a downstream user might choose to import articles or to apply another substance or process. There will potentially be a range of different implications for different actors and processes up and down in the same supply chain and/or in other supply chains. In answering this question, consultation with relevant supply chains will generally be very important.
• Step 2.4: Set the scope of the SEA by defining time periods and geographical boundaries and the types of impacts to be covered in the SEA. Having defined the “baseline” and the “proposed restriction” scenario, it may be possible to determine these factors (e.g. competitiveness and trade impacts might be relevant depending on what type of behavioural responses are considered most likely). When relevant impacts are analysed in more detail (in the next stage) further iterations of the SEA process may be required to adjust the boundaries of the SEA.
36
SOCIO-ECONOMIC ANALYSIS – RESTRICTIONS
What is involved in describing a “proposed restriction” scenario?
What is the likely behavioural response?
Characterising the behavioural response of actors in relevant supply chains to a proposed restriction is a key element in the SEA. The following types of behavioural responses (not an exhaustive list) should typically be considered, preferably in consultation with other MS authorities and relevant supply chains:
• Use of a “suitable” alternative, replacing the substance while still delivering equivalent functionality;
• Use of a less suitable alternative or simply removing use of the substance (this could have significant impacts such as changed quality of the goods that the substance is used for);
• Relocation of certain production activities outside of the EU;
• Certain goods or services no longer being available.
It might not be clear from consultation and from available information what response is the more likely under the proposed restriction. In such cases, all relevant possible responses should be taken forward. In the next stage – Identification and assessment of impacts – it may be possible to determine the most likely response (for example, the response may be dictated by the scale of additional costs faced by a supply chain).
In identifying the possible responses under the “proposed restriction” scenario, it might be useful to conduct a ‘brainstorming’ type of meeting/workshop/conference call involving key experts from other MS authorities and other relevant stakeholders. Such an event could focus on firstly determining the possible responses under the proposed restriction and secondly, help identify the likely impacts under the “proposed restriction” scenario (identifying impacts are described in the next stage). Relevant stakeholders could be representatives from the supply chain for the substance but also those from other supply chains if the “proposed restriction” scenario potentially involves other substances or technologies.
What are the SEA boundaries?
The scope of what needs to be covered in terms of relevant supply chains, time period and geographical area depends on what has been identified as the likely response(s) under the RMO scenarios.
Relevant supply chains – This should consider:
• Effects can appear both upstream (suppliers) or downstream from the uses included in the restriction proposal. The industries directly affected by the proposed restriction will have to use other substance, technologies, or products or modify the characteristics of the product all of which have effects on different supply chains. Also other connected supply chains may get affected. An important element of setting the boundaries is to identify which supply chains are affected.
• The identification of relevant supply chains can be supported by drawing a process tree of both the baseline and the “proposed restriction” situations. The process tree should include all relevant material flows of using the substance or using the alternative.
37

SOCIO-ECONOMIC ANALYSIS – RESTRICTIONS
38
Time boundaries of the SEA – This should consider:
• The most important aspect on setting the time period is to make sure that all relevant impacts are included irrespectively of when they might occur in time.
• For the practical organisation of the analysis, the first step would be to define a typical investment cycle for the uses addressed by the proposed restriction (for example 20 years). Thereafter there are two basic methodological approaches to carrying out the analysis:
• If there are no major changes in the future (e.g. the trend is linear) and a representative year can be defined, then select a representative year (e.g. 2030), as the basis for the analysis as it will make it simple to conduct.
• The definition of either the “baseline” or the “proposed restriction” scenarios may involve significant changes in the trends in use of the substance. This may occur e.g. because of the development of technology/process, developments in other relevant legislation, or where the proposed restriction includes different time derogations for different uses. In such cases a cumulative period of, for instance, 20 years (covering e.g. 2010-2030) should be selected.
• The investment cycle period (of e.g. 20 years) would be the boundary within which impacts are triggered (e.g. emission of chemical substances). The impacts may materialise at a (much) later stage, in particular for impacts on human health and the environment. As will be outlined in Section 3.4 these impacts will often be described qualitatively6.
• More guidance on how to consistently compare monetised impacts occurring at different periods in time is given in Section 3.8.
Geographical boundaries – This should consider:
• All impacts should be included independently of where they occur. It should be clearly stated where any impacts occur outside the EU.
• The ‘relevant market’ for each use of the substance being proposed for restrictions (i.e. is the product traded within a Member State, within neighbouring Member States only, at an EU level or globally?).
It should be noted that there are no upfront boundaries on the types of impacts to be considered. All types of impacts (human health, environmental, economic and social) should be considered. Stage 3 includes the guidance on how to identify potential impacts within each type and how to assess their importance.
Please note that setting the boundaries will involve some – at least qualitative - considerations about the impacts foreseen as this will implicitly steer what is considered important to include and what not. Likewise, the further identification and assessment of impacts in Stage 3 may trigger the need to revisit the boundaries of the analysis as new important issues may turn out to be significant.
6 Note that section 4.1 addresses how to compare different types of impacts.

SOCIO-ECONOMIC ANALYSIS – RESTRICTIONS
The outputs from Stage 2 include firstly the identification and description of the “baseline” scenario and the “proposed restriction” scenario. Secondly, they include the delineation of the SEA in terms of relevant supply chains, types of impacts, time period and geographical boundaries.
1.4.4 Stage 3: Identifying and Assessing Impacts
Figure 8 SEA process – Stage 3
What is Stage 3: Identifying and Assessing Impacts?
This stage involves the identification and assessment of impacts. The aim is to answer the question: What are the impacts of the “proposed restriction” compared to the “baseline” scenario? The human health, environmental, economic, social and other impacts are determined as the difference between the two scenarios defined in Stage 2. If there is more than one likely response under the “proposed restriction” scenario, the difference in the impact between each response and the “baseline” scenario should be identified and analysed.
How is Stage 3 undertaken?
Stage 3 includes four generic steps:
• Step 3.1: Identification of impacts. The potential impacts of the proposed restriction are identified through data already collected as part of the Annex XV dossier and through further data collected based on the baseline and "proposed restriction" scenarios defined in Stage 2. This involves where needed, consultation with other MS authorities, relevant supply chains and with other relevant stakeholders.
• Step 3.2: Collection of data. Certain data on emissions and exposures and on the related human health and environmental risks of the substance will already be available in the risk assessment. Data on alternatives will also have been collected and analysed as part of the information on alternatives (Guidance on Annex XV for restrictions section 5.5).
39
SOCIO-ECONOMIC ANALYSIS – RESTRICTIONS
• Step 3.3: Assessment of impacts. The assessment of impacts can be done at different levels of quantification or may simply be done qualitatively. Following the suggested iterative procedure for the SEA, the first assessment will build on immediately available data which is likely to lead to a mixture of a quantitative and qualitative assessment. In subsequent iterations (if these are undertaken) more detail and further qualitative, quantitative and monetised information may be added.
• Step 3.4: Ensure the consistency of the analysis. Before a robust conclusion can be determined a series of good practice checks should be carried out on the analysis undertaken. This will include checks to make sure that the results are not misleading to the reader and that impacts are not over/under estimated, including giving appropriate consideration to uncertainty.
It is important to emphasise that the assessment of impacts should focus on the difference between the “baseline” scenario and the “proposed restriction” scenario. For example, what are the additional costs or costs savings associated with a “proposed restriction” scenario compared to the “baseline” scenario? Or how much are the health and environmental impacts changed in the “proposed restriction” scenario compared to the “baseline” scenario? Please note that, for situations where there are no differences between the scenarios for some types of impacts assessed, this could still be important to document; i.e. to document that those impacts are not likely to be significant for that SEA.
How to identify and assess impacts?
Consultation with other MS authorities, relevant supply chains and with other organisations is likely to be a key component of identifying all relevant impacts. The guidance includes a suggestion for a consultation plan that is developed in Stage 2 and revised in this stage to reflect the needs for data.
The guidance also includes several check-lists (a non-exhaustive list of possible impacts, see Appendix G) which may be relevant to consider and which can be documented to demonstrate that all relevant impacts have been considered.
Information on changes in the emissions of and exposure to the substance and information on the risks to human health and the environment related to the substance being proposed for restriction should have been developed in the risk assessment. Any use of potential alternatives should have been covered when gathering information on alternatives (see Guidance on Annex XV for restrictions section 5.5) while guidance on how to undertake risk assessments is included in both Guidance on the Chemical Safety Report and in section 5.2 of Guidance on Annex XV for restrictions.
Impacts will ideally be described by quantitative data where suitable data sources exist and where such an analysis is proportionate. For impacts that are difficult to quantify and monetise, for example the environmental and human health risks, this guidance includes suggestions on how to take the analysis of those elements as far as possible. There are references and links to possible external sources of data and valuations that can be applied.
In many cases the impact will have to be assessed by using expert judgement. The nature of expert judgements is such that that it is difficult to provide guidance on how to make such judgements. What is important is transparency. If judgments are made, the assumptions behind the judgements should be clearly stated.
40

SOCIO-ECONOMIC ANALYSIS – RESTRICTIONS
The types of impacts to consider include the following:
• Human health and environmental impacts: These impacts cover all possible effects directly related to the toxic, eco-toxic or physicochemical properties of the substance proposed for restriction or any alternative substance, as well as any other health and environmental impacts occurring in all affected supply chains in relation to the introduction of alternative substances or technologies. These impacts can therefore include for example differences in emissions from raw material extraction or processing or from the disposal of final products. Information on changes to emissions of and exposure to the substance in question, and other related human health and environmental risks (including potential alternatives) may have been produced already (see Guidance on Annex XV for restrictions section 5.5). For the purposes of the SEA, more analysis might be useful, focusing on both the severity of the effects and exposure, e.g. assessing how many people or what environmental populations are exposed, in order to describe the impacts on human health or the environment (what happens as a result of the exposure).
• Economic impacts: These are the net costs or savings to manufacturers, importers, downstream users, distributors and consumers in the supply chains of the substance and the alternatives. Economic impacts to society of for example health care services caused by human health effects or reduced crop yield due to acidification are covered under “human health and environmental impacts”.
• Social impacts: These are all relevant impacts which may affect: workers, consumers and the general public and are not covered under health, environmental or economic impacts (e.g. employment, working conditions, job satisfaction, education of workers and social security). Impacts on certain social groups may need to be considered.
• Trade, competition and economic development (in short referred to as wider economic impacts): Wider economic impacts are impacts that have macro-economic implications such as economic growth, inflation, and taxes. These types of effects follow from the distribution of the economic effects and how the relevant markets function. For example, additional costs could mean that certain businesses or industries might face trade or competition issues that will reduce their business. The production of alternatives is likely to induce business opportunities, which also need to be included in the analysis of wider economic impacts, unless they were already covered earlier under economic impact.
The definition of the different types of impacts follows what is set out in the legal text as well as the standard categories used the EU impact assessment guidance (Available via: http://ec.europa.eu/governance/impact/). Health and environmental impacts as well as social impacts can incur costs, for example increased health care costs. Such costs should be included as health or environmental impacts not as economic impacts. No matter which heading any significant impact is categorised, the important thing is that it is included in the SEA but only included once and that the documentation is clear and transparent.
The human health, environmental and economic impacts are often the most significant and therefore should be assessed first. Analysis of social and wider economic impacts should follow on from the assessment of economic impacts as the economic, human health and environmental data gathered provides the starting point for further analysis on most of the social and wider economic impacts.
The output from Stage 3 is a description of all the impacts, either qualitative or quantitative. It is important for all relevant impacts identified to be included. There should be no bias towards
41
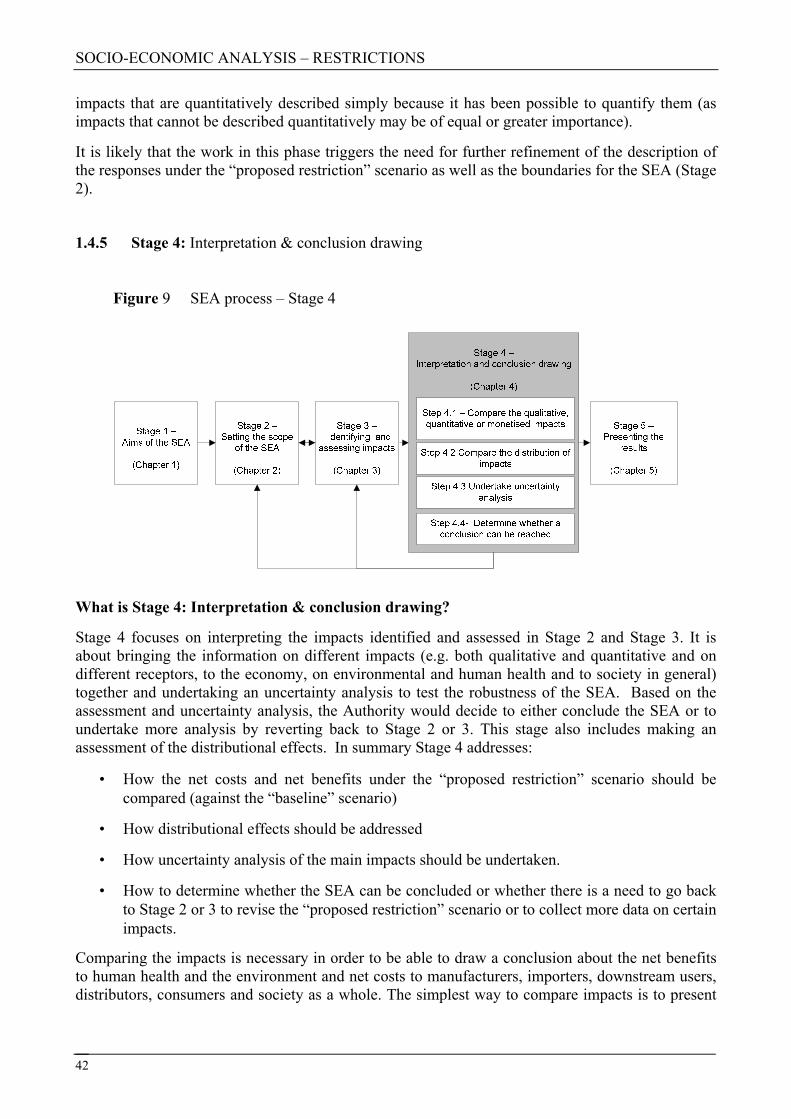
SOCIO-ECONOMIC ANALYSIS – RESTRICTIONS
impacts that are quantitatively described simply because it has been possible to quantify them (as impacts that cannot be described quantitatively may be of equal or greater importance).
It is likely that the work in this phase triggers the need for further refinement of the description of the responses under the “proposed restriction” scenario as well as the boundaries for the SEA (Stage 2).
1.4.5 Stage 4: Interpretation & conclusion drawing
Figure 9 SEA process – Stage 4
What is Stage 4: Interpretation & conclusion drawing?
Stage 4 focuses on interpreting the impacts identified and assessed in Stage 2 and Stage 3. It is about bringing the information on different impacts (e.g. both qualitative and quantitative and on different receptors, to the economy, on environmental and human health and to society in general) together and undertaking an uncertainty analysis to test the robustness of the SEA. Based on the assessment and uncertainty analysis, the Authority would decide to either conclude the SEA or to undertake more analysis by reverting back to Stage 2 or 3. This stage also includes making an assessment of the distributional effects. In summary Stage 4 addresses:
• How the net costs and net benefits under the “proposed restriction” scenario should be compared (against the “baseline” scenario)
• How distributional effects should be addressed
• How uncertainty analysis of the main impacts should be undertaken.
• How to determine whether the SEA can be concluded or whether there is a need to go back to Stage 2 or 3 to revise the “proposed restriction” scenario or to collect more data on certain impacts.
Comparing the impacts is necessary in order to be able to draw a conclusion about the net benefits to human health and the environment and net costs to manufacturers, importers, downstream users, distributors, consumers and society as a whole. The simplest way to compare impacts is to present
42
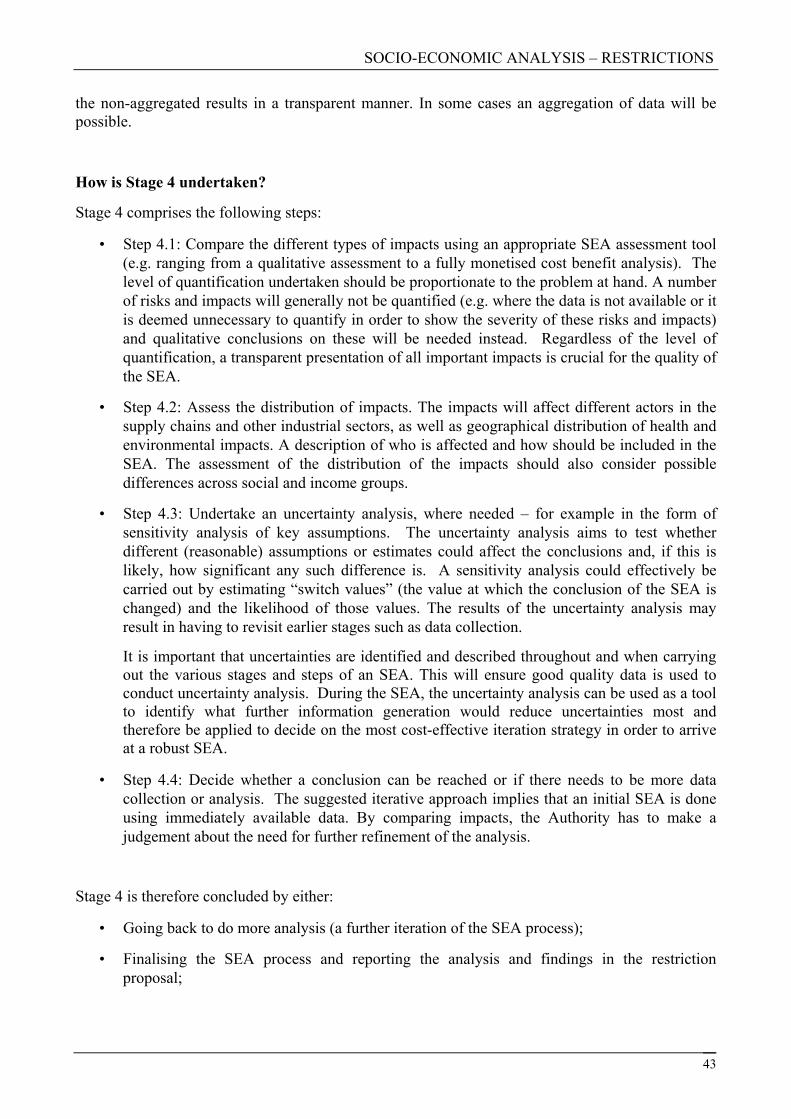
SOCIO-ECONOMIC ANALYSIS – RESTRICTIONS
the non-aggregated results in a transparent manner. In some cases an aggregation of data will be possible.
How is Stage 4 undertaken?
Stage 4 comprises the following steps:
• Step 4.1: Compare the different types of impacts using an appropriate SEA assessment tool (e.g. ranging from a qualitative assessment to a fully monetised cost benefit analysis). The level of quantification undertaken should be proportionate to the problem at hand. A number of risks and impacts will generally not be quantified (e.g. where the data is not available or it is deemed unnecessary to quantify in order to show the severity of these risks and impacts) and qualitative conclusions on these will be needed instead. Regardless of the level of quantification, a transparent presentation of all important impacts is crucial for the quality of the SEA.
• Step 4.2: Assess the distribution of impacts. The impacts will affect different actors in the supply chains and other industrial sectors, as well as geographical distribution of health and environmental impacts. A description of who is affected and how should be included in the SEA. The assessment of the distribution of the impacts should also consider possible differences across social and income groups.
• Step 4.3: Undertake an uncertainty analysis, where needed – for example in the form of sensitivity analysis of key assumptions. The uncertainty analysis aims to test whether different (reasonable) assumptions or estimates could affect the conclusions and, if this is likely, how significant any such difference is. A sensitivity analysis could effectively be carried out by estimating “switch values” (the value at which the conclusion of the SEA is changed) and the likelihood of those values. The results of the uncertainty analysis may result in having to revisit earlier stages such as data collection.
It is important that uncertainties are identified and described throughout and when carrying out the various stages and steps of an SEA. This will ensure good quality data is used to conduct uncertainty analysis. During the SEA, the uncertainty analysis can be used as a tool to identify what further information generation would reduce uncertainties most and therefore be applied to decide on the most cost-effective iteration strategy in order to arrive at a robust SEA.
• Step 4.4: Decide whether a conclusion can be reached or if there needs to be more data collection or analysis. The suggested iterative approach implies that an initial SEA is done using immediately available data. By comparing impacts, the Authority has to make a judgement about the need for further refinement of the analysis.
Stage 4 is therefore concluded by either:
• Going back to do more analysis (a further iteration of the SEA process);
• Finalising the SEA process and reporting the analysis and findings in the restriction proposal;
43
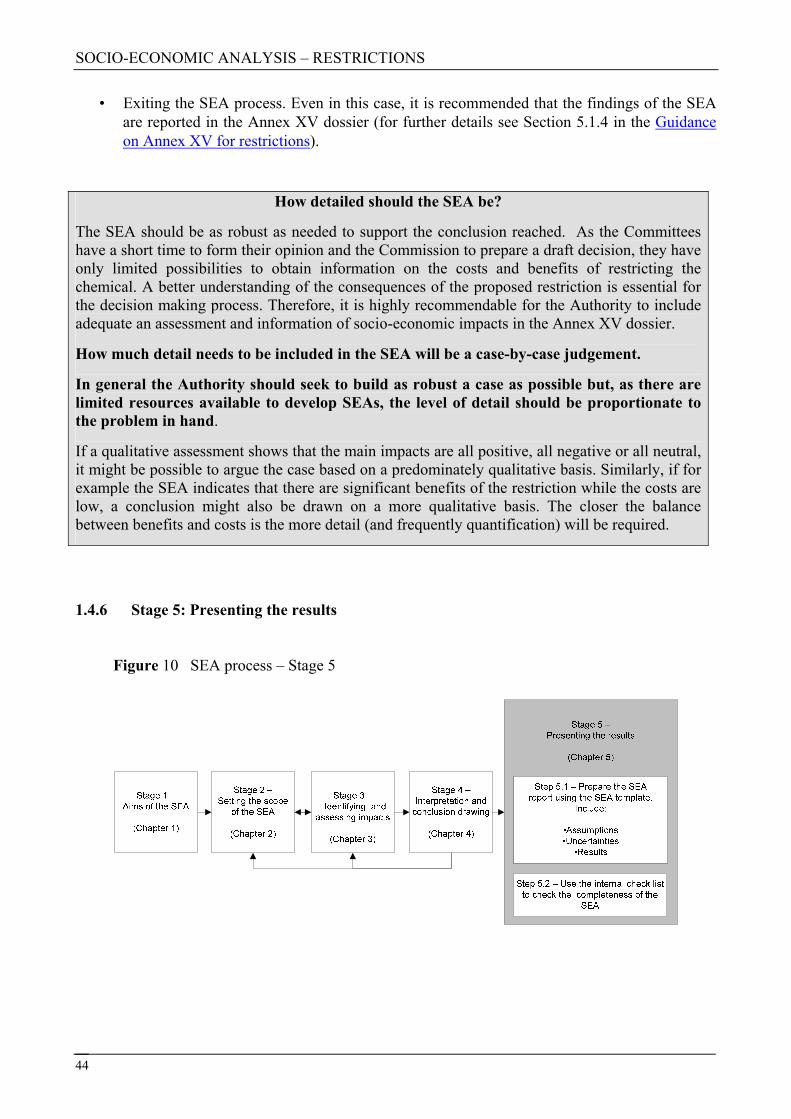
SOCIO-ECONOMIC ANALYSIS – RESTRICTIONS
• Exiting the SEA process. Even in this case, it is recommended that the findings of the SEA are reported in the Annex XV dossier (for further details see Section 5.1.4 in the Guidance on Annex XV for restrictions).
How detailed should the SEA be?
The SEA should be as robust as needed to support the conclusion reached. As the Committees have a short time to form their opinion and the Commission to prepare a draft decision, they have only limited possibilities to obtain information on the costs and benefits of restricting the chemical. A better understanding of the consequences of the proposed restriction is essential for the decision making process. Therefore, it is highly recommendable for the Authority to include adequate an assessment and information of socio-economic impacts in the Annex XV dossier.
How much detail needs to be included in the SEA will be a case-by-case judgement.
In general the Authority should seek to build as robust a case as possible but, as there are limited resources available to develop SEAs, the level of detail should be proportionate to the problem in hand.
If a qualitative assessment shows that the main impacts are all positive, all negative or all neutral, it might be possible to argue the case based on a predominately qualitative basis. Similarly, if for example the SEA indicates that there are significant benefits of the restriction while the costs are low, a conclusion might also be drawn on a more qualitative basis. The closer the balance between benefits and costs is the more detail (and frequently quantification) will be required.
1.4.6 Stage 5: Presenting the results
Figure 10 SEA process – Stage 5
44

SOCIO-ECONOMIC ANALYSIS – RESTRICTIONS
45
What is the Stage 5: Presenting results stage?
Stage 5 is the final stage in the SEA process. In this stage the main findings and results of the analysis are summarised using the process outlined in Figure 10. For transparency and reliability of the results, the key assumptions used and uncertainties involved should be presented with the final results.
It is important to present all data in a systematic and transparent manner in order to aid the decision-making process. Given that the information in the SEA submitted as one part of an Annex XV dossier is an important opportunity for the Authority to justify a restriction7, the argument needs to be presented in a convincing but also unbiased way. For any interested party providing comments to an SEA or their own SEA during the 6 month long consultation period according to Article 69(6), a transparent and unbiased presentation will facilitate the use of the information being submitted.
If the assessment of the net benefits to human health and the environment under the proposed restriction are disproportionate to the net costs to manufacturers, importers, downstream users, distributors, consumers and society as a whole then the Authority is recommended to document this conclusion in the relevant parts of the Annex XV dossier and submit this documentation to the Agency and Member States CAs. To ensure the transparency and reliability of the results, the key assumptions used and uncertainties involved should be presented with the final results.
How is Stage 5 undertaken?
The output of this stage is the SEA report. This can be presented using a template and checked against an internal checklist to check to the key aspects of an SEA report have been included). Reporting the results of the SEA includes:
• Presenting the “baseline” scenario, the “proposed restriction” scenario and any other restriction or other RMO scenarios included in the SEA. This should include the main assumptions made / decisions taken when the scenarios were defined (e.g. why certain RMO was not assessed further). This can be a reference to another part of the Annex XV dossier or, where further reasoning is useful, to include this in an appendix to the main SEA report.
• Presenting all the key assumptions/decisions on the time and geographical boundaries of the SEA and impacts which are covered by the assessment. If relevant, this should also include information on why certain issues are not covered.
• Presenting all the key decisions/assumptions that have been used to estimate and describe impacts should be presented in order for the SEA to be transparent. These could be presented in an appendix to aid readability of the main SEA report.
• Presenting all the key impacts and the SEA results. If impacts are aggregated using a cost-benefit approach or a multi-criteria approach, it is important to present the individual impacts. A template has been developed to support the presentation of all the key elements of the SEA (see Chapter 5). Appendix G includes several non-exhaustive checklists that could be used to demonstrate which impacts have been considered and which have not been included.
7 Since the time available for revising an SEA (or the subsequent inclusion of an SEA within the Annex XV dossier) at later stages will be more limited.

SOCIO-ECONOMIC ANALYSIS – RESTRICTIONS
• Presenting the results of the uncertainty analysis: Having undertaken sensitivity analysis or an alternative form of uncertainty analysis to test the robustness of the SEA, the results of this analysis should also be presented.
• Presenting the main conclusions: The Authority or interested party should summarise the results of the analysis, provide their conclusions and make appropriate recommendations. The implications of uncertainties for the conclusions should be clearly set out.
1.4.7 Pitfalls to avoid
Following the recommendations in this guidance the Authority or interested party preparing an SEA should consider the issues outlined in the following text box.
Examples of issues that will decrease the quality or credibility of an SEA
Boundary restrictions:
• Not using the most realistic behavioural responses to a proposed restriction; • Lack or no consideration for all impacts that are either significant or are perceived by some to be
significant; • No attempt to account properly for geographic and temporal limits; • No consideration of future trends and implication of existing regulation/legislation;
Use of poor quality inputs:
• Use of outdated information; • Lack of awareness of respected data sources; • Lack of consultation to obtain relevant data
Poorly thought out methodology:
• Not documenting assumptions; • No attempt to quantify effects where this is possible and appropriate to do so; • No attempt to qualitatively assess impacts that cannot be quantified; • No, or inadequate, account given to the uncertainties in the analysis;
Failure to properly explain the rationale for conclusions:
• Lack of clear explanation for the conclusion reached based on the information provided; • Lack of account of uncertainties in drawing conclusions; • Lack of account in the decision making process for un-quantified effects; • Lack of transparency in how the results were derived.
1.4.8 Overview flow chart
The flowchart in Figure 11 provides an overview of all of the stages and steps in the process.
46

SOCIO-ECONOMIC ANALYSIS – RESTRICTIONS
Figure 11 Flow diagram for the process of conducting a restriction SEA
Stage 5 –Presenting results
Presenting the results within the Annex XV dossier
Or Exit the SEA process – It is still advisable to present the results in the
Annex XV dossier
(Chapter 5) Is the evidence sufficient to draw a robust conclusion and finalise the
SEA?
Yes
Stage 1 –Aims of the SEA
Why do an SEA?
(Chapter 1)
Stage 3 –Identifying and assessing impacts
Assess the impacts of the “proposed restriction” scenario compared to the
baseline scenario?
(Chapter 3)
Step 3.1 – Identify the relevant impacts
Step 3.2 – Collect data
Step 3.3 – Assess impacts
Stage 4 –Interpretation and conclusion drawing
How do human health, environment, economic and social impacts compare?
(Chapter 4)
No
Stage 2 –Setting the scope of the SEA
What will be the likely response(s) to the proposed restriction?
(Chapter 2)
Step 2.2 Define the “baseline” scenario
Step 2.3 Define the “proposed restriction” scenario
Step 2.4 Setting the boundaries of the SEA
Step 2.1 Organising the work
Step 3.4- Ensure the consistency of the analysis
Step 5.1 – Prepare the SEAreport using the SEA template.
Include:
•Assumptions•Uncertainties
•Results
Step 5.2 – Use the internal check list to check the completeness of the
SEA
Step 4.1 – Compare the qualitative, quantitative or monetised impacts
Step 4.3 Undertake uncertainty analysis
Step 4.4- Determine whether a conclusion can be reached
Step 4.2 Compare the distribution of impacts
No
47

SOCIO-ECONOMIC ANALYSIS – RESTRICTIONS
2 THE SEA PROCESS – STAGE 2: SCOPING PHASE
2.1 Introduction to the scoping phase
The scoping phase is the second stage in developing an SEA. This is shown below in Figure 12.
Figure 12 SEA process – Stage 2
The scoping phase deals with how the relevant scenario(s) and boundaries for the SEA should be defined. The process for identifying and describing impacts is covered in the next chapter. Defining a scenario involves assessing the expected behaviour of the supply chain and potentially other actors and implications resulting from the restriction. For example, if the substance is restricted then a downstream user might choose to import articles or to apply another substance or process.
This section describes the proposed approach to this stage of the SEA in detail. It is recognised that the overall approach to the SEA should be an iterative one and the Authority should undertake this stage at a level of detail appropriate to that of the SEA iteration being undertaken.
As with all stages in the SEA process, the Authority should give consideration to the uncertainties present in the data and analysis. The implications of uncertainties should be considered and acknowledged in the presentation of results.
2.2 Step 2.1 – Organising the work
Developing an SEA will generally draw upon different expertise and sources of information from within the Authority/Agency and from consultation with the affected industries, other Member States and relevant stakeholders. Early consultation with the affected industries is important for developing a restriction proposal. At this stage of SEA initiation, such consultation might already have been established as part of developing the restriction proposal; (see Guidance on Annex XV for restrictions section 4.2.2).
Some of the key elements that may be involved in organising the work for the SEA include:
48
SOCIO-ECONOMIC ANALYSIS – RESTRICTIONS
49
• Organising the work within the Authority preparing the SEA:
• Identifying in-house expertise (skills);
• Organising a start-up/inception meeting or briefing;
• Considering the need for external support (e.g. due to lack of skills or resources)
• Developing a work plan based on the stages and steps as set out in this guidance;
• Developing a consultation plan for the consultation with relevant stakeholders:
• Identifying the relevant supply chain for the uses being proposed restricted and individual contacts;
• Consulting with authorities in other Member States and with the Agency; and
• Establishing contact with and agree involvement of each key person.
The SEA will require expertise in a variety of fields: technical (use of the substance and possible alternatives, risk management measures), risk/impact assessment, operations (e.g. costs of production), and markets (e.g. on demand or competition) and economic (e.g. cost-benefit analysis). Most of this expertise might be found in-house or in affiliated organisations8. The need for external expertise will depend on the complexity of the SEA. Developing a work plan based on the stages and steps outlined in this guidance will help to identify any such need.
CASE STUDY EXPERIENCES Experiences of those carrying out an SEA as part of the development of this guidance found that: 1) Coordination of work is one of the main challenges in developing an SEA. The project leader
should have a good understanding of the restriction process, the development of a restriction dossier and the expertise fields covered by the SEA.
2) It is important to establish early a multidisciplinary team and hold an internal kick-off or
brainstorming meeting so that all understand what the scope of the study is, and that they understand the assignment in the same manner.
Source: case study conducted by RIVM
If it is envisaged that stakeholder consultation is useful, it would be prudent to develop a consultation plan. Appendix A provides guidance on how to develop a consultation plan. The box below provides advice on contact with relevant supply chains.
8 Such as other government institutions in the Member State or research institutions

SOCIO-ECONOMIC ANALYSIS – RESTRICTIONS
Box 1 Tip: Importance of supply chain contact Key points about supply chain contacts:
1. Engaging with relevant supply chains is one of the few ways to get specific information about their possible ‘behavioural response’ to the proposed restriction.
2. Engaging with relevant supply chains is important as it enables the Authority to explore the implications of the proposed restriction for the supply chain actors.
3. Exploring different supply chains for information about the use of alternative substances/processes will be important in order to gain a balanced perspective from the consultation.
If the scoping phase identifies that information and data from relevant supply chains are needed to complete the SEA and contacts with the supply chain have not been established then this should be initiated during the scoping phase.
The accuracy of the SEA will depend on the plausibility of possible behavioural responses. For anything but the most simple supply chains, communication and consultation with relevant supply chains is the only way to get accurate information (in the absence of detailed market analysis from other sources).
If commercial confidentiality or other factors restricts actors in relevant supply chains from providing information, expert judgement may need be to be applied (any uncertainties and assumptions used will need to be noted in the SEA report within the restriction proposal).
In relation to the use of alternative substances/processes, the industries that will be directly affected by the restriction (those producing and using the substance and related products) might not have information about the use of alternatives. They also have limited incentive to reveal information that shows feasibility of substitution to an alternative. Consulting with suppliers of alternative substances/process could be important to overcome the problem of disincentives to supply information about alternatives.
2.3 Step 2.2 – Define the “baseline” scenario
The “baseline” scenario is the situation in the absence of the proposed restriction (or any further Risk Management Options (RMOs)). This is not necessarily the current situation as the “baseline” scenario should consider any relevant impending legislation/regulation or modifications to existing legislation/regulation which are expected to come into effect over the timescale of the SEA. These considerations should also be extended to relevant alternatives (substances or processes) under the “baseline” scenario.
Based on the information gathered from the development of the restriction proposal (Annex XV dossier) it should be possible to define the “baseline” scenario. The process to achieve this is illustrated in Figure 13.
50
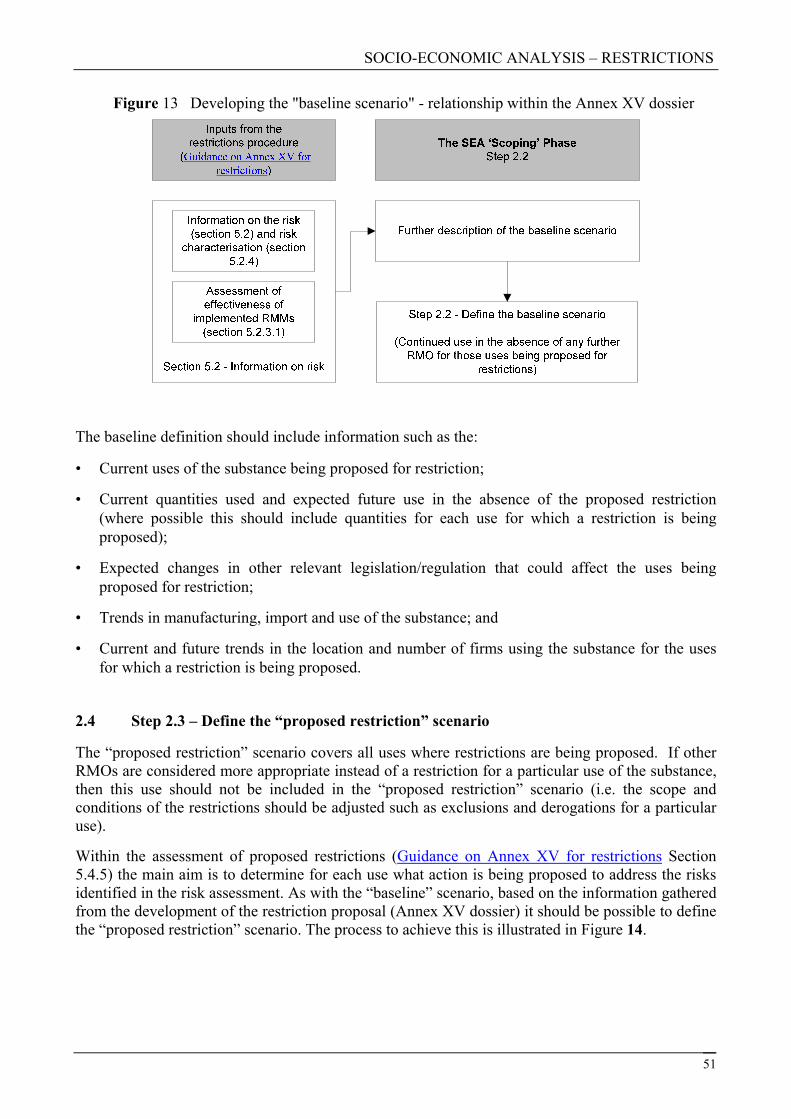
SOCIO-ECONOMIC ANALYSIS – RESTRICTIONS
Figure 13 Developing the "baseline scenario" - relationship within the Annex XV dossier
The baseline definition should include information such as the:
• Current uses of the substance being proposed for restriction;
• Current quantities used and expected future use in the absence of the proposed restriction (where possible this should include quantities for each use for which a restriction is being proposed);
• Expected changes in other relevant legislation/regulation that could affect the uses being proposed for restriction;
• Trends in manufacturing, import and use of the substance; and
• Current and future trends in the location and number of firms using the substance for the uses for which a restriction is being proposed.
2.4 Step 2.3 – Define the “proposed restriction” scenario
The “proposed restriction” scenario covers all uses where restrictions are being proposed. If other RMOs are considered more appropriate instead of a restriction for a particular use of the substance, then this use should not be included in the “proposed restriction” scenario (i.e. the scope and conditions of the restrictions should be adjusted such as exclusions and derogations for a particular use).
Within the assessment of proposed restrictions (Guidance on Annex XV for restrictions Section 5.4.5) the main aim is to determine for each use what action is being proposed to address the risks identified in the risk assessment. As with the “baseline” scenario, based on the information gathered from the development of the restriction proposal (Annex XV dossier) it should be possible to define the “proposed restriction” scenario. The process to achieve this is illustrated in Figure 14.
51
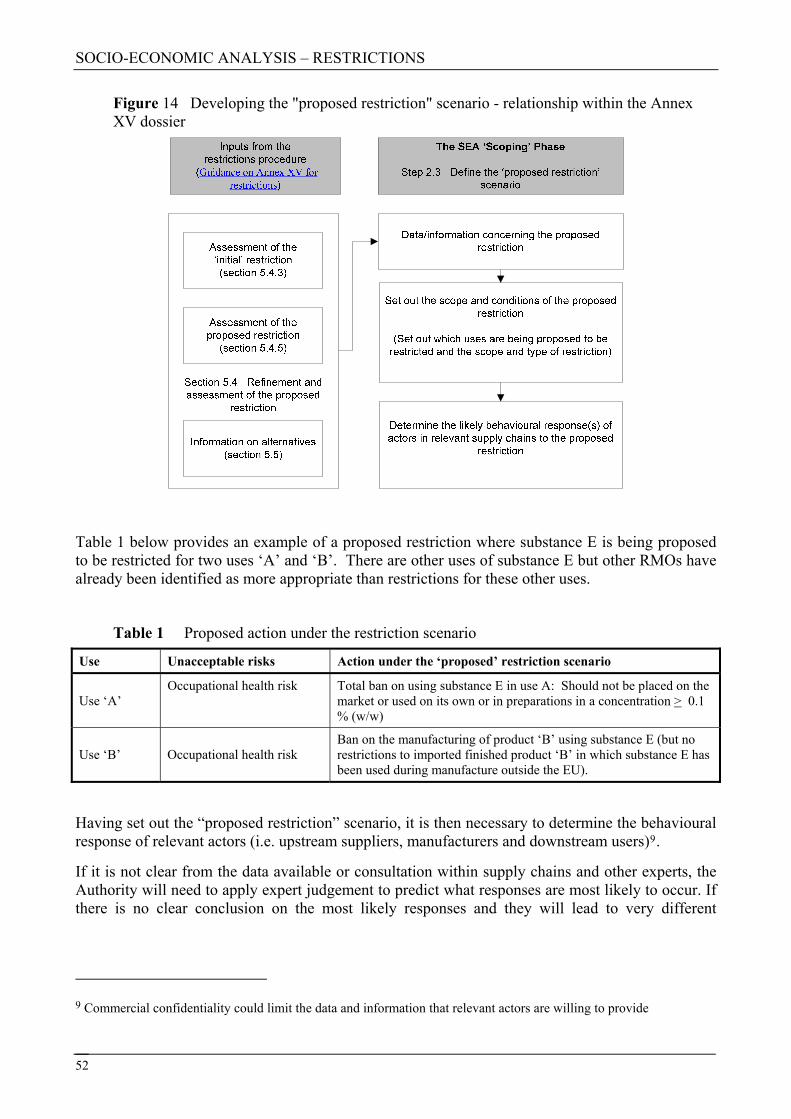
SOCIO-ECONOMIC ANALYSIS – RESTRICTIONS
52
Figure 14 Developing the "proposed restriction" scenario - relationship within the Annex XV dossier
Table 1 below provides an example of a proposed restriction where substance E is being proposed to be restricted for two uses ‘A’ and ‘B’. There are other uses of substance E but other RMOs have already been identified as more appropriate than restrictions for these other uses.
Table 1 Proposed action under the restriction scenario
Use Unacceptable risks Action under the ‘proposed’ restriction scenario
Use ‘A’ Occupational health risk Total ban on using substance E in use A: Should not be placed on the
market or used on its own or in preparations in a concentration > 0.1 % (w/w)
Use ‘B’ Occupational health risk Ban on the manufacturing of product ‘B’ using substance E (but no restrictions to imported finished product ‘B’ in which substance E has been used during manufacture outside the EU).
Having set out the “proposed restriction” scenario, it is then necessary to determine the behavioural response of relevant actors (i.e. upstream suppliers, manufacturers and downstream users)9.
If it is not clear from the data available or consultation within supply chains and other experts, the Authority will need to apply expert judgement to predict what responses are most likely to occur. If there is no clear conclusion on the most likely responses and they will lead to very different
9 Commercial confidentiality could limit the data and information that relevant actors are willing to provide
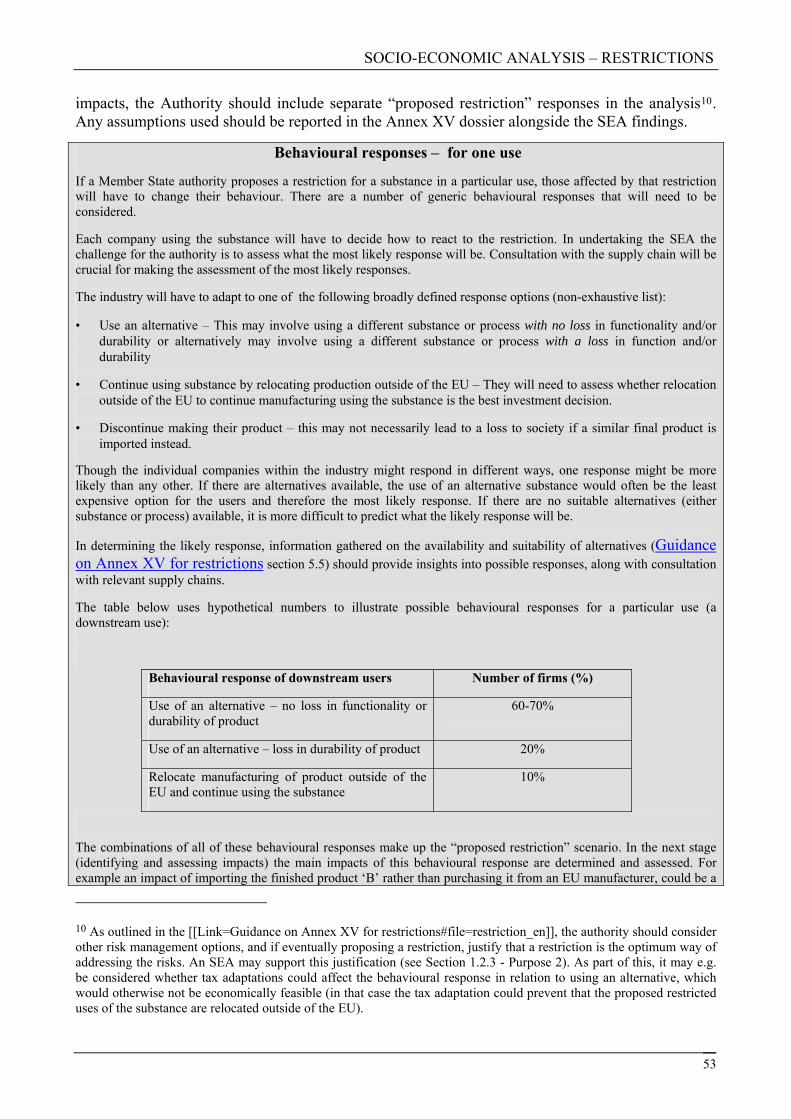
SOCIO-ECONOMIC ANALYSIS – RESTRICTIONS
53
impacts, the Authority should include separate “proposed restriction” responses in the analysis10. Any assumptions used should be reported in the Annex XV dossier alongside the SEA findings.
Behavioural responses – for one use
If a Member State authority proposes a restriction for a substance in a particular use, those affected by that restriction will have to change their behaviour. There are a number of generic behavioural responses that will need to be considered.
Each company using the substance will have to decide how to react to the restriction. In undertaking the SEA the challenge for the authority is to assess what the most likely response will be. Consultation with the supply chain will be crucial for making the assessment of the most likely responses.
The industry will have to adapt to one of the following broadly defined response options (non-exhaustive list):
• Use an alternative – This may involve using a different substance or process with no loss in functionality and/or durability or alternatively may involve using a different substance or process with a loss in function and/or durability
• Continue using substance by relocating production outside of the EU – They will need to assess whether relocation outside of the EU to continue manufacturing using the substance is the best investment decision.
• Discontinue making their product – this may not necessarily lead to a loss to society if a similar final product is imported instead.
Though the individual companies within the industry might respond in different ways, one response might be more likely than any other. If there are alternatives available, the use of an alternative substance would often be the least expensive option for the users and therefore the most likely response. If there are no suitable alternatives (either substance or process) available, it is more difficult to predict what the likely response will be.
In determining the likely response, information gathered on the availability and suitability of alternatives (Guidance on Annex XV for restrictions section 5.5) should provide insights into possible responses, along with consultation with relevant supply chains.
The table below uses hypothetical numbers to illustrate possible behavioural responses for a particular use (a downstream use):
Behavioural response of downstream users Number of firms (%)
Use of an alternative – no loss in functionality or durability of product
60-70%
Use of an alternative – loss in durability of product 20%
Relocate manufacturing of product outside of the EU and continue using the substance
10%
The combinations of all of these behavioural responses make up the “proposed restriction” scenario. In the next stage (identifying and assessing impacts) the main impacts of this behavioural response are determined and assessed. For example an impact of importing the finished product ‘B’ rather than purchasing it from an EU manufacturer, could be a
10 As outlined in the [[Link=Guidance on Annex XV for restrictions#file=restriction_en]], the authority should consider other risk management options, and if eventually proposing a restriction, justify that a restriction is the optimum way of addressing the risks. An SEA may support this justification (see Section 1.2.3 - Purpose 2). As part of this, it may e.g. be considered whether tax adaptations could affect the behavioural response in relation to using an alternative, which would otherwise not be economically feasible (in that case the tax adaptation could prevent that the proposed restricted uses of the substance are relocated outside of the EU).
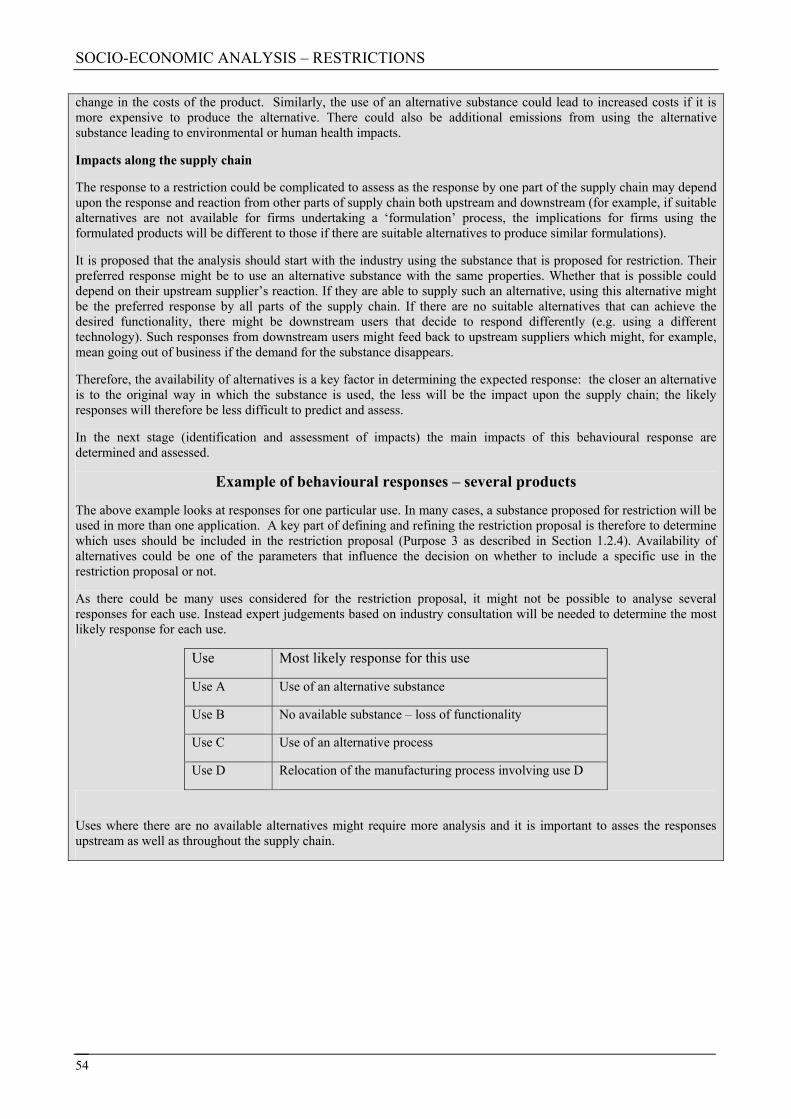
SOCIO-ECONOMIC ANALYSIS – RESTRICTIONS
change in the costs of the product. Similarly, the use of an alternative substance could lead to increased costs if it is more expensive to produce the alternative. There could also be additional emissions from using the alternative substance leading to environmental or human health impacts.
Impacts along the supply chain
The response to a restriction could be complicated to assess as the response by one part of the supply chain may depend upon the response and reaction from other parts of supply chain both upstream and downstream (for example, if suitable alternatives are not available for firms undertaking a ‘formulation’ process, the implications for firms using the formulated products will be different to those if there are suitable alternatives to produce similar formulations).
It is proposed that the analysis should start with the industry using the substance that is proposed for restriction. Their preferred response might be to use an alternative substance with the same properties. Whether that is possible could depend on their upstream supplier’s reaction. If they are able to supply such an alternative, using this alternative might be the preferred response by all parts of the supply chain. If there are no suitable alternatives that can achieve the desired functionality, there might be downstream users that decide to respond differently (e.g. using a different technology). Such responses from downstream users might feed back to upstream suppliers which might, for example, mean going out of business if the demand for the substance disappears.
Therefore, the availability of alternatives is a key factor in determining the expected response: the closer an alternative is to the original way in which the substance is used, the less will be the impact upon the supply chain; the likely responses will therefore be less difficult to predict and assess.
In the next stage (identification and assessment of impacts) the main impacts of this behavioural response are determined and assessed.
Example of behavioural responses – several products
The above example looks at responses for one particular use. In many cases, a substance proposed for restriction will be used in more than one application. A key part of defining and refining the restriction proposal is therefore to determine which uses should be included in the restriction proposal (Purpose 3 as described in Section 1.2.4). Availability of alternatives could be one of the parameters that influence the decision on whether to include a specific use in the restriction proposal or not.
As there could be many uses considered for the restriction proposal, it might not be possible to analyse several responses for each use. Instead expert judgements based on industry consultation will be needed to determine the most likely response for each use.
Use Most likely response for this use
Use A Use of an alternative substance
Use B No available substance – loss of functionality
Use C Use of an alternative process
Use D Relocation of the manufacturing process involving use D
Uses where there are no available alternatives might require more analysis and it is important to asses the responses upstream as well as throughout the supply chain.
54

SOCIO-ECONOMIC ANALYSIS – RESTRICTIONS
2.5 Step 2.4 – Setting the boundaries of the SEA
2.5.1 Overview
Understanding what needs to be included in the SEA is the last step in the scoping phase. It is likely that the boundaries setting out what should be included in the SEA will change to some extent as a result of the next stages in the SEA process when the impacts are further identified and assessed (Stage 3) and compared (Stage 4). This is another reason why it is advisable to conduct the SEA in an iterative way (e.g. having assessed the impacts in more detail it may be necessary to update the time and geographical boundaries of the SEA).
The boundaries of the SEA are determined by:
• The relevant supply chains including the affected markets;
• The time period for the analysis; and
• The geographical coverage of the analysis.
The identification of impacts is described as part of Stage 3. There are no boundaries in regard to the types of impacts to be covered. Any difference – whether this be environmental, health, economic or social – between the baseline scenario and the “proposed restriction” scenario should be included if it is considered to be important.
2.5.2 Relevant supply chains
The “proposed restriction” scenario is defined based on expected responses from the main supply chain. This supply chain needs to be considered all the way to the supply of consumer goods or services.
It is very likely that impacts resulting from the behavioural responses to the restriction will include other supply chains (e.g. those involving production, supply and use of alternatives). It is therefore a key consideration for the Authority as to which other supply chains to include. This was illustrated in the example in section 2.4.
Possible additional supply chains that should be considered are included in Table 2 for various types of “proposed restriction” scenarios (note that this may also include modifications to the existing supply chains where the substance is currently used). However, this should be reconsidered when identifying impacts as this may generate information to suggest to which extent additional supply chains should be considered.
55

SOCIO-ECONOMIC ANALYSIS – RESTRICTIONS
56
Table 2 Which supply chains to include?
Generic responses to a proposed restriction11 Additional relevant supply chains to consider
Use of an alternative (substance or technology);
(e.g. where the restriction prohibits the manufacturing, placing on the market or use of the substance)
The supply chain that delivers the alternative(s).
Potentially supply chains that provide raw materials (for either the substance being proposed to be restricted or to the alternative) if there are any major changes (e.g. use of different raw materials)
Increased import of articles from outside EU, where the substance is being used
(e.g. if there are no restrictions placed on the finished product);
Even though the main focus is on impacts inside EU (See section 2.4.4), it is important that significant impact outside the EU are identified at least qualitatively. E.g. whether they use more or less of the substance and on the way they control the use.
Lower quality of downstream article(s)
(e.g. where there are restrictions on the placing on the market or in the use of the substance for particular uses and the use of the alternatives leads to lower quality products);
In this case there could be additional supply chains if the lower quality of downstream article leads the consumers of that article to substitute to a different product or to change consumption of other products. For example if the article is less energy efficient the supply chain delivering that additional energy needs to be considered (that could for example be a fuel or electricity supply chain).
Some articles no longer being available
The implications for those supply chains that are further downstream (including end-users/consumers), should be included. The result of an article no longer being available could be substitution with another article which implies that the supply chain for that other article should be included.
The relevant supply chains can be identified by determining:
• The physical flow of inputs to the uses proposed for restriction and
• Economic flows through affected markets.
With regard to looking at physical flows of materials one approach would be to draw up a process diagram/tree showing all the material flows in the supply chains to and from the production process related to each use covered by the proposed restriction. This should be done for the baseline as well as for the “proposed restriction” scenario. For example if the use of an alternative substance means use of different raw materials, then the supply chain covering the extraction and processing of the other raw materials needs to be considered. Description of the material flows is important in relation to being able to identify the health and environmental impacts. Guidance on how to identify human health and environmental impacts are included in Section 3.4.
There could be situations where the response in the “proposed restriction” scenario would result in an increase in the price of the product (for example if an alternative more expensive technology would be used). Such a prince increase could result in consumers switching to other products. In
11 The full scenario will obviously be defined in more detail, including predicted responses of the various actors within the supply chains.
SOCIO-ECONOMIC ANALYSIS – RESTRICTIONS
57
such a situation the supply chains delivering the other products should be included as a relevant supply chain.
2.5.3 Time period for the SEA
There are several aspects to setting the appropriate time period. Although these aspects are only partly related to the boundaries of the analysis they can affect the way data on impacts are collected and assessed and therefore are included in this section12.
The most important aspect on setting the time period is to make sure that all relevant impacts are included irrespectively of when they might occur in time. The difficulty in setting an appropriate time period comes from the fact that all impacts are results of potentially long cause-effects relationships. It means that no matter how long a time period is used in the analysis, there are likely to be impacts that occur beyond that time period chosen. In particular the environmental and health impacts could appear long after the emissions have take place (certain substances may persist in the environment for many years or where the effects associated with exposure are not manifested within the time period, such as for carcinogenicity). Often long term impacts can only be described qualitatively. For example, the impact from accumulation of persistent substances will be very difficult to quantify. It is generally not difficult to qualitatively describe how a substance could accumulate and therefore could have increasing effects over time.
The next aspect to consider when setting the appropriate time period is inter-related to the determination of relevant impacts. This aspect of setting the time period is mainly about defining the time period for the cause (part of the cause-effect relationship). The cause represents the changes introduced under the “proposed restriction” scenario, for example, the use of an alternative substance or technology, as compared to the baseline scenario (continued use of the substance without restriction). The methodological choice is whether to base the assessment over a cumulative time period of, for instance, 20 years or use an annual basis based on a representative year of, for instance, 2030 (where all relevant numbers are expressed as equivalent annual costs or annual benefits in 2030).
For the practical organisation of the analysis, the first step would be to define a typical investment cycle for the uses addressed by the proposed restriction (for example 20 years). Thereafter there are two basic methodological approaches to carrying out the analysis:
• If there are no major changes in the future (e.g. the trend is linear) and a representative year can be defined, then select a representative year, for instance 2030, as the basis for the analysis as it will make it simple to conduct.
• The definition of either the “baseline” or the “proposed restriction” scenarios may involve significant changes in the trends in use of the substance. This may occur e.g. because of the development of technology/process, developments in other relevant legislation, or where the proposed restriction includes different time derogations for different uses. In such cases a cumulative period of, for instance, 20 years (covering e.g. 2010-2030) should be selected.
Having chosen one of the time period approaches for the analysis it is important that impacts reaching beyond the selected time period are considered. If impacts are considered in a qualitative
12 Setting the time period could be seen as an element of making the analysis consistent which is otherwise described in Chapter 3, Section 3.8)

SOCIO-ECONOMIC ANALYSIS – RESTRICTIONS
58
way, the description should include the extent of the impacts in the future. If quantification is undertaken, section 3.7.3 includes guidance on how to take account of future impacts in a consistent way.
Finally, there is an aspect of time period to consider which relates to the timing of the introduction of the restriction. This should have been defined under description of the “proposed restriction” scenarios (Section 2.3)13. The shorter the “transition” time relevant actors in the supply chain have, the higher the potential costs of compliance, but also the benefits of early action).
2.5.4 Geographical area covered by the SEA
The Authority should already have attempted to describe the likely responses to the proposed restriction. Such responses may cause changes and have impacts that occur outside as well as inside the European Union.
In setting the geographical coverage and undertaking the assessment of impacts, it should be kept in mind that the final comitology decision (see 'Regulatory procedure with scrutiny' in the glossary) on whether or not to implement a restriction will most likely focus mainly on impacts inside the EU.
As a consequence, it is recommended that the emphasis be placed on describing and possibly quantifying what happens inside the EU. However, responses/impacts outside the EU should not be neglected and significant impacts should as a minimum be described qualitatively.
A clear distinction should be made between impacts inside and impacts outside of the EU boundaries, whenever reporting on impacts.
2.6 Example of Stage 2
This worked example is built upon an example used in Guidance on Annex XV for restrictions using a substance called ‘substance E’. More background information can be found in Guidance on Annex XV for restrictions Example 2. This example14 focuses on one particular use (use ‘A’).
Background information (as described in Guidance on Annex XV for restrictions)
Substance E:
“A liquid/gas is produced in the European Union at a volume of ~100,000 tonnes. Substance E is already regulated in the working environment with occupational exposure limits already in force in x Member States”.
“With regard to the inhalation irritating properties of the substance, the Chemical Safety Report (CSR) shows that the use of Personal Protective Equipment (PPE) successfully reduces the risk to occupational health. However, the Authority has reasons to question this both due to evidence that PPE is not used in practice (in other words the Exposure Scenario is not applied correctly by DUs) and due to lower efficiency of PPE than assumed in the CSR”.
13 Under purpose 3 (about setting the scope of the proposed restriction, see Section 1.2) it will be important to consider the effects on the time boundary under different conditions and/or scopes of a restriction.
14 Theoretical numbers have been used for illustrative purposes so references to data sources can not be included. In practice, Authorities should include reference to all data sources for all SEAs submitted to the SEA committee. This example may therefore oversimplify the actual problems faced in real SEA.

SOCIO-ECONOMIC ANALYSIS – RESTRICTIONS
Use ‘A’:
“Building surface cleaning cannot be minimised by normal workplace protection procedures (including PPE) due to the very high irritancy of the substance and due to current practices in the industry, especially the presence of mobile workplaces within many small-sized enterprises. Moreover, statistical data from authorities in Member States suggest that a considerable number of people employed in the cleaning industry are admitted to hospital with respiratory problems each year and these problems appear to be associated with the use of solutions of Substance E”.
STAGE 1: AIMS OF THE SEA
Aims of the SEA
The aim of the SEA is to:
• Determine whether a possible restriction on the manufacture, placing on the market or the use of substance ‘E’ is the most appropriate Community-wide action compared to other RMOs;
• To assess the net benefits of the proposed restriction to human health and the environment and the net costs to manufacturers, importers, downstream users, distributors, consumers and society as a whole.
STAGE 2: SCOPING PHASE
“Baseline” scenario
The situation in the absence of any further RMO is that substance ‘E’ will continue be used for cleaning the surfaces of buildings (use ‘A’) in x Member States. Of the ~100,000 tonnes per annum, the building surface industry has historically used approximately 10,000-44,000 tonnes per annum of substance ‘E’ across the EU (based on sales over the last ten years). Due to increasing demand for housing there is expected to be a 1% increase per annum in demand for building cleaning and therefore in the use of substance ‘E’.
“Proposed restriction” scenario
The proposed restriction is to ban the use of substance ‘E’ for use ‘A’ at a Community-wide level with phase out of the substance within 18 months. There is no current restriction on the manufacture and placing on the market of substance ‘E’. No behavioural change is expected by manufacturers of substance ‘E’ since no restrictions are being proposed on manufacturing substance ‘E’ although a significant proportion of the market may disappear (this will depend on what percentage use ‘A’ - cleaning buildings – in the EU makes up on overall sales of substance ‘E’. It is currently high at 10-44% and is possibly increasing) which may prompt them to consider production levels in the context of likely future demand and hence influence any future investments. The proposed restriction may prompt several behavioural responses by existing building cleaning companies:
• Use an alternative (substance or process) to clean buildings;
• No longer clean buildings;
NB! During the work on optimising the scope/conditions of the restriction (see Section 1.2.4 – Purpose 3), one may also consider whether non-compliance with a possible restriction could take place, for example if the substance is available for other uses. However, for the eventually proposed restriction, the Authority needs to demonstrate practicability and enforceability of the proposed restriction. In other words, non-compliance should therefore not be a realistic scenario in relation to the eventually proposed restriction.
There is no simple method that can be used to predict the most likely response or combination of responses (a mixed response is possible). In this example, the use of an alternative substance is the most likely outcome. In reality a change of process could also occur although it may require significant investments which in some cases would be too high to warrant the expenditure.
An identified alternative substance, a mild bleach-based solution, could be used to scrub and jet-wash buildings without using substance ‘E’. Using this alternative is likely to be less expensive in material prices than using substance ‘E’ but it is not as effective as a cleaning product. It is anticipated that the time required to clean building surfaces (per square metre) is likely to double when using the alternative. Existing safety requirements for the alternative (the product should be used in a well ventilated area and not orally consumed) are sufficient to prevent any human health risks with no need for personal protective equipment (PPE). This is unlike substance ‘E’ which has been associated with several cases of respiratory problems within the industry when workers have not used personal protective equipment.
59
SOCIO-ECONOMIC ANALYSIS – RESTRICTIONS
Delayed restriction scenario - Phase out use of the substance within 6 years (i.e. Purpose 3 – see section 1.2.4)
Here the conditions of the restriction is changed where there is a mandatory phase out of substance ‘E’ for cleaning buildings (use ‘A’) within 6 years. No constraints have been placed on the use of the substance in these 6 years, although after this period use of the substance at a concentration of > 0,1 % (w/w) will not be allowed. This will allow industry time to develop an alternative cleaning solution which reduces occupational health risks, but which is equally technically and economically feasible from them to use. If this alternative is not available, then the alternative substance used in the proposed restriction could be used which is anticipated to double the time taken to clean building compared to using substance ‘E’.
Voluntary agreement scenario (“RMO 1”) Stepwise phase-out within 10 years, follow-up and reporting on the progress in identifying suitable alternatives
A possible alternative risk management option (RMO) is voluntary action by the building cleaning industry to either alter the process involved or to cease use of the substance in order to reduce risks. Any action would be voluntary and would only be effective if adopted by the main building cleaning companies in the EU. Companies have agreed to actively seek an alternative substance which is equally technically and economically feasible to use with a step-wise phase within 10 years. However this will take several years based on the lack of alternative substances which are both technically and economically feasible to use. The findings of the search for alternatives are to be reported. Therefore the occupational heath risks are unlikely to change for the next few years.
Developing and implementing an occupational exposure limit (“RMO 2”)
The final RMO considered would allow the continuation of substance ‘E’ to clean building surfaces but subject to an occupational exposure limit. This may allow companies to continue using existing infrastructure but it could take longer to clean buildings. There are two possible types of occupational exposure limits being considered: Under the Chemical Agents Directive the Commission sets Binding Occupational Exposure Limit Values (BOELVs) and Indicative Occupational Exposure Limit Values (IOELVs). Limits can also be set under the Carcinogens Directive.
60
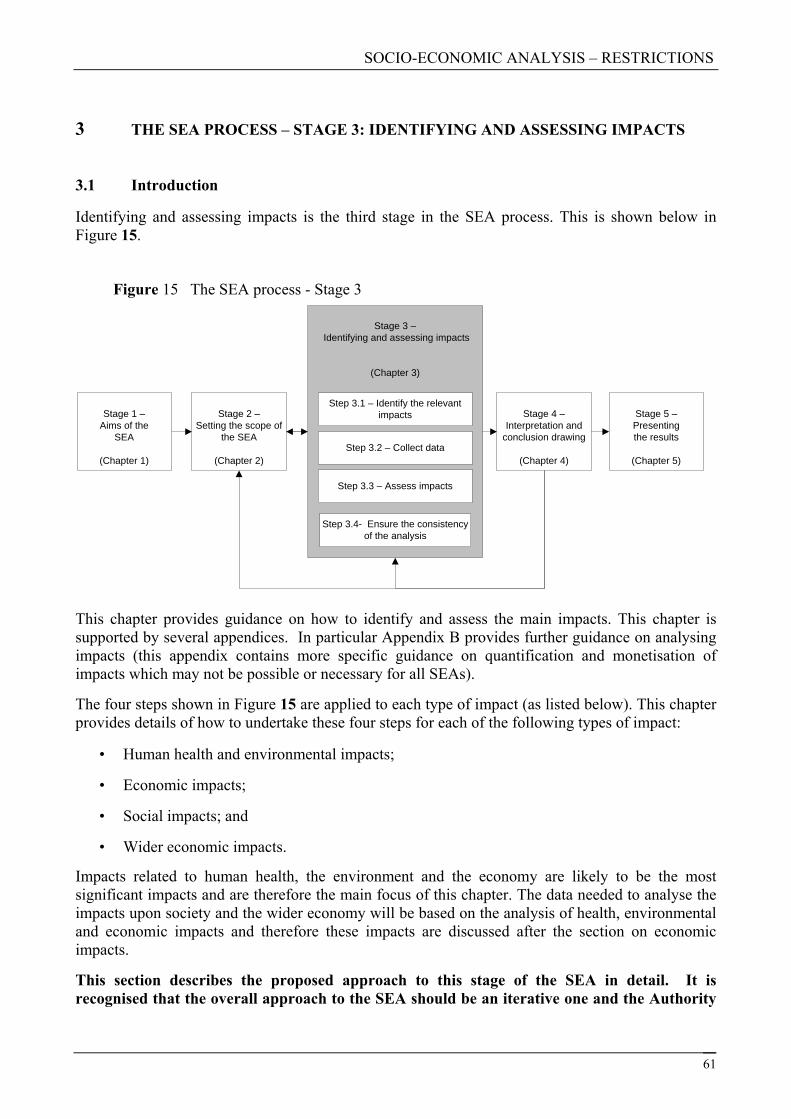
SOCIO-ECONOMIC ANALYSIS – RESTRICTIONS
3 THE SEA PROCESS – STAGE 3: IDENTIFYING AND ASSESSING IMPACTS
3.1 Introduction
Identifying and assessing impacts is the third stage in the SEA process. This is shown below in Figure 15.
Figure 15 The SEA process - Stage 3
Stage 3 – Identifying and assessing impacts
(Chapter 3)
Stage 4 –Interpretation and
conclusion drawing
(Chapter 4)
Stage 5 –Presenting the results
(Chapter 5)
Stage 2 –Setting the scope of
the SEA
(Chapter 2)
Stage 1 –Aims of the
SEA
(Chapter 1)
Step 3.1 – Identify the relevant impacts
Step 3.2 – Collect data
Step 3.3 – Assess impacts
Step 3.4- Ensure the consistency of the analysis
This chapter provides guidance on how to identify and assess the main impacts. This chapter is supported by several appendices. In particular Appendix B provides further guidance on analysing impacts (this appendix contains more specific guidance on quantification and monetisation of impacts which may not be possible or necessary for all SEAs).
The four steps shown in Figure 15 are applied to each type of impact (as listed below). This chapter provides details of how to undertake these four steps for each of the following types of impact:
• Human health and environmental impacts;
• Economic impacts;
• Social impacts; and
• Wider economic impacts.
Impacts related to human health, the environment and the economy are likely to be the most significant impacts and are therefore the main focus of this chapter. The data needed to analyse the impacts upon society and the wider economy will be based on the analysis of health, environmental and economic impacts and therefore these impacts are discussed after the section on economic impacts.
This section describes the proposed approach to this stage of the SEA in detail. It is recognised that the overall approach to the SEA should be an iterative one and the Authority
61

SOCIO-ECONOMIC ANALYSIS – RESTRICTIONS
should undertake this stage at a level of detail appropriate to that of the SEA iteration being undertaken.
As with all stages in the SEA process, the Authority should give consideration to the uncertainties present in available data. The implications of uncertainties should be considered and acknowledged in the presentation of the assessment of impacts.
3.2 Step 3.1 - How to identify the main impacts
The steps below outline a proposed approach to identifying the main differences in impacts between the scenarios. This process is summarised in Figure 16. This work should of course build on the relevant supply chains and other boundaries as identified and defined in Stage 2.
Step 3.1 a Create a list of impacts
Appendix G of this guidance contains a non-exhaustive checklist of questions that may lead to the identification of impacts. The consultation undertaken may also allow relevant impacts to be identified.
The checklists can be used to assist the screening process i.e. to show that all the impacts have been considered and either taken forward or not considered further, but not missed. Submitting the completed checklists as part of the documentation would therefore improve the transparency of the analysis, but a key aspect is to ensure any decisions made and assumptions used are documented.
The EC Impact Assessment Guidelines – chapter 4 (15 June 2005) also introduces a useful approach to identify impacts which may support the screening of impacts (Step 3.1.b) by building causal conceptual models. These models can be built in the form of diagram or matrix and should be able to identify impacts and their interrelations.
Step 3.1 b Screen the impacts (only consider the major impacts)
Guidance on how to determine whether an identified impact is sufficiently significant for it to be brought forward is presented as part of the guidance on each type of impact.
All impacts considered a ‘main impact’ in the checklist should be considered further but if it is not possible to determine whether some of the impacts in the checklist should be considered further, there are several approaches which may help:
• Gather more information (through a desk based study);
• Gain opinions from experts (remember to document their opinion and any assumptions that may have been used in the SEA report); this could include a written consultation or a workshop event, with experts (or industries representatives and trade associations) specifically to help determine whether these impacts should be analysed in more detail.
62

SOCIO-ECONOMIC ANALYSIS – RESTRICTIONS
Figure 16 How to determine the main impacts
3.3 Important considerations when collecting and assessing impacts
There are a few principles that will make collecting and assessing the impacts more efficient:
1. Conduct the analysis of impacts using a stepwise approach (see Figure 17);
2. Focus on the differences in impacts between each scenario;
3. Try to reduce key uncertainties that may arise in the analysis when it is feasible to do so;
4. Avoid double counting an impact along the supply chain.
3.3.1 Consider using a stepwise approach
The level of resources devoted to analysing impacts should be proportionate to the level of analysis required in order to be able to produce a robust conclusion as to whether a restriction is the most appropriate RMO and whether the benefits of the proposed restriction outweigh the costs. A stepwise approach is recommended, starting with a qualitative analysis of impacts. This is illustrated below in Figure 17. If SEA arguments are used to provide supporting information within the restriction proposal, the Authority will need to decide whether the value of this supporting information could be improved by further quantifying and monetising the impacts.
63
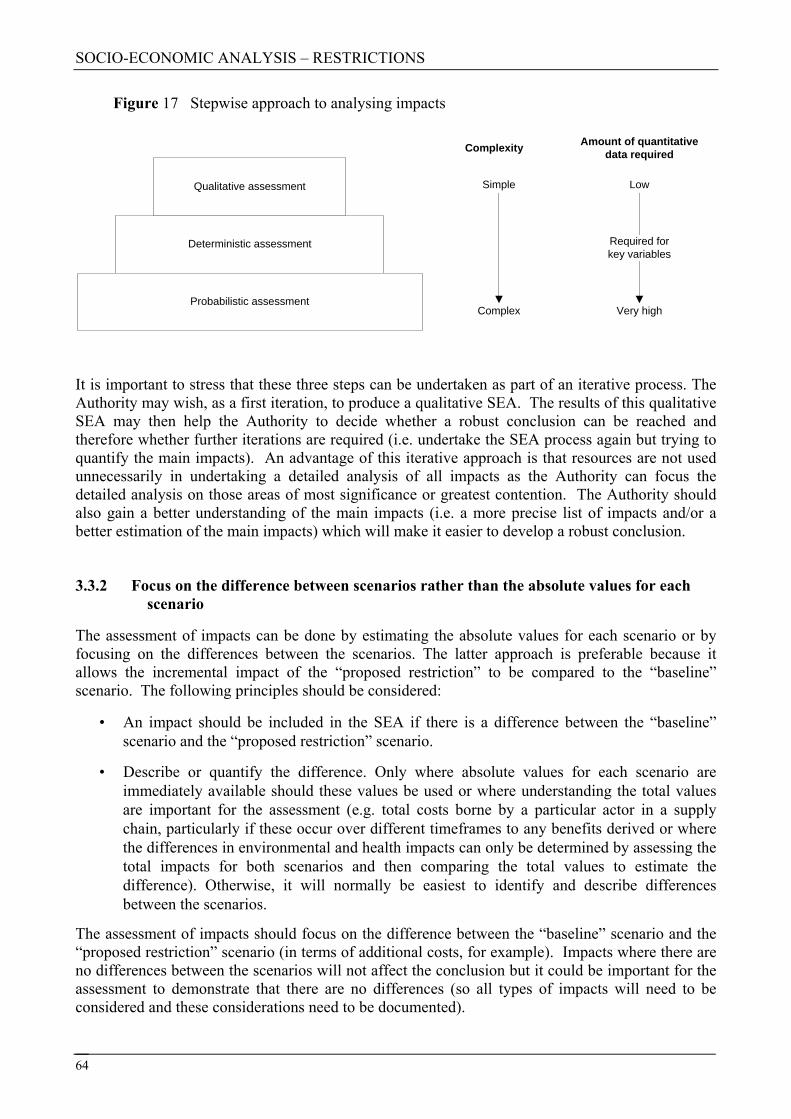
SOCIO-ECONOMIC ANALYSIS – RESTRICTIONS
Figure 17 Stepwise approach to analysing impacts
Deterministic assessment
Probabilistic assessment
Qualitative assessment
Required for key variables
Very high
Low
Complex
Simple
Complexity Amount of quantitative data required
It is important to stress that these three steps can be undertaken as part of an iterative process. The Authority may wish, as a first iteration, to produce a qualitative SEA. The results of this qualitative SEA may then help the Authority to decide whether a robust conclusion can be reached and therefore whether further iterations are required (i.e. undertake the SEA process again but trying to quantify the main impacts). An advantage of this iterative approach is that resources are not used unnecessarily in undertaking a detailed analysis of all impacts as the Authority can focus the detailed analysis on those areas of most significance or greatest contention. The Authority should also gain a better understanding of the main impacts (i.e. a more precise list of impacts and/or a better estimation of the main impacts) which will make it easier to develop a robust conclusion.
3.3.2 Focus on the difference between scenarios rather than the absolute values for each scenario
The assessment of impacts can be done by estimating the absolute values for each scenario or by focusing on the differences between the scenarios. The latter approach is preferable because it allows the incremental impact of the “proposed restriction” to be compared to the “baseline” scenario. The following principles should be considered:
• An impact should be included in the SEA if there is a difference between the “baseline” scenario and the “proposed restriction” scenario.
• Describe or quantify the difference. Only where absolute values for each scenario are immediately available should these values be used or where understanding the total values are important for the assessment (e.g. total costs borne by a particular actor in a supply chain, particularly if these occur over different timeframes to any benefits derived or where the differences in environmental and health impacts can only be determined by assessing the total impacts for both scenarios and then comparing the total values to estimate the difference). Otherwise, it will normally be easiest to identify and describe differences between the scenarios.
The assessment of impacts should focus on the difference between the “baseline” scenario and the “proposed restriction” scenario (in terms of additional costs, for example). Impacts where there are no differences between the scenarios will not affect the conclusion but it could be important for the assessment to demonstrate that there are no differences (so all types of impacts will need to be considered and these considerations need to be documented).
64
SOCIO-ECONOMIC ANALYSIS – RESTRICTIONS
3.3.3 Minimise key uncertainties that arise in the analysis (if it is feasible to do so)
The SEA is likely to be partly based on assumptions, projections and predictions about the likely behavioural response of actors in relevant supply chains, on their future usage (of the substance or an alternative substance) and the significance of each impact under the relevant scenarios. During the analysis it should become more apparent what the key uncertainties are.
The greater the uncertainty, the less confidence there will be in the predicted impacts. The Authority or interested party should try to minimise these key uncertainties during their data collection process and should demonstrate the implications of uncertainties in their analysis. As part of the analysis, the Authority or interested party should focus on uncertainties that are likely to have the greatest impact i.e. those that prevent the Authority or interested party from developing a robust conclusion.
It is important to realise that some uncertainties will be impossible to eliminate (e.g. due to a lack of scientific knowledge about the effects of a substance). These are known as residual uncertainties. Guidance on how to analyse uncertainties is provided section 4.4.
3.3.4 Avoid double counting an impact along the supply chain
It will be necessary to determine the likely response of each actor along the supply chain to the proposed restriction. This is likely to be best achieved through consultation with affected actors along each relevant supply chain (see the previous chapter for further details).
When determining the real cost of the proposed restriction it is important to avoid double counting impacts along the supply chain, so as to not exaggerate the impacts. If a manufacturer can pass on any additional cost along the supply chain, the Authority should not consider this a cost to that actor.
There is another aspect of potential double counting that should be considered. Payment of environmental charges and taxes sometimes constitutes internalisation of external environmental costs. If that is the case, then these environmental costs should not be covered under the environmental and human health impacts. In practise, this aspect should be dealt with by considering if any of the environmental costs are in already covered under the economic impacts.
Another example is that the costs associated with worker health are only covered under health and environmental impacts, and are not additionally included under economic and/or social impacts.
In general, it should be assured that a given impact is only counted under one impact heading.
By being transparent about how impacts are allocated and calculated (e.g. the methodology, what factors make up the estimate and what variables were used), it should make it clear to the reader that impacts have not been double counted. This will improve the credibility of the SEA.
65
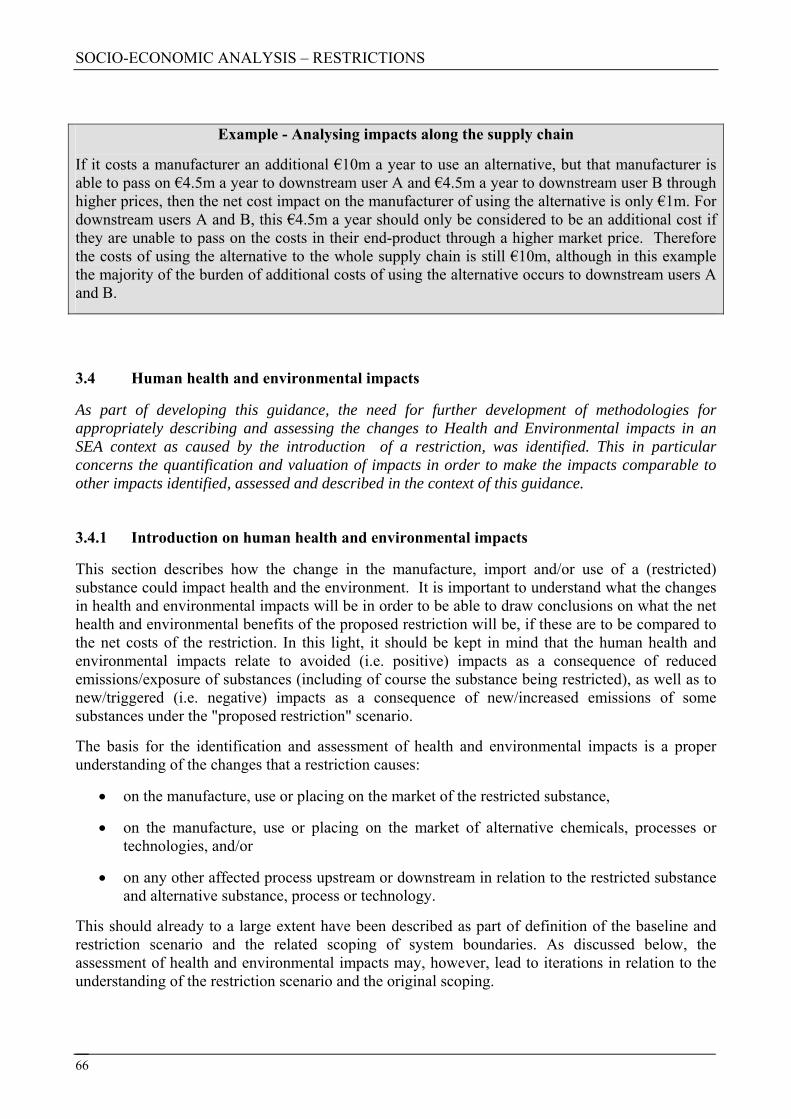
SOCIO-ECONOMIC ANALYSIS – RESTRICTIONS
Example - Analysing impacts along the supply chain
If it costs a manufacturer an additional €10m a year to use an alternative, but that manufacturer is able to pass on €4.5m a year to downstream user A and €4.5m a year to downstream user B through higher prices, then the net cost impact on the manufacturer of using the alternative is only €1m. For downstream users A and B, this €4.5m a year should only be considered to be an additional cost if they are unable to pass on the costs in their end-product through a higher market price. Therefore the costs of using the alternative to the whole supply chain is still €10m, although in this example the majority of the burden of additional costs of using the alternative occurs to downstream users A and B.
3.4 Human health and environmental impacts
As part of developing this guidance, the need for further development of methodologies for appropriately describing and assessing the changes to Health and Environmental impacts in an SEA context as caused by the introduction of a restriction, was identified. This in particular concerns the quantification and valuation of impacts in order to make the impacts comparable to other impacts identified, assessed and described in the context of this guidance.
3.4.1 Introduction on human health and environmental impacts
This section describes how the change in the manufacture, import and/or use of a (restricted) substance could impact health and the environment. It is important to understand what the changes in health and environmental impacts will be in order to be able to draw conclusions on what the net health and environmental benefits of the proposed restriction will be, if these are to be compared to the net costs of the restriction. In this light, it should be kept in mind that the human health and environmental impacts relate to avoided (i.e. positive) impacts as a consequence of reduced emissions/exposure of substances (including of course the substance being restricted), as well as to new/triggered (i.e. negative) impacts as a consequence of new/increased emissions of some substances under the "proposed restriction" scenario.
The basis for the identification and assessment of health and environmental impacts is a proper understanding of the changes that a restriction causes:
• on the manufacture, use or placing on the market of the restricted substance,
• on the manufacture, use or placing on the market of alternative chemicals, processes or technologies, and/or
• on any other affected process upstream or downstream in relation to the restricted substance and alternative substance, process or technology.
This should already to a large extent have been described as part of definition of the baseline and restriction scenario and the related scoping of system boundaries. As discussed below, the assessment of health and environmental impacts may, however, lead to iterations in relation to the understanding of the restriction scenario and the original scoping.
66
SOCIO-ECONOMIC ANALYSIS – RESTRICTIONS
With regard to impacts associated with alternative substances or techniques the information can be scarce. This is particularly likely to be the case for impacts not directly linked to the substance/alternative (for instance changes in energy consumption up or down the supply chain). Annex XV requires the authority to document information available to them on risks, availability and technical/economical feasibility of alternatives. There is no requirement to assess the risks associated with alternative substances or techniques in the same detail as the risks associated with the substance of concern (see Guidance on Annex XV for restrictions). However, for the SEA, it might be useful to consider more detailed description of significant health and environmental impacts related to the proposed restriction, including impacts of reduced/abandoned manufacture, use ore placing on the market of the substance of concern and impacts of the anticipated implementation of the identified alternative substance or technology or other significant health and environment impacts. In line with the general principles in this guidance, it is basically the choice of the authority proposing a restriction to present a robust and unbiased SEA covering all relevant impacts (see also Chapter 2 scoping phase).
When assessing health and environmental impacts, a stepwise approach is proposed, whereby the assessment focuses on those health and environmental impacts that are considered to be significant outcomes of the restriction, with the level of detail and quantification applied determined by the extent to which further information will contribute to developing a robust SEA. Throughout the process, judgements will need to be made (drawing on the expertise of others as appropriate) on what impacts are likely to be significant and how these can best be assessed.
The two main challenges are to identify the scope of relevant impacts (i.e. how 'wide' to go) and the extent to which impacts are quantified (how 'deep' to go). In relation to the latter, it should be considered that the outcome of this chapter should be compared to the changes in impacts identified in other parts of this guidance.
Figure 18 and the related text below describe the steps that can be taken to identify, assess and valuate the impacts.
67
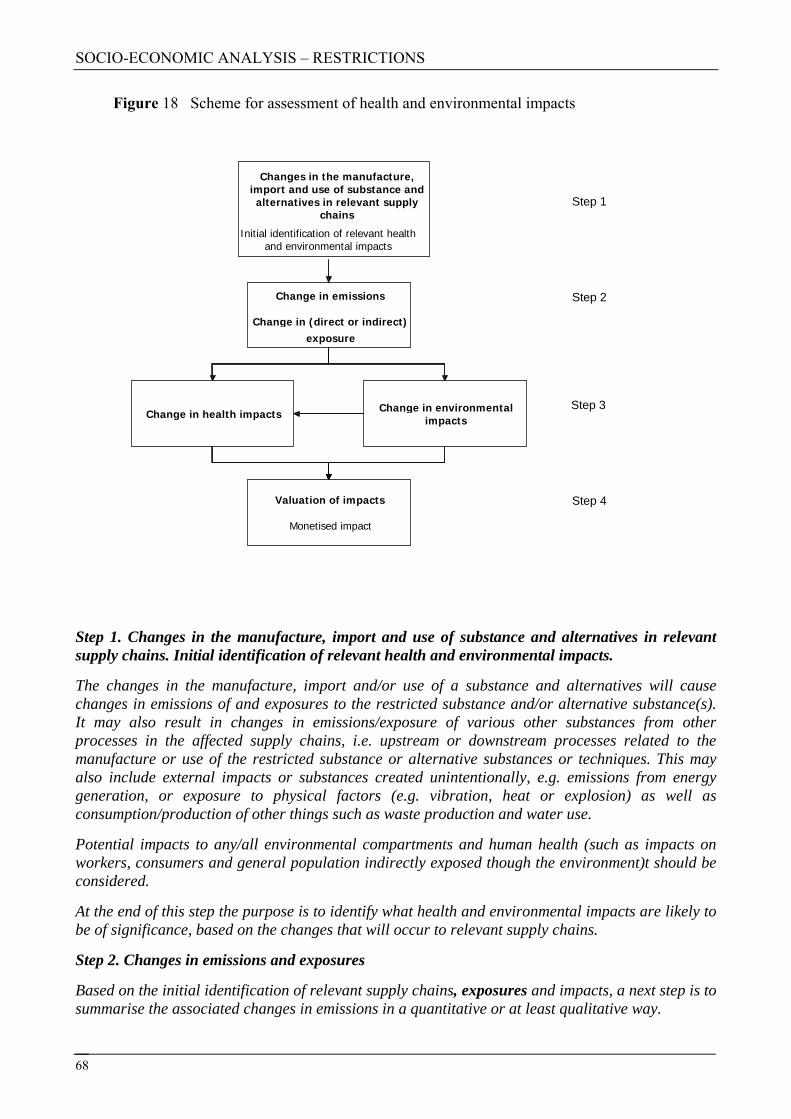
SOCIO-ECONOMIC ANALYSIS – RESTRICTIONS
Figure 18 Scheme for assessment of health and environmental impacts
Changes in the manufacture, import and use of substance and alternatives in relevant supply
chains
Step 1. Changes in the manufacture, import and use of substance and alternatives in relevant supply chains. Initial identification of relevant health and environmental impacts.
The changes in the manufacture, import and/or use of a substance and alternatives will cause changes in emissions of and exposures to the restricted substance and/or alternative substance(s). It may also result in changes in emissions/exposure of various other substances from other processes in the affected supply chains, i.e. upstream or downstream processes related to the manufacture or use of the restricted substance or alternative substances or techniques. This may also include external impacts or substances created unintentionally, e.g. emissions from energy generation, or exposure to physical factors (e.g. vibration, heat or explosion) as well as consumption/production of other things such as waste production and water use.
Potential impacts to any/all environmental compartments and human health (such as impacts on workers, consumers and general population indirectly exposed though the environment)t should be considered.
At the end of this step the purpose is to identify what health and environmental impacts are likely to be of significance, based on the changes that will occur to relevant supply chains.
Step 2. Changes in emissions and exposures
Based on the initial identification of relevant supply chains, exposures and impacts, a next step is to summarise the associated changes in emissions in a quantitative or at least qualitative way.
Initial identification of relevant health and environmental impacts
Change in emissions
Change in (direct or indirect)exposure
Change in health impacts Change in environmental impacts
Step 1
Step 2
Step 3
Valuation of impacts Step 4
Monetised impact
68
SOCIO-ECONOMIC ANALYSIS – RESTRICTIONS
Step 3. Change in Health and Environmental Impacts
The exposure may lead to – depending on the characteristics of the substance and the level of exposure – an unwanted impact of the substance on human health or the environment. Examples of unwanted human health impacts are skin irritation and cancer, and for environmental impacts toxic impacts on populations and secondary impacts at ecosystem level, deterioration of habitats and ultimately extinction of species. When assessing impacts one needs initially to assess qualitatively how the changes in emissions and exposure (that result from the restriction) may affect the impacts. This may include a range of other health and environmental impacts in addition to the toxic/ecotoxic impacts of the substance and alternatives.
In some cases the identified changes in impacts can be quantified in physical terms (e.g. by assessing how many cases of skin irritation or cancer would be reduced per year as a result of the restriction or the expected reduced impact in a population of a certain species in a specific local environment), while in other cases they can only be described in qualitative or semi-quantitative terms (e.g. number of workers exposed to a carcinogen or the percentage of species in an environmental compartment that are likely to be affected).
To the extent the impacts can be quantified, it is possible to move to the next step; the valuation/monetisation of impacts.
Step 4. Valuation of impacts
The final step is to give a further interpretation of the changes in impacts. This may be done as damage indicators and/or by assigning monetary values to the identified impacts.
It is possible to give monetary values for several quantified human health impacts. In some cases it is also possible to give monetary values for environmental impacts. By applying these values, one can monetise the human health and the environment impacts due to an imposed restriction.
The above outline is used as the conceptual framework for identifying, assessing and, if possible, quantifying, and ultimately valuating health and environmental impacts.
Section 3.4.2.2 describes how to identify relevant supply chains affected by the restriction and how to make an initial identification of relevant health and environmental impacts; section 3.4.3 further addresses how to identify changes in emissions and exposure. Section 3.4.4 addresses how to determine, assess and if possible quantify impacts; and Section 3.4.5 deals with the valuation of impacts. Possible sources of data are highlighted and example boxes provided.
As indicated above, it will not be possible to quantify (Step 3) or give values (Step 4) to all impacts. However, the aim should be to at least qualitatively describe the main changes in health and environmental impacts foreseen as a result of a restriction. Finally, section 3.4.6 describes how results may be reported.
Some iteration may be needed as the data collection takes place throughout the exercise. This may, for example, point to new relevant emissions that were not thought of initially, or it may turn out that during quantification of impacts an emission initially considered important is of less relevance. Therefore, as a starting point the scope of the exercise should be as broad as possible. In this way one makes sure that important aspects are not overlooked. The scope should cover changes in the entire supply chain(s) of both the substance of concern and the alternative and include direct and indirect emissions/exposures and impacts.
69

SOCIO-ECONOMIC ANALYSIS – RESTRICTIONS
3.4.2 Changes in the manufacture, import and use of substance and alternatives in relevant supply chains and initial identification of relevant impacts
3.4.2.1 Relevant supply chains
The relevant supply chains to consider are all those supply chains where there will be a difference between the restriction and the baseline scenarios; i.e. ‘what will happen’ if a restriction is implemented. These should already be largely described in the scoping and definition of baseline and restriction scenarios. At this point it should be considered in more detail what the changes in emissions/exposures/impacts will be in the affected supply chains and whether all relevant supply chains were initially identified. In other words, the activities may lead to iterations. The following gives some idea of the type of questions/considerations that are relevant at this stage of the assessment.
Consider whether an implemented restriction will cause more or less emissions/exposure/impacts:
• Upstream: For example, if another substance fulfils the function(s) of the restricted substance it will lead to differences in emissions/exposure/impacts upstream to the restricted substance (lesser emissions), as well as upstream to the alternative (higher emissions)?
• Manufacture: There will of course be lower emissions/exposures/impacts of the restricted substance and other substances used/generated during that manufacture; and higher emissions of a possible alternative substance as well as other substances used/generated during that manufacture.
• Downstream: For example, will an alternative substance/technology trigger lower or higher emissions and/or different resource use and/or different consumer/worker exposure?
• Other affected supply chains: For example, will it require less or more energy or reduce or increase other emissions in the processing steps needed to produce a different technology fulfilling the function(s) of the restricted substance?
• Overall, there will be reduced emissions/exposure/impacts for the restricted substance and increases directly related to the alternative(s). However, for emissions of other substances and for other types of impacts (e.g. energy use), impacts at all supply-chain stages may potentially increase or decrease, depending upon the particular circumstances.
If the proposed restriction could lead to use of an alternative substance, then the supply chains producing and using that alternative should be considered (including end-of-life stages). The procedure will be, subject to the need and accessibility of information, to look at raw material production, production of the two substances, use of the two substances throughout the supply chains and final disposal of any downstream user products.
If the restriction scenario implies use of alternative technology, the procedure is similar. The supply chain for the alternative technology should be included. For example, it should include considerations of whether there is equipment which causes any significant emissions or other impacts during manufacture (including the raw material use for the equipment).
The extent to which the analysis of different supply chains needs to be conducted should depend upon the overall level of detail that is likely to be practicable and proportionate to demonstrating the relevant impacts of the proposed restriction.
70

SOCIO-ECONOMIC ANALYSIS – RESTRICTIONS
3.4.2.2 Initial identification of relevant health and environmental impacts
The basis for proposing a restriction will relate to the risks to human health and/or the environment associated with the substance. There should already be a good understanding of the risks associated with the substance in question arising as a result of its properties and its emissions/exposures. As noted in the beginning of this section, the restriction proposal will in any case also have to consider available information related to the risks/impacts of alternative substances and technologies.
In the SEA, consideration should also be given to other relevant changes of impacts in relevant supply chains that will be caused by introducing anticipated alternative substance/technology as compared to continued use of the substance under the baseline scenario.
The starting point in this further analysis will often be to look at changes in emissions/exposures of the restricted substance and changes in emissions/exposures of substances closely related to the response described in the "proposed restriction" scenario, including foreseen use of alternatives; as well as the possible changes in (eco-)toxic impacts of these.
For example, where there is a ‘drop-in’ alternative substance with a similar production and use pattern, a comparison of the hazardous properties of the two (or more) substances may provide useful information on determining what types of impacts are likely to be relevant: those for the substance that are addressed by the restriction and those for the alternative substance that may be introduced as a result of using that alternative. However, in this case, consideration should also be given to the (eco-)toxic impacts of other substances used in the production of the substance of interest and of unwanted by-products to which relevant exposure conditions might occur.
In many cases, a restriction is likely to result in wider changes to the supply chains that could have other impacts on human health and the environment. This should in all cases be considered when the expected alternatives are alternative processes or technologies.
Consideration should be given to the types of impacts that may occur at each stage of the supply chains (from raw material extraction to ultimate disposal).
A non-exhaustive list of the types of health and environmental impacts that may be relevant is provided in Example 1.
71
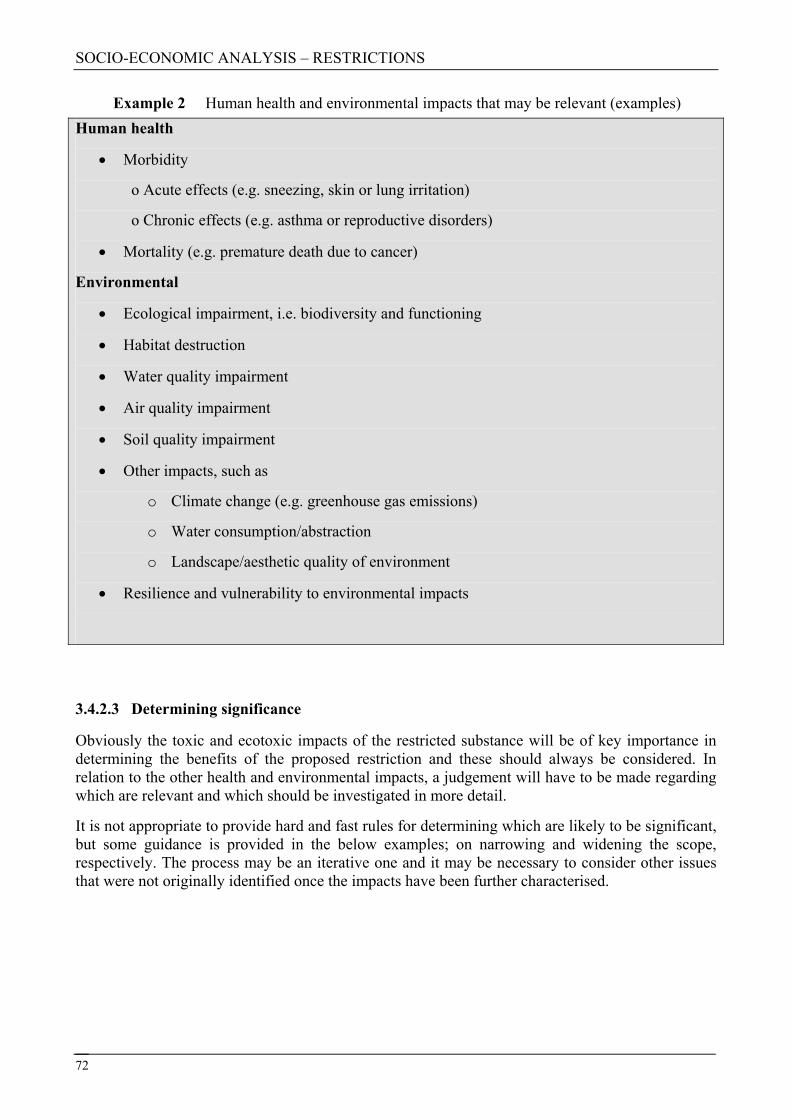
SOCIO-ECONOMIC ANALYSIS – RESTRICTIONS
Example 2 Human health and environmental impacts that may be relevant (examples) Human health
• Morbidity
o Acute effects (e.g. sneezing, skin or lung irritation)
o Chronic effects (e.g. asthma or reproductive disorders)
• Mortality (e.g. premature death due to cancer)
Environmental
• Ecological impairment, i.e. biodiversity and functioning
• Habitat destruction
• Water quality impairment
• Air quality impairment
• Soil quality impairment
• Other impacts, such as
o Climate change (e.g. greenhouse gas emissions)
o Water consumption/abstraction
o Landscape/aesthetic quality of environment
• Resilience and vulnerability to environmental impacts
3.4.2.3 Determining significance
Obviously the toxic and ecotoxic impacts of the restricted substance will be of key importance in determining the benefits of the proposed restriction and these should always be considered. In relation to the other health and environmental impacts, a judgement will have to be made regarding which are relevant and which should be investigated in more detail.
It is not appropriate to provide hard and fast rules for determining which are likely to be significant, but some guidance is provided in the below examples; on narrowing and widening the scope, respectively. The process may be an iterative one and it may be necessary to consider other issues that were not originally identified once the impacts have been further characterised.
72
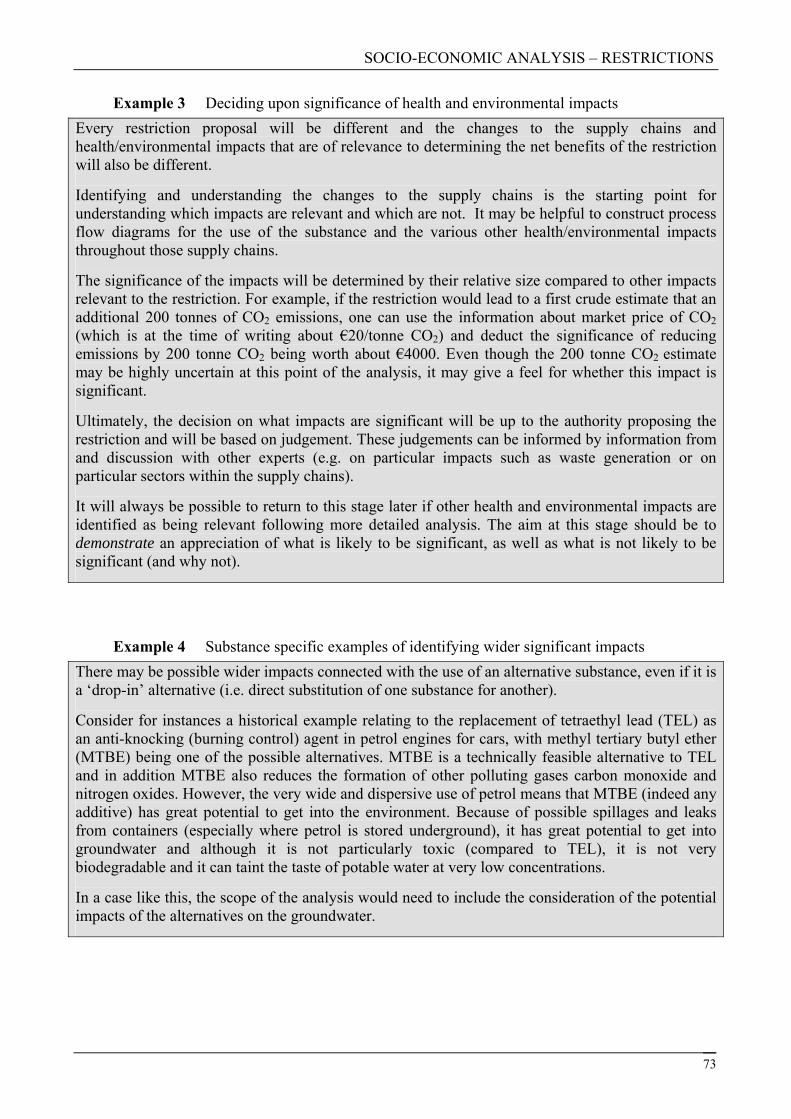
SOCIO-ECONOMIC ANALYSIS – RESTRICTIONS
Example 3 Deciding upon significance of health and environmental impacts Every restriction proposal will be different and the changes to the supply chains and health/environmental impacts that are of relevance to determining the net benefits of the restriction will also be different.
Identifying and understanding the changes to the supply chains is the starting point for understanding which impacts are relevant and which are not. It may be helpful to construct process flow diagrams for the use of the substance and the various other health/environmental impacts throughout those supply chains.
The significance of the impacts will be determined by their relative size compared to other impacts relevant to the restriction. For example, if the restriction would lead to a first crude estimate that an additional 200 tonnes of CO2 emissions, one can use the information about market price of CO2 (which is at the time of writing about €20/tonne CO2) and deduct the significance of reducing emissions by 200 tonne CO2 being worth about €4000. Even though the 200 tonne CO2 estimate may be highly uncertain at this point of the analysis, it may give a feel for whether this impact is significant.
Ultimately, the decision on what impacts are significant will be up to the authority proposing the restriction and will be based on judgement. These judgements can be informed by information from and discussion with other experts (e.g. on particular impacts such as waste generation or on particular sectors within the supply chains).
It will always be possible to return to this stage later if other health and environmental impacts are identified as being relevant following more detailed analysis. The aim at this stage should be to demonstrate an appreciation of what is likely to be significant, as well as what is not likely to be significant (and why not).
Example 4 Substance specific examples of identifying wider significant impacts There may be possible wider impacts connected with the use of an alternative substance, even if it is a ‘drop-in’ alternative (i.e. direct substitution of one substance for another).
Consider for instances a historical example relating to the replacement of tetraethyl lead (TEL) as an anti-knocking (burning control) agent in petrol engines for cars, with methyl tertiary butyl ether (MTBE) being one of the possible alternatives. MTBE is a technically feasible alternative to TEL and in addition MTBE also reduces the formation of other polluting gases carbon monoxide and nitrogen oxides. However, the very wide and dispersive use of petrol means that MTBE (indeed any additive) has great potential to get into the environment. Because of possible spillages and leaks from containers (especially where petrol is stored underground), it has great potential to get into groundwater and although it is not particularly toxic (compared to TEL), it is not very biodegradable and it can taint the taste of potable water at very low concentrations.
In a case like this, the scope of the analysis would need to include the consideration of the potential impacts of the alternatives on the groundwater.
73
SOCIO-ECONOMIC ANALYSIS – RESTRICTIONS
3.4.2.4 Outcomes
The analyses described above should provide an understanding of what health and environmental impacts are relevant for the supply chains in question and which of these are likely to be of most significance. This will provide a scope for more detailed analysis.
It may be possible at this stage to take a decision that sufficient information is already available to analyse the impacts of the proposed restriction. For example, if the alternative most likely to be used under the restriction scenario would be a ‘drop-in’ substitute, it may be possible to infer that changes relevant for health and environment do not go beyond the same supply chain and thus the scope of the analysis can be narrowed to this.
In many cases it will be necessary to give further consideration to the emissions, exposure and impacts of the changes to the supply chains as these determine the actual impacts on health and the environment. This should certainly be the case where the overall level of health and environmental impacts (toxic/ecotoxic or otherwise) are likely to be extensive.
3.4.3 Changes in emissions and exposure
3.4.3.1 Background
In order to determine the consequences of changes to the supply chains resulting from the restriction (in terms of the relevant health and environmental impacts), it is necessary to gain an understanding of the extent to which the humans and the environment will be exposed to the various factors considered. In this context, ‘exposure’ may include direct or indirect exposure to substances or exposure to physical changes (e.g. temperature, noise, resource use, waste generation, etc.).
This section provides an overview of how the extent of such potential changes may be characterised.
The relevant emissions/exposures are all types of emissions to air, water and soil that can lead to human health or environmental exposures and impacts.
Also resource consumption should be considered in particular when resource consumption leads to emissions, e.g. as a result of mining or as emission from energy consumption.
Human health impacts may follow from:
• Exposure of workers (via inhalation, dermal or ingestion in the workplace)
• Exposure of consumers (via inhalation, dermal contact or oral intake following use of consumer products)
• Exposure of man via the environment (e.g. via inhalation of ambient air and consumption of contaminated food and drinking water)
Humans can also be exposed to physical impacts associated to physicochemical properties of chemicals, (including flammability, explosion, etc) and to properties of (alternative) processes/technologies (e.g. risk of accidents, vibrations, noise etc.).
Environmental impacts may follow from emissions to the environment that may lead to pollution of different compartments (e.g. air, water, soil, sediment) and eventually to impacts on living
74
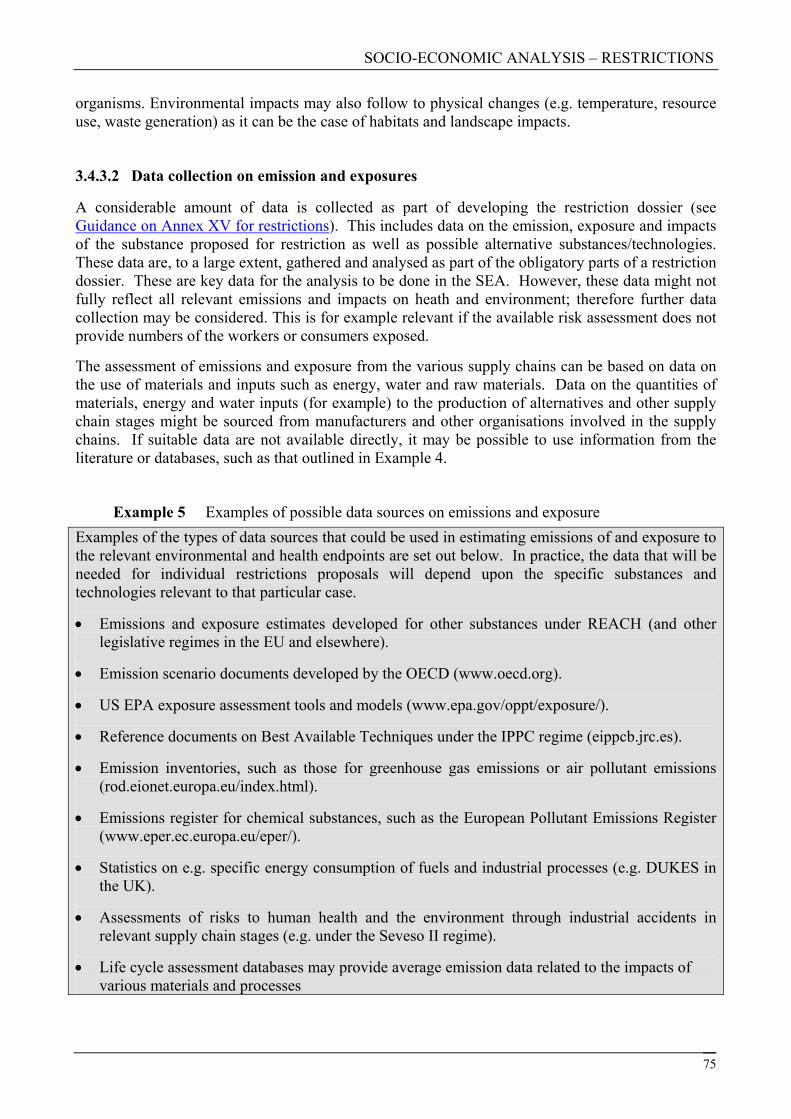
SOCIO-ECONOMIC ANALYSIS – RESTRICTIONS
organisms. Environmental impacts may also follow to physical changes (e.g. temperature, resource use, waste generation) as it can be the case of habitats and landscape impacts.
3.4.3.2 Data collection on emission and exposures
A considerable amount of data is collected as part of developing the restriction dossier (see Guidance on Annex XV for restrictions). This includes data on the emission, exposure and impacts of the substance proposed for restriction as well as possible alternative substances/technologies. These data are, to a large extent, gathered and analysed as part of the obligatory parts of a restriction dossier. These are key data for the analysis to be done in the SEA. However, these data might not fully reflect all relevant emissions and impacts on heath and environment; therefore further data collection may be considered. This is for example relevant if the available risk assessment does not provide numbers of the workers or consumers exposed.
The assessment of emissions and exposure from the various supply chains can be based on data on the use of materials and inputs such as energy, water and raw materials. Data on the quantities of materials, energy and water inputs (for example) to the production of alternatives and other supply chain stages might be sourced from manufacturers and other organisations involved in the supply chains. If suitable data are not available directly, it may be possible to use information from the literature or databases, such as that outlined in Example 4.
Example 5 Examples of possible data sources on emissions and exposure Examples of the types of data sources that could be used in estimating emissions of and exposure to the relevant environmental and health endpoints are set out below. In practice, the data that will be needed for individual restrictions proposals will depend upon the specific substances and technologies relevant to that particular case.
• Emissions and exposure estimates developed for other substances under REACH (and other legislative regimes in the EU and elsewhere).
• Emission scenario documents developed by the OECD (www.oecd.org).
• US EPA exposure assessment tools and models (www.epa.gov/oppt/exposure/).
• Reference documents on Best Available Techniques under the IPPC regime (eippcb.jrc.es).
• Emission inventories, such as those for greenhouse gas emissions or air pollutant emissions (rod.eionet.europa.eu/index.html).
• Emissions register for chemical substances, such as the European Pollutant Emissions Register (www.eper.ec.europa.eu/eper/).
• Statistics on e.g. specific energy consumption of fuels and industrial processes (e.g. DUKES in the UK).
• Assessments of risks to human health and the environment through industrial accidents in relevant supply chain stages (e.g. under the Seveso II regime).
• Life cycle assessment databases may provide average emission data related to the impacts of various materials and processes
75
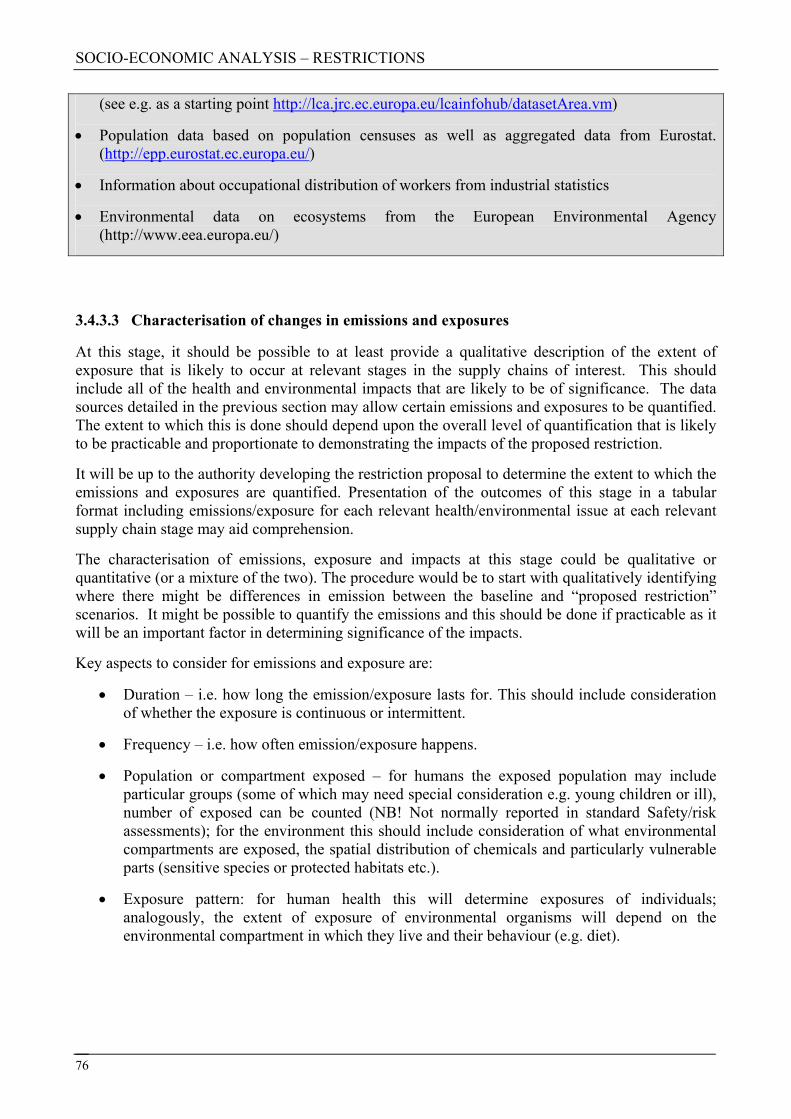
SOCIO-ECONOMIC ANALYSIS – RESTRICTIONS
(see e.g. as a starting point http://lca.jrc.ec.europa.eu/lcainfohub/datasetArea.vm)
• Population data based on population censuses as well as aggregated data from Eurostat. (http://epp.eurostat.ec.europa.eu/)
• Information about occupational distribution of workers from industrial statistics
• Environmental data on ecosystems from the European Environmental Agency (http://www.eea.europa.eu/)
3.4.3.3 Characterisation of changes in emissions and exposures
At this stage, it should be possible to at least provide a qualitative description of the extent of exposure that is likely to occur at relevant stages in the supply chains of interest. This should include all of the health and environmental impacts that are likely to be of significance. The data sources detailed in the previous section may allow certain emissions and exposures to be quantified. The extent to which this is done should depend upon the overall level of quantification that is likely to be practicable and proportionate to demonstrating the impacts of the proposed restriction.
It will be up to the authority developing the restriction proposal to determine the extent to which the emissions and exposures are quantified. Presentation of the outcomes of this stage in a tabular format including emissions/exposure for each relevant health/environmental issue at each relevant supply chain stage may aid comprehension.
The characterisation of emissions, exposure and impacts at this stage could be qualitative or quantitative (or a mixture of the two). The procedure would be to start with qualitatively identifying where there might be differences in emission between the baseline and “proposed restriction” scenarios. It might be possible to quantify the emissions and this should be done if practicable as it will be an important factor in determining significance of the impacts.
Key aspects to consider for emissions and exposure are:
• Duration – i.e. how long the emission/exposure lasts for. This should include consideration of whether the exposure is continuous or intermittent.
• Frequency – i.e. how often emission/exposure happens.
• Population or compartment exposed – for humans the exposed population may include particular groups (some of which may need special consideration e.g. young children or ill), number of exposed can be counted (NB! Not normally reported in standard Safety/risk assessments); for the environment this should include consideration of what environmental compartments are exposed, the spatial distribution of chemicals and particularly vulnerable parts (sensitive species or protected habitats etc.).
• Exposure pattern: for human health this will determine exposures of individuals; analogously, the extent of exposure of environmental organisms will depend on the environmental compartment in which they live and their behaviour (e.g. diet).
76
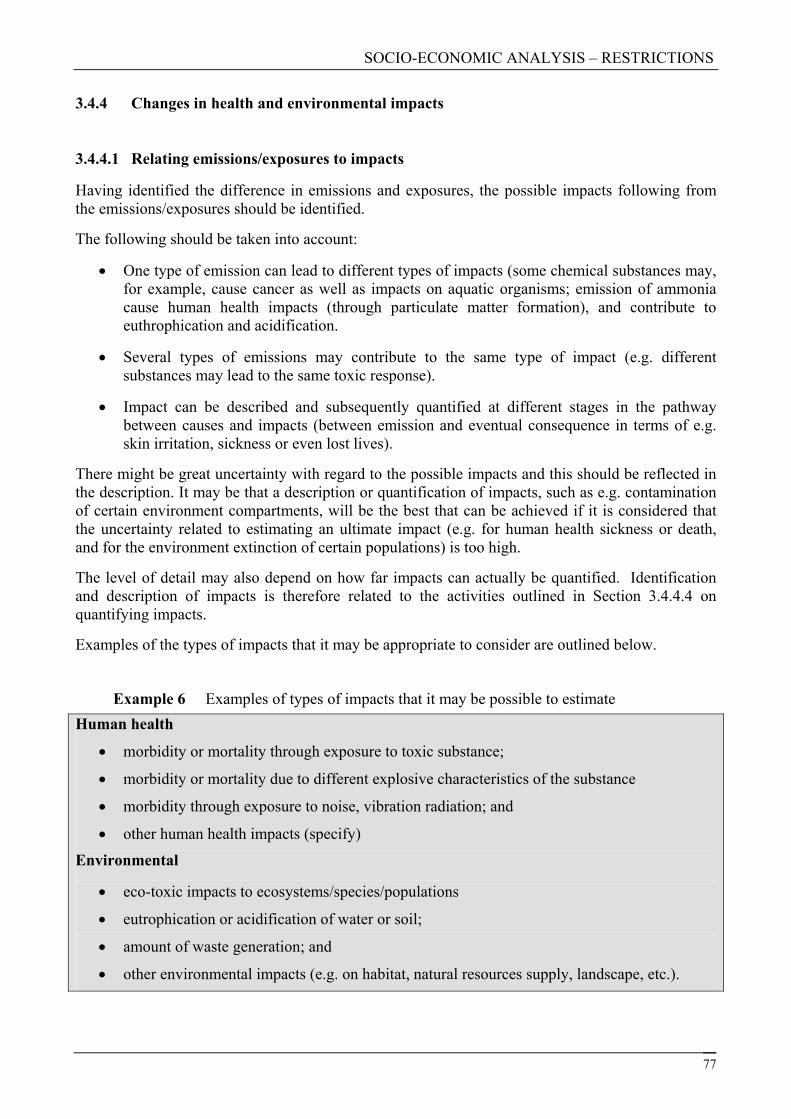
SOCIO-ECONOMIC ANALYSIS – RESTRICTIONS
3.4.4 Changes in health and environmental impacts
3.4.4.1 Relating emissions/exposures to impacts
Having identified the difference in emissions and exposures, the possible impacts following from the emissions/exposures should be identified.
The following should be taken into account:
• One type of emission can lead to different types of impacts (some chemical substances may, for example, cause cancer as well as impacts on aquatic organisms; emission of ammonia cause human health impacts (through particulate matter formation), and contribute to euthrophication and acidification.
• Several types of emissions may contribute to the same type of impact (e.g. different substances may lead to the same toxic response).
• Impact can be described and subsequently quantified at different stages in the pathway between causes and impacts (between emission and eventual consequence in terms of e.g. skin irritation, sickness or even lost lives).
There might be great uncertainty with regard to the possible impacts and this should be reflected in the description. It may be that a description or quantification of impacts, such as e.g. contamination of certain environment compartments, will be the best that can be achieved if it is considered that the uncertainty related to estimating an ultimate impact (e.g. for human health sickness or death, and for the environment extinction of certain populations) is too high.
The level of detail may also depend on how far impacts can actually be quantified. Identification and description of impacts is therefore related to the activities outlined in Section 3.4.4.4 on quantifying impacts.
Examples of the types of impacts that it may be appropriate to consider are outlined below.
Example 6 Examples of types of impacts that it may be possible to estimate Human health
• morbidity or mortality through exposure to toxic substance;
• morbidity or mortality due to different explosive characteristics of the substance
• morbidity through exposure to noise, vibration radiation; and
• other human health impacts (specify)
Environmental
• eco-toxic impacts to ecosystems/species/populations
• eutrophication or acidification of water or soil;
• amount of waste generation; and
• other environmental impacts (e.g. on habitat, natural resources supply, landscape, etc.).
77
SOCIO-ECONOMIC ANALYSIS – RESTRICTIONS
The potential impacts identified above will generally need to be further assessed and, where possible, adequate and proportionate, they should be described qualitatively, quantitatively or as a mixture of the two.
It will be a matter of judgement for the authority proposing the restriction in determining how far the assessment should involve quantification and monetisation of impacts. The overall aim should be to have gained, and be able to communicate, an understanding of (or a ‘feel for’) the significance of the impacts.
3.4.4.2 Data on impacts assessment
Understanding the likely impacts from each exposure requires expertise in toxicology and eco-toxicology and in other health and environmental impacts. As with elsewhere, depending on the case, it is likely to be appropriate to consult with relevant experts in the fields concerned. In the case several emissions not related to (eco)-toxicity have been identified, Life Cycle Impact Assessment (LCIA) methodologies may be applied to get an idea of the likely resulting impacts, see e.g. http://lca.jrc.ec.europa.eu/EPLCA/lcia.htm for links to some organisations providing such methodologies. These methods may also be used for the further quantification of impacts to be described in below sections.
3.4.4.3 Qualitative assessment of impacts
Toxic impacts to human health
When a quantitative measure is not feasible, qualitative criteria can be used to characterise impacts.
The human health and physical impacts can be characterised by means of criteria of potency (hazard) and exposure. For example, it may be possible to come to a qualitative description of the likely impacts by considering the following criteria (in practice, other criteria may be appropriate):
a) the potency of intrinsic properties of concern (e.g. no-effect-level or other indicators of dose-response (i.e. median or other percent effects levels); potency could be indicated descriptively (e.g. mild, moderate and severe);
b) severity of the effect (i.e. the type of effect and whether it lead to morbidity and/or mortality) for example skin irritation would be considered less severe than asthma and both considered less severe than cancer;
c) exposure characteristics, including which populations are exposed (workers, consumers, man via environment), to which extent/level (concentration/dose), how often (frequency), for how long (duration). This could also consider the likelihood of failure of risk management measures (different performance, likelihood of non-application).
In cases where a risk characterisation ratio has been estimated as part of a safety/risk assessment, the value can be used as an indicator of whether the exposure exceeds a derived or predicted no-effect level. The potency of the intrinsic property of concern (criteria a) will be expressed by the no-effect level used to calculate the risk characterisation ratio. The ratio should in any case not be used as the only criterion, because it does not include information about the severity of effects (which is important when comparing two or more substances) and the exposed populations. Furthermore, the quantitative interpretation of the risk characterisation ratio is only possible if the dose-response curve is defined.
78
SOCIO-ECONOMIC ANALYSIS – RESTRICTIONS
Qualitative conclusions can then be drawn as to the expected severity and extent of the impacts. This exercise would be repeated for each relevant exposure situation and end-point.
It may not be possible to quantify human health or environmental impacts from substances. See also the Guidance on the Chemical Safety Report in relation to assessment of toxic risks from substances.
Health impacts caused by physicochemical properties and other physical forces
It will generally only be possible to describe in qualitative terms the impacts caused by the physicochemical properties associated with a substance and physical forces associated with alternative technologies. To the extent possible, the types of impacts that may result from an imposed restriction should be described, including increased/decreased likelihood of e.g. flammability/explosion, vibration/noise and the associated numbers of workers/consumers affected in a particular way. This may already to a large extent have been done in previous steps.
Environmental impacts
Similar criteria as for human health can be used to describe the expected impacts on the environment. In general terms, eco-toxicological and environmental impacts are more usually characterised by means of criteria of magnitude and significance, where magnitude is the intensity of the potential effect and significance indicates the foreseeable damages of the receptor (population, community, ecosystem, and natural resources). Examples of criteria that may be used include the following:
• frequency of impact;
• duration (i.e. will the impact be temporary or permanent);
• extent, e.g. the percentage of a habitat that may be lost, geographical scale of exposure;
• sensitivity/vulnerability of the receptor affected;
• resilience of the receptor affected; and
• ecological, economic or cultural relevance of the impacted receptor.
At this stage, it may be possible to describe the likely magnitude and extent of the expected environmental impacts. For example, this may include, for each relevant endpoint, a description of the types of ecosystems (or organisms) likely to be affected, how widespread the impacts are likely to be and what the effect on those ecosystems will be.
In order to aid presentation, it may be appropriate to rank the magnitude and significance of impacts (e.g. as high, medium or low), according to set criteria, provided that these are set out transparently and the decision-making processes can be followed.
3.4.4.4 Quantitative assessment of impacts
Overview
It is important to attempt to quantify the human health and environmental impacts to the extent possible, practicable and proportionate. The more the health and environmental impacts can be quantified, the more solid case can be made for proposing the restriction. One should not forget to take into account and document uncertainty related to the quantification.
79
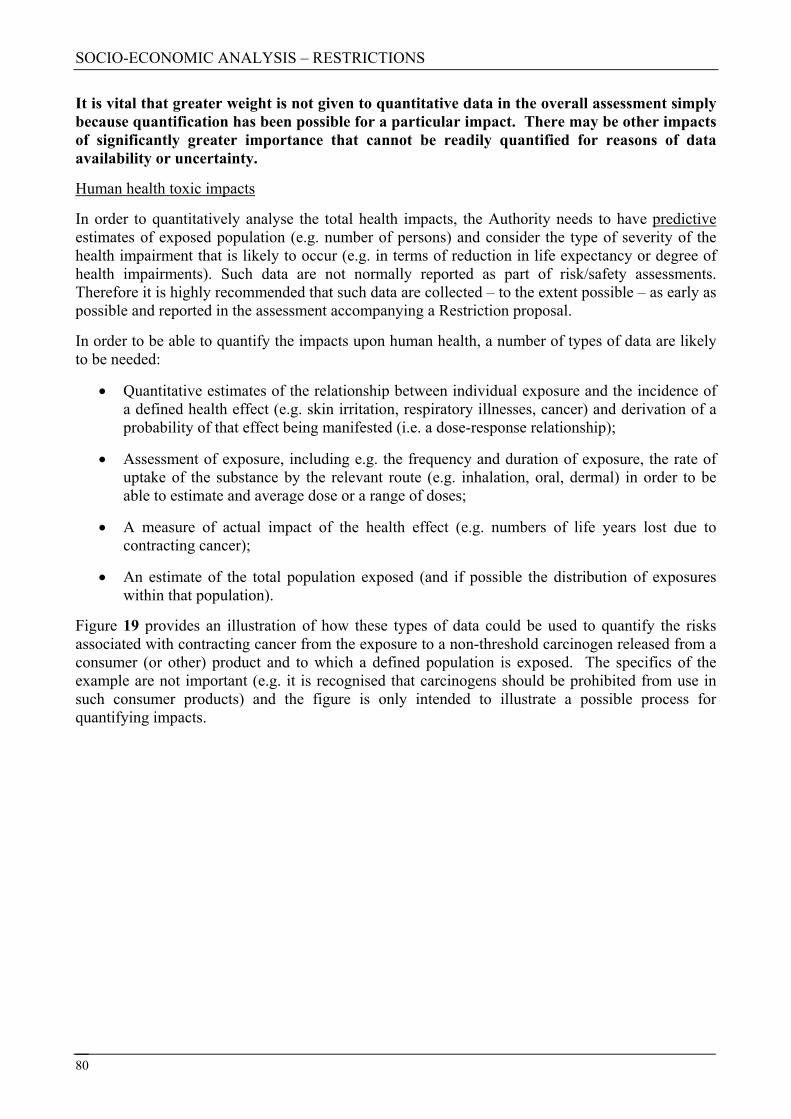
SOCIO-ECONOMIC ANALYSIS – RESTRICTIONS
It is vital that greater weight is not given to quantitative data in the overall assessment simply because quantification has been possible for a particular impact. There may be other impacts of significantly greater importance that cannot be readily quantified for reasons of data availability or uncertainty.
Human health toxic impacts
In order to quantitatively analyse the total health impacts, the Authority needs to have predictive estimates of exposed population (e.g. number of persons) and consider the type of severity of the health impairment that is likely to occur (e.g. in terms of reduction in life expectancy or degree of health impairments). Such data are not normally reported as part of risk/safety assessments. Therefore it is highly recommended that such data are collected – to the extent possible – as early as possible and reported in the assessment accompanying a Restriction proposal.
In order to be able to quantify the impacts upon human health, a number of types of data are likely to be needed:
• Quantitative estimates of the relationship between individual exposure and the incidence of a defined health effect (e.g. skin irritation, respiratory illnesses, cancer) and derivation of a probability of that effect being manifested (i.e. a dose-response relationship);
• Assessment of exposure, including e.g. the frequency and duration of exposure, the rate of uptake of the substance by the relevant route (e.g. inhalation, oral, dermal) in order to be able to estimate and average dose or a range of doses;
• A measure of actual impact of the health effect (e.g. numbers of life years lost due to contracting cancer);
• An estimate of the total population exposed (and if possible the distribution of exposures within that population).
Figure 19 provides an illustration of how these types of data could be used to quantify the risks associated with contracting cancer from the exposure to a non-threshold carcinogen released from a consumer (or other) product and to which a defined population is exposed. The specifics of the example are not important (e.g. it is recognised that carcinogens should be prohibited from use in such consumer products) and the figure is only intended to illustrate a possible process for quantifying impacts.
80
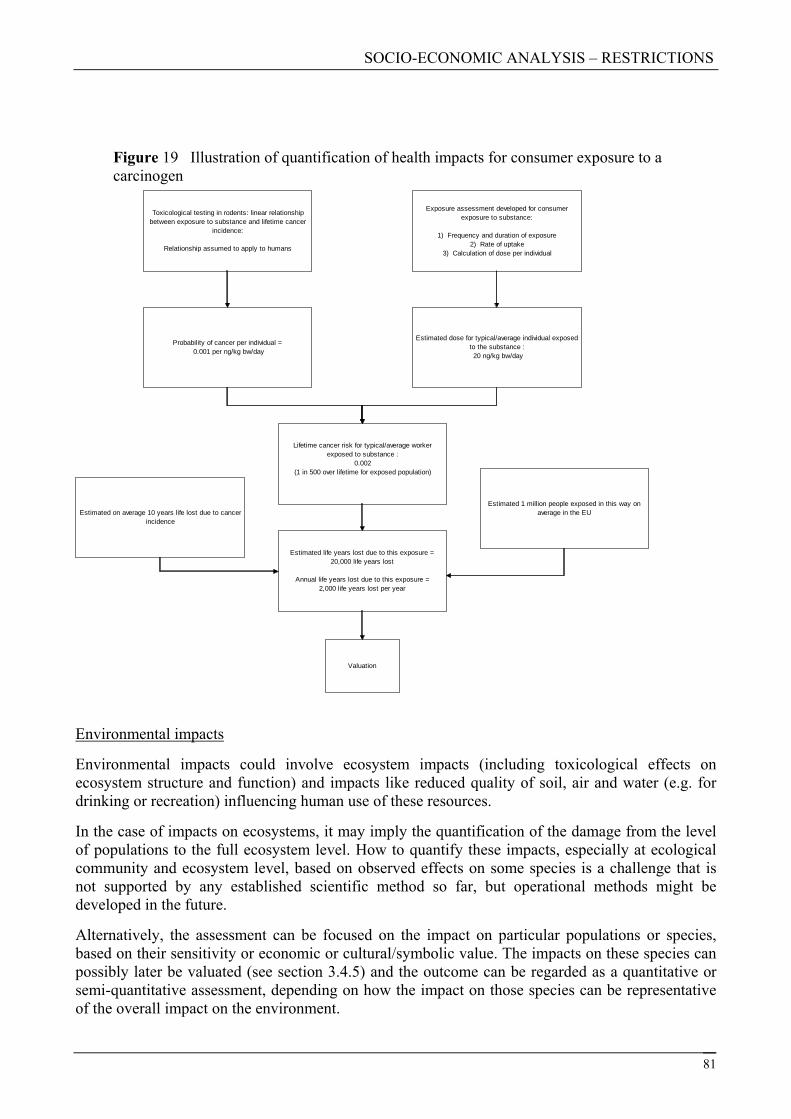
SOCIO-ECONOMIC ANALYSIS – RESTRICTIONS
81
Figure 19 Illustration of quantification of health impacts for consumer exposure to a carcinogen
nvironmental impactsE
could involve ecosystem impacts (including toxicological effects on
tion of the damage from the level
ment can be focused on the impact on particular populations or species,
Environmental impacts ecosystem structure and function) and impacts like reduced quality of soil, air and water (e.g. for drinking or recreation) influencing human use of these resources.
In the case of impacts on ecosystems, it may imply the quantificaof populations to the full ecosystem level. How to quantify these impacts, especially at ecological community and ecosystem level, based on observed effects on some species is a challenge that is not supported by any established scientific method so far, but operational methods might be developed in the future.
Alternatively, the assessbased on their sensitivity or economic or cultural/symbolic value. The impacts on these species can possibly later be valuated (see section 3.4.5) and the outcome can be regarded as a quantitative or semi-quantitative assessment, depending on how the impact on those species can be representative of the overall impact on the environment.
Toxicological testing in rodents: linear relationship between exposure to substance and lifetime cancer
incidence:
Relationship assumed to apply to humans
Exposure assessment developed for consumer exposure to substance:
1) Frequency and duration of exposure2) Rate of uptake
3) Calculation of dose per individual
Probability of cancer per individual = 0.001 per ng/kg bw/day
Estimated dose for typical/average individual exposed to the substance : 20 ng/kg bw/day
Lifetime cancer risk for typical/average worker exposed to substance :
0.002(1 in 500 over lifetime for exposed population)
Estimated 1 million people exposed in this way on average in the EUEstimated on average 10 years life lost due to cancer
incidence
Estimated life years lost due to this exposure =20,000 life years lost
Annual life years lost due to this exposure =2,000 life years lost per year
Valuation
SOCIO-ECONOMIC ANALYSIS – RESTRICTIONS
82
The feasibility of a (semi)quantitative impact assessment is normally higher where applied to a local environment, e.g. to a specific industry site.
ommission applied in its Thematic Strategy on Air
potential accidental releases of dangerous 17
e
The valuation of human health impacts is based on the prediction of the total health damage, i.e. affected by a certain health effect, ranging from morbidity to
on how this
U and other parts of the
Based on the extensive work carried out under the Convention on Long-range Transboundary Air Pollution of the UNECE, the European CPollution, the latest scientific findings of the critical levels and loads of acidifying and eutrophying substances, as well as the effects of ozone on ecosystems15. Furthermore several activities have focused on identifying the impacts of heavy metals on the environment16. Thus, a lot of existing knowledge can be used concerning the impacts of releases of heavy metals, ammonia, volatile organic compounds, NOx and SO2 to the environment.
Other useful methodological references for the application of (semi)quantitative environmental impact assessment can be found in the assessment ofsubstances for Seveso Directive (2003/105/EC) sites.
3.4.5 Valuation of impacts
3.4.5.1 How and what to valu
number of persons that might bemortality. To the extent such quantification has been carried out (see previous section) it is possible to aggregate the health impacts. Two possible methodological approaches can be used.
One possibility is to use weights based on disability or quality adjusted life years (DALY or QALY), in order to aggregate health impacts. Appendix B1 gives further information could be carried out. With DALYs and QALYs it is possible to carry out cost-effectiveness analysis as the benefits are in the units of “years” and costs in the units of “euros”.
A second method is to use the willingness-to-pay estimates (WTP) of people of reducing the risk of dying or avoiding illness. Such values have been estimated both in the Eworld. For instance, the most recent estimate used at EU-wide level for the value of gaining a “life year” was €55.800 (in 2003 price level). The example below shows how such a value can be applied.
15 For details see, e.g. the Coordination Centre for Effects available at http://www.mnp.nl/cce/
16 For details, see e.g. the integrated assessment of heavy metal releases in Europe (ESPREME) available at http://espreme.ier.uni-stuttgart.de/
17 See http://ec.europa.eu/environment/seveso/index.htm
SOCIO-ECONOMIC ANALYSIS – RESTRICTIONS
EXAMPLE: How to apply a value of life year
Continuing with the example of Figure 2, using the value of life year in Appendix B.1.2, it is possible to estimate the benefit reduced exposure of the carcinogenic substance, with the assumption that the alternatives do not have such properties. Given that the benefit of not using the substance would be 2000 life years per year and given that the value of the life year is €55.800, the monetised value of the benefit would be €111 million per year. This could be compared against the costs of restriction in a cost-benefit analysis.
Changes in health care costs (hospital costs, medicine etc) and changes in production due to sick leaves are means of valuing the impacts of improved health. This has been the basis for estimating the value of avoiding a “minor restricted activity day” at €41/day (in 2003 price level). Appendix B.1.2 gives more details, including values for reducing the emissions of main air pollutants. Such values are likely to be helpful when different kinds of health end-points are valued.
It is possible to value the external effects of air pollutants, which will mainly be caused by burning of fossil fuels. For example, for particular air pollutants, the European Commission – as part of the Clean Air for Europe programme – has estimated the value of the impacts for releasing one tonne of PM2.5 (particulate matter with a diameter smaller than 2.5 μm), NH3, SO2, NOx and VOCs in different Member States. Concerning the valuation of the impacts of greenhouse gases, the current or predicted market price of CO2 (being about €20/tCO2 at the time of writing) is likely to be a helpful source to value the changes in greenhouse gas emissions. Such reference values can be found also from other sources. These are likely to be helpful in making the quantitative analysis of air pollution or externalities of energy production. See Appendix B.1.2 for further details.
Ecosystem services contribute to the economic welfare by, for instance, the generation of income (e.g. crops, fisheries) or wellbeing (recreational values and non-use values, e.g. existence values) and through the prevention of damages resulting in costs for society (e.g. water regulation, erosion control etc.). Therefore, for environmental impacts, the costs and benefits could be described as the value of changes in the services provided to the society by the natural environment.
Valuation of impacts should be carried out when possible and proportional. Valuation helps in making the comparison between different types of impacts easier by giving an order of magnitude of the impacts. Like in the analysis of other impacts relating to the restriction of the use of substances, also the valuation of impacts has uncertainties attached to them. Therefore, the assumptions and sources of the values need be reported transparently.
If there are no values that can be used it is possible undertake a specific valuation study. It should be noted that such studies require multi-disciplinary expertise and are rather resource intensive.
However, there are many techniques that can be applied to valuate environment degradation in more general terms and the reduction of environmental services. The example below shows several applications of such values.
83
SOCIO-ECONOMIC ANALYSIS – RESTRICTIONS
84
EXAMPLE: Valuation of environmental and health impacts
Some examples of assessing environmental impacts resulting in monetary appraisal can be found in a study ordered by the European Commission analysing benefits of REACH on the environment. The benefits have been calculated by three different approaches: via the willingness-to-pay (WTP) for avoiding the environmental damage, via an identification of costs caused by environmental damages, and via an estimation of the current costs that could be avoided if the release of chemical substances would be better controlled (e.g. less expensive drinking water purification).
Among those three, the damage function approach was based on case studies of selected substances (already restricted in the EU). While the value of the overall benefit of REACH presented in this study should be treated with caution due to certain assumptions and extrapolations18, and while different approaches can also be applied, the substances-specific case studies can give some indications for an appraisal of environmental benefits in the context of REACH SEA.
Below, the extracts of the case studies are presented. The detailed calculations could be found in the above-mentioned report.
1,2,4-trichlorobenzene in drinking water
An EU Community risk assessment has been conducted for 1,2,4-trichlorobenzene (1,2,4-TCB) and in particular the contamination of drinking water was considered. It is estimated that 1.3 million people are exposed to concentrations in drinking water exceeding the WHO-limit of 20 μg/L, which is estimated to result in 582 cancer incidents per year in EU-25. The WTP to avoid a cancer case is €400,000 per non-fatal case and €1 million per fatal case. It was not known whether the incidents caused by 1,2,4-TCB would be fatal or non-fatal, which meant that the incidents correspond to a cost in the range €98 to €582 million per year. Thus the monetised benefit of not using 1,2,4-TBC were estimated to be in this range. Moreover, the cost of cleaning the drinking water is estimated to €14-89 million per year.
Nonylphenol in sewage sludge
Nonylphenol may be accumulated in sewage sludge in concentrations higher than the limit value, which is set for protection of the soil environment at farmlands. It is estimated that between 1.1 and 9.1 million tonnes (dry weight) of sewage sludge contains nonylphenol in concentrations exceeding the limit causing it unsuitable for use as fertiliser at farmlands. There, the sludge is often incinerated and, in addition, other fertiliser has to be supplied to farmlands. The total cost of that is estimated to €229-1,829 million per year.
Tetrachloroethylene in ground water
Tetrachloroethylene (PER) is classified as carcinogenic category 3 and intake of drinking water with a concentration of 1 μg/L causes an extra lifetime cancer risk of 1.5 in 1 million. It is estimated that 0.8% of drinking water is contaminated in concentrations exceeding 10 μg/L, but it is not known how big a percentage that exceeds 1 μg/L. However, it is estimated that 3.6 mill people in EU-25 would be exposed to PER in concentrations exceeding 10 μg/L and, assuming a linear dose-response relationship, this would in average result in 0.8 extra cancer incidents per year. The cost is
18 An extrapolation of monetised impacts identified for case study substances to other chemicals with similar attributed impact scores resulting in a very rough estimate of costs of current use of chemicals; potential benefits of REACH indicated by assuming that REACH will function by reducing the release and impact to a certain level.
SOCIO-ECONOMIC ANALYSIS – RESTRICTIONS
estimated to €0.3-0.8 million per year for non-fatal (€400,000) and fatal (€1 million) incidents, respectively.
Polychlorinated biphenyls (PBC) in fish
PCB levels are still elevated in the environment and in particular in biota despite the ban on manufacture more than 20 years ago. The concentrations in fish are so high that the number of cancer incidents is estimated to be 194-583 per year in EU-25. As no information is available on whether these cancer cases would be fatal or non-fatal, the cost is given as a range at €78-583 million per year.
The full study and case studies can be found on: http://ec.europa.eu/environment/chemicals/reach/background/docs/impact_on_environment_report.pdf.
3.4.5.2 Data collection
In many cases the Authority does not have enough information i) on the values themselves and ii) on quantification of the environmental impacts. Lack of such information hampers the possibility to monetize environmental benefits of the restrictions. However, there exist valuation studies containing values of ecosystem services. These can be used with a technique called “benefit transfer”. In this technique values of an environmental asset can be transferred from an existing study to a similar context. Thus, the value of benefit in the case of the restriction under consideration can be derived. For instance, the Environmental Valuation Reference Inventory (EVRI) database of valuation studies – accessible through the Internet (http://www.evri.ec.gc.ca) – contains detailed information of environmental valuation studies, primarily from North America but with about 460 studies from Europe. Also market-based methods, describing straightforward commercial and financial gains and losses, such as lost productivity (e.g. crop production) or additional costs to recreation and leisure, could be used in this context. Appendix B1 gives further details on data sources.
3.4.6 Reporting the results
It is most likely that the results of the assessment of changes in health and environmental impacts will not be one aggregate number but rather a mixture of qualitative, semi-quantitative and quantitative information about the impact of the proposed restriction.
It is therefore recommended that the reporting of the outcome of the assessment of the human health and environmental impacts, always comprise a comprehensive narrative description of ALL foreseen changes in impacts addressing:
• The human health and environmental endpoints being affected both qualitatively and quantitatively;
• The possible values used associated with environmental and human health end-points and the estimates of monetised impacts;
• The significance of the impacts;
• The certainty and confidence in the description of the impacts;
85
SOCIO-ECONOMIC ANALYSIS – RESTRICTIONS
• All relevant assumptions/decision and estimated uncertainties relating to what has been included, measurements, data sources, etc.
This should at least be described qualitatively with additional quantified/monetised information where generated and available.
3.5 Economic impacts
Economic impacts are concerned with costs or cost savings comparing the “proposed restriction” scenario with the “baseline” scenario. Economic impacts comprise the net costs to manufacturers, importers, downstream users, distributors, consumers and society as a whole. “Net costs” should take into account both costs to actors due to restriction and possible cost savings caused by the transfer to alternatives.
Economic impacts include for example:
• Cost of new equipment or production process necessary to comply with the proposed restriction or ceasing use of equipment/facilities before the end of their intended life:
• Operation and maintenance costs (labour costs, energy costs etc);
• Cost differences between different substances due to different production costs and purchase prices of the substances;
• Cost differences due to differences in under the two scenarios (due to reduced or improved efficiency for example)
• Changes in transport costs; and
• Design, monitoring, training and regulatory costs.
In much literature, e.g. the EU guidelines for Impact Assessment (Available via: http://ec.europa.eu/governance/impact/), a distinction is made between economic, environmental and social impacts, where health impacts are covered usually under either “environmental” or "social" impacts. Here, human health impacts are covered separately as part of human health and environmental impacts. The EU IA guidelines also consider costs that arise from environmental or human health impacts as part of environmental and human health category. It means that economic impacts are primarily impacts on business and consumers. This guidance follows the same approach.
Economic efficiency and equity
Economic analysis makes a distinction between an efficiency and equity. Efficiency relates to the most efficient use of scarce resources, For instance, if using a potential alternative technology requires more labour or energy input and therefore increases the production costs this is considered as a negative impact. This is because the overall efficiency of society to produce the same amount of goods and services is reduced. On the other hand, if a given new technology requires less labour input it is a benefit to society as there would be resources free for an alternative use. In this case, the overall efficiency (also called productivity) increases.
Full utilisation of all factors of production (labour, capital etc.) is often assumed in cost-benefit analysis. So if the “proposed restriction” scenario results in more capital and labour being used,
86
SOCIO-ECONOMIC ANALYSIS – RESTRICTIONS
then these additional scarce resources can not be used for alternative uses. In economics these costs are called “opportunity costs” and refer to the costs of the restriction to society. If there are a lot of free resources (e.g. a lot of unemployment) the opportunity costs would be low. In a full employment situation the opportunity cost would equal the market rate of labour costs. As it is difficult to measure the effect of unemployment to real labour costs, market based labour costs are usually used in economic analysis.
The equity rationale relates to the distributional impacts of a scenario. If certain groups are be affected by increased unemployment, for example, this is seen as a negative distributional impact, even if employment is offset (to some degree) elsewhere. However, this situation is less evident when the overall level of employment in society increases but there is still a reduction of employment for some sections of society (e.g. a reduction in demand for a particular type of worker skill/occupation) These issues are usually dealt by under the heading social impacts (see Section 3.6).
In all cases, it is important to state the assumptions that are being used for the assessment and the conclusions that are drawn. In summary, economic impacts can be assessed based on:
• Efficiency: Changes in resource use (equal to changes in the use of production factors such as raw material, energy, labour or capital);
• Equity: Distribution of economic impacts on different industries or social groups.
The efficiency rationale is covered in this section. The distributional aspects should be integrated into the assessment with a clear identification of who will be affected by the impact documented (section 4.3).
3.5.1 Distinction between private costs and social costs
In any assessment of options, an important distinction is made between costs to the private sector (often called “private costs”) and costs to the society as a whole (often called “social costs”). In order to compare the “baseline” scenario with the “proposed restriction” scenario, it is necessary to know the costs to the society as a whole of each option. Part of the overall cost of an option is made up of private costs but only part of these costs is used in economic analysis that analyses the societal point of view.
There are also situations where the social costs could be higher than the private costs leading to an upwards adjustment of estimates based on private costs. The prices of exhaustible resources do not always reflect the long term scarcity of the resource. In such situations the price should be increased in order to reflect that the resource is non-renewable. It is a case by case judgement whether there are any changes in consumption of non-renewable resources that needs to be taken into account beyond what is reflected in the existing market price of the resource.
Private costs are the costs incurred by the identified actors in relevant supply chains. Economic analysis needs to strip out any parts of the private cost from these companies which are actually ‘transfers’ from one section of the economy to another. The reason is that such costs are not additional to the society as a whole. These include first of all taxes and subsidies. Transfer payments or ‘transfers’ refers to the transfer of value between sections of society. They do not represent an overall cost to society, simply a redistribution of value (notwithstanding the equity issues described above). Significant transfer payments should be discussed when considering the distributional impacts (section 4.3).
87
SOCIO-ECONOMIC ANALYSIS – RESTRICTIONS
88
If the costs of the proposed restriction are partly paid for through a subsidy (or the level of a subsidy required changes because of the proposed restriction) the costs to society of that subsidy needs to be included in the analysis – even though the subsidy does not represent a cost to the private sector.
If costs include taxes, it would be good to remove them. The reason is that taxes represent a transfer from those paying the tax to those who receive the tax revenues. Taxes overstate the costs of the measure to the society as a whole (by the amount of the tax paid). Value added taxes and excise duties are examples of taxes that can relatively easily be removed from the analysis. However, labour taxes and indirect business taxes (such as social security charges) are less straight forward.
There is an important special case regarding taxes – if a tax is charged to cover the damage of an environmental or other externality (e.g. a landfill tax) the tax is not a transfer, but rather a reflection of the true costs of the resource to society. Such taxes should be included, but should not be double-counted when analysing environmental impacts.
The issue of adjusting the private costs correcting for transfer payments is most relevant if the assessment of costs is based on reported accounting data. If the costs of a measure are calculated from scratch based on estimations of capital costs and operational costs, there will not be any transfer payment included and no adjustment will be needed.
As general guidance the following recommendations are made when carrying out economic analysis: 1) avoid using costs that include taxes and subsidies and 2) state clearly what kinds of costs have been included (e.g. what taxes and subsidies may be included in the costs).
3.5.2 Step 3.1 – Identifying economic impacts
A practical way of identifying and screening impacts is to use checklists. The checklists19 presented in Appendix G include questions such as:
• Are there any changes to investment costs?
• Are there any changes to operating costs?
• Are there likely to be changes to regulatory costs?
The questions focus on the possible changes in these types of costs to sectors that are affected by the proposed restriction (e.g. manufacturers, importers, downstream users, distributors, consumers and society as a whole).
The checklists set out in this guidance provide pointers as to the types of effects that could be considered. They can also be used to document the analysis and can be included in the reporting of the SEA to show that all relevant impacts have been considered.
What about costs in other supply chains?
If a downstream user is assumed to change to an alternative technology as a result of the proposed restriction, the difference in production costs is measured from the perspective of the downstream
19 The checklists are neither exhaustive nor definitive. They are intended to guide you towards ensuring that impacts and issues that are particularly relevant are considered during the analysis. Types of impacts falling outside those listed in these checklists but are relevant under the proposed restriction should therefore be considered.

SOCIO-ECONOMIC ANALYSIS – RESTRICTIONS
89
user. The supplier of the alternative technology will have an income from selling this technology, whilst the previously supplier (before the restriction was imposed) has a loss of revenue. The costs of each supplier represents an important distributional effect, but there is no net cost from the perspective of society (assuming all other factors remain the same e.g. customers pay the same price, product quality is the same, etc) but just a redistribution of income.
However, the restriction may result in certain companies in the original supply having relevant resources become redundant (e.g. capital - such as equipment and labour – skills and experience, etc) and thus a proportion of the original investment will not be recoverable. This will entail a cost to the original supply chain, even if the income from the supply of the alternative balances out the income foregone by the restriction on the original substance. It might be necessary to consult suppliers in order to obtain an estimate of the price of the alternative technology. Therefore it is advisable to consider and report both the net economic costs to society of the proposed restriction and also the distributional effects to different actors in all the relevant supply chains.
It is normally assumed in economic analysis of this type of analysis that changes in the activity within one sector will not affect prices throughout the economy. So if the downstream user in the “proposed restriction” scenario purchases an alternative substance/technology, it is assumed that it does so at the “normal” market price. Generally, it can therefore be assumed that the changes in the supply chain in question will not affect prices of any inputs (e.g. raw materials) and it will therefore not result in either costs or savings in other supply chains20.
3.5.3 Step 3.2 – Data collection process
Data on economic impacts can be obtained from a variety of sources but, whatever the source, the user needs to think critically about the validity of the data. Estimates found in literature may either be over or under estimated as they are likely to have been derived for a specific purpose rather than a generic indicator of the cost. The data will also have a ‘shelf-life’, as costs and prices can vary significantly over time. For example, the price of a technique could fall as the technology changes from an experimental to a mass-produced technique. It may be possible to gather data on economic impacts using various sources such as:
• Consultation with the industry producing or using the substance (trade associations and individual companies);
• Consultation with the industry producing or using alternatives to the substance (trade associations and individual companies);
• Consultants and other independent industry experts knowledgeable about the industry;
• Published information, such as reports, journals, websites;
20 This assumption will need to be tested on a case by case basis, as in some instances changes in demand may affect other supply chains. For example, if the proposed restriction leads to the use of an alternative substance and the additional demand for the alternative substance can not be satisfied through additional supply, higher prices for the alternative may have impacts on the current users of that alternative (e.g. they can not afford the higher price and cease making their product). It is also possible for there to be a decrease in the price of the alternative as extra demand makes it viable for manufacturers to take advantage of “economies of scale” (e.g. cost savings of mass production, bulk purchases of raw materials, etc). However in most cost benefit analysis the assumption of normal market price is a valid assumption.

SOCIO-ECONOMIC ANALYSIS – RESTRICTIONS
• Research groups;
• Comparable cost estimates found in literature sources for similar industries or sectors;
• Expert estimates;
• Eurostat or similar statistical services; and
• Financial reporting by companies.
Table 3 provides a non-exhaustive list of information that may be relevant for the analysis of economic impacts. The information identified in Table 3 can be very difficult to collect without effective consultation with the relevant companies (or trade associations). Appendix A provides guidance on one approach to undertaking consultation during the preparation of the restriction proposal.
90
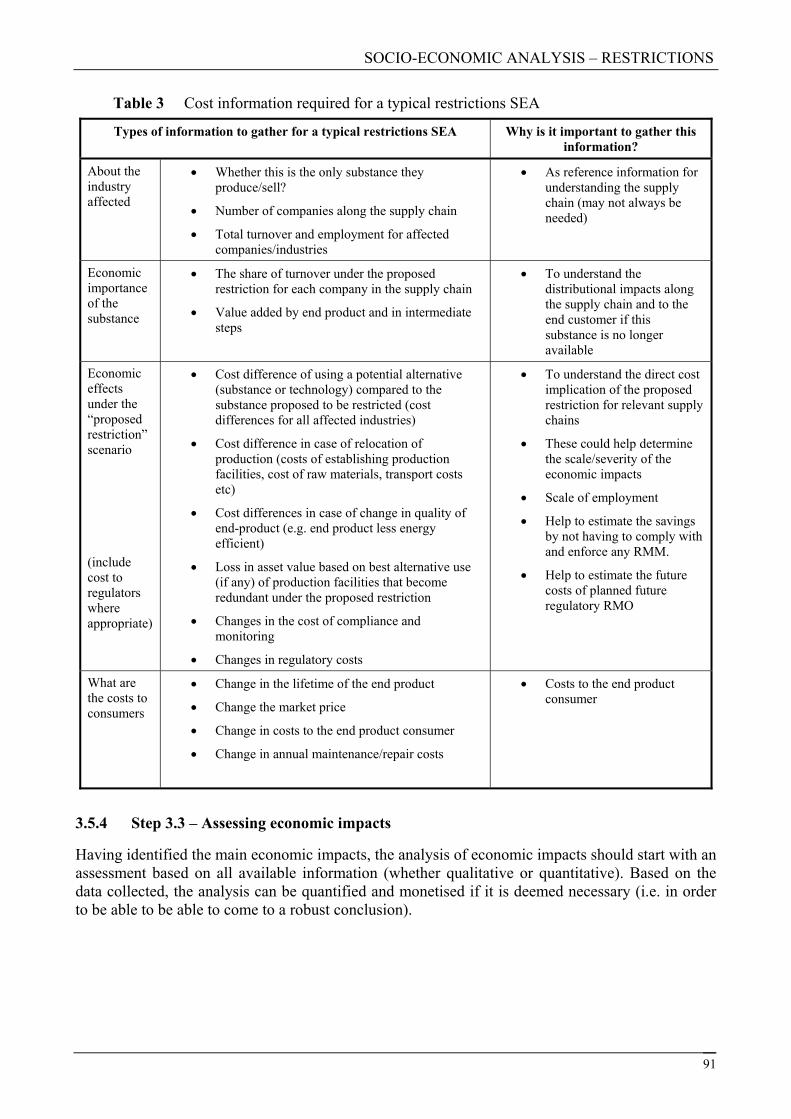
SOCIO-ECONOMIC ANALYSIS – RESTRICTIONS
Table 3 Cost information required for a typical restrictions SEA
Types of information to gather for a typical restrictions SEA Why is it important to gather this information?
About the industry affected
• Whether this is the only substance they produce/sell?
• Number of companies along the supply chain
• Total turnover and employment for affected companies/industries
• As reference information for understanding the supply chain (may not always be needed)
Economic importance of the substance
• The share of turnover under the proposed restriction for each company in the supply chain
• Value added by end product and in intermediate steps
• To understand the distributional impacts along the supply chain and to the end customer if this substance is no longer available
Economic effects under the “proposed restriction” scenario
(include cost to regulators where appropriate)
• Cost difference of using a potential alternative (substance or technology) compared to the substance proposed to be restricted (cost differences for all affected industries)
• Cost difference in case of relocation of production (costs of establishing production facilities, cost of raw materials, transport costs etc)
• Cost differences in case of change in quality of end-product (e.g. end product less energy efficient)
• Loss in asset value based on best alternative use (if any) of production facilities that become redundant under the proposed restriction
• Changes in the cost of compliance and monitoring
• Changes in regulatory costs
• To understand the direct cost implication of the proposed restriction for relevant supply chains
• These could help determine the scale/severity of the economic impacts
• Scale of employment
• Help to estimate the savings by not having to comply with and enforce any RMM.
• Help to estimate the future costs of planned future regulatory RMO
What are the costs to consumers
• Change in the lifetime of the end product
• Change the market price
• Change in costs to the end product consumer
• Change in annual maintenance/repair costs
• Costs to the end product consumer
3.5.4 Step 3.3 – Assessing economic impacts
Having identified the main economic impacts, the analysis of economic impacts should start with an assessment based on all available information (whether qualitative or quantitative). Based on the data collected, the analysis can be quantified and monetised if it is deemed necessary (i.e. in order to be able to be able to come to a robust conclusion).
91
SOCIO-ECONOMIC ANALYSIS – RESTRICTIONS
92
Disaggregating the cost data between individual cost components is useful and should be carried out as far as is practicable. The five checklists21 presented in Appendix B.2 list some of the cost components that are most useful for the assessment. The checklists cover: investment and sunk costs, operating and maintenance costs, revenues, regulatory costs and downstream & consumer costs. These checklists are not exhaustive and other components might be important in individual cases22. Having identified the main economic impacts, it will only be necessary to analyse the relevant selection of impacts identified in these checklists.
A systematic approach to identification and assessment of economic impacts should avoid costs and benefits being counted more than once.
The output of the assessment of the economic impacts is a clear description of any changes in costs or savings to the affected supply chains and consumers. It is also an assessment of the distribution of the costs indicating who will be incurring the costs or the savings. Often with economic impacts, either the monetised data is available (through consultation or other forms of research) or is difficult to obtain due to confidentiality reasons (e.g. it may be very difficult to gather data on the profitability of a company which makes several products, unless their financial reporting is broken-down by each product and the data is publicly available). If the latter is the case, then it is important that a more qualitative assessment is carried out, and in some cases this will be proportional to the problem at hand.
3.6 Social impacts
Social impacts are here understood as all relevant impacts which may affect: workers, consumers and the general public and are not analysed under human health and environmental risks and economic impacts. For most SEA this will mainly be impacts on employment and any major impacts that result as a consequence of changes in employment (e.g. changes in working conditions, job satisfaction, education of workers and social security) and changes to the quality of life (change in availability and quality of consumers products). Further details on social impacts can be found in chapter 4 of the EC Impact Assessment guidelines23.
3.6.1 Step 3.1 – Identification of social impacts
When should employment effects be considered in the SEA?
Employment effects are important from a distributional point of view. If certain groups are affected by increased unemployment (for example when some business activities close down or are relocated to outside of the EU) this could be seen as negative distributional impact. Whether the total level of employment is affected is a macro-economic issue. Here the following is suggested:
21 The checklists are neither exhaustive nor definitive. They are intended to guide you towards ensuring that impacts and issues that are particularly relevant are considered during the analysis. Types of impacts falling outside those listed in these checklists but are relevant under the proposed restriction should therefore be considered.
22 The checklists draw on EC (2006) Economics and Cross-media effects; Reference document for IPPC, June 2006. This document presents guidance on various cost elements and how to assess them, although in the context of IPPC.
23 EC Impact Assessment Guidelines (p31-32) 15 June 2005
SOCIO-ECONOMIC ANALYSIS – RESTRICTIONS
93
• Minor employment effects that arise from “marginal” changes in the activity of a given company (for example using one substance instead of another) should not be included as they are covered by the analysis of the economic impacts.
• Employment effects that are caused by a given activity, e.g. a company closing down or relocating production outside of the EU, should be estimated and included as a distributional impact.
Are there other relevant social impacts?
If there are major effects on employment which will affect certain regions and certain social groups, it could be relevant to consider these impacts24. A non-exhaustive list of impacts include; educational level of workers, family support, child work, forced labour, corruption index, wages and salaries, good labour criteria of ILO, quality factors, supplier evaluation, social security, part time workers, gender equality, trainees, strikes and lockouts and employees qualifications.
Another important social impact to consider is changes to the “welfare” of consumers. Economists use the term to describe the well being of an individual or society, so naturally many factors could affect the welfare of an individual or society. For example, some consumers may miss the satisfaction (economists prefer the term – utility) they derive from the use of a product, or a change in the quality of the product (e.g. it is not as durable, or can not be used it in the same way it was previously used) can result in a loss of consumer welfare (e.g. the utility of an individual).
For example, if paint used to decorate a house is now less durable, the utility an individual gains from having a nice looking house will diminish sooner than had they used the previous product which was more durable. Appendix C provides some further details of some non-market valuation techniques (goods/services that do not have a value in the market place) which can be used in value losses/gains in utility. However in most cases, it will be very difficult and perhaps not necessary to go beyond a qualitative assessment of consumer welfare.
3.6.2 Step 3.2 – Data collection process
The starting point is using information already gathered as part of the analysis of economic impacts (such as number of workers and location of plants) to estimate the impacts on employment. Concerning impacts on employment, some generic issues to consider are listed in the following bullet points. They are neither exhaustive nor definitive and are posed from the perspective of manufacturers/importers, but the same thinking can be applied to downstream users:
• How many producers/importers of the substance exist;
• How many people do they employ;
• What are the main jobs/skills required by these companies?
• What are the alternatives to employing these people (i.e. if an alternative process is used which is more capital rather than labour intensive)
• Question: Are there any changes in the above issues likely due to the proposed restriction?
24 Chapter 4 of the EC Impact Assessment Guidelines (p31-32) 15 June 2005 provides a more comprehensive range of social impacts which may be relevant to consider in order to be to able to produce a robust conclusion.

SOCIO-ECONOMIC ANALYSIS – RESTRICTIONS
94
The main sources of information which will enable a detailed industry/sector assessment are likely to be:
• Consultation with industry that is producing or using the substance (trade associations and individual companies)
• Consultation with industry that is producing or using alternatives to the substance (trade associations and individual companies) and
• Consultation with relevant labour unions;
• Relevant company websites and publications (e.g. company reports to stakeholders)
Additionally, for a wider (less detailed) assessment of employment, generally at a regional level (e.g. where the main companies are situated) several publicly available sources could be used. These might include:
• National census25 / statistical institute data – For example, it will be possible to the determine the qualification level of workers in the area, the level of unemployment, a broad classification of the types of industry located in the area and so forth.
• Local authority / regional government reports and websites
• Statistical services such as Eurostat (the statistical office of the European communities)
• Published information such as Employment in Europe and the quarterly EU labour market review
National census data is likely to be a key source of information when only a less detailed assessment is required or is concerned more relevant given the scale of the problem. One potential problem with national survey data in general is that they are only updated periodically and therefore may not accurately reflect the true socio-economic demographic in an area if significant changes have occurred after the census survey was carried out. Nevertheless the census data is likely to be one of the best sources of publicly available information to support the assessment of potential social impacts. Another potential problem with census data is that the categories and labelling of data (e.g. qualification and occupation groups) will vary for each Member State, although in general it should be possible to collate and compare the information.
The checklist26 presented in Appendix B.3 lists some of the components relevant to employment that are most useful for the assessment. The checklist covers several aspects: numbers of jobs, occupational groups, location and working environment. The checklist is not exhaustive and other components might be important in individual cases27.
25 Official survey of population carried out periodically, with details as to age, sex, occupation, etc
26 The checklists are neither exhaustive nor definitive. They are intended to guide you towards ensuring that impacts and issues that are particularly relevant are considered during the analysis. Types of impacts falling outside those listed in these checklists but are relevant under the proposed restriction should therefore be considered.
27 Chapter 4 of the EC Impact Assessment Guidelines (p31-32) 15 June 2005 provides a more comprehensive range of social impacts which may be relevant to consider in order to be to able to produce a robust conclusion.

SOCIO-ECONOMIC ANALYSIS – RESTRICTIONS
Having identified the main social impacts, it will only be necessary to analyse the relevant selection of impacts identified in this checklist (as well as any other impacts identified that are not included in the checklist).
For other social impacts such as consumer welfare, consultation with non-governmental organisations (NGOs) such as consumer groups and publicly available information on the internet are likely to be the main sources of information. Of course consultation with relevant supply chain actors will also be useful as they will have dedicated teams for marketing their product, and will generally have an excellent understanding of the needs of their customers and will therefore be able to provide a valuable insight into the customer welfare of their products, and any changes that could occur due to the proposed restriction.
3.6.3 Step 3.3 – Assessing social impacts
A simple approach to assessing employment effects is outlined below. In Appendix B.3 a more thorough approach is included (this will only be possible if there is sufficient data and if more detailed analysis is deemed necessary).
Task 1 Estimate the changes in employment
Estimate the change in employment based on the best available information. It may be possible to estimate the change in the typical number of people required within a process using a representative firm(s), followed by up-scaling to the relevant geographic area. Some form of sensitivity analysis should be carried out when up-scaling the results (uncertainty analysis is discussed in the next chapter).
The assessment should cover all relevant supply chains.
Task 2 Estimate the types of jobs and skills level in the relevant regions
Estimate either the skills (or qualifications) of people in the region where these industries are located and the types of businesses located within the local region. This information should be available in national census data.
Task 3 Estimate the effect on the location of these jobs
Determine what type of jobs may be lost / created in the region and how this relates to the types of businesses located in these regions, to determine how significant these jobs are within those regions affected.
TIP BOX – Some useful social indicators that can be found in national census data
• Number of people employed relative to the working age population in the local area
• Relevant employment sector distribution in the region e.g. manufacturing, construction, transport storage and communication
• Job occupation type in the local area e.g. managers and senior officials, plant and machine operatives
• Qualifications of people in the local area who are of working age
95
SOCIO-ECONOMIC ANALYSIS – RESTRICTIONS
96
The output of the assessment of the social impacts will be a list of significant social impacts. Impacts such as employment effects are likely to quantifiable while wider social effects will be qualitatively described.
3.7 Trade, competition and economic development (wider economic impacts)
3.7.1 Step 3.1 – Identifying trade, competition and economic development impacts
The starting point for the identification of potential impacts on trade, competition and economic development is the estimate of economic impacts. If the difference in costs between the “baseline” scenario and the “proposed restriction” scenario is very significant this might lead to significant wider economic effects.
Appendix G includes a checklist28 with questions to support the identification of wider economic impacts. It includes questions such as:
• Are there any likely to be changes to competition within the EU? (e.g. changes in the number of products available to downstream users and consumers and changes to the numbers of manufacturers/importers supplying these products)
• Are there any likely to be changes to competitiveness outside of the EU? (E.g. would the conditions of the restriction give an advantage to manufacturers outside of the EU?)
• Are there any likely to be changes to international trade? (e.g. trade flows between EU and non-EU countries)
To answer these questions it will typically be necessary to undertake some analysis of the relevant markets. Section 3.7.3 includes a description of the kind of analysis that is needed for understanding whether wider economic impacts on trade, competition and economic development could be relevant for the SEA.
As a rough indicator only, as each restriction will vary on a case-by-case basis, competition and competitiveness impacts will generally be important (a main impact) to assess further given that mainly substances are globally traded now. Impacts such as changes in investment flows and international trade will only be relevant to analyse further if there is likely to be significant impacts on the competitiveness of EU manufacturers (e.g. when there becomes an significant advantage/disadvantage to being located in the EU, which will give EU manufacturers an advantage/disadvantage over manufacturers outside of the EU, as a result of the conditions of the proposed restriction).
3.7.2 Step 3.2 – Data collection process
The starting point for gathering the information required is identifying information not collected during the assessment of economic impacts and which is relevant for analysing the possible impacts on trade, competition and wider economic impacts. Such data might include:
28 The checklists are neither exhaustive nor definitive. They are intended to guide you towards ensuring that impacts and issues that are particularly relevant are considered during the analysis. Types of impacts falling outside those listed in these checklists but are relevant under the proposed restriction should therefore be considered.

SOCIO-ECONOMIC ANALYSIS – RESTRICTIONS
• What is the geographical extent of the market (e.g. national, EU or global)? (It may be useful to gather statistics on import and exports to determine where the key markets are.)
• How many competitors are there (and where are they located)?
• How price sensitive is the demand for the product?
In case where changes in the profitability of companies in the market can be described, this should also be considered. Information on these aspects can be provided for example by the supply chain, trade statistics, financial statistics (profitability of individual companies or industry sectors) or market reviews.
3.7.3 Step 3.3 – Assessing wider economic impacts
The majority of these impacts will only be analysed qualitatively and supported where possible by quantitative data. A proposed process for analysing trade, economic and wider economic impacts is outlined below:
• Task 1 – Analyse the market to determine the ability to pass through additional costs;
• Task 2 – Determine how well the industry can withstand major changes in their economic environment (resilience) using, if possible, financial ratios.
Task 1 - Analyse the market to determine the pass through of additional costs
Use the data gathered on the level of competition and possible price sensitivity of demand to make an informed judgement on whether additional costs at any part of the supply chain will be passed on further down the chain.
There are several established methodologies that have been developed for analysing markets. One commonly used methodology is ‘Porter’s five forces theory’. Competitive forces determine industry profitability because they influence the prices, the costs, and the required investments of firms in an industry. See Appendix B.4 for further details on this methodology.
97
SOCIO-ECONOMIC ANALYSIS – RESTRICTIONS
Task 2 - Determine the resilience of the industry using financial ratios
Note of caution when using financial ratios
1. Data on the profitability can be difficult to obtain
a. It may be possible to gain an understanding of the overall profitability of the firm but not necessarily the performance of an individual product in their portfolio
2. It will be necessary to obtain a series of profitability data (i.e. data over at least a 5 year period) as some industries profitability can vary significantly in different market conditions.
a. One year's profitability in most cases can not be used as a representative year for future years
b. Trends in profitability based on past years performance may not necessarily give a true representative of future conditions faced by these industries in the future, especially under the new conditions of the proposed restriction
3. It will be important that the analyst is comfortable reading and understanding financial ratios to be able to understand what “message/signals” they are showing.
The resilience of the industry can best be calculated using financial ratios of a representative firm or the industry average (as elsewhere, uncertainty analysis should be carried out). This is because financial ratios of companies or industries can provide a good overall impression of the financial performance of a company or industry but not necessarily the true performance of an individual product (i.e. a company may not report on the financial performance of each of their products but rather the performance of the complete portfolio of products). Appendix B.4 provides a list of useful financial ratios which describe the liquidity, solvency and profitability of a firm, where:
When describing the resilience of a sector, the consideration of longer-term trends (5-10 years) is useful to ensure that short-term fluctuations are not allowed to distort the understanding of the long term resilience of the sector.
Output of the assessment of wider economic impacts
The results of assessment are likely to be a list of possible impacts qualitatively described.
3.8 Step 3.4 – Ensuring the consistency of the analysis
This section includes guidance on how to ensure a consistent analysis and it applies to all types of impacts (environmental, human health, economic, social and wider economic impacts).
To improve validity, the Authority should gather data from a number of independent sources, if possible. The source and the origin of all data should be recorded. This will allow the data to be traced and validated at a later date if necessary. If the data source is a published report or database, then a standard bibliography will normally suffice for this purpose. If the data source is a verbal or some other form of non-public communication, this should be clearly stated and the source and date
98
SOCIO-ECONOMIC ANALYSIS – RESTRICTIONS
99
recorded. It is also very important that all assumptions that are made during the analysis are documented in a transparent way.
It is recommended that (where possible), costs and benefits be described in similar terms.
• Monetary estimates: these should be expressed in a common currency e.g. Euros (€) and they should be in the price level of a common year (e.g. all prices should be quoted in 2008 prices).
• Quantitative estimates: these should be expressed in physical terms e.g. man hours saved, amount of energy saved in kWh.
• Qualitative estimates: where possible these should be as similar to the quantitative estimates as possible e.g. qualitative description of how man hours and energy saved could change.
The Authority should strive to identify and use the most recent valid data available. The year to which the cost data apply and the currency exchange rate applied should always be stated. This ensures transparency and allows other users to reproduce (confirm the validity of) the analysis if necessary. These aspects are discussed below.
3.8.1 Exchange rates
Where prices are quoted in different currencies, they need to be converted to a common currency, i.e. Euros. When making this conversion, the Authority/interested party will need to specify the exchange rate used in the calculation as well as the source and date of that exchange rate. An important source of European price indices is Eurostat although the market currency exchange rate should equally be sufficient.
3.8.2 Inflation
The general price level and the relative prices of goods and services (e.g. cost of investment equipment, market price for raw materials) in an economy will change over time because of inflation. There will often be a need to use estimates for costs and benefits found in literature sources that were based on findings in different years and in such cases inflation will need to be taken into account.
For example, if the cost of investment in equipment was quoted in 2001 prices this is likely to be an underestimate compared to the cost in today prices. It will be necessary to adjust prices into equivalent base year prices (which in most cases would be the present year29).
29 Making the distinction between real and nominal prices is unlikely to be necessary if the base year is the present year.

SOCIO-ECONOMIC ANALYSIS – RESTRICTIONS
Establishing prices in the base year
To adjust the cost data into an equivalent price in a selected year (the nominal price), it is necessary to use a price adjuster, which can be derived by the following two steps:
Step 1:
price adjuster = appropriate price index for the 'base year' of the analysis
appropriate price index for the year to which the raw cost valuation pertains Step 2: adjusted cost = original cost valuation x price adjuster
What is the appropriate price index?
An important source of European price indices is Eurostat. As a general rule, one should use the gross domestic product (GDP) deflator, which is based on the inflation rate of either the EU as a whole, or the Member State from where the information is obtained. If warranted other deflators (e.g. based on producer price or consumer price indexes can be used but it should be noted that these indexes are closely correlated with the overall inflation rate (expressed by the GDP deflator)
3.8.3 Discounting
Discounting is only relevant if:
• Some of the impacts have been monetised; and
• The timing of costs and benefits is known (within an acceptable level of uncertainty) or can be expressed in annual terms.
Introduction
The decision whether or not to impose a restriction (or any other RMO) is likely to have consequences (i.e. costs and benefits) now and in the future. The current and future costs and benefits to those people in society affected by the decision need to be taken into account in the SEA (i.e. including impacts which are not immediately priced through markets such as health and environmental effects). A mechanism is therefore required to compare costs and benefits occurring at different times.
In economic analyses the most common method used to compare costs and benefits over time is called discounting. Discounting makes it possible to calculate equivalent amounts in today’s terms, i.e. the ‘present value’, or at any other fixed point in time. The further away in time a cost or benefit occurs, the lower its present value becomes. The size of the reduction in the present value depends on the discount rate: future costs or benefits estimated using a higher discount rate will have a lower present value. This is discussed further in Appendix D.
100
SOCIO-ECONOMIC ANALYSIS – RESTRICTIONS
101
The net present value (NPV) of an option, for example, is the net value today of the present value of the benefits of a continued use minus the present value of the costs, i.e. a positive net present value means that the socio economic benefits of continued use outweigh the costs (it is important to note however that the net present value is not necessarily the criterion with which the final decision is made as some impacts can not be monetised). Appendix D also discusses concerns about discounting future health and environmental effect.
An alternative to the net present value is to provide a representative annual value for (or to annualise) the investment costs and add the annual operating costs (and other recurrent costs), to get a total annualised cost. This approach is often used for environmental policies because the environmental and health impacts are often assessed on an annual basis (e.g. how many people are affected by a pollutant in a year and what effects occur). The annualised value involves somewhat less work than the net present value approach and is appropriate when the costs and benefits are likely to be relatively stable year-on-year. It can be particularly useful when comparing options against one another where the impacts occur over different lifetimes.
Appendix D provides further information on:
• Why discounting is important;
• Why the choice of discount rate is important; and
• How to determine the discount rate using different approaches.
Approach
The proposed approach to discounting future costs and benefits is described below.
Task 1 Apply the formula for discounting to calculate the present value of costs and benefits
In order to discount and calculate the present value of a future cost or benefit it is necessary to know:
• The time period of the SEA – this should have been determined in Stage 2 of the SEA. It should be of sufficient length to capture with reasonable certainty all of the significant costs and benefits;
• The magnitude and timing of specific costs and benefits over the time period; and
• The discount rate – the default discount rate is set at 4% (as used for Impact Assessment guideline of the European Commission30).
30 guidelines: http://ec.europa.eu/governance/impact/docs/key_docs/sec_2005_0791_en.pdf
Annexes to the guidelines: http://ec.europa.eu/governance/impact/docs/key_docs/sec_2005_0791_anx_en.pdf
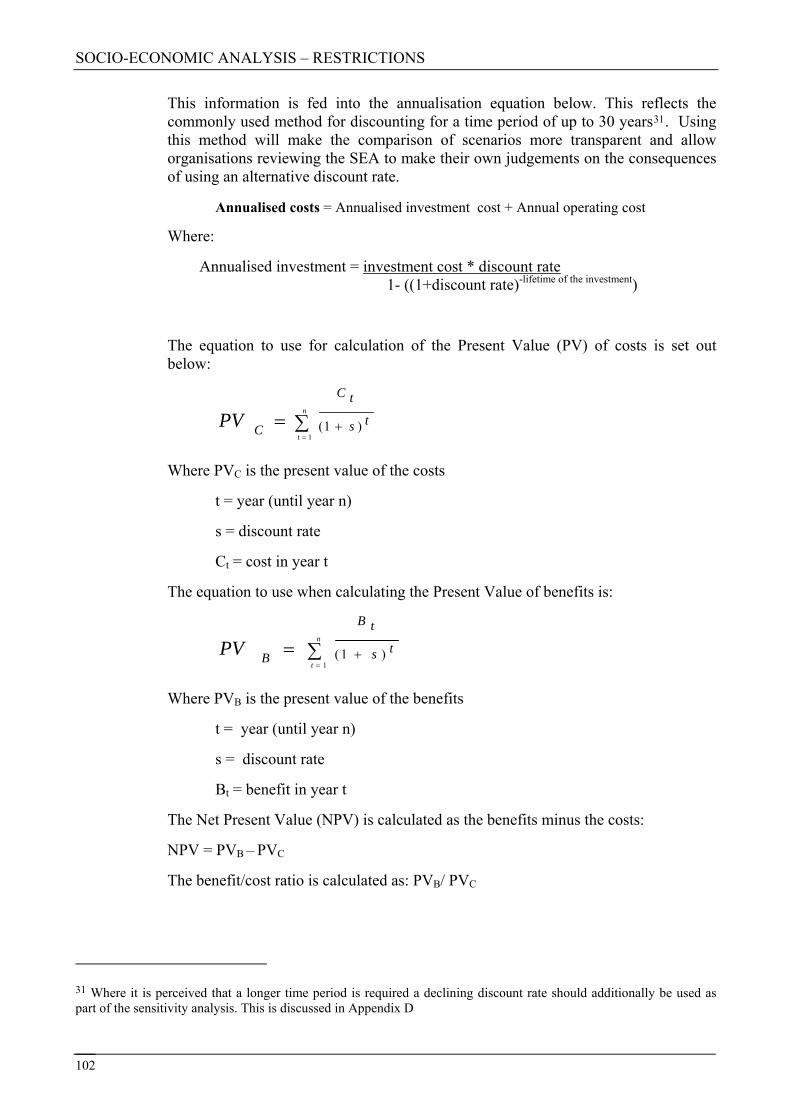
SOCIO-ECONOMIC ANALYSIS – RESTRICTIONS
102
This information is fed into the annualisation equation below. This reflects the commonly used method for discounting for a time period of up to 30 years31. Using this method will make the comparison of scenarios more transparent and allow organisations reviewing the SEA to make their own judgements on the consequences of using an alternative discount rate.
Annualised costs = Annualised investment cost + Annual operating cost
Where:
Annualised investment = investment cost * discount rate 1- ((1+discount rate)-lifetime of the investment)
The equation to use for calculation of the Present Value (PV) of costs is set out below:
∑==
+n
t
ts
tC
CPV1
)1(
Where PVC is the present value of the costs
t = year (until year n)
s = discount rate
Ct = cost in year t
The equation to use when calculating the Present Value of benefits is:
∑==
+n
t
ts
tB
BPV1
)1(
Where PVB is the present value of the benefits
t = year (until year n)
s = discount rate
Bt = benefit in year t
The Net Present Value (NPV) is calculated as the benefits minus the costs:
NPV = PVB – PVC
The benefit/cost ratio is calculated as: PVB/ PVC
31 Where it is perceived that a longer time period is required a declining discount rate should additionally be used as part of the sensitivity analysis. This is discussed in Appendix D
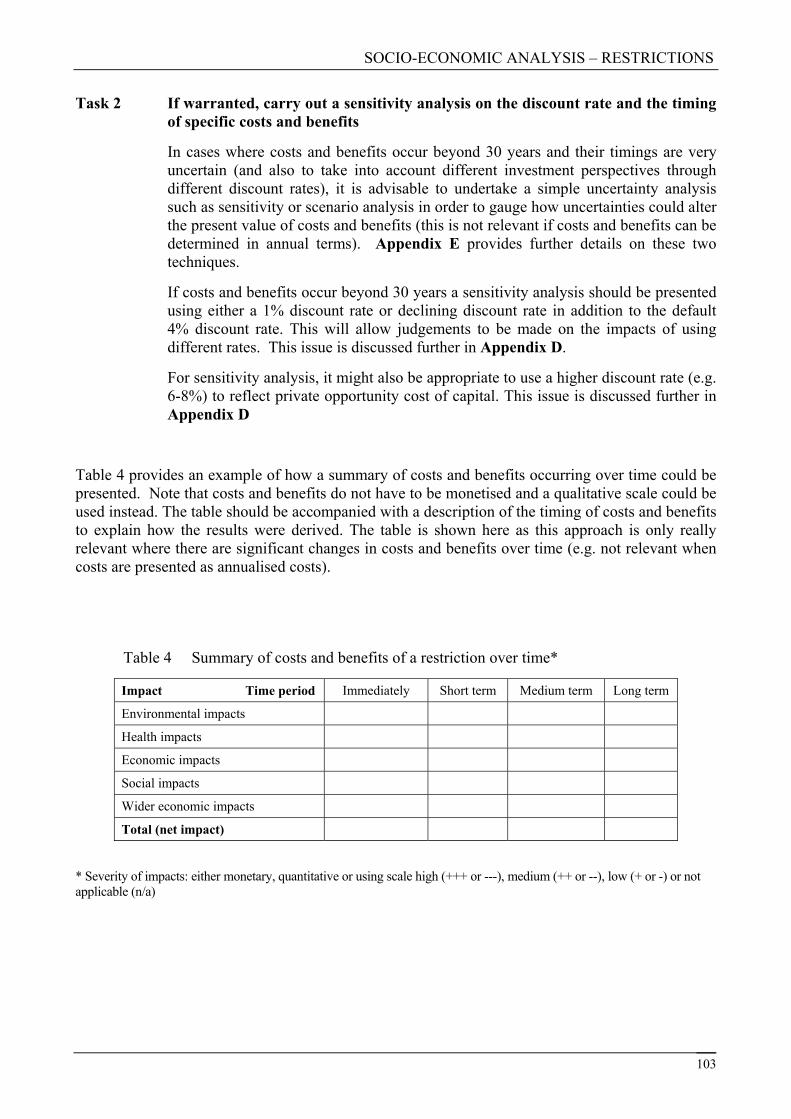
SOCIO-ECONOMIC ANALYSIS – RESTRICTIONS
Task 2 If warranted, carry out a sensitivity analysis on the discount rate and the timing of specific costs and benefits
In cases where costs and benefits occur beyond 30 years and their timings are very uncertain (and also to take into account different investment perspectives through different discount rates), it is advisable to undertake a simple uncertainty analysis such as sensitivity or scenario analysis in order to gauge how uncertainties could alter the present value of costs and benefits (this is not relevant if costs and benefits can be determined in annual terms). Appendix E provides further details on these two techniques.
If costs and benefits occur beyond 30 years a sensitivity analysis should be presented using either a 1% discount rate or declining discount rate in addition to the default 4% discount rate. This will allow judgements to be made on the impacts of using different rates. This issue is discussed further in Appendix D.
For sensitivity analysis, it might also be appropriate to use a higher discount rate (e.g. 6-8%) to reflect private opportunity cost of capital. This issue is discussed further in Appendix D
Table 4 provides an example of how a summary of costs and benefits occurring over time could be presented. Note that costs and benefits do not have to be monetised and a qualitative scale could be used instead. The table should be accompanied with a description of the timing of costs and benefits to explain how the results were derived. The table is shown here as this approach is only really relevant where there are significant changes in costs and benefits over time (e.g. not relevant when costs are presented as annualised costs).
Table 4 Summary of costs and benefits of a restriction over time*
Impact Time period Immediately Short term Medium term Long term
Environmental impacts
Health impacts
Economic impacts
Social impacts
Wider economic impacts
Total (net impact)
* Severity of impacts: either monetary, quantitative or using scale high (+++ or ---), medium (++ or --), low (+ or -) or not applicable (n/a)
103

SOCIO-ECONOMIC ANALYSIS – RESTRICTIONS
104
3.9 Example on how to identify and assess impacts32
The following example illustrates how identify and assess several types of impacts. It is very important to highlight that this example is hypothetical and purely for illustrative purposes. Although some values are referenced the example can not be taken to represent any factual situation.
How to assess economic impacts?
This is an illustrative example continued from Section 2.6 where it is assumed that the substance “E” is used to clean buildings.
Firstly the economic impacts in terms of changes total economic costs are described; secondly the distribution of the economic impacts is discussed.
Total economic costs to industry and consumers
The “proposed restriction” scenario assumes that the response of the industry is to use an alternative substance that together with jet-washing can achieve the same result.
The elements that need to be considered as economic impacts include:
− Difference in production costs between substance “E” and the alternative (can be estimated as the price difference between the two substances);
− Additional equipment to perform the jet-washing;
− Costs of using water for jet-washing;
− Savings on the use of personal protective equipment (needed when using “E”); and
− Additional manpower costs as the cleaning process takes about 20% longer to perform.
All of these economic impacts affect industry and consumers within the EU. All costs are assumed to social costs based on prices excluding taxes.
The question is whether there are further impacts than need to be considered. The supplier of substance “E” will experience a decrease in demand and turnover – but should that be included?
Only if for example the reduced demand increases the production costs of other substances manufactured by that chemical company. If there are such joint production effects, then the additional production costs for the other products should be included as an economic impact.
In this example, it assumed that consultation with the industry has revealed the change in demand from substance “E” to the alternative substance will have no major impacts on production costs for the affected suppliers of the substances.
The results for listed impacts are:
32 Theoretical numbers have been used for illustrative purposes so references to data sources can not be included. In practice, Authorities should include reference to all data sources for all SEAs submitted to the SEA committee. This example may therefore oversimplify the actual problems faced in real SEA.
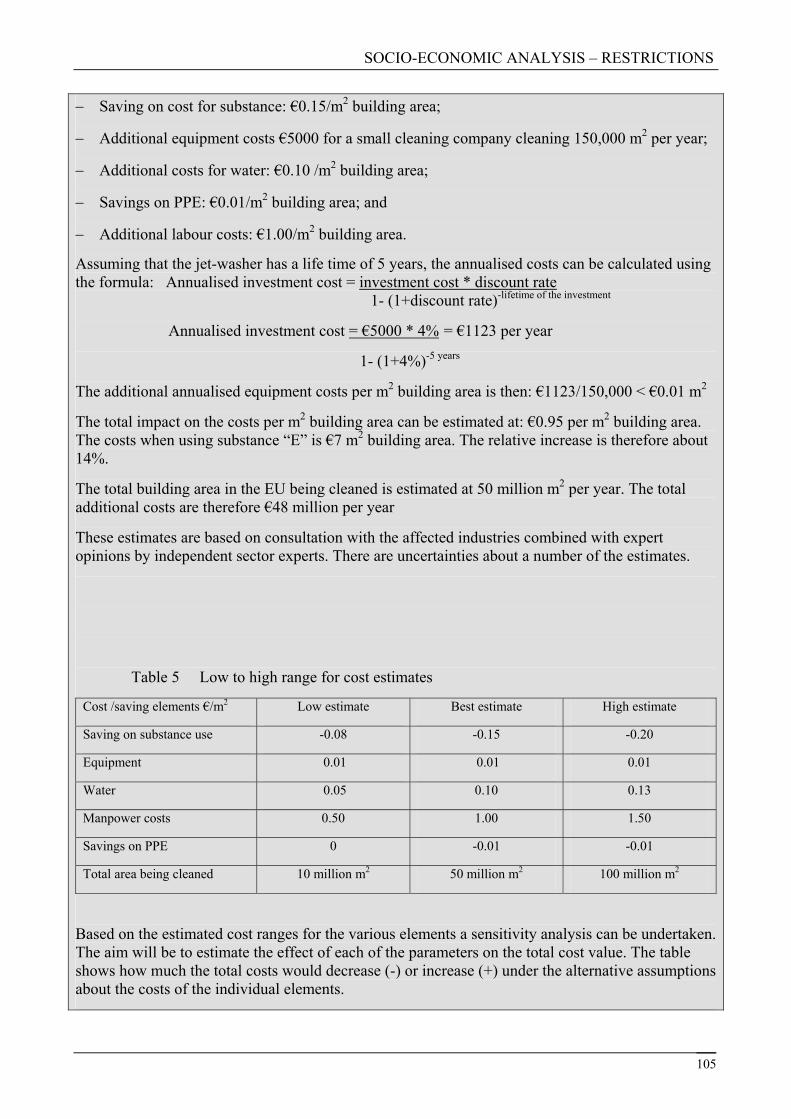
SOCIO-ECONOMIC ANALYSIS – RESTRICTIONS
− Saving on cost for substance: €0.15/m2 building area;
− Additional equipment costs €5000 for a small cleaning company cleaning 150,000 m2 per year;
− Additional costs for water: €0.10 /m2 building area;
− Savings on PPE: €0.01/m2 building area; and
− Additional labour costs: €1.00/m2 building area.
Assuming that the jet-washer has a life time of 5 years, the annualised costs can be calculated using the formula: Annualised investment cost = investment cost * discount rate 1- (1+discount rate)-lifetime of the investment
Annualised investment cost = €5000 * 4% = €1123 per year
1- (1+4%)-5 years
The additional annualised equipment costs per m2 building area is then: €1123/150,000 < €0.01 m2
The total impact on the costs per m2 building area can be estimated at: €0.95 per m2 building area. The costs when using substance “E” is €7 m2 building area. The relative increase is therefore about 14%.
The total building area in the EU being cleaned is estimated at 50 million m2 per year. The total additional costs are therefore €48 million per year
These estimates are based on consultation with the affected industries combined with expert opinions by independent sector experts. There are uncertainties about a number of the estimates.
Table 5 Low to high range for cost estimates
Cost /saving elements €/m2 Low estimate Best estimate High estimate
Saving on substance use -0.08 -0.15 -0.20
Equipment 0.01 0.01 0.01
Water 0.05 0.10 0.13
Manpower costs 0.50 1.00 1.50
Savings on PPE 0 -0.01 -0.01
Total area being cleaned 10 million m2 50 million m2 100 million m2
Based on the estimated cost ranges for the various elements a sensitivity analysis can be undertaken. The aim will be to estimate the effect of each of the parameters on the total cost value. The table shows how much the total costs would decrease (-) or increase (+) under the alternative assumptions about the costs of the individual elements.
105

SOCIO-ECONOMIC ANALYSIS – RESTRICTIONS
Table 6 Sensitivity analysis: Impact on total costs from variation in each cost element
Cost /saving elements €/m2 Low estimate Best estimate High estimate
Saving on substance use 51 48 45
Equipment 48 48 48
Water 45 48 49
Manpower costs 23 48 73
Savings on PPE 48 48 48
Total area being cleaned 10 48 95
The most important uncertainties are about the manpower costs and the total area that is being cleaned using the substance. If further data collection is suggested, then these elements should be targeted.
A more refined assessment of how the uncertainties affect the result could be achieved by a simple Monte Carlo simulation. That would give a range on the total cost estimate. A rough approximation to such an analysis would suggest that the range would be close to range caused by the element that has the largest impact. A range from €10m to €95m would therefore be such a rough estimate based on the variation in the estimated total building area being cleaned.
In addition to looking at the uncertainty on the estimate, the distribution of the costs should be assessed. The proposed restriction could significantly increase the cost for the cleaning companies and assuming that there are a large number of small companies such a significant increase in their production costs could potentially be an issue. Assuming that the cleaning is important and that it comprises only a small costs for the owners of the buildings (relative to all other operation and maintenance costs) it is likely that the costs can be passed on to the owners of the buildings. They will therefore bear the costs burden of the proposed restriction for this particular use.
Distributional effects
Following on from the assessment of the economic impacts, the main distribution issues are:
− Changes in operating income for different industries; and
− Changes in costs for consumers.
The distributional effects on industry comprise of reduced sales revenue for substance E suppliers and the increased sales revenue for the suppliers of the alternative substance. The quantity of both substances is estimated at 5000 tons (1 kg per m2 times 50 million m2) and using an estimated price of 250 per tons for substance E and 100 per tons for the alternative, the distributional impacts can be calculated.
The most relevant measure is the operating income (one measures of profitability of the production). This might not be known as it could be for example commercially confidential information. From public available annual reports some indication can be found. For making an
106
SOCIO-ECONOMIC ANALYSIS – RESTRICTIONS
assessment of how different industries are affected the impact on sales could be used.
In this example the reduced revenue for the supplier of substance E will be €1.25m while the increased revenue for the supplier of the alternative substance will be €0.5m.
By comparing the change in revenue to the total revenue of the suppliers the relative impact can be estimated. In this example, we assumed that the suppliers’ total sales revenues are around €25m and €5m respectively. The relative change is therefore 5% for the substance E supplier and 10% for the supplier of the alternative substance.
For consumers the impact is an increase in the expenditure on cleaning at €48m based on the above argument for a full pass through of the increased costs. It is advisable that distribution effects are reported, so that they can be taken into account by decision makers who are forming their opinions on the proposed restriction.
How to assess social impacts?
The identification of social effects start off with looking at where there could be a potential impact on employment:
− Change in level of employment at substance suppliers
− Change in level of employment at producers of equipment
− Change in level of employment at the cleaning companies
The further assessment shows that there is no net impact at chemical industry as the difference in costs between substance “E” and the alternative is due to different raw material and energy intensity in the production process.
The increased demand for jet washers is marginal and has no employment impact. That leaved the impact on the affected industry as the main potential employment effect. If the demand for cleaning of the building is assumed to be constant, then the demand for manpower will increase by about 50% as the best estimate. This is roughly estimated to about 4500 people that will additionally be employed.
It is not straightforward to determine how this impact should be included in the analysis. It depends on whether the additionally employed people would be employed at something else if this proposed restriction would not be introduced. It is a question of whether there is a macro-economic effect in the form of increased resource utilisation (of unskilled workers). If it is the case then the employment effect is positive and partly offsets the economic effect of increased costs. (Ideally, the economic assessment presented above should apply prices on each type of resource that reflects its scarcity. So if there is unemployment it could be argued that the price of hiring more staff is zero.)
Assuming the level of qualification for these jobs are relatively low, it might be that there is a positive effect on employment. If that is the case it could have further positive social impacts. They will be difficult to quantify but could be qualitatively described.
How to assess wider economic impacts?
Wider economic impacts include possible effects on trade, competition and economic development. The cleaning industry affected is not exposed any international (meaning outside of EU) competition as the activity takes place at purely domestic markets. The assumption that the potential additional costs to the owners of the buildings are very small means that the “proposed restriction” scenario will not affect their businesses. Therefore, there is no impact on trade. There is also no
107

SOCIO-ECONOMIC ANALYSIS – RESTRICTIONS
impact on competition. Although the industry is dominated by SMEs, the additional investment in equipment is very limited and it is therefore no barrier for new entrants or something that will change market shares from the smallest companies to companies.
In terms of economic development no impacts can be identified. The possible increase in employment is already covered under the social impacts and there are no additional effects that need to be considered.
108

SOCIO-ECONOMIC ANALYSIS – RESTRICTIONS
4 THE SEA PROCESS – STAGE 4: INTERPRETATION AND CONCLUSION DRAWING
4.1 Introduction
Interpretation and conclusion drawing is the fourth stage in the SEA process, as shown in Figure 20 below. The main aim is to present and compare the qualitative, quantitative and monetised costs and benefits of each RMO scenario against the “baseline” scenario (i.e. to present the differences between the scenarios).
Figure 20 SEA process – Stage 4
The main steps of Stage 4 are shown in Figure 20. Each step is explained in more detail in the following sections.
This section describes the proposed approach to this stage of the SEA in detail. It is recognised that the overall approach to the SEA should be an iterative one and the Authority should undertake this stage at a level of detail appropriate to that of the SEA iteration being undertaken as a whole.
As with all stages in the SEA process, the Authority should give consideration to the uncertainties present in the data and analysis. The implications of uncertainties should be considered and acknowledged in the presentation of results.
4.2 Step 4.1: Compare the qualitative, quantitative or monetised impacts
There are several SEA tools and comparative techniques which can be applied in order to assess the net benefits of the proposed restriction to human health and the environment and the net costs to manufacturers, importers, downstream users, distributors, consumers and society as a whole.
109
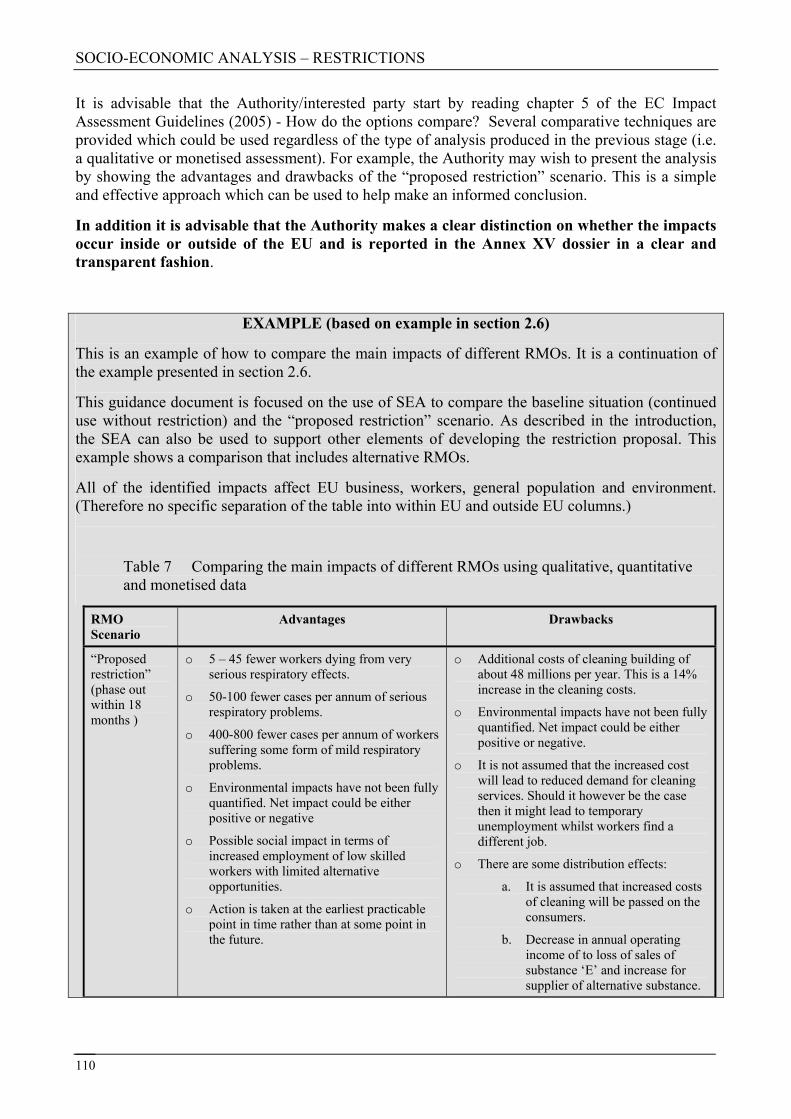
SOCIO-ECONOMIC ANALYSIS – RESTRICTIONS
It is advisable that the Authority/interested party start by reading chapter 5 of the EC Impact Assessment Guidelines (2005) - How do the options compare? Several comparative techniques are provided which could be used regardless of the type of analysis produced in the previous stage (i.e. a qualitative or monetised assessment). For example, the Authority may wish to present the analysis by showing the advantages and drawbacks of the “proposed restriction” scenario. This is a simple and effective approach which can be used to help make an informed conclusion.
In addition it is advisable that the Authority makes a clear distinction on whether the impacts occur inside or outside of the EU and is reported in the Annex XV dossier in a clear and transparent fashion.
EXAMPLE (based on example in section 2.6)
This is an example of how to compare the main impacts of different RMOs. It is a continuation of the example presented in section 2.6.
This guidance document is focused on the use of SEA to compare the baseline situation (continued use without restriction) and the “proposed restriction” scenario. As described in the introduction, the SEA can also be used to support other elements of developing the restriction proposal. This example shows a comparison that includes alternative RMOs.
All of the identified impacts affect EU business, workers, general population and environment. (Therefore no specific separation of the table into within EU and outside EU columns.)
Table 7 Comparing the main impacts of different RMOs using qualitative, quantitative and monetised data
RMO Scenario
Advantages Drawbacks
“Proposed restriction” (phase out within 18 months )
o 5 – 45 fewer workers dying from very serious respiratory effects.
o 50-100 fewer cases per annum of serious respiratory problems.
o 400-800 fewer cases per annum of workers suffering some form of mild respiratory problems.
o Environmental impacts have not been fully quantified. Net impact could be either positive or negative
o Possible social impact in terms of increased employment of low skilled workers with limited alternative opportunities.
o Action is taken at the earliest practicable point in time rather than at some point in the future.
o Additional costs of cleaning building of about 48 millions per year. This is a 14% increase in the cleaning costs.
o Environmental impacts have not been fully quantified. Net impact could be either positive or negative.
o It is not assumed that the increased cost will lead to reduced demand for cleaning services. Should it however be the case then it might lead to temporary unemployment whilst workers find a different job.
o There are some distribution effects:
a. It is assumed that increased costs of cleaning will be passed on the consumers.
b. Decrease in annual operating income of to loss of sales of substance ‘E’ and increase for supplier of alternative substance.
110

SOCIO-ECONOMIC ANALYSIS – RESTRICTIONS
Delayed restriction scenario - Phase out use of the substance within 6 years
o 5 – 45 fewer workers dying from very serious respiratory effects.
o 50-100 fewer cases per annum of serious respiratory problems.
o 400-800 fewer cases per annum of workers suffering some form of mild respiratory problems.
o Gives the industry time to change their process in a cost-efficient way.
o Environmental impacts have not been fully quantified. Net impact could be either positive or negative.
o It is unknown whether there will be any reductions in occupational health risks during the phase out period.
o Additional costs of cleaning building of about 48 millions per year. This is a 14% increase in the cleaning costs.
o Environmental impacts have not been fully quantified. Net impact could be either positive or negative.
Voluntary Agreement:
Stepwise phase-out within 10 years, follow-up and reporting on the progress in identifying suitable alternatives (RMO 1)
o Gives the industry time to change their process in a cost-efficient way.
o It is anticipated that the full cost of the RMO can be passed on to the customer in the long term as the costs can be slowly phased in before the alternative is used.
o Less administrative costs for the public authorities
o It is unclear whether or not and how quickly / slowly reductions in occupational health risks happens within the 10 years period as the agreement binds the phase out to availability of suitable alternatives
o Less certainty of the outcome with potential for free riders.
Developing and implementing an occupational exposure limit (OEL)
(RMO 2)
o May not require existing companies to invest significant resources to meet new occupational exposure limit – anticipated to be the least cost option for existing companies.
o Some reduction in occupational risks which should result in fewer reported incidents of both mild and severe respiratory problems.
o Uncertainty on how well companies will comply with the new OEL as there is no knowledge on more practicable RMMs (the currently known and used RMMs (PPE) have not been implemented in a correct way in practise)
o It will take companies longer to clean the same building (if additional workers are not used).
o The costs of compliance are not known yet
Determining the level of quantification to be used is best achieved through an iterative process starting with a qualitative assessment of the impacts with further analysis carried out in future iterations if this is necessary to produce adequate support for the decision making. In some cases a qualitative analysis will be sufficient to produce a robust conclusion and, in such cases, further quantification would not be necessary. In other cases quantification brings added value for the decision making.
When there is a need for monetisation, the appropriate tool for comparing quantified and monetised impacts is cost-benefit analysis (CBA). Cost-benefit analysis uses monetised values. It puts all costs and benefits into standard units (usually Euros) so that they can be compared directly. In reality however, it is unlikely that it will be possible to monetise all impacts (e.g. social and wider economic impacts). Also, it might be difficult and sometimes impossible to estimate environmental impacts based on the current body of knowledge. Some costs or benefits do not have a market
111

SOCIO-ECONOMIC ANALYSIS – RESTRICTIONS
value, and when attempts have been made, there may be a lack of monetised valuation data available that could be used for a benefit transfer. However market-based methods, describing straightforward commercial and financial gains and losses, such as lost productivity (e.g. crop production), costs for the replication of services e.g. water purification) or additional costs to recreation and leisure, could be used in this context.
This guidance suggests using a cost-benefit analysis type approach which involves recognising that not all impacts can be quantified or monetised. As such, it is proposed that the analysis should involve quantifying and monetising impacts as far as is practicable (and appropriate) and combining the monetised results with qualitative and/or quantitative descriptions of all non-monetised impacts.
The iterative approach to the SEA means that a first “initial” SEA could be undertaken applying immediately available information. This is likely to be made up of predominately qualitative information.
It is therefore suggested that the Authority should:
• Compile all available information and describe all impacts qualitatively
• Go through the next steps 4.2 and 4.3 on distributional and uncertainty analysis, then evaluate the results and decide how far it would be appropriate to take the analysis in terms of greater quantification and monetisation.
EXAMPLE OF ASSESSING COSTS AND BENEFITS (based on example above)
Based on assessment of each type of impact, a summary of all the most significant impacts can be compiled. The below table shows such a comparison of impacts. In includes qualitatively described impacts, quantified impacts and monetised impacts. In this example there are several impacts that have been monetised using unit values provided in Appendix B1.2.
Table 8 Qualitatively and quantitatively comparing the main costs and benefits of the proposed restriction
Impact Costs Benefits
Environmental Within EU Within EU
Additional damage costs from increased energy (use of jet washer) – monetised to €16m to €45m per year
Reduced energy consumption in manufacture of substance E – monetised at €3m to €7m per
year
Outside of EU Outside of EU
Reduced energy use and associated emission
due to less raw material extraction – not quantified.
Within EU Within EU
-* 5 – 45 fewer workers dying from very serious respiratory effects – monetised at €5m to €45m per year Human health
-* 50-100 fewer cases per annum of serious respiratory problems – monetised at €0.1m to €0.3m per year.
112

SOCIO-ECONOMIC ANALYSIS – RESTRICTIONS
-* 400-800 fewer cases per annum of workers suffering some form of mild respiratory problems – monetised at €0.08m to €0.16m
-* Action is taken at the earliest practicable point in time rather than at some point in the future.
Within EU Within EU
Economic
Additional costs of cleaning building of about 48 millions per year. This is a 14% increase in the cleaning costs. Sensitivity analysis of the costs indicates range from €10m to €95m per year.
Social Within EU Within EU
Possible social impact in terms of increased
employment of low skilled workers with limited alternative opportunities.
Wider economic -* -* * - proposed restriction is not considered to result in a significant impact (i.e. there are not anticipated to be any major wider economic impacts if the proposed restriction is adopted)
In this case the all costs that have been monetised range from €26m to €140m per year, while the monetised benefits range from €8m to €52m per year. In additional to the monetised impacts there environmental and possible social benefits that are qualitatively described.
In Appendix F information is provided on cost benefit analysis as well as several other SEA tools such as cost-effectiveness analysis (CEA) and multi-criteria analysis (MCA). Given that not all impacts can be quantified and monetised, the cost-benefit type approach suggested above has similarities with a multi-criteria analysis.
If all the quantitative and qualitative impacts were assigned a score and they were all weighted to give an overall score it would be a formal multi-criteria analysis. The use of a multi-criteria approach including more formalised scoring and weighting could be useful when there is a long list of impacts that are not monetised. More information can be found in Appendix F.
4.3 Step 4.2: Compare distributional impacts
4.3.1 Introduction
In addition to the main SEA results, socio-economic analysis of the distributional costs and benefits should be presented. It is important to consider costs and benefits:
• Within the EU and outside the EU.
113

SOCIO-ECONOMIC ANALYSIS – RESTRICTIONS
114
• Along the supply chain currently using the substance – e.g. to manufacturers, suppliers, importers and downstream users;
• Along all other relevant supply chains e.g. manufacturers/importers of any alternative substances or techniques;
• To the end consumer and final product/service – e.g. price and quality;
• To different socio-economic groups along relevant supply chains – e.g. highly skilled, semi-skilled, manual workers and unskilled workers; and
• To different member states or regions; and
The analysis of distribution of impacts should where relevant cover all types of impacts, i.e. not just distribution of cost and savings between different actors, but also e.g. which type of workers are more or less exposed and how this is distributed geographically or will there be changes in exposed environmental compartments or location of exposed environments.
4.3.2 Approach
One approach to the consideration of distributional impacts is to use a checklist33 of questions as a prompt for thinking about how different sections of the supply chain, people and regions would be affected by the “proposed restriction” scenario. Table 9 provides a non-exhaustive list of questions that could be considered – they will not all be relevant to all SEAs. These questions can be applied to each RMO scenario.
No further data collection and analysis should be necessary to answer these questions. It should be possible, based on the analysis undertaken in Stage 3, to at least go through the questions qualitatively to describe the distributional impacts. If further analysis is required these should be noted so that during further iterations in the SEA process, these impacts can be analysed in more detail during stage 3.
Table 9 Questions for considering distributional impacts of the proposed restriction
Analyse the identified benefits of the restriction to determine: (consider all relevant supply chains)
Q1. Who is most likely to benefit from the restriction?
Q2. Which specific sectors are most likely to benefit from the restriction?
Q3. Which parts of the environment, which geographical areas benefit / are most likely to suffer from the restriction?
Q4. Which sections of society are most likely to benefit from the restriction?
Analyse the identified costs of the restriction to determine: (consider all relevant supply chains)
33 This checklist is neither exhaustive nor definitive. It is intended to guide you towards ensuring that distributional impacts and distributional issues that are particularly relevant are considered during the analysis. Types of impacts falling outside those listed in this checklist but are relevant under the proposed restriction should therefore be considered.
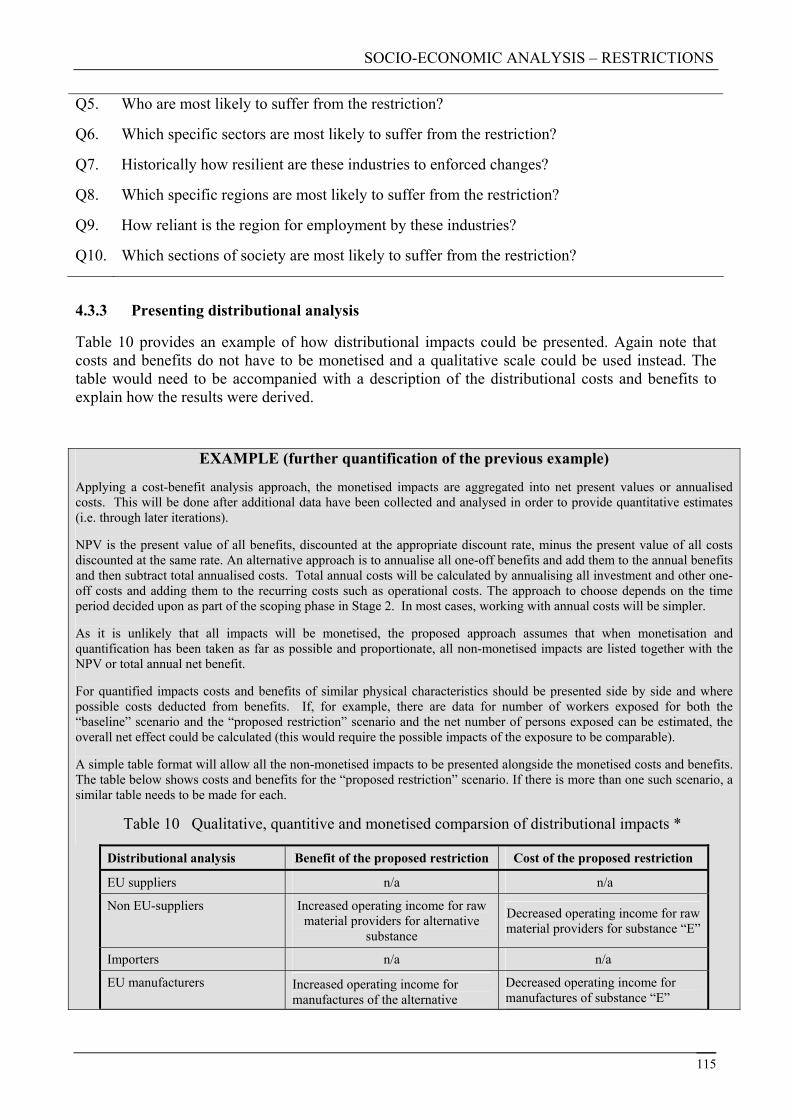
SOCIO-ECONOMIC ANALYSIS – RESTRICTIONS
Q5. Who are most likely to suffer from the restriction?
Q6. Which specific sectors are most likely to suffer from the restriction?
Q7. Historically how resilient are these industries to enforced changes?
Q8. Which specific regions are most likely to suffer from the restriction?
Q9. How reliant is the region for employment by these industries?
Q10. Which sections of society are most likely to suffer from the restriction?
4.3.3 Presenting distributional analysis
Table 10 provides an example of how distributional impacts could be presented. Again note that costs and benefits do not have to be monetised and a qualitative scale could be used instead. The table would need to be accompanied with a description of the distributional costs and benefits to explain how the results were derived.
EXAMPLE (further quantification of the previous example)
Applying a cost-benefit analysis approach, the monetised impacts are aggregated into net present values or annualised costs. This will be done after additional data have been collected and analysed in order to provide quantitative estimates (i.e. through later iterations).
NPV is the present value of all benefits, discounted at the appropriate discount rate, minus the present value of all costs discounted at the same rate. An alternative approach is to annualise all one-off benefits and add them to the annual benefits and then subtract total annualised costs. Total annual costs will be calculated by annualising all investment and other one-off costs and adding them to the recurring costs such as operational costs. The approach to choose depends on the time period decided upon as part of the scoping phase in Stage 2. In most cases, working with annual costs will be simpler.
As it is unlikely that all impacts will be monetised, the proposed approach assumes that when monetisation and quantification has been taken as far as possible and proportionate, all non-monetised impacts are listed together with the NPV or total annual net benefit.
For quantified impacts costs and benefits of similar physical characteristics should be presented side by side and where possible costs deducted from benefits. If, for example, there are data for number of workers exposed for both the “baseline” scenario and the “proposed restriction” scenario and the net number of persons exposed can be estimated, the overall net effect could be calculated (this would require the possible impacts of the exposure to be comparable).
A simple table format will allow all the non-monetised impacts to be presented alongside the monetised costs and benefits. The table below shows costs and benefits for the “proposed restriction” scenario. If there is more than one such scenario, a similar table needs to be made for each.
Table 10 Qualitative, quantitive and monetised comparsion of distributional impacts *
Distributional analysis Benefit of the proposed restriction Cost of the proposed restriction
EU suppliers n/a n/a
Non EU-suppliers Increased operating income for raw material providers for alternative
substance
Decreased operating income for raw material providers for substance “E”
Importers n/a n/a
EU manufacturers Increased operating income for manufactures of the alternative
Decreased operating income for manufactures of substance “E”
115

SOCIO-ECONOMIC ANALYSIS – RESTRICTIONS
substance
Downstream user group 1 – Use A service providers
No effects as it is assumed that all the additional costs can be passed on to the consumers
End customer Additional costs of €48m per year for cleaning of buildings.
+
(Less indirect exposure to substance ‘E’ whilst workers are cleaning a
building)
n/a
Public ++
(possible reduction in waiting times at hospitals and also lower costs of
health care provision)
n/a
Regulators +
(reduction in monitoring and administrative costs to regulators)
-
(increase in enforcement costs to regulators)
Specific MS regions +++
(this restriction is likely to disproportionately benefit Member
State Y which has several manufacturers who make the
alternative cleaner)
---
(this restriction is likely to disproportionately affected Member
State X which has several manufacturers who make substance
‘E’)
Socio-economic group1
Group A – Highly skilled n/a n/a
Group B – Skilled/semi-skilled n/a n/a
Group C – Manual/non skilled €5m - €45m avoided health cost per year n/a
* Severity of impacts: either monetary or using scale high (+++ or ---), medium (++ or --), low (+ or -) or not applicable (n/a)
1 Occupation group classifications may vary for each Member State although it should be possible to group the data similarly. Group A includes: Managers and senior officials, professional occupations and associate professional and technical. Group B includes: Administrative and secretarial, skilled trades occupations and personal service occupations. Group C includes: Sales and customer service occupations, process; plant and machine operatives and elementary occupations.
It should be noted that the individual costs and benefits should also be documented in the SEA as well as the net impacts. Having aggregated and summarised the impacts, the Authority may feel that there is sufficient information to draw a conclusion.
116

SOCIO-ECONOMIC ANALYSIS – RESTRICTIONS
117
4.4 Step 4.3: Consider how uncertainties in the analysis may alter the outcome of the SEA
4.4.1 Introduction
Throughout this guidance it has been emphasised that uncertainties should be considered and recorded throughout the SEA, whether that be in understanding the response behaviour of actors in relevant supply chains or in estimates valuing the scale of impacts (or any other aspects). The Authority proposing a restriction should be able to show the extent to which the outcome of their SEA takes into consideration these potential uncertainties.
The purpose of uncertainty analysis is to test the overall uncertainty in the SEA. This analysis will lead to several possible outcomes:
• Returning to stage 2 and carrying out further analysis on specific behavioural responses e.g. whether it is possible to narrow down the possible behavioural responses to get a better estimate of the impacts of the proposed restriction in stage 3.
• Returning to stage 3 and carrying out further analysis on the assessment of specific impacts to reduce the variability34 or uncertainty in the estimate.
• Returning to stage 3 and conducting a further iteration of the assessment of the main impacts - Deciding that a more quantitative or monetary assessment is necessary in order to be able to produce a robust conclusion concerning the proposed restriction.
• Determine that the assessment of the net benefits to human health and the environment and the net costs to manufacturers, importers, downstream users, distributors, consumers and society as a whole of the proposed restriction is robust enough to conclude the SEA.
The next section below outlines a stepwise approach to uncertainty analysis. Upon completion of the uncertainty analysis, the next step will be to describe and document the uncertainties in the analysis (section 4.4.3).
4.4.2 Approach
The level of resources devoted to uncertainty analysis and the level of detail at which it is undertaken should be proportionate to the scope of the SEA. It is proposed that a stepwise approach be adopted, starting with a simple qualitative assessment of uncertainties that may on its own be sufficient to determine whether uncertainties affect the outcome of the SEA and therefore whether further analysis is required. If uncertainties do appear critical to the outcome of the SEA, then a more quantitative assessment is likely to be necessary, using a deterministic approach and then, if necessary and feasible, a probabilistic assessment.
Figure 21 outlines this stepwise approach and Figure 22 illustrates the process in more detail. A deterministic approach typically involves a simplified sensitivity or scenario analysis whereby low and high estimates are determined for each of the main costs and benefits identified in the SEA. A 34 See Appendix E for definitions of variability, uncertainty and risk.
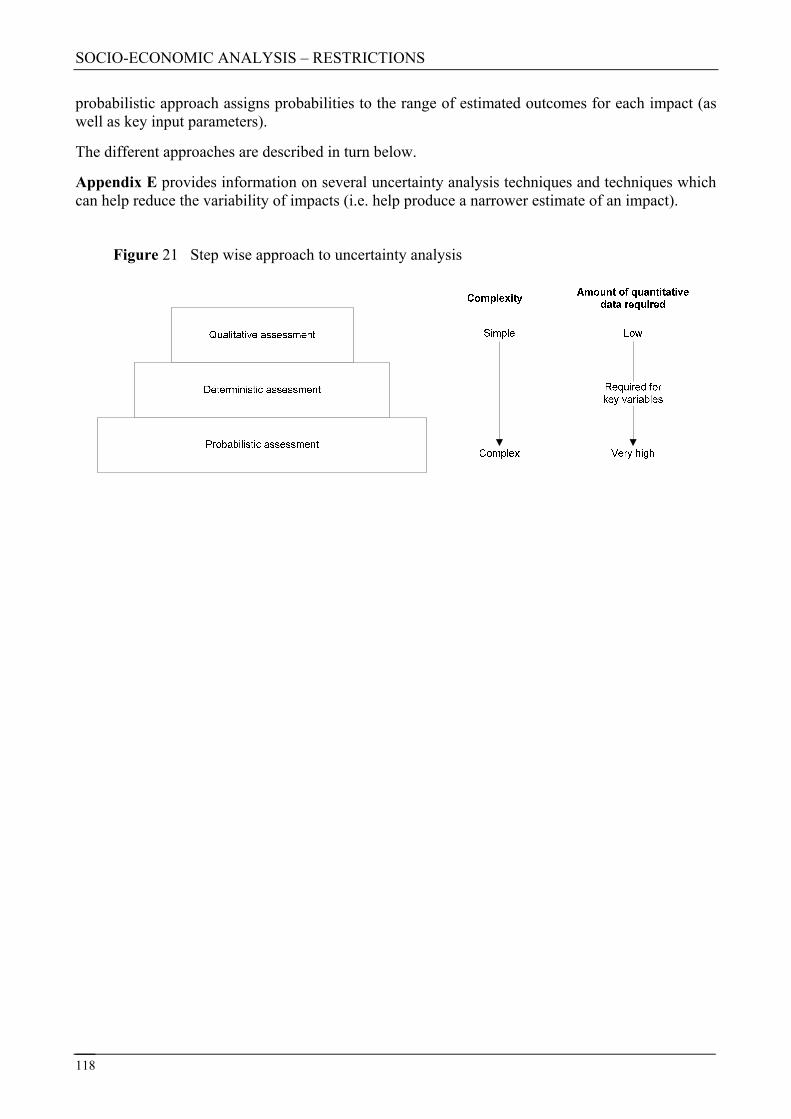
SOCIO-ECONOMIC ANALYSIS – RESTRICTIONS
probabilistic approach assigns probabilities to the range of estimated outcomes for each impact (as well as key input parameters).
The different approaches are described in turn below.
Appendix E provides information on several uncertainty analysis techniques and techniques which can help reduce the variability of impacts (i.e. help produce a narrower estimate of an impact).
Figure 21 Step wise approach to uncertainty analysis
118
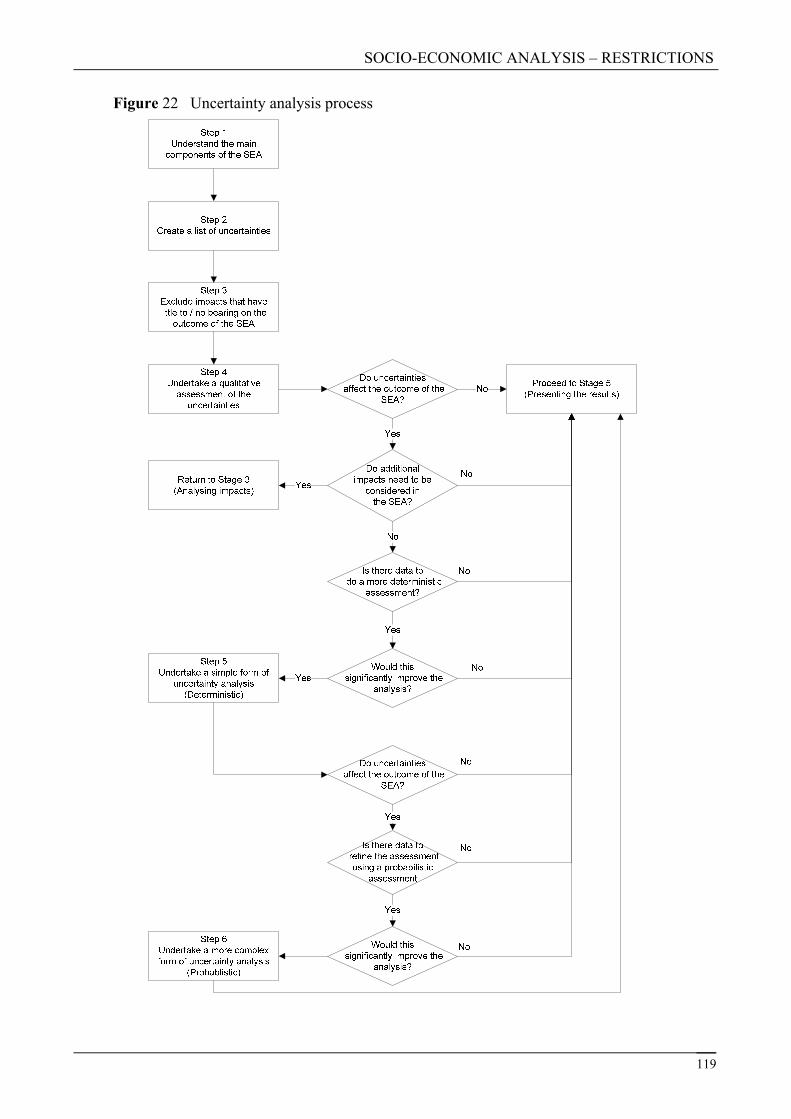
SOCIO-ECONOMIC ANALYSIS – RESTRICTIONS
Figure 22 Uncertainty analysis process
119
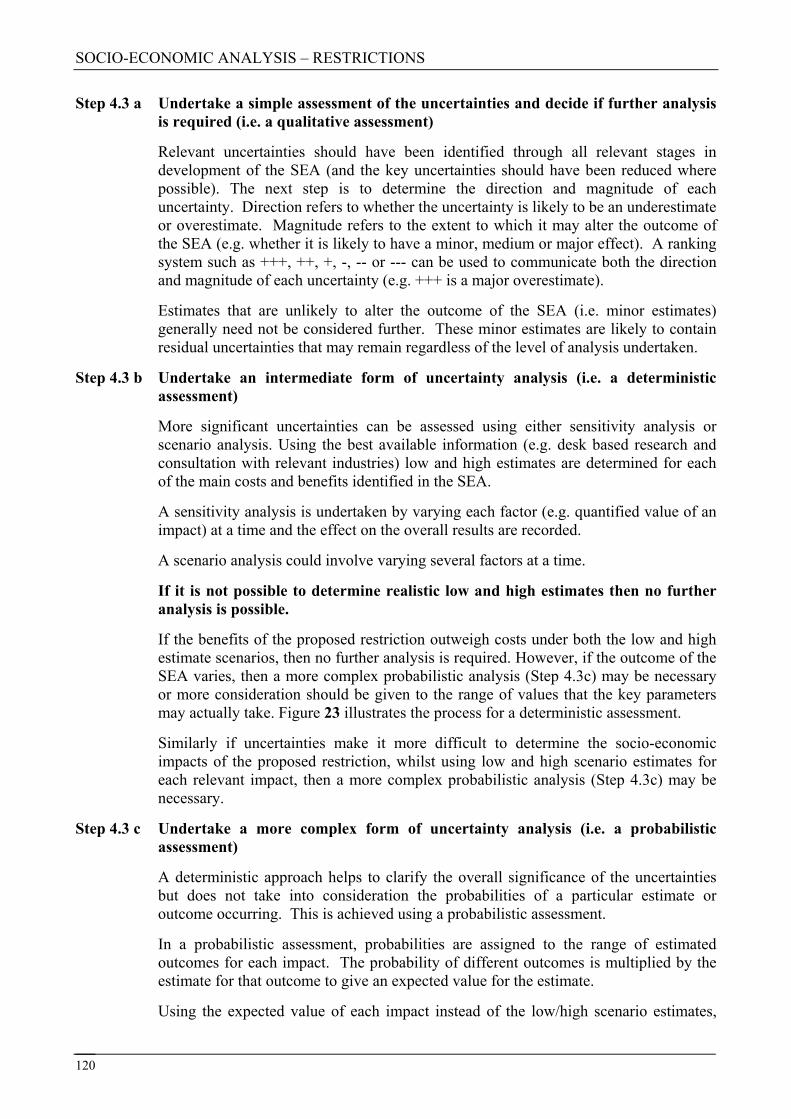
SOCIO-ECONOMIC ANALYSIS – RESTRICTIONS
Step 4.3 a Undertake a simple assessment of the uncertainties and decide if further analysis is required (i.e. a qualitative assessment)
Relevant uncertainties should have been identified through all relevant stages in development of the SEA (and the key uncertainties should have been reduced where possible). The next step is to determine the direction and magnitude of each uncertainty. Direction refers to whether the uncertainty is likely to be an underestimate or overestimate. Magnitude refers to the extent to which it may alter the outcome of the SEA (e.g. whether it is likely to have a minor, medium or major effect). A ranking system such as +++, ++, +, -, -- or --- can be used to communicate both the direction and magnitude of each uncertainty (e.g. +++ is a major overestimate).
Estimates that are unlikely to alter the outcome of the SEA (i.e. minor estimates) generally need not be considered further. These minor estimates are likely to contain residual uncertainties that may remain regardless of the level of analysis undertaken.
Step 4.3 b Undertake an intermediate form of uncertainty analysis (i.e. a deterministic assessment)
More significant uncertainties can be assessed using either sensitivity analysis or scenario analysis. Using the best available information (e.g. desk based research and consultation with relevant industries) low and high estimates are determined for each of the main costs and benefits identified in the SEA.
A sensitivity analysis is undertaken by varying each factor (e.g. quantified value of an impact) at a time and the effect on the overall results are recorded.
A scenario analysis could involve varying several factors at a time.
If it is not possible to determine realistic low and high estimates then no further analysis is possible.
If the benefits of the proposed restriction outweigh costs under both the low and high estimate scenarios, then no further analysis is required. However, if the outcome of the SEA varies, then a more complex probabilistic analysis (Step 4.3c) may be necessary or more consideration should be given to the range of values that the key parameters may actually take. Figure 23 illustrates the process for a deterministic assessment.
Similarly if uncertainties make it more difficult to determine the socio-economic impacts of the proposed restriction, whilst using low and high scenario estimates for each relevant impact, then a more complex probabilistic analysis (Step 4.3c) may be necessary.
Step 4.3 c Undertake a more complex form of uncertainty analysis (i.e. a probabilistic assessment)
A deterministic approach helps to clarify the overall significance of the uncertainties but does not take into consideration the probabilities of a particular estimate or outcome occurring. This is achieved using a probabilistic assessment.
In a probabilistic assessment, probabilities are assigned to the range of estimated outcomes for each impact. The probability of different outcomes is multiplied by the estimate for that outcome to give an expected value for the estimate.
Using the expected value of each impact instead of the low/high scenario estimates,
120
SOCIO-ECONOMIC ANALYSIS – RESTRICTIONS
this will involve assessing the main socio-economic impacts of the restriction proposal. The results should be documented alongside the SEA results so that the SEA committee and interested parties can understand how uncertainties could alter the SEA outcome. If it is not possible to assign probabilities to the range of estimates then no further analysis is possible. Specialist knowledge is generally required to undertake probabilistic uncertainty analysis.
Figure 23 Process for deterministic uncertainty analysis
Determine low and high estimates for each of the main impacts
Assess the net costs and net benefits of the proposed restriction under both
the low and high scenarios
Is the outcome of the assessment of the net costs
and benefits similar under both scenarios?
Consider proceeding to Step 4e if it will significantly improve the analysis
and is feasbile
Proceed to Stage 5 (presenting the results)Yes
No
4.4.3 Presenting uncertainty analysis
The Authority or interested party should consider including:
• an appreciation of the overall degree of uncertainty and of the confidence that can be placed in the analysis and its findings;
• an understanding of the key sources of uncertainty and their impacts on the analysis;
• an understanding of the critical assumptions and their importance to the analysis and findings; this should include details of any assumptions which relate to the subjective judgments of the analysts performing the analysis;
• an understanding of the unimportant assumptions and why they are considered unimportant;
• an understanding of the extent to which plausible alternative assumptions could affect any conclusions; and
121

SOCIO-ECONOMIC ANALYSIS – RESTRICTIONS
122
• an understanding of key scientific debates related to the assessment and a sense of what difference they might make regarding the conclusion.
Table 11 provides an example of how assumptions used in the SEA could be presented.
Table 11 Assumptions used in the SEA
Impact/variable Default assumptions/data/estimates
used to assess impact
Justification for using the assumption/data/estimate
Discount rate 4% This is consistent with the EC Impact Assessment guidelines
Shadow price35 of CO2
€20/tonne Current market price of CO2
Table 12 provides an example of how the findings of uncertainty analysis could be presented.
Table 12 Uncertainty analysis results
ns/date/ estimates
as stasses act
uncertainty /
assumption
Potential impact on the SEA outcome AssumptioDefault
sumptions/data/eimates used to
s imp
Level of
alternative
Discount rate 4%
- is a declining discount rate
This may underestimate future net benefits of environmental and health benefits which could occur beyond 30 years. As a sensitivity analyscould be used.
Shadow price of CO2 €20/ nne
t
(£26/ d be us d
ng the €20/tonne and the UK £26/t estimate)
to
For sensitivity he UK estimateof the shadow price of carbon in 2008 prices
t) coule
(In this box the Authority should show the effects on the outcome of the SEA, usi
35 The shadow price of carbon captures the damage costs of climate change caused by each additional tonne of greenhouse gas emitted.

SOCIO-ECONOMIC ANALYSIS – RESTRICTIONS
123
EXAMPLE
The sales volume of substance ‘E’ for use in the cleaning building industry (use ‘A’) over the last ten years has seemed to follow a fairly cyclical trend. In order to consistently base all impacts on an annual basis a representative annual sales volume is required. The suggested starting point in the uncertainty analysis is to determine low and high scenarios to test whether the outcome of the SEA may be affected. The sales volume (tonnes) of substance ‘E’ over the last ten years in shown below:
Year 1 Year 2 Year 3 Year 4 Year 5 Year 6 Year 7 Year 8 Year 9 Year 10 10,000 22,000 25,000 44,000 41,000 24,000 19,000 23,000 33,000 36,000
Under a low and high scenario, the values to use would be 10,000 and 44,000. Although this is quite a big difference taking the mean (average) 27,700 may not accurately reflect the cyclical demand for substance ‘E’ within the building cleaning industry. If it is not possible to draw a robust conclusion concerning the restriction proposal because of the uncertainties using low and high estimates, then further analysis will be required to estimate a more accurate representative annual sales volume. For example, it maybe possible to test the analysis using a 10% confidence interval around the mean (25,000-30,000 to the nearest thousand), or using sensitivity analysis (further information is provided in Appendix E).
The updated estimate for the sales volumes including the implications of uncertainties would then be carried forward in the subsequent analysis using this parameter in order to determine consequent implications for the overall results.
4.5 Step 4.4: Decide whether a conclusion can be reached
As part of an iterative process, the level of analysis undertaken and the scope and conditions of the restriction may need to be refined until robust conclusions can be developed on the implications of the proposed restriction in terms of net benefits of the proposed restriction to human health and the environment and the net costs to manufacturers, importers, downstream users, distributors, consumers and society as a whole.
At the end of each iteration36 (see Figure 4) the Authority will have to decide whether a conclusion can be reached or whether there is need to change the scope and conditions of the “proposed restriction” scenario, collect more data and/or undertake more detailed analysis. The uncertainty analysis carried out (in the previous step – 4.3) should provide the basis for making this decision.
The suggested iterative approach implies that an initial SEA (first iteration) is done using immediately available data (likely to be primarily of a qualitative nature). By comparing impacts, the Authority has to make a judgement as to whether a robust conclusion can be reached and therefore whether there is a need for further refinement of the analysis. This means either:
• Going back to do more analysis (a further iteration of the SEA process);
• Finalising the SEA process and reporting the analysis and findings in the restriction proposal.
• Exiting the SEA process. NB! Even in this case, it is recommended that the findings of the SEA are reported in the Annex XV dossier (for further details see Section 5.1.4 in the Guidance on Annex XV for restrictions)
36 Note - There may be in some instances the need for one iteration

SOCIO-ECONOMIC ANALYSIS – RESTRICTIONS
Tip: Principle of proportionality
In general the Authority should seek to build as robust a case as possible but, as there are limited resources to develop SEAs, they should be proportionate to the problem at hand. The level of detail should thus be sufficient to demonstrate the proposal put forward but need not include information that does not substantially further aid the decision making on the basis of the proposal.
In taking into account proportionality in the level of detail to be included, the Authority may wish to consider:
1) The higher the absolute level of costs and benefits are the more details and quantification is likely to be useful. Alternatively, however, if for example the costs are obviously very large and the benefits very small, this would suggest that significant additional analysis would have little merit.
2) The closer the balance between benefits and risks/costs, the more detail and quantification is likely to be required.
124

SOCIO-ECONOMIC ANALYSIS – RESTRICTIONS
5 THE SEA PROCESS – STAGE 5: PRESENTING THE RESULTS
5.1 Introduction
Figure 24 SEA process -Stage 5
Stage 5 is the final stage in the SEA process. Its aim is to highlight the key findings of the SEA which the SEA committee should consider when preparing its opinion and the Commission to consider when making the decision. The results of the analysis are summarised in an SEA report within the restriction proposal (Annex XV dossier), together with the key assumptions used in the SEA and the findings of uncertainty analysis.
The Authority should document the analytical process and the decisions made with respect any impact included (and excluded) in the SEA. This section presents tools which may assist the Authority with documenting and presenting the SEA. The Authority should first refer to the EC Impact Assessment Guidelines (2005) and in particular part II chapter 9 (Presenting the findings: The Impact Assessment Report). The chapter provides some principles of good practice which should be adhered to. These are summarised below:
• Prepare a summary report – The summary should include not only the main results but data sources, assumptions and methodologies that are important for the results.
• Remember to flag-up uncertainties or assumptions in the final SEA report. It will also be necessary to specify which analytical method was used to assess and compare the impacts, e.g. cost benefit analysis or multi-criteria analysis.
• Keep it simple – Ideally any non-specialist should be able to follow the argumentation and understand the positive and negative impacts of the proposed restriction considered in the SEA. To enhance the clarity and readability of the SEA report, use tables and diagrams to summarise some key points. Examples of such tables can be found in Part III of the EC Impact Assessment Guidelines and also some tables have been included stage 4 of this guidance.
125
SOCIO-ECONOMIC ANALYSIS – RESTRICTIONS
5.2 Reporting format
The Authority and interested party can structure their SEA in any way which they feel will best present their findings. The template bellows provides one suggested approach to present the SEA report (within the Annex XV dossier for the Authority). Appendix H provides a checklist which interested parties may wish to use when submitting their SEA or input into one.
RESTRICTIONS SEA TEMPLATE
1. SUMMARY OF THE SEA
2. AIMS AND SCOPE OF THE SEA
2.1. The aim of the SEA
2.2. Definition of the “baseline” scenario
2.3. Definition of the “proposed restriction” scenario
2.4. Set out the time and geographical boundaries of the SEA
3. ANALYSIS OF THE IMPACTS
3.1. Economic impacts
3.2. Environmental risks
3.3. Human Health risks
3.4. Social impacts
3.5. Wider economic impacts
126

SOCIO-ECONOMIC ANALYSIS – RESTRICTIONS
4. COMPARING THE SCENARIOS
4.1. Key assumptions used in the SEA
4.2. Results of uncertainty analysis
4.3. SEA results
5. CONCLUSIONS
APPENDICES:
A.1 LIST OF DATA SOURCES
A.2 DATA COLLECTION APPROACH
A.3 ORGANISATIONS CONSULTED
5.2.1 Information on how to fill in the template
Overview
It is recommended that the Authority undertakes their SEA using the process outlined within the guidance. This process is summarised in chapter 1 and explained in detail in chapters 2-4. For interested parties providing input into an SEA it is recommended for transparency that the order of the template be followed, even if the intention is to submit limited information. Appendix H provides a checklist which interested parties may wish to use when submitting their SEA or input into one.
127

SOCIO-ECONOMIC ANALYSIS – RESTRICTIONS
Summary of the SEA
This section should be completed once the SEA results and conclusions have been finalised.
Aims and scope of the SEA
It is highly recommended that the user read chapters 1-2 in order to understand how different terms are used in this guidance and, in particular, how to set the aims of the SEA, the boundaries, defining the “baseline” scenario and the “proposed restriction” scenario are recommended to be carried out. It is important to be able to define each scenario and understand the behavioural responses of actors along relevant supply chains. It is however unlikely using a step-by-step guide that the user will not have to re-visit earlier steps in the process. Therefore the SEA process has been designed so that the user undertakes an iterative approach to developing the SEA. Chapter 1 explained the notion of an iterative process.
Analysis of the impacts
In the case of the Authority proposing a restriction, this section should outline all the net benefits to human health and the environment and the net costs to manufacturers, importers, downstream users, distributors, consumers and society as a whole of the proposed restriction compared to the “baseline” scenario (i.e. the differences between the two scenarios). It may not be possible or necessary to quantify all impacts. This may be due, for example, to a lack of data to convert environmental risks into impacts (which can then be assigned a monetary value), or it may be that certain impacts are so severe that a qualitative assessment will be sufficient to produce a robust conclusion concerning the merits of the proposed restriction. The user should refer to chapter 3 of this guidance.
As well as considering the scale of the impact, it will also be necessary to explain how these impacts affect different sections within society (i.e. the distributional impacts to the local/regional economy such as employment). It will not be sufficient to simply present the tables with results. The user should refer to chapter 4 of this guidance.
For interested parties submitting specific information rather than a complete SEA, it may not be necessary to reproduce the whole analysis. However it is recommended the impact of this ‘new’ information is reported in the context of how the outcome of the Authority’s SEA is affected by this ‘new’ information. Appendix H provides a checklist which interested parties may wish to use when submitting their SEA or input into one.
Comparing the scenarios
Here the user should present the findings of their SEA, or input to one. The methodology used in the analysis, uncertainties, assumptions and data sources should all be transparently presented. The user should refer to chapter 4 this guidance.
Conclusions
The user should outline their SEA findings concerning the proposed restriction.
128

SOCIO-ECONOMIC ANALYSIS – RESTRICTIONS
129
Appendix A
It is highly recommended that the user document within their SEA, or input to one:
• Data sources;
• How the data was obtained (e.g. questionnaires used);
• Which tools and methods where used to estimate impacts and to derive the main results; and
• Who was consulted?
This will improve the transparency of the results and will facilitate an assessment of whether the data has been obtained from reliable and up-to-date sources. For example this may include any questionnaires used and literature sources for any monetary valuations of impacts.
5.3 Internal checklist – Relevant for Authorities submitting an SEA within the Annex XV dossier
This chapter contains a checklist of information to be included in the SEA report as part of the Annex XV dossier37 (to be used internally). It is important to note that the questions in the checklist are neither exhaustive nor definitive and the checklist is indicative only (although some may seem good practice of any report, they are worth noting as a reminder). Appendix H provides a checklist which interested parties may wish to use when submitting their SEA or input into one.
Summary of the SEA
(This section of the SEA report should be completed last and in general be no more than 10 pages)
1. Have you summarised the scope and conditions of the proposed restriction?
2. Have you summarised the main impacts?
3. Have you presented a summary of the SEA results?
4. Have you presented your recommendation(s)?
37 Completing all the aspects on the checklist does not guarantee a restriction will be successful.
SOCIO-ECONOMIC ANALYSIS – RESTRICTIONS
Aims
5. Have you set out the aims of the SEA?
6. Have you described the “baseline” and the “proposed restriction” scenario?
7. Have you considered future trends in the use of the substance?
8. Have you set out which uses restrictions are being proposed?
9. Have you set out the scope and conditions of the proposed restriction?
Analysis of impacts
10. Have you analysed and described the main economic impacts of the “proposed restriction” scenario against the “baseline” scenario?
11. Have you analysed and described the main human health risks of the “proposed restriction” scenario against the “baseline” scenario?
12. Have you analysed and described the main environmental risks of the “proposed restriction” scenario against the “baseline” scenario?
13. Have you analysed and described the main social impacts of the “proposed restriction” scenario against the “baseline” scenario?
14. Have you analysed and described the main wider economic impacts of the “proposed restriction” scenario against the “baseline” scenario?
15. Have you ensured the consistency of the analysis e.g. referenced data sources and set prices in a common year (base year)
130
SOCIO-ECONOMIC ANALYSIS – RESTRICTIONS
16. Have you discounted any monetised impacts?
17. Have you conducted sensitivity analysis on the discount rate and when impacts occur over time? (only relevant for monetised impacts)
Comparing scenarios
18. Have you listed and provided justification for using the assumptions in the SEA?
19. Have you explained what implications the assumptions might have on the outcome of the SEA?
20. Have you listed unimportant assumptions and why they are unimportant?
21. Have you listed the uncertainties in the SEA?
22. Have you discussed the key sources of uncertainty and their impacts on the SEA?
23. Have you discussed the overall degree of uncertainty and of the confidence that can be placed in the SEA findings?
24. Have you presented and justified the time period of the SEA?
25. Have you determined when costs and benefits are likely to occur?
26. Have you shown impacts along all relevant supply chains?
27. Have you shown impacts on the final consumers?
131
SOCIO-ECONOMIC ANALYSIS – RESTRICTIONS
28. Have you shown how impacts affect different socio-economic groups in society?
29. Have you shown the geographical location of impacts? (e.g. EU and non-EU impacts)
30. Have you explained what analytical tools were used in the SEA?
Conclusions
31. Have you presented clear arguments to support your case?
32. Have you made a recommendation to the SEA Committee?
Appendix A
33. Have you listed the data sources used in the SEA?
34. Have you included any data collection material? (e.g. questionnaires used)
35. Have you included a list of organisations consulted?
132

SOCIO-ECONOMIC ANALYSIS – RESTRICTIONS
APPENDIX A CONSULTING DURING THE PREPARATION OF THE RESTRICTION PROPOSAL
CONSULTING DURING THE PREPARATION OF THE RESTRICTION
133
SOCIO-ECONOMIC ANALYSIS – RESTRICTIONS
APPENDIX A – Consulting during the preparation of the restriction proposal
A.1 Introduction
The development of different parts of an Annex XV dossier (Guidance on Annex XV for restrictions) is likely to include some form of consultation or preparation for one. Try to integrate the consultation process to cover aspects relevant for the gathering of information on alternatives and the SEA.
The benefits of effective consultation can include:
• Permitting greater access to information which may not always be publicly available;
• Improving the understanding on which sectors / actors could be affected by the restriction and how they could be affected
• Improving the credibility of the SEA findings by consulting a wide range of relevant organisations and drawing upon wide expertise;
• Minimising the risk of potentially confrontational challenges to the SEA findings at a later stage;
• Improving the quality of the analysis; and
• Utilising expertise and skills which may not be available in-house.
Consultation may range from requests for limited and well specified information to wide public consultation. The aims of consultations need to be clear and the consultation should be proportionate to the issue. When conducting consultation it will be important to ensure that the procedures used are consistent with any consultation procedures already in place within the Authority.
CASE STUDY EXPERIENCES
Experiences of those carrying out an SEA as part of the development of this guidance found that:
1) The Member State developing a restriction dossier has no legal possibilities to require SEA-data from industry. A good understanding of the drivers for industry to participate in developing an SEA is needed.
2) In an early stage of the study stakeholders should be involved in scoping the study and data
collection. Much of the data needed for performing an SEA is not available in the public domain. Without stakeholder participation it will be very difficult to write a robust SEA, especially with regard to the economic impact assessment.
Source: RIVM case study
134
SOCIO-ECONOMIC ANALYSIS – RESTRICTIONS
A.2 Stages in the development of a consultation plan
Set consultation objectives
The plan needs to clarify the objectives of consultation, both for the people involved in preparing the SEA and for stakeholders who will be consulted. Consultation can be a very important part of the SEA process with multiple objectives. It can:
• Help to identify what might be the likely response(s) of all affected parties under the proposed restriction (this is part of the scoping phase). For example, is it possible for downstream users to use an alterative?
• Help to identify the main impacts of the proposed restriction. For example, what would be the change in occupational risk if downstream users use an alternative substance? What would be the environmental consequences of switching to this alternative?
• Provide data or information on the changes in costs and benefits to all affected parties under the proposed restriction. For example, what are the impacts associated with an increase in demand for the alternative substance such as on jobs, energy consumption, product price and in terms of any supply constraints on existing users of the alternative substance;
• Draw upon expertise which may help to reduce uncertainties that may arise during the SEA; and
• Provide feedback on the socio-economic analysis and recommendations.
The consultation can also contribute to assessment of other risk management options (RMOs).
Those responsible for preparing an SEA should be aware, however, that there is no legal obligation for industry or other stakeholders to provide information. It is especially important to communicate to stakeholders how consultation fits into the overall SEA decision making process and how stakeholder input may affect the outcomes of the SEA. It may sometimes be appropriate to involve stakeholders in the decision on how their input is to be used, especially if they are providing confidential information.
Develop a consultation schedule
The consultation plan should include measures to ensure that time and resources are available to plan, deliver and assess the findings of consultation activities. Stakeholders should be provided with start and finish dates for consultation periods in advance and given enough time to be involved. The consultation should be timed to ensure that its findings can be used to contribute to the SEA being developed as part of the restriction process: in general, consultation should take place as early in the process as possible. The resources required should be identified early and, ideally, included in the budget for the overall SEA.
Identify who to consult
Authorities should aim to consult all the parties affected or potentially affected by the outcome of the proposed restriction.
135

SOCIO-ECONOMIC ANALYSIS – RESTRICTIONS
TIP BOX
Consider consulting with:
• Internally with other government ministries and enforcement agencies
• Other Member State authorities
• Trade associations / industrial bodies – (think carefully about which industries could be affected)
• Manufacturers/importers of the substance or alternatives (consider including these manufacturers even if they are not subject to the restriction)
• Downstream users (consider their inclusion even if they are not subject to the restriction as there maybe indirect impacts to their business depending on the outcome of the restriction proposal)
• Upstream suppliers (again consider their inclusion even if they are not subject to the restriction)
• Inter-related supply chains (that maybe affected by the outcome of the proposed restriction i.e. consider supply chains related to any substitutes / alternatives to the substance / retailers and consumer bodies even though they may not be immediately available )
• Non-governmental organisations (NGO) – e.g. consumer and environmental organisations
• Labour and trade unions
Make sure that those consulted provide representative views considering possible differences across Member States
It could be useful to develop a matrix that shows who is likely to contribute with which type of information (as shown in Table 13). This could be a useful internal planning tool to check with relevant stakeholders who have particular expertise with different types of impacts (e.g. human health, environmental and social) if all the relevant impacts have been identified. Any information gathered from stakeholders should help to develop a more complete analysis of impacts. It is also a useful internal check to see if sufficient stakeholders have been identified for each type of impact.
Consultation can be hindered by the time each stakeholder can devote during the consultation period, so where possible do not rely on any one stakeholder to provide input. The level of consultation needed should be proportional to the quality of readily available information. The greater the quality of readily available information, the easier it will be to understand the main issues and to use consultation to gather comments on these identified issues, rather than using the consultation to understand what are the main issues.
136
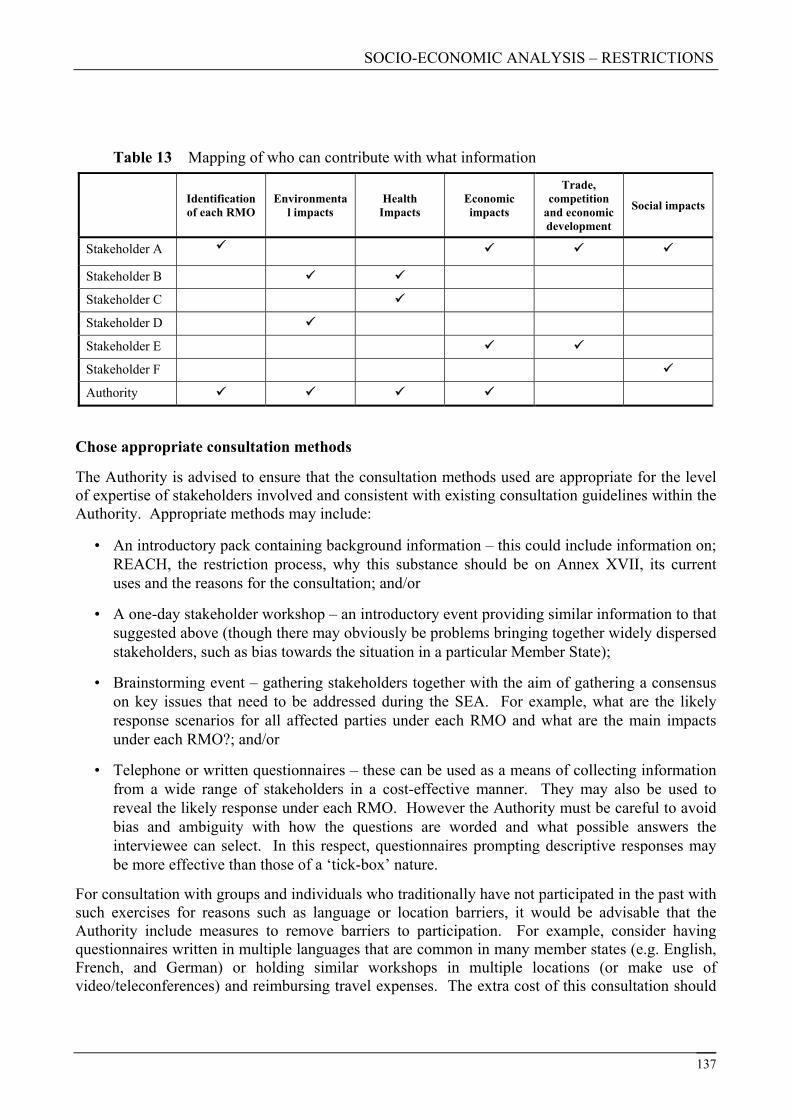
SOCIO-ECONOMIC ANALYSIS – RESTRICTIONS
Table 13 Mapping of who can contribute with what information
Identification of each RMO
Environmental impacts
Health Impacts
Economic impacts
Trade, competition
and economic development
Social impacts
Stakeholder A
Stakeholder B
Stakeholder C
Stakeholder D
Stakeholder E
Stakeholder F
Authority
Chose appropriate consultation methods
The Authority is advised to ensure that the consultation methods used are appropriate for the level of expertise of stakeholders involved and consistent with existing consultation guidelines within the Authority. Appropriate methods may include:
• An introductory pack containing background information – this could include information on; REACH, the restriction process, why this substance should be on Annex XVII, its current uses and the reasons for the consultation; and/or
• A one-day stakeholder workshop – an introductory event providing similar information to that suggested above (though there may obviously be problems bringing together widely dispersed stakeholders, such as bias towards the situation in a particular Member State);
• Brainstorming event – gathering stakeholders together with the aim of gathering a consensus on key issues that need to be addressed during the SEA. For example, what are the likely response scenarios for all affected parties under each RMO and what are the main impacts under each RMO?; and/or
• Telephone or written questionnaires – these can be used as a means of collecting information from a wide range of stakeholders in a cost-effective manner. They may also be used to reveal the likely response under each RMO. However the Authority must be careful to avoid bias and ambiguity with how the questions are worded and what possible answers the interviewee can select. In this respect, questionnaires prompting descriptive responses may be more effective than those of a ‘tick-box’ nature.
For consultation with groups and individuals who traditionally have not participated in the past with such exercises for reasons such as language or location barriers, it would be advisable that the Authority include measures to remove barriers to participation. For example, consider having questionnaires written in multiple languages that are common in many member states (e.g. English, French, and German) or holding similar workshops in multiple locations (or make use of video/teleconferences) and reimbursing travel expenses. The extra cost of this consultation should
137

SOCIO-ECONOMIC ANALYSIS – RESTRICTIONS
be proportional to the level of consultation deemed necessary (i.e. us the value added of this extra consultation justified?)
CASE STUDY EXPERIENCES
Experiences of those carrying out an SEA as part of the development of this guidance found that:
1) “A kick-off meeting would be recommended to be held with those key stakeholders that have information that is necessary for a good SEA. In particular, it would be important to invite to a kick-off meeting those stakeholders that would welcome the restriction (e.g. companies that would produce alternatives or provide alternative technologies), as these are likely to give such information, and in a kick-off workshop other parties would peer review that kind of information”.
2) The Member State developing a restriction dossier has no legal mechanism to require SEA-
data from industry. A good understanding of the drivers for industry to participate in developing an SEA is needed.
3) “In an early stage of the study stakeholders should be involved in scoping the study and data collection. Much of the data needed for performing an SEA is not available in the public domain. Without stakeholder participation it will be very difficult to write a robust SEA, especially with regard to the economic impact assessment”.
Source: RIVM case study
Consider what information stakeholders might need
Consultation should be based on informed comment and input. This means making high-quality information available to stakeholders that helps them to understand what is required of them. The type of information given to stakeholders will depend on the audience but in general information should be presented in an easy to understand format, readable and well presented and you should consider the language used, especially if consultation occurs at a Community-wide level.
Consider how outcomes will be collated, reviewed and reported
Documenting, evaluating and reporting the views expressed through consultation activities are essential steps in demonstrating that the SEA has been a transparent and robust process. Feedback should be provided to stakeholders showing how their views have influenced the SEA and hence why their involvement was worthwhile.
138
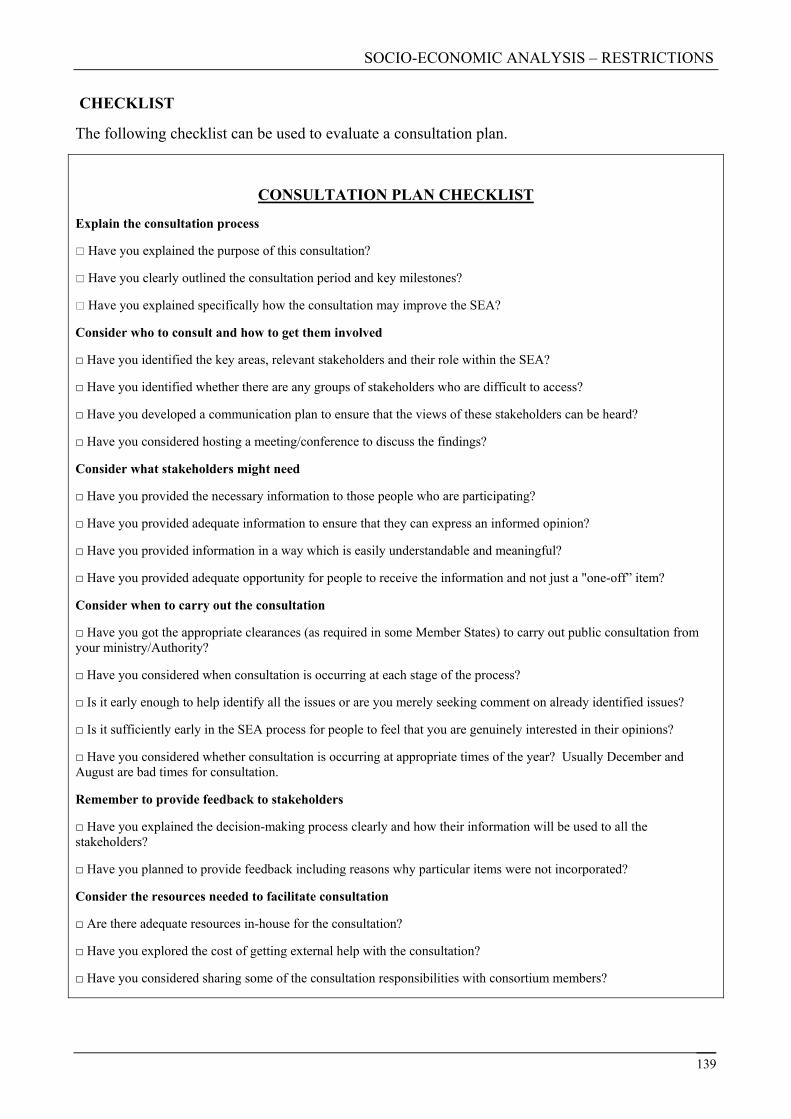
SOCIO-ECONOMIC ANALYSIS – RESTRICTIONS
CHECKLIST
The following checklist can be used to evaluate a consultation plan.
CONSULTATION PLAN CHECKLIST
Explain the consultation process
Have you explained the purpose of this consultation?
Have you clearly outlined the consultation period and key milestones?
Have you explained specifically how the consultation may improve the SEA?
Consider who to consult and how to get them involved
□ Have you identified the key areas, relevant stakeholders and their role within the SEA?
□ Have you identified whether there are any groups of stakeholders who are difficult to access?
□ Have you developed a communication plan to ensure that the views of these stakeholders can be heard?
□ Have you considered hosting a meeting/conference to discuss the findings?
Consider what stakeholders might need
□ Have you provided the necessary information to those people who are participating?
□ Have you provided adequate information to ensure that they can express an informed opinion?
□ Have you provided information in a way which is easily understandable and meaningful?
□ Have you provided adequate opportunity for people to receive the information and not just a "one-off” item?
Consider when to carry out the consultation
□ Have you got the appropriate clearances (as required in some Member States) to carry out public consultation from your ministry/Authority?
□ Have you considered when consultation is occurring at each stage of the process?
□ Is it early enough to help identify all the issues or are you merely seeking comment on already identified issues?
□ Is it sufficiently early in the SEA process for people to feel that you are genuinely interested in their opinions?
□ Have you considered whether consultation is occurring at appropriate times of the year? Usually December and August are bad times for consultation.
Remember to provide feedback to stakeholders
□ Have you explained the decision-making process clearly and how their information will be used to all the stakeholders?
□ Have you planned to provide feedback including reasons why particular items were not incorporated?
Consider the resources needed to facilitate consultation
□ Are there adequate resources in-house for the consultation?
□ Have you explored the cost of getting external help with the consultation?
□ Have you considered sharing some of the consultation responsibilities with consortium members?
139
SOCIO-ECONOMIC ANALYSIS – RESTRICTIONS
140
FURTHER READING LIST
EC Impact Assessment Guidelines (p9-12) 15 June 2005
Communication from the Commission - Towards a reinforced culture of consultation and dialogue - General principles and minimum standards for consultation of interested parties by the Commission. COM(2002) 704
General consultation plan guidelines:
Consultation Guidelines: Public Health Group
Victorian Local Governance Association (VLGA) - Local government consultation and Engagement – Principles
Consultation Guidelines, Our Scottish Borders
South Western Sydney Area Health Service Consultation Guidelines
Public Consultation Policy and Guidelines (Queensland Government EPA)
SOCIO-ECONOMIC ANALYSIS – RESTRICTIONS
APPENDIX B ESTIMATING IMPACTS
ESTIMATING IMPACTS
141

SOCIO-ECONOMIC ANALYSIS – RESTRICTIONS
B.1 Human health and environmental risks
B.1.1 “Quality Adjusted Life Year” (QALY) and Disability Adjusted Life Years (DALYs)
The following describes the concept of “Quality Adjusted Life Year” (QALY) and Disability Adjusted Life Years (DALYs).
The most common of these measures is the “Quality Adjusted Life Year” (QALY). Other measures which are increasingly being used and recommended for use are Disability Adjusted Life Years (DALYs) and Healthy Years Equivalents (HYEs). Each of these concepts can be used to measure the utility of a specified “health profile” (i.e. a time path of health states ending in death) in terms of an equally valuable length of time lived in full health. As greater emphasis is being placed on such measures in recent documents produced for the World Health Organisation, they are briefly reviewed here.
Quality Adjusted Life Year (QALY)
A quality-adjusted life-year (QALY) takes into account both quantity and the quality of life generated by healthcare interventions. It is the arithmetic product of life expectancy and a measure of the quality of the remaining life-years.
A QALY places a weight on the time which a patient spends in different health states. A year of perfect health is worth 1; a year of less than perfect health life expectancy is worth less than 1. Death is considered to be equivalent to 0, however, some health states may be considered worse than death and have negative scores. The amount of time spent in a health state is weighted by the utility score given to that health state. It takes one year of perfect health (utility score of 1) to be one QALY, but regards one year in a health state valued at 0.5 to be equivalent to half a QALY.
There is currently some debate within the field of health economics as to whether or not QALYs are the appropriate unit of output, given its limited applicability to CBA. As a result, there is a growing field of study which is researching and developing approaches for assigning monetary values to QALYs based on the use of value of statistical life (VSL) and value of life year (VOLY) estimates.
This requires information on:
• the QALY value that should be attached to the health effects of concern and the duration of these health effects;
• the money value of the VSL and the appropriate discount rate to provide the basis for calculating the VOLY; and
• the number of QALYs in a statistical life.
For example, the UK Health and Safety Executive calculates the money value of a year of ill-health as the product of the number of QALYs lost and the money value of a ‘full health life year’. They take the component of the UK VSL related to pain, grief and suffering (WTP to avoid the risk of death) and equate this to the value of one QALY. Assuming that the WTP component of the VSL is £550,000 and that an accident results in the loss of 39 years of life, and applying a 4% discount rate, the resulting VOLY is £27,150.
142
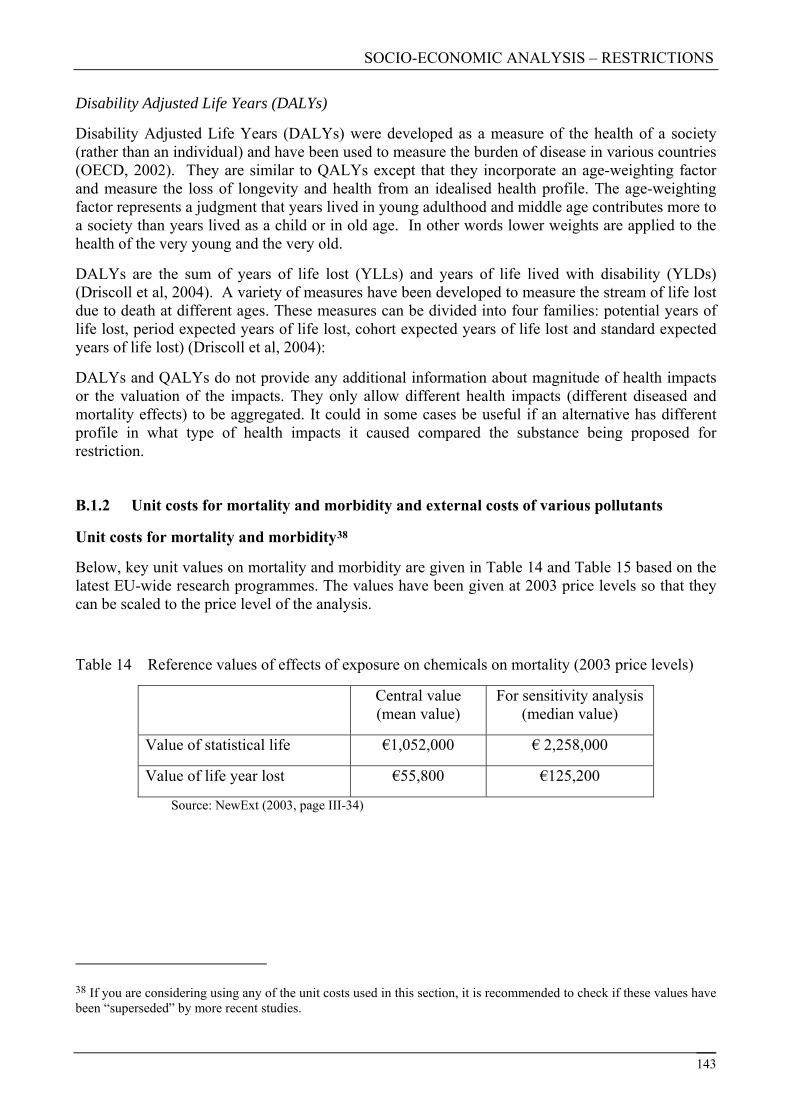
SOCIO-ECONOMIC ANALYSIS – RESTRICTIONS
143
Disability Adjusted Life Years (DALYs)
Disability Adjusted Life Years (DALYs) were developed as a measure of the health of a society (rather than an individual) and have been used to measure the burden of disease in various countries (OECD, 2002). They are similar to QALYs except that they incorporate an age-weighting factor and measure the loss of longevity and health from an idealised health profile. The age-weighting factor represents a judgment that years lived in young adulthood and middle age contributes more to a society than years lived as a child or in old age. In other words lower weights are applied to the health of the very young and the very old.
DALYs are the sum of years of life lost (YLLs) and years of life lived with disability (YLDs) (Driscoll et al, 2004). A variety of measures have been developed to measure the stream of life lost due to death at different ages. These measures can be divided into four families: potential years of life lost, period expected years of life lost, cohort expected years of life lost and standard expected years of life lost) (Driscoll et al, 2004):
DALYs and QALYs do not provide any additional information about magnitude of health impacts or the valuation of the impacts. They only allow different health impacts (different diseased and mortality effects) to be aggregated. It could in some cases be useful if an alternative has different profile in what type of health impacts it caused compared the substance being proposed for restriction.
B.1.2 Unit costs for mortality and morbidity and external costs of various pollutants
Unit costs for mortality and morbidity38
Below, key unit values on mortality and morbidity are given in Table 14 and Table 15 based on the latest EU-wide research programmes. The values have been given at 2003 price levels so that they can be scaled to the price level of the analysis.
Table 14 Reference values of effects of exposure on chemicals on mortality (2003 price levels)
Central value (mean value)
For sensitivity analysis (median value)
Value of statistical life €1,052,000 € 2,258,000
Value of life year lost €55,800 €125,200
Source: NewExt (2003, page III-34)
38 If you are considering using any of the unit costs used in this section, it is recommended to check if these values have been “superseded” by more recent studies.
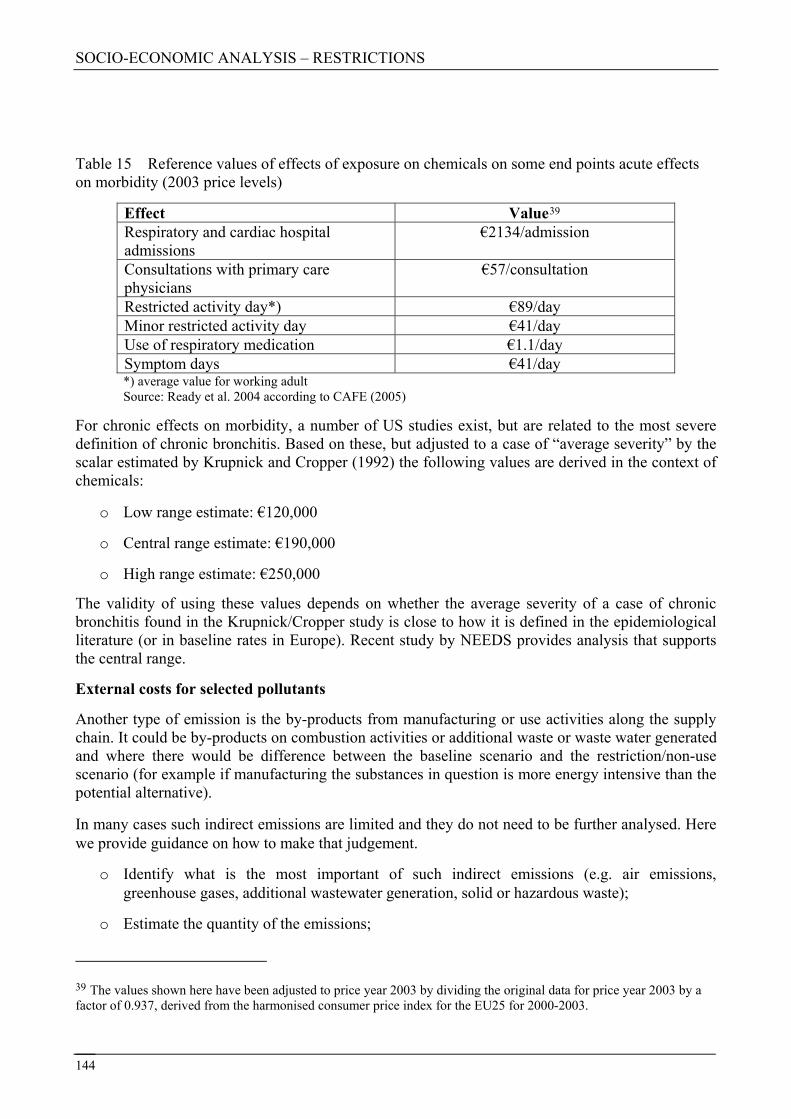
SOCIO-ECONOMIC ANALYSIS – RESTRICTIONS
144
Table 15 Reference values of effects of exposure on chemicals on some end points acute effects on morbidity (2003 price levels)
Effect Value39
Respiratory and cardiac hospital admissions
€2134/admission
Consultations with primary care physicians
€57/consultation
Restricted activity day*) €89/day Minor restricted activity day €41/day Use of respiratory medication €1.1/day Symptom days €41/day *) average value for working adult Source: Ready et al. 2004 according to CAFE (2005)
For chronic effects on morbidity, a number of US studies exist, but are related to the most severe definition of chronic bronchitis. Based on these, but adjusted to a case of “average severity” by the scalar estimated by Krupnick and Cropper (1992) the following values are derived in the context of chemicals:
o Low range estimate: €120,000
o Central range estimate: €190,000
o High range estimate: €250,000
The validity of using these values depends on whether the average severity of a case of chronic bronchitis found in the Krupnick/Cropper study is close to how it is defined in the epidemiological literature (or in baseline rates in Europe). Recent study by NEEDS provides analysis that supports the central range.
External costs for selected pollutants
Another type of emission is the by-products from manufacturing or use activities along the supply chain. It could be by-products on combustion activities or additional waste or waste water generated and where there would be difference between the baseline scenario and the restriction/non-use scenario (for example if manufacturing the substances in question is more energy intensive than the potential alternative).
In many cases such indirect emissions are limited and they do not need to be further analysed. Here we provide guidance on how to make that judgement.
o Identify what is the most important of such indirect emissions (e.g. air emissions, greenhouse gases, additional wastewater generation, solid or hazardous waste);
o Estimate the quantity of the emissions;
39 The values shown here have been adjusted to price year 2003 by dividing the original data for price year 2003 by a factor of 0.937, derived from the harmonised consumer price index for the EU25 for 2000-2003.
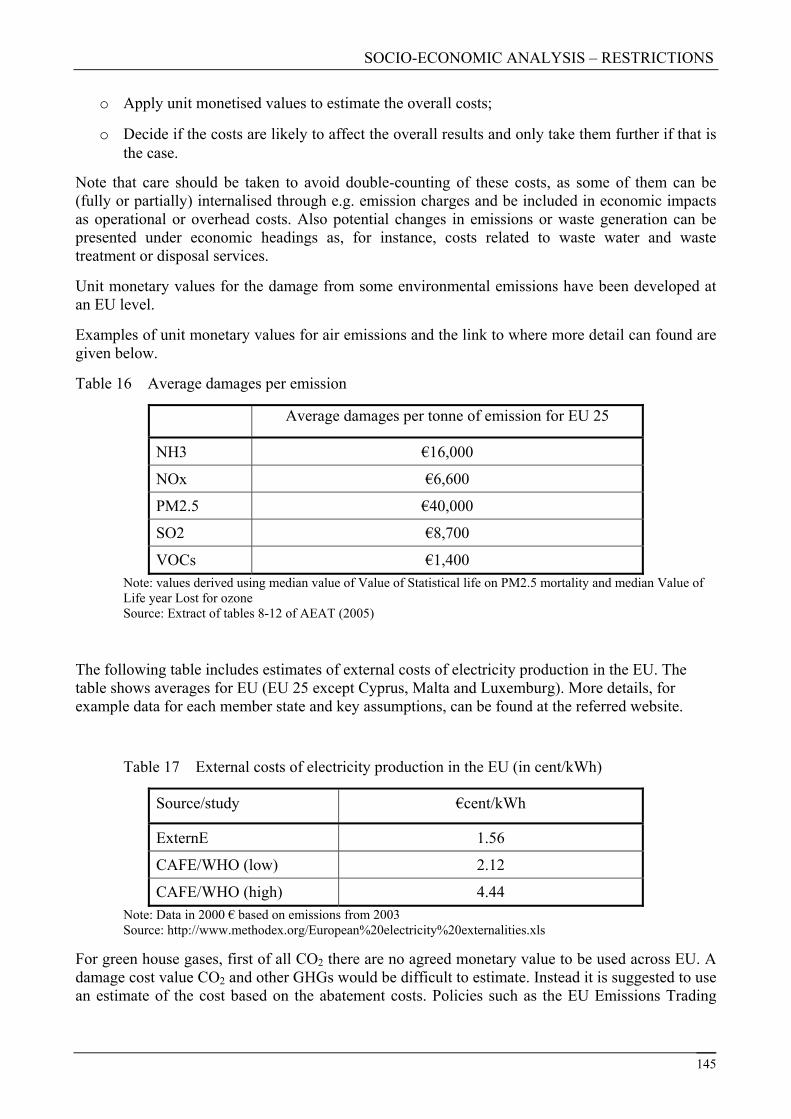
SOCIO-ECONOMIC ANALYSIS – RESTRICTIONS
o Apply unit monetised values to estimate the overall costs;
o Decide if the costs are likely to affect the overall results and only take them further if that is the case.
Note that care should be taken to avoid double-counting of these costs, as some of them can be (fully or partially) internalised through e.g. emission charges and be included in economic impacts as operational or overhead costs. Also potential changes in emissions or waste generation can be presented under economic headings as, for instance, costs related to waste water and waste treatment or disposal services.
Unit monetary values for the damage from some environmental emissions have been developed at an EU level.
Examples of unit monetary values for air emissions and the link to where more detail can found are given below.
Table 16 Average damages per emission
Average damages per tonne of emission for EU 25
NH3 €16,000
NOx €6,600
PM2.5 €40,000
SO2 €8,700
VOCs €1,400 Note: values derived using median value of Value of Statistical life on PM2.5 mortality and median Value of Life year Lost for ozone Source: Extract of tables 8-12 of AEAT (2005)
The following table includes estimates of external costs of electricity production in the EU. The table shows averages for EU (EU 25 except Cyprus, Malta and Luxemburg). More details, for example data for each member state and key assumptions, can be found at the referred website.
Table 17 External costs of electricity production in the EU (in cent/kWh)
Source/study €cent/kWh
ExternE 1.56
CAFE/WHO (low) 2.12
CAFE/WHO (high) 4.44 Note: Data in 2000 € based on emissions from 2003 Source: http://www.methodex.org/European%20electricity%20externalities.xls
For green house gases, first of all CO2 there are no agreed monetary value to be used across EU. A damage cost value CO2 and other GHGs would be difficult to estimate. Instead it is suggested to use an estimate of the cost based on the abatement costs. Policies such as the EU Emissions Trading
145
SOCIO-ECONOMIC ANALYSIS – RESTRICTIONS
146
Scheme is likely to set a cap on the total emission, which means than action that increases or decreases CO2 emissions will not impact to total EU level of emissions40.
In the SEA, it is recommended that the reference value for CO2 unit value is the future price of the relevant period of analysis. For instance, the price per tonne of CO2 for the period 2008-2012 was at the time of writing this guidance document about €20/tCO2. However, this value will change depending on the post 2012 overall cap on greenhouse gas emissions in the EU and the world by 2020. For the analysis of effects that occur in the first Kyoto period 2008-2012, the reference value would be €20/tCO2. It is recommended that for sensitivity analysis the price would be varied.
For additional wastewater generated there are no EU wide unit costs to apply. As part of implementing the Water Framework Directive most member states will develop economic analysis and estimate the unit abatement costs for removal of such substances.
It is unlikely that there would be many situations where additional wastewater would be generated in amounts significant to affect the outcome of the SEA.
USEFUL REFERENCES
- CAFE (2005) Impact assessment of the Thematic Strategy on Air Pollution: http://ec.europa.eu/environment/air/cafe/pdf/annex_sec_2005_1132_en.pdf
- European Commission (2005a), Impact Assessment Guidelines of the European Commission: http://ec.europa.eu/governance/impact/docs_en.htm
- NewExt (2003) New Elements for the Assessment of External Costs from Energy Technologies: http://www.ier.uni-stuttgart.de/forschung/projektwebsites/newext/newext_final.pdf
B.2 Economic impacts
These checklists support the analysis of economic impacts (see section 3.5.4). The term ‘change’ used in these checklists can refer to revenues or costs/cost savings. These checklists should be used for all relevant supply chains (i.e. supply chain of an alternative substance) and not just the current supply chain using the substance being proposed for restrictions or another form of RMO.
Investment and sunk costs
What do we mean by investment and sunk costs?
Investment costs refer to the purchase of capital equipment such as plant and machinery. ‘Sunk costs’ refer to investments which have already been paid for, and cannot be recuperated by selling the investment. Thus, sunk costs no longer figure in the decision making process of the company. For example, once an unpatented product is brought to the market, research and development costs 40 It can be argued that if there is cap and trade policy regarding a certain type of emission that specifically makes sure that a given cap (target) will be achieved, then implication of changes in emissions should be measured by the price of treading emissions.
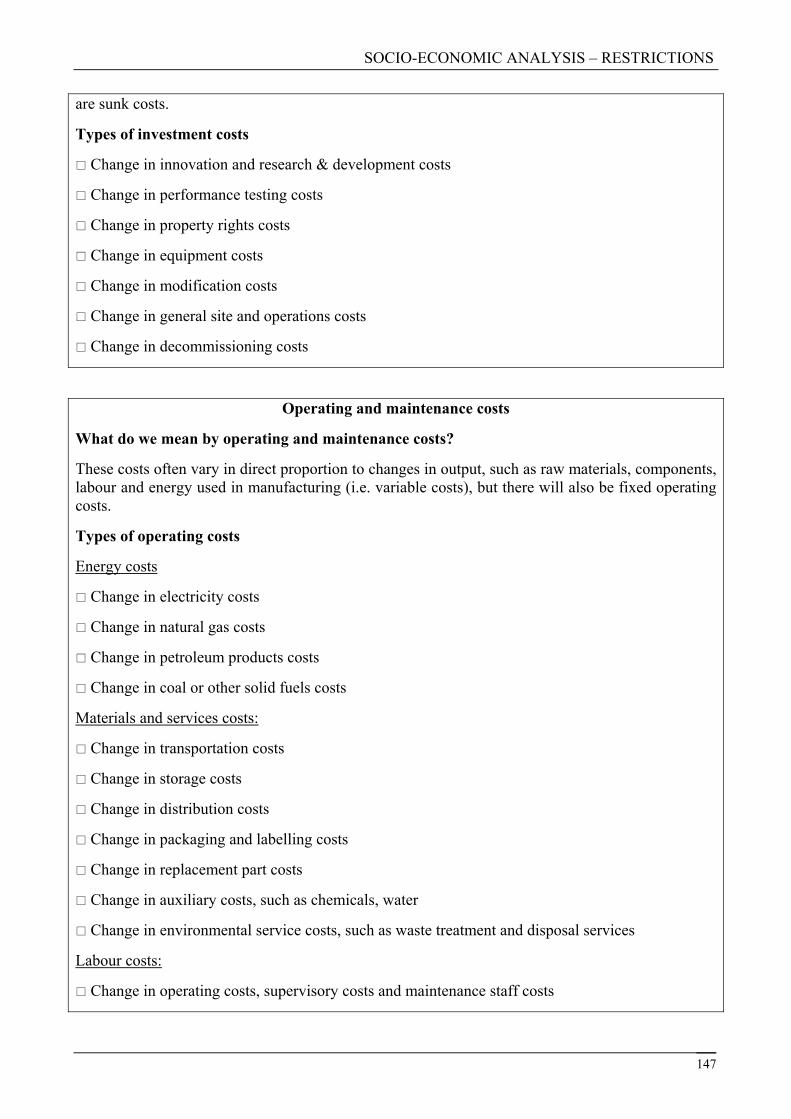
SOCIO-ECONOMIC ANALYSIS – RESTRICTIONS
are sunk costs.
Types of investment costs
Change in innovation and research & development costs
Change in performance testing costs
Change in property rights costs
Change in equipment costs
Change in modification costs
Change in general site and operations costs
Change in decommissioning costs
Operating and maintenance costs
What do we mean by operating and maintenance costs?
These costs often vary in direct proportion to changes in output, such as raw materials, components, labour and energy used in manufacturing (i.e. variable costs), but there will also be fixed operating costs.
Types of operating costs
Energy costs
Change in electricity costs
Change in natural gas costs
Change in petroleum products costs
Change in coal or other solid fuels costs
Materials and services costs:
Change in transportation costs
Change in storage costs
Change in distribution costs
Change in packaging and labelling costs
Change in replacement part costs
Change in auxiliary costs, such as chemicals, water
Change in environmental service costs, such as waste treatment and disposal services
Labour costs:
Change in operating costs, supervisory costs and maintenance staff costs
147

SOCIO-ECONOMIC ANALYSIS – RESTRICTIONS
Change in training costs of the above staff.
Types of maintenance costs
Change in sampling, testing and monitoring costs
Change in insurance premium costs
Change in marketing costs, license fees and other regulatory compliance activities
Change in emergency provision costs
Change in other general overhead costs (e.g. administration)
Subsequent (indirect) costs:
The implementation of a new technique can lead to changes in the production process, which again might lead to increasing costs, for instance, a drop in system effectiveness or inferior product quality. Derived costs should be assessed as far as possible and clearly identified when reporting the results.
Revenues
What do we mean by revenues?
Revenue refers to value received in the market for the quantity of the product sold.
Revenue sources:
Change in sales
Change in production efficiency / downtime
Change in interest on working capital
Change in residual value of equipment
Regulator costs
What do we mean by regulator costs?
The costs of regulation to the competent authority (or ‘regulator’) are known as regulator costs.
Types of regulator costs?
Change in administrative costs associated with, for example, licensing an activity
Change in inspection and monitoring costs (e.g. of imports, of emissions, etc.)
Change in costs of any scientific modelling, sampling and testing
Change in enforcement costs
Change in income stemming from changes in permitting or taxed activities
148

SOCIO-ECONOMIC ANALYSIS – RESTRICTIONS
Subsequent (indirect) benefits
The implementation of a restriction may lead to changes in the requirements of the regulator, which again may lead to lower costs, for instance, a reduction in labour costs or redistribution of expertise. Derived benefits should be assessed as far as possible and clearly identified when reporting the results.
Downstream user and consumer costs
What do we mean by downstream user and consumer costs?
Consumer costs are costs that affect the end product consumer. Some of costs mentioned above are relevant to downstream users (i.e. Revenues, avoided costs and benefits) as well as the ones listed below.
Types of consumer costs
Change in the lifetime of the end product
Change in market price
Change in annual maintenance /repair costs (i.e. if the product is not as durable)
Change in effectiveness of the end product
Change in the availability and choice
Types of downstream user costs
Change in the lifetime of the suppliers product (i.e. from a manufacturer/importer)
Change in the market price of the suppliers product
Change in effectiveness of the suppliers product
Change in the availability and cost of using an alternative
B.3 Social impacts
This checklist supports the analysis of social impacts (see section 3.6.3). The term ‘change’ used in this checklist can refer to an increase or a decrease. This checklist should be used for all relevant supply chains (i.e. supply chain of an alternative substance) and not just the current supply chain using the substance being proposed for restrictions or another form of RMO.
Employment Impacts
What do we mean by employment impacts?
Employment impacts refer to not only to the change in total employment but also to the change in the types of jobs and where they are located. It is important to consider both the change in employment for those industries currently using and manufacturing the substance and also changes
149

SOCIO-ECONOMIC ANALYSIS – RESTRICTIONS
in employment due to a change in demand for an alternative product or process.
How realistic is it to obtain quantitative information?
In most cases it will not be possible to obtain quantitative information on employment impacts especially on specific issues such as different occupational groups (especially without consultation with industry representatives and trade associations) but a “good” SEA would at least qualitatively consider how the proposed restriction may affect impacts such as different occupation groups (e.g. which kind of jobs and skills could be most affected under the proposed restriction).
Number of jobs
Change in labour required by upstream suppliers (including upstream suppliers for an alternative)
Change in labour required for manufacturers of the substance / alternative
Change in labour required for transporting the substance / alternative
Change in labour required for distributing the substance / alternative
Change in labour required for storing the substance / alternative
Change in labour required by downstream users
Occupational groups
Change in demand for unskilled workers
Change in demand for manual workers
Change in demand for skilled and specialist workers (particular relevant for niche industries)
Change in demand for management positions
Location
Change in employment for each Member State
Change in employment overall inside of the EU
Change in employment overall outside of the EU
Other relevant social impacts
Working environment
Change in job quality
Change in training available
Change in worker rights and protection
Change in job security
Change in employment conditions
Change in support given to families
150

SOCIO-ECONOMIC ANALYSIS – RESTRICTIONS
Workers
Change in the number of children employed
Change in the number of forced labour
Change in average wages and salary
Change in the good labour criteria of ILO
Change in working hours / patterns (e.g. more part time or shift work)
Change in equality – gender, race, ethnic origin
Consumer welfare
Change in utility (satisfaction) - from loss in functionality of the product
Change in utility (satisfaction) - from loss in durability of the product
Change in utility (satisfaction) - from product no longer being available
Change in utility (satisfaction) - for any other reason
Outlined below is a more detailed approach to analysing employment. This should only be considered if the simple approach shown in section 3.6.3 deems further analysis is required.
Task 1 Estimate the change to employment
Estimate the change in employment based on the best available information. It may be possible to estimate the change in the typical number of people required within the process using a representative firm(s), followed by up-scaling to the relevant geographic area. Some form of sensitivity analysis should be carried out when up-scaling the results (uncertainty analysis techniques is discussed in the Appendix E).
Task 2 Estimate leakage effects
The change in jobs occurring outside of the geographical scope of the SEA should be excluded from the change in employment. The geographical scope of the SEA should have been determined in stage 2 (Setting the scope of the SEA).
Task 3 Estimate the displacement effects
The change in employment should consider any redistribution or substitution of jobs elsewhere within the geographical scope of the SEA. It may help to consider what type of jobs may be lost / created. Consider the skills required for these jobs to determine whether these skills are in demand elsewhere within the local region area.
TIP BOX
If industries downscale or relocate, consider:
• Will industries take some of the employees with them i.e. highly skilled specialist workers, long serving workers who have a lot of experience and are well trained
• Redistribution - Can employees find jobs easily within the local area (consider the types of jobs available and the skills of these workers)
151
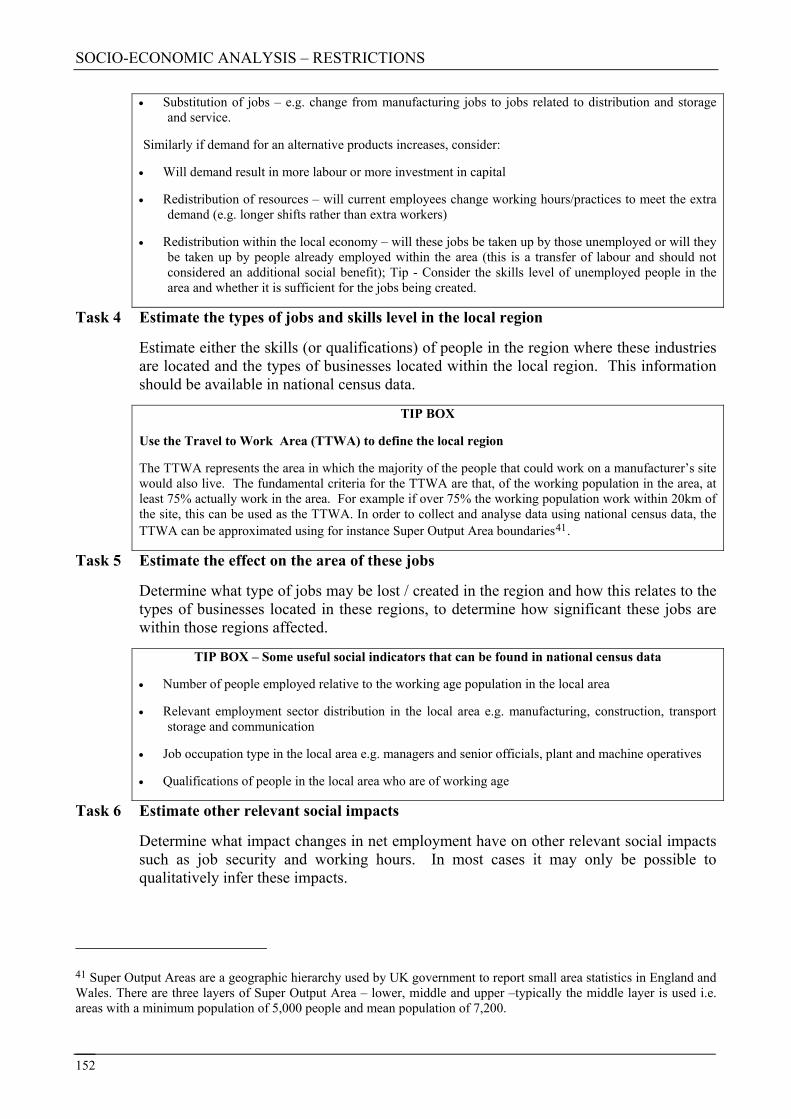
SOCIO-ECONOMIC ANALYSIS – RESTRICTIONS
152
• Substitution of jobs – e.g. change from manufacturing jobs to jobs related to distribution and storage and service.
Similarly if demand for an alternative products increases, consider:
• Will demand result in more labour or more investment in capital
• Redistribution of resources – will current employees change working hours/practices to meet the extra demand (e.g. longer shifts rather than extra workers)
• Redistribution within the local economy – will these jobs be taken up by those unemployed or will they be taken up by people already employed within the area (this is a transfer of labour and should not considered an additional social benefit); Tip - Consider the skills level of unemployed people in the area and whether it is sufficient for the jobs being created.
Task 4 Estimate the types of jobs and skills level in the local region
Estimate either the skills (or qualifications) of people in the region where these industries are located and the types of businesses located within the local region. This information should be available in national census data.
TIP BOX
Use the Travel to Work Area (TTWA) to define the local region
The TTWA represents the area in which the majority of the people that could work on a manufacturer’s site would also live. The fundamental criteria for the TTWA are that, of the working population in the area, at least 75% actually work in the area. For example if over 75% the working population work within 20km of the site, this can be used as the TTWA. In order to collect and analyse data using national census data, the TTWA can be approximated using for instance Super Output Area boundaries41.
Task 5 Estimate the effect on the area of these jobs
Determine what type of jobs may be lost / created in the region and how this relates to the types of businesses located in these regions, to determine how significant these jobs are within those regions affected.
TIP BOX – Some useful social indicators that can be found in national census data
• Number of people employed relative to the working age population in the local area
• Relevant employment sector distribution in the local area e.g. manufacturing, construction, transport storage and communication
• Job occupation type in the local area e.g. managers and senior officials, plant and machine operatives
• Qualifications of people in the local area who are of working age
Task 6 Estimate other relevant social impacts
Determine what impact changes in net employment have on other relevant social impacts such as job security and working hours. In most cases it may only be possible to qualitatively infer these impacts.
41 Super Output Areas are a geographic hierarchy used by UK government to report small area statistics in England and Wales. There are three layers of Super Output Area – lower, middle and upper –typically the middle layer is used i.e. areas with a minimum population of 5,000 people and mean population of 7,200.
SOCIO-ECONOMIC ANALYSIS – RESTRICTIONS
C.4 Trade, competition and wider economic impacts
This section supports the analysis in section 3.7.3
In particular:
Task 1 – Analyse the market to determine the ability to pass through additional costs
Extent of the market
A good starting pointing point is being able to identify the size of the market. The analysis undertaken in stage 2 when identifying the relevant markets and geographical boundaries should provide a good basis for determining the extent of the market (and further information may become available as part of the data collection for economic impacts). The size of the market can be broadly defined as a:
• ‘Local’ market – this is where there is a need for goods and services to be near to the customer. This can be limited to a region or regions within a single member state.
• ‘Regional’ market – this is generally limited to a few neighbouring member states
• ‘EU market’ – this is when the product is traded within EU member states but not globally
• ‘Global’ market – this is where firms are competing against competitors from all over the world
TIP BOX
Information that could be useful to help determine the size of the market
• The location of manufacturers (and their relative size)
• Where are the main suppliers are located
• Import/export trade data to find out the flow of materials and the size of the market
• Sales data to see the value of the market and where the main downstream users and end customers are located
• Physical characteristics of the product – is it easy to transport the substance & feasible to do so over long distances
Price elasticity
There may be an option to pass on any additional costs of restrictions (e.g. additional cost of the alternative) on to downstream users and the end product customer. Price elasticity is a term used to describe how sensitive downstream users and the end product customers are to changes in the manufacturer’s price. For some products such as petrol and pharmaceuticals (not covered under the remit of REACH), downstream users and customers might not be happy with price increases, but an increase does not have a significant impact on demand so the prices of these products are described as ‘inelastic’. If inelastic prices are a characteristic of that industry sector, then it can be relatively easy to pass on the costs to downstream users and the end product customer.
Price changes in other products can have a far greater impact on demand and downstream users and the end product customer can be very sensitive to changes in price. The prices for these products
153
SOCIO-ECONOMIC ANALYSIS – RESTRICTIONS
are described as ‘elastic’. When the price is elastic, it is difficult to pass on the costs to downstream users and the end product customer so the manufacturer/importer may have to bear the brunt of any increase in costs. It will be important to consider the elasticity of the product along the whole supply chain and what impact this could have on the long term viability of the industry.
Some issues that might affect the elasticity of the price of a commodity include; the level of competition in the sector, the power of downstream users and buyers, the power of suppliers (upstream), and the ease with which downstream users and end product customers can switch to an alternative product.
TIP BOX
Information to assess price elasticity
It is advisable to consult with an economist as determining price elasticity can be very complicated. The main information considerations are explained below. It is quite a comprehensive list of information (although not exhaustive) which may not be relevant for all types of restrictions.
1. Information about the bargaining power of downstream users and the end product consumer to dictate the price that a manufacturer can charge.
Try to find information about the rivalry within the sector, economists typically try to use the concentration ratio (CR) (or the Herfindahl-Hirschmann Index which is more difficult to find). The CR indicates the percent of market share held by the four largest firms (although it maybe possible to find data for the largest 8, 25 and 50 firms in an industry). National census and other forms of statistical reporting often report the CR for major Standard Industrial Classifications (SIC’s).
2. Information about the bargaining power of suppliers to charge a high price for raw materials required by manufacturers.
This will affect the operating costs of the manufacturer. These costs can either been absorbed by the manufacturer or passed on to downstream users in the market price.
3. Information about the threat of new entrants
The threat of new entrants could reduce prices. If manufacturers (or the industry in general) are making large profits this would encourage new firms to ‘enter the market’ and try to take a share of the profits being made. Several factors would influence the decision of a potential new entrant and in general a lot of this information can be obtained through desk based research and the use of sector /industry experts.
4. The threat of alternatives
The threat of alternatives could reduce prices depending on how real the threat is. A real threat is likely to make the price elastic, whereas when the threat of alternative is low then the price is more likely to be inelastic. Some of the information can be obtained from sector/industry experts or by consultation with downstream users.
Competitive rivalry
In a sector where there is little or no differentiation between the products that are supplied by a large number of manufacturers then competition is fierce. This might be the situation in industries such as metals, bulk chemicals and cement where individual manufacturers have little flexibility for setting or increasing prices. Where the threat of competition is large, opportunities for manufacturers to pass on any additional costs of a restriction to downstream users and the end product customer are limited (this is particular relevant when there is a real threat of imports from outside the EU and/or there is a real threat that downstream users will use an alternative).
Alternatively, if the sector is characterised by more specialist products, and where there is an opportunity to differentiate one manufacturer’s product from that of the competition, then there may
154

SOCIO-ECONOMIC ANALYSIS – RESTRICTIONS
be more flexibility on the price. In these situations there is more opportunity for the operator to pass the costs to the customer.
Since a restriction is a community wide action, this should not be a significant issue as regards intra-EU competition (this is not to say that a restriction would not have a disproportionate impact on a particular Member State). However, it may be an important issue if there is a considerable degree of EU-external competition. In a situation where the risks (e.g. human health risks) are only related to the manufacturing of a product, a manufacturer outside of the EU that is not subject to the conditions of the restriction (i.e. there is no ban on the import of the finished product) is likely to gain a competitive advantage over EU manufacturers who have to manufacture the same product using an alternative (i.e. more expense alternative - substance or process).
TIP BOX
Information that could be useful to assess competitiveness
Competitiveness is a comparative concept of the ability and performance of a firm, sub-sector or county to sell and supply goods and/or services in a given market. Information that may be relevant to gather is listed below. Generally some of this information can be obtained from desk based research, although the majority of this information can only be obtained from manufacturers and trade associations.
• number of competitors in the market
• Market share of competitors
• rate of growth in the industry
• exit barriers – i.e. costs to leave the industry
• diversity of competitors – is this the only substance they make/sell?
• Product differentiation
• cost of manufacturing per unit (alternatively the cost of value added)
• level of advertising expense
Resilience of the industry
‘Resilience’ describes the supply chains ability to absorb any increase in costs due to a proposed restriction, while ensuring that it remains viable in the short-, medium- and long-term. In order to ensure this viability, manufacturers and downstream users in the sector will need to be able to generate sufficient financial returns on an ongoing basis to be able to invest in, for example, process development, product development or safety and environmental improvements. Any increased costs associated with a proposed restriction (e.g. for downstream users this could be the cost of using an alternative or the cost of using the manufacturers modified product or the cost of importing – if this is applicable under the scope and conditions of the restriction) will either need to be absorbed along the supply chain (i.e. by the manufacturer or downstream users) or passed on to the customer.
155

SOCIO-ECONOMIC ANALYSIS – RESTRICTIONS
TIP BOX
Information that could be useful to assess resilience
It may be possible to gather information such as that listed below about specific companies via credit reports and financial reporting to shareholders.
• Current assets and current liabilities
• Equity capital and total liabilities
• Operating profit and financial costs
• Gross profit and sales
• Net profit after tax
• Share capital, reserves and long term loans
If this information is not available (perhaps due to confidentiality or because that this information does not need to be disclosed) it may be possible using the same sources to find an industry average for profitability, liquidity and solvency. Alternatively consider desk-based research looking into how volatile the market may be and how the industry has performed when demand for these goods was low and when it was high.
The main sources of trade, competition and wider economic impacts are likely to be from:
• Statistical services and in particular Eurostat
• Member State specific trade data i.e. uktradeinfo (part of HM Revenue & Customs)
• Financial reporting to shareholders and company credit reports
• Published information i.e. websites, journals and reports
• Consultation with industry that is producing or using the substance (trade associations and individual companies)
• Consultation with industry that is producing or using alternatives to the substance (trade associations and individual companies)
• Research groups
• Expert estimates
Task 1 - Analyse the market using ‘Porter’s five forces theory’
The purpose of analysis the market situation using for example “Porter” theory is to gain an understanding of how the proposed restriction will affect competition and competitiveness. Specifically it will help to determine:
− Whether additional costs be passed on to downstream users and consumers
According to Porter’s view, the rules of competition are embodied in five forces that shape the structure and intensity of competition:
156
SOCIO-ECONOMIC ANALYSIS – RESTRICTIONS
1. rivalry among existing firms
2. the bargaining power of suppliers (upstream supply chain)
3. the bargaining power of buyers (downstream users and the end product customer)
4. the threat of alternative products or services
5. the threat of new entrants
The strength of these five forces varies from industry to industry, and can change as an industry evolves over time. In most cases undertaking a five forces test will require specialist expertise, although it will not require any economic modelling capabilities.
Rivalry among existing firms
Strong rivalry in a sector (i.e. between competing manufacturers, or competition within each downstream user market) is likely to result in strong competition on price and may possibly constrain profit margins and, therefore, the sector’s ability to absorb or to pass on any costs of the proposed restriction. The concentration, or number of players in the market, can indicate the level of rivalry in the sector (the concentration ratio (CR) can give an indication of the concentration in the sector). If overcapacity exists, then there will be limited opportunity to gain market share (this can sometimes be the case in sectors where products are sold to a standard specification, such as cement). Also, if there are high exit barriers (i.e. high shutdown costs) then these factors are likely to lead to strong rivalry within the sector.
Bargaining power of suppliers (upstream supply chain)
If there are a large number of manufacturers/importers in a sector or a small number of downstream users and the end product consumers, then there is likely to be keen competition on price. Upstream suppliers might also be in a powerful position if the manufacturers / importers are constrained by high switching costs (i.e. re-tooling or increased transport costs) and cannot switch upstream suppliers easily. A good indication of this is the size of the market i.e. an international market would imply that switching costs are low. If a sector is only a small outlet for an upstream supplier, then the supplier is again in a powerful position and can dictate the price and reduce the manufacturer’s ability to bargain for lower costs.
Bargaining power of buyers (downstream users and the end product consumer)
If a sector is characterised by a small number of buyers (downstream users and the end product consumer) taking a significant market share of the sales, then the buyer tends to be in a strong position and can exert more influence on the price. The ability of existing manufacturers in the sector to pass on any costs of restrictions may, therefore, be constrained. However when the product is a small fraction of the buyer’s costs, there may be more flexibility to pass the costs on.
The buyer may also be able to influence the market price, if there is low cost to switching to an alternative (i.e. process/substance). Similarly, if a competing manufacturer uses a more expensive alternative (i.e. process/substance) it may not necessarily be able to charge a higher price, because of significant buyer power, forcing the manufacturer to absorb the higher cost of the alternative.
Threat of alternative products or services
Where the buyer has the option of switching to an alternative product, then this may present a threat to the sector (for example, aluminium and plastics are increasingly being used as raw material in the production of cars, as a substitute for steel), then the opportunities to pass on increased costs to the
157
SOCIO-ECONOMIC ANALYSIS – RESTRICTIONS
buyer are limited. The buyer may initially be reluctant to make the switch because of the cost of investment cost of modifying their process that they would have to make to accommodate the switch, but as the cost of restrictions increases and these costs are reflected in product price increases, the threat of buyers switching to substitute products may become more of an issue.
In the context of restrictions, this issue can be less significant (compared to an authorisation under REACH), because from society’s point of view it is a shift in ‘market share’ from one industry to another (e.g. from steel to non-ferrous metals and chemicals). However it becomes an important issue when it results in changes in employment and revenue going to competitors located outside of the EU.
Threat of new entrants
Highly profitable markets tend to attract new entrants. This threat tends to be constrained if there are high entry barriers (new equipment, access to distribution channels, customers switching costs, legal permits, etc.). An important consideration for restrictions proposals is increased costs (i.e. from using an alternative product, change in process) which could make non EU companies more competitive in the market, prompting EU industries to consider relocating outside of the EU.
This section supports the analysis in section 3.7.3
In particular:
Task 2 – Determine the resilience of the industry using financial ratios
Task 2 - Determine the resilience of the industry using financial ratios
For a firm to be economically viable it must be able to adapt and grow under varying economic conditions and fluctuations within its industry. Analysing the viability of an industry using the financial rations will help to determine whether additional costs on the industry will limit any further growth in industry or even put part of the industry out of business.
To be economically viable a firm must maintain sufficient:
• Liquidity;
• Solvency; and
• Profitability
Liquidity is a short-term measure of the health of a company and describes the company’s ability to pay off its immediate liabilities. This appendix includes a method for calculating both the ‘current ratio’ and the ‘quick ratio’, which are routinely used to describe liquidity.
Solvency of a company describes the company’s ability to fulfil its obligations in the longer term. Solvency is when a firm’s assets exceed its external debt (liabilities). Therefore the firm has a good financial basis or stability and, as such, solvency is a good measure for the overall well being of the company. If external debts are greater than the asset values, a state of insolvency exists. Calculations for ‘debt/asset ratio’ and ‘interest coverage’, which are routinely used to describe solvency, are included in this appendix.
158

SOCIO-ECONOMIC ANALYSIS – RESTRICTIONS
Profitability: Companies with higher profit margins and overall profits will find it easier to absorb any increase in production costs (this is mostly a distributional impact to society). A business that is both solvent and liquid will not necessarily be profitable. A simple definition of profit is revenue after costs have been deducted. More importantly profit can also indicate the return on capital invested i.e. it compensates the owner of the capital for the loss of the capital for any other potential use. This is usually a good basis for investors to determine whether the return on their investment will yield an adequate return relative to the solvency risk of the company as well as alternative investments elsewhere including risk-free investments. There are various measures of profitability. Financial ratios for ‘gross profit margin’, ‘net profit margin’ and ‘return on capital employed’ are discussed in this appendix.
This section includes several financial ratios for each of these key indicators.
Liquidity
Liquidity (‘Current’) Ratio = Current Assets
Current liabilities
This is considered the main test for liquidity. There is no exact value for this ratio which can be used as a guide to a firm’s health as it will depend on the industry and the particular circumstances. Generally figures of around 1.5 are recommended though the trend is more important. A value at or below 1.0 indicates concern (can not meet short term debt) and values greater than 2.0 may mean that too much finance is tied up in short term assets.
Acid Test (‘Quick’) Ratio = Current Assets - stock
Current liabilities
Under the acid test stock is deducted because it can be hard to quickly convert stock into cash due to various factors such as the weather or legislation. Accountants recommend that the acid test ratio should be around 1 i.e. that there should be about €1 of liquid assets for every €1 of short-term debt.
Solvency
Debt/asset ratio = total firm liabilities total firm assets
Debt/asset ratio is a common measure of business solvency. Generally smaller debt/asset ratio values are preferred to larger ones. Smaller values indicate a better chance of maintaining the solvency of the business should it be faced with a period of adverse economic conditions. Low debt/asset ratios may also indicate that the firm is reluctant to use debt capital to take advantage of profitable investment opportunities. Values which are less than 1 indicate a solvent business.
Profitability
There are various measures of profitability. This section focuses on gross and net profit margins as well as return to capital Employed (ROCE):
Gross profit Margin = Gross Profit X 100
Sales
The gross profit margin is the percentage of sales revenue before other expenses are considered.
159
SOCIO-ECONOMIC ANALYSIS – RESTRICTIONS
Net profit margin = net (operating) profit X 100
Sales
Net gross profit margin is generally considered more significant because unlike gross margins, fixed overheads are taken into account.
Return to capital employed (ROCE) = Profit before tax and interest X 100
Capital employed
The ROCE is the percentage of return the firm is able to generate on its long-term capital employed in the business. It is also sometimes used as a measure of efficiency. A firm’s ROCE allows investors to judge the financial effectiveness of the company action and possibly be used for growth forecasts. A high ROCE indicates that a significant proportion of profits can be invested back into the company for the benefit of shareholders. The reinvested capital is employed again at a higher rate of return, which helps to produce higher earnings-per-share growth. A high ROCE is, therefore, a sign of a successful growth company.
If the ROCE is lower than the rate of a risk-free investment such as a fixed savings account, then the firm maybe better off closing down, selling its assets and putting the money in this fixed savings account. Investors can use the ROCE to other potential investments to see who is likely to generate the best return.
Consistency is a key factor of performance. Sudden changes in the ROCE could indicate a loss of competitiveness in the market or that more assets are held as cash. There are no firm benchmarks because ROCE can be low during periods of recession, but as a very general rule of thumb, ROCE should be at least double the current interest rate. An ROCE any lower than this suggests that a company is making poor use of its capital resources.
160
SOCIO-ECONOMIC ANALYSIS – RESTRICTIONS
APPENDIX C VALUATION TECHNIQUES
VALUATION TECHNIQUES
161

SOCIO-ECONOMIC ANALYSIS – RESTRICTIONS
Introduction
This appendix outlines alternative valuation techniques for estimating the monetary values of human health or environmental impacts. The Commission’s Annexes to Impact Assessment Guidelines (chapter 11) provides information on a range of valuation techniques.
This appendix provides a few more details on most of the techniques including how they could be used in an SEA. The appendix is intended to provide only an introduction to the different techniques available. More detailed information and specialist expertise should be sought before carrying out the valuation of impacts.
The valuation techniques described in this appendix present several alternative approaches to establishing monetary values for impacts or changes where there is not market price that can be applied. The valuation techniques will therefore primarily be relevant for human health and environmental impacts. They could however also be relevant in situations where a restriction proposal will result in a quality change to a good or service.
Traditionally in chemicals risk management, value transfers have often been used to value impacts such as environmental and human health impacts. The remaining techniques presented in this appendix have not usually been used partly because it is more difficult to apply them to chemical risk management but also because they require a lot of resources to be devoted to gathering data. The Authority should take this into consideration when planning their resources and budget.
It should also be kept in mind that valuation techniques such as avoided costs and in some cases resource costs are not providing valuation of the impacts as such and there they should be applied with care making it clear why they are used.
Where can I find more information about valuation technique?
Economic literature on valuation techniques is plentiful. A couple of more recent books include:
o Freeman, A. Myrick; “The Measurements of Environmental and Resource Values: Theory and Methods”, Resource for the Future Press, 2003
o Carson Richard: “Contingent Valuation: A Comprehensive Bibliography and History”, Edward Elgar Pub, 2008.
C.1 Value transfers
What is this technique?
Value or benefit transfer is the process of taking information about monetary values (which can be benefits or costs) from one context (the ‘study site’) and applying it to another context (the ‘policy site’).
Due to constraints on time and resources, it is unlikely to be practicable to conduct new valuation studies when developing an SEA. Therefore, estimated values can be transferred from previous studies with similar characteristics. The context in which the original valuation study was conducted is often termed the ‘study site’, and the site where the new value estimate is needed is termed the ‘policy site’. Value transfer can be used across different sites (spatial value transfer) or at one specific site over time (temporal value transfer). The main assumption with value transfers is that estimates of the value of an impact at one site are able to provide a reasonable approximation to the value for another site with similar conditions.
162
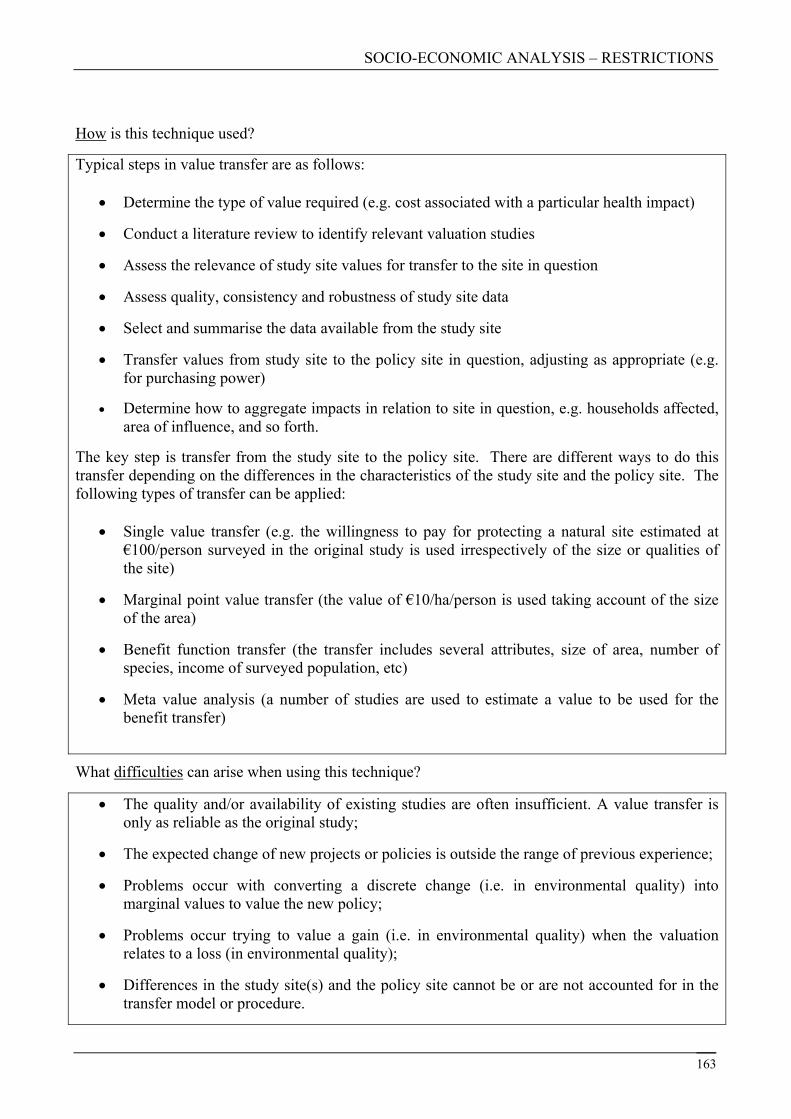
SOCIO-ECONOMIC ANALYSIS – RESTRICTIONS
How is this technique used?
Typical steps in value transfer are as follows:
• Determine the type of value required (e.g. cost associated with a particular health impact)
• Conduct a literature review to identify relevant valuation studies
• Assess the relevance of study site values for transfer to the site in question
• Assess quality, consistency and robustness of study site data
• Select and summarise the data available from the study site
• Transfer values from study site to the policy site in question, adjusting as appropriate (e.g. for purchasing power)
• Determine how to aggregate impacts in relation to site in question, e.g. households affected, area of influence, and so forth.
The key step is transfer from the study site to the policy site. There are different ways to do this transfer depending on the differences in the characteristics of the study site and the policy site. The following types of transfer can be applied:
• Single value transfer (e.g. the willingness to pay for protecting a natural site estimated at €100/person surveyed in the original study is used irrespectively of the size or qualities of the site)
• Marginal point value transfer (the value of €10/ha/person is used taking account of the size of the area)
• Benefit function transfer (the transfer includes several attributes, size of area, number of species, income of surveyed population, etc)
• Meta value analysis (a number of studies are used to estimate a value to be used for the benefit transfer)
What difficulties can arise when using this technique?
• The quality and/or availability of existing studies are often insufficient. A value transfer is only as reliable as the original study;
• The expected change of new projects or policies is outside the range of previous experience;
• Problems occur with converting a discrete change (i.e. in environmental quality) into marginal values to value the new policy;
• Problems occur trying to value a gain (i.e. in environmental quality) when the valuation relates to a loss (in environmental quality);
• Differences in the study site(s) and the policy site cannot be or are not accounted for in the transfer model or procedure.
163
SOCIO-ECONOMIC ANALYSIS – RESTRICTIONS
When could this technique be used? (within the SEA process)
It is not feasible to estimate all impacts in a typical SEA using the data that will typically be available. Value transfer methods may be particularly useful for an SEA where a ‘rough and ready’ indication of impacts may be sufficient to reach a judgement. They are also particularly relevant when time and financial constraints rule out the use of other valuation techniques.
Chapter 4 on impact assessment includes a table with benefit transfer values that has been developed as part of an EU initiative. They cover some health and environmental impacts and have been developed through a meta analysis approach and agreed amongst the Member States.
Example of how to use this technique
There are some existing databases of valuation studies and it can be expected that further databases will become available in the future. Currently, the EVRI database is one example of a valuation study database. EVRI includes about 1500 to 2000 valuation studies and new studies are added regularly. Whilst use of valuation studies are likely to be relevant for an SEA in only a limited number of cases, the example below shows how one can use benefit studies to get an understanding of the likely order of magnitude for certain impacts.
Valuation of recreation benefits are particularly well covered as this type of use value has been subject to many studies. One of the studies that can be accessed in the EVRI database is a study that summarised values available for recreation benefit42, drawing upon values from a number of primary studies. It is therefore a meta study and provides the basis for using meta value benefit transfer. The meta analysis is likely to provide a more robust basis for the benefit transfer than transfer from studies covering individual sites.
This study summarises the value of different recreational activities. It includes, for example, the value attributed to swimming and fishing. A monetary welfare value is given in $ per activity day per person. The mean value for swimming is $21 per day per person, while the mean value for fishing is $36 per day per person. The uncertainty is given by the gross range of values; for fishing the range is from $2 to $210 per person. (This highlights the uncertainties inherent in such an approach and uncertainty analysis – see Appendix F – is likely to be a fundamental part of any SEA using value transfer techniques. Where possible a more plausible range could be used i.e. weighted average or confidence interval around a mean value)
Before using such values, the issues listed above, regarding considering whether the benefit values are suitable for transfer, need to be addressed.
In this case, most of data are from North American studies. One needs to consider whether this affects the applicability for use in the EU. This covers two aspects: i) Are there differences in income levels and ii) are there differences in preferences for recreational activities.
In this example, the difference in income levels can be measures as by the difference in GDP/capita in EU and in the US. The GDP values needs to be based on purchase power parity (PPP)43. It means that there is accounted for differences in price level (if the nominal income/capita in country A is twice that of country B but all prices of goods and services are also twice as high in country A, then the PPP adjusted income/capita will be the same).
If it is further assumed that there is no reason to believe in any particular difference in preferences
164
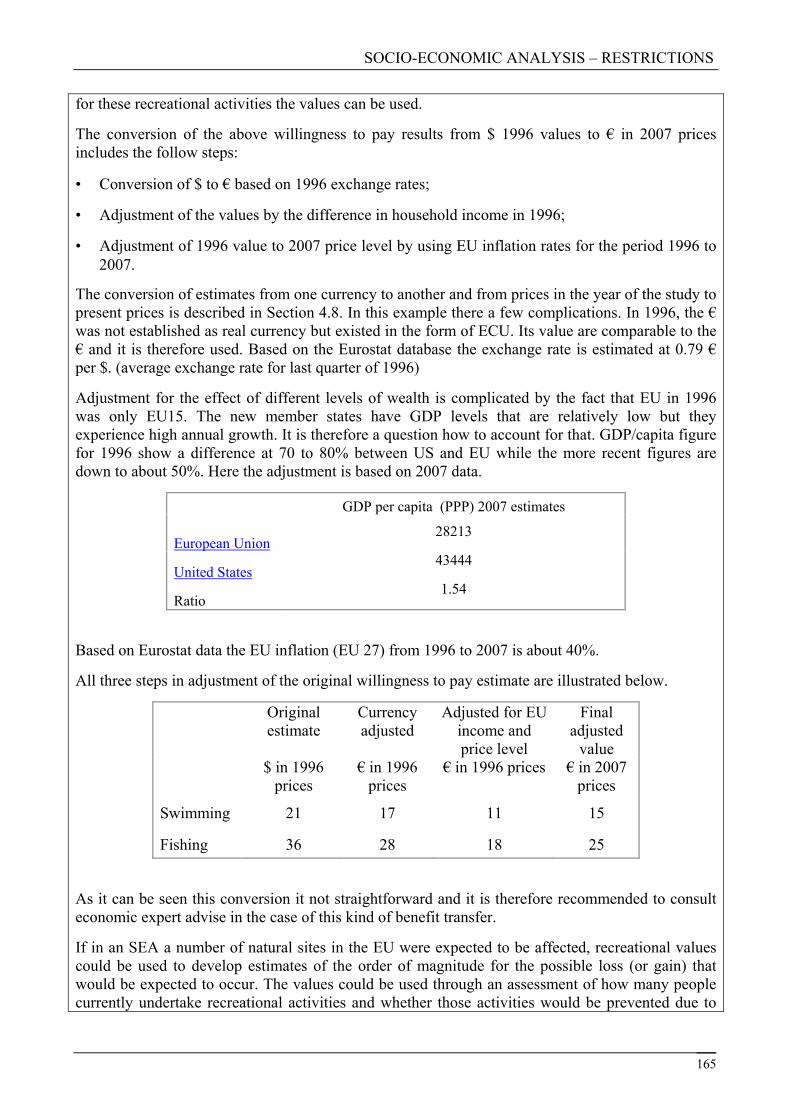
SOCIO-ECONOMIC ANALYSIS – RESTRICTIONS
165
for these recreational activities the values can be used.
The conversion of the above willingness to pay results from $ 1996 values to € in 2007 prices includes the follow steps:
• Conversion of $ to € based on 1996 exchange rates;
• Adjustment of the values by the difference in household income in 1996;
• Adjustment of 1996 value to 2007 price level by using EU inflation rates for the period 1996 to 2007.
The conversion of estimates from one currency to another and from prices in the year of the study to present prices is described in Section 4.8. In this example there a few complications. In 1996, the € was not established as real currency but existed in the form of ECU. Its value are comparable to the € and it is therefore used. Based on the Eurostat database the exchange rate is estimated at 0.79 € per $. (average exchange rate for last quarter of 1996)
Adjustment for the effect of different levels of wealth is complicated by the fact that EU in 1996 was only EU15. The new member states have GDP levels that are relatively low but they experience high annual growth. It is therefore a question how to account for that. GDP/capita figure for 1996 show a difference at 70 to 80% between US and EU while the more recent figures are down to about 50%. Here the adjustment is based on 2007 data.
GDP per capita (PPP) 2007 estimates
European Union
28213
United States
43444
Ratio 1.54
Based on Eurostat data the EU inflation (EU 27) from 1996 to 2007 is about 40%.
All three steps in adjustment of the original willingness to pay estimate are illustrated below.
Original estimate
Currency adjusted
Adjusted for EU income and price level
Final adjusted
value
$ in 1996 prices
€ in 1996 prices
€ in 1996 prices € in 2007 prices
Swimming 21 17 11 15
Fishing 36 28 18 25
As it can be seen this conversion it not straightforward and it is therefore recommended to consult economic expert advise in the case of this kind of benefit transfer.
If in an SEA a number of natural sites in the EU were expected to be affected, recreational values could be used to develop estimates of the order of magnitude for the possible loss (or gain) that would be expected to occur. The values could be used through an assessment of how many people currently undertake recreational activities and whether those activities would be prevented due to
SOCIO-ECONOMIC ANALYSIS – RESTRICTIONS
166
contamination (or improvement) of the sites. If in total 500,000 person days of fishing would be affected, the potential loss would be €14 million per year with range of €1 million to €82 million.
If the number of people affected were not known, a sensitivity analysis following what we have called the ‘backwards calculation’ approach could be undertaken (see Section 4.4 and 4.5 of the main guidance for descriptions of the “backwards calculation” approach). If the total economic cost difference between the two SEA scenarios was estimated to be €100 million per year, the backwards calculation could show that if more than 3.7 million recreational fishing days were potentially affected, the loss would exceed the economic costs (€100 million divided by €27/fishing day equals 3.7 million days). If additional information indicated that the total fishing activities in the areas potentially affected was only 100,000 recreational fishing days, it could be concluded that this loss would be unlikely to exceed the economic costs. In most cases there would be other types of environmental effects to consider, making this kind of analysis more complex.
Where can I find more information about this technique?
EC Impact Assessment Guidelines Annexes (see chapter 11) 15 June 2005
UK Treasury Greenbook (Chapter 5)
The Environmental Valuation Reference Inventory is a searchable database of valuation studies of environmental benefits (and human health) and is intended as a tool for facilitating benefits transfer. http://www.evri.ca/
Technical guidance document on the use of socio-economic analysis in chemical risk management decision making (OECD 2002)
Central Queensland University: A Systematic Database for Benefit Transfer of NRM Values in Queensland
Cost-Benefit Analysis and the Environment Recent Developments (Chapter 17) -OECD 2006
C.2 Stated preference
What is this technique?
The basic idea behind any stated preference (SP) technique for estimating impacts which are typically not assigned a value through the market (non-market prices) is to quantify a person’s willingness to bear a financial cost in order to achieve some potential (non-financial) improvement or to avoid some potential harm. SP approaches are based on hypothetical markets and rely on asking people hypothetical questions utilising questionnaires. These questions can ascertain the economic value people attach to certain goods and services. With any study conducted using questionnaires, the reliability of the valuations are only as good as the actual questions and the language used (i.e. any bias in the language or options available will affect the usefulness of the results).
Within the class of SP methods, there are two alternative groups of techniques: the contingent valuation method (CVM) and choice modelling (CM).
Contingent valuation method (CVM)
When deploying the CVM, the examiner constructs a scenario or hypothetical market which is then
SOCIO-ECONOMIC ANALYSIS – RESTRICTIONS
posed to a random sample of the population to estimate their willingness to pay (WTP) for an improvement or their willingness to accept (WTA) monetary compensation for the decline in quality (e.g. in terms of environmental quality). Based on survey responses, examiners estimate values such as the mean and median WTP for an improvement or willingness to accept compensation for a decline in quality.
Choice modelling (CM)
In applying CM goods are described in terms of their attributes (quality, price etc) and of the levels that these attributes take. Respondents are presented with various alternative descriptions of a good, differentiated by their attributes and the levels of these attributes, and are asked to rank, rate or choose their preferred alternative with respect to the set of attributes. WTP can be indirectly recovered from people’s choices as long as price is one of the attributes, with the advantage of avoiding an explicit elicitation of WTP itself.
How is this technique used?
Expert guidance is recommended when utilising SP techniques. The following steps are needed for a successful SP study (Pearce et al., 2002):
• Initial Research – What question is being answered? What is the object or impact being valued? • Choice of survey method and valuation technique – Is the survey method face to face? Mail?
Internet? Will it be CM or CV? • Choice of population and sample – What is the target population, and what kind of sample
should be selected? • Questionnaire design – Payment vehicle (Tax, Price, Donation etc.)? Elicitation format? Form
of question? (Avoid wording questions which steer the audience in a particular direction.) • Testing the questionnaire – Focus groups, pilot surveys, and redesign. • Conduct the main survey – Redesign questionnaire and conduct main survey. • Econometric analysis – Construct a database of results and pass to econometrics experts. • Validity and reliability testing – Do the results meet validity and reliability tests?
• Aggregation and reporting – Aggregating from the sample results to the target population.
When could this technique be used? (within the SEA process)
It is generally not expected that an SEA would include primary valuation work. If however, the values at stake are sufficiently high it could be decided to undertake primary valuation. Such valuation studies could be relevant for different types of impacts. Monetary valuation techniques are often considered in the relation to environmental and health impacts. They could also be used to assess whether a restriction/”non-use” scenario would result in a changed quality of an end product. The choice modelling (CM) technique was originally designed to gain understanding of consumers’ willingness to pay for changes in quality and other attributes of consumer goods. By designing a questionnaire covering the different qualities of the end-product, the willingness to pay for a change in those qualities due to restriction/ban of the substance could be estimated.
A valuation study could also be designed to specifically analyse the willingness to pay for the change in risks between the two scenarios. This could enable the willingness to pay for reducing
167

SOCIO-ECONOMIC ANALYSIS – RESTRICTIONS
168
the risks(s) to be analysed even if only a qualitative description of the risks is available.
Undertaking a primary valuation study would require expert input. There are organisations specialised in design of (unbiased) questionnaires, selection of representative samples and implementation of surveys.
What difficulties can arise when using this technique?
• Respondents may not offer a genuine response because they do not believe in the scenario
• Results obtained are not based on actual behaviour and can therefore miss factors present in markets
• It is possible for respondents to agree with the bid offered without properly considering the magnitude of the bid or other considerations
• Social desirability bias occurs if respondents give responses in such a way as to portray themselves in a favourable light with respect to social norms
• Statistical analysis of data can be very complex and requires expert assistance and specialist software
• The payment vehicle used and framing of the questions can greatly influence results
• The technique can be very costly and time consuming
Where can I find more information about this technique?
Ecosystem Valuation, Methods chapter 6: Contingent Valuation
DTLR: Economic Valuation with Stated Preference Techniques Summary Guide
NOAA Coastal Services Center - Environmental Valuation: Principles, Techniques, and Applications:
DEWR - The Economic Value of Biodiversity: a scoping paper
Technical guidance document on the use of socio-economic analysis in chemical risk management decision making (OECD 2002):
Cost-Benefit Analysis and the Environment Recent Developments (Chapter 8-9) - OECD 2006
C.3 Revealed preference
What is this technique?
Revealed preferences (RP) are uncovered through actual choices made by individuals in the marketplace and share the common feature of using market information and behaviour to infer the monetary value of an associated non-market impact. Three approaches under this heading are introduced below.
SOCIO-ECONOMIC ANALYSIS – RESTRICTIONS
The hedonic price method of environmental valuation uses surrogate markets in order to ascertain values for environmental quality. The real estate market is the most commonly used surrogate market used in hedonic pricing of environmental values. Property prices are affected by different pollutants such as air and noise and this as a direct impact on their value. By comparing properties with otherwise similar characteristics and correcting for all non-environmental factors, information on the housing market can be used to estimate people's willingness to pay for environmental quality.
Under the travel cost method, a demand curve for a non-marketed recreational/tourist asset that is dependent on the condition of its environment can be inferred from an estimated relationship between visitation rates and the costs of travelling to a site. In other words, by investigating how much people are willing to pay to get to a site, it is possible to infer the value they enjoy from being at the site.
Averting behaviour and defensive expenditure approaches are similar to the previous two, but differ to the extent that they refer to individual behaviour to avoid negative intangible impacts. People might buy goods such as safety helmets to reduce accident risk and double-glazing to reduce traffic noise which in turn reveals their valuation of these negative impacts. Avoided cost approach is explained in section B.5.
When could this technique be used? (within the SEA process)
Techniques based on revealed preferences are less likely to be useful in an SEA context. In terms of preferences for avoiding exposure to chemicals in the work place or in during consumer use, there may be examples that could be used to assess how a population at risk would be expected to choose to avoid or reduce the risks and their willingness to pay for that. To undertake a revealed preference study, one would need to identify a situation where workers or consumers have a choice between different levels of exposure to a chemical/chemicals and where the choices have a financial implication, such as on salary or product price. As with the stated preference techniques, specialist input would be required.
(Benefit transfer values are often based on revealed preference studies.)
What difficulties can arise when using this technique?
• Coefficients on attributes in models estimated from choices in actual settings provide only limited predictions of the impact of changing policies
• Statistical analysis of data can be very complex and requires expert assistance
• Co linearity among multiple attributes is common in revealed preference data, making it difficult to separate the effects of attributes and creating implausible results
• Revealed preference methods are relatively complex to implement and interpret, requiring a high degree of statistical expertise
• The techniques requires a large amount of data gathering and manipulation is required and can therefore be costly depending on data accessibility
169

SOCIO-ECONOMIC ANALYSIS – RESTRICTIONS
170
• Problems with hedonic pricing include
• The scope of impacts that can be measured is limited to things that are related to the surrogate markets involved
• The method only takes into account perceived impacts so impacts that individuals are unaware of will be missed
• Problems of the TCM include
- The travel itself may have a value
- The same costs might be incurred to access more than one site
-Some of the costs are intangible (e.g. opportunity costs of time)
• Averting behaviour has the difficulty that the market goods may have more benefits then just reducing the intangible negative impact being measured
Where can I find more information about this technique?
Energy, Transport And Environment Center For Economic Studies: the development and application of economic valuation techniques and their use in environmental policy – a survey
NOAA Coastal Services Center - Environmental Valuation: Principles, Techniques, and Applications:
DEWR - The Economic Value of Biodiversity: a scoping paper
Technical guidance document on the use of socio-economic analysis in chemical risk management decision making (OECD 2002):
Cost-Benefit Analysis and the Environment Recent Developments (Chapter 7) -OECD 2006
C.4 Resource cost approach
What is this technique?

SOCIO-ECONOMIC ANALYSIS – RESTRICTIONS
The resource cost approach can be used to make monetary valuations of health effects such as illness. The resource costs of an illness consist of two components. The first is the actual costs of illness, which are the easiest to measure. Estimation of these costs is based either on the actual expenditure associated with treating different illnesses, or on the expected frequency of the use of different services for different illnesses together with the costs of those services. The key problem in assessing the direct costs is the ability to collect data on the actual costs associated with a particular health end-point, given that accounting practices adopted by health practitioners have not generally been developed with this in mind.
The second component of resource costs is that of lost earnings and/or time, often referred to as indirect productivity costs. The costs of lost earnings are typically valued at the after-tax wage rate (for the work time lost), and lost home time at the opportunity cost of leisure (for the leisure time lost). However, a basic drawback of including these indirect costs is that, although well established, the approach does not necessarily provide a reliable estimate in times of high unemployment (OECD, 2002). Total resource costs are then estimated as the sum of:
1. actual expenditure (e.g. medicines, doctor and hospital bills) per day, i.e. direct costs; and
2. the value of lost earnings and leisure time per day, i.e. indirect costs; and
These are then multiplied by the number of days sick and number of cases of sickness for the illness.
It needs to be recognised that, because the resource costs approach focuses only on the more tangible costs avoided, it does not necessarily reflect an individual’s full WTP to avoid an illness (Freeman, 1993, in OECD, 2002). Care is needed when WTP values include the costs incurred by the individuals for treating an illness, in order to avoid double counting.
When could this technique be used? (within the SEA process)
The resource costs approach is similar to any cost assessment and it could be relevant to use in the SEA context. If health impacts are identified and the use of benefit transfer is not suitable, an estimation of the resource costs related to the health impact would be useful.
What difficulties can arise when using this technique?
• The technique is limited to specific situations which involve health impacts and therefore the technique will have limited applicability
• The approach does not necessarily reflect an individual’s full WTP to avoid an illness as it just focuses on the resource costs e.g. losses in utility associated with the pain the individual suffers
• Obtaining data on actual costs for a specific analysis may be difficult given the accounting practices generally adopted by health services
171
SOCIO-ECONOMIC ANALYSIS – RESTRICTIONS
172
Where can I find more information about this technique?
Technical guidance document on the use of socio-economic analysis in chemical risk management decision making (OECD 2002)
Cost-Benefit Analysis and the Environment Recent Developments (Chapter 14) -OECD 2006
C.5 Avoided cost approach
What is this technique?
This technique assesses the cost of measures that have been introduced with the purpose of preventing, avoiding, or mitigating the damages caused by, for example, use of a substance with non-threshold effects. Instead of providing a strict measure of monetary values based on people’s willingness to pay for a product or service, the approach assumes that the costs of avoiding damages to ecosystems or their services provide useful estimates of their respective values. This is based on the assumption that, if people incur costs to avoid damages caused by lost ecosystem services for example, then those services must be worth at least what people paid to avoid the damage.
How is this technique used?
The initial step for the avoided cost approach involves assessing the environmental services or other services which are provided. This consists of specifying the relevant services, including how they are provided, to whom and at what levels. The second step is to estimate the potential damage which could occur, either annually or over some discrete time period. Finally the monetary value of potential damage, or the amount that people spend to avoid such damage, is calculated.
What difficulties can arise when using this technique?
• Costs incurred are usually not an accurate measure of the benefits derived which contradicts one of the main assumptions of this approach. This approach should, therefore, be used as a last resort as social preferences for ecosystem services or individuals’ behaviour in the absence of those services are not considered.
• The methods may be inconsistent because few environmental actions and regulations are based solely on benefit-cost comparisons, particularly at the national level. Therefore, the cost of a protective action may either exceed or fall short of the benefits to society.
• These approaches should be used only after society has demonstrated their willingness-to-pay for the investment in some way (e.g., approved spending for the investment). Otherwise there is no indication that the value of the good or service provided by the ecological resource to the affected community is greater than the estimated cost of the investment.
When could this technique be used? (within the SEA process)
The avoided cost approach could be used to value impacts where an EU wide target means that increasing or decreasing emissions of a substance would have to be offset by changes in other sectors. The avoided cost approach is suggested in relation to the emissions of CO2 and other greenhouse gas where it is almost impossible to derive a useful damage estimate; see Section 4.4.3
SOCIO-ECONOMIC ANALYSIS – RESTRICTIONS
173
of the guidance. Avoidance costs might also be used to consider the impact of use of hazardous substances on the costs of wastewater treatment. Chemicals discharge into the sewer systems might require the wastewater treatment plants to increase the level of treatment as they have to comply with certain limit values. In this case there will not be damage to the environment as the substance is removed but there will be increased costs to treatment and potentially higher costs of sludge disposal due to high concentration of hazardous substances.
Where can I find more information about this technique?
Ecosystem Valuation, Methods, Section 5: Damage Cost Avoided, Replacement Cost, and Substitute Cost Methods
SOCIO-ECONOMIC ANALYSIS – RESTRICTIONS
APPENDIX D DISCOUNTING
DISCOUNTING
174
SOCIO-ECONOMIC ANALYSIS – RESTRICTIONS
DISCOUNTING – APPENDIX D
This appendix aims to give supporting guidance to section 3.8.3 on how to carry out the discounting of costs and benefits in an SEA. This appendix provides information on:
• The reasons for discounting
• Choosing the discount rate
• Discounting rate approaches
• Other key considerations;
o market rates vs. social time preference rate
o environmental and health issues
o intergenerational issues
o Future generation’s valuation of health and the environment
D.1 The reasons for discounting: ‘valuing the future less than today’
The two main, non-exclusive reasons why the large majority of economists argue that costs and benefits should be discounted over time are:
• A time preference reason, which could have two components:
• Individuals are ‘impatient’. Although most individuals may be (almost) indifferent as to whether they receive a gift in a year’s time compared to a year and one day, people will generally clearly prefer to have their gift today rather than tomorrow, even if both gifts are equally guaranteed. Economists term this ‘pure time preference’. Some economists have argued that society as a whole does not or should not have this impatience as single individuals have.
• Individuals are ‘mortal’. Individuals may not be around to benefit from future consumption and so place greater value on present consumption (that is not to say they do not consider the future as many individuals have for example pensions and leave bequests for future relations). Government though will need to consider future generations and human/environmental/social catastrophe. This will be discussed later in more detail.
• Capital is ‘productive’. Productive capital implies that current consumption is more expensive compared to future consumption. When you save /invest your money, you receive a positive return (interest) that allows you to consume more in the future. This premium for not consuming now is a concept also referred to as ‘marginal productivity of capital’. An individual can earn ‘interest’ on their money invested in a savings account. This interest in the ‘marginal productivity of capital’ of the savings account.
Similarly, if a company invests in updating its existing machinery, the value of any additional output, is the ‘marginal productivity of capital’ for that particular investment. If we continue with this analogy, new investment in say public education may result in a better educated society and workforce. Here the ‘marginal productivity of capital’ could be a more productive workforce or savings from less training required. If we assume consumption continues to growth
175

SOCIO-ECONOMIC ANALYSIS – RESTRICTIONS
(as historical trends over the past century show) diminishing marginal utility of consumption implies that additional consumption in the future is less valuable than consumption today.
Often, risk is mentioned as a third reason for discounting. It concerns the uncertainty related to specific costs and benefits (incurred by a specific party), which is often reflected in a surcharge on the interest rate required for getting the financial means to incur costs and benefits at different points in time. Discounting implicitly assumes that such spreading out is possible. In the evaluation of investment projects such a risk mark-up is commonly used. For an SEA, however, it is recommended to book such costs as a separate item, and not through the discount rate as the latter reflects the general price of waiting and the risk is related to specific costs of benefits only.
As said above, the consequences of discounting are that the impacts that occur further away in the future have a lower PV compared to impacts that occur in the short term. It has therefore been argued that discounting should not be used for certain environmental, health and intergeneration impacts. Many of the arguments brought forward are essentially moral in character; for instance, is a fatality over 5 years less grave a matter than one over 2 years time? Should one refrain from any such comparison through economic evaluation?
These considerations are valid and merit therefore separate consideration in the appraisal and reporting activities. However, it is also true that in practice people, companies and governments make such trade-offs in everyday decisions. Rather than doing so implicitly for a restriction decision, we recommend doing so explicitly so as to gain insight on the (possible) consequences and the trade-offs related to the decision at hand.
D.2 Choosing the discount rate
The choice of discount rate can alter the comparison between various impacts within the SEA. For example, if the benefits of a proposed restriction mainly accrue in the future, the mere use of a high discount rate would reduce the PV of these benefits. This is of particular importance when the time period under consideration has to be rather long; a relatively high discount rate effectively gives a weight of practically zero to effects in the further future.
Table 18 shows the benefit of one sick day avoided using a hypothetical estimate of €200. The table shows how the discount factor changes depending on the discount rate and the timing of the impact. It shows that when using a 4% discount rate the estimated savings of one sick day avoided in the 10th year is valued at € 135.11 whereas the savings is only € 3.96 in the 100th year (all other things being equal). This is a mere € 0.59 in the 100th year if a 6% discount rate is used.
Table 18 Example of why the timing of the impact matters
Year 10 20 30 50 100
Discount factor using a 4% discount rate 0.6756 0.4564 0.3083 0.1407 0.0198
Benefit of one sick day avoided (€200) € 135.11 € 91.28 € 61.66 € 28.14 € 3.96
Discount factor using a 6% discount rate 0.5584 0.3118 0.1741 0.0543 0.0029
Benefit of one sick day avoided (€200) € 111.68 € 62.36 € 34.82 € 10.86 € 0.59
Unfortunately, there is no consensus on a uniformly applicable standard value of the discount rate. Partly this reflects heterogeneity: different groups and different societies may have a different time preference; moreover, the appropriate discount rate may depend on the scope and running time of
176
SOCIO-ECONOMIC ANALYSIS – RESTRICTIONS
the specific appraisal exercise. For example, if a substance has PBT or vPvB properties and ceases to be produced after the proposed restriction, there may still be environmental impacts resulting from production which lingers for beyond 30 years. Therefore for sensitivity the use of declining discount rates may be appropriate to use in addition to the 4% discount rate.
Moreover, for some types of problems it matters whether the actual preference of the involved economic agents as expressed as market behaviour is taken as a point of reference or an ethical principle; for other type of problems it does not. For example, if one of the reasons for proposing a restriction (i.e. total ban) is to ensure the existence value of a particular ecosystem which is adversely affected by the production of the substance, it may be appropriate to again use declining discount rates if the existence value is a highly significant impact.
Setting of the discount rate, in particular over a longer period of time, adds to the complexity of choosing the discount rate and because there is also no full consensus among economists, it is highly recommended to run a sensitivity analysis comparing a few different discount rates.
It is recommended that the user undertake a sensitive analysis of the effect of alternative discount rates. It is unlikely that a consensus on discounting will emerge among experts as the trade-off between the welfare of current and future generations is political. By analysing the implication of alternative discount rates, the use presents the evidence in the most transparent manner allowing any reader of the SEA to make own judgements about the trade-off.
Following on to the arguments for why to discount the following list includes alternative ways to determine the discount rate:
• Social time preference based on ‘actually observed behaviour’ usually combines the ‘impatience’ argument of people preferring consumption now for consumption later, a pure time preference usually estimated to be around 1.5 %, with the effect of the prospect of higher future consumption due to economic growth (about 2–3%). This results in an overall time preference and thus a discount rate typically in the range level of 3% to 5%.
• Intergenerational equity is another argument to base the time preference rate on. The intergenerational equity argument suggests that the opportunities for consumption should be equal over time. The basis for this rate would therefore be expected real per capita growth rate in the economy. The real growth per capita rate is difficult to predict over a long time period and it has historically and regionally varied significantly. Currently the real growth rate forecast for EU for 2007 is around 2% and real growth has been in the range of 1-3 % over the last years.
• Lastly, the discount rate could be based on the return on capital. This is the opportunity cost argument that money used to invest in risk reductions could alternatively have received the average return for private investments. A discount rate based on this type of argument would be in order of 5%-8%. Here, it matters for the choice of discounting rate which economic agent specifically is incurring the cost or benefits in the course of time. For consumers this may be the relevant market interest rate; for industry, this may be the (required) return on investment. This approach is not consider applicable under restrictions and is therefore not mentioned further in this guidance.
Some possible discount rates are shown in Table 19. If the impacts are likely to occur over a long period of time, it is recommended to include in the sensitivity analysis a discount rate scheme that allows for a falling rate after 30 years.
177
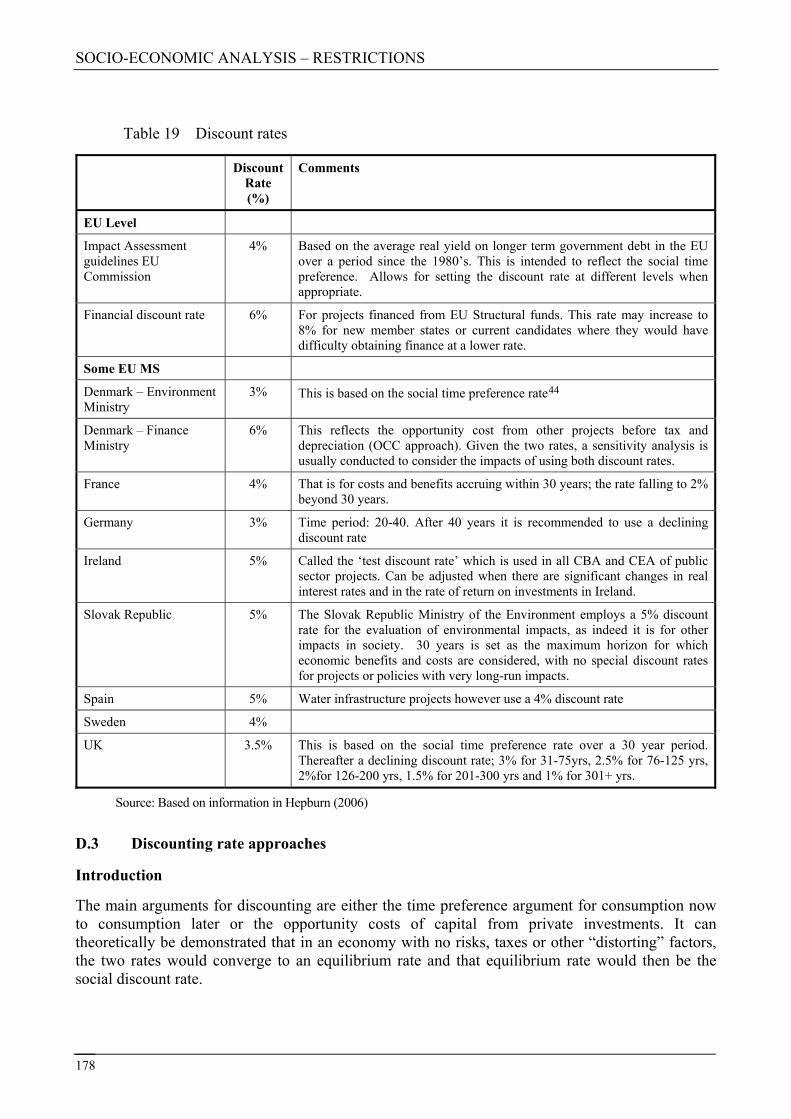
SOCIO-ECONOMIC ANALYSIS – RESTRICTIONS
178
Table 19 Discount rates
Discount Rate (%)
Comments
EU Level
Impact Assessment guidelines EU Commission
4% Based on the average real yield on longer term government debt in the EU over a period since the 1980’s. This is intended to reflect the social time preference. Allows for setting the discount rate at different levels when appropriate.
Financial discount rate 6% For projects financed from EU Structural funds. This rate may increase to 8% for new member states or current candidates where they would have difficulty obtaining finance at a lower rate.
Some EU MS
Denmark – Environment Ministry
3% This is based on the social time preference rate44
Denmark – Finance Ministry
6% This reflects the opportunity cost from other projects before tax and depreciation (OCC approach). Given the two rates, a sensitivity analysis is usually conducted to consider the impacts of using both discount rates.
France 4% That is for costs and benefits accruing within 30 years; the rate falling to 2% beyond 30 years.
Germany 3% Time period: 20-40. After 40 years it is recommended to use a declining discount rate
Ireland 5% Called the ‘test discount rate’ which is used in all CBA and CEA of public sector projects. Can be adjusted when there are significant changes in real interest rates and in the rate of return on investments in Ireland.
Slovak Republic 5% The Slovak Republic Ministry of the Environment employs a 5% discount rate for the evaluation of environmental impacts, as indeed it is for other impacts in society. 30 years is set as the maximum horizon for which economic benefits and costs are considered, with no special discount rates for projects or policies with very long-run impacts.
Spain 5% Water infrastructure projects however use a 4% discount rate
Sweden 4%
UK 3.5% This is based on the social time preference rate over a 30 year period. Thereafter a declining discount rate; 3% for 31-75yrs, 2.5% for 76-125 yrs, 2%for 126-200 yrs, 1.5% for 201-300 yrs and 1% for 301+ yrs.
Source: Based on information in Hepburn (2006)
D.3 Discounting rate approaches
Introduction
The main arguments for discounting are either the time preference argument for consumption now to consumption later or the opportunity costs of capital from private investments. It can theoretically be demonstrated that in an economy with no risks, taxes or other “distorting” factors, the two rates would converge to an equilibrium rate and that equilibrium rate would then be the social discount rate.
SOCIO-ECONOMIC ANALYSIS – RESTRICTIONS
In the real world economy the two might differ for several reasons and also arguments about specific characteristic of health and environmental impacts might lead to deviation from any of the two theoretically based discount rates.
In the guidance text, a practical approach has been suggested applying the discount rate recommended by EC for impact assessments and undertaking sensitivity analysis. In cases where the decision is not influenced by the choice of discount rate there is no need to focus on the discounting issue. In other cases where the timing of costs and benefits imply that discounting has an impact on ranking of alternative outcomes, it might be relevant to further explore the discounting issue.
This appendix provides more guidance on how to undertake a more detailed analysis. It does not contain a detailed theoretical coverage of all aspects45.
Discounting rate approaches
There two main competing theories for determining the discount rate, which are summarised below include:
• Consumption rate of interest (CRI) or social time preference rate (STPR)
• Opportunity costs of capital (OCC) – this is not discussed further in this guidance.
Consumption Rate of Interest (CRI)/Social time preference rate (STPR)
As mentioned earlier people are impatient. The rate at which an individual is willing to forgo consumption now, for future consumption is known as the CRI. It reflects the income that a consumer would require in the future to compensate for surrendering a unit of income today. The term CRI is sometimes used to denote the individual time preference rate while the social time preference rate is called STPR. They are both based on the same theoretical arguments. The social rate is an aggregation on the individual rates. The relevant social discount rate to use in the SEA is the social rate and we will use the term STPR to describe the time preference based rate. The STPR can be broken down in two components as illustrated in Equation 1.
s = δ + μg Equation 1
s = social time preference rate
δ = utility discount rate
μ = income elasticity of marginal utility
g = long-run average rate of growth of consumption per capita = that of income (GDP) as well
The variable δ is the rate that future utility is discounted. For example setting δ=0 would imply that utility today is valued the same as utility in the distant future. Some economists would argue for this based on ethical grounds that utility should not fall just because they occur in the future.
Some researches have further split the δ, the utility discount rate, in two components: the pure time preference rate element and the “changes in life chances” element46. There is some empirical evidence for determining these elements. Oxera (2002) contains a review of the literature which
179
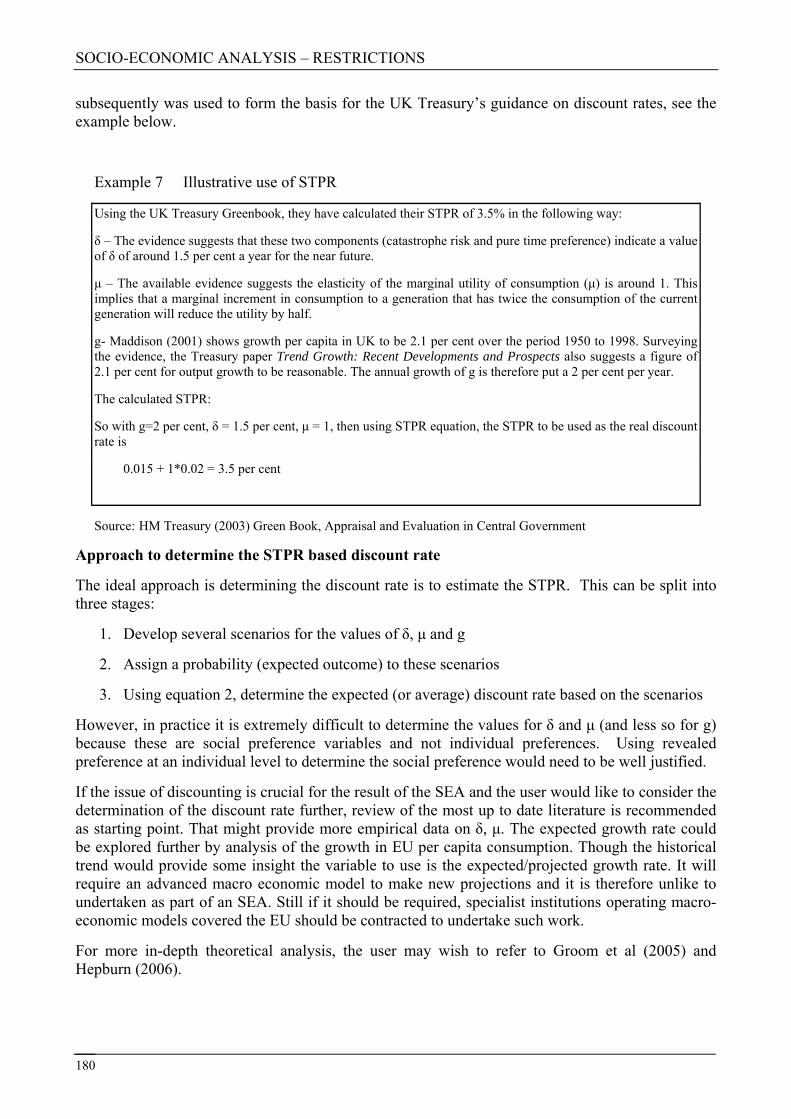
SOCIO-ECONOMIC ANALYSIS – RESTRICTIONS
subsequently was used to form the basis for the UK Treasury’s guidance on discount rates, see the example below.
Example 7 Illustrative use of STPR
Using the UK Treasury Greenbook, they have calculated their STPR of 3.5% in the following way:
δ – The evidence suggests that these two components (catastrophe risk and pure time preference) indicate a value of δ of around 1.5 per cent a year for the near future.
μ – The available evidence suggests the elasticity of the marginal utility of consumption (μ) is around 1. This implies that a marginal increment in consumption to a generation that has twice the consumption of the current generation will reduce the utility by half.
g- Maddison (2001) shows growth per capita in UK to be 2.1 per cent over the period 1950 to 1998. Surveying the evidence, the Treasury paper Trend Growth: Recent Developments and Prospects also suggests a figure of 2.1 per cent for output growth to be reasonable. The annual growth of g is therefore put a 2 per cent per year.
The calculated STPR:
So with g=2 per cent, δ = 1.5 per cent, μ = 1, then using STPR equation, the STPR to be used as the real discount rate is
0.015 + 1*0.02 = 3.5 per cent
Source: HM Treasury (2003) Green Book, Appraisal and Evaluation in Central Government
Approach to determine the STPR based discount rate
The ideal approach is determining the discount rate is to estimate the STPR. This can be split into three stages:
1. Develop several scenarios for the values of δ, μ and g
2. Assign a probability (expected outcome) to these scenarios
3. Using equation 2, determine the expected (or average) discount rate based on the scenarios
However, in practice it is extremely difficult to determine the values for δ and μ (and less so for g) because these are social preference variables and not individual preferences. Using revealed preference at an individual level to determine the social preference would need to be well justified.
If the issue of discounting is crucial for the result of the SEA and the user would like to consider the determination of the discount rate further, review of the most up to date literature is recommended as starting point. That might provide more empirical data on δ, μ. The expected growth rate could be explored further by analysis of the growth in EU per capita consumption. Though the historical trend would provide some insight the variable to use is the expected/projected growth rate. It will require an advanced macro economic model to make new projections and it is therefore unlike to undertaken as part of an SEA. Still if it should be required, specialist institutions operating macro-economic models covered the EU should be contracted to undertake such work.
For more in-depth theoretical analysis, the user may wish to refer to Groom et al (2005) and Hepburn (2006).
180
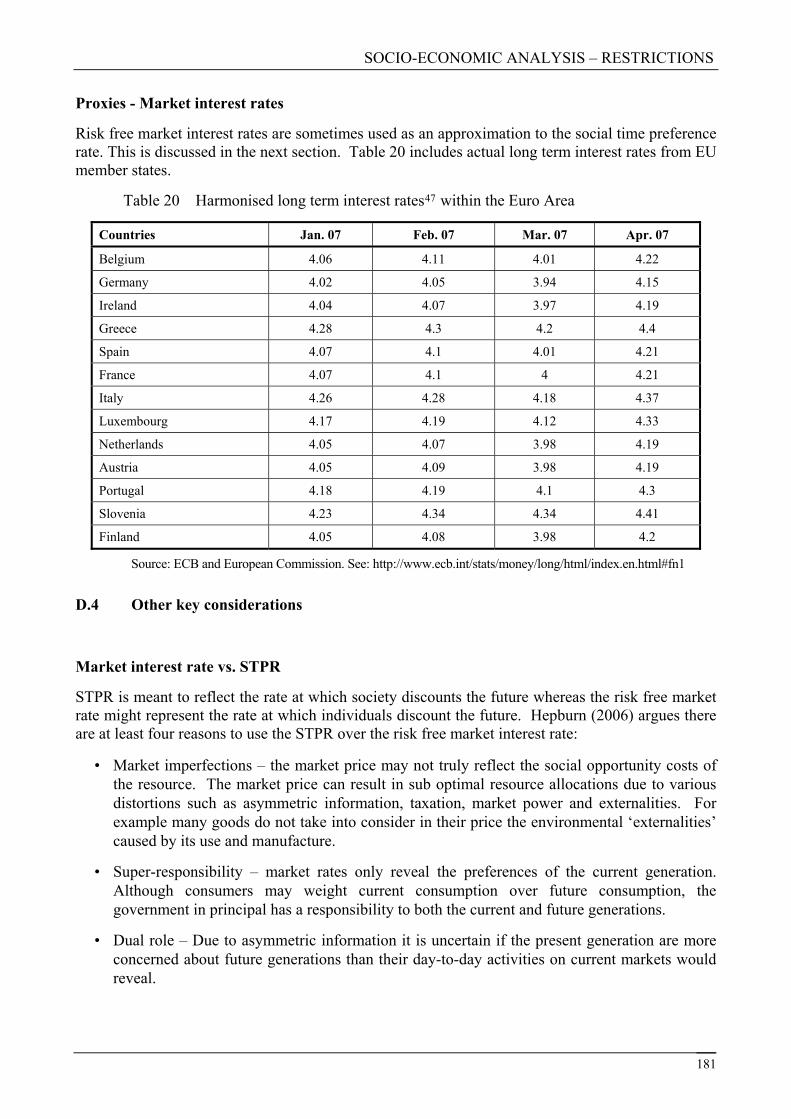
SOCIO-ECONOMIC ANALYSIS – RESTRICTIONS
Proxies - Market interest rates
Risk free market interest rates are sometimes used as an approximation to the social time preference rate. This is discussed in the next section. Table 20 includes actual long term interest rates from EU member states.
Table 20 Harmonised long term interest rates within the Euro Area 47
Countries Jan. 07 Feb. 07 Mar. 07 Apr. 07
Belgium 4.06 4.11 4.01 4.22
Germany 4.02 4.05 3.94 4.15
Ireland 4.04 4.07 3.97 4.19
Greece 4.28 4.3 4.2 4.4
Spain 4.07 4.1 4.01 4.21
France 4.07 4.1 4 4.21
Italy 4.26 4.28 4.18 4.37
Luxembourg 4.17 4.19 4.12 4.33
Netherlands 4.05 4.07 3.98 4.19
Austria 4.05 4.09 3.98 4.19
Portugal 4.18 4.19 4.1 4.3
Slovenia 4.23 4.34 4.34 4.41
Finland 4.05 4.08 3.98 4.2
Source: ECB and European Commission. See: http://www.ecb.int/stats/money/long/html/index.en.html#fn1
D.4 Other key considerations
Market interest rate vs. STPR
STPR is meant to reflect the rate at which society discounts the future whereas the risk free market rate might represent the rate at which individuals discount the future. Hepburn (2006) argues there are at least four reasons to use the STPR over the risk free market interest rate:
• Market imperfections – the market price may not truly reflect the social opportunity costs of the resource. The market price can result in sub optimal resource allocations due to various distortions such as asymmetric information, taxation, market power and externalities. For example many goods do not take into consider in their price the environmental ‘externalities’ caused by its use and manufacture.
• Super-responsibility – market rates only reveal the preferences of the current generation. Although consumers may weight current consumption over future consumption, the government in principal has a responsibility to both the current and future generations.
• Dual role – Due to asymmetric information it is uncertain if the present generation are more concerned about future generations than their day-to-day activities on current markets would reveal.
181
SOCIO-ECONOMIC ANALYSIS – RESTRICTIONS
• Isolation – Based on arguments by Sen (1892) individuals may be more willing to invest for the future under a collective contract even though they are unwilling to invest in as much in isolation.
However, it can be argued that the lowest risk-free market rate, i.e. the one on the market for long-running government bonds (which are corrected for inflation), meets the first and fourth criteria above in a satisfactory way. The market for such bonds is deep and liquid and the issuers of this paper, governments, have negligible default risks and many buyers have long run perspective. For example those who are close to retirement will convert the majority of their pension fund into government bonds to protect the value of their retirement fund, whilst those with a wishing to diversify their portfolio may also have a proportion of the assets as government bonds due to the low risks associated with these bonds.
The other arguments also seem to ignore that the present generation has preferences for the next generation as people do save and consider the welfare of their children and their future offspring. It is important to realise that discounting on the long run attempts to take intergenerational effects on board but that unavoidably it can only do this through the preferences of the current generation.
Environmental and health issues
For consistency all impacts which can be monetised should be discounted whether they are health, financial or environmental impacts. Sunstein and Rowell (2005) for example argue although human lives can not be invested in the same way as capital can, the resources used to save lives (or to reduce risk) can indeed be invested in a variety of ways. Therefore there is no reason not to discount such impacts. Some economists such as Revesz (1999) have argued though that environmental and health impacts should be discounted at a lower rate compared to economic impacts because they are different.
Often the arguments used are actually about the valuation of environmental and health impacts and not necessarily about their discount rate. For example it has often been argued that environmental goods are luxury goods, implying that as people’s income increases, their desire for environmental protection/preservation increases. Adjusting the discount rate to reflect for expected growth in income is therefore not the appropriate response. Instead valuations over the lifetime period should be adjusted to reflect their value over time as income increases (i.e. increasing WTP for environmental protection/preservation). Therefore it is not appropriate to use lower discount rates to compensate of uncertainties and differing intergenerational valuations of these impacts.
Using a simple example, where a new piece of equipment is being proposed to reduce the level of emissions exposure, this would result in improvements in the health of workers using this chemical. If the benefits over the lifetime of the equipment are based on the sum of each years discounted benefits (based on using the NPV approach), and societies income was expected to increase, future generations may then value these benefits more than the present generation. To account for this the approach should not be to reduce the discount rate but to incorporate future generations, by increasing the valuation of these benefits in the future.
Intergenerational issues
The concept of capital is ‘productive’ implies nicely to intergenerational issues. Without using discounting, a life saved today would be valued the same as a life saved in 2050. However discounting would take into consideration that the investment today would save €X today and be used to save more lives by 2050. However a balance or compromise needs to be made as benefits that occur in the future should not be overly penalised because of our impatience.
182
SOCIO-ECONOMIC ANALYSIS – RESTRICTIONS
Dealing with impacts that occur over a long period of time (especially relevant for PBTs and vPvB substances) makes determining the discount rate very difficult. The main reasons are that we do not know the preferences of future generations and the rate of income and economic growth are uncertain. This has lead to the idea of decreasing discount rates gaining more prominence (Groom et al 2005). For example the uncertainty of economic conditions was the basis for the UK government to incorporate declining social rates in the HM Treasury Green Book which is their official guidance on government project and policy appraisals.
Incorporating declining social rates over time could allow for:
• Changes in future preferences – individuals and societies preferences are likely to change throughout their lifetime and there attitudes to future generations and potential human catastrophe may change.
• Uncertainty about future economic conditions – It is very difficult to predict the future especially those beyond 30 years and very controversial to do so. An economic optimal growth model can be adapted to introduce a ‘prudence’ effect which will require several assumptions of the future. A prudent society is one where individuals save because the future is uncertain and are taking precautions. Gollier (2002) argues that a prudent society should care more about the future when it is more uncertain, and this is achieved by reducing the discount rate, so that more investment (favouring the future) becomes profitable. Using an optimal growth model and developing the necessary assumptions for the model is likely to be beyond most SEA with some form of sensitivity analysis of using different declining discount rates more appropriate.
• Intergenerational equity – Using a declining discount rate is likely to result in higher values for impacts on that occur to future generations compared to using a single discounting rate over the whole period (if the declining rate is set below the single constant rate).
However the use of declining discount rates is problematic in practice because there is no universally accepted guide for:
• At what point in time is it appropriate to start using declining discount rates. As shown in Table 19 some member states have chosen to use declining discounting rates for impacts that occur after 30-40 years.
• The speed (in terms of time) at which the rates fall. Again as shown in Table 19 the rate of decline used by several member states varies.
Overall, there is no definitive approach for the treatment of intergenerational effects within SEA. The clearest way to actually understand any implications for future generations are to present the stream of costs or benefits undiscounted on a year by year basis and then to undertake sensitivity analysis using both the default 4% discount rate and a decreasing discount rate.
Future generation’s valuations of health and environment
A solution to some of the concerns about the use of positive discount rates for long term health and environmental effects lay in the way these effects are valued or monetised. Valuations of health or environmental effects has to be based the current generations preferences. It is however possible to make a correction for the possible changes in these valuations over time. Based on the assumption that health and environment quality are so called ‘luxury’ goods where their marginal utility increases with income, the valuations should be increased if the income is expected to grow. This will require specialist input to implement.
183

SOCIO-ECONOMIC ANALYSIS – RESTRICTIONS
REFERENCES
European Commission (2005) Annexes to Impact Assessment Guidelines with 15 March 2006 update of Annex 10. Assessing administrative costs imposed by legislation
Gollier, C(2002) Discounting an uncertain future, Journal of Public Economics, Vol. 85, pp. 149-166.
Groom et al (2005) Declining Discount Rates: The Long and the Short of it, Environmental & Resource Economics (2005) 32: 445-493
Hepburn (2006) Use of Discount Rates in the Estimation of the Costs on Inaction with Respect to Selected Environmental Concerns, ENV/EPOC/WPNEC(2006)13
HM Treasury (2003) Green Book, Appraisal and Evaluation in Central Government
Nordhaus, W (1997) Discounting in economics and climate change: An editorial comment Climatic Change, Vol. 37, pp. 315-328.
OECD (2002) Technical Guidance Document on the use of Socio-Economic Analysis in Chemical Risk Management Decision Making
Oxera (2002) A social time preference rate for long term discounting.
Philibert (2003) Discounting the future, International Energy Agency, Energy and Environmental Division
Sen, A. K (1982) Approaches to the choice of discount rate for social benefit-cost analysis, in Lind, R. C. (ed) Discounting for Time and Risk in Energy Policy. Washington, DC: Resources for the Future, pp. 325-353
184
SOCIO-ECONOMIC ANALYSIS – RESTRICTIONS
APPENDIX E UNCERTAINTY ANALYSIS TECHNIQUES
UNCERTAINTY ANALYSIS
TECHNIQUES
185

SOCIO-ECONOMIC ANALYSIS – RESTRICTIONS
Introduction
This section contains an overview of several uncertainty analysis techniques which supports section 4.4 where the aim is to determine whether uncertainties in the estimation of impacts could affect the overall conclusions made about the net costs and benefits under the “proposed restriction” scenario. More accurately the techniques shown in this appendix can be used to either reduce the variability of estimates, or to help test whether uncertainties affect the conclusions being drawn in the SEA. The only way to actually reduce uncertainty is through better data, better understanding and knowledge of the uncertainties and through further analysis. However in most cases residual uncertainties will always remain. This appendix is intended to provide only an introduction to several different techniques available. More detailed information and specialist expertise should be sought before using any of the techniques.
The following techniques are covered in this section:
• Sensitivity analysis–used to test whether uncertainties affect the conclusions being drawn;
• Scenario analysis –used to test whether uncertainties affect the conclusions being drawn;
• Expert judgement – used to reduce the variability of an estimate; and
• Monte Carlo simulations – used to reduce the variability of an estimate.
There are other less commonly used techniques such as risk-risk analysis, Delphi techniques and portfolio analysis which can be used to help reduce the variability of estimates but are not discussed in this guidance48.
Definitions of risk, uncertainty and variability
Risk: Risk is the combination of the probability of a consequence and its magnitude. Therefore risk considers the frequency or likelihood of occurrence of certain states or events (often termed ‘hazards’) and the magnitude of the likely consequences.
Uncertainty: Uncertainty exists where there is a lack of knowledge concerning outcomes. Uncertainty may result from an imprecise knowledge of the risk, i.e. where the probabilities and magnitude of either the hazards and/or their associated consequences are uncertain. Even when there is a precise knowledge of these components there is still uncertainty because outcomes are determined probabilistically49.
Further information can be found at: http://www.ukcip.org.uk/resources/publications/documents/4.pdf
Variability: The size (scale) of the range of estimates for a particular risk or impact due to uncertainties. Techniques such as Monte Carlo analysis can be used be reduce the variability of estimates (given there is sufficient data to run a Monte Carlo simulation).
186
SOCIO-ECONOMIC ANALYSIS – RESTRICTIONS
E.1 Sensitivity analysis
What is sensitivity analysis?
Adopting only the most likely value (estimated or average) of each impact within an SEA provides no indication of the level of uncertainty surrounding the analysis and hence has implications for any decisions based on the conclusions. Instead, it is recommended that information be developed on the range of plausible outcomes associated with a given option.
This type of information is developed through the use of sensitivity analysis, which is a generic term for the techniques that involve identifying key assumptions (or variables) for which uncertainty as to their values could significantly affect the conclusions drawn on costs or benefits. Sensitivity analysis is therefore used to identify the variables that contribute most to uncertainty in predictions.
How is this technique used?
The basic principles of sensitivity analysis (whether in relation to industry estimates, expert judgment or models) are to:
• Focus on key variables: Often a full sensitivity analysis is not feasible (due to time or data constraints) and the analyst must limit the analysis to those assumptions that are considered key.
• Identify a plausible range for the key variables: The analyst should be careful to determine what is considered a plausible range of values for the key variables and to document the rationale behind the range assigned and the level of certainty associated with this range.
• Determine the impact upon the overall conclusions using the ranges for each of these variables: This can provide an understanding of how sensitive the overall results are to differences in each of the key variables.
• Identify switching points, break-even values or threshold values: Switching points, break-even values or threshold values are those values at which the results of the SEA would change from selection of one scenario to another (for example, benefits minus costs of a restriction scenario change from being positive to negative or the net benefits of one scenario become greater/less than those of another); they can often provide an indication of the robustness of choosing one scenario over another;
• Identifying switch points is similar to the idea of “backwards calculations” introduced in Chapter 4 for environmental and human health impacts. If there are no monetary estimates of impacts on, for example, the benefits side, a backwards calculation can be used as a type of sensitivity analysis to check what the benefit in physical units would need to be to exceed the costs.
• Clearly present the results: The results of the sensitivity analysis should be presented clearly and with accompanying descriptive text. The results might be presented in terms of (a) conclusions under basic assumptions; (b) description of parameters varied for sensitivity testing and impact on the conclusions.
187
SOCIO-ECONOMIC ANALYSIS – RESTRICTIONS
188
What difficulties can arise when using this technique?
• Generally this is a fairly simple process, although it can become more complicated depending on the number of variables considered at one time.
• The main difficulty is in being able to identify a plausible range using the data available. This is a range of possible values that could occur e.g. it may be possible for a manufacturer to pass on between 5 and 10% of the additional costs incurred under a scenario to downstream users through higher prices.
When could this technique be used? (Within the SEA process)
• Scoping phase: This technique can be particularly useful when trying to determine whether an impact is an important impact which should be analysed further.
• Analysing impacts: For the estimates of the main impacts a sensitivity analysis could be carried out to determine switching points.
What can be achieved using this technique?
• Identification of switching points or threshold values to see whether an impact could alter the SEA outcome
• Assessment of whether there is a need for more detailed analysis: sensitivity analysis can also be used as a screening device to determine if more extensive analysis is required.
• Ideally, the end result of an uncertainty analysis should be a probabilistic range resembling a confidence interval.
Where can I find more information about this technique?
EC Impact Assessment Guidelines Annexes (chapter 13) 15 June 2005
UK Treasury Greenbook (Chapter 5)
Technical guidance document on the use of socio-economic analysis in chemical risk management decision making (OECD 2002)
E.2 Scenario Analysis
What is scenario analysis?
For most decisions characterised by uncertainty, there will be more than one uncertain variable affecting the choice of options. Instead of examining the uncertainty associated with each of these variables separately (e.g. by using sensitivity analysis), a fuller picture of the implications of the combined uncertainty affecting a particular decision may be gained through the simultaneous variation of the key uncertain variables. This approach is often referred to as scenario analysis, or ‘what if’ analysis.

SOCIO-ECONOMIC ANALYSIS – RESTRICTIONS
Scenario analysis is one of the more useful and simple methods for assessing the importance of uncertainty inherent in a decision based on SEA. It can be used to provide an understanding of what could happen without the need to specify probabilities; it can be applied quickly and does not have as significant data requirements as the more probabilistic approaches. Scenarios can be used to represent both qualitative and quantitative types of uncertainty. Scenario analysis is also often the starting point for the use of many of the more advanced techniques for uncertainty analysis – such the Delphi technique or Monte Carlo analysis – when there are numerous scenarios to be considered.
Scenario analysis involves defining a range of possible outcomes based on the uncertainty surrounding key variables. Values of uncertain inputs are selected (e.g. best and worst cases), which give rise to the specified outcomes. These are then modelled deterministically (i.e. without assigning probabilities to the likelihood of these inputs) to indicate the range of likely outcomes.
How is this technique used?
The types of scenarios that may be appropriate include: worst case; best case; business-as-usual; best guess; trend analysis; low, medium and high; different periods in the future; different scales of effect, etc.
• Focus on key variables: Often a full scenario analysis is not feasible (due to time or data constraints) and the analyst must limit the analysis to those assumptions that are considered key.
• Identify the estimated costs and benefits of scenarios by varying the key variables: The user should identify appropriate values for each of the key variables under each scenario considered and then determine the overall costs and benefits (as well as any relevant intermediate results) of each scenario.
• Clearly present the results: The results of the scenario analysis should be presented clearly and with accompanying descriptive text.
What difficulties can arise when using this technique?
Generally this is a fairly simple process although it can become more complicated depending on the number of variables considered at one time. Care is required to avoid excessive scenario testing as this may introduce additional uncertainty (for example, if no conclusion is drawn as to which scenario(s) is (are) considered most likely to occur. There are other problems associated with scenario analyses, including:
• maintaining consistency when specifying the scenarios; and
• preventing emphasis being placed on average values to ensure that a sufficiently wide range is considered.
When could this technique be used? (Within the SEA process)
• Scoping phase: This technique can be particularly useful when trying to determine whether an impact is an important impact which should be analysed further.
• Analysing impacts (stage 4) using a deterministic approach: For the estimates of the main
189
SOCIO-ECONOMIC ANALYSIS – RESTRICTIONS
190
impacts low and high scenarios could be analysed (i.e. selecting values of input parameters that tend to give a low result for one scenario and a high result for another scenario) to determine whether the SEA outcome would be different using different plausible assumptions for input values.
What can be achieved using this technique?
Low and high scenarios can be used to determine whether the SEA outcome would be different if various input parameters are varied within a plausible range. If the results of the SEA differ under each scenario, further uncertainty analysis may be justified to determine which scenario is most likely to occur. If the SEA outcome is the same under all the scenarios, then it is reasonable to conclude that the uncertainties considered will not alter the outcome of the SEA (hence increasing the level of certainty in the final results).
Where can I find more information about this technique?
UK Treasury Greenbook (Chapter 5)
Technical guidance document on the use of socio-economic analysis in chemical risk management decision making (OECD 2002)
E.3 Expert Judgement
What is expert judgement?
Because the possible implications of a restriction may be very uncertain, it is likely that expert opinion is needed in order to determine not only what the impacts might be, but also to judge how likely it is that those impacts will be realised as estimated.
Such experts might include, for example, specialists in particular chemicals, products or sectors; economic analysts; or market analysts.
When is it appropriate to use this technique?
Experts can be used to develop data related to the likelihood of future events or scenarios, ranges or probability distributions for model parameters, potential impacts and more qualitative views on the relative significance of such impacts. Expert judgment may also be important to understanding and bridging conflicting opinions on the interpretation of models or other results.
What difficulties can arise when using this technique?
• Time constraints: It will be important to contact experts as early as possible in the process to ensure that they are available when you foresee the need for their services. Consider including experts at key stages in the development of the SEA, such as during any brainstorming meetings/workshops.
SOCIO-ECONOMIC ANALYSIS – RESTRICTIONS
• Budget constraints: Consider what role experts may have in the SEA. Try to make best use of their available time in areas where their expertise is most required.
• Experts may not be independent but represent certain interests.
When could this technique be used? (Within the SEA process)
Use of expert judgement necessarily involves identifying the most appropriate experts to provide advice and input into the SEA. These experts may be in-house or may be specialists brought in from outside.
If you intend to carry out the SEA internally with input from experts, then consider including them in:
• Brainstorming sessions or workshops
• During the scoping phase, when determining the main impacts and the likely response by industry and other affected organisations under each RMO.
• Reviewing/inputting on important analytical sections of the SEA report
• Data collection and analysis – this is likely to be the main need for expert input
• Consultation process
What can be achieved using this technique?
Experts – by definition – have a better understanding of a particular subject than others. Utilising this knowledge should help to minimise knowledge uncertainties, providing a more realistic estimate of expected behavioural change, values for key parameters in the analysis and various other factors. The use of expert judgement can thus significantly reduce the time needed for data collection and analysis.
What help should I get to use this technique?
It will be important early on in the process to identify what skills will be needed to carry out the SEA and then consider to what extent may internal or external expertise be required. Consider whether you have sufficient expertise with:
• The markets involved for the chemicals and associated products and services, including historical and likely future behavioural change in the event of unavailability of substances.
• Stakeholder engagement – an important source of information for restrictions will be cost data directly obtained from industry. Therefore effective consultation and engagement is crucial to the quality of data available to make an informed decision and to reduce uncertainties.
• Impact assessment – those familiar with using the EC impact assessment guidelines should be well placed to conduct an SEA. It would be advisable to have a team capable of assessing impacts on the environment and human health as well as social and economic impacts (including wider economic impacts such as trade, competition, viability and profitability).
191

SOCIO-ECONOMIC ANALYSIS – RESTRICTIONS
E.4 Monte Carlo Analysis
What is Monte Carlo analysis?
Monte Carlo analysis is a further step in the analysis of uncertainty than the previous mentioned techniques. It is a probabilistic tool, which is particularly useful since it explicitly characterises the uncertainty of input parameters by use of probability density functions (PDFs). A PDF provides an indication of the range of likely values for a particular parameter and the probabilities of different values within that range (e.g. uniform, normal, triangular distribution). There must, therefore, be some sort of information on the uncertainty of the input data to use this tool. This may include defining the likely ‘shape’ of the PDF (such as ‘normal’ or skewed distributions) together with an indication of mean values and associated variance or range of possible values.
How is this technique used?
• Collect sample values from each input value and combine them to generate numerous possible output values and the likelihoods of those values occurring (for example, this could involve estimating the mean and standard deviation values for a particular parameter). Parameter or model probability distributions may be derived empirically (for example from population data or indirectly from regression of other statistical models) or by using appropriate assumptions based on available data or expert judgement.
• Document all assumptions and model specifications: The quality of the overall analysis is only as good as the quality of its components; therefore all assumptions or model specifications should be justified and well documented.
• Run the simulation: The accessibility of software to undertake Monte Carlo simulations is now widespread, with many add-ons available for spreadsheets. However, it is important to recognise that such analyses require knowledge of the shape of the probability distribution functions for the uncertain input variables as well the degree of interdependence amongst the input variables (which can be readily incorporated into the analysis). The analysis itself is generally an automatic process whereby different values for each parameter of interest are selected according to their probability in the PDF; the overall results are computed using the selected values and the process is repeated – often using several thousand iterations. The number of iterations that are required to ensure that each PDF is adequately sampled is an important consideration (sometimes 10,000 or more).
• Documenting the results: After sufficient iterations, the result of a Monte Carlo analysis is a probability distribution of the final output value(s). The analyst can therefore make determine, for example, the degree of confidence (e.g. as confidence intervals) that the results will fall within a certain range, such as below a switching point for the final results, or the most likely value of the final result.
When is it appropriate to use this technique?
Where there are numerous uncertainties affecting the assessment, it may be important to go beyond a scenario analysis and to consider the probabilistic distributions of possible values. Where this is the case, then a Monte Carlo analysis may be valuable.
192
SOCIO-ECONOMIC ANALYSIS – RESTRICTIONS
193
What difficulties can arise when using this technique?
• Finding a significant volume of data on the uncertainties
• Appropriate computer software is required. The accessibility to Monte Carlo simulations is now widespread, with many add-ons available for spreadsheets. However, it is important to recognise that such analyses require knowledge of the shape of the probability distribution functions for the uncertain input variables as well the degree of interdependence amongst the input variables (which can be readily incorporated into the analysis).
• Good understanding of statistics and the outputs of the program i.e. probability density functions (PDF) are required in order to understand and present the results in a meaningful way.
When could this technique be used? (Within the SEA process)
Given the level of expertise and data required to use this technique, it should only be used if the results of a sensitivity or scenario analysis indicates that further analysis is required on the uncertainties and how they could affect the SEA. If the SEA is conducted in an iterative process (i.e. starting with a simple low tier qualitative assessment which is built up to a more developed assessment) then a Monte Carlo analysis should only be carried out if a high tier (fully quantitative) assessment is required.
What can be achieved using this technique?
The main benefit to using a Monte Carlo analysis is the results are presented as a PDF. Therefore it is possible to present the results in various ways - for example, the ‘best’ (median) estimate of the cost is €6.5m but there is a 10% chance that the cost will exceed €8.5m.
Where can I find more information about this technique?
UK Treasury Greenbook (Chapter 5)
Technical guidance document on the use of socio-economic analysis in chemical risk management decision making (OECD 2002)
SOCIO-ECONOMIC ANALYSIS – RESTRICTIONS
APPENDIX F SOCIO-ECONOMIC ASSESSMENT TOOLS
SOCIO-ECONOMIC ASSESSMENT TOOLS
194
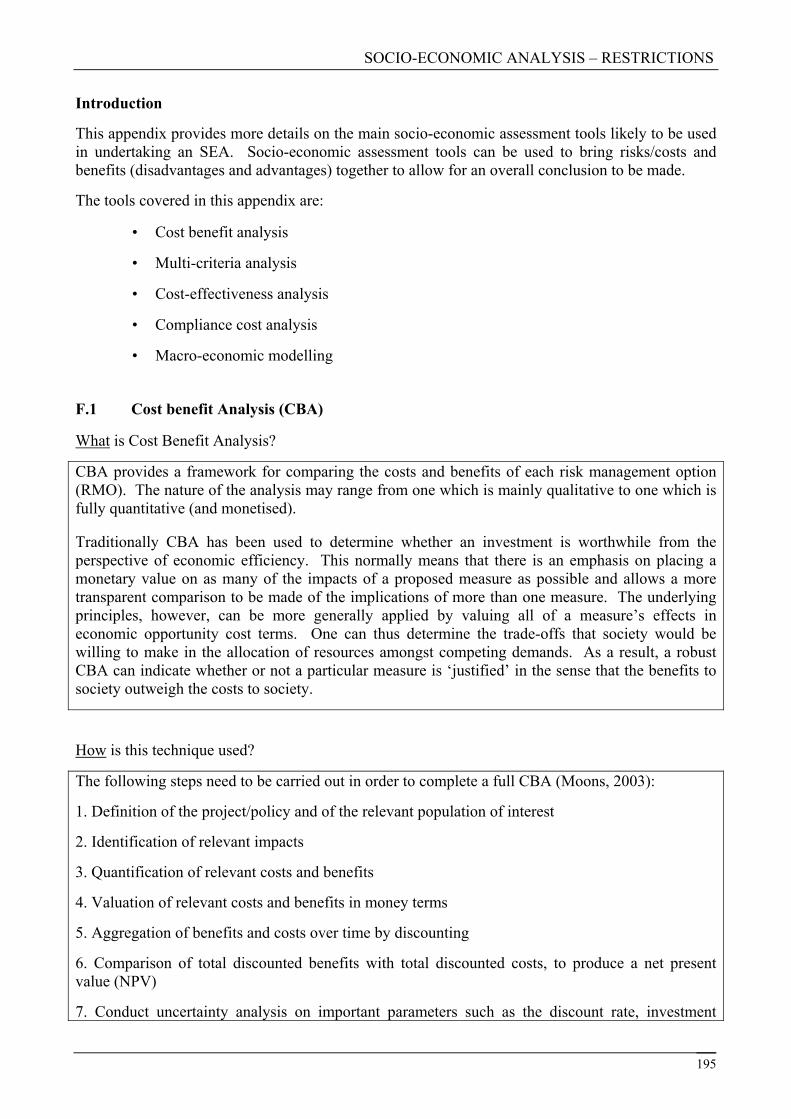
SOCIO-ECONOMIC ANALYSIS – RESTRICTIONS
Introduction
This appendix provides more details on the main socio-economic assessment tools likely to be used in undertaking an SEA. Socio-economic assessment tools can be used to bring risks/costs and benefits (disadvantages and advantages) together to allow for an overall conclusion to be made.
The tools covered in this appendix are:
• Cost benefit analysis
• Multi-criteria analysis
• Cost-effectiveness analysis
• Compliance cost analysis
• Macro-economic modelling
F.1 Cost benefit Analysis (CBA)
What is Cost Benefit Analysis?
CBA provides a framework for comparing the costs and benefits of each risk management option (RMO). The nature of the analysis may range from one which is mainly qualitative to one which is fully quantitative (and monetised). Traditionally CBA has been used to determine whether an investment is worthwhile from the perspective of economic efficiency. This normally means that there is an emphasis on placing a monetary value on as many of the impacts of a proposed measure as possible and allows a more transparent comparison to be made of the implications of more than one measure. The underlying principles, however, can be more generally applied by valuing all of a measure’s effects in economic opportunity cost terms. One can thus determine the trade-offs that society would be willing to make in the allocation of resources amongst competing demands. As a result, a robust CBA can indicate whether or not a particular measure is ‘justified’ in the sense that the benefits to society outweigh the costs to society.
How is this technique used?
The following steps need to be carried out in order to complete a full CBA (Moons, 2003):
1. Definition of the project/policy and of the relevant population of interest
2. Identification of relevant impacts
3. Quantification of relevant costs and benefits
4. Valuation of relevant costs and benefits in money terms
5. Aggregation of benefits and costs over time by discounting
6. Comparison of total discounted benefits with total discounted costs, to produce a net present value (NPV)
7. Conduct uncertainty analysis on important parameters such as the discount rate, investment
195

SOCIO-ECONOMIC ANALYSIS – RESTRICTIONS
196
lifetime and cost and benefit estimates.
These steps are similar to the structure of the SEA technical guidance document. Guidance on the above steps can be found in chapters 2-6 respectively.
When is it appropriate to use this technique?
The CBA is the approach which underpins this guidance. In line with other guidance document it takes a pragmatic approach where CBA is understood as the aim but realising that often many important impacts can not be quantified. They will have to be presented alongside the quantified impact in an equal manner. When drawing a conclusion and considering all impacts either an implicit or explicit weighting is necessary. From that perspective the CBA analysis becomes almost similar to what is described in the next section under multi-criteria analysis.
What difficulties can arise when using this technique?
The main guidance deals with the different difficulties such as quantification of impacts, monetisation of impacts, discounting and uncertainties.
Where can I find more information about the technique?
EC Impact Assessment Guidelines Annexes (chapter 13) 15 June 2005
Technical guidance document on the use of socio-economic analysis in chemical risk management decision making (OECD 2002)
DTLR: Economic Valuation with Stated Preference Techniques Summary Guide
Energy, Transport And Environment Center For Economic Studies: the development and application of economic valuation techniques and their use in environmental policy – a survey
Cost-Benefit Analysis and the Environment Recent Developments -OECD 2006
F.2 Multi Criteria Analysis (MCA)
What is Multi Criteria Analysis?
MCA describes any structured approach used to determine overall preferences among alternative options, where the options have several types of impacts and/or accomplish several objectives.
In MCA, desirable objectives are specified and corresponding attributes or indicators are identified. The actual measurement of indicators is often based on the quantitative analysis (through scoring, ranking and weighting) of a wide range of qualitative and quantitative impact categories and criteria. This need not be done in monetary terms. Different environmental and social indicators may be developed side by side with economic costs and benefits and MCA provides techniques for comparing and ranking different outcomes, even though a variety of indictors are used. Explicit recognition is given to the fact that a variety of both monetary and non-monetary objectives may influence policy decisions.
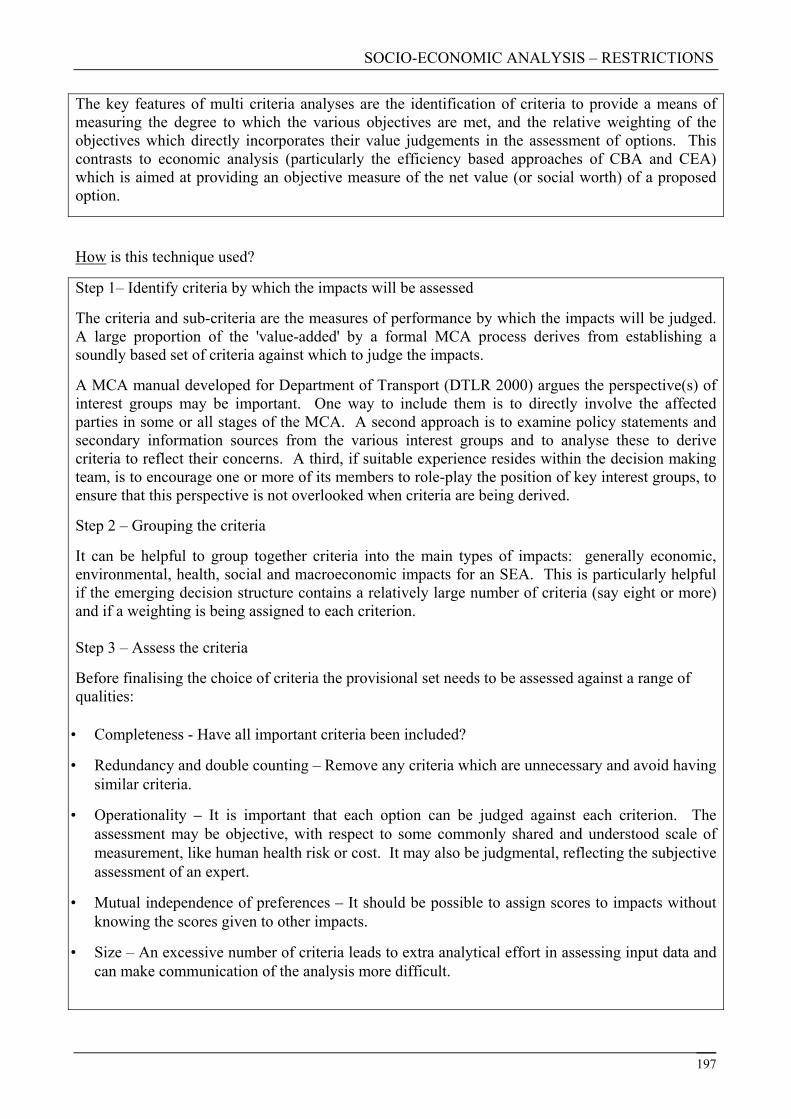
SOCIO-ECONOMIC ANALYSIS – RESTRICTIONS
The key features of multi criteria analyses are the identification of criteria to provide a means of measuring the degree to which the various objectives are met, and the relative weighting of the objectives which directly incorporates their value judgements in the assessment of options. This contrasts to economic analysis (particularly the efficiency based approaches of CBA and CEA) which is aimed at providing an objective measure of the net value (or social worth) of a proposed option.
How is this technique used?
Step 1– Identify criteria by which the impacts will be assessed
The criteria and sub-criteria are the measures of performance by which the impacts will be judged. A large proportion of the 'value-added' by a formal MCA process derives from establishing a soundly based set of criteria against which to judge the impacts.
A MCA manual developed for Department of Transport (DTLR 2000) argues the perspective(s) of interest groups may be important. One way to include them is to directly involve the affected parties in some or all stages of the MCA. A second approach is to examine policy statements and secondary information sources from the various interest groups and to analyse these to derive criteria to reflect their concerns. A third, if suitable experience resides within the decision making team, is to encourage one or more of its members to role-play the position of key interest groups, to ensure that this perspective is not overlooked when criteria are being derived.
Step 2 – Grouping the criteria
It can be helpful to group together criteria into the main types of impacts: generally economic, environmental, health, social and macroeconomic impacts for an SEA. This is particularly helpful if the emerging decision structure contains a relatively large number of criteria (say eight or more) and if a weighting is being assigned to each criterion. Step 3 – Assess the criteria
Before finalising the choice of criteria the provisional set needs to be assessed against a range of qualities:
• Completeness - Have all important criteria been included?
• Redundancy and double counting – Remove any criteria which are unnecessary and avoid having similar criteria.
• Operationality – It is important that each option can be judged against each criterion. The assessment may be objective, with respect to some commonly shared and understood scale of measurement, like human health risk or cost. It may also be judgmental, reflecting the subjective assessment of an expert.
• Mutual independence of preferences – It should be possible to assign scores to impacts without knowing the scores given to other impacts.
• Size – An excessive number of criteria leads to extra analytical effort in assessing input data and can make communication of the analysis more difficult.
197

SOCIO-ECONOMIC ANALYSIS – RESTRICTIONS
198
Step 4 – Set up a scoring system
Set up a scoring system whereby qualitative, quantitative and monetary impacts can be scored against the criteria. Often scoring is normalised with a scale between 0-1. However a key aspect is that the scoring system is transparent and that the scoring system is consistently applied to all scenarios. By introducing transparent, unbiased and well justified criteria, the rationale behind the SEA results can be clearly interpreted by the SEA committee and interested parties, and the decision of whether socio-economic benefits outweigh costs should be easier to make.
Step 5 - Weight criteria and compare scenarios
It is optional to apply a weighting to each impact. It will often involve a subjective perspective and is hence often sited as a drawback to MCA. If a weighting system is applied then the justification and rationale should be clearly set out. Once each cost and benefit has been assigned a score (and weighting applied if appropriate) then the sum score of costs should be deducted from the sum score of benefits. A positive score would indicate that the socio-economic benefits outweigh the socio-economic costs.
When is it appropriate to use this technique?
MCA is a type of decision analysis tool that is particularly applicable to cases significant environmental and social impacts cannot be assigned robust monetary values. Most SEAs will include a combination of impacts that are measured in qualitative, quantitative or monetary terms. It could therefore be argued that MCA could be applied to any socio-economic analysis although it is not formalised with scoring and weighted criteria as described above.
What difficulties can arise when using this technique?
Similar to CBA assessing the various impacts is subject to difficulties. The specific issues with MCA are the choice of the score for each impact and the choice of weights for each criterion. Scoring of impacts that are described in qualitative terms is subjective as are the choice of weighting. If a formal MCA is applied it is important to list all assumptions so that the scoring and weighting are presented transparently.
Where can I find more information about this technique?
EC Impact Assessment Guidelines Annexes (chapter 13) 15 June 2005
Technical guidance document on the use of socio-economic analysis in chemical risk management decision making (OECD 2002)
DTLR (2002) multi-criteria analysis manual
The encyclopaedia of earth: Multi-criteria analysis in environmental decision-making
UNFCC brief summary of MCA
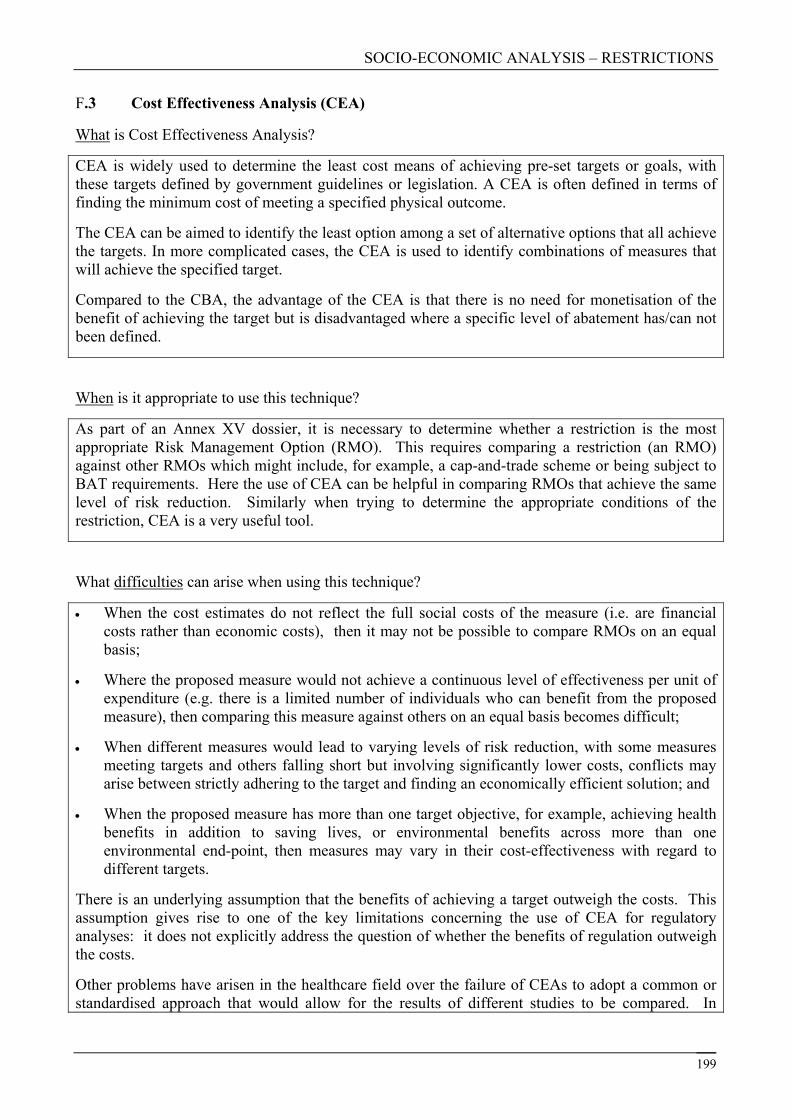
SOCIO-ECONOMIC ANALYSIS – RESTRICTIONS
F.3 Cost Effectiveness Analysis (CEA)
What is Cost Effectiveness Analysis?
CEA is widely used to determine the least cost means of achieving pre-set targets or goals, with these targets defined by government guidelines or legislation. A CEA is often defined in terms of finding the minimum cost of meeting a specified physical outcome.
The CEA can be aimed to identify the least option among a set of alternative options that all achieve the targets. In more complicated cases, the CEA is used to identify combinations of measures that will achieve the specified target.
Compared to the CBA, the advantage of the CEA is that there is no need for monetisation of the benefit of achieving the target but is disadvantaged where a specific level of abatement has/can not been defined.
When is it appropriate to use this technique?
As part of an Annex XV dossier, it is necessary to determine whether a restriction is the most appropriate Risk Management Option (RMO). This requires comparing a restriction (an RMO) against other RMOs which might include, for example, a cap-and-trade scheme or being subject to BAT requirements. Here the use of CEA can be helpful in comparing RMOs that achieve the same level of risk reduction. Similarly when trying to determine the appropriate conditions of the restriction, CEA is a very useful tool.
What difficulties can arise when using this technique?
• When the cost estimates do not reflect the full social costs of the measure (i.e. are financial costs rather than economic costs), then it may not be possible to compare RMOs on an equal basis;
• Where the proposed measure would not achieve a continuous level of effectiveness per unit of expenditure (e.g. there is a limited number of individuals who can benefit from the proposed measure), then comparing this measure against others on an equal basis becomes difficult;
• When different measures would lead to varying levels of risk reduction, with some measures meeting targets and others falling short but involving significantly lower costs, conflicts may arise between strictly adhering to the target and finding an economically efficient solution; and
• When the proposed measure has more than one target objective, for example, achieving health benefits in addition to saving lives, or environmental benefits across more than one environmental end-point, then measures may vary in their cost-effectiveness with regard to different targets.
There is an underlying assumption that the benefits of achieving a target outweigh the costs. This assumption gives rise to one of the key limitations concerning the use of CEA for regulatory analyses: it does not explicitly address the question of whether the benefits of regulation outweigh the costs.
Other problems have arisen in the healthcare field over the failure of CEAs to adopt a common or standardised approach that would allow for the results of different studies to be compared. In
199
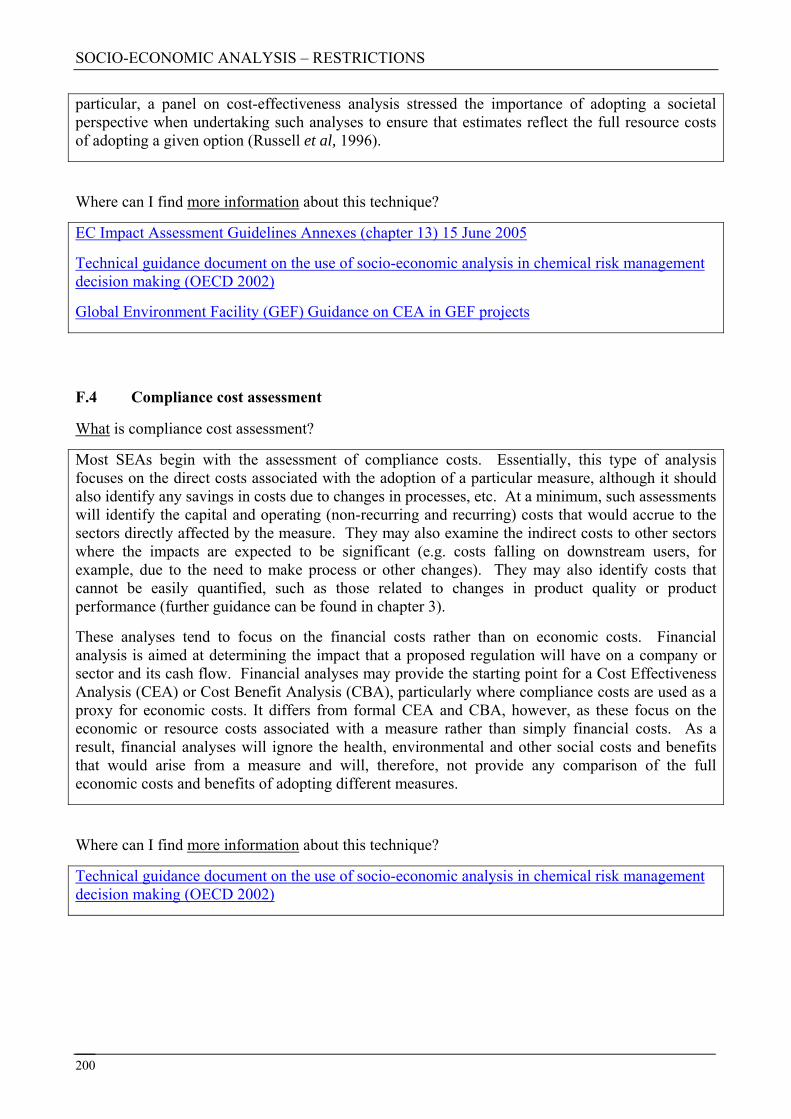
SOCIO-ECONOMIC ANALYSIS – RESTRICTIONS
200
particular, a panel on cost-effectiveness analysis stressed the importance of adopting a societal perspective when undertaking such analyses to ensure that estimates reflect the full resource costs of adopting a given option (Russell et al, 1996).
Where can I find more information about this technique?
EC Impact Assessment Guidelines Annexes (chapter 13) 15 June 2005
Technical guidance document on the use of socio-economic analysis in chemical risk management decision making (OECD 2002)
Global Environment Facility (GEF) Guidance on CEA in GEF projects
F.4 Compliance cost assessment
What is compliance cost assessment?
Most SEAs begin with the assessment of compliance costs. Essentially, this type of analysis focuses on the direct costs associated with the adoption of a particular measure, although it should also identify any savings in costs due to changes in processes, etc. At a minimum, such assessments will identify the capital and operating (non-recurring and recurring) costs that would accrue to the sectors directly affected by the measure. They may also examine the indirect costs to other sectors where the impacts are expected to be significant (e.g. costs falling on downstream users, for example, due to the need to make process or other changes). They may also identify costs that cannot be easily quantified, such as those related to changes in product quality or product performance (further guidance can be found in chapter 3).
These analyses tend to focus on the financial costs rather than on economic costs. Financial analysis is aimed at determining the impact that a proposed regulation will have on a company or sector and its cash flow. Financial analyses may provide the starting point for a Cost Effectiveness Analysis (CEA) or Cost Benefit Analysis (CBA), particularly where compliance costs are used as a proxy for economic costs. It differs from formal CEA and CBA, however, as these focus on the economic or resource costs associated with a measure rather than simply financial costs. As a result, financial analyses will ignore the health, environmental and other social costs and benefits that would arise from a measure and will, therefore, not provide any comparison of the full economic costs and benefits of adopting different measures.
Where can I find more information about this technique?
Technical guidance document on the use of socio-economic analysis in chemical risk management decision making (OECD 2002)
SOCIO-ECONOMIC ANALYSIS – RESTRICTIONS
201
F.5 Macro-economic modelling
What is macro-economic modelling?
Macro-economic models are mathematical models that aim at describing the interactions in the economy. They allow for all economic effects including all feed backs responses on different markets to be covered in a consistent way. There are different types of models that are suited to answer different types of questions. In relation to SEAs, the use of macro-economic modelling is less likely to be relevant. Only if there are economic impacts that affect sectors of the economy in a significant way the use of macro-economic modelling could become useful. Applying a macro-economic approach will require the use of a suitable model and given that it is very resource demanding to develop macro-economic models their applications in SEAs would have to be based on existing models. It would therefore require expert advice on which model to apply and similar expert input to undertake the analysis. The EU impact guidance includes more details on the different type of macro-economic models and lists some of the more used models which has been developed through EU funding and therefore typically cover the whole of EU.
Where can I find more information about this technique?
EC Impact Assessment Guidelines Annexes (chapter 7) 15 June 2005
Technical guidance document on the use of socio-economic analysis in chemical risk management decision making (OECD 2002)
SOCIO-ECONOMIC ANALYSIS – RESTRICTIONS
APPENDIX G INITIAL CHECKLISTS – IDENTIFICATION OF IMPACTS
CHECKLISTS –
IDENTIFICATION OF IMPACTS
202

SOCIO-ECONOMIC ANALYSIS – RESTRICTIONS
APPENDIX G CHECKLISTS – IDENTIFICATION OF IMPACTS
This appendix contains five checklists to help determine the main impacts of the “proposed restriction” compared against the “baseline” scenario, during the assessing impacts stage (a more comprehensive checklist is used later on in the SEA process). The checklists are for:
• Human health risks;
• Environmental risks;
• Economic impacts;
• Social impacts; and
• Wider economic impacts.
The checklists are intended to be used as an internal decision-making tool to facilitate the process of determining the main impacts and do not constitute a comprehensive list of impacts. They cover only some of the impacts identified in the EC Impact Assessment guidelines (2005). It is therefore recommended that the guidelines for impact assessment are referred to for more information. These are available online at:
http://ec.europa.eu/governance/impact/docs/key_docs/sec_2005_0791_anx_en.pdf
Completed checklists can be submitted with the SEA to improve the transparency of the analysis.
HOW TO USE THE CHECKLISTS
If the risk assessment (Guidance on the Chemical Safety Report) indicates that risks for a particular endpoint are not significant (or possibly not relevant) then the answer in the checklist should be No Impact that are not significant should be acknowledged in the SEA report, but there is no need to analyse the impact any further as it is unlikely to alter the outcome of the SEA However, risks should be considered where there is no concern identified in the risk assessment (under the baseline) but where the proposed restriction introduces new risks.
If a risk has been identified, then the answer in the checklist could be Yes or unknown. It is necessary to try to establish whether this is:
• Yes - a significant impact (main impact) – This impact must be analysed further in the SEA process; or
• Unknown – With the information available at this stage in the SEA process, it may not be possible to determine whether an impact is a significant (main) impact. In this instance, more information is required to determine the relevance of the risk.
It may be helpful to complete the checklists during a brainstorming workshop or meeting, at which internal/external experts and relevant stakeholders are invited to participate. In completing the checklists, it may be appropriate to draw upon sources of information such as the EC Impact Assessment guidelines. In particular, pages 29-32 of the EC Impact Assessment guidelines contains questions aimed to the guide the reader towards ensuring the impacts and issues that have particular relevance are considered during stage 3 (Identification and Assessment of Impacts). Note though, these questions (as with the questions in the checklists in this appendix) are neither exhaustive nor definitive. They are meant as an aid to facilitate the reader to consider a wider range of potential
203
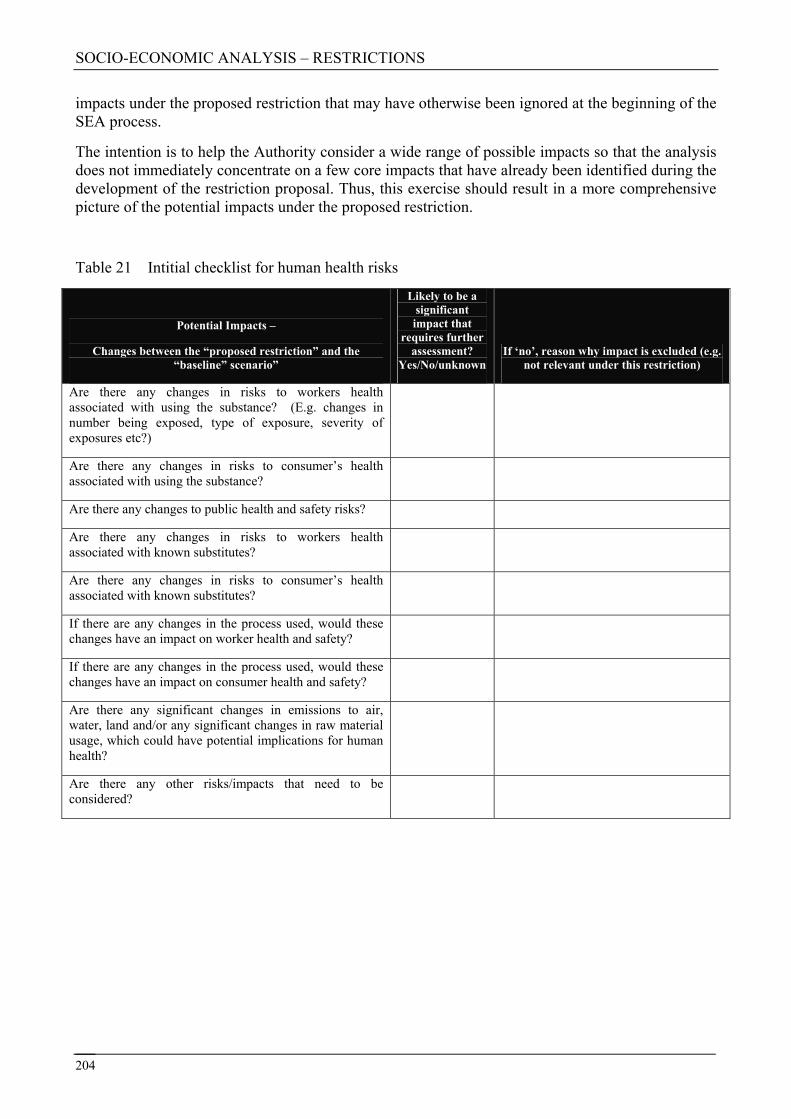
SOCIO-ECONOMIC ANALYSIS – RESTRICTIONS
impacts under the proposed restriction that may have otherwise been ignored at the beginning of the SEA process.
The intention is to help the Authority consider a wide range of possible impacts so that the analysis does not immediately concentrate on a few core impacts that have already been identified during the development of the restriction proposal. Thus, this exercise should result in a more comprehensive picture of the potential impacts under the proposed restriction.
Table 21 Intitial checklist for human health risks
Potential Impacts –
Changes between the “proposed restriction” and the “baseline” scenario”
Likely to be a significant impact that
requires further assessment?
Yes/No/unknown If ‘no’, reason why impact is excluded (e.g.
not relevant under this restriction)
Are there any changes in risks to workers health associated with using the substance? (E.g. changes in number being exposed, type of exposure, severity of exposures etc?)
Are there any changes in risks to consumer’s health associated with using the substance?
Are there any changes to public health and safety risks?
Are there any changes in risks to workers health associated with known substitutes?
Are there any changes in risks to consumer’s health associated with known substitutes?
If there are any changes in the process used, would these changes have an impact on worker health and safety?
If there are any changes in the process used, would these changes have an impact on consumer health and safety?
Are there any significant changes in emissions to air, water, land and/or any significant changes in raw material usage, which could have potential implications for human health?
Are there any other risks/impacts that need to be considered?
204

SOCIO-ECONOMIC ANALYSIS – RESTRICTIONS
Table 22 Initial checklist for environmental risks
Potential Impacts –
Changes between the “proposed restriction” and the “baseline” scenario”
Likely to be a significant impact that
requires further assessment?
Yes/No/unknown If ‘no’, reason why impact is excluded (e.g.
not relevant under this restriction)
Are there any changes in risks in air quality? (e.g. any effect from emissions on acidifying, eutrophication, photochemical or harmful air pollutants that might affect human health, damage crops or buildings or lead to deterioration in the environment (polluted soil or rivers etc)
Are there any changes in risks to water quality and/or the quantity of water and drinking water?
Are there any changes in risks to soil quality and/or the quantity of available soil and usable soil?
Are there any changes in risks to the emission of ozone depleting substances (CFCs, HCFCs, etc.) and greenhouse gases (e.g. carbon dioxide, methane etc) into the atmosphere?
Are there any changes in demand/usage of renewable resources (fish, freshwater) or changes to rate of demand/usage of non-renewable resources (groundwater, minerals etc)?
Are there any changes in risks to biodiversity (e.g. the number of species and varieties/races), flora, fauna and/or landscapes (e.g. the scenic value of protected landscape)?
Are there any changes in risks to land use which may affect the environment? (e.g. affect the balance between urban and rural land use, reduction of ‘greenfield’ sites, etc)
Are there any changes to waste production (solid, urban, agricultural, industrial, mining, radioactive or toxic waste) or how waste is treated, disposed of or recycled?
Are there any changes in the risks to the likelihood of the prevention of fire, explosives, breakdowns, accidents and accidental emissions? Any changes risks to the likelihood of natural disasters?
Are there any changes to mobility (transport modes) and the use of energy? (e.g. is the a change in the consumption of energy and production of heat, demand for transport and change in vehicle emissions)
Are there any changes in the environmental consequences of firms’ activities? (E.g. does this change the use of natural resources required per unit of output and will the process becoming more or less energy intensive? Will this change the operating behaviour of firms to pollute more or less?)
Are there any changes in risks to animal and plant health, food and/or feed safety?
205

SOCIO-ECONOMIC ANALYSIS – RESTRICTIONS
206
Potential Impacts –
Changes between the “proposed restriction” and the “baseline” scenario”
Likely to be a significant impact that
requires further assessment?
Yes/No/unknown If ‘no’, reason why impact is excluded (e.g.
not relevant under this restriction)
Are there any changes in environmental risks associated with substitutes?
Are there any changes in the process used that may have an impact on the environment? (e.g. alternative process uses a different amount of natural resources or amount of energy used)
Are there any significant changes in emissions to air, water, and land or in raw material usage, which could have potential implications for the environment? (e.g. change in raw materials which need to be imported from outside of the EU which leads to additional emissions from transport)
Are there any other risks/impacts that need to be considered?
Table 23 Initial checklist for economic impacts
Potential Impacts –
Changes between the “proposed restriction” and the “baseline” scenario”
Likely to be a significant impact that
requires further assessment?
Yes/No/unknown If ‘no’, reason why impact is excluded (e.g.
not relevant under this restriction)
Are there any changes to operating costs?
Are there any changes to investment costs? E.g. costs to avoid risks to human health such as waste and waste water handling.
Are there likely to be changes to profitability? E.g. costs of using an alternative substance can not be passed on along the supply chain.
Are there likely to be changes to sales and turnover? E.g. a loss of functionality leads to reduction in demand
Are there likely to be changes to administration costs?
Are there likely to be changes to innovation and research?
Are there likely to be changes to the market price?
Are there likely to be changes to the quality of the final product?
Are there likely to be changes to employment?
Are there likely to be changes to monitoring, compliance and enforcement?
Are there likely to be changes to the trend in sales and production?

SOCIO-ECONOMIC ANALYSIS – RESTRICTIONS
207
Potential Impacts –
Changes between the “proposed restriction” and the “baseline” scenario”
Likely to be a significant impact that
requires further assessment?
Yes/No/unknown If ‘no’, reason why impact is excluded (e.g.
not relevant under this restriction)
Are there likely to be changes to the cost associated with substitutes?
Are there likely to be changes to the performance and product quality associated with substitutes?
Are there likely to be any changes in the process used that may have an impact on economic costs?
Are there likely to be any changes in emissions to air, water, land and/or any changes in raw material usage, which could have potential economic costs?
Are there any other risks/impacts that need to be considered?
Table 24 Initial checklist for social impacts
Potential Impacts –
Changes between the “proposed restriction” and the “baseline” scenario”
Likely to be a significant impact that
requires further assessment?
Yes/No/unknown If ‘no’, reason why impact is excluded (e.g.
not relevant under this restriction)
Are there any likely to be changes in employment at an EU level?
Are there any likely to be changes in employment at a MS level?
Are there any likely to be changes in employment outside of the EU?
Are there any likely to be changes in the type of job occupations?
Are there any likely to be changes in the working environment? (e.g. working hours, job satisfaction, training available etc)
Are there any likely to be changes to employment to other sectors within the community? i.e. local restaurants, retail shops and other service industries.
Are there any other risks/impacts that need to be considered?

SOCIO-ECONOMIC ANALYSIS – RESTRICTIONS
Table 25 Initial checklist for competition, trade and wider economic impacts
Potential Impacts –
Changes between the “proposed restriction” and the “baseline” scenario”
Likely to be a significant impact that
requires further
assessment? Yes/No/unkno
wn If ‘no’, reason why impact is excluded (e.g.
not relevant under this restriction)
Are there any likely to be changes to competition within the EU? (e.g. changes in the number of products available to downstream users and consumers)
Are there any likely to be changes to competitiveness outside of the EU? (E.g. would the conditions of the restriction give an advantage to manufacturers outside of the EU?)
Are there any likely to be changes to international trade? (e.g. trade flows between EU and non-EU countries)
Are there any likely to be changes in investment flows? (e.g. businesses deciding to locate outside of the EU)
Are there any likely to be changes on EU and MS finances? (e.g., changes in revenue from corporation taxes)
Are there any likely to be changes to the labour market? (e.g. demand for specialist skills, job migration outside of the EU)
Are there any other risks/impacts that need to be considered?
208
SOCIO-ECONOMIC ANALYSIS – RESTRICTIONS
APPENDIX H: TYPES OF INFORMATION AN INTERESTED PARTY MAY WISH TO SUBMIT TO THE SEA COMMITTEE CONCERNING A SUBMITTED SEA
TYPES OF SEA INFORMATION AN INTERESTED PARTY MAY WISH TO SUBMIT TO THE SEA COMMITTEE CONCERNING A SUBMITTED
ANNEX XV DOSSIER
209
SOCIO-ECONOMIC ANALYSIS – RESTRICTIONS
Introduction
The following checklist has been designed for interested parties who wish to submit comments or socio-economic analyses regarding an Annex XV dossier submitted to the SEA committee. For example, an interested party may wish to provide cost information on the use of an alternative which they wish to keep confidential.
Interested parties should clearly indicate within their submissions the information that they wish to remain confidential and the reasons for not disclosing information submitted in this format. The Agency may grant access to documents under specific circumstances (see section 5.4 in the Guidance on authorisation application which provides specific information relevant under the restrictions process also). Therefore, if clear reasons for not disclosing information are not provided, the Agency reserves its right to decide that access can be given to your comments.
Interested parties who have requested that information remains confidential may still decide to make available:
• certain parts of the document to anyone requesting access to it or
• Certain parts, or all, of the document to a restricted number of actors requesting access to it.
In chapter 5 a separate checklist is included for those preparing an Annex XV dossier. That checklist is intended as an internal audit check and it is not necessary to include it with the submission of an Annex XV dossier. Further guidance is provided in chapter 6 for those preparing an Annex XV dossier.
In most instances, given the limited time (and/or resources) available for interested parties to comment on a submitted Annex XV dossier, conducting a complete SEA and subsequently producing a report is unlikely to be feasible. An interested party may only have enough time to submit partial information using predominately in-house expertise. Submitting this information using the checklist, along with any comments, should help the SEA committee easily identify and organise all the information submitted to them, without the need for the interested party to produce a detailed report.
210

SOCIO-ECONOMIC ANALYSIS – RESTRICTIONS
Checklist for interested party submission to the SEA Committee
Information on the “baseline” scenario
Information on a risk management option (other than a restriction)
Information on changes to the uses and/or conditions of the “proposed restriction” scenario
Information on environnemental risks/impacts
Information on human health risks/impacts
Information on economic impacts
Information on social impacts
Information on competition, trade and other wider economic impacts
Information on uncertainties and assumptions used in the submitted SEA
Information on distributional impacts; e.g. impacts for a particular region/industry
Information on recommendations for the proposed restriction
Any other SEA information relevant for the SEA Committee to consider
211