annex 1 bd adopted opinion fenpyrazamine - echa
TRANSCRIPT
ANNEX 1 – BACKGROUND DOCUMENT TO THE RAC OPINION ON FENPYRAZAMINE
Committee for Risk Assessment
RAC
Annex 1
Background document
to the Opinion proposing harmonised classification
and labelling at EU level of
fenpyrazamine
EC Number: not assigned
CAS Number: 473798-59-3
ECHA/RAC/CLH-O-0000003187-73-01/A1
The background document is a compilation of information considered relevant by the dossier
submitter or by RAC for the proposed classification. It includes the proposal of the dossier
submitter and the conclusion of RAC. It is based on the official CLH report submitted to
public consultation. RAC has not changed the text of this CLH report but inserted text which
is specifically marked as ‘RAC evaluation’. Only the RAC text reflects the view of RAC.
Adopted
30 November 2012
ANNEX 1 – BACKGROUND DOCUMENT TO THE RAC OPINION ON FENPYRAZAMINE
2
CLH report
Proposal for Harmonised Classification and Labelling
Based on Regulation (EC) No 1272/2008 (CLP Regulation),
Annex VI, Part 2
Substance Name: Fenpyrazamine
EC Number: Not allocated
CAS Number: 473798-59-3
Index Number: -
Contact details for dossier submitter:
Austrian Agency for Health and Food Safety
Institute for Plant Protection Products Evaluation and Authorisation
Spargelfeldstraße 191, 1220 Vienna
Austria
Version number: 3 Date: 6. December 2011

ANNEX 1 – BACKGROUND DOCUMENT TO THE RAC OPINION ON FENPYRAZAMINE
3
ANNEX 1 – BACKGROUND DOCUMENT TO THE RAC OPINION ON FENPYRAZAMINE
4
CONTENTS
Part A.
1 PROPOSAL FOR HARMONISED CLASSIFICATION AND LABELLING ....................... 8
1.1 SUBSTANCE ....................................................................................................... 8
1.2 HARMONISED CLASSIFICATION AND LABELLING PROPOSAL .................................................. 8
1.3 PROPOSED HARMONISED CLASSIFICATION AND LABELLING BASED ON CLP REGULATION AND/OR DSD
CRITERIA ..................................................................................................................... 9
2 BACKGROUND TO THE CLH PROPOSAL ............................................................... 14
2.1 HISTORY OF THE PREVIOUS CLASSIFICATION AND LABELLING ............................................ 14
2.2 SHORT SUMMARY OF THE SCIENTIFIC JUSTIFICATION FOR THE CLH PROPOSAL ........................ 14
2.3 CURRENT HARMONISED CLASSIFICATION AND LABELLING ................................................. 14
2.3.1 Current classification and labelling in Annex VI, Table 3.1 in the CLP Regulation . 14
2.3.2 Current classification and labelling in Annex VI, Table 3.2 in the CLP Regulation . 14
2.4 CURRENT SELF-CLASSIFICATION AND LABELLING ........................................................... 15
2.4.1 Current self-classification and labelling based on the CLP Regulation criteria ...... 15
2.4.2 Current self-classification and labelling based on DSD criteria ........................... 15
3 JUSTIFICATION THAT ACTION IS NEEDED AT COMMUNITY LEVEL ..................... 15
SCIENTIFIC EVALUATION OF THE DATA ................................................................... 16
1 IDENTITY OF THE SUBSTANCE ........................................................................... 16
1.1 NAME AND OTHER IDENTIFIERS OF THE SUBSTANCE ....................................................... 16
1.2 COMPOSITION OF THE SUBSTANCE ........................................................................... 17
1.2.1 Composition of test material ........................................................................ 17
1.3 PHYSICO-CHEMICAL PROPERTIES ............................................................................. 18
2 MANUFACTURE AND USES .................................................................................. 28
2.1 MANUFACTURE .................................................................................................. 28
2.2 IDENTIFIED USES ............................................................................................... 28
3 CLASSIFICATION FOR PHYSICO-CHEMICAL PROPERTIES .................................. 29
4 HUMAN HEALTH HAZARD ASSESSMENT ............................................................. 29
4.1.1 Non-human information ............................................................................... 29
4.1.2 Human information ..................................................................................... 32
4.1.3 Summary and discussion on toxicokinetics ..................................................... 32
4.2 ACUTE TOXICITY ................................................................................................ 34
4.2.1 Non-human information ............................................................................... 34
4.2.1.1 Acute toxicity: oral .................................................................................. 34
4.2.1.2 Acute toxicity: inhalation .......................................................................... 34
4.2.1.3 Acute toxicity: dermal .............................................................................. 35
4.2.1.4 Acute toxicity: other routes ....................................................................... 35
4.2.2 Human information ..................................................................................... 35
4.2.3 Summary and discussion of acute toxicity ...................................................... 35
4.2.4 Comparison with criteria .............................................................................. 35
4.2.5 Conclusions on classification and labelling ...................................................... 35
4.3 SPECIFIC TARGET ORGAN TOXICITY – SINGLE EXPOSURE (STOT SE) .................................. 36
4.3.1 Summary and discussion of Specific target organ toxicity – single exposure ....... 36
4.3.2 Comparison with criteria .............................................................................. 36
4.3.3 Conclusions on classification and labelling ...................................................... 36
4.4 IRRITATION ...................................................................................................... 37
4.4.1 Skin irritation ............................................................................................. 37
ANNEX 1 – BACKGROUND DOCUMENT TO THE RAC OPINION ON FENPYRAZAMINE
5
4.4.1.1 Non-human information ........................................................................... 37
4.4.1.2 Human information ................................................................................. 37
4.4.1.3 Summary and discussion of skin irritation ..................................................... 38
4.4.1.4 Comparison with criteria ........................................................................... 38
4.4.1.5 Conclusions on classification and labelling ..................................................... 38
4.4.2 Eye irritation .............................................................................................. 38
4.4.2.1 Non-human information ........................................................................... 38
4.4.2.2 Human information ................................................................................. 40
4.4.2.3 Summary and discussion of eye irritation ...................................................... 40
4.4.2.4 Comparison with criteria ........................................................................... 40
4.4.2.5 Conclusions on classification and labelling ..................................................... 40
4.4.3 Respiratory tract irritation ............................................................................ 40
4.4.3.1 Non-human information ........................................................................... 40
4.4.3.2 Human information ................................................................................. 40
4.4.3.3 Summary and discussion of respiratory tract irritation ...................................... 40
4.4.3.4 Comparison with criteria ........................................................................... 41
4.4.3.5 Conclusions on classification and labelling ..................................................... 41
4.5 CORROSIVITY ................................................................................................... 41
4.6 SENSITISATION ................................................................................................. 41
4.6.1 Skin sensititsation ....................................................................................... 41
4.6.1.1 Non-human information ........................................................................... 42
4.6.1.2 Human information ................................................................................. 43
4.6.1.3 Summary and discussion of skin sensitisation ................................................ 43
4.6.1.4 Comparison with criteria ........................................................................... 43
4.6.1.5 Conclusions on classification and labelling ..................................................... 43
4.6.2 Respiratory sensitisation .............................................................................. 43
4.7 REPEATED DOSE TOXICITY ..................................................................................... 45
4.7.1 Non-human information ............................................................................... 49
4.7.1.1 Repeated dose toxicity: oral ...................................................................... 49
4.7.1.2 Repeated dose toxicity: inhalation ............................................................... 51
4.7.1.3 Repeated dose toxicity: dermal .................................................................. 51
4.7.1.4 Repeated dose toxicity: other routes ........................................................... 51
4.7.1.5 Human information ................................................................................. 51
4.7.1.6 Other relevant information ........................................................................ 51
4.7.1.7 Summary and discussion of repeated dose toxicity .......................................... 51 4.7.1.8 Summary and discussion of repeated dose toxicity findings relevant for classification
according to DSD ................................................................................................. 53 4.7.1.9 Comparison with criteria of repeated dose toxicity findings relevant for classification
according to DSD ................................................................................................. 53 4.7.1.10 Conclusions on classification and labelling of repeated dose toxicity findings relevant
for classification according to DSD ............................................................................ 53
4.8 SPECIFIC TARGET ORGAN TOXICITY (CLP REGULATION) – REPEATED EXPOSURE (STOT RE) ...... 53
4.8.1 Summary and discussion of repeated dose toxicity findings relevant for
classification as STOT RE according to CLP Regulation ............................................... 53
4.8.2 Comparison with criteria of repeated dose toxicity findings relevant for
classification as STOT RE ....................................................................................... 53
4.8.3 Conclusions on classification and labelling of repeated dose toxicity findings
relevant for classification as STOT RE ...................................................................... 53
4.9 GERM CELL MUTAGENICITY (MUTAGENICITY) ............................................................... 57
4.9.1 Non-human information ............................................................................... 59
4.9.1.1 In vitro data .......................................................................................... 59
4.9.1.2 In vivo data .......................................................................................... 66
4.9.2 Human information ..................................................................................... 67
4.9.3 Other relevant information ........................................................................... 67
4.9.4 Summary and discussion of mutagenicity....................................................... 67
4.9.5 Comparison with criteria .............................................................................. 67
4.9.6 Conclusions on classification and labelling ...................................................... 67
ANNEX 1 – BACKGROUND DOCUMENT TO THE RAC OPINION ON FENPYRAZAMINE
6
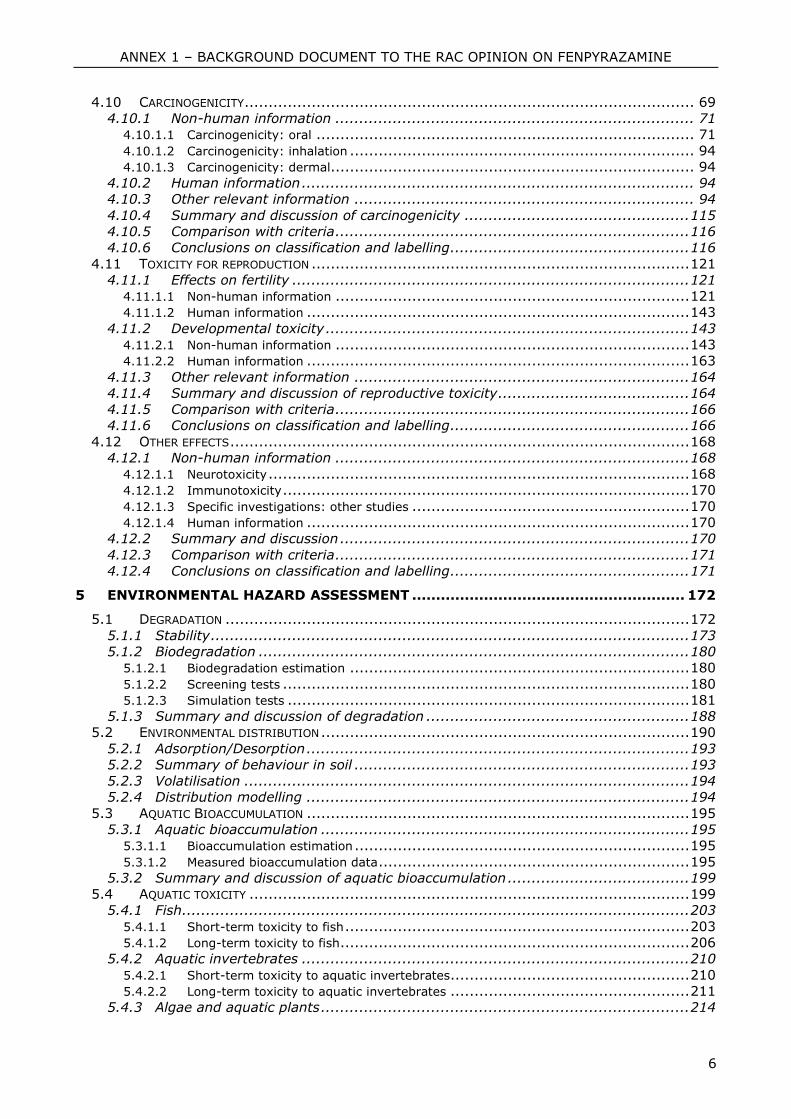
4.10 CARCINOGENICITY .............................................................................................. 69
4.10.1 Non-human information ........................................................................... 71
4.10.1.1 Carcinogenicity: oral ............................................................................... 71
4.10.1.2 Carcinogenicity: inhalation ........................................................................ 94
4.10.1.3 Carcinogenicity: dermal............................................................................ 94
4.10.2 Human information .................................................................................. 94
4.10.3 Other relevant information ....................................................................... 94
4.10.4 Summary and discussion of carcinogenicity ............................................... 115
4.10.5 Comparison with criteria .......................................................................... 116
4.10.6 Conclusions on classification and labelling .................................................. 116
4.11 TOXICITY FOR REPRODUCTION ............................................................................... 121
4.11.1 Effects on fertility ................................................................................... 121
4.11.1.1 Non-human information .......................................................................... 121
4.11.1.2 Human information ................................................................................ 143
4.11.2 Developmental toxicity ............................................................................ 143
4.11.2.1 Non-human information .......................................................................... 143
4.11.2.2 Human information ................................................................................ 163
4.11.3 Other relevant information ...................................................................... 164
4.11.4 Summary and discussion of reproductive toxicity ........................................ 164
4.11.5 Comparison with criteria .......................................................................... 166
4.11.6 Conclusions on classification and labelling .................................................. 166
4.12 OTHER EFFECTS ................................................................................................ 168
4.12.1 Non-human information .......................................................................... 168
4.12.1.1 Neurotoxicity ........................................................................................ 168
4.12.1.2 Immunotoxicity ..................................................................................... 170
4.12.1.3 Specific investigations: other studies .......................................................... 170
4.12.1.4 Human information ................................................................................ 170
4.12.2 Summary and discussion ......................................................................... 170
4.12.3 Comparison with criteria .......................................................................... 171
4.12.4 Conclusions on classification and labelling .................................................. 171
5 ENVIRONMENTAL HAZARD ASSESSMENT ......................................................... 172
5.1 DEGRADATION ................................................................................................. 172
5.1.1 Stability .................................................................................................... 173
5.1.2 Biodegradation .......................................................................................... 180
5.1.2.1 Biodegradation estimation ....................................................................... 180
5.1.2.2 Screening tests ..................................................................................... 180
5.1.2.3 Simulation tests .................................................................................... 181
5.1.3 Summary and discussion of degradation ....................................................... 188
5.2 ENVIRONMENTAL DISTRIBUTION ............................................................................. 190
5.2.1 Adsorption/Desorption ................................................................................ 193
5.2.2 Summary of behaviour in soil ...................................................................... 193
5.2.3 Volatilisation ............................................................................................. 194
5.2.4 Distribution modelling ................................................................................ 194
5.3 AQUATIC BIOACCUMULATION ................................................................................ 195
5.3.1 Aquatic bioaccumulation ............................................................................. 195
5.3.1.1 Bioaccumulation estimation ...................................................................... 195
5.3.1.2 Measured bioaccumulation data ................................................................. 195
5.3.2 Summary and discussion of aquatic bioaccumulation ...................................... 199
5.4 AQUATIC TOXICITY ............................................................................................ 199
5.4.1 Fish .......................................................................................................... 203
5.4.1.1 Short-term toxicity to fish ........................................................................ 203
5.4.1.2 Long-term toxicity to fish ......................................................................... 206
5.4.2 Aquatic invertebrates ................................................................................. 210
5.4.2.1 Short-term toxicity to aquatic invertebrates .................................................. 210
5.4.2.2 Long-term toxicity to aquatic invertebrates .................................................. 211
5.4.3 Algae and aquatic plants ............................................................................. 214

ANNEX 1 – BACKGROUND DOCUMENT TO THE RAC OPINION ON FENPYRAZAMINE
7
5.4.4 Other aquatic organisms (including sediment) ............................................... 215
5.5 COMPARISON WITH CRITERIA FOR ENVIRONMENTAL HAZARDS (SECTIONS 5.1 – 5.4) .............. 216
5.6 CONCLUSIONS ON CLASSIFICATION AND LABELLING FOR ENVIRONMENTAL HAZARDS (SECTIONS 5.1 –
5.4) 217
6 OTHER INFORMATION ..................................................................................... 220
7 REFERENCES .................................................................................................... 221
7.1 PHYSICO-CHEMICAL PROPERTIES ............................................................................ 221
7.2 HUMAN HEALTH HAZARD ASSESSMENT ...................................................................... 222
7.3 ENVIRONMENTAL HAZARD ASSESSMENT .................................................................... 227
7.3.1 Fate and Behaviour in the environment ........................................................ 227
7.3.2 Aquatic Toxicity ......................................................................................... 229
8 ANNEXES ......................................................................................................... 231
ANNEX 1 – BACKGROUND DOCUMENT TO THE RAC OPINION ON FENPYRAZAMINE
8
Part A.
1 PROPOSAL FOR HARMONISED CLASSIFICATION AND LABELLING
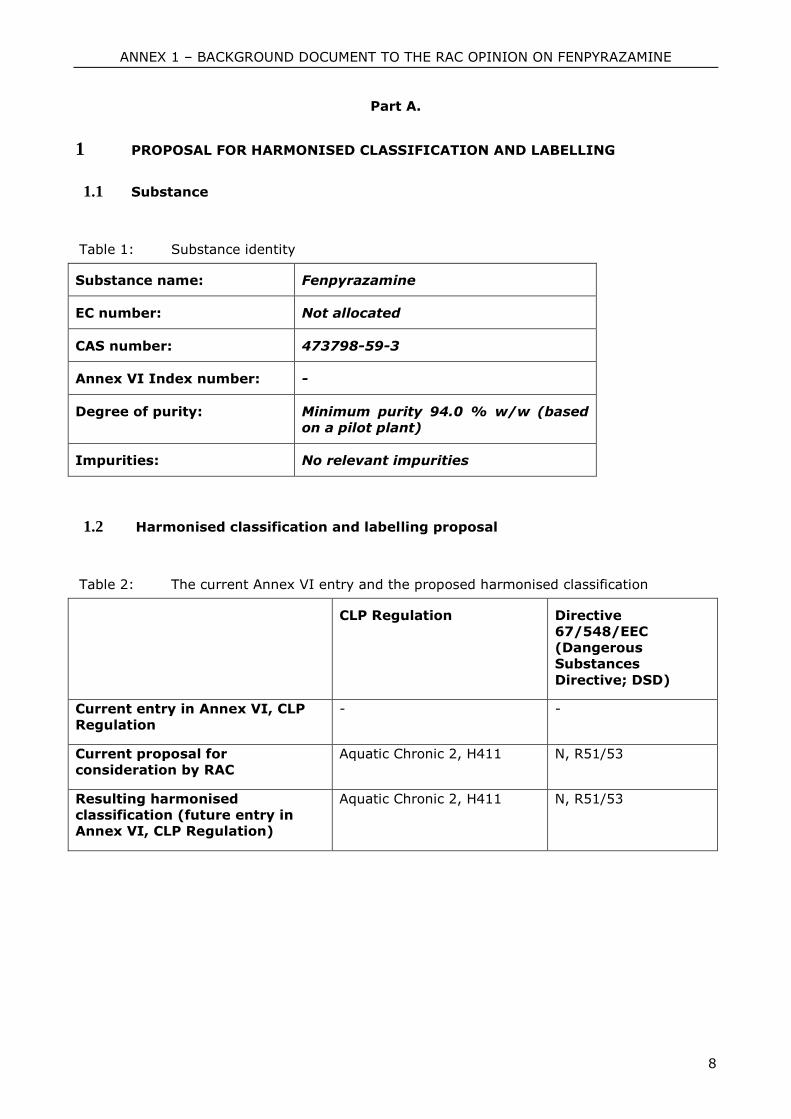
1.1 Substance
Table 1: Substance identity
Substance name: Fenpyrazamine
EC number: Not allocated
CAS number: 473798-59-3
Annex VI Index number: -
Degree of purity: Minimum purity 94.0 % w/w (based
on a pilot plant)
Impurities: No relevant impurities
1.2 Harmonised classification and labelling proposal
Table 2: The current Annex VI entry and the proposed harmonised classification
CLP Regulation Directive
67/548/EEC
(Dangerous
Substances
Directive; DSD)
Current entry in Annex VI, CLP
Regulation
- -
Current proposal for
consideration by RAC
Aquatic Chronic 2, H411 N, R51/53
Resulting harmonised
classification (future entry in
Annex VI, CLP Regulation)
Aquatic Chronic 2, H411 N, R51/53
ANNEX 1 – BACKGROUND DOCUMENT TO THE RAC OPINION ON FENPYRAZAMINE
9
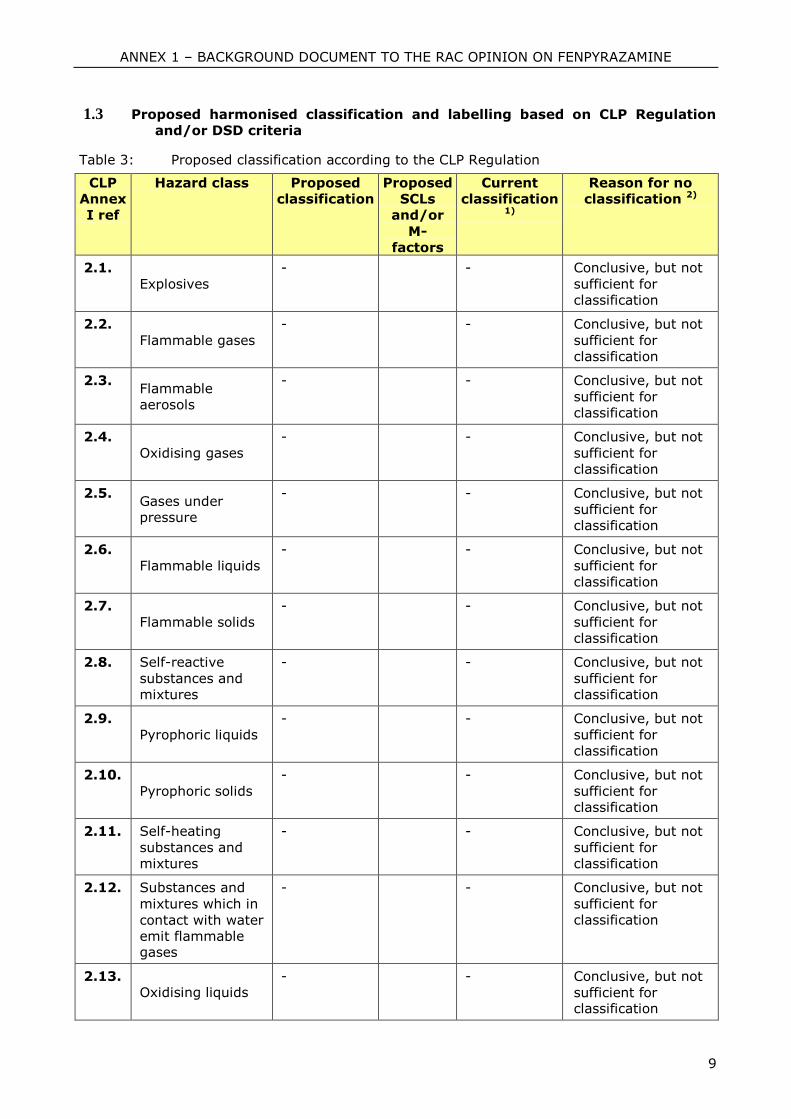
1.3 Proposed harmonised classification and labelling based on CLP Regulation
and/or DSD criteria
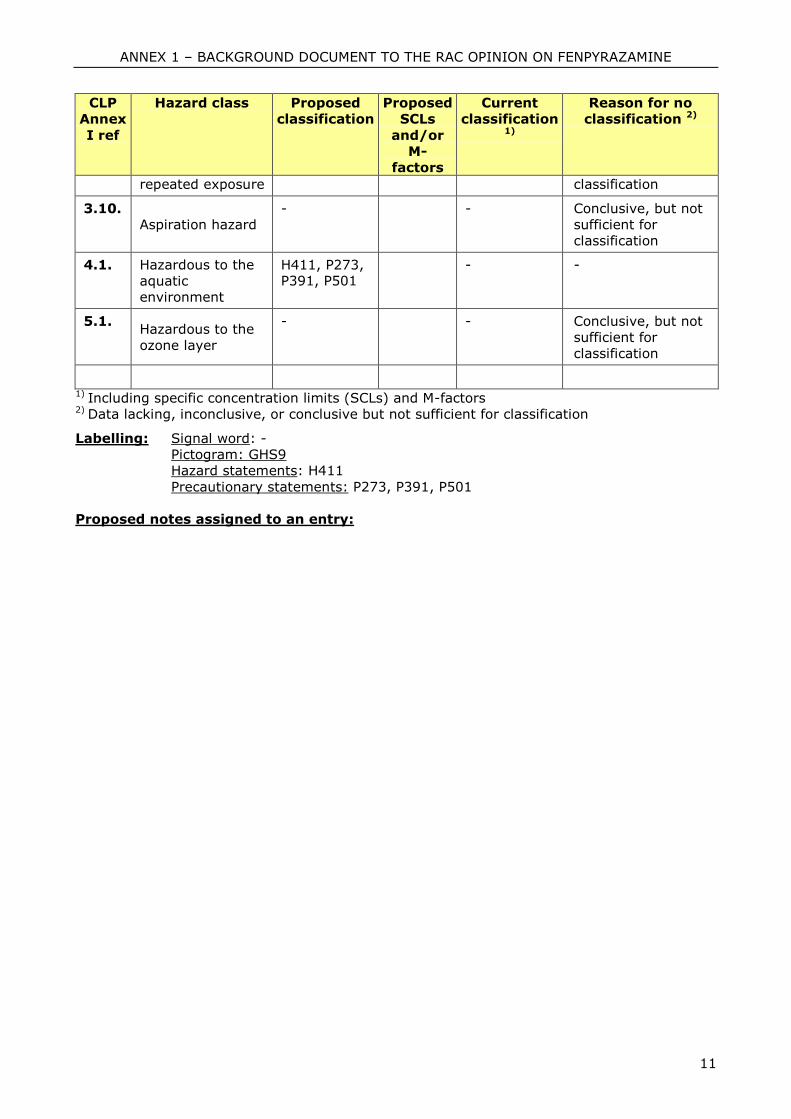
Table 3: Proposed classification according to the CLP Regulation
CLP
Annex
I ref
Hazard class Proposed
classification
Proposed
SCLs
and/or
M-
factors
Current
classification 1)
Reason for no
classification 2)
2.1.
Explosives
- - Conclusive, but not
sufficient for
classification
2.2.
Flammable gases
- - Conclusive, but not
sufficient for
classification
2.3. Flammable
aerosols
- - Conclusive, but not
sufficient for
classification
2.4.
Oxidising gases
- - Conclusive, but not
sufficient for
classification
2.5. Gases under
pressure
- - Conclusive, but not
sufficient for
classification
2.6.
Flammable liquids
- - Conclusive, but not
sufficient for
classification
2.7.
Flammable solids
- - Conclusive, but not
sufficient for
classification
2.8. Self-reactive
substances and
mixtures
- - Conclusive, but not
sufficient for
classification
2.9.
Pyrophoric liquids
- - Conclusive, but not
sufficient for
classification
2.10.
Pyrophoric solids
- - Conclusive, but not
sufficient for
classification
2.11. Self-heating
substances and
mixtures
- - Conclusive, but not
sufficient for
classification
2.12. Substances and
mixtures which in
contact with water
emit flammable gases
- - Conclusive, but not
sufficient for
classification
2.13.
Oxidising liquids
- - Conclusive, but not
sufficient for classification
ANNEX 1 – BACKGROUND DOCUMENT TO THE RAC OPINION ON FENPYRAZAMINE
10
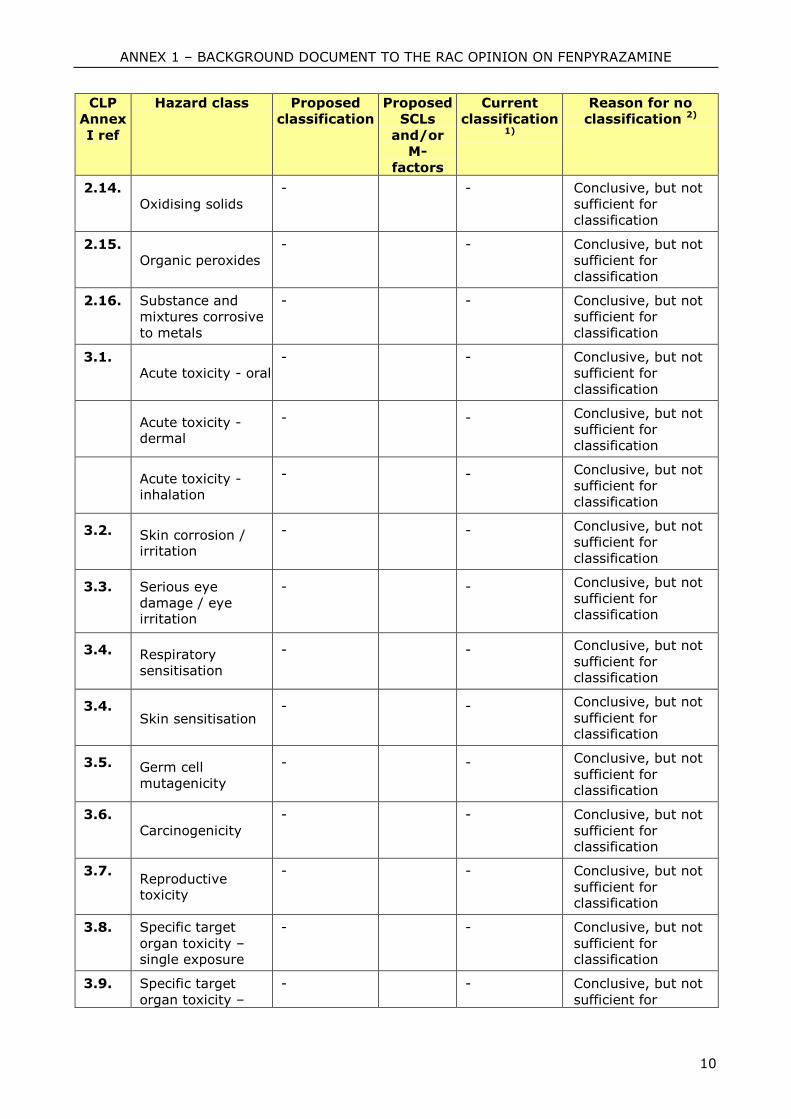
CLP
Annex
I ref
Hazard class Proposed
classification
Proposed
SCLs
and/or
M-
factors
Current
classification 1)
Reason for no
classification 2)
2.14.
Oxidising solids
- - Conclusive, but not
sufficient for
classification
2.15.
Organic peroxides
- - Conclusive, but not
sufficient for
classification
2.16. Substance and
mixtures corrosive
to metals
- - Conclusive, but not
sufficient for
classification
3.1.
Acute toxicity - oral
- - Conclusive, but not
sufficient for
classification
Acute toxicity - dermal
- - Conclusive, but not
sufficient for
classification
Acute toxicity - inhalation
- - Conclusive, but not
sufficient for
classification
3.2. Skin corrosion / irritation
- - Conclusive, but not
sufficient for
classification
3.3. Serious eye
damage / eye irritation
- - Conclusive, but not
sufficient for
classification
3.4. Respiratory
sensitisation
- - Conclusive, but not
sufficient for classification
3.4. Skin sensitisation
- - Conclusive, but not
sufficient for classification
3.5. Germ cell
mutagenicity
- - Conclusive, but not
sufficient for classification
3.6.
Carcinogenicity
- - Conclusive, but not
sufficient for classification
3.7. Reproductive toxicity
- - Conclusive, but not
sufficient for classification
3.8. Specific target
organ toxicity –single exposure
- - Conclusive, but not
sufficient for classification
3.9. Specific target
organ toxicity –
- - Conclusive, but not
sufficient for
ANNEX 1 – BACKGROUND DOCUMENT TO THE RAC OPINION ON FENPYRAZAMINE
11
CLP
Annex
I ref
Hazard class Proposed
classification
Proposed
SCLs
and/or
M-
factors
Current
classification 1)
Reason for no
classification 2)
repeated exposure classification
3.10.
Aspiration hazard
- - Conclusive, but not
sufficient for
classification
4.1. Hazardous to the
aquatic
environment
H411, P273, P391, P501
- -
5.1. Hazardous to the
ozone layer
- - Conclusive, but not
sufficient for
classification
1) Including specific concentration limits (SCLs) and M-factors
2) Data lacking, inconclusive, or conclusive but not sufficient for classification
Labelling: Signal word: -
Pictogram: GHS9
Hazard statements: H411
Precautionary statements: P273, P391, P501
Proposed notes assigned to an entry:
ANNEX 1 – BACKGROUND DOCUMENT TO THE RAC OPINION ON FENPYRAZAMINE
12
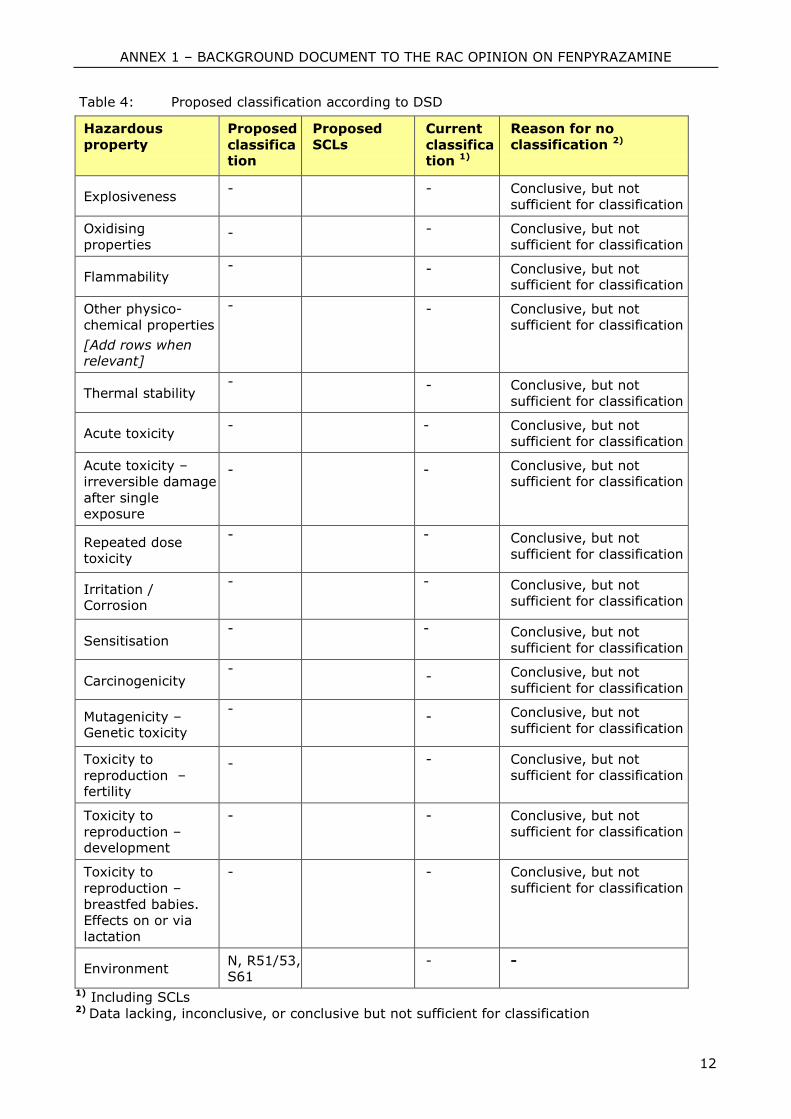
Table 4: Proposed classification according to DSD
Hazardous
property
Proposed
classification
Proposed
SCLs
Current
classification 1)
Reason for no
classification 2)
Explosiveness - - Conclusive, but not
sufficient for classification
Oxidising
properties - - Conclusive, but not
sufficient for classification
Flammability - - Conclusive, but not
sufficient for classification
Other physico-
chemical properties
[Add rows when relevant]
- - Conclusive, but not
sufficient for classification
Thermal stability - - Conclusive, but not
sufficient for classification
Acute toxicity - - Conclusive, but not
sufficient for classification
Acute toxicity –
irreversible damage
after single exposure
- - Conclusive, but not sufficient for classification
Repeated dose toxicity
-
- Conclusive, but not
sufficient for classification
Irritation / Corrosion
-
- Conclusive, but not
sufficient for classification
Sensitisation -
- Conclusive, but not
sufficient for classification
Carcinogenicity -
- Conclusive, but not
sufficient for classification
Mutagenicity – Genetic toxicity
- - Conclusive, but not
sufficient for classification
Toxicity to
reproduction – fertility
- - Conclusive, but not
sufficient for classification
Toxicity to
reproduction – development
- - Conclusive, but not
sufficient for classification
Toxicity to
reproduction –
breastfed babies.
Effects on or via
lactation
- - Conclusive, but not
sufficient for classification
Environment N, R51/53, S61
- -
1) Including SCLs 2) Data lacking, inconclusive, or conclusive but not sufficient for classification

ANNEX 1 – BACKGROUND DOCUMENT TO THE RAC OPINION ON FENPYRAZAMINE
13
Labelling: Indication of danger: N, Dangerous for the environment
R-phrases: R51/53
S-phrases: S61
ANNEX 1 – BACKGROUND DOCUMENT TO THE RAC OPINION ON FENPYRAZAMINE
14
2 BACKGROUND TO THE CLH PROPOSAL
2.1 History of the previous classification and labelling
Fenpyrazamine has not yet been approved for Annex I under Council Directive 91/414/EEC
(new active substance), with Austria as Rapporteur Member State. The open issues in the
European peer-review of fenpyrazamine (not relevant for classification and labelling)
considering mammalian toxicology were discussed in an expert meeting (PRAPeR) end of
September 2011; the EFSA (European Food Safety Authority) conclusion on the substance is
expected in 2012. The experts did not discuss C&L of fenpyrazamine.
In accordance with Article 36(2) of the CLP Regulation, fenpyrazamine should be considered
for harmonised classification and labelling (including the criteria of the 2nd ATP). Therefore, this
proposal considers all physico-chemical, human health and environmental end points. This
Annex VI dossier presents a classification and labelling proposal based mainly on the
information presented in the assessment of fenpyrazamine under Directive 91/414/EEC. The
assessment made under that Directive is attached to the IUCLID 5 dossier. No other
registration dossiers are available for fenpyrazamine at time of the submission of the revised
CLH report.
Fenpyrazamine is not listed on Annex VI of the CLP Regulation This proposal seeks for
classification for environment. No classification is required for human health and physico-
chemical properties.
2.2 Short summary of the scientific justification for the CLH proposal
For Fenpyrazamine, no classification and labelling has been proposed regarding physical and
chemical properties and human health.
Justification for the proposal with respect to environmental effects:
The classification and labelling of the active substance Fenpyrazamine is based on the toxicity
to fish (Oncorhynchus mykiss, LC50 = 5.2 mg/L, Cafarella, 2006a) and the fact that the active
substance is not rapidly biodegradable (Lewis, C.J. & Troth, K., 2007). The log Pow of
fenpyrazamine is 3.52 (Lentz, N.R., 2005b).
Combing all these criteria for classification with respect to environmental effects, according to
Directive 67/548/EEC, R51/53, Toxic to aquatic organisms, may cause long-term adverse
effects in the aquatic environment and according to Regulation 1272/2008, H411, Toxic to
aquatic life with long lasting effects, is proposed for Fenpyrazamine.
2.3 Current harmonised classification and labelling
2.3.1 Current classification and labelling in Annex VI, Table 3.1 in the CLP
Regulation
No current entry in Annex VI, Table 3.1 in the CLP Regulation.
2.3.2 Current classification and labelling in Annex VI, Table 3.2 in the CLP
Regulation
No current entry in Annex VI, Table 3.2 in the CLP Regulation.
ANNEX 1 – BACKGROUND DOCUMENT TO THE RAC OPINION ON FENPYRAZAMINE
15
2.4 Current self-classification and labelling
2.4.1 Current self-classification and labelling based on the CLP Regulation criteria
No current self-classification based on the CLP Regulation criteria.
2.4.2 Current self-classification and labelling based on DSD criteria
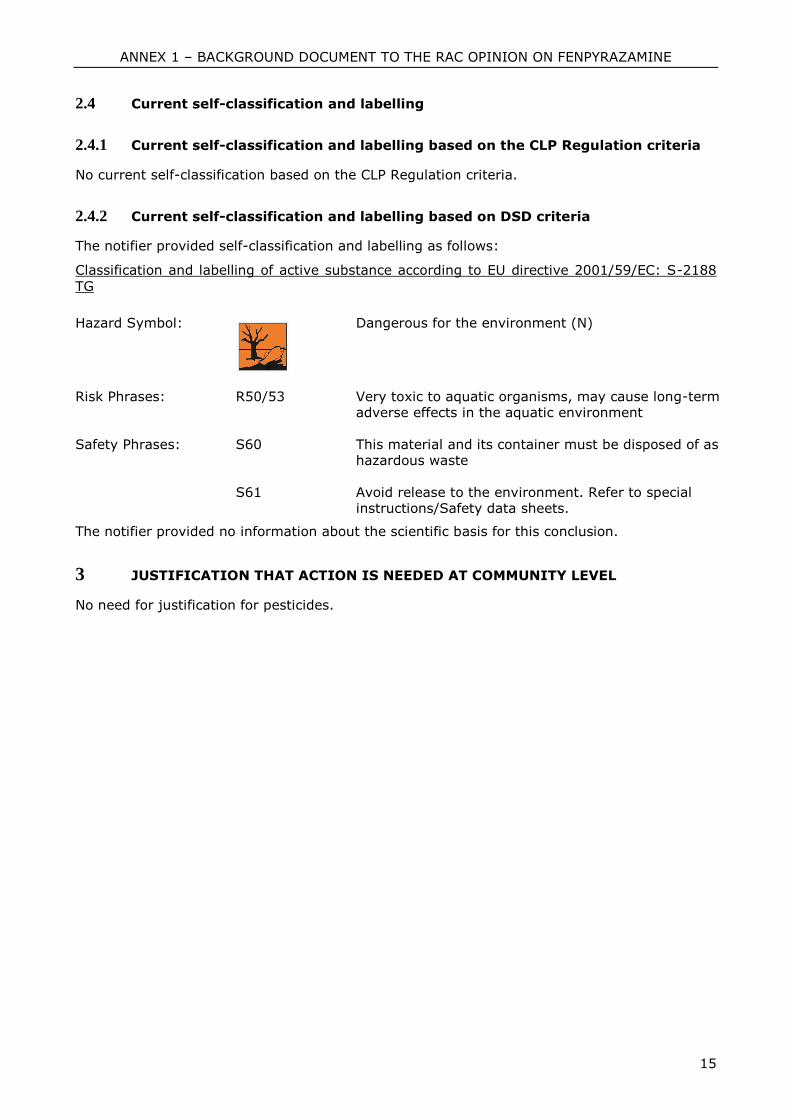
The notifier provided self-classification and labelling as follows:
Classification and labelling of active substance according to EU directive 2001/59/EC: S-2188
TG
The notifier provided no information about the scientific basis for this conclusion.
3 JUSTIFICATION THAT ACTION IS NEEDED AT COMMUNITY LEVEL
No need for justification for pesticides.
Hazard Symbol:
Dangerous for the environment (N)
Risk Phrases: R50/53 Very toxic to aquatic organisms, may cause long-term adverse effects in the aquatic environment
Safety Phrases: S60 S61
This material and its container must be disposed of as hazardous waste Avoid release to the environment. Refer to special instructions/Safety data sheets.
ANNEX 1 – BACKGROUND DOCUMENT TO THE RAC OPINION ON FENPYRAZAMINE
16
Part B.
SCIENTIFIC EVALUATION OF THE DATA
1 IDENTITY OF THE SUBSTANCE
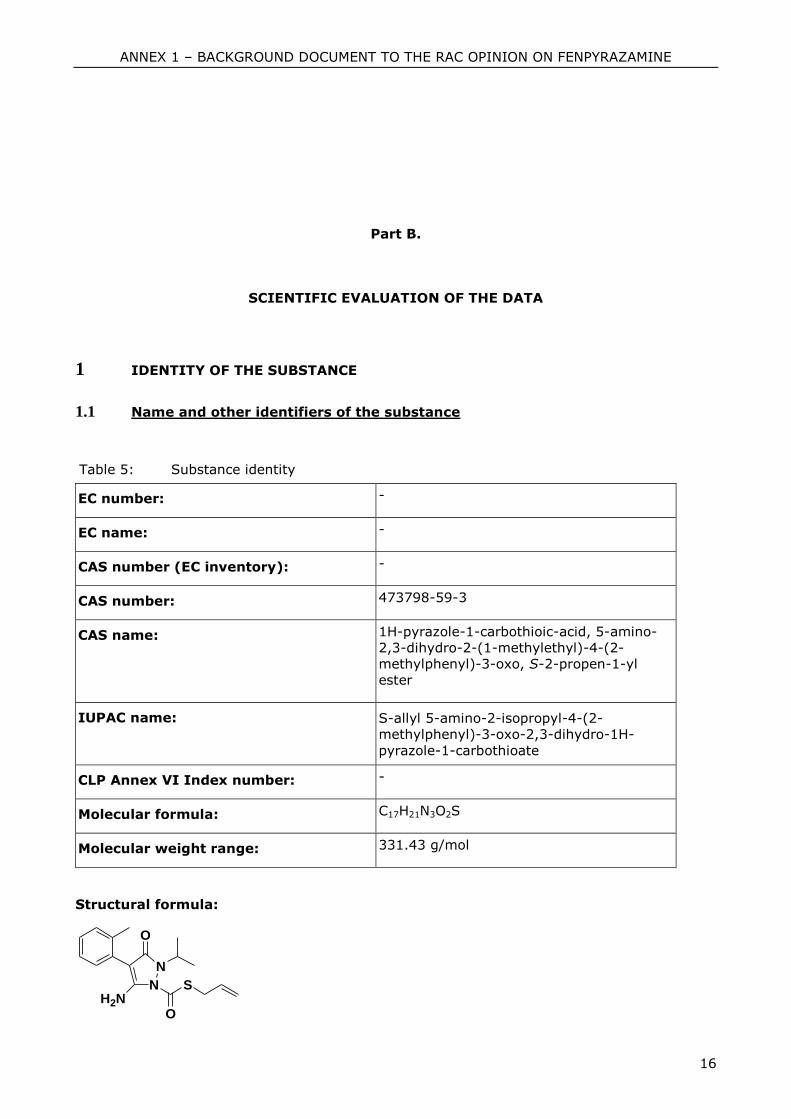
1.1 Name and other identifiers of the substance
Table 5: Substance identity
EC number: -
EC name: -
CAS number (EC inventory): -
CAS number: 473798-59-3
CAS name: 1H-pyrazole-1-carbothioic-acid, 5-amino-
2,3-dihydro-2-(1-methylethyl)-4-(2-
methylphenyl)-3-oxo, S-2-propen-1-yl
ester
IUPAC name: S-allyl 5-amino-2-isopropyl-4-(2-
methylphenyl)-3-oxo-2,3-dihydro-1H-
pyrazole-1-carbothioate
CLP Annex VI Index number: -
Molecular formula: C17H21N3O2S
Molecular weight range: 331.43 g/mol
Structural formula:
N
N
H2N
O
S
O
ANNEX 1 – BACKGROUND DOCUMENT TO THE RAC OPINION ON FENPYRAZAMINE
17
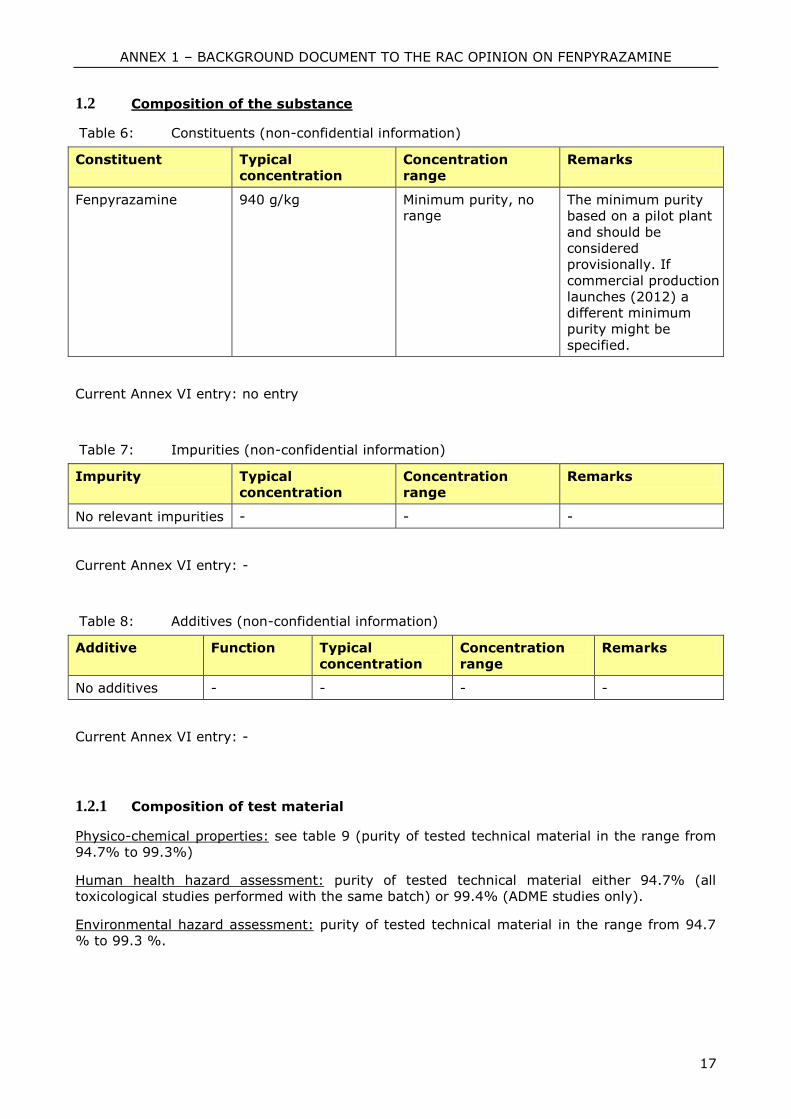
1.2 Composition of the substance
Table 6: Constituents (non-confidential information)
Constituent Typical
concentration
Concentration
range
Remarks
Fenpyrazamine 940 g/kg Minimum purity, no range
The minimum purity
based on a pilot plant
and should be
considered
provisionally. If
commercial production
launches (2012) a
different minimum
purity might be
specified.
Current Annex VI entry: no entry
Table 7: Impurities (non-confidential information)
Impurity Typical
concentration
Concentration
range
Remarks
No relevant impurities - - -
Current Annex VI entry: -
Table 8: Additives (non-confidential information)
Additive Function Typical
concentration
Concentration
range
Remarks
No additives - - - -
Current Annex VI entry: -
1.2.1 Composition of test material
Physico-chemical properties: see table 9 (purity of tested technical material in the range from
94.7% to 99.3%)
Human health hazard assessment: purity of tested technical material either 94.7% (all
toxicological studies performed with the same batch) or 99.4% (ADME studies only).
Environmental hazard assessment: purity of tested technical material in the range from 94.7
% to 99.3 %.
ANNEX 1 – BACKGROUND DOCUMENT TO THE RAC OPINION ON FENPYRAZAMINE
18
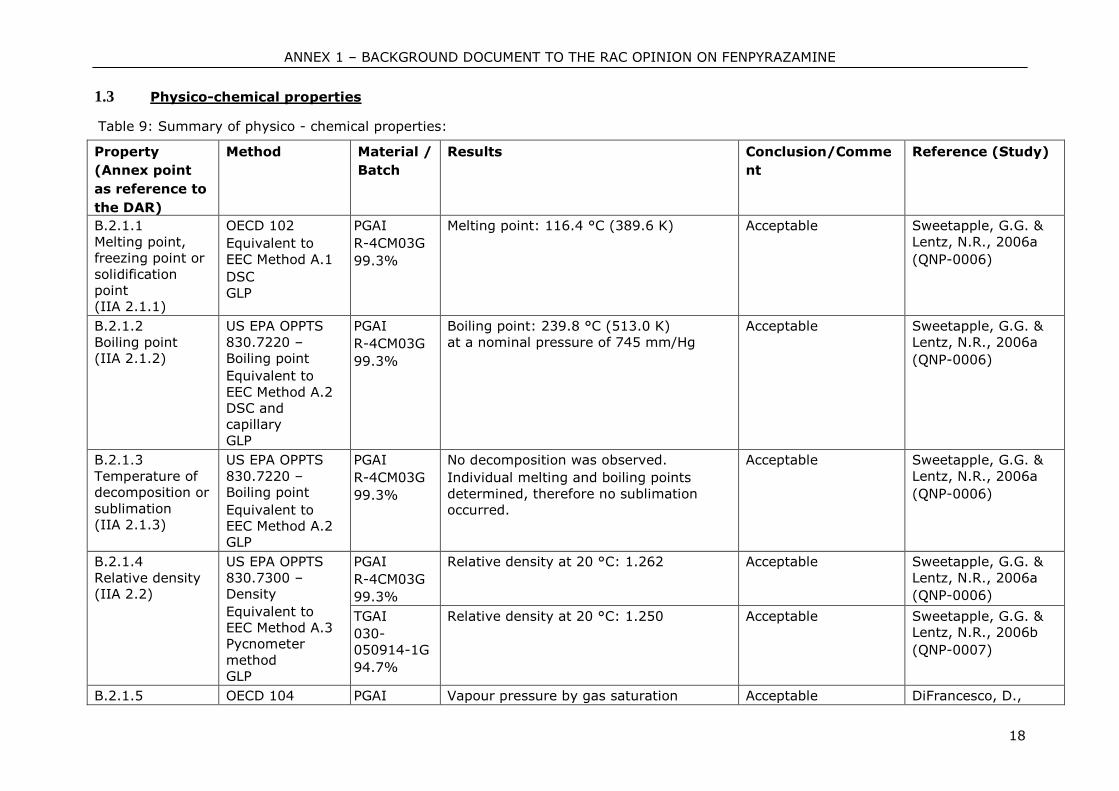
1.3 Physico-chemical properties
Table 9: Summary of physico - chemical properties:
Property
(Annex point
as reference to
the DAR)
Method Material /
Batch
Results Conclusion/Comme
nt
Reference (Study)
B.2.1.1
Melting point,
freezing point or
solidification
point
(IIA 2.1.1)
OECD 102
Equivalent to
EEC Method A.1
DSC
GLP
PGAI
R-4CM03G
99.3%
Melting point: 116.4 °C (389.6 K) Acceptable Sweetapple, G.G. &
Lentz, N.R., 2006a
(QNP-0006)
B.2.1.2
Boiling point
(IIA 2.1.2)
US EPA OPPTS
830.7220 –
Boiling point
Equivalent to
EEC Method A.2
DSC and
capillary
GLP
PGAI
R-4CM03G
99.3%
Boiling point: 239.8 °C (513.0 K)
at a nominal pressure of 745 mm/Hg
Acceptable Sweetapple, G.G. &
Lentz, N.R., 2006a
(QNP-0006)
B.2.1.3
Temperature of
decomposition or
sublimation
(IIA 2.1.3)
US EPA OPPTS
830.7220 –
Boiling point
Equivalent to
EEC Method A.2
GLP
PGAI
R-4CM03G
99.3%
No decomposition was observed.
Individual melting and boiling points
determined, therefore no sublimation
occurred.
Acceptable Sweetapple, G.G. &
Lentz, N.R., 2006a
(QNP-0006)
B.2.1.4
Relative density
(IIA 2.2)
US EPA OPPTS
830.7300 –
Density
Equivalent to
EEC Method A.3
Pycnometer
method
GLP
PGAI
R-4CM03G
99.3%
Relative density at 20 °C: 1.262 Acceptable Sweetapple, G.G. &
Lentz, N.R., 2006a
(QNP-0006)
TGAI
030-
050914-1G
94.7%
Relative density at 20 °C: 1.250 Acceptable Sweetapple, G.G. &
Lentz, N.R., 2006b
(QNP-0007)
B.2.1.5 OECD 104 PGAI Vapour pressure by gas saturation Acceptable DiFrancesco, D.,
ANNEX 1 – BACKGROUND DOCUMENT TO THE RAC OPINION ON FENPYRAZAMINE
19
Property
(Annex point
as reference to
the DAR)
Method Material /
Batch
Results Conclusion/Comme
nt
Reference (Study)
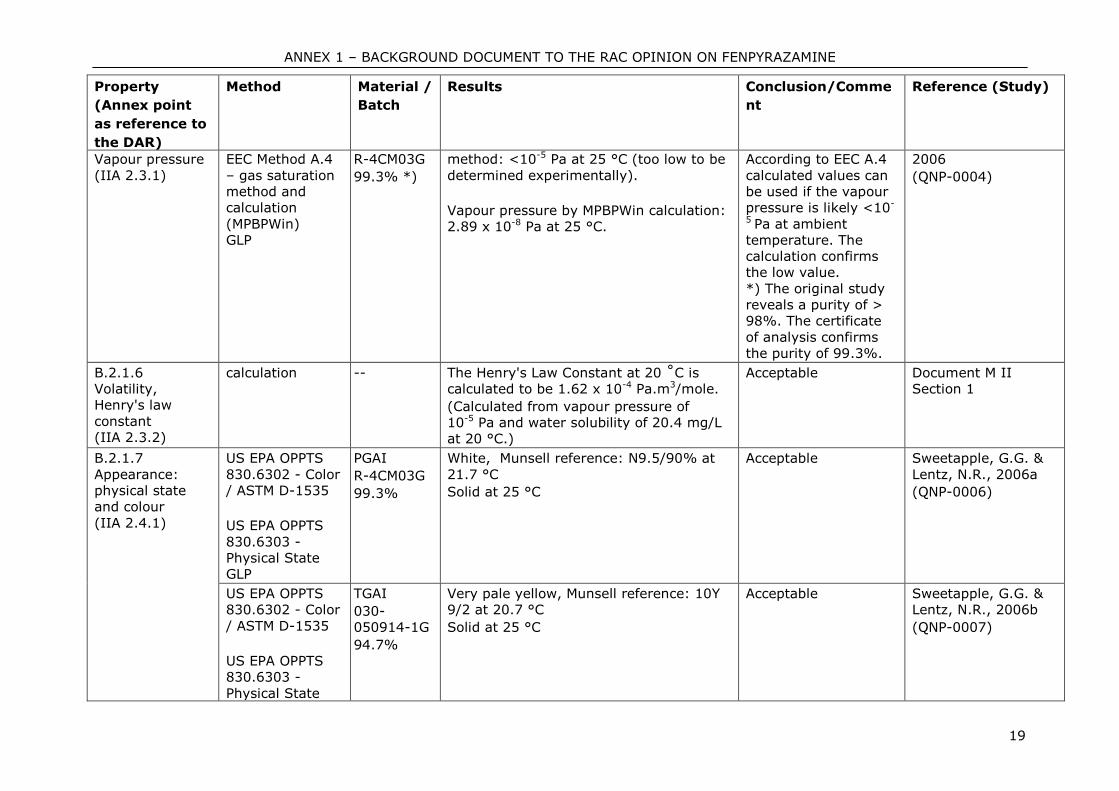
Vapour pressure
(IIA 2.3.1)
EEC Method A.4
– gas saturation
method and
calculation
(MPBPWin)
GLP
R-4CM03G
99.3% *)
method: <10-5 Pa at 25 °C (too low to be
determined experimentally).
Vapour pressure by MPBPWin calculation:
2.89 x 10⁻⁸ Pa at 25 °C.
According to EEC A.4
calculated values can
be used if the vapour
pressure is likely <10-
5 Pa at ambient
temperature. The
calculation confirms
the low value.
*) The original study
reveals a purity of >
98%. The certificate
of analysis confirms
the purity of 99.3%.
2006
(QNP-0004)
B.2.1.6
Volatility,
Henry's law
constant
(IIA 2.3.2)
calculation -- The Henry's Law Constant at 20 ˚C is
calculated to be 1.62 x 10⁻⁴ Pa.m3/mole.
(Calculated from vapour pressure of
10-5 Pa and water solubility of 20.4 mg/L
at 20 °C.)
Acceptable Document M II
Section 1
B.2.1.7
Appearance:
physical state
and colour
(IIA 2.4.1)
US EPA OPPTS
830.6302 - Color
/ ASTM D-1535
US EPA OPPTS
830.6303 -
Physical State
GLP
PGAI
R-4CM03G
99.3%
White, Munsell reference: N9.5/90% at
21.7 °C
Solid at 25 °C
Acceptable Sweetapple, G.G. &
Lentz, N.R., 2006a
(QNP-0006)
US EPA OPPTS
830.6302 - Color
/ ASTM D-1535
US EPA OPPTS
830.6303 -
Physical State
TGAI
030-
050914-1G
94.7%
Very pale yellow, Munsell reference: 10Y
9/2 at 20.7 °C
Solid at 25 °C
Acceptable Sweetapple, G.G. &
Lentz, N.R., 2006b
(QNP-0007)
ANNEX 1 – BACKGROUND DOCUMENT TO THE RAC OPINION ON FENPYRAZAMINE
20
Property
(Annex point
as reference to
the DAR)
Method Material /
Batch
Results Conclusion/Comme
nt
Reference (Study)
GLP
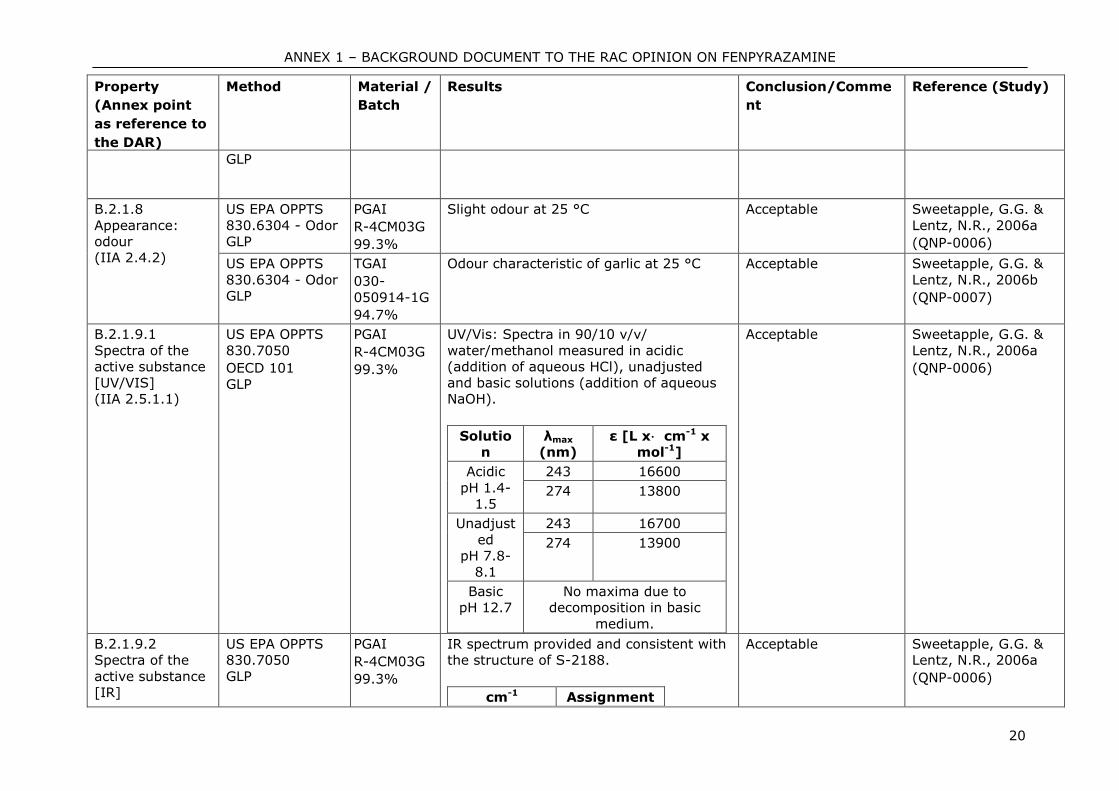
B.2.1.8
Appearance:
odour
(IIA 2.4.2)
US EPA OPPTS
830.6304 - Odor
GLP
PGAI
R-4CM03G
99.3%
Slight odour at 25 °C Acceptable Sweetapple, G.G. &
Lentz, N.R., 2006a
(QNP-0006)
US EPA OPPTS
830.6304 - Odor
GLP
TGAI
030-
050914-1G
94.7%
Odour characteristic of garlic at 25 °C Acceptable Sweetapple, G.G. &
Lentz, N.R., 2006b
(QNP-0007)
B.2.1.9.1
Spectra of the
active substance
[UV/VIS]
(IIA 2.5.1.1)
US EPA OPPTS
830.7050
OECD 101
GLP
PGAI
R-4CM03G
99.3%
UV/Vis: Spectra in 90/10 v/v/
water/methanol measured in acidic
(addition of aqueous HCl), unadjusted
and basic solutions (addition of aqueous
NaOH).
Solutio
n
λmax
(nm)
ε [L x⋅ cm-1 x
mol-1]
Acidic
pH 1.4-
1.5
243 16600
274 13800
Unadjust
ed
pH 7.8-
8.1
243 16700
274 13900
Basic
pH 12.7
No maxima due to
decomposition in basic
medium.
Acceptable Sweetapple, G.G. &
Lentz, N.R., 2006a
(QNP-0006)
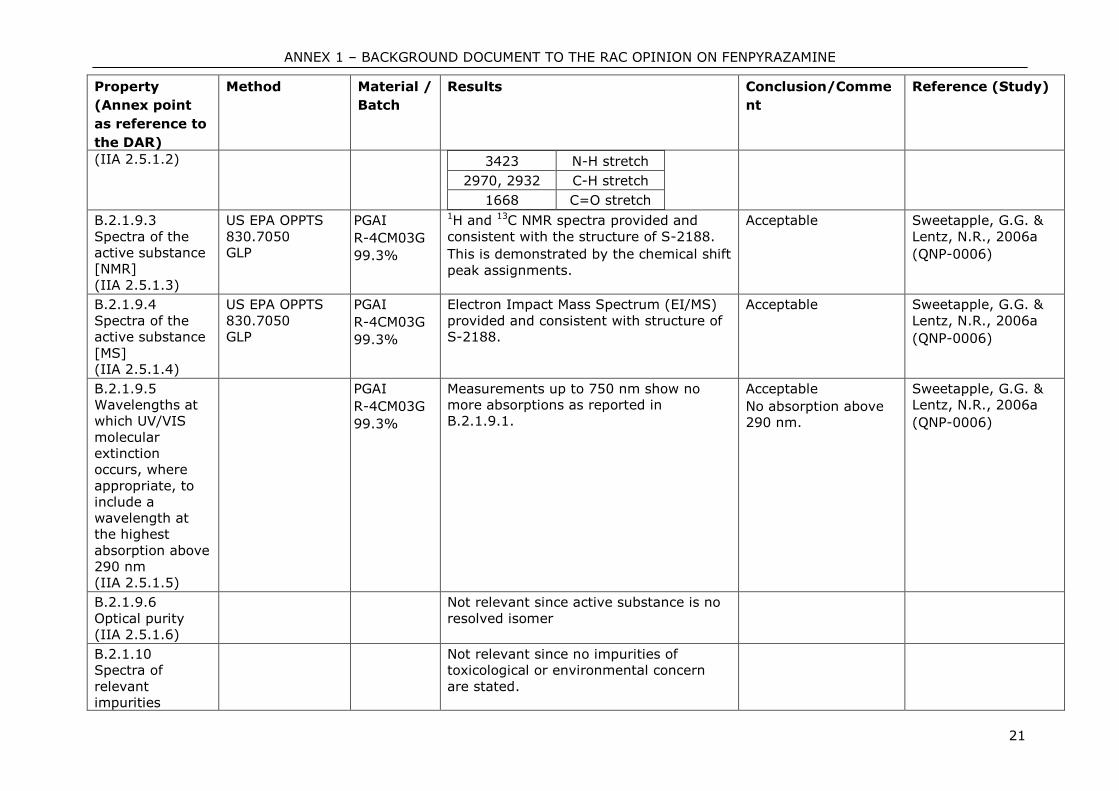
B.2.1.9.2
Spectra of the
active substance
[IR]
US EPA OPPTS
830.7050
GLP
PGAI
R-4CM03G
99.3%
IR spectrum provided and consistent with
the structure of S-2188.
cm-1 Assignment
Acceptable Sweetapple, G.G. &
Lentz, N.R., 2006a
(QNP-0006)
ANNEX 1 – BACKGROUND DOCUMENT TO THE RAC OPINION ON FENPYRAZAMINE
21
Property
(Annex point
as reference to
the DAR)
Method Material /
Batch
Results Conclusion/Comme
nt
Reference (Study)
(IIA 2.5.1.2) 3423 N-H stretch
2970, 2932 C-H stretch
1668 C=O stretch
B.2.1.9.3
Spectra of the
active substance
[NMR]
(IIA 2.5.1.3)
US EPA OPPTS
830.7050
GLP
PGAI
R-4CM03G
99.3%
1H and 13C NMR spectra provided and
consistent with the structure of S-2188.
This is demonstrated by the chemical shift
peak assignments.
Acceptable Sweetapple, G.G. &
Lentz, N.R., 2006a
(QNP-0006)
B.2.1.9.4
Spectra of the
active substance
[MS]
(IIA 2.5.1.4)
US EPA OPPTS
830.7050
GLP
PGAI
R-4CM03G
99.3%
Electron Impact Mass Spectrum (EI/MS)
provided and consistent with structure of
S-2188.
Acceptable Sweetapple, G.G. &
Lentz, N.R., 2006a
(QNP-0006)
B.2.1.9.5
Wavelengths at
which UV/VIS
molecular
extinction
occurs, where
appropriate, to
include a
wavelength at
the highest
absorption above
290 nm
(IIA 2.5.1.5)
PGAI
R-4CM03G
99.3%
Measurements up to 750 nm show no
more absorptions as reported in
B.2.1.9.1.
Acceptable
No absorption above
290 nm.
Sweetapple, G.G. &
Lentz, N.R., 2006a
(QNP-0006)
B.2.1.9.6
Optical purity
(IIA 2.5.1.6)
Not relevant since active substance is no
resolved isomer
B.2.1.10
Spectra of
relevant
impurities
Not relevant since no impurities of
toxicological or environmental concern
are stated.
ANNEX 1 – BACKGROUND DOCUMENT TO THE RAC OPINION ON FENPYRAZAMINE
22
Property
(Annex point
as reference to
the DAR)
Method Material /
Batch
Results Conclusion/Comme
nt
Reference (Study)
(IIA 2.5.2)
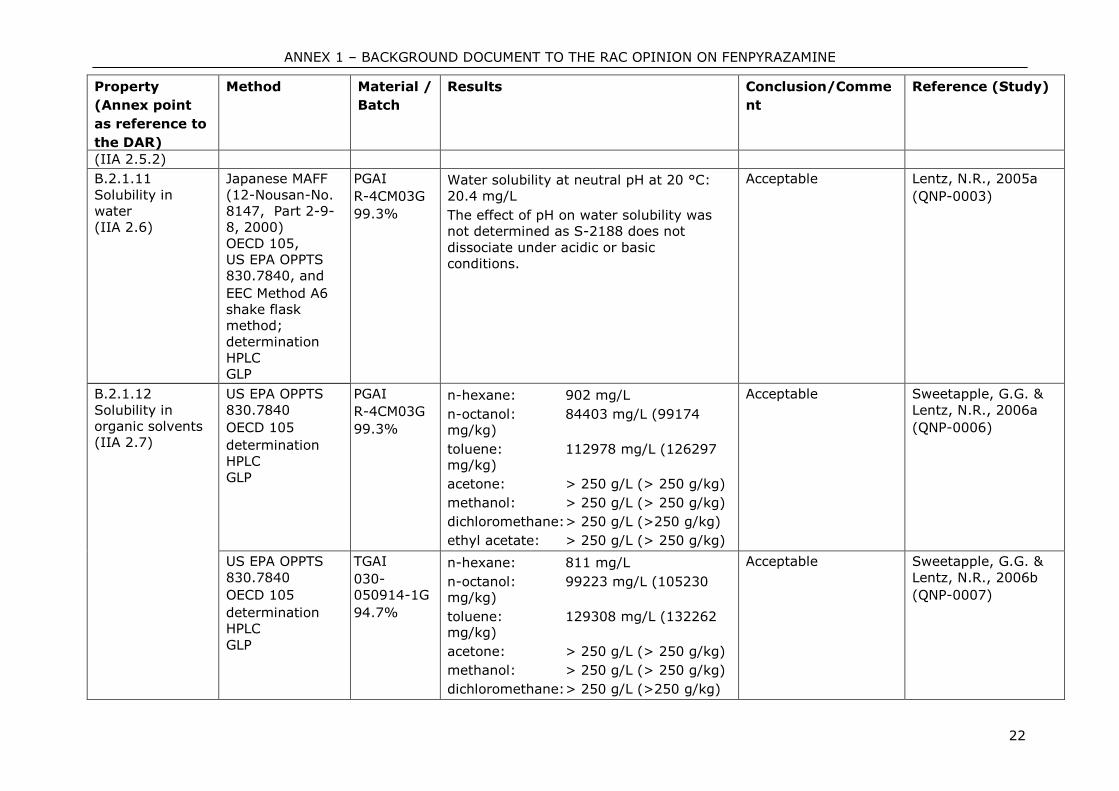
B.2.1.11
Solubility in
water
(IIA 2.6)
Japanese MAFF
(12-Nousan-No.
8147, Part 2-9-
8, 2000)
OECD 105,
US EPA OPPTS
830.7840, and
EEC Method A6
shake flask
method;
determination
HPLC
GLP
PGAI
R-4CM03G
99.3%
Water solubility at neutral pH at 20 °C:
20.4 mg/L
The effect of pH on water solubility was
not determined as S-2188 does not
dissociate under acidic or basic
conditions.
Acceptable Lentz, N.R., 2005a
(QNP-0003)
B.2.1.12
Solubility in
organic solvents
(IIA 2.7)
US EPA OPPTS
830.7840
OECD 105
determination
HPLC
GLP
PGAI
R-4CM03G
99.3%
n-hexane: 902 mg/L
n-octanol: 84403 mg/L (99174 mg/kg)
toluene: 112978 mg/L (126297 mg/kg)
acetone: > 250 g/L (> 250 g/kg)
methanol: > 250 g/L (> 250 g/kg)
dichloromethane: > 250 g/L (>250 g/kg)
ethyl acetate: > 250 g/L (> 250 g/kg)
Acceptable Sweetapple, G.G. &
Lentz, N.R., 2006a
(QNP-0006)
US EPA OPPTS
830.7840
OECD 105
determination
HPLC
GLP
TGAI
030-
050914-1G
94.7%
n-hexane: 811 mg/L
n-octanol: 99223 mg/L (105230 mg/kg)
toluene: 129308 mg/L (132262 mg/kg)
acetone: > 250 g/L (> 250 g/kg)
methanol: > 250 g/L (> 250 g/kg)
dichloromethane: > 250 g/L (>250 g/kg)
Acceptable Sweetapple, G.G. &
Lentz, N.R., 2006b
(QNP-0007)
ANNEX 1 – BACKGROUND DOCUMENT TO THE RAC OPINION ON FENPYRAZAMINE
23
Property
(Annex point
as reference to
the DAR)
Method Material /
Batch
Results Conclusion/Comme
nt
Reference (Study)
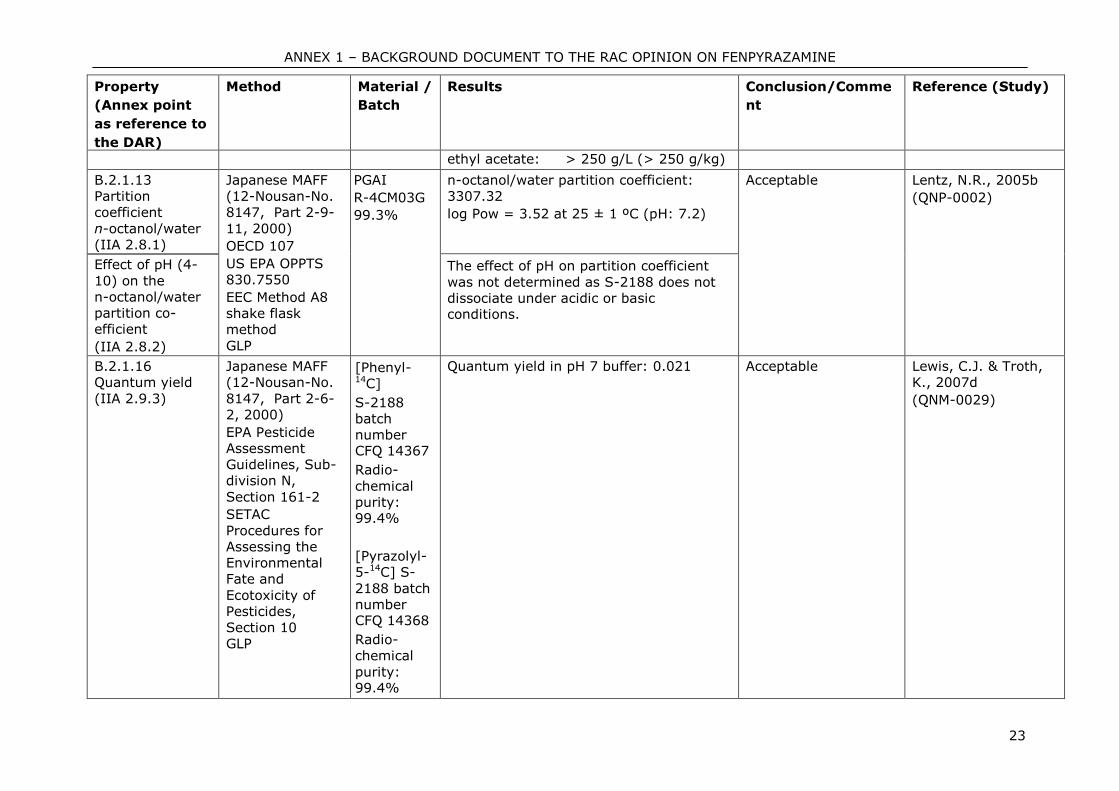
ethyl acetate: > 250 g/L (> 250 g/kg)
B.2.1.13
Partition
coefficient
n-octanol/water
(IIA 2.8.1)
Japanese MAFF
(12-Nousan-No.
8147, Part 2-9-
11, 2000)
OECD 107
US EPA OPPTS
830.7550
EEC Method A8
shake flask
method
GLP
PGAI
R-4CM03G
99.3%
n-octanol/water partition coefficient:
3307.32
log Pow = 3.52 at 25 ± 1 ºC (pH: 7.2)
Acceptable Lentz, N.R., 2005b
(QNP-0002)
Effect of pH (4-
10) on the
n-octanol/water
partition co-
efficient
(IIA 2.8.2)
The effect of pH on partition coefficient
was not determined as S-2188 does not
dissociate under acidic or basic conditions.
B.2.1.16
Quantum yield
(IIA 2.9.3)
Japanese MAFF
(12-Nousan-No.
8147, Part 2-6-
2, 2000)
EPA Pesticide
Assessment
Guidelines, Sub-
division N,
Section 161-2
SETAC
Procedures for
Assessing the
Environmental
Fate and
Ecotoxicity of
Pesticides,
Section 10
GLP
[Phenyl-14C]
S-2188
batch
number CFQ 14367
Radio-
chemical
purity: 99.4%
[Pyrazolyl-
5-14C] S-
2188 batch
number CFQ 14368
Radio-
chemical
purity: 99.4%
Quantum yield in pH 7 buffer: 0.021 Acceptable Lewis, C.J. & Troth,
K., 2007d
(QNM-0029)
ANNEX 1 – BACKGROUND DOCUMENT TO THE RAC OPINION ON FENPYRAZAMINE
24
Property
(Annex point
as reference to
the DAR)
Method Material /
Batch
Results Conclusion/Comme
nt
Reference (Study)
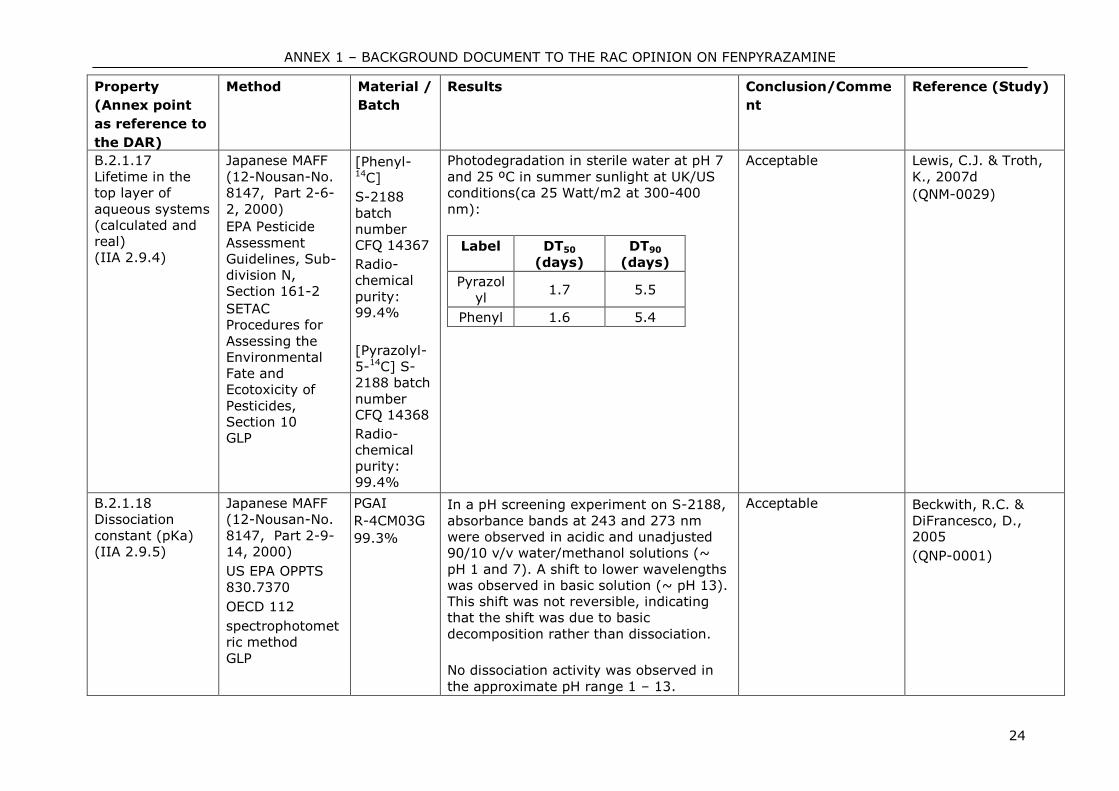
B.2.1.17
Lifetime in the
top layer of
aqueous systems
(calculated and
real)
(IIA 2.9.4)
Japanese MAFF
(12-Nousan-No.
8147, Part 2-6-
2, 2000)
EPA Pesticide
Assessment
Guidelines, Sub-
division N,
Section 161-2
SETAC
Procedures for
Assessing the
Environmental
Fate and
Ecotoxicity of
Pesticides,
Section 10
GLP
[Phenyl-14C]
S-2188
batch
number CFQ 14367
Radio-
chemical
purity: 99.4%
[Pyrazolyl-
5-14C] S-
2188 batch
number CFQ 14368
Radio-
chemical
purity:
99.4%
Photodegradation in sterile water at pH 7
and 25 ºC in summer sunlight at UK/US
conditions(ca 25 Watt/m2 at 300-400
nm):
Label DT50
(days)
DT90
(days)
Pyrazol
yl 1.7 5.5
Phenyl 1.6 5.4
Acceptable Lewis, C.J. & Troth,
K., 2007d
(QNM-0029)
B.2.1.18
Dissociation
constant (pKa)
(IIA 2.9.5)
Japanese MAFF
(12-Nousan-No.
8147, Part 2-9-
14, 2000)
US EPA OPPTS
830.7370
OECD 112
spectrophotomet
ric method
GLP
PGAI
R-4CM03G
99.3%
In a pH screening experiment on S-2188,
absorbance bands at 243 and 273 nm
were observed in acidic and unadjusted
90/10 v/v water/methanol solutions (~
pH 1 and 7). A shift to lower wavelengths
was observed in basic solution (~ pH 13).
This shift was not reversible, indicating
that the shift was due to basic
decomposition rather than dissociation.
No dissociation activity was observed in
the approximate pH range 1 – 13.
Acceptable Beckwith, R.C. &
DiFrancesco, D., 2005
(QNP-0001)
ANNEX 1 – BACKGROUND DOCUMENT TO THE RAC OPINION ON FENPYRAZAMINE
25
Property
(Annex point
as reference to
the DAR)
Method Material /
Batch
Results Conclusion/Comme
nt
Reference (Study)
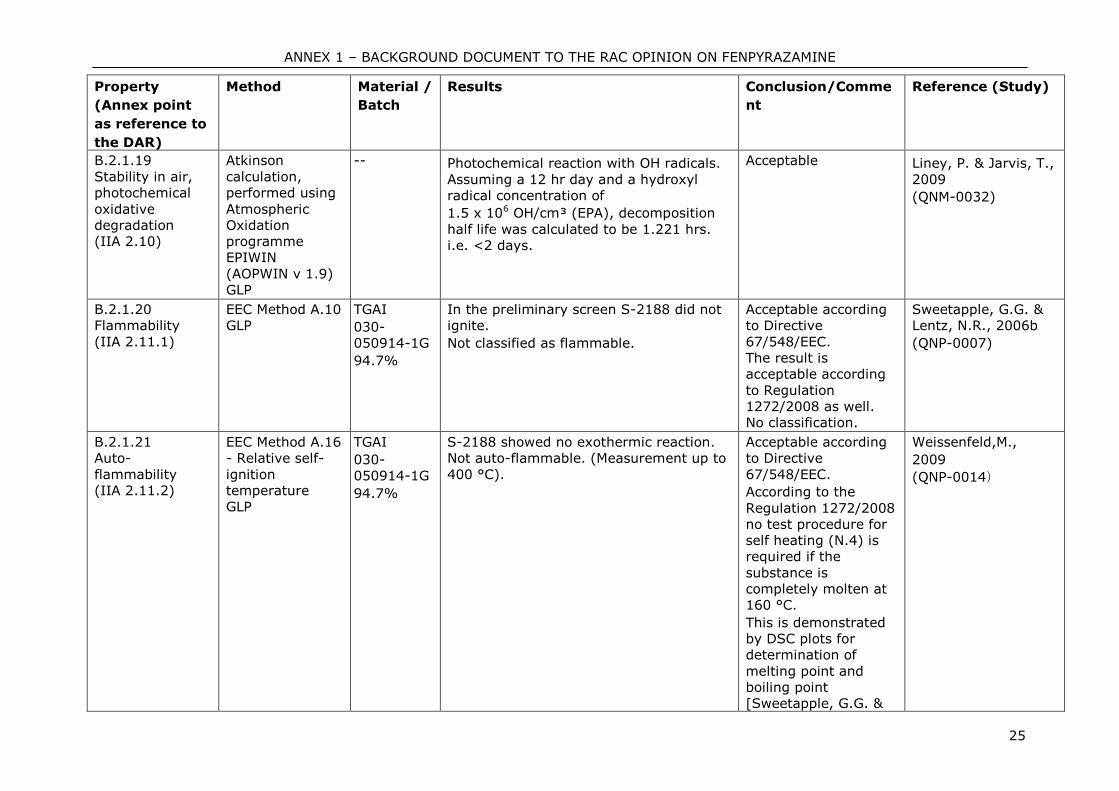
B.2.1.19
Stability in air,
photochemical
oxidative
degradation
(IIA 2.10)
Atkinson
calculation,
performed using
Atmospheric
Oxidation
programme
EPIWIN
(AOPWIN v 1.9)
GLP
-- Photochemical reaction with OH radicals.
Assuming a 12 hr day and a hydroxyl
radical concentration of
1.5 x 10⁶ OH/cm³ (EPA), decomposition
half life was calculated to be 1.221 hrs.
i.e. <2 days.
Acceptable Liney, P. & Jarvis, T.,
2009
(QNM-0032)
B.2.1.20
Flammability
(IIA 2.11.1)
EEC Method A.10
GLP
TGAI
030-
050914-1G
94.7%
In the preliminary screen S-2188 did not
ignite.
Not classified as flammable.
Acceptable according
to Directive
67/548/EEC.
The result is
acceptable according
to Regulation
1272/2008 as well.
No classification.
Sweetapple, G.G. &
Lentz, N.R., 2006b
(QNP-0007)
B.2.1.21
Auto-
flammability
(IIA 2.11.2)
EEC Method A.16
- Relative self-
ignition
temperature
GLP
TGAI
030-
050914-1G
94.7%
S-2188 showed no exothermic reaction.
Not auto-flammable. (Measurement up to
400 °C).
Acceptable according
to Directive
67/548/EEC.
According to the
Regulation 1272/2008
no test procedure for
self heating (N.4) is
required if the
substance is
completely molten at
160 °C.
This is demonstrated
by DSC plots for
determination of
melting point and
boiling point
[Sweetapple, G.G. &
Weissenfeld,M.,
2009
(QNP-0014)
ANNEX 1 – BACKGROUND DOCUMENT TO THE RAC OPINION ON FENPYRAZAMINE
26
Property
(Annex point
as reference to
the DAR)
Method Material /
Batch
Results Conclusion/Comme
nt
Reference (Study)
Lentz, N.R., 2006a
(QNP-0006)]
No classification.
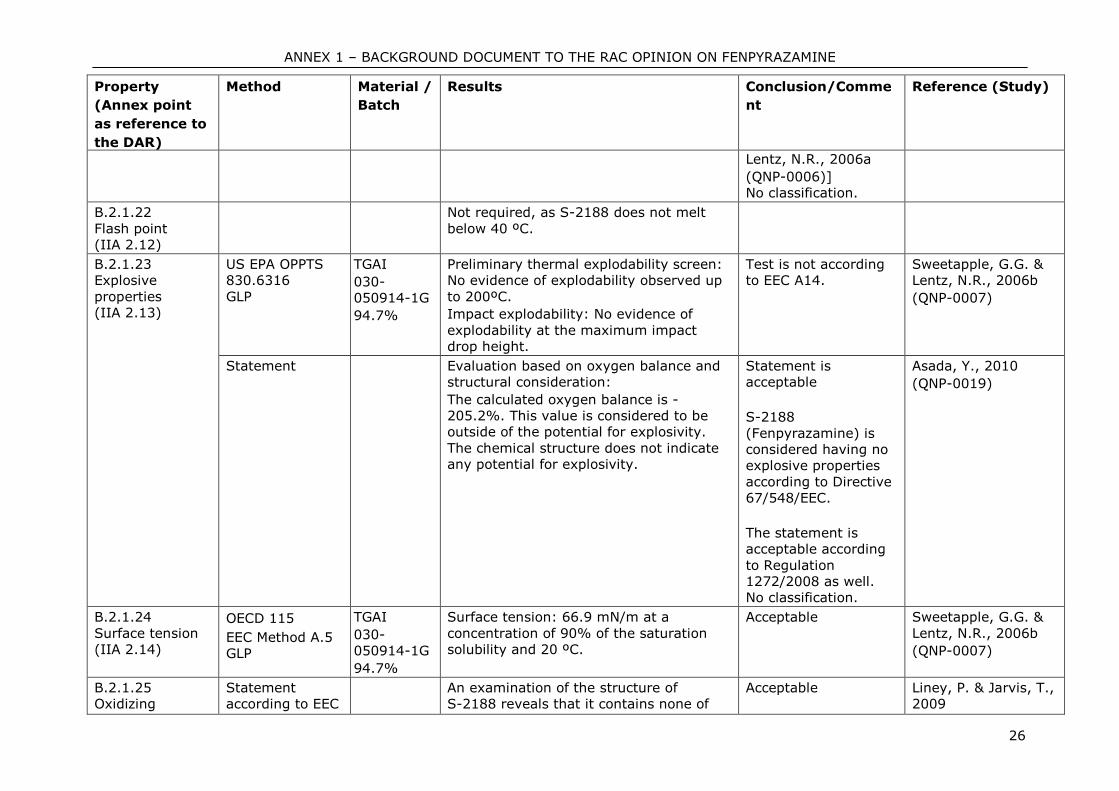
B.2.1.22
Flash point
(IIA 2.12)
Not required, as S-2188 does not melt
below 40 ºC.
B.2.1.23
Explosive
properties
(IIA 2.13)
US EPA OPPTS
830.6316
GLP
TGAI
030-
050914-1G
94.7%
Preliminary thermal explodability screen:
No evidence of explodability observed up
to 200ºC.
Impact explodability: No evidence of
explodability at the maximum impact
drop height.
Test is not according
to EEC A14.
Sweetapple, G.G. &
Lentz, N.R., 2006b
(QNP-0007)
Statement Evaluation based on oxygen balance and
structural consideration:
The calculated oxygen balance is -
205.2%. This value is considered to be
outside of the potential for explosivity.
The chemical structure does not indicate
any potential for explosivity.
Statement is
acceptable
S-2188
(Fenpyrazamine) is
considered having no
explosive properties
according to Directive
67/548/EEC.
The statement is
acceptable according
to Regulation
1272/2008 as well.
No classification.
Asada, Y., 2010
(QNP-0019)
B.2.1.24
Surface tension
(IIA 2.14)
OECD 115
EEC Method A.5
GLP
TGAI
030-
050914-1G
94.7%
Surface tension: 66.9 mN/m at a
concentration of 90% of the saturation
solubility and 20 ºC.
Acceptable Sweetapple, G.G. &
Lentz, N.R., 2006b
(QNP-0007)
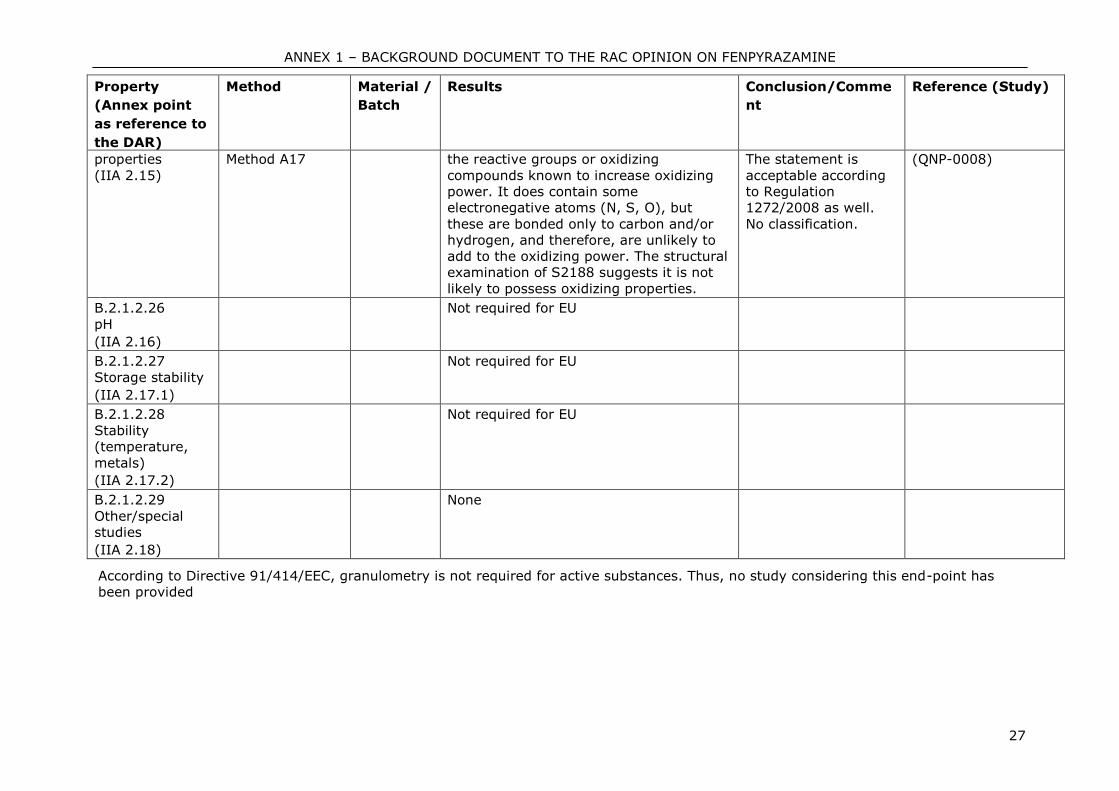
B.2.1.25
Oxidizing
Statement
according to EEC
An examination of the structure of
S-2188 reveals that it contains none of
Acceptable
Liney, P. & Jarvis, T.,
2009
ANNEX 1 – BACKGROUND DOCUMENT TO THE RAC OPINION ON FENPYRAZAMINE
27
Property
(Annex point
as reference to
the DAR)
Method Material /
Batch
Results Conclusion/Comme
nt
Reference (Study)
properties
(IIA 2.15)
Method A17 the reactive groups or oxidizing
compounds known to increase oxidizing
power. It does contain some
electronegative atoms (N, S, O), but
these are bonded only to carbon and/or
hydrogen, and therefore, are unlikely to
add to the oxidizing power. The structural
examination of S2188 suggests it is not
likely to possess oxidizing properties.
The statement is
acceptable according
to Regulation
1272/2008 as well.
No classification.
(QNP-0008)
B.2.1.2.26
pH
(IIA 2.16)
Not required for EU
B.2.1.2.27
Storage stability
(IIA 2.17.1)
Not required for EU
B.2.1.2.28
Stability
(temperature,
metals)
(IIA 2.17.2)
Not required for EU
B.2.1.2.29
Other/special
studies
(IIA 2.18)
None
According to Directive 91/414/EEC, granulometry is not required for active substances. Thus, no study considering this end-point has
been provided
ANNEX 1 – BACKGROUND DOCUMENT TO THE RAC OPINION ON FENPYRAZAMINE
28
2 MANUFACTURE AND USES
2.1 Manufacture
Not relevant for Classification and Labelling.
2.2 Identified uses
Fenpyrazamine is a fungicide to be used for control of grey mould (Botrytis). It is not
systemic but there is some translocation in plants. Fenpyrazamine shows its fungicidal
activity through inhibition on germ tube elongation and mycelium elongation. However, the
biochemical mechanism of fungicidal activity is not clarified to date.
ANNEX 1 – BACKGROUND DOCUMENT TO THE RAC OPINION ON FENPYRAZAMINE
29
3 CLASSIFICATION FOR PHYSICO-CHEMICAL PROPERTIES
No classification required.
4 HUMAN HEALTH HAZARD ASSESSMENT
Toxicokinetics (absorption, metabolism, distribution and elimination)
4.1.1 Non-human information
Absorption, distribution, excretion and metabolism (toxicokinetics):
Absorption and Excretion
Fenpyrazamine was rapidly absorbed and than rapidly eliminated after single oral
administration of 3 mg/kg body weight and 300 mg/kg body weight whereby the absorption
was more rapid at low than at high dose. Based on the toxicokinetic parameters investigated
(AUC), the systemic availability increased with dose level applied. Longer T½ and over
proportionally higher AUC at high dose might indicate that in the high dose animals the
saturation of elimination could be reached.
Absorption of fenpyrazamine was extensive, and fenpyrazamine was almost totally
metabolised after administration of single oral low and high dose. Excretion of the low dose
was almost complete within 24 hours and of the high dose within 48 hours. Urine was the
most important route of elimination (> 80% for males and females, at low or high doses),
and elimination as CO2 almost insignificant. In the repeated dose study recovery of
eliminated radioactivity in excreta after 24 days was 96.5% of administered dose in males
and 97.2% in females. The majority of radioactivity was recovered in urine (up to 78.7%)
and faeces (up to 13.6%). While the excretion up to last dose administration was high and
constant, it declined rapidly after the dosing was finished. After ceasing of administration,
only very low amounts of radioactivity were found in urine, cage wash and faeces. The
results of excretion (route of excretion and metabolite pattern) obtained in repeated dose
study were in line with those from single dose study. The amount of radioactivity found in
urine after single and repeated dose administration indicates a high resorption from GI tract.
Distribution
While after the administration of single oral low dose the highest radioactivity concentration
in most tissues was reached 1 hour post-dosing, in high dose animals the highest
concentration was reached 6 hours post-dosing. This is supported by the pharmacokinetic
study showing higher Tmax in blood/plasma of high dose animals compared to low dose. 7
days after administration of single oral low and high dose, the proportion of dose remaining
in tissues was very low. Distribution of radioactivity into tissues was very even. There was
no evidence of accumulation, with the exception of stomach and caecum (including contents)
which was considered unusual but was not further explained in the study report. There were
no significant dose or sex differences in tissue distribution. During repeated dosing the
concentration of radioactivity in most tissues maximised approximately up to day 7 and then
remained relatively constant for the rest of the dosing period. Tissue residues declined after
finishing of dosing period. As noticed in the single dose study, no evidence of unusual
ANNEX 1 – BACKGROUND DOCUMENT TO THE RAC OPINION ON FENPYRAZAMINE
30
accumulation into tissue and no sex differences were observed in the repeated dose study.
Metabolism
Regarding the metabolite pattern in plasma of low and high dose animals, there were some
differences in sex and doses after administration of single low and high dose. While S-2188-
DC was the major metabolite in both sexes (but much higher amount were measured in
females) and for both doses applied, the unknown metabolite “RT 31 min” was present at
high amounts in low dose males but was not quantified in low dose females, which may
indicate slightly different metabolite pattern in low dose males and females. For both sexes
and doses, the parent fenpyrazamine was minor in plasma at each time point. In high dose
animals the difference in metabolites occurrence and amount measured in males and
females was less pronounced. In repeated dose study, a mixture of S-2188-CH2OH-DC and
MPPZ was the major identified metabolite fraction in plasma of both males and females.
In liver of low and high dose animals after single exposure, additional unknown metabolites
occurred compared to plasma samples, but no identification was performed. These
unidentified metabolites made max. 30% and 17% in low dose males and females,
respectively and 13% and 15% in high dose males and females. In the repeated dose study,
parent fenpyrazamine was a major component in liver (max 9.6% of liver TRR).
The metabolite pattern of kidney was similar to that of liver. The results of plasma, liver and
kidney measurement indicate that there are differences between sexes in metabolic
degradation pathway of fenpyrazamine, as well as in metabolite pattern depending on the
dose applied.
In urine of animals in the repeated dose study, the relative amounts of identified metabolites
were similar for both sampling periods (days 2 to 4 and days 13 to 15) and both sexes. In
males, MPPZ sulphate and S-2188-CH2OH-DC contributed mostly to the identified
radioactivity in urine, while S-2188-DC was present < 10%. In urine of females, MPPZ, MPPZ
sulphate and S-2188-DC contributed evenly to the identified radioactivity. In the animals of
single low dose very similar pattern as in repeated dose study was observed. In single high
dose males and females S-2188-DC was by far the major component of excreta.
In faeces of animals in the repeated dose study S-2188-CH2OH-DC was the major metabolite
in males (max. 25.1%) and MPPZ (max. 26.6%) in females. MPPZ sulphate was not
identified in faeces, neither in males nor in females. Considerable radiolabel was
unextractable from faeces.
Elimination of the allylsulfanylcarbonyl group to produce S-2188-DC was the initial step in
metabolism. This metabolite was eliminated as a significant fraction in males and females at
high and low doses (particularly in females of the low dose). S-2188-DC was hydroxylised to
form S-2188-OH in only small amounts. Dealkylation of S-2188-DC to MPPZ was important
in both sexes at high and low doses. MPPZ was conjugated with sulphate and with
glucuronide (sulphation was more important at the low dose). The proportion of dose
identified as metabolites was satisfactory (> 68% in all groups), however the unknown
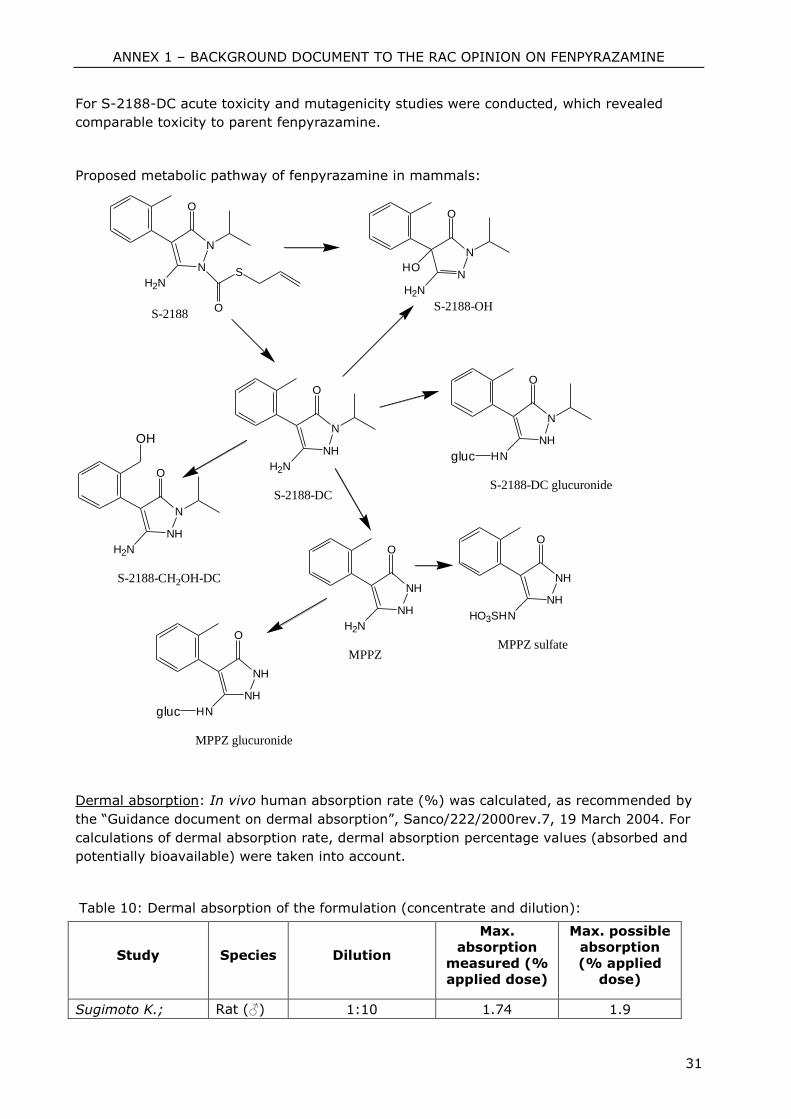
metabolites were not identified. The proposed metabolic pathway is shown in figure below.
Since the identified metabolites like MPPZ (including its conjugates), S-2188-DC and S-
2188-CH2OH-DC are present in rat metabolism > 10% of applied dose, these compounds are
considered to contribute to the toxicological profile of fenpyrazamine (parent). S-2188-OH
(hydoxylised S-2188-DC) is probably of comparable toxicity as the precursor S-2188-DC
since hydroxylation on the pyrazolyl ring might be considered to be a step of detoxification.
ANNEX 1 – BACKGROUND DOCUMENT TO THE RAC OPINION ON FENPYRAZAMINE
31
For S-2188-DC acute toxicity and mutagenicity studies were conducted, which revealed
comparable toxicity to parent fenpyrazamine.
Proposed metabolic pathway of fenpyrazamine in mammals:
N
N
O
SH2N
O
NH
N
H2N
O
S-2188
S-2188-DC
N
N
H2N
O
S-2188-OH
HO
NH
N
H2N
O
S-2188-CH2OH-DC
NH
NH
H2N
O
MPPZ
NH
NH
HO3SHN
O
MPPZ sulfate
NH
NH
HN
O
MPPZ glucuronide
NH
N
HN
O
S-2188-DC glucuronide
gluc
gluc
OH
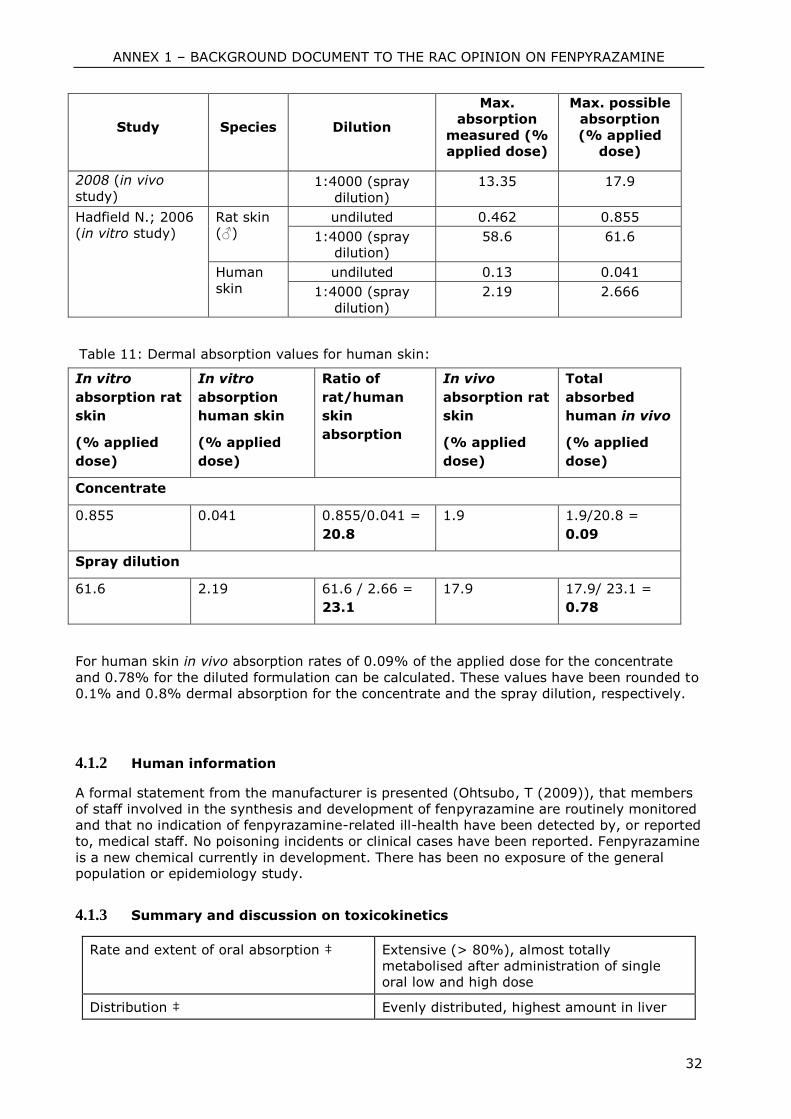
Dermal absorption: In vivo human absorption rate (%) was calculated, as recommended by
the “Guidance document on dermal absorption”, Sanco/222/2000rev.7, 19 March 2004. For
calculations of dermal absorption rate, dermal absorption percentage values (absorbed and
potentially bioavailable) were taken into account.
Table 10: Dermal absorption of the formulation (concentrate and dilution):
Study Species Dilution
Max.
absorption
measured (%
applied dose)
Max. possible
absorption
(% applied
dose)
Sugimoto K.; Rat (♂) 1:10 1.74 1.9
ANNEX 1 – BACKGROUND DOCUMENT TO THE RAC OPINION ON FENPYRAZAMINE
32
Study Species Dilution
Max.
absorption
measured (%
applied dose)
Max. possible
absorption
(% applied
dose)
2008 (in vivo
study) 1:4000 (spray
dilution)
13.35 17.9
Hadfield N.; 2006
(in vitro study)
Rat skin (♂)
undiluted 0.462 0.855
1:4000 (spray
dilution)
58.6 61.6
Human
skin
undiluted 0.13 0.041
1:4000 (spray
dilution)
2.19 2.666
Table 11: Dermal absorption values for human skin:
In vitro
absorption rat
skin
(% applied
dose)
In vitro
absorption
human skin
(% applied
dose)
Ratio of
rat/human
skin
absorption
In vivo
absorption rat
skin
(% applied
dose)
Total
absorbed
human in vivo
(% applied
dose)
Concentrate
0.855 0.041 0.855/0.041 =
20.8
1.9 1.9/20.8 =
0.09
Spray dilution
61.6 2.19 61.6 / 2.66 =
23.1
17.9 17.9/ 23.1 =
0.78
For human skin in vivo absorption rates of 0.09% of the applied dose for the concentrate
and 0.78% for the diluted formulation can be calculated. These values have been rounded to
0.1% and 0.8% dermal absorption for the concentrate and the spray dilution, respectively.
4.1.2 Human information
A formal statement from the manufacturer is presented (Ohtsubo, T (2009)), that members
of staff involved in the synthesis and development of fenpyrazamine are routinely monitored
and that no indication of fenpyrazamine-related ill-health have been detected by, or reported
to, medical staff. No poisoning incidents or clinical cases have been reported. Fenpyrazamine
is a new chemical currently in development. There has been no exposure of the general population or epidemiology study.
4.1.3 Summary and discussion on toxicokinetics
Rate and extent of oral absorption ‡ Extensive (> 80%), almost totally
metabolised after administration of single
oral low and high dose
Distribution ‡ Evenly distributed, highest amount in liver

ANNEX 1 – BACKGROUND DOCUMENT TO THE RAC OPINION ON FENPYRAZAMINE
33
and kidney
Potential for accumulation ‡ No potential for accumulation
Rate and extent of excretion ‡ > 80% via urine in males and females
Metabolism in animals ‡ Extensively metabolized; main metabolites in
urine and feces: S-2188-DC, MPPZ , MPPZ
sulphate, S-2188-CH2OH-DC
ANNEX 1 – BACKGROUND DOCUMENT TO THE RAC OPINION ON FENPYRAZAMINE
34
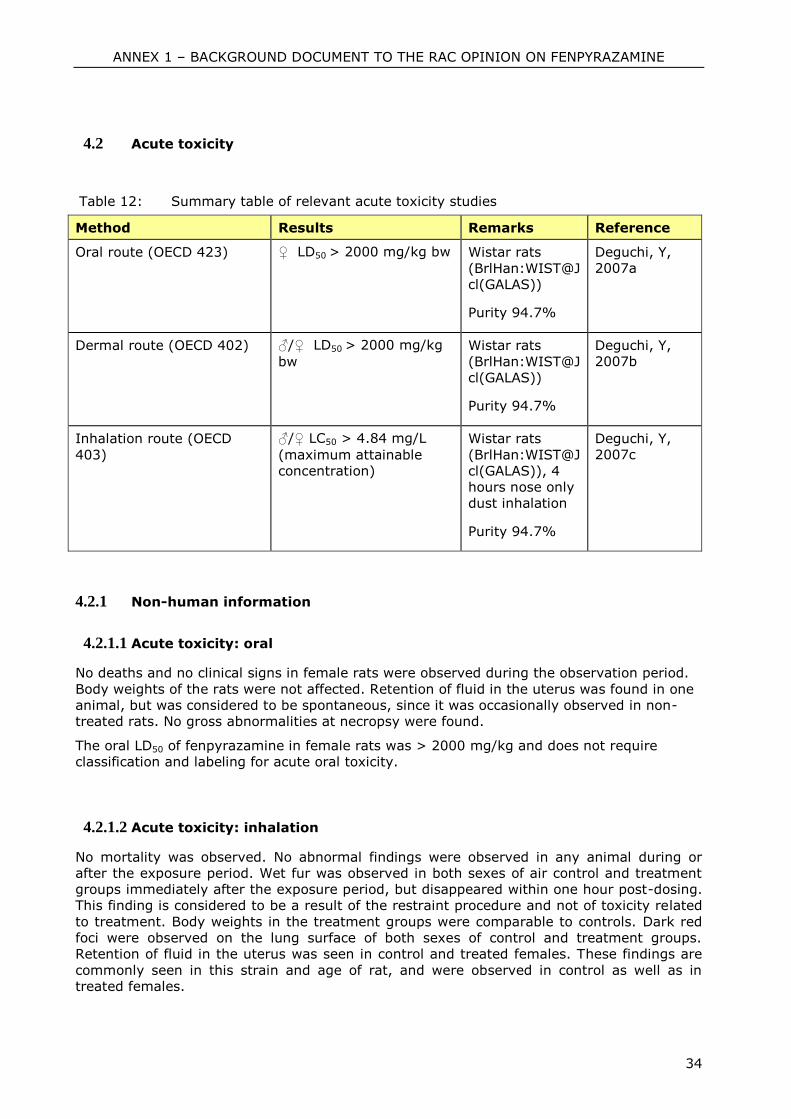
4.2 Acute toxicity
Table 12: Summary table of relevant acute toxicity studies
Method Results Remarks Reference
Oral route (OECD 423)
♀ LD50 > 2000 mg/kg bw Wistar rats
(BrlHan:WIST@J
cl(GALAS))
Purity 94.7%
Deguchi, Y,
2007a
Dermal route (OECD 402)
♂/♀ LD50 > 2000 mg/kg
bw
Wistar rats
(BrlHan:WIST@J
cl(GALAS))
Purity 94.7%
Deguchi, Y,
2007b
Inhalation route (OECD
403)
♂/♀ LC50 > 4.84 mg/L
(maximum attainable
concentration)
Wistar rats
(BrlHan:WIST@J
cl(GALAS)), 4
hours nose only
dust inhalation
Purity 94.7%
Deguchi, Y,
2007c
4.2.1 Non-human information
4.2.1.1 Acute toxicity: oral
No deaths and no clinical signs in female rats were observed during the observation period.
Body weights of the rats were not affected. Retention of fluid in the uterus was found in one
animal, but was considered to be spontaneous, since it was occasionally observed in non-
treated rats. No gross abnormalities at necropsy were found.
The oral LD50 of fenpyrazamine in female rats was > 2000 mg/kg and does not require
classification and labeling for acute oral toxicity.
4.2.1.2 Acute toxicity: inhalation
No mortality was observed. No abnormal findings were observed in any animal during or
after the exposure period. Wet fur was observed in both sexes of air control and treatment
groups immediately after the exposure period, but disappeared within one hour post-dosing.
This finding is considered to be a result of the restraint procedure and not of toxicity related
to treatment. Body weights in the treatment groups were comparable to controls. Dark red
foci were observed on the lung surface of both sexes of control and treatment groups.
Retention of fluid in the uterus was seen in control and treated females. These findings are
commonly seen in this strain and age of rat, and were observed in control as well as in
treated females.
ANNEX 1 – BACKGROUND DOCUMENT TO THE RAC OPINION ON FENPYRAZAMINE
35
The 4-hour inhalation LC50 was determined to be > 4.84 mg/L (maximum attainable
concentration) for male and female rats and therefore, classification and labelling for acute
inhalation toxicity of fenpyrazamine is not required.
4.2.1.3 Acute toxicity: dermal
No deaths were observed during the observation period. One male rat was found with scab
in the dorsal neck, but this finding was considered to be spontaneous since occasionally
observed in non-treated rats. No clinical signs were observed in females. Body weights of the
rats were not affected. No treatment-related gross pathological findings were observed.
The dermal LD50 of fenpyrazamine in male and female rats was > 2000 mg/kg and does not
require classification and labelling for acute dermal toxicity.
4.2.1.4 Acute toxicity: other routes
No data on other routes available.
4.2.2 Human information
A formal statement from the manufacturer is presented (Ohtsubo, T (2009)), that members
of staff involved in the synthesis and development of fenpyrazamine are routinely monitored
and that no indication of fenpyrazamine-related ill-health have been detected by, or reported
to, medical staff. No poisoning incidents or clinical cases have been reported. Fenpyrazamine
is a new chemical currently in development. There has been no exposure of the general
population or epidemiology study.
4.2.3 Summary and discussion of acute toxicity
Fenpyrazaminel has low acute oral, dermal and inhalation toxicity (oral LD50 > 2000 mg/kg
bw, dermal LD50 > 2000 mg/kg bw, LC50 > 4.84 mg/L air ) in rats.
4.2.4 Comparison with criteria
All estimated LD50 values are above the criteria for classification and labelling (both DSD and
CLP).
4.2.5 Conclusions on classification and labelling
No classification and labelling is proposed for fenpyrazamine regarding acute toxicity.
RAC evaluation of acute toxicity
Acute toxicity
Summary of the Dossier submitter’s proposal The dossier submitter did not propose a classification for acute toxicity (oral, dermal, by
inhalation). The proposal was based on oral, dermal and inhalation studies in rats.
Comments received during public consultation There were no specific comments received during public consultation regarding acute
toxicity.
Assessment and comparison with the classification criteria
ANNEX 1 – BACKGROUND DOCUMENT TO THE RAC OPINION ON FENPYRAZAMINE
36
Fenpyrazamine was tested for acute oral toxicity in female rats. There was no lethality at
2000 mg/kg (the only dose level tested). Classification for acute oral toxicity is only
indicated for substances with oral LD50 values less than 2000 mg/kg (CLP and DSD).
Fenpyrazamine was tested for acute dermal toxicity in male and female rats. There was
no lethality at 2000 mg/kg (the only dose level tested). Classification for acute dermal
toxicity is only indicated for substances with dermal LD50 values less than 2000 mg/kg
(CLP and DSD).
Fenpyrazamine was tested for acute inhalation toxicity in male and female rats. The test
concentration of 4.84 mg/l air was reported to be the highest air-borne concentration
that could technically be administered. At this air-borne concentration of 4.84 mg/l there
was no mortality in exposed rats. LC50 values need to be lower than 5 mg/l air in order
to classify a substance (dust) for acute inhalation toxicity (both CLP and DSD).
Based on the data available for acute toxicity, RAC concluded that for all routes of
exposure specified, fenpyrazamine does not require classification for acute toxicity. This
conclusion is in agreement with the dossier submitter’s proposal.
Supplemental information - In depth analyses by RAC None
4.3 Specific target organ toxicity – single exposure (STOT SE)
No specific, non lethal, target organ toxicity after single exposure was observed in acute
toxicity studies and acute neurotoxicity study. Almost no clinical effects were observed. No
classification as STOT-SE under the CLP Regulation is proposed.
4.3.1 Summary and discussion of Specific target organ toxicity – single exposure
No specific target organ toxicity after single exposure was observed in acute toxicity studies
and acute neurotoxicity study.
4.3.2 Comparison with criteria
No effects observed in acute toxicity studies and acute neurotoxicity study would trigger
criteria for classification and labelling as STOT SE.
4.3.3 Conclusions on classification and labelling
No classification and labelling is proposed for fenpyrazamine regarding specific target organ
toxicity after single exposure.
RAC evaluation of specific target organ toxicity – single exposure (STOT SE)
Summary of the Dossier submitter’s proposal The dossier submitter did not propose a classification for specific target organ toxicity for
single exposure. The proposal was based on low toxicity in acute tests in rats.
Comments received during public consultation There were no specific comments received during public consultation regarding specific
target organ toxicity for single exposure.
ANNEX 1 – BACKGROUND DOCUMENT TO THE RAC OPINION ON FENPYRAZAMINE
37
Assessment and comparison with the classification criteria Acute toxicity studies by three different routes of application (oral, dermal, inhalation), as
already indicated in the chapter on acute toxicity, did not induce lethality at dose levels
relevant for classification. Furthermore, there were no clinical signs and no gross
abnormalities at necropsy seen in any of the studies. Thus, there were no indications of
specific non-lethal target organ toxicity.
In the acute inhalation study no signs of irritation of the respiratory tract were observed.
Based on the data available for acute toxicity RAC concluded that fenpyrazamine does not
require classification for specific target organ toxicity (single exposure). This conclusion is
in agreement with the dossier submitter’s proposal.
Supplemental information - In depth analyses by RAC None
4.4 Irritation
4.4.1 Skin irritation
Table 13: Summary table of relevant skin irritation studies
Method Results Remarks Reference
Primary skin irritation
(OECD 404)
Not irritating New Zealand
White Rabbit
Purity: 94.7%
Odawara, K,
2007a
4.4.1.1 Non-human information
No signs of ill health or toxicity were observed in any of the animals during the experimental
period. No skin irritation reactions were observed in any animal during the observation
period of 72 hours after the removal of the patches.
The irritation was calculated to be 0.0 (no irritating) and therefore fenpyrazamine does not
require classification and labelling for skin irritation.
4.4.1.2 Human information
A formal statement from the manufacturer is presented (Ohtsubo, T (2009)), that members
of staff involved in the synthesis and development of fenpyrazamine are routinely monitored
and that no indication of fenpyrazamine-related ill-health have been detected by, or reported
to, medical staff. No poisoning incidents or clinical cases have been reported. Fenpyrazamine
is a new chemical currently in development. There has been no exposure of the general
population or epidemiology study.
ANNEX 1 – BACKGROUND DOCUMENT TO THE RAC OPINION ON FENPYRAZAMINE
38
4.4.1.3 Summary and discussion of skin irritation
According to the results of the rabbit skin irritation study, fenpyrazamine is not irritant to the
intact shaved rabbit skin.
4.4.1.4 Comparison with criteria
Estimated skin irritation scores (0.00) are below the criteria for triggering classification and
labelling (according to both DSD and CLP).
4.4.1.5 Conclusions on classification and labelling
No classification and labelling is proposed for fenpyrazamine regarding skin irritation.
4.4.2 Eye irritation
Table 14: Summary table of relevant eye irritation studies
Method Results Remarks Reference
Eye irritation (OECD 405)
Slight irritating New Zealand
White rabbit
Purity: 94.7%
Odawara, K,
2007b
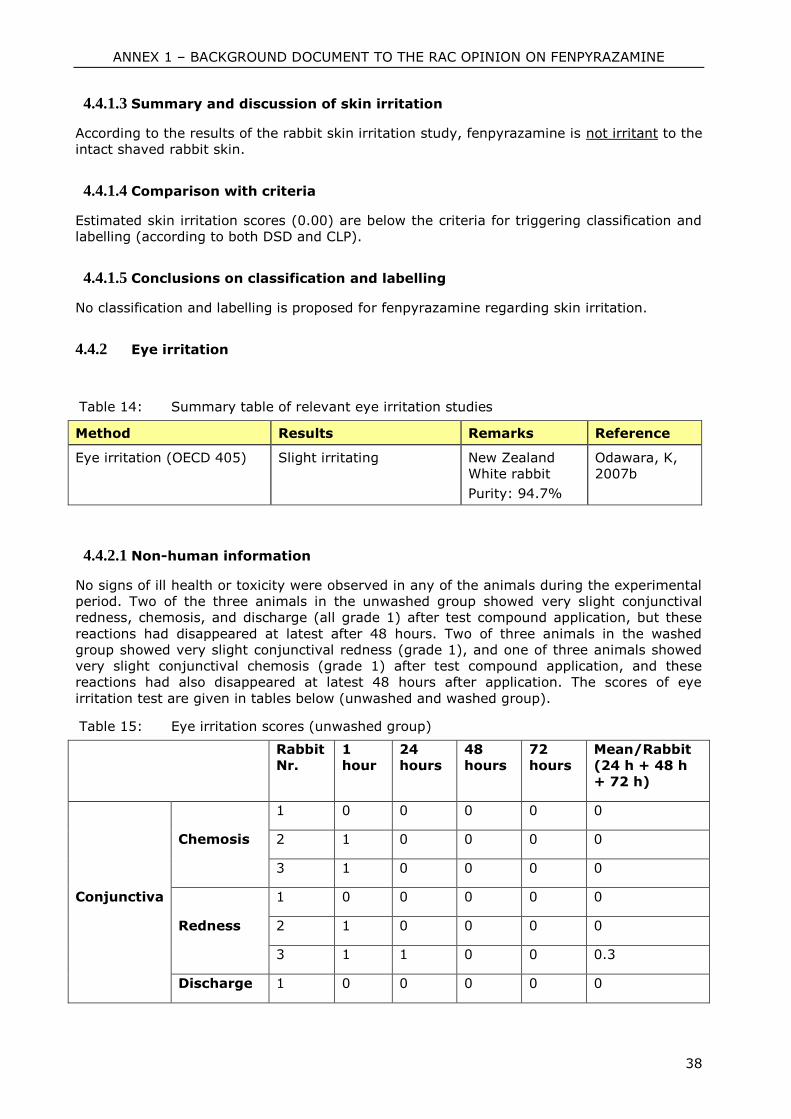
4.4.2.1 Non-human information
No signs of ill health or toxicity were observed in any of the animals during the experimental
period. Two of the three animals in the unwashed group showed very slight conjunctival
redness, chemosis, and discharge (all grade 1) after test compound application, but these
reactions had disappeared at latest after 48 hours. Two of three animals in the washed
group showed very slight conjunctival redness (grade 1), and one of three animals showed
very slight conjunctival chemosis (grade 1) after test compound application, and these
reactions had also disappeared at latest 48 hours after application. The scores of eye
irritation test are given in tables below (unwashed and washed group).
Table 15: Eye irritation scores (unwashed group)
Rabbit
Nr.
1
hour
24
hours
48
hours
72
hours
Mean/Rabbit
(24 h + 48 h
+ 72 h)
Conjunctiva
Chemosis
1 0 0 0 0 0
2 1 0 0 0 0
3 1 0 0 0 0
Redness
1 0 0 0 0 0
2 1 0 0 0 0
3 1 1 0 0 0.3
Discharge 1 0 0 0 0 0
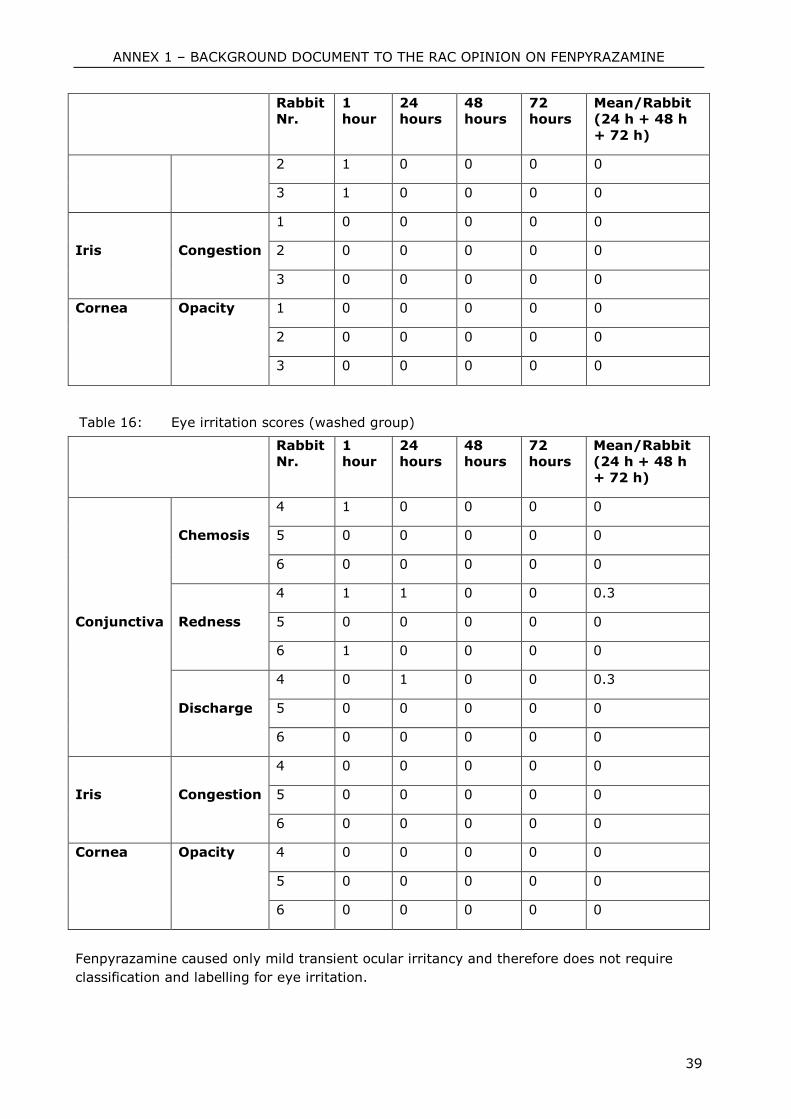
ANNEX 1 – BACKGROUND DOCUMENT TO THE RAC OPINION ON FENPYRAZAMINE
39
Rabbit
Nr.
1
hour
24
hours
48
hours
72
hours
Mean/Rabbit
(24 h + 48 h
+ 72 h)
2 1 0 0 0 0
3 1 0 0 0 0
Iris Congestion
1 0 0 0 0 0
2 0 0 0 0 0
3 0 0 0 0 0
Cornea Opacity 1 0 0 0 0 0
2 0 0 0 0 0
3 0 0 0 0 0
Table 16: Eye irritation scores (washed group)
Rabbit
Nr.
1
hour
24
hours
48
hours
72
hours
Mean/Rabbit
(24 h + 48 h
+ 72 h)
Conjunctiva
Chemosis
4 1 0 0 0 0
5 0 0 0 0 0
6 0 0 0 0 0
Redness
4 1 1 0 0 0.3
5 0 0 0 0 0
6 1 0 0 0 0
Discharge
4 0 1 0 0 0.3
5 0 0 0 0 0
6 0 0 0 0 0
Iris Congestion
4 0 0 0 0 0
5 0 0 0 0 0
6 0 0 0 0 0
Cornea Opacity 4 0 0 0 0 0
5 0 0 0 0 0
6 0 0 0 0 0
Fenpyrazamine caused only mild transient ocular irritancy and therefore does not require
classification and labelling for eye irritation.
ANNEX 1 – BACKGROUND DOCUMENT TO THE RAC OPINION ON FENPYRAZAMINE
40
4.4.2.2 Human information
A formal statement from the manufacturer is presented (Ohtsubo, T (2009)), that members
of staff involved in the synthesis and development of fenpyrazamine are routinely monitored
and that no indication of fenpyrazamine-related ill-health have been detected by, or reported
to, medical staff. No poisoning incidents or clinical cases have been reported. Fenpyrazamine
is a new chemical currently in development. There has been no exposure of the general
population or epidemiology study.
4.4.2.3 Summary and discussion of eye irritation
According to the results of the eye irritation study, fenpyrazamine is slight irritant to the
rabbit eye; according to classification criteria, classification and labelling is not warranted.
4.4.2.4 Comparison with criteria
Estimated eye irritation scores (24 – 72 hours; 0.3 (conjunctival redness), 0.3 (conjuctival
discharge)) are below the criteria for triggering classification and labelling (according to both
DSD and CLP).
4.4.2.5 Conclusions on classification and labelling
No classification and labelling is proposed for fenpyrazamine regarding eye irritation.
4.4.3 Respiratory tract irritation
4.4.3.1 Non-human information
In the acute inhalation toxicity study no mortality was observed. No abnormal findings were
observed in any animal during or after the exposure period. Wet fur was observed in both
sexes of air control and treatment groups immediately after the exposure period, but
disappeared within one hour post-dosing. This finding is considered to be a result of the
restraint procedure and not of toxicity related to treatment. Body weights in the treatment
groups were comparable to controls. Dark red foci were observed on the lung surface of both
sexes of control and treatment groups. Retention of fluid in the uterus was seen in control
and treated females. These findings are commonly seen in this strain and age of rat, and
were observed in control as well as in treated females. No signs of irritation on respiratory
tract were observed.
4.4.3.2 Human information
A formal statement from the manufacturer is presented (Ohtsubo, T (2009)), that members
of staff involved in the synthesis and development of fenpyrazamine are routinely monitored
and that no indication of fenpyrazamine-related ill-health have been detected by, or reported
to, medical staff. No poisoning incidents or clinical cases have been reported. Fenpyrazamine
is a new chemical currently in development. There has been no exposure of the general
population or epidemiology study.
4.4.3.3 Summary and discussion of respiratory tract irritation
No respiratory tract irritation was observed in acute inhalation toxicity study in rats.
ANNEX 1 – BACKGROUND DOCUMENT TO THE RAC OPINION ON FENPYRAZAMINE
41
4.4.3.4 Comparison with criteria
No irritating effects on respiratory tract were observed in acute inhalation study with
fenpyrazamine (according to both DSD and CLP).
4.4.3.5 Conclusions on classification and labelling
No classification and labelling is proposed for fenpyrazamine regarding respiratory tract
irritation.
4.5 Corrosivity
Fenpyrazamine did not show any corrosive properties in rabbit skin and eye irritation studies
(see 4.4.1 and 4.4.2).
RAC evaluation of eye irritation and skin corrosion/ irritation
Summary of the Dossier submitter’s proposal The dossier submitter proposed not to classify fenpyrazamine for irritation (skin, eye) or
corrosivity. The proposal was based on a skin and an eye irritation study in rabbits.
Comments received during public consultation There were no specific comments received during public consultation regarding
irritation/corrosivity.
Assessment and comparison with the classification criteria Fenpyrazamine was tested for skin irritation in rabbits. No skin irritation reactions were
observed in any animal during the observation period of 72 hours after the removal of
the patches.
Fenpyrazamine was tested for eye irritation in rabbits. No effects on cornea or iris were
observed. With respect to conjunctiva, the only finding was a score of 1 for redness of
the conjunctiva in one animal after 24 hours. Thus, for the redness of conjunctivae, the
individual mean score (based on the 24-, 48- and 72-hour values) for this animal was
0.3. The minimum individual score for conjunctival effects that triggers classification is a
score of 2 under both CLP and DSD. Therefore these data do not require a classification
for eye irritation.
Based on the data available, RAC concluded that fenpyrazamine does not require a
classification for skin, eye, or respiratory tract corrosion/irritation. This conclusion is in
agreement with the dossier submitter’s proposal.
Supplemental information - In depth analyses by RAC None
4.6 Sensitisation
4.6.1 Skin sensititsation
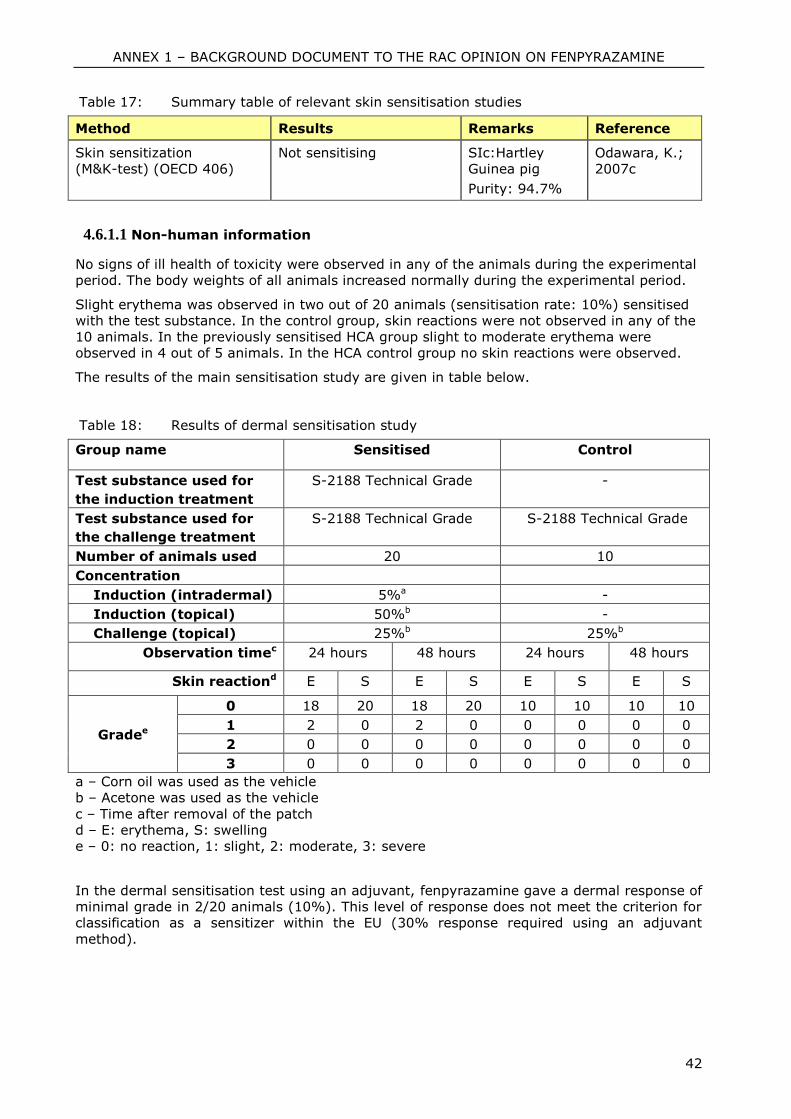
ANNEX 1 – BACKGROUND DOCUMENT TO THE RAC OPINION ON FENPYRAZAMINE
42
Table 17: Summary table of relevant skin sensitisation studies
Method Results Remarks Reference
Skin sensitization
(M&K-test) (OECD 406)
Not sensitising SIc:Hartley
Guinea pig
Purity: 94.7%
Odawara, K.;
2007c
4.6.1.1 Non-human information
No signs of ill health of toxicity were observed in any of the animals during the experimental
period. The body weights of all animals increased normally during the experimental period.
Slight erythema was observed in two out of 20 animals (sensitisation rate: 10%) sensitised
with the test substance. In the control group, skin reactions were not observed in any of the
10 animals. In the previously sensitised HCA group slight to moderate erythema were
observed in 4 out of 5 animals. In the HCA control group no skin reactions were observed.
The results of the main sensitisation study are given in table below.
Table 18: Results of dermal sensitisation study
Group name Sensitised Control
Test substance used for
the induction treatment
S-2188 Technical Grade -
Test substance used for
the challenge treatment
S-2188 Technical Grade S-2188 Technical Grade
Number of animals used 20 10
Concentration
Induction (intradermal) 5%a -
Induction (topical) 50%b -
Challenge (topical) 25%b 25%b
Observation timec 24 hours 48 hours 24 hours 48 hours
Skin reactiond E S E S E S E S
Gradee
0 18 20 18 20 10 10 10 10
1 2 0 2 0 0 0 0 0
2 0 0 0 0 0 0 0 0
3 0 0 0 0 0 0 0 0
a – Corn oil was used as the vehicle
b – Acetone was used as the vehicle
c – Time after removal of the patch
d – E: erythema, S: swelling
e – 0: no reaction, 1: slight, 2: moderate, 3: severe
In the dermal sensitisation test using an adjuvant, fenpyrazamine gave a dermal response of
minimal grade in 2/20 animals (10%). This level of response does not meet the criterion for
classification as a sensitizer within the EU (30% response required using an adjuvant
method).
ANNEX 1 – BACKGROUND DOCUMENT TO THE RAC OPINION ON FENPYRAZAMINE
43
4.6.1.2 Human information
A formal statement from the manufacturer is presented (Ohtsubo, T (2009)), that members
of staff involved in the synthesis and development of fenpyrazamine are routinely monitored
and that no indication of fenpyrazamine-related ill-health have been detected by, or reported
to, medical staff. No poisoning incidents or clinical cases have been reported. Fenpyrazamine
is a new chemical currently in development. There has been no exposure of the general
population or epidemiology study.
4.6.1.3 Summary and discussion of skin sensitisation
According to the results of the skin sensitisation study in guinea pig (Maximisation test),
fenpyrazamine is not sensitising to guinea pig skin; according to classification criteria,
classification and labelling is not warranted.
4.6.1.4 Comparison with criteria
Effects observed in the skin sensitisation study on guinea pig are below the criteria for
triggering classification and labelling (according to both DSD and CLP).
4.6.1.5 Conclusions on classification and labelling
No classification and labelling is proposed for fenpyrazamine regarding skin sensitisation.
4.6.2 Respiratory sensitisation
No data on respiratory sensitisation available.
RAC evaluation of sensitisation (skin, respiratory)
Summary of the Dossier submitter’s proposal The dossier submitter did not propose a classification for sensitisation (skin, respiratory).
The dossier submitter’s conclusion not to propose classification for sensitisation was based
on a skin sensitisation study in Guinea pigs (OECD 406).
Comments received during public consultation There were no specific comments received during public consultation regarding skin
sensitisation. With regard to respiratory sensitisation there were no comments questioning
the proposal not to classify fenpyrazamine for respiratory sensitisation. Some explicitly
supported non-classification for respiratory sensitisation.
Assessment and comparison with the classification criteria In a valid Guinea pig maximisation test (GPMT), 2 of the 20 test animals showed grade 1
irritation (challenge phase, both observation times). In the control group, skin reactions
were not observed in any of the 10 animals. These findings are equivalent to a
sensitisation rate of 10%.
Because test results from a GPMT need to exceed a 30% level of incidence, RAC
concluded not to classify fenpyrazamine for skin sensitisation (CLP and DSD). This
conclusion is in agreement with the dossier submitter’s proposal. No data are available on
respiratory sensitisation.
Based on the data available for skin and respiratory sensitisation RAC concluded that
fenpyrazamine does not require a classification for the hazard class “sensitisation” (CLP
and DSD). This conclusion is in agreement with the dossier submitter’s proposal and the
ANNEX 1 – BACKGROUND DOCUMENT TO THE RAC OPINION ON FENPYRAZAMINE
44
comments received during public consultation.
Supplemental information - In depth analyses by RAC None
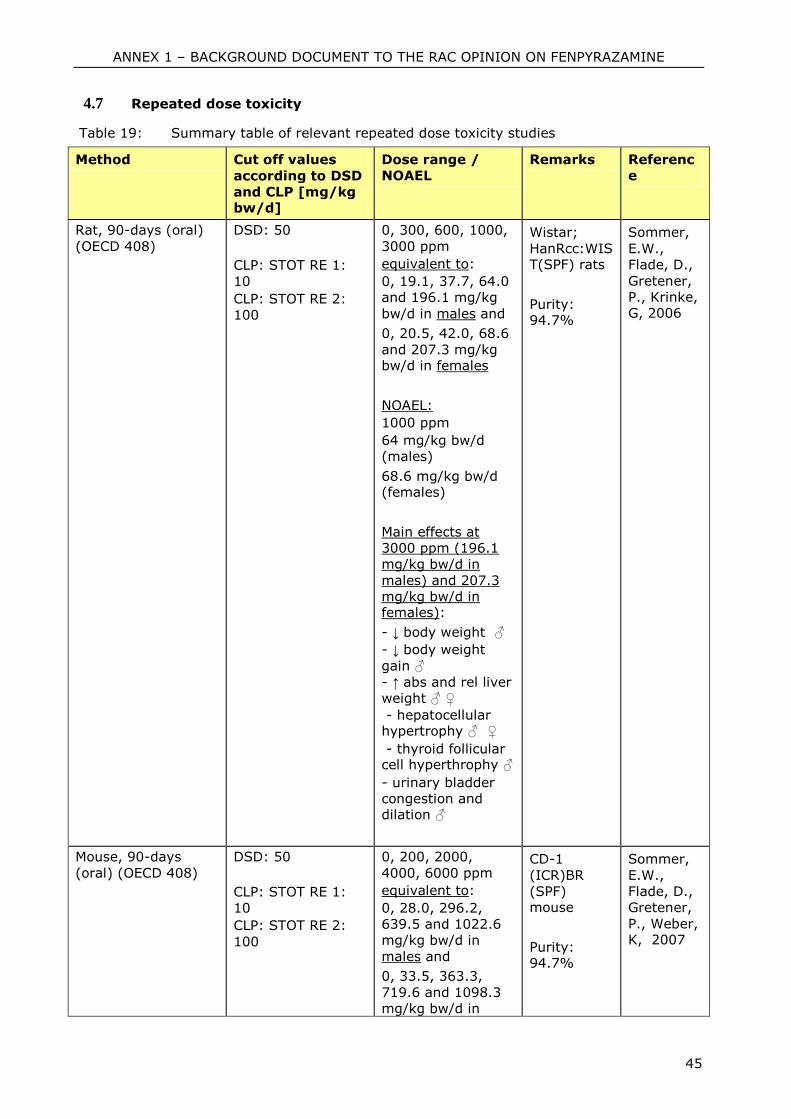
ANNEX 1 – BACKGROUND DOCUMENT TO THE RAC OPINION ON FENPYRAZAMINE
45
4.7 Repeated dose toxicity
Table 19: Summary table of relevant repeated dose toxicity studies
Method Cut off values
according to DSD
and CLP [mg/kg bw/d]
Dose range /
NOAEL
Remarks Referenc
e
Rat, 90-days (oral)
(OECD 408)
DSD: 50
CLP: STOT RE 1:
10
CLP: STOT RE 2:
100
0, 300, 600, 1000,
3000 ppm
equivalent to:
0, 19.1, 37.7, 64.0
and 196.1 mg/kg
bw/d in males and
0, 20.5, 42.0, 68.6
and 207.3 mg/kg bw/d in females
NOAEL:
1000 ppm
64 mg/kg bw/d
(males)
68.6 mg/kg bw/d (females)
Main effects at
3000 ppm (196.1
mg/kg bw/d in
males) and 207.3
mg/kg bw/d in females):
- ↓ body weight ♂
- ↓ body weight
gain ♂
- ↑ abs and rel liver
weight ♂ ♀
- hepatocellular hypertrophy ♂ ♀
- thyroid follicular cell hyperthrophy ♂
- urinary bladder
congestion and dilation ♂
Wistar;
HanRcc:WIST(SPF) rats
Purity: 94.7%
Sommer,
E.W.,
Flade, D.,
Gretener,
P., Krinke, G, 2006
Mouse, 90-days
(oral) (OECD 408)
DSD: 50
CLP: STOT RE 1:
10
CLP: STOT RE 2:
100
0, 200, 2000,
4000, 6000 ppm
equivalent to:
0, 28.0, 296.2,
639.5 and 1022.6
mg/kg bw/d in
males and
0, 33.5, 363.3,
719.6 and 1098.3
mg/kg bw/d in
CD-1
(ICR)BR
(SPF) mouse
Purity: 94.7%
Sommer,
E.W.,
Flade, D.,
Gretener,
P., Weber, K, 2007
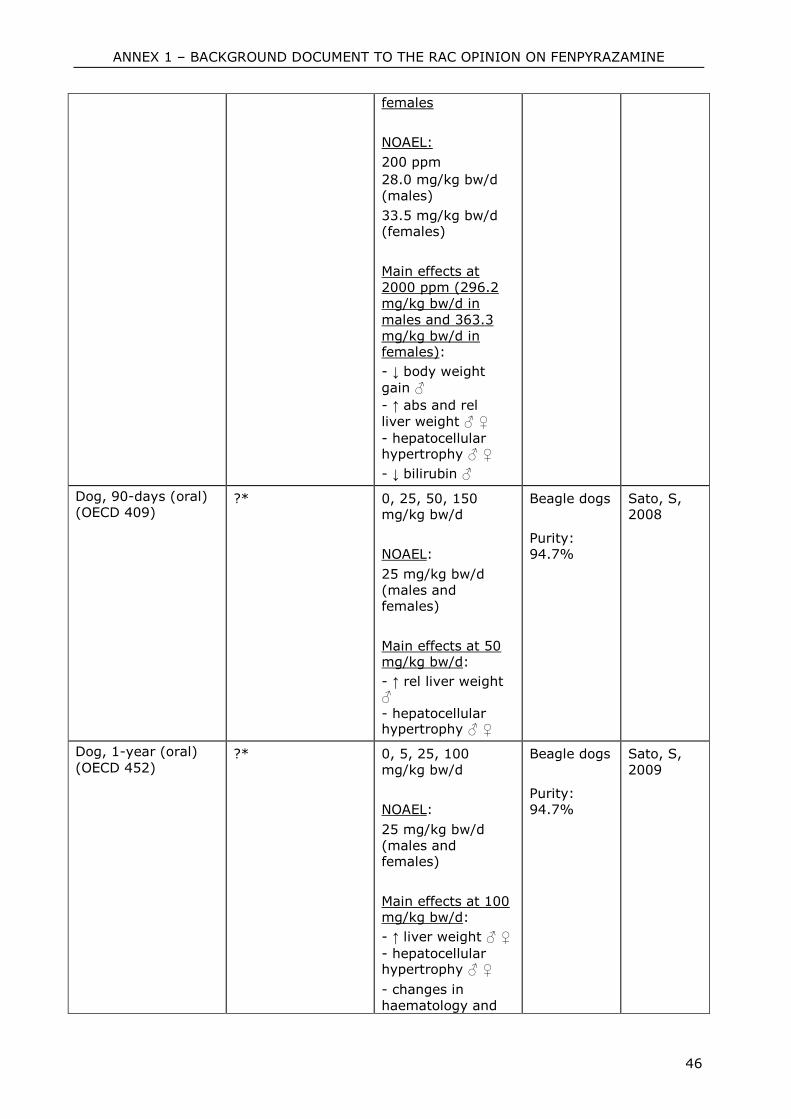
ANNEX 1 – BACKGROUND DOCUMENT TO THE RAC OPINION ON FENPYRAZAMINE
46
females
NOAEL:
200 ppm
28.0 mg/kg bw/d
(males)
33.5 mg/kg bw/d (females)
Main effects at
2000 ppm (296.2
mg/kg bw/d in
males and 363.3
mg/kg bw/d in females):
- ↓ body weight
gain ♂
- ↑ abs and rel
liver weight ♂ ♀
- hepatocellular hypertrophy ♂ ♀
- ↓ bilirubin ♂
Dog, 90-days (oral)
(OECD 409)
?* 0, 25, 50, 150 mg/kg bw/d
NOAEL:
25 mg/kg bw/d
(males and females)
Main effects at 50 mg/kg bw/d:
- ↑ rel liver weight ♂
- hepatocellular hypertrophy ♂ ♀
Beagle dogs
Purity: 94.7%
Sato, S, 2008
Dog, 1-year (oral)
(OECD 452)
?* 0, 5, 25, 100
mg/kg bw/d
NOAEL:
25 mg/kg bw/d
(males and females)
Main effects at 100 mg/kg bw/d:
- ↑ liver weight ♂ ♀
- hepatocellular hypertrophy ♂ ♀
- changes in
haematology and
Beagle dogs
Purity:
94.7%
Sato, S,
2009
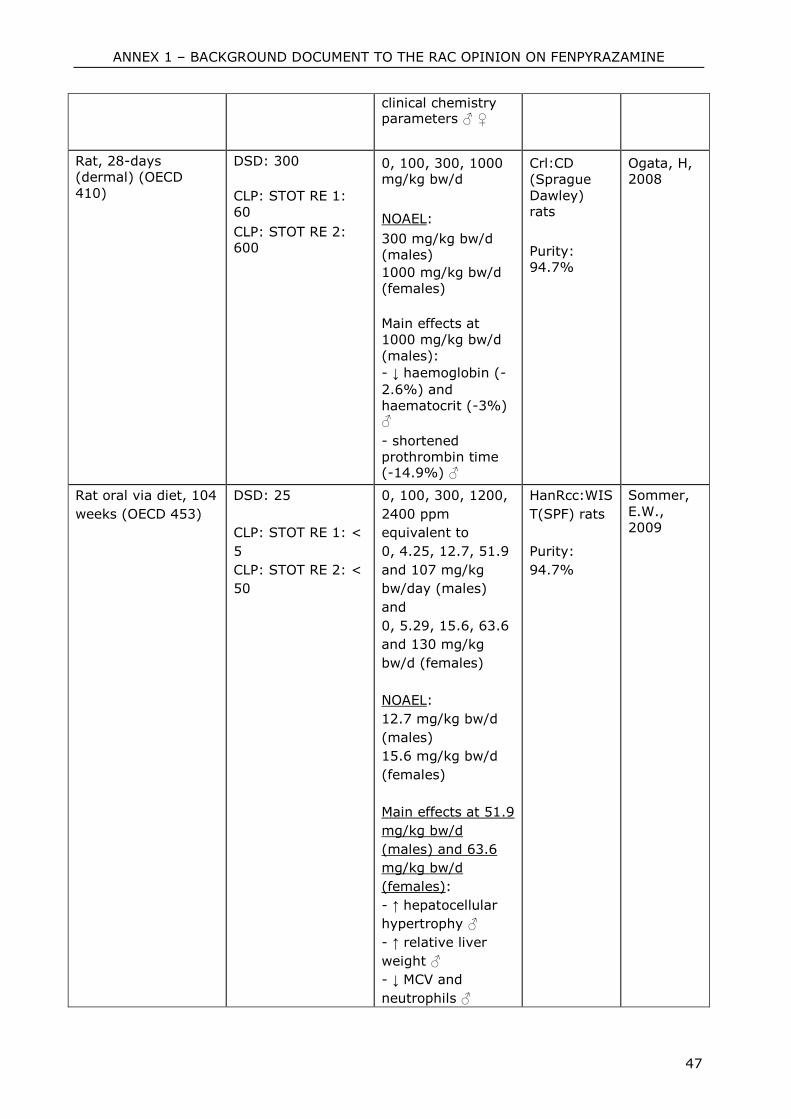
ANNEX 1 – BACKGROUND DOCUMENT TO THE RAC OPINION ON FENPYRAZAMINE
47
clinical chemistry parameters ♂ ♀
Rat, 28-days
(dermal) (OECD
410)
DSD: 300
CLP: STOT RE 1:
60
CLP: STOT RE 2: 600
0, 100, 300, 1000 mg/kg bw/d
NOAEL:
300 mg/kg bw/d
(males)
1000 mg/kg bw/d
(females)
Main effects at
1000 mg/kg bw/d
(males):
- ↓ haemoglobin (-
2.6%) and
haematocrit (-3%) ♂
- shortened
prothrombin time (-14.9%) ♂
Crl:CD
(Sprague
Dawley) rats
Purity:
94.7%
Ogata, H, 2008
Rat oral via diet, 104
weeks (OECD 453)
DSD: 25
CLP: STOT RE 1: <
5
CLP: STOT RE 2: <
50
0, 100, 300, 1200,
2400 ppm
equivalent to
0, 4.25, 12.7, 51.9
and 107 mg/kg
bw/day (males)
and
0, 5.29, 15.6, 63.6
and 130 mg/kg
bw/d (females)
NOAEL:
12.7 mg/kg bw/d
(males)
15.6 mg/kg bw/d
(females)
Main effects at 51.9
mg/kg bw/d
(males) and 63.6
mg/kg bw/d
(females):
- ↑ hepatocellular
hypertrophy ♂
- ↑ relative liver
weight ♂
- ↓ MCV and
neutrophils ♂
HanRcc:WIS
T(SPF) rats
Purity:
94.7%
Sommer,
E.W.,
2009
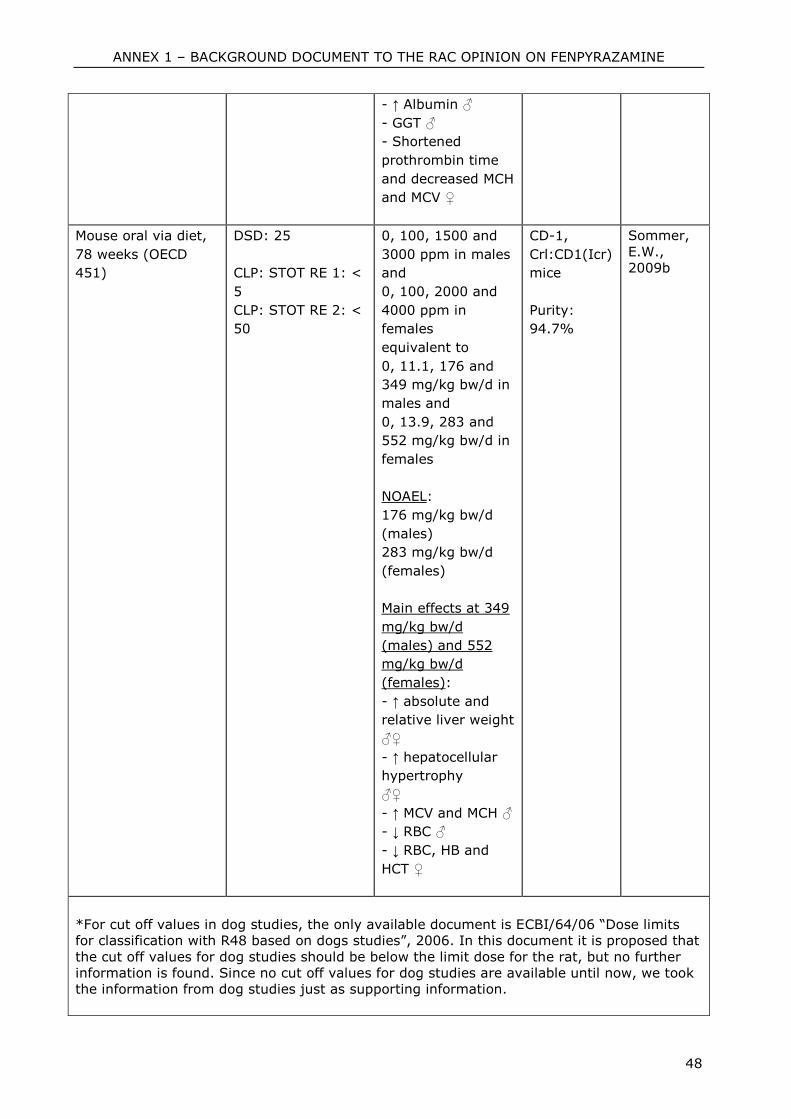
ANNEX 1 – BACKGROUND DOCUMENT TO THE RAC OPINION ON FENPYRAZAMINE
48
- ↑ Albumin ♂
- GGT ♂
- Shortened
prothrombin time
and decreased MCH
and MCV ♀
Mouse oral via diet,
78 weeks (OECD
451)
DSD: 25
CLP: STOT RE 1: <
5
CLP: STOT RE 2: <
50
0, 100, 1500 and
3000 ppm in males
and
0, 100, 2000 and
4000 ppm in
females
equivalent to
0, 11.1, 176 and
349 mg/kg bw/d in
males and
0, 13.9, 283 and
552 mg/kg bw/d in
females
NOAEL:
176 mg/kg bw/d
(males)
283 mg/kg bw/d
(females)
Main effects at 349
mg/kg bw/d
(males) and 552
mg/kg bw/d
(females):
- ↑ absolute and
relative liver weight
♂♀
- ↑ hepatocellular
hypertrophy
♂♀
- ↑ MCV and MCH ♂
- ↓ RBC ♂
- ↓ RBC, HB and
HCT ♀
CD-1,
Crl:CD1(Icr)
mice
Purity:
94.7%
Sommer,
E.W.,
2009b
*For cut off values in dog studies, the only available document is ECBI/64/06 “Dose limits
for classification with R48 based on dogs studies”, 2006. In this document it is proposed that
the cut off values for dog studies should be below the limit dose for the rat, but no further
information is found. Since no cut off values for dog studies are available until now, we took
the information from dog studies just as supporting information.
ANNEX 1 – BACKGROUND DOCUMENT TO THE RAC OPINION ON FENPYRAZAMINE
49
*+ For extrapolation from subchronic to chronic studies in rodents regarding cut off values
for effects observed, different approaches were found: whereas in the ECBI/64/06 “Dose
limits for classification with R48 based on dogs studies”, 2006, the cut off value for chronic
studies in rodents of 6.25 mg/kg bw/d is found, in the REACH guidance on information
requirements and chemical safety assessment, chapter R8 is stated that factor of 2 should
be applied resulting in the cut off value of 25 mg/kg bw/d in chronic studies in rodents.
4.7.1 Non-human information
4.7.1.1 Repeated dose toxicity: oral
Rat:
13 week feeding study
Based on reduced mean body weight and body weight gain, increased absolute and relative
liver weight with hepatocellular hypertrophy in males and females at 3000 ppm (196.1
mg/kg bw/d in males and 207.3 mg/kg bw/d in females):, additionally thyroid follicular cell
hypertrophy and urinary bladder congestion and dilation in males at 3000 ppm, the NOAEL
was determined to be 1000 ppm for both genders, equivalent to 64 mg/kg bw/d for males
and 68.6 mg/kg bw/d for females. No neurotoxic effects were observed in the study. Taking
into consideration the cut off values for repeated dose toxicity (DSD: 50 mg/kg bw/d, CLP,
STOT RE 1: 10 mg/kg bw/d, CLP, STOT RE 2: 100 mg/kg bw/d) and the nature of the
observed effects, no classification and labelling for repeated dose toxicity is triggered for
fenpyrazamine.
104 weeks feeding study
In the combined chronic and carcinogenicity study (2 years) in rat, the NOAEL is set at 300
ppm (15.6 mg/kg bw/d) in females, based on shortened prothrombin time and decreased
MCH and MCV at 1200 ppm. In males, the NOAEL is set also at 300 ppm (12.7 mg/kg bw/d),
based on statistically significantly increased hepatocellular hypertrophy accompanied by
increased relative liver weight at 1200 ppm at week 52 in satellite group and hepatocellular
hypertrophy (but without change in relative liver weight) in main group males at week 104.
In addition, in males of 1200 ppm group and above (week 52, satellite group), MCV and
neutrophils were statistically significantly decreased and albumin increased. Taking into
consideration the cut off values for repeated dose toxicity (DSD: 25 mg/kg bw/d, CLP, STOT
RE 1: < 5 mg/kg bw/d, CLP, STOT RE 2: < 50 mg/kg bw/d) and the nature of the observed
effects, no classification and labelling for repeated dose toxicity is triggered for
fenpyrazamine.
Mouse:
13 week feeding study
In the 90 days study in mice, the NOAEL for fenpyrazamine is determined at 200 ppm for
males (equivalent to 28.0 mg/kg bw/d) and females (equivalent to 33.5 mg/kg bw/d) based
on significantly reduced body weight gain, significantly increased absolute and relative liver
weight, significantly increased hepatocellular hypertrophy and significantly decreased
ANNEX 1 – BACKGROUND DOCUMENT TO THE RAC OPINION ON FENPYRAZAMINE
50
bilirubin level in males at 2000 ppm (296.2 mg/kg bw/d) and significantly increased relative
liver weight and hepatocellular hypertrophy in females at 2000 ppm (363.3 mg/kg bw/d).
Taking into consideration the cut off values for repeated dose toxicity (DSD: 50 mg/kg bw/d,
CLP, STOT RE 1: 10 mg/kg bw/d, CLP, STOT RE 2: 100 mg/kg bw/d) and the nature of the
observed effects, no classification and labelling for repeated dose toxicity is triggered for
fenpyrazamine.
78 weeks feeding study
In the carcinogenicity study in CD-1 mouse (78 weeks), the NOAEL for males is set at 1500
ppm (176 mg/kg bw/d), based on statistically significantly higher relative liver weight in
satellite and main group animals accompanied by higher incidence of hepatocellular
hypertrophy observed in main group animals, and supported by statistically significantly
increased MCV and MCH and decreased RBC at 3000 ppm. In females, NOAEL is set at 2000
ppm (283 mg/kg bw/d), based on statistically significantly higher relative liver weight in
satellite and main group animals accompanied by statistically significantly increased
hepatocellular hypertrophy observed in main group animals, and supported by statistically
significantly decreased RBC, HB and HCT at 4000 ppm. Taking into consideration the cut off
values for repeated dose toxicity (DSD: 25 mg/kg bw/d, CLP, STOT RE 1: < 5 mg/kg bw/d,
CLP, STOT RE 2: < 50 mg/kg bw/d), no classification and labelling for repeated dose toxicity
is triggered for fenpyrazamine.
Dog:
3 months feeding study
In the 90 days study in dog the NOAEL for males and females is proposed at 25 mg/kg bw/d,
based on increased mean relative liver weight (12.9% compared to control) and hepatocyte
hypertrophy in two males at 50 mg/kg group and on hepatocellular hypertrophy (but without
changes in liver weight) in females. Since no cut off values for dog studies are available,
neither according to DSD not to CLP, the information from dog studies can be taken only as
supportive information.
1 year feeding study
In the 1-year dog study the NOAEL for males is proposed at 25 mg/kg bw/d, based on
significantly increased mean absolute liver weight and slight hepatocyte hypertrophy in three
males at 100 mg/kg group, as well as based on statistically significant increase in MCHC and
ALP and decrease in MCV. In females, the NOAEL is proposed at 25 mg/kg bw/d, based on
increased relative liver weight (+10.4%) and slight hepatocyte hypertrophy in two animals
at 100 mg/kg, supported by increased platelet count. Since no cut off values for dog studies
are available, neither according to DSD not to CLP, the information from dog studies can be
taken only as supportive information.
ANNEX 1 – BACKGROUND DOCUMENT TO THE RAC OPINION ON FENPYRAZAMINE
51
4.7.1.2 Repeated dose toxicity: inhalation
No repeated dose inhalation studies are available.
4.7.1.3 Repeated dose toxicity: dermal
28 days dermal study
In the dermal 28-days study in rats dosed at 100, 300, and 1000 mg/kg, only statistically
significantly lower values for hemoglobin (-2.6%) and hematocrit (-3%) and shortened
prothrombin time (-14.9%) were seen in males at 1000 mg/kg bw/d. No effects in females
were noted. Based on the observed results, the NOAEL was considered to be 300 mg/kg
bw/day for male and 1000 mg/kg bw/d for female rats. Taking into consideration the cut off
values for repeated dose toxicity (DSD: 300 mg/kg bw/d, CLP, STOT RE 1: 60 mg/kg bw/d,
CLP, STOT RE 2: 600 mg/kg bw/d) and the severity of observed effects, no classification and
labelling for repeated dose toxicity is triggered for fenpyrazamine.
4.7.1.4 Repeated dose toxicity: other routes
No data on other routes available.
4.7.1.5 Human information
A formal statement from the manufacturer is presented (Ohtsubo, T (2009)), that members
of staff involved in the synthesis and development of fenpyrazamine are routinely monitored
and that no indication of fenpyrazamine-related ill-health have been detected by, or reported
to, medical staff. No poisoning incidents or clinical cases have been reported. Fenpyrazamine
is a new chemical currently in development. There has been no exposure of the general
population or epidemiology study.
4.7.1.6 Other relevant information
No other relevant information.
4.7.1.7 Summary and discussion of repeated dose toxicity
A series of studies were carried out to investigate the effects of orally administered
fenpyrazamine in rats (one 90-day study), mice (one 90-day study) and dogs (one 90-day
and one 1-year study) following repeated exposure via the oral route over subchronic
periods. In addition, the effects after repeated exposure via the dermal route were also
investigated in the rat (one 28-day study).
In the 90 days rat study, based on reduced mean body weight and body weight gain,
increased absolute and relative liver weight with hepatocellular hypertrophy in males and
females at 3000 ppm (196.1 mg/kg bw/d in males and 207.3 mg/kg bw/d in females),
additionally thyroid follicular cell hypertrophy and urinary bladder congestion and dilation in
males at 3000 ppm, the NOAEL was determined to be 1000 ppm for both genders,
equivalent to 64 mg/kg bw/d for males and 68.6 mg/kg bw/d for females. No neurotoxic
effects were observed in the study. Taking into consideration the cut off values for repeated
dose toxicity (DSD: 50 mg/kg bw/d, CLP, STOT RE 1: 10 mg/kg bw/d, CLP, STOT RE 2: 100
mg/kg bw/d) and the nature of the observed effects, no classification and labelling for
repeated dose toxicity is triggered for fenpyrazamine.
ANNEX 1 – BACKGROUND DOCUMENT TO THE RAC OPINION ON FENPYRAZAMINE
52
In the 90 days study in mice, the NOAEL is determined at 200 ppm for males (equivalent to
28.0 mg/kg bw/d) and females (equivalent to 33.5 mg/kg bw/d) based on significantly
reduced body weight gain, significantly increased absolute and relative liver weight,
significantly increased hepatocellular hypertrophy and significantly decreased bilirubin level
in males at 2000 ppm (296.2 mg/kg bw/d) and significantly increased relative liver weight
and hepatocellular hypertrophy in females at 2000 ppm (363.3 mg/kg bw/d). Taking into
consideration the cut off values for repeated dose toxicity (DSD: 50 mg/kg bw/d, CLP, STOT
RE 1: 10 mg/kg bw/d, CLP, STOT RE 2: 100 mg/kg bw/d) and the nature of the observed
effects, no classification and labelling for repeated dose toxicity is triggered for
fenpyrazamine.
In the 90 days study in dog the NOAEL for males and females is proposed at 25 mg/kg bw/d,
based on increased mean relative liver weight (12.9% compared to control) and hepatocyte
hypertrophy in two males at 50 mg/kg group and on hepatocellular hypertrophy (but without
changes in liver weight) in females. Since no cut off values for dog studies are available,
neither according to DSD not to CLP, the information from dog studies can be taken only as
supportive information.
In the 1-year dog study the NOAEL for males is proposed at 25 mg/kg bw/d, based on
significantly increased mean absolute liver weight and slight hepatocyte hypertrophy in three
males at 100 mg/kg group, as well as based on statistically significant increase in MCHC and
ALP and decrease in MCV. In females, the NOAEL is proposed at 25 mg/kg bw/d, based on
increased relative liver weight (+10.4%) and slight hepatocyte hypertrophy in two animals
at 100 mg/kg, supported by increased platelet count. Since no cut off values for dog studies
are available, neither according to DSD not to CLP, the information from dog studies can be
taken only as supportive information.
In the dermal 28-days study in rats dosed at 100, 300, and 1000 mg/kg, only statistically
significantly lower values for hemoglobin (-2.6%) and hematocrit (-3%) and shortened
prothrombin time (-14.9%) were seen in males at 1000 mg/kg bw/d. No effects in females
were noted. Based on the observed results, the NOAEL was considered to be 300 mg/kg
bw/day for male and 1000 mg/kg bw/d for female rats. Taking into consideration the cut off
values for repeated dose toxicity (DSD: 300 mg/kg bw/d, CLP, STOT RE 1: 60 mg/kg bw/d,
CLP, STOT RE 2: 600 mg/kg bw/d) and the severity of observed effects, no classification and
labelling for repeated dose toxicity is triggered for fenpyrazamine.
In the combined chronic and carcinogenicity study (2 years) in rat, the NOAEL is set at 300
ppm (15.6 mg/kg bw/d) in females, based on shortened prothrombin time and decreased
MCH and MCV at 1200 ppm. In males, the NOAEL is set at 300 ppm (12.7 mg/kg bw/d),
based on statistically significantly increased hepatocellular hypertrophy accompanied by
increased relative liver weight at 1200 ppm at week 52 in satellite group and hepatocellular
hypertrophy (but without change in relative liver weight) in main group males at week 104.
In addition, in males of 1200 ppm group and above (week 52, satellite group), MCV and
neutrophils were statistically significantly decreased and albumin increased. Taking into
consideration the cut off values for repeated dose toxicity (DSD: 25 mg/kg bw/d, CLP, STOT
RE 1: < 5 mg/kg bw/d, CLP, STOT RE 2: < 50 mg/kg bw/d) and the nature of the observed
effects, no classification and labelling for repeated dose toxicity is triggered for
fenpyrazamine.
In the carcinogenicity study in CD-1 mouse (78 weeks), the NOAEL for males is set at 1500
ppm (176 mg/kg bw/d), based on statistically significantly higher relative liver weight in
satellite and main group animals accompanied by higher incidence of hepatocellular
hypertrophy observed in main group animals, and supported by statistically significantly
increased MCV and MCH and decreased RBC at 3000 ppm. In females, NOAEL is set at 2000
ppm (283 mg/kg bw/d), based on statistically significantly higher relative liver weight in
satellite and main group animals accompanied by statistically significantly increased
hepatocellular hypertrophy observed in main group animals, and supported by statistically
ANNEX 1 – BACKGROUND DOCUMENT TO THE RAC OPINION ON FENPYRAZAMINE
53
significantly decreased RBC, HB and HCT at 4000 ppm. Taking into consideration the cut off
values for repeated dose toxicity (DSD: 25 mg/kg bw/d, CLP, STOT RE 1: < 5 mg/kg bw/d,
CLP, STOT RE 2: < 50 mg/kg bw/d), no classification and labelling for repeated dose toxicity
is triggered for fenpyrazamine.
4.7.1.8 Summary and discussion of repeated dose toxicity findings relevant for
classification according to DSD
Effects observed in the subchronic (oral and dermal) and chronic (oral) studies in rat, mouse
and dog do not trigger the criteria for classification and labelling for repeated dose toxicity
(for more details please see 4.7.1.1, 4.7.1.3 and 4.7.1.7).
4.7.1.9 Comparison with criteria of repeated dose toxicity findings relevant for
classification according to DSD
Effects observed in the subchronic (oral and dermal) and chronic (oral) studies in rat, mouse
and dog do not trigger the criteria for classification and labelling for repeated dose toxicity
(for more details please see 4.7.1.1, 4.7.1.3 and 4.7.1.7).
4.7.1.10 Conclusions on classification and labelling of repeated dose toxicity
findings relevant for classification according to DSD
Effects observed in the subchronic (oral and dermal) and chronic (oral) studies in rat, mouse
and dog do not trigger the criteria for classification and labelling for repeated dose toxicity.
4.8 Specific target organ toxicity (CLP Regulation) – repeated exposure
(STOT RE)
4.8.1 Summary and discussion of repeated dose toxicity findings relevant for
classification as STOT RE according to CLP Regulation
Effects observed in the subchronic (oral and dermal) and chronic (oral) studies in rat, mouse
and dog do not trigger the criteria for classification and labelling for repeated dose toxicity
(for more details please see 4.7.1.1, 4.7.1.3 and 4.7.1.7).
4.8.2 Comparison with criteria of repeated dose toxicity findings relevant for
classification as STOT RE
Effects observed in the subchronic (oral and dermal) and chronic (oral) studies in rat, mouse
and dog do not trigger the criteria for classification and labelling for repeated dose toxicity
(for more details please see 4.7.1.1, 4.7.1.3 and 4.7.1.7).
4.8.3 Conclusions on classification and labelling of repeated dose toxicity findings
relevant for classification as STOT RE
Effects observed in the subchronic (oral and dermal) and chronic (oral) studies in rat, mouse
and dog do not trigger the criteria for classification and labelling for repeated dose toxicity.
RAC evaluation of repeated dose toxicity (DSD) and specific target
organ toxicity (CLP) – repeated exposure (STOT RE)
Summary of the Dossier submitter’s proposal
ANNEX 1 – BACKGROUND DOCUMENT TO THE RAC OPINION ON FENPYRAZAMINE
54
The dossier submitter did not propose a classification for repeated dose toxicity. The
proposal was based on repeated dose toxicity studies: two rat studies (90 days and 2
years), two mouse studies (90 days and 78 weeks), and two dog studies (90 days and 1
year).
Comments received during public consultation There were no specific comments received during public consultation regarding repeated
dose toxicity.
Assessment and comparison with the classification criteria Data reporting of repeated dose toxicity (RDT) findings in the CLH dossier is essentially
restricted to NOAELs and LOAELs and to a qualitative description of the adverse effects at
the LOAELs (e.g. “reduced level of haemoglobin”). As a rule, there is no dose-related
information on the incidence and severity of lesions. This is usually needed in order to
differentiate between LOAELs and “effective doses”. For classification purposes effective
doses rather than LOAELs are compared with guidance values. Nevertheless, the RAC
concluded that reporting of the RDT data for fenpyrazamine ialloweda conclusion to be
reached on the need, or not to classify fenpyrazamine for targeted organ toxicity for
repeated exposure.
For the time being, there is no agreed EU position on how to apply the guidance values
for classification of tested species other than rats. . The current practice of RAC is to
apply the guidance values for rats to other species as well. The guidance values are
based on 90-day studies. The adjustment when using studies with different exposure
duration usually follows the rule that doubling of duration of exposure results in halving
of the guidance values, and vice versa. For the ease of discussion RAC introduced a table
containing the study-specific cut-off levels and the available relevant RDT data (especially
NOAELs and LOAELs; see supplemental information – in depth analysis by RAC in the
BD).
In addition to the repeated dose toxicity studies in mice, rats and dogs, here is an
additional 90-day neurotoxicity study in rats. The common toxicological profile seems to
be an increase in liver weight and hepatocellular hypertrophy; such effects (without any
further evidence of cytotoxicity) are not considered to support RDT classification. There
are some changes in blood parameters as well for which however there is only limited
quantitative information. When the longer-duration studies in rats (2-years), mice (78-
weeks) and dogs (52-weeks) are examined, there is no LOAEL lower than the highest
guidance value calculated. For the rat and the dog, the corresponding NOAELs are
equivalent to the highest guidance values; for the mice the NOAEL (78-weeks) is very
much higher than the highest guidance value calculated (for details see table
supplemental information – in depth analysis by RAC in the BD).
Fenpyrazamine was additionally tested for dermal toxicity (rat, 28-day study). The LOAEL
of 1000 mg/kg/d which is not considered to be an effective dose (see table) is higher
than the highest guidance value calculated (600 mg/kg/d).
Thus RAC concluded that the reported data from repeated dose studies do not support a
RDT classification for fenpyrazamine (both CLP and DSD). This conclusion is in agreement
with the dossier submitter’s proposal
Supplemental information - In depth analyses by RAC
RAC considered it helpful to organise the available repeated dose toxicity data in tables
that directly allow for a comparison of the relevant cut-off levels with the study-related
NOAELs/LOAELs. For a short interpretation of the comparison of cut-off levels and
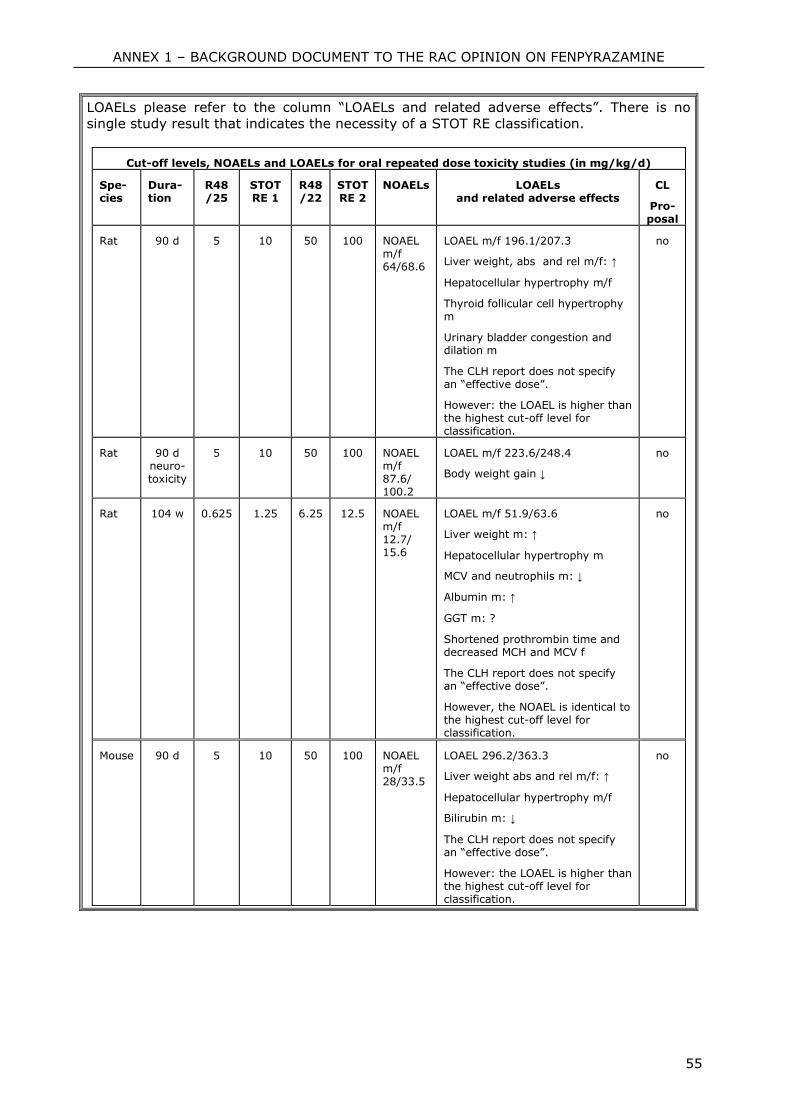
ANNEX 1 – BACKGROUND DOCUMENT TO THE RAC OPINION ON FENPYRAZAMINE
55
LOAELs please refer to the column “LOAELs and related adverse effects”. There is no
single study result that indicates the necessity of a STOT RE classification.
Cut-off levels, NOAELs and LOAELs for oral repeated dose toxicity studies (in mg/kg/d)
Spe- cies
Dura- tion
R48 /25
STOT RE 1
R48 /22
STOT RE 2
NOAELs
LOAELs and related adverse effects
CL
Pro- posal
Rat 90 d 5 10 50 100 NOAEL m/f 64/68.6
LOAEL m/f 196.1/207.3
Liver weight, abs and rel m/f: ↑
Hepatocellular hypertrophy m/f
Thyroid follicular cell hypertrophy m
Urinary bladder congestion and dilation m
The CLH report does not specify an “effective dose”.
However: the LOAEL is higher than the highest cut-off level for classification.
no
Rat 90 d neuro- toxicity
5 10 50 100 NOAEL m/f 87.6/ 100.2
LOAEL m/f 223.6/248.4
Body weight gain ↓
no
Rat 104 w 0.625 1.25 6.25 12.5 NOAEL m/f 12.7/ 15.6
LOAEL m/f 51.9/63.6
Liver weight m: ↑
Hepatocellular hypertrophy m
MCV and neutrophils m: ↓
Albumin m: ↑
GGT m: ?
Shortened prothrombin time and decreased MCH and MCV f
The CLH report does not specify an “effective dose”.
However, the NOAEL is identical to the highest cut-off level for classification.
no
Mouse 90 d 5 10 50 100 NOAEL m/f 28/33.5
LOAEL 296.2/363.3
Liver weight abs and rel m/f: ↑
Hepatocellular hypertrophy m/f
Bilirubin m: ↓
The CLH report does not specify an “effective dose”.
However: the LOAEL is higher than the highest cut-off level for classification.
no
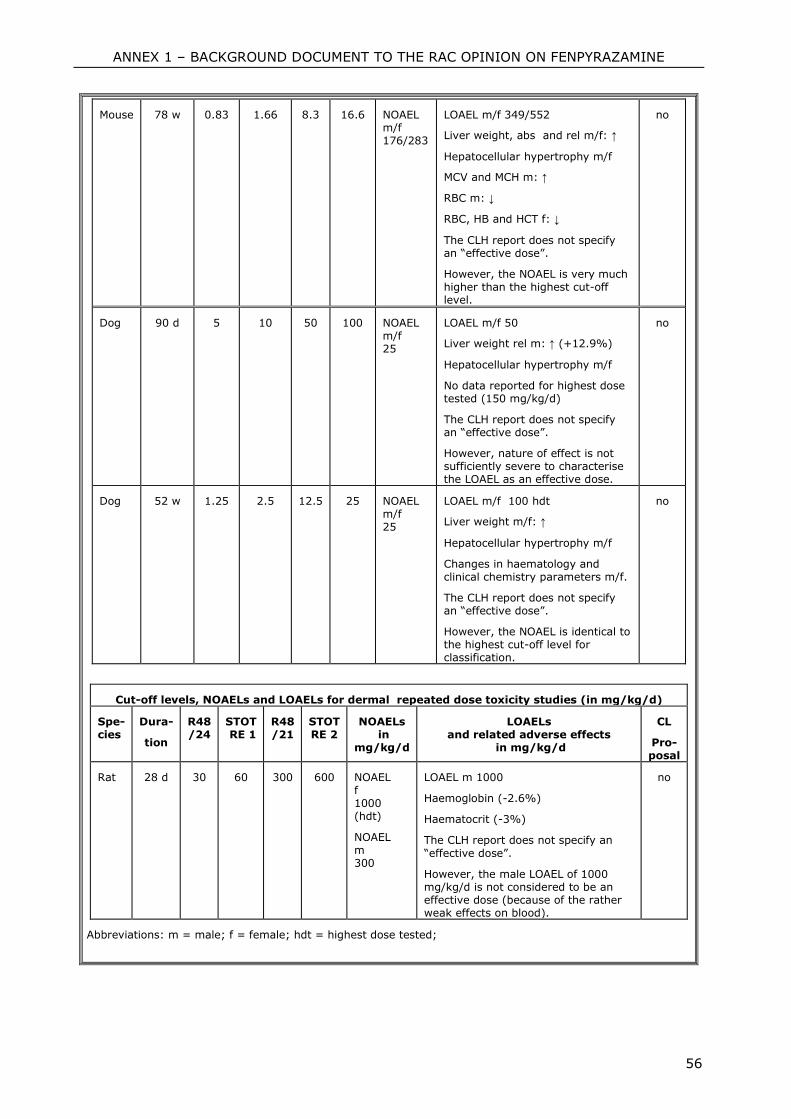
ANNEX 1 – BACKGROUND DOCUMENT TO THE RAC OPINION ON FENPYRAZAMINE
56
Mouse 78 w 0.83 1.66 8.3 16.6 NOAEL m/f 176/283
LOAEL m/f 349/552
Liver weight, abs and rel m/f: ↑
Hepatocellular hypertrophy m/f
MCV and MCH m: ↑
RBC m: ↓
RBC, HB and HCT f: ↓
The CLH report does not specify an “effective dose”.
However, the NOAEL is very much higher than the highest cut-off level.
no
Dog 90 d 5 10 50 100 NOAEL m/f 25
LOAEL m/f 50
Liver weight rel m: ↑ (+12.9%)
Hepatocellular hypertrophy m/f
No data reported for highest dose tested (150 mg/kg/d)
The CLH report does not specify an “effective dose”.
However, nature of effect is not sufficiently severe to characterise the LOAEL as an effective dose.
no
Dog 52 w 1.25 2.5 12.5 25 NOAEL m/f 25
LOAEL m/f 100 hdt
Liver weight m/f: ↑
Hepatocellular hypertrophy m/f
Changes in haematology and clinical chemistry parameters m/f.
The CLH report does not specify an “effective dose”.
However, the NOAEL is identical to the highest cut-off level for classification.
no
Cut-off levels, NOAELs and LOAELs for dermal repeated dose toxicity studies (in mg/kg/d)
Spe- cies
Dura-
tion
R48 /24
STOT RE 1
R48 /21
STOT RE 2
NOAELs in
mg/kg/d
LOAELs and related adverse effects
in mg/kg/d
CL
Pro- posal
Rat 28 d 30 60 300 600 NOAEL f 1000 (hdt)
NOAEL m 300
LOAEL m 1000
Haemoglobin (-2.6%)
Haematocrit (-3%)
The CLH report does not specify an
“effective dose”.
However, the male LOAEL of 1000 mg/kg/d is not considered to be an effective dose (because of the rather weak effects on blood).
no
Abbreviations: m = male; f = female; hdt = highest dose tested;

ANNEX 1 – BACKGROUND DOCUMENT TO THE RAC OPINION ON FENPYRAZAMINE
57
4.9 Germ cell mutagenicity (Mutagenicity)
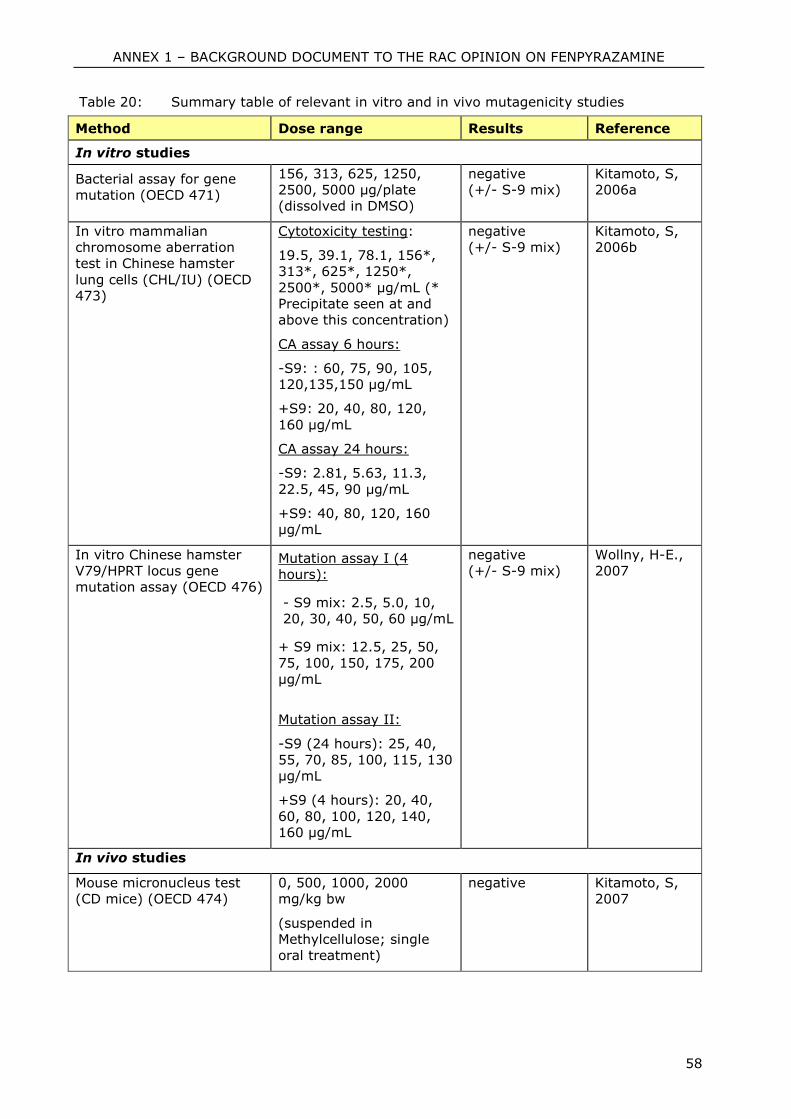
ANNEX 1 – BACKGROUND DOCUMENT TO THE RAC OPINION ON FENPYRAZAMINE
58
Table 20: Summary table of relevant in vitro and in vivo mutagenicity studies
Method Dose range Results Reference
In vitro studies
Bacterial assay for gene
mutation (OECD 471)
156, 313, 625, 1250,
2500, 5000 µg/plate
(dissolved in DMSO)
negative
(+/- S-9 mix)
Kitamoto, S,
2006a
In vitro mammalian
chromosome aberration
test in Chinese hamster
lung cells (CHL/IU) (OECD
473)
Cytotoxicity testing:
19.5, 39.1, 78.1, 156*,
313*, 625*, 1250*,
2500*, 5000* µg/mL (*
Precipitate seen at and
above this concentration)
CA assay 6 hours:
-S9: : 60, 75, 90, 105,
120,135,150 µg/mL
+S9: 20, 40, 80, 120,
160 µg/mL
CA assay 24 hours:
-S9: 2.81, 5.63, 11.3,
22.5, 45, 90 µg/mL
+S9: 40, 80, 120, 160
µg/mL
negative
(+/- S-9 mix)
Kitamoto, S,
2006b
In vitro Chinese hamster
V79/HPRT locus gene
mutation assay (OECD 476)
Mutation assay I (4
hours):
- S9 mix: 2.5, 5.0, 10,
20, 30, 40, 50, 60 µg/mL
+ S9 mix: 12.5, 25, 50,
75, 100, 150, 175, 200
µg/mL
Mutation assay II:
-S9 (24 hours): 25, 40,
55, 70, 85, 100, 115, 130
µg/mL
+S9 (4 hours): 20, 40,
60, 80, 100, 120, 140,
160 µg/mL
negative
(+/- S-9 mix)
Wollny, H-E.,
2007
In vivo studies
Mouse micronucleus test
(CD mice) (OECD 474)
0, 500, 1000, 2000
mg/kg bw
(suspended in
Methylcellulose; single
oral treatment)
negative Kitamoto, S,
2007
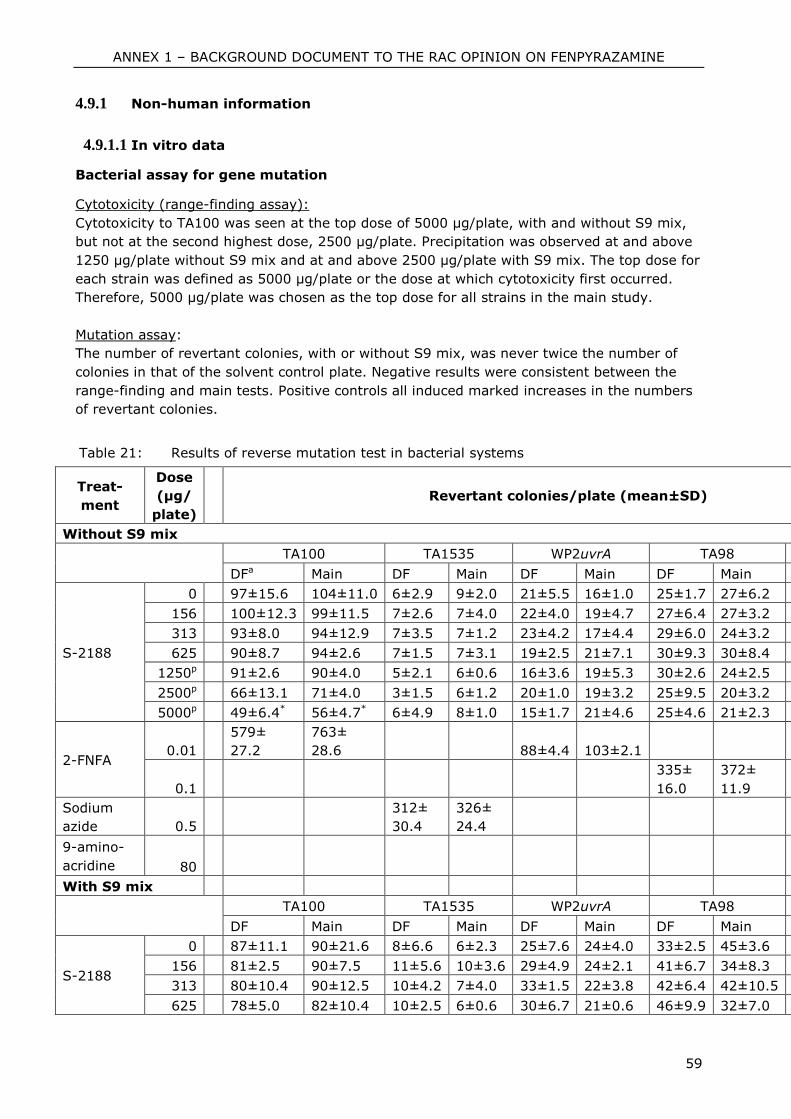
ANNEX 1 – BACKGROUND DOCUMENT TO THE RAC OPINION ON FENPYRAZAMINE
59
4.9.1 Non-human information
4.9.1.1 In vitro data
Bacterial assay for gene mutation
Cytotoxicity (range-finding assay):
Cytotoxicity to TA100 was seen at the top dose of 5000 µg/plate, with and without S9 mix,
but not at the second highest dose, 2500 µg/plate. Precipitation was observed at and above
1250 µg/plate without S9 mix and at and above 2500 µg/plate with S9 mix. The top dose for
each strain was defined as 5000 µg/plate or the dose at which cytotoxicity first occurred.
Therefore, 5000 µg/plate was chosen as the top dose for all strains in the main study.
Mutation assay:
The number of revertant colonies, with or without S9 mix, was never twice the number of
colonies in that of the solvent control plate. Negative results were consistent between the
range-finding and main tests. Positive controls all induced marked increases in the numbers
of revertant colonies.
Table 21: Results of reverse mutation test in bacterial systems
Treat-
ment
Dose
(µg/
plate)
Revertant colonies/plate (mean±SD)
Without S9 mix
TA100 TA1535 WP2uvrA TA98 TA1537
DFa Main DF Main DF Main DF Main DF Main
S-2188
0 97±15.6 104±11.0 6±2.9 9±2.0 21±5.5 16±1.0 25±1.7 27±6.2 11±3.8 11±3.0
156 100±12.3 99±11.5 7±2.6 7±4.0 22±4.0 19±4.7 27±6.4 27±3.2 7±1.5 8±3.8
313 93±8.0 94±12.9 7±3.5 7±1.2 23±4.2 17±4.4 29±6.0 24±3.2 10±3.8 13±6.4
625 90±8.7 94±2.6 7±1.5 7±3.1 19±2.5 21±7.1 30±9.3 30±8.4 12±3.5 6±2.5
1250p 91±2.6 90±4.0 5±2.1 6±0.6 16±3.6 19±5.3 30±2.6 24±2.5 7±1.5 7±0.0
2500p 66±13.1 71±4.0 3±1.5 6±1.2 20±1.0 19±3.2 25±9.5 20±3.2 3±0.6 5±4.5
5000p 49±6.4* 56±4.7* 6±4.9 8±1.0 15±1.7 21±4.6 25±4.6 21±2.3 4±1.2 10±6.1
2-FNFA 0.01
579±
27.2
763±
28.6 88±4.4 103±2.1
0.1
335±
16.0
372±
11.9
Sodium
azide 0.5
312±
30.4
326±
24.4
9-amino-
acridine 80
520±
58.9
595±
89.1
With S9 mix
TA100 TA1535 WP2uvrA TA98 TA1537
DF Main DF Main DF Main DF Main DF Main
S-2188
0 87±11.1 90±21.6 8±6.6 6±2.3 25±7.6 24±4.0 33±2.5 45±3.6 10±3.2 11±4.7
156 81±2.5 90±7.5 11±5.6 10±3.6 29±4.9 24±2.1 41±6.7 34±8.3 8±4.0 12±0.6
313 80±10.4 90±12.5 10±4.2 7±4.0 33±1.5 22±3.8 42±6.4 42±10.5 13±3.6 9±4.0
625 78±5.0 82±10.4 10±2.5 6±0.6 30±6.7 21±0.6 46±9.9 32±7.0 7±0.0 10±4.7
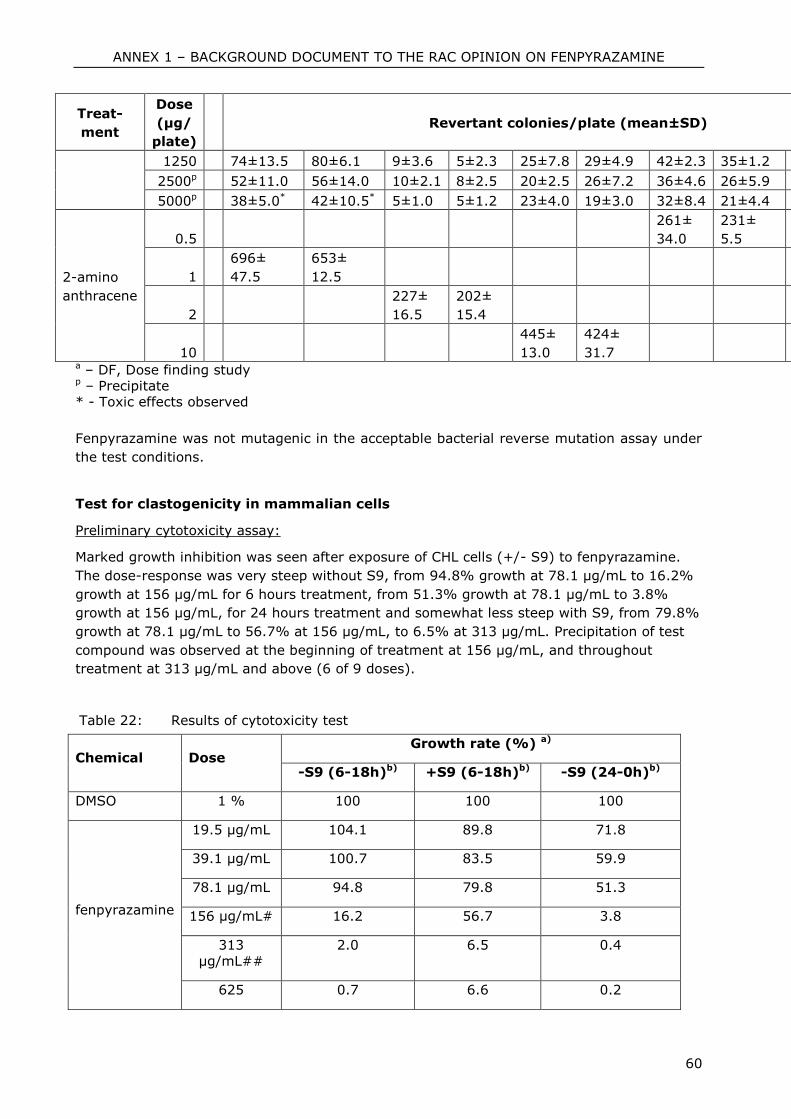
ANNEX 1 – BACKGROUND DOCUMENT TO THE RAC OPINION ON FENPYRAZAMINE
60
Treat-
ment
Dose
(µg/
plate)
Revertant colonies/plate (mean±SD)
1250 74±13.5 80±6.1 9±3.6 5±2.3 25±7.8 29±4.9 42±2.3 35±1.2 9±1.7 8±0.6
2500p 52±11.0 56±14.0 10±2.1 8±2.5 20±2.5 26±7.2 36±4.6 26±5.9 3±0.6 3±1.2
5000p 38±5.0* 42±10.5* 5±1.0 5±1.2 23±4.0 19±3.0 32±8.4 21±4.4 2±0.6 3±0.6
2-amino
anthracene
0.5
261±
34.0
231±
5.5
1
696±
47.5
653±
12.5
2
227±
16.5
202±
15.4
107±
13.9
114±
6.8
10
445±
13.0
424±
31.7 a – DF, Dose finding study p – Precipitate * - Toxic effects observed
Fenpyrazamine was not mutagenic in the acceptable bacterial reverse mutation assay under
the test conditions.
Test for clastogenicity in mammalian cells
Preliminary cytotoxicity assay:
Marked growth inhibition was seen after exposure of CHL cells (+/- S9) to fenpyrazamine.
The dose-response was very steep without S9, from 94.8% growth at 78.1 µg/mL to 16.2%
growth at 156 µg/mL for 6 hours treatment, from 51.3% growth at 78.1 µg/mL to 3.8%
growth at 156 µg/mL, for 24 hours treatment and somewhat less steep with S9, from 79.8%
growth at 78.1 µg/mL to 56.7% at 156 µg/mL, to 6.5% at 313 µg/mL. Precipitation of test
compound was observed at the beginning of treatment at 156 µg/mL, and throughout
treatment at 313 µg/mL and above (6 of 9 doses).
Table 22: Results of cytotoxicity test
Chemical Dose Growth rate (%) a)
-S9 (6-18h)b) +S9 (6-18h)b) -S9 (24-0h)b)
DMSO 1 % 100 100 100
fenpyrazamine
19.5 µg/mL 104.1 89.8 71.8
39.1 µg/mL 100.7 83.5 59.9
78.1 µg/mL 94.8 79.8 51.3
156 µg/mL# 16.2 56.7 3.8
313
µg/mL##
2.0 6.5 0.4
625 0.7 6.6 0.2
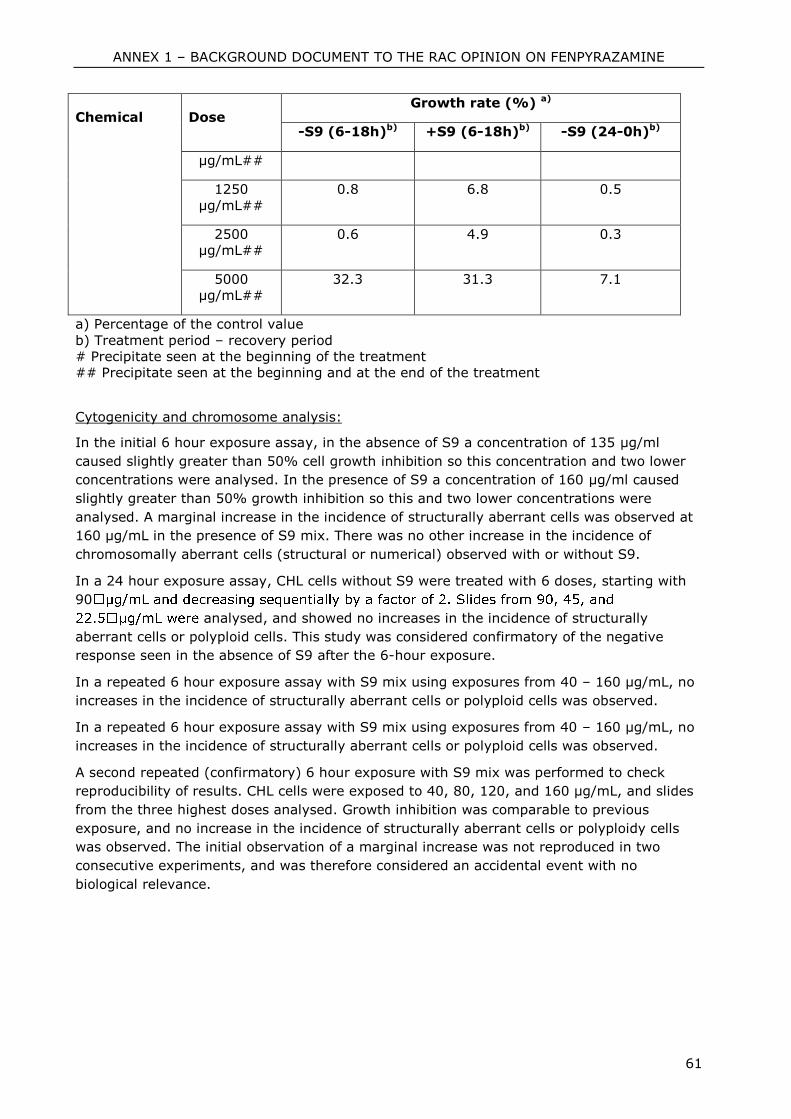
ANNEX 1 – BACKGROUND DOCUMENT TO THE RAC OPINION ON FENPYRAZAMINE
61
Chemical Dose Growth rate (%) a)
-S9 (6-18h)b) +S9 (6-18h)b) -S9 (24-0h)b)
µg/mL##
1250
µg/mL##
0.8 6.8 0.5
2500
µg/mL##
0.6 4.9 0.3
5000
µg/mL##
32.3 31.3 7.1
a) Percentage of the control value
b) Treatment period – recovery period
# Precipitate seen at the beginning of the treatment
## Precipitate seen at the beginning and at the end of the treatment
Cytogenicity and chromosome analysis:
In the initial 6 hour exposure assay, in the absence of S9 a concentration of 135 µg/ml
caused slightly greater than 50% cell growth inhibition so this concentration and two lower
concentrations were analysed. In the presence of S9 a concentration of 160 µg/ml caused
slightly greater than 50% growth inhibition so this and two lower concentrations were
analysed. A marginal increase in the incidence of structurally aberrant cells was observed at
160 µg/mL in the presence of S9 mix. There was no other increase in the incidence of
chromosomally aberrant cells (structural or numerical) observed with or without S9.
In a 24 hour exposure assay, CHL cells without S9 were treated with 6 doses, starting with
90
analysed, and showed no increases in the incidence of structurally
aberrant cells or polyploid cells. This study was considered confirmatory of the negative
response seen in the absence of S9 after the 6-hour exposure.
In a repeated 6 hour exposure assay with S9 mix using exposures from 40 – 160 µg/mL, no
increases in the incidence of structurally aberrant cells or polyploid cells was observed.
In a repeated 6 hour exposure assay with S9 mix using exposures from 40 – 160 µg/mL, no
increases in the incidence of structurally aberrant cells or polyploid cells was observed.
A second repeated (confirmatory) 6 hour exposure with S9 mix was performed to check
reproducibility of results. CHL cells were exposed to 40, 80, 120, and 160 µg/mL, and slides
from the three highest doses analysed. Growth inhibition was comparable to previous
exposure, and no increase in the incidence of structurally aberrant cells or polyploidy cells
was observed. The initial observation of a marginal increase was not reproduced in two
consecutive experiments, and was therefore considered an accidental event with no
biological relevance.
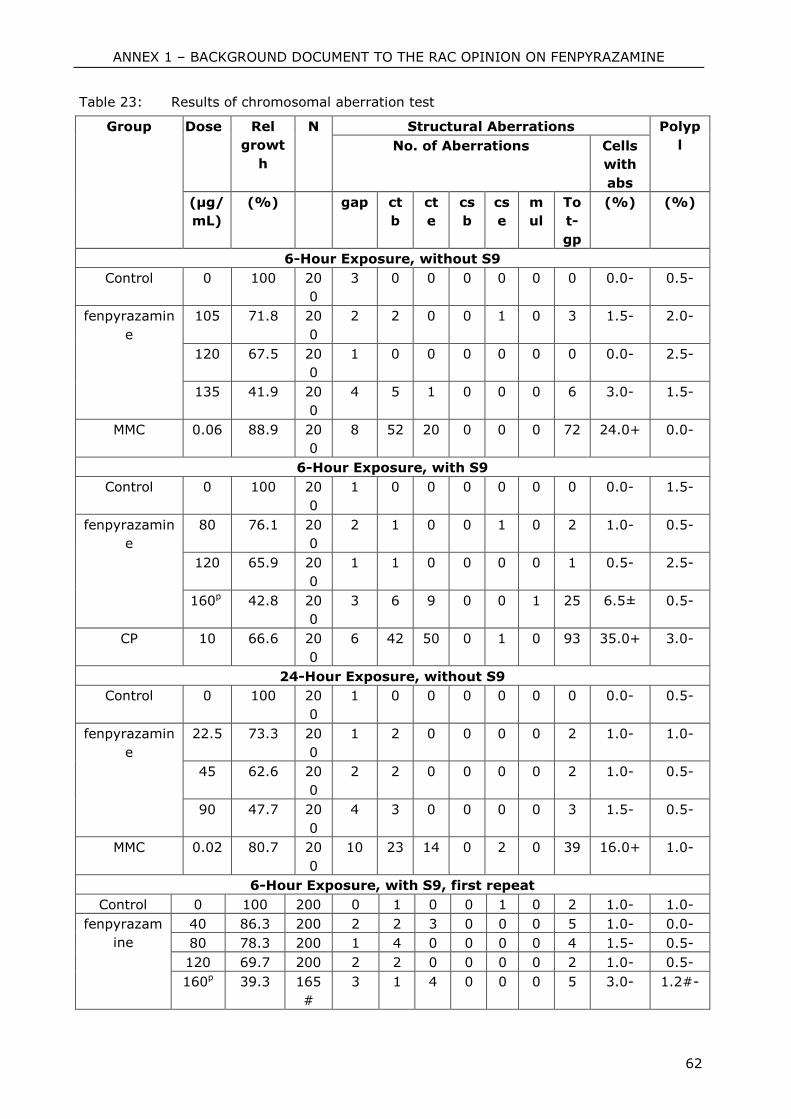
ANNEX 1 – BACKGROUND DOCUMENT TO THE RAC OPINION ON FENPYRAZAMINE
62
Table 23: Results of chromosomal aberration test
Group Dose Rel
growt
h
N Structural Aberrations Polyp
l No. of Aberrations Cells
with
abs
(µg/
mL)
(%) gap ct
b
ct
e
cs
b
cs
e
m
ul
To
t-
gp
(%) (%)
6-Hour Exposure, without S9
Control 0 100 20
0
3 0 0 0 0 0 0 0.0- 0.5-
fenpyrazamin
e
105 71.8 20
0
2 2 0 0 1 0 3 1.5- 2.0-
120 67.5 20
0
1 0 0 0 0 0 0 0.0- 2.5-
135 41.9 20
0
4 5 1 0 0 0 6 3.0- 1.5-
MMC 0.06 88.9 20
0
8 52 20 0 0 0 72 24.0+ 0.0-
6-Hour Exposure, with S9
Control 0 100 20
0
1 0 0 0 0 0 0 0.0- 1.5-
fenpyrazamin
e
80 76.1 20
0
2 1 0 0 1 0 2 1.0- 0.5-
120 65.9 20
0
1 1 0 0 0 0 1 0.5- 2.5-
160p 42.8 20
0
3 6 9 0 0 1 25 6.5± 0.5-
CP 10 66.6 20
0
6 42 50 0 1 0 93 35.0+ 3.0-
24-Hour Exposure, without S9
Control 0 100 20
0
1 0 0 0 0 0 0 0.0- 0.5-
fenpyrazamin
e
22.5 73.3 20
0
1 2 0 0 0 0 2 1.0- 1.0-
45 62.6 20
0
2 2 0 0 0 0 2 1.0- 0.5-
90 47.7 20
0
4 3 0 0 0 0 3 1.5- 0.5-
MMC 0.02 80.7 20
0
10 23 14 0 2 0 39 16.0+ 1.0-
6-Hour Exposure, with S9, first repeat
Control 0 100 200 0 1 0 0 1 0 2 1.0- 1.0-
fenpyrazam
ine
40 86.3 200 2 2 3 0 0 0 5 1.0- 0.0-
80 78.3 200 1 4 0 0 0 0 4 1.5- 0.5-
120 69.7 200 2 2 0 0 0 0 2 1.0- 0.5-
160p 39.3 165
#
3 1 4 0 0 0 5 3.0- 1.2#-
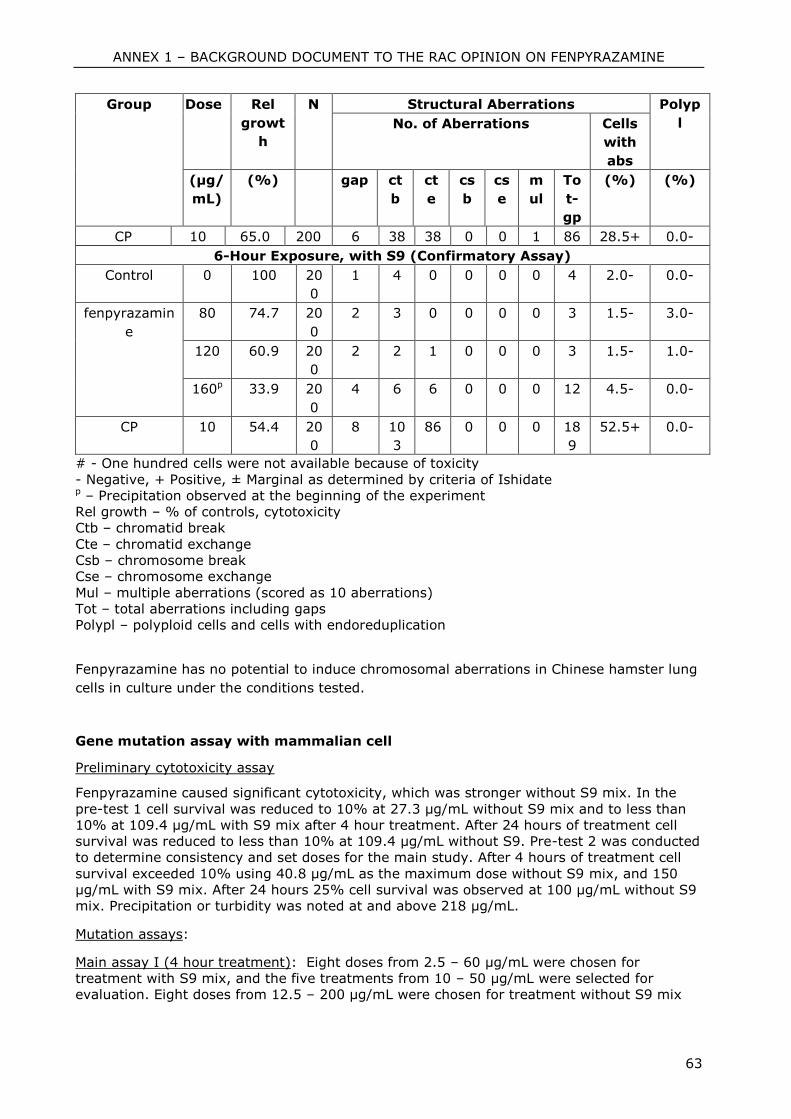
ANNEX 1 – BACKGROUND DOCUMENT TO THE RAC OPINION ON FENPYRAZAMINE
63
Group Dose Rel
growt
h
N Structural Aberrations Polyp
l No. of Aberrations Cells
with
abs
(µg/
mL)
(%) gap ct
b
ct
e
cs
b
cs
e
m
ul
To
t-
gp
(%) (%)
CP 10 65.0 200 6 38 38 0 0 1 86 28.5+ 0.0-
6-Hour Exposure, with S9 (Confirmatory Assay)
Control 0 100 20
0
1 4 0 0 0 0 4 2.0- 0.0-
fenpyrazamin
e
80 74.7 20
0
2 3 0 0 0 0 3 1.5- 3.0-
120 60.9 20
0
2 2 1 0 0 0 3 1.5- 1.0-
160p 33.9 20
0
4 6 6 0 0 0 12 4.5- 0.0-
CP 10 54.4 20
0
8 10
3
86 0 0 0 18
9
52.5+ 0.0-
# - One hundred cells were not available because of toxicity
- Negative, + Positive, ± Marginal as determined by criteria of Ishidate p – Precipitation observed at the beginning of the experiment
Rel growth – % of controls, cytotoxicity
Ctb – chromatid break
Cte – chromatid exchange
Csb – chromosome break
Cse – chromosome exchange
Mul – multiple aberrations (scored as 10 aberrations)
Tot – total aberrations including gaps
Polypl – polyploid cells and cells with endoreduplication
Fenpyrazamine has no potential to induce chromosomal aberrations in Chinese hamster lung
cells in culture under the conditions tested.
Gene mutation assay with mammalian cell
Preliminary cytotoxicity assay
Fenpyrazamine caused significant cytotoxicity, which was stronger without S9 mix. In the
pre-test 1 cell survival was reduced to 10% at 27.3 µg/mL without S9 mix and to less than
10% at 109.4 µg/mL with S9 mix after 4 hour treatment. After 24 hours of treatment cell
survival was reduced to less than 10% at 109.4 µg/mL without S9. Pre-test 2 was conducted
to determine consistency and set doses for the main study. After 4 hours of treatment cell
survival exceeded 10% using 40.8 µg/mL as the maximum dose without S9 mix, and 150
µg/mL with S9 mix. After 24 hours 25% cell survival was observed at 100 µg/mL without S9
mix. Precipitation or turbidity was noted at and above 218 µg/mL.
Mutation assays:
Main assay I (4 hour treatment): Eight doses from 2.5 – 60 µg/mL were chosen for
treatment with S9 mix, and the five treatments from 10 – 50 µg/mL were selected for
evaluation. Eight doses from 12.5 – 200 µg/mL were chosen for treatment without S9 mix
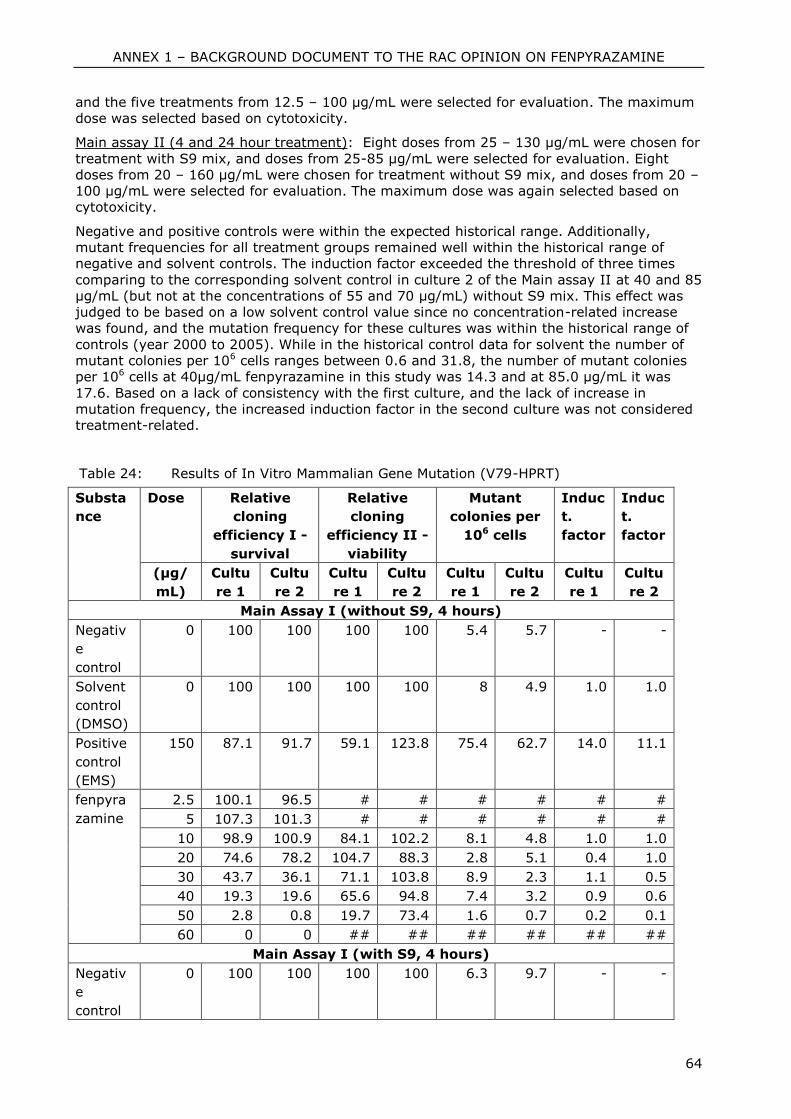
ANNEX 1 – BACKGROUND DOCUMENT TO THE RAC OPINION ON FENPYRAZAMINE
64
and the five treatments from 12.5 – 100 µg/mL were selected for evaluation. The maximum
dose was selected based on cytotoxicity.
Main assay II (4 and 24 hour treatment): Eight doses from 25 – 130 µg/mL were chosen for
treatment with S9 mix, and doses from 25-85 µg/mL were selected for evaluation. Eight
doses from 20 – 160 µg/mL were chosen for treatment without S9 mix, and doses from 20 –
100 µg/mL were selected for evaluation. The maximum dose was again selected based on
cytotoxicity.
Negative and positive controls were within the expected historical range. Additionally,
mutant frequencies for all treatment groups remained well within the historical range of
negative and solvent controls. The induction factor exceeded the threshold of three times
comparing to the corresponding solvent control in culture 2 of the Main assay II at 40 and 85
µg/mL (but not at the concentrations of 55 and 70 µg/mL) without S9 mix. This effect was
judged to be based on a low solvent control value since no concentration-related increase
was found, and the mutation frequency for these cultures was within the historical range of
controls (year 2000 to 2005). While in the historical control data for solvent the number of
mutant colonies per 106 cells ranges between 0.6 and 31.8, the number of mutant colonies
per 106 cells at 40µg/mL fenpyrazamine in this study was 14.3 and at 85.0 µg/mL it was
17.6. Based on a lack of consistency with the first culture, and the lack of increase in
mutation frequency, the increased induction factor in the second culture was not considered
treatment-related.
Table 24: Results of In Vitro Mammalian Gene Mutation (V79-HPRT)
Substa
nce
Dose Relative
cloning
efficiency I -
survival
Relative
cloning
efficiency II -
viability
Mutant
colonies per
106 cells
Induc
t.
factor
Induc
t.
factor
(μg/
mL)
Cultu
re 1
Cultu
re 2
Cultu
re 1
Cultu
re 2
Cultu
re 1
Cultu
re 2
Cultu
re 1
Cultu
re 2
Main Assay I (without S9, 4 hours)
Negativ
e
control
0 100 100 100 100 5.4 5.7 - -
Solvent
control
(DMSO)
0 100 100 100 100 8 4.9 1.0 1.0
Positive
control
(EMS)
150 87.1 91.7 59.1 123.8 75.4 62.7 14.0 11.1
fenpyra
zamine
2.5 100.1 96.5 # # # # # #
5 107.3 101.3 # # # # # #
10 98.9 100.9 84.1 102.2 8.1 4.8 1.0 1.0
20 74.6 78.2 104.7 88.3 2.8 5.1 0.4 1.0
30 43.7 36.1 71.1 103.8 8.9 2.3 1.1 0.5
40 19.3 19.6 65.6 94.8 7.4 3.2 0.9 0.6
50 2.8 0.8 19.7 73.4 1.6 0.7 0.2 0.1
60 0 0 ## ## ## ## ## ##
Main Assay I (with S9, 4 hours)
Negativ
e
control
0 100 100 100 100 6.3 9.7 - -
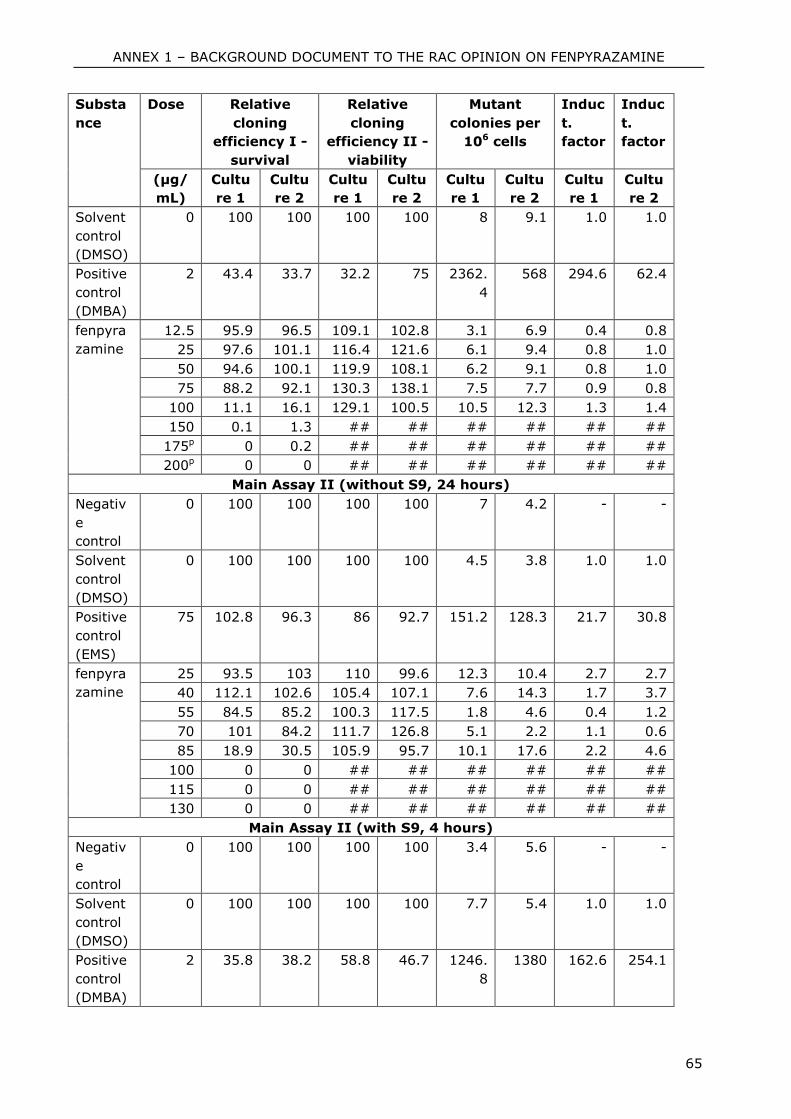
ANNEX 1 – BACKGROUND DOCUMENT TO THE RAC OPINION ON FENPYRAZAMINE
65
Substa
nce
Dose Relative
cloning
efficiency I -
survival
Relative
cloning
efficiency II -
viability
Mutant
colonies per
106 cells
Induc
t.
factor
Induc
t.
factor
(μg/
mL)
Cultu
re 1
Cultu
re 2
Cultu
re 1
Cultu
re 2
Cultu
re 1
Cultu
re 2
Cultu
re 1
Cultu
re 2
Solvent
control
(DMSO)
0 100 100 100 100 8 9.1 1.0 1.0
Positive
control
(DMBA)
2 43.4 33.7 32.2 75 2362.
4
568 294.6 62.4
fenpyra
zamine
12.5 95.9 96.5 109.1 102.8 3.1 6.9 0.4 0.8
25 97.6 101.1 116.4 121.6 6.1 9.4 0.8 1.0
50 94.6 100.1 119.9 108.1 6.2 9.1 0.8 1.0
75 88.2 92.1 130.3 138.1 7.5 7.7 0.9 0.8
100 11.1 16.1 129.1 100.5 10.5 12.3 1.3 1.4
150 0.1 1.3 ## ## ## ## ## ##
175p 0 0.2 ## ## ## ## ## ##
200p 0 0 ## ## ## ## ## ##
Main Assay II (without S9, 24 hours)
Negativ
e
control
0 100 100 100 100 7 4.2 - -
Solvent
control
(DMSO)
0 100 100 100 100 4.5 3.8 1.0 1.0
Positive
control
(EMS)
75 102.8 96.3 86 92.7 151.2 128.3 21.7 30.8
fenpyra
zamine
25 93.5 103 110 99.6 12.3 10.4 2.7 2.7
40 112.1 102.6 105.4 107.1 7.6 14.3 1.7 3.7
55 84.5 85.2 100.3 117.5 1.8 4.6 0.4 1.2
70 101 84.2 111.7 126.8 5.1 2.2 1.1 0.6
85 18.9 30.5 105.9 95.7 10.1 17.6 2.2 4.6
100 0 0 ## ## ## ## ## ##
115 0 0 ## ## ## ## ## ##
130 0 0 ## ## ## ## ## ##
Main Assay II (with S9, 4 hours)
Negativ
e
control
0 100 100 100 100 3.4 5.6 - -
Solvent
control
(DMSO)
0 100 100 100 100 7.7 5.4 1.0 1.0
Positive
control
(DMBA)
2 35.8 38.2 58.8 46.7 1246.
8
1380 162.6 254.1
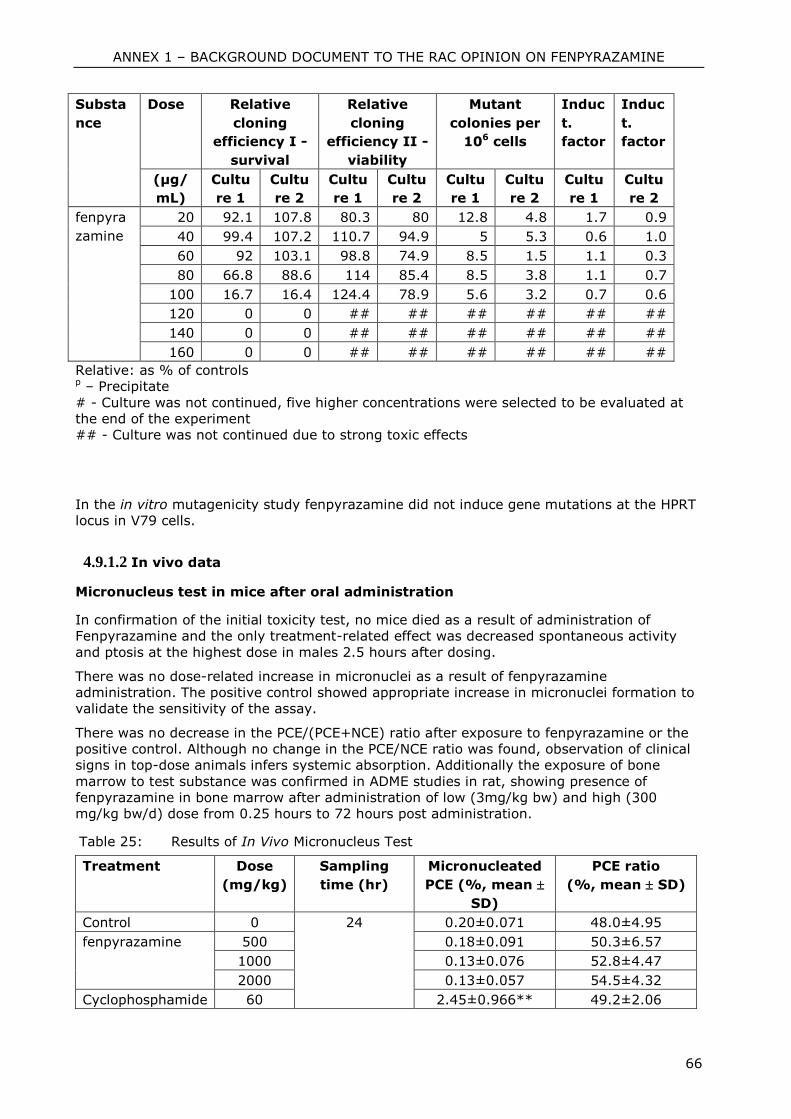
ANNEX 1 – BACKGROUND DOCUMENT TO THE RAC OPINION ON FENPYRAZAMINE
66
Substa
nce
Dose Relative
cloning
efficiency I -
survival
Relative
cloning
efficiency II -
viability
Mutant
colonies per
106 cells
Induc
t.
factor
Induc
t.
factor
(μg/
mL)
Cultu
re 1
Cultu
re 2
Cultu
re 1
Cultu
re 2
Cultu
re 1
Cultu
re 2
Cultu
re 1
Cultu
re 2
fenpyra
zamine
20 92.1 107.8 80.3 80 12.8 4.8 1.7 0.9
40 99.4 107.2 110.7 94.9 5 5.3 0.6 1.0
60 92 103.1 98.8 74.9 8.5 1.5 1.1 0.3
80 66.8 88.6 114 85.4 8.5 3.8 1.1 0.7
100 16.7 16.4 124.4 78.9 5.6 3.2 0.7 0.6
120 0 0 ## ## ## ## ## ##
140 0 0 ## ## ## ## ## ##
160 0 0 ## ## ## ## ## ##
Relative: as % of controls p – Precipitate
# - Culture was not continued, five higher concentrations were selected to be evaluated at
the end of the experiment
## - Culture was not continued due to strong toxic effects
In the in vitro mutagenicity study fenpyrazamine did not induce gene mutations at the HPRT
locus in V79 cells.
4.9.1.2 In vivo data
Micronucleus test in mice after oral administration
In confirmation of the initial toxicity test, no mice died as a result of administration of
Fenpyrazamine and the only treatment-related effect was decreased spontaneous activity
and ptosis at the highest dose in males 2.5 hours after dosing.
There was no dose-related increase in micronuclei as a result of fenpyrazamine
administration. The positive control showed appropriate increase in micronuclei formation to
validate the sensitivity of the assay.
There was no decrease in the PCE/(PCE+NCE) ratio after exposure to fenpyrazamine or the
positive control. Although no change in the PCE/NCE ratio was found, observation of clinical
signs in top-dose animals infers systemic absorption. Additionally the exposure of bone
marrow to test substance was confirmed in ADME studies in rat, showing presence of
fenpyrazamine in bone marrow after administration of low (3mg/kg bw) and high (300
mg/kg bw/d) dose from 0.25 hours to 72 hours post administration.
Table 25: Results of In Vivo Micronucleus Test
Treatment Dose
(mg/kg)
Sampling
time (hr)
Micronucleated
PCE (%, mean
SD)
PCE ratio
(%, mean SD)
Control 0 24 0.20±0.071 48.0±4.95
fenpyrazamine 500 0.18±0.091 50.3±6.57
1000 0.13±0.076 52.8±4.47
2000 0.13±0.057 54.5±4.32
Cyclophosphamide 60 2.45±0.966** 49.2±2.06
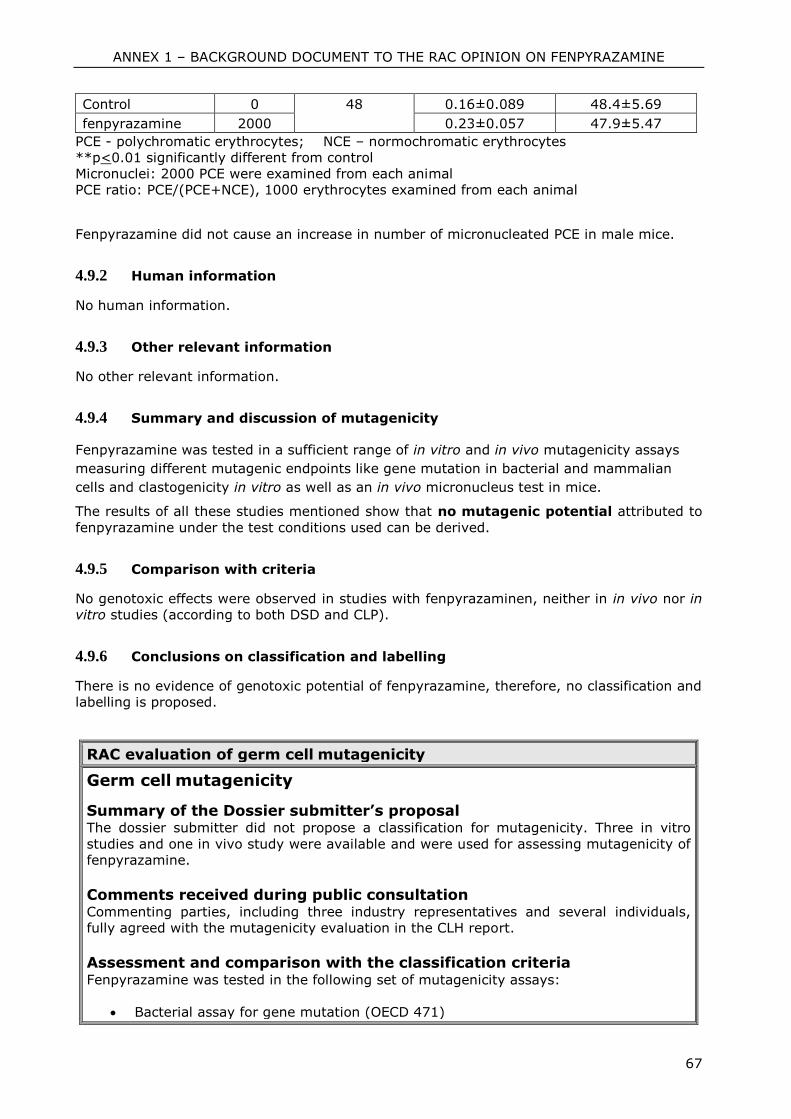
ANNEX 1 – BACKGROUND DOCUMENT TO THE RAC OPINION ON FENPYRAZAMINE
67
Control 0 48 0.16±0.089 48.4±5.69
fenpyrazamine 2000 0.23±0.057 47.9±5.47
PCE - polychromatic erythrocytes; NCE – normochromatic erythrocytes
**p<0.01 significantly different from control
Micronuclei: 2000 PCE were examined from each animal
PCE ratio: PCE/(PCE+NCE), 1000 erythrocytes examined from each animal
Fenpyrazamine did not cause an increase in number of micronucleated PCE in male mice.
4.9.2 Human information
No human information.
4.9.3 Other relevant information
No other relevant information.
4.9.4 Summary and discussion of mutagenicity
Fenpyrazamine was tested in a sufficient range of in vitro and in vivo mutagenicity assays
measuring different mutagenic endpoints like gene mutation in bacterial and mammalian
cells and clastogenicity in vitro as well as an in vivo micronucleus test in mice.
The results of all these studies mentioned show that no mutagenic potential attributed to
fenpyrazamine under the test conditions used can be derived.
4.9.5 Comparison with criteria
No genotoxic effects were observed in studies with fenpyrazaminen, neither in in vivo nor in
vitro studies (according to both DSD and CLP).
4.9.6 Conclusions on classification and labelling
There is no evidence of genotoxic potential of fenpyrazamine, therefore, no classification and
labelling is proposed.
RAC evaluation of germ cell mutagenicity
Germ cell mutagenicity
Summary of the Dossier submitter’s proposal The dossier submitter did not propose a classification for mutagenicity. Three in vitro
studies and one in vivo study were available and were used for assessing mutagenicity of
fenpyrazamine.
Comments received during public consultation Commenting parties, including three industry representatives and several individuals,
fully agreed with the mutagenicity evaluation in the CLH report.
Assessment and comparison with the classification criteria Fenpyrazamine was tested in the following set of mutagenicity assays:
Bacterial assay for gene mutation (OECD 471)
ANNEX 1 – BACKGROUND DOCUMENT TO THE RAC OPINION ON FENPYRAZAMINE
68
In vitro mammalian chromosome aberration test in Chinese hamster lung cells
(CHL/IU) (OECD 473)
In vitro Chinese hamster V79/HPRT locus gene mutation assay (OECD 476)
Mouse micronucleus test (CD mice) (OECD 474)
The results of all these in vitro and in vivo mutagenicity tests have been evaluated to be
negative. Thus there is no experimental evidence of a genotoxic potential of
fenpyrazamine. RAC concluded that these data do not justify a classification of
fenpyrazamine for mutagenicity (both CLP and DSD). This conclusion is in agreement
with the dossier submitter’s proposal and the comments received during public
consultation.
Supplemental information - In depth analyses by RAC None
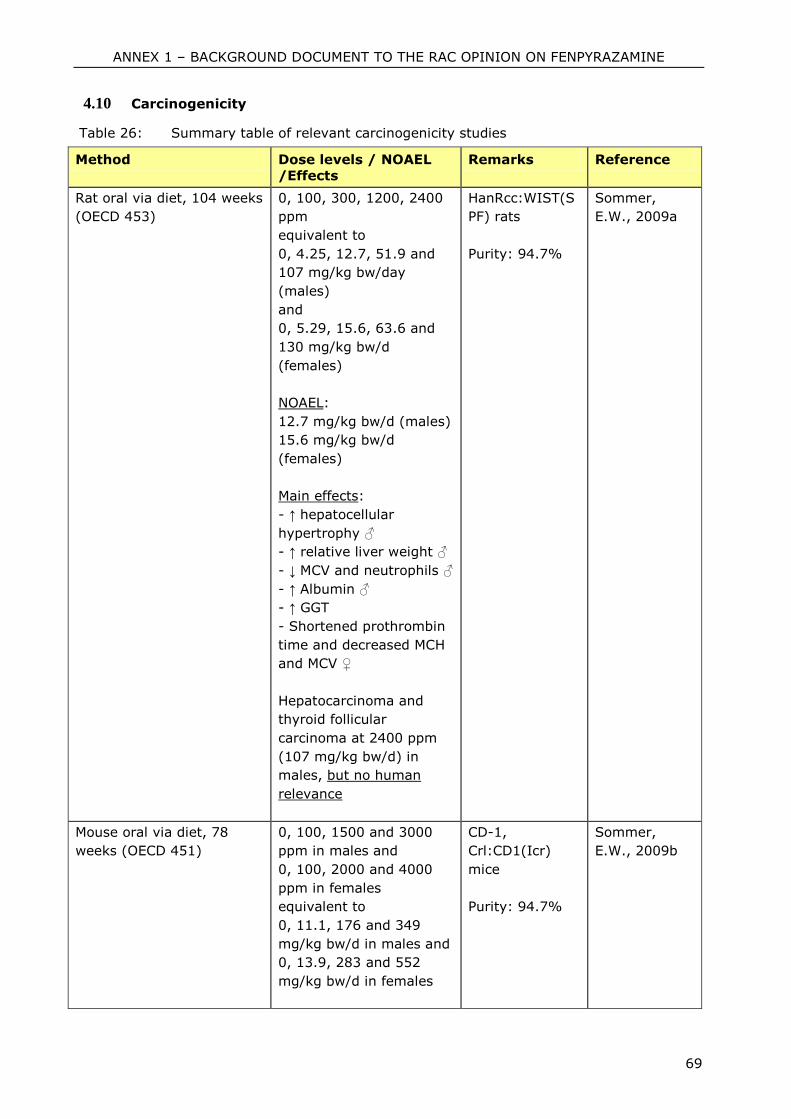
ANNEX 1 – BACKGROUND DOCUMENT TO THE RAC OPINION ON FENPYRAZAMINE
69
4.10 Carcinogenicity
Table 26: Summary table of relevant carcinogenicity studies
Method Dose levels / NOAEL
/Effects
Remarks Reference
Rat oral via diet, 104 weeks
(OECD 453)
0, 100, 300, 1200, 2400
ppm
equivalent to
0, 4.25, 12.7, 51.9 and
107 mg/kg bw/day
(males)
and
0, 5.29, 15.6, 63.6 and
130 mg/kg bw/d
(females)
NOAEL:
12.7 mg/kg bw/d (males)
15.6 mg/kg bw/d
(females)
Main effects:
- ↑ hepatocellular
hypertrophy ♂
- ↑ relative liver weight ♂
- ↓ MCV and neutrophils ♂
- ↑ Albumin ♂
- ↑ GGT
- Shortened prothrombin
time and decreased MCH
and MCV ♀
Hepatocarcinoma and
thyroid follicular
carcinoma at 2400 ppm
(107 mg/kg bw/d) in
males, but no human
relevance
HanRcc:WIST(S
PF) rats
Purity: 94.7%
Sommer,
E.W., 2009a
Mouse oral via diet, 78
weeks (OECD 451)
0, 100, 1500 and 3000
ppm in males and
0, 100, 2000 and 4000
ppm in females
equivalent to
0, 11.1, 176 and 349
mg/kg bw/d in males and
0, 13.9, 283 and 552
mg/kg bw/d in females
CD-1,
Crl:CD1(Icr)
mice
Purity: 94.7%
Sommer,
E.W., 2009b
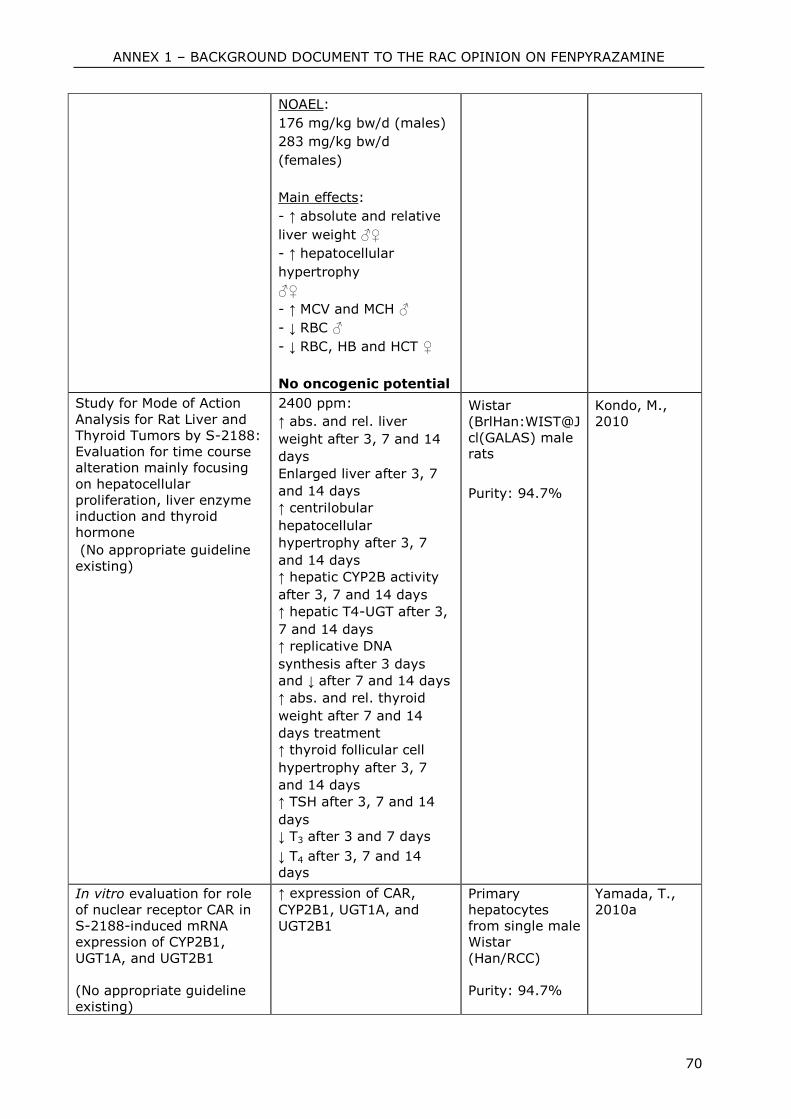
ANNEX 1 – BACKGROUND DOCUMENT TO THE RAC OPINION ON FENPYRAZAMINE
70
NOAEL:
176 mg/kg bw/d (males)
283 mg/kg bw/d
(females)
Main effects:
- ↑ absolute and relative
liver weight ♂♀
- ↑ hepatocellular
hypertrophy
♂♀
- ↑ MCV and MCH ♂
- ↓ RBC ♂
- ↓ RBC, HB and HCT ♀
No oncogenic potential
Study for Mode of Action
Analysis for Rat Liver and
Thyroid Tumors by S-2188:
Evaluation for time course
alteration mainly focusing
on hepatocellular
proliferation, liver enzyme
induction and thyroid
hormone
(No appropriate guideline
existing)
2400 ppm:
↑ abs. and rel. liver
weight after 3, 7 and 14
days
Enlarged liver after 3, 7
and 14 days
↑ centrilobular
hepatocellular
hypertrophy after 3, 7
and 14 days
↑ hepatic CYP2B activity
after 3, 7 and 14 days
↑ hepatic T4-UGT after 3,
7 and 14 days
↑ replicative DNA
synthesis after 3 days
and ↓ after 7 and 14 days
↑ abs. and rel. thyroid
weight after 7 and 14
days treatment
↑ thyroid follicular cell
hypertrophy after 3, 7
and 14 days
↑ TSH after 3, 7 and 14
days
↓ T3 after 3 and 7 days
↓ T4 after 3, 7 and 14
days
Wistar
(BrlHan:WIST@J
cl(GALAS) male rats
Purity: 94.7%
Kondo, M.,
2010
In vitro evaluation for role
of nuclear receptor CAR in
S-2188-induced mRNA
expression of CYP2B1,
UGT1A, and UGT2B1
(No appropriate guideline
existing)
↑ expression of CAR,
CYP2B1, UGT1A, and
UGT2B1
Primary
hepatocytes
from single male
Wistar
(Han/RCC)
Purity: 94.7%
Yamada, T.,
2010a
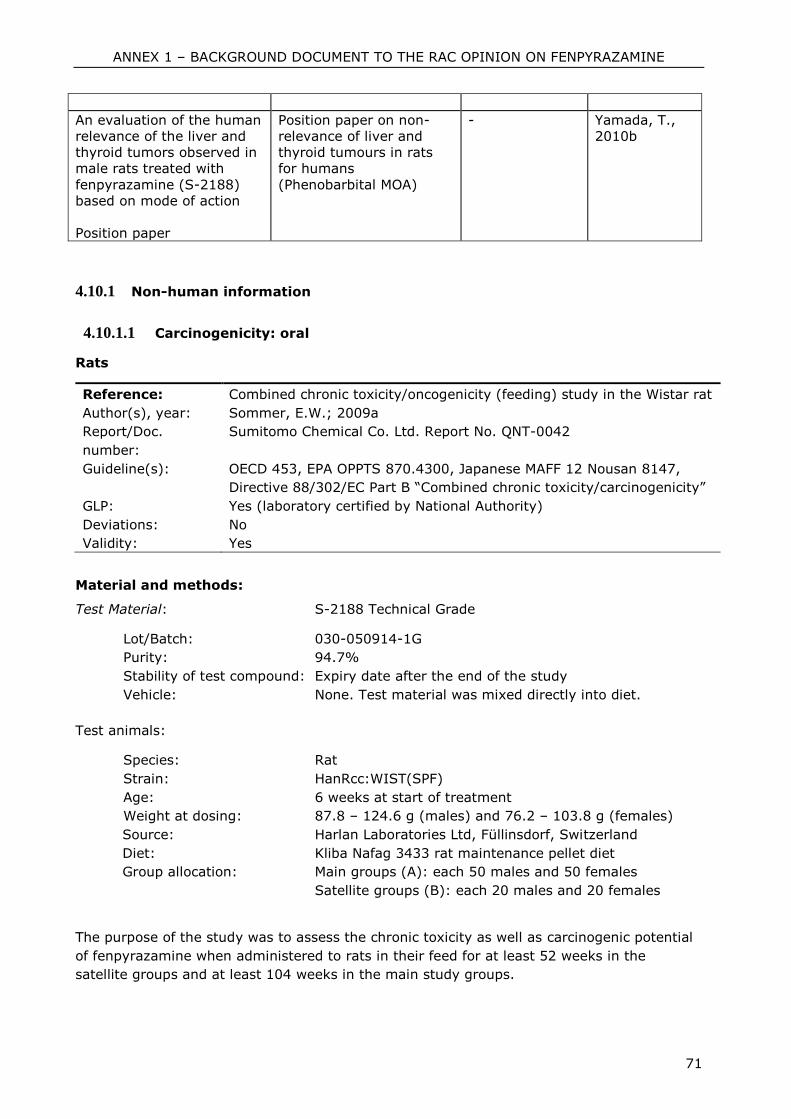
ANNEX 1 – BACKGROUND DOCUMENT TO THE RAC OPINION ON FENPYRAZAMINE
71
An evaluation of the human
relevance of the liver and
thyroid tumors observed in
male rats treated with
fenpyrazamine (S-2188)
based on mode of action
Position paper
Position paper on non-
relevance of liver and
thyroid tumours in rats
for humans
(Phenobarbital MOA)
- Yamada, T.,
2010b
4.10.1 Non-human information
4.10.1.1 Carcinogenicity: oral
Rats
Reference: Combined chronic toxicity/oncogenicity (feeding) study in the Wistar rat
Author(s), year: Sommer, E.W.; 2009a
Report/Doc.
number:
Sumitomo Chemical Co. Ltd. Report No. QNT-0042
Guideline(s): OECD 453, EPA OPPTS 870.4300, Japanese MAFF 12 Nousan 8147,
Directive 88/302/EC Part B “Combined chronic toxicity/carcinogenicity”
GLP: Yes (laboratory certified by National Authority)
Deviations: No
Validity: Yes
Material and methods:
Test Material: S-2188 Technical Grade
Lot/Batch: 030-050914-1G
Purity: 94.7%
Stability of test compound: Expiry date after the end of the study
Vehicle: None. Test material was mixed directly into diet.
Test animals:
Species: Rat
Strain: HanRcc:WIST(SPF)
Age: 6 weeks at start of treatment
Weight at dosing: 87.8 – 124.6 g (males) and 76.2 – 103.8 g (females)
Source: Harlan Laboratories Ltd, Füllinsdorf, Switzerland
Diet: Kliba Nafag 3433 rat maintenance pellet diet
Group allocation: Main groups (A): each 50 males and 50 females
Satellite groups (B): each 20 males and 20 females
The purpose of the study was to assess the chronic toxicity as well as carcinogenic potential
of fenpyrazamine when administered to rats in their feed for at least 52 weeks in the
satellite groups and at least 104 weeks in the main study groups.
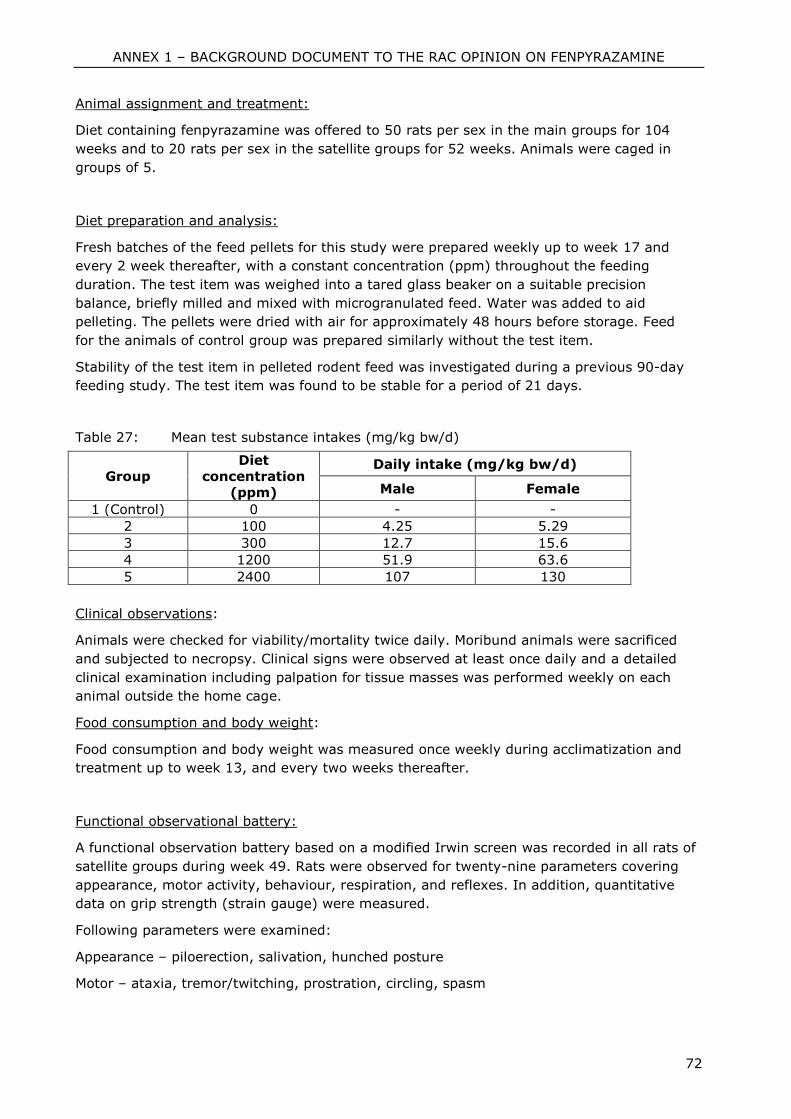
ANNEX 1 – BACKGROUND DOCUMENT TO THE RAC OPINION ON FENPYRAZAMINE
72
Animal assignment and treatment:
Diet containing fenpyrazamine was offered to 50 rats per sex in the main groups for 104
weeks and to 20 rats per sex in the satellite groups for 52 weeks. Animals were caged in
groups of 5.
Diet preparation and analysis:
Fresh batches of the feed pellets for this study were prepared weekly up to week 17 and
every 2 week thereafter, with a constant concentration (ppm) throughout the feeding
duration. The test item was weighed into a tared glass beaker on a suitable precision
balance, briefly milled and mixed with microgranulated feed. Water was added to aid
pelleting. The pellets were dried with air for approximately 48 hours before storage. Feed
for the animals of control group was prepared similarly without the test item.
Stability of the test item in pelleted rodent feed was investigated during a previous 90-day
feeding study. The test item was found to be stable for a period of 21 days.
Table 27: Mean test substance intakes (mg/kg bw/d)
Group
Diet
concentration
(ppm)
Daily intake (mg/kg bw/d)
Male Female
1 (Control) 0 - -
2 100 4.25 5.29
3 300 12.7 15.6
4 1200 51.9 63.6
5 2400 107 130
Clinical observations:
Animals were checked for viability/mortality twice daily. Moribund animals were sacrificed
and subjected to necropsy. Clinical signs were observed at least once daily and a detailed
clinical examination including palpation for tissue masses was performed weekly on each
animal outside the home cage.
Food consumption and body weight:
Food consumption and body weight was measured once weekly during acclimatization and
treatment up to week 13, and every two weeks thereafter.
Functional observational battery:
A functional observation battery based on a modified Irwin screen was recorded in all rats of
satellite groups during week 49. Rats were observed for twenty-nine parameters covering
appearance, motor activity, behaviour, respiration, and reflexes. In addition, quantitative
data on grip strength (strain gauge) were measured.
Following parameters were examined:
Appearance – piloerection, salivation, hunched posture
Motor – ataxia, tremor/twitching, prostration, circling, spasm
ANNEX 1 – BACKGROUND DOCUMENT TO THE RAC OPINION ON FENPYRAZAMINE
73
Behaviour – hyperactivity, somnolence, increased exploration, reduced grooming,
vocalisation
Respiration – dyspnea, tachypnea, bradypnea
Reflexes – blink, pinna, iridic light reflex, push-off (hind leg), pain response, startle/hearing
Miscellaneous – lacrimation, limbs cyanotic, mydriases, miosis, exophthalmos, reduced
muscle tone
Locomotor activity was measured quantitatively in week 49. Activity of the animals was
recorded for 10-minute intervals over a period of 60 minutes and as total activity over 60
minutes.
Ophthalmoscopy:
Ophthalmoscopic examinations were performed on all animals during acclimatization and on
all surviving satellite group animals of the control and high dose group during week 51. As
no test item related lesions were detected, animals of the low and intermediate dose groups
were not examined at week 51.
Haematology, clinical chemistry and urine analysis:
Satellite group:
Blood and urine samples for clinical laboratory investigations (haematology, clinical
biochemistry, and urine analysis) were collected from all satellite groups animals in weeks
13, 26 and 52. These animals were fasted for approximately 18 hours before blood sampling
but water was provided. The samples were collected early in the working day to reduce
biological variation caused by circadian rhythms. Blood samples were drawn from the retro-
orbital plexus under isoflurane anesthesia.
The following parameters were examined in satellite group rats: erythrocyte count,
haemoglobin(HGB), haematocrit (HCT), mean corpuscular volume (MCV), mean corpuscular
haemoglobin (MCH), mean corpuscular haemoglobin concentration (MCHC), reticulocyte
count, total and differential leukocyte count, (neutrophils, eosinophils, basophils,
lymphocytes, monocytes, large unstained cells), and thrombocyte count. Coagulation
parameters of prothrombin time and activated partial thromboplastin time were measured.
Samples for clinical chemistry parameters included: glucose, urea, creatinine, bilirubin
(total), cholesterol (total), triglycerides, phospholipids, aspartate aminotransferase, alanine
aminotransferase, alkaline phosphatase (ALP), gamma-glutamyl transferase (GGT), sodium,
potassium, chloride, calcium, phosphorus (inorganic), total protein, albumin, globulin, and
albumin/globulin ratio. Data on bilirubin (total) in females and phospholipids in both sexes at
52 weeks were missing.
Urine samples were collected using metabolism cages, during the overnight fasting period.
Volume, relative density and osmolality were measured and colour and appearance
recorded. The following urine components were investigated semi-quantitatively using a test
strip analyzer: pH, protein, glucose, ketones, urobilinogen, bilirubin, erythrocytes and
leukocytes. After centrifugation, the urine sediment was examined microscopically and
ANNEX 1 – BACKGROUND DOCUMENT TO THE RAC OPINION ON FENPYRAZAMINE
74
classified as to number of blood cells (RBC and WBC), epithelial cells (squamous, renal,
transitional), crystals (triple phosphate, calcium oxalate, uric acid, unidentified), and casts.
Main group:
Blood samples were collected from all main group animals during weeks 78 and 104, without
fasting, for haematology investigations only (reduced number of parameters: erythrocyte
count, total leukocyte count and differential leukocyte count).
Sacrifice and pathology:
Animals found in poor health or moribund were sacrificed once found. Surviving satellite
group animals were sacrificed on completion of 52 weeks of treatment. Surviving main group
animals were sacrificed after completion of 104 weeks of treatment. Animals were sacrificed
by exsanguinations under pentobarbitone anaesthesia.
All animals, either found dead or sacrificed, were subject to detailed necropsy and collection
of tissues. The following tissues were collected from all animals and fixed in neutral
phosphate buffered formaldehyde:
Adrenal glands
Aorta
Bone (sternum, femur including joint)
Bone marrow (femur, sternum)
Bone marrow smear*
Brain (cerebrum, cerebellum,
medulla/pons)
Carcass*
Cecum
Colon
Duodenum
Epididymides (fixed in Bouin’s solution)
Esophagus
Eyes w/optic nerve (fixed in Davidson’s
solution)
Harderian gland (fixed in Davidson’s
solution)
Head, remaining
Heart
Ileum, with Peyer’s patches
Jejunum, with Peyer’s patches
Kidneys
Larynx
Lacrimal gland, exorbital*
Liver
Lungs, inflated with formalin at necropsy
Lymph nodes (mesenteric, mandibular)
Mammary gland area
Nasal cavity with nasopharynx &
paranasal sinus
Ovaries
Pancreas
Pituitary gland
Preputial/clitoral gland*
Prostate gland
Rectum
Salivary glands – mandibular, parotid*,
sublingual
Sciatic nerve
Seminal vesicles
Skeletal muscle
Skin
Spinal cord – cervical, midthoracic,
lumbar
Spleen
Stomach
Testes (fixed in Bouin’s solution)
Thymus
Thyroid (including parathyroid)
Tongue
Trachea
Urinary bladder, inflated w/formalin at
necropsy
Uterus with cervix
Vagina
Gross lesions and tissue masses
(tumours)
*Not processed for histopathology
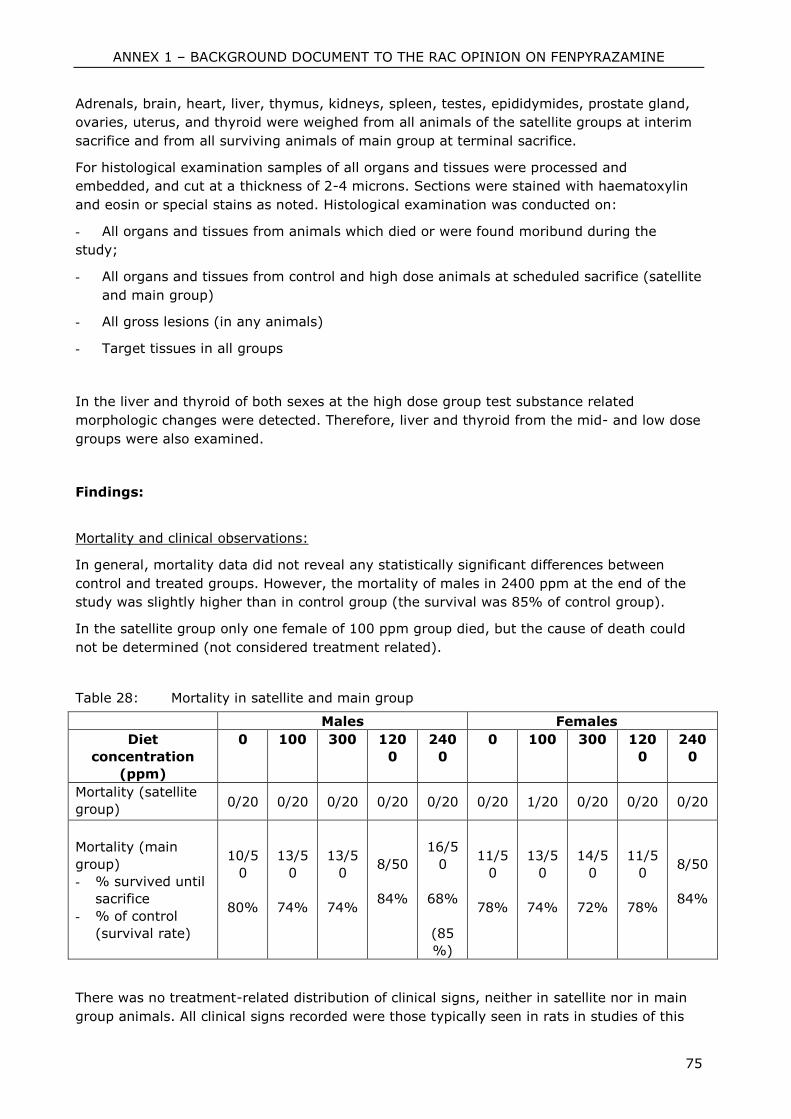
ANNEX 1 – BACKGROUND DOCUMENT TO THE RAC OPINION ON FENPYRAZAMINE
75
Adrenals, brain, heart, liver, thymus, kidneys, spleen, testes, epididymides, prostate gland,
ovaries, uterus, and thyroid were weighed from all animals of the satellite groups at interim
sacrifice and from all surviving animals of main group at terminal sacrifice.
For histological examination samples of all organs and tissues were processed and
embedded, and cut at a thickness of 2-4 microns. Sections were stained with haematoxylin
and eosin or special stains as noted. Histological examination was conducted on:
- All organs and tissues from animals which died or were found moribund during the
study;
- All organs and tissues from control and high dose animals at scheduled sacrifice (satellite
and main group)
- All gross lesions (in any animals)
- Target tissues in all groups
In the liver and thyroid of both sexes at the high dose group test substance related
morphologic changes were detected. Therefore, liver and thyroid from the mid- and low dose
groups were also examined.
Findings:
Mortality and clinical observations:
In general, mortality data did not reveal any statistically significant differences between
control and treated groups. However, the mortality of males in 2400 ppm at the end of the
study was slightly higher than in control group (the survival was 85% of control group).
In the satellite group only one female of 100 ppm group died, but the cause of death could
not be determined (not considered treatment related).
Table 28: Mortality in satellite and main group
Males Females
Diet
concentration
(ppm)
0 100 300 120
0
240
0
0 100 300 120
0
240
0
Mortality (satellite
group) 0/20 0/20 0/20 0/20 0/20 0/20 1/20 0/20 0/20 0/20
Mortality (main
group)
- % survived until
sacrifice
- % of control
(survival rate)
10/5
0
80%
13/5
0
74%
13/5
0
74%
8/50
84%
16/5
0
68%
(85
%)
11/5
0
78%
13/5
0
74%
14/5
0
72%
11/5
0
78%
8/50
84%
There was no treatment-related distribution of clinical signs, neither in satellite nor in main
group animals. All clinical signs recorded were those typically seen in rats in studies of this
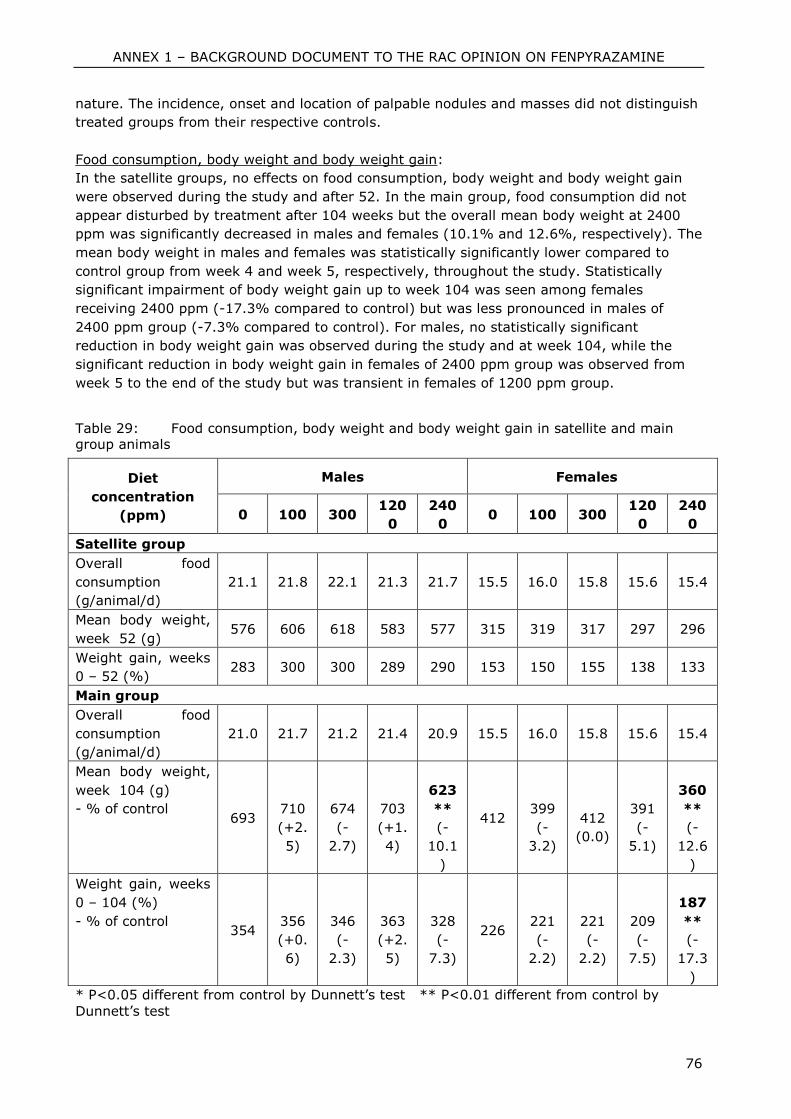
ANNEX 1 – BACKGROUND DOCUMENT TO THE RAC OPINION ON FENPYRAZAMINE
76
nature. The incidence, onset and location of palpable nodules and masses did not distinguish
treated groups from their respective controls.
Food consumption, body weight and body weight gain:
In the satellite groups, no effects on food consumption, body weight and body weight gain
were observed during the study and after 52. In the main group, food consumption did not
appear disturbed by treatment after 104 weeks but the overall mean body weight at 2400
ppm was significantly decreased in males and females (10.1% and 12.6%, respectively). The
mean body weight in males and females was statistically significantly lower compared to
control group from week 4 and week 5, respectively, throughout the study. Statistically
significant impairment of body weight gain up to week 104 was seen among females
receiving 2400 ppm (-17.3% compared to control) but was less pronounced in males of
2400 ppm group (-7.3% compared to control). For males, no statistically significant
reduction in body weight gain was observed during the study and at week 104, while the
significant reduction in body weight gain in females of 2400 ppm group was observed from
week 5 to the end of the study but was transient in females of 1200 ppm group.
Table 29: Food consumption, body weight and body weight gain in satellite and main group animals
Diet
concentration
(ppm)
Males Females
0 100 300 120
0
240
0 0 100 300
120
0
240
0
Satellite group
Overall food
consumption
(g/animal/d)
21.1 21.8 22.1 21.3 21.7 15.5 16.0 15.8 15.6 15.4
Mean body weight,
week 52 (g) 576 606 618 583 577 315 319 317 297 296
Weight gain, weeks
0 – 52 (%) 283 300 300 289 290 153 150 155 138 133
Main group
Overall food
consumption
(g/animal/d)
21.0 21.7 21.2 21.4 20.9 15.5 16.0 15.8 15.6 15.4
Mean body weight,
week 104 (g)
- % of control
693
710
(+2.
5)
674
(-
2.7)
703
(+1.
4)
623
**
(-
10.1
)
412
399
(-
3.2)
412
(0.0)
391
(-
5.1)
360
**
(-
12.6
)
Weight gain, weeks
0 – 104 (%)
- % of control
354
356
(+0.
6)
346
(-
2.3)
363
(+2.
5)
328
(-
7.3)
226
221
(-
2.2)
221
(-
2.2)
209
(-
7.5)
187
**
(-
17.3
)
* P<0.05 different from control by Dunnett’s test ** P<0.01 different from control by
Dunnett’s test
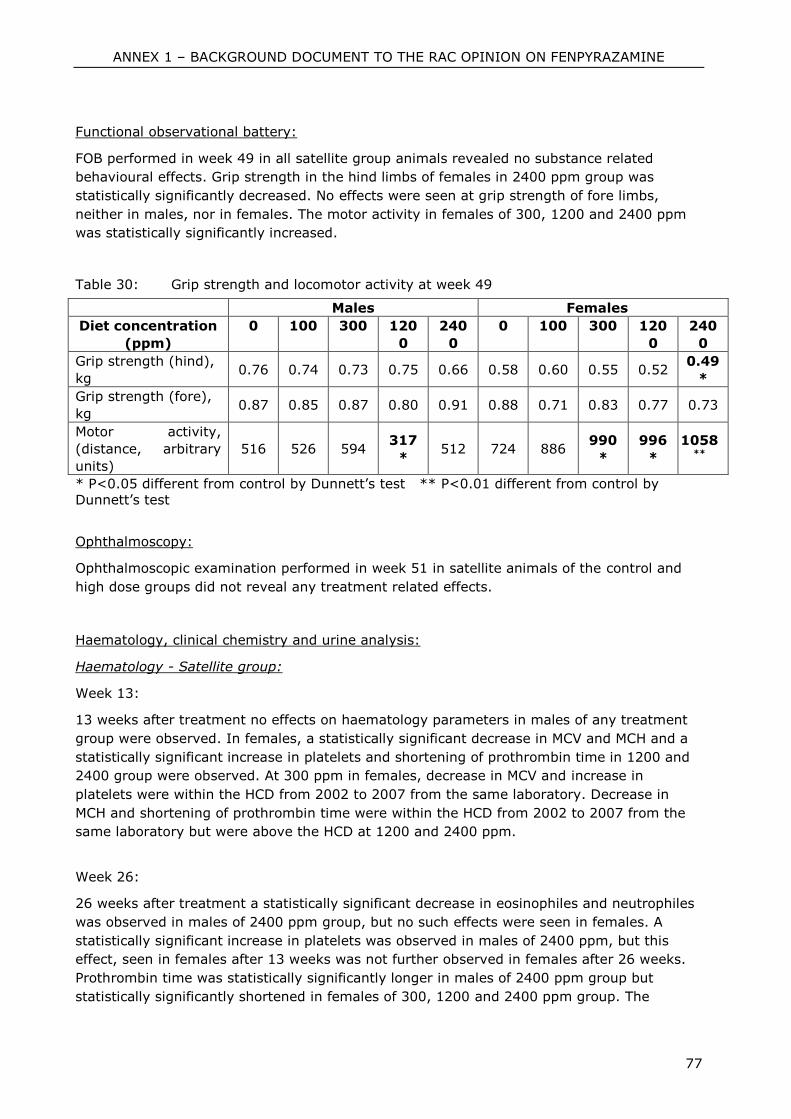
ANNEX 1 – BACKGROUND DOCUMENT TO THE RAC OPINION ON FENPYRAZAMINE
77
Functional observational battery:
FOB performed in week 49 in all satellite group animals revealed no substance related
behavioural effects. Grip strength in the hind limbs of females in 2400 ppm group was
statistically significantly decreased. No effects were seen at grip strength of fore limbs,
neither in males, nor in females. The motor activity in females of 300, 1200 and 2400 ppm
was statistically significantly increased.
Table 30: Grip strength and locomotor activity at week 49
Males Females
Diet concentration
(ppm)
0 100 300 120
0
240
0
0 100 300 120
0
240
0
Grip strength (hind),
kg 0.76 0.74 0.73 0.75 0.66 0.58 0.60 0.55 0.52
0.49
*
Grip strength (fore),
kg 0.87 0.85 0.87 0.80 0.91 0.88 0.71 0.83 0.77 0.73
Motor activity,
(distance, arbitrary
units)
516 526 594 317
* 512 724 886
990
*
996
*
1058**
* P<0.05 different from control by Dunnett’s test ** P<0.01 different from control by
Dunnett’s test
Ophthalmoscopy:
Ophthalmoscopic examination performed in week 51 in satellite animals of the control and
high dose groups did not reveal any treatment related effects.
Haematology, clinical chemistry and urine analysis:
Haematology - Satellite group:
Week 13:
13 weeks after treatment no effects on haematology parameters in males of any treatment
group were observed. In females, a statistically significant decrease in MCV and MCH and a
statistically significant increase in platelets and shortening of prothrombin time in 1200 and
2400 group were observed. At 300 ppm in females, decrease in MCV and increase in
platelets were within the HCD from 2002 to 2007 from the same laboratory. Decrease in
MCH and shortening of prothrombin time were within the HCD from 2002 to 2007 from the
same laboratory but were above the HCD at 1200 and 2400 ppm.
Week 26:
26 weeks after treatment a statistically significant decrease in eosinophiles and neutrophiles
was observed in males of 2400 ppm group, but no such effects were seen in females. A
statistically significant increase in platelets was observed in males of 2400 ppm, but this
effect, seen in females after 13 weeks was not further observed in females after 26 weeks.
Prothrombin time was statistically significantly longer in males of 2400 ppm group but
statistically significantly shortened in females of 300, 1200 and 2400 ppm group. The
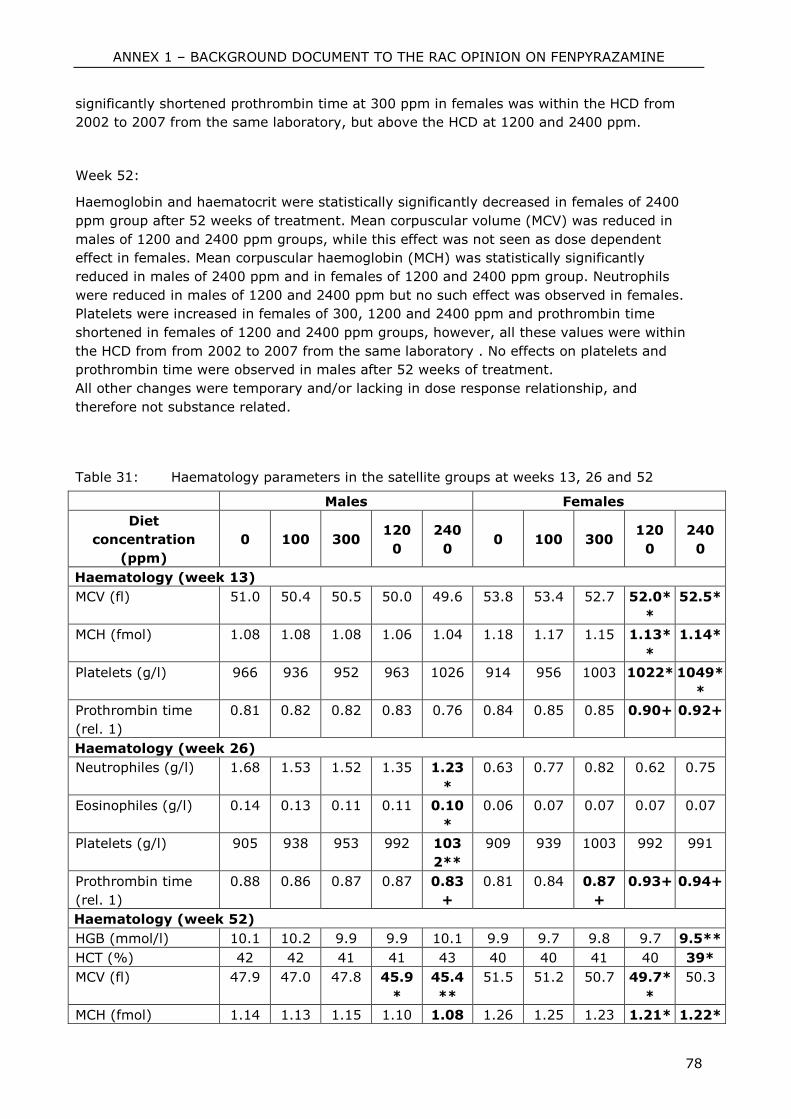
ANNEX 1 – BACKGROUND DOCUMENT TO THE RAC OPINION ON FENPYRAZAMINE
78
significantly shortened prothrombin time at 300 ppm in females was within the HCD from
2002 to 2007 from the same laboratory, but above the HCD at 1200 and 2400 ppm.
Week 52:
Haemoglobin and haematocrit were statistically significantly decreased in females of 2400
ppm group after 52 weeks of treatment. Mean corpuscular volume (MCV) was reduced in
males of 1200 and 2400 ppm groups, while this effect was not seen as dose dependent
effect in females. Mean corpuscular haemoglobin (MCH) was statistically significantly
reduced in males of 2400 ppm and in females of 1200 and 2400 ppm group. Neutrophils
were reduced in males of 1200 and 2400 ppm but no such effect was observed in females.
Platelets were increased in females of 300, 1200 and 2400 ppm and prothrombin time
shortened in females of 1200 and 2400 ppm groups, however, all these values were within
the HCD from from 2002 to 2007 from the same laboratory . No effects on platelets and
prothrombin time were observed in males after 52 weeks of treatment.
All other changes were temporary and/or lacking in dose response relationship, and
therefore not substance related.
Table 31: Haematology parameters in the satellite groups at weeks 13, 26 and 52
Males Females
Diet
concentration
(ppm)
0 100 300 120
0
240
0 0 100 300
120
0
240
0
Haematology (week 13)
MCV (fl) 51.0 50.4 50.5 50.0 49.6 53.8 53.4 52.7 52.0*
*
52.5*
MCH (fmol) 1.08 1.08 1.08 1.06 1.04 1.18 1.17 1.15 1.13*
*
1.14*
Platelets (g/l) 966 936 952 963 1026 914 956 1003 1022* 1049*
*
Prothrombin time
(rel. 1)
0.81 0.82 0.82 0.83 0.76 0.84 0.85 0.85 0.90+ 0.92+
Haematology (week 26)
Neutrophiles (g/l) 1.68 1.53 1.52 1.35 1.23
*
0.63 0.77 0.82 0.62 0.75
Eosinophiles (g/l) 0.14 0.13 0.11 0.11 0.10
*
0.06 0.07 0.07 0.07 0.07
Platelets (g/l) 905 938 953 992 103
2**
909 939 1003 992 991
Prothrombin time
(rel. 1)
0.88 0.86 0.87 0.87 0.83
+
0.81 0.84 0.87
+
0.93+ 0.94+
Haematology (week 52)
HGB (mmol/l) 10.1 10.2 9.9 9.9 10.1 9.9 9.7 9.8 9.7 9.5**
HCT (%) 42 42 41 41 43 40 40 41 40 39*
MCV (fl) 47.9 47.0 47.8 45.9
*
45.4
**
51.5 51.2 50.7 49.7*
*
50.3
MCH (fmol) 1.14 1.13 1.15 1.10 1.08 1.26 1.25 1.23 1.21* 1.22*
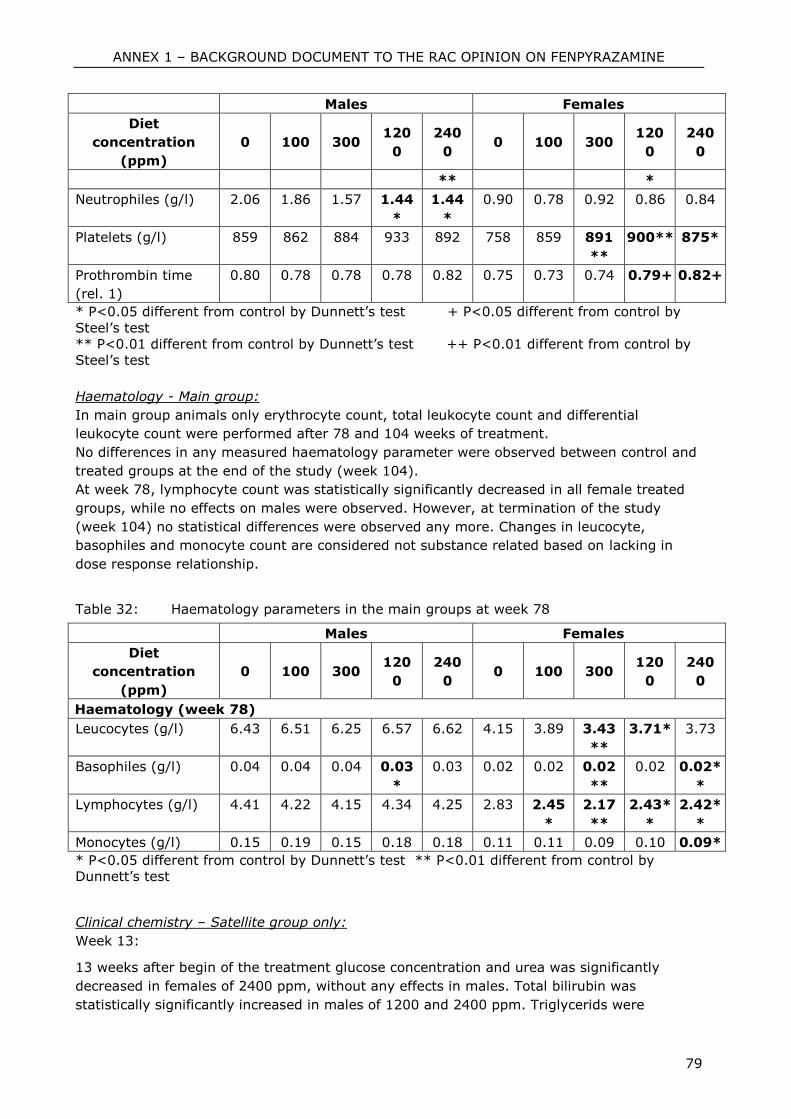
ANNEX 1 – BACKGROUND DOCUMENT TO THE RAC OPINION ON FENPYRAZAMINE
79
Males Females
Diet
concentration
(ppm)
0 100 300 120
0
240
0 0 100 300
120
0
240
0
** *
Neutrophiles (g/l) 2.06 1.86 1.57 1.44
*
1.44
*
0.90 0.78 0.92 0.86 0.84
Platelets (g/l) 859 862 884 933 892 758 859 891
**
900** 875*
Prothrombin time
(rel. 1)
0.80 0.78 0.78 0.78 0.82 0.75 0.73 0.74 0.79+ 0.82+
* P<0.05 different from control by Dunnett’s test + P<0.05 different from control by
Steel’s test
** P<0.01 different from control by Dunnett’s test ++ P<0.01 different from control by
Steel’s test
Haematology - Main group:
In main group animals only erythrocyte count, total leukocyte count and differential
leukocyte count were performed after 78 and 104 weeks of treatment.
No differences in any measured haematology parameter were observed between control and
treated groups at the end of the study (week 104).
At week 78, lymphocyte count was statistically significantly decreased in all female treated
groups, while no effects on males were observed. However, at termination of the study
(week 104) no statistical differences were observed any more. Changes in leucocyte,
basophiles and monocyte count are considered not substance related based on lacking in
dose response relationship.
Table 32: Haematology parameters in the main groups at week 78
Males Females
Diet
concentration
(ppm)
0 100 300 120
0
240
0 0 100 300
120
0
240
0
Haematology (week 78)
Leucocytes (g/l) 6.43 6.51 6.25 6.57 6.62 4.15 3.89 3.43
**
3.71* 3.73
Basophiles (g/l) 0.04 0.04 0.04 0.03
*
0.03 0.02 0.02 0.02
**
0.02 0.02*
*
Lymphocytes (g/l) 4.41 4.22 4.15 4.34 4.25 2.83 2.45
*
2.17
**
2.43*
*
2.42*
*
Monocytes (g/l) 0.15 0.19 0.15 0.18 0.18 0.11 0.11 0.09 0.10 0.09*
* P<0.05 different from control by Dunnett’s test ** P<0.01 different from control by
Dunnett’s test
Clinical chemistry – Satellite group only:
Week 13:
13 weeks after begin of the treatment glucose concentration and urea was significantly
decreased in females of 2400 ppm, without any effects in males. Total bilirubin was
statistically significantly increased in males of 1200 and 2400 ppm. Triglycerids were
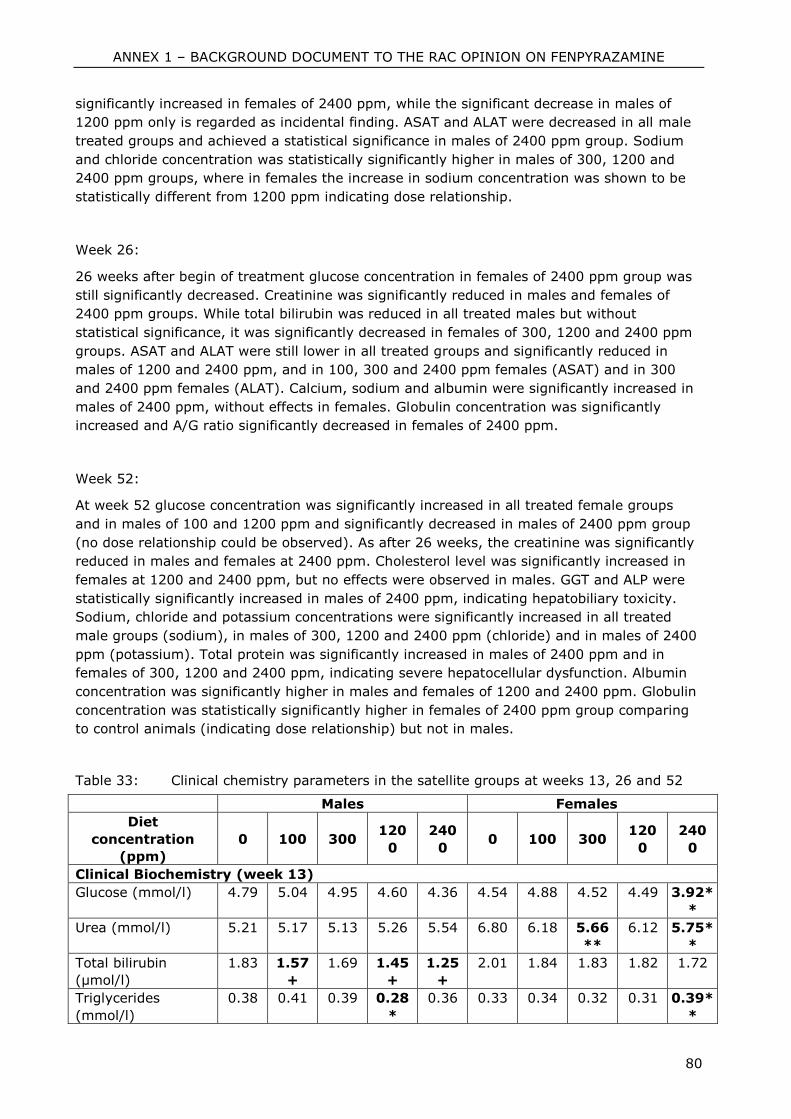
ANNEX 1 – BACKGROUND DOCUMENT TO THE RAC OPINION ON FENPYRAZAMINE
80
significantly increased in females of 2400 ppm, while the significant decrease in males of
1200 ppm only is regarded as incidental finding. ASAT and ALAT were decreased in all male
treated groups and achieved a statistical significance in males of 2400 ppm group. Sodium
and chloride concentration was statistically significantly higher in males of 300, 1200 and
2400 ppm groups, where in females the increase in sodium concentration was shown to be
statistically different from 1200 ppm indicating dose relationship.
Week 26:
26 weeks after begin of treatment glucose concentration in females of 2400 ppm group was
still significantly decreased. Creatinine was significantly reduced in males and females of
2400 ppm groups. While total bilirubin was reduced in all treated males but without
statistical significance, it was significantly decreased in females of 300, 1200 and 2400 ppm
groups. ASAT and ALAT were still lower in all treated groups and significantly reduced in
males of 1200 and 2400 ppm, and in 100, 300 and 2400 ppm females (ASAT) and in 300
and 2400 ppm females (ALAT). Calcium, sodium and albumin were significantly increased in
males of 2400 ppm, without effects in females. Globulin concentration was significantly
increased and A/G ratio significantly decreased in females of 2400 ppm.
Week 52:
At week 52 glucose concentration was significantly increased in all treated female groups
and in males of 100 and 1200 ppm and significantly decreased in males of 2400 ppm group
(no dose relationship could be observed). As after 26 weeks, the creatinine was significantly
reduced in males and females at 2400 ppm. Cholesterol level was significantly increased in
females at 1200 and 2400 ppm, but no effects were observed in males. GGT and ALP were
statistically significantly increased in males of 2400 ppm, indicating hepatobiliary toxicity.
Sodium, chloride and potassium concentrations were significantly increased in all treated
male groups (sodium), in males of 300, 1200 and 2400 ppm (chloride) and in males of 2400
ppm (potassium). Total protein was significantly increased in males of 2400 ppm and in
females of 300, 1200 and 2400 ppm, indicating severe hepatocellular dysfunction. Albumin
concentration was significantly higher in males and females of 1200 and 2400 ppm. Globulin
concentration was statistically significantly higher in females of 2400 ppm group comparing
to control animals (indicating dose relationship) but not in males.
Table 33: Clinical chemistry parameters in the satellite groups at weeks 13, 26 and 52
Males Females
Diet
concentration
(ppm)
0 100 300 120
0
240
0 0 100 300
120
0
240
0
Clinical Biochemistry (week 13)
Glucose (mmol/l) 4.79 5.04 4.95 4.60 4.36 4.54 4.88 4.52 4.49 3.92*
*
Urea (mmol/l) 5.21 5.17 5.13 5.26 5.54 6.80 6.18 5.66
**
6.12 5.75*
*
Total bilirubin
(µmol/l)
1.83 1.57
+
1.69 1.45
+
1.25
+
2.01 1.84 1.83 1.82 1.72
Triglycerides
(mmol/l)
0.38 0.41 0.39 0.28
*
0.36 0.33 0.34 0.32 0.31 0.39*
*
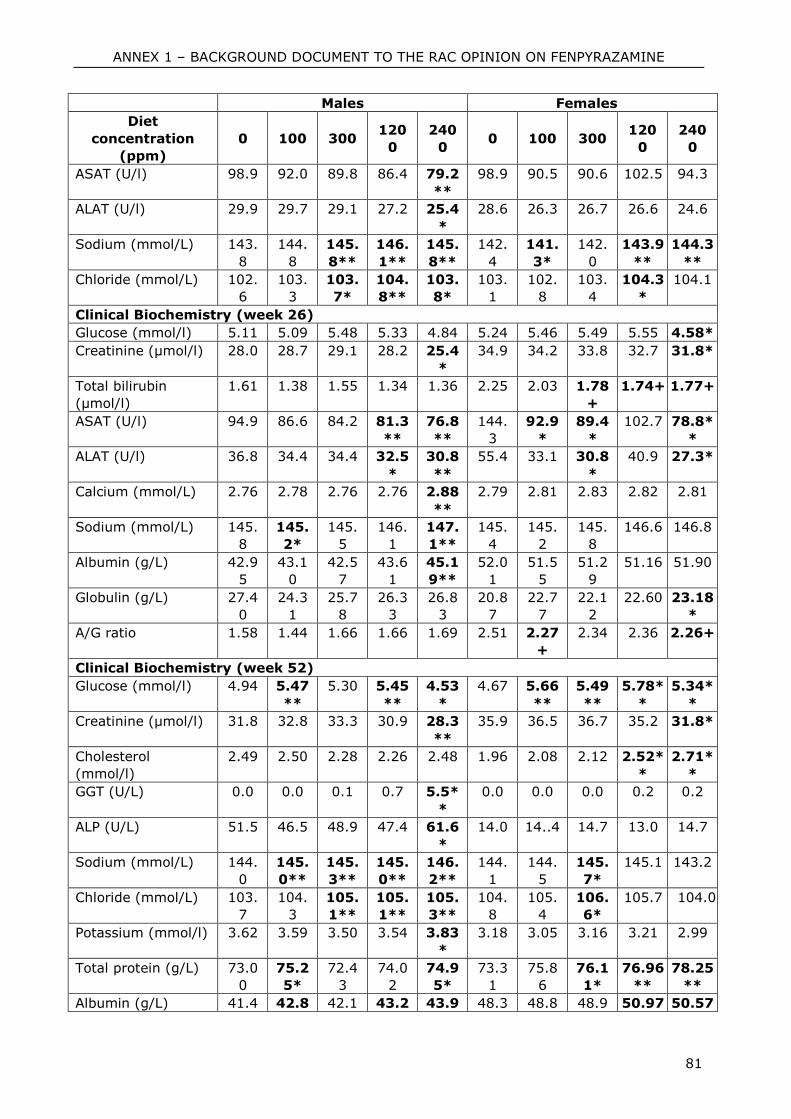
ANNEX 1 – BACKGROUND DOCUMENT TO THE RAC OPINION ON FENPYRAZAMINE
81
Males Females
Diet
concentration
(ppm)
0 100 300 120
0
240
0 0 100 300
120
0
240
0
ASAT (U/l) 98.9 92.0 89.8 86.4 79.2
**
98.9 90.5 90.6 102.5 94.3
ALAT (U/l) 29.9 29.7 29.1 27.2 25.4
*
28.6 26.3 26.7 26.6 24.6
Sodium (mmol/L) 143.
8
144.
8
145.
8**
146.
1**
145.
8**
142.
4
141.
3*
142.
0
143.9
**
144.3
**
Chloride (mmol/L) 102.
6
103.
3
103.
7*
104.
8**
103.
8*
103.
1
102.
8
103.
4
104.3
*
104.1
Clinical Biochemistry (week 26)
Glucose (mmol/l) 5.11 5.09 5.48 5.33 4.84 5.24 5.46 5.49 5.55 4.58*
Creatinine (μmol/l) 28.0 28.7 29.1 28.2 25.4
*
34.9 34.2 33.8 32.7 31.8*
Total bilirubin
(µmol/l)
1.61 1.38 1.55 1.34 1.36 2.25 2.03 1.78
+
1.74+ 1.77+
ASAT (U/l) 94.9 86.6 84.2 81.3
**
76.8
**
144.
3
92.9
*
89.4
*
102.7 78.8*
*
ALAT (U/l) 36.8 34.4 34.4 32.5
*
30.8
**
55.4 33.1 30.8
*
40.9 27.3*
Calcium (mmol/L) 2.76 2.78 2.76 2.76 2.88
**
2.79 2.81 2.83 2.82 2.81
Sodium (mmol/L) 145.
8
145.
2*
145.
5
146.
1
147.
1**
145.
4
145.
2
145.
8
146.6 146.8
Albumin (g/L) 42.9
5
43.1
0
42.5
7
43.6
1
45.1
9**
52.0
1
51.5
5
51.2
9
51.16 51.90
Globulin (g/L) 27.4
0
24.3
1
25.7
8
26.3
3
26.8
3
20.8
7
22.7
7
22.1
2
22.60 23.18
*
A/G ratio 1.58 1.44 1.66 1.66 1.69 2.51 2.27
+
2.34 2.36 2.26+
Clinical Biochemistry (week 52)
Glucose (mmol/l) 4.94 5.47
**
5.30 5.45
**
4.53
*
4.67 5.66
**
5.49
**
5.78*
*
5.34*
*
Creatinine (μmol/l) 31.8 32.8 33.3 30.9 28.3
**
35.9 36.5 36.7 35.2 31.8*
Cholesterol
(mmol/l)
2.49 2.50 2.28 2.26 2.48 1.96 2.08 2.12 2.52*
*
2.71*
*
GGT (U/L) 0.0 0.0 0.1 0.7 5.5*
*
0.0 0.0 0.0 0.2 0.2
ALP (U/L) 51.5 46.5 48.9 47.4 61.6
*
14.0 14..4 14.7 13.0 14.7
Sodium (mmol/L) 144.
0
145.
0**
145.
3**
145.
0**
146.
2**
144.
1
144.
5
145.
7*
145.1 143.2
Chloride (mmol/L) 103.
7
104.
3
105.
1**
105.
1**
105.
3**
104.
8
105.
4
106.
6*
105.7 104.0
Potassium (mmol/l) 3.62 3.59 3.50 3.54 3.83
*
3.18 3.05 3.16 3.21 2.99
Total protein (g/L) 73.0
0
75.2
5*
72.4
3
74.0
2
74.9
5*
73.3
1
75.8
6
76.1
1*
76.96
**
78.25
**
Albumin (g/L) 41.4 42.8 42.1 43.2 43.9 48.3 48.8 48.9 50.97 50.57
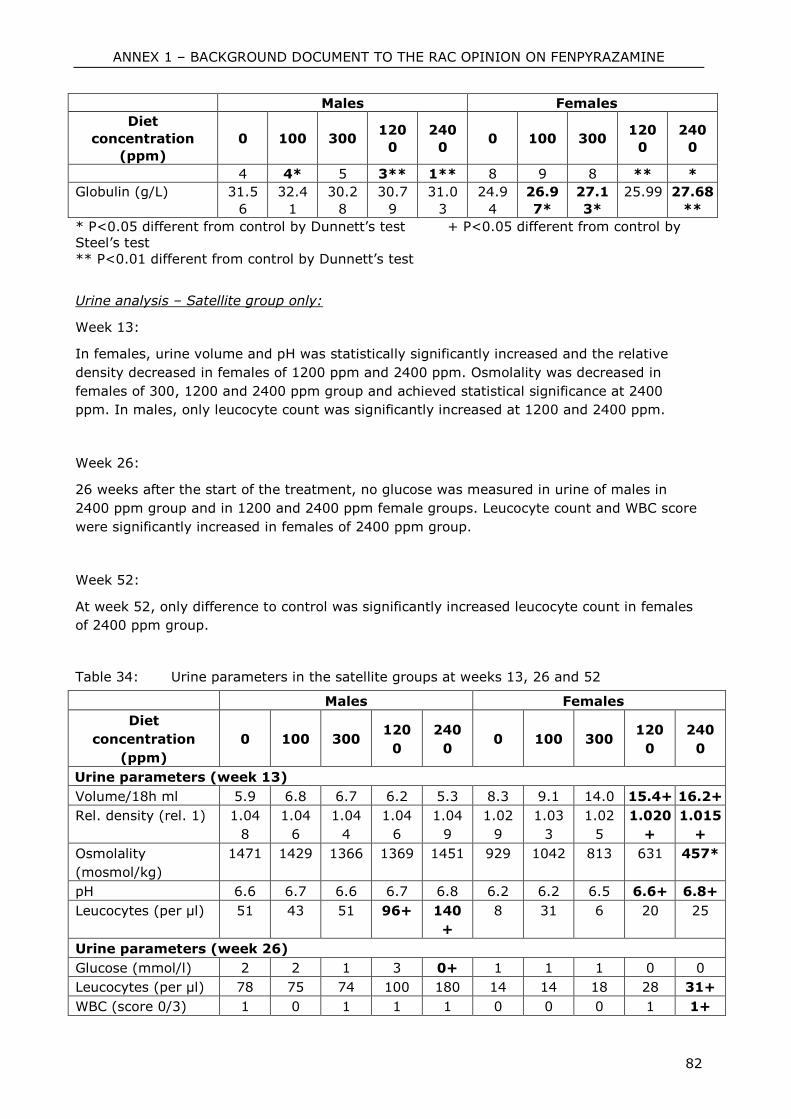
ANNEX 1 – BACKGROUND DOCUMENT TO THE RAC OPINION ON FENPYRAZAMINE
82
Males Females
Diet
concentration
(ppm)
0 100 300 120
0
240
0 0 100 300
120
0
240
0
4 4* 5 3** 1** 8 9 8 ** *
Globulin (g/L) 31.5
6
32.4
1
30.2
8
30.7
9
31.0
3
24.9
4
26.9
7*
27.1
3*
25.99 27.68
**
* P<0.05 different from control by Dunnett’s test + P<0.05 different from control by
Steel’s test
** P<0.01 different from control by Dunnett’s test
Urine analysis – Satellite group only:
Week 13:
In females, urine volume and pH was statistically significantly increased and the relative
density decreased in females of 1200 ppm and 2400 ppm. Osmolality was decreased in
females of 300, 1200 and 2400 ppm group and achieved statistical significance at 2400
ppm. In males, only leucocyte count was significantly increased at 1200 and 2400 ppm.
Week 26:
26 weeks after the start of the treatment, no glucose was measured in urine of males in
2400 ppm group and in 1200 and 2400 ppm female groups. Leucocyte count and WBC score
were significantly increased in females of 2400 ppm group.
Week 52:
At week 52, only difference to control was significantly increased leucocyte count in females
of 2400 ppm group.
Table 34: Urine parameters in the satellite groups at weeks 13, 26 and 52
Males Females
Diet
concentration
(ppm)
0 100 300 120
0
240
0 0 100 300
120
0
240
0
Urine parameters (week 13)
Volume/18h ml 5.9 6.8 6.7 6.2 5.3 8.3 9.1 14.0 15.4+ 16.2+
Rel. density (rel. 1) 1.04
8
1.04
6
1.04
4
1.04
6
1.04
9
1.02
9
1.03
3
1.02
5
1.020
+
1.015
+
Osmolality
(mosmol/kg)
1471 1429 1366 1369 1451 929 1042 813 631 457*
pH 6.6 6.7 6.6 6.7 6.8 6.2 6.2 6.5 6.6+ 6.8+
Leucocytes (per µl) 51 43 51 96+ 140
+
8 31 6 20 25
Urine parameters (week 26)
Glucose (mmol/l) 2 2 1 3 0+ 1 1 1 0 0
Leucocytes (per µl) 78 75 74 100 180 14 14 18 28 31+
WBC (score 0/3) 1 0 1 1 1 0 0 0 1 1+
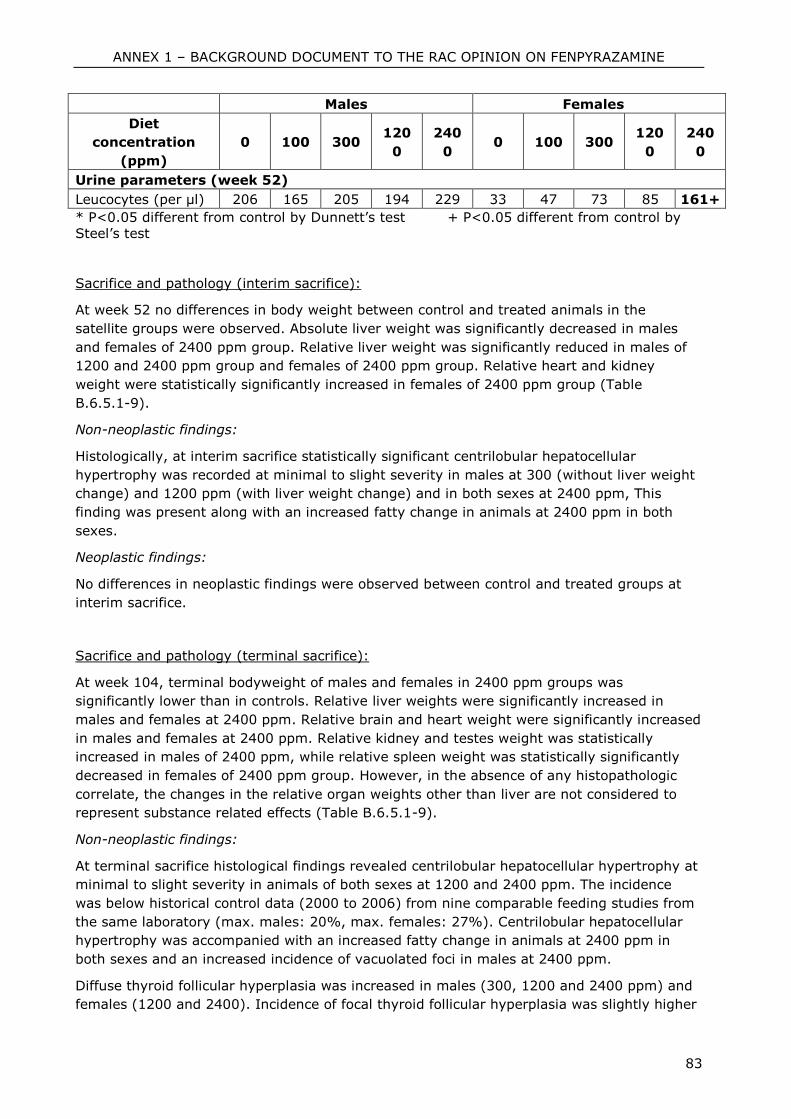
ANNEX 1 – BACKGROUND DOCUMENT TO THE RAC OPINION ON FENPYRAZAMINE
83
Males Females
Diet
concentration
(ppm)
0 100 300 120
0
240
0 0 100 300
120
0
240
0
Urine parameters (week 52)
Leucocytes (per µl) 206 165 205 194 229 33 47 73 85 161+
* P<0.05 different from control by Dunnett’s test + P<0.05 different from control by
Steel’s test
Sacrifice and pathology (interim sacrifice):
At week 52 no differences in body weight between control and treated animals in the
satellite groups were observed. Absolute liver weight was significantly decreased in males
and females of 2400 ppm group. Relative liver weight was significantly reduced in males of
1200 and 2400 ppm group and females of 2400 ppm group. Relative heart and kidney
weight were statistically significantly increased in females of 2400 ppm group (Table
B.6.5.1-9).
Non-neoplastic findings:
Histologically, at interim sacrifice statistically significant centrilobular hepatocellular
hypertrophy was recorded at minimal to slight severity in males at 300 (without liver weight
change) and 1200 ppm (with liver weight change) and in both sexes at 2400 ppm, This
finding was present along with an increased fatty change in animals at 2400 ppm in both
sexes.
Neoplastic findings:
No differences in neoplastic findings were observed between control and treated groups at
interim sacrifice.
Sacrifice and pathology (terminal sacrifice):
At week 104, terminal bodyweight of males and females in 2400 ppm groups was
significantly lower than in controls. Relative liver weights were significantly increased in
males and females at 2400 ppm. Relative brain and heart weight were significantly increased
in males and females at 2400 ppm. Relative kidney and testes weight was statistically
increased in males of 2400 ppm, while relative spleen weight was statistically significantly
decreased in females of 2400 ppm group. However, in the absence of any histopathologic
correlate, the changes in the relative organ weights other than liver are not considered to
represent substance related effects (Table B.6.5.1-9).
Non-neoplastic findings:
At terminal sacrifice histological findings revealed centrilobular hepatocellular hypertrophy at
minimal to slight severity in animals of both sexes at 1200 and 2400 ppm. The incidence
was below historical control data (2000 to 2006) from nine comparable feeding studies from
the same laboratory (max. males: 20%, max. females: 27%). Centrilobular hepatocellular
hypertrophy was accompanied with an increased fatty change in animals at 2400 ppm in
both sexes and an increased incidence of vacuolated foci in males at 2400 ppm.
Diffuse thyroid follicular hyperplasia was increased in males (300, 1200 and 2400 ppm) and
females (1200 and 2400). Incidence of focal thyroid follicular hyperplasia was slightly higher
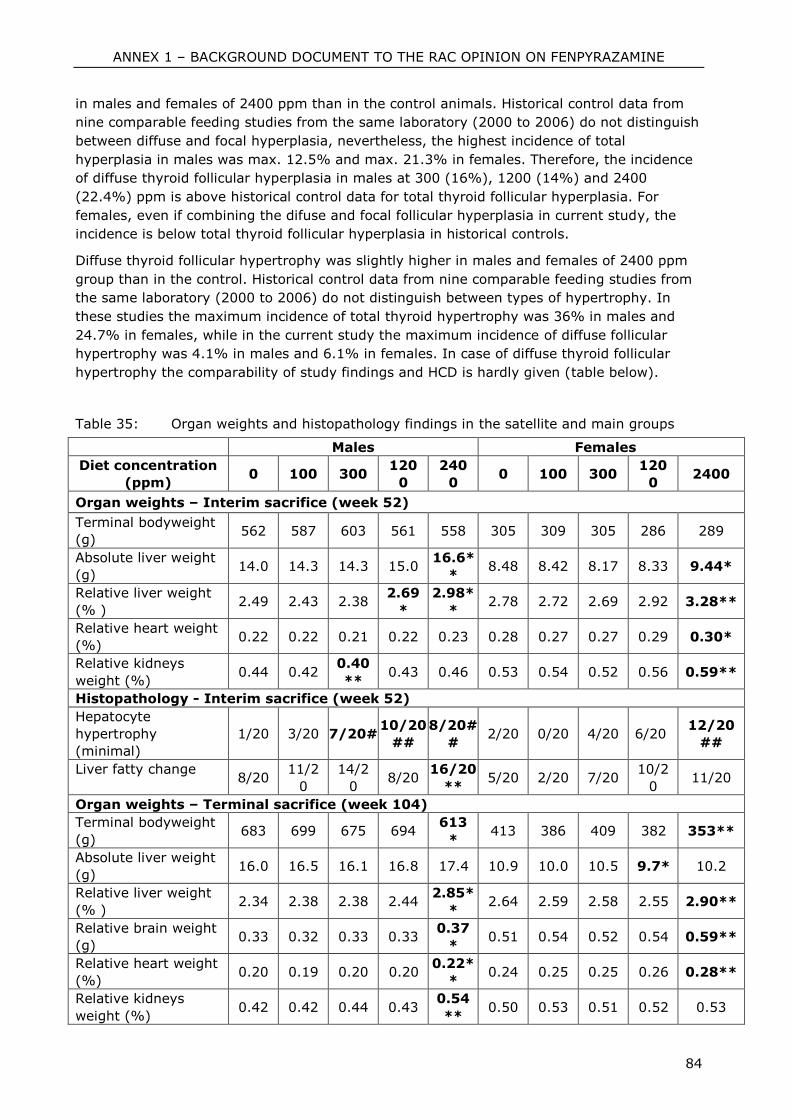
ANNEX 1 – BACKGROUND DOCUMENT TO THE RAC OPINION ON FENPYRAZAMINE
84
in males and females of 2400 ppm than in the control animals. Historical control data from
nine comparable feeding studies from the same laboratory (2000 to 2006) do not distinguish
between diffuse and focal hyperplasia, nevertheless, the highest incidence of total
hyperplasia in males was max. 12.5% and max. 21.3% in females. Therefore, the incidence
of diffuse thyroid follicular hyperplasia in males at 300 (16%), 1200 (14%) and 2400
(22.4%) ppm is above historical control data for total thyroid follicular hyperplasia. For
females, even if combining the difuse and focal follicular hyperplasia in current study, the
incidence is below total thyroid follicular hyperplasia in historical controls.
Diffuse thyroid follicular hypertrophy was slightly higher in males and females of 2400 ppm
group than in the control. Historical control data from nine comparable feeding studies from
the same laboratory (2000 to 2006) do not distinguish between types of hypertrophy. In
these studies the maximum incidence of total thyroid hypertrophy was 36% in males and
24.7% in females, while in the current study the maximum incidence of diffuse follicular
hypertrophy was 4.1% in males and 6.1% in females. In case of diffuse thyroid follicular
hypertrophy the comparability of study findings and HCD is hardly given (table below).
Table 35: Organ weights and histopathology findings in the satellite and main groups
Males Females
Diet concentration
(ppm) 0 100 300
120
0
240
0 0 100 300
120
0 2400
Organ weights – Interim sacrifice (week 52)
Terminal bodyweight
(g) 562 587 603 561 558 305 309 305 286 289
Absolute liver weight
(g) 14.0 14.3 14.3 15.0
16.6*
* 8.48 8.42 8.17 8.33 9.44*
Relative liver weight
(% ) 2.49 2.43 2.38
2.69
*
2.98*
* 2.78 2.72 2.69 2.92 3.28**
Relative heart weight
(%) 0.22 0.22 0.21 0.22 0.23 0.28 0.27 0.27 0.29 0.30*
Relative kidneys
weight (%) 0.44 0.42
0.40
** 0.43 0.46 0.53 0.54 0.52 0.56 0.59**
Histopathology - Interim sacrifice (week 52)
Hepatocyte
hypertrophy
(minimal)
1/20 3/20 7/20# 10/20
##
8/20#
# 2/20 0/20 4/20 6/20
12/20
##
Liver fatty change 8/20
11/2
0
14/2
0 8/20
16/20
** 5/20 2/20 7/20
10/2
0 11/20
Organ weights – Terminal sacrifice (week 104)
Terminal bodyweight
(g) 683 699 675 694
613
* 413 386 409 382 353**
Absolute liver weight
(g) 16.0 16.5 16.1 16.8 17.4 10.9 10.0 10.5 9.7* 10.2
Relative liver weight
(% ) 2.34 2.38 2.38 2.44
2.85*
* 2.64 2.59 2.58 2.55 2.90**
Relative brain weight
(g) 0.33 0.32 0.33 0.33
0.37
* 0.51 0.54 0.52 0.54 0.59**
Relative heart weight
(%) 0.20 0.19 0.20 0.20
0.22*
* 0.24 0.25 0.25 0.26 0.28**
Relative kidneys
weight (%) 0.42 0.42 0.44 0.43
0.54
** 0.50 0.53 0.51 0.52 0.53
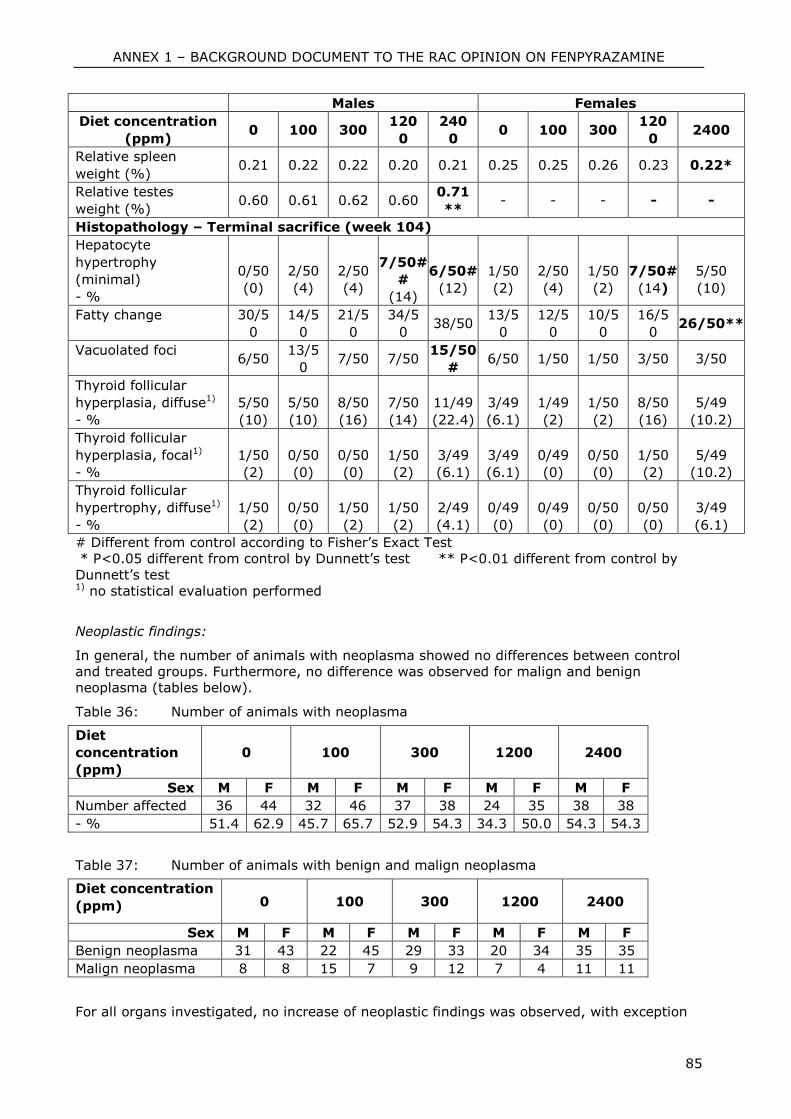
ANNEX 1 – BACKGROUND DOCUMENT TO THE RAC OPINION ON FENPYRAZAMINE
85
Males Females
Diet concentration
(ppm) 0 100 300
120
0
240
0 0 100 300
120
0 2400
Relative spleen
weight (%) 0.21 0.22 0.22 0.20 0.21 0.25 0.25 0.26 0.23 0.22*
Relative testes
weight (%) 0.60 0.61 0.62 0.60
0.71
** - - - - -
Histopathology – Terminal sacrifice (week 104)
Hepatocyte
hypertrophy
(minimal)
- %
0/50
(0)
2/50
(4)
2/50
(4)
7/50#
#
(14)
6/50#
(12)
1/50
(2)
2/50
(4)
1/50
(2)
7/50#
(14)
5/50
(10)
Fatty change 30/5
0
14/5
0
21/5
0
34/5
0 38/50
13/5
0
12/5
0
10/5
0
16/5
0 26/50**
Vacuolated foci 6/50
13/5
0 7/50 7/50
15/50
# 6/50 1/50 1/50 3/50 3/50
Thyroid follicular
hyperplasia, diffuse1)
- %
5/50
(10)
5/50
(10)
8/50
(16)
7/50
(14)
11/49
(22.4)
3/49
(6.1)
1/49
(2)
1/50
(2)
8/50
(16)
5/49
(10.2)
Thyroid follicular
hyperplasia, focal1)
- %
1/50
(2)
0/50
(0)
0/50
(0)
1/50
(2)
3/49
(6.1)
3/49
(6.1)
0/49
(0)
0/50
(0)
1/50
(2)
5/49
(10.2)
Thyroid follicular
hypertrophy, diffuse1)
- %
1/50
(2)
0/50
(0)
1/50
(2)
1/50
(2)
2/49
(4.1)
0/49
(0)
0/49
(0)
0/50
(0)
0/50
(0)
3/49
(6.1)
# Different from control according to Fisher’s Exact Test
* P<0.05 different from control by Dunnett’s test ** P<0.01 different from control by
Dunnett’s test 1) no statistical evaluation performed
Neoplastic findings:
In general, the number of animals with neoplasma showed no differences between control
and treated groups. Furthermore, no difference was observed for malign and benign
neoplasma (tables below).
Table 36: Number of animals with neoplasma
Diet
concentration
(ppm)
0 100 300 1200 2400
Sex M F M F M F M F M F
Number affected 36 44 32 46 37 38 24 35 38 38
- % 51.4 62.9 45.7 65.7 52.9 54.3 34.3 50.0 54.3 54.3
Table 37: Number of animals with benign and malign neoplasma
Diet concentration
(ppm) 0 100 300 1200 2400
Sex M F M F M F M F M F
Benign neoplasma 31 43 22 45 29 33 20 34 35 35
Malign neoplasma 8 8 15 7 9 12 7 4 11 11
For all organs investigated, no increase of neoplastic findings was observed, with exception
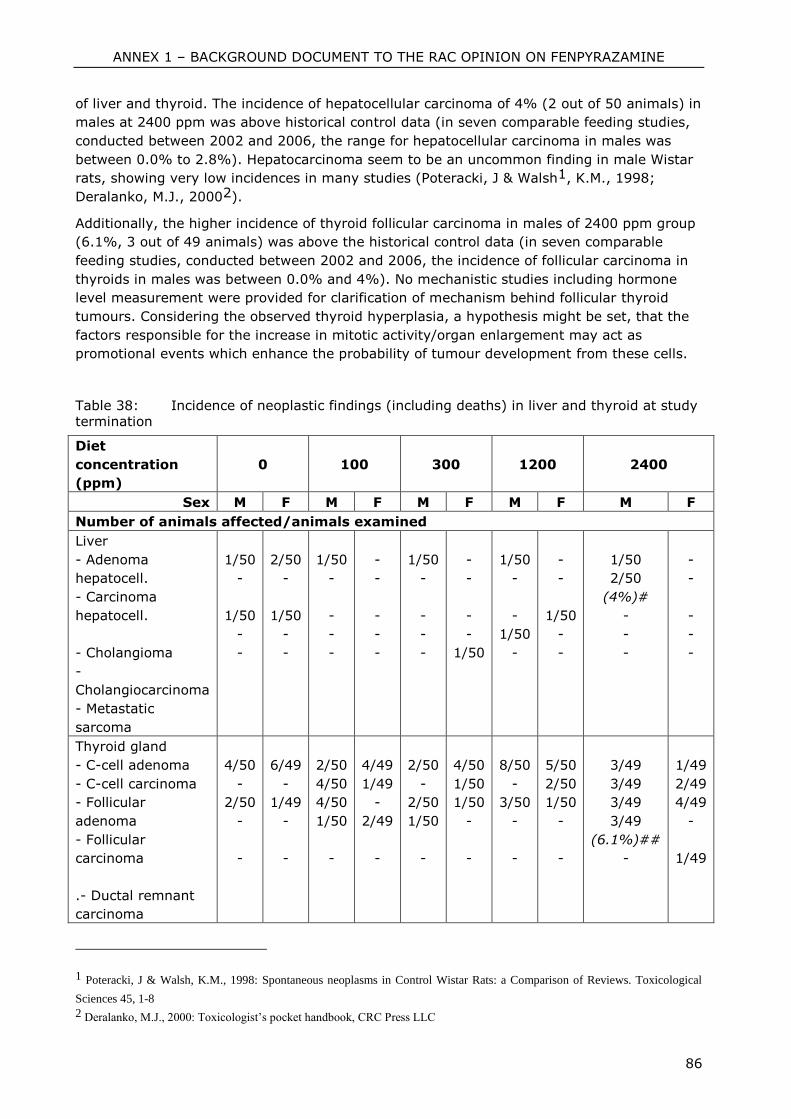
ANNEX 1 – BACKGROUND DOCUMENT TO THE RAC OPINION ON FENPYRAZAMINE
86
of liver and thyroid. The incidence of hepatocellular carcinoma of 4% (2 out of 50 animals) in
males at 2400 ppm was above historical control data (in seven comparable feeding studies,
conducted between 2002 and 2006, the range for hepatocellular carcinoma in males was
between 0.0% to 2.8%). Hepatocarcinoma seem to be an uncommon finding in male Wistar
rats, showing very low incidences in many studies (Poteracki, J & Walsh1, K.M., 1998;
Deralanko, M.J., 20002).
Additionally, the higher incidence of thyroid follicular carcinoma in males of 2400 ppm group
(6.1%, 3 out of 49 animals) was above the historical control data (in seven comparable
feeding studies, conducted between 2002 and 2006, the incidence of follicular carcinoma in
thyroids in males was between 0.0% and 4%). No mechanistic studies including hormone
level measurement were provided for clarification of mechanism behind follicular thyroid
tumours. Considering the observed thyroid hyperplasia, a hypothesis might be set, that the
factors responsible for the increase in mitotic activity/organ enlargement may act as
promotional events which enhance the probability of tumour development from these cells.
Table 38: Incidence of neoplastic findings (including deaths) in liver and thyroid at study termination
Diet
concentration
(ppm)
0 100 300 1200 2400
Sex M F M F M F M F M F
Number of animals affected/animals examined
Liver
- Adenoma
hepatocell.
- Carcinoma
hepatocell.
- Cholangioma
-
Cholangiocarcinoma
- Metastatic
sarcoma
1/50
-
1/50
-
-
2/50
-
1/50
-
-
1/50
-
-
-
-
-
-
-
-
-
1/50
-
-
-
-
-
-
-
-
1/50
1/50
-
-
1/50
-
-
-
1/50
-
-
1/50
2/50
(4%)#
-
-
-
-
-
-
-
-
Thyroid gland
- C-cell adenoma
- C-cell carcinoma
- Follicular
adenoma
- Follicular
carcinoma
.- Ductal remnant
carcinoma
4/50
-
2/50
-
-
6/49
-
1/49
-
-
2/50
4/50
4/50
1/50
-
4/49
1/49
-
2/49
-
2/50
-
2/50
1/50
-
4/50
1/50
1/50
-
-
8/50
-
3/50
-
-
5/50
2/50
1/50
-
-
3/49
3/49
3/49
3/49
(6.1%)##
-
1/49
2/49
4/49
-
1/49
1 Poteracki, J & Walsh, K.M., 1998: Spontaneous neoplasms in Control Wistar Rats: a Comparison of Reviews. Toxicological
Sciences 45, 1-8 2 Deralanko, M.J., 2000: Toxicologist’s pocket handbook, CRC Press LLC
ANNEX 1 – BACKGROUND DOCUMENT TO THE RAC OPINION ON FENPYRAZAMINE
87
- : no finding, # above historical control data (range from 0 – 2.8%), ## above historical
control data (range from 0 – 4%)
Conclusion:
In the combined chronic and carcinogenicity study (2 years) in rat, the NOAEL is set at 300
ppm (12.7 mg/kg bw/d) in females, based on decreased MCV and MCH at weeks 13 and 52
(termination) and shortened prothrombin time at weeks 13, 26 and 52. The effects observed
at 100 ppm were within the historical control data from studies conducted between 2002 and
2006. In males, the NOAEL is set also at 300 ppm (12.7 mg/kg bw/d), based on statistically
significantly increased hepatocellular hypertrophy accompanied by increased relative liver
weight at 1200 ppm at week 52 in satellite group and hepatocellular hypertrophy (but
without change in relative liver weight) in main group males at week 104, as well as on
increase in albumin and gamma-glutamyl-transferase. In addition, in males of 1200 ppm
group and above (week 52, satellite group), MCV and neutrophils were statistically
significantly decreased and albumin increased.
Regarding carcinogenic potential of fenpyrazamine, no increase of neoplastic findings was
observed in any organ of treated animals, with exception of liver and thyroid. The incidence
of hepatocellular carcinoma of 4% in males at 2400 ppm was above historical control data
(0.0% to 2.8%) from comparable feeding studies. The higher incidence of thyroid follicular
carcinoma in males of 2400 ppm group (6.1%) was higher than the historical control data
(max. 4% in males) from comparable feeding studies. At the dose causing higher incidence
of liver and thyroid tumours (2400 ppm) no excessive toxicity was observed. The animals
with tumours survived until scheduled sacrifice. A clear threshold dose (1200 ppm) could be
estimated where no increased incidence of liver and thyroid carcinoma was seen.
By default, carcinogenic effects in experimental animals are considered relevant to humans
and are considered for classification as carcinogens (Guidance on the Application of CLP
Criteria, Guidance to Regulation (EC) No 1272/2008 on classification, labelling and packaging
(CLP) of substances and mixtures, 2009). Only if there is sufficient evidence showing non-
relevance of a certain type of tumours to humans, this tumour type should be excluded for
classification. Fenpyrazamine is not genotoxic. In the provided carcinogenicity study,
malignant tumours were observed in male rats in multiple sites (liver and thyroid), which
incidence was above historical control data of well comparable studies. No exceeding of MTD
(maximum tolerated dose) was observed in males (body weight loss was 10.1% compared
to control, but no signs of severe toxicity including reduced survival rate was seen). Both
affected tissues, liver and thyroid, have their equivalent in humans. Two mechanistic studies
provided (one in vivo and one in vitro, see Chapter 6.8.1) could show that fenpyrazamine
has a comparable MOA to phenobarbital (perturbation of homeostasis of pituitary-thyroid-
axis by extrathyroidal mechanism). Phenobarbital MOA is considered to be not relevant for
humans3. No liver and thyroid tumours were observed above historical control data in
mouse carcinogenicity study or in female rats (male rats are frequently found to be more
sensitive with respect to induction of thyroid tumours than female rats and mice) showing
that even if fenpyrazamine may have a MOA comparable to phenobarbital, it is of much
lower potency (shown also by low incidences of liver and thyroid tumours in male rats).
Combining all these criteria for classification of a substance as a carcinogen, according to
Dangerous Substance Directive (67/548/EC) and Regulation 1272/2008, no classification and
labelling is proposed for fenpyrazamine.
Mice
3 IPCS, 2007: Part 1: IPCS Framework for analysing the relevance of a cancer mode of action for humans and case studies
ANNEX 1 – BACKGROUND DOCUMENT TO THE RAC OPINION ON FENPYRAZAMINE
88
Reference: 78-Week oncogenicity (feeding) study in the CD-1 mouse
Author(s), year: Sommer, E.W.; 2009b
Report/Doc.
number:
Sumitomo Chemical Co. Ltd. Report No. QNT-0043
Guideline(s): OECD 451, EPA OPPTS 870.4200, Japanese MAFF 12 NohSan 8147,
Directive 88/302/EEC Part B.32
GLP: Yes (laboratory certified by National Authority)
Deviations: Yes: thyroid was not weighed although it is one of the organs which
is mandatory to investigate according to OECD 453
Validity: Yes
Material and methods:
Test Material: S-2188 Technical Grade
Lot/Batch: 030-050914-1G
Purity: 94.7%
Stability of test compound: Expiry date after the end of the study
Vehicle: None. Test material was mixed directly into diet
Test animals:
Species: Mouse
Strain: CD-1, Crl:CD1(Icr) SPF quality
Age: 5 weeks at delivery
Weight at acclimatisation: 21.8-29.6 g (males) and 19.4 – 25.6 g (females)
Source: Charles River, Sulzfeld/ Germany
Diet: Kliba 3433 maintenance pellet diet, ad libitum
Group allocation: Main groups (A): each 52 males and 52 females
Satellite groups (B): each 12 males and 12 females
The purpose of the study was to assess the carcinogenic potential of fenpyrazamine when
administered to mice in their feed for at least 52 weeks in the satellite groups and at least
78 weeks in the main study groups.
Animal assignment and treatment:
Diet containing fenpyrazamine was offered to 52 mice per sex in the main groups for 78
weeks and to 12 rats per sex in the satellite groups for 52 weeks. Animals were caged
individually.
Diet preparation and analysis:
Fresh batches of the feed pellets for this study were prepared weekly up to week 13 and
every 2 week thereafter, with a constant concentration (ppm) throughout the feeding
duration. The test item was weighed into a tared glass beaker on a suitable precision
balance, briefly milled and mixed with microgranulated feed. Water was added to aid
pelleting. The pellets were dried with air for approximately 48 hours before storage. Feed
for the animals of control group was prepared similarly without the test item.
ANNEX 1 – BACKGROUND DOCUMENT TO THE RAC OPINION ON FENPYRAZAMINE
89
Stability of the test item in pelleted rodent feed was investigated during a previous 90-day
feeding study. The test item was found to be stable for a period of 21 days. Therefore,
stability of the test item was not reanalyzed in this study. Concentration and homogeneity
of the actual test item batch in the feed were determined with the first feed preparations.
The concentration and homogeneity were determined every three months thereafter.
Table 39: Mean test substance intakes (mg/kg bw/d)
Group Diet preparation (ppm) Daily intake (mg/kg bw/d)
Male Female Male Female
1 (Control) 0 0 0 0
2 100 100 11.1 13.9
3 1500 2000 176 283
4 3000 4000 349 552
Clinical observations:
Animals were checked for viability/mortality twice daily. Clinical signs were observed at least
once daily and a detailed clinical examination including palpation for tissue masses was
performed weekly on each animal outside the home cage.
Food consumption and body weight:
Food consumption and body weight was measured once weekly during acclimatization and
treatment up to week 13, and every two weeks thereafter.
Haematology, clinical chemistry and urine analysis:
Blood samples for haematology were collected under isoflurane anesthesia from all satellite
group animals at week 52 and from all main group animals at week 78. The animals were
not fasted before blood collection. Blood samples were collected early in the working day to
reduce biological variation caused by circadian rhythms. Blood samples were also drawn
from any moribund animal, when feasible. Blood samples were drawn from the retroorbital
plexus and tri-potassium-EDTA was used as anticoagulant for investigation of the
hematological parameters.
The following haematology parameters were determined: erythrocyte count, haemoglobin,
hematocrit, mean corpuscular volume, mean corpuscular haemoglobin, mean corpuscular
haemoglobin concentration, reticulocyte count, total leukocyte count and differential
leukocyte count (neutrophils, eosinophils, basophils, lymphocytes, monocytes, large
unstained cells).
Blood smears were prepared, but not evaluated further.
Sacrifice and pathology:
Animals found in poor health or moribund were sacrificed once found. Surviving satellite
group animals were sacrificed on completion of 52 weeks of treatment. Surviving main group
animals were sacrificed after completion of 78 weeks of treatment. Animals were sacrificed
by exsanguinations under pentobarbitone anaesthesia.
All animals, either found dead or sacrificed, were subject to detailed necropsy and collection
of tissues. The following tissues were collected from all animals and fixed in neutral
ANNEX 1 – BACKGROUND DOCUMENT TO THE RAC OPINION ON FENPYRAZAMINE
90
phosphate buffered formaldehyde:
Adrenal glands
Aorta
Bone (sternum, femur including joint)
Bone marrow (femur, sternum)
Brain (cerebrum, cerebellum,
medulla/pons)
Carcass*
Cecum
Colon
Duodenum
Epididymides (fixed in Bouin’s solution)
Esophagus
Eyes w/optic nerve (fixed in Davidson’s
solution)
Harderian gland (fixed in Davidson’s
solution)
Head, remaining
Heart
Ileum, with Peyer’s patches
Jejunum, with Peyer’s patches
Kidneys
Larynx
Lacrimal gland, exorbital*
Liver, with gall bladder
Lungs, inflated with formalin at necropsy
Lymph nodes (mesenteric, mandibular)
Mammary gland area
Nasal cavity with nasopharynx &
paranasal sinus
Ovaries
Pancreas
Pituitary gland
Prostate gland
Rectum
Salivary glands – mandibular, parotid,
sublingual
Sciatic nerve
Seminal vesicles and coagulating gland
Skeletal muscle
Skin
Spinal cord – cervical, midthoracic,
lumbar
Spleen
Stomach
Testes (fixed in Bouin’s solution)
Thymus
Thyroid (including parathyroid)
Tongue
Trachea
Urinary bladder, inflated w/formalin at
necropsy
Uterus with cervix
Vagina
Zymbal gland with external ear*
Gross lesions and tissue masses
(tumours)
*Not processed for histopathology
Adrenals, brain, heart, liver with gallbladder, kidneys, spleen, testes, epididymides, ovaries
and uterus were weighed from all animals of the satellite groups at interim sacrifice and from
at least 10 animals per sex and group of main group at terminal sacrifice. Thyroid was not
included in organ weight measurements, although mandatory according to OECD 453, but no
explanation was given.
For histological examination samples of all organs and tissues were processed and
embedded, and cut at a thickness of 2-4 microns. Sections were stained with haematoxylin
and eosin or special stains as noted. Histological examination was conducted on:
- All organs and tissues from animals which died or were found moribund during the
study;
- All organs and tissues from control and high dose animals at scheduled sacrifice (satellite
and main group)
- All gross lesions (in any animals)
- Target tissues in all groups
-
Findings:
Mortality and clinical observations:
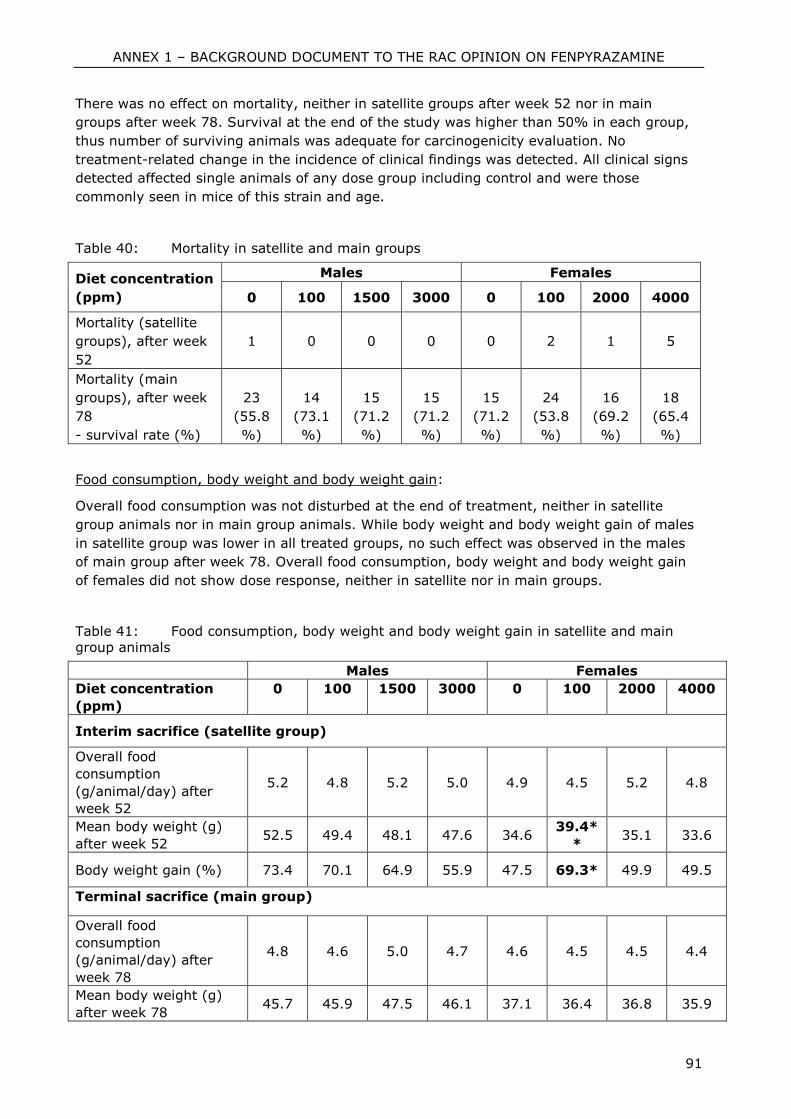
ANNEX 1 – BACKGROUND DOCUMENT TO THE RAC OPINION ON FENPYRAZAMINE
91
There was no effect on mortality, neither in satellite groups after week 52 nor in main
groups after week 78. Survival at the end of the study was higher than 50% in each group,
thus number of surviving animals was adequate for carcinogenicity evaluation. No
treatment-related change in the incidence of clinical findings was detected. All clinical signs
detected affected single animals of any dose group including control and were those
commonly seen in mice of this strain and age.
Table 40: Mortality in satellite and main groups
Diet concentration
(ppm)
Males Females
0 100 1500 3000 0 100 2000 4000
Mortality (satellite
groups), after week
52
1 0 0 0 0 2 1 5
Mortality (main
groups), after week
78
- survival rate (%)
23
(55.8
%)
14
(73.1
%)
15
(71.2
%)
15
(71.2
%)
15
(71.2
%)
24
(53.8
%)
16
(69.2
%)
18
(65.4
%)
Food consumption, body weight and body weight gain:
Overall food consumption was not disturbed at the end of treatment, neither in satellite
group animals nor in main group animals. While body weight and body weight gain of males
in satellite group was lower in all treated groups, no such effect was observed in the males
of main group after week 78. Overall food consumption, body weight and body weight gain
of females did not show dose response, neither in satellite nor in main groups.
Table 41: Food consumption, body weight and body weight gain in satellite and main
group animals
Males Females
Diet concentration
(ppm)
0 100 1500 3000 0 100 2000 4000
Interim sacrifice (satellite group)
Overall food
consumption
(g/animal/day) after
week 52
5.2 4.8 5.2 5.0 4.9 4.5 5.2 4.8
Mean body weight (g)
after week 52 52.5 49.4 48.1 47.6 34.6
39.4*
* 35.1 33.6
Body weight gain (%) 73.4 70.1 64.9 55.9 47.5 69.3* 49.9 49.5
Terminal sacrifice (main group)
Overall food
consumption
(g/animal/day) after
week 78
4.8 4.6 5.0 4.7 4.6 4.5 4.5 4.4
Mean body weight (g)
after week 78 45.7 45.9 47.5 46.1 37.1 36.4 36.8 35.9
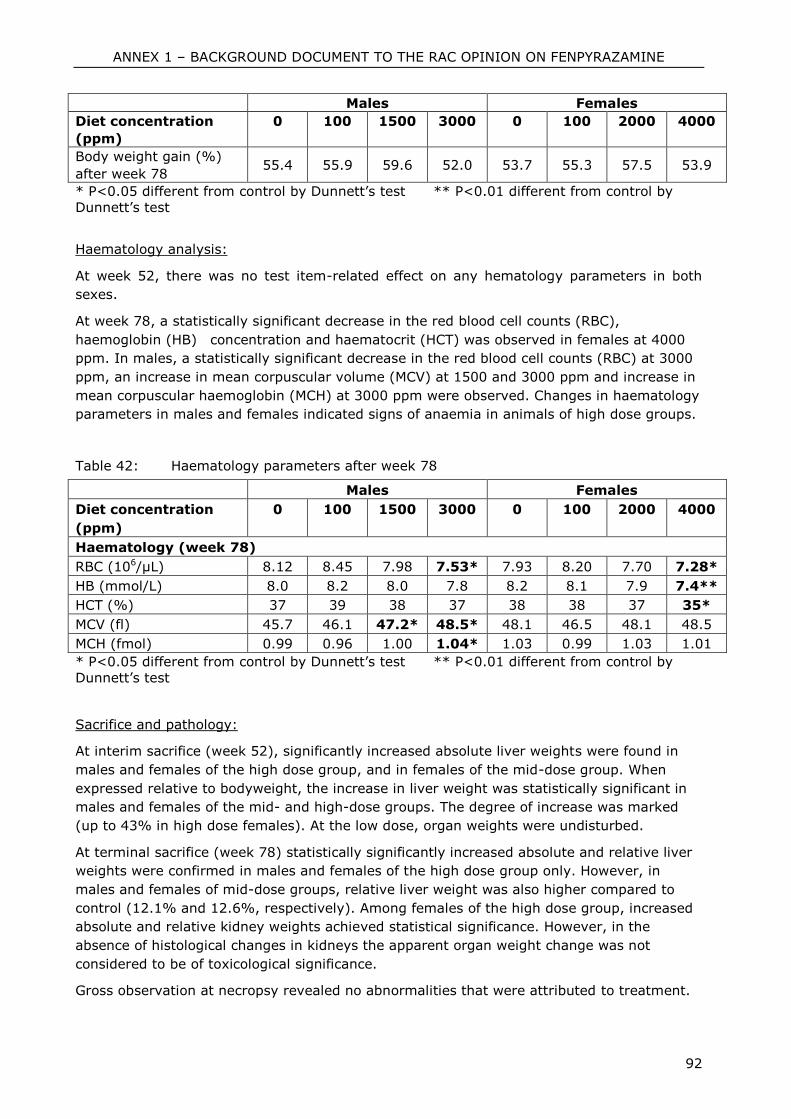
ANNEX 1 – BACKGROUND DOCUMENT TO THE RAC OPINION ON FENPYRAZAMINE
92
Males Females
Diet concentration
(ppm)
0 100 1500 3000 0 100 2000 4000
Body weight gain (%)
after week 78 55.4 55.9 59.6 52.0 53.7 55.3 57.5 53.9
* P<0.05 different from control by Dunnett’s test ** P<0.01 different from control by
Dunnett’s test
Haematology analysis:
At week 52, there was no test item-related effect on any hematology parameters in both
sexes.
At week 78, a statistically significant decrease in the red blood cell counts (RBC),
haemoglobin (HB) concentration and haematocrit (HCT) was observed in females at 4000
ppm. In males, a statistically significant decrease in the red blood cell counts (RBC) at 3000
ppm, an increase in mean corpuscular volume (MCV) at 1500 and 3000 ppm and increase in
mean corpuscular haemoglobin (MCH) at 3000 ppm were observed. Changes in haematology
parameters in males and females indicated signs of anaemia in animals of high dose groups.
Table 42: Haematology parameters after week 78
Males Females
Diet concentration
(ppm)
0 100 1500 3000 0 100 2000 4000
Haematology (week 78)
RBC (106/µL) 8.12 8.45 7.98 7.53* 7.93 8.20 7.70 7.28*
HB (mmol/L) 8.0 8.2 8.0 7.8 8.2 8.1 7.9 7.4**
HCT (%) 37 39 38 37 38 38 37 35*
MCV (fl) 45.7 46.1 47.2* 48.5* 48.1 46.5 48.1 48.5
MCH (fmol) 0.99 0.96 1.00 1.04* 1.03 0.99 1.03 1.01
* P<0.05 different from control by Dunnett’s test ** P<0.01 different from control by
Dunnett’s test
Sacrifice and pathology:
At interim sacrifice (week 52), significantly increased absolute liver weights were found in
males and females of the high dose group, and in females of the mid-dose group. When
expressed relative to bodyweight, the increase in liver weight was statistically significant in
males and females of the mid- and high-dose groups. The degree of increase was marked
(up to 43% in high dose females). At the low dose, organ weights were undisturbed.
At terminal sacrifice (week 78) statistically significantly increased absolute and relative liver
weights were confirmed in males and females of the high dose group only. However, in
males and females of mid-dose groups, relative liver weight was also higher compared to
control (12.1% and 12.6%, respectively). Among females of the high dose group, increased
absolute and relative kidney weights achieved statistical significance. However, in the
absence of histological changes in kidneys the apparent organ weight change was not
considered to be of toxicological significance.
Gross observation at necropsy revealed no abnormalities that were attributed to treatment.
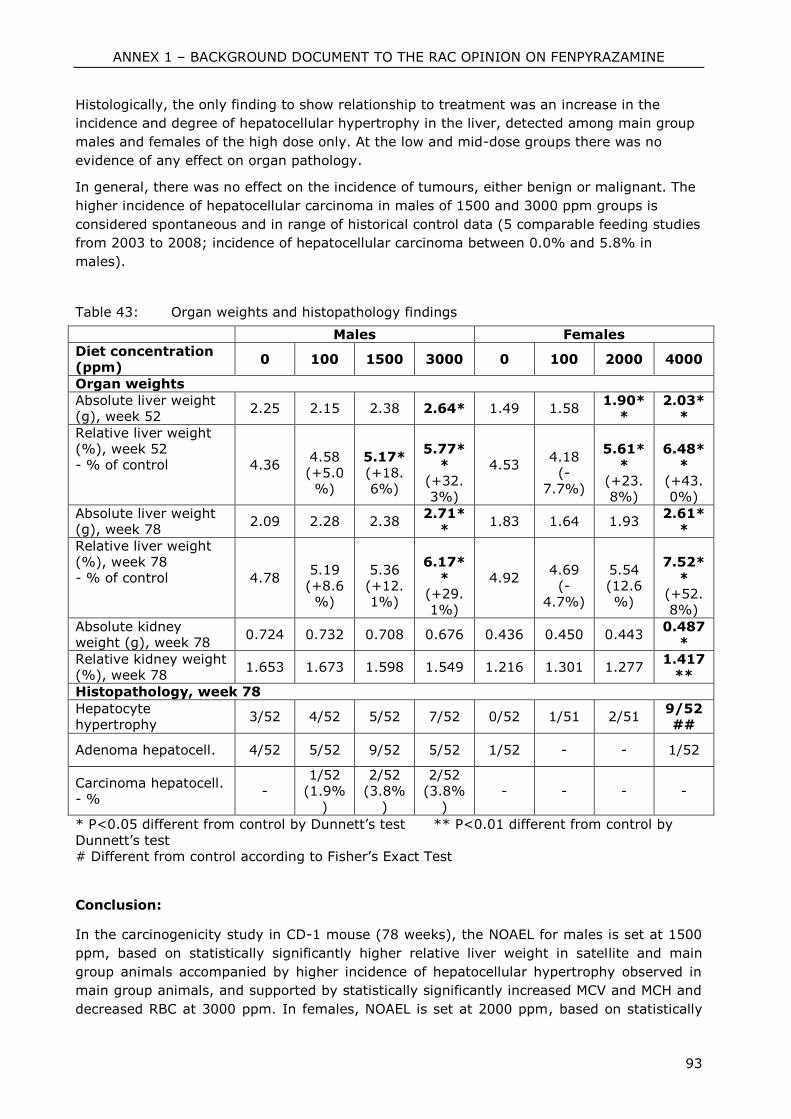
ANNEX 1 – BACKGROUND DOCUMENT TO THE RAC OPINION ON FENPYRAZAMINE
93
Histologically, the only finding to show relationship to treatment was an increase in the
incidence and degree of hepatocellular hypertrophy in the liver, detected among main group
males and females of the high dose only. At the low and mid-dose groups there was no
evidence of any effect on organ pathology.
In general, there was no effect on the incidence of tumours, either benign or malignant. The
higher incidence of hepatocellular carcinoma in males of 1500 and 3000 ppm groups is
considered spontaneous and in range of historical control data (5 comparable feeding studies
from 2003 to 2008; incidence of hepatocellular carcinoma between 0.0% and 5.8% in
males).
Table 43: Organ weights and histopathology findings
Males Females
Diet concentration (ppm)
0 100 1500 3000 0 100 2000 4000
Organ weights
Absolute liver weight (g), week 52
2.25 2.15 2.38 2.64* 1.49 1.58 1.90*
* 2.03*
*
Relative liver weight (%), week 52 - % of control
4.36
4.58 (+5.0%)
5.17* (+18.6%)
5.77*
* (+32.3%)
4.53
4.18 (-
7.7%)
5.61*
* (+23.8%)
6.48*
* (+43.0%)
Absolute liver weight (g), week 78
2.09 2.28 2.38 2.71*
* 1.83 1.64 1.93
2.61**
Relative liver weight (%), week 78 - % of control
4.78
5.19 (+8.6%)
5.36 (+12.1%)
6.17*
* (+29.1%)
4.92
4.69 (-
4.7%)
5.54 (12.6%)
7.52*
* (+52.8%)
Absolute kidney weight (g), week 78
0.724 0.732 0.708 0.676 0.436 0.450 0.443 0.487
*
Relative kidney weight (%), week 78
1.653 1.673 1.598 1.549 1.216 1.301 1.277 1.417
**
Histopathology, week 78
Hepatocyte hypertrophy
3/52 4/52 5/52 7/52 0/52 1/51 2/51 9/52##
Adenoma hepatocell. 4/52 5/52 9/52 5/52 1/52 - - 1/52
Carcinoma hepatocell. - %
- 1/52
(1.9%)
2/52 (3.8%
)
2/52 (3.8%
) - - - -
* P<0.05 different from control by Dunnett’s test ** P<0.01 different from control by
Dunnett’s test
# Different from control according to Fisher’s Exact Test
Conclusion:
In the carcinogenicity study in CD-1 mouse (78 weeks), the NOAEL for males is set at 1500
ppm, based on statistically significantly higher relative liver weight in satellite and main
group animals accompanied by higher incidence of hepatocellular hypertrophy observed in
main group animals, and supported by statistically significantly increased MCV and MCH and
decreased RBC at 3000 ppm. In females, NOAEL is set at 2000 ppm, based on statistically
ANNEX 1 – BACKGROUND DOCUMENT TO THE RAC OPINION ON FENPYRAZAMINE
94
significantly higher relative liver weight in satellite and main group animals accompanied by
statistically significantly increased hepatocellular hypertrophy observed in main group
animals, and supported by statistically significantly decreased RBC, HB and HCT at 4000
ppm. In the mouse carcinogenicity study, no carcinogenic potential of fenpyrazamine could
be observed.
4.10.1.2 Carcinogenicity: inhalation
No data available.
4.10.1.3 Carcinogenicity: dermal
No data available.
4.10.2 Human information
A formal statement from the manufacturer is presented (Ohtsubo, T (2009)), that members
of staff involved in the synthesis and development of fenpyrazamine are routinely monitored
and that no indication of fenpyrazamine-related ill-health have been detected by, or reported
to, medical staff. No poisoning incidents or clinical cases have been reported. Fenpyrazamine
is a new chemical currently in development. There has been no exposure of the general
population or epidemiology study.
4.10.3 Other relevant information
With respect to the clarification of MOA of fenpyrazamine regarding liver and thyroid
tumours in male rats, two mechanistic studies (one in vitro, one in vivo) have been
performed showing that fenpyrazamine has a MOA comparable to Phenobarbital, which is
considered not relevant for humans4.
Reference: Study for Mode of Action Analysis for Rat Liver and Thyroid Tumors by
S-2188: Evaluation for time course alteration mainly focusing on
hepatocellular proliferation, liver enzyme induction and thyroid
hormone
Author(s), year: Kondo, M.; 2010
Report/Doc.
number:
Sumitomo Chemical Co. Ltd. Report No. QNT-0048
Guideline(s): No appropriate guideline
GLP: No. Conducted in a GLP-compliant facility, but standard procedures are
not generally available for studies of this nature
Deviations: -
Validity: Yes
Material and methods:
4 IPCS, 2007: Part 1: IPCS Framework for analysing the relevance of a cancer mode of action for humans and case studies
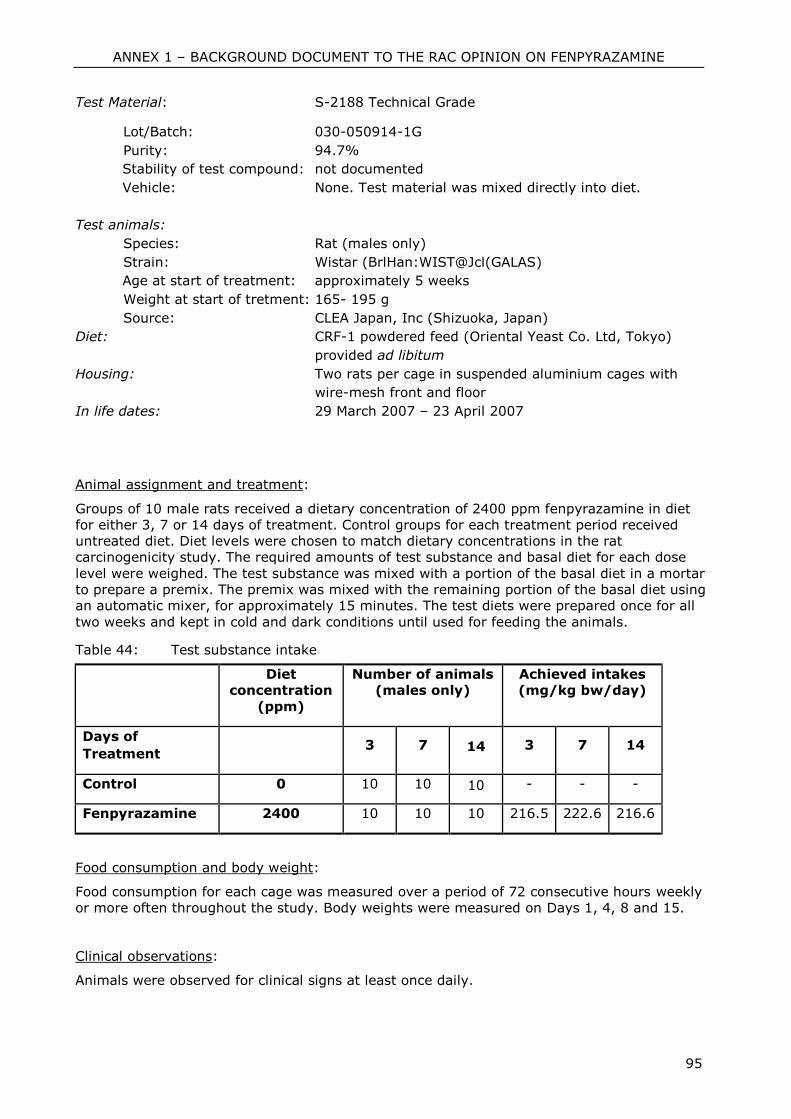
ANNEX 1 – BACKGROUND DOCUMENT TO THE RAC OPINION ON FENPYRAZAMINE
95
Test Material: S-2188 Technical Grade
Lot/Batch: 030-050914-1G
Purity: 94.7%
Stability of test compound: not documented
Vehicle: None. Test material was mixed directly into diet.
Test animals:
Species: Rat (males only)
Strain: Wistar (BrlHan:WIST@Jcl(GALAS)
Age at start of treatment: approximately 5 weeks
Weight at start of tretment: 165- 195 g
Source: CLEA Japan, Inc (Shizuoka, Japan)
Diet: CRF-1 powdered feed (Oriental Yeast Co. Ltd, Tokyo)
provided ad libitum
Housing: Two rats per cage in suspended aluminium cages with
wire-mesh front and floor
In life dates: 29 March 2007 – 23 April 2007
Animal assignment and treatment:
Groups of 10 male rats received a dietary concentration of 2400 ppm fenpyrazamine in diet
for either 3, 7 or 14 days of treatment. Control groups for each treatment period received
untreated diet. Diet levels were chosen to match dietary concentrations in the rat
carcinogenicity study. The required amounts of test substance and basal diet for each dose
level were weighed. The test substance was mixed with a portion of the basal diet in a mortar
to prepare a premix. The premix was mixed with the remaining portion of the basal diet using
an automatic mixer, for approximately 15 minutes. The test diets were prepared once for all
two weeks and kept in cold and dark conditions until used for feeding the animals.
Table 44: Test substance intake
Diet
concentration
(ppm)
Number of animals
(males only)
Achieved intakes
(mg/kg bw/day)
Days of
Treatment 3 7 14 3 7 14
Control 0 10 10 10 - - -
Fenpyrazamine 2400 10 10 10 216.5 222.6 216.6
Food consumption and body weight:
Food consumption for each cage was measured over a period of 72 consecutive hours weekly
or more often throughout the study. Body weights were measured on Days 1, 4, 8 and 15.
Clinical observations:
Animals were observed for clinical signs at least once daily.
ANNEX 1 – BACKGROUND DOCUMENT TO THE RAC OPINION ON FENPYRAZAMINE
96
Sacrifice and pathology:
After the treatment period, rats were given an i.p. injection of bromodeoxyuridine (BrdU;
100 mg/kg bw) dissolved in saline. Two hours later animals were sacrificed by decapitation
without prior fasting, and blood collected. BrdU labelling indices for the livers were calculated
by dividing the number of labeled hepatocellular nuclei by the total number of hepatocellular
nuclei (%).
All animals were subject to detailed necropsy examination. The following samples were
collected:
- Blood samples for hormone analysis were collected at sacrifice by decapitation.
Serum was prepared from the collected blood and stored at -90 to -70 degrees
centigrade until analysis.
- After liver weight was recorded, samples of liver were collected. Samples were fixed in
buffered formalin for histological examination, or in RNA stabilisation solution for potential
future gene expression analysis. Remaining liver was frozen in liquid nitrogen and stored
at -80°C until analyzed for enzyme activity.
- A sample of duodenum from all animals was stored in buffered formalin and dehydrated for
immunohistochemical staining, as a quality control measure.
Organ weights:
Liver (before fixation) and thyroid (after fixation) were weighed while wet from all animals.
Relative organ weight (organ weight to body weight ratio) was calculated on the basis of the
body weight on the day of sacrifice.
Histopathology:
Liver and thyroid were dehydrated, embedded in paraffin wax, and sectioned. Sections were
stained with haematoxylin and eosin and examined using light microscopy. The severity of
lesions was graded from - to 3+ (- none, +- slight, + mild, 2+ moderate, or 3+ severe).
Hormone analysis:
Serum hormone concentrations were determined by immunoassay (Access2 Immunoassay
System, Beckman Coulter Inc., California, U.S.A.) for total T3 and T4, or by commercially
available kit (Rat thyroid stimulating hormone (rTSH)[125I] assay system, GE Healthcare
Bio-Sciences Corp., New Jersey, U.S.A.) for TSH.
Hepatic enzyme analysis:
A portion of fresh liver (approximately 2 g) was homogenized in 4 volumes of Tris/HCl buffer
(pH7.4; 50 mM; containing 154 mM KCl) with a Potter homogenizer. Liver homogenate was
centrifuged at 9,000 × g for 20 min at 4 °C to separate S9 fractions. The protein level in the
S9 fraction was determined using the DC protein assay kit (Bio-Rad, CA) with bovine serum
albumin as the protein standard.
a) 7-Pentoxyresorufin O-depentylase activity (PROD)
The reaction mixture (200 μL) consisted of 3 μM 7-pentoxyresorufin, 10 μM dicoumarol, 1
mM NADPH, 1 μL S9 fractions in Tris/HCl buffer (pH7.4) and was added to 96-well
microplates. After incubation for 10 min at 37 ºC, the reaction was stopped by addition of
100 μL acetonitrile. Activity of 7-pentoxyresorufin O-depentylase was determined by
fluorometric analysis. The fluorescence of the sample was measured with a microplate
ANNEX 1 – BACKGROUND DOCUMENT TO THE RAC OPINION ON FENPYRAZAMINE
97
reader (Saffire II, Tecan) with an excitation wavelength of 550 nm and an emission
wavelength of 589 nm. The activity was expressed as the rate of resorufin formation, and
was calculated based on the fluorescence of a standard curve of resorufin.
b) UDP-glucuronosyltransferase activity to T4 (T4-UGT)
The reaction mixture consisted of 5 μL of liver S9, 10 mM MgCl2, 0.05% Brij58, 1.4 mM D-
saccharic acid-1,4-lactone, 4 mM UDP-glucuronic acid and 1 μM 125I-thyroxine (30,000
cpm, GE Healthcare, UK) in 200 μL of 66 mM Tris-HCl Buffer (pH 7.4). After incubation for 2
hours at 37 ºC, 200μL of methanol was added to the reaction mixture. T4-UGT activity was
determined by autoradiography with a fluorescent image analyzer (FLA-5000, FujiFilm,
Japan) after separation by TLC with a solvent system of ethyl acetate/ methyl ethyl ketone/
formic acid/ water (5:3:1:1,v/v/v/v as the TLC solvent system has four components)
Statistics:
A comparison between two groups procedure was used for analysis of data for bodyweight,
body weight gains, food consumption, absolute and relative organ weights, BrdU labeling
index, microsomal protein level, hepatic enzyme activities, and serum hormone levels. The
F-test was applied to compare the fenpyrazamine -treated group with the control group. If
the variance was homogeneous, Student’s t-test was used. If the variance was
heterogeneous, Aspin-Welch-test was used. The Mann-Whitney U test was used for analysis
of the gradable histopathological findings, comparing test substance and control groups. The
Fisher's Exact probability test was similarly employed for analysis of gross pathological
findings. Each evaluation was by 2-tailed tests with 0.05 and 0.01 as the levels of
significance. Fisher's exact probability test was by 1-tailed tests with 0.05 and 0.01 as the
levels of significance.
Findings:
Mortality and clinical signs:
No treatment-related abnormalities were detected. No animals died before terminal sacrifice.
Food consumption and body weight:
Food consumption was not negatively affected by the treatment. No treatment-related and
biologically relevant disturbance in body weight and body weight gain was seen.
Table 45: Food consumption, terminal body weight and body weight gain (mean values
+ SD)
Diet concentration
(ppm)
0 2400 0 2400 0 2400
Treatment days 3 7 14
Food consumption
(g/animal/day)
18+1.0 19+1.2 20+1.4 21*+0.8 20+1.5 20+0.7
Terminal body weight
(g)
202+7.9 204+8.8 226+10.1 230+9.0 255+12.7 259+8.8
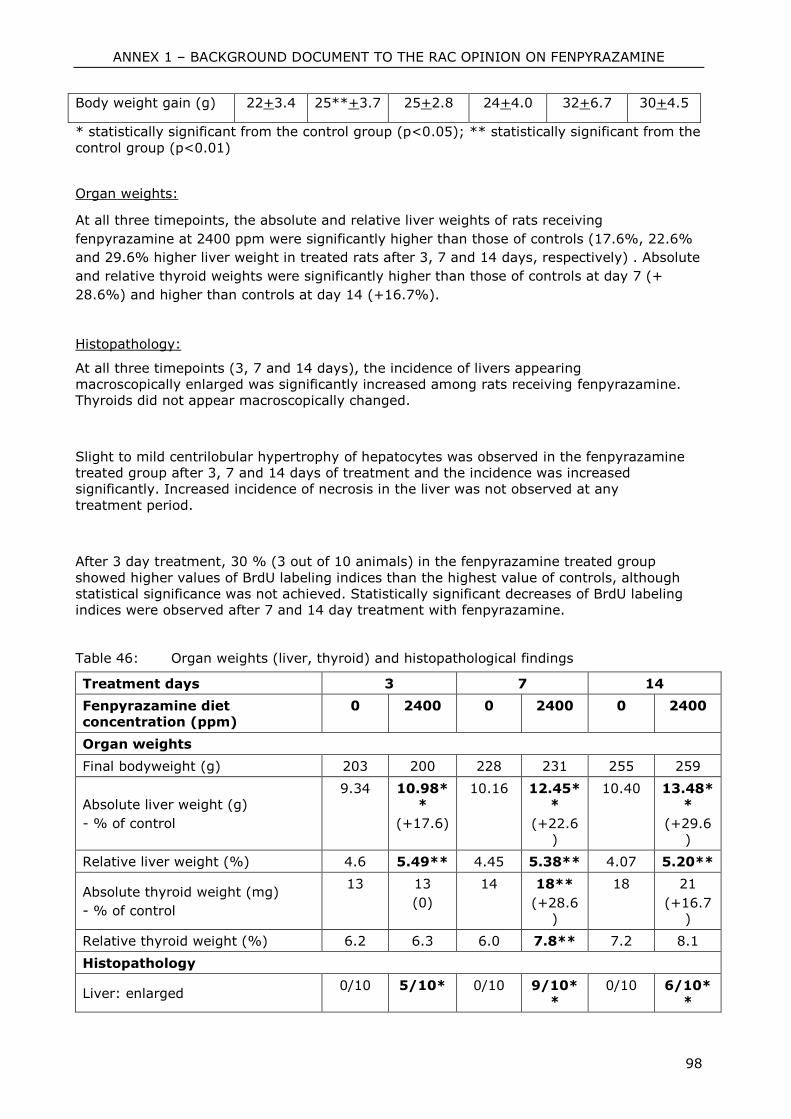
ANNEX 1 – BACKGROUND DOCUMENT TO THE RAC OPINION ON FENPYRAZAMINE
98
Body weight gain (g) 22+3.4 25**+3.7 25+2.8 24+4.0 32+6.7 30+4.5
* statistically significant from the control group (p<0.05); ** statistically significant from the
control group (p<0.01)
Organ weights:
At all three timepoints, the absolute and relative liver weights of rats receiving
fenpyrazamine at 2400 ppm were significantly higher than those of controls (17.6%, 22.6%
and 29.6% higher liver weight in treated rats after 3, 7 and 14 days, respectively) . Absolute
and relative thyroid weights were significantly higher than those of controls at day 7 (+
28.6%) and higher than controls at day 14 (+16.7%).
Histopathology:
At all three timepoints (3, 7 and 14 days), the incidence of livers appearing
macroscopically enlarged was significantly increased among rats receiving fenpyrazamine.
Thyroids did not appear macroscopically changed.
Slight to mild centrilobular hypertrophy of hepatocytes was observed in the fenpyrazamine
treated group after 3, 7 and 14 days of treatment and the incidence was increased
significantly. Increased incidence of necrosis in the liver was not observed at any
treatment period.
After 3 day treatment, 30 % (3 out of 10 animals) in the fenpyrazamine treated group
showed higher values of BrdU labeling indices than the highest value of controls, although
statistical significance was not achieved. Statistically significant decreases of BrdU labeling
indices were observed after 7 and 14 day treatment with fenpyrazamine.
Table 46: Organ weights (liver, thyroid) and histopathological findings
Treatment days 3 7 14
Fenpyrazamine diet
concentration (ppm)
0 2400 0 2400 0 2400
Organ weights
Final bodyweight (g) 203 200 228 231 255 259
Absolute liver weight (g)
- % of control
9.34 10.98*
*
(+17.6)
10.16 12.45*
*
(+22.6)
10.40 13.48*
*
(+29.6)
Relative liver weight (%) 4.6 5.49** 4.45 5.38** 4.07 5.20**
Absolute thyroid weight (mg)
- % of control
13 13
(0)
14 18**
(+28.6)
18 21
(+16.7)
Relative thyroid weight (%) 6.2 6.3 6.0 7.8** 7.2 8.1
Histopathology
Liver: enlarged 0/10 5/10* 0/10 9/10*
*
0/10 6/10*
*
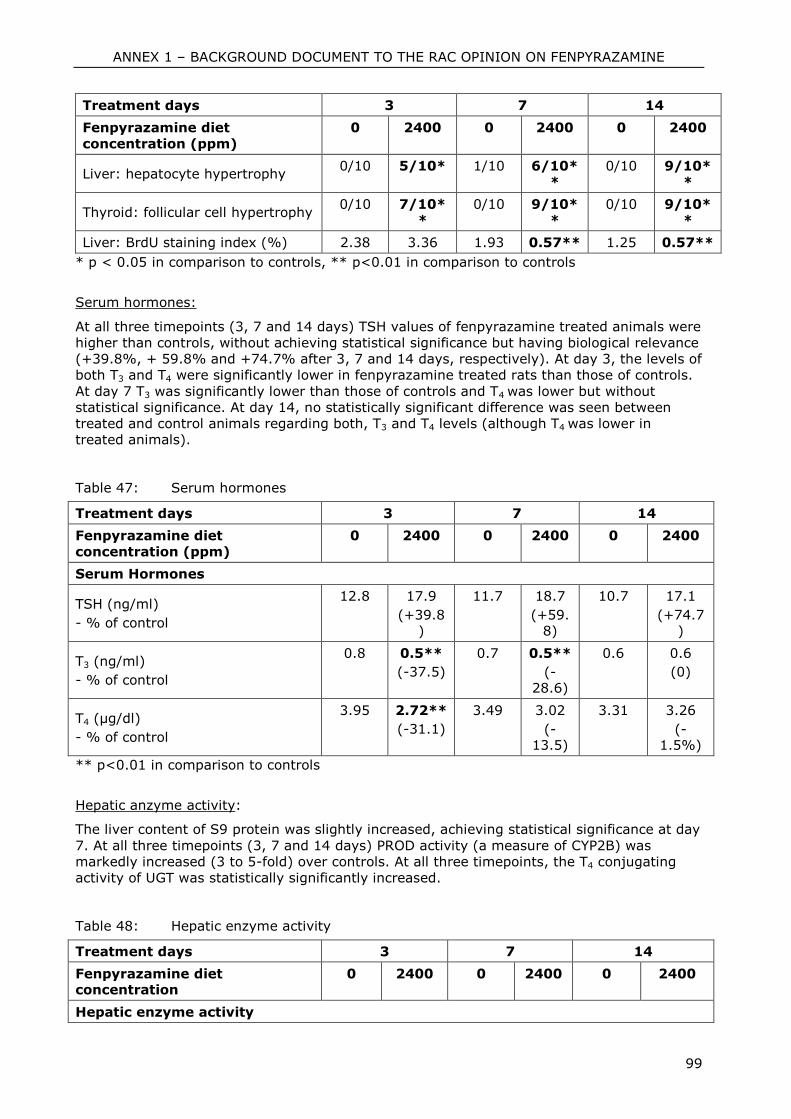
ANNEX 1 – BACKGROUND DOCUMENT TO THE RAC OPINION ON FENPYRAZAMINE
99
Treatment days 3 7 14
Fenpyrazamine diet
concentration (ppm)
0 2400 0 2400 0 2400
Liver: hepatocyte hypertrophy 0/10 5/10* 1/10 6/10*
*
0/10 9/10*
*
Thyroid: follicular cell hypertrophy 0/10 7/10*
*
0/10 9/10*
*
0/10 9/10*
*
Liver: BrdU staining index (%) 2.38 3.36 1.93 0.57** 1.25 0.57**
* p < 0.05 in comparison to controls, ** p<0.01 in comparison to controls
Serum hormones:
At all three timepoints (3, 7 and 14 days) TSH values of fenpyrazamine treated animals were
higher than controls, without achieving statistical significance but having biological relevance
(+39.8%, + 59.8% and +74.7% after 3, 7 and 14 days, respectively). At day 3, the levels of
both T3 and T4 were significantly lower in fenpyrazamine treated rats than those of controls.
At day 7 T3 was significantly lower than those of controls and T4 was lower but without
statistical significance. At day 14, no statistically significant difference was seen between
treated and control animals regarding both, T3 and T4 levels (although T4 was lower in
treated animals).
Table 47: Serum hormones
Treatment days 3 7 14
Fenpyrazamine diet
concentration (ppm)
0 2400 0 2400 0 2400
Serum Hormones
TSH (ng/ml)
- % of control
12.8 17.9
(+39.8)
11.7 18.7
(+59.8)
10.7 17.1
(+74.7)
T3 (ng/ml)
- % of control
0.8 0.5**
(-37.5)
0.7 0.5**
(-28.6)
0.6 0.6
(0)
T4 (µg/dl)
- % of control
3.95 2.72**
(-31.1)
3.49 3.02
(-13.5)
3.31 3.26
(-1.5%)
** p<0.01 in comparison to controls
Hepatic anzyme activity:
The liver content of S9 protein was slightly increased, achieving statistical significance at day
7. At all three timepoints (3, 7 and 14 days) PROD activity (a measure of CYP2B) was
markedly increased (3 to 5-fold) over controls. At all three timepoints, the T4 conjugating
activity of UGT was statistically significantly increased.
Table 48: Hepatic enzyme activity
Treatment days 3 7 14
Fenpyrazamine diet concentration
0 2400 0 2400 0 2400
Hepatic enzyme activity
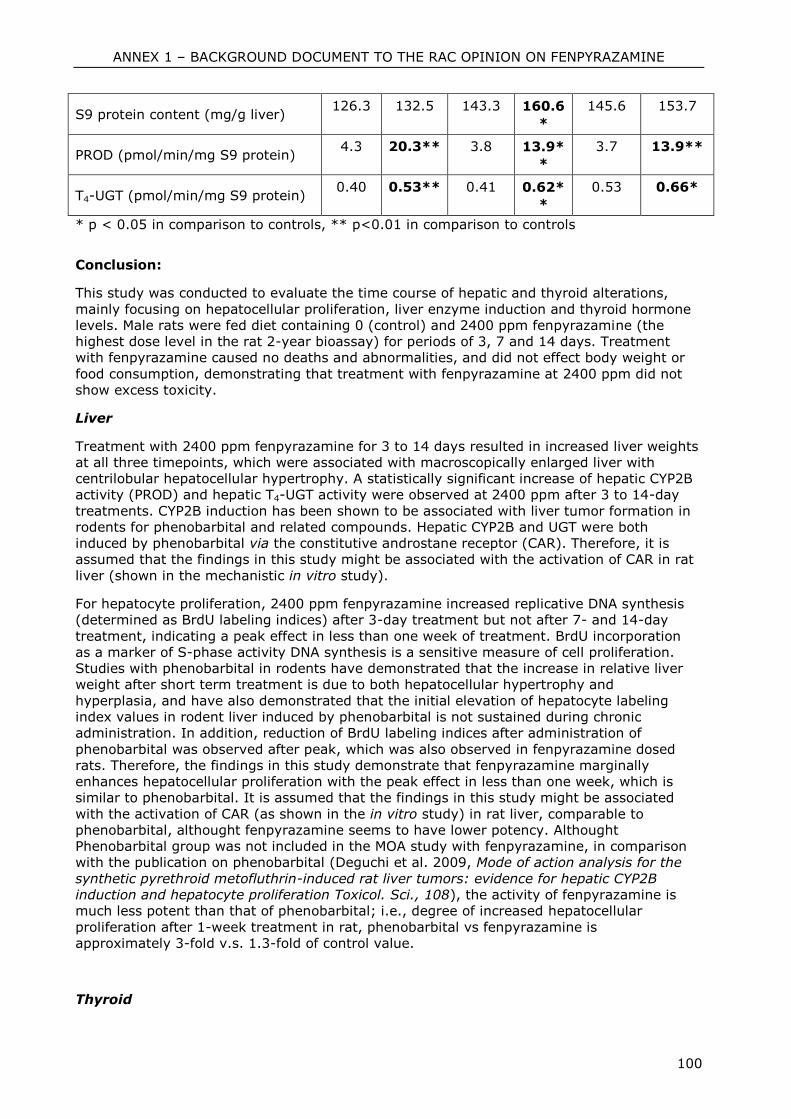
ANNEX 1 – BACKGROUND DOCUMENT TO THE RAC OPINION ON FENPYRAZAMINE
100
S9 protein content (mg/g liver) 126.3 132.5 143.3 160.6
*
145.6 153.7
PROD (pmol/min/mg S9 protein) 4.3 20.3** 3.8 13.9*
*
3.7 13.9**
T4-UGT (pmol/min/mg S9 protein) 0.40 0.53** 0.41 0.62*
*
0.53 0.66*
* p < 0.05 in comparison to controls, ** p<0.01 in comparison to controls
Conclusion:
This study was conducted to evaluate the time course of hepatic and thyroid alterations,
mainly focusing on hepatocellular proliferation, liver enzyme induction and thyroid hormone
levels. Male rats were fed diet containing 0 (control) and 2400 ppm fenpyrazamine (the
highest dose level in the rat 2-year bioassay) for periods of 3, 7 and 14 days. Treatment
with fenpyrazamine caused no deaths and abnormalities, and did not effect body weight or
food consumption, demonstrating that treatment with fenpyrazamine at 2400 ppm did not
show excess toxicity.
Liver
Treatment with 2400 ppm fenpyrazamine for 3 to 14 days resulted in increased liver weights
at all three timepoints, which were associated with macroscopically enlarged liver with
centrilobular hepatocellular hypertrophy. A statistically significant increase of hepatic CYP2B
activity (PROD) and hepatic T4-UGT activity were observed at 2400 ppm after 3 to 14-day
treatments. CYP2B induction has been shown to be associated with liver tumor formation in
rodents for phenobarbital and related compounds. Hepatic CYP2B and UGT were both
induced by phenobarbital via the constitutive androstane receptor (CAR). Therefore, it is
assumed that the findings in this study might be associated with the activation of CAR in rat
liver (shown in the mechanistic in vitro study).
For hepatocyte proliferation, 2400 ppm fenpyrazamine increased replicative DNA synthesis
(determined as BrdU labeling indices) after 3-day treatment but not after 7- and 14-day
treatment, indicating a peak effect in less than one week of treatment. BrdU incorporation
as a marker of S-phase activity DNA synthesis is a sensitive measure of cell proliferation.
Studies with phenobarbital in rodents have demonstrated that the increase in relative liver
weight after short term treatment is due to both hepatocellular hypertrophy and
hyperplasia, and have also demonstrated that the initial elevation of hepatocyte labeling
index values in rodent liver induced by phenobarbital is not sustained during chronic
administration. In addition, reduction of BrdU labeling indices after administration of
phenobarbital was observed after peak, which was also observed in fenpyrazamine dosed
rats. Therefore, the findings in this study demonstrate that fenpyrazamine marginally
enhances hepatocellular proliferation with the peak effect in less than one week, which is
similar to phenobarbital. It is assumed that the findings in this study might be associated
with the activation of CAR (as shown in the in vitro study) in rat liver, comparable to
phenobarbital, althought fenpyrazamine seems to have lower potency. Althought
Phenobarbital group was not included in the MOA study with fenpyrazamine, in comparison
with the publication on phenobarbital (Deguchi et al. 2009, Mode of action analysis for the
synthetic pyrethroid metofluthrin-induced rat liver tumors: evidence for hepatic CYP2B
induction and hepatocyte proliferation Toxicol. Sci., 108), the activity of fenpyrazamine is
much less potent than that of phenobarbital; i.e., degree of increased hepatocellular
proliferation after 1-week treatment in rat, phenobarbital vs fenpyrazamine is
approximately 3-fold v.s. 1.3-fold of control value.
Thyroid
ANNEX 1 – BACKGROUND DOCUMENT TO THE RAC OPINION ON FENPYRAZAMINE
101
Another feature of some CYP enzyme inducers such as phenobarbital in rats are the effects
on thyroid due to increased catabolism of thyroid hormones (T3 and T4) driven by
increased hepatic UGT activity, leading to increased thyroid stimulating hormone (TSH)
and resulting in thyroid hypertrophy, hyperplasia and tumors. Hepatic UGT is induced by
phenobarbital via CAR. In the present study, histopathological examination by light
microscopy revealed diffuse follicular cell hypertrophy in thyroids of rats treated with
fenpyrazamine. It is well accepted, that TSH stimulation results in increased thyroid
weight, thyroid follicular cell hypertrophy, and proliferation. In this study, serum TSH
showed a tendency of increase during the treatment period without statistical significance.
However, it is known that small increases in serum TSH (Hood, A., Liu, Y. P., Gattone, V.
H., 2nd and Klaassen, C. D. (1999). Sensitivity of thyroid gland growth to thyroid
stimulating hormone (TSH) in rats treated with antithyroid drugs. Toxicol. Sci. 49) can be
sufficient to stimulate thyroid follicular cell proliferation. Therefore, the slight TSH
increases even without statistical significance seems to be a biologically meaningful
change. Significantly increased thyroid weight was observed after 7-day treatment and an
increased weight (without statistical significance) after 14 days treatment. Fenpyrazamine
treatment resulted in decreases in serum T3 and T4 levels in the present study. Thyroid
gland histopathology, serum T4 and TSH are considered as the most reliable parameters
for identifying chemicals with thyroid hormone modulating activity. Therefore, the effects
of fenpyrazamine on rat thyroid are considered secondary to perturbation of the thyroid
hormone axis, by a comparable mode of action as phenobarbital
The findings in the present study indicate that fenpyrazamine induces CYP2B and T4-UGT
activities, and marginally enhances hepatocellular proliferation at an early stage of treatment
(in less than one week) and perturbs the thyroid hormone axis. Bnd both effects are
comaparable to phenobarbital, which is a CAR activator.
Reference: In vitro evaluation for role of nuclear receptor CAR in S-2188-induced
mRNA expression of CYP2B1, UGT1A, and UGT2B1
Author(s), year: Yamada, T.; 2010a
Report/Doc.
number:
Sumitomo Chemical Co. Ltd. Report No. QNT-0049
Guideline(s): No appropriate guideline
GLP: No. Conducted in a GLP-compliant facility, but standard procedures are
not generally available for studies of this nature
Deviations: -
Validity: Yes
Material and methods:
Test Material: S-2188 Technical Grade
Lot/Batch: 030-050914-1G
Purity: 94.7%
Stability of test compound: not documented
Vehicle: None (Williams E medium, as used for cell culture)
ANNEX 1 – BACKGROUND DOCUMENT TO THE RAC OPINION ON FENPYRAZAMINE
102
Test cells:
Primary hepatocytes from a single male Wistar (Han/RCC)
rat, 9 weeks of age, by a modified two-step collagenase
digestion method. Rat liver was perfused and hepatocytes
were dispersed from digested liver and washed with
William’s E medium (GIBCO) three times by
centrifugation. The hepatocytes were cultured in
supplemented William’s E medium at a density of
approximately 4 x10⁵ cells/well, and allowed to attach for
3 hours at 37 ºC in a humidified chamber. After 3 hours,
the culture dishes were gently swirled and fresh medium
was added after removing unattached hepatocytes
Culture medium: Williams E medium; supplemented with 5% fetal calf
serum, 100U/ml penicillin, 100
2mM L-
nicotinamide, except during transfection. MATra-si
Reagent (IBA) was added to medium during the
transfection process
Transfection reagents: a) siRNA for CAR (Hayashi-Kasei Co., Ltd.) or
b) Negative Control (Stealth RNAi Negative Control
with Medium GC, Code No. 12935-300, Invitrogen)
Transfection procedure: On day 1, cells were rinsed and supplemented with
serum/antibiotics free medium (2mL). siRNA (1µg) for
CAR (Hayashi-Kasei Co.,Ltd.) or Negative Control (Stealth
RNAi Negative Control with Medium GC, Code No.;
12935-300, Invitrogen), and 1 µL of MATra-si Reagent
(IBA) were each diluted with 200µL of serum/antibiotics
free medium according to the manufacture’s instructions,
and the two solutions were gently mixed. After 20 min,
the transfection mixtures (200µL) were added to the
cells, and the culture plates were placed on a magnet
plate (IBA) for 15 min. After 4 hours, the mediums were
changed to the supplemented Williams E medium
containing serum and antibiotics
Performance date: 11 - 30 November 2010
Test method:
The influence of the Constitutive Androstene Receptor (CAR) on fenpyrazamine hepatic
effects was investigated by the technique of RNA-interference gene silencing (“CAR-
knockdown”). In this method, cells are transfected with interference RNA (si-RNA) to impair
CAR synthesis, then exposed to the test agent. Test cultures of untransfected cells, and of
cultures transfected either with siRNA (CAR) or with a siRNA (used as negative control (NC))
were incubated in medium containing 50µM fenpyrazamine. Since fenpyrazamine
concentration in liver after administration of 300 mg/kg bw in rat metabolism study (Quistad
ANNEX 1 – BACKGROUND DOCUMENT TO THE RAC OPINION ON FENPYRAZAMINE
103
& Kovatchev, 2007a, QNM-0023) was estimated to be about 11.18-14.8, corresponding to
33.7 – 44.65 µM5, 50 µM of fenpyrazamine is considered to be reliable for evaluation of in
vivo situation. Additionally, 50 µM fenpyrazamine was selected on the basis of a range-
finding assay (using concentrations of 10, 25, 50, 75, 100, 150, 300 and 450 µM
fenpyrazamine) as the highest concentration without cytotoxicity but demonstrating
sufficient induction of CYP2B, UGT1A and UGT2B1.
The dose level used in the tissue distribution study (300 mg/kg bw/d) is remarkable higher
comparing to the highest dose level used in the long term rat study (107 – 130 mg/kg
bw/d). Considering that the fenpyrazamine level in the liver after administration of 107 –
130 mg/kg bw/d is not known (while usually not measured in the carcinogenicity studies)
and that the duration of dosing in the carcinogenicity study (2 years) is much longer
comparing to the metabolism study (3 days), the dose used in the in vitro mechanistic study
is considered justified.
An additional culture of untransfected cells, not exposed to fenpyrazamine, served as an
untransfected control. Four wells per culture were conducted.
Test procedure:
Cultures of transfected or non-transfected cells were incubated under test conditions for 3
days. On day 3, cultures were terminated and total RNA extracted. RNA was purified to
remove DNA contamination. From the RNA, cDNA was prepared by reverse transcription.
cDNA was then assayed by real-time PCR using specific primers for rat CAR, CYP2B1,
UGT1A, and UGT2B1.
Total RNA extraction:
On day 3, hepatocytes were washed with PBS and the total RNA were extracted using Isogen
solution (Wako). Total RNA was purified using RNeasy Mini kit (Qiagen) with on-column
DNase treatment to avoid genomic DNA contamination. Total RNA was quantified by UV
analysis at 260 nm and 280 nm using a UV spectrometer (Shimadzu). The total RNA solution
was stored at –80 ºC until needed for complementary DNA (cDNA) generation.
Reverse transcription:
cDNA was prepared from total RNA by reverse transcription using the High Capacity cDNA
Reverse Transcription Kit (Applied Biosystems). Solution (20µL) containing 10x RT Buffer
(2µL), 25x NTP Mix (0.8 µL), 10x RT Random Primers (2µL), MultiScribe™ Reverse
Transcriptase (50U), RNase Inhibitor (1µL), DEPC treated water (11.2µL), total RNA (400
ng) was incubated at 25 ºC for 10min, 37 ºC for 120 min, and 85 ºC for 5sec. The resultant
cDNA was stored at –20 ºC until needed for real-time PCR assays.
Quantitative real-time PCR:
Quantitative real-time PCR assays for rat CAR, CYP2B1, UGT1A and UGT2B1 were performed
following the instruction manual of the PCR system (GeneAmp 7500 Sequence Detection
5 Calculation: 300 mg/kg bw, 6 hours exposure: in males 140.2 µg/g total radioactivity in liver; females: 115.3 µg/g
total radioactivity in liver; in males fenpyrazamine (parent) made 10.6% of total radioactivity in liver, while in
females, fenpyrazamine (parent) made 9.7% of total radioactivity in liver; this allows the calculation that
fenpyrazamine (parent) was present at 14.8 µg/g in male liver and 11.18 µg/g in females liver; MW of fenpyrazamine
is 331, 43 g/mol which leads to the calculation that 14.8 µg/g (ppm) corresponds to 33.7 µM and 11.18 µg/g (ppm)
corresponds to 44.65 µM
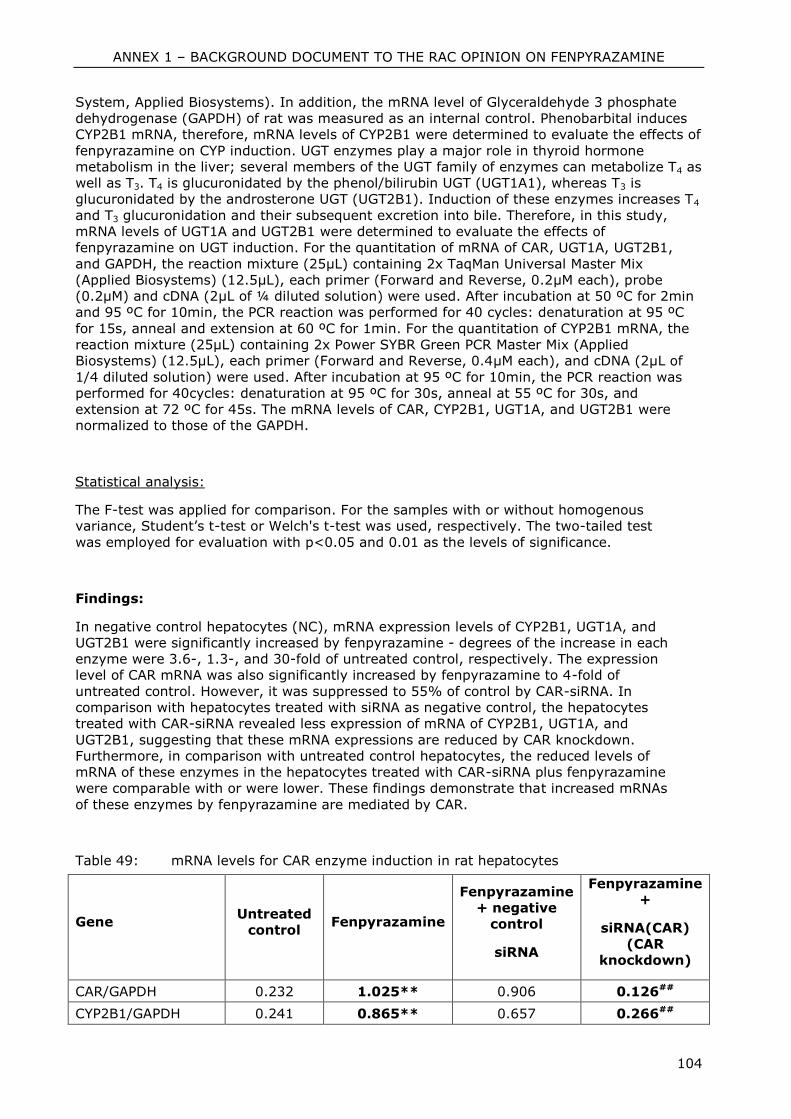
ANNEX 1 – BACKGROUND DOCUMENT TO THE RAC OPINION ON FENPYRAZAMINE
104
System, Applied Biosystems). In addition, the mRNA level of Glyceraldehyde 3 phosphate
dehydrogenase (GAPDH) of rat was measured as an internal control. Phenobarbital induces
CYP2B1 mRNA, therefore, mRNA levels of CYP2B1 were determined to evaluate the effects of
fenpyrazamine on CYP induction. UGT enzymes play a major role in thyroid hormone
metabolism in the liver; several members of the UGT family of enzymes can metabolize T4 as
well as T3. T4 is glucuronidated by the phenol/bilirubin UGT (UGT1A1), whereas T3 is
glucuronidated by the androsterone UGT (UGT2B1). Induction of these enzymes increases T4
and T3 glucuronidation and their subsequent excretion into bile. Therefore, in this study,
mRNA levels of UGT1A and UGT2B1 were determined to evaluate the effects of
fenpyrazamine on UGT induction. For the quantitation of mRNA of CAR, UGT1A, UGT2B1,
and GAPDH, the reaction mixture (25µL) containing 2x TaqMan Universal Master Mix
(Applied Biosystems) (12.5µL), each primer (Forward and Reverse, 0.2µM each), probe
(0.2µM) and cDNA (2µL of ¼ diluted solution) were used. After incubation at 50 ºC for 2min
and 95 ºC for 10min, the PCR reaction was performed for 40 cycles: denaturation at 95 ºC
for 15s, anneal and extension at 60 ºC for 1min. For the quantitation of CYP2B1 mRNA, the
reaction mixture (25µL) containing 2x Power SYBR Green PCR Master Mix (Applied
Biosystems) (12.5µL), each primer (Forward and Reverse, 0.4µM each), and cDNA (2µL of
1/4 diluted solution) were used. After incubation at 95 ºC for 10min, the PCR reaction was
performed for 40cycles: denaturation at 95 ºC for 30s, anneal at 55 ºC for 30s, and
extension at 72 ºC for 45s. The mRNA levels of CAR, CYP2B1, UGT1A, and UGT2B1 were
normalized to those of the GAPDH.
Statistical analysis:
The F-test was applied for comparison. For the samples with or without homogenous
variance, Student’s t-test or Welch's t-test was used, respectively. The two-tailed test
was employed for evaluation with p<0.05 and 0.01 as the levels of significance.
Findings:
In negative control hepatocytes (NC), mRNA expression levels of CYP2B1, UGT1A, and
UGT2B1 were significantly increased by fenpyrazamine - degrees of the increase in each
enzyme were 3.6-, 1.3-, and 30-fold of untreated control, respectively. The expression
level of CAR mRNA was also significantly increased by fenpyrazamine to 4-fold of
untreated control. However, it was suppressed to 55% of control by CAR-siRNA. In
comparison with hepatocytes treated with siRNA as negative control, the hepatocytes
treated with CAR-siRNA revealed less expression of mRNA of CYP2B1, UGT1A, and
UGT2B1, suggesting that these mRNA expressions are reduced by CAR knockdown.
Furthermore, in comparison with untreated control hepatocytes, the reduced levels of
mRNA of these enzymes in the hepatocytes treated with CAR-siRNA plus fenpyrazamine
were comparable with or were lower. These findings demonstrate that increased mRNAs
of these enzymes by fenpyrazamine are mediated by CAR.
Table 49: mRNA levels for CAR enzyme induction in rat hepatocytes
Gene Untreated
control Fenpyrazamine
Fenpyrazamine
+ negative
control
siRNA
Fenpyrazamine
+
siRNA(CAR)
(CAR
knockdown)
CAR/GAPDH 0.232 1.025** 0.906 0.126##
CYP2B1/GAPDH 0.241 0.865** 0.657 0.266##
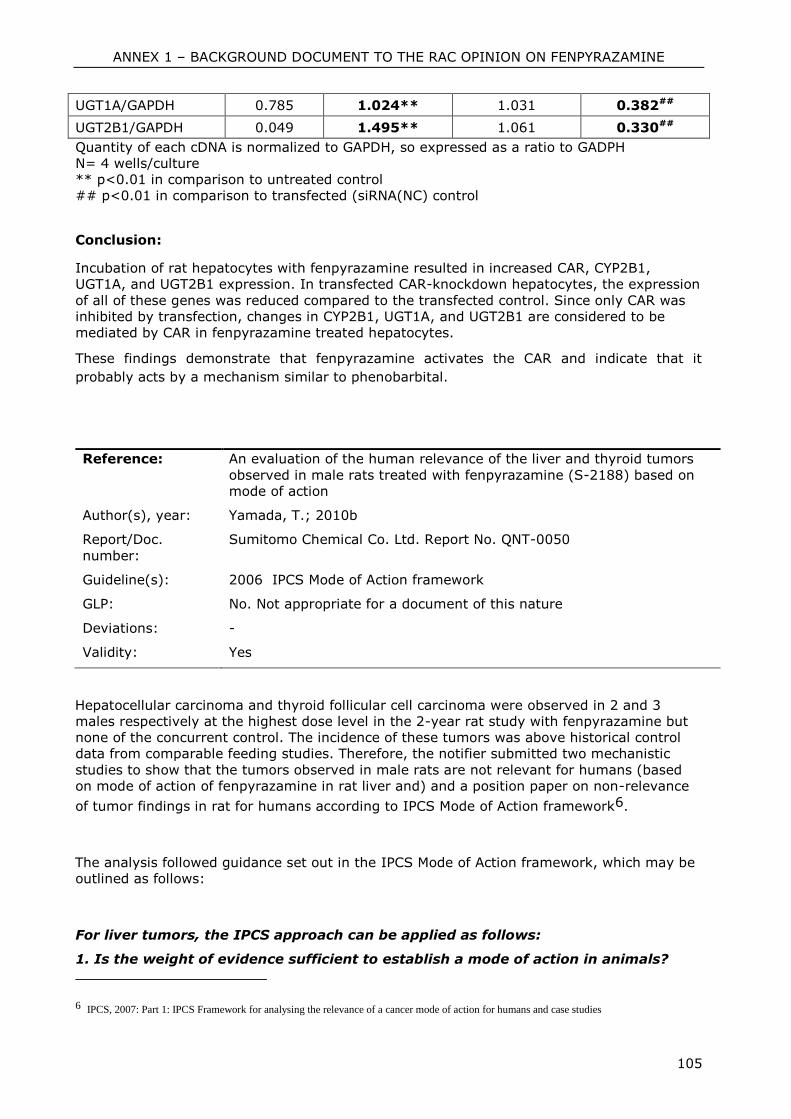
ANNEX 1 – BACKGROUND DOCUMENT TO THE RAC OPINION ON FENPYRAZAMINE
105
UGT1A/GAPDH 0.785 1.024** 1.031 0.382##
UGT2B1/GAPDH 0.049 1.495** 1.061 0.330##
Quantity of each cDNA is normalized to GAPDH, so expressed as a ratio to GADPH
N= 4 wells/culture
** p<0.01 in comparison to untreated control
## p<0.01 in comparison to transfected (siRNA(NC) control
Conclusion:
Incubation of rat hepatocytes with fenpyrazamine resulted in increased CAR, CYP2B1,
UGT1A, and UGT2B1 expression. In transfected CAR-knockdown hepatocytes, the expression
of all of these genes was reduced compared to the transfected control. Since only CAR was
inhibited by transfection, changes in CYP2B1, UGT1A, and UGT2B1 are considered to be
mediated by CAR in fenpyrazamine treated hepatocytes.
These findings demonstrate that fenpyrazamine activates the CAR and indicate that it
probably acts by a mechanism similar to phenobarbital.
Reference: An evaluation of the human relevance of the liver and thyroid tumors
observed in male rats treated with fenpyrazamine (S-2188) based on
mode of action
Author(s), year: Yamada, T.; 2010b
Report/Doc.
number:
Sumitomo Chemical Co. Ltd. Report No. QNT-0050
Guideline(s): 2006 IPCS Mode of Action framework
GLP: No. Not appropriate for a document of this nature
Deviations: -
Validity: Yes
Hepatocellular carcinoma and thyroid follicular cell carcinoma were observed in 2 and 3
males respectively at the highest dose level in the 2-year rat study with fenpyrazamine but
none of the concurrent control. The incidence of these tumors was above historical control
data from comparable feeding studies. Therefore, the notifier submitted two mechanistic
studies to show that the tumors observed in male rats are not relevant for humans (based
on mode of action of fenpyrazamine in rat liver and) and a position paper on non-relevance
of tumor findings in rat for humans according to IPCS Mode of Action framework6.
The analysis followed guidance set out in the IPCS Mode of Action framework, which may be
outlined as follows:
For liver tumors, the IPCS approach can be applied as follows:
1. Is the weight of evidence sufficient to establish a mode of action in animals?
6 IPCS, 2007: Part 1: IPCS Framework for analysing the relevance of a cancer mode of action for humans and case studies
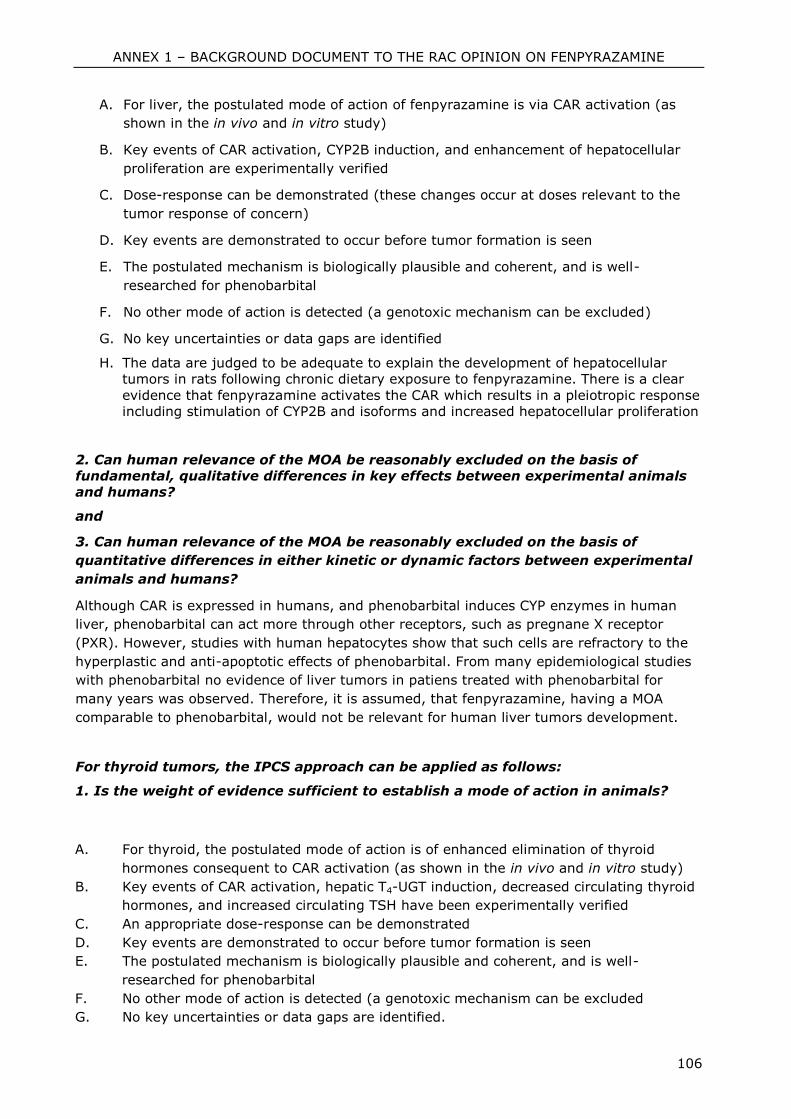
ANNEX 1 – BACKGROUND DOCUMENT TO THE RAC OPINION ON FENPYRAZAMINE
106
A. For liver, the postulated mode of action of fenpyrazamine is via CAR activation (as
shown in the in vivo and in vitro study)
B. Key events of CAR activation, CYP2B induction, and enhancement of hepatocellular
proliferation are experimentally verified
C. Dose-response can be demonstrated (these changes occur at doses relevant to the
tumor response of concern)
D. Key events are demonstrated to occur before tumor formation is seen
E. The postulated mechanism is biologically plausible and coherent, and is well-
researched for phenobarbital
F. No other mode of action is detected (a genotoxic mechanism can be excluded)
G. No key uncertainties or data gaps are identified
H. The data are judged to be adequate to explain the development of hepatocellular
tumors in rats following chronic dietary exposure to fenpyrazamine. There is a clear
evidence that fenpyrazamine activates the CAR which results in a pleiotropic response
including stimulation of CYP2B and isoforms and increased hepatocellular proliferation
2. Can human relevance of the MOA be reasonably excluded on the basis of
fundamental, qualitative differences in key effects between experimental animals
and humans?
and
3. Can human relevance of the MOA be reasonably excluded on the basis of
quantitative differences in either kinetic or dynamic factors between experimental
animals and humans?
Although CAR is expressed in humans, and phenobarbital induces CYP enzymes in human
liver, phenobarbital can act more through other receptors, such as pregnane X receptor
(PXR). However, studies with human hepatocytes show that such cells are refractory to the
hyperplastic and anti-apoptotic effects of phenobarbital. From many epidemiological studies
with phenobarbital no evidence of liver tumors in patiens treated with phenobarbital for
many years was observed. Therefore, it is assumed, that fenpyrazamine, having a MOA
comparable to phenobarbital, would not be relevant for human liver tumors development.
For thyroid tumors, the IPCS approach can be applied as follows:
1. Is the weight of evidence sufficient to establish a mode of action in animals?
A. For thyroid, the postulated mode of action is of enhanced elimination of thyroid
hormones consequent to CAR activation (as shown in the in vivo and in vitro study)
B. Key events of CAR activation, hepatic T4-UGT induction, decreased circulating thyroid
hormones, and increased circulating TSH have been experimentally verified
C. An appropriate dose-response can be demonstrated
D. Key events are demonstrated to occur before tumor formation is seen
E. The postulated mechanism is biologically plausible and coherent, and is well-
researched for phenobarbital
F. No other mode of action is detected (a genotoxic mechanism can be excluded
G. No key uncertainties or data gaps are identified.
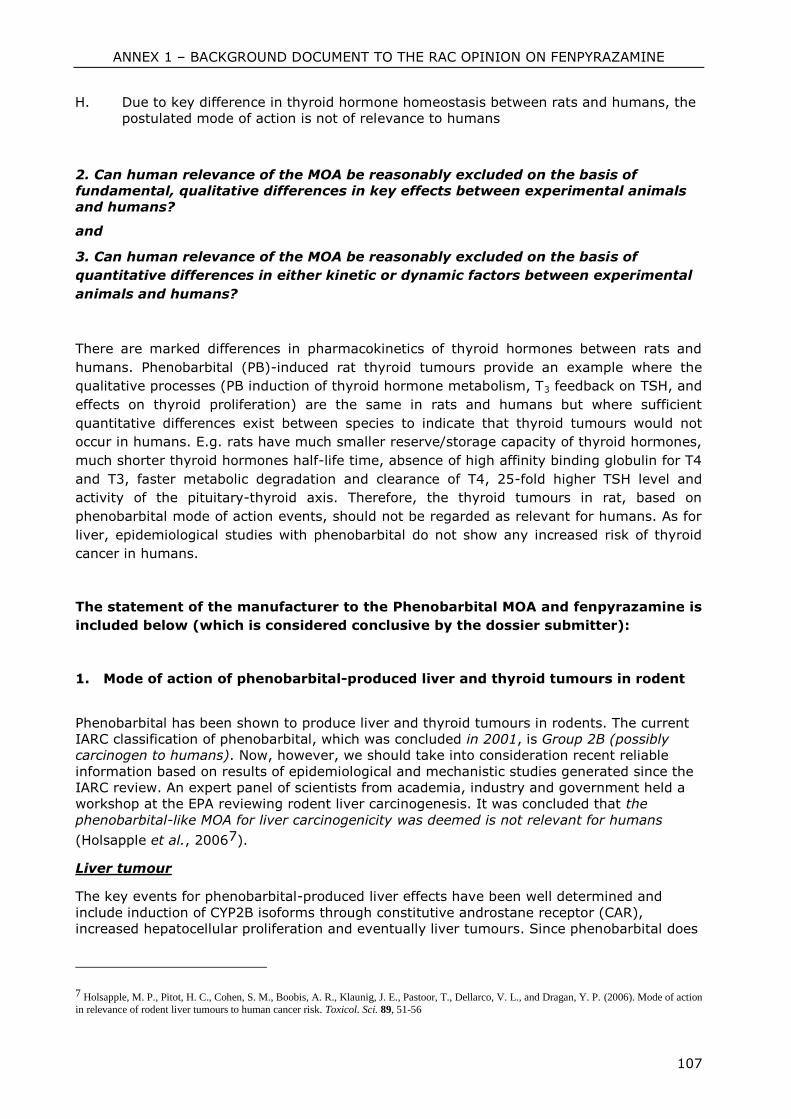
ANNEX 1 – BACKGROUND DOCUMENT TO THE RAC OPINION ON FENPYRAZAMINE
107
H. Due to key difference in thyroid hormone homeostasis between rats and humans, the
postulated mode of action is not of relevance to humans
2. Can human relevance of the MOA be reasonably excluded on the basis of
fundamental, qualitative differences in key effects between experimental animals
and humans?
and
3. Can human relevance of the MOA be reasonably excluded on the basis of
quantitative differences in either kinetic or dynamic factors between experimental
animals and humans?
There are marked differences in pharmacokinetics of thyroid hormones between rats and
humans. Phenobarbital (PB)-induced rat thyroid tumours provide an example where the
qualitative processes (PB induction of thyroid hormone metabolism, T3 feedback on TSH, and
effects on thyroid proliferation) are the same in rats and humans but where sufficient
quantitative differences exist between species to indicate that thyroid tumours would not
occur in humans. E.g. rats have much smaller reserve/storage capacity of thyroid hormones,
much shorter thyroid hormones half-life time, absence of high affinity binding globulin for T4
and T3, faster metabolic degradation and clearance of T4, 25-fold higher TSH level and
activity of the pituitary-thyroid axis. Therefore, the thyroid tumours in rat, based on
phenobarbital mode of action events, should not be regarded as relevant for humans. As for
liver, epidemiological studies with phenobarbital do not show any increased risk of thyroid
cancer in humans.
The statement of the manufacturer to the Phenobarbital MOA and fenpyrazamine is
included below (which is considered conclusive by the dossier submitter):
1. Mode of action of phenobarbital-produced liver and thyroid tumours in rodent
Phenobarbital has been shown to produce liver and thyroid tumours in rodents. The current
IARC classification of phenobarbital, which was concluded in 2001, is Group 2B (possibly
carcinogen to humans). Now, however, we should take into consideration recent reliable
information based on results of epidemiological and mechanistic studies generated since the
IARC review. An expert panel of scientists from academia, industry and government held a
workshop at the EPA reviewing rodent liver carcinogenesis. It was concluded that the
phenobarbital-like MOA for liver carcinogenicity was deemed is not relevant for humans
(Holsapple et al., 20067).
Liver tumour
The key events for phenobarbital-produced liver effects have been well determined and
include induction of CYP2B isoforms through constitutive androstane receptor (CAR),
increased hepatocellular proliferation and eventually liver tumours. Since phenobarbital does
7 Holsapple, M. P., Pitot, H. C., Cohen, S. M., Boobis, A. R., Klaunig, J. E., Pastoor, T., Dellarco, V. L., and Dragan, Y. P. (2006). Mode of action
in relevance of rodent liver tumours to human cancer risk. Toxicol. Sci. 89, 51-56
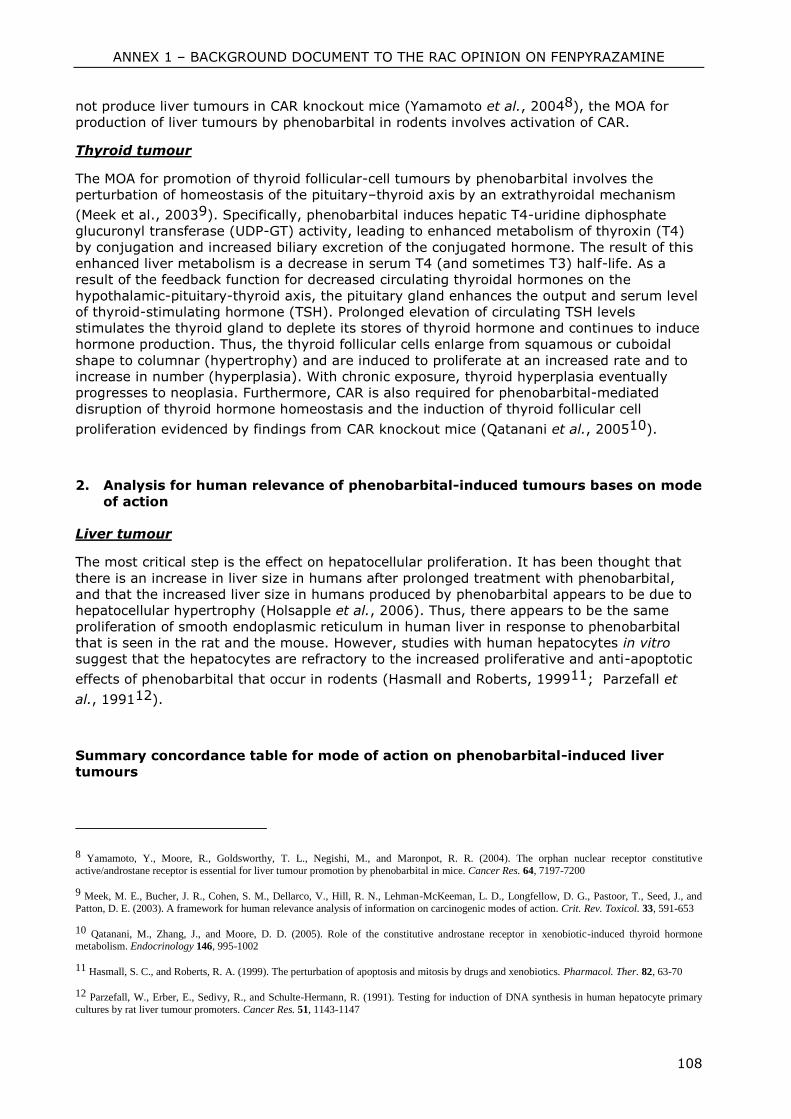
ANNEX 1 – BACKGROUND DOCUMENT TO THE RAC OPINION ON FENPYRAZAMINE
108
not produce liver tumours in CAR knockout mice (Yamamoto et al., 20048), the MOA for
production of liver tumours by phenobarbital in rodents involves activation of CAR.
Thyroid tumour
The MOA for promotion of thyroid follicular-cell tumours by phenobarbital involves the
perturbation of homeostasis of the pituitary–thyroid axis by an extrathyroidal mechanism
(Meek et al., 20039). Specifically, phenobarbital induces hepatic T4-uridine diphosphate
glucuronyl transferase (UDP-GT) activity, leading to enhanced metabolism of thyroxin (T4)
by conjugation and increased biliary excretion of the conjugated hormone. The result of this
enhanced liver metabolism is a decrease in serum T4 (and sometimes T3) half-life. As a
result of the feedback function for decreased circulating thyroidal hormones on the
hypothalamic-pituitary-thyroid axis, the pituitary gland enhances the output and serum level
of thyroid-stimulating hormone (TSH). Prolonged elevation of circulating TSH levels
stimulates the thyroid gland to deplete its stores of thyroid hormone and continues to induce
hormone production. Thus, the thyroid follicular cells enlarge from squamous or cuboidal
shape to columnar (hypertrophy) and are induced to proliferate at an increased rate and to
increase in number (hyperplasia). With chronic exposure, thyroid hyperplasia eventually
progresses to neoplasia. Furthermore, CAR is also required for phenobarbital-mediated
disruption of thyroid hormone homeostasis and the induction of thyroid follicular cell
proliferation evidenced by findings from CAR knockout mice (Qatanani et al., 200510).
2. Analysis for human relevance of phenobarbital-induced tumours bases on mode
of action
Liver tumour
The most critical step is the effect on hepatocellular proliferation. It has been thought that
there is an increase in liver size in humans after prolonged treatment with phenobarbital,
and that the increased liver size in humans produced by phenobarbital appears to be due to
hepatocellular hypertrophy (Holsapple et al., 2006). Thus, there appears to be the same
proliferation of smooth endoplasmic reticulum in human liver in response to phenobarbital
that is seen in the rat and the mouse. However, studies with human hepatocytes in vitro
suggest that the hepatocytes are refractory to the increased proliferative and anti-apoptotic
effects of phenobarbital that occur in rodents (Hasmall and Roberts, 199911; Parzefall et
al., 199112).
Summary concordance table for mode of action on phenobarbital-induced liver
tumours
8 Yamamoto, Y., Moore, R., Goldsworthy, T. L., Negishi, M., and Maronpot, R. R. (2004). The orphan nuclear receptor constitutive
active/androstane receptor is essential for liver tumour promotion by phenobarbital in mice. Cancer Res. 64, 7197-7200
9 Meek, M. E., Bucher, J. R., Cohen, S. M., Dellarco, V., Hill, R. N., Lehman-McKeeman, L. D., Longfellow, D. G., Pastoor, T., Seed, J., and
Patton, D. E. (2003). A framework for human relevance analysis of information on carcinogenic modes of action. Crit. Rev. Toxicol. 33, 591-653
10 Qatanani, M., Zhang, J., and Moore, D. D. (2005). Role of the constitutive androstane receptor in xenobiotic-induced thyroid hormone metabolism. Endocrinology 146, 995-1002
11 Hasmall, S. C., and Roberts, R. A. (1999). The perturbation of apoptosis and mitosis by drugs and xenobiotics. Pharmacol. Ther. 82, 63-70
12 Parzefall, W., Erber, E., Sedivy, R., and Schulte-Hermann, R. (1991). Testing for induction of DNA synthesis in human hepatocyte primary
cultures by rat liver tumour promoters. Cancer Res. 51, 1143-1147
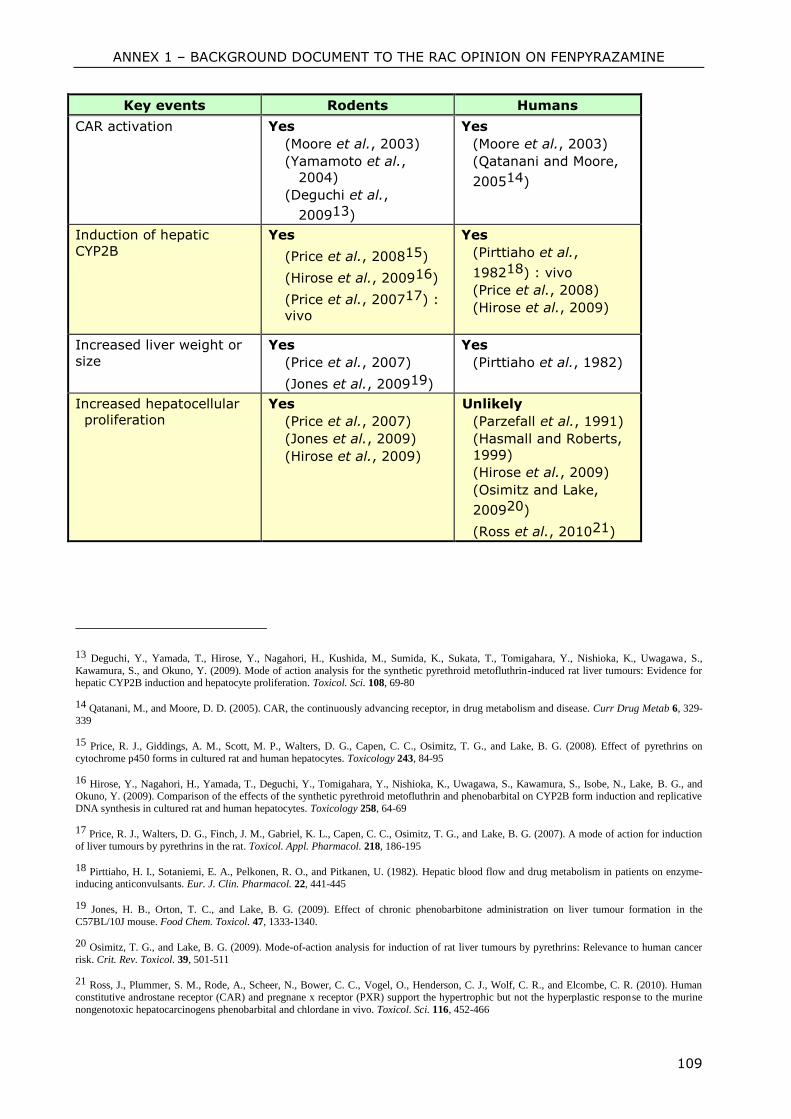
ANNEX 1 – BACKGROUND DOCUMENT TO THE RAC OPINION ON FENPYRAZAMINE
109
Key events Rodents Humans
CAR activation Yes
(Moore et al., 2003)
(Yamamoto et al.,
2004)
(Deguchi et al.,
200913)
Yes
(Moore et al., 2003)
(Qatanani and Moore,
200514)
Induction of hepatic
CYP2B
Yes
(Price et al., 200815)
(Hirose et al., 200916)
(Price et al., 200717) :
vivo
Yes
(Pirttiaho et al.,
198218) : vivo
(Price et al., 2008)
(Hirose et al., 2009)
Increased liver weight or
size
Yes
(Price et al., 2007)
(Jones et al., 200919)
Yes
(Pirttiaho et al., 1982)
Increased hepatocellular
proliferation
Yes
(Price et al., 2007)
(Jones et al., 2009)
(Hirose et al., 2009)
Unlikely
(Parzefall et al., 1991)
(Hasmall and Roberts,
1999)
(Hirose et al., 2009)
(Osimitz and Lake,
200920)
(Ross et al., 201021)
13 Deguchi, Y., Yamada, T., Hirose, Y., Nagahori, H., Kushida, M., Sumida, K., Sukata, T., Tomigahara, Y., Nishioka, K., Uwagawa, S.,
Kawamura, S., and Okuno, Y. (2009). Mode of action analysis for the synthetic pyrethroid metofluthrin-induced rat liver tumours: Evidence for hepatic CYP2B induction and hepatocyte proliferation. Toxicol. Sci. 108, 69-80
14 Qatanani, M., and Moore, D. D. (2005). CAR, the continuously advancing receptor, in drug metabolism and disease. Curr Drug Metab 6, 329-
339
15 Price, R. J., Giddings, A. M., Scott, M. P., Walters, D. G., Capen, C. C., Osimitz, T. G., and Lake, B. G. (2008). Effect of pyrethrins on
cytochrome p450 forms in cultured rat and human hepatocytes. Toxicology 243, 84-95
16 Hirose, Y., Nagahori, H., Yamada, T., Deguchi, Y., Tomigahara, Y., Nishioka, K., Uwagawa, S., Kawamura, S., Isobe, N., Lake, B. G., and Okuno, Y. (2009). Comparison of the effects of the synthetic pyrethroid metofluthrin and phenobarbital on CYP2B form induction and replicative
DNA synthesis in cultured rat and human hepatocytes. Toxicology 258, 64-69
17 Price, R. J., Walters, D. G., Finch, J. M., Gabriel, K. L., Capen, C. C., Osimitz, T. G., and Lake, B. G. (2007). A mode of action for induction
of liver tumours by pyrethrins in the rat. Toxicol. Appl. Pharmacol. 218, 186-195
18 Pirttiaho, H. I., Sotaniemi, E. A., Pelkonen, R. O., and Pitkanen, U. (1982). Hepatic blood flow and drug metabolism in patients on enzyme-inducing anticonvulsants. Eur. J. Clin. Pharmacol. 22, 441-445
19 Jones, H. B., Orton, T. C., and Lake, B. G. (2009). Effect of chronic phenobarbitone administration on liver tumour formation in the
C57BL/10J mouse. Food Chem. Toxicol. 47, 1333-1340.
20 Osimitz, T. G., and Lake, B. G. (2009). Mode-of-action analysis for induction of rat liver tumours by pyrethrins: Relevance to human cancer
risk. Crit. Rev. Toxicol. 39, 501-511
21 Ross, J., Plummer, S. M., Rode, A., Scheer, N., Bower, C. C., Vogel, O., Henderson, C. J., Wolf, C. R., and Elcombe, C. R. (2010). Human constitutive androstane receptor (CAR) and pregnane x receptor (PXR) support the hypertrophic but not the hyperplastic response to the murine
nongenotoxic hepatocarcinogens phenobarbital and chlordane in vivo. Toxicol. Sci. 116, 452-466
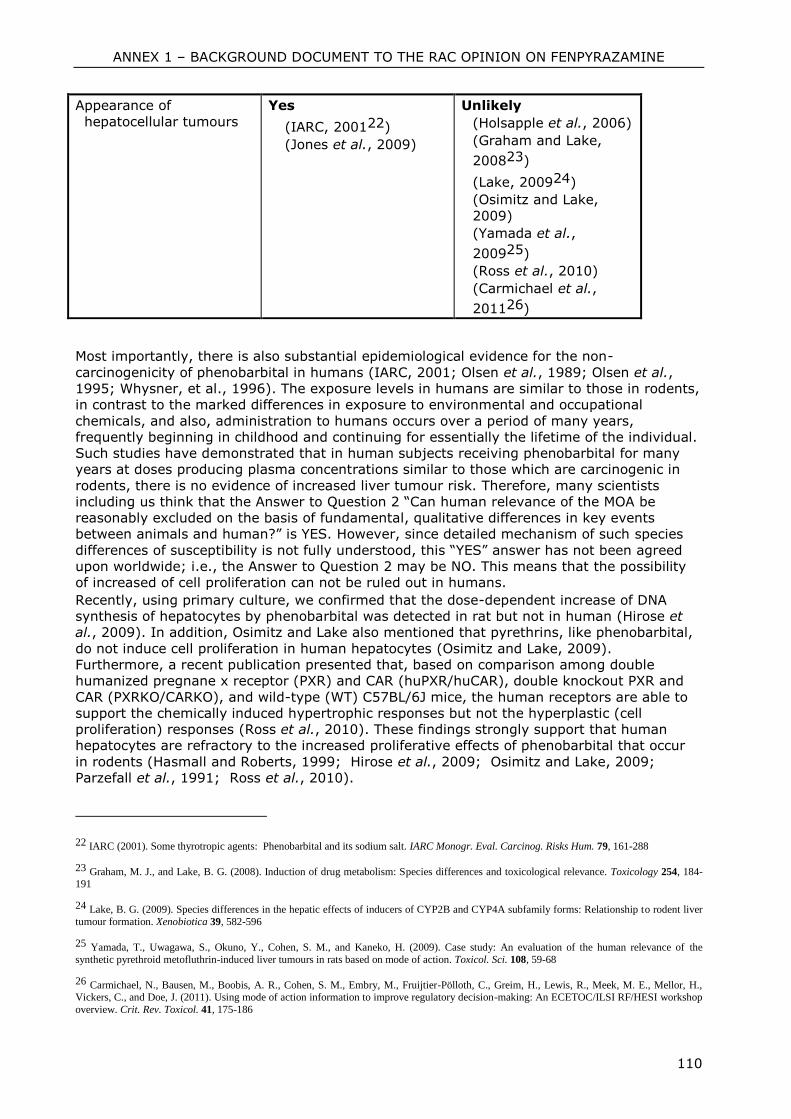
ANNEX 1 – BACKGROUND DOCUMENT TO THE RAC OPINION ON FENPYRAZAMINE
110
Appearance of
hepatocellular tumours
Yes
(IARC, 200122)
(Jones et al., 2009)
Unlikely
(Holsapple et al., 2006)
(Graham and Lake,
200823)
(Lake, 200924)
(Osimitz and Lake,
2009)
(Yamada et al.,
200925)
(Ross et al., 2010)
(Carmichael et al.,
201126)
Most importantly, there is also substantial epidemiological evidence for the non-
carcinogenicity of phenobarbital in humans (IARC, 2001; Olsen et al., 1989; Olsen et al.,
1995; Whysner, et al., 1996). The exposure levels in humans are similar to those in rodents,
in contrast to the marked differences in exposure to environmental and occupational
chemicals, and also, administration to humans occurs over a period of many years,
frequently beginning in childhood and continuing for essentially the lifetime of the individual.
Such studies have demonstrated that in human subjects receiving phenobarbital for many
years at doses producing plasma concentrations similar to those which are carcinogenic in
rodents, there is no evidence of increased liver tumour risk. Therefore, many scientists
including us think that the Answer to Question 2 “Can human relevance of the MOA be
reasonably excluded on the basis of fundamental, qualitative differences in key events
between animals and human?” is YES. However, since detailed mechanism of such species
differences of susceptibility is not fully understood, this “YES” answer has not been agreed
upon worldwide; i.e., the Answer to Question 2 may be NO. This means that the possibility
of increased of cell proliferation can not be ruled out in humans.
Recently, using primary culture, we confirmed that the dose-dependent increase of DNA
synthesis of hepatocytes by phenobarbital was detected in rat but not in human (Hirose et
al., 2009). In addition, Osimitz and Lake also mentioned that pyrethrins, like phenobarbital,
do not induce cell proliferation in human hepatocytes (Osimitz and Lake, 2009).
Furthermore, a recent publication presented that, based on comparison among double
humanized pregnane x receptor (PXR) and CAR (huPXR/huCAR), double knockout PXR and
CAR (PXRKO/CARKO), and wild-type (WT) C57BL/6J mice, the human receptors are able to
support the chemically induced hypertrophic responses but not the hyperplastic (cell
proliferation) responses (Ross et al., 2010). These findings strongly support that human
hepatocytes are refractory to the increased proliferative effects of phenobarbital that occur
in rodents (Hasmall and Roberts, 1999; Hirose et al., 2009; Osimitz and Lake, 2009;
Parzefall et al., 1991; Ross et al., 2010).
22 IARC (2001). Some thyrotropic agents: Phenobarbital and its sodium salt. IARC Monogr. Eval. Carcinog. Risks Hum. 79, 161-288
23 Graham, M. J., and Lake, B. G. (2008). Induction of drug metabolism: Species differences and toxicological relevance. Toxicology 254, 184-191
24 Lake, B. G. (2009). Species differences in the hepatic effects of inducers of CYP2B and CYP4A subfamily forms: Relationship to rodent liver
tumour formation. Xenobiotica 39, 582-596
25 Yamada, T., Uwagawa, S., Okuno, Y., Cohen, S. M., and Kaneko, H. (2009). Case study: An evaluation of the human relevance of the
synthetic pyrethroid metofluthrin-induced liver tumours in rats based on mode of action. Toxicol. Sci. 108, 59-68
26 Carmichael, N., Bausen, M., Boobis, A. R., Cohen, S. M., Embry, M., Fruijtier-Pölloth, C., Greim, H., Lewis, R., Meek, M. E., Mellor, H., Vickers, C., and Doe, J. (2011). Using mode of action information to improve regulatory decision-making: An ECETOC/ILSI RF/HESI workshop
overview. Crit. Rev. Toxicol. 41, 175-186
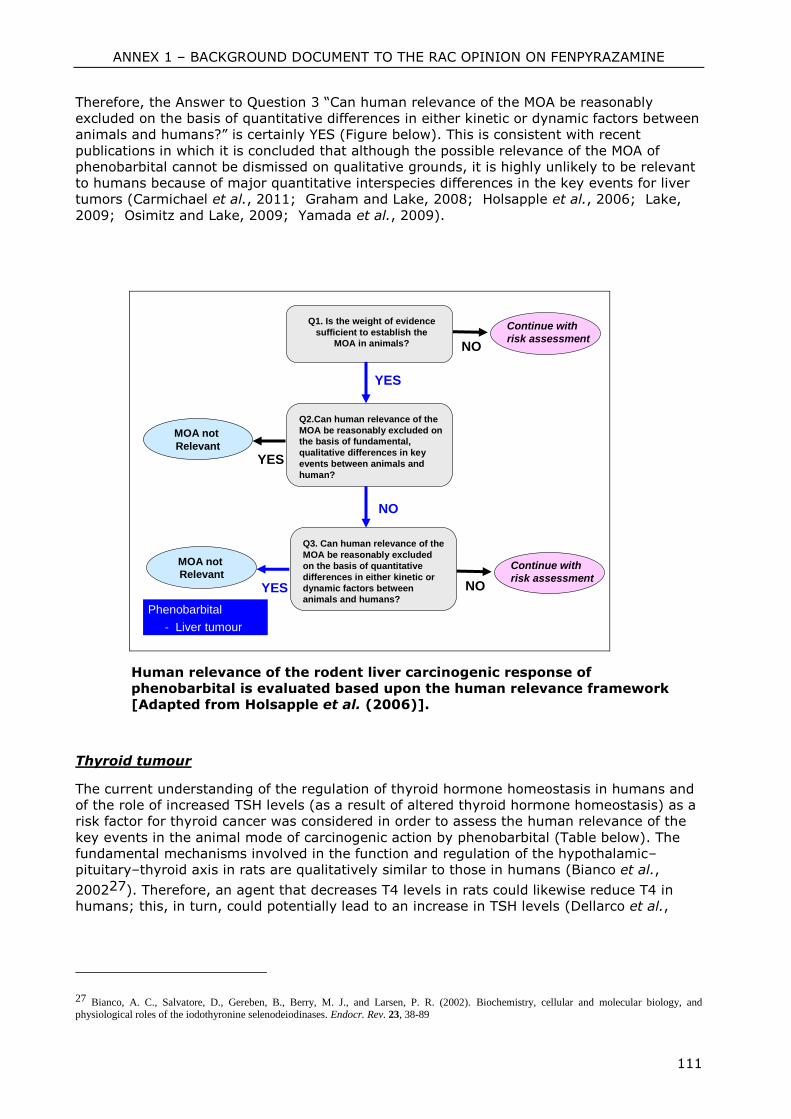
ANNEX 1 – BACKGROUND DOCUMENT TO THE RAC OPINION ON FENPYRAZAMINE
111
Therefore, the Answer to Question 3 “Can human relevance of the MOA be reasonably
excluded on the basis of quantitative differences in either kinetic or dynamic factors between
animals and humans?” is certainly YES (Figure below). This is consistent with recent
publications in which it is concluded that although the possible relevance of the MOA of
phenobarbital cannot be dismissed on qualitative grounds, it is highly unlikely to be relevant
to humans because of major quantitative interspecies differences in the key events for liver
tumors (Carmichael et al., 2011; Graham and Lake, 2008; Holsapple et al., 2006; Lake,
2009; Osimitz and Lake, 2009; Yamada et al., 2009).
YES
NO
YES
MOA not
Relevant
Q2.Can human relevance of the
MOA be reasonably excluded on
the basis of fundamental,
qualitative differences in key
events between animals and
human?
Q3. Can human relevance of the
MOA be reasonably excluded
on the basis of quantitative
differences in either kinetic or
dynamic factors between
animals and humans?
NO
Continue with
risk assessment
NO
Continue with
risk assessmentYES
MOA not
Relevant
Phenobarbital
- Liver tumour
Q1. Is the weight of evidence
sufficient to establish the
MOA in animals?
Human relevance of the rodent liver carcinogenic response of
phenobarbital is evaluated based upon the human relevance framework
[Adapted from Holsapple et al. (2006)].
Thyroid tumour
The current understanding of the regulation of thyroid hormone homeostasis in humans and
of the role of increased TSH levels (as a result of altered thyroid hormone homeostasis) as a
risk factor for thyroid cancer was considered in order to assess the human relevance of the
key events in the animal mode of carcinogenic action by phenobarbital (Table below). The
fundamental mechanisms involved in the function and regulation of the hypothalamic–
pituitary–thyroid axis in rats are qualitatively similar to those in humans (Bianco et al.,
200227). Therefore, an agent that decreases T4 levels in rats could likewise reduce T4 in
humans; this, in turn, could potentially lead to an increase in TSH levels (Dellarco et al.,
27 Bianco, A. C., Salvatore, D., Gereben, B., Berry, M. J., and Larsen, P. R. (2002). Biochemistry, cellular and molecular biology, and
physiological roles of the iodothyronine selenodeiodinases. Endocr. Rev. 23, 38-89
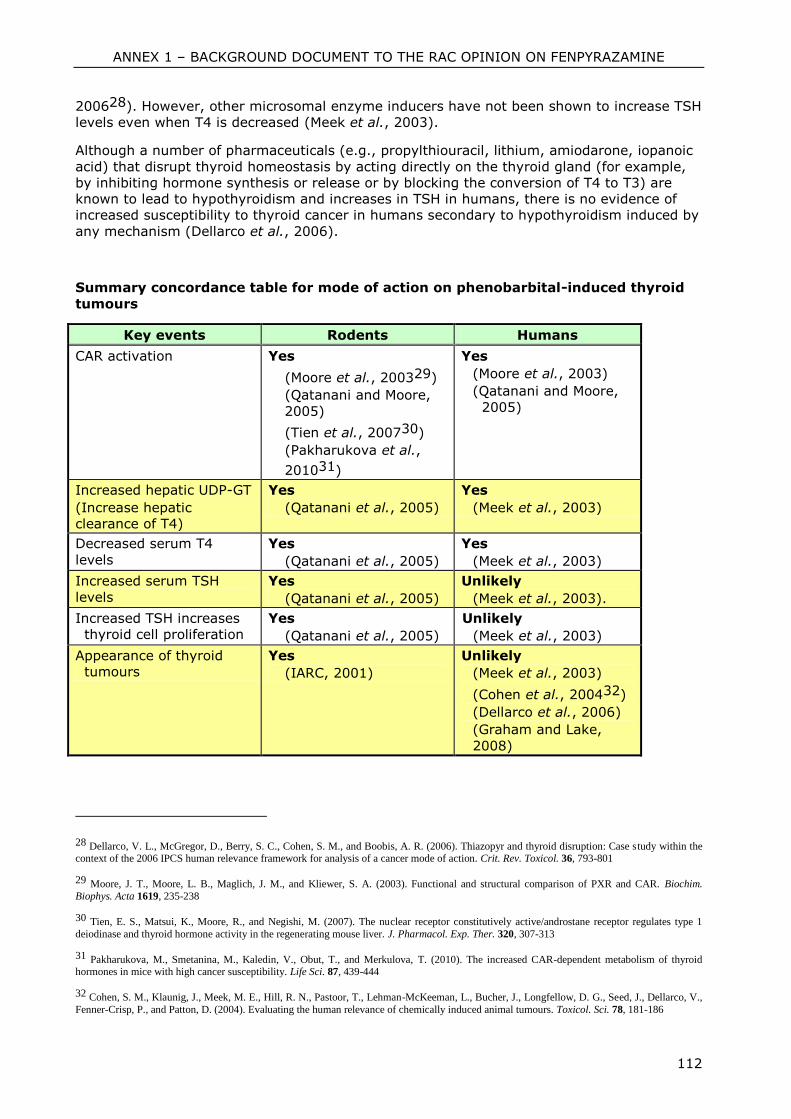
ANNEX 1 – BACKGROUND DOCUMENT TO THE RAC OPINION ON FENPYRAZAMINE
112
200628). However, other microsomal enzyme inducers have not been shown to increase TSH
levels even when T4 is decreased (Meek et al., 2003).
Although a number of pharmaceuticals (e.g., propylthiouracil, lithium, amiodarone, iopanoic
acid) that disrupt thyroid homeostasis by acting directly on the thyroid gland (for example,
by inhibiting hormone synthesis or release or by blocking the conversion of T4 to T3) are
known to lead to hypothyroidism and increases in TSH in humans, there is no evidence of
increased susceptibility to thyroid cancer in humans secondary to hypothyroidism induced by
any mechanism (Dellarco et al., 2006).
Summary concordance table for mode of action on phenobarbital-induced thyroid
tumours
Key events Rodents Humans
CAR activation Yes
(Moore et al., 200329)
(Qatanani and Moore,
2005)
(Tien et al., 200730)
(Pakharukova et al.,
201031)
Yes
(Moore et al., 2003)
(Qatanani and Moore,
2005)
Increased hepatic UDP-GT
(Increase hepatic
clearance of T4)
Yes
(Qatanani et al., 2005)
Yes
(Meek et al., 2003)
Decreased serum T4
levels
Yes
(Qatanani et al., 2005)
Yes
(Meek et al., 2003)
Increased serum TSH
levels
Yes
(Qatanani et al., 2005)
Unlikely
(Meek et al., 2003).
Increased TSH increases
thyroid cell proliferation
Yes
(Qatanani et al., 2005)
Unlikely
(Meek et al., 2003)
Appearance of thyroid
tumours
Yes
(IARC, 2001)
Unlikely
(Meek et al., 2003)
(Cohen et al., 200432)
(Dellarco et al., 2006)
(Graham and Lake,
2008)
28 Dellarco, V. L., McGregor, D., Berry, S. C., Cohen, S. M., and Boobis, A. R. (2006). Thiazopyr and thyroid disruption: Case study within the context of the 2006 IPCS human relevance framework for analysis of a cancer mode of action. Crit. Rev. Toxicol. 36, 793-801
29 Moore, J. T., Moore, L. B., Maglich, J. M., and Kliewer, S. A. (2003). Functional and structural comparison of PXR and CAR. Biochim.
Biophys. Acta 1619, 235-238
30 Tien, E. S., Matsui, K., Moore, R., and Negishi, M. (2007). The nuclear receptor constitutively active/androstane receptor regulates type 1
deiodinase and thyroid hormone activity in the regenerating mouse liver. J. Pharmacol. Exp. Ther. 320, 307-313
31 Pakharukova, M., Smetanina, M., Kaledin, V., Obut, T., and Merkulova, T. (2010). The increased CAR-dependent metabolism of thyroid hormones in mice with high cancer susceptibility. Life Sci. 87, 439-444
32 Cohen, S. M., Klaunig, J., Meek, M. E., Hill, R. N., Pastoor, T., Lehman-McKeeman, L., Bucher, J., Longfellow, D. G., Seed, J., Dellarco, V.,
Fenner-Crisp, P., and Patton, D. (2004). Evaluating the human relevance of chemically induced animal tumours. Toxicol. Sci. 78, 181-186
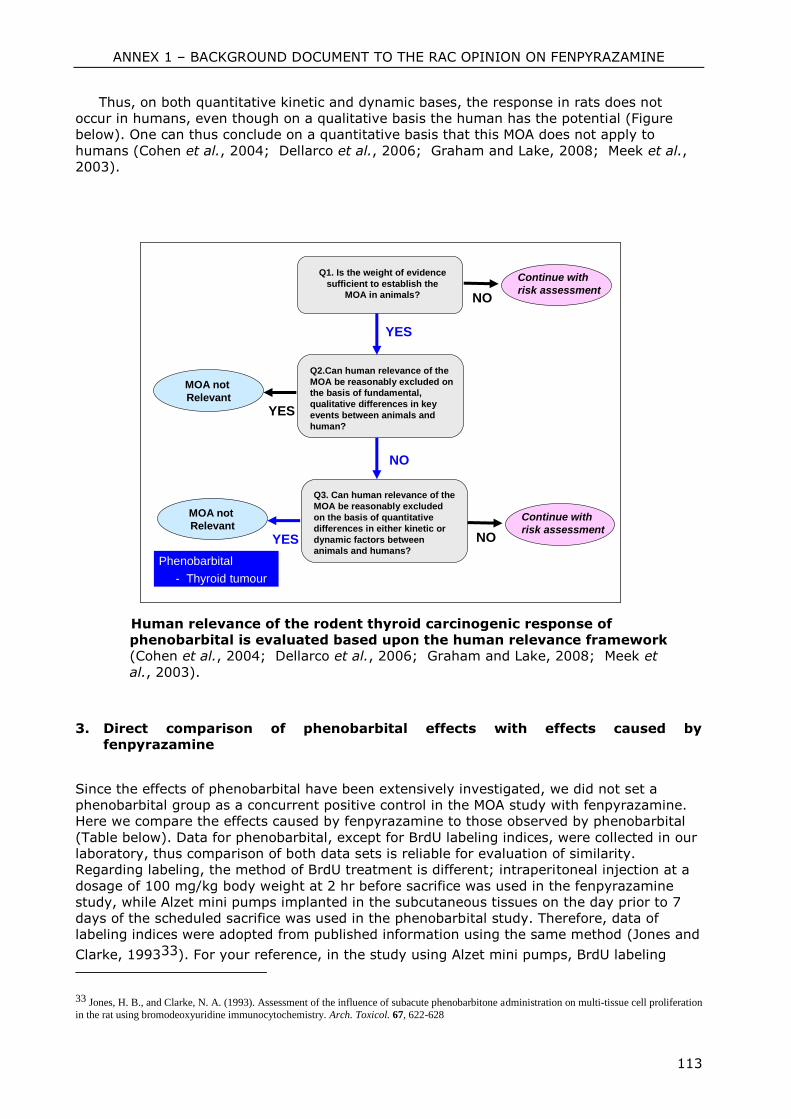
ANNEX 1 – BACKGROUND DOCUMENT TO THE RAC OPINION ON FENPYRAZAMINE
113
Thus, on both quantitative kinetic and dynamic bases, the response in rats does not
occur in humans, even though on a qualitative basis the human has the potential (Figure
below). One can thus conclude on a quantitative basis that this MOA does not apply to
humans (Cohen et al., 2004; Dellarco et al., 2006; Graham and Lake, 2008; Meek et al.,
2003).
YES
NO
YES
MOA not
Relevant
Q2.Can human relevance of the
MOA be reasonably excluded on
the basis of fundamental,
qualitative differences in key
events between animals and
human?
Q3. Can human relevance of the
MOA be reasonably excluded
on the basis of quantitative
differences in either kinetic or
dynamic factors between
animals and humans?
NO
Continue with
risk assessment
NO
Continue with
risk assessmentYES
MOA not
Relevant
Phenobarbital
- Thyroid tumour
Q1. Is the weight of evidence
sufficient to establish the
MOA in animals?
Human relevance of the rodent thyroid carcinogenic response of
phenobarbital is evaluated based upon the human relevance framework
(Cohen et al., 2004; Dellarco et al., 2006; Graham and Lake, 2008; Meek et
al., 2003).
3. Direct comparison of phenobarbital effects with effects caused by
fenpyrazamine
Since the effects of phenobarbital have been extensively investigated, we did not set a
phenobarbital group as a concurrent positive control in the MOA study with fenpyrazamine.
Here we compare the effects caused by fenpyrazamine to those observed by phenobarbital
(Table below). Data for phenobarbital, except for BrdU labeling indices, were collected in our
laboratory, thus comparison of both data sets is reliable for evaluation of similarity.
Regarding labeling, the method of BrdU treatment is different; intraperitoneal injection at a
dosage of 100 mg/kg body weight at 2 hr before sacrifice was used in the fenpyrazamine
study, while Alzet mini pumps implanted in the subcutaneous tissues on the day prior to 7
days of the scheduled sacrifice was used in the phenobarbital study. Therefore, data of
labeling indices were adopted from published information using the same method (Jones and
Clarke, 199333). For your reference, in the study using Alzet mini pumps, BrdU labeling
33 Jones, H. B., and Clarke, N. A. (1993). Assessment of the influence of subacute phenobarbitone administration on multi-tissue cell proliferation
in the rat using bromodeoxyuridine immunocytochemistry. Arch. Toxicol. 67, 622-628
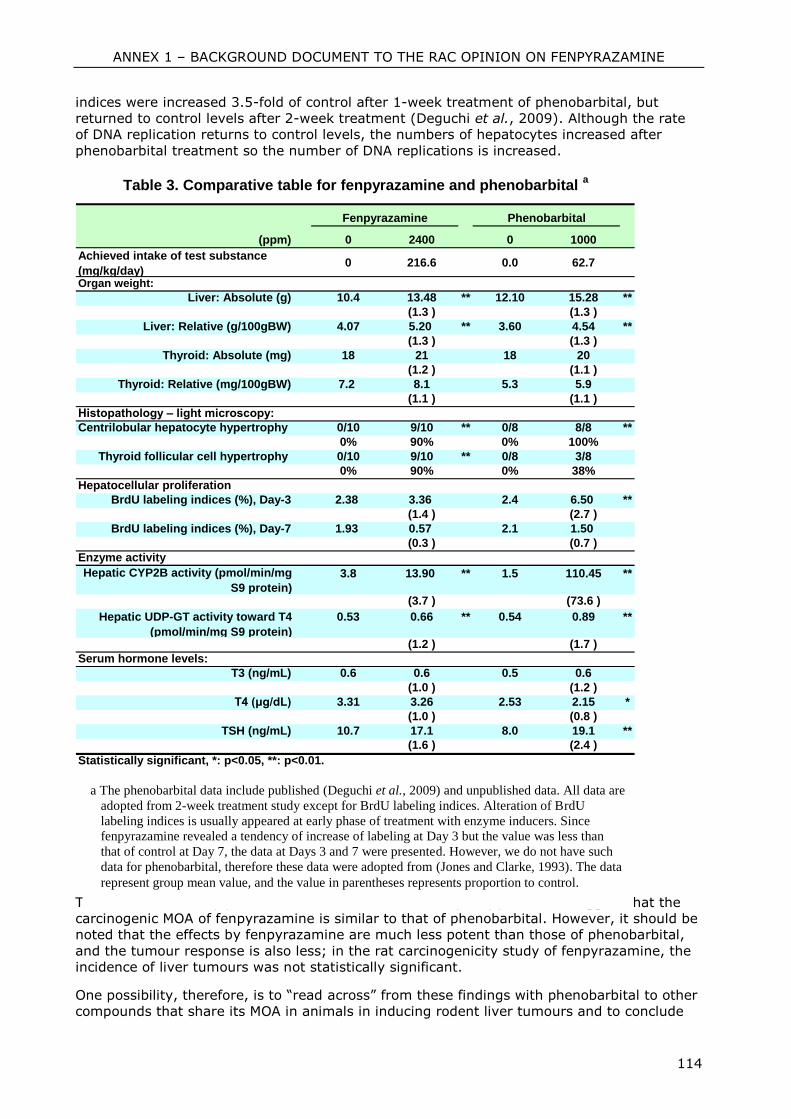
ANNEX 1 – BACKGROUND DOCUMENT TO THE RAC OPINION ON FENPYRAZAMINE
114
indices were increased 3.5-fold of control after 1-week treatment of phenobarbital, but
returned to control levels after 2-week treatment (Deguchi et al., 2009). Although the rate
of DNA replication returns to control levels, the numbers of hepatocytes increased after
phenobarbital treatment so the number of DNA replications is increased.
0 2400 0 1000
Achieved intake of test substance
(mg/kg/day)0 216.6 0.0 62.7
Organ weight:
Liver: Absolute (g) 10.4 13.48 ** 12.10 15.28 **
(1.3 ) (1.3 )
Liver: Relative (g/100gBW) 4.07 5.20 ** 3.60 4.54 **
(1.3 ) (1.3 )
Thyroid: Absolute (mg) 18 21 18 20
(1.2 ) (1.1 )
Thyroid: Relative (mg/100gBW) 7.2 8.1 5.3 5.9
(1.1 ) (1.1 )
Histopathology – light microscopy:
Centrilobular hepatocyte hypertrophy 0/10 9/10 ** 0/8 8/8 **
0% 90% 0% 100%
Thyroid follicular cell hypertrophy 0/10 9/10 ** 0/8 3/8
0% 90% 0% 38%
Hepatocellular proliferation
BrdU labeling indices (%), Day-3 2.38 3.36 2.4 6.50 **
(1.4 ) (2.7 )
BrdU labeling indices (%), Day-7 1.93 0.57 2.1 1.50
(0.3 ) (0.7 )
Enzyme activity
Hepatic CYP2B activity (pmol/min/mg
S9 protein)
3.8 13.90 ** 1.5 110.45 **
(3.7 ) (73.6 )
Hepatic UDP-GT activity toward T4
(pmol/min/mg S9 protein)
0.53 0.66 ** 0.54 0.89 **
(1.2 ) (1.7 )
Serum hormone levels:
T3 (ng/mL) 0.6 0.6 0.5 0.6
(1.0 ) (1.2 )
T4 (μg/dL) 3.31 3.26 2.53 2.15 *
(1.0 ) (0.8 )
TSH (ng/mL) 10.7 17.1 8.0 19.1 **
(1.6 ) (2.4 )
Statistically significant, *: p<0.05, **: p<0.01.
Table 3. Comparative table for fenpyrazamine and phenobarbital a
(ppm)
Fenpyrazamine Phenobarbital
The effects caused by phenobarbital to those observed by fenpyrazamine suggest that the
carcinogenic MOA of fenpyrazamine is similar to that of phenobarbital. However, it should be
noted that the effects by fenpyrazamine are much less potent than those of phenobarbital,
and the tumour response is also less; in the rat carcinogenicity study of fenpyrazamine, the
incidence of liver tumours was not statistically significant.
One possibility, therefore, is to “read across” from these findings with phenobarbital to other
compounds that share its MOA in animals in inducing rodent liver tumours and to conclude
a The phenobarbital data include published (Deguchi et al., 2009) and unpublished data. All data are
adopted from 2-week treatment study except for BrdU labeling indices. Alteration of BrdU
labeling indices is usually appeared at early phase of treatment with enzyme inducers. Since
fenpyrazamine revealed a tendency of increase of labeling at Day 3 but the value was less than
that of control at Day 7, the data at Days 3 and 7 were presented. However, we do not have such
data for phenobarbital, therefore these data were adopted from (Jones and Clarke, 1993). The data
represent group mean value, and the value in parentheses represents proportion to control.
ANNEX 1 – BACKGROUND DOCUMENT TO THE RAC OPINION ON FENPYRAZAMINE
115
that the tumours caused by such a compound are not relevant to the risk assessment of the
compound in humans (Cohen, 201034; Cohen et al., 2004; Dellarco et al., 2006; Meek et
al., 2003; Yamada et al., 2009). Such a conclusion would be critically dependent on the
reliability of the epidemiological data and the similarity between the MOA for the chemical
under test to that of the compound for which there are epidemiological data available.
4.10.4 Summary and discussion of carcinogenicity
In the combined chronic and carcinogenicity study (2 years) in rat, the NOAEL is set at 300
ppm (15.6 mg/kg bw/d) in females, based on shortened prothrombin time and decreased
MCV and MCH and 12.7 mg/kg bw/d in males, based on statistically significantly increased
hepatocellular hypertrophy accompanied by increased relative liver weight at 1200 ppm at
week 52 in satellite group and hepatocellular hypertrophy (but without change in relative
liver weight) in main group males at week 104, as well as on increase in albumin and
gamma-glutamyl-transferase).
Regarding carcinogenic potential of fenpyrazamine, no increase of neoplastic findings was
observed in any organ of treated animals, with exception of liver and thyroid. The incidence
of hepatocellular carcinoma of 4% in males at 2400 ppm was above historical control data
(0.0% to 2.8%) from comparable feeding studies. The higher incidence of thyroid follicular
carcinoma in males of 2400 ppm group (6.1%) was higher than the historical control data
(max. 4% in males) from comparable feeding studies. At the dose causing higher incidence
of liver and thyroid tumours (2400 ppm) no excessive toxicity was observed. The animals
with tumours survived until scheduled sacrifice. A clear threshold dose (1200 ppm) could be
estimated where no increased incidence of liver and thyroid carcinoma was seen.
By default, carcinogenic effects in experimental animals are considered relevant to humans
and are considered for classification as carcinogens (Guidance on the Application of CLP
Criteria, Guidance to Regulation (EC) No 1272/2008 on classification, labeling and packaging
(CLP) of substances and mixtures, 2009). Only if there is sufficient evidence showing non-
relevance of a certain type of tumors to humans, this tumor type should be excluded for
classification. Fenpyrazamine is not genotoxic. In the provided carcinogenicity study,
malignant tumors were observed in male rats in multiple sites (liver and thyroid), which
incidence was above historical control data of well comparable studies. No exceeding of MTD
(maximum tolerated dose) was observed in males (body weight loss was 10.1% compared
to control, but no signs of severe toxicity including reduced survival rate was seen). Both
affected tissues, liver and thyroid, have their equivalent in humans. Two mechanistic studies
provided (one in vivo and one in vitro, see “other relevant information”, 4.10.3) could show
that fenpyrazamine has a comparable MOA to phenobarbital (perturbation of homeostasis of
pituitary-thyroid-axis by extrathyroidal mechanism). Phenobarbital MOA is considered to be
not relevant for humans35. No liver and thyroid tumors were observed above historical
control data in mouse carcinogenicity study or in female rats (male rats are frequently found
to be more sensitive with respect to induction of thyroid tumors than female rats and mice)
showing that even if fenpyrazamine may have a MOA comparable to phenobarbital, it is of
much lower potency (shown also by low incidences of liver and thyroid tumors in male rats).
Combining all these criteria for classification of a substance as a carcinogen, according to
Dangerous Substance Directive (67/548/EC) and Regulation 1272/2008, no classification and
labeling is proposed for fenpyrazamine.
34 Cohen, S. M. (2010). Evaluation of possible carcinogenic risk to humans based on liver tumours in rodent assays: The two-year bioassay is no
longer necessary. Toxicol. Pathol. 38, 487-501
35 IPCS, 2007: Part 1: IPCS Framework for analysing the relevance of a cancer mode of action for humans and case studies
ANNEX 1 – BACKGROUND DOCUMENT TO THE RAC OPINION ON FENPYRAZAMINE
116
In the carcinogenicity study in CD-1 mouse (78 weeks), the NOAEL for males is set at 1500
ppm (176 mg/kg bw/d), based on statistically significantly higher relative liver weight in
satellite and main group animals accompanied by higher incidence of hepatocellular
hypertrophy observed in main group animals, and supported by statistically significantly
increased MCV and MCH and decreased RBC at 3000 ppm. In females, NOAEL is set at 2000
ppm (283 mg/kg bw/d), based on statistically significantly higher relative liver weight in
satellite and main group animals accompanied by statistically significantly increased
hepatocellular hypertrophy observed in main group animals, and supported by statistically
significantly decreased RBC, HB and HCT at 4000 ppm. In the mouse carcinogenicity study,
no carcinogenic potential of fenpyrazamine could be observed.
4.10.5 Comparison with criteria
By default, carcinogenic effects in experimental animals are considered relevant to humans
and are considered for classification as carcinogens (Guidance on the Application of CLP
Criteria, Guidance to Regulation (EC) No 1272/2008 on classification, labeling and packaging
(CLP) of substances and mixtures, 2009). Only if there is sufficient evidence showing non-
relevance of a certain type of tumors to humans, this tumor type should be excluded for
classification. Fenpyrazamine is not genotoxic. In the provided carcinogenicity study,
malignant tumors were observed in male rats in multiple sites (liver and thyroid), which
incidence was above historical control data of well comparable studies. No exceeding of MTD
(maximum tolerated dose) was observed in males (body weight loss was 10.1% compared
to control, but no signs of severe toxicity including reduced survival rate was seen). Both
affected tissues, liver and thyroid, have their equivalent in humans. Two mechanistic studies
provided (one in vivo and one in vitro, see “other relevant information”, 4.10.3) could show
that fenpyrazamine has a comparable MOA to phenobarbital (perturbation of homeostasis of
pituitary-thyroid-axis by extrathyroidal mechanism). Phenobarbital MOA is considered to be
not relevant for humans. No liver and thyroid tumours were observed above historical
control data in mouse carcinogenicity study or in female rats (male rats are frequently found
to be more sensitive with respect to induction of thyroid tumors than female rats and mice)
showing that even if fenpyrazamine may have a MOA comparable to phenobarbital, it is of
much lower potency (shown also by low incidences of liver and thyroid tumors in male rats).
Combining all these criteria for classification of a substance as a carcinogen, according to
Dangerous Substance Directive (67/548/EC) and Regulation (EC) 1272/2008, no
classification and labelling is proposed for fenpyrazamine.
4.10.6 Conclusions on classification and labelling
No classification and labelling is proposed for fenpyrazamine regarding carcinogenicity.
RAC evaluation of carcinogenicity
Summary of the Dossier submitter’s proposal The dossier submitter did not propose a classification. The evaluation is based on the results
of the oral carcinogenicity studies in rodents (CD-1 mice and Wistar rats) and on Mode of
Action (MoA) considerations.
Carcinogenic effects in the liver and the thyroid gland were observed in male rats, but not in
female rats or female and male mice.
There was a small increase of carcinomas in male rats in follicular tissue of the thyroid
gland. This increase was only observed at the highest dose level tested (3/49 versus a
highest incidence of 1/50 at lower dose levels). The incidence observed was above the
relevant historical control data (ranging from 0 to 4%). The dossier submitter concluded
ANNEX 1 – BACKGROUND DOCUMENT TO THE RAC OPINION ON FENPYRAZAMINE
117
that the experimental data indicated that fenpyrazamine increased catabolism of thyroid
hormones driven by increased hepatic UGT activity leading to increased TSH levels,
hypertrophy and thyroid gland tumours. Referring to an agreed EU position (ECB, 1999),
that was also cited in the ECHA CLP guidance p 400, version 3.0 on the (limited) human
relevance of this MoA in combination with a low experimental carcinogenic potency, the
dossier submitter evaluated the observed thyroid gland tumours as not relevant for
classification.
The liver proved to be a second target organ for carcinogenicity in male rats. There was a
small increase of liver carcinomas at the highest dose level tested (2/50 versus 0/50 at the
lower dose levels). There was no increase in the incidence of adenomas (1/50 in controls
and at all dose levels). The corresponding historical control incidences for liver carcinomas
range between 0 and 2.8%. Based on fenpyrazamine MoA data the dossier submitter
recognised evidence of a phenobarbital-like mode of action (activation of the nuclear
receptor CAR) and indicated that the experimental carcinogenic potency of fenpyrazamine
appeared to be lower than the corresponding potency of phenobarbital. Significantly, the
dossier submitter did not consider this CAR-mediated MoA to be relevant for humans
andased on this weight-of-evidence approach proposed not to classify fenpyrazamine for
liver carcinogenicity.
Comments received during public consultation Comments received during public consultation supported the dossier submitter’s proposal
not to classify fenpyrazamine based on the increased incidence of thyroid gland tumours in
male rats. There was no comment indicating the need for classifying fenpyrazamine for
carcinogenicity based on the thyroid gland tumours.
Although there was no comment received during public consultation directly requiring a
carcinogenicity classification for liver tumours there were nevertheless recommendations to
have a more in depth discussion on the relevance of the liver tumours observed. These
comments and questions can be summarised as follows:
Can the liver tumours (2/50) be considered a chance finding?
Is the carcinogenic profile of fenpyrazamine similar to the corresponding profile of
phenobarbital?
Is there sufficient information to conclude that a phenobarbital-like mode of action is
not relevant for humans and thus to conclude that a carcinogenicity classification for
this type of tumour development is not warranted?
What might be the role of the pregnane X receptor?
Assessment and comparison with the classification criteria RAC considered the key data and arguments that are relevant to the proposal not to classify
fenpyrazamine for carcinogenicity.
It is one of the central classification criteria (in both the CLP and DSD regulation) that the
relevance of substance-related tumours observed in animal studies to humans should be
considered. If there is sufficiently reliable information that a specific MoA for tumour
development in rodents does not sufficiently affect humans, then a corresponding
classification is not warranted. Human relevance is therefore discussed below both for the
thyroid gland and liver tumours observed in male rats.
Thyroid gland tumours
RAC supports the dossier submitter’s proposal that there is no justification to classify
fenpyrazamine for carcinogenicity based on the thyroid gland tumours. There was only a
small increase in thyroid tumours in male rats, not in female rats or mice. The thyroid gland
related carcinogenicity in male rats is considered of low potency. Fenpyrazamine MoA data
sufficiently indicate that there is a substance-related enhancement of thyroid hormone
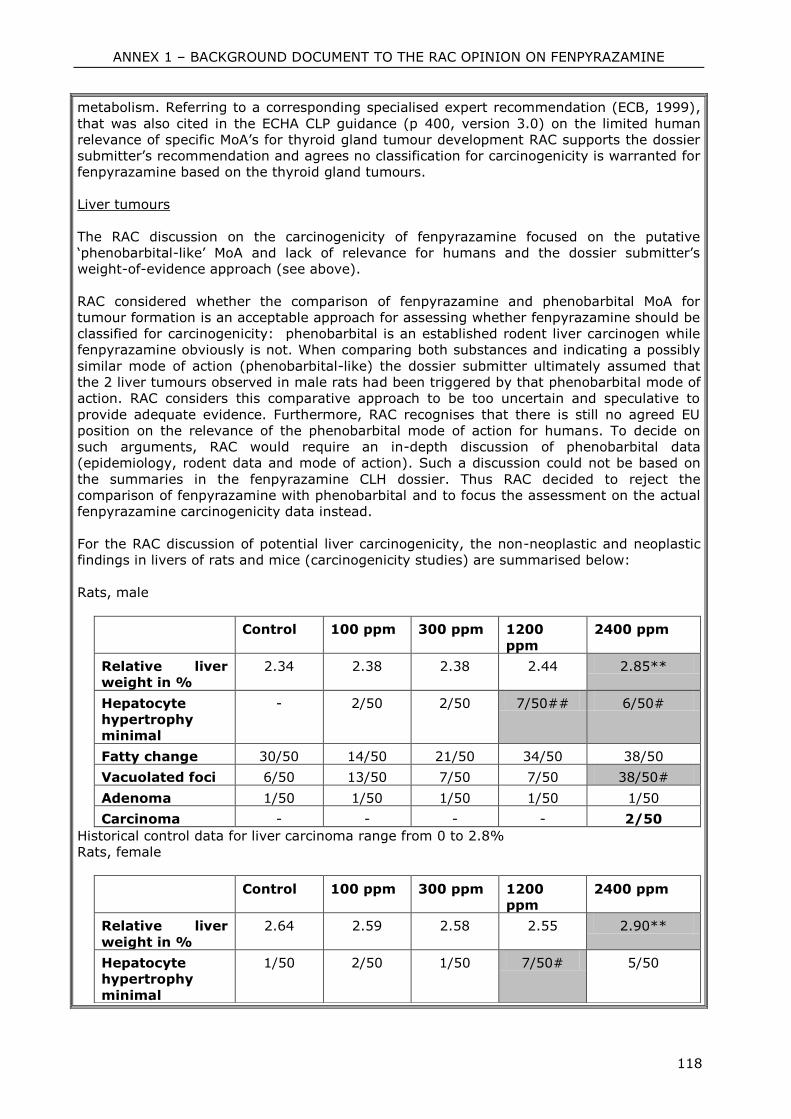
ANNEX 1 – BACKGROUND DOCUMENT TO THE RAC OPINION ON FENPYRAZAMINE
118
metabolism. Referring to a corresponding specialised expert recommendation (ECB, 1999),
that was also cited in the ECHA CLP guidance (p 400, version 3.0) on the limited human
relevance of specific MoA’s for thyroid gland tumour development RAC supports the dossier
submitter’s recommendation and agrees no classification for carcinogenicity is warranted for
fenpyrazamine based on the thyroid gland tumours.
Liver tumours
The RAC discussion on the carcinogenicity of fenpyrazamine focused on the putative
‘phenobarbital-like’ MoA and lack of relevance for humans and the dossier submitter’s
weight-of-evidence approach (see above).
RAC considered whether the comparison of fenpyrazamine and phenobarbital MoA for
tumour formation is an acceptable approach for assessing whether fenpyrazamine should be
classified for carcinogenicity: phenobarbital is an established rodent liver carcinogen while
fenpyrazamine obviously is not. When comparing both substances and indicating a possibly
similar mode of action (phenobarbital-like) the dossier submitter ultimately assumed that
the 2 liver tumours observed in male rats had been triggered by that phenobarbital mode of
action. RAC considers this comparative approach to be too uncertain and speculative to
provide adequate evidence. Furthermore, RAC recognises that there is still no agreed EU
position on the relevance of the phenobarbital mode of action for humans. To decide on
such arguments, RAC would require an in-depth discussion of phenobarbital data
(epidemiology, rodent data and mode of action). Such a discussion could not be based on
the summaries in the fenpyrazamine CLH dossier. Thus RAC decided to reject the
comparison of fenpyrazamine with phenobarbital and to focus the assessment on the actual
fenpyrazamine carcinogenicity data instead.
For the RAC discussion of potential liver carcinogenicity, the non-neoplastic and neoplastic
findings in livers of rats and mice (carcinogenicity studies) are summarised below:
Rats, male
Control 100 ppm 300 ppm 1200
ppm
2400 ppm
Relative liver
weight in %
2.34 2.38 2.38 2.44 2.85**
Hepatocyte
hypertrophy
minimal
- 2/50 2/50 7/50## 6/50#
Fatty change 30/50 14/50 21/50 34/50 38/50
Vacuolated foci 6/50 13/50 7/50 7/50 38/50#
Adenoma 1/50 1/50 1/50 1/50 1/50
Carcinoma - - - - 2/50
Historical control data for liver carcinoma range from 0 to 2.8%
Rats, female
Control 100 ppm 300 ppm 1200
ppm
2400 ppm
Relative liver
weight in %
2.64 2.59 2.58 2.55 2.90**
Hepatocyte
hypertrophy
minimal
1/50 2/50 1/50 7/50# 5/50
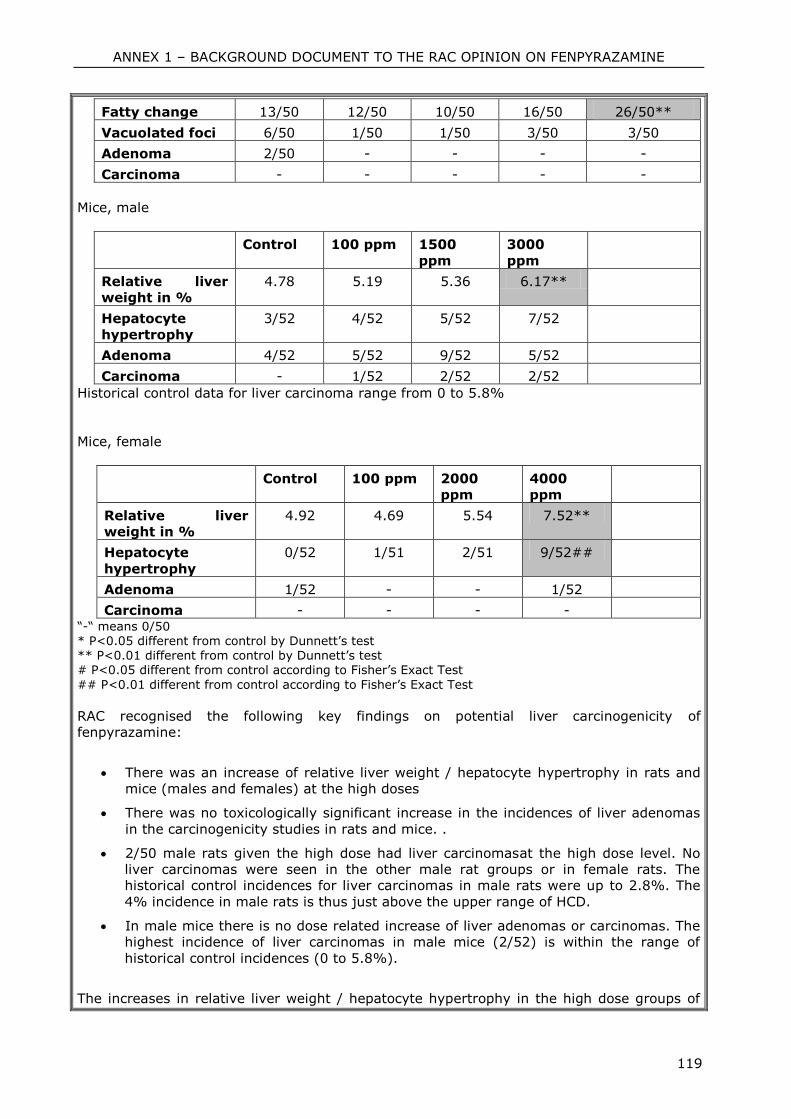
ANNEX 1 – BACKGROUND DOCUMENT TO THE RAC OPINION ON FENPYRAZAMINE
119
Fatty change 13/50 12/50 10/50 16/50 26/50**
Vacuolated foci 6/50 1/50 1/50 3/50 3/50
Adenoma 2/50 - - - -
Carcinoma - - - - -
Mice, male
Control 100 ppm 1500
ppm
3000
ppm
Relative liver
weight in %
4.78 5.19 5.36 6.17**
Hepatocyte
hypertrophy
3/52 4/52 5/52 7/52
Adenoma 4/52 5/52 9/52 5/52
Carcinoma - 1/52 2/52 2/52
Historical control data for liver carcinoma range from 0 to 5.8%
Mice, female
Control 100 ppm 2000
ppm
4000
ppm
Relative liver
weight in %
4.92 4.69 5.54 7.52**
Hepatocyte
hypertrophy
0/52 1/51 2/51 9/52##
Adenoma 1/52 - - 1/52
Carcinoma - - - - “-“ means 0/50 * P<0.05 different from control by Dunnett’s test ** P<0.01 different from control by Dunnett’s test # P<0.05 different from control according to Fisher’s Exact Test
## P<0.01 different from control according to Fisher’s Exact Test
RAC recognised the following key findings on potential liver carcinogenicity of
fenpyrazamine:
There was an increase of relative liver weight / hepatocyte hypertrophy in rats and
mice (males and females) at the high doses
There was no toxicologically significant increase in the incidences of liver adenomas
in the carcinogenicity studies in rats and mice. .
2/50 male rats given the high dose had liver carcinomasat the high dose level. No
liver carcinomas were seen in the other male rat groups or in female rats. The
historical control incidences for liver carcinomas in male rats were up to 2.8%. The
4% incidence in male rats is thus just above the upper range of HCD.
In male mice there is no dose related increase of liver adenomas or carcinomas. The
highest incidence of liver carcinomas in male mice (2/52) is within the range of
historical control incidences (0 to 5.8%).
The increases in relative liver weight / hepatocyte hypertrophy in the high dose groups of
ANNEX 1 – BACKGROUND DOCUMENT TO THE RAC OPINION ON FENPYRAZAMINE
120
female rats and male and female mice were not associated with an increased incidence of
liver adenomas and carcinomas. Taking this into account , the slightly elevated incidence of
liver carcinomas in male rats could be considered a chance finding.
Overall conclusion for carcinogenicity
RAC concluded that the slightly increased incidence of thyroid tumours in male rats should
be considered species-specific and not relevant for humans. The small increase of liver
carcinomas in male rats is assessed to be a chance finding. Additionally recognising that
fenpyrazamine can be considered a non-genotoxic substance RAC finally concluded that the
available data did not warrant a carcinogenicity classification for fenpyrazamine.
Supplemental information - In depth analyses by RAC None

ANNEX 1 – BACKGROUND DOCUMENT TO THE RAC OPINION ON FENPYRAZAMINE
121
4.11 Toxicity for reproduction
Table 50: Summary table of relevant reproductive toxicity studies
Method NOAEL Remarks Reference
Preliminary 1-generation
reproduction toxicity study
(rat) (no appropriate
guideline, pilot study)
Reproduction:
244.7 mg/kg bw/d
(males) and 253.7 mg/kg
bw/d (females)
Parental: 24.8 mg/kg
bw/d (males) and 75.0
mg/kg bw/d (females)
Offspring: 75.0 mg/kg
bw/d
(females)
Wistar,
HanRcc:WIST(S
PF) rats
Purity: 94.7%
Pössnecker,
A., Flade, D,
2008
Two-generation rat (OECD
416)
Reproduction: 73.7
mg/kg bw/d
Parental: 20.3 mg/kg
bw/d
(males) and 31.6 mg/kg
bw/d (females)
Offspring: 28.5 mg/kg
bw/d
Wistar,
HanRcc:WIST(SPF) rats
Purity: 94.7%
Gerspach, R.,
Weber, K., Flade, D, 2009
Developmental range
finding study (rat) (OECD
414)
Foetal: no NOAEL established
Maternal: 300 mg/kg bw/d
No teratogenic potential
Wistar,
HanRcc:WIST(S
PF)
Purity: 94.7%
Pössnecker, A, 2006
Developmental toxicity
study (rat) (OECD 414)
Foetal: 125 mg/kg bw/d
Maternal: 30 mg/kg bw/d
No teratogenic potential
Wistar,
HanRcc:WIST(SPF)
Purity: 94.7%
Gerspach, R.,
and Flade, D, 2009
Developmental range
finding study (rabbit)
(guideline not stated, range
finding study)
Foetal: 60 mg/kg bw/d
Maternal: 60 mg/kg bw/d
No teratogenic potential
New Zealand
White (Kbl:NZW SPF) Rabbit
Purity: 94.7%
Inakawa, K,
2008a
Developmental toxicity
study (rabbit) (OECD 414) Foetal: 30 mg/kg bw/d
Maternal: 30 mg/kg bw/d
No teratogenic potential
New Zealand
White (Kbl:NZW
SPF) Rabbit
Purity: 94.7%
Inakawa, K, 2008b
4.11.1 Effects on fertility
4.11.1.1 Non-human information
Reference: Preliminary reproduction toxicity study in the Han Wistar rat
ANNEX 1 – BACKGROUND DOCUMENT TO THE RAC OPINION ON FENPYRAZAMINE
122
Author(s), year: Pössnecker, A., Flade, D.; 2008
Report/Doc.
number:
Sumitomo Chemical Co. Ltd. Report No. QNT-0020
Guideline(s): No appropriate guideline; pilot study
GLP: Yes (laboratory certified by National Authority)
Deviations: Organ/body weight ratios calculated based on unverified body weight
data; not considered relevant, since preliminary study only
Validity: Yes; supporting study
Material and methods:
Test Material: S-2188
Lot/Batch: 030-050914-1G
Purity: 94.7%
Test animals:
Species: Rat
Strain: Wistar, HanRcc:WIST(SPF)
Age: Minimum 8 weeks at delivery
Weight at start: Males 260 – 294g, females 162 – 194 g
Source: RCC Ltd, Laboratory Animal Services, Füllinsdorf,
Switzerland
Diet: Pelleted standard Kliba-Nafag 3433 maintenance diet; ad
libitum
The purpose of the preliminary reproduction study was to determine suitable dose levels of
the test substance for a subsequent main two-generation reproduction study. The dosing
was based on a preliminary 2-week feeding study in rats, where animals of both sexes at the
dose level of 3000 ppm revealed decreased body weight gain and effects on liver and
thyroid.
Animal assignment and treatment
Groups of 5 male and 5 female young adult rats were offered fenpyrazamine in diet at
dietary concentrations of 0 (control), 400, 1000 or 3000 ppm for 14 days pre-pairing period,
and then continuously throughout pairing, gestation, and lactation. A pairing period of 14
days was allowed. The first day on which evidence of mating was seen was designated day 0
post-coitum. Females were returned to individual cages once evidence of mating was seen,
and allowed to complete gestation and lactation. They were sacrificed at 21 days post-
partum, at weaning of the pups. Adult males were sacrificed 43 days after pairing.
Diet preparation and analysis:
Fresh batches of the feed pellets for this study were prepared at least each 2 weeks with a
constant concentration (ppm) throughout the feeding duration. The test item was mixed with
granulated feed in a pelleting machine. Water was added to each feed preparation at a
volume/weight ratio of approximately 1:10 to ensure pelleting. The pellets were dried with
air for approximately 48 hours before storage. Feed for the control group was prepared
similarly without the test item.
Accuracy of diet preparation was confirmed by analysis (GC). Stability of the test item in
pelleted rodent feed was investigated over 21 days and found to be stable. Concentration
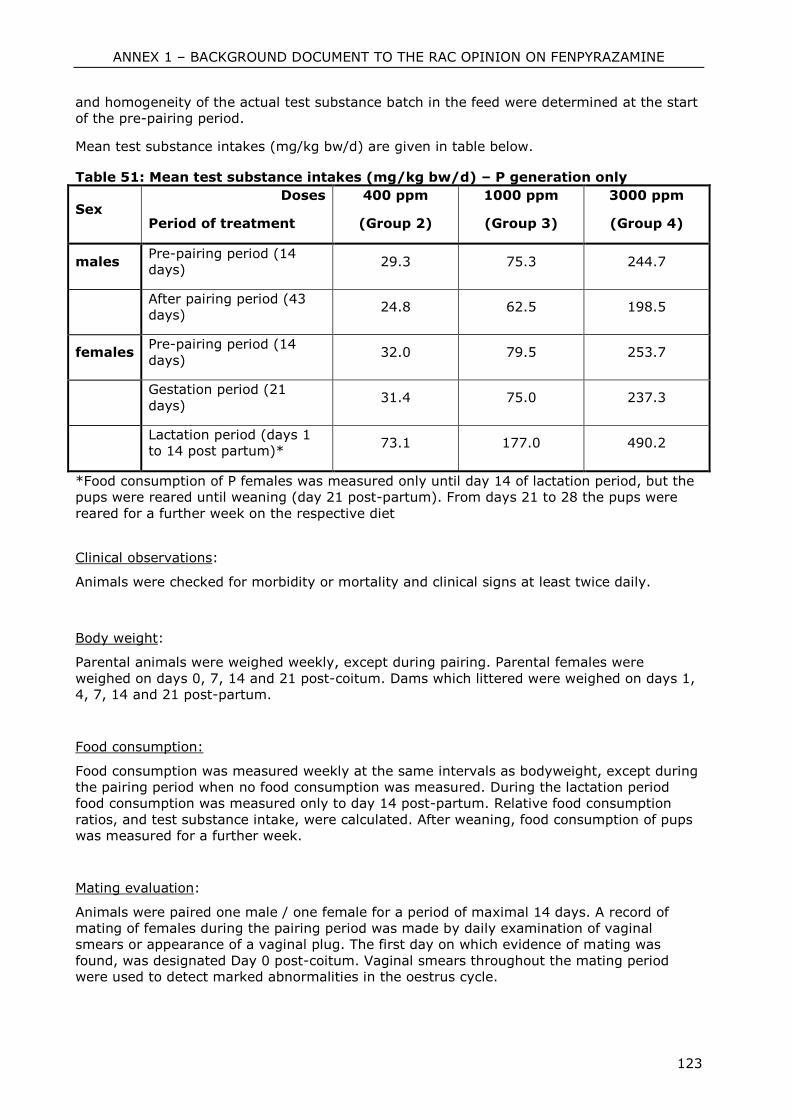
ANNEX 1 – BACKGROUND DOCUMENT TO THE RAC OPINION ON FENPYRAZAMINE
123
and homogeneity of the actual test substance batch in the feed were determined at the start
of the pre-pairing period.
Mean test substance intakes (mg/kg bw/d) are given in table below.
Table 51: Mean test substance intakes (mg/kg bw/d) – P generation only
Sex Doses
Period of treatment
400 ppm
(Group 2)
1000 ppm
(Group 3)
3000 ppm
(Group 4)
males Pre-pairing period (14
days) 29.3 75.3 244.7
After pairing period (43
days) 24.8 62.5 198.5
females Pre-pairing period (14
days) 32.0 79.5 253.7
Gestation period (21
days) 31.4 75.0 237.3
Lactation period (days 1
to 14 post partum)* 73.1 177.0 490.2
*Food consumption of P females was measured only until day 14 of lactation period, but the
pups were reared until weaning (day 21 post-partum). From days 21 to 28 the pups were
reared for a further week on the respective diet
Clinical observations:
Animals were checked for morbidity or mortality and clinical signs at least twice daily.
Body weight:
Parental animals were weighed weekly, except during pairing. Parental females were
weighed on days 0, 7, 14 and 21 post-coitum. Dams which littered were weighed on days 1,
4, 7, 14 and 21 post-partum.
Food consumption:
Food consumption was measured weekly at the same intervals as bodyweight, except during
the pairing period when no food consumption was measured. During the lactation period
food consumption was measured only to day 14 post-partum. Relative food consumption
ratios, and test substance intake, were calculated. After weaning, food consumption of pups
was measured for a further week.
Mating evaluation:
Animals were paired one male / one female for a period of maximal 14 days. A record of
mating of females during the pairing period was made by daily examination of vaginal
smears or appearance of a vaginal plug. The first day on which evidence of mating was
found, was designated Day 0 post-coitum. Vaginal smears throughout the mating period
were used to detect marked abnormalities in the oestrus cycle.
ANNEX 1 – BACKGROUND DOCUMENT TO THE RAC OPINION ON FENPYRAZAMINE
124
Gestation and parturition:
Approaching the end of the gestational period dams were examined twice daily for signs of
parturition, and the duration of gestation was recorded.
Offsprings:
The day of birth was designated Day 0 post-partum. Litters were examined as soon as
possible for litter size, live births, stillbirths and any gross abnormalities. Pups were weighed
on days 0 and/or 1, 4, 7, 14, 21 and 28 post-partum and the sex ratio of live pups was
determined at first litter check and on day 21. All dams and pups were observed daily for
survival, and behavioural abnormalities in nesting and nursing. Dead pups were necropsied.
At 4 days post-partum, litters were standardised to 8 pups and surplus pups were necropsied
and then discarded. Following weaning (day 21 post-partum), pups were maintained on
treated diets for one further week to day 28 post-partum and then sacrificed and necropsied.
Gross Necropsy
All P (parent generation) animals were subject to macroscopic post-mortem examination.
Examination of parental animals gave special attention to reproductive organs. In dams, the
number of implantation sites was counted after staining the uterus in ammonium sulphide.
Histopathology
Tissue harvesting: From parental animals, liver, thyroid, and any tissue with gross lesions
were fixed in buffered formaldehyde for possible future histological examination.
Organ weights: From pups killed at 28 days post-partum, the following weights were
recorded from at least one male and one female per litter: bodyweight, brain, spleen,
thymus, and uterus.
Findings:
Parental animals:
All animals survived until scheduled necropsy. No clinical signs or signs of discomfort were
noted in parent animals. During the pre-pairing period the mean body weight of males and
females was similar to control. During the gestation and lactation of females, males in all
treated groups showed a body weight gain loss (-9.1%, -14.8% and -15.9% comparing to
control). Parental female weight gain during gestation showed no consistent pattern. Only in
the high dose females, body weight gain was -15.8% comparing to control animals. Mean
body weight of females in the high dose at the end of gestation was -8.5% lower than in
controls.
Enlarged thyroids were measured in 4 females of high dose group and in 2, 3 and 2 males of
low, mid- and high dose group. No macroscopic changes were observed in any parent animal
of low dose.
Reproduction:
There was no effect on time-to-mating, on numbers of females becoming pregnant, or length
of gestation. There was no effect on number of implantation sites. Post-implantation loss
was higher (but not statistically significant) in high dose animals than in controls (12.2%
comparing to 3.8%). The number of live pups at birth was lower in high dose animals than in
control (10.6 comparing to 13.5 in control), but the difference was not statistically
significant.
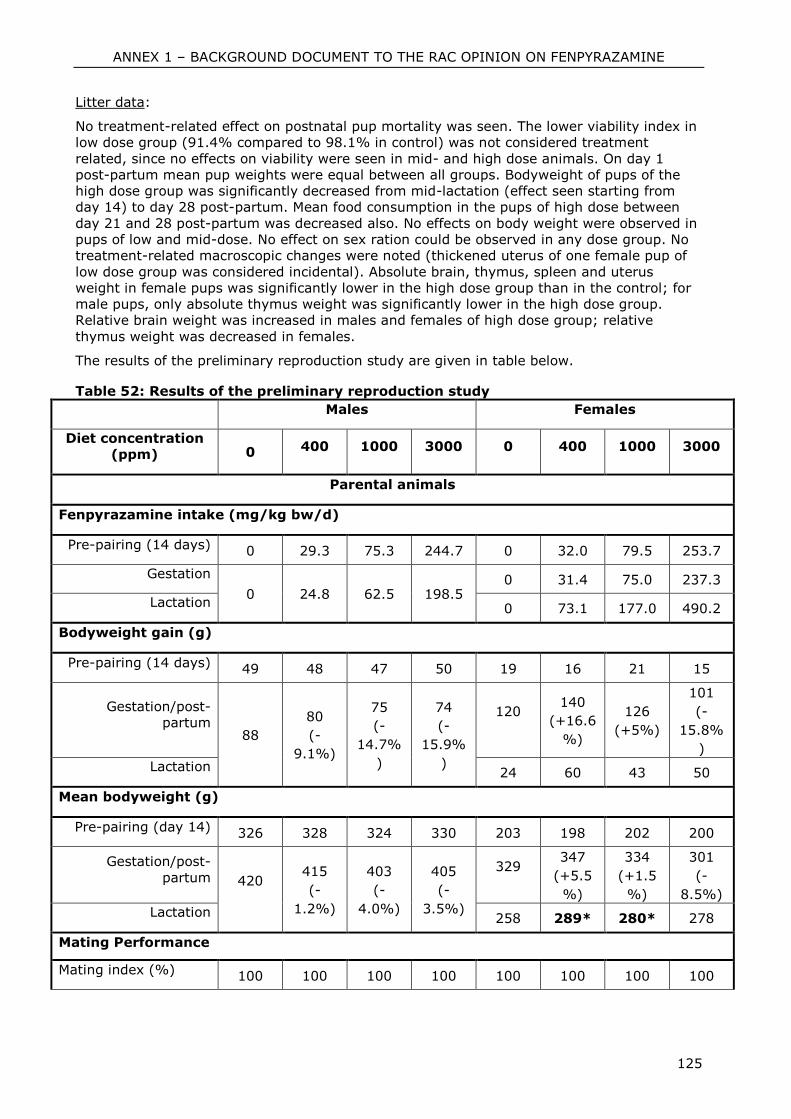
ANNEX 1 – BACKGROUND DOCUMENT TO THE RAC OPINION ON FENPYRAZAMINE
125
Litter data:
No treatment-related effect on postnatal pup mortality was seen. The lower viability index in
low dose group (91.4% compared to 98.1% in control) was not considered treatment
related, since no effects on viability were seen in mid- and high dose animals. On day 1
post-partum mean pup weights were equal between all groups. Bodyweight of pups of the
high dose group was significantly decreased from mid-lactation (effect seen starting from
day 14) to day 28 post-partum. Mean food consumption in the pups of high dose between
day 21 and 28 post-partum was decreased also. No effects on body weight were observed in
pups of low and mid-dose. No effect on sex ration could be observed in any dose group. No
treatment-related macroscopic changes were noted (thickened uterus of one female pup of
low dose group was considered incidental). Absolute brain, thymus, spleen and uterus
weight in female pups was significantly lower in the high dose group than in the control; for
male pups, only absolute thymus weight was significantly lower in the high dose group.
Relative brain weight was increased in males and females of high dose group; relative
thymus weight was decreased in females.
The results of the preliminary reproduction study are given in table below.
Table 52: Results of the preliminary reproduction study
Males Females
Diet concentration
(ppm) 0 400 1000 3000 0 400 1000 3000
Parental animals
Fenpyrazamine intake (mg/kg bw/d)
Pre-pairing (14 days) 0 29.3 75.3 244.7 0 32.0 79.5 253.7
Gestation
0 24.8 62.5 198.5 0 31.4 75.0 237.3
Lactation 0 73.1 177.0 490.2
Bodyweight gain (g)
Pre-pairing (14 days) 49 48 47 50 19 16 21 15
Gestation/post-
partum 88
80
(-
9.1%)
75
(-
14.7%
)
74
(-
15.9%
)
120
140
(+16.6
%)
126
(+5%)
101
(-
15.8%
)
Lactation 24 60 43 50
Mean bodyweight (g)
Pre-pairing (day 14) 326 328 324 330 203 198 202 200
Gestation/post-
partum 420
415
(-
1.2%)
403
(-
4.0%)
405
(-
3.5%)
329
347
(+5.5
%)
334
(+1.5
%)
301
(-
8.5%)
Lactation 258 289* 280* 278
Mating Performance
Mating index (%) 100 100 100 100 100 100 100 100
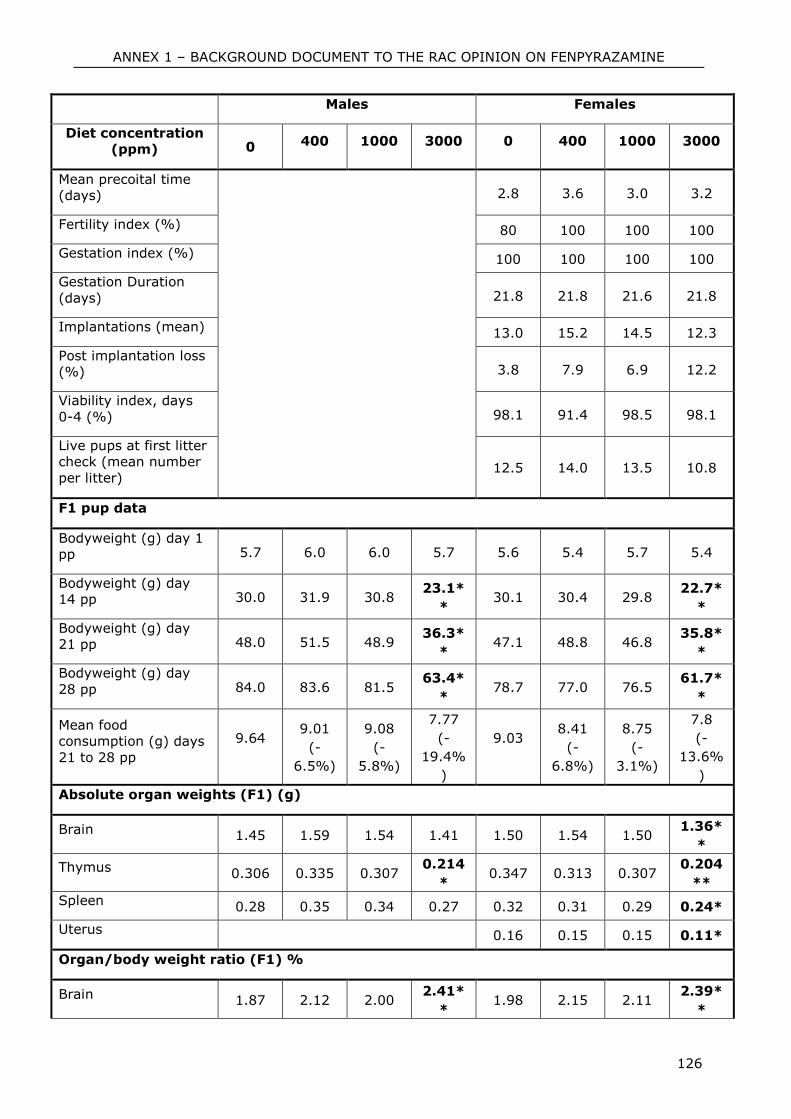
ANNEX 1 – BACKGROUND DOCUMENT TO THE RAC OPINION ON FENPYRAZAMINE
126
Males Females
Diet concentration
(ppm) 0 400 1000 3000 0 400 1000 3000
Mean precoital time
(days)
2.8 3.6 3.0 3.2
Fertility index (%) 80 100 100 100
Gestation index (%) 100 100 100 100
Gestation Duration
(days) 21.8 21.8 21.6 21.8
Implantations (mean) 13.0 15.2 14.5 12.3
Post implantation loss
(%) 3.8 7.9 6.9 12.2
Viability index, days
0-4 (%) 98.1 91.4 98.5 98.1
Live pups at first litter
check (mean number
per litter) 12.5 14.0 13.5 10.8
F1 pup data
Bodyweight (g) day 1
pp 5.7 6.0 6.0 5.7 5.6 5.4 5.7 5.4
Bodyweight (g) day
14 pp 30.0 31.9 30.8 23.1*
* 30.1 30.4 29.8
22.7*
*
Bodyweight (g) day
21 pp 48.0 51.5 48.9 36.3*
* 47.1 48.8 46.8
35.8*
*
Bodyweight (g) day
28 pp 84.0 83.6 81.5 63.4*
* 78.7 77.0 76.5
61.7*
*
Mean food
consumption (g) days
21 to 28 pp
9.64
9.01
(-
6.5%)
9.08
(-
5.8%)
7.77
(-
19.4%
)
9.03
8.41
(-
6.8%)
8.75
(-
3.1%)
7.8
(-
13.6%
)
Absolute organ weights (F1) (g)
Brain 1.45 1.59 1.54 1.41 1.50 1.54 1.50 1.36*
*
Thymus 0.306 0.335 0.307 0.214
* 0.347 0.313 0.307
0.204
**
Spleen 0.28 0.35 0.34 0.27 0.32 0.31 0.29 0.24*
Uterus 0.16 0.15 0.15 0.11*
Organ/body weight ratio (F1) %
Brain 1.87 2.12 2.00 2.41*
* 1.98 2.15 2.11
2.39*
*
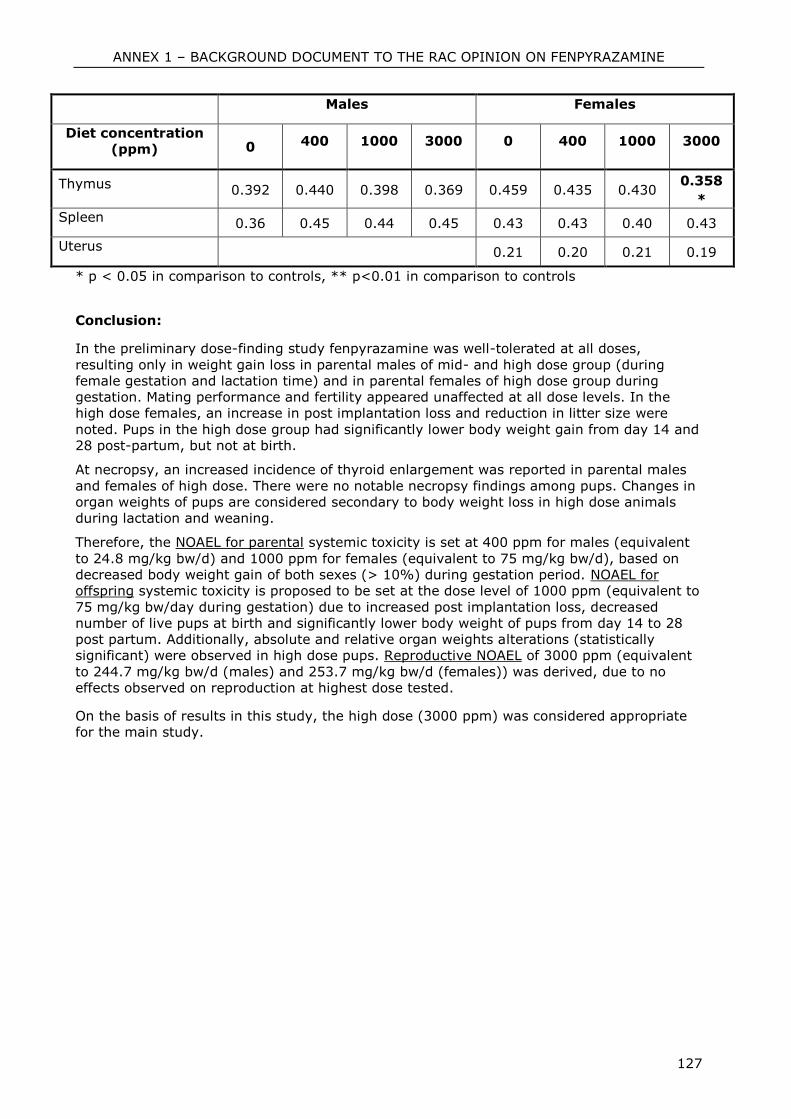
ANNEX 1 – BACKGROUND DOCUMENT TO THE RAC OPINION ON FENPYRAZAMINE
127
Males Females
Diet concentration
(ppm) 0 400 1000 3000 0 400 1000 3000
Thymus 0.392 0.440 0.398 0.369 0.459 0.435 0.430 0.358
*
Spleen 0.36 0.45 0.44 0.45 0.43 0.43 0.40 0.43
Uterus 0.21 0.20 0.21 0.19
* p < 0.05 in comparison to controls, ** p<0.01 in comparison to controls
Conclusion:
In the preliminary dose-finding study fenpyrazamine was well-tolerated at all doses,
resulting only in weight gain loss in parental males of mid- and high dose group (during
female gestation and lactation time) and in parental females of high dose group during
gestation. Mating performance and fertility appeared unaffected at all dose levels. In the
high dose females, an increase in post implantation loss and reduction in litter size were
noted. Pups in the high dose group had significantly lower body weight gain from day 14 and
28 post-partum, but not at birth.
At necropsy, an increased incidence of thyroid enlargement was reported in parental males
and females of high dose. There were no notable necropsy findings among pups. Changes in
organ weights of pups are considered secondary to body weight loss in high dose animals
during lactation and weaning.
Therefore, the NOAEL for parental systemic toxicity is set at 400 ppm for males (equivalent
to 24.8 mg/kg bw/d) and 1000 ppm for females (equivalent to 75 mg/kg bw/d), based on
decreased body weight gain of both sexes (> 10%) during gestation period. NOAEL for
offspring systemic toxicity is proposed to be set at the dose level of 1000 ppm (equivalent to
75 mg/kg bw/day during gestation) due to increased post implantation loss, decreased
number of live pups at birth and significantly lower body weight of pups from day 14 to 28
post partum. Additionally, absolute and relative organ weights alterations (statistically
significant) were observed in high dose pups. Reproductive NOAEL of 3000 ppm (equivalent
to 244.7 mg/kg bw/d (males) and 253.7 mg/kg bw/d (females)) was derived, due to no
effects observed on reproduction at highest dose tested.
On the basis of results in this study, the high dose (3000 ppm) was considered appropriate
for the main study.
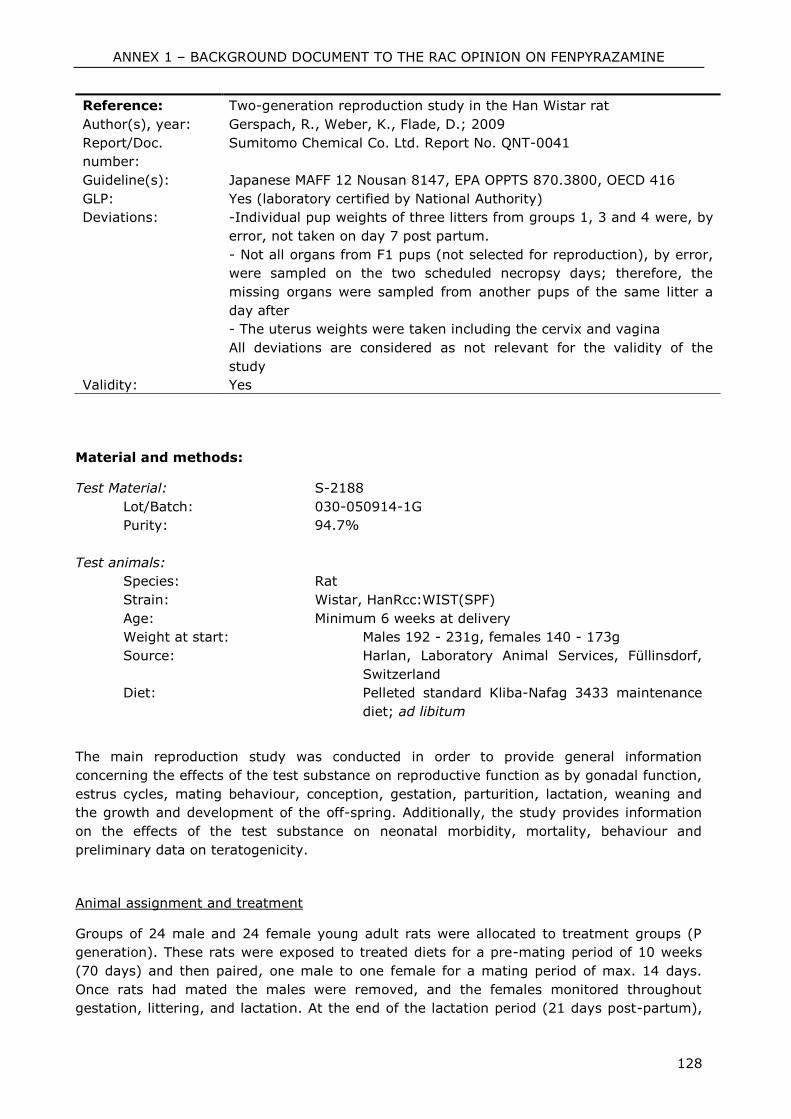
ANNEX 1 – BACKGROUND DOCUMENT TO THE RAC OPINION ON FENPYRAZAMINE
128
Reference: Two-generation reproduction study in the Han Wistar rat
Author(s), year: Gerspach, R., Weber, K., Flade, D.; 2009
Report/Doc.
number:
Sumitomo Chemical Co. Ltd. Report No. QNT-0041
Guideline(s): Japanese MAFF 12 Nousan 8147, EPA OPPTS 870.3800, OECD 416
GLP: Yes (laboratory certified by National Authority)
Deviations: -Individual pup weights of three litters from groups 1, 3 and 4 were, by
error, not taken on day 7 post partum.
- Not all organs from F1 pups (not selected for reproduction), by error,
were sampled on the two scheduled necropsy days; therefore, the
missing organs were sampled from another pups of the same litter a
day after
- The uterus weights were taken including the cervix and vagina
All deviations are considered as not relevant for the validity of the
study
Validity: Yes
Material and methods:
Test Material: S-2188
Lot/Batch: 030-050914-1G
Purity: 94.7%
Test animals:
Species: Rat
Strain: Wistar, HanRcc:WIST(SPF)
Age: Minimum 6 weeks at delivery
Weight at start: Males 192 - 231g, females 140 - 173g
Source: Harlan, Laboratory Animal Services, Füllinsdorf,
Switzerland
Diet: Pelleted standard Kliba-Nafag 3433 maintenance
diet; ad libitum
The main reproduction study was conducted in order to provide general information
concerning the effects of the test substance on reproductive function as by gonadal function,
estrus cycles, mating behaviour, conception, gestation, parturition, lactation, weaning and
the growth and development of the off-spring. Additionally, the study provides information
on the effects of the test substance on neonatal morbidity, mortality, behaviour and
preliminary data on teratogenicity.
Animal assignment and treatment
Groups of 24 male and 24 female young adult rats were allocated to treatment groups (P
generation). These rats were exposed to treated diets for a pre-mating period of 10 weeks
(70 days) and then paired, one male to one female for a mating period of max. 14 days.
Once rats had mated the males were removed, and the females monitored throughout
gestation, littering, and lactation. At the end of the lactation period (21 days post-partum),
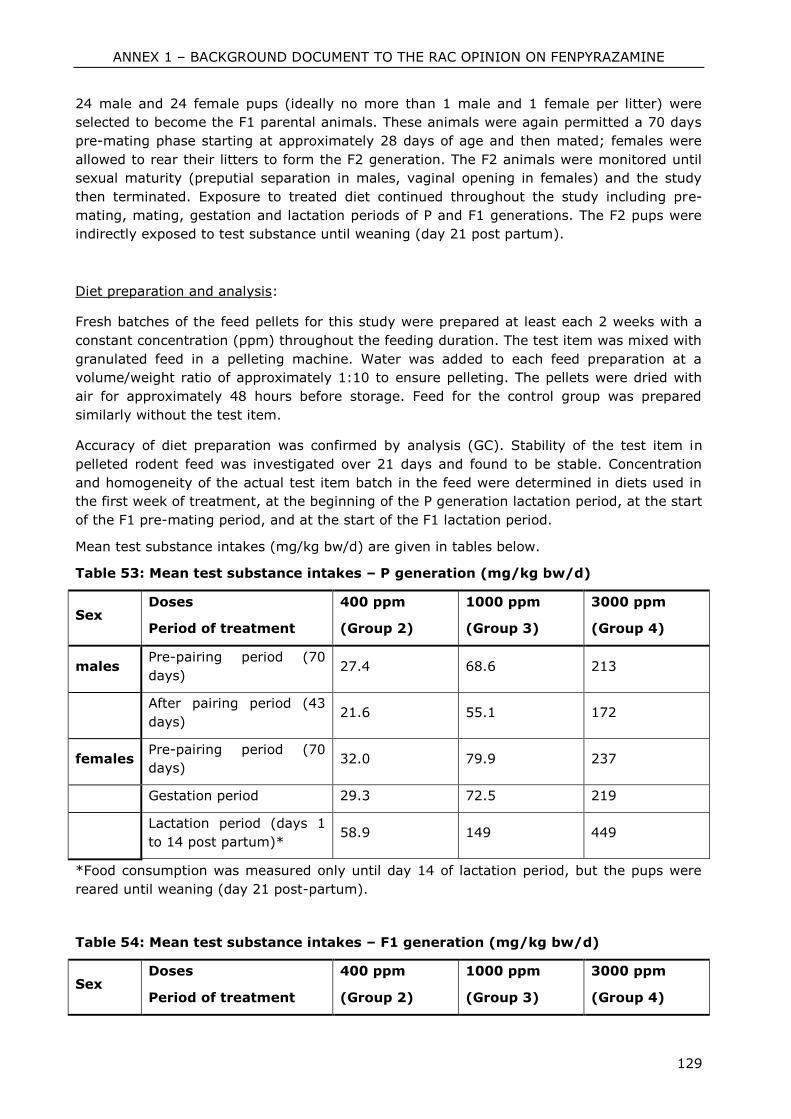
ANNEX 1 – BACKGROUND DOCUMENT TO THE RAC OPINION ON FENPYRAZAMINE
129
24 male and 24 female pups (ideally no more than 1 male and 1 female per litter) were
selected to become the F1 parental animals. These animals were again permitted a 70 days
pre-mating phase starting at approximately 28 days of age and then mated; females were
allowed to rear their litters to form the F2 generation. The F2 animals were monitored until
sexual maturity (preputial separation in males, vaginal opening in females) and the study
then terminated. Exposure to treated diet continued throughout the study including pre-
mating, mating, gestation and lactation periods of P and F1 generations. The F2 pups were
indirectly exposed to test substance until weaning (day 21 post partum).
Diet preparation and analysis:
Fresh batches of the feed pellets for this study were prepared at least each 2 weeks with a
constant concentration (ppm) throughout the feeding duration. The test item was mixed with
granulated feed in a pelleting machine. Water was added to each feed preparation at a
volume/weight ratio of approximately 1:10 to ensure pelleting. The pellets were dried with
air for approximately 48 hours before storage. Feed for the control group was prepared
similarly without the test item.
Accuracy of diet preparation was confirmed by analysis (GC). Stability of the test item in
pelleted rodent feed was investigated over 21 days and found to be stable. Concentration
and homogeneity of the actual test item batch in the feed were determined in diets used in
the first week of treatment, at the beginning of the P generation lactation period, at the start
of the F1 pre-mating period, and at the start of the F1 lactation period.
Mean test substance intakes (mg/kg bw/d) are given in tables below.
Table 53: Mean test substance intakes – P generation (mg/kg bw/d)
Sex Doses
Period of treatment
400 ppm
(Group 2)
1000 ppm
(Group 3)
3000 ppm
(Group 4)
males Pre-pairing period (70
days) 27.4 68.6 213
After pairing period (43
days) 21.6 55.1 172
females Pre-pairing period (70
days) 32.0 79.9 237
Gestation period 29.3 72.5 219
Lactation period (days 1
to 14 post partum)* 58.9 149 449
*Food consumption was measured only until day 14 of lactation period, but the pups were
reared until weaning (day 21 post-partum).
Table 54: Mean test substance intakes – F1 generation (mg/kg bw/d)
Sex Doses
Period of treatment
400 ppm
(Group 2)
1000 ppm
(Group 3)
3000 ppm
(Group 4)
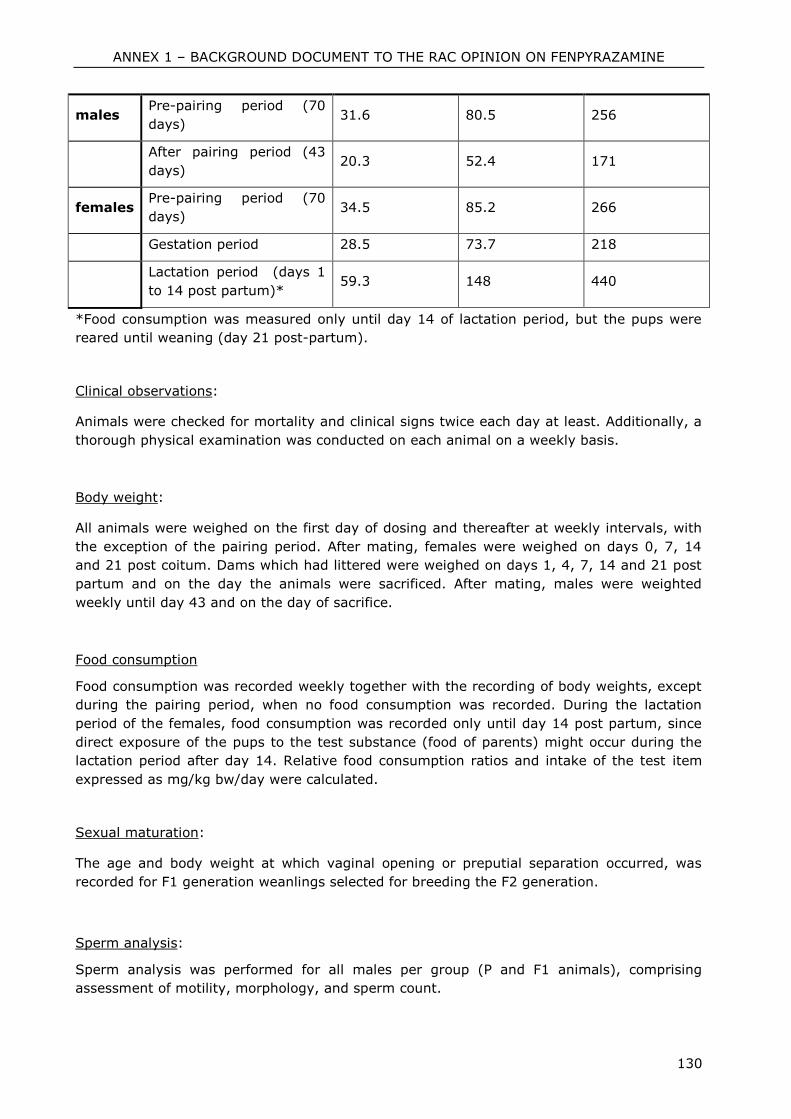
ANNEX 1 – BACKGROUND DOCUMENT TO THE RAC OPINION ON FENPYRAZAMINE
130
males Pre-pairing period (70
days) 31.6 80.5 256
After pairing period (43
days) 20.3 52.4 171
females Pre-pairing period (70
days) 34.5 85.2 266
Gestation period 28.5 73.7 218
Lactation period (days 1
to 14 post partum)* 59.3 148 440
*Food consumption was measured only until day 14 of lactation period, but the pups were
reared until weaning (day 21 post-partum).
Clinical observations:
Animals were checked for mortality and clinical signs twice each day at least. Additionally, a
thorough physical examination was conducted on each animal on a weekly basis.
Body weight:
All animals were weighed on the first day of dosing and thereafter at weekly intervals, with
the exception of the pairing period. After mating, females were weighed on days 0, 7, 14
and 21 post coitum. Dams which had littered were weighed on days 1, 4, 7, 14 and 21 post
partum and on the day the animals were sacrificed. After mating, males were weighted
weekly until day 43 and on the day of sacrifice.
Food consumption
Food consumption was recorded weekly together with the recording of body weights, except
during the pairing period, when no food consumption was recorded. During the lactation
period of the females, food consumption was recorded only until day 14 post partum, since
direct exposure of the pups to the test substance (food of parents) might occur during the
lactation period after day 14. Relative food consumption ratios and intake of the test item
expressed as mg/kg bw/day were calculated.
Sexual maturation:
The age and body weight at which vaginal opening or preputial separation occurred, was
recorded for F1 generation weanlings selected for breeding the F2 generation.
Sperm analysis:
Sperm analysis was performed for all males per group (P and F1 animals), comprising
assessment of motility, morphology, and sperm count.
ANNEX 1 – BACKGROUND DOCUMENT TO THE RAC OPINION ON FENPYRAZAMINE
131
Motility:
At necropsy of adult males an epididymal sperm sample was obtained from the left cauda
epididymidis of each male. The sample was diluted with a pre-warmed (about 35°C)
physiological medium, and rapidly after being obtained, one hundred sperm were counted
microscopically for determination of percentage of not motile, stationary motile and
progressively motile sperm.
Morphology:
A sperm sample from the left vas deferens was used for morphological assessment after
fixation and Eosin staining. 500 sperm per sample were evaluated microscopically and
classified into the following categories:
A Normal, complete sperm
B Normal head only (tail detached)
C Complete sperm, misshapen hook
D Complete sperm, abnormally curved hook
E Complete sperm, reversed head
F Abnormal head only (tail detached)
Morphological sperm evaluation was performed initially only for control and high dose males.
In the absence of a test item-related effect the slides for the group 2 and 3 males were not
evaluated for the P generation males. As considered necessary for further evaluation, F1
parent males groups 2 and 3 were evaluated.
Sperm and spermatid count:
The left caudal epididymis and left testis were taken for determination of homogenization-
resistant spermatids and caudal epididymal sperm reserve. These tissues were frozen at -20
± 5°C pending evaluation. For evaluation, the weighed tissues were placed in Triton-X-100
solution and homogenized with a blender (Ultra Turrax) and an ultrasonic water bath. Sperm
or spermatid heads were counted microscopically using a modified Neubauer chamber. These
evaluations were performed only for control and high dose males. In the absence of a test
item related effect the remaining frozen tissues were not evaluated.
Mating evaluation:
A record of mating of females was made by daily examination of the vaginal smears for
spermatozoa and/or appearance of a vaginal plug throughout the pairing period. The day on
which evidence of mating was observed was considered to be day 0 post coitum. Once
evidence of mating had been noted, the females were housed individually.
The mating data were used to determine the precoital time, detect whether or not pregnancy
was interrupted after mating, detect marked anomalies of the estrus cycle, and determine
duration of gestation.
ANNEX 1 – BACKGROUND DOCUMENT TO THE RAC OPINION ON FENPYRAZAMINE
132
Gestation and parturition:
Towards the end of the gestation period, females were examined twice daily for signs of
parturition. Duration of gestation was calculated. Females without litters were killed and
necropsied together with the dams after weaning of the pups. Females which lost their litter
were killed and necropsied either directly after litter loss or with the other dams after
weaning of pups.
Lactation and litter examination:
Day 0 of lactation was the day on which a female had delivered all its pups. The litters were
examined for litter size, live birth, stillbirth and any gross anomalies. Sex ratios of live pups
were recorded on day 0 and/or day 1, day 4 and day 21 of lactation. Litters were caged
together with the dam until weaning on day 21 of lactation. Pups were weighed individually
on days 0 and / or 1, 4, 7, 14 and 21 of lactation.
Sacrifice and pathology:
All P and F1 males were sacrificed after day 43 post-coitus. All P and F1 females were
sacrificed after lactation period. Excess F1 and F2 pups after standardization of litter sizes
(24 male and 24 female F1 pups) were sacrificed on day 4 post-partum, examined
macroscopically and preserved in neutral phosphate buffered 4% formaldehyde solution.
All parent generation animals (P and F1) were examined macroscopically for any structural
abnormalities or pathological changes either at scheduled sacrifice or if death occurred
during the study. Special attention was directed to the organs of the reproductive system.
Implantation sites were counted for all dams. The uteri were placed in a solution of
ammonium sulphide to visualize possible hemorrhagic areas of implantation sites.
The following organ weights were recorded from all P and F1 parent animals on day 21 post-
partum or shortly thereafter: brain (with entire brainstem), kidney, pituitary, adrenal glands,
liver, spleen, thyroid, seminal vesicles (with coagulating glands and their fluids (as one
unit)), epididymides (total weight and cauda separately), testes, prostate, uterus (including
cervix and vagina, excluding oviducts). Paired organs were weighed individually
Brain, spleen, thymus and uterus were recorded from one randomly selected male and
female pup of each F1 and F2 litter (on day 21 post-partum).
Histopathology:
From all P and F1 animals selected for pairing and from one male and one female pup
(selected for organ weight recording; not selected for breeding) of each F1 and F2 litter,
samples of the following tissues and organs were collected at necropsy and fixed in neutral
phosphate buffered 4% formaldehyde solution: gross lesions, pituitary, adrenal glands, liver,
thyroid, vagina, prostate, seminal vesicles with coagulating gland, right testis and epididymis
(in Bouin's fixative), ovaries, uterus and cervix.
Full histopathology was performed on the organs listed above for all high dose and control P
and F1 animals selected for pairing and on one male and one female pup (selected for organ
ANNEX 1 – BACKGROUND DOCUMENT TO THE RAC OPINION ON FENPYRAZAMINE
133
weight recording) of each F2 litter (high dose and control). Organs demonstrating pathology
in these animals were then examined in the animals from the other dose groups.
Microscopic examination of all tissues showing gross pathological changes was made.
Ovarian histopathology, in addition to qualitative examination, included quantitative
evaluation of primordial follicles, growing follicles and antral follicles and corpora lutea from
10 sections per ovary for the ten females of the F1 generations in control and high dose
group. Additionally, corpora lutea were counted on one section per ovary. In absence of test
item-related effects in group 4, the group 2 and 3 females were not evaluated.
Findings:
Clinical signs and mortality
There were no treated-related mortalities or clinical signs in any generation. One dam in
group 4 was found dead on day 23 post coitum. This was considered related to dystocia on
day 22.
Body weight and body weight gain
In the P generation, no statistical differences in body weight gain during pre-mating period,
gestation and lactation were seen among the treated groups for both, males and females.
Nevertheless, in highest dose group there was a decrease in body weight gain in males and
females during pre-mating period and in females during gestation comparing to control
animals.
In the pups selected to form F1 generation and parental F1 animals respectively, also no
statistical differences in body weight gain during pre-mating period, gestation and lactation
were seen among the treated groups. Nevertheless, as well as for P parental generation, in
highest dose group there was a decrease in body weight gain in males and females during
pre-mating period and in females during gestation to control animals.
Food consumption
There was a statistically significant decrease of food consumption in P parental females
during pre-mating period and gestation (statistical significance was not proved for mean
values but was observed during themeasurments time points during the study), and F1
parental animals of the highest dose group during pre-mating period, gestation and lactation
(statistical significance was not proved for mean values but was observed during
themeasurments time points during the study). There was no effect on males or females of
low and mid-dose group.
Reproductive performance
P parents:
ANNEX 1 – BACKGROUND DOCUMENT TO THE RAC OPINION ON FENPYRAZAMINE
134
No effect was seen on oestrus cycle, on number of pairs mating, in time to mating, or in the
number of females becoming pregnant. There was no effect on the length of gestation. One
pregnant female of the highest dose was found dead on day 23, which was considered a
consequence of dystocia observed the preceding day. This single decedent was not
considered associated with treatment in the absence of any effect on gestation length in
other females of this group.
F1 pups:
The number of live pups born per litter was similar between groups. The increase in post
natal loss and reduced viability index in the high dose group achieved statistical significance.
However, the incidence only marginally exceeded the historical control data (seven studies
conducted prior to current study, two studies conducted after) and was considered
secondary to reduced body weight gain and reduced food consumption of maternal animals
during gestation period. No breeding losses (days 5 to 21 post-partum) were observed in
any group (weaning index = 100%).
The mean pup weight of F1 pups at birth and 21 days post-partum was significantly lower in
pups (males and females) of the high dose compared to controls. Additionally, the female
pups of the mid-dose group had significantly lower body weight comparing to control pups
on day 21 post-partum. However, this finding in the mid-dose group was considered
transient, since it was not seen later in the development (day 33, vaginal opening). On the
other hand, male pups in mid-dose showed statistically significant body weight decrease at
time of preputial separation (day 26), although their weight on day 21 post-partum was in
range of control pups. In the F1 high dose group, sexual maturity was delayed in both,
males and females (preputial separation, and vaginal opening respectively), but this was
considered secondary to decreased body weight of pups. Sex ratios (%males / % females)
were similar in all groups (45/55; 49/51; 50/50; 46/54).
F1 parents:
No effect was seen on oestrus cycle, on number of pairs mating, in time to mating, or in the
number of females becoming pregnant. There was no effect on the length of gestation.
However, in the high dose group there was a significant reduction in the mean number of
implantations per dam and litter size, and a statistically significant increase in post-
implantation loss.
F2 pups:
Bodyweights of F2 pups in the high dose group were significantly lower compared to control
pups at the start of lactation and remained so throughout the lactation period. Also at the
mid-dose level, bodyweights of female pups were significantly lower than those of controls
from day 14 to day 21 post-partum. There was no effect on pups of low dose group. Post-
natal loss during the first 4 days post-partum was significantly increased in all dose groups
comparing to concurrent control but was within the historical control data. Viability index
was significantly decreased in all treated groups but was still within the range of historical
control data (seven studies conducted prior to current study, two studies conducted after).
Sex ratios (% males / % females) were similar in all groups (45/55; 48/52; 48/52; 46/54).
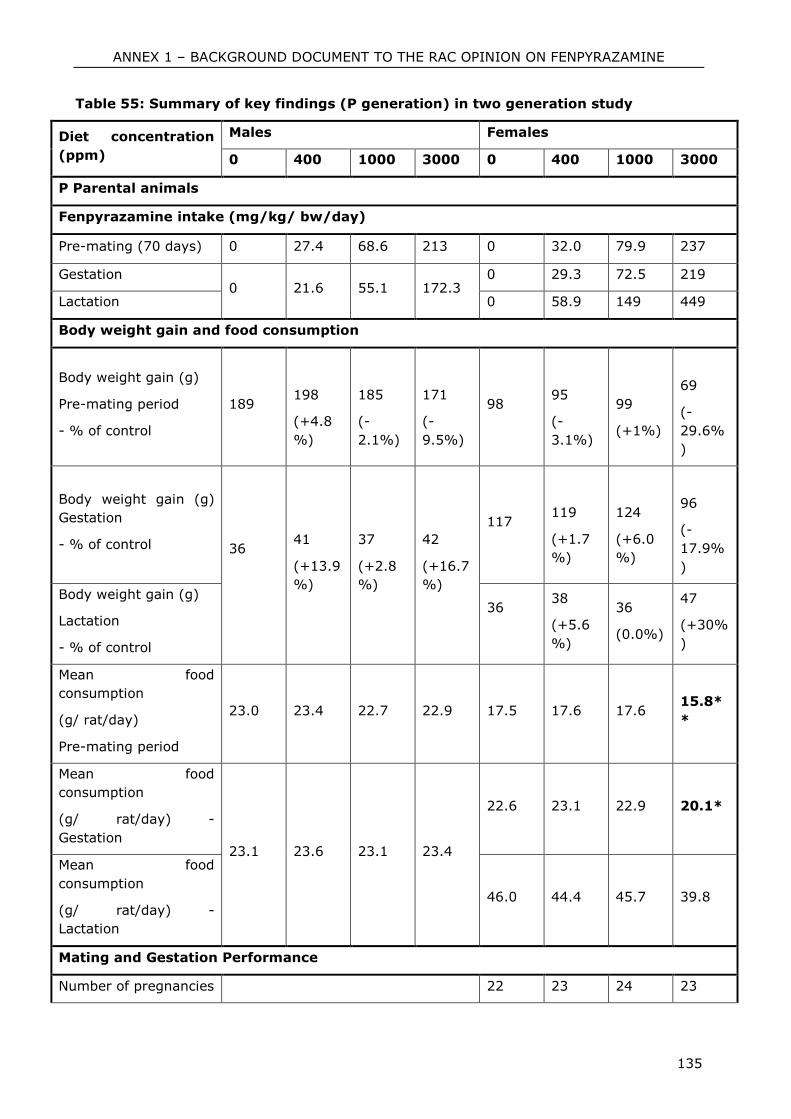
ANNEX 1 – BACKGROUND DOCUMENT TO THE RAC OPINION ON FENPYRAZAMINE
135
Table 55: Summary of key findings (P generation) in two generation study
Diet concentration
(ppm)
Males Females
0 400 1000 3000 0 400 1000 3000
P Parental animals
Fenpyrazamine intake (mg/kg/ bw/day)
Pre-mating (70 days) 0 27.4 68.6 213 0 32.0 79.9 237
Gestation 0 21.6 55.1 172.3
0 29.3 72.5 219
Lactation 0 58.9 149 449
Body weight gain and food consumption
Body weight gain (g)
Pre-mating period
- % of control
189
198
(+4.8
%)
185
(-
2.1%)
171
(-
9.5%)
98
95
(-
3.1%)
99
(+1%)
69
(-
29.6%
)
Body weight gain (g)
Gestation
- % of control 36
41
(+13.9
%)
37
(+2.8
%)
42
(+16.7
%)
117
119
(+1.7
%)
124
(+6.0
%)
96
(-
17.9%
)
Body weight gain (g)
Lactation
- % of control
36
38
(+5.6
%)
36
(0.0%)
47
(+30%
)
Mean food
consumption
(g/ rat/day)
Pre-mating period
23.0 23.4 22.7 22.9 17.5 17.6 17.6 15.8*
*
Mean food
consumption
(g/ rat/day) -
Gestation 23.1 23.6 23.1 23.4
22.6 23.1 22.9 20.1*
Mean food
consumption
(g/ rat/day) -
Lactation
46.0 44.4 45.7 39.8
Mating and Gestation Performance
Number of pregnancies 22 23 24 23
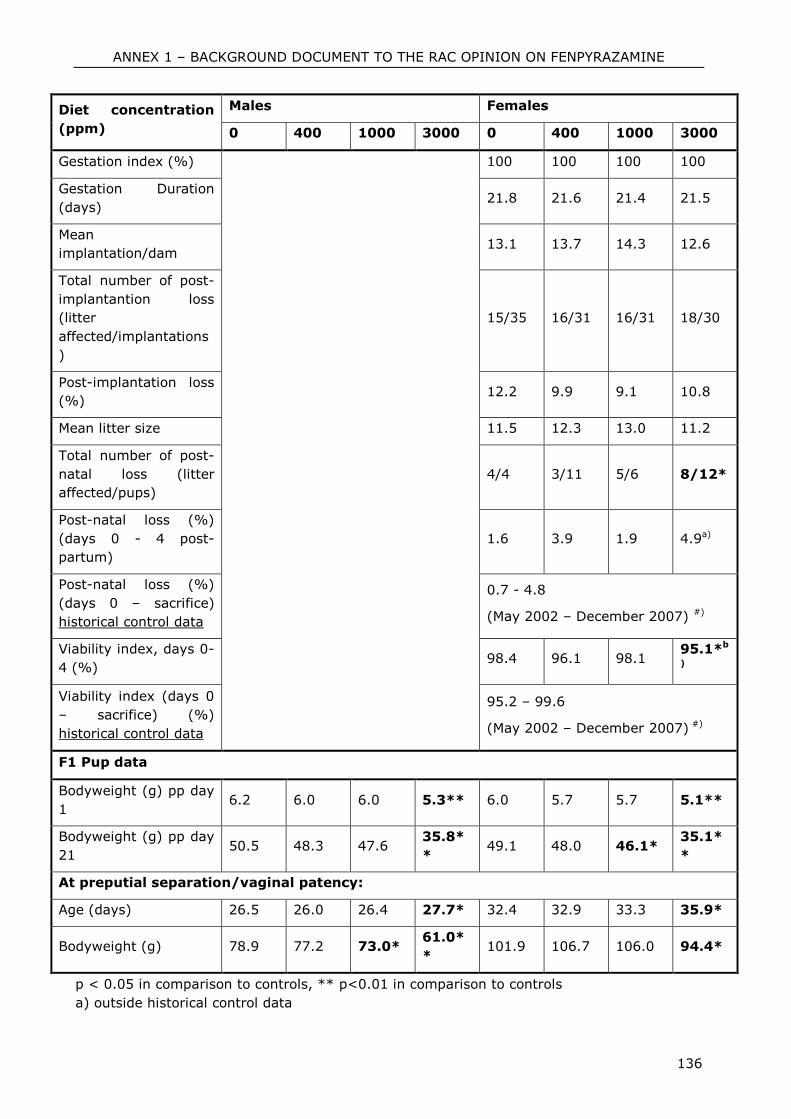
ANNEX 1 – BACKGROUND DOCUMENT TO THE RAC OPINION ON FENPYRAZAMINE
136
Diet concentration
(ppm)
Males Females
0 400 1000 3000 0 400 1000 3000
Gestation index (%) 100 100 100 100
Gestation Duration
(days) 21.8 21.6 21.4 21.5
Mean
implantation/dam 13.1 13.7 14.3 12.6
Total number of post-
implantantion loss
(litter
affected/implantations
)
15/35 16/31 16/31 18/30
Post-implantation loss
(%) 12.2 9.9 9.1 10.8
Mean litter size 11.5 12.3 13.0 11.2
Total number of post-
natal loss (litter
affected/pups)
4/4 3/11 5/6 8/12*
Post-natal loss (%)
(days 0 - 4 post-
partum)
1.6 3.9 1.9 4.9a)
Post-natal loss (%)
(days 0 – sacrifice)
historical control data
0.7 - 4.8
(May 2002 – December 2007) #)
Viability index, days 0-
4 (%) 98.4 96.1 98.1
95.1*b
)
Viability index (days 0
– sacrifice) (%)
historical control data
95.2 – 99.6
(May 2002 – December 2007) #)
F1 Pup data
Bodyweight (g) pp day
1 6.2 6.0 6.0 5.3** 6.0 5.7 5.7 5.1**
Bodyweight (g) pp day
21 50.5 48.3 47.6
35.8*
* 49.1 48.0 46.1*
35.1*
*
At preputial separation/vaginal patency:
Age (days) 26.5 26.0 26.4 27.7* 32.4 32.9 33.3 35.9*
Bodyweight (g) 78.9 77.2 73.0* 61.0*
* 101.9 106.7 106.0 94.4*
p < 0.05 in comparison to controls, ** p<0.01 in comparison to controls
a) outside historical control data
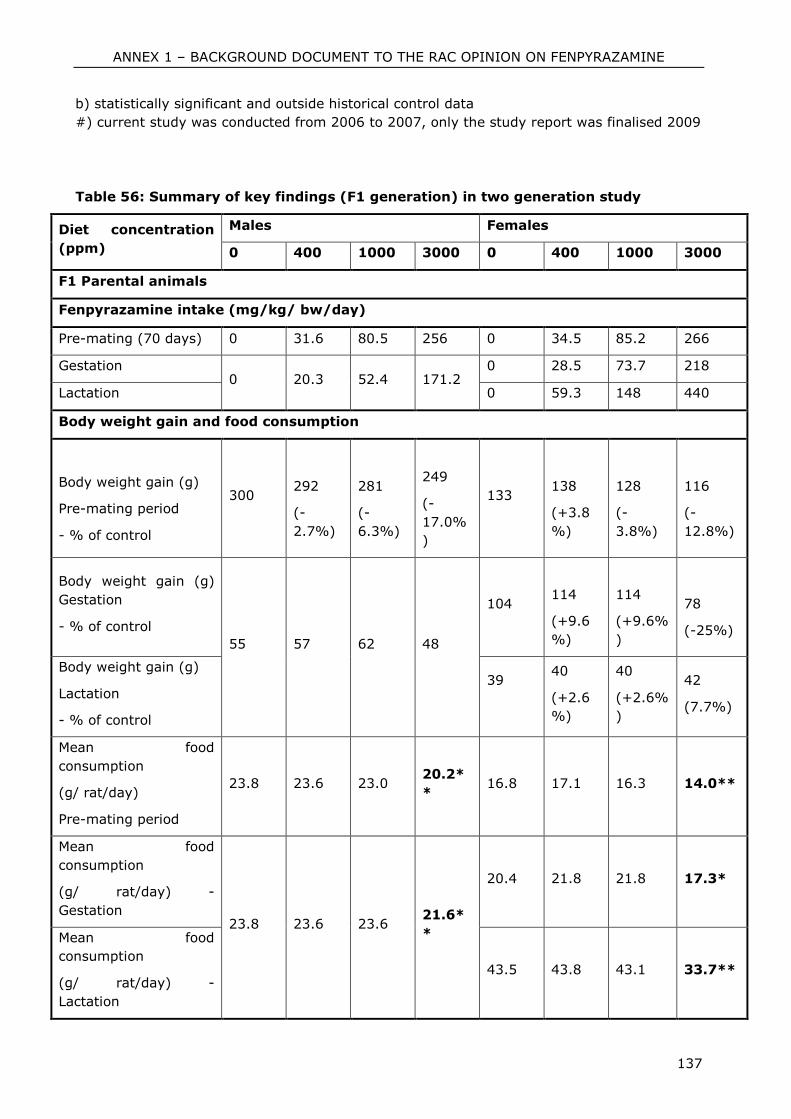
ANNEX 1 – BACKGROUND DOCUMENT TO THE RAC OPINION ON FENPYRAZAMINE
137
b) statistically significant and outside historical control data
#) current study was conducted from 2006 to 2007, only the study report was finalised 2009
Table 56: Summary of key findings (F1 generation) in two generation study
Diet concentration
(ppm)
Males Females
0 400 1000 3000 0 400 1000 3000
F1 Parental animals
Fenpyrazamine intake (mg/kg/ bw/day)
Pre-mating (70 days) 0 31.6 80.5 256 0 34.5 85.2 266
Gestation 0 20.3 52.4 171.2
0 28.5 73.7 218
Lactation 0 59.3 148 440
Body weight gain and food consumption
Body weight gain (g)
Pre-mating period
- % of control
300
292
(-
2.7%)
281
(-
6.3%)
249
(-
17.0%
)
133
138
(+3.8
%)
128
(-
3.8%)
116
(-
12.8%)
Body weight gain (g)
Gestation
- % of control
55 57 62 48
104
114
(+9.6
%)
114
(+9.6%
)
78
(-25%)
Body weight gain (g)
Lactation
- % of control
39
40
(+2.6
%)
40
(+2.6%
)
42
(7.7%)
Mean food
consumption
(g/ rat/day)
Pre-mating period
23.8 23.6 23.0 20.2*
* 16.8 17.1 16.3 14.0**
Mean food
consumption
(g/ rat/day) -
Gestation 23.8 23.6 23.6
21.6*
*
20.4 21.8 21.8 17.3*
Mean food
consumption
(g/ rat/day) -
Lactation
43.5 43.8 43.1 33.7**
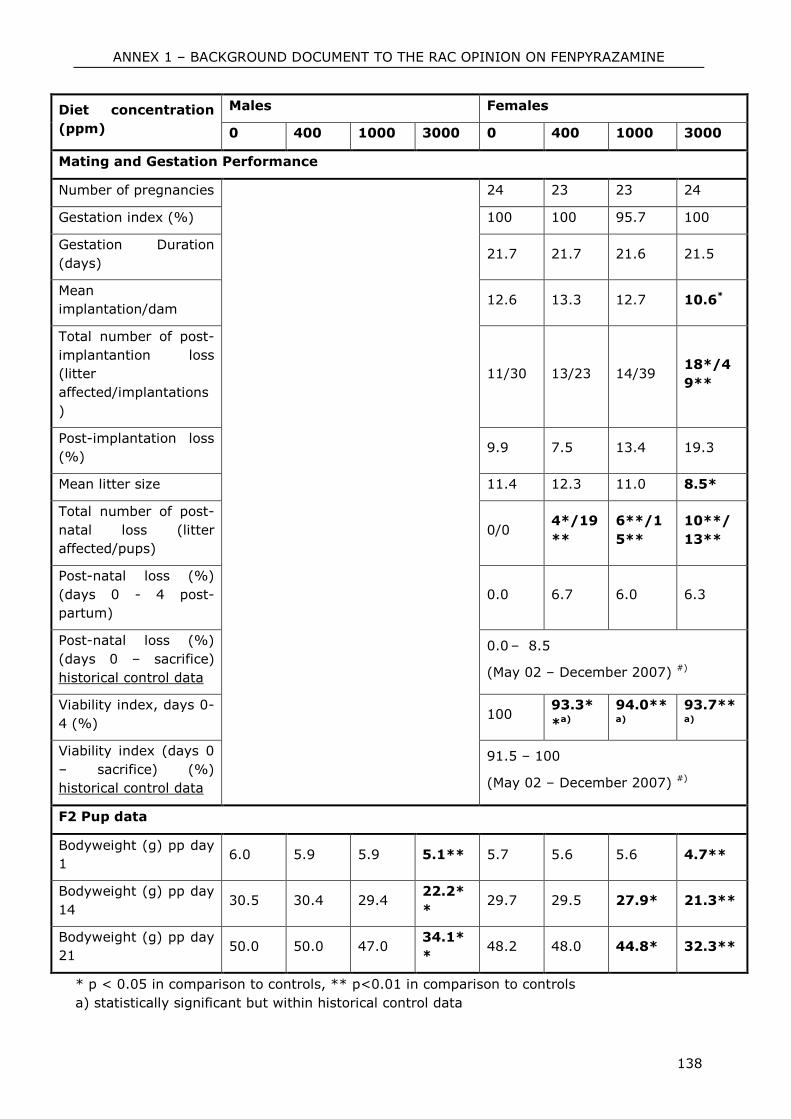
ANNEX 1 – BACKGROUND DOCUMENT TO THE RAC OPINION ON FENPYRAZAMINE
138
Diet concentration
(ppm)
Males Females
0 400 1000 3000 0 400 1000 3000
Mating and Gestation Performance
Number of pregnancies 24 23 23 24
Gestation index (%) 100 100 95.7 100
Gestation Duration
(days) 21.7 21.7 21.6 21.5
Mean
implantation/dam 12.6 13.3 12.7 10.6*
Total number of post-
implantantion loss
(litter
affected/implantations
)
11/30 13/23 14/39 18*/4
9**
Post-implantation loss
(%) 9.9 7.5 13.4 19.3
Mean litter size 11.4 12.3 11.0 8.5*
Total number of post-
natal loss (litter
affected/pups)
0/0 4*/19
**
6**/1
5**
10**/
13**
Post-natal loss (%)
(days 0 - 4 post-
partum)
0.0 6.7 6.0 6.3
Post-natal loss (%)
(days 0 – sacrifice)
historical control data
0.0 – 8.5
(May 02 – December 2007) #)
Viability index, days 0-
4 (%) 100
93.3*
*a)
94.0**a)
93.7**a)
Viability index (days 0
– sacrifice) (%)
historical control data
91.5 – 100
(May 02 – December 2007) #)
F2 Pup data
Bodyweight (g) pp day
1 6.0 5.9 5.9 5.1** 5.7 5.6 5.6 4.7**
Bodyweight (g) pp day
14 30.5 30.4 29.4
22.2*
* 29.7 29.5 27.9* 21.3**
Bodyweight (g) pp day
21 50.0 50.0 47.0
34.1*
* 48.2 48.0 44.8* 32.3**
* p < 0.05 in comparison to controls, ** p<0.01 in comparison to controls
a) statistically significant but within historical control data
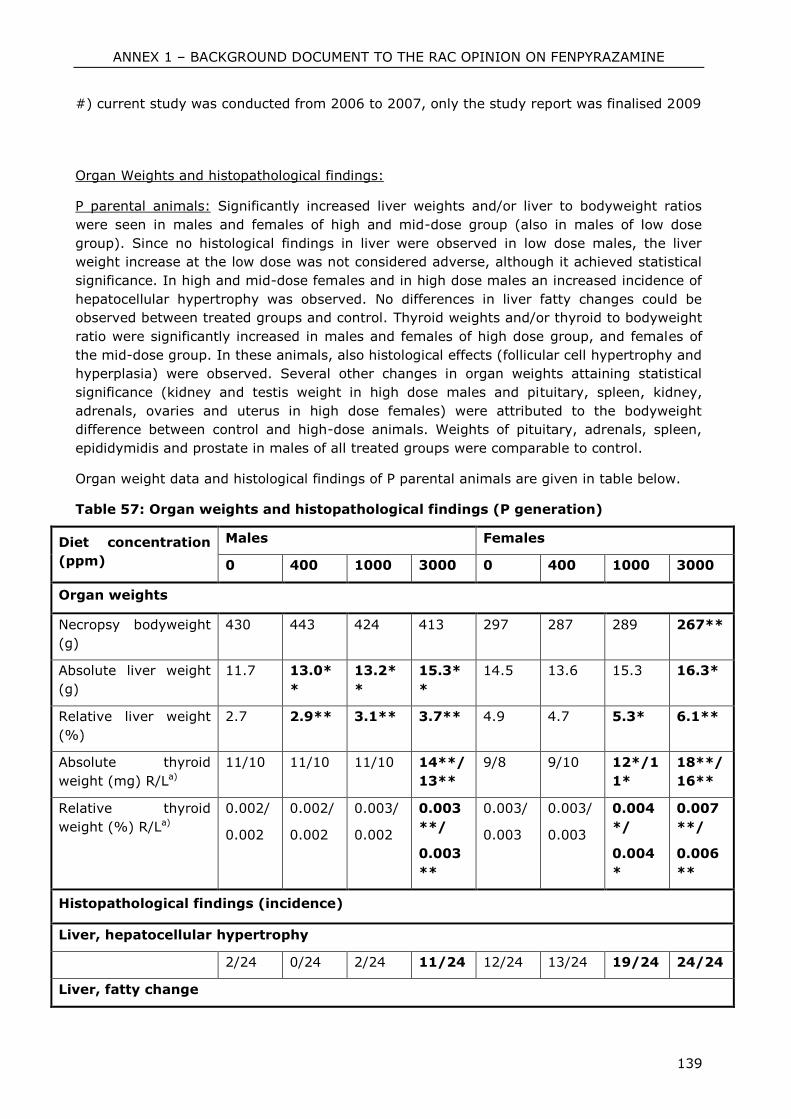
ANNEX 1 – BACKGROUND DOCUMENT TO THE RAC OPINION ON FENPYRAZAMINE
139
#) current study was conducted from 2006 to 2007, only the study report was finalised 2009
Organ Weights and histopathological findings:
P parental animals: Significantly increased liver weights and/or liver to bodyweight ratios
were seen in males and females of high and mid-dose group (also in males of low dose
group). Since no histological findings in liver were observed in low dose males, the liver
weight increase at the low dose was not considered adverse, although it achieved statistical
significance. In high and mid-dose females and in high dose males an increased incidence of
hepatocellular hypertrophy was observed. No differences in liver fatty changes could be
observed between treated groups and control. Thyroid weights and/or thyroid to bodyweight
ratio were significantly increased in males and females of high dose group, and females of
the mid-dose group. In these animals, also histological effects (follicular cell hypertrophy and
hyperplasia) were observed. Several other changes in organ weights attaining statistical
significance (kidney and testis weight in high dose males and pituitary, spleen, kidney,
adrenals, ovaries and uterus in high dose females) were attributed to the bodyweight
difference between control and high-dose animals. Weights of pituitary, adrenals, spleen,
epididymidis and prostate in males of all treated groups were comparable to control.
Organ weight data and histological findings of P parental animals are given in table below.
Table 57: Organ weights and histopathological findings (P generation)
Diet concentration
(ppm)
Males Females
0 400 1000 3000 0 400 1000 3000
Organ weights
Necropsy bodyweight
(g)
430 443 424 413 297 287 289 267**
Absolute liver weight
(g)
11.7 13.0*
*
13.2*
*
15.3*
*
14.5 13.6 15.3 16.3*
Relative liver weight
(%)
2.7 2.9** 3.1** 3.7** 4.9 4.7 5.3* 6.1**
Absolute thyroid
weight (mg) R/La)
11/10 11/10 11/10 14**/
13**
9/8 9/10 12*/1
1*
18**/
16**
Relative thyroid
weight (%) R/La)
0.002/
0.002
0.002/
0.002
0.003/
0.002
0.003
**/
0.003
**
0.003/
0.003
0.003/
0.003
0.004
*/
0.004
*
0.007
**/
0.006
**
Histopathological findings (incidence)
Liver, hepatocellular hypertrophy
2/24 0/24 2/24 11/24 12/24 13/24 19/24 24/24
Liver, fatty change
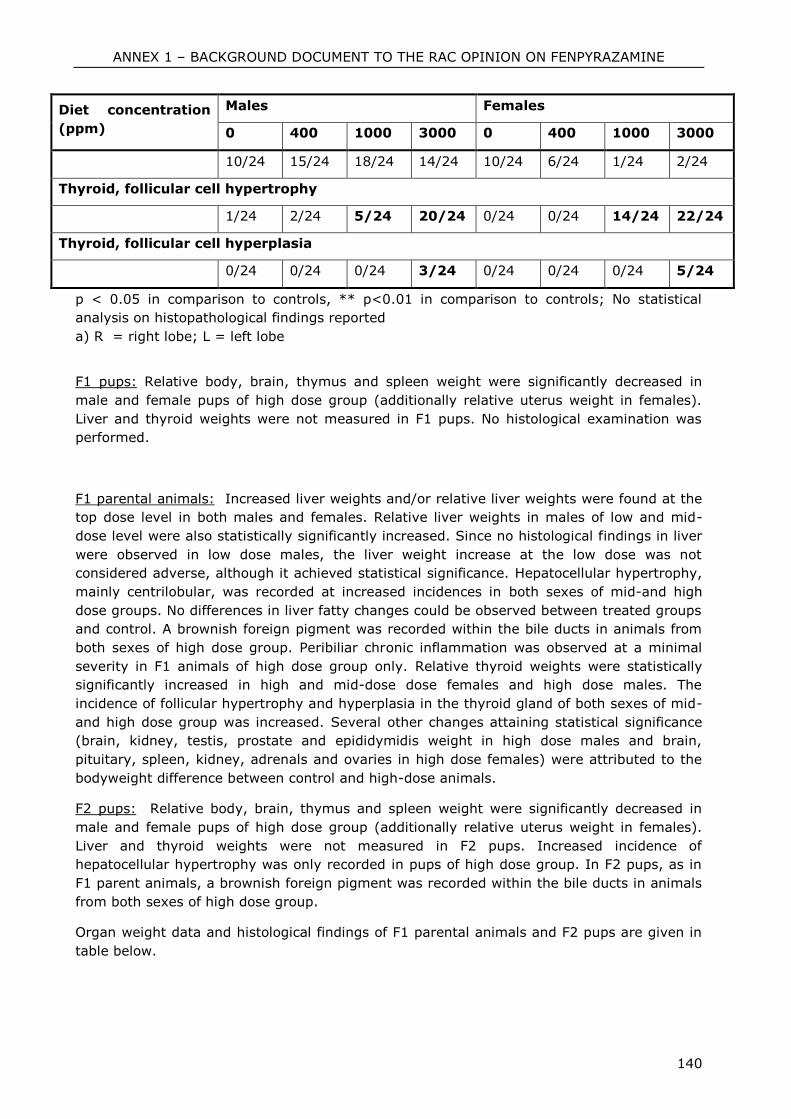
ANNEX 1 – BACKGROUND DOCUMENT TO THE RAC OPINION ON FENPYRAZAMINE
140
Diet concentration
(ppm)
Males Females
0 400 1000 3000 0 400 1000 3000
10/24 15/24 18/24 14/24 10/24 6/24 1/24 2/24
Thyroid, follicular cell hypertrophy
1/24 2/24 5/24 20/24 0/24 0/24 14/24 22/24
Thyroid, follicular cell hyperplasia
0/24 0/24 0/24 3/24 0/24 0/24 0/24 5/24
p < 0.05 in comparison to controls, ** p<0.01 in comparison to controls; No statistical
analysis on histopathological findings reported
a) R = right lobe; L = left lobe
F1 pups: Relative body, brain, thymus and spleen weight were significantly decreased in
male and female pups of high dose group (additionally relative uterus weight in females).
Liver and thyroid weights were not measured in F1 pups. No histological examination was
performed.
F1 parental animals: Increased liver weights and/or relative liver weights were found at the
top dose level in both males and females. Relative liver weights in males of low and mid-
dose level were also statistically significantly increased. Since no histological findings in liver
were observed in low dose males, the liver weight increase at the low dose was not
considered adverse, although it achieved statistical significance. Hepatocellular hypertrophy,
mainly centrilobular, was recorded at increased incidences in both sexes of mid-and high
dose groups. No differences in liver fatty changes could be observed between treated groups
and control. A brownish foreign pigment was recorded within the bile ducts in animals from
both sexes of high dose group. Peribiliar chronic inflammation was observed at a minimal
severity in F1 animals of high dose group only. Relative thyroid weights were statistically
significantly increased in high and mid-dose dose females and high dose males. The
incidence of follicular hypertrophy and hyperplasia in the thyroid gland of both sexes of mid-
and high dose group was increased. Several other changes attaining statistical significance
(brain, kidney, testis, prostate and epididymidis weight in high dose males and brain,
pituitary, spleen, kidney, adrenals and ovaries in high dose females) were attributed to the
bodyweight difference between control and high-dose animals.
F2 pups: Relative body, brain, thymus and spleen weight were significantly decreased in
male and female pups of high dose group (additionally relative uterus weight in females).
Liver and thyroid weights were not measured in F2 pups. Increased incidence of
hepatocellular hypertrophy was only recorded in pups of high dose group. In F2 pups, as in
F1 parent animals, a brownish foreign pigment was recorded within the bile ducts in animals
from both sexes of high dose group.
Organ weight data and histological findings of F1 parental animals and F2 pups are given in
table below.
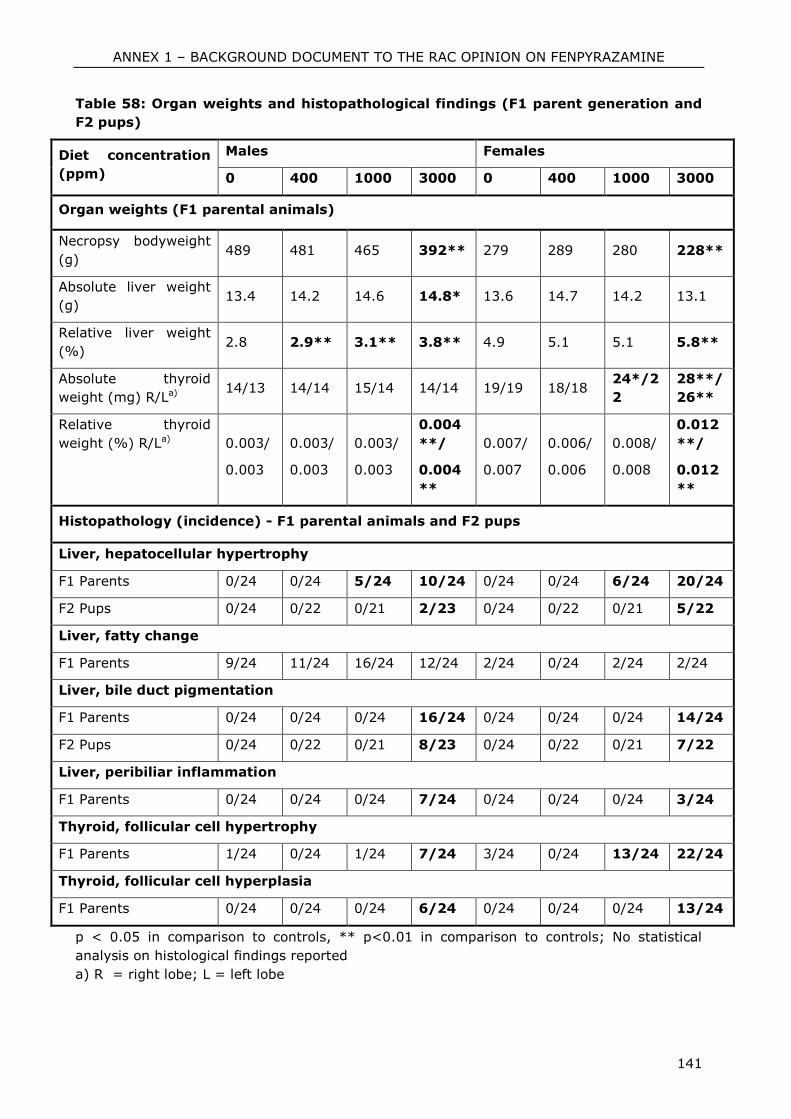
ANNEX 1 – BACKGROUND DOCUMENT TO THE RAC OPINION ON FENPYRAZAMINE
141
Table 58: Organ weights and histopathological findings (F1 parent generation and
F2 pups)
Diet concentration
(ppm)
Males Females
0 400 1000 3000 0 400 1000 3000
Organ weights (F1 parental animals)
Necropsy bodyweight
(g) 489 481 465 392** 279 289 280 228**
Absolute liver weight
(g) 13.4 14.2 14.6 14.8* 13.6 14.7 14.2 13.1
Relative liver weight
(%) 2.8 2.9** 3.1** 3.8** 4.9 5.1 5.1 5.8**
Absolute thyroid
weight (mg) R/La) 14/13 14/14 15/14 14/14 19/19 18/18
24*/2
2
28**/
26**
Relative thyroid
weight (%) R/La) 0.003/
0.003
0.003/
0.003
0.003/
0.003
0.004
**/
0.004
**
0.007/
0.007
0.006/
0.006
0.008/
0.008
0.012
**/
0.012
**
Histopathology (incidence) - F1 parental animals and F2 pups
Liver, hepatocellular hypertrophy
F1 Parents 0/24 0/24 5/24 10/24 0/24 0/24 6/24 20/24
F2 Pups 0/24 0/22 0/21 2/23 0/24 0/22 0/21 5/22
Liver, fatty change
F1 Parents 9/24 11/24 16/24 12/24 2/24 0/24 2/24 2/24
Liver, bile duct pigmentation
F1 Parents 0/24 0/24 0/24 16/24 0/24 0/24 0/24 14/24
F2 Pups 0/24 0/22 0/21 8/23 0/24 0/22 0/21 7/22
Liver, peribiliar inflammation
F1 Parents 0/24 0/24 0/24 7/24 0/24 0/24 0/24 3/24
Thyroid, follicular cell hypertrophy
F1 Parents 1/24 0/24 1/24 7/24 3/24 0/24 13/24 22/24
Thyroid, follicular cell hyperplasia
F1 Parents 0/24 0/24 0/24 6/24 0/24 0/24 0/24 13/24
p < 0.05 in comparison to controls, ** p<0.01 in comparison to controls; No statistical
analysis on histological findings reported
a) R = right lobe; L = left lobe
ANNEX 1 – BACKGROUND DOCUMENT TO THE RAC OPINION ON FENPYRAZAMINE
142
Sperm evaluation
No differences were detected between control and high dose P parental sperm parameters
after examination of sperm motility, morphology, or homogenisation-resistant spermatid
count. Similarly, no alteration of sperm quality was detected in the high dose F1 parental
male animals. In the absence of a detectable effect, no further investigations were
undertaken.
Ovary staging
Detailed histological assessment of the ovaries revealed no treatment-related disturbance.
The number of primordial, growing and antral follicles, as well as corpora lutea was
comparable between control and F1 high dose females.
Conclusion:
In the 2-generation study, fenpyrazamine was administered continuously in the feed to rats
at dietary concentrations of 0, 400, 1000, and 3000 ppm. The toxicological response of the
treated animals was principally characterised by increase in relative liver and thyroid weight
and histological findings in these organs (cell hypertrophy) and reduced food consumption
and decreased body weight gain throughout the whole study period. Significantly lower
number of implantations, significantly increased post implantation loss and significantly
increased post natal loss in the high dose group of F1 generation is considered to be the
effect of systemic toxicity in maternal animals (body weight gain loss, body weight
reduction, thyroid enlargement, hepatocellular and thyroid cell hypertrophy). Fenpyrazamine
showed no effects on fertility. Sperm evaluation and ovary staging did not reveal any test
substance related findings.
A No-Observed-Adverse-Effect Level (NOAEL) for parental effects in P and F1 generation is
proposed at the dietary level of 400 ppm (20.3 mg/kg bw/d; mean substance intake of
males of F1 generation during after-mating period), based on occurrence of increased
relative liver and thyroid weights and corresponding histological findings (liver and thyroid
cell hypertrophy) at 3000 ppm and 1000 ppm. Statistically significant decrease of relative
liver weight of males at 400 ppm was not considered adverse because of absence of
histopathological findings in liver at this dose. A No-Observed-Adverse-Effect Level (NOAEL)
for offspring effects in F1 and F2 pups is proposed at 400 ppm (28.5 mg/kg bw/d; mean
substance intake of females of F1 generation during gestation), based on significantly lower
body weights of F1 and F2 pups during lactation at 3000 ppm and 1000 ppm. Statistically
significant increase of post implantation loss and decreased viability index for pups of all F1
parents are within the historical control data are therefore not regarded as relevant for
setting the NOAEL. A No-Observed-Adverse-Effect Level (NOAEL) for reproductive effects is
proposed at the dietary level of 1000 ppm (73.7 mg/kg bw/d; mean substance intake of
females of F1 generation during gestation), based on significantly decreased number of
implantations observed in F1 females at 3000 ppm.
ANNEX 1 – BACKGROUND DOCUMENT TO THE RAC OPINION ON FENPYRAZAMINE
143
4.11.1.2 Human information
A formal statement from the manufacturer is presented (Ohtsubo, T (2009)), that members
of staff involved in the synthesis and development of fenpyrazamine are routinely monitored
and that no indication of fenpyrazamine-related ill-health have been detected by, or reported
to, medical staff. No poisoning incidents or clinical cases have been reported. Fenpyrazamine
is a new chemical currently in development. There has been no exposure of the general
population or epidemiology study.
4.11.2 Developmental toxicity
4.11.2.1 Non-human information
Rats:
Reference: S-2188: Dose range-finding prenatal development toxicity study in the
Han Wistar Rat
Author(s), year: Pössnecker, A.; 2006
Report/Doc.
number:
Sumitomo Chemical Co. Ltd. Report No. QNT-0005
Guideline(s): Japanese MAFF 12 NohSan 8147 Teratology (2-1-18), EPA OPPTS
870.3700, OECD 414
GLP: Yes (laboratory certified by National Authority)
Deviations: No
Validity: Yes (supplementary study)
Material and methods:
Test Material: S-2188
Lot/Batch: 030-050914-1G
Purity: 94.7%
Test animals:
Species: Rat
Strain: Wistar, HanRcc:WIST(SPF)
Age at pairing: 12 weeks
Weight at start: 192 – 228 g
Source: RCC Ltd, Laboratory Animal Services, Füllinsdorf,
Switzerland
Diet: Pelleted standard Kliba-Nafag 3433 maintenance diet; ad
libitum
The purpose of the study was to detect adverse effects of fenpyrazamine on the pregnant
rats and on the development of the embryo and the foetus consequent to exposure of the
females to the test substance (0, 150, 300 and 500 mg/kg bw/d) from implantation through
day 20 post coitum in order to establish suitable dose levels for a subsequent developmental
study. Investigations were limited to maternal growth and food consumption, and pregnancy
parameters to ensure that dose selection in future study would result in sufficient pups for a
full evaluation of developmental toxicity.
ANNEX 1 – BACKGROUND DOCUMENT TO THE RAC OPINION ON FENPYRAZAMINE
144
Animal assignment and treatment
Groups of young adult female rats were paired with male rats of proven fertility in special
automatic mating cages with synchronised timing to initiate the nightly mating period until
evidence of copulation was observed. Once evidence of mating was seen (presence of
copulation plug or sperm positive vaginal smear), 5 presumed-pregnant females were
allocated to each dosage group (0, 150, 300 and 500 mg/kg bw/d).
Diet preparation, analysis and administration:
The test substance was weighed and then ground in an agate stone mortar. The vehicle (1%
aqueous CMC solution) was added (w/v) and a homogenous mixture was prepared. The
mixture was continuously stirred up to the surface during the application procedure.
Separate formulations were prepared for each concentration. Accuracy of mixing, stability
and homogeneity of dose formulations were confirmed by analysis. Samples for
determination of concentration, homogeneity and stability (4 hours and 7 days) of the dose
formulations were taken during the first week of the administration period.
Presumed-pregnant female rats were administered fenpyrazamine by gavage at a dose
volume of 10 mL/kg bw once daily during days 6 to 20 of pregnancy, and sacrificed on day
21 of pregnancy for examination of litters. Dose volumes were determined on the basis of
the most recent bodyweight, determined daily.
Clinical observations:
All animals were checked at least twice daily for any mortality. Any female sacrificed or
found dead during the study was subjected to macroscopic examination with emphasis on
the uterus and its contents. Specimens of abnormal tissue were fixed in neutral phosphate
buffered 4% formaldehyde solution.
All animals were observed at least twice daily for signs of reaction to treatment and/or
symptoms of ill health.
Food consumption and body weight:
Food consumption was recorded on 3-day intervals (day 0–3, 3–6, 6–9, 9–12, 12–15, 15–
18, and 18–21) throughout pregnancy. Body weights were recorded daily from day 0 until
day 21 of pregnancy.
Sacrifice and pathology
At the scheduled necropsy on day 21 post coitum, females were sacrificed and the foetuses
removed by Caesarean section.
Post mortem examination, including gross macroscopic examination of all internal organs,
with emphasis on the uterus, uterine contents, position of foetuses in the uterus and number
of corpora lutea, was performed and the data recorded. All parental organs or tissues
showing grossly visible abnormalities were preserved in neutral phosphate buffered 4%
formaldehyde solution. The uteri (and contents) of all females with live foetuses were
weighed at necropsy on day 21 post coitum to enable the calculation of the corrected body
weight gain. Placental weights were measured separately.
ANNEX 1 – BACKGROUND DOCUMENT TO THE RAC OPINION ON FENPYRAZAMINE
145
Foetal examination
The foetuses were sexed, weighted individually examined for gross external abnormalities
and stored in 70% alcohol. One foetus with an obvious skeletal defect was stained for
skeletal examination.
Findings:
Mortality and clinical signs:
One female of the high dose group was found dead on pregnancy day 11. There were no
preceding clinical signs. Necropsy of this animal showed signs of discharge on the snout; the
stomach was distended with gas and contained red particles; the fore stomach was reported
to have a red surface. Lungs were partly emphysematous with red discolouration. The uterus
contained 13 implantations, and 14 corpora lutea were counted in this animal. It could not
be excluded that the findings were not treatment-related. One female of the mid-dose group
was found to have started parturition on day 21, and was sacrificed within the terminal
sacrifice procedure before completion of parturition.
No clinical signs and no changed behaviour were noted in any other female during the whole
study.
Food consumption, body weight and body weight gain:
Food consumption of the high dose females was lower (-8.8%) than that of the controls, but
no statistical significance was achieved. There was no effect on food consumption at the
mid- or low-dose. Bodyweight gain of females in the mid- and high dose groups showed
dose-related impairment (-15.5% and -19.8% respectively, compared to control) without
statistical significance. Females of high dose group had significantly lower corrected body
weight gain (excluding uterus) (1.8% of starting weight) comparing to control (12% of
starting weight), while uterus weight was comparable between all groups. Between days 19
and 21 post coitus, the body weight of mid-dose females was statistically significantly
decreased when compared to control. There were no statistically significant effects at the low
and high dose.
Reproduction data
All mated females were pregnant. Mean number of corpora lutea per dam was comparable in
all groups.
Necropsy findings
One dam of the high dose group was found dead at day 11 post coitum. Necropsy of this
animal showed signs of discharge on the snout; the stomach was distended with gas and
contained red particles; the fore stomach was reported to have a red surface. Lungs were
partly emphysematous with red discolouration. It can not be excluded that the death was
not treatment-related. One dam of the mid-dose group was found to have started parturition
on day 21, and was sacrificed within the terminal sacrifice procedure before completion of
parturition. No abnormal necropsy findings were noted in any other animal.
Foetal data
The post implantation loss was markedly higher in the mid-dose group than in the control
and the litter size of the mid-dose group was smaller (11.6 foetuses comparing to 13.4 in
ANNEX 1 – BACKGROUND DOCUMENT TO THE RAC OPINION ON FENPYRAZAMINE
146
control). These findings are mainly contributed to 1 dam of mid-dose group which had 5
resorptions. No similar findings were observed in high dose animals, therefore, it was
considered incidental.
The mean foetal weight of high dose group was statistically significantly decreased. The
mean placental weight of animals in all treated groups was significantly increased (26.7%,
23.1% and 46.3% compared to control). No histopathological examinations of placenta or
hormone level measurements were conducted. The information provided by the Notifier, that
anaemia and restricted food consumption are common reasons for increased placental
weight can not be truly followed since the female rats in 90 days study did not show any
sign of anaemia at comparable dose levels and a restriction in food consumption could be
observed in the current study only for animals of highest dose. Therefore, the reason of the
increased placental weight stays unclear and could be, e.g. also a result of hormonal
imbalance or prompted induction of placental metabolic activity. The sex ratio was not
significantly shifted by the treatment (males/females: 35/32, 25/42, 30/28, 23/34).
During necropsy, malformations were noted in 1 foetus of each low (hind limb flexure of
both legs) and mid-dose group (umbilical hernia with exposed short length of intestine,
subcutaneous oedema in cervical region). The malformations showed no consistency
between groups and were not considered treatment-related (no effected foetuses in high
dose group). No findings were observed in other foetuses.
Results of preliminary developmental study in rats are given in table below.
Table 59: Results of the preliminary rat developmental study
Dose (mg/kg bw/day) 0 150 300 500
Number of females mated 5 5 5 5
Non-pregnant 0 0 0 0
Mortality 0 0 0 1
Number of females with live
foetuses 5 5 5 4
Food consumption, days 6-21
- g/rat/day
- % of control
23.8
23.6
(-0.8%)
24.0
(+0.8%)
21.7
(-8.8%)
Maternal weight gain, days 6-
21 (g)
- % of control
116
111
(-4.3%)
98
(-15.5%)
93
(-19.8%)
Corrected body weight gain
(excluding gravid uterus), days
6-21
- total (g)
- % of starting weight
27.6
12.0
23.5
10.3
19.6
8.6
3.9*
1.8
Maternal body weight, day 21
(g) 347 339 323* 331
Corpora lutea (mean/dam) 16.2 14.8 16.2 16.0
Post implantation loss (total) 2 2 10 0
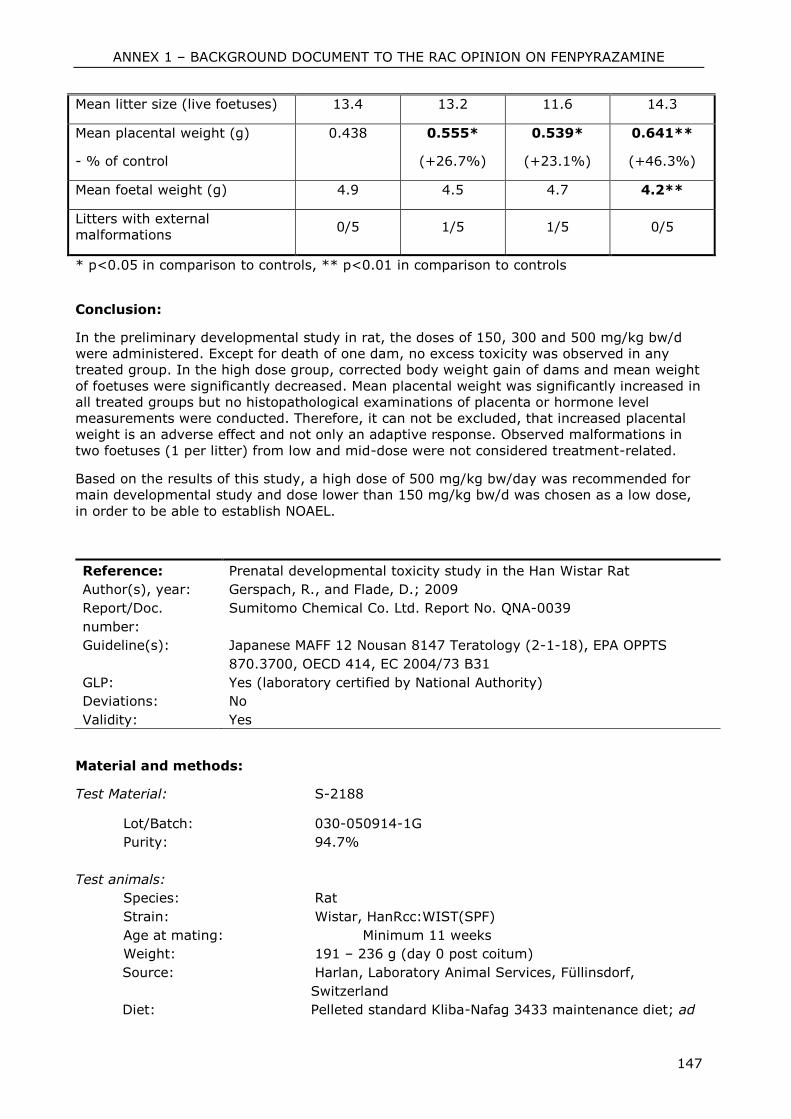
ANNEX 1 – BACKGROUND DOCUMENT TO THE RAC OPINION ON FENPYRAZAMINE
147
Mean litter size (live foetuses) 13.4 13.2 11.6 14.3
Mean placental weight (g)
- % of control
0.438
0.555*
(+26.7%)
0.539*
(+23.1%)
0.641**
(+46.3%)
Mean foetal weight (g) 4.9 4.5 4.7 4.2**
Litters with external
malformations 0/5 1/5 1/5 0/5
* p<0.05 in comparison to controls, ** p<0.01 in comparison to controls
Conclusion:
In the preliminary developmental study in rat, the doses of 150, 300 and 500 mg/kg bw/d
were administered. Except for death of one dam, no excess toxicity was observed in any
treated group. In the high dose group, corrected body weight gain of dams and mean weight
of foetuses were significantly decreased. Mean placental weight was significantly increased in
all treated groups but no histopathological examinations of placenta or hormone level
measurements were conducted. Therefore, it can not be excluded, that increased placental
weight is an adverse effect and not only an adaptive response. Observed malformations in
two foetuses (1 per litter) from low and mid-dose were not considered treatment-related.
Based on the results of this study, a high dose of 500 mg/kg bw/day was recommended for
main developmental study and dose lower than 150 mg/kg bw/d was chosen as a low dose,
in order to be able to establish NOAEL.
Reference: Prenatal developmental toxicity study in the Han Wistar Rat
Author(s), year: Gerspach, R., and Flade, D.; 2009
Report/Doc.
number:
Sumitomo Chemical Co. Ltd. Report No. QNA-0039
Guideline(s): Japanese MAFF 12 Nousan 8147 Teratology (2-1-18), EPA OPPTS
870.3700, OECD 414, EC 2004/73 B31
GLP: Yes (laboratory certified by National Authority)
Deviations: No
Validity: Yes
Material and methods:
Test Material: S-2188
Lot/Batch: 030-050914-1G
Purity: 94.7%
Test animals:
Species: Rat
Strain: Wistar, HanRcc:WIST(SPF)
Age at mating: Minimum 11 weeks
Weight: 191 – 236 g (day 0 post coitum)
Source: Harlan, Laboratory Animal Services, Füllinsdorf,
Switzerland
Diet: Pelleted standard Kliba-Nafag 3433 maintenance diet; ad
ANNEX 1 – BACKGROUND DOCUMENT TO THE RAC OPINION ON FENPYRAZAMINE
148
libitum
The purpose of the study was to detect adverse effects of fenpyrazamine on the pregnant
rats and on the development of the embryo and the foetus consequent to exposure of the
females to the test substance (0, 30, 125 and 500 mg/kg bw/d) from implantation (day 6
post coitum) through day 20 p.c.
Animal assignment and treatment:
Groups of young adult female rats were paired with male rats of proven fertility in special
automatic mating cages with synchronised timing to initiate the nightly mating period until
evidence of copulation was observed. Once evidence of mating was seen (presence of
copulation plug or sperm positive vaginal smear), 22 presumed-pregnant females were
allocated to each dosage group (0, 30, 125 and 500 mg/kg bw/d).
Diet preparation, analysis and administration:
The test item was weighed and then ground. The vehicle (1% aqueous CMC
(carboxymethylcellulose) solution) was added (w/v) and a homogenous mixture was
prepared. The mixture was continuously stirred up to the surface during the application
procedure.
Separate formulations were prepared for each concentration. Accuracy of mixing, stability
and homogeneity of dose formulations were confirmed by analysis. Samples for
determination of concentration, homogeneity and stability (4 hours and 7 days) of the dose
formulations were taken during the first week of the administration period. Additionally,
samples for determination of concentration and homogeneity were taken during the last
week of the administration period.
On each occasion three samples of approximately 2 g were taken from the top, middle and
bottom of each formulation. Stability samples were taken from the middle only. The samples
were frozen (-25 °C to -15 °C) prior to analysis.
Dams were administered fenpyrazamine by gavage at a dose volume of 10 mL/kg bw once
daily during days 6 to 20 of pregnancy, and sacrificed on day 21 of pregnancy for
examination of litters. Dose volumes were determined on the basis of the latest bodyweight,
determined daily.
Clinical observations:
All animals were checked at least twice daily for any mortality. Any female sacrificed or
found dead during the study was subjected to macroscopic examination with emphasis on
the uterus and its contents. Specimens of abnormal tissue were fixed in neutral phosphate
buffered 4% formaldehyde solution.
All animals were observed at least twice daily for signs of reaction to treatment and/or
symptoms of ill health.
Food consumption and body weight:
Food consumption was recorded on 3-day intervals (days 0-3, 3-6, 6-9, 9-12, 12-15, 15-18
and 18-21 post coitum) throughout pregnancy. Body weights were recorded daily from day 0
until day 21 of pregnancy.
Sacrifice and pathology:
ANNEX 1 – BACKGROUND DOCUMENT TO THE RAC OPINION ON FENPYRAZAMINE
149
At the scheduled necropsy on day 21 post coitum, females were sacrificed and the foetuses
removed by Caesarean section. Post mortem examination, including gross macroscopic
examination of all internal organs, with emphasis on the uterus, uterine contents, position of
foetuses in the uterus and number of corpora lutea, was performed and the data recorded.
All organs or tissues showing grossly visible abnormalities were preserved in neutral
phosphate buffered 4% formaldehyde solution. The uteri (and contents) of all females with
live foetuses were weighed at necropsy on day 21 post coitum to enable the calculation of
the corrected body weight gain. Placental weights were measured separately. The placentae
were fixed in neutral phosphate buffered 4% formaldehyde solution for possible microscopic
examination.
Foetal examination:
Fetuses were removed from the uterus, sexed, weighed individually, examined for gross
external abnormalities, and allocated either to microdissection technique or skeletal
examination.
1. Visceral examination (microdissection technique)
At least one half of the foetuses from each litter were fixed in Bouin's fixative (one foetus per
container). They were examined by a combination of serial sections of the head and
microdissection of the thorax and abdomen. This included detailed examination of the major
blood vessels and sectioning of the heart and kidneys. After examination, the tissue was
preserved in a solution of glycerine/ethanol. Descriptions of any abnormalities and variations
were recorded.
2. Skeletal examination
The remaining foetuses were prepared for skeletal examination, whereby with the exception
of paws, the skin was removed and discarded. Foetuses were processed through solutions of
ethanol, glacial acetic acid with Alcian blue (for cartilage staining), potassium hydroxide with
Alizarin red S (for clearing and staining ossified bone) and aqueous glycerin for preservation
and storage. The skeletons were examined and all abnormal findings and variations were
recorded. Non-removal of skin on the paws precluded examination of the cartilaginous
regions of all forepaw and hindpaw bones. This included the carpals, tarsals, metacarpals,
metatarsals and phalanges. The specimens were preserved individually in plastic bags.
If no implantation sites were evident, the uterus was placed in an aqueous solution of
ammonium sulfide to accentuate possible hemorrhagic areas of implantation sites. When
considered appropriate, macroscopic changes in the dams were photographed and samples
of tissue fixed in neutral phosphate buffered 4% formaldehyde solution for possible
microscopic examination. Foetuses with abnormalities were photographed, when considered
appropriate.
Findings:
Mortality and clinical signs:
There were no mortalities. All animals survived to terminal sacrifice. Occurrence of clinical
signs (hair los on legs, abdomen and chest), which were considered incidental, was
restricted to one animal of mid-dose group and 4 animals of high dose group. No clinical
ANNEX 1 – BACKGROUND DOCUMENT TO THE RAC OPINION ON FENPYRAZAMINE
150
signs were observed in low dose animals.
Food consumption, body weight and body weight gain:
Food consumption of rats in the high dose level was lower (-7.3%) than that in control. In
the last three days of pregnancy (18–21) this finding achieved statistical significance.There
was no disturbance of food consumption in females of mid- and low dose.
Bodyweight of females in the high dose group was statistically significantly lower than in the
control. This was achieved towards the end of the gestation period (day 20 and 21). No
effects on body weight were observed in the low and mid-dose animals. Bodyweight gains
(% of starting weight) of females in the mid- and high dose animals were statistically
significantly lower than those of the controls (38% of starting weight and 32% of starting
weight, respectively). This effect started at day 13 of pregnancy in the high dose females
and at day 19 of pregnancy in the mid-dose females. Females of high dose group had
significantly lower corrected body weight gain (excluding uterus) (3.3% of starting weight
comparing to 13% in control animals).There were no effects on body weight gain at the low
dose.
Reproduction data
Of 22 mated females in each group, 22, 21, 22 and 21 were pregnant in control, low, mid-
and high dose, respectively. No effects on mean number of corpora lutea/dam was observed
(this parameter shows only the biological variability, since the treatment began on day 6
p.c).
Foetal data
No effects on post implantation loss and mean litter size could be observed in any treated
group. One foetus of the high dose was found with whole body oedema (anasarca). As a
single finding, this was considered incidental. The mean foetal weight of high dose foetuses
was statistically significantly decreased. The mean placental weight of animals in mid-dose
group was increased comparing to control (+8.9%); in high dose group placental weight was
significantly higher compared to the control (+42.7%). Comparable increase of placental
weight was observed also in the preliminary rat developmental study. No histopathological
examinations of placenta or hormone level measurements were conducted. Therefore, the
reason of the increased placental weight stays unclear and could be, e.g. also a result of
hormonal imbalance or prompted induction of placental metabolic activity. The sex ratio
(male% / female%) was 47.5/52.5, 54.1/45.9, 48.7/51.3, 52.1/47.9 and thus close to equal
distribution.
Maternal, reproduction and foetal data are given in table below
Table 60: Maternal, reproductive and foetal findings of the rat developmental study
Dose (mg/kg bw/d) 0 30 125 500
Number of females mated 22 22 22 22
Non-pregnant 0 1 0 1
Premature delivery 0 0 0 1
Number of females with live
foetuses 22 21 22 20
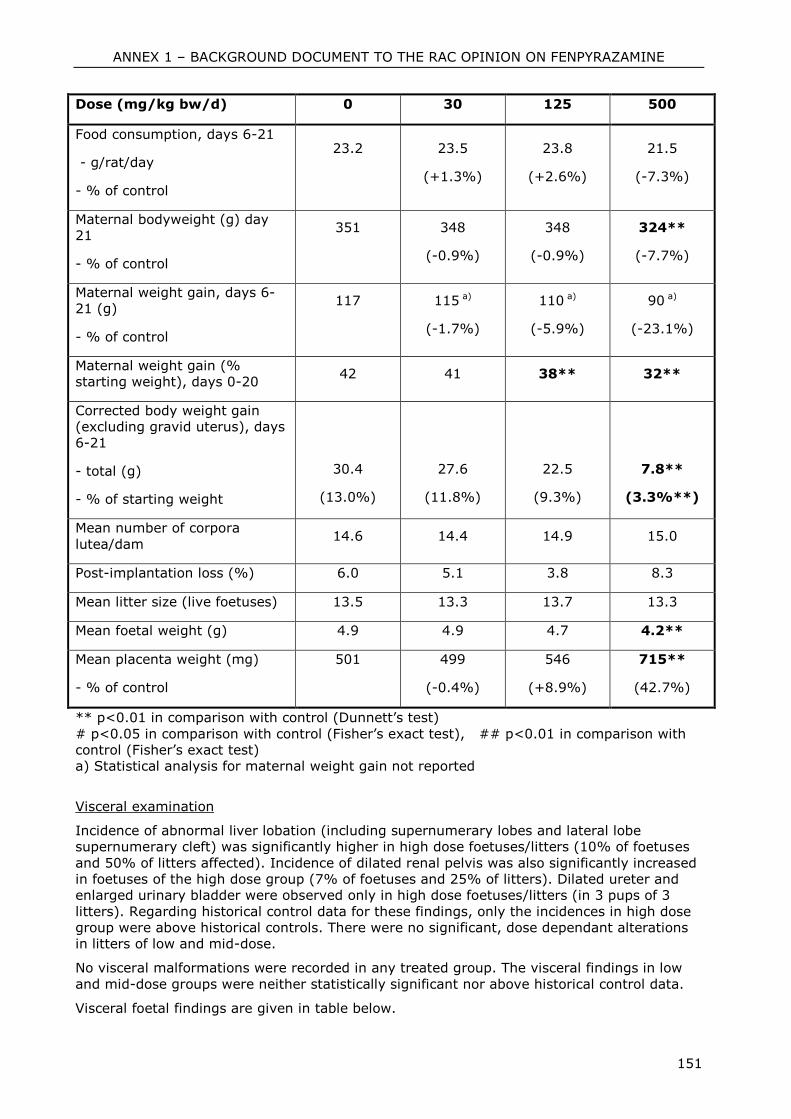
ANNEX 1 – BACKGROUND DOCUMENT TO THE RAC OPINION ON FENPYRAZAMINE
151
Dose (mg/kg bw/d) 0 30 125 500
Food consumption, days 6-21
- g/rat/day
- % of control
23.2
23.5
(+1.3%)
23.8
(+2.6%)
21.5
(-7.3%)
Maternal bodyweight (g) day
21
- % of control
351
348
(-0.9%)
348
(-0.9%)
324**
(-7.7%)
Maternal weight gain, days 6-
21 (g)
- % of control
117
115 a)
(-1.7%)
110 a)
(-5.9%)
90 a)
(-23.1%)
Maternal weight gain (%
starting weight), days 0-20 42 41 38** 32**
Corrected body weight gain
(excluding gravid uterus), days
6-21
- total (g)
- % of starting weight
30.4
(13.0%)
27.6
(11.8%)
22.5
(9.3%)
7.8**
(3.3%**)
Mean number of corpora
lutea/dam 14.6 14.4 14.9 15.0
Post-implantation loss (%) 6.0 5.1 3.8 8.3
Mean litter size (live foetuses) 13.5 13.3 13.7 13.3
Mean foetal weight (g) 4.9 4.9 4.7 4.2**
Mean placenta weight (mg)
- % of control
501
499
(-0.4%)
546
(+8.9%)
715**
(42.7%)
** p<0.01 in comparison with control (Dunnett’s test)
# p<0.05 in comparison with control (Fisher’s exact test), ## p<0.01 in comparison with
control (Fisher’s exact test)
a) Statistical analysis for maternal weight gain not reported
Visceral examination
Incidence of abnormal liver lobation (including supernumerary lobes and lateral lobe
supernumerary cleft) was significantly higher in high dose foetuses/litters (10% of foetuses
and 50% of litters affected). Incidence of dilated renal pelvis was also significantly increased
in foetuses of the high dose group (7% of foetuses and 25% of litters). Dilated ureter and
enlarged urinary bladder were observed only in high dose foetuses/litters (in 3 pups of 3
litters). Regarding historical control data for these findings, only the incidences in high dose
group were above historical controls. There were no significant, dose dependant alterations
in litters of low and mid-dose.
No visceral malformations were recorded in any treated group. The visceral findings in low
and mid-dose groups were neither statistically significant nor above historical control data.
Visceral foetal findings are given in table below.
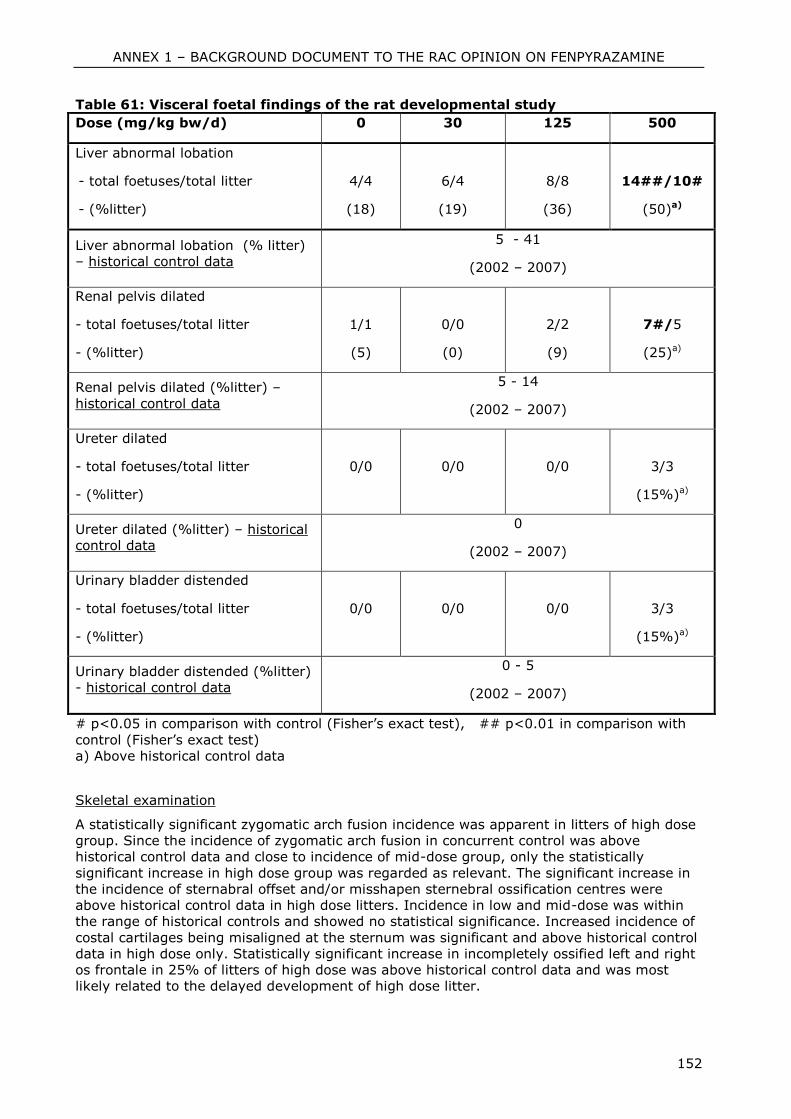
ANNEX 1 – BACKGROUND DOCUMENT TO THE RAC OPINION ON FENPYRAZAMINE
152
Table 61: Visceral foetal findings of the rat developmental study
Dose (mg/kg bw/d) 0 30 125 500
Liver abnormal lobation
- total foetuses/total litter
- (%litter)
4/4
(18)
6/4
(19)
8/8
(36)
14##/10#
(50)a)
Liver abnormal lobation (% litter)
– historical control data
5 - 41
(2002 – 2007)
Renal pelvis dilated
- total foetuses/total litter
- (%litter)
1/1
(5)
0/0
(0)
2/2
(9)
7#/5
(25)a)
Renal pelvis dilated (%litter) –
historical control data
5 - 14
(2002 – 2007)
Ureter dilated
- total foetuses/total litter
- (%litter)
0/0
0/0
0/0
3/3
(15%)a)
Ureter dilated (%litter) – historical
control data
0
(2002 – 2007)
Urinary bladder distended
- total foetuses/total litter
- (%litter)
0/0
0/0
0/0
3/3
(15%)a)
Urinary bladder distended (%litter)
- historical control data
0 - 5
(2002 – 2007)
# p<0.05 in comparison with control (Fisher’s exact test), ## p<0.01 in comparison with
control (Fisher’s exact test)
a) Above historical control data
Skeletal examination
A statistically significant zygomatic arch fusion incidence was apparent in litters of high dose
group. Since the incidence of zygomatic arch fusion in concurrent control was above
historical control data and close to incidence of mid-dose group, only the statistically
significant increase in high dose group was regarded as relevant. The significant increase in
the incidence of sternabral offset and/or misshapen sternebral ossification centres were
above historical control data in high dose litters. Incidence in low and mid-dose was within
the range of historical controls and showed no statistical significance. Increased incidence of
costal cartilages being misaligned at the sternum was significant and above historical control
data in high dose only. Statistically significant increase in incompletely ossified left and right
os frontale in 25% of litters of high dose was above historical control data and was most
likely related to the delayed development of high dose litter.
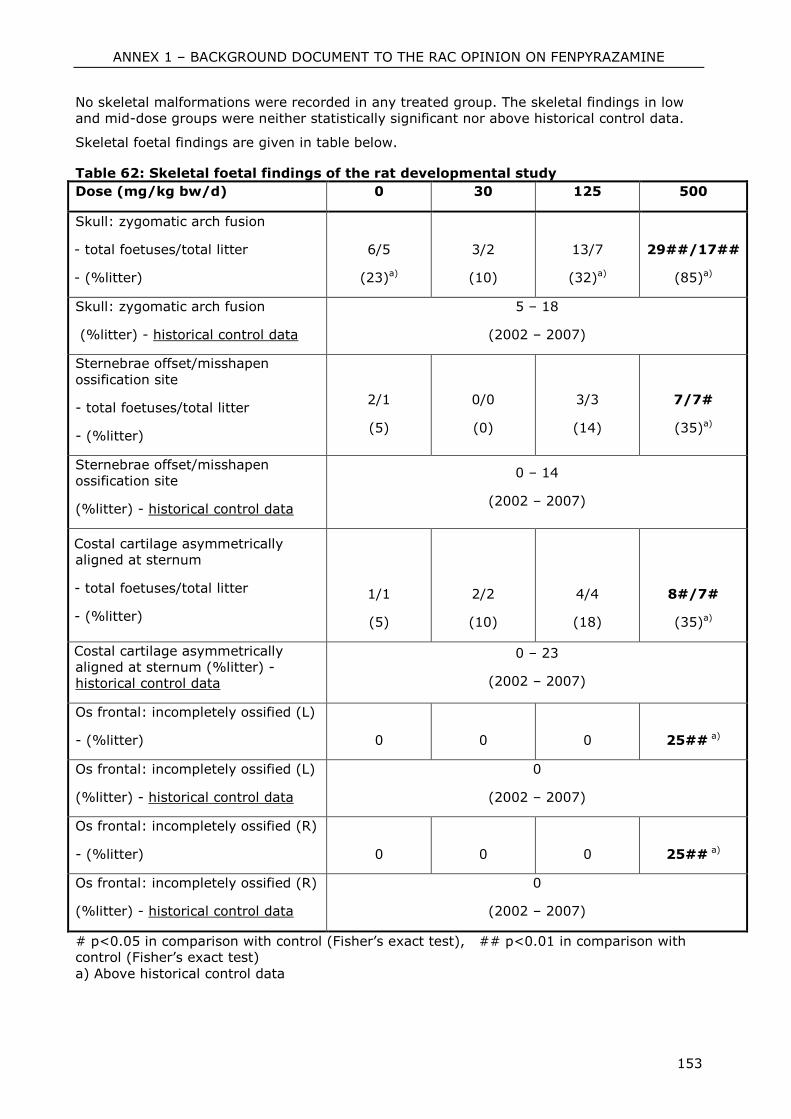
ANNEX 1 – BACKGROUND DOCUMENT TO THE RAC OPINION ON FENPYRAZAMINE
153
No skeletal malformations were recorded in any treated group. The skeletal findings in low
and mid-dose groups were neither statistically significant nor above historical control data.
Skeletal foetal findings are given in table below.
Table 62: Skeletal foetal findings of the rat developmental study
Dose (mg/kg bw/d) 0 30 125 500
Skull: zygomatic arch fusion
- total foetuses/total litter
- (%litter)
6/5
(23)a)
3/2
(10)
13/7
(32)a)
29##/17##
(85)a)
Skull: zygomatic arch fusion
(%litter) - historical control data
5 – 18
(2002 – 2007)
Sternebrae offset/misshapen
ossification site
- total foetuses/total litter
- (%litter)
2/1
(5)
0/0
(0)
3/3
(14)
7/7#
(35)a)
Sternebrae offset/misshapen
ossification site
(%litter) - historical control data
0 – 14
(2002 – 2007)
Costal cartilage asymmetrically
aligned at sternum
- total foetuses/total litter
- (%litter)
1/1
(5)
2/2
(10)
4/4
(18)
8#/7#
(35)a)
Costal cartilage asymmetrically
aligned at sternum (%litter) -
historical control data
0 – 23
(2002 – 2007)
Os frontal: incompletely ossified (L)
- (%litter)
0
0
0
25## a)
Os frontal: incompletely ossified (L)
(%litter) - historical control data
0
(2002 – 2007)
Os frontal: incompletely ossified (R)
- (%litter)
0
0
0
25## a)
Os frontal: incompletely ossified (R)
(%litter) - historical control data
0
(2002 – 2007)
# p<0.05 in comparison with control (Fisher’s exact test), ## p<0.01 in comparison with
control (Fisher’s exact test)
a) Above historical control data
ANNEX 1 – BACKGROUND DOCUMENT TO THE RAC OPINION ON FENPYRAZAMINE
154
Conclusion:
In the main developmental study in rats fenpyrazamine at dose levels of 0, 30, 125, and 500
mg/kg bw/day was well tolerated. All animals survived to the scheduled sacrifice and did not
show any adverse clinical signs. No malformations were observed in the study.
At 125 and 500 mg/kg dose level, mean body weight gains of dams were statistically
significantly lower when compared to the control group, thus indicating the occurrence of
maternal toxicity.
At 500 mg/kg dose level, placenta weights were statistically significantly increased, as
already observed in preliminary developmental study. Since no histolopathological
examinations or wet/dry weight measurements for estimation of hyperplasia or hypertrophy
and no hormone level measurement were conducted, it can not be excluded that the
increase in placental weight is an adverse effect, and not only an adaptive response.
No visceral or skeletal malformations were observed in the study.
The increased incidences of visceral (dilated kidney pelvis, dilated ureters, distended urinary
bladder, and of additional liver lobes in foetuses) and skeletal (zygomatic arch fusions,
sternebra offset or sternebra with misshapen ossification site, incomplete ossification of the
frontal bone and costal cartilages asymmetrically aligned at sternum) foetal findings in high
dose animals were considered related to observed maternal toxicity in this dose group.
In conclusion, the No Observed Adverse Effect Level (NOAEL) for maternal animals is
proposed at 30 mg/kg bw/day (lowest tested dose), based on statistically significantly lower
body weight gain in mid-and high dose dose animals during pregnancy. The developmental
NOAEL is proposed at 125 mg/kg bw/day (mid-dose), based on significant decrease of mean
foetal weight and significant increase of placental weight, visceral and skeletal variations and
delayed ossifications (above historical control data) in foetuses of high dose group (500
mg/kg bw/d).
Rabbits:
Reference: Dose range-finding teratology study in rabbits with S-2188
Author(s), year: Inawaka, K.; 2008a
Report/Doc.
number:
Sumitomo Chemical Co. Ltd. Report No. QNT-0030
Guideline(s): None stated (range finding study)
GLP: No
Deviations: Supplementary study
Validity: Yes
Material and methods:
Test Material: S-2188
Lot/Batch: 030-050914-1G
Purity: 94.7%
Test animals:
Species: Rabbit
ANNEX 1 – BACKGROUND DOCUMENT TO THE RAC OPINION ON FENPYRAZAMINE
155
Strain: New Zealand White (Kbl:NZW SPF)
Age at receipt: 19 weeks (male) or 17 weeks (female)
Weight: 3.44-3.66 kg (males), 3.34-3.78 kg (females)
Source: Kitayama Labes Co., Ltd.
Diet: LRC4, Oriental Yeast Co., Ltd.; available ad libitum
The purpose of the study was to select proper dose levels of fenpyrazamine for main
developmental study in rabbits.
Animal assignment and treatment:
Groups of female rabbits were artificially inseminated using semen collected from the males.
The day of insemination was designated Day 0 of gestation. Five (presumed pregnant)
females were allocated to each dosage group (control, 60, 90, 120 and 150 mg/kg bw/d).
Rabbits were dosed once each day during days 6 to 27 of gestation.
Diet preparation, analysis and administration:
The highest concentration was prepared by suspending test material in CMC solution; lower
doses were prepared by serial dilution of top dose material. Dose suspensions were prepared
at least once each two weeks. Test material stability in dose suspension was confirmed prior
to the study. During the study, concentration and homogeneity of dose preparations were
confirmed by analysis.
Fenpyrazamine technical was administered orally (using disposable syringe and silicon
catheter) as a suspension in a 1% aqueous carboxymethylcellulose (CMC) solution, at a dose
volume of 5 ml/kg bw.
Clinical observations:
Animals were observed at least once daily for mortality and clinical signs. During the dosing
period (days 6 – 27 of gestation), animals were observed at least twice (prior to dosing, and
1-3 hours after dosing) each day.
Food consumption and body weight:
Food consumption was measured between days 3-6, 6-9, 9-12, 12-15, 15-18, 18-21, 21-24,
24-27 and 28 of gestation. Bodyweights were measured on days 0, 6, 9, 12, 15, 18, 21, 24,
27 and 28 of gestation.
Sacrifice and pathology:
From females that gave birth prematurely or aborted, numbers of foetuses or placentas was
counted on discovery; animals were then sacrificed and necropsied.
All surviving females were sacrificed on gestation day 28, by i.v. injection of sodium
pentobarbital.
A gross examination was performed. Gravid uterine weight was measured. Foetuses were
removed by caesarean section, and number of corpora lutea, number of implantations,
number of live foetuses, number and intrauterine position of embryonic/foetal deaths, and
time of death were recorded (also from animals that aborted or gave birth prematurely).
ANNEX 1 – BACKGROUND DOCUMENT TO THE RAC OPINION ON FENPYRAZAMINE
156
Foetal examination:
Each live foetus was weighed and examined externally (including the oral cavity). Sex was
determined from observation of internal genitalia. After observation, all foetuses were fixed
in dehydration alcohol.
Findings:
Clinical signs and mortality:
Two animals (one each in 90 and 150 mg/kg bw group) did not become pregnant; the
number of pregnant females was therefore 5, 5, 4, 5 and 4.
One pregnant doe in 120 mg/kg bw group died on day 26 of gestation. Additionally, abortion
and/or premature delivery were seen in 1, 2 and 3 does in 90, 120 and 150 mg/kg bw
group, respectively. These events occurred between days 21 and 28 of gestation. In one of
these animals (high dose) it was not possible to determine the day of abortion.
The number of live litters available for examination at termination was 5, 5, 3, 2 and 1 for
the control, 60, 90, 120 and 150 mg/kg bw/day groups, respectively.
Orange discoloured urine, red fluid under the cage grid, or red fluid around the vagina was
seen in several animals from the 120 and 150 mg/kg bw/day groups (Table B.6.6.2.2.-1).
Food consumption, body weight and body weight gain
Between the three high dose groups (90, 120 and 150 mg/kg bw/d), a total of 6 animals
were observed to have ceased eating as the study progressed. These animals either died,
aborted or delivered prematurely.
Food consumption among rabbits of the 150 mg/kg/day group was lower almost throughout
the study. Animals given 120 or 150 mg/kg bw/day generally lost weight during gestation;
the majority of these animals aborted or delivered early.
No marked difference in bodyweight, adjusted body weight or bodyweight gain was seen in
animals which survived until termination.
Sacrifice and pathology:
At terminal necropsy on day 28 of pregnancy no notable abnormalities among surviving
animals of any group were found.
Among rabbits that aborted or delivered prematurely, findings of abnormal caecal contents
(dark brown and muddy in appearance), pale liver, distension of the gallbladder and/or red
fluid around the vagina, were considered treatment-related.
Foetal data:
Foetal bodyweight in the single surviving litter of the top dose group was marginally lower
than that of controls at terminal sacrifice. Post implantation losses, sex distribution and
foetus weights were comparable across the groups. Foetal examination was limited to
observation for external defects. No abnormalities or malformations were found.
Results of preliminary developmental study in rabbit are given in table below.
Table 63: Results of the preliminary developmental study in rabbit
Dose (mg/kg bw/day) 0 60 90 120 150
Number of females inseminated 5 5 5 5 5
ANNEX 1 – BACKGROUND DOCUMENT TO THE RAC OPINION ON FENPYRAZAMINE
157
Non-pregnant 0 0 1 0 1
Reduced/no food consumption 0 0 1 3 3
Pregnant does dead or
moribund 0 0 0 1 0
Abortion/ premature delivery 0 0 1 2 3
Total litter resorptions 0 0 0 0 0
Number of litters for evaluation 5 5 3 2 1
Maternal bodyweight (kg)
- day 6
- day 28 (surviving does)
3.98
4.23
4.06
4.28
4.00
4.12
4.11
4.45
4.12
4.34
Adjusted (without gravid
uterus) body weight (kg) on
day 28
3.82 3.94 3.68 4.02 4.04
Number of implantations/doe 9.0 7.8 10.7 8.0 7.0
Mean litter size (live foetuses) 8.8 7.0 9.0 6.5 7.0
Mean foetus weight (g) 33.7 34.7 30.4 37.8 30.6
Clinical signs
Orange urine 0 0 0 3 1
Orange urine, red fluid under
grid floor, pale eyes (non-
pregnant animal)
0 0 0 0 1
Red fluid under grid floor 0 0 0 3 2
Red fluid around vagina 0 0 0 1 1
No statistical significance reported
Conclusion:
In the range finding rabbit developmental study, five presumed-pregnant female rabbits per
group were administered fenpyrazamine at doses of 0, 60, 90, 120 or 150 mg/kg bw/day as
a suspension in 1% aqueous CMC from days 6 to 27 of pregnancy.
Mortality was observed at 120 mg/kg bw/d (one doe). Reduced food consumption/refusal of
food was observed in three high dose groups (90, 120 and 150 mg/kg bw/day), followed by
abortion and/or premature deliveries. As a result, there was a reduced litter number for
further examination. Clinical findings among affected does were largely restricted to orange
discoloured urine and/ or a red fluid beneath the cage, mainly observed in 120 and 150
mg/kg bw group. No effect on development of the foetuses was detected. Although the study
was only a range-finding study, maternal and foetal NOAELs are proposed at 60 mg/kg
bw/d, based on food refusal of does, and subsequent abortions/premature deliveries at next
higher dose.
ANNEX 1 – BACKGROUND DOCUMENT TO THE RAC OPINION ON FENPYRAZAMINE
158
Reference: Teratology study in rabbits with S-2188 Technical Grade
Author(s), year: Inawaka, K.; 2008b
Report/Doc.
number:
Sumitomo Chemical Co. Ltd. Report No. QNT-0032
Guideline(s): Japanese MAFF 12 Nousan 8147, EPA OPPTS 870.3700, OECD 414
GLP: Yes (self-certification)
Deviations: - One animal of the control group was excluded from the study on day
16 since it bit and swallowed the catheter
- According to OECD 414, the study may not be appropriate if there are
less than 16 litters left in one treated group. Although in the current
study there were only 15 litters left, it is considered acceptable, since
there are enough litters for evaluation in the next lower dose, which is
considered to be LOAEL for foetal and maternal effects.
Validity: Yes
Material and methods:
Test Material: S-2188
Lot/Batch: 030-050914-1G
Purity: 94.7%
Test animals:
Species: Rabbit
Strain: New Zealand White (Kbl:NZW SPF)
Age at receipt: 19 weeks (male) or 17 weeks (female)
Weight: 3.40-3.82 kg (males), 3.10-3.80 kg (females)
Source: Kitayama Labes Co., Ltd.
Diet: LRC4, Oriental Yeast Co., Ltd.; available ad libitum
The purpose of the study was to detect adverse effects of fenpyrazamine on pregnant rabbits
and on the development of embryos and the foetuses consequent to exposure of the females
to the test substance (0, 30, 50 and 90 mg/kg bw/d) from implantation (day 6 post coitum)
until day 28 p.c.
Animal assignment and treatment:
Groups of 24 female rabbits were artificially inseminated using semen collected from the
males. The day of insemination was designated Day 0 of gestation. 24 (presumed pregnant)
females were allocated to each dosage group (control, 30, 50 and 90 mg/kg bw/d). Rabbits
were dosed once each day during days 6 to 27 of gestation.
Diet preparation, analysis and administration:
The highest concentration was prepared by suspending test material in CMC solution; lower
doses were prepared by serial dilution of top dose material. Dose suspensions were prepared
at least once each two weeks. Test material stability in dose suspension was confirmed prior
to the study. During the study, concentration and homogeneity of dose preparations were
confirmed by analysis.
Fenpyrazamine technical was administered orally (using disposable syringe and silicon
ANNEX 1 – BACKGROUND DOCUMENT TO THE RAC OPINION ON FENPYRAZAMINE
159
catheter) as a suspension in a 1% aqueous carboxymethylcellulose (CMC) solution, at a dose
volume of 5 ml/kg bw.
Clinical observations:
Animals were observed at least once daily for mortality and clinical signs. During the dosing
period (days 6 – 27 of gestation), animals were observed at least twice (prior to dosing, and
1-3 hours after dosing) each day.
Food consumption and body weight:
Food consumption was measured between days 3-6, 6-9, 9-12, 12-15, 15-18, 18-21, 21-24,
24-27 and 28 of gestation. Bodyweights were measured on days 0, 6, 9, 12, 15, 18, 21, 24,
27 and 28 of gestation.
Sacrifice and pathology:
From females that gave birth prematurely or aborted, number of foetuses was counted on
discovery, the animals were then sacrificed and necropsied. All remaining females were
sacrificed on gestation day 28, by i.v. injection of sodium pentobarbital.
A gross examination was performed. Gravid uterine weight was measured. Foetuses were
removed by caesarean section, and number of corpora lutea, number of implantations,
number of live foetuses, number and intrauterine position of embryonic/foetal deaths
(including time of resorptions) were recorded.
Foetal examination:
Each live foetus was weighed and examined externally (including the oral cavity). Sex was
determined from observation of internal genitalia. Foetuses with external abnormalities were
fixed in buffered 10% formalin and stored; these were not subject to visceral or skeletal
examination. The cervical, thoracic and abdominal viscera of all foetuses were examined for
visceral alterations.
The heads of approximately one-half of the live foetuses were examined by cross-section of
the coronal suture. The heads of the remaining foetuses, and hearts of all foetuses, were
fixed in Bouin’s solution and examined.
The remaining skeletons were fixed in dehydrating alcohol, stained with Alizarin Red S using
Kawamura’s method, then examined for skeletal abnormalities. After examination, skeletons
were stored in glycerol. Skeletal examination of heads fixed in Bouin’s solution was not
performed.
Findings:
Clinical signs and mortality:
A small proportion of females in each group did not become pregnant; the number of
pregnant females was 20, 19, 21 and 22. One further animal of the control group was
sacrificed on day 12 of gestation after a technical malfunction during dosing, and excluded
from evaluation.
No animal died as a result of maternal toxicity. As a result of abortion/premature delivery,
one mid-dose and seven top-dose animals failed to complete the study; animals were killed
prior to scheduled kill. The number of animals reaching scheduled necropsy was therefore
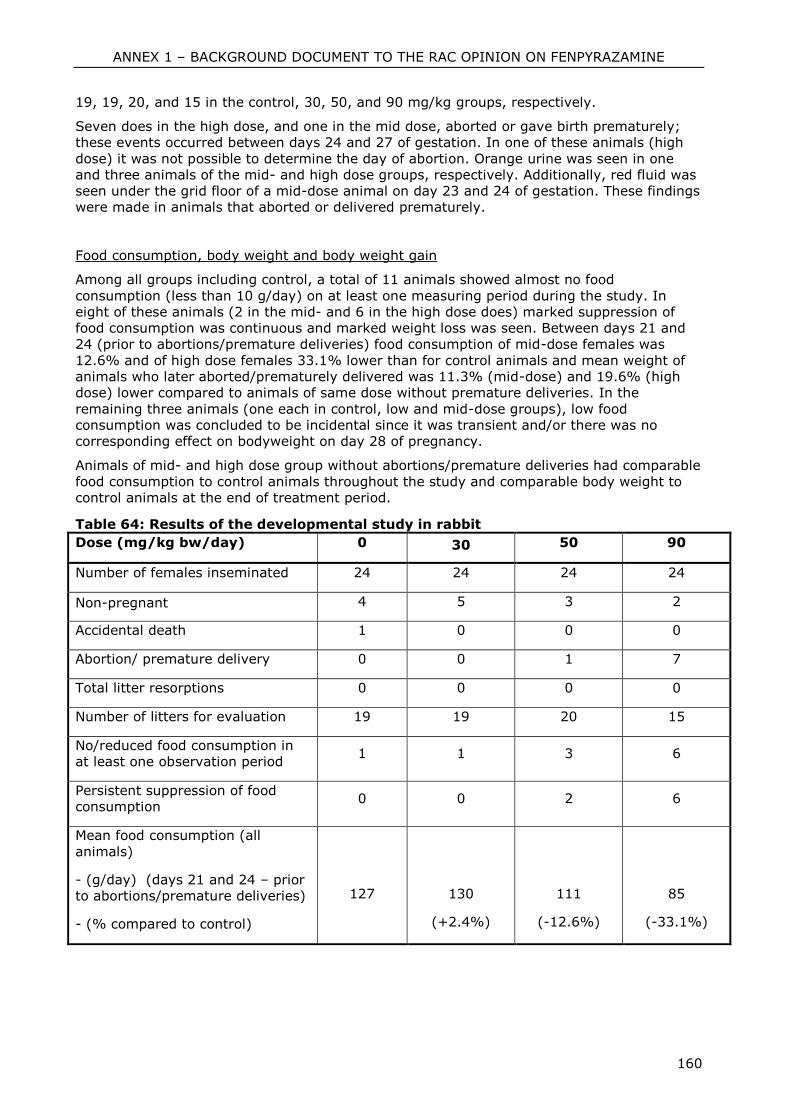
ANNEX 1 – BACKGROUND DOCUMENT TO THE RAC OPINION ON FENPYRAZAMINE
160
19, 19, 20, and 15 in the control, 30, 50, and 90 mg/kg groups, respectively.
Seven does in the high dose, and one in the mid dose, aborted or gave birth prematurely;
these events occurred between days 24 and 27 of gestation. In one of these animals (high
dose) it was not possible to determine the day of abortion. Orange urine was seen in one
and three animals of the mid- and high dose groups, respectively. Additionally, red fluid was
seen under the grid floor of a mid-dose animal on day 23 and 24 of gestation. These findings
were made in animals that aborted or delivered prematurely.
Food consumption, body weight and body weight gain
Among all groups including control, a total of 11 animals showed almost no food
consumption (less than 10 g/day) on at least one measuring period during the study. In
eight of these animals (2 in the mid- and 6 in the high dose does) marked suppression of
food consumption was continuous and marked weight loss was seen. Between days 21 and
24 (prior to abortions/premature deliveries) food consumption of mid-dose females was
12.6% and of high dose females 33.1% lower than for control animals and mean weight of
animals who later aborted/prematurely delivered was 11.3% (mid-dose) and 19.6% (high
dose) lower compared to animals of same dose without premature deliveries. In the
remaining three animals (one each in control, low and mid-dose groups), low food
consumption was concluded to be incidental since it was transient and/or there was no
corresponding effect on bodyweight on day 28 of pregnancy.
Animals of mid- and high dose group without abortions/premature deliveries had comparable
food consumption to control animals throughout the study and comparable body weight to
control animals at the end of treatment period.
Table 64: Results of the developmental study in rabbit
Dose (mg/kg bw/day) 0 30 50 90
Number of females inseminated 24 24 24 24
Non-pregnant 4 5 3 2
Accidental death 1 0 0 0
Abortion/ premature delivery 0 0 1 7
Total litter resorptions 0 0 0 0
Number of litters for evaluation 19 19 20 15
No/reduced food consumption in
at least one observation period 1 1 3 6
Persistent suppression of food
consumption 0 0 2 6
Mean food consumption (all
animals)
- (g/day) (days 21 and 24 – prior
to abortions/premature deliveries)
- (% compared to control)
127
130
(+2.4%)
111
(-12.6%)
85
(-33.1%)
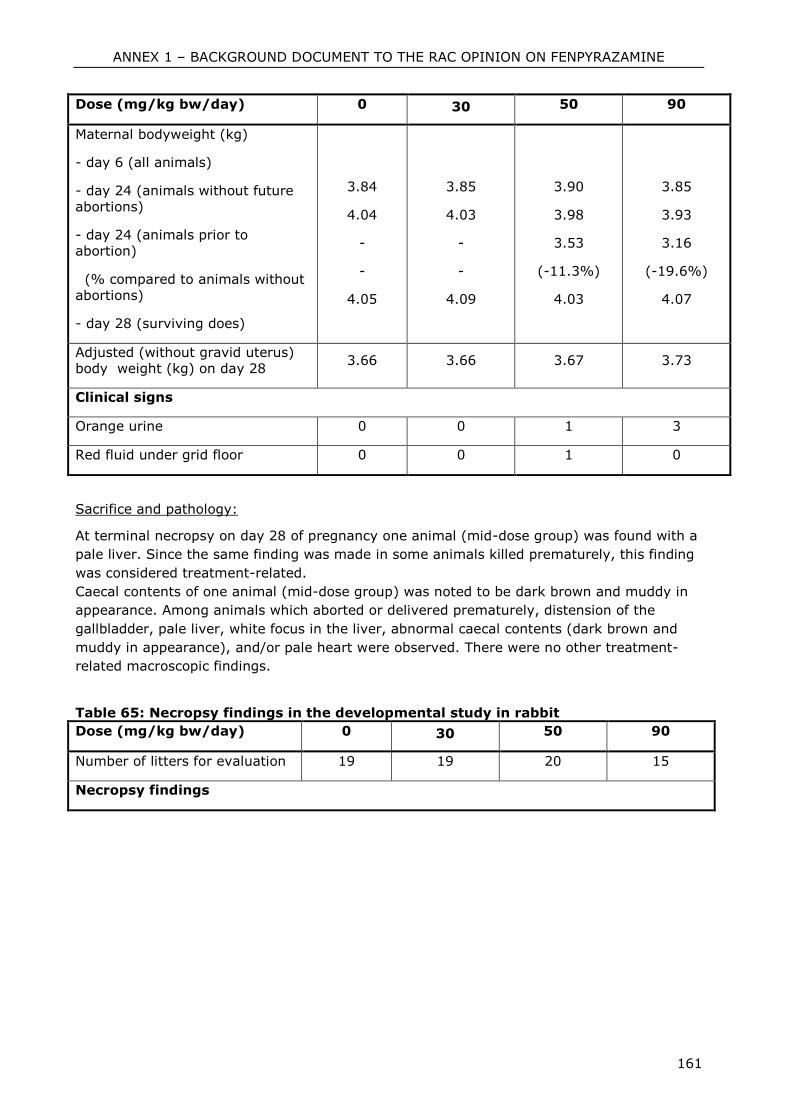
ANNEX 1 – BACKGROUND DOCUMENT TO THE RAC OPINION ON FENPYRAZAMINE
161
Dose (mg/kg bw/day) 0 30 50 90
Maternal bodyweight (kg)
- day 6 (all animals)
- day 24 (animals without future
abortions)
- day 24 (animals prior to
abortion)
(% compared to animals without
abortions)
- day 28 (surviving does)
3.84
4.04
-
-
4.05
3.85
4.03
-
-
4.09
3.90
3.98
3.53
(-11.3%)
4.03
3.85
3.93
3.16
(-19.6%)
4.07
Adjusted (without gravid uterus)
body weight (kg) on day 28 3.66 3.66 3.67 3.73
Clinical signs
Orange urine 0 0 1 3
Red fluid under grid floor 0 0 1 0
Sacrifice and pathology:
At terminal necropsy on day 28 of pregnancy one animal (mid-dose group) was found with a
pale liver. Since the same finding was made in some animals killed prematurely, this finding
was considered treatment-related.
Caecal contents of one animal (mid-dose group) was noted to be dark brown and muddy in
appearance. Among animals which aborted or delivered prematurely, distension of the
gallbladder, pale liver, white focus in the liver, abnormal caecal contents (dark brown and
muddy in appearance), and/or pale heart were observed. There were no other treatment-
related macroscopic findings.
Table 65: Necropsy findings in the developmental study in rabbit
Dose (mg/kg bw/day) 0 30 50 90
Number of litters for evaluation 19 19 20 15
Necropsy findings
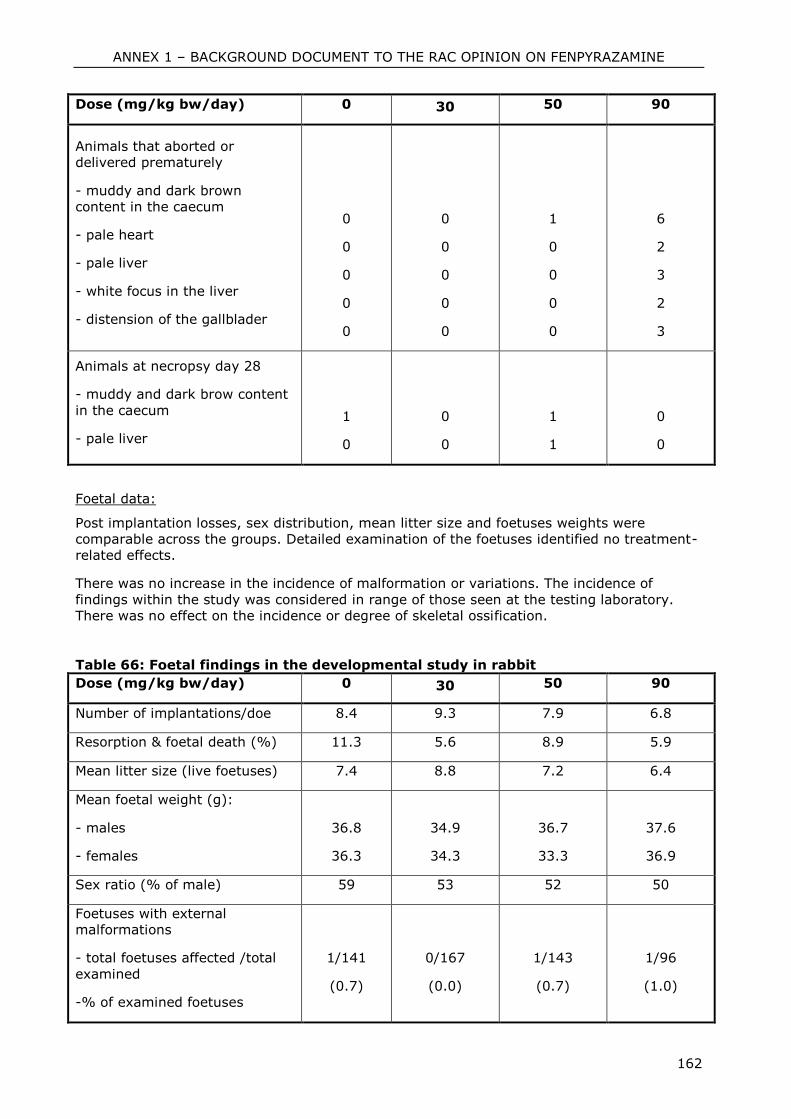
ANNEX 1 – BACKGROUND DOCUMENT TO THE RAC OPINION ON FENPYRAZAMINE
162
Dose (mg/kg bw/day) 0 30 50 90
Animals that aborted or
delivered prematurely
- muddy and dark brown
content in the caecum
- pale heart
- pale liver
- white focus in the liver
- distension of the gallblader
0
0
0
0
0
0
0
0
0
0
1
0
0
0
0
6
2
3
2
3
Animals at necropsy day 28
- muddy and dark brow content
in the caecum
- pale liver
1
0
0
0
1
1
0
0
Foetal data:
Post implantation losses, sex distribution, mean litter size and foetuses weights were
comparable across the groups. Detailed examination of the foetuses identified no treatment-
related effects.
There was no increase in the incidence of malformation or variations. The incidence of
findings within the study was considered in range of those seen at the testing laboratory.
There was no effect on the incidence or degree of skeletal ossification.
Table 66: Foetal findings in the developmental study in rabbit
Dose (mg/kg bw/day) 0 30 50 90
Number of implantations/doe 8.4 9.3 7.9 6.8
Resorption & foetal death (%) 11.3 5.6 8.9 5.9
Mean litter size (live foetuses) 7.4 8.8 7.2 6.4
Mean foetal weight (g):
- males
- females
36.8
36.3
34.9
34.3
36.7
33.3
37.6
36.9
Sex ratio (% of male) 59 53 52 50
Foetuses with external
malformations
- total foetuses affected /total
examined
-% of examined foetuses
1/141
(0.7)
0/167
(0.0)
1/143
(0.7)
1/96
(1.0)
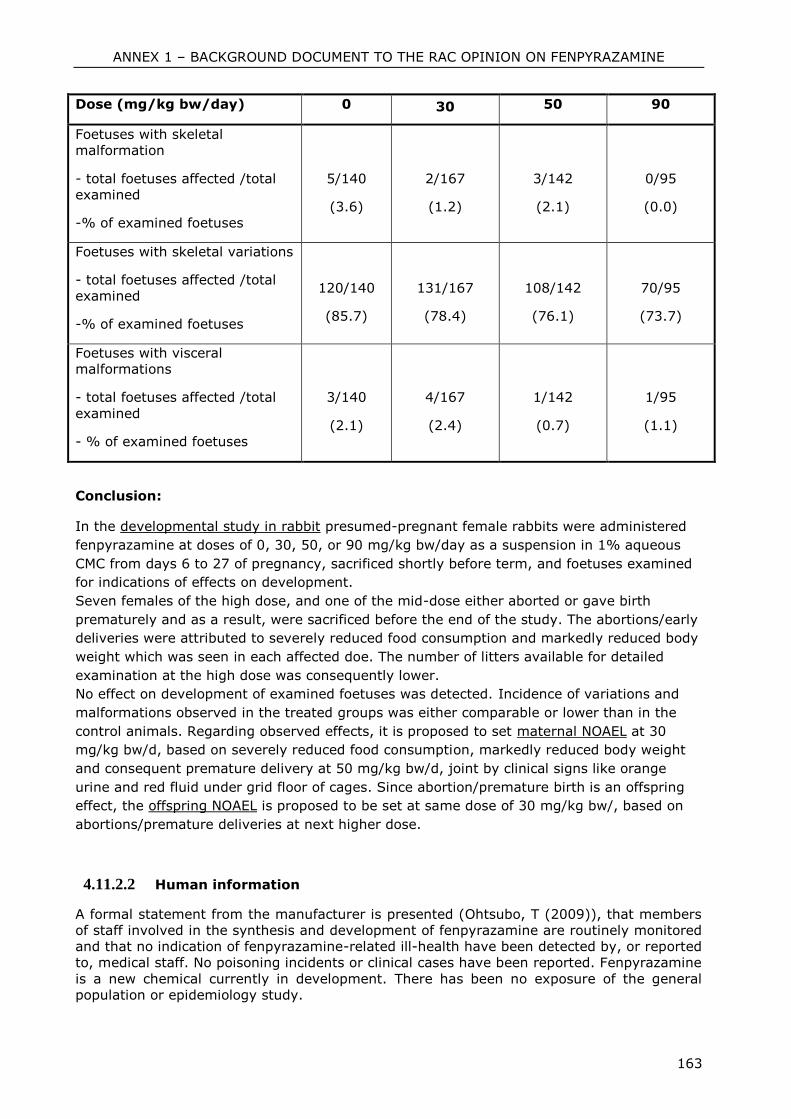
ANNEX 1 – BACKGROUND DOCUMENT TO THE RAC OPINION ON FENPYRAZAMINE
163
Dose (mg/kg bw/day) 0 30 50 90
Foetuses with skeletal
malformation
- total foetuses affected /total
examined
-% of examined foetuses
5/140
(3.6)
2/167
(1.2)
3/142
(2.1)
0/95
(0.0)
Foetuses with skeletal variations
- total foetuses affected /total
examined
-% of examined foetuses
120/140
(85.7)
131/167
(78.4)
108/142
(76.1)
70/95
(73.7)
Foetuses with visceral
malformations
- total foetuses affected /total
examined
- % of examined foetuses
3/140
(2.1)
4/167
(2.4)
1/142
(0.7)
1/95
(1.1)
Conclusion:
In the developmental study in rabbit presumed-pregnant female rabbits were administered
fenpyrazamine at doses of 0, 30, 50, or 90 mg/kg bw/day as a suspension in 1% aqueous
CMC from days 6 to 27 of pregnancy, sacrificed shortly before term, and foetuses examined
for indications of effects on development.
Seven females of the high dose, and one of the mid-dose either aborted or gave birth
prematurely and as a result, were sacrificed before the end of the study. The abortions/early
deliveries were attributed to severely reduced food consumption and markedly reduced body
weight which was seen in each affected doe. The number of litters available for detailed
examination at the high dose was consequently lower.
No effect on development of examined foetuses was detected. Incidence of variations and
malformations observed in the treated groups was either comparable or lower than in the
control animals. Regarding observed effects, it is proposed to set maternal NOAEL at 30
mg/kg bw/d, based on severely reduced food consumption, markedly reduced body weight
and consequent premature delivery at 50 mg/kg bw/d, joint by clinical signs like orange
urine and red fluid under grid floor of cages. Since abortion/premature birth is an offspring
effect, the offspring NOAEL is proposed to be set at same dose of 30 mg/kg bw/, based on
abortions/premature deliveries at next higher dose.
4.11.2.2 Human information
A formal statement from the manufacturer is presented (Ohtsubo, T (2009)), that members
of staff involved in the synthesis and development of fenpyrazamine are routinely monitored
and that no indication of fenpyrazamine-related ill-health have been detected by, or reported
to, medical staff. No poisoning incidents or clinical cases have been reported. Fenpyrazamine
is a new chemical currently in development. There has been no exposure of the general
population or epidemiology study.
ANNEX 1 – BACKGROUND DOCUMENT TO THE RAC OPINION ON FENPYRAZAMINE
164
4.11.3 Other relevant information
No other relevant information available.
4.11.4 Summary and discussion of reproductive toxicity
In the preliminary dose-finding study fenpyrazamine was well-tolerated at all doses,
resulting only in weight gain loss in parental males of mid- and high dose group (during
female gestation and lactation time) and in parental females of high dose group during
gestation. Mating performance and fertility appeared unaffected at all dose levels. In the
high dose females, an increase in post implantation loss and reduction in litter size were
noted. Pups in the high dose group showed statistically significant body weight loss from day
14 and 28 post-partum, but not at birth. At necropsy, an increased incidence of thyroid
enlargement was reported in parental males and females of high dose. There were no
notable necropsy findings among pups. Changes in organ weights of pups are considered
secondary to body weight loss in high dose animals during lactation and weaning. Therefore,
the NOAEL for parental systemic toxicity is set at 400 ppm for males (equivalent to 24.8
mg/kg bw/d) and 1000 ppm for females (equivalent to 75 mg/kg bw/d), based on decreased
body weight gain of both sexes (> 10%) during gestation period. NOAEL for offspring
systemic toxicity is proposed to be set at the dose level of 1000 ppm (equivalent to 75
mg/kg bw/day during gestation) due to increased post implantation loss, decreased number
of live pups at birth and significantly lower body weight of pups from day 14 to 28 post
partum. Additionally, absolute and relative organ weights alterations (statistically significant)
were observed in high dose pups. Reproductive NOAEL of 3000 ppm (equivalent to 244.7
mg/kg bw/d (males) and 253.7 mg/kg bw/d (females)) was derived, due to no effects
observed on reproduction at highest dose tested.
In the 2-generation study, fenpyrazamine was administered continuously in the feed to rats
at dietary concentrations of 0, 400, 1000, and 3000 ppm. The toxicological response of the
treated animals was principally characterised by increase in relative liver and thyroid weight
and histological findings in these organs (cell hypertrophy) and reduced food consumption
and decreased body weight gain throughout the whole study period. Significantly lower
number of implantations, significantly increased post implantation loss and significantly
increased post natal loss in the high dose group of F1 generation is considered to be the
effect of systemic toxicity in maternal animals (body weight gain loss, body weight
reduction, thyroid enlargement, hepatocellular and thyroid cell hypertrophy). Fenpyrazamine
showed no effects on fertility. Sperm evaluation and ovary staging did not reveal any test
substance related findings. A No-Observed-Adverse-Effect Level (NOAEL) for parental effects
in P and F1 generation is proposed at the dietary level of 400 ppm (20.3 mg/kg bw/d; mean
substance intake of males of F1 generation during after-mating period), based on occurrence
of increased relative liver and thyroid weights and corresponding histological findings (liver
and thyroid cell hypertrophy) at 3000 ppm and 1000 ppm. Statistically significant decrease
of relative liver weight of males at 400 ppm was not considered adverse because of absence
of histopathological findings in liver at this dose. A No-Observed-Adverse-Effect Level
(NOAEL) for offspring effects in F1 and F2 pups is proposed at 400 ppm (28.5 mg/kg bw/d;
mean substance intake of females of F1 generation during gestation), based on significantly
lower body weights of F1 and F2 pups during lactation at 3000 ppm and 1000 ppm.
Statistically significant increase of post implantation loss and decreased viability index for
pups of all F1 parents are within the historical control data are therefore not regarded as
relevant for setting the NOAEL. A No-Observed-Adverse-Effect Level (NOAEL) for
reproductive effects is proposed at the dietary level of 1000 ppm (73.7 mg/kg bw/d; mean
ANNEX 1 – BACKGROUND DOCUMENT TO THE RAC OPINION ON FENPYRAZAMINE
165
substance intake of females of F1 generation during gestation), based on significantly
decreased number of implantations observed in F1 females at 3000 ppm.
In the preliminary developmental study in rat, the doses of 150, 300 and 500 mg/kg bw/d
were administered. Except for death of one dam, no excess toxicity was observed in any
treated group. In the high dose group, corrected body weight gain of dams and mean weight
of foetuses were significantly decreased. Mean placental weight was significantly increased in
all treated groups but no histopathological examinations of placenta or horomone level
measurements were conducted. Therefore, it can not be excluded, that increased placental
weight is an adverse effect and not only an adaptive response. Observed malformations in
two foetuses (1 per litter) from low and mid-dose were not considered treatment-related.
Based on the results of this study, a high dose of 500 mg/kg bw/day was recommended for
main developmental study and dose lower than 150 mg/kg bw/d was chosen as a low dose,
in order to be able to establish NOAEL.
In the main developmental study in rats fenpyrazamine at dose levels of 0, 30, 125, and 500
mg/kg bw/day was well tolerated. All animals survived to the scheduled sacrifice and did not
show any adverse clinical signs. No malformations were observed in the study.
At 125 and 500 mg/kg dose level, mean body weight gains of dams were statistically
significantly lower when compared to the control group, thus indicating the occurrence of
maternal toxicity.
At 500 mg/kg dose level, placenta weights were statistically significantly increased, as
already observed in the preliminary developmental study. Since no histolopathological
examinations or wet/dry weight measurements for estimation of hyperplasia or hypertrophy
and no hormone level measurements were conducted, it can not be excluded that the
increase in placental weight is an adverse effect and not only an adaptive response.
No visceral or skeletal malformations were observed in the study.
The increased incidences of visceral (dilated kidney pelvis, dilated ureters, distended urinary
bladder, and of additional liver lobes in foetuses) and skeletal (zygomatic arch fusions,
sternebra offset or sternebra with misshapen ossification site, incomplete ossification of the
frontal bone and costal cartilages asymmetrically aligned at sternum) foetal findings in high
dose animals were considered related to observed maternal toxicity in this dose group.
In conclusion, the No Observed Adverse Effect Level (NOAEL) for maternal animals is
proposed at 30 mg/kg bw/day (lowest tested dose), based on statistically significantly lower
body weight gain in mid-and high dose dose animals during pregnancy. The developmental
NOAEL is proposed at 125 mg/kg bw/day (mid-dose), based on significant decrease of mean
foetal weight and significant increase of placental weight, visceral and skeletal variations and
delayed ossifications (above historical control data) in foetuses of high dose group (500
mg/kg bw/d).
In the range finding rabbit developmental study, five presumed-pregnant female rabbits per
group were administered fenpyrazamine at doses of 0, 60, 90, 120 or 150 mg/kg bw/day as
a suspension in 1% aqueous CMC from days 6 to 27 of pregnancy.
Mortality was observed at 120 mg/kg bw/d (one doe). Reduced food consumption/refusal of
food was observed in three high dose groups (90, 120 and 150 mg/kg bw/day), followed by
abortion and/or premature deliveries. As a result, there was a reduced litter number for
further examination. Clinical findings among affected does were largely restricted to orange
discoloured urine and/ or a red fluid beneath the cage, mainly observed in 120 and 150
ANNEX 1 – BACKGROUND DOCUMENT TO THE RAC OPINION ON FENPYRAZAMINE
166
mg/kg bw group. No effect on development of the foetuses was detected. Although the study
was only a range-finding study, maternal and foetal NOAELs are proposed at 60 mg/kg
bw/d, based on food refusal of does, and subsequent abortions/premature deliveries at next
higher dose.
In the developmental study in rabbit presumed-pregnant female rabbits were administered
fenpyrazamine at doses of 0, 30, 50, or 90 mg/kg bw/day as a suspension in 1% aqueous
CMC from days 6 to 27 of pregnancy, sacrificed shortly before term, and foetuses examined
for indications of effects on development.
Seven females of the high dose, and one of the mid-dose either aborted or gave birth
prematurely and as a result, were sacrificed before the end of the study. The abortions/early
deliveries were attributed to severely reduced food consumption and markedly reduced body
weight which was seen in each affected doe. The number of litters available for detailed
examination at the high dose was consequently lower.
No effect on development of examined foetuses was detected. Incidence of variations and
malformations observed in the treated groups was either comparable or lower than in the
control animals. Regarding observed effects, it is proposed to set maternal NOAEL at 30
mg/kg bw/d, based on severely reduced food consumption, markedly reduced body weight
and consequent premature delivery at 50 mg/kg bw/d, joint by clinical signs like orange
urine and red fluid under grid floor of cages. Since abortion/premature birth is an offspring
effect, the offspring NOAEL is proposed to be set at same dose of 30 mg/kg bw/, based on
abortions/premature deliveries at next higher dose.
4.11.5 Comparison with criteria
Regarding maternal and developmental findings from one 2-generation rat study and two
developmental studies on each rat and rabbit, no classification and labelling is triggered for
fenpyrazamine.
4.11.6 Conclusions on classification and labelling
There is no evidence of effects on reproduction and development caused by fenpyrazamine,
therefore, no classification and labelling is proposed.
RAC evaluation of reproductive toxicity
Summary of the Dossier submitter’s proposal
The dossier submitter proposed not to classify fenpyrazamine for reproductive toxicity
based on two reproductive toxicity studies in rats and one in rabbits.
Comments received during public consultation Interested parties fully agreed with the reproductive toxicity evaluation in the CLH report.
Assessment and comparison with the classification criteria Fenpyrazamine was tested for reproductive toxicity according to the following study
guidelines:
o Two-generation reproduction toxicity study rat (OECD 416)
o Developmental toxicity study (rat) (OECD 414)
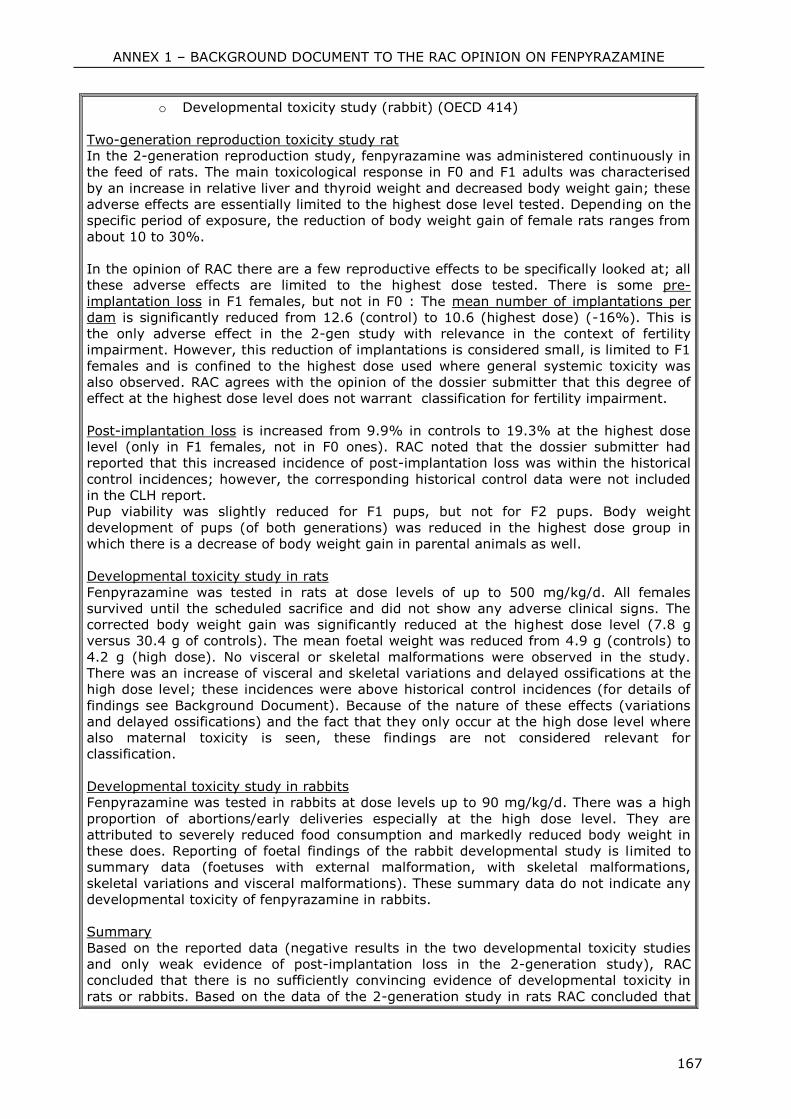
ANNEX 1 – BACKGROUND DOCUMENT TO THE RAC OPINION ON FENPYRAZAMINE
167
o Developmental toxicity study (rabbit) (OECD 414)
Two-generation reproduction toxicity study rat
In the 2-generation reproduction study, fenpyrazamine was administered continuously in
the feed of rats. The main toxicological response in F0 and F1 adults was characterised
by an increase in relative liver and thyroid weight and decreased body weight gain; these
adverse effects are essentially limited to the highest dose level tested. Depending on the
specific period of exposure, the reduction of body weight gain of female rats ranges from
about 10 to 30%.
In the opinion of RAC there are a few reproductive effects to be specifically looked at; all
these adverse effects are limited to the highest dose tested. There is some pre-
implantation loss in F1 females, but not in F0 : The mean number of implantations per
dam is significantly reduced from 12.6 (control) to 10.6 (highest dose) (-16%). This is
the only adverse effect in the 2-gen study with relevance in the context of fertility
impairment. However, this reduction of implantations is considered small, is limited to F1
females and is confined to the highest dose used where general systemic toxicity was
also observed. RAC agrees with the opinion of the dossier submitter that this degree of
effect at the highest dose level does not warrant classification for fertility impairment.
Post-implantation loss is increased from 9.9% in controls to 19.3% at the highest dose
level (only in F1 females, not in F0 ones). RAC noted that the dossier submitter had
reported that this increased incidence of post-implantation loss was within the historical
control incidences; however, the corresponding historical control data were not included
in the CLH report.
Pup viability was slightly reduced for F1 pups, but not for F2 pups. Body weight
development of pups (of both generations) was reduced in the highest dose group in
which there is a decrease of body weight gain in parental animals as well.
Developmental toxicity study in rats
Fenpyrazamine was tested in rats at dose levels of up to 500 mg/kg/d. All females
survived until the scheduled sacrifice and did not show any adverse clinical signs. The
corrected body weight gain was significantly reduced at the highest dose level (7.8 g
versus 30.4 g of controls). The mean foetal weight was reduced from 4.9 g (controls) to
4.2 g (high dose). No visceral or skeletal malformations were observed in the study.
There was an increase of visceral and skeletal variations and delayed ossifications at the
high dose level; these incidences were above historical control incidences (for details of
findings see Background Document). Because of the nature of these effects (variations
and delayed ossifications) and the fact that they only occur at the high dose level where
also maternal toxicity is seen, these findings are not considered relevant for
classification.
Developmental toxicity study in rabbits
Fenpyrazamine was tested in rabbits at dose levels up to 90 mg/kg/d. There was a high
proportion of abortions/early deliveries especially at the high dose level. They are
attributed to severely reduced food consumption and markedly reduced body weight in
these does. Reporting of foetal findings of the rabbit developmental study is limited to
summary data (foetuses with external malformation, with skeletal malformations,
skeletal variations and visceral malformations). These summary data do not indicate any
developmental toxicity of fenpyrazamine in rabbits.
Summary
Based on the reported data (negative results in the two developmental toxicity studies
and only weak evidence of post-implantation loss in the 2-generation study), RAC
concluded that there is no sufficiently convincing evidence of developmental toxicity in
rats or rabbits. Based on the data of the 2-generation study in rats RAC concluded that
ANNEX 1 – BACKGROUND DOCUMENT TO THE RAC OPINION ON FENPYRAZAMINE
168
there is no specific evidence of impaired fertility.
Thus RAC recommends not classifying fenpyrazamine for either developmental toxicity or
for adverse effects on sexual function and fertility (CLP and DSD). .This is in agreement
with the dossier submitter’s proposal and the comments received during public
consultation.
Supplemental information - In depth analyses by RAC None
4.12 Other effects
4.12.1 Non-human information
4.12.1.1 Neurotoxicity
With respect to the possible neurotoxicological potential of fenpyrazamine, two acute
(preliminary and main study) and one subchronic neurotoxicity study have been performed.
No studies on delayed neurotoxicity are available.
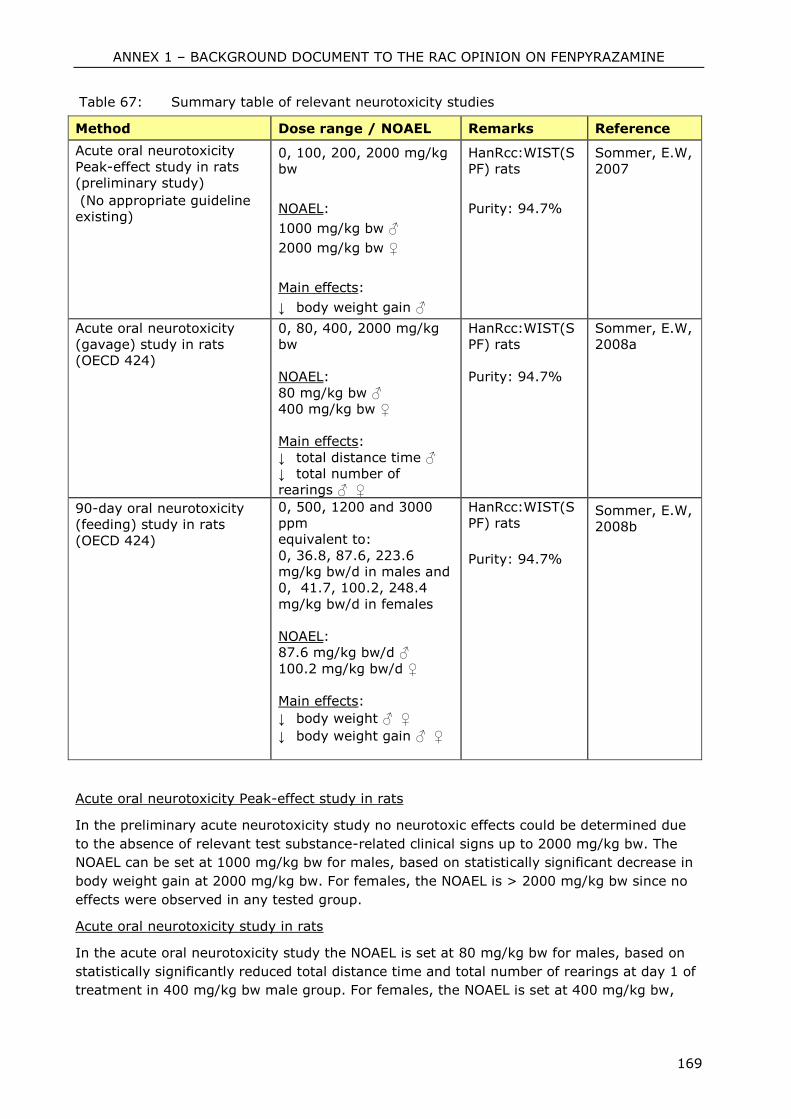
ANNEX 1 – BACKGROUND DOCUMENT TO THE RAC OPINION ON FENPYRAZAMINE
169
Table 67: Summary table of relevant neurotoxicity studies
Method Dose range / NOAEL Remarks Reference
Acute oral neurotoxicity
Peak-effect study in rats
(preliminary study)
(No appropriate guideline
existing)
0, 100, 200, 2000 mg/kg
bw
NOAEL:
1000 mg/kg bw ♂
2000 mg/kg bw ♀
Main effects:
↓ body weight gain ♂
HanRcc:WIST(S
PF) rats
Purity: 94.7%
Sommer, E.W,
2007
Acute oral neurotoxicity
(gavage) study in rats
(OECD 424)
0, 80, 400, 2000 mg/kg
bw
NOAEL:
80 mg/kg bw ♂
400 mg/kg bw ♀
Main effects:
↓ total distance time ♂
↓ total number of
rearings ♂ ♀
HanRcc:WIST(S
PF) rats
Purity: 94.7%
Sommer, E.W,
2008a
90-day oral neurotoxicity
(feeding) study in rats
(OECD 424)
0, 500, 1200 and 3000
ppm
equivalent to:
0, 36.8, 87.6, 223.6
mg/kg bw/d in males and
0, 41.7, 100.2, 248.4
mg/kg bw/d in females
NOAEL:
87.6 mg/kg bw/d ♂
100.2 mg/kg bw/d ♀
Main effects:
↓ body weight ♂ ♀
↓ body weight gain ♂ ♀
HanRcc:WIST(S
PF) rats
Purity: 94.7%
Sommer, E.W,
2008b
Acute oral neurotoxicity Peak-effect study in rats
In the preliminary acute neurotoxicity study no neurotoxic effects could be determined due
to the absence of relevant test substance-related clinical signs up to 2000 mg/kg bw. The
NOAEL can be set at 1000 mg/kg bw for males, based on statistically significant decrease in
body weight gain at 2000 mg/kg bw. For females, the NOAEL is > 2000 mg/kg bw since no
effects were observed in any tested group.
Acute oral neurotoxicity study in rats
In the acute oral neurotoxicity study the NOAEL is set at 80 mg/kg bw for males, based on
statistically significantly reduced total distance time and total number of rearings at day 1 of
treatment in 400 mg/kg bw male group. For females, the NOAEL is set at 400 mg/kg bw,
ANNEX 1 – BACKGROUND DOCUMENT TO THE RAC OPINION ON FENPYRAZAMINE
170
based on statistically significantly reduced total number of rearings at day 1 of treatment in
2000 mg/kg bw group.
90-day oral neurotoxicity (feeding) study in rats
In the subchronic (90 days) oral neurotoxicity study in rats no clinical signs or mortality, no
significant changes during FOB or motor activity and no microscopic pathology indicative of
neurotoxicity was found at necropsy. The only treatment-related finding was a decrease in
body weight and bodyweight gain in both sexes at 3000 ppm. On the basis of the body
weight and body weight gain decrease at 3000 ppm, the NOAEL in this study was
determined to be 1200 ppm for both males and females (87.6 and 100.2 mg/kg bw/day,
respectively).
4.12.1.2 Immunotoxicity
No data available.
4.12.1.3 Specific investigations: other studies
No other data available.
4.12.1.4 Human information
A formal statement from the manufacturer is presented (Ohtsubo, T (2009)), that members
of staff involved in the synthesis and development of fenpyrazamine are routinely monitored
and that no indication of fenpyrazamine-related ill-health have been detected by, or reported
to, medical staff. No poisoning incidents or clinical cases have been reported. Fenpyrazamine
is a new chemical currently in development. There has been no exposure of the general
population or epidemiology study.
4.12.2 Summary and discussion
In the preliminary acute neurotoxicity study no neurotoxic effects could be determined due
to the absence of relevant test substance-related clinical signs up to 2000 mg/kg bw. The
NOAEL can be set at 1000 mg/kg bw for males, based on statistically significant decrease in
body weight gain at 2000 mg/kg bw. For females, the NOAEL is > 2000 mg/kg bw since no
effects were observed in any tested group.
In the acute oral neurotoxicity study the NOAEL is set at 80 mg/kg bw for males, based on
statistically significantly reduced total distance time and total number of rearings at day 1 of
treatment in 400 mg/kg bw male group. For females, the NOAEL is set at 400 mg/kg bw,
based on statistically significantly reduced total number of rearings at day 1 of treatment in
2000 mg/kg bw group.
In the subchronic (90 days) oral neurotoxicity study in rats no clinical signs or mortality, no
significant changes during FOB or motor activity and no microscopic pathology indicative of
neurotoxicity was found at necropsy. The only treatment-related finding was a decrease in
body weight and bodyweight gain in both sexes at 3000 ppm. On the basis of the body
weight and body weight gain decrease at 3000 ppm, the NOAEL in this study was
determined to be 1200 ppm for both males and females (87.6 and 100.2 mg/kg bw/day,
respectively).

ANNEX 1 – BACKGROUND DOCUMENT TO THE RAC OPINION ON FENPYRAZAMINE
171
4.12.3 Comparison with criteria
According to the available studies, there was no indication of a neurotoxic potential of
fenpyrazamine (neither neurobehavioural changes nor any morphological changes in the
CNS or in the peripheral nerves).
Based on the available acute, subchronic and chronic studies, there was no indication of an
immunotoxic potential.
4.12.4 Conclusions on classification and labelling
No classification and labelling is proposed for fenpyrazamine regarding neurotoxicity or
immunotoxicity.
ANNEX 1 – BACKGROUND DOCUMENT TO THE RAC OPINION ON FENPYRAZAMINE
172
5 ENVIRONMENTAL HAZARD ASSESSMENT
5.1 Degradation
Table 68: Summary of relevant information on degradation
Method Results Remarks Reference
Hydrolysis
Guideline: EEC Method C.7
, OPPTS 835-2110, J MAFF
Nousan 8147, section 2-6-1 (2001)
Fenpyrazamine, [phenyl-
14C] and [pyrazolyl-14C]
labels:
DT50 (pH 4, 20 °C): stable to hydrolysis
DT50 (pH 7, 20 °C,
extrapolated): > 1 year
(SFO)
DT50 (pH 9, 20 °C,
extrapolated): 24 days
(SFO)
radiochemical
purity: > 99 % (HPLC)
Lewis, C.J.
(2007)
Report No.:
0333/257-
D2149; QNM-0017
Photolysis
Guideline: 95/36/EC,
94/37/EC, SETAC (1995),
US-EPA N 161-2 (1982), J
MAFF Nousan-8147
section 2-6-2 (2000)
Fenpyrazamine, [pyrazolyl-14C] and [phenyl-14C]
labels:
DT50 values (also equivalent
to natural summer sunlight in UK/US) of 1.7 days
S-2188-DC (max. 63.8%
after 7 days) and MCNI
(max 17.7% after 30 days).
radiochemical
purity: 98 %
(HPLC)
Lewis, C.J.,
Troth, K. (2007)
Report No:
0333/258-
D2149; QNM-0029
Biological degradation
Guideline: Method C.4-C
of Annex V of EU Directive 67/548/EEC, OECD 301 B
Not ready biodegradable purity 94.7 % Burwood,
C.E., Scholey, A. (2006)
Report No.
0333/261-
D2149; QNM-0011
Water/Sediment Study
Guideline: EC Directive
95/36/EC, OECD Guideline 308 (2002)
Water:
DT50: 41 d
DT90: 136 d
Whole system:
DT50: 68.1 d DT90: 226.3 d
radiochemical
purity: > 99
% and > 98 % (HPLC)
Lewis, C.J.,
Troth, K.
(2007)
Report No:
D2149-
0333/260, QNM-0028
Jarvis, T.,
Callow, B.,
(2009)
Report No:
QNM-0040
ANNEX 1 – BACKGROUND DOCUMENT TO THE RAC OPINION ON FENPYRAZAMINE
173
Method Results Remarks Reference
Kinetic Evaluation of the
Aerobic Aquatic
metabolism (Menke, 2006c)
Guideline: FOCUS
Degradation Kinetics
Report (FOCUS 2006)
Water:
DT50: 25.5 d (geometric
mean)
DT90: 84.7 d (geometric
mean)
Whole system:
DT50: 35.5 d (geometric
mean)
DT90: 117.9 d (geometric mean)
Lewis, C.J.,
Troth, K. (2007)
Report No:
D2149-
0333/260,
QNM-0028
Jarvis, T.,
Callow, B., (2009)
Report No: QNM-0040
5.1.1 Stability
Hydrolysis:
Studies on the hydrolytic degradation were conducted with S-2188 at pH 4, 7 and 9,
[phenyl-14C] and [pyrazolyl-14C] labels.
Reference: [14C]S-21988: Hydrolytic Stability
Author(s), year: Lewis, C.J., 2007
Study/report
number: 0333/257-D2149; QNM-0017
Guideline(s):
EEC Method C.7 – Abiotic degradation. Hydrolysis as a function of pH
(1992), OPPTS 835-2110 – Hydrolysis as a function of pH (1998),
Japan MAFF New Test Guideline 12-Nousan 8147, section 2-6-1
(2001)
GLP: Yes
Deviations: None
Validity: Study considered acceptable
Material and methods:
Test substance: [Phenyl-14C]S-2188, 4.33 GBq mmol-1,
> 99 % radiochemical purity (HPLC), batch CFQ14367
[Pyrazolyl-14C]S-2188, 2.04 GBq mmol-1,
> 99 % radiochemical purity (HPLC), batch CFQ14368.
Reference
substances:
S-2188 (unlabelled), S-2188-OH, S-2188-DC, S-2188-DTC, MCNI.
Test systems: pH 4: 0.05 M citrate buffer (monopotatium citrate solution adjusted
with sodium hydroxide)
pH 7: 0.05 M phosphate buffer (potassium dihydrogen phosphate
solution adjusted with sodium hydroxide)
pH 9: 0.05 M borate buffer (sodium tetraborate solution adjusted
with hydrochloric acid)
All buffers sterilized by autoclaving. Oxygen content reduced by
sonication and nitrogen bubbling.
Volatile traps: No volatile traps (no volatiles expected – confirmed by complete
material balance).
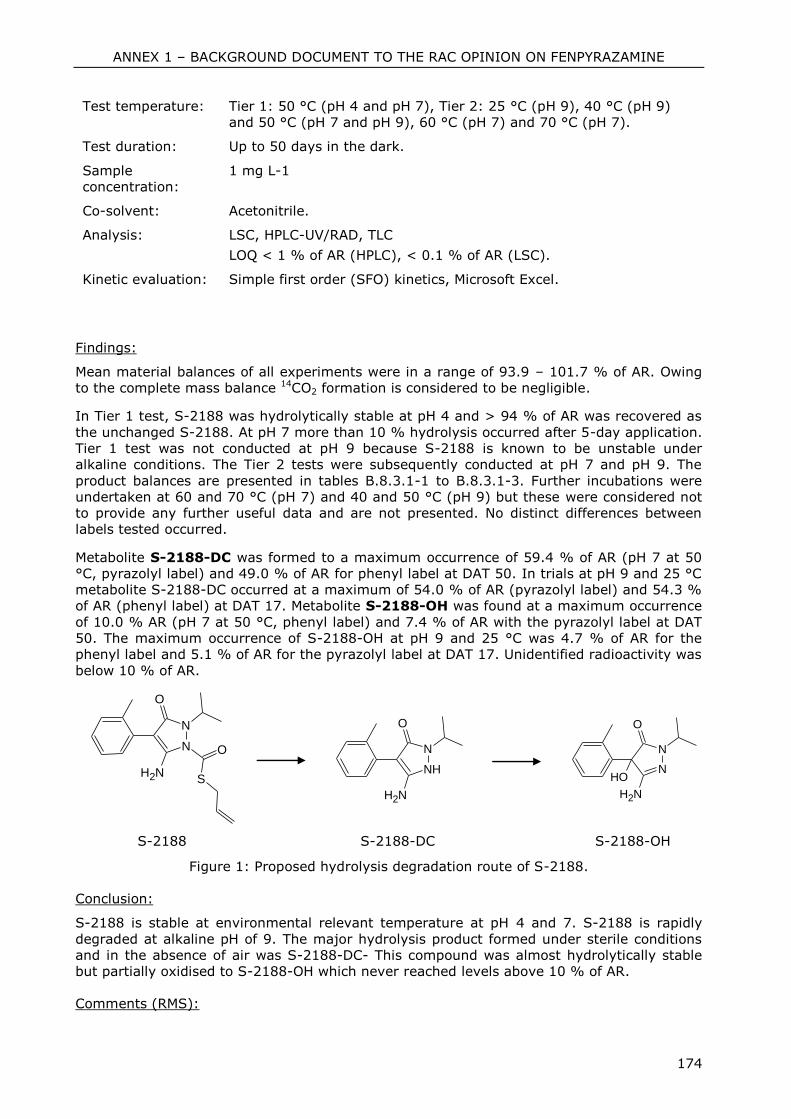
ANNEX 1 – BACKGROUND DOCUMENT TO THE RAC OPINION ON FENPYRAZAMINE
174
Test temperature: Tier 1: 50 °C (pH 4 and pH 7), Tier 2: 25 °C (pH 9), 40 °C (pH 9)
and 50 °C (pH 7 and pH 9), 60 °C (pH 7) and 70 °C (pH 7).
Test duration: Up to 50 days in the dark.
Sample
concentration:
1 mg L-1
Co-solvent: Acetonitrile.
Analysis: LSC, HPLC-UV/RAD, TLC
LOQ < 1 % of AR (HPLC), < 0.1 % of AR (LSC).
Kinetic evaluation: Simple first order (SFO) kinetics, Microsoft Excel.
Findings:
Mean material balances of all experiments were in a range of 93.9 – 101.7 % of AR. Owing
to the complete mass balance 14CO2 formation is considered to be negligible.
In Tier 1 test, S-2188 was hydrolytically stable at pH 4 and > 94 % of AR was recovered as
the unchanged S-2188. At pH 7 more than 10 % hydrolysis occurred after 5-day application.
Tier 1 test was not conducted at pH 9 because S-2188 is known to be unstable under
alkaline conditions. The Tier 2 tests were subsequently conducted at pH 7 and pH 9. The
product balances are presented in tables B.8.3.1-1 to B.8.3.1-3. Further incubations were
undertaken at 60 and 70 °C (pH 7) and 40 and 50 °C (pH 9) but these were considered not
to provide any further useful data and are not presented. No distinct differences between
labels tested occurred.
Metabolite S-2188-DC was formed to a maximum occurrence of 59.4 % of AR (pH 7 at 50
°C, pyrazolyl label) and 49.0 % of AR for phenyl label at DAT 50. In trials at pH 9 and 25 °C
metabolite S-2188-DC occurred at a maximum of 54.0 % of AR (pyrazolyl label) and 54.3 %
of AR (phenyl label) at DAT 17. Metabolite S-2188-OH was found at a maximum occurrence
of 10.0 % AR (pH 7 at 50 °C, phenyl label) and 7.4 % of AR with the pyrazolyl label at DAT
50. The maximum occurrence of S-2188-OH at pH 9 and 25 °C was 4.7 % of AR for the
phenyl label and 5.1 % of AR for the pyrazolyl label at DAT 17. Unidentified radioactivity was
below 10 % of AR.
NH2
O
N
N O
S
NH2
O
N
NH
NH2
O
N
NOH
S-2188 S-2188-DC S-2188-OH
Figure 1: Proposed hydrolysis degradation route of S-2188.
Conclusion:
S-2188 is stable at environmental relevant temperature at pH 4 and 7. S-2188 is rapidly
degraded at alkaline pH of 9. The major hydrolysis product formed under sterile conditions
and in the absence of air was S-2188-DC- This compound was almost hydrolytically stable
but partially oxidised to S-2188-OH which never reached levels above 10 % of AR.
Comments (RMS):
ANNEX 1 – BACKGROUND DOCUMENT TO THE RAC OPINION ON FENPYRAZAMINE
175
None
Photolysis:
Studies on the photolytic degradation were conducted with S-2188 in sterile buffered water
(pH 7.0), [pyrazolyl-14C] and [phenyl-14C] labels.
Quantum yield and half-life time under environmental conditions were determined for S-
2188.
Reference: [14C]S-2188: Photodegradation and Quantum Yield in
Sterile, Aqueous Solution.
Author(s), year: Lewis, C.J., Troth, K., 2007
Study/report
number:
0333/258-D2149; QNM-0029
Guideline(s): 95/36/EC, 94/37/EC, SETAC (1995), US-EPA N 161-2 (1982), J
MAFF Nousan-8147 section 2-6-2 (2000)
GLP: Yes
Deviations: None
Validity: Study considered acceptable
Material and methods:
Test substances: [Phenyl-14C]S-2188, 4.33 GBq mmol-1,
98 % radiochemical purity (HPLC), batch CFQ14367
[Pyrazolyl-14C]S-2188, 2.04 GBq mmol-1,
98 % radiochemical purity (HPLC), batch CFQ14368
Reference
substances:
S-2188 (unlabelled), S-2188-OH, S-2188-DC, S-2188-DTC, MCNI,
MPPZ
Test system: Sterile pH 7.0 buffer (0.01 M phosphate buffer, autoclaved),
adjusted with 2 M NaOH, sterility was checked throughout the
experiment.
A PNAP/PYR actinometer for determination of quantum yield.
Test temperature: 25 ± 1 °C
Test duration: 30 days continuous irradiation (1 day incubation equivalent to ca.
30 solar midsummer days in US and UK, ca. 3.3 days of natural
Japanese spring sunlight) or dark incubation.
Sample
concentration:
1.0 mg L-1
Co-solvent: Acetonitrile
Test system: Xenon arc lamp (Suntest Accelerated Exposure machine), cut-off <
290 nm, ca. 25 watts m-2 (300 – 400 nm).
Spectrum of experimental radiation is qualitatively similar to solar
irradiation of Harrogate in summer. Three other Suntest machines
were used and displayed similar radiation spectrum as the one
presented.
Volatile traps: Polyurethane bung, 1 x ethanediol trap and 2 x 2 M NaOH trap
Analysis: LSC, HPLC-UV/RAD, TLC, HPLC-MS
LOD < 0.1 % of AR (LSC), LOD < 0.5 % of AR (HPLC)
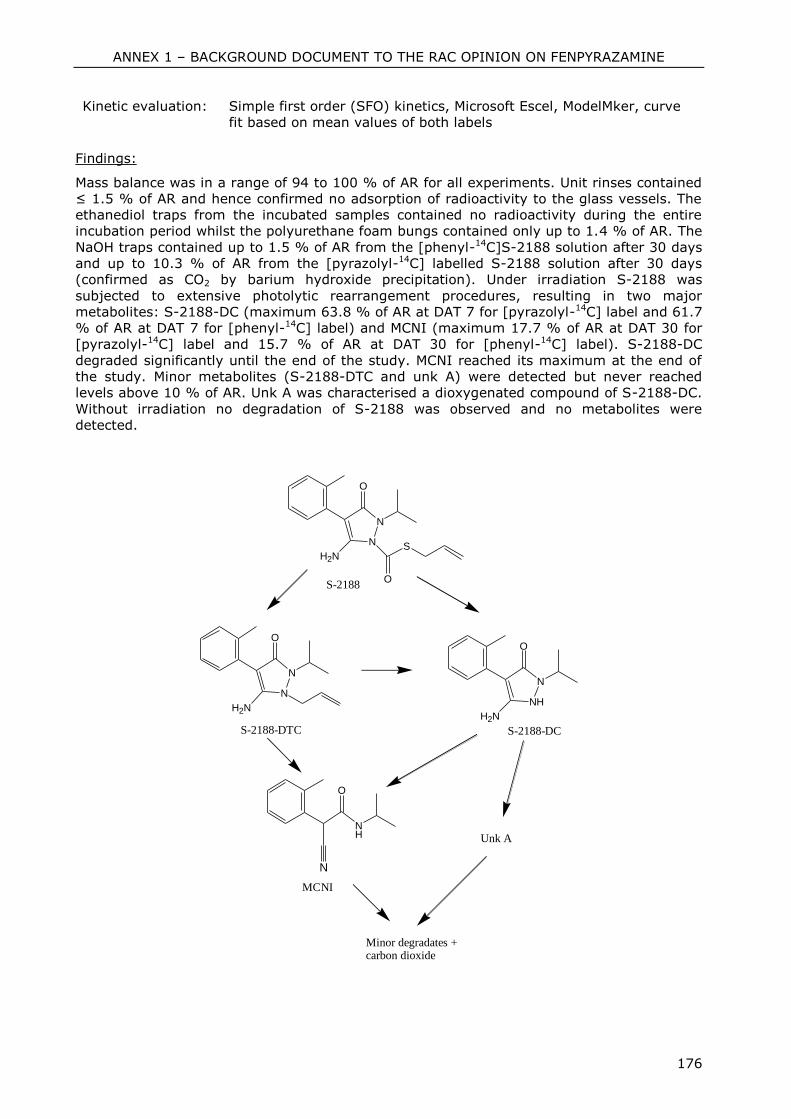
ANNEX 1 – BACKGROUND DOCUMENT TO THE RAC OPINION ON FENPYRAZAMINE
176
Kinetic evaluation: Simple first order (SFO) kinetics, Microsoft Escel, ModelMker, curve
fit based on mean values of both labels
Findings:
Mass balance was in a range of 94 to 100 % of AR for all experiments. Unit rinses contained
≤ 1.5 % of AR and hence confirmed no adsorption of radioactivity to the glass vessels. The
ethanediol traps from the incubated samples contained no radioactivity during the entire
incubation period whilst the polyurethane foam bungs contained only up to 1.4 % of AR. The
NaOH traps contained up to 1.5 % of AR from the [phenyl-14C]S-2188 solution after 30 days
and up to 10.3 % of AR from the [pyrazolyl-14C] labelled S-2188 solution after 30 days
(confirmed as CO2 by barium hydroxide precipitation). Under irradiation S-2188 was
subjected to extensive photolytic rearrangement procedures, resulting in two major
metabolites: S-2188-DC (maximum 63.8 % of AR at DAT 7 for [pyrazolyl-14C] label and 61.7
% of AR at DAT 7 for [phenyl-14C] label) and MCNI (maximum 17.7 % of AR at DAT 30 for
[pyrazolyl-14C] label and 15.7 % of AR at DAT 30 for [phenyl-14C] label). S-2188-DC
degraded significantly until the end of the study. MCNI reached its maximum at the end of
the study. Minor metabolites (S-2188-DTC and unk A) were detected but never reached
levels above 10 % of AR. Unk A was characterised a dioxygenated compound of S-2188-DC.
Without irradiation no degradation of S-2188 was observed and no metabolites were
detected.
N
N
O
SH2N
O
NH
N
H2N
O
N
N
H2N
O
S-2188
S-2188-DCS-2188-DTC
NH
O
N
MCNI
Unk A
Minor degradates +carbon dioxide

ANNEX 1 – BACKGROUND DOCUMENT TO THE RAC OPINION ON FENPYRAZAMINE
177
Figure 2: Proposed photolysis degradation route of S-2188
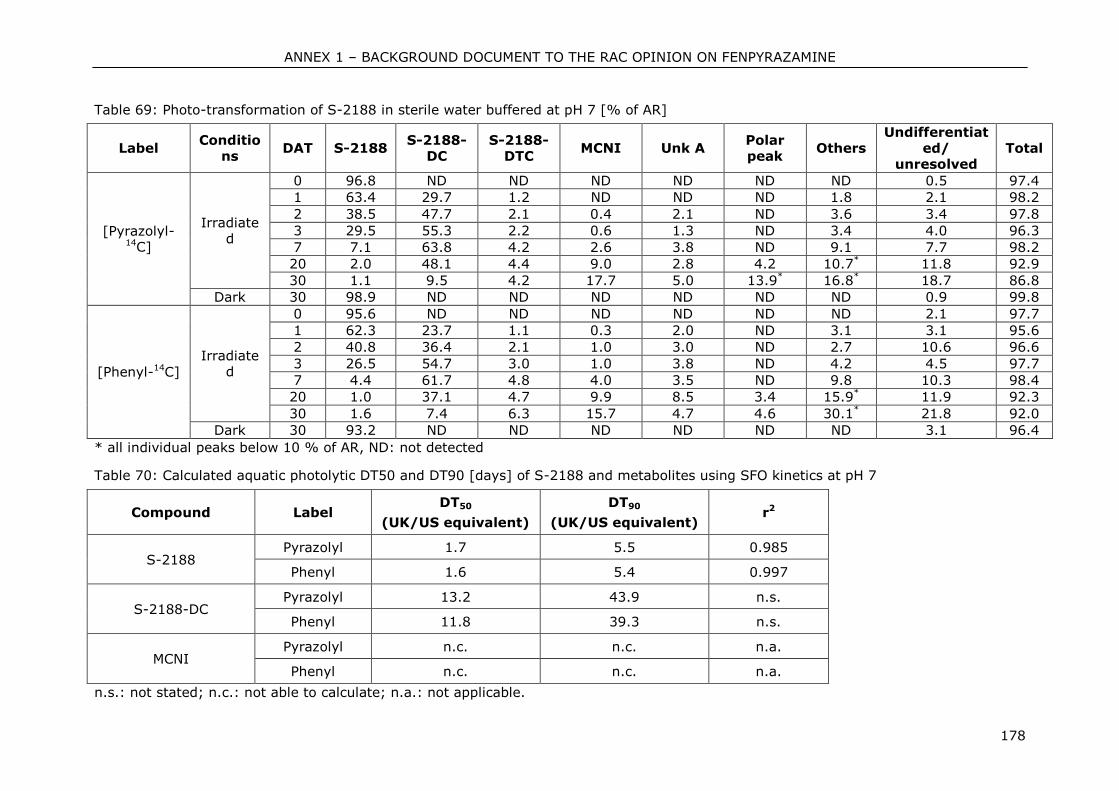
ANNEX 1 – BACKGROUND DOCUMENT TO THE RAC OPINION ON FENPYRAZAMINE
178
Table 69: Photo-transformation of S-2188 in sterile water buffered at pH 7 [% of AR]
Label Conditio
ns DAT S-2188
S-2188-DC
S-2188-DTC
MCNI Unk A Polar peak
Others Undifferentiat
ed/ unresolved
Total
[Pyrazolyl-14C]
Irradiated
0 96.8 ND ND ND ND ND ND 0.5 97.4
1 63.4 29.7 1.2 ND ND ND 1.8 2.1 98.2
2 38.5 47.7 2.1 0.4 2.1 ND 3.6 3.4 97.8
3 29.5 55.3 2.2 0.6 1.3 ND 3.4 4.0 96.3
7 7.1 63.8 4.2 2.6 3.8 ND 9.1 7.7 98.2
20 2.0 48.1 4.4 9.0 2.8 4.2 10.7* 11.8 92.9
30 1.1 9.5 4.2 17.7 5.0 13.9* 16.8* 18.7 86.8
Dark 30 98.9 ND ND ND ND ND ND 0.9 99.8
[Phenyl-14C]
Irradiated
0 95.6 ND ND ND ND ND ND 2.1 97.7
1 62.3 23.7 1.1 0.3 2.0 ND 3.1 3.1 95.6
2 40.8 36.4 2.1 1.0 3.0 ND 2.7 10.6 96.6
3 26.5 54.7 3.0 1.0 3.8 ND 4.2 4.5 97.7
7 4.4 61.7 4.8 4.0 3.5 ND 9.8 10.3 98.4
20 1.0 37.1 4.7 9.9 8.5 3.4 15.9* 11.9 92.3
30 1.6 7.4 6.3 15.7 4.7 4.6 30.1* 21.8 92.0
Dark 30 93.2 ND ND ND ND ND ND 3.1 96.4
* all individual peaks below 10 % of AR, ND: not detected
Table 70: Calculated aquatic photolytic DT50 and DT90 [days] of S-2188 and metabolites using SFO kinetics at pH 7
Compound Label DT50
(UK/US equivalent)
DT90
(UK/US equivalent) r2
S-2188 Pyrazolyl 1.7 5.5 0.985
Phenyl 1.6 5.4 0.997
S-2188-DC Pyrazolyl 13.2 43.9 n.s.
Phenyl 11.8 39.3 n.s.
MCNI Pyrazolyl n.c. n.c. n.a.
Phenyl n.c. n.c. n.a.
n.s.: not stated; n.c.: not able to calculate; n.a.: not applicable.

ANNEX 1 – BACKGROUND DOCUMENT TO THE RAC OPINION ON FENPYRAZAMINE
179
ANNEX 1 – BACKGROUND DOCUMENT TO THE RAC OPINION ON FENPYRAZAMINE
180
Conclusion:
Under irradiated experimental conditions, S-2188 degraded with a half-life of 1.7 days at pH
7 and 25 °C (SFO kinetic) owing to photolysis. This experimental half-life corresponds to
about 1.7 days under environmental conditions in US/UK summer (reference Harrogate 54
°N). Appropriate controls confirmed that there was no degradation in darkness. The main
photolytic metabolites were S-2188-DC (max. 63.8% after 7 days) and MCNI (max 17.7%
after 30 days). A mean SFO DT50 value of 12.5 days was calculated for S-2188-DC. The
degradation of MCNI could not be calculated as the maximum occurrence was reached at the
end of the study period (DAT 30). Extensive breakdown of the molecule structure was
observed after 30 days incubation as evidenced by the large number of minor unknown
peaks and undifferentiated/unresolved radioactivity.
The quantum yield for S-2188 was determined to be 0.021.
Comments (RMS):
No comments. The study is considered acceptable.
5.1.2 Biodegradation
5.1.2.1 Biodegradation estimation
As measured data are available estimation is not relevant for this dossier.
5.1.2.2 Screening tests
Readily biodegradability:
Reference: S-2188: Assessment of Ready Biodegradability by
Measurement of Carbon Dioxide evolution.
Author(s), year: Burwood, C.E., Scholey, A., 2006
Study/Report
number:
0333/261-D2149; QNM-0011
Guideline(s): Method C.4-C of Annex V of EU Directive 67/548/EEC, OECD 301 B
GLP: Yes
Deviations: None
Validity: Study considered acceptable
Material and methods:
Test substance: S-2188 (unlabelled), purity 94.7 %, batch 030-050914-1G
Reference
substance:
Sodium benzoate
Inoculum: Aeration tank of a waste water plant (Burley Menston) treating
predominately domestic sewage
(30 mg L-1)
Treatments: Replicates (except for toxicity control):
Blank control
Reference substance: Na-benzoate (3 mL mg L-1)
Test substance: S-2188 (3 mL L-1)
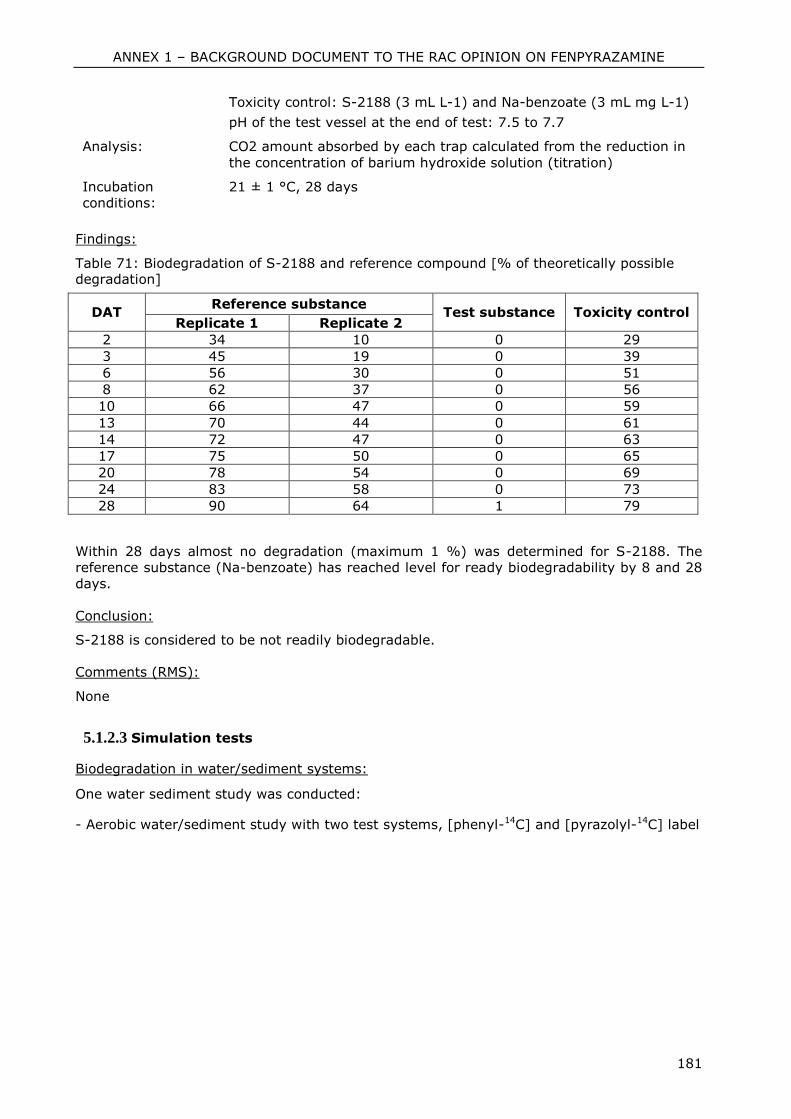
ANNEX 1 – BACKGROUND DOCUMENT TO THE RAC OPINION ON FENPYRAZAMINE
181
Toxicity control: S-2188 (3 mL L-1) and Na-benzoate (3 mL mg L-1)
pH of the test vessel at the end of test: 7.5 to 7.7
Analysis: CO2 amount absorbed by each trap calculated from the reduction in
the concentration of barium hydroxide solution (titration)
Incubation
conditions:
21 ± 1 °C, 28 days
Findings:
Table 71: Biodegradation of S-2188 and reference compound [% of theoretically possible degradation]
DAT Reference substance
Test substance Toxicity control Replicate 1 Replicate 2
2 34 10 0 29
3 45 19 0 39
6 56 30 0 51
8 62 37 0 56
10 66 47 0 59
13 70 44 0 61
14 72 47 0 63
17 75 50 0 65
20 78 54 0 69
24 83 58 0 73
28 90 64 1 79
Within 28 days almost no degradation (maximum 1 %) was determined for S-2188. The
reference substance (Na-benzoate) has reached level for ready biodegradability by 8 and 28
days.
Conclusion:
S-2188 is considered to be not readily biodegradable.
Comments (RMS):
None
5.1.2.3 Simulation tests
Biodegradation in water/sediment systems:
One water sediment study was conducted:
- Aerobic water/sediment study with two test systems, [phenyl-14C] and [pyrazolyl-14C] label
ANNEX 1 – BACKGROUND DOCUMENT TO THE RAC OPINION ON FENPYRAZAMINE
182
Reference: [14C]S-2188: Degradation and Retention in Water-Sediment
Systems
Author(s), year: Lewis, C.J., Troth, K., 2007
Study/report
number:
D2149-0333/260, QNM-0028
Guideline(s): EC Directive 95/36/EC, OECD Guideline 308 (2002)
GLP: Yes
Deviations: Minor deviations
Validity: Study considered acceptable
Reference: Determination of rates of degradation for S-2188 from a water
sediment study incubated under laboratory conditions.
Author(s), year: Jarvis, T., Callow, B., 2009
Report/Doc.
number:
QNM-0040
Guideline(s): FOCUS Degradation Kinetics Report (FOCUS 2006)
GLP: Not applicable
Deviations: None
Validity: Yes
Material and methods:
Test substances: [Phenyl-14C]S-2188,12.9 MBq mg-1,
> 98 % radiochemical purity (HPLC), batch CFQ14367
[Pyrazolyl-14C]S-2188, 6.1 MBq mg-1,
> 99 % radiochemical purity (HPLC), batch CFQ14368
Reference
substances:
S-2188 (unlabelled), S-2188-OH, S-2188-DC, S-2188-DTC, MCNI
Application rate: 0.08 µg mL-1 (under the assumption of 750 g ai ha-1, 100 cm
water depth)
Co-solvent: Acetonitrile (0.005 %, v/v)
Incubation set-up: 3 cm depth of dry Calwich Abbey or Swiss Lake sediment (2 mm
sieved) in individual borosilate glass cylinder (ca 4.5 cm in
diameter), 9 cm depth of associated water (0.2 mm sieved).
Sediment units were aerated, slightly agitated on an orbital shaker.
Flow through system (moistured air at flow rate of ca. 20-60 mL
min-1).
Acclimatization
period:
Approx. 35 days
Test duration: 100 days
Incubation
conditions:
20 ± 2 °C in darkness
Volatile traps: Ethanediol (polar volatiles), 2 % paraffin in xylene (non-polar
volatiles), sodium hydroxide (CO2), addition of barium chloride
slution to confirm presence of 14CO2.
Analysis: Water phase mixed with 130 mL acetonitrile and radio-assayed by
LSC and analysed by chromatography. Sub-samples (ca 10 mL)
collected and added to 2 M sodium hydroxide solution to determine
presence of dissolved CO2.
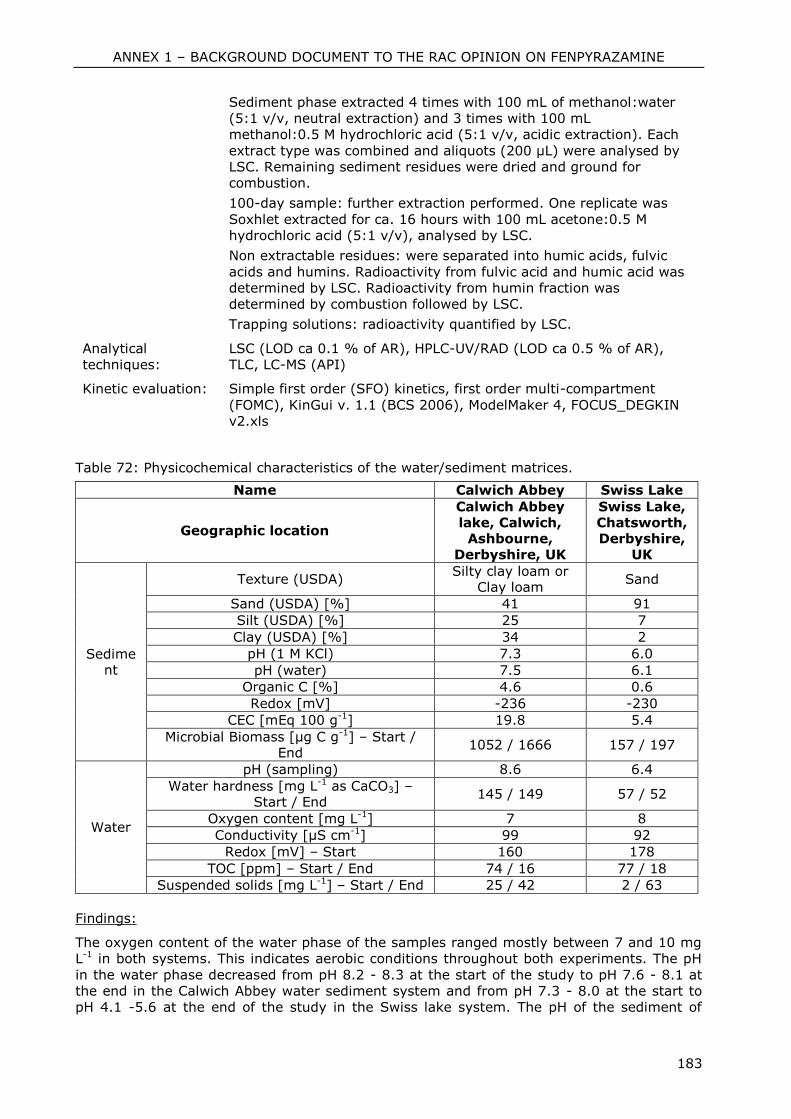
ANNEX 1 – BACKGROUND DOCUMENT TO THE RAC OPINION ON FENPYRAZAMINE
183
Sediment phase extracted 4 times with 100 mL of methanol:water
(5:1 v/v, neutral extraction) and 3 times with 100 mL
methanol:0.5 M hydrochloric acid (5:1 v/v, acidic extraction). Each
extract type was combined and aliquots (200 µL) were analysed by
LSC. Remaining sediment residues were dried and ground for
combustion.
100-day sample: further extraction performed. One replicate was
Soxhlet extracted for ca. 16 hours with 100 mL acetone:0.5 M
hydrochloric acid (5:1 v/v), analysed by LSC.
Non extractable residues: were separated into humic acids, fulvic
acids and humins. Radioactivity from fulvic acid and humic acid was
determined by LSC. Radioactivity from humin fraction was
determined by combustion followed by LSC.
Trapping solutions: radioactivity quantified by LSC.
Analytical
techniques:
LSC (LOD ca 0.1 % of AR), HPLC-UV/RAD (LOD ca 0.5 % of AR),
TLC, LC-MS (API)
Kinetic evaluation: Simple first order (SFO) kinetics, first order multi-compartment
(FOMC), KinGui v. 1.1 (BCS 2006), ModelMaker 4, FOCUS_DEGKIN
v2.xls
Table 72: Physicochemical characteristics of the water/sediment matrices.
Name Calwich Abbey Swiss Lake
Geographic location
Calwich Abbey lake, Calwich,
Ashbourne, Derbyshire, UK
Swiss Lake, Chatsworth, Derbyshire,
UK
Sediment
Texture (USDA) Silty clay loam or
Clay loam Sand
Sand (USDA) [%] 41 91
Silt (USDA) [%] 25 7
Clay (USDA) [%] 34 2
pH (1 M KCl) 7.3 6.0
pH (water) 7.5 6.1
Organic C [%] 4.6 0.6
Redox [mV] -236 -230
CEC [mEq 100 g-1] 19.8 5.4
Microbial Biomass [µg C g-1] – Start / End
1052 / 1666 157 / 197
Water
pH (sampling) 8.6 6.4
Water hardness [mg L-1 as CaCO3] – Start / End
145 / 149 57 / 52
Oxygen content [mg L-1] 7 8
Conductivity [µS cm-1] 99 92
Redox [mV] – Start 160 178
TOC [ppm] – Start / End 74 / 16 77 / 18
Suspended solids [mg L-1] – Start / End 25 / 42 2 / 63
Findings:
The oxygen content of the water phase of the samples ranged mostly between 7 and 10 mg
L-1 in both systems. This indicates aerobic conditions throughout both experiments. The pH
in the water phase decreased from pH 8.2 - 8.3 at the start of the study to pH 7.6 - 8.1 at
the end in the Calwich Abbey water sediment system and from pH 7.3 - 8.0 at the start to
pH 4.1 -5.6 at the end of the study in the Swiss lake system. The pH of the sediment of
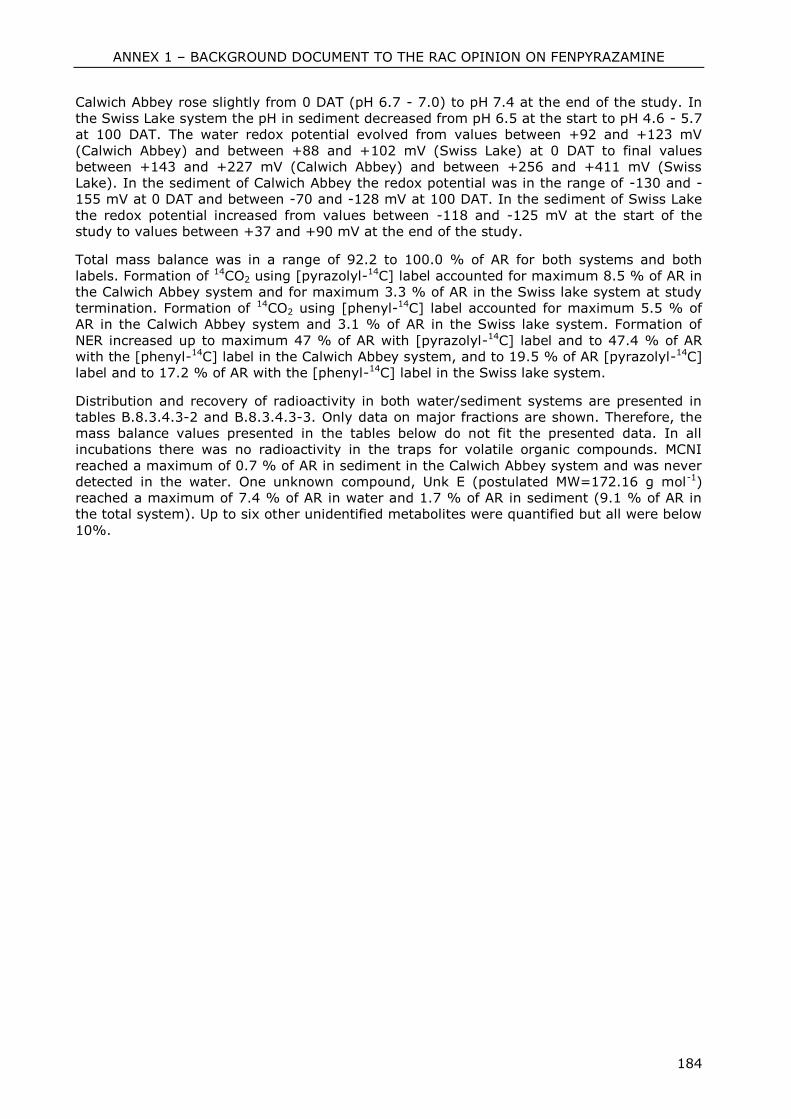
ANNEX 1 – BACKGROUND DOCUMENT TO THE RAC OPINION ON FENPYRAZAMINE
184
Calwich Abbey rose slightly from 0 DAT (pH 6.7 - 7.0) to pH 7.4 at the end of the study. In
the Swiss Lake system the pH in sediment decreased from pH 6.5 at the start to pH 4.6 - 5.7
at 100 DAT. The water redox potential evolved from values between +92 and +123 mV
(Calwich Abbey) and between +88 and +102 mV (Swiss Lake) at 0 DAT to final values
between +143 and +227 mV (Calwich Abbey) and between +256 and +411 mV (Swiss
Lake). In the sediment of Calwich Abbey the redox potential was in the range of -130 and -
155 mV at 0 DAT and between -70 and -128 mV at 100 DAT. In the sediment of Swiss Lake
the redox potential increased from values between -118 and -125 mV at the start of the
study to values between +37 and +90 mV at the end of the study.
Total mass balance was in a range of 92.2 to 100.0 % of AR for both systems and both
labels. Formation of 14CO2 using [pyrazolyl-14C] label accounted for maximum 8.5 % of AR in
the Calwich Abbey system and for maximum 3.3 % of AR in the Swiss lake system at study
termination. Formation of 14CO2 using [phenyl-14C] label accounted for maximum 5.5 % of
AR in the Calwich Abbey system and 3.1 % of AR in the Swiss lake system. Formation of
NER increased up to maximum 47 % of AR with [pyrazolyl-14C] label and to 47.4 % of AR
with the [phenyl-14C] label in the Calwich Abbey system, and to 19.5 % of AR [pyrazolyl-14C]
label and to 17.2 % of AR with the [phenyl-14C] label in the Swiss lake system.
Distribution and recovery of radioactivity in both water/sediment systems are presented in
tables B.8.3.4.3-2 and B.8.3.4.3-3. Only data on major fractions are shown. Therefore, the
mass balance values presented in the tables below do not fit the presented data. In all
incubations there was no radioactivity in the traps for volatile organic compounds. MCNI
reached a maximum of 0.7 % of AR in sediment in the Calwich Abbey system and was never
detected in the water. One unknown compound, Unk E (postulated MW=172.16 g mol-1)
reached a maximum of 7.4 % of AR in water and 1.7 % of AR in sediment (9.1 % of AR in
the total system). Up to six other unidentified metabolites were quantified but all were below
10%.
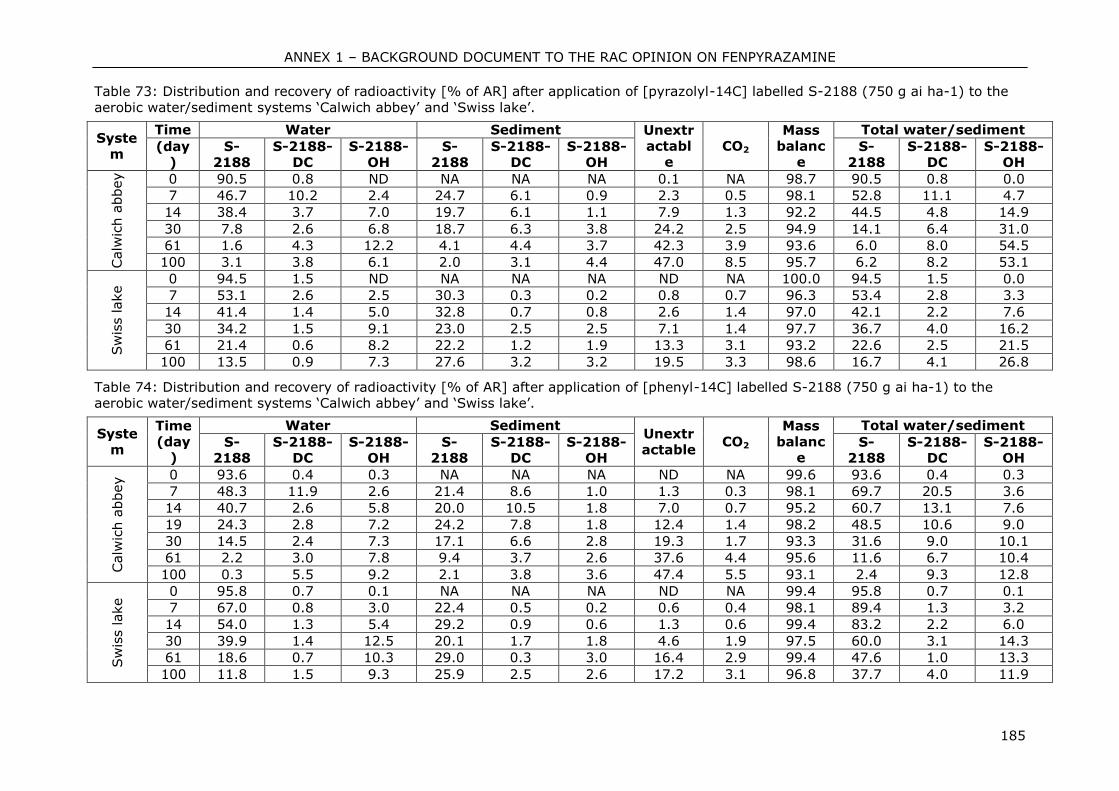
ANNEX 1 – BACKGROUND DOCUMENT TO THE RAC OPINION ON FENPYRAZAMINE
185
Table 73: Distribution and recovery of radioactivity [% of AR] after application of [pyrazolyl-14C] labelled S-2188 (750 g ai ha-1) to the
aerobic water/sediment systems ‘Calwich abbey’ and ‘Swiss lake’.
System
Time Water Sediment Unextractabl
e CO2
Mass balanc
e
Total water/sediment
(day)
S-2188
S-2188-DC
S-2188-OH
S-2188
S-2188-DC
S-2188-OH
S-2188
S-2188-DC
S-2188-OH
Calw
ich a
bbey
0 90.5 0.8 ND NA NA NA 0.1 NA 98.7 90.5 0.8 0.0
7 46.7 10.2 2.4 24.7 6.1 0.9 2.3 0.5 98.1 52.8 11.1 4.7
14 38.4 3.7 7.0 19.7 6.1 1.1 7.9 1.3 92.2 44.5 4.8 14.9
30 7.8 2.6 6.8 18.7 6.3 3.8 24.2 2.5 94.9 14.1 6.4 31.0
61 1.6 4.3 12.2 4.1 4.4 3.7 42.3 3.9 93.6 6.0 8.0 54.5
100 3.1 3.8 6.1 2.0 3.1 4.4 47.0 8.5 95.7 6.2 8.2 53.1
Sw
iss lake 0 94.5 1.5 ND NA NA NA ND NA 100.0 94.5 1.5 0.0
7 53.1 2.6 2.5 30.3 0.3 0.2 0.8 0.7 96.3 53.4 2.8 3.3
14 41.4 1.4 5.0 32.8 0.7 0.8 2.6 1.4 97.0 42.1 2.2 7.6
30 34.2 1.5 9.1 23.0 2.5 2.5 7.1 1.4 97.7 36.7 4.0 16.2
61 21.4 0.6 8.2 22.2 1.2 1.9 13.3 3.1 93.2 22.6 2.5 21.5
100 13.5 0.9 7.3 27.6 3.2 3.2 19.5 3.3 98.6 16.7 4.1 26.8
Table 74: Distribution and recovery of radioactivity [% of AR] after application of [phenyl-14C] labelled S-2188 (750 g ai ha-1) to the aerobic water/sediment systems ‘Calwich abbey’ and ‘Swiss lake’.
System
Time (day
)
Water Sediment Unextractable
CO2 Mass
balance
Total water/sediment
S-2188
S-2188-DC
S-2188-OH
S-2188
S-2188-DC
S-2188-OH
S-2188
S-2188-DC
S-2188-OH
Calw
ich a
bbey 0 93.6 0.4 0.3 NA NA NA ND NA 99.6 93.6 0.4 0.3
7 48.3 11.9 2.6 21.4 8.6 1.0 1.3 0.3 98.1 69.7 20.5 3.6
14 40.7 2.6 5.8 20.0 10.5 1.8 7.0 0.7 95.2 60.7 13.1 7.6
19 24.3 2.8 7.2 24.2 7.8 1.8 12.4 1.4 98.2 48.5 10.6 9.0
30 14.5 2.4 7.3 17.1 6.6 2.8 19.3 1.7 93.3 31.6 9.0 10.1
61 2.2 3.0 7.8 9.4 3.7 2.6 37.6 4.4 95.6 11.6 6.7 10.4
100 0.3 5.5 9.2 2.1 3.8 3.6 47.4 5.5 93.1 2.4 9.3 12.8
Sw
iss lake 0 95.8 0.7 0.1 NA NA NA ND NA 99.4 95.8 0.7 0.1
7 67.0 0.8 3.0 22.4 0.5 0.2 0.6 0.4 98.1 89.4 1.3 3.2
14 54.0 1.3 5.4 29.2 0.9 0.6 1.3 0.6 99.4 83.2 2.2 6.0
30 39.9 1.4 12.5 20.1 1.7 1.8 4.6 1.9 97.5 60.0 3.1 14.3
61 18.6 0.7 10.3 29.0 0.3 3.0 16.4 2.9 99.4 47.6 1.0 13.3
100 11.8 1.5 9.3 25.9 2.5 2.6 17.2 3.1 96.8 37.7 4.0 11.9
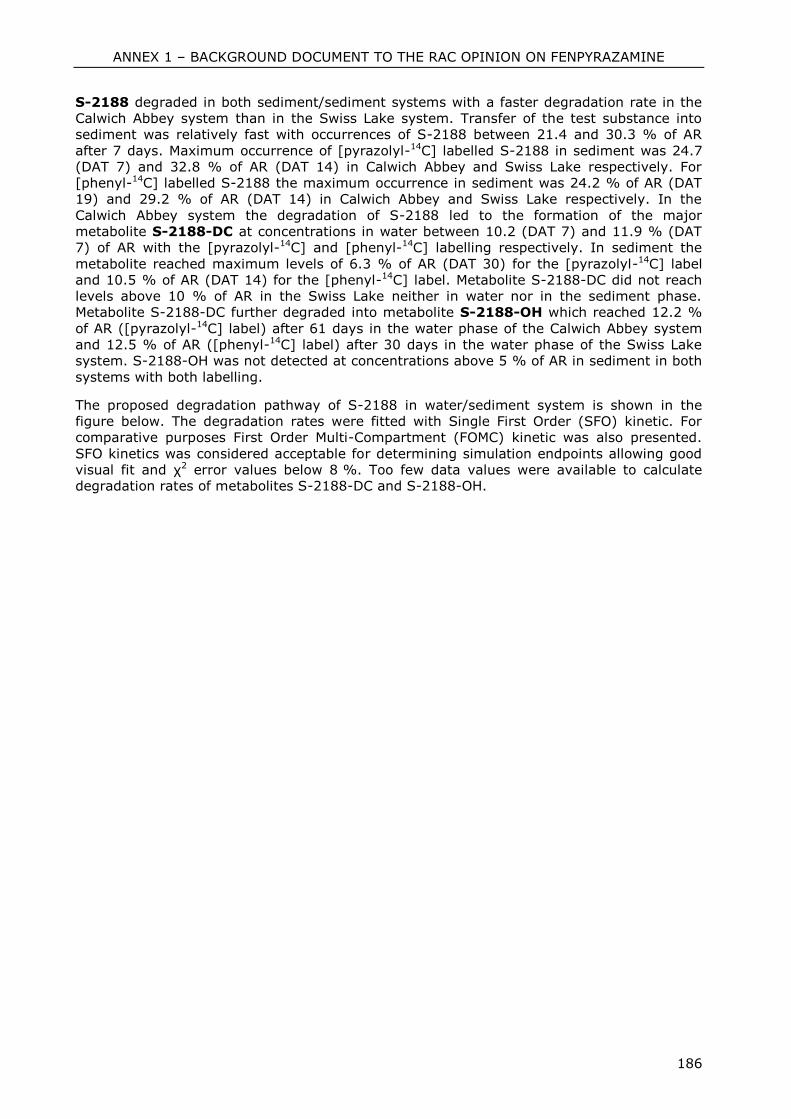
ANNEX 1 – BACKGROUND DOCUMENT TO THE RAC OPINION ON FENPYRAZAMINE
186
S-2188 degraded in both sediment/sediment systems with a faster degradation rate in the
Calwich Abbey system than in the Swiss Lake system. Transfer of the test substance into
sediment was relatively fast with occurrences of S-2188 between 21.4 and 30.3 % of AR
after 7 days. Maximum occurrence of [pyrazolyl-14C] labelled S-2188 in sediment was 24.7
(DAT 7) and 32.8 % of AR (DAT 14) in Calwich Abbey and Swiss Lake respectively. For
[phenyl-14C] labelled S-2188 the maximum occurrence in sediment was 24.2 % of AR (DAT
19) and 29.2 % of AR (DAT 14) in Calwich Abbey and Swiss Lake respectively. In the
Calwich Abbey system the degradation of S-2188 led to the formation of the major
metabolite S-2188-DC at concentrations in water between 10.2 (DAT 7) and 11.9 % (DAT
7) of AR with the [pyrazolyl-14C] and [phenyl-14C] labelling respectively. In sediment the
metabolite reached maximum levels of 6.3 % of AR (DAT 30) for the [pyrazolyl-14C] label
and 10.5 % of AR (DAT 14) for the [phenyl-14C] label. Metabolite S-2188-DC did not reach
levels above 10 % of AR in the Swiss Lake neither in water nor in the sediment phase.
Metabolite S-2188-DC further degraded into metabolite S-2188-OH which reached 12.2 %
of AR ([pyrazolyl-14C] label) after 61 days in the water phase of the Calwich Abbey system
and 12.5 % of AR ([phenyl-14C] label) after 30 days in the water phase of the Swiss Lake
system. S-2188-OH was not detected at concentrations above 5 % of AR in sediment in both
systems with both labelling.
The proposed degradation pathway of S-2188 in water/sediment system is shown in the
figure below. The degradation rates were fitted with Single First Order (SFO) kinetic. For
comparative purposes First Order Multi-Compartment (FOMC) kinetic was also presented.
SFO kinetics was considered acceptable for determining simulation endpoints allowing good
visual fit and χ2 error values below 8 %. Too few data values were available to calculate
degradation rates of metabolites S-2188-DC and S-2188-OH.
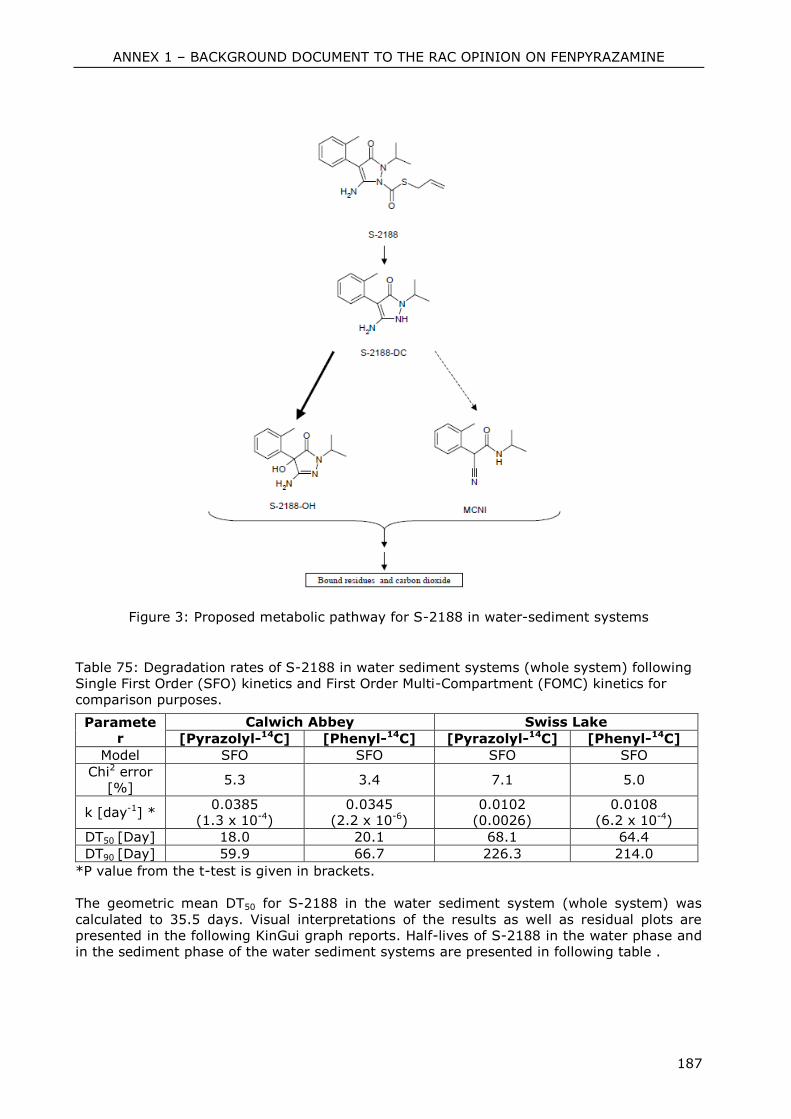
ANNEX 1 – BACKGROUND DOCUMENT TO THE RAC OPINION ON FENPYRAZAMINE
187
Figure 3: Proposed metabolic pathway for S-2188 in water-sediment systems
Table 75: Degradation rates of S-2188 in water sediment systems (whole system) following
Single First Order (SFO) kinetics and First Order Multi-Compartment (FOMC) kinetics for
comparison purposes.
Parameter
Calwich Abbey Swiss Lake
[Pyrazolyl-14C] [Phenyl-14C] [Pyrazolyl-14C] [Phenyl-14C]
Model SFO SFO SFO SFO
Chi2 error [%]
5.3 3.4 7.1 5.0
k [day-1] * 0.0385
(1.3 x 10⁻⁴) 0.0345
(2.2 x 10⁻⁶) 0.0102
(0.0026) 0.0108
(6.2 x 10⁻⁴)
DT50 [Day] 18.0 20.1 68.1 64.4
DT90 [Day] 59.9 66.7 226.3 214.0
*P value from the t-test is given in brackets.
The geometric mean DT50 for S-2188 in the water sediment system (whole system) was
calculated to 35.5 days. Visual interpretations of the results as well as residual plots are
presented in the following KinGui graph reports. Half-lives of S-2188 in the water phase and
in the sediment phase of the water sediment systems are presented in following table .
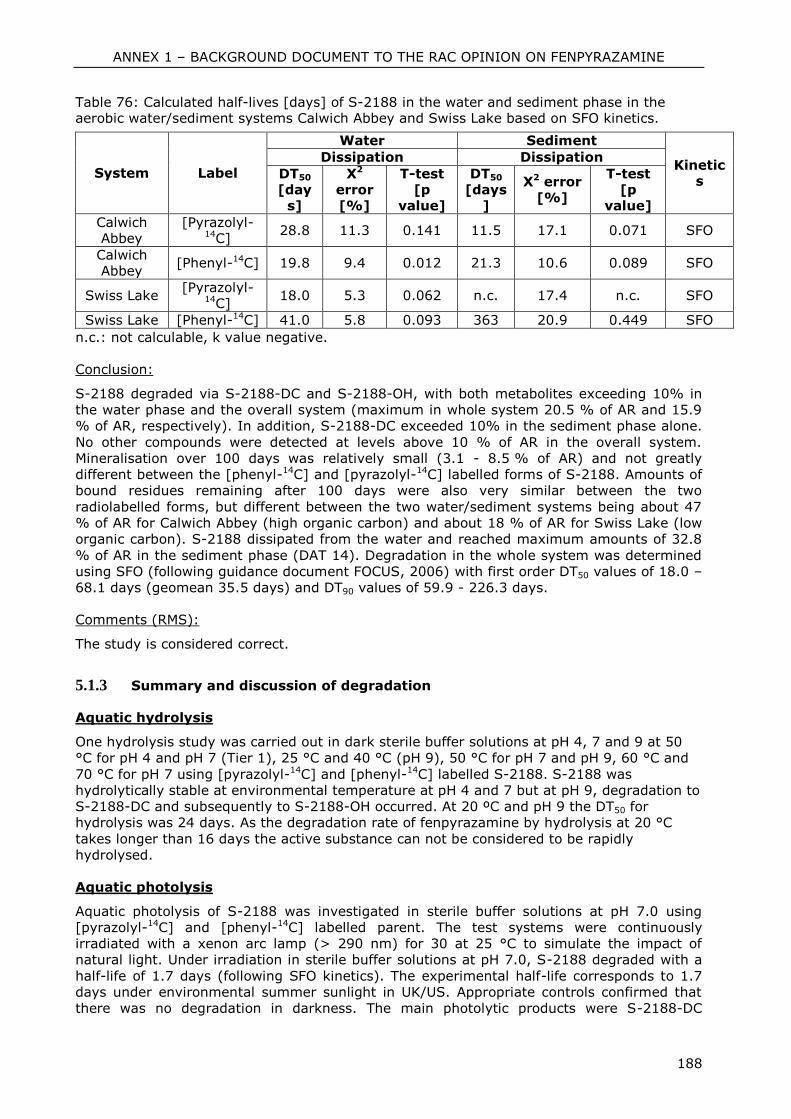
ANNEX 1 – BACKGROUND DOCUMENT TO THE RAC OPINION ON FENPYRAZAMINE
188
Table 76: Calculated half-lives [days] of S-2188 in the water and sediment phase in the aerobic water/sediment systems Calwich Abbey and Swiss Lake based on SFO kinetics.
System Label
Water Sediment
Kinetics
Dissipation Dissipation
DT50 [day
s]
Χ2 error [%]
T-test [p
value]
DT50 [days
]
Χ2 error [%]
T-test [p
value]
Calwich Abbey
[Pyrazolyl-14C]
28.8 11.3 0.141 11.5 17.1 0.071 SFO
Calwich Abbey
[Phenyl-14C] 19.8 9.4 0.012 21.3 10.6 0.089 SFO
Swiss Lake [Pyrazolyl-
14C] 18.0 5.3 0.062 n.c. 17.4 n.c. SFO
Swiss Lake [Phenyl-14C] 41.0 5.8 0.093 363 20.9 0.449 SFO
n.c.: not calculable, k value negative.
Conclusion:
S-2188 degraded via S-2188-DC and S-2188-OH, with both metabolites exceeding 10% in
the water phase and the overall system (maximum in whole system 20.5 % of AR and 15.9
% of AR, respectively). In addition, S-2188-DC exceeded 10% in the sediment phase alone.
No other compounds were detected at levels above 10 % of AR in the overall system.
Mineralisation over 100 days was relatively small (3.1 - 8.5 % of AR) and not greatly
different between the [phenyl-14C] and [pyrazolyl-14C] labelled forms of S-2188. Amounts of
bound residues remaining after 100 days were also very similar between the two
radiolabelled forms, but different between the two water/sediment systems being about 47
% of AR for Calwich Abbey (high organic carbon) and about 18 % of AR for Swiss Lake (low
organic carbon). S-2188 dissipated from the water and reached maximum amounts of 32.8
% of AR in the sediment phase (DAT 14). Degradation in the whole system was determined
using SFO (following guidance document FOCUS, 2006) with first order DT50 values of 18.0 –
68.1 days (geomean 35.5 days) and DT90 values of 59.9 - 226.3 days.
Comments (RMS):
The study is considered correct.
5.1.3 Summary and discussion of degradation
Aquatic hydrolysis
One hydrolysis study was carried out in dark sterile buffer solutions at pH 4, 7 and 9 at 50
°C for pH 4 and pH 7 (Tier 1), 25 °C and 40 °C (pH 9), 50 °C for pH 7 and pH 9, 60 °C and
70 °C for pH 7 using [pyrazolyl-14C] and [phenyl-14C] labelled S-2188. S-2188 was
hydrolytically stable at environmental temperature at pH 4 and 7 but at pH 9, degradation to
S-2188-DC and subsequently to S-2188-OH occurred. At 20 ºC and pH 9 the DT50 for
hydrolysis was 24 days. As the degradation rate of fenpyrazamine by hydrolysis at 20 °C
takes longer than 16 days the active substance can not be considered to be rapidly
hydrolysed.
Aquatic photolysis
Aquatic photolysis of S-2188 was investigated in sterile buffer solutions at pH 7.0 using
[pyrazolyl-14C] and [phenyl-14C] labelled parent. The test systems were continuously
irradiated with a xenon arc lamp (> 290 nm) for 30 at 25 °C to simulate the impact of
natural light. Under irradiation in sterile buffer solutions at pH 7.0, S-2188 degraded with a
half-life of 1.7 days (following SFO kinetics). The experimental half-life corresponds to 1.7
days under environmental summer sunlight in UK/US. Appropriate controls confirmed that
there was no degradation in darkness. The main photolytic products were S-2188-DC
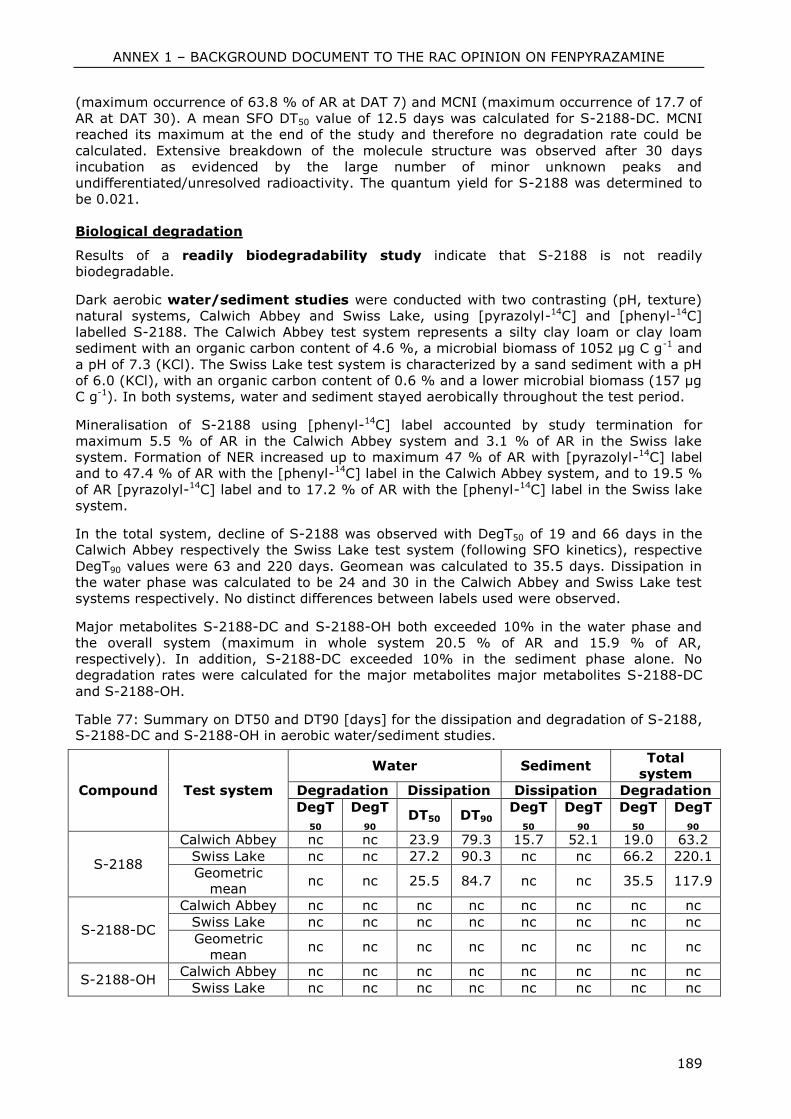
ANNEX 1 – BACKGROUND DOCUMENT TO THE RAC OPINION ON FENPYRAZAMINE
189
(maximum occurrence of 63.8 % of AR at DAT 7) and MCNI (maximum occurrence of 17.7 of
AR at DAT 30). A mean SFO DT50 value of 12.5 days was calculated for S-2188-DC. MCNI
reached its maximum at the end of the study and therefore no degradation rate could be
calculated. Extensive breakdown of the molecule structure was observed after 30 days
incubation as evidenced by the large number of minor unknown peaks and
undifferentiated/unresolved radioactivity. The quantum yield for S-2188 was determined to
be 0.021.
Biological degradation
Results of a readily biodegradability study indicate that S-2188 is not readily
biodegradable.
Dark aerobic water/sediment studies were conducted with two contrasting (pH, texture)
natural systems, Calwich Abbey and Swiss Lake, using [pyrazolyl-14C] and [phenyl-14C]
labelled S-2188. The Calwich Abbey test system represents a silty clay loam or clay loam
sediment with an organic carbon content of 4.6 %, a microbial biomass of 1052 µg C g-1 and
a pH of 7.3 (KCl). The Swiss Lake test system is characterized by a sand sediment with a pH
of 6.0 (KCl), with an organic carbon content of 0.6 % and a lower microbial biomass (157 µg
C g-1). In both systems, water and sediment stayed aerobically throughout the test period.
Mineralisation of S-2188 using [phenyl-14C] label accounted by study termination for
maximum 5.5 % of AR in the Calwich Abbey system and 3.1 % of AR in the Swiss lake
system. Formation of NER increased up to maximum 47 % of AR with [pyrazolyl-14C] label
and to 47.4 % of AR with the [phenyl-14C] label in the Calwich Abbey system, and to 19.5 %
of AR [pyrazolyl-14C] label and to 17.2 % of AR with the [phenyl-14C] label in the Swiss lake
system.
In the total system, decline of S-2188 was observed with DegT50 of 19 and 66 days in the
Calwich Abbey respectively the Swiss Lake test system (following SFO kinetics), respective
DegT90 values were 63 and 220 days. Geomean was calculated to 35.5 days. Dissipation in
the water phase was calculated to be 24 and 30 in the Calwich Abbey and Swiss Lake test
systems respectively. No distinct differences between labels used were observed.
Major metabolites S-2188-DC and S-2188-OH both exceeded 10% in the water phase and
the overall system (maximum in whole system 20.5 % of AR and 15.9 % of AR,
respectively). In addition, S-2188-DC exceeded 10% in the sediment phase alone. No
degradation rates were calculated for the major metabolites major metabolites S-2188-DC
and S-2188-OH.
Table 77: Summary on DT50 and DT90 [days] for the dissipation and degradation of S-2188, S-2188-DC and S-2188-OH in aerobic water/sediment studies.
Compound Test system
Water Sediment Total
system
Degradation Dissipation Dissipation Degradation
DegT
50 DegT
90 DT50 DT90
DegT
50 DegT
90 DegT
50 DegT
90
S-2188
Calwich Abbey nc nc 23.9 79.3 15.7 52.1 19.0 63.2
Swiss Lake nc nc 27.2 90.3 nc nc 66.2 220.1
Geometric mean
nc nc 25.5 84.7 nc nc 35.5 117.9
S-2188-DC
Calwich Abbey nc nc nc nc nc nc nc nc
Swiss Lake nc nc nc nc nc nc nc nc
Geometric mean
nc nc nc nc nc nc nc nc
S-2188-OH Calwich Abbey nc nc nc nc nc nc nc nc
Swiss Lake nc nc nc nc nc nc nc nc
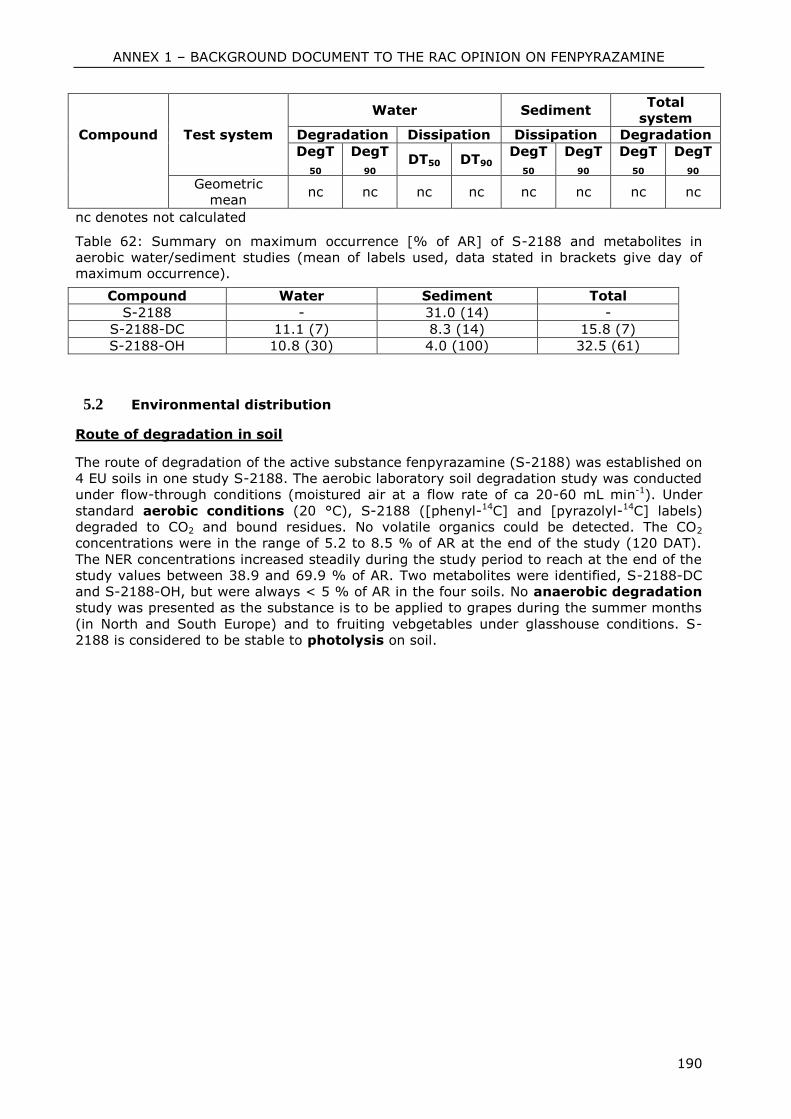
ANNEX 1 – BACKGROUND DOCUMENT TO THE RAC OPINION ON FENPYRAZAMINE
190
Compound Test system
Water Sediment Total
system
Degradation Dissipation Dissipation Degradation
DegT
50 DegT
90 DT50 DT90
DegT
50 DegT
90 DegT
50 DegT
90
Geometric mean
nc nc nc nc nc nc nc nc
nc denotes not calculated
Table 62: Summary on maximum occurrence [% of AR] of S-2188 and metabolites in
aerobic water/sediment studies (mean of labels used, data stated in brackets give day of maximum occurrence).
Compound Water Sediment Total
S-2188 - 31.0 (14) -
S-2188-DC 11.1 (7) 8.3 (14) 15.8 (7)
S-2188-OH 10.8 (30) 4.0 (100) 32.5 (61)
5.2 Environmental distribution
Route of degradation in soil
The route of degradation of the active substance fenpyrazamine (S-2188) was established on
4 EU soils in one study S-2188. The aerobic laboratory soil degradation study was conducted
under flow-through conditions (moistured air at a flow rate of ca 20-60 mL min-1). Under
standard aerobic conditions (20 °C), S-2188 ([phenyl-14C] and [pyrazolyl-14C] labels)
degraded to CO2 and bound residues. No volatile organics could be detected. The CO2
concentrations were in the range of 5.2 to 8.5 % of AR at the end of the study (120 DAT).
The NER concentrations increased steadily during the study period to reach at the end of the
study values between 38.9 and 69.9 % of AR. Two metabolites were identified, S-2188-DC
and S-2188-OH, but were always < 5 % of AR in the four soils. No anaerobic degradation
study was presented as the substance is to be applied to grapes during the summer months
(in North and South Europe) and to fruiting vebgetables under glasshouse conditions. S-
2188 is considered to be stable to photolysis on soil.
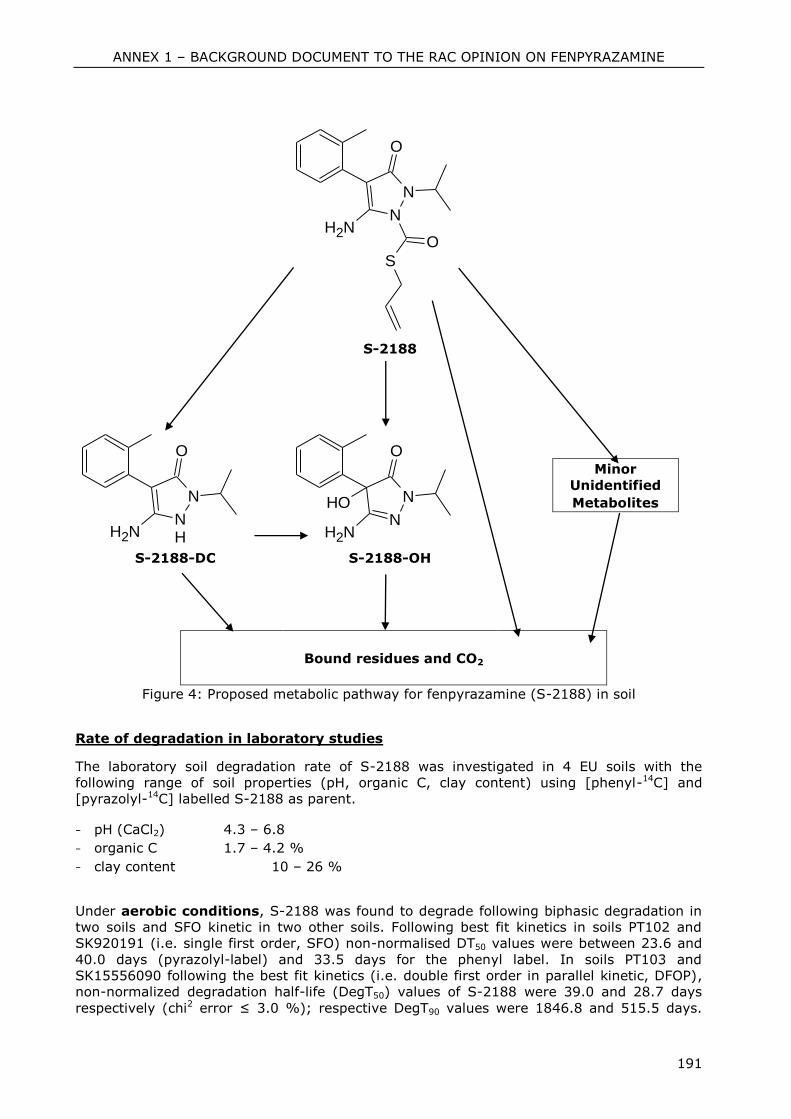
ANNEX 1 – BACKGROUND DOCUMENT TO THE RAC OPINION ON FENPYRAZAMINE
191
NH2
O
N
N
O
S
S-2188
NH2
O
N
NH
NH2
O
N
NOH
Minor
Unidentified
Metabolites
S-2188-DC S-2188-OH
Bound residues and CO2
Figure 4: Proposed metabolic pathway for fenpyrazamine (S-2188) in soil
Rate of degradation in laboratory studies
The laboratory soil degradation rate of S-2188 was investigated in 4 EU soils with the
following range of soil properties (pH, organic C, clay content) using [phenyl-14C] and
[pyrazolyl-14C] labelled S-2188 as parent.
- pH (CaCl2) 4.3 – 6.8
- organic C 1.7 – 4.2 %
- clay content 10 – 26 %
Under aerobic conditions, S-2188 was found to degrade following biphasic degradation in
two soils and SFO kinetic in two other soils. Following best fit kinetics in soils PT102 and
SK920191 (i.e. single first order, SFO) non-normalised DT50 values were between 23.6 and
40.0 days (pyrazolyl-label) and 33.5 days for the phenyl label. In soils PT103 and
SK15556090 following the best fit kinetics (i.e. double first order in parallel kinetic, DFOP),
non-normalized degradation half-life (DegT50) values of S-2188 were 39.0 and 28.7 days
respectively (chi2 error ≤ 3.0 %); respective DegT90 values were 1846.8 and 515.5 days.
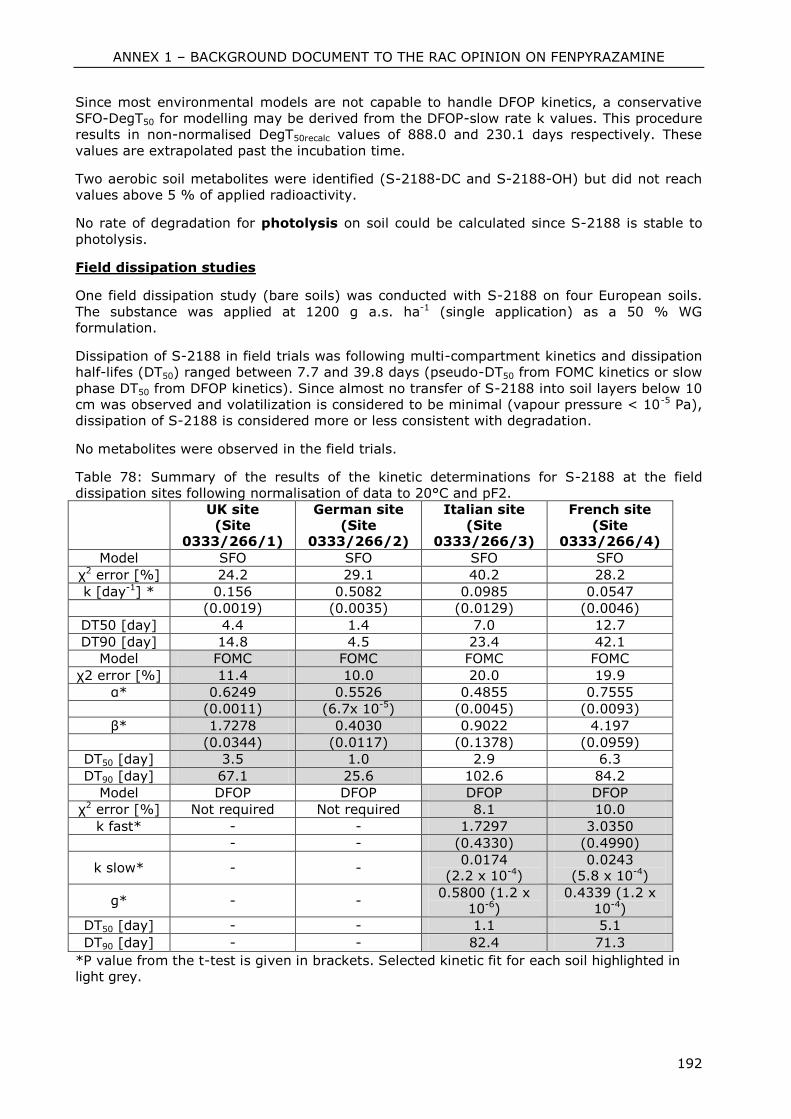
ANNEX 1 – BACKGROUND DOCUMENT TO THE RAC OPINION ON FENPYRAZAMINE
192
Since most environmental models are not capable to handle DFOP kinetics, a conservative
SFO-DegT50 for modelling may be derived from the DFOP-slow rate k values. This procedure
results in non-normalised DegT50recalc values of 888.0 and 230.1 days respectively. These
values are extrapolated past the incubation time.
Two aerobic soil metabolites were identified (S-2188-DC and S-2188-OH) but did not reach
values above 5 % of applied radioactivity.
No rate of degradation for photolysis on soil could be calculated since S-2188 is stable to
photolysis.
Field dissipation studies
One field dissipation study (bare soils) was conducted with S-2188 on four European soils.
The substance was applied at 1200 g a.s. ha-1 (single application) as a 50 % WG
formulation.
Dissipation of S-2188 in field trials was following multi-compartment kinetics and dissipation
half-lifes (DT50) ranged between 7.7 and 39.8 days (pseudo-DT50 from FOMC kinetics or slow
phase DT50 from DFOP kinetics). Since almost no transfer of S-2188 into soil layers below 10
cm was observed and volatilization is considered to be minimal (vapour pressure < 10-5 Pa),
dissipation of S-2188 is considered more or less consistent with degradation.
No metabolites were observed in the field trials.
Table 78: Summary of the results of the kinetic determinations for S-2188 at the field
dissipation sites following normalisation of data to 20°C and pF2.
UK site (Site
0333/266/1)
German site (Site
0333/266/2)
Italian site (Site
0333/266/3)
French site (Site
0333/266/4)
Model SFO SFO SFO SFO
χ2 error [%] 24.2 29.1 40.2 28.2
k [day-1] * 0.156 0.5082 0.0985 0.0547
(0.0019) (0.0035) (0.0129) (0.0046)
DT50 [day] 4.4 1.4 7.0 12.7
DT90 [day] 14.8 4.5 23.4 42.1
Model FOMC FOMC FOMC FOMC
χ2 error [%] 11.4 10.0 20.0 19.9
α* 0.6249 0.5526 0.4855 0.7555
(0.0011) (6.7x 10⁻⁵) (0.0045) (0.0093)
β* 1.7278 0.4030 0.9022 4.197
(0.0344) (0.0117) (0.1378) (0.0959)
DT50 [day] 3.5 1.0 2.9 6.3
DT90 [day] 67.1 25.6 102.6 84.2
Model DFOP DFOP DFOP DFOP
χ2 error [%] Not required Not required 8.1 10.0
k fast* - - 1.7297 3.0350
- - (0.4330) (0.4990)
k slow* - - 0.0174
(2.2 x 10⁻⁴) 0.0243
(5.8 x 10⁻⁴)
g* - - 0.5800 (1.2 x
10-6) 0.4339 (1.2 x
10-4)
DT50 [day] - - 1.1 5.1
DT90 [day] - - 82.4 71.3
*P value from the t-test is given in brackets. Selected kinetic fit for each soil highlighted in
light grey.
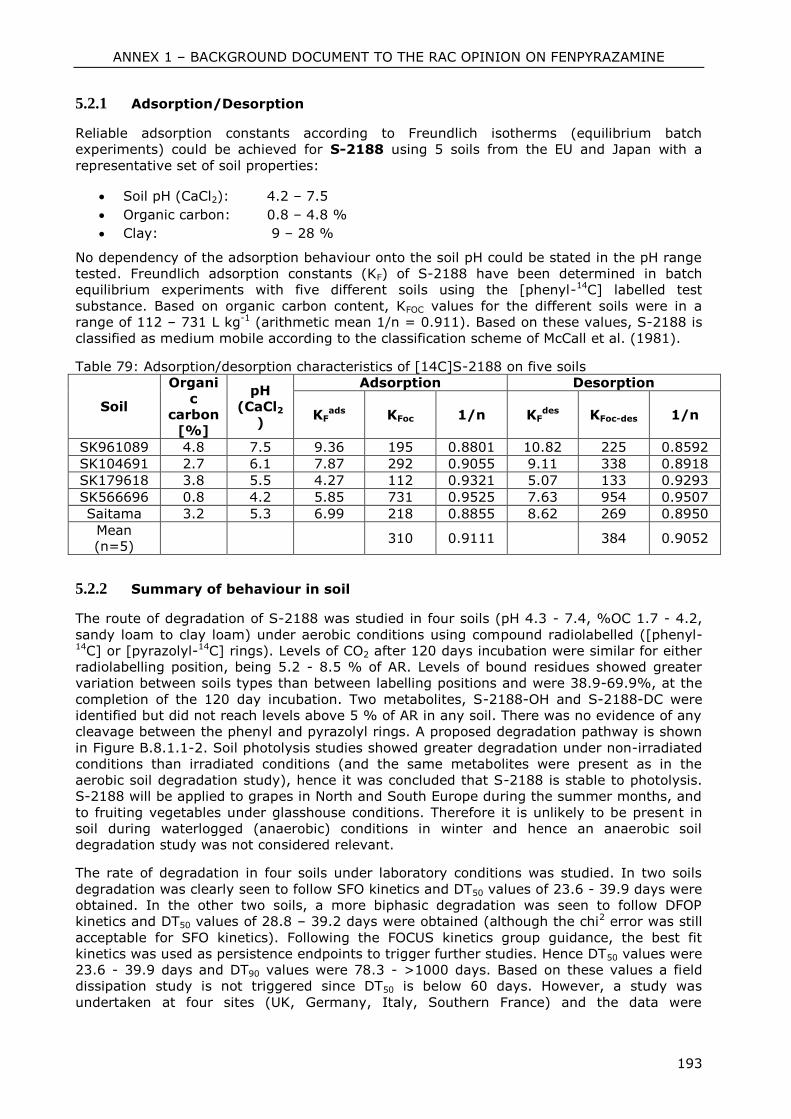
ANNEX 1 – BACKGROUND DOCUMENT TO THE RAC OPINION ON FENPYRAZAMINE
193
5.2.1 Adsorption/Desorption
Reliable adsorption constants according to Freundlich isotherms (equilibrium batch
experiments) could be achieved for S-2188 using 5 soils from the EU and Japan with a
representative set of soil properties:
Soil pH (CaCl2): 4.2 – 7.5
Organic carbon: 0.8 – 4.8 %
Clay: 9 – 28 %
No dependency of the adsorption behaviour onto the soil pH could be stated in the pH range
tested. Freundlich adsorption constants (KF) of S-2188 have been determined in batch
equilibrium experiments with five different soils using the [phenyl-14C] labelled test
substance. Based on organic carbon content, KFOC values for the different soils were in a
range of 112 – 731 L kg-1 (arithmetic mean 1/n = 0.911). Based on these values, S-2188 is
classified as medium mobile according to the classification scheme of McCall et al. (1981).
Table 79: Adsorption/desorption characteristics of [14C]S-2188 on five soils
Soil
Organic
carbon [%]
pH (CaCl2
)
Adsorption Desorption
KFads KFoc 1/n KF
des KFoc-des 1/n
SK961089 4.8 7.5 9.36 195 0.8801 10.82 225 0.8592
SK104691 2.7 6.1 7.87 292 0.9055 9.11 338 0.8918
SK179618 3.8 5.5 4.27 112 0.9321 5.07 133 0.9293
SK566696 0.8 4.2 5.85 731 0.9525 7.63 954 0.9507
Saitama 3.2 5.3 6.99 218 0.8855 8.62 269 0.8950
Mean (n=5)
310 0.9111 384 0.9052
5.2.2 Summary of behaviour in soil
The route of degradation of S-2188 was studied in four soils (pH 4.3 - 7.4, %OC 1.7 - 4.2,
sandy loam to clay loam) under aerobic conditions using compound radiolabelled ([phenyl-14C] or [pyrazolyl-14C] rings). Levels of CO2 after 120 days incubation were similar for either
radiolabelling position, being 5.2 - 8.5 % of AR. Levels of bound residues showed greater
variation between soils types than between labelling positions and were 38.9-69.9%, at the
completion of the 120 day incubation. Two metabolites, S-2188-OH and S-2188-DC were
identified but did not reach levels above 5 % of AR in any soil. There was no evidence of any
cleavage between the phenyl and pyrazolyl rings. A proposed degradation pathway is shown
in Figure B.8.1.1-2. Soil photolysis studies showed greater degradation under non-irradiated
conditions than irradiated conditions (and the same metabolites were present as in the
aerobic soil degradation study), hence it was concluded that S-2188 is stable to photolysis.
S-2188 will be applied to grapes in North and South Europe during the summer months, and
to fruiting vegetables under glasshouse conditions. Therefore it is unlikely to be present in
soil during waterlogged (anaerobic) conditions in winter and hence an anaerobic soil
degradation study was not considered relevant.
The rate of degradation in four soils under laboratory conditions was studied. In two soils
degradation was clearly seen to follow SFO kinetics and DT50 values of 23.6 - 39.9 days were
obtained. In the other two soils, a more biphasic degradation was seen to follow DFOP
kinetics and DT50 values of 28.8 – 39.2 days were obtained (although the chi2 error was still
acceptable for SFO kinetics). Following the FOCUS kinetics group guidance, the best fit
kinetics was used as persistence endpoints to trigger further studies. Hence DT50 values were
23.6 - 39.9 days and DT90 values were 78.3 - >1000 days. Based on these values a field
dissipation study is not triggered since DT50 is below 60 days. However, a study was
undertaken at four sites (UK, Germany, Italy, Southern France) and the data were
ANNEX 1 – BACKGROUND DOCUMENT TO THE RAC OPINION ON FENPYRAZAMINE
194
normalised following the time step normalisation. Best fit for the UK and German sites were
obtained with FOMC kinetic, and for the Italian and French sites with DFOP kinetic. The range
of pseudo-DT50 (FOMC kinetic) and DT50 values calculated from the slow rate k value (DFOP
kinetic) ranged between 7.7 and 39.8 days.
For use as simulation input values, the FOCUS (2006) document recommends in the first
instance using the slow phase from the DFOP kinetics as a first order value to be input into
the models if the fit to SFO kinetics is not acceptable. However, this leads to unrealistic
degradation rates in the PT103 and SK15556090 soils (equivalent SFO DT50 values would be
231-936 days based on the slow rate from DFOP kinetics) since the DFOP fit is clearly
strongly influenced by minor variation at the later timepoints. For simulation purposes the
Notifier proposed to use SFO kinetics data for PT103 and SK15556090 soils. The values
obtained (DT50 67.9 and 56.4 days, respectively (DT90s 225.7 and 187.5 days)) were
consistent with the other two laboratory degradation studies and the field dissipation study.
The use of SFO was not considered adequate by RMS since even if the χ2 error values were
below 15 % the visual fit was not satisfactory as supported by the biased residual plots. The
consistency to the other two degradation studies and the field study was not considered as a
valid argument. Therefore the field degradation studies were normalised and the obtained
geometric mean DT50 value of 20.5 days was used for modelling purposes.
The sorption of S-2188 was studied in four European soils and one Japanese soil (pH range
4.2 to 7.5, % OC 0.8 – 4.8 loamy sand to clay loam). Adsorption KFoc values were between
112 and 731 ml g-1 (mean 310 ml g-1, mean 1/n = 0.911) and desorption KFoc-des values
were between 133 and 954 ml g-1 (mean 384 ml/g, mean 1/n= 0.905) indicating that S-
2188 is slightly to moderately mobile. There was no evidence of any pH dependence. No
metabolites reached levels above 3 % of AR in soil and hence there was no need for further
sorption or column leaching studies.
5.2.3 Volatilisation
S-2188 has a very low vapour pressure of below 10–5 Pa at 25 ºC (see Annex IIA point
2.3.1) and is predicted to degrade rapidly in air through reaction with hydroxyl radicals (DT50
of 1.221 hr assuming 1.5 x 10⁶ hydroxyl radicals cm-³, see Annex IIA point 2.10). Therefore
it is considered that there is no risk of exposure to air and no further data are required.
5.2.4 Distribution modelling
No information available.
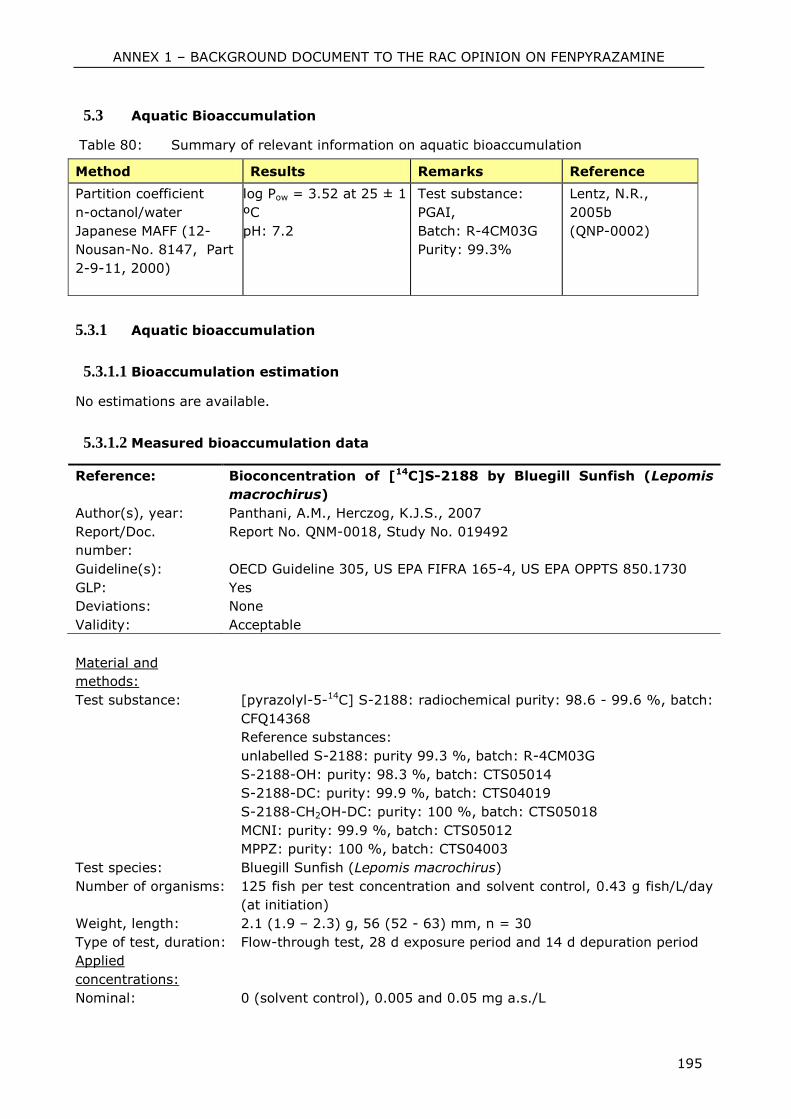
ANNEX 1 – BACKGROUND DOCUMENT TO THE RAC OPINION ON FENPYRAZAMINE
195
5.3 Aquatic Bioaccumulation
Table 80: Summary of relevant information on aquatic bioaccumulation
Method Results Remarks Reference
Partition coefficient
n-octanol/water
Japanese MAFF (12-
Nousan-No. 8147, Part
2-9-11, 2000)
log Pow = 3.52 at 25 ± 1
ºC
pH: 7.2
Test substance:
PGAI,
Batch: R-4CM03G
Purity: 99.3%
Lentz, N.R.,
2005b
(QNP-0002)
5.3.1 Aquatic bioaccumulation
5.3.1.1 Bioaccumulation estimation
No estimations are available.
5.3.1.2 Measured bioaccumulation data
Reference: Bioconcentration of [14C]S-2188 by Bluegill Sunfish (Lepomis
macrochirus)
Author(s), year: Panthani, A.M., Herczog, K.J.S., 2007
Report/Doc.
number:
Report No. QNM-0018, Study No. 019492
Guideline(s): OECD Guideline 305, US EPA FIFRA 165-4, US EPA OPPTS 850.1730
GLP: Yes
Deviations: None
Validity: Acceptable
Material and
methods:
Test substance: [pyrazolyl-5-14C] S-2188: radiochemical purity: 98.6 - 99.6 %, batch:
CFQ14368
Reference substances:
unlabelled S-2188: purity 99.3 %, batch: R-4CM03G
S-2188-OH: purity: 98.3 %, batch: CTS05014
S-2188-DC: purity: 99.9 %, batch: CTS04019
S-2188-CH2OH-DC: purity: 100 %, batch: CTS05018
MCNI: purity: 99.9 %, batch: CTS05012
MPPZ: purity: 100 %, batch: CTS04003
Test species: Bluegill Sunfish (Lepomis macrochirus)
Number of organisms: 125 fish per test concentration and solvent control, 0.43 g fish/L/day
(at initiation)
Weight, length: 2.1 (1.9 – 2.3) g, 56 (52 - 63) mm, n = 30
Type of test, duration: Flow-through test, 28 d exposure period and 14 d depuration period
Applied
concentrations:
Nominal: 0 (solvent control), 0.005 and 0.05 mg a.s./L
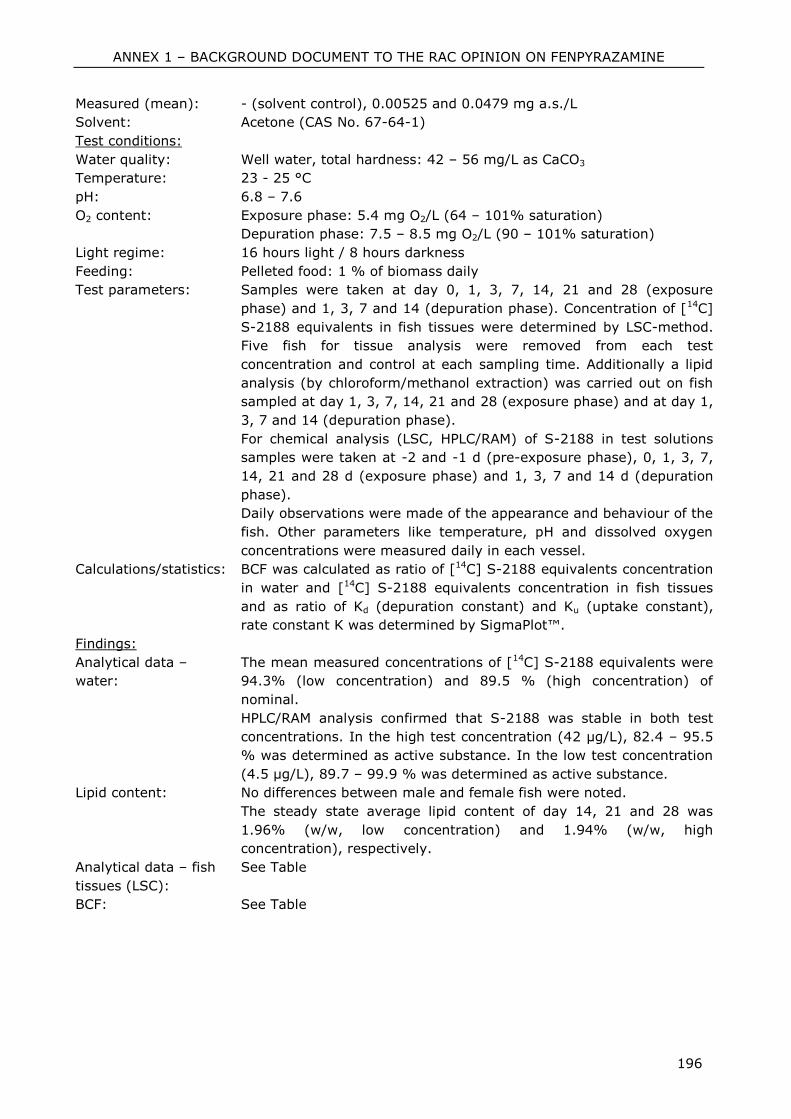
ANNEX 1 – BACKGROUND DOCUMENT TO THE RAC OPINION ON FENPYRAZAMINE
196
Measured (mean): - (solvent control), 0.00525 and 0.0479 mg a.s./L
Solvent: Acetone (CAS No. 67-64-1)
Test conditions:
Water quality: Well water, total hardness: 42 – 56 mg/L as CaCO3
Temperature: 23 - 25 °C
pH: 6.8 – 7.6
O2 content: Exposure phase: 5.4 mg O2/L (64 – 101% saturation)
Depuration phase: 7.5 – 8.5 mg O2/L (90 – 101% saturation)
Light regime: 16 hours light / 8 hours darkness
Feeding: Pelleted food: 1 % of biomass daily
Test parameters: Samples were taken at day 0, 1, 3, 7, 14, 21 and 28 (exposure
phase) and 1, 3, 7 and 14 (depuration phase). Concentration of [14C]
S-2188 equivalents in fish tissues were determined by LSC-method.
Five fish for tissue analysis were removed from each test
concentration and control at each sampling time. Additionally a lipid
analysis (by chloroform/methanol extraction) was carried out on fish
sampled at day 1, 3, 7, 14, 21 and 28 (exposure phase) and at day 1,
3, 7 and 14 (depuration phase).
For chemical analysis (LSC, HPLC/RAM) of S-2188 in test solutions
samples were taken at -2 and -1 d (pre-exposure phase), 0, 1, 3, 7,
14, 21 and 28 d (exposure phase) and 1, 3, 7 and 14 d (depuration
phase).
Daily observations were made of the appearance and behaviour of the
fish. Other parameters like temperature, pH and dissolved oxygen
concentrations were measured daily in each vessel.
Calculations/statistics: BCF was calculated as ratio of [14C] S-2188 equivalents concentration
in water and [14C] S-2188 equivalents concentration in fish tissues
and as ratio of Kd (depuration constant) and Ku (uptake constant),
rate constant K was determined by SigmaPlot™.
Findings:
Analytical data –
water:
The mean measured concentrations of [14C] S-2188 equivalents were
94.3% (low concentration) and 89.5 % (high concentration) of
nominal.
HPLC/RAM analysis confirmed that S-2188 was stable in both test
concentrations. In the high test concentration (42 µg/L), 82.4 – 95.5
% was determined as active substance. In the low test concentration
(4.5 µg/L), 89.7 – 99.9 % was determined as active substance.
Lipid content: No differences between male and female fish were noted.
The steady state average lipid content of day 14, 21 and 28 was
1.96% (w/w, low concentration) and 1.94% (w/w, high
concentration), respectively.
Analytical data – fish
tissues (LSC):
See Table
BCF: See Table
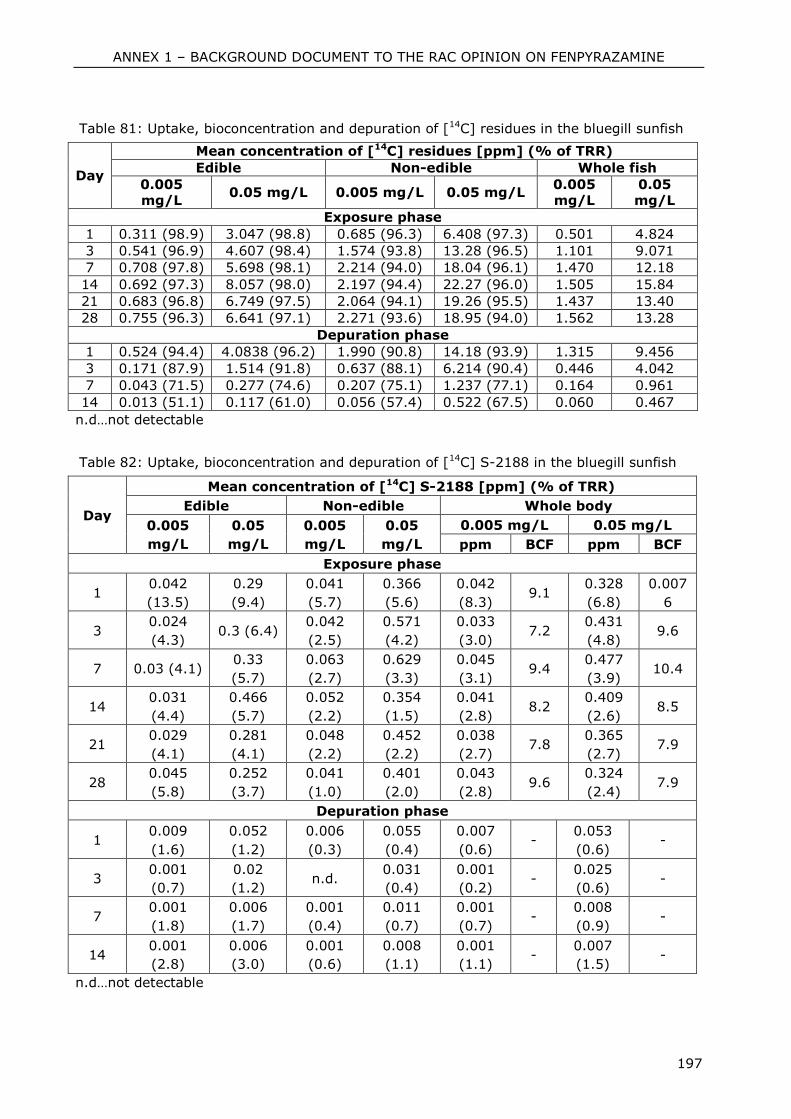
ANNEX 1 – BACKGROUND DOCUMENT TO THE RAC OPINION ON FENPYRAZAMINE
197
Table 81: Uptake, bioconcentration and depuration of [14C] residues in the bluegill sunfish
Day
Mean concentration of [14C] residues [ppm] (% of TRR)
Edible Non-edible Whole fish
0.005 mg/L
0.05 mg/L 0.005 mg/L 0.05 mg/L 0.005 mg/L
0.05 mg/L
Exposure phase
1 0.311 (98.9) 3.047 (98.8) 0.685 (96.3) 6.408 (97.3) 0.501 4.824
3 0.541 (96.9) 4.607 (98.4) 1.574 (93.8) 13.28 (96.5) 1.101 9.071
7 0.708 (97.8) 5.698 (98.1) 2.214 (94.0) 18.04 (96.1) 1.470 12.18
14 0.692 (97.3) 8.057 (98.0) 2.197 (94.4) 22.27 (96.0) 1.505 15.84
21 0.683 (96.8) 6.749 (97.5) 2.064 (94.1) 19.26 (95.5) 1.437 13.40
28 0.755 (96.3) 6.641 (97.1) 2.271 (93.6) 18.95 (94.0) 1.562 13.28
Depuration phase
1 0.524 (94.4) 4.0838 (96.2) 1.990 (90.8) 14.18 (93.9) 1.315 9.456
3 0.171 (87.9) 1.514 (91.8) 0.637 (88.1) 6.214 (90.4) 0.446 4.042
7 0.043 (71.5) 0.277 (74.6) 0.207 (75.1) 1.237 (77.1) 0.164 0.961
14 0.013 (51.1) 0.117 (61.0) 0.056 (57.4) 0.522 (67.5) 0.060 0.467
n.d…not detectable
Table 82: Uptake, bioconcentration and depuration of [14C] S-2188 in the bluegill sunfish
Day
Mean concentration of [14C] S-2188 [ppm] (% of TRR)
Edible Non-edible Whole body
0.005
mg/L
0.05
mg/L
0.005
mg/L
0.05
mg/L
0.005 mg/L 0.05 mg/L
ppm BCF ppm BCF
Exposure phase
1 0.042
(13.5)
0.29
(9.4)
0.041
(5.7)
0.366
(5.6)
0.042
(8.3) 9.1
0.328
(6.8)
0.007
6
3 0.024
(4.3) 0.3 (6.4)
0.042
(2.5)
0.571
(4.2)
0.033
(3.0) 7.2
0.431
(4.8) 9.6
7 0.03 (4.1) 0.33
(5.7)
0.063
(2.7)
0.629
(3.3)
0.045
(3.1) 9.4
0.477
(3.9) 10.4
14 0.031
(4.4)
0.466
(5.7)
0.052
(2.2)
0.354
(1.5)
0.041
(2.8) 8.2
0.409
(2.6) 8.5
21 0.029
(4.1)
0.281
(4.1)
0.048
(2.2)
0.452
(2.2)
0.038
(2.7) 7.8
0.365
(2.7) 7.9
28 0.045
(5.8)
0.252
(3.7)
0.041
(1.0)
0.401
(2.0)
0.043
(2.8) 9.6
0.324
(2.4) 7.9
Depuration phase
1 0.009
(1.6)
0.052
(1.2)
0.006
(0.3)
0.055
(0.4)
0.007
(0.6) -
0.053
(0.6) -
3 0.001
(0.7)
0.02
(1.2) n.d.
0.031
(0.4)
0.001
(0.2) -
0.025
(0.6) -
7 0.001
(1.8)
0.006
(1.7)
0.001
(0.4)
0.011
(0.7)
0.001
(0.7) -
0.008
(0.9) -
14 0.001
(2.8)
0.006
(3.0)
0.001
(0.6)
0.008
(1.1)
0.001
(1.1) -
0.007
(1.5) -
n.d…not detectable
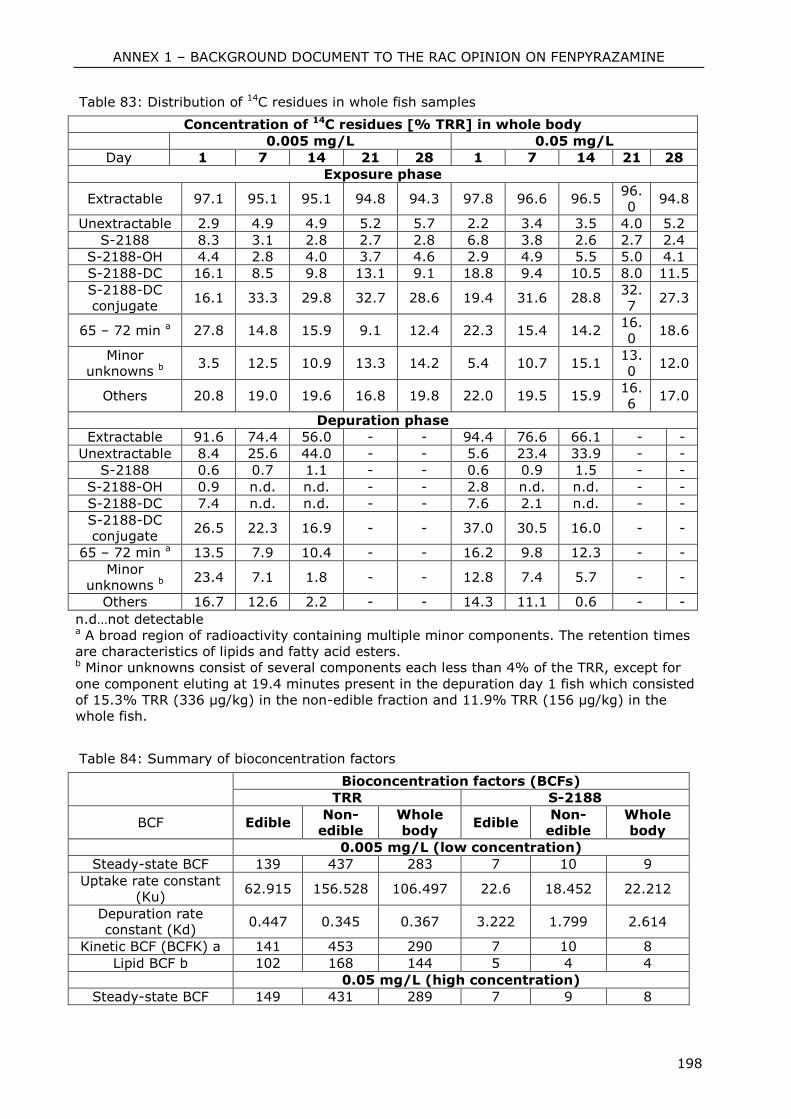
ANNEX 1 – BACKGROUND DOCUMENT TO THE RAC OPINION ON FENPYRAZAMINE
198
Table 83: Distribution of 14C residues in whole fish samples
Concentration of 14C residues [% TRR] in whole body
0.005 mg/L 0.05 mg/L
Day 1 7 14 21 28 1 7 14 21 28
Exposure phase
Extractable 97.1 95.1 95.1 94.8 94.3 97.8 96.6 96.5 96.0
94.8
Unextractable 2.9 4.9 4.9 5.2 5.7 2.2 3.4 3.5 4.0 5.2
S-2188 8.3 3.1 2.8 2.7 2.8 6.8 3.8 2.6 2.7 2.4
S-2188-OH 4.4 2.8 4.0 3.7 4.6 2.9 4.9 5.5 5.0 4.1
S-2188-DC 16.1 8.5 9.8 13.1 9.1 18.8 9.4 10.5 8.0 11.5
S-2188-DC conjugate
16.1 33.3 29.8 32.7 28.6 19.4 31.6 28.8 32.7
27.3
65 – 72 min a 27.8 14.8 15.9 9.1 12.4 22.3 15.4 14.2 16.0
18.6
Minor unknowns b 3.5 12.5 10.9 13.3 14.2 5.4 10.7 15.1
13.0
12.0
Others 20.8 19.0 19.6 16.8 19.8 22.0 19.5 15.9 16.6
17.0
Depuration phase
Extractable 91.6 74.4 56.0 - - 94.4 76.6 66.1 - -
Unextractable 8.4 25.6 44.0 - - 5.6 23.4 33.9 - -
S-2188 0.6 0.7 1.1 - - 0.6 0.9 1.5 - -
S-2188-OH 0.9 n.d. n.d. - - 2.8 n.d. n.d. - -
S-2188-DC 7.4 n.d. n.d. - - 7.6 2.1 n.d. - -
S-2188-DC conjugate
26.5 22.3 16.9 - - 37.0 30.5 16.0 - -
65 – 72 min a 13.5 7.9 10.4 - - 16.2 9.8 12.3 - -
Minor unknowns b 23.4 7.1 1.8 - - 12.8 7.4 5.7 - -
Others 16.7 12.6 2.2 - - 14.3 11.1 0.6 - -
n.d…not detectable a A broad region of radioactivity containing multiple minor components. The retention times
are characteristics of lipids and fatty acid esters. b Minor unknowns consist of several components each less than 4% of the TRR, except for
one component eluting at 19.4 minutes present in the depuration day 1 fish which consisted
of 15.3% TRR (336 µg/kg) in the non-edible fraction and 11.9% TRR (156 µg/kg) in the
whole fish.
Table 84: Summary of bioconcentration factors
Bioconcentration factors (BCFs)
TRR S-2188
BCF Edible Non-
edible Whole body
Edible Non-
edible Whole body
0.005 mg/L (low concentration)
Steady-state BCF 139 437 283 7 10 9
Uptake rate constant (Ku)
62.915 156.528 106.497 22.6 18.452 22.212
Depuration rate constant (Kd)
0.447 0.345 0.367 3.222 1.799 2.614
Kinetic BCF (BCFK) a 141 453 290 7 10 8
Lipid BCF b 102 168 144 5 4 4
0.05 mg/L (high concentration)
Steady-state BCF 149 431 289 7 9 8
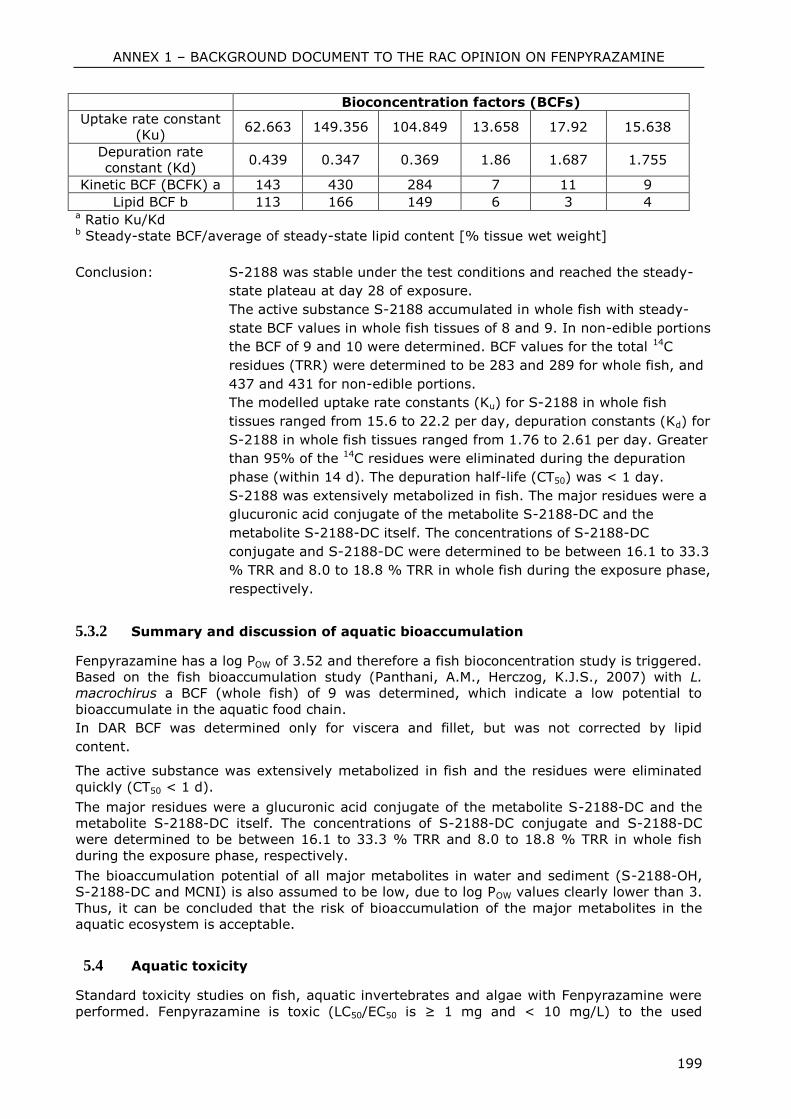
ANNEX 1 – BACKGROUND DOCUMENT TO THE RAC OPINION ON FENPYRAZAMINE
199
Bioconcentration factors (BCFs)
Uptake rate constant (Ku)
62.663 149.356 104.849 13.658 17.92 15.638
Depuration rate constant (Kd)
0.439 0.347 0.369 1.86 1.687 1.755
Kinetic BCF (BCFK) a 143 430 284 7 11 9
Lipid BCF b 113 166 149 6 3 4 a Ratio Ku/Kd b Steady-state BCF/average of steady-state lipid content [% tissue wet weight]
Conclusion: S-2188 was stable under the test conditions and reached the steady-
state plateau at day 28 of exposure.
The active substance S-2188 accumulated in whole fish with steady-
state BCF values in whole fish tissues of 8 and 9. In non-edible portions
the BCF of 9 and 10 were determined. BCF values for the total 14C
residues (TRR) were determined to be 283 and 289 for whole fish, and
437 and 431 for non-edible portions.
The modelled uptake rate constants (Ku) for S-2188 in whole fish
tissues ranged from 15.6 to 22.2 per day, depuration constants (Kd) for
S-2188 in whole fish tissues ranged from 1.76 to 2.61 per day. Greater
than 95% of the 14C residues were eliminated during the depuration
phase (within 14 d). The depuration half-life (CT50) was < 1 day.
S-2188 was extensively metabolized in fish. The major residues were a
glucuronic acid conjugate of the metabolite S-2188-DC and the
metabolite S-2188-DC itself. The concentrations of S-2188-DC
conjugate and S-2188-DC were determined to be between 16.1 to 33.3
% TRR and 8.0 to 18.8 % TRR in whole fish during the exposure phase,
respectively.
5.3.2 Summary and discussion of aquatic bioaccumulation
Fenpyrazamine has a log POW of 3.52 and therefore a fish bioconcentration study is triggered.
Based on the fish bioaccumulation study (Panthani, A.M., Herczog, K.J.S., 2007) with L.
macrochirus a BCF (whole fish) of 9 was determined, which indicate a low potential to
bioaccumulate in the aquatic food chain.
In DAR BCF was determined only for viscera and fillet, but was not corrected by lipid
content.
The active substance was extensively metabolized in fish and the residues were eliminated
quickly (CT50 < 1 d).
The major residues were a glucuronic acid conjugate of the metabolite S-2188-DC and the
metabolite S-2188-DC itself. The concentrations of S-2188-DC conjugate and S-2188-DC
were determined to be between 16.1 to 33.3 % TRR and 8.0 to 18.8 % TRR in whole fish
during the exposure phase, respectively.
The bioaccumulation potential of all major metabolites in water and sediment (S-2188-OH,
S-2188-DC and MCNI) is also assumed to be low, due to log POW values clearly lower than 3.
Thus, it can be concluded that the risk of bioaccumulation of the major metabolites in the
aquatic ecosystem is acceptable.
5.4 Aquatic toxicity
Standard toxicity studies on fish, aquatic invertebrates and algae with Fenpyrazamine were
performed. Fenpyrazamine is toxic (LC50/EC50 is ≥ 1 mg and < 10 mg/L) to the used

ANNEX 1 – BACKGROUND DOCUMENT TO THE RAC OPINION ON FENPYRAZAMINE
200
standard fresh water test species. The most sensitive species is the algae Pseudokirchneriella
subcapitata with an EbC50 of 0.42 mg a.s./L.
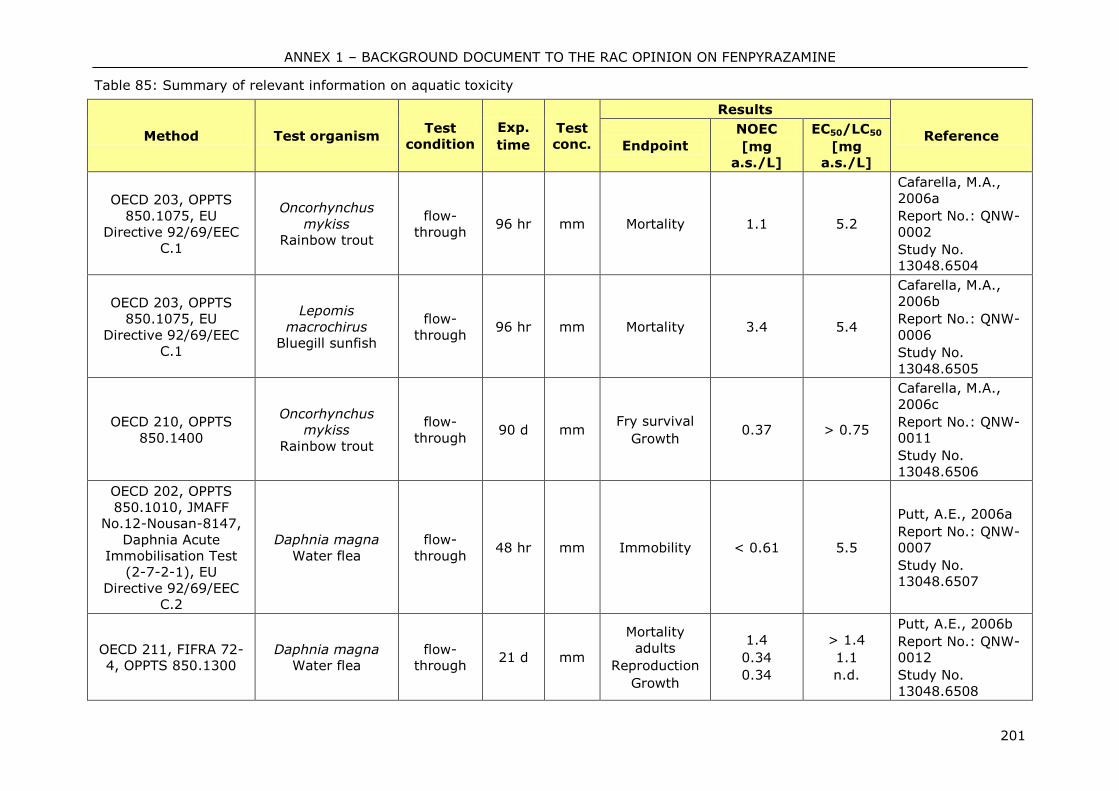
ANNEX 1 – BACKGROUND DOCUMENT TO THE RAC OPINION ON FENPYRAZAMINE
201
Table 85: Summary of relevant information on aquatic toxicity
Method Test organism Test
condition
Exp.
time
Test
conc.
Results
Reference Endpoint
NOEC
[mg
a.s./L]
EC50/LC50
[mg
a.s./L]
OECD 203, OPPTS
850.1075, EU
Directive 92/69/EEC
C.1
Oncorhynchus
mykiss
Rainbow trout
flow-
through 96 hr mm Mortality 1.1 5.2
Cafarella, M.A.,
2006a
Report No.: QNW-
0002
Study No.
13048.6504
OECD 203, OPPTS
850.1075, EU
Directive 92/69/EEC
C.1
Lepomis
macrochirus
Bluegill sunfish
flow-
through 96 hr mm Mortality 3.4 5.4
Cafarella, M.A.,
2006b
Report No.: QNW-
0006
Study No.
13048.6505
OECD 210, OPPTS
850.1400
Oncorhynchus
mykiss
Rainbow trout
flow-
through 90 d mm
Fry survival
Growth 0.37 > 0.75
Cafarella, M.A.,
2006c
Report No.: QNW-
0011
Study No.
13048.6506
OECD 202, OPPTS
850.1010, JMAFF
No.12-Nousan-8147,
Daphnia Acute
Immobilisation Test
(2-7-2-1), EU
Directive 92/69/EEC
C.2
Daphnia magna
Water flea
flow-
through 48 hr mm Immobility < 0.61 5.5
Putt, A.E., 2006a
Report No.: QNW-
0007
Study No.
13048.6507
OECD 211, FIFRA 72-
4, OPPTS 850.1300
Daphnia magna
Water flea
flow-
through 21 d mm
Mortality
adults
Reproduction
Growth
1.4
0.34
0.34
> 1.4
1.1
n.d.
Putt, A.E., 2006b
Report No.: QNW-
0012
Study No.
13048.6508
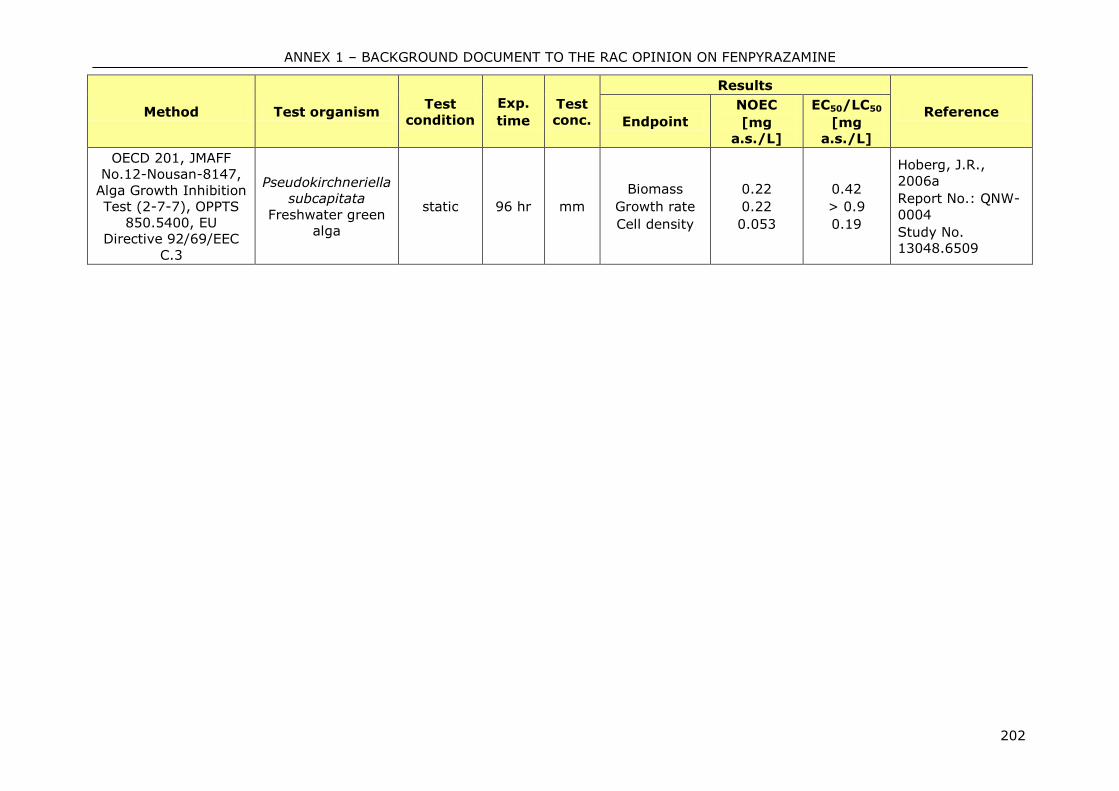
ANNEX 1 – BACKGROUND DOCUMENT TO THE RAC OPINION ON FENPYRAZAMINE
202
Method Test organism Test
condition
Exp.
time
Test
conc.
Results
Reference Endpoint
NOEC
[mg
a.s./L]
EC50/LC50
[mg
a.s./L]
OECD 201, JMAFF
No.12-Nousan-8147,
Alga Growth Inhibition
Test (2-7-7), OPPTS
850.5400, EU
Directive 92/69/EEC
C.3
Pseudokirchneriella
subcapitata
Freshwater green
alga
static 96 hr mm
Biomass
Growth rate
Cell density
0.22
0.22
0.053
0.42
> 0.9
0.19
Hoberg, J.R.,
2006a
Report No.: QNW-
0004
Study No.
13048.6509
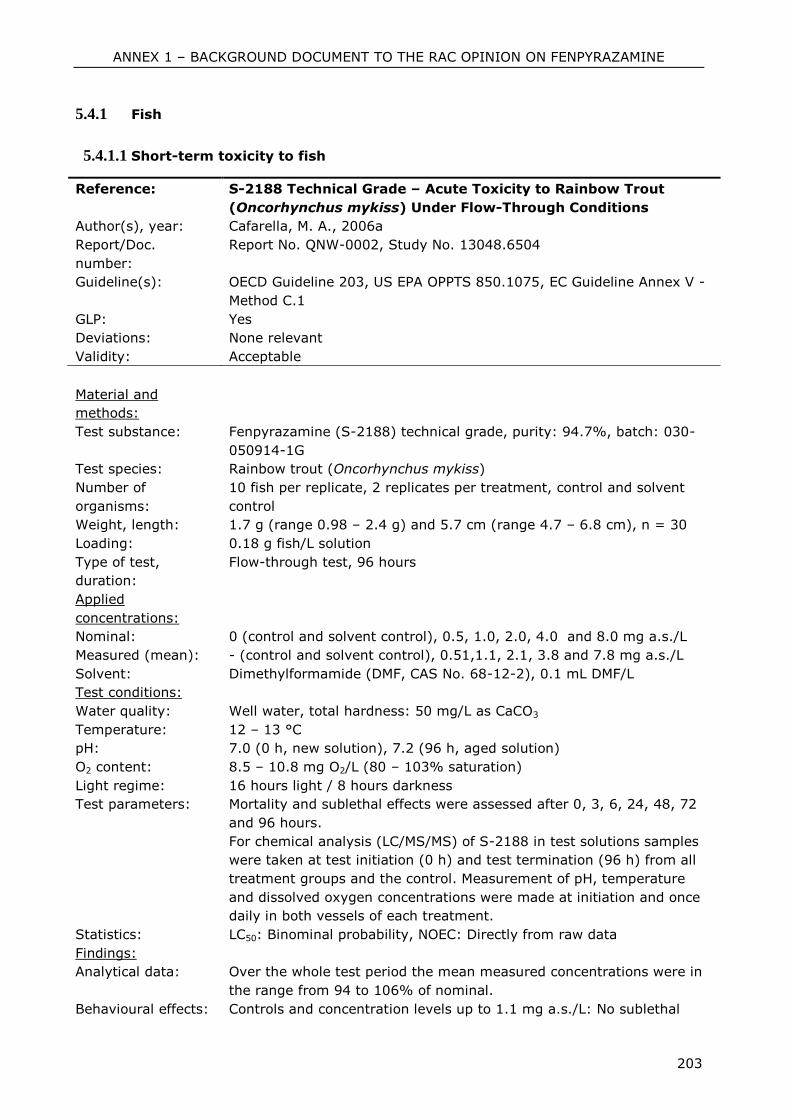
ANNEX 1 – BACKGROUND DOCUMENT TO THE RAC OPINION ON FENPYRAZAMINE
203
5.4.1 Fish
5.4.1.1 Short-term toxicity to fish
Reference: S-2188 Technical Grade – Acute Toxicity to Rainbow Trout
(Oncorhynchus mykiss) Under Flow-Through Conditions
Author(s), year: Cafarella, M. A., 2006a
Report/Doc.
number:
Report No. QNW-0002, Study No. 13048.6504
Guideline(s): OECD Guideline 203, US EPA OPPTS 850.1075, EC Guideline Annex V -
Method C.1
GLP: Yes
Deviations: None relevant
Validity: Acceptable
Material and
methods:
Test substance: Fenpyrazamine (S-2188) technical grade, purity: 94.7%, batch: 030-
050914-1G
Test species: Rainbow trout (Oncorhynchus mykiss)
Number of
organisms:
10 fish per replicate, 2 replicates per treatment, control and solvent
control
Weight, length: 1.7 g (range 0.98 – 2.4 g) and 5.7 cm (range 4.7 – 6.8 cm), n = 30
Loading: 0.18 g fish/L solution
Type of test,
duration:
Flow-through test, 96 hours
Applied
concentrations:
Nominal: 0 (control and solvent control), 0.5, 1.0, 2.0, 4.0 and 8.0 mg a.s./L
Measured (mean): - (control and solvent control), 0.51,1.1, 2.1, 3.8 and 7.8 mg a.s./L
Solvent: Dimethylformamide (DMF, CAS No. 68-12-2), 0.1 mL DMF/L
Test conditions:
Water quality: Well water, total hardness: 50 mg/L as CaCO3
Temperature: 12 – 13 °C
pH: 7.0 (0 h, new solution), 7.2 (96 h, aged solution)
O2 content: 8.5 – 10.8 mg O2/L (80 – 103% saturation)
Light regime: 16 hours light / 8 hours darkness
Test parameters: Mortality and sublethal effects were assessed after 0, 3, 6, 24, 48, 72
and 96 hours.
For chemical analysis (LC/MS/MS) of S-2188 in test solutions samples
were taken at test initiation (0 h) and test termination (96 h) from all
treatment groups and the control. Measurement of pH, temperature
and dissolved oxygen concentrations were made at initiation and once
daily in both vessels of each treatment.
Statistics: LC50: Binominal probability, NOEC: Directly from raw data
Findings:
Analytical data: Over the whole test period the mean measured concentrations were in
the range from 94 to 106% of nominal.
Behavioural effects: Controls and concentration levels up to 1.1 mg a.s./L: No sublethal
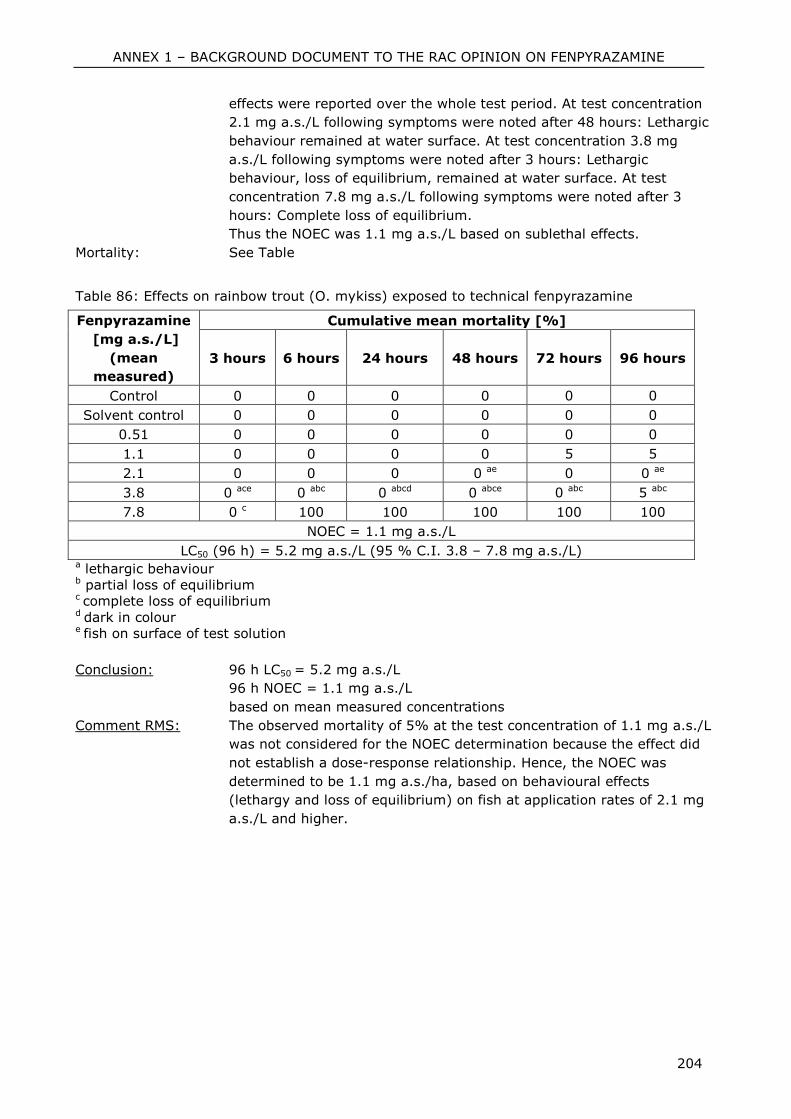
ANNEX 1 – BACKGROUND DOCUMENT TO THE RAC OPINION ON FENPYRAZAMINE
204
effects were reported over the whole test period. At test concentration
2.1 mg a.s./L following symptoms were noted after 48 hours: Lethargic
behaviour remained at water surface. At test concentration 3.8 mg
a.s./L following symptoms were noted after 3 hours: Lethargic
behaviour, loss of equilibrium, remained at water surface. At test
concentration 7.8 mg a.s./L following symptoms were noted after 3
hours: Complete loss of equilibrium.
Thus the NOEC was 1.1 mg a.s./L based on sublethal effects.
Mortality: See Table
Table 86: Effects on rainbow trout (O. mykiss) exposed to technical fenpyrazamine
Fenpyrazamine
[mg a.s./L]
(mean
measured)
Cumulative mean mortality [%]
3 hours 6 hours 24 hours 48 hours 72 hours 96 hours
Control 0 0 0 0 0 0
Solvent control 0 0 0 0 0 0
0.51 0 0 0 0 0 0
1.1 0 0 0 0 5 5
2.1 0 0 0 0 ae 0 0 ae
3.8 0 ace 0 abc 0 abcd 0 abce 0 abc 5 abc
7.8 0 c 100 100 100 100 100
NOEC = 1.1 mg a.s./L
LC50 (96 h) = 5.2 mg a.s./L (95 % C.I. 3.8 – 7.8 mg a.s./L) a lethargic behaviour b partial loss of equilibrium c complete loss of equilibrium d dark in colour e fish on surface of test solution
Conclusion: 96 h LC50 = 5.2 mg a.s./L
96 h NOEC = 1.1 mg a.s./L
based on mean measured concentrations
Comment RMS: The observed mortality of 5% at the test concentration of 1.1 mg a.s./L
was not considered for the NOEC determination because the effect did
not establish a dose-response relationship. Hence, the NOEC was
determined to be 1.1 mg a.s./ha, based on behavioural effects
(lethargy and loss of equilibrium) on fish at application rates of 2.1 mg
a.s./L and higher.
ANNEX 1 – BACKGROUND DOCUMENT TO THE RAC OPINION ON FENPYRAZAMINE
205
Reference: S-2188 Technical Grade – Acute Toxicity to Bluegill Sunfish
(Lepomis macrochirus) Under Flow-through Conditions
Author(s), year: Cafarella, M. A., 2006b
Report/Doc.
number:
Report No. QNW-0006, Study No. 13048.6505
Guideline(s): OECD Guideline 203, US EPA OPPTS 850.1075, EC Guideline Annex V -
Method C.1
GLP: Yes
Deviations: None relevant
Validity: Acceptable
Material and
methods:
Test substance: Fenpyrazamine (S-2188) technical grade, purity: 94.7%, batch: 030-
050914-1G
Test species: Bluegill Sunfish (Lepomis macrochirus)
Number of
organisms:
10 fish per replicate, 2 replicates per treatment, control and solvent
control
Weight, length: 1.7 g (range 1.1 – 2.9 g) and 4.7 mm (range 4.0 – 5.6 mm), n = 30
Loading: 0.17 g fish/L solution
Type of test,
duration:
Flow-through test, 96 hours
Applied
concentrations:
Nominal: 0 (control and solvent control), 1.0, 2.0, 4.0, 8.0 and 16.0 mg a.s./L
Measured (mean): - (control and solvent control), 0.88, 1.8, 3.4, 6.9 and 12.0 mg a.s./L
Solvent: Dimethylformamide (DMF, CAS No. 68-12-2), 0.1 mL DMF/L
Test conditions:
Water quality: Well water, total hardness: 48 mg/L as CaCO3
Temperature: 22 ± 1 °C
pH: 7.2 ± 0.1 (0 h, new solution), 7.3 ± 0.1 (96 h, aged solution)
O2 content: 7.6 – 9.5 mg O2/L (94 – 108% saturation)
Light regime: 16 hours light / 8 hours darkness
Test parameters: Mortality and sublethal effects were assessed after 0, 3, 6, 24, 48, 72
and 96 hours.
For chemical analysis (LC/MS/MS) of S-2188 in test solutions samples
were taken at test initiation (0 h) and test termination (96 h) from all
treatment groups and the control. Measurement of pH, temperature
and dissolved oxygen concentrations were made at initiation and once
daily in both vessels of each treatment.
Statistics: LC50: Binominal probability, NOEC: Directly from raw data
Findings:
Analytical data: Over the whole test period the mean measured concentrations were in
the range from 77 to 91% of nominal concentrations.
Behavioural effects: Controls and concentration levels up to 3.4 mg a.s./L: No sublethal
effects were reported over the whole test period. At test concentration
6.9 mg a.s./L following symptoms were noted after 3 hours: Partial and
complete loss of equilibrium. At test concentration 12.0 mg a.s./L
following symptoms were noted after 3 hours: Complete loss of
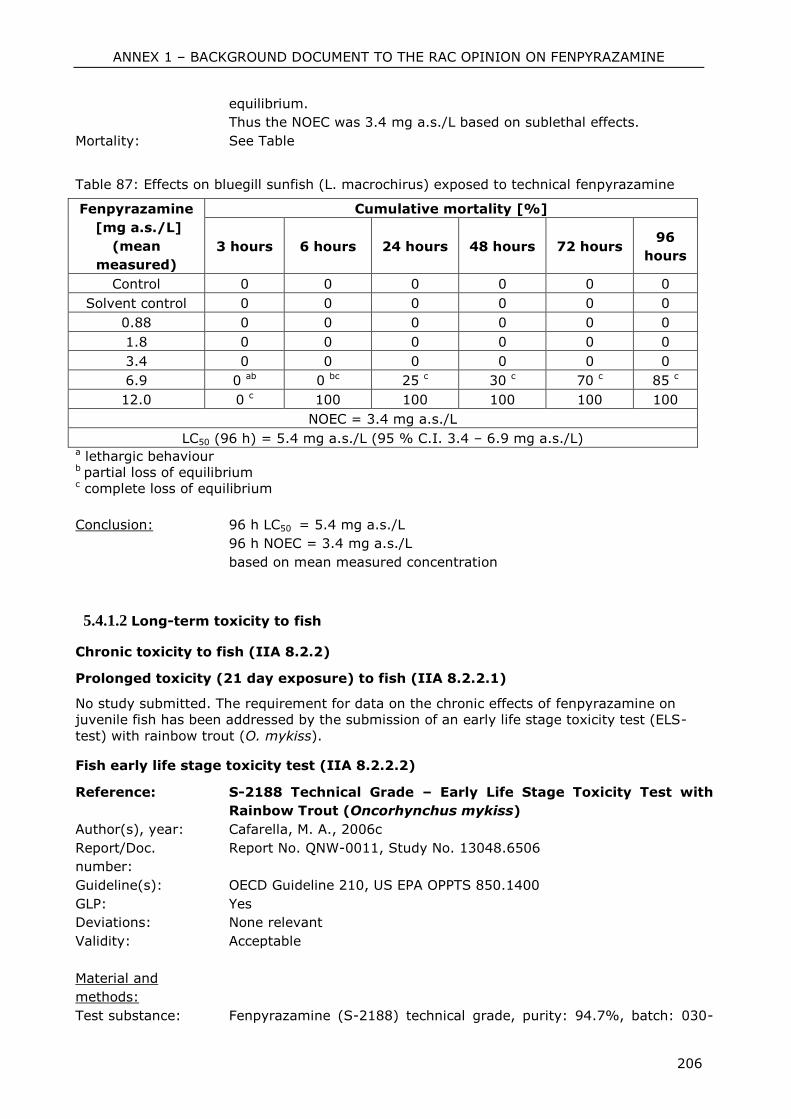
ANNEX 1 – BACKGROUND DOCUMENT TO THE RAC OPINION ON FENPYRAZAMINE
206
equilibrium.
Thus the NOEC was 3.4 mg a.s./L based on sublethal effects.
Mortality: See Table
Table 87: Effects on bluegill sunfish (L. macrochirus) exposed to technical fenpyrazamine
Fenpyrazamine
[mg a.s./L]
(mean
measured)
Cumulative mortality [%]
3 hours 6 hours 24 hours 48 hours 72 hours 96
hours
Control 0 0 0 0 0 0
Solvent control 0 0 0 0 0 0
0.88 0 0 0 0 0 0
1.8 0 0 0 0 0 0
3.4 0 0 0 0 0 0
6.9 0 ab 0 bc 25 c 30 c 70 c 85 c
12.0 0 c 100 100 100 100 100
NOEC = 3.4 mg a.s./L
LC50 (96 h) = 5.4 mg a.s./L (95 % C.I. 3.4 – 6.9 mg a.s./L) a lethargic behaviour b partial loss of equilibrium c complete loss of equilibrium
Conclusion: 96 h LC50 = 5.4 mg a.s./L
96 h NOEC = 3.4 mg a.s./L
based on mean measured concentration
5.4.1.2 Long-term toxicity to fish
Chronic toxicity to fish (IIA 8.2.2)
Prolonged toxicity (21 day exposure) to fish (IIA 8.2.2.1)
No study submitted. The requirement for data on the chronic effects of fenpyrazamine on
juvenile fish has been addressed by the submission of an early life stage toxicity test (ELS-
test) with rainbow trout (O. mykiss).
Fish early life stage toxicity test (IIA 8.2.2.2)
Reference: S-2188 Technical Grade – Early Life Stage Toxicity Test with
Rainbow Trout (Oncorhynchus mykiss)
Author(s), year: Cafarella, M. A., 2006c
Report/Doc.
number:
Report No. QNW-0011, Study No. 13048.6506
Guideline(s): OECD Guideline 210, US EPA OPPTS 850.1400
GLP: Yes
Deviations: None relevant
Validity: Acceptable
Material and
methods:
Test substance: Fenpyrazamine (S-2188) technical grade, purity: 94.7%, batch: 030-
ANNEX 1 – BACKGROUND DOCUMENT TO THE RAC OPINION ON FENPYRAZAMINE
207
050914-1G
Test species: Rainbow Trout (Oncorhynchus mykiss)
Number of
organisms:
2 replicates per test concentration, control and solvent control.
50 eggs per egg incubation cup, after completion of hatch larvae were
thinned to 20 individuals per aquarium.
At the highest nominal treatment level, an additional of 10 eggs were
selected from each incubation cup and suspended in each exposure
aquarium. For the recovery/reversibility test group 20 (high dose
recovery group – HDR) larvae per aquarium from the highest test
concentration were transferred to clean dilution water containing no S-
2188.
Age: Freshly fertilized eggs, 2.5 hours old
Type of test,
duration:
Flow-through test, 90 days (60 days post hatch)
Applied
concentrations:
Nominal: 0 (control and solvent control), 50, 100, 200, 400 and 800 µg/L
Measured (mean): - (control and solvent control), 50, 100, 190, 370 and 750 µg/L
Solvent Dimethylformamide (DMF, CAS No. 68-12-2), 0.01 mL/L
Test conditions:
Water quality: Well water, total hardness: 32 – 58 mg/L as CaCO3
Temperature: 11 – 13 °C
pH: 6.9 – 7.8 during the total test period
O2 content: 8.2 – 11.1 mg O2/L (76 – 103 % saturation)
Light regime: Continuous darkness during incubation phase and prior to the larval
development to the swim-up stage. From swim-up phase onwards: 16
hours light / 8 hours darkness, sudden transitions were avoided
Feeding Larvae were fed of live brine shrimp nauplii (Artemia salina) 3 times
daily beginning on day 11 post-hatch. Larvae were not fed during the
final 48 hours of the test.
Residual food and fecal matter were brushed and siphoned when
necessary in order to minimise microbiological growth.
Test parameters: Abnormal appearance and behaviour of larvae were assessed daily.
Number of surviving larvae was estimated at least twice a week. At test
termination the length and the weight were determined.
Determined endpoints were: Hatching success, overall fry survival (fry
survival before and after thinning), mean length, wet and dry weight.
Temperature, pH and dissolved oxygen concentration were measured
daily. Total hardness, alkalinity and specific conductance were
measured weekly.
Analytical measurements (LC/MS/MS) of S-2188 in test solutions
samples were taken at 0, 7, 14, 21, 28, 35, 42, 49, 56, 63, 73, 77, 84
and 90 days.
Statistics: If control and solvent control can be pooled: t-Test
Testing for normal distribution: Shapiro Wilks’ Test
Homogeneity of variance, data for embryo viability: Bartlett’s Test
Larval survival: Bonferroni’s t-Test, Kruskal-Wallis Test and ANOVA
Time to hatch, hatching success, mean length, mean dry and wet
weight: Williams test with previous acrisine transformation
Findings:
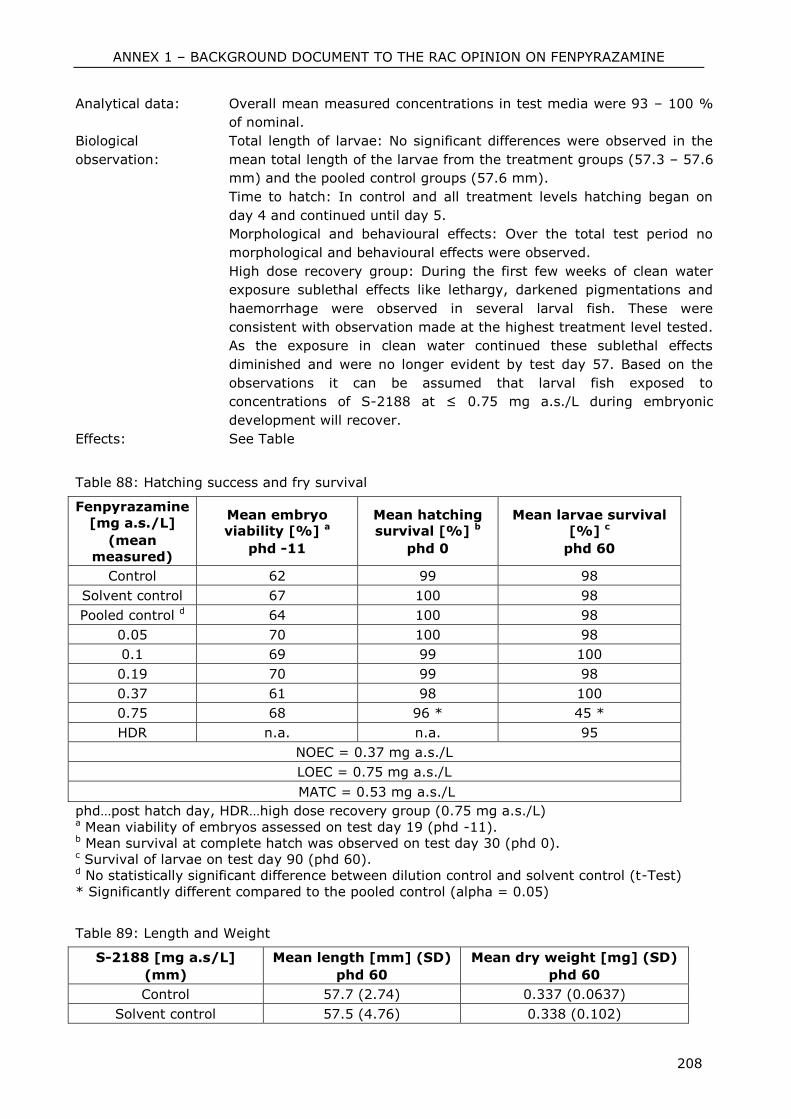
ANNEX 1 – BACKGROUND DOCUMENT TO THE RAC OPINION ON FENPYRAZAMINE
208
Analytical data: Overall mean measured concentrations in test media were 93 – 100 %
of nominal.
Biological
observation:
Total length of larvae: No significant differences were observed in the
mean total length of the larvae from the treatment groups (57.3 – 57.6
mm) and the pooled control groups (57.6 mm).
Time to hatch: In control and all treatment levels hatching began on
day 4 and continued until day 5.
Morphological and behavioural effects: Over the total test period no
morphological and behavioural effects were observed.
High dose recovery group: During the first few weeks of clean water
exposure sublethal effects like lethargy, darkened pigmentations and
haemorrhage were observed in several larval fish. These were
consistent with observation made at the highest treatment level tested.
As the exposure in clean water continued these sublethal effects
diminished and were no longer evident by test day 57. Based on the
observations it can be assumed that larval fish exposed to
concentrations of S-2188 at ≤ 0.75 mg a.s./L during embryonic
development will recover.
Effects: See Table
Table 88: Hatching success and fry survival
Fenpyrazamine
[mg a.s./L]
(mean
measured)
Mean embryo
viability [%] a
phd -11
Mean hatching
survival [%] b
phd 0
Mean larvae survival
[%] c
phd 60
Control 62 99 98
Solvent control 67 100 98
Pooled control d 64 100 98
0.05 70 100 98
0.1 69 99 100
0.19 70 99 98
0.37 61 98 100
0.75 68 96 * 45 *
HDR n.a. n.a. 95
NOEC = 0.37 mg a.s./L
LOEC = 0.75 mg a.s./L
MATC = 0.53 mg a.s./L
phd…post hatch day, HDR…high dose recovery group (0.75 mg a.s./L) a Mean viability of embryos assessed on test day 19 (phd -11). b Mean survival at complete hatch was observed on test day 30 (phd 0). c Survival of larvae on test day 90 (phd 60). d No statistically significant difference between dilution control and solvent control (t-Test)
* Significantly different compared to the pooled control (alpha = 0.05)
Table 89: Length and Weight
S-2188 [mg a.s/L]
(mm)
Mean length [mm] (SD)
phd 60
Mean dry weight [mg] (SD)
phd 60
Control 57.7 (2.74) 0.337 (0.0637)
Solvent control 57.5 (4.76) 0.338 (0.102)
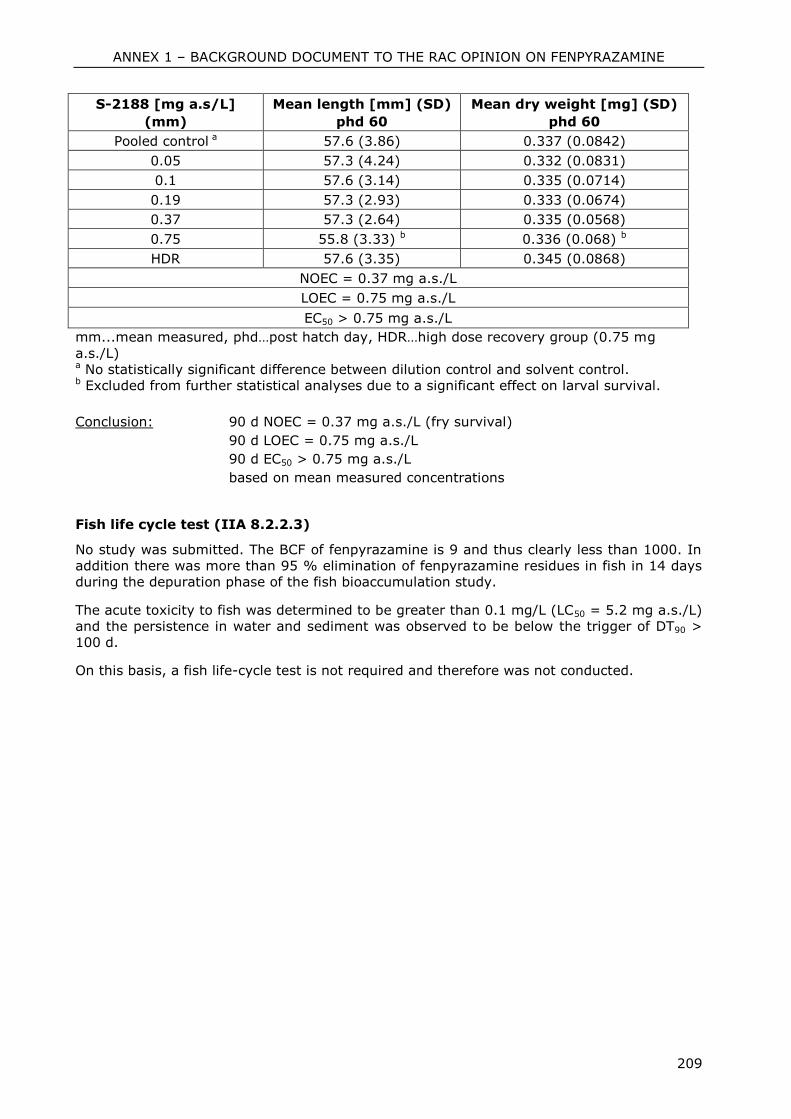
ANNEX 1 – BACKGROUND DOCUMENT TO THE RAC OPINION ON FENPYRAZAMINE
209
S-2188 [mg a.s/L]
(mm)
Mean length [mm] (SD)
phd 60
Mean dry weight [mg] (SD)
phd 60
Pooled control a 57.6 (3.86) 0.337 (0.0842)
0.05 57.3 (4.24) 0.332 (0.0831)
0.1 57.6 (3.14) 0.335 (0.0714)
0.19 57.3 (2.93) 0.333 (0.0674)
0.37 57.3 (2.64) 0.335 (0.0568)
0.75 55.8 (3.33) b 0.336 (0.068) b
HDR 57.6 (3.35) 0.345 (0.0868)
NOEC = 0.37 mg a.s./L
LOEC = 0.75 mg a.s./L
EC50 > 0.75 mg a.s./L
mm...mean measured, phd…post hatch day, HDR…high dose recovery group (0.75 mg
a.s./L) a No statistically significant difference between dilution control and solvent control. b Excluded from further statistical analyses due to a significant effect on larval survival.
Conclusion: 90 d NOEC = 0.37 mg a.s./L (fry survival)
90 d LOEC = 0.75 mg a.s./L
90 d EC50 > 0.75 mg a.s./L
based on mean measured concentrations
Fish life cycle test (IIA 8.2.2.3)
No study was submitted. The BCF of fenpyrazamine is 9 and thus clearly less than 1000. In
addition there was more than 95 % elimination of fenpyrazamine residues in fish in 14 days
during the depuration phase of the fish bioaccumulation study.
The acute toxicity to fish was determined to be greater than 0.1 mg/L (LC50 = 5.2 mg a.s./L)
and the persistence in water and sediment was observed to be below the trigger of DT90 >
100 d.
On this basis, a fish life-cycle test is not required and therefore was not conducted.
ANNEX 1 – BACKGROUND DOCUMENT TO THE RAC OPINION ON FENPYRAZAMINE
210
5.4.2 Aquatic invertebrates
5.4.2.1 Short-term toxicity to aquatic invertebrates
Reference: S-2188 Technical Grade – Acute Toxicity to Water Fleas,
(Daphnia magna) Under Flow-Through Conditions
Author(s), year: Putt, A. E., 2006a
Report/Doc.
number:
Report No. QNW-0007, Study No. 13048.6507
Guideline(s): OECD Guideline 202, US EPA OPPTS 850.1010, JMAFF No.12-Nousan-
8147, Daphnia Acute Immobilisation Test (2-7-2-1), EC Guideline
Annex V - Method C.2
GLP: Yes
Deviations: - The temperature measured on test day 2 was between 19 and 22 °C
instead of 20 ± 1 °C as stated in the protocol. The performance of the
control organisms was satisfactory according to the given criteria.
Therefore, the deviation was considered not to have an adverse effect
on the results of the study.
Validity: Acceptable
Material and
methods:
Test substance: Fenpyrazamine (S-2188) technical grade, purity: 94.7%, batch: 030-
050914-1G
Test species: Water flea (Daphnia magna)
Number of
organisms:
2 replicates each with 10 daphnids per treatment, control and solvent
control
Age: First instar, ≤ 24 hours old
Type of test,
duration:
Flow-through test, 48 hours
Applied
concentrations:
Nominal: 0 (control and solvent control), 0.75, 1.5, 3.0, 6.0 and 12 mg a.s./L
Measured (mean): - (control and solvent control), 0.61, 1.2, 2.2, 3.8 and 8.0 mg a.s./L
Solvent: Dimethylformamide (DMF, CAS No. 68-12-2), 0.1 mL DMF/L
Test conditions:
Water quality: Fortified well water, total hardness: 160 - 170 mg/L as CaCO3
Temperature: 19 - 22 °C
pH: 8.3 (0 - 48 h)
O2 content: 8.2 – 9.1 mg O2/L (90 – 100 % saturation)
Light regime: 16 hours light / 8 hours darkness
Test parameters: Immobility and sublethal effects were assessed after 0, 24 and 48
hours. For chemical analysis (LC/MS/MS) of S-2188 in the test media
samples were taken at test initiation (0 h) and termination (48 h). The
water samples were analysed by automated injection into the
LC/MS/MS instrument without centrifugation.
Measurements of pH, temperature and dissolved oxygen concentrations
were made at initiation and once daily. Total hardness, total alkalinity
and specific conductance were measured at test initiation.
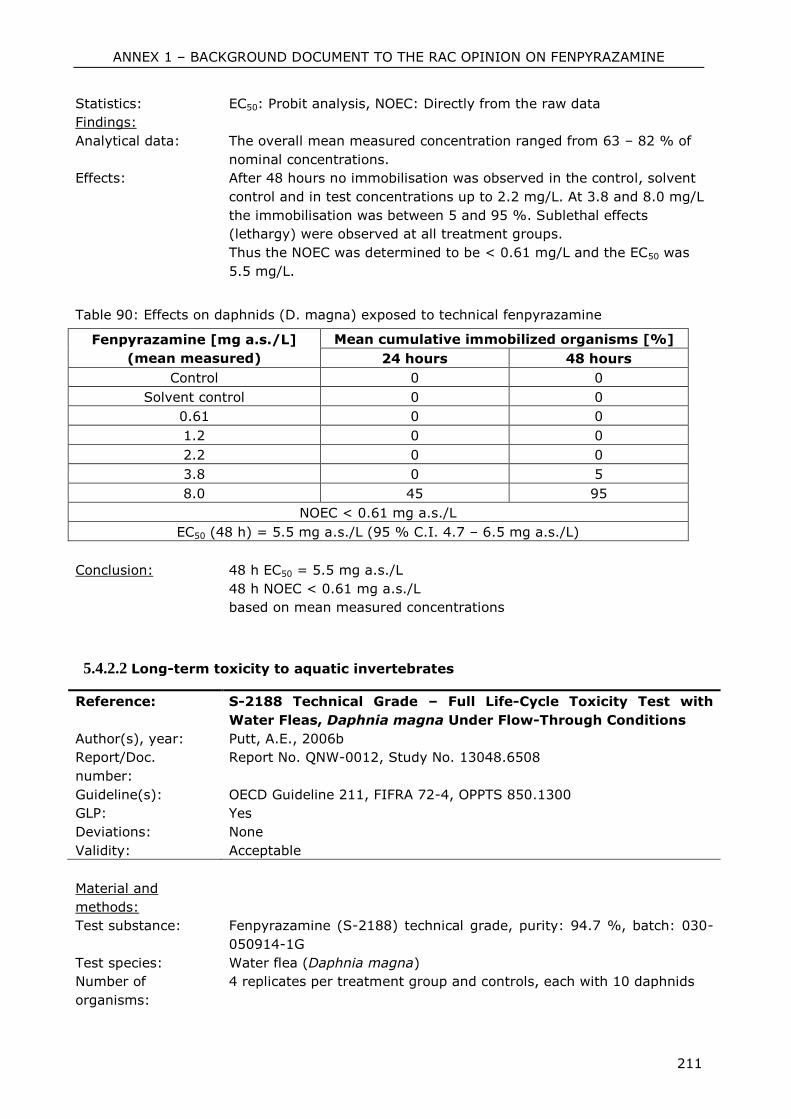
ANNEX 1 – BACKGROUND DOCUMENT TO THE RAC OPINION ON FENPYRAZAMINE
211
Statistics: EC50: Probit analysis, NOEC: Directly from the raw data
Findings:
Analytical data: The overall mean measured concentration ranged from 63 – 82 % of
nominal concentrations.
Effects: After 48 hours no immobilisation was observed in the control, solvent
control and in test concentrations up to 2.2 mg/L. At 3.8 and 8.0 mg/L
the immobilisation was between 5 and 95 %. Sublethal effects
(lethargy) were observed at all treatment groups.
Thus the NOEC was determined to be < 0.61 mg/L and the EC50 was
5.5 mg/L.
Table 90: Effects on daphnids (D. magna) exposed to technical fenpyrazamine
Fenpyrazamine [mg a.s./L]
(mean measured)
Mean cumulative immobilized organisms [%]
24 hours 48 hours
Control 0 0
Solvent control 0 0
0.61 0 0
1.2 0 0
2.2 0 0
3.8 0 5
8.0 45 95
NOEC < 0.61 mg a.s./L
EC50 (48 h) = 5.5 mg a.s./L (95 % C.I. 4.7 – 6.5 mg a.s./L)
Conclusion: 48 h EC50 = 5.5 mg a.s./L
48 h NOEC < 0.61 mg a.s./L
based on mean measured concentrations
5.4.2.2 Long-term toxicity to aquatic invertebrates
Reference: S-2188 Technical Grade – Full Life-Cycle Toxicity Test with
Water Fleas, Daphnia magna Under Flow-Through Conditions
Author(s), year: Putt, A.E., 2006b
Report/Doc.
number:
Report No. QNW-0012, Study No. 13048.6508
Guideline(s): OECD Guideline 211, FIFRA 72-4, OPPTS 850.1300
GLP: Yes
Deviations: None
Validity: Acceptable
Material and
methods:
Test substance: Fenpyrazamine (S-2188) technical grade, purity: 94.7 %, batch: 030-
050914-1G
Test species: Water flea (Daphnia magna)
Number of
organisms:
4 replicates per treatment group and controls, each with 10 daphnids
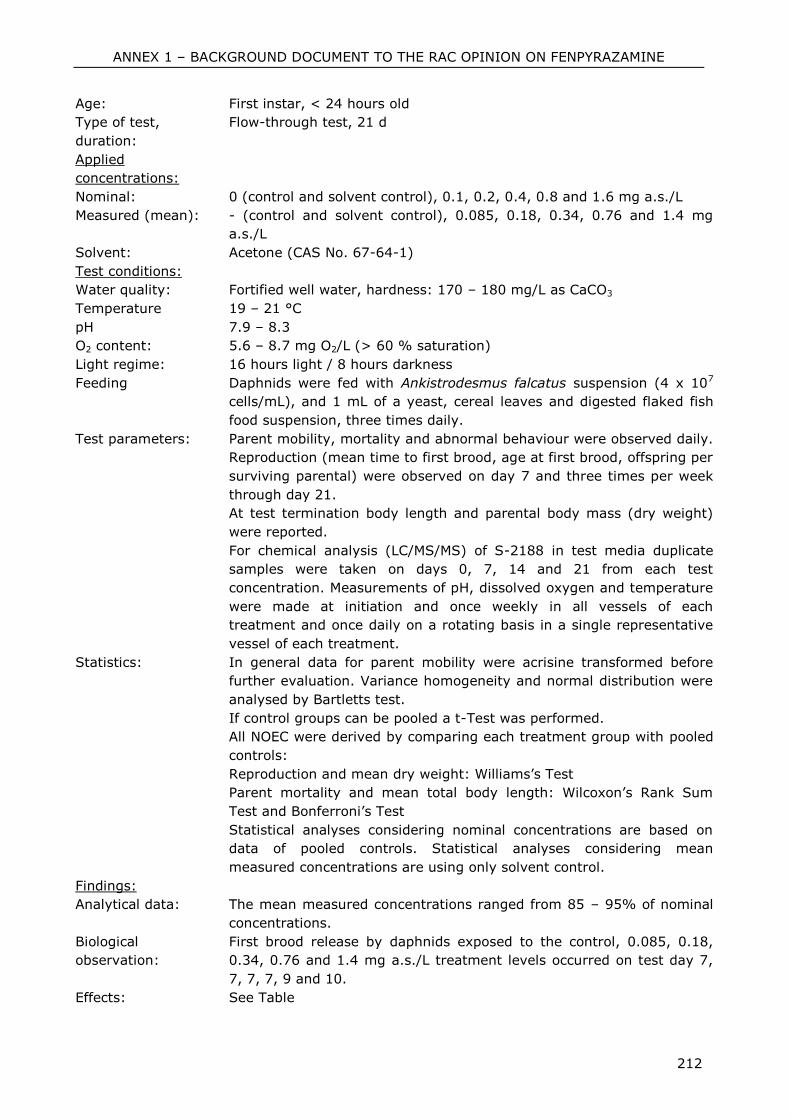
ANNEX 1 – BACKGROUND DOCUMENT TO THE RAC OPINION ON FENPYRAZAMINE
212
Age: First instar, < 24 hours old
Type of test,
duration:
Flow-through test, 21 d
Applied
concentrations:
Nominal: 0 (control and solvent control), 0.1, 0.2, 0.4, 0.8 and 1.6 mg a.s./L
Measured (mean): - (control and solvent control), 0.085, 0.18, 0.34, 0.76 and 1.4 mg
a.s./L
Solvent: Acetone (CAS No. 67-64-1)
Test conditions:
Water quality: Fortified well water, hardness: 170 – 180 mg/L as CaCO3
Temperature 19 – 21 °C
pH 7.9 – 8.3
O2 content: 5.6 – 8.7 mg O2/L (> 60 % saturation)
Light regime: 16 hours light / 8 hours darkness
Feeding Daphnids were fed with Ankistrodesmus falcatus suspension (4 x 10⁷
cells/mL), and 1 mL of a yeast, cereal leaves and digested flaked fish
food suspension, three times daily.
Test parameters: Parent mobility, mortality and abnormal behaviour were observed daily.
Reproduction (mean time to first brood, age at first brood, offspring per
surviving parental) were observed on day 7 and three times per week
through day 21.
At test termination body length and parental body mass (dry weight)
were reported.
For chemical analysis (LC/MS/MS) of S-2188 in test media duplicate
samples were taken on days 0, 7, 14 and 21 from each test
concentration. Measurements of pH, dissolved oxygen and temperature
were made at initiation and once weekly in all vessels of each
treatment and once daily on a rotating basis in a single representative
vessel of each treatment.
Statistics: In general data for parent mobility were acrisine transformed before
further evaluation. Variance homogeneity and normal distribution were
analysed by Bartletts test.
If control groups can be pooled a t-Test was performed.
All NOEC were derived by comparing each treatment group with pooled
controls:
Reproduction and mean dry weight: Williams’s Test
Parent mortality and mean total body length: Wilcoxon’s Rank Sum
Test and Bonferroni’s Test
Statistical analyses considering nominal concentrations are based on
data of pooled controls. Statistical analyses considering mean
measured concentrations are using only solvent control.
Findings:
Analytical data: The mean measured concentrations ranged from 85 – 95% of nominal
concentrations.
Biological
observation:
First brood release by daphnids exposed to the control, 0.085, 0.18,
0.34, 0.76 and 1.4 mg a.s./L treatment levels occurred on test day 7,
7, 7, 7, 9 and 10.
Effects: See Table
ANNEX 1 – BACKGROUND DOCUMENT TO THE RAC OPINION ON FENPYRAZAMINE
213
Table 91: Summary of effects of long-term exposure of fenpyrazamine on Daphnia magna
Fenpyrazami
ne
[mg a.s./L]
(nom)
S-2188
techn. [mg
a.s./L]
(mm)
Mean
parent
mortality
at day 21
[%]
Offspring
per
surviving
female at
day 21
Mean dry
weight of
parent after
21 d [mg]
Mean body
length of
parent
after
21 d [mm]
Control Control 10 ± 8 201 ± 14 1.60 ± 0.14 5.2 ± 0.05
Solvent
control
Solvent
control 7 ± 10 210 ± 29 1.74 ± 0.13 5.3 ± 0.08
Pooled control a
Pooled
control a 9 ± 8 205 ± 22 1.67 ± 0.14 5.3 ± 0.07
0.1 0.085 5 ± 10 216 ± 22 1.57 ± 0.18 5.3 ± 0.03
0.2 0.18 10 ± 8 200 ± 16 0.67 ± 0.06 5.2 ± 0.04
0.4 0.34 2 ± 5 205 ± 13 1.66 ± 0.07 5.2 ± 0.02
0.8 0.76 0 156 ± 3* 1.49 ± 0.09* 4.8 ± 0.03**
1.6 1.4 7 ± 10 58 ± 24* 0.82 ± 0.22* 4.0 ± 0.31**
NOEC (based on mean
measured)
1.4 mg
a.s./L
0.34 mg
a.s./L
0.34 mg
a.s./L
0.34 mg
a.s./L
LOEC (based on mean
measured)
> 1.4 mg
a.s./L
0.76 mg
a.s./L
0.76 mg
a.s./L
0.76 mg
a.s./L
EC50 (based on mean
measured)
> 1.4 mg
a.s./L
1.1 mg
a.s./L n.d. n.d.
MATC (based on mean
measured) 0.51 mg a.s./L
n.d…not determined, mm…mean measured, nom…nominal a No statistically significant difference between control and solvent control.
* Significantly reduced compared to the pooled control, based on Williams’ Test
** Significantly reduced compared to the pooled control, based on Wilcoxon’s Rank Sum
Test
Conclusion: NOEC = 1.4 mg a.s./L (adult mortality)
LOEC > 1.4 mg a.s./L
NOEC = 0.34 mg a.s./L (reproduction)
LOEC = 0.76 mg a.s./L
NOEC = 0.34 mg a.s./L (growth, weight and length)
LOEC = 0.76 mg a.s./L
based on mean measured concentrations
ANNEX 1 – BACKGROUND DOCUMENT TO THE RAC OPINION ON FENPYRAZAMINE
214
5.4.3 Algae and aquatic plants
Reference: S-2188 Technical Grade – Acute Toxicity to the Freshwater
Green Alga, Pseudokirchneriella subcapitata
Author(s), year: Hoberg, J.R., 2006a
Report/Doc.
number:
Report No. QNW-0004, Study No. 13048.6509
Guideline(s): OECD Guideline 201, JMAFF No.12-Nousan-8147, Alga Growth
Inhibition Test (2-7-7), US EPA OPPTS 850.5400, EC Guideline Annex V
- Method C.3
GLP: Yes
Deviations: - During the definitive test, the initial control solution pH was 6.8. The
72 h control pH was 8.6 and exceeded the initial value by 1.8 units
instead of acceptable 1.5 units as stated in the protocol. This increase
in solution pH is due to photosynthesis by the algae and cannot be
controlled. The 72 h mean control cell density (95.33 * 104 cells/mL)
exceeds the required 16 times increase form the initial density (1.0 *
104 cells/mL). Therefore, the growth of the algal population was not
affected by the increase solution pH.
Validity: Acceptable
Material and
methods:
Test substance: Fenpyrazamine (S-2188) technical grade, purity: 94.7%, batch: 030-
050914-1G
Test species: Green alga (Pseudokirchneriella subcapitata)
Number of
organisms:
1 x 10⁴ cells/mL; 4 replicates per treatment group, medium control and
solvent control
Type of test,
duration:
Static test, 96 hours
Applied
concentrations:
Nominal: 0 (medium control and solvent control), 0.063, 0.13, 0.25, 0.50 and
1.0 mg a.s./L
Measured (mean): - (medium control and solvent control), 0.053, 0.11, 0.22, 0.43 and
0.90 mg a.s./L
Solvent: Dimethylformamide (DMF, CAS No. 68-12-2), 0.1 mL/L
Test conditions:
Water quality: Algal Assay Procedure (AAP) medium (according to OECD guideline),
total hardness: 15 mg/L as NaHCO3
Temperature: 22 – 24 °C
pH: 6.7 – 7.0 (0 h), 6.9 – 9.2 (96 h)
Incubation: Continuous illumination at 3900 to 4700 lux
Test parameters: Cell counts were estimated using a haemocytometer and microscope.
Observations of the health and morphology of the algal cells were made
under the microscope on each study day. For chemical analysis
(LC/MS/MS method) of test the substance, samples of test solution
were taken at test initiation, after 72 h and at test termination.
Measurements of pH and conductivity were made at initiation, after 72
h and at termination, light intensity was measured ad daily intervals
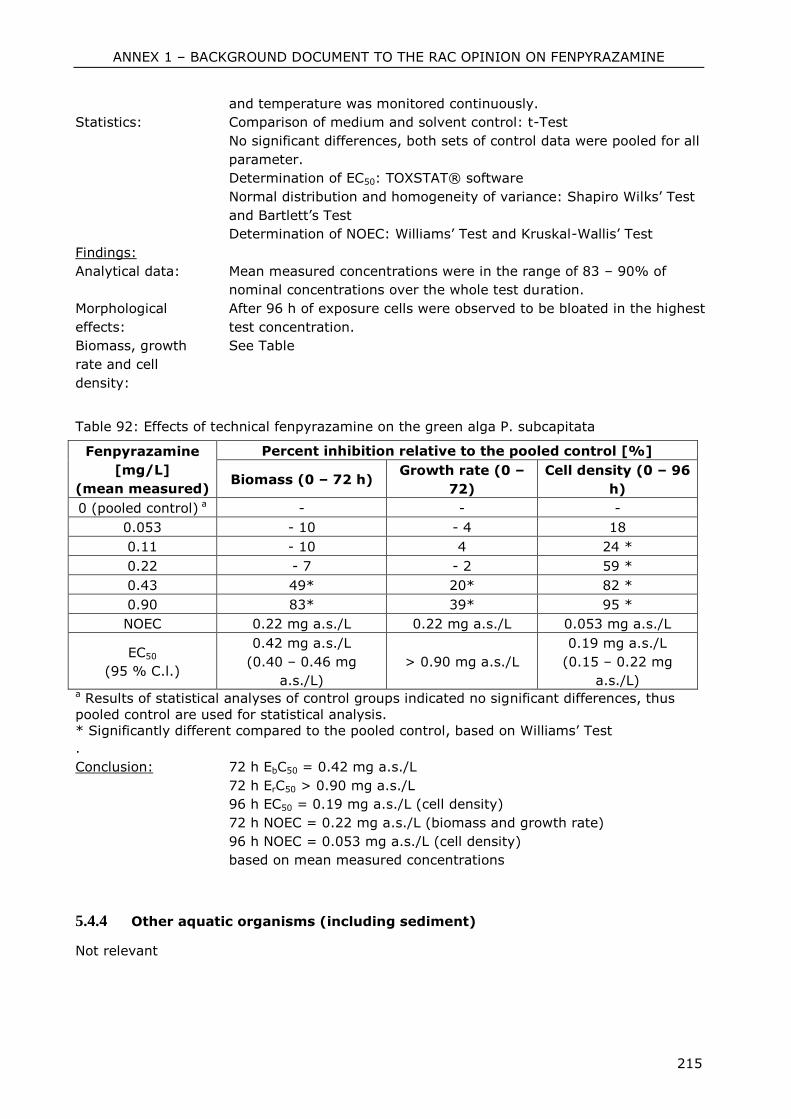
ANNEX 1 – BACKGROUND DOCUMENT TO THE RAC OPINION ON FENPYRAZAMINE
215
and temperature was monitored continuously.
Statistics: Comparison of medium and solvent control: t-Test
No significant differences, both sets of control data were pooled for all
parameter.
Determination of EC50: TOXSTAT® software
Normal distribution and homogeneity of variance: Shapiro Wilks’ Test
and Bartlett’s Test
Determination of NOEC: Williams’ Test and Kruskal-Wallis’ Test
Findings:
Analytical data: Mean measured concentrations were in the range of 83 – 90% of
nominal concentrations over the whole test duration.
Morphological
effects:
After 96 h of exposure cells were observed to be bloated in the highest
test concentration.
Biomass, growth
rate and cell
density:
See Table
Table 92: Effects of technical fenpyrazamine on the green alga P. subcapitata
Fenpyrazamine
[mg/L]
(mean measured)
Percent inhibition relative to the pooled control [%]
Biomass (0 – 72 h) Growth rate (0 –
72)
Cell density (0 – 96
h)
0 (pooled control) a - - -
0.053 - 10 - 4 18
0.11 - 10 4 24 *
0.22 - 7 - 2 59 *
0.43 49* 20* 82 *
0.90 83* 39* 95 *
NOEC 0.22 mg a.s./L 0.22 mg a.s./L 0.053 mg a.s./L
EC50
(95 % C.l.)
0.42 mg a.s./L
(0.40 – 0.46 mg
a.s./L)
> 0.90 mg a.s./L
0.19 mg a.s./L
(0.15 – 0.22 mg
a.s./L) a Results of statistical analyses of control groups indicated no significant differences, thus
pooled control are used for statistical analysis.
* Significantly different compared to the pooled control, based on Williams’ Test
.
Conclusion: 72 h EbC50 = 0.42 mg a.s./L
72 h ErC50 > 0.90 mg a.s./L
96 h EC50 = 0.19 mg a.s./L (cell density)
72 h NOEC = 0.22 mg a.s./L (biomass and growth rate)
96 h NOEC = 0.053 mg a.s./L (cell density)
based on mean measured concentrations
5.4.4 Other aquatic organisms (including sediment)
Not relevant
ANNEX 1 – BACKGROUND DOCUMENT TO THE RAC OPINION ON FENPYRAZAMINE
216
5.5 Comparison with criteria for environmental hazards (sections 5.1 – 5.4)
Conclusion of environmental classification according to Regulation EC 1272/2008
Pictogram: GHS 09
Aquatic Chronic 2
H411 ‘Toxic to aquatic life with long lasting effects’
Justification for the proposal
H411 follows from the toxicity of the active substance Fenpyrazamine to algae (P.
subcapitata, NOEC = 0.22 mg/L, Hoberg, 2006a) and the fact that the active substance is
not readily biodegradable (Burwood, C. & Scholey, A., 2006) and not rapidly biodegradable
(Lewis, C.J. & Troth, K., 2007f). In the water-sediment study a DT50 of 35.5 days
(geomean) was determined for the whole system. Also Fenpyrazamine does not meet the
criterion of rapid degradation > 70 % within a 28-day period the aquatic environment.
Based on the fish bioaccumulation study (Panthani, A.M., Herczog, K.J.S., 2007) with L.
macrochirus a BCF (whole fish) of 9 was determined, which indicate a low potential to
bioaccumulate in the aquatic food chain. The substance Fenpyrazamine does not meet the
CLP criteria (BCF ≥ 500) based on the measured fish BCF.
Fenpyrazamine fulfils the criteria for classification as aquatic environmental hazard based
on the CLP Regulation and should be classified.
The statements P273, P391 and P501 follow a general precautionary approach for
dangerous substances.
Conclusion of environmental classification and labelling according to Directive 67/548/EEC
Hazard symbol(s)
Dead fish, dead tree
Indications of danger N Dangerous for the environment
Risk phrases R51/53 Toxic to aquatic organisms, may cause long-term
adverse effect in the aquatic environment.
Safety phrases S61 Avoid release to the environment. Refer to special
instructions/safety data sheets.
Justification for the proposal
R51/53 follows from the toxicity of the active substance Fenpyrazamine to fish
(Oncorhynchus mykiss, LC50 = 5.2 mg/L, Cafarella, 2006a) and the fact that the active
substance is not ready biodegradable (Burwood, C. & Scholey, A., 2006). The log Pow of
fenpyrazamine is 3.52 (Lentz, N.R., 2005b) and the measured fish BCF was 9 (Panthani,
A.M., Herczog, K.J.S., 2007). The substance Fenpyrazamine does not meet the DSD criteria
(BCF ≥ 500) based on the measured fish BCF.
The safety phrase S61 has to be applied based on the proposed R51/53.
ANNEX 1 – BACKGROUND DOCUMENT TO THE RAC OPINION ON FENPYRAZAMINE
217
5.6 Conclusions on classification and labelling for environmental hazards
(sections 5.1 – 5.4)
Fenpyrazamine was hydrolytically stable at environmental temperature at pH 4 and 7 but at
pH 9, degradation to S-2188-DC and subsequently to S-2188-OH occurred. At 20ºC and pH
9 the DT50 for hydrolysis was 24 days which is longer than the 16 days trigger for rapidly
hydrolysed compounds. In contrast S-2188 was rapidly photolysed in aqueous solution, with
experimental DT50 values of 1.7 days. The main photolytic products were S-2188-DC (max.
63.8% after 7 days) and MCNI (max 17.7% after 30 days).
Fenpyrazamine is not readily biodegradable and can not be classified as rapidly degraded in
water sediment systems since less than 70 % is degraded within 28 days (DT50whole system of
35.5 days). Furthermore, mineralisation of the active substance is below 10 % of AR after
100 days after application.
Fenpyrazamine has a low potential of bioaccumulation in aquatic system because of a
measured fish BCF of 9 (Panthani, A.M., Herczog, K.J.S., 2007).
Fenpyrazamine is chronic toxic to algae (P. subcapitata) with a NOEC value of 0.22 mg/L
(Hoberg, 2006a).
Hazard pictogram
Environment
Hazard class and
category:
Hazardous to the aquatic environment, Chronic Hazard Category
2
Signal word -
Hazard statement: H411 Toxic to aquatic life with long lasting effects
Precautionary statements
- Prevention P273 Avoid release to the environment
Precautionary statements
- Response P391 Collect spillage
Precautionary Statement
Disposal P501 Proper disposal of contents/container
RAC evaluation of environmental hazards
Summary of the Dossier submitter’s proposal The Dossier Submitter proposed to classify the substance as Aquatic chronic 2 (CLP
H411, DSD N; R51/53). The proposal is based on a long-term algal toxicity result (72-h
NOEC of 0.22 mg/L) (CLP),an acute fish toxicity result (96-h LC50 of 5.2 mg/L) (DSD) as
well as a screening test and two simulation tests concluding that the substance is not
rapidly biodegradable according to CLP or readily biodegradable according to DSD..
The dossier submitter reported that the notifier Under Council Directive 91/414/EEC self-
classifies the substance with R50/53 according to DSD, but provided no information
about the scientific basis for this conclusion.
Comments received during public consultation A large number of comments in support of the proposed environmental classification
were made during the public consultation. The only critical comment on the proposed
environmental classification concerned a suggestion to classify the substance with
Aquatic acute 1, based on the biomass end point for algae and rapid photolysis leading to
ANNEX 1 – BACKGROUND DOCUMENT TO THE RAC OPINION ON FENPYRAZAMINE
218
a possible lower effect concentration in that test. In the post public consultation response
the dossier submitter did not agree with this comment since the algal NOEC based on the
growth rate should be used according to CLP. RAC agrees with the dossier submitter’s
view since also the CLP Guidance indicates that growth rate (reproduction) is preferred to
biomass as an end point. Since the results are expressed in terms of mean measured
concentrations (which were in the range of 83 – 90% of nominal concentrations over the
whole test duration), photolysis is not an issue. The addition of Aquatic acute 1 is
therefore not appropriate on these grounds.
Assessment and comparison with the classification criteria Degradability: Fenpyrazamine is hydrolytically stable under standard conditions at pH 4
and 7, but hydrolyses under alkaline conditions, with a half-life of 24 days at pH 9.
Aqueous photolysis is rapid, with extensive breakdown after 30 days’ incubation and an
estimated half-life of about 1.7 days under natural summer sunlight conditions at pH 7.
While photolysis is not relevant for classification purposes, it might be a factor in the
interpretation of aquatic toxicity tests. Fenpyrazamine failed a test for ready
biodegradation (achieving 1% mineralisation in 28 days). Simulation tests in two aerobic
water-sediment systems using radio-labelled substance indicated primary degradation
and formation of non-extractable residues, with first order degradation DT50 values for
the whole system of 18 – 68 days (geometric mean 35.5 days), and relatively little
mineralisation over 100 days (3.1 – 8.5 % of applied radioactivity (AR)). Aerobic
degradation in soils follows a similar pattern, with limited mineralisation after 120 days
(5.2 – 8.5 % of AR) and DT50 values of 24 – 40 days. Based on the lack of ready
biodegradation, limited mineralisation and primary degradation half-lives exceeding 16
days in an aquatic simulation study, fenpyrazamine does not meet the criteria for being
rapidly degradable or readily biodegradable in the environment.
Bioaccumulation: The log n-octanol-water partition coefficient (Kow) of fenpyrazamine is
3.5 at pH 7.2. The experimentally derived steady state bioconcentration factor (BCF) for
the parent substance was between 8 and 9 L/kg wet weight (ww) for fish with an average
lipid content of about 1.9% (w/w). This is equivalent to a BCF of up to 24 L/kg ww after
normalization to a 5% lipid content.
The parent substance was extensively metabolized in fish, and the steady-state BCF
based on total radio-active residues (TRR) was 283 – 289 L/kg ww (equivalent to a BCF
of up to 760 L/kg ww after normalization to a 5% lipid content). The major residues were
the metabolite S-2188-DC and its glucuronic acid conjugate (at concentrations in whole
fish of 8.0 – 18.8% and 16.1 – 33.3 % TRR, respectively). More than 95% of the 14C
residues were eliminated during the depuration phase (within 14 days), and the
depuration half-life was less than one day.
S-2188-DC is also one of the main products of photolysis, alkaline hydrolysis and
mammalian metabolism. It forms through loss of the S-2-propen-1-yl carbothioic-acid
ester group from the parent substance. No data are presented about the aquatic
degradability of S-2188-DC (too few data were available in the water-sediment study to
estimate a DT50). The DAR2 indicates that its log Kow is 0.23 (estimated using KOWWIN,
version not stated). It is not stated whether this substance falls within the applicability
domain of the model, but it appears to have a lower bioaccumulation potential than the
parent. Aquatic acute toxicity tests for fish, Daphnia and algae are summarised in the
DAR, and it is an order of magnitude less acutely toxic than the parent substance (all
acute L(E)C50s were above 82 mg/L; the 72-h NOEC for algae was 2.7 mg/L). Based on
this evidence, fish metabolites do not need to be taken into account in defining the BCF
for fenpyrazamine.
In summary, the BCF for the parent substance is below the threshold values of CLP(500)
and DSD, (100)for the purposes of classification and labelling.
Ecotoxicity: The lowest reliable ecotoxicity results were as follows (the key studies are
highlighted in bold):
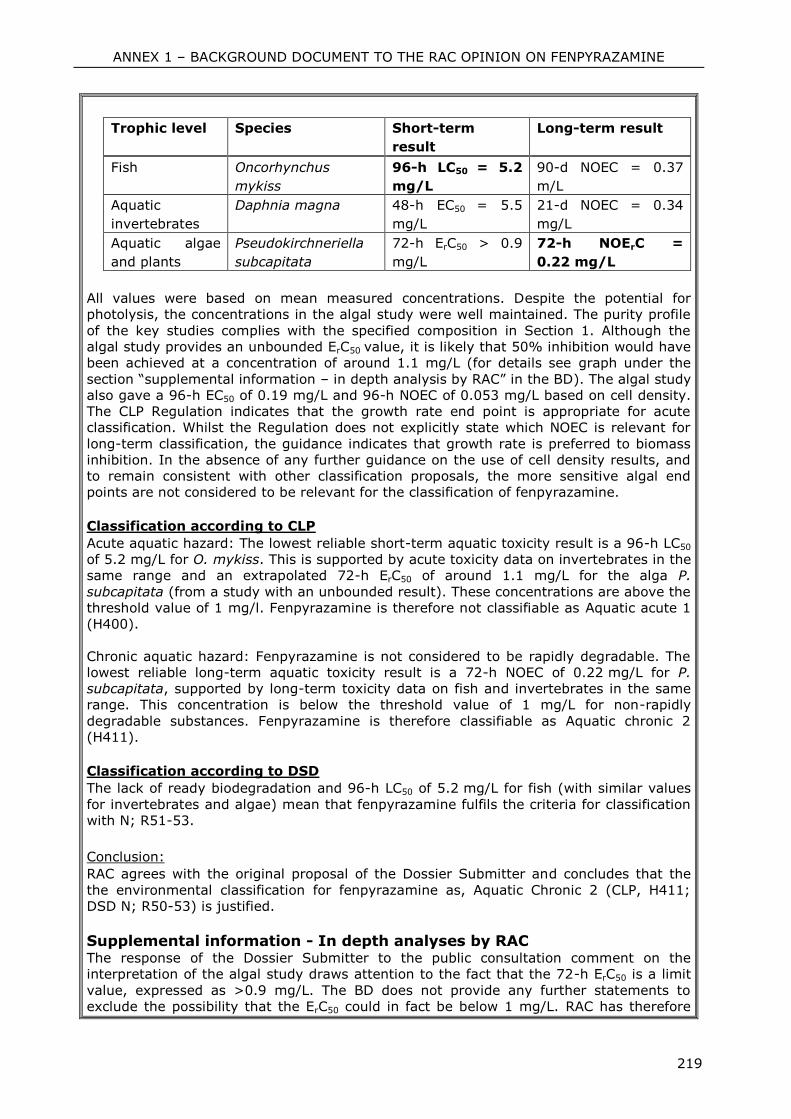
ANNEX 1 – BACKGROUND DOCUMENT TO THE RAC OPINION ON FENPYRAZAMINE
219
Trophic level Species Short-term
result
Long-term result
Fish Oncorhynchus
mykiss
96-h LC50 = 5.2
mg/L
90-d NOEC = 0.37
m/L
Aquatic
invertebrates
Daphnia magna 48-h EC50 = 5.5
mg/L
21-d NOEC = 0.34
mg/L
Aquatic algae
and plants
Pseudokirchneriella
subcapitata
72-h ErC50 > 0.9
mg/L
72-h NOErC =
0.22 mg/L
All values were based on mean measured concentrations. Despite the potential for
photolysis, the concentrations in the algal study were well maintained. The purity profile
of the key studies complies with the specified composition in Section 1. Although the
algal study provides an unbounded ErC50 value, it is likely that 50% inhibition would have
been achieved at a concentration of around 1.1 mg/L (for details see graph under the
section “supplemental information – in depth analysis by RAC” in the BD). The algal study
also gave a 96-h EC50 of 0.19 mg/L and 96-h NOEC of 0.053 mg/L based on cell density.
The CLP Regulation indicates that the growth rate end point is appropriate for acute
classification. Whilst the Regulation does not explicitly state which NOEC is relevant for
long-term classification, the guidance indicates that growth rate is preferred to biomass
inhibition. In the absence of any further guidance on the use of cell density results, and
to remain consistent with other classification proposals, the more sensitive algal end
points are not considered to be relevant for the classification of fenpyrazamine.
Classification according to CLP
Acute aquatic hazard: The lowest reliable short-term aquatic toxicity result is a 96-h LC50
of 5.2 mg/L for O. mykiss. This is supported by acute toxicity data on invertebrates in the
same range and an extrapolated 72-h ErC50 of around 1.1 mg/L for the alga P.
subcapitata (from a study with an unbounded result). These concentrations are above the
threshold value of 1 mg/l. Fenpyrazamine is therefore not classifiable as Aquatic acute 1
(H400).
Chronic aquatic hazard: Fenpyrazamine is not considered to be rapidly degradable. The
lowest reliable long-term aquatic toxicity result is a 72-h NOEC of 0.22 mg/L for P.
subcapitata, supported by long-term toxicity data on fish and invertebrates in the same
range. This concentration is below the threshold value of 1 mg/L for non-rapidly
degradable substances. Fenpyrazamine is therefore classifiable as Aquatic chronic 2
(H411).
Classification according to DSD
The lack of ready biodegradation and 96-h LC50 of 5.2 mg/L for fish (with similar values
for invertebrates and algae) mean that fenpyrazamine fulfils the criteria for classification
with N; R51-53.
Conclusion:
RAC agrees with the original proposal of the Dossier Submitter and concludes that the
the environmental classification for fenpyrazamine as, Aquatic Chronic 2 (CLP, H411;
DSD N; R50-53) is justified.
Supplemental information - In depth analyses by RAC The response of the Dossier Submitter to the public consultation comment on the
interpretation of the algal study draws attention to the fact that the 72-h ErC50 is a limit
value, expressed as >0.9 mg/L. The BD does not provide any further statements to
exclude the possibility that the ErC50 could in fact be below 1 mg/L. RAC has therefore
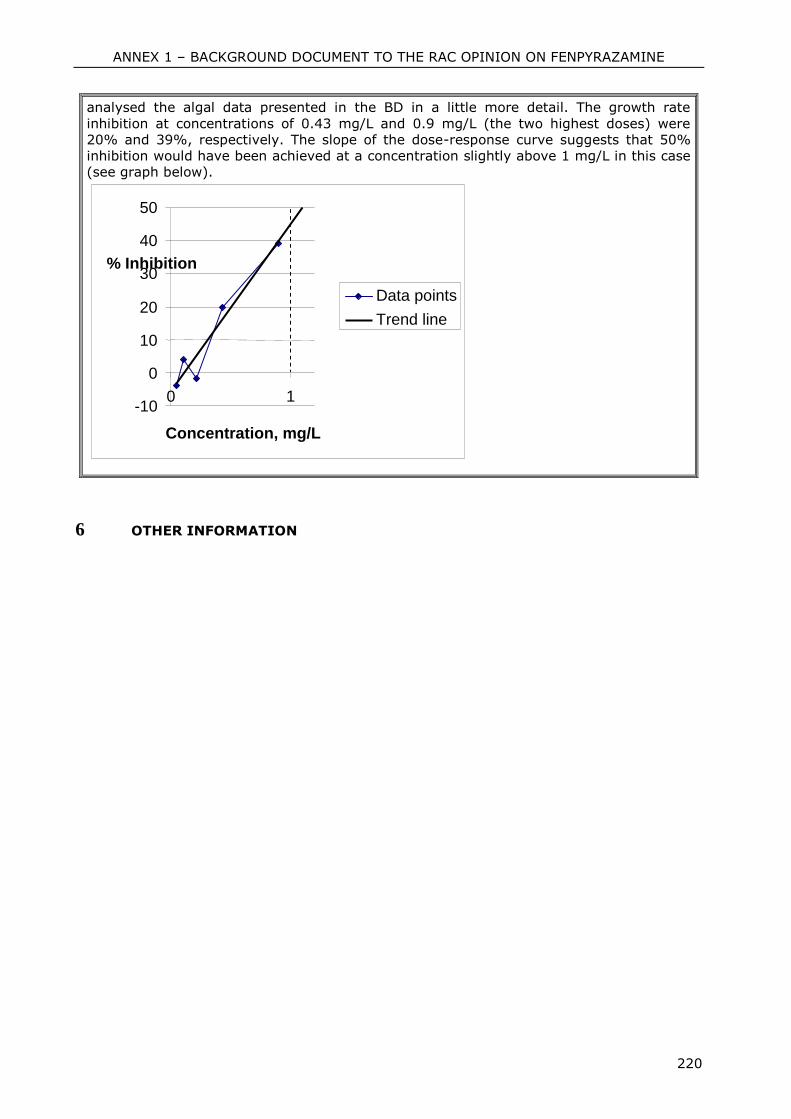
ANNEX 1 – BACKGROUND DOCUMENT TO THE RAC OPINION ON FENPYRAZAMINE
220
analysed the algal data presented in the BD in a little more detail. The growth rate
inhibition at concentrations of 0.43 mg/L and 0.9 mg/L (the two highest doses) were
20% and 39%, respectively. The slope of the dose-response curve suggests that 50%
inhibition would have been achieved at a concentration slightly above 1 mg/L in this case
(see graph below).
6 OTHER INFORMATION
-10
0
10
20
30
40
50
0 1
Concentration, mg/L
% Inhibition
Data points
Trend line
ANNEX 1 – BACKGROUND DOCUMENT TO THE RAC OPINION ON FENPYRAZAMINE
221
7 REFERENCES
7.1 Physico-chemical properties
Author(s)
Year
Title
Source (where different from company)
Company, Report No
GLP or GEP status (where relevant),
Published or not
Data
Protection
Claimed
Y/N-R/NR
Owner
Asada, Y 2010 Explosive properties of S-2188
(Sumitomo QNP-0019)
Not GLP, Unpublished
Y SUM
Beckwith,
R.C. &
DiFrancesco,
D.
2005 Determination of Dissociation Constant
(pKa) - S-2188
Ricerca Biosciences LLC, Report No.
018410-1
(Sumitomo QNP-0001)
GLP, Unpublished
Y SUM
DiFrancesco,
D.
2006 Determination of vapour pressure - S-
2188
Ricerca Biosciences LLC, Report No.
018435-1
(Sumitomo QNP-0004)
GLP, Unpublished
Y SUM
Lentz, N.R. 2005
a
Determination of water solubility - S-2188
Ricerca Biosciences LLC, Report No.
018315-1
(Sumitomo QNP-0003)
GLP, Unpublished
Y SUM
Lenz, N.R. 2005
b
Determination of n-Octanol/Water Partition
Coefficient - S-2188
Ricerca Biosciences LLC, Report No.
018434-1
(Sumitomo QNP-0002)
GLP, Unpublished
Y SUM
Lewis C.J. 2007 [14C]S-2188: Hydrolytic Stability
Covance Laboratories Ltd, Report No.
0333/257-D2149
(Sumitomo QNM-0017)
GLP, Unpublished.
Y SUM
Lewis, C.J. &
Troth, K.
2007
d
[14C]S-2188: Photodegradation and
Quantum Yield in Sterile, Aqueous Solution
Covance Laboratories Ltd, Report No.
0333/258-D2149
(Sumitomo QNM-0029)
GLP, Unpublished.
Y SUM
ANNEX 1 – BACKGROUND DOCUMENT TO THE RAC OPINION ON FENPYRAZAMINE
222
Liney, P. &
Jarvis, T.
2009 S-2188 – Stability in Air
Exponent International Ltd.,
(Sumitomo QNM-0032)
Not GLP, Unpublished
Y SUM
Liney, P. &
Jarvis, T.
2009 S-2188 – Oxidising Properties Assessment
of Structure
Exponent International Ltd.,
(Sumitomo QNP-0008)
Not GLP, Unpublished
Y SUM
Sweetapple,
G.G. &
Lentz, N.R.
2006
a
Determination of Physical-Chemical
Properties of S-2188PAI (amended report)
Ricerca Biosciences LLC, Report no.
019388-1-1
(Sumitomo QNP-0006)
GLP, Unpublished
Y SUM
Sweetapple,
G.G. &
Lentz, N.R.
2006
b
Determination of Physical-Chemical
Properties of S-2188TGAI (amended
report)
Ricerca Biosciences LLC, Report no.
019387-1-1
(Sumitomo QNP-0007)
GLP, Unpublished
Y SUM
Weissenfeld,
M
2009 S-2188 Technical Grade: Determination of
the Relative Self-Ignition Temperature
Harlan Laboratories Ltd, Report no.
C40706
(Sumitomo QNP-0014)
GLP, Unpublished
Y SUM
7.2 Human health hazard assessment
Author(s)
Year
Title
Source (where different from
company)
Company, Report No
GLP or GEP status (where relevant),
Published or not
Data
Protection
Claimed
Y/N-
R/NR
Owner
Deguchi, Y. 2007a Acute Oral Toxicity Study of S-2188
Technical Grade in Rats
Sumitomo, Report No. 4053
(Sumitomo QNT-0013)
GLP, Unpublished.
Y SUM
Deguchi, Y. 2007b Acute Dermal Toxicity Study of S-2188
Technical Grade in Rats
Sumitomo, Report No. 4054
(Sumitomo QNT-0012)
GLP, Unpublished.
Y SUM
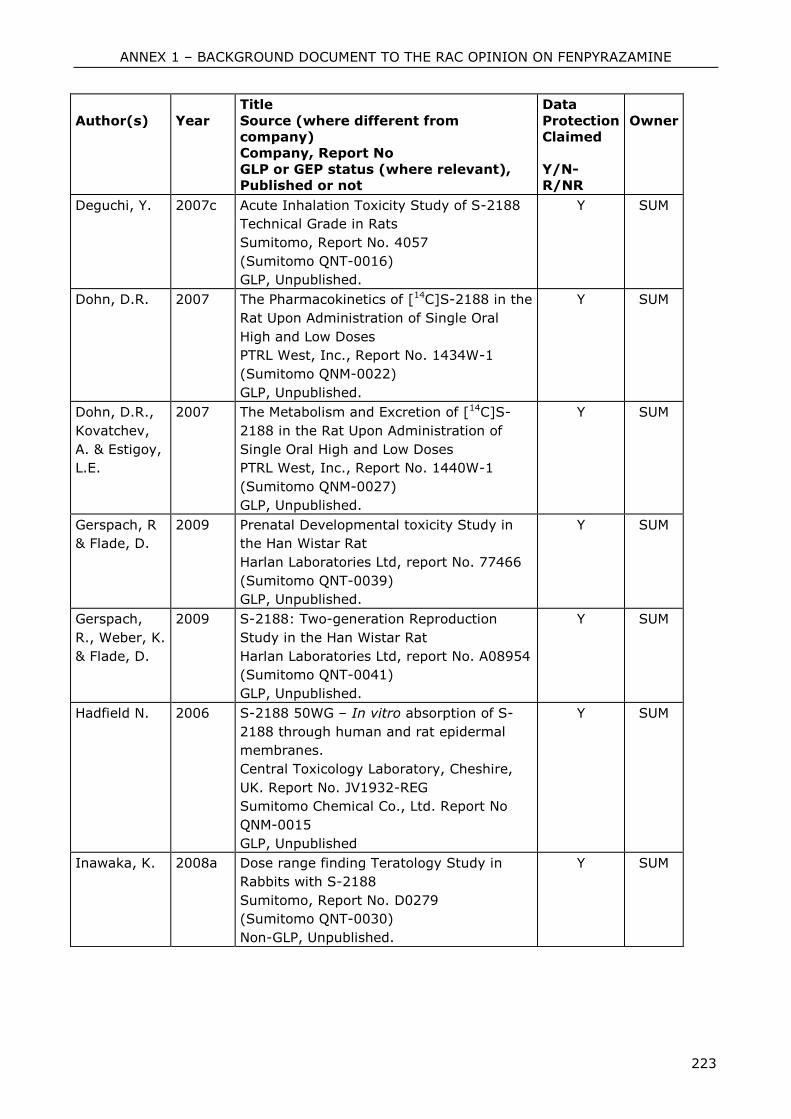
ANNEX 1 – BACKGROUND DOCUMENT TO THE RAC OPINION ON FENPYRAZAMINE
223
Author(s)
Year
Title
Source (where different from
company)
Company, Report No
GLP or GEP status (where relevant),
Published or not
Data
Protection
Claimed
Y/N-
R/NR
Owner
Deguchi, Y. 2007c Acute Inhalation Toxicity Study of S-2188
Technical Grade in Rats
Sumitomo, Report No. 4057
(Sumitomo QNT-0016)
GLP, Unpublished.
Y SUM
Dohn, D.R. 2007 The Pharmacokinetics of [14C]S-2188 in the
Rat Upon Administration of Single Oral
High and Low Doses
PTRL West, Inc., Report No. 1434W-1
(Sumitomo QNM-0022)
GLP, Unpublished.
Y SUM
Dohn, D.R.,
Kovatchev,
A. & Estigoy,
L.E.
2007 The Metabolism and Excretion of [14C]S-
2188 in the Rat Upon Administration of
Single Oral High and Low Doses
PTRL West, Inc., Report No. 1440W-1
(Sumitomo QNM-0027)
GLP, Unpublished.
Y SUM
Gerspach, R
& Flade, D.
2009 Prenatal Developmental toxicity Study in
the Han Wistar Rat
Harlan Laboratories Ltd, report No. 77466
(Sumitomo QNT-0039)
GLP, Unpublished.
Y SUM
Gerspach,
R., Weber, K.
& Flade, D.
2009 S-2188: Two-generation Reproduction
Study in the Han Wistar Rat
Harlan Laboratories Ltd, report No. A08954
(Sumitomo QNT-0041)
GLP, Unpublished.
Y SUM
Hadfield N. 2006 S-2188 50WG – In vitro absorption of S-
2188 through human and rat epidermal
membranes.
Central Toxicology Laboratory, Cheshire,
UK. Report No. JV1932-REG
Sumitomo Chemical Co., Ltd. Report No
QNM-0015
GLP, Unpublished
Y SUM
Inawaka, K. 2008a Dose range finding Teratology Study in
Rabbits with S-2188
Sumitomo, Report No. D0279
(Sumitomo QNT-0030)
Non-GLP, Unpublished.
Y SUM
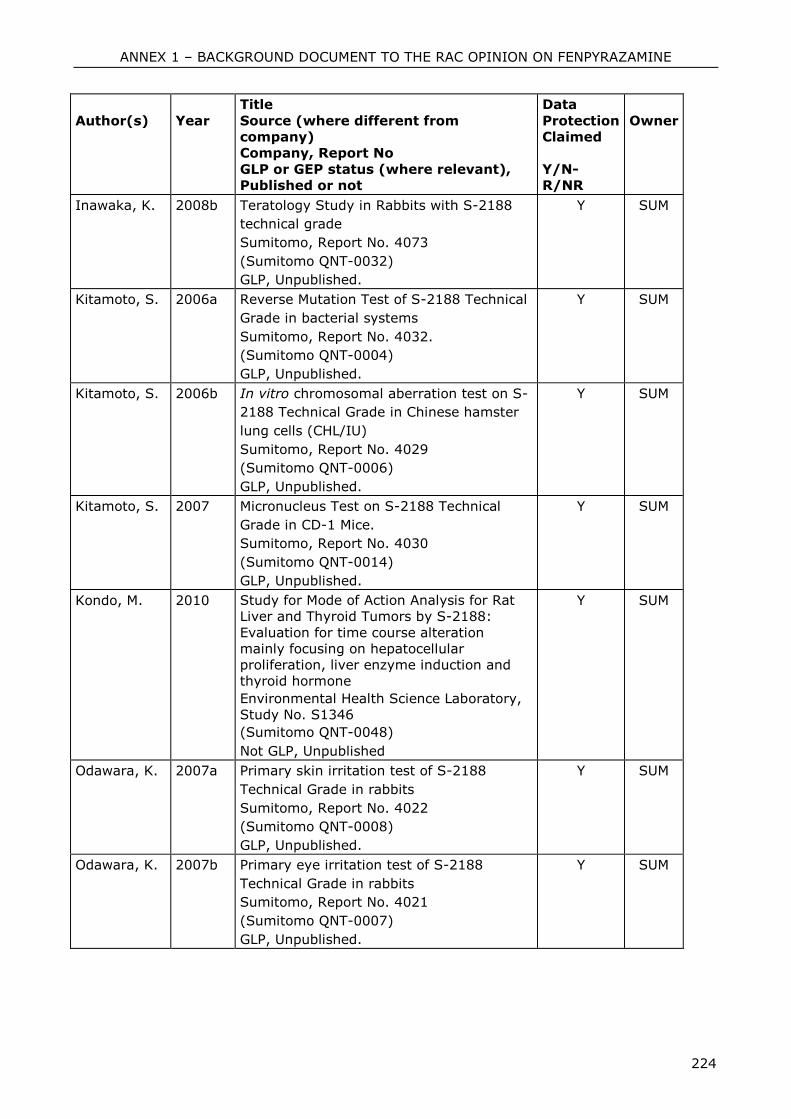
ANNEX 1 – BACKGROUND DOCUMENT TO THE RAC OPINION ON FENPYRAZAMINE
224
Author(s)
Year
Title
Source (where different from
company)
Company, Report No
GLP or GEP status (where relevant),
Published or not
Data
Protection
Claimed
Y/N-
R/NR
Owner
Inawaka, K. 2008b Teratology Study in Rabbits with S-2188
technical grade
Sumitomo, Report No. 4073
(Sumitomo QNT-0032)
GLP, Unpublished.
Y SUM
Kitamoto, S. 2006a Reverse Mutation Test of S-2188 Technical
Grade in bacterial systems
Sumitomo, Report No. 4032.
(Sumitomo QNT-0004)
GLP, Unpublished.
Y SUM
Kitamoto, S. 2006b In vitro chromosomal aberration test on S-
2188 Technical Grade in Chinese hamster
lung cells (CHL/IU)
Sumitomo, Report No. 4029
(Sumitomo QNT-0006)
GLP, Unpublished.
Y SUM
Kitamoto, S. 2007 Micronucleus Test on S-2188 Technical
Grade in CD-1 Mice.
Sumitomo, Report No. 4030
(Sumitomo QNT-0014)
GLP, Unpublished.
Y SUM
Kondo, M. 2010 Study for Mode of Action Analysis for Rat
Liver and Thyroid Tumors by S-2188:
Evaluation for time course alteration
mainly focusing on hepatocellular
proliferation, liver enzyme induction and
thyroid hormone
Environmental Health Science Laboratory,
Study No. S1346
(Sumitomo QNT-0048)
Not GLP, Unpublished
Y SUM
Odawara, K. 2007a Primary skin irritation test of S-2188
Technical Grade in rabbits
Sumitomo, Report No. 4022
(Sumitomo QNT-0008)
GLP, Unpublished.
Y SUM
Odawara, K. 2007b Primary eye irritation test of S-2188
Technical Grade in rabbits
Sumitomo, Report No. 4021
(Sumitomo QNT-0007)
GLP, Unpublished.
Y SUM
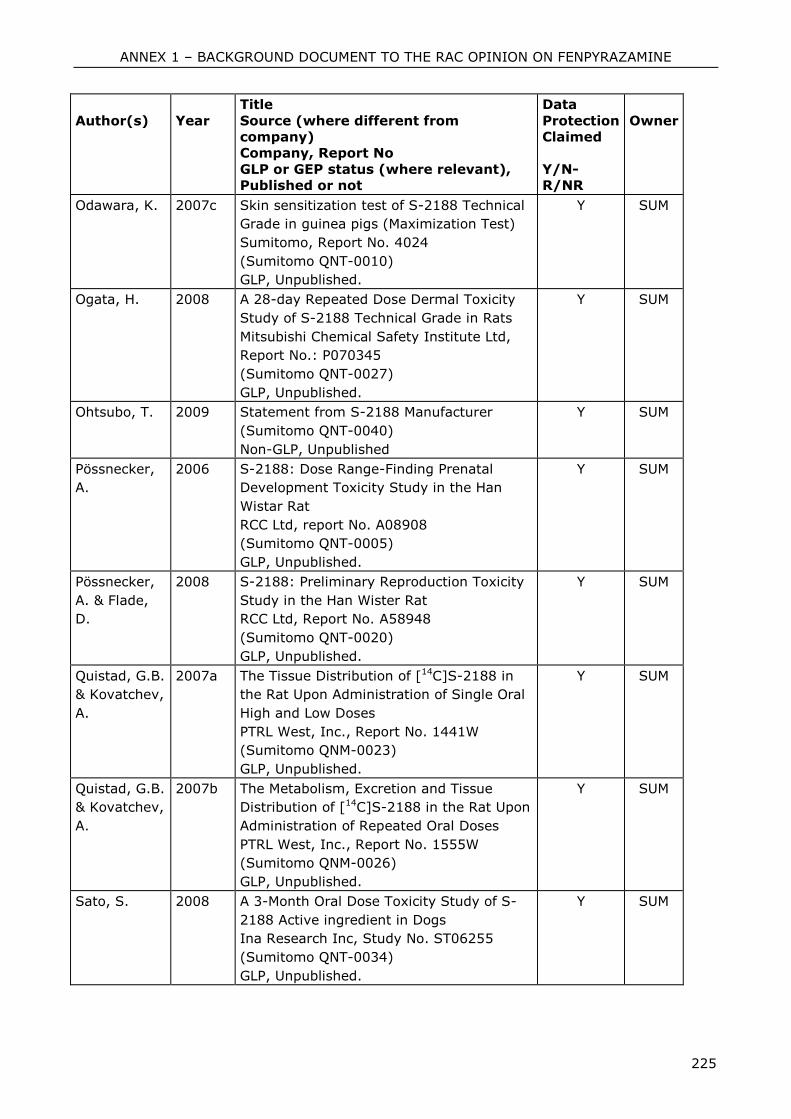
ANNEX 1 – BACKGROUND DOCUMENT TO THE RAC OPINION ON FENPYRAZAMINE
225
Author(s)
Year
Title
Source (where different from
company)
Company, Report No
GLP or GEP status (where relevant),
Published or not
Data
Protection
Claimed
Y/N-
R/NR
Owner
Odawara, K. 2007c Skin sensitization test of S-2188 Technical
Grade in guinea pigs (Maximization Test)
Sumitomo, Report No. 4024
(Sumitomo QNT-0010)
GLP, Unpublished.
Y SUM
Ogata, H. 2008 A 28-day Repeated Dose Dermal Toxicity
Study of S-2188 Technical Grade in Rats
Mitsubishi Chemical Safety Institute Ltd,
Report No.: P070345
(Sumitomo QNT-0027)
GLP, Unpublished.
Y SUM
Ohtsubo, T. 2009 Statement from S-2188 Manufacturer
(Sumitomo QNT-0040)
Non-GLP, Unpublished
Y SUM
Pössnecker,
A.
2006 S-2188: Dose Range-Finding Prenatal
Development Toxicity Study in the Han
Wistar Rat
RCC Ltd, report No. A08908
(Sumitomo QNT-0005)
GLP, Unpublished.
Y SUM
Pössnecker,
A. & Flade,
D.
2008 S-2188: Preliminary Reproduction Toxicity
Study in the Han Wister Rat
RCC Ltd, Report No. A58948
(Sumitomo QNT-0020)
GLP, Unpublished.
Y SUM
Quistad, G.B.
& Kovatchev,
A.
2007a The Tissue Distribution of [14C]S-2188 in
the Rat Upon Administration of Single Oral
High and Low Doses
PTRL West, Inc., Report No. 1441W
(Sumitomo QNM-0023)
GLP, Unpublished.
Y SUM
Quistad, G.B.
& Kovatchev,
A.
2007b The Metabolism, Excretion and Tissue
Distribution of [14C]S-2188 in the Rat Upon
Administration of Repeated Oral Doses
PTRL West, Inc., Report No. 1555W
(Sumitomo QNM-0026)
GLP, Unpublished.
Y SUM
Sato, S. 2008 A 3-Month Oral Dose Toxicity Study of S-
2188 Active ingredient in Dogs
Ina Research Inc, Study No. ST06255
(Sumitomo QNT-0034)
GLP, Unpublished.
Y SUM
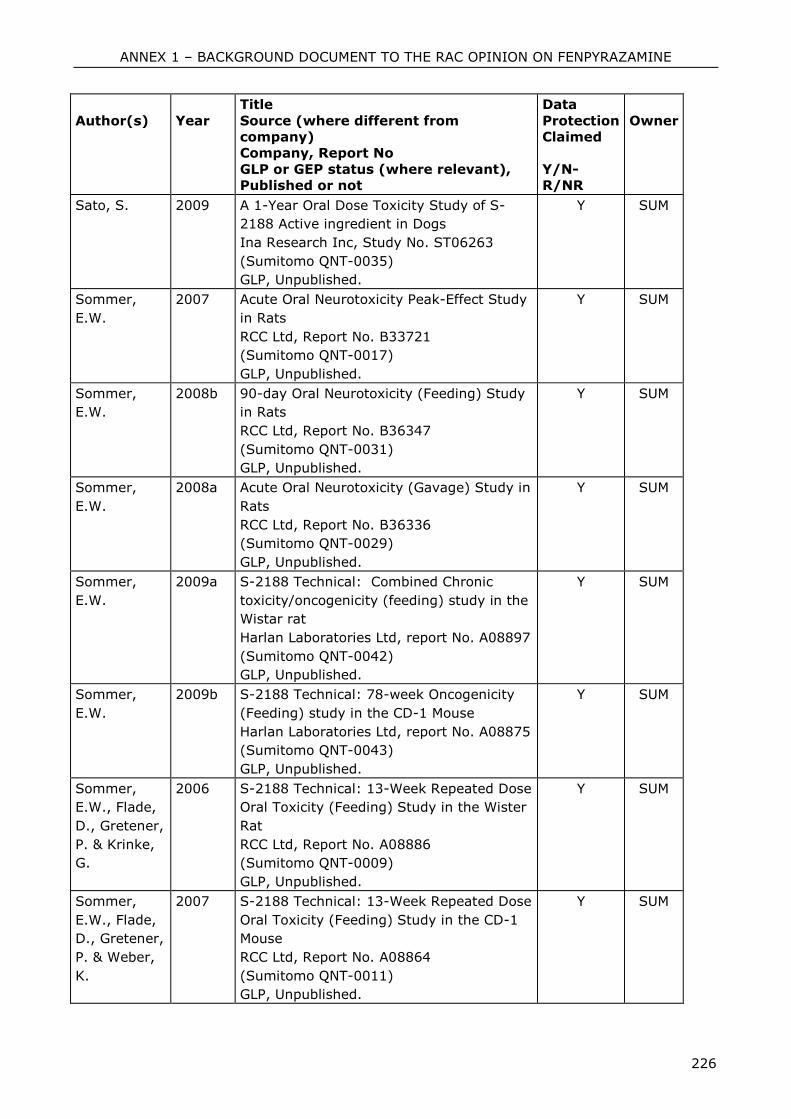
ANNEX 1 – BACKGROUND DOCUMENT TO THE RAC OPINION ON FENPYRAZAMINE
226
Author(s)
Year
Title
Source (where different from
company)
Company, Report No
GLP or GEP status (where relevant),
Published or not
Data
Protection
Claimed
Y/N-
R/NR
Owner
Sato, S. 2009 A 1-Year Oral Dose Toxicity Study of S-
2188 Active ingredient in Dogs
Ina Research Inc, Study No. ST06263
(Sumitomo QNT-0035)
GLP, Unpublished.
Y SUM
Sommer,
E.W.
2007 Acute Oral Neurotoxicity Peak-Effect Study
in Rats
RCC Ltd, Report No. B33721
(Sumitomo QNT-0017)
GLP, Unpublished.
Y SUM
Sommer,
E.W.
2008b 90-day Oral Neurotoxicity (Feeding) Study
in Rats
RCC Ltd, Report No. B36347
(Sumitomo QNT-0031)
GLP, Unpublished.
Y SUM
Sommer,
E.W.
2008a Acute Oral Neurotoxicity (Gavage) Study in
Rats
RCC Ltd, Report No. B36336
(Sumitomo QNT-0029)
GLP, Unpublished.
Y SUM
Sommer,
E.W.
2009a S-2188 Technical: Combined Chronic
toxicity/oncogenicity (feeding) study in the
Wistar rat
Harlan Laboratories Ltd, report No. A08897
(Sumitomo QNT-0042)
GLP, Unpublished.
Y SUM
Sommer,
E.W.
2009b S-2188 Technical: 78-week Oncogenicity
(Feeding) study in the CD-1 Mouse
Harlan Laboratories Ltd, report No. A08875
(Sumitomo QNT-0043)
GLP, Unpublished.
Y SUM
Sommer,
E.W., Flade,
D., Gretener,
P. & Krinke,
G.
2006 S-2188 Technical: 13-Week Repeated Dose
Oral Toxicity (Feeding) Study in the Wister
Rat
RCC Ltd, Report No. A08886
(Sumitomo QNT-0009)
GLP, Unpublished.
Y SUM
Sommer,
E.W., Flade,
D., Gretener,
P. & Weber,
K.
2007 S-2188 Technical: 13-Week Repeated Dose
Oral Toxicity (Feeding) Study in the CD-1
Mouse
RCC Ltd, Report No. A08864
(Sumitomo QNT-0011)
GLP, Unpublished.
Y SUM
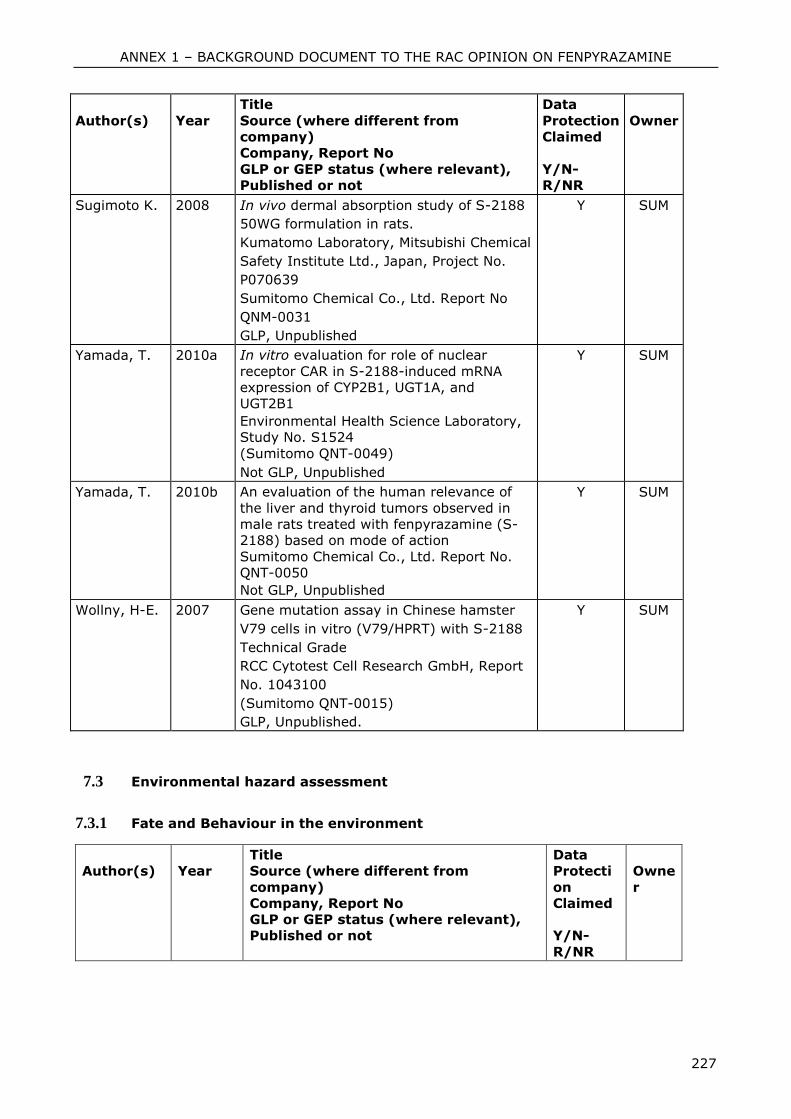
ANNEX 1 – BACKGROUND DOCUMENT TO THE RAC OPINION ON FENPYRAZAMINE
227
Author(s)
Year
Title
Source (where different from
company)
Company, Report No
GLP or GEP status (where relevant),
Published or not
Data
Protection
Claimed
Y/N-
R/NR
Owner
Sugimoto K. 2008 In vivo dermal absorption study of S-2188
50WG formulation in rats.
Kumatomo Laboratory, Mitsubishi Chemical
Safety Institute Ltd., Japan, Project No.
P070639
Sumitomo Chemical Co., Ltd. Report No
QNM-0031
GLP, Unpublished
Y SUM
Yamada, T. 2010a In vitro evaluation for role of nuclear
receptor CAR in S-2188-induced mRNA
expression of CYP2B1, UGT1A, and
UGT2B1
Environmental Health Science Laboratory,
Study No. S1524
(Sumitomo QNT-0049)
Not GLP, Unpublished
Y SUM
Yamada, T. 2010b An evaluation of the human relevance of
the liver and thyroid tumors observed in
male rats treated with fenpyrazamine (S-
2188) based on mode of action
Sumitomo Chemical Co., Ltd. Report No.
QNT-0050
Not GLP, Unpublished
Y SUM
Wollny, H-E. 2007 Gene mutation assay in Chinese hamster
V79 cells in vitro (V79/HPRT) with S-2188
Technical Grade
RCC Cytotest Cell Research GmbH, Report
No. 1043100
(Sumitomo QNT-0015)
GLP, Unpublished.
Y SUM
7.3 Environmental hazard assessment
7.3.1 Fate and Behaviour in the environment
Author(s)
Year
Title
Source (where different from
company)
Company, Report No
GLP or GEP status (where relevant),
Published or not
Data
Protecti
on
Claimed
Y/N-
R/NR
Owne
r
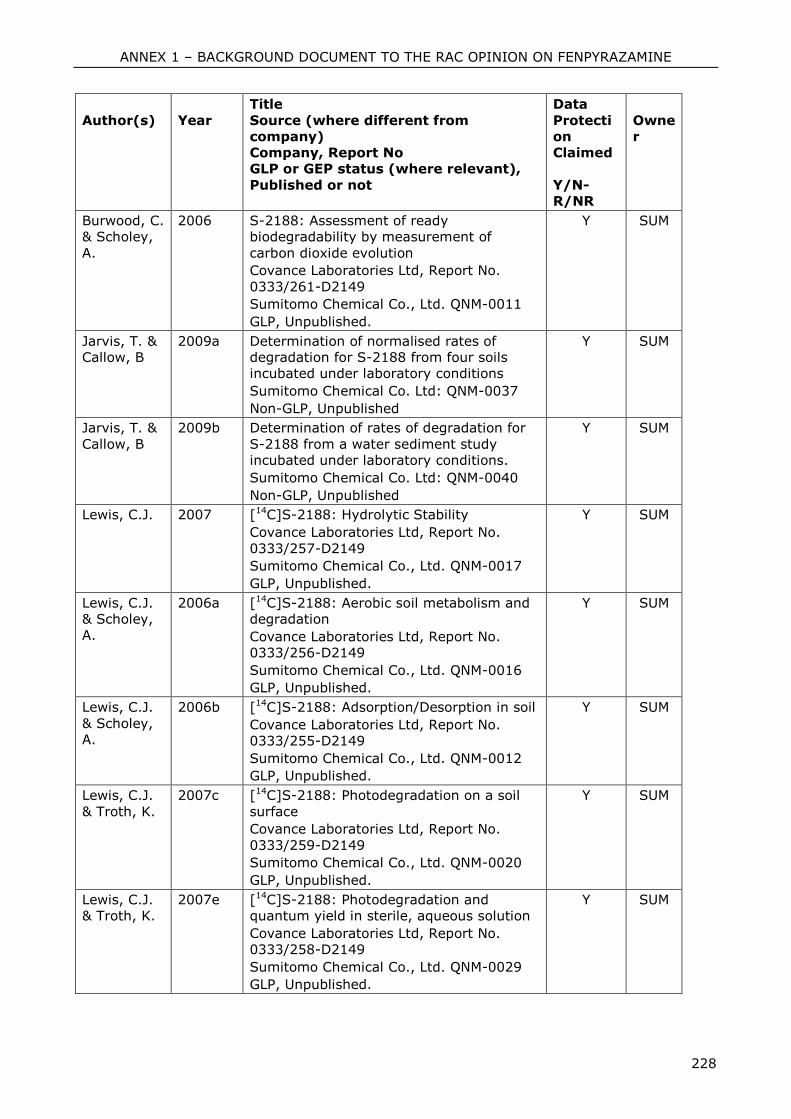
ANNEX 1 – BACKGROUND DOCUMENT TO THE RAC OPINION ON FENPYRAZAMINE
228
Author(s)
Year
Title
Source (where different from
company)
Company, Report No
GLP or GEP status (where relevant),
Published or not
Data
Protecti
on
Claimed
Y/N-
R/NR
Owne
r
Burwood, C.
& Scholey,
A.
2006 S-2188: Assessment of ready
biodegradability by measurement of
carbon dioxide evolution
Covance Laboratories Ltd, Report No.
0333/261-D2149
Sumitomo Chemical Co., Ltd. QNM-0011
GLP, Unpublished.
Y SUM
Jarvis, T. &
Callow, B
2009a Determination of normalised rates of
degradation for S-2188 from four soils
incubated under laboratory conditions
Sumitomo Chemical Co. Ltd: QNM-0037
Non-GLP, Unpublished
Y SUM
Jarvis, T. &
Callow, B
2009b Determination of rates of degradation for
S-2188 from a water sediment study
incubated under laboratory conditions.
Sumitomo Chemical Co. Ltd: QNM-0040
Non-GLP, Unpublished
Y SUM
Lewis, C.J. 2007 [14C]S-2188: Hydrolytic Stability
Covance Laboratories Ltd, Report No.
0333/257-D2149
Sumitomo Chemical Co., Ltd. QNM-0017
GLP, Unpublished.
Y SUM
Lewis, C.J.
& Scholey,
A.
2006a [14C]S-2188: Aerobic soil metabolism and
degradation
Covance Laboratories Ltd, Report No.
0333/256-D2149
Sumitomo Chemical Co., Ltd. QNM-0016
GLP, Unpublished.
Y SUM
Lewis, C.J.
& Scholey,
A.
2006b [14C]S-2188: Adsorption/Desorption in soil
Covance Laboratories Ltd, Report No.
0333/255-D2149
Sumitomo Chemical Co., Ltd. QNM-0012
GLP, Unpublished.
Y SUM
Lewis, C.J.
& Troth, K.
2007c [14C]S-2188: Photodegradation on a soil
surface
Covance Laboratories Ltd, Report No.
0333/259-D2149
Sumitomo Chemical Co., Ltd. QNM-0020
GLP, Unpublished.
Y SUM
Lewis, C.J.
& Troth, K.
2007e [14C]S-2188: Photodegradation and
quantum yield in sterile, aqueous solution
Covance Laboratories Ltd, Report No.
0333/258-D2149
Sumitomo Chemical Co., Ltd. QNM-0029
GLP, Unpublished.
Y SUM
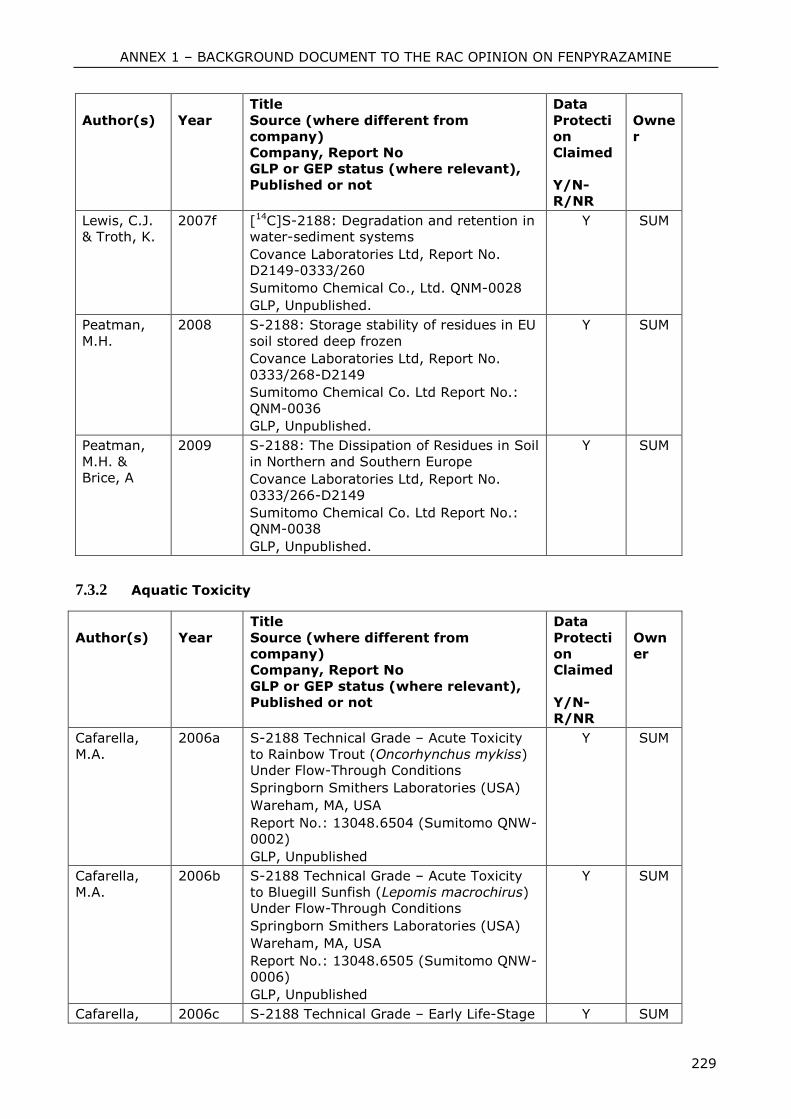
ANNEX 1 – BACKGROUND DOCUMENT TO THE RAC OPINION ON FENPYRAZAMINE
229
Author(s)
Year
Title
Source (where different from
company)
Company, Report No
GLP or GEP status (where relevant),
Published or not
Data
Protecti
on
Claimed
Y/N-
R/NR
Owne
r
Lewis, C.J.
& Troth, K.
2007f [14C]S-2188: Degradation and retention in
water-sediment systems
Covance Laboratories Ltd, Report No.
D2149-0333/260
Sumitomo Chemical Co., Ltd. QNM-0028
GLP, Unpublished.
Y SUM
Peatman,
M.H.
2008 S-2188: Storage stability of residues in EU
soil stored deep frozen
Covance Laboratories Ltd, Report No.
0333/268-D2149
Sumitomo Chemical Co. Ltd Report No.:
QNM-0036
GLP, Unpublished.
Y SUM
Peatman,
M.H. &
Brice, A
2009 S-2188: The Dissipation of Residues in Soil
in Northern and Southern Europe
Covance Laboratories Ltd, Report No.
0333/266-D2149
Sumitomo Chemical Co. Ltd Report No.:
QNM-0038
GLP, Unpublished.
Y SUM
7.3.2 Aquatic Toxicity
Author(s)
Year
Title
Source (where different from
company)
Company, Report No
GLP or GEP status (where relevant),
Published or not
Data
Protecti
on
Claimed
Y/N-
R/NR
Own
er
Cafarella,
M.A.
2006a S-2188 Technical Grade – Acute Toxicity
to Rainbow Trout (Oncorhynchus mykiss)
Under Flow-Through Conditions
Springborn Smithers Laboratories (USA)
Wareham, MA, USA
Report No.: 13048.6504 (Sumitomo QNW-
0002)
GLP, Unpublished
Y SUM
Cafarella,
M.A.
2006b S-2188 Technical Grade – Acute Toxicity
to Bluegill Sunfish (Lepomis macrochirus)
Under Flow-Through Conditions
Springborn Smithers Laboratories (USA)
Wareham, MA, USA
Report No.: 13048.6505 (Sumitomo QNW-
0006)
GLP, Unpublished
Y SUM
Cafarella, 2006c S-2188 Technical Grade – Early Life-Stage Y SUM
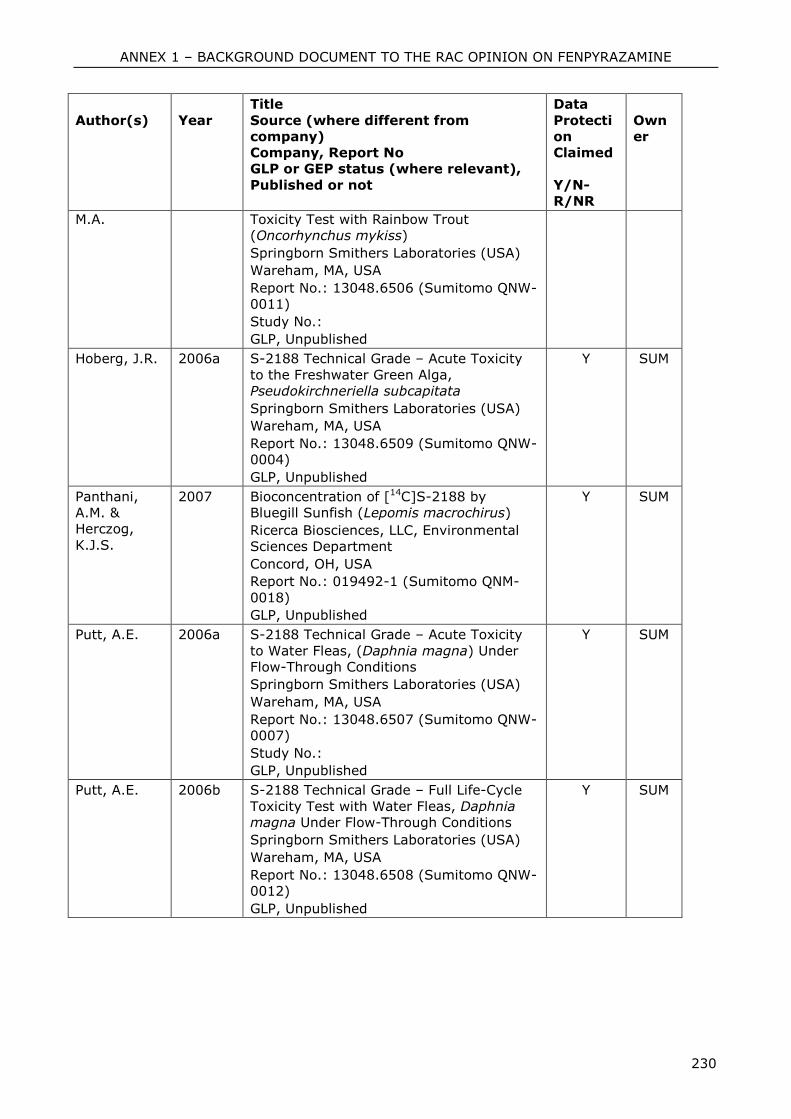
ANNEX 1 – BACKGROUND DOCUMENT TO THE RAC OPINION ON FENPYRAZAMINE
230
Author(s)
Year
Title
Source (where different from
company)
Company, Report No
GLP or GEP status (where relevant),
Published or not
Data
Protecti
on
Claimed
Y/N-
R/NR
Own
er
M.A. Toxicity Test with Rainbow Trout
(Oncorhynchus mykiss)
Springborn Smithers Laboratories (USA)
Wareham, MA, USA
Report No.: 13048.6506 (Sumitomo QNW-
0011)
Study No.:
GLP, Unpublished
Hoberg, J.R. 2006a S-2188 Technical Grade – Acute Toxicity
to the Freshwater Green Alga,
Pseudokirchneriella subcapitata
Springborn Smithers Laboratories (USA)
Wareham, MA, USA
Report No.: 13048.6509 (Sumitomo QNW-
0004)
GLP, Unpublished
Y SUM
Panthani,
A.M. &
Herczog,
K.J.S.
2007 Bioconcentration of [14C]S-2188 by
Bluegill Sunfish (Lepomis macrochirus)
Ricerca Biosciences, LLC, Environmental
Sciences Department
Concord, OH, USA
Report No.: 019492-1 (Sumitomo QNM-
0018)
GLP, Unpublished
Y SUM
Putt, A.E. 2006a S-2188 Technical Grade – Acute Toxicity
to Water Fleas, (Daphnia magna) Under
Flow-Through Conditions
Springborn Smithers Laboratories (USA)
Wareham, MA, USA
Report No.: 13048.6507 (Sumitomo QNW-
0007)
Study No.:
GLP, Unpublished
Y SUM
Putt, A.E. 2006b S-2188 Technical Grade – Full Life-Cycle
Toxicity Test with Water Fleas, Daphnia
magna Under Flow-Through Conditions
Springborn Smithers Laboratories (USA)
Wareham, MA, USA
Report No.: 13048.6508 (Sumitomo QNW-
0012)
GLP, Unpublished
Y SUM

ANNEX 1 – BACKGROUND DOCUMENT TO THE RAC OPINION ON FENPYRAZAMINE
231
8 ANNEXES