adopted budget - cdn site
TRANSCRIPT
2019-2020
ADOPTED BUDGETAdopted June 24, 2019
Northwest Independent School DistrictFort Worth, Texas 76177
www.nisdtx.org
NORTHWEST INDEPENDENT SCHOOL DISTRICT Fort Worth, Texas 76177
BUDGET FOR THE YEAR 2019-2020
July 1, 2019 to June 30, 2020
BOARD OF TRUSTEES
Judy Copp, President
Anne Davis-Simpson, Ph.D., Vice President
Lillian Rauch, Ph.D., Secretary
Ron Hastings
Mark Schluter
R. Stephen Sprowls
DeAnne Hatfield
ADMINISTRATIVE STAFF
Ryder Warren, Ed.D. Superintendent of Schools
Robert Thornell, Ed. D. Deputy Superintendent for Curriculum and Instruction
Kim Caley, Ed. D. Assistant Superintendent for Human Resources
Brian Carter Chief Financial Officer
Emily Conklin Executive Director of Communications
Michael Griffin, Ed. D. Assistant Superintendent for Curriculum and Instruction
Christie Hobbs General Counsel
Tim McClure Assistant Superintendent for Facilities
Cover & Divider Art
NISD Aquatic Center / Haslet Elementary / BNHS Addition / EHS Addition
www.nisdtx.org
Northwest Independent School District
2019 - 2020 Budget
Table of Contents
Executive Summary: Executive Summary ...................................................................................................................................... 1
2019 - 2020 Board of Trustees and Administrators .................................................................................... 27
Association of School Business Officials International - Meritorious Budget Award ............................... 29
Organizational Section: The Northwest Independent School District ............................................................................................... 31
Mission Statement, Vision, Core Beliefs, and Operational Goals .............................................................. 32
Strategic Planning Flowchart and Strategic Framework ............................................................................. 33
Profile of an NISD Educator ....................................................................................................................... 34
Profile of a Graduate ................................................................................................................................... 35
District Improvement Plan – Strategic Framework .................................................................................... 36
District Improvement Plan – Strategic Planning Schedule ......................................................................... 37
District Improvement Plan - Strategic Goals, Performance Objectives, and Strategies ............................. 38
2019-2020 Administrative Organizational Chart ........................................................................................ 45
Budget and Financial Policies ..................................................................................................................... 46
Budget Process ............................................................................................................................................ 54
Budget Calendar for the Year 2019-2020 ................................................................................................... 57
Staffing Formulas for 2019-2020 ................................................................................................................ 58
Campus Funding Allocations ...................................................................................................................... 61
Budget Control and Management Process .................................................................................................. 62
Financial Structure ...................................................................................................................................... 63
Account Code Structure .............................................................................................................................. 65
Financial Section: Fund Financial Statements Combined Statement of Revenues, Expenditures and Changes in Fund Balance ...................................... 69
General Fund............................................................................................................................................... 70
Combined Statement of Revenues, Expenditures and Changes in Fund Balance ......................... 71
Special Revenue Funds ............................................................................................................................... 72
Combined Statement of Revenues, Expenditures and Changes in Fund Balance ......................... 73
Fund Statement of Revenues, Expenditures and Changes in Fund Balance .................................. 74
Debt Service Funds ..................................................................................................................................... 76
Combined Statement of Revenues, Expenditures and Changes in Fund Balance ......................... 77
All Outstanding Unlimited Tax Debt ............................................................................................. 78
Aggregate Debt Service ................................................................................................................. 80
Estimated Overlapping Debt .......................................................................................................... 81
Capital Projects Funds ................................................................................................................................ 82
Combined Statement of Revenues, Expenditures and Changes in Fund Balance ......................... 83
Master Project List ......................................................................................................................... 84
Operating Costs .............................................................................................................................. 85 Supporting Financial Schedules and Crosswalks........................................................................................ 86
Combined Statement of Expenditures by Function and Object Code............................................ 87
Budgeted Expenditures by Function and Object Code .................................................................. 92
Fund Balance ................................................................................................................................. 97
Financial Section: Schools and Programs Northwest High School ............................................................................................................................... 99
Byron Nelson High School ........................................................................................................................ 100
V. R. Eaton High School ........................................................................................................................... 101
James M. Steele Accelerated High School ................................................................................................ 102
Alternative Education Campuses ............................................................................................................... 103
Medlin Middle School ............................................................................................................................... 104
Gene Pike Middle School .......................................................................................................................... 105
Chisholm Trail Middle School .................................................................................................................. 106
John M. Tidwell Middle School ................................................................................................................ 107
Truett Wilson Middle School .................................................................................................................... 108
Leo Adams Middle School ........................................................................................................................ 109
Haslet Elementary School ......................................................................................................................... 110
Justin Elementary School .......................................................................................................................... 111
Lakeview Elementary School .................................................................................................................... 112
Roanoke Elementary School ..................................................................................................................... 113
Seven Hills Elementary Schools................................................................................................................ 114
Samuel Beck Elementary School .............................................................................................................. 115
W. R. Hatfield Elementary School ............................................................................................................ 116
Prairie View Elementary School ............................................................................................................... 117
Sonny & Allegra Nance Elementary School ............................................................................................. 118
J. Lyndal Hughes Elementary School ........................................................................................................ 119
Kay Granger Elementary School ............................................................................................................... 120
Sendera Ranch Elementary School ............................................................................................................ 121
O. A. Peterson Elementary School ............................................................................................................ 122
Clara Love Elementary School .................................................................................................................. 123
J. C. Thompson Elementary School .......................................................................................................... 124
Carl E. Schluter Elementary School .......................................................................................................... 125
Wayne A. Cox Elementary School ............................................................................................................ 126
Lizzie Curtis Elementary School ............................................................................................................... 127
Lance Thompson Elementary School ........................................................................................................ 128
Enhanced Services ..................................................................................................................................... 129
Cocurricular / Extracurricular Activities ................................................................................................... 130
Board of Trustees ...................................................................................................................................... 131
Superintendent of Schools ......................................................................................................................... 132
General Counsel ........................................................................................................................................ 133
Communications ........................................................................................................................................ 134
Curriculum and Instruction ........................................................................................................................ 135
Administrative Services ............................................................................................................................. 136
Financial Services ...................................................................................................................................... 137
Technology Division ................................................................................................................................. 138
Student (Pupil) Transportation .................................................................................................................. 139
Facilities, Planning, & Construction.......................................................................................................... 140
Multi-Campus ............................................................................................................................................ 141
Intergovernmental Charges........................................................................................................................ 142
Northwest Independent School District ..................................................................................................... 143
Informational Section
State and Local Funding of School Districts in Texas .............................................................................. 144
Current Public School Finance System ..................................................................................................... 145
Major Revenue Sources ............................................................................................................................. 152
Combined Statement of Revenues............................................................................................................. 153
Tax Information ......................................................................................................................................... 155
Assessed Value of Taxable Property ......................................................................................................... 164
Property Tax Rates .................................................................................................................................... 165
Informational Section (Continued): Property Tax Collections .......................................................................................................................... 166
Comparison of Levy on Average Residence ............................................................................................. 167
Notice of Public Meeting to Discuss Budget and Proposed Tax Rate ...................................................... 168
Resolution ................................................................................................................................................. 169
Student Enrollment Projections ................................................................................................................ 170
Enrollment by Organization ...................................................................................................................... 171
Employee Count by Organization ............................................................................................................. 172
Financial Forecast ..................................................................................................................................... 173
2017-2018 Parent Survey .......................................................................................................................... 175
Performance Measures – Texas Academic Performance Reports (TAPR) .............................................. 177
Performance Measures – Financial Integrity Rating System of Texas (FIRST) ....................................... 179
District, Student, and Staff Accomplishments for 2018-2019 .................................................................. 183
The District Area Economy ...................................................................................................................... 188
2019 – 2020 School Calendar ................................................................................................................... 192
Glossary of Terms ..................................................................................................................................... 193
Haslet Elementary – Exterior
EXECUTIVE SUMMARY
2019 - 2020 Adopted Budget 1
November 11, 2019
Board of Trustees
Northwest Independent School District
2001 Texan Drive
Fort Worth, TX 76177
Dear Board Members:
We are proud to publish and disseminate information to the Board of Trustees and to the community. We welcome
the opportunity to present and discuss educational and operational plans and related financial impact with all
interested parties. Interaction among interested groups consistently leads to educational and operational
improvements thereby benefiting the students of the Northwest Independent School District.
Budget Presentation
The development, review, and consideration of the 2019-2020 Governmental Fund Budgets (the General Fund, the
Special Revenue Funds, the Debt Service Funds, the Capital Project Funds) were completed with a detailed and
exhaustive review of every revenue and expenditure item within the context of the District's Mission Statement,
Strategic Goals, Operational Goals, Performance Objectives, and Board Policy. Information on each of the fund
budgets is provided in this budget document.
The budget document and the year-end Comprehensive Annual Financial Report ("CAFR") are the primary vehicles
to present the financial plan and the results of operations of the District. Copies of the Adopted Budget and
Comprehensive Annual Financial Report including past fiscal years maybe found on the District web site under the
Financial Services Department at http://www.nisdtx.org/departments/financial_services
The document is organized into the following sections:
Executive Summary - Introduces the reader to the document as a whole. It highlights important information
contained in the budget. Users rely on this section to get an overview - a snapshot of what they can expect to find
in the rest of the document.
Organizational Section - Provides the context and framework within which the budget is developed and
managed. The context for the budget is substantially predicated on the type and level of service to be provided
the students of the community. The framework also includes the District's organizational and financial structure
as well as the controls that direct and regulate the development and administration of the budget.
Financial Section: Fund Financial Statements - Presents the heart of the school budget document. The budget
financial schedules present the adopted budgets for the District compared with the results of past budget plans and
with future projections.
Financial Section: School and Programs - Provides the Mission Statements carried out by the school or
program, objective methods of results by school or program, and includes the resources, both personnel and
dollars, allocated to the school or program to carry out the stated mission.
Informational Section - Contains information on past and future budgets and factors influencing the proposed
budget. Puts the adopted budget into context and it explains past budget decisions.
2019 - 2020 Adopted Budget 2
Association of School Business Officials International
and
Government Finance Officers Association
The information included in the budget document is structured to meet the requirements of the Meritorious Budget
Award ("MBA") of the Association of School Business Officials International ("ASBO"). To receive this award, a
school entity must publish a budget document as a policy document, as an operations guide, as a financial plan, and as
a communications medium. We believe our current budget conforms to the requirements of this program, and we are
submitting this document to ASBO to determine its eligibility for this award.
This award represents the highest level of recognition in budgeting for school entities. This attainment represents a
significant accomplishment by a school entity and its management. The award is made after comprehensive review
by a panel of independent budget professionals. Using extensive criteria, the reviewers not only evaluate the
effectiveness of the budget in meeting the program criteria, but also provide commentary and feedback to the
submitting entity as a basis for improving the presentation of the District's financial and operational plan.
The Northwest Independent School District budget document has been awarded the Meritorious Budget Award by
ASBO for the fiscal years 2001-2002 through 2018-2019.
Additionally, the Northwest Independent School District Comprehensive Annual Financial Report has been awarded
the Certificate of Excellence in Financial Reporting by the Association of School Business Officials International
("ASBO") for the fiscal year ended June 30, 2003 through 2018 (excluding 2010) and the Certificate of Achievement
for Excellence in Financial Reporting by the Government Finance Officers Association (“GFOA”) for the fiscal years
ending June 30, 2002 through 2018.
However, our most important concern in the presentation of the budget data is to improve the quality of information
provided to our community about the District's financial plan for the educational programs and services for the 2019-
2020 fiscal year.
Mission Statement and Strategic Goals
Strategic planning serves to assure the long range success of the District. As part of continuous improvement, the
Board of Trustees and Administration have worked together to review the District’s mission and goals, as per
Northwest Independent School District Board Policy BQ (LOCAL):
“The Board shall approve and periodically review the District's mission and goals to improve student
performance. The mission, goals, and the approved District and campus objectives shall be mutually
supportive and shall support the state goals and objectives under Education Code, Chapter 4.”
Our Mission
Northwest ISD, in collaboration with students, families, communities,
and global partners, will engage in a culture of learning that prepares
all students to confidently navigate their future.
2019 - 2020 Adopted Budget 3
Strategic Goals
Goal I Students will achieve success through meaningful learning experiences, innovative pathways, and personalized
opportunities.
Goal II Northwest ISD will recruit, value, and retain an exceptional staff to create a rewarding learning environment.
Goal III Northwest ISD will create and foster an environment where all stakeholders are engaged in the transformational work
of the NISD family.
Budget Process
The Budget Process covers the financial cycle starting with budget planning and ending with the audited CAFR:
Budget Planning January - February 2019
Budget Preparation February 2019
Board of Trustee Budget Review March - May 2019
Budget Adoption June 2019
Tax Rate Adoption July - August 2019
Budget Amendments July - June 2019 - 2020
Comprehensive Annual Financial Report (“CAFR”) November 2020
2018-2022 Northwest ISD Strategic Framework
The Northwest ISD Board of Trustees approved the district’s 2018-2022 Strategic Framework at the meeting on May
29, 2018. The framework includes the district’s Core Beliefs, Vision, Mission, and Strategic Goals. Based on the
recommendations of the Strategic Summit participants, this plan establishes the direction of the district for the next
four years. A team of approximately 85 participants made up of students, parents, community members, and staff
served to develop this plan that will set the tone for NISD’s future.
2019-2020 District Improvement Plan
Northwest ISD’s annual development of a District Improvement Plan helps maintain the direction of the district as we
empower learners and leaders to positively impact the world. In accordance with the Texas Education Code, the
superintendent is to annually develop the District Improvement Plan, with the Board of Trustees annually approving
the performance objectives.
The 2019-2020 District Improvement Plan is an extension of the district’s Strategic Framework. As part of our
strategic initiative, the emphasis in developing the District Improvement Plan was again placed on focusing on
identified imperatives for the coming school year. It was approved by the Northwest ISD Board of Trustees on
September 9, 2019.
Budget Planning
As a fast (student) growth district, the Board of Trustees regularly receive Academic Performance, Five-Year
Financial Forecast, Financial & Investment, and Demographic, Facilities, Planning & Construction reports throughout
the year. The annual development of the District budget incorporates all the District planning efforts into a single
process.
2019 - 2020 Adopted Budget 4
Capital Budget Development Process The citizen Long-Range Planning Committee which serves in an advisory capacity reviews data, prioritizes the capital
needs, and formulates a plan to address the needs. It then presents recommendations to the Board of Trustees who act
upon the Long-Range Planning Committee recommendations including any modifications to the original plan.
In October 2016, the Long Range Planning Committee began meeting to discuss the upcoming facility, technology,
curriculum, and extra-curricular needs of Northwest ISD. The committee membership consisted of a well-rounded
cross section of our District to ensure all of the areas of Northwest ISD were represented. During the meetings, the
Long Range Planning Committee received and evaluated information regarding previous and projected growth of
Northwest ISD, technology needs, new facility construction, major building component replacement needs (roofs,
HVAC, flooring, security system), and program enhancement needs. After extensive analysis of all the presented
needs of Northwest ISD, the Long Range Planning Committee recommended that the School Board authorize a
Capital Bond Election for $399,000,000. On February 13th the Board of Trustees approved an Order Calling a
$399,000,000 Bond Election which passed on May 6, 2017.
Budget Preparation The District uses site-based budgeting to enhance the ability of principals to serve as effective instructional leaders.
Site-based budgeting places the principal at the center of the budget preparation process. The Campus Improvement
Plans referenced under the previous paragraph, Budget Planning, link the resources required to the local campus
strategies to improve student achievement. The accomplishments are reviewed in the subsequent year.
Board of Trustee Budget Review
The Board of Trustees received budget updates that included any revisions to the original Five-Year Financial
Forecast. The Preliminary Budget including the Personnel & Compensation Plan was reviewed in detail throughout
April. The 2019 – 2020 Personnel & Compensation Plan was then adopted June 10th. Early adoption provides
advantages in teacher recruitment and allows for the salary detail to be loaded into the adopted budget.
Budget Adoption
The Central Appraisal Districts (“CAD”) 2019 Certified Estimate Appraisal Roll Totals occurred in early June and the
rollback tax rate was calculated shortly thereafter. The required legal notice was published on June 15th. The Board
of Trustees held the required public meeting and adopted the budget on June 24, 2019.
Tax Rate Adoption The Central Appraisal Districts (“CAD”) Certification of the 2019 Appraisal Records occurred in late July and the
Denton County Tax Assessor-Collector calculated the effective and rollback tax rates shortly thereafter. The required
legal notice was published on August 17th. The Board of Trustees held the required public meeting and adopted the
tax rate on August 26, 2019.
Budget Amendments
The initial Campus Budget Worksheet allocation represents 80% of the campus funding allocation based on projected
enrollment. The remaining amount is distributed in October based on actual enrollment and staff on hand at the end of
the first six weeks. The Final Amended Budget for the Year Ending June 30, 2020, will be submitted at the June 22,
2020, Board meeting. It will reflect all amendments previously approved by the Board of Trustees plus any final
amendments. The Final Amended Budget for the Year Ending June 30, 2020, will be used in the preparation of the
Comprehensive Annual Financial Report (“CAFR”).
Comprehensive Annual Financial Report (“CAFR”)
The final stage of the budget cycle is the approval by the Board of Trustees of the audited Comprehensive Annual
Financial Report which includes budget to actual comparisons scheduled for October 28, 2020.
2019 - 2020 Adopted Budget 5
Budget Priorities
The Northwest Independent School District lies within one of the fastest growing areas in Texas. The District serves
25,263 students in grades pre-kindergarten through twelfth, a projected increase of 992 students. The district operates
three comprehensive high schools, an accelerated high school, six middle schools, 19 elementary schools, a special
programs center and a community-based youth residential program.
Fast Growth School District
As a fast growth school district the ongoing construction of facilities and infrastructure to provide for student growth
is a major priority. On May 6, 2017, District voters passed a $399 million bond election. Enrollment is expected to
increase by an additional 6,500 students during the next five years. The district’s growth is a result of several factors:
the size of the school district; the number of active housing developments; and the attractive housing, retail and
business industry in the immediate area. Combined with current school district projects, the bond will provide for an
additional 7,000 student seats. More than two-thirds of the approved bond package addresses student growth. Major
new or improved facility highlights include:
• Three new elementary schools
• A replacement school for Haslet Elementary
• Renovation of the existing Haslet Elementary to serve as a district instructional facility
• Expansions of Byron Nelson and Eaton high schools to 3,200 students
• Expansions of Medlin and Tidwell middle schools to 1,200 students
• Expansions for three existing elementary schools from 650 to 850 students
• A district aquatic center to serve all campuses
• A classroom addition to Beck Elementary to allow growth for current enrollment
• Outdoor fieldhouses for Byron Nelson and Northwest high schools
Current Public School Finance System
Funding for school districts in the State is provided primarily from State and local sources. State funding for all school
districts is provided through a set of funding formulas comprising the “Foundation School Program”, as well as two
facilities funding programs. Generally, the Finance System is designed to promote wealth equalization among school
districts by balancing State and local sources of funds available to school districts. In particular, because districts with
relatively high levels of property wealth per student can raise more local funding, such districts receive less State aid,
and in some cases, are required to disburse local funds to equalize their overall funding relative to other school
districts. Conversely, because districts with relatively low levels of property wealth per student have limited access to
local funding, the Finance System is designed to provide more State funding to such districts. Thus, as a school
district’s property wealth per student increases, State funding to the school district is reduced. As a school district’s
property wealth per student declines, the Finance System is designed to increase that district’s State funding. The
Finance System provides a similar equalization system for facilities funding wherein districts with the same tax rate
for debt service raise the same amount of combined State and local funding.
2019 Legislation
The 86th Regular Session of the Texas Legislature began on January 8, 2019, and adjourned on May 27, 2019. A total
of 7,420 House and Senate bills were filed during the session. Of the bills filed, 1,429 passed, and 56 were vetoed by
the governor. The Texas Legislature passed the most consequential public school finance reform since 1993; House
Bill 3, authored by House Public Education Committee Chairman Dan Huberty (R-Kingwood) and sponsored by
Senate Education Committee Chairman Larry Taylor (R-Friendswood). House Bill 3 dramatically reduces statewide
recapture payments over the next biennium. It is important to note that school district property tax reform is directly
connected to the school finance reform efforts in House Bill 3. The legislation compresses local school district
property taxes over a two-year period and establishes a school district revenue cap of 2.5 percent. These provisions
help to reduce the challenge of funding public schools with local revenue, while increasing the state’s share of
funding public education. This historic reform legislation increases the state’s share of funding public education from
38 percent to 45 percent and reduces the burdensome cost of recapture.
2019 - 2020 Adopted Budget 6
The School Finance System as Applied to the District
The District's wealth per student is greater than the equalized wealth value. Accordingly, the District has been
required to exercise one of the permitted wealth equalization options. As a district with wealth per student in excess of
the equalized wealth value, the District reduces its wealth per student by exercising Option 3 (purchase of attendance
credits) pursuant to Chapter 49 of the Texas Education Code, as amended. District voters previously authorized
Option 3 as a means of equalizing wealth at an election held within the District. As a so-called “Chapter 49 district”,
the District does not receive any State funding to pay debt service requirements on its outstanding indebtedness,
including the Bonds.
Litigation Relating to the Texas Public School Finance System
On seven occasions in the last thirty years, the Texas Supreme Court (the "Court") has issued decisions assessing the
constitutionality of the Texas public school finance system (the "Finance System"). The litigation has primarily
focused on whether the Finance System, as amended by the Texas Legislature (the "Legislature") from time to time
(i) met the requirements of article VII, section 1 of the Texas Constitution, which requires the Legislature to "establish
and make suitable provision for the support and maintenance of an efficient system of public free schools," or (ii)
imposed a statewide ad valorem tax in violation of article VIII, section 1-e of the Texas Constitution because the
statutory limit on property taxes levied by school districts for maintenance and operation purposes had allegedly
denied school districts meaningful discretion in setting their tax rates. In response to the Court's previous decisions,
the Legislature enacted multiple laws that made substantive changes in the way the Finance System is funded in
efforts to address the prior decisions declaring the Finance System unconstitutional.
On May 13, 2016, the Court issued its opinion in the most recent school finance litigation, Morath, et al. v. The Texas
Taxpayer and Student Fairness Coalition, et al., No. 14-0776 (Tex. May 13, 2016) ("Morath"). The plaintiffs and
interveners in the case had alleged that the Finance System, as modified by the Legislature in part in response to prior
decisions of the Court, violated article VII, section 1 and article VIII, section 1-e of the Texas Constitution. In its
opinion, the Court held that "despite the imperfections of the current school funding regime, it meets minimum
constitutional requirements." The Court also noted that:
Lawmakers decide if laws pass, and judges decide if those laws pass muster. But our lenient standard of
review in this policy-laden area counsels modesty. The judicial role is not to second-guess whether our
system is optimal, but whether it is constitutional. Our Byzantine school funding "system" is undeniably
imperfect, with immense room for improvement. But it satisfies minimum constitutional requirements.
Possible Effects of Litigation and Changes in Law
The Court's decision in Morath upheld the constitutionality of the Finance System but noted that the Financing
System was "undeniably imperfect." While not compelled by the Morath decision to reform the Finance System, the
Legislature could enact future changes to the Finance System. Any such changes could benefit or be a detriment to the
District. If the Legislature enacts future changes to, or fails adequately to fund the Finance System, or if changes in
circumstances otherwise provide grounds for a challenge, the Finance System could be challenged again in the future.
District Approach
The District approach to coping with the combination of fast student growth in a restricted funding environment that
satisfies minimum constitutional requirements with increasing academic standards has been to ensure that the budget
process is instructionally driven and guided by the Strategic Plan. The Board of Trustees, administration, and staff are
committed to Our Vision.
Our Vision
Northwest ISD empowers learners and leaders to positively impact the world.
2019 - 2020 Adopted Budget 7
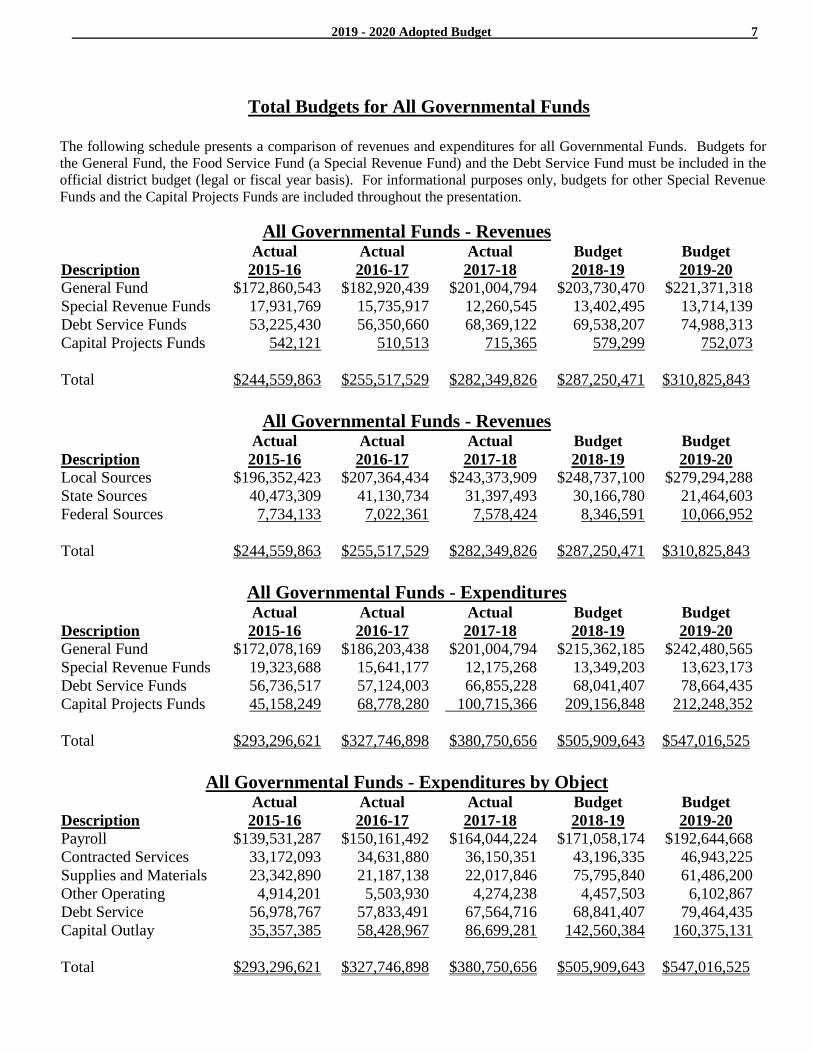
Total Budgets for All Governmental Funds
The following schedule presents a comparison of revenues and expenditures for all Governmental Funds. Budgets for
the General Fund, the Food Service Fund (a Special Revenue Fund) and the Debt Service Fund must be included in the
official district budget (legal or fiscal year basis). For informational purposes only, budgets for other Special Revenue
Funds and the Capital Projects Funds are included throughout the presentation.
All Governmental Funds - Revenues
Description
Actual
2015-16
Actual
2016-17
Actual
2017-18
Budget
2018-19
Budget
2019-20
General Fund $172,860,543 $182,920,439 $201,004,794 $203,730,470 $221,371,318
Special Revenue Funds 17,931,769 15,735,917 12,260,545 13,402,495 13,714,139
Debt Service Funds 53,225,430 56,350,660 68,369,122 69,538,207 74,988,313
Capital Projects Funds 542,121 510,513 715,365 579,299 752,073
Total $244,559,863 $255,517,529 $282,349,826 $287,250,471 $310,825,843
All Governmental Funds - Revenues
Description
Actual
2015-16
Actual
2016-17
Actual
2017-18
Budget
2018-19
Budget
2019-20
Local Sources $196,352,423 $207,364,434 $243,373,909 $248,737,100 $279,294,288
State Sources 40,473,309 41,130,734 31,397,493 30,166,780 21,464,603
Federal Sources 7,734,133 7,022,361 7,578,424 8,346,591 10,066,952
Total $244,559,863 $255,517,529 $282,349,826 $287,250,471 $310,825,843
All Governmental Funds - Expenditures
Description
Actual
2015-16
Actual
2016-17
Actual
2017-18
Budget
2018-19
Budget
2019-20
General Fund $172,078,169 $186,203,438 $201,004,794 $215,362,185 $242,480,565
Special Revenue Funds 19,323,688 15,641,177 12,175,268 13,349,203 13,623,173
Debt Service Funds 56,736,517 57,124,003 66,855,228 68,041,407 78,664,435
Capital Projects Funds 45,158,249 68,778,280 100,715,366 209,156,848 212,248,352
Total $293,296,621 $327,746,898 $380,750,656 $505,909,643 $547,016,525
All Governmental Funds - Expenditures by Object
Description
Actual
2015-16
Actual
2016-17
Actual
2017-18
Budget
2018-19
Budget
2019-20
Payroll $139,531,287 $150,161,492 $164,044,224 $171,058,174 $192,644,668
Contracted Services 33,172,093 34,631,880 36,150,351 43,196,335 46,943,225
Supplies and Materials 23,342,890 21,187,138 22,017,846 75,795,840 61,486,200
Other Operating 4,914,201 5,503,930 4,274,238 4,457,503 6,102,867
Debt Service 56,978,767 57,833,491 67,564,716 68,841,407 79,464,435
Capital Outlay 35,357,385 58,428,967 86,699,281 142,560,384 160,375,131
Total $293,296,621 $327,746,898 $380,750,656 $505,909,643 $547,016,525
2019 - 2020 Adopted Budget 8
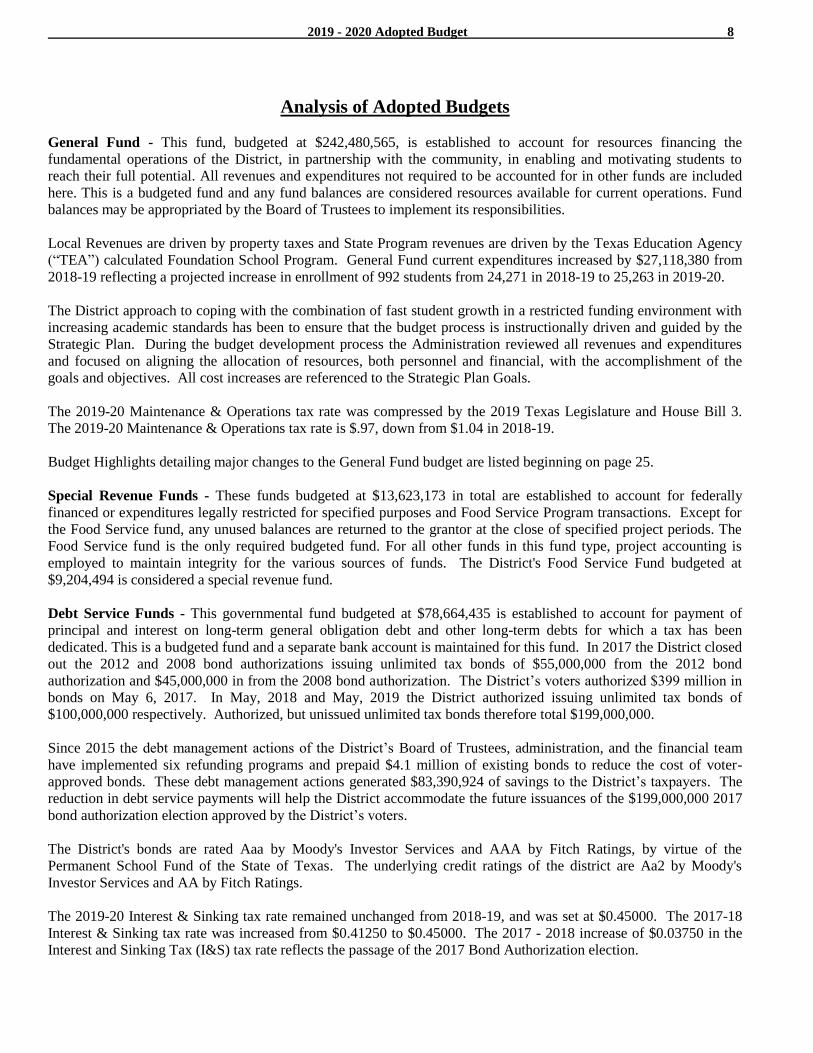
Analysis of Adopted Budgets
General Fund - This fund, budgeted at $242,480,565, is established to account for resources financing the
fundamental operations of the District, in partnership with the community, in enabling and motivating students to
reach their full potential. All revenues and expenditures not required to be accounted for in other funds are included
here. This is a budgeted fund and any fund balances are considered resources available for current operations. Fund
balances may be appropriated by the Board of Trustees to implement its responsibilities.
Local Revenues are driven by property taxes and State Program revenues are driven by the Texas Education Agency
(“TEA”) calculated Foundation School Program. General Fund current expenditures increased by $27,118,380 from
2018-19 reflecting a projected increase in enrollment of 992 students from 24,271 in 2018-19 to 25,263 in 2019-20.
The District approach to coping with the combination of fast student growth in a restricted funding environment with
increasing academic standards has been to ensure that the budget process is instructionally driven and guided by the
Strategic Plan. During the budget development process the Administration reviewed all revenues and expenditures
and focused on aligning the allocation of resources, both personnel and financial, with the accomplishment of the
goals and objectives. All cost increases are referenced to the Strategic Plan Goals.
The 2019-20 Maintenance & Operations tax rate was compressed by the 2019 Texas Legislature and House Bill 3.
The 2019-20 Maintenance & Operations tax rate is $.97, down from $1.04 in 2018-19.
Budget Highlights detailing major changes to the General Fund budget are listed beginning on page 25.
Special Revenue Funds - These funds budgeted at $13,623,173 in total are established to account for federally
financed or expenditures legally restricted for specified purposes and Food Service Program transactions. Except for
the Food Service fund, any unused balances are returned to the grantor at the close of specified project periods. The
Food Service fund is the only required budgeted fund. For all other funds in this fund type, project accounting is
employed to maintain integrity for the various sources of funds. The District's Food Service Fund budgeted at
$9,204,494 is considered a special revenue fund.
Debt Service Funds - This governmental fund budgeted at $78,664,435 is established to account for payment of
principal and interest on long-term general obligation debt and other long-term debts for which a tax has been
dedicated. This is a budgeted fund and a separate bank account is maintained for this fund. In 2017 the District closed
out the 2012 and 2008 bond authorizations issuing unlimited tax bonds of $55,000,000 from the 2012 bond
authorization and $45,000,000 in from the 2008 bond authorization. The District’s voters authorized $399 million in
bonds on May 6, 2017. In May, 2018 and May, 2019 the District authorized issuing unlimited tax bonds of
$100,000,000 respectively. Authorized, but unissued unlimited tax bonds therefore total $199,000,000.
Since 2015 the debt management actions of the District’s Board of Trustees, administration, and the financial team
have implemented six refunding programs and prepaid $4.1 million of existing bonds to reduce the cost of voter-
approved bonds. These debt management actions generated $83,390,924 of savings to the District’s taxpayers. The
reduction in debt service payments will help the District accommodate the future issuances of the $199,000,000 2017
bond authorization election approved by the District’s voters.
The District's bonds are rated Aaa by Moody's Investor Services and AAA by Fitch Ratings, by virtue of the
Permanent School Fund of the State of Texas. The underlying credit ratings of the district are Aa2 by Moody's
Investor Services and AA by Fitch Ratings.
The 2019-20 Interest & Sinking tax rate remained unchanged from 2018-19, and was set at $0.45000. The 2017-18
Interest & Sinking tax rate was increased from $0.41250 to $0.45000. The 2017 - 2018 increase of $0.03750 in the
Interest and Sinking Tax (I&S) tax rate reflects the passage of the 2017 Bond Authorization election.
2019 - 2020 Adopted Budget 9
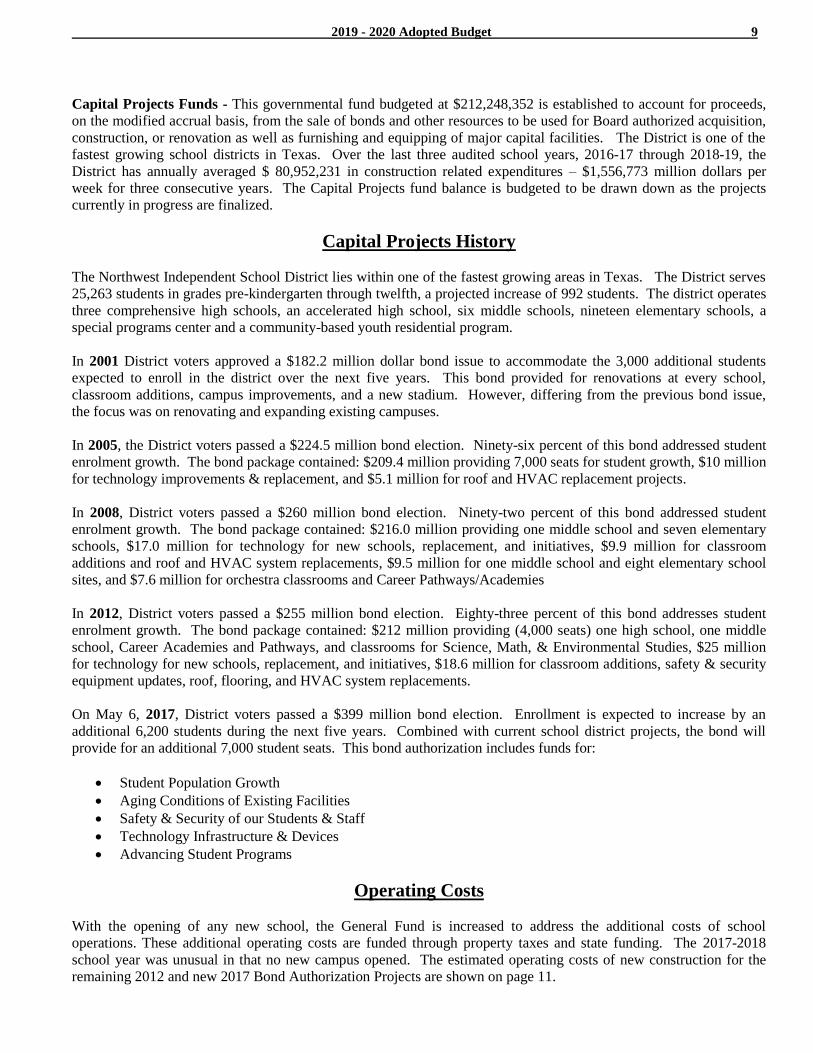
Capital Projects Funds - This governmental fund budgeted at $212,248,352 is established to account for proceeds,
on the modified accrual basis, from the sale of bonds and other resources to be used for Board authorized acquisition,
construction, or renovation as well as furnishing and equipping of major capital facilities. The District is one of the
fastest growing school districts in Texas. Over the last three audited school years, 2016-17 through 2018-19, the
District has annually averaged $ 80,952,231 in construction related expenditures – $1,556,773 million dollars per
week for three consecutive years. The Capital Projects fund balance is budgeted to be drawn down as the projects
currently in progress are finalized.
Capital Projects History
The Northwest Independent School District lies within one of the fastest growing areas in Texas. The District serves
25,263 students in grades pre-kindergarten through twelfth, a projected increase of 992 students. The district operates
three comprehensive high schools, an accelerated high school, six middle schools, nineteen elementary schools, a
special programs center and a community-based youth residential program.
In 2001 District voters approved a $182.2 million dollar bond issue to accommodate the 3,000 additional students
expected to enroll in the district over the next five years. This bond provided for renovations at every school,
classroom additions, campus improvements, and a new stadium. However, differing from the previous bond issue,
the focus was on renovating and expanding existing campuses.
In 2005, the District voters passed a $224.5 million bond election. Ninety-six percent of this bond addressed student
enrolment growth. The bond package contained: $209.4 million providing 7,000 seats for student growth, $10 million
for technology improvements & replacement, and $5.1 million for roof and HVAC replacement projects.
In 2008, District voters passed a $260 million bond election. Ninety-two percent of this bond addressed student
enrolment growth. The bond package contained: $216.0 million providing one middle school and seven elementary
schools, $17.0 million for technology for new schools, replacement, and initiatives, $9.9 million for classroom
additions and roof and HVAC system replacements, $9.5 million for one middle school and eight elementary school
sites, and $7.6 million for orchestra classrooms and Career Pathways/Academies
In 2012, District voters passed a $255 million bond election. Eighty-three percent of this bond addresses student
enrolment growth. The bond package contained: $212 million providing (4,000 seats) one high school, one middle
school, Career Academies and Pathways, and classrooms for Science, Math, & Environmental Studies, $25 million
for technology for new schools, replacement, and initiatives, $18.6 million for classroom additions, safety & security
equipment updates, roof, flooring, and HVAC system replacements.
On May 6, 2017, District voters passed a $399 million bond election. Enrollment is expected to increase by an
additional 6,200 students during the next five years. Combined with current school district projects, the bond will
provide for an additional 7,000 student seats. This bond authorization includes funds for:
Student Population Growth
Aging Conditions of Existing Facilities
Safety & Security of our Students & Staff
Technology Infrastructure & Devices
Advancing Student Programs
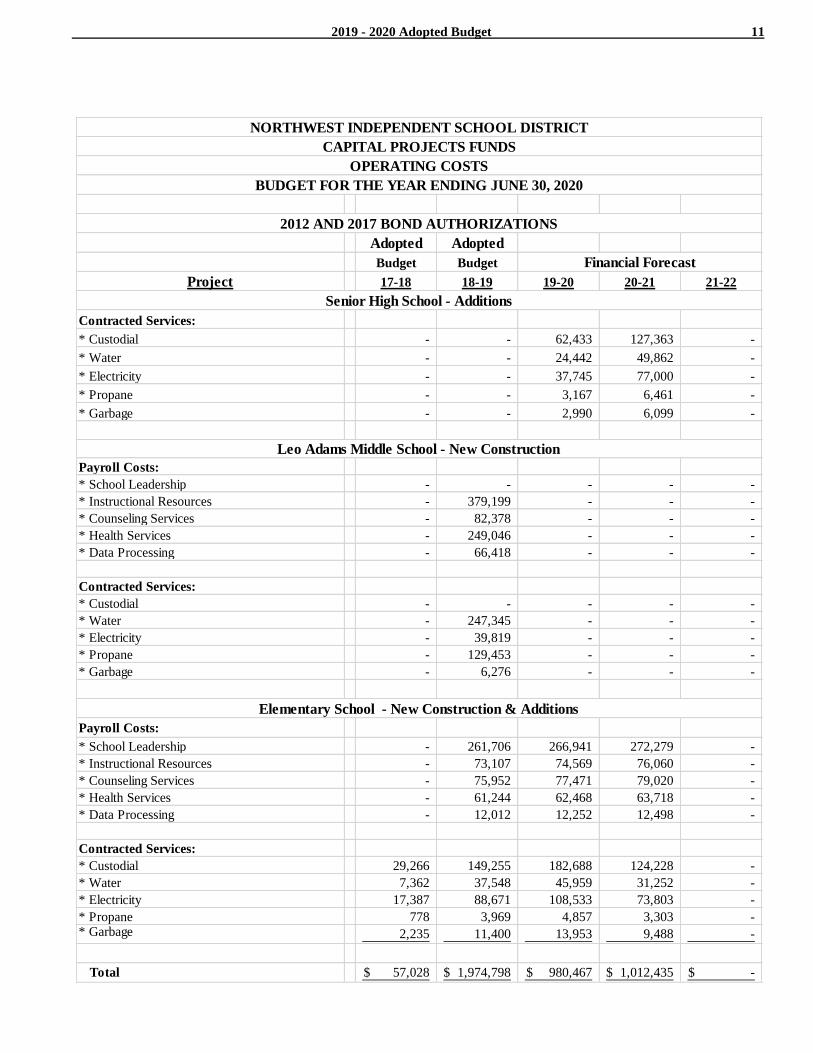
Operating Costs
With the opening of any new school, the General Fund is increased to address the additional costs of school
operations. These additional operating costs are funded through property taxes and state funding. The 2017-2018
school year was unusual in that no new campus opened. The estimated operating costs of new construction for the
remaining 2012 and new 2017 Bond Authorization Projects are shown on page 11.
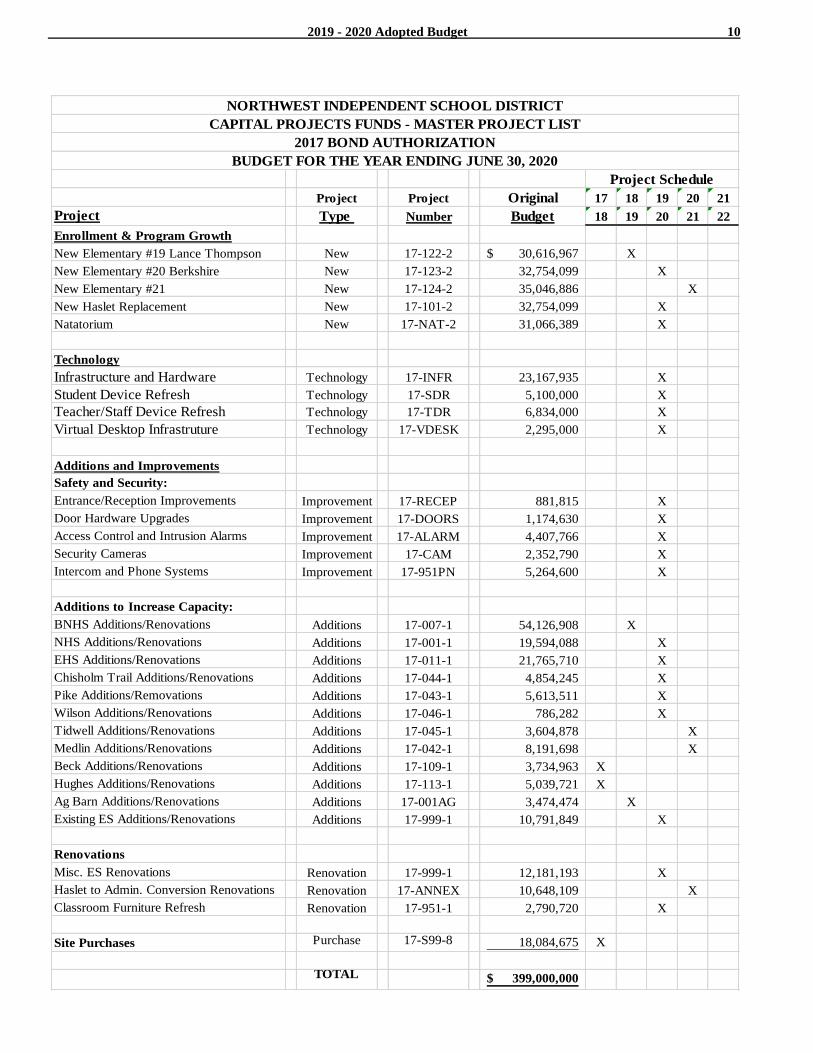
2019 - 2020 Adopted Budget 10
Project Project Original 17 18 19 20 21
Project Type Number Budget 18 19 20 21 22
Enrollment & Program Growth
New Elementary #19 Lance Thompson New 17-122-2 30,616,967$ X
New Elementary #20 Berkshire New 17-123-2 32,754,099 X
New Elementary #21 New 17-124-2 35,046,886 X
New Haslet Replacement New 17-101-2 32,754,099 X
Natatorium New 17-NAT-2 31,066,389 X
Technology
Infrastructure and Hardware Technology 17-INFR 23,167,935 X
Student Device Refresh Technology 17-SDR 5,100,000 X
Teacher/Staff Device Refresh Technology 17-TDR 6,834,000 X
Virtual Desktop Infrastruture Technology 17-VDESK 2,295,000 X
Additions and Improvements
Safety and Security:
Entrance/Reception Improvements Improvement 17-RECEP 881,815 X
Door Hardware Upgrades Improvement 17-DOORS 1,174,630 X
Access Control and Intrusion Alarms Improvement 17-ALARM 4,407,766 X
Security Cameras Improvement 17-CAM 2,352,790 X
Intercom and Phone Systems Improvement 17-951PN 5,264,600 X
Additions to Increase Capacity:
BNHS Additions/Renovations Additions 17-007-1 54,126,908 X
NHS Additions/Renovations Additions 17-001-1 19,594,088 X
EHS Additions/Renovations Additions 17-011-1 21,765,710 X
Chisholm Trail Additions/Renovations Additions 17-044-1 4,854,245 X
Pike Additions/Removations Additions 17-043-1 5,613,511 X
Wilson Additions/Renovations Additions 17-046-1 786,282 X
Tidwell Additions/Renovations Additions 17-045-1 3,604,878 X
Medlin Additions/Renovations Additions 17-042-1 8,191,698 X
Beck Additions/Renovations Additions 17-109-1 3,734,963 X
Hughes Additions/Renovations Additions 17-113-1 5,039,721 X
Ag Barn Additions/Renovations Additions 17-001AG 3,474,474 X
Existing ES Additions/Renovations Additions 17-999-1 10,791,849 X
Renovations
Misc. ES Renovations Renovation 17-999-1 12,181,193 X
Haslet to Admin. Conversion Renovations Renovation 17-ANNEX 10,648,109 X
Classroom Furniture Refresh Renovation 17-951-1 2,790,720 X
Site Purchases Purchase 17-S99-8 18,084,675 X
TOTAL 399,000,000$
BUDGET FOR THE YEAR ENDING JUNE 30, 2020
NORTHWEST INDEPENDENT SCHOOL DISTRICT
CAPITAL PROJECTS FUNDS - MASTER PROJECT LIST
2017 BOND AUTHORIZATION
Project Schedule
2019 - 2020 Adopted Budget 11
Adopted Adopted
Budget Budget
Project 17-18 18-19 19-20 20-21 21-22
Contracted Services:
* Custodial - - 62,433 127,363 -
* Water - - 24,442 49,862 -
* Electricity - - 37,745 77,000 -
* Propane - - 3,167 6,461 -
* Garbage - - 2,990 6,099 -
Payroll Costs:
* School Leadership - - - - -
* Instructional Resources - 379,199 - - -
* Counseling Services - 82,378 - - -
* Health Services - 249,046 - - -
* Data Processing - 66,418 - - -
Contracted Services:
* Custodial - - - - -
* Water - 247,345 - - -
* Electricity - 39,819 - - -
* Propane - 129,453 - - -
* Garbage - 6,276 - - -
Payroll Costs:
* School Leadership - 261,706 266,941 272,279 -
* Instructional Resources - 73,107 74,569 76,060 -
* Counseling Services - 75,952 77,471 79,020 -
* Health Services - 61,244 62,468 63,718 -
* Data Processing - 12,012 12,252 12,498 -
Contracted Services:
* Custodial 29,266 149,255 182,688 124,228 -
* Water 7,362 37,548 45,959 31,252 -
* Electricity 17,387 88,671 108,533 73,803 -
* Propane 778 3,969 4,857 3,303 - * Garbage 2,235 11,400 13,953 9,488 -
Total 57,028$ 1,974,798$ 980,467$ 1,012,435$ -$
NORTHWEST INDEPENDENT SCHOOL DISTRICT
CAPITAL PROJECTS FUNDS
OPERATING COSTS
BUDGET FOR THE YEAR ENDING JUNE 30, 2020
2012 AND 2017 BOND AUTHORIZATIONS
Leo Adams Middle School - New Construction
Senior High School - Additions
Financial Forecast
Elementary School - New Construction & Additions
2019 - 2020 Adopted Budget 12
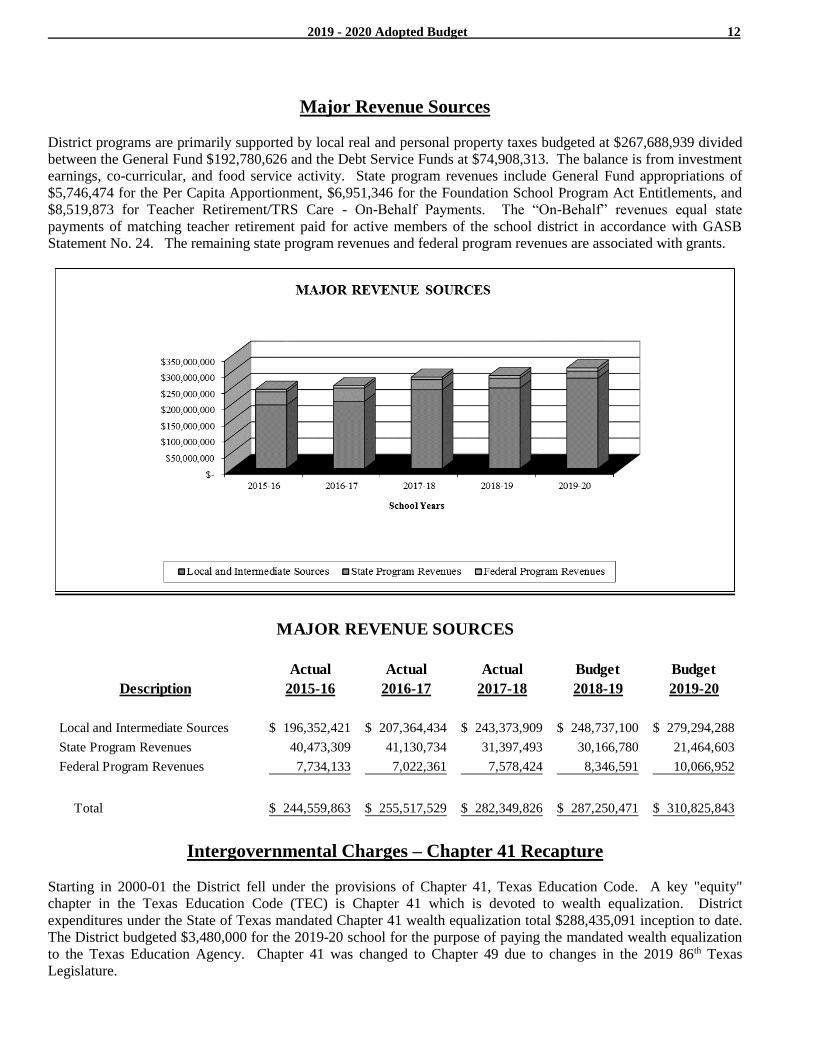
Major Revenue Sources
District programs are primarily supported by local real and personal property taxes budgeted at $267,688,939 divided
between the General Fund $192,780,626 and the Debt Service Funds at $74,908,313. The balance is from investment
earnings, co-curricular, and food service activity. State program revenues include General Fund appropriations of
$5,746,474 for the Per Capita Apportionment, $6,951,346 for the Foundation School Program Act Entitlements, and
$8,519,873 for Teacher Retirement/TRS Care - On-Behalf Payments. The “On-Behalf” revenues equal state
payments of matching teacher retirement paid for active members of the school district in accordance with GASB
Statement No. 24. The remaining state program revenues and federal program revenues are associated with grants.
Actual Actual Actual Budget Budget
Description 2015-16 2016-17 2017-18 2018-19 2019-20
Local and Intermediate Sources 196,352,421$ 207,364,434$ 243,373,909$ 248,737,100$ 279,294,288$
State Program Revenues 40,473,309 41,130,734 31,397,493 30,166,780 21,464,603
Federal Program Revenues 7,734,133 7,022,361 7,578,424 8,346,591 10,066,952
Total 244,559,863$ 255,517,529$ 282,349,826$ 287,250,471$ 310,825,843$
MAJOR REVENUE SOURCES
Intergovernmental Charges – Chapter 41 Recapture
Starting in 2000-01 the District fell under the provisions of Chapter 41, Texas Education Code. A key "equity"
chapter in the Texas Education Code (TEC) is Chapter 41 which is devoted to wealth equalization. District
expenditures under the State of Texas mandated Chapter 41 wealth equalization total $288,435,091 inception to date.
The District budgeted $3,480,000 for the 2019-20 school for the purpose of paying the mandated wealth equalization
to the Texas Education Agency. Chapter 41 was changed to Chapter 49 due to changes in the 2019 86th Texas
Legislature.
2019 - 2020 Adopted Budget 13
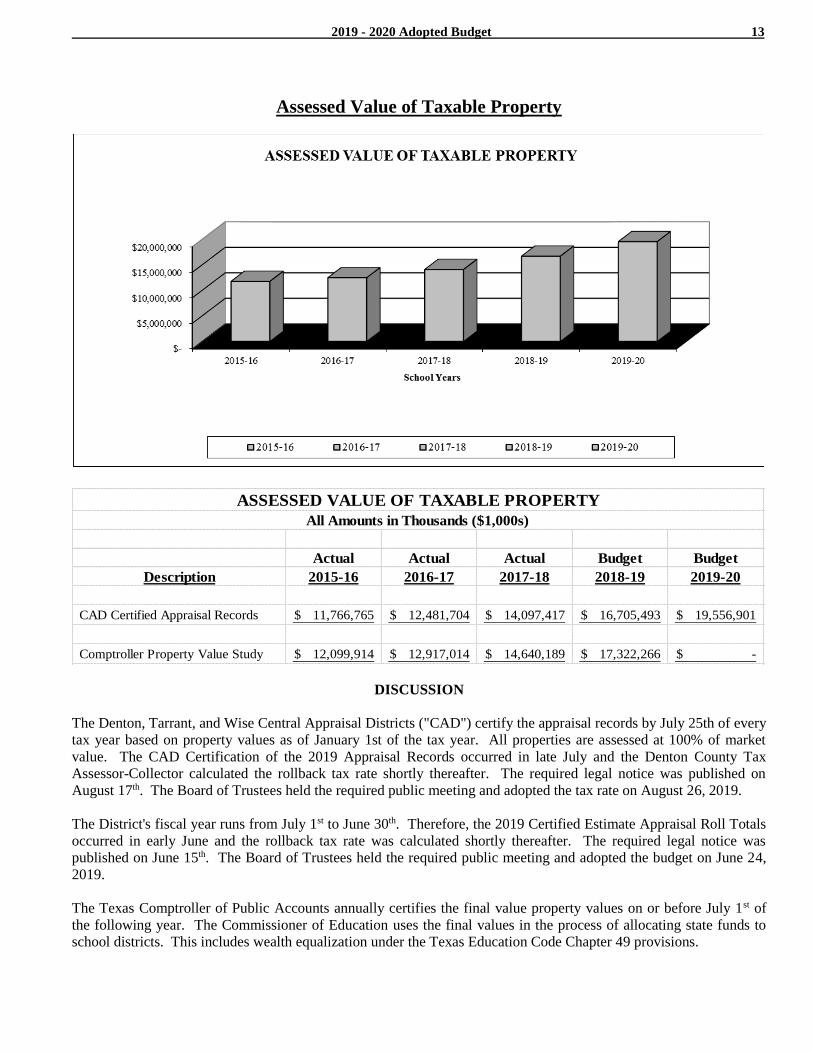
Assessed Value of Taxable Property
Actual Actual Actual Budget Budget
Description 2015-16 2016-17 2017-18 2018-19 2019-20
CAD Certified Appraisal Records 11,766,765$ 12,481,704$ 14,097,417$ 16,705,493$ 19,556,901$
Comptroller Property Value Study 12,099,914$ 12,917,014$ 14,640,189$ 17,322,266$ -$
ASSESSED VALUE OF TAXABLE PROPERTY
All Amounts in Thousands ($1,000s)
DISCUSSION
The Denton, Tarrant, and Wise Central Appraisal Districts ("CAD") certify the appraisal records by July 25th of every
tax year based on property values as of January 1st of the tax year. All properties are assessed at 100% of market
value. The CAD Certification of the 2019 Appraisal Records occurred in late July and the Denton County Tax
Assessor-Collector calculated the rollback tax rate shortly thereafter. The required legal notice was published on
August 17th. The Board of Trustees held the required public meeting and adopted the tax rate on August 26, 2019.
The District's fiscal year runs from July 1st to June 30th. Therefore, the 2019 Certified Estimate Appraisal Roll Totals
occurred in early June and the rollback tax rate was calculated shortly thereafter. The required legal notice was
published on June 15th. The Board of Trustees held the required public meeting and adopted the budget on June 24,
2019.
The Texas Comptroller of Public Accounts annually certifies the final value property values on or before July 1st of
the following year. The Commissioner of Education uses the final values in the process of allocating state funds to
school districts. This includes wealth equalization under the Texas Education Code Chapter 49 provisions.
2019 - 2020 Adopted Budget 14
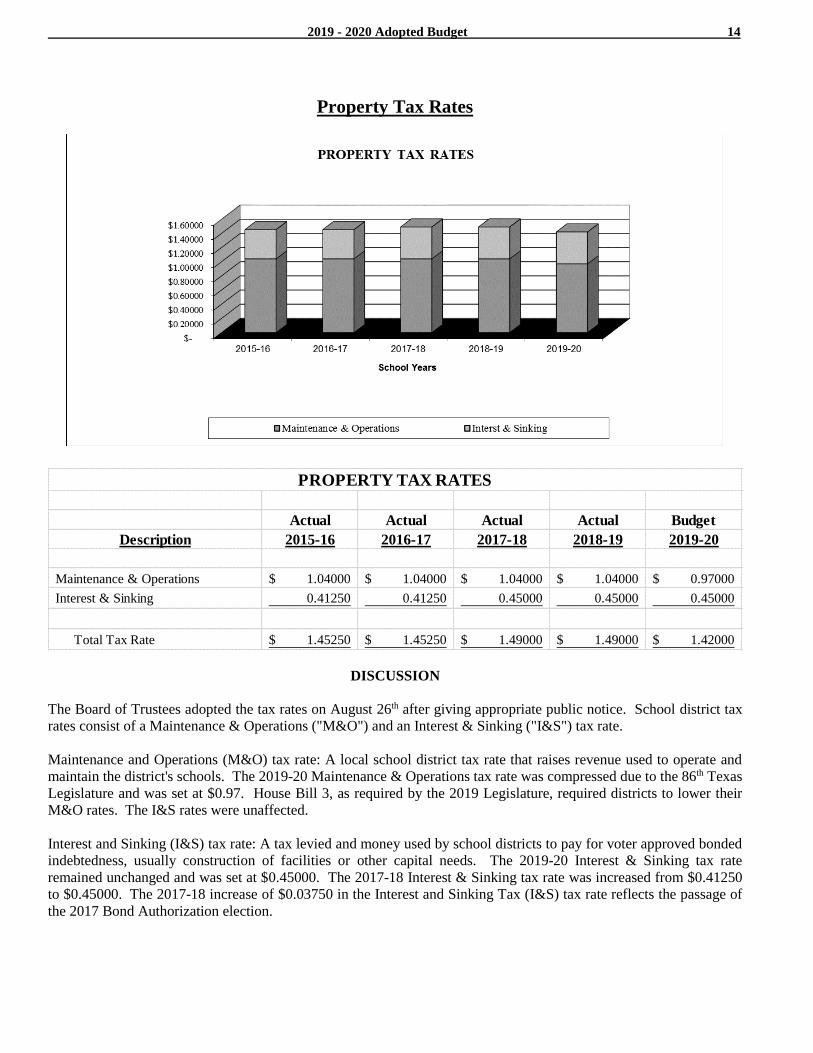
Property Tax Rates
Actual Actual Actual Actual Budget
Description 2015-16 2016-17 2017-18 2018-19 2019-20
Maintenance & Operations 1.04000$ 1.04000$ 1.04000$ 1.04000$ 0.97000$
Interest & Sinking 0.41250 0.41250 0.45000 0.45000 0.45000
Total Tax Rate 1.45250$ 1.45250$ 1.49000$ 1.49000$ 1.42000$
PROPERTY TAX RATES
DISCUSSION
The Board of Trustees adopted the tax rates on August 26th after giving appropriate public notice. School district tax
rates consist of a Maintenance & Operations ("M&O") and an Interest & Sinking ("I&S") tax rate.
Maintenance and Operations (M&O) tax rate: A local school district tax rate that raises revenue used to operate and
maintain the district's schools. The 2019-20 Maintenance & Operations tax rate was compressed due to the 86th Texas
Legislature and was set at $0.97. House Bill 3, as required by the 2019 Legislature, required districts to lower their
M&O rates. The I&S rates were unaffected.
Interest and Sinking (I&S) tax rate: A tax levied and money used by school districts to pay for voter approved bonded
indebtedness, usually construction of facilities or other capital needs. The 2019-20 Interest & Sinking tax rate
remained unchanged and was set at $0.45000. The 2017-18 Interest & Sinking tax rate was increased from $0.41250
to $0.45000. The 2017-18 increase of $0.03750 in the Interest and Sinking Tax (I&S) tax rate reflects the passage of
the 2017 Bond Authorization election.
2019 - 2020 Adopted Budget 15
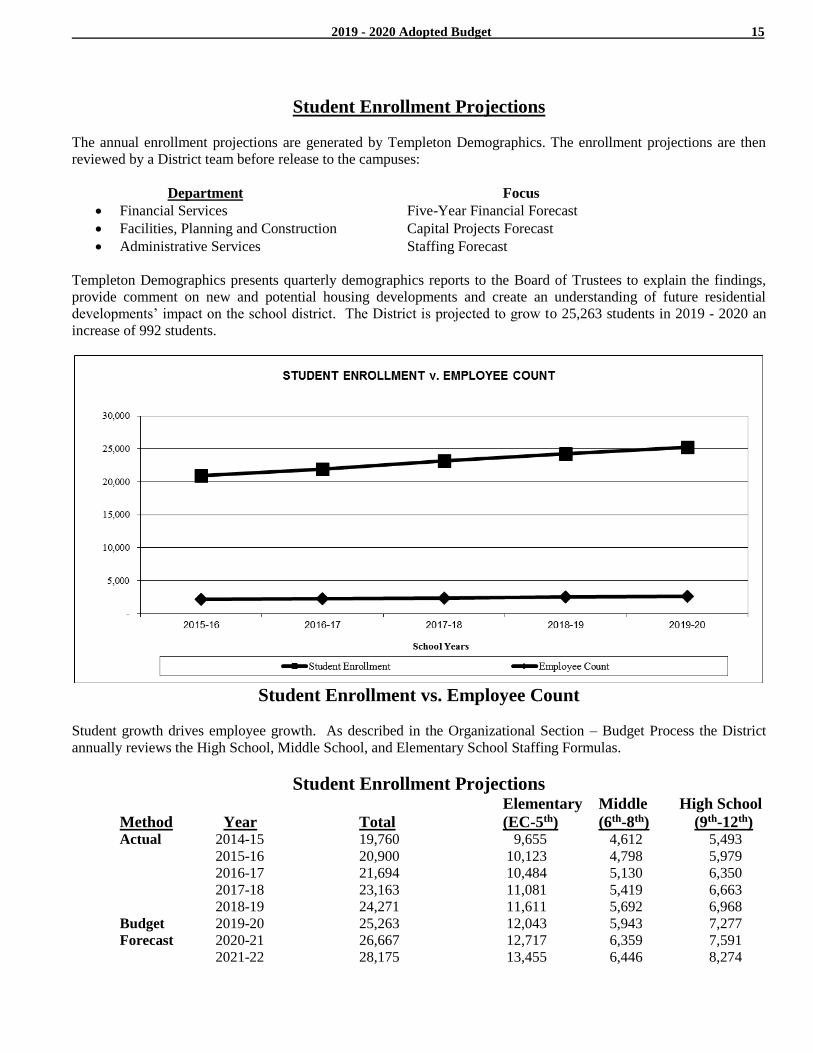
Student Enrollment Projections
The annual enrollment projections are generated by Templeton Demographics. The enrollment projections are then
reviewed by a District team before release to the campuses:
Department Focus
Financial Services Five-Year Financial Forecast
Facilities, Planning and Construction Capital Projects Forecast
Administrative Services Staffing Forecast
Templeton Demographics presents quarterly demographics reports to the Board of Trustees to explain the findings,
provide comment on new and potential housing developments and create an understanding of future residential
developments’ impact on the school district. The District is projected to grow to 25,263 students in 2019 - 2020 an
increase of 992 students.
Student Enrollment vs. Employee Count
Student growth drives employee growth. As described in the Organizational Section – Budget Process the District
annually reviews the High School, Middle School, and Elementary School Staffing Formulas.
Student Enrollment Projections
Elementary Middle High School
Method Year Total (EC-5th) (6th-8th) (9th-12th) Actual 2014-15 19,760 9,655 4,612 5,493
2015-16 20,900 10,123 4,798 5,979
2016-17 21,694 10,484 5,130 6,350
2017-18 23,163 11,081 5,419 6,663
2018-19 24,271 11,611 5,692 6,968
Budget 2019-20 25,263 12,043 5,943 7,277
Forecast 2020-21 26,667 12,717 6,359 7,591
2021-22 28,175 13,455 6,446 8,274
2019 - 2020 Adopted Budget 16
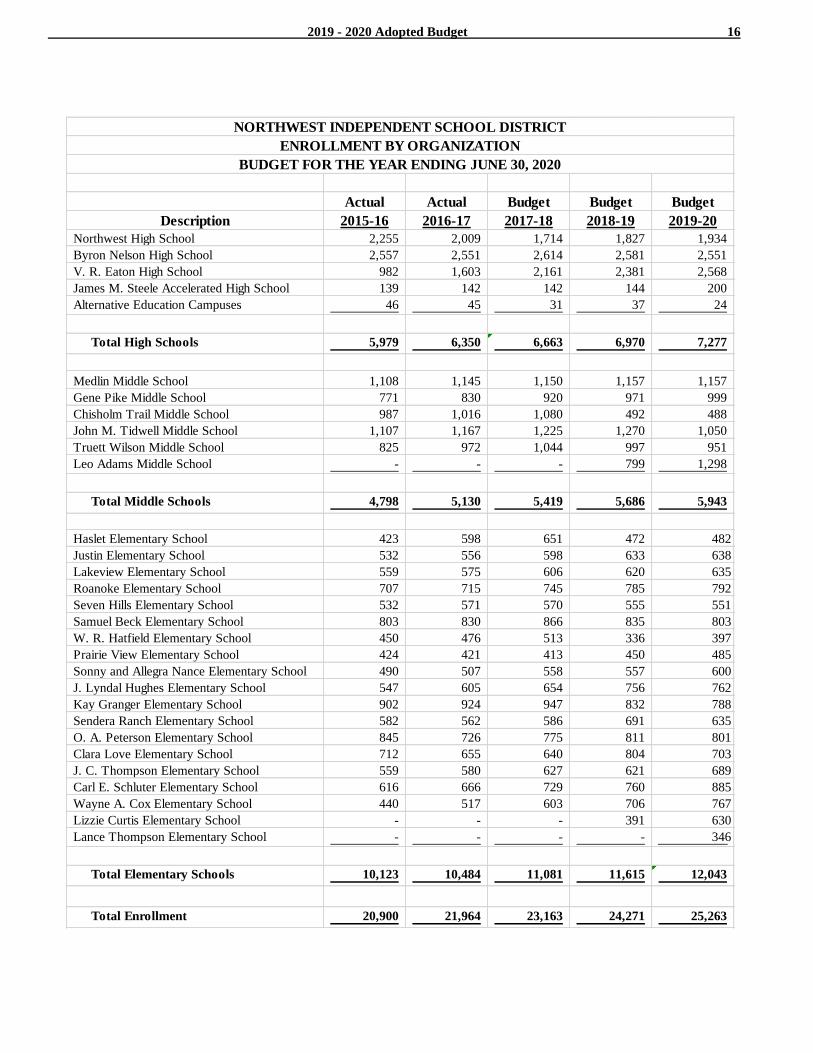
Actual Actual Budget Budget Budget
Description 2015-16 2016-17 2017-18 2018-19 2019-20
Northwest High School 2,255 2,009 1,714 1,827 1,934
Byron Nelson High School 2,557 2,551 2,614 2,581 2,551
V. R. Eaton High School 982 1,603 2,161 2,381 2,568
James M. Steele Accelerated High School 139 142 142 144 200
Alternative Education Campuses 46 45 31 37 24
Total High Schools 5,979 6,350 6,663 6,970 7,277
Medlin Middle School 1,108 1,145 1,150 1,157 1,157
Gene Pike Middle School 771 830 920 971 999
Chisholm Trail Middle School 987 1,016 1,080 492 488
John M. Tidwell Middle School 1,107 1,167 1,225 1,270 1,050
Truett Wilson Middle School 825 972 1,044 997 951
Leo Adams Middle School - - - 799 1,298
Total Middle Schools 4,798 5,130 5,419 5,686 5,943
Haslet Elementary School 423 598 651 472 482
Justin Elementary School 532 556 598 633 638
Lakeview Elementary School 559 575 606 620 635
Roanoke Elementary School 707 715 745 785 792
Seven Hills Elementary School 532 571 570 555 551
Samuel Beck Elementary School 803 830 866 835 803
W. R. Hatfield Elementary School 450 476 513 336 397
Prairie View Elementary School 424 421 413 450 485
Sonny and Allegra Nance Elementary School 490 507 558 557 600
J. Lyndal Hughes Elementary School 547 605 654 756 762
Kay Granger Elementary School 902 924 947 832 788
Sendera Ranch Elementary School 582 562 586 691 635
O. A. Peterson Elementary School 845 726 775 811 801
Clara Love Elementary School 712 655 640 804 703
J. C. Thompson Elementary School 559 580 627 621 689
Carl E. Schluter Elementary School 616 666 729 760 885
Wayne A. Cox Elementary School 440 517 603 706 767
Lizzie Curtis Elementary School - - - 391 630
Lance Thompson Elementary School - - - - 346
Total Elementary Schools 10,123 10,484 11,081 11,615 12,043
Total Enrollment 20,900 21,964 23,163 24,271 25,263
NORTHWEST INDEPENDENT SCHOOL DISTRICT
BUDGET FOR THE YEAR ENDING JUNE 30, 2020
ENROLLMENT BY ORGANIZATION
2019- 2020 Adopted Budget 17
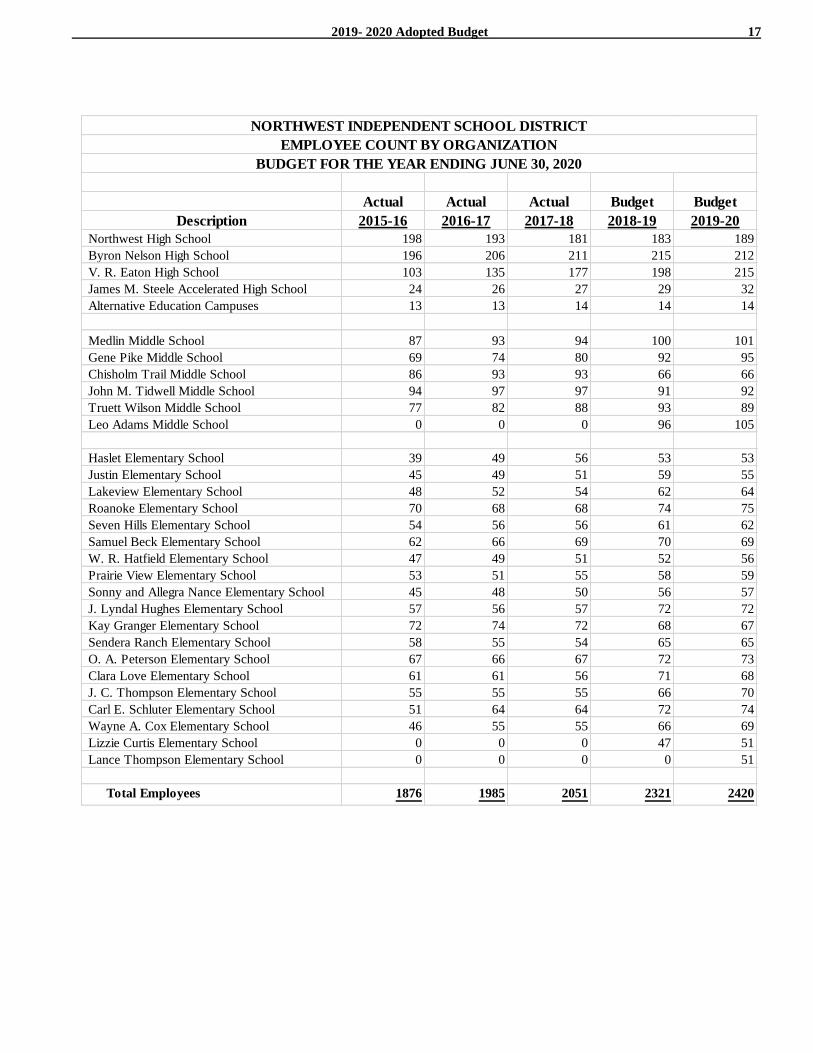
Actual Actual Actual Budget Budget
Description 2015-16 2016-17 2017-18 2018-19 2019-20
Northwest High School 198 193 181 183 189
Byron Nelson High School 196 206 211 215 212
V. R. Eaton High School 103 135 177 198 215
James M. Steele Accelerated High School 24 26 27 29 32
Alternative Education Campuses 13 13 14 14 14
Medlin Middle School 87 93 94 100 101
Gene Pike Middle School 69 74 80 92 95
Chisholm Trail Middle School 86 93 93 66 66
John M. Tidwell Middle School 94 97 97 91 92
Truett Wilson Middle School 77 82 88 93 89
Leo Adams Middle School 0 0 0 96 105
Haslet Elementary School 39 49 56 53 53
Justin Elementary School 45 49 51 59 55
Lakeview Elementary School 48 52 54 62 64
Roanoke Elementary School 70 68 68 74 75
Seven Hills Elementary School 54 56 56 61 62
Samuel Beck Elementary School 62 66 69 70 69
W. R. Hatfield Elementary School 47 49 51 52 56
Prairie View Elementary School 53 51 55 58 59
Sonny and Allegra Nance Elementary School 45 48 50 56 57
J. Lyndal Hughes Elementary School 57 56 57 72 72
Kay Granger Elementary School 72 74 72 68 67
Sendera Ranch Elementary School 58 55 54 65 65
O. A. Peterson Elementary School 67 66 67 72 73
Clara Love Elementary School 61 61 56 71 68
J. C. Thompson Elementary School 55 55 55 66 70
Carl E. Schluter Elementary School 51 64 64 72 74
Wayne A. Cox Elementary School 46 55 55 66 69
Lizzie Curtis Elementary School 0 0 0 47 51
Lance Thompson Elementary School 0 0 0 0 51
Total Employees 1876 1985 2051 2321 2420
NORTHWEST INDEPENDENT SCHOOL DISTRICT
BUDGET FOR THE YEAR ENDING JUNE 30, 2020
EMPLOYEE COUNT BY ORGANIZATION
2019- 2020 Adopted Budget 18
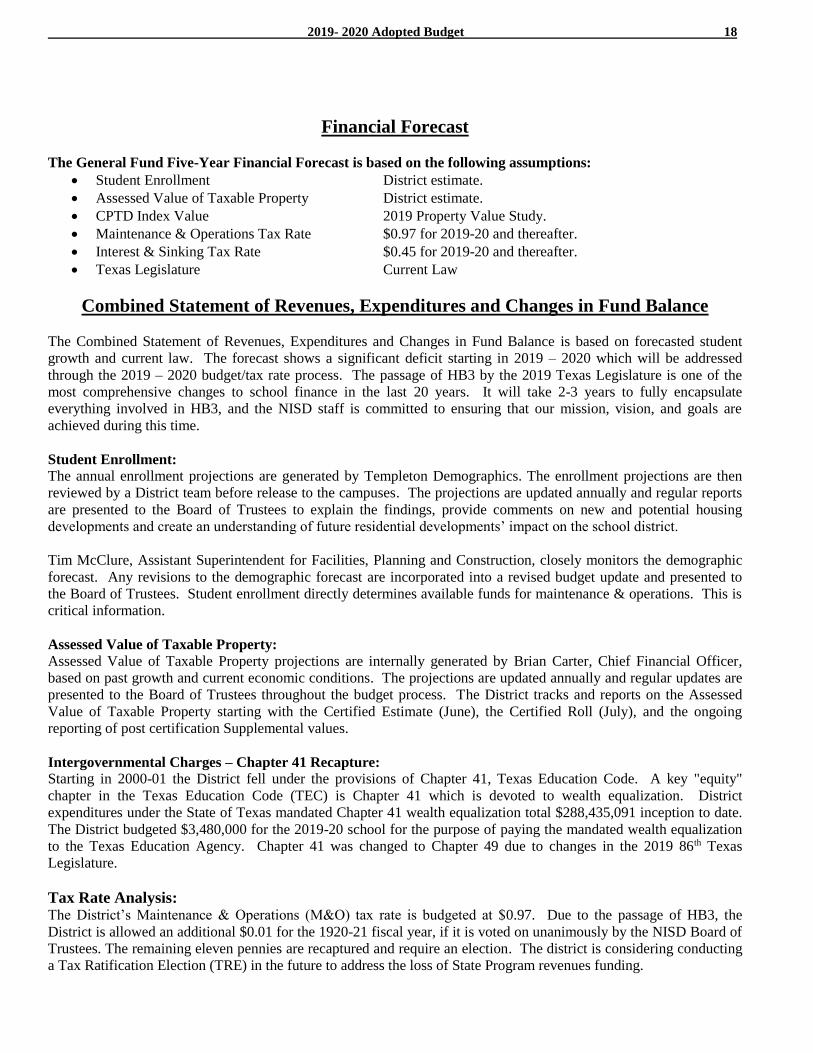
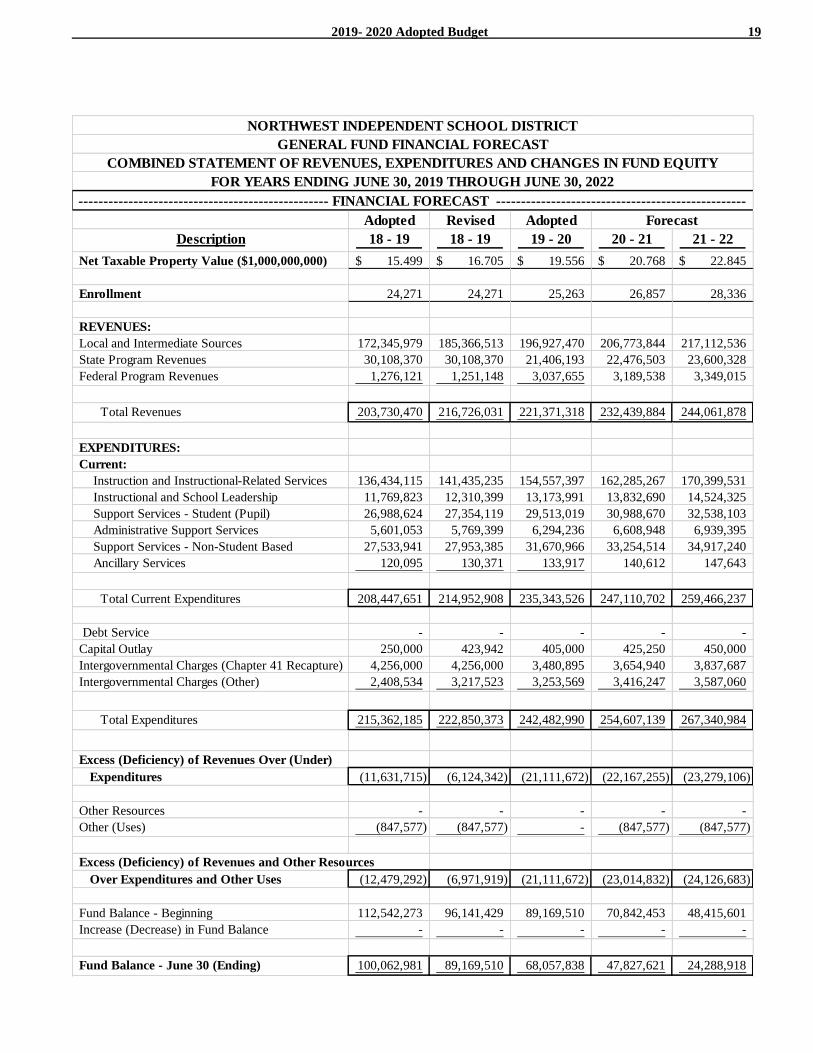
Financial Forecast
The General Fund Five-Year Financial Forecast is based on the following assumptions:
Student Enrollment District estimate.
Assessed Value of Taxable Property District estimate.
CPTD Index Value 2019 Property Value Study.
Maintenance & Operations Tax Rate $0.97 for 2019-20 and thereafter.
Interest & Sinking Tax Rate $0.45 for 2019-20 and thereafter.
Texas Legislature Current Law
Combined Statement of Revenues, Expenditures and Changes in Fund Balance
The Combined Statement of Revenues, Expenditures and Changes in Fund Balance is based on forecasted student
growth and current law. The forecast shows a significant deficit starting in 2019 – 2020 which will be addressed
through the 2019 – 2020 budget/tax rate process. The passage of HB3 by the 2019 Texas Legislature is one of the
most comprehensive changes to school finance in the last 20 years. It will take 2-3 years to fully encapsulate
everything involved in HB3, and the NISD staff is committed to ensuring that our mission, vision, and goals are
achieved during this time.
Student Enrollment:
The annual enrollment projections are generated by Templeton Demographics. The enrollment projections are then
reviewed by a District team before release to the campuses. The projections are updated annually and regular reports
are presented to the Board of Trustees to explain the findings, provide comments on new and potential housing
developments and create an understanding of future residential developments’ impact on the school district.
Tim McClure, Assistant Superintendent for Facilities, Planning and Construction, closely monitors the demographic
forecast. Any revisions to the demographic forecast are incorporated into a revised budget update and presented to
the Board of Trustees. Student enrollment directly determines available funds for maintenance & operations. This is
critical information.
Assessed Value of Taxable Property:
Assessed Value of Taxable Property projections are internally generated by Brian Carter, Chief Financial Officer,
based on past growth and current economic conditions. The projections are updated annually and regular updates are
presented to the Board of Trustees throughout the budget process. The District tracks and reports on the Assessed
Value of Taxable Property starting with the Certified Estimate (June), the Certified Roll (July), and the ongoing
reporting of post certification Supplemental values.
Intergovernmental Charges – Chapter 41 Recapture:
Starting in 2000-01 the District fell under the provisions of Chapter 41, Texas Education Code. A key "equity"
chapter in the Texas Education Code (TEC) is Chapter 41 which is devoted to wealth equalization. District
expenditures under the State of Texas mandated Chapter 41 wealth equalization total $288,435,091 inception to date.
The District budgeted $3,480,000 for the 2019-20 school for the purpose of paying the mandated wealth equalization
to the Texas Education Agency. Chapter 41 was changed to Chapter 49 due to changes in the 2019 86th Texas
Legislature.
Tax Rate Analysis: The District’s Maintenance & Operations (M&O) tax rate is budgeted at $0.97. Due to the passage of HB3, the
District is allowed an additional $0.01 for the 1920-21 fiscal year, if it is voted on unanimously by the NISD Board of
Trustees. The remaining eleven pennies are recaptured and require an election. The district is considering conducting
a Tax Ratification Election (TRE) in the future to address the loss of State Program revenues funding.
2019- 2020 Adopted Budget 19
Adopted Revised Adopted
Description 18 - 19 18 - 19 19 - 20 20 - 21 21 - 22
Net Taxable Property Value ($1,000,000,000) 15.499$ 16.705$ 19.556$ 20.768$ 22.845$
Enrollment 24,271 24,271 25,263 26,857 28,336
REVENUES:
Local and Intermediate Sources 172,345,979 185,366,513 196,927,470 206,773,844 217,112,536
State Program Revenues 30,108,370 30,108,370 21,406,193 22,476,503 23,600,328
Federal Program Revenues 1,276,121 1,251,148 3,037,655 3,189,538 3,349,015
Total Revenues 203,730,470 216,726,031 221,371,318 232,439,884 244,061,878
EXPENDITURES:
Current:
Instruction and Instructional-Related Services 136,434,115 141,435,235 154,557,397 162,285,267 170,399,531
Instructional and School Leadership 11,769,823 12,310,399 13,173,991 13,832,690 14,524,325
Support Services - Student (Pupil) 26,988,624 27,354,119 29,513,019 30,988,670 32,538,103
Administrative Support Services 5,601,053 5,769,399 6,294,236 6,608,948 6,939,395
Support Services - Non-Student Based 27,533,941 27,953,385 31,670,966 33,254,514 34,917,240
Ancillary Services 120,095 130,371 133,917 140,612 147,643
Total Current Expenditures 208,447,651 214,952,908 235,343,526 247,110,702 259,466,237
Debt Service - - - - -
Capital Outlay 250,000 423,942 405,000 425,250 450,000
Intergovernmental Charges (Chapter 41 Recapture) 4,256,000 4,256,000 3,480,895 3,654,940 3,837,687
Intergovernmental Charges (Other) 2,408,534 3,217,523 3,253,569 3,416,247 3,587,060
Total Expenditures 215,362,185 222,850,373 242,482,990 254,607,139 267,340,984
Excess (Deficiency) of Revenues Over (Under)
Expenditures (11,631,715) (6,124,342) (21,111,672) (22,167,255) (23,279,106)
Other Resources - - - - -
Other (Uses) (847,577) (847,577) - (847,577) (847,577)
Excess (Deficiency) of Revenues and Other Resources
Over Expenditures and Other Uses (12,479,292) (6,971,919) (21,111,672) (23,014,832) (24,126,683)
Fund Balance - Beginning 112,542,273 96,141,429 89,169,510 70,842,453 48,415,601
Increase (Decrease) in Fund Balance - - - - -
Fund Balance - June 30 (Ending) 100,062,981 89,169,510 68,057,838 47,827,621 24,288,918
NORTHWEST INDEPENDENT SCHOOL DISTRICT
GENERAL FUND FINANCIAL FORECAST
COMBINED STATEMENT OF REVENUES, EXPENDITURES AND CHANGES IN FUND EQUITY
FOR YEARS ENDING JUNE 30, 2019 THROUGH JUNE 30, 2022
-------------------------------------------------- FINANCIAL FORECAST --------------------------------------------------
Forecast
2019- 2020 Adopted Budget 20
To measure the satisfaction level of our parents with the District’s educational programs and services, Northwest ISD
conducts a Parent Survey every other year. The results and input are used to determine measurements and strategies
for campus action plans and the District Improvement Plan.
In November 2018, the parents and guardians of all Northwest Independent School District (NISD) students were
invited to complete a parent satisfaction survey. The survey was available from November 26 – December 14, during
which there were 2,700 individual responses. This represents an overall parent response rate of 11% of the total
district enrollment. The responses represented all the various educational levels of NISD with 1.6% preschool
representation, 46.7% elementary school representation, 26.8% middle school representation, and 24.8% high school
representation. Survey topics included:
School Climate
Communications
Safe and Orderly Environment
Instructional Program
Support Services
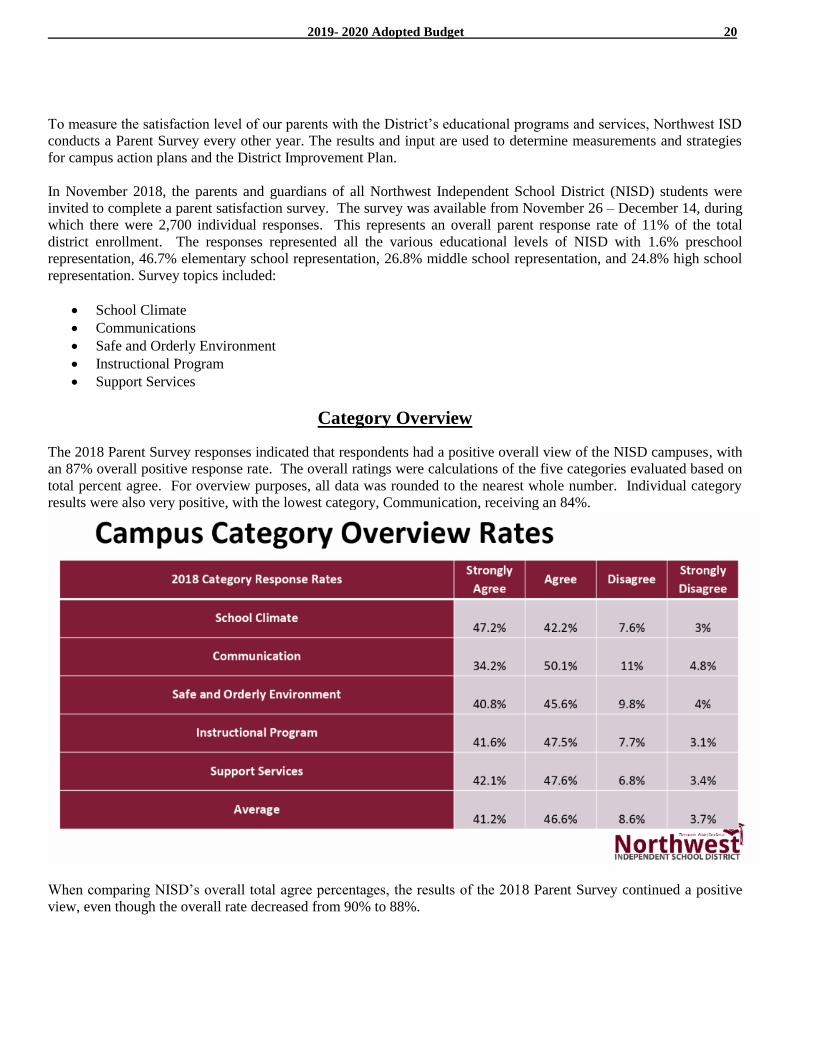
Category Overview
The 2018 Parent Survey responses indicated that respondents had a positive overall view of the NISD campuses, with
an 87% overall positive response rate. The overall ratings were calculations of the five categories evaluated based on
total percent agree. For overview purposes, all data was rounded to the nearest whole number. Individual category
results were also very positive, with the lowest category, Communication, receiving an 84%.
When comparing NISD’s overall total agree percentages, the results of the 2018 Parent Survey continued a positive
view, even though the overall rate decreased from 90% to 88%.
2019- 2020 Adopted Budget 21
2019- 2020 Adopted Budget 22
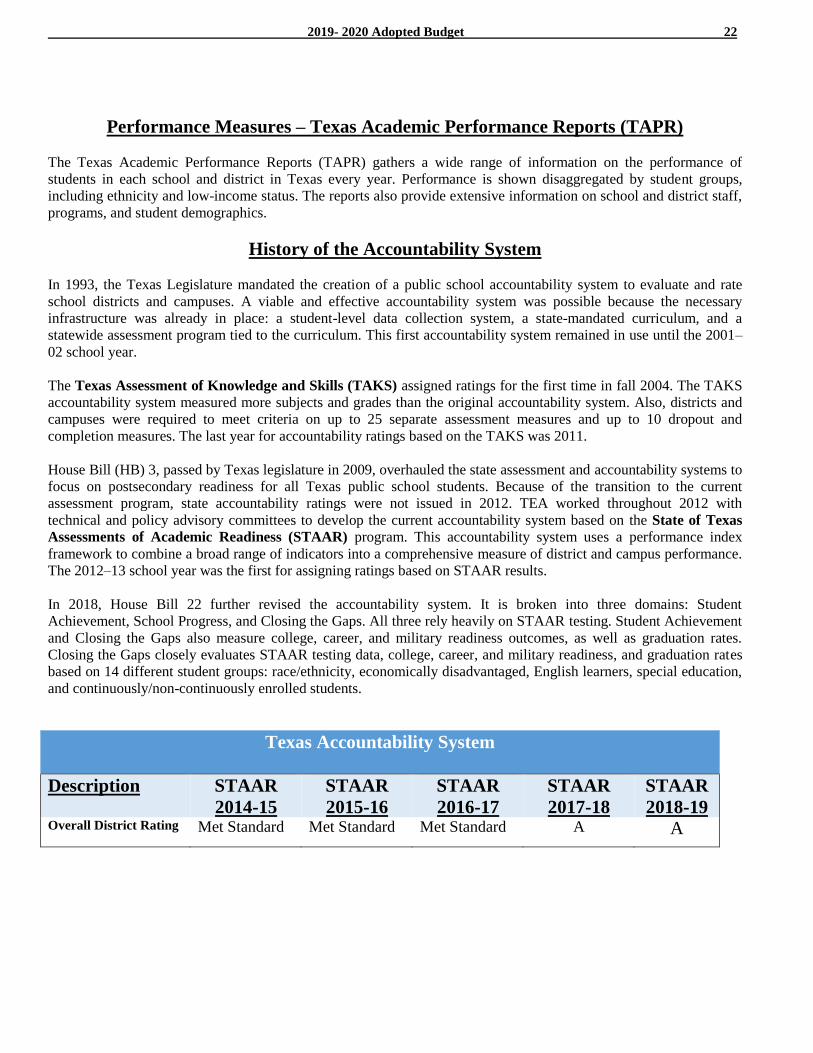
Performance Measures – Texas Academic Performance Reports (TAPR)
The Texas Academic Performance Reports (TAPR) gathers a wide range of information on the performance of
students in each school and district in Texas every year. Performance is shown disaggregated by student groups,
including ethnicity and low-income status. The reports also provide extensive information on school and district staff,
programs, and student demographics.
History of the Accountability System
In 1993, the Texas Legislature mandated the creation of a public school accountability system to evaluate and rate
school districts and campuses. A viable and effective accountability system was possible because the necessary
infrastructure was already in place: a student-level data collection system, a state-mandated curriculum, and a
statewide assessment program tied to the curriculum. This first accountability system remained in use until the 2001–
02 school year.
The Texas Assessment of Knowledge and Skills (TAKS) assigned ratings for the first time in fall 2004. The TAKS
accountability system measured more subjects and grades than the original accountability system. Also, districts and
campuses were required to meet criteria on up to 25 separate assessment measures and up to 10 dropout and
completion measures. The last year for accountability ratings based on the TAKS was 2011.
House Bill (HB) 3, passed by Texas legislature in 2009, overhauled the state assessment and accountability systems to
focus on postsecondary readiness for all Texas public school students. Because of the transition to the current
assessment program, state accountability ratings were not issued in 2012. TEA worked throughout 2012 with
technical and policy advisory committees to develop the current accountability system based on the State of Texas
Assessments of Academic Readiness (STAAR) program. This accountability system uses a performance index
framework to combine a broad range of indicators into a comprehensive measure of district and campus performance.
The 2012–13 school year was the first for assigning ratings based on STAAR results.
In 2018, House Bill 22 further revised the accountability system. It is broken into three domains: Student
Achievement, School Progress, and Closing the Gaps. All three rely heavily on STAAR testing. Student Achievement
and Closing the Gaps also measure college, career, and military readiness outcomes, as well as graduation rates.
Closing the Gaps closely evaluates STAAR testing data, college, career, and military readiness, and graduation rates
based on 14 different student groups: race/ethnicity, economically disadvantaged, English learners, special education,
and continuously/non-continuously enrolled students.
Texas Accountability System
Description STAAR
2014-15
STAAR
2015-16
STAAR
2016-17
STAAR
2017-18
STAAR
2018-19 Overall District Rating Met Standard Met Standard Met Standard A A
2019- 2020 Adopted Budget 23
Texas Education Agency
State Accountability
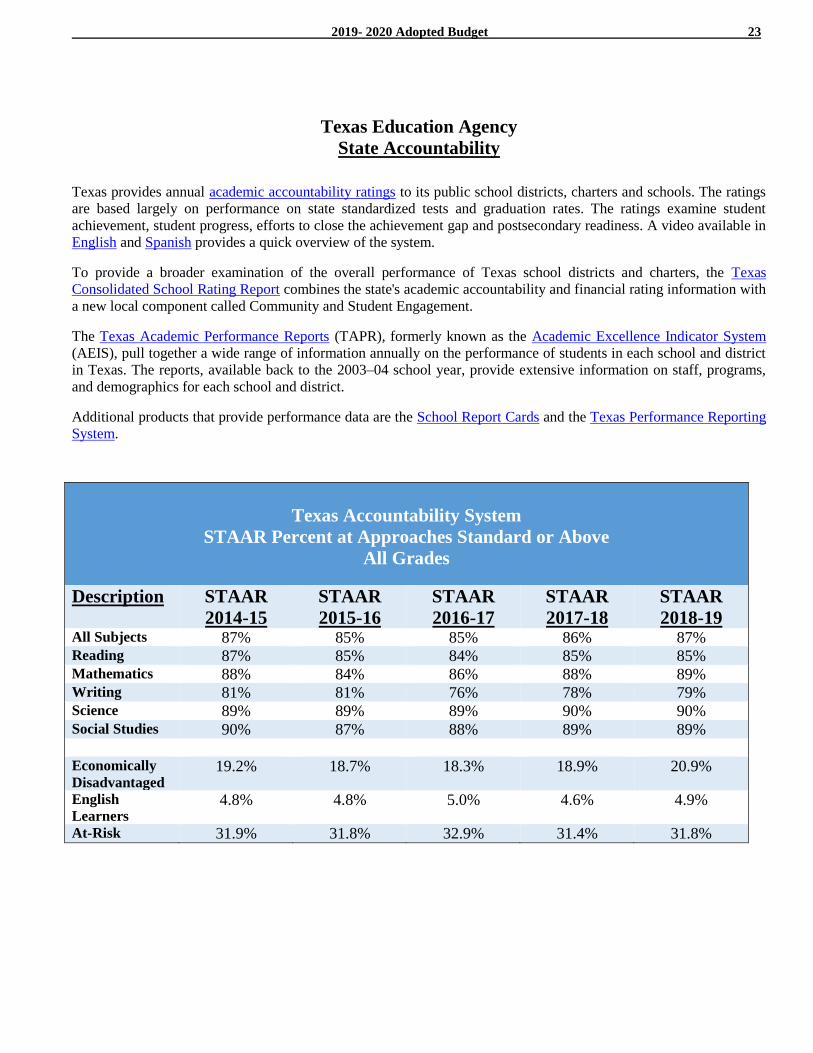
Texas provides annual academic accountability ratings to its public school districts, charters and schools. The ratings
are based largely on performance on state standardized tests and graduation rates. The ratings examine student
achievement, student progress, efforts to close the achievement gap and postsecondary readiness. A video available in
English and Spanish provides a quick overview of the system.
To provide a broader examination of the overall performance of Texas school districts and charters, the Texas
Consolidated School Rating Report combines the state's academic accountability and financial rating information with
a new local component called Community and Student Engagement.
The Texas Academic Performance Reports (TAPR), formerly known as the Academic Excellence Indicator System
(AEIS), pull together a wide range of information annually on the performance of students in each school and district
in Texas. The reports, available back to the 2003–04 school year, provide extensive information on staff, programs,
and demographics for each school and district.
Additional products that provide performance data are the School Report Cards and the Texas Performance Reporting
System.
Texas Accountability System
STAAR Percent at Approaches Standard or Above
All Grades
Description STAAR
2014-15
STAAR
2015-16
STAAR
2016-17
STAAR
2017-18
STAAR
2018-19 All Subjects 87% 85% 85% 86% 87% Reading 87% 85% 84% 85% 85% Mathematics 88% 84% 86% 88% 89% Writing 81% 81% 76% 78% 79% Science 89% 89% 89% 90% 90% Social Studies 90% 87% 88% 89% 89%
Economically
Disadvantaged 19.2% 18.7% 18.3% 18.9% 20.9%
English
Learners 4.8% 4.8% 5.0% 4.6% 4.9%
At-Risk 31.9% 31.8% 32.9% 31.4% 31.8%
2019- 2020 Adopted Budget 24
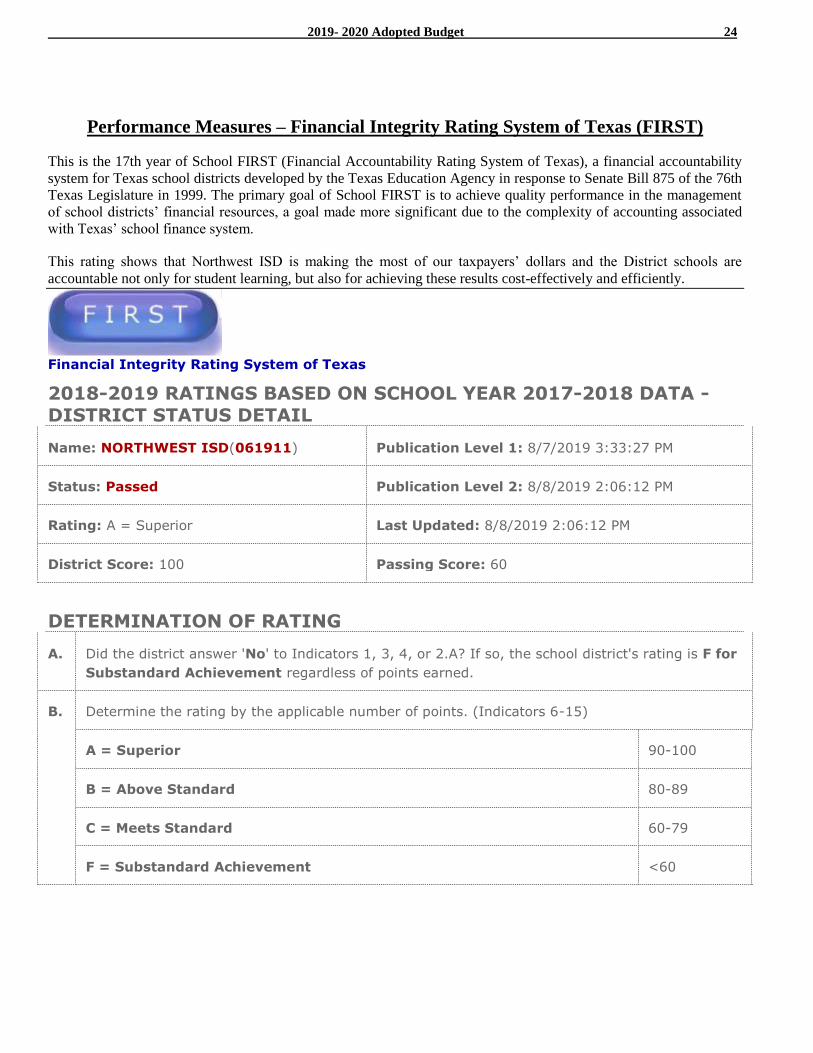
Performance Measures – Financial Integrity Rating System of Texas (FIRST)
This is the 17th year of School FIRST (Financial Accountability Rating System of Texas), a financial accountability
system for Texas school districts developed by the Texas Education Agency in response to Senate Bill 875 of the 76th
Texas Legislature in 1999. The primary goal of School FIRST is to achieve quality performance in the management
of school districts’ financial resources, a goal made more significant due to the complexity of accounting associated
with Texas’ school finance system.
This rating shows that Northwest ISD is making the most of our taxpayers’ dollars and the District schools are
accountable not only for student learning, but also for achieving these results cost-effectively and efficiently.
Financial Integrity Rating System of Texas
2018-2019 RATINGS BASED ON SCHOOL YEAR 2017-2018 DATA - DISTRICT STATUS DETAIL
Name: NORTHWEST ISD(061911) Publication Level 1: 8/7/2019 3:33:27 PM
Status: Passed Publication Level 2: 8/8/2019 2:06:12 PM
Rating: A = Superior Last Updated: 8/8/2019 2:06:12 PM
District Score: 100 Passing Score: 60
DETERMINATION OF RATING
A. Did the district answer 'No' to Indicators 1, 3, 4, or 2.A? If so, the school district's rating is F for
Substandard Achievement regardless of points earned.
B. Determine the rating by the applicable number of points. (Indicators 6-15)
A = Superior 90-100
B = Above Standard 80-89
C = Meets Standard 60-79
F = Substandard Achievement <60
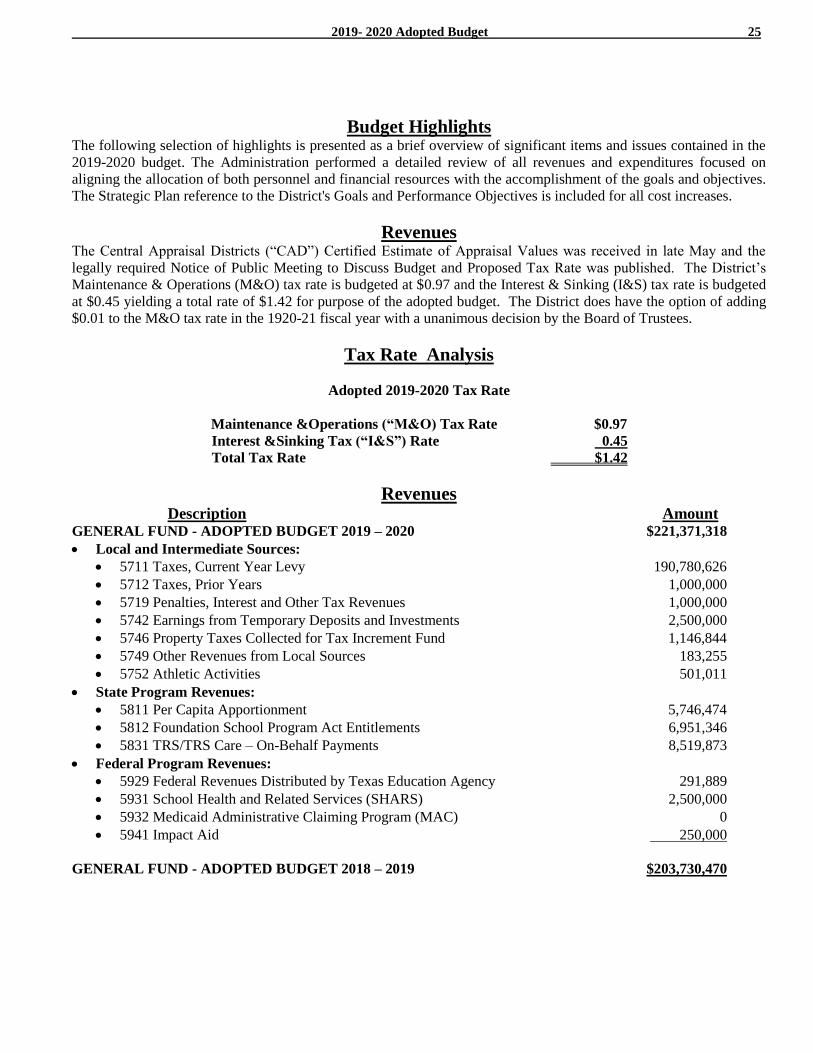
2019- 2020 Adopted Budget 25
Budget Highlights The following selection of highlights is presented as a brief overview of significant items and issues contained in the
2019-2020 budget. The Administration performed a detailed review of all revenues and expenditures focused on
aligning the allocation of both personnel and financial resources with the accomplishment of the goals and objectives.
The Strategic Plan reference to the District's Goals and Performance Objectives is included for all cost increases.
Revenues The Central Appraisal Districts (“CAD”) Certified Estimate of Appraisal Values was received in late May and the
legally required Notice of Public Meeting to Discuss Budget and Proposed Tax Rate was published. The District’s
Maintenance & Operations (M&O) tax rate is budgeted at $0.97 and the Interest & Sinking (I&S) tax rate is budgeted
at $0.45 yielding a total rate of $1.42 for purpose of the adopted budget. The District does have the option of adding
$0.01 to the M&O tax rate in the 1920-21 fiscal year with a unanimous decision by the Board of Trustees.
Tax Rate Analysis
Adopted 2019-2020 Tax Rate
Maintenance &Operations (“M&O) Tax Rate $0.97
Interest &Sinking Tax (“I&S”) Rate 0.45
Total Tax Rate $1.42
Revenues Description Amount
GENERAL FUND - ADOPTED BUDGET 2019 – 2020 $221,371,318
Local and Intermediate Sources:
5711 Taxes, Current Year Levy 190,780,626
5712 Taxes, Prior Years 1,000,000
5719 Penalties, Interest and Other Tax Revenues 1,000,000
5742 Earnings from Temporary Deposits and Investments 2,500,000
5746 Property Taxes Collected for Tax Increment Fund 1,146,844
5749 Other Revenues from Local Sources 183,255
5752 Athletic Activities 501,011
State Program Revenues:
5811 Per Capita Apportionment 5,746,474
5812 Foundation School Program Act Entitlements 6,951,346
5831 TRS/TRS Care – On-Behalf Payments 8,519,873
Federal Program Revenues:
5929 Federal Revenues Distributed by Texas Education Agency 291,889
5931 School Health and Related Services (SHARS) 2,500,000
5932 Medicaid Administrative Claiming Program (MAC) 0
5941 Impact Aid 250,000
GENERAL FUND - ADOPTED BUDGET 2018 – 2019 $203,730,470
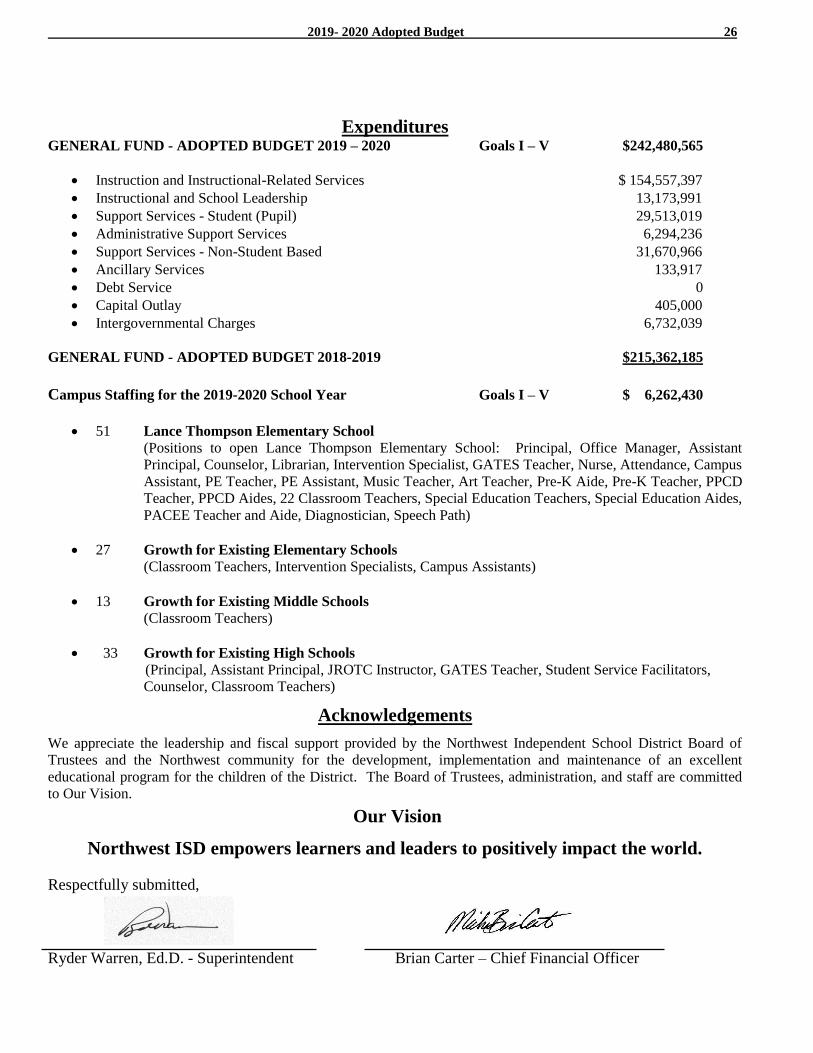
2019- 2020 Adopted Budget 26
Expenditures GENERAL FUND - ADOPTED BUDGET 2019 – 2020 Goals I – V $242,480,565
Instruction and Instructional-Related Services $ 154,557,397
Instructional and School Leadership 13,173,991
Support Services - Student (Pupil) 29,513,019
Administrative Support Services 6,294,236
Support Services - Non-Student Based 31,670,966
Ancillary Services 133,917
Debt Service 0
Capital Outlay 405,000
Intergovernmental Charges 6,732,039
GENERAL FUND - ADOPTED BUDGET 2018-2019 $215,362,185
Campus Staffing for the 2019-2020 School Year Goals I – V $ 6,262,430
51 Lance Thompson Elementary School
(Positions to open Lance Thompson Elementary School: Principal, Office Manager, Assistant
Principal, Counselor, Librarian, Intervention Specialist, GATES Teacher, Nurse, Attendance, Campus
Assistant, PE Teacher, PE Assistant, Music Teacher, Art Teacher, Pre-K Aide, Pre-K Teacher, PPCD
Teacher, PPCD Aides, 22 Classroom Teachers, Special Education Teachers, Special Education Aides,
PACEE Teacher and Aide, Diagnostician, Speech Path)
27 Growth for Existing Elementary Schools
(Classroom Teachers, Intervention Specialists, Campus Assistants)
13 Growth for Existing Middle Schools
(Classroom Teachers)
33 Growth for Existing High Schools
(Principal, Assistant Principal, JROTC Instructor, GATES Teacher, Student Service Facilitators,
Counselor, Classroom Teachers)
Acknowledgements
We appreciate the leadership and fiscal support provided by the Northwest Independent School District Board of
Trustees and the Northwest community for the development, implementation and maintenance of an excellent
educational program for the children of the District. The Board of Trustees, administration, and staff are committed
to Our Vision.
Our Vision
Northwest ISD empowers learners and leaders to positively impact the world.
Respectfully submitted,
Ryder Warren, Ed.D. - Superintendent Brian Carter – Chief Financial Officer

2019- 2020 Adopted Budget 27
NORTHWEST INDEPENDENT SCHOOL DISTRICT
2019 - 2020 BOARD OF TRUSTEES
Judy Copp
President, Place 4
Retired Educator
Elected 2012
Term Ends 2019
Dr. Anne Simpson
Vice President, Place 3
Professor
Elected 2013
Term Ends 2019
Dr. Lillian Rauch
Member, Place 6
Retired Educator
Elected 2014
Term Ends 2020
Ron Hastings
Member, Place 7
Retired Educator
Elected 2018
Term Ends 2020
Mark Schluter
Member, Place 2
Senior Project Engineer
Elected 2006
Term Ends 2021
Steve Sprowls
Member, Place 5
Airline Pilot
Elected 2017
Term Ends 2020
DeAnne Hatfield
Member, Place 1
Retired School
Administrator
Elected 2019
Term Ends 2021
Ryder Warren, Ed.D. Superintendent
Appointed by
Board of Trustees
2016
Board Meetings: All Northwest ISD board meetings are open to the public. Regular meetings are held at 6:30 p.m.
on the second and fourth Monday of each month in the board room located at the NISD Administration Building at
2001 Texan Drive, Justin. With public notice, trustees will also hold special meetings and work sessions as needed.
Within the limits of the Texas Open Meetings Act, parts of the board meetings may be closed to the public for topics
including, but not limited to, real estate transactions, personnel matters, student hearings, and legal matters.
If You Wish to Address the Board: The public may address the board during the public participation portion of the
board meeting. Remarks may be related to any topic, whether agenda items or non-agenda items, and are usually
limited to three minutes. Those wishing to speak during public participation may sign the roster in the room within
the hour preceding the meeting. www.nisdtx.org
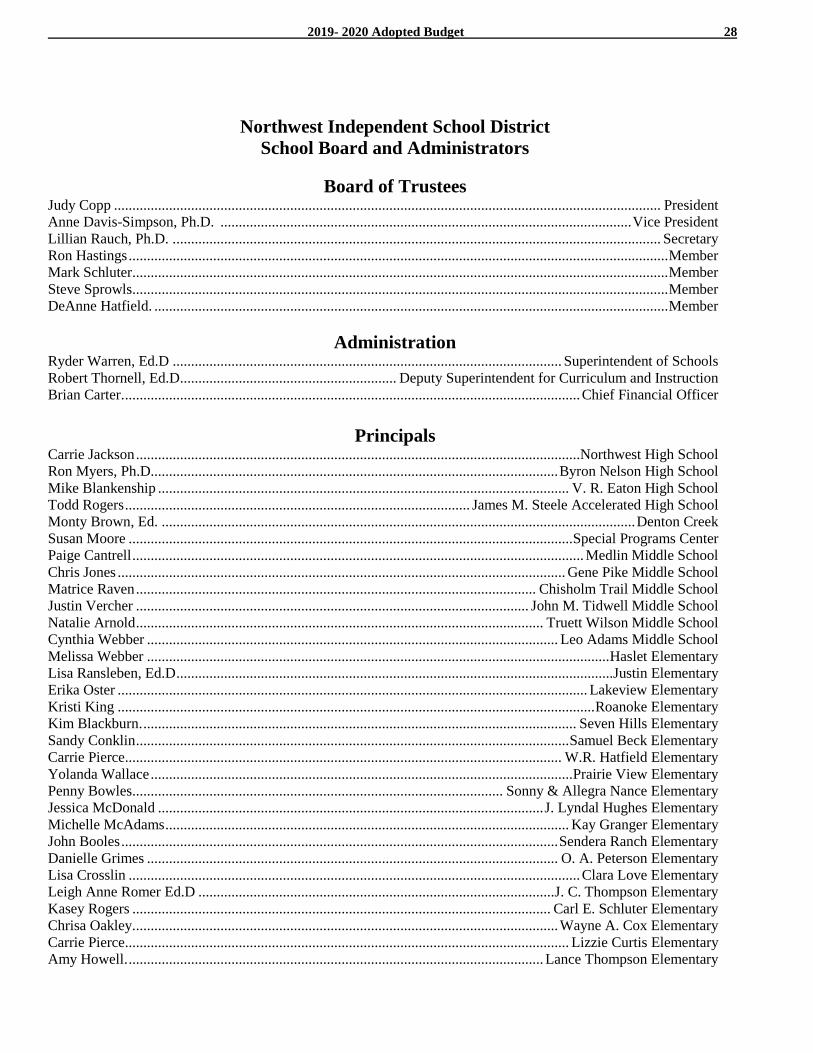
2019- 2020 Adopted Budget 28
Northwest Independent School District
School Board and Administrators
Board of Trustees Judy Copp ..................................................................................................................................................... President
Anne Davis-Simpson, Ph.D. ................................................................................................................ Vice President
Lillian Rauch, Ph.D. . .................................................................................................................................... Secretary
Ron Hastings ................................................................................................................................................... Member
Mark Schluter. ................................................................................................................................................. Member
Steve Sprowls. ................................................................................................................................................. Member
DeAnne Hatfield. ............................................................................................................................................ Member
Administration Ryder Warren, Ed.D .......................................................................................................... Superintendent of Schools
Robert Thornell, Ed.D ........................................................... Deputy Superintendent for Curriculum and Instruction
Brian Carter. ............................................................................................................................ Chief Financial Officer
Principals Carrie Jackson .........................................................................................................................Northwest High School
Ron Myers, Ph.D... ............................................................................................................ Byron Nelson High School
Mike Blankenship ................................................................................................................ V. R. Eaton High School
Todd Rogers .............................................................................................. James M. Steele Accelerated High School
Monty Brown, Ed. ................................................................................................................................. Denton Creek
Susan Moore ......................................................................................................................... Special Programs Center
Paige Cantrell ........................................................................................................................... Medlin Middle School
Chris Jones .......................................................................................................................... Gene Pike Middle School
Matrice Raven ............................................................................................................. Chisholm Trail Middle School
Justin Vercher ........................................................................................................... John M. Tidwell Middle School
Natalie Arnold ............................................................................................................... Truett Wilson Middle School
Cynthia Webber ................................................................................................................ Leo Adams Middle School
Melissa Webber .............................................................................................................................. Haslet Elementary
Lisa Ransleben, Ed.D .......................................................................................................................Justin Elementary
Erika Oster ................................................................................................................................ Lakeview Elementary
Kristi King .................................................................................................................................. Roanoke Elementary
Kim Blackburn. ...................................................................................................................... Seven Hills Elementary
Sandy Conklin ...................................................................................................................... Samuel Beck Elementary
Carrie Pierce ....................................................................................................................... W.R. Hatfield Elementary
Yolanda Wallace ................................................................................................................... Prairie View Elementary
Penny Bowles ..................................................................................................... Sonny & Allegra Nance Elementary
Jessica McDonald ......................................................................................................... J. Lyndal Hughes Elementary
Michelle McAdams .............................................................................................................. Kay Granger Elementary
John Booles ....................................................................................................................... Sendera Ranch Elementary
Danielle Grimes ................................................................................................................ O. A. Peterson Elementary
Lisa Crosslin ........................................................................................................................... Clara Love Elementary
Leigh Anne Romer Ed.D ................................................................................................. J. C. Thompson Elementary
Kasey Rogers .................................................................................................................. Carl E. Schluter Elementary
Chrisa Oakley. ................................................................................................................... Wayne A. Cox Elementary
Carrie Pierce. ........................................................................................................................ Lizzie Curtis Elementary
Amy Howell. ................................................................................................................. Lance Thompson Elementary
2019- 2020 Adopted Budget 29
Byron Nelson High School – Courtyard
ORGANIZATIONAL SECTION
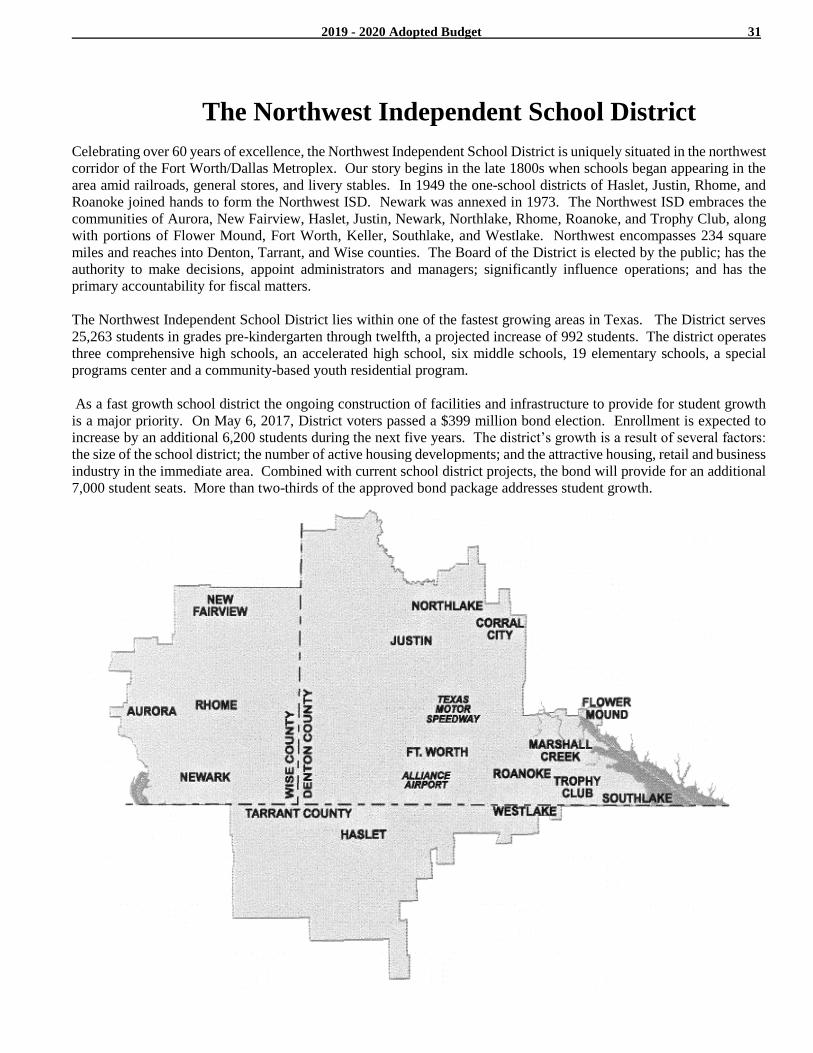
2019 - 2020 Adopted Budget 31
The Northwest Independent School District
Celebrating over 60 years of excellence, the Northwest Independent School District is uniquely situated in the northwest
corridor of the Fort Worth/Dallas Metroplex. Our story begins in the late 1800s when schools began appearing in the
area amid railroads, general stores, and livery stables. In 1949 the one-school districts of Haslet, Justin, Rhome, and
Roanoke joined hands to form the Northwest ISD. Newark was annexed in 1973. The Northwest ISD embraces the
communities of Aurora, New Fairview, Haslet, Justin, Newark, Northlake, Rhome, Roanoke, and Trophy Club, along
with portions of Flower Mound, Fort Worth, Keller, Southlake, and Westlake. Northwest encompasses 234 square
miles and reaches into Denton, Tarrant, and Wise counties. The Board of the District is elected by the public; has the
authority to make decisions, appoint administrators and managers; significantly influence operations; and has the
primary accountability for fiscal matters.
The Northwest Independent School District lies within one of the fastest growing areas in Texas. The District serves
25,263 students in grades pre-kindergarten through twelfth, a projected increase of 992 students. The district operates
three comprehensive high schools, an accelerated high school, six middle schools, 19 elementary schools, a special
programs center and a community-based youth residential program.
As a fast growth school district the ongoing construction of facilities and infrastructure to provide for student growth
is a major priority. On May 6, 2017, District voters passed a $399 million bond election. Enrollment is expected to
increase by an additional 6,200 students during the next five years. The district’s growth is a result of several factors:
the size of the school district; the number of active housing developments; and the attractive housing, retail and business
industry in the immediate area. Combined with current school district projects, the bond will provide for an additional
7,000 student seats. More than two-thirds of the approved bond package addresses student growth.
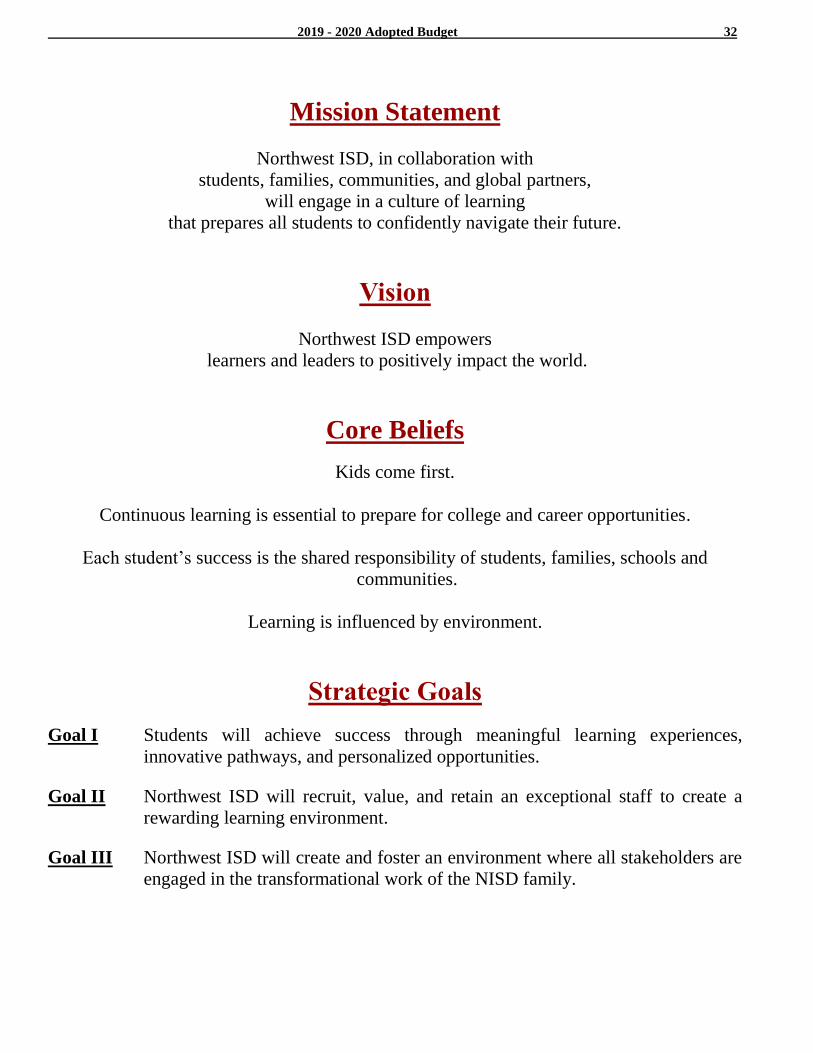
2019 - 2020 Adopted Budget 32
Mission Statement
Northwest ISD, in collaboration with
students, families, communities, and global partners,
will engage in a culture of learning
that prepares all students to confidently navigate their future.
Vision
Northwest ISD empowers
learners and leaders to positively impact the world.
Core Beliefs
Kids come first.
Continuous learning is essential to prepare for college and career opportunities.
Each student’s success is the shared responsibility of students, families, schools and
communities.
Learning is influenced by environment.
Strategic Goals
Goal I Students will achieve success through meaningful learning experiences,
innovative pathways, and personalized opportunities.
Goal II Northwest ISD will recruit, value, and retain an exceptional staff to create a
rewarding learning environment.
Goal III Northwest ISD will create and foster an environment where all stakeholders are
engaged in the transformational work of the NISD family.
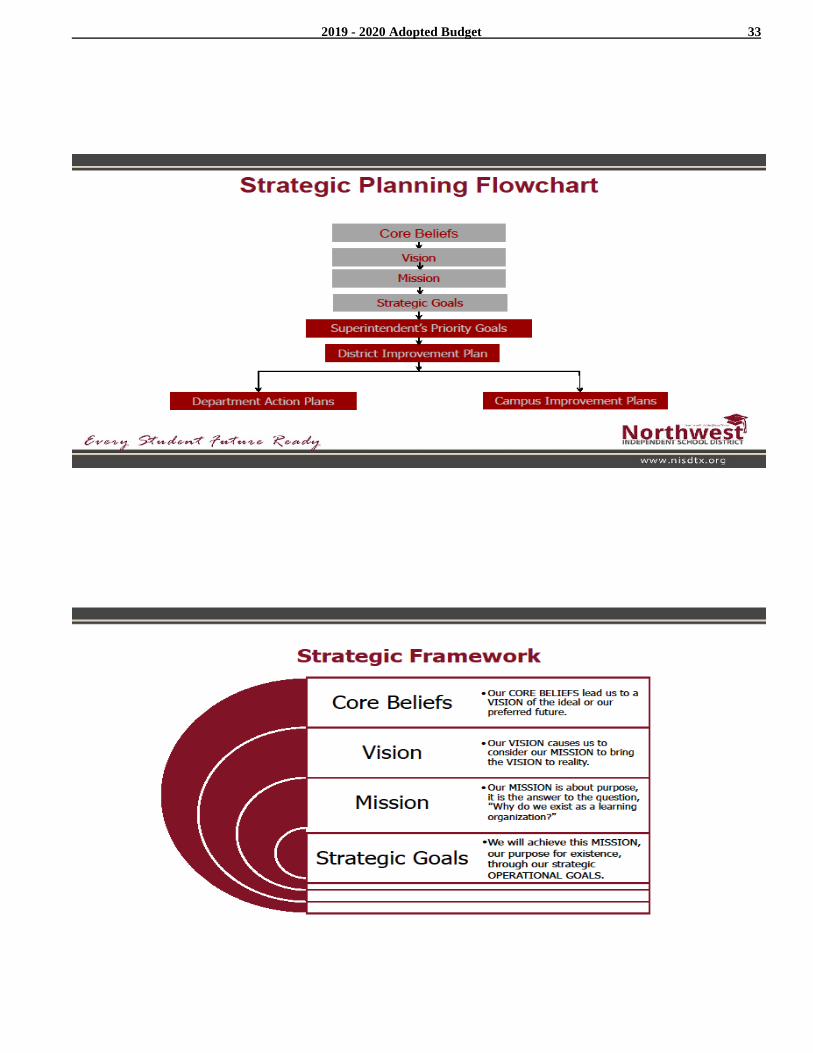
2019 - 2020 Adopted Budget 33
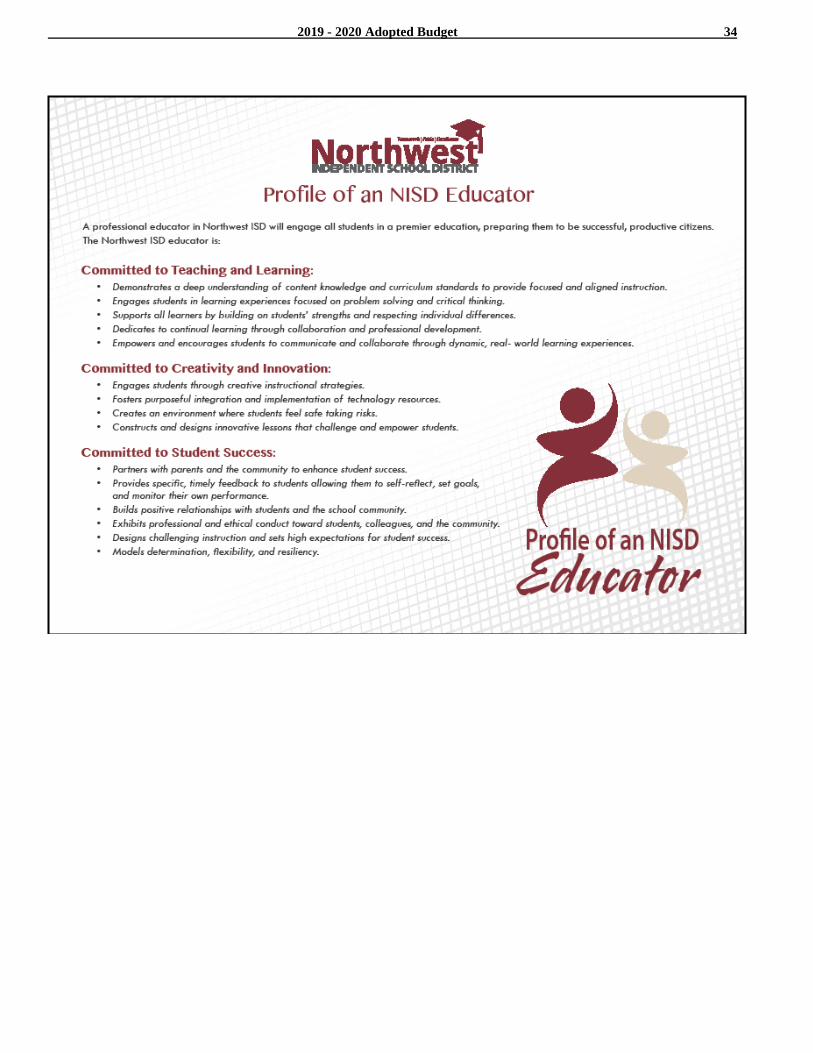
2019 - 2020 Adopted Budget 34

2019 - 2020 Adopted Budget 35

2019 - 2020 Adopted Budget 36
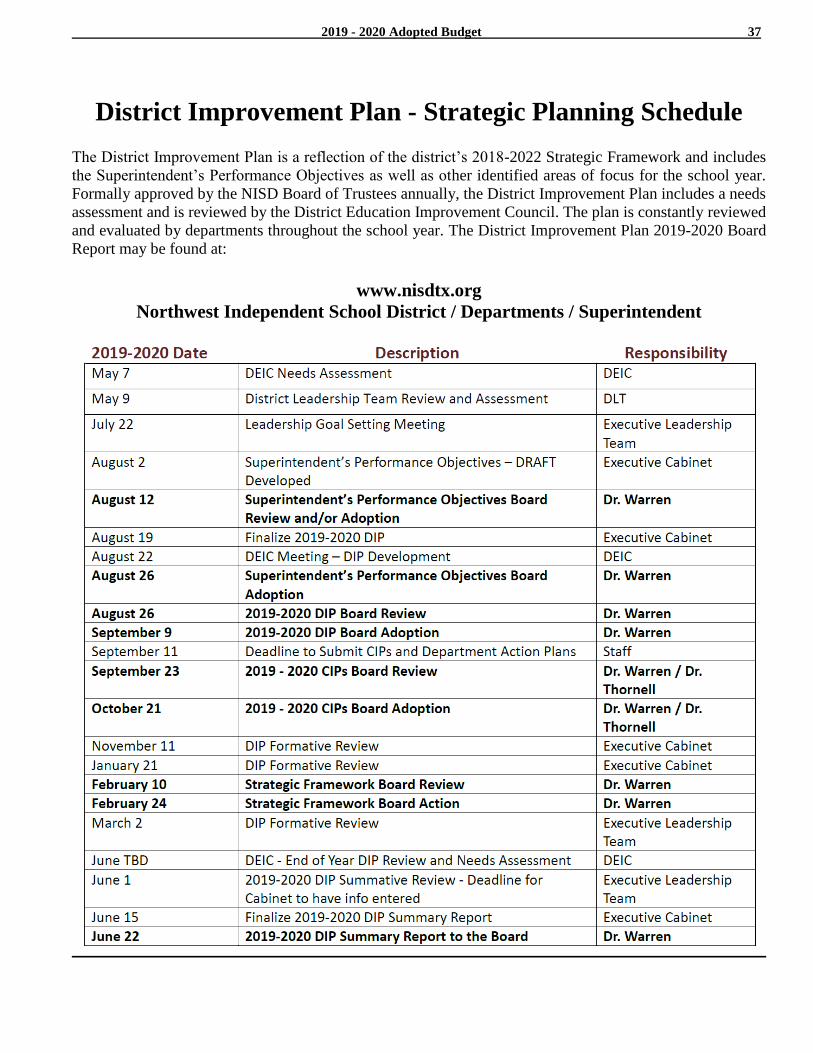
2019 - 2020 Adopted Budget 37
District Improvement Plan - Strategic Planning Schedule
The District Improvement Plan is a reflection of the district’s 2018-2022 Strategic Framework and includes
the Superintendent’s Performance Objectives as well as other identified areas of focus for the school year.
Formally approved by the NISD Board of Trustees annually, the District Improvement Plan includes a needs
assessment and is reviewed by the District Education Improvement Council. The plan is constantly reviewed
and evaluated by departments throughout the school year. The District Improvement Plan 2019-2020 Board
Report may be found at:
www.nisdtx.org
Northwest Independent School District / Departments / Superintendent
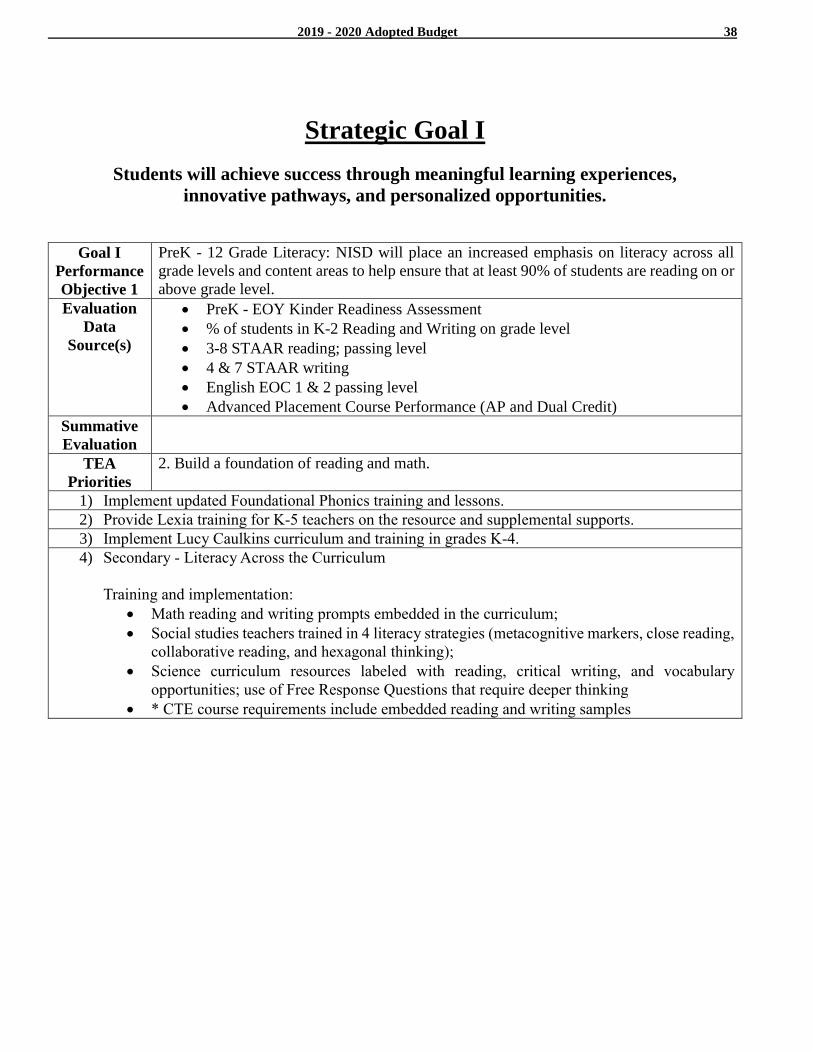
2019 - 2020 Adopted Budget 38
Strategic Goal I
Students will achieve success through meaningful learning experiences,
innovative pathways, and personalized opportunities.
Goal I
Performance
Objective 1
PreK - 12 Grade Literacy: NISD will place an increased emphasis on literacy across all
grade levels and content areas to help ensure that at least 90% of students are reading on or
above grade level.
Evaluation
Data
Source(s)
PreK - EOY Kinder Readiness Assessment
% of students in K-2 Reading and Writing on grade level
3-8 STAAR reading; passing level
4 & 7 STAAR writing
English EOC 1 & 2 passing level
Advanced Placement Course Performance (AP and Dual Credit)
Summative
Evaluation
TEA
Priorities
2. Build a foundation of reading and math.
1) Implement updated Foundational Phonics training and lessons.
2) Provide Lexia training for K-5 teachers on the resource and supplemental supports.
3) Implement Lucy Caulkins curriculum and training in grades K-4.
4) Secondary - Literacy Across the Curriculum
Training and implementation:
Math reading and writing prompts embedded in the curriculum;
Social studies teachers trained in 4 literacy strategies (metacognitive markers, close reading,
collaborative reading, and hexagonal thinking);
Science curriculum resources labeled with reading, critical writing, and vocabulary
opportunities; use of Free Response Questions that require deeper thinking
* CTE course requirements include embedded reading and writing samples
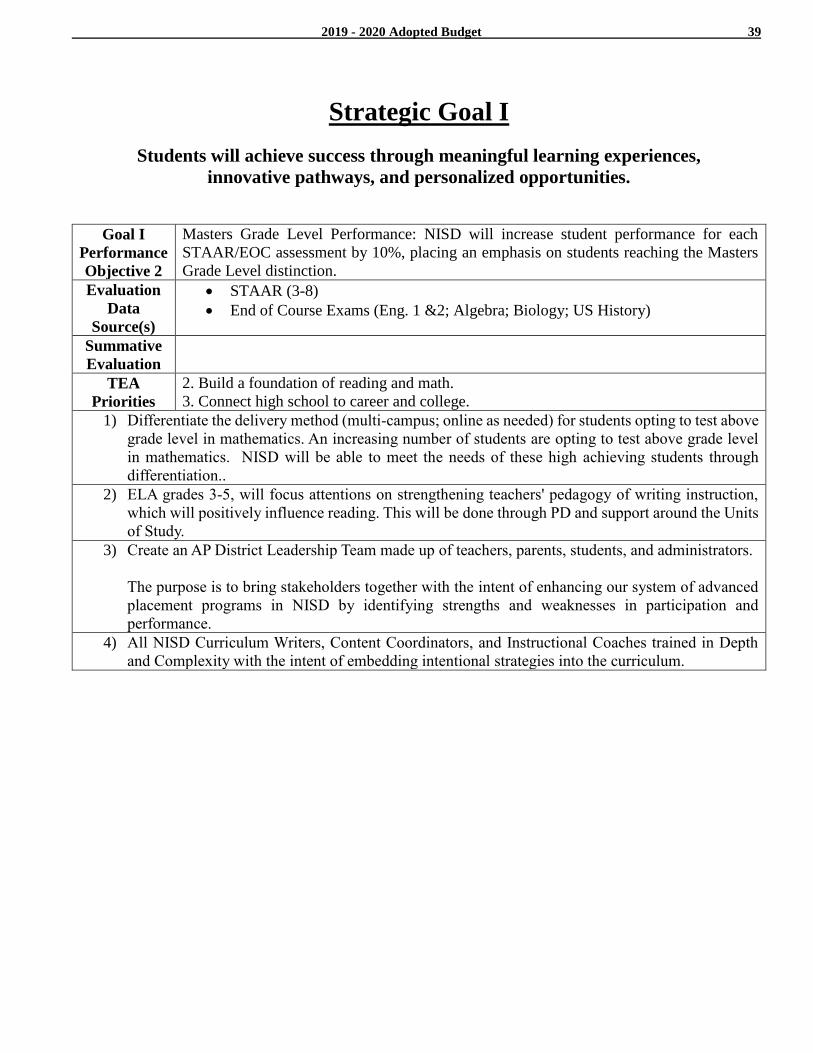
2019 - 2020 Adopted Budget 39
Strategic Goal I
Students will achieve success through meaningful learning experiences,
innovative pathways, and personalized opportunities.
Goal I
Performance
Objective 2
Masters Grade Level Performance: NISD will increase student performance for each
STAAR/EOC assessment by 10%, placing an emphasis on students reaching the Masters
Grade Level distinction.
Evaluation
Data
Source(s)
STAAR (3-8)
End of Course Exams (Eng. 1 &2; Algebra; Biology; US History)
Summative
Evaluation
TEA
Priorities
2. Build a foundation of reading and math.
3. Connect high school to career and college.
1) Differentiate the delivery method (multi-campus; online as needed) for students opting to test above
grade level in mathematics. An increasing number of students are opting to test above grade level
in mathematics. NISD will be able to meet the needs of these high achieving students through
differentiation..
2) ELA grades 3-5, will focus attentions on strengthening teachers' pedagogy of writing instruction,
which will positively influence reading. This will be done through PD and support around the Units
of Study.
3) Create an AP District Leadership Team made up of teachers, parents, students, and administrators.
The purpose is to bring stakeholders together with the intent of enhancing our system of advanced
placement programs in NISD by identifying strengths and weaknesses in participation and
performance.
4) All NISD Curriculum Writers, Content Coordinators, and Instructional Coaches trained in Depth
and Complexity with the intent of embedding intentional strategies into the curriculum.

2019 - 2020 Adopted Budget 40
Strategic Goal I
Students will achieve success through meaningful learning experiences,
innovative pathways, and personalized opportunities.
Goal I
Performance
Objective 3
College, Career, and Life Readiness: NISD will ensure that every student is achieving
Exemplary CCR status (in accordance with NISD's CCR Rubric), experiencing
personalized learning opportunities, and developing social-emotional skills in order to
attain their definition of personal success.
Evaluation
Data
Source(s)
AP Testing (participation and performance)
Dual Credit (participation and performance)
Professional Certification and Licensure
Internship (participation and completions)
ACT/SAT (participation and performance)
# of student TSI met
Identification and adoption of District SEL standards
Participation rates in extra-curricular/co-curricular activities
Summative
Evaluation
TEA
Priorities
3. Connect high school to career and college.
1) Utilize CTE Ambassadors to promote CTE programs for meetings and support of staff / counselors
administration.
2) Increase Student Internships and Job Shadowing by soliciting more community partners and
recruiting more students.
3) Host community events that inform and build trust in CTE programs and NISD performance.
4) AVID - increase in student participation and teacher training to campus-wide model.
5) Reconvene Character Education Committee to adopt district-wide standards for Social-Emotional
Learning.
NISD staff will be trained on standards and campuses will identify needs for implementation in
2019-2020.
6) Engage students in extra-curricular or co-curricular activities at a higher rate.
This may include but is not limited to:
Athletics
Fine Arts
Academic UIL
Battle of the Books
Destination Imagination
Student Council
Service clubs
7) Integrate Social-Emotional Learning with Digital Citizenship.
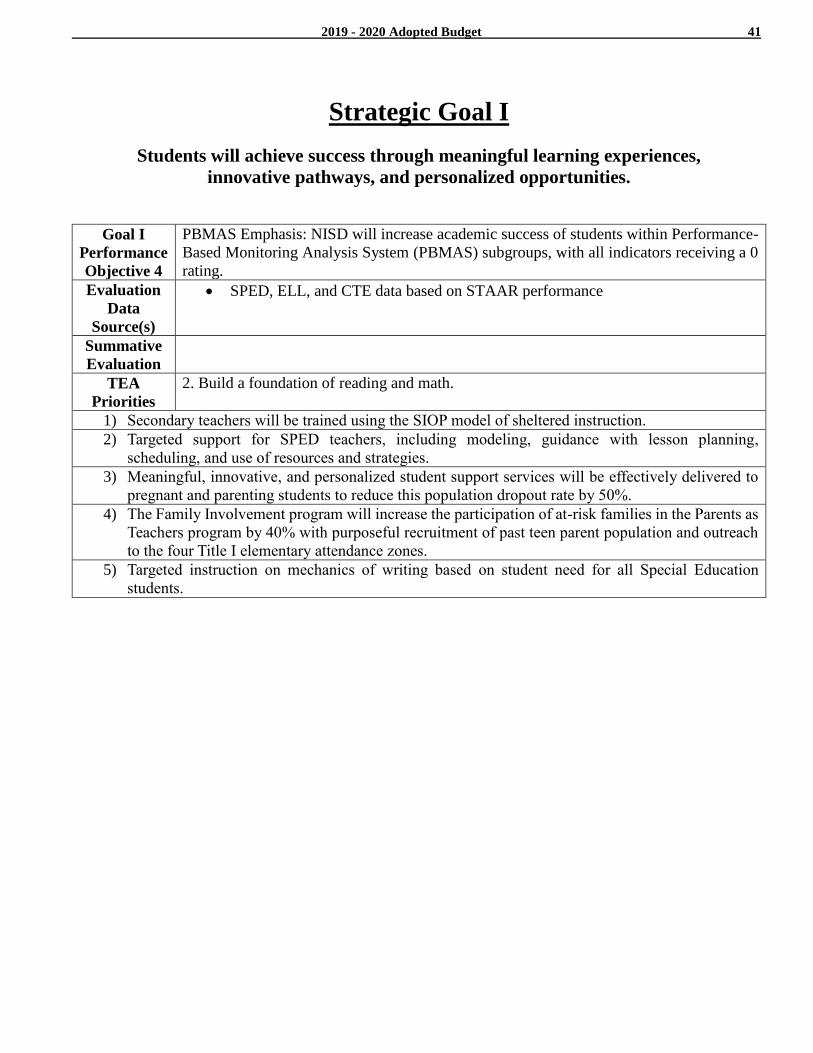
2019 - 2020 Adopted Budget 41
Strategic Goal I
Students will achieve success through meaningful learning experiences,
innovative pathways, and personalized opportunities.
Goal I
Performance
Objective 4
PBMAS Emphasis: NISD will increase academic success of students within Performance-
Based Monitoring Analysis System (PBMAS) subgroups, with all indicators receiving a 0
rating.
Evaluation
Data
Source(s)
SPED, ELL, and CTE data based on STAAR performance
Summative
Evaluation
TEA
Priorities
2. Build a foundation of reading and math.
1) Secondary teachers will be trained using the SIOP model of sheltered instruction.
2) Targeted support for SPED teachers, including modeling, guidance with lesson planning,
scheduling, and use of resources and strategies.
3) Meaningful, innovative, and personalized student support services will be effectively delivered to
pregnant and parenting students to reduce this population dropout rate by 50%.
4) The Family Involvement program will increase the participation of at-risk families in the Parents as
Teachers program by 40% with purposeful recruitment of past teen parent population and outreach
to the four Title I elementary attendance zones.
5) Targeted instruction on mechanics of writing based on student need for all Special Education
students.
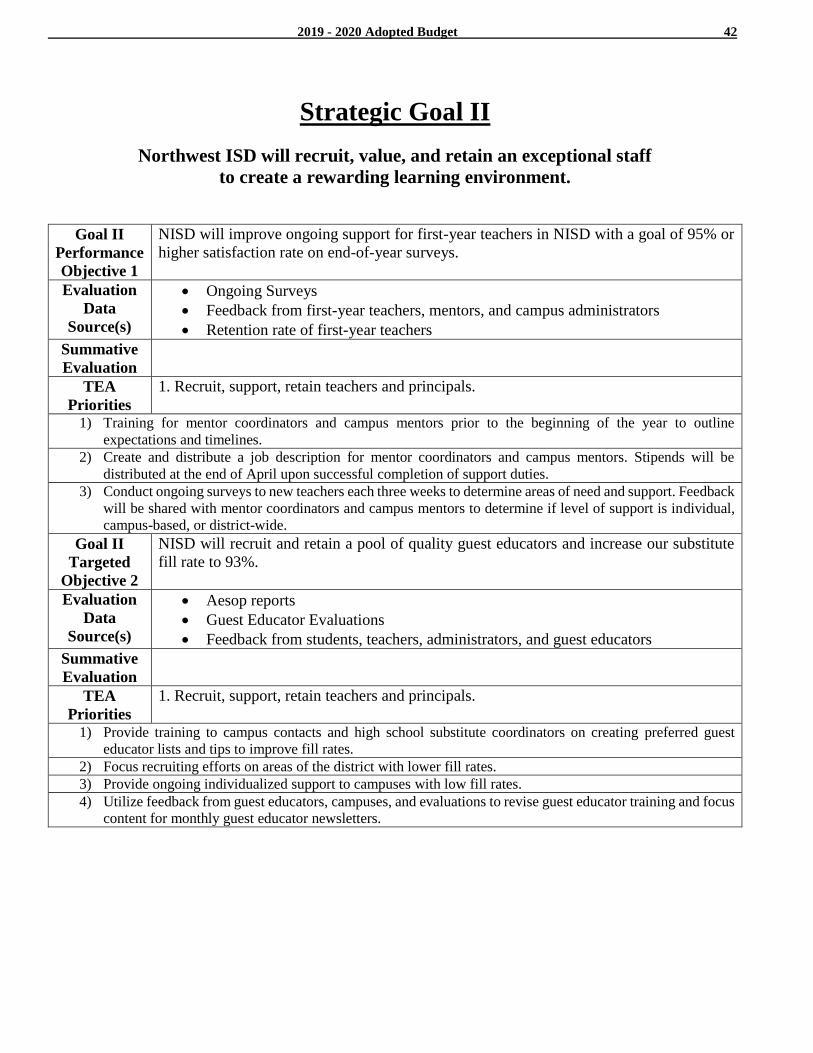
2019 - 2020 Adopted Budget 42
Strategic Goal II
Northwest ISD will recruit, value, and retain an exceptional staff
to create a rewarding learning environment.
Goal II
Performance
Objective 1
NISD will improve ongoing support for first-year teachers in NISD with a goal of 95% or
higher satisfaction rate on end-of-year surveys.
Evaluation
Data
Source(s)
Ongoing Surveys
Feedback from first-year teachers, mentors, and campus administrators
Retention rate of first-year teachers
Summative
Evaluation
TEA
Priorities
1. Recruit, support, retain teachers and principals.
1) Training for mentor coordinators and campus mentors prior to the beginning of the year to outline
expectations and timelines.
2) Create and distribute a job description for mentor coordinators and campus mentors. Stipends will be
distributed at the end of April upon successful completion of support duties.
3) Conduct ongoing surveys to new teachers each three weeks to determine areas of need and support. Feedback
will be shared with mentor coordinators and campus mentors to determine if level of support is individual,
campus-based, or district-wide.
Goal II
Targeted
Objective 2
NISD will recruit and retain a pool of quality guest educators and increase our substitute
fill rate to 93%.
Evaluation
Data
Source(s)
Aesop reports
Guest Educator Evaluations
Feedback from students, teachers, administrators, and guest educators
Summative
Evaluation
TEA
Priorities
1. Recruit, support, retain teachers and principals.
1) Provide training to campus contacts and high school substitute coordinators on creating preferred guest
educator lists and tips to improve fill rates.
2) Focus recruiting efforts on areas of the district with lower fill rates.
3) Provide ongoing individualized support to campuses with low fill rates.
4) Utilize feedback from guest educators, campuses, and evaluations to revise guest educator training and focus
content for monthly guest educator newsletters.
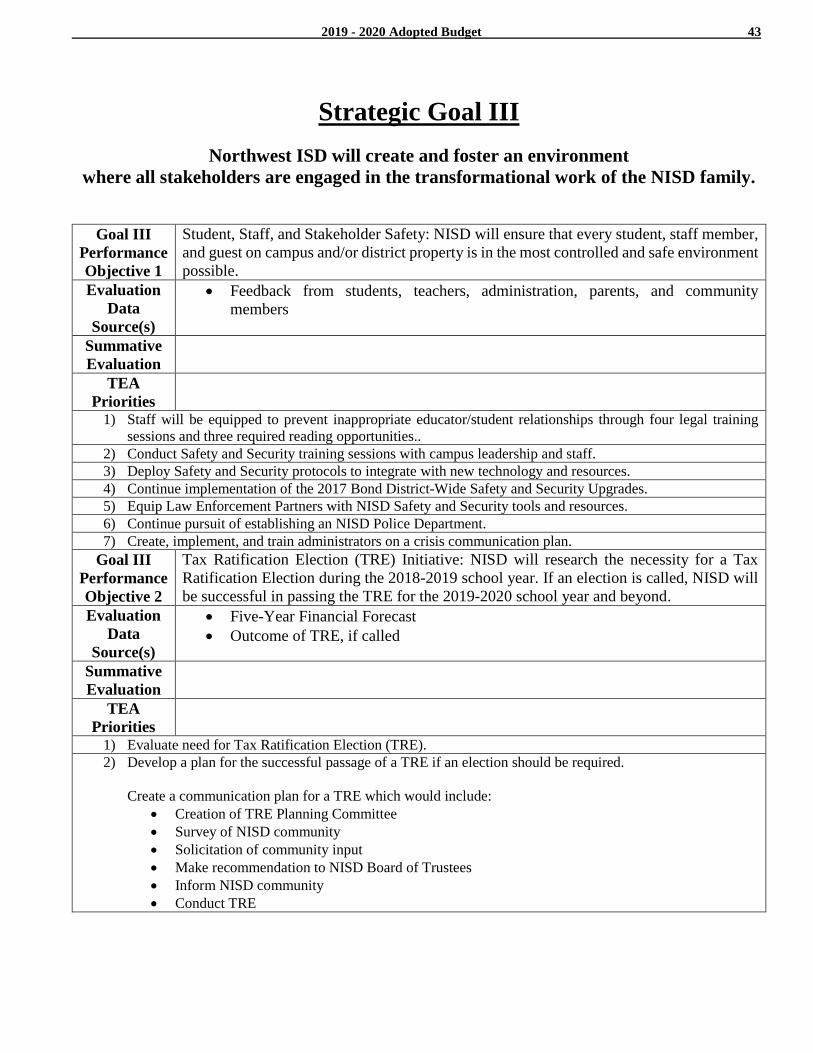
2019 - 2020 Adopted Budget 43
Strategic Goal III
Northwest ISD will create and foster an environment
where all stakeholders are engaged in the transformational work of the NISD family.
Goal III
Performance
Objective 1
Student, Staff, and Stakeholder Safety: NISD will ensure that every student, staff member,
and guest on campus and/or district property is in the most controlled and safe environment
possible.
Evaluation
Data
Source(s)
Feedback from students, teachers, administration, parents, and community
members
Summative
Evaluation
TEA
Priorities
1) Staff will be equipped to prevent inappropriate educator/student relationships through four legal training
sessions and three required reading opportunities..
2) Conduct Safety and Security training sessions with campus leadership and staff.
3) Deploy Safety and Security protocols to integrate with new technology and resources.
4) Continue implementation of the 2017 Bond District-Wide Safety and Security Upgrades.
5) Equip Law Enforcement Partners with NISD Safety and Security tools and resources.
6) Continue pursuit of establishing an NISD Police Department.
7) Create, implement, and train administrators on a crisis communication plan.
Goal III
Performance
Objective 2
Tax Ratification Election (TRE) Initiative: NISD will research the necessity for a Tax
Ratification Election during the 2018-2019 school year. If an election is called, NISD will
be successful in passing the TRE for the 2019-2020 school year and beyond.
Evaluation
Data
Source(s)
Five-Year Financial Forecast
Outcome of TRE, if called
Summative
Evaluation
TEA
Priorities
1) Evaluate need for Tax Ratification Election (TRE).
2) Develop a plan for the successful passage of a TRE if an election should be required.
Create a communication plan for a TRE which would include:
Creation of TRE Planning Committee
Survey of NISD community
Solicitation of community input
Make recommendation to NISD Board of Trustees
Inform NISD community
Conduct TRE
2019 - 2020 Adopted Budget 44
Strategic Plan Notes
The detailed strategies of the 2018-2019 District Improvement Plan reflect the identified areas of focus for
the year. While some of the following areas are detailed in the DIP, most are processes that are a part of the
daily operations of the district and can be found on the district's website and/or in the Department Action
Plans:
1. Instructional methods for all student groups not achieving their full potential, [TEC 11.252(a)(3)(A)]
2. Methods for addressing needs of students for special programs:
a. suicide prevention including a parental or guardian notification procedure [TEC 11.252(3)(B)(i)]
b. conflict resolution programs [TEC 11.252(3)(B)(ii)]
c. violence prevention programs [TEC 11.252(3)(B)(iii)]
d. dyslexia treatment programs [TEC 11.252(a)(3)(B)(iv)]
e. Accelerated education [TEC 11.252(c)(3)(H)]
3. Dropout reduction [TEC 11.255]
4. Integration of technology in instructional and administrative programs [TEC 11.252(a)(3)(D)]
5. Discipline management including unwanted physical or verbal aggression and sexual harassment [TEC
11.252(3)(E) and TEC 37.083(a)]
6. Dating violence [TEC 37.0831]
7. Sexual abuse, sex trafficking, and other maltreatment of children, including methods for increasing staff,
student and parent awareness and staff training
[TEC 38.0041(a)], [TEC 11.252(c)(9)]
8. Career education to assist students in developing the knowledge, skills, and competencies necessary for a
broad range of career opportunities [TEC 11.252(3)(G)]
9. Strategies for recruiting highly effective teachers
10. Information for middle school, junior high, and high school students, their teachers and counselors and
their parents about
a. higher education admissions and financial aid opportunities
b. the TEXAS grant program and the Teach for Texas grant program
c. the need for students to make informed curriculum choices to be prepared for success beyond high
school
d. sources of information on higher education admissions and financial aid [TEC 11.252(c)(4)(A-D)]
11. Staff development for professional staff of the district [TEC 11.252(3)(F)]
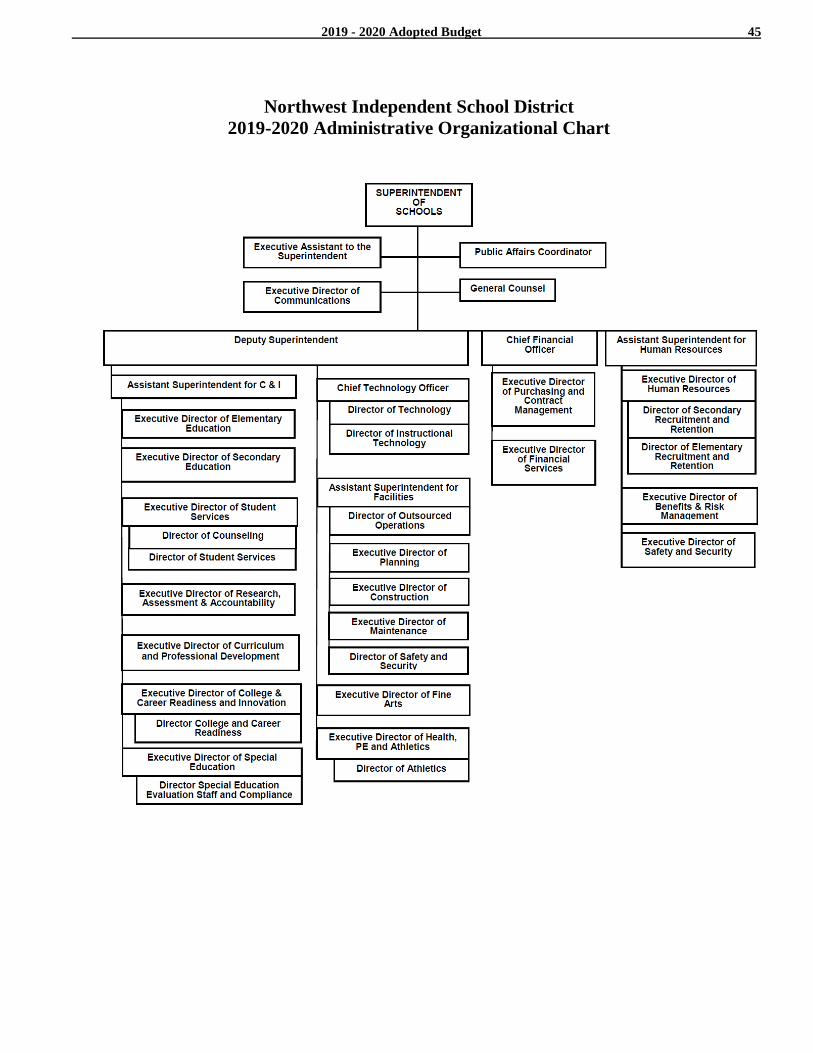
2019 - 2020 Adopted Budget 45
Northwest Independent School District
2019-2020 Administrative Organizational Chart
2019 - 2020 Adopted Budget 46
Budget and
Financial
Policies
Legal Requirements for Budgets Legal requirements for school district
budgets are formulated by the state, TEA, and
the local district. Additional legal
requirements also may be imposed by state
and federal grants.
Statement of Texas Law Sections 44.002 through 44.006 of the Texas
Education Code establish the legal basis for
budget development in school districts. The
following six items summarize the legal
requirements from the code:
The superintendent is the budget officer
for the district and prepares or causes the
budget to be prepared.
The district budget must be prepared by
a date set by the state board of education,
currently June 30. In order for the budget
to be adopted by the board of trustees,
inclusive of amendments, the district
budget must be prepared by June 19.
The president of the board of trustees
must call a public meeting of the board of
trustees, giving ten days public notice in
a newspaper, for the adoption of the
district budget. Any taxpayer in the
district may be present and participate in
the meeting.
Concurrently with the publication of
notice of the budget above, a school
district must post a summary of the
proposed budget on the school district’s
Internet website or in the district’s central
administrative office if the school district
has no Internet website. The budget
summary must include a comparison to
the previous year’s actual spending and
information relating to per-student and
aggregate spending on instruction,
instructional support, central
administration, district operations, debt
service, and any other category
designated by the commissioner.
(Section 44.0041, TEC).
The summary of the budget should be
presented in the following function areas:
(A) Instruction – functions 11, 12, 13, 95
(B) Instructional Support – functions 21,
23, 31, 32, 33, 36
(C) Central Administration – function 41
(E) Debt Service – function 71
(F) Other – functions 61, 81, 91, 92, 93,
97, 99
The “per student” will be based on
student enrollment.
No funds may be expended in any
manner other than as provided for in the
adopted budget. The board does have the
authority to amend the budget or adopt a
supplementary emergency budget to
cover unforeseen expenditures.
The budget must be prepared in
accordance with GAAP (generally
accepted accounting principles) and state
guidelines.
The budget must be legally adopted
before the adoption of the tax rate.
However, if a school district has a July 1st
fiscal year start date, then a school
district must not adopt a tax rate until
after the district receives the certified
appraisal roll for the district required by
Section 26.01, Tax Code. Additionally, a
school district must publish a revised
notice and hold another public
meeting before the district may adopt a
tax rate that exceeds the following: (1)
The rate proposed in the notice prepared
using the estimate; or (2) The district’s
rollback rate determined under Section
26.08, Tax Code, using the certified
appraisal roll.
2019 - 2020 Adopted Budget 47
If a school district elects to adopt a tax
rate before adopting a budget, the district
must publish notice and hold a meeting
for the purpose of discussing the
proposed tax rate as provided by TEC
44.004. Following adoption of the tax
rate, the district must publish notice and
hold another public meeting before the
district may adopt a budget. The
comptroller shall prescribe the language
and format to be used in the notices. The
school district may use the certified
estimate of taxable value in preparing a
notice.
HB 3, 81st Regular Session, added TEC
39.084 which requires that on final
approval of the budget by the school
board, the school district shall post on the
district’s Internet website a copy of the
adopted budget. The website must
prominently display the electronic link to
the adopted budget until the third
anniversary of the date the budget was
adopted.
TEA Legal Requirements TEA has developed additional requirements
for school district budget preparation as
follows:
The budget must be adopted by the board
of trustees, inclusive of amendments, no
later than June 30. In order to prepare the
public notice to be published 10 days
prior to the meeting, the district budget
must be prepared by a date set by the state
board of education, currently June 19.
• Minutes from district board meetings
will be used by TEA to record adoption
of and amendments to the budget.
Budgets for the General Fund, the Food
Service Fund (whether accounted for in the
General Fund, a Special Revenue Fund or
Enterprise Fund) and the Debt Service Fund
must be included in the official district
budget (legal or fiscal year basis). These
budgets must be prepared and approved at
least at the fund and function levels to comply
with the state’s legal level of control
mandates. Funds to be budgeted and reported
through PEIMS, both required and optional,
are shown in Exhibit 2 in section 2.6.3.
Note: Districts may prepare and approve
budgets for other funds and/or with even
greater detail at their discretion. Such local
decisions may affect the need for budget
amendments and financial reporting
requirements.
The officially adopted district budget, as
amended, must be filed with TEA
through PEIMS (Public Education
Information Management System) by the
date prescribed in the annual system
guidelines. Revenues, other sources,
other uses, and fund balances must be
reported by fund, object (at the fourth
level), fiscal year, and amount.
Expenditures must be reported by fund,
function, object (at the second level),
organization, fiscal year, program intent
and amount. These requirements are
discussed in further detail in the Data
Collection and Reporting module.
A school district must amend the official
budget before exceeding a functional
expenditure category, i.e., instruction,
administration, etc., in the total district
budget. The annual financial and
compliance report should reflect the
amended budget amounts on the
schedule comparing budgeted and actual
amounts. The requirement for filing the
amended budget with TEA is satisfied
when the school district files its Annual
Financial and Compliance Report.
2019 - 2020 Adopted Budget 48
Local District Requirements
ANNUAL OPERATING BUDGET
CE (LEGAL) DATE ISSUED: 10/30/15
AUTHORIZED EXPENDITURES
A district shall not lend its credit or
gratuitously grant public money or things of
value in aid of any individual, association, or
corporation. Tex. Const. Art. III, Sec. 52;
Brazoria County v. Perry, 537 S.W.2d 89
(Tex. Civ. App.—Houston [1st Dist.] 1976, no
writ)
A district shall not grant any extra
compensation, fee, or allowance to a public
officer, agent, servant, or contractor after
service has been rendered or a contract
entered into and performed in whole or in
part. Nor shall a district pay or authorize the
payment of any claim against the district
under any agreement or contract made
without authority of law. Tex. Const. Art. III,
Sec. 53; Harlingen Indep. Sch. Dist. v. C.H.
Page and Bro., 48 S.W.2d 983 (Comm. App.
1932)
The state and county available funds
disbursed to a district shall be used
exclusively for salaries of professional
certified staff and for interest on money
borrowed on short time to pay such salaries,
when salaries become due before school
funds for the current year become available.
Loans for paying professional certified staff
salaries may not be paid out of funds other
than those for the current year. Education
Code 45.105(b)
Local funds from district taxes, tuition fees,
other local sources, and state funds not
designated for a specific purpose may be used
for salaries of any personnel and for
purchasing appliances and supplies; for the
payment of insurance premiums; for buying
school sites; for buying, building, repairing,
and renting school buildings, including
acquisition of school buildings and sites by
leasing through annual payments with an
ultimate option to purchase [see CHG]; and
for other purposes necessary in the conduct
of the public schools to be determined by a
board. Education Code 45.105(c)
No public funds of a district may be spent in
any manner other than as provided for in the
budget adopted by the board. Education
Code 44.006(a)
USE OF DISTRICT RESOURCES
IMPROVEMENTS TO REAL
PROPERTY
Except as provided below or by Education
Code 45.109(a-1), (a-2), or (a-3) [see CX], a
board shall not enter into an agreement
authorizing the use of school district
employees, property, or resources for the
provision of materials or labor for the design,
construction, or renovation of improvements
to real property not owned or leased by the
district.
This section does not prohibit the board from
entering into an agreement for the design,
construction, or renovation of improvements
to real property not owned or leased by the
district if the improvements benefit real
property owned or leased by the district.
Benefits to real property owned or leased by
the district include the design, construction,
or renovation of highways, roads, streets,
sidewalks, crosswalks, utilities, and drainage
improvements that serve or benefit the real
property owned or leased by the district.
Education Code 11.168
HOTELS
The board may not impose taxes, issue bonds,
use or authorize the use of district employees,
use or authorize the use of district property,
money, or other resources, or acquire
property for the design, construction,
renovation, or operation of a hotel. The board
may not enter into a lease, contract, or other
agreement that obligates the board to engage
in an activity prohibited by this section or
obligates the use of district employees or
resources in a manner prohibited by this
section.
2019 - 2020 Adopted Budget 49
“Hotel” means a building in which members
of the public obtain sleeping
accommodations for consideration. The term
includes a motel.
Education Code 11.178
ELECTIONEERING
A board may not use state or local funds or
other resources of the district to electioneer
for or against any candidate, measure, or
political party. Education Code 11.169
COMMITMENT OF CURRENT
REVENUE
A contract for the acquisition, including
lease, of real or personal property is a
commitment of a district’s current revenue
only, provided the contract contains either or
both of the following provisions:
1. Retains to a board the continuing right
to terminate the contract at the
expiration of each budget period during
the term of the contract.
2. Is conditioned on a best efforts attempt
by the board to obtain and appropriate
funds for payment of the contract.
Local Gov’t Code 271.903
FISCAL YEAR
A board may determine if a district’s fiscal
year begins on July 1 or September 1 of each
year. Education Code 44.0011
BUDGET PREPARATION
A superintendent shall prepare, or cause to be
prepared, a proposed budget covering all
estimated revenue and proposed expenditures
of a district for the following fiscal year.
Education Code 44.002
FUNDS FOR ACCELERATED
INSTRUCTION
A district that is required to provide
accelerated instruction under Education Code
29.081(b-1) [see EHBC] shall separately
budget sufficient funds, including funds
under Education Code 42.152, for that
purpose. A district may not budget funds
received under Education Code 42.152 for
any other purpose until the district adopts a
budget to support additional accelerated
instruction. Education Code 29.081(b-2)
DEADLINES
The proposed budget shall be prepared on or
before a date set by the State Board of
Education, currently August 20 (June 19 if a
district uses a July 1 fiscal year start date).
Education Code 44.002(a); 19 TAC 109.1(a),
.41
The adopted budget must be filed with the
Texas Education Agency on or before the
date established in the Financial
Accountability System Resource Guide.
Education Code 44.005; 19 TAC 109.1(a)
PUBLIC MEETING ON BUDGET AND
PROPOSED TAX RATE
After the proposed budget has been prepared,
a board president shall call a board meeting
for the purpose of adopting a budget for the
succeeding fiscal year. Any taxpayer of a
district may be present and participate in the
meeting. Education Code 44.004(a), (f) [See
CCG for provisions governing tax rate
adoption.]
The meeting must comply with the notice
requirements of the Open Meetings Act.
Gov’t Code 551.041, .043
PUBLISHED NOTICE
A board president shall also provide for
publication of notice of the budget and
proposed tax rate meeting in a daily, weekly,
or biweekly newspaper published in a
district. If no daily, weekly, or biweekly
newspaper is published in a district, the
president shall provide for publication of
notice in at least one newspaper of general
circulation in the county in which the
district’s central administrative office is
located. The notice shall be published not
earlier than the 30th day or later than the tenth
day before the date of the hearing.
FORM OF NOTICE
The published notice of the public meeting to
discuss and adopt the budget and the
proposed tax rate must meet the size, format,
and content requirements dictated by law.
2019 - 2020 Adopted Budget 50
The notice is not valid if it does not
substantially conform to the language and
format prescribed by the comptroller.
TAXPAYER INJUNCTION
If a district has not complied with the
published notice requirements in the FORM
OF NOTICE described above, and the
requirements for DISTRICTS WITH JULY 1
FISCAL YEAR below, if applicable, and the
failure to comply was not in good faith, a
person who owns taxable property in the
district is entitled to an injunction restraining
the collection of taxes by the district. An
action to enjoin the collection of taxes must
be filed before the date a district delivers
substantially all of its tax bills.
Education Code 44.004(b)–(e)
PUBLICATION OF PROPOSED
BUDGET SUMMARY
Concurrently with the publication of notice
of the budget under Education Code 44.004,
a district shall post a summary of the
proposed budget on the school district’s
Internet website or, if the district has no
Internet website, in the district’s central
administrative office.
The budget summary must include a
comparison to the previous year’s actual
spending and information relating to per
student and aggregate spending on:
1. Instruction;
2. Instructional support;
3. Central administration;
4. District operations;
5. Debt service; and
6. Any other category designated by the
Commissioner.
Education Code 44.0041
DECREASE IN DEBT SERVICE RATE
If the debt service rate calculated under
Education Code 44.004(c)(5)(A)(ii)(b)
decreases after the publication of the notice
required by this section, the board president
is not required to publish another notice or
call another meeting to discuss and adopt the
budget and the proposed lower tax rate.
Education Code 44.004(g-1)
BUDGET ADOPTION
A board shall adopt a budget to cover all
expenditures for the succeeding fiscal year at
the meeting called for that purpose and before
the adoption of the tax rate for the tax year in
which the fiscal year covered by the budget
begins. Education Code 44.004(f)–(g)
CERTIFIED ESTIMATE
By April 30, the chief appraiser shall prepare
and certify an estimate of the taxable value of
school district property. Tax Code 26.01(e)
DISTRICTS WITH JULY 1 FISCAL
YEAR
A district with a fiscal year beginning July 1
may use the certified estimate of the taxable
value of district property in preparing the
published notice if the district does not
receive the certified appraisal roll on or
before June 7. A district that uses a certified
estimate may adopt a budget at the public
meeting designated in the published notice
prepared using the estimate, but a district
may not adopt a tax rate before the district
receives the certified appraisal roll for the
district. Education Code 44.004(h)–(i)
BUDGET ADOPTION AFTER TAX
RATE ADOPTION
Notwithstanding Education Code 44.004(g),
(h), and (i), above, a district may adopt a
budget after the district adopts a tax rate for
the tax year in which the fiscal year covered
by the budget begins if the district elects to
adopt a tax rate before receiving the certified
appraisal roll for the district as provided by
Tax Code 26.05(g). Following adoption of
the tax rate [see CCG], the district must
publish notice and hold a public meeting
before the district may adopt a budget. The
comptroller shall prescribe the language and
format to be used in the notice. The district
may use the certified estimate of taxable
value in preparing the notice. Education
Code 44.004(j)
2019 - 2020 Adopted Budget 51
PUBLICATION OF ADOPTED
BUDGET
On final approval of the budget by the board,
a district shall post on the district’s Internet
website a copy of the budget adopted by the
board. The district’s website must
prominently display the electronic link to the
adopted budget.
A district shall maintain the adopted budget
on the district’s website until the third
anniversary of the date the budget was
adopted. Education Code 44.0051
AMENDMENT OF APPROVED
BUDGET
A board shall have the authority to amend the
approved budget or to adopt a supplementary
emergency budget to cover necessary
unforeseen expenses.
Copies of any amendment or supplementary
budget must be prepared and filed in
accordance with State Board rules.
Education Code 44.006
FAILURE TO COMPLY WITH
BUDGET AMENDMENTS
A board member who votes to approve any
expenditure of school funds in excess of the
item or items appropriated in the adopted
budget or a supplementary or amended
budget commits a misdemeanor offense.
Education Code 44.052(c)
CERTAIN DONATIONS
A district may donate funds or other property
or service to the adjutant general’s
department, the Texas National Guard, or the
Texas State Guard. Gov’t Code 437.111(b),
.252, .304(a)
ANNUAL OPERATING BUDGET
CE (LOCAL) DATE ISSUED: 11/03/08
FISCAL YEAR The District shall operate on a fiscal year
beginning July 1 and ending June 30.
BUDGET PLANNING
Budget planning shall be an integral part of
overall program planning so that the budget
effectively reflects the District’s programs
and activities and provides the resources to
implement them. In the budget planning
process, general educational goals, specific
program goals, and alternatives for achieving
program goals shall be considered, as well as
input from the District- and campus-level
planning and decision-making committees.
Budget planning and evaluation are
continuous processes and shall be a part of
each month’s activities.
BUDGET MEETING
The annual public meeting to discuss the
proposed budget and tax rate shall be
conducted as follows:
1. The Board President shall request at the
beginning of the meeting that all persons
who desire to speak on the proposed
budget and/or tax rate sign up on the
sheet provided.
2. Prior to the beginning of the meeting, the
Board may establish time limits for
speakers.
3. Speakers shall confine their remarks to
the appropriation of funds as contained in
the proposed budget and/or the tax rate.
4. No officer or employee of the District
shall be required to respond to questions
from speakers at the meeting.
AUTHORIZED EXPENDITURES
The adopted budget provides authority to
expend funds for the purposes indicated and
in accordance with state law, Board policy,
and the District’s approved purchasing
procedures. The expenditure of funds shall
be under the direction of the Superintendent
or designee who shall ensure that funds are
expended in accordance with the adopted
budget.
BUDGET AMENDMENTS The Board shall amend the budget when a
change is made increasing any one of the
functional spending categories or increasing
revenue object accounts and other resources.
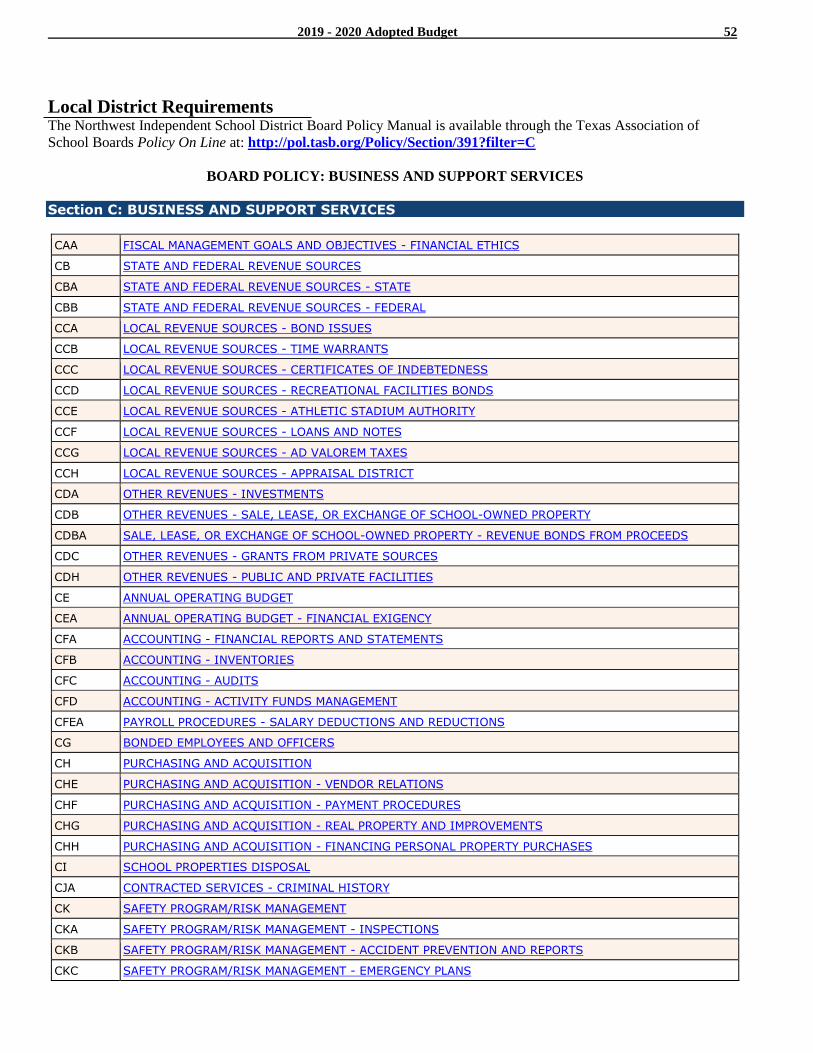
2019 - 2020 Adopted Budget 52
Local District Requirements The Northwest Independent School District Board Policy Manual is available through the Texas Association of
School Boards Policy On Line at: http://pol.tasb.org/Policy/Section/391?filter=C
BOARD POLICY: BUSINESS AND SUPPORT SERVICES
Section C: BUSINESS AND SUPPORT SERVICES
CAA FISCAL MANAGEMENT GOALS AND OBJECTIVES - FINANCIAL ETHICS
CB STATE AND FEDERAL REVENUE SOURCES
CBA STATE AND FEDERAL REVENUE SOURCES - STATE
CBB STATE AND FEDERAL REVENUE SOURCES - FEDERAL
CCA LOCAL REVENUE SOURCES - BOND ISSUES
CCB LOCAL REVENUE SOURCES - TIME WARRANTS
CCC LOCAL REVENUE SOURCES - CERTIFICATES OF INDEBTEDNESS
CCD LOCAL REVENUE SOURCES - RECREATIONAL FACILITIES BONDS
CCE LOCAL REVENUE SOURCES - ATHLETIC STADIUM AUTHORITY
CCF LOCAL REVENUE SOURCES - LOANS AND NOTES
CCG LOCAL REVENUE SOURCES - AD VALOREM TAXES
CCH LOCAL REVENUE SOURCES - APPRAISAL DISTRICT
CDA OTHER REVENUES - INVESTMENTS
CDB OTHER REVENUES - SALE, LEASE, OR EXCHANGE OF SCHOOL-OWNED PROPERTY
CDBA SALE, LEASE, OR EXCHANGE OF SCHOOL-OWNED PROPERTY - REVENUE BONDS FROM PROCEEDS
CDC OTHER REVENUES - GRANTS FROM PRIVATE SOURCES
CDH OTHER REVENUES - PUBLIC AND PRIVATE FACILITIES
CE ANNUAL OPERATING BUDGET
CEA ANNUAL OPERATING BUDGET - FINANCIAL EXIGENCY
CFA ACCOUNTING - FINANCIAL REPORTS AND STATEMENTS
CFB ACCOUNTING - INVENTORIES
CFC ACCOUNTING - AUDITS
CFD ACCOUNTING - ACTIVITY FUNDS MANAGEMENT
CFEA PAYROLL PROCEDURES - SALARY DEDUCTIONS AND REDUCTIONS
CG BONDED EMPLOYEES AND OFFICERS
CH PURCHASING AND ACQUISITION
CHE PURCHASING AND ACQUISITION - VENDOR RELATIONS
CHF PURCHASING AND ACQUISITION - PAYMENT PROCEDURES
CHG PURCHASING AND ACQUISITION - REAL PROPERTY AND IMPROVEMENTS
CHH PURCHASING AND ACQUISITION - FINANCING PERSONAL PROPERTY PURCHASES
CI SCHOOL PROPERTIES DISPOSAL
CJA CONTRACTED SERVICES - CRIMINAL HISTORY
CK SAFETY PROGRAM/RISK MANAGEMENT
CKA SAFETY PROGRAM/RISK MANAGEMENT - INSPECTIONS
CKB SAFETY PROGRAM/RISK MANAGEMENT - ACCIDENT PREVENTION AND REPORTS
CKC SAFETY PROGRAM/RISK MANAGEMENT - EMERGENCY PLANS
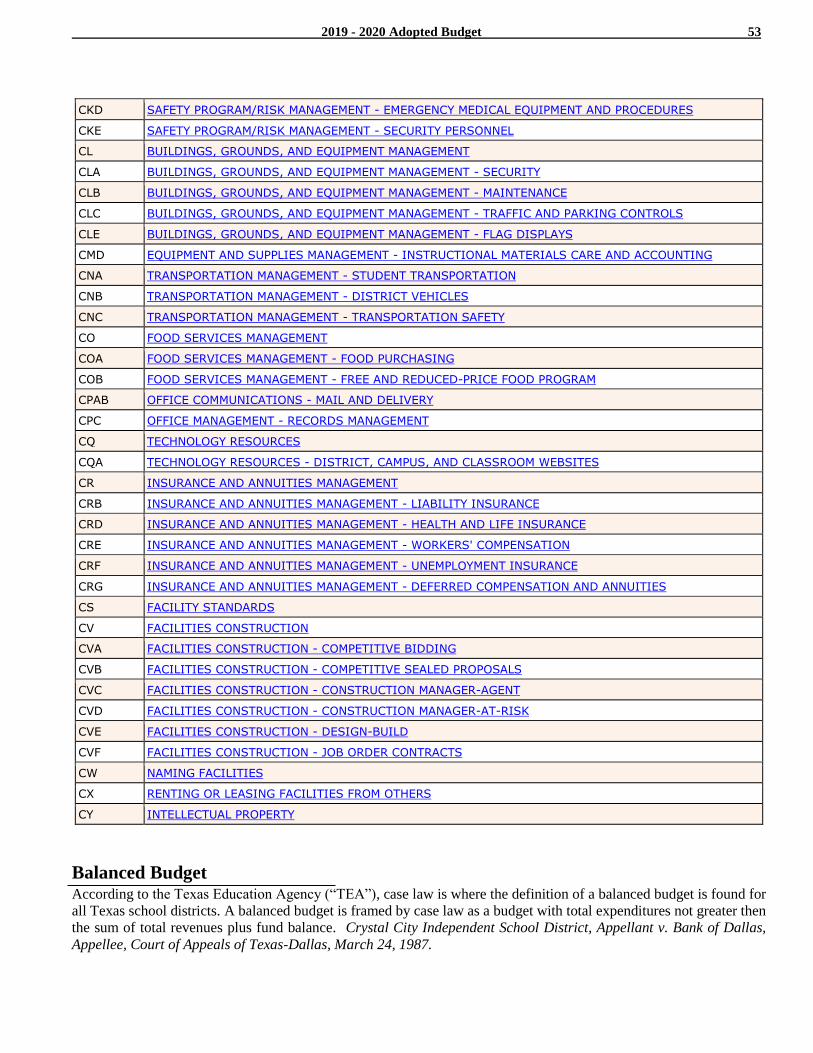
2019 - 2020 Adopted Budget 53
CKD SAFETY PROGRAM/RISK MANAGEMENT - EMERGENCY MEDICAL EQUIPMENT AND PROCEDURES
CKE SAFETY PROGRAM/RISK MANAGEMENT - SECURITY PERSONNEL
CL BUILDINGS, GROUNDS, AND EQUIPMENT MANAGEMENT
CLA BUILDINGS, GROUNDS, AND EQUIPMENT MANAGEMENT - SECURITY
CLB BUILDINGS, GROUNDS, AND EQUIPMENT MANAGEMENT - MAINTENANCE
CLC BUILDINGS, GROUNDS, AND EQUIPMENT MANAGEMENT - TRAFFIC AND PARKING CONTROLS
CLE BUILDINGS, GROUNDS, AND EQUIPMENT MANAGEMENT - FLAG DISPLAYS
CMD EQUIPMENT AND SUPPLIES MANAGEMENT - INSTRUCTIONAL MATERIALS CARE AND ACCOUNTING
CNA TRANSPORTATION MANAGEMENT - STUDENT TRANSPORTATION
CNB TRANSPORTATION MANAGEMENT - DISTRICT VEHICLES
CNC TRANSPORTATION MANAGEMENT - TRANSPORTATION SAFETY
CO FOOD SERVICES MANAGEMENT
COA FOOD SERVICES MANAGEMENT - FOOD PURCHASING
COB FOOD SERVICES MANAGEMENT - FREE AND REDUCED-PRICE FOOD PROGRAM
CPAB OFFICE COMMUNICATIONS - MAIL AND DELIVERY
CPC OFFICE MANAGEMENT - RECORDS MANAGEMENT
CQ TECHNOLOGY RESOURCES
CQA TECHNOLOGY RESOURCES - DISTRICT, CAMPUS, AND CLASSROOM WEBSITES
CR INSURANCE AND ANNUITIES MANAGEMENT
CRB INSURANCE AND ANNUITIES MANAGEMENT - LIABILITY INSURANCE
CRD INSURANCE AND ANNUITIES MANAGEMENT - HEALTH AND LIFE INSURANCE
CRE INSURANCE AND ANNUITIES MANAGEMENT - WORKERS' COMPENSATION
CRF INSURANCE AND ANNUITIES MANAGEMENT - UNEMPLOYMENT INSURANCE
CRG INSURANCE AND ANNUITIES MANAGEMENT - DEFERRED COMPENSATION AND ANNUITIES
CS FACILITY STANDARDS
CV FACILITIES CONSTRUCTION
CVA FACILITIES CONSTRUCTION - COMPETITIVE BIDDING
CVB FACILITIES CONSTRUCTION - COMPETITIVE SEALED PROPOSALS
CVC FACILITIES CONSTRUCTION - CONSTRUCTION MANAGER-AGENT
CVD FACILITIES CONSTRUCTION - CONSTRUCTION MANAGER-AT-RISK
CVE FACILITIES CONSTRUCTION - DESIGN-BUILD
CVF FACILITIES CONSTRUCTION - JOB ORDER CONTRACTS
CW NAMING FACILITIES
CX RENTING OR LEASING FACILITIES FROM OTHERS
CY INTELLECTUAL PROPERTY
Balanced Budget According to the Texas Education Agency (“TEA”), case law is where the definition of a balanced budget is found for
all Texas school districts. A balanced budget is framed by case law as a budget with total expenditures not greater then
the sum of total revenues plus fund balance. Crystal City Independent School District, Appellant v. Bank of Dallas,
Appellee, Court of Appeals of Texas-Dallas, March 24, 1987.
2019 - 2020 Adopted Budget 54
Budget
Process
Objectives of Budgeting The objectives of budgeting are outlined by
the Texas Education Agency in the Financial
Accountability System Resource Guide.
Performance evaluation allows citizens and
taxpayers to hold policy makers and
administrators accountable for their actions.
Because accountability to citizens often is
stated explicitly in state laws and
constitutions, it is considered a cornerstone of
budgeting and financial reporting. The
Governmental Accounting Standards Board
(GASB) recognizes its importance with these
objectives in its GASB Concepts Statement
No. 1 (Section 100.177):
Financial reporting should provide
information to determine whether
current-year revenues were sufficient to
pay for current-year services.
Financial reporting should demonstrate
whether resources were obtained and
used in accordance with the entity's
legally adopted budget. It should also
demonstrate compliance with other
finance-related legal or contractual
requirements.
Financial reporting should provide
information to assist users in assessing
the service efforts, costs and
accomplishments of the governmental
entity.
Meeting these objectives requires budget
preparation to include several concepts
recognizing accountability. Often these
concepts have been mandated for state and
local public sector budgets. They include
requirements that budgets should:
Be balanced so that current revenues are
sufficient to pay for current services.
Be prepared in accordance with all
applicable federal, state, and local legal
mandates and requirements.
Provide a basis for the evaluation of a
government's service efforts, costs and
accomplishments.
Note: Although the objective of balanced
budgets is generally applicable to all school
districts to ensure long-term fiscal health,
variations of this objective which are
considered appropriate for some school
districts over short-term periods are
available. For example, the balanced budget
objective may be met through the use of fund
balance reserves to pay for current services
during certain periods. Such uses of fund
balance reserves must be in accordance with
applicable state and local fund balance
policies.
Budget Process Overview
The budgeting process is comprised of three
major phases: planning, preparation and
evaluation. The budgetary process begins
with sound planning. Planning defines the
goals and objectives of campuses and the
school district and develops programs to
attain those goals and objectives. Once these
programs and plans have been established,
budgetary resource allocations are made to
support them. Budgetary resource allocations
are the preparation phase of budgeting. The
allocations cannot be made, however, until
plans and programs have been established.
Finally, the budget is evaluated for its
effectiveness in attaining goals and
objectives. Evaluation typically involves an
examination of: how funds were expended,
what outcomes resulted from the expenditure
of funds, and to what degree these outcomes
achieved the objectives stated during the
planning phase. This evaluation phase is
important in determining the following year's
budgetary allocations. In summary, budget
preparation is not a one-time exercise to
determine how a school district will allocate
funds. Rather, school district budget
preparation is part of a continuous cycle of
planning and evaluation to achieve district
goals.
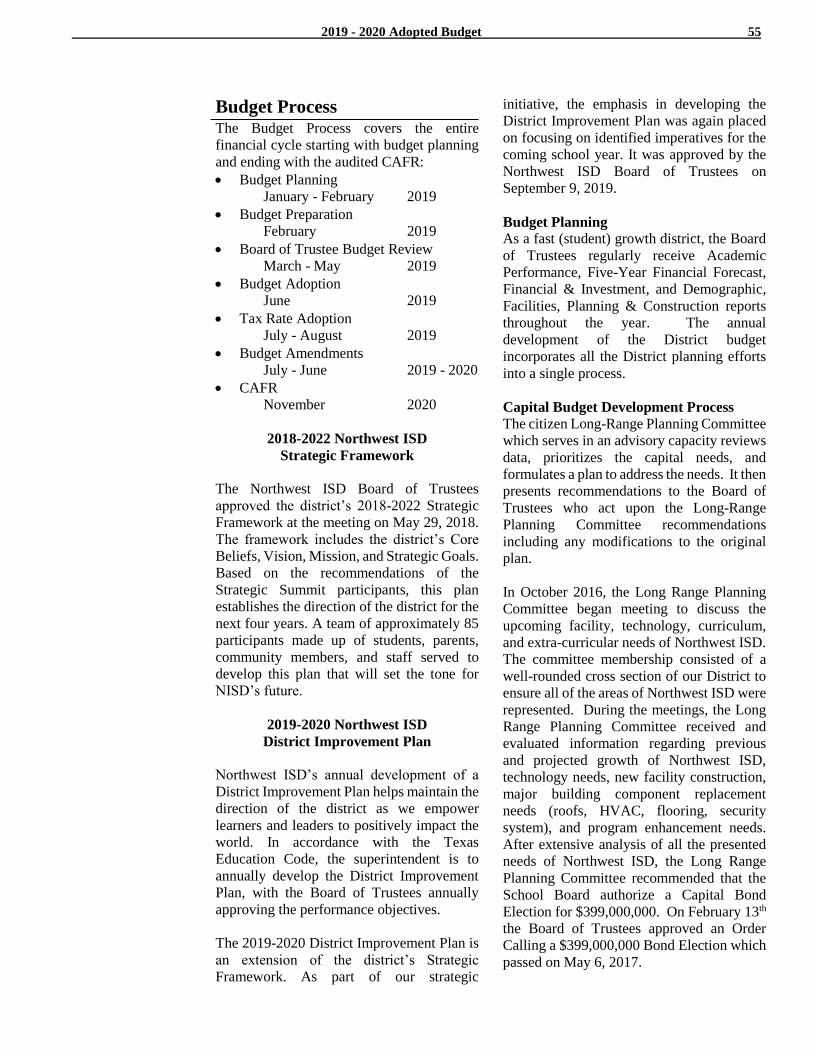
2019 - 2020 Adopted Budget 55
Budget Process The Budget Process covers the entire
financial cycle starting with budget planning
and ending with the audited CAFR:
Budget Planning
January - February 2019
Budget Preparation
February 2019
Board of Trustee Budget Review
March - May 2019
Budget Adoption
June 2019
Tax Rate Adoption
July - August 2019
Budget Amendments
July - June 2019 - 2020
CAFR
November 2020
2018-2022 Northwest ISD
Strategic Framework
The Northwest ISD Board of Trustees
approved the district’s 2018-2022 Strategic
Framework at the meeting on May 29, 2018.
The framework includes the district’s Core
Beliefs, Vision, Mission, and Strategic Goals.
Based on the recommendations of the
Strategic Summit participants, this plan
establishes the direction of the district for the
next four years. A team of approximately 85
participants made up of students, parents,
community members, and staff served to
develop this plan that will set the tone for
NISD’s future.
2019-2020 Northwest ISD
District Improvement Plan
Northwest ISD’s annual development of a
District Improvement Plan helps maintain the
direction of the district as we empower
learners and leaders to positively impact the
world. In accordance with the Texas
Education Code, the superintendent is to
annually develop the District Improvement
Plan, with the Board of Trustees annually
approving the performance objectives.
The 2019-2020 District Improvement Plan is
an extension of the district’s Strategic
Framework. As part of our strategic
initiative, the emphasis in developing the
District Improvement Plan was again placed
on focusing on identified imperatives for the
coming school year. It was approved by the
Northwest ISD Board of Trustees on
September 9, 2019.
Budget Planning
As a fast (student) growth district, the Board
of Trustees regularly receive Academic
Performance, Five-Year Financial Forecast,
Financial & Investment, and Demographic,
Facilities, Planning & Construction reports
throughout the year. The annual
development of the District budget
incorporates all the District planning efforts
into a single process.
Capital Budget Development Process The citizen Long-Range Planning Committee
which serves in an advisory capacity reviews
data, prioritizes the capital needs, and
formulates a plan to address the needs. It then
presents recommendations to the Board of
Trustees who act upon the Long-Range
Planning Committee recommendations
including any modifications to the original
plan.
In October 2016, the Long Range Planning
Committee began meeting to discuss the
upcoming facility, technology, curriculum,
and extra-curricular needs of Northwest ISD.
The committee membership consisted of a
well-rounded cross section of our District to
ensure all of the areas of Northwest ISD were
represented. During the meetings, the Long
Range Planning Committee received and
evaluated information regarding previous
and projected growth of Northwest ISD,
technology needs, new facility construction,
major building component replacement
needs (roofs, HVAC, flooring, security
system), and program enhancement needs.
After extensive analysis of all the presented
needs of Northwest ISD, the Long Range
Planning Committee recommended that the
School Board authorize a Capital Bond
Election for $399,000,000. On February 13th
the Board of Trustees approved an Order
Calling a $399,000,000 Bond Election which
passed on May 6, 2017.
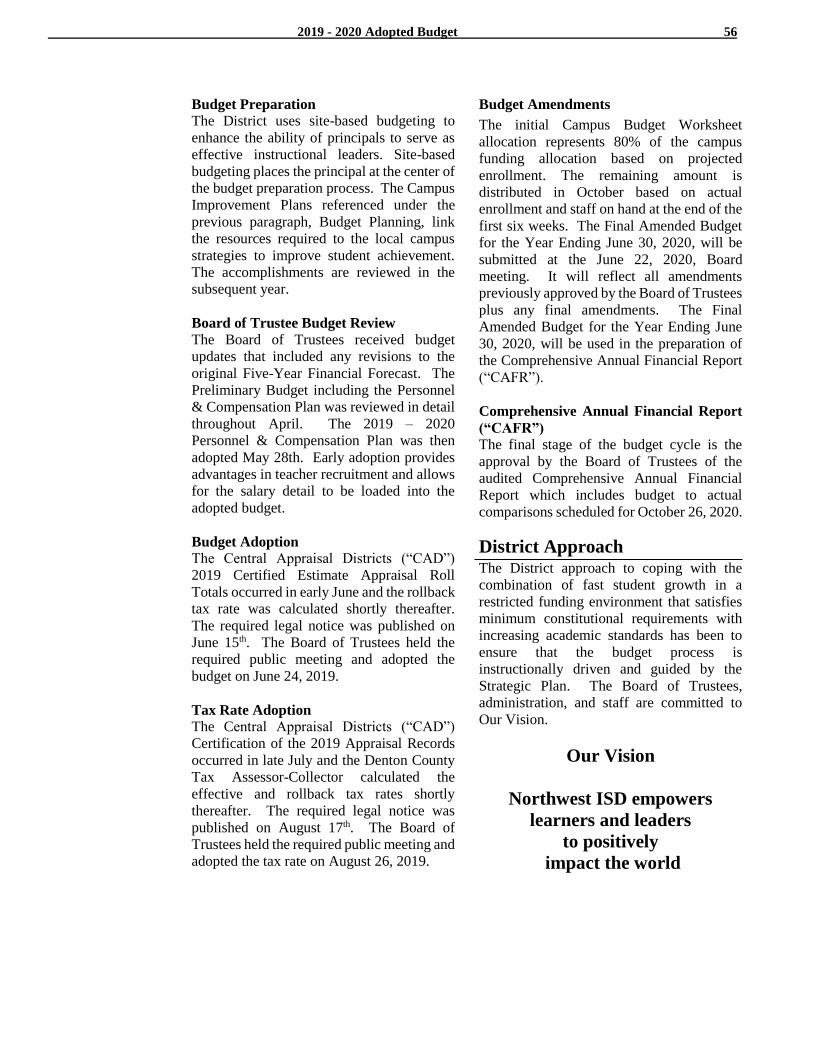
2019 - 2020 Adopted Budget 56
Budget Preparation The District uses site-based budgeting to
enhance the ability of principals to serve as
effective instructional leaders. Site-based
budgeting places the principal at the center of
the budget preparation process. The Campus
Improvement Plans referenced under the
previous paragraph, Budget Planning, link
the resources required to the local campus
strategies to improve student achievement.
The accomplishments are reviewed in the
subsequent year.
Board of Trustee Budget Review
The Board of Trustees received budget
updates that included any revisions to the
original Five-Year Financial Forecast. The
Preliminary Budget including the Personnel
& Compensation Plan was reviewed in detail
throughout April. The 2019 – 2020
Personnel & Compensation Plan was then
adopted May 28th. Early adoption provides
advantages in teacher recruitment and allows
for the salary detail to be loaded into the
adopted budget.
Budget Adoption
The Central Appraisal Districts (“CAD”)
2019 Certified Estimate Appraisal Roll
Totals occurred in early June and the rollback
tax rate was calculated shortly thereafter.
The required legal notice was published on
June 15th. The Board of Trustees held the
required public meeting and adopted the
budget on June 24, 2019.
Tax Rate Adoption The Central Appraisal Districts (“CAD”)
Certification of the 2019 Appraisal Records
occurred in late July and the Denton County
Tax Assessor-Collector calculated the
effective and rollback tax rates shortly
thereafter. The required legal notice was
published on August 17th. The Board of
Trustees held the required public meeting and
adopted the tax rate on August 26, 2019.
Budget Amendments
The initial Campus Budget Worksheet
allocation represents 80% of the campus
funding allocation based on projected
enrollment. The remaining amount is
distributed in October based on actual
enrollment and staff on hand at the end of the
first six weeks. The Final Amended Budget
for the Year Ending June 30, 2020, will be
submitted at the June 22, 2020, Board
meeting. It will reflect all amendments
previously approved by the Board of Trustees
plus any final amendments. The Final
Amended Budget for the Year Ending June
30, 2020, will be used in the preparation of
the Comprehensive Annual Financial Report
(“CAFR”).
Comprehensive Annual Financial Report
(“CAFR”)
The final stage of the budget cycle is the
approval by the Board of Trustees of the
audited Comprehensive Annual Financial
Report which includes budget to actual
comparisons scheduled for October 26, 2020.
District Approach The District approach to coping with the
combination of fast student growth in a
restricted funding environment that satisfies
minimum constitutional requirements with
increasing academic standards has been to
ensure that the budget process is
instructionally driven and guided by the
Strategic Plan. The Board of Trustees,
administration, and staff are committed to
Our Vision.
Our Vision
Northwest ISD empowers
learners and leaders
to positively
impact the world
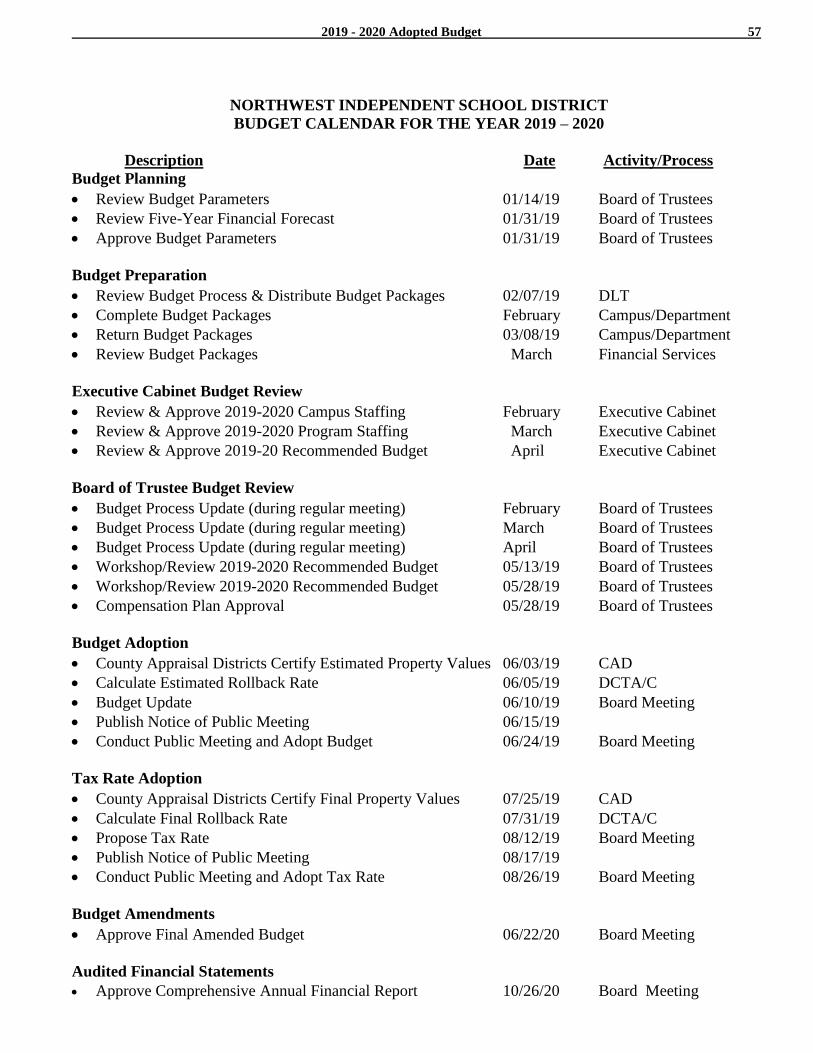
2019 - 2020 Adopted Budget 57
NORTHWEST INDEPENDENT SCHOOL DISTRICT
BUDGET CALENDAR FOR THE YEAR 2019 – 2020
Description Date Activity/Process
Budget Planning
Review Budget Parameters 01/14/19 Board of Trustees
Review Five-Year Financial Forecast 01/31/19 Board of Trustees
Approve Budget Parameters 01/31/19 Board of Trustees
Budget Preparation
Review Budget Process & Distribute Budget Packages 02/07/19 DLT
Complete Budget Packages February Campus/Department
Return Budget Packages 03/08/19 Campus/Department
Review Budget Packages March Financial Services
Executive Cabinet Budget Review
Review & Approve 2019-2020 Campus Staffing February Executive Cabinet
Review & Approve 2019-2020 Program Staffing March Executive Cabinet
Review & Approve 2019-20 Recommended Budget April Executive Cabinet
Board of Trustee Budget Review
Budget Process Update (during regular meeting) February Board of Trustees
Budget Process Update (during regular meeting) March Board of Trustees
Budget Process Update (during regular meeting) April Board of Trustees
Workshop/Review 2019-2020 Recommended Budget 05/13/19 Board of Trustees
Workshop/Review 2019-2020 Recommended Budget 05/28/19 Board of Trustees
Compensation Plan Approval 05/28/19 Board of Trustees
Budget Adoption
County Appraisal Districts Certify Estimated Property Values 06/03/19 CAD
Calculate Estimated Rollback Rate 06/05/19 DCTA/C
Budget Update 06/10/19 Board Meeting
Publish Notice of Public Meeting 06/15/19
Conduct Public Meeting and Adopt Budget 06/24/19 Board Meeting
Tax Rate Adoption
County Appraisal Districts Certify Final Property Values 07/25/19 CAD
Calculate Final Rollback Rate 07/31/19 DCTA/C
Propose Tax Rate 08/12/19 Board Meeting
Publish Notice of Public Meeting 08/17/19
Conduct Public Meeting and Adopt Tax Rate 08/26/19 Board Meeting
Budget Amendments
Approve Final Amended Budget 06/22/20 Board Meeting
Audited Financial Statements
Approve Comprehensive Annual Financial Report 10/26/20 Board Meeting
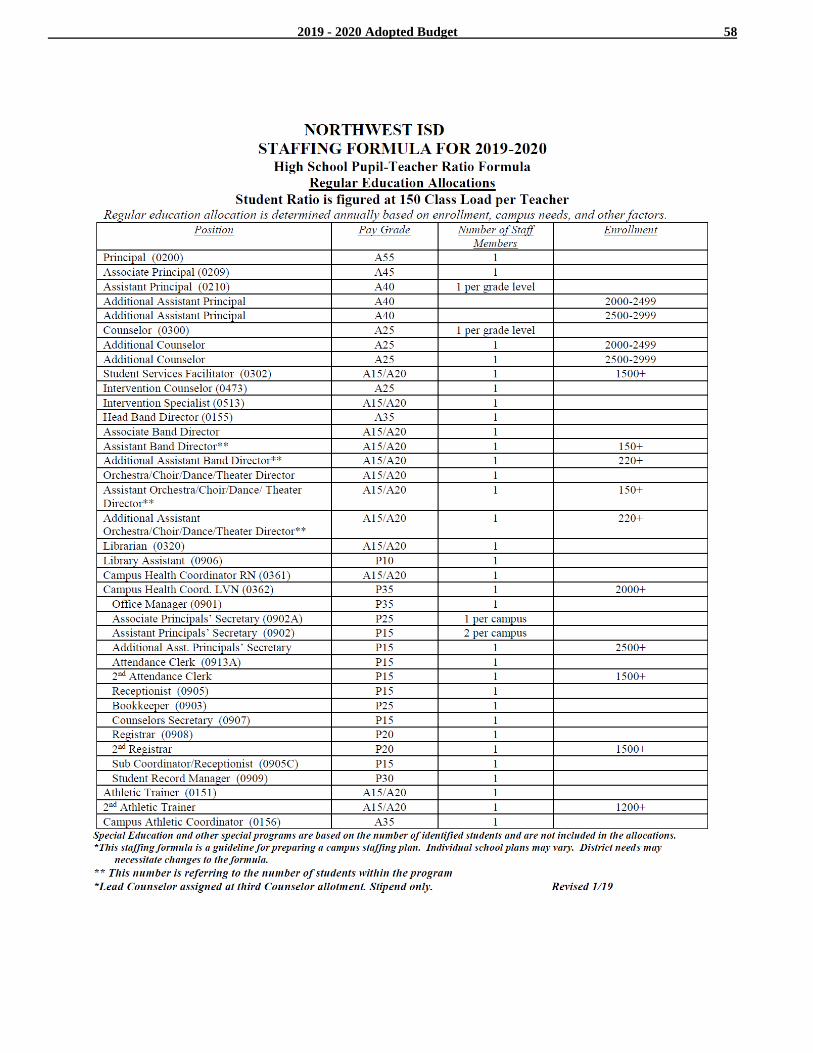
2019 - 2020 Adopted Budget 58
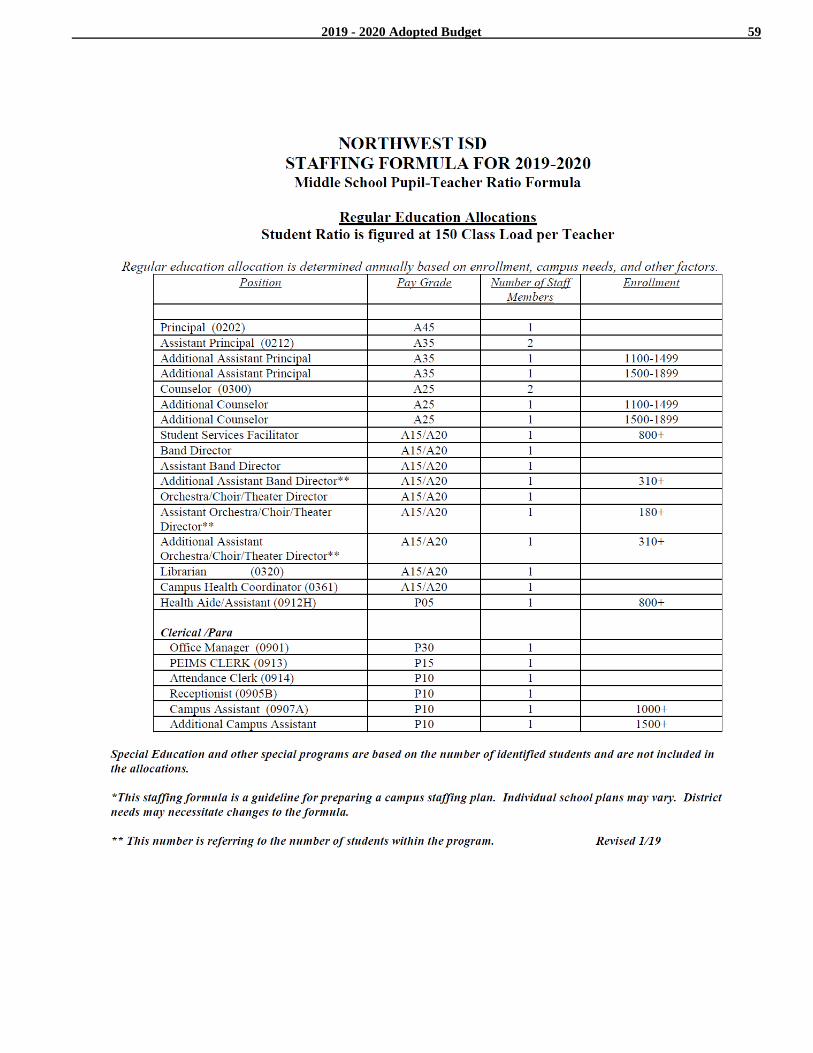
2019 - 2020 Adopted Budget 59
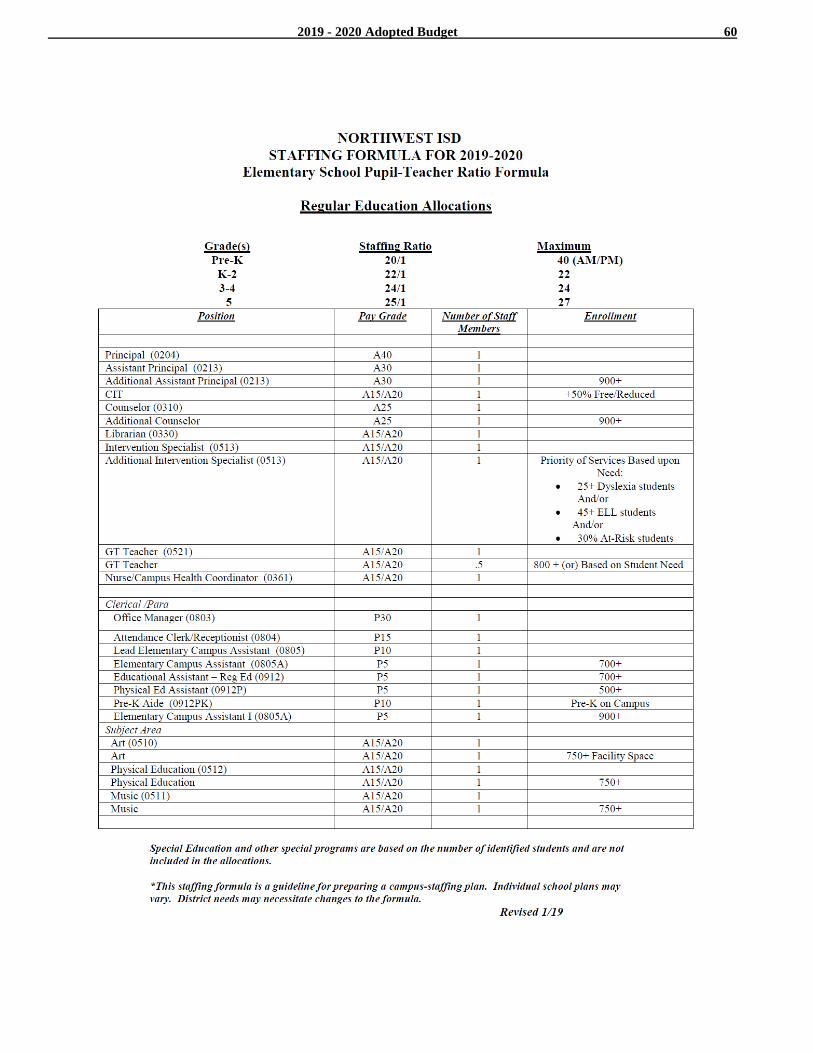
2019 - 2020 Adopted Budget 60
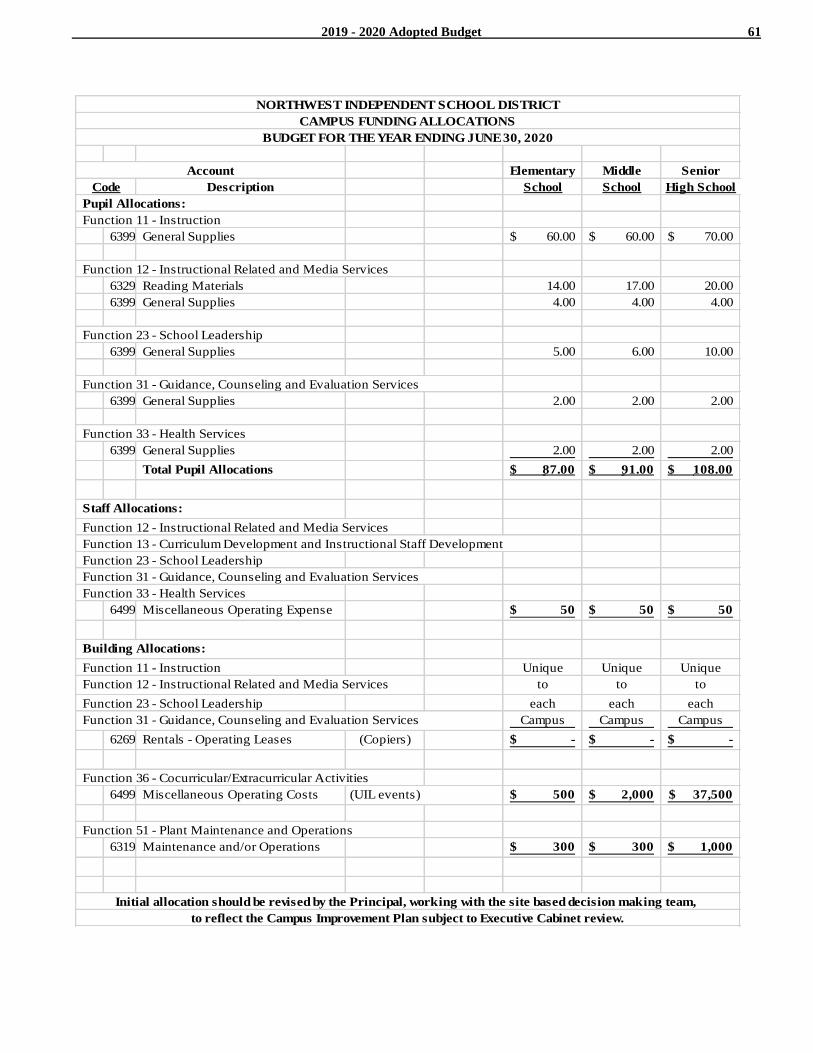
2019 - 2020 Adopted Budget 61
Elementary Middle Senior
Description School School High School
Pupil Allocations:
Function 11 - Instruction
6399 General Supplies 60.00$ 60.00$ 70.00$
Function 12 - Instructional Related and Media Services
6329 Reading Materials 14.00 17.00 20.00
6399 General Supplies 4.00 4.00 4.00
Function 23 - School Leadership
6399 General Supplies 5.00 6.00 10.00
Function 31 - Guidance, Counseling and Evaluation Services
6399 General Supplies 2.00 2.00 2.00
Function 33 - Health Services
6399 General Supplies 2.00 2.00 2.00
Total Pupil Allocations 87.00$ 91.00$ 108.00$
Staff Allocations:
Function 12 - Instructional Related and Media Services
Function 13 - Curriculum Development and Instructional Staff Development
Function 23 - School Leadership
Function 31 - Guidance, Counseling and Evaluation Services
Function 33 - Health Services
6499 Miscellaneous Operating Expense 50$ 50$ 50$
Building Allocations:
Function 11 - Instruction Unique Unique Unique
Function 12 - Instructional Related and Media Services to to to
Function 23 - School Leadership each each each
Function 31 - Guidance, Counseling and Evaluation Services Campus Campus Campus
6269 Rentals - Operating Leases (Copiers) -$ -$ -$
Function 36 - Cocurricular/Extracurricular Activities
6499 Miscellaneous Operating Costs (UIL events) 500$ 2,000$ 37,500$
Function 51 - Plant Maintenance and Operations
6319 Maintenance and/or Operations 300$ 300$ 1,000$
Initial allocation should be revised by the Principal, working with the site based decision making team,
to reflect the Campus Improvement Plan subject to Executive Cabinet review.
Code
Account
NORTHWEST INDEPENDENT SCHOOL DISTRICT
CAMPUS FUNDING ALLOCATIONS
BUDGET FOR THE YEAR ENDING JUNE 30, 2020
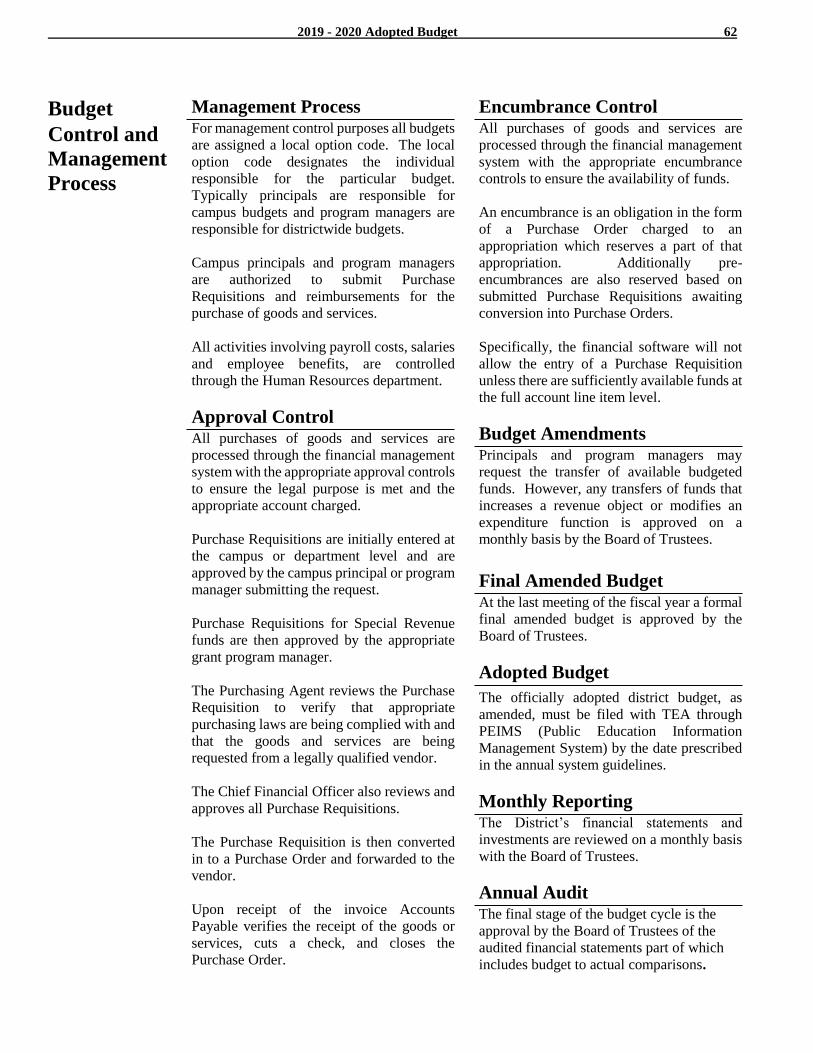
2019 - 2020 Adopted Budget 62
Budget
Control and
Management
Process
Management Process For management control purposes all budgets
are assigned a local option code. The local
option code designates the individual
responsible for the particular budget.
Typically principals are responsible for
campus budgets and program managers are
responsible for districtwide budgets.
Campus principals and program managers
are authorized to submit Purchase
Requisitions and reimbursements for the
purchase of goods and services.
All activities involving payroll costs, salaries
and employee benefits, are controlled
through the Human Resources department.
Approval Control All purchases of goods and services are
processed through the financial management
system with the appropriate approval controls
to ensure the legal purpose is met and the
appropriate account charged.
Purchase Requisitions are initially entered at
the campus or department level and are
approved by the campus principal or program
manager submitting the request.
Purchase Requisitions for Special Revenue
funds are then approved by the appropriate
grant program manager.
The Purchasing Agent reviews the Purchase
Requisition to verify that appropriate
purchasing laws are being complied with and
that the goods and services are being
requested from a legally qualified vendor.
The Chief Financial Officer also reviews and
approves all Purchase Requisitions.
The Purchase Requisition is then converted
in to a Purchase Order and forwarded to the
vendor.
Upon receipt of the invoice Accounts
Payable verifies the receipt of the goods or
services, cuts a check, and closes the
Purchase Order.
Encumbrance Control All purchases of goods and services are
processed through the financial management
system with the appropriate encumbrance
controls to ensure the availability of funds.
An encumbrance is an obligation in the form
of a Purchase Order charged to an
appropriation which reserves a part of that
appropriation. Additionally pre-
encumbrances are also reserved based on
submitted Purchase Requisitions awaiting
conversion into Purchase Orders.
Specifically, the financial software will not
allow the entry of a Purchase Requisition
unless there are sufficiently available funds at
the full account line item level.
Budget Amendments Principals and program managers may
request the transfer of available budgeted
funds. However, any transfers of funds that
increases a revenue object or modifies an
expenditure function is approved on a
monthly basis by the Board of Trustees.
Final Amended Budget At the last meeting of the fiscal year a formal
final amended budget is approved by the
Board of Trustees.
Adopted Budget
The officially adopted district budget, as
amended, must be filed with TEA through
PEIMS (Public Education Information
Management System) by the date prescribed
in the annual system guidelines.
Monthly Reporting The District’s financial statements and
investments are reviewed on a monthly basis
with the Board of Trustees.
Annual Audit The final stage of the budget cycle is the
approval by the Board of Trustees of the
audited financial statements part of which
includes budget to actual comparisons.
2019 - 2020 Adopted Budget 63
Financial
Structure
Summary of Significant
Accounting Policies The Northwest Independent School District
(District) is a public educational agency
operating under the applicable laws and
regulations of the State of Texas. It is
governed by a seven member Board of
Trustees that are elected by registered voters
of the District. The District prepares its basic
financial statements in conformity with
Generally Accepted Accounting Principles
(GAAP) promulgated by the Governmental
Accounting Standards Board (GASB) and
other authoritative sources identified in
Statement of Auditing Standards No. 69 of
the American Institute of Certified Public
Accountants. Additionally, the District
complies with the requirements of the
appropriate version of the Texas Education
Agency (TEA) Financial Accountability
System Resource Guide (FASRG) and the
requirements of contracts and grants of
agencies from which it receives funds.
Reporting Entity The Board of the District is elected by the
public; has the authority to make decisions,
appoint administrators and managers;
significantly influence operations; and has
the primary accountability for fiscal matters.
Therefore, the District is a financial reporting
entity as defined by the Governmental
Accounting Standards Board (GASB) in its
Statement No. 14, “The Financial Reporting
Entity.” There are no component units
included within the reporting entity.
Basis of Accounting Governmental fund financial statements are
reported using the current financial resources
measurement focus and the modified accrual
basis of accounting. Revenues are
recognized as soon as they are both
measurable and available. Revenues are
considered to be available when they are
collectible within the current period or soon
enough thereafter to pay liabilities of the
current period. For this purpose, the
government considers revenues to be
available if they are collected within 60 days
of the end of the current fiscal period.
Expenditures generally are recorded when a
liability is incurred, as under accrual
accounting. However, debt service
expenditures, as well as expenditures related
to compensated absences and claims and
judgments, are recorded only when payment
is due.
Revenues from local sources consist
primarily of property taxes. Property tax
revenues and revenues received from the
State of Texas are recognized under the
susceptible-to-accrual concept.
Miscellaneous revenues are recorded as
revenue when received in cash because they
are generally not measurable until actually
received. Investment earnings are recorded
as earned, since they are both measurable and
available.
Grant funds are considered earned to the
extent of the expenditures made under the
provisions of the grant. Accordingly, when
such funds are received, they are recorded as
deferred revenues until the related and
authorized expenditures have been made. If
balances have not been expended by the end
of the project period, grantors sometimes
require the District to refund all or part of the
unused amount.
The District reports the following major
governmental funds:
Governmental Fund Types The general fund is the government’s
primary operating fund. It accounts for all
financial resources of the District, except
those required to be accounted for in another
fund. Major revenue sources include local
property taxes, state funding under the
Available School Fund and interest earnings.
Expenditures include all costs associated
with the daily operations of the District
except for specific programs funded by the
federal or state government, food service,
debt service, and capital projects. This is a
budgeted fund.
2019 - 2020 Adopted Budget 64
The special revenue funds account for
resources restricted to, or designated for,
specific purposes by a grantor. Federal and
state financial assistance generally is
accounted for in a special revenue fund. The
Child Nutrition Program adopts an annual
budget. All other special revenue funds
budgets are provided for informational
purposes only.
The District's Food Service Fund is
considered a special revenue fund since it
meets the following criteria: (1) User fees are
charged to supplement the National School
Lunch Program (NSLP), (2) The General
Fund subsidizes the Food Service Program
for all expenditures in excess of NSLP, and
(3) The District does not consider the Food
Service Program completely self-supporting.
Food Service fund balances are used
exclusively for child nutrition program
purposes.
The debt service fund accounts for the
resources accumulated and payments made
for principal and interest on long-term
general obligation debt of governmental
funds. This is a budgeted fund.
The capital projects fund accounts for
proceeds from long-term debt financing
(including the sale of bonds) and revenues
and expenditures related to authorized
construction and other capital asset
acquisitions. The capital projects fund
budget is provided for informational
purposes only.
The District reports the following proprietary
funds:
The internal service funds account for
revenues and expenses related to services
provided to organizations inside the District
on a cost reimbursement basis. The District’s
Internal Service Funds are Self -Insurance
and Netbooks. These are not budgeted funds.
Additionally, the District reports the
following fiduciary funds:
The agency fund accounts for resources held
in a custodial capacity by the District, and
consists of funds that are the property of
students or others. The District’s Agency
Funds are the Student Activity Account,
Student Council Account, and the High
School Student Activity Account. These are
not budgeted funds.
Basis of Budgeting Legal requirements for school district
budgets are formulated by the state, TEA, and
the local district. The Board adopts an
“appropriated budget” on a basis consistent
with GAAP for the general fund, debt service
fund and child nutrition program (which is
included in special revenue funds). At a
minimum, the District is required to present
the original and the final amended budgets
for revenues and expenditures compared to
actual revenues and expenditures for these
three funds.
Encumbrance accounting, under which
purchase orders, contracts and other
commitments are recorded in order to reserve
that portion of the applicable appropriation,
is used in all governmental funds.
Encumbrances outstanding at year-end are
commitments that do not constitute
expenditures or liabilities, but are reported as
reservations of fund balances. Since
appropriations lapse at the end of each year,
outstanding encumbrances are appropriately
provided for in the subsequent fiscal year’s
budget to provide for the liquidation of the
prior commitments.
Budgets are prepared on the same basis of
accounting as that used in the financial
statements. The basis of budgeting refers to
when revenues and expenditures are
recognized in the accounts and reported in the
financial statements. Governmental fund
types, the general fund, special revenue
funds, debt service fund, and capital projects
fund, are budgeted using the current financial
resources measurement focus and the
modified accrual basis of accounting. The
proprietary funds, the internal services funds,
and the fiduciary funds, the agency fund, are
not budgeted funds.
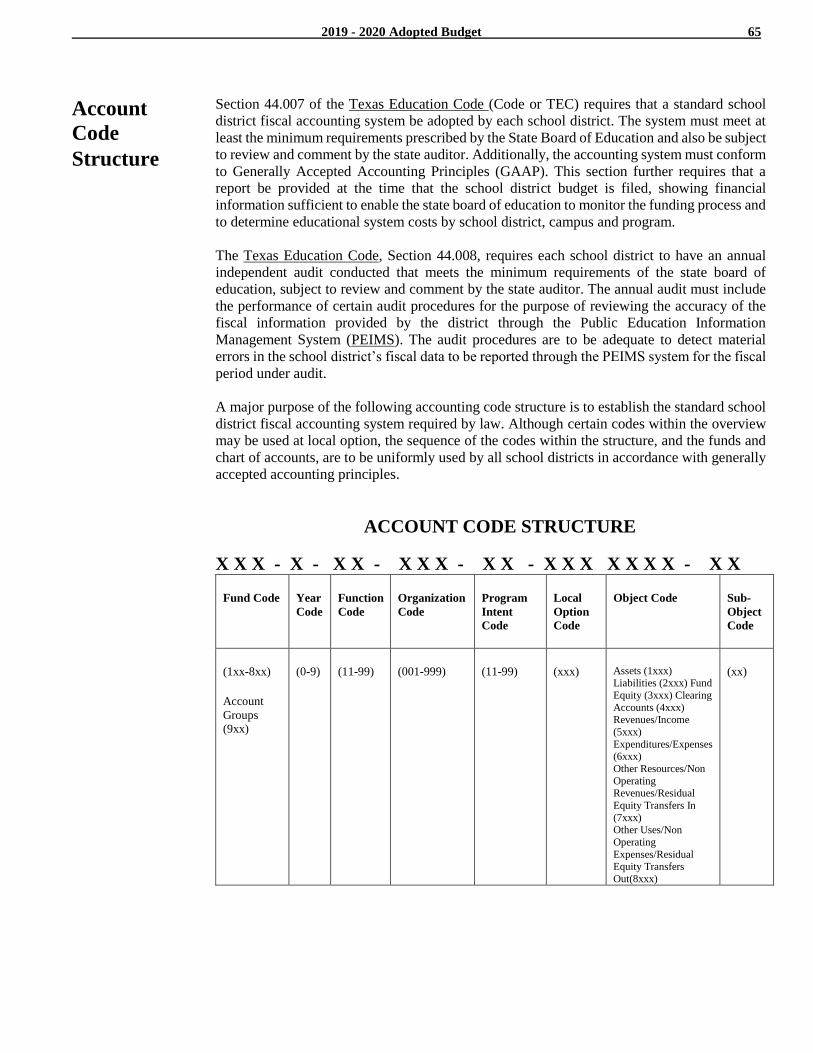
2019 - 2020 Adopted Budget 65
Account
Code
Structure
Section 44.007 of the Texas Education Code (Code or TEC) requires that a standard school
district fiscal accounting system be adopted by each school district. The system must meet at
least the minimum requirements prescribed by the State Board of Education and also be subject
to review and comment by the state auditor. Additionally, the accounting system must conform
to Generally Accepted Accounting Principles (GAAP). This section further requires that a
report be provided at the time that the school district budget is filed, showing financial
information sufficient to enable the state board of education to monitor the funding process and
to determine educational system costs by school district, campus and program.
The Texas Education Code, Section 44.008, requires each school district to have an annual
independent audit conducted that meets the minimum requirements of the state board of
education, subject to review and comment by the state auditor. The annual audit must include
the performance of certain audit procedures for the purpose of reviewing the accuracy of the
fiscal information provided by the district through the Public Education Information
Management System (PEIMS). The audit procedures are to be adequate to detect material
errors in the school district’s fiscal data to be reported through the PEIMS system for the fiscal
period under audit.
A major purpose of the following accounting code structure is to establish the standard school
district fiscal accounting system required by law. Although certain codes within the overview
may be used at local option, the sequence of the codes within the structure, and the funds and
chart of accounts, are to be uniformly used by all school districts in accordance with generally
accepted accounting principles.
ACCOUNT CODE STRUCTURE
X X X - X - X X - X X X - X X - X X X X X X X - X X
Fund Code Year
Code
Function
Code
Organization
Code
Program
Intent
Code
Local
Option
Code
Object Code Sub-
Object
Code
(1xx-8xx)
Account
Groups
(9xx)
(0-9) (11-99) (001-999) (11-99) (xxx) Assets (1xxx) Liabilities (2xxx) Fund
Equity (3xxx) Clearing
Accounts (4xxx) Revenues/Income
(5xxx)
Expenditures/Expenses (6xxx)
Other Resources/Non
Operating Revenues/Residual
Equity Transfers In
(7xxx) Other Uses/Non
Operating
Expenses/Residual Equity Transfers
Out(8xxx)
(xx)
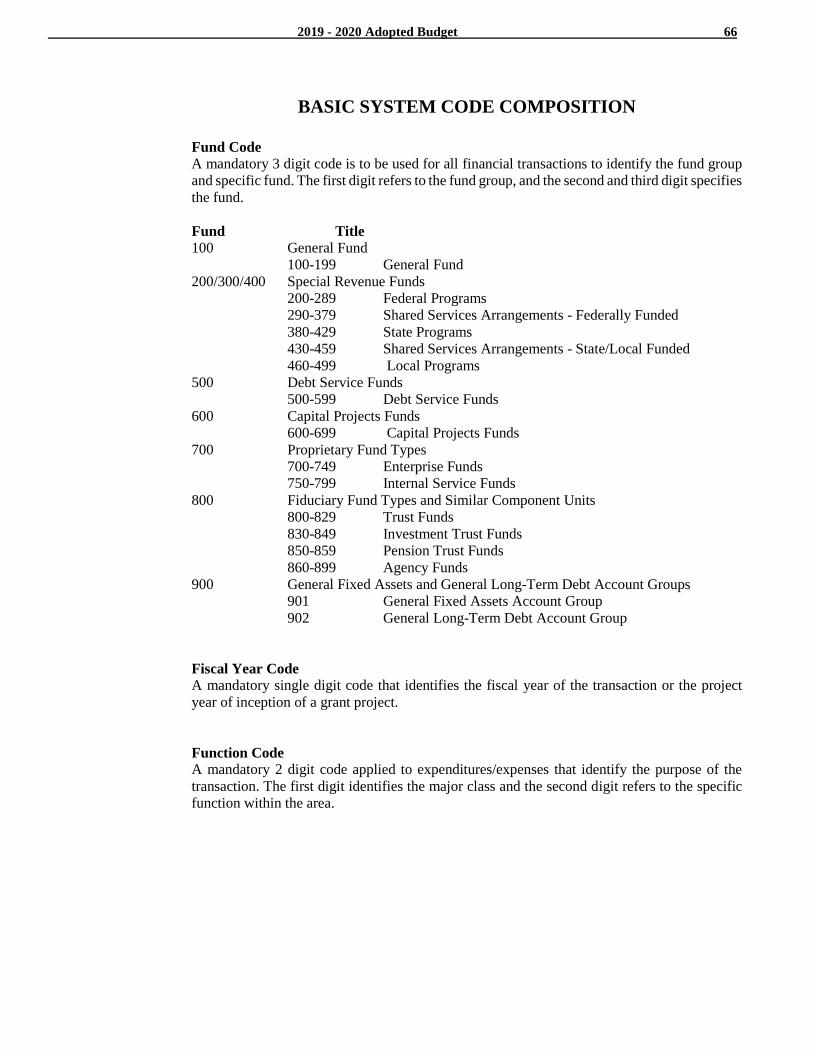
2019 - 2020 Adopted Budget 66
BASIC SYSTEM CODE COMPOSITION
Fund Code
A mandatory 3 digit code is to be used for all financial transactions to identify the fund group
and specific fund. The first digit refers to the fund group, and the second and third digit specifies
the fund.
Fund Title
100 General Fund
100-199 General Fund
200/300/400 Special Revenue Funds
200-289 Federal Programs
290-379 Shared Services Arrangements - Federally Funded
380-429 State Programs
430-459 Shared Services Arrangements - State/Local Funded
460-499 Local Programs
500 Debt Service Funds
500-599 Debt Service Funds
600 Capital Projects Funds
600-699 Capital Projects Funds
700 Proprietary Fund Types
700-749 Enterprise Funds
750-799 Internal Service Funds
800 Fiduciary Fund Types and Similar Component Units
800-829 Trust Funds
830-849 Investment Trust Funds
850-859 Pension Trust Funds
860-899 Agency Funds
900 General Fixed Assets and General Long-Term Debt Account Groups
901 General Fixed Assets Account Group
902 General Long-Term Debt Account Group
Fiscal Year Code
A mandatory single digit code that identifies the fiscal year of the transaction or the project
year of inception of a grant project.
Function Code A mandatory 2 digit code applied to expenditures/expenses that identify the purpose of the
transaction. The first digit identifies the major class and the second digit refers to the specific
function within the area.
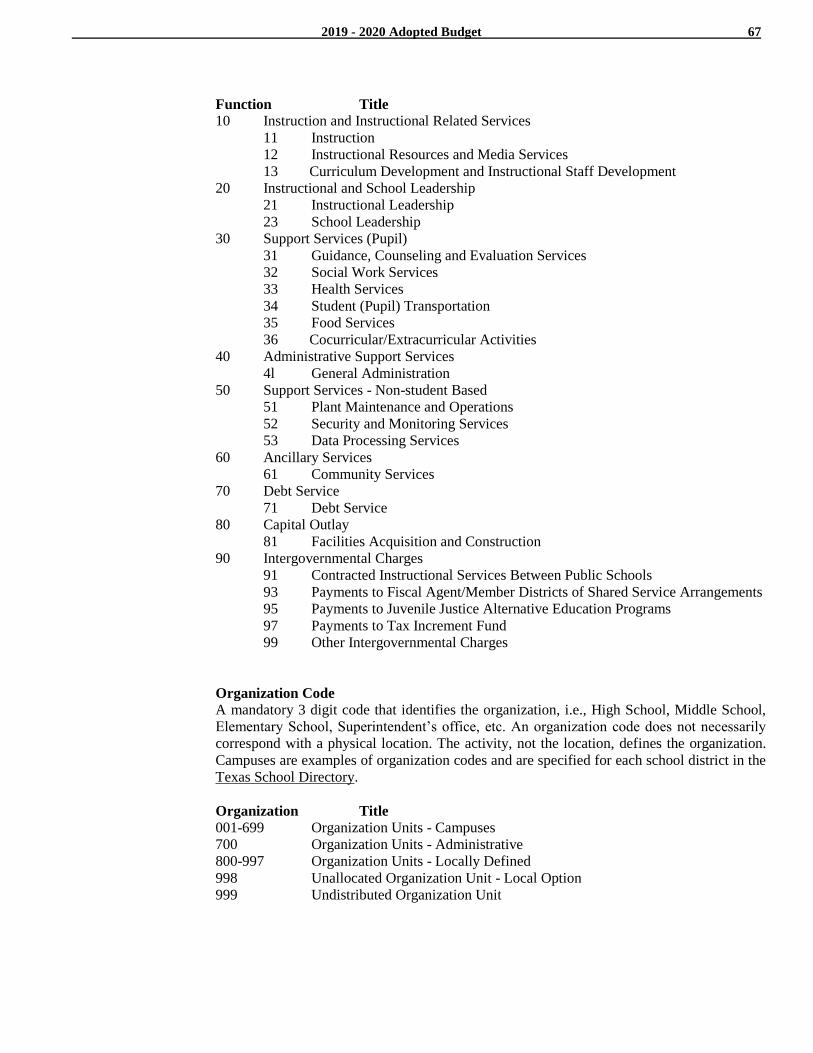
2019 - 2020 Adopted Budget 67
Function Title
10 Instruction and Instructional Related Services
11 Instruction
12 Instructional Resources and Media Services
13 Curriculum Development and Instructional Staff Development
20 Instructional and School Leadership
21 Instructional Leadership
23 School Leadership
30 Support Services (Pupil)
31 Guidance, Counseling and Evaluation Services
32 Social Work Services
33 Health Services
34 Student (Pupil) Transportation
35 Food Services
36 Cocurricular/Extracurricular Activities
40 Administrative Support Services
4l General Administration
50 Support Services - Non-student Based
51 Plant Maintenance and Operations
52 Security and Monitoring Services
53 Data Processing Services
60 Ancillary Services
61 Community Services
70 Debt Service
71 Debt Service
80 Capital Outlay
81 Facilities Acquisition and Construction
90 Intergovernmental Charges
91 Contracted Instructional Services Between Public Schools
93 Payments to Fiscal Agent/Member Districts of Shared Service Arrangements
95 Payments to Juvenile Justice Alternative Education Programs
97 Payments to Tax Increment Fund
99 Other Intergovernmental Charges
Organization Code
A mandatory 3 digit code that identifies the organization, i.e., High School, Middle School,
Elementary School, Superintendent’s office, etc. An organization code does not necessarily
correspond with a physical location. The activity, not the location, defines the organization.
Campuses are examples of organization codes and are specified for each school district in the
Texas School Directory.
Organization Title
001-699 Organization Units - Campuses
700 Organization Units - Administrative
800-997 Organization Units - Locally Defined
998 Unallocated Organization Unit - Local Option
999 Undistributed Organization Unit
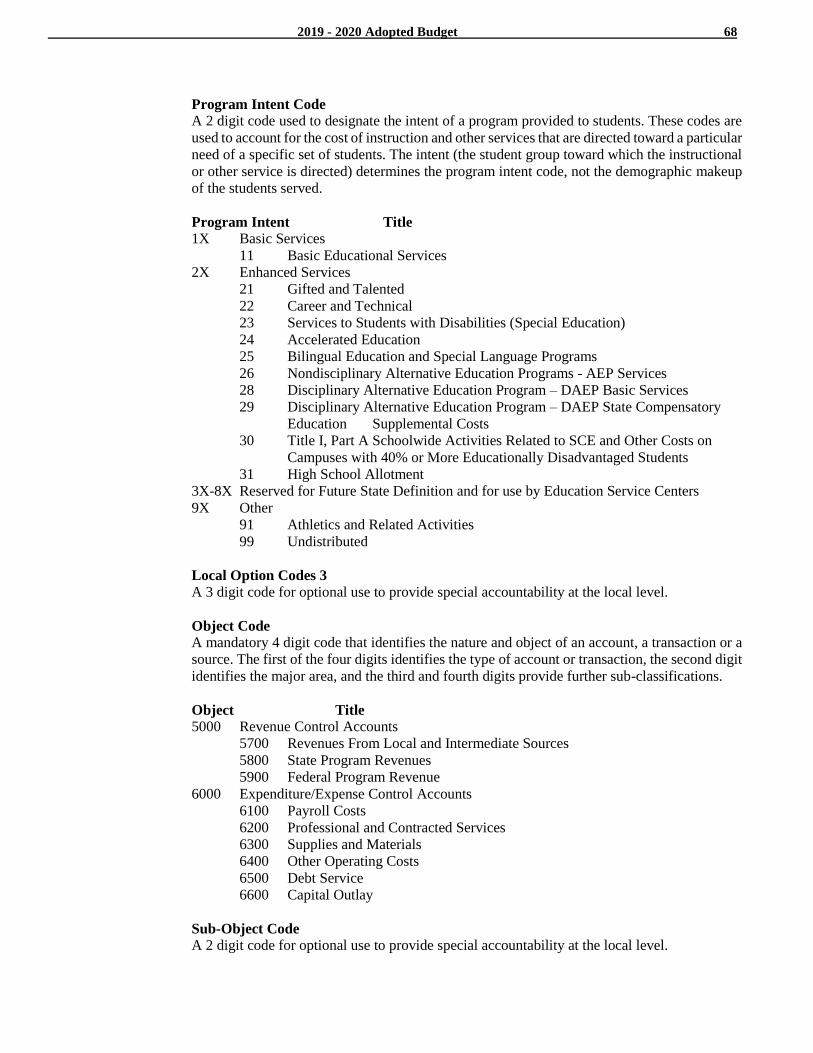
2019 - 2020 Adopted Budget 68
Program Intent Code
A 2 digit code used to designate the intent of a program provided to students. These codes are
used to account for the cost of instruction and other services that are directed toward a particular
need of a specific set of students. The intent (the student group toward which the instructional
or other service is directed) determines the program intent code, not the demographic makeup
of the students served.
Program Intent Title
1X Basic Services
11 Basic Educational Services
2X Enhanced Services
21 Gifted and Talented
22 Career and Technical
23 Services to Students with Disabilities (Special Education)
24 Accelerated Education
25 Bilingual Education and Special Language Programs
26 Nondisciplinary Alternative Education Programs - AEP Services
28 Disciplinary Alternative Education Program – DAEP Basic Services
29 Disciplinary Alternative Education Program – DAEP State Compensatory
Education Supplemental Costs
30 Title I, Part A Schoolwide Activities Related to SCE and Other Costs on
Campuses with 40% or More Educationally Disadvantaged Students
31 High School Allotment
3X-8X Reserved for Future State Definition and for use by Education Service Centers
9X Other
91 Athletics and Related Activities
99 Undistributed
Local Option Codes 3
A 3 digit code for optional use to provide special accountability at the local level.
Object Code
A mandatory 4 digit code that identifies the nature and object of an account, a transaction or a
source. The first of the four digits identifies the type of account or transaction, the second digit
identifies the major area, and the third and fourth digits provide further sub-classifications.
Object Title
5000 Revenue Control Accounts
5700 Revenues From Local and Intermediate Sources
5800 State Program Revenues
5900 Federal Program Revenue
6000 Expenditure/Expense Control Accounts
6100 Payroll Costs
6200 Professional and Contracted Services
6300 Supplies and Materials
6400 Other Operating Costs
6500 Debt Service
6600 Capital Outlay
Sub-Object Code
A 2 digit code for optional use to provide special accountability at the local level.

V.R. Eaton High School – Exterior
Financial SectionFund Financial Statements
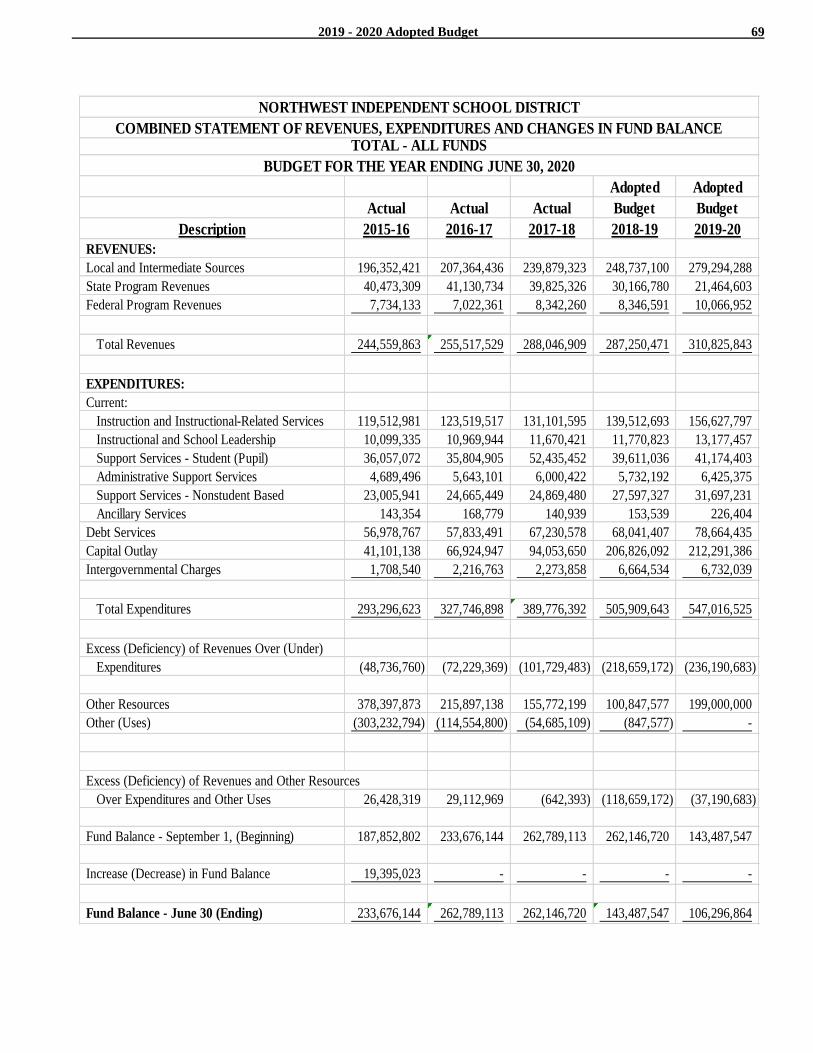
2019 - 2020 Adopted Budget 69
Adopted Adopted
Actual Actual Actual Budget Budget
Description 2015-16 2016-17 2017-18 2018-19 2019-20
REVENUES:
Local and Intermediate Sources 196,352,421 207,364,436 239,879,323 248,737,100 279,294,288
State Program Revenues 40,473,309 41,130,734 39,825,326 30,166,780 21,464,603
Federal Program Revenues 7,734,133 7,022,361 8,342,260 8,346,591 10,066,952
Total Revenues 244,559,863 255,517,529 288,046,909 287,250,471 310,825,843
EXPENDITURES:
Current:
Instruction and Instructional-Related Services 119,512,981 123,519,517 131,101,595 139,512,693 156,627,797
Instructional and School Leadership 10,099,335 10,969,944 11,670,421 11,770,823 13,177,457
Support Services - Student (Pupil) 36,057,072 35,804,905 52,435,452 39,611,036 41,174,403
Administrative Support Services 4,689,496 5,643,101 6,000,422 5,732,192 6,425,375
Support Services - Nonstudent Based 23,005,941 24,665,449 24,869,480 27,597,327 31,697,231
Ancillary Services 143,354 168,779 140,939 153,539 226,404
Debt Services 56,978,767 57,833,491 67,230,578 68,041,407 78,664,435
Capital Outlay 41,101,138 66,924,947 94,053,650 206,826,092 212,291,386
Intergovernmental Charges 1,708,540 2,216,763 2,273,858 6,664,534 6,732,039
Total Expenditures 293,296,623 327,746,898 389,776,392 505,909,643 547,016,525
Excess (Deficiency) of Revenues Over (Under)
Expenditures (48,736,760) (72,229,369) (101,729,483) (218,659,172) (236,190,683)
Other Resources 378,397,873 215,897,138 155,772,199 100,847,577 199,000,000
Other (Uses) (303,232,794) (114,554,800) (54,685,109) (847,577) -
Excess (Deficiency) of Revenues and Other Resources
Over Expenditures and Other Uses 26,428,319 29,112,969 (642,393) (118,659,172) (37,190,683)
Fund Balance - September 1, (Beginning) 187,852,802 233,676,144 262,789,113 262,146,720 143,487,547
Increase (Decrease) in Fund Balance 19,395,023 - - - -
Fund Balance - June 30 (Ending) 233,676,144 262,789,113 262,146,720 143,487,547 106,296,864
BUDGET FOR THE YEAR ENDING JUNE 30, 2020
NORTHWEST INDEPENDENT SCHOOL DISTRICT
COMBINED STATEMENT OF REVENUES, EXPENDITURES AND CHANGES IN FUND BALANCETOTAL - ALL FUNDS
2019 - 2020 Adopted Budget 70
General
Fund
The general fund is a governmental fund
with budgetary control which is used to
show transactions resulting from operations
of on-going organizations and activities
from a variety of revenue sources for which
fund balance is controlled by and retained
for the use of the local education agency.
The general fund utilizes the modified
accrual basis of accounting. To maintain
separate revenue and expenditure accounts
to assure the integrity of specific revenue
purposes when required by law or rule, the
general fund is to employ the classification
defined below by the Texas Education
Agency.
Fund 199 – General Fund – This
classification must be used to account for
funds in which the local governing board
designates. The local governing board has
wide discretion in their use as provided by
law. This fund usually includes transactions
as a result of revenues from local
maintenance taxes, payments in lieu of
taxes, foundation entitlements, State and
County available and other Foundation
School Program sources which are not
identified on warrants for foundation
entitlements. Any locally defined codes that
are used at the local option are to be
converted to Fund 199 for PEIMS reporting
Fund 184 – Cocurricular/Extracurricular
Activities – This locally defined fund code
is used to account for expenditures/expenses
for school-sponsored activities during or
after the school day that are not essential to
the delivery of services for Function 11 -
Instructional, the Function code 20 series –
Instructional and School Leadership or other
Function code 30 series – Support Services
Student (Pupil). These activities are
generally designed to provide students with
experiences such as motivation and the
enjoyment and improvement of skills in
either a competitive or noncompetitive
setting. These activities include student
groups such as Future Farmers of America
(FFA), National Honor Society, etc.
Cocurricular activities are those activities
that are not essential to instruction but
enhance the curriculum and include
University Interscholastic League
competition such as one-act plays, speech,
debate, band, etc.
Extracurricular activities are those activities
that do not enhance the instructional
program including athletics that normally
involve competition between schools (and
frequently involve offsetting gate receipts or
fees such as football, baseball, volleyball,
track and tennis). Also included are related
activities (such as drill team, pep squad and
cheer leading) that exist because of athletics.
This fund is converted to Fund 199 for
PEIMS reporting.
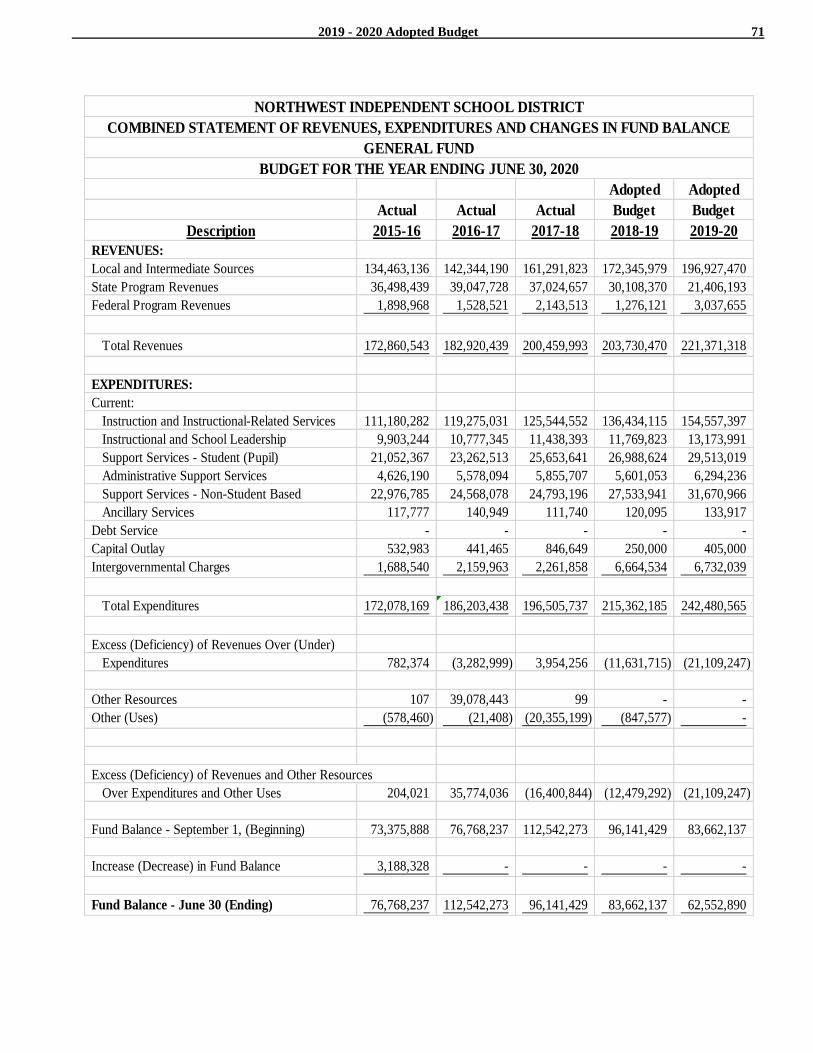
2019 - 2020 Adopted Budget 71
Adopted Adopted
Actual Actual Actual Budget Budget
Description 2015-16 2016-17 2017-18 2018-19 2019-20
REVENUES:
Local and Intermediate Sources 134,463,136 142,344,190 161,291,823 172,345,979 196,927,470
State Program Revenues 36,498,439 39,047,728 37,024,657 30,108,370 21,406,193
Federal Program Revenues 1,898,968 1,528,521 2,143,513 1,276,121 3,037,655
Total Revenues 172,860,543 182,920,439 200,459,993 203,730,470 221,371,318
EXPENDITURES:
Current:
Instruction and Instructional-Related Services 111,180,282 119,275,031 125,544,552 136,434,115 154,557,397
Instructional and School Leadership 9,903,244 10,777,345 11,438,393 11,769,823 13,173,991
Support Services - Student (Pupil) 21,052,367 23,262,513 25,653,641 26,988,624 29,513,019
Administrative Support Services 4,626,190 5,578,094 5,855,707 5,601,053 6,294,236
Support Services - Non-Student Based 22,976,785 24,568,078 24,793,196 27,533,941 31,670,966
Ancillary Services 117,777 140,949 111,740 120,095 133,917
Debt Service - - - - -
Capital Outlay 532,983 441,465 846,649 250,000 405,000
Intergovernmental Charges 1,688,540 2,159,963 2,261,858 6,664,534 6,732,039
Total Expenditures 172,078,169 186,203,438 196,505,737 215,362,185 242,480,565
Excess (Deficiency) of Revenues Over (Under)
Expenditures 782,374 (3,282,999) 3,954,256 (11,631,715) (21,109,247)
Other Resources 107 39,078,443 99 - -
Other (Uses) (578,460) (21,408) (20,355,199) (847,577) -
Excess (Deficiency) of Revenues and Other Resources
Over Expenditures and Other Uses 204,021 35,774,036 (16,400,844) (12,479,292) (21,109,247)
Fund Balance - September 1, (Beginning) 73,375,888 76,768,237 112,542,273 96,141,429 83,662,137
Increase (Decrease) in Fund Balance 3,188,328 - - - -
Fund Balance - June 30 (Ending) 76,768,237 112,542,273 96,141,429 83,662,137 62,552,890
BUDGET FOR THE YEAR ENDING JUNE 30, 2020
NORTHWEST INDEPENDENT SCHOOL DISTRICT
COMBINED STATEMENT OF REVENUES, EXPENDITURES AND CHANGES IN FUND BALANCE
GENERAL FUND
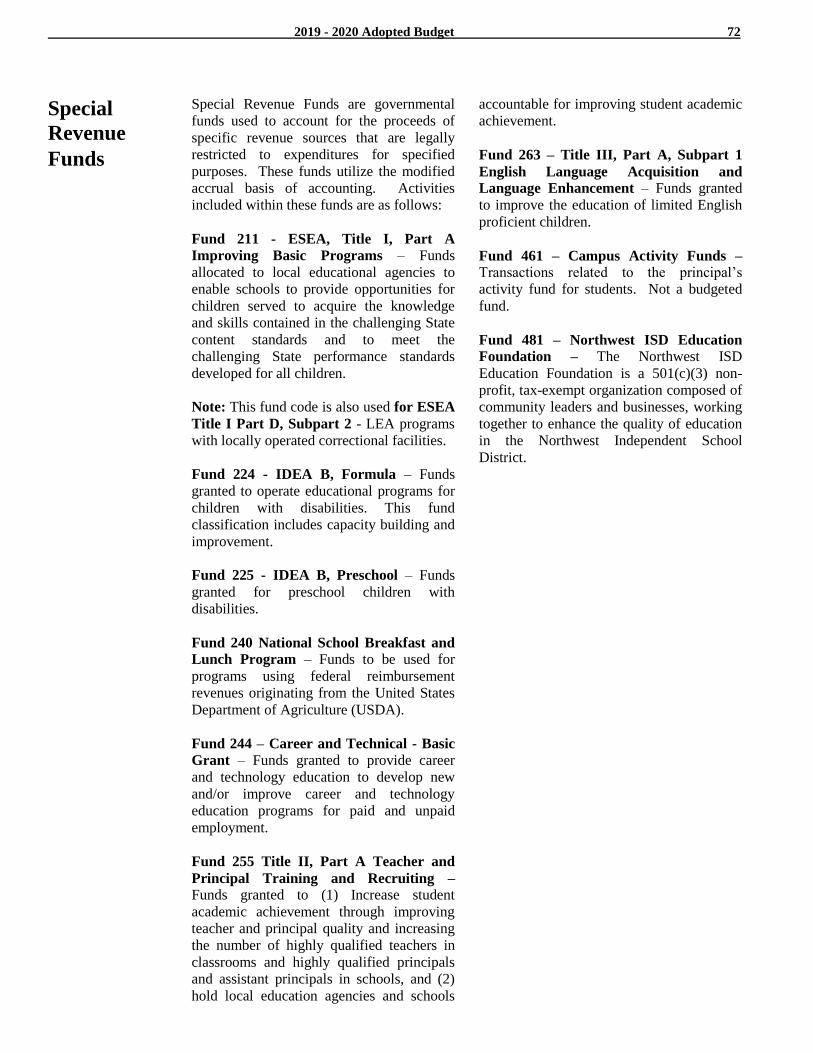
2019 - 2020 Adopted Budget 72
Special
Revenue
Funds
Special Revenue Funds are governmental
funds used to account for the proceeds of
specific revenue sources that are legally
restricted to expenditures for specified
purposes. These funds utilize the modified
accrual basis of accounting. Activities
included within these funds are as follows:
Fund 211 - ESEA, Title I, Part A
Improving Basic Programs – Funds
allocated to local educational agencies to
enable schools to provide opportunities for
children served to acquire the knowledge
and skills contained in the challenging State
content standards and to meet the
challenging State performance standards
developed for all children.
Note: This fund code is also used for ESEA
Title I Part D, Subpart 2 - LEA programs
with locally operated correctional facilities.
Fund 224 - IDEA B, Formula – Funds
granted to operate educational programs for
children with disabilities. This fund
classification includes capacity building and
improvement.
Fund 225 - IDEA B, Preschool – Funds
granted for preschool children with
disabilities.
Fund 240 National School Breakfast and
Lunch Program – Funds to be used for
programs using federal reimbursement
revenues originating from the United States
Department of Agriculture (USDA).
Fund 244 – Career and Technical - Basic
Grant – Funds granted to provide career
and technology education to develop new
and/or improve career and technology
education programs for paid and unpaid
employment.
Fund 255 Title II, Part A Teacher and
Principal Training and Recruiting – Funds granted to (1) Increase student
academic achievement through improving
teacher and principal quality and increasing
the number of highly qualified teachers in
classrooms and highly qualified principals
and assistant principals in schools, and (2)
hold local education agencies and schools
accountable for improving student academic
achievement.
Fund 263 – Title III, Part A, Subpart 1
English Language Acquisition and
Language Enhancement – Funds granted
to improve the education of limited English
proficient children.
Fund 461 – Campus Activity Funds –
Transactions related to the principal’s
activity fund for students. Not a budgeted
fund.
Fund 481 – Northwest ISD Education
Foundation – The Northwest ISD
Education Foundation is a 501(c)(3) non-
profit, tax-exempt organization composed of
community leaders and businesses, working
together to enhance the quality of education
in the Northwest Independent School
District.
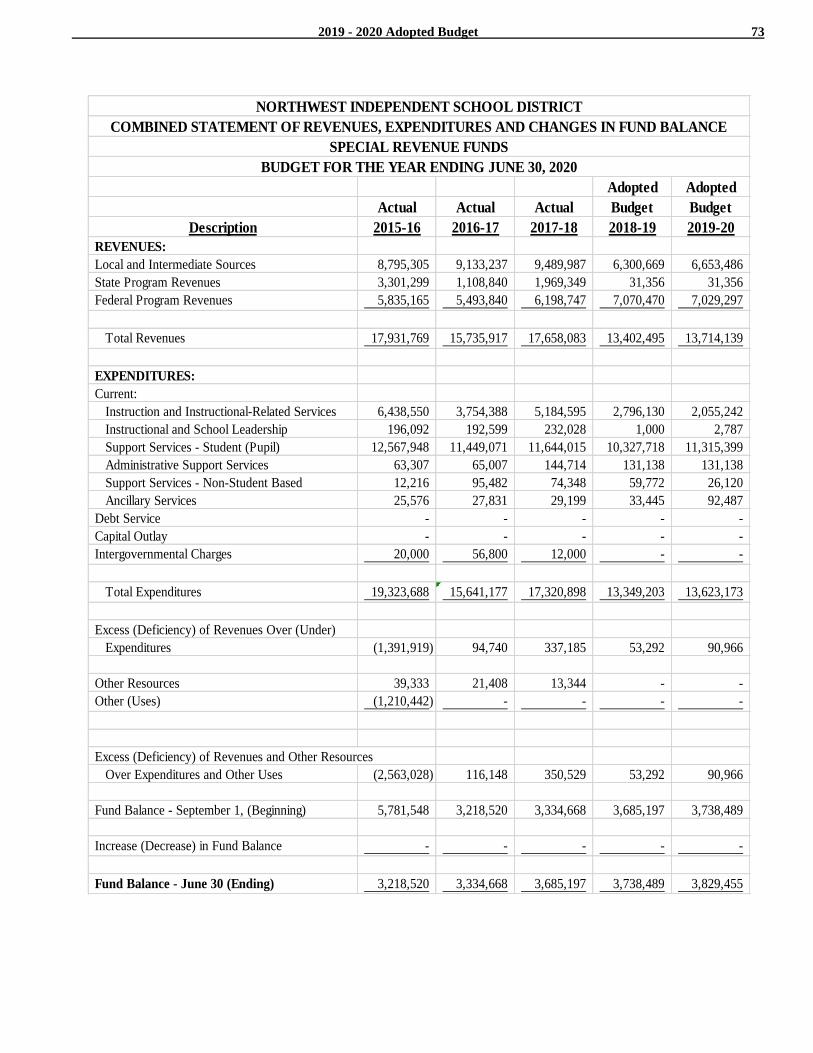
2019 - 2020 Adopted Budget 73
Adopted Adopted
Actual Actual Actual Budget Budget
Description 2015-16 2016-17 2017-18 2018-19 2019-20
REVENUES:
Local and Intermediate Sources 8,795,305 9,133,237 9,489,987 6,300,669 6,653,486
State Program Revenues 3,301,299 1,108,840 1,969,349 31,356 31,356
Federal Program Revenues 5,835,165 5,493,840 6,198,747 7,070,470 7,029,297
Total Revenues 17,931,769 15,735,917 17,658,083 13,402,495 13,714,139
EXPENDITURES:
Current:
Instruction and Instructional-Related Services 6,438,550 3,754,388 5,184,595 2,796,130 2,055,242
Instructional and School Leadership 196,092 192,599 232,028 1,000 2,787
Support Services - Student (Pupil) 12,567,948 11,449,071 11,644,015 10,327,718 11,315,399
Administrative Support Services 63,307 65,007 144,714 131,138 131,138
Support Services - Non-Student Based 12,216 95,482 74,348 59,772 26,120
Ancillary Services 25,576 27,831 29,199 33,445 92,487
Debt Service - - - - -
Capital Outlay - - - - -
Intergovernmental Charges 20,000 56,800 12,000 - -
Total Expenditures 19,323,688 15,641,177 17,320,898 13,349,203 13,623,173
Excess (Deficiency) of Revenues Over (Under)
Expenditures (1,391,919) 94,740 337,185 53,292 90,966
Other Resources 39,333 21,408 13,344 - -
Other (Uses) (1,210,442) - - - -
Excess (Deficiency) of Revenues and Other Resources
Over Expenditures and Other Uses (2,563,028) 116,148 350,529 53,292 90,966
Fund Balance - September 1, (Beginning) 5,781,548 3,218,520 3,334,668 3,685,197 3,738,489
Increase (Decrease) in Fund Balance - - - - -
Fund Balance - June 30 (Ending) 3,218,520 3,334,668 3,685,197 3,738,489 3,829,455
BUDGET FOR THE YEAR ENDING JUNE 30, 2020
NORTHWEST INDEPENDENT SCHOOL DISTRICT
COMBINED STATEMENT OF REVENUES, EXPENDITURES AND CHANGES IN FUND BALANCE
SPECIAL REVENUE FUNDS
2019 - 2020 Adopted Budget 74
School
Breakfast
ESEA ESEA and
Title I Title I IDEA B IDEA B Lunch
(Part A) (Part D) Formula Preschool Program
Description 211 211 224 225 240
REVENUES:
Local and Intermediate Sources -$ -$ -$ -$ 6,591,653$
State Program Revenues - - - - 31,356
Federal Program Revenues 870,667 31,239 2,872,580 21,479 2,741,756
Total Revenues 870,667 31,239 2,872,580 21,479 9,364,765
EXPENDITURES:
Current:
Instruction and Instructional-Related Services 734,087 31,239 772,283 21,479 -
Instructional and School Leadership - - - - -
Support Services - Student (Pupil) 96,000 - 2,074,177 - 9,273,799
Administrative Support Services - - - - -
Support Services - Non-Student Based - - 26,120 - -
Ancillary Services 40,580 - - - -
Debt Service - - - - -
Capital Outlay - - - - -
Intergovernmental Charges - - - - -
Total Expenditures 870,667 31,239 2,872,580 21,479 9,273,799
Excess (Deficiency) of Revenues Over (Under)
Expenditures - - - - 90,966
Other Resources - - - - -
Other (Uses) - - - - -
Excess (Deficiency) of Revenues and Other Resources
Over Expenditures and Other Uses - - - - 90,966
Fund Balance - July 1, (Beginning) - - - - 940,789
Increase (Decrease) in Fund Balance - - - - -
Fund Balance - June 30 (Ending) -$ -$ -$ -$ 1,031,755$
NORTHWEST INDEPENDENT SCHOOL DISTRICT
FUND STATEMENT OF REVENUES, EXPENDITURES AND CHANGES IN FUND BALANCE
SPECIAL REVENUE FUNDS
BUDGET FOR THE YEAR ENDING JUNE 30, 2020
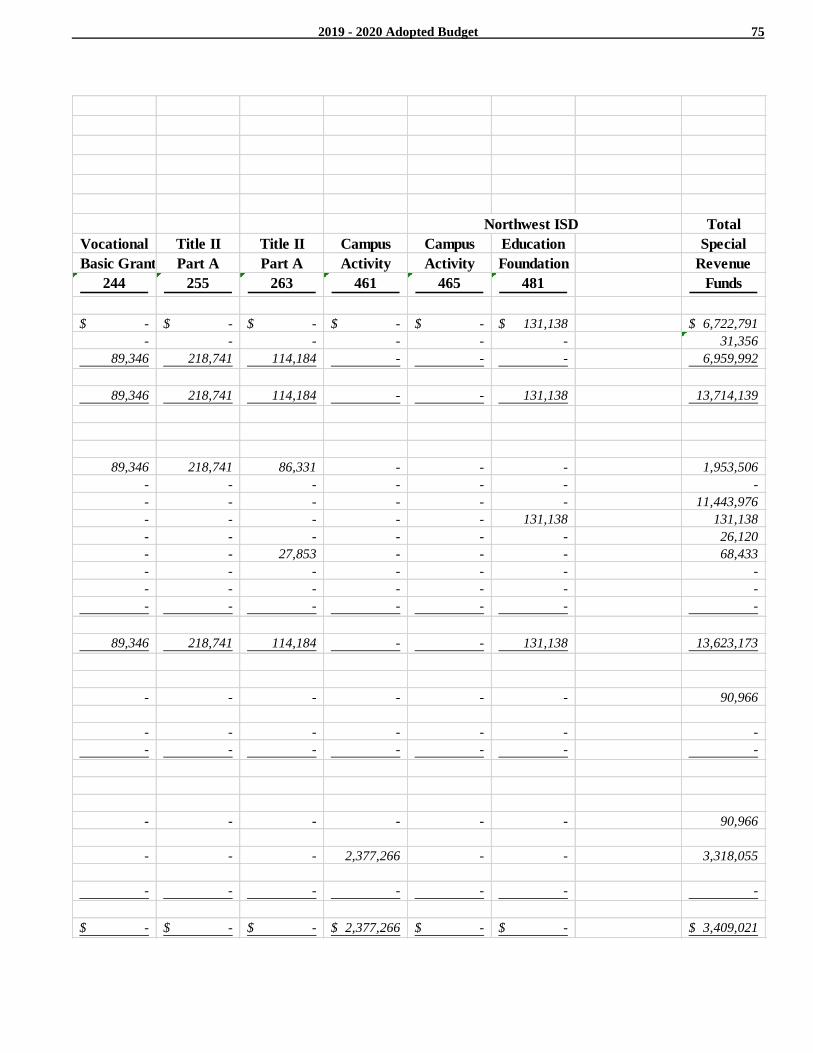
2019 - 2020 Adopted Budget 75
Northwest ISD Total
Vocational Title II Title II Campus Campus Education Special
Basic Grant Part A Part A Activity Activity Foundation Revenue
244 255 263 461 465 481 Funds
-$ -$ -$ -$ -$ 131,138$ 6,722,791$
- - - - - - 31,356
89,346 218,741 114,184 - - - 6,959,992
89,346 218,741 114,184 - - 131,138 13,714,139
89,346 218,741 86,331 - - - 1,953,506
- - - - - - -
- - - - - - 11,443,976
- - - - - 131,138 131,138
- - - - - - 26,120
- - 27,853 - - - 68,433
- - - - - - -
- - - - - - -
- - - - - - -
89,346 218,741 114,184 - - 131,138 13,623,173
- - - - - - 90,966
- - - - - - -
- - - - - - -
- - - - - - 90,966
- - - 2,377,266 - - 3,318,055
- - - - - - -
-$ -$ -$ 2,377,266$ -$ -$ 3,409,021$
2019 - 2020 Adopted Budget 76
Debt Service
Funds
Debt Service Funds A debt service fund is a governmental fund,
with budgetary control, that must be used to
account for general long-term debt principal
and interest for debt issues and other long-
term debts for which a tax has been
dedicated. A separate bank account must be
kept for this fund. Principal and interest
payments for operating indebtedness
including warrants, notes, and short-term
lease-purchase agreements, are to be made
from the fund for which the debt was
incurred. This fund utilizes the modified
accrual basis of accounting.
Tax Supported Debt Limitation A school district is also authorized to issue
bonds and levy taxes for payment of bonds
subject to voter approval of a proposition
submitted to the voters under Section 45.003
(b)(1), Texas Education Code, as amended,
which provides a tax unlimited as to rate or
amount for the support school district
bonded indebtedness.
Chapter 45 of the Texas Education Code, as
amended, requires a district to demonstrate
to the Texas Attorney General that it has the
prospective ability to pay debt service on a
proposed issue of bonds, together with debt
service on other outstanding “new debt” of
the district, from a tax levied at a rate of
$0.50 per $100 of assessed valuation before
bonds may be issued. In demonstrating the
ability to pay debt service at a rate of $0.50,
a district may take into account State
allotments to the district which effectively
reduce the district’s local share of debt
service. Once the prospective ability to pay
such tax has been shown and the bonds are
issued, a district may levy an unlimited tax
to pay debt service.
Computation of Legal Debt Limit
(Per $100 of Assessed Valuation)
Debt Limit $0.50000
Interest & Sinking tax rate 0.45000
Balance $0.05000
Outstanding Authorized Bonds In 2017 the District closed out the 2012 and
2008 bond authorizations issuing unlimited
tax bonds of $55,000,000 from the 2012
bond authorization and $45,000,000 in from
the 2008 bond authorization. The District’s
voters authorized $399 million in bonds on
May 6, 2017. In May, 2018, and May 2019,
the District made two issuances of the 2017
bond authorization issuing unlimited tax
bonds of $100,000,000 respectively.
Authorized, but unissued unlimited tax
bonds therefore total $199,000,000.
Since 2015 the debt management actions of
the District’s Board of Trustees,
administration, and the financial team have
implemented six refunding programs and
prepaid $4.1 million of existing bonds to
reduce the cost of voter-approved bonds.
These debt management actions generated
$83,390,924 of savings to the District’s
taxpayers. The reduction in debt service
payments will help the District
accommodate the future issuances of the
$399,000,000 2017 bond authorization
election approved by the District’s voters..
Debt Guideline Although the Board of Trustees do not have
an adopted, formal debt policy, the
conservatively projected annual growth in
assessed valuation should allow the District
to meet its guideline of maintaining a
maximum Interest & Sinking tax rate of no
more then $0.45000 per $100 of assessed
property valuation.
The 2018-19 Interest & Sinking tax rate
remained unchanged and was set at
$0.45000.
Ratings The District's bonds are rated Aaa by
Moody's Investor Services and AAA by
Fitch Ratings, by virtue of the Permanent
School Fund of the State of Texas. The
underlying credit ratings of the district are
Aa2 by Moody's Investor Services and AA
by Fitch Ratings. .
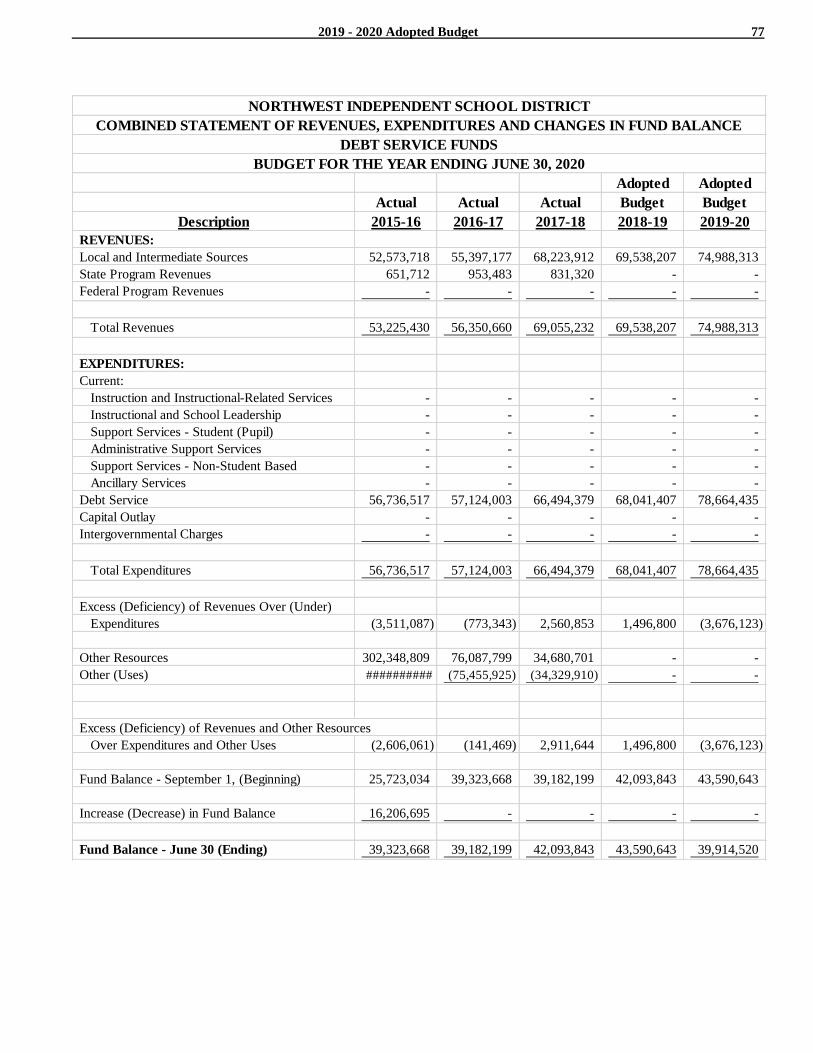
2019 - 2020 Adopted Budget 77
Adopted Adopted
Actual Actual Actual Budget Budget
Description 2015-16 2016-17 2017-18 2018-19 2019-20
REVENUES:
Local and Intermediate Sources 52,573,718 55,397,177 68,223,912 69,538,207 74,988,313
State Program Revenues 651,712 953,483 831,320 - -
Federal Program Revenues - - - - -
Total Revenues 53,225,430 56,350,660 69,055,232 69,538,207 74,988,313
EXPENDITURES:
Current:
Instruction and Instructional-Related Services - - - - -
Instructional and School Leadership - - - - -
Support Services - Student (Pupil) - - - - -
Administrative Support Services - - - - -
Support Services - Non-Student Based - - - - -
Ancillary Services - - - - -
Debt Service 56,736,517 57,124,003 66,494,379 68,041,407 78,664,435
Capital Outlay - - - - -
Intergovernmental Charges - - - - -
Total Expenditures 56,736,517 57,124,003 66,494,379 68,041,407 78,664,435
Excess (Deficiency) of Revenues Over (Under)
Expenditures (3,511,087) (773,343) 2,560,853 1,496,800 (3,676,123)
Other Resources 302,348,809 76,087,799 34,680,701 - -
Other (Uses) ########## (75,455,925) (34,329,910) - -
Excess (Deficiency) of Revenues and Other Resources
Over Expenditures and Other Uses (2,606,061) (141,469) 2,911,644 1,496,800 (3,676,123)
Fund Balance - September 1, (Beginning) 25,723,034 39,323,668 39,182,199 42,093,843 43,590,643
Increase (Decrease) in Fund Balance 16,206,695 - - - -
Fund Balance - June 30 (Ending) 39,323,668 39,182,199 42,093,843 43,590,643 39,914,520
BUDGET FOR THE YEAR ENDING JUNE 30, 2020
NORTHWEST INDEPENDENT SCHOOL DISTRICT
COMBINED STATEMENT OF REVENUES, EXPENDITURES AND CHANGES IN FUND BALANCE
DEBT SERVICE FUNDS
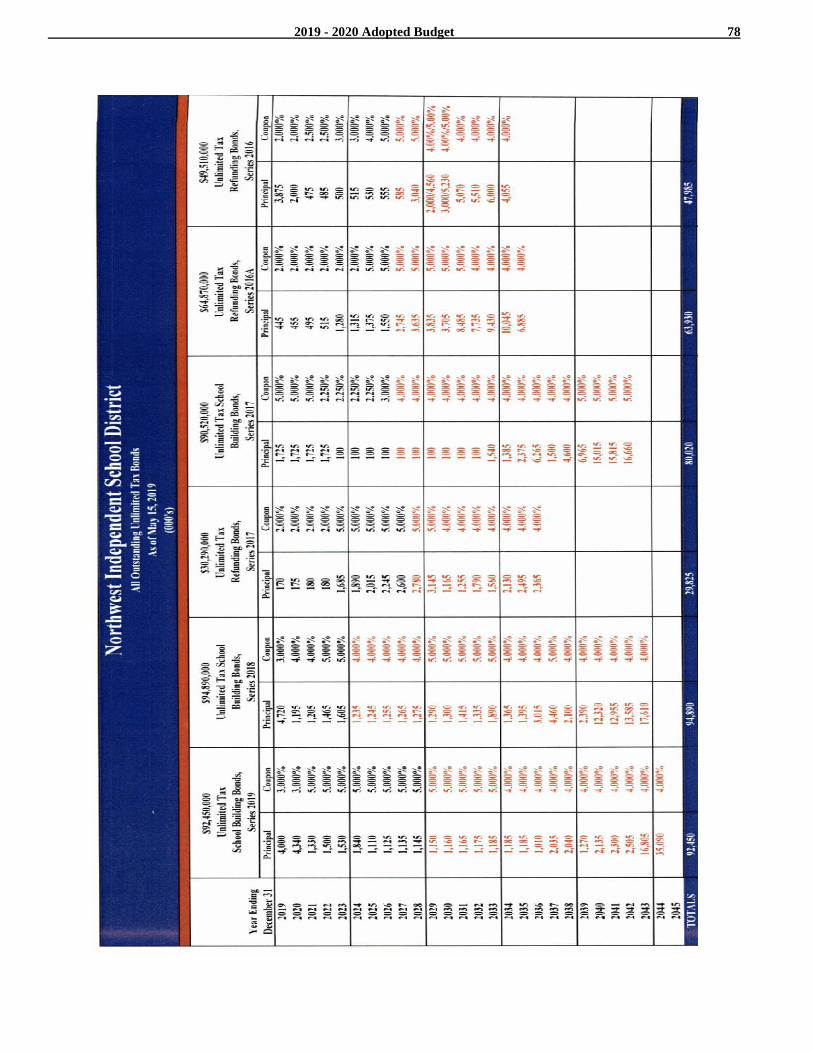
2019 - 2020 Adopted Budget 78
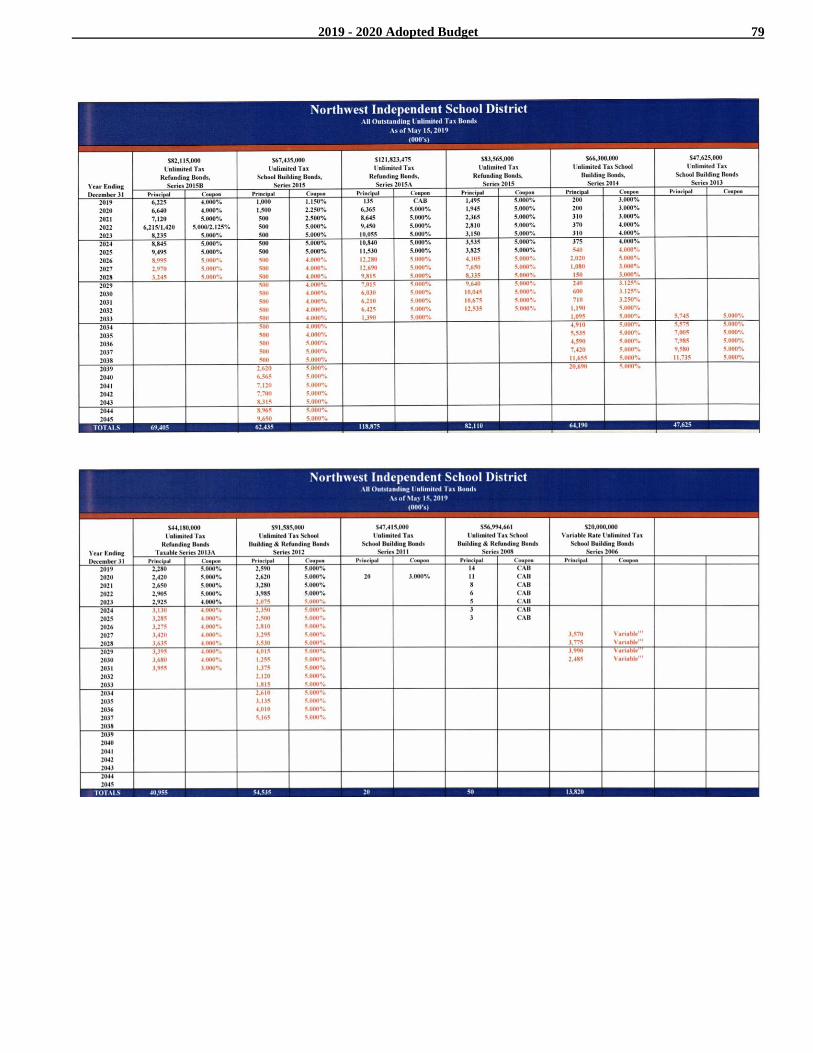
2019 - 2020 Adopted Budget 79
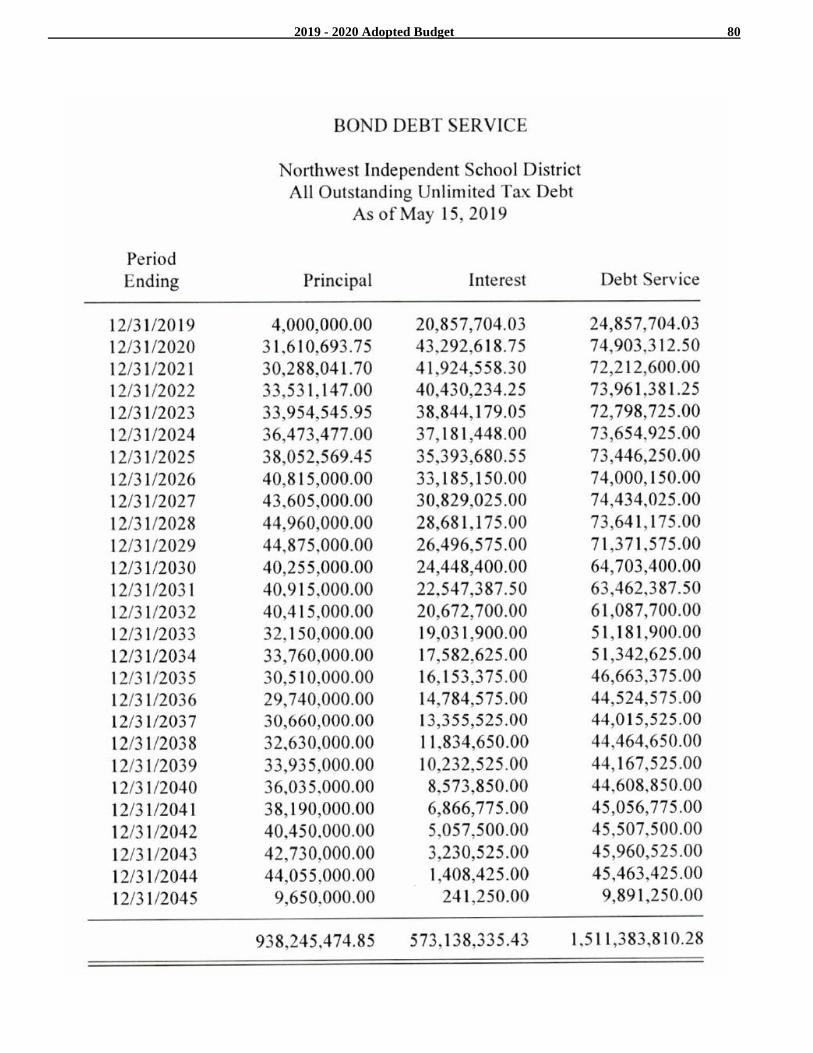
2019 - 2020 Adopted Budget 80
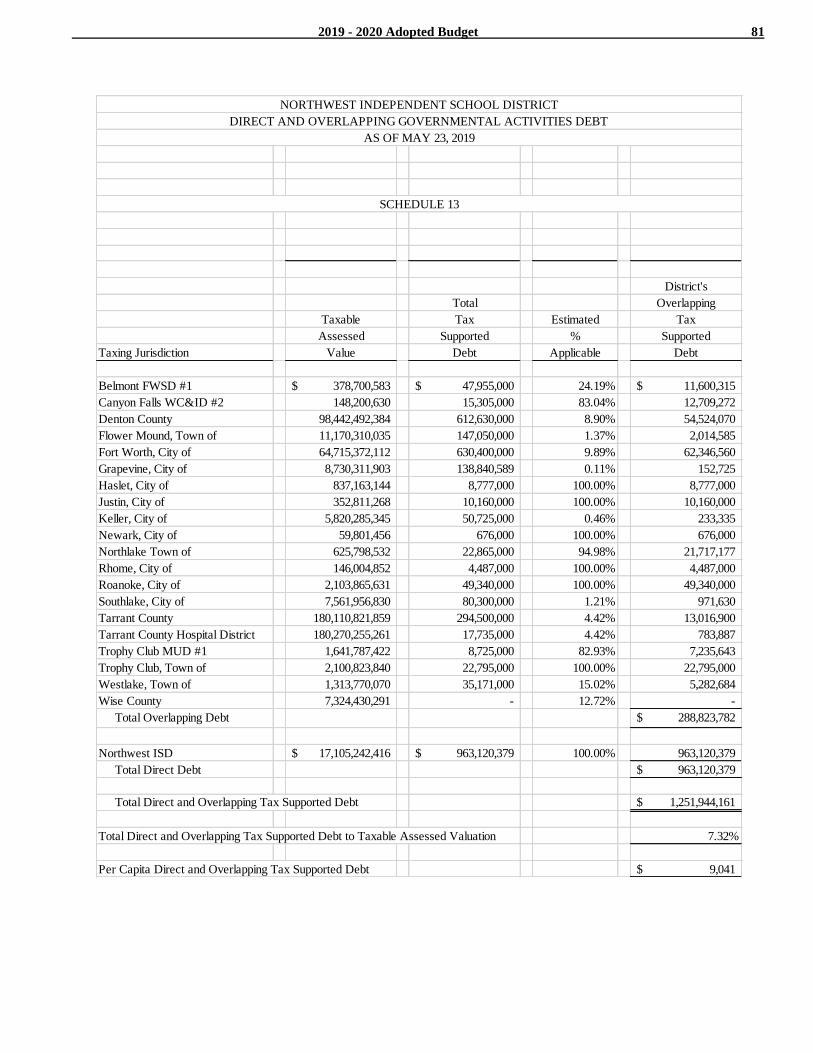
2019 - 2020 Adopted Budget 81
District's
Total Overlapping
Taxable Tax Estimated Tax
Assessed Supported % Supported
Taxing Jurisdiction Value Debt Applicable Debt
Belmont FWSD #1 378,700,583$ 47,955,000$ 24.19% 11,600,315$
Canyon Falls WC&ID #2 148,200,630 15,305,000 83.04% 12,709,272
Denton County 98,442,492,384 612,630,000 8.90% 54,524,070
Flower Mound, Town of 11,170,310,035 147,050,000 1.37% 2,014,585
Fort Worth, City of 64,715,372,112 630,400,000 9.89% 62,346,560
Grapevine, City of 8,730,311,903 138,840,589 0.11% 152,725
Haslet, City of 837,163,144 8,777,000 100.00% 8,777,000
Justin, City of 352,811,268 10,160,000 100.00% 10,160,000
Keller, City of 5,820,285,345 50,725,000 0.46% 233,335
Newark, City of 59,801,456 676,000 100.00% 676,000
Northlake Town of 625,798,532 22,865,000 94.98% 21,717,177
Rhome, City of 146,004,852 4,487,000 100.00% 4,487,000
Roanoke, City of 2,103,865,631 49,340,000 100.00% 49,340,000
Southlake, City of 7,561,956,830 80,300,000 1.21% 971,630
Tarrant County 180,110,821,859 294,500,000 4.42% 13,016,900
Tarrant County Hospital District 180,270,255,261 17,735,000 4.42% 783,887
Trophy Club MUD #1 1,641,787,422 8,725,000 82.93% 7,235,643
Trophy Club, Town of 2,100,823,840 22,795,000 100.00% 22,795,000
Westlake, Town of 1,313,770,070 35,171,000 15.02% 5,282,684
Wise County 7,324,430,291 - 12.72% -
Total Overlapping Debt 288,823,782$
Northwest ISD 17,105,242,416$ 963,120,379$ 100.00% 963,120,379
Total Direct Debt 963,120,379$
Total Direct and Overlapping Tax Supported Debt 1,251,944,161$
Total Direct and Overlapping Tax Supported Debt to Taxable Assessed Valuation 7.32%
Per Capita Direct and Overlapping Tax Supported Debt 9,041$
NORTHWEST INDEPENDENT SCHOOL DISTRICT
DIRECT AND OVERLAPPING GOVERNMENTAL ACTIVITIES DEBT
AS OF MAY 23, 2019
SCHEDULE 13
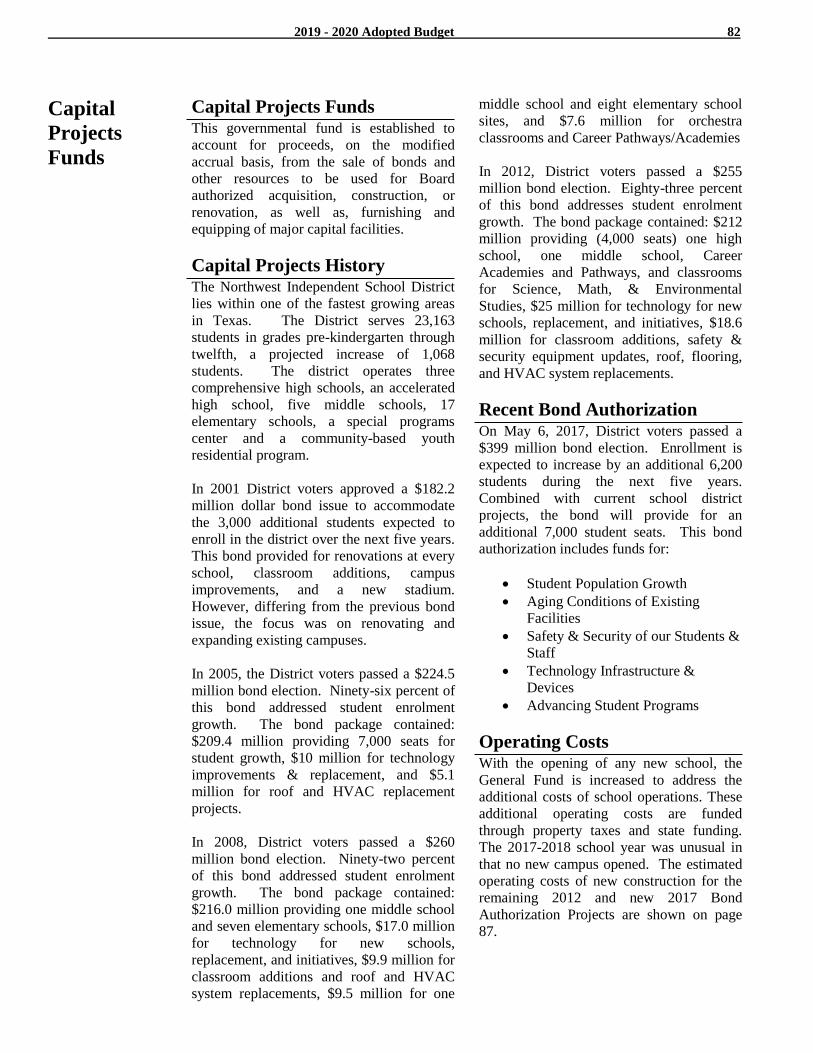
2019 - 2020 Adopted Budget 82
Capital
Projects
Funds
Capital Projects Funds This governmental fund is established to
account for proceeds, on the modified
accrual basis, from the sale of bonds and
other resources to be used for Board
authorized acquisition, construction, or
renovation, as well as, furnishing and
equipping of major capital facilities.
Capital Projects History The Northwest Independent School District
lies within one of the fastest growing areas
in Texas. The District serves 23,163
students in grades pre-kindergarten through
twelfth, a projected increase of 1,068
students. The district operates three
comprehensive high schools, an accelerated
high school, five middle schools, 17
elementary schools, a special programs
center and a community-based youth
residential program.
In 2001 District voters approved a $182.2
million dollar bond issue to accommodate
the 3,000 additional students expected to
enroll in the district over the next five years.
This bond provided for renovations at every
school, classroom additions, campus
improvements, and a new stadium.
However, differing from the previous bond
issue, the focus was on renovating and
expanding existing campuses.
In 2005, the District voters passed a $224.5
million bond election. Ninety-six percent of
this bond addressed student enrolment
growth. The bond package contained:
$209.4 million providing 7,000 seats for
student growth, $10 million for technology
improvements & replacement, and $5.1
million for roof and HVAC replacement
projects.
In 2008, District voters passed a $260
million bond election. Ninety-two percent
of this bond addressed student enrolment
growth. The bond package contained:
$216.0 million providing one middle school
and seven elementary schools, $17.0 million
for technology for new schools,
replacement, and initiatives, $9.9 million for
classroom additions and roof and HVAC
system replacements, $9.5 million for one
middle school and eight elementary school
sites, and $7.6 million for orchestra
classrooms and Career Pathways/Academies
In 2012, District voters passed a $255
million bond election. Eighty-three percent
of this bond addresses student enrolment
growth. The bond package contained: $212
million providing (4,000 seats) one high
school, one middle school, Career
Academies and Pathways, and classrooms
for Science, Math, & Environmental
Studies, $25 million for technology for new
schools, replacement, and initiatives, $18.6
million for classroom additions, safety &
security equipment updates, roof, flooring,
and HVAC system replacements.
Recent Bond Authorization On May 6, 2017, District voters passed a
$399 million bond election. Enrollment is
expected to increase by an additional 6,200
students during the next five years.
Combined with current school district
projects, the bond will provide for an
additional 7,000 student seats. This bond
authorization includes funds for:
Student Population Growth
Aging Conditions of Existing
Facilities
Safety & Security of our Students &
Staff
Technology Infrastructure &
Devices
Advancing Student Programs
Operating Costs With the opening of any new school, the
General Fund is increased to address the
additional costs of school operations. These
additional operating costs are funded
through property taxes and state funding.
The 2017-2018 school year was unusual in
that no new campus opened. The estimated
operating costs of new construction for the
remaining 2012 and new 2017 Bond
Authorization Projects are shown on page
87.
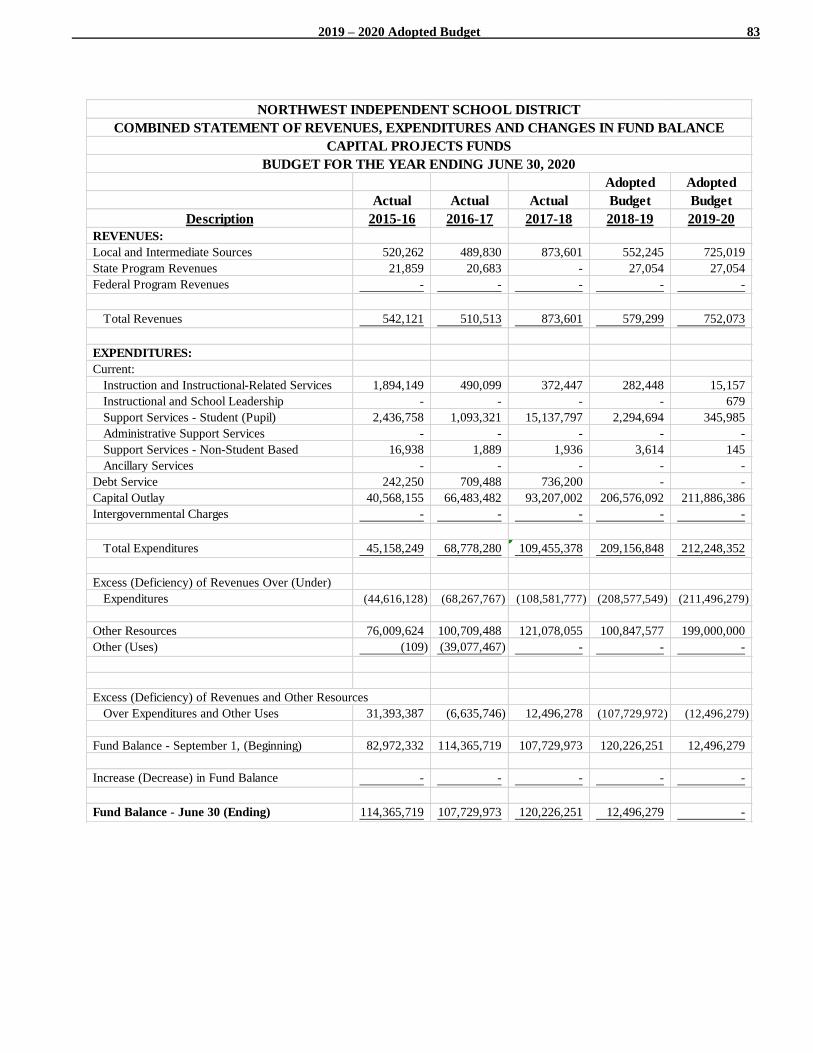
2019 – 2020 Adopted Budget 83
Adopted Adopted
Actual Actual Actual Budget Budget
Description 2015-16 2016-17 2017-18 2018-19 2019-20
REVENUES:
Local and Intermediate Sources 520,262 489,830 873,601 552,245 725,019
State Program Revenues 21,859 20,683 - 27,054 27,054
Federal Program Revenues - - - - -
Total Revenues 542,121 510,513 873,601 579,299 752,073
EXPENDITURES:
Current:
Instruction and Instructional-Related Services 1,894,149 490,099 372,447 282,448 15,157
Instructional and School Leadership - - - - 679
Support Services - Student (Pupil) 2,436,758 1,093,321 15,137,797 2,294,694 345,985
Administrative Support Services - - - - -
Support Services - Non-Student Based 16,938 1,889 1,936 3,614 145
Ancillary Services - - - - -
Debt Service 242,250 709,488 736,200 - -
Capital Outlay 40,568,155 66,483,482 93,207,002 206,576,092 211,886,386
Intergovernmental Charges - - - - -
Total Expenditures 45,158,249 68,778,280 109,455,378 209,156,848 212,248,352
Excess (Deficiency) of Revenues Over (Under)
Expenditures (44,616,128) (68,267,767) (108,581,777) (208,577,549) (211,496,279)
Other Resources 76,009,624 100,709,488 121,078,055 100,847,577 199,000,000
Other (Uses) (109) (39,077,467) - - -
Excess (Deficiency) of Revenues and Other Resources
Over Expenditures and Other Uses 31,393,387 (6,635,746) 12,496,278 (107,729,972) (12,496,279)
Fund Balance - September 1, (Beginning) 82,972,332 114,365,719 107,729,973 120,226,251 12,496,279
Increase (Decrease) in Fund Balance - - - - -
Fund Balance - June 30 (Ending) 114,365,719 107,729,973 120,226,251 12,496,279 -
BUDGET FOR THE YEAR ENDING JUNE 30, 2020
NORTHWEST INDEPENDENT SCHOOL DISTRICT
COMBINED STATEMENT OF REVENUES, EXPENDITURES AND CHANGES IN FUND BALANCE
CAPITAL PROJECTS FUNDS
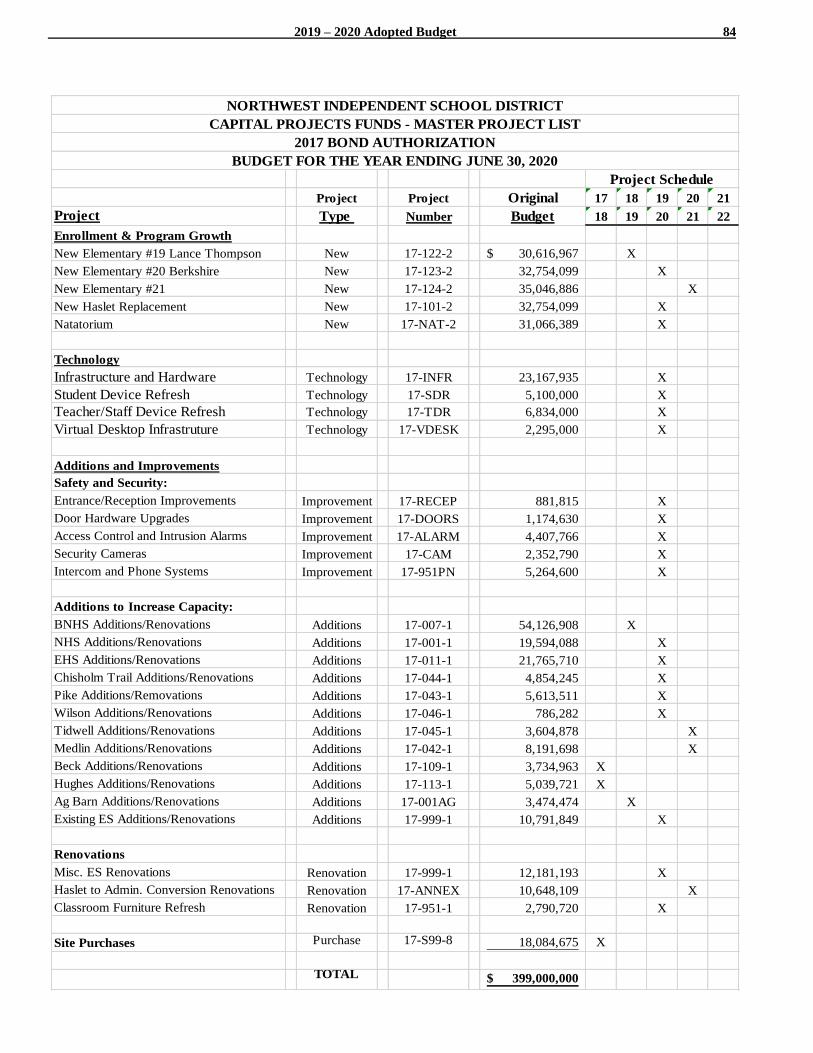
2019 – 2020 Adopted Budget 84
Project Project Original 17 18 19 20 21
Project Type Number Budget 18 19 20 21 22
Enrollment & Program Growth
New Elementary #19 Lance Thompson New 17-122-2 30,616,967$ X
New Elementary #20 Berkshire New 17-123-2 32,754,099 X
New Elementary #21 New 17-124-2 35,046,886 X
New Haslet Replacement New 17-101-2 32,754,099 X
Natatorium New 17-NAT-2 31,066,389 X
Technology
Infrastructure and Hardware Technology 17-INFR 23,167,935 X
Student Device Refresh Technology 17-SDR 5,100,000 X
Teacher/Staff Device Refresh Technology 17-TDR 6,834,000 X
Virtual Desktop Infrastruture Technology 17-VDESK 2,295,000 X
Additions and Improvements
Safety and Security:
Entrance/Reception Improvements Improvement 17-RECEP 881,815 X
Door Hardware Upgrades Improvement 17-DOORS 1,174,630 X
Access Control and Intrusion Alarms Improvement 17-ALARM 4,407,766 X
Security Cameras Improvement 17-CAM 2,352,790 X
Intercom and Phone Systems Improvement 17-951PN 5,264,600 X
Additions to Increase Capacity:
BNHS Additions/Renovations Additions 17-007-1 54,126,908 X
NHS Additions/Renovations Additions 17-001-1 19,594,088 X
EHS Additions/Renovations Additions 17-011-1 21,765,710 X
Chisholm Trail Additions/Renovations Additions 17-044-1 4,854,245 X
Pike Additions/Removations Additions 17-043-1 5,613,511 X
Wilson Additions/Renovations Additions 17-046-1 786,282 X
Tidwell Additions/Renovations Additions 17-045-1 3,604,878 X
Medlin Additions/Renovations Additions 17-042-1 8,191,698 X
Beck Additions/Renovations Additions 17-109-1 3,734,963 X
Hughes Additions/Renovations Additions 17-113-1 5,039,721 X
Ag Barn Additions/Renovations Additions 17-001AG 3,474,474 X
Existing ES Additions/Renovations Additions 17-999-1 10,791,849 X
Renovations
Misc. ES Renovations Renovation 17-999-1 12,181,193 X
Haslet to Admin. Conversion Renovations Renovation 17-ANNEX 10,648,109 X
Classroom Furniture Refresh Renovation 17-951-1 2,790,720 X
Site Purchases Purchase 17-S99-8 18,084,675 X
TOTAL 399,000,000$
BUDGET FOR THE YEAR ENDING JUNE 30, 2020
NORTHWEST INDEPENDENT SCHOOL DISTRICT
CAPITAL PROJECTS FUNDS - MASTER PROJECT LIST
2017 BOND AUTHORIZATION
Project Schedule
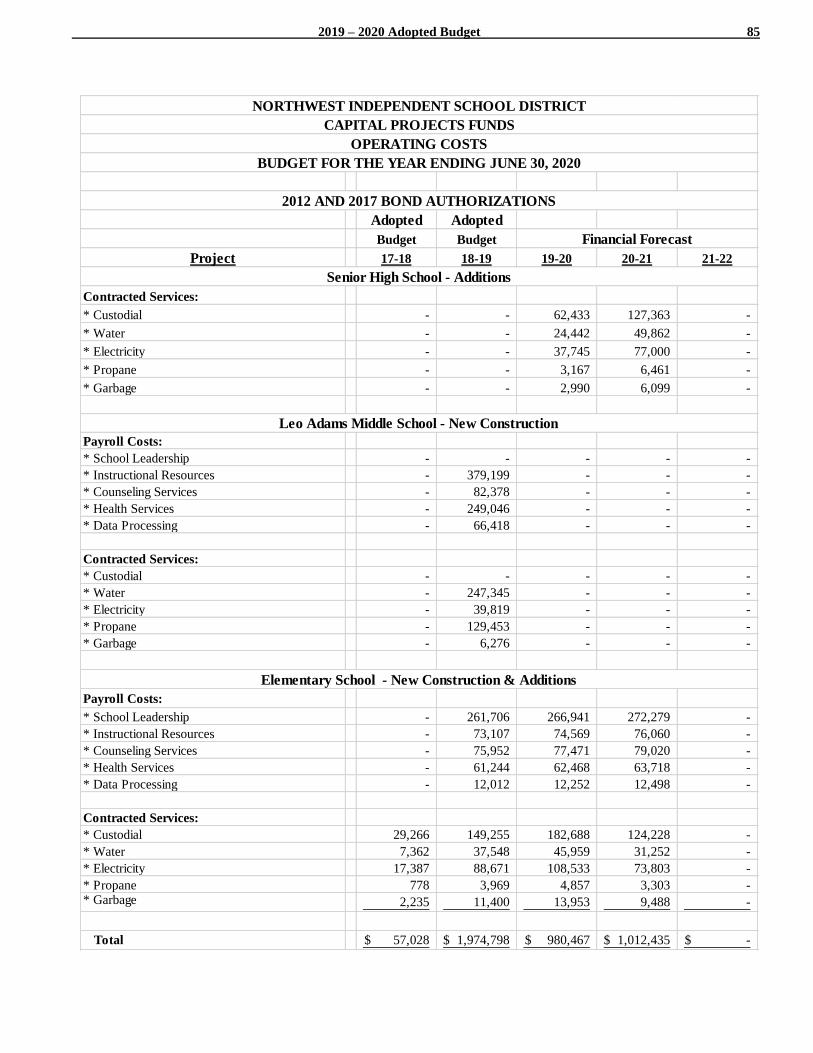
2019 – 2020 Adopted Budget 85
Adopted Adopted
Budget Budget
Project 17-18 18-19 19-20 20-21 21-22
Contracted Services:
* Custodial - - 62,433 127,363 -
* Water - - 24,442 49,862 -
* Electricity - - 37,745 77,000 -
* Propane - - 3,167 6,461 -
* Garbage - - 2,990 6,099 -
Payroll Costs:
* School Leadership - - - - -
* Instructional Resources - 379,199 - - -
* Counseling Services - 82,378 - - -
* Health Services - 249,046 - - -
* Data Processing - 66,418 - - -
Contracted Services:
* Custodial - - - - -
* Water - 247,345 - - -
* Electricity - 39,819 - - -
* Propane - 129,453 - - -
* Garbage - 6,276 - - -
Payroll Costs:
* School Leadership - 261,706 266,941 272,279 -
* Instructional Resources - 73,107 74,569 76,060 -
* Counseling Services - 75,952 77,471 79,020 -
* Health Services - 61,244 62,468 63,718 -
* Data Processing - 12,012 12,252 12,498 -
Contracted Services:
* Custodial 29,266 149,255 182,688 124,228 -
* Water 7,362 37,548 45,959 31,252 -
* Electricity 17,387 88,671 108,533 73,803 -
* Propane 778 3,969 4,857 3,303 - * Garbage 2,235 11,400 13,953 9,488 -
Total 57,028$ 1,974,798$ 980,467$ 1,012,435$ -$
NORTHWEST INDEPENDENT SCHOOL DISTRICT
CAPITAL PROJECTS FUNDS
OPERATING COSTS
BUDGET FOR THE YEAR ENDING JUNE 30, 2020
2012 AND 2017 BOND AUTHORIZATIONS
Leo Adams Middle School - New Construction
Senior High School - Additions
Financial Forecast
Elementary School - New Construction & Additions
2019 – 2020 Adopted Budget 86
Supporting
Financial
Schedules
And
Crosswalks
Combined Statement of Expenditures by Function and Object Code
The Combined Statement of Expenditures by Function and Object Code expands upon the
expenditures portion of the Combined Statement of Revenues, Expenditures and Changes in
Fund Balance shown on page 41. Expenditures for all funds are broken down to the Function
Code and major Object Code level.
The Function Code is a mandatory 2 digit code applied to expenditures/ expenses that
identifies the purpose of the transaction. The first digit identifies the major class and the
second digit refers to the specific function within the area. Example: The function "Health
Service" is coded 33. The first 3 specifies Support Services - Student (Pupil) and the second 3
is Health Services.
The Object Code is a mandatory 4 digit code identifying the nature and object of an account,
a transaction or a source. The first of the four digits identifies the type of account or
transaction, the second digit identifies the major area, and the third and fourth digits provide
further sub-classifications. Example: Money received for current year taxes is classified in
account 5711. The 5 denotes revenue, the 7 shows Local and Intermediate Sources, the 1
denotes local real and personal property taxes revenue and the final 1 specifies current year
levy.
Three years actual, prior year adopted budget, and current year adopted budget are detailed.
Also, a financial crosswalk is included which summarizes the information by major object
code.
Budgeted Expenditures by Fund, Function and Object
The Budgeted Expenditures by Fund, Function and Object expands upon the expenditures
portion of the Combined Statement of Revenues, Expenditures and Changes in Fund Balance
for the General Fund, Special Revenue Funds, Debt Service Funds, and Capital Projects
Funds. Expenditures for all funds are broken down to the Function Code and major Object
Code level. The Function Code and Object Code are explained in the preceding paragraphs
above.
The current year adopted budget is organized by major fund. Also, a financial crosswalk is
included which summarizes the information by major object code.
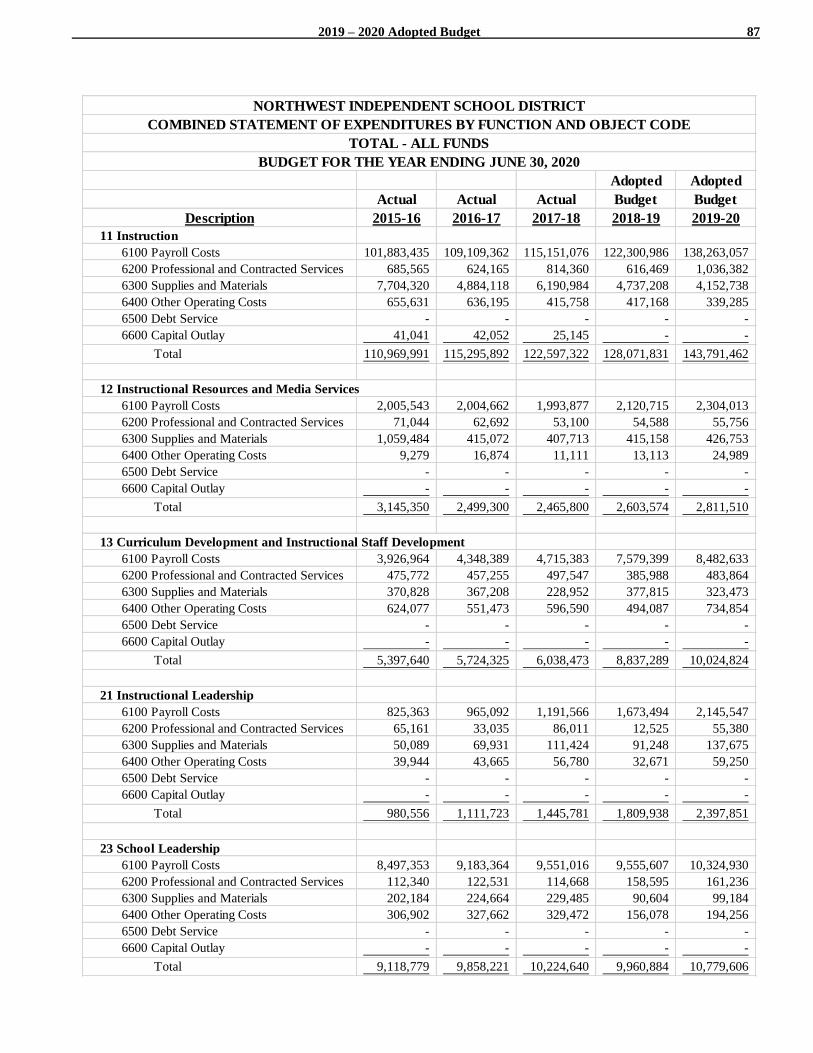
2019 – 2020 Adopted Budget 87
Adopted Adopted
Actual Actual Actual Budget Budget
Description 2015-16 2016-17 2017-18 2018-19 2019-20
11 Instruction
6100 Payroll Costs 101,883,435 109,109,362 115,151,076 122,300,986 138,263,057
6200 Professional and Contracted Services 685,565 624,165 814,360 616,469 1,036,382
6300 Supplies and Materials 7,704,320 4,884,118 6,190,984 4,737,208 4,152,738
6400 Other Operating Costs 655,631 636,195 415,758 417,168 339,285
6500 Debt Service - - - - -
6600 Capital Outlay 41,041 42,052 25,145 - -
Total 110,969,991 115,295,892 122,597,322 128,071,831 143,791,462
12 Instructional Resources and Media Services
6100 Payroll Costs 2,005,543 2,004,662 1,993,877 2,120,715 2,304,013
6200 Professional and Contracted Services 71,044 62,692 53,100 54,588 55,756
6300 Supplies and Materials 1,059,484 415,072 407,713 415,158 426,753
6400 Other Operating Costs 9,279 16,874 11,111 13,113 24,989
6500 Debt Service - - - - -
6600 Capital Outlay - - - - -
Total 3,145,350 2,499,300 2,465,800 2,603,574 2,811,510
13 Curriculum Development and Instructional Staff Development
6100 Payroll Costs 3,926,964 4,348,389 4,715,383 7,579,399 8,482,633
6200 Professional and Contracted Services 475,772 457,255 497,547 385,988 483,864
6300 Supplies and Materials 370,828 367,208 228,952 377,815 323,473
6400 Other Operating Costs 624,077 551,473 596,590 494,087 734,854
6500 Debt Service - - - - -
6600 Capital Outlay - - - - -
Total 5,397,640 5,724,325 6,038,473 8,837,289 10,024,824
21 Instructional Leadership
6100 Payroll Costs 825,363 965,092 1,191,566 1,673,494 2,145,547
6200 Professional and Contracted Services 65,161 33,035 86,011 12,525 55,380
6300 Supplies and Materials 50,089 69,931 111,424 91,248 137,675
6400 Other Operating Costs 39,944 43,665 56,780 32,671 59,250
6500 Debt Service - - - - -
6600 Capital Outlay - - - - -
Total 980,556 1,111,723 1,445,781 1,809,938 2,397,851
23 School Leadership
6100 Payroll Costs 8,497,353 9,183,364 9,551,016 9,555,607 10,324,930
6200 Professional and Contracted Services 112,340 122,531 114,668 158,595 161,236
6300 Supplies and Materials 202,184 224,664 229,485 90,604 99,184
6400 Other Operating Costs 306,902 327,662 329,472 156,078 194,256
6500 Debt Service - - - - -
6600 Capital Outlay - - - - -
Total 9,118,779 9,858,221 10,224,640 9,960,884 10,779,606
NORTHWEST INDEPENDENT SCHOOL DISTRICT
COMBINED STATEMENT OF EXPENDITURES BY FUNCTION AND OBJECT CODE
TOTAL - ALL FUNDS
BUDGET FOR THE YEAR ENDING JUNE 30, 2020
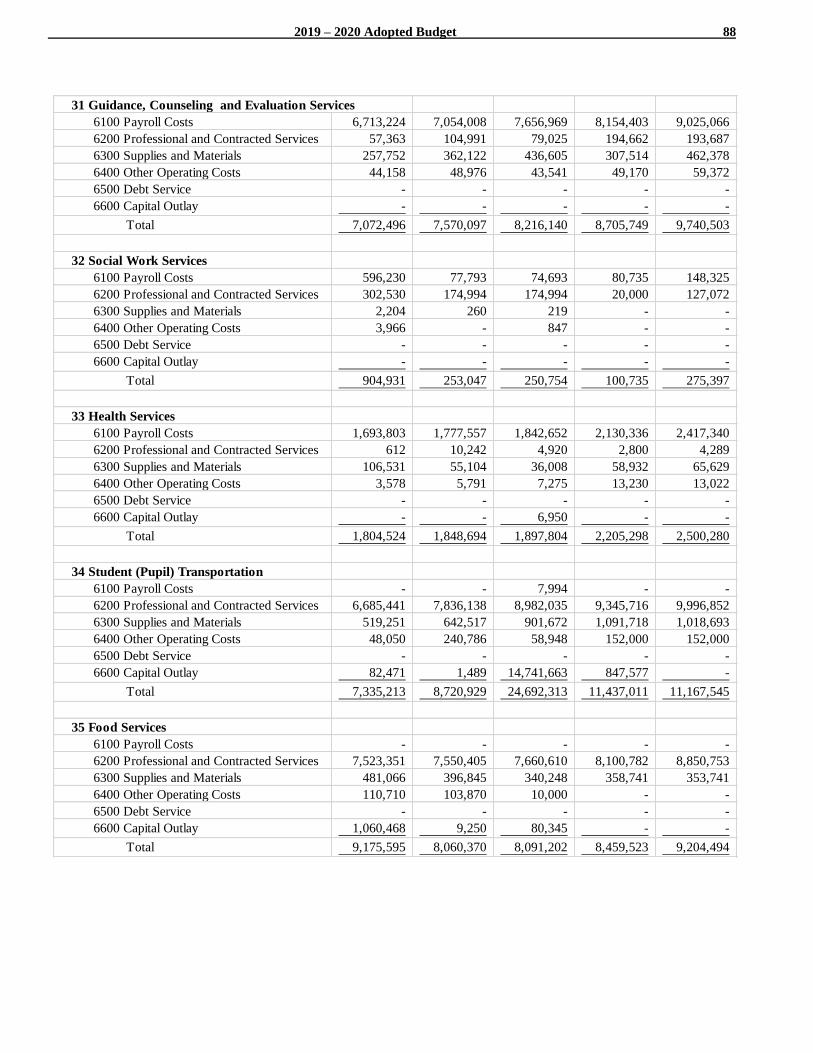
2019 – 2020 Adopted Budget 88
31 Guidance, Counseling and Evaluation Services
6100 Payroll Costs 6,713,224 7,054,008 7,656,969 8,154,403 9,025,066
6200 Professional and Contracted Services 57,363 104,991 79,025 194,662 193,687
6300 Supplies and Materials 257,752 362,122 436,605 307,514 462,378
6400 Other Operating Costs 44,158 48,976 43,541 49,170 59,372
6500 Debt Service - - - - -
6600 Capital Outlay - - - - -
Total 7,072,496 7,570,097 8,216,140 8,705,749 9,740,503
32 Social Work Services
6100 Payroll Costs 596,230 77,793 74,693 80,735 148,325
6200 Professional and Contracted Services 302,530 174,994 174,994 20,000 127,072
6300 Supplies and Materials 2,204 260 219 - -
6400 Other Operating Costs 3,966 - 847 - -
6500 Debt Service - - - - -
6600 Capital Outlay - - - - -
Total 904,931 253,047 250,754 100,735 275,397
33 Health Services
6100 Payroll Costs 1,693,803 1,777,557 1,842,652 2,130,336 2,417,340
6200 Professional and Contracted Services 612 10,242 4,920 2,800 4,289
6300 Supplies and Materials 106,531 55,104 36,008 58,932 65,629
6400 Other Operating Costs 3,578 5,791 7,275 13,230 13,022
6500 Debt Service - - - - -
6600 Capital Outlay - - 6,950 - -
Total 1,804,524 1,848,694 1,897,804 2,205,298 2,500,280
34 Student (Pupil) Transportation
6100 Payroll Costs - - 7,994 - -
6200 Professional and Contracted Services 6,685,441 7,836,138 8,982,035 9,345,716 9,996,852
6300 Supplies and Materials 519,251 642,517 901,672 1,091,718 1,018,693
6400 Other Operating Costs 48,050 240,786 58,948 152,000 152,000
6500 Debt Service - - - - -
6600 Capital Outlay 82,471 1,489 14,741,663 847,577 -
Total 7,335,213 8,720,929 24,692,313 11,437,011 11,167,545
35 Food Services
6100 Payroll Costs - - - - -
6200 Professional and Contracted Services 7,523,351 7,550,405 7,660,610 8,100,782 8,850,753
6300 Supplies and Materials 481,066 396,845 340,248 358,741 353,741
6400 Other Operating Costs 110,710 103,870 10,000 - -
6500 Debt Service - - - - -
6600 Capital Outlay 1,060,468 9,250 80,345 - -
Total 9,175,595 8,060,370 8,091,202 8,459,523 9,204,494
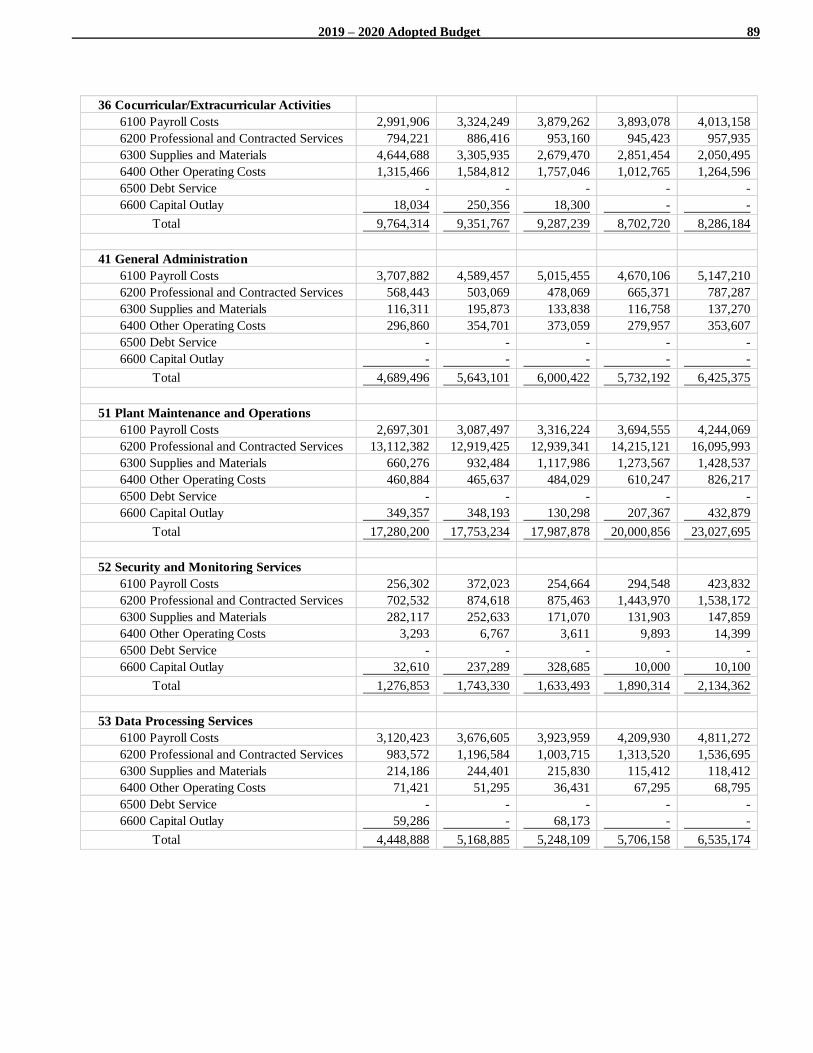
2019 – 2020 Adopted Budget 89
36 Cocurricular/Extracurricular Activities
6100 Payroll Costs 2,991,906 3,324,249 3,879,262 3,893,078 4,013,158
6200 Professional and Contracted Services 794,221 886,416 953,160 945,423 957,935
6300 Supplies and Materials 4,644,688 3,305,935 2,679,470 2,851,454 2,050,495
6400 Other Operating Costs 1,315,466 1,584,812 1,757,046 1,012,765 1,264,596
6500 Debt Service - - - - -
6600 Capital Outlay 18,034 250,356 18,300 - -
Total 9,764,314 9,351,767 9,287,239 8,702,720 8,286,184
41 General Administration
6100 Payroll Costs 3,707,882 4,589,457 5,015,455 4,670,106 5,147,210
6200 Professional and Contracted Services 568,443 503,069 478,069 665,371 787,287
6300 Supplies and Materials 116,311 195,873 133,838 116,758 137,270
6400 Other Operating Costs 296,860 354,701 373,059 279,957 353,607
6500 Debt Service - - - - -
6600 Capital Outlay - - - - -
Total 4,689,496 5,643,101 6,000,422 5,732,192 6,425,375
51 Plant Maintenance and Operations
6100 Payroll Costs 2,697,301 3,087,497 3,316,224 3,694,555 4,244,069
6200 Professional and Contracted Services 13,112,382 12,919,425 12,939,341 14,215,121 16,095,993
6300 Supplies and Materials 660,276 932,484 1,117,986 1,273,567 1,428,537
6400 Other Operating Costs 460,884 465,637 484,029 610,247 826,217
6500 Debt Service - - - - -
6600 Capital Outlay 349,357 348,193 130,298 207,367 432,879
Total 17,280,200 17,753,234 17,987,878 20,000,856 23,027,695
52 Security and Monitoring Services
6100 Payroll Costs 256,302 372,023 254,664 294,548 423,832
6200 Professional and Contracted Services 702,532 874,618 875,463 1,443,970 1,538,172
6300 Supplies and Materials 282,117 252,633 171,070 131,903 147,859
6400 Other Operating Costs 3,293 6,767 3,611 9,893 14,399
6500 Debt Service - - - - -
6600 Capital Outlay 32,610 237,289 328,685 10,000 10,100
Total 1,276,853 1,743,330 1,633,493 1,890,314 2,134,362
53 Data Processing Services
6100 Payroll Costs 3,120,423 3,676,605 3,923,959 4,209,930 4,811,272
6200 Professional and Contracted Services 983,572 1,196,584 1,003,715 1,313,520 1,536,695
6300 Supplies and Materials 214,186 244,401 215,830 115,412 118,412
6400 Other Operating Costs 71,421 51,295 36,431 67,295 68,795
6500 Debt Service - - - - -
6600 Capital Outlay 59,286 - 68,173 - -
Total 4,448,888 5,168,885 5,248,109 5,706,158 6,535,174
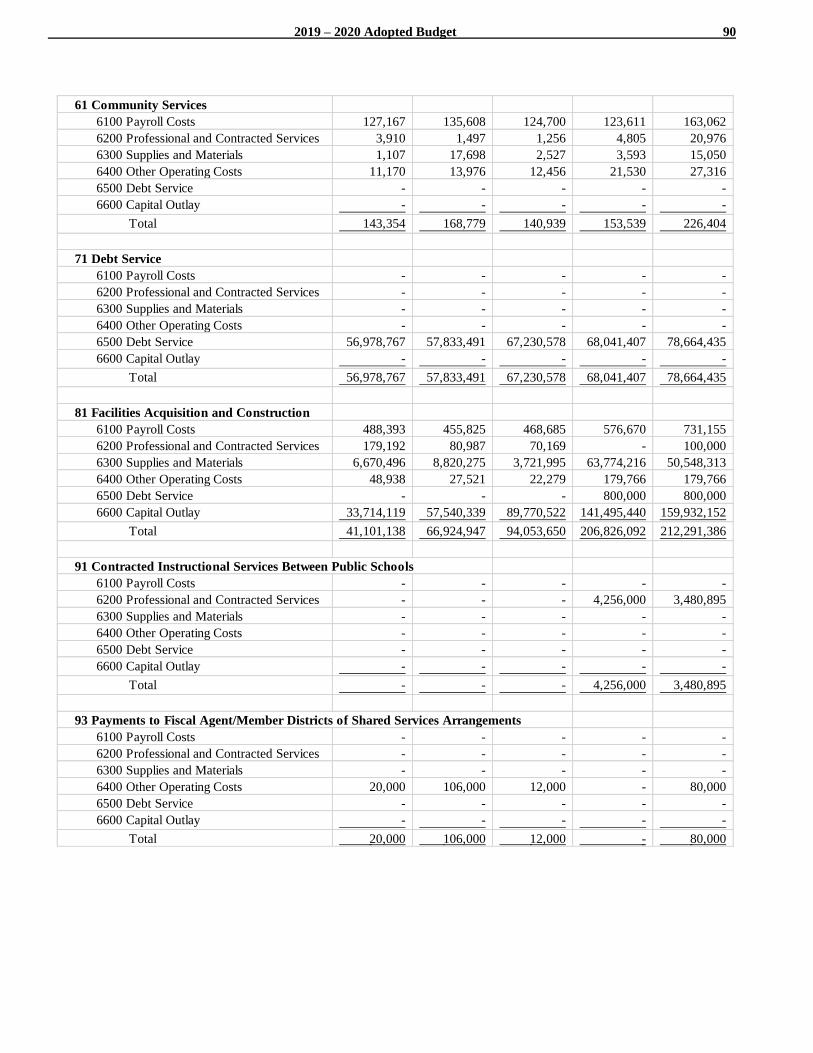
2019 – 2020 Adopted Budget 90
61 Community Services
6100 Payroll Costs 127,167 135,608 124,700 123,611 163,062
6200 Professional and Contracted Services 3,910 1,497 1,256 4,805 20,976
6300 Supplies and Materials 1,107 17,698 2,527 3,593 15,050
6400 Other Operating Costs 11,170 13,976 12,456 21,530 27,316
6500 Debt Service - - - - -
6600 Capital Outlay - - - - -
Total 143,354 168,779 140,939 153,539 226,404
71 Debt Service
6100 Payroll Costs - - - - -
6200 Professional and Contracted Services - - - - -
6300 Supplies and Materials - - - - -
6400 Other Operating Costs - - - - -
6500 Debt Service 56,978,767 57,833,491 67,230,578 68,041,407 78,664,435
6600 Capital Outlay - - - - -
Total 56,978,767 57,833,491 67,230,578 68,041,407 78,664,435
81 Facilities Acquisition and Construction
6100 Payroll Costs 488,393 455,825 468,685 576,670 731,155
6200 Professional and Contracted Services 179,192 80,987 70,169 - 100,000
6300 Supplies and Materials 6,670,496 8,820,275 3,721,995 63,774,216 50,548,313
6400 Other Operating Costs 48,938 27,521 22,279 179,766 179,766
6500 Debt Service - - - 800,000 800,000
6600 Capital Outlay 33,714,119 57,540,339 89,770,522 141,495,440 159,932,152
Total 41,101,138 66,924,947 94,053,650 206,826,092 212,291,386
91 Contracted Instructional Services Between Public Schools
6100 Payroll Costs - - - - -
6200 Professional and Contracted Services - - - 4,256,000 3,480,895
6300 Supplies and Materials - - - - -
6400 Other Operating Costs - - - - -
6500 Debt Service - - - - -
6600 Capital Outlay - - - - -
Total - - - 4,256,000 3,480,895
93 Payments to Fiscal Agent/Member Districts of Shared Services Arrangements
6100 Payroll Costs - - - - -
6200 Professional and Contracted Services - - - - -
6300 Supplies and Materials - - - - -
6400 Other Operating Costs 20,000 106,000 12,000 - 80,000
6500 Debt Service - - - - -
6600 Capital Outlay - - - - -
Total 20,000 106,000 12,000 - 80,000
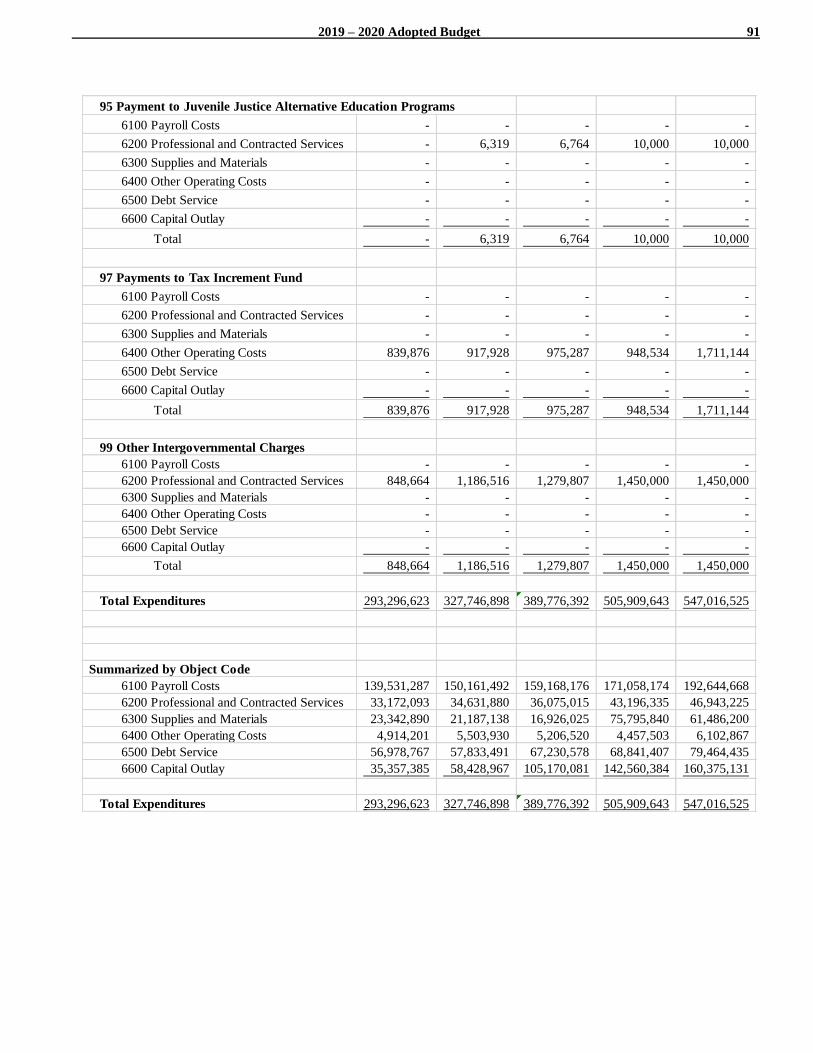
2019 – 2020 Adopted Budget 91
95 Payment to Juvenile Justice Alternative Education Programs
6100 Payroll Costs - - - - -
6200 Professional and Contracted Services - 6,319 6,764 10,000 10,000
6300 Supplies and Materials - - - - -
6400 Other Operating Costs - - - - -
6500 Debt Service - - - - -
6600 Capital Outlay - - - - -
Total - 6,319 6,764 10,000 10,000
97 Payments to Tax Increment Fund
6100 Payroll Costs - - - - -
6200 Professional and Contracted Services - - - - -
6300 Supplies and Materials - - - - -
6400 Other Operating Costs 839,876 917,928 975,287 948,534 1,711,144
6500 Debt Service - - - - -
6600 Capital Outlay - - - - -
Total 839,876 917,928 975,287 948,534 1,711,144
99 Other Intergovernmental Charges
6100 Payroll Costs - - - - -
6200 Professional and Contracted Services 848,664 1,186,516 1,279,807 1,450,000 1,450,000
6300 Supplies and Materials - - - - -
6400 Other Operating Costs - - - - -
6500 Debt Service - - - - -
6600 Capital Outlay - - - - -
Total 848,664 1,186,516 1,279,807 1,450,000 1,450,000
Total Expenditures 293,296,623 327,746,898 389,776,392 505,909,643 547,016,525
Summarized by Object Code
6100 Payroll Costs 139,531,287 150,161,492 159,168,176 171,058,174 192,644,668
6200 Professional and Contracted Services 33,172,093 34,631,880 36,075,015 43,196,335 46,943,225
6300 Supplies and Materials 23,342,890 21,187,138 16,926,025 75,795,840 61,486,200
6400 Other Operating Costs 4,914,201 5,503,930 5,206,520 4,457,503 6,102,867
6500 Debt Service 56,978,767 57,833,491 67,230,578 68,841,407 79,464,435
6600 Capital Outlay 35,357,385 58,428,967 105,170,081 142,560,384 160,375,131
Total Expenditures 293,296,623 327,746,898 389,776,392 505,909,643 547,016,525
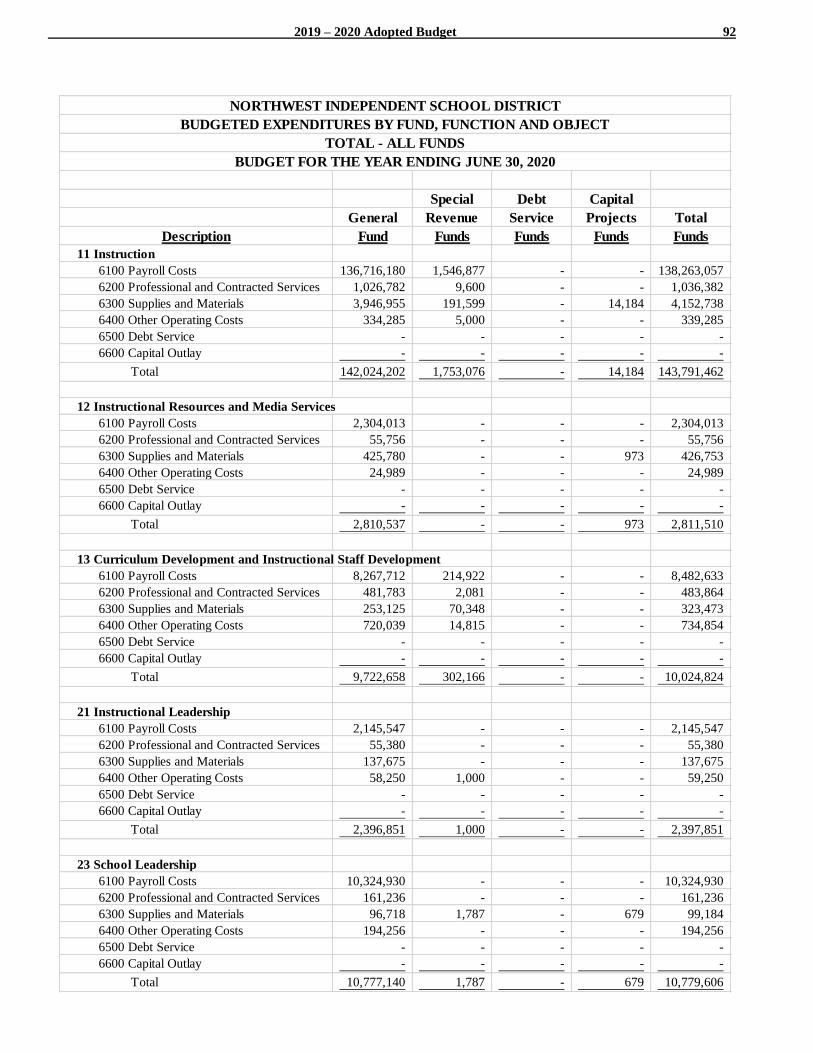
2019 – 2020 Adopted Budget 92
Special Debt Capital
General Revenue Service Projects Total
Description Fund Funds Funds Funds Funds
11 Instruction
6100 Payroll Costs 136,716,180 1,546,877 - - 138,263,057
6200 Professional and Contracted Services 1,026,782 9,600 - - 1,036,382
6300 Supplies and Materials 3,946,955 191,599 - 14,184 4,152,738
6400 Other Operating Costs 334,285 5,000 - - 339,285
6500 Debt Service - - - - -
6600 Capital Outlay - - - - -
Total 142,024,202 1,753,076 - 14,184 143,791,462
12 Instructional Resources and Media Services
6100 Payroll Costs 2,304,013 - - - 2,304,013
6200 Professional and Contracted Services 55,756 - - - 55,756
6300 Supplies and Materials 425,780 - - 973 426,753
6400 Other Operating Costs 24,989 - - - 24,989
6500 Debt Service - - - - -
6600 Capital Outlay - - - - -
Total 2,810,537 - - 973 2,811,510
13 Curriculum Development and Instructional Staff Development
6100 Payroll Costs 8,267,712 214,922 - - 8,482,633
6200 Professional and Contracted Services 481,783 2,081 - - 483,864
6300 Supplies and Materials 253,125 70,348 - - 323,473
6400 Other Operating Costs 720,039 14,815 - - 734,854
6500 Debt Service - - - - -
6600 Capital Outlay - - - - -
Total 9,722,658 302,166 - - 10,024,824
21 Instructional Leadership
6100 Payroll Costs 2,145,547 - - - 2,145,547
6200 Professional and Contracted Services 55,380 - - - 55,380
6300 Supplies and Materials 137,675 - - - 137,675
6400 Other Operating Costs 58,250 1,000 - - 59,250
6500 Debt Service - - - - -
6600 Capital Outlay - - - - -
Total 2,396,851 1,000 - - 2,397,851
23 School Leadership
6100 Payroll Costs 10,324,930 - - - 10,324,930
6200 Professional and Contracted Services 161,236 - - - 161,236
6300 Supplies and Materials 96,718 1,787 - 679 99,184
6400 Other Operating Costs 194,256 - - - 194,256
6500 Debt Service - - - - -
6600 Capital Outlay - - - - -
Total 10,777,140 1,787 - 679 10,779,606
NORTHWEST INDEPENDENT SCHOOL DISTRICT
BUDGETED EXPENDITURES BY FUND, FUNCTION AND OBJECT
TOTAL - ALL FUNDS
BUDGET FOR THE YEAR ENDING JUNE 30, 2020
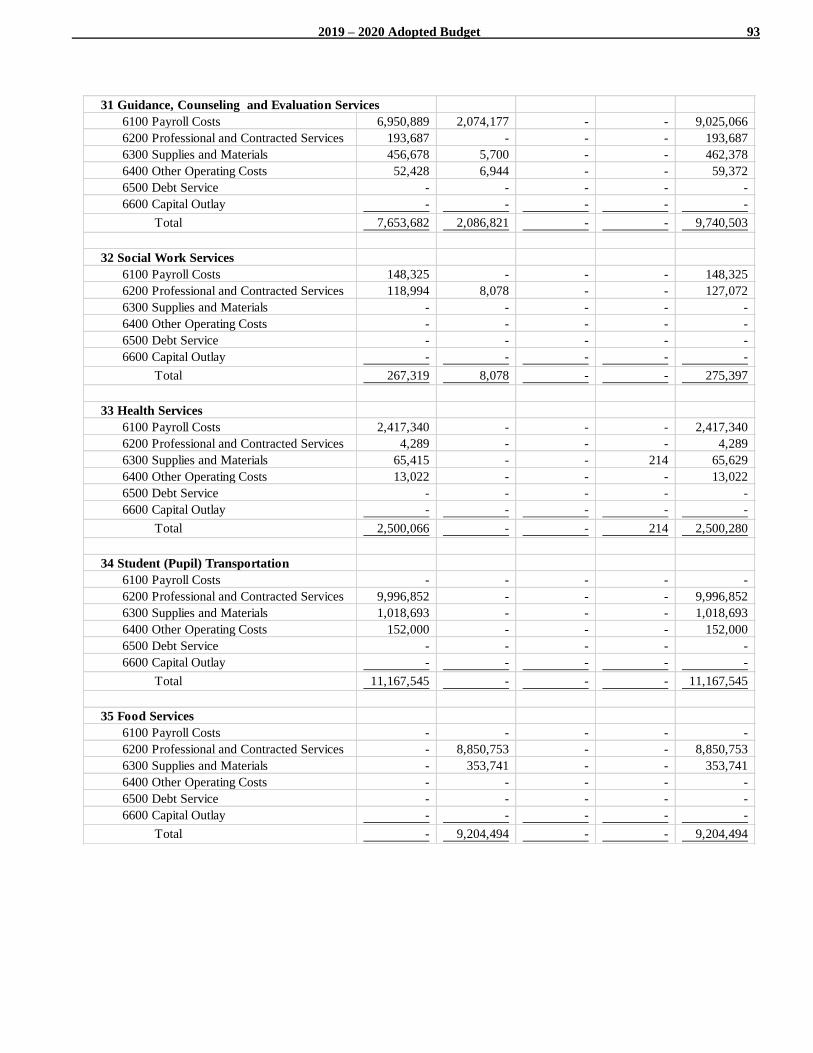
2019 – 2020 Adopted Budget 93
31 Guidance, Counseling and Evaluation Services
6100 Payroll Costs 6,950,889 2,074,177 - - 9,025,066
6200 Professional and Contracted Services 193,687 - - - 193,687
6300 Supplies and Materials 456,678 5,700 - - 462,378
6400 Other Operating Costs 52,428 6,944 - - 59,372
6500 Debt Service - - - - -
6600 Capital Outlay - - - - -
Total 7,653,682 2,086,821 - - 9,740,503
32 Social Work Services
6100 Payroll Costs 148,325 - - - 148,325
6200 Professional and Contracted Services 118,994 8,078 - - 127,072
6300 Supplies and Materials - - - - -
6400 Other Operating Costs - - - - -
6500 Debt Service - - - - -
6600 Capital Outlay - - - - -
Total 267,319 8,078 - - 275,397
33 Health Services
6100 Payroll Costs 2,417,340 - - - 2,417,340
6200 Professional and Contracted Services 4,289 - - - 4,289
6300 Supplies and Materials 65,415 - - 214 65,629
6400 Other Operating Costs 13,022 - - - 13,022
6500 Debt Service - - - - -
6600 Capital Outlay - - - - -
Total 2,500,066 - - 214 2,500,280
34 Student (Pupil) Transportation
6100 Payroll Costs - - - - -
6200 Professional and Contracted Services 9,996,852 - - - 9,996,852
6300 Supplies and Materials 1,018,693 - - - 1,018,693
6400 Other Operating Costs 152,000 - - - 152,000
6500 Debt Service - - - - -
6600 Capital Outlay - - - - -
Total 11,167,545 - - - 11,167,545
35 Food Services
6100 Payroll Costs - - - - -
6200 Professional and Contracted Services - 8,850,753 - - 8,850,753
6300 Supplies and Materials - 353,741 - - 353,741
6400 Other Operating Costs - - - - -
6500 Debt Service - - - - -
6600 Capital Outlay - - - - -
Total - 9,204,494 - - 9,204,494
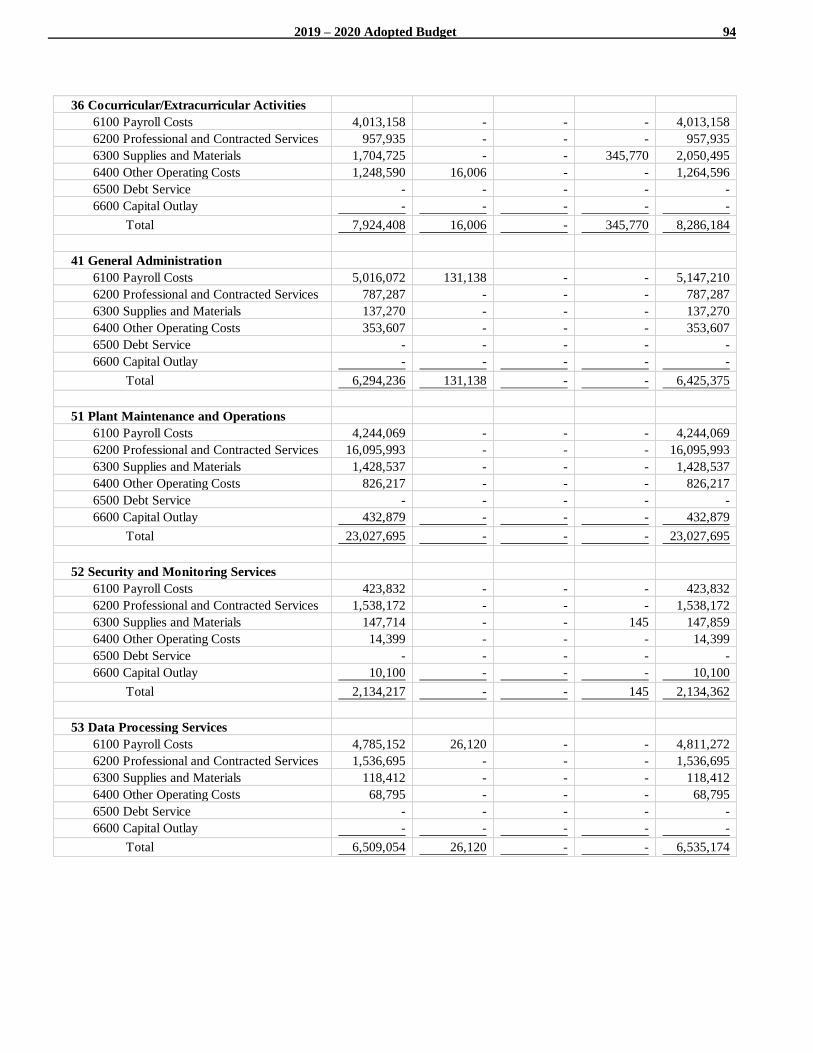
2019 – 2020 Adopted Budget 94
36 Cocurricular/Extracurricular Activities
6100 Payroll Costs 4,013,158 - - - 4,013,158
6200 Professional and Contracted Services 957,935 - - - 957,935
6300 Supplies and Materials 1,704,725 - - 345,770 2,050,495
6400 Other Operating Costs 1,248,590 16,006 - - 1,264,596
6500 Debt Service - - - - -
6600 Capital Outlay - - - - -
Total 7,924,408 16,006 - 345,770 8,286,184
41 General Administration
6100 Payroll Costs 5,016,072 131,138 - - 5,147,210
6200 Professional and Contracted Services 787,287 - - - 787,287
6300 Supplies and Materials 137,270 - - - 137,270
6400 Other Operating Costs 353,607 - - - 353,607
6500 Debt Service - - - - -
6600 Capital Outlay - - - - -
Total 6,294,236 131,138 - - 6,425,375
51 Plant Maintenance and Operations
6100 Payroll Costs 4,244,069 - - - 4,244,069
6200 Professional and Contracted Services 16,095,993 - - - 16,095,993
6300 Supplies and Materials 1,428,537 - - - 1,428,537
6400 Other Operating Costs 826,217 - - - 826,217
6500 Debt Service - - - - -
6600 Capital Outlay 432,879 - - - 432,879
Total 23,027,695 - - - 23,027,695
52 Security and Monitoring Services
6100 Payroll Costs 423,832 - - - 423,832
6200 Professional and Contracted Services 1,538,172 - - - 1,538,172
6300 Supplies and Materials 147,714 - - 145 147,859
6400 Other Operating Costs 14,399 - - - 14,399
6500 Debt Service - - - - -
6600 Capital Outlay 10,100 - - - 10,100
Total 2,134,217 - - 145 2,134,362
53 Data Processing Services
6100 Payroll Costs 4,785,152 26,120 - - 4,811,272
6200 Professional and Contracted Services 1,536,695 - - - 1,536,695
6300 Supplies and Materials 118,412 - - - 118,412
6400 Other Operating Costs 68,795 - - - 68,795
6500 Debt Service - - - - -
6600 Capital Outlay - - - - -
Total 6,509,054 26,120 - - 6,535,174
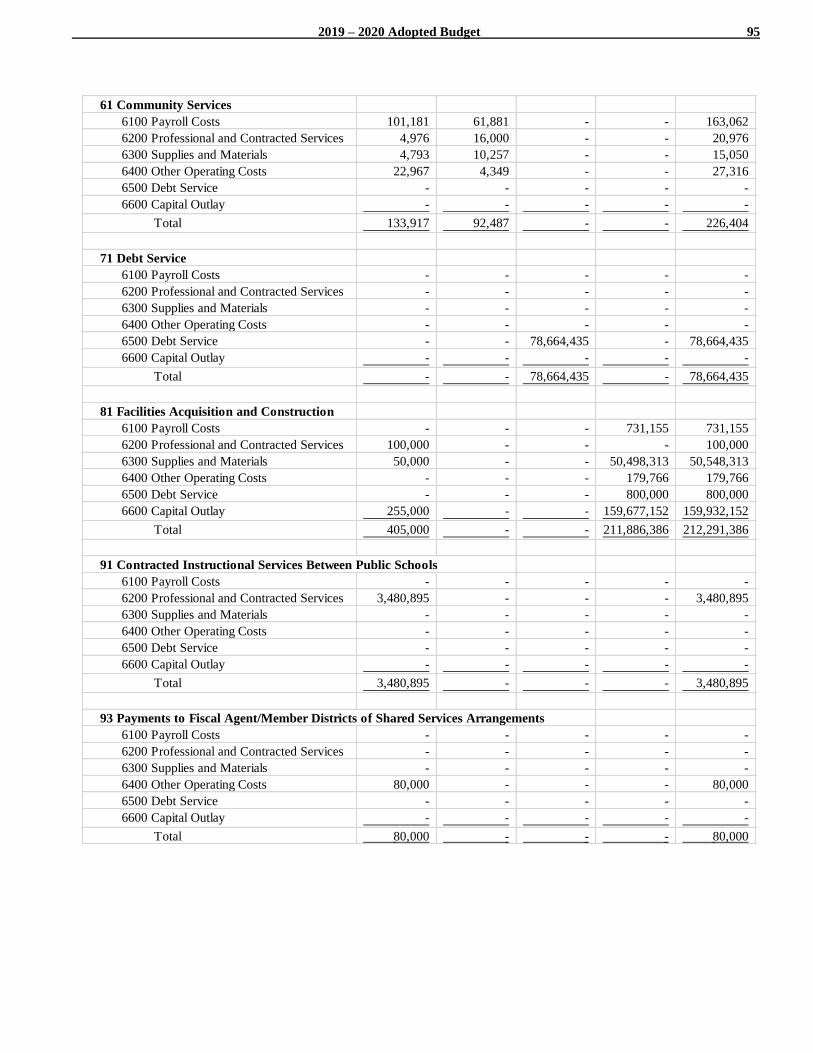
2019 – 2020 Adopted Budget 95
61 Community Services
6100 Payroll Costs 101,181 61,881 - - 163,062
6200 Professional and Contracted Services 4,976 16,000 - - 20,976
6300 Supplies and Materials 4,793 10,257 - - 15,050
6400 Other Operating Costs 22,967 4,349 - - 27,316
6500 Debt Service - - - - -
6600 Capital Outlay - - - - -
Total 133,917 92,487 - - 226,404
71 Debt Service
6100 Payroll Costs - - - - -
6200 Professional and Contracted Services - - - - -
6300 Supplies and Materials - - - - -
6400 Other Operating Costs - - - - -
6500 Debt Service - - 78,664,435 - 78,664,435
6600 Capital Outlay - - - - -
Total - - 78,664,435 - 78,664,435
81 Facilities Acquisition and Construction
6100 Payroll Costs - - - 731,155 731,155
6200 Professional and Contracted Services 100,000 - - - 100,000
6300 Supplies and Materials 50,000 - - 50,498,313 50,548,313
6400 Other Operating Costs - - - 179,766 179,766
6500 Debt Service - - - 800,000 800,000
6600 Capital Outlay 255,000 - - 159,677,152 159,932,152
Total 405,000 - - 211,886,386 212,291,386
91 Contracted Instructional Services Between Public Schools
6100 Payroll Costs - - - - -
6200 Professional and Contracted Services 3,480,895 - - - 3,480,895
6300 Supplies and Materials - - - - -
6400 Other Operating Costs - - - - -
6500 Debt Service - - - - -
6600 Capital Outlay - - - - -
Total 3,480,895 - - - 3,480,895
93 Payments to Fiscal Agent/Member Districts of Shared Services Arrangements
6100 Payroll Costs - - - - -
6200 Professional and Contracted Services - - - - -
6300 Supplies and Materials - - - - -
6400 Other Operating Costs 80,000 - - - 80,000
6500 Debt Service - - - - -
6600 Capital Outlay - - - - -
Total 80,000 - - - 80,000
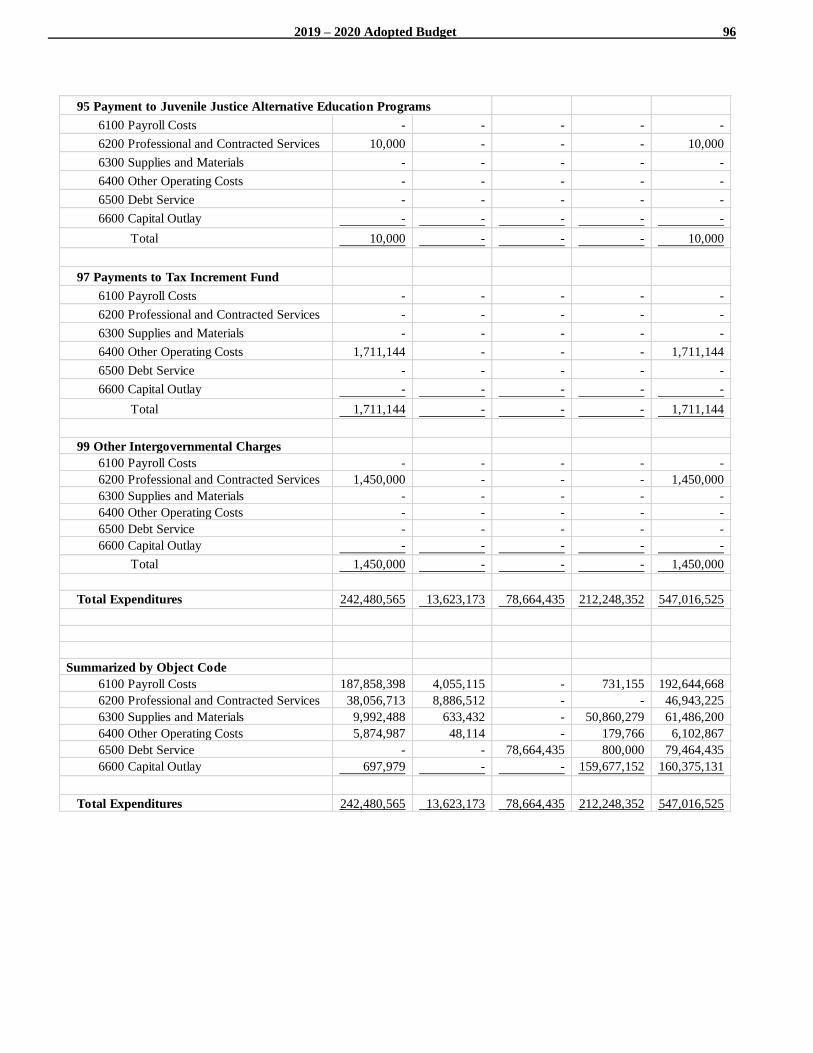
2019 – 2020 Adopted Budget 96
95 Payment to Juvenile Justice Alternative Education Programs
6100 Payroll Costs - - - - -
6200 Professional and Contracted Services 10,000 - - - 10,000
6300 Supplies and Materials - - - - -
6400 Other Operating Costs - - - - -
6500 Debt Service - - - - -
6600 Capital Outlay - - - - -
Total 10,000 - - - 10,000
97 Payments to Tax Increment Fund
6100 Payroll Costs - - - - -
6200 Professional and Contracted Services - - - - -
6300 Supplies and Materials - - - - -
6400 Other Operating Costs 1,711,144 - - - 1,711,144
6500 Debt Service - - - - -
6600 Capital Outlay - - - - -
Total 1,711,144 - - - 1,711,144
99 Other Intergovernmental Charges
6100 Payroll Costs - - - - -
6200 Professional and Contracted Services 1,450,000 - - - 1,450,000
6300 Supplies and Materials - - - - -
6400 Other Operating Costs - - - - -
6500 Debt Service - - - - -
6600 Capital Outlay - - - - -
Total 1,450,000 - - - 1,450,000
Total Expenditures 242,480,565 13,623,173 78,664,435 212,248,352 547,016,525
Summarized by Object Code
6100 Payroll Costs 187,858,398 4,055,115 - 731,155 192,644,668
6200 Professional and Contracted Services 38,056,713 8,886,512 - - 46,943,225
6300 Supplies and Materials 9,992,488 633,432 - 50,860,279 61,486,200
6400 Other Operating Costs 5,874,987 48,114 - 179,766 6,102,867
6500 Debt Service - - 78,664,435 800,000 79,464,435
6600 Capital Outlay 697,979 - - 159,677,152 160,375,131
Total Expenditures 242,480,565 13,623,173 78,664,435 212,248,352 547,016,525
2019 – 2020 Adopted Budget 97
Fund
Balance
Northwest Independent
School District
Financial Statements Notes
FYE June 30, 2020
The District has implemented GASB
Statement No. 54, "Fund Balance Reporting
and Governmental Fund Type Definitions"
which provides more clearly defined fund
balance categories to make the nature and
extent of the constraints placed on a
government's fund balances more
transparent.
Fund Balance Classification: The
governmental fund financial statements
present fund balances based on
classifications that comprise a hierarchy that
is based primarily on the extent to which the
District is bound to honor constraints on the
specific purposes for which amounts in the
respective governmental funds can be spent.
The classifications used in the governmental
fund financial statements are as follows:
• Nonspendable: This classification
includes amounts that cannot be spent
because they are either (a) not in
spendable form or (b) are legally or
contractually required to be maintained
intact. The District has classified
prepaid items as being nonspendable as
these items are not expected to be
converted to cash.
• Restricted: This classification
includes amounts for which constraints
have been placed on the use of the
resources either (a) externally imposed
by creditors, grantors, contributors, or
laws or regulations of other
governments, or (b) imposed by law
through constitutional provisions or
enabling legislation. Debt service
resources are to be used for future
servicing of the District's bonded debt
and are restricted through debt
covenants. Capital projects fund
resources are to be used for future
construction and renovation projects and
are restricted through bond orders and
constitutional law.
• Committed: This classification
includes amounts that can be used only
for specific purposes pursuant to
constraints imposed by formal action of
the District's Board of Trustees. The
Board of Trustees establishes (and
modifies or rescinds) fund balance
commitments by passage of a resolution.
This can also be done through adoption
and amendment of the budget. These
amounts cannot be used for any other
purpose unless the Board removes or
changes the specified use by taking the
same type of action that was employed
when the funds were initially
committed. This classification also
includes contractual obligations to the
extent that existing resources have been
specifically committed for use in
satisfying those contractual
requirements. The Board of Trustees
have committed resources as of June 30,
2019 for campus activities.
• Assigned: This classification
includes amounts that are constrained by
the District's intent to be used for a
specific purpose but are neither
restricted nor committed. This intent can
be expressed by the Board of Trustees or
through the Board of Trustees
delegating this responsibility to other
individuals in the District. Under the
District's adopted policy, the Board of
Trustees may assign amounts for
specific purposes but it has also
delegated authority to assign fund
balance to the Superintendent. This
classification also includes the
remaining positive fund balance for all
governmental funds except for the
General Fund. The District has assigned
fund balance of the General Fund as of
June 30, 2019 as detailed below.
2019 – 2020 Adopted Budget 98
Unassigned: This classification includes
all amounts not included in other
spendable classifications, including the
residual fund balance for the General
Fund. A negative unassigned fund
balance may be reported in other
governmental funds if expenditures
incurred for specific purposes exceed
the amounts restricted, committed or
assigned to those purposes.
When an expenditure is incurred for
purposes for which both restricted and
unrestricted fund balance is available,
the District considers restricted funds to
have been spent first. When an
expenditure is incurred for which
committed, assigned, or unassigned fund
balances are available, the District
considers amounts to have been spent
first out of committed funds, then
assigned funds, and finally unassigned
funds, as needed, unless the Board of
Trustees has provided otherwise in its
commitment or assignment actions.
During the current fiscal period, the
Board of Trustees adopted a fund
balance policy that expresses an intent
to maintain a level of assigned and
unassigned fund balance in the general
fund equal to 25 percent of the fund's
operating expenditures.
The details of the fund balances are
included in the Governmental Funds
Balance Sheet and are described below:
General Fund
The General Fund has unassigned fund
balance of $99,134,726 at June 30,
2019.
Other Major Funds
The Debt Service Fund has restricted
funds of $55,537,296 at June 30, 2019
consisting primarily of property tax
collections that are restricted for debt
service payments on bonded debt. The
Capital Projects Fund has restricted
funds of $116,709,700 at June 30, 2019
consisting primarily of unspent bond
funds.
Other Funds
The fund balance of $2,377,266 of the
Campus Activity Fund (a special
revenue fund) is shown as committed
due to Board policy committing those
funds to campus activities. The fund
balance of $1,031,755 in the Child
Nutrition Fund is shown as restricted for
the food service program.
NISD Aquatic Center – Interior
Financial SectionSchools & Programs
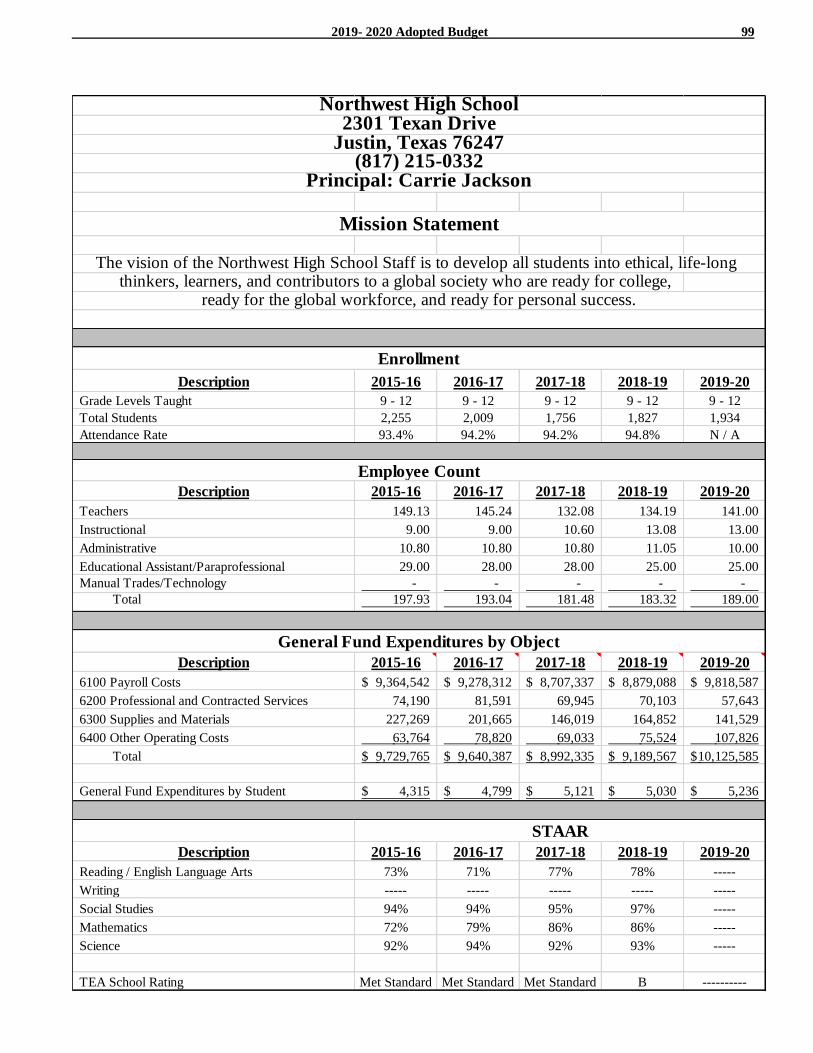
2019- 2020 Adopted Budget 99
thinkers, learners, and contributors to a global society who are ready for college,
Description 2015-16 2016-17 2017-18 2018-19 2019-20
Grade Levels Taught 9 - 12 9 - 12 9 - 12 9 - 12 9 - 12
Total Students 2,255 2,009 1,756 1,827 1,934
Attendance Rate 93.4% 94.2% 94.2% 94.8% N / A
Description 2015-16 2016-17 2017-18 2018-19 2019-20
Teachers 149.13 145.24 132.08 134.19 141.00
Instructional 9.00 9.00 10.60 13.08 13.00
Administrative 10.80 10.80 10.80 11.05 10.00
Educational Assistant/Paraprofessional 29.00 28.00 28.00 25.00 25.00
Manual Trades/Technology - - - - -
Total 197.93 193.04 181.48 183.32 189.00
Description 2015-16 2016-17 2017-18 2018-19 2019-20
6100 Payroll Costs 9,364,542$ 9,278,312$ 8,707,337$ 8,879,088$ 9,818,587$
6200 Professional and Contracted Services 74,190 81,591 69,945 70,103 57,643
6300 Supplies and Materials 227,269 201,665 146,019 164,852 141,529
6400 Other Operating Costs 63,764 78,820 69,033 75,524 107,826
Total 9,729,765$ 9,640,387$ 8,992,335$ 9,189,567$ 10,125,585$
General Fund Expenditures by Student 4,315$ 4,799$ 5,121$ 5,030$ 5,236$
Description 2015-16 2016-17 2017-18 2018-19 2019-20
Reading / English Language Arts 73% 71% 77% 78% -----
Writing ----- ----- ----- ----- -----
Social Studies 94% 94% 95% 97% -----
Mathematics 72% 79% 86% 86% -----
Science 92% 94% 92% 93% -----
TEA School Rating Met Standard Met Standard Met Standard B ----------
STAAR
Northwest High School
Mission Statement
2301 Texan DriveJustin, Texas 76247
(817) 215-0332Principal: Carrie Jackson
General Fund Expenditures by Object
The vision of the Northwest High School Staff is to develop all students into ethical, life-long
Enrollment
Employee Count
ready for the global workforce, and ready for personal success.
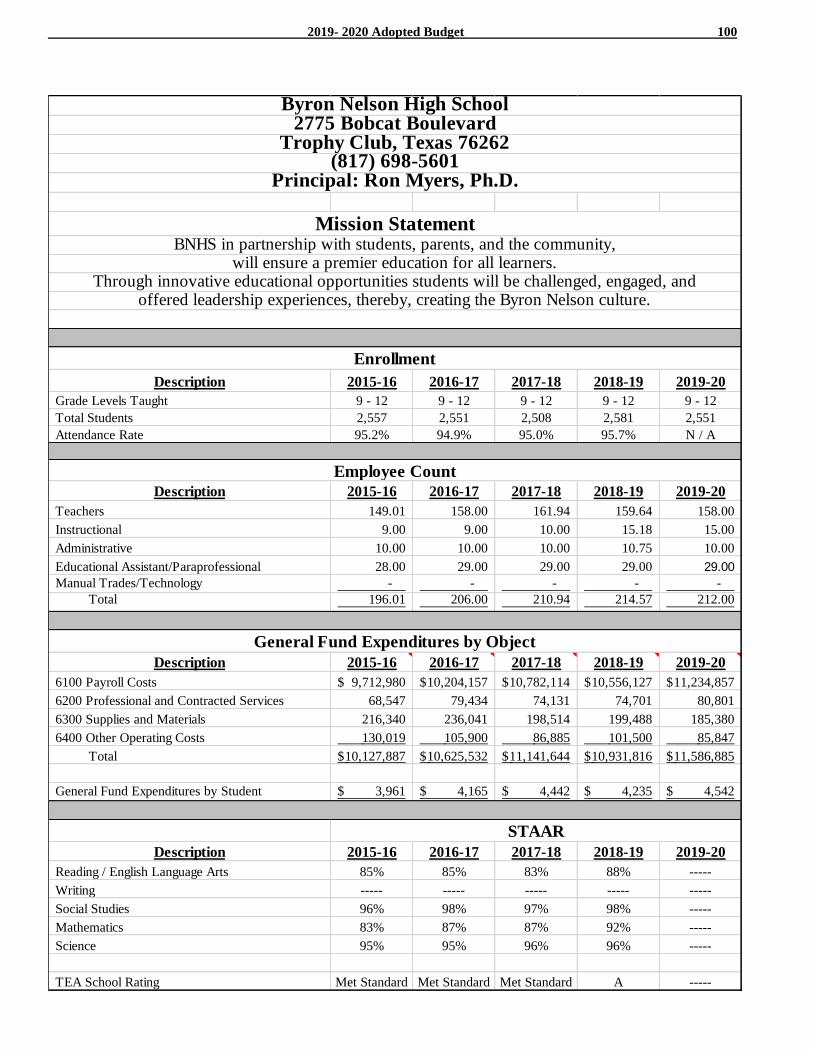
2019- 2020 Adopted Budget 100
Description 2015-16 2016-17 2017-18 2018-19 2019-20
Grade Levels Taught 9 - 12 9 - 12 9 - 12 9 - 12 9 - 12
Total Students 2,557 2,551 2,508 2,581 2,551
Attendance Rate 95.2% 94.9% 95.0% 95.7% N / A
Description 2015-16 2016-17 2017-18 2018-19 2019-20
Teachers 149.01 158.00 161.94 159.64 158.00
Instructional 9.00 9.00 10.00 15.18 15.00
Administrative 10.00 10.00 10.00 10.75 10.00
Educational Assistant/Paraprofessional 28.00 29.00 29.00 29.00 29.00
Manual Trades/Technology - - - - -
Total 196.01 206.00 210.94 214.57 212.00
Description 2015-16 2016-17 2017-18 2018-19 2019-20
6100 Payroll Costs 9,712,980$ 10,204,157$ 10,782,114$ 10,556,127$ 11,234,857$
6200 Professional and Contracted Services 68,547 79,434 74,131 74,701 80,801
6300 Supplies and Materials 216,340 236,041 198,514 199,488 185,380
6400 Other Operating Costs 130,019 105,900 86,885 101,500 85,847
Total 10,127,887$ 10,625,532$ 11,141,644$ 10,931,816$ 11,586,885$
General Fund Expenditures by Student 3,961$ 4,165$ 4,442$ 4,235$ 4,542$
Description 2015-16 2016-17 2017-18 2018-19 2019-20
Reading / English Language Arts 85% 85% 83% 88% -----
Writing ----- ----- ----- ----- -----
Social Studies 96% 98% 97% 98% -----
Mathematics 83% 87% 87% 92% -----
Science 95% 95% 96% 96% -----
TEA School Rating Met Standard Met Standard Met Standard A -----
STAAR
will ensure a premier education for all learners.
General Fund Expenditures by Object
Byron Nelson High School
Mission Statement
2775 Bobcat BoulevardTrophy Club, Texas 76262
(817) 698-5601Principal: Ron Myers, Ph.D.
BNHS in partnership with students, parents, and the community,
Enrollment
Employee Count
Through innovative educational opportunities students will be challenged, engaged, andoffered leadership experiences, thereby, creating the Byron Nelson culture.
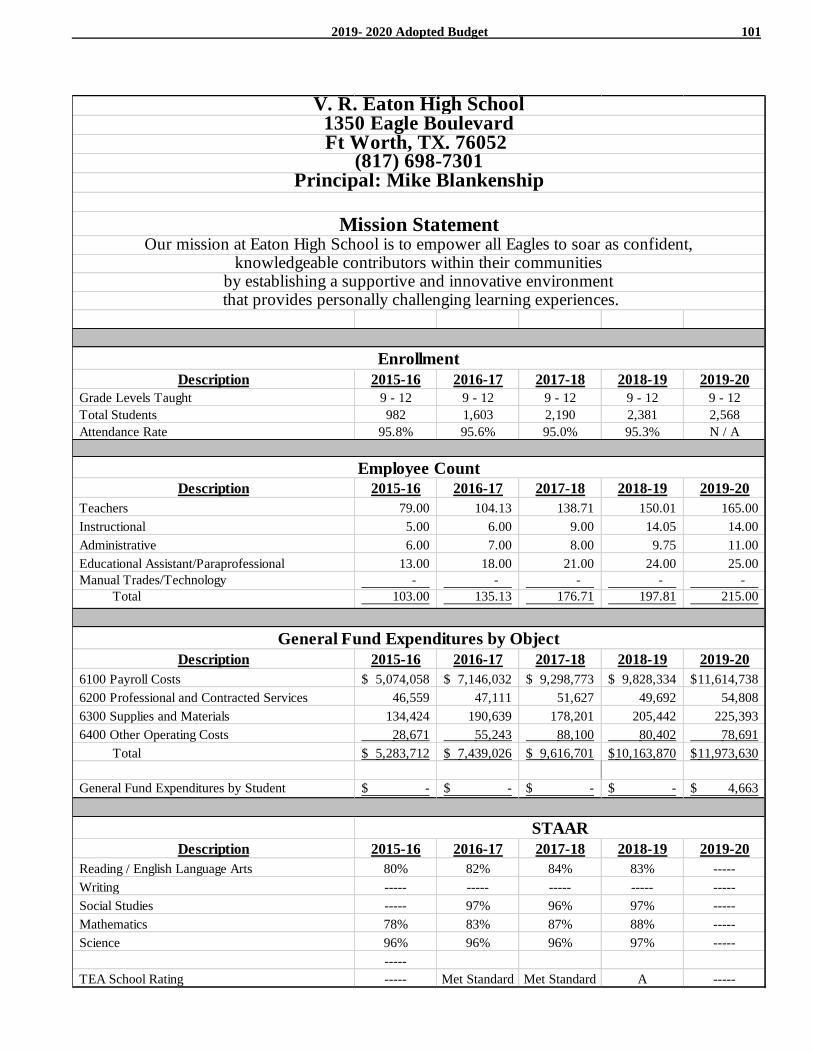
2019- 2020 Adopted Budget 101
Description 2015-16 2016-17 2017-18 2018-19 2019-20
Grade Levels Taught 9 - 12 9 - 12 9 - 12 9 - 12 9 - 12
Total Students 982 1,603 2,190 2,381 2,568
Attendance Rate 95.8% 95.6% 95.0% 95.3% N / A
Description 2015-16 2016-17 2017-18 2018-19 2019-20
Teachers 79.00 104.13 138.71 150.01 165.00
Instructional 5.00 6.00 9.00 14.05 14.00
Administrative 6.00 7.00 8.00 9.75 11.00
Educational Assistant/Paraprofessional 13.00 18.00 21.00 24.00 25.00
Manual Trades/Technology - - - - -
Total 103.00 135.13 176.71 197.81 215.00
Description 2015-16 2016-17 2017-18 2018-19 2019-20
6100 Payroll Costs 5,074,058$ 7,146,032$ 9,298,773$ 9,828,334$ 11,614,738$
6200 Professional and Contracted Services 46,559 47,111 51,627 49,692 54,808
6300 Supplies and Materials 134,424 190,639 178,201 205,442 225,393
6400 Other Operating Costs 28,671 55,243 88,100 80,402 78,691
Total 5,283,712$ 7,439,026$ 9,616,701$ 10,163,870$ 11,973,630$
General Fund Expenditures by Student -$ -$ -$ -$ 4,663$
Description 2015-16 2016-17 2017-18 2018-19 2019-20
Reading / English Language Arts 80% 82% 84% 83% -----
Writing ----- ----- ----- ----- -----
Social Studies ----- 97% 96% 97% -----
Mathematics 78% 83% 87% 88% -----
Science 96% 96% 96% 97% -----
-----
TEA School Rating ----- Met Standard Met Standard A -----
STAAR
Enrollment
Our mission at Eaton High School is to empower all Eagles to soar as confident,knowledgeable contributors within their communities
by establishing a supportive and innovative environment that provides personally challenging learning experiences.
V. R. Eaton High School1350 Eagle BoulevardFt Worth, TX. 76052
(817) 698-7301Principal: Mike Blankenship
General Fund Expenditures by Object
Employee Count
Mission Statement
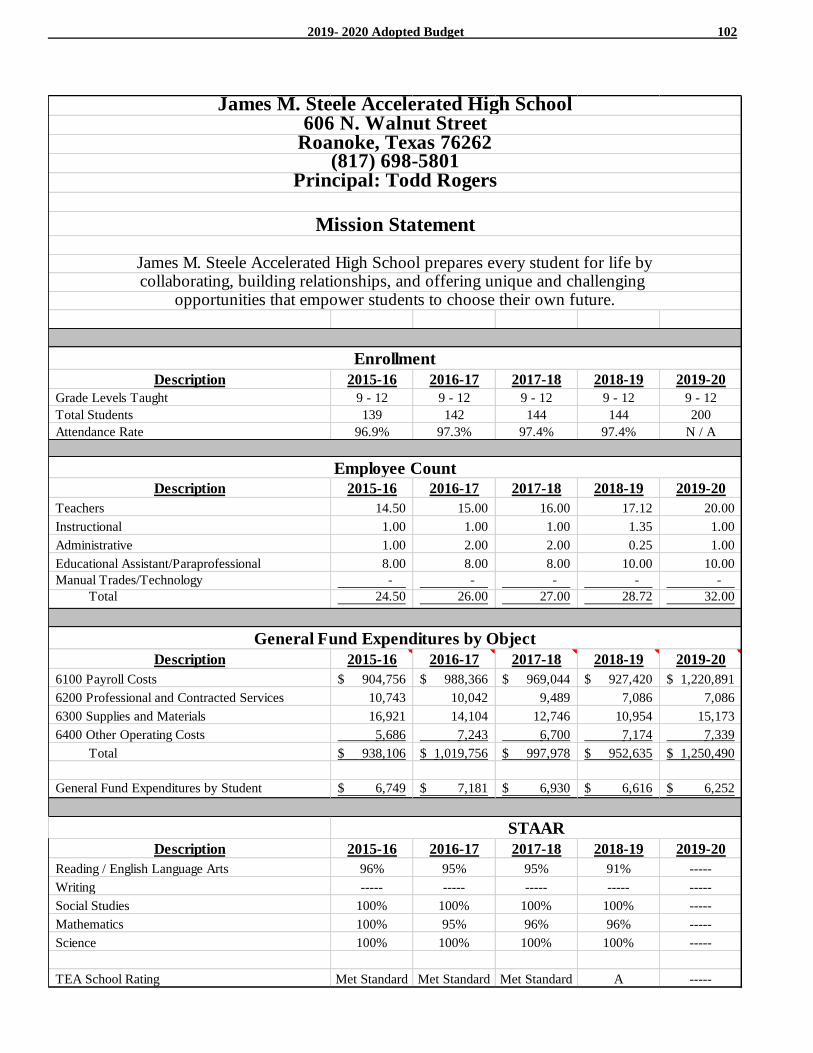
2019- 2020 Adopted Budget 102
Description 2015-16 2016-17 2017-18 2018-19 2019-20
Grade Levels Taught 9 - 12 9 - 12 9 - 12 9 - 12 9 - 12
Total Students 139 142 144 144 200
Attendance Rate 96.9% 97.3% 97.4% 97.4% N / A
Description 2015-16 2016-17 2017-18 2018-19 2019-20
Teachers 14.50 15.00 16.00 17.12 20.00
Instructional 1.00 1.00 1.00 1.35 1.00
Administrative 1.00 2.00 2.00 0.25 1.00
Educational Assistant/Paraprofessional 8.00 8.00 8.00 10.00 10.00
Manual Trades/Technology - - - - -
Total 24.50 26.00 27.00 28.72 32.00
Description 2015-16 2016-17 2017-18 2018-19 2019-20
6100 Payroll Costs 904,756$ 988,366$ 969,044$ 927,420$ 1,220,891$
6200 Professional and Contracted Services 10,743 10,042 9,489 7,086 7,086
6300 Supplies and Materials 16,921 14,104 12,746 10,954 15,173
6400 Other Operating Costs 5,686 7,243 6,700 7,174 7,339
Total 938,106$ 1,019,756$ 997,978$ 952,635$ 1,250,490$
General Fund Expenditures by Student 6,749$ 7,181$ 6,930$ 6,616$ 6,252$
Description 2015-16 2016-17 2017-18 2018-19 2019-20
Reading / English Language Arts 96% 95% 95% 91% -----
Writing ----- ----- ----- ----- -----
Social Studies 100% 100% 100% 100% -----
Mathematics 100% 95% 96% 96% -----
Science 100% 100% 100% 100% -----
TEA School Rating Met Standard Met Standard Met Standard A -----
James M. Steele Accelerated High School606 N. Walnut Street
Roanoke, Texas 76262(817) 698-5801
Principal: Todd Rogers
General Fund Expenditures by Object
Employee Count
STAAR
Mission Statement
Enrollment
James M. Steele Accelerated High School prepares every student for life bycollaborating, building relationships, and offering unique and challenging
opportunities that empower students to choose their own future.
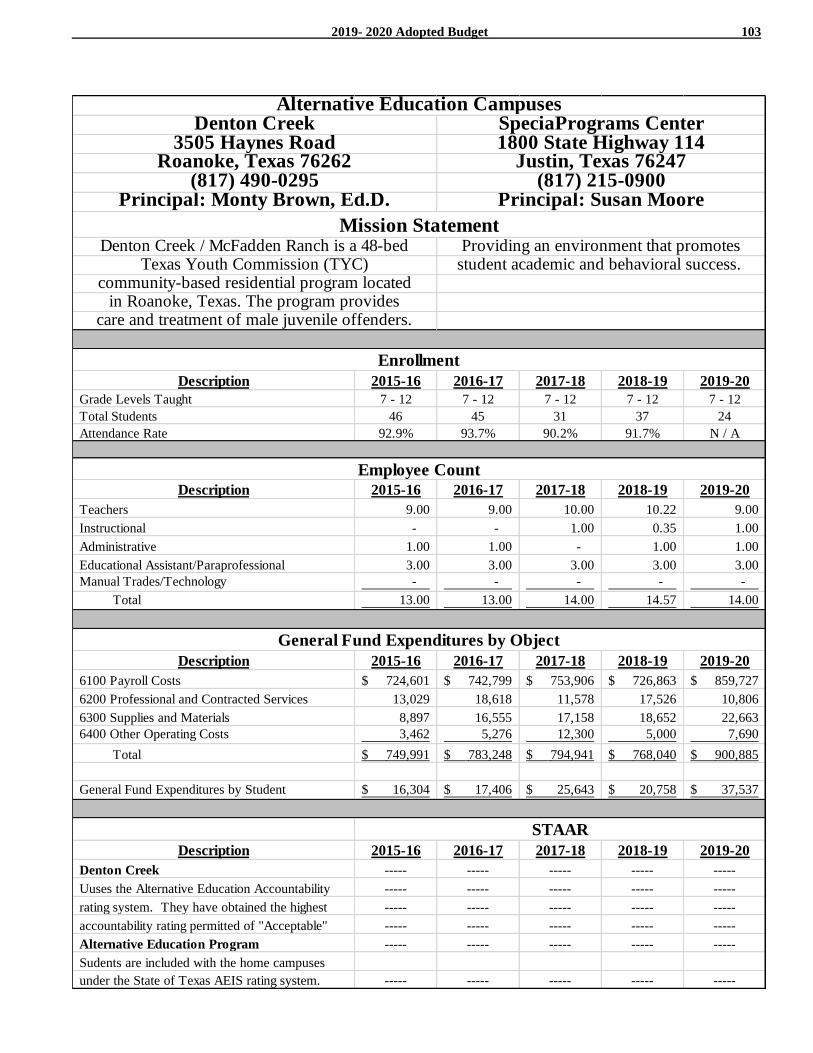
2019- 2020 Adopted Budget 103
Description 2015-16 2016-17 2017-18 2018-19 2019-20
Grade Levels Taught 7 - 12 7 - 12 7 - 12 7 - 12 7 - 12
Total Students 46 45 31 37 24
Attendance Rate 92.9% 93.7% 90.2% 91.7% N / A
Description 2015-16 2016-17 2017-18 2018-19 2019-20
Teachers 9.00 9.00 10.00 10.22 9.00
Instructional - - 1.00 0.35 1.00
Administrative 1.00 1.00 - 1.00 1.00
Educational Assistant/Paraprofessional 3.00 3.00 3.00 3.00 3.00
Manual Trades/Technology - - - - -
Total 13.00 13.00 14.00 14.57 14.00
Description 2015-16 2016-17 2017-18 2018-19 2019-20
6100 Payroll Costs 724,601$ 742,799$ 753,906$ 726,863$ 859,727$
6200 Professional and Contracted Services 13,029 18,618 11,578 17,526 10,806
6300 Supplies and Materials 8,897 16,555 17,158 18,652 22,663
6400 Other Operating Costs 3,462 5,276 12,300 5,000 7,690
Total 749,991$ 783,248$ 794,941$ 768,040$ 900,885$
General Fund Expenditures by Student 16,304$ 17,406$ 25,643$ 20,758$ 37,537$
Description 2015-16 2016-17 2017-18 2018-19 2019-20
Denton Creek ----- ----- ----- ----- -----
Uuses the Alternative Education Accountability ----- ----- ----- ----- -----
rating system. They have obtained the highest ----- ----- ----- ----- -----
accountability rating permitted of "Acceptable" ----- ----- ----- ----- -----
Alternative Education Program ----- ----- ----- ----- -----
Sudents are included with the home campuses
under the State of Texas AEIS rating system. ----- ----- ----- ----- -----
(817) 490-0295Principal: Monty Brown, Ed.D. Principal: Susan Moore
Alternative Education CampusesSpeciaPrograms Center1800 State Highway 114
Justin, Texas 76247
Denton Creek3505 Haynes Road
Roanoke, Texas 76262
STAAR
General Fund Expenditures by Object
Employee Count
(817) 215-0900
in Roanoke, Texas. The program providescare and treatment of male juvenile offenders.
student academic and behavioral success.
Enrollment
Mission Statement
community-based residential program located
Denton Creek / McFadden Ranch is a 48-bed Providing an environment that promotesTexas Youth Commission (TYC)
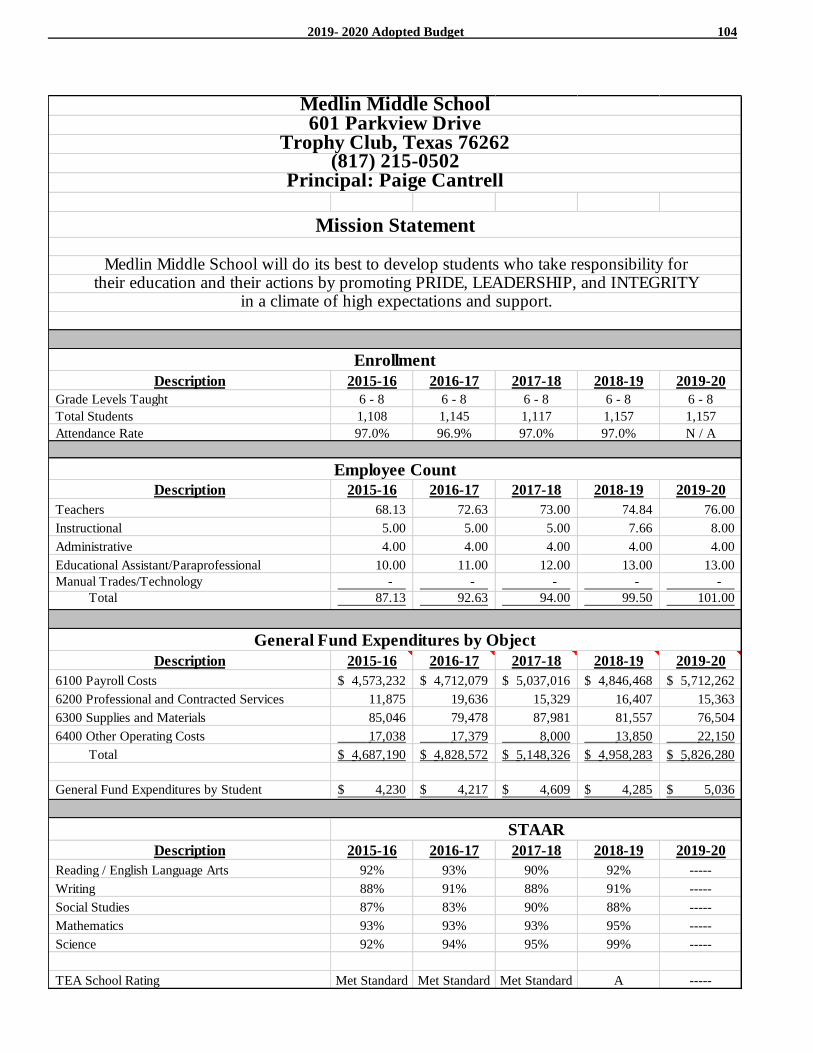
2019- 2020 Adopted Budget 104
Description 2015-16 2016-17 2017-18 2018-19 2019-20
Grade Levels Taught 6 - 8 6 - 8 6 - 8 6 - 8 6 - 8
Total Students 1,108 1,145 1,117 1,157 1,157
Attendance Rate 97.0% 96.9% 97.0% 97.0% N / A
Description 2015-16 2016-17 2017-18 2018-19 2019-20
Teachers 68.13 72.63 73.00 74.84 76.00
Instructional 5.00 5.00 5.00 7.66 8.00
Administrative 4.00 4.00 4.00 4.00 4.00
Educational Assistant/Paraprofessional 10.00 11.00 12.00 13.00 13.00
Manual Trades/Technology - - - - -
Total 87.13 92.63 94.00 99.50 101.00
Description 2015-16 2016-17 2017-18 2018-19 2019-20
6100 Payroll Costs 4,573,232$ 4,712,079$ 5,037,016$ 4,846,468$ 5,712,262$
6200 Professional and Contracted Services 11,875 19,636 15,329 16,407 15,363
6300 Supplies and Materials 85,046 79,478 87,981 81,557 76,504
6400 Other Operating Costs 17,038 17,379 8,000 13,850 22,150
Total 4,687,190$ 4,828,572$ 5,148,326$ 4,958,283$ 5,826,280$
General Fund Expenditures by Student 4,230$ 4,217$ 4,609$ 4,285$ 5,036$
Description 2015-16 2016-17 2017-18 2018-19 2019-20
Reading / English Language Arts 92% 93% 90% 92% -----
Writing 88% 91% 88% 91% -----
Social Studies 87% 83% 90% 88% -----
Mathematics 93% 93% 93% 95% -----
Science 92% 94% 95% 99% -----
TEA School Rating Met Standard Met Standard Met Standard A -----
in a climate of high expectations and support.
General Fund Expenditures by Object
their education and their actions by promoting PRIDE, LEADERSHIP, and INTEGRITY
Mission Statement
Medlin Middle School will do its best to develop students who take responsibility for
Medlin Middle School601 Parkview Drive
Trophy Club, Texas 76262(817) 215-0502
Principal: Paige Cantrell
STAAR
Employee Count
Enrollment
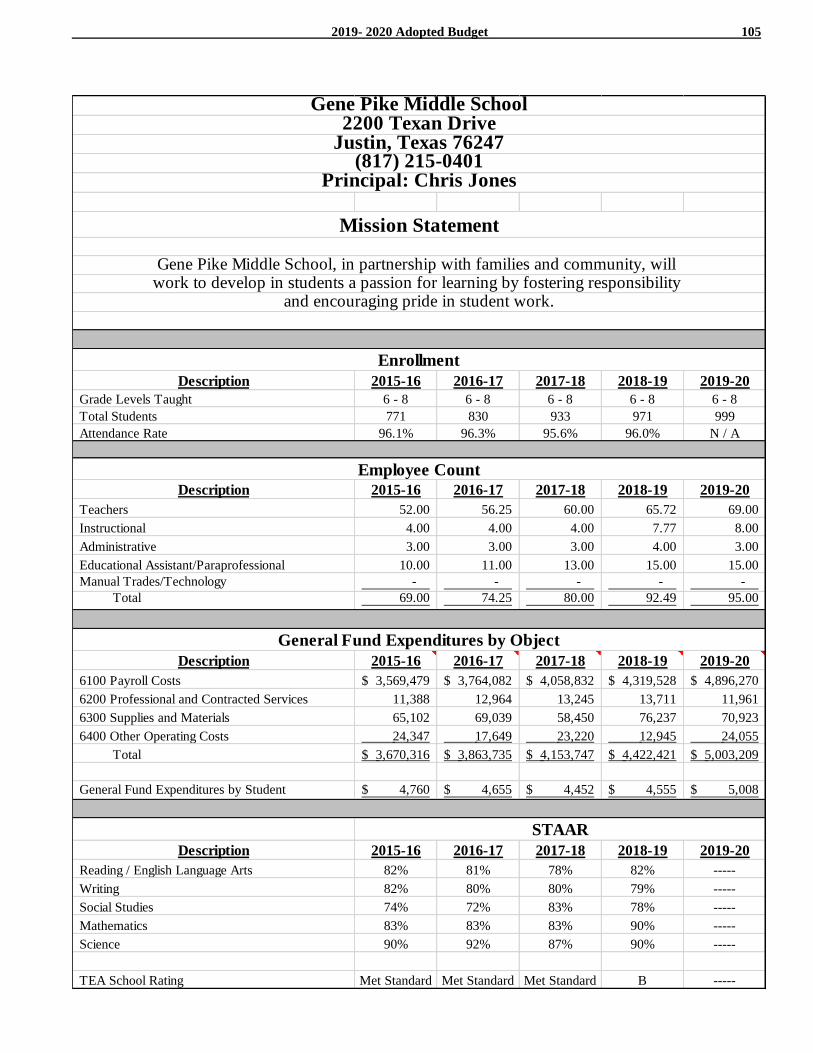
2019- 2020 Adopted Budget 105
Description 2015-16 2016-17 2017-18 2018-19 2019-20
Grade Levels Taught 6 - 8 6 - 8 6 - 8 6 - 8 6 - 8
Total Students 771 830 933 971 999
Attendance Rate 96.1% 96.3% 95.6% 96.0% N / A
Description 2015-16 2016-17 2017-18 2018-19 2019-20
Teachers 52.00 56.25 60.00 65.72 69.00
Instructional 4.00 4.00 4.00 7.77 8.00
Administrative 3.00 3.00 3.00 4.00 3.00
Educational Assistant/Paraprofessional 10.00 11.00 13.00 15.00 15.00
Manual Trades/Technology - - - - -
Total 69.00 74.25 80.00 92.49 95.00
Description 2015-16 2016-17 2017-18 2018-19 2019-20
6100 Payroll Costs 3,569,479$ 3,764,082$ 4,058,832$ 4,319,528$ 4,896,270$
6200 Professional and Contracted Services 11,388 12,964 13,245 13,711 11,961
6300 Supplies and Materials 65,102 69,039 58,450 76,237 70,923
6400 Other Operating Costs 24,347 17,649 23,220 12,945 24,055
Total 3,670,316$ 3,863,735$ 4,153,747$ 4,422,421$ 5,003,209$
General Fund Expenditures by Student 4,760$ 4,655$ 4,452$ 4,555$ 5,008$
Description 2015-16 2016-17 2017-18 2018-19 2019-20
Reading / English Language Arts 82% 81% 78% 82% -----
Writing 82% 80% 80% 79% -----
Social Studies 74% 72% 83% 78% -----
Mathematics 83% 83% 83% 90% -----
Science 90% 92% 87% 90% -----
TEA School Rating Met Standard Met Standard Met Standard B -----
STAAR
Employee Count
General Fund Expenditures by Object
Gene Pike Middle School
Gene Pike Middle School, in partnership with families and community, will
Enrollment
Mission Statement
2200 Texan DriveJustin, Texas 76247
(817) 215-0401Principal: Chris Jones
work to develop in students a passion for learning by fostering responsibility and encouraging pride in student work.
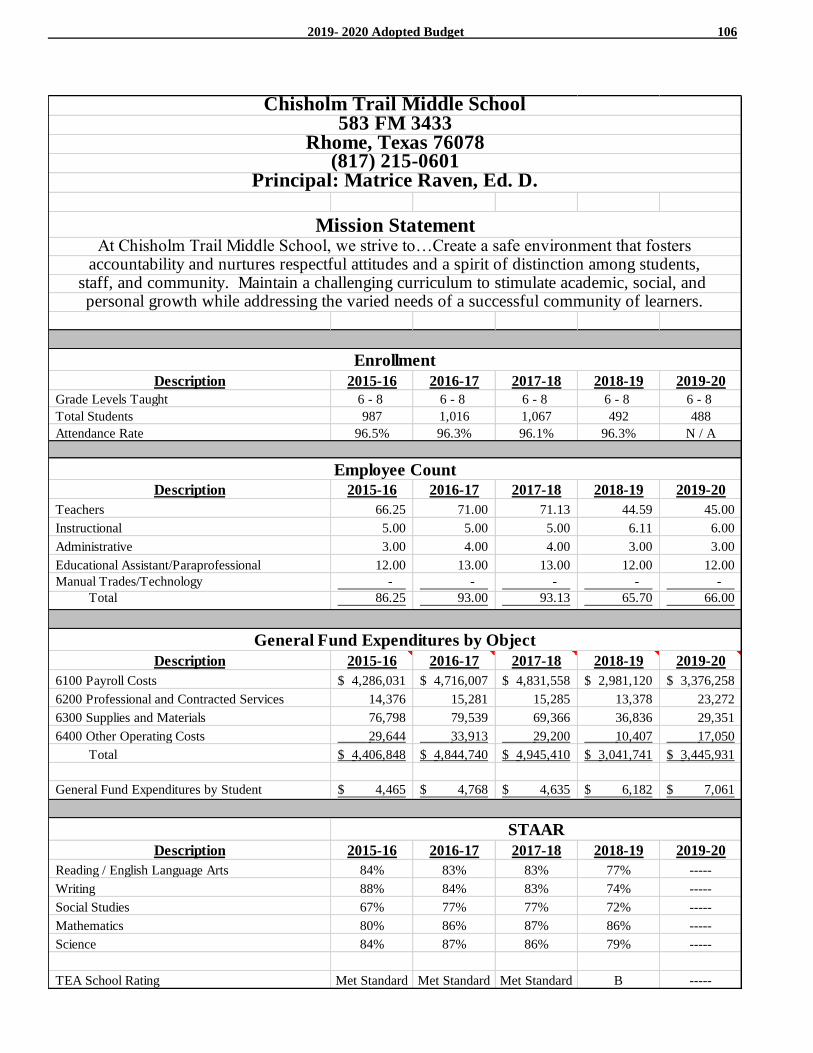
2019- 2020 Adopted Budget 106
Description 2015-16 2016-17 2017-18 2018-19 2019-20
Grade Levels Taught 6 - 8 6 - 8 6 - 8 6 - 8 6 - 8
Total Students 987 1,016 1,067 492 488
Attendance Rate 96.5% 96.3% 96.1% 96.3% N / A
Description 2015-16 2016-17 2017-18 2018-19 2019-20
Teachers 66.25 71.00 71.13 44.59 45.00
Instructional 5.00 5.00 5.00 6.11 6.00
Administrative 3.00 4.00 4.00 3.00 3.00
Educational Assistant/Paraprofessional 12.00 13.00 13.00 12.00 12.00
Manual Trades/Technology - - - - -
Total 86.25 93.00 93.13 65.70 66.00
Description 2015-16 2016-17 2017-18 2018-19 2019-20
6100 Payroll Costs 4,286,031$ 4,716,007$ 4,831,558$ 2,981,120$ 3,376,258$
6200 Professional and Contracted Services 14,376 15,281 15,285 13,378 23,272
6300 Supplies and Materials 76,798 79,539 69,366 36,836 29,351
6400 Other Operating Costs 29,644 33,913 29,200 10,407 17,050
Total 4,406,848$ 4,844,740$ 4,945,410$ 3,041,741$ 3,445,931$
General Fund Expenditures by Student 4,465$ 4,768$ 4,635$ 6,182$ 7,061$
Description 2015-16 2016-17 2017-18 2018-19 2019-20
Reading / English Language Arts 84% 83% 83% 77% -----
Writing 88% 84% 83% 74% -----
Social Studies 67% 77% 77% 72% -----
Mathematics 80% 86% 87% 86% -----
Science 84% 87% 86% 79% -----
TEA School Rating Met Standard Met Standard Met Standard B -----
STAAR
staff, and community. Maintain a challenging curriculum to stimulate academic, social, and
Mission StatementAt Chisholm Trail Middle School, we strive to…Create a safe environment that fosters
accountability and nurtures respectful attitudes and a spirit of distinction among students,
General Fund Expenditures by Object
Enrollment
Employee Count
personal growth while addressing the varied needs of a successful community of learners.
Chisholm Trail Middle School583 FM 3433
Rhome, Texas 76078(817) 215-0601
Principal: Matrice Raven, Ed. D.
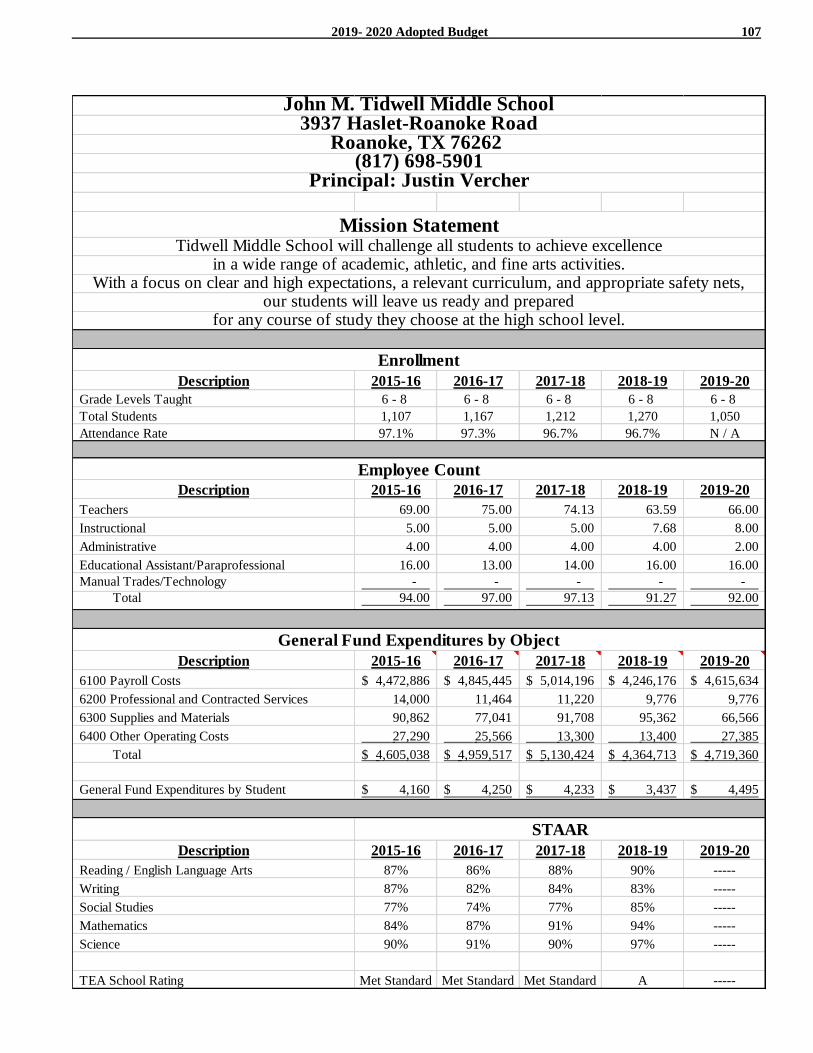
2019- 2020 Adopted Budget 107
Description 2015-16 2016-17 2017-18 2018-19 2019-20
Grade Levels Taught 6 - 8 6 - 8 6 - 8 6 - 8 6 - 8
Total Students 1,107 1,167 1,212 1,270 1,050
Attendance Rate 97.1% 97.3% 96.7% 96.7% N / A
Description 2015-16 2016-17 2017-18 2018-19 2019-20
Teachers 69.00 75.00 74.13 63.59 66.00
Instructional 5.00 5.00 5.00 7.68 8.00
Administrative 4.00 4.00 4.00 4.00 2.00
Educational Assistant/Paraprofessional 16.00 13.00 14.00 16.00 16.00
Manual Trades/Technology - - - - -
Total 94.00 97.00 97.13 91.27 92.00
Description 2015-16 2016-17 2017-18 2018-19 2019-20
6100 Payroll Costs 4,472,886$ 4,845,445$ 5,014,196$ 4,246,176$ 4,615,634$
6200 Professional and Contracted Services 14,000 11,464 11,220 9,776 9,776
6300 Supplies and Materials 90,862 77,041 91,708 95,362 66,566
6400 Other Operating Costs 27,290 25,566 13,300 13,400 27,385
Total 4,605,038$ 4,959,517$ 5,130,424$ 4,364,713$ 4,719,360$
General Fund Expenditures by Student 4,160$ 4,250$ 4,233$ 3,437$ 4,495$
Description 2015-16 2016-17 2017-18 2018-19 2019-20
Reading / English Language Arts 87% 86% 88% 90% -----
Writing 87% 82% 84% 83% -----
Social Studies 77% 74% 77% 85% -----
Mathematics 84% 87% 91% 94% -----
Science 90% 91% 90% 97% -----
TEA School Rating Met Standard Met Standard Met Standard A -----
in a wide range of academic, athletic, and fine arts activities.
for any course of study they choose at the high school level.
STAAR
Enrollment
Employee Count
our students will leave us ready and prepared
General Fund Expenditures by Object
With a focus on clear and high expectations, a relevant curriculum, and appropriate safety nets,
Mission StatementTidwell Middle School will challenge all students to achieve excellence
John M. Tidwell Middle School3937 Haslet-Roanoke Road
Roanoke, TX 76262 (817) 698-5901
Principal: Justin Vercher
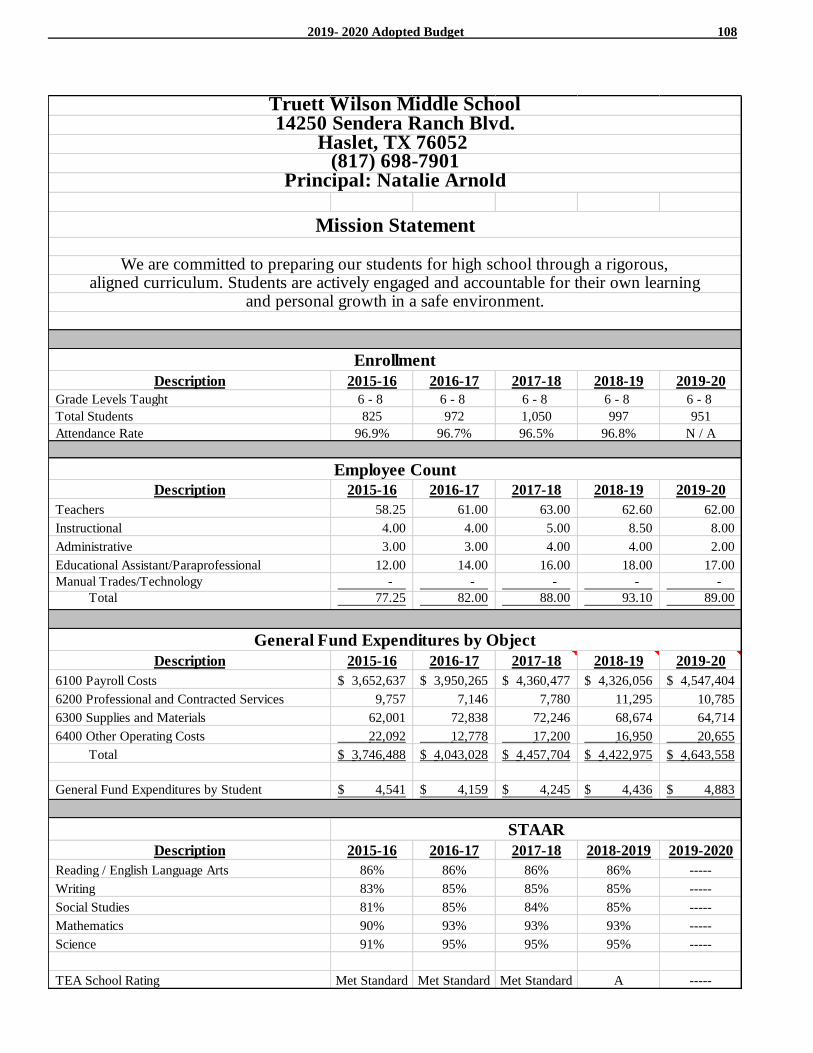
2019- 2020 Adopted Budget 108
Description 2015-16 2016-17 2017-18 2018-19 2019-20
Grade Levels Taught 6 - 8 6 - 8 6 - 8 6 - 8 6 - 8
Total Students 825 972 1,050 997 951
Attendance Rate 96.9% 96.7% 96.5% 96.8% N / A
Description 2015-16 2016-17 2017-18 2018-19 2019-20
Teachers 58.25 61.00 63.00 62.60 62.00
Instructional 4.00 4.00 5.00 8.50 8.00
Administrative 3.00 3.00 4.00 4.00 2.00
Educational Assistant/Paraprofessional 12.00 14.00 16.00 18.00 17.00
Manual Trades/Technology - - - - -
Total 77.25 82.00 88.00 93.10 89.00
Description 2015-16 2016-17 2017-18 2018-19 2019-20
6100 Payroll Costs 3,652,637$ 3,950,265$ 4,360,477$ 4,326,056$ 4,547,404$
6200 Professional and Contracted Services 9,757 7,146 7,780 11,295 10,785
6300 Supplies and Materials 62,001 72,838 72,246 68,674 64,714
6400 Other Operating Costs 22,092 12,778 17,200 16,950 20,655
Total 3,746,488$ 4,043,028$ 4,457,704$ 4,422,975$ 4,643,558$
General Fund Expenditures by Student 4,541$ 4,159$ 4,245$ 4,436$ 4,883$
Description 2015-16 2016-17 2017-18 2018-2019 2019-2020
Reading / English Language Arts 86% 86% 86% 86% -----
Writing 83% 85% 85% 85% -----
Social Studies 81% 85% 84% 85% -----
Mathematics 90% 93% 93% 93% -----
Science 91% 95% 95% 95% -----
TEA School Rating Met Standard Met Standard Met Standard A -----
We are committed to preparing our students for high school through a rigorous,
STAAR
Enrollment
Employee Count
and personal growth in a safe environment.
General Fund Expenditures by Object
aligned curriculum. Students are actively engaged and accountable for their own learning
Mission Statement
Truett Wilson Middle School14250 Sendera Ranch Blvd.
Haslet, TX 76052 (817) 698-7901
Principal: Natalie Arnold
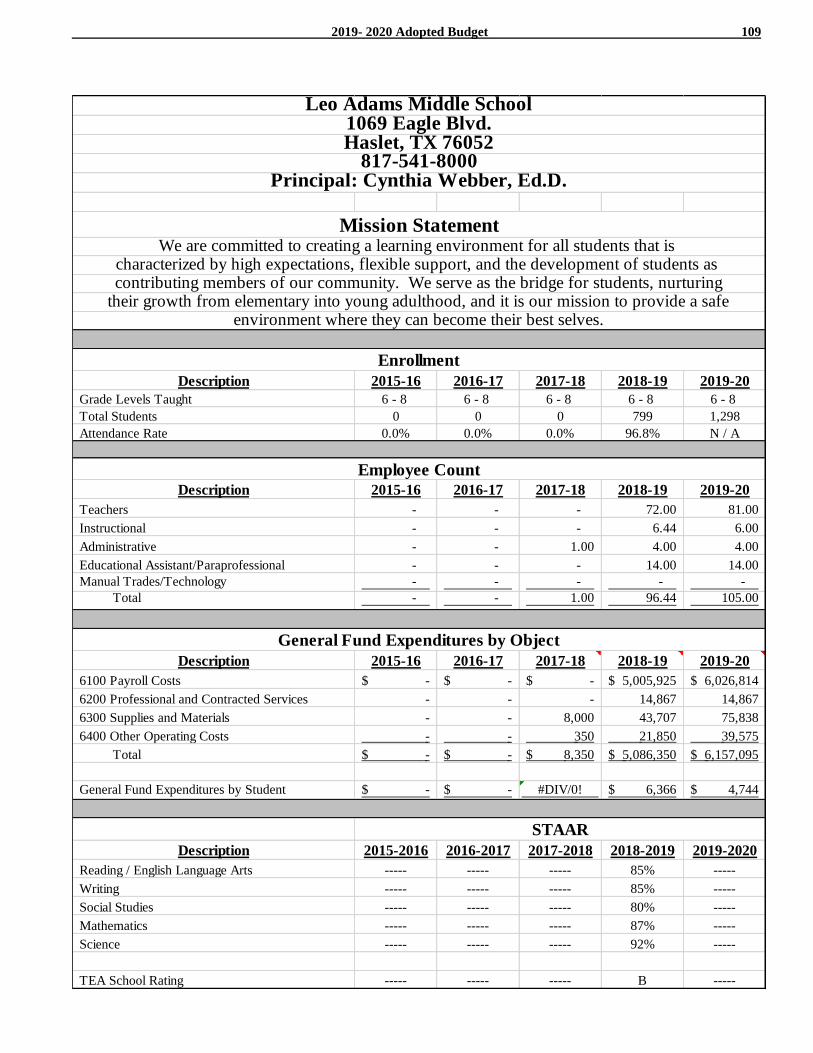
2019- 2020 Adopted Budget 109
Description 2015-16 2016-17 2017-18 2018-19 2019-20
Grade Levels Taught 6 - 8 6 - 8 6 - 8 6 - 8 6 - 8
Total Students 0 0 0 799 1,298
Attendance Rate 0.0% 0.0% 0.0% 96.8% N / A
Description 2015-16 2016-17 2017-18 2018-19 2019-20
Teachers - - - 72.00 81.00
Instructional - - - 6.44 6.00
Administrative - - 1.00 4.00 4.00
Educational Assistant/Paraprofessional - - - 14.00 14.00
Manual Trades/Technology - - - - -
Total - - 1.00 96.44 105.00
Description 2015-16 2016-17 2017-18 2018-19 2019-20
6100 Payroll Costs -$ -$ -$ 5,005,925$ 6,026,814$
6200 Professional and Contracted Services - - - 14,867 14,867
6300 Supplies and Materials - - 8,000 43,707 75,838
6400 Other Operating Costs - - 350 21,850 39,575
Total -$ -$ 8,350$ 5,086,350$ 6,157,095$
General Fund Expenditures by Student -$ -$ #DIV/0! 6,366$ 4,744$
Description 2015-2016 2016-2017 2017-2018 2018-2019 2019-2020
Reading / English Language Arts ----- ----- ----- 85% -----
Writing ----- ----- ----- 85% -----
Social Studies ----- ----- ----- 80% -----
Mathematics ----- ----- ----- 87% -----
Science ----- ----- ----- 92% -----
TEA School Rating ----- ----- ----- B -----
their growth from elementary into young adulthood, and it is our mission to provide a safeenvironment where they can become their best selves.
STAAR
Leo Adams Middle School1069 Eagle Blvd.Haslet, TX 76052
817-541-8000Principal: Cynthia Webber, Ed.D.
Mission Statement
Enrollment
Employee Count
General Fund Expenditures by Object
We are committed to creating a learning environment for all students that is characterized by high expectations, flexible support, and the development of students as contributing members of our community. We serve as the bridge for students, nurturing
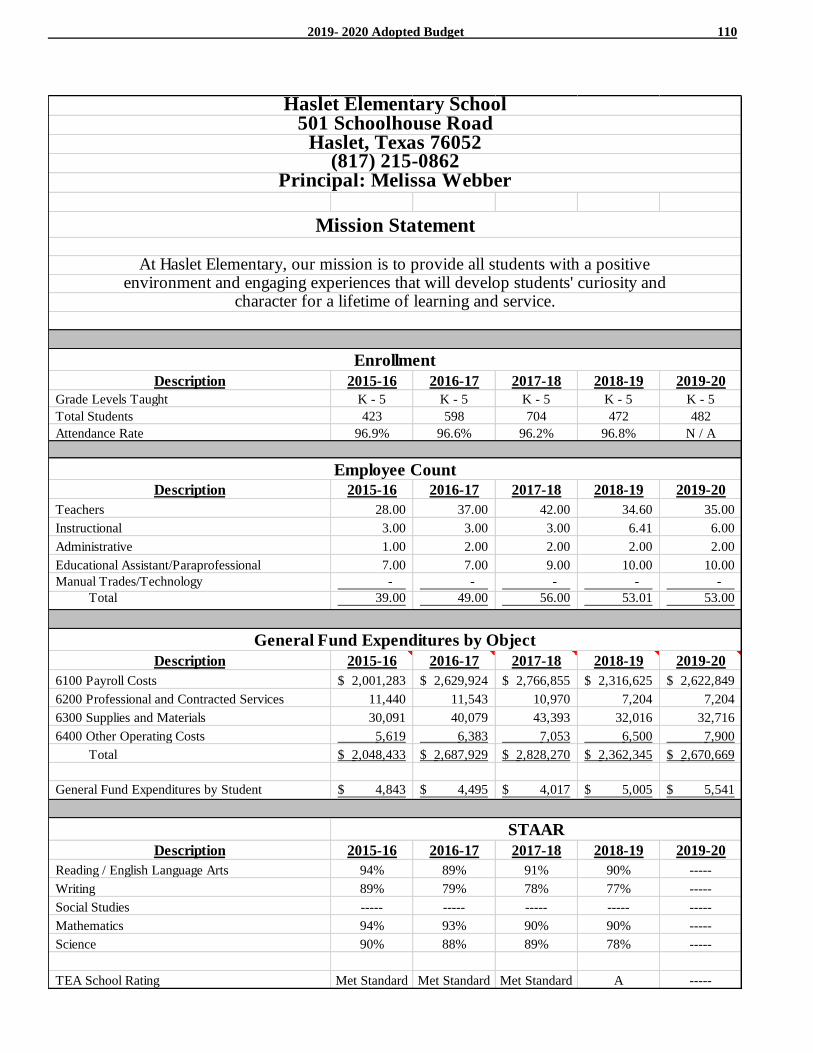
2019- 2020 Adopted Budget 110
Description 2015-16 2016-17 2017-18 2018-19 2019-20
Grade Levels Taught K - 5 K - 5 K - 5 K - 5 K - 5
Total Students 423 598 704 472 482
Attendance Rate 96.9% 96.6% 96.2% 96.8% N / A
Description 2015-16 2016-17 2017-18 2018-19 2019-20
Teachers 28.00 37.00 42.00 34.60 35.00
Instructional 3.00 3.00 3.00 6.41 6.00
Administrative 1.00 2.00 2.00 2.00 2.00
Educational Assistant/Paraprofessional 7.00 7.00 9.00 10.00 10.00
Manual Trades/Technology - - - - -
Total 39.00 49.00 56.00 53.01 53.00
Description 2015-16 2016-17 2017-18 2018-19 2019-20
6100 Payroll Costs 2,001,283$ 2,629,924$ 2,766,855$ 2,316,625$ 2,622,849$
6200 Professional and Contracted Services 11,440 11,543 10,970 7,204 7,204
6300 Supplies and Materials 30,091 40,079 43,393 32,016 32,716
6400 Other Operating Costs 5,619 6,383 7,053 6,500 7,900
Total 2,048,433$ 2,687,929$ 2,828,270$ 2,362,345$ 2,670,669$
General Fund Expenditures by Student 4,843$ 4,495$ 4,017$ 5,005$ 5,541$
Description 2015-16 2016-17 2017-18 2018-19 2019-20
Reading / English Language Arts 94% 89% 91% 90% -----
Writing 89% 79% 78% 77% -----
Social Studies ----- ----- ----- ----- -----
Mathematics 94% 93% 90% 90% -----
Science 90% 88% 89% 78% -----
TEA School Rating Met Standard Met Standard Met Standard A -----
STAAR
(817) 215-0862Principal: Melissa Webber
General Fund Expenditures by Object
environment and engaging experiences that will develop students' curiosity andcharacter for a lifetime of learning and service.
Employee Count
Haslet Elementary School
At Haslet Elementary, our mission is to provide all students with a positive
Enrollment
Mission Statement
501 Schoolhouse RoadHaslet, Texas 76052

2019- 2020 Adopted Budget 111
skills, and meet or exceed grade level expectations.
Description 2015-16 2016-17 2017-18 2018-19 2019-20
Grade Levels Taught EE - 5 EE - 5 EE - 5 EE - 5 EE - 5
Total Students 532 556 567 633 638
Attendance Rate 96.2% 96.3% 95.8% 96.2% N / A
Description 2015-16 2016-17 2017-18 2018-19 2019-20
Teachers 34.00 36.50 38.00 41.49 38.00
Instructional 3.00 3.00 4.00 5.95 5.00
Administrative 1.00 2.00 2.00 2.00 2.00
Educational Assistant/Paraprofessional 7.00 7.00 7.00 10.00 10.00
Manual Trades/Technology - - - - -
Total 45.00 48.50 51.00 59.44 55.00
Description 2015-16 2016-17 2017-18 2018-19 2019-20
6100 Payroll Costs 2,314,736$ 2,493,753$ 2,671,363$ 2,618,294$ 2,563,336$
6200 Professional and Contracted Services 12,744 11,336 10,970 7,204 7,204
6300 Supplies and Materials 50,648 55,824 50,814 49,006 30,518
6400 Other Operating Costs 5,781 7,430 2,389 7,260 8,272
Total 2,383,909$ 2,568,343$ 2,735,536$ 2,681,764$ 2,609,330$
General Fund Expenditures by Student 4,481$ 4,619$ 4,825$ 4,237$ 4,090$
Description 2015-16 2016-17 2017-18 2018-19 2019-20
Reading / English Language Arts 74% 76% 84% 85% -----
Writing 58% 48% 62% 83% -----
Social Studies ----- ----- ----- ----- -----
Mathematics 71% 72% 86% 84% -----
Science 74% 72% 84% 79% -----
TEA School Rating Met Standard Met Standard Met Standard B -----
STAAR
General Fund Expenditures by Object
Enrollment
Employee Count
students to voice their strengths, set and achieve goals, apply future-readyJustin Elementary, in partnership with parents and community, will prepare
Justin Elementary School
Mission Statement
425 Boss Range RoadJustin, Texas 76247
(817) 215-0803Principal: Lisa Ransleben, Ed.D.
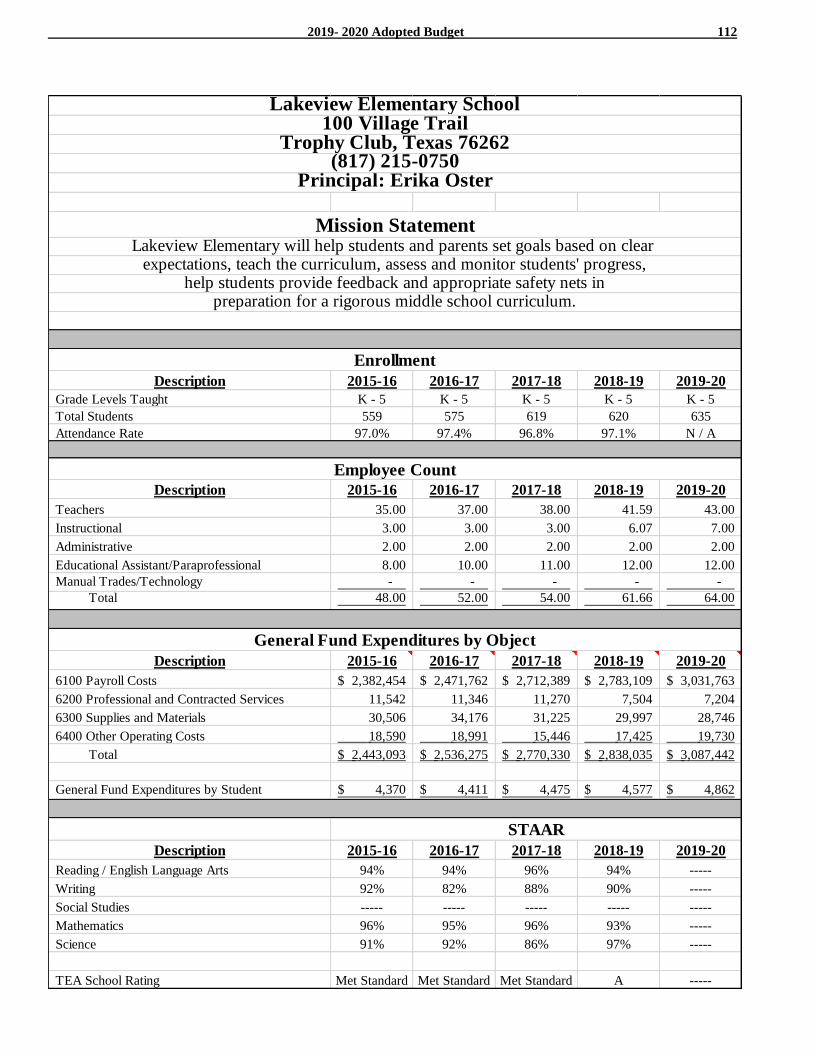
2019- 2020 Adopted Budget 112
Description 2015-16 2016-17 2017-18 2018-19 2019-20
Grade Levels Taught K - 5 K - 5 K - 5 K - 5 K - 5
Total Students 559 575 619 620 635
Attendance Rate 97.0% 97.4% 96.8% 97.1% N / A
Description 2015-16 2016-17 2017-18 2018-19 2019-20
Teachers 35.00 37.00 38.00 41.59 43.00
Instructional 3.00 3.00 3.00 6.07 7.00
Administrative 2.00 2.00 2.00 2.00 2.00
Educational Assistant/Paraprofessional 8.00 10.00 11.00 12.00 12.00
Manual Trades/Technology - - - - -
Total 48.00 52.00 54.00 61.66 64.00
Description 2015-16 2016-17 2017-18 2018-19 2019-20
6100 Payroll Costs 2,382,454$ 2,471,762$ 2,712,389$ 2,783,109$ 3,031,763$
6200 Professional and Contracted Services 11,542 11,346 11,270 7,504 7,204
6300 Supplies and Materials 30,506 34,176 31,225 29,997 28,746
6400 Other Operating Costs 18,590 18,991 15,446 17,425 19,730
Total 2,443,093$ 2,536,275$ 2,770,330$ 2,838,035$ 3,087,442$
General Fund Expenditures by Student 4,370$ 4,411$ 4,475$ 4,577$ 4,862$
Description 2015-16 2016-17 2017-18 2018-19 2019-20
Reading / English Language Arts 94% 94% 96% 94% -----
Writing 92% 82% 88% 90% -----
Social Studies ----- ----- ----- ----- -----
Mathematics 96% 95% 96% 93% -----
Science 91% 92% 86% 97% -----
TEA School Rating Met Standard Met Standard Met Standard A -----
STAAR
(817) 215-0750Principal: Erika Oster
General Fund Expenditures by Object
help students provide feedback and appropriate safety nets inpreparation for a rigorous middle school curriculum.
Employee Count
Lakeview Elementary School
Lakeview Elementary will help students and parents set goals based on clear expectations, teach the curriculum, assess and monitor students' progress,
Enrollment
Mission Statement
100 Village TrailTrophy Club, Texas 76262
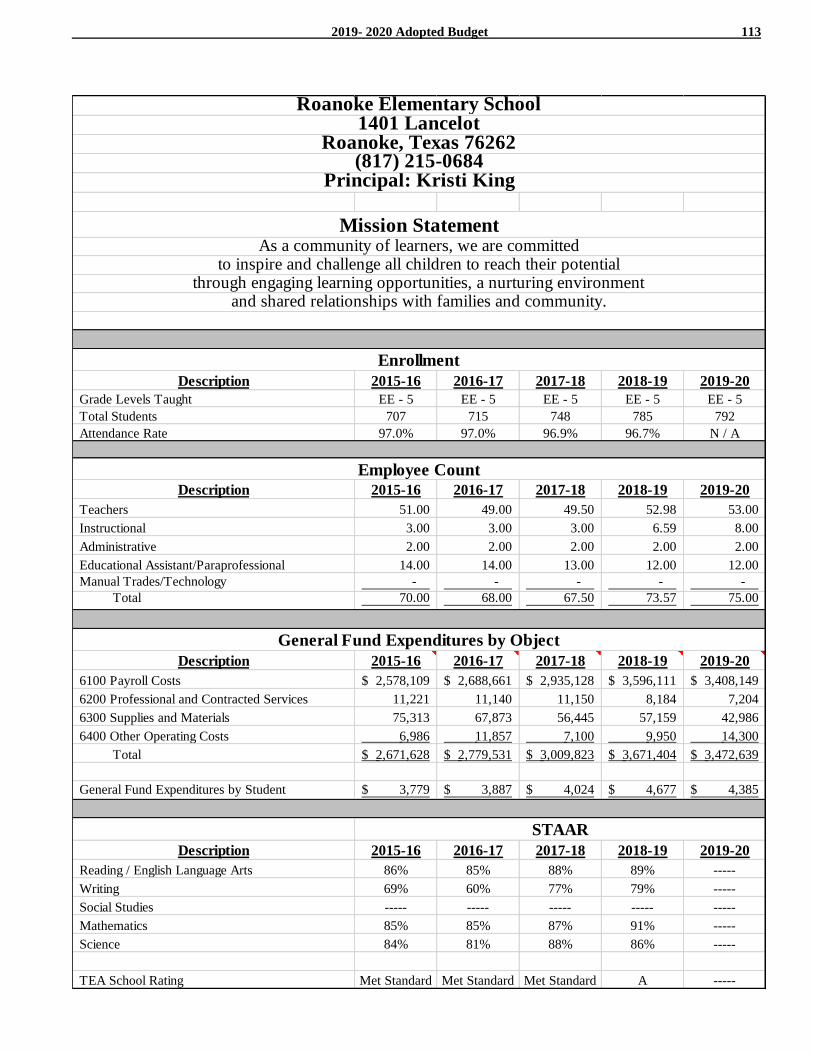
2019- 2020 Adopted Budget 113
Description 2015-16 2016-17 2017-18 2018-19 2019-20
Grade Levels Taught EE - 5 EE - 5 EE - 5 EE - 5 EE - 5
Total Students 707 715 748 785 792
Attendance Rate 97.0% 97.0% 96.9% 96.7% N / A
Description 2015-16 2016-17 2017-18 2018-19 2019-20
Teachers 51.00 49.00 49.50 52.98 53.00
Instructional 3.00 3.00 3.00 6.59 8.00
Administrative 2.00 2.00 2.00 2.00 2.00
Educational Assistant/Paraprofessional 14.00 14.00 13.00 12.00 12.00
Manual Trades/Technology - - - - -
Total 70.00 68.00 67.50 73.57 75.00
Description 2015-16 2016-17 2017-18 2018-19 2019-20
6100 Payroll Costs 2,578,109$ 2,688,661$ 2,935,128$ 3,596,111$ 3,408,149$
6200 Professional and Contracted Services 11,221 11,140 11,150 8,184 7,204
6300 Supplies and Materials 75,313 67,873 56,445 57,159 42,986
6400 Other Operating Costs 6,986 11,857 7,100 9,950 14,300
Total 2,671,628$ 2,779,531$ 3,009,823$ 3,671,404$ 3,472,639$
General Fund Expenditures by Student 3,779$ 3,887$ 4,024$ 4,677$ 4,385$
Description 2015-16 2016-17 2017-18 2018-19 2019-20
Reading / English Language Arts 86% 85% 88% 89% -----
Writing 69% 60% 77% 79% -----
Social Studies ----- ----- ----- ----- -----
Mathematics 85% 85% 87% 91% -----
Science 84% 81% 88% 86% -----
TEA School Rating Met Standard Met Standard Met Standard A -----
STAAR
Roanoke Elementary School
(817) 215-0684Principal: Kristi King
General Fund Expenditures by Object
As a community of learners, we are committedto inspire and challenge all children to reach their potential
Enrollment
Mission Statement
1401 LancelotRoanoke, Texas 76262
through engaging learning opportunities, a nurturing environmentand shared relationships with families and community.
Employee Count
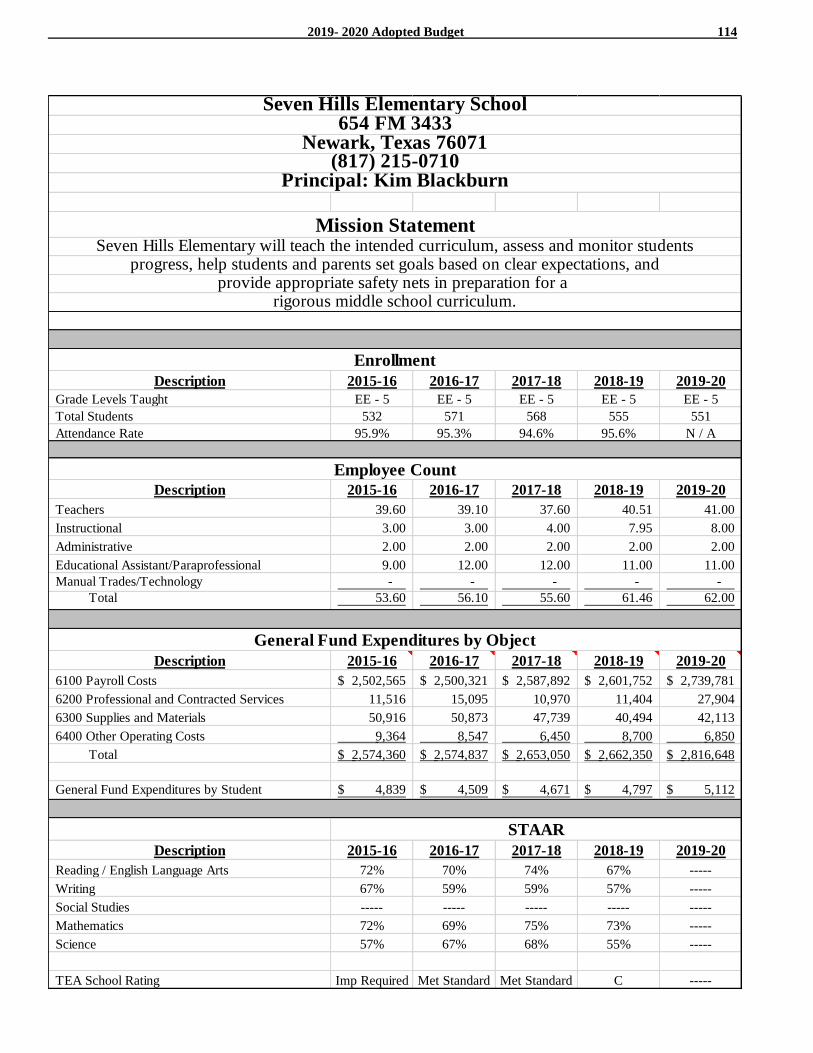
2019- 2020 Adopted Budget 114
Description 2015-16 2016-17 2017-18 2018-19 2019-20
Grade Levels Taught EE - 5 EE - 5 EE - 5 EE - 5 EE - 5
Total Students 532 571 568 555 551
Attendance Rate 95.9% 95.3% 94.6% 95.6% N / A
Description 2015-16 2016-17 2017-18 2018-19 2019-20
Teachers 39.60 39.10 37.60 40.51 41.00
Instructional 3.00 3.00 4.00 7.95 8.00
Administrative 2.00 2.00 2.00 2.00 2.00
Educational Assistant/Paraprofessional 9.00 12.00 12.00 11.00 11.00
Manual Trades/Technology - - - - -
Total 53.60 56.10 55.60 61.46 62.00
Description 2015-16 2016-17 2017-18 2018-19 2019-20
6100 Payroll Costs 2,502,565$ 2,500,321$ 2,587,892$ 2,601,752$ 2,739,781$
6200 Professional and Contracted Services 11,516 15,095 10,970 11,404 27,904
6300 Supplies and Materials 50,916 50,873 47,739 40,494 42,113
6400 Other Operating Costs 9,364 8,547 6,450 8,700 6,850
Total 2,574,360$ 2,574,837$ 2,653,050$ 2,662,350$ 2,816,648$
General Fund Expenditures by Student 4,839$ 4,509$ 4,671$ 4,797$ 5,112$
Description 2015-16 2016-17 2017-18 2018-19 2019-20
Reading / English Language Arts 72% 70% 74% 67% -----
Writing 67% 59% 59% 57% -----
Social Studies ----- ----- ----- ----- -----
Mathematics 72% 69% 75% 73% -----
Science 57% 67% 68% 55% -----
TEA School Rating Imp Required Met Standard Met Standard C -----
STAAR
provide appropriate safety nets in preparation for a rigorous middle school curriculum.
General Fund Expenditures by Object
Employee Count
Seven Hills Elementary School
Seven Hills Elementary will teach the intended curriculum, assess and monitor studentsprogress, help students and parents set goals based on clear expectations, and
Enrollment
Mission Statement
654 FM 3433Newark, Texas 76071
(817) 215-0710Principal: Kim Blackburn
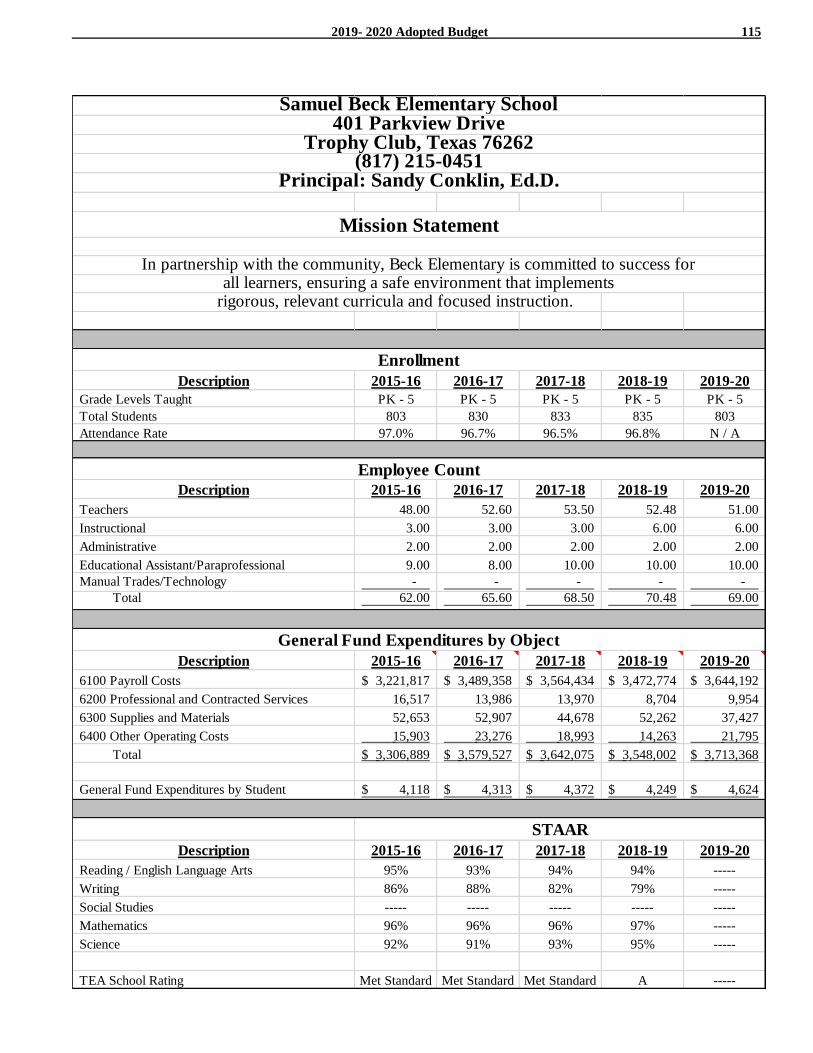
2019- 2020 Adopted Budget 115
rigorous, relevant curricula and focused instruction.
Description 2015-16 2016-17 2017-18 2018-19 2019-20
Grade Levels Taught PK - 5 PK - 5 PK - 5 PK - 5 PK - 5
Total Students 803 830 833 835 803
Attendance Rate 97.0% 96.7% 96.5% 96.8% N / A
Description 2015-16 2016-17 2017-18 2018-19 2019-20
Teachers 48.00 52.60 53.50 52.48 51.00
Instructional 3.00 3.00 3.00 6.00 6.00
Administrative 2.00 2.00 2.00 2.00 2.00
Educational Assistant/Paraprofessional 9.00 8.00 10.00 10.00 10.00
Manual Trades/Technology - - - - -
Total 62.00 65.60 68.50 70.48 69.00
Description 2015-16 2016-17 2017-18 2018-19 2019-20
6100 Payroll Costs 3,221,817$ 3,489,358$ 3,564,434$ 3,472,774$ 3,644,192$
6200 Professional and Contracted Services 16,517 13,986 13,970 8,704 9,954
6300 Supplies and Materials 52,653 52,907 44,678 52,262 37,427
6400 Other Operating Costs 15,903 23,276 18,993 14,263 21,795
Total 3,306,889$ 3,579,527$ 3,642,075$ 3,548,002$ 3,713,368$
General Fund Expenditures by Student 4,118$ 4,313$ 4,372$ 4,249$ 4,624$
Description 2015-16 2016-17 2017-18 2018-19 2019-20
Reading / English Language Arts 95% 93% 94% 94% -----
Writing 86% 88% 82% 79% -----
Social Studies ----- ----- ----- ----- -----
Mathematics 96% 96% 96% 97% -----
Science 92% 91% 93% 95% -----
TEA School Rating Met Standard Met Standard Met Standard A -----
Employee Count
STAAR
General Fund Expenditures by Object
Samuel Beck Elementary School
In partnership with the community, Beck Elementary is committed to success for
Enrollment
Mission Statement
401 Parkview DriveTrophy Club, Texas 76262
all learners, ensuring a safe environment that implements
(817) 215-0451Principal: Sandy Conklin, Ed.D.
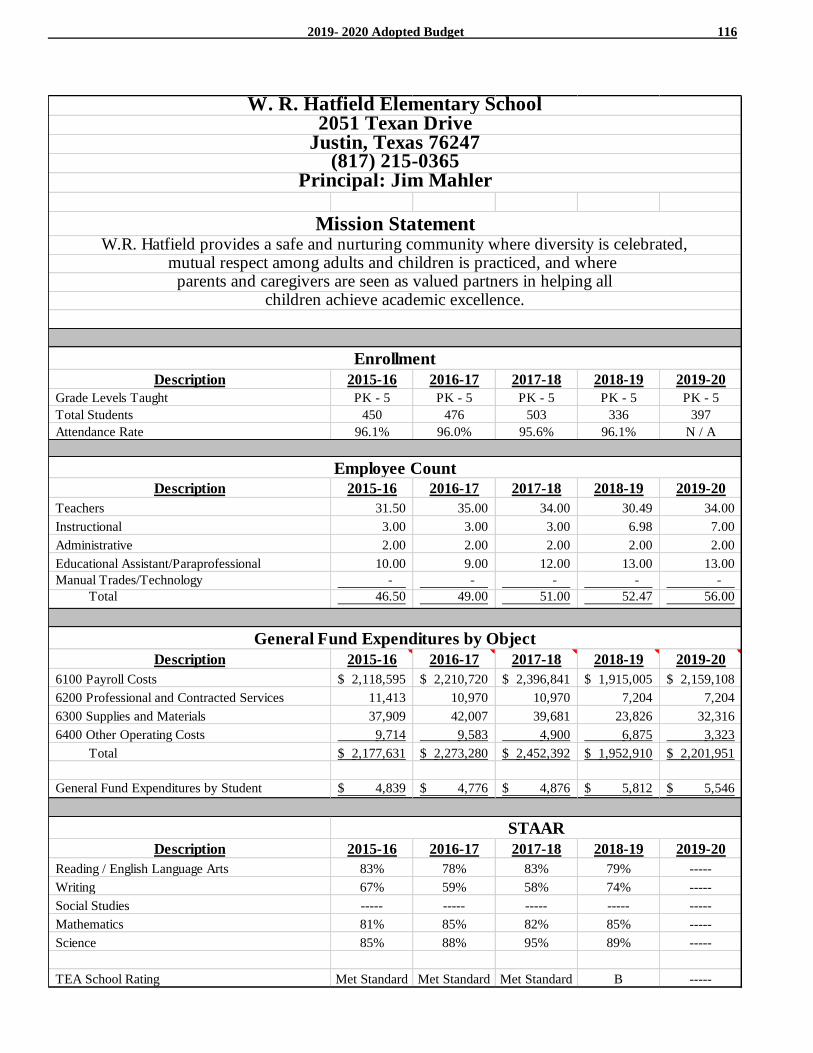
2019- 2020 Adopted Budget 116
Description 2015-16 2016-17 2017-18 2018-19 2019-20
Grade Levels Taught PK - 5 PK - 5 PK - 5 PK - 5 PK - 5
Total Students 450 476 503 336 397
Attendance Rate 96.1% 96.0% 95.6% 96.1% N / A
Description 2015-16 2016-17 2017-18 2018-19 2019-20
Teachers 31.50 35.00 34.00 30.49 34.00
Instructional 3.00 3.00 3.00 6.98 7.00
Administrative 2.00 2.00 2.00 2.00 2.00
Educational Assistant/Paraprofessional 10.00 9.00 12.00 13.00 13.00
Manual Trades/Technology - - - - -
Total 46.50 49.00 51.00 52.47 56.00
Description 2015-16 2016-17 2017-18 2018-19 2019-20
6100 Payroll Costs 2,118,595$ 2,210,720$ 2,396,841$ 1,915,005$ 2,159,108$
6200 Professional and Contracted Services 11,413 10,970 10,970 7,204 7,204
6300 Supplies and Materials 37,909 42,007 39,681 23,826 32,316
6400 Other Operating Costs 9,714 9,583 4,900 6,875 3,323
Total 2,177,631$ 2,273,280$ 2,452,392$ 1,952,910$ 2,201,951$
General Fund Expenditures by Student 4,839$ 4,776$ 4,876$ 5,812$ 5,546$
Description 2015-16 2016-17 2017-18 2018-19 2019-20
Reading / English Language Arts 83% 78% 83% 79% -----
Writing 67% 59% 58% 74% -----
Social Studies ----- ----- ----- ----- -----
Mathematics 81% 85% 82% 85% -----
Science 85% 88% 95% 89% -----
TEA School Rating Met Standard Met Standard Met Standard B -----
STAAR
children achieve academic excellence.
Justin, Texas 76247(817) 215-0365
General Fund Expenditures by Object
Employee Count
Enrollment
parents and caregivers are seen as valued partners in helping all
W. R. Hatfield Elementary School
W.R. Hatfield provides a safe and nurturing community where diversity is celebrated,mutual respect among adults and children is practiced, and where
Mission Statement
2051 Texan Drive
Principal: Jim Mahler
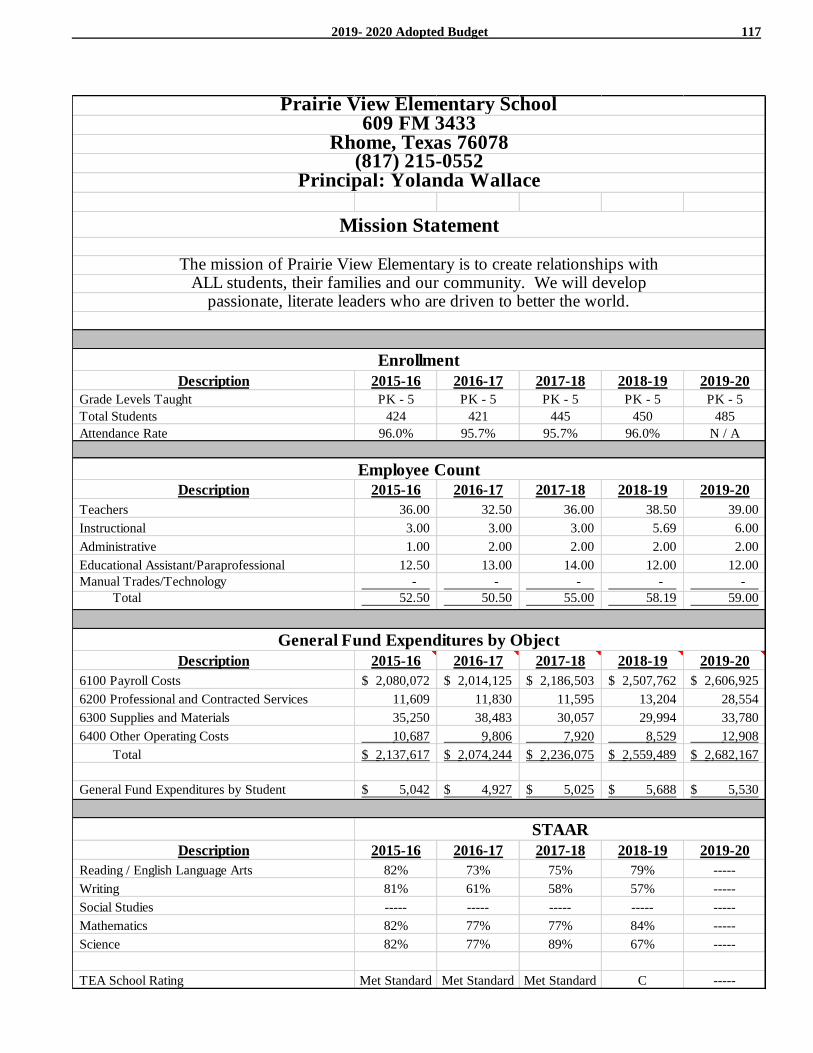
2019- 2020 Adopted Budget 117
Description 2015-16 2016-17 2017-18 2018-19 2019-20
Grade Levels Taught PK - 5 PK - 5 PK - 5 PK - 5 PK - 5
Total Students 424 421 445 450 485
Attendance Rate 96.0% 95.7% 95.7% 96.0% N / A
Description 2015-16 2016-17 2017-18 2018-19 2019-20
Teachers 36.00 32.50 36.00 38.50 39.00
Instructional 3.00 3.00 3.00 5.69 6.00
Administrative 1.00 2.00 2.00 2.00 2.00
Educational Assistant/Paraprofessional 12.50 13.00 14.00 12.00 12.00
Manual Trades/Technology - - - - -
Total 52.50 50.50 55.00 58.19 59.00
Description 2015-16 2016-17 2017-18 2018-19 2019-20
6100 Payroll Costs 2,080,072$ 2,014,125$ 2,186,503$ 2,507,762$ 2,606,925$
6200 Professional and Contracted Services 11,609 11,830 11,595 13,204 28,554
6300 Supplies and Materials 35,250 38,483 30,057 29,994 33,780
6400 Other Operating Costs 10,687 9,806 7,920 8,529 12,908
Total 2,137,617$ 2,074,244$ 2,236,075$ 2,559,489$ 2,682,167$
General Fund Expenditures by Student 5,042$ 4,927$ 5,025$ 5,688$ 5,530$
Description 2015-16 2016-17 2017-18 2018-19 2019-20
Reading / English Language Arts 82% 73% 75% 79% -----
Writing 81% 61% 58% 57% -----
Social Studies ----- ----- ----- ----- -----
Mathematics 82% 77% 77% 84% -----
Science 82% 77% 89% 67% -----
TEA School Rating Met Standard Met Standard Met Standard C -----
STAAR
Prairie View Elementary School
General Fund Expenditures by Object
The mission of Prairie View Elementary is to create relationships with
Enrollment
Employee Count
ALL students, their families and our community. We will develop
Mission Statement
609 FM 3433Rhome, Texas 76078
(817) 215-0552Principal: Yolanda Wallace
passionate, literate leaders who are driven to better the world.
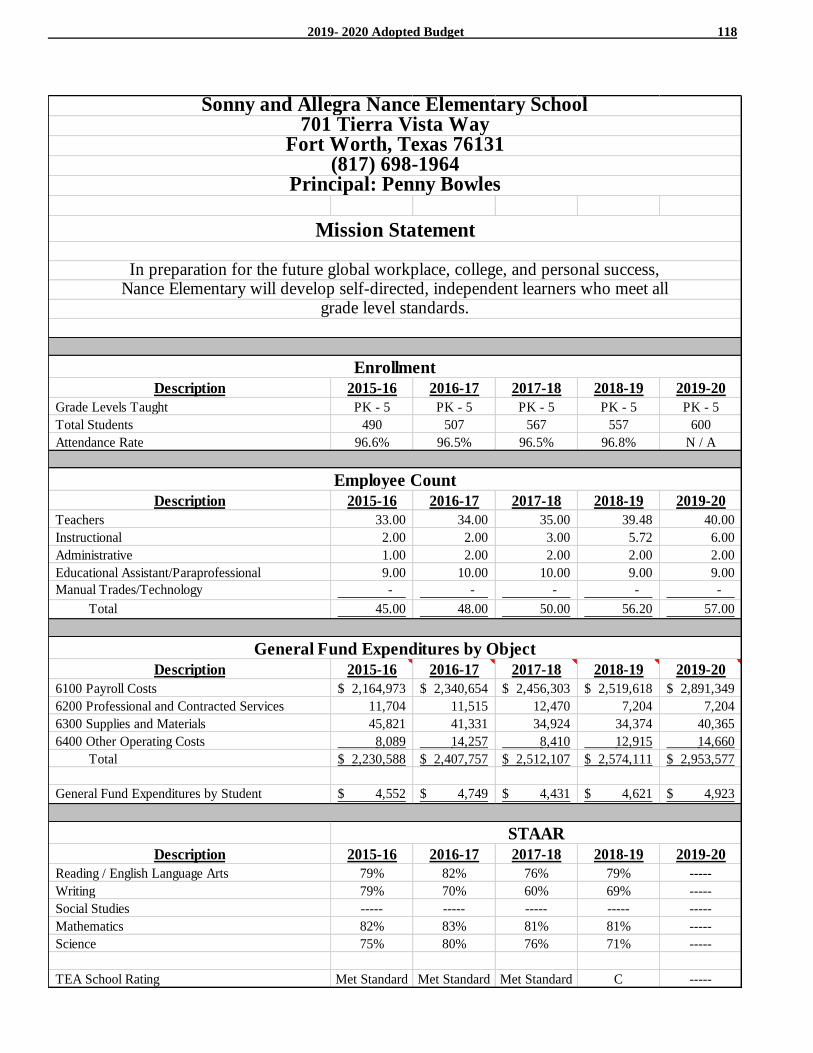
2019- 2020 Adopted Budget 118
Description 2015-16 2016-17 2017-18 2018-19 2019-20
Grade Levels Taught PK - 5 PK - 5 PK - 5 PK - 5 PK - 5
Total Students 490 507 567 557 600
Attendance Rate 96.6% 96.5% 96.5% 96.8% N / A
Description 2015-16 2016-17 2017-18 2018-19 2019-20
Teachers 33.00 34.00 35.00 39.48 40.00
Instructional 2.00 2.00 3.00 5.72 6.00
Administrative 1.00 2.00 2.00 2.00 2.00
Educational Assistant/Paraprofessional 9.00 10.00 10.00 9.00 9.00
Manual Trades/Technology - - - - -
Total 45.00 48.00 50.00 56.20 57.00
Description 2015-16 2016-17 2017-18 2018-19 2019-20
6100 Payroll Costs 2,164,973$ 2,340,654$ 2,456,303$ 2,519,618$ 2,891,349$
6200 Professional and Contracted Services 11,704 11,515 12,470 7,204 7,204
6300 Supplies and Materials 45,821 41,331 34,924 34,374 40,365
6400 Other Operating Costs 8,089 14,257 8,410 12,915 14,660
Total 2,230,588$ 2,407,757$ 2,512,107$ 2,574,111$ 2,953,577$
General Fund Expenditures by Student 4,552$ 4,749$ 4,431$ 4,621$ 4,923$
Description 2015-16 2016-17 2017-18 2018-19 2019-20
Reading / English Language Arts 79% 82% 76% 79% -----
Writing 79% 70% 60% 69% -----
Social Studies ----- ----- ----- ----- -----
Mathematics 82% 83% 81% 81% -----
Science 75% 80% 76% 71% -----
TEA School Rating Met Standard Met Standard Met Standard C -----
Mission Statement
grade level standards.
Enrollment
Employee Count
Sonny and Allegra Nance Elementary School701 Tierra Vista Way
Fort Worth, Texas 76131(817) 698-1964
Principal: Penny Bowles
General Fund Expenditures by Object
STAAR
In preparation for the future global workplace, college, and personal success,Nance Elementary will develop self-directed, independent learners who meet all
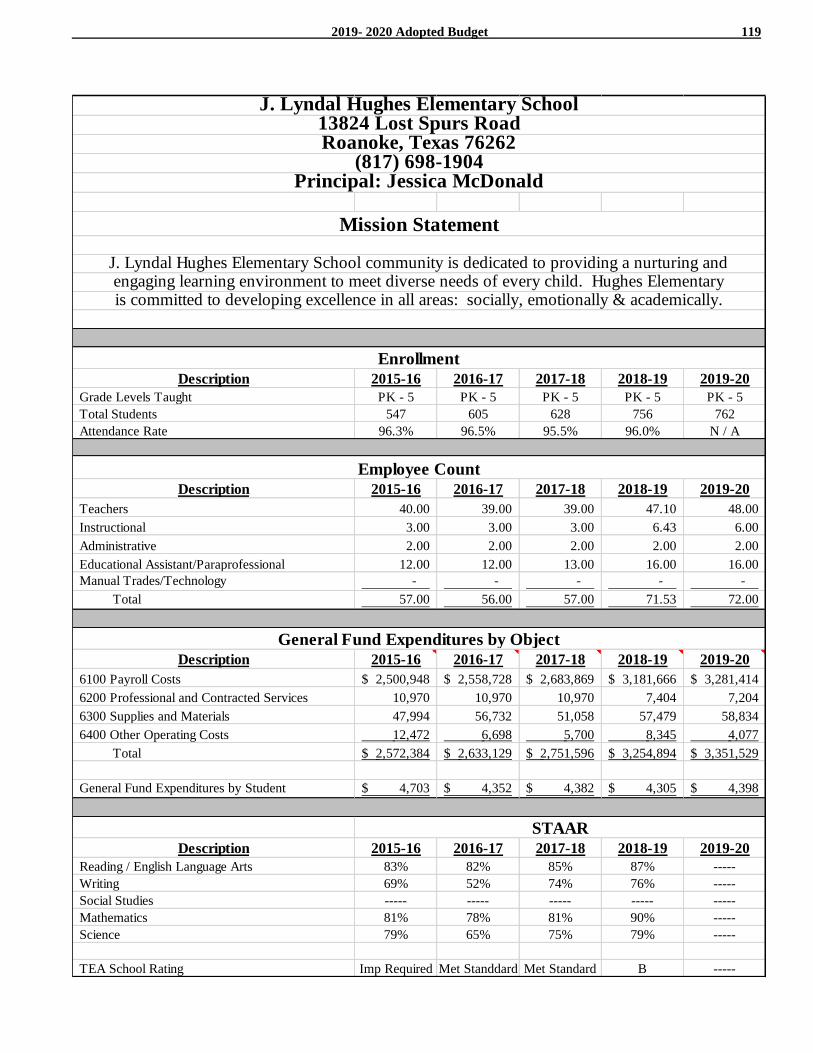
2019- 2020 Adopted Budget 119
Description 2015-16 2016-17 2017-18 2018-19 2019-20
Grade Levels Taught PK - 5 PK - 5 PK - 5 PK - 5 PK - 5
Total Students 547 605 628 756 762
Attendance Rate 96.3% 96.5% 95.5% 96.0% N / A
Description 2015-16 2016-17 2017-18 2018-19 2019-20
Teachers 40.00 39.00 39.00 47.10 48.00
Instructional 3.00 3.00 3.00 6.43 6.00
Administrative 2.00 2.00 2.00 2.00 2.00
Educational Assistant/Paraprofessional 12.00 12.00 13.00 16.00 16.00
Manual Trades/Technology - - - - -
Total 57.00 56.00 57.00 71.53 72.00
Description 2015-16 2016-17 2017-18 2018-19 2019-20
6100 Payroll Costs 2,500,948$ 2,558,728$ 2,683,869$ 3,181,666$ 3,281,414$
6200 Professional and Contracted Services 10,970 10,970 10,970 7,404 7,204
6300 Supplies and Materials 47,994 56,732 51,058 57,479 58,834
6400 Other Operating Costs 12,472 6,698 5,700 8,345 4,077
Total 2,572,384$ 2,633,129$ 2,751,596$ 3,254,894$ 3,351,529$
General Fund Expenditures by Student 4,703$ 4,352$ 4,382$ 4,305$ 4,398$
Description 2015-16 2016-17 2017-18 2018-19 2019-20
Reading / English Language Arts 83% 82% 85% 87% -----
Writing 69% 52% 74% 76% -----
Social Studies ----- ----- ----- ----- -----
Mathematics 81% 78% 81% 90% -----
Science 79% 65% 75% 79% -----
TEA School Rating Imp Required Met Standdard Met Standard B -----
STAAR
Employee Count
General Fund Expenditures by Object
engaging learning environment to meet diverse needs of every child. Hughes Elementaryis committed to developing excellence in all areas: socially, emotionally & academically.
Enrollment
Principal: Jessica McDonald
Mission Statement
J. Lyndal Hughes Elementary School community is dedicated to providing a nurturing and
J. Lyndal Hughes Elementary School13824 Lost Spurs RoadRoanoke, Texas 76262
(817) 698-1904
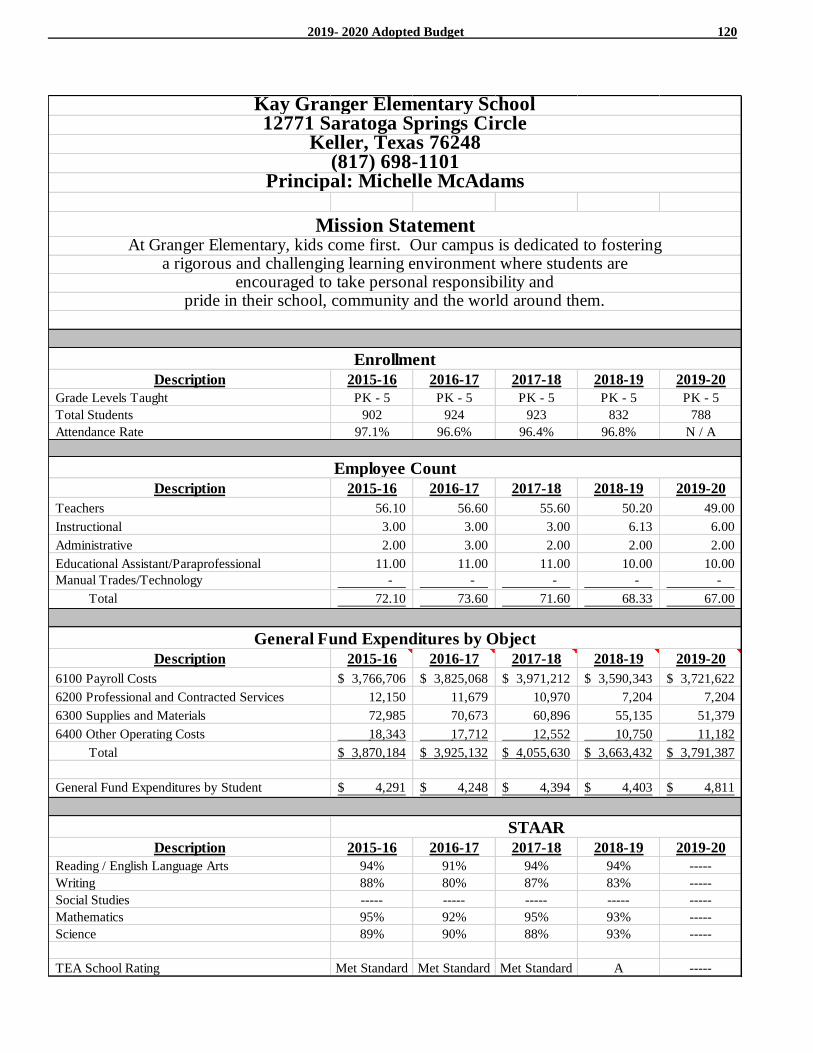
2019- 2020 Adopted Budget 120
Description 2015-16 2016-17 2017-18 2018-19 2019-20
Grade Levels Taught PK - 5 PK - 5 PK - 5 PK - 5 PK - 5
Total Students 902 924 923 832 788
Attendance Rate 97.1% 96.6% 96.4% 96.8% N / A
Description 2015-16 2016-17 2017-18 2018-19 2019-20
Teachers 56.10 56.60 55.60 50.20 49.00
Instructional 3.00 3.00 3.00 6.13 6.00
Administrative 2.00 3.00 2.00 2.00 2.00
Educational Assistant/Paraprofessional 11.00 11.00 11.00 10.00 10.00
Manual Trades/Technology - - - - -
Total 72.10 73.60 71.60 68.33 67.00
Description 2015-16 2016-17 2017-18 2018-19 2019-20
6100 Payroll Costs 3,766,706$ 3,825,068$ 3,971,212$ 3,590,343$ 3,721,622$
6200 Professional and Contracted Services 12,150 11,679 10,970 7,204 7,204
6300 Supplies and Materials 72,985 70,673 60,896 55,135 51,379
6400 Other Operating Costs 18,343 17,712 12,552 10,750 11,182
Total 3,870,184$ 3,925,132$ 4,055,630$ 3,663,432$ 3,791,387$
General Fund Expenditures by Student 4,291$ 4,248$ 4,394$ 4,403$ 4,811$
Description 2015-16 2016-17 2017-18 2018-19 2019-20
Reading / English Language Arts 94% 91% 94% 94% -----
Writing 88% 80% 87% 83% -----
Social Studies ----- ----- ----- ----- -----
Mathematics 95% 92% 95% 93% -----
Science 89% 90% 88% 93% -----
TEA School Rating Met Standard Met Standard Met Standard A -----
STAAR
Enrollment
Kay Granger Elementary School12771 Saratoga Springs Circle
Keller, Texas 76248(817) 698-1101
Principal: Michelle McAdams
Mission Statement
Employee Count
General Fund Expenditures by Object
At Granger Elementary, kids come first. Our campus is dedicated to fosteringa rigorous and challenging learning environment where students are
encouraged to take personal responsibility andpride in their school, community and the world around them.
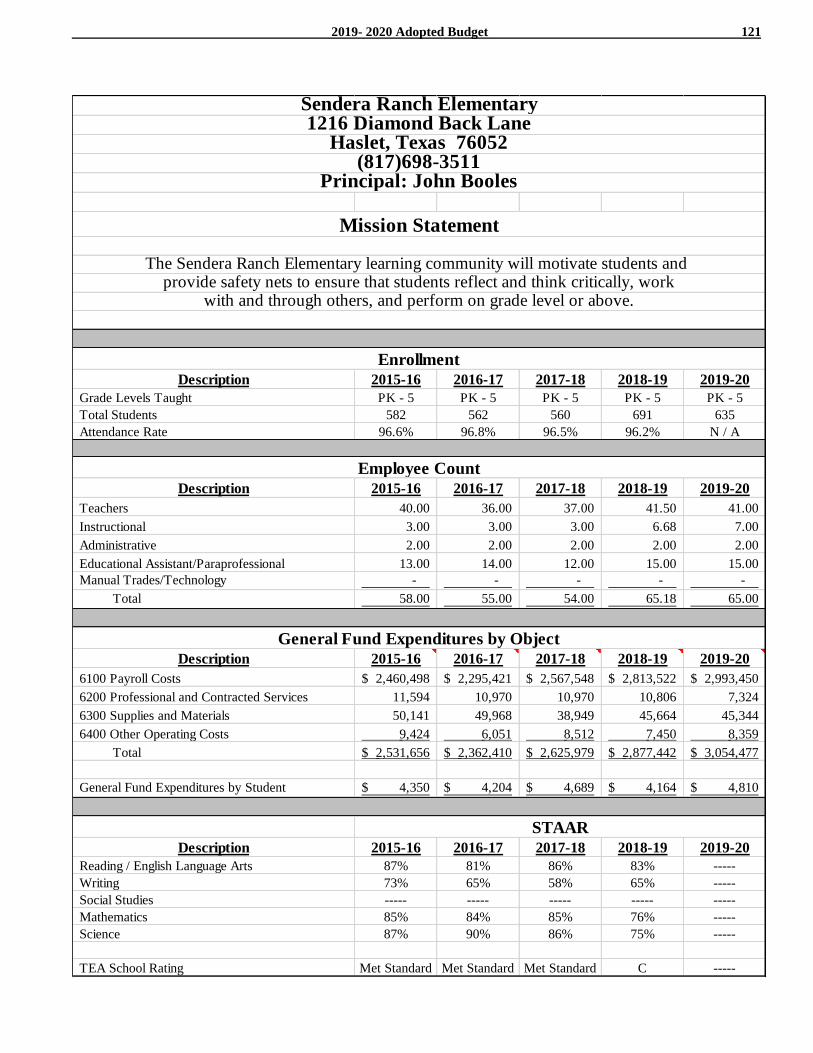
2019- 2020 Adopted Budget 121
Description 2015-16 2016-17 2017-18 2018-19 2019-20
Grade Levels Taught PK - 5 PK - 5 PK - 5 PK - 5 PK - 5
Total Students 582 562 560 691 635
Attendance Rate 96.6% 96.8% 96.5% 96.2% N / A
Description 2015-16 2016-17 2017-18 2018-19 2019-20
Teachers 40.00 36.00 37.00 41.50 41.00
Instructional 3.00 3.00 3.00 6.68 7.00
Administrative 2.00 2.00 2.00 2.00 2.00
Educational Assistant/Paraprofessional 13.00 14.00 12.00 15.00 15.00
Manual Trades/Technology - - - - -
Total 58.00 55.00 54.00 65.18 65.00
Description 2015-16 2016-17 2017-18 2018-19 2019-20
6100 Payroll Costs 2,460,498$ 2,295,421$ 2,567,548$ 2,813,522$ 2,993,450$
6200 Professional and Contracted Services 11,594 10,970 10,970 10,806 7,324
6300 Supplies and Materials 50,141 49,968 38,949 45,664 45,344
6400 Other Operating Costs 9,424 6,051 8,512 7,450 8,359
Total 2,531,656$ 2,362,410$ 2,625,979$ 2,877,442$ 3,054,477$
General Fund Expenditures by Student 4,350$ 4,204$ 4,689$ 4,164$ 4,810$
Description 2015-16 2016-17 2017-18 2018-19 2019-20
Reading / English Language Arts 87% 81% 86% 83% -----
Writing 73% 65% 58% 65% -----
Social Studies ----- ----- ----- ----- -----
Mathematics 85% 84% 85% 76% -----
Science 87% 90% 86% 75% -----
TEA School Rating Met Standard Met Standard Met Standard C -----
STAAR
Enrollment
Sendera Ranch Elementary1216 Diamond Back Lane
Haslet, Texas 76052(817)698-3511
Principal: John Booles
Mission Statement
Employee Count
General Fund Expenditures by Object
The Sendera Ranch Elementary learning community will motivate students and provide safety nets to ensure that students reflect and think critically, work
with and through others, and perform on grade level or above.
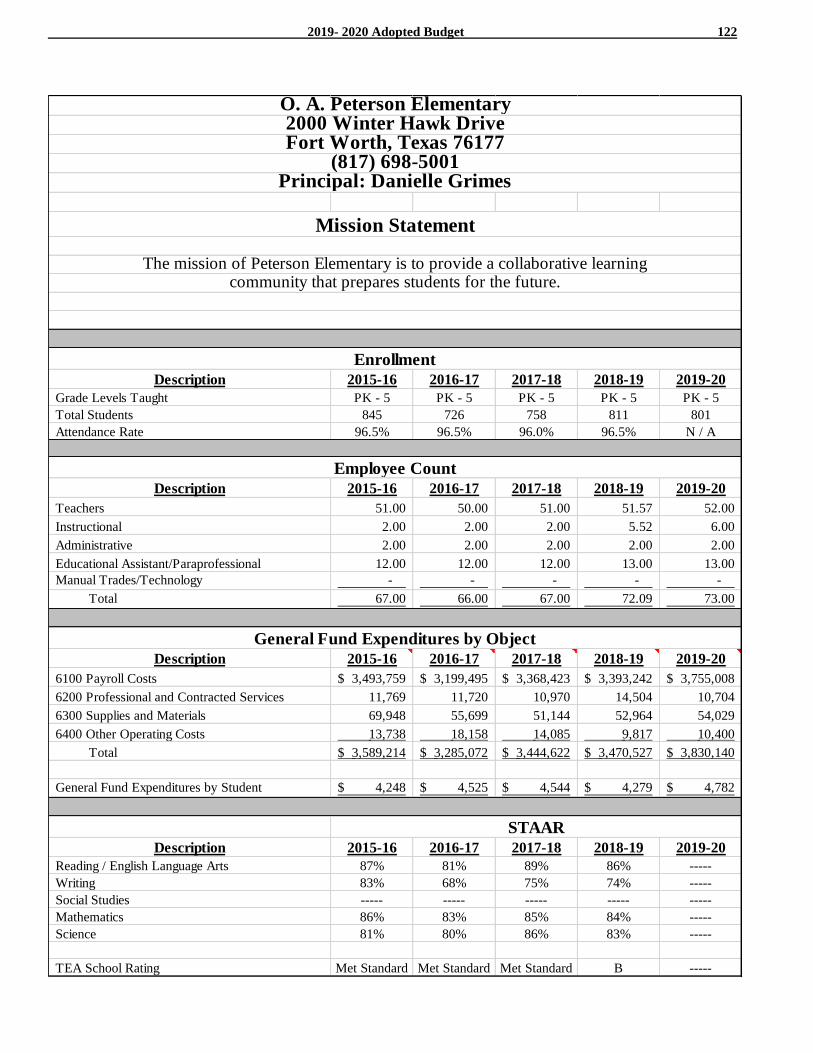
2019- 2020 Adopted Budget 122
Description 2015-16 2016-17 2017-18 2018-19 2019-20
Grade Levels Taught PK - 5 PK - 5 PK - 5 PK - 5 PK - 5
Total Students 845 726 758 811 801
Attendance Rate 96.5% 96.5% 96.0% 96.5% N / A
Description 2015-16 2016-17 2017-18 2018-19 2019-20
Teachers 51.00 50.00 51.00 51.57 52.00
Instructional 2.00 2.00 2.00 5.52 6.00
Administrative 2.00 2.00 2.00 2.00 2.00
Educational Assistant/Paraprofessional 12.00 12.00 12.00 13.00 13.00
Manual Trades/Technology - - - - -
Total 67.00 66.00 67.00 72.09 73.00
Description 2015-16 2016-17 2017-18 2018-19 2019-20
6100 Payroll Costs 3,493,759$ 3,199,495$ 3,368,423$ 3,393,242$ 3,755,008$
6200 Professional and Contracted Services 11,769 11,720 10,970 14,504 10,704
6300 Supplies and Materials 69,948 55,699 51,144 52,964 54,029
6400 Other Operating Costs 13,738 18,158 14,085 9,817 10,400
Total 3,589,214$ 3,285,072$ 3,444,622$ 3,470,527$ 3,830,140$
General Fund Expenditures by Student 4,248$ 4,525$ 4,544$ 4,279$ 4,782$
Description 2015-16 2016-17 2017-18 2018-19 2019-20
Reading / English Language Arts 87% 81% 89% 86% -----
Writing 83% 68% 75% 74% -----
Social Studies ----- ----- ----- ----- -----
Mathematics 86% 83% 85% 84% -----
Science 81% 80% 86% 83% -----
TEA School Rating Met Standard Met Standard Met Standard B -----
STAAR
Employee Count
General Fund Expenditures by Object
community that prepares students for the future.
Enrollment
Principal: Danielle Grimes
Mission Statement
The mission of Peterson Elementary is to provide a collaborative learning
O. A. Peterson Elementary2000 Winter Hawk DriveFort Worth, Texas 76177
(817) 698-5001
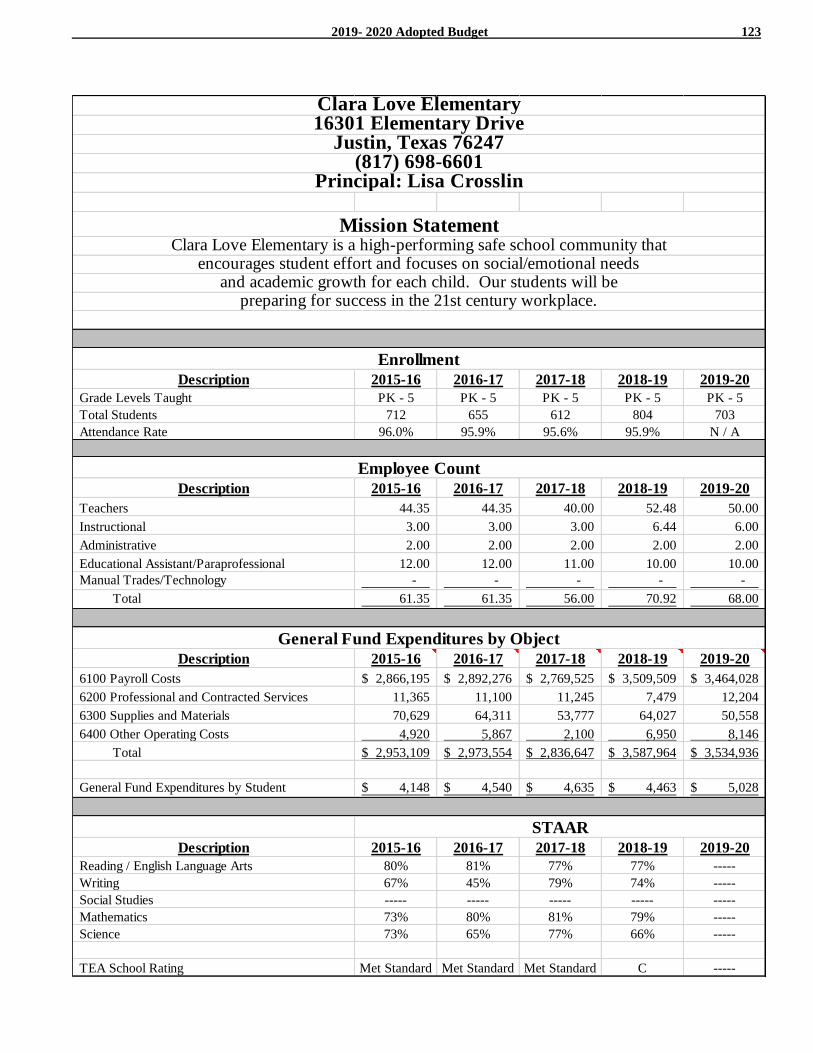
2019- 2020 Adopted Budget 123
Description 2015-16 2016-17 2017-18 2018-19 2019-20
Grade Levels Taught PK - 5 PK - 5 PK - 5 PK - 5 PK - 5
Total Students 712 655 612 804 703
Attendance Rate 96.0% 95.9% 95.6% 95.9% N / A
Description 2015-16 2016-17 2017-18 2018-19 2019-20
Teachers 44.35 44.35 40.00 52.48 50.00
Instructional 3.00 3.00 3.00 6.44 6.00
Administrative 2.00 2.00 2.00 2.00 2.00
Educational Assistant/Paraprofessional 12.00 12.00 11.00 10.00 10.00
Manual Trades/Technology - - - - -
Total 61.35 61.35 56.00 70.92 68.00
Description 2015-16 2016-17 2017-18 2018-19 2019-20
6100 Payroll Costs 2,866,195$ 2,892,276$ 2,769,525$ 3,509,509$ 3,464,028$
6200 Professional and Contracted Services 11,365 11,100 11,245 7,479 12,204
6300 Supplies and Materials 70,629 64,311 53,777 64,027 50,558
6400 Other Operating Costs 4,920 5,867 2,100 6,950 8,146
Total 2,953,109$ 2,973,554$ 2,836,647$ 3,587,964$ 3,534,936$
General Fund Expenditures by Student 4,148$ 4,540$ 4,635$ 4,463$ 5,028$
Description 2015-16 2016-17 2017-18 2018-19 2019-20
Reading / English Language Arts 80% 81% 77% 77% -----
Writing 67% 45% 79% 74% -----
Social Studies ----- ----- ----- ----- -----
Mathematics 73% 80% 81% 79% -----
Science 73% 65% 77% 66% -----
TEA School Rating Met Standard Met Standard Met Standard C -----
STAAR
Enrollment
Clara Love Elementary16301 Elementary Drive
Justin, Texas 76247(817) 698-6601
Principal: Lisa Crosslin
Mission Statement
Employee Count
General Fund Expenditures by Object
Clara Love Elementary is a high-performing safe school community thatencourages student effort and focuses on social/emotional needs
and academic growth for each child. Our students will bepreparing for success in the 21st century workplace.
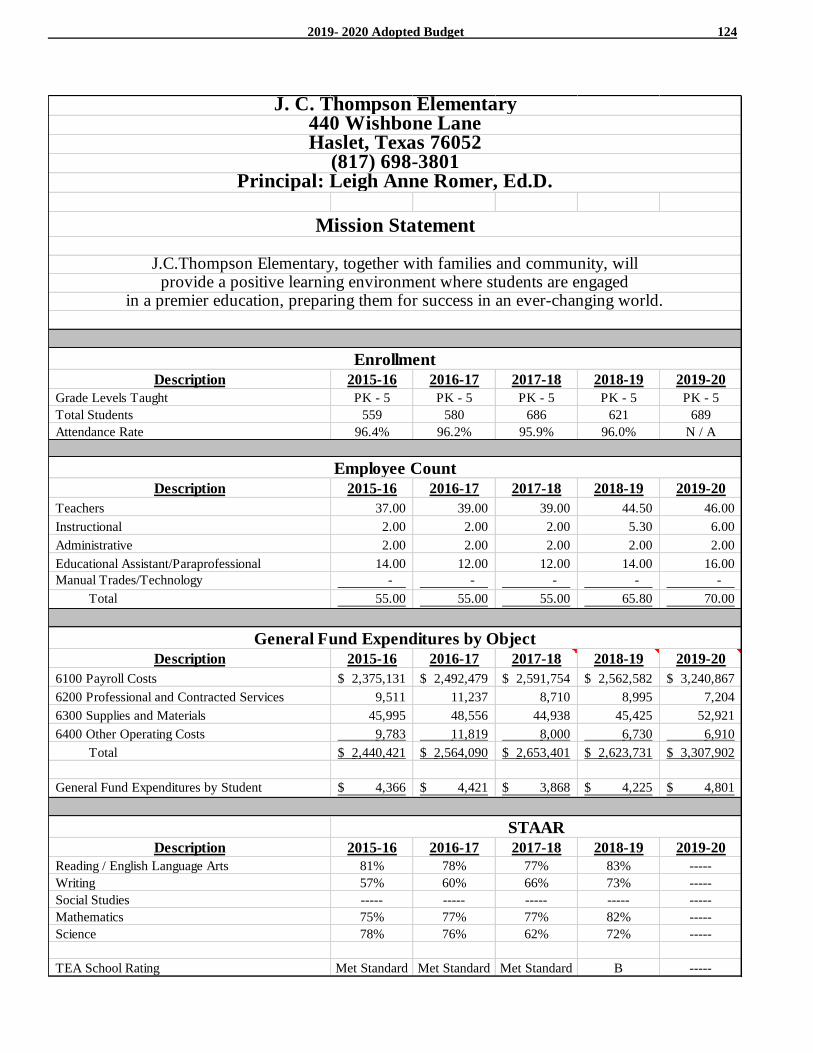
2019- 2020 Adopted Budget 124
Description 2015-16 2016-17 2017-18 2018-19 2019-20
Grade Levels Taught PK - 5 PK - 5 PK - 5 PK - 5 PK - 5
Total Students 559 580 686 621 689
Attendance Rate 96.4% 96.2% 95.9% 96.0% N / A
Description 2015-16 2016-17 2017-18 2018-19 2019-20
Teachers 37.00 39.00 39.00 44.50 46.00
Instructional 2.00 2.00 2.00 5.30 6.00
Administrative 2.00 2.00 2.00 2.00 2.00
Educational Assistant/Paraprofessional 14.00 12.00 12.00 14.00 16.00
Manual Trades/Technology - - - - -
Total 55.00 55.00 55.00 65.80 70.00
Description 2015-16 2016-17 2017-18 2018-19 2019-20
6100 Payroll Costs 2,375,131$ 2,492,479$ 2,591,754$ 2,562,582$ 3,240,867$
6200 Professional and Contracted Services 9,511 11,237 8,710 8,995 7,204
6300 Supplies and Materials 45,995 48,556 44,938 45,425 52,921
6400 Other Operating Costs 9,783 11,819 8,000 6,730 6,910
Total 2,440,421$ 2,564,090$ 2,653,401$ 2,623,731$ 3,307,902$
General Fund Expenditures by Student 4,366$ 4,421$ 3,868$ 4,225$ 4,801$
Description 2015-16 2016-17 2017-18 2018-19 2019-20
Reading / English Language Arts 81% 78% 77% 83% -----
Writing 57% 60% 66% 73% -----
Social Studies ----- ----- ----- ----- -----
Mathematics 75% 77% 77% 82% -----
Science 78% 76% 62% 72% -----
TEA School Rating Met Standard Met Standard Met Standard B -----
STAAR
Enrollment
J. C. Thompson Elementary440 Wishbone LaneHaslet, Texas 76052
(817) 698-3801Principal: Leigh Anne Romer, Ed.D.
Mission Statement
Employee Count
General Fund Expenditures by Object
J.C.Thompson Elementary, together with families and community, willprovide a positive learning environment where students are engaged
in a premier education, preparing them for success in an ever-changing world.
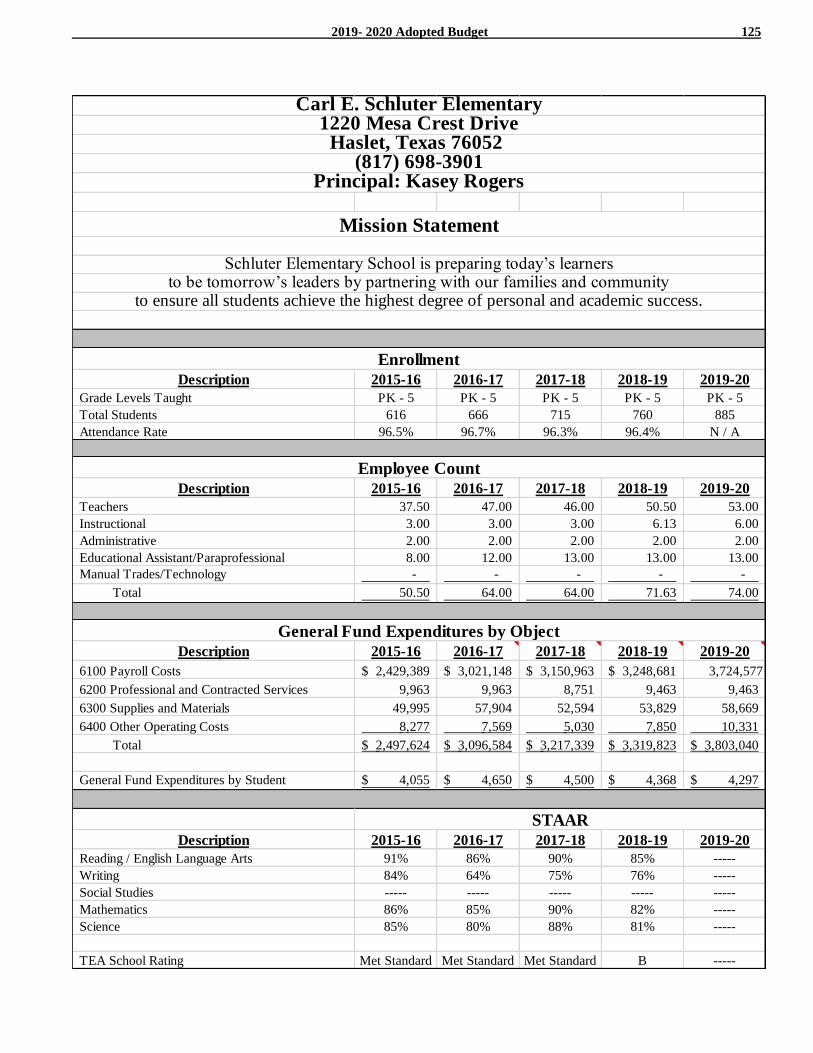
2019- 2020 Adopted Budget 125
Description 2015-16 2016-17 2017-18 2018-19 2019-20
Grade Levels Taught PK - 5 PK - 5 PK - 5 PK - 5 PK - 5
Total Students 616 666 715 760 885
Attendance Rate 96.5% 96.7% 96.3% 96.4% N / A
Description 2015-16 2016-17 2017-18 2018-19 2019-20
Teachers 37.50 47.00 46.00 50.50 53.00
Instructional 3.00 3.00 3.00 6.13 6.00
Administrative 2.00 2.00 2.00 2.00 2.00
Educational Assistant/Paraprofessional 8.00 12.00 13.00 13.00 13.00
Manual Trades/Technology - - - - -
Total 50.50 64.00 64.00 71.63 74.00
Description 2015-16 2016-17 2017-18 2018-19 2019-20
6100 Payroll Costs 2,429,389$ 3,021,148$ 3,150,963$ 3,248,681$ 3,724,577
6200 Professional and Contracted Services 9,963 9,963 8,751 9,463 9,463
6300 Supplies and Materials 49,995 57,904 52,594 53,829 58,669
6400 Other Operating Costs 8,277 7,569 5,030 7,850 10,331
Total 2,497,624$ 3,096,584$ 3,217,339$ 3,319,823$ 3,803,040$
General Fund Expenditures by Student 4,055$ 4,650$ 4,500$ 4,368$ 4,297$
Description 2015-16 2016-17 2017-18 2018-19 2019-20
Reading / English Language Arts 91% 86% 90% 85% -----
Writing 84% 64% 75% 76% -----
Social Studies ----- ----- ----- ----- -----
Mathematics 86% 85% 90% 82% -----
Science 85% 80% 88% 81% -----
TEA School Rating Met Standard Met Standard Met Standard B -----
STAAR
Enrollment
Carl E. Schluter Elementary1220 Mesa Crest Drive
Haslet, Texas 76052 (817) 698-3901
Principal: Kasey Rogers
Mission Statement
Employee Count
General Fund Expenditures by Object
Schluter Elementary School is preparing today’s learnersto be tomorrow’s leaders by partnering with our families and community
to ensure all students achieve the highest degree of personal and academic success.
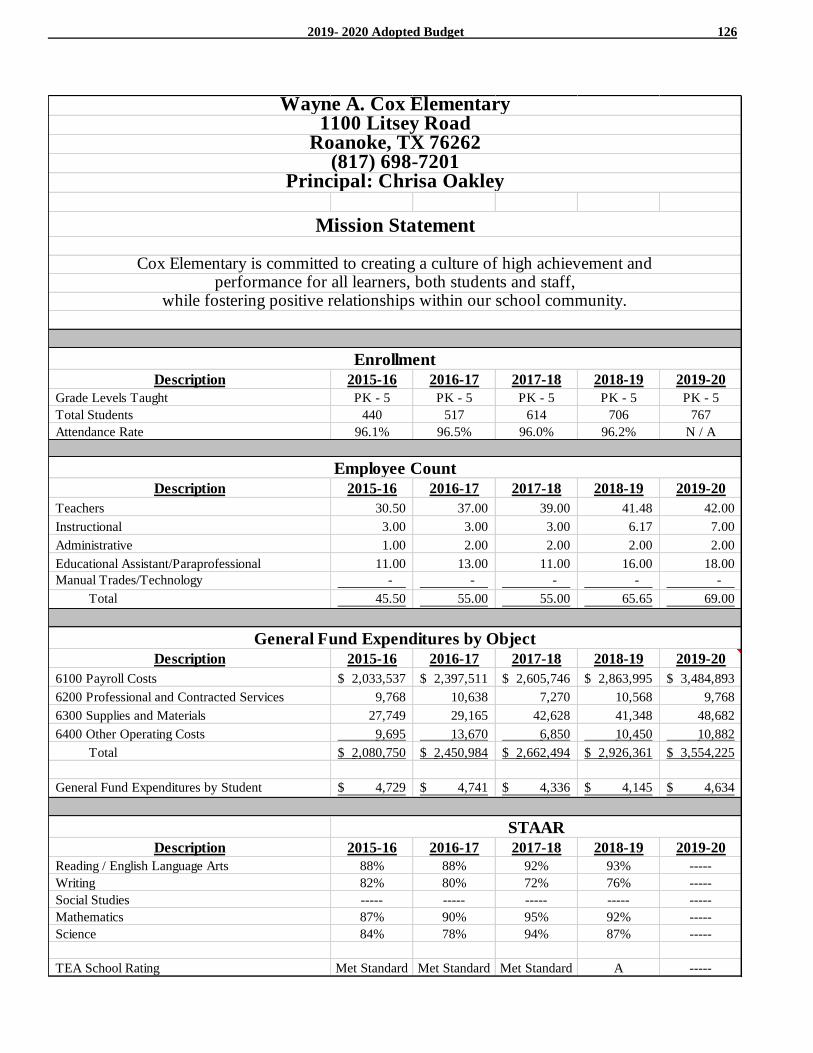
2019- 2020 Adopted Budget 126
Description 2015-16 2016-17 2017-18 2018-19 2019-20
Grade Levels Taught PK - 5 PK - 5 PK - 5 PK - 5 PK - 5
Total Students 440 517 614 706 767
Attendance Rate 96.1% 96.5% 96.0% 96.2% N / A
Description 2015-16 2016-17 2017-18 2018-19 2019-20
Teachers 30.50 37.00 39.00 41.48 42.00
Instructional 3.00 3.00 3.00 6.17 7.00
Administrative 1.00 2.00 2.00 2.00 2.00
Educational Assistant/Paraprofessional 11.00 13.00 11.00 16.00 18.00
Manual Trades/Technology - - - - -
Total 45.50 55.00 55.00 65.65 69.00
Description 2015-16 2016-17 2017-18 2018-19 2019-20
6100 Payroll Costs 2,033,537$ 2,397,511$ 2,605,746$ 2,863,995$ 3,484,893$
6200 Professional and Contracted Services 9,768 10,638 7,270 10,568 9,768
6300 Supplies and Materials 27,749 29,165 42,628 41,348 48,682
6400 Other Operating Costs 9,695 13,670 6,850 10,450 10,882
Total 2,080,750$ 2,450,984$ 2,662,494$ 2,926,361$ 3,554,225$
General Fund Expenditures by Student 4,729$ 4,741$ 4,336$ 4,145$ 4,634$
Description 2015-16 2016-17 2017-18 2018-19 2019-20
Reading / English Language Arts 88% 88% 92% 93% -----
Writing 82% 80% 72% 76% -----
Social Studies ----- ----- ----- ----- -----
Mathematics 87% 90% 95% 92% -----
Science 84% 78% 94% 87% -----
TEA School Rating Met Standard Met Standard Met Standard A -----
STAAR
Enrollment
Employee Count
General Fund Expenditures by Object
Wayne A. Cox Elementary1100 Litsey Road
Roanoke, TX 76262(817) 698-7201
Principal: Chrisa Oakley
Mission Statement
Cox Elementary is committed to creating a culture of high achievement andperformance for all learners, both students and staff,
while fostering positive relationships within our school community.
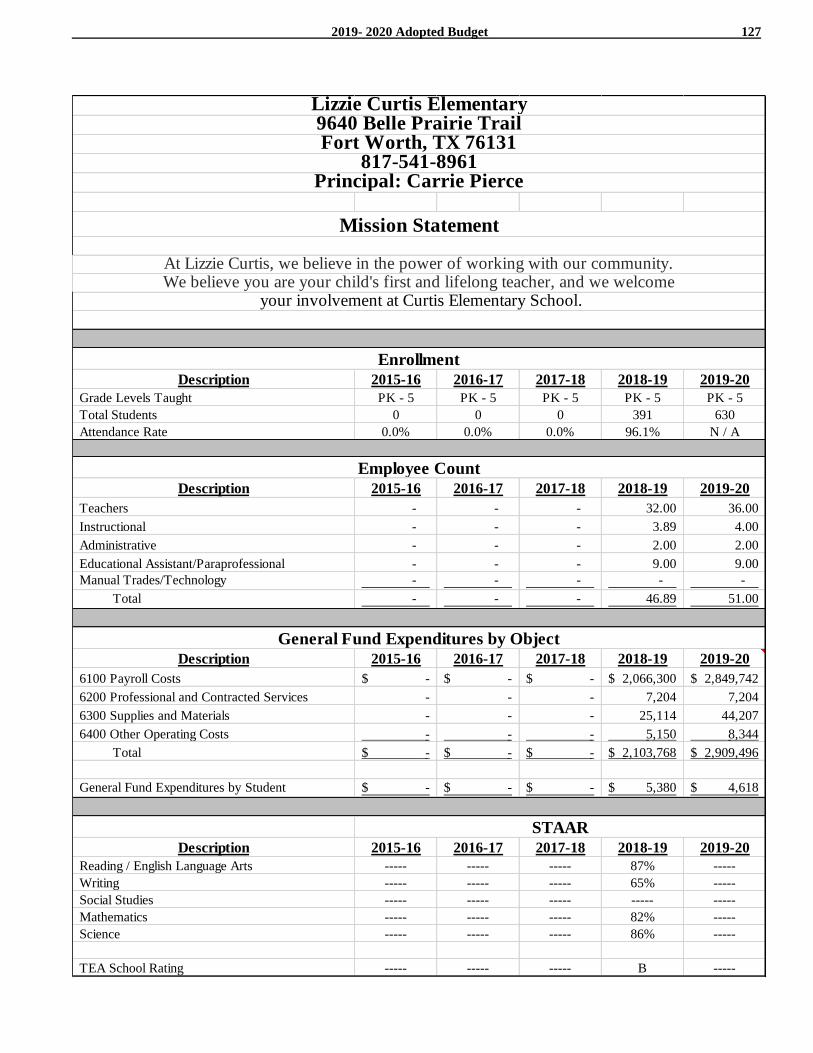
2019- 2020 Adopted Budget 127
Description 2015-16 2016-17 2017-18 2018-19 2019-20
Grade Levels Taught PK - 5 PK - 5 PK - 5 PK - 5 PK - 5
Total Students 0 0 0 391 630
Attendance Rate 0.0% 0.0% 0.0% 96.1% N / A
Description 2015-16 2016-17 2017-18 2018-19 2019-20
Teachers - - - 32.00 36.00
Instructional - - - 3.89 4.00
Administrative - - - 2.00 2.00
Educational Assistant/Paraprofessional - - - 9.00 9.00
Manual Trades/Technology - - - - -
Total - - - 46.89 51.00
Description 2015-16 2016-17 2017-18 2018-19 2019-20
6100 Payroll Costs -$ -$ -$ 2,066,300$ 2,849,742$
6200 Professional and Contracted Services - - - 7,204 7,204
6300 Supplies and Materials - - - 25,114 44,207
6400 Other Operating Costs - - - 5,150 8,344
Total -$ -$ -$ 2,103,768$ 2,909,496$
General Fund Expenditures by Student -$ -$ -$ 5,380$ 4,618$
Description 2015-16 2016-17 2017-18 2018-19 2019-20
Reading / English Language Arts ----- ----- ----- 87% -----
Writing ----- ----- ----- 65% -----
Social Studies ----- ----- ----- ----- -----
Mathematics ----- ----- ----- 82% -----
Science ----- ----- ----- 86% -----
TEA School Rating ----- ----- ----- B -----
Lizzie Curtis Elementary9640 Belle Prairie TrailFort Worth, TX 76131
817-541-8961Principal: Carrie Pierce
Mission Statement
At Lizzie Curtis, we believe in the power of working with our community.We believe you are your child's first and lifelong teacher, and we welcome
your involvement at Curtis Elementary School.
Enrollment
Employee Count
General Fund Expenditures by Object
STAAR
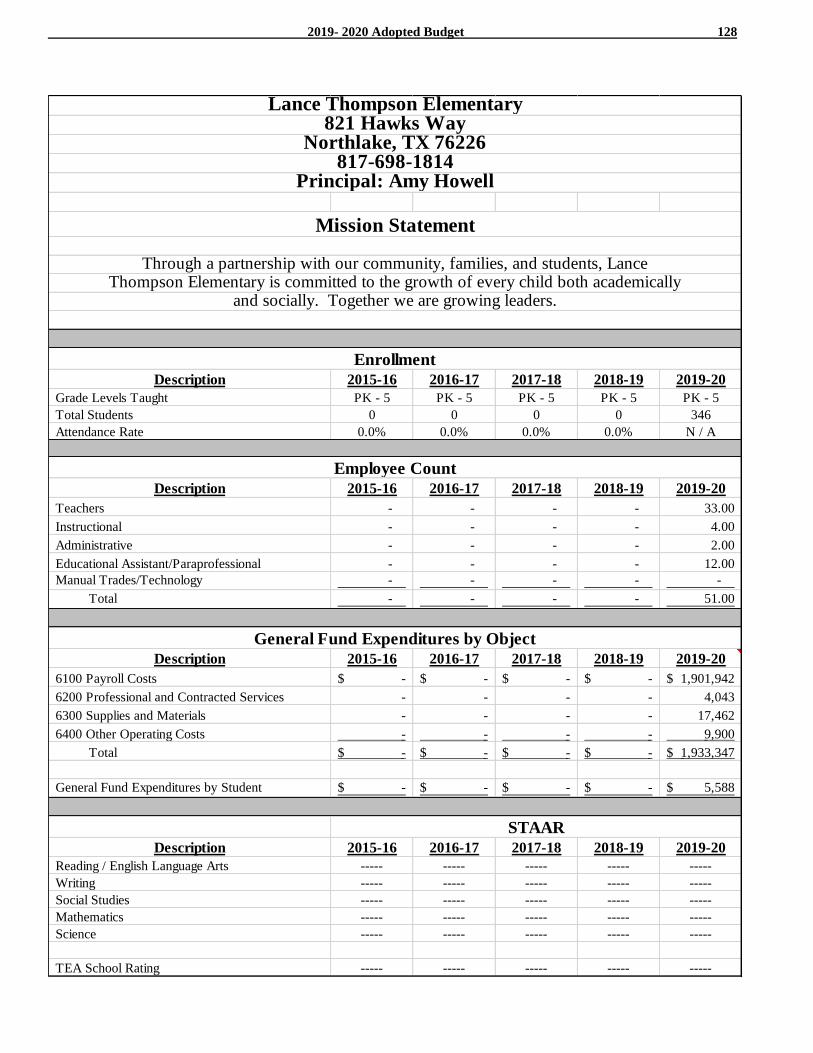
2019- 2020 Adopted Budget 128
Description 2015-16 2016-17 2017-18 2018-19 2019-20
Grade Levels Taught PK - 5 PK - 5 PK - 5 PK - 5 PK - 5
Total Students 0 0 0 0 346
Attendance Rate 0.0% 0.0% 0.0% 0.0% N / A
Description 2015-16 2016-17 2017-18 2018-19 2019-20
Teachers - - - - 33.00
Instructional - - - - 4.00
Administrative - - - - 2.00
Educational Assistant/Paraprofessional - - - - 12.00
Manual Trades/Technology - - - - -
Total - - - - 51.00
Description 2015-16 2016-17 2017-18 2018-19 2019-20
6100 Payroll Costs -$ -$ -$ -$ 1,901,942$
6200 Professional and Contracted Services - - - - 4,043
6300 Supplies and Materials - - - - 17,462
6400 Other Operating Costs - - - - 9,900
Total -$ -$ -$ -$ 1,933,347$
General Fund Expenditures by Student -$ -$ -$ -$ 5,588$
Description 2015-16 2016-17 2017-18 2018-19 2019-20
Reading / English Language Arts ----- ----- ----- ----- -----
Writing ----- ----- ----- ----- -----
Social Studies ----- ----- ----- ----- -----
Mathematics ----- ----- ----- ----- -----
Science ----- ----- ----- ----- -----
TEA School Rating ----- ----- ----- ----- -----
Lance Thompson Elementary821 Hawks Way
Northlake, TX 76226817-698-1814
Principal: Amy Howell
Mission Statement
Through a partnership with our community, families, and students, LanceThompson Elementary is committed to the growth of every child both academically
and socially. Together we are growing leaders.
Enrollment
Employee Count
General Fund Expenditures by Object
STAAR
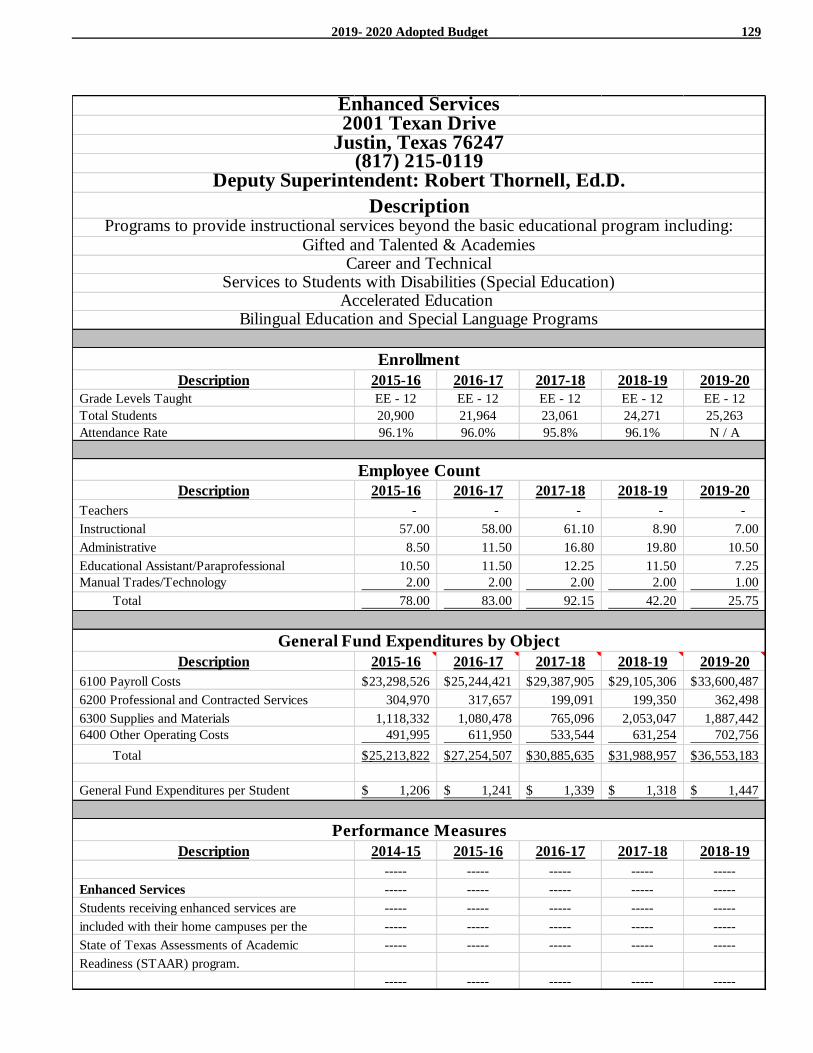
2019- 2020 Adopted Budget 129
Description 2015-16 2016-17 2017-18 2018-19 2019-20
Grade Levels Taught EE - 12 EE - 12 EE - 12 EE - 12 EE - 12
Total Students 20,900 21,964 23,061 24,271 25,263
Attendance Rate 96.1% 96.0% 95.8% 96.1% N / A
Description 2015-16 2016-17 2017-18 2018-19 2019-20
Teachers - - - - -
Instructional 57.00 58.00 61.10 8.90 7.00
Administrative 8.50 11.50 16.80 19.80 10.50
Educational Assistant/Paraprofessional 10.50 11.50 12.25 11.50 7.25
Manual Trades/Technology 2.00 2.00 2.00 2.00 1.00
Total 78.00 83.00 92.15 42.20 25.75
Description 2015-16 2016-17 2017-18 2018-19 2019-20
6100 Payroll Costs 23,298,526$ 25,244,421$ 29,387,905$ 29,105,306$ 33,600,487$
6200 Professional and Contracted Services 304,970 317,657 199,091 199,350 362,498
6300 Supplies and Materials 1,118,332 1,080,478 765,096 2,053,047 1,887,442
6400 Other Operating Costs 491,995 611,950 533,544 631,254 702,756
Total 25,213,822$ 27,254,507$ 30,885,635$ 31,988,957$ 36,553,183$
General Fund Expenditures per Student 1,206$ 1,241$ 1,339$ 1,318$ 1,447$
Description 2014-15 2015-16 2016-17 2017-18 2018-19
----- ----- ----- ----- -----
Enhanced Services ----- ----- ----- ----- -----
Students receiving enhanced services are ----- ----- ----- ----- -----
included with their home campuses per the ----- ----- ----- ----- -----
State of Texas Assessments of Academic ----- ----- ----- ----- -----
Readiness (STAAR) program.
----- ----- ----- ----- -----
Programs to provide instructional services beyond the basic educational program including:Description
Enhanced Services2001 Texan Drive
Justin, Texas 76247(817) 215-0119
Deputy Superintendent: Robert Thornell, Ed.D.
Enrollment
Employee Count
General Fund Expenditures by Object
Performance Measures
Gifted and Talented & AcademiesCareer and Technical
Services to Students with Disabilities (Special Education)Accelerated Education
Bilingual Education and Special Language Programs
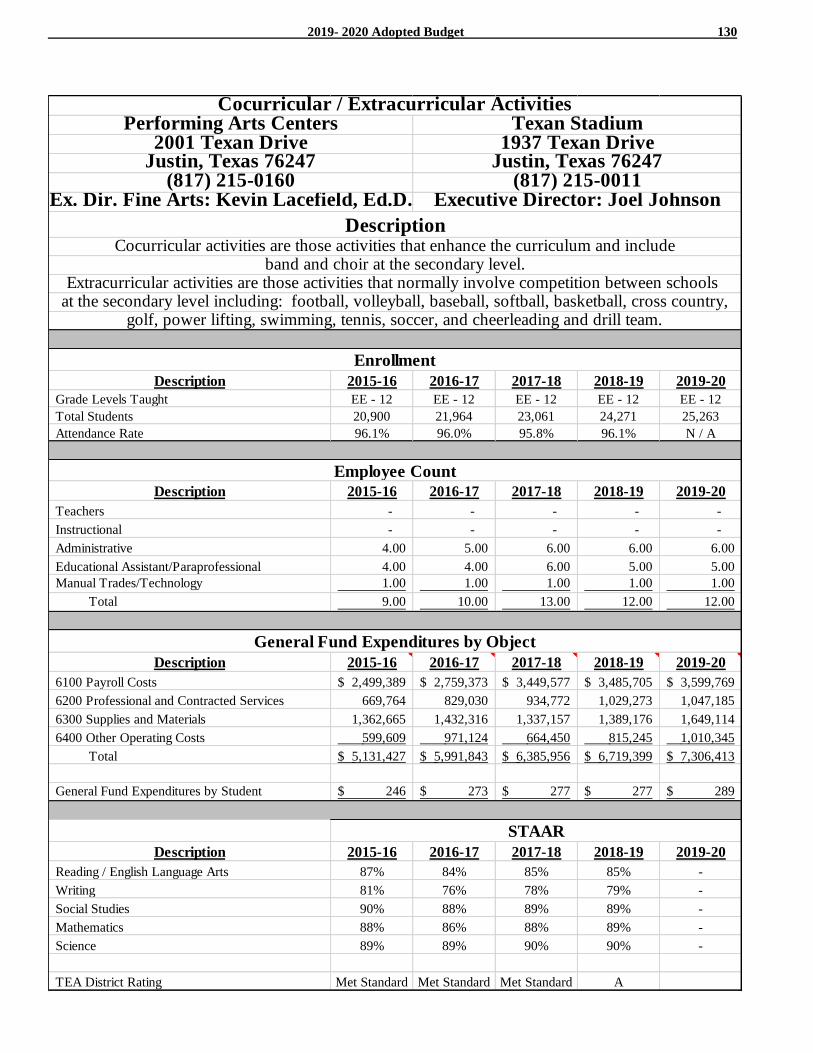
2019- 2020 Adopted Budget 130
Description 2015-16 2016-17 2017-18 2018-19 2019-20
Grade Levels Taught EE - 12 EE - 12 EE - 12 EE - 12 EE - 12
Total Students 20,900 21,964 23,061 24,271 25,263
Attendance Rate 96.1% 96.0% 95.8% 96.1% N / A
Description 2015-16 2016-17 2017-18 2018-19 2019-20
Teachers - - - - -
Instructional - - - - -
Administrative 4.00 5.00 6.00 6.00 6.00
Educational Assistant/Paraprofessional 4.00 4.00 6.00 5.00 5.00
Manual Trades/Technology 1.00 1.00 1.00 1.00 1.00
Total 9.00 10.00 13.00 12.00 12.00
Description 2015-16 2016-17 2017-18 2018-19 2019-20
6100 Payroll Costs 2,499,389$ 2,759,373$ 3,449,577$ 3,485,705$ 3,599,769$
6200 Professional and Contracted Services 669,764 829,030 934,772 1,029,273 1,047,185
6300 Supplies and Materials 1,362,665 1,432,316 1,337,157 1,389,176 1,649,114
6400 Other Operating Costs 599,609 971,124 664,450 815,245 1,010,345
Total 5,131,427$ 5,991,843$ 6,385,956$ 6,719,399$ 7,306,413$
General Fund Expenditures by Student 246$ 273$ 277$ 277$ 289$
Description 2015-16 2016-17 2017-18 2018-19 2019-20
Reading / English Language Arts 87% 84% 85% 85% -
Writing 81% 76% 78% 79% -
Social Studies 90% 88% 89% 89% -
Mathematics 88% 86% 88% 89% -
Science 89% 89% 90% 90% -
TEA District Rating Met Standard Met Standard Met Standard A
STAAR
Cocurricular activities are those activities that enhance the curriculum and include
Executive Director: Joel JohnsonEx. Dir. Fine Arts: Kevin Lacefield, Ed.D.
Performing Arts Centers2001 Texan Drive
Justin, Texas 76247(817) 215-0160
Description
Enrollment
Employee Count
General Fund Expenditures by Object
band and choir at the secondary level.Extracurricular activities are those activities that normally involve competition between schools
at the secondary level including: football, volleyball, baseball, softball, basketball, cross country,golf, power lifting, swimming, tennis, soccer, and cheerleading and drill team.
Cocurricular / Extracurricular ActivitiesTexan Stadium
1937 Texan DriveJustin, Texas 76247
(817) 215-0011
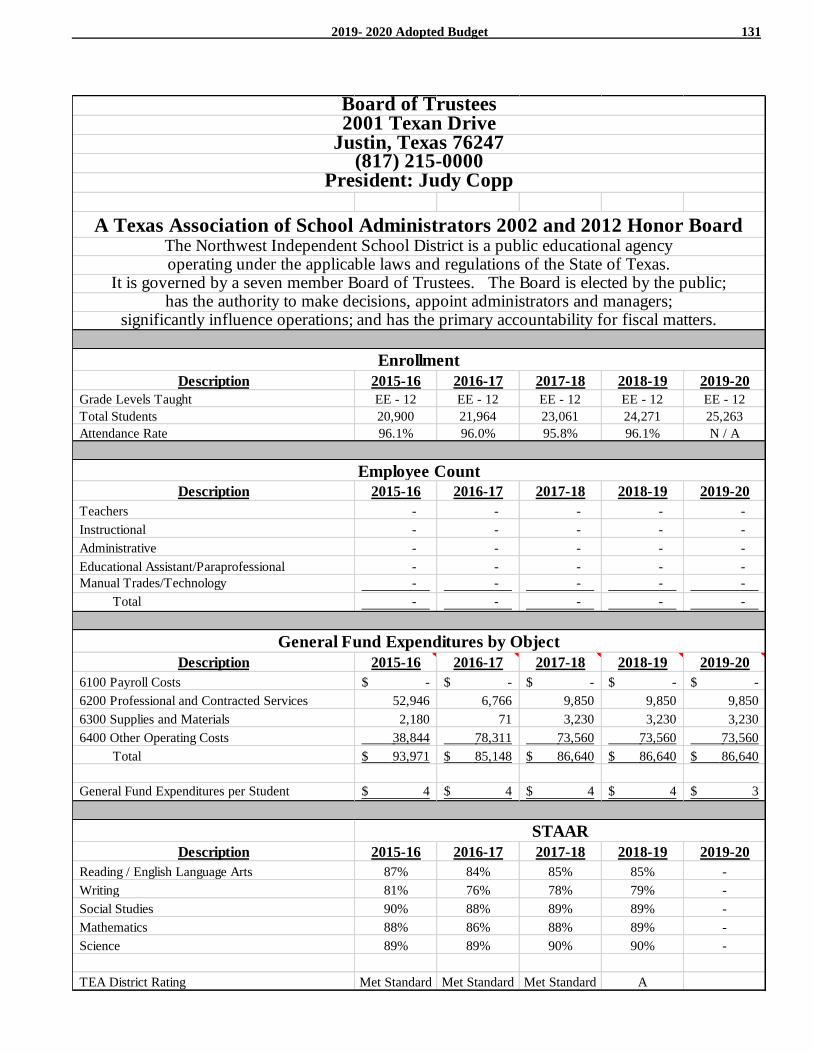
2019- 2020 Adopted Budget 131
Description 2015-16 2016-17 2017-18 2018-19 2019-20
Grade Levels Taught EE - 12 EE - 12 EE - 12 EE - 12 EE - 12
Total Students 20,900 21,964 23,061 24,271 25,263
Attendance Rate 96.1% 96.0% 95.8% 96.1% N / A
Description 2015-16 2016-17 2017-18 2018-19 2019-20
Teachers - - - - -
Instructional - - - - -
Administrative - - - - -
Educational Assistant/Paraprofessional - - - - -
Manual Trades/Technology - - - - -
Total - - - - -
Description 2015-16 2016-17 2017-18 2018-19 2019-20
6100 Payroll Costs -$ -$ -$ -$ -$
6200 Professional and Contracted Services 52,946 6,766 9,850 9,850 9,850
6300 Supplies and Materials 2,180 71 3,230 3,230 3,230
6400 Other Operating Costs 38,844 78,311 73,560 73,560 73,560
Total 93,971$ 85,148$ 86,640$ 86,640$ 86,640$
General Fund Expenditures per Student 4$ 4$ 4$ 4$ 3$
Description 2015-16 2016-17 2017-18 2018-19 2019-20
Reading / English Language Arts 87% 84% 85% 85% -
Writing 81% 76% 78% 79% -
Social Studies 90% 88% 89% 89% -
Mathematics 88% 86% 88% 89% -
Science 89% 89% 90% 90% -
TEA District Rating Met Standard Met Standard Met Standard A
Board of Trustees
It is governed by a seven member Board of Trustees. The Board is elected by the public;
Justin, Texas 762472001 Texan Drive
(817) 215-0000President: Judy Copp
A Texas Association of School Administrators 2002 and 2012 Honor BoardThe Northwest Independent School District is a public educational agencyoperating under the applicable laws and regulations of the State of Texas.
STAAR
Employee Count
General Fund Expenditures by Object
has the authority to make decisions, appoint administrators and managers;significantly influence operations; and has the primary accountability for fiscal matters.
Enrollment
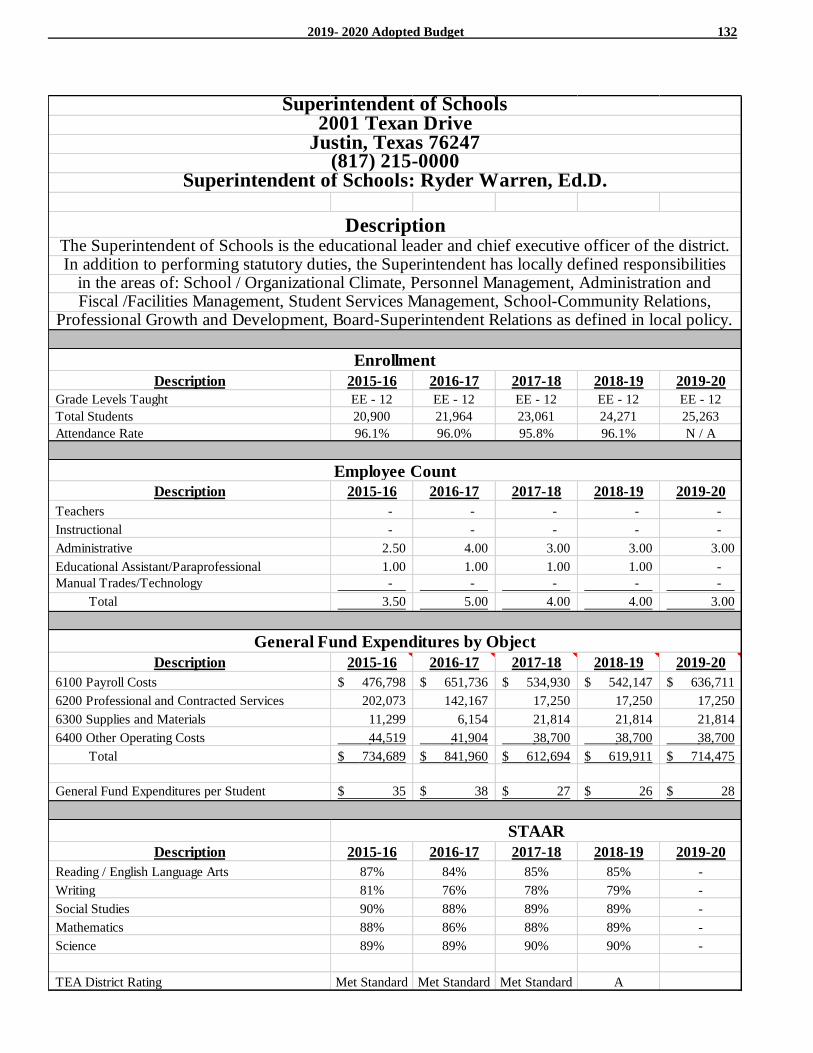
2019- 2020 Adopted Budget 132
Description 2015-16 2016-17 2017-18 2018-19 2019-20
Grade Levels Taught EE - 12 EE - 12 EE - 12 EE - 12 EE - 12
Total Students 20,900 21,964 23,061 24,271 25,263
Attendance Rate 96.1% 96.0% 95.8% 96.1% N / A
Description 2015-16 2016-17 2017-18 2018-19 2019-20
Teachers - - - - -
Instructional - - - - -
Administrative 2.50 4.00 3.00 3.00 3.00
Educational Assistant/Paraprofessional 1.00 1.00 1.00 1.00 -
Manual Trades/Technology - - - - -
Total 3.50 5.00 4.00 4.00 3.00
Description 2015-16 2016-17 2017-18 2018-19 2019-20
6100 Payroll Costs 476,798$ 651,736$ 534,930$ 542,147$ 636,711$
6200 Professional and Contracted Services 202,073 142,167 17,250 17,250 17,250
6300 Supplies and Materials 11,299 6,154 21,814 21,814 21,814
6400 Other Operating Costs 44,519 41,904 38,700 38,700 38,700
Total 734,689$ 841,960$ 612,694$ 619,911$ 714,475$
General Fund Expenditures per Student 35$ 38$ 27$ 26$ 28$
Description 2015-16 2016-17 2017-18 2018-19 2019-20
Reading / English Language Arts 87% 84% 85% 85% -
Writing 81% 76% 78% 79% -
Social Studies 90% 88% 89% 89% -
Mathematics 88% 86% 88% 89% -
Science 89% 89% 90% 90% -
TEA District Rating Met Standard Met Standard Met Standard A
STAAR
General Fund Expenditures by Object
Professional Growth and Development, Board-Superintendent Relations as defined in local policy.
Enrollment
Employee Count
Superintendent of Schools
in the areas of: School / Organizational Climate, Personnel Management, Administration andFiscal /Facilities Management, Student Services Management, School-Community Relations,
Justin, Texas 762472001 Texan Drive
(817) 215-0000Superintendent of Schools: Ryder Warren, Ed.D.
DescriptionThe Superintendent of Schools is the educational leader and chief executive officer of the district.In addition to performing statutory duties, the Superintendent has locally defined responsibilities
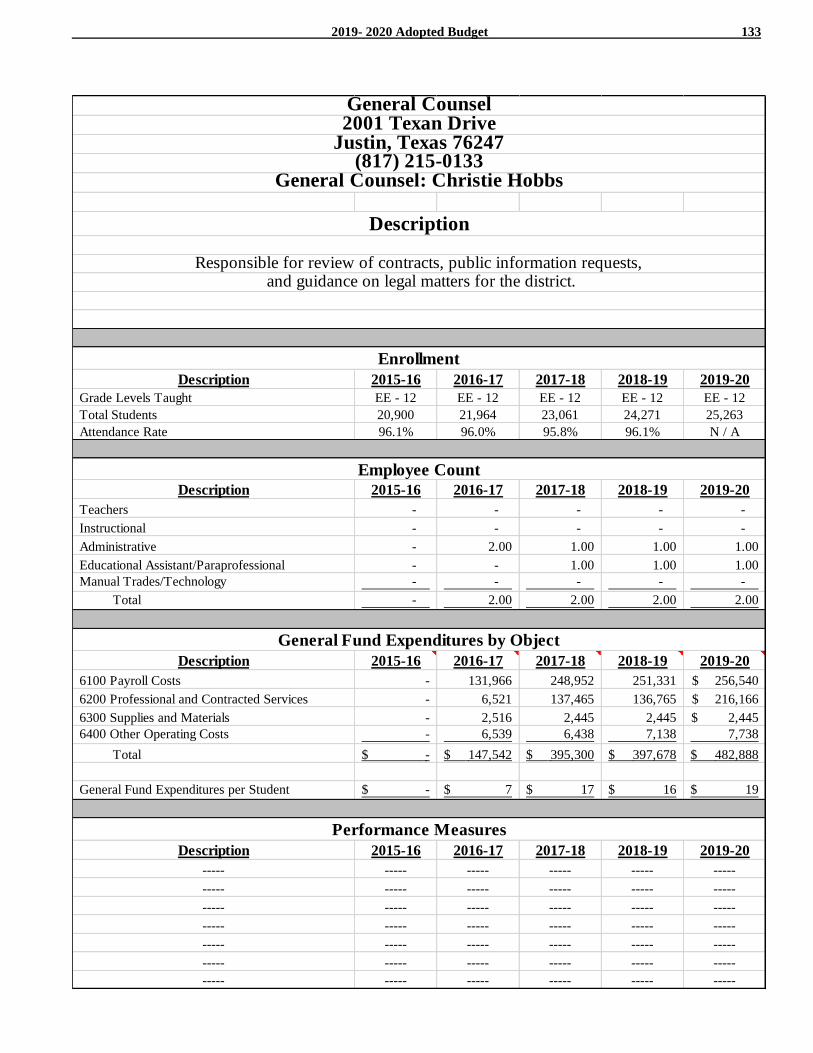
2019- 2020 Adopted Budget 133
Description 2015-16 2016-17 2017-18 2018-19 2019-20
Grade Levels Taught EE - 12 EE - 12 EE - 12 EE - 12 EE - 12
Total Students 20,900 21,964 23,061 24,271 25,263
Attendance Rate 96.1% 96.0% 95.8% 96.1% N / A
Description 2015-16 2016-17 2017-18 2018-19 2019-20
Teachers - - - - -
Instructional - - - - -
Administrative - 2.00 1.00 1.00 1.00
Educational Assistant/Paraprofessional - - 1.00 1.00 1.00
Manual Trades/Technology - - - - -
Total - 2.00 2.00 2.00 2.00
Description 2015-16 2016-17 2017-18 2018-19 2019-20
6100 Payroll Costs - 131,966 248,952 251,331 256,540$
6200 Professional and Contracted Services - 6,521 137,465 136,765 216,166$
6300 Supplies and Materials - 2,516 2,445 2,445 2,445$
6400 Other Operating Costs - 6,539 6,438 7,138 7,738
Total -$ 147,542$ 395,300$ 397,678$ 482,888$
General Fund Expenditures per Student -$ 7$ 17$ 16$ 19$
Description 2015-16 2016-17 2017-18 2018-19 2019-20
----- ----- ----- ----- ----- -----
----- ----- ----- ----- ----- -----
----- ----- ----- ----- ----- -----
----- ----- ----- ----- ----- -----
----- ----- ----- ----- ----- -----
----- ----- ----- ----- ----- -----
----- ----- ----- ----- ----- -----
General Counsel2001 Texan Drive
Justin, Texas 76247(817) 215-0133
General Counsel: Christie Hobbs
Description
Enrollment
Employee Count
General Fund Expenditures by Object
Performance Measures
Responsible for review of contracts, public information requests, and guidance on legal matters for the district.
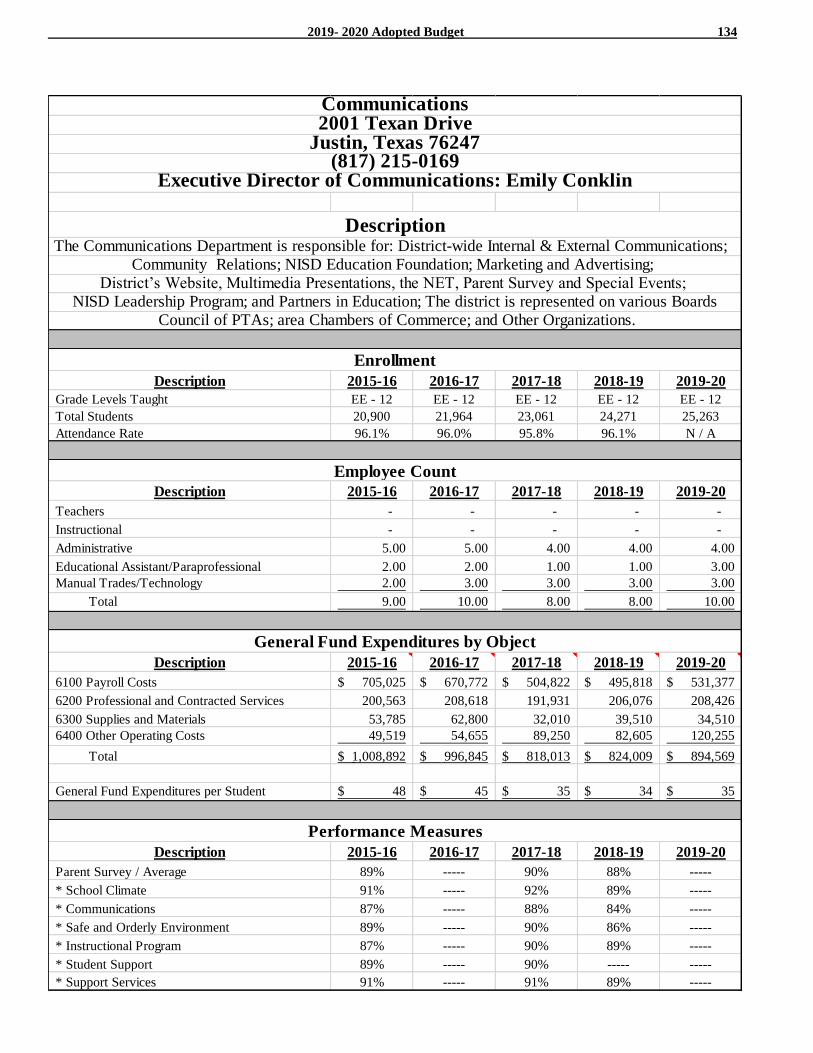
2019- 2020 Adopted Budget 134
Description 2015-16 2016-17 2017-18 2018-19 2019-20
Grade Levels Taught EE - 12 EE - 12 EE - 12 EE - 12 EE - 12
Total Students 20,900 21,964 23,061 24,271 25,263
Attendance Rate 96.1% 96.0% 95.8% 96.1% N / A
Description 2015-16 2016-17 2017-18 2018-19 2019-20
Teachers - - - - -
Instructional - - - - -
Administrative 5.00 5.00 4.00 4.00 4.00
Educational Assistant/Paraprofessional 2.00 2.00 1.00 1.00 3.00
Manual Trades/Technology 2.00 3.00 3.00 3.00 3.00
Total 9.00 10.00 8.00 8.00 10.00
Description 2015-16 2016-17 2017-18 2018-19 2019-20
6100 Payroll Costs 705,025$ 670,772$ 504,822$ 495,818$ 531,377$
6200 Professional and Contracted Services 200,563 208,618 191,931 206,076 208,426
6300 Supplies and Materials 53,785 62,800 32,010 39,510 34,510
6400 Other Operating Costs 49,519 54,655 89,250 82,605 120,255
Total 1,008,892$ 996,845$ 818,013$ 824,009$ 894,569$
General Fund Expenditures per Student 48$ 45$ 35$ 34$ 35$
Description 2015-16 2016-17 2017-18 2018-19 2019-20
Parent Survey / Average 89% ----- 90% 88% -----
* School Climate 91% ----- 92% 89% -----
* Communications 87% ----- 88% 84% -----
* Safe and Orderly Environment 89% ----- 90% 86% -----
* Instructional Program 87% ----- 90% 89% -----
* Student Support 89% ----- 90% ----- -----
* Support Services 91% ----- 91% 89% -----
Communications
Justin, Texas 762472001 Texan Drive
Community Relations; NISD Education Foundation; Marketing and Advertising;
(817) 215-0169Executive Director of Communications: Emily Conklin
DescriptionThe Communications Department is responsible for: District-wide Internal & External Communications;
Council of PTAs; area Chambers of Commerce; and Other Organizations.
District’s Website, Multimedia Presentations, the NET, Parent Survey and Special Events;
NISD Leadership Program; and Partners in Education; The district is represented on various Boards
Performance Measures
Enrollment
Employee Count
General Fund Expenditures by Object
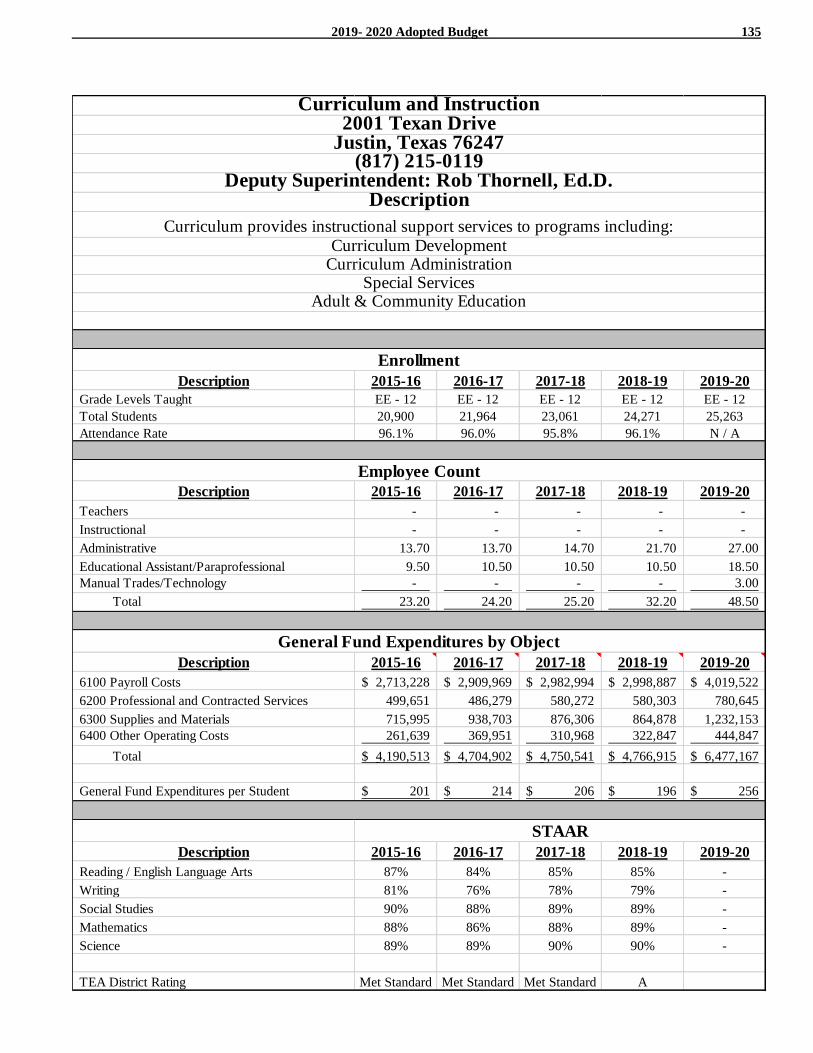
2019- 2020 Adopted Budget 135
Description 2015-16 2016-17 2017-18 2018-19 2019-20
Grade Levels Taught EE - 12 EE - 12 EE - 12 EE - 12 EE - 12
Total Students 20,900 21,964 23,061 24,271 25,263
Attendance Rate 96.1% 96.0% 95.8% 96.1% N / A
Description 2015-16 2016-17 2017-18 2018-19 2019-20
Teachers - - - - -
Instructional - - - - -
Administrative 13.70 13.70 14.70 21.70 27.00
Educational Assistant/Paraprofessional 9.50 10.50 10.50 10.50 18.50
Manual Trades/Technology - - - - 3.00
Total 23.20 24.20 25.20 32.20 48.50
Description 2015-16 2016-17 2017-18 2018-19 2019-20
6100 Payroll Costs 2,713,228$ 2,909,969$ 2,982,994$ 2,998,887$ 4,019,522$
6200 Professional and Contracted Services 499,651 486,279 580,272 580,303 780,645
6300 Supplies and Materials 715,995 938,703 876,306 864,878 1,232,153
6400 Other Operating Costs 261,639 369,951 310,968 322,847 444,847
Total 4,190,513$ 4,704,902$ 4,750,541$ 4,766,915$ 6,477,167$
General Fund Expenditures per Student 201$ 214$ 206$ 196$ 256$
Description 2015-16 2016-17 2017-18 2018-19 2019-20
Reading / English Language Arts 87% 84% 85% 85% -
Writing 81% 76% 78% 79% -
Social Studies 90% 88% 89% 89% -
Mathematics 88% 86% 88% 89% -
Science 89% 89% 90% 90% -
TEA District Rating Met Standard Met Standard Met Standard A
STAAR
Curriculum Development
Employee Count
General Fund Expenditures by Object
Curriculum Administration
Enrollment
Curriculum and Instruction
Special ServicesAdult & Community Education
Justin, Texas 762472001 Texan Drive
(817) 215-0119Deputy Superintendent: Rob Thornell, Ed.D.
Description
Curriculum provides instructional support services to programs including:
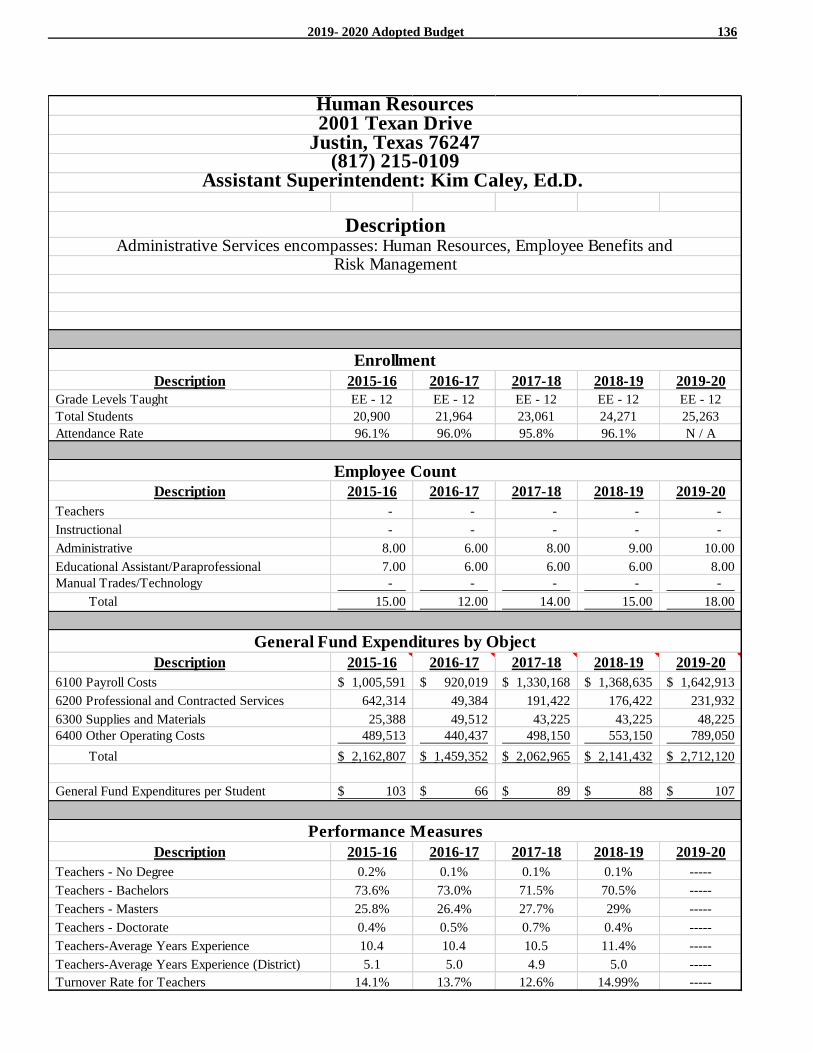
2019- 2020 Adopted Budget 136
Description 2015-16 2016-17 2017-18 2018-19 2019-20
Grade Levels Taught EE - 12 EE - 12 EE - 12 EE - 12 EE - 12
Total Students 20,900 21,964 23,061 24,271 25,263
Attendance Rate 96.1% 96.0% 95.8% 96.1% N / A
Description 2015-16 2016-17 2017-18 2018-19 2019-20
Teachers - - - - -
Instructional - - - - -
Administrative 8.00 6.00 8.00 9.00 10.00
Educational Assistant/Paraprofessional 7.00 6.00 6.00 6.00 8.00
Manual Trades/Technology - - - - -
Total 15.00 12.00 14.00 15.00 18.00
Description 2015-16 2016-17 2017-18 2018-19 2019-20
6100 Payroll Costs 1,005,591$ 920,019$ 1,330,168$ 1,368,635$ 1,642,913$
6200 Professional and Contracted Services 642,314 49,384 191,422 176,422 231,932
6300 Supplies and Materials 25,388 49,512 43,225 43,225 48,225
6400 Other Operating Costs 489,513 440,437 498,150 553,150 789,050
Total 2,162,807$ 1,459,352$ 2,062,965$ 2,141,432$ 2,712,120$
General Fund Expenditures per Student 103$ 66$ 89$ 88$ 107$
Description 2015-16 2016-17 2017-18 2018-19 2019-20
Teachers - No Degree 0.2% 0.1% 0.1% 0.1% -----
Teachers - Bachelors 73.6% 73.0% 71.5% 70.5% -----
Teachers - Masters 25.8% 26.4% 27.7% 29% -----
Teachers - Doctorate 0.4% 0.5% 0.7% 0.4% -----
Teachers-Average Years Experience 10.4 10.4 10.5 11.4% -----
Teachers-Average Years Experience (District) 5.1 5.0 4.9 5.0 -----
Turnover Rate for Teachers 14.1% 13.7% 12.6% 14.99% -----
Performance Measures
Enrollment
Employee Count
General Fund Expenditures by Object
Human Resources
Justin, Texas 762472001 Texan Drive
(817) 215-0109Assistant Superintendent: Kim Caley, Ed.D.
DescriptionAdministrative Services encompasses: Human Resources, Employee Benefits and
Risk Management
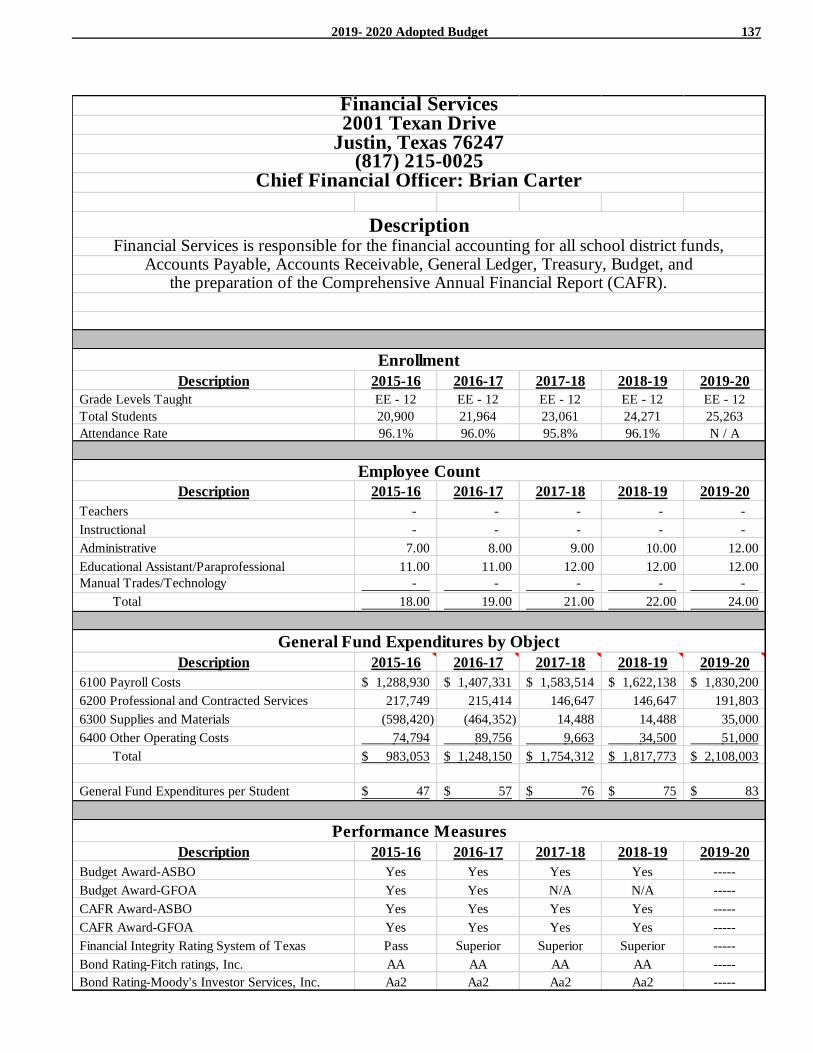
2019- 2020 Adopted Budget 137
Description 2015-16 2016-17 2017-18 2018-19 2019-20
Grade Levels Taught EE - 12 EE - 12 EE - 12 EE - 12 EE - 12
Total Students 20,900 21,964 23,061 24,271 25,263
Attendance Rate 96.1% 96.0% 95.8% 96.1% N / A
Description 2015-16 2016-17 2017-18 2018-19 2019-20
Teachers - - - - -
Instructional - - - - -
Administrative 7.00 8.00 9.00 10.00 12.00
Educational Assistant/Paraprofessional 11.00 11.00 12.00 12.00 12.00
Manual Trades/Technology - - - - -
Total 18.00 19.00 21.00 22.00 24.00
Description 2015-16 2016-17 2017-18 2018-19 2019-20
6100 Payroll Costs 1,288,930$ 1,407,331$ 1,583,514$ 1,622,138$ 1,830,200$
6200 Professional and Contracted Services 217,749 215,414 146,647 146,647 191,803
6300 Supplies and Materials (598,420) (464,352) 14,488 14,488 35,000
6400 Other Operating Costs 74,794 89,756 9,663 34,500 51,000
Total 983,053$ 1,248,150$ 1,754,312$ 1,817,773$ 2,108,003$
General Fund Expenditures per Student 47$ 57$ 76$ 75$ 83$
Description 2015-16 2016-17 2017-18 2018-19 2019-20
Budget Award-ASBO Yes Yes Yes Yes -----
Budget Award-GFOA Yes Yes N/A N/A -----
CAFR Award-ASBO Yes Yes Yes Yes -----
CAFR Award-GFOA Yes Yes Yes Yes -----
Financial Integrity Rating System of Texas Pass Superior Superior Superior -----
Bond Rating-Fitch ratings, Inc. AA AA AA AA -----
Bond Rating-Moody's Investor Services, Inc. Aa2 Aa2 Aa2 Aa2 -----
Performance Measures
Enrollment
Employee Count
General Fund Expenditures by Object
Financial Services
the preparation of the Comprehensive Annual Financial Report (CAFR).
Justin, Texas 762472001 Texan Drive
(817) 215-0025Chief Financial Officer: Brian Carter
DescriptionFinancial Services is responsible for the financial accounting for all school district funds,
Accounts Payable, Accounts Receivable, General Ledger, Treasury, Budget, and

2019- 2020 Adopted Budget 138
Description 2015-16 2016-17 2017-18 2018-19 2019-20
Grade Levels Taught EE - 12 EE - 12 EE - 12 EE - 12 EE - 12
Total Students 20,900 21,964 23,061 24,271 25,263
Attendance Rate 96.1% 96.0% 95.8% 96.1% N / A
Description 2015-16 2016-17 2017-18 2018-19 2019-20
Teachers - - - 0.25 0.25
Instructional - - - - -
Administrative 4.00 2.00 2.00 2.00 4.00
Educational Assistant/Paraprofessional 2.50 2.00 2.00 2.00 2.00
Manual Trades/Technology 34.25 43.50 44.00 49.00 47.00
Total 40.75 47.50 48.00 53.25 53.25
Description 2015-16 2016-17 2017-18 2018-19 2019-20
6100 Payroll Costs 2,275,755$ 2,724,380$ 3,078,263$ 3,262,242$ 3,644,406$
6200 Professional and Contracted Services 1,202,176 1,509,720 1,710,433 2,044,399 2,546,424
6300 Supplies and Materials 367,323 408,486 304,411 304,411 311,212
6400 Other Operating Costs 164,055 284,247 97,195 97,195 101,195
Total 4,009,309$ 4,926,834$ 5,190,302$ 5,708,248$ 6,603,237$
General Fund Expenditures per Student 192$ 224$ 225$ 235$ 261$
Description 2015-16 2016-17 2017-18 2018-19 2019-20
----- ----- ----- ----- -----
----- ----- ----- ----- -----
----- ----- ----- ----- -----
----- ----- ----- ----- -----
----- ----- ----- ----- -----
----- ----- ----- ----- -----
Technology Division
Justin, Texas 762472001 Texan Drive
(817) 215-0103
DescriptionThe Technology Division is composed of Instructional Technology,
Technology, and Data Services.
Performance Measures
Enrollment
Employee Count
General Fund Expenditures by Object
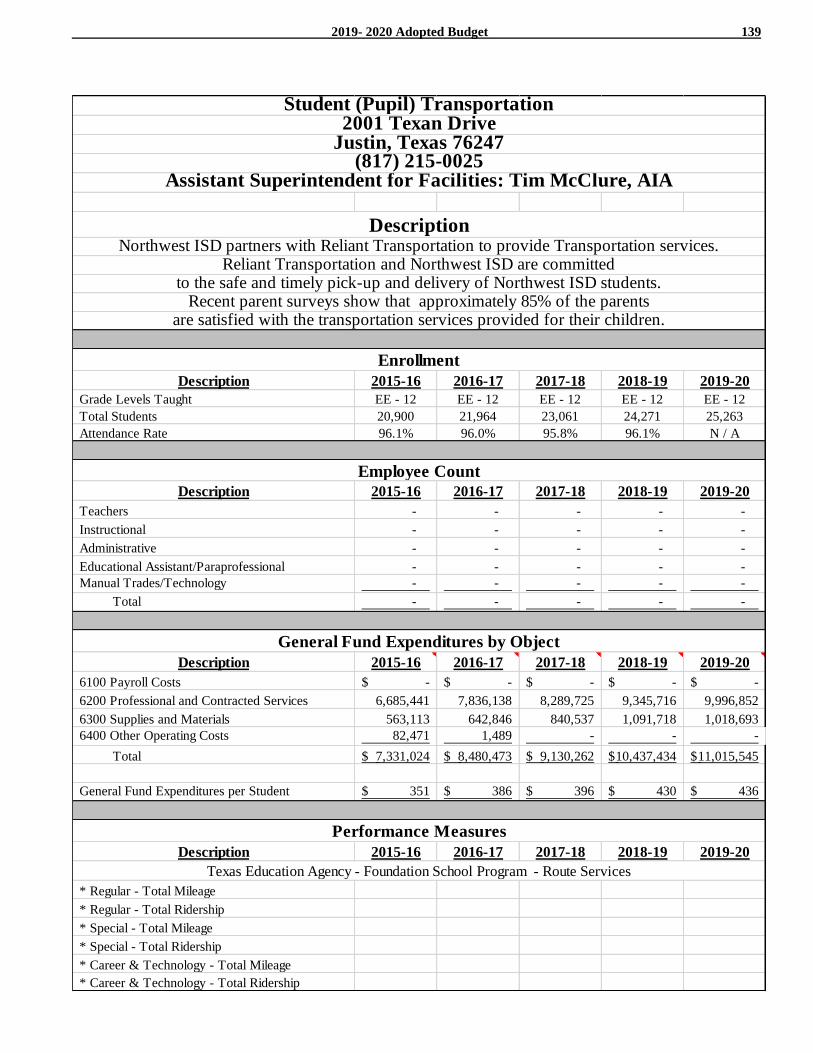
2019- 2020 Adopted Budget 139
Description 2015-16 2016-17 2017-18 2018-19 2019-20
Grade Levels Taught EE - 12 EE - 12 EE - 12 EE - 12 EE - 12
Total Students 20,900 21,964 23,061 24,271 25,263
Attendance Rate 96.1% 96.0% 95.8% 96.1% N / A
Description 2015-16 2016-17 2017-18 2018-19 2019-20
Teachers - - - - -
Instructional - - - - -
Administrative - - - - -
Educational Assistant/Paraprofessional - - - - -
Manual Trades/Technology - - - - -
Total - - - - -
Description 2015-16 2016-17 2017-18 2018-19 2019-20
6100 Payroll Costs -$ -$ -$ -$ -$
6200 Professional and Contracted Services 6,685,441 7,836,138 8,289,725 9,345,716 9,996,852
6300 Supplies and Materials 563,113 642,846 840,537 1,091,718 1,018,693
6400 Other Operating Costs 82,471 1,489 - - -
Total 7,331,024$ 8,480,473$ 9,130,262$ 10,437,434$ 11,015,545$
General Fund Expenditures per Student 351$ 386$ 396$ 430$ 436$
Description 2015-16 2016-17 2017-18 2018-19 2019-20
* Regular - Total Mileage
* Regular - Total Ridership
* Special - Total Mileage
* Special - Total Ridership
* Career & Technology - Total Mileage
* Career & Technology - Total Ridership
Student (Pupil) Transportation
to the safe and timely pick-up and delivery of Northwest ISD students.Recent parent surveys show that approximately 85% of the parents
Justin, Texas 762472001 Texan Drive
(817) 215-0025Assistant Superintendent for Facilities: Tim McClure, AIA
DescriptionNorthwest ISD partners with Reliant Transportation to provide Transportation services.
Reliant Transportation and Northwest ISD are committed
Employee Count
General Fund Expenditures by Object
Texas Education Agency - Foundation School Program - Route Services
are satisfied with the transportation services provided for their children.
Performance Measures
Enrollment
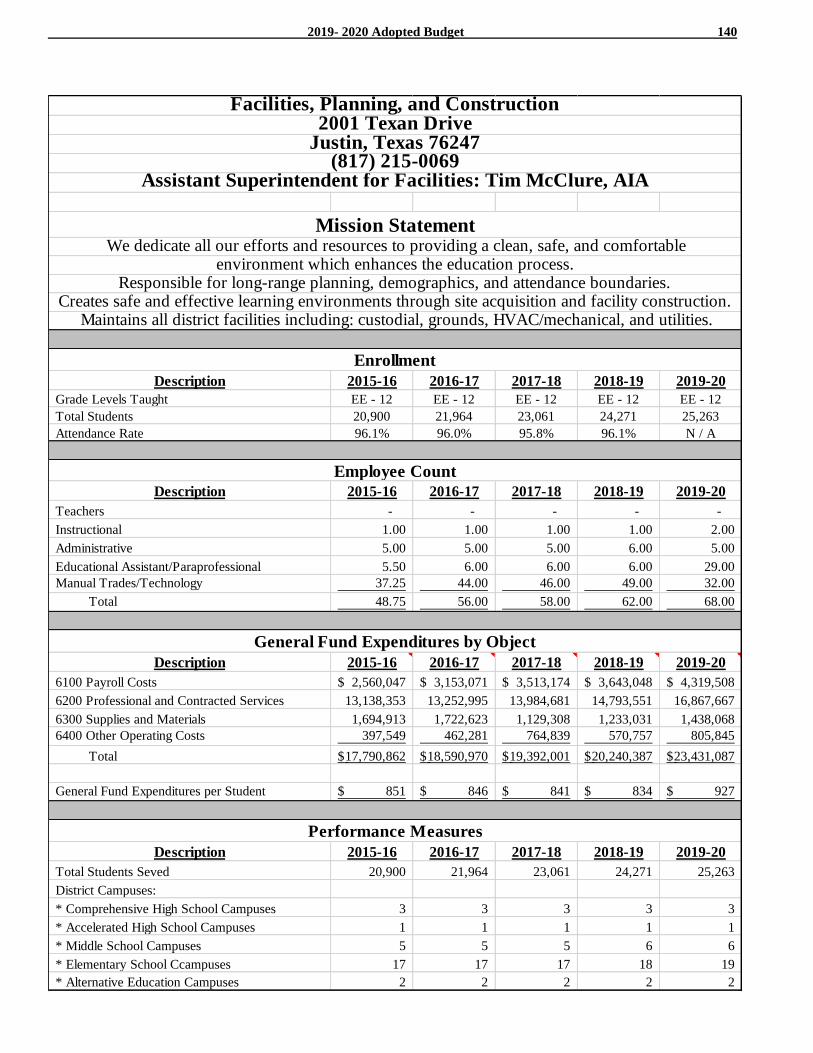
2019- 2020 Adopted Budget 140
Description 2015-16 2016-17 2017-18 2018-19 2019-20
Grade Levels Taught EE - 12 EE - 12 EE - 12 EE - 12 EE - 12
Total Students 20,900 21,964 23,061 24,271 25,263
Attendance Rate 96.1% 96.0% 95.8% 96.1% N / A
Description 2015-16 2016-17 2017-18 2018-19 2019-20
Teachers - - - - -
Instructional 1.00 1.00 1.00 1.00 2.00
Administrative 5.00 5.00 5.00 6.00 5.00
Educational Assistant/Paraprofessional 5.50 6.00 6.00 6.00 29.00
Manual Trades/Technology 37.25 44.00 46.00 49.00 32.00
Total 48.75 56.00 58.00 62.00 68.00
Description 2015-16 2016-17 2017-18 2018-19 2019-20
6100 Payroll Costs 2,560,047$ 3,153,071$ 3,513,174$ 3,643,048$ 4,319,508$
6200 Professional and Contracted Services 13,138,353 13,252,995 13,984,681 14,793,551 16,867,667
6300 Supplies and Materials 1,694,913 1,722,623 1,129,308 1,233,031 1,438,068
6400 Other Operating Costs 397,549 462,281 764,839 570,757 805,845
Total 17,790,862$ 18,590,970$ 19,392,001$ 20,240,387$ 23,431,087$
General Fund Expenditures per Student 851$ 846$ 841$ 834$ 927$
Description 2015-16 2016-17 2017-18 2018-19 2019-20
Total Students Seved 20,900 21,964 23,061 24,271 25,263
District Campuses:
* Comprehensive High School Campuses 3 3 3 3 3
* Accelerated High School Campuses 1 1 1 1 1
* Middle School Campuses 5 5 5 6 6
* Elementary School Ccampuses 17 17 17 18 19
* Alternative Education Campuses 2 2 2 2 2
Facilities, Planning, and Construction
Justin, Texas 762472001 Texan Drive
environment which enhances the education process.
(817) 215-0069Assistant Superintendent for Facilities: Tim McClure, AIA
Mission Statement We dedicate all our efforts and resources to providing a clean, safe, and comfortable
Responsible for long-range planning, demographics, and attendance boundaries.Creates safe and effective learning environments through site acquisition and facility construction.
Maintains all district facilities including: custodial, grounds, HVAC/mechanical, and utilities.
Performance Measures
Enrollment
Employee Count
General Fund Expenditures by Object
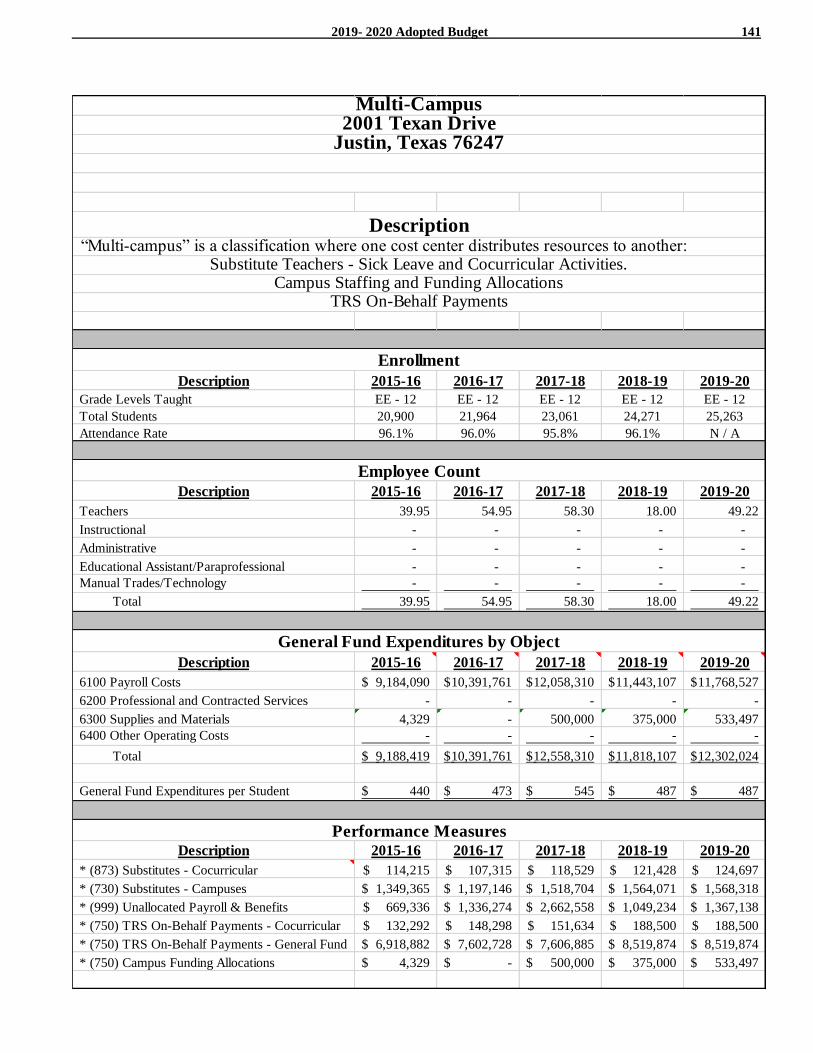
2019- 2020 Adopted Budget 141
Description 2015-16 2016-17 2017-18 2018-19 2019-20
Grade Levels Taught EE - 12 EE - 12 EE - 12 EE - 12 EE - 12
Total Students 20,900 21,964 23,061 24,271 25,263
Attendance Rate 96.1% 96.0% 95.8% 96.1% N / A
Description 2015-16 2016-17 2017-18 2018-19 2019-20
Teachers 39.95 54.95 58.30 18.00 49.22
Instructional - - - - -
Administrative - - - - -
Educational Assistant/Paraprofessional - - - - -
Manual Trades/Technology - - - - -
Total 39.95 54.95 58.30 18.00 49.22
Description 2015-16 2016-17 2017-18 2018-19 2019-20
6100 Payroll Costs 9,184,090$ 10,391,761$ 12,058,310$ 11,443,107$ 11,768,527$
6200 Professional and Contracted Services - - - - -
6300 Supplies and Materials 4,329 - 500,000 375,000 533,497
6400 Other Operating Costs - - - - -
Total 9,188,419$ 10,391,761$ 12,558,310$ 11,818,107$ 12,302,024$
General Fund Expenditures per Student 440$ 473$ 545$ 487$ 487$
Description 2015-16 2016-17 2017-18 2018-19 2019-20
* (873) Substitutes - Cocurricular 114,215$ 107,315$ 118,529$ 121,428$ 124,697$
* (730) Substitutes - Campuses 1,349,365$ 1,197,146$ 1,518,704$ 1,564,071$ 1,568,318$
* (999) Unallocated Payroll & Benefits 669,336$ 1,336,274$ 2,662,558$ 1,049,234$ 1,367,138$
* (750) TRS On-Behalf Payments - Cocurricular 132,292$ 148,298$ 151,634$ 188,500$ 188,500$
* (750) TRS On-Behalf Payments - General Fund 6,918,882$ 7,602,728$ 7,606,885$ 8,519,874$ 8,519,874$
* (750) Campus Funding Allocations 4,329$ -$ 500,000$ 375,000$ 533,497$
Campus Staffing and Funding Allocations
Multi-Campus2001 Texan Drive
Justin, Texas 76247
Substitute Teachers - Sick Leave and Cocurricular Activities.
Description“Multi-campus” is a classification where one cost center distributes resources to another:
Performance Measures
TRS On-Behalf Payments
Enrollment
Employee Count
General Fund Expenditures by Object
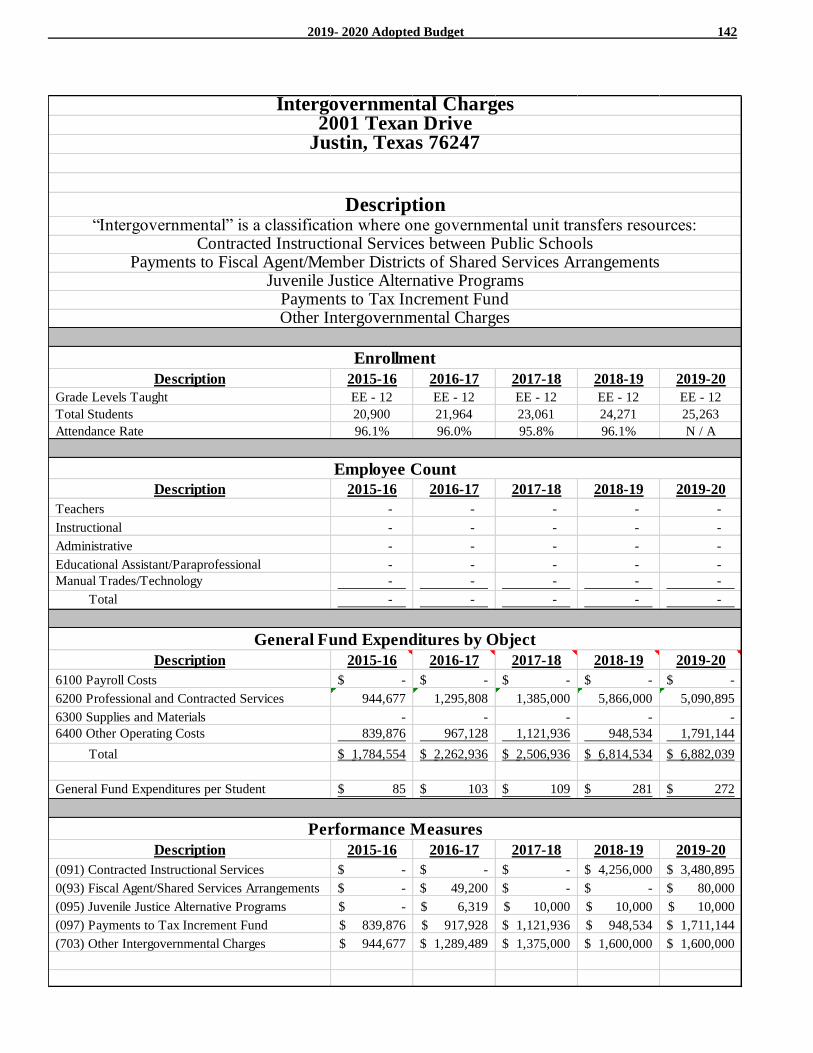
2019- 2020 Adopted Budget 142
Description 2015-16 2016-17 2017-18 2018-19 2019-20
Grade Levels Taught EE - 12 EE - 12 EE - 12 EE - 12 EE - 12
Total Students 20,900 21,964 23,061 24,271 25,263
Attendance Rate 96.1% 96.0% 95.8% 96.1% N / A
Description 2015-16 2016-17 2017-18 2018-19 2019-20
Teachers - - - - -
Instructional - - - - -
Administrative - - - - -
Educational Assistant/Paraprofessional - - - - -
Manual Trades/Technology - - - - -
Total - - - - -
Description 2015-16 2016-17 2017-18 2018-19 2019-20
6100 Payroll Costs -$ -$ -$ -$ -$
6200 Professional and Contracted Services 944,677 1,295,808 1,385,000 5,866,000 5,090,895
6300 Supplies and Materials - - - - -
6400 Other Operating Costs 839,876 967,128 1,121,936 948,534 1,791,144
Total 1,784,554$ 2,262,936$ 2,506,936$ 6,814,534$ 6,882,039$
General Fund Expenditures per Student 85$ 103$ 109$ 281$ 272$
Description 2015-16 2016-17 2017-18 2018-19 2019-20
(091) Contracted Instructional Services -$ -$ -$ 4,256,000$ 3,480,895$
0(93) Fiscal Agent/Shared Services Arrangements -$ 49,200$ -$ -$ 80,000$
(095) Juvenile Justice Alternative Programs -$ 6,319$ 10,000$ 10,000$ 10,000$
(097) Payments to Tax Increment Fund 839,876$ 917,928$ 1,121,936$ 948,534$ 1,711,144$
(703) Other Intergovernmental Charges 944,677$ 1,289,489$ 1,375,000$ 1,600,000$ 1,600,000$
Intergovernmental Charges2001 Texan Drive
Justin, Texas 76247
Other Intergovernmental Charges
Employee Count
Description
General Fund Expenditures by Object
Performance Measures
Enrollment
Contracted Instructional Services between Public SchoolsPayments to Fiscal Agent/Member Districts of Shared Services Arrangements
Juvenile Justice Alternative ProgramsPayments to Tax Increment Fund
“Intergovernmental” is a classification where one governmental unit transfers resources:
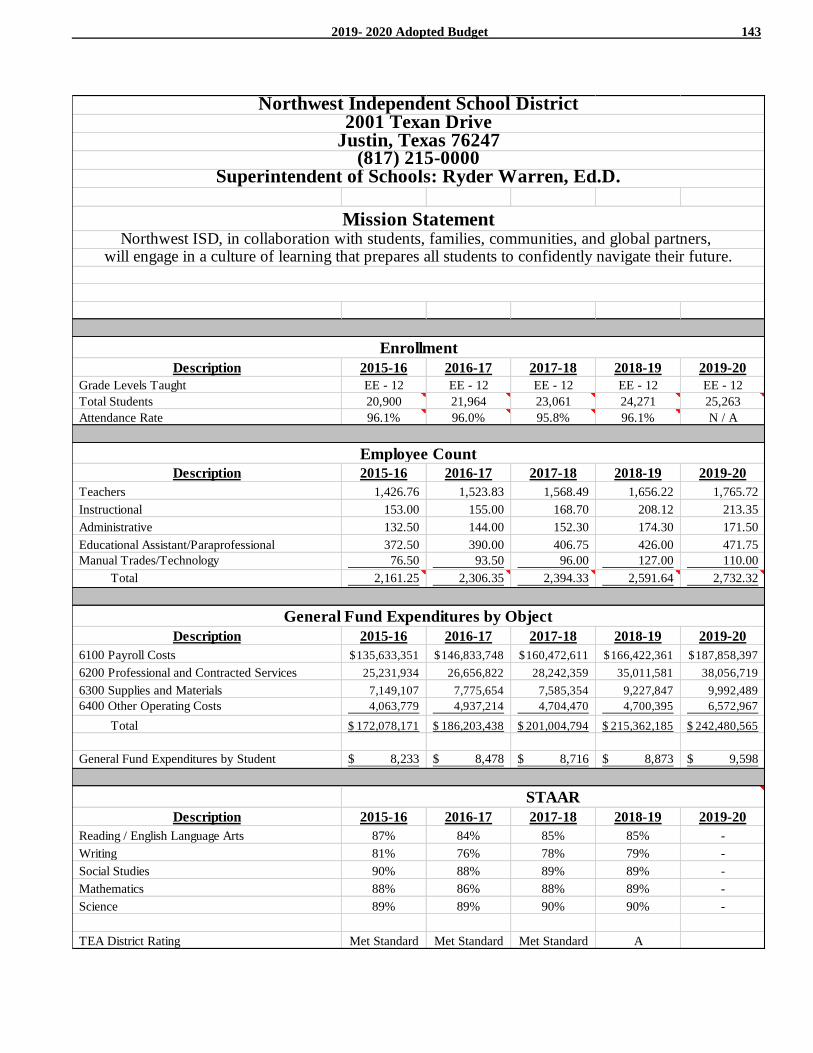
2019- 2020 Adopted Budget 143
Description 2015-16 2016-17 2017-18 2018-19 2019-20
Grade Levels Taught EE - 12 EE - 12 EE - 12 EE - 12 EE - 12
Total Students 20,900 21,964 23,061 24,271 25,263
Attendance Rate 96.1% 96.0% 95.8% 96.1% N / A
Description 2015-16 2016-17 2017-18 2018-19 2019-20
Teachers 1,426.76 1,523.83 1,568.49 1,656.22 1,765.72
Instructional 153.00 155.00 168.70 208.12 213.35
Administrative 132.50 144.00 152.30 174.30 171.50
Educational Assistant/Paraprofessional 372.50 390.00 406.75 426.00 471.75
Manual Trades/Technology 76.50 93.50 96.00 127.00 110.00
Total 2,161.25 2,306.35 2,394.33 2,591.64 2,732.32
Description 2015-16 2016-17 2017-18 2018-19 2019-20
6100 Payroll Costs 135,633,351$ 146,833,748$ 160,472,611$ 166,422,361$ 187,858,397$
6200 Professional and Contracted Services 25,231,934 26,656,822 28,242,359 35,011,581 38,056,719
6300 Supplies and Materials 7,149,107 7,775,654 7,585,354 9,227,847 9,992,489
6400 Other Operating Costs 4,063,779 4,937,214 4,704,470 4,700,395 6,572,967
Total 172,078,171$ 186,203,438$ 201,004,794$ 215,362,185$ 242,480,565$
General Fund Expenditures by Student 8,233$ 8,478$ 8,716$ 8,873$ 9,598$
Description 2015-16 2016-17 2017-18 2018-19 2019-20
Reading / English Language Arts 87% 84% 85% 85% -
Writing 81% 76% 78% 79% -
Social Studies 90% 88% 89% 89% -
Mathematics 88% 86% 88% 89% -
Science 89% 89% 90% 90% -
TEA District Rating Met Standard Met Standard Met Standard A
STAAR
Enrollment
Employee Count
General Fund Expenditures by Object
Northwest Independent School District2001 Texan Drive
Justin, Texas 76247
will engage in a culture of learning that prepares all students to confidently navigate their future.
(817) 215-0000Superintendent of Schools: Ryder Warren, Ed.D.
Mission StatementNorthwest ISD, in collaboration with students, families, communities, and global partners,
Haslet Elementary – Exterior
Informational Section
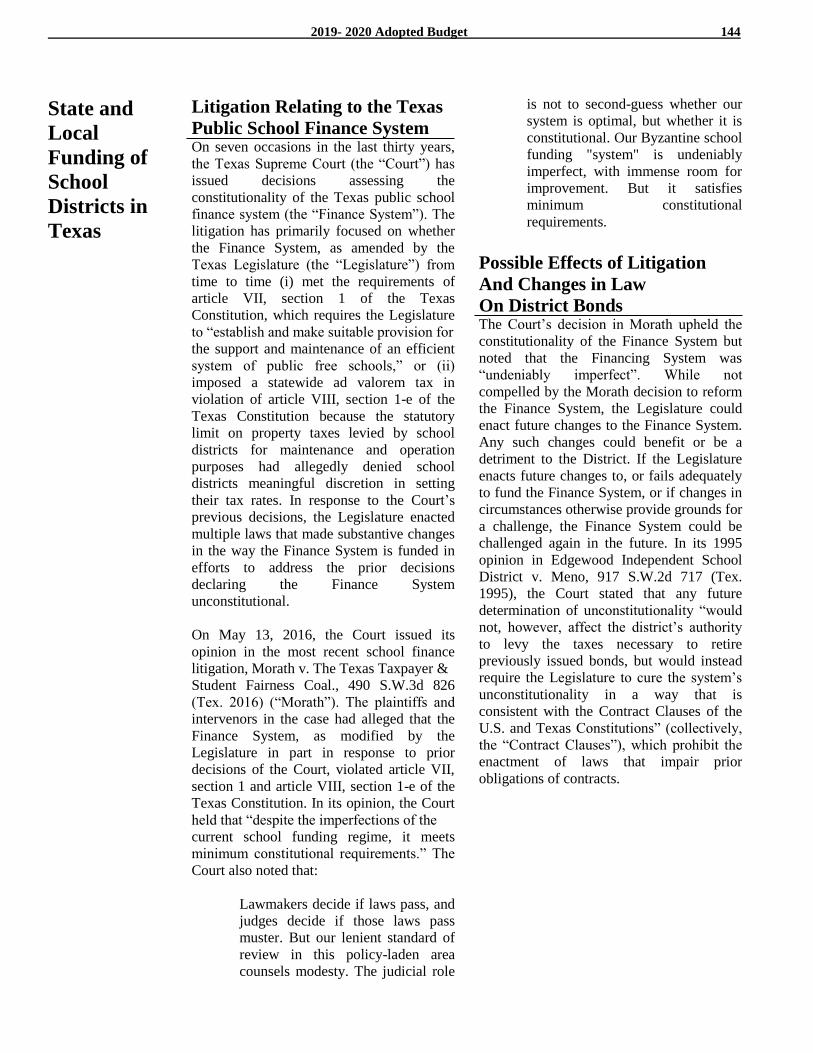
2019- 2020 Adopted Budget 144
State and
Local
Funding of
School
Districts in
Texas
Litigation Relating to the Texas
Public School Finance System On seven occasions in the last thirty years,
the Texas Supreme Court (the “Court”) has
issued decisions assessing the
constitutionality of the Texas public school
finance system (the “Finance System”). The
litigation has primarily focused on whether
the Finance System, as amended by the
Texas Legislature (the “Legislature”) from
time to time (i) met the requirements of
article VII, section 1 of the Texas
Constitution, which requires the Legislature
to “establish and make suitable provision for
the support and maintenance of an efficient
system of public free schools,” or (ii)
imposed a statewide ad valorem tax in
violation of article VIII, section 1-e of the
Texas Constitution because the statutory
limit on property taxes levied by school
districts for maintenance and operation
purposes had allegedly denied school
districts meaningful discretion in setting
their tax rates. In response to the Court’s
previous decisions, the Legislature enacted
multiple laws that made substantive changes
in the way the Finance System is funded in
efforts to address the prior decisions
declaring the Finance System
unconstitutional.
On May 13, 2016, the Court issued its
opinion in the most recent school finance
litigation, Morath v. The Texas Taxpayer &
Student Fairness Coal., 490 S.W.3d 826
(Tex. 2016) (“Morath”). The plaintiffs and
intervenors in the case had alleged that the
Finance System, as modified by the
Legislature in part in response to prior
decisions of the Court, violated article VII,
section 1 and article VIII, section 1-e of the
Texas Constitution. In its opinion, the Court
held that “despite the imperfections of the
current school funding regime, it meets
minimum constitutional requirements.” The
Court also noted that:
Lawmakers decide if laws pass, and
judges decide if those laws pass
muster. But our lenient standard of
review in this policy-laden area
counsels modesty. The judicial role
is not to second-guess whether our
system is optimal, but whether it is
constitutional. Our Byzantine school
funding "system" is undeniably
imperfect, with immense room for
improvement. But it satisfies
minimum constitutional
requirements.
Possible Effects of Litigation
And Changes in Law
On District Bonds The Court’s decision in Morath upheld the
constitutionality of the Finance System but
noted that the Financing System was
“undeniably imperfect”. While not
compelled by the Morath decision to reform
the Finance System, the Legislature could
enact future changes to the Finance System.
Any such changes could benefit or be a
detriment to the District. If the Legislature
enacts future changes to, or fails adequately
to fund the Finance System, or if changes in
circumstances otherwise provide grounds for
a challenge, the Finance System could be
challenged again in the future. In its 1995
opinion in Edgewood Independent School
District v. Meno, 917 S.W.2d 717 (Tex.
1995), the Court stated that any future
determination of unconstitutionality “would
not, however, affect the district’s authority
to levy the taxes necessary to retire
previously issued bonds, but would instead
require the Legislature to cure the system’s
unconstitutionality in a way that is
consistent with the Contract Clauses of the
U.S. and Texas Constitutions” (collectively,
the “Contract Clauses”), which prohibit the
enactment of laws that impair prior
obligations of contracts.
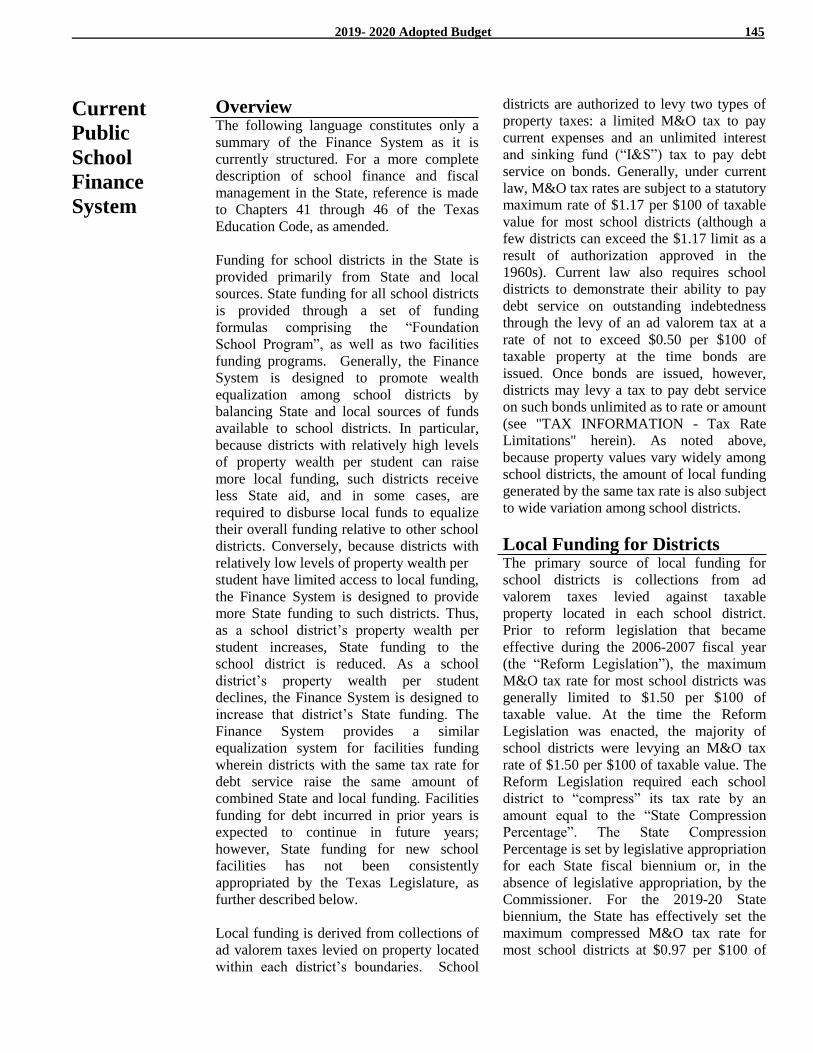
2019- 2020 Adopted Budget 145
Current
Public
School
Finance
System
Overview The following language constitutes only a
summary of the Finance System as it is
currently structured. For a more complete
description of school finance and fiscal
management in the State, reference is made
to Chapters 41 through 46 of the Texas
Education Code, as amended.
Funding for school districts in the State is
provided primarily from State and local
sources. State funding for all school districts
is provided through a set of funding
formulas comprising the “Foundation
School Program”, as well as two facilities
funding programs. Generally, the Finance
System is designed to promote wealth
equalization among school districts by
balancing State and local sources of funds
available to school districts. In particular,
because districts with relatively high levels
of property wealth per student can raise
more local funding, such districts receive
less State aid, and in some cases, are
required to disburse local funds to equalize
their overall funding relative to other school
districts. Conversely, because districts with
relatively low levels of property wealth per
student have limited access to local funding,
the Finance System is designed to provide
more State funding to such districts. Thus,
as a school district’s property wealth per
student increases, State funding to the
school district is reduced. As a school
district’s property wealth per student
declines, the Finance System is designed to
increase that district’s State funding. The
Finance System provides a similar
equalization system for facilities funding
wherein districts with the same tax rate for
debt service raise the same amount of
combined State and local funding. Facilities
funding for debt incurred in prior years is
expected to continue in future years;
however, State funding for new school
facilities has not been consistently
appropriated by the Texas Legislature, as
further described below.
Local funding is derived from collections of
ad valorem taxes levied on property located
within each district’s boundaries. School
districts are authorized to levy two types of
property taxes: a limited M&O tax to pay
current expenses and an unlimited interest
and sinking fund (“I&S”) tax to pay debt
service on bonds. Generally, under current
law, M&O tax rates are subject to a statutory
maximum rate of $1.17 per $100 of taxable
value for most school districts (although a
few districts can exceed the $1.17 limit as a
result of authorization approved in the
1960s). Current law also requires school
districts to demonstrate their ability to pay
debt service on outstanding indebtedness
through the levy of an ad valorem tax at a
rate of not to exceed $0.50 per $100 of
taxable property at the time bonds are
issued. Once bonds are issued, however,
districts may levy a tax to pay debt service
on such bonds unlimited as to rate or amount
(see "TAX INFORMATION - Tax Rate
Limitations" herein). As noted above,
because property values vary widely among
school districts, the amount of local funding
generated by the same tax rate is also subject
to wide variation among school districts.
Local Funding for Districts The primary source of local funding for
school districts is collections from ad
valorem taxes levied against taxable
property located in each school district.
Prior to reform legislation that became
effective during the 2006-2007 fiscal year
(the “Reform Legislation”), the maximum
M&O tax rate for most school districts was
generally limited to $1.50 per $100 of
taxable value. At the time the Reform
Legislation was enacted, the majority of
school districts were levying an M&O tax
rate of $1.50 per $100 of taxable value. The
Reform Legislation required each school
district to “compress” its tax rate by an
amount equal to the “State Compression
Percentage”. The State Compression
Percentage is set by legislative appropriation
for each State fiscal biennium or, in the
absence of legislative appropriation, by the
Commissioner. For the 2019-20 State
biennium, the State has effectively set the
maximum compressed M&O tax rate for
most school districts at $0.97 per $100 of
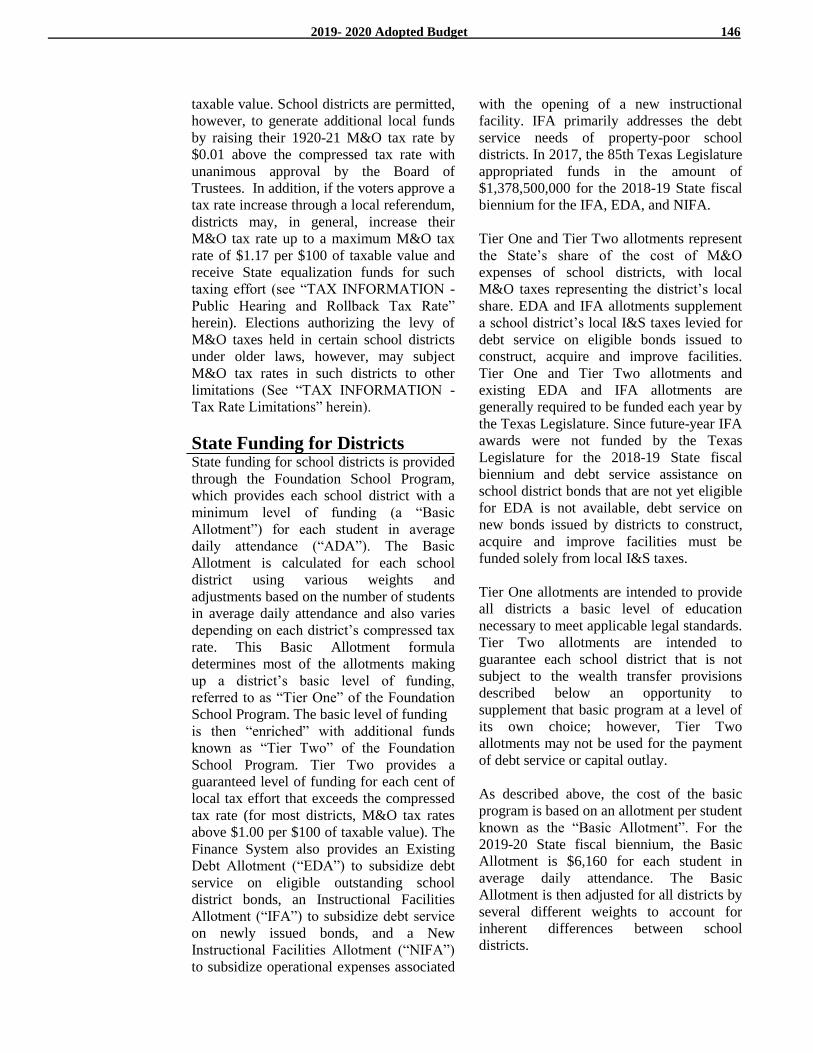
2019- 2020 Adopted Budget 146
taxable value. School districts are permitted,
however, to generate additional local funds
by raising their 1920-21 M&O tax rate by
$0.01 above the compressed tax rate with
unanimous approval by the Board of
Trustees. In addition, if the voters approve a
tax rate increase through a local referendum,
districts may, in general, increase their
M&O tax rate up to a maximum M&O tax
rate of $1.17 per $100 of taxable value and
receive State equalization funds for such
taxing effort (see “TAX INFORMATION -
Public Hearing and Rollback Tax Rate”
herein). Elections authorizing the levy of
M&O taxes held in certain school districts
under older laws, however, may subject
M&O tax rates in such districts to other
limitations (See “TAX INFORMATION -
Tax Rate Limitations” herein).
State Funding for Districts State funding for school districts is provided
through the Foundation School Program,
which provides each school district with a
minimum level of funding (a “Basic
Allotment”) for each student in average
daily attendance (“ADA”). The Basic
Allotment is calculated for each school
district using various weights and
adjustments based on the number of students
in average daily attendance and also varies
depending on each district’s compressed tax
rate. This Basic Allotment formula
determines most of the allotments making
up a district’s basic level of funding,
referred to as “Tier One” of the Foundation
School Program. The basic level of funding
is then “enriched” with additional funds
known as “Tier Two” of the Foundation
School Program. Tier Two provides a
guaranteed level of funding for each cent of
local tax effort that exceeds the compressed
tax rate (for most districts, M&O tax rates
above $1.00 per $100 of taxable value). The
Finance System also provides an Existing
Debt Allotment (“EDA”) to subsidize debt
service on eligible outstanding school
district bonds, an Instructional Facilities
Allotment (“IFA”) to subsidize debt service
on newly issued bonds, and a New
Instructional Facilities Allotment (“NIFA”)
to subsidize operational expenses associated
with the opening of a new instructional
facility. IFA primarily addresses the debt
service needs of property-poor school
districts. In 2017, the 85th Texas Legislature
appropriated funds in the amount of
$1,378,500,000 for the 2018-19 State fiscal
biennium for the IFA, EDA, and NIFA.
Tier One and Tier Two allotments represent
the State’s share of the cost of M&O
expenses of school districts, with local
M&O taxes representing the district’s local
share. EDA and IFA allotments supplement
a school district’s local I&S taxes levied for
debt service on eligible bonds issued to
construct, acquire and improve facilities.
Tier One and Tier Two allotments and
existing EDA and IFA allotments are
generally required to be funded each year by
the Texas Legislature. Since future-year IFA
awards were not funded by the Texas
Legislature for the 2018-19 State fiscal
biennium and debt service assistance on
school district bonds that are not yet eligible
for EDA is not available, debt service on
new bonds issued by districts to construct,
acquire and improve facilities must be
funded solely from local I&S taxes.
Tier One allotments are intended to provide
all districts a basic level of education
necessary to meet applicable legal standards.
Tier Two allotments are intended to
guarantee each school district that is not
subject to the wealth transfer provisions
described below an opportunity to
supplement that basic program at a level of
its own choice; however, Tier Two
allotments may not be used for the payment
of debt service or capital outlay.
As described above, the cost of the basic
program is based on an allotment per student
known as the “Basic Allotment”. For the
2019-20 State fiscal biennium, the Basic
Allotment is $6,160 for each student in
average daily attendance. The Basic
Allotment is then adjusted for all districts by
several different weights to account for
inherent differences between school
districts.
2019- 2020 Adopted Budget 147
Tier Two supplements the basic funding of
Tier One and provides two levels of
enrichment with different guaranteed yields
(i.e., guaranteed levels of funding by the
State) depending on the district’s local tax
effort. The first six cents of tax effort that
exceeds the compressed tax rate (for most
districts, M&O tax rates ranging from $1.00
to $1.06 per $100 of taxable value) will, for
most districts, generate a guaranteed yield of
$99.41 and $106.28 per cent per weighted
student in average daily attendance
("WADA") in the 2017-18 and 2018-19
State fiscal years, respectively. a guaranteed
yield of $99.41 and $106.28 per cent per
weighted student in average daily attendance
("WADA") in the 2017-18 and 2018-19
State fiscal years, respectively. The second
level of Tier Two is generated by tax effort
that exceeds the district’s compressed tax
rate plus six cents (for most districts eligible
for this level of funding, M&O tax rates
ranging from $1.06 to $1.17 per $100 of
taxable value) and has a guaranteed yield
per cent per WADA of $31.95 for the 2018-
19 State fiscal biennium. Property-wealthy
school districts that have an M&O tax rate
that exceeds the district’s compressed tax
rate plus six cents are subject to recapture
above this tax rate level at the equivalent
wealth per student of $319,500 (see “Wealth
Transfer Provisions” below).
Previously, a district with a compressed tax
rate below $1.00 per $100 of taxable value
(known as a "fractionally funded district")
received a Basic Allotment which was
reduced proportionately to the degree that
the district's compressed tax rate fell short of
$1.00. Beginning in the 2017-2018 fiscal
year, the compressed tax rate of a
fractionally funded district now includes the
portion of such district’s current M&O tax
rate in excess of the first six cents above the
district's compressed tax rate until the
district's compressed tax rate is equal to the
state maximum compressed tax rate of
$1.00. Thus, for fractionally funded districts,
each eligible one cent of M&O tax levy
above the district’s compressed tax rate plus
six cents will have a guaranteed yield based
on Tier One funding instead of the Tier Two
yield, thereby reducing the penalty against
the Basic Allotment.
In addition to the operations funding
components of the Foundation School
Program discussed above, the Foundation
School Program provides a facilities funding
component consisting of the Instructional
Facilities Allotment (IFA) program and the
Existing Debt Allotment (EDA) program.
These programs assist school districts in
funding facilities by, generally, equalizing a
district’s I&S tax effort. The IFA guarantees
each awarded school district a specified
amount per student (the “IFA Guaranteed
Yield”) in State and local funds for each
cent of tax effort to pay the principal of and
interest on eligible bonds issued to
construct, acquire, renovate or improve
instructional facilities. The guaranteed yield
per cent of local tax effort per student in
ADA has been $35 since this program first
began in 1997. New awards of IFA are only
available if appropriated funds are allocated
for such purpose by the State Legislature. To
receive an IFA award, in years where the
State Legislature allocates appropriated
funds for new IFA awards, a school district
must apply to the Commissioner in
accordance with rules adopted by the
Commissioner before issuing the bonds to
be paid with IFA state assistance. The total
amount of debt service assistance over a
biennium for which a district may be
awarded is limited to the lesser of (1) the
actual debt service payments made by the
district in the biennium in which the bonds
2019- 2020 Adopted Budget 148
are issued; or (2) the greater of (a) $100,000
or (b) $250 multiplied by the number of
students in ADA. The IFA is also available
for lease-purchase agreements and refunding
bonds meeting certain prescribed conditions.
Once a district receives an IFA award for
bonds, it is entitled to continue receiving
State assistance for such bonds without
reapplying to the Commissioner. The
guaranteed level of State and local funds per
student per cent of local tax effort applicable
to the bonds may not be reduced below the
level provided for the year in which the
bonds were issued. The 85th State
Legislature did not appropriate any funds for
new IFA awards for the 2018-2019 State
fiscal biennium; however, awards previously
granted in years the State Legislature did
appropriate funds for new IFA awards will
continue to be funded. State financial
assistance is provided for certain existing
eligible debt issued by school districts
through the EDA program. The EDA
guaranteed yield (the “EDA Yield”) was the
same as the IFA Guaranteed Yield ($35 per
cent of local tax effort per student in ADA).
The 85th Texas Legislature changed the
EDA Yield to the lessor of (i) $40 or a
greater amount for any year provided by
appropriation; or (ii) the amount that would
result in a total additional EDA of $60
million more than the EDA to which
districts would have been entitled to if the
EDA Yield were $35. The yield for the
2017-2018 fiscal year is approximately $37.
The portion of a district’s local debt service
rate that qualifies for EDA assistance is
limited to the first 29 cents of debt service
tax (or a greater amount for any year
provided by appropriation by the Texas
Legislature). In general, a district’s bonds
are eligible for EDA assistance if (i) the
district made payments on the bonds during
the final fiscal year of the preceding State
fiscal biennium, or (ii) the district levied
taxes to pay the principal of and interest on
the bonds for that fiscal year. Each
biennium, access to EDA funding is
determined by the debt service taxes
collected in the final year of the preceding
biennium. A district may not receive EDA
funding for the principal and interest on a
series of otherwise eligible bonds for which
the district receives IFA funding.
A district may also qualify for a NIFA
allotment, which provides assistance to
districts for operational expenses associated
with opening new instructional facilities.
The 85th Texas Legislature did appropriate
funds in the amount of $23,750,000 for each
of the 2017-18 and 2018-19 State fiscal
years for NIFA allotments.
2006 Legislation Since the enactment of the Reform
Legislation in 2006, most school districts in
the State have operated with a “target”
funding level per student (“Target
Revenue”) that is based upon the “hold
harmless” principles embodied in the
Reform Legislation. This system of Target
Revenue was superimposed on the
Foundation School Program and made
existing funding formulas substantially less
important for most school districts. The
Reform Legislation was intended to lower
M&O tax rates in order to give school
districts “meaningful discretion” in setting
their M&O tax rates, while holding school
districts harmless by providing them with
the same level of overall funding they
received prior to the enactment of the
Reform Legislation. To make up for this
shortfall, the Reform Legislation authorized
Additional State Aid for Tax Reduction
(“ASATR”) for each school district in an
amount equal to the difference between the
amount that each district would receive
under the Foundation School Program and
the amount of each district’s Target Revenue
funding level. However, in subsequent
legislative sessions, the Texas Legislature
has gradually reduced the reliance on
ASATR by increasing the funding formulas,
and beginning with the 2017-18 school year,
the statutes authorizing ASATR are repealed
(eliminating revenue targets and ASATR
funding).
2019- 2020 Adopted Budget 149
2017 Legislation The 85th Texas Legislature, including the
regular session which concluded on May 29,
2017 and the special session which
concluded on August 15, 2017, did not enact
substantive changes to the Finance System.
However, certain bills during the regular
session and House Bill 21, which was
passed during the special session and signed
by the Governor on August 16, 2017,
revised certain aspects of the formulas used
to determine school district entitlements
under the Finance System. In addition to
amounts previously discussed, the 85th
Texas Legislature additionally appropriated
funds to (i) establish a Financial Hardship
Transition Program, which provides grants
(“Hardship Grants”) to those districts which
were heavily reliant on ASATR funding,
and (ii) provide an Adjustment for Rapid
Decline in Taxable Value of Property
(“DPV Decline Adjustment") for districts
which experienced a decline in their tax base
of more than four percent for tax years 2015
and 2016. A district may receive either a
Hardship Grant or a DPV Decline
Adjustment, but cannot receive both. In a
case where a district would have been
eligible to receive funding under both
programs, the district will receive the greater
of the two amounts.
2019 Legislation The 86th Regular Session of the Texas
Legislature began on January 8, 2019, and
adjourned on May 27, 2019. A total of 7,420
House and Senate bills were filed during the
session. Of the bills filed, 1,429 passed, and
56 were vetoed by the governor. The Texas
Legislature passed the most consequential
public school finance reform since 1993;
House Bill 3, authored by House Public
Education Committee Chairman Dan
Huberty (R-Kingwood) and sponsored by
Senate Education Committee Chairman
Larry Taylor (R-Friendswood). House Bill
3 dramatically reduces statewide recapture
payments over the next biennium. It is
important to note that school district
property tax reform is directly connected to
the school finance reform efforts in House
Bill 3. The legislation compresses local
school district property taxes over a two-
year period and establishes a school district
revenue cap of 2.5 percent. These provisions
help to reduce the challenge of funding
public schools with local revenue, while
increasing the state’s share of funding public
education. This historic reform legislation
increases the state’s share of funding public
education from 38 percent to 45 percent and
reduces the burdensome cost of recapture.
Wealth Transfer Provisions Some districts have sufficient property
wealth per student in WADA (“wealth per
student”) to generate their statutory level of
funding through collections of local property
taxes alone. Districts whose wealth per
student generates local property tax
collections in excess of their statutory level
of funding are now referred to as “Chapter
49” districts because they are subject to the
wealth equalization provisions contained in
Chapter 49 of the Texas Education Code.
Chapter 49 districts may receive State funds
for certain competitive grants and a few
programs that remain outside the Foundation
School Program. Otherwise, Chapter 49
districts are not eligible to receive State
funding. Furthermore, Chapter 49 districts
must exercise certain measures in order to
reduce their wealth level to equalized wealth
levels of funding, as determined by formulas
set forth in the 2019 Legislation. For most
Chapter 49 districts, this equalization
process entails paying the portion of the
district’s local taxes collected in excess of
the equalized wealth levels of funding to the
State (for redistribution to other school
districts) or directly to other school districts
with a wealth per student that does not
generate local funds sufficient to meet the
statutory level of funding, a process known
as “recapture”.
The previous method to calculate recapture
used prior year values to arrive at a
proportional tax base reduction percentage.
This percentage was applied to current year
tax collections to arrive at recapture amount.
This recapture formula created budget
instability, i.e. surpluses and deficits. The
shift to current year values aligns recapture
2019- 2020 Adopted Budget 150
with entitlement. More details forthcoming in
correspondence regarding current year values.
Portions of income from the Permanent
School Fund distributed to the Available
School Fund (ASF) are intended to be
provided to school districts on a per-student
basis; however, prior to HB 3, not all districts
benefited equally from the ASF. For non-
recapture districts, this money counted toward
the total entitlement funding a district
receives. For recapture districts, the
constitutional funds were often provided on
top of the locally generated entitlement
funding. To provide this funding more
equitably under HB 3, all districts now receive
ASF funding as the first method of finance
before incorporating local and other state
revenues into the funding calculations.
HB 3 also eliminates the benefit received by
districts subject to reduced recapture based on
information from the district in the 1992-93
school year over a five-year period, through
the creation of the Equalized Wealth
Transition Grant. The increase in the basic
allotment and other formula changes will
mitigate recapture by an estimated $3.6 billion
over the next biennium. Under HB 3, districts
now have the option of making one lump-sum
payment in August. The payment option to
submit seven equal payments from February
through August remains unchanged. Districts
subject to recapture will select a payment
option in the Excess Local Revenue subsystem
of the online Foundation School Program
(FSP) system to the Texas Education Agency
(TEA) by January 15 annually.
Section 41.0041, Education Code, which
provided certain districts the option of
authorizing the Commissioner to withhold
state aid in lieu of holding an election has been
repealed. However, provisions in the TEC,
§48.257(c), allow districts to offset the
reduction of excess local revenue against
Chapter 48 funds provided in Subchapter F.
All districts will have the option to use state
aid calculated under Subchapter F, Chapter 48,
Education Code as an offset to their
attendance credit for purposes of reducing
their local revenue level. Districts using this
option are required to submit the district
intent/choice selection form and complete an
Option 3 netting contract, which can be found
in the Options and Procedures for Local
Revenue in Excess of Entitlement 2019–2020
School Year.
A district with local revenue in excess of
entitlement has the following five options
available to reduce the district’s revenue level
under TEC, Chapter 49.
1) Consolidation with another district
2) Detachment of territory
3) Purchase of average daily attendance
4) Education of nonresident students
5) Tax base consolidation
Districts have historically selected Option 3.
A voter election is required when exercising
any form of Option 3 or Option 4. All
districts notified as having a local revenue
level in excess of entitlement must hold an
election authorizing the purchase of
attendance credit under Section 49.156,
Education Code. Successful elections
conducted under TEC former Chapter 41,
carry over into TEC, Chapter 49. The most
commonly chosen method of paying
recapture is Option 3 (paying directly to the
state). This option currently represents 100%
of recapture. Funds received by the state
from recapture are appropriated in the
General Appropriations Act as a method of
finance to help pay for the Foundation
School Program (FSP). Each year, the TEA
notifies school districts with local revenue
levels estimated to exceed the tier two, level
two guaranteed yield of $49.28. However,
the final determination of whether a school
district will be required to make recapture
payments is based on the district’s tax effort
and the extent to which the district’s local
revenue level exceeds the Tier One
entitlement, or the tier two copper penny
guaranteed yield of $49.28, if the district is
assessing copper pennies.

2019- 2020 Adopted Budget 151
The School Finance System as
Applied to the District The District's wealth per student is greater
than the equalized wealth value.
Accordingly, the District has been required
to exercise one of the permitted wealth
equalization options. As a district with
wealth per student in excess of the equalized
wealth value, the District reduces its wealth
per student by exercising Option 3 (purchase
of attendance credits) pursuant to Chapter 49
of the Texas Education Code, as amended.
District voters previously authorized Option
3 as a means of equalizing wealth at an
election held within the District. As a so-
called “Chapter 49 district”, the District
does not receive any State funding to pay
debt service requirements on its outstanding
indebtedness, including the Bonds. For a
detailed discussion of State funding for
school districts, see “CURRENT PUBLIC
SCHOOL FINANCE SYSTEM - State
Funding for Local School Districts”.
A district's wealth per student must be tested
for each future school year and, if it exceeds
the maximum permitted level, must be
reduced by exercise of one of the permitted
wealth equalization options. Accordingly, if
the District's wealth per student should
exceed the maximum permitted level in
future school years, it will be required each
year to exercise one or more of the wealth
reduction options. If the District were to
consolidate (or consolidate its tax base for
all purposes) with a property-poor district,
the outstanding debt of each district could
become payable from the consolidated
district's combined property tax base, and
the District's ratio of taxable property to debt
could become diluted. If the District were to
detach property voluntarily, a portion of its
outstanding debt (including the Bonds)
could be assumed by the district to which
the property is annexed, in which case
timely payment of the Bonds could become
dependent in part on the financial
performance of the annexing district.
Source: Northwest Independent School
District OFFICIAL STATEMENT dated
May 13, 2019.

2019- 2020 Adopted Budget 152
Major Revenue Sources
District programs are primarily supported by local real and personal property taxes budgeted at $267,688,939 divided
between the General Fund $192,780,626 and the Debt Service Funds at $74,908,313. The balance is from investment
earnings, co-curricular, and food service activity. State program revenues include General Fund appropriations of
$5,746,474 for the Per Capita Apportionment, $6,951,346 for the Foundation School Program Act Entitlements, and
$8,519,873 for Teacher Retirement/TRS Care - On-Behalf Payments. The “On-Behalf” revenues equal state
payments of matching teacher retirement paid for active members of the school district in accordance with GASB
Statement No. 24. The remaining state program revenues and federal program revenues are associated with grants.
Actual Actual Actual Budget Budget
Description 2015-16 2016-17 2017-18 2018-19 2019-20
Local and Intermediate Sources 196,352,421$ 207,364,434$ 243,373,909$ 248,737,100$ 279,294,288$
State Program Revenues 40,473,309 41,130,734 31,397,493 30,166,780 21,464,603
Federal Program Revenues 7,734,133 7,022,361 7,578,424 8,346,591 10,066,952
Total 244,559,863$ 255,517,529$ 282,349,826$ 287,250,471$ 310,825,843$
MAJOR REVENUE SOURCES
Intergovernmental Charges – Chapter 41 Recapture
Starting in 2000-01 the District fell under the provisions of Chapter 41, Texas Education Code. A key "equity"
chapter in the Texas Education Code (TEC) is Chapter 41 which is devoted to wealth equalization. District
expenditures under the State of Texas mandated Chapter 41 wealth equalization total $288,435,091 inception to date.
The District budgeted $3,480,000 for the 2019-20 school for the purpose of paying the mandated wealth equalization
to the Texas Education Agency. Chapter 41 was changed to Chapter 49 due to changes in the 2019 86th Texas
Legislature.
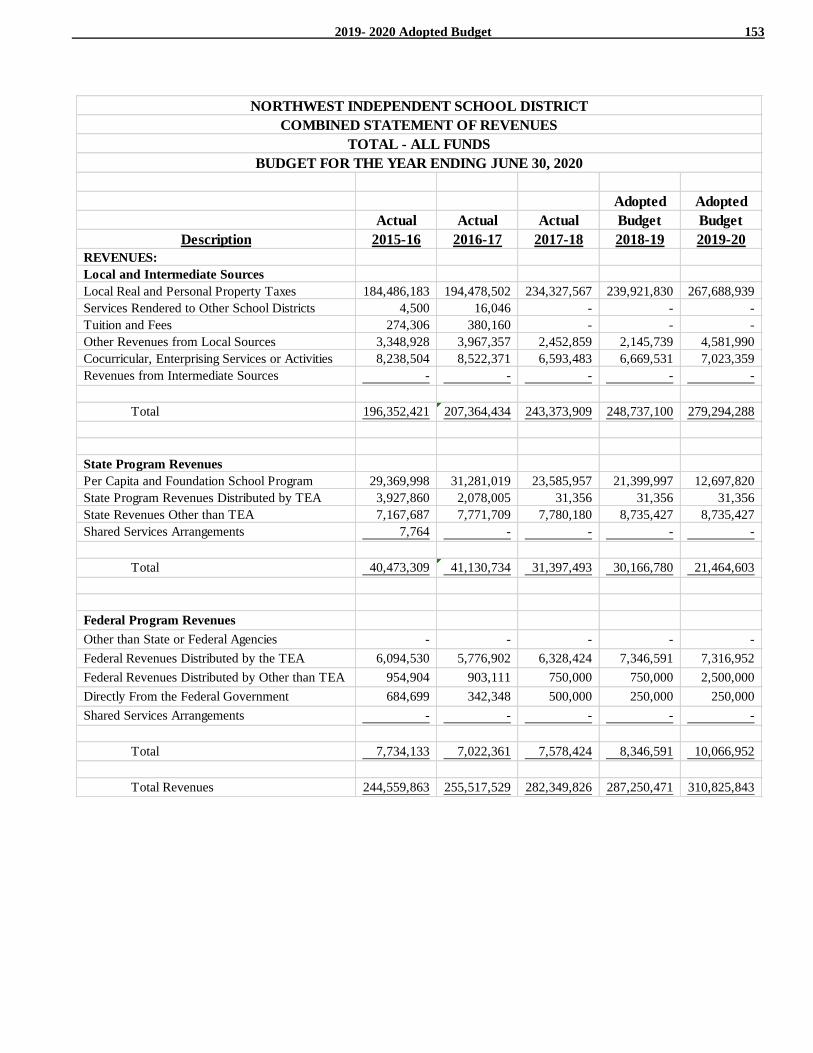
2019- 2020 Adopted Budget 153
Adopted Adopted
Actual Actual Actual Budget Budget
Description 2015-16 2016-17 2017-18 2018-19 2019-20
REVENUES:
Local and Intermediate Sources
Local Real and Personal Property Taxes 184,486,183 194,478,502 234,327,567 239,921,830 267,688,939
Services Rendered to Other School Districts 4,500 16,046 - - -
Tuition and Fees 274,306 380,160 - - -
Other Revenues from Local Sources 3,348,928 3,967,357 2,452,859 2,145,739 4,581,990
Cocurricular, Enterprising Services or Activities 8,238,504 8,522,371 6,593,483 6,669,531 7,023,359
Revenues from Intermediate Sources - - - - -
Total 196,352,421 207,364,434 243,373,909 248,737,100 279,294,288
State Program Revenues
Per Capita and Foundation School Program 29,369,998 31,281,019 23,585,957 21,399,997 12,697,820
State Program Revenues Distributed by TEA 3,927,860 2,078,005 31,356 31,356 31,356
State Revenues Other than TEA 7,167,687 7,771,709 7,780,180 8,735,427 8,735,427
Shared Services Arrangements 7,764 - - - -
Total 40,473,309 41,130,734 31,397,493 30,166,780 21,464,603
Federal Program Revenues
Other than State or Federal Agencies - - - - -
Federal Revenues Distributed by the TEA 6,094,530 5,776,902 6,328,424 7,346,591 7,316,952
Federal Revenues Distributed by Other than TEA 954,904 903,111 750,000 750,000 2,500,000
Directly From the Federal Government 684,699 342,348 500,000 250,000 250,000
Shared Services Arrangements - - - - -
Total 7,734,133 7,022,361 7,578,424 8,346,591 10,066,952
Total Revenues 244,559,863 255,517,529 282,349,826 287,250,471 310,825,843
BUDGET FOR THE YEAR ENDING JUNE 30, 2020
TOTAL - ALL FUNDS
NORTHWEST INDEPENDENT SCHOOL DISTRICT
COMBINED STATEMENT OF REVENUES
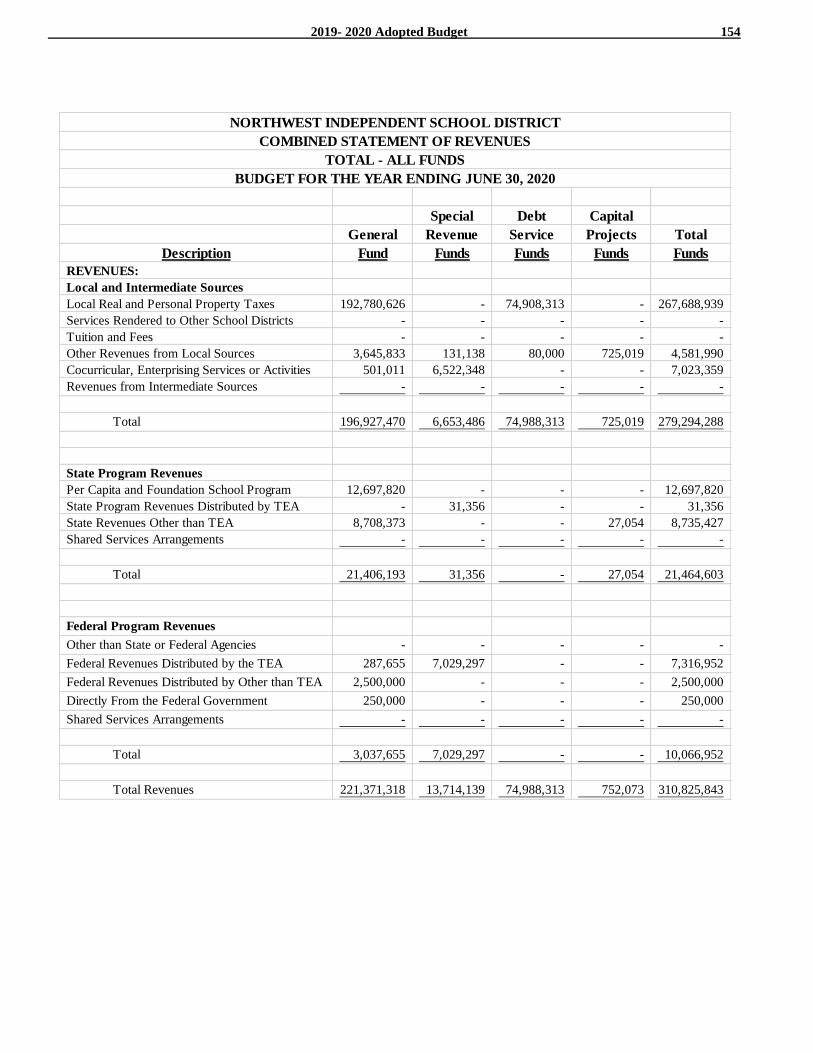
2019- 2020 Adopted Budget 154
Special Debt Capital
General Revenue Service Projects Total
Description Fund Funds Funds Funds Funds
REVENUES:
Local and Intermediate Sources
Local Real and Personal Property Taxes 192,780,626 - 74,908,313 - 267,688,939
Services Rendered to Other School Districts - - - - -
Tuition and Fees - - - - -
Other Revenues from Local Sources 3,645,833 131,138 80,000 725,019 4,581,990
Cocurricular, Enterprising Services or Activities 501,011 6,522,348 - - 7,023,359
Revenues from Intermediate Sources - - - - -
Total 196,927,470 6,653,486 74,988,313 725,019 279,294,288
State Program Revenues
Per Capita and Foundation School Program 12,697,820 - - - 12,697,820
State Program Revenues Distributed by TEA - 31,356 - - 31,356
State Revenues Other than TEA 8,708,373 - - 27,054 8,735,427
Shared Services Arrangements - - - - -
Total 21,406,193 31,356 - 27,054 21,464,603
Federal Program Revenues
Other than State or Federal Agencies - - - - -
Federal Revenues Distributed by the TEA 287,655 7,029,297 - - 7,316,952
Federal Revenues Distributed by Other than TEA 2,500,000 - - - 2,500,000
Directly From the Federal Government 250,000 - - - 250,000
Shared Services Arrangements - - - - -
Total 3,037,655 7,029,297 - - 10,066,952
Total Revenues 221,371,318 13,714,139 74,988,313 752,073 310,825,843
BUDGET FOR THE YEAR ENDING JUNE 30, 2020
TOTAL - ALL FUNDS
NORTHWEST INDEPENDENT SCHOOL DISTRICT
COMBINED STATEMENT OF REVENUES
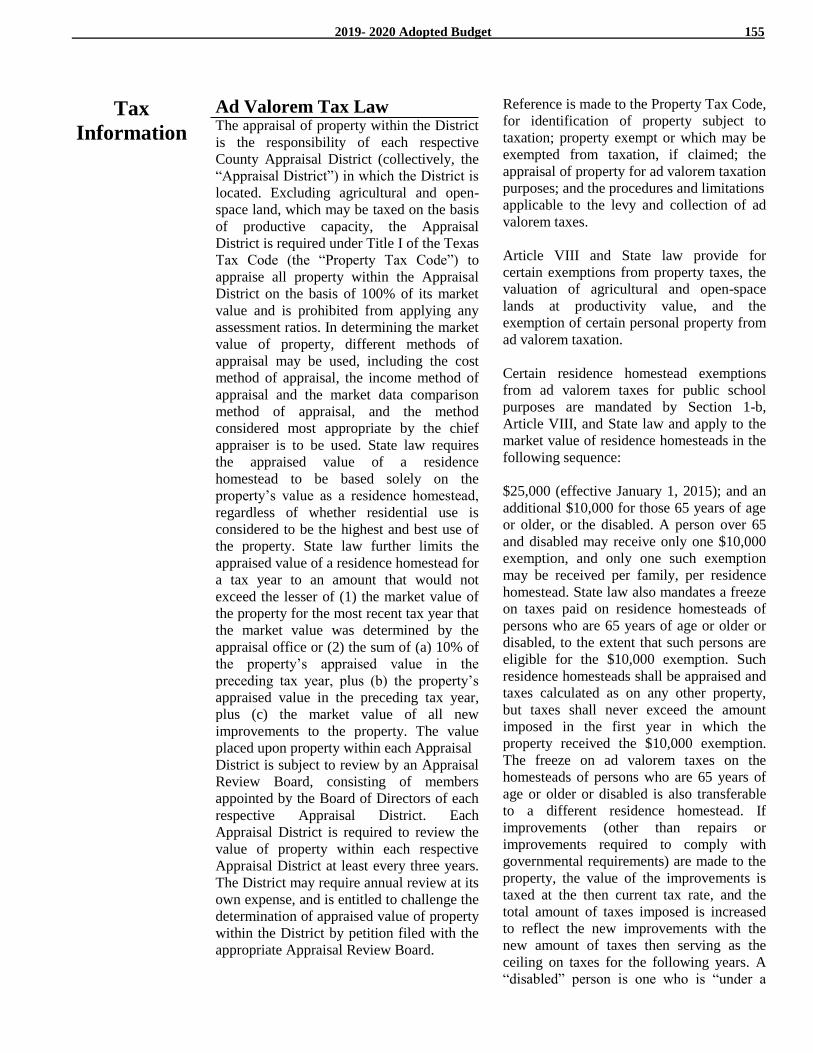
2019- 2020 Adopted Budget 155
Tax
Information
Ad Valorem Tax Law
The appraisal of property within the District
is the responsibility of each respective
County Appraisal District (collectively, the
“Appraisal District”) in which the District is
located. Excluding agricultural and open-
space land, which may be taxed on the basis
of productive capacity, the Appraisal
District is required under Title I of the Texas
Tax Code (the “Property Tax Code”) to
appraise all property within the Appraisal
District on the basis of 100% of its market
value and is prohibited from applying any
assessment ratios. In determining the market
value of property, different methods of
appraisal may be used, including the cost
method of appraisal, the income method of
appraisal and the market data comparison
method of appraisal, and the method
considered most appropriate by the chief
appraiser is to be used. State law requires
the appraised value of a residence
homestead to be based solely on the
property’s value as a residence homestead,
regardless of whether residential use is
considered to be the highest and best use of
the property. State law further limits the
appraised value of a residence homestead for
a tax year to an amount that would not
exceed the lesser of (1) the market value of
the property for the most recent tax year that
the market value was determined by the
appraisal office or (2) the sum of (a) 10% of
the property’s appraised value in the
preceding tax year, plus (b) the property’s
appraised value in the preceding tax year,
plus (c) the market value of all new
improvements to the property. The value
placed upon property within each Appraisal
District is subject to review by an Appraisal
Review Board, consisting of members
appointed by the Board of Directors of each
respective Appraisal District. Each
Appraisal District is required to review the
value of property within each respective
Appraisal District at least every three years.
The District may require annual review at its
own expense, and is entitled to challenge the
determination of appraised value of property
within the District by petition filed with the
appropriate Appraisal Review Board.
Reference is made to the Property Tax Code,
for identification of property subject to
taxation; property exempt or which may be
exempted from taxation, if claimed; the
appraisal of property for ad valorem taxation
purposes; and the procedures and limitations
applicable to the levy and collection of ad
valorem taxes.
Article VIII and State law provide for
certain exemptions from property taxes, the
valuation of agricultural and open-space
lands at productivity value, and the
exemption of certain personal property from
ad valorem taxation.
Certain residence homestead exemptions
from ad valorem taxes for public school
purposes are mandated by Section 1-b,
Article VIII, and State law and apply to the
market value of residence homesteads in the
following sequence:
$25,000 (effective January 1, 2015); and an
additional $10,000 for those 65 years of age
or older, or the disabled. A person over 65
and disabled may receive only one $10,000
exemption, and only one such exemption
may be received per family, per residence
homestead. State law also mandates a freeze
on taxes paid on residence homesteads of
persons who are 65 years of age or older or
disabled, to the extent that such persons are
eligible for the $10,000 exemption. Such
residence homesteads shall be appraised and
taxes calculated as on any other property,
but taxes shall never exceed the amount
imposed in the first year in which the
property received the $10,000 exemption.
The freeze on ad valorem taxes on the
homesteads of persons who are 65 years of
age or older or disabled is also transferable
to a different residence homestead. If
improvements (other than repairs or
improvements required to comply with
governmental requirements) are made to the
property, the value of the improvements is
taxed at the then current tax rate, and the
total amount of taxes imposed is increased
to reflect the new improvements with the
new amount of taxes then serving as the
ceiling on taxes for the following years. A
“disabled” person is one who is “under a
2019- 2020 Adopted Budget 156
disability for purposes of payment of
disability insurance benefits under the
Federal Old Age, Survivors and Disability
Insurance”. Also, a surviving spouse of a
taxpayer who qualifies for the freeze on ad
valorem taxes is entitled to the same
exemption so long as the property was the
residence homestead of the surviving spouse
when the deceased spouse died, remains the
residence homestead of the surviving spouse
and the spouse was at least 55 years of age
at the time of the death of the individual’s
spouse. Pursuant to a constitutional
amendment approved by the voters on May
12, 2007, legislation was enacted to reduce
the school property tax limitation imposed
by the freeze on taxes paid on residence
homesteads of persons 65 years of age or
over or of disabled persons to correspond to
reductions in local school district tax rates
from the 2005 tax year to the 2006 tax year
and from the 2006 tax year to the 2007 tax
year (see “CURRENT PUBLIC SCHOOL
FINANCE SYSTEM - General” herein).
The school property tax limitation provided
by the constitutional amendment and
enabling legislation apply to the 2007 and
subsequent tax years. The school property
tax limitation provided by the constitutional
amendment and enabling legislation apply to
the 2007 and subsequent tax years.
In addition, under Section 1-b, Article VIII,
and State law, the governing body of a
political subdivision, at its option, may grant
either or both of the following:
(i) An exemption of not less than
$3,000 of the market value of the
residence homestead of persons 65
years of age or older and the
disabled from all ad valorem taxes
thereafter levied by the political
subdivision;
(ii) An exemption of up to 20% of
the market value of residence
homesteads; minimum exemption
$5,000.
After the exemption described in (i) above is
authorized, such exemption may be repealed
or decreased or increased in amount (a) by
the governing body of the political
subdivision or (b) by a favorable vote of a
majority of the qualified voters at an
election called by the governing body of the
political subdivision, which election must be
called upon receipt of a petition signed by at
least 20% of the number of qualified voters
who voted in the preceding election of the
political subdivision. In the case of a
decrease, the amount of the exemption may
not be reduced to less than $3,000 of the
market value.
The surviving spouse of an individual who
qualifies for the exemption listed in (i)
above for the residence homestead of a
person 65 or older (but not the disabled) is
entitled to an exemption for the same
property in an amount equal to that of the
exemption for which the deceased spouse
qualified if (i) the deceased spouse died in a
year in which the deceased spouse qualified
for the exemption, (ii) the surviving spouse
was at least 55 years of age at the time of the
death of the individual’s spouse and (iii) the
property was the residence homestead of the
surviving spouse when the deceased spouse
died and remains the residence homestead of
the surviving spouse. On November 3, 2015,
Texas voters approved an amendment to this
law to provide for the exemption from ad
valorem taxation for those surviving spouses
of veterans who died before 2011, of which
such amendment applies for the tax year
beginning on or after January 1, 2016.
In the case of residence homestead
exemptions granted under Section 1-b,
Article VIII, ad valorem taxes may continue
to be levied against the value of homesteads
exempted where ad valorem taxes have
previously been pledged for the payment of
debt if cessation of the levy would impair
the obligation of the contract by which the
debt was created.
State law and Section 2, Article VIII,
mandate an additional property tax
exemption for disabled veterans or the
surviving spouse or children of a deceased
veteran who died while on active duty in the
armed forces; the exemption applies to
either real or personal property with the
2019- 2020 Adopted Budget 157
amount of assessed valuation exempted
ranging from $5,000 to a maximum of
$12,000; provided, however, that a disabled
veteran who receives from the from the
United States Department of Veterans
Affairs or its successor, 100 percent
disability compensation due to a service-
connected disability and a rating of 100
percent disabled or of individual
unemployability is entitled to an exemption
from taxation of the total appraised value of
the veteran’s residence homestead. Effective
January 1, 2012 and subject to certain
conditions, surviving spouses of a deceased
veteran who had received a disability rating
of 100% will be entitled to receive a
residential homestead exemption equal to
the exemption received by the deceased
spouse until such surviving spouse
remarries. In addition, a partially disabled
veteran or the surviving spouse of a partially
disabled veteran is entitled to an exemption
from taxation of a percentage of the
appraised value of their residence homestead
in an amount equal to the partially disabled
veteran’s disability rating if the residence
homestead was donated at no cost by a
charitable organization. Finally, the
surviving spouse of a member of the armed
forces who was killed in action is entitled to
an exemption of the total appraised value of
the surviving spouse’s residence homestead
if the surviving spouse has not remarried
since the service member’s death and said
property was the service member’s
residence homestead at the time of death.
Such exemption may be transferred to a
subsequent residence homestead of the
surviving spouse, if the surviving spouse has
not remarried, in an amount equal to the
exemption received on the prior residence in
the last year in which such exemption was
received.
Effective January 1, 2018, a partially
disabled veteran or the surviving spouse of a
partially disabled veteran is entitled, if a
residence is donated by a charitable
organization, to an exemption equal to the
percentage of the veteran’s disability, or at
some cost to the disabled veteran in the form
of a cash payment, a mortgage, or both in an
aggregate amount that is not more than 50%
of the good faith estimate of the market
value of the residence homestead made by
the charitable donation as of the date the
donation is made.
Following the approval by the voters at a
November 7, 2017 Statewide election (and
effective as of January 1, 2018), the
surviving spouse of a member of the armed
forces who is killed in action is entitled to a
property tax exemption for all or part of the
market value of such surviving spouse’s
residences homestead, if the surviving
spouse has not remarried since the service
member’s death and said property was the
service member’s residence homestead at
the time of death. Such exemption is
transferable to a different property of the
surviving spouse, if the surviving spouse has
not remarried, in an amount equal to the
exemption received on the prior residence in
the last year in which such exemption was
received.
Article VIII provides that eligible owners of
both agricultural land (Section l-d) and
open-space land (Section l-d-l), including
open-space land devoted to farm or ranch
purposes or open-space land devoted to
timber production, may elect to have such
property appraised for property taxation on
the basis of its productive capacity. The
same land may not be qualified under both
Section 1-d and 1-d-1.
Nonbusiness personal property, such as
automobiles or light trucks, are exempt from
ad valorem taxation unless the governing
body of a political subdivision elects to tax
this property. Boats owned as nonbusiness
property are exempt from ad valorem
taxation.
Article VIII, Section 1-j of the Texas
Constitution provides for “freeport property”
to be exempted from ad valorem taxation.
Freeport property is defined as goods
detained in Texas for 175 days or less for
the purpose of assembly, storage,
manufacturing, processing or fabrication.
Notwithstanding such exemption, counties,
school districts, junior college districts and
cities may tax such tangible personal
2019- 2020 Adopted Budget 158
property provided official action to tax the
same was taken before April 1, 1990.
Decisions to continue to tax may be reversed
in the future; decisions to exempt freeport
property are not subject to reversal.
Article VIII, Section 1-n of the Texas
Constitution provides for the exemption
from taxation of “goods-in-transit.” “Goods-
in-transit” is defined by Section 11.253 of
the Tax Code, which is effective for tax
years 2008 and thereafter, as personal
property acquired or imported into Texas
and transported to another location in the
State or outside of the State within 175 days
of the date the property was acquired or
vessel and out-board motor, heavy
equipment and manufactured housing
inventory. Section 11.253 permits local
governmental entities, on a local option
basis, to take official action by January 1 of
the year preceding a tax year, after holding a
public hearing, to tax goods-intransit during
the following tax year. A taxpayer may
receive only one of the freeport exemption
or the goods-in-transit exemption for items
of personal property.
A city or county may create a tax increment
financing district (“TIF”) within the city or
county with defined boundaries and
establish a base value of taxable property in
the TIF at the time of its creation.
Overlapping taxing units, including school
districts, may agree with the city or county
to contribute all or part of future ad valorem
taxes levied and collected against the
“incremental value” (taxable value in excess
of the base value) of taxable real property in
the TIF to pay or finance the costs of certain
public improvements in the TIF, and such
taxes levied and collected for and on behalf
of the TIF are not available for general use
by such contributing taxing units. Prior to
September 1, 2001, school districts were
allowed to enter into tax abatement
agreements to encourage economic
development. Under such agreements, a
property owner agrees to construct certain
improvements on its property. The school
district in turn agrees not to levy a tax on all
or part of the increased value attributable to
the improvements until the expiration of the
agreement. The abatement agreement could
last for a period of up to 10 years. School
districts have been prohibited from entering
into new tax abatement agreements since
September 1, 2001. In addition, credit will
not be given by the Commissioner of
Education in determining a district’s
property value wealth per student for (1) the
appraised value, in excess of the “frozen”
value, of property that is located in a TIF
created after May 31, 1999 (except in certain
limited circumstances where the
municipality creating the tax increment
financing zone gave notice prior to May 31,
1999 to all other taxing units that levy ad
valorem taxes in the TIF of its intention to
create the TIF and the TIF was created and
had its final project and financing plan
approved by the municipality prior to
August 31, 1999), or (2) for the loss of value
of abated property under any abatement
agreement entered into after May 31, 1993.
Notwithstanding the foregoing, in 2001 the
Legislature enacted legislation known as the
Texas Economic Development Act, which
provides incentives for school districts to
grant limitations on appraised property
values and provide ad valorem tax credits to
certain corporations and limited liability
companies to encourage economic
development within the district. Generally,
during the last eight years of the ten-year
term of a tax limitation agreement, the
school district may only levy and collect ad
valorem taxes for maintenance and
operation purposes on the agreed-to limited
appraised property value. The taxpayer is
entitled to a tax credit from the school
district for the amount of taxes imposed
during the first two years of the tax
limitation agreement on the appraised value
of the property above the agreed-to limited
value. Additional State funding is provided
to a school district for each year of such tax
limitation in the amount of the tax credit
provided to the taxpayer. During the first
two years of a tax limitation agreement, the
school district may not adopt a tax rate that
exceeds the district’s rollback tax rate (see
“TAX INFORMATION - Public Hearing
and Rollback Tax Rate” and “TAX
INFORMATION – District Application of
Tax Code”).
2019- 2020 Adopted Budget 159
The governing body of a political
subdivision is prohibited from repealing or
reducing the amount of an optional
homestead exemption that was in place for
the 2014 tax year (fiscal year 2015) for a
period ending December 31, 2019.
Tax Rate Limitations
A school district is authorized to levy
maintenance and operation (“M&O”) taxes
subject to approval of a proposition
submitted to district voters under Section
45.003(d) of the Texas Education Code, as
amended. The maximum M&O tax rate that
may be levied by a district cannot exceed the
voted maximum rate or the maximum rate
described in the next succeeding paragraph.
The maximum voted M&O tax rate for the
District is $1.50 per $100 of assessed
valuation as approved by the voters at an
election held on March 14, 1972 under
Chapter 20, Texas Education Code (now
codified at Section 45.003, Texas Education
Code).
The maximum tax rate per $100 of assessed
valuation that may be adopted by the
District may not exceed $1.50. The State
Compression Percentage is set by legislative
appropriation for each State fiscal biennium
or, in the absence of legislative
appropriation, by the Commissioner. For a
more detailed description of the State
Compression Percentage, see “CURRENT
PUBLIC SCHOOL FINANCE SYSTEM -
Local Funding for School Districts.”
Furthermore, a school district cannot
annually increase its tax rate in excess of the
district's “rollback tax rate” without
submitting such tax rate to a referendum
election and a majority of the voters voting
at such election approving the adopted rate.
See “TAX INFORMATION - Public
Hearing and Rollback Tax Rate.”
A school district is also authorized to issue
bonds and levy taxes for payment of bonds
subject to voter approval of a proposition
submitted to the voters under Section
45.003(b)(1), Texas Education Code, as
amended, which provides a tax unlimited as
to rate or amount for the support of` school
district bonded indebtedness (see “THE
BONDS – Security and Source of
Payment”).
Section 45.0031, Texas Education Code, as
amended (“Section 45.0031”), requires a
district to demonstrate to the Texas Attorney
General that it has the prospective ability to
pay its maximum annual debt service on a
proposed issue of bonds and all previously
issued bonds, other than bonds approved by
district voters at an election held on or
before April 1, 1991 and issued before
September 1, 1992 (or debt issued to refund
such bonds, collectively, “exempt bonds”),
from a tax levied at a rate of $0.50 per $100
of assessed valuation before bonds may be
issued. In demonstrating the ability to pay
debt service at a rate of $0.50, a district may
take into account EDA and IFA allotments
to the district, which effectively reduce the
district's local share of debt service, and may
also take into account Tier One funds
allotted to the district. The District is
required to deposit any State allotments
provided solely for payment of debt service
into the District’s interest and sinking fund
upon receipt of such amounts. In addition,
the District must, prior to levying an interest
and sinking fund tax rate that exceeds $0.50
per $100 of assessed valuation, credit to the
interest and sinking fund other State
assistance, including Tier One funds that
may be used for either operating purposes or
for payment of debt service, in an amount
equal to the amount needed to demonstrate
compliance with the threshold tax rate test
and which is received or to be received in
that year. Once the prospective ability to pay
such tax has been shown and the bonds are
issued, a district may levy an unlimited tax
to pay debt service. Taxes levied to pay
refunding bonds issued pursuant to Chapter
1207, Texas Government Code, are not
subject to the $0.50 tax rate test; however,
taxes levied to pay debt service on such
2019- 2020 Adopted Budget 160
bonds (other than bonds issued to refund
exempt bonds) are included in maximum
annual debt service for calculation of the
$0.50 threshold tax rate test when applied to
subsequent bond issues. The Bonds are
issued for school building purposes pursuant
to Chapter 45, Texas Education Code as new
debt and are subject to the threshold tax rate
test. Under current law, a district may
demonstrate its ability to comply with the
$0.50 threshold tax rate test by applying the
$0.50 tax rate to an amount equal to 90% of
projected future taxable value of property in
the district, as certified by a registered
professional appraiser, anticipated for the
earlier of the tax year five years after the
current tax year or the tax year in which the
final payment for the bonds is due.
However, if a district uses projected future
taxable values to meet the $0.50 threshold
tax rate test and subsequently imposes a tax
at a rate greater than $0.50 per $100 of
valuation to pay for bonds subject to the test,
then for subsequent bond issues, the
Attorney General must find that the district
has the projected ability to pay principal and
interest on the proposed bonds and all
previously issued bonds subject to the $0.50
threshold tax rate test from a tax rate of
$0.45 per $100 of valuation. The District has
used projected property values to satisfy this
threshold test. See “TAX INFORMATION
– Tax Rate Limitations” herein.
Public Hearing and Rollback
Tax Rate
In setting its annual tax rate, the governing
body of a school district generally cannot
adopt a tax rate exceeding the district's
“rollback tax rate” without approval by a
majority of the voters voting at an election
approving the higher rate. The tax rate
consists of two components: (1) a rate for
funding of maintenance and operation
expenditures and (2) a rate for debt service.
The rollback tax rate for a school district is
the lesser of (A) the sum of (1) the product
of the district's “State Compression
Percentage” for that year multiplied by
$1.50, (2) the rate of $0.04, (3) any rate
increase above the rollback tax rate in prior
years that were approved by voters, and (4)
the district's current debt rate, or (B) the sum
of (1) the district's effective maintenance
and operations tax rate, (2) the product of
the district's State Compression Percentage
for that year multiplied by $0.06; and (3) the
district's current debt rate (see “CURRENT
PUBLIC SCHOOL FINANCE SYSTEM -
Local Funding for School Districts” for a
description of the “State Compression
Percentage”). If for the preceding tax year a
district adopted an M&O tax rate that was
less than its effective M&O tax rate for that
preceding tax year, the district's rollback tax
for the current year is calculated as if the
district had adopted an M&O tax rate for the
preceding tax year equal to its effective
M&O tax rate for that preceding tax year.
The “effective maintenance and operations
tax rate” for a school district is the tax rate
that, applied to the current tax values, would
provide local maintenance and operating
funds, when added to State funds to be
distributed to the district pursuant to Chapter
42 of the Texas Education Code for the
school year beginning in the current tax
year, in the same amount as would have
been available to the district in the preceding
year if the funding elements of wealth
equalization and State funding for the
current year had been in effect for the
preceding year.
Section 26.05 of the Tax Code provides that
the governing body of a taxing unit is
required to adopt the annual tax rate for the
unit before the later of September 30 or the
60th day after the date the certified appraisal
roll is received by the taxing unit, and a
failure to adopt a tax rate by such required
date will result in the tax rate for the taxing
unit for the tax year to be the lower of the
effective tax rate calculated for that tax year
or the tax rate adopted by the taxing unit for
the preceding tax year. Before adopting its
annual tax rate, a public meeting must be
held for the purpose of adopting a budget for
the succeeding year. A notice of public
meeting to discuss budget and proposed tax
rate must be published in the time, format
and manner prescribed in Section 44.004 of
the Texas Education Code. Section
2019- 2020 Adopted Budget 161
44.004(e) of the Texas Education Code
provides that a person who owns taxable
property in a school district is entitled to an
injunction restraining the collection of taxes
by the district if the district has not complied
with such notice requirements or the
language and format requirements of such
notice as set forth in Section 44.004(b), (c)
and (d), and, if applicable, Subsection (i),
and if such failure to comply was not in
good faith. Section 44.004(e) further
provides the action to enjoin the collection
of taxes must be filed before the date the
district delivers substantially all of its tax
bills. A district may adopt its budget after
adopting a tax rate for the tax year in which
the fiscal year covered by the budget begins
if the district elects to adopt its tax rate
before receiving the certified appraisal roll.
A district that adopts a tax rate before
adopting its budget must hold a public
hearing on the proposed tax rate followed by
another public hearing on the proposed
budget rather than holding a single hearing
on the two items.
Property Assessment
and Tax Payment
Property within the District is generally
assessed as of January 1 of each year.
Business inventory may, at the option of the
taxpayer, be assessed as of September 1. Oil
and gas reserves are assessed on the basis of
a valuation process which uses pricing
information contained in the most recently
published Early Release Overview of the
Annual Energy Outlook published by the
United States Energy Information
Administration, as well as appraisal
formulas developed by the State
Comptroller of Public Accounts. Effective
January 1, 2016, the valuation of assessment
of oil and gas reserves depends upon pricing
information in either the standard edition of
the Annual Energy Outlook or, if the most
recently published edition of the Annual
Energy Outlook was published before
December 1 of the preceding calendar year,
the Short-Term Energy Outlook report
published in January of the current calendar
year. Taxes become due October 1 of the
same year, and become delinquent on
February 1 of the following year. Taxpayers
65 years old or older are permitted by State
law to pay taxes on homesteads in four
installments with the first installment due on
February 1 of each year and the final
installment due on August 1.
Penalties and Interest
Charges for penalty and interest on the
unpaid balance of delinquent taxes are made
as follows:
Month Penalty Interest(b) Total
February 6% 1% 7%
March 7 2 9
April 8 3 11
May 9 4 13
June 10 5 15
July 12 6 18
After July, penalty remains at 12%, and
interest accrues at a rate of one percent (1%)
for each month or portion of a month the tax
remains unpaid. A delinquent tax continues
to accrue interest as long as the tax remains
unpaid, regardless of whether a judgment for
the delinquent tax has been rendered. The
purpose of imposing such interest penalty is
to compensate the taxing unit for revenue
lost because of the delinquency. In addition,
if an account is delinquent in July, an
attorney's collection fee of up to 20% may
be added to the total tax penalty and interest
charge.
Taxes levied by the District are a personal
obligation of the owner of the property. On
January 1 of each year, a tax lien attaches to
property to secure the payment of all taxes,
penalties and interest ultimately imposed for
the year on the property. The lien exists in
favor of the State and each taxing unit,
including the District, having the power to
tax the property. The District's tax lien is on
a parity with tax liens of all other such
taxing units. A tax lien on real property has
priority over the claim of most creditors and
other holders of liens on the property
encumbered by the tax lien, whether or not
the debt or lien existed before the
attachment of the tax lien. Personal property
2019- 2020 Adopted Budget 162
under certain circumstances is subject to
seizure and sale for the payment of
delinquent taxes, penalty and interest.
Except with respect to taxpayers who are 65
years of age or older or disabled. At any
time after taxes on property become
delinquent, the District may file suit to
foreclose the lien securing payment of the
tax, to enforce personal liability for the tax,
or both. In filing a suit to foreclose a tax lien
on real property, the District must join other
taxing units that have claims for delinquent
taxes against all or part of the same
property. The ability of the District to collect
delinquent taxes by foreclosure may be
adversely affected by the amount of taxes
owed to other taxing units, adverse market
conditions, taxpayer redemption rights, or
bankruptcy proceedings which restrain the
collection of a taxpayer's debt.
Federal bankruptcy law provides that an
automatic stay of actions by creditors and
other entities, including governmental units,
goes into effect with the filing of any
petition in bankruptcy. The automatic stay
prevents governmental units from
foreclosing on property and prevents liens
for post-petition taxes from attaching to
property and obtaining secured creditor
status unless, in either case, an order lifting
the stay is obtained from the bankruptcy
court. In many cases post-petition taxes are
paid as an administrative expense of the
estate in bankruptcy or by order of the
bankruptcy court.
2019- 2020 Adopted Budget 163
District Application of Tax Code
The District does not grant an optional or
additional exemption to the market value of
the residence homestead of persons 65 years
of age or older and the disabled.
The District does not grant an additional
exemption of 20% of the market value of
residence homesteads.
See Table 1 for a listing of the amounts of
the exemptions described above.
Ad valorem taxes are not levied by the
District against the exempt value of
residence homesteads for the payment of
debt.
The District does not tax nonbusiness
personal property; and the District contracts
with the Denton County Tax Collector's
office for the collection of its own ad
valorem taxes.
The District has a tax abatement policy, but
has no abatement agreements in place.
The District does not permit split payments,
and discounts are not allowed.
The District does not tax freeport property.
The District has opted to tax goods-in-
transit.
The District has not entered into any
appraised value limitation agreements
pursuant to the Texas Economic
Development Act, Chapter 313, Texas Tax
Code.
Tax Increment Finance Zones
The District participates in two Tax
Increment Financing Reinvestment Zones
(“TIRZ #1” and “TIRZ #2”). TIRZ #1 has
an incremental value of $35,922,635 and
TIRZ #2 has an incremental value of
$81,245,587.
Source: Northwest Independent School
District OFFICIAL STATEMENT dated
May 7, 2019.
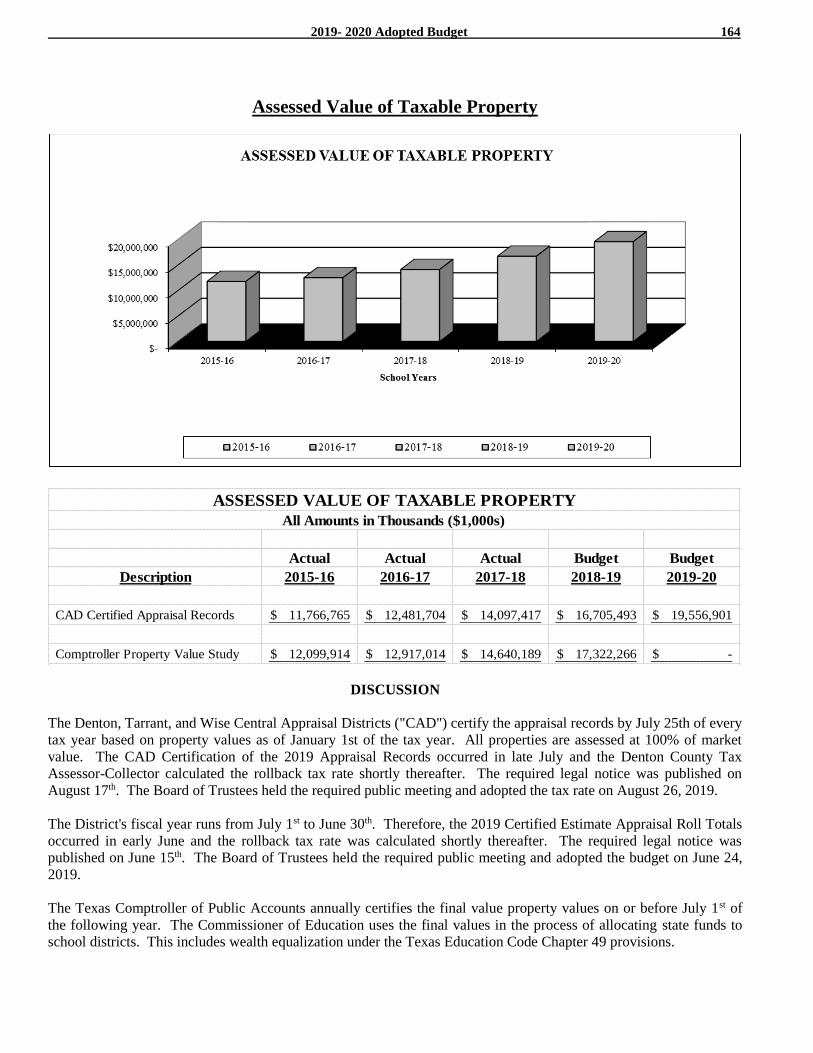
2019- 2020 Adopted Budget 164
Assessed Value of Taxable Property
Actual Actual Actual Budget Budget
Description 2015-16 2016-17 2017-18 2018-19 2019-20
CAD Certified Appraisal Records 11,766,765$ 12,481,704$ 14,097,417$ 16,705,493$ 19,556,901$
Comptroller Property Value Study 12,099,914$ 12,917,014$ 14,640,189$ 17,322,266$ -$
ASSESSED VALUE OF TAXABLE PROPERTY
All Amounts in Thousands ($1,000s)
DISCUSSION
The Denton, Tarrant, and Wise Central Appraisal Districts ("CAD") certify the appraisal records by July 25th of every
tax year based on property values as of January 1st of the tax year. All properties are assessed at 100% of market
value. The CAD Certification of the 2019 Appraisal Records occurred in late July and the Denton County Tax
Assessor-Collector calculated the rollback tax rate shortly thereafter. The required legal notice was published on
August 17th. The Board of Trustees held the required public meeting and adopted the tax rate on August 26, 2019.
The District's fiscal year runs from July 1st to June 30th. Therefore, the 2019 Certified Estimate Appraisal Roll Totals
occurred in early June and the rollback tax rate was calculated shortly thereafter. The required legal notice was
published on June 15th. The Board of Trustees held the required public meeting and adopted the budget on June 24,
2019.
The Texas Comptroller of Public Accounts annually certifies the final value property values on or before July 1st of
the following year. The Commissioner of Education uses the final values in the process of allocating state funds to
school districts. This includes wealth equalization under the Texas Education Code Chapter 49 provisions.
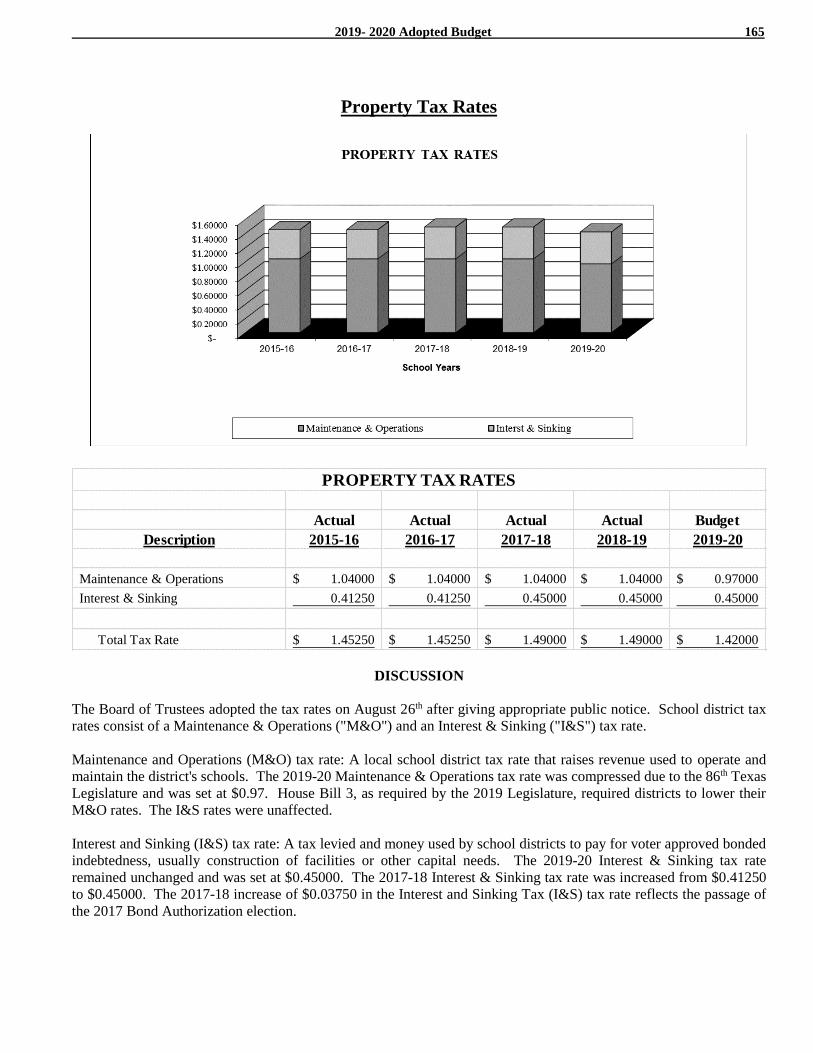
2019- 2020 Adopted Budget 165
Property Tax Rates
Actual Actual Actual Actual Budget
Description 2015-16 2016-17 2017-18 2018-19 2019-20
Maintenance & Operations 1.04000$ 1.04000$ 1.04000$ 1.04000$ 0.97000$
Interest & Sinking 0.41250 0.41250 0.45000 0.45000 0.45000
Total Tax Rate 1.45250$ 1.45250$ 1.49000$ 1.49000$ 1.42000$
PROPERTY TAX RATES
DISCUSSION
The Board of Trustees adopted the tax rates on August 26th after giving appropriate public notice. School district tax
rates consist of a Maintenance & Operations ("M&O") and an Interest & Sinking ("I&S") tax rate.
Maintenance and Operations (M&O) tax rate: A local school district tax rate that raises revenue used to operate and
maintain the district's schools. The 2019-20 Maintenance & Operations tax rate was compressed due to the 86th Texas
Legislature and was set at $0.97. House Bill 3, as required by the 2019 Legislature, required districts to lower their
M&O rates. The I&S rates were unaffected.
Interest and Sinking (I&S) tax rate: A tax levied and money used by school districts to pay for voter approved bonded
indebtedness, usually construction of facilities or other capital needs. The 2019-20 Interest & Sinking tax rate
remained unchanged and was set at $0.45000. The 2017-18 Interest & Sinking tax rate was increased from $0.41250
to $0.45000. The 2017-18 increase of $0.03750 in the Interest and Sinking Tax (I&S) tax rate reflects the passage of
the 2017 Bond Authorization election.
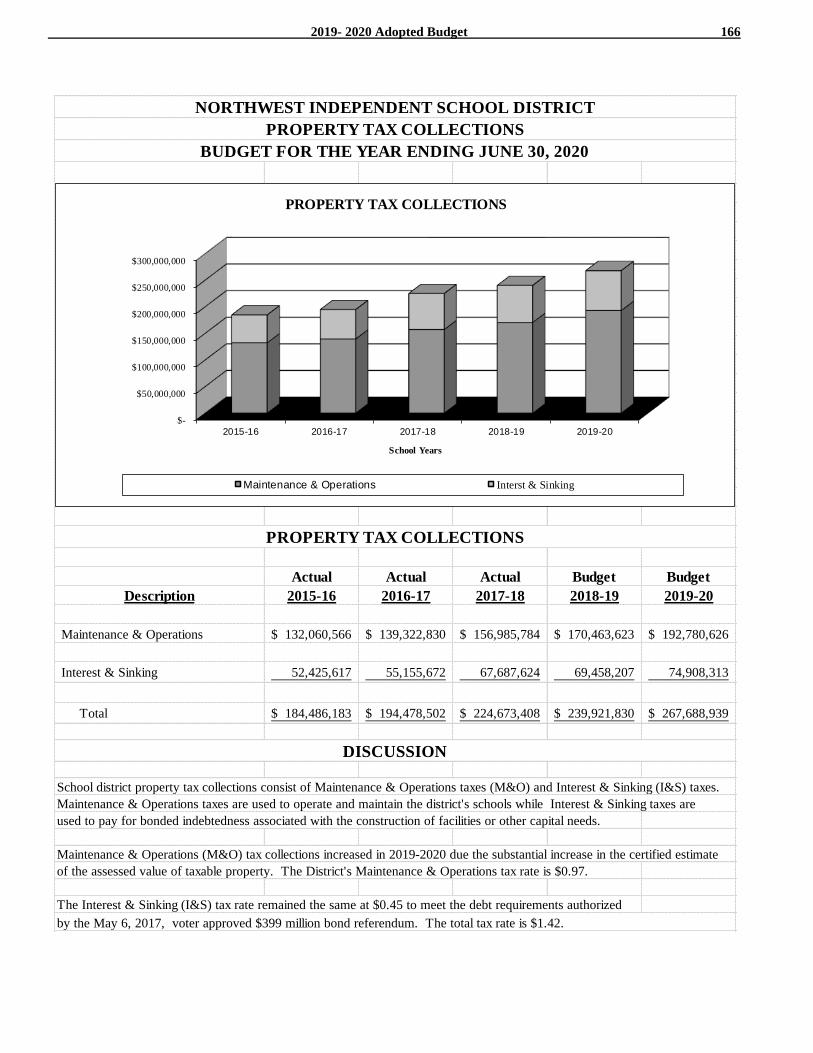
2019- 2020 Adopted Budget 166
Actual Actual Actual Budget Budget
Description 2015-16 2016-17 2017-18 2018-19 2019-20
Maintenance & Operations 132,060,566$ 139,322,830$ 156,985,784$ 170,463,623$ 192,780,626$
Interest & Sinking 52,425,617 55,155,672 67,687,624 69,458,207 74,908,313
Total 184,486,183$ 194,478,502$ 224,673,408$ 239,921,830$ 267,688,939$
School district property tax collections consist of Maintenance & Operations taxes (M&O) and Interest & Sinking (I&S) taxes.
Maintenance & Operations taxes are used to operate and maintain the district's schools while Interest & Sinking taxes are
used to pay for bonded indebtedness associated with the construction of facilities or other capital needs.
Maintenance & Operations (M&O) tax collections increased in 2019-2020 due the substantial increase in the certified estimate
of the assessed value of taxable property. The District's Maintenance & Operations tax rate is $0.97.
The Interest & Sinking (I&S) tax rate remained the same at $0.45 to meet the debt requirements authorized
DISCUSSION
PROPERTY TAX COLLECTIONS
NORTHWEST INDEPENDENT SCHOOL DISTRICT
BUDGET FOR THE YEAR ENDING JUNE 30, 2020
PROPERTY TAX COLLECTIONS
by the May 6, 2017, voter approved $399 million bond referendum. The total tax rate is $1.42.
$-
$50,000,000
$100,000,000
$150,000,000
$200,000,000
$250,000,000
$300,000,000
2015-16 2016-17 2017-18 2018-19 2019-20
School Years
PROPERTY TAX COLLECTIONS
Maintenance & Operations Interst & Sinking
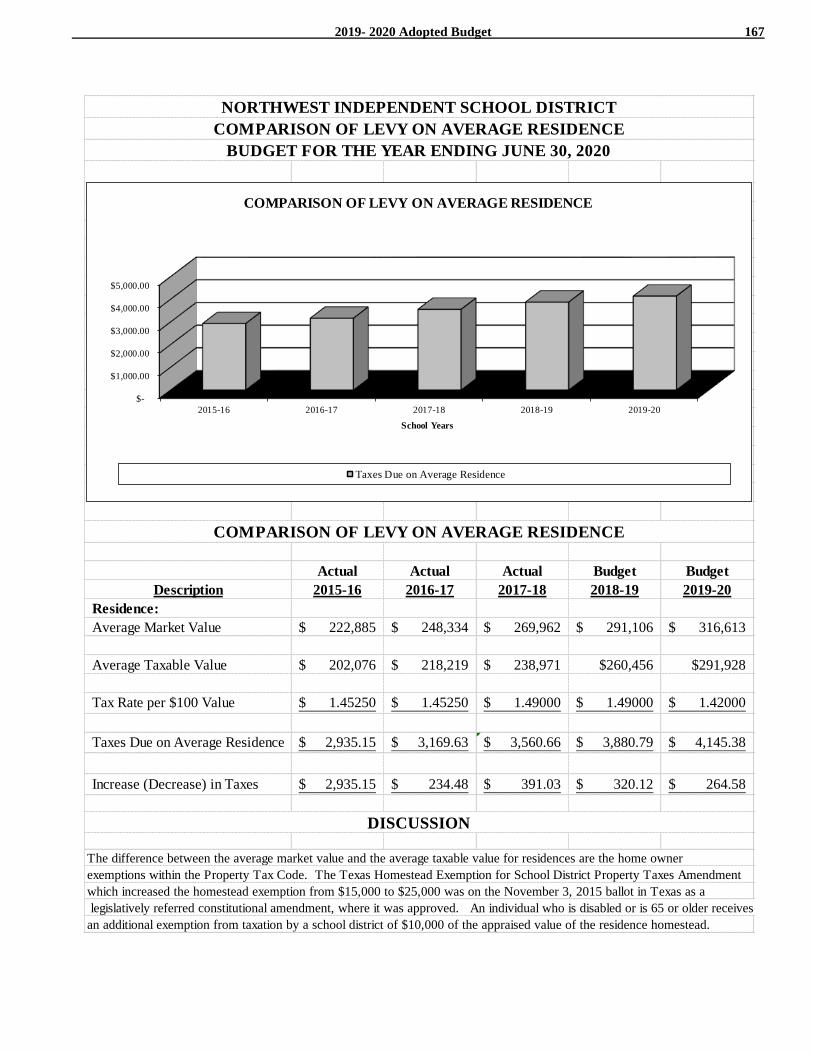
2019- 2020 Adopted Budget 167
Actual Actual Actual Budget Budget
Description 2015-16 2016-17 2017-18 2018-19 2019-20
Residence:
Average Market Value 222,885$ 248,334$ 269,962$ 291,106$ 316,613$
Average Taxable Value 202,076$ 218,219$ 238,971$ $260,456 $291,928
Tax Rate per $100 Value 1.45250$ 1.45250$ 1.49000$ 1.49000$ 1.42000$
Taxes Due on Average Residence 2,935.15$ 3,169.63$ 3,560.66$ 3,880.79$ 4,145.38$
Increase (Decrease) in Taxes 2,935.15$ 234.48$ 391.03$ 320.12$ 264.58$
The difference between the average market value and the average taxable value for residences are the home owner
exemptions within the Property Tax Code. The Texas Homestead Exemption for School District Property Taxes Amendment
which increased the homestead exemption from $15,000 to $25,000 was on the November 3, 2015 ballot in Texas as a
legislatively referred constitutional amendment, where it was approved. An individual who is disabled or is 65 or older receives
an additional exemption from taxation by a school district of $10,000 of the appraised value of the residence homestead.
DISCUSSION
COMPARISON OF LEVY ON AVERAGE RESIDENCE
NORTHWEST INDEPENDENT SCHOOL DISTRICT
BUDGET FOR THE YEAR ENDING JUNE 30, 2020
COMPARISON OF LEVY ON AVERAGE RESIDENCE
$-
$1,000.00
$2,000.00
$3,000.00
$4,000.00
$5,000.00
2015-16 2016-17 2017-18 2018-19 2019-20
School Years
COMPARISON OF LEVY ON AVERAGE RESIDENCE
Taxes Due on Average Residence
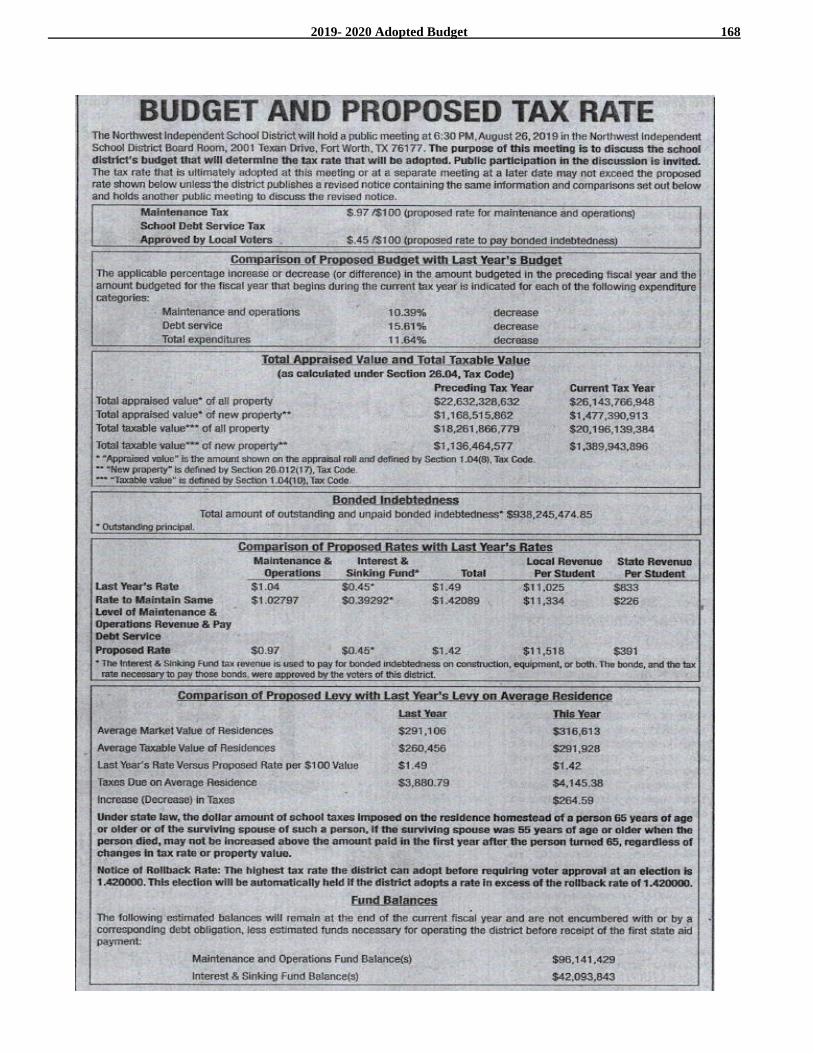
2019- 2020 Adopted Budget 168
2019- 2020 Adopted Budget 169
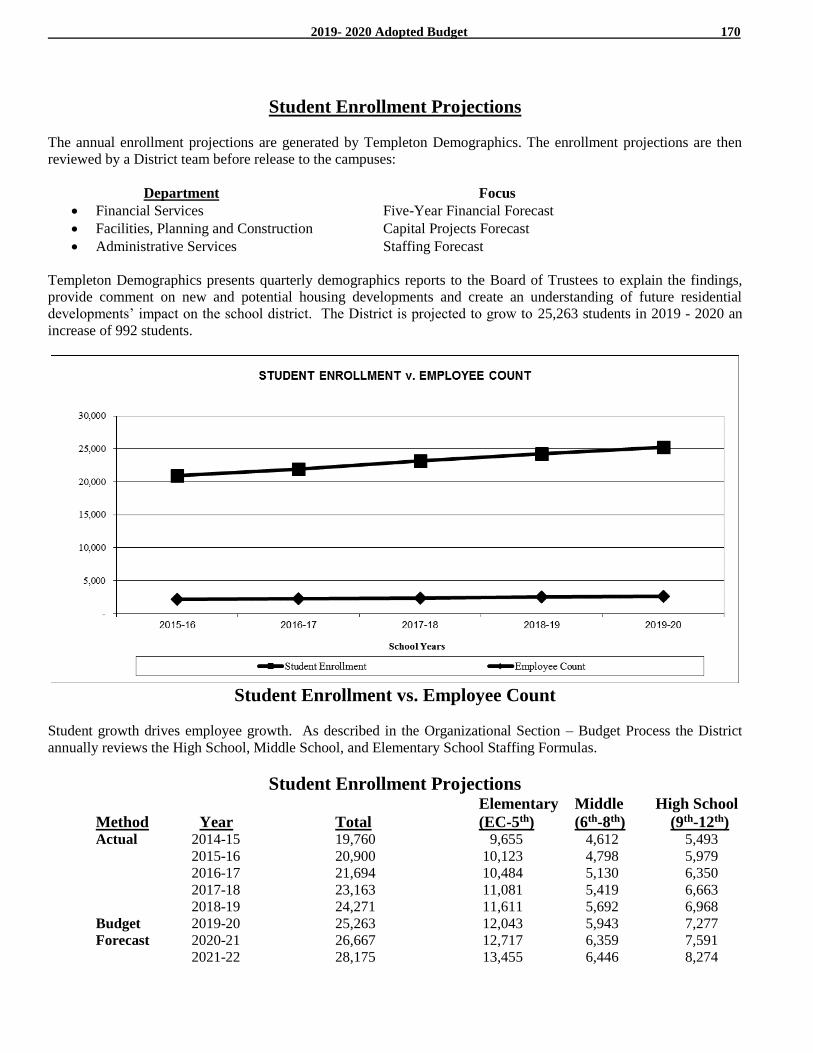
2019- 2020 Adopted Budget 170
Student Enrollment Projections
The annual enrollment projections are generated by Templeton Demographics. The enrollment projections are then
reviewed by a District team before release to the campuses:
Department Focus
Financial Services Five-Year Financial Forecast
Facilities, Planning and Construction Capital Projects Forecast
Administrative Services Staffing Forecast
Templeton Demographics presents quarterly demographics reports to the Board of Trustees to explain the findings,
provide comment on new and potential housing developments and create an understanding of future residential
developments’ impact on the school district. The District is projected to grow to 25,263 students in 2019 - 2020 an
increase of 992 students.
Student Enrollment vs. Employee Count
Student growth drives employee growth. As described in the Organizational Section – Budget Process the District
annually reviews the High School, Middle School, and Elementary School Staffing Formulas.
Student Enrollment Projections
Elementary Middle High School
Method Year Total (EC-5th) (6th-8th) (9th-12th) Actual 2014-15 19,760 9,655 4,612 5,493
2015-16 20,900 10,123 4,798 5,979
2016-17 21,694 10,484 5,130 6,350
2017-18 23,163 11,081 5,419 6,663
2018-19 24,271 11,611 5,692 6,968
Budget 2019-20 25,263 12,043 5,943 7,277
Forecast 2020-21 26,667 12,717 6,359 7,591
2021-22 28,175 13,455 6,446 8,274
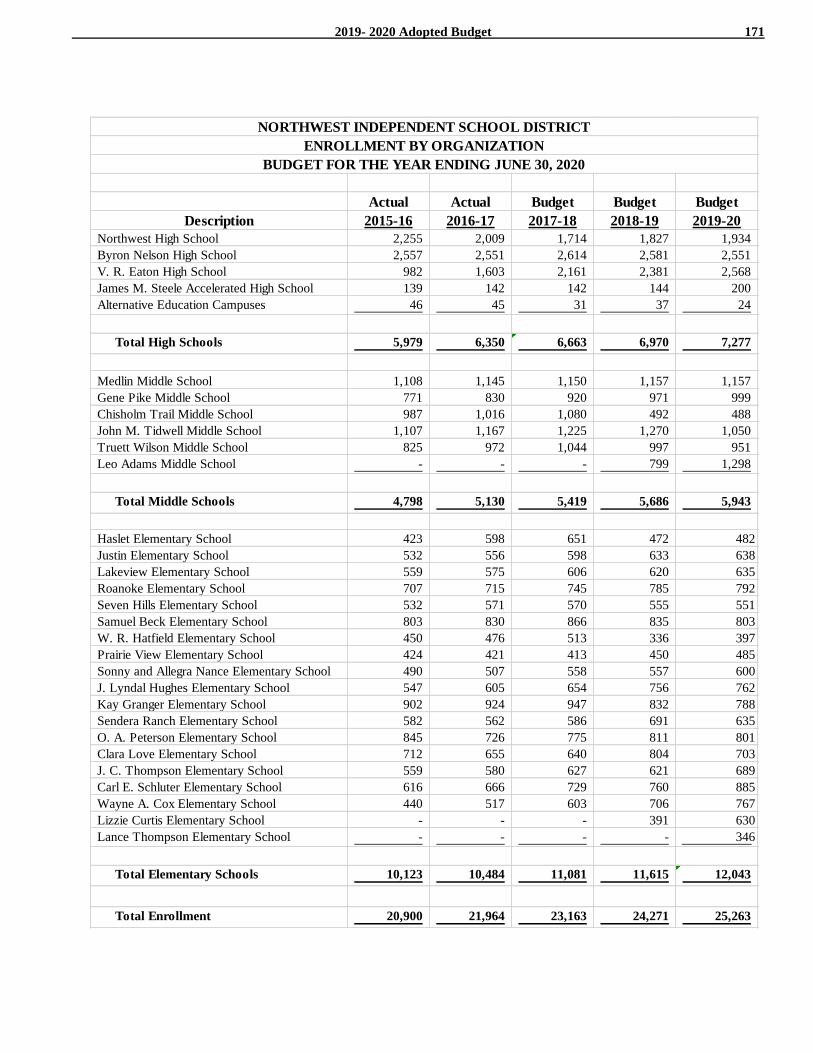
2019- 2020 Adopted Budget 171
Actual Actual Budget Budget Budget
Description 2015-16 2016-17 2017-18 2018-19 2019-20
Northwest High School 2,255 2,009 1,714 1,827 1,934
Byron Nelson High School 2,557 2,551 2,614 2,581 2,551
V. R. Eaton High School 982 1,603 2,161 2,381 2,568
James M. Steele Accelerated High School 139 142 142 144 200
Alternative Education Campuses 46 45 31 37 24
Total High Schools 5,979 6,350 6,663 6,970 7,277
Medlin Middle School 1,108 1,145 1,150 1,157 1,157
Gene Pike Middle School 771 830 920 971 999
Chisholm Trail Middle School 987 1,016 1,080 492 488
John M. Tidwell Middle School 1,107 1,167 1,225 1,270 1,050
Truett Wilson Middle School 825 972 1,044 997 951
Leo Adams Middle School - - - 799 1,298
Total Middle Schools 4,798 5,130 5,419 5,686 5,943
Haslet Elementary School 423 598 651 472 482
Justin Elementary School 532 556 598 633 638
Lakeview Elementary School 559 575 606 620 635
Roanoke Elementary School 707 715 745 785 792
Seven Hills Elementary School 532 571 570 555 551
Samuel Beck Elementary School 803 830 866 835 803
W. R. Hatfield Elementary School 450 476 513 336 397
Prairie View Elementary School 424 421 413 450 485
Sonny and Allegra Nance Elementary School 490 507 558 557 600
J. Lyndal Hughes Elementary School 547 605 654 756 762
Kay Granger Elementary School 902 924 947 832 788
Sendera Ranch Elementary School 582 562 586 691 635
O. A. Peterson Elementary School 845 726 775 811 801
Clara Love Elementary School 712 655 640 804 703
J. C. Thompson Elementary School 559 580 627 621 689
Carl E. Schluter Elementary School 616 666 729 760 885
Wayne A. Cox Elementary School 440 517 603 706 767
Lizzie Curtis Elementary School - - - 391 630
Lance Thompson Elementary School - - - - 346
Total Elementary Schools 10,123 10,484 11,081 11,615 12,043
Total Enrollment 20,900 21,964 23,163 24,271 25,263
NORTHWEST INDEPENDENT SCHOOL DISTRICT
BUDGET FOR THE YEAR ENDING JUNE 30, 2020
ENROLLMENT BY ORGANIZATION
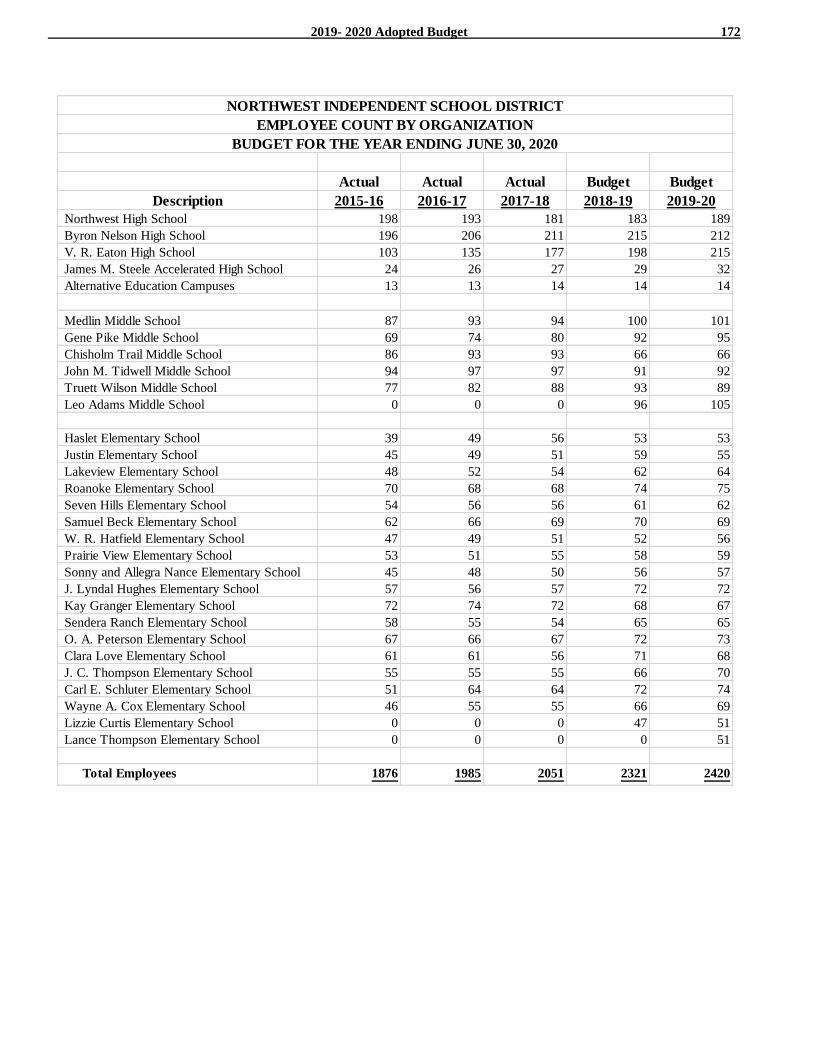
2019- 2020 Adopted Budget 172
Actual Actual Actual Budget Budget
Description 2015-16 2016-17 2017-18 2018-19 2019-20
Northwest High School 198 193 181 183 189
Byron Nelson High School 196 206 211 215 212
V. R. Eaton High School 103 135 177 198 215
James M. Steele Accelerated High School 24 26 27 29 32
Alternative Education Campuses 13 13 14 14 14
Medlin Middle School 87 93 94 100 101
Gene Pike Middle School 69 74 80 92 95
Chisholm Trail Middle School 86 93 93 66 66
John M. Tidwell Middle School 94 97 97 91 92
Truett Wilson Middle School 77 82 88 93 89
Leo Adams Middle School 0 0 0 96 105
Haslet Elementary School 39 49 56 53 53
Justin Elementary School 45 49 51 59 55
Lakeview Elementary School 48 52 54 62 64
Roanoke Elementary School 70 68 68 74 75
Seven Hills Elementary School 54 56 56 61 62
Samuel Beck Elementary School 62 66 69 70 69
W. R. Hatfield Elementary School 47 49 51 52 56
Prairie View Elementary School 53 51 55 58 59
Sonny and Allegra Nance Elementary School 45 48 50 56 57
J. Lyndal Hughes Elementary School 57 56 57 72 72
Kay Granger Elementary School 72 74 72 68 67
Sendera Ranch Elementary School 58 55 54 65 65
O. A. Peterson Elementary School 67 66 67 72 73
Clara Love Elementary School 61 61 56 71 68
J. C. Thompson Elementary School 55 55 55 66 70
Carl E. Schluter Elementary School 51 64 64 72 74
Wayne A. Cox Elementary School 46 55 55 66 69
Lizzie Curtis Elementary School 0 0 0 47 51
Lance Thompson Elementary School 0 0 0 0 51
Total Employees 1876 1985 2051 2321 2420
NORTHWEST INDEPENDENT SCHOOL DISTRICT
BUDGET FOR THE YEAR ENDING JUNE 30, 2020
EMPLOYEE COUNT BY ORGANIZATION
2019- 2020 Adopted Budget 173
Financial Forecast
The General Fund Five-Year Financial Forecast is based on the following assumptions:
Student Enrollment District estimate.
Assessed Value of Taxable Property District estimate.
CPTD Index Value 2019 Property Value Study.
Maintenance & Operations Tax Rate $0.97 for 2019-20 and thereafter.
Interest & Sinking Tax Rate $0.45 for 2019-20 and thereafter.
Texas Legislature Current Law
Combined Statement of Revenues, Expenditures and Changes in Fund Balance
The Combined Statement of Revenues, Expenditures and Changes in Fund Balance is based on forecasted student
growth and current law. The forecast shows a significant deficit starting in 2019 – 2020 which will be addressed
through the 2019 – 2020 budget/tax rate process. The passage of HB3 by the 2019 Texas Legislature is one of the
most comprehensive changes to school finance in the last 20 years. It will take 2-3 years to fully encapsulate
everything involved in HB3, and the NISD staff is committed to ensuring that our mission, vision, and goals are
achieved during this time.
Student Enrollment:
The annual enrollment projections are generated by Templeton Demographics. The enrollment projections are then
reviewed by a District team before release to the campuses. The projections are updated annually and regular reports
are presented to the Board of Trustees to explain the findings, provide comments on new and potential housing
developments and create an understanding of future residential developments’ impact on the school district.
Tim McClure, Assistant Superintendent for Facilities, Planning and Construction, closely monitors the demographic
forecast. Any revisions to the demographic forecast are incorporated into a revised budget update and presented to
the Board of Trustees. Student enrollment directly determines available funds for maintenance & operations. This is
critical information.
Assessed Value of Taxable Property:
Assessed Value of Taxable Property projections are internally generated by Brian Carter, Chief Financial Officer,
based on past growth and current economic conditions. The projections are updated annually and regular updates are
presented to the Board of Trustees throughout the budget process. The District tracks and reports on the Assessed
Value of Taxable Property starting with the Certified Estimate (June), the Certified Roll (July), and the ongoing
reporting of post certification Supplemental values.
Intergovernmental Charges – Chapter 41 Recapture:
Starting in 2000-01 the District fell under the provisions of Chapter 41, Texas Education Code. A key "equity"
chapter in the Texas Education Code (TEC) is Chapter 41 which is devoted to wealth equalization. District
expenditures under the State of Texas mandated Chapter 41 wealth equalization total $288,435,091 inception to date.
The District budgeted $3,480,000 for the 2019-20 school for the purpose of paying the mandated wealth equalization
to the Texas Education Agency. Chapter 41 was changed to Chapter 49 due to changes in the 2019 86th Texas
Legislature.
Tax Rate Analysis: The District’s Maintenance & Operations (M&O) tax rate is budgeted at $0.97. Due to the passage of HB3, the
District is allowed an additional $0.01 for the 1920-21 fiscal year, if it is voted on unanimously by the NISD Board of
Trustees. The remaining eleven pennies are recaptured and require an election. The district is considering conducting
a Tax Ratification Election (TRE) in the future to address the loss of State Program revenues funding.
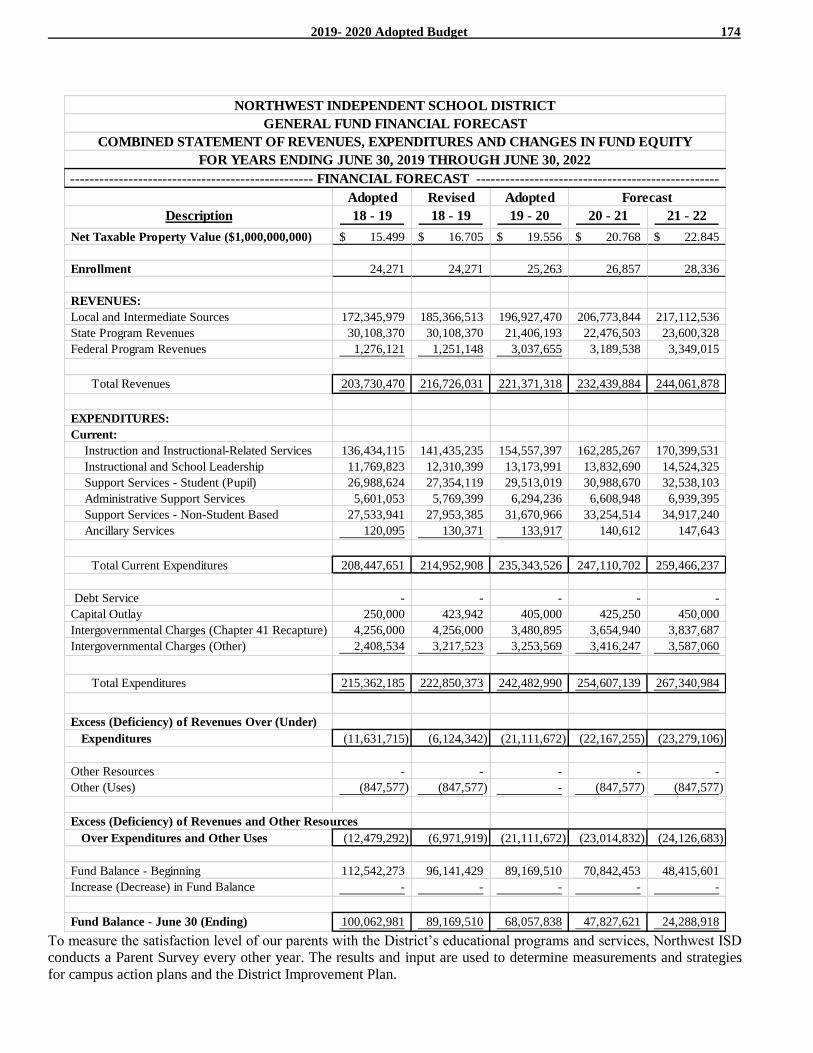
2019- 2020 Adopted Budget 174
Adopted Revised Adopted
Description 18 - 19 18 - 19 19 - 20 20 - 21 21 - 22
Net Taxable Property Value ($1,000,000,000) 15.499$ 16.705$ 19.556$ 20.768$ 22.845$
Enrollment 24,271 24,271 25,263 26,857 28,336
REVENUES:
Local and Intermediate Sources 172,345,979 185,366,513 196,927,470 206,773,844 217,112,536
State Program Revenues 30,108,370 30,108,370 21,406,193 22,476,503 23,600,328
Federal Program Revenues 1,276,121 1,251,148 3,037,655 3,189,538 3,349,015
Total Revenues 203,730,470 216,726,031 221,371,318 232,439,884 244,061,878
EXPENDITURES:
Current:
Instruction and Instructional-Related Services 136,434,115 141,435,235 154,557,397 162,285,267 170,399,531
Instructional and School Leadership 11,769,823 12,310,399 13,173,991 13,832,690 14,524,325
Support Services - Student (Pupil) 26,988,624 27,354,119 29,513,019 30,988,670 32,538,103
Administrative Support Services 5,601,053 5,769,399 6,294,236 6,608,948 6,939,395
Support Services - Non-Student Based 27,533,941 27,953,385 31,670,966 33,254,514 34,917,240
Ancillary Services 120,095 130,371 133,917 140,612 147,643
Total Current Expenditures 208,447,651 214,952,908 235,343,526 247,110,702 259,466,237
Debt Service - - - - -
Capital Outlay 250,000 423,942 405,000 425,250 450,000
Intergovernmental Charges (Chapter 41 Recapture) 4,256,000 4,256,000 3,480,895 3,654,940 3,837,687
Intergovernmental Charges (Other) 2,408,534 3,217,523 3,253,569 3,416,247 3,587,060
Total Expenditures 215,362,185 222,850,373 242,482,990 254,607,139 267,340,984
Excess (Deficiency) of Revenues Over (Under)
Expenditures (11,631,715) (6,124,342) (21,111,672) (22,167,255) (23,279,106)
Other Resources - - - - -
Other (Uses) (847,577) (847,577) - (847,577) (847,577)
Excess (Deficiency) of Revenues and Other Resources
Over Expenditures and Other Uses (12,479,292) (6,971,919) (21,111,672) (23,014,832) (24,126,683)
Fund Balance - Beginning 112,542,273 96,141,429 89,169,510 70,842,453 48,415,601
Increase (Decrease) in Fund Balance - - - - -
Fund Balance - June 30 (Ending) 100,062,981 89,169,510 68,057,838 47,827,621 24,288,918
NORTHWEST INDEPENDENT SCHOOL DISTRICT
GENERAL FUND FINANCIAL FORECAST
COMBINED STATEMENT OF REVENUES, EXPENDITURES AND CHANGES IN FUND EQUITY
FOR YEARS ENDING JUNE 30, 2019 THROUGH JUNE 30, 2022
-------------------------------------------------- FINANCIAL FORECAST --------------------------------------------------
Forecast
To measure the satisfaction level of our parents with the District’s educational programs and services, Northwest ISD
conducts a Parent Survey every other year. The results and input are used to determine measurements and strategies
for campus action plans and the District Improvement Plan.
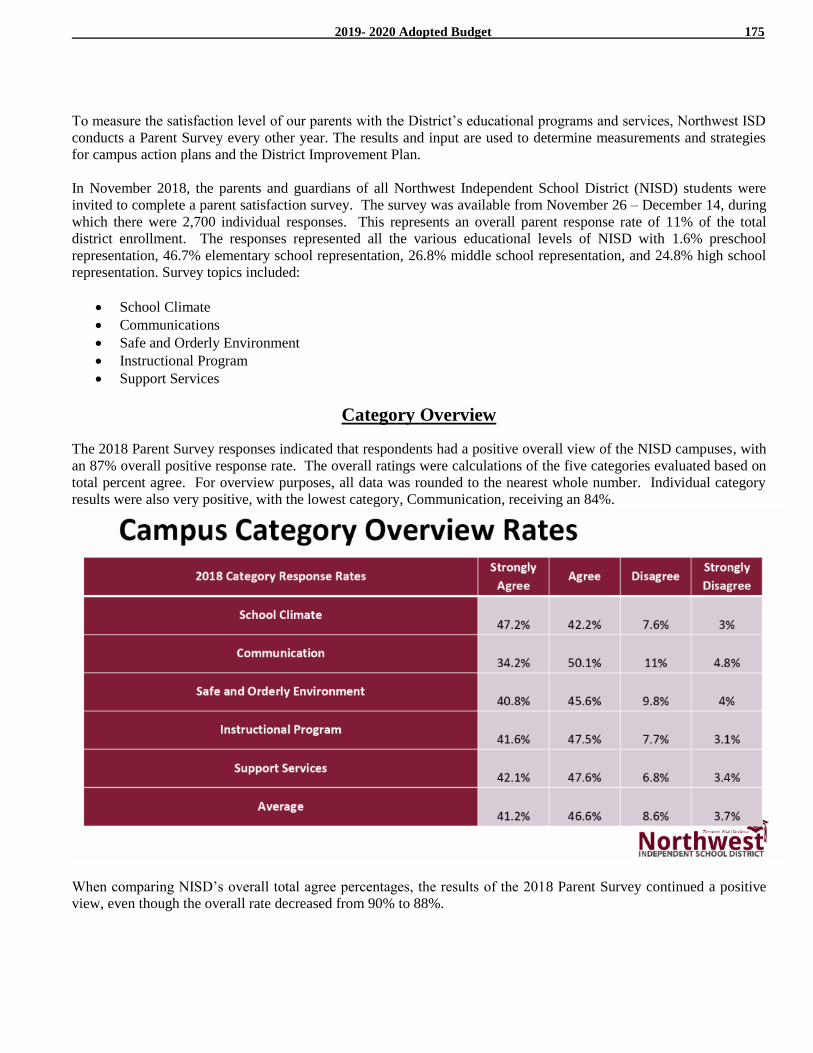
2019- 2020 Adopted Budget 175
To measure the satisfaction level of our parents with the District’s educational programs and services, Northwest ISD
conducts a Parent Survey every other year. The results and input are used to determine measurements and strategies
for campus action plans and the District Improvement Plan.
In November 2018, the parents and guardians of all Northwest Independent School District (NISD) students were
invited to complete a parent satisfaction survey. The survey was available from November 26 – December 14, during
which there were 2,700 individual responses. This represents an overall parent response rate of 11% of the total
district enrollment. The responses represented all the various educational levels of NISD with 1.6% preschool
representation, 46.7% elementary school representation, 26.8% middle school representation, and 24.8% high school
representation. Survey topics included:
School Climate
Communications
Safe and Orderly Environment
Instructional Program
Support Services
Category Overview
The 2018 Parent Survey responses indicated that respondents had a positive overall view of the NISD campuses, with
an 87% overall positive response rate. The overall ratings were calculations of the five categories evaluated based on
total percent agree. For overview purposes, all data was rounded to the nearest whole number. Individual category
results were also very positive, with the lowest category, Communication, receiving an 84%.
When comparing NISD’s overall total agree percentages, the results of the 2018 Parent Survey continued a positive
view, even though the overall rate decreased from 90% to 88%.
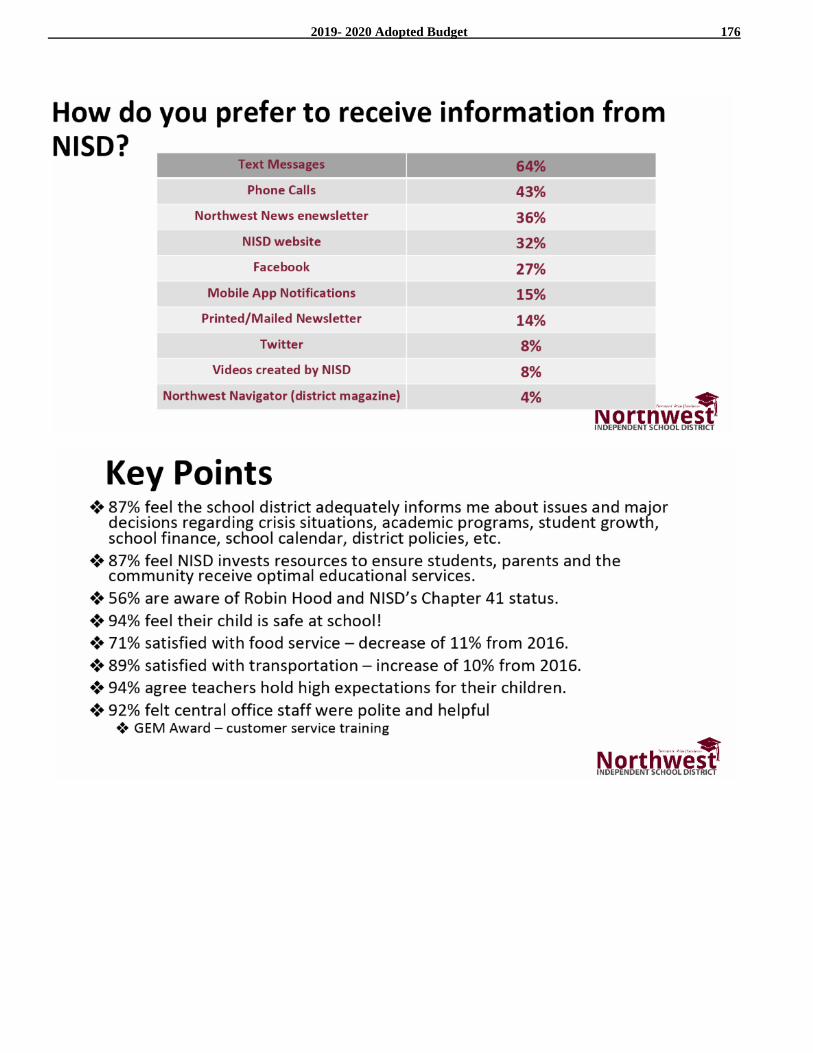
2019- 2020 Adopted Budget 176
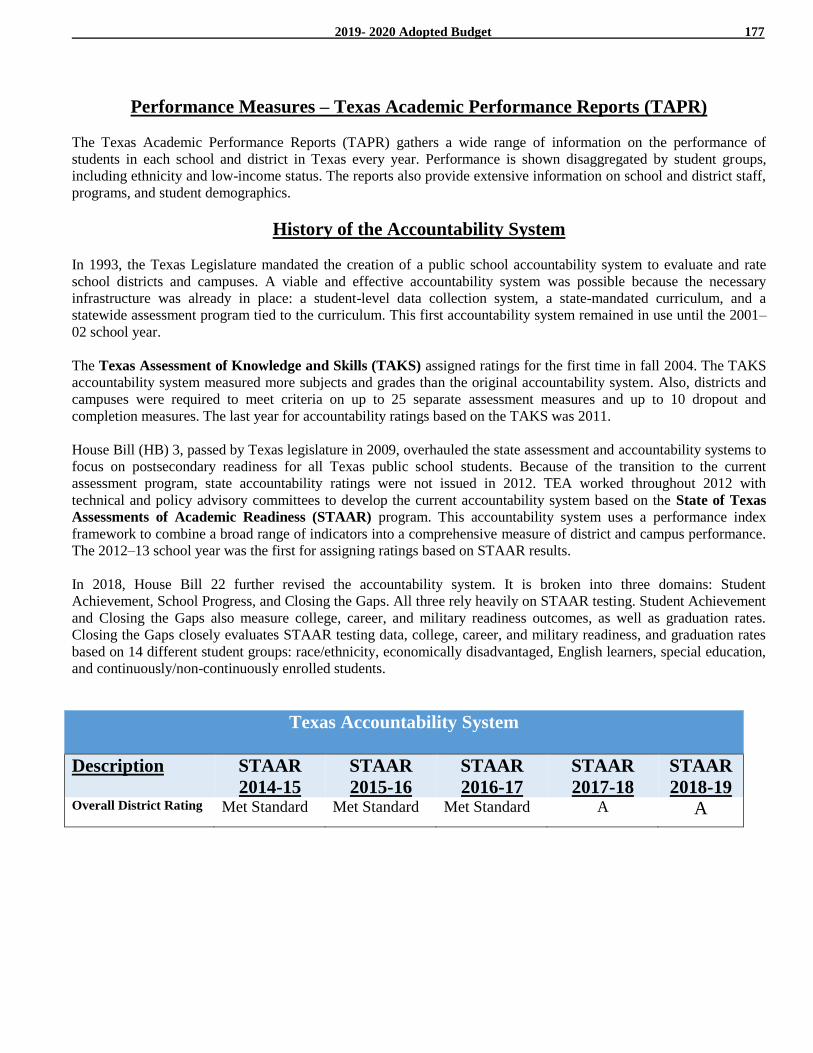
2019- 2020 Adopted Budget 177
Performance Measures – Texas Academic Performance Reports (TAPR)
The Texas Academic Performance Reports (TAPR) gathers a wide range of information on the performance of
students in each school and district in Texas every year. Performance is shown disaggregated by student groups,
including ethnicity and low-income status. The reports also provide extensive information on school and district staff,
programs, and student demographics.
History of the Accountability System
In 1993, the Texas Legislature mandated the creation of a public school accountability system to evaluate and rate
school districts and campuses. A viable and effective accountability system was possible because the necessary
infrastructure was already in place: a student-level data collection system, a state-mandated curriculum, and a
statewide assessment program tied to the curriculum. This first accountability system remained in use until the 2001–
02 school year.
The Texas Assessment of Knowledge and Skills (TAKS) assigned ratings for the first time in fall 2004. The TAKS
accountability system measured more subjects and grades than the original accountability system. Also, districts and
campuses were required to meet criteria on up to 25 separate assessment measures and up to 10 dropout and
completion measures. The last year for accountability ratings based on the TAKS was 2011.
House Bill (HB) 3, passed by Texas legislature in 2009, overhauled the state assessment and accountability systems to
focus on postsecondary readiness for all Texas public school students. Because of the transition to the current
assessment program, state accountability ratings were not issued in 2012. TEA worked throughout 2012 with
technical and policy advisory committees to develop the current accountability system based on the State of Texas
Assessments of Academic Readiness (STAAR) program. This accountability system uses a performance index
framework to combine a broad range of indicators into a comprehensive measure of district and campus performance.
The 2012–13 school year was the first for assigning ratings based on STAAR results.
In 2018, House Bill 22 further revised the accountability system. It is broken into three domains: Student
Achievement, School Progress, and Closing the Gaps. All three rely heavily on STAAR testing. Student Achievement
and Closing the Gaps also measure college, career, and military readiness outcomes, as well as graduation rates.
Closing the Gaps closely evaluates STAAR testing data, college, career, and military readiness, and graduation rates
based on 14 different student groups: race/ethnicity, economically disadvantaged, English learners, special education,
and continuously/non-continuously enrolled students.
Texas Accountability System
Description STAAR
2014-15
STAAR
2015-16
STAAR
2016-17
STAAR
2017-18
STAAR
2018-19 Overall District Rating Met Standard Met Standard Met Standard A A
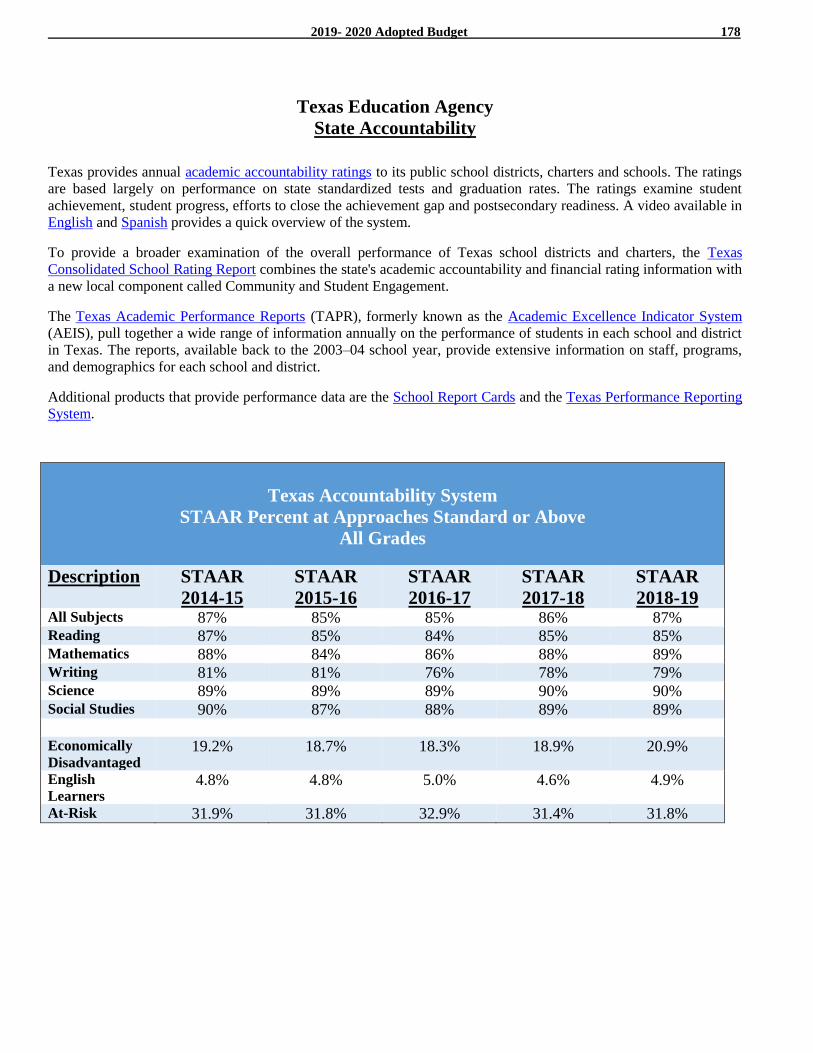
2019- 2020 Adopted Budget 178
Texas Education Agency
State Accountability
Texas provides annual academic accountability ratings to its public school districts, charters and schools. The ratings
are based largely on performance on state standardized tests and graduation rates. The ratings examine student
achievement, student progress, efforts to close the achievement gap and postsecondary readiness. A video available in
English and Spanish provides a quick overview of the system.
To provide a broader examination of the overall performance of Texas school districts and charters, the Texas
Consolidated School Rating Report combines the state's academic accountability and financial rating information with
a new local component called Community and Student Engagement.
The Texas Academic Performance Reports (TAPR), formerly known as the Academic Excellence Indicator System
(AEIS), pull together a wide range of information annually on the performance of students in each school and district
in Texas. The reports, available back to the 2003–04 school year, provide extensive information on staff, programs,
and demographics for each school and district.
Additional products that provide performance data are the School Report Cards and the Texas Performance Reporting
System.
Texas Accountability System
STAAR Percent at Approaches Standard or Above
All Grades
Description STAAR
2014-15
STAAR
2015-16
STAAR
2016-17
STAAR
2017-18
STAAR
2018-19 All Subjects 87% 85% 85% 86% 87% Reading 87% 85% 84% 85% 85% Mathematics 88% 84% 86% 88% 89% Writing 81% 81% 76% 78% 79% Science 89% 89% 89% 90% 90% Social Studies 90% 87% 88% 89% 89%
Economically
Disadvantaged 19.2% 18.7% 18.3% 18.9% 20.9%
English
Learners 4.8% 4.8% 5.0% 4.6% 4.9%
At-Risk 31.9% 31.8% 32.9% 31.4% 31.8%
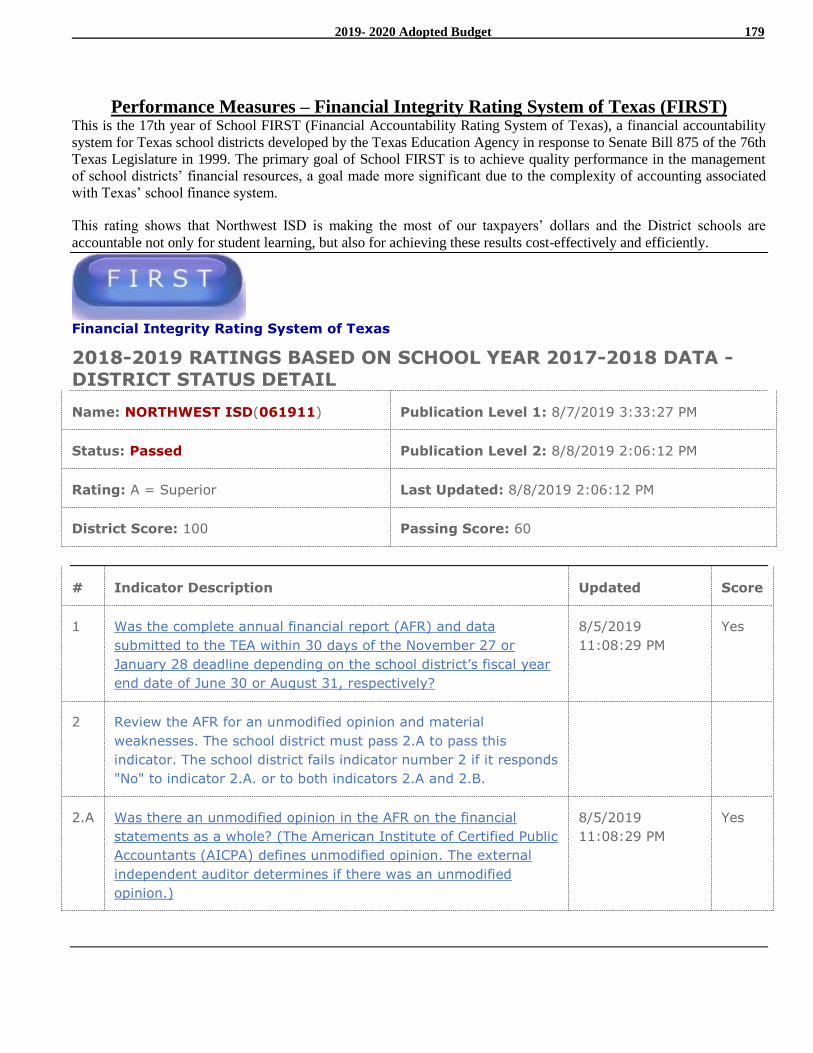
2019- 2020 Adopted Budget 179
Performance Measures – Financial Integrity Rating System of Texas (FIRST)
This is the 17th year of School FIRST (Financial Accountability Rating System of Texas), a financial accountability
system for Texas school districts developed by the Texas Education Agency in response to Senate Bill 875 of the 76th
Texas Legislature in 1999. The primary goal of School FIRST is to achieve quality performance in the management
of school districts’ financial resources, a goal made more significant due to the complexity of accounting associated
with Texas’ school finance system.
This rating shows that Northwest ISD is making the most of our taxpayers’ dollars and the District schools are
accountable not only for student learning, but also for achieving these results cost-effectively and efficiently.
Financial Integrity Rating System of Texas
2018-2019 RATINGS BASED ON SCHOOL YEAR 2017-2018 DATA - DISTRICT STATUS DETAIL
Name: NORTHWEST ISD(061911) Publication Level 1: 8/7/2019 3:33:27 PM
Status: Passed Publication Level 2: 8/8/2019 2:06:12 PM
Rating: A = Superior Last Updated: 8/8/2019 2:06:12 PM
District Score: 100 Passing Score: 60
# Indicator Description Updated Score
1 Was the complete annual financial report (AFR) and data
submitted to the TEA within 30 days of the November 27 or
January 28 deadline depending on the school district’s fiscal year
end date of June 30 or August 31, respectively?
8/5/2019
11:08:29 PM
Yes
2 Review the AFR for an unmodified opinion and material
weaknesses. The school district must pass 2.A to pass this
indicator. The school district fails indicator number 2 if it responds
"No" to indicator 2.A. or to both indicators 2.A and 2.B.
2.A Was there an unmodified opinion in the AFR on the financial
statements as a whole? (The American Institute of Certified Public
Accountants (AICPA) defines unmodified opinion. The external
independent auditor determines if there was an unmodified
opinion.)
8/5/2019
11:08:29 PM
Yes
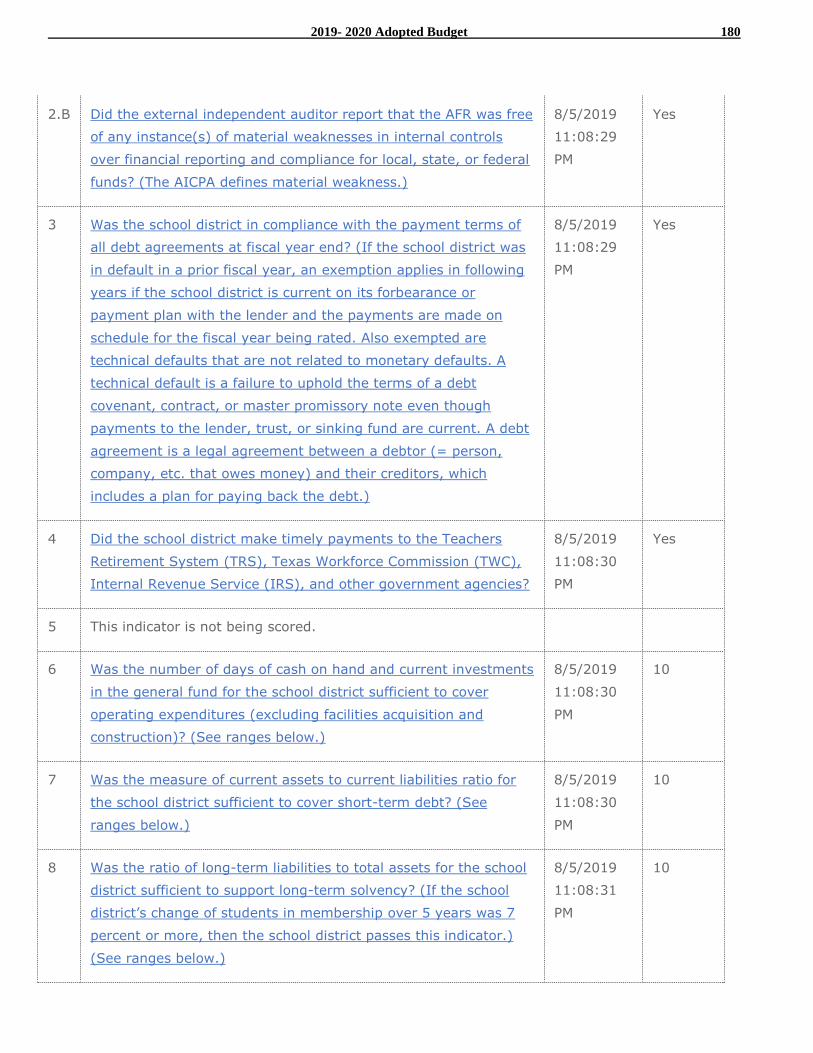
2019- 2020 Adopted Budget 180
2.B Did the external independent auditor report that the AFR was free
of any instance(s) of material weaknesses in internal controls
over financial reporting and compliance for local, state, or federal
funds? (The AICPA defines material weakness.)
8/5/2019
11:08:29
PM
Yes
3 Was the school district in compliance with the payment terms of
all debt agreements at fiscal year end? (If the school district was
in default in a prior fiscal year, an exemption applies in following
years if the school district is current on its forbearance or
payment plan with the lender and the payments are made on
schedule for the fiscal year being rated. Also exempted are
technical defaults that are not related to monetary defaults. A
technical default is a failure to uphold the terms of a debt
covenant, contract, or master promissory note even though
payments to the lender, trust, or sinking fund are current. A debt
agreement is a legal agreement between a debtor (= person,
company, etc. that owes money) and their creditors, which
includes a plan for paying back the debt.)
8/5/2019
11:08:29
PM
Yes
4 Did the school district make timely payments to the Teachers
Retirement System (TRS), Texas Workforce Commission (TWC),
Internal Revenue Service (IRS), and other government agencies?
8/5/2019
11:08:30
PM
Yes
5 This indicator is not being scored.
6 Was the number of days of cash on hand and current investments
in the general fund for the school district sufficient to cover
operating expenditures (excluding facilities acquisition and
construction)? (See ranges below.)
8/5/2019
11:08:30
PM
10
7 Was the measure of current assets to current liabilities ratio for
the school district sufficient to cover short-term debt? (See
ranges below.)
8/5/2019
11:08:30
PM
10
8 Was the ratio of long-term liabilities to total assets for the school
district sufficient to support long-term solvency? (If the school
district’s change of students in membership over 5 years was 7
percent or more, then the school district passes this indicator.)
(See ranges below.)
8/5/2019
11:08:31
PM
10
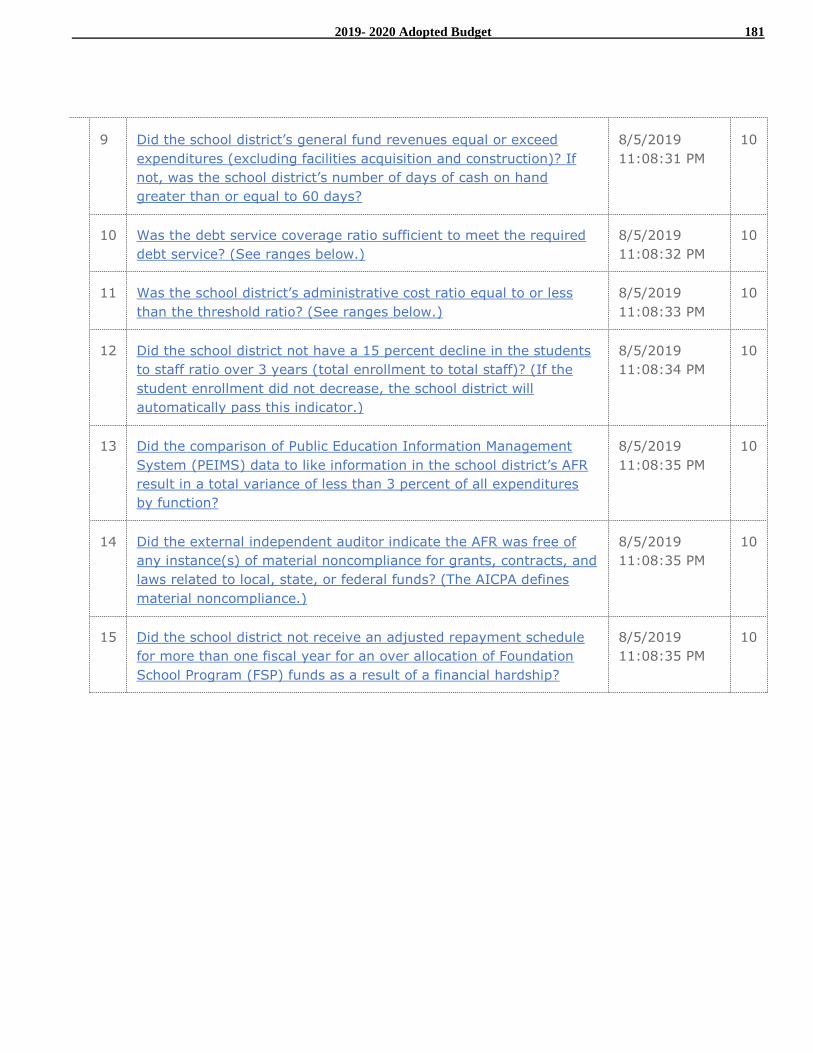
2019- 2020 Adopted Budget 181
9 Did the school district’s general fund revenues equal or exceed
expenditures (excluding facilities acquisition and construction)? If
not, was the school district’s number of days of cash on hand
greater than or equal to 60 days?
8/5/2019
11:08:31 PM
10
10 Was the debt service coverage ratio sufficient to meet the required
debt service? (See ranges below.)
8/5/2019
11:08:32 PM
10
11 Was the school district’s administrative cost ratio equal to or less
than the threshold ratio? (See ranges below.)
8/5/2019
11:08:33 PM
10
12 Did the school district not have a 15 percent decline in the students
to staff ratio over 3 years (total enrollment to total staff)? (If the
student enrollment did not decrease, the school district will
automatically pass this indicator.)
8/5/2019
11:08:34 PM
10
13 Did the comparison of Public Education Information Management
System (PEIMS) data to like information in the school district’s AFR
result in a total variance of less than 3 percent of all expenditures
by function?
8/5/2019
11:08:35 PM
10
14 Did the external independent auditor indicate the AFR was free of
any instance(s) of material noncompliance for grants, contracts, and
laws related to local, state, or federal funds? (The AICPA defines
material noncompliance.)
8/5/2019
11:08:35 PM
10
15 Did the school district not receive an adjusted repayment schedule
for more than one fiscal year for an over allocation of Foundation
School Program (FSP) funds as a result of a financial hardship?
8/5/2019
11:08:35 PM
10
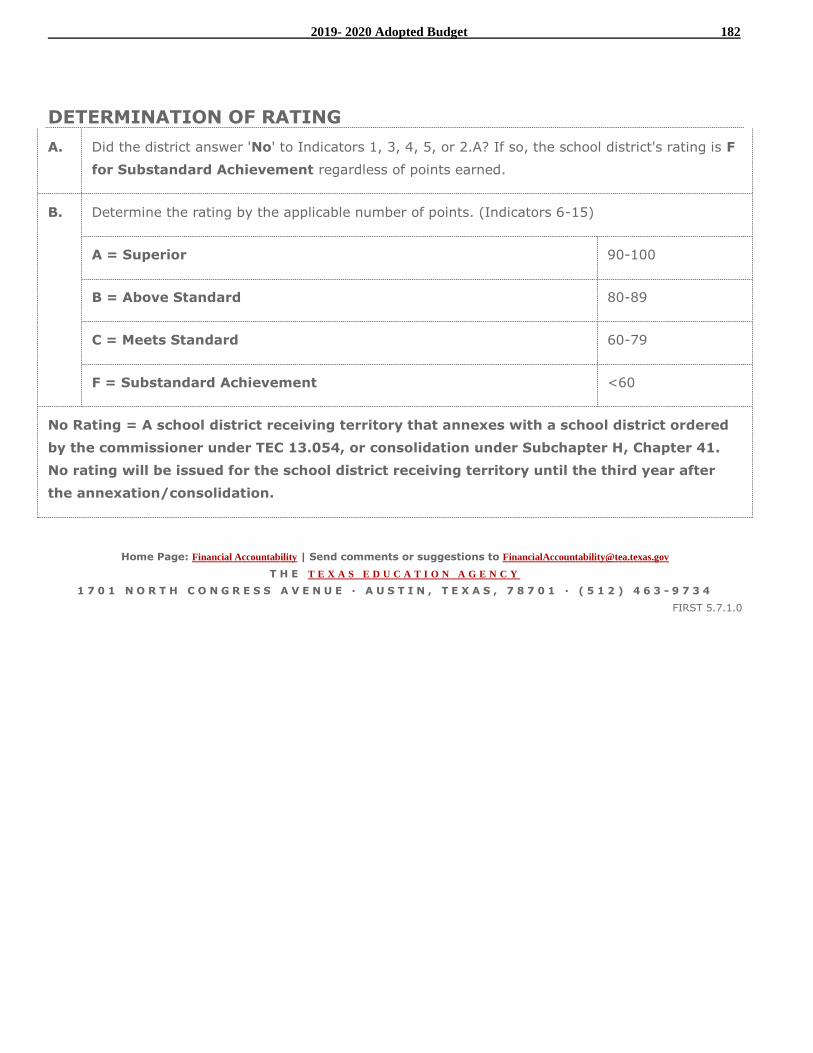
2019- 2020 Adopted Budget 182
DETERMINATION OF RATING
A. Did the district answer 'No' to Indicators 1, 3, 4, 5, or 2.A? If so, the school district's rating is F
for Substandard Achievement regardless of points earned.
B. Determine the rating by the applicable number of points. (Indicators 6-15)
A = Superior 90-100
B = Above Standard 80-89
C = Meets Standard 60-79
F = Substandard Achievement <60
No Rating = A school district receiving territory that annexes with a school district ordered
by the commissioner under TEC 13.054, or consolidation under Subchapter H, Chapter 41.
No rating will be issued for the school district receiving territory until the third year after
the annexation/consolidation.
Home Page: Financial Accountability | Send comments or suggestions to [email protected]
T H E T E X A S E D U C A T I O N A G E N C Y
1 7 0 1 N O R T H C O N G R E S S A V E N U E · A U S T I N , T E X A S , 7 8 7 0 1 · ( 5 1 2 ) 4 6 3 - 9 7 3 4
FIRST 5.7.1.0
2019- 2020 Adopted Budget 183
District, Student, and Staff Accomplishments for 2018-2019
District/Campus Accomplishments
Northwest ISD is a member of the Texas High Performance Schools Consortium, selected by the Texas
Education Agency, which extends the ongoing work of the Public Education Visioning Institute. The vision
encourages innovation, creativity and more meaningful assessment and accountability measures.
Northwest ISD received high marks on a recent security audit. Results showed a significant amount of work and
capital has been invested in the schools' physical security.
Northwest ISD earned a 4.0 star rating in the Financial Allocation Study for Texas (FAST) report for low cost, high
efficiency operations. The district received a rating of "Superior Achievement" under Texas' Schools First Financial
accountability rating system for the twelfth consecutive year.
The Northwest ISD budget document was awarded the Meritorious Budget Award by ASBO for the fiscal years
2001-2002 through 2018-2019 and the Distinguished Budget Presentation Award by GFOA for the fiscal years
2002-2003 through 2018-2019.
Additionally, the Northwest Independent School District Comprehensive Annual Financial Report has been awar ded
the Certificate of Excellence in Financial Reporting by the Association of School Business Officials for the 20 th time
and the Meritorious Budget Award for the 18th year.
Northwest ISD received the Award of Merit for Purchasing Operations with Recognized Status from the Texas
Association of School Business Officials for the eighth consecutive year.
The National Parent Teacher Association named six Northwest ISD schools – Beck, Justin, Love and Schluter
elementary schools as well as Byron Nelson and Northwest high schools – to its list of 2018-20 Schools of Excellence.
The schools were named to the list for maintaining positive community environments with their associations.
The Northwest ISD Twitter account, @NorthwestISD, was ranked among the top 10 school district Twitter accounts in
Region XI by Texas Social Media Research Institute . The account was the top-ranked among school districts with
Northwest ISD’s enrollment or smaller.
The Outdoor Learning Center’s design earned the Caudill Class recognition in the Texas Association of School
Administrators’ annual architecture competition, the top honor available for a school’s architecture.
Byron Nelson, Eaton and Northwest high schools were named recipients of the Counselors Reinforcing Excellence for
Students in Texas – or CREST – award. This award is the top honor for public school counseling staffs in the state.
Chisholm Trail Middle School has been named to the Texas Schools to Watch list for the third consecutive time,
honoring the school’s commitments to academics and ensuring all students reach lofty achievement levels. The program
honors middle-level schools across the state based on academic excellence, responsiveness to the needs and interests of
students, a commitment to all students, and strong organizational structures and processes.
The National Association of Music Merchants Foundation named Northwest ISD to its 2019 Best Communities for
Music Education list, marking the 11th consecutive time the district has received the honor. School districts selected to
this list are awarded for their demonstration of outstanding achievement in efforts to provide music education and access
to all students.
Byron Nelson High School has been named to the U.S. News & World Report 2019 Best High Schools list. The
recognition places Byron Nelson in the top third of schools across the nation, according to the publication.
Educational Results Partnership and the Institute for Productivity in Education recognized Steele Accelerated High
School as a 2018-19 Texas Honor Roll awardee. Steele earned the recognition for demonstrating consistently high levels
of student academic achievement, student improvement over time and a reduction in achievement gaps.
2019- 2020 Adopted Budget 184
Hughes Elementary School was honored as a School Transforming Learning by the Principals’ Institute, recognizing
each school’s commitment to providing innovative educational services. Just three elementary schools across Texas
received the honor in 2019.
Niche.com ranks Northwest ISD among the top 100 school districts in Texas for the 2018-19 school year. The website
gave the district high marks in all categories, particularly health and safety, academics, college prep, and clubs and
activities.
Northwest ISD schools earned the EPA Energy Star certification for their energy conservation. Buildings with this
certification are guaranteed to perform in the top 25 percent of buildings nationwide in terms of conserving energy usage.
Prairie View and Seven Hills elementary schools were named Leader in Me Lighthouse Schools for their positive
student response to the program’s leadership and emotional development initiatives.
2019- 2020 Adopted Budget 185
Student Accomplishments The Class of 2019 earned a record breaking $57.3 million in scholarships.
Northwest ISD earned AP District Honor Roll, one of just 373 school districts in the nation.
Nearly 3,000 industry-recognized certifications (including Microsoft Masters, emergency medical technicians, Adobe, welding
and more) were earned by high school students.
Eleven students earned associate degrees at Steele Accelerated High School.
Northwest ISD’s high school fine arts programs combined to have 13 students named to the Texas Music Educator
Association’s all-state music groups. Students were selected from each of the district’s three comprehensive high
schools into five groups – all-state band, all-state jazz ensemble, all-state mixed choir, all-state tenor-bass choir and all-
state treble choir.
The staff of NHSTV, the student-run television network at Northwest High School operated by the Academy of Media
Arts & Technology, was named the Best Daily Live Show in the Southwest Region by the Student Television
Network for the fourth consecutive year.
Two Northwest ISD Destination Imagination teams (representing Thompson Elementary School and Medlin Middle
School) advanced to the Texas Destination Imagination Global Finals, the top national and international round of
competition for the problem-solving contest.
Byron Nelson High School’s Paige Flickinger earned the Gatorade Texas Volleyball Player of the Year award for her
exemplary play in her sport as well as her academic excellence.
Seven Northwest ISD wrestlers earned medals at the 2019 UIL Wrestling State Tournament, including two state
champions. State champions include Byron Nelson’s Lexie Basham in the 6A girls 138-pound weight class and
Northwest’s Aiden Jean in the 5A boys 182-pound weight class.
Northwest High School’s Cooper McDonald won the gold medal in the 5A boys discus, and Byron Nelson High
School’s Calvin Wiggins Jr. earned the silver medal in the 6A boys 200-meter dash at the 2019 UIL Track & Field
State Meet.
Seventy-nine Northwest ISD senior student-athletes have signed to play collegiate sports after graduating in 2018,
spanning all three of the district’s comprehensive high schools.
The Northwest High School girls golf team and Byron Nelson High School boys and girls golf teams all advanced to
the 2019 UIL Golf State Tournament.
The Northwest High School one-act play theatre group advanced to the 2019 UIL 5A Region I One-Act Play Meet,
earning state alternate status.
Byron Nelson High School earned five nominations in the eighth annual Dallas Summer Musicals High School Musical
Theatre Awards, among the most for any school.
2019- 2020 Adopted Budget 186
Northwest ISD’s three comprehensive high schools combined for 12 nominations in the Betty Lynn Buckley Awards,
one of the top theatre awards contests in the state. Eaton High School’s Jenelle Cumberland won the overall award
for excellence in scenic design.
Three Northwest ISD students – Byron Nelson’s Sarah Cornerstone and Hannah Stauss, and Eaton’s Grant Westfall –
were named National Merit Finalists, placing them among the top-scoring PSAT-takers in the state and nation. In all, 18
Northwest ISD seniors earned some form of distinction from top PSAT test scores.
Byron Nelson High School’s softball team earned the top weighted team GPA in the nation in its sport for the sixth
straight year, earning the National Fastpitch Softball Coaches Association’s All-Academic Team award. Additionally,
Eaton High School placed fourth on the list of top weighted team GPAs in its second year of eligibility; it moved up from
the No. 5 spot in 2017.
All three Northwest ISD high school marching bands – from Byron Nelson, Eaton and Northwest – earned the top
score possible, Division 1, at the UIL Region 2 contest.
Northwest High School’s cheerleading squad and Sidekicks drill team members performed in the 2018 Macy’s
Thanksgiving Day Parade in New York City in front of more than 50 million television and 3 million in -person viewers.
The Byron Nelson High School cheerleading squad earned bronze medals by finishing third overall in the 6A Division
II classification of the 2019 UIL State Spirit Championships.
2019- 2020 Adopted Budget 187
Staff Accomplishments
The Northwest ISD Education Foundation presented 27 grants to 19 campuses totaling $86,000.
Byron Nelson High School’s Tammy McClure was named the 2019 Eddie G. Bull State Advisor of the Year by the
Texas Association of Student Councils for her work leading Byron Nelson’s council.
Thompson Elementary School’s Marcie Conrad was named a finalist for the HEB Lifetime Achievement Award,
honoring her career in education.
District educator Kaycee Bennett earned the Marty Murrell Excellence in Education Award for her work teaching and
assisting deafblind students and their teachers, representing the top regional honor in her profession.
Jason Sanders, the district’s coordinator of instructional technology, received the Technology Administrator of the
Year Award from the Texas Computer Education Association for his exemplary work integrating technology in schools.
Northwest ISD’s communications team earned five state awards in the Texas School Public Relations Association’s
2019 Star Awards banquet. These awards serve as the top professional honors for school public relations professionals
in the state.
Eaton High School counselor Shana Jackson was named a Texas OnCourse leader fellow, making her one of just 29
counselors and advisers in the state selected among the top in their field.
Byron Nelson High School’s counseling team received 2018 RAMP distinction from the American School Counselor
Association, designating it as one of the top counseling staffs in the nation for five years.
2019- 2020 Adopted Budget 188
THE
DISTRICT
AREA
ECONOMY
The commercial, industrial, and residential growth of the District has kept pace with that of
the Fort Worth/Dallas area, and has been aided by the District’s close proximity to both
Dallas/Fort Worth International Airport and Fort Worth’s Alliance Airport.
Other Institutions of Higher Learning
In addition, the following major colleges are located within a 100-mile radius of the District.
Austin College Sherman, Texas
Dallas Community College System Dallas County, Texas
Texas A&M University at Commerce Commerce, Texas
Grayson County Community College Sherman, Texas
Southern Methodist University Dallas, Texas
Texas Christian University Fort Worth, Texas
Texas Woman’s University Denton, Texas
University of Dallas Dallas, Texas
University of North Texas Denton, Texas
University of Texas at Arlington Arlington, Texas
University of Texas at Dallas Dallas, Texas
Area Developments
AllianceTexas
AllianceTexas, developed by Hillwood - a Perot Company, is an 18,000-acre master-planned,
mixed-use community located in north Fort Worth. AllianceTexas offers a variety of
commercial real estate options, including new industrial, office and retail space. Anchored by
the multi-modal inland port known as the Alliance Global Logistics Hub, AllianceTexas is
home to more than 400 companies, over 40,000 employees and integrated home options for
any budget and lifestyle.
Global Logistics Hub
Centrally located in the United States, the 18,000-acre AllianceTexas development is
anchored by the Alliance Global Logistics Hub, one of the world’s premier inland ports. The
Alliance Global Logistics Hub offers strategic multi-modal transportation infrastructure,
including:
BNSF Railway’s Alliance Intermodal Facility
Two Class I rail lines (BNSF and UP)
Fort Worth Alliance Airport - the world’s first industrial airport
Interstate Highway 35W from Mexico to Canada, Texas Highways 114 and 170,
FedEx Southwest Regional Sort Hub, and UPS Hub
In addition to the established transportation infrastructure at the Alliance Global Logistics
Hub, there are significant economic benefits and supply-chain services available, including:
Foreign-Trade Zone (FTZ) #196
User-friendly FTZ services
Triple Freeport Inventory Tax Exemption
Air cargo ground handling and aviation services
Existing rail-served facilities
Third-party logistics
Workforce recruitment and retention services
2019- 2020 Adopted Budget 189
Industrial/Flex
Facilities are constructed with high standards, incorporating LEED elements. Sectors zoned
for industrial and flex space include:
Alliance Center
Alliance Commerce Center
Alliance Gateway
Westport at Alliance
Alliance Center North
Office
The office market at Alliance Texas offers more than 4 million square feet of corporate
campus, Class A office and flex space. Alliance Texas has a multitude of office amenities
including business services, retail, dining, medical services, and more. The development's
proximity to DFW Airport enables passenger service to all major cities in North America
within four hours. Fort Worth Alliance Airport, which anchors the project, provides the best
of corporate aviation service
Fort Worth Alliance Airport
Fort Worth Alliance Airport (AFW) is the world's first 100% industrial airport designed for
cargo and corporate aviation. AFW features a vast array of flight services, including air
cargo, corporate and military aviation, and is the cornerstone for the nation's fastest-growing
industrial complex, the Alliance Global Logistics Hub. There is no finer facility for corporate,
industrial/air cargo or military aviation than Fort Worth Alliance Airport.
Owned by the City of Fort Worth and managed by privately-held Alliance Air Services, Fort
Worth Alliance Airport provides state-of-the-art infrastructure and an award-winning FAA
Air Traffic Control Tower.
Retail
Several unique retail centers are available within the 18,000-acre Alliance Texas®
development that provide needed services to a variety of customers. With an abundance of
daytime professionals and a growing residential market, Alliance Texas is an excellent
location for shopping, dining, entertainment and business services.
As Alliance Texas matures into a world-class development, it continues to drive tremendous
growth in one of the fastest-growing areas of the country's most vibrant state. 2010 Census
data revealed that Fort Worth has grown by 38.6 percent since 2000, adding over 200,000
new residents, with much of that growth taking place in the north Fort Worth / Alliance
corridor. In fact, Fort Worth ranked as the fastest-growing large city (population over
500,000) in the entire U.S. for the past decade. Tarrant County, in which Fort Worth is found,
grew by over 25 percent over the period, adding more than 350,000 new residents. Nearby
communities of Haslet, Roanoke and Keller, Texas also experienced tremendous growth,
making Alliance Texas an ideal location for retail. A variety of retail environments are
available within Alliance Texas, including:
Alliance Crossing
Alliance Town Center
Heritage Marketplace
Lone Star Crossing
Westlake Corners
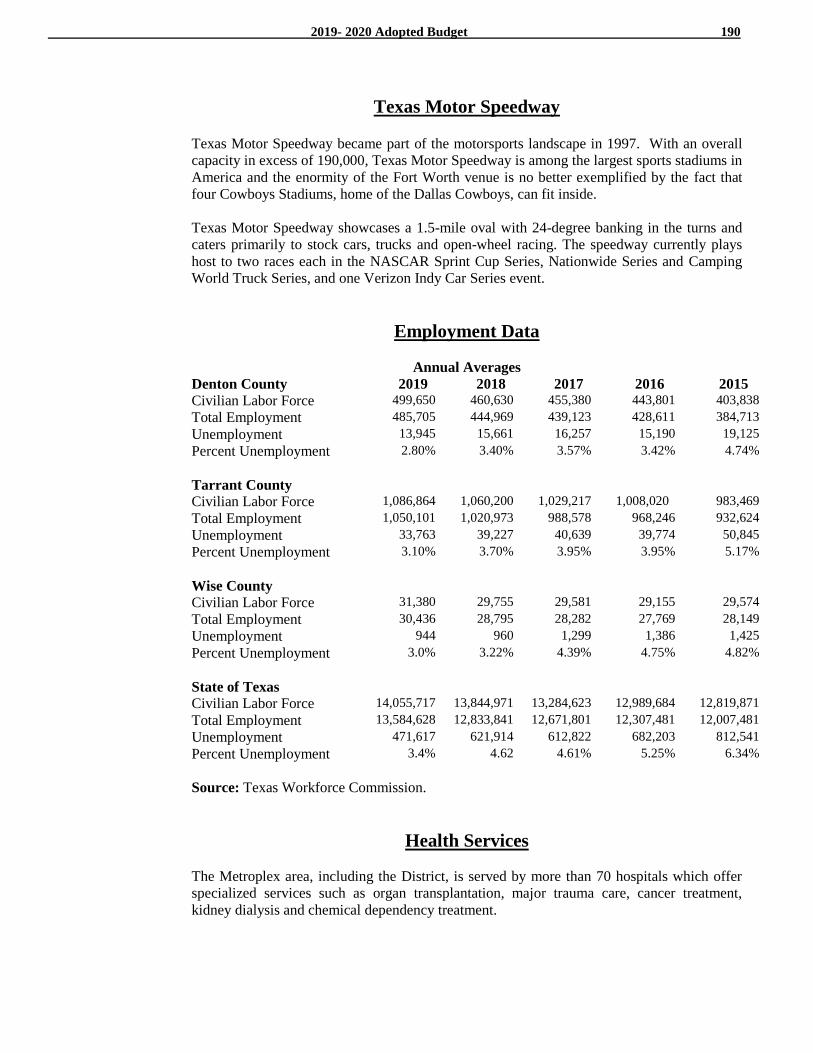
2019- 2020 Adopted Budget 190
Texas Motor Speedway
Texas Motor Speedway became part of the motorsports landscape in 1997. With an overall
capacity in excess of 190,000, Texas Motor Speedway is among the largest sports stadiums in
America and the enormity of the Fort Worth venue is no better exemplified by the fact that
four Cowboys Stadiums, home of the Dallas Cowboys, can fit inside.
Texas Motor Speedway showcases a 1.5-mile oval with 24-degree banking in the turns and
caters primarily to stock cars, trucks and open-wheel racing. The speedway currently plays
host to two races each in the NASCAR Sprint Cup Series, Nationwide Series and Camping
World Truck Series, and one Verizon Indy Car Series event.
Employment Data
Annual Averages
Denton County 2019 2018 2017 2016 2015
Civilian Labor Force 499,650 460,630 455,380 443,801 403,838
Total Employment 485,705 444,969 439,123 428,611 384,713
Unemployment 13,945 15,661 16,257 15,190 19,125
Percent Unemployment 2.80% 3.40% 3.57% 3.42% 4.74%
Tarrant County
Civilian Labor Force 1,086,864 1,060,200 1,029,217 1,008,020 983,469
Total Employment 1,050,101 1,020,973 988,578 968,246 932,624
Unemployment 33,763 39,227 40,639 39,774 50,845
Percent Unemployment 3.10% 3.70% 3.95% 3.95% 5.17%
Wise County
Civilian Labor Force 31,380 29,755 29,581 29,155 29,574
Total Employment 30,436 28,795 28,282 27,769 28,149
Unemployment 944 960 1,299 1,386 1,425
Percent Unemployment 3.0% 3.22% 4.39% 4.75% 4.82%
State of Texas
Civilian Labor Force 14,055,717 13,844,971 13,284,623 12,989,684 12,819,871
Total Employment 13,584,628 12,833,841 12,671,801 12,307,481 12,007,481
Unemployment 471,617 621,914 612,822 682,203 812,541
Percent Unemployment 3.4% 4.62 4.61% 5.25% 6.34%
Source: Texas Workforce Commission.
Health Services
The Metroplex area, including the District, is served by more than 70 hospitals which offer
specialized services such as organ transplantation, major trauma care, cancer treatment,
kidney dialysis and chemical dependency treatment.
2019- 2020 Adopted Budget 191
Air Transport and the Airline Industry
DFW Airport is located between the Cities of Dallas and Fort Worth and is the principal air carrier facility serving the North Central Texas region and the Dallas/Fort Worth metropolitan area (the “Metroplex”). The Metroplex contains 24 percent of the state’s population and 27 percent of the labor force. Population growth, corporate activity, and business diversity are significant drivers of the Airport’s business. DFW’s central North American location makes it the preeminent U.S. hub and connecting point for the entire continent. DFW’s strategic central location, superior air service, and diverse economy are the major reasons that businesses relocate to the area and propel the Metroplex to be the fastest-growing metropolitan market in the United States with one of the most stable economies. There are 17 Fortune 500 companies headquartered in the Metroplex, including Exxon Mobil, AT&T and J.C. Penney. The region’s diverse economy has enabled it to weather economic downturns in key sectors. DFW is known as the economic engine for the North Texas region with an estimated annual impact of $15.7 billion, 321,000 jobs, and $7.4 billion in payroll based on the most recent North Texas Commission and University of North Texas data. These jobs consist of airport and airline employees, as well as construction, maintenance, hospitality and tourism employees. The City of Fort Worth Aviation Systems is home to three world-class airports – Alliance,
Meacham International and Spinks. Each airport offers a diverse industrial base, which makes it an attractive location for a variety of businesses. Both Meacham International and Spinks Airports provide regional aviation services for air charter, corporate, business and recreational flyers. The airports feature full service FBOs, multiple maintenance facilities, flight schools, on site rental car facilities, and hotel facilities only minutes away. Owned by the City of Fort Worth and managed by privately-held Alliance Air Services, Fort Worth Alliance Airport provides a state-of-the-art infrastructure servicing air cargo, corporate aviation and military flight needs.
Surface Transport Three interstate highways (Interstate 20, Interstate 30 and Interstate 35), five federal and four state highways provide all-weather routes within Fort Worth and to and from the rest of the nation. Interstate 820, which encircles the City, allows quick access to all parts of the Fort Worth area. Fort Worth is served by six major railroad systems one of which, Burlington Northern/Santa Fe Railroad, has its corporate headquarters in Fort Worth. Rail passenger service is provided through Fort Worth, including AMTRAK service between Houston and Chicago. Fort Worth’s position as a major southwest distribution center is supported by the presence of 75 regular route motor carriers with over 750 schedules. Local transit service is provided by The T, operated by the Fort Worth Transportation Authority. Trinity Railway Express provides service for the Metroplex. Greyhound Trailways Bus Lines furnish Fort Worth with transcontinental passenger service; intrastate bus service is provided by Transportation Enterprises and Texas
Bus Lines.
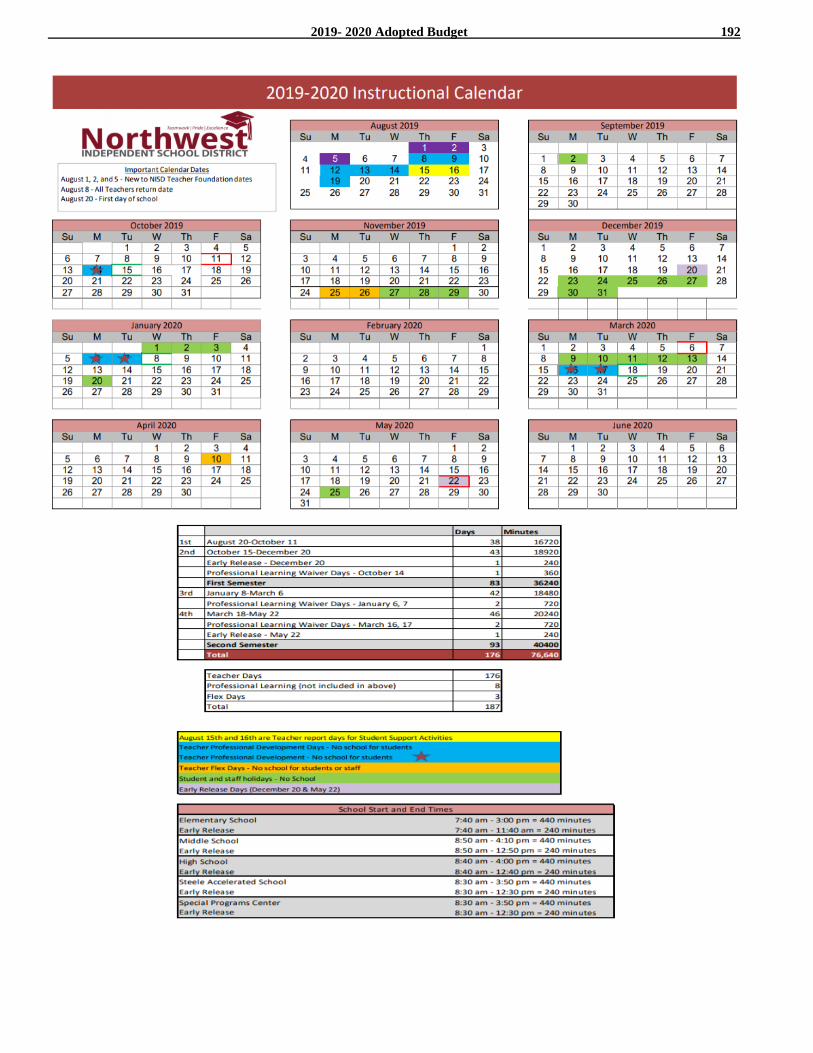
2019- 2020 Adopted Budget 192
2019- 2020 Adopted Budget 193
Education Terms and Abbreviations
Academic Excellence Indicators System (AEIS): A system of indicators established by the Legislature and adopted by the State
Board of Education to help determine the quality of learning on a campus and in a school district. The indicators include passing
rates on the state assessment tests, attendance, graduation rates, dropout rates, and scores on college entrance exams. The state
will assess district and school performance compared with state-level standards. AEIS is the foundation for a school district's
accountability rating.
Accountability Ratings: The Accountability Ratings System ranks campuses and districts as exemplary, recognized, acceptable,
and low performing based on the percentage of students who pass the state assessment instruments and the dropout rate.
Accrual Basis of Accounting: A method of accounting that recognizes the financial effect of transactions, events, and interfund
activities when they occur, regardless of the timing of related cash flows.
Actual Tax Rate or Nominal Tax Rate: The tax rate levied by school districts and used to calculate tax bills. (See "Effective
Tax Rate.")
Alternative Education Program (AEP): The law governing AEPs requires school districts to set up an educational setting for
students who engage in certain illegal conduct or for students who violate certain provisions of the school district's code of
conduct. Students assigned to an AEP must be separated from students not included in that program. These programs have come
to be called “disciplinary AEPs.” Many school districts have established alternative education programs for dropout prevention
and to address the unique needs of the small percentage of students who do not “fit” the traditional secondary schools. All AEPs
must provide for students’ educational and behavioral needs. Districts must allocate to an AEP the same expenditure per student
that would be allocated to the student’s school if the student was attending the student’s regularly assigned program, including a
special education program.
Alternative Teacher Education Programs: Some institutions of higher education, education service centers, and large school
districts have been approved by the State Board for Educator Certification to operate alternative programs of preparation for
teachers and administrators. These programs may involve university coursework or other professional development experiences,
as well as intense mentoring and supervision during the candidate's first year in the role of educator. In addition, some regional
education service centers offer alternative programs of preparation similar to the school-based programs.
Association of School Business Official s International (ASBO): The Association of School Business Official s International,
founded in 1910, is a professional association which provides programs and services to promote the highest standards of school
business management practices, professional growth, and the effective use of educational resources.
Available School Fund (ASF): Created by the Texas Constitution of 1876, the ASF is made up of earnings from the Permanent
School Fund and constitutionally dedicated motor fuel taxes and other miscellaneous revenue sources. The bulk of ASF revenue
is distributed on a per-capita basis to all school districts. A portion provides funding for free textbooks and technology needs for
schoolchildren.
Basic Allotment: The basic allotment is the initial or starting number that, after adjustment, is used to calculate foundation
program costs and state aid to school districts. Currently, the basic allotment is $2,537 per student.
Budgetary Basis of Accounting: The method used to determine when revenues and expenditures are recognized for budgetary
purposes.
Campus or Campus Program Charter: A local school board may grant a charter to parents and teachers of a campus within the
district if the board receives a petition signed by the parents of a majority of the students at the campus and a majority of teachers
at the campus. The code also permits two or more campuses to form a cooperative charter program. Other charters are home-rule
school district charters and open-enrollment charters.
Capital Appreciation Bond (CAB): A bond that is issued at a deep discount and does not have a stated coupon rate. Both
principal and interest are due and payable at maturity.
Caps: A general term that describes statutory limits on tax rates, revenues, or increases in school district expenditures.
Chapter 49 District: Refers to Chapter 49 of the Texas Education Code, which pertains to school districts with property wealth
in excess of $305,000 per weighted student and subject to reduction provisions.
2019- 2020 Adopted Budget 194
Chapter 49 Options: Provides school districts with property wealth in excess of $305,000 per weighted ADA with five options
to reduce their property wealth to the $305,000 threshold: (1) district consolidation by board action, (2) detachment and
annexation of property by board action, (3) purchase of attendance credits from the state (voter approval required), (4) contract
with other districts for educating their students (voter approval required), and (5) tax base consolidation (voter approval required).
CISD: Consolidated Independent School District.
Compensatory Education: The state compensatory education allotment provides additional financial support to school districts
to teach educationally disadvantaged pupils and underachieving students. A program of compensatory education should provide
additional services and instructional support, beyond the regular program, to help students compensate for academic deficiencies
and includes programs for at-risk students. The allotment is based upon the number of students participating in the federal free or
reduced-price lunch program.
Completion Rate: A longitudinal measure that shows the status of students expected to graduate, starting with their first
attendance in ninth grade.
Comprehensive Annual Financial Report (CAFR): A financial report that encompasses all funds and component units of the
government. The CAFR should contain (a) the basic financial statements and required supplementary information, (b) combining
statements to support columns in the basic financial statements that aggregate information from more than one fund or component
unit, and (c) individual fund statements as needed. The CAFR is the governmental unit's official annual report and also should
contain introductory information, schedules necessary to demonstrate compliance with finance-related legal and contractual
provisions, and statistical data.
Conforming Textbook List: One of two lists to which the State Board of Education assigns textbooks it adopts. This list includes
textbooks that address all of the adopted Texas Essential Knowledge and Skills (TEKS) for the subject and grade level and that
meet applicable physical specifications. (See "Nonconforming Textbook List.")
Cost of Education Index (CEI) or Adjustment: An index the state uses to adjust the basic allotment to account for geographic
or other cost differences beyond local school district control. The current index has not been updated since 1990.
County Appraisal District (CAD): Each county (some multicounties) has established an appraisal district office that is
responsible for maintaining taxable real and personal property records and placing a value on all property for taxation purposes. A
chief appraiser, an individual appointed by an appraisal district board of directors, heads the CAD office. The appraisal district
board is, in turn, elected by certain taxing entities.
CSD or CCSD: Common School District or Common Consolidated School. Generally, very small districts with three-member
(CSD) or seven-member boards of trustees that govern district affairs. Taxing authority is held by the county commissioner’s
court.
Denton Central Appraisal District (DCAD): (See "County Appraisal District.")
Denton County Tax Assessor / Collector (DCTA/C): The Tax Assessor/Collector is the constitutional office directed to assess
and collect all ad valorem tax accounts as identified and valued by the Denton Central Appraisal District. The Denton County Tax
Office also collects property taxes for 47 other taxing jurisdictions (school districts, cities and special districts).
Debt Service: (See "Interest and Sinking Fund.")
Disciplinary Alternative Education Programs: (See "Alternative Education Program.")
Distinguished Budget Presentation Award (Budget Awards Program): The Budget Awards Program is designed Government
Finance Officers Association to encourage governments to prepare budget documents of the highest quality to meet the needs of
decision-makers and citizens. Since the program was first established in 1984, participation has grown from 113 to 912. During
FY 2001, approximately 925 governments are expected to submit budgets to the program.
District: Northwest Independent School District.
District-Level Decision-Making Process: The school board annually approves district and campus performance objectives and
assures that district and campus plans are mutually supportive and, at a minimum, meet the state’s educational goals. Each
district has a distinct improvement plan that is developed, evaluated, and revised each year by the superintendent, with the
assistance of the district-level decision-making committee.

2019- 2020 Adopted Budget 195
Dropout: A student is identified as a dropout if he or she is absent without an approved excuse or document transfer and does not
return to school by the fall of the following year, or if he or she completes the school year but fails to reenroll the following
school year. School districts report the status of all students enrolled in grades 7 through 12 in the district during the prior school
year in one of two ways: as being in school or as having left school. The “leaver record” provides reasons for leaving school.
Dropout Rate (Annual): The annual dropout rate is the count of official dropouts summed across all grades (7 through 12)
divided by the number of students summed across all grades (7 through 12). The annual dropout rate is different than a
longitudinal rate, which compares the number of students who began school together in the seventh grade and who eventually
graduate.
Edgewood v. Meno: The long-running school finance equity lawsuit formerly known as Edgewood v. Kirby, was filed in 1984 by
a group of low-property wealth school districts (led by Edgewood ISD in San Antonio). At the center of the dispute was what
constitutes an efficient system of school finance. In 1995, the Texas Supreme Court defined an efficient system of school finance
as one that provides all districts with substantially equal access to operations and facilities funding necessary for the general
diffusion of knowledge. The court held that Senate Bill 7, the 1993 school finance law, met this standard.
Education Service Center (ESC): Twenty intermediate education units located in regions throughout Texas that assist and
provide services for local school districts.
Educator Certification: Everyone certified to teach in Texas must hold a bachelor's degree with coursework in three areas: (1) a
broad general education, (2) an academic specialization(s), and (3) teaching knowledge and abilities. The exceptions to the degree
requirement are certain career and technology certificates issued on the basis of work experience. Additionally, candidates for
certification must demonstrate basic academic skills by passing tests in reading, mathematics, and writing before admission to a
teacher-preparation program or must show evidence of these skills on other appropriate alternative assessments.
Effective Tax Rate: The tax rate that, if applied to the current local tax roll, would raise the same amount of revenue as in the
previous year. This tax rate is an important element of the annual truth-in-taxation process.
Electronic Textbooks: This term includes computer software, interactive video- disc, magnetic media, CD-ROM, computer
courseware, on-line services, an electronic medium, or other electronic means.
Equity: In school finance, the term refers to fair or equal distribution of resources for schooling, taking into account student
differences and school district characteristics. The standard used by the Texas Supreme Court is a taxpayer equity standard, which
means similar revenue for similar tax effort. In other words, the school finance system is to be property wealth neutral: a district's
property tax base should have little or no impact on its ability to finance the local share of the Foundation School Program.
Facilities Funding: The Legislature provides assistance to school districts for facilities construction in two ways. The
Instructional Facilities Allotment (IFA) provides a state partnership with local districts in making debt service payments to retire
bonds for construction of new facilities or renovations to existing facilities. Districts receiving aid are guaranteed $35 per pupil
per penny of tax effort. State aid is limited by appropriations and low-wealth districts have priority in receiving IFA funding. The
Existing Debt Allotment provides state assistance to districts for existing debt that is not covered by IFA funding. The state
guarantees $35 per unweighted student per penny for up to 12 cents of tax effort. The commissioner of education has extended
the tax cap to 29 cents for the 2002-03 school year.
Financial Integrity Rating System of Texas (FIRST): The 77th Legislative Session directed the commissioner of education, in
consultation of the Comptroller's office, to "...develop and implement a financial accountability rating system for school districts
in this state." In response to this directive, the Texas Education Agency (TEA) developed the Financial Integrity Rating System of
Texas (FIRST), which was fully implemented in the 2003-04 school year using 2002-03 data.
Foundation School Program (FSP): A program for the support of a basic instructional program for all Texas schoolchildren.
Money to support the program comes from the Permanent School Fund, Available School Fund, Foundation School Fund, state
general revenue, and local property taxes. The state establishes a foundation level and sets, for each district, a calculated
contribution level called the local fund assignment (LFA). The greater a district's property wealth, the higher the LFA. State aid
makes up the difference between the LFA and the foundation level. (See also "Local Fund Assignment.") Currently, the FSP
described in the Texas Education Code consists of three parts or tiers. The first tier provides funding for a basic program. The
second tier provides a guaranteed-yield system so that school districts have substantially equal access to revenue sufficient to
support an accredited program. The third tier equalizes debt service requirements for existing facilities debt.
2019- 2020 Adopted Budget 196
Foundation School Program Tax Rate: This is the rate used in calculating state aid to school districts. It is calculated by
dividing actual collections by the prior year’s taxable value determined by the state property tax division of the state comptroller.
Government Finance Officers Association (GFOA): A professional association of state/provincial and local finance officers in
the United States and Canada, and has served the public finance profession since 1906. The association's nearly 15,000 members
are dedicated to the sound management of government financial resources.
Guaranteed Yield: A school finance plan in which the state specifies a revenue yield that it will guarantee in terms of revenue
per student per penny of local tax effort. The districts adopt tax rates and levy taxes. The state makes up the difference between
what each district levies locally per student and the guaranteed-yield per student. High-wealth districts may raise all of their
guaranteed-yield revenue from local tax sources. In Texas, this is commonly known as Tier 2 in the Foundation School Program.
In 2002-03, the guarantee is $27.14 per weighted student.
Home-Rule School District Charters: The Texas Education Code permits a school district to adopt a home-rule school district
charter itself and break free from many state rules and regulations. Home-rule school districts must maintain satisfactory
performance on the statewide accountability system. The concept is patterned after home-rule municipalities in Texas. Other
charter programs include open-enrollment charters and campus, or campus program, charters. To date, no Texas school district
has gone through the home-rule charter process.
Independent School District (ISD): The Texas Constitution permits the state Legislature to create school districts. Each district
operates its schools and taxes property within the district to support, in part, the schools. The term independent refers to the fact
that the school district is not a part of city or county government and has independent budgeting and taxing authority. In some
states, cities or town- ships operate or fund schools in addition to providing other government services. ISDs are governed by
locally elected boards of trustees.
Individual Education Plan (IEP): A document required by federal law that details the special education requirements for each
disabled student and explains how the school intends to address the student's needs. An IEP is intended to help ensure that
disabled students have equal access to public education in the least restrictive environment.
Individuals with Disabilities Education Act (IDEA): The 1997 IDEA strengthens academic expectations and accountability for
the nation's 5.4 million children with disabilities.
Instructional Facilities Allotment (IFA): Since 1997, the IFA has provided districts funds to school districts to help pay for debt
service. The mechanism for computing the state and local share of the IFA payment is a guaranteed-yield formula. Low-wealth
school districts and school districts not already participating in the IFA program have priority in receiving IFA funding for
construction or ;ease of new instructional facilities.
Interest and Sinking Fund (I&S) Tax Levy: Also called the debt service fund. A tax levied and money used by school districts
to pay for bonded indebtedness, usually construction of facilities or other capital needs.
Juvenile Justice Alternative Education Program (JJAEP): In counties with populations greater than 125,000, the juvenile
board must develop a juvenile justice AEP approved by the Texas Juvenile Probation Commission. In these larger counties,
students who engage in conduct requiring expulsion under Chapter 37 of the Texas Education Code must be placed in a JJAFP.
Local Fund Assignment (LFA): The portion of the foundation program allotment required to be paid by school districts using
the local property tax. The greater the property wealth of the district, the higher the LFA and the lower the amount of state aid the
district will receive. (See also "Foundation School Program.")
Maintenance and Operations Tax (M&O): A local school district tax rate that raises revenue to be used for any legal purpose to
operate and maintain the district's schools.
Modified Accrual Basis of Accounting: Basis of accounting according to which (a) revenues are recognized in the accounting
period in which they become available and measurable and (b) expenditures are recognized in the accounting period in which the
fund liability is incurred, if measurable, except for unmatured interest on general long-term debt and certain similar accrued
obligations, which should be recognized when due.
Meritorious Budget Award (MBA): The Meritorious Budget Award was designed by the Association of School Business
Officials International and school business management professionals to enable school business administrators to achieve a
standard of excellence in budget presentation. The program helps school systems build a solid foundation in the skills of
2019- 2020 Adopted Budget 197
developing, analyzing, and presenting a budget. The Meritorious Budget Award is only conferred to school systems that have
met or exceeded the Meritorious Budget Award Program Criteria.
Nonconforming Textbook List: One of two lists to which the State Board of Education assigns textbooks it adopts. This list
must include textbooks that address at least half of the adopted Texas Essential Knowledge and Skills (TEKS) for the subject and
grade level and meet applicable physical specifications. (See "Conforming Textbook List.")
Open-Enrollment Charters: Open-enrollment charter schools may be established by private nonprofit organizations, colleges
and universities, and other governmental entities that apply to the State Board of Education. The law authorizes the State Board to
approve up to 215 open-enrollment charter schools. Law also provides for creation of college or university charter schools at
“public senior colleges and universities.” There is no limit on the number of these charter schools that may be granted. Other
charter programs include home-rule school district charters and campus or campus program charters.
Permanent School Fund (PSF): A perpetual trust fund created by the Texas Constitution in 1876. PSF earnings go into the
Available School Fund, which the state apportions on a per-capita basis to districts for students enrolled in Texas public schools
after funding state textbook purchases. PSF investments include U.S. Treasury bonds, Texas municipal bonds, school district
building bonds, and securities. The State Board of Education administers the Fund under constitutional and statutory
requirements.
Premium Capital Appreciation Bond (PCAB): A bond that is issued at a deep discount and does not have a stated coupon rate.
Principal, interest and premium are all due and payable at maturity.
Public Education Grant (PEG) Program: In 1995, legislation passed to permit students in low-performing schools to attend
another public school in the student's home district or in another district. The amount of the public education grant is the total
state and local funding per student for the student's home district. The receiving district may accept or reject the student and may
not charge the student tuition.
Public Education Information Management System (PEIMS): A data management system that includes information on
student demographics, performance, teacher salaries, etc. The information for PEIMS is transmitted from local school districts to
the Texas Education Agency by the education service centers.
Public Information Act (PIA): PIA defines public information as information collected, assembled, or maintained under a law
or in connection with a governmental body's transaction of official business. PIA provides that public information must be made
available to the public upon request during the normal business hours of the district, unless an exception applies that allows or
requires that the information not be made public.
Rollback: Rollback is a taxpayer relief mechanism that allows local voters to contravene the school board's maintenance and
operations (M&O) tax rate decision if it exceeds a certain level. If the school board adopts an M&O tax rate that exceeds the
rollback tax rate, the district must call an election so voters can determine whether to ratify the adopted tax rate. The rollback rate
is equal to the tax rate that would provide the same local taxes and state aid per weighted average daily attendance as was
available the previous year plus $0.06.
School Board Authority: Statute gives local school boards the exclusive power and duty to govern and oversee the management
of the public schools. Powers and duties not specifically delegated to the Texas Education Agency or the State Board of
Education are reserved for local trustees.
State Board for Educator Certification (SBEC): SBEC is a quasi-independent body that gives educators more authority to
govern the standards of their profession. SBEC regulates and oversees all aspects of the certification, continuing education, and
standards of conduct of public school educators. As a state agency, SBEC is responsible for certification testing, accountability
programs for educator preparation programs, and certification of teachers and administrators.
State Board of Education (SBOE): A 15-member body elected by general election (staggered, four-year terms) from various
regions statewide to provide leadership and to adopt rules and policies for public education in the state. The board's primary
responsibility is to manage the Permanent School Fund.
Tax-Increment Financing: Financing secured by the anticipated incremental increase in tax revenues, resulting from the
redevelopment of an area.
Teacher Retirement System (TRS): TRS delivers retirement and related benefits authorized by law for members.
2019- 2020 Adopted Budget 198
Technology Allotment: This allotment is part of the state textbook fund and can be used to purchase electronic textbooks or
technological equipment that contributes to student leaning or teacher training. The allotment is $30 per ADA.
Telecommunications Infrastructure Fund (TIF): Created by the Legislature in 1995, the TIF has funded schools, libraries, and
hospitals with $1.5 billion for distance learning and information sharing.
Texas Assessment of Academic Skills (TAAS): A state-developed test administered each year to students in grades 3 through 8
and 10 (exit-level) to determine student achievement levels on state-established leaning objectives. Replaced by the Texas
Assessment of Knowledge and Skills (TAKS) effective for the 2002-03 school year.
Texas Assessment of Knowledge and Skills (TAKS): TAKS replaces the Texas Assessment of Academic Skills (TAAS), a
criterion-referenced test used in Texas schools for 12 years. TAKS will begin in spring 2003, with tests in reading in grades 3
through 9; language arts in grades 10 and 11; mathematics in grades 3 through 11. The 11 th grade exit-level test will assess
English III, algebra I, geometry, biology, integrated chemistry and physics, early American and U.S. history, world geography,
and world history. TAKS will be a more challenging examination for Texas students, according to the results of field tests.
Texas Education Agency (TEA): The administrative and regulatory unit for the Texas public education system managed by the
commissioner of education. TEA is responsible for implementing public education policies as established by the Legislature,
State Board of Education, and commissioner of education.
Texas Education Code (TEC): This code applies to all educational institutions supported in whole or in part by state tax funds.
Texas Essential Knowledge and Skills (TEKS): Subject-specific state leaning objectives adopted by the State Board of
Education. The state’s academic tests. [see Texas Assessment of Knowledge and Skills (TAKS)] are aligned with the TEKS.
Texas Open Meetings Act (TOMA): TOMA makes school board meetings to discuss and decide public business accessible. The
TOMA Decision requires governmental entities to provide prior public notice of what is to be discussed and where and when
discussion will take place. Closed meetings are permitted only when specifically authorized by law. Civil and criminal penalties
can result when a board violates provisions of this act.
University Interscholastic League (UIL): The governing organization for most public school extracurricular activities operated
through The University of Texas at Austin. Rulemaking authority for the UIL lies with its members and the State Board of
Education.
Vouchers: The use of taxpayer funds for private school education. Legislation was introduced during the 76th Legislative
Session (1999) to implement a pilot program for certain students. Although the legislation failed, this issue may be an important
one during the 78th Legislative Session in 2003.
Wealth: In school finance, the wealth of a district is measured in taxable value of property per weighted ADA.
Weighted Students in Average Daily Attendance (WADA): In Texas, students with special educational needs are weighted for
funding purposes to help recognize the additional costs of educating those students. Weighted programs include special education,
career and technology, bilingual, gifted and talented, and compensatory education. A weighted student count is used to distribute
guaranteed-yield funding and establish Chapter 41 thresholds.
Zero Tolerance: This concept that student misbehavior in class will not be allowed was passed by the 1995 Legislature
empowered teachers to remove from class students who disrupt the learning process.
Source: Texas Association of School Boards, A Reporter's Guide to Texas Public Education, with local district
additions.
2019- 2020 Adopted Budget 199
This Page Intentionally Blank