জেলা পরিসংখ্যান ২০১১ district statistics 2011 satkhira...
TRANSCRIPT
জেলা পরিসংখ্যান ২০১১
District Statistics 2011 Satkhira
December 2013
BANGLADESH BUREAU OF STATISTICS (BBS) STATISTICS AND INFORMATICS DIVISION (SID)
MINISTRY OF PLANNING
GOVERNMENT OF THE PEOPLE'S REPUBLIC OF BANGLADESH

District Statistics 2011
Satkhira District
ii
District Statistics 2011
Published in December, 2013
Published by : Bangladesh Bureau of Statistics (BBS)
Printed at : Reproduction, Documentation and
Publication (RDP) Section, FA & MIS, BBS
Cover Design: Chitta Ranjon Ghosh, RDP, BBS
ISBN:
For further information, please contact:
Bangladesh Bureau of Statistics (BBS)
Statistics and Informatics Division (SID)
Ministry of Planning
Government of the People’s Republic of Bangladesh
Parishankhan Bhaban
E-27/A, Agargaon, Dhaka-1207.
www.bbs.gov.bd
COMPLIMENTARY
This book or any portion thereof cannot be copied, microfilmed or reproduced for any
commercial purpose. Data therein can, however, be used and published with
acknowledgement of the sources.

District Statistics 2011
Satkhira District
iii
Foreword
I am delighted to learn that Bangladesh Bureau of Statistics (BBS) has successfully completed the
‘District Statistics 2011’ under Medium-Term Budget Framework (MTBF). The initiative of publishing
‘District Statistics 2011’ has been undertaken considering the importance of district and upazila level
data in the process of determining policy, strategy and decision-making. The basic aim of the activity is
to publish the various priority statistical information and data relating to all the districts of Bangladesh.
The data are collected from various upazilas belonging to a particular district.
The Government has been preparing and implementing various short, medium and long term plans and
programs of development in all sectors of the country in order to realize the goals of Vision 2021. For
any pragmatic approach in formulating and evaluating development plans and programs reliable
statistics are indispensible. BBS has been performing the major responsibility of supplying
comprehensive and accurate statistics at the national level.
The present government, in line with its commitment to decentralize administration, has declared
upazila as the focal point of administration regenerating upazila parishad through participatory
elections. However, upazila level official statistics are still very inadequate. It is praiseworthy that BBS
has undertaken timely program of publishing ‘District Statistics 2011’ where data representing socio-
economic characteristics of upazilas of all districts will be available. I am confident that this publication
will be of invaluable help to the planners, administrators, researchers, field level officers as well as
other users. Various government, non-government and international organizations closely related to
policy formulation and implementation may also find this publication useful.
I sincerely thank Mr. Golam Mostafa Kamal, Director General, BBS for bringing out the publication of
‘District Statistics 2011’. I hope that in future ‘District Statistics’ will be published in much more
improved form to make it more effective and informative.
Dhaka
December, 2013 (Md. Nojibur Rahman)
Secretary
Statistics and Informatics Division
Ministry of Planning
Government of the People’s Republic of
Bangladesh

District Statistics 2011
Satkhira District
iv

District Statistics 2011
Satkhira District
v
Preface
The ‘District Statistics 2011’ is mainly a compilation work of Bangladesh Bureau of Statistics (BBS).
The decentralization policy of government has enhanced demand for timely, qualitative and
comprehensive statistical data both for administrative and development requirements. The major
regular publications of Bangladesh Bureau of Statistics like Statistical Pocketbook of Bangladesh,
Statistical Yearbook of Bangladesh and Agricultural Yearbook of Bangladesh provide aggregate data
mainly at the national and regional level. Data for smaller administrative unit like upazila often remains
absent in such publications. The ‘District Statistics 2011’ emphasises to provide upazila level data.
The ‘District Statistics 2011’ provides both structural and flow-type information of almost all of the
priority sectors of our national economy depending on data availability both from published and
unpublished sources.
The publication of ‘District Statistics 2011’ would have not been feasible without the wholehearted
co-operation of the various government, semi-government, autonomous, non-government offices and
other organizations. In particular, the district and upazila level officials extended their total support and
supplied all data. I like to express my sincere thanks to them and hope such co-operation will continue
in future.
I am obliged and grateful to Mr. Md. Nojibur Rahman, Secretary, Statistics and Informatics Division
(SID) for his enormous support and advice to prepare and to finalize this important publication. My
sincere thanks also go to all officers of SID for their wholehearted support and sincere co-operation
towards accomplishing this document.
I acknowledge the contributions of Mr. Md. Mizanur Rahman, Deputy Director General, BBS and Mr.
Ghose Subobrata, Director, FA & MIS, BBS during development of the Document.
The regional and upazila statistics officers of BBS actively participated in preparation of the report. I
thank them all. Finally, I thank Mr. Iftekhairul Karim, Focal Point Officer and Mr. Nasir Uddin
Ahmmed, Deputy Director & Ex.Focal Point Officer as well as staff members of Bangladesh Bureau of
Statistics for their untiring efforts in making the ‘District Statistics 2011’ a success. Through user’s
interaction and feedback, we hope to improve the coverage and quality of information contained in this
edition. Any suggestion for improvement of the publication will be highly appreciated.
Dhaka
December, 2013 (Golam Mostafa Kamal)
(Additional Secretary)
Director General
Bangladesh Bureau of Statistics

District Statistics 2011
Satkhira District
vi

District Statistics 2011
Satkhira District
vii
Acknowledgement
The report on ‘District Statistics 2011’ is the result of the initiative of the honorable Secretary,
Statistics and Informatics Division (SID). Ex-Director General Mr. Md. Shahjahan Ali Mollah and
the present Director General Mr. Golam Mostafa Kamal of Bangladesh Bureau of Statistics (BBS)
have guided us in every steps of the journey to whom we remain grateful.
All the data providers of different offices/organizations of respective district and upazila deserve
special thanks for their cooperation. We will be in need of such cooperation in future too and hope
that the same hospitality will be received from them again.
I gratefully acknowledge the contribution of all members of Editors’ Forum and also of Project
Directors’ Forum of BBS in editing this compilation work.
I acknowledge the contribution of Begum Aziza Parvin, Director, Computer Wing, Mr. Md.
Mofizul Islam, Programmer and the members of data entry team.
I would like to thank Mr. Iftekhairul Karim, Focal Point Officer for his rigorous exercise and
valuable contribution in bringing out this publication. I also acknowledge the hard work of Mr.
Nasir Uddin Ahmmed, Deputy Director & Ex-Focal Point Officer for this activity. My sincere
thanks also go to the respective Regional Statistical Officers, Upazila Statistical Officers and the
employees of BBS.
I acknowledge the work of Mr. Md. Abdul Mannan, Administrative Officer, Mr. Mohammad
Abdullah, Assistant Statistical Officer, Mr. Md. Monzurul Islam, Assistant Statistical Officer and
Mr. Md. Yeasin Miah, Statistical Investigator for their sincere assistance to the Focal Point Officer
in many possible ways. Officers and staff of Reproduction, Documentation and Publication Section
of FA & MIS have contributed in printing the report in possible shortest time.
Finally, I want to be submissive that this work of compiling data from various secondary sources at
district and upazila level is undertaken after a long time gap of almost 25 years. Some errors or
unwilling mistakes may remain there in spite of our full hearted endeavor to make it an error free
publication. It will be highly appreciated if any user kindly communicates any shortcomings of the
report.
Dhaka
December, 2013
Ghose Subobrata
Director Finance, Administration & MIS
Bangladesh Bureau of Statistics

District Statistics 2011
Satkhira District
viii
District Statistics 2011
Satkhira District
ix
Contents
Table
No. Topics
Page
No.
Foreword ................................................................................ Error! Bookmark not defined. Preface .................................................................................... Error! Bookmark not defined. Acknowledgement .................................................................. Error! Bookmark not defined. Contents ................................................................................................................................... ix District Map ............................................................................................................................ xv Upazila and Union/Ward with Geo-code .............................................................................. xvi
Chapter 1: Introduction
District at a Glance ................................................................................................................... 3 Concepts and Definitions ......................................................................................................... 9
Chapter 2: General Information
2.01 Broad classification of area 2011 ............................................................................................ 17
2.02 Number of municipality, union, mauza, mahalla and village 2011 ........................................ 17 2.03 Number of household, population and density 2011 .............................................................. 17
2.04 Population and literacy rate of 1981, 1991, 2001 & 2011 and number of voter 2011 ........... 18 2.05 Population by religion 2011 .................................................................................................... 18 2.06(a) Percentage distribution of population (10 years and above) by marital status 2011 ............... 18
2.06(b) Percentage distribution of population (10 years and above) by marital status 2011 .............. 19 2.07 Percentage distribution of population by type of disability 2011 ........................................... 19
2.08 Number of religious institution 2011 ...................................................................................... 19 2.09 Number of pond, dighee, flood camps/shelter, cyclone shelter, stadium/ playground,
park/ amusement park 2011 ..................................................................................................... 20 2.10 Number of filling station, fire brigade station, police station/camp, union land (tohsil)
office, BOP (BGB camp), cyber cafe 2011 ............................................................................. 20 2.11 Number of growth centre, hat /bazar, poultry farm, dairy farm, nursery, horticulture
centre,brick kiln, decorator service 2011 ................................................................................. 20
2.12 Name of land/river port, important or historical/tourist places/objects,
important/famous crop or food production 2011 ..................................................................... 21
Chapter 3: Meteorology
3.01 Temperature, rainfall, humidity during the years 2008-2011 ............................................... 25
3.02 Occurrence of storm during the years 2008-2011 ................................................................... 25 3.03 Occurrence of river erosion during the years 2008-2011 ..................................................... 25
Chapter 4: Agriculture
4.01 Number of agriculture holding by tenure ................................................................................ 29 4.02 Land area based on utilization 2008 ....................................................................................... 29
4.03 Land utilization (temporary cropped area) 2008 .................................................................... 29 4.04 Land area under irrigation for selected crops 2008 ................................................................ 30 4.05 Cropped area sprayed with plant protection measures 2008 .................................................. 30 4.06 Number of holding reporting cattle head 2008 ....................................................................... 30 4.07 Number of holding reporting selected livestock species 2008 .............................................. 31 4.08 Selected poultry/birds 2008 .................................................................................................... 31

District Statistics 2011
Satkhira District
x
4.09 Area of high, medium and low land 2008 ............................................................................... 31
4.10 Broad soil classification 2008 ................................................................................................. 32 4.11 Irrigation by means 2010-2011 ............................................................................................... 32 4.12 Number of low lift pump scheme 2010-11 ............................................................................. 32
4.13 Number of deep tube-well scheme 2010-11 ........................................................................... 33 4.14 Number of selected agricultural machine 2008 ...................................................................... 33 4.15 Use of chemical fertilizer 2010-11 ......................................................................................... 33 4.16 Distribution of chemical fertilizer 2010-11 ............................................................................ 34 4.17 Area and production of rice crops 2010-11 ............................................................................ 34
4.18 Area and production of rice crops 2009-2010 ........................................................................ 34 4.19 Area and production of wheat, jute and sugarcane 2010-11 ................................................... 35 4.20 Area and production of wheat, jute and sugarcane 2009-10 ................................................... 35 4.21 Area and production of lentil (masur), mug and maize crops 2010-11 .................................. 35
4.22 Area and production of lentil (masur), mug and maize crops 2009-10 .................................. 36 4.23 Area and production of pulse by type 2010-11 ....................................................................... 36
4.24 Area and production of potato by type 2010-11 ..................................................................... 36 4.25 Area and production of potato by type 2009-10 ..................................................................... 37
4.26 Area and production of oil seed by type 2010-11 ................................................................... 37 4.27 Area and production of oil seed by type 2009-10 ................................................................... 37 4.28 Area and production of pepper, onion and garlic 2010-11 ..................................................... 38
4.29 Area and production of pepper, onion and garlic 2009-10 ..................................................... 38 4.30 Area and production of turmeric and ginger 2010-11 ............................................................ 38
4.31 Area and production of turmeric and ginger 2009-10 ............................................................ 39 4.32 Area and production of tomato, radish and bean 2010-11 ...................................................... 39 4.33 Area and production of tomato, radish and bean 2009-10 ...................................................... 39
4.34 Area and production of pumpkin, parble (potol) and cabbage 2010-11 ................................. 40
4.35 Area and production of pumpkin, parble (potol) and cabbage 2009-10 ................................. 40 4.36 Area and production of brinjal, lady’s finger and arum 2010-11 ........................................... 40 4.37 Area and production of brinjal, lady’s finger and arum 2009-10 ........................................... 41
4.38 Area and production of cauliflower and cucumber 2010-11 .................................................. 41 4.39 Area and production of cauliflower and cucumber 2009-10 .................................................. 41
4.40 Area and production of papaya, guava, lime and lemon 2010-11 .......................................... 42 4.41 Area and production of papaya, guava, lime and lemon 2009-10 .......................................... 42
4.42 Area and production of jackfruit, banana and pineapple 2010-11 .......................................... 42 4.43 Area and production of jackfruit, banana and pineapple 2009-10 .......................................... 43 4.44 Area and production of mango, litchi and blackberry 2010-11 .............................................. 43 4.45 Area and production of mango, litchi and blackberry 2009-10 .............................................. 43 4.46 Area and production at water melon/melon (bangi) in following years ................................. 44
4.47 Cotton and Sericulture cultivation for the year 2010-11 ........................................................ 44 4.48 Number and area of pond, dighee and other area 2010-2011 ................................................. 44
4.49 Number of fisherman and production of fish in following years............................................ 45
Chapter 5: Industry
5.01 Number of selected industry 2011 .......................................................................................... 49 5.02 Number of textile industry 2011 ............................................................................................. 49 5.03 Number of handloom establishment and loom 2011 .............................................................. 49 5.04 Employment status in handloom industry 2011...................................................................... 50

District Statistics 2011
Satkhira District
xi
5.05 Dying facilities of handloom industry 2011 ........................................................................... 50
5.06 Number of small scale and cottage industry 2011 .................................................................. 50 5.07 Number of establishment and person engaged in cottage industry 2011 ................................ 51 5.08 Number of bamboo and cane industry and person engaged 2011 .......................................... 51
5.09 Number of wooden furniture and person engaged 2011 ......................................................... 51 5.10 Number of Saw mill and person engaged 2011 ...................................................................... 52 5.11 Number of auto rice mill and person engaged 2011 ............................................................... 52 5.12 Number of semi-auto rice mill and person engaged 2011 ...................................................... 52 5.13 Number of rice mill and person engaged 2011 ....................................................................... 53
5.14 Number of oil mill and person engaged 2011 ......................................................................... 53 5.15 Number of bakery and person engaged 2011 ......................................................................... 53 5.16 Number of pottery and person engaged 2011 ......................................................................... 54 5.17 Number of printing press and person engaged 2011 .............................................................. 54
5.18 Number of tailoring shop and person engaged 2011 .............................................................. 54 5.19 Number of cold storage and capacity in following years ....................................................... 55
5.20 Number of flour mill and person engaged 2011 ..................................................................... 55
Chapter 6: Education
6.01 Literacy (7+) rate of 2001 & 2011 ......................................................................................... 59 6.02 Number of Government primary school (class I-V), teacher and student 2011 ..................... 59
6.03 Number of registered primary school (class I-V), teacher and student 2011 ......................... 59 6.04 Number of private (non-registered) primary school (class I-V), teacher and student 2011 ... 60 6.05 Number of kindergarten school (pre schooling), teacher and student 2011 ........................... 60
6.06 Number of NGO school, teacher and student 2011 ................................................................ 60 6.07 Number of Government secondary school, teacher and student 2011 .................................... 61
6.08 Number of Non-government secondary school, teacher and student 2011 ............................ 61
6.09 Number of school & college (operating jointly), teacher and student 2011 ........................... 61
6.10 Number of Government college, teacher and student 2011 .................................................... 62 6.11 Number of Non government college, teacher and student 2011 ............................................. 62
6.12 Number of madrasah, teacher and student under the madrasah education board 2011 .......... 62 6.13 Number of kawmi madrasah, teacher and student 2011 ......................................................... 63 6.14 Number of ebtedayee madrasah 2011 ..................................................................................... 63
6.15 Number of technical and vocational institution, teacher and student 2011 ............................ 63 6.16 Number of agricultural and veterinary college, teacher and student 2011 ............................. 64
Chapter 7: Health and Social welfare
7.01 Number of Government health complex and health personnel 2011 ..................................... 67 7.02 Number of private hospital/clinic and related health personnel 2011 .................................... 67
7.03 Number of diagnostic centre and related health personnel 2011 ............................................ 67
7.04 Number of missionary hospital and charitable dispensary 2011 ............................................ 68
7.05 Number of physician/practitioner in the upazila/city corporation 2011 ................................. 68 7.06 Number of health centre, providing health and family planning service 2011 ....................... 68 7.07 Number of existing family planning personnel 2011 ............................................................. 69 7.08 Status of family planning activity 2011 .................................................................................. 69 7.09 Number of cooperative society and member 2011 ................................................................. 69 7.10 Number of Government office, post office, bank, NGO and dak-banglow/rest house 2011 . 70 7.11 Number of cinema hall, registered club, auditorium, public library and orphanage 2011 ..... 70

District Statistics 2011
Satkhira District
xii
7.12 Number of different club 2011 ............................................................................................... 70
7.13 Number of hat-bazar, growth centre, hotel & restaurant 2011 ............................................... 71 7.14 Number of warehouse and their storage capacity 2011 .......................................................... 71 7.15 Progress of rural electrification 2011 ...................................................................................... 71
7.16 Number of technical personnel 2011 ...................................................................................... 72 7.17 Number of community clinic and person engaged 2011 ........................................................ 72
Chapter 8: Transportation and Communication
8.01 Length of metalled, semi metalled and unmetalled road 2011 ............................................... 75
8.02 Length of railway and water way 2011 ................................................................................... 75 8.03 Length of embankment road & canal 2011 ............................................................................. 75 8.04 Number of bridge, baily bridge, culvert, pool, shako, etc. 2011 ............................................ 76 8.05 Number of railway station, steamer/launch station and bus stand 2011 ................................. 76 8.06 Number of registered rickshaw, van, easy bike and auto-rickshaw 2011 ............................... 76
8.07 Number of non-registered rickshaw, van, easy bike and auto-rickshaw 2011 ....................... 77
Chapter 9: Price and Wage
9.01 Average price of selected item 2011 ....................................................................................... 81
9.02 Annual average wholesale price of selected building material 2011 ...................................... 81 9.03 Daily average wage rate of agricultural labour 2011 .............................................................. 81 9.04 Daily average wage rate of construction labour 2011 ............................................................ 82
9.05 Daily average wage rate of non-agricultural labour 2011 ...................................................... 82 9.06 Average doctor’s fee per patient 2011 .................................................................................... 82
9.07 Average rate of vehicle per kilo meter 2011 ........................................................................... 83
Chapter 10: Urban Area Statistics
10.01 Number of ward, mahalla and household by municipality 2011 ............................................ 87
10.02 Area, population and density by municipality 2011 ............................................................... 87 10.03 Number of primary school (Class I-V), teacher and student by municipality 2011 ............... 87 10.04 Number of secondary school, teacher and student by municipality 2011 .............................. 88
10.05 Number of secondary school & college (operating jointly), teacher and student by
municipality 2011 .................................................................................................................... 88
10.06 Number of college, teacher and student by municipality 2011 .............................................. 88 10.07 Number of vocational institute by municipality 2011 ............................................................ 88
10.08 Number of family planning clinical centre by municipality 2011 .......................................... 88 10.09 Number of family planning personnel working by municipality 2011................................... 89 10.10 Number of fire service unit and causality by municipality 2011 ............................................ 89 10.11 Number of cinema hall and audience capacity by municipality 2011 .................................... 89 10.12 Institutional accommodation facility by municipality 2011 ................................................... 89
10.13Other accommodation facility by municipality 2011 .............................................................. 89 10.14 Police personnel and criminal offences by municipality 2011 ............................................... 90
10.15 Medical institution and personnel by municipality 2011 ........................................................ 90 10.16 Number of published newspaper & television centre 2011 .................................................... 90
Chapter 11: Public Administration, Accounts and Banking
11.01 Sanction post of Government employee by category 2011 .................................................... 93 11.02 Existing position of Government employee by category 2011 ............................................... 93 11.03 Number of employee by type 2011 ......................................................................................... 93

District Statistics 2011
Satkhira District
xiii
11.04 Number of employee by local Government institution 2011.................................................. 94
11.05 Number of branch of nationalized commercial bank 2011 ..................................................... 94 11.06 Number of branch of private commercial bank 2011 ............................................................. 94 11.07 Number of branch of specialized (Krishi, Co-operative etc) bank 2011 ................................ 95
11.08 Number of branch of Grameen bank 2011 ............................................................................. 95 11.09 Number of insurance company 2011 ...................................................................................... 95 11.10 Number of co-operative society 2011 ..................................................................................... 96 11.11 Numbers of money exchange agency 2011 ............................................................................ 96 11.12 Number of branch and accounts of Sonali and Janata bank 2011 .......................................... 96
11.13 Number of branch and accounts of Rupali and Agrani bank 2011 ......................................... 97 11.14 Number of branch and accounts of Pubali and Uttara bank 2011 .......................................... 97 11.15 Number of branch and accounts of Krishi and Co-operative bank 2011 ................................ 97
Chapter 12: Miscellaneous
12.01 Number of Government health complex and health facility 2011 ........................................ 101
12.02 Number of Non-Government health complex and health facility 2011 ............................... 101 12.03 Number of person/institute borrowing money from nationalized bank 2011 ....................... 102
12.04 Number of person/institute borrowing money from private commercial bank 2011 ........... 102

District Statistics 2011
Satkhira District
xiv
District Statistics 2011
Satkhira District
xv
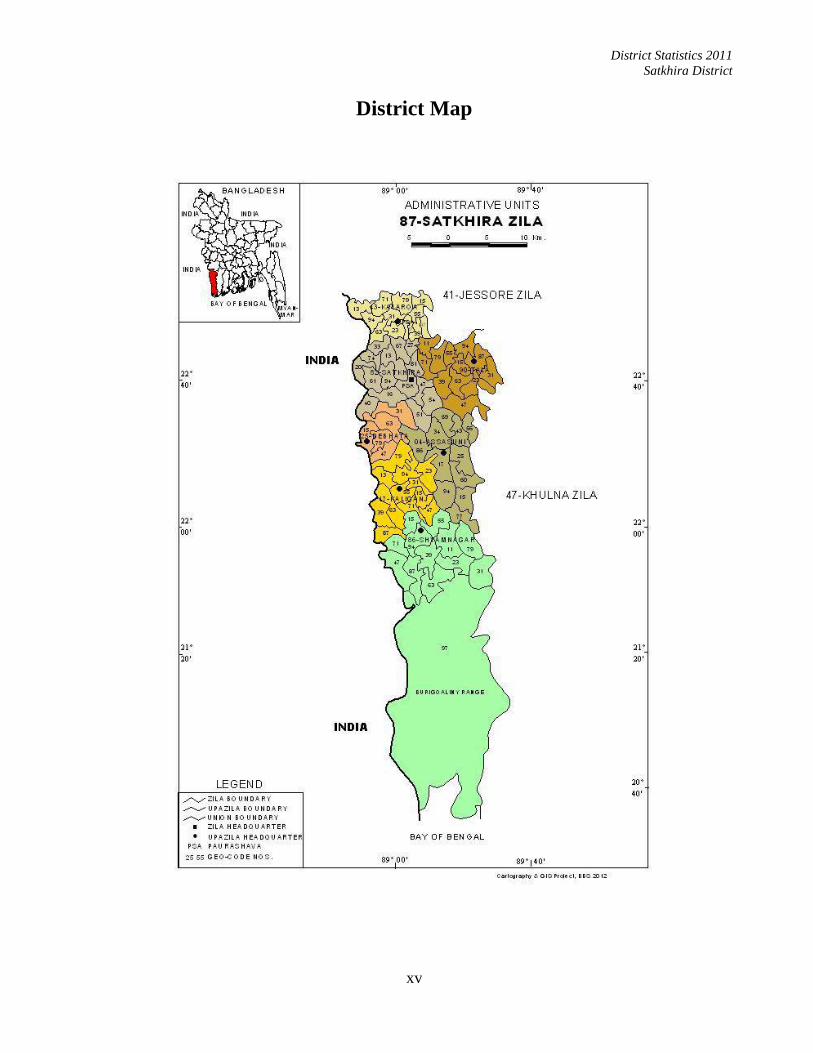
District Map
District Statistics 2011
Satkhira District
xvi
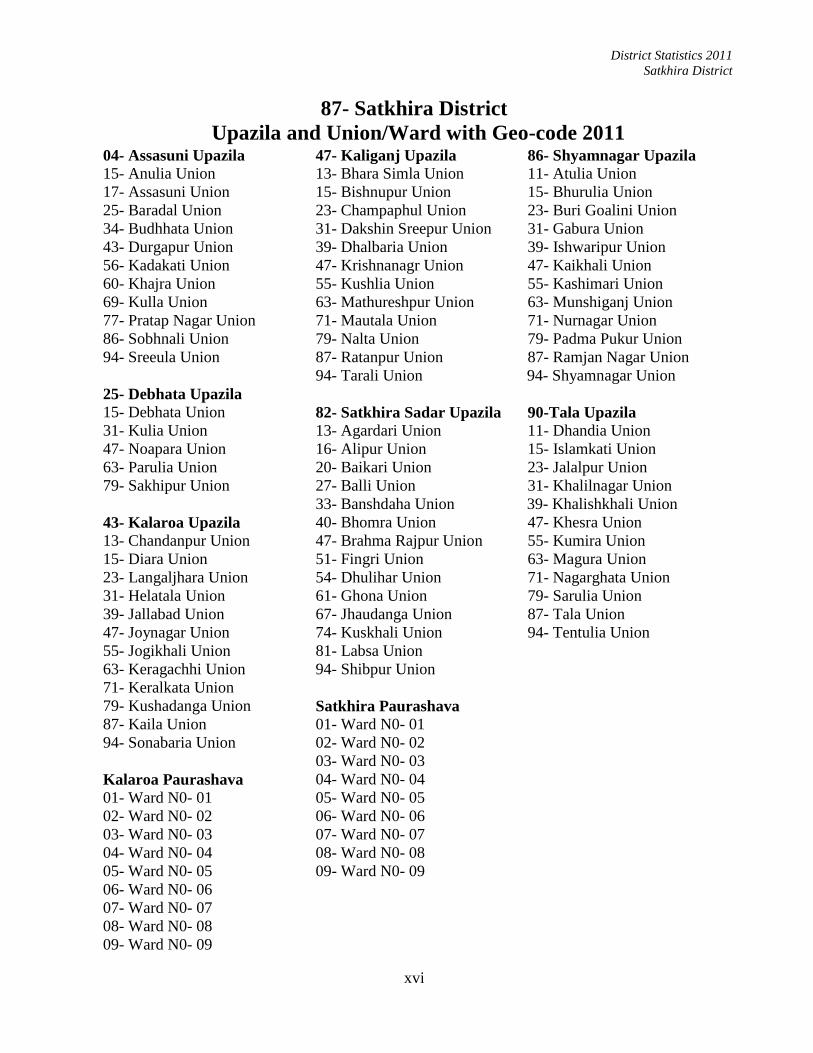
87- Satkhira District Upazila and Union/Ward with Geo-code 2011
04- Assasuni Upazila 47- Kaliganj Upazila 86- Shyamnagar Upazila 15- Anulia Union 13- Bhara Simla Union 11- Atulia Union
17- Assasuni Union 15- Bishnupur Union 15- Bhurulia Union
25- Baradal Union 23- Champaphul Union 23- Buri Goalini Union
34- Budhhata Union 31- Dakshin Sreepur Union 31- Gabura Union
43- Durgapur Union 39- Dhalbaria Union 39- Ishwaripur Union
56- Kadakati Union 47- Krishnanagr Union 47- Kaikhali Union
60- Khajra Union 55- Kushlia Union 55- Kashimari Union
69- Kulla Union 63- Mathureshpur Union 63- Munshiganj Union
77- Pratap Nagar Union 71- Mautala Union 71- Nurnagar Union
86- Sobhnali Union 79- Nalta Union 79- Padma Pukur Union
94- Sreeula Union 87- Ratanpur Union 87- Ramjan Nagar Union
94- Tarali Union 94- Shyamnagar Union
25- Debhata Upazila
15- Debhata Union 82- Satkhira Sadar Upazila 90-Tala Upazila 31- Kulia Union 13- Agardari Union 11- Dhandia Union
47- Noapara Union 16- Alipur Union 15- Islamkati Union
63- Parulia Union 20- Baikari Union 23- Jalalpur Union
79- Sakhipur Union 27- Balli Union 31- Khalilnagar Union
33- Banshdaha Union 39- Khalishkhali Union
43- Kalaroa Upazila 40- Bhomra Union 47- Khesra Union
13- Chandanpur Union 47- Brahma Rajpur Union 55- Kumira Union
15- Diara Union 51- Fingri Union 63- Magura Union
23- Langaljhara Union 54- Dhulihar Union 71- Nagarghata Union
31- Helatala Union 61- Ghona Union 79- Sarulia Union
39- Jallabad Union 67- Jhaudanga Union 87- Tala Union
47- Joynagar Union 74- Kuskhali Union 94- Tentulia Union
55- Jogikhali Union 81- Labsa Union
63- Keragachhi Union 94- Shibpur Union
71- Keralkata Union
79- Kushadanga Union Satkhira Paurashava
87- Kaila Union 01- Ward N0- 01
94- Sonabaria Union 02- Ward N0- 02
03- Ward N0- 03
Kalaroa Paurashava 04- Ward N0- 04
01- Ward N0- 01 05- Ward N0- 05
02- Ward N0- 02 06- Ward N0- 06
03- Ward N0- 03 07- Ward N0- 07
04- Ward N0- 04 08- Ward N0- 08
05- Ward N0- 05 09- Ward N0- 09
06- Ward N0- 06
07- Ward N0- 07
08- Ward N0- 08
09- Ward N0- 09
District Statistics 2011
Satkhira District
1
CHAPTER 1
Introduction

District Statistics 2011
Satkhira District
2

District Statistics 2011
Satkhira District
3
District at a Glance
Background: Satkhira is a district in south-western Bangladesh and is part of Khulna Division.
Satkhira was originally a sub-division of Khulna District. It was upgraded to a district on February
3, 1984. Nothing is definitely known about the origin of name of the district. There is a popular
belief that Bishu Ram, a Dewan of the Moharaja Krishna Chandra of Nadia (now in India),
rehabilitated seven aristocrate Brahmins in seven (meaning Sath in Bengali) separate house
(meaning Ghar in Bengali), in consequence of which the area took its name as Sathgharia.
Subsequently it was renamed as Satkhira when the British Administration upgraded it to a sub-
division in 1861.
Geographic Area and Location: Satkhira district is bounded on the north by Jessore District, on
the east by Khulna District, on the south by Bay of Bengal and on the west by India. It lies between
21º36' and 22º54' north latitudes and between 88º54' and 89º20' east longitudes. The total area of
the district is 3817.29 sq. km. of which 1534.88 km is under reserve forest.
Annual Average Temperature: The annual average temperature of this distrct varies maximum
24.8°C to minimum 8.6°C.The annual rainfall is 1374 mm.
Main Rivers: The Kobadak, Sonai, Kholpatua, Morischap, Raimangal, Hariabhanga, Ichamati,
Betrabati, Kalindi-jamuna etc. are main rivers of this district.
Administration: Satkhira subdivision was established in 1861 under Jessore district. It was
included into Khulna district in 1882. The subdivision was turned into a district in 1984 .The
district consists of 7 upazilas, 79 unions, 953 mauzas, 1440 villages, 2 paurashavas, 18 wards and
42 mahallas. The upazilas are Satkhira Sadar, Assasuni, Debhata, Kalaroa, Kaliganj, Shyamnagar
and Tala.
Satkhira Town: Satkhira, a municipal town, consists of 9 wards and 31 mahallas. The area of the
town is 27.84 sq km. The town has a population of 86372; male 51.75%, female 48.25%;
population density per sq km 3102. Literacy rate among the town people is 49.7%. The main
business centre of the town is Sultanpur Bazar (old name Pransayar Bazar).
Historical Events: The ancient name of Satkhira was Satgharia (noted zamindar Prannath Roy
Chowdhury established Satgharia). During the permanent settlement Bishnuram Chakravorti, an
official of Raja Krishnachandra of Nadia, purchased Buran Pargana by auction in 1772 and settled
at Satgharia village. Prananath Roy Chowdhury, son of Bishnuran Chakravorti, made considerable
development in the area. In 1781, most of the areas of Jessore, Faridpur and Khulna were brought
under a single administration. But later on while peasant movement spread over the region against
the oppressions of indigo planters and the local zamindars, the British established a subdivision at
Satgharia under Jessore district to control indigo revolt and to strengthen local administration. By
this time 'Satgharia'turned into 'Satkhira' in the records of the British. Satkhira region was a part of
the ancient Vanga Janapada. Once it was the capital of the state of Bara-Bhuiyan of Bengal.
Peasant Movement against the east India Company and oppressions of the local Zamindars spread
over the district in 1801 under the leadership of Titumir. Besides, Indigo Resistance Movement and
Wahabi Movement spread over the district during 1854 to 1860.
Archaeological Heritage and Relics: Dargah of Mai Champa (Labasa, 1417), Jahajghata Naval
Fort (Mautala, 1567), Dighee and Clay walled Moneyghar of Tittar Raja (Nawapara, 1582),
Nabaratna Mandir (Demrail, 1580), Baro Duary (Ishwaripur, 1582), Tenga Mosque
District Statistics 2011
Satkhira District
4
(Banshipur,1599), Sonabaria Nabaratna Mandir (Kalaroa, 1767), Joseshwari Mandir (Ishwaripur,
1899), Triangular Mandir of Chanda Bhairabi (Ishwaripur), Nagar Fort of Raja Pratapaditya
(Kaliganj), Parabajpur Mosque (Mukundapur), Hamman Khana (Ishwaripur), Gopalpur Mandir
(terocota decorated), Moutala Mosque, Annapunna Nabaratna Mandir (Satkhira), Sultanpur
Mosque, Nagarghata Mosque, Katunia Mandir etc. are notable archaeological heritage and relics
of this district.
Marks of War of Liberation: Mass killing site: Places adjacent to Satkhira Government Boy's
High School, Jhaudanga Shahid Siraj Sarani, Binerpota Bridge, Bankal Bridge and Mahmudpur
High School, Harinagar and Kathkhali; Mass grave: Debhata and Kalaroa Bazar; Memorial
monument: Baliadanga, Kalaroa, Gopalpur and Harinagar.All are the marks of war of liberation of
this district.
Educational Institutions:The number of educational institution of this district are medical college
and hospital 1, Govt college 4, Non-Govt.college 56, Govt.high 4, Non-Govt. high school 295,
government primary school 622, non-government (Registered) primary school 424, collegiate
school 9, madrasa 235, Ebtedayee madrasah 97, Koume madrasah 66, survey institute 1, nursing
institute 1, vocational institute 1, primary education institute 1, law college 1, technical educational
institution 6, satellite school 5, retarded school 1, kindergarten 107 and art school 8.
Locally Published Newspapers and Periodicals: The Dailies: Kafela, Patradut, Alor Parso,
Jugerbarta, Dristipat, Satkhira Chitra; The Weeklies: Dakhinayan, Satkhira Digest, Sahajatry,
Ajker Satkhira; monthly Chharar Dak, Pragalav (Assasuni), The Quarterly: Ikkhan, Dakhiner
Janala, Saumma, Pratya (Assasuni); periodicals: Kaliganj Barta, Gram Bangla, Saikat, Samatat,
Suryashikha, Pathikrit, Surya Tarun, Ayan (Nurnagar, Shyamnagar), Pratya (Shyamnagar) etc. are
locally published newspapers and periodicals of this district.
Main Crops: Paddy, jute, sugarcane, mustard seed, potato, onion, betel leaf etc. are main crops of
this district.
Main Fruits: Mango, black berry, jackfruit, banana, papaya, litchi, coconut, guava etc. are main
fruits of this district.
NGO Activities: Operationally important NGOs are BRAC, CARE, World Vision, Caritas,
Grameen Bank, ASA, Barsa, Chetana, Swadesh, Uttaran, Pragati, Usha, Parapar, Jubo Academy
Satkhira, Seeds etc.
Health Centres: The numbers of health centres of this district are district sadar hospital 1, upazila
health complex 7, child hospital 1, TB hospital 1, health and family welfare centre 66, private
hospital 1, government clinic 2, private clinic 76, maternity and child welfare centre 1.
Economic Situation: The rural economy of Satkhira is predominantly agricultural. Out of total
436,178 holdings 252,036 were farm holdings and they produce varieties of crops, namely, local
and HYV rice, vegetables, spices, pulse and others. Fruits available in the district are banana, jack-
fruits, papaya, guava, olive etc. Besides crops, fishery and forestry are other sources of household
income. Prawn is one of the main export items of Bangladesh, which is abundantly available in the
district. Prawn farming in the coastal area is the most important economic activities of the
households. The district is very rich in forest resources. The Sundarban is another source of income
of the people of Satkhira district.

District Statistics 2011
Satkhira District
5
The non-farm economic activites are also important of this district.The following table-1 shows the
number of establishments and their distribution by major establishments and persons engaged by
activity.
Table-1: Number of Establishments and Persons Engaged By Activity
Activity Establishments Persons Engaged
Total Urban Rural Total Male Female
Mining and quarrying 3 1 2 56 40 16
Manufacturing 13492 659 12833 43316 33019 10297
Electricity, gas and water supply 66 4 62 359 316 43
Construction 209 108 101 656 539 26
Wholesale & retail trade 35867 8535 27332 64250 60945 3305
Hotels and restaurants 2269 584 1685 4951 4525 426
Transport, storage and communication 2721 1311 1410 4121 4062 59
Bank, insurance and financial institution 348 143 205 3216 2571 645
Real estate and renting 667 329 338 1390 1375 15
Public administration and defense 355 210 145 3447 3327 120
Education 2441 271 2170 13502 11694 1808
Health and social work 1914 323 1591 4406 3684 722
Community, social and personal services 8683 1039 7644 15241 13810 1431
Satkhira District 69035 13517 55518 158820 139907 18913 Source: Census of Non-farm Economic Activities 2001-2003
According to above table, there are 69035 establishments in the district in which 139907 persons
engaged in different types of non-farm activities. Female participation in non-farm activities is very
poor. About 11.91% female engaged against 88.09% of male in non-farm activities. Wholesale &
retail trade emerges as the single largest activity (51.95%) with 35867 establishments and 64250
persons engaged (40.45%) in the establishments of Satkhira District.
Flora and Fauna
Flora: One third of Satkhira district on the south is covered by thick forest of mangroves, canes
creepers and other trees thriving on muddy saline tidal banks. The forests are known as Sundarban.
The forest is named after sunduri tree (Heritiera fomes) which is most valuable and beautiful of all
trees in the forest.
The eastern boundary of the forest of the district extends beyond the eastern boundary line of the
district into the present Khulna district while the western one is formed by the river Raimongal
forming the border line of Bangladesh and West Bengal (India). The southern boundary of the
forest is the Bay of Bengal. At present the northern boundary of the Sundarban is the northern
boundary of the government forest.
The sundari (Heritiera minor) is the most important of the forest trees. The colour of its wood is
reddish which is very soothing to the eye. Because of its durability it has a great demand. It can
tolerate saline water but attains full height on the bank of sweet water rivers like `Sela’ and
`Passur’ and available in large quantity. Its timber is very durable and has great demand for posts

District Statistics 2011
Satkhira District
6
and planks. The amur (Amoor cucullata) and dhundhul (Xytocarpus granatum) have a similarity
with `Pasur’ but they are of inferior quality and as used sometimes for making house posts. Small
Amoor trees are used for making ‘hookka’ (Local smoling pipes) stems. One of the largest of the
Sundarbans trees is `bain’ (Avicennia officinalis) tree. Generally it attains 60 feet in height with
large girth. The wood is used for planking and as fuel. The flowers of the tree are small yellow and
sweet smelling and afford a distinctive quality of honey. Other important trees are garjan
(Dipterocarpus turbinatus), goran (Ceriops roxburghiana) and kankra (Broguicra gyomosniza).
There is a great possibility of utilizing them for tanning purposes. Of them only kankra attains
sufficient size and has some value as timber. The gewa (Excecaria agallocha) tree thrives in the
most saline areas near the sea. Its wood is white hard and produces good timber. It is very much
suitable for making match sticks and boxes and paper pulp. The most striking tree is keora
(Sonneratia apetala). Deer are especially fond of its leaves and fruits. They flock under its
branches to eat its fruits and browse its leaves off as high as they can reach producing a uniform
adrupt line along the grove where the foliage has been bitten off. The singra tree supplies best fire
wood. The karanj (Pongamia glabra) tree is large in size and grows on high river banks.
The hental (Phoenix paludosa) and the golpata (Nipa fruticans) are found in muddy areas every
where. The hental resembles a dwarf date-palm and rafters are made it. The goalpatta is regarded as
one of the most important products and its leaves are used for thatchung houses.
Except for the Sundarban the flora of the districts is similar to those in the adjoining districts.
Innumerable indigenons weeds grow in the beel area. Several types of palms and bamboo clumps
grow in almost all the villages. Mango (Mangifera indica) and jackfruits (Artocarpus
heterophyllus) supply the commonest timber and are used for making doors, windows, boxes etc.
Fauna: Animals which are common all over the district are jackal (Canis aureus), wild hog, wild
cat (Felis chaus), tree cat etc.
The rivers, khals (Channels) and beels (low lying marshy places) of the district teem with varieties
of fish which are listed below according to the source of supply sea fish prawns, shrimps etc.
River fish: Pungas (Pangasius pangasius), hilsha (Hilsa ilisa), bagair (Bagarius bagarius), chital
(Notopterus chitala), boal (Wallago attu) etc.
Beel and Tank fish: Calibaus (Labeo calbasu), ruhi (Labeo rohita), katla (Catla catla), mrigel or
Carp (Cirrhinus cirrhosus), boal (Wallago attu), shoil (Channa striatus), koi (Anabas testudineus),
magur (Amblysceps mangois) etc.
In paddy fields bhetki, bhangan (Labeo boga), tangra (Mystus vittatus) and parsia find a quick
growth. They are caught by the farmers in the months of October, November and December when
paddy fields start drying up.
The district affords a very lucrative place to game birds hunters. At the advent of winter season
snipes (Gallinago gallinago), ducks (Anas poecilorhyncha ) and geese (Anser indicus) begin to
flock on beel and char areas. Others common birds are crow (Corvus splendens), vulture
(Gypsbengalensis), sparrow (Passer domesticus), cuckoo (Cuculus microplerus), kingfisher
(Alcedo atthis), bulbul (Picnonotus cafer), parrot (Psillacula krameri), tailorbird (Orthotomus
sutorius) and lark (Eremophila alpestris).
The sundarban is rich in wild animals. The Royal Bengal Tiger (Panthera tigris) famous for its
large size strength and colourful stripped body is the lord of the Sundarban. The most important of
other fauna of the forest is the spotted or chitra deer (Odocoileus hemionus). Flocks of deer are
District Statistics 2011
Satkhira District
7
seen in moonlit night grazing eating keora fruit dropped by monkeys (Macaca mullata). Monkeys
(Macca mulatta) literally rule over the trees. Several kinds of serpent’s including poisonous cobra
(Naja naja), karait (Bungarus caeruleus), rajshap and non-venomenous python (Python molurus),
dhora (xenodrophis piscator), grass snake are seen everywhere creeping in the grass and from tree
and place to place.
Crocodiles (Crocodylus porosus) and sharks (Rhincodon typus) swarm in the river beds,
butterflies, moths, bees and wasps fly from flowers specially in spring to gather honey.
Hundred’s of varieties of fish various sizes are available in the rivers and creeks of the Sundarbans.
Most important are the species are vetki (Lates calcarifer), bhangon (Labeo boga), jaba (Siganus
javus), prawn (Farfantepenaeus aztecus) of different types are also available.
In the sundarban bon morog (Gallus gallus murghi) are also found. Crane, curled doves of various
types, paddy-birds, pigeons (Pavo criptatus) and other game birds are also plentiful.

District Statistics 2011
Satkhira District
8
District Statistics 2011
Satkhira District
9
Concepts and Definitions
1. Population and Housing Census 2011
The population and housing census is the unique source of reliable and comprehensive data about
the size of the population of the country, major socio-economic and socio-demographic
characteristics.
It is the total process of collecting, compiling, evaluating, analyzing and publishing or otherwise
disseminating demographic, economic and social data pertaining, at a specified time, to all persons
in a country. The essential features of a population census are individual enumeration, universality
within a defined territory, simultaneity and defined periodicity.
The population and housing census provides information on the geographic and administrative
distribution of the population and household in addition to the demographic and socioeconomic
characteristics of all the people in the country. The data from the census are classified, tabulated
and disseminated so that political leaders, election officials, planners, national organizations
including NGOs and civil society, regional and international organizations can use the data in
decision-making.
The purpose of community report is to disseminate census data by communities (ward/mahalla in
urban area and union/mauza/village in rural area). Data on all key variables namely area,
household, population by sex and age group, ethnic population, literacy rate, marital status, school
attendance, employment status and religion as well as physical facilities such as source of drinking
water, sanitation, electricity and dwelling units have been presented in this report. The planners,
researchers and policy makers as well as development partners and community administrators will
find this report as a valuable reference for use in advising plans and programs for advancing
welfare and well-being of the common people, in particular and the community in general.
Household
Persons, either related or unrelated, living together and taking food from the same kitchen
constitute a household. A single person living and eating alone forms one-person household.
Literacy
It denotes ability to write a letter in any language. Literacy status assessment is made for
population 7 years and over.
Community
It refers to the following five lower geographic, administrative or revenue units:
i) Union: Smallest administrative rural geographic unit comprising of mauzas and villages and
having union parishad institution.
ii) Mauza : Mauza is the lowest administrative unit having a separate jurisdiction list number (J.L.
No.) in revenue records. Every mauza has its well-demarcated cadastral map. Mauza should be
distinguished from local village since a mauza may consist of one or more villages.
iii) Village: Lowest rural geographic unit either equivalent to a mauza or part of a mauza.
iv) Ward: Smallest administrative urban geographic unit comprising of mahallas and having ward
council institution.
v) Mahalla: Lowest urban geographic unit having identifiable boundaries.

District Statistics 2011
Satkhira District
10
Urban Area
It corresponds with area developed around a central place having such amenities as metalled roads,
improved communication, electricity, gas, water supply, sewerage, sanitation and also having
comparatively higher density of population with majority population in non-agricultural
occupations.
i) City Corporation: It includes city corporation area declared by the Ministry of Local
Government.
ii) Paurashava/Municipality Area: It includes paurashavas incorporated and administered by
local government under Paurashava Ordinance, 1977.
2. Agriculture Census year and reference period
The census year extends over twelve consecutive months having for different census items the
different reference periods or days of data collections. Some items have a year or week reference
period. Some others have a specific reference day. The different census items by their reference
periods or days are shown below:
Agriculture holding
An agriculture holding is a techno-economic unit of agricultural production under single
management comprising all livestock kept and all land used wholly or partly for agricultural
production purposes without regard to title, legal form or size. Single management may be
exercised by either an individual holder or jointly by two or more individuals or holders or by a
judicial person such as a corporation, co-operative or government agency. A holding may consist
of one or more parcels (fragments of land) located in one or more areas or mauzas or in more than
one administrative unit or division provided that all separate parcels of fragments form parts of
same technical unit under operational control of same management.
The definition covers practically all holdings/households engaged in agricultural production of
both crops and livestock. Some agriculture holdings may have no significant agricultural land, e.g.
holdings keeping livestock, poultry and hatcheries for which land is not an indispensable input for
production.
Farm holding
A farm holding is defined as being an agricultural production unit having cultivated land equal to
or more than 0.05 acres. Farm holdings are classified into following three broad groups:
(a) small: Farm holdings having minimum cultivated land 0.05 acre but operated land more than
this minimum but upto 2.49 acres.
(b) medium: Farm holdings having operated land in between 2.50 to 7.49 acres.
(c) large: Farm holdings having operated land 7.50 acres and above.
Small cultivated land 0.04 acre or less is generally used for kitchen garden growing mainly
vegetables. Often seeds of white gourd, water gourd, pumpkin and other strains are sown on
households; but these creepers spread out around house roofs and other structures. As such, the
minimum cultivated land considered for qualifying to be a farm holding is 0.05 acres.

District Statistics 2011
Satkhira District
11
Non-farm holdings
A non-farm holding is defined as being the one which has neither cultivated nor operated land or
has cultivated land less than 0.05 acre.
Tenancy
Owner holdings are those having and operating their owned land and who may or may not be
leasing out land.
Tenant holdings are those having no owned land but operating land taken from others on share
cropping basis or on other terms.
Owner-cum-tenant holdings are those having owned land and who may or may not be leasing out
their own land to others and who may be taking land from others on share cropping basis or on
other terms.
Agriculture work
Agriculture work signifies all activities of holder and his/her labour force doing planning,
management, and operation of a holding. It includes land preparation, sowing, weeding, harvesting,
feeding and tending livestock & poultry, kitchen gardening, supervising agricultural workers,
keeping farm records & accounts, preparing agriculture products for marketing (including
packaging), repairing farm equipment, constructing farm buildings & fences, and engaging in land
reclamation and improvement and other related activities. It excludes home and other family
domestic chores.
Area under pond
The pond area remains under water almost through out the year. Normally, households use pond
water for various domestic and sometimes agriculture purposes. Ponds are also generally used for
fish culture.
In the census the pond area data were collected separately for both single ownership and joint
ownership of households.
Area under temporary crops
It is the land area planted to crops having growing cycle or length of life less than one year. These
are the temporary crops such as paddy, wheat, jute, cotton, tobacco, sugarcane, pulses, oil seeds,
potato, vegetables and other seasonal crops. A list of temporary crops for which data were
collected separately was given in back page of “Tally Sheet”. The minimum area recorded for a
temporary crop was 0.01 acre. Area under temporary crops and temporary-crops net area are
equivalents.
Area under permanent crops
It is the land area planted to crops which remain standing for a long period of time and do not need
to be replanted after a seasonal harvest. Mango, jackfruit, coconut, guava, lemon, and other fruit
varieties are all permanent crops.
Current fallow
It is land brought into cultivation but left out uncultivated in census year for fertility regaining and
improvement or for other reasons.
District Statistics 2011
Satkhira District
12
Net cultivated area
This is land area actually cropped during the census year regardless of number of crops grown plus
current fallow. It includes areas under temporary and permanent crops and also current fallow.
Permanent fallow
It is land not available for cultivation due to coming into residence and commercial & other uses.
Play ground, graveyard, wild shrubs and jungles, marshy land, and the like fall in this category.
Irrigated area
This is area of total land brought under irrigation coverage for growing crops with irrigations done
through mechanical or manual means. Irrigated area classifications fall into two categories: (1)
surface water irrigation with main water sources being rivers, canals, beels, ponds, and other water
bodies; and (2) underground water irrigation with water lifted by shallow tube-wells, deep tube-
wells, and country traditional devices. The irrigation equipments are run by electricity, diesel or
petrol, or manual labour.
Cattle and Buffalo
Cattle and buffalo heads owned by households on day of enumeration were counted.
Goats and Sheep
Goats and sheep owned by households on day of enumeration were counted.
Fowls, Ducks, and Pigeons
Fowls, ducks, and pigeons owned by households on day of enumeration were counted.
Temporary crops gross area
Areas aggregated for all temporary crops grown in the census year have made temporary crops
gross area greater than temporary crops net area since the latter has within it the same land
cropped more than once in different seasons of a year.
Intensity of cropping
It is percentage of temporary crops gross area in comparison with temporary crops net area. It is
expressed as follows:
Intensity of cropping = areanet cropsTemporary
area gross cropsTemporary × 100
Cereals
Main cereals are rice and then wheat. Other cereals are jab, barley, cheena, maize, kaun, bajra and
joar.
Pulses
Main and common pulses are gram, mung, lentil, arhar, gari kalai, khesari and pea.
Oil seeds
Main oil seeds are rape and mustard, sesamum, linseed, groundnut, soybean, sunflower and castor.

District Statistics 2011
Satkhira District
13
Vegetables
Farmers grow both summer and winter vegetables. Main vegetables are potato, brinjal, raddish,
arum, lady's finger, cauliflower, cabbage, bean, tomato, patal, gourd, cucumber, pumpkin, knoll-
kal-turnip, dhundal, barbati, khirai, chichinga, carrot, kakrol and sak.
Cash crop
Main cash crops are jute, mesta, sunhemp, cotton, sugarcane and tobacco.
Spices
The main spices include turmeric, ginger, chillies, onion, garlic, corriander, black cumin and ani
seed.
Fuel crops
Dhaincha and other smaller plants used as cooking-fuel.
Chapter sources: i) Banglapedia
ii) Population & Housing Census 2001 and 2011
iii) Census of Agriculture 2008
iv) Economic Census 2001 & 2003

District Statistics 2011
Satkhira District
14

District Statistics 2011
Satkhira District
15
CHAPTER 2
General Information

District Statistics 2011
Satkhira District
16
District Statistics 2011
Satkhira District
17
General Information
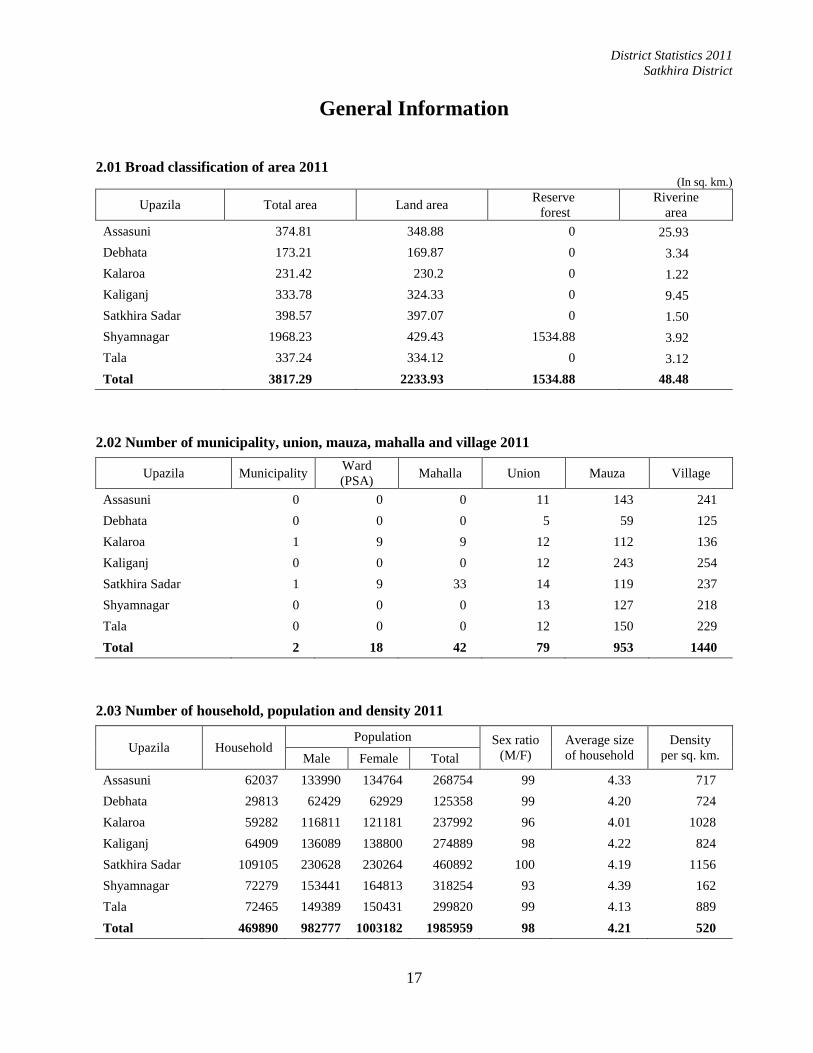
2.01 Broad classification of area 2011
(In sq. km.)
Upazila Total area Land area Reserve
forest
Riverine
area
Assasuni 374.81 348.88 0 25.93
Debhata 173.21 169.87 0 3.34
Kalaroa 231.42 230.2 0 1.22
Kaliganj 333.78 324.33 0 9.45
Satkhira Sadar 398.57 397.07 0 1.50
Shyamnagar 1968.23 429.43 1534.88 3.92
Tala 337.24 334.12 0 3.12
Total 3817.29 2233.93 1534.88 48.48
2.02 Number of municipality, union, mauza, mahalla and village 2011
Upazila Municipality Ward
(PSA) Mahalla Union Mauza Village
Assasuni 0 0 0 11 143 241
Debhata 0 0 0 5 59 125
Kalaroa 1 9 9 12 112 136
Kaliganj 0 0 0 12 243 254
Satkhira Sadar 1 9 33 14 119 237
Shyamnagar 0 0 0 13 127 218
Tala 0 0 0 12 150 229
Total 2 18 42 79 953 1440
2.03 Number of household, population and density 2011
Upazila Household Population Sex ratio
(M/F)
Average size
of household
Density
per sq. km. Male Female Total
Assasuni 62037 133990 134764 268754 99 4.33 717
Debhata 29813 62429 62929 125358 99 4.20 724
Kalaroa 59282 116811 121181 237992 96 4.01 1028
Kaliganj 64909 136089 138800 274889 98 4.22 824
Satkhira Sadar 109105 230628 230264 460892 100 4.19 1156
Shyamnagar 72279 153441 164813 318254 93 4.39 162
Tala 72465 149389 150431 299820 99 4.13 889
Total 469890 982777 1003182 1985959 98 4.21 520

District Statistics 2011
Satkhira District
18
2.04 Population and literacy rate of 1981, 1991, 2001 & 2011 and number of voter 2011
Upazila Population (000) Literacy rate (%) Number of voter (000)
1981 1991 2001 2011 1981 1991 2001 2011 Male Female Total
Assasuni 230 221 249 269 27.6 30.3 40.3 49.8 90 90 180
Debhata 81 99 119 125 25.4 30.9 49.9 54.8 40 40 81
Kalaroa 155 191 222 238 21.5 25.6 45.6 50.9 73 78 151
Kaliganj 208 226 256 275 27.6 32.3 46.8 51.8 89 89 179
Satkhira Sadar 254 344 410 461 27.4 34.6 50.7 56.5 144 149 292
Shyamnagar 243 265 314 318 22.9 28.2 39.7 48.6 102 104 207
Tala 228 251 294 300 20.8 29.7 45.7 50.9 100 102 202
Total 1399 1597 1865 1986 24.7 30.5 45.5 52.1 639 652 1291
2.05 Population by religion 2011
Upazila Muslim Hindu Christian Buddhist Others Total
Assasuni 196026 71122 1342 1 263 268754
Debhata 101776 23573 8 0 1 125358
Kalaroa 223459 12363 1812 0 358 237992
Kaliganj 231610 43027 242 1 9 274889
Satkhira Sadar 400126 59419 885 10 452 460892
Shyamnagar 252545 64816 30 3 860 318254
Tala 220240 77231 1859 3 487 299820
Total 1625782 351551 6178 18 2430 1985959
2.06(a) Percentage distribution of population (10 years and above) by marital status 2011
Upazila Total Unmarried (%) Married (%)
Male Female Male Female Male Female
Assasuni 105676 107791 34.6 21.2 64.5 68.7
Debhata 50266 51210 34.1 20.6 64.9 68.8
Kalaroa 94370 99602 34.3 21.1 65.0 68.4
Kaliganj 108450 112460 34.9 20.9 64.4 69.4
Satkhira Sadar 186814 188079 36.0 22.1 63.2 68.0
Shyamnagar 119082 131546 35.2 22.5 64.0 67.2
Tala 120741 123116 33.2 19.9 66.0 69.5
Total 785399 813804 34.8 21.3 64.4 68.5

District Statistics 2011
Satkhira District
19
2.06(b) Percentage distribution of population (10 years and above) by marital status 2011
Upazila Total Widowed (%) Divorced/separated (%)
Male Female Male Female Male Female
Assasuni 105676 107791 0.8 8.8 0.1 1.3
Debhata 50266 51210 0.9 8.8 0.2 1.8
Kalaroa 94370 99602 0.5 8.6 0.2 1.8
Kaliganj 108450 112460 0.6 8.4 0.1 1.3
Satkhira Sadar 186814 188079 0.6 8.3 0.2 1.7
Shyamnagar 119082 131546 0.6 8.8 0.1 1.6
Tala 120741 123116 0.7 9.4 0.1 1.2
Total 785399 813804 0.7 8.7 0.1 1.5
2.07 Percentage distribution of population by type of disability 2011
Upazila Total
population All Speech Vision Hearing Physical Mental Autistic
Assasuni 268754 1.7 0.2 0.4 0.2 0.6 0.2 0.1
Debhata 125358 1.7 0.2 0.3 0.2 0.7 0.2 0.1
Kalaroa 237992 1.7 0.2 0.3 0.1 0.8 0.2 0.1
Kaliganj 274889 1.7 0.2 0.3 0.2 0.7 0.3 0.1
Satkhira Sadar 460892 1.5 0.2 0.2 0.1 0.7 0.2 0.1
Shyamnagar 318254 2.0 0.2 0.4 0.2 0.7 0.3 0.1
Tala 299820 1.8 0.2 0.3 0.2 0.8 0.2 0.1
Total 1985959 1.7 0.2 0.3 0.2 0.7 0.2 0.1
2.08 Number of religious institution 2011
Upazila Mosque Eid-Gah Temple
(Mandir)
Church
(Girza) Pagoda Others
Assasuni 331 263 108 3 0 0
Debhata 209 102 10 0 0 0
Kalaroa 462 205 8 8 0 0
Kaliganj 385 172 6 1 0 0
Satkhira Sadar 526 211 8 1 0 0
Shyamnagar 514 324 168 0 0 0
Tala 423 135 15 4 0 0
Total 2850 1412 323 17 0 0

District Statistics 2011
Satkhira District
20
2.09 Number of pond, dighee, flood camps/shelter, cyclone shelter, stadium/ playground, park/
amusement park 2011
Upazila Pond Dighee River flow Flood camp/
shelter
Cyclone
shelter
Stadium/
playground
Park/
amusement
park
Assasuni 4531 0 4 0 2 125 0
Debhata 5588 0 1 0 7 0 2
Kalaroa 7800 0 1 0 0 39 0
Kaliganj 11296 27 3 3 3 60 0
Satkhira Sadar 4261 0 1 0 26 59 2
Shyamnagar 6754 12 5 8 8 132 2
Tala 7957 0 2 9 2 230 0
Total 48187 39 17 20 48 645 6
2.10 Number of filling station, fire brigade station, police station/camp, union land (tohsil) office, BOP
(BGB camp), cyber cafe 2011
Upazila Filling
station
Fire
brigade
station
Police
station/
camp
Union land
(tohsil)
office
Sub-
registry
office
BOP
(BGB
camp)
ISP
provider
Cyber
cafe
Assasuni 1 0 1 9 1 0 0 0
Debhata 0 0 2 4 1 4 0 0
Kalaroa 3 0 3 7 1 3 0 0
Kaliganj 2 1 2 8 1 7 0 0
Satkhira Sadar 8 1 5 11 1 7 0 5
Shyamnagar 3 0 1 11 1 6 0 0
Tala 3 0 7 8 1 0 0 0
Total 20 2 21 58 7 27 0 5
2.11 Number of growth centre, hat /bazar, poultry farm, dairy farm, nursery, horticulture centre,
brick kiln, decorator service 2011
Upazila Growth
centre
Hat
/bazar
Poultry
farm
Dairy
farm Nursery
Horticulture
centre
Brick
kiln
Decorator
service
Assasuni 6 38 120 221 13 0 9 15
Debhata 4 15 220 150 20 0 7 12
Kalaroa 5 35 122 265 15 0 17 40
Kaliganj 6 49 1032 125 176 1 8 29
Satkhira Sadar 6 52 671 260 92 1 26 39
Shyamnagar 6 45 165 131 16 1 8 25
Tala 6 40 260 67 14 1 16 19
Total 39 274 2590 1219 346 4 91 179

District Statistics 2011
Satkhira District
21
2.12 Name of land/river port, important or historical/tourist places/objects, important/famous crop or
food production 2011
Upazila
Name of
land/river/sea
port
Name of Important or
historical/tourist
place/object
Name of important
/famous crop or
food production
Customer care
service provider’s
name of cell phone
operator
Distance
between
district head
quarter &
upazila by
road (km)
Assasuni - - - Citycell 26
Debhata - - - - 26
Kalaroa - - - Robi 18
Kaliganj - - - - 43
Satkhira Sadar - Mozaffar Garden Mustard Robi/Cityicell 2
Shyamnagar Khol Patua Petoyojahaz Gata
Mosque Jahajgata - Robi 51
Tala - - Brinjel Airtel 25
Chapter sources : i) Population and Housing Census 2011
ii) Agriculture Census 2008
iii) Upazila Statistical Office, BBS

District Statistics 2011
Satkhira District
22

District Statistics 2011
Satkhira District
23
CHAPTER 3
Meteorology

District Statistics 2011
Satkhira District
24
District Statistics 2011
Satkhira District
25
Meteorology
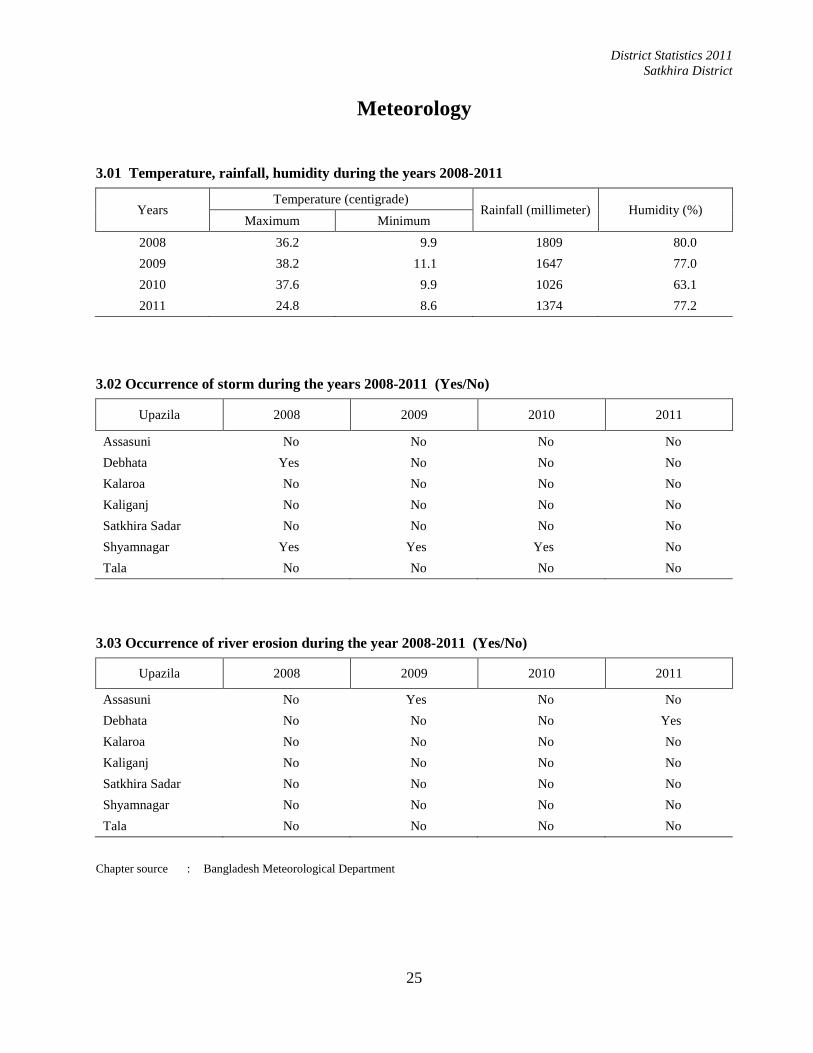
3.01 Temperature, rainfall, humidity during the years 2008-2011
Years Temperature (centigrade)
Rainfall (millimeter) Humidity (%) Maximum Minimum
2008 36.2 9.9 1809 80.0
2009 38.2 11.1 1647 77.0
2010 37.6 9.9 1026 63.1
2011 24.8 8.6 1374 77.2
3.02 Occurrence of storm during the years 2008-2011 (Yes/No)
Upazila 2008 2009 2010 2011
Assasuni No No No No
Debhata Yes No No No
Kalaroa No No No No
Kaliganj No No No No
Satkhira Sadar No No No No
Shyamnagar Yes Yes Yes No
Tala No No No No
3.03 Occurrence of river erosion during the year 2008-2011 (Yes/No)
Upazila 2008 2009 2010 2011
Assasuni No Yes No No
Debhata No No No Yes
Kalaroa No No No No
Kaliganj No No No No
Satkhira Sadar No No No No
Shyamnagar No No No No
Tala No No No No
Chapter source : Bangladesh Meteorological Department

District Statistics 2011
Satkhira District
26
District Statistics 2011
Satkhira District
27
CHAPTER 4
Agriculture (Land area in acre & production in metric ton)

District Statistics 2011
Satkhira District
28

District Statistics 2011
Satkhira District
29
Agriculture
4.01 Number of agriculture holding by tenure
(According to Agriculture Census 2008)
Upazila Total farm
holding Owner holding Owner cum tenant Tenant holding
Assasuni 27127 42587 10453 5359
Debhata 12319 19267 6276 1817
Kalaroa 40155 33049 19700 3050
Kaliganj 36125 41601 13338 4337
Satkhira Sadar 55192 64027 26792 7046
Shyamnagar 34541 51006 12557 4955
Tala 46577 50703 14787 3471
Total 252036 302240 103903 30035
4.02 Land area based on utilization 2008
Upazila Operated
area
Permanent
cropped area
Temporary
cropped area
Permanent
fallow area Others
Assasuni 59548 1711 25375 288 32462
Debhata 28691 1131 11944 595 15616
Kalaroa 47250 4768 32985 327 9497
Kaliganj 58959 3652 38836 252 16471
Satkhira Sadar 86455 3711 61514 304 21230
Shyamnagar 78683 1185 37129 442 40369
Tala 64939 5427 49564 143 9948
Total 424525 21585 257347 2351 145593
4.03 Land utilization (temporary cropped area) 2008
Upazila Current fallow Temporary cropped area Productivity
of crop Single Double Triple Net Gross
Assasuni 275 20815 3255 1305 25375 31240 123
Debhata 92 5203 4615 2126 11944 20811 174
Kalaroa 653 10290 14238 8457 32985 64137 194
Kaliganj 163 30564 4036 4236 38836 51344 132
Satkhira Sadar 309 32421 16550 12543 61514 103150 168
Shyamnagar 173 33393 1790 1946 37129 42811 115
Tala 134 28452 17603 3509 49564 74185 150
Total 1799 161138 62087 34122 257347 387678 151

District Statistics 2011
Satkhira District
30
4.04 Land area under irrigation for selected crops 2008
Upazila Paddy Wheat Potato
Total area Irrigated area Total area Irrigated area Total area Irrigated area
Assasuni 27007 12262 54 36 674 345
Debhata 17234 8896 149 102 468 790
Kalaroa 48477 30439 1051 1050 448 448
Kaliganj 38645 17594 354 122 2529 1660
Satkhira Sadar 82535 52760 1740 1560 1494 1402
Shyamnagar 35720 9574 33 17 1969 850
Tala 53642 41911 1479 1015 2373 2350
Total 303260 173438 4860 3902 9955 7845
4.05 Cropped area sprayed with plant protection measures 2008
Upazila Total farm holding Spraying farm holding Reporting area
sprayed Number Cropped area Number Cropped area
Assasuni 27127 40452 18701 26294 13150
Debhata 12319 16796 12319 16796 16796
Kalaroa 40155 64123 40150 32450 22450
Kaliganj 36125 42651 30906 36898 36898
Satkhira Sadar 55192 63265 55192 63265 63265
Shyamnagar 34541 94512 34541 94512 44721
Tala 46577 91810 46571 91300 42675
Total 252036 413609 238380 361515 239955
4.06 Number of holding reporting cattle head 2008
Upazila Total holding
Number of holding based on cattle heads
1-3 head 4-6 head 7-9 head 10-15 head 15 head &
above
Assasuni 11493 4597 3332 1839 1145 580
Debhata 24682 18378 5080 816 272 136
Kalaroa 31504 22332 7382 1163 501 126
Kaliganj 34192 19398 8271 4596 1872 55
Satkhira Sadar 44144 26486 12349 5309 0 0
Shyamnagar 15529 10250 3882 1397 0 0
Tala 65328 42500 16533 3007 2960 328
Total 226872 143941 56829 18127 6750 1225

District Statistics 2011
Satkhira District
31
4.07 Number of holding reporting selected livestock species 2008
Upazila
Cow & buffalo Goat Sheep
Holding
number
Number
of animal
Holding
number
Number
of goat
Holding
number
Number
of sheep
Assasuni 16995 47871 13660 46024 3292 13951
Debhata 12033 26866 8679 27446 548 2714
Kalaroa 31654 68898 29466 81260 122 586
Kaliganj 25230 59168 20666 61516 1144 4931
Satkhira Sadar 46909 107664 31110 85299 754 3463
Shyamnagar 15711 45510 21207 71016 2458 9217
Tala 43584 95616 31953 81772 490 2083
Total 192116 451593 156741 454333 8808 36945
4.08 Selected poultry/birds 2008
Upazila
Hen and cock Duck Others
Holding
reporting
Total
number
Holding
reporting
Total
number
Holding
reporting
Total
number
Assasuni 38391 198561 28884 106596 180 68782
Debhata 17096 82124 11483 39405 241 119485
Kalaroa 37028 227523 31180 128597 310 108000
Kaliganj 42906 227497 28283 92846 210 98761
Satkhira Sadar 48929 257724 38311 148719 270 109024
Shyamnagar 46960 234759 35993 140939 2210 12957
Tala 43575 230120 29189 97670 136 52570
Total 274885 1461308 203323 754772 3557 569579
4.09 Area of high, medium and low land 2008
Upazila High land Medium land Low land Total land
Assasuni 12879 1912 25661 40452
Debhata 1865 6349 9066 17280
Kalaroa 14296 28593 14298 57187
Kaliganj 4576 14590 19670 38836
Satkhira Sadar 23157 50116 25217 98490
Shyamnagar 4510 80013 9989 94512
Tala 2176 11782 37138 51096
Total 63459 193355 141039 397853

District Statistics 2011
Satkhira District
32
4.10 Broad soil classification 2008
Upazila Total Soil classification
Doash Bele Etel Kankar Others
Assasuni 59751 29875 8962 17925 0 2989
Debhata 16796 837 2295 10028 0 3636
Kalaroa 99 45 10 45 0 0
Kaliganj 82277 26507 6575 49195 0 0
Satkhira Sadar `97231 45130 36006 16095 0 0
Shyamnagar 114915 682 0 114233 0 0
Tala 74447 50200 15700 8547 0 0
Total 348285 153276 69548 216068 0 6625
4.11 Irrigation by means 2010-2011
(In acre)
Upazila
Irrigation management
Total Power
pump Tube well Doon
Swing
basket Canal Others
Assasuni 657 0 0 69 0 70 139
Debhata 661 0 0 0 0 0 1112
Kalaroa 7877 0 0 0 0 0 27
Kaliganj 839 15564 0 50 30 0 17256
Satkhira Sadar 9667 51488 149 45 0 0 65810
Shyamnagar 226 0 660 0 0 0 7900
Tala 2716 49500 600 0 700 1000 58300
Total 22643 116552 1409 164 730 1070 150544
4.12 Number of low lift pump scheme 2010-11
Upazila Number of pump fielded Area irrigated
(in acre) Electric Diesel Total
Assasuni 256 4704 4960 26565
Debhata 73 4485 4558 20886
Kalaroa 37 4004 4041 14020
Kaliganj 70 6114 6184 17256
Satkhira Sadar 2626 486 3112 65810
Shyamnagar 6 455 461 1736
Tala 1542 3082 4624 58300
Total 4610 23330 27940 204573

District Statistics 2011
Satkhira District
33
4.13 Number of deep tube-well scheme 2010-11
Upazila Number of deep tube-well Area irrigated
(In acre) Commissioned Operated
Assasuni 0 0 0
Debhata 0 3 87
Kalaroa 0 470 19513
Kaliganj 0 0 0
Satkhira Sadar 0 807 65810
Shyamnagar 0 0 0
Tala 0 20 1700
Total 0 1300 87110
4.14 Number of selected agricultural machine 2008
Upazila Number of power tiller Tractor Number of threshing
machine
Assasuni 92 25 491
Debhata 71 12 344
Kalaroa 366 40 1062
Kaliganj 247 108 847
Satkhira Sadar 538 84 2741
Shyamnagar 290 83 580
Tala 270 21 1688
Total 1874 373 7733
4.15 Use of chemical fertilizer 2010-11
Upazila UREA TSP MP DAP Others
Assasuni 3240 841 755 491 222
Debhata 1960 821 378 252 345
Kalaroa 3520 1678 1065 960 692
Kaliganj 320 1209 820 780 563
Satkhira Sadar 8900 560 780 336 205
Shyamnagar 3100 924 595 588 400
Tala 18200 2242 1034 834 190
Total 39240 8275 5427 4241 2617

District Statistics 2011
Satkhira District
34
4.16 Distribution of chemical fertilizer 2010-11
(In metric ton)
Upazila UREA TSP MP DAP HP NPK SP Others
Assasuni 3778 841 755 491 0 0 0 222
Debhata 3166 821 378 252 0 158 0 187
Kalaroa 6622 1678 1065 960 0 0 0 692
Kaliganj 312 210 195 220 0 0 0 563
Satkhira Sadar 13410 470 650 250 0 0 0 160
Shyamnagar 4318 924 595 588 0 0 0 400
Tala 37225 2242 1034 834 0 0 0 190
Total 68831 7186 4672 3595 0 158 0 2414
4.17 Area and production of rice crops 2010-11
(Area in acre and production in metric ton)
Upazila Aus Aman Boro
Area Production Area Production Area Production
Assasuni 510 428 28144 27289 14950 18578
Debhata 1482 1423 15487 1658 15869 25962
Kalaroa 1418 1361 30750 35461 30773 36927
Kaliganj 5150 5000 43120 48159 11794 12407
Satkhira Sadar 8900 9259 57643 67426 61194 100508
Shyamnagar 500 429 44286 54742 5384 6593
Tala 4224 3868 33000 36395 40150 62402
Total 22184 21768 252430 271130 180114 263377
4.18 Area and production of rice crops 2009-2010
(Area in acre and production in metric ton)
Upazila Aus Aman Boro
Area Production Area Production Area Production
Assasuni 96 83 29593 27156 16115 20182
Debhata 692 643 16925 18278 16857 25830
Kalaroa 1250 1200 30460 24368 28450 40345
Kaliganj 5150 5000 42833 42737 12197 18449
Satkhira Sadar 1720 1801 51802 48335 59005 93201
Shyamnagar 119 94 21935 16949 3039 3505
Tala 2850 2081 13971 11503 41550 61208
Total 11877 10902 207519 189326 177213 262720
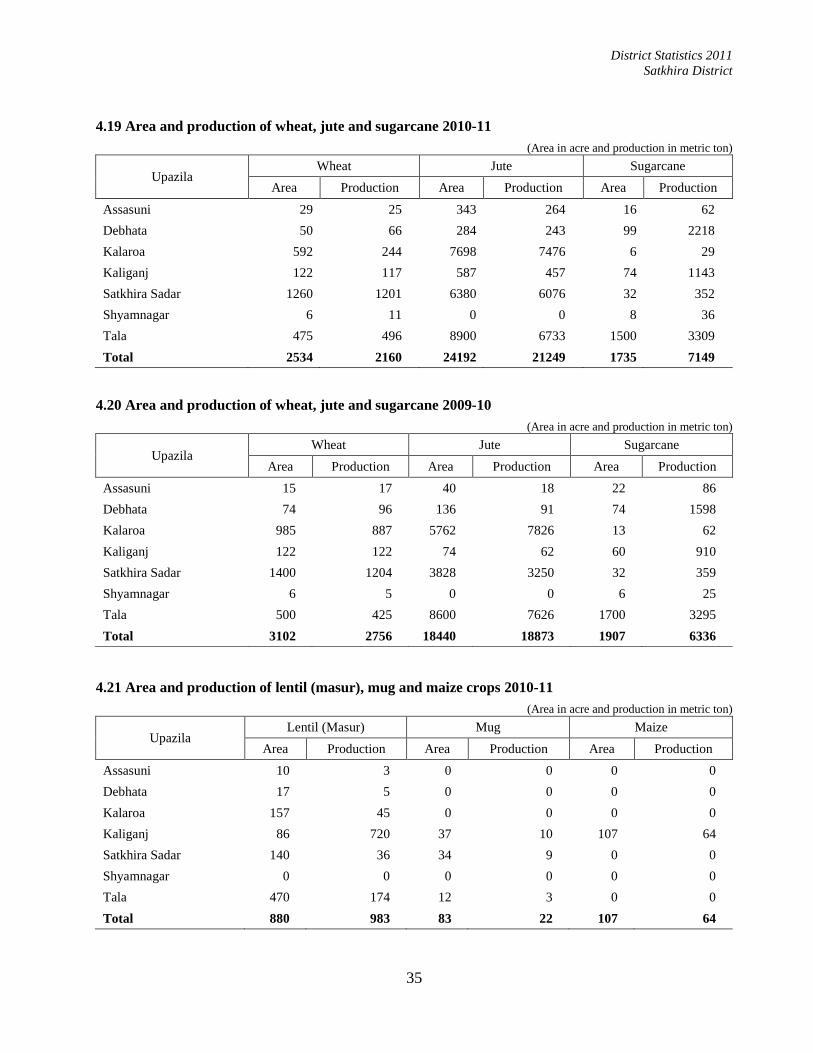
District Statistics 2011
Satkhira District
35
4.19 Area and production of wheat, jute and sugarcane 2010-11
(Area in acre and production in metric ton)
Upazila Wheat Jute Sugarcane
Area Production Area Production Area Production
Assasuni 29 25 343 264 16 62
Debhata 50 66 284 243 99 2218
Kalaroa 592 244 7698 7476 6 29
Kaliganj 122 117 587 457 74 1143
Satkhira Sadar 1260 1201 6380 6076 32 352
Shyamnagar 6 11 0 0 8 36
Tala 475 496 8900 6733 1500 3309
Total 2534 2160 24192 21249 1735 7149
4.20 Area and production of wheat, jute and sugarcane 2009-10
(Area in acre and production in metric ton)
Upazila Wheat Jute Sugarcane
Area Production Area Production Area Production
Assasuni 15 17 40 18 22 86
Debhata 74 96 136 91 74 1598
Kalaroa 985 887 5762 7826 13 62
Kaliganj 122 122 74 62 60 910
Satkhira Sadar 1400 1204 3828 3250 32 359
Shyamnagar 6 5 0 0 6 25
Tala 500 425 8600 7626 1700 3295
Total 3102 2756 18440 18873 1907 6336
4.21 Area and production of lentil (masur), mug and maize crops 2010-11
(Area in acre and production in metric ton)
Upazila Lentil (Masur) Mug Maize
Area Production Area Production Area Production
Assasuni 10 3 0 0 0 0
Debhata 17 5 0 0 0 0
Kalaroa 157 45 0 0 0 0
Kaliganj 86 720 37 10 107 64
Satkhira Sadar 140 36 34 9 0 0
Shyamnagar 0 0 0 0 0 0
Tala 470 174 12 3 0 0
Total 880 983 83 22 107 64
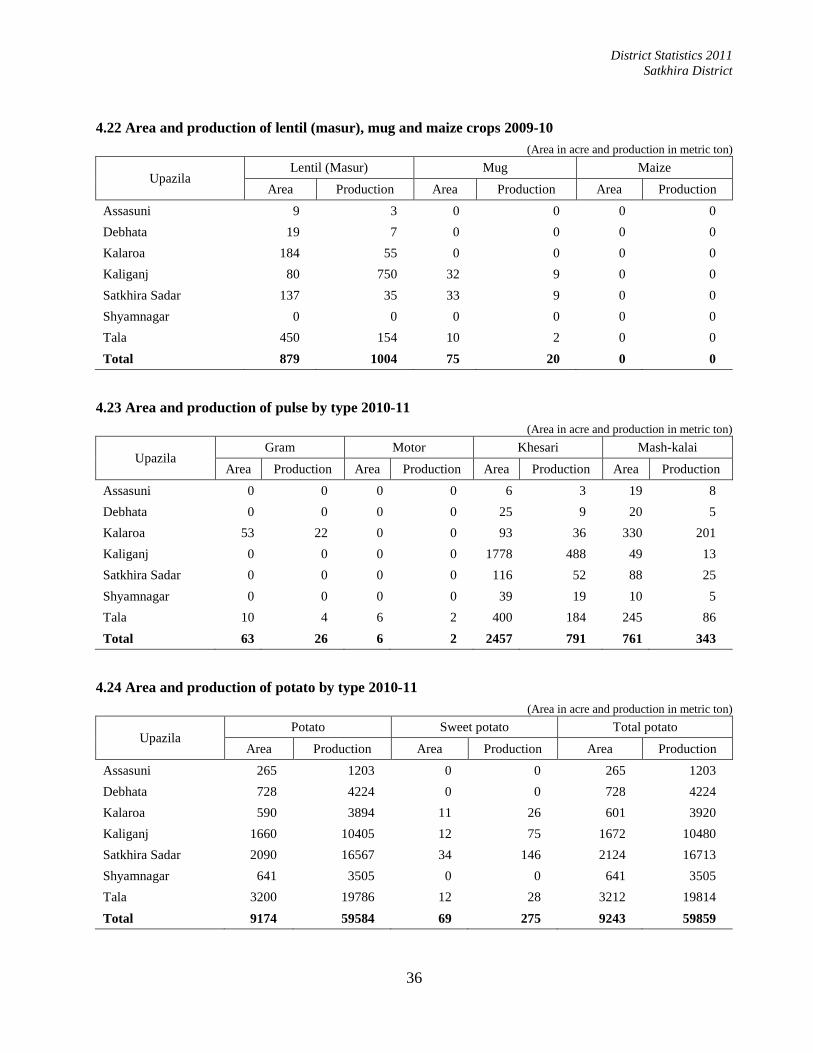
District Statistics 2011
Satkhira District
36
4.22 Area and production of lentil (masur), mug and maize crops 2009-10
(Area in acre and production in metric ton)
Upazila Lentil (Masur) Mug Maize
Area Production Area Production Area Production
Assasuni 9 3 0 0 0 0
Debhata 19 7 0 0 0 0
Kalaroa 184 55 0 0 0 0
Kaliganj 80 750 32 9 0 0
Satkhira Sadar 137 35 33 9 0 0
Shyamnagar 0 0 0 0 0 0
Tala 450 154 10 2 0 0
Total 879 1004 75 20 0 0
4.23 Area and production of pulse by type 2010-11
(Area in acre and production in metric ton)
Upazila Gram Motor Khesari Mash-kalai
Area Production Area Production Area Production Area Production
Assasuni 0 0 0 0 6 3 19 8
Debhata 0 0 0 0 25 9 20 5
Kalaroa 53 22 0 0 93 36 330 201
Kaliganj 0 0 0 0 1778 488 49 13
Satkhira Sadar 0 0 0 0 116 52 88 25
Shyamnagar 0 0 0 0 39 19 10 5
Tala 10 4 6 2 400 184 245 86
Total 63 26 6 2 2457 791 761 343
4.24 Area and production of potato by type 2010-11
(Area in acre and production in metric ton)
Upazila Potato Sweet potato Total potato
Area Production Area Production Area Production
Assasuni 265 1203 0 0 265 1203
Debhata 728 4224 0 0 728 4224
Kalaroa 590 3894 11 26 601 3920
Kaliganj 1660 10405 12 75 1672 10480
Satkhira Sadar 2090 16567 34 146 2124 16713
Shyamnagar 641 3505 0 0 641 3505
Tala 3200 19786 12 28 3212 19814
Total 9174 59584 69 275 9243 59859

District Statistics 2011
Satkhira District
37
4.25 Area and production of potato by type 2009-10
(Area in acre and production in metric ton)
Upazila Potato Sweet potato Total potato
Area Production Area Production Area Production
Assasuni 240 1074 0 0 240 1074
Debhata 716 6706 0 0 716 6706
Kalaroa 642 3893 11 17 653 3910
Kaliganj 1375 6760 10 70 1385 6830
Satkhira Sadar 1870 14600 33 143 1903 14743
Shyamnagar 710 3236 0 0 710 3236
Tala 3500 21651 12 31 3512 21682
Total 9053 57920 66 261 9119 58181
4.26 Area and production of oil seed by type 2010-11
(Area in acre and production in metric ton)
Upazila Rape & mustard Ground nut Til
Area Production Area Production Area Production
Assasuni 50 20 0 0 8 3
Debhata 2729 888 0 0 75 21
Kalaroa 1358 329 0 0 55 14
Kaliganj 423 186 0 0 74 18
Satkhira Sadar 1110 355 0 0 49 13
Shyamnagar 27 8 0 0 0 0
Tala 530 248 0 0 200 88
Total 6227 2033 0 0 461 157
4.27 Area and production of oil seed by type 2009-10
(Area in acre and production in metric ton)
Upazila Rape & mustard Ground nut Til
Area Production Area Production Area Production
Assasuni 20 9 0 0 9 4
Debhata 2710 746 0 0 80 26
Kalaroa 3335 347 0 0 60 17
Kaliganj 492 221 0 0 61 15
Satkhira Sadar 1100 361 0 0 51 14
Shyamnagar 45 13 0 0 0 0
Tala 517 233 0 0 220 115
Total 8219 1930 0 0 481 190
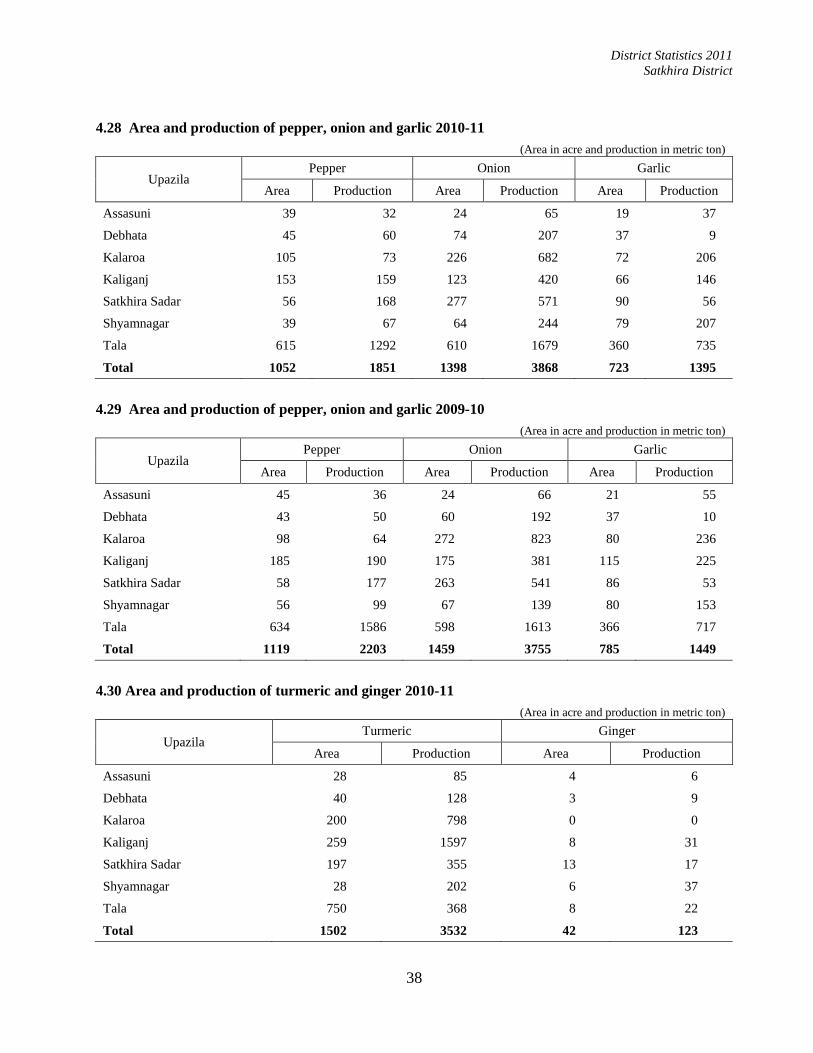
District Statistics 2011
Satkhira District
38
4.28 Area and production of pepper, onion and garlic 2010-11
(Area in acre and production in metric ton)
Upazila Pepper Onion Garlic
Area Production Area Production Area Production
Assasuni 39 32 24 65 19 37
Debhata 45 60 74 207 37 9
Kalaroa 105 73 226 682 72 206
Kaliganj 153 159 123 420 66 146
Satkhira Sadar 56 168 277 571 90 56
Shyamnagar 39 67 64 244 79 207
Tala 615 1292 610 1679 360 735
Total 1052 1851 1398 3868 723 1395
4.29 Area and production of pepper, onion and garlic 2009-10
(Area in acre and production in metric ton)
Upazila Pepper Onion Garlic
Area Production Area Production Area Production
Assasuni 45 36 24 66 21 55
Debhata 43 50 60 192 37 10
Kalaroa 98 64 272 823 80 236
Kaliganj 185 190 175 381 115 225
Satkhira Sadar 58 177 263 541 86 53
Shyamnagar 56 99 67 139 80 153
Tala 634 1586 598 1613 366 717
Total 1119 2203 1459 3755 785 1449
4.30 Area and production of turmeric and ginger 2010-11
(Area in acre and production in metric ton)
Upazila Turmeric Ginger
Area Production Area Production
Assasuni 28 85 4 6
Debhata 40 128 3 9
Kalaroa 200 798 0 0
Kaliganj 259 1597 8 31
Satkhira Sadar 197 355 13 17
Shyamnagar 28 202 6 37
Tala 750 368 8 22
Total 1502 3532 42 123

District Statistics 2011
Satkhira District
39
4.31 Area and production of turmeric and ginger 2009-10
(Area in acre and production in metric ton)
Upazila Turmeric Ginger
Area Production Area Production
Assasuni 27 49 7 14
Debhata 37 111 2 7
Kalaroa 246 708 0 0
Kaliganj 340 2085 7 27
Satkhira Sadar 197 352 12 15
Shyamnagar 29 214 5 40
Tala 695 448 9 49
Total 1571 3967 41 151
4.32 Area and production of tomato, radish and bean 2010-11
(Area in acre and production in metric ton)
Upazila Tomato Radish Bean
Area Production Area Production Area Production
Assasuni 19 44 26 55 14 10
Debhata 58 325 50 180 37 155
Kalaroa 79 300 82 395 57 146
Kaliganj 329 942 146 763 147 354
Satkhira Sadar 104 333 87 474 66 195
Shyamnagar 43 51 9 73 10 26
Tala 170 464 350 1381 225 605
Total 802 2459 750 3321 556 1491
4.33 Area and production of tomato, radish and bean 2009-10
(Area in acre and production in metric ton)
Upazila Tomato Radish Bean
Area Production Area Production Area Production
Assasuni 21 18 27 57 13 8
Debhata 60 364 48 154 36 160
Kalaroa 80 309 80 387 56 147
Kaliganj 360 842 146 610 120 264
Satkhira Sadar 107 345 91 460 69 215
Shyamnagar 49 70 15 139 12 45
Tala 195 700 386 1807 250 960
Total 872 2648 793 3612 556 1800
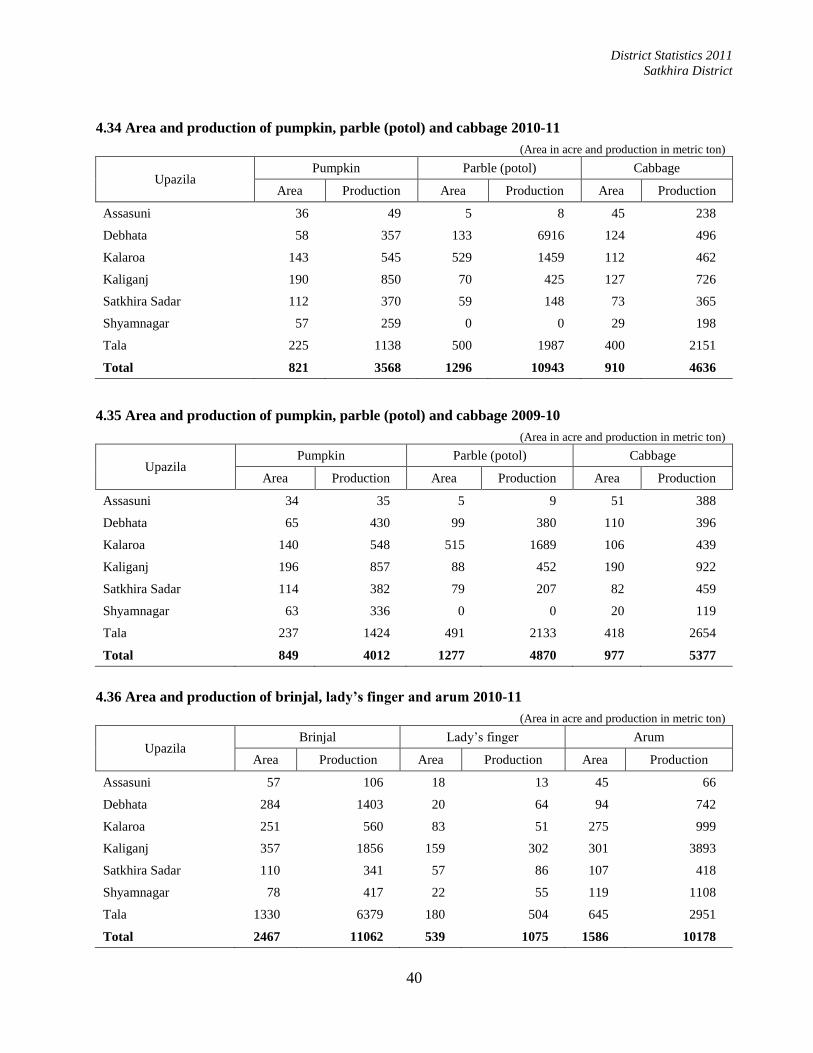
District Statistics 2011
Satkhira District
40
4.34 Area and production of pumpkin, parble (potol) and cabbage 2010-11
(Area in acre and production in metric ton)
Upazila Pumpkin Parble (potol) Cabbage
Area Production Area Production Area Production
Assasuni 36 49 5 8 45 238
Debhata 58 357 133 6916 124 496
Kalaroa 143 545 529 1459 112 462
Kaliganj 190 850 70 425 127 726
Satkhira Sadar 112 370 59 148 73 365
Shyamnagar 57 259 0 0 29 198
Tala 225 1138 500 1987 400 2151
Total 821 3568 1296 10943 910 4636
4.35 Area and production of pumpkin, parble (potol) and cabbage 2009-10
(Area in acre and production in metric ton)
Upazila Pumpkin Parble (potol) Cabbage
Area Production Area Production Area Production
Assasuni 34 35 5 9 51 388
Debhata 65 430 99 380 110 396
Kalaroa 140 548 515 1689 106 439
Kaliganj 196 857 88 452 190 922
Satkhira Sadar 114 382 79 207 82 459
Shyamnagar 63 336 0 0 20 119
Tala 237 1424 491 2133 418 2654
Total 849 4012 1277 4870 977 5377
4.36 Area and production of brinjal, lady’s finger and arum 2010-11
(Area in acre and production in metric ton)
Upazila Brinjal Lady’s finger Arum
Area Production Area Production Area Production
Assasuni 57 106 18 13 45 66
Debhata 284 1403 20 64 94 742
Kalaroa 251 560 83 51 275 999
Kaliganj 357 1856 159 302 301 3893
Satkhira Sadar 110 341 57 86 107 418
Shyamnagar 78 417 22 55 119 1108
Tala 1330 6379 180 504 645 2951
Total 2467 11062 539 1075 1586 10178
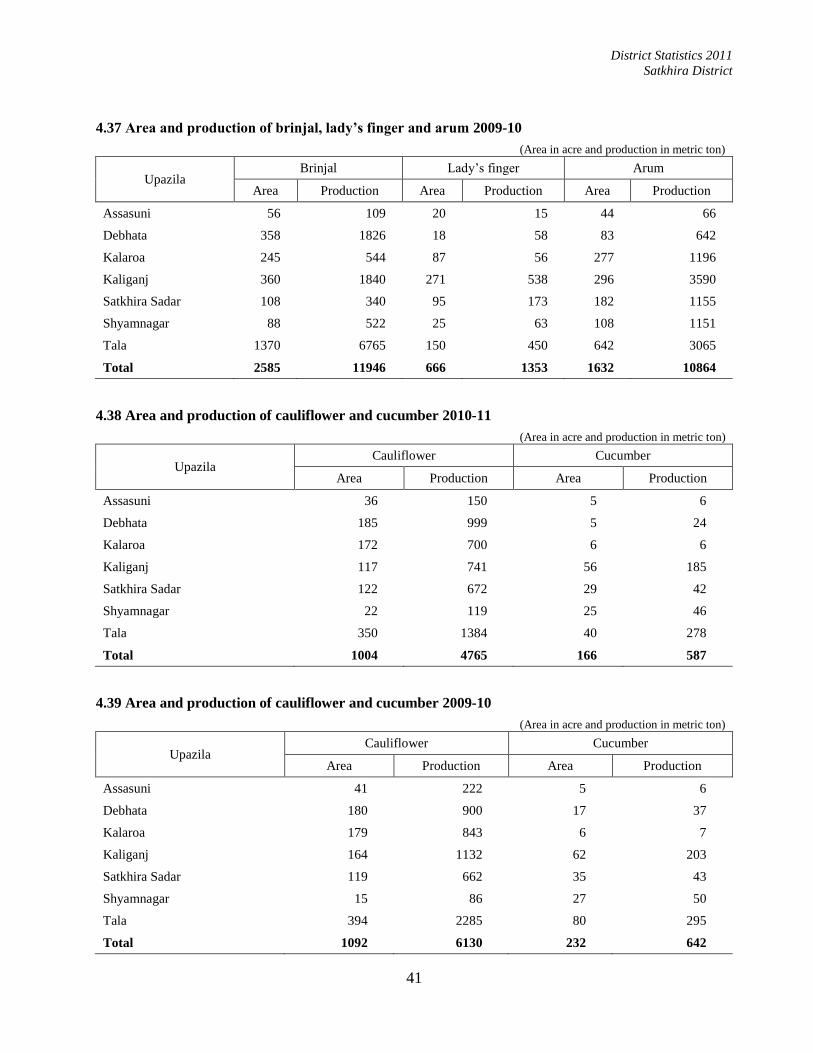
District Statistics 2011
Satkhira District
41
4.37 Area and production of brinjal, lady’s finger and arum 2009-10
(Area in acre and production in metric ton)
Upazila Brinjal Lady’s finger Arum
Area Production Area Production Area Production
Assasuni 56 109 20 15 44 66
Debhata 358 1826 18 58 83 642
Kalaroa 245 544 87 56 277 1196
Kaliganj 360 1840 271 538 296 3590
Satkhira Sadar 108 340 95 173 182 1155
Shyamnagar 88 522 25 63 108 1151
Tala 1370 6765 150 450 642 3065
Total 2585 11946 666 1353 1632 10864
4.38 Area and production of cauliflower and cucumber 2010-11
(Area in acre and production in metric ton)
Upazila Cauliflower Cucumber
Area Production Area Production
Assasuni 36 150 5 6
Debhata 185 999 5 24
Kalaroa 172 700 6 6
Kaliganj 117 741 56 185
Satkhira Sadar 122 672 29 42
Shyamnagar 22 119 25 46
Tala 350 1384 40 278
Total 1004 4765 166 587
4.39 Area and production of cauliflower and cucumber 2009-10
(Area in acre and production in metric ton)
Upazila Cauliflower Cucumber
Area Production Area Production
Assasuni 41 222 5 6
Debhata 180 900 17 37
Kalaroa 179 843 6 7
Kaliganj 164 1132 62 203
Satkhira Sadar 119 662 35 43
Shyamnagar 15 86 27 50
Tala 394 2285 80 295
Total 1092 6130 232 642

District Statistics 2011
Satkhira District
42
4.40 Area and production of papaya, guava, lime and lemon 2010-11
(Area in acre and production in metric ton)
Upazila Papaya Guava Lime and lemon
Area Production Area Production Area Production
Assasuni 17 17 12 163 12 123
Debhata 31 373 35 197 19 269
Kalaroa 4 161 955 69 8 33
Kaliganj 13 3080 15 150 7 57
Satkhira Sadar 80 1077 74 399 23 153
Shyamnagar 81 329 21 1130 7 93
Tala 135 884 235 334 295 132
Total 361 5920 1347 2442 371 860
4.41 Area and production of papaya, guava, lime and lemon 2009-10
(Area in acre and production in metric ton)
Upazila Papaya Guava Lime and lemon
Area Production Area Production Area Production
Assasuni 16 16 11 223 11 137
Debhata 30 304 34 153 18 259
Kalaroa 5 86 13 81 10 200
Kaliganj 14 3586 16 148 7 55
Satkhira Sadar 105 1835 74 396 23 152
Shyamnagar 81 401 20 1146 5 90
Tala 130 694 245 403 313 134
Total 381 6922 413 2549 387 1027
4.42 Area and production of jackfruit, banana and pineapple 2010-11
(Area in acre and production in metric ton)
Upazila Jackfruits Banana Pineapple
Area Production Area Production Area Production
Assasuni 25 475 53 114 1 2
Debhata 91 550 19 95 3 22
Kalaroa 24 300 217 674 2 5
Kaliganj 5 186 167 889 12 11
Satkhira Sadar 65 441 666 8342 8 7
Shyamnagar 8 236 16 62 0 0
Tala 150 1161 455 3177 16 18
Total 368 3349 1593 13353 42 64

District Statistics 2011
Satkhira District
43
4.43 Area and production of jackfruit, banana and pineapple 2009-10
(Area in acre and production in metric ton)
Upazila Jackfruit Banana Pineapple
Area Production Area Production Area Production
Assasuni 17 385 5250 111 1 2
Debhata 87 446 15 68 3 23
Kalaroa 23 241 237 784 2 7
Kaliganj 5 460 172 928 14 13
Satkhira Sadar 65 436 661 8263 8 6
Shyamnagar 8 276 11 48 0 0
Tala 148 1163 445 3061 12 12
Total 353 3407 6791 13262 40 64
4.44 Area and production of mango, litchi and blackberry 2010-11
(Area in acre and production in metric ton)
Upazila Mango Litchi Blackberry
Area Production Area Production Area Production
Assasuni 80 423 11 13 4 13
Debhata 164 2084 15 56 7 10
Kalaroa 250 811 26 122 11 43
Kaliganj 90 3974 2 115 2 2
Satkhira Sadar 232 2033 75 152 209 912
Shyamnagar 7 202 4 1 8 14
Tala 446 1451 36 45 175 56
Total 1269 10977 169 504 416 1050
4.45 Area and production of mango, litchi and blackberry 2009-10
(Area in acre and production in metric ton)
Upazila Mango Litchi Blackberry
Area Production Area Production Area Production
Assasuni 60 739 11 14 4 14
Debhata 163 2225 14 57 7 11
Kalaroa 300 367 21 111 11 32
Kaliganj 90 4664 2 110 2 2
Satkhira Sadar 232 2014 75 149 205 901
Shyamnagar 7 176 0 0 8 13
Tala 436 1600 59 45 160 48
Total 1288 11785 182 486 397 1022
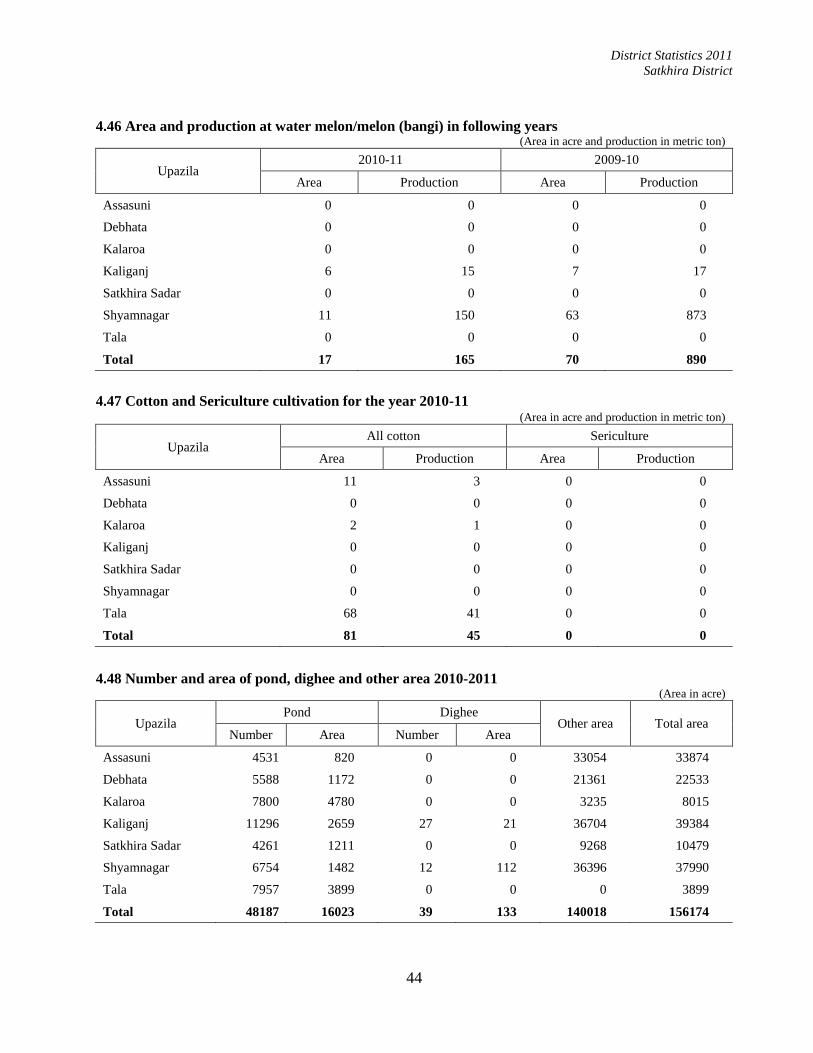
District Statistics 2011
Satkhira District
44
4.46 Area and production at water melon/melon (bangi) in following years (Area in acre and production in metric ton)
Upazila 2010-11 2009-10
Area Production Area Production
Assasuni 0 0 0 0
Debhata 0 0 0 0
Kalaroa 0 0 0 0
Kaliganj 6 15 7 17
Satkhira Sadar 0 0 0 0
Shyamnagar 11 150 63 873
Tala 0 0 0 0
Total 17 165 70 890
4.47 Cotton and Sericulture cultivation for the year 2010-11 (Area in acre and production in metric ton)
Upazila All cotton Sericulture
Area Production Area Production
Assasuni 11 3 0 0
Debhata 0 0 0 0
Kalaroa 2 1 0 0
Kaliganj 0 0 0 0
Satkhira Sadar 0 0 0 0
Shyamnagar 0 0 0 0
Tala 68 41 0 0
Total 81 45 0 0
4.48 Number and area of pond, dighee and other area 2010-2011 (Area in acre)
Upazila Pond Dighee
Other area Total area Number Area Number Area
Assasuni 4531 820 0 0 33054 33874
Debhata 5588 1172 0 0 21361 22533
Kalaroa 7800 4780 0 0 3235 8015
Kaliganj 11296 2659 27 21 36704 39384
Satkhira Sadar 4261 1211 0 0 9268 10479
Shyamnagar 6754 1482 12 112 36396 37990
Tala 7957 3899 0 0 0 3899
Total 48187 16023 39 133 140018 156174
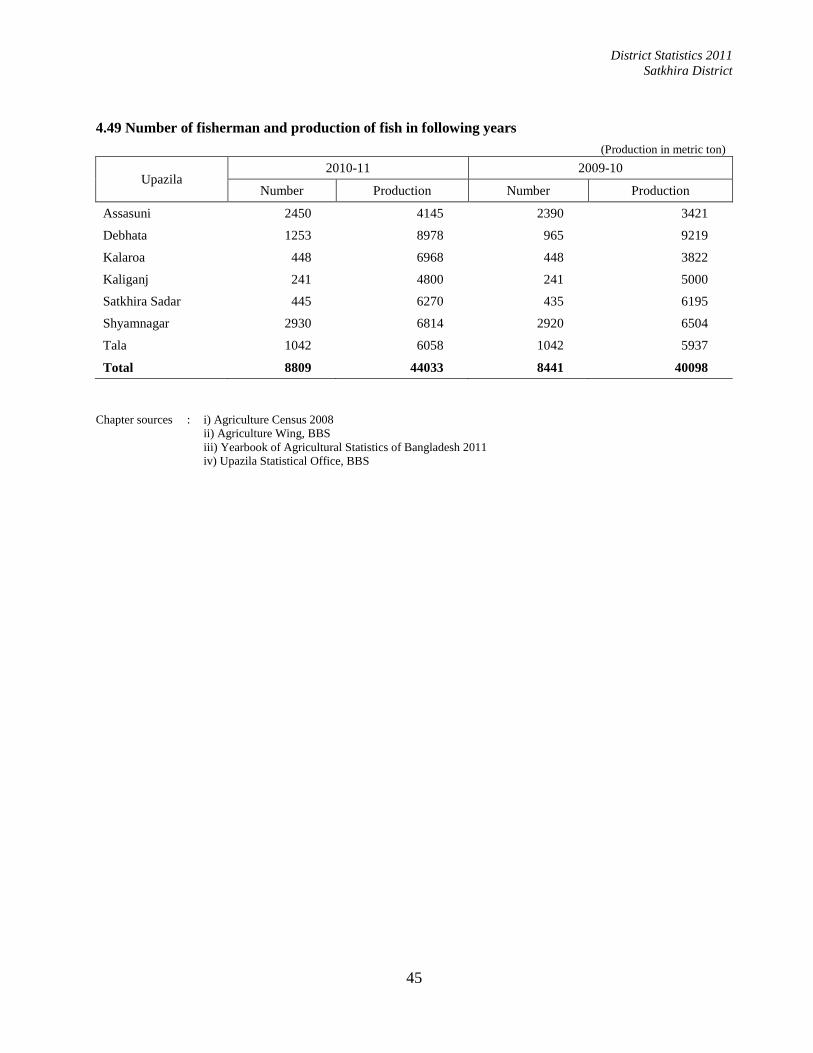
District Statistics 2011
Satkhira District
45
4.49 Number of fisherman and production of fish in following years
(Production in metric ton)
Upazila 2010-11 2009-10
Number Production Number Production
Assasuni 2450 4145 2390 3421
Debhata 1253 8978 965 9219
Kalaroa 448 6968 448 3822
Kaliganj 241 4800 241 5000
Satkhira Sadar 445 6270 435 6195
Shyamnagar 2930 6814 2920 6504
Tala 1042 6058 1042 5937
Total 8809 44033 8441 40098
Chapter sources : i) Agriculture Census 2008
ii) Agriculture Wing, BBS
iii) Yearbook of Agricultural Statistics of Bangladesh 2011
iv) Upazila Statistical Office, BBS

District Statistics 2011
Satkhira District
46

District Statistics 2011
Satkhira District
47
CHAPTER 5
Industry

District Statistics 2011
Satkhira District
48

District Statistics 2011
Satkhira District
49
Industry
5.01 Number of selected industry 2011
Upazila Textile
mill
Garments
factory
Rice
mill
Match
factory
Steel and
engineering Aluminium Jute mill Sugar mill Others
Assasuni 0 0 123 0 0 0 0 0 5
Debhata 0 0 52 0 0 0 0 0 0
Kalaroa 0 0 55 0 0 0 0 0 0
Kaliganj 0 0 41 0 0 0 0 0 0
Satkhira Sadar 0 0 248 0 0 0 0 0 0
Shyamnagar 0 0 47 0 0 0 0 0 0
Tala 0 0 566 0 0 0 0 0 0
5.02 Number of textile industry 2011
Upazila Number of mill Installed capacity Person engaged
Spindle Loom Male Female Total
Assasuni 0 0 0 0 0 0
Debhata 0 0 0 0 0 0
Kalaroa 0 0 0 0 0 0
Kaliganj 0 0 0 0 0 0
Satkhira Sadar 1 0 0 14 0 14
Shyamnagar 0 0 0 0 0 0
Tala 0 0 0 0 0 0
Total 1 0 0 14 0 14
5.03 Number of handloom establishment and loom 2011
Upazila Number of unit
(factory)
Number of loom
Operational Non-operational Total
Assasuni 0 0 0 0
Debhata 0 0 0 0
Kalaroa 0 0 0 0
Kaliganj 500 300 200 500
Satkhira Sadar 15 10 5 15
Shyamnagar 21 19 2 21
Tala 51 51 0 51
Total 587 380 207 587

District Statistics 2011
Satkhira District
50
5.04 Employment status in handloom industry 2011
Upazila Number of
handloom
Person engaged
Total Family member Regular
Hired
/Casual
Assasuni 0 0 0 0 0
Debhata 0 0 0 0 0
Kalaroa 0 0 0 0 0
Kaliganj 500 500 0 68 568
Satkhira Sadar 10 56 20 30 106
Shyamnagar 19 28 4 6 38
Tala 51 102 0 0 102
Total 580 686 24 104 814
5.05 Dying facilities of handloom industry 2011
Upazila With dying facility Without dying facility Total
Assasuni 0 0 0
Debhata 0 0 0
Kalaroa 0 0 0
Kaliganj 0 0 0
Satkhira Sadar 0 0 0
Shyamnagar 0 19 19
Tala 0 0 0
Total 0 19 19
5.06 Number of small scale and cottage industry 2011
Upazila
Small scale and cottage industry
Weaving/
handloom Handy
Husking
crafts mill
Goor
processing
Biri
factory
Salt
processing
Dry fish
processing Pottery Others
Assasuni 0 145 123 0 0 0 0 30 9
Debhata 0 0 52 0 0 0 0 8 15
Kalaroa 0 2164 127 0 0 0 0 62 0
Kaliganj 300 184 3 0 0 0 0 104 0
Satkhira Sadar 10 20 200 100 0 0 0 25 0
Shyamnagar 19 148 1233 0 0 0 13 8 32
Tala 51 631 15974 65 0 0 25 95 546
Total 380 3292 17712 165 0 0 38 332 602

District Statistics 2011
Satkhira District
51
5.07 Number of establishment and person engaged in cottage industry 2011
Upazila Number of unit Person engaged
Family Hired Total
Assasuni 1850 3951 75 4026
Debhata 15 200 75 275
Kalaroa 526 575 70 645
Kaliganj 484 482 68 550
Satkhira Sadar 25 400 300 700
Shyamnagar 3994 3729 382 4111
Tala 1518 2625 1310 3935
Total 8412 11962 2280 14242
5.08 Number of bamboo and cane industry and person engaged 2011
Upazila Unit Person engaged
Family Hired Total
Assasuni 185 518 0 518
Debhata 210 420 0 420
Kalaroa 348 870 0 870
Kaliganj 278 322 7 329
Satkhira Sadar 50 200 0 200
Shyamnagar 681 1381 162 1543
Tala 548 1422 0 1422
Total 2300 5133 169 5302
5.09 Number of wooden furniture and person engaged 2011
Upazila Unit Person engaged
Family Hired Total
Assasuni 145 145 300 445
Debhata 42 42 126 168
Kalaroa 165 165 247 412
Kaliganj 75 125 150 275
Satkhira Sadar 200 350 1500 1850
Shyamnagar 618 1258 1912 3170
Tala 107 107 287 394
Total 1352 2192 4522 6714
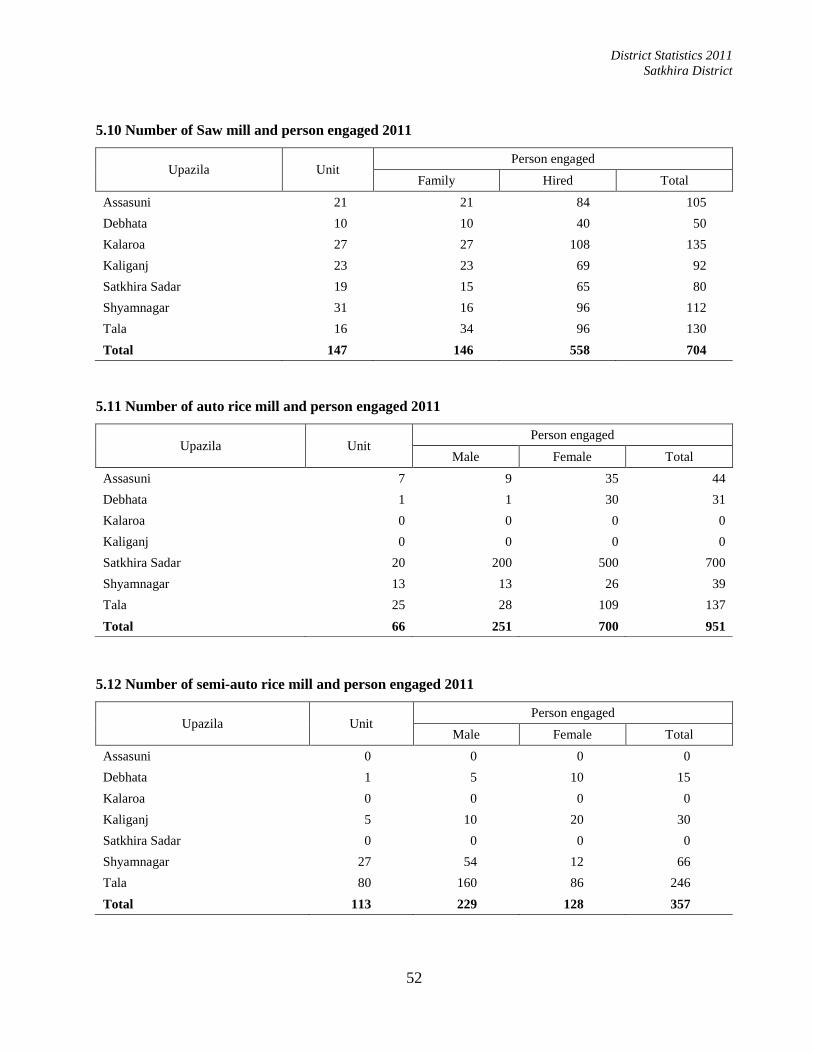
District Statistics 2011
Satkhira District
52
5.10 Number of Saw mill and person engaged 2011
Upazila Unit Person engaged
Family Hired Total
Assasuni 21 21 84 105
Debhata 10 10 40 50
Kalaroa 27 27 108 135
Kaliganj 23 23 69 92
Satkhira Sadar 19 15 65 80
Shyamnagar 31 16 96 112
Tala 16 34 96 130
Total 147 146 558 704
5.11 Number of auto rice mill and person engaged 2011
Upazila Unit Person engaged
Male Female Total
Assasuni 7 9 35 44
Debhata 1 1 30 31
Kalaroa 0 0 0 0
Kaliganj 0 0 0 0
Satkhira Sadar 20 200 500 700
Shyamnagar 13 13 26 39
Tala 25 28 109 137
Total 66 251 700 951
5.12 Number of semi-auto rice mill and person engaged 2011
Upazila Unit Person engaged
Male Female Total
Assasuni 0 0 0 0
Debhata 1 5 10 15
Kalaroa 0 0 0 0
Kaliganj 5 10 20 30
Satkhira Sadar 0 0 0 0
Shyamnagar 27 54 12 66
Tala 80 160 86 246
Total 113 229 128 357

District Statistics 2011
Satkhira District
53
5.13 Number of rice mill and person engaged 2011
Upazila Unit Person engaged
Male Female Total
Assasuni 116 142 90 232
Debhata 50 177 232 409
Kalaroa 16 48 91 139
Kaliganj 36 83 25 108
Satkhira Sadar 30 400 100 14000
Shyamnagar 7 36 42 78
Tala 45 65 205 270
Total 300 951 785 15236
5.14 Number of oil mill and person engaged 2011
azila Unit Person engaged
Family Hired Total
Assasuni 4 7 10 17
Debhata 4 4 8 12
Kalaroa 19 19 57 76
Kaliganj 8 8 24 32
Satkhira Sadar 4 6 40 46
Shyamnagar 2 0 4 4
Tala 7 13 27 40
Total 48 57 170 227
5.15 Number of bakery and person engaged 2011
Upazila Unit Person engaged
Family Hired Total
Assasuni 5 8 25 33
Debhata 3 6 6 12
Kalaroa 6 12 138 150
Kaliganj 11 11 30 41
Satkhira Sadar 25 30 1500 1530
Shyamnagar 3 7 21 28
Tala 8 8 120 128
Total 61 82 1840 1922

District Statistics 2011
Satkhira District
54
5.16 Number of pottery and person engaged 2011
Upazila Unit Person engaged
Family Hired Total
Assasuni 30 90 10 100
Debhata 8 24 10 34
Kalaroa 62 124 155 279
Kaliganj 104 125 50 175
Satkhira Sadar 300 320 100 420
Shyamnagar 8 32 0 32
Tala 95 309 0 309
Total 607 1024 325 1349
5.17 Number of printing press and person engaged 2011
Upazila Unit Person engaged
Family Hired Total
Assasuni 0 0 0 0
Debhata 0 0 0 0
Kalaroa 0 0 0 0
Kaliganj 0 0 0 0
Satkhira Sadar 23 5 130 135
Total 27 10 137 147
5.18 Number of tailoring shop and person engaged 2011
Upazila Unit Person engaged
Family Hired Total
Assasuni 225 280 340 620
Debhata 1248 1248 240 1488
Kalaroa 994 994 298 1192
Kaliganj 350 350 700 1050
Satkhira Sadar 908 1005 2000 3005
Shyamnagar 1062 1062 214 1276
Tala 295 295 397 692
Total 5082 5234 4189 9323
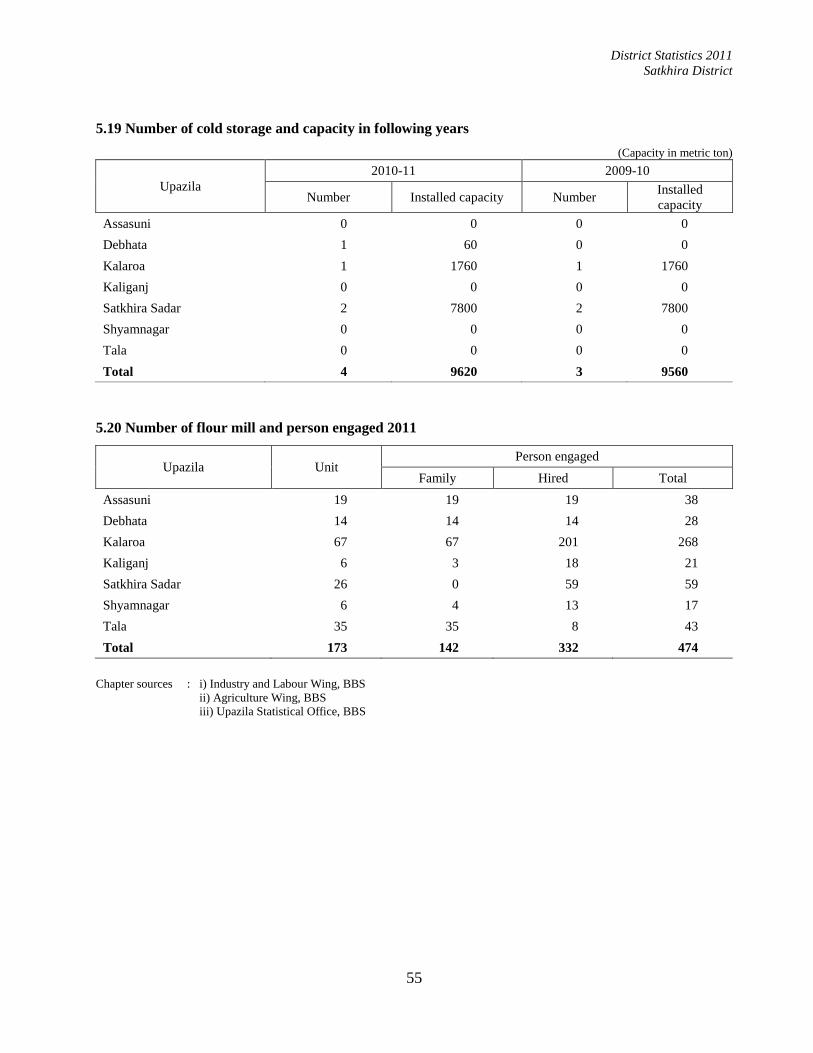
District Statistics 2011
Satkhira District
55
5.19 Number of cold storage and capacity in following years
(Capacity in metric ton)
Upazila
2010-11 2009-10
Number Installed capacity Number Installed
capacity
Assasuni 0 0 0 0
Debhata 1 60 0 0
Kalaroa 1 1760 1 1760
Kaliganj 0 0 0 0
Satkhira Sadar 2 7800 2 7800
Shyamnagar 0 0 0 0
Tala 0 0 0 0
Total 4 9620 3 9560
5.20 Number of flour mill and person engaged 2011
Upazila Unit Person engaged
Family Hired Total
Assasuni 19 19 19 38
Debhata 14 14 14 28
Kalaroa 67 67 201 268
Kaliganj 6 3 18 21
Satkhira Sadar 26 0 59 59
Shyamnagar 6 4 13 17
Tala 35 35 8 43
Total 173 142 332 474
Chapter sources : i) Industry and Labour Wing, BBS
ii) Agriculture Wing, BBS
iii) Upazila Statistical Office, BBS

District Statistics 2011
Satkhira District
56

District Statistics 2011
Satkhira District
57
CHAPTER 6
Education

District Statistics 2011
Satkhira District
58

District Statistics 2011
Satkhira District
59
Education
6.01 Literacy (7+) rate of 2001 & 2011
Upazila 2001 2011
Male Female Both Male Female Both
Assasuni 48.0 32.5 40.3 54.9 44.8 49.8
Debhata 55.6 43.9 49.9 58.8 50.9 54.8
Kalaroa 50.6 40.5 45.6 53.6 48.4 50.9
Kaliganj 53.0 40.4 46.8 55.4 48.2 51.8
Satkhira Sadar 55.9 45.1 50.7 59.8 53.2 56.5
Shyamnagar 47.7 31.3 39.7 53.8 43.9 48.6
Tala 51.9 39.1 45.7 55.3 46.5 50.9
Total 51.8 38.9 45.5 56.1 48.2 52.1
6.02 Number of Government primary school (class I-V), teacher and student 2011
Upazila
Number of
Government
primary school
Number of teacher Number of student Students
per teacher Male Female Total Male Female Total
Assasuni 89 191 252 443 10449 10148 20597 46
Debhata 35 88 124 212 7467 7041 14508 68
Kalaroa 67 119 219 338 7101 6899 14000 41
Kaliganj 86 183 343 526 10298 10898 21196 40
Satkhira Sadar 140 255 496 751 11318 15177 30495 41
Shyamnagar 96 191 297 488 11471 11336 22807 47
Tala 109 292 253 545 9910 9514 19424 36
Total 622 1319 1984 3303 68014 71013 143027 43
6.03 Number of registered primary school (class I-V), teacher and student 2011
Upazila
Number of
registered
primary school
Number of teacher Number of student Students
per teacher Male Female Total Male Female Total
Assasuni 64 133 83 216 4640 4466 9106 42
Debhata 23 54 19 73 2017 1839 3856 53
Kalaroa 57 114 66 180 4835 4423 9257 51
Kaliganj 43 86 94 180 3487 3987 7474 42
Satkhira Sadar 58 103 90 193 4510 4513 9023 47
Shyamnagar 82 243 39 282 7776 7775 15551 55
Tala 97 195 149 344 6265 6020 12285 36
Total 424 928 540 1468 33530 33023 66552 45

District Statistics 2011
Satkhira District
60
6.04 Number of private (non-registered) primary school (class I-V), teacher and student 2011
Upazila
Number of Non-
govt. primary
school
Number of teacher Number of student Students
per teacher Male Female Total Male Female Total
Assasuni 2 6 2 8 166 146 312 39
Debhata 1 2 2 4 90 63 153 38
Kalaroa 2 2 10 12 125 106 231 19
Kaliganj 3 4 4 8 126 175 301 38
Satkhira Sadar 2 3 1 4 124 120 244 61
Shyamnagar 7 12 16 28 304 306 610 22
Tala 1 3 1 4 65 54 119 30
Total 18 32 36 68 1000 970 1970 29
6.05 Number of kindergarten school (pre schooling), teacher and student 2011
Upazila
Number of
kindergarten
school
Number of teacher Number of student Students
per teacher Male Female Total Male Female Total
Assasuni 5 18 5 23 167 146 313 14
Debhata 5 28 10 38 209 119 328 9
Kalaroa 11 40 25 65 666 623 1289 20
Kaliganj 16 26 50 76 709 778 1487 20
Satkhira Sadar 46 300 252 552 7451 5007 12458 23
Shyamnagar 6 10 20 30 161 165 326 11
Tala 18 45 27 72 910 795 1705 24
Total 107 467 389 856 10273 7633 17906 21
6.06 Number of NGO school, teacher and student 2011
Upazila Number of
NGO school
Number of teacher Number of student Students
per teacher Male Female Total Male Female Total
Assasuni 3 5 7 12 179 147 326 27
Debhata 7 0 7 7 99 111 210 30
Kalaroa 114 62 89 151 1709 1441 3150 21
Kaliganj 10 3 7 10 170 180 350 35
Satkhira Sadar 143 83 60 143 1656 1728 3384 24
Shyamnagar 0 0 0 0 0 0 0 0
Tala 35 4 31 35 802 795 1597 46
Total 312 157 201 358 4615 4402 9017 25

District Statistics 2011
Satkhira District
61
6.07 Number of Government secondary school, teacher and student 2011
Upazila Number of
school
Number of teacher Number of student Students
per teacher Male Female Total Male Female Total
Assasuni 0 0 0 0 0 0 0 0
Debhata 0 0 0 0 0 0 0 0
Kalaroa 0 0 0 0 0 0 0 0
Kaliganj 0 0 0 0 0 0 0 0
Satkhira Sadar 2 60 20 80 1025 892 1917 24
Shyamnagar 0 0 0 0 0 0 0 0
Tala 2 18 4 22 350 324 674 31
Total 4 78 24 102 1375 1216 2591 25
6.08 Number of Non-government secondary school, teacher and student 2011
Upazila Number of
school
Number of teacher Number of student Students
per teacher Male Female Total Male Female Total
Assasuni 39 387 69 456 6357 6743 13100 29
Debhata 15 161 36 197 2524 2524 6048 31
Kalaroa 42 626 172 798 6968 7461 14429 18
Kaliganj 36 450 32 482 7469 8329 15798 33
Satkhira Sadar 62 726 168 894 16824 19629 36453 41
Shyamnagar 41 363 59 422 6596 7050 13640 32
Tala 60 798 159 957 7506 7013 16519 17
Total 295 3511 695 4206 54244 58749 115987 28
6.09 Number of school & college (operating jointly), teacher and student 2011
Upazila Number of
institute
Number of teacher Number of student Students
per teacher Male Female Total Male Female Total
Assasuni 3 77 9 86 1230 952 2182 25
Debhata 0 0 0 0 0 0 0 0
Kalaroa 0 0 0 0 0 0 0 0
Kaliganj 1 33 3 36 557 391 948 26
Satkhira Sadar 1 16 11 27 357 180 537 20
Shyamnagar 3 61 7 68 1034 884 1918 28
Tala 1 9 2 11 230 193 423 38
Total 9 196 32 228 3408 2600 6008 26

District Statistics 2011
Satkhira District
62
6.10 Number of Government college, teacher and student 2011
Upazila Number of
college
Number of teacher Number of student Students
per teacher Male Female Total Male Female Total
Assasuni 0 0 0 0 0 0 0 0
Debhata 0 0 0 0 0 0 0 0
Kalaroa 1 19 3 22 739 445 1184 54
Kaliganj 0 0 0 0 0 0 0 0
Satkhira Sadar 2 60 33 93 10130 5330 15460 166
Shyamnagar 0 0 0 0 0 0 0 0
Tala 1 22 1 23 432 96 528 23
Total 4 101 37 138 11301 5871 17172 124
6.11 Number of Non government college, teacher and student 2011
Upazila Number of
college
Number of teacher Number of student Students
per teacher Male Female Total Male Female Total
Assasuni 5 131 9 140 1278 1261 2539 18
Debhata 3 131 21 152 1134 1042 2176 14
Kalaroa 10 228 37 265 2459 1579 4037 15
Kaliganj 7 191 14 205 2653 1326 3979 19
Satkhira Sadar 16 250 100 350 6301 3025 9326 27
Shyamnagar 5 152 13 165 2208 1980 4188 25
Tala 10 104 39 143 1375 993 2368 17
Total 56 1187 233 1420 17408 11206 28613 20
6.12 Number of madrasah, teacher and student under the madrasah education board 2011
Upazila Number of
madrasah
Number of teacher Number of student Students
per teacher Male Female Total Male Female Total
Assasuni 31 382 34 416 4980 6065 11045 27
Debhata 15 130 14 144 1647 2051 3698 26
Kalaroa 32 420 54 474 2464 3633 6097 13
Kaliganj 25 277 26 303 4290 2145 6435 21
Satkhira Sadar 60 576 144 720 8412 7629 16041 22
Shyamnagar 36 414 26 440 4245 7180 11425 26
Tala 36 515 55 570 9105 3044 12149 21
Total 235 2714 353 3067 35143 31747 66890 22

District Statistics 2011
Satkhira District
63
6.13 Number of kawmi madrasah, teacher and student 2011
Upazila Number of
madrasah
Number of teacher Number of student Students
per teacher Male Female Total Male Female Total
Assasuni 35 45 0 45 525 0 525 12
Debhata 3 12 0 12 228 240 468 39
Kalaroa 3 10 0 10 82 51 133 13
Kaliganj 4 35 0 35 1320 255 1575 45
Satkhira Sadar 7 98 4 102 631 210 841 8
Shyamnagar 12 142 0 142 960 0 960 7
Tala 2 12 2 14 88 28 116 8
Total 66 354 6 360 3834 784 4618 13
6.14 Number of ebtedayee madrasah 2011
Upazila Number of
madrasah
Number of teacher Number of student Students
per teacher Male Female Total Male Female Total
Assasuni 13 47 5 52 452 491 1033 20
Debhata 3 7 5 12 182 138 320 27
Kalaroa 36 36 0 36 690 390 1080 30
Kaliganj 25 85 15 100 2218 2600 4818 48
Satkhira Sadar 9 24 11 35 815 312 1127 32
Shyamnagar 6 22 8 30 388 392 780 26
Tala 5 42 12 54 1867 643 2520 47
Total 97 263 56 319 6612 4966 11678 37
6.15 Number of technical and vocational institution, teacher and student 2011
Upazila Institution Number of teacher Number of student Students
per teacher Male Female Total Male Female Total
Assasuni 1 13 0 13 131 63 194 15
Debhata 1 17 0 17 199 49 248 15
Kalaroa 1 4 1 5 29 24 53 11
Kaliganj 0 0 0 0 0 0 0 0
Satkhira Sadar 3 20 15 35 2012 1506 3518 101
Shyamnagar 2 20 2 22 310 136 446 20
Tala 0 0 0 0 0 0 0 0
Total 8 74 18 92 2681 1778 4459 48
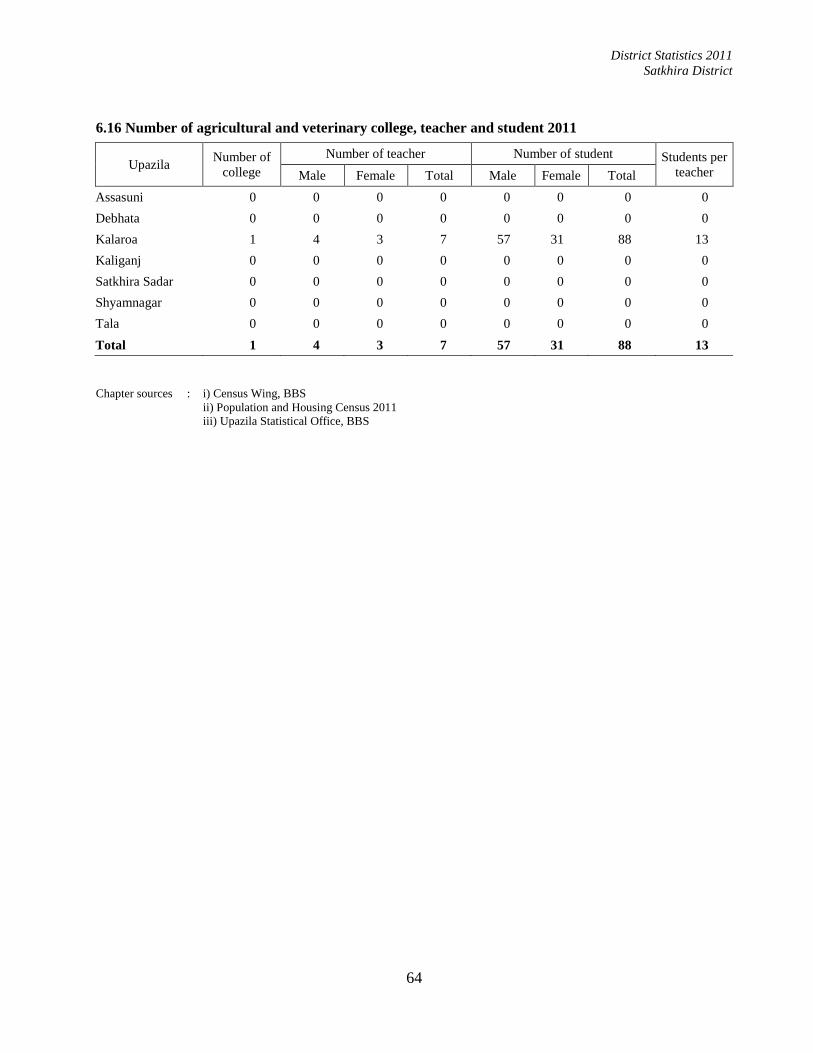
District Statistics 2011
Satkhira District
64
6.16 Number of agricultural and veterinary college, teacher and student 2011
Upazila Number of
college
Number of teacher Number of student Students per
teacher Male Female Total Male Female Total
Assasuni 0 0 0 0 0 0 0 0
Debhata 0 0 0 0 0 0 0 0
Kalaroa 1 4 3 7 57 31 88 13
Kaliganj 0 0 0 0 0 0 0 0
Satkhira Sadar 0 0 0 0 0 0 0 0
Shyamnagar 0 0 0 0 0 0 0 0
Tala 0 0 0 0 0 0 0 0
Total 1 4 3 7 57 31 88 13
Chapter sources : i) Census Wing, BBS
ii) Population and Housing Census 2011
iii) Upazila Statistical Office, BBS

District Statistics 2011
Satkhira District
65
CHAPTER 7 Health and Social Welfare

District Statistics 2011
Satkhira District
66

District Statistics 2011
Satkhira District
67
Health and Social Welfare
7.01 Number of Government health complex and health personnel 2011
Upazila Number of
bed
Number of
doctor
Number of
nurse
Number of
technician
Number of
other staff
Assasuni 31 6 10 5 93
Debhata 31 7 10 8 32
Kalaroa 50 18 16 7 119
Kaliganj 50 12 11 4 107
Satkhira Sadar 100 20 38 3 33
Shyamnagar 50 7 15 5 54
Tala 50 10 15 21 89
Total 362 80 115 53 527
7.02 Number of private hospital/clinic and related health personnel 2011
Upazila Number of
centre
Number
of bed
Number of
doctor
Number of
nurse
Number of
technician
Number of
other staff
Assasuni 5 50 8 10 0 19
Debhata 3 30 3 9 1 24
Kalaroa 14 109 14 14 6 42
Kaliganj 9 120 12 20 9 45
Satkhira Sadar 32 350 20 32 0 320
Shyamnagar 9 90 2 2 0 43
Tala 5 28 5 10 5 35
Total 77 777 64 97 21 528
7.03 Number of diagnostic centre and related health personnel 2011
Upazila Number of
centre
Number of
doctor
Number of
nurse
Number of
technician
Number of
other staff
Assasuni 0 0 0 0 0
Debhata 0 0 0 0 0
Kalaroa 11 11 11 22 40
Kaliganj 3 3 6 3 18
Satkhira Sadar 18 7 0 18 60
Shyamnagar 9 0 0 2 27
Tala 6 6 1 6 9
Total 47 27 18 51 154

District Statistics 2011
Satkhira District
68
7.04 Number of missionary hospital and charitable dispensary 2011
Upazila Number of
centre
Number of
bed
Number of
doctor
Number of
nurse
Number of
technician
Number of
other staff
Assasuni 0 0 0 0 0 0
Debhata 0 0 0 0 0 0
Kalaroa 0 0 0 0 0 0
Kaliganj 2 0 2 1 0 4
Satkhira Sadar 2 20 2 4 0 20
Shyamnagar 1 0 2 0 1 5
Tala 0 0 0 0 0 0
Total 5 20 6 5 1 29
7.05 Number of physician/practitioner in the upazila/city corporation 2011
Upazila Physician MBBS,
FCPS/over L.M.F
Unani /
ayurbedic Homeopathy
Assasuni 416 0 235 16 165
Debhata 45 6 5 2 32
Kalaroa 569 20 357 25 167
Kaliganj 192 2 3 29 160
Satkhira Sadar 72 20 30 2 20
Shyamnagar 282 2 0 18 262
Tala 366 3 145 0 218
Total 1942 53 775 92 1024
7.06 Number of health centre, providing health and family planning service 2011
Upazila
Number of
union health
centre
Health
service Sterilization M.R.
Injection/
copper-T
Oral pill/
condom
Number of
immunization
centre
Assasuni 10 11541 3 10 11851 11852 265
Debhata 4 4412 1 4 4452 4741 126
Kalaroa 12 4874 1 12 12125 12874 288
Kaliganj 8 8451 1 8 12148 12962 288
Satkhira
Sadar 13 13857 8 13 13984 13472 340
Shyamnagar 11 12125 2 11 11874 12936 288
Tala 9 12984 2 12 12214 9471 215
Total 67 68244 18 70 78648 78308 1810
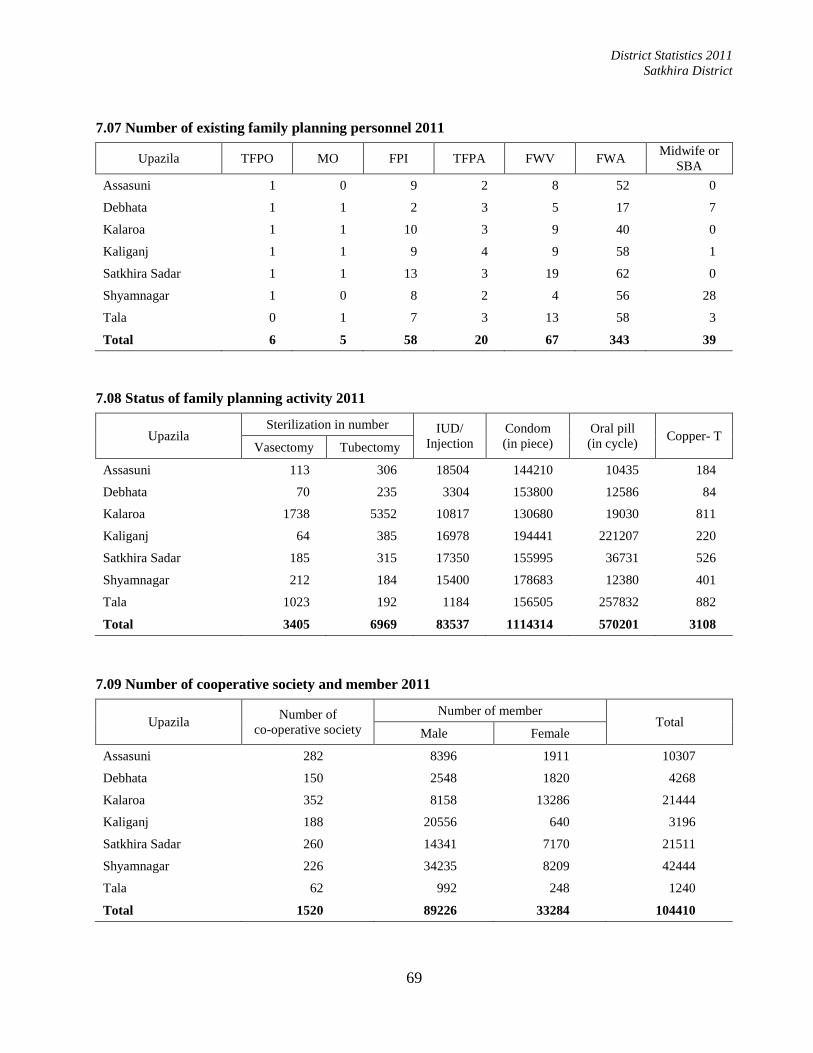
District Statistics 2011
Satkhira District
69
7.07 Number of existing family planning personnel 2011
Upazila TFPO MO FPI TFPA FWV FWA Midwife or
SBA
Assasuni 1 0 9 2 8 52 0
Debhata 1 1 2 3 5 17 7
Kalaroa 1 1 10 3 9 40 0
Kaliganj 1 1 9 4 9 58 1
Satkhira Sadar 1 1 13 3 19 62 0
Shyamnagar 1 0 8 2 4 56 28
Tala 0 1 7 3 13 58 3
Total 6 5 58 20 67 343 39
7.08 Status of family planning activity 2011
Upazila Sterilization in number IUD/
Injection
Condom
(in piece)
Oral pill
(in cycle) Copper- T
Vasectomy Tubectomy
Assasuni 113 306 18504 144210 10435 184
Debhata 70 235 3304 153800 12586 84
Kalaroa 1738 5352 10817 130680 19030 811
Kaliganj 64 385 16978 194441 221207 220
Satkhira Sadar 185 315 17350 155995 36731 526
Shyamnagar 212 184 15400 178683 12380 401
Tala 1023 192 1184 156505 257832 882
Total 3405 6969 83537 1114314 570201 3108
7.09 Number of cooperative society and member 2011
Upazila Number of
co-operative society
Number of member Total
Male Female
Assasuni 282 8396 1911 10307
Debhata 150 2548 1820 4268
Kalaroa 352 8158 13286 21444
Kaliganj 188 20556 640 3196
Satkhira Sadar 260 14341 7170 21511
Shyamnagar 226 34235 8209 42444
Tala 62 992 248 1240
Total 1520 89226 33284 104410

District Statistics 2011
Satkhira District
70
7.10 Number of Government office, post office, bank, NGO and dak-banglow/rest house 2011
Upazila
All
Government
offices
Post office
All
nationalized
bank branches
All private
bank
branches
All
NGOs
Dak-
banglow/
rest house
Assasuni 26 21 6 0 38 1
Debhata 25 10 7 2 25 1
Kalaroa 27 23 7 3 30 1
Kaliganj 27 25 9 2 17 2
Satkhira Sadar 47 49 5 14 22 6
Shyamnagar 25 35 9 6 33 6
Tala 26 24 8 3 30 2
Total 203 187 51 30 195 19
7.11 Number of cinema hall, registered club, auditorium, public library and orphanage 2011
Upazila Cinema hall Registered club Library Orphanage Auditorium
Assasuni 1 119 0 10 1
Debhata 2 76 0 5 1
Kalaroa 1 16 1 1 1
Kaliganj 1 32 1 11 1
Satkhira Sadar 3 182 1 16 1
Shyamnagar 2 230 1 25 1
Tala 1 48 3 3 1
Total 11 703 7 71 7
7.12 Number of different club 2011
Upazila Sports club Cultural club Science club Other social club
Assasuni 3 4 0 2
Debhata 74 1 0 1
Kalaroa 16 1 0 1
Kaliganj 2 2 0 1
Satkhira Sadar 12 2 0 3
Shyamnagar 2 1 0 3
Tala 50 12 0 3
Total 159 23 0 14

District Statistics 2011
Satkhira District
71
7.13 Number of hat-bazar, growth centre, hotel & restaurant 2011
Upazila Daily bazar Weekly hat Growth centre Restaurant Hotel
(residential)
Assasuni 9 29 6 102 1
Debhata 11 4 4 72 1
Kalaroa 20 15 5 245 1
Kaliganj 11 38 6 75 5
Satkhira Sadar 31 21 6 375 13
Shyamnagar 14 31 6 106 8
Tala 40 2 6 135 1
Total 136 140 39 1110 30
7.14 Number of warehouse and their storage capacity 2011 (Capacity in metric ton)
Upazila Food godown Fertilizer godown Jute godown Other godown
Number Capacity Number Capacity Number Capacity Number Capacity
Assasuni 4 2500 0 0 0 0 0 0
Debhata 1 1000 0 0 0 0 0 0
Kalaroa 3 15000 0 0 0 0 0 0
Kaliganj 2 1000 0 0 0 0 0 0
Satkhira Sadar 8 4000 0 0 0 0 58 14100
Shyamnagar 2 2000 0 0 0 0 0 0
Tala 1 2000 0 0 10 10000 5 5000
Total 21 27500 0 0 10 10000 63 19100
7.15 Progress of rural electrification 2011
Upazila
Number of electrified
Village Residential
holding
Large
scale
industry
Small
scale
Industry
Deep
tube-
well
Power
pump
Commercial
holding Others
Assasuni 72 8697 0 163 0 256 1117 0
Debhata 15 295 0 0 0 26 135 0
Kalaroa 75 11155 0 129 470 27 6600 0
Kaliganj 94 8638 0 169 0 187 1120 0
Satkhira Sadar 211 14372 0 36 2626 105 9626 0
Shyamnagar 66 3968 0 82 0 22 1828 0
Tala 187 21323 0 323 20 795 3923 0
Total 720 68448 0 902 3116 1418 24349 0

District Statistics 2011
Satkhira District
72
7.16 Number of technical personnel 2011
Upazila Agricultural
personnel
Live-
stock
personnel
Plant
protection
Fishery
personnel
Sanitary
personnel
Family
planning
personnel
Trained
midwife
Assasuni 26 6 1 3 8 64 14
Debhata 45 52 1 5 5 64 88
Kalaroa 27 8 1 7 5 40 16
Kaliganj 35 55 1 716 20 77 10
Satkhira Sadar 55 140 11 905 61 112 39
Shyamnagar 42 56 45 1048 40 157 38
Tala 33 160 26 635 55 116 150
Total 263 477 86 3319 194 630 355
7.17 Number of community clinic and person engaged 2011
Upazila Number of
clinic
Number of
health
assistant
Number of
FPI
Number of
FWV
Number of
FWA
Number of
other staff
Assasuni 34 52 0 6 50 21
Debhata 14 19 2 0 14 5
Kalaroa 21 29 10 9 40 80
Kaliganj 8 16 5 9 58 7
Satkhira Sadar 38 42 13 19 62 6
Shyamnagar 35 55 0 6 55 22
Tala 24 38 7 13 58 0
Total 174 251 37 62 337 141
Chapter sources : i) Demography and Health Wing, BBS
ii) Upazila Statistical Office, BBS
District Statistics 2011
Satkhira District
73
CHAPTER 8 Transportation and Communication

District Statistics 2011
Satkhira District
74
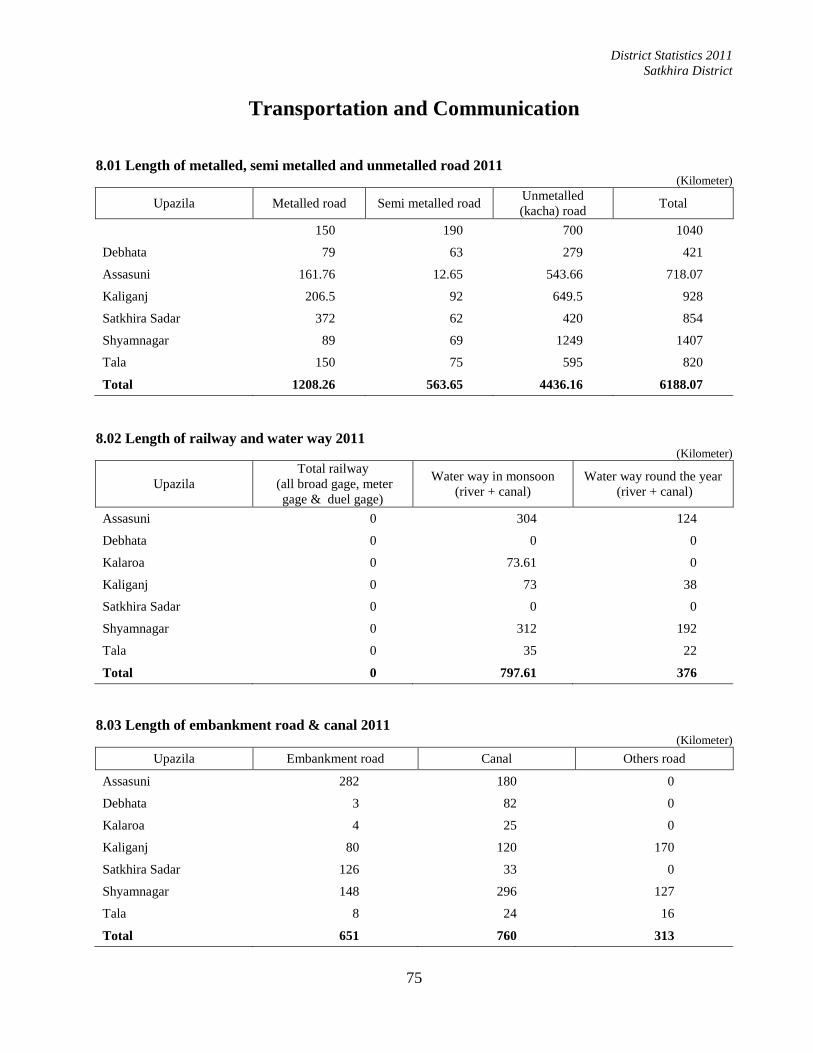
District Statistics 2011
Satkhira District
75
Transportation and Communication
8.01 Length of metalled, semi metalled and unmetalled road 2011
(Kilometer)
Upazila Metalled road Semi metalled road Unmetalled
(kacha) road Total
150 190 700 1040
Debhata 79 63 279 421
Assasuni 161.76 12.65 543.66 718.07
Kaliganj 206.5 92 649.5 928
Satkhira Sadar 372 62 420 854
Shyamnagar 89 69 1249 1407
Tala 150 75 595 820
Total 1208.26 563.65 4436.16 6188.07
8.02 Length of railway and water way 2011 (Kilometer)
Upazila
Total railway
(all broad gage, meter
gage & duel gage)
Water way in monsoon
(river + canal)
Water way round the year
(river + canal)
Assasuni 0 304 124
Debhata 0 0 0
Kalaroa 0 73.61 0
Kaliganj 0 73 38
Satkhira Sadar 0 0 0
Shyamnagar 0 312 192
Tala 0 35 22
Total 0 797.61 376
8.03 Length of embankment road & canal 2011 (Kilometer)
Upazila Embankment road Canal Others road
Assasuni 282 180 0
Debhata 3 82 0
Kalaroa 4 25 0
Kaliganj 80 120 170
Satkhira Sadar 126 33 0
Shyamnagar 148 296 127
Tala 8 24 16
Total 651 760 313
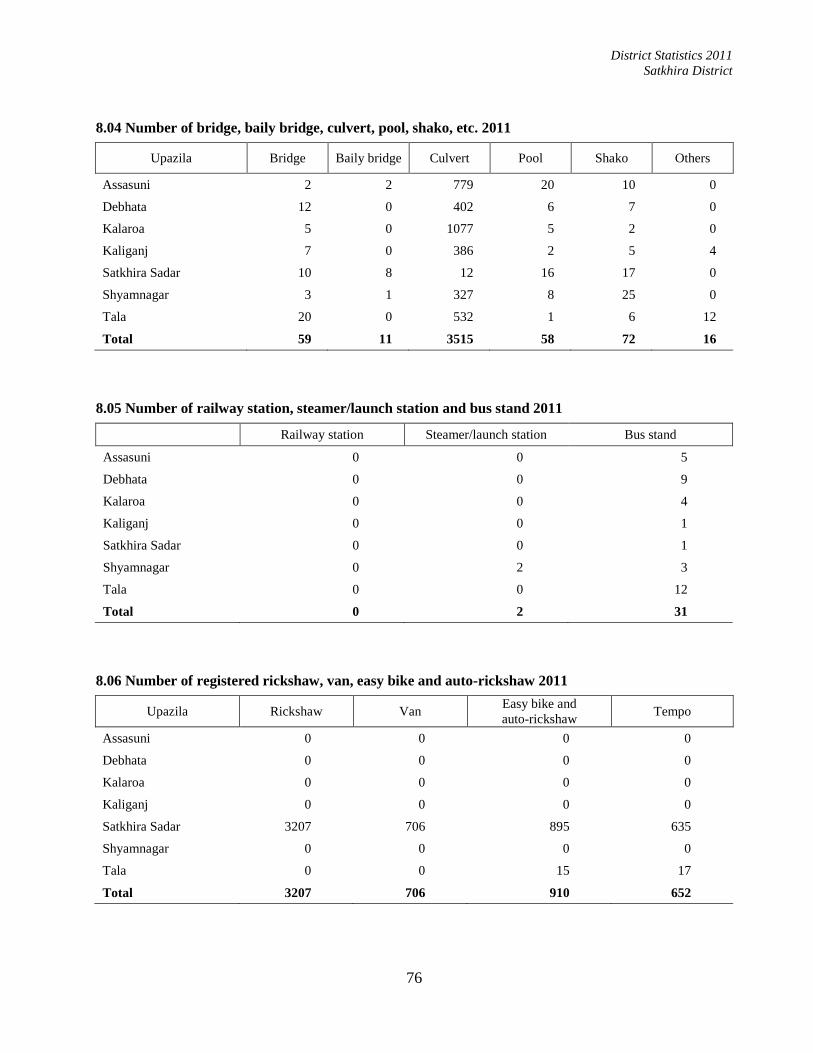
District Statistics 2011
Satkhira District
76
8.04 Number of bridge, baily bridge, culvert, pool, shako, etc. 2011
Upazila Bridge Baily bridge Culvert Pool Shako Others
Assasuni 2 2 779 20 10 0
Debhata 12 0 402 6 7 0
Kalaroa 5 0 1077 5 2 0
Kaliganj 7 0 386 2 5 4
Satkhira Sadar 10 8 12 16 17 0
Shyamnagar 3 1 327 8 25 0
Tala 20 0 532 1 6 12
Total 59 11 3515 58 72 16
8.05 Number of railway station, steamer/launch station and bus stand 2011
Railway station Steamer/launch station Bus stand
Assasuni 0 0 5
Debhata 0 0 9
Kalaroa 0 0 4
Kaliganj 0 0 1
Satkhira Sadar 0 0 1
Shyamnagar 0 2 3
Tala 0 0 12
Total 0 2 31
8.06 Number of registered rickshaw, van, easy bike and auto-rickshaw 2011
Upazila Rickshaw Van Easy bike and
auto-rickshaw Tempo
Assasuni 0 0 0 0
Debhata 0 0 0 0
Kalaroa 0 0 0 0
Kaliganj 0 0 0 0
Satkhira Sadar 3207 706 895 635
Shyamnagar 0 0 0 0
Tala 0 0 15 17
Total 3207 706 910 652

District Statistics 2011
Satkhira District
77
8.07 Number of non-registered rickshaw, van, easy bike and auto-rickshaw 2011
Upazila Rickshaw Van Easy bike and
auto-rickshaw Tempo
Nochimon/kori
mon/ bhotvoti
Assasuni 0 1695 6 47 645
Debhata 0 220 35 15 250
Kalaroa 0 760 15 6 145
Kaliganj 0 2552 37 14 5521
Satkhira Sadar 205 225 100 125 335
Shyamnagar 0 1740 0 0 592
Tala 0 3750 0 0 751
Total 205 10942 193 207 8239
Chapter sources : i) National Accounting Wing, BBS
ii) Upazila Statistical Office, BBS

District Statistics 2011
Satkhira District
78
District Statistics 2011
Satkhira District
79
CHAPTER 9
Price and Wage

District Statistics 2011
Satkhira District
80

District Statistics 2011
Satkhira District
81
Price and Wage
9.01 Average price of selected item 2011 (Price unit per kg/taka)
Upazila Fine rice
(minicate)
Medium
rice
Coarse rice
(normal) Wheat
Coarse flour
(Aata) Potato
Soyabean
oil
Assasuni 42 32 26 24 32 13 130
Debhata 40 30 25 20 26 12 130
Kalaroa 38 32 28 20 26 12 135
Kaliganj 35 25 21 25 31 10 130
Satkhira Sadar 41 33 24 24 28 12 130
Shyamnagar 42 30 24 20 24 12 128
Tala 45 32 28 22 35 12 136
Average 40 31 25 22 29 12 131
9.02 Annual average wholesale price of selected building material 2011 (Price in taka)
Upazila Brick-01
(per1000)
Cement
(per 50 kg bag)
Iron bar
(per ton) Sand-01
(per c.f.t.)
Sand -02
(per c.f.t.)
Stone
(per c.f.t.)
Assasuni 5200 460 58000 30 4 100
Debhata 5500 450 73000 35 25 130
Kalaroa 6500 400 62000 24 20 120
Kaliganj 5800 440 64000 25 21 120
Satkhira Sadar 6400 445 59000 26 22 130
Shyamnagar 5400 435 60000 30 25 120
Tala 8000 445 72000 42 22 120
Average 6114 439 64000 30 20 120
9.03 Daily average wage rate of agricultural labour 2011 (Rate in taka)
Upazila Labour
Male Female Child (under 15 years old)
Assasuni 200 150 100
Debhata 150 80 80
Kalaroa 200 150 80
Kaliganj 200 120 100
Satkhira Sadar 150 100 80
Shyamnagar 150 120 80
Tala 200 160 120
Average 179 126 91

District Statistics 2011
Satkhira District
82
9.04 Daily average wage rate of construction labour 2011 (Rate in taka)
Upazila
Labour
Mason Helper
(Jogaly) Carpenter Colour Electric Plumber
Assasuni 280 180 250 250 300 300
Debhata 300 200 350 350 400 400
Kalaroa 250 180 250 250 250 250
Kaliganj 250 180 200 200 300 250
Satkhira Sadar 300 200 300 300 300 300
Shyamnagar 300 200 300 300 300 300
Tala 300 225 300 300 350 350
Average 283 195 279 279 314 307
9.05 Daily average wage rate of non-agricultural labour 2011 (Wage in taka)
Upazila Porter
(coolee)
Garden labour
male
Garden female
labour
Other labour
(Adult)
Other labour
(Child)
Assasuni 300 150 110 150 70
Debhata 200 150 80 180 80
Kalaroa 200 200 100 120 100
Kaliganj 150 150 100 120 100
Satkhira Sadar 250 220 210 180 150
Shyamnagar 200 150 120 180 80
Tala 300 220 170 200 120
Average 229 177 127 161 100
9.06 Average doctor’s fee per patient 2011 (Fee in taka)
Upazila Doctor
MBBS FCPS Dentist Gynaecologist Homeopathy
Assasuni 100 0 50 0 50
Debhata 200 300 300 300 100
Kalaroa 150 0 50 200 30
Kaliganj 200 300 150 200 30
Satkhira Sadar 400 400 300 350 100
Shyamnagar 200 300 200 200 50
Tala 100 0 100 0 20
Average 195 325 164 250 55
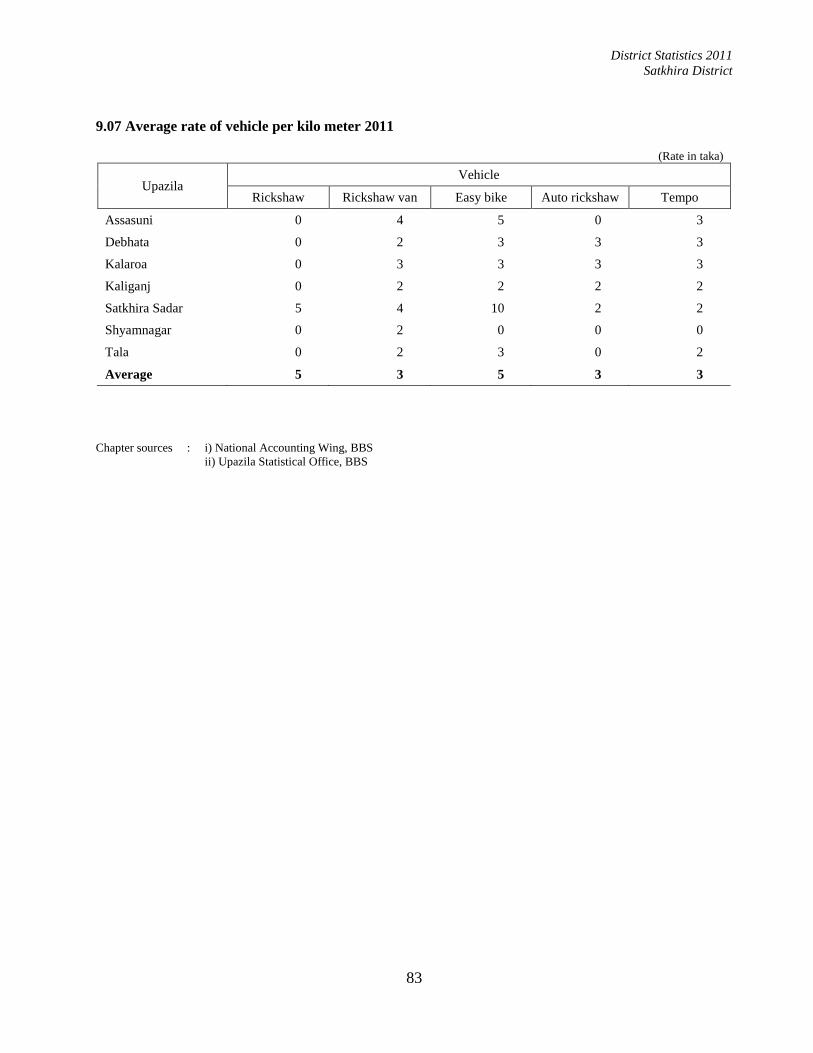
District Statistics 2011
Satkhira District
83
9.07 Average rate of vehicle per kilo meter 2011
(Rate in taka)
Upazila Vehicle
Rickshaw Rickshaw van Easy bike Auto rickshaw Tempo
Assasuni 0 4 5 0 3
Debhata 0 2 3 3 3
Kalaroa 0 3 3 3 3
Kaliganj 0 2 2 2 2
Satkhira Sadar 5 4 10 2 2
Shyamnagar 0 2 0 0 0
Tala 0 2 3 0 2
Average 5 3 5 3 3
Chapter sources : i) National Accounting Wing, BBS
ii) Upazila Statistical Office, BBS

District Statistics 2011
Satkhira District
84

District Statistics 2011
Satkhira District
85
CHAPTER 10
Urban Area Statistics

District Statistics 2011
Satkhira District
86

District Statistics 2011
Satkhira District
87
Urban Area Statistics
10.01 Number of ward, mahalla and household by municipality 2011
Upazila Name of
municipality Total ward Total mahalla Total household
Assasuni - 0 0 0
Debhata - 0 0 0
Kalaroa Kalaroa 9 9 6570
Kaliganj - 0 0 0
Satkhira Sadar Satkhira 9 33 26896
Shyamnagar - 0 0 0
Tala - 0 0 0
Total - 18 42 33466
10.02 Area, population and density by municipality 2011
Upazila Name of
municipality
Area
(In sq. km.)
Population census-2011 Density per
sq.km. Male Female Total
Assasuni - 0 0 0 0 0
Debhata - 0 0 0 0 0
Kalaroa Kalaroa 14.54 13510 13740 27250 1874
Kaliganj - 0 0 0 0 0
Satkhira Sadar Satkhira 32.03 57616 55706 113322 3538
Shyamnagar - 0 0 0 0 0
Tala - 0 0 0 0 0
Total - 46.57 71126 69446 140572 3019
10.03 Number of primary school (Class I-V), teacher and student by municipality 2011
Municipality
Primary school Number of teacher Number of student Students
per
teacher Govt. Non-
govt. Total Govt.
Non-
govt. Total Govt.
Non-
govt. Total
Kalaroa 5 2 7 32 8 40 1485 389 1874 47
Satkhira 34 0 34 180 0 180 6801 0 6801 38
Total 39 2 41 212 8 220 8286 389 8675 39

District Statistics 2011
Satkhira District
88
10.04 Number of secondary school, teacher and student by municipality 2011
Municipality
Number
of
institute
Number of teacher Number of student Students
per
teacher Male Female Total Male Female Total
Kalaroa 6 68 27 95 1324 1535 2859 30
Satkhira 14 200 65 265 3400 800 4200 16
Total 20 268 92 360 4724 2335 7059 20
10.05 Number of secondary school & college (operating jointly), teacher and student by municipality
2011
Municipality
Number
of
institute
Number of teacher Number of student Students
per
teacher Male Female Total Male Female Total
Kalaroa 0 0 0 0 0 0 0 0
Satkhira 2 20 10 30 1501 365 1866 62
Total 2 20 10 30 1501 365 1866 62
10.06 Number of college, teacher and student by municipality 2011
Municipality
Number
of
college
Number of teacher Number of student Students
per
teacher Male Female Total Male Female Total
Kalaroa 4 101 24 125 1636 1140 2776 22
Satkhira 7 300 85 385 10000 6000 16000 42
Total 11 401 109 510 11636 7140 18776 37
10.07 Number of vocational institute by municipality 2011
Municipality Number of institution Number of teacher Number of student
Kalaroa 0 0 0
Satkhira 1 16 260
Total 1 16 260
10.08 Number of family planning clinical centre by municipality 2011
Municipality Sterilization
centre Mobile centre Injection centre
Menstrual
regularization
centre
Family welfare
centre
Kalaroa 0 0 0 0 0
Satkhira 1 0 1 1 1
Total 1 0 1 1 1
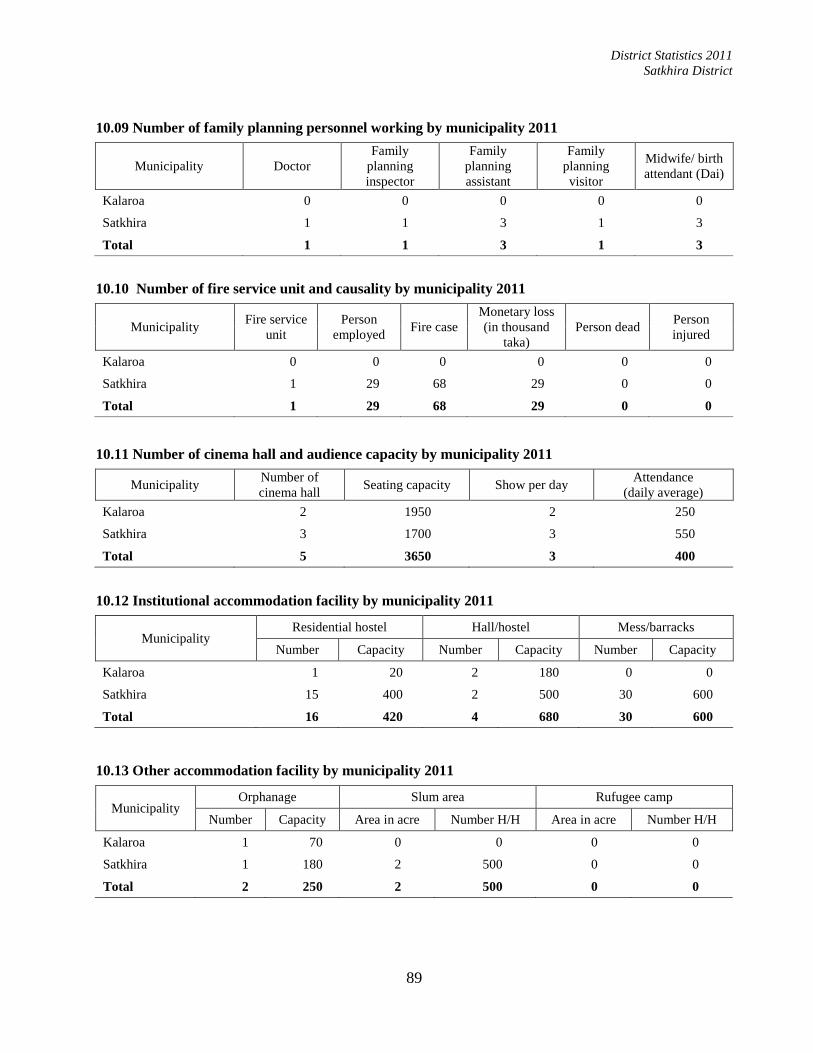
District Statistics 2011
Satkhira District
89
10.09 Number of family planning personnel working by municipality 2011
Municipality Doctor
Family
planning
inspector
Family
planning
assistant
Family
planning
visitor
Midwife/ birth
attendant (Dai)
Kalaroa 0 0 0 0 0
Satkhira 1 1 3 1 3
Total 1 1 3 1 3
10.10 Number of fire service unit and causality by municipality 2011
Municipality Fire service
unit
Person
employed Fire case
Monetary loss
(in thousand
taka)
Person dead Person
injured
Kalaroa 0 0 0 0 0 0
Satkhira 1 29 68 29 0 0
Total 1 29 68 29 0 0
10.11 Number of cinema hall and audience capacity by municipality 2011
Municipality Number of
cinema hall Seating capacity Show per day
Attendance
(daily average)
Kalaroa 2 1950 2 250
Satkhira 3 1700 3 550
Total 5 3650 3 400
10.12 Institutional accommodation facility by municipality 2011
Municipality Residential hostel Hall/hostel Mess/barracks
Number Capacity Number Capacity Number Capacity
Kalaroa 1 20 2 180 0 0
Satkhira 15 400 2 500 30 600
Total 16 420 4 680 30 600
10.13 Other accommodation facility by municipality 2011
Municipality Orphanage Slum area Rufugee camp
Number Capacity Area in acre Number H/H Area in acre Number H/H
Kalaroa 1 70 0 0 0 0
Satkhira 1 180 2 500 0 0
Total 2 250 2 500 0 0
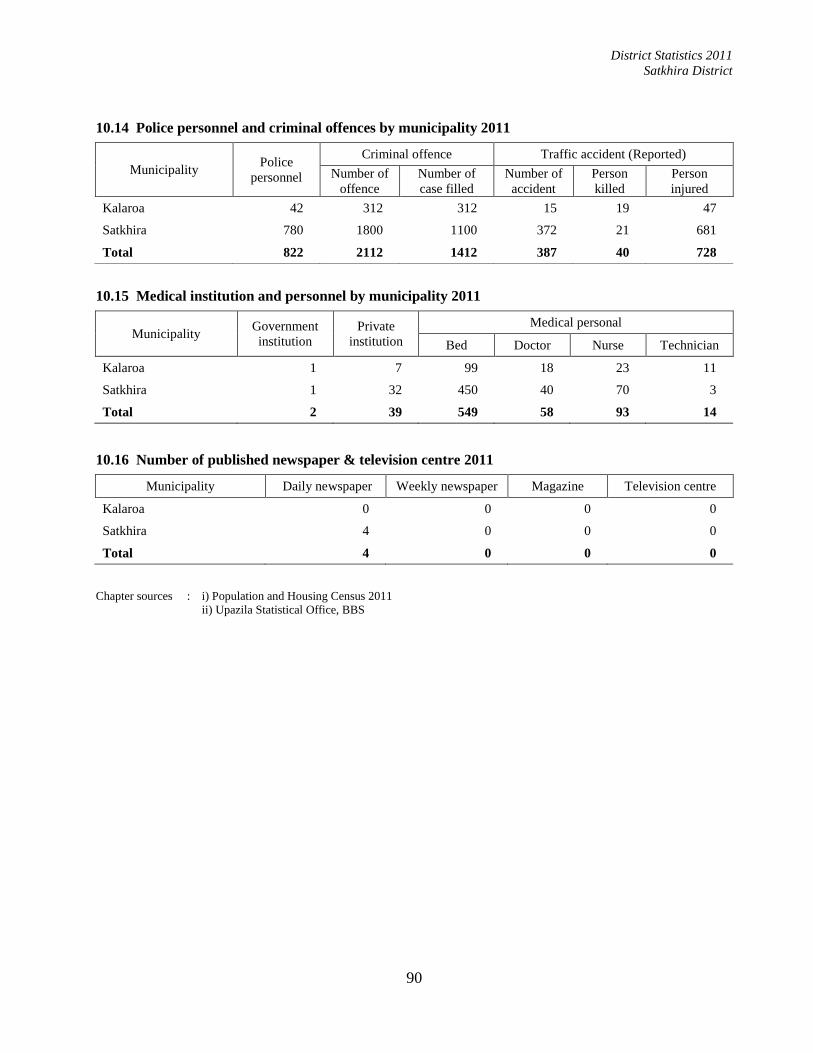
District Statistics 2011
Satkhira District
90
10.14 Police personnel and criminal offences by municipality 2011
Municipality Police
personnel
Criminal offence Traffic accident (Reported)
Number of
offence
Number of
case filled
Number of
accident
Person
killed
Person
injured
Kalaroa 42 312 312 15 19 47
Satkhira 780 1800 1100 372 21 681
Total 822 2112 1412 387 40 728
10.15 Medical institution and personnel by municipality 2011
Municipality Government
institution
Private
institution
Medical personal
Bed Doctor Nurse Technician
Kalaroa 1 7 99 18 23 11
Satkhira 1 32 450 40 70 3
Total 2 39 549 58 93 14
10.16 Number of published newspaper & television centre 2011
Municipality Daily newspaper Weekly newspaper Magazine Television centre
Kalaroa 0 0 0 0
Satkhira 4 0 0 0
Total 4 0 0 0
Chapter sources : i) Population and Housing Census 2011
ii) Upazila Statistical Office, BBS
District Statistics 2011
Satkhira District
91
CHAPTER 11 Public Administration, Accounts and Banking

District Statistics 2011
Satkhira District
92

District Statistics 2011
Satkhira District
93
Public Administration, Accounts and Banking
11.01 Sanction post of Government employee by category 2011
Upazila Class-I Class-II Class-III Class-IV Number of
employee
Assasuni 40 40 338 114 532
Debhata 36 26 219 121 402
Kalaroa 105 24 847 97 1073
Kaliganj 28 38 993 162 1201
Satkhira Sadar 110 62 1661 147 1980
Shyamnagar 32 49 1340 115 1536
Tala 58 27 383 142 610
Total 409 266 5781 898 7334
11.02 Existing position of Government employee by category 2011
Upazila Class-I Class-II Class-III Class-IV Number of
employee
Assasuni 18 31 262 90 401
Debhata 27 17 168 94 306
Kalaroa 89 16 729 99 911
Kaliganj 26 35 808 113 992
Satkhira Sadar 82 53 1589 115 1839
Shyamnagar 29 45 1222 98 1394
Tala 26 18 307 125 476
Total 297 215 5085 734 6319
11.03 Number of employee by type 2011
Upazila Police personnel Ansar personnel VDP personnel Autonomous
body
Local
Government
employee
Assasuni 21 484 15808 4 146
Debhata 36 3040 3040 2 55
Kalaroa 76 548 10752 0 132
Kaliganj 37 516 15552 17 134
Satkhira Sadar 780 448 15040 150 82
Shyamnagar 36 516 11520 7 150
Tala 130 416 13440 0 165
Total 1116 5968 85152 180 864
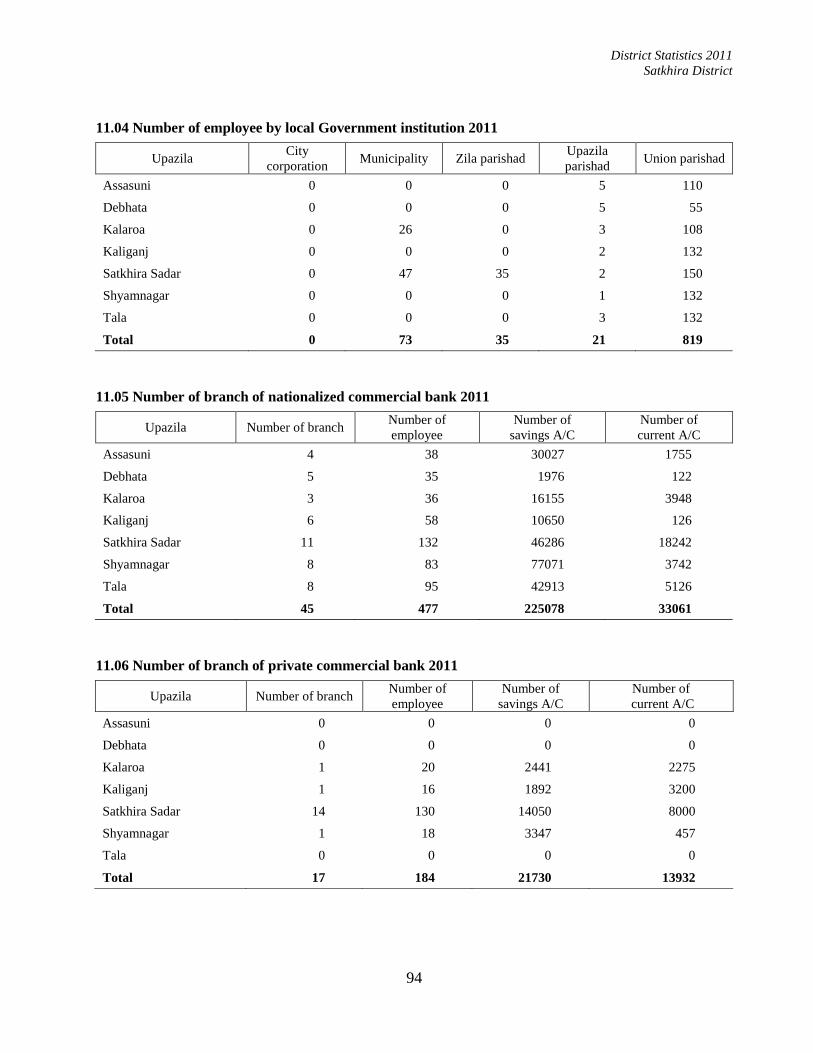
District Statistics 2011
Satkhira District
94
11.04 Number of employee by local Government institution 2011
Upazila City
corporation Municipality Zila parishad
Upazila
parishad Union parishad
Assasuni 0 0 0 5 110
Debhata 0 0 0 5 55
Kalaroa 0 26 0 3 108
Kaliganj 0 0 0 2 132
Satkhira Sadar 0 47 35 2 150
Shyamnagar 0 0 0 1 132
Tala 0 0 0 3 132
Total 0 73 35 21 819
11.05 Number of branch of nationalized commercial bank 2011
Upazila Number of branch Number of
employee
Number of
savings A/C
Number of
current A/C
Assasuni 4 38 30027 1755
Debhata 5 35 1976 122
Kalaroa 3 36 16155 3948
Kaliganj 6 58 10650 126
Satkhira Sadar 11 132 46286 18242
Shyamnagar 8 83 77071 3742
Tala 8 95 42913 5126
Total 45 477 225078 33061
11.06 Number of branch of private commercial bank 2011
Upazila Number of branch Number of
employee
Number of
savings A/C
Number of
current A/C
Assasuni 0 0 0 0
Debhata 0 0 0 0
Kalaroa 1 20 2441 2275
Kaliganj 1 16 1892 3200
Satkhira Sadar 14 130 14050 8000
Shyamnagar 1 18 3347 457
Tala 0 0 0 0
Total 17 184 21730 13932

District Statistics 2011
Satkhira District
95
11.07 Number of branch of specialized (Krishi, Co-operative etc) bank 2011
Upazila Number of branch Number of
employee
Number of
savings A/C Number of current A/C
Assasuni 2 17 14980 82
Debhata 2 14 698 69
Kalaroa 4 27 33363 425
Kaliganj 3 19 11650 126
Satkhira Sadar 17 91 17091 1302
Shyamnagar 1 11 5708 66
Tala 1 18 5621 323
Total 30 197 89111 2393
11.08 Number of branch of Grameen bank 2011
Upazila Number of branch Number of
employee
Number of
member Number of account
Assasuni 4 26 11846 13073
Debhata 2 15 4859 6878
Kalaroa 1 33 9370 2500
Kaliganj 2 8 40500 40500
Satkhira Sadar 4 40 13850 16675
Shyamnagar 6 32 10075 12356
Tala 3 35 13642 9712
Total 22 189 104142 101694
11.09 Number of insurance company 2011
Upazila Number of
insurance company Number of employee Number of client
Assasuni 7 46 16154
Debhata 2 12 2000
Kalaroa 4 24 4770
Kaliganj 8 686 14675
Satkhira Sadar 5 150 20000
Shyamnagar 23 138 81685
Tala 7 37 9154
Total 56 1093 148438

District Statistics 2011
Satkhira District
96
11.10 Number of co-operative society 2011
Upazila Number Number of employee Number of client
Assasuni 282 21 10307
Debhata 111 5 2220
Kalaroa 352 46 21444
Kaliganj 188 237 20552
Satkhira Sadar 260 300 21511
Shyamnagar 266 113 42444
Tala 274 5 7550
Total 1733 727 126028
11.11 Numbers of money exchange agency 2011
Upazila Number of money
exchange agency Number of employee
Annual profit
per agency (lac tk)
Assasuni 0 0 0
Debhata 0 0 0
Kalaroa 0 0 0
Kaliganj 0 0 0
Satkhira Sadar 1 2 30
Shyamnagar 0 0 0
Tala 0 0 0
Total 1 2 30
11.12 Number of branch and accounts of Sonali and Janata bank 2011
Upazila
Sonali bank Janata bank
Number
of branch
Account Number
of branch
Account
S.D C.D F.D S.T.D S.D C.D F.D S.T.D
Assasuni 2 1734 416 548 44 1 11431 608 137 18
Debhata 3 1079 76 51 9 0 0 0 0 0
Kalaroa 2 4770 632 180 47 0 0 0 0 0
Kaliganj 1 11455 946 465 46 2 9911 132 90 9
Satkhira Sadar 4 18200 2100 117 52 5 13200 1500 542 30
Shyamnagar 1 10463 1068 108 38 1 10344 452 101 7
Tala 5 22873 3242 476 110 1 8834 505 331 27
Total 18 70574 8480 1945 346 10 53720 3197 1201 91
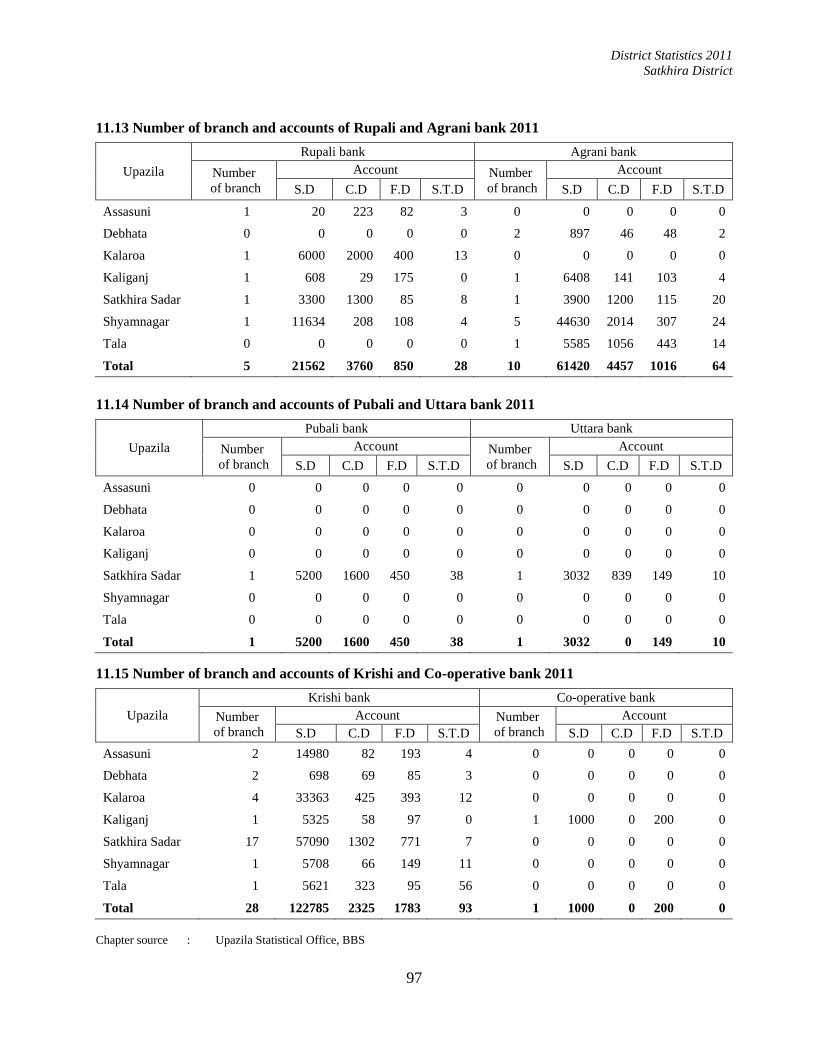
District Statistics 2011
Satkhira District
97
11.13 Number of branch and accounts of Rupali and Agrani bank 2011
Upazila
Rupali bank Agrani bank
Number
of branch
Account Number
of branch
Account
S.D C.D F.D S.T.D S.D C.D F.D S.T.D
Assasuni 1 20 223 82 3 0 0 0 0 0
Debhata 0 0 0 0 0 2 897 46 48 2
Kalaroa 1 6000 2000 400 13 0 0 0 0 0
Kaliganj 1 608 29 175 0 1 6408 141 103 4
Satkhira Sadar 1 3300 1300 85 8 1 3900 1200 115 20
Shyamnagar 1 11634 208 108 4 5 44630 2014 307 24
Tala 0 0 0 0 0 1 5585 1056 443 14
Total 5 21562 3760 850 28 10 61420 4457 1016 64
11.14 Number of branch and accounts of Pubali and Uttara bank 2011
Upazila
Pubali bank Uttara bank
Number
of branch
Account Number
of branch
Account
S.D C.D F.D S.T.D S.D C.D F.D S.T.D
Assasuni 0 0 0 0 0 0 0 0 0 0
Debhata 0 0 0 0 0 0 0 0 0 0
Kalaroa 0 0 0 0 0 0 0 0 0 0
Kaliganj 0 0 0 0 0 0 0 0 0 0
Satkhira Sadar 1 5200 1600 450 38 1 3032 839 149 10
Shyamnagar 0 0 0 0 0 0 0 0 0 0
Tala 0 0 0 0 0 0 0 0 0 0
Total 1 5200 1600 450 38 1 3032 0 149 10
11.15 Number of branch and accounts of Krishi and Co-operative bank 2011
Upazila
Krishi bank Co-operative bank
Number
of branch
Account Number
of branch
Account
S.D C.D F.D S.T.D S.D C.D F.D S.T.D
Assasuni 2 14980 82 193 4 0 0 0 0 0
Debhata 2 698 69 85 3 0 0 0 0 0
Kalaroa 4 33363 425 393 12 0 0 0 0 0
Kaliganj 1 5325 58 97 0 1 1000 0 200 0
Satkhira Sadar 17 57090 1302 771 7 0 0 0 0 0
Shyamnagar 1 5708 66 149 11 0 0 0 0 0
Tala 1 5621 323 95 56 0 0 0 0 0
Total 28 122785 2325 1783 93 1 1000 0 200 0
Chapter source : Upazila Statistical Office, BBS

District Statistics 2011
Satkhira District
98
District Statistics 2011
Satkhira District
99
CHAPTER 12
Miscellaneous

District Statistics 2011
Satkhira District
100

District Statistics 2011
Satkhira District
101
Miscellaneous
12.01 Number of Government health complex and health facility 2011
Upazila
Number
of
hospital/
clinic/
nursing
home
Number
of bed
Number
of
doctor
Number
of nurse
Number of
technician
Number
of
other
staff
Number of patient
under health facility
Indoor Outdoor
Male Female Male Female
Assasuni 1 31 6 10 5 93 1205 1966 22705 37345
Debhata 1 31 7 10 8 32 1091 1496 22893 46817
Kalaroa 1 50 18 16 7 119 6181 7879 14665 18755
Kaliganj 1 50 10 11 4 115 911 1231 12865 44442
Satkhira Sadar 1 100 20 38 7 136 3000 1800 41000 49000
Shyamnagar 1 50 7 15 5 54 5680 8430 46892 51962
Tala 1 50 10 15 21 87 1723 2508 22899 24149
Total 7 362 78 115 57 636 19791 25310 183919 272470
12.02 Number of Non-Government health complex and health facility 2011
Upazila
Number of
hospital/
clinic/
nursing
home
Number
of bed
Number
of
doctor
Number
of nurse
Number of
technician
Number
of
other
staff
Number of patient
under health facilitiy
Indoor Outdoor
Male Female Male Female
Assasuni 5 50 8 10 10 19 475 995 3130 7342
Debhata 3 30 3 9 1 24 295 900 3570 6640
Kalaroa 14 109 14 14 6 42 4206 7913 4590 16672
Kaliganj 9 120 12 20 9 45 1240 1390 8545 17543
Satkhira Sadar 32 350 20 32 0 320 1825 1900 28000 32000
Shyamnagar 9 90 2 2 0 43 2672 2972 10100 12870
Tala 5 50 5 10 5 35 343 436 3265 4037
Total 77 799 64 97 31 528 11056 16506 61200 97104

District Statistics 2011
Satkhira District
102
12.03 Number of person/institute borrowing money from nationalized bank 2011
Upazila
Number of
branch of all
nationalized
banks
Number of borrower
Agriculture debt Industry debt Other debt Number of
borrower
Total debt
(crore tk)
Male Female Male Female Male Female Male Female Male Female
Assasuni 4 1355 2 0 0 880 310 2235 312 8 2
Debhata 7 1227 53 12 0 1547 81 2786 134 67 36
Kalaroa 7 4714 1349 18 0 448 411 5180 1760 12 3
Kaliganj 7 6220 10 0 0 540 0 6760 10 34 1
Satkhira Sadar 5 1728 130 22 0 4250 560 6000 690 14 4
Shyamnagar 9 7240 38 0 0 1042 26 8282 64 33 2
Tala 8 1620 88 0 0 2065 532 3685 620 26 5
Total 47 24104 1670 52 0 10772 1920 34928 3590 194 52
12.04 Number of person/institute borrowing money from private commercial bank 2011
Upazila
Number of
branch of
all private
commercial
banks
Number of borrower
Agriculture debt Industry debt Other debt Number of
borrower
Total debt
(crore tk)
Male Female Male Female Male Female Male Female Male Female
Assasuni 4 260 0 0 0 515 850 775 850 12 15
Debhata 2 0 4859 0 0 0 0 0 4856 0 5
Kalaroa 2 3200 13420 0 0 1342 2570 4542 15990 40 24
Kaliganj 3 105 0 0 0 0 0 105 0 25 0
Satkhira Sadar 14 8500 1200 4010 0 10020 1300 22530 2500 59 1
Shyamnagar 1 87 0 0 0 38 4 125 4 0 0
Tala 3 250 4982 0 0 550 130 800 5112 19 2
Total 29 12402 24461 4010 0 12465 4854 28877 29312 155 47
Chapter source : Upazila Statistical Office, BBS

District Statistics 2011
Satkhira District
103
The Personnel of Editors’ and PDs’ Forum Engaged in Editing the Report
Editors’ Forum
Convener
Mr. Jafor Ahmed Khan (Deputy Secretary)
Director
Bangladesh Bureau of Statistics
Members
Ms. Aziza Parvin Director
Mr. Md. Moniruzzaman Director (Deputy Secretary)
Ms. Salima Sultana Director (Deputy Secretary)
Mr. Md. Altaf Hossain Director (Deputy Secretary)
Mr. Md. Zahidul Hoque Sardar Director
Mr. Ghose Subobrata Director
Mr. Md. Shamsul Alam Director (C.C)
Mr. Dilip Kumar Bhadra Joint Director
Dr. Dipankar Roy Deputy Director
Mr. Mohammad Shaheen Deputy Director
Member Secretary
Mr. Abul Kalam Azad Director, BBS
District Statistics 2011
Satkhira District
104
PDs’ Forum
Convener
Md. Mashud Alam Joint Director
Bangladesh Bureau of Statistics
Members
Mr. Md. Zahidul Hoque Sardar Project Director, GIS Project
Mr. Md. Altaf Hossain Project Director, Population & Housing Census 2011 Project
Mr. Md. Mashud Alam Project Director, FS-NSC Project
Mr. Kabir Uddin Ahmed Project Director, SISB Project
Mr. Bidhan Baral Project Director, HDUAPS Project
Dr. Dipankar Roy Project Director, MSCW Project
Mr. Dilder Hossain Project Director, Economic Census 2013 Project
Mr. Jatan Kumar Saha Project Director, DIS Project
Mr. A K M Ashraful Haque Project Director, MSVSB Project

District Statistics 2011
Satkhira District
105
List of BBS Officials Engaged in Preparation of this Report
1. Mr. Iftekhairul Karim, Focal Point Officer, District Statistics 2011, BBS
2. Mr. Nasir Uddin Ahmmed, Deputy Director & Ex. Focal Point Officer, BBS
3. Mr. Md. Mizanur Rahman Howlader, Regional Statistical Officer, Khulna, BBS
4. Mr. Md. Mofizur Rahman, Programmer, Computer Wing, BBS
5. Mr. Mohammad Abdullah, Assistant Statistical Officer, FA and MIS, BBS
6. Mr. Md. Monzurul Islam, Upazila Statistical Officer, Chuadanga Sadar, BBS
7. Mr. Md. Abdul Mannan, Administrative Officer, FA and MIS, BBS
8. Mr. Md. Yeasin Miah, Statistical Investigator, Upazila Statistical Office, Rupganj, Narayanganj.