demographic considerations and population policies ... - core
TRANSCRIPT
Demographic Considerations and Population Policies in Development Planning: A Survey of Third World Countries with Case Studies of Bangladesh and Pakistan
Bruce Frederick Maxwell Stamper
Submitted for the degree of Ph D The London School of Economics and Political Science
University of London 1979

ProQuest Number: 11010402
All rights reserved
INFORMATION TO ALL USERS The quality of this reproduction is dependent upon the quality of the copy submitted.
In the unlikely event that the author did not send a com p le te manuscript and there are missing pages, these will be noted. Also, if material had to be removed,
a note will indicate the deletion.
uestProQuest 11010402
Published by ProQuest LLC(2018). Copyright of the Dissertation is held by the Author.
All rights reserved.This work is protected against unauthorized copying under Title 17, United States C ode
Microform Edition © ProQuest LLC.
ProQuest LLC.789 East Eisenhower Parkway
P.O. Box 1346 Ann Arbor, Ml 48106- 1346
ABSTRACT
This thesis seeks to determine the attention and importance
given to population growth in the overall strategy of development
planning. The first part of the thesis analyzes the population
content of the national development plans of 60 developing countries.
The findings indicate a surprising dearth of demographic data
in development plans of the Third World. With a few exceptions,
the data found in these plans are inadequate and are not presented
in forms easily used by planners. The recognition of population
problems is substantial: two-thirds of the countries studied men
tion a wide spectrum of population problems in their plans. Forty-
three per cent of the countries studied propose some policy to re
duce the rate of population growth. Still, the most important con
clusion is that too few plans are preparing to accommodate for the
inevitable growth of the population.
The second part of the thesis is an investigation of population
and development on a national level for the countries of Pakistan
and Bangladesh. The analysis of Pakistan’s and Bangladesh’s develop
ment plans presents a picture of population planning in extremely
adverse circumstances. Even though the plans did propose programmes
to reduce population growth, implementation was difficult because of
little demand for contraceptives, adminstrative and political obstacles
and logistical complexities.
Four conceptual frameworks incorporating theories of fertility
decline, when analyzed for their relevance and utility in Pakistan
and Bangladesh, all reveal theoretical or practical flaws. The
family planning approach, the policy mainly relied on, has so far
not been efficiently administered or demographically effective.
A detailed analysis of a planning framework which incorporates
population, income distribution and the evaluation of alternative
development strategies illustrates the importance of the distribu
tive aspect of development strategy, but reveals that the model
lacks both the sophistication and the appropriate data to be analyti
cally useful.

ACKNOWLEDGEMENTS
I would like to express my gratitude to the late Professor
D.V. Glass who supervised my research and served as my advisor for
this dissertation. I would also like to thank Mr. C. Langford and
other colleagues at the London School of Economics who gave helpful
comments on earlier drafts and to the entire staff of the Population
Investigation Committee who have been most co-operative.
Finally, I would most like to thank my wife and family for
their help, encouragement, and patience throughout the years of this
study.
B. M. S.
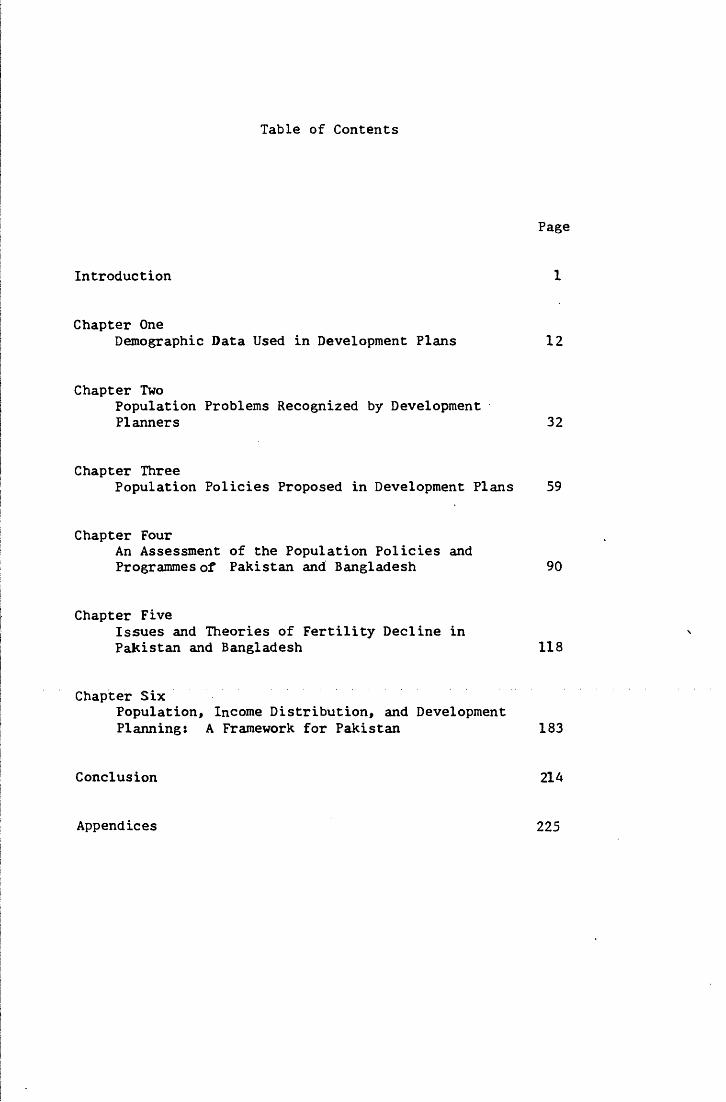
Table of Contents
Introduction
Chapter OneDemographic Data Used in Development Plans
Chapter TwoPopulation Problems Recognized by Development Planners
Chapter ThreePopulation Policies Proposed in Development Plans
Chapter FourAn Assessment of the Population Policies and Programmes of Pakistan and Bangladesh
Chapter FiveIssues and Theories of Fertility Decline in Pakistan and Bangladesh
Chapter SixPopulation, Income Distribution, and Development Planning: A Framework for Pakistan
Conclusion
Page
1
12
32
59
90
118
183
214
Appendices 225
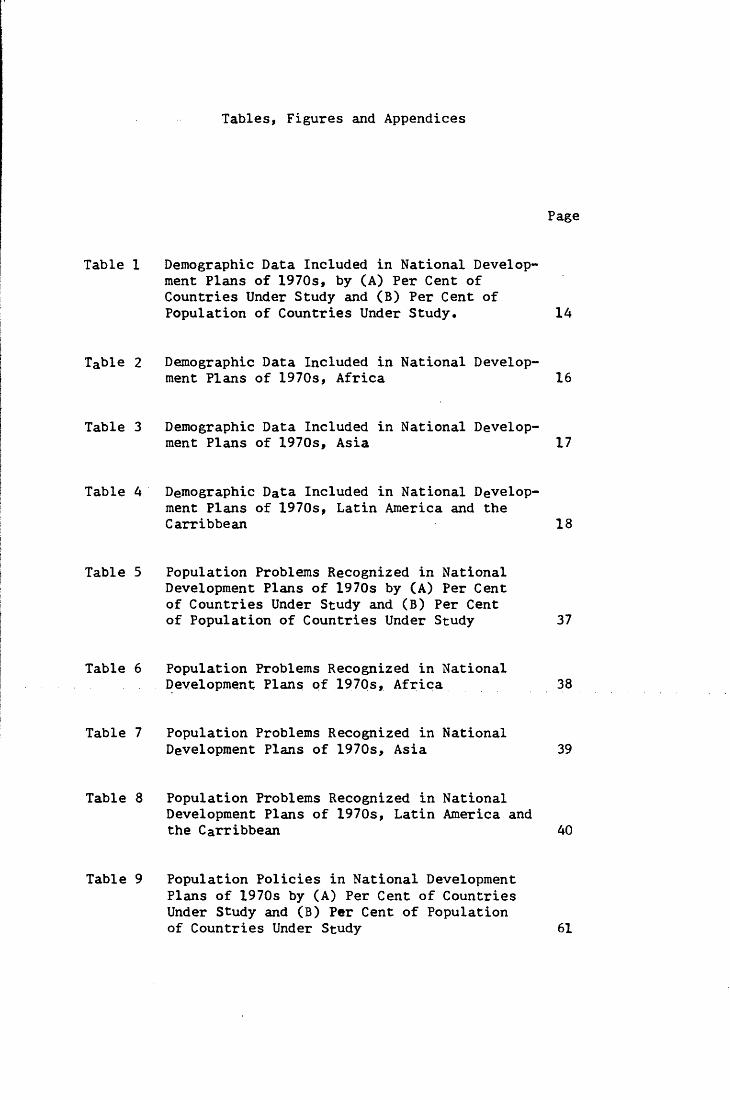
Tables, Figures and Appendices
Page
Table 1 Demographic Data Included in National Development Plans of 1970s, by (A) Per Cent of Countries Under Study and (B) Per Cent of Population of Countries Under Study. 14
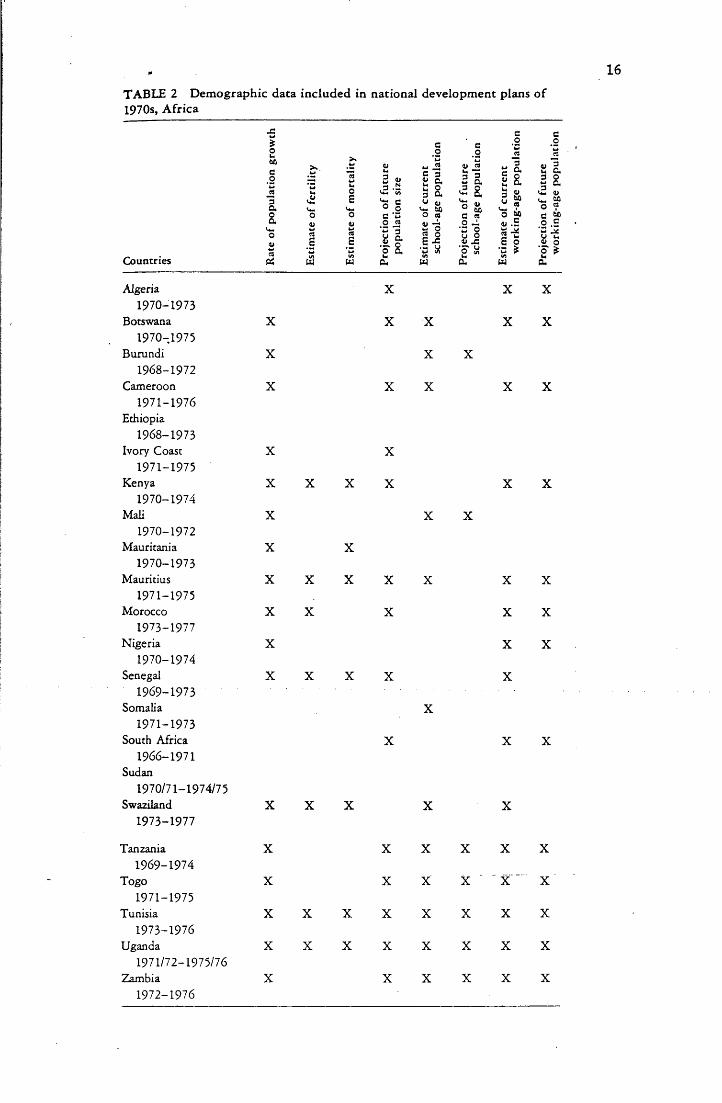
Table 2 Demographic Data Included in National Development Plans of 1970s, Africa 16
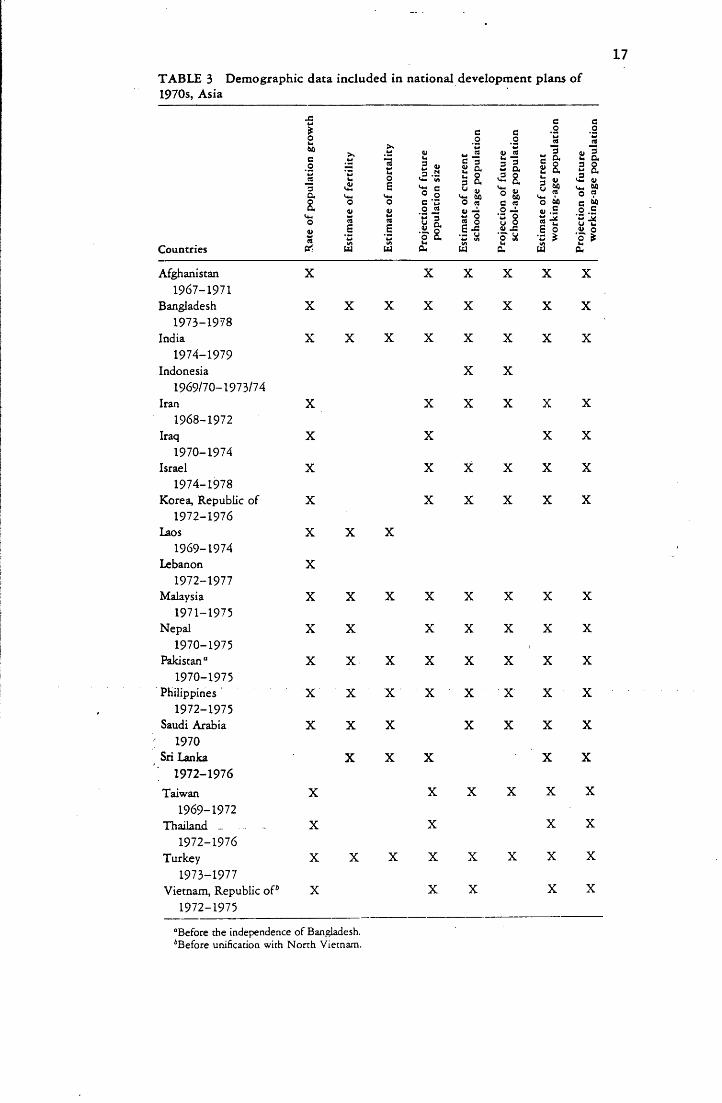
Table 3 Demographic Data Included in National Development Plans of 1970s, Asia 17
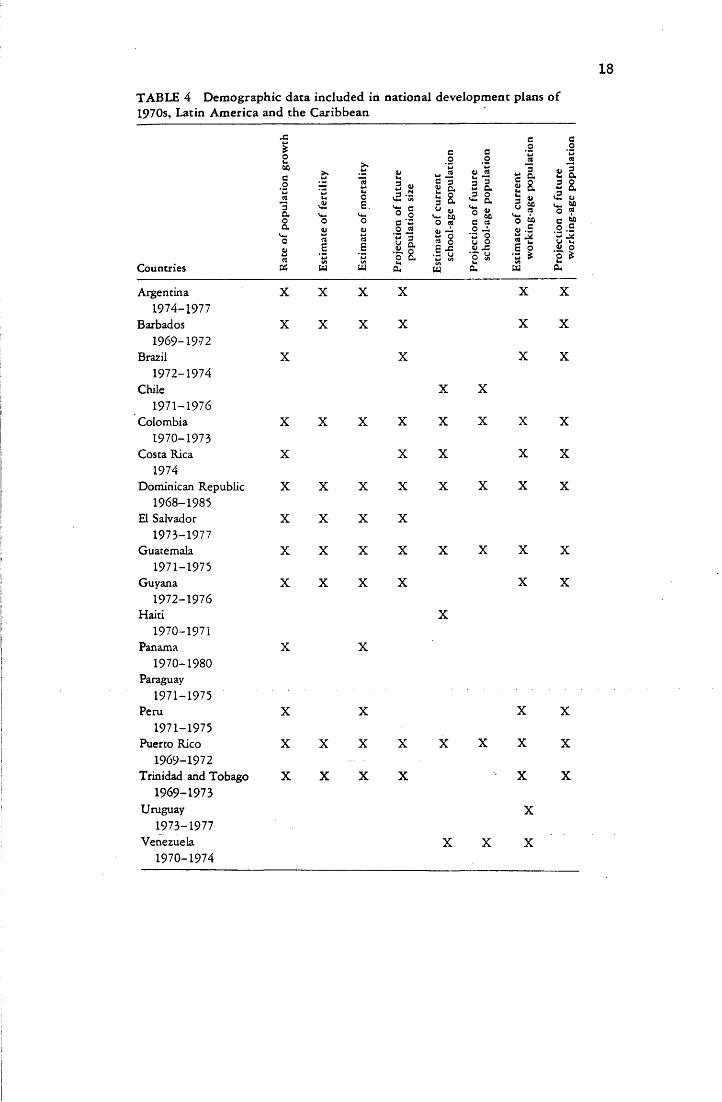
Table 4 Demographic Data Included in National Development Plans of 1970s, Latin America and the Carribbean 18
Table 5 Population Problems Recognized in National Development Plans of 1970s by (A) Per Cent of Countries Under Study and (B) Per Cent of Population of Countries Under Study 37
Table 6 Population Problems Recognized in NationalDevelopment Plans of 1970s, Africa 38
Table 7 Population Problems Recognized in NationalDevelopment Plans of 1970s, Asia 39
Table 8 Population Problems Recognized in NationalDevelopment Plans of 1970s, Latin America and the Carribbean 40
Table 9 Population Policies in National Development Plans of 1970s by (A) Per Cent of Countries Under Study and (B) Per Cent of Population of Countries Under Study 61
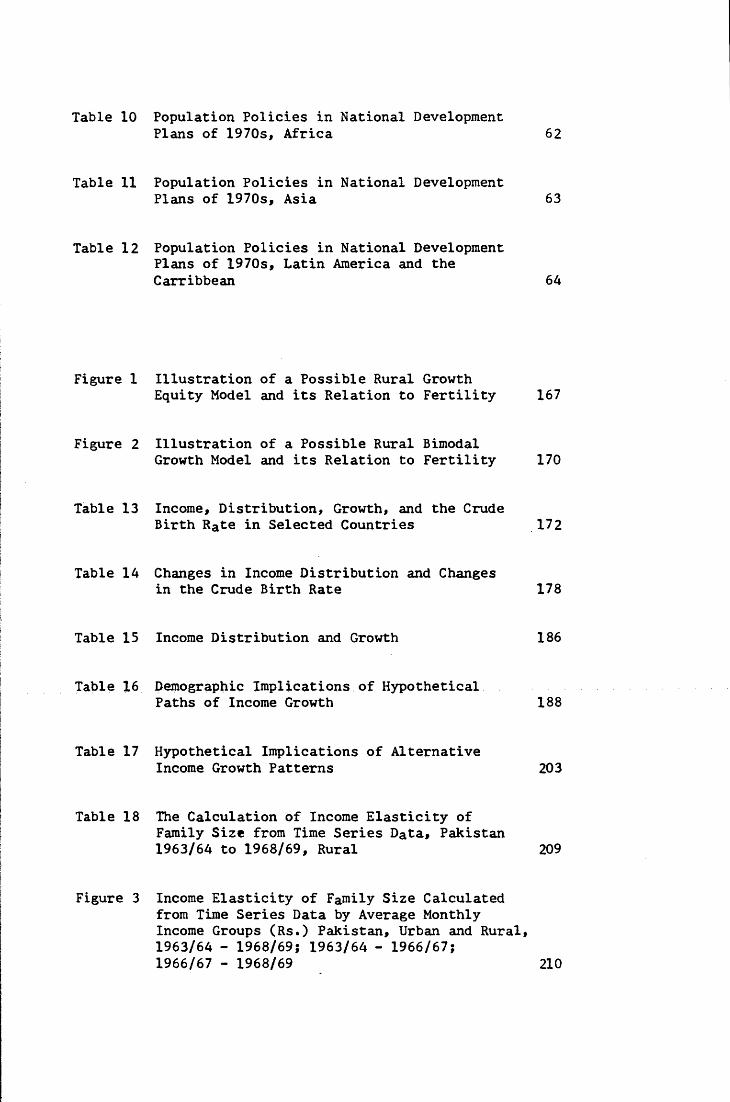
Table 10
Table 11
Table 12
Figure 1
Figure 2
Table 13
Table 14
Table 15
Table 16
Table 17
Table 18
Figure 3
Population Policies in National Development Plans of 1970s, Africa
Population Policies in National Development Plans of 1970s, Asia
Population Policies in National Development Plans of 1970s, Latin America and the Carribbean
Illustration of a Possible Rural Growth Equity Model and its Relation to Fertility
Illustration of a Possible Rural Bimodal Growth Model and its Relation to Fertility
Income, Distribution, Growth, and the Crude Birth Rate in Selected Countries
Changes in Income Distribution and Changes in the Crude Birth Rate
Income Distribution and Growth
Demographic Implications of Hypothetical Paths of Income Growth
Hypothetical Implications of Alternative Income Growth Patterns
The Calculation of Income Elasticity of Family Size from Time Series Data, Pakistan 1963/64 to 1968/69, Rural
Income Elasticity of Family Size Calculated from Time Series Data by Average Monthly Income Groups (Rs.) Pakistan, Urban and Rural, 1963/64 - 1968/69; 1963/64 - 1966/67;1966/67 - 1968/69
62
63
64
167
170
172
178
186
188
203
209
210
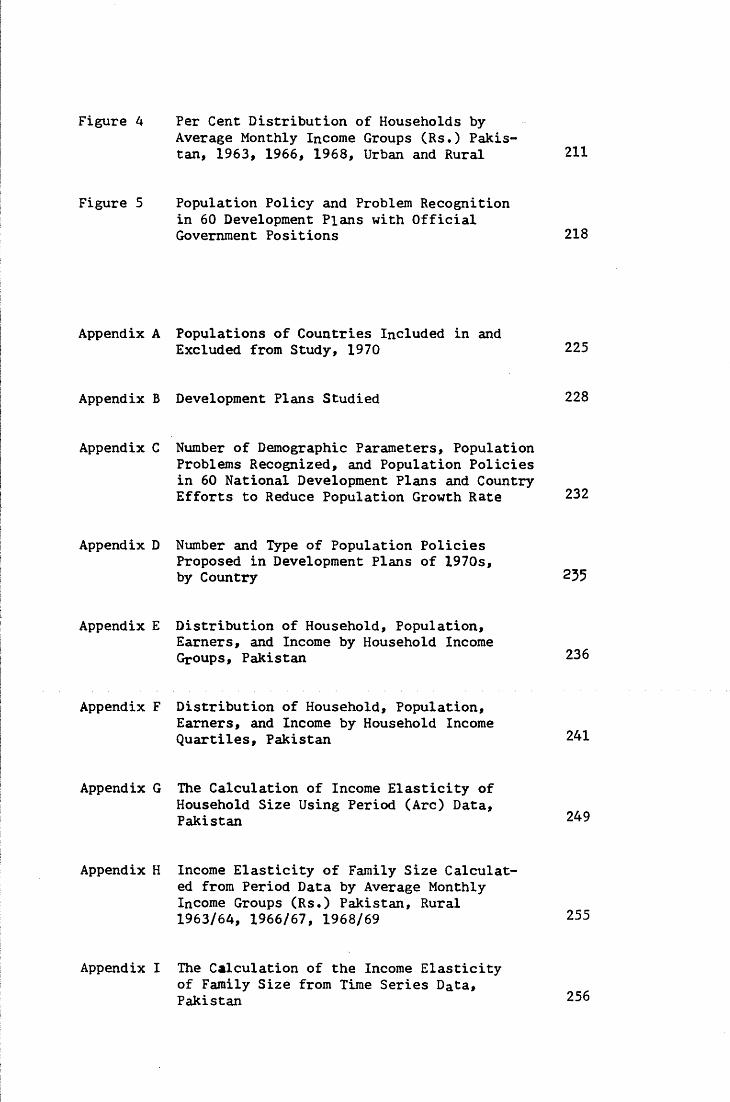
Figure 4
Figure 5
Appendix A
Appendix B
Appendix C
Appendix D
Appendix E
Appendix F
Appendix G
Appendix H
Per Cent Distribution of Households by Average Monthly Income Groups (Rs.) Pakistan, 1963, 1966, 1968, Urban and Rural
Population Policy and Problem Recognition in 60 Development Plans with Official Government Positions
Populations of Countries Included in and Excluded from Study, 1970
Development Plans Studied
Number of Demographic Parameters, Population Problems Recognized, and Population Policies in 60 National Development Plans and Country Efforts to Reduce Population Growth Rate
Number and Type of Population Policies Proposed in Development Plans of 1970s, by Country
Distribution of Household, Population, Earners, and Income by Household Income Groups, Pakistan
Distribution of Household, Population, Earners, and Income by Household Income Quartiles, Pakistan
The Calculation of Income Elasticity of Household Size Using Period (Arc) Data, Pakistan
Income Elasticity of Family Size Calculated from Period Data by Average Monthly Income Groups (Rs.) Pakistan, Rural 1963/64, 1966/67, 1968/69
211
218
225
228
232
255
236
241
249
255
Appendix I The Calculation of the Income Elasticity of Family Size from Time Series Data, Pakistan 256
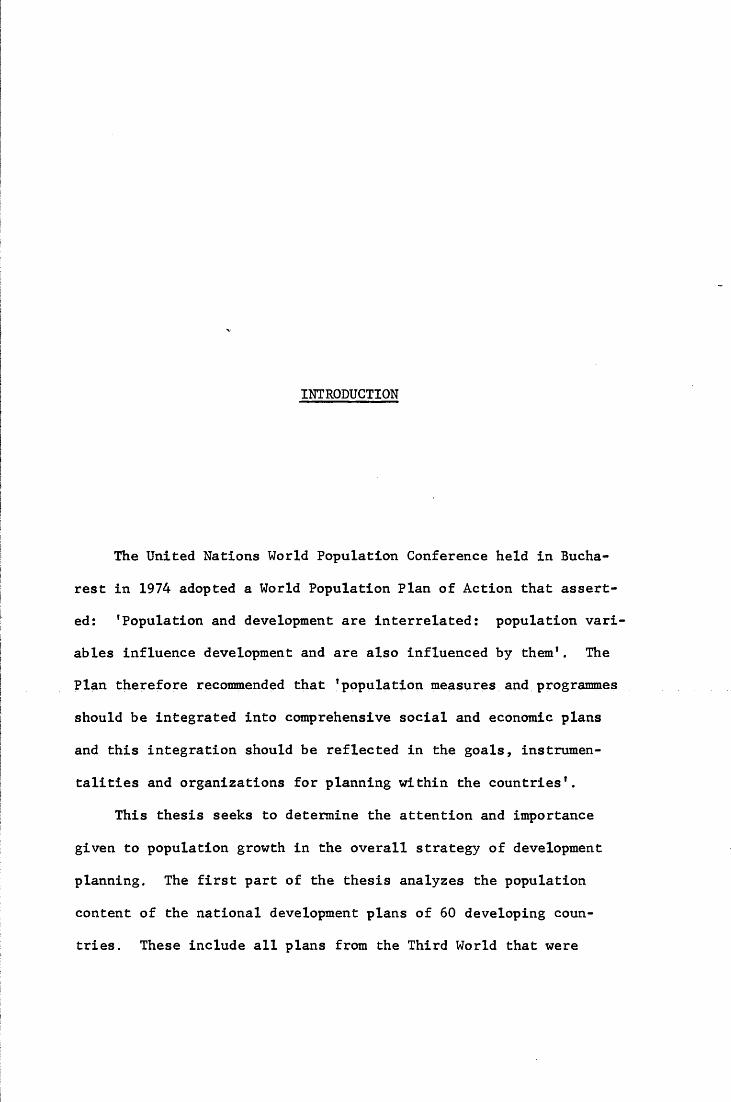
INTRODUCTION
The United Nations World Population Conference held in Bucha
rest in 1974 adopted a World Population Plan of Action that assert
ed: 'Population and development are interrelated: population vari
ables influence development and are also influenced by them'. The
Plan therefore recommended that 'population measures and programmes
should be integrated into comprehensive social and economic plans
and this integration should be reflected in the goals, instrumen
talities and organizations for planning within the countries'.
This thesis seeks to determine the attention and importance
given to population growth in the overall strategy of development
planning. The first part of the thesis analyzes the population
content of the national development plans of 60 developing coun
tries. These include all plans from the Third World that were
’available to the author at the time of the study and that were rele
vant to the 1970s.^ The second part of the thesis is an investiga
tion of population and development planning on a national level, for
the countries of Pakistan and Bangladesh.
National Development Plans
The decade of the 1960s was marked by a widespread prolifer
ation of development plans. Previously, many governments planned
no more than two years ahead for fiscal budgets, somewhat longer
for investment projects. The five-year plan became popular be
cause it is a more integrated and comprehensive approach to devel
opment planning, it fulfills a need for a longer-range fiscal plan
of public investment, it is often a prerequisite for foreign aid,
and it has effective national and international publicity value.
Individual development plans vary widely in objectives, programmes,
comprehensiveness, details, types of change proposed, and degrees
of private and foreign involvement. Each plan reflects the social
and economic system for which it was designed and the nature and
extent of changes desired by political elites.
Many serious questions have been raised concerning the extent
to which development plans address themselves to the real obstacles
to development. The degree of implementation, the inconsistent
^This study reviews plans written in the 1970s and a few that were published in the late 1960s but which cover periods extending into the 1970s. See Appendix R for the plans studied; for a more comprehensive list, see International Bank for Reconstruction and Development, List of National Development Plans, 4th ed. , Washington D.C., September, 1973.

objectives, the emphasis on fiscal budgets rather than on struc
tural changes, and the role of international agencies in encourag
ing the plans also have been debated. One must keep these ques
tions in mind in order to understand the role of population in the
planning framework.
It is hazardous to make cross-national comparisons of plans
derived from different systems of development planning and applied
to different types of economic, social, and demographic develop
ment. Countries vary widely in the emphasis they place on develop
ment planning, from those that develop very comprehensive plans to
those that do almost no planning. The relationships of development
planning to actual programme implementation and of implementation
to actual development also cover a wide range. But a systematic
content analysis does allow important inferences to be drawn about
the way various aspects of population are used in actual development
plans.
The Plan Period
There are three types of national development plans: the short-
range plan (usually for one year), the medium-range plan (from three
to seven years but most often for five), and the long-term plan (ten
or twenty years). The medium-range plan outlines national policies,
programmes, goals, and targets, and serves as a guide for the impor
tant policy decisions for the annual budgets.
The first part of this thesis focuses mainly on medium-range
plans, though three countries studied (Costa Rica, Haiti, and Saudi

Arabia) had only short-range plans available, and two (the Dominican
Republic and Panama) had only long-range plans. In four cases
(Sudan, Sri Lanka, Taiwan, and Turkey) both medium-range and per
spective plans were available, and these long-range plans have also
been examined. Of the medium-range plans, the most common are for
five years, though a few cover shorter periods.
The duration of the planning period affects the consideration
of population matters in a number of ways. Many social services,
including education, health, and urban development, have long-range
lead times beyond the scope of the five-year plan to accommodate
for future population growth. The training of a teacher, for exam
ple, may have to begin before the birth of the student. Many cur
rent expenditures must be based on needs of projected populations.
In the longer-range perspective the consequences of rapid popula
tion growth are likely to become much more serious because, in addi
tion to the rate of growth and the age structure, the sheer size of
the population added every year may begin to place heavy burdens on
resources.
Policies for reducing population growth through fertility de
clines are also likely to have a long lead time before they become
demographically effective. Moreover, the final payoff from reduced
fertility will extend even farther into the future. The payoff in
the education sector would not even begin until the "lower fertil
ity" cohort reached school age, another five years later. The bene
fits from slowing the growth of the working-age population would
not begin for at least 15 years. Thus, if the planning period is
5
limited to five years, the most important considerations in regard
to both influencing population growth and accommodating to long-
run growth may be overlooked.
The Unreality of Planning
Marshall Wolfe has argued that development "planning can receive
a good deal of formal backing and publicity without any serious
attention on the part of the national authorities to the practical
measures needed for its implementation."^ On the other hand, Gerald
Desmond has pointed out: "It is fashionable these days to dis
count the effectiveness, or even the reality, of many development
plans....In some cases these reservations are probably deserved
and in others they may be unduly c y n i c a l . G a v i n Jones has warned
that the development plan should not be looked upon as the "prime
mover in development but rather as an attempt to channel the power
ful forces at work...in ways that will result in the greatest advan
tage or, at worst, the least disadvantage, to the country's develop-............. 3 ..................................................ment efforts."
Htolfe, Marshall. 'Between the Idea and the Reality: Notes on Plan Implementation', International Social Development Review, 1971, Vol. 3, p. 34.
n _Desmond, Gerald, 'The Impact of National and Regional Development Policies on Urbanization', in Urbanization and National Development, ed. Leo Jakobsen and Ved Prakash, (Beverly Hills, California: Sage Publications) 1971, p. 70.
3Jones, Gavin, 'Implications of Prospective Urbanization for Development', Paper presented at the Seminar on Population and Development: The Urban Focus, sponsored by SEADAG and the Instituteof Population Studies, 1972, p. 10.

6
One might well ask: What is the use of studying development
plans if most of their programmes are never fully implemented and
they represent an unreal world--if not a Platonic ideal, than some
thing like a collection of political campaign promises? First,
whatever the implementation, the use of demographic data in plan
ing is probably highly correlated with certain data that are found in
in a plan. So the plans provide an indication of the extent to
which these data are used and the degree of emphasis placed upon
them. In addition, there are advantages to pulling demographic
data out of the plans and making them available so that indepen
dent checks can be undertaken.
Second, it important to determine the perception of various
population problems. The pattern of problem recognition gives
some indication of the ways in which rapid population growth is
affecting development efforts, and sheds some light on the way pro
grammes are being designed to accommodate population growth.
Finally, even if none of the proposals for population policies
are fully implemented, they are of some interest in and of them
selves. At least the scope and pattern of intervention tools are
identified. If the scope of proposed policies is narrow (limited
to the family planning approach, for example), that in itself is
an important finding. If broad population policies are to be im
plemented, they must first be proposed; and proposing them in a
national development plan is strategically effective, since broad
social engineering may involve the actions of more than one minis
try or department, and the plan can provide substantial publicity

7
and influence on behalf of its policies. Broad policies of this
sort are usually effective only when they are implemented and co
ordinated within a strategy of integrated reinforcing programmes.
At any rate, it is impprtant to know what policy was proposed and
by whom, even if it was not fully implemented— if only to find out
that very little was proposed to begin with. In order to evaluate
the execution of a programme, one must know (among other things)
what was proposed and what goals were set.
Caution should be exercised in interpreting the information
presented in Part One of this study. It should not be assumed that
the policies proposed have actually been implemented or that coun
tries have been limited to the policies proposed in their plans.
Furthermore, these countries were not filling in a systematic ques
tionnaire when they wrote their plans. The plans were written with
many objectives in mind, and there is no reason to assume that the
planners felt any need to outline all their problems. They may
have felt that some problems were self-evident. As we shall see
later on, omissions:6f data, problems, and policies may be explain
ed in a number of ways.

8
Organization of the Thesis
This thesis is organized into two parts. In Part One findings
are categorized into three major areas of analysis— utilization of
demographic data, recognition of population problems, and dimensions
of population policy.
Demographic data are essential for realistic development plan
ning. Chapter 1 analyzes the use of eight demographic parameters
found in national plans. The study determines which countries used
rates of growth, estimates of fertility and mortality, and popula
tion projections in their plans. It also looks at current and fu
ture projections of the school-age and working-age populations.
Countries not including such data in their national plans are iden
tified as well.
In Chapter 2 development plans are analyzed for their recog
nition of a number of important problems: whether the growth of
the working-age and school-age populations is viewed as a popula
tion problem; if it is felt that economic growth is being reduced
by population grox th; if there is perceived population pressure on
social and health services, on housing, on individual or family
welfare, or on food or agricultural systems; if the dependency

9
ratio is a burden; and if high population density is viewed as
a problem. The objective here is not to determine whether these
problems actually exist but to determine how they are perceived
by development planners.
Chapter 3 discusses the patterns of population policy stra
tegy found in the development plans. Some 16 population policies
are analyzed.^ The policies range from the specific, such as
family planning, to the broad, such as a reduction in fertility
as a consequence of socioeconomic development. All of them have
at least the partial but intended aim of reducing population growth.
The supporting research notes for Chapters 1, 2, and 3 are pub
lished as the second part of Population and Planning in Developing 2Nations which is being submitted as a supplement to the thesis.
It reviews all of the 60 development plans studied. Each plan
description begins with a list of the demographic data used, pro
blems recognized, and policies proposed in the plan. All popula
tion projections found in a national development plan, as well as
estimates of fertility, mortality, and rates of growth, are presented.
Sources of estimates and methods of estimation are stated as well
^See page 6l for a full list of these policies. Although migration is often an extremely important demographic aspect of development planning, it has not been included within the scope of this study because of the large volume of material to be surveyed. With the exception of migration, and within the limitations and definitions described in Chapters 2 and 3, most of the explicit population problems and policies found in the plans are included in one or more of the categories of this study.
2Stamper, B. Maxwell, Population and Planning m Developing Nations, A Review of Sixty Development Plans for the 1970s, (NewYork: The Population Council), 1977, 265p.
10
(if these were given in the plan). Simple checks were made to
see if the demographic data were internally consistent.
All important statements about population problems and all
relevant population policy proposals found in the national develop
ment plans have been included in each country plan description.
A brief policy perspective is also given for each country to pro
vide a better framework in which to view the plan and its possible
implementation.
Chapter A begins the specific examination of population and
development planning in Pakistan and Bangladesh. The first, second,
and third national plans of Pakistan and the first plan of Bang
ladesh are reviewed for their utilization of demographic data,
their recognition of population problems, and their proposed pop
ulation policies. The plans and their population policies are ex
amined within the wider social^ economic, and political context in
which they were proposed. The implementation of the population
programmes is evaluated, and the administrative and policy obsta
cles which impeded demographic effectiveness is also examined.
Chapter 5 investigates various theories about fertility de
cline and analyzes four conceptual frameworks and their relevance
and utility for development planning in Pakistan and Bangladesh:
the family planning approach, beyond family planning measures,
the development hypothesis and the transition theory, and the dis
tributive hypothesis and fertility decline. Various specific policy
interventions are analyzed in regard to their administrative feas
ibility, economic reality,(and pqliticalacceptability, as well as
their potential for demographic impact.

1 1
Chapter 6 is an exploratory examination of a planning frame
work which incorporates population, income distribution, and the
evaluation of alternative development strategies. It involves an ex
tension of the social welfare index which attempts to incorporate
the effects upon fertility of differential income growth. Pakis
tani data on income distribution and family size from the years
1963/64, 1966/67, and 1968/69 are employed in an attempt to evaluate
the utility of the model and perhaps shed some light on the quality
of the data as well.
12
CHAPTER ONE
DEMOGRAPHIC DATA USED IN DEVELOPMENT PLANS
Not a great deal is known about the actualusages ofdemographic data
in the Third World. In countries experiencing rapid population
growth, as almost all of these are, development programmes must
take demographic changes in population size, age structure, and
distribution into account. It is not possible to know the full ex
tent to which these data are actually taken into account in the
planning process, but some indication can be found by analyzing
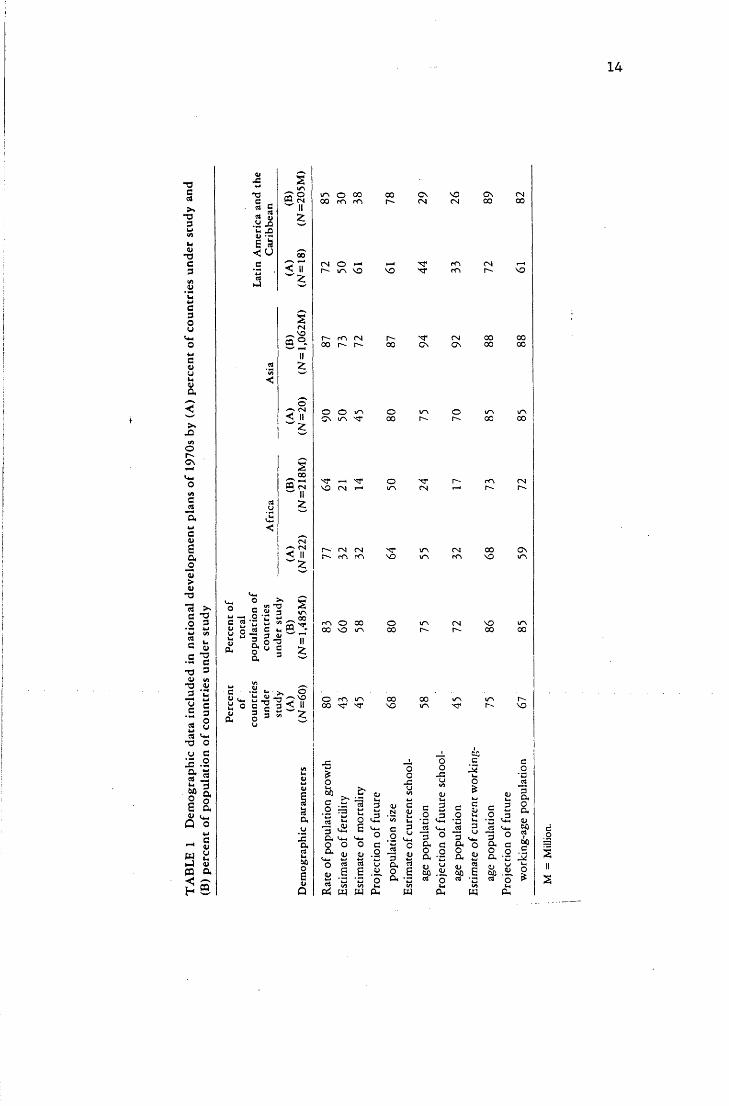
the content and emphases of the national development plans. Tables
1-4 show the use of eight demographic parameters in the national
development plans of 60 countries.
It seems likely, although not necessary, that countries seek
ing to accommodate rapid population growth in their national devel
opment plans would present at least a few of the eight parameters
looked for in this study. A country's omission of one of these
parameters may indicate that;
13
1. The planners did not have the data.
2. They had the data but felt they were not sufficiently impor
tant, accurate, useful, or relevant to be published in the
planning document.
3. The statistical office possessed the data but did not furn
ish them in tabulations that could be readily used by the
planning agency.
4. The planners were inexperienced and possibly lacked demo
graphic skill.
5. The planning models and techniques used did not readily
accommodate demographic statistics.
6. The planners were unwilling to make demographic assumptions
about the future or to make use of those made by others.
Rate of Population Growth
The rate of population growth is obviously one of the most important
demographic measures used in planning and should form the critical
basis for many policy and programmatic assumptions. Although it is
impossible to know the full extent to which population growth rates
are actually employed in the planning process, we can get some idea
of their use by analyzing those that appear in national development
plans.
Of the 60 countries studied here, 48, or about 80 per cent,
present some type of estimate of the rate of population growth in
their national development plans. The Asian countries are most
strongly represented, but there is not a great deal of variation
among regions (see Table 1). Even though a large number of the
countries studied do include rates of population growth in their plans,
14
-acC4"O3
0>"3C3
>«.XIV)
©c \
aHIE ajo>
*3
c 'SO 3 «-> </>
a b•SI”3 3HI vi
"3 HI 3 Z C.5 3
Ht 0 W fj w« u -
*3 O u Cx .2u 3§ tE a
£ ■*- 0 ow^ s
s *l-J <uca atSg
*3 « C GJ 3
.« X u _Cn> • -E S3
03
S<N ^ VOo ° .
II£
< II
a
u . oO Cw — Oe - —u
w -o a£ i 3 un- « 'E u 00
o « s "S xU | o 3 IT
o * u § £a 3 ~
w *ri 3o c 5 d ;3 5 w O 3
U-N o 00 00 <T> cC\
<N O — ' I— l/"\ NO
r- m <n oo r» r~~
O O w CN IA IT
'sr —■ 'srVO fN *->
CSCM
C \
VO<N
CN00
0000
o00
pfN O 00 00 VO w\
O rfl in 00 ^ ^
-C%o
&« .3 ^•2 3 c
v-1 O■§ v2 EO. Vt.,o o a
ooo
00VO
00VO
vo00
oHi Hi
Oa .§c3 to -. _pi w w a
E Si •c o
o C co St oJS La ’3u<oHILa
o& HILa_23a
c 3 c cHi c 3 oa_o 3 o La _o 3V_Vt_ -2
La3 _rtLa-aHua
HI603 o ~a HIla_ 3 O caiOa c a o a 3 60o O o CO o O COa a a S2HI60
uSi HI60
«6 H)60
HISi
LaOES”o <4 A o
<-> — Q — w —ViaOHI
W w
•15
it is still alarming that any country might neglect such an important
parameter, one that influences so many aspects of social planning.
Were the development programmes of the remaining 12 countries plan
ned without knowledge or use of growth rates, or were the rates
simply not published in the planning documents? Clearly, some coun
tries that make no mention of population growth rates in their plans
have reasonably good estimates available to them. Algeria, Indonesia,
Sri Lanka, Chile, Uruguay, and Venezuela fall into this category;
the Algerian plan, in fact, presents a population projection. On
the other hand, Ethiopia, Somalia, Sudan, Haiti, and Paraguay have
not had high-quality demographic data, and their planners may not
have had satisfactory estimates available to them.
In the plans that do include rates of population growth, many of
the estimates are either unsatisfactory or of dubious quality. The
prevalence of inaccurate estimates can almost be assumed if only
because of the very uncertain nature of many demographic statistics
in the Third World. Apart from the uncertainty of the data, many of
them are unsatisfactory because they are out of date. A number of
countries published intercensal rates of growth, but some went back
as far as 1940. Peru, for example, published what is apparently an
intercensal rate of growth averaged per year over the period 1940-
1960, a time when the country experienced rapidly declining mortality.
This rate was used for the planning period 1970-1975.
No source is given for most of the estimates published. It is
most likely that the planning commissions obtained the estimates from
the national statistical offices, whose data are often based on an
incomplete vital registration system, census data, and sometimes
sample surveys. In most plans no method of estimation is given,
TA B LE 2 Demographic data included in national development plans o f1970s, A frica
Countries Rate
of
popu
latio
n gr
owth
Estim
ate
of fe
rtili
ty
Estim
ate
of m
orta
lity
Proj
ectio
n of
futu
re
popu
latio
n si
ze
Estim
ate
of cu
rren
t sc
hool
-age
po
pula
tion
Proj
ectio
n of
futu
re
scho
ol-a
ge
popu
latio
n
Estim
ate
of cu
rren
tw
orki
ng-a
ge
popu
latio
n
Proj
ectio
n of
futu
rew
orki
ng-a
ge
popu
latio
n
Algeria X X X1970-1973
Botswana X X X X X1970-1975
Burundi X X X1968-1972
Cameroon X X X X X1971-1976
Ethiopia1968-1973
Ivory Coast X X1971-1975
Kenya X X X X X X1970-1974
Mali X X X1970-1972
Mauritania X X1970-1973
Mauritius X X X X X X X1971-1975
Morocco X X X X X1973-1977
Nigeria X X X1970-1974
Senegal X X X X X1969-1973
Somalia X1971-1973
South Africa X X X1966-1971
Sudan
1970/71-1974/75Swaziland X X X X X
1973-1977
Tanzania X X X X X X1969-1974
Togo X X X X ' X " X1971-1975
Tunisia X X X X X X X X1973-1976
Uganda X X X X X X X X1971/72-1975/76
Zambia X X X X X X1972-1976
T A B LE 3 Demographic data included in national development plans o f1970s, Asia
Countries Rate
of
popu
latio
n gr
owth
Estim
ate
of fe
rtili
ty
Estim
ate
of m
orta
lity
Proj
ectio
n of
futu
re
popu
latio
n si
ze
Estim
ate
of cu
rren
t sc
hool
-age
po
pula
tion
Proj
ectio
n of
futu
re
scho
ol-a
ge
popu
latio
n
Estim
ate
of cu
rren
t w
orki
ng-a
ge
popu
latio
n
Proj
ectio
n of
futu
re
wor
king
-age
po
pula
tion
Afghanistan X X X X X X1967-1971
Bangladesh X X X X X X X X1973-1978
India X X X X X X X X1974-1979
Indonesia X X1969/70-1973/74
Iran X X X X X X1968-1972
Iraq X X X X1970-1974
Israel X X X X X X1974-1978
Korea, Republic of X X X X X X1972-1976
Laos X X X1969-1974
Lebanon X1972-1977
Malaysia X X X X X X X X1971-1975
Nepal X X X X X X X1970-1975
Pakistan0 X X X X X X X X1970-1975
Philippines X X X X X X X X1972-1975
Saudi Arabia X X X X X X X1970
Sri Lanka X X X X X1972-1976
Taiwan X X X X X X
1969-1972Thailand .. X X X X
1972-1976Turkey X X X X X X X X
1973-1977Vietnam, Republic o f6 X X X X X
1972-1975
“Before the independence o f Bangladesh. 6Before unification with N o rth Vietnam.
18TA B LE 4 Demographic data included in national development plans o f1970s, Latin America and the Caribbean
% c ao oe ao .9
3 ^ 3Q. u O,Sk <U .. M « «O S3 73 3 C "3 3 3 S o 3 0■2 r= t: 2 « « c, 2 a 2 H « o,« S o vH '3 S ? 5 2 § at »2 «— 4i e •+* *n 3 a * * a 3 m . tn2 ^ E Q c ° 0 ^ <UO* U* <-*-* O tC V*- Ja KfSO O o B -a o « c a O w 5 «®* O O O M «, O _i 4) .£ .2-2**• - - ’5 "5 S o 'So tj.* «a Uo o <j O 2 u ut,o r * C .c oj «e g o o o
■ & 'o y « * o £Countries PS W w a, w 0, u
Argentina X X X X X X1974-1977
Barbados X X X X X X1969-1972
Brazil X X X X1972-1974
Chile X X1971-1976
Colombia X X X X X X X X
1970-1973Costa Rica X X X X X
1974Dominican Republic X X X X X X X X
1968-1985El Salvador X X X X
1973-1977Guatemala X X X X X X X X
1971-1975Guyana X X X X X X
1972-1976Haiti X
1970-1971Panama X X
1970-1980Paraguay
1971-1975Peru X X X X
1971-1975Puerto Rico X X X X X X X X
1969-1972Trinidad and Tobago X X X X X X
1969-1973Uruguay X
1973-1977Venezuela X X X
1970-1974
19
although a number of countries do present the crude birth and death
rates. In many cases the growth-rate figure was obtained simply by
subtracting the crude death rate from the crude birth rate. In most
countries international migration has a trivial demographic effect,
but it is substantial in a few small countries, and therefore distinc
tions are sometimes made between the rate of "natural” increase and
the "actual" rate after migration. In no plan is the intrinsic
rate explicitly used.
Although 26 countries give estimates of the level of fertility
and 27 give estimates of mortality level, only a few give both esti
mates from the same year in a comparable form so that a natural rate
of increase can be calculated. And not in every case does the natu
ral rate correspond with the rate assumed in the plan. This discrep
ancy is probably due to the use of migration statistics or an inter-
censal rate of growth.
Estimate of Fertility
Although fertility estimates are of less direct importance in develop
ment planning than some of the other parameters studied here, they
are a necessary component of good projections. Information on the
number of births is useful in some specific planning contexts, and
it is of great importance to countries that wish to reduce their rates
of population growth.
Only 26 countries, representing 60 per cent of the combined pop
ulation under study, include fertility data in their plans. Fertility
information usually comes in the form of a crude birth rate and is
discussed in the context of the rate of natural increase. In only
a few cases is it presented as the age-specific fertility rates ne
20
cessary for component projections. In some plans in which it is dis
cussed in detail, targets for reducing the birth rate are explicitly
introduced. Of the 26 countries presenting fertility data, 19 present
policies to reduce fertility, and one, Argentina, proposes to increase
it.
Of the seven African countries that provide fertility data (see
Table 2), only two present comparative figures. Mauritius reports that
its crude birth rate dropped from 50 in 1950 to AO in 1960 and to 27 in
1969. Tunisia reports that its crude birth rate dropped from 46 in 1961
to 37 in 1972 for a general fertility rate of 162, a decrease of 5
births per 1,000 women of reproductive age between 1965 and 1971.
Of the ten Asian countries (see Table 3), Bangladesh and Laos
have the highest crude birth rates, each with 47 births per 1,000.
India and Malaysia have the lowest, with 35. India*s plan expresses
disappointment in the figure, since the aim of its earlier plan had
been to reduce the birth rate from 39 in 1968 to 32 by 1974, and it
had been assumed that the rate would then drop further to 25 by 1981.
That goal, the 1974-1979 plan states, no longer appears "feasible.*'
Of the nine countries of Latin America and the Caribbean (see Table
4), Argentina and Barbados report the lowest crude birth rate, 22.
Barbados hopes to lower it further and Argentina wants to raise it.
The plan of Trinidad and Tobago reports a decline in their combined
birth rate from 38 in 1962 to 30 in 1968. El Salvador, with the high
est crude birth rate reported in the region, also has experienced a
sharp drop, from 50 in 1961 to 43 in 1973.
Estimate of Mortality
Mortality data are essential for establishing health conditions as
21
well as setting requirements and priorities for health programmes and,
later, evaluating their progress and effectiveness. Not only the level
or mortality but also the causes of death, the sex- and age-specific
rates, infant mortality, and other measures are crucial for effective
health planning. Data on the geographic distribution of mortality as
well as on the population distributions and the age structure of the
population are needed. Mortality data are, of course, necessary for
projections of population growth.
w
Only 27 countries include data on the total level of mortality in
their plans. Most of these countries devote at least a chapter of their
national development plans to health services, and it is in this context
or in a discussion of population growth that mortality data are present
ed. In most cases only crude death rates are mentioned; seldom are age-
specific rates or expectation-of-life figures given. Infant mortality
measures and figures on deaths by certain major causes are sometimes
given, but more attention is paid to medical-administrative statistics,
such as ratios of doctors, nurses, and hospital patients to population.
Of the seven African countries that report mortality figures in
their plans (see Table 2), crude death rates range from 25 per 1,000 in
Senegal to less than 10 in Mauritius, and Mauritius expects its death
rate to decline to as little as 6 per 1,000 by the early 1980s. Life
expectancy at birth, its plan reports, was 50 years at the beginning of
the 1950s and 60 years at the beginning of the 1960s. "It can be expec
ted, on present trends, to increase to about 70 years by the early 1980s."
Nine Asian countries include mortality estimates in their plans
(see Table 3), ranging from 23 per 1,000 in Laos to 7 in the Philip-
22
pines. Sri Lanka reports a decline in its crude death rate from 20
per 1,000 in 1946 to 8 in 1968.
Eleven countries of Latin America and the Caribbean provide
mortality figures in their plans (see Table 4). Peru's figures il
lustrate the inadequacies of and contradictions in the demographic
data included in the plans of many Third World countries. An official
figure of 10 deaths per 1,000 is given, but the plan estimates that
the true figure is between 15 and 16; yet the plan goes on to present
mortality rates by cause.
It is possible that more countries have used mortality data than
those that publish them in their plans. Thus the use of mortality
data cannot be completely assessed, but the information available
indicates that they have received very little attention and emphasis.
Projection of Future Population Size
The future is the essence of planning. And yet, though most countries
use future population projections in planning, they have not been
salient features of development planning documents.
In this study a population projection is defined very broadly:
Any country whose plan estimates the future size of its population is
classified as having a population projection. Forty-one countries —
68 per cent of those studied — present some basic population projec
tion or some estimate of the future size of the population. Thus 19
countries project no estimates or projections of future population
size.
About a third of the African countries studied, representing 50
per cent of the African population, do not give this basic information
(see Table 2). Demographic data in these countries are notably incom
23
plete, and failure to present projections must be traceable in large
part to this lack. Of the 14 African nations that do give this infor
mation, Botswana gives projections through the year 2000 at varying
growth rates. Population growth seems to be of concern to Botswana's
planners solely for economic reasons; Each per centage point of growth
rate, the plan notes, represents a decline of 1 per cent in the rise
of per capita income. Morocco presents two projections for the years
between 1971 and 1999, one assuming a "normal" decline in fertility
and the other assuming an increased decline as a result of the country's
family planning program.
In Asia 4 of 20 countries, representing about 13 per cent of the
Asian population under study, give no such estimates (see Table 3).
The availability of demographic data is less of a problem in these
countries than in Africa, and other factors must be responsible for
their failure to publish estimates or projections of future population
in their plans. Indeed, two of these countries, Indonesia and Saudi
Arabia, do publish school-age projections, and Saudi Arabia publishes
a working-age projection as well, thus indicating a projection of the
age distribution. Sixteen Asian countries do include population pro
jections in their plans. India gives projections for three periods
between 1971 and 1986 by sex and age group, and details seven assump
tions on which they are based. Nepal gives projections by age at
five-year intervals, and also estimates future population density by
region.
Seven Latin American countries give no projections (see Table 4),
and they represent 22 per cent of the Latin American and Caribbean
population under study. Among the 11 countries in this region that
do provide population projections, Brazil notes that important
24
demographic data from the 1970 census were not available for inclusion,
but nevertheless projects a population increase of 11 million between
1970 and 1974. In the plan of the Dominican Republic a projection
of mortality patterns by age is incorporated into detailed projections
of population by age and sex at five-year intervals to the year 2000.
The methods used to make these projections and the assumptions
on which they are based are not often explained, and the reliability
of the base data is rarely discussed. Furthermore, most of the pro
jections are made for only one future date and one total size; a
range of possible projections to encompass various alternatives is
usually not given. The lengths of the projection periods vary, of
course; most are limited to the duration of the development plan
period. It is apparent that most projections are not based on the
component projection method of age distribution, but are merely pro
ducts of the current estimates of total population multiplied by the
current estimates of rate of growth. The projections are therefore
of little use in social and economic planning, since this requires a
projection of the age distribution.
Of the countries presenting component systems, few stress the
variability of the components, perhaps because of the short periods
covered by the estimates. From the evidence in most of the plans, it
does not appear that the projections used are designed to allow for
future revisions to accommodate new or more complete data. This
study found neither a widespread use of the component system of pro
jections nor a system projecting future approximations of demographic
situations or possible emerging trends. On the other hand, however
limited the projections may appear, they may be based on procedures
adequate to the given situation in the country concerned.
25
Estimate of Current School-Age Population
Estimates of current school-age populations are published in the de
velopment plans of only 35 of the 60 countries studied. The inclusion
follows regional patterns, with 75 per cent of the Asian countries in
cluding such data but only 55 per cent of the African countries and
44 per cent of the countries of Latin America and the Caribbean. The
Asian countries represent over 90 per cent of the combined Asian coun
tries under study, as compared with less than 30 per cent of the re
spective populations for the other two regions.
It is not certain why 42 per cent of these Third World countries
would not include such rudimentary information as size of school-age
population. In most of them the exclusion is probably due to a lack
of emphasis on educational planning as a part of the overall develop
ment strategy as much as to the unavailability of data or a failure
or unwillingness to publish them. In many African countries, however,
these data are still likely to be unavailable.
Burundi, which provides no projection of population size, no
current estimate or projection of working-age population, and neither
fertility nor mortality rate, is one of the 12 African countries
that do give figures for current school-age population. So are
Somalia, which offers no other data among the categories under dis
cussion here, and Mali, which otherwise notes only its growth rate.
Both Somalia and Mali discuss their need for statistical information
and their plans for acquiring some.
Among the 15 Asian countries that provide information on current
school-age population, Afghanistan bases its estimate on a UNESCO
survey. India’s statistics on school-age population are, as usual,
sophisticated.
26
Among the eight countries of Latin America and the Caribbean
that present this information are Haiti, which estimates the school-
age population and size „ and Per cent of school enrolment but offers
none of the other demographic data under study here, and Venezuela,
which otherwise provides data only on future school-age population
and current working-age population.
Of the nine countries that provide data on only one or two of
the categories under consideration, four give estimates of current
school-age population. Both Indonesia and Chile provide data only
on current and future school-age populations.
Of the plans that contain school-age population data, most do
not give these data by single-year ages, but aggregate them by pri
mary school and secondary school, and many present them only indi
rectly. In fact, many of the 35 plans containing school-age
data really present only the primary school enrolment figures and
estimates of their per centage of the primary school-age population.
Projection of Future School-Age Population
Educational planning by its very nature is one of the longest range
planning functions for a development strategy. Its long lead time
necessitates population projections for realistic planning of class
rooms and teachers. Training of teachers often begins before the
birth of the children they will teach. Educational planners cannot
assume that the school-age population is increasing at the same rate
as the total population; in fact, since fertility rates are high and
mortality rates, especially of the young, are declining in these
countries, the school-age population may be growing at a signifi
cantly higher rate than the population as a whole. In these

27
situations, an adequate demographic projection is essential for
realistic planning.
Projections of the school-age population (in many cases only
primary school) are published in the development plans of only 27
of the 60 countries. The countries that do present projections fol
low regional patterns; over two-thirds of the Asian countries include
them but only about one-third of the nations of Africa and of Latin
America and the Caribbean.
The school-age projections range in quality from demographic
projections of the primary school-age groups by single-year age
distribution to estimates of the future aggregate primary school-
age group. The few countries that present projections of the total
population with single-year distributions are presented in a context
other than that of education. Some of the plans contain projections
of enrolment. The enrolment figures and their per centage of the
school-age population usually come from ministries of education,
many of which may not be able to give accurate estimates of the school
age population.
Working-Age Populations
The International Labour Office estimates that 237 million persons
may be added to the Third World labour force during the Second United
Nations Development Decade (1970-1980): Africa, 33 million; Asia,
178 million; Latin America, 26 million. This increase in the labour
force is an extremely serious problem in these regions, since the
supply of labour already outstrips demand.
Working-age population projections are the principal component
of labour force projections. The working-age population is defined
28
here as the total population between the ages of 15 and 65. The
figure is often broken down by age and sex. The working-age popu
lation must be distinguished from various measures of economic activ
ity, such as labour force and employment.
Trends in the working-age population alone are not sufficient
for projection of trends in the labour force, because the rates of
activity vary greatly, as do the ages of those participating in
work and the participation of women. Nevertheless, in most Third
World countries the increase in the labour force is determined to a
large extent by the growth of the working-age population. Therefore,
simple projections of the labour force are usually made by multiply
ing expected age- and sex-specific activity rates by age- and sex-
specific working-age projections. These rates must be distinguished
from labour-foree-demand projections, which estimate future employment
needs in various sectors; demand projections are of economic rather
than demographic concern, and thus are not treated at all in this
study.
Estimate of Current Working-Age Population. Seventy-five per cent of
the countries studied have published some kind of estimate of current
working-age population in their development plans (see Table 1).
These countries represent almost 90 per cent of the populations of
both Asia and the Latin American Caribbean area under study and 73
per cent of the African population under study. The estimates vary
in quality from regional estimates with age distributions to aggre
gate estimates of the total population between the ages of 15 and 65.
Most of the plans give estimates of the levels of employment and un
employment and of employment by sector. Some plans, especially those
29
of the African countries, include- projections of the managerial needs
for each sector. The actual estimates of the current working-age
population have not been collected in this study. Many of the 15
countries that do not include current estimates do not have good dem
ographic data.
Fifteen African countries include estimates of current working-
age population in their plans (see Table 2). Algeria breaks down
its working-age population only into agricultural and nonagricultural
sectors. Togo notes that of its current working-age population of
921,000 (1970), 667,000 are gainfully employed.
In Asia 17 of the 20 countries include these estimates. India's
plan includes estimates of both working-age population and participa
tion rates by age, sex, sector, and residence. Indonesia notes that
its working-age population is unequally distributed, with resulting
high unemployment in some sections and labour shortages in others.
Iran includes children from the age of 12 in its estimates. South
Korea notes that although its population under 14 declined from 41.2
per cent of total population in 1966 to 39.4 per cent in 1970, the
working-age population grew from 32.1 per cent to 33.3 per cent in
the same period.
Thirteen of the 18 Latin American and Caribbean national plans
include this information. Costa Rica notes that its working-age
population grew from 47 per cent of the population in 1963 to 52
per cent in 1973. Guatemala, estimating its working-age population
for 1970, notes that "in accordance with the experience of past
mortality," only 70-75 per cent of those born in 1955 can be expected
to survive to reach the age of 15 in 1970, or 110,000-120,000 young
people. Of these, "not less than 45,000 young people exert pressure

30
on the work force per year." Since the level of educational attain
ment is not high, it would appear that Guatemala's large Indian popu
lation exerts little pressure on the work force. Venezuela's plan
shows a steadily decreasing per centage of population between the ages
of 15 and 59 from 1950 to 1969.
Projection of Future Working-Age Population. Sixty-seven per cent of
the countries in this study, representing 85 per cent of the popula
tion under study, have published some form of future working-age
population projection in their plans. The quality of the projec
tions varies considerably; most of them do not present regional or
single-year age estimates. In all, 19 countries present no estimates
of future working-age populations — all 15 of the countries that
present no current estimates plus Swaziland, Senegal, Uruguay, and
Venezuela.
Only 13 of the 22 African countries include projections of working-
age population in their plans (see Table 2). Botswana's plan gives
projections of both working-age population and wage employment, and
expresses dismay at their implications. Even the most optimistic
assumptions, it is noted, indicate a progressively decreasing per
centage of the working-age population that can be absorbed into wage
employment unless the population growth rate can be significantly re
duced. Although Ivory Coast provides no figures on working-age
population, either present or future, it anticipates that the demand
for manual labour will outstrip the supply and therefore expects to
absorb an increasing number of immigrants, who already were estimated
to comprise about 25 per cent of the population in 1965.
In Asia, 17 of the 20 countries provide working-age projections
31
(see Table 3). India's plan notes that a decline in the population
growth rate "affects the growth of the labour force only after a lag
of about 15 years." By that time India's labour force is expected
to grow by 65 million, which "alone is more than three and a half
times the present level of employment in the entire organised sector,
including both public and private sectors." In making these pro
jections the planners omitted from their calculations those under the
age of 15 who were shown as workers in the 1971 census, as "it has
been assumed that child labour will be abolished." Malaysia notes
that a rapidly increasing working-age population is already placing
a heavy burden on the economy, and expects that the high rate of growth
in this cohort will continue through the 1970s.
Eleven of the 18 Latin American and Caribbean countries provide
projections of working-age populations in their plans (see Table 4).
Barbados expresses concern that its increasing working-age population
will not continue to be absorbed in agriculture, and deplores the
lack of capital and skills that would "permit sufficient alternative
employment in other sectors. The situation is made more difficult by
the small size of the population base, which acts as a brake on in
dustrial development." Thus Barbados sees its population as at once
too large and too small. Peru gives a projection of the "economically
active population," but it is unclear whether this represents the pro
jected employed population only or whether it also includes those who
participate in the market economy but are not formally employed, or
whether the figures are based on the projection of working-age
population.
32
CHAPTER TWO
POPULATION PROBLEMS RECOGNIZED BY DEVELOPMENT PLANNERS
Ten types of population problems are discussed in this study. The
term is defined here as any current or future situation that is view
ed by planners as a problem and whose causes are recognized in the
plan as having some major demographic components. The objective,
then, is to determine the perception of the development planners
rather than to determine whether in fact the country has a popula
tion problem.
Several necessary qualifications arise from this definition.
Some plans directly refer to a demographic situation as a problem
or discuss the problematic implications of the situation. For ex
ample, a high dependency ratio or a rapidly increasing school-age
population may be described as a strain on resources or a burden on
the labour force or a hindrance to educational goals. Such a refer
ence is considered an indication that the planners have recognized a
33
population problem. A demographic situation discussed objectively
in a plan without any such reference is not classified as a pro
blem unless the overall thrust of the plan’s text implies recognition
of a problem. Such judgments inevitably involve a subjective factor,
but the need for them has arisen in only a few cases, and any errors
could not have significantly overstated the level of problem percep
tion. The possibility also exists, of course, that some planners
have perceived certain situations as population problems but for
some reason have intentionally or unintentionally not so described
them in the plans.
Another qualification concerns the treatment of situations that
have been recognized as problems but have not been clearly recognized
as population problems. Obviously the problems dealt with by devel
opment planners are complex in causes and consequences. The causes
themselves are complex and are perceived in various ways according to
one’s ideology, training, interests, and experience. What may seem
to some to be unemployment caused by population growth is likely to
be perceived by others as the surplus labour assumed to be inherent
in a capitalist society or, more commonly, as a shortage of jobs
rather than an excess of people. Thus in this study a situation is
classified as a population problem only when the development plan it
self makes a causal link between population growth or age structure
and a social or economic problem, or if a population component is
mentioned explicitly as one of several factors contributing direct
ly to a social or economic problem.
Shortages Perspective
One of the most important advantages of medium- and long-range plans

34
over short-term plans is that they permit .long-term trends to emerge
more clearly, and a broader perspective on various problems may be
gained. If it is estimated, for example, that x per cent of a
country*s population is presently without adequate housing, and that
some very large number of housing units will have to be built within
the next five years merely to keep that percentage from increasing,
one may easily conclude that the problem does not reside wholly in
a laggard construction industry. Yet many such social problems dis
cussed in medium-range development plans are still perceived as the
results of shortages — shortages of jobs, schools, doctors, and so
on. There are indeed shortages, but the reasons for them are often
not fully examined or related to needs created by a growing popula
tion, even over the period covered by the plan. Why should this be,
if, as has been said, medium-range plans provide perspective on emerg
ing trends? The answer seems to lie primarily in population projec
tions or the lack of them. When population projections are lacking
or inadequate, it is all too easy to restrict one*s view of a short
age of houses, say, to the obvious reasons — lack of money to pay
for them, lack of jobs that would provide that money, lack of invest
ment that would provide those jobs, and so on. The role of rapid
population growth is less immediately evident. Countries that make
strong use of population projections, on the other hand, are less
inclined to view social problems as the results of shortages and
more likely to view them in a framework of multiple causes, in which
emerging trends, including those of population, are taken into
account.
35
Severity and Breadth of Problems
The perceived severity of population problems cannot be directly
measured by this classification system. It is partly for this rea
son that extensive excerpts from the plans are presented in Part
Two of Population and Planning in Developing Nations, A Review of
Sixty Development Plans for the 1970s. The plan excerpts are not
included in the thesis because they were too lengthy. The Bangladesh
plan, for example, not only recognizes a broad range of problems but
also perceives them as critical obstacles to development and devotes
much attention to them. A country's recognition of the severity of
a particular problem cannot be reflected in this study's classifica
tion system. However, we can make inferences about the breadth of
a country's problem recognition by examining the range of population
problems the country specifically recognizes (see Tables 5-8).
Ommission of Problems
What can be inferred from a plan that omits any mention of specific
or general population problems? It is not always easy to discover
whether the omission is meaningful or not. This study's systematic
content analysis of 10 types of problem, 8 demographic parameters,
and 16 policy dimensions provides a framework for evaluating a
particular omission. The breadth of problem recognition in a par
ticular country may be compared with the breadth of its demographic
data and population policies. Specific problems or omissions of
problems can in some cases be compared with corresponding demographic
parameters. For example, nonrecognition of a school-age population
problem gains in significance if it is accompanied by estimates of
current and future school-age population. But inferences are limited
36
when one is restricted to the contents of a plan.
Why might members of a planning commission omit mention of popu
lation problems from their national development plan?
1. They did not have a population problem.
2. They had a population problem but did not realize it.
3. The planning was not taken seriously — it was carried out
only for political or publicity reasons.
4. They realized there was a problem but either intentionally
or unintentionally failed to mention it because:
(a) They were powerless to resolve it by either influencing
the growth rate or accommodating to it.
(b) It would have been a political liability to do so.
(c) The situation was viewed as a social problem, and they
were more interested in planning for the growth of the
economic sectors.
(d) They were not reviewing problems, but outlining pro
grammes and budgets.
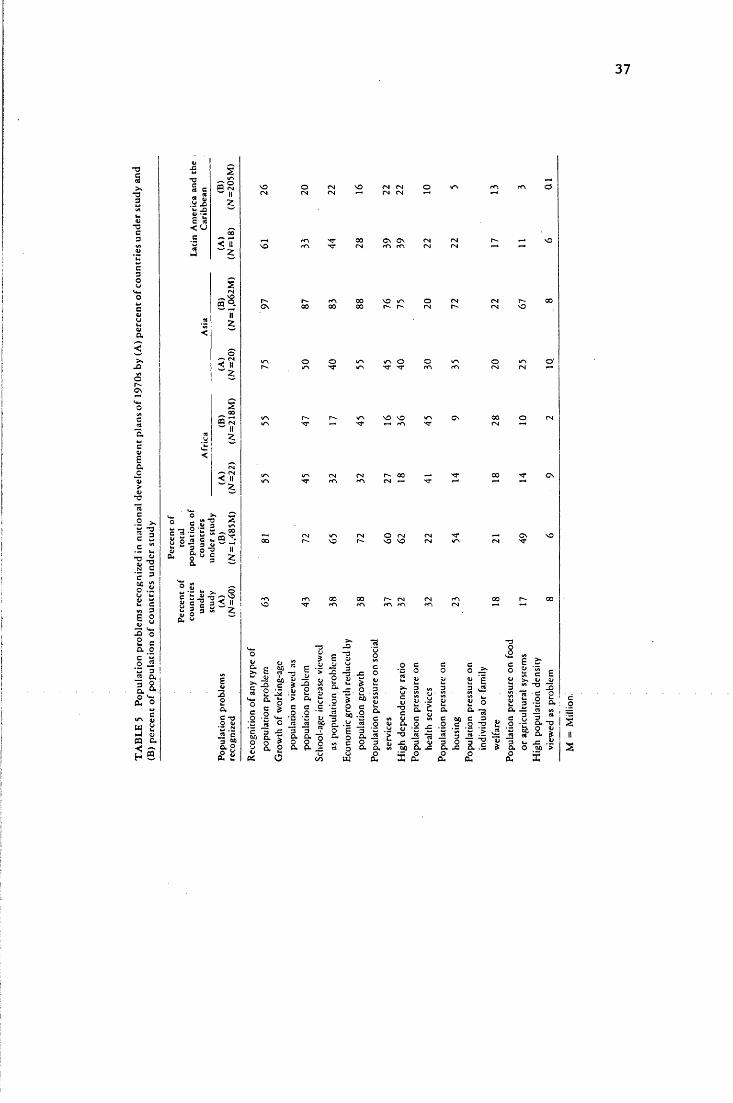
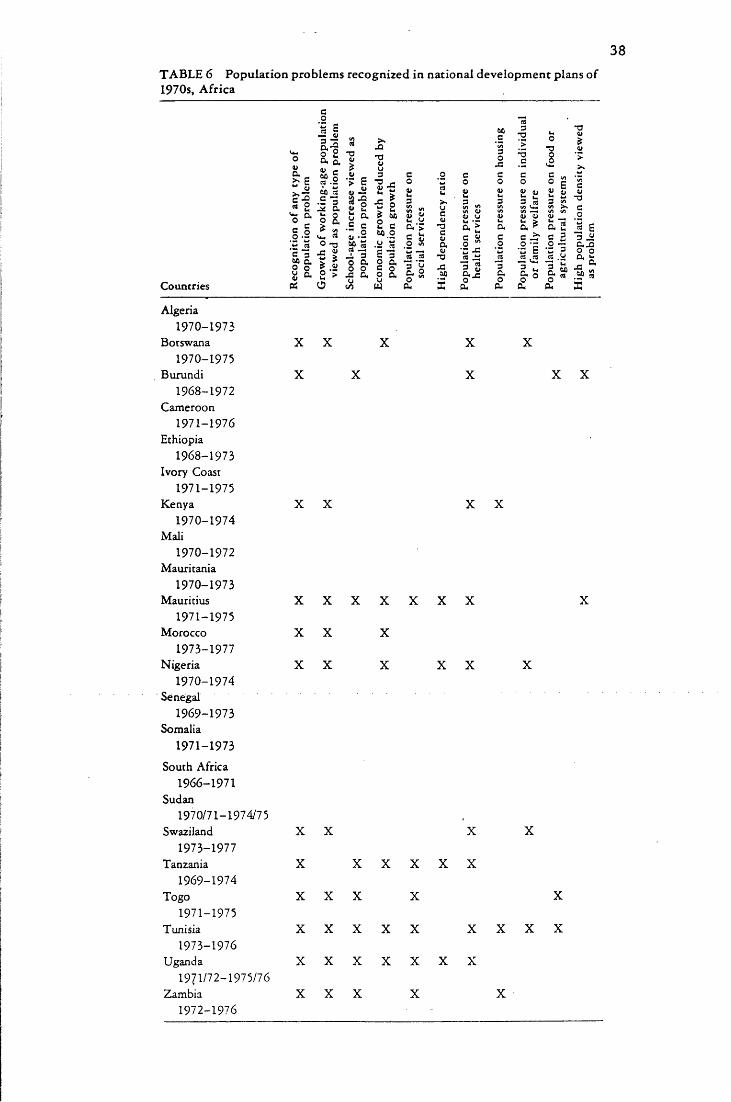
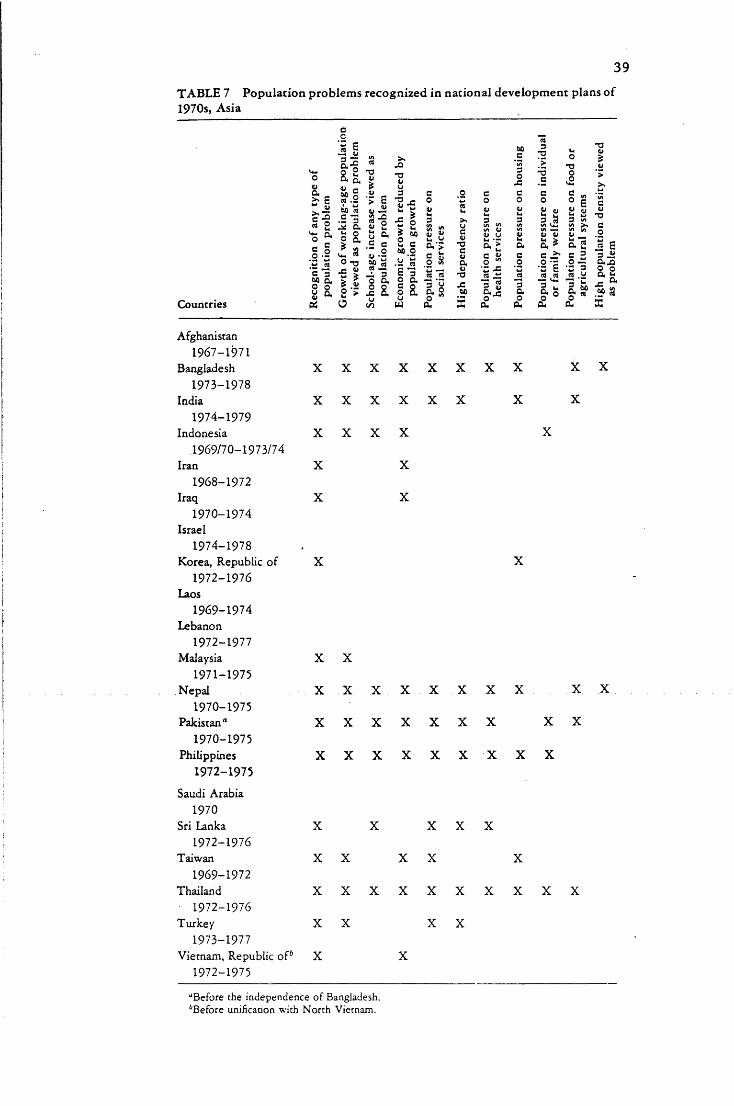
Recognition of Population Problems
Of the 60 development plans studied, 38 recognize some type of popu
lation problem (as defined in this study). These countries represent
81 per cent of the combined population of the countries under study.
The 12 African countries — 55 per cent of these studied — also repre
sent 55 per cent of the African population under study. The 15 Asian
countries — 75 per cent — represent 97 per cent of the Asian popu
lation under study. The 11 countries of Latin America and the
Caribbean form only 26 per cent of the population of that area under
study.
37
« c_ rt5 2C .os a< u
< ii “ 2
5IN«!*
72
< ll'"Z
^ IN< II
O X P„ »•:) *5S •- 3 "■'•3 .2 k " 002 - s “ a8 2 -
u N Ce 32.2 O uu cV) 3E 0c u U w3 'o 2 e a o‘w 3 !jj aa a.£ 'o
ci/N ^w 2*-i Ocq a 2 §
O -3 U C
3 < « a z
a£o va 'a•3 60a o
IN —
IN —
— ir IN — •
r- 00 —
7 "300 y% E ^ 2
P •£ -=* 3 C5 > -£ -3 .= oo
a. 'Z S 1-3. J; > Q- s 5t> — *4 ' u
■§ I
** 2 2 E
o •- n- -a -a•a s 0 « .2e a r l 3 n a ;; o. aP o 5
8 EJ2 o
Ojm « q Cl. a,
</» a; a> aU 4;g It> -S.
&o co a -a
2 "2 5 >£ S.
"3 -2 3 JH :41 3 O 3 c ^ -c a -c a .= S o oa. cu
E &
g «2 E £2 3-2 5.Q. — rt v)- 3 -q ai
JJ o -r 0.3S ■: i 5 "2 # K O' >
a ooa.
Million.
TA B LE 6 Population problems recognized in national development plans of1970s, A frica
Countries
w E4)
« S^ O,o
1 1 •tj 13 e *s60 Q.o o u a4> **
co£ E
-P 4)
a-g2 2 a, a« etc « .S 3as a * «o -3 J3 u
I *$ O ° '>o
•- p> c4»% o 2 <- S aS = - .2SP5_i 3 o a o o ja ao
3 C-a - oSj «■5 2 3? (SC <D «o -In CW> O
C Oa ‘> c o
C 32 a 5 ° 8 a w
.2"5D- Oo " 0*
C ^o “w J= « —1 2a
6C_cv?3OJ5CO
aoa
3-o o-o
SJ 4J 2 u 3 .«t> £• V2 *■* ~o
to to3tO >v
O Os ,*c 2? ■z ScS ,« 3 ua sa
*> _ a 2'Z 3 « .2a “ o « a
c_o
is E3 Jia ja o oa aJS(sc 5
2
Algeria1970-1973
Botswana1970-1975
Burundi1968-1972
Cameroon1971-1976
Ethiopia1968-1973
Ivory Coast1971-1975
Kenya1970-1974
Mali1970-1972
Mauritania1970-1973
Mauritius1971-1975
Morocco1973-1977
Nigeria1970-1974
Senegal1969-1973
Somalia1971-1973
South Africa 1966-1971
Sudan1970/71-1974/75
Swaziland1973-1977
Tanzania1969-1974
Togo1971-1975
Tunisia1973-1976
Uganda1971/72-1975/76
Zambia1972-1976
X X X
X X
X X
X
X
X
X X
X X
X X X X X X X
X X X
X X X X X X
X
X X X X
X X X X X X
X X X X X
x x x x x x x x x
X X X X X X X
X X X X X
39TA B LE 7 Population problems recognized in national development plans of1970s, Asia
Countries
I I s I S 1D.-S * T5 <U
; 1 I 1 I :u ai _ > o ry^ - M £ .2 ~ 3 = 2 «= c c C w -S>- £ « .2 £ £ -a - o Z o o o o<U 4> 41 <0 4> 1 5l_ W 1-1 . u X>» 3 w u JJ u
3 3 <3 3VJ (A Vta- V)
a. m S i _ 3 c>> E « . 2 > S ’3 _e o W *I/v w *5 rt»>.3 ^J2 S!3 * > ae-S .S : J 5 3« g - * a « 2 ; S %• S f t S g , S “ 28 » S -a 2 S Si 2 3 -2 „6 § a ^ o. > a a * a § « §o -2 < * . « « . = "".s C S « c « c c 2 3 —Wrt ®TD «> £ .2 « o. o ’" O 0 - - O ~ ft. .ftc-’ u - « u X 3 S £ w 3 O oC 3 - S > _ i 3 C 3 S c 3 T 3 cs ~ rt <a .« « .2 a £O o | . J i o g C o 3 ' 9 -C 3 S "3 | | 5, X J1u a g > x g . o S . a o « C.J a a 0 £ « £> 3
O <o w cu S o . cu cu o. EC
Afghanistan1967-1971
Bangladesh X X X1973-1978
India X X X1974-1979
Indonesia X X X1969/70-1973 /74
Iran X1968-1972
Iraq X1970-1974
Israel1974-1978
Korea, Republic o f X1972-1976
Laos1969-1974
Lebanon1972-1977
Malaysia X X1971-1975
Nepal X X X1970-1975
Pakistan a X X X1970-1975
Philippines X X X1972-1975
Saudi Arabia1970
Sri Lanka X X1972-1976
Taiwan X X1969-1972
Thailand X X X1972-1976
Turkey X X1973-1977
Vietnam, Republic o f6 X1972-1975
X X X X X X X
X X X X X
X X
X
X
X
X X X X X x X
X X X X X X
X X X X X X
X X X
X X X
X X X X X X X
X X
X
‘'Before the independence o f Bangladesh. ^Before unification with North Vietnam.
40TABLE 8 Population problems recognized in national development plans o f1970s, Latin Am erica and the Caribbean
coi sa ?
Countries
a ~ >» £
1 1 .t2*c *3O o ° a a* **
“ ItO Ac —
.U 3
£ 3O >o JSf 4) 2 >
o
HI —2 -QS P JB *■£ o* tc2 cto o
«E "3 2 a § a(Jw
y 412 oa >r- ^s uO </)
3to ^ </>
bfi ^-S -
*£ a o o 1,1Oh
C fo 1,1 'S -c
a Oh
3 3
c jT•S e
JSI s
■oov2
0 E a «3 « <n >.(S)^ _S.2S J '£ 3 * .E■0 lHa »£Oh
■OC_o
J sZs « a Z o oa a
-e , .sp a
Argentina1974-1977
Barbados1969-1972
Brazil1972-1974
Chile1971-1976
Colombia
1970-1973 Costa Rica
1974Dominican Republic
1968-1985 El Salvador
1973-1977 Guatemala
1971-1975 Guyana
1972-1976 Haiti
1970-1971Panama
1970-1980 Paraguay
1971-1975 Peru
1971-1975
Puerto Rico1969-1972
Trinidad and Tobago
1969-1973 Uruguay
1973-1977 Venezuela
1970-1974
X X
X
X X
X X X
X X X
X X
X X X X
X X
X X
X X
X X X X
X X
X X
X X X
X
X X X
X X X
X
X X X X X X
X X X X X X
X
“Argentina described its population growth rate as too low.
41
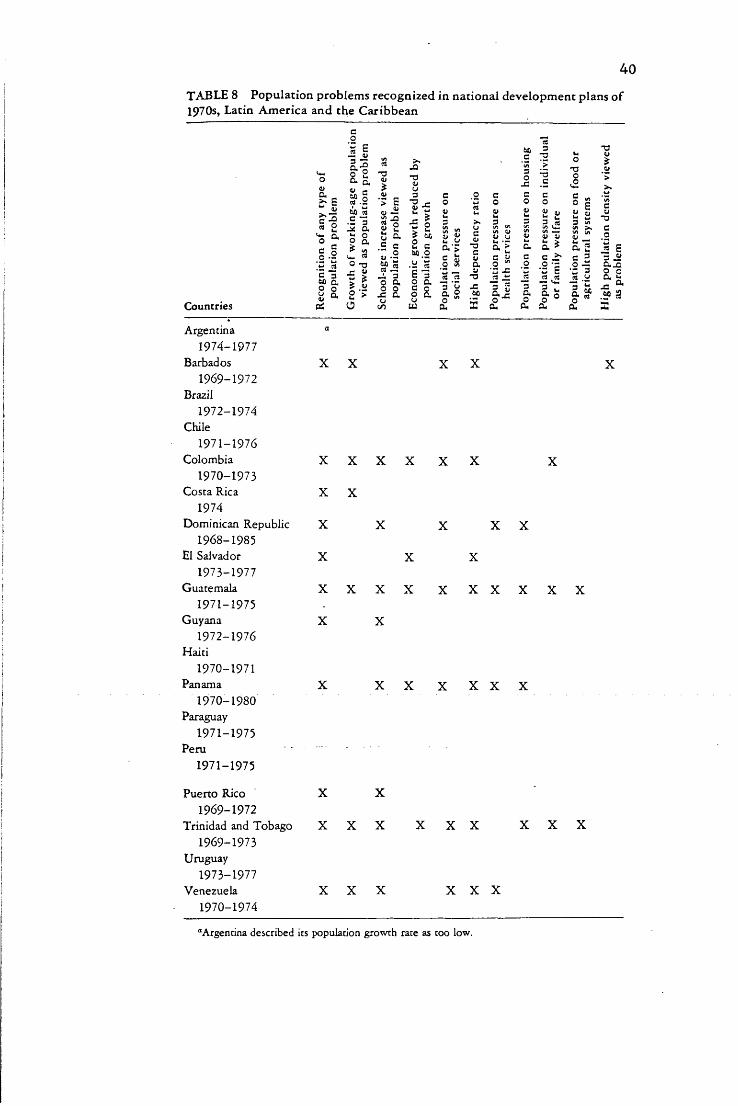
The ten population problems, plus a recognition of "any type of
population problem," are listed in Tables 5-8.
Growth of Working-Age Population Viewed as a Population Problem
Almost all of the countries studied recognize unemployment as a pro
blem — but how is the role of population growth perceived in relation
to unemployment? An attempt has been made to assess this perception,
to note whether or not the development plan drew a direct causal
link between the growth of population and unemployment. Unemployment
in this study is classified as a population problem only if a national
plan assesses population growth as one of its component causes.
If, for example, a plan merely discusses unemployment in relation
to surplus labour or jobs that could be created, those planners do
not appear to perceive a population problem.
Twenty-six countries, or 43 per cent of the countries studied,
cite rapid population growth as a component of their unemployment
problems 45 per cent of the African countries (see Table 6), 50
per cent of the Asian countries (see Table 7), and 33 per cent of
the countries of Latin America and the Caribbean (see Table 8).
In most of the countries under study the level of unemployment
and underemployment is high and growing. Planning for full employ
ment has not been undertaken, although some special projects for
increasing it have been planned. The establishment of employment
targets is seldom based on a projection of labour-force growth.
The plans usually emphasize production rather than employment.
Ten African countries recognize working-age population growth
as a population problem. Botswana states flatly, "The analysis of
the labour force and the projected expansion in wage employment •..
42
indicates clearly that, even on the most optimistic assumptions con
cerning long-term economic growth, the percentage of the labour force
in wage employment will continue to fall unless the rate of growth of
population is curbed significantly." Togo links its estimates of
the working-age population with unemployment, and although the
population components of unemployment are not discussed further, the
plan does state that they make visible one of "the most important
problems in Togo."
Among the ten Asian countries that view working-age population
growth as a population problem, Bangladesh and Pakistan list it as
one of a number of problems that they propose to attack vigorously
by an array of population strategies, while Indonesia compares the
growth rate with the rate of economic expansion and is concerned
about the unequal distribution of the working-age population, which
it links with "the limited absorption capacity of the available culti
vated land," which "causes a population increase in towns which cannot
offer jobs so that the underemployment in rural areas extends to
urban areas where it becomes full unemployment ...."
Colombia, one of six countries of Latin America and the Caribbean
that recognize this problem, explores the impact of population growth
on employment and the economy, which it views as increasingly serious.
Since a decline in fertility can have no effect on the labour market
for 15 years, Colombia proposes to implement its population policy
with strategies to reduce urbanization as well as fertility. The
impact of working-age population on employment is the only population
problem recognized in Costa Rica's plan.

43
School-Age Increase Viewed as a Population Problem
The changing age distribution of a population affects both the demand
for education and the capacity of a society to supply the demand.
The age composition of a population is usually predominantly deter
mined by past fertility rather than past mortality. Most of the
countries in this study have had high levels of fertility, which have
resulted in extremely young age structures. In addition, infant
mortality rates are declining in many of these countries, contribut
ing further to young age structures. Under these conditions both
the absolute size and the proportion of the population in the school-
age groups are increasing dramatically. Even if a moderate decline
in fertility is assumed, the number of school-age children in the
Third World will nearly triple by the year 2000. Just to maintain
the present unsatisfactory standards of education, the number of
teachers and schools must be tripled.
At the same time, there is a declining proportion of the popula
tion in the working-age cohorts that must support the ever-increasing
young populations educational needs. Thus societal capacity for
even maintaining past per-student educational expenditure is reduced.
The increasing school-age population is recognized as a problem
by only 23 of the 60 countries studied or 38 per cent. Thirty-two
per cent of the African countries studied (see Table 6), 40 per cent
of the Asian countries studied (see Table 7), and 44 per cent of the
countries of Latin America and the Caribbean studied (see Table 8)
recognize such a problem. Although there is not much difference
in the percentage of countries in each region that recognize this
problem, about four-fifths of the combined populations of the coun
tries both of Africa and of Latin America and the Caribbean live in
44
nations that do not discuss the increasing school-age population in
their plans.
Six of the seven African countries and five of the six countries
of Latin America and the Caribbean that include projections of the
school-age population in their plans recognize the increasing school-
age population as a problem. Only 6 of the 14 Asian countries that
use such projections, however, discuss the problem of increasing
school-age populations.
Burundi, which has no policies or programmes designed to limit
fertility, proposes to deal with Mthe rapid increase of the primary
school-age population” by constructing 300 new classrooms. -Mauritius,
on the other hand, recognizes that "a high proportion of children in
the population means that a high proportion of public expenditure .
needs to be devoted simply to maintaining the level of social services,
in particular education •.. instead of being available for an improve
ment in those services, not least for the benefit of the children
themselves. A population policy for Mauritius must aim at reducing
fertility rates ... in order to improve the age structure of the
population .... To state the obvious, a population policy ... must
be concerned with the dynamics of population growth and not with the
absolute levels of population.” It is obvious to Mauritius but it
seems less clear to most of the other countries whose development
plans are explored in this study.
Nepal computes the number of children at the primary, middle,
and higher education levels in 1981 on the basis of its population
projections and states that ”if the estimated growth of population
were to take place ... it would be more and more difficult to fulfill
the increasing needs in the field of education.” Thailand's plan
45
notes that "since the birth rate cannot be instantly slowed down,
the number of students will greatly increase each year at every
educational level, while the budget for educational development will
not increase at the same rate. Under these circumstances, educa
tional development, both in quantity and quality, might not be
achieved as fast as planned."
The only population problem discussed in Puerto Rico*s plan
is the increase in the school-age population. Guatemala discusses
its rapidly increasing school-age population in detail, and recog
nizes that "school-age" does not necessarily mean "school-attending."
The sheer numbers of children under 15 "obligates the use of ele
vated proportions of family investment" for their care and "neces
sitates the employment of young children, restricting their neces
sary education, which is a decisive factor for social and economic
progress on a large scale."
Economic Growth Reduced by Population Growth
Twenty-three countries, 38 per cent of those studied, present state
ments to the effect that their economic growth has been reduced by
population growth. A few plans discuss intermediate variables to
explain how economic growth is influenced by population growth,
but most either simply observe that population growth reduces per
capita income or do not comment further on the relationships.
In most of these plans, the relationship between population and
the development process (excluding the demands upon governmental
services) is not treated at all. But in several plans a capital-
output ratio is introduced, and the investment needed to offset the
population growth's "deterrence" on per capita income is calculated.
46
For example, if the country's total, income is increasing at 6 per
cent per year, its population is increasing at 2 per cent per year,
and its marginal capital-output ratio is 3 to 1, then 6 per cent of
the total income must be invested each year just to maintain the
current level of per capita income. For every increase of 1 per
cent in per capita income, 3 per cent of the total national income
must be invested. This kind of analysis has serious deficiencies,
of course. A few plans go further to look at the effects of the age
structure on dependency and social overhead costs, and at ways in
which these effects influence the potential for higher investment
levels and more directly productive uses for that investment. Other
plans mention the pressure of population on resources, especially in
certain sectors such as agriculture.
Seven African countries discuss such problems in their plans
(see Table 6). They represent 32 per cent of the African countries
under study and 45 per cent of the population. Botswana's,plan
states that at the country's present stage of development, "economic
growth is in no way assisted by the rising population." Morocco
suggests a relationship between the need to reduce the population
growth rate and "matters of production" but does not elaborate.
Mauritius, as always, takes the large view. Stating flatly that the
island "has become overpopulated," the plan goes on: "The population
of Mauritius cannot be contained within the present structure of the
economy. A population policy cannot in this situation be a substi
tute for the structural changes that are needed in the economy; it
needs to be an integral part of a strategy for the economic and social
development of the people of Mauritius."
The 11 Asian countries (see Table 7) total 55 per cent of the
47
Asian countries studied but represent 88 per cent of the population.
Iran recognizes that its economic development has been adversely
affected by population growth and considers the implementation of a
family planning programmtfessential." The Philippine plan states that
considerable resources that could otherwise be used for direct devel
opment projects must be diverted for educational and other services
required by the country’s large dependent population.
In Latin America and the Caribbean area only five countries,
or 28 per cent of those studied in the region, mention the effects
of population growth on economic growth (see Table 8). These countries
represent only 16 per cent of the population of the area. Guatemala's
plan states, "Development is a slow process, difficult and expensive,
and the rapid increase in population constitutes one of the most ser
ious obstacles."
Thus in most of these 23 plans, population growth is viewed as
a hindrance but not as an overwhelming obstacle to development.
Several plans, however — Bangladesh, India, Pakistan, the Philippines,
Thailand — view population growth as the critical obstacle to devel
opment. Not a single plan explicitly states that economic growth is
being reduced because population growth is too low. Argentina wants
a larger population, but that is because it has "frontier" regions
that it wants settled. Barbados, as we have seen, feels that its
population is at the same time too small aid too large — that is,
its high density does not permit continued absorption of the growing
labour force in agriculture, but at the same time the smallness of
its population is felt to act "as a brake on industrial development"
by limiting large-scale production. No arguments are found in any
other development plan in support of rapid population growth to pro-
48
mote economic development.
Population Pressure on Social Services
The increasing population, as well as the increase in the number of
children, is cited as a problem affecting the cost, adequacy, and
nature of government social and welfare services in 22 countries, or
37 per cent of those studied (see Table 5). The population pressure
from migration into urban areas, where such services are most often
provided, is also discussed in many plans. Plans including only
pressures from migration are not included in this classification,
however•
In many respects this category encompasses the other classifi
cations of health, education, and housing, but discussion of these
factors in a plan is not sufficient to qualify the plan for inclusion
here. A discussion of either other welfare programmesor/social ser
vices in general has been required for inclusion in this category.
The six African countries that mention population pressures on
social services in their development plans (see Table 6) represent 27
per cent of the African countries under study and 16 per cent of the
African population under study. Uganda's plan claims that if the
population growth rate were reduced (it does not say how much), the
government would be able to "increase, by about one-third, per capita
expenditure on the social services." Zambia says that the projected
high rate of population growth accentuates "the need for accelerat
ed social services development."
The nine Asian countries (see Table 7) account for 45 per cent
of the Asian countries under study and 76 per cent of the Asian popu
lation under study. Nepal, concerned about the density of population
49
in the Katmandu Valley, says that *'it will be more and more difficult
to arrange necessary social and economical infrastructure (such as
education, health, housing, culture and recreation) because of the
increase in population." Turkey states that its population growth
rate of 2.7 per cent "leads to a great amount of expenditure in ...
various social services."
The seven countries of Latin America and the Caribbean that ex
press concern about population pressure on social services represent
39 per cent of the area's countries under study but only 22 per cent
of their population. Colombia regards the expansion of social ser
vices in rural areas as essential as a means of drawing people from
the overcrowded cities and encouraging the present inhabitants to
remain. Trinidad and Tobago assert that population pressure on social
services is placing a "tremendous burden on Government recurrent
expenditure."
High Dependency Ratio
The dependency ratio is the ratio of the population considered in
eligible for productive activity to the population that is considered
to be in the prime working ages. The productive years are commonly
considered to be 15-65. Countries with the higheset levels of fertil
ity generally have the highest dependency ratios. The higher the de
pendency ratio, the greater the burden on society, although one of
the positive effects of a high dependency ratio may be a younger,
healthier, and more productive labour force.
Nineteen countries, or 32 per cent of those studied, recognize
high dependency ratios as problems in their development plans; these
countries account for 62 per cent of the combined population of the
50
countries under study.
The four African countries (see Table 6) account for 18 per
cent of the African countries under study but 36 per cent of the pop
ulation. While Nigeria recognizes that the "high youth-dependency
ratio is, of course, serious from the viewpoint of mobilizing domestic
saving and of growth-inducing capital formation,*' at the same time
it considers that it "offers an opportunity for innovations in social
organization, designed to harness the energies of the youth more pur
posefully for the development process." Tanzania considers it "very
good to increase our population, because our country is large and
there is plenty of unused land. But it is necessary to remember that'
the increasing numbers of children born every year will be babies
in arms, not workers .... It is obvious that just as the number of
our children is increasing, so-the burden on the adults — the work
ers — is increasing."
The eight Asian countries concerned about high dependency
ratios (see Table 7) account for 40 per cent of the Asian countries
under study but 75 per cent of the population. Bangladesh states
that if its high rate of population growth continues, "the percentage
of dependent population will further increase, aggravating the already
unfavourable population structure." Such a high dependency ratio is
not conducive to the growth of the economy, as it will neutralize
many of the gains obtained by the country's development efforts.
Thailand points out that "for every 100 Thais of working age the
number of dependents 15 years or under is as much as 89. This repre
sents a heavy burden and limits the improvement of living standards
for many large families."
The seven countries of Latin America and the Caribbean (see Table
51
8) comprise 39 per cent of the area's nations under study but only
22 per cent of their population. Venezuela notes that its popula
tion under 15 rose from 42 per cent in 1950 to 47 per cent in 1969,
while the 15-59 age group fell from 54 per cent to 49 per cent.
"The proportion of adults will continue to decline, with a corres
ponding elevation in the coefficient of dependency and a decline
of the level of participation, which has diverse repercussions, social
and economic ...." Guatemala states that "the population under 15
years of age constitutes a serious problem in the short term, inde
pendent of future changes in fertility pattern, for now those al
ready b o m require education at all levels and assistance in the
area of health, including nutrition, for the next 15 years."
Population Pressure on Health Services
Many of the same factors that put pressure on education and social
services are mentioned in the plans as affecting health services.
It is often felt that rapid population growth, increased aspirations
for medical services, and urbanization ensure the failure of current
medical facilities to meet the demand for them. Some countries re
cognize that their health services need to be greatly expanded just
to maintain the current inadequate ratios of the services to popu
lation. They also recognize that high-fertility populations with
a large proportion of infants require increased medical facilities.
Public health measures implemented on a large scale are, of course,
credited for dramatic declines in mortality. Personal health ser
vices are viewed as inadequate and necessary, though costly.
Nineteen countries, or 32 per cent of those studied, mention
population pressures on health services in their development plans;
52
they represented only 22 per cent of the combined population under
study. The nine African countries (see Table 6) account for 41 per
cent of the African countries under study and represent 45 per cent
of the African population under study. Mauritius notes that free
or low-cost services provided by the government, in particular the
health agencies, "are an important part of the consumption of the
lower income groups, which in Mauritius include the great mass of
the population." A great increase in expenditures for these ser
vices "has resulted in the level of these services being barely main
tained.” Swaziland calculates that "if current fertility rates
remain unchanged, an average of 60 new beds in general hospitals
will have to be provided each year until the year 2000 to ensure that
the bedjpopulation ratio has not deteriorated by then .... Such
demands would require additional physical facilities and personnel
which are well beyond the reach of Swaziland's limited resources.”
The six Asian countries that express concern about population
pressure on health services (see Table 7) account for 30 per cent of
the Asian countries under study but only 20 per cent of the popul-
lation. Sri Lanka states that any further increase in the birth rate
would place "inordinate strains” on hospitals and other services, "and
in such a situation, it is only by a shift of investment from pro
ductive activities that it would be possible to maintain these ser
vices even at present levels." Pakistan, which in 1970 had only
one doctor for 6,000 persons, one hospital bed for about 3,000,
and one nurse for 1,500, says that it is committed to providing its
people with adequate health care, but that every gain it managers
to make in this area is "swallowed by the rapidly growing popula
tion."

53
The four countries of Latin America and the Caribbean that
mention population pressure on health services (see Table 8) repre
sent 22 per cent of the area's countries under study but only 10
per cent of the population. The Dominican Republic says that unless
family size is reduced in the poorest, neediest sectors, expenditures
for health services must increase, "reducing the amount available
for the economic development that these same families need."
Population Pressure on Housing
Although acute housing shortages are recognized in a number of plans,
housing data from precise studies are usually not available. A
number of plans discuss housing problems, but only 14 countries (23
per cent of those studied) assert in their plans that housing con
struction cannot keep up with the increase in population or the rate
of new family formations. Plans that discuss housing shortages
only in terms of migration and urbanization are not included in
this classification.
The three African countries (see Table 6) that recognize popu
lation pressure on housing as a problem represent 14 per cent of the
African countries under study and 9 per cent of the population.
Tunisia estimates that even if "old and unhealthy real estate" is
renovated, roughly 59,000 new housing units will still be required
each year to accommodate the population increase. Zambia declares,
"The overcrowding in urban areas in general and in the squatter areas
in particular is intensified by ... the high rate of demographic
growth."
The seven Asian countries that are concerned about population
pressure on housing (see Table 7) represent 35 per cent of the Asian
54
countries under study but 72 per cent of the population. South
Korea's plan states that although there were 50,000 more housing
units in the country in 1970 than in 1966, there was still an unfill
ed demand in 1970 for 1.2 million residences. This meant that 22
per cent of total housing demands were not being met. Korea's
planners blame the housing shortage on population growth, the dis
solution of the extended family system, urbanization, and the rising
costs of land and construction materials, in that order.
The four countries of Latin America and the Caribbean that ac
knowledge population pressure on housing (see Table 8) represent
22 per cent of the area's countries under study but only 5 per cent
of the population. Guatemala estimates that during the decade of
the 1970s its population growth will require a minimum of 320,000
new houses and as many as 403,000 if the growth rate is not reduced.
Trinidad and Tobago declare that housing construction cannot keep
up with population growth and the formation of new families.
Population Pressure on Individual or Family Welfare
Eleven plans (18 per cent) mention the effects of population groxjth
on either individual or family welfare; for example, health of moth
ers and children and distribution of scarce resources among members
of large families. Often these pressures are discussed in conjunction
with a rationale for family planning service. A number of other
countries indirectly imply population pressure on individual and
family standards of living in their discussions of other population
problems.
Four African countries (18 per cent of those under study) re
cognize population pressure on individual and family welfare (see
55
Table 6), Swaziland's planners, after discussing the ill effects
of population growth on employment and health services, state,
nperhaps even more significant, however, as far as the individual is
concerned, are the effects of such rapid rates of population growth
on the welfare of the family .... If current fertility rates are
not reduced, the number of children in the 0-14 age group will almost
treble by the end of the century. This situation can only have ser
ious detrimental effects on the health of mothers and children.
Maternal death rates are known to increase sharply as the number of
pregnancies goes beyond three, while the inadequate spacing of births,
itself a direct cause of nutritional deficiency in mothers, also
exposes their children to inadequate nutrition and care which may
permanently stunt their growth and development.”
Four Asian countries (20 per cent of those studied) express
concern about population pressure on individual and family welfare
(see Table 7). Indonesia's plan notes that the health and welfare
of families and their individual members have not yet reached "pro
per” levels, largely because families are too large to give their
members adequate clothing, health care, education, and living con
ditions in general. Thailand states that its high birth rate has a
harmful effect on living conditions and on the quality of the labour
force.
Three countries of Latin America and the Caribbean (17 per cent)
are equally concerned about this problem (see Table 8). Typical in
this regard is the plan of Trinidad and Tobago, which says that "it
has been found necessary to reduce considerably our rapid rate of
population growth" in keeping with the government's policy of rais
ing the standard of living of the entire population.
56
Population Pressure on Food or Agricultural Systems
One of the great shortcomings of development plans is the scanty
attention often paid to food and agricultural development. This
seems surprising in view of the near-famine conditions in some
countries. It is also unfortunate because the great majority of
people in the Third World live in rural areas, and agricultural pro
ductivity may well be the key to development in most nations. Too
often development planners emphasize the modern sectors and high-
prestige, capital-intensive manufacturing projects at the expense
of agriculture. Still less has been done on the complex relations
between agriculture and population.
Only ten countries, or 17 per cent of those studied, recognize
population pressures on food supplies or on agricultural systems in
their development plans. They do, however, represent almost half
(49 per cent) of the combined population under study. The three
African countries represent 14 per cent of the African countries
under study but only 10 per cent of the population. Burundi notes
that "the need of a growing population for space decreases the avail
able land for cultivation." Togo notes that "the rate of increase
of the production of cereals has been particularly slow and sometimes
below the rate of demographic growth." Tunisia also voices concern
about the pressure exerted by a growing population on food production.
Five Asian countries (25 per cent) mention this problem.
Bangladesh states that as population grows, more land is needed to
grow more food, and the country simply does not have enough land to
satisfy the competing demands being made on it by a rapidly in
creasing population. Thailand feels that rapid population growth
tends to reduce the average size of farms and thus slows the agri-

57
cultural development required to feed the additional mouths.
Only two of the countries of Latin America and the Caribbean
under study voice concern about this problem. Guatemala, which re
cognizes nine of the ten population problems dealt with here —
only three other countries, all of them in Asia, recognize as
many — mentions this one too. Trinidad and Tobago also discuss
"the need for a high rate of increase in the production of food*'
to feed their expanding population.
High Population Density Viewed as a Population Problem
This investigation has aimed to determine which plans perceive the
population density to the entire country as a problem. A number
of countries mention problems with urban or regional population den
sities, but these were excluded from the study. So, of course, was
the one plan (Argentina's) that expressed the view that the density
was too low.
The plans of only five countries, representing 8 per cent of
those studied and 6 per cent of the combined population under study,
recognize high population density as a problem. The two African
countries, Burundi and Mauritius, represent 9 per cent of the Afri
can countries under study but only 2 per cent of the population.
The Burundi plan calls its population density "exceptional for Africa."
Mauritius, a small island, discusses its high density in relation to
its size and to the fact that its agricultural technology, already
at a high level, cannot employ an ever-increasing labour force.
The two Asian countries, Bangladesh and Nepal, represent 10 per
cent of the Asian countries under study and 8 per cent of the popu
lation. The language of the Bangladesh plan leaves no doubt about
58
the seriousness with which population density is viewed there:
"The present 3 per cent growth rate of its population will double it
in 23 years and' treble it by the beginning of the next century.
Even a doubling of population on the limited land space of Bangla
desh is a disturbing prospect. A trebling of the population is
simply frightful to visualise." Nepal states that its overall pop
ulation density is 173.2 persons per square mile* In view of the
country's mountainous terrain, the amount of habitable land, and the
amount of land under cultivation, "the density of population seems
to be quite high," and the population density of the Katmandu
Valley is much higher. "It seems desirable," Nepal's planners
say, "to launch a programme resettling some people from the highly
densely populated region to the less densely populated regions ...."
In Latin America and the Caribbean, only Barbados clearly re
cognizes a density problem. Its high population density on such a
small amount of land, its planners say, will not permit the continu
ed absorption of the labour force in agriculture, and a lack of capital
and skills prevents its absorption elsewhere.
CHAPTER THREE
POPULATION POLICIES PROPOSED IN DEVELOPMENT PLANS
The population policies treated in this study are rather select:
They are limited to specific policies or programmes that are design
ed to reduce fertility and have at least partially a demographic
rationale. The study does not deal with policies involving migration
(internal or international) or with policies influencing mortality.
Policies that may have an unintended consequence upon fertility are
also excluded, but policies that may have indirect effects on fertil
ity are included if they have been proposed or discussed in the con
text of fertility reduction. A search was made for pronatalist
policies in development plans but only one was found, in the Argentine
plan.
Policies designed to accommodate to population growth have
been excluded from the study. Although they might rightfully be
regarded as population policies, they are too broad and too implicit
60
in other policies to be studied in this context. Accommodation
policies are in some ways reflected in the sections analyzing the
use of demographic data and the recognition of population problems.
This study is concerned only with population policies that
have been proposed in the national development plans; it does not
attempt to evaluate fully their actual implementation or demographic
effectivenss. In order to assess a country*s population policy fully,
one must study various other dimensions, many of which are outside
the planning process and the development plan. Many of the popula
tion policy programmes outlined in plans are never implemented;
on the other hand, some countries implement programmes not mentioned
in their development plans. Planning is an ongoing process and
plans are quickly outdated, especially in regard to population, since
so many countries have only recently adopted population policies.
Plans are also made obsolete when governments change; this has hap
pened to several of the plans considered in this study.
While a development plan may contain some hollow policy state
ments, it may also neglect to mention policies that a country in
fact pursues. A policy may be unstated because it is an obvious and
commonly accepted objective, such as lowering mortality; or the policy
may be intentionally unstated because it is politically divisive.I
Government officials may have every intention of extending family plan
ning programmes, for example, but may consider it wiser to talk only
of expanding maternal and child health services. As discussed in
the introduction, the reality of planning is often not very concrete;
yet, if the contents of national development plans are interpreted
very cautiously, they can yield important information about population
policy.
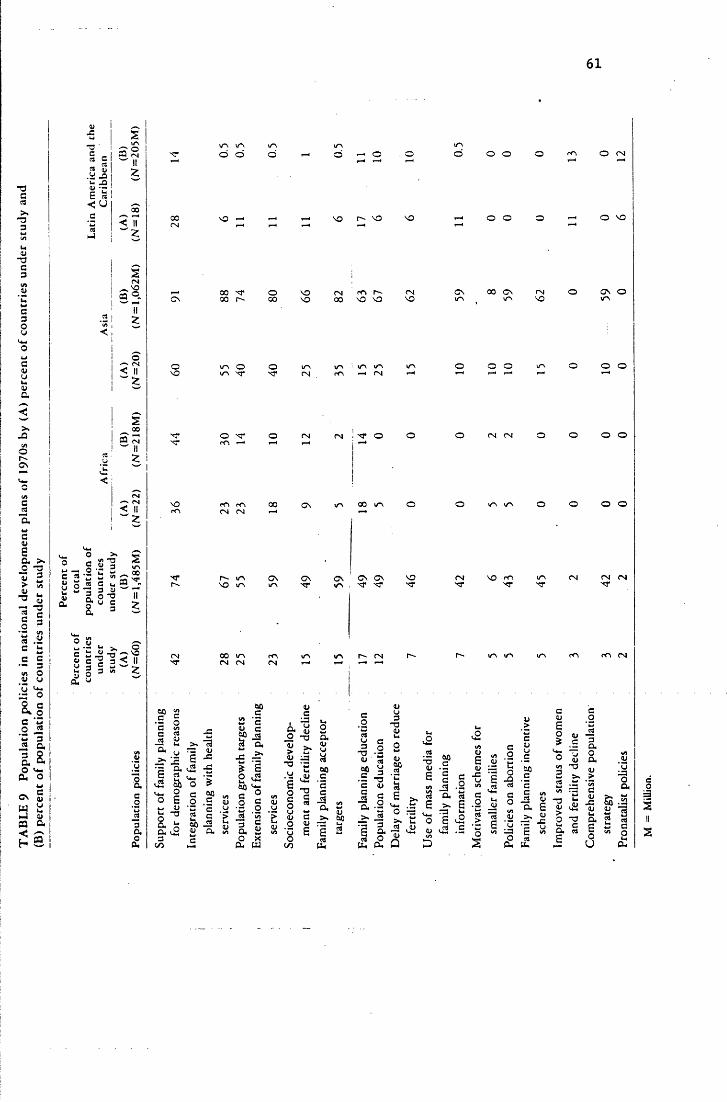
61
~acaSk*T33
-ac3
C.
>»J3
ci C a Hi
.a ^i- -Q «> ■- E S< u
^voS®IT2:
>r\ i/~\ O O
so so vO
O O
O O
O CN
O 'O
oVO
oo -cr oo r-
irs Ovr\
O00
O■vr
VOVO CN00 VO VO VOCV O
o orOi i—i i—i <n tN ■ o o o
C\
ci>6a >» o -3 "5J 3 > £■* S1 ’ S 3
^ <N< II ~ 2
~o"-=112 c s 'Z w “fl_l ^ m» **2 o JS § 5 S -T u R o -o IIau g £
c 3 O
_ u(1 Cm:E o O c Ok og I"5 3«a q,l aO vi_
a ow
_ C CV 4)w a1-4 1>pa a h £
8.V**O V)
.2CO<J
uC35 -n 2 2InV 0 3
a*
3aoa
rOrfs 00 CS ITS 00 WS O O IA uv O O O OtN tN —i —i
r~- ir\ VO U-S
00 ITS <N (N
CS~<T
CV CV•sr ^
voVT
vo rn vT
tN tN
ac J2 .S nC§ «— Ina ra
aa3CO
(OCSVu. >S 13
<uao%
uIE
rs u wE j= J3
a c2 -Crte&
<4N0 *
oUlaoO
Sc
.000c </>OJ c
o-a 5 ’c
c _Sw ob uu *3-2 li a a
ao cw "S
c .3 a >*
2 - c u O u'I K<u u
_ Xa a
i3a Ci
u o_o -a a,13> >. <uu<u 13-o 00uCi , <u cE 'Eo -a 3c cCTJoCi a(U a
.o 0)G E Eo cdCO a
3-o
3-a<uco
oaol—irt >» J2= 3E a 3 o
<u Ui ou O uiO Cm tow 2 00_c <UOi00Cj -E11 ED'£%
Eto
1 3J .2-CCJUI
E >N % a a cQt+N E >» EO rall CmO ra *->E c2 rt>cd Vi_* 1)V) ,<rt c OQ D s
co'£o-QclCo
oa
Cli li> Ec1)
o <ucCi Cmc 0 Cili00 </>3 “Oc >.rtcc (A c/l”a 4i£ -3li MliCfi>. u
x:>0 "3
E uV)
ua CC4ga
— Cw rt 1
<U VaE “ o “
U
oa
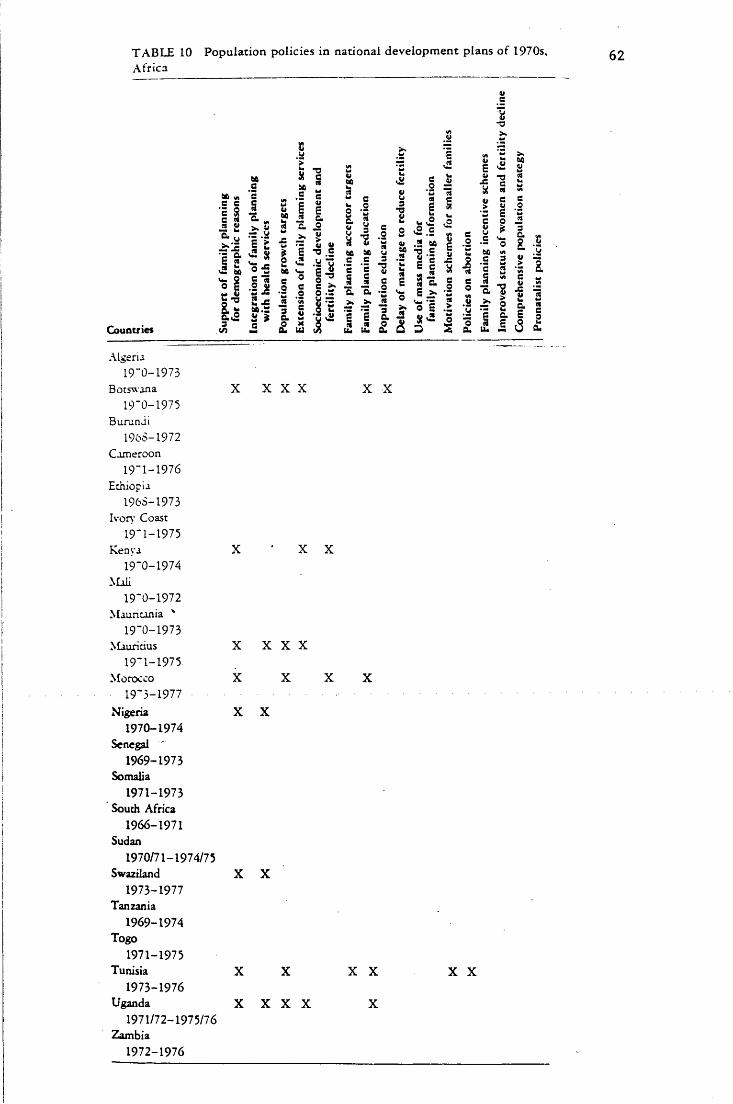
TAB LE 10 Population policies in national development plans o f 1970s,Africa
e c c S§ 3
.5 ca s 5 E a o
t* 3u —os a
S*v2 bO<4. OO SC u■ag.
Countries </>
1 £ g
o -s S *3-Si!2 xa »s
* § 2 <2 6A.1 I(8 (AI 8a w o x a u
4t U~a .c 8 8 S *
r I
ute3w cs -8a «« a c u -5 o & ^ et tc u•S .£ .2c e «I I oa a •§ >* >» ^ - l a
« p a a a
So *3 « £
s e* i 1 °<3
- s £ S.= We xs »* § >. -s “ «8 £ > v2 o 2
-o
c o8 *-S 'q66 v) 8. -SS .s 2 S 2 ■a e 2 *a a"a "2^ Is aI s
Algeria19~0—1973
Botswana
19*0-1975Burundi
1968-1972C am eroon
19~1—1976 Ethiopia
1968-1973 Ivory Coast
19“ 1 —197 5 Kenya
19“0—1974
Mali19*0 -1972
Mauritania v19“0—1973
Mauritius19“ 1—1975
Morocco 19*3-1977
Nigeria1970-1974
Senegal ""1969-1973
Somalia
1971-1973 South Africa
1966-1971Sudan
1970/71-1974/75Swaziland
1973-1977Tanzania
1969-1974Togo
1971-1975 Tunisia
1973-1976Uganda
1971/72-1975/76/Gambia
1972-1976
X X X X X
X X X
X X X X
X X X
X X
X X
X
X X X X
X X
X
X X
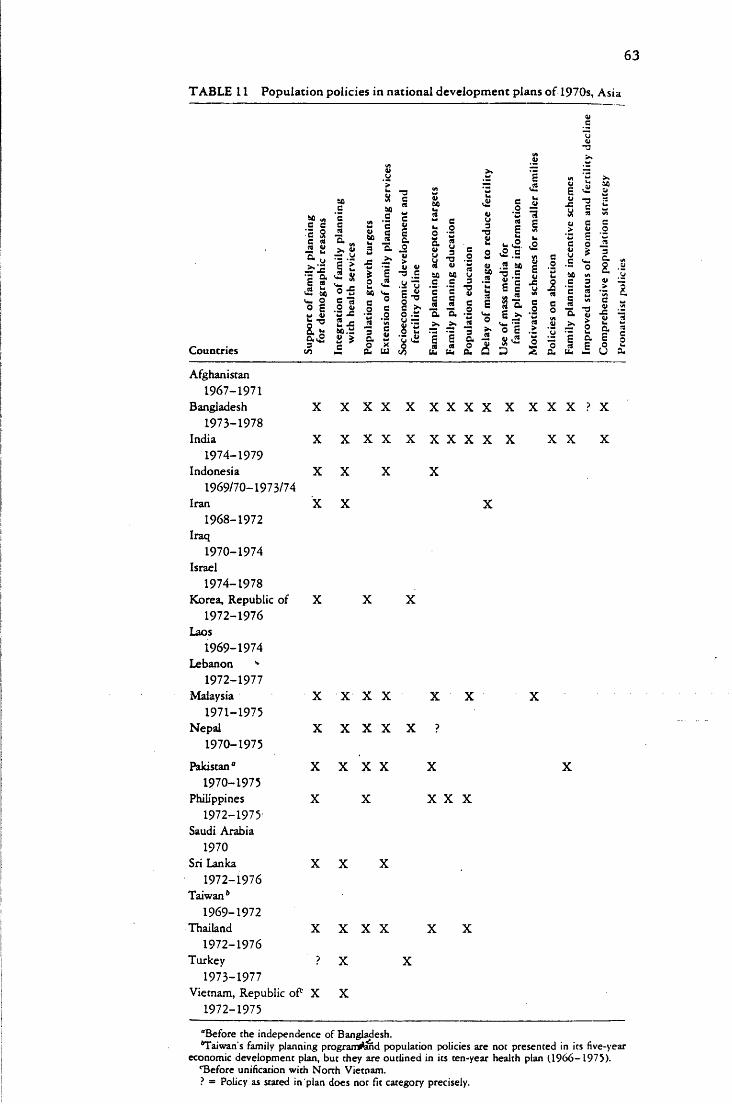
63
TA B LE 11 Population policies in national development plans o f 1970s, Asia
e c ■c S e «i 2“■ <j — jC ‘e ato'*■ 2 o gy O‘ "O
2 a. oj= — >
8.Countries Hto
S'*• i-o -gS "3O 41y J5 40.“ 2 * e
3aoeu
41 U•3 .£. 2 "u P v§ £ <J —
v ..x S '2U
C3w eo -2o. 2u s e8 -o .2a « sit) 60 U C C 3
’5 C§ 3 Ca a .2 J£* •£* —1 ! | a a a
3■avo v£ c
WM "fu C
E 1
« ° ■5 2 3
- '5 «••s 2 .2 *'3 .2O da a
1 § « w>C C4) OP '3 o J2<! 2. ® £w 2M C w-3 « .2£ -S 22 S- 2a S §c o uJs u a
Afghanistan1967-1971
Bangladesh1973-1978
India1974-1979
Indonesia1969/70-1973/74
Iran1968-1972
Iraq1970-1974
Israel1974-1978
Korea Republic of1972-1976
Laos1969-1974
Lebanon v1972-1977
Malaysia1971-1975
Nepal1970-1975
X X X X X X X X X X X X X P X
X X X X X X X X X X X X X
X X X X
X X X
X X X X X
X X X X X ?
X
Pakistan0 1970-1975
Philippines
1972-1975 Saudi Arabia
1970 Sri Lanka
1972-1976 Taiwan6
1969-1972 Thailand
1972-1976 Turkey
1973-1977Vietnam, Republic oP X X
1972-1975
X X X X
X X
X X X
X
X X X
X X X X
X X
X
“Before the independence of Bangladesh.Taiwan's family planning progranrfand population policies are not presented in its five-year
economic development plan, but they are outlined in its ten-year health plan (1966-1975). 'Before unification with North Vietnam.? = Policy as stated in plan does not fit category precisely.
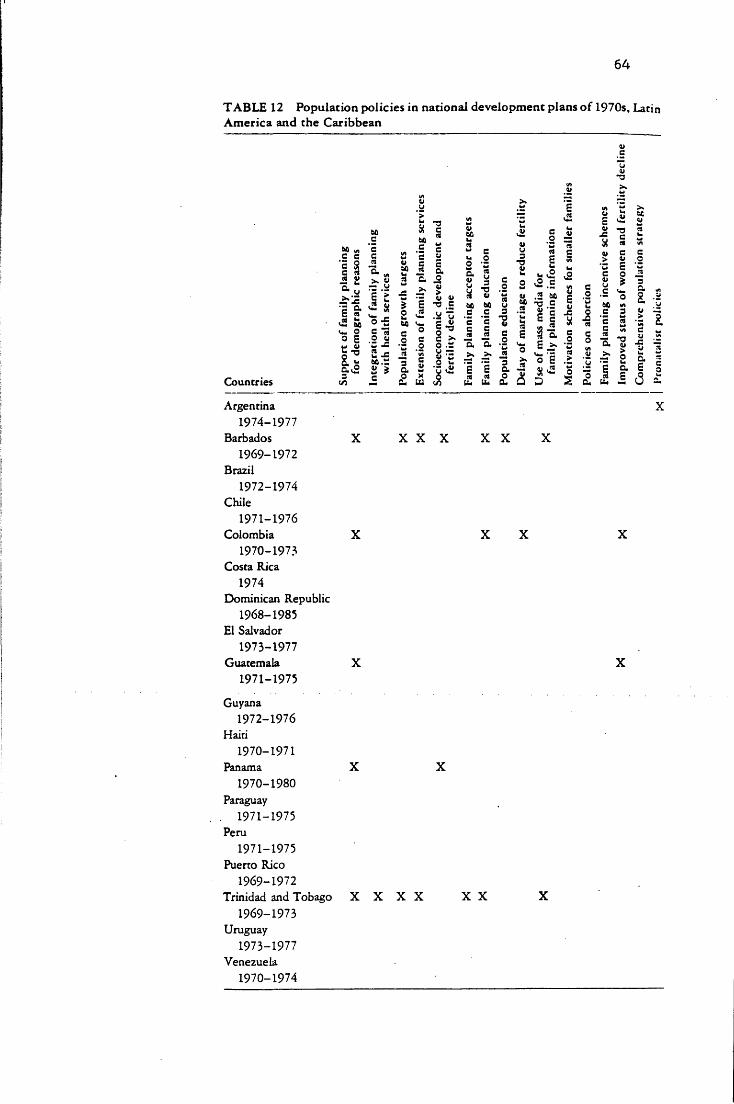
64
T A B LE 12 Population policies in national development plans o f 1970s, LatinAmerica and the Caribbean
uV■o
n uu vh« = «C M) u o — (,c s l 2 I I ! g - * =c 2 - £, S e 2 «c 3 a u, 2 l.2 & S. ?»— Ji >• 2 £■ — g 3£•- 1 > -5 •■= E v S “8 ■§ u ,S u c .2 •“ *o 2 s
•*= H <2 v £ E ^ c to to S ^ .£ g s .yitSi I * -si •§ 1 4 i I H l l 8 11a t -i| ! 11 S Is 1 8 i s I aa 1 .13 § = * & I i s 1*8 §i-S|-sw « o o — a a •- >*. 2 >> ‘w a u _o"° 2 j j 2'| 8=5 * .3 ° ^ p 5 « ^ o g, Ss* a s IJ B i S. 4 51 S £ I a I §
Countries <2 2 £ u JS i ! £ £ S 3 J £ £ i U 1Argentina X
1974-1977Barbados X X X X X X X
1969-1972 Brazil
1972-1974 Chile
1971-1976Colombia X X X X
1970-197?Costa Rica
1974Dominican Republic
1968-1985 El Salvador
1973-1977Guatemala X X
1971-1975
Guyana1972-1976
Haiti1970-1971
Panama X X1970-1980
Paraguay. 1971-1975Peru
1971-1975 Puerto Rico
1969-1972Trinidad and Tobago X X X X X X X
1969-1973 Uruguay
1973-1977 Venezuela
1970-1974
65
This study looks at 16 dimensions of policy found in national
development plans (see Tables 9-12) and discusses them in order of
their frequency. The policy classifications provide a framework for
a systematic review of the plans* contents. They are not meant to
imply approval or advocacy of any particular policy in all cases.
Support of Family Planning for Demographic Reasons
Of the countries that propose or support family planning programmes
in their national development plans, nearly all do so with the expres
sed intention of reducing the rate of population growth. This demo
graphic rationale is often listed among such other goals as family
well-being and maternal and child health, but every country studied
supports such a policy at least partly from a demographic point of
view. In all, the development plans of 25 of the 60 countries, or
42 per cent, support family planning for demographic reasons. These
countries represent 74 per cent of the combined population under study
but, of course, only a fraction of this population is actually covered
by such programmes.
In Africa, 8 of the 22 countries, or 36 per cent, support family
planning programmes for demographic reasons (see Table 10); they
represent 44 per cent of the combined African population under study.
The Botswana plan expresses the hope that, partly with the help of
the International Planned Parenthood Federation, a network of maternal
and child welfare clinics can be established at which family planning
advice will be available. The plan states that the country "can
ill afford to allow a population explosion to outstrip the economic
expansion." Kenya supports a family planning programme partly for
demographic reasons and partly in the context of rising unemployment;
66
plans of its programme expansion are outlined. Mauritius reports "a
dramatic decline in fertility" and supports expansion of its family
planning programme to reduce the island's fertility further. The
plan contains a full chapter on the country's demographic situation,
including details of programmatic implementation and population growth
targets. Morocco continues to support its family planning programme
for demographic reasons and presents a new population growth target.
The plan also discusses "the weaknesses of past efforts." Nigeria
proposes the integration of its family planning programme with the
health ministry as a part of its overall population policy. It also
announces that the government will establish a national population
council to oversee the country's family planning and population activ
ities and to coordinate external aid support for them. Swaziland
discusses at some length the problems caused by rapid population
growth and concludes that a family planning programme would be highly
beneficial; however, no details of implementation are presented. The
Tunisian plan outlines in detail the population growth targets of
Tunisia's family planning programme, including the number of births
to be averted by various future dates. Uganda supports family plan
ning services because of the social, economic, and health problems
arising from high birth rates. In addition, a population growth
target is given for the programme.
In Asia, 12 of the 20 countries, or 60 per cent, support family
planning programmes for demographic reasons in their plans (see Table
11); they represent 91 per cent of the combined Asian population under
study. The Bangladesh plan states in detail the country's plans for
implementing its family planning programme. sri Lanka urges continued
support for family planning but stresses that not nearly enough is
67
being done to come to grips with its severe population problems. The
Thai planners outline in some detail their government's strengthened
support of its family planning programme, and hope that it will
substantially reduce the rate of population growth over the plan's
duration. The South Vietnam plan, written before the end of the
Vietnam war, mentions only a proposal to establish a family planning
unit in every hospital, with the goal of limiting the rate of popula
tion growth to 3 per cent.
In Latin America and the Caribbean 5 of the 18 countries, or 28
per cent, support family planning programmes for demographic reasons
in their plans (see Table 12); they represent 14 per cent of the com
bined population of the 18 countries under study. The Barbados plan
gives continued support to family planning in the hope that the birth
rate will be reduced and the rate of population growth will be no
greater than 1 per cent. In the Colombian plan there is some ambi
guity about direct support of family planning. Although Colombia
does have a policy of reducing fertility for demographic reasons and
does urge that information and medical services be made available
in this connection, it does not outline programmatic details or use
the words "family planning." It does, however, outline a number of
family planning and "beyond family planning" measures to be taken.
The Guatemala plan discusses several of its population problems and
then identifies as its best alternative a family planning programme
formulated in light of traditional attitudes and with respect for
human life. No details of implementation are discussed. The Panama
plan recommends that family planning be included as a part of its
overall development strategy so that, over the long run, more funds
will be available for direct economic development in place of expendi

68
tures on health and education for a .larger population. The Trinidad
and Tobago plan presents programmatic details for family planning ser
vices that it is hoped will considerably reduce the rate of population
growth and halve the birth rate in a decade.
Integration of Family Planning With Health Services
A number of countries seeking to extend their provision of family
planning have emphasized its integration with the national health
system. This may or may not result in more effective or more utilized
service; but if such integration is emphasized in the plan, it has
been done at least partially with this end in mind. Since several
of the countries under study have already fully integrated their
family planning programmes with their health services, and some
countries that do not officially sponsor family planning programmes
nevertheless make family planning services available as a health
measure in government health facilities^
^conclusions about the residual countries cannot be based only
on the information given here. In all, 17 of the 60 countries, or
28 per cent, mention in their national plans the integration of family
planning with their health services; they represent 67 per cent of
the combined population under study.
Five of the 22 African countries, or 23 per cent, mention in
their plans the integration of family planning with health services
in some form (see Table 10); they represent 30 per cent of the African
population under study. Botswana urges the establishment of a net
work of maternal and child health (MCH) clinics at which family
planning advice would be available. Mauritius proposes that family
planning services be made available in 50 health clinics, 30 of which
69
are to be built during the plan period. Nigeria advocates the inte
gration of various voluntary family planning schemes with the health
and social welfare ministry. Swaziland stresses that family plan
ning services could be implemented most effectively by being inte
grated with the public health service, and especially with the regular
MCH clinics. Uganda advocates the gradual administrative take-over
of the family planning programme by the Ministry of Health and the
training and equipping of the health staff for this service.
Eleven of the 20 Asian countries, or 55 per cent, support this
integration in their plans (see Table 11), and they represent 88 per
cent of the Asian population under study. The Bangladesh plan em
phasizes that the Ministry of Health and Family Planning will supply
contraceptive materials and services through its multipurpose field-
workers. India aims at increasing the integration of family planning
services with those for general health, MCH, and nutrition. Indonesia
endorses government support for family planning activities by the MCH
clinics, but the integration of nongovernment programmes with the
health ministry is not mentioned in the plan. Iran proposes that 250
counseling and MCH centers be converted into family welfare centers,
where family planning services would be provided along with other
health services. Malaysia proposes the integration of the family
planning service with the rural health service system. Nepal says
its family planning efforts have been intensively operated within the
family planning and MCH project and that special family planning
training has been given to its regular health personnel. Pakistan
urges that whereever multipurpose rural health centers are available,
family planning workers will be induced to integrate the services.
The Sri Lanka plan states that family planning services are provided
70
in 40 per cent of the MCH clinics on the island but still in isola
tion from most of their antenatal and postnatal activities. The
plan asserts that provision is being made for family planning services
to be well integrated with MCH activities throughout the island. The
Thai plan proposes the integration of family planning services with
100 hospitals and 4,000 health clinics. Turkey supports family
planning in provincial health units as part of an integrated system
of health care. The South Vietnam plan, written before the end of
the war in Vietnam, proposes a family planning bureau at every hospit
al .
Of the 18 Latin American and Caribbean countries studied, only
one, Trinidad and Tobago, mentions this integration in its develop
ment plan. It proposes to establish a family planning unit within
the Ministry of Health. In addition to administering such activities,
the unit would create a climate within the health services conducive
to the provision of family planning services as an integral part of
the country’s health care.
Population Growth Targets
It is important for development objectives to be quantified lest they
become completely meaningless and impossible to evaluate; yet many
of the early attempts to quantify population growth targets proved
to be overly optimistic and highly impractical. Part of the problem
arose because the planners often set targets without examining the
assumptions (demographic as well as programmatic) that were necessary
for their achievement.
Fifteen of the countries studied here, or 25 per cent, present
some form of population growth target; they represent 55 per cent of
71
the combined population, but only because Asia so outweighs the
other regions. Although the targets are expressed in various para
meters — birth rates, rates of growth, gross reproduction rates,
birth averted, and so on — and over a range of time periods, all
of them represent reductions in growth rates. Argentina, the only
country trying to increase its growth rate, sets no specific target.
The plans of five African countries mention population growth
targets (see Table 10). They represent 23 per cent of the African
countries under study but only 14 per cent of the population. Botswana
has a goal of reducing its 3.0 per cent rate of growth to 2.5 per
cent per year averaged throughout the decade of the 1970s. It is
hoped that this can be accomplished through the establishment of a
network of MCH clinics that will provide family planning services and
also through a programme of family planning and population education.
The Mauritius plan establishes the goal of reducing the gross repro
duction rate from 1.9 in 1969 to 1.2 in 1980-1985. Morocco hopes
that its birth rate can be decreased from 49 per 1,000 in 1972 to 43
in 1977. Tunisia hopes for a reduction in its general fertility
rate from 162 in 1971 to 138 in 1981. The Ugandan plan presents the
goal of reducing the rate of growth to 3 per cent in 1979. The plan
suggest that a 10 per cent fertility decline would reduce the crude
birth rate to 45 per 1,000; with a crude death rate of 15 per 1,000,
the 3 per cent goal would be achieved.
In Asia, eight countries, or 40 per cent, have population growth
targets (see Table 11), and they represent 74 per cent of the popula
tion. Bangladesh sets the goal of a reduction in its rate of increase
from 3.0 per cent to 2.8 per cent during^the plan period, 1973-1978.
The projected goal is a decline in the crude birth rate from 47 to 43
72
per 1,000 along with a decline in the crude death rate from 17 to
15 per 1,000 by the end of the plan period. The Fifth India Draft
Plan discusses an earlier plan's goal of reducing the birth rate from
39 to 32 by the end of the Fourth Plan period and then to 25 in
another five to seven years. The planners expected that by the begin
ning of the Fifth Plan period (1974) the birth rate would be around
35, but that a drop to 25 by 1980-1981 was not feasible. The new
target is to lower the rate to 30 by the end of the Fifth Plan period
(1979) and then to 25 by 1983-1984. Contraceptive acceptor targets
are proposed in order to link programme efforts with these goals.
South Korea proposes to reduce its population growth rate from 1.8
per cent in 1970 to 1.5 per cent in 1976. Malaysia proposes to re
duce the rate of population growth from 3 per cent to 2 per cent by
1985. The specific goal during the five-year plan period is a reduc
tion in the birth rate from 35 per 1,000 to 32 by 1975. Malaysia
also links its contraceptive acceptor targets to this goal. Nepal
aims to reduce its birth rate from around 40 births per 1,000 by
bringing about social and economic changes, and through providing
family planning to at least 15 per cent of married couples. Pakistan
aims to reduce the crude birth rate from 45 to 40 during the plan
period (the plan was drawn up before the independence of Bangladesh).
The Philippine planners set a goal of 50,000 contraceptive acceptors
per month; if this goal is attained, they are reasonably confident
that it will reduce the rate of population growth from 3.1 to 2.0 per
cent per year. The objective of Thailand is to bring the growth rate
down from 3.0 to 2.5 per cent by the end of the plan period (1976).
Only two countries of Latin America and the.Caribbean, or 11 per
cent, have population growth targets (see Table 12); they represent

73
less than 1 per cent of the population. The objectives of the Barbados
plan are to bring the birth rate down from 22 in 1967 to no more than
20, and the rate of increase down to no more than 1 per cent per year.
Trinidad and Tobago aims to reduce the birth rate by 50 per cent over
a period of ten years. Contraceptive acceptor targets are also pre
sented in the plan.
Extension of Family Planning Services
Among the national plans that express support of family planning for
demographic reasons, a few place special emphasis on its extension
to a greater proportion of the public, to the population in the rural
areas, or to low-income groups.
In Africa, Botswana proposes to establish a network of MCH clinics
with family planning services. Kenya proposes to double the existing
130 family planning clinics (outside of Nairobi) and to more than
double to 700 the number of part-time family planning workers. The
plan*s proposed intent is to serve "most of the adult population."
Mauritius proposes family planning services for 50 health clinics;
30 of the clinics are to be built during the plan period, with 20
located in the towns and 30 in the rural areas. Tunisia proposes to
advertise its family planning programme more intensively but does
not indicate whether its family planning services will have to be
expanded if its campaign is successful in attracting acceptors. Uganda
proposes the use of mobile units to enable the programme to reach "all
areas of the country."
In Asia, Bangladesh proposes a broad extension of services and
also aims to reach women under the age of 30 as well as older women.
India also proposes a broad extension of services with emphasis on
74
younger as well as older women, taking into account the preferences
for different methods by women of different ages. A special effort
is to be made in the poorest urban areas and tribal areas through the
disadvantaged-area scheme. Indonesia proposes an emphasis in the urban
areas because facilities and personnel are available there and be
cause the motivation to accept the services is highest there. The
programme would first be instituted in the large cities and provincial
capitals, then in the district capitals, and finally, in the last few
years of the plan, in the rural villages. Malaysia discusses its re
cent integration of family planning with the rural health service in
selected areas; the planners hope that effective programmatic approaches
will be developed in these selected areas and then be used in the
remaining rural areas. Another objective is an increase in the number
of acceptors in the urban areas. The possibility of government sup
port for a programme in Sabah and Sarawak is also mentioned. Nepal
proposes the establishment of 260 family planning and MCH clinics;
60 such clinics were reportedly opened during the previous plan per
iod. It is hoped that these clinics will provide services to 15 per
cent of the married couples in the country. The Sri Lanka plan states
that the family planning activities have been "insignificant in re
lation to the magnitude of the problem,” and that only 40 per cent
of the MCH clinics provide family planning services. The plan pro
poses a special emphasis on the population in the lowest income groups.
Thailand proposes to aim its family planning programmes at the low-
income groups and to extend them to the rural areas through the health
stations.
In the Caribbean, Barbados plans to concentrate its efforts on
the lowest income groups and to attempt islandwide coverage through
75
four full-time and seven part-time clinics. Trinidad and Tobago
also has a goal of islandwide availability of family planning ser
vices.
Socioeconomic Development and Fertility Decline
It has been argued that, in the long run, development is the most im
portant way of reducing fertility. The aims of this section are to
determine which governments discuss socioeconomic development in its
relationship to a decline in fertility and to what extent it is as
sumed that development x ill itself result in fertility decline. Are
countries without explicit population policies assuming that develop
ment will reduce their fertility? Perhaps they are; over the long
run it is certainly not an unreasonable assumption. But out of 60
countries studied, 34 have no explicit policy to reduce fertility in
their plans, and of those, 22 recognize no population problems in
their plans (see Figure 5 ). Presumably these 22 countries are not
waiting exclusively for development to reduce their fertility; it is
possible, though, that they do not recognize any problems because
they anticipate that development will reduce their fertility or at
least enable them to accommodate to it.
Of the remaining 12 countries that did recognize a population
problem but had no policy in their plans, 4 have officially adopted
population policies and programmes outside the plan, thus not waiting
exclusively for development, and 4 others actually support family
planning programmes for nondemographic reasons. Thus only 4 remain
ing countries (Burundi, Togo, Zambia, and Guyana) recognize a popu
lation problem in their plans but have no specific policy to reduce
it or give support to an official family planning programme. None
76
of the 34 countries explicitly states that development would result
in a decline in fertility or a slower rate of population growth,
although they may tacitly assume that is would.
Of the 26 countries that do have a policy to reduce the rate of
population growth in their plans, only 9 explicitly state that develop
ment will result in a decline in fertility, though again some of the
others may tacitly assume so. Surprisingly, perhaps, only one plan
with a policy to reduce fertility explicitly argues that fertility
will decline sufficiently by itself as long as development progresses.
Every plan that explicitly assumes that its development will result
in declining fertility also gives support to a family planning pro
gramme, although only 8 countries do so for demographic reasons.
Thus, with the possible exception of Turkey, none of these countries
explicitly rejects all other population policies and then proposes
only development as an exclusive approach to reducing its rate of
population growth.
It is argued by some that a key to sustained fertility decline
is not merely economic growth but broad development that improves the
income equity of the poorest and often the most fertile popula
tions. In some plans governments do design development strategies '
with a real emphasis on improving the distributional aspects of
government programmes and improving the welfare of the rural poor.
But this is done, at least ostensibly, for its own sake, and any
presumed consequence of reduced fertility is not explicitly mentioned.
Kenya feels that the rising standard of living as well as its
population policies will, over the long run, result in some decline
in the rate of population growth. Morocco hopes its population
policies will accelerate what it calls a "normal decline" in fertility
77
due to "cultural progress," social changes, and attitudinal changes.
In Asia, Bangladesh discusses the linked roles of development
and fertility and proposes that a population study centre be estab
lished for the study of development efforts in relation to population
growth. The India draft plan suggests that, in addition to India's
population policies, urbanization and "socio-economic constraints”
may be contributing to the reported decline in fertility. South Korea
attributes its fall in fertility to a rise in income, to rapid urban
ization, to education, and "particularly to the family planning
programme." The Nepal plan emphasizes that the prerequisites for
reducing fertility are changes in the socioeconomic conditions, "cul
tural patterns, and aspirations of the common man." Another need is
a family planning programme that will consolidate the changes in
motivation brought about by earlier development. The Turkish plan
supports family planning as a health service but not ostensibly for
demographic reasons. It does explicitly state the expectation that
a decline in fertility will occur as a consequence of changes in
socioeconomic conditions.
In a discussion of its population policy the Barbados plan men
tions that need for general development, rising standards of living,
and increased education to reduce fertility; however, it calls these
measures slow, expensive, and difficult because "habits and tradi
tions of the people die hard.” The solution, it argues, must be
found in the whole strategy of economic and social development that
improves the standard of living, increases industrialization, expands
educational facilities, and improves the understanding of sociolog
ical development. It further argues that family planning programmes
should be included in this strategy.
78
Family Planning Acceptor Targets
This study attempts to identify countries that have proposed some sort
of family planning acceptor target; such a policy is important be
cause it ties in population growth targets with programme efforts.
Quantification of this sort allows one to examine the feasibility
and assumptions of a plan's population targets, and later to eval
uate the implementation of the programme. There is considerable
debate, however, about the validity of assessing the programme's
demographic effects and births averted merely by the analysis of
acceptor rates from service statistics.
In Africa, only Tunisia presents a contraceptive acceptor tar
get. The programme began in 1971 with 50,000 women, and a target
of 160,000 women is set for 1981. Tunisia hopes that by that time
some 300,000 births will have been averted.
Seven Asian countries (35 per cent) discuss acceptor targets
in their plans * In Bangladesh, which hopes to lower its birth rate
from 47 to 43 by 1978, the target population consists of women under
30, who contribute 82 per cent of all births. The draft of India's
Fifth Plan states that 15 million couples had been protected under
the family planning programme at the time the Fifth Plan was drawn
up, and expresses the hope that the number will be raised to 19
million by the end of the "current” (Fourth?) plan period. The
Fifth Plan (1974-1979) has targeted 18.0 million sterilizations,
5,9 million IUD insertions, and 8.8 million conventional contra
ceptive users. Indonesia expresses the hope that its policies will
help prevent 600,000-700,000 births by reaching a target of 3 mil
lion contraceptive acceptors. Malaysia plans to reduce its birth
rate from 35 to 32 by 1975; the family planning programme has been
79
given a five-year target of 600,000 new contraceptive acceptors.
The Pakistan plan outlines in detail the government*s present and
past goals for contraceptive acceptors and births averted; the tar
get for the Fourth Plan (1970-1975) was 9.6 million births averted.
It is indicated that the Third Plan (1965-1970) proposed 5 million
births averted, but that only 3.3 million were reportedly averted,
almost entirely by IUDs. The Philippine plan proposes a target of
50,000 contraceptive acceptors per month; it is hoped that this will
result in a drop in the population growth rate from 3.1 to 2.0 per
cent per year. Thailand anticipated that some 2.5 million family
planning acceptors could be reached during the plan period, 1972-
1976, and hoped that this would reduce the rate of growth from 3.0
to 2.5.
In Latin America and the Caribbean, only Trinidad and Tobago
sets a contraceptive acceptor target. In order to reduce the birth
rate by half in ten years, the island nation aims to provide free
contraceptives to more than 100,000 women per year.
Family Planning Education
Family planning education programmes are mentioned in the develop
ment plans of only ten of the countries under study. In most of these
plans the coverage is limited to one or two sentences and includes
no detailed plans for implementation.
In Africa, Botswana stresses that, without efforts to improve
knowledge of family planning while medical services are improved,
its rate of population growth may rise above 3 per cent. Morocco
supports the establishment of a family planning information campaign.
In Uganda, information on family planning is reported to be dissem-

80
inated by government publicity agencies and through ministry offices
in contact with the people in the rural areas. Tunisia recommends
that information about its family planning programme be more widely
disseminated among mothers during the postpartum period.
In Asia, the Bangladesh plan proposes that the Ministry of
Information and Broadcasting disseminate family planning informa
tion. It also suggests that such information be included in the
nutrition-agricultural extension education programmes of the Minis
tries of Agriculture and Rural Development and in the social work
programmes of the Ministries of Labour and Social Welfare. India's
draft plan proposes a number of family planning educational ap
proaches through individual and group contacts and audiovisual media.
In Latin America and the Caribbean, the Barbados plan mentions
a recent six-week family planning publicity and education drive,
and proposes to supply funds to its Family Planning Association for
a yearly education drive. Colombia proposes to make information
on family planning available and to raise the general educational
level "with the aim of developing greater parental responsibility."
The Trinidad and Tobago plan expresses the hope that the family
planning education programme will "orient the thinking of the popu
lation towards a more enlightened acceptance of our Family Planning
policies ...."
Population Education
Education about population issues, distinguished here from family
planning education, forms a part of the population policies of
seven development plan.
In Africa, the Botswana plan urges the education of the whole nation

81
about the "issues involved,” presumably both population issues and
family planning methods.
Bangladesh devotes more attention to population education than
any other Asian country. It urges a major educational campaign to
draw attention to the seriousness of population growth and proposes
to set up group discussions in villages, factories, schools, and
colleges. The plan urges political leaders, teachers, social workers,
and intellectuals to voice their concern about the high rate of growth.
It proposes that the Ministry of Education introduce population edu
cation into the curriculum at all levels. The Ministry of Information
and Broadcasting is to use radio, television, newspapers, posters,
and pamphlets to transmit information on both population problems
and methods of family planning. The Ministry of Labour and Social
Welfare is to stress population and family planning through rele
vant social work programmes. The plan expresses the hope that these
measures will at least bring about a climate that will permit the
"possiblity of more drastic measures, such as compulsory sterili
zation of either husband or wife after the second child, legalization
of abortion and the establishment of abortion clinics for performing
abortion free of cost, social measures to bring about women's eman
cipation, etc ”
The Indian draft plan only remarks that the population education
will be given greater emphasis in radio and other mass media. The
Malaysian plan mentions the recent government decision to introduce
population-related subject matter into the curricula of the public
schools. The Philippines proposes to integrate information on popu
lation and family planning with school curricula and to promote
understanding of the consequences of differing rates of population
82
growth upon family and national well-being. The national develop
ment plan of Thailand urges programmes to promote understanding of
the country's population problems, especially among the young. It
is suggested that these programmes be brought into being by curricu
lum changes in the areas of adult education, nursing, and midwifery,
in teacher training programmes, and in-some areas of higher education.
Barbados considers the solution of its population problems to lie
in, among other things, "expanded educational facilities and a deeper
understanding of our sociological development."
Delay of Marriage To Reduce Fertility
Delayed marriage and reduction in the proportion of the population
that does marry will obviously reduce overall fertility rates.
Policies designed to encourage changes in marriage patterns for
demographic reasons are discussed in only a very few national plans.
Tunisia considered raising the minimum legal age of marriage
for women from 17 years to 18 years in order to reduce fertility,
but the proposal was rejected, largely on the grounds that it would
create other social problems and hardships for the 30 per cent of
women who now marry as soon as they reach 17 and for the thousand or
so who marry below the current legal age (with special authorization)
each year. A further stated reason for the rejection of the proposal
was that it had been estimated that such a change in policy would
avert only 2,000 births a year (no method of estimation is discussed).
In a single sentence the Bangladesh plan mentions that measures
to promulgate a law raising the legal age of marriage will be under
taken by the relevant ministries during the plan period. The policy
is raised in the context of reducing the rate of population growth,

83
but no details of implementation are .given.
The Iranian planners deem as "essential ... the establishment
of relative equilibrium of the lower age groups in the population
during the Fourth Plan period by means of the strict enforcement
of Article 1041 of the Civil Law concerning the prohibition of mar
riage for women under 16 years of age."
The Colombian plan suggests that such measures as longer reten
tion in the educational system, youth movements, and voluntary or
obligatory social services for women should be taken to encourage
later marriages.
Use of Mass Media for Family Planning Information
Of the countries that propose family planning education, only four
discuss the use of mass media. The subject is often limited to one
or two sentences and is presented without detailed plans for imple
mentation. There is some ambiguity about whether an information
campaign (discussed under family planning education) may also imply
use of the mass media, but only countries that actually mention public
or mass media are included in this category. The distinction has been
made for the purpose of making visible what may be a qualitative
difference in the overall impact of family planning education.
No African."plans specify the use of the mass or public media for
family planning education, although it may have been implied in the
information campaigns proposed in Botswana, Morocco, Tunisia, and
Uganda.
In Asia, Bangladesh proposes the use of radio, television, news
papers, posters, and pamphlets in addition to the proposed educational
schemes of various ministries. The Indian draft plan proposes the

84
use of radio and television as part of the overall information
campaign.
In Latin America and the Caribbean only the Barbados plan and
the Trinidad and Tobago plan mention the use of radio broadcasts
to support family planning information campaigns.
Motivation Schemes for Smaller Families
While a number of countries have discussed publicity campaigns
and even monetary incentives to induce people to accept contrac-
ceptives or sterilization only three discuss policies designed either
to motivate people to desire smaller families or to penalize those
who have large families.
The Tunisian plan proposes an investigation into the impact
that could be achieved by a change in the family allowance system
that would discourage couples from having more than three children
by providing greater payments to small families and to single per
sons. The planners acknowledge that this scheme would not have a
significant demographic impact, but they feel that it would at
least bring consistency to family planning policies.
The Bangladesh plan urges the consideration of ’’progressively
increasing punitive measures against additional children after the
second child on all couples.” The possibility of restricting ration
cards to a maximum of two children per family is raised, as well
as the idea of prohibiting couples with more than two children from
using the fair-price shops. These measures are discussed more as
long-range possibilities than as immediate policy proposals. The
Malaysian plan proposes that maternity benefits for government work
ers be allowed for the first three children only.
85
There are many other intervention policies that a country might
propose, especially within the context of its national development
plan, but these issues have not been discussed in the development
plans under study here.
Policies On Abortion
Only three national plans discuss abortion;
Tunisia’s plan states that if the country is to reach its "demo
graphic objective," it must avert more births each year than can be
averted by its family planning effort. The "supplementary ’saving'
of births ... should reach 15,000 in 1981.” To reach this "supple
mentary" target, about 30,000 pregnancies must be interrupted by 1981.
At the time the plan was written, Tunisia’s laws authorized "social"
(nontherapeutic) abortions only for women who already had at least
five living children. The plan announced that this legislation would
be revised to permit realization of Tunisia's demographic objective.
The Bangladesh plan asserts that the legalization of abortion
is probably one of the best and most effective strategies for con
trolling population growth, and it declares that, "while keeping in
mind the question of social acceptability, all efforts must be made
to allow this method to play its proper role in controlling the growth
of population in Bangladesh."
The India draft plan mentions in only a single sentence India's
increased facilities for "medical termination of pregnancy”; the
plan asserts that abortion may have some demographic impact on the
national birth rate.
86
Family Planning Incentive Schemes
Various monetary incentive schemes for encouraging people to use
birth control have been proposed in the Third World, and a consid
erable debate has developed over their ethical and practical impli
cations. Only Bangladesh, India, and Pakistan, however, give any
attention to such incentives in their development plans. Bangladesh
stresses that its incentive scheme led to corruption and inflated
acceptance reporting, which distorted the perspective of the programme
and actually reduced its effectiveness by overburdening administra
tors with disbursement duties. The plan proposes a new system of
incentives for vasectomies, tubal ligations, and abortions, with
demographic impact forming its basis rather than acceptance of con
traceptives. The India draft plan supports the continuation of
"compensation** payments for sterilizations and IUD insertions. De
tails of the incentive scheme outlined in Pakistan's plan need not
be reviewed here because it is significantly outdated, having been
written before the independence of Bangladesh.
In addition to family planning incentive schemes designed for
the individual, Bangladesh and India propose schemes for incentives
on the community level. Bangladesh proposes a zonal award through
priority in funding for community facilities. India proposes a
"package of community incentives and awards." No elaboration is given
in either plan about implementation of such programmes.
Bangladesh apparently proposes to end incentive payments to
family planning workers (based on the number of recruits) because
they lead to corruption and programmatic ineffectiveness. India
proposes to discontinue incentive payments to doctors and family
planning workers gradually and to institute instead a community
87
awards system.
Improved Status of Women and Fertility Decline
Measures to improve the roles and status of women, for their own
sake or in connection with a presumed negative effect on fertility •
or for their inputs to development, are all but absent from the
national development plans reviewed in this study. Only the plans
of Colombia and Guatemala make any mention of women's roles in con
nection with reducing population growth*
The Colombian plan urges that its population policies be accom
panied by the creation of equal opportunities for women in all aspects
of life, including jobs traditionally reserved for men, equal salaries,
and increased social mobility. It also proposes that women be in
volved in social services on either an obligatory or a voluntary
basis. No details of implementation are given, however.
The Guatemalan plan, in one phrase of a single sentence, urges
that a policy of full employment include increased participation of
women. This statement is made at least partly in the context of
advocacy of some general type of population policy, but again no
details of implementation are given.
Bangladesh expresses the hope that its population education
campaign will create a climate in which a number of "drastic** mea
sures may someday be considered, among them compulsory steriliza
tion, legalized abortion, and "social measures to bring about women's
emancipation•"
Comprehensive Population Strategy
The plans of only two countries, Bangladesh and India, substantially
88
integrate their proposed population policies into a comprehensive
population strategy. Both countries attempt, in their plans, to use
other concurrent and reinforcing programmes, to use a broad range
of population policies, to work through a number of ministries and
departments, and to strive toward some consistency in related policies.
These sections of the plans offer only proposals for policy strat
egies; actual implementation is perhaps quite another story.
Most of the countries have made little effort to integrate com
prehensive population strategies with the various economic and social
sectors of their plans• Appendix D lists the countries according to
the number of policies proposed in their plans, to give some indi
cation of the breadth and comprehensiveness of their population
strategies.
Pronatalist Policies
Only one country of the 60 studied advocates a pronatalist policy in
its national development plans Argentina. This pronatalist and
proimmigration policy stems from Argentina's desire to populate its
frontier regions. Argentina feels that the population is in "regional
disequilibrium," and that the situation is made worse by migration
from the frontier regions to the urban areas. The plan's goal is
simply stated: "to increase births." No explanation of ways in
which more births may be encouraged is given. The plan also aims
at reducing mortality, increasing international immigration, de
creasing emigration, and promoting internal migration to the southern,
northeastern, and central provinces.
Brazil, a country that has expressed some pronatalist arguments
elsewhere, presents none in its national development plan. An early

89
plan of Ethiopia (1963-1967) described its rapid population growth
as "encouraging," but the more recent plan (1968-1973) does not dis
cuss any population problems or policies.
90
CHAPTER FOUR
AN ASSESSMENT OF THE POPULATION POLICIES AND PROGRAMMES OF PAKISTAN
AND BANGLADESH
The previous chapters have analyzed the population content
and policies in development plans alone. The following three chap
ters examine population concerns and development planning for Pak
istan and Bangladesh in broader contexts. Chapter Four examines
the population policies proposed in the plans, and the extent to
which they were implemented and effective. The administrative,
political, social, and economic realities affecting the population
programmes are briefly assessed.
The First Five Year Plan (1955-1960)
The First Five Year Plan (1955-1960) had all sorts of diffi
91
culties;^ it was not commissioned until 1955, some eight years
after independence; it was not published until December 1957 —
midway through the plan period; and not authenticated by the govern
ment until 1958. It was moralistic and libertarian in tone and
deliberately published many false estimates to make the develop
ment setting look more optimistic. The Plan itself never became 2operational; and the rest of the government's development efforts
during that period are generally regarded as a complete failure,
and the country's poor agricultural performance ensured that de
velopment targets would not be met.
Of course, the political setting for the First Plan could hard
ly have been worse. Prior to independence, the Muslim League was
so involved in its fight for partition and against Hindu dominance
^In April of 1958 Pakistan's prime minister stated: "I wasstaggered to learn that until a few days ago the Five-Year Plan had not even been authenticated by the Government for publication. With hardly two more years to go, the Plan continues to be regarded as routine departmental file, meant only for recording of prolific notes and cross-notes. Even a properly coordinated machinery for the implementation of the Plan has not yet been evolved.” (Quoted in Mushtaq Ahmad, Government and Politics in Pakistan, Pakistan Publishing House, Karachi, 1959, P* 6>8.)
2"The first five-year plan was commissioned in 1955, full eight years after independence. It did not receive formal approval of the government till 1957. During these years there was a total neglect of the primary sector of our economy — agriculture; we squandered the windfall surpluses of the Korean war boom in buying, on open General Licenses, European cosmetics and radiograms. It is not only that we failed to develop basic heavy industries. We did not even make any provisions for their future establishment; not even to the extent of starting to get our men trained in basic technologies. And, lastly, we completely neglected the exploitation of our minerals. Not even a survey was undertaken." (An address by Professor Abdus Salam, President, XIII Annual All Pakistan Science Conference, Dacca, 11 January 1961.)

92
that no social or political programmes were articulated (unlike
the Indian Congress), Islam was the answer. It was clearly in the
class interest of the Muslim League and those who came to power
not to make social change the issue. Following the death of Jinnah
in 1948, the break-up of the League, and the assassination of Ali
Khan in 1951, various groups competed not for principles and pro
grammes but openly for the spoils of corruption. Unabashed cor
ruption continued and became so pervasive that by the time the
First Plan was published, just prior to Ayub Khan's take-over,
Pakistan's Chief Minister admitted that "from top to bottom, there
was hardly a person who was not corrupt."^
The Pakistan Civil Service, maintaining some colonial tra
ditions, did manage to restore law and order from the near anarchy2conditions of independence. But more than law and order was need
ed for development and such a law and order mentality was inimical
to social change and land reform. The Pakistan Civil Service was
neither willing nor able to undertake serious social reforms or
^Pakistan Times, August 26, 1958.2"So far as law and order, administration of justice and col
lection of revenues...are concerned, the system continues to serve the country reasonably well. The efficiency of the system within this essential field invests it with a factitious appearance of adequacy for all purposes, including the new and supremely important task of planned development. This, on the one hand, creates a psychological atmosphere of complacence unfavourable to reform, and, on the other, increases the inertia of the system, its power of resisting change." Pakistan, National Planning Board, The First Five Year Plan, 1955-60, Karachi, December, 1957, Vol. I, p. 99.
93
properly plan for development.^- This arrangement of stability
without land and other egalitarian reforms was clearly in the in
terests of the wealthy classes whose ranks were now being swelled
by the corrupt civil service.
The First Plan gave substantial attention — an entire chap
ter — to the growth of the population and the labour force. Al
though the demographic estimates were not adequate, the Plan did
deliberately underestimate the rate of population growth so that2it would convey a more optimistic tone. Serious population pro
blems were recognized however ("Pakistan, with other countries in
Southern Asia, confronts a serious population problem"...Cthere
are3"...dangers of population growth outpacing growth in national
income.") A half million rupees were appropriated in the 1957-58
central budget to support private family planning programmes ("main
ly by private agencies, for carrying out family planning work in
a few big cities."). This policy was supported both for demogra-
According to the National Planning Board's Chief Economist in 1955s "It is...probable that the per capita income after 1954- 55 would be less than what it was about seven years ago. Inequalities in income have increased. A smaller national income, relative to the size of the population, more unequally distributed than before, implies that the living standards of the masses of the people which were already very low, have deteriorated still further." (M. L. Qureshi, Conference of the Pakistan Economic Association, Peshawar, 1955, p. 11.)
2"When the Five-Year Plan was being framed I urged, and successfully too, that the rate of growth should not be shown as higher than 1.4%. This was to keep despair away. We are, however, all convinced that population is growing faster than that. But as has been said, 'Hope builds sooner than knowledge destroys'". Said Husan, Chairman of the Executive Committee of the Institute of Development Economics, quoted by M. L. Qureshi, ed., in Population Growth and Economic Development, Summary Report of a Seminar, 8-13 September 1959, Karachi, p. vii.
94
phic reasons as well as "better health for the mother and better
care and upbringing for the children." The Plan also stated:
We realize that a visible effort of such measures can be felt only after some years. It is also realized that negligible results would be achieved until the family planning programme reaches a large proportion of the population. Nevertheless measures to this effect should be initiated now so that evils of under-feeding and over-crowding may not undo the efforts for the provision of a better life to the nation. The country must appreciate that population growth is a rock on which all hopes of improved conditions of living may founder. It admits of no approach except that the rates of growth must be low. (Pakistan, The First Five Year Plan. 1955-60, p. 192)
But the Plan was still very cautious in its approach and re
flected the general government position taken in 1952 by the Report
of the Economic Appraisal Committee: "...the suggestion of family
planning is neither easy nor generally acceptable, and in any case
it will take years to show effects. The problem, however, requires1careful consideration." Ayub's takeover in 1958 greatly changed the of
ficial approach to population.2 He mentioned population growth and family^-Pakistan, The Ministry of Economic Affairs, The Report of the
Economic Appraisal Committee, 1952> p. 77.
2 ......................In 1959 the Ayub Government issued a pamphlet outlining itsnew policies. "The watchword of the New Regime is 'face your problems.' They are not hampered by fhe timidity of the politicians who shelved all reforms for fear of unpopularity. Parts of Pakistan are heavily overpopulated, and whatever the improvements may be in the means of production, they cannot keep pace with the rapid increase in the numbers to be fed. The politician knew this full well, but was afraid to tackle the problem, as this would have made him unpopular with the conservative section of the public.The new Government, however, squarely faced the problem and has encouraged and actively helped the Family Planning Association of Pakistan to undertake rigorous measures in the interest of the well-being of the nation, to educate the masses on the need for family planning and population control. An appeal has also been made to the religious leaders to cooperate with the population control movement." (Pakistan, Government of, Pakistan under the new Regime, a Period of Reconstruction, Karachi, 1959, p. 19.)

95
planning in nearly all major speeches and the subject was given a
much higher priority in government programmes. In a speech re
ported in March 1959 Ayub stated that he had "...impressed upon
the Minister of Finance the need for allocating more and more funds
for the movement of family planning." As for religious objections
to birth control he said he "...could not visualize that any good
religion could advocate human misery. Religion was for the bet
terment of mankind, and no good religion could stand in the way
of human progress and happiness."
The Second Five Year Plan (1960-1965)
The new military junta substantially upgraded the Planning
Commission, which critically evaluated the First Plan and then de
vised the Second Plan 1960-65. The new Plan gave prime attention
to agriculture and education and aimed to increase the national in
come by some 20 pei/cent by 1966. The setting for the new Plan was
much improved as corruption was actually reduced for a time; and
more importantly, the harvests were good and were supplemented
with major food imports from the United States.
In fact, nearly all the agriculture and economic targets of the
Second Plan were achieved or surpassed including the 24 per cent
increase in the national income over the period. But this was
still growth without development. The new land reform laws were
not really implemented and perhaps only 2 per cent of cultivated2land was actually redistributed. Even the Governor of the State
^Population News (London), March 1959.2The Economist, London, December 2, 1961, p. 935.

96
Bank reported in 1964 a "wide spread feeling that disparities in
income and wealth in Pakistan have tended to increase.^
The Second Plan devoted considerably more attention to pop
ulation problems stating that population growth threatened "to
wipe out the gains of development*.."
Since population growth can threaten to wipe out the gains of development, the Plan clearly recognizes the paramount need for a conscious population policy and its implementation. A population policy, however, must take into account many implications of population growth for other aspects of planning. The existing pressure of population leads to an intense struggle for the means of life at subsistence levels. Inadequate diet results in a prevalent malnutrition that cannot be cured by public health measures alone. Apathy is the companion of malnutrition and ignorance. Under these conditions people have meagre reserves of energy to strive for wider understanding and improvement. (The Second Five Year Plan (1960-1965), p. 335)
The Second Plan represented a considerable change of emphasis in
its population policy over the earlier First Plan. It lamented
the meagre efforts of the First Plan stating "practically nothing
was done." The Second Plan expanded its population programme pro
posing Rs. 30 million for family planning services to be establish
ed at hospitals and other medical dispensaries. Family planning
workers were to be trained; research was to be undertaken; and
publicity, education, and motivational efforts for smaller fami
lies were proposed. The Plan suggested that if "any measure of
prosperity is to be gained from the developmental effort, it is
essential that family planning receive high priority." The Plan
continued:
The Times (London), September 4, 1964.
97
The First Plan contained a small provision for family planning but practically nothing was done except some pilot work by the family planning associations. Since a declining trend in fertility must be sought over a long period, the Second Plan health programme is primarily designed to influence social attitudes and practices in favour of family planning.It also seeks to provide the necessary medical and other facilities. Clinics will be established in all general hospitals, dispensaries and maternity centres. Provision is also made for educational and other materials, training programmes and research. Publicity and education programmes will be organized through all available media, with the assistance of voluntary organizations, Village AID and community development units. Arrangements will be made for the training of doctors, nurses, health visitors, midwives and medical administrators in family planning methods. Research will be initiated on reproductive behaviour, on factors which motivate parents to have large or small families, and on the acceptability and effectiveness of different methods of birth limitation. The Plan provides Rs. 30 million for family planning. (The Second Five Year Plan (1960-1965). p. 360)
The programme was to be developed within the existing Health Ser
vices with a new National Family Planning Directorate and Direc
torates within each province. In West Pakistan the National Re
search Institute of Family Planning (NRIFP) was established in
K a r a c hi and the Training-cum-Research Institutes (TCRI) were
established at Hyderbad and Lahore. The Second Plan allocated
some Rs. 30.5 million for the family planning programme but the
amount of money actually spent on family planning was only half
that budgeted in the Plan. Nevertheless, the programme at least
appeared to be reasonably well planned and fairly comprehensive,
and optimism about its success continued through the First Mid-Plan
Review of the Second Plan in 1963 which stated:
The family planning programmes received an increasing measure of attention. 1,573 centres were established in both wings of the country; of these 553 centres were established in East Pakistan and 1,020 centres in West Pakistan. 605 doctors, 446 health visitors/nurses and 4,800 V-AID workers and Ansars were

98
trained. Two medical social research projects were set up at Lahore and Dacca with the assistance of the Population Council of New York. Four films were produced on family planning.Seven persons were sent to the USA for higher training in demography, statistics and maternal and child health education.In East Pakistan, construction of 3 child welfare centres wascompleted. (Mid-Plan Review of Progress in 1960-61---1969-62under Second Five Year Plan, p. 42)
But before the Second Plan period was completed in 1965 it was ob
vious that the programme was an administrative failure and was not
having a demographic impact. Administratively, the scheme had
many shortcomings: only half the funds were allocated and there
were many shortages of supplies and personnel. The programme was
carried out within the existing health services which only reached
a pitifully small proportion of the population and ignored most of
the rural areas. In addition, the health personnel largely ignored
family planning because they were faced with much more serious and
compelling clinical cases.
The question then arises, could the programme have been demo-
graphically effective if it had been fully and adequately adminis
tered? Probably not. Besides the overwhelming administrative dif
ficulties a more fundamental problem was the lack of motivation
to use contraception, which will be discussed later in detail.
By 1965 the Third Plan (1965-1970) had been formulated and it
was obvious that the earlier programme had failed:
The achievements of this programme have on the whole fallen below expectations. The allocation was too small to permit adequate supplies and proper distribution aid the motivational barriers outlined earlier were not consciously tackled. Besides the programme was administered as a normal function of the existing personnel running these^ services who were over-burdened with clinical work and could not Sive adequate attention to family planning. (The Third Five Year Plan (1965-1970), p. 267)
99
The failure of the Second Plan's programme was also assessed in
an international conference earlier in May 1964 which founds
(i) Lack of motivation in the general masses (ii) unsatisfactory arrangements for the distribution of contraceptives (iii) inadequate education and information of the masses in family planning (iv) shortage of administrative personnel; the programme was administered as a normal function of the existing health services with the result that doctors and other health personnel running those services were over-burdened with clinical work and could not give adequate attention to family planning. (Pakistan, Consultative Committee of Colombo Plan, 1965)
The Third Five Year Plan (1965-1970)
By the time of the Third Plan (1965-1970) rapid population
growth and policies to reduce that growth were receiving substan
tial attention from the highest political levels.^- The importance
of reducing population growth was certainly recognized by the plan
ners, for example. :
^Ayub Khan while inaugurating the Family Planning Association's National Seminar in Lahore on 10 March 1964 stated: "If the birthrate goes on as before, which is happening now-a-days, the population is bound to grow by leaps and bounds. This is happening in actual fact all over the world and particularly in our country.This rapid growth of population creates frightening prospects for those looking into the future. If our numbers go on multiplying at this rate, I have grave doubts whether all our efforts for the development of our country and the amelioration of the lot of our people, would have any meaning whatsoever. Our planning, our sacrifices and our hard work for the progress of the country would be neutralized by the rapid growth of population. If nothing is done to check the rate of growth, I shudder to think of what will happen after a few decades. My only consolation is that I shall not be there to face that situation. But my country and my people would be faced with it. And the coming generations would not forgive us for landing them in such a bad mess." (Cited in Pakistan, Ministry of Health, Labour and Social Welfare, Family Planning Scheme for Pakistan, During the Third Five Year Plan Period, 1965- 1970. (Rawalpindi, n.d.) the foreword)
100
The size of population, estimated at 112 million for 1965, is expected to grow at an annual comptjfid rate of about 2.6 per cent during the Perspective Plan (1965-1985). With the planned improvement in health facilities and nutritional standards, the mortality rate is likely to decline fairly rapidly. Unless it is checked by a fall in the fertility rate, the population growth rate could easily be pushed beyond 3 per cent per annum. If this happens, population will double itself by 1985. Such an increase would defeat any attempts to raise per capita incomes by a significant amount. One of the basic assumptions of the present projections is that the rate of growth of population will decline after 1975 owing to a decrease in the fertility rate. In other words, it is assumed that declining fertility will more than offset declining mortality. The population in 1985 is thus projected at 187 million. A vigorous and broadly based programme of family planning is, therefore, an integral part of the strategy for the Perspective Plan. (The Third Five Year Plan (1965-1970), p. 24)
Moreover, the present 2.6 per cent growth rate of population may well increase in future. Pakistan is in a phase of demographic transition; of declining mortality rate unaccompanied by a corresponding decline in fertility. The mortality rate is projected to decline from 29 to 15 over the period of the Perspective Plan. To prevent a population explosion which may imperil most of the targets of the Perspective Plan, from tripling per capita income to universal literacy, the Plan assumes that birth rates will decline from 55 to 35. Thus, the growth rate in 1985 is expected to decline to 2 per cent and the overall growth rate during the period is estimated at 2.6 per cent.
Clearly, if the increases of per capita income postulated in the Perspective Plan are to be achieved, a decline in fertility is a necessary condition. The availability of modern medicines and related health facilities has been and continues to be the main determinant of the dramatic decline in mortality rates.The supply of contraceptive devices and extension of family planning facilities is similarly called for if fertility rates are to be contained. (The Third Five Year Plan (1965-1970), p. 265)
There was great enthusiasm by some because the Third Plan appear
ed on the surface to face up to the problems of population growth
by presenting in detail an ambitious family planning scheme to co
ver the entire country. This programme seemed to contain much more
than pious statements and unrealistic goals. It had real details
for implementation - nearly 200 pages of instructions were published

101
in conjunction with the Plan by the Ministry of Health, Labour
and Social Welfares Family Planning Scheme for Pakistan, During
the Third Five Year Plan Period, 1965-1970. The cost of this total
scheme was to be some 280 million rupees though the Third Plan al-0
located some 166 million rupees.
The family planning scheme for the Third Plan was ambitious,
in fact, excessively ambitious. The Plan aimed to reduce the crude
birth rate by some 20 percent in five years from 55 per thousand
to 45. The Plan estimated that nearly all of the women in the re
productive ages, some 20 million couples by 1970, would be involved
in the scheme which would over the five year duration of the Plan
cover all of East and West Pakistan.
The principal objective of the new programme is to bring down the birth rate from 55 per thousand to 45 per thousand. To achieve this target, 20 million couples, who represent almost all the women in the reproductive ages in 1970, will be induced to practice family planning in one form or another. The scheme is to be launched in 36 districts of West Pakistan and 16 districts of East Pakistan during the Third Plan period. Two- thirds of the districts will be covered in the first two years and the remaining one-third in subsequent years. (The Third Five Year Plan (1965-1970), p. 267)
One of the crucial aspects of the scheme was thought to be its
introduction of a monetary incentives programme for IUD insertions,
vasectomies, and tubectomies. More than 26 million rupees were
budgeted for payment to both the recipient and to the programme
staff as well as to the many part-time and volunteer personnel on
whom the scheme heavily depended.
For each vasectomy both doctor/lady health visitor/dai and the client will be paid Rs. 25. Insertions of IUDs will be free for the client. For each insertion doctors will be paid Rs. 8 and

102
trained nurses/midwives/dais Rs. 4. Besides, dais will be paid Rs. 2.50 and other Rs. 2 for referring cases leading to an insertion. A 50 per cent rebate on the cost of contraceptives will go as commission to the sellers. (The Third Five Yoar Plan (1965-1970), p. 268)
The elaborately planned administrative detail was nearly over
whelming. An entire chain of command was outlined from the Central
Family Planning Council, to the Provincial Family Planning Boards,
to the District Family Planning Boards to the Thana and Union Coun
cils and so on to the village dais. The scheme was to be widespread
thirty-seven full-time clinics were proposed in the urban areas and
718 part-time clinics (318 in the West and 400 in the East). The
local village dais were to have a major role and less emphasis was
paid to the established health centres and clinics.
There will be a Family Planning Council at the Centre and Family Planning Boards at the Provincial and District levels. All the Union Councils in East Pakistan and Thana Councils in East Pakistan will be associated with the programme. The family planning work at these levels will be looked after by a Family Planning Supervisor (one for 3 Union Councils) in West Pakistan and Thana Family Planning Officer (one for 3 Union Councils) in West Pakistan and Thana Family Planning Officer (one for each Thana) in East Pakistan. At the bottom of the hierachy will be the village dai. She will perform such functions as motivating the people and distributing contraceptives. At the national level the programme will be supervised by the Family Planning Commissioner who heads a new Division in the Ministry of Health, Labour and Social Welfare to be called the Family Planning Division. (The Third Five Year Plan (1965-1970), pp. 268-269)
The Administrative set-up at the Central, Provincial and District levels has been considerably strengthened. The Scheme provides for 1,000 Family Planning Supervisors in West Pakistan who will work with the Union Council Secretaries. In East Pakistan 400 Thana Family Planning Officers have been provided.One general assistant, one female assistant and one male assistant will be attached to each Thana Family Planning Officer.A total of 50,000 village dais will be employed. 30,000 in East Pakistan and 20,000 in West Pakistan at the rate of one dai for two villages or 1600 population in East Pakistan and one dai for two villages in West Pakistan. About 2,400 part-
103
time family planning doctors at the rate of 6 for each Tehsil in West Pakistan and 3 for each Thana in East Pakistan will be registered and appointed for the purpose of IUD insertions and clinical sterilization, (The Third Five Year Plan (1965- 1970), pp. 268-269)
Within municipal, town committee and cantonment limits in West Pakistan the functions assigned to the Family Planning Supervisors and Union Council Secretaries will be performed by the District Family Planning Board through its whole-time staff and other personnel available already to Deputy Commissioners, Union Committees and the Civil Surgeon/Medical Superintendent.... In 16 cities of West Pakistan 21 urban clinics will have sufficient staff to cover the urban areas of those districts. Furthermore, the West Pakistan Family Planning Board may b y reappropriation allocate up to 10% of the provision made for Family Planning Supervisors to rural areas to provide them for urban areas at the rate of one per 100,000 population and at least one for every district headquarters....So far as East Pakistan is concerned, the entire area (inclusive of Municipal, Town Committee and Cantonment Areas) will be covered by the wholetime Thana Family Planning Officers and the male and female assistants appointed there. (Family Planning Scheme for Pakistan during the Third Five Year Plan 1965-1970, p. 8)
In 1966, following the publication of the Plan and the Family
Planning Scheme, Warren Robinson in a perceptive analysis of the
new strategy pointed out many areas of potential difficulty.^" The
geographic scope of the scheme was impossibly vast. Rather than
consolidating gains and building a durable organization in areas
where motivation to accept contraception was high - urban areas,
for example - and then gradually expanding a successful operation
with proven 'demonstration' effects; the Plan chose to cover vir
tually the entire country in five years. Even the sheer logistics
of getting contraceptives supplied throughout the entire countryside
every month is an overwhelming problem which was not carefully
^"Warren C. Robinson, 'Family Planning in Pakistan's Third Five Year Plan', The Pakistan Development Review, Vol. 6, No. 2, Summer 1966, pp. 285, 281.
104
planned for in the Plan or the Scheme Plan.
The scheme did attempt to rely on existing political and ad
ministrative structures— union council secretaries, deputy district
commissioners and thana development officers. While this strategy
avoided the Second Plan's problem of reliance on the over-worked
Health Ministry, it did impose itself on political administrators
who had only a secondary interest in it at best. Nearly all the
staff in the Scheme were to work for free, or for small fees, or
for some part-time wage, only a very few actually were employed
full-time on family planning.
The local dais were in many ways crucial to the success of
the programme, even though little was known about how they would
undertake a 180 degree change in their maternity role. In rely
ing on the dais, the entire approach of the Scheme was thus female-
oriented, which of course it must be to some extent because of
Purdah. But in this traditional rural Muslim society the sole re
liance on the female-orientation may not be effective, since con
traceptives will probably only be used if the husband also favours
their use.
Robinson^ also argued that the scheme placed too much emphasis
on "non-clinical" methods of contraception and that more attention
should have been given to clinical methods, especially the IUD.
Despite the great attention in the plans to evaluation, Robinson
points out that the type of evaluation was unrealistic to the goals
of the programme. The evaluation of service statistics for the
number of contraceptives distributed or the number of training
^Warren C. Robinson, op. cit.
105
seminars held may be useful in measuring administrative discipline;
but it will not measure the programme’s real aim— a demographic
impact.
It was also argued that publicity for the programme was insuf
ficient, partly because this was to be undertaken at the district
level which would overemphasize printed material and posters while
underutilizing the more important mass media of radio, newspapers,
and cinemas.
Despite these notes of caution, the ambitious Scheme was begun
in mid-1965 (after a short delay because of the Indian conflict);
and as the Third Plan period progressed, glowingly optimistic ser
vice statistics were reported. By 1968 some observers (Bean and
Bhatti, 1969) reported an apparent striking success while the of
ficial reports^” claimed that the rate of growth was slowing and that
the various targets might be surpassed.
In three years of activities the programme appears to be strikingly successful: about four-fifths of the population havebeen covered by the programme in which over 90,000 persons are engaged in family planning activities in some direct fashion as full-time, part-time, cut-piece workers or programme agents; more than 1.6 million IUDs have been reported as inserted; over 296 million conventional contraceptives are reported as distributed; and over 320,000 vasectomies or tubal ligations have been performed. The programme has proved to be both
^Pakistan, Family Planning Division, Ministry of Health, Year Book for 1967/68. (Karachi: Family Planning Division, Ministryof Health, Government of Pakistan, 1968); and Pakistan, Planning Commission, Mid-Plan Review of the Third Five-Year Plan. (Rawalpindi: Government of Pakistan Press, April, 1968).
106
flexible and imaginative. For example, clinical methods have proved to be acceptable and as a result receive far more attention than originally anticipated. Where medical personnel have been in short supply, the programme has successfully trained paramedical personnel to insert IUDs. ^
Service statistics based on reports from the Pakistan Family
Planning Council were analyzed by Bean and Bhatti (1969) and they
reported the successful spread of the programme geographically
to "at least 79 percent of the population" by mid-1968. They also
found few difficulties in staffing the nonmedical positions of the2scheme (though much of their actual performance was minimal) but
serious shortages of medical personnel especially in the then East
Pakistan were found.
Assuming the validity of the service statistics, and makingBean, L.L., and A.D. Bhatti,'Three Years of Pakistan’s New National
Family Planning Programme,' The Pakistan Development Review. Spring, 1969, pp. 34-35.
2Even if the service statistics are assumed to be correct, there were serious problems of inefficiency in particular with the dais in their new role as preventers of births. Bean and Bhatti reports "...if one assumes that agents and dais sell an equal number of contraceptives and are responsible for all sales, their performance is minimal. Assuming the employment and distribution figures to be accurate, the agent or dais would on the average, during the last six months of the period, sell or distribute only 10 dozen conventional contraceptive units during a month and as units are presently computed in the programme this might mean the sale, for example, of only three to four bottles of foaming liquids. If one assumes that the dais are responsible for motivating women to accept an IUD insertion, the staff performance record is even more depressing; on the average, other things being equal, a dai is able to motivate only two women per month to accept an IUD." Bean and Bhatti, 1969, p. 51.
107
some other heroic assumptions, Bean and Bhatti estimated that
as of mid-1968, "as much as 11 per cent of the eligible popula
tion in Pakistan may now be practising family planning."2The performance of the dais proved to be very unsatisfactory.
Tbese illiterate women were obviously incapable or unwilling to
change the fertility practices of others; their monetary incen
tives were ineffective or insufficient; and they were largely
unable to convince husbands of the benefits of contraceptives.
Another major programmatic setback was the disrepute of the
IUD which was the major contraceptive method in the programme.
Following unhygienic or faulty insertions, there were many reports
of bleeding and rumoursquickly spread making the IUD a largely un
acceptable method. There were few follow-up services and the drop
out rate was extremely high.
^"The..."as much as 11 per cent..." estimate is apparently a reduced figure from the sum of 7.5% for conventionals, 4.5% for IUDs, and 1.5% vasectomies and tubal ligations. "Assume that ten units monthly are employed by the average couple using conventionals on a regular basis and that roughly one-third of all units distributed are defective, accepted by non-regular, inefficient users, or simply wasted. Under these assumptions the distribution figures suggest a million regular users, or 5 per cent of the married couples in the country, or roughly 7.5 per cent of the married couples where the wife is not pregnant, other things being equal....Using Grecent IUD follow-up studies in East and West Pakistan} it is estimated that 940,000 women of the 1,612,000 reported receiving an IUD may still be wearing the IUD at the end of the third year, or roughly 4.5 per cent of the eligible women....Assuming that all of the men having a vasectomy or women having a tuba 1 ligation are still living and in the childbearing years, an additional 1.5 per cent of the eligible population is protected against the risk of childbearing." Ibid., p. 54.
2Wajihuddin Ahmad, Field Structures in Family Planning, Appraisal and Search, Islamabad: Pakistan Family PlanningCouncil, 1970.
108
Inexpensive oral contraceptives were to be distributed with
out prescription to rural women; but this xvas countermanded just
before the programme was to begin because of the fear of side ef
fects, though this was later reversed again and they were made
available within two years. But at the time, the programme was
left with only conventional contraceptives, mainly the condom.
There were other institutional difficulties as well. The pro
gramme's implementation had not been adequately planned. There
were disputes with the Ministries of Health and Education. Other
departments were grasping for the large family planning budget
and they were able to obtain some of the funds after Ayub Khan's
opponents castigated the programme.^ Later a Continuous Motiva
tion Scheme was developed using both a man and a woman in a team
to go to each household and talk to parents. While many plans
were made for this, it was never really implemented. There were
many reasons: the political changes from 1969 and onward, the
new provincial changes in the country and the beginning of the
Civil War, and a severe cutback in national funds for foreign
assistance. All combined to virtually shut down the programme.
Thus, the population policy of the Fourth Five-Year Plan (1970-
^See Shahid Javed Burki, 'Pakistan: A Demographic Report*,Population Bulletin, Vol. 29, No. 4, Washington D.C.: Population Reference Bureau, 1973; and a personal communication from Burki, 1974, cited in Tine Bussink, 'Major Aspects of Family Planning in Pakistan', Prologue to Development Policy and Population Policy - The Pakistan Experience, Population Planning Division, Government of Pakistan and the I.C.P. Smithsonian Institution, 1975, p. 47.

109
1975) written prior to the independence of Bangladesh is not re
viewed here.^
In Pakistan in 1972, the then Prime Minister Zulfikar Bhutto
instituted a Special Committee which developed a Two-Year Scheme
that was to have a broader approach to population and was to in
tegrate demographic considerations into development efforts. The
Family Planning Programme was now dubbed the Population Planning
Programme. A budget of Rs. 20A million was proposed. The Con
tinuous Motivation Scheme was to be expanded to cover nine million
fertile couples. New population growth targets were set. A
Demographic Policies and Action Research Centre has been estab
lished in order to integrate a so-called ’population planning
bias* into the planning for education, welfare, employment and
manpower, rural development, housing, and other sectors.
The U. S. Agency for International Development has made a
grant of 7.5 million U. S. (Rs. 75 million) for contraceptive
supplies. It is hoped that this programme will saturate the
country with low cost contraceptives given out by all health
clinics, family planning workers, and some 20,000 commercial dis
tributors.
The implementation of the latest plans has not yet been in
vestigated by this writer; but since the success or failure of
the efforts may depend largely upon the people's motivation to
control reproduction as well as administrative strength, it seems
^Stamper, B. Maxwell, Population and Planning in Developing Nations, (New York: The Population Council), 1977, pp. 171-174.
110
unlikely that these programmes will be demographically effective.
In addition, one might speculate that under the present political
circumstances in Pakistan, the administrative efficiency of govern
ment efforts may not be high.
BANGLADESH
The First Five Year Plan (1973-1978)
Much has been written about the tragic circumstances of Bang
ladeshi struggle for independence. A desperately poor country
hit by a cyclone and tidal wave in 1970, it fought a war of inde
pendence in 1971 that killed many and left almost ten million re
fugees. Even if the new government had not been grossly incompe
tent, there would have been great difficulties in rebuilding the
country. And following all this came the great famine of 1974.
In November 1973, The First Five Year Plan was published.
The Plan was extremely optimistic in most respects, and it naively
assumed that the rate of economic growth of the late 1960s would
soon return. It failed to consider the real severity of the dis
rupted economy. Like many plans, it was a political document writ
ten to encourage the national and international audiences with
what might have been possible - in theory only. With the benefit
of some luck, several years of excellent harvests, a huge amount
of aid, and effective leadership, the economy might have recuperat
ed somewhat within a few years had it not been for the rise in im
port prices.
Ill
But the harvests were not good, nor was the weather, nor the
political leadership; and, furthermore, there was a fantastic
rise in import prices which completely ruined any reality of the
plan and devastated any chance of a smooth management of the economy.
This ultimately resulted in severe production cutbacks through
shortages in imports. Things were made even more difficult in
1973-74 because the export performance^" fell short of the Plan and
the additional foreign aid was less than anticipated.
Unfortunately, Bangladesh's limited modern sector is extremely
dependent upon heavy foreign trade and critical imports. When im
port' prices rose, critical imports were curtailed. Petroleum
imports were about one-third less than planned; cement and ferti
lizer were reduced by about half; 2.2 million tons of foodgrains,
valued at U. S. 213 million, were planned for 1973-74 but the ac
tual imports were more like 1.6 million tons, but at a price of
U.S. 296 million - nearly twice the 100 per ton estimate.
Customs and excise duties account for a substantial proportion
of government revenue, thus the curtailment of imports substantial
ly lowered expected government revenue which had been earmarked
for development expenditure.
The First Five Year Plan presents an entire chapter detailing
its population planning programme. The plan utilizes considerable
demographic data and presents projections of the total population,
"The Plan placed critical importance upon the jute manufacturing industry and in the early years of the Plan period the annual production deteriorated. According to the Annual Plan for 1974-75 and The White Paper on Economic Situation in Bangladesh, the annual production of jute textiles was 561 thousand tons in 1969/70;446 in 1972/73; 500 in 1973/74; and 450 in 1974/75.
112
school-age population, and working-age population.
The plan recognizes a broad range of problems that are ex
acerbated by rapid population growth: economic development; unem
ployment; increasing school-age population; high dependency ratio;
population pressure on health services, social services, housing,
and food production; and the effects of population density upon
physical infrastructures, recreation space, roads, and land.
The planners state that rapid population growth is ’likely
to continue unless radical preventive steps are taken,* and urge
that the nation's programmes for population control be critically
reviewed and that a new programme be formulated with 'a set of
bold and, if necessary, drastic policies for vigorous action with
a view to reducing this high rate of population growth within a
reasonable time. Failure in this critical area would frustrate
all our development efforts. Therefore, the programme for popu
lation planning is given a place of high priority in the develop
ment plan'.
The plan's population policy falls basically into five cate
gories: (1) a campaign for both population education and contra
ceptive education; (2) the integration of family planning and pop
ulation education programmes with the various ministries; (3)
the voicing of public concern about rapid population growth by
political leaders, educators, social workers, and student organ
izations; (A) an increased role for abortion; and (5) the serious
national consideration of the 'imposition of progressively increas
ing punitive measures against Cfamilies withj more than two chil
dren' .
113
The planners evaluate past efforts to reduce population growth
and credit them with bringing about a new awareness of the problems
of population growth, an organizational structure for the family
planning programme, and a new environment conducive to other fer-
tility-control programmes. A number of weaknesses of the past pro
gramme are also discussed, including unrealistic targets that, with
out extensive supervision, led to fictitious reporting and to abuses
of the cash incentive programme. The underemphasis of such nonclin-
ical methods as oral contraceptives and condoms is also viewed as
a weakness. Past programmes, the planners say, were limited too
strictly to family planning; better defined population policies
would adopt more non-family planning strategies for fertility
control. A number of organizational drawbacks are also discussed,
including the untrained and part-time working staff, conflicts a-
mong supervising staff members, and problems of coordination.
The plan sets the demographic target of reducing the rate of
population growth, estimated to be 3 per cent, 'by at least 0.2
per cent at the end of the plan period' (i.e., from 3.0 to 2.8
per cent)♦ Two projections of future populations are given, one
based on the assumption of a decline in the birth rate from 47
births per 1,000 population to 43 by 1978. This projection is
based on the assumed effect of the family planning programme.
The other projection of total population is based on an assumption
of no family planning programme. It is not evident frcm the pub
lished data if there is any decline in fertility in the second
projection. No method of projection or source of data is pre
sented and neither projection gives a distribution by age and
114
sex. The rate of growth assumed in the plan is three per cent,
based on (CBR = 47) - (CDR = 17) = 30 per 1,000, but other rates
are given in connection with the population policies' anticipated
effects. No source of data is given for any of these rates. Long
er range projections are discussed in the plan, with four different
paths of reduction in fertility to the year 2003. The details of
the assumptions as well as the age distributions are not published.
The plan presents a comprehensive population strategy for re
ducing fertility, indeed more comprehensive than any other national
development plan surveyed. It is comprehensive in the range of
policies considered and proposed, and it is a broad strategy involv
ing more than six different government ministries. It attempts
to integrate the policies and programmes and to make them consis
tent, cogent, and reinforcing. There is an attempt to integrate
these efforts at the highest levels of government with a national
population council which oversees the efforts by various ministries.
The Ministry of Health and Family Planning is to carry out
the bulk of the programme, of course, by supplying contraceptives
and attempting to motivate their acceptance by the activities of
health and multipurpose field workers. The Minister of Rural De
velopment is to promote women cooperatives for increasing literacy
and employment potential, and it will also promote family plan
ning education. The Ministry of Education is to introduce popu
lation education into the school and adult education curriculum.
’The Ministry of Agriculture will incorporate family planning into
its nutrition education of its extension programmes. The Ministry
of Information and Broadcasting will have programmes about both
115
population and family planning in its radio, t.v., newspapers,
posters, pamphlets, etc.. The Ministry of Labour and Social Wel
fare is to promote population and family planning information,
education, and motivation in its relevant social work programmes.
Various student organizations are encouraged to carry out similiar
activities and political leaders, educationalists, social workers
and intellectuals are urged to voice their concern and advocate
fertility control.
Does all of this mean anything? It is clear from the plan
that an attempt is being made to produce programmes which reinforce
each other. This would have a greater potential than programmes
set up in isolation. But the extent to which they in fact do rein
force each other depends upon their implementation at the village
level.^ It may well be that these programmes will be implemented
at the top levels of government, but will they be integrated at
the bottom? There are thousands of villages in Bangladesh. In
tegration at the top is easy but integration at the bottom of
a long chain of command in a newly created bureaucracy is diffi
cult. And it would be difficult even if it were not plagued
with widespread corruption. At best, different levels of govern
ment are likely to have different priorities.
Furthermore, for most ministries, population programmes are
outside the scope of their main functions and it seems unlikely
that peripheral functions will be maintained and run with any
^Paul Demeny, Observations on Population Policy and Population Program in Bangladesh, 1960-74', Population and Development Review, Vol. 1, No. 2, December 1975, pp. 307-321.
116
vigour*,especially down through the bureaucracy.
It is hoped that all-purpose field workers will be a key to
integration of a population policy at the bottom of the hierarchy.
But will these mostly middle class women really be successful at
the village level? Can they really relate to the villagers?
The population programme, along with most other government
programmes, was brought to a virtual standstill during the civil
war, and it has been only partly reestablished. IUD insertions,
the major method of the former programme, were near nil in 1971.
By 1974, only 35,000 were reported - less than 10 per cent of the
number reported in 1968. Oral contraceptives were introduced in
1973 and more than 750,000 cycles were distributed in 1974. Ster
ilizations in 1974 were only about 20 per cent of the number carried
out in 1968.^
The plan does not outline specific targets for the number of
contraceptive acceptors or births to be averted, but it does give
a proportional allocation to each method: orals, 20-25 per cent;IUD, 20-25 per cent* condoms, 25-30 per cent; vasectomy, 20-25 per cent;/other, 10-12
per cent. To obtain the plan’s crude birth rate target of 44 per
1,000 (with a crude death rate of 15) by mid-1978, it has been2roughly estimated that some 620,000 births must be averted.
A number of population projects are currently under way, backed
Hi. Ataur Rahman and Lincoln C. Chen, 'Bangladesh', Family Planning Programs: World Review 1974, Walter B. Watson andRobert J. Lapham, eds., Studies in Family Planning, Vol. 6,No. 8, August 1974, pp. 248-251.
2Ibid.

117
by almost all of the large international population donors. UNFPA
and USAID have committed some U.S. 10 million each during the plan
period. The World Bank has established a U.S. 46 million IDA
credit for a national population programme in the same period.
The population programme is officially stated to be the second
national priority - after agricultural development - and one member
of the Planning Commission is quoted^ as explaining:
When we say that population control should be our second priority, what we mean is that we will spend the next four or five years concentrating on agriculture, and then we will take up population control in a big way. For the present, we really haven't had time to think about it - besides, it is probably a subject that is best left in the background until our people are ready for it.
Following the publication of the plan, the population programme
was reorganized under the new Population Control and Family Planning
Division within the Ministry of Health, Population Control, and
Family Planning, which was to implement the new programme by in
tegrating it with the MCH services. But given the recent political
changes, the policies and development strategy of the new government
cannot be told with any certainty.
^Marcus F. Franda, 'Perceptions of a Population Policy for Bangladesh*, American University Field Staff Reports, South Asia Series, Vol. 17, No. 2, 1973.
CHAPTER FIVE
ISSUES AND THEORIES OF FERTILITY DECLINE IN PAKISTAN AND BANGLADESH
Assuming the validity of the goal to reduce the rate of popu
lation growth in Bangladesh and Pakistan; and further recognizing
that a substantial reduction in fertility is the only feasible or
acceptable approach; then, how can the various theories about fer
tility decline be utilized in development planning?
In looking for a conceptual framework for Bangladesh and Pak
istan's population policies we shall briefly mention several basic
approaches and discuss their utility and limitations. A simple
typology of these approaches would include the following:
1. The family planning approach.
2. Beyond family planning measures.
3. The development hypothesis and the transition theory.
4. The distributive hypothesis and fertility.
119
The Family Planning Approach
There is a widespread disillusionment with the family planning
approach as the principal policy instrument for reducing fertility.
After all these years of effort, the 1975 Pakistan fertility Sur
vey, conducted as a part of the World Fertility Survey Programme,
found no evidence of a fertility decline.^ In Bangladesh, an an
alysis of the 1974 Census and its special survey on fertility found2no evidence of a decline in fertility. Nevertheless, the family
planning approach remains the chief policy instrument for reducing
the rate of population growth.
Two fundamental problems lie at the heart of the family plan
ning failure in these countries: an extremely difficult setting
for the administration of such a programme, and insufficient mo
tivation to control reproduction. The setting for the Pakistan
family planning programme is exceedingly adverse; in fact, if the
family planning approach can succeed in Pakistan and Bangladesh,3it most certainly can succeed anywhere m the world. Enver Adil,
the Pakistan Commissioner of Family Planning in 1965, gave the fol
lowing reasons for the continued high fertility: (1) Early and
^Population Council of Pakistan, Pakistan Fertility Survey:First Report, Lahore: Directorate of Production and Publication,1976, 110p.
^Bangladesh, Census Commission, Bangladesh Population Census, 1974, Provisional Results Bulletin, Dacca, 1975.
3Enver Adil» 'Pakistan', Family Planning and Population Programs: A Review of World Developments, Bernard Berelson, et al., eds.Chicago: The University of Chicago Press, 1966, p. 124.
120
near universal marriage with an average female age of marriage of
between 15 and 16, and nearly 100 per cent of the women marrying
by the end of their reproductive ages. (2) Early childbearing
within marriage. (3) The remarriage of widows. (4) A predominate
ly (near 90 per cent) rural population with perhaps three-quarters
of the population working in agriculture. (5) Very high illiter
acy rates. (6) General isolation of the population. (7) A very
low standard of living with per capita incomes of less than U.S.
100. (8) A traditional extended family organization. (9) A degree
of fatalistic attitudes. (10) A lack of economic incentives to
limit family size. Dudley Kirk^ has also argued that Islamic so
cial values have tended to favour high fertility. Additional rea
sons for the adverse setting for the family planning programme were
cited by Warren Robinson: infant mortality is still so high that
a high fertility is perceived as being necessary; the proportion
of the population which is educated is extremely low and among wo
men it is exceedingly low; the population is predominately rural;
in Bangladesh travel and communications are extremely difficult;
and finally, male dominance and Purdah make it very difficult to
introduce contraceptive information. Robinson goes on to say, "This
totality of socio-economic-psychological barriers, the combination
of poverty, ill-health and deprivation with strong religious and
social values in favour of high fertility and strong resistance to
any change, probably make the ’setting* in Pakistan one of the most
^"Dudley Kirk, ’Factors Affecting Muslim Natality', Family Planning and Population Programs, Bernard Berelson, et al., eds., Chicago: University of Chicago Press, 1966, pp. 561-579.
121
difficult in the world for the successful introduction of a sudden
large-scale family planning scheme"
Given the adverse setting in Pakistan, the family planning pro
gramme may have been expected to fail. The best that can be said
is that it may not have failed worse than other programmes. Social
programmes have not done very well, certainly health and educational
services have been a disaster, and few of the development goals
have been met. Family planning as an organizational feat may have
succeeded better, or at least failed less than many other programmes.
What can we learn from the failure of the family planning ap
proach to actually reduce fertility? Should the effort be continued
or strengthened or discontinued? Part of the answer may lie in the
fact that too much is expected from the programme; and if less were
expected, it might not be judged a failure so quickly. In the his
torical European setting changes in fertility took generations;
but in Pakistan if changes in the birth rate are not measured from
year to year, then some charge that the effort is a failure and
should be abandoned. Despite a long period of activity in family
planning, serious efforts only started in 1965 and lasted until 1969.
So at best there were only four years of strong programme efforts.
It might also be argued that rather than family planning, it is
the failure of development efforts - and no one wants to abandon
them - that has hindered a reduction of fertility. It could also
^Warren C. Robinson, 'Family Planning in Pakistan's Third Five Year Plan', The Pakistan Development Review, Vol. 6, No. 2, Summer 1966, p. 275.

122
be said that it is the failure of these development efforts that
has hindered the family planning programme itself. Defenders of
this approach claim that the programme may accelerate the accept
ance, adoption, and diffusion of birth control-practices, if not
initiate a decline in fertility. Even if the programme fails to
initiate a general decline in fertility it will, nevertheless,
provide services for those who are motivated. Thus, any given level
of motivation for reducing fertility will result in more effective
fertility control. Any "natural decline" in overall fertility
would probably be accelerated if a national family planning pro
gramme were established. It is also argued, and generally agreed,
that family planning is a basic human right; that people, and espec
ially women, should have the right to control their own family size;
and that a population which controls and spaces its fertility will
generally have better maternal and child health* and better health
through the reduction of dangerous illegal abortions. It is also2argued by Bernard Berelson that this approach is acceptable and
feasible while most other population policies which go beyond fam
ily planning are either politically unrealistic, morally unaccept
able, or administratively infeasible.
There is some consensus that the family planning approach should
*While most agree that family planning is worthwhile in terms of health and as a basic human right, some would argue that it has been "actively nurtured at the cost of the general health services particularly in the rural areas". D. Banerji speaking of India, in D. Banerji, 'Health Services and Population Policies', Economic and Political Weekly, Vol. 11, Nos. 31-33, August 1976, p. 1251.
^Bernard Berelson, 'Beyond Family Planning', Studies in Family Planning, Vol. 1, No. 38, February 1969, pp. 1-16.
123
not be abandoned; that it is necessary; and that perhaps it should
even be strengthened, though it must be recognized that the approach
is not at all sufficient to significantly reduce population growth.
Planners should not be misled into thinking that this approach
alone will have a meaningful demographic impact.
Demand for Family Planning
It is evident that there is little motivation to control re
production. Either it is not within the range of conscious choice
to limit fertility, or it is not perceived to be an economic or
social advantage to do so. Sirageldin and others^ in studying
the 1968-1969 National Impact Survey for Bangladesh found that
only 3.7 per cent of the population were currently using contracep
tives and only 6.4 per cent had ever used contraception. They
further argue on the basis of the Impact Survey that the demand for
reduced fertility is not at all sufficient to have a major impact
upon population growth. They report that if one takes "all current
use and expected future use based on reported intentions, this to
tal expected demand was and is not large enough to generate the2desired fertility reductions in Bangladesh."
To what extent does the demand for children reflect the eco
nomic advantages to the family? In a micro-study of the economic
activities of children in the village of Char Gopalpur in north-
^Ismael Sirageldin, Monowar Hossain, and Mead Cain, 'Family Planning in Bangladesh; An Empirical Investigation', Bangladesh Development Studies, Vol. 3, No. 1, 1975, p. 6,
2Ibid, p. 24.
124
central Bangladesh, Mead Cain found that from the point of view of
the parents, high fertility and many children were economically
"rational".^ Children put in long hours of work and by the aver
age age of twelve, male children were net producers; by the aver
age age of fifteen, they had compensated for their own cumulative
consumption. Because of the rigid division of labour by sex, fe
male children did not compensate for their consumption, but Cain
found that by the age of 22, male children had compensated for their
sisters' cumulative consumption as well as their own. The ages
at which children compensated for their consumption varied accord
ing to economic class. Children of landless households were of
the least economic value to their parents because the children had
less return for their labour and parents had less control over the
income.
The study was essentially limited to the work contributions
of children and since the costs of child rearing were not thoroughly
analyzed, the study's conclusions must remain somewhat tenuous.
In addition, the study did not attempt to measure changes in the
average productivity and employment with different numbers of chil
dren in the household. This could be a serious limitation since
fertility decisions might be different if the average productivity
of children declined as the number of children in the family in
creased. Cain suggests that in the case of male children the aver
age productivity may not be affected by the number of brothers in
^Mead T. Cain, 'The Economic Activities of Children in a Village in Bangladesh*, Population and Development Review, Vol.3, No. 3, September 1977, pp. 201-227.
125
the household. If there is sufficient labour to operate the farm
the relatively well-to-do can diversify the household enterprise
via trade and wage employment or by the education of one or more
sons. The constraints to employment among the poor are external
to the household and these constraints will not be changed by the
number of sons. However, the average productivity for an increas
ing number of daughters may well decline since the amount of house
hold work is limited and the opportunities for productive work out
side the household are extremely limited for women.
Although high fertility may be economically "rational” from
the point of view of the family, it is clearly not economically
rational from the point of view of the village; and Cain reports
that "continued rapid population growth is likely to intensify
the pressure on resources and erode overall economic welfare".^
Thus, there exists the serious dilemma between the competing in
terests of the family and the society. Because the costs of high
fertility are being externalized and are paid by the community,
high fertility is economically rational from the family viewpoint.
Demeny argues that "...unwittingly, people are locked in a compet
itive race, in which almost everybody wins, yet by the same token
almost everybody loses as society pays the price for rapid popu- 21ation growth".
*Cain, op« cit., p. 202.
^aul Demeny, ’Observations on Population Policy and Population Programs in Bangladesh', Population and Development Review,Vol. 1, No. 2, December, 1975, 316. For a further treatment of this issue see Paul Demeny, 'The Economics of Population Control', Rapid Population Growth, National Academy of Sciences, Baltimore and London: The Johns Hopkins Press, 1971, pp. 199-221; and Geoffrey McNicoll, 'Community-Level Population Policy: An exploration',Population and Development Review, Vol. 1, No. 1, September 1975,pp. 1-21.
126
If high fertility is economically rational from the family
viewpoint, then no matter how effective the family planning pro
gramme is, the demand for its services will only be marginal.
Essentially, the family planning programme is only a supply mech
anism which subsidizes the cost of contraceptives, improves the
ease of access, and provides relevant information. If there was
sufficient demand for contraceptives, the private market could
supply them. If sufficient demand existed for contraceptives,
even a restrictive government policy could not prevent the black
market from supplying them, as it now supplies everything from il
legal drugs to bicycles, and in so doing it overcomes the most dif
ficult transportation problems.
The new Bangladesh and Pakistan population schemes are en
visioned to be more than a supply system; it is hoped that they
will be able to create demand as well. But it seems questionable
that these middle class motivators will be able to create the
demand for their services if to do so runs against the economic
interest of the average family. Information and motivation cam
paigns of this sort may have some small effect, but they are not
likely to have a significant demographic impact. To the extent
that they are not demographically effective, government policy
options will be limited to disincentives and policies to intern
alize externalities; or to more stringent measures; or to broad
structural measures which will indirectly alter how families per
ceive the costs of their children.

127
Beyond Family Planning Measures
A number of policies have been advocated to reduce fertility
which go beyond the family planning approach and attempt to direct
ly influence the demand for reproductive control and contraceptives.
Policies aiming to reduce the demand for additional children have
ranged from the provision of old age support, to monetary incen
tives for reduced fertility at the family and community level, and
even to stringent and coercive measures.
Fertility and Old Age Support
It is generally agreed that one motivational reason for high
fertility is the parents* need to have enough children in order to
support them in their old age. This may be a powerful' and long
term motive for having children which is not easily influenced by
short term government policies. In an attempt to deal with this
phenomenon Ridker and Muscat^ have proposed a scheme in which the
payment of a pension to a couple is linked with the number of sur
viving children. This scheme was developed for Malaysia but its
authors claim that it is, with suitable modifications, applicable
to many other Third World countries as well. No payments would be
made for parents with four or more children; but for those with
fewer children, payments would vary inversely with the number of
surviving children. Many variations of the scheme and the scale
of incentives are possible. Its authors argue that these schemes
^■Ronald Ridker and Robert J. Muscat, ’Incentives for Family Welfare and Fertility Reduction’, Studies in Family Planning,January 1973.
128
force the state to pay substantial sums only if they produce re
sults - that is, if there are fewer surviving children and the
rate of growth is actually reduced. The payment would be delayed
for many years and would be presumably be paid at a time when in
comes were higher. Many people would remain ineligible since they
had four or more surviving children. At the current age structure
only about seven per cent of the population is aged 60 or over.
But this represents about 15 per cent of the fflnployed population
aged 15 to 59. Reduced fertility would, of course, increase their
proportion of the total population, but the total dependency ratio
would continue to decline until the reduced fertility cohorts mov
ed well into their working ages.
Even if such a scheme were feasible in Malaysia it is doubt
ful that it would work in Bangladesh or Pakistan. Malaysia has a
population of only eleven million and a per capita income of some
U. S. 430 - this compares with Bangladesh's 80 million people and
per capita income of only U. S. 70. In this writer's view, this
and similar schemes have several fatal flaws. The scheme would
be open to fraud on a massive scale. This would be true even if,
somehow, there was suddenly a complete vital registration system
for all births and deaths and a register for migrants. Such a
scheme would require an effective governmental administrationi
and also the long-term confidence of the people in that govern
ment. This is hardly what one would expect under the political
circumstances in Bangladesh and Pakistan.
129
Fertility Decisions at the Community Level
The new Bangladesh Plan does call for the immediate adoption
of a programme giving awards to communities on the basis of the
demographic impact; that is, 'priority in providing community and
public facility' for areas where fertility is reduced. Geoffrey
McNicoll^ argues for such an approach where communities and not
individuals would be the target of policies aimed at internalizing
the costs of high fertility. This might be a reasonable approach
providing it happens within the context of a unified community de
velopment programme. Certainly, the success of these sorts of2efforts in China are notable, as Pi-chao Chen reports:
A Ward ("Street") Committee or Commune may suggest as a target that the crude birth rate be brought down a few points from that of the previous year, perhaps from 25/1000 to 22/1000; this reference point (not binding at lower levels) would be passed down through administrative channels. The eligible couples would meet in their production team, residents' group, or factory to plan how to meet such targets. Taking into account their population size, they calculate the number of births which would yield the proposed birth rate, then proceed to "allocate" the births among themselves - deciding who should have a child in the coming year. In doing this they follow certain priorities in the following order: 1) newly marrieds are free to bear their first childwithout delay. (In some areas they may not even get birth control education until after the first child); 2) couples with only one or two children; 3) couples whose youngest child is closer to five years old. The couples thus allocated a turn will refrain from using contraception while the others practice contraception. Obviously adjustments have to be made for failure to conceive within the year, unexpected pregnancies, and situations where the husband works away from home; these are made by discussion and mutual agreement.
^Geoffrey McNicoll, 'Community-Level Population Policy: AnExploration*, Population and Development Review, September 1975, Vol. 1, No. 1, pp. 1-21.
2Pi-chao Chen, 'The 'Planned Birth' Program of the People's Republic of China', mimeograph, 1974, cited in McNicoll, Ibid.
130
This is certainly a straightforward and effective population policy,
but it seems highly unlikely that even a much less radical and
watered-down version of this approach would be workable in Bangla
desh and Pakistan under the present social structure. This approach
implies a consensus within the community, but given the hostilities
between the landowners and the landless it seems doubtful that fam
ily fertility decisions will move into the community arena.
With the apparent failure of voluntary family planning, some
have urged stronger methods to reduce fertility. But the case-
wise incentive system for both the acceptor and the family plan
ning worker used in Pakistan was rejected in the Bangladesh Five
Year Plan for the following reasons: The scheme led to corruption
and inflated reporting of contraceptive acceptance; it kept the
supervisory field officers deskbound making disbursements and
keeping records; it distorted the perspective of the programme,
and its demographic impact was low.
Any scheme which pays recipients for irreversible steriliza
tion raises difficult political and ethical issues which would have
to be carefully resolved in light of the Indian experience.
Stringent Fertility Policies
The Bangladesh Plan called for "...a set of bold and if neces
sary drastic policies for vigorous action with a view to reducing
this high rate of population growth..."^ It goes on to say that
^Planning Commission, Government of the People's Republic of Bangladesh, The First Five-Year Plan, 1973-78, Dacca, 1973, p. 537.
131
"No civilized measure would be too drastic to keep the population
of Bangladesh on the smaller side of 15 crores (150 million) for
sheer ecological viability of the nation".*
The Plan entertains the idea of punitive measures against
large families without actually calling for its immediate adoption.
We must consider the imposition of progressively increasing punitive measures against additional children after the second child on all couples. Once the programme gets well under way it may be worthwhile, for example, (i) to restrict ration cards in statutory and modified rationing areas to a maximum of two children; (ii) to debar couples from enjoying the benefit of fair price shops for more than two children per family. All couples should be required by law to register with the family planning organization.
The first phase of launching a major educational and motivational drive, if successful, should, at least, create a climate where the possibility of more drastic measures, such as compulsory- sterilization of either husband or wife after the second child, legalization of abortion and establishment of abortion clinics for performing abortion free of cost, social measures to bring about women's emancipation, etc., may be considered.2
Some stringent policies have been theoretically justified
to some as an attempt to internalize externalities. That is, if
many of the costs of high fertility are being externalized or paid
at the community or national level, it will be cheaper to have
higher fertility from the family point of view. If the family is
forced to accept the true costs of high fertility, their external
ities will be internalized; and the costs of high fertility will
be greater.
However, policies aimed at internalizing the cost of high
^Planning Commission, Government of the People's Republic of Bangladesh, The First Five-Year Plan, 1973-78, Dacca, 1973, p. 537.
2Ibid.

132
fertility upon large families would have adverse distributional
implications. The large families, already poor, would be made
poorer by paying the direct costs of educating their children, for
example. These sorts of policies would have an inverse welfare
effect, and would directly penalize the children in large fami
lies who, after all, had no involvement in the decisions regarding
their own existence. Such policies are likely to be viewed as
morally unacceptable as well as politically impractical and ad
ministratively infeasible. Furthermore, the demographic effec
tiveness is questionable.
Compulsory population policies have now been implemented in
India, and all the world knows the result. Without a well-defined
national policy, the Indian state governments began instituting
drastic policies of compulsory birth control. Overzealous bureau
crats proposed a number of compulsory birth control laws which
harassed the poor into irreversible sterility. Early in 1976 the
Haryana government passed legislation to punish the parents giv
ing birth to a third child with forced sterilization and a fine.
A few days later the Punjab government was reported to have ap
proved legislation making it an offense to have more than two
children. This crime was to be punishable with imprisonment and
a fine. The Maharashtra government had announced its planned
compulsory family planning. The state chief minister proclaimed
that people with "communicable diseases" would be forcibly ster
ilized. He did not specify which communicable diseases or what

133
would be done in the event the disease was cured.
The district magistrate of Varanasi reportedly ordered that
government employees in the district would not be paid their sal
aries in March 1976 if they did not "persuade” two persons to
accept vasectomy or tubectomy operations. It was reported that
the Delhi administration had forced every teacher it employs to
bring five persons to be sterilized in order to obtain their teach
ing salary for the month of March 1976. In some talukas of
Aurangabad, district teachers had been "advised" to be sterilized
and to "bring some cases for operations". On 30 March 1976 the
Maharashtra government proposed legislation in the state assembly2which authorized m certain conditions forced sterilization.
Years ago Frank Notestein wrote that such compulsory policies
will bring down the government before they bring down the birth
rate. They did bring down the government; but they also abused
the poor and powerless with irreversible sterilizations, and they
damaged the viability of the voluntary family planning programmes
as well.
The Development Hypothes-fs And The Transition Theory
What is the relevance of the demographic transition theory for
^"'Drastic Solutions’, Economic and Political Weekly, Vol. XI, No. 13, March 27, 1976, pp. 479-480.
2Ibid.
134
development planners in Bangladesh and Pakistan? At a time when
the demographic transition theory had been discredited by demo
graphers, it was adopted by many others, including important policy
makers, as a key assumption in the so called population-development
debate throughout the Third World and, particularly, at the U.N.
Bucharest conference in 1974.
...in a developing country where fertility is initially high, improving economic and social conditions are likely to have little if any effect on fertility until a certain economic and social level is reached; but once that level is achieved, fertility is likely to enter a decided decline and to continue downward until it is again stabilized on a much lower plane.
2It has truly been said that the best contraceptive is development.
Development goals generally have an effect on the socio-economic context of reproductive decisions that tend to moderate fertility levels.
4Take care of the people and population will take care of itself.
There is no need to take steps to affect fertility directly; all our resources should be directed to accelerating development, not preventing births
These statements take as a presupposition the theory of the
demographic transition, which itself is largely based upon the his
torical experiences of Europe. The Princeton European Fertility
^United Nations, Population Bulletin of the United Nations,No. 7, New York* United Nations, 1963, p. 143.
^Karan Singh, Statement made at the World Population Conference, Bucharest, August 1974, Mimeograph.
3World Population Conference, World Population Plan of Action,New York: United Nations Economic and Social Council, E/5585.(E/CONF. 60/19).
4Action Pack, Distributed by the World Population Year Secretariat of the United Nations Fund for Population Activities, 1974.
^National Academy of Sciences, et al., In Search of Population Policy* Views from the Developing World. Washington D.C.s National Academy of Sciences.
135
1Studies found very few generalizations that could be made about
the specific causal mechanisms which reduced fertility in Europe,
Furthermore, in some cases, fertility was found to have declined
prior to mortality. Of the generalizations that remain, Ansley2Coale offers three preconditions for a sustained decline m
marital fertility: 1) fertility control must be a matter of con
scious choice, 2) it must be perceived as a social or economic
advantage, and 3) birth control methods must be known, accepted,
and used.
Strictly speaking, the demographic transition theory is not
a scientific theory at all. The transition theory is too grand a
generalization; it lacks a measurable and specifiable causation
mechanism — it does not "explain"; it lacks a definite time scale;
it is of little predictive value; and furthermore, it does not even
accurately describe the experiences of Europe and Japan much less
Pakistan and Bangladesh,
Nevertheless, this grand generalization remains fundamental
to many assumptions upon which population and development policies
are based. The theory itself is based largely upon the historical
experiences of Europe which differed greatly from that of present
day south Asia. The following section analyzes these differences,
some of which might in general postpone a decline in fertility, and
some which might accelerate such a decline.
^Ansley Coale, 'The Demographic Transition Reconsidered',In International Population Conference, I.U.S.S.P., Liege, 1973, Vol. 1, pp. 53-72.
2Ibid.
136
Mortality and Fertility Decline
Mortality declined slowly in Europe over a long period of time,
and it was brought down largely by the improvement in the standard
of living. Naturally, declining mortality would have a positive
effect upon family size because there would be more survivors.
But the improved standard of living also had the important effect
of increasing people's aspirations, which in turn improved their
reproductive control, both directly and through changes in mar
riage patterns. At the same time, these increased aspirations
followed an intergenerational pattern and people acted in ways
that would prevent a decline in their standard of living. Thus,changed
they may have reduced their marital fertility or their marriage
patterns in an attempt to maintain themselves at their parents'
standard of living.^"
See D. V. Glass, 'Population Growth and Population Policy', Public Health and Population Change: Current Research Issues,Mindel C. Sheps and Jeanne Clare Ridley, Pittsburgh: Universityof Pittsburgh Press., 1965, pp. 3-24.
137
The decline in mortality in Pakistan and Bangladesh was caused
largely by technological advances transferred from the West and not
so much from any improved standard of living. These declines were
not only quicker but brought down the level of mortality below
that of early industrial Europe; and, thus, much higher rates of
population growth have ensued. But the mechanism which probably
did most to bring down fertility in the West — an improved stan
dard of living — is still absent in Pakistan.
Warren C. Robinson has identified four phases of mortality
decline in Pakistan.^ The first was during the period between
the turn of the century and the 1920s when sharp fluctuations in
mortality caused by famine and epidemics were controlled. Then,
during the 1920s and the 1930s, smallpox, plague, and cholera
were brought under greater control. At the time of Partition,
typhoid, malaria, tuberculosis and maternal mortality were the
major causes of death; but deaths from typhoid and malaria were
quickly reduced. Robinson sees the fourth phase occurring in the
mid-1960s when malaria and typhoid deaths continued to decline
along with a rapid decline in tuberculosis^rrelated deaths; but
with maternal and infant mortality rates remaining high — aver
aging between 172 and 211 deaths per thousand^
‘SSTTcrude death rate of around 15 to 18 per 1000 population. In addition, there have been a great number of major
disasters including the 1974 famine, the 1971 War of independence,
^Warren C. Robinson, 'Recent Mortality Trends in Pakistan', in Studies in the Demography of Pakistan, ed. W. C. Robinson, Karachi: Pakistan Institute of Development Economics, 1967.
138
the 1970 cyclone and tidal wave, the 1947 partition of India,
and the Bengal famine of 1943, to name a few. Thus, the source
and pace of mortality decline in Pakistan was quite different
from that of the European experience upon which the demographic
transition theory is based.
The Rate of Growth
A rate of growth of around three per cent may not sound ex
cessive, but by historical standards it is phenomenally high; in
fact, it is unprecedented. A three per cent rate of growth, if
continued, will result in a doubling of the population every 23
years; and if further sustained, would result in nearly a 32
fold increase in a century. Historically, the rate of growth of
the human population from its earliest to its early modern times,
though marked with great fluctuations from disease and famine,
must have been nearly zero. That is, its growth rate could not .
have averaged more than 0.002 per cent or 20 per million per
year. Compare this with the annual rate of growth for Pakistan
and Bangladesh which is more than three per cent or 30,000 per
million. That is 1,500 times greater! During the European demo
graphic transition the annual rates of growth ranged between 0.5
to 1.5 per cent (5,000 to 15,000 per million) while averaging
around 0.7 per cent (7,000 per million). Europe had few countries
with doubling times less than 50 years, and most doubled around
every 90 years. A three per cent rate of growth requires a huge
effort just to maintain investments in social overhead at current
inadequate per capita levels. And investments to actually improve
139
the standard of living — the driving force of the decline in fer
tility in the West — are all the more difficult.
In 1901 the population of what was later West and East Pakistan
was estimated to have been around 46 million; 50 years later in
1951 the population had increased to around 76 million, an addi
tion of 30 million persons. During the following ten years, 1951
to 1961, the population grew by some 18 million to 102 in 1961.
In 1951, after Pakistan*s first partition, the population size
for the West was reported to be 33.7 million with an average annual
rate of growth of 1.7 per cent between 1941 and 1951, a rate which
would double its population every 40 years. In 1972, at the time
of Pakistan's second partition, the Census reported a population
size for the West of 64.9 million with an average annual growth
rate of 3.7 per cent between 1961 and 1972, a rate which would
double its population every 19 years. If one accepts these figures
as true, then Pakistan has very nearly the highest rate of growth
in the world
If the following conservative estimates of the average rates
of growth (3.0 per cent for Bangladesh and 2.5 per cent for Pakis
tan) were to continue unchanged and are applied to mid-year 1970
*Lee L. Bean has argued, on the other hand, that the population estimate of the 1972 Census of Pakistan is inflated because the Census occured at the same time as the Sind language riots and conflicts over state representation to the National Assembly which resulted in overreporting to gain greater regional representation, much like India in 1931, and Nigeria in 1962 and 1972. But Bean still estimates the true size at around 60 million with an average annual rate of growth of three per cent. See Lee L. Bean, 'Demographic Review, The Population of Pakistan: An Evaluation of Recent Statistical Data', Middle East Journal, Vol. 28, No* 2, Spring 1974, pp. 177-184.
140
estimates of 69.2 million (100) and 57.0 million (100) (with the numbers in the parentheses as base index numbers), then by the
year 2000 the population would reach 170.2 million (246) and
120.7 million (212). By the year 2030 the population would reach
418.6 million (605) and 255.5 million (448) — more than a six and
four fold increase respectively. But are these projections real
istic? No, this sort of projection makes the unlikely assumption
that fertility, mortality, and migration will remain unchanged;
or, at least, that their net sum, the rate of growth, will remain
unchanged•
Population Growth
Using alternative projections, Tomas Frejka* suggests that by
the year 2000 these populations could increase to between 151 and
186 million for Bangladesh and 110 and 130 million for Pakistan.
What are the basis for these projections? Essentially the range
of these projections result from differing assumptions about fer
tility declines. International migration is assumed to be nil
while mortality is assumed to decline, but this decline is the
same in each projection. Thus, the differing range for the year
*Frejka assumes the following demographic statistics for Bangladesh and Pakistan, respectively. In 1972, a crude birth rate of 44 and 45; a crude death rate of 17 and 16; and thus a crude rate of natural increase of 27 and 29. For the period 1965 to 1970 the total fertility rate (TFR) is assumed to be 6.8 and 6.2, the gross reproduction rate was estimated at 3.3 and 3.0, and a net reproduction rate of 2.5 and 2.3 was used. Under these mortality conditions a total fertility rate of 2.6 would represent replacement in both countries. See Tomas Frejka, 'Bangladesh", Country Prospects, New York, The Population Council, 1974, 31p; and Tomas Frejka, 'Pakistan', Country Prospects, New York, The Population Council, 1974, 31p.

141
2000 is entirely due to different assumptions about fertility
decline. Under these assumptions a slow decline in fertility
would result in the high estimates of 186 and 130 million, re
spectively; but with a drastic decline in fertility, the popula
tion would still reach 151 and 110 million, respectively. Frejka's
approach assumes that at some point in time the population of
Bangladesh and Pakistan will cease to grow and will become sta
tionary. These alternative projections allow us to examine the
feasibility of a stationary population at different points in time,
to get some idea of the eventual size of the population, and to
see the demographic conditions occurring with different paths of
growth. However, they do not show the more pessimistic path to
a stationary population created by a substantially increased mor
tality.
Age Structure
Because of the high fertility, the age structure in Asia is
much "younger'' than it was in Europe; and, thus, it is much more
difficult to reduce the rate of population growth. The momentum
of this young age structure will ensure a substantial growth in
population even if fertility were suddenly to drop to replacement
levels. Let us suppose that fertility were to immediately drop
to the level of replacement; that is, a level just above two chil
dren per family on average, a level which would ensure that enough
children would survive to their own childbearing years to enable
then to exactly replace their parents. Each person in the popula
tion would be replaced by only one other person, no more and no
142
less. At first glance one might expect that the rate of population
growth would then immediately drop to nil. However, the high pro
portion of young people in the age structure will make the con
tinued growth of the population inevitable for some 60 to 70
years•
One of the most startling implications which leaps from Frejka's
projections is the effect of the age structure on the evermal size
of the population. Even on the most unrealistically optimistic,
indeed now impossible, assumption where there
is an immediate decline in fertility to the level of replacement
in 1970 and from there afterward, Bangladesh's population would
grow by about 46 per cent by the year 2000 and would finally level
off in the year 2050 with a population some 87 per cent larger
than in 1970. Under the same assumptions, Pakistan's population
would level off at a size some 70 per cent greater than in 1970.
Fertility
The present levels of fertility in Bangladesh and Pakistan,
with a crude bixth rate of between 45 and 50 per thousand, are
much higher than that of pretransition Europe. The crude birth
rate of early 19th century Britain was less than 35 per thousand.
The main reason for this difference is the early and near univers
ality of marriage in Asia. Such a high fertility level would
have to fall a great deal farther than it did in the West in order
to achieve a low rate of growth. To date, there has been no
evidence of a decline in fertility.
A major effort to make an estimate of fertility was the Pakistan
143
Population Growth Experiment of 1962-1965. This was the first
national dual record survey which required four years of field
work and another five years for matching, analysis, rechecking,
and publication. The fertility estimates for what is now Bangla
desh were thought to be somewhere between the registration figures
( Crude birth rate of 44 and a total fertility rate of 6.29)
and the Chandrasekaran-Deming adjusted figures ( C.B.R. of
53 and total fertility of 7.4). Similiarly, crude birth rates
for Pakistan were reported to be between 42 and 52. Serious
methodological criticisms including false non-matches resulting
in inflated estimates have been raised about this study. J.G.C.
Blacker has also criticized the time and apparent cost of such
dual procedures relative to the effort needed to complete single1 2 surveys. In analyzing the data M. Badrud Duza found no signif
icant fertility differentials among urban and rural populations.
Since fertility differentials usually accompany a decline in fer
tility, he argues on theoretical grounds that a decline in fertility
was unlikely, especially since the mass of the population has been
so little affected by the kinds of socio-economic development
^See F. Yusuf, Population Growth Estimation: Studies inMethodological Matching of Vital Events, Research Report No. 67, Karachi: Pakistan Institute of Development Studies, 1968; W.Brass, 'A Critique of Methods for Estimating Population Growth in Countries with Limited Data', Bulletin of the International Statistics Institute, Vol. 44, No. 1; and most recently see J.G.C. Blacker, 'Dual Record Demographic Surveys, A re-assessment', Population Studies, Vol. 31, No. 3, November 1977, pp. 585-597.
^M. Badrud Duza, 'Differential Fertility in Pakistan*, Studies in the Demography of Pakistan, Warren C. Robinson, ed., Karachi: Pakistan Institute of Development Economics, 1967, pp. 93-137.
144
normally associated with smaller family size. Duza also argues
that the age specific fertility rates arelikely to have remained
fairly constant even though the crude birth rate may have fluc
tuated because of changes in the age structure of the population
as well as random and nonrandom changes from year to year.
Between 1968 and 1969 the National Impact Survey was under
taken to study the demographic effects of the family planning pro
gramme. The validity of the fertility and infant mortality level
and trend data are dubious at best.^
The Bangladesh Retrospective Survey of Fertility and Mortality
followed immediately upon the 1974 Census and gave estimates of
7.08 for total fertility and a crude birth rate of 48 per thou- 2sand. Blacker has noted that the indirect techniques used to
derive these estimates probably resulted in an underestimation of3the events rather than an overestimation. In any case, there is
no evidence of a fertility decline.
No evidence of a fertility decline was found in the 1975 Pak
istan fertility survey conducted as a part of the World Fertility_...............4 .................................................Survey programme.
*See I. Sirageldin, D. Norris and M. Ahmad, ’Fertility in Bangladesh: Fact and Fancies*, Population Studies, Vol. 29, No.2, July 1975, pp. 209-216.
^Bangladesh, Census Commission, Bangladesh Population Census, 1974, Provisional Results, Bulletin, Dacca, 1975.
3Blacker, loc. cit., p. 589.APopulation Council of Pakistan, Pakistan Fertility Survey:
First Report Lahore, Directorate of Production and Publication, 1976, xix, llOp.
145
Thus, the fertility levels in Bangladesh and Pakistan are
high compared to those of other less developed countries and are
extremely high in comparison with those of pretransition Europe.
Fertility would have to drop much farther to reach replacement
levels, and to the best of our knowledge, a downward trend has
not yet begun.
Education
There is some evidence that universal primary education may
reduce the level of fertility in Asian countries. Primary educa
tion, especially for women, may result in a desire for smaller
families by expanding nontraditional opportunities and by increas
ing the opportunity costs of early marriage and familial roles.
It also raises intellectual barriers between them and earlier and
more traditional generations. Education also raises the costs of
children through school-related expenditures while diminishing
their productive value in agriculture and at home. It is also
argued that education may make people more receptive to family
planning information.
However, because the school-age population is increasing so
rapidly, Pakistan and Bangladesh are having difficulty maintain
ing even past enrollment ratios which are abysmally low. Less than
one out of ten persons in Bangladesh is functionally literate, or
has at least five years of formal education.^ Gavin Jones has
Hf. Henry Mosley and Monowar Hossain, ’Population: Backgroundand Prospects', Disaster in Bangladesh: Health Crisis in a Developing Nation, New York: Oxford University Press, pp. 8-17.
146
analyzed educational targets against projected population growth
for Pakistan and concluded "(the nation). •.would find it impossible
to provide universal, high quality education within a decade or
two even if fertility were to decline quite rapidly."^Nevertheless, much more could be done to improve education
even within the existing financial constraints. The distribution
of primary education could be greatly expanded if less were spent
on higher education. The curriculum could be vastly altered and
made relevant to rural peoples. Some type of nonformal education
combined with an agricultural extension service could be more ef
fective than a formal system.
Gavin W. Jones, * Effect of Population Change on the Attainment of Education Goals in the Developing Countries', Rapid Population Growth. National Academy of Sciences, Baltimore and Londons The Johns Hopkins Press, 1971.
147
Nonagricultural Employment
There is some reason to believe that Europe's fertility declinei
i was accompanied and reinforced by urbanization and a movement away
from agricultural employment. But because of Asia's rapid popula
tion growth, the demand for non-agricultural jobs far exceeds the
supply; and since urbanization without urban jobs will not improveI[j the standard of living, fertility may remain high. According
to an unpublished paper by Hofraeister,^ the total employment for
registered factories (all factories with more than ten employees)
was less than the average yearly increase in the labour force, de
spite the fact that manufacturing represents more than 15 per cent
of Pakistan's gross domestic product. The growth of the labour
force in relation to expected employment is perhaps the most dis-iI 2turbing and most inevitable aspect of population dynamics.I| The scarcity of jobs and, thus, the low standard of living mayfI in part account for the unusual fact that fertility differentials
between urban and rural areas are so slight.
Employment of Women
If the increase in nonagricultural employment of women was
^R. Hofmeister, 'Economic Situation and Prospects in Pakistan, 1974', Annex D, Document of the World Bank, forthcoming, 1974.Cited in D. C. Rao, 'Urban Target Groups', Redistribution with Growth, Hollis Chenery et al., Londons Oxford University Press, 1974, p. 139.
2See, for example, the work by Ghazi Farooq including, 'Dimensions and Structures of Labour Force in Relation to Economic Development: A Comparative Study of Pakistan and Bangladesh', Islamabad,Pakistan Institute of Development Studies, 1975.
148
a factor in Europe's reduced fertility, it is not likely to be a
factor which will reduce fertility in Bangladesh and Pakistan.
Even if the status of women were somehow greatly improved, the
number of women entering into employment would be severely limit
ed because of the rapid growth of the labour force population.
Chaudhry has recently found an overall negative relationship
between fertility and the proportion of women in the labour force
in Bangladesh,^ and he even reported a negative relationship with
agricultural activity and a positive relationship with non-agricul-
tural activity. Nasra M. Shah, however, argues that this might
result from an artifact in the data as participation rates might
have been over-reported and fertility under-reported in the rural 2areas.
Shah's multivariate analysis of the 1968-69 National Impact
Survey found that a weak bivariate relationship was not substanti
ated, and that the "net" effect of the wife's employment on desiring
an additional child was negligible. The age of wife and the num
ber of living sons was deemed much more crucial than any socio
economic factors. "Given our data limitations, we can say with
some confidence that policies for increasing female employment can
not be expected to have miraculous negative effects on fertility,
^Chaudhry, Rafiqul-Huda. 'Labour Force Status and Fertility',The Bangladesh Development Studies, Vol. II, No. 4, October, 1974, pp; 819-838.
^Shah, Nasra M.. 'Female Labour Force Participation and Fertility Desires in Pakistan: An Empirical Investigation',Pakistan Development Review, (Islamabad) Vol. 14, No, 2, Summer 1975, pp. 185-206.
149
except for specific jobs in some subgroups (such as professionals)*"
Migration
Migration played an important role in Europe by lessening the
effects of rapid population growth as tens of millions of persons
moved to the Americas and elsewhere. But it is completely unreal
istic to expect outmigration to mitigate the current population
growth. The migrants would be unacceptable to any other country
and Pakistan’s history of mass migration has already been more
than tragic. Following the first partition, the 1951 Census found
one out of every 14 Pakistanis was a refugee. During the Bangla
desh War of Independence there were perhaps as many as ten million
refugees, though this official estimate may be an overstatement.2But the appalling conditions m the refugee camps is not overstated.
Any policy or programme which would encourage migration on a scale
that would be demographically effective would not be politically
realistic, administratively feasible, nor morally acceptable. Such
a migration could only be another tragic response to a catastrophe.
Shah, Nasra M.. 'Female Labour Force Participation and Fertility Desires in Pakistan: An Empirical Investigation’,Pakistan Development Review, (Islamabad) Vol. 14, No. 2, Summer 1975, p. 203.
2J. E. Rohde, L. C. Chen, and P. Gardner, 'Refugees m India: Health Priorities', Disaster in Bangladesh: Health Crises in aDeveloping Nation, L. C. Chen, ed., New York: Oxford UniversityPress, 1973.

150
Marriage
Because of the early and near universal marriage in Asia
there is a greater potential for reduced fertility via a delay
in the age of marriage or a reduction in the proportion marrying
than existed in Europe. European marriage patterns prior to the
decline in fertility consisted of much later and less universal
marriages.^ The decline in overall fertility would have been
even greater in Europe had these marriage patterns remained con
stant, but some countries experienced trends toward earlier and
more universal marriages. At least this is not possible in Bang
ladesh and Pakistan.
In Bangladesh the female age of marriage among rural women is
as early as 13 and around 16 for urban women. The average age of
marriage for men is comparably high at around 23 to 24, making2them on average nearly ten years older. Mosley and Hossain re
port that "nearly all women marry and...marry at an early age.
Fifty per cent of all females are married by the age 13 and over
99 per cent are married by the age of 19. On average, males........................................3are ten years older than their wives."
^Industrializing Western Europe was very unusual in its pattern of late marriage and nonmarriage. See John Hajnal, 'European Marriage Patterns in Perspective', Population in History, D. V. Glass and D. E. C. Eversley, eds., Chicago: Aldine, 1965.
^See Mohammad Afzal, 'The Fertility of East Pakistan Married Women', in W. C. Robinson, loc. cit., 1967j M. Dadrud Duza, loc. cit., 1967; M. Obaidullah, 'On Marriage, Fertility and Mortality', Demographic Survey in East Pakistan, Dacca: University of Dacca;and M. Badrud Duza and C. Stephen Baldwin, Nuptiality and Population Policy, The Population Council, 1977, pp. 49-56.
3W. Henry Mosley and Monowar Hossain, loc. cit.
151
With the limited capacity for educational expansion, it seems
doubtful that formal education for women could be employed to re
duce or delay marriage. The best that might be done within this
social structure would be to greatly expand nonformal educational
programmes for women.
It is also unrealistic to expect industrial employment or even
urbanization to have much impact on marriage patterns. The Bangla
desh Academy for Rural Development has successfully experimented
with new cottage industries for women’s cooperatives; and while it
may demonstrate some feasibility, that is, Muslim women are will
ing to work outside the home, there are great difficulties in ex
tending such programmes across the countryside. The Women’s Re
habilitation Board^ and the Bangladesh Rural Advancement Committee
are also involved in such experiments.
The Bangladesh First Five Year Plan proposes to increase the
age of marriage through legislation: "in an attempt to check high
growth rate of population necessary steps to promulgate a law
raising the legal age of marriage will be taken during the plan
period in collaboration with the relevant Ministries." This is
not much. There are no details of implementation; and no mention
is made of how low the age of marriage is, how much it varies, or
its universality. But how effective might a policy be if it were
really implemented? Many countries have attempted to ensure a
minimum legal age at marriage for nondemographic social reasons,
^See S. Jahangeer Haider, ed., Women’s Work, Dacca: NationalBoard of Bangladesh Women’s Rehabilitation Program, 1974; and Khushi Kabir, Ayesha Abed, and Marty Chen, 'Rural Women in Bangladesh: Exploding Some Myths’, Report No. 42, Dacca, Ford Foundation, May 1976.
152
but any enforcemnt in Bangladesh, for any reason, would be very
difficult. A government incentive scheme would be dependent upon
the ability to prove one's legal age, nearly impossible in a coun
try without vital registration or similiar administrative measures.
Birth Control Technology
New methods of birth control have become much more effective
than the traditional methods used in the European decline of fer
tility. Providing that such methods are known, available, and
acceptable, any given level of motivation for reducing fertility
will probably result in more effective fertility control.
Abortion, another factor reducing fertility in Europe, is now
a potentially safe technique. In some countries government policies
on abortion have produced some dramatically rapid changes in fertil
ity. In Japan, fertility declined rapidly after the legalization2 . . . of abortion, while in Romania fertility rapidly increased lmraedi-
^This brings to mind a relevant statement by Karol Krotki in which he explained the opposition by some to a vital registration system, "...the public is only too happy to go on with its present erratic systems. In fact it sees an actual advantage in not having births registered. In the absence of a birth certificate, the age limit at stages of one's life when it really matters, such as: admission to school, early marriage, admission and promotionin public life, compulsory retirement, becomes less rigidly operative." Karol J. Krotki, The Problem of Estimating Vital Rates in Pakistan, United Nations World Population Conference, September, 1965, WPC/WP/234, mimeographed, p. 1.
TCingsley Davis, 'The Theory of Change and Response in Modern Demographic History', Population Index, Vol. 20, No. 4, October 1963, pp. 345-366.
153
ately following-restrictive policies. There are no laws forbid-
ing abortion in Pakistan and the Bangladesh First Five Year Plan
suggests a liberalization of the abortion laws. Ambulatory ser
vices for abortion and "menstrual regulation" were provided by
at least two clinics in 1974. In 1975 the government of Pakistan
officially sponsored training in the use of aspiration abortion 2procedures. But abortion is not openly discussed m either of
the two countries; and though it is practiced in the rural areas
to prevent unwanted illegitimate births, there are strong reli
gious and social objections to its use. Although there is no
specific mention of abortion in the Quran, and some modern Is
lamic thinkers have agreed on a rather liberal view of abortion
in the first 120 days after conception, much of the population
and even those women who resort to abortions themselves may view
it as contrary to their religion. It is commonly believed that
.if abortion was to become an important public policy, it would be
strongly opposed.
In .general, modem methods of contraception, if acceptable
^Fertility rose for only a short time and then fell, suggesting that the population at first had become dependent upon abortion as a normal method of birth control; but then they accomodated to the new regulations by simply changing to other methods of birth control. The increase in fertility resulted from a lag in the change from one method of birth control to another.
See Michael S. Teitelbaum, 'Fertility Effects of the Abolition of Legal Abortion in Romania', Population Studies, Vol. 26, No. 3, November, 1972, pp. 405-417.
Xhristopher Tietze and Marjorie Cooper Murstein, Induced Abortions: 1975 Factbook, Reports on Population/Family Planning,No. 14, 1975.
154
and accompanied with appropriate motivation, provide a greater
potential for a rapid fertility decline than existed in Europe*
European fertility might have fallen much more quickly and to a
lower level had oral contraceptives, IUDs and other modern methods
been used instead of the more traditional methods which included
coitus interruptus. The traditional methods can be effective pro
viding there is enough motivation to use them properly. The main
difference is that there was substantial motivation in Europe
while there is little in Asia today. But for any given level of
motivation, modern contraceptives will result in more effective
birth control. Some modern methods may also require less fre
quent motivation, that is, a person may only have to be motivated
once to have an IUD. Thus, if there is sufficient motivation to
regulate fertility, the methods are available today for a more
rapid transition than occutjed in Europe.
Certainly there were no population policies and family plan
ning programmes to supply these contraceptives during the European
fertility transition, and the whole range of policies discussed
in other sections of this thesis may well accelerate a decline in
fertility.
Linguistic Barriers, the Mass Media, and Fertility Decline
The Princeton European Fertility Studies found some evidence
that contraceptive practices in Europe spread easily within linguis
tic or cultural groups but not easily between them. This may facil
itate the diffusion of these practices in Bangladesh but not in Pak
istan where there is much less unification among the Punjabis,
155
Pathans, Sindis, and Baluchis.^ But unlike transitional Europe,
Pakistan is developing a modern communication system which has a
much greater potential for permeating these linguistic barriers.
In Bangladesh, travel and communications are very difficult in
much of the rural area and during some seasons, are not possible
at all.
Through technical improvements in the mass media there may come
a general commercial saturation by Western culture; and among
its many influences, it may bring an "increased legitimacy of2the small family norm". This example, which pretransition Eu
rope never really had, may show that a small family is normal and
legitimate and that the planning of births is both within the
calculus of conscious choice and is really feasible,3 AThere is also increasing evidence from Kirk, Beaver, and
Mauldin^ that in other Third World countries where fertility is
^The 1951 Pakistan Census (Vol. I, p. 71) found the following linguistic proportions: Urdu, 7.2 per cent; Punjabi, 28.Aper cent; Pushto, 7.1 per cent; Sindhi, 5.0 per cent, and Bengali,5A .6 per cent.
^Michael Teitelbaum, * Relevance of Demographic Transition Theory for Developing Countries', Science, Vol. 188, 2 May 1975, pp. 420-425.
3Dudley Kirk, 'A New Demographic Transition?' Rapid Population Growth, National Academy of Sciences, Baltimore: JohnsHopkins Press, 1971, pp. 123-147.
4Steven E. Beaver, Demographic Transition Theory Reinterpreted: An Application to Recent Natality Trends in Latin America. Lexington: Lexington Books, 1975, 208 p.
5W. Parker Mauldin, 'Assessment of National Family Planning Programs in Developing Countries', Studies in Family Planning,Vol. 6, No. 2, 1975, pp. 30-36.
156
declining, it is doing .so at "a much more rapid pace than it did
historically in Europe and among Europeans overseas".^
Development and Fertility
During the decade of the 1960s Pakistan's rate of economic
growth was much more rapid than anything experienced during the
European transition. That rapid growth did not continue during the
1970s, but it could not have been expected to in view of the civil
war and all the other political and natural calamities; and besides,
such growth rates often fluctuate. But nevertheless, there re
mains a great potential for rapid economic expansion in the agri
cultural sector for Bangladesh and in both agricultural and non
agricultural sectors in Pakistan. The agricultural output per
acre in Bangladesh is exceedingly low by international standards,
and this is to a large extent a reflection of the low level of
fertilizer and other biological inputs used per acre. So even
without massive investments in flood control, Bangladesh has a
tremendous potential for increased agricultural output.
Shortages of capital, technology, and trained personnel can
be surmounted by transfers from the developed world; and, if ap
propriately applied to the problems of development, they could,
in theory, be a great advantage which transitional Europe did
not have. Unfortunately, such transfers also bring a tremendous
dependency and a distortion of development objectives.
The rate of population growth, the absolute number of people
“Dudley Kirk, fA New Demographic Transition?1 Rapid Population Growth. Consequences and Policy Implications. National Academy of Sciences, (Baltimore: The Johns Hopkins Press), 1971, pp. 123-147.
157
added every year, and even the density of population on. the land
is so high, that the chances for development are less than those
of pretransition Europe. A large proportion of the development
budget must go toward maintaining, rather than improving, per
capita investments' in social overhead for a growing number of
people. . w Since fertility
is high, the child dependency ratio is high; and, thus, there
are relatively higher costs to maintain the same per-capita in
vestments in education, housing, health, and so forth. This in
turn reduces the potential level of investment, and it may limit other
investment from/more productive sectors. With the labour force
growing so rapidly, the capital investment per worker is reduced;
and, thus, the productivity per worker may not increase. At
the same time, unemployment continues to increase.
To the best of our knowledge, the rapid economic growth in
the 1960s did not result in a reduction of fertility. There could
be many explanations of this since we are unsure of the causal
mechanisms which relate these phenomena. It might easily be argued
that under the present circumstances, economic growth reduces fer
tility only over the long run through indirect effects, and that
in the short run, it might have the direct effect of increasing
fertility. Pakistan's economic growth was not sustained for a
long period and had it continued for a longer duration, there
might have been a measurable demographic change. It might be
that a rapid rate of growth at this low level of development would
not have a negative effect upon fertility in any case. But per
haps the key issue lies in how this rate of growth was distributed
158
across the population.
Is development an ip so facto population policy? Over the
long run development is an important way of reducing fertility.
But the desire for economic growth is widespread; and if govern
ments are not already doing everything they can to accelerate
economic growth, it seems doubtful that they will do more to fos
ter growth just because over the long run it might reduce fertility.^
There is certainly a consensus that the more economic growth these
countries have the better; it will improve the standard of living;
it will enable better preparation for the population growth that
is inevitable; and it may reduce fertility over the long run. But2such platitudes are not of much use to development planners. The
fundamental issue is the type of developments what set of policies?
how will these be implemented? and what sort of impact and distri
bution will there be? Demographic considerations should be taken
into account in all of these aspects, and particularly in regards
to which aspects of development strategy will most effectively re
duce fertility.
^"That population policy considerations somehow could speed up the overall level of such development efforts of governments seems to me to be an extremely farfetched idea". Paul Demeny,•On the Economic Theory of Fertility*, A paper presented at the Conference on the Economic Aspects of Population Growth, Valescure, France, 3 September 1973, Mimeo, p. 4.
2"We are likely to be left with the platitudinous proposition that economic and social development will be helpful in solving the population problem - the more development, the better - but the structure of development measures, the real policy issue, remains determined without reference to demographic considerations". Paul Demeny, Ibid, p. 5.
159
Population policies and development are not mutually exclus
ive and there are many reasons to think that they are reinforcing.
Any "either/or" type of argument is not cogent because there is
little reason to choose between them if they are mutually suppor
tive.^ Population policies should not and have not been a sub
stitute for development efforts. This does not mean that there is
no room to argue about their relative importance or the way in which
international agencies have given emphasis to population. But
nevertheless, in this writer’s view, the size of the family plan
ning budget compared to development budgets has not been excessive,
especially in relation to the magnitude of the population growth
in these countries. If the entire family planning budget for Pak
istan in 1966 or 1967 had been diverted instead to education it
would have brought 8 and 7 days respectively, of extra education;2or raised by 3.6 and 3.0 per cent the number of children in school.
The family planning programme then accounted for about 12 per cent3of the budget for the Ministry of Health. Had the funds been di
verted to the military they would have raised deferc e expenditure
1See Michael S. Teitelbaum, 'Population and Developments Is
a Consensus Possible?' Foreign Affairs, Vol. 52, No. 4, July 1974, pp. 742-760.
2Gavin W. Jones, 'Effect of Population Change on the Attainment of Educational Goals in the Developing Countries', Rapid Population Growth, Consequences and Policy Implications, National Academy of Sciences, Baltimore and Londons The Johns Hopkins Press, 1971, p. 357.
3Dorothy Nortman, 'Population and Family Planning Programss A Factbook', Reports on Population/Family Planning, New Yorks The Population Council, December, 1969.
160
by only 1.8^percent. If anything is competing with the develop
ment budget it is the military and not the family planning pro- 2gramme.
While population policies have not been a substitute for devel
opment, neither should development be a substitute for population
policies. Population policies should be a component of develop
ment policies, and they should be integrated into development 3planning. Unfortunately, this is not as easy as it may seem. It
is relatively simple, though discouraging, to incorporate demographic
projections into various sectoral plans and to see what efforts
are needed to accomodate to the expected population. But integrat
ing policies of family planning and "beyond family planning measures"
is more difficult. How is family planning going to be efficiently
integrated into such programmes as health, maternal and child care,
^Gavin W. Jones, 'Effect of Population Change on the Attainment of Educational Goals in the Developing Countries', Rapid Population Growth, Consequences and Policy Implications, National Academy of Sciences, Baltimore and Londons The Johns Hopkins Press, 1971, p. 357.
2"To an economist...the inescapable conclusion would seem to be that Pakistan, which was already spending too much of her own resources on military purposes, was encouraged by the U.S. military aid program to spend even more on military purposes". David Bell, then Deputy Director, Pakistan-Iran Advisory Group, Graduate School of Public Administration, Harvard University, in Hearings on the Mutual Security Programs, House of Representatives, 86th Congress, First session, 22 January 1959.
3Riad B. Tabbarah, 'Population Policy Issues in International Instruments: With Special Reference to the World Population Planof Action', Draft of paper for publication in Journal of International Law and Economics, December 1974.
161
community and rural development, agriculture, and so on? Is
that really efficient? Are the benefits of specialization lost
by these steps? Will it not raise more problems?*1 Such policies
may be integrated at the top levels of government but integrating2them at the village level is difficult.
Perhaps what is needed is not so much an integration of the
family planning programme into these other areas but that these
other areas, or certain areas, be identified for special emphasis
in the development strategy. Kocher and Rich and others have em
phasized the extension of primary education; a greater equality
for women; a more equitable distribution of income; greater ef
forts to increase employment, especially for women; old age welfare
payments and so on. These sorts of policies with an important dis
tributional emphasis- will by definition most directly change the3lives and standard of living of the population. Such a distri-
These are questions raised by Bernard Berelson in The Great Debate on Population Policy, An Instructive Entertainment, New Yorks The Population Council, 1975, p. 4.
^aul Demeny, * Observations on Population Policy and Population Program in Bangladesh, 1960-74', Population and Development Review, Vol. 1, No. 2, December 1975, pp. 307-321.
3D. V. Glass has asserted that "direct programmes for spreading the use of birth control are, however, only a small part of the action in which developing societies will require to engage. The largest part will have to consist of planned economic and social development— and development at a considerably higher rate than appears to have been evident so far. This will be needed because, without an improvement in levels of living, birth control programmes may well be empty frameworks...Desirable social change may involve additional expenditure beyond that justifiable for purely economic considerations...Many of the developing societies themselves could and should do much more to mobilize and use their own resources, especially their human resources. Economic and social development must be shown to have meaning for, and impact upon, the population in general." D. V. Glass, 'Population Growth and Population Policy', Public Health and Population Change, M. C. Sheps and J. C. Ridley eds., Pittsburgh: University of Pittsburgh Press, 1965, pp. 23-24.
162
butional emphasis, if successfully implemented, would probably
have a tremendous demographic impact because of the sheer arith
metical power of weighted averages. There is an emerging inter
national consensus that this is the developmental structure which
is worthwhile in and of itself,^" and, furthermore, is likely to
have important influences on the motivation for reproductive con
trol .
But a word of caution must be added. Development plans and
programmes and virtually all other governmental efforts are made
within political and economic constraints and represent political
compromises within the existing power structure. Because these
programmes are worthwhile in and of themselves, they should have
been adopted already and they have not been. It certainly seems
unlikely that they will now be adopted because of their presumed3negative effect upon fertility.
^Even the World Bank is now emphasizing the distributional aspects of its programmes, see Hollis Chenery, et al., Redistribution With Growth, Londons Oxford University Press, 1974.
2See World Bank, Population Policies and Economic Development, Staff Report Baltimore* The Johns Hopkins University Press.
3"It is, in fact, doubtful whether arguments based on fertility effects of development policies are ever strong enough appreciably to modify the mix of development measures that planners would otherwise propose." Paul Demeny, ’Population Policy* The Role of National Governments', Paper presented at the First Regional Population Conference, Beirut, 18 February 1974, p. 9.
163
The Distributive Hypothesis And Fertility
It is evident that Pakistan’s rapid economic growth of the
1960s was extremely concentrated in a small modern sector which
absorbed a huge proportion of the total investment. This growth
was not shared with the vast majority of the population who were
denied access to physical and human capital. The inequitable
distribution of income was further reinforced by trade and
fiscal policies which intentionally financed industrial growth
with transfers from agriculture. Government policies further ac-r
celerated the trend toward a dual, bimodal agricultural system.
Furthermore, the inequality was exacerbated by the distribution
of public expenditure.
This has been the experience of many countries, especially
in the early stages of development. But it is not necessarily in
evitable as the experience from many countries during the last
fifteen years shows; there is a great diversity in income dis
tribution and, in a few cases, rapid growth has been accompanied
with a real improvement in the actual and relative welfare of
the poorest. Traditional welfare economics, which had stressed
that policies for optimum growth and policies for equitable dis
tribution are mutually exclusive, is now being called into greater
question. Even the World Bank is now emphasizing development
strategies, within the narrow limits of fiscal measures, which
will have growth implications for the poorest of the poor. Such
policies would encourage greater incomes for the poor by a redi
recting of public investment to expand their productive capacity
164
and income•
The development and demographic transition hypothesis fo
cuses mainly on «J»regate economic and social measures rather than
on their underlying distributions* This is essentially where it
differs from the distributive hypothesis as proposed by Kocher,^"2 3 4Rich, Repetto, and others including Stamper* James E* Kocher
has argued that a redistribution of income in the rural areas of
the Third World would not only accelerate a broad development
process and reduce dual or bimodal agriculture, but that such a
process may be crucial to a sustained decline in fertility. Kocher
does not specifically apply this theory to Bangladesh or Pakistan,
and it is one of the aims of this thesis to explore more fully
its relevance and application in these particular countries.
When discussing the effects of income on fertility, it is
first necessary to make an important distinction between the short-
run and the long-run effects. In the long-run, a previous in
crease in income influences structural changes by buying more ed
ucation, or better health, improved housing, and locational changes,
^James E. Kocher, Rural Development, Income Distribution, and Fertility Decline, New Yorks The Population Council, 1973.
^William Rich, Smaller Families Through Social and Economic Progress, Monograph No. 7, Washington, D.C.s Overseas Development Council, 1973.
3Robert Repetto, The Interaction of Fertility and the Size Distribution of Income, Research Paper No. 8, Cambridge, Mass.: Center for Population Studies, Harvard University, 1974.
4B. Maxwell Stamper, 'Some Demographic Consequences of the Cuban Revolution', Concerned Demography, Vol. 2, No. 4, March 1971, see also Amit K. Bhattacharyya, 'Income Inequality and Fertility;A Comparative View', Population Studies, Vol. 24, No. 1, March 1975, pp. 5-19.
165
as well as changes in outlook, and, some would argue, changes in
tastes for buying consumer durables including children. In the
short-run, however, an increase in income will have less impact
on such structural changes which might have fertility-reducing
effects later on. Thus, an increase in income may not reduce fer
tility but increase it temporarily, because the desire for children
has not changed though the cost of children is cheaper. It is this
time distinction which is usually used to explain the apparent
inconsistency between the negative relationship of income and
fertility in cross-sectional studies and the positive relation
ship found in time series
Another distinction should be made between absolute and re
lative income and fertility. First, we might ask, to what extent
is fertility influenced by redistribution of incomes to improve
the absolute incomes of the poorest? Secondly, to what extent
is fertility influenced by the redistribution of incomes to alter
a family's income relative to other families' incomes? Clearly
the latter is of less importance.
It is, of course, difficult to specify the exact causal mech
anism of these relationships. Part of this argument must lie in
the more general concept that fertility declines within the broad
context of social and economic development. And since it is gen
erally agreed that development will ultimately reduce fertility,
it seems evident that fertility will decline more quickly the
*See Julian L. Simon, 'The Effect of Income on Fertility', Population Studies, Vol. 23, No. 3, November 1969, pp. 327-341; Julian Simon, The Effects of Income on Fertility, Chapel Hills University of North Carolina Press, 1974.
166
sooner development reaches a greater proportion of the popula
tion. The sheer power of weighted arithmetical averages supports
the distributional argument.
According to this approach government policies should promote
a greater level of investment in human capital, and should do so
with a much wider distributional emphasis. Although much could
be done to improve the distributional aspects of government pro
grammes, it would be expensive for these poor countries to radical
ly increase the level of investment in human capital. But it
is argued here that it is feasible to increase the incomes of
the poor by redirecting public investment to expand their produc
tive capacity. Any efforts to increase the productive capacity
of the poor in Bangladesh or Pakistan must lie within the agricul
tural sector.^"
To briefly summarize, Kocher argues that government develop
ment policies which aim to accelerate the broad diffusion of new
agricultural technologies (See Figure 1 ) to the smallest farmers
would increase and widely diffuse productivity and incomes. This
in itself would enchance development. Greater incomes for the poor
In discussing rural development projects something must be said about the fundamental causes of rural poverty and inequality and different models of development. Neoclassicists might argue that the poor were excluded from technological changes while the large landowners were quick to adopt technology and thus became richer. While others might argue that the poor are so for historical reasons and that they have been systematically exploited, alienated, and marginalized by the landowning class. The type of interventions recommended for reducing rural poverty depend largely upon ones view of these fundamental causes. If one takes the latter view then projects which challenge the social structure are of great iraportancef^nstituting land reform, and the organization of landless and near landless peasant to challenge the existing structure^
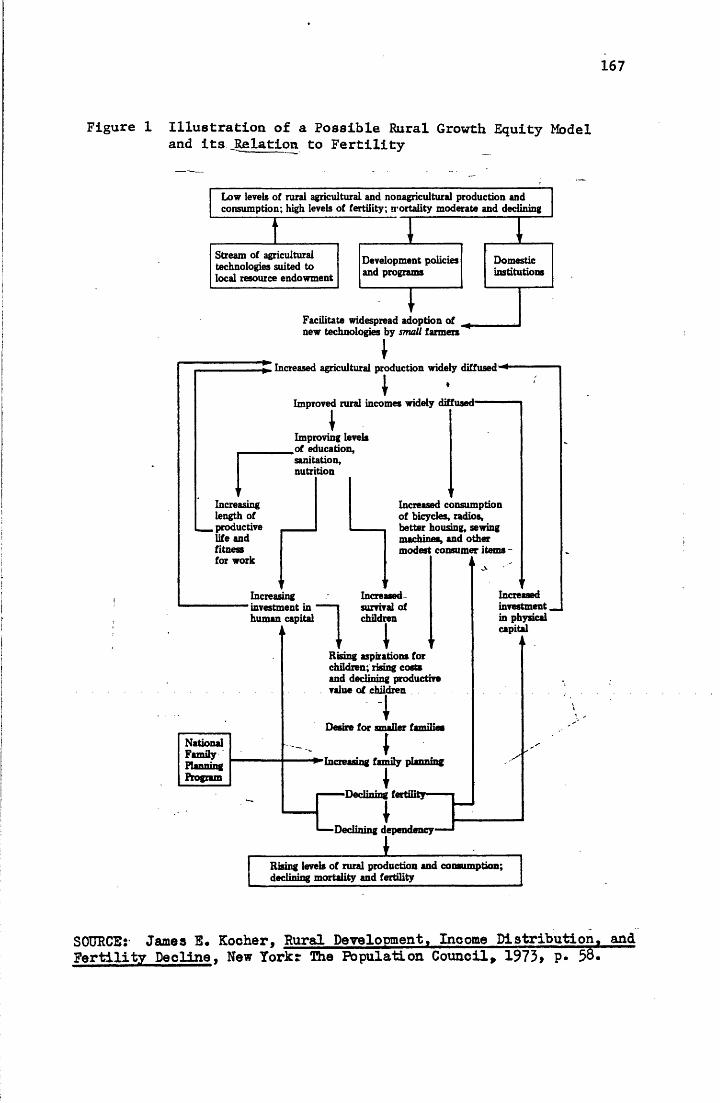
167
Figure 1 Illustration of a Possible Rural Growth Equity Model and its Jtelation to Fertility
Facilitate widespread adoption of new technologies by small fanners
Increased agricultural production widely d iffused^
Improved rural incomes widely diffused1
Improving levels ,of education, sanitation, nutrition
Increasing length of productive life and fitness for work
Increased consumption of bicycles, radios, better housing, sewing nmnhinaa, and Other modest consumer items -
Increasedinvestment__in physical capital
Increased survival of children
Increasing investment in human capital
Rising aspirations for children; rising costs and declining productive value of children
Desire for smaller families
'Increasing family planning
■Declining fertility*
Declining dependency*—^
National Family ' Planning Program
Domesticinstitutions
Development policies and programs
Stream of agricultural technologies suited to local resource endowment
Rising levels of rural production and consumption; declining mortality and fertility
Low levels of rural agricultural and nonagricultural production and consumption; high levels of fertility; mortality moderate and declining
SOURCE: Jamea E« Kocher, Rural Development, Income Distribution, andFertility Decline, New Yorkr The Population Council, 1 9 7 3 * P» 58*

168
would bring greater investment in physical capital as well as
a greater distribution and increased investment in human capital,
i.e., education, sanitation, nutrition and so forth. This new
and diffused investment in human capital would indirectly in
fluence the desire to control reproduction. These services would
bring an increase in child survival, and fewer births would be
necessary for a desired number of children to survive. With a
greater investment in human capital, parents* aspirations for
their children would increase. The child*s cost to the parents
would increase while the productive value of the children would
decline. Education, especially of women and children, will pro
bably in the long-run result in a desire for smaller families.
The cost of raising children increases when they attend even
free schools because of clothing, transportation and supply costs
and because they are of less productive value when they are away
from the home and the fields. It is also argued that education
raises intellectual barriers between their own generation and that
of more traditional earlier generations. Furthermore, education
for women expands nontraditional opportunities and raises the op
portunity costs of early marriage and familial roles.
It is also argued that diffused modernization brings with
it materialistic aspirations for not only radios, housing, sewing
machines and bicycles but also for water pumps, fertilizer, im
proved implements, and other physical investments which will fur
ther increase productivity. These materialistic aspirations begin
to compete with the cost of additional children.
All these factors working together over time and reinforcing

169
each other within the context of broad development will substan
tially contribute to the control of human reproduction. Under
these circumstances, a programme which supplies contraceptives
and relevant information is likely to accelerate the decline in
fertility.
On the other hand, if the productive capacity of the poor is
not substantially improved then the agricultural sector in these
countries will continue along its bimodal path. An accelerating
trend toward a dual agricultural sector — one modern, small,
highly productive subsector and one large, traditional subsector
having only marginal productivity. The trend toward dualism
is accelerated not only by the existing economic and political
power structure but by new technology and the way that new tech
nology is introduced and supported by government policies.
Kocher’s second scheme (Figure 2 ) . shows a remarkable
resemblance to the agricultural system of present day Pakistan.
The left of the illustration represents the small, modern, agri
cultural sector benefiting from government supports of mechanical
and biological technologies; rapidly rising incomes; conspicuous
consumption of imported luxury goods; investment in physical cap
ital (often labour replacing); and expenditure for education, san
itation, and nutrition and modern health services for a small pro
portion of the population. All this may result in some fertility
declines among those in this subsector but since its population is
so small, national fertility rates may remain unchanged.
The right side of the illustration represents the large, tra
ditional, poor, agricultural subsector, with little or no change
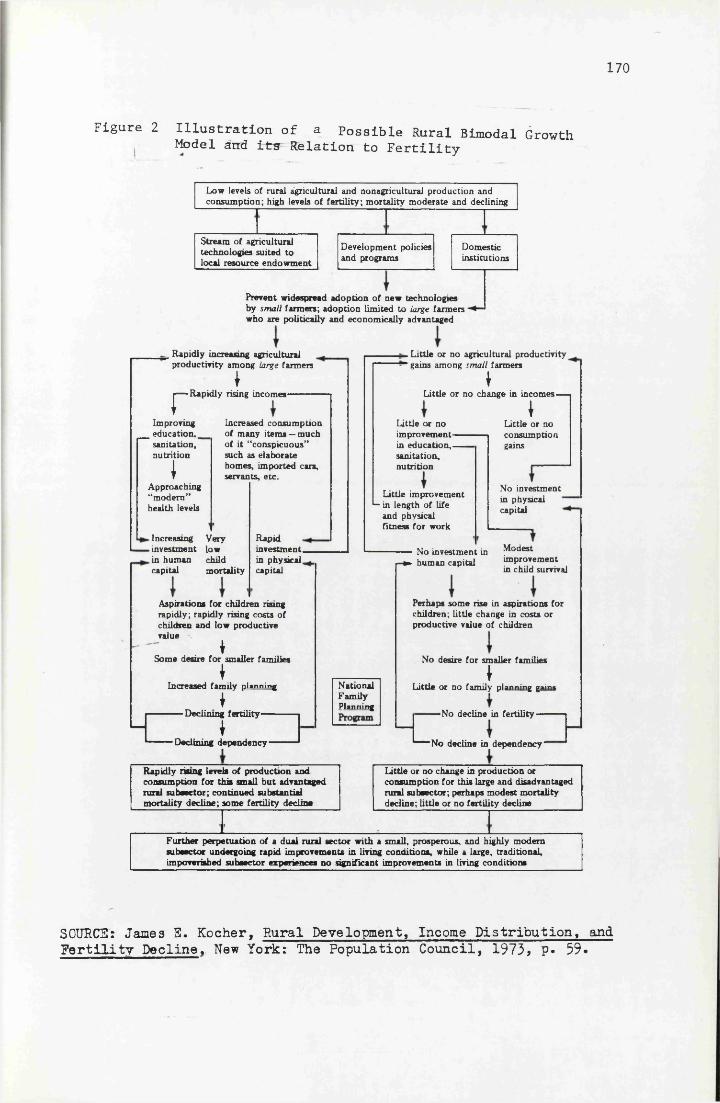
170
Figure 2 Illustration of a Possible Rural Bimodal Growth Model and itn Relation to Fertility
Prevent widespread adoption of new technologies by small farmers; adoption limited to large fanners
Domesticinstitutions
Development policies and programs
Stream of agricultural technologies suited to local resource endowment
Low levels of rural agricultural and nonagricultural production and consumption; high levels of fe rtility ; m ortality moderate and declining
who are politically and economically advantaged
, Rapidly increasing agricultural productivity among large farmers
Ir Rapidly rising incomes —
Improving education.
sanitation,nutrition
\Approaching “modem” health levels
Increased consumption of many items —much of it “conspicuous” such as elaborate homes, imported cars, servants, etc.
Increasing investment in human capital
Verylowchildmortality
\
Rapidinvestment, in physical, capital
. L ittle or no agricultural productivity gains among small farmers
ILittle or no change in incomes—
ILittle or no consumption gains
Little or noimprovement-----in education,-----sanitation,nutrition
Little improvement ^ in length of life
and physical fitness for work
No investment in physical capital
No investment in
4 1
Aspirations for children rising rapidly; rapidly rising costs of children and tow productive value
1Some desire for smaller families
IIncreased family planning
IDeclining fe rtility -----------
1Declining dependency*
NationalFamilyPlanning
—► human capitalModest improvement in child survival
Perhaps some rise in aspirations for children; little change in costs or productive value of children
No desire for smaller families
ILittle or no family planning gain*
No decline in fe rtility --------
No decline in dependency*
Rapidly rinng levels of production and consumption for this small but advantaged rural subsector; continued substantial m ortality decline; some fertility decline
Little or no change in production or consumption for this large and disadvantaged rural subsector; perhaps modest mortality decline; little or no fe rtility decline
Further perpetuation of a dual rural sector with a small, prosperous, and highly modern subsector undergoing rapid improvements in living conditions, while a large, traditional, impoverished subsector experiences no significant improvements in living conditions
SOURCE: James E. Kocher, Rural Development, Income Distribution, and Fertility Decline,. New York: The Population Council, 1973, P* 39*
171
in incomes; no improvement in education, nutrition, sanitation;
little investment in human or physical capital; little improve
ment in health; few changes in the costs or the productive value
of children; continued desire for large families; no motivation
for accepting contraception; and continued high fertility and de
pendency ratios. Since there is little demand for contraceptives,
family planning programmes would be ineffective even if they were
administratively effective.
There is not a great deal of evidence on this relationship
but what there is suggests some relationship between a more equit
able income distribution and lower fertility. Kocher looked at
the experience of twelve Third World countries and the U.S. (see
Table 13 ). He arranged these countries into three groups accord
ing to their fertility experiences (Columns 9 and 10), the first
group having the greatest declines in fertility and the last group
having the least. Within a group, the countries were then ranked
in order of their index of relative income inequality (Column 4)
from more to less equal. In the first group were South Korea,
Japan, Taiwan, and West Malaysia which have had rapid and sub
stantial declines in fertility and which according to these d&fca
had relatively less income inequality. Kocher hypothesized that
if a fertility decline was related to a more equitable distribu
tion of income then the first group of countries with the greatest
declines would also have had the most equitable distribution and
the group with little change would have greater inequality. In
the second group he listed the U.S.A., Sri Lanka, China, and Costa
Rica which have had more moderate declines in fertility but for
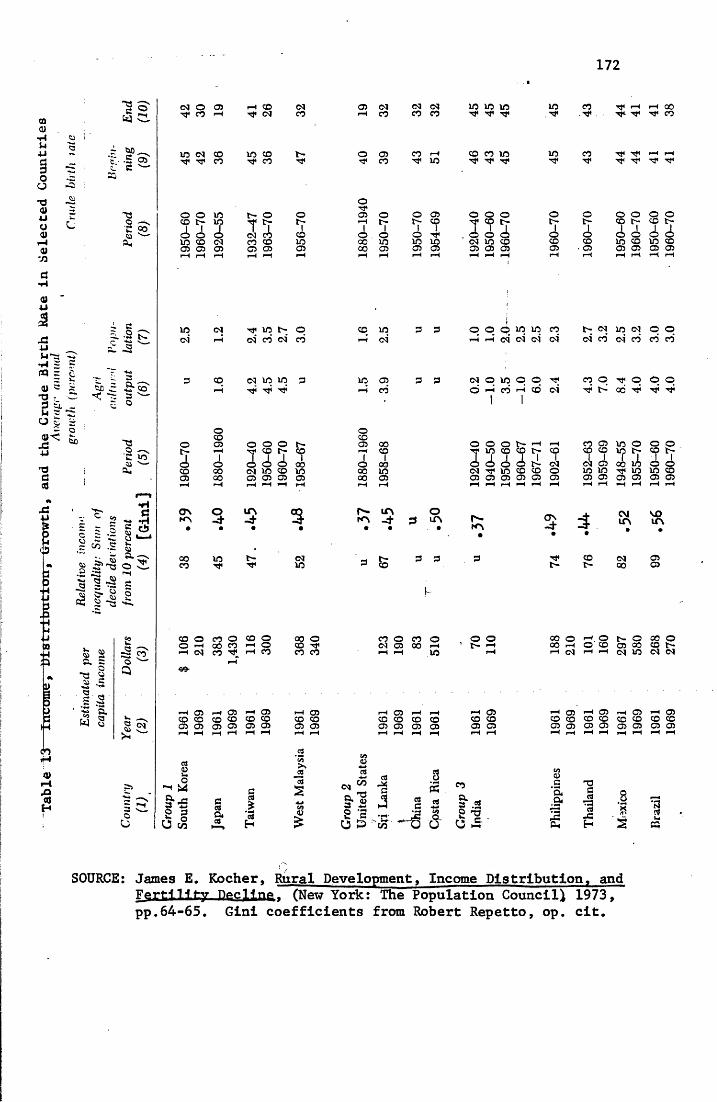
172
OQ<u1-1In4Jadoo'd<u4Joo0)V3
a
"Qct*a
~ 00_ •£•■ .s oT5. St
olaAi
00
JS•U _M-ts •H 5 cPQ = CZ V.a> ® £ tx cT3 : ~ T:3 tl _ '3Ih s 0 3 = ,«< I
kP - a 3oCO
45anin
V C <oc - Cci — 3:S co .S
C rh45o l— 1as &>a -ta S ° -"d o tp
a 5 ps S"3 C3- § O «i 3 -y
o“d SP» "S. o . - . S .•§ '"8 °- w 8
sS oo o 'wQ
<upH&
5 OU
(SI © Tp CO
i n (SiTf Tp
p H CO rf CsJ
i n c oTp CO
(SICO
t-Tp
CD O O — I H (SI€©■
pH 05CO CO 05 05
CO O CO O 0 0 CO i-i O CO ^ co
00 O CO TP CO CO
PH 05C O c o05 05
O
i" -13 2 U cnaC9aCO
pH 05CO co05 05
(4H
»-H 05CO CO05 05r-H p H
.2* 5>*JS"c3s4JC/3<u£
05 CO pH CO
o<p 05CO
(SI (SI CO CO
CO pHt p i n
i n m mT p T P T p
c o e o i nTp rp
i nTP
i nTP
in (SI TP in fp © cq in 3 3 o q o(si pH (si C O c4 C O p H c4 pH pH ci
0 p (SI in in 3 in 0 5 3 3 (SI o inp H T p TP TP p H C O © p H
1C O
O oCO COo 0 5 o o O fp 0 5 0 0 o o ot > p H CO l > CO p H CO tp in COd) 1o i Io 1o 100 i 100 o d>oCO oo (SI in CO in oo in (SI T f in0 5 00 0 5 0 5 0 5 0 5 oo 0 5 0 5 0 5 0 5p H p H rH p H »"H p H p H pH p H p H p H
ON O m °Q t - m OKN -d- -d- m - * 3 i n r -• • • • • • • m
•
00 in (SI i> 3 3 3C O TP TP in 3 CO
i n i n
oCO
CO t>i i>-CO CO
CTN-d-
T pt-p
CO■TP
COTp
^ i-H Tp- T p
Tp TP TP TP
o in o ooTP05 o o 05 o o o o o o Otp in T(SI
t" pH tp fp CO CO tp tp CO fpio i i cA 1o .1o 1o 1TP . 1
1o i1o i i
1oCO (SI co CO in 0 0 in in in (SI in CO CO CO in CO05 05 05 05 05 0 0 05 05 05 05 05 05 05 • 05 05 05p H pH r H p H p H r H pH pH pH p H p H p H p H pH p H pH
i— I 00 T p CO
T P T p
S id)i n c oCD 05
t> CO 1/3 CO © © CO co’ co' CO CO CO
CO OTp
TP O 00 TP
<s» oTp TP
CO CO
i n i n05 05 05 05
CO
C Min
(SI00
i n c o05 05
VOin
0505
C O O C O O CO 05 00 i— I p H pH i n
c o T345§■* 2 BU
i-H 05 i-HCO CO CD 05 05 05
(4p5<c‘S (3»-3 c
o oI> pH
pH Oi C O C O 05 05
0000 O HCO
O O CO
H O) H oCO CO CD CO 05 05 05 05
r- o oo o05 00 CD Nc o i n c o c o
pH 05 pH 05 CO CO CO CO 05 05 05 05
C4_os .
CO
c4 a3 •Svs
S'2O 'V
C-PH
05C’a.a§
c(4(4hCH
SOURCE: James E. Kocher, Rural Development, Income Distribution, and F e r t i l i t y D e c l i n e . (New York: The Population Council) 1973, pp.64-65. Gini coefficients from Robert Repetto, op. cit.
173
which few data on income inequality/were presented. In the third
group is listed India, Philippines, Thailand, Mexico, and Brazil
which have had smaller declines in fertility and whose relative
income inequality was found to be greater. In comparing columns
4, 9, and 10 there is a fairly close and consistent relationship
between fertility trends and the data on relative income inequality.
If one takes this index of inequality, which is the sum of
decile deviations from ten per cent, and averages the index for
Group One and Group Three, one gets a mean of A6 and 83, respec
tively, which ammounts to a substantial difference with the latter
some 80 per cent larger.
As a check on the findings this writer used a different es
timate of income inequality, Gini coefficients taken from Robert
Repetto's work^ and substituted them for Groups 1 and 3 for the2same countries for which data were presented. Gini coefficient
means of 43 and 50'respectively were found. : Though not numeri
cally comparable to the earlier index, these estimates show the latter
group to be only 16 per cent larger than the former, as compareddata.
to the 80 per cent difference with the Original j Since Kocher
first grouped the countries by their fertility experience, a
finding of substantially smaller differences between the groups
^Repetto, 197A, loc. cit., Annex A.2The Gini estimates may, however, introduce an unfair time
comparison. Though Kocher's indices of income inequalityshow levels and not trends, at least they generally fall within the corresponding changes in fertility unlike some of the Gini coefficients which were substituted into the table.
174
would weaken the significance of the relationship.^
Another interesting aspect of Table is that there is no
apparent relationship between the growth of agricultural output
and fertility decline, nor does there seem to be any relation be
tween the growth of agricultural output and income inequality,
. . L
Furthermore, population growth and food produc
tion are not related. Thus, if one accepts the data as valid,
then income distribution is the most distinguishing variable in
fluencing fertility.
In studying the relationship between the general fertility rate
and the share of income to the poorest 40 per cent of households
in 64 countries (using data from 1960-65), Repetto found an elas
ticity of -.36, while the elasticity between average growth of
per capita income and the general fertility rate was -.20. How
ever, if lower fertility results in a more equitable distribution
of income, then these estimates which were based upon an ordinary
least-squares technique could be biased.
In a subsequent study of 68 countries Repetto attempted to
get around this by using a two-stage, least-squares analysis and
his results were similiar; indeed, the size of the regression coef
ficient was larger. A reduction of 0.10 in the Gini coefficient
^When a Gini estimate for India was substituted, the former was only twelve per cent larger than the latter.
2Robert Repetto, Appendix A, Population Policies and Economic Development, Timothy King, et al., eds., Baltimore: The JohnsHopkins University Press, 1976.
175
was associated with a gross reproduction rate lower by 0.21. With
sample means of 0.4415 (Gini) and 2.41 (GRR) an elasticity of 0.39
was implied, thus a ten per cent reduction of income inequality
(in Gini coefficients) was associated with a reduction in fertility
of 3.9 per cent (in the gross reproduction rate).. Using another
measure of fertility, an approximate of the general fertility rate,
the elasticity was found to be even greater at 0.47.
Repetto's model also took into account infant mortality, fe
male literacy, growth of per capita income, and newspaper circula
tion and over 60 per cent of the total fertility
variation (with one exception) was accounted for by the model. The
elasticity at the sample mean of fertility with the average growth
of income per capita was -.10 and with female literacy, -.25;
and with infant mortality, 0.02. Thus, Repetto tentatively con
cluded that income distribution is by far the most distinguishing
variable influencing fertility, not only because of the high elas
ticities but because the coefficients increased when estimated as
part of a larger model encompassing other variables and because
his use of the two-stage, least-squares technique reduced the pos
sible effects of high fertility upon income distribution.
The sample of 68 countries was very wide, including countries
with all types of development; and since the variables, especially
from the Third World, were often unreliable, a more accurate esti
mate of the coefficients is given when the true underlying vari
ables come from a wide range. However, when the sample was
^■Repetto, 1974, loc. cit.
176
restricted to forty-one less developed countries, the regression
coefficient of income distribution was statistically insignificant.
More significantl5j|however# was the case when the entire world sam
ple^ was run but with the exclusion of only five East European
countries— Bulgaria, Czechoslovakia, Hungary, Poland, and Yugoslavia-
all of which were extreme in their equitable income distribution
and their low fertility. Without these five countries, the rela
tionship was no longer significant.
It would be an understatement to say that there were serious
deficiencies in the income distribution data. Furthermore, such
data are likely to have changed over time, particularly in the thir
teen rapidly changing countries selected by Kocher. Though we are
given some time series data on the per capita income and crude birth
rate we are only able to make cross-sectional comparisons with his
income inequality data. The estimates come from the years between
1958 and 1966.
Perhaps a more important aspect of this relationship is not
so much the level of inequality but the trends in inequality over
time. And, unfortunately, though Kocher presented time-scale data
for crude birth rates and per capita income, he was not able to ob-2tain time-scale data on income distribution. Robert Repetto has
^China and Cuba, two important countries with relatively equitable income distribution and declining fertility, were not included in any of the samples presumably because the necessary data were not available. North Korea and North Vietnam were not included either.
^Repetto, loc. cit., pp. 14-15.
177
put together some income distribution time-series data for ten
countries (see Table 14 ). in the first group are countries in
which income distribution apparently improved— Costa Rica, Sri
Lanka, and Taiwan; in the second group were countries in which
it apparently deteriorated— Brazil, India, and Puerto Rico, In
comparing changes in the crude birth rates in these countries over
the same period, Repetto concluded that when income distribution
became more equal, birth rates dropped more rapidly than when it
did not.
Repetto did not mention that fertility declines were about
the same or perhaps slightly greater in countries where income dis
tribution deteriorated than where income distribution remained
substantially unchanged. But nevertheless, he argues
that income distribution was the best distinguishing variable—
much better than the rate of growth of per capita income which was
low in Sri Lanka and India but high in Taiwan, Mexico, Brazil, and
Puerto Rico.
In a contrasting view the inegalitarian effects of biomodal
agriculture are recognized as inherent, though to some extent they
may be compensated by other fiscal policies and programmes, in
cluding price policies against capital-intensive labour replacing
mechanization. As productivity increases, largely through new bio
logical technology, improved irrigation, and multiple cropping,
the demand for labour may rise. Though evidence on the demand for
labour under different modes of agricultural production is mixed
and depends upon many factors.
The transition in the mode of production from the peasant to
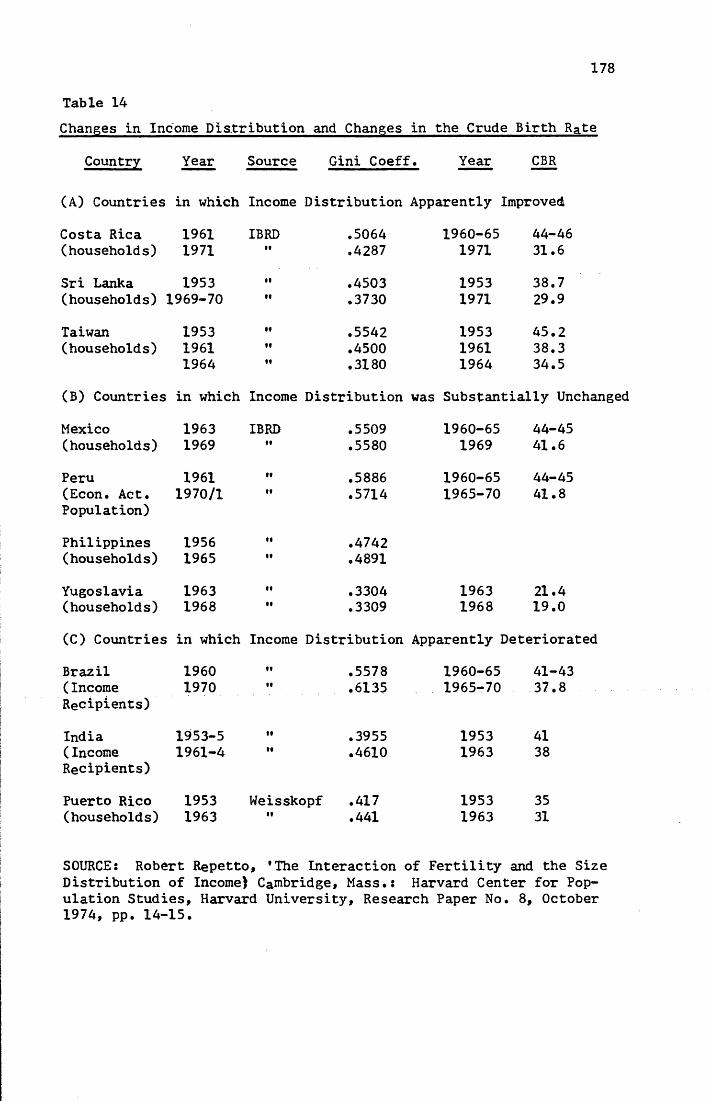
178
Table 14Changes in Income Distribution and Changes in the Crude Birth Rate
Country Year Source Gini Coeff. Year CBR
(A) Countries in which Income Distribution Apparently ;[mprovedl
Costa Rica 1961 IBRD .5064 1960-65 44-46(households) 1971 «« .4287 1971 31.6
Sri Lanka 1953 II .4503 1953 38.7(households) 1969-70 • • .3730 1971 29.9
Taiwan 1953 If .5542 1953 45.2(households) 1961 If .4500 1961 38.3
1964 If .3180 1964 34.5
(B) Countries in which Income Distribution was Substantially Unchanged
Mexico 1963 IBRD .5509 1960-65 44-45(households) 1969 II .5580 1969 41.6
Peru 1961 If .5886 1960-65 44-45(Econ. Act. 1970/1 It .5714 1965-70 41.8Population)
Philippines 1956 II .4742(households) 1965 II .4891
Yugoslavia 1963 • I .3304 1963 21.4(households) 1968 II .3309 1968 19.0
(C) Countries in which Income Distribution Apparently Deteriorated
Brazil 1960 It .5578 1960-65 41-43(Income 1970 It .6135 1965-70 37.8Recipients)
India 1953-5 II .3955 1953 41(Income 1961-4 •1 .4610 1963 38Recipients)
Puerto Rico 1953 Weisskopf .417 1953 35(households) 1963 II .441 1963 31
SOURCE: Robert Repetto, 'The Interaction of Fertility and the SizeDistribution of Income) Cambridge, Mass.: Harvard Center for Population Studies, Harvard University, Research Paper No. 8, October 1974, pp. 14-15.
179
the capitalist, or from the familial to the nonfarailial may, how-2ever, reduce the incentives for high fertility. It may increase
the costs and reduce the benefits of additional children; lessen
traditional kinship ties which emphasize children, and increase
migration and urbanization which may also reduce fertility; where
as the integrated rural development programmes, according to some,
may subsidize the costs of children while increasing their benefit
on the family farm. Thus, the bimodal agricultural process may
have the important and unintended impact of reducing fertility even
though it conflicts with the more important development objectives
of equity and employment. This hypothesis in part rests on the
perceived and actual costs and benefits of children in peasant ag
riculture about which there is still considerable debate.
In peasant agriculture, children are both economic consumers
and producers, and their net economic contribution to their parents
changes over time and is often different according to sex. Eva 3Mueller has carefully reviewed the available evidence, mostly
from Asia, and found, contrary to much opinion, that children rep
resent a serious economic burden in peasant agriculture. She
transition of the mode of production^... _ 4?rom the peasant to the communal may result
in reduced fertility* also. ^ This may have happened in China, a country which also achieved some of its objectives of equity and employment.
2Caldwell, John C.,'Toward A Restatement of the Demographic Transition Theory', Population and Development Review, Vol. 2,Nos. 3-4, 1976, pp. 321-366.
3Mueller, Eva, 'The Economic Value of Children m Peasant Agriculture', Population and Development: The Search for SelectiveInterventions, Ronald G. Ridker, ed., (Baltimore, Johns Hopkins University Press) 1976, pp. 98-153.
180
found that from birth to the time of their own marriage, children
consume far more than they produce; and because there is an excess
of supply of adult labour in the countryside, child labour-partic-
ipation rates are low. The policy findings from her study recommend
1) More research to improve the data base, and to construct con
sumption profiles, production profiles, and analyze the intra
family transfer systems. 2) Government or cooperatively run social
security systems for the aged, perhaps restricted to couples with
fewer than two sons. 3) The development of secure savings insti
tutions with access for rural poor. 4) Life insurance schemes
and 5) Policies that might encourage women to spend more time, and
children less time, in|the market— though child labour laws would
be difficult to enforce and have negative welfare implications
for the poor.
Most of Mueller's data is based on national employment and
labour force statistics and not on village and household level
studies; therefore, they may have underestimated the actual amount
of work that children perform. Micro analysis on the household
level and the village level is greatly needed to examine the costs
and benefits of children in peasant agriculture and to see how
fertility might change in response to labour demand for both the
mother and the child.
Some recent studies have contradicted Mueller's conclusions
about child labour participation rates (White, 1976 for Indonesia;
Caldwell, 1977 in Nigeria; Cleave, 1974, in Uganda and Gambia, and
181
Cain, 1977, 1978 in Bangladesh).^" These studies generally sup-2port the strong arguments made by Mamdani, (1972) about the par
ents* perception of their children as valuable economic assets
in peasant agriculture.
One must conclude that the evidence supporting the equity/
fertility thesis is mixed and is mostly based on national data3(Kocher, and Repetto) which, because of its aggregation is in
adequate to substantiate the hypothesis. The case studies of
China and the Indian state of Kerala (J. Ratcliffe, 1977; 1978)
tend to support the thesis but the evidence is still fragmentary
and even if validated it is not apparent that such policies could
be duplicated elsewhere.
Will a strategy of poverty alleviation, meeting the basic
^"White, Benjamin, 'Population Involution and Employment in Rural Java', Development and Change, Vol. 7, 1976, pp. 267-290; Caldwell, John C., *The Economic Rationality of High Fertility:An Investigation Illustrated with Nigerian Survey Data', Population Studies, Vol. 31, No. 1, March 1977; Cleave, John H., African Farmers: Labor Use in the Development of Smallholder Agriculture,New York: Praeger, 1974, 253p; Cain, Mead T., 'The Economic Activities of Children in a Village in Bangladesh', Population and Development Review, Vol. 3, No. 3, September 1977, pp. 201-227.
Mamdani,Mahmood, The Myth of Population Control: Family,Caste, and Class in an Indian Village, (New York: Monthly Review Press) 1972.
3Kocher, 1973, loc. cit.; Repetto, 1974, op. cit., and 1976 op. cit.
4Ratcliffe, John, 'Poverty, Politics, aid Fertility: TheAnomaly of Kerala*, Hastings Center Report, February 1977, pp. 34-42, and Ratcliffe, John, 'Social Justice and the Demographic Transition: Lessons from India's Kerala State',International Journal of Health Services, Vol. 8, No. 1, 1978, pp. 123-144.
182
needs of the poorest of the poor, reduce fertility? It is entirely
possible that development strategies which benefit the poor may in
the short run actually increase fertility. The costs of children
may be subsidized by welfare programmes. The demand for child
labour may increase with rural labour-intensive strategies. And
improved health and nutrition may increase fecundity. But ul
timately, socioeconomic development will result in a decline in
fertility, and the sooner an improved standard of living is shared
by the poor, perhaps the sooner fertility will decline.
In this writer's view, all of the major conceptual frameworks
for analyzing fertility-related policies for Pakistan and Bangla
desh are inadequate or seriously flawed. Theories about fertility
reduction are not pragmatic - they do not answer the kinds of ques
tions that development planners need to know. They often do not
identify or give weights to the crucial causal factors, nor do
they specify thresholds or critical minimum levels. They are often
atemporal, that is, they do not usually have a specified time sche
dule or time horizon. They all have a high unexplained variance,
they often ignore cultural settings, and none are anthropological.^
In addition to not being able to specify the key variables or their
thresholds, theories attempting to explain fertility are not use
ful • for planners because they often ignore the manip-
ulability of the key variables.
^Thomas K. Burch, 'Theories of Fertility Decline as Guides to Policy', Draft of a paper presented at the Annual Meeting of the Population Association of America, New York City, 19 April 1974. Mimeo.
183
CHAPTER SIX
POPULATION, INCOME DISTRIBUTION, AND DEVELOPMENT PLANNING:
A FRAMEWORK FOR PAKISTAN
This is an exploratory examination of a framework for develop
ment planning. It is being investigated because it is a promising
way of integrating the crucial issues faced by development planners
in Pakistan and Bangladesh; population> income distribution, and
the evaluation of alternative development strategies. Since ap
propriate data were available, Pakistan was chosen.
In the early 1970s the international approach to the study of
economic development among economists began a substantial change
away from the near exclusive emphasis on gross national product to
a broader scope of development which included the distribution of
income, the absolute level of poverty, the problem of increasing
employment, and so forth. This changing concern was also expressed
by a number of economists in Pakistan and x as even reflected
184
ostensibly in the Fourth Five-Year Development Plan.
An outcome of this new concern was the development of three
broad types of social welfare indices to measure development and
to examine development strategies: (1) a GNP index, (2) a poverty
weights index, and (3) an equal weights index.^ The GNP index
employs the existing size distribution of income as a welfare
weight. Therefore, if,
W = The weighted index for aggregate economic or socialwelfare growth, (expressed in per cents)
g. = the rate of growth of income for the i ^ group(expressed in per cents). Each group has an equal number of households (average family size and ^umber of people will be different in each group) and is ordered from lowest income to highest.
w. = the social welfare weight for each i group, andTw. = 11
1
i = 1, 2, 3..»n
then,
W = wn g + w g + ... + w g 1 1 2 2 n n
Taking income distribution data derived from the Khandker
study of West Pakistan for 1963-64 (see Appendix E ) and substituting
^"See H. Chenery et al., Redistribution with Growth, (New York: Oxford University Press), 1974.
2Simon Kuznets argues that the measure of income distribution by ’household income per person' is a more appropriate measure than I 'individual head of household', or by family or household alone. See Simon Kuznets, 'Demographic Aspects of the Size Distribution of Income*, Economic Development and Cultural Change, Vol. 25,No. 1 (October 1976) 1-94.
185
it into the GNP Index formula we get the following:
W = 10g^ + + *2^83 + »50g^where w^ = .10, W2 = *26, and so forth.
If, for example, the average family income per person were
to increase by 10 per cent for each income group, then W and the
GNP would both increase by 10 per cent. On the other hand, suppose
that g^ and g^* the lower income groups, did not grow at all while
g^ and g^ grew by 10 and 20 per cent respectively. Then both W
and the GNP would reflect a vigorous 12.A per cent growth. The ab
solute level of income for the poorest 50 per cent of households
would not have improved at all; and, furthermore, their relative
income would have deteriorated substantially as the distribution
of income became more unequal. Hence, in this case, the GNP is
actually measuring the economic growth of the upper income house
holds; and the GNP index, which uses the existing size distribution
of income as the actual welfare weights, is a wealthy weighted
social welfare index.
Attempts have been made to develop various poverty weighted
indices that would measure the impact of development strategies
aimed at diminishing poverty among the very poor. Welfare weights
favouring the poor would of course be larger for w^ and w^ and
smaller for w^ and w^. For example, this writer has employed the
same Pakistan data in the inverse to the existing size distribution
of income. That is,
W = .50g^ + .24g2 + * ^ & 3 + .10g^.
If this social function were to be used, government programmes could
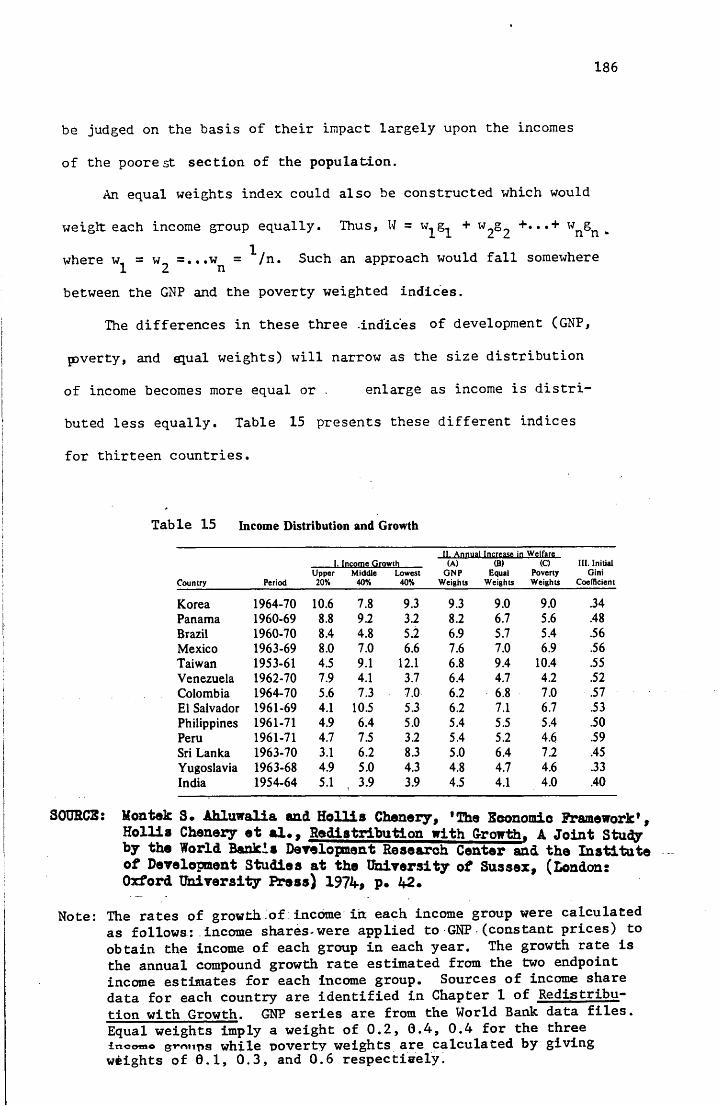
186
be judged on the basis of their impact largely upon the incomes
of the poorest section of the population.
An equal weights index could also be constructed which would
weiglt each income group equally. Thus, W = + W2S2 +,,* + WnSn -where w„ = w„ =...w = ^/n. Such an approach would fall somewhere1 2 nbetween the GNP and the poverty weighted indices.
The differences in these three -indices of development (GNP,
poverty, and equal weights) will narrow as the size distribution
of income becomes more equal or . enlarge as income is distri
buted less equally. Table 15 presents these different indices
for thirteen countries.
Table 15 Income Distribution and GrowthII. Annual Increase in Welfare
1. Income Growth (A) (B) (C) III. Initial
Country PeriodUpper20%
Middle40%
Lowest40%
GNPWeights
EqualWeights
PovertyWeights
GiniCoefficient
Korea 1964-70 10.6 7.8 9.3 9.3 9.0 9.0 .34Panama 1960-69 8.8 9.2 3.2 8.2 6.7 5.6 .48Brazil 1960-70 8.4 4.8 5.2 6.9 5.7 5.4 .56Mexico 1963-69 8.0 7.0 6.6 7.6 7.0 6.9 .56Taiwan 1953-61 4.5 9.1 12.1 6.8 9.4 10.4 .55Venezuela 1962-70 7.9 4.1 3.7 6.4 4.7 4.2 .52Colombia 1964-70 5.6 7.3 7.0 6.2 6.8 7.0 .57El Salvador 1961-69 4.1 10.5 5.3 6.2 7.1 6.7 .53Philippines 1961-71 4.9 6.4 5.0 5.4 5.5 5.4 .50Peru 1961-71 4.7 7.5 3.2 5.4 5.2 4.6 .59Sri Lanka 1963-70 3.1 6.2 8.3 5.0 6.4 7.2 .45Yugoslavia 1963-68 4.9 5.0 4.3 4.8 4.7 4.6 .33India 1954-64 5.1 3.9 3.9 4.5 4.1 4.0 .40
SOURCE: Montek 3* Ahluwalia and Hollis Chenery, 1 The Economic Framework* ,Hollis Chenery at al#, Redistribution with Growth. A Joint Study by the World Bank Is Development Research Center and the Institute of Development Studies at the University of Sussex, (London: Oxford University Press) 1974, p. 42.
Note: The rates of growth of income in each income group were calculated as follows: income shares-were applied to GNP (constant prices) to obtain the income of each group in each year. The growth rate is the annual compound growth rate estimated from the two endpoint income estimates for each income group. Sources of income share data for each country are identified in Chapter 1 of Redistribution with Growth. GNP series are from the World Bank data files. Equal weights imply a weight of 0.2, 0.4, 0.4 for the three incomo sr-nnps while poverty weights are calculated by giving weights of 0.1, 0.3, and 0.6 respectively.
187
Let us examine in a theoretical way an approach for relating
population, income distribution, and development planning. Table 16
represents the following hypothetical situation: Column 1 divides
all households into quartiles ranked by income, from lowest to
highest, with each quartile having the same number of households.
Column 2 represents the percentage distribution of income (w^) for
West Pakistan in 1963-64. Column 3 represents a hypothetical
proportion of the population in each quartile (^4). Column 4
represents a hypothetical coefficient for income elasticity of
f family size (^) • The last two columns represent two different
hypothetical distributions of income growth (g^). The first re
flects an income growth which is favourable to the high income
groups (HI), while the second reflects an income growth distri
bution which is favourable to the low income groups (LI). The HI
column might represent the outcome of successful development poli
cies in the modern, urban, industrial sectors while the LI might
represent the outcome of successful development policies in the
traditional, rural, small-scale agricultural sector.
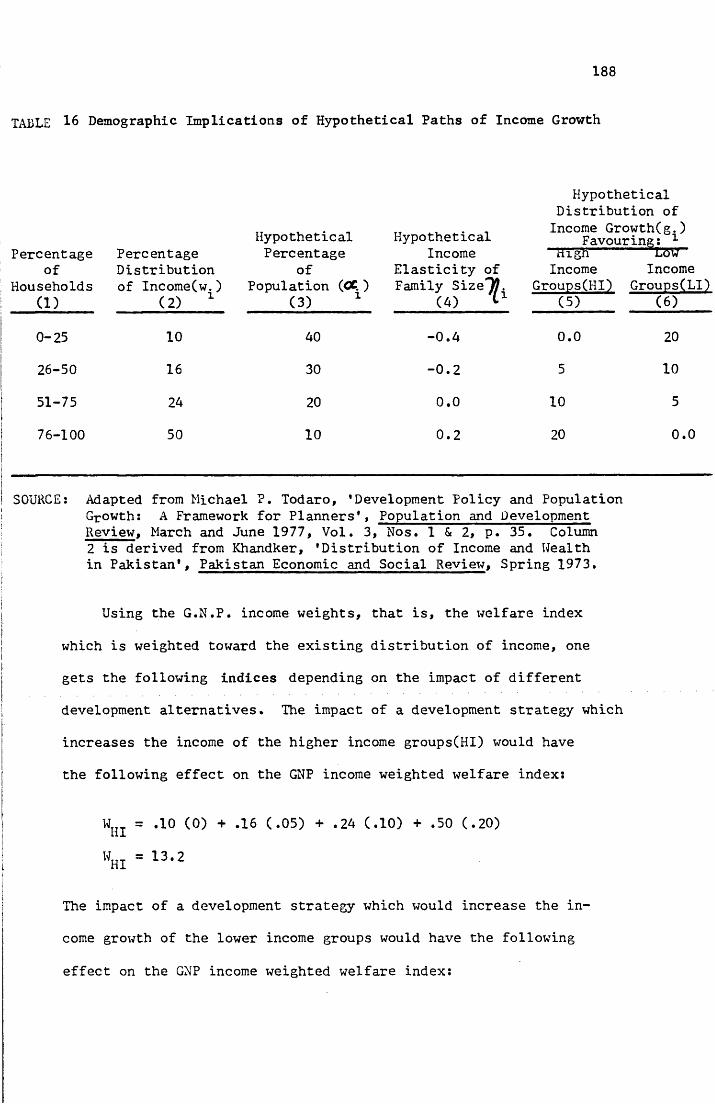
188
TABLE 16 Demographic Implications of Hypothetical Paths of Income Growth
Percentageof
Households(1)
Percentage Distribution of Income(w.)
(2) 1
HypotheticalPercentage
ofPopulation (<X.)
(3) 1
Hypothetical Income
Elasticity of Family SizeTJ.
(4) t1
HypotheticalDistribution ofIncome Growth(g.)
Favouring: 1 tiign LoWIncome Income
Groups(HI) Groups(LI)(5) (6)
0-25 10 40 -0.4 0.0 20
26-50 16 30 -0.2 5 10
51-75 24 20 0.0 10 5
76-100 50 10 0.2 20 0.0
SOURCE: Adapted from Michael P. Todaro, ’Development Policy and PopulationGrowth: A Framework for Planners’, Population and DevelopmentReview, March and June 1977, Vol. 3, Nos. 1 & 2, p. 35. Column2 is derived from Khandker, 'Distribution of Income and Wealthin Pakistan', Pakistan Economic and Social Review, Spring 1973.
Using the G.N.P. income weights, that is, the welfare index
which is weighted toward the existing distribution of income, one
gets the following indices depending on the impact of different
development alternatives. The impact of a development strategy which
increases the income of the higher income groups(HI) would have
the following effect on the GNP income weighted welfare index:
W = .10 (0) + .16 (.05) + .24 (.10) + .50 (.20)
WHI = 13-2
The impact of a development strategy which would increase the in
come growth of the lower income groups would have the following
effect on the GNP income weighted welfare index:
189
W = .10 (.20) + .16 (.10) + .24 (.05) + .50 (0.0)1-jX
uli = A-8
The substantial difference between the two indices can, of
course, disappear or be reversed if the equal weights welfare in
dex or the poverty weighted index is employed. For example, in
employing the equal weights index where w^ = w^ « w^ = 1/n, one
finds no difference in the measures:
W = .25 (0) + .25 (.05) + .25 (.10) + .25 (.20)
WHX = 8-75
WLI = *25 ^'20 + *25 ^*10) + *25 (,05) + *25 (0,0)
WLI = 8’75
In employing the poverty weighted index one finds the reverse,
WUT = .50 (0) + .24 (.05) + .16 (.10) = .10 (20)Hx
"hi = 4’8WIT = .50 ( 20) + .24 (.10) + .16 (0.5) + .10 (0.0)LtX
^LI = 13,2
The difference between the high income group strategy and the
low income group strategy, even when using the GNP income weights
(Wri = 13.2; = 4.8; = 8.4) might be reduced if one
could calculate the long-run impact of the more equitable distri
bution strategy upon fertility and family size.
Michael Todaro^ has recently developed an extension of the
^Michael P. Todaro, ’Development Policy and Population Growth: A Framework for Planners', Population and Development Review, March and June, 1977, Vol. 3, Nos. 1 Sc 2, pp. 23-43.
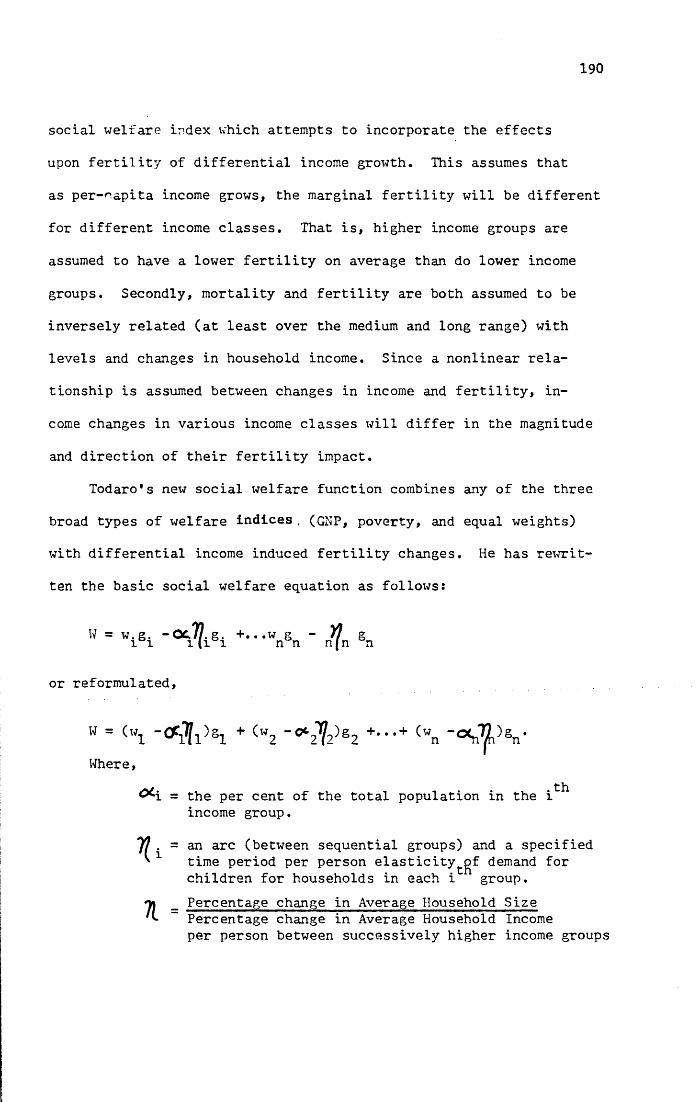
190
social welfare index which attempts to incorporate the effects
upon fertility of differential income growth. This assumes that
as per-oapita income grows, the marginal fertility will be different
for different income classes. That is, higher income groups are
assumed to have a lower fertility on average than do lower income
groups. Secondly, mortality and fertility are both assumed to be
inversely related (at least over the medium and long range) with
levels and changes in household income. Since a nonlinear rela
tionship is assumed between changes in income and fertility, in
come changes in various income classes will differ in the magnitude
and direction of their fertility impact.
Todaro's new social welfare function combines any of the three
broad types of welfare indices , (GNP, poverty, and equal weights)
with differential income induced fertility changes. He has rewrit
ten the basic social welfare equation as follows:
W = w.g. - OC.ll. g. +. ..w g - Yf g1 1 1 (1 1 n n njn n
or reformulated,
w = (Wj + Cw2 - 0 ‘27 2>S2 + - " + (wn - « n ^ )sn-Where,
^ i = the per cent of the total population in the i ^ income group.
yj . = an arc (between sequential groups) and a specified' time period per person elasticity^gf demand for
children for households in each i group.71 - Percentage change in Average Household Size
"" Percentage change in Average Household Incomeper person between successively higher income groups

191
could be positive or negative. Todaro assumes that gener
ally it would be negative for most income groups in developing
countries. He concedes that it might be positive for the lower
income groups, but this would normally be the case only in the
short-run. Several different theoretical and operational defini
tions are actually presented in the framework. In theory,
^ is the income elasticity of the birth rate and its calculation
would be based on sophisticated time series data on actual family
income and family size, adjusted for age of parents, and their de
sired and actual family size. This would incorporate the concept
of expected permanent family income and its relationship to de
sired family size. Admittedly, even if such sophisticated data
were available, it would be inadequate because of changes in in
tergen erational behaviour, and expectations. But ih attempting to
make use of generally available statistics, the above operational
definition is employed for period data.
There is some ambiguity in the article outlining this frame
work and in places it mistakenly labels the latter of the above
coefficients the "Income Elasticity of the Birth Rate" when in
fact it is the income elasticity of family size which is being
defined. A number of issues are raised by the use of income elas
ticity of family size instead of the income elasticity of the birth
rate. Indeed, income and mortality are perhaps more closely re
lated than are income and fertility. An improvement in overall
income is likely to result from development, which is likely to
be strongly associated with an improvement in the mortality con
ditions, which will naturally result in a greater number of surviving
192
children. The author of the model recognizes this difficulty
and explains:
Although income growth will also lower mortality rates among low-income groups and thus partially or completely offset any short-run birth rate reductions, our perspective is on the long-term decline in population growth, and, thus, our primary focus is on the fertility effects of family income growth. Moreover, mortality declines are inevitable short-run outcomes of successful development policies and should not be viewed as undesirable "side effects" (from ^ social welfare viewpoint) of antinatal population policies.
But it seems that this does not really answer the difficulties
in the operation of the model. Increased income for income groups
w^ and w^ will probably reduce mortality in the short, medium,
and long run. And this will contribute a positive influence on
family size from the short to the long-run. Whether or not it is
"desirable" is not relevant to the model. Furthermore, we do
not know with any certainty that an increase in income will have
a negative short-run effect upon fertility. Since an improved in
come will reduce the costs of childbearing and childrearing, and
it is associated with improved nutrition and health, there are
many reasons to believe that in the short-run it may increase
fertility and family size. It is true that in the long-run we
would expect that increased income would, in a number of indirect
ways reduce fertility and family size, though the mechanisms by
which it would do so would be complex and synergetic.
A change in income among various income groups is likely to
have a significant influence on the rate of new family formations,
both independently and in association with changes in fertility
^Todaro, lo. cit., p. 42.
193
and mortality. Naturally, changes in the rate of family forma
tions will directly alter family sizes and are likely to do so
differently for each income group. Furthermore, the concepts of
"household” and "family” are used interchangeably to simplify the
framework but the differences in meaning, particularly for Pakis
tan, are more than slight, and present a formidable complication.
Hovrever, the available data are no more sophisticated than the
model in this respect.
By using the income elasticity of family size as a proxy for
the income elasticity of the birth rate, the model is employing
at least two addtional components, changes in mortality and family
formation, which may be substantially more powerful than fertility
in the determination of7|^. This may be true even over the long
run.
On the other hand, there are hundreds of potential interven
ing variables which might exert such an influence and it is not
possible with the present data base to unravel the problems with
simultaneity, multicollinearity, accurate specification, time lag
structures, and controls for ceteris paribus assumptions. Julian
Simon argues,
"All of these correlations of rises in income are closely associated statistically which makes it impossible to learn their separate effects by statistical analysis, and these forces are all interacting constituent parts of economic development, all linked and working hand in hand. Hence,^it is not even sensible to try to separate their effects."
^■Julian L. Simon, ‘Income, Wealth, and Their Distribution As Policy Tools in Fertility Control*, Population and Development; The Search for Selective Interventions. Ronald Ridker, ed., (Baltimore: Johns Hopkins Press), 1976, p. 55.
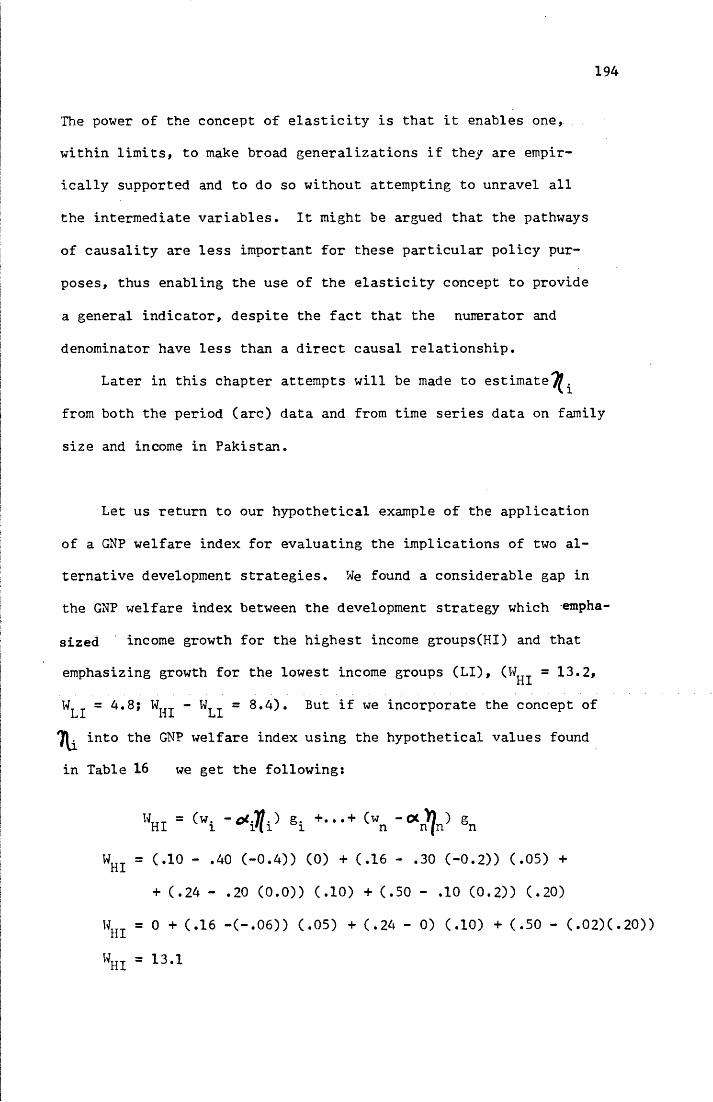
194
The power of the concept of elasticity is that it enables one,
within limits, to make broad generalizations if they are empir
ically supported and to do so without attempting to unravel all
the intermediate variables. It might be argued that the pathways
of causality are less important for these particular policy pur
poses, thus enabling the use of the elasticity concept to provide
a general indicator, despite the fact that the numerator and
denominator have less than a direct causal relationship.
Later in this chapter attempts will be made to estimate*^
from both the period (arc) data and from time series data on family
size and income in Pakistan.
Let us return to our hypothetical example of the application
of a GNP welfare index for evaluating the implications of two al
ternative development strategies. We found a considerable gap in
the GNP welfare index between the development strategy which empha
sized income growth for the highest income groups(HI) and that
emphasizing growth for the lowest income groups (LI), (W = 13.2,H i
W _ = 4.8; W - W_ = 8.4). But if we incorporate the concept of Li L i1L Li L^ into the GNP welfare index using the hypothetical values found
in Table 16 we get the following:
WHI = (wi - “ i V gi +" >+ (Vn - ‘’‘n V Sn
WUT = (.10 - .40 (-0.4)) (0) + (.16 - .30 (-0.2)) (.05) +hi+ (.24 - .20 (0.0)) (.10) + (.50 - .10 (0.2)) (.20)
W = 0 + (.16 -(-.06)) (.05) + (.24 - 0) (.10) + (.50 - (,02)(.20))
WHI = 13,1
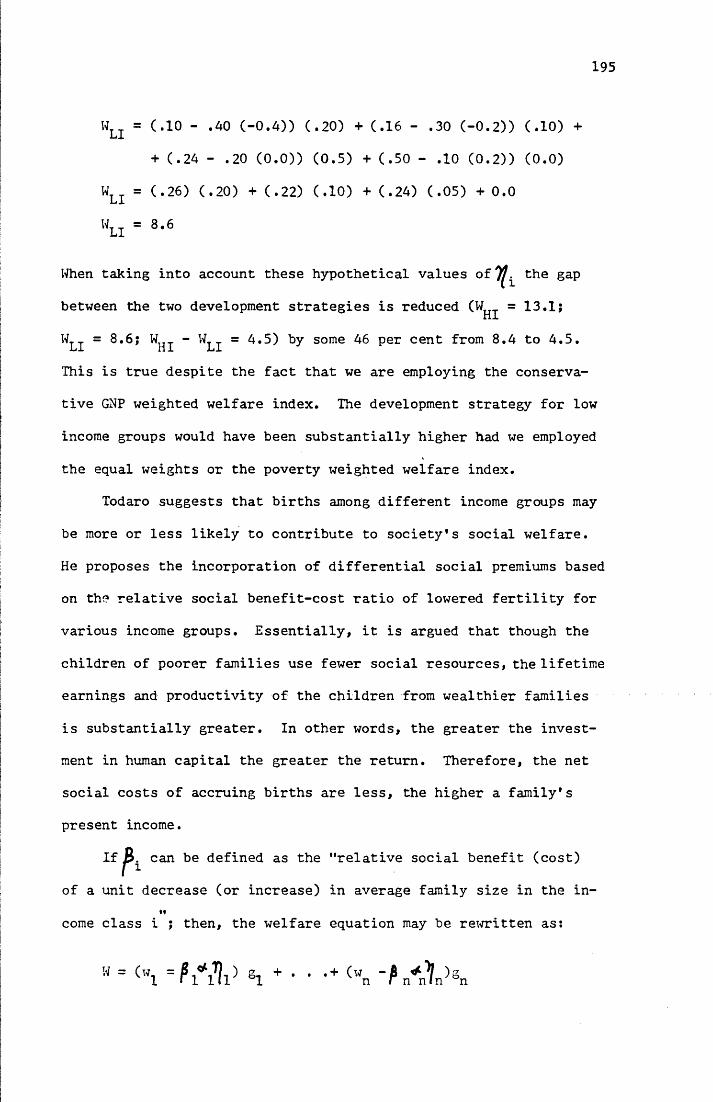
195
W = (.10 - .40 (-0.4)) (.20) + (.16 - .30 (-0.2)) (.10) +
+ (.24 - .20 (0.0)) (0.5) + (.50 - .10 (0.2)) (0.0)
WLI = (*26) (,20) + (,22) ('#10') + (,2A) (,05) + 0,0
WU = 8‘6
When taking into account these hypothetical values the gap
between the two development strategies is reduced (W = 13.1;HIW-j. = 8.6; W^j - W^j = 4.5) by some 46 per cent from 8.4 to 4.5.
This is true despite the fact that we are employing the conserva
tive GNP weighted welfare index. The development strategy for low
income groups would have been substantially higher had we employed
the equal weights or the poverty weighted welfare index.
Todaro suggests that births among different income groups may
be more or less likely to contribute to society's social welfare.
He proposes the incorporation of differential social premiums based
on the relative social benefit-cost ratio of lowered fertility for
various income groups. Essentially, it is argued that though the
children of poorer families use fewer social resources, the lifetime
earnings and productivity of the children from wealthier families
is substantially greater. In other words, the greater the invest
ment in human capital the greater the return. Therefore, the net
social costs of accruing births are less, the higher a family's
present income.
If can be defined as the "relative social benefit (cost)
of a unit decrease (or increase) in average family size in the in-
come class i ; then, the welfare equation may be rewritten as:
W = (W1 S1 + * • *+ (wn - K * X K
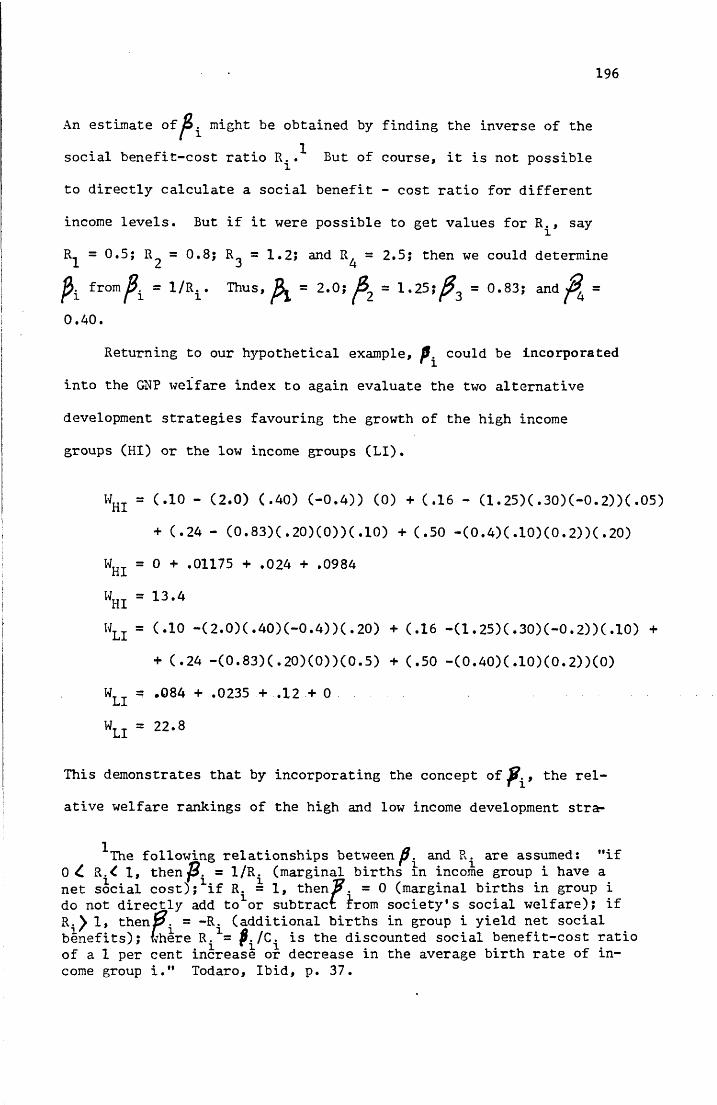
196
An estimate of might be obtained by finding the inverse of the
social benefit-cost ratio Rut of course, it is not possible
to directly calculate a social benefit - cost ratio for different
income levels. But if it were possible to get values for R^, say
R = 0.5; R = 0.8; R = 1.25 and R. = 2.5; then we could determine 1 2 3 4P i from = 1/R^ T h u s , ^ = 2.0; = 1.25;^3 = 0.83; and =
0.40.
Returning to our hypothetical example, could be incorporated
into the GRP welfare index to again evaluate the two alternative
development strategies favouring the growth of the high income
groups (HI) or the low income groups (LI).
WHI = (,1° " (2*0) ( ‘40) (0) + (-16 “ (1.25)(.30)(-0.2))(.05)+ (.24 - (0.83)(.20)(0))(.10) + (.50 -(0.4)(.10)(0.2))(.20)
W = 0 + .01175 + .024 + .0984
W = 13.4
Wu = (.10 -(2.0)(.40)(-0.4))(.20) + (.16 -(1.25)(.30)(-0.2))(.10) +
+ (.24 -(0.83)(.20)(0))(0.5) + (.50 -(0.40)(.10)(0.2))(0)
W = .084 + .0235 + .12 + 0
WLI = 22*8
This demonstrates that by incorporating the concept of the rel
ative welfare rankings of the high and low income development stra-
"The following relationships between^, and R. are assumed: "if0 ^ R.^ 1, then jS. = 1/R. (marginal births m income group i have anet social cost);1if R. = 1, then 2?. = 0 (marginal births in group ido not directly add to1or subtract £rom society's social welfare); if R.^ 1, thenp. = -R. (additional births in group i yield net social benefits); where R.1 $./C. is the discounted social benefit-cost ratio of a 1 per cent increase or decrease in the average birth rate of income group i." Todaro, Ibid, p. 37.
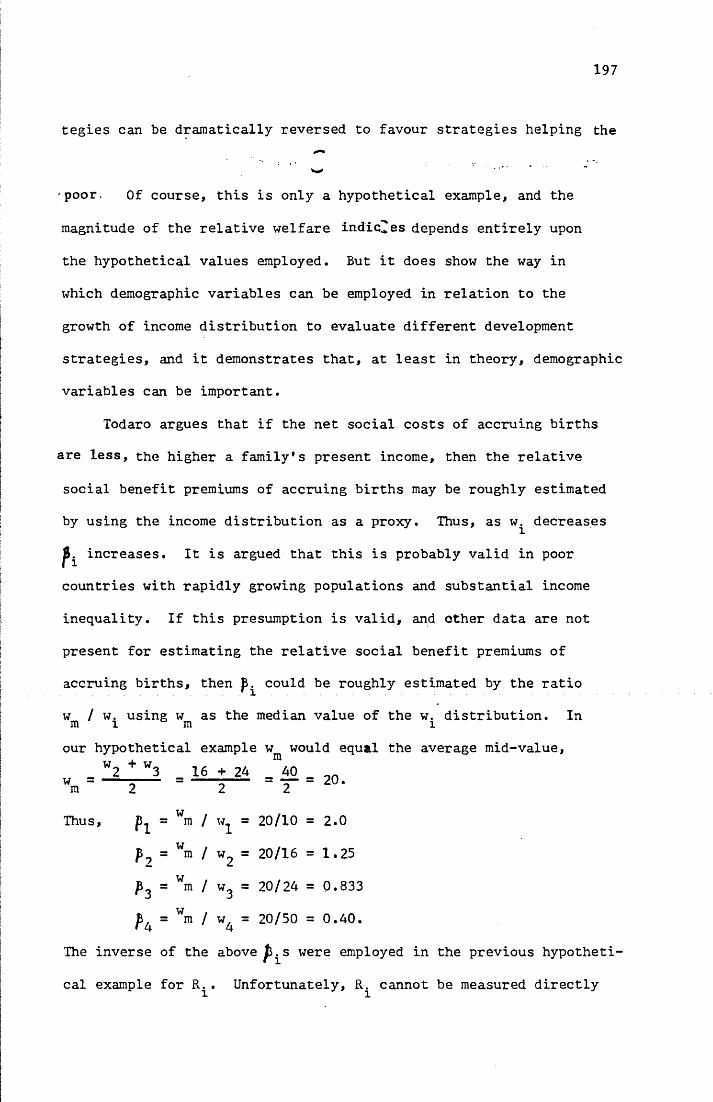
197
tegies can be dramatically reversed to favour strategies helping the
'poor. Of course, this is only a hypothetical example, and the
magnitude of the relative welfare indic^es depends entirely upon
the hypothetical values employed. But it does show the way in
which demographic variables can be employed in relation to the
growth of income distribution to evaluate different development
strategies, and it demonstrates that, at least in theory, demographic
variables can be important.
Todaro argues that if the net social costs of accruing births
are less, the higher a family's present income, then the relative
social benefit premiums of accruing births may be roughly estimated
by using the income distribution as a proxy. Thus, as w^ decreases
^ increases. It is argued that this is probably valid in poor
countries with rapidly growing populations and substantial income
inequality. If this presumption is valid, and other data are not
present for estimating the relative social benefit premiums of
accruing births, then could be roughly estimated by the ratio
w / w. using w as the median value of the w. distribution. In m 1 ° m 1our hypothetical example w would equal the average mid-value,
W~ + W3 16 + 24 40w = —m 2 2 = — = 20.
Thus, hw
= m / W1 = 20/10 = 2.0
p2w
= m / W2 = 20/16 = 1.25
hw
= m / w3 = 20/24 = 0.833
hw
= m / W4 = 20/50 = 0.40.
The inverse of the above p^s were employed in the previous hypotheti
cal example for R^. Unfortunately, R^ cannot be measured directly
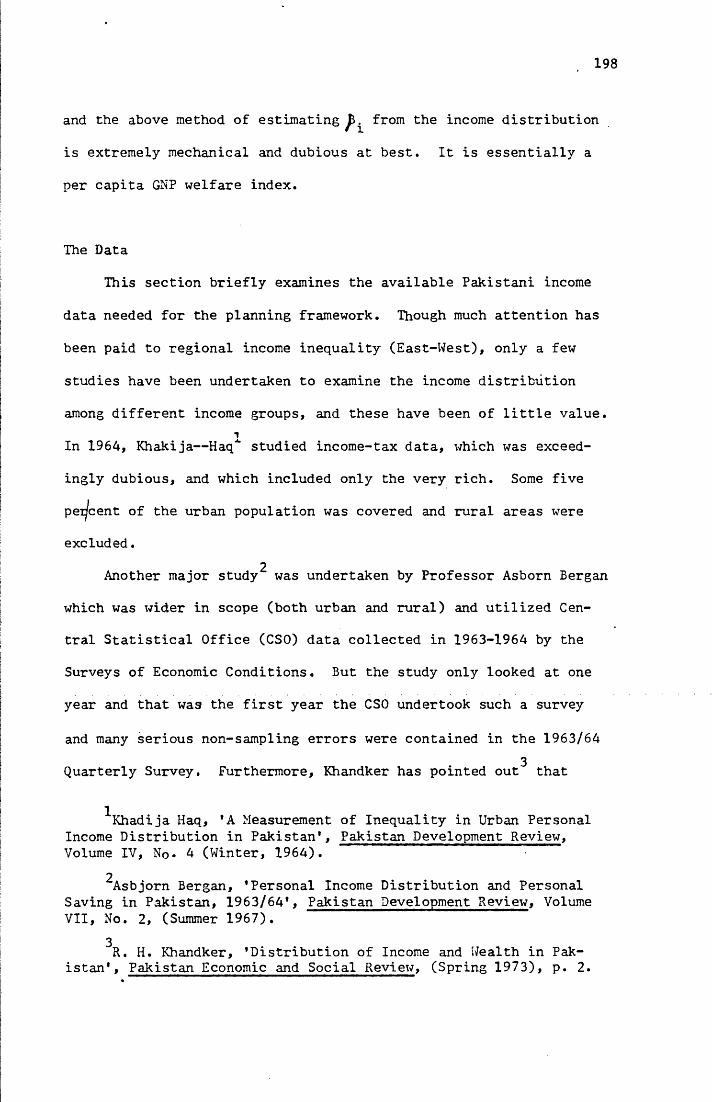
198
and the above method of estimating from the income distribution
is extremely mechanical and dubious at best. It is essentially a
per capita GNP welfare index.
The Data
This section briefly examines the available Pakistani income
data needed for the planning framework. Though much attention has
been paid to regional income inequality (East-West), only a few
studies have been undertaken to examine the income distribution
among different income groups, and these have been of little value.
In 1964, Khakija— Haqx studied income-tax data, which was exceed
ingly dubious, and which included only the very rich. Some five
percent of the urban population was covered and rural areas x%Tere
excluded.2Another major study was undertaken by Professor Asborn Bergan
which was wider in scope (both urban and rural) and utilized Cen
tral Statistical Office (CSO) data collected in 1963-1964 by the
Surveys of Economic Conditions. But the study only looked at one
year and that was the first year the CSO undertook such a survey
and many serious non-sampling errors were contained in the 1963/643Quarterly Survey. Furthermore, Khandker has pointed out that
^Khadija Haq, *A Measurement of Inequality in Urban Personal Income Distribution in Pakistan', Pakistan Development Review, Volume IV, No. 4 (Winter, 1964).
2Asbjorn Bergan, 'Personal Income Distribution and Personal Saving in Pakistan, 1963/64', Pakistan Development Review, Volume VII, No. 2, (Summer 1967).
3R. H. Khandker, 'Distribution of Income and Wealth in Pakistan', Pakistan Economic and Social Review, (Spring 1973), p. 2.
199
Bergan's unpublished data differed from the Central Statistical
Office's data published subsequently.
Khandker published his own study of the CSO's Quarterly Sur
veys for 1963/64, 1966/67, and 1968/69, in the then West Pakistan.^
Khandker arrived at the extraordinary finding that income inequality
had lessened over the period 1963/64 to 1968/69. In the rural areas
he reported a decline in the inequality of income which he attri
butes to agricultural growth over the period and he makes the sur
prising argument that the so called Green Revolution might have
lessened income inequality by helping medium farmers more than those
owning larger or small farms. In the urban areas he reported
an increase in inequality between 1963/64 and 1966/67 and then a subse
quent decline in 1968/69.Khandker admits that the urban areas were under repre
sented in the sample and, in addition, that the high income groups
were under-enumerated and therefore the study must significantly2"understate the degree of inequality of income." Nevertheless,
he holds to his conclusions despite, as he says, the nearly uni
versal disagreement with the general public including politicians
and economic planners who believe precisely the opposite is true
that income inequality has increased over the period. He argues
that while his work may not disprove the consensus, it does show
that the income curve has flattened. This he maintains could hap
pen concurrently with the accumulation of great fortunes by a very
■R. H. Khandker, 'Distribution of Income and Wealth in Pakistan', Pakistan Economic and Social Review, (Spring 1973), p. 2.
2Ibid., p. 4.
200
few families, and that capital gains, which were excluded from his
study, may have contributed greatly to income inequality.
Data on income distribution in Pakistan can only be obtained
from bwo sources, either the Central Board of Revenue’s Income-
tax Revenue Statistics or the Central Statistical Officers Quarterly
Surveys of Economic Conditions. The Income-tax Revenue Statistics
have not been published in many years, Qvat even if the unpublished were available, they
data/would not be useful for studying income distribution because
of the pervasive tax evasion, the high legal exemption and the great
differences between "assessable income" and total income. The other
data base, the Quarterly Surveys, have serious nonsampling errors
from respondents* biases. Khandker reports also that the extreme
ly low and extremely high income groups have by far the greatest
undernumeratioi through rejection and non-response.^ Thus the Quar
terly Surveys understate the extent of income inequality.
Unfortunately, one must be especially cautious in accepting»
Pakistan's official or semi-official data precisely because .they
are optimistic. We have previously described a pattern of official
adulteration of demographic statistics and because these figures
run counter to an overwhelming consensus that inequality is growing,
we must be especially suspicious. Even if we do not doubt the
honesty of the survey, we know a substantial list of reasons to
doubt the quality of the data. Any attempt to adjust these figures
on our part would only introduce an additional bias. Recognizing
these serious limitations, we will proceed, hoping to shed perhaps
some light on the utility of the model and the reasonableness of
^Ibid., p. 5.
201
the data themselves.
The following procedures were undertaken to change the form
of the data to make them appropriate for the model. The Khandker
data, shown in A p p e n d i x E", is a distribution by percentage and
cummulative percentages of household population, earners, and arranged
income, / by household income groups. The average monthly income
(in Rs.), the percentage of households, the population per house
hold, and the earners per household, are also given by the size
distribution of household income. This is available for rural
areas, urban areas, and rural and urban combined. Furthemore, it
is available over three time periods for the fiscal years 1963/64,
1966/67, and 1968/69. The time-series aspect of this body of data is
important because it enables us to calculate the g^s, the per cent
distribution of income growth. Using the three surveys we can also
examine changes in family size and changes in family income and
together these can be used to make new time series extimates of
VIt was felt that the data would be more manageable if the
eleven to thirteen income categories were reduced to four for the
initial analysis. It is necessary that each category have an
equal number of households. Given the nature of the data,this
reduction does not result in a loss of precision in the model,
and most probably this step improves reliability as the numbers
in each case are greatly increased. The data have been divided
into quartiles by finding the exact location of the 25, 50, and
75 percentage points within the cumulative household distribution
ranked by income (see a p p e n d i x 1? ) . Four groups of households with
202
exactly the same number of households in each group have been
identified and ranked according to ascending income.
These quartiles are then interpolated against the cumulative per
centage of income distribution to find the per cert distribution
of income or w^. Therefore, equals the percentage distribution
of income received by the poorest quarter of the households, and
so, with represents the income of the richest household quartile.
Table 17 summarizes the calculations of Appendix F . The first
column presents the percentage distribution of income for the
years 1963/4, 1966/67, and 1968/69. These figures indicate that
roughly half of the income went to the top household quartile while
about 10 per cent went to the bottom quartile. This income struc
ture remained roughly constant throughout the three surveys and
it held up in both urban and rural areas. The average income
(in Rs.) reportedly rose slightly between 1963/64 and 1966/67
only to fall again in 1968/69. By world standards the level of
income is extremely low. The concentration ratios of the reported
household income distribution (Gini coefficients: .358, .346, and
.333 respectively for the above years) are, by world standards,
exceedingly low (equal) and becoming more equal. Indeed, if one
were to accept these estimates, one would have to place Pakistan
as one of the most equitable countries in the world.
These figures reflect income and not wealth so they exclude
great fortunes in land or capital, though in theory they should
measure the income returned from these investments. In reality,
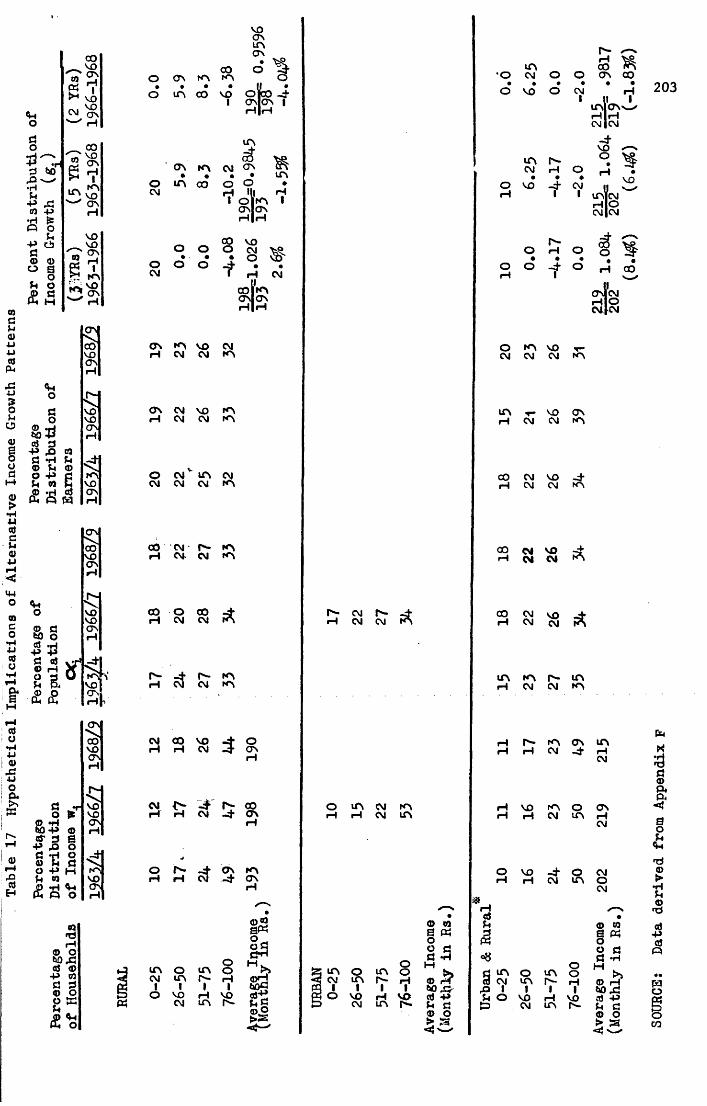
4-1odo
toa &•Hup x:BO -P •H & « O
V.p cb da> <o o s
oVi o
d H£
03dVia)ppcoPHMP5oVt0V1oda>•HPcOdu<up
cpo00do•HPCOo
i*
cOa•HP©x ipoaEC
XicOH
CO VO« If>“• VO<M a\' ’ r l
COvoon
ini
KNVOON
VO ^ VO 'ZZ on5 HS ’r* NN
on
ON
4-i
sia* a-p ,o COd *H Vi © Vi <D p P d JH « Crd 05 eu o w
«Ho© a to o« # d ©© rHg a
£ (2
do
© »r4 to P ar 3 p x> d *H © Vl O P Vi ©JP *P(£ «
ON»r-*\
ONlNCOVOONrH
HN_T vo* voON© rHf ioo -4d \
H KNn o
4-i ONO rH
© •tJ rH © O
to x : © ©
P w d d © o p IEM
<Po£
00
voONinONd u
O ON KN kn o• • • • II •
O UN 00 vo1
O faO -4ONION | rH |rH
ITS6o
ON KN CM ON min
o m oo o o CM H III H
i o |m IONIONH H
o o • ■ •o o o
CM
CO VO° . s ^^ H W
cojmONIONH |rH
O n kn vo CM H CM CM KN
on cm vo mrH CM CM KN
o cm m cmCM CM CM m
co cm Is- kniH CM. CM m
CO O CO -4 H CM CM KN
r*- -4 knrH CM CM KN
CM CO VO -4 O rH rH CM -4" ON
CM O COrH rH CM -4 ON
rH
rH rH -4 ON H
UN o UNOO
CM UN Is- rH1 1 1 1
O vo rH VOCM UN Is-
<D ©S «
Is£U)COJ-P© o > s
• oo
mCM
voo#o
£ * ON CO « •
rHII I UN|ONv-r
N C\1 N 4 H CM CM in
m cm knrH CM in
m Is-CM
CM I CM-4VO ■o
rH OO VO rH f ^ V • micM
H OcmIcm
VO
O rH OO OfH
i % • •rH CO '—r
onI cmrH iOCM|CM
o kn voCM CM CM KN
in r VO ON rH CM CM m
CO CM vo 4rH CM CM m
CO CM VO -4 rH CM CM m
CO CM vorH CM CM
un kn r - inH CM CM KN
n - m on mrH CM 4 - rH
CM
NO
VO
KN Ocm m
ONrHCM
-4 O CM CM in O
CM$
rH©Vi3
§E=>
in oCM mI
oI
vo
UNr -I
rHCM UN
OOI*VOIs-
© © S tt oz sH s>>© rHto x: © p Vi d © OS 3
203
SOURCE:
Data
derived
from
Appendix
F
even Khandker admits that the distribution has been truncated
at both ends and that it appears too equal. Khandker acknowledge
that the few very rich families who reportedly own and control
vast fortunes are not included in the sample. However, he argues
that the figures are a reasonable reflection of the income distri
bution of the bulk of the households, though they do not reflect
the true national distribution. If this is true, we might still
be able to analyze changes in income and family size for most of
the population, recognizing that the sample had been truncated.
But if, as seems likely, the development strategies of the 1960s
channelled vast funds into one or two per cent of the households
which were not included in these samples, then it is rather im
possible to evaluate the impact of the development strategy by
the reported per cent distributions of income growth (g^s).
Therefore, the calculation of various welfare indices with these
g^s is not warranted.
The per cent distribution of income growth (g^) essentially
expresses the relative changes in distribution among different
income groups (w^). These figures show some relative improvement
in the share of income received by the poorest household quartile
Unfortunately, the bottom of the distribution has also been
truncated and had the very poor, particularly the landless, been
fully included in the surveys, the share of the bottom household
quartile may not have looked as relatively favourable.
The most striking feature of the data is the minimal growth
which occurred in average monthly income over the three time per
iods. From 1963 to 1968 the combined urban/rural average income
205
increased from Rs. 202 to Rs. 215 (see Appendix E ) only 6.4 per
cent over the five years, while the rural income actually declined
from Rs. 193 to Rs. 190 during the same period. Therefore,
represents changes in relative shares of the income, so while the
rural g^ may have changed by 20 per cent between 1963 and 1968, the
actual level of monthly income only rose from Rs. 37.57 to Rs. 40.03
among the very poor and from Rs. 77.85 to Rs. 80.37 among those
averaging a monthly income of between 50 and 100 Rs. Certainly
it is the level of income and not the relative share which most
affects the lives of the very poor. No one could argue, on the
basis of this data, that the level of income actually improved for
the very poor. Taking the data at face value, it still amounts
to an increase of only one per cent per year for the very poor,
and given inflation, the actual income probably deteriorated
significantly.
The percentage of the p o p u l a t i o n i s also presented for
the three time periods and for urban, rural, and combined. These
figures are extraordinary. One would expect that the households
in the poorest quartile would have the largest population by virtue
of its large family size and likewise we would assume that the rich
est household quartile would have the smallest family size and
the smaller population. Instead, these figures suggest exactly the
reverse. This pattern holds up, though with some variation, through'
out the three surveys and in urban and rural areas as well as the
urban/rural combined.
The inverse pattern of 'family size and income, if not an arti
fact of the data, might be explained by several factors. We know

206
that family income is closely related to the structure of the house
hold. Appendix E lists the proportion and numbers respectively,
of earners per household. We know that many of the very poor, the landless, have not been included in this survey. Of those very poorhouseholds that have been included, the land holdings may be too
small to support an extended family. Children leave early to seek
wage employment. Cousins, uncles, and others move on. Poor health
and nutrition may also affect family size through reduced fertility
and increased mortality. Larger landholdings attract and support
the extended family and may provide a greater economic rationale for additional children.
This may help explain the inverse pattern of household size
and income in the rural areas, but it seems less likely to be true
in the urban areas. These relationships do point out the mechanical
and simplistic nature of the planning model in its use of
arbitrary income groupings rather than actual social classes and
its simplification of complex relationships.
In looking at changes in average family sizes over the three
surveys we find that there were some small declines among several
household groups (see Appendix E). The following average family
sizes for all income groups combined were reported:
1963/64 1966/67 1968/69
Rural 5.5 5.6 5.4
Urban 5.9 5.6 5.6
Combined 5.6 5.6 5.4
207
Recognizing that the samples have been truncated at both ends,
but with the hope that they might still reflect some valid charac
teristics of the majority of the population in the large middle
range, an attempt has been made to analyze the income elasticity
of family size using period (arc) data from the three sur
veys. Using the average family size (X.) data between successiveX(n+1) 1income groups an arc, ~ ----- - 1, was calculated. As explainedn
earlier, these data had the unusual feature of generally showing larger family sizes in
^higher income groups; therefore, the arc data are usually positive
instead of negative. The average monthly household income (in Rs.)
for each income group was then divided by the average family size
X. in that grcup to obtain the monthly household income per person 1 Y
y These data were then used to calculate another arc, - 1.n
The ratio of the two arcs,
X(n+1)X
i i )Yn
is then employed to calculate the income elasticity of household
size. These estimates were made separately for both the urban and
rural samples using the data from 1963/64, 1966/67, and 1968/69.
They are generally positive because income and family size are pos
itively related in these samples. Graphs of these elasticities in
Appendix H show wide fluctuations; and though they are generally
positive, they literally cover the graph, and it is difficult to
find any significant relationships except that the only negative
coefficients are among the higher income groups. It must be noted
that the sample sizes are smallest in the highest income groups and
208
we night expect some instability in the highest income groups re
presented by fewer cases. There are, however, wide fluctuations
in the elasticities of the second to fifth lowest income groups
and these have the largest sample sizes.
Figure 3 presents the income elasticity of family size for
different income groups calculated in time series data for the
three periods, 1963/64 to 1968/69; 1963/64 to 1966/67; and 1966/67
to 1968/69. These elasticities are characterized by some strong
fluctuations, but the values are negative and in general they de
cline with income rather than increase. They are lower than the
hypothetical values employed in the theoretical section of this
chapter and they generally go in the opposite direction. We might
disregard the first income category Rs. 0-50 because the sample
must have been very small, and sample sizes from income groups
above Rs. 500 have also been excluded.^ T h e s e u s are of a more
reasonable magnitude and are more stable than those found by cal
culating with period (arc) data. When calculating^^ with period
^Unfortunately, Khandker did not publish the sample sizes so we must be especially cautious in interpreting the data in particular income groups. We do have the per cent distribution of the population sample (see: AppendixE , Figure 4) and we know that nearly three-fourths of the population is concentrated in the second through sixth income groups. The lowest group has a population of less than one per cent of the sample and, therefore, its sample size is probably too small. Coefficients were not calculated for the highest income groups because they represented a very small proportion of the households and, therefore, their numbers must have been very small. In addition, the income categories for these groups were different in each survey and thus not strictly comparable. Figure 4 presents the distribution of households across the income scale. From this we can see that the great majority of the households fall within the group averaging less than Rs. 500 per month. It is also apparent that the distribution of rural households has remained stable over the three surveys though there has been an apparent decline in the proportion of poor urban households. The relative stability of the rural household distribution is at least an indication that changes in the persons per household distribution, used to calculate' 71. are not a reflection of underlying changes in family formation. 1
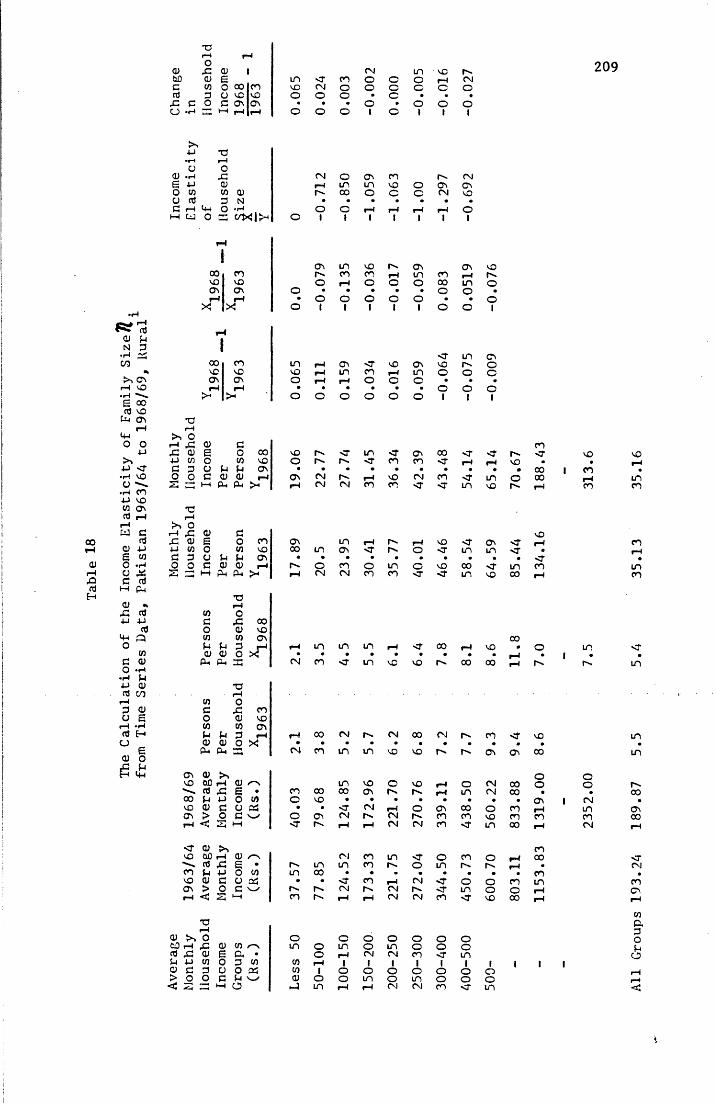
The Calculation
of the
Income
Elasticity
of Family
Size/(
from
Time
Series Da
ta, Pakistan
1963/64
to 1968/69, Ru
ral•H
i
<u x: o) \to cu = in <rG w 5 00 oo vo CMid 3 o VO vO O Ox: G o 3 as ON • •o •r-t33 I—IrH 1—4 o o
4-1 T3•H i—io D<U•r4 X3 CNe 4-> CU 1—4o W in CUo cd 3 N •G *—1<4-1 <3 ♦ |H oI—ICO o - C/X 1 >H o irH
ON00 00 r*.vo VO oOn ON o .i-4 rH • oX! X o 1rH
100 00 in rHvO VO VO rHON ON O rH1—4 1—4 • .>* >4 o O
TDi-1>•.oi—tx: <U Gx: (U E O CO vO r>*4-> CD O in VC oG 3 o -4 *4 ON .O O G CU CU 1—4 ON CM2 =1-4 A. Ah >4 rH CM
•dr—
X o•—A X3 0> Gx: cu E o OO ON+j CO O C/1 VO 00 inG 3 u g G ON « .O O G 0) CU 1-4 o53 I—1Ah A h >4 rH CM•o1—4(0 o
G x: 00O cu VO(0 CO ON*4CU Gcu 3o * r1-4 in.
tG A h 33 CM COTOrH(0 0
G X3 ooO <u VO(0 CO ON(4 G 3 f—1 rH 00cu CU o X « .A* A h 33 CM oo
o n 0) k»NVO 00 CUcd X E • 00 0000 G 4-» 0 CO o VOvo cu G o AS . .On > O G o ONI-4< I—l <r
<r cu >nvo 00 f—I CU /“\cd X E • in00 G 4-> O CO in 00vO cu G u ai ■ •ON > O c vy r>-rH < 53 •H oo r
TJcu 0 otD i-l X3 CU CO in ocd X3 CU E a • oG 4-> C/1 o 3 CO CO |H<u c 3 o O as CO 1> o O G G V4 cu o< 2 i— a .-J in
CM in - VC00 O o o rH CNo O c o O oo • c . • •« c • o o oo 1 o 1 1 1
o ON 00 r-» CNin in VO o ON CN00 o c o CN vO• • • • . •01
rH1
rH1
r—ti
rH1
01
in vO n* ON ON00 OO rH in OO rHrH o o o 00 in• • » • o OO o o o . •1 1 1 i o O
<r inON <r vO O n vo r-in OO rH UO o o|H o O C . •
. • • . o oo o o o i I
<r in <r ON 00 <rr - 00 oo <r |H• • • • • •
|H VO CM 00CM oo 00 HJ- <r in
in «H r>. rH voON <r n- o <r in• • • • • .oo o in o vO CO(N 00 oo <r uo
in in rH <r 00 rH• • • • • .<r in VC vo r . 00
CM r - CN 00 CM• • • • • .uo in VO vo I"" n*
in vo o VO rH o00 ON r-» n- rH uo• • . • • .HT CM rH o ON 00CN r*. CM CO oo«H rH CN CM OO
nj OO UO <r o 00in OO o in. • • • • •<r oo rH CM <r oCM r-> CM <r uorH rH CM CM 00 <r
o O O O o oin O in o o orH CN CN oo <r UO1o 1O 1o 1o io 1oo in o in o o
rH |H CN CN oo
209
voo01
CNoc•01
oo<r r - <TrH vo •• • 00
uo o 00vo |H
ON <r VOrHuo HT .• .<r uo CO
vO 00 rH
00vo * O• |H •00 rH
oo sr VO• m •ON ON 00
o o CM 00 o OCM CO • •• • | (NO 00 rH U0vo oo oo ooin 00 rH CMooo rH 00n- |H •• . 00o OO UNo O |H
VO 00 rH
Oin All
Groups
193.24
189.87
5.5
5.4
35.13
35.1
6
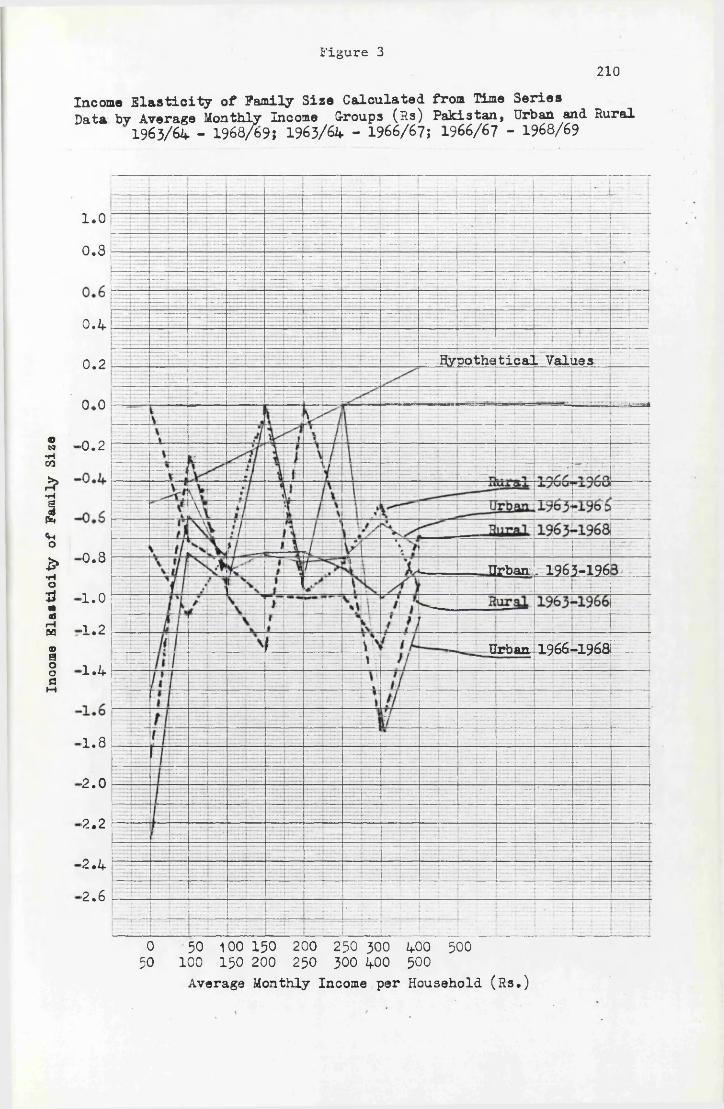
Income
Elasticity
of Family
Size
Figure 3210
Income Elasticity of Family Size Calculated from Time Series Data by Average Monthly Income Groups (Rs) Pakistan, Urban and Rural
1963/64 - 1968/695 1963/64 - 1966/67; 1966/67 - 1968/69
1.00.8
0.4
Hypothetical Values0.2
0.0
•0.2
•0.8 Urban. 1963-196•1.0•1.2
Urban 1966-1968.•1.4
■1.8
■2.0
•2 .2
■2.4•2 .6
0 50 100 150 200 250 300 400 50050 100 150 200 250 300 400 500
Average Monthly Income per Household (Rs.)
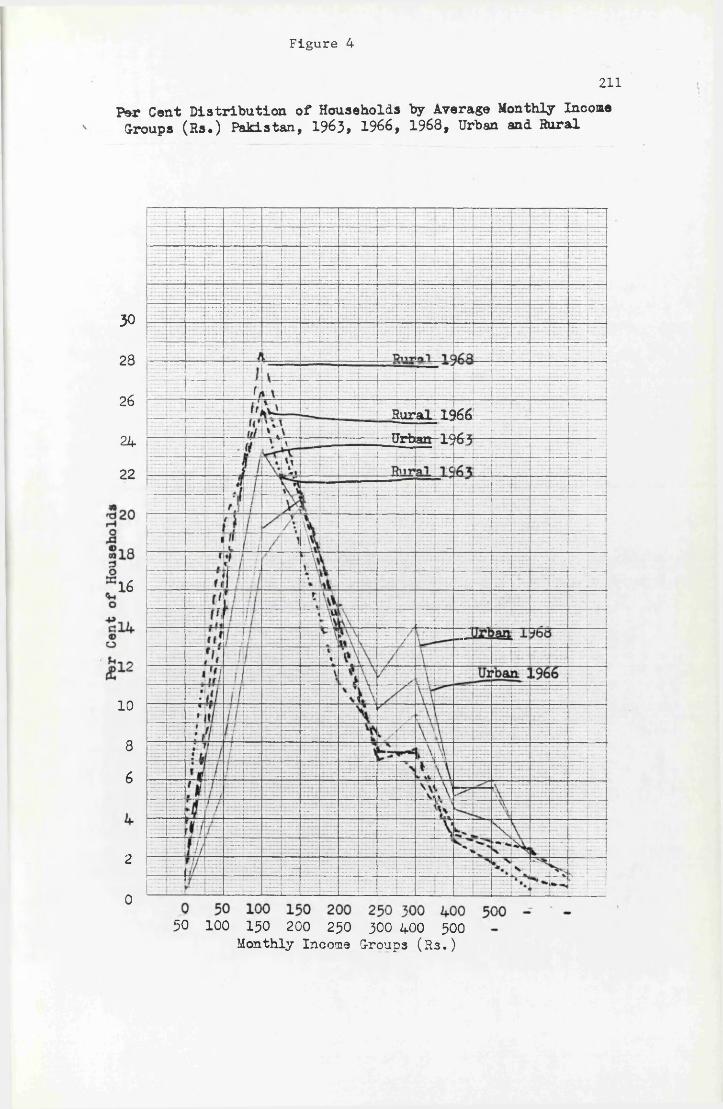
Figure 4
211
Per Cent Distribution of Households by Average Monthly Income Groups (Rs.) Pakistan, 1963, 1966, 1968, Urban and Rural
30
28
26Rural: X96& Urban 1963r24
22
16
10
86
2
0
50 100 150 200 250 300 400 500 Monthly Income Groups (R3.)
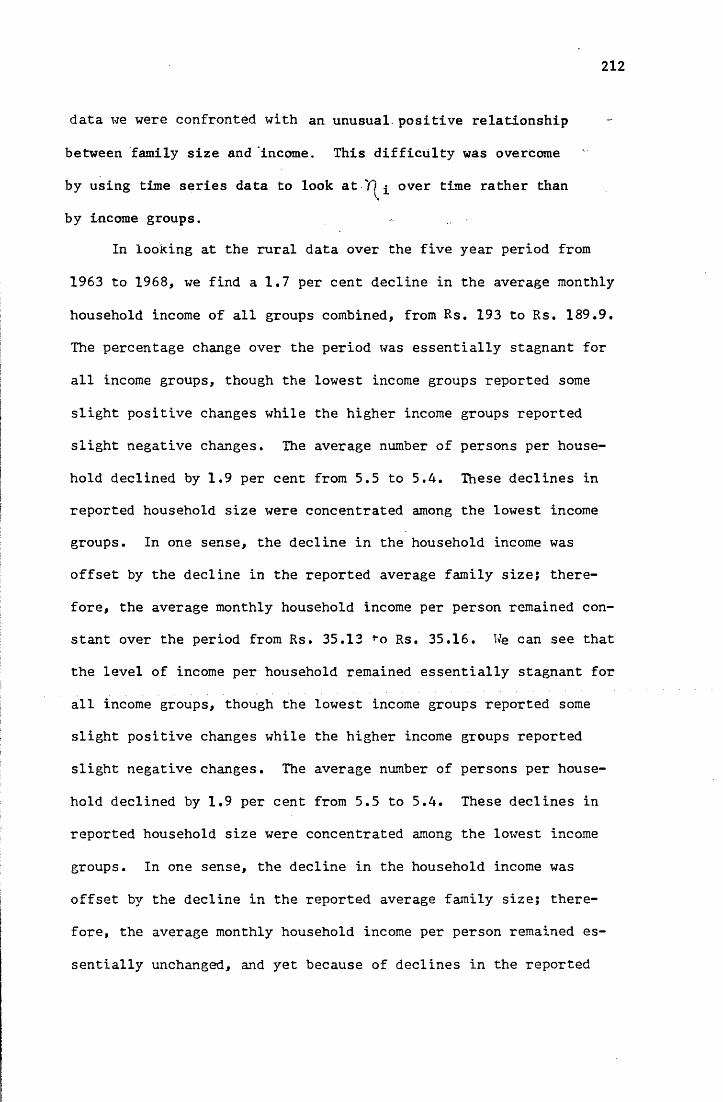
212
data we were confronted with an unusual positive relationship
between family size and "income. This difficulty was overcome
by using time series data to look at over time rather than
by income groups.
In looking at the rural data over the five year period from
1963 to 1968, we find a 1.7 per cent decline in the average monthly
household income of all groups combined, from Rs. 193 to Rs. 189.9.
The percentage change over the period was essentially stagnant for
all income groups, though the lowest income groups reported some
slight positive changes while the higher income groups reported
slight negative changes. The average number of persons per house
hold declined by 1.9 per cent from 5.5 to 5.4. These declines in
reported household size were concentrated among the lowest income
groups. In one sense, the decline in the household income was
offset by the decline in the reported average family size; there
fore, the average monthly household income per person remained con
stant over the period from Rs. 35.13 ^o Rs. 35.16. We can see that
the level of income per household remained essentially stagnant for
all income groups, though the lowest income groups reported some
slight positive changes while the higher income groups reported
slight negative changes. The average number of persons per house
hold declined by 1.9 per cent from 5.5 to 5.4. These declines in
reported household size were concentrated among the lowest income
groups. In one sense, the decline in the household income was
offset by the decline in the reported average family size; there
fore, the average monthly household income per person remained es
sentially unchanged, and yet because of declines in the reported
213
family size, the income per person among certain income groups
changed dramatically. The households earning between Rs. 50-100
and Rs. 100-150 reported rather substantial declines in family
size and only slight gains in family income. Careful examination
o f r e v e a l s a further limitation of the planning model. Upon
first inspection the income elasticities of the household size
look fairly reasonable. They are based on the per cent change
in household income per person. Household income per person is
acknowledged to be a better indicator than average household in
come. But problems of circular causality remain, in this case
we do not know why family size declined but we can determine that
it was not the rise in household income per person which reduced
family size. The decline in family size is the chief reason why
household income per person increased.
This framework illustrates some of the important relationships
between population, income distribution, and the evaluation of
alternative development strategies. However, it is much too sim
plistic to be used as an analytical tool for actual planning pur
poses and even if high quality data were available, serious method-
ogical difficulties would remain.
214
CONCLUSION
The findings in the first part of this thesis indicate a surprising dearth of demographic data in development plans of the Third World. With a few exceptions, the data found in these plans are inadequate and are not presented in forms easily used by planners. Use varies significantly by region, with Asia presenting more data than Africa or Latin America and the Caribbean. This regional variation is even more marked when population is
taken into consideration. A substantial variation in the parameters of demographic data used is also evident. More demographic
data are found in recent plans than in earlier ones,^ but many
^Stamper, B. Maxwell, ’Population Policy in Development Planning: A Study of Seventy Less Developed Countries,* Reports onPopulation/Family Planning, No. 13, 1973.
215
countries with rapid population growth continue not to consider
rudimentary demographic statistics in their national development
plans. Few of the projections that are presented are sufficiently
detailed for effective planning, and even fewer have actually
been integrated with development strategies.
The recognition of population problems in development plans
is substantial! Two**thirds of the countries studied mention a
wide spectrum of population problems in their plans. An earlier
study of 70 development plans of the 1960s* found slightly more
than one-third of them acknowledging such problems. Recognition
of population problems has thus increased dramatically. The
regional differences in problem recognition are acute when pop
ulation is taken into consideration, Asia again having the most
comprehensive coverage.
Countries that make extensive use of demographic data tend
to recognize more population problems than those that do not.
Data on the age structure of a population, for example, appear
to help alert a planning commission to the problems of a high de
pendency ratio and an increasing working-age population; when
population projections are available to be studied in conjunction
with economic data, the effect of population growth on economic
development is more readily apparent. And once at least two
population problems are recognized, others suggest themselves I
Of the countries that recognize more than one such problem —
^Stamper, B. Maxwell, ’Population Policy in Development Planning; A Study of Seventy Less Developed Countries,' Reports on Population/Family Planning, No. 13, 1973.
216
and just half of the countries studied do — 80 per cent recognize
four or more.
Forty-three per cent of the countries studied propose some
policy to reduce the rate of population growth. Only 26 per
cent of the 1960s development plans studied had such policies,
so it is apparent that Third World countries are becoming in
creasingly aware not only of the problems arising from population
growth but of the advisability of some sort of action to deal
with them. Yet the evidence found in these plans strongly sug
gests that many countries do not plan for the consequences of
short-term population growth, let alone long-term growth. Most
of these policies support only family planning programmes; other
measures receive relatively little attention. Nine plans ad
vocate special family planning education efforts and seven ad
vocate broader education about population issues, but only four
mention the use of the mass media to spread this information.
Nine plans explicitly state a policy assumption that economic
development would result in reduced fertility. Two plans advo
cate an improvement in the status of women in conjunction with
a decline in fertility. Almost no attention is given in the
plans to an improvement in the status of women for their own
sake or for their contribution to development. Again a regional
pattern emerges, with the Asian plans having far more population
policies than those of Africa or Latin America and the Caribbean.
Twenty-two countries recognize no population problems and
include no population policies in their plans; twelve countries
recognize population problems but have no population policies;
the remaining both recognize population problems and include
population policies in their plans (see Figure 5 ). There are
great extremes in this group: Bangladesh recognizes nine pop
ulation problems and has 14 policies for dealing with them;
Guatemala also recognizes nine problems but has only two policies
and one of these is increased employment of women, only partially
in the context of population policy. Malaysia, on the other hand,
mentions only one problem but proposes seven policies. A median
<of 4.0 policies is proposed by the countries that have policies;
the mean is 4.8. These figures are rather high, and might be
explained by an overlap of classifications. As might have been
anticipated, there tends to be a positive relationship between
the number of population problems recognized and the number of
policies proposed in the development plans.
Figure 5 gives a more realistic view of the population pol
icies and problem recognition in the development plans by com
paring them with the official positions of the governments con
cerned.^ The dates of official policy adoptions are presented
as well as the plan periods so that sequential comparisons can
be made. Of the 60 countries studied, 22 countries (37 per
cent) do not recognize a problem from rapid population growth,
^Nigeria, Uganda, Panama, and Swaziland, which had weak statements of policy in the plans, are in apparent contradiction, with no official government policy but with a policy stated in the plan. The contradiction can be explained by different interpretations of the plan document or the fact that the official classification may be based on countervailing information outside of the plan.

218
usco-C
co»Ec._c"a;>4>T3
Ctcou<uuE
JLJ2o-sca>%u2aco3aoa
waO
C \ Cn Cn Cn
e
S..2
_c U >c.2c5t6JJ
5Ic.0
9Q.0CL
*0■ i s. 2 u & “2£k o
Note: A date before a country name represents the year the official governmentposition was adopted, see Dorothy Nortman, 'Population and Family Planning Programs: A Factbook', Reports in Population/Family P l a n n i n g , No. 2, 7th ed., New York: Population Council, October, 1975. Countries that give no official support to a family planning programme, of course, have no date of policy adoption. The dates following the country names represent the development plan periods.aBased on the classification developed by Nortman, Ibid b ,Classified by the author
NO
TE:
A da
te
befo
re
a co
untr
y na
me
repr
esen
ts
ibe
year
the
o
ffic
ial
go
vern
me
nt
posi
tion
was
adop
ted
<»ce
N
on
ma
n.
1975
), co
untr
ies
lhai
giv
e no
o
fhci
ul
supp
on
io a
fam
ily
plan
ning
p
rog
ram
, of
Co
uric
, ha
ve
no
Jace
of
polic
y a
do
ptio
n.
The
date
s fo
llow
ing
ihe
coun
try
nam
es
repr
esen
t the
d
eve
lop
me
nt
|>lan
p
criix
ls.
"Bas
ed
on
the
clas
sihc
alio
n de
velo
ped
by
Non
man
(1
97
5)
‘Cla
ssifi
ed
by
tbc
au
tho
r.
219
while 38 countries (63 per cent) do recognize such a problem.
Of these, 26 countries (43 per cent) present a policy to reduce
the rate of population growth in their plans. Of the remaining
twelve countries that do recognize a population problem but have
no policy in their plans, four have adopted official govemmant
positions supporting a policy and a programme outside the plan,
and four others actually support family planning programmes for
nondemographic reasons. Thus, only four countries (Burundi,
Togo, Zambia, and Guyana) recognize a population problem in
their plans but have no specific policy to reduce it and give no
support to an official family planning programme.
Chapter 4, which begins the second part of this thesis, is
a specific examination of population and planning in the develop
ment plans of Pakistan and Bangladesh. Pakistan's First Five-
Year Plan (1955-1960) never became operational and the general
background of the plan — economically, administratively, and
politically — was that of complete failure. Though population
growth was regarded as a serious problem in the Plan, officials
deliberately understated the rate of population growth in order
to present a more optimistic picture. Virtually no policies
were proposed to reduce fertility.
The Second Plan (1960-1965) gave much more attention to the
problems of population growth stating that they 'threatened to
wipe out the gains of development...* (p. 335). The policy ef
forts directed by the Second Plan did not have a demographic
impact for several reasons. There was little demand for con
traceptives; the programme was administered through existing
220
health facilities which did not reach most of the population
and whose personnel, facing more critical clinical cases, did
not actively promote contraceptive use; and only half of the funds
proposed in the Flan were actually allocated.
The Third Plan's (1965-1970) objectives and programmes to
reduce fertility were excessively ambitious. The strategy again
faced the basic problem of insufficient demand for contraceptives.
Administratively, it reli ed on existing political structures (rather
than medical facilities) that were often uninterested in the ob
jectives, and unwilling to work with little or no compensation.
The utilization of the local dais proved ineffective. There
were logistical difficulties because the geographic scope of
the programme was so wide. Finally, reports of bleeding caused
by the IUD made the method unacceptable, and the monetary incen
tive scheme implemented for IUD insertions, vasectomies, and
tubligations was plagued with corruption.
Bangladesh's First Plan (1973-1978) gave considerable atten
tion to population, but extremely adverse conditions in the
country have made its implementation exceedingly difficult. The
country's efforts since 1974 have not been reviewed in this study.
In Chapter 5 four conceptual frameworks incorporating theories
of fertility decline were analyzed, and their relevance and utilityifor development planning in Pakistan and Bangladesh was assessed.
The family planning approach, (i.e., essentially supplying con
traceptives and information about their use), remains the princi
pal policy instrument for reducing fertility, though there remain
substantial socio-economic-psychological barriers to this approach;
221
and it has not been successfully implemented nor has it been
demographically effective. Until there is greater motivation
to control reproduction, the demand for contraceptives and the
demographic impact of the family planning programme are not likely
to substantially reduce the rate of population growth. In the
long run the approach may have some demographic impact; and it
remains the most politically acceptable and administratively
and economically feasible intervention for reducing fertility.
Policies going beyond the family planning approach which
attempt to directly influence the demand for reproductive con
trol, such as the provision of old age support, monetary incen
tives, stringent and coercive measures, are likely to be econom
ically and administratively infeasible and politically unrealistic.
The demographic transition theory, which states that general
economic development brings reduced mortality and greater demand
for fertility control, remains fundamental to many assumptions
employed by development planners. The historical experiences
upon which this theory is based are found to be quite different
from the present conditions of Pakistan and Bangladesh; these
differences are assessed to determine which in general may post
pone a decline in fertility and which may accelerate such a de
cline. The source and pace of mortality decline, the high rate
of growth, the growth in absolute size, the young age structure,
the high level of fertility, and the unlikely prospect of uni
versal education or nonagricultural employment (especially for
women) all combine to generally impede the demographic transition
as it occurred in Europe and other Western countries. Furthermore,
222
migration is not likely to lessen the effects of population growth
as it did in the West. On the other hand, the early and near
universal marriage patterns of Pakistan present a greater
potential for reducing fertility via a delay in the age of mar
riage or in a reduction in the proportion marrying than existed
in Europe. New birth control technology is more effective, it
may require less frequent motivation, and the potential for safe
medical abortions now exists. Modem communication systems which
have a greater potential for permeating linguistic barriers and
bringing a modernization of attitudes now reach remote rural
areas. There is also evidence that where fertility is declining
in other Third World countries, it is doing so more rapidly
than it did in Europe and other Western countries.
Finally, the distributive and fertility decline hypothesis,
which focuses on the underlying distributions rather than on ag
gregate economic and social measures, is examined to evaluate
more fully its relevance and application to Pakistan and Bangla
desh. This approach raises issues about the redistribution of
income growth which in turn raises issues about the bimodal
trends in agriculture and rural development, the sector in which
the vast majority of the people work and live. Development stra
tegies which emphasize the rural poor are examined for their po
tential impact upon fertility.
The available evidence from other countries on the fertility/
equity thesis is reviewed but because of the aggregate nature ofdrawnthe data, few conclusions can be / about these relationships.
Equity oriented growth strategies may in the short-run increase
223
fertility though in the long-run they may result in reduced fer
tility by the various indirect mechanisms discussed.
The approach analyzed in Chapter 6 attempts to integrate
the crucial issues faced by development planners in Pakistan and
Bangladesh: population, income distribution and the evaluation
of alternative development strategies. It is an extension of the
social welfare index which aims to incorporate the effects upon
fertility of differential income growth. While it successfully
illustrates some of these relationships and adds an important
emphasis to the distributive-fertility aspect of alternative de
velopment strategies, it cannot succeed, in this writer*s view,
as an analytical tool because of its inherent simplicity. As we
have seen, the available data on income distribution and f a m i l y
size (Pakistan 1963/64, 1966/67, and 1968/69) is not of sufficient
quality to be appropriately employed even in this simple framework.
A more complex model would have to overcome substantial methodologi
cal difficulties and would require data of such sophistication that
it is not likely to become available.
Though development plans represent only one aspect of planning,
their systematic content analysis does point to some tentative con
clusions about the emphasis given to population in development
planning. Perhaps the most important conclusion is that few plans
are preparing to accommodate for the inevitable growth of the popu
lation. This is particularly important for employment and educa
tion.
224
Policies for reducing fertility mainly rely upon the family
planning approach. In the case of Pakistan and Bangladesh this
approach has so far not been efficiently administered nor has it
been demographically effective. Direct policies to influence re
productive motivation may not be administratively or politically
realistic. Broad changes in development strategy such as a rural
based growth-equity emphasis may reduce fertility in the long-run
by indirect mechanisms, but the evidence is not conclusive. Math
ematical frameworks, though they may illustrate the importance of
this distributive aspect of development strategy, lack both the
sophistication and the appropriate data to be used analytically.
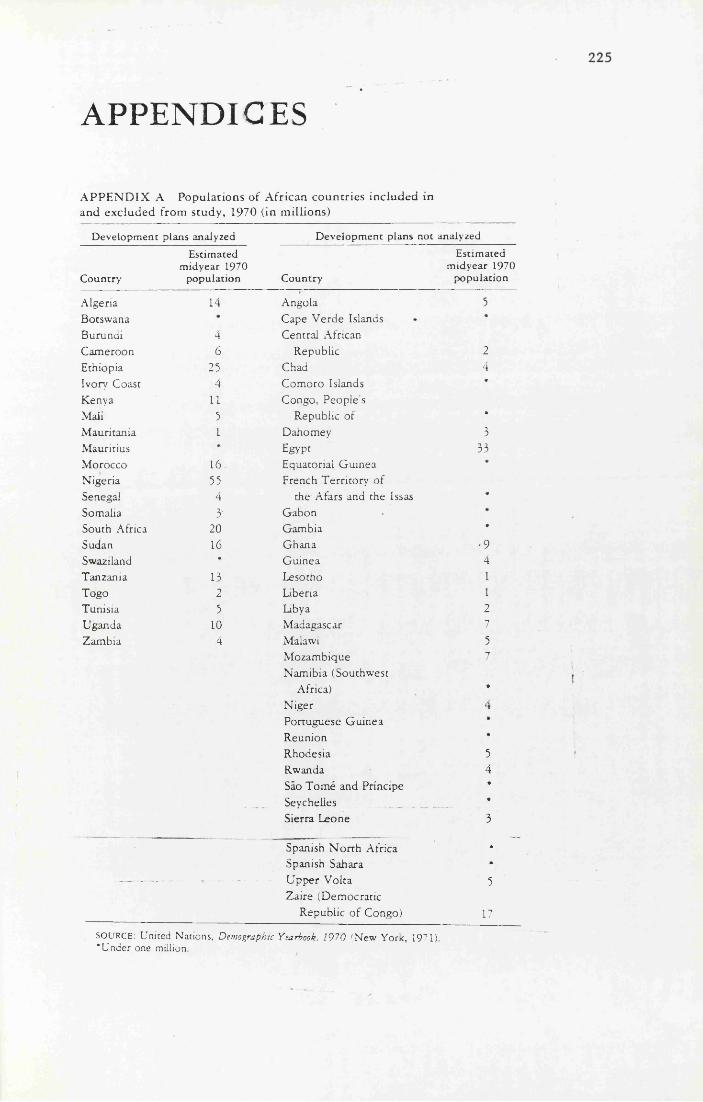
APPENDICESA P P E N D IX A P o p u la tio n s o f A fr ic a n c o u n tr ie s in c lu d e d in and exc lu d e d fro m s tud y , 1970 ( in m illio n s )
Development plans analyzed Development plans not analyzed
Estimated Estimatedmidyear 1970 midyear 1970
Country population Country population
Algeria 14 Angola 5Botswana * Cape Verde Islands *
Burund i 4 Central A fricanCameroon 6 Republic 2
Ethiopia 25 Chad 4
Ivory Coast 4 Com oro Islands •
Kenya 11 Congo, People’sM ali 5 Republic o f *
M auritania 1 Dahomey 3M auritius * Egypt 33M orocco 16 Equatorial Guinea #
N igeria 55 French T e rr ito ry o fSenegal 4 the Afars and the Issas *
Somalia 3 Gabon *
South A frica 20 Gambia #
Sudan 16 Ghana •9Swaziland * Guinea 4
Tanzania 13 Lesotho 1Togo 2 Liberia 1Tunisia 5 Libya 2Uganda 10 Madagascar 7
Zambia 4 Malawi 5M ozambique 7Nam ibia (Southwest
Africa) *
N iger 4Portuguese Guinea #
Reunion ♦
Rhodesia 5Rwanda 4Sao Tom e and Principe *
Seychelles *
Sierra Leone 3
Spanish N o rth A frica *
Spanish Sahara *_ -- - — U pper V o lta 5
Zaire (Dem ocraticRepublic o f Congo) 17
S O U R C E : U nited Nations, Demographic Yearbook. 1970 (N e w Y o rk , 1971). ‘ U nde r one m illion .
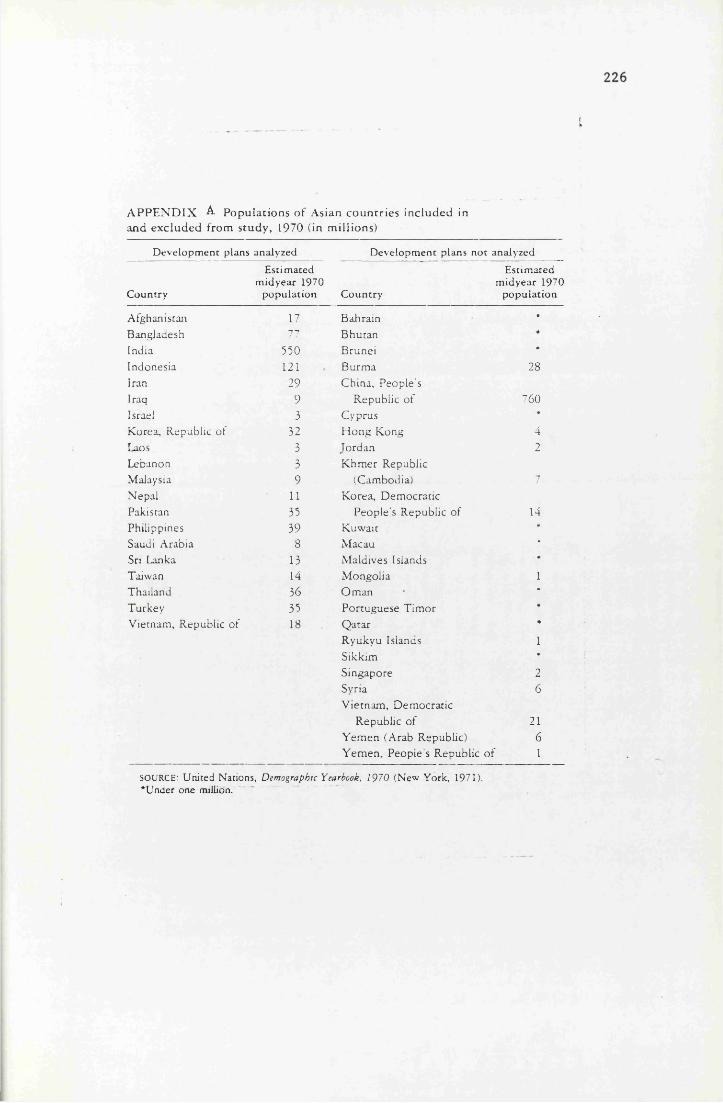
A P P E N D IX A. P o p u la tio n s o f A s ian c o u n tr ie s in c lu d e d in and exc lu d e d fro m s tud y , 1970 ( in m il lio n s )
D e v e lo p m e n t p lan s ana lyzed D e v e lo p m e n t p lans n o t an a lyzed
E s tim a te d E s tim a te dm id y e a r 1970 m id y e a r 1970
Country population Country population
Afghanistan 17 Bahrain *
Bangladesh 77 Bhutan *
India 550 B runei »
Indonesia 121 Burm a 28Iran 29 China, People'sIraq 9 Republic o f 760Israel 3 Cyprus ♦
Korea, Republic o f 32 H ong Kong 4Laos 3 Jordan 2Lebanon 3 K hm er RepublicMalaysia 9 (Cambodia) 7Nepal 11 Korea, Dem ocraticPakistan 35 People’s Republic o f 14Philippines 39 Kuw ait •
Saudi Arabia 8 Macau •
Sri Lanka 13 Maldives Islands •
Taiwan 14 M ongolia 1Thailand 36 Oman *
Turkey 35 Portuguese T im o r *
Vietnam, Republic o f 18 Qatar •
Ryukyu Islands 1S ikk im *
Singapore 2Syria 6V ietnam , Dem ocratic
Republic o f 21Yem en (Arab Republic) 6Yem en, People's Republic o f 1
S O U R C E : U n ited N ations, Demographic Yearbook, 1970 (N ew Y o rk , 1971). ‘ U nder one m illion .
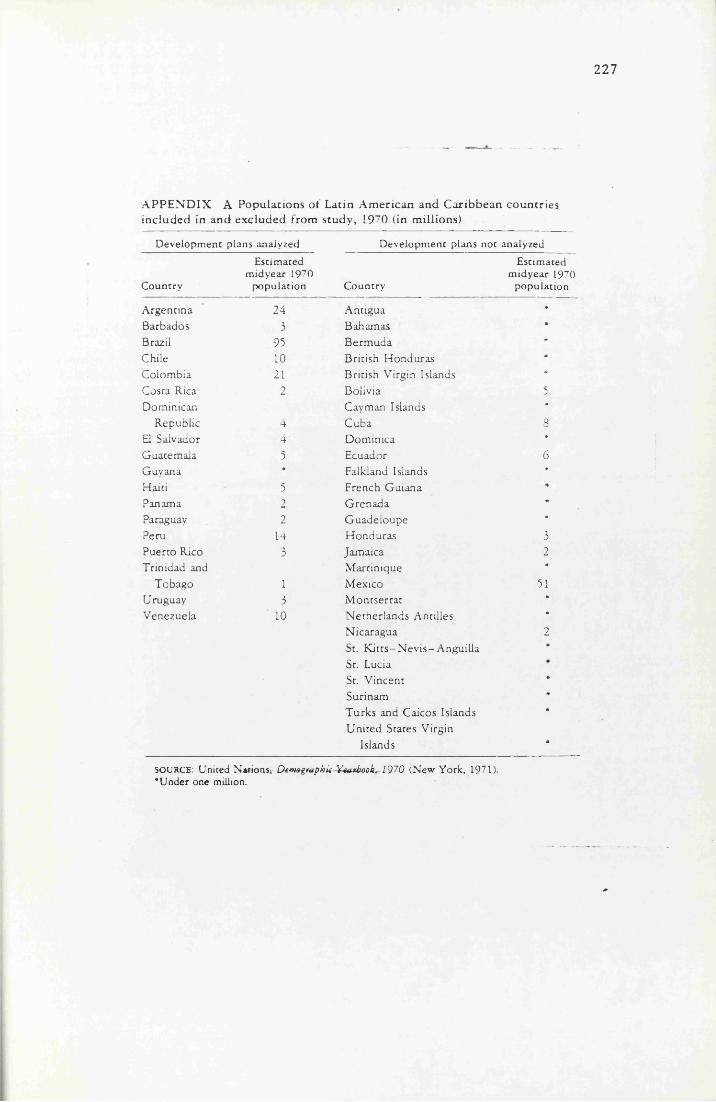
227
A P P E N D IX A P op u la tion s o f L a t in A m e ric a n and C a rib b e a n c o u n tr ie s in c lu d e d in a n d exc lu d e d fro m s tu d y , 1970 ( in m illio n s )
Development plans analyzed Development plans not analyzed
Country
Estimated midyear 1 9 7 0
population Country
Estimated midyear 1 9 7 0
population
Argentina 24 A ntigua *
Barbados 3 Bahamas *
Brazil 95 Berm uda *Chile 10 B ritish Honduras #Colom bia 21 B ritish V irg in Islands *Costa Rica 2 B o liv ia 5Dom inican Cayman Islands *
Republic 4 Cuba 8El Salvador 4 Dom m ica *Guatemala 5 Ecuador 6Guyana * Falkland Islands *
H a iti 5 French Guiana ♦Panama 2 Grenada *
Paraguay 2 Guadeloupe •
Peru 14 Honduras 3Puerto Rico 3 Jamaica 2Trin idad and M artin ique #
Tobago 1 M exico 51Uruguay 3 M ontserrat *
Venezuela 10 Netherlands A ntilles *
NicaraguaSt. K it ts -N e v is -A n g u illa St. Lucia St. V incent SurinamT urks and Caicos Islands U n ited States V irg in
Islands
2
*##
#
SOURCE: U n ited Nations^ Dem>apkK^w&ooXr-1970 (N e w Y o rk , 1971). "U n d e r one m illion .
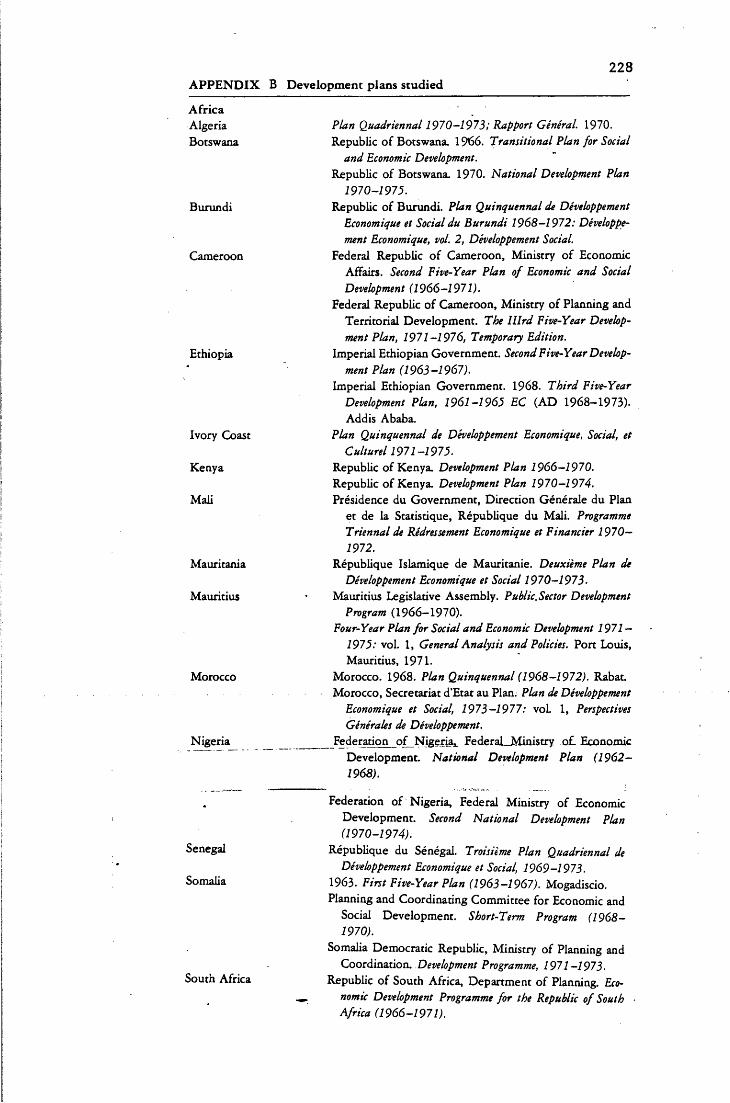
A P P E N D IX B Development plans studied228
A fr ic aAlgeriaBotswana
Burundi
Cameroon
Ethiopia
Ivory Coast
Kenya
M ali
Mauritania
Mauritius
Morocco
Nigeria
Senegal
Somalia
South Africa
Plan Quadriennal 1970-1973; Rapport General. 1970.Republic o f Botswana. 1966. Transitional Plan for Social and Economic Development.
Republic o f Botswana. 1970. National Development Plan 1970-1975.
Republic o f Burundi. Plan Quinquennal de Developpement Economique et Social du Burundi 1968-1972: Developpement Economique, vol. 2, Developpement Social.
Federal Republic o f Cameroon, Ministry o f Economic Affairs. Second Five-Year Plan of Economic and Social Development (1966-1971).
Federal Republic o f Cameroon, Ministry o f Planning and Territorial Development. The Illrd Five-Year Development Plan, 1971-1976, Temporary Edition.
Imperial Ethiopian Government. Second Five-Year Development Plan (1963-1967).
Imperial Ethiopian Government. 1968. Third Five-Year Development Plan, 1961-1965 EC (A D 1968-1973). Addis Ababa.
Plan Quinquennal de D&eloppement Economique, Social, et Culturel 1971-1975.
Republic o f Kenya. Development Plan 1966—1970.Republic o f Kenya. Development Plan 1970—1974.Presidence du Government, Direction Generale du Plan
et de la Statistique, Republique du Mali. Programme Triennal de Redressement Economique et Financier 1970—1972.
Republique Islamique de Mauritanie. Deuxieme Plan de Developpement Economique et Social 1970-1973.
Mauritius Legislative Assembly. Public.Sector Development Program (1966-1970).
Four-Year Plan for Social and Economic Development 1971 — 1975: vol. 1, General Analysis and Policies. Port Louis, Mauritius, 1971.
Morocco. 1968. Plan Quinquennal (1968-1972). Rabat.Morocco, Secretariat d'Etat au Plan. Plan de Developpement Economique et Social, 1973-1977: voL 1, Perspectives Generates de Developpement.
Federation o f Nigeria^ FederaLMinistry of. Economic Development. National Development Plan (1962- 1968).
Federation o f Nigeria, Federal Ministry o f Economic Development. Second National Development Plan (1970-1974).
Republique du Senegal. Troisiime Plan Quadriennal de Developpement Economique et Social, 1969-1973.
1963. First Five-Year Plan (1963-1967). Mogadiscio.Planning and Coordinating Committee for Economic and
Social Development. Short-Term Program (1968—1970).
Somalia Democratic Republic, Ministry o f Planning and Coordination. Development Programme, 1971-1973.
Republic o f South Africa, Department o f Planning. Economic Development Programme for the Republic of South ■ Africa (1966-1971).
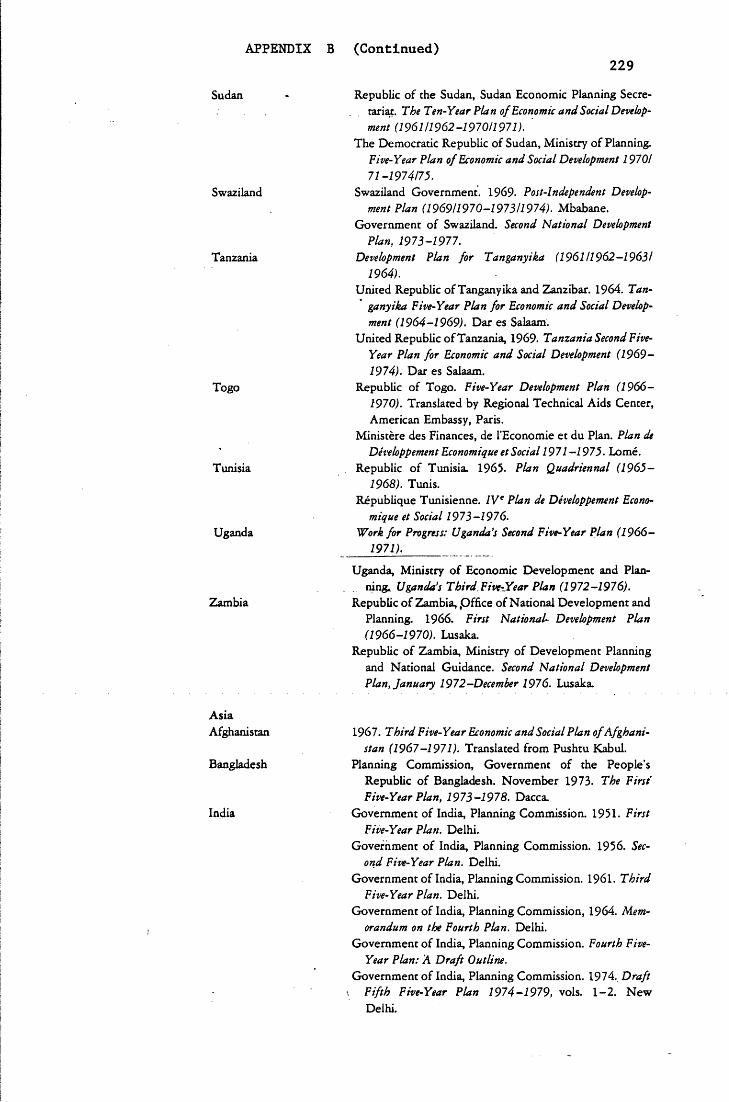
APPENDIX B (Continued)
Sudan
Swaziland
Tanzania
Togo
Tunisia
Uganda
Zambia
AsiaAfghanistan
Bangladesh
India
229Republic o f the Sudan, Sudan Economic Planning Secre
tariat. The Ten-Year Plan ofEconomic and Social Development (196111962-197011971).
The Democratic Republic o f Sudan, Ministry o f Planning. Five-Year Plan of Economic and Social Development 19701 71-1974/75.
Swaziland Government. 1969. Post-Independent Development Plan (1969/1970-197311974). Mbabane.
Government o f Swaziland. Second National Development Plan, 1973-1977.
Development Plan for Tanganyika (1961/1962-1963/ 1964).
United Republic o f Tanganyika and Zanzibar. 1964. Tanganyika Five-Year Plan for Economic and Social Development (1964-1969). D ar es Salaam.
United Republic o f Tanzania, 1969. Tanzania Second Five- Year Plan for Economic and Social Development (1969- 1974). Dar es Salaam.
Republic o f Togo. Five-Year Development Plan (1966-1970). Translated by Regional Technical Aids Center, American Embassy, Paris.
Ministere des Finances, de 1’Economie et du Plan. Plan de Developpement Economique et Social 1971—1975. Lome.
Republic o f Tunisia. 1965. Plan Quadriennal (1965- 1968). Tunis.
Republique Tunisienne. IVe Plan de Developpement Economique et Social 1973—1976.
Work for Progress: Uganda’s Second Five-Year Plan (1966-1971).
Uganda, Ministry o f Economic Development and Planning* Uganda’s Third. Five-Year Plan (1972-1976).
Republic o f Zam bia,,Office o f National Development and Planning. 1966. First National- Development Plan (1966-1970). Lusaka.
Republic o f Zambia, Ministry o f Development Planning and National Guidance. Second National Development Plan, January 1972—December 1976. Lusaka.
1967. T bird Five-Year Economic and Social Plan of Afghanistan (1967-1971). Translated from Pushtu Kabul.
Planning Commission, Government o f the People’s Republic o f Bangladesh. Novem ber 1973. The First' Five-Year Plan, 1973-1978. Dacca.
Government o f India, Planning Commission. 1951. First Five-Year Plan. Delhi.
Government o f India, Planning Commission. 1956. Second Five-Year Plan. Delhi.
Government o f India, Planning Commission. 1961. Third Five-Year Plan. Delhi.
Government o f India, Planning Commission, 1964. Memorandum on the Fourth Plan. Delhi.
Government o f India, Planning Commission. Fourth Five- Year Plan: A Draft Outline.
Government o f India, Planning Commission. 1974. Draft Fifth Five-Year Plan 1974-1979, vols. 1 -2 . N ew Delhi.
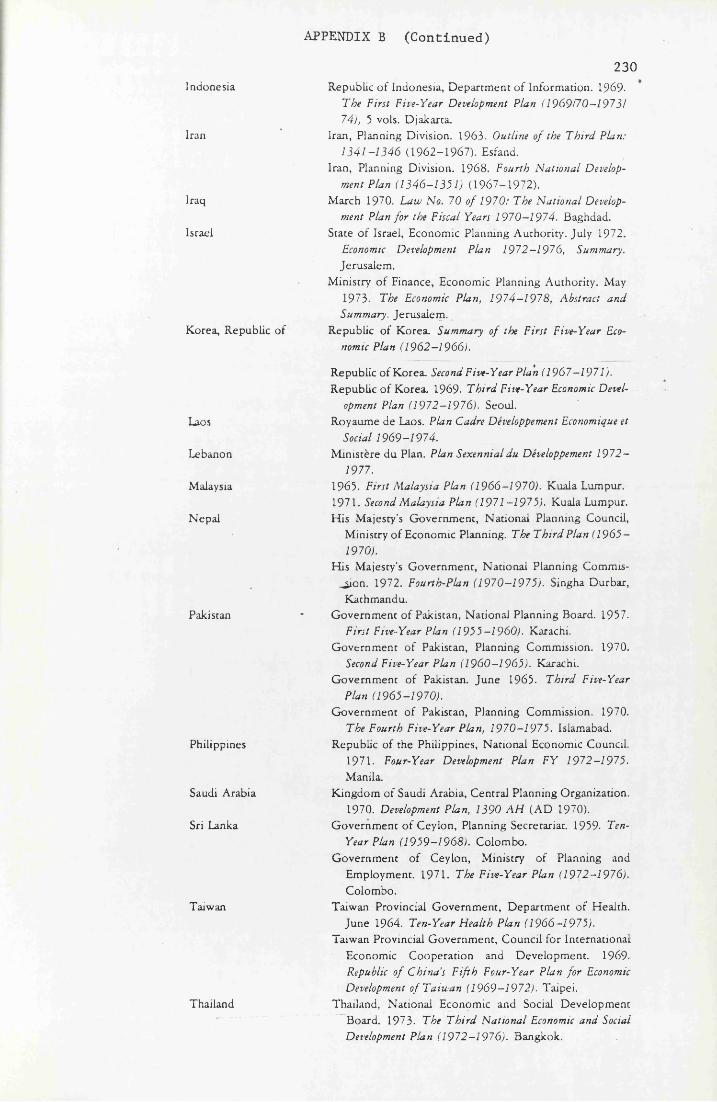
APPENDIX B (Continued)
Indonesia
Iran
Iraq
Israel
Korea, Republic o f
Laos
Lebanon
Malaysia
Nepal
Pakistan
Philippines
Saudi Arabia
Sri Lanka
Taiwan
Thailand
230Republic o f Indonesia, Departm ent o f In form ation . 1969.
The First Five-Year Development Plan (1969170-19731 74), 5 vols. Djakarta.
Iran, Planning D ivis ion. 1963. Outline of the Third Plan: 1341-1346 (1962-1967). Esfand.
Iran, Planning D iv is ion . 1968. Fourth National Development Plan (1346-1351) (1967 -1972).
M arch 1970. Law No. 70 o f 1970: The National Development Plan for the Fiscal Years 1970-1974. Baghdad.
State o f Israel, Economic Planning A u th o rity . July 1972. Economic Development Plan 1972-1976, Summary. Jerusalem.
M in is try o f Finance, Economic Planning A u th o rity . May1973. The Economic Plan, 1974-1978, Abstract and Summary. Jerusalem.
Republic o f Korea. Summary of the First Five-Year Economic Plan (1962-1966).
Republic o f Korea. Second Five-Year Plan (1967-1971). Republic o f Korea. 1969. Third Five-Year Economic Devel
opment Plan (1972-1976). Seoul.Royaume de Laos. Plan Cadre Developpement Economique et
Social 1969-1974.M in istere du Plan. Plan Sexennial du Developpement 1972-
1977.1965. First Malaysia Plan (1966-1970). Kuala Lum pur. 1971. Second Malaysia Plan (1971 -1975). Kuala Lumpur. H is M ajesty’s G overnm ent, N a tiona l Planning Council,
M in is try o f Economic Planning. T heT hird Plan (1965 - 1970).
H is M ajesty’s G overnm ent, N ationa l Planning Com m iss io n . 1972. Fourth-Plan (1970-1975). Singha Durbar,
Kathmandu.G overnm ent o f Pakistan, N ational Planning Board. 1957.
First Five-Year Plan (1955-1960). Karachi.G overnm ent o f Pakistan, Planning Commission. 1970.
Second Five-Year Plan (1960-1965). Karachi. G overnm ent o f Pakistan. June 1965. Third Five-Year
Plan (1965-1970).G overnm ent o f Pakistan, Planning Commission. 1970.
The Fourth Five-Year Plan, 1970-1975. Islamabad. Republic o f the Philippines, N ationa l Economic Council.
1971. Four-Year Development Plan FY 1972-1975. Manila.
K ingdom o f Saudi Arabia, Central Planning Organization.1970. Development Plan, 1390 A H (A D 1970).
G overnm ent o f Ceylon, Planning Secretariat. 1959. Ten- Year Plan (1959-1968). Colom bo.
G overnm ent o f Ceylon, M in is try o f Planning and Em ploym ent. 1971. The Five-Year Plan (1972-1976). Colom bo.
Taiwan Provincia l G overnm ent, Departm ent o f Health.
June 1964. Ten-Year Health Plan (1966-1975).Taiwan Provincia l G overnm ent, C ouncil fo r In ternational
Economic Cooperation and Developm ent. 1969. Republic o f China’s Fifth Four-Year Plan for Economic Development of Taiwan (1969-1972). Taipei.
Thailand, N ationa l Economic and Social Developm ent Board. 1973. The Third National Economic and Social Development Plan (1972-1976). Bangkok.
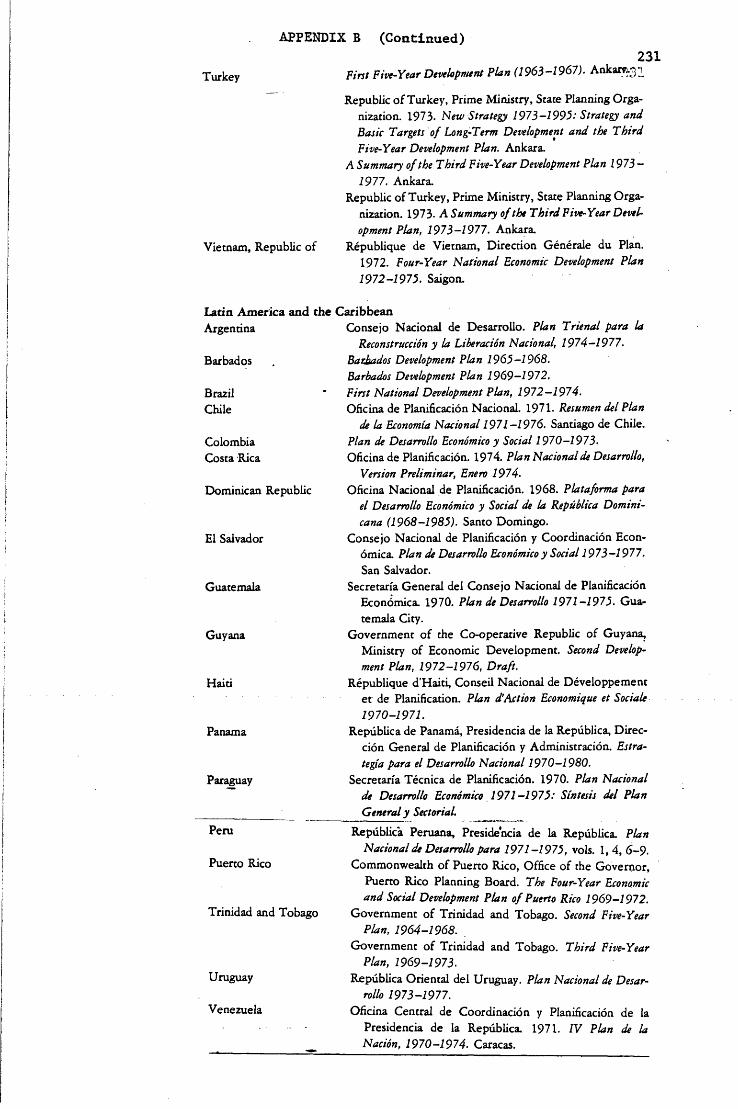
APPENDIX B (Continued)231
Turkey First Five-Year Development Plan (1963 -1967). Ankare.31
Vietnam, Republic o f
Republic o f Turkey, Prime Ministry, State Planning Organization. 1973. New Strategy 1973—1995: Strategy and Basic Targets of Long-Term Development and the Third Five-Year Development Plan. Ankara.
A Summary of the Third Five-Year Development Plan 1973 — 1977. Ankara.
Republic o f Turkey, Prime Ministry, State Planning Organization. 1973- A Summary of the Third Five-Year Development Plan, 1973—1977. Ankara.
Republique de Vietnam, Direction Generale du Plan.1972. Four-Year National Economic Development Plan 1972-1975. Saigon.
Latin A m erica and the Argentina
Barbados
BrazilChile
Colombia Costa Rica
Dominican Republic
El Salvador
Guatemala
Guyana
Haiti
Panama
Paraguay
Peru
Puerto Rico
Trinidad and Tobago
Uruguay
Venezuela
CaribbeanConsejo Nacional de Desarrollo. Plan Trienal para la Reconstruction y la Liberacion Nacional, 1974-1977’.
Barbados Development Plan 1965—1968.Barbados Development Plan 1969—1972.First National Development Plan, 1972-1974.Oficina de Planificacion Nacional. 1971. Resumen del Plan de la Economia Nacional 1971-1976. Santiago de Chile.
Plan de Desarrollo Economico y Social 1970—1973.Oficina de Planificacion. 1974. Plan Nacional de Desarrollo, Version Preliminar, Enero 1974.
Oficina Nacional de Planificacion. 1968. Plataforma para el Desarrollo Economico y Social de la Republica Domtni- cana (1968-1985). Santo Domingo.
Consejo Nacional de Planificacion y Coordinacion Economica. Plan de Desarrollo Economico y Social 1973-1977. San Salvador.
Secretarfa General del Consejo Nacional de Planificacion Economica. 1970. Plan de Desarrollo 1971—1975. Guatemala City.
Government o f the Co-operative Republic o f Guyana, Ministry o f Economic Development. Second Development Plan, 1972—1976, Draft.
Republique d’Haiti, Conseil Nacional de Developpement et de Planification. Plan d’Action Economique et Sociale 1970-1971.
Republica de Panama, Presidencia de la Republica, Direction General de Planificacion y Administration. Estra- tegia para el Desarrollo Nacional 1970—1980.
Secretarfa Tecnica de Planificacion. 1970. Plan Nacional de Desarrollo Economico 1971—1975: Sintesis del Plan General y Sectorial.
Republica Peruana, Presidencia de la Republica. Plan Nacional de Desarrollo para 1971-1975, voIs. 1, 4, 6 -9 .
Commonwealth o f Puerto Rico, Office o f the Governor, Puerto Rico Planning Board. The Four-Year Economic and Social Development Plan of Puerto Rico 1969-1972.
Government o f Trinidad and Tobago. Second Five-Year Plan, 1964-1968.
Government o f Trinidad and Tobago. Third Five-Year Plan, 1969-1973.
Republica Oriental del Uruguay. Plan Nacional de Desarrollo 1973-1977.
Oficina Central de Coordinacion y Planificacion de la Presidencia de la Republica. 1971. IV Plan de la Nation, 1970-1974. Caracas.
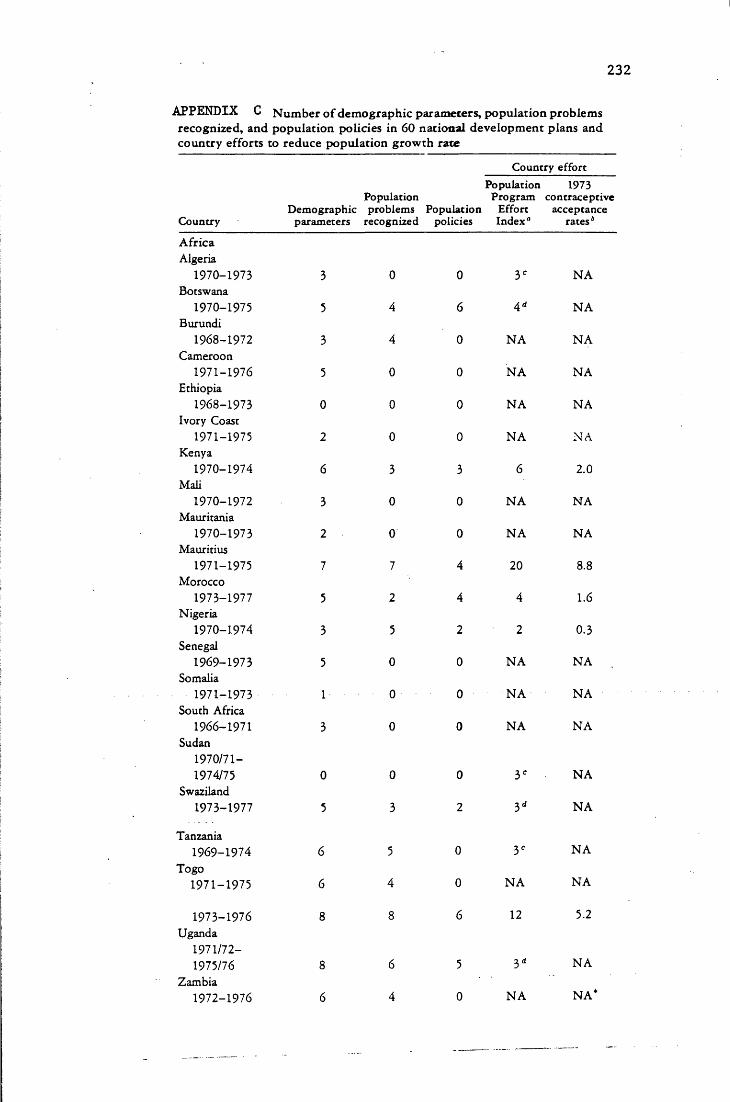
232
A P P E N D IX C N u m b e r o f dem ographic parameters, popu lation problem s recognized, and population policies in 60 national developm ent plans and country efforts to reduce population g ro w th rate
Country effort
Population 1973 Population Program contraceptive
Demographic problems Population Effort acceptance Country parameters recognized policies Index0 rates6
A fric aAlgeria
1970-1973 3 0 0 3 C N ABotswana
1970-1975 5 4 6 4 d N ABurundi
1968-1972 3 4 0 N A N ACameroon
1971-1976 5 0 0 N A N AEthiopia
1968-1973 0 0 0 N A N AIvory Coast
1971-1975 2 0 0 N A N AKenya
1970-1974 6 3 3 6 2.0Mali
1970-1972 3 0 0 N A N AMauritania
1970-1973 2 0 0 N A N AMauritius
1971-1975 7 7 4 20 8.8Morocco
1973-1977 5 2 4 4 1.6Nigeria
1970-1974 3 5 2 2 0.3Senegal
1969-1973 5 0 0 N A N ASomalia
1971-1973 0 0 N A N ASouth Africa
1966-1971 3 0 0 N A N ASudan
1970/71-1974/75 0 0 0 3 e N A
Swaziland1973-1977 5 3 2 3 d N A
Tanzania1969-1974 6 5 0 3 C N A
Togo19 71 -197 5 6 4 0 N A N A
1973-1976 8 8 6 12 5.2
Uganda1971 /72-1975/76 8 6 5 3 d N A
Zambia1972-1976 6 4 0 N A N A
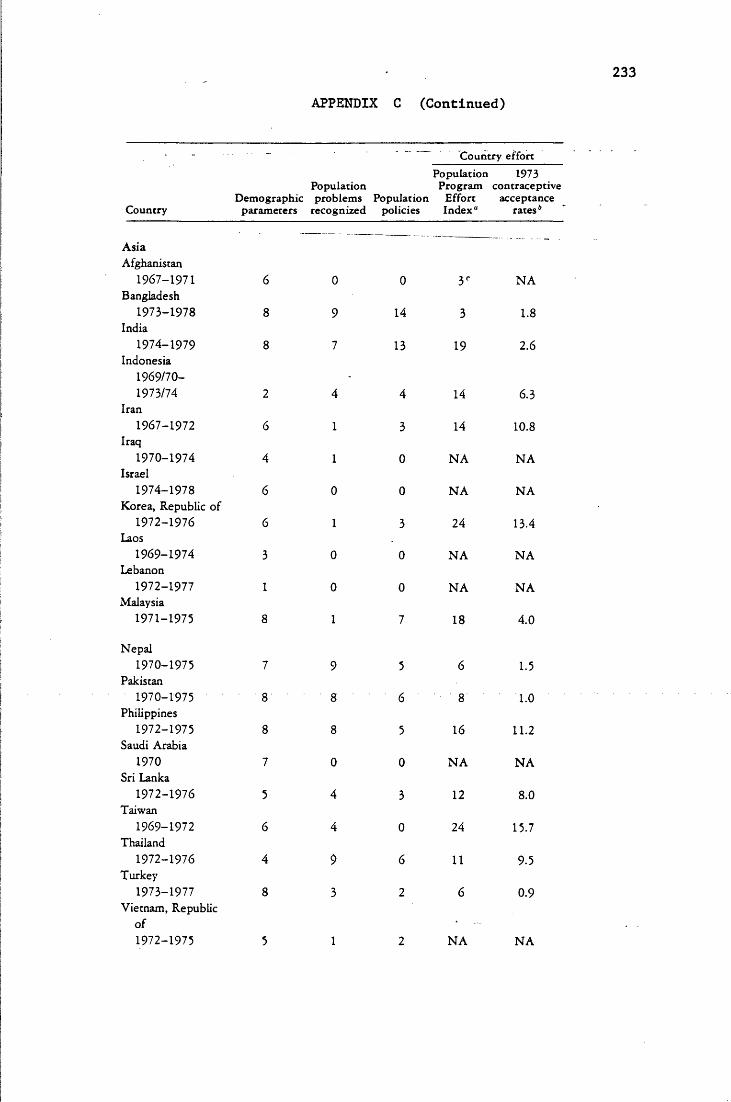
APPENDIX C (Continued)233
Country effort
Population 1973 Population Program contraceptive
Demographic problems Population Effort acceptance Country parameters recognized policies Index" rates"
AsiaAfghanistan
1967-1971 6 0 0 3 C N ABangladesh
1973-1978 8 9 14 3 1.8India
1974-1979 8 7 13 19 2.6Indonesia
1969/70-1973/74 2 4 4 14 6.3
Iran1967-1972 6 1 3 14 10.8
Iraq1970-1974 4 1 0 N A N A
Israel1974-1978 6 0 0 N A N A
Korea, Republic o f 1972-1976 6 1 3 24 13.4
Laos1969-1974 3 0 0 N A N A
Lebanon1972-1977 1 0 0 N A N A
Malaysia1971-1975 8 1 7 18 4.0
Nepal1970-1975 7 9 5 6 1.5
Pakistan1970-1975 8 8 6 8 1.0
Philippines1972-1975 8 8 5 16 11.2
Saudi Arabia 1970 7 0 0 N A N A
Sri Lanka
1972-1976 5 4 3 12 8.0Taiwan
1969-1972 6 4 0 24 15.7Thailand
1972-1976 4 9 6 11 9.5Turkey
1973-1977 8 3 2 6 0.9Vietnam, Republic
o f1972-1975 5 1 2 N A N A
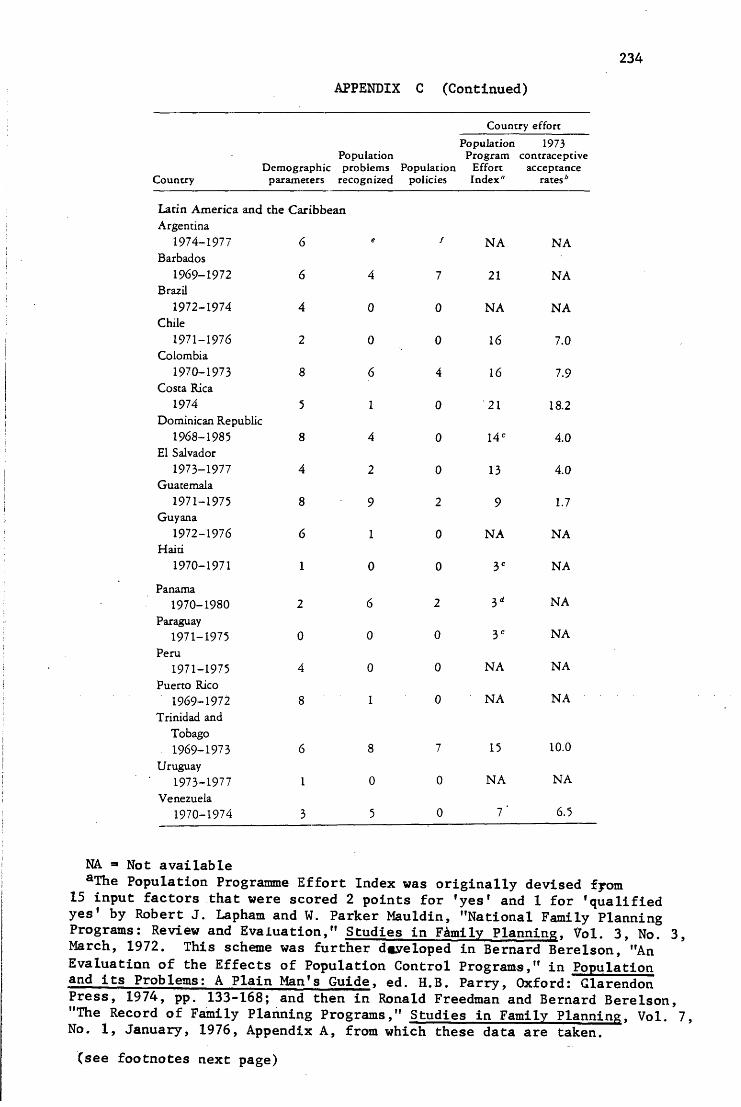
APPENDIX C (Continued)234
Demographic Country parameters
Populationproblems
recognizedPopulation
policies
Country effort
Population 1973 Program contraceptive
Effort acceptance Index" rates*
Lacin Am erica and the Caribbean Argentina
1974-1977 6 e / N A N ABarbados
1969-1972 6 4 7 21 N ABrazil
1972-1974 4 0 0 N A N AChile
1971-1976 2 0 0 16 7.0Colombia
1970-1973 8 6 4 16 7.9Costa Rica
1974 5 1 0 21 18.2Dominican Republic
1968-1985 8 4 0 14 C 4.0El Salvador
1973-1977 4 2 0 13 4.0Guatemala
1971-1975 8 9 2 9 1.7Guyana
1972-1976 6 1 0 N A N AHaiu
1970-1971 1 0 0 3° N A
Panama1970-1980 2 6 2 3 d N A
Paraguay1971-1975 0 0 0 3 C N A
Peru1971-1975 4 0 0 N A N A
Puerto Rico 1969-1972 8 1 0 N A N A
Trinidad and
Tobago 1969-1973 6 8 7 15 10.0
Uruguay1973-1977 1 0 0 N A N A
Venezuela1970-1974 3 5 0 7 ' 6.5
NA » Not availableaThe Population Programme Effort Index was originally devised iyom
15 input factors that were scored 2 points for 'yes' and 1 for 'qualified yes' by Robert J. Lapham and W. Parker Mauldin, "National Family Planning Programs: Review and Evaluation," Studies in Family Planning, Vol. 3, No. 3, March, 1972. This scheme was further developed in Bernard Berelson, "An Evaluation of the Effects of Population Control Programs," in Population and its Problems: A Plain Man's Guide, ed. H.B. Parry, Oxford: Glarendon Press, 1974, pp. 133-168; and then in Ronald Freedman and Bernard Berelson, "The Record of Family Planning Programs," Studies in Family Planning. Vol. 7, No. 1, January, 1976, Appendix A, from which these data are taken.(see footnotes next page)
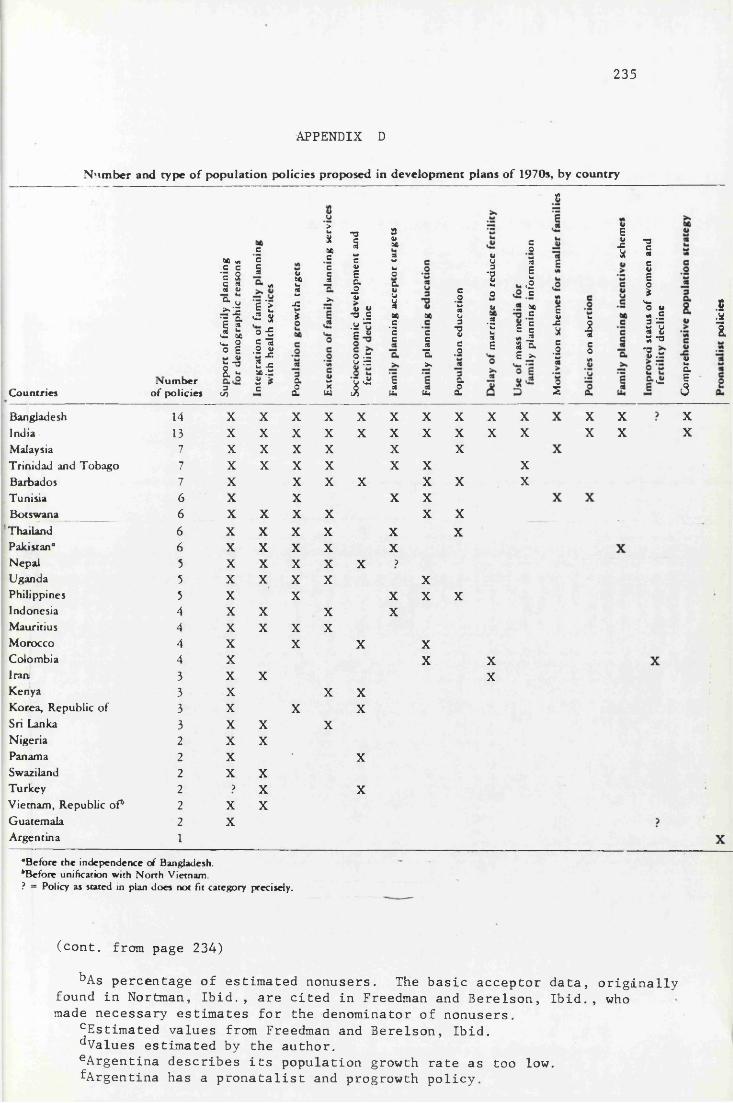
235
APPENDIX D
N u m b e r and type o f population policies proposed in developm ent plans o f 1970s, by country
8
9C Mc c"e 9 § 3G. *’
ec§-
* 2 i’*- t ^ J! I 2 'o -c<2 sc ° “'*•2 = 73o g .2 Jiu -2j g -a u "5u 90."
u90
§JS
Eto
>u5t90ecsa>.
T3swC$Ea_oUV VT 3 .£.2 “ c *>o .2 -■=r..«
23v902uOauua90c'5e
90
cI"a>»
e.ow08U3
"Seo
Countries.Number
of policies 3<Si2 t c
a£
wXua r
eC8u. u.
_
£
Bangladesh 14 X X X X X X X XIndia 13 X X X X X X X XMalaysia 7 X X X X X XTrinidad and Tobago 7 X X X X X XBarbados 7 X X X X X XTunisia 6 X X X XBotswana 6 X X X X X XThailand 6 X X X X X XPakistan" 6 X X X X XNepal 5 X X X X X >
Uganda 5 X X X X XPhilippines 5 X X X X XIndonesia 4 X X X XMauritius 4 X X X XMorocco 4 X X X XColombia 4 X XIran 3 X XKenya 3 X X XKorea, Republic of 3 X X XSn Lanka 3 X X XNigeria 2 X XPanama 2 X XSwaziland 2 X XTurkey 2 > X XVietnam, Republic oP 2 X XGuatemala 2 XArgentina 1
Vu3
*8uOo>.2CSE
XX
XX
coaEU,2c90e
41E
s iJ2 a a E
EVJS 2 c o>s ’w
o5XX
XX
uIeo
a
XX
VSV X2TJe08e6Ea*WaO U« .S3 —a a a *o*8.2aj!
VuaE6
.5.2I
XX
XX
•Before the independence of Bangladesh.Before unification with North Vietnam.? = Policy as stated in plan does not fit category precisely.
(cont. from page 234)
^As percentage of estimated nonusers. The basic acceptor data, originally found in Nortman, Ibid., are cited in Freedman and Berelson, Ibid., who made necessary estimates for the denominator of nonusers.
cEstimated values from Freedman and Berelson, Ibid.^Values estimated by the author.eArgentina describes its population growth rate as too low.^Argentina has a pronatalist and progrowth policy.

APPENDIX E
DISTRIBUTION OF HOUSEHOLD, POPULATION, EARNERS
A N D INCOME BY H O U S E H O L D INCOME GROUPS
236
SOURCE: R* H. Khandker 1 Dis-trHVm-M .*» ▼Pakistan', Pakistan ? * . * * * *»1973, Economic and Social *T-\nc
-=*1VOcrv
KVVOcr\
bj n- , *■{ *ci 5*5 O V. — — • t 1'3 J i 0 ' 0 ' - * - C 0 —- O < c , r | c |
-f-rtsC — O t l r l r ' , 7 — ^ O
I vC t ~ l C r~ -J- >c - — - o
■ r|rn O nt-3' "t ft'l O — ci r i — O
| -C r- r* ri -- ’c, O' r ' i1 coot — *t t n -o Oct -r m o c-cc "j> O' o
i ri t r i X 'Ort x - O • b j r ^ O o e d - C v t r v C O— flOt'COMC'C'C'C
— r- O -f vc -- O-toot'OC Cint' O' O
- r r n l ' V. O' O' O' O
ri'c'o t' O'tot C O! /cn rl 73 O O ri O cn O I I. M ’tOl'MC ? T1? O
, j o y. m » o *t >5 r> I O t " 0 o n — — r - i - , /
bj NNjiiCiW'O'tf^C niANoo—Ox*tm
5!! <N Tf c- cl tn ~ t cl in -o'
Oo■✓I —“ oo~'J I* >,y^ jc £§5o a
1 * S ^ g S 8 g S 8 3 i, - — r i m r f i r , r - 7 . ^
! 5| J i i ! ! ! i i ! i| “jOQOOOOO o/o o mOific-TOOSoo
3
Mvocrv
<vovoCN 3£
3o
I •_
fcJ
b j
b)
C’tmr'-t'-’TOvOO' — — O'"! ©© cl 90 c| — O' cn O' — VC >n <© © g
— t C ^ r i ' / I C f l ' £ > c t vCVO O
O O ® K 0 i o i * h M k | _ , O O O
- co rn v, C O oo O r| •/) I' C O — O —• O
c l — r*"i t ' - O ' r~ t c c c c i "ci o o
Cl c t ' n i - n c - v i w i C O QO c-'t-ooo 'ctcoo*?cl t 'Cl -O oo O O ON c> 2
ici "i ri ci ici r- m x ici so 3 oOMt'COjiCtOC^cioO.-CVil't'OfMM'OOO
>cr- cj-tr'in — -t-ror- ocO —• cn "+ O' 7 3 0 * t M C \ ( T ' C ' 0 — ci'riiCr-MClJyO'tAC'O
t c ' c i o ' ^3 - r « o c i ' o — ■ x o ' i o i OOCttC«icicnoo\oio\C\0’- f o r ' a o O ' o \ o ' c i i > c i O
r l * y ~ ci © cn in t w n o o e OOOtoiooinccrio — — O
m oc o o m c-l i n o C ' r<,
O ClJO Ci.o n3 a-'> ij IT “ • <y OC£*EwJO Oa 2
viri-OnooOrnOo-noicioooint - d r i - —
I 0 0 0 0 3 5 0 0 0 0 . ‘ciO'OO'ciOOOin I -'-'f'iMci'tkir'I I I I I I I I !c/>2 °Q 0 Q0 Q-~ 0 *< o vrj o * o o O O
•— •— r i CN c"> r f »o
■ O
-lodo
rf — <n —■^oco
— —0005
sC_
o6
c o o o■n o O o r-O'nO
OSvoOSCOVOOSrH
bj
b j
cn VO -f -f 'n 'ci ci co — 'Ci — cn o O —'C ~ — — O v o c - c i m v n c i a o
- . r i c i - f K - — - ? c c 'c i - t c » O ’ttto tcl'OiOxci-.O-i
— -.lO C 'C ic i — M t-W C V C nO c n c i c - ! L c l i — o o o c i — O — i
c l © m O r , nf- —. c I C O ' cn 90 » ic- 'C - • — O O
CiCN'tvj'tJ'CiCtOxlOOO iC 'C itO —t — 'C0 5 0 0 0 0 O rl*i-'OC003\OMMJ\I O0 " C ' C i c i r i ' O C e o n o o O I O l OO — c c n - n i ' o O ' O ' 3 ' O N O -cncw^gioioioioio'c i -et- m — o O O cn c i co O ' O ' O oot'aci-ciisn^cioio— c, mc-ooC'O'C'O'O'C'Ocifnioi r'neor-icioociC'O-'O'tvioir't'cnoioio'O'■'t'Or'OO'TiOO'MMJlO
m m © Cl rn r-» <c* vo cn cn © ClOcocfl'OOcmo<o-o I -
O M s O O i M C l X O T r M O — •—Ll! O O *C5 O *c i co O 4 C l O O l o * ^ « (n rs —
| in o O co o O C ' c J i - o -b. ooscn — tno—'tMOO ri c-| — i — i
lOct'—O'cioO'Cocn —' l -i/ioo-'tr'C'Ci-CO —. ri d —
O -f>JO cu 2 "3 2
^ o vJ^£0S x: o- 352
Cn 3 '5 5 un O S— — r i n re tc o < o ic i I vn r ~ i
;«o O -{<c» O
1 !O O jn O — c|
—> w ’t/i o < d cn ■
11 » C3
| «8 08• —. r»

APPENDIX E (Continued) 237
C/3cuDOcdaUjsouz- IoUJV33O
>•23UJ•«"*ouz1— 1
Qz'<coOSUJZo4<uj
ZoN-4H<-43cuOcu
erfQ- lO33UJCODO
- *vo
1^ 1
c |NO Io xr j>
zr i Cm-3C33 •>u
1
(mOr/) toOtonc a.r j'■JuoCL Km
~—
w0vo ic \O uj> |"I_ a.3C3u i
;i
r*.1
1 a;
'J-.V Ujto |rt•wco a.o Iwu 1CL | s.
1*1
icivor-so-t'circoriCTvCd r- so — ci »r ci o ■'f oci ci ici o r- oo 3». j, o
vo Cl d -f cl :o 3 * t N O4 *t 'o "t c c '‘I 'O :o C « - i c i i o ' C c » 0\ ^ 0\ O
^ C - t - c v o c i i c o r l Od — recrvovovXS — -C S 3 C c i ^ i O r ' S S ^ C N O ' O
0 0 r ' C c c i ' O ' O - ci — o ». I C ' C t U * t — 'O C OCI't'OCCOC\CM3\JiO
I *“*'•
^vTire— vo— oer— d t — — O
d v£> <ci vo d — — r— 00 Tf >n O
vqvO tI- — d oo vc cl rfooso O_ d — O s d O N O N 'C i 'r } - — — O
— d — — o
3S >C1 O C~ V£> 3 V O r~ lr Cl SO
W JvCOOCC^ GC Cl 31 Cl C~ >C1 C. — OO t~~ — Cl — o
ri c f' c, c r i ic c,'' t *t o
3>c icO '0 '0 " t V l l» 5' C ) Cd o O C ' ^ c l c 5 ' ' t C Q— n^tocsooocMJiOT f o o t ' o c i ' c n - o — 0O f v C C C I — o r j O v t C - Orl't'CC'MXSNC'Oclxci'T'Ci — i c C ^ o c_ »<■, c C o M r- c| v, vi c— c'c i — d so -v ©• 3* c
o
V 0
- « t M ? -t X X c c r- c, o O 1C S' 'Cl v ' T. r| O C. ci IO C o — "-i -r <o d sc c o\ os -3 ~
I re — C'O'r-^cjx) — Occi\ooUj ' o OO 'Cl 'C, O — re O vo OO ON d dn ^ o c o o a o i O i a K ^ o
u
"I- O — f • — - rc. t c o
o
MO voo ONo rH
Nv ov oONrH
UJ
C \ T f ^ » C X - c - - t cO U i O ' S N ’t X — C T . r l c i
^ *t >0 — Ci ri ri i
ci vc *r ci c i - Tt >c o — •- o
E3
u
i O C C O ' S T ' O r i h x o S i C I - c i i o c r - ' X O M C C C C O
NcicccciccririaoooO ’c c O t c i o c o e c i c 'c o- c , \ o c c o o ' c c ' c s \ o 6
- n c t - ' d ’ t o c c - c c O vci r e O - r 3\ r e as SO re" d ’ — C I
caeoeM x'c iiO ciO 'friji-}'^ . o-rocivoiciciooo o
t C - C c r i V C C C ' O c n O
c'COooijic^oocO'tMri o
O -r c c c. r c 'o vc c c o C ci C c, ti *t co r Oitn 3 ci c
— M c i ^ i c ^ O C m U i C i O
„ in ci o ci r- c c. us « m t oUJ i o' r| — v o v c c \ v 3 * f d o o C ' © I Cl-r<cii0dcc<30'a'i'3i0
«OiCI*tCciTiciciTirsOOO ’fCCl'IciMcicnoxOvO- . e i o o c o e C o i C M C C
ci ci 'o ci ci c\ ci o c c oi *r oO » c a n M ■c o 'ci c x si O
N ’ t ^ O C c o O v O l C C C O
c t v i c c t o i o c o - n oCMSOCI-OiCiOi-^vicio d
o I
' ci 3 M O C 3 '/I C, C 'Cl cl Tf ci OI C ' t ^ ' C C - l c i c . o c u n i C O — c i T 'C t 'X S 'O 'C S 'C
r- »r >ci 3 <o d ici ct ci ci vc d ©
- I a.
ONv oON
COv oONrH
UJ — © <ci Cl 'Cl o Cl 1C VC r- VC 13 o© vo VO CO ic © re d d ci — © © g
— co re ciI ic, y© © so O ci so d o ©o - t "'f OO vci O -3 d os’ re -i o — d
ci — re r-- O' d •<* d d © c i *ci o o
Uj
UJ
— 0, 3
E3
u
Uj
- tv o 3 c i3 s c -r - td 3 > c iic © OcrsCvOvciicisorei— X ?! 31 O
d *c iv0 d s o 3 3 3 3 >3l 0
O re ciici © ci d »/i ci o d ©— re Orf-reciicicoooiCvQ — re 'O r 'X C lC \O v O iO \0 \0
cidddicvc-)- — veddeo O't'tVOrfCrtl'r'ClriO
r~re*ci-t-'ocioo3vsoO'r— re oO O i M O T i O l - ' t c i - O O O © Cl c l — — O
■ t c i o o c o r ' O i v o o e M ' O — * t ©doodov-ioicucid — © d o ©c l c i — — o
© d VO <3 r e »ci d <ci oo d — r e C
— c i v c i d r t - s o C T v r e d O O O O © — c i d — O
r e o v r e o v c i o c i o — ' O C ' O O
— e n ff iC o o ff ire re C v T to o oOctsovorrreoivc-Tvosoood- e ^ ' v o c o o O ' O M j \ O v 5
— d ici c ci e — 'ci e cl c c• • • • OO......................... ...O r c i c - i r r - r — ^ovcircvooocrso
— r e VC C SO O 'o v Ov O ' O
cl co r e e 'ci O ci ci - t d o 0 <c s r e r e ^ 3 N * 3 - S M c i C ' S & o dCirf VOWooOvOVOVOvO
te'-oe 1 'Cl 'Cl CI os — 'Cl — re o —
— ci Cl *l- sc — — 3- O V|0 'Cl -r ci c 0 3 - - t s o ^ c i v o d o c c i — c — " —
— — v c c v O ti — x ’ t s i c i ' c i e ©
O 3 c l c 1 2 c l c vo oo c i — O — ©
ClvOiciOr j3- — c i C 3 v e * t » © oecOTi — eic'o— — oo cr
■ a p p a r e n t e r r o r , s h o u l d b e 89.7
U «ozoHDa
c/3Q
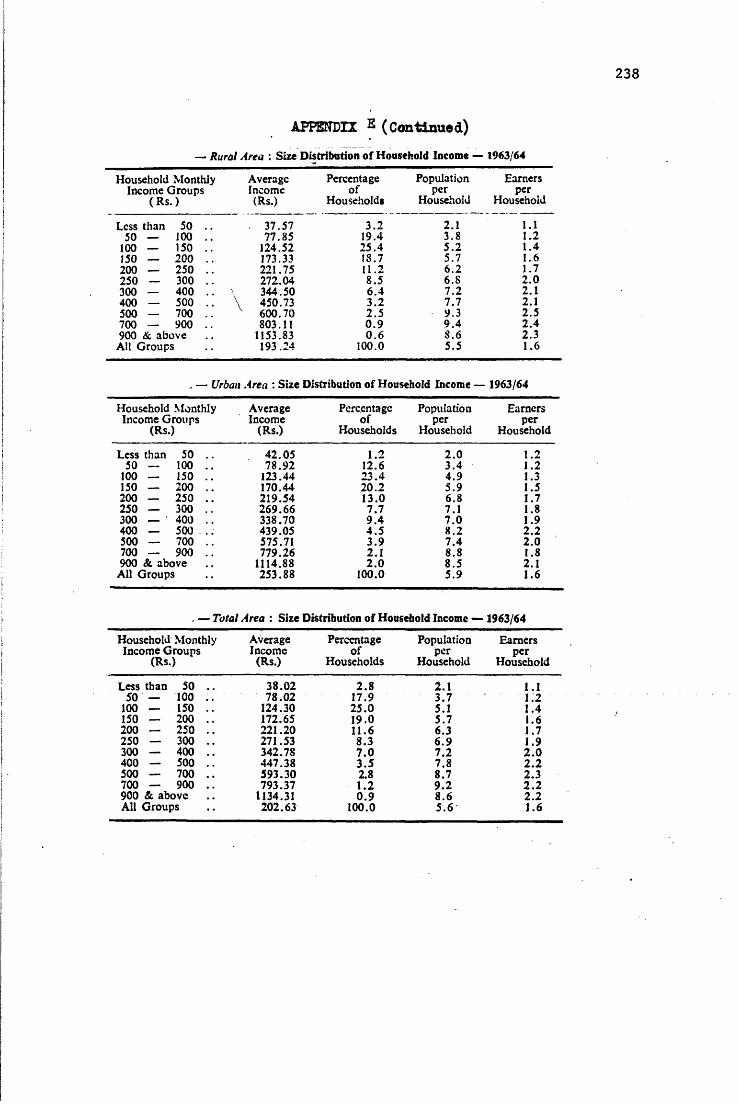
APPENDIX E (Contiausd)— R ura l A rea : Size D istribution o f Household Income — 1963/64
Household Monthly Income G roups
( R s .)
AverageIncome(Rs.)
Percentageof
Households
Populationper
Household
Earnersper
Household
Less than 50 . . • 37.57 3 .2 2.1 1.150 — 100 . . 77.85 19.4 3.8 1.2
100 — 150 . . 124.52 25 .4 5 .2 1.4150 — 200 . 173.33 18.7 5.7 1.6200 — 250 . . 221.75 11.2 6 .2 1.7250 — 300 . . 272.04 8 .5 6.8 2 .0300 — 400 . . 344.50 6 .4 7 .2 2.1400 — 500 . . \ 450.73 3 .2 7.7 2.1500 — 700 . . v 600.70 2 .5 9.3 2.5700 — 900 . . 803.11 0 .9 9 .4 2 .4900 & above 1153.83 0 .6 8 .6 2.3
All G roups 193.24 100.0 5.5 1.6
, —■ Urban Area : Size Distribution o f Household Income — 1963/64
Household Monthly Average Percentage Population EarnersIncome G roups Income of per per
(Rs. ) (R s.) Households Household Household
Less than 50 . . 42 .05 1.2 2 .0 1.250 — 100 . . 78 .92 12.6 3 .4 1.2
100 — 150 . . 123.44 23 .4 4.9 1.3150 — 200 . . 170.44 20 .2 5 .9 1.5200 — 250 . . 219.54 13.0 6.8 1.7250 — 300 . . 269.66 7 .7 7.1 1.8300 — ■ 400 . . 338.70 9 .4 7 .0 1.9400 — 500 . . 439.05 4 .5 8 .2 2 .2500 — 700 . . 575.71 3 .9 7 .4 2 .0700 — 900 . . 779.26 2.1 8.8 1.8900 & above 1114.88 2 .0 8 .5 2.1All G roups 253.88 100.0 5 .9 1.6
. — Tota l A rea : Size Distribution o f Household Income — 1963/64
Household Monthly Incom e G roups
(Rs.)
AverageIncom e
(Rs.)
Percentageo f
Households
Populationper
Household
Earnersper
Household
Less than 50 . . 38 .02 2 .8 2.1 1.150 — 100 . . 78 .02 17.9 3 .7 1.2
100 — 150 . . 124.30 25 .0 5.1 1.4150 — 200 . . 172.65 19.0 5 .7 1.6200 — 250 . . 221.20 11.6 6.3 1.7250 — 300 . . 271.53 8.3 6 .9 1.9300 — 400 . . 342.78 7 .0 7 .2 2 .0400 — 500 . . 447.38 3 .5 7.8 2 .2500 — 700 . . 593.30 2.8 8.7 2 .3700 — 900 . . 793.37 1.2 9 .2 2 .2900 & above 1134.31 0 .9 8 .6 2 .2All G roups 202.63 100.0 5 .6 1.6
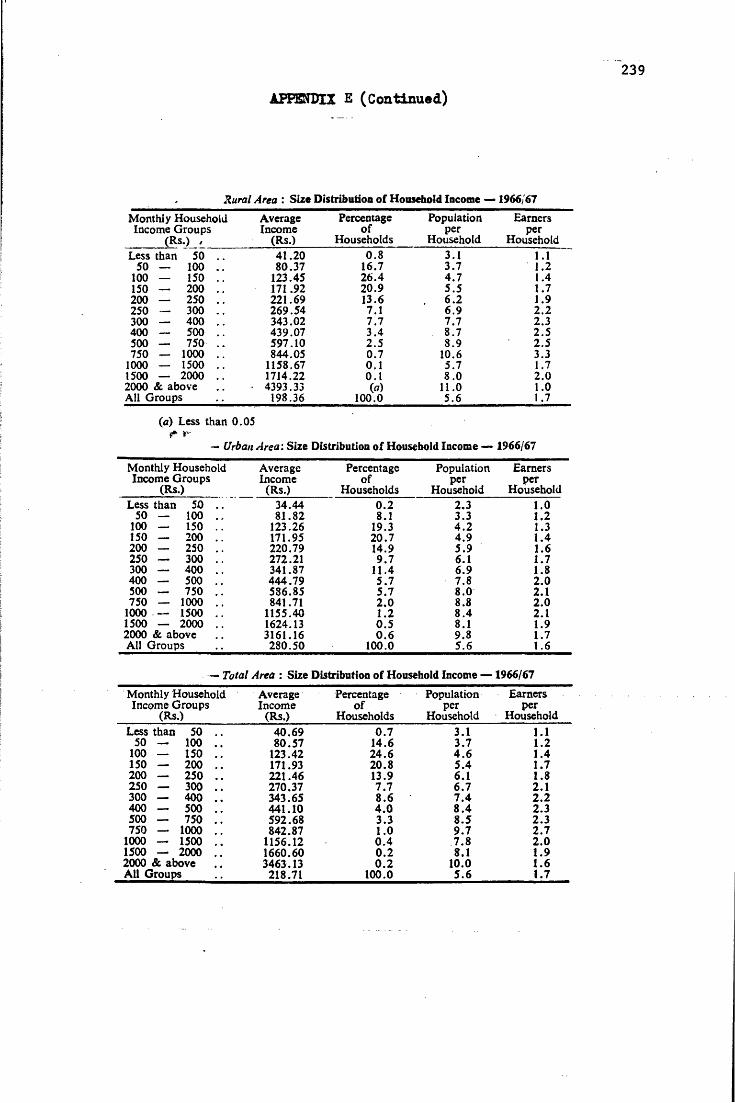
APPENDIX E (Continued)
R u ra l Area : Size Distribution o f Household Income — 1966/67
M onthly Household Income G roups
(Rs.) ,
AverageIncome
(Rs.)
Percentageo f
Households
Populationper
Household
Earnersper
HouseholdLess than 50 . . 41.20 0 .8 3.1 1.1
50 — 100 . . 80.37 16.7 3 .7 1.2100 — 150 . . 123.45 26 .4 4 .7 1.4150 — 200 . . 171.92 20.9 5 .5 1.7200 — 250 . . 221.69 13.6 6 .2 1.9250 — 300 . . 269.54 7.1 6 .9 2 .2300 — 400 . . 343.02 7 .7 7 .7 2.3400 — 500 . . 439.07 3 .4 8 .7 2 .5500 — 750 . . 597.10 2 .5 8 .9 2.5750 — 1000 . . 844.05 0 .7 10.6 3.3
1000 — 1500 . . 1158.67 0.1 5.7 1.71500 — 2000 . . 1714.22 0.1 8 .0 2 .02000 & above • 4393.33 (*) 11.0 1.0All G roups 198.36 100.0 5 .6 1.7
(a) Less than 0.05
— Urban A re a : Size Distribution o f Household Income — 1966/67
M onthly Household Incom e G roups
(Rs.)
AverageIncom e
(Rs.)
Percentageof
Households
Populationper
Household
Earnersper
HouseholdLess than 50 34.44 0 .2 2.3 1.0
50 — 100 . . 81 .82 8.1 3 .3 1.2100 — 150 . . 123.26 19.3 4 .2 1.3150 — 200 . . 171.95 20 .7 4 .9 1 .4200 — 250 . . 220.79 14.9 5 .9 1.6250 — 300 . . 272.21 9 .7 6.1 1.7300 — 400 . . 341.87 11.4 6 .9 1.8400 — 500 . . 444.79 5 .7 7 .8 2 .0500 — 750 . . 586.85 5.7 8 .0 2.1750 — 1000 . . 841.71 2 .0 8.8 2 .0
1000 — 1500 . . 1155.40 1 .2 8 .4 2.11500 — 2000 . . 1624.13 0 .5 8.1 1.92000 & above 3161.16 0 .6 9.8 1.7All G roups 280.50 100.0 5 .6 1.6
— T ota l Area : Size Distribution of Household Income — 1966/67
Monthly Household Average Percentage Population EarnersIncome G roups Incom e of per per
(Rs.) (Rs.) Households Household HouseholdLess than 50 40 .69 0 .7 3.1 1.1
50 — 100 . . 80 .57 14.6 3 .7 1.2100 — 150 . . 123.42 24 .6 4 .6 1 .4150 — 200 . . 171.93 20 .8 5 .4 1.7200 — 250 . . 221.46 13.9 6.1 1.8250 — 300 . . 270.37 7 .7 6 .7 2.1300 — 400 . . 343.65 8 .6 7 .4 2 .2400 — 500 . . 441.10 4 .0 8 .4 2 .3500 — 750 . . 592.68 3 .3 8 .5 2 .3750 — 1000 . . 842.87 1 .0 9 .7 2 .7
1000 — 1500 . . 1156.12 0 .4 7 .8 2 .01500 — 2000 . . 1660.60 0 .2 8.1 1.92000 & above 3463.13 0 .2 10.0 1 .6All Groups 218.71 100.0 5 .6 1.7
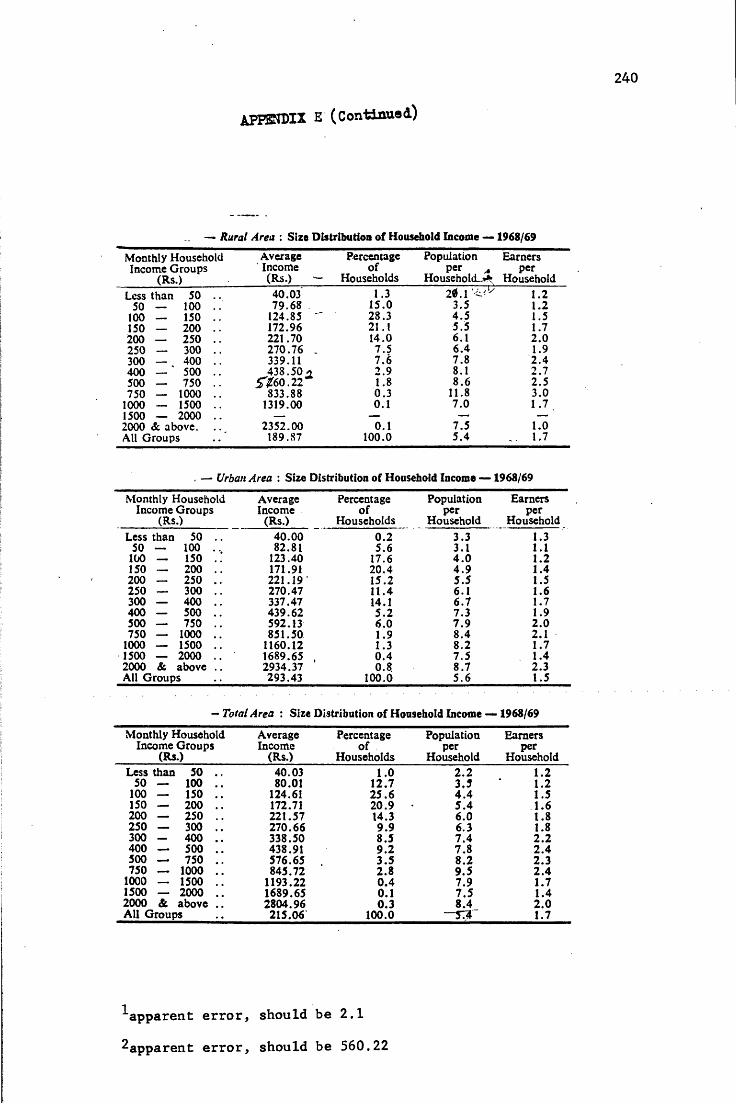
AFFSrn>IX E (Continued)
— R u ra l A rea : Size D istribution o f Household Income — 1968/69
M onthly Household Income G roups
(Rs.)
Average Income (R s.) -
Percentageof
Households
Populationper
H ouseholds*
Earnersper
HouseholdLess than 50 40.03 1.3 2 0.1 1.2
50 — 100 . . 79 .68 15.0 3.5 1.2100 — 150 . . 124.85 " 28.3 4 .5 1.5150 — 200 . . 172.96 21.1 5 .5 1.7200 — 250 . . 221.70 14.0 6.1 2 .0250 — 300 . . 270.76 . 7 .5 6 .4 1.9300 — 400 . . 339.11 7 .6 7 .8 2 .4400 — ' 500 . . 438.50.4 2 .9 8.1 2 .7500 — 750 . . 5 ^ 6 0 .2 2 1.8 8 .6 2 .5750 — 1000 . . 833.88 0 .3 11.8 3.0
1000 — 1500 . . 1319.00 0.1 7 .0 1-71500 — 2000 . . — — — —2000 & above. 2352.00 0.1 7 .5 1.0All G roups 189.87 100.0 5 .4 1.7
. — Urban A rea : Size Distribution of Household Income — 1968/69
M onthly Household Average Percentage Population EarnersIncom e G roups Income of per per
(Rs.) (Rs.) H ouseholds H ousehold HouseholdLess than 50 40.00 0 .2 3 .3 1.3
50 — 100 ... 82.81 5 .6 3.1 1.1100 — 150 . . 123.40 17.6 4 .0 1.2150 — 200 . . 171.91 20 .4 4 .9 1.4200 — 250 . . 22 1 .1 9 ' 15 .2 5 .5 1.5250 — 300 . . 270.47 11.4 6.1 1.6300 — 400 . . 337.47 14.1 6 .7 1.7400 — 500 . . 439.62 5 .2 7.3 1.9500 — 750 . . 592.13 6 .0 7 .9 2 .0750 — 1000 . . 851.50 1.9 8 .4 2.1
1000 — 1500 . . 1160.12 1.3 8 .2 1 .71500 — 2000 . . 1689.65 0 .4 7 .5 1.42000 & above .. 2934.37 0.8. 8 .7 2.3All G roups 293.43 100.0 5 .6 1.5
— Tota l A rea : Size D istribution o f Household Income — 1968/69
M onthly Household Average Percentage Population EarnersIncome G roups Income of per per
(Rs.) (R s.) H ouseholds Household HouseholdLess than 50 . . 40.03 1 .0 2 .2 1.2
50 — 100 . . 80.01 12 .7 3 .5 1.2O18
124.61 2 5 .6 4 .4 1.5150 — 200 . . 172.71 20 .9 5 .4 1.6200 — 250 . . 221.57 14.3 6 .0 1.8250 — 300 . . 270.66 9 .9 6.3 1.8300 — 400 . . 338.50 8 .5 7 .4 2 .2400 — 500 . . 438.91 9 .2 7 .8 2 .4500 — 750 . . 576.65 3 .5 8 .2 2 .3750 — 1000 . . 845.72 2 .8 9 .5 2 .4
1000 — 1500 . . 1193.22 0 .4 7 .9 1.71500 — 2000 . . 1689.65 0.1 7 .5 1.42000 & above . . 2804.96 0 .3 8 .4 2 .0All G roups 215.06 100.0 — s x 1.7
■^apparent error, should be 2.1
^apparent error, should be 560.22
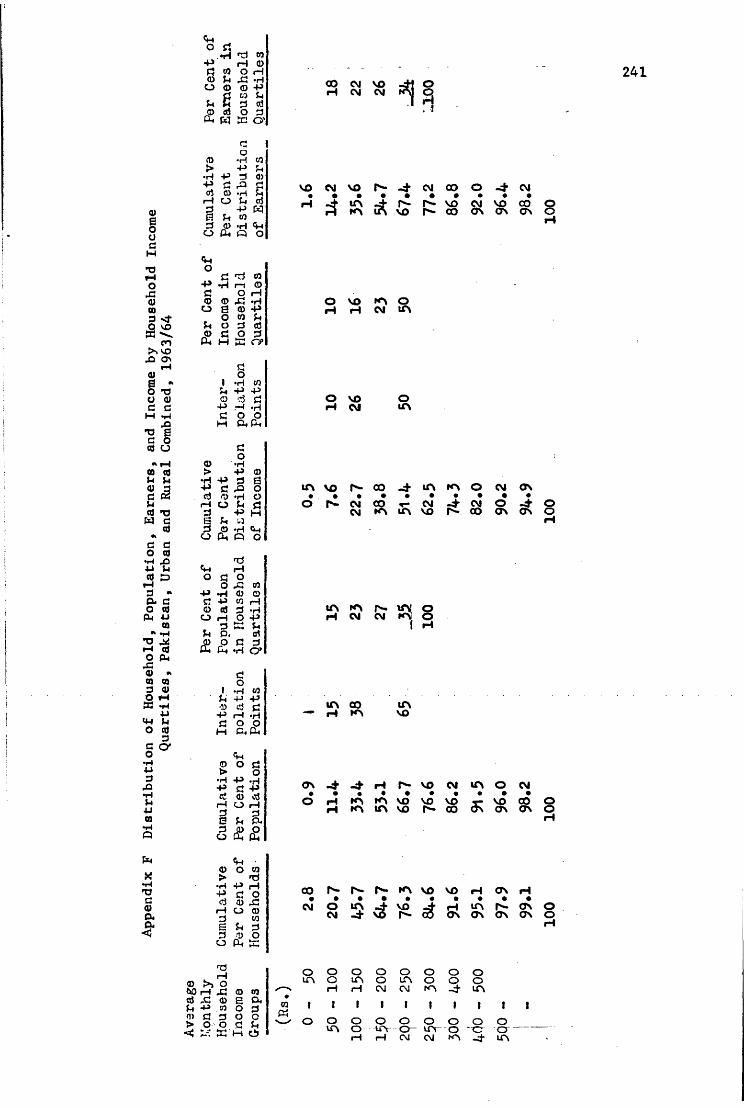
Appendix
F Distribution
of Household, Po
pulation
, Earners, and
Income
by Household
Inco
meQu
arti
les,
Pakistan,
Urban
and
Rural
Combined,
1963
/64
[
-P rH 0« O H © k XI *H O © © -P ff to U
U w 3 cd O J) O 3o« pq re o>
oo CM VO CM CM Oaa o
© -H > -P•h p 3 p 3 p0) 0).Hr l O2 p w0 U ©3 © <w O (X, « O
VO CM VOH* 4 £ £
Is- 4 CM CO O 4 W• • • • • •vo cm vo covo r*** co on on on
o c rrf © ■P r i n © 3 O rH © © ,3 »H O g © Po ©^ O 3 «J (!) C o 3
X H K O ’
O VO *N O rl ri CM
3oI *H ©
P -P O c3 3 P rH *H O O
O voH CM
Ou n
co© *H > P © •H ^ 3 S P 3 P O (J OnH O H O ^ fl 3 P M 6 J* .3 33 © -H Cm O P kfi O
un vo f'** co 4 in io o cm on• • • • • • • • « •O N N C 0 r C M 4 W O 4 O CM NN UN VO Is*- CO ON ON O
£
o 3 oP *H © 0 3 P W M © «} 3 -HO rH O P, 3 K ^ U P< (rt
0 3 3 CmH O’
in h tf\i oH CM CM KN O
©P© 3
> o <
» •H Wu P P© d 3p M •HCJ O OM a , eu
<i-4© o 3> O•H p •HP 3 Pci © *3rH O r—133 3S P>33
O £ £
© o ©> fd•H p MP 3 Oa © K
rH o ©3 w& 33 o
O Ot K
t3rHO.c © ©© s Or© o 33 O OO 3K m c±»
UN CO iH KN
UNVO
0 \ - 4 - 4 H r - \ 0 C M U N O C M • • « • • • • • • •O H K V K N V O V O V O T- vo CO H KN UN VO r- 00 ON ON ON Oo
CO N N fv- KN VO VO *H ONCM O CM in 4 vo 4 4 vo 1- co iH UN Is*. ON ON ON ON ON oo
rH
O o O O O O O oUN o UN O UN o O o
M i—1 CM CM KN -4 UN
© 1 t 1 t 1 1 I 1 1 IV / O o O o O O o o o
UN o UN o UN o o o -------rH M CM CM KN -4 UN
241
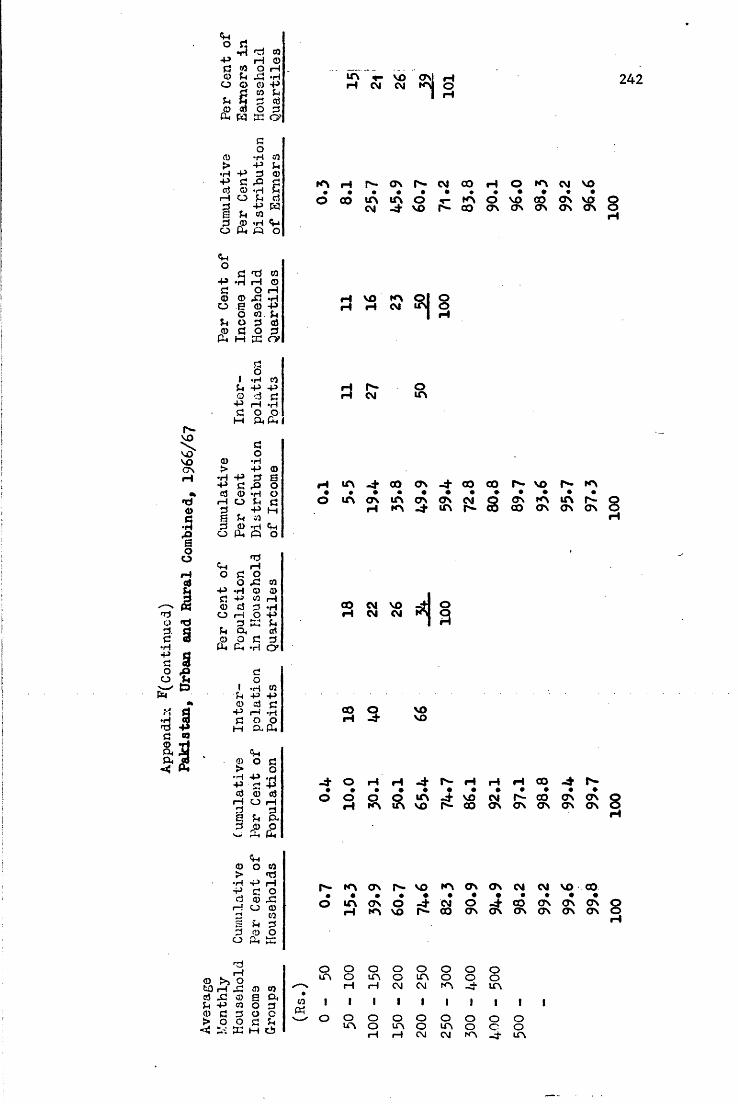
Appendix
Cont
inue
d)
O O 0) -p “ > * -f t CM
VOCM *1
242
Oh pq W O'G O
© *H > -P •H P G P G P © © -H
f t O G G P pqe g ©3 ® -H Vi
o Oh f t o
KN f t rs- O N r * - C M C O f t © K ' \O CO i n m O t - K N O V O C O
CM -4" VO P - CO ON OV ON
ftopG
G ft M •H iH 0
O H © © Si -H
o e © p O © G O G © G O G
Oh H PC O ’
VOft K>CM
Oo
P'-\VOVOON
GOI *H rt G P P© © Gp H *H G O O H f t Oh I
Go© *H > P ©
•H P G S P G P O © © • H O f t O G G G . P H fi G si G © -H f t
O Oh f t O
r-CM
OLfN
H > 0 4 © O N 4 © f f l N N OO IfN ON ITN ON ON CM ft kv -4 m r- On rn
co crv
ftoft
G o O «G cq
p -H © © C! -P 83 ft © © G *H
O f t O P G f t G
G f t trt © O G G
Oh Oh *H O ’
CO CM VO f t CM CM
A
GOI ft © G P P
© © £ P f t f t G o
f t f t OhS 3 VO
vo
© O G> o
f t p f t P G P © © © ft O ft G G
G ft2S.S.
- 4 0 f t r l 4 N f t f t f t ® » * • • • • • • • •
o o o o m - 4 v o c M f ^ - c oft KV in vo N © ON ON ON
© P G p © G > o
ft© o 03> ft•H p ftP G oa © pft O ©r-t 03s G GG © C>O ft
ftftoG © 03© e ft03 o GG o CO G GX ft Gj
03ft
P* m ON Is* © KN ON ON (Nl CM« • • • ♦ • • • • •O i f \ < r v o - 4 C M O - 4 c o c r \ ft KN VO Is- CO ON ON ON ON
oLfN ooft
o
oLfNf t
oo
ooCM
oin
OinCM
OOCM
OON'N
OIfNCM
OO
ooKN
OoIfN
OC-4
I IOOIfN
99.6
99.fc
95.7
99.2
99.8
99.7
97.3
96.6
100
100
100
100
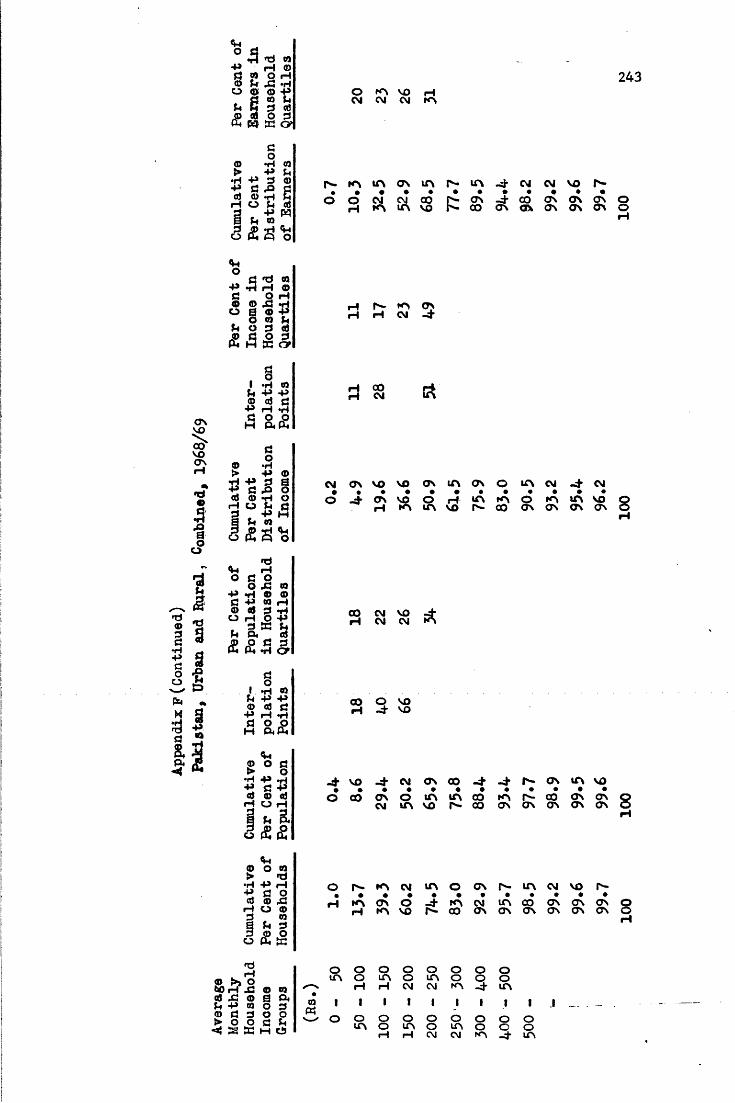
° *3 'b «P H © a « o h© U J3 *H
O o O f§ (Q U 3 © O 3pa w &<2
243O ^ V£> H CM CM CM KN
3 O<D *rl> P
•H P 3 P 3 -a © © *h
H O (ha . +* mS h ra 3 J> *H o A « o
m os i r \ r -
O O CM CM 00 Is- CTvh m m vo r>- co
i n 4 n w vo n --4" CO ON ON ON O ON ON ON ON ON O
*4O d 3 n P *rJ pH © 3 O H © ® .3 H O 0 © P . O © U h O 3 4<2 cc 3
n m o\ H CVl 4
© ©
£
£ ft H Cf
&
H 00 iH CM
w o v v o v o o N i n o N o m w ^ w^ ON NO O r-f
rH KN UN NOUN KN O KN ITN NO r - CO ON ON ON ON
CO CM NO -d*H CM CM KN
CO O NOH 4 VO
no -d- cm on co 4 J - r " on m noco on o m in co
CM in NO r - COKN r— CO ON ON ON ON ON ON ON
*4© o n > *3•H P rHP 3 O © © X! H O © 3 Wa ti 3 3 © o o ft w
o r ^ K N C M m o o N r ^ m c M v o r -KN ON O -d’ h kn no
KN CM in CO ON ON ON00 ON ON ON ON ON ON
ndH
© >5 O*>0 H JG © W © .3 © a f t u P » O 3 © 3 3 0 0 > O O fl U
<4 S B H O
o o O O O O O oUN o UN O UN O O oH H CM CM KN -d- UN
© 1 1 1 1 1 1 1 Ift O o O O O O o oUN O in o UN o oH H CM CM kn -d-
I Ioom
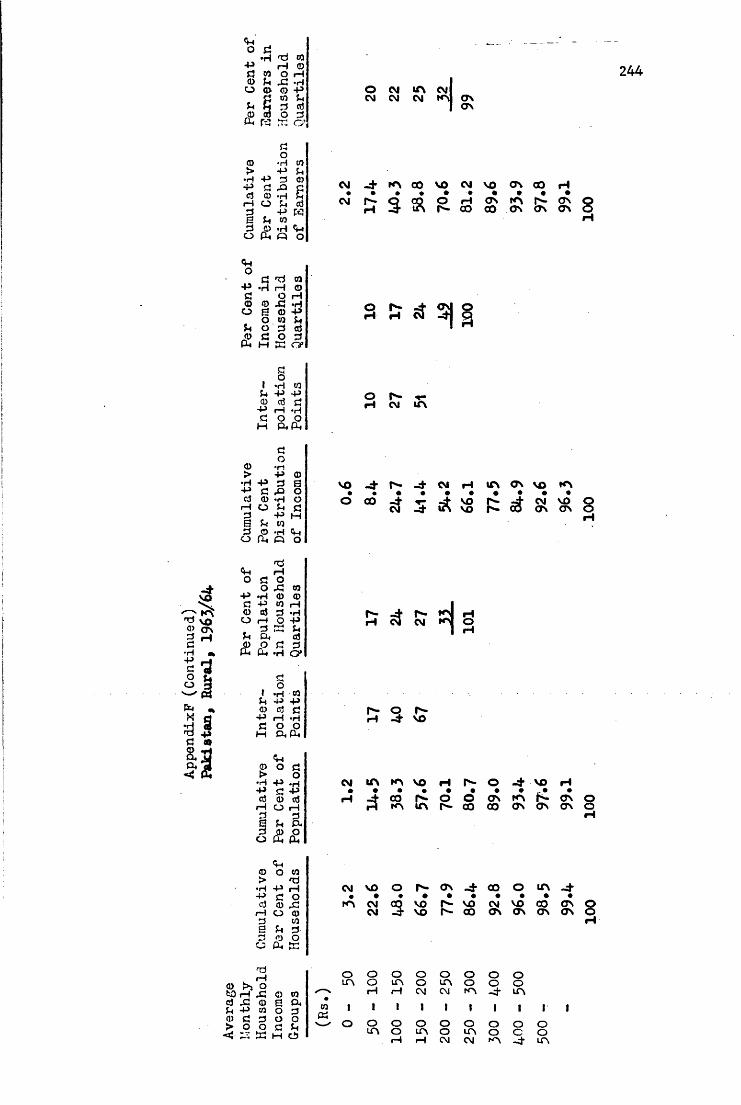
Cl (1)P W
o d. «
O CM m CM CM CM *1 ONON
CM - d ' K N c O V O C M N O O N C O HCM 3 ft p rH ON t N r > ON Or- co co on on on o
<PIop3©oufO
cj rrf n •rl rH © O rH © .3 .H
S © P O to Pt 0 3 <0 - 3 0 3 PU M f f i 0 >
o r-
3, oI *H CO Pi P P o d d P H - H O OH Or (1.
o r- •«-iH CM lf\
3o© *n
> P © •H P 3 S P 3 P O d © -H O rH O Pi 3 3 -P M S P «3 © -H <H Odifi O
VO -4* r - 4 W rl VfN ON VO KN• * • • • • • • • •O C O - i ' T - H t vO I >,“ ^ CN* vO QCM hJ’ Sn VO I"- CO ON ON OrH
c©<Vh iH 0 3 0
O JZ W P *H © © 3 P to r l O e4 3 H O .H O P„ 3 53 OO Or 0}
0 3 3 (H »H O’«£
P*-CMiHO
O P © 3 > O
r
<-•o
©Pt P P© cj 3p iH •H3 O OM Or fir
©ShO 3t> o
•H P •HP 3 Pd © drH O rH3 3Pi fX
O (5 £
©<PO CO> <3
•H P rHP 3 Od © rCrH O ©3 ©a U 33 © OO Or K
ojrHOJ3 © n© a £X© O 33 o OO 3 Pia M CiJ
r- q r—rH -d- VO
CM IfN KN VO iH r - O -d- VO H• • • • • • • • • •rH -4 CO P ^ - O O ff\ KN K ON O H KN IfN P*» CO CO ON ON- ON O
W V D O N O N d f f l O i n dKN CM CM CO VO-4- vo f-s. VO CM VO CO ON O
CO ON ON ON ON O
o o o o o o o oIfN O LfN O IfN O O OrH rH CM CM KN -4* IfNGO«
I 1OVfN
IOo
IoUN
I I Io o
CM CM KN
OO OUN
IOc-J
ooUN
244
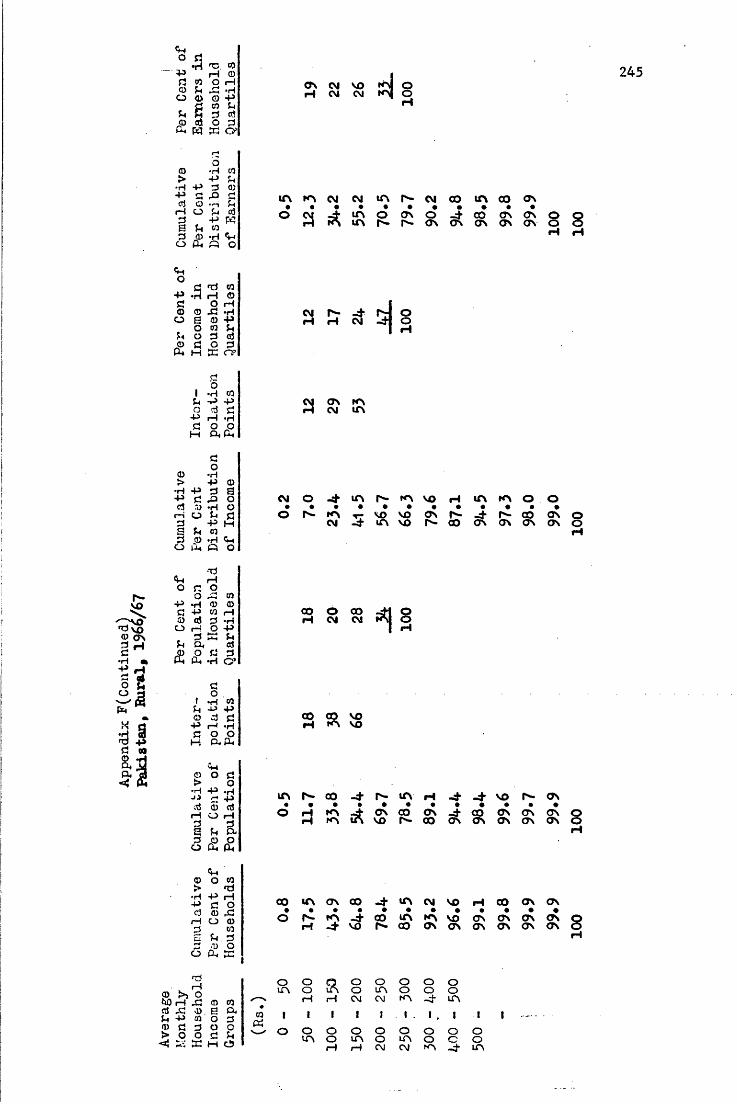
° *1 •H ^ °> P H O r? w o hO in ^ *H o 0 © PS CO ft
3 3© 3 0 3a . pq k O ’
ONH CMCM
VOCM sio
oH
1-1O
<D •H co> P ft,•H P 3 ©P rj P r->cl O H uH O ft, 33 P w£ ft. co3 P •HO PU » 0
O3 <3 COP H O3 O H<D © X •HO e © P0 CO ft
ft 0 3 3O 3 O 3PU H rn O ’
UN KN CM CM IA Is* C\l CO lf\ CO ONUN o o\ o -d" co ov as
r - Is*- ON ON ON ON ONooH
CM fv. ^ H CM= 1
Oo
3O
I *H CO ft P -POp3
H
3 3H *rl0 P O, PU
21 ON KN CM IfN
coo *H> p o H -P 3 £3 3 p o
y *H o O ft 3 P H
ft CO <0 *H Cft
P3H3s3
CM O UN P"* KN VO H UN KN O ON I A r VO COCM -d* UN VO on r- -d- r*- co on
r - 00 ON ON ON ON
•ino 3 o
3 p O fljo ft &
p Oo oCO H 3 -H H O P 3 K ft a, aj
O Cl 3 PU -H O ’
CO oCM COCM
ao
f H CO(h -U po d d P H -H 3 0 0H PU £U
CO CO VO H kn VO
0 0 3> O ■H P H j J C1 P3 55 3
H O H 23 3a i< &o Po a. fi,
in n 00 -j- r- UNO H KN -d>KN UN VO
H -d* -d’ VO Is- ON• • • • • •ON 00 ON 4 CO O N O N O N
r - CO ON ON ON ON ON
Q) O co > H •H P H p a od <D rC H O © CO
3 O£ ft3 ©O IX,
CO UN ON CO -4" UN CM VO H C O O N O V• « • « • * • • • • • •O h - -KN 00 UN KN VO ON ON ON ON
H - 4 - V 0 f* 00 ON ON ON ON ON ON
<3r “4ffl >1 o
&0 H X i CD toa X i © s o .ft, P co o 3© 3 3 0 0 > 0 0
ft-; X H c5
O O Q O O O O OUN O UN O UN O O OH H CM CM KN -d- UN
COrv* I 1 1 ! 1 1 1 . 1 1 lf-M O O O O O O O O 0
UN O UN O UN O O 0H H CM CM KN -d- UN
245
100
100
100
100
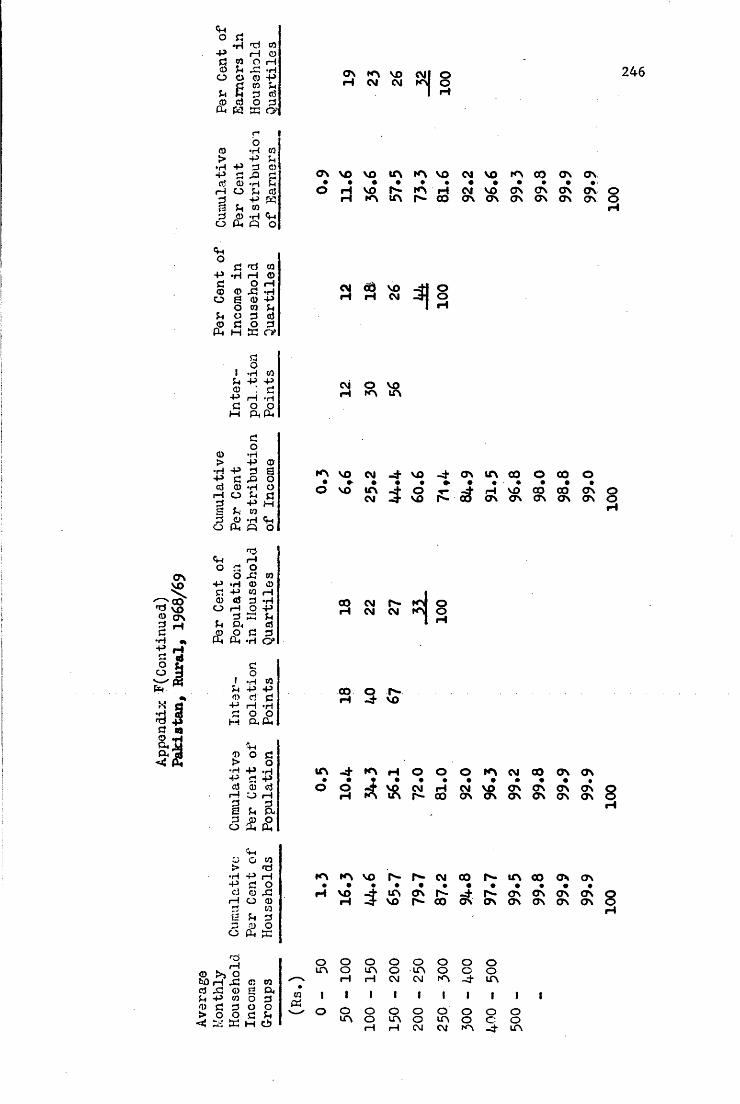
-° rt •H 'ri ro - P r—I © 3 © O rH <0 U JZ *H o o © fte co U
3 td O (S O 3 ft K EC O ’
ON KN VD rl CM CM Oo
co© *H> -p■rl -P 3 ft 3 &0} 0) -Hrl O 33 ft Wa 5-1 CO © -H ft
ON VO VO I f N K N V O CM VO fO 00 O N O N• • • • * « • • • • • • >© H VO CM NO ON ON ON OV O
H KN UN CO ON ON ON ON ON ON O
fto3 'O ©
-P .H rH O 3 O H © © .3 -H O g © ft O W U ^ O 3 fiJ
£ O 33f t M EC O*
CM od VO H CM OO
3oI *H co 0t ft ft3•Ho oM ftftCM O VO KN IfN
3o© *H > -P © •H -P 3 S ft c ocj © -H O H O ^ fl 3 ft m S co 3 O - r l O Oh ft O
KN VO CM ^ VO -d ON IfN CO O 00 OVO IfN CM i °VO t- -d rl VO CO COIs* CO ON ON ON ON ON O
ON O
T3«M rl 0 3 0 O-C n f t - H © © S3 P « H © cS 3 ftO rH O -P
3 EC J-t k Oh © 0 3 3 ft ft Q*£
CO CM N rl CM CM Oorl
CoI ft © M ft ft(1) cj 3 ft H ftc o o M f t O.
CO o i*. -d vo
© o CJ> o •H P ft ■ P e p«J © cjC-3 rl3Ph ftS3O £ _oft
UN -d KNO O
O O O KN CM 00 ON ONON ON ON ON ON ON ON ONVO CM rl CM VO KN UN r- CO ON ON 8rl
ftO ©> Tj•H P rHP 3 OcJ © JSrH O ©3 05fi Sh 33 JP OO ft ECr3rH
© E»» ob0 rl JC © ©rf -C © g ft U P © O 3 © 3 3 0 0 > O O C Jh <! ^ C h b
K N K N V O IN. C\l CO N UN CO ON ON• • • • « • • • • • • •H V O d U N O \ N d N O \ O N O N O N rl -d VO |n~ CO ON ON ON ON ON ON
O o o O O O o oin o m O m o o orl rl CM CM kn -d UN© I 1 1 1 I 1 1 1 ift o O O O o o O o om O UN o m o c- orl rl CM CM kn -d UN
246
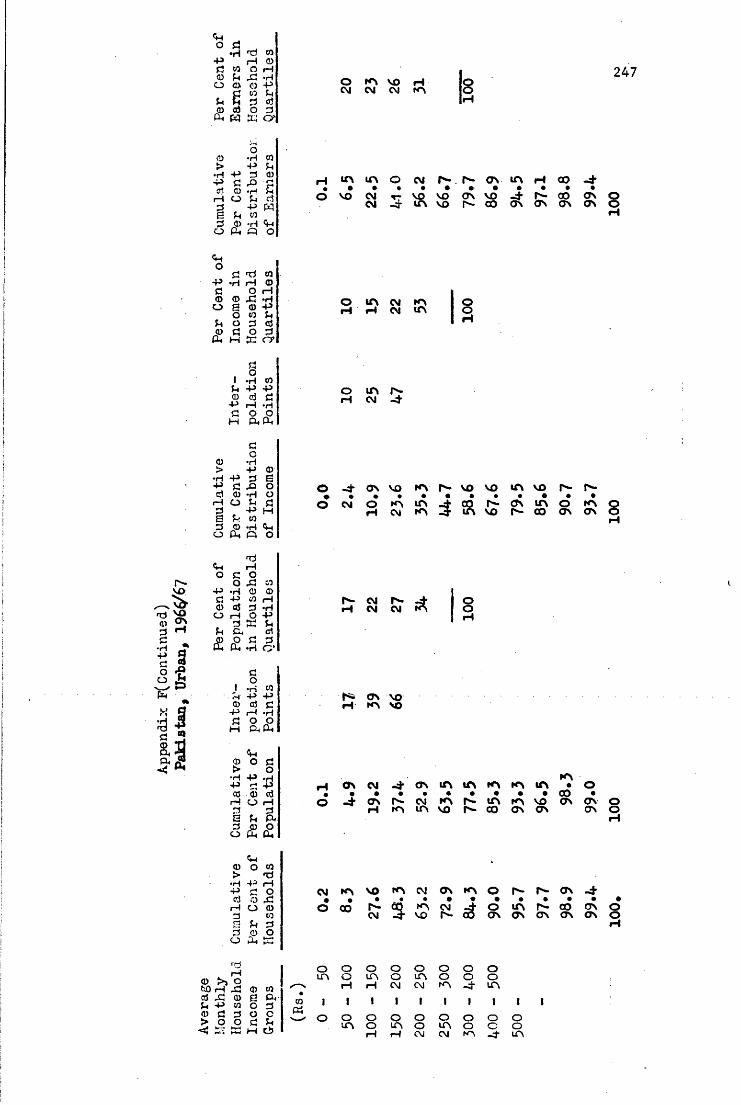
Appendix
F(Co
ntin
ued)
<UtO 5 •G 0
P H ©g 0 o i—I© G P •Ho o © Pg g COG G
d© a) o 3
On W sco>
© o•H 0> P SC•H p 3 0
P G P • f~* *-4crt 0 •H £
rH o G dG P We G ©g © • r l <wo pu O
O KN VO HCM CM CM KN
h r n t n o cm r-.r*- ov u\ h* • • • • • • • • •O VO CM r VO VO 0\ VO 4 Ncm 4 ir\ vo r- co on on
<Popg©oG0PU P
frtPOX!©03Osc
UN CM KNh « m ooH
&voON
9I
IQ
1GO•H 0g P P
© d Gp P *HG o OM PUPU
0>GO•riP ©•H P G dP G P od 0 •H oi—lO SC G3 G P M6 03 0 •H <Go PU O
o GTJPoO p 0
p •H © ©G P 0 P0 aj G •HO rH O P
G w Gg CG d& (2 G
•HGO ’
;GO•H 0G P P
0 d cP P •HG O OP PUPU
© o G>•H p O
•HP H P© © dP o PGS g aGO £ £
© of 0>•H P
T*P
P r* o© s prH o 0GG g
0GG o O
O PU SC
OH un r -CM -4"
O -4* ON VO KN I"*- VO VO UN VO• • • * • • * » * •o CM O KN UN 4 CO N ffN mH CM KN 13- UN VO P'-CO
cm r*-CM CM
Oo
N ON VO tH KN VO
H ON CM - 4 - O N U N U N K N K N U N• • • • * • • • • •o -4" ON P"- CM KN N in K> VOh m m vo r- co o n o n
cm kn vo kn c\j on kn o r-• • • • • •o co n ® m cj 4 o inCM 4 VO N ■
r-ON ON ON
rHo o O o O O O o
0 > » o t o P P
UN o UN o UN O O o
© 0 p P CM CM KN - 4 - UN
d P © d PU 0 I I ■ I I 1 1G P 0 o G© GS A G oG C O o O o O O o o o^ CJ O H
G jUN o UN o UN o o oM-l P p P CM CM KN - 4 UN
247
98.9
98.3
90.7
98.8
99.4
99-0
93.7
99.4
100.
100
100
100
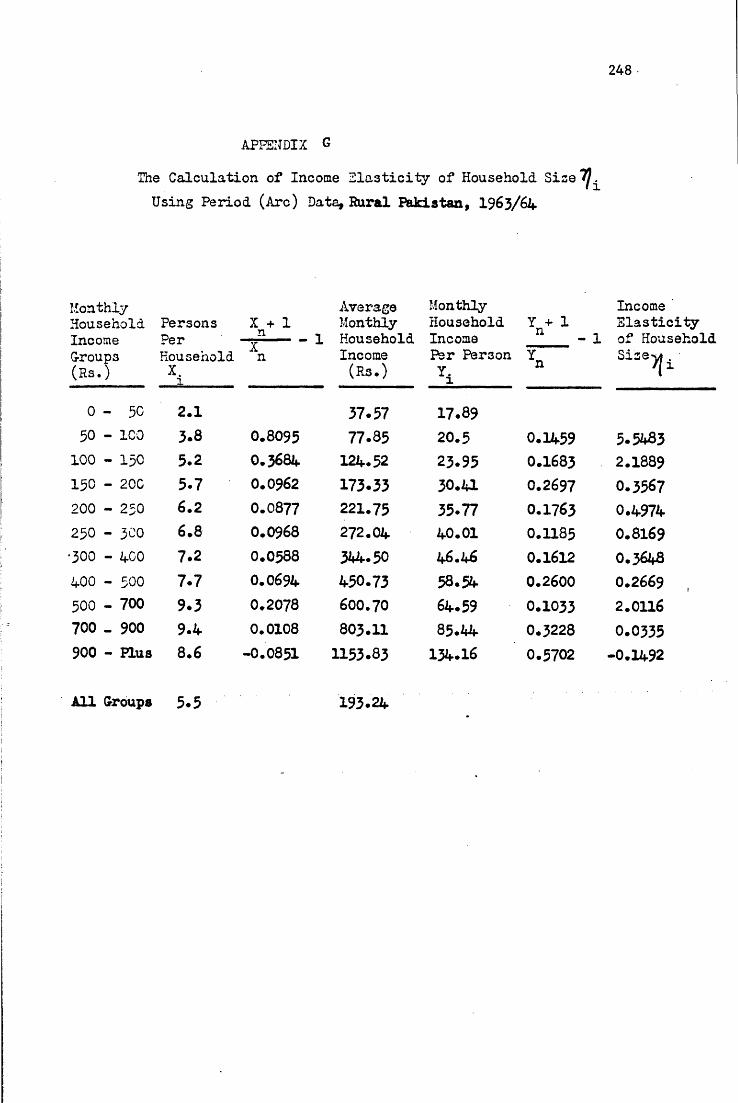
248
APPENDIX G
The Calculation of Income Elasticity of Household Size*^Using Period (Arc) Data, Rural Pakistan, 1963/64
MonthlyHouseholdIncomeGroups(Rs.)
PersonsPerHouseholdX.1
X + 1nXn
Average Monthly
1 Household Income (Rs.)
Monthly Household Income Per Per3onYi
Y + 1 n
Yn
Income Elasticity
1 of Household Sizevt .
>I1
0 - 30 2.1 37.57 17.8950 - ICO 3.8 0.8095 77.85 20.5 0.1459 5.5483
100 - 130 5.2 0.3684 124.52 23.95 0.1683 2.1889150 - 20C 5.7 0.0962 173.33 30.41 0.2697 0.3567200 - 230 6.2 0.0877 221.75 35.77 0.1763 0.4974250 - 300 6.8 0.0968 272.04 40.01 0.1185 0.8169•300 - 400 7.2 0.0588 344.50 46*46 0.1612 0.3648400 - 300 7.7 0.0694 450.73 58*54 0.2600 0.2669500 - 700 9.3 0.2078 600.70 64.59 0.1033 2.0116
0 0 1 vo 0 0 9.4 0.0108 803.11 85.44 0.3228 0.0335900 - Plus 8.6 -0.0851 1153.83 134.16 0.5702 -0.1492
All Groups 5.5 193.24
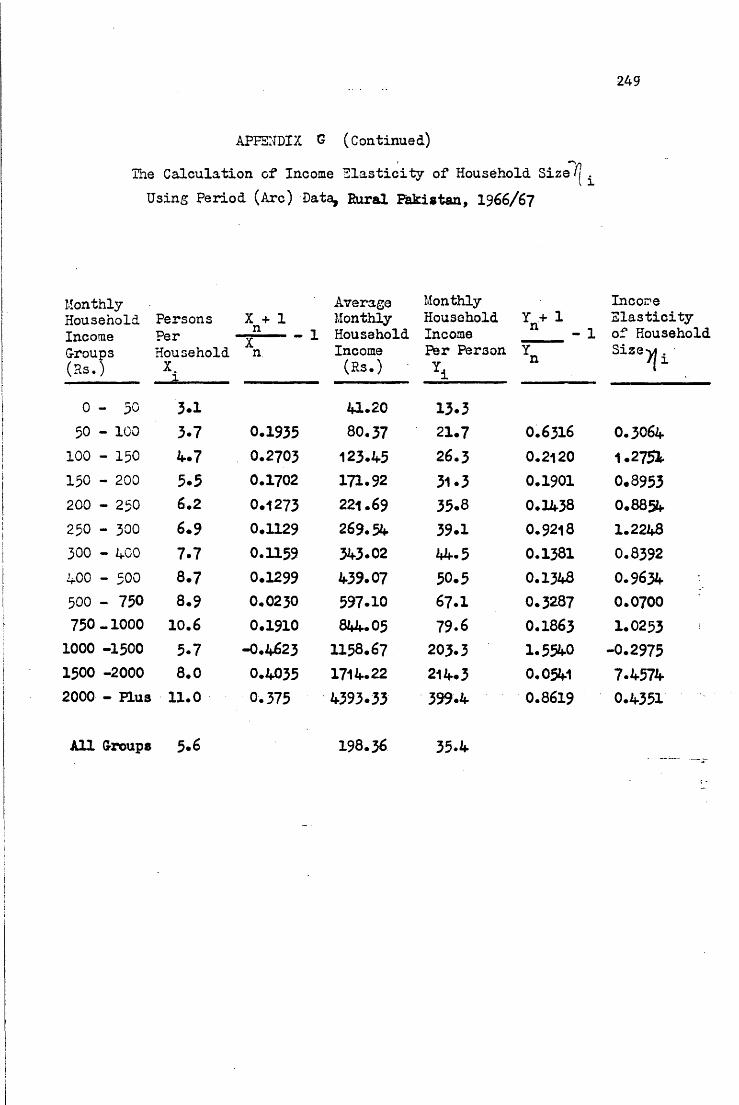
249
APPENDIX G (Continued)
The Calculation of Income Elasticity of Household Size fj Using Period (Arc) Data, Rural Pakistan, 1966/67
MonthlyHouseholdIncomeG-roups(Hs.)
PersonsPerHouseholdX.
1______
X + 1 nXn
- 1
AverageMonthlyHouseholdIncome(Rs.)
Monthly Household Income Per Person Y.i
Y + 1 n
n- 1
Incoire Elasticity of Household Sizevf .
'I1
0 - 5 0 3.1 41.20 13.350 - 100 3.7 0.1935 80.37 21.7 0.6316 0.3064
100 - 150 4.7 0.2703 123.45 26.3 0.2120 1.2754150 - 200 5.5 0.1702 171.92 31.3 0.1901 0.8953200 - 250 6.2 0.1273 221.69 35.8 0.1438 0.8854250 - 300 6.9 0.1129 269.54 39.1 0.9218 1.2248300 - AGO 7.7 0.1159 343.02 44.5 0.1381 0.8392
00100-+ 8.7 0.1299 439.07 50.5 0.1348 0.9634500 - 750 8.9 0.0230 597.10 67.1 0.3287 0.0700750-1000 10.6 0.1910 844.05 79.6 0.1863 1.0253
1000 -1500 5.7 -O.4623 1158.67 203.3 1.5540 -0.29751500 -2000 8.0 0.4035 1714.22 214.3 0.0541 7.45742000 - Plus 11.0 0.375 4393.33 399.4 0.8619 0.4351
All Groups 5.6 198.36 35.4
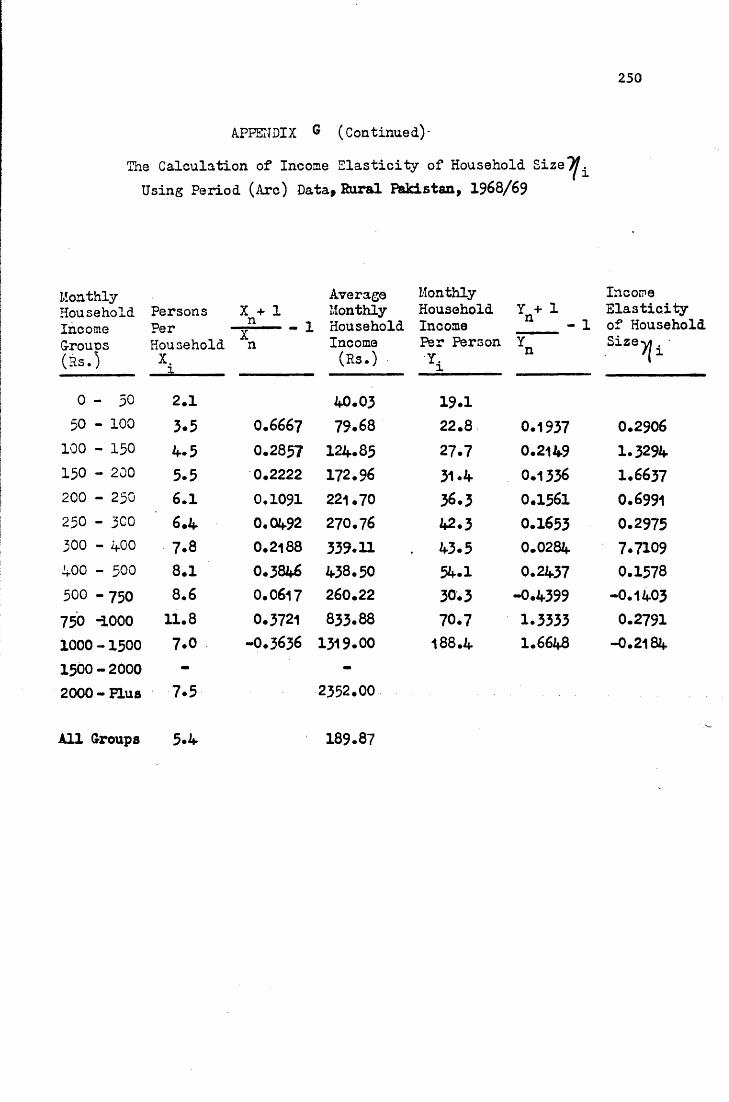
250
APPENDIX G (Continued) -
The Calculation of Income Elasticity of Household Sizeyj^Using Period (Arc) Data* Rural Pakistan* 1968/69
MonthlyHouseholdIncomeG-rouns(Rs.)
PersonsPerHouseholdX.1______
X + 1nXn
- 1
AverageMonthly
MonthlyHousehold Yn+ 1
Household Income _____Income(Rs.)
Per Person YY.i
n
Income Elasticity
1 of Household Size*v» .
'I1
0 - 50 2.1 40.03 19.150 - 100 3.5 0.6667 79.68 22.8 0.1937 0.2906
100 - 150 4.5 0.2857 124.85 27.7 0.2149 1.3294150 - 200 5.5 0.2222 172.96 31.4 0.1336 1.6637200 - 250 6.1 0.1091 221.70 36.3 0.1561 0.6991250 - 3C0 6.4 0.0492 270.76 42.3 0.1653 0.2975300 - 100 7.8 0.2188 339.11 43.5 0.0284 7.7109400 - 500 8.1 0.3846 438.50 54.1 0.2437 0.1578500 - 750 8.6 0.0617 260.22 30.3 -0.4399 -0.1403750 -1000 11.8 0.3721 833.88 70.7 1.3333 0.27911000- 1500 7.0 -0.3636 1319.00 188.4 1.6648 -0.21841500- 2000 - -2000- Plus 7.5 2352.00
All Groups 5.4 189.87
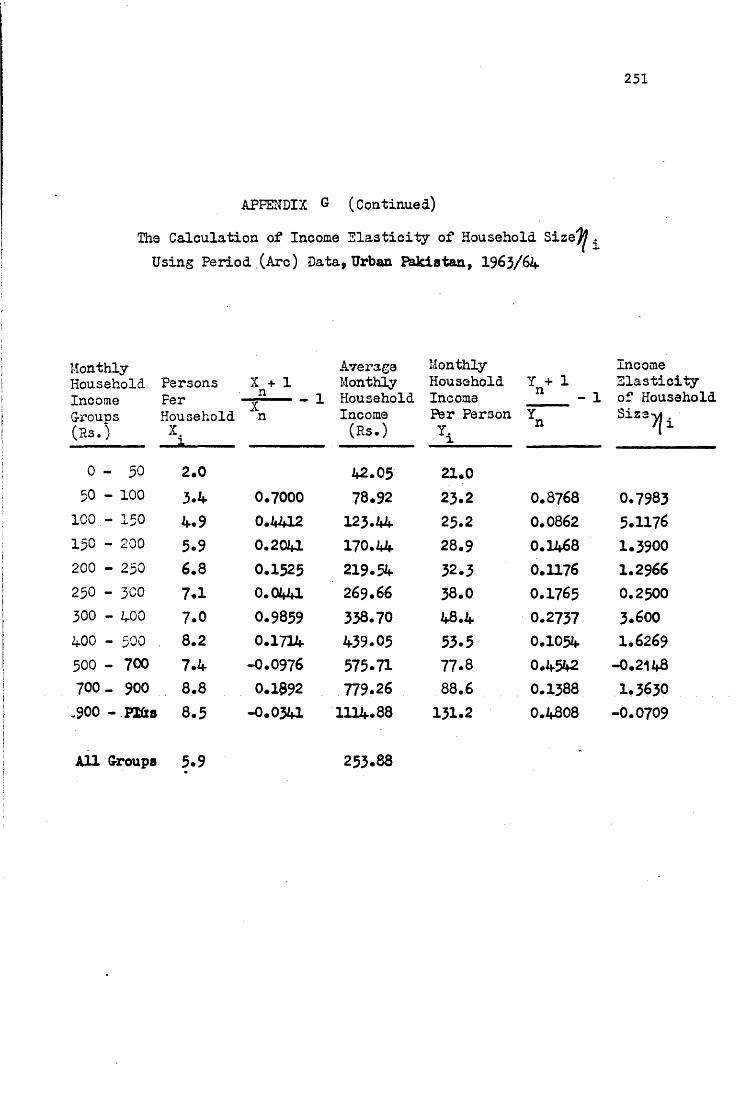
251
APPENDIX G (Continued)
The Calculation of Income Elasticity of Household Size^ Using Period .(Arc) Data, Urban Pakistan, 1963/64
MonthlyHouseholdIncomeG-roups(Rs.)
PersonsFerHouseholdX. 1______
X + 1nXn
- 1
AverageMonthlyHouseholdIncome(Rs.)
Monthly Household Income Per Person
Y + 1 n
n
income Elasticity
1 of Household SizeM .
M 1
0 - 3 0 2.0 42.05 21.050 - 100 3.4 0.7000 78.92 23.2 0.8768 0.7983
I C O - 130 4.9 0.4412 123.44 25.2 0.0862 5.1176130 - 200 5.9 0.2041 170.44 28.9 0.1468 1.3900200 - 230 6.8 0.1525 219.54 32.3 0.1176 1.2966230 - 300 7.1 0.0441 269.66 38.0 0.1765 0.2500300 - 400 7.0 0.9859 358.70 48.4 0.2737 3.600400 - 500 . 8.2 0.1714 439.05 53.5 0.1054 1.6269500 - 700 7.4 -0.0976 575.71 77.8 0.42*2 -0.2148700 - 900 8.8 0.1892 779.26 88.6 0.1388 1.3630
-900 -FKxs 8.3 -0.0341 1114.88 131.2 0.4808 -0.0709
All G-roups 5.9 253.88
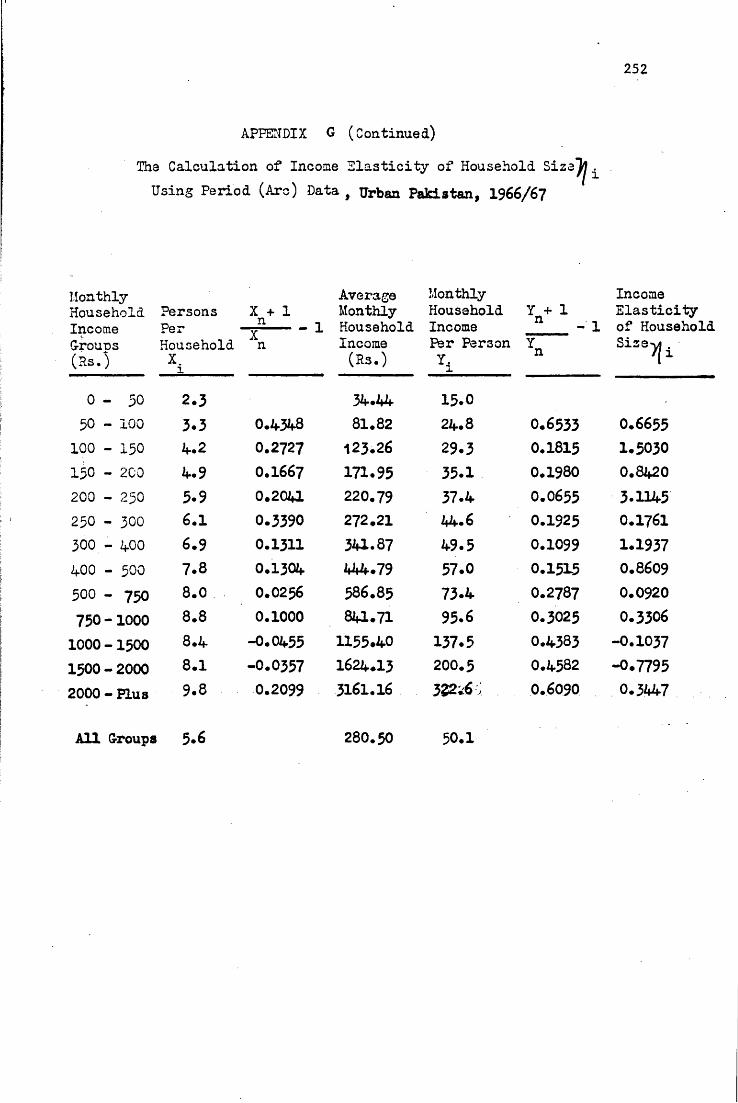
252
APPENDIX G (Continued)
The Calculation of Income Elasticity of Household SizajjUsing Period (Arc) Data , Urban Pakistan, 1966/67
MonthlyHousehold Persons X + 1Income Per ■G-rouos Household n(as.) ______
- 1
AverageMonthly
MonthlyHousehold Y + 1
Household IncomeIncome(Rs.)
Per Per3on Y.
- 1n
Income Elasticity of Household Size-d .
0 - 5 0 2.3 34.44 15.0 '50 - 100 3*3 0.4348 81.82 24.8 0.6533 0.6655
100 - 150 4.2 0.2727 123.26 29.3 0.1815 1.5030150 - 2C0 4.9 0.1667 171.95 35.1 0.1980 0.8420200 - 250 5.9 0.2041 220.79 37.4 0.0655 3.1145250 - 300 6.1 0.3390 272.21 44.6 0.1925 0.1761
0 0 -d-100 6.9 0.1311 341.87 49.5 0.1099 1.1937400 - 500 7.8 0.1304 444.79 57.0 0.1515 0.8609500 - 750 8*0 0.0256 586.85 73.4 0.2787 0.0920750 -1000 8.8 0.1000 841.71 95.6 0.3025 0.3306
1000 -1500 8.4 -0.0455 1155.40 137.5 0.4383 -0.10371500 - 2000 8.1 -0.0357 1624*13 200.5 0.4582 -0.77952000 - Plus 9.8 0.2099 3161.16 32226; 0.6090 0.3447
All G-roups 5*6 280.50 50.1
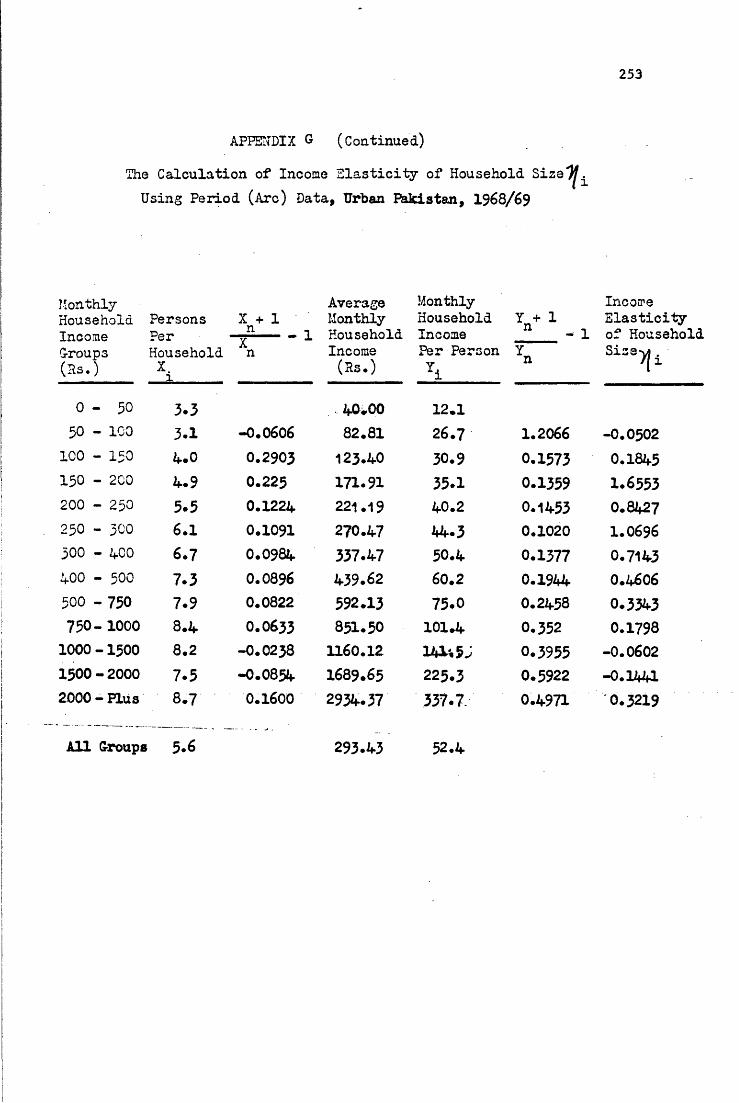
253
APPENDIX G (Continued)
The Calculation of Income Elasticity of Household Size7Using Period (Arc) Data, Urban Pakistan, 1968/69
MonthlyHouseholdIncomeG-roups(Rs.)
PersonsPerHouseholdX.x
X + 1n 1
AverageMonthlyHouseholdIncome(Rs.)
Monthly Household Income Per PersonYi
Y + 1n - 1
Y n
Income Elastic: of Hous< Size-vj .
7(1X 1 n
0 - 5 0 3.3 40*00 12.150 - ICO 3.1 -0.0606 82.81 26.7 1.2066 -0.0502
ICO - 150 4.0 0.2903 123.40 30.9 0.1573 0.1845150 - 2C0 4.9 0.225 171.91 35.1 0.1359 1.6553200 - 250 5.5 0.1224 221.19 40.2 0.1453 0.8427250 - 3C0 6.1 0.1091 270.47 44.3 0.1020 1.0696300 - 4C0 6.7 0.0984 337.47 50.4 0.1377 0.7143400 - 500 7.3 0.0896 439.62 60.2 0.1944 0.4606500 - 750 7.9 0.0822 592.13 75.0 0.2458 0.3343750- 1000 8.4 0.0633 851.50 101.4 0.352 0.1798
1000 -1500 8.2 -0.0238 1160.12 141*5; 0.3955 -0.06021500-2000 7.5 -0.0854 1689.65 225.3 0.5922 -0.14412000 - Plus 8.7 0.1600 2934.37 337.7 0.4971 0.3219
All Groups 5.6 293.43 32.4
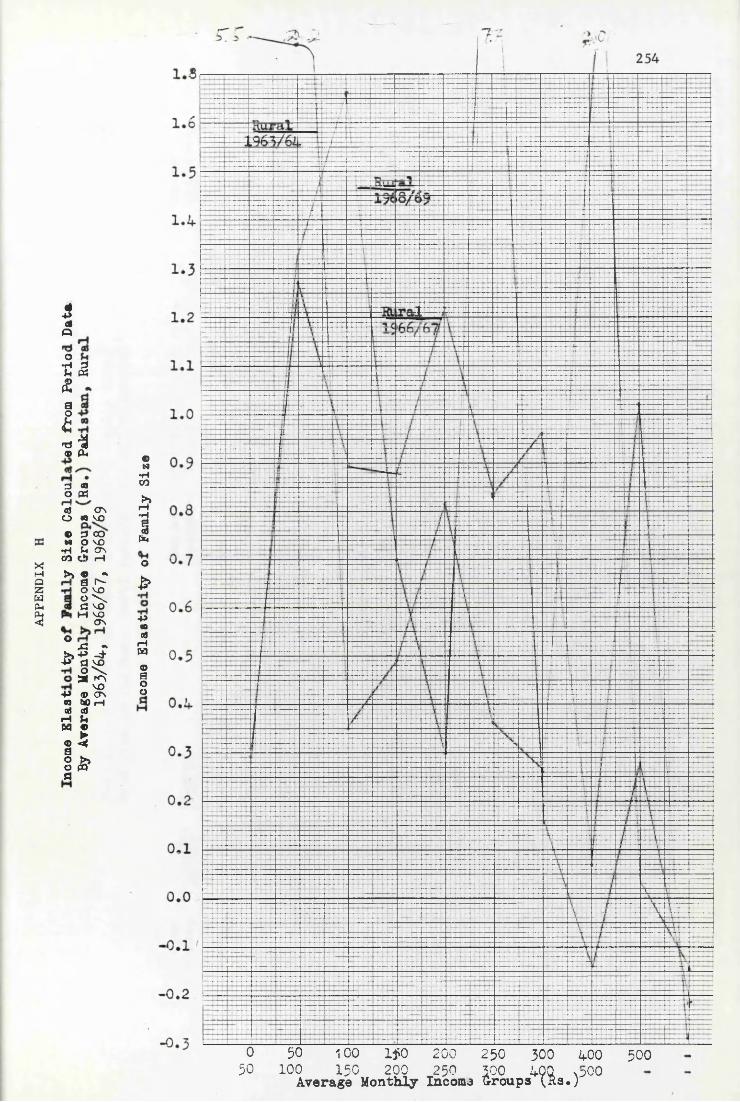
XHQ25WP-t2!
4-PatQo*S (§t£aoa* ® *3 «O P5ato©N
•HCO
>>
o£
•pCDatrHH<0aooa
CTn «9 VO
d ooo voU ON C*> rH
© »a r - o vo o \ d VO M vo
crv
jd •»- p -d- d vo o \ * vo® CTn i iOrHatU©5
©N*HCO
S1F*«o
I?
•p»atrHW©aoo
&
0 5 0 I C O 1 * 0 2 0 0 2 5 0 3 0 0 4 0 0 5 0 050 100 150 200 250 300 400 o00Average Monthly Income Groups tRs.)
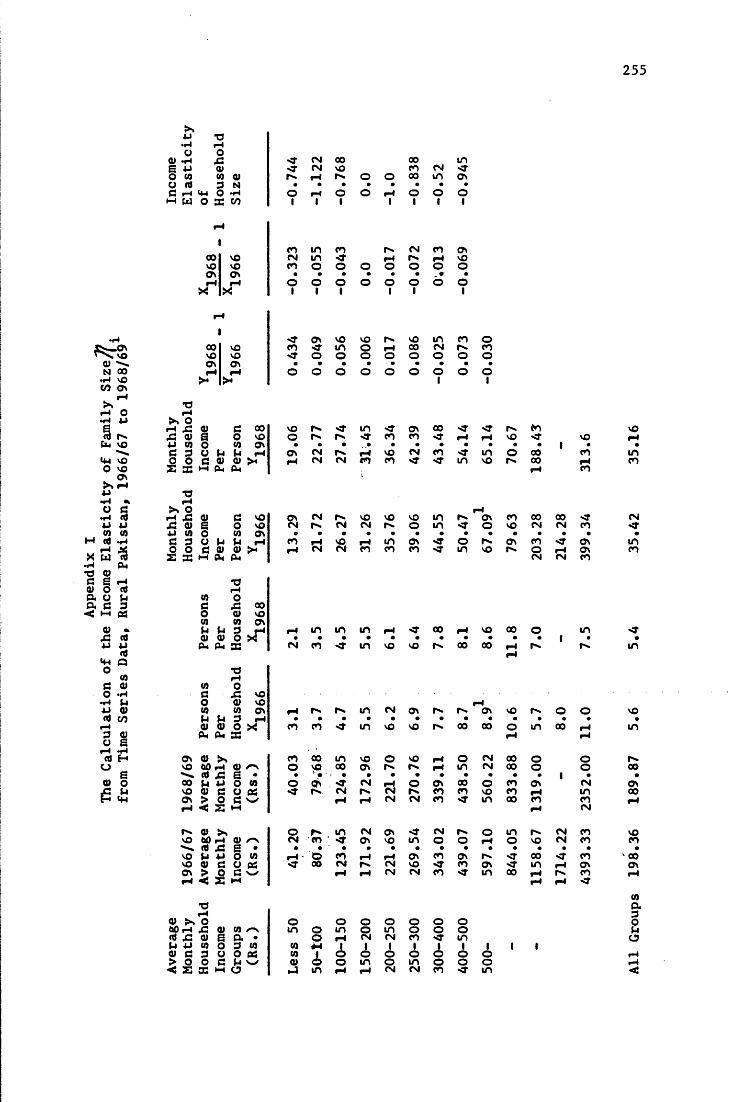
Appendix
IThe
Calculation
of the
Income
Elasticity
of Family
Size/f
from
Time
Series Data,
Rural
Pakistan,
1966/67
to 19
68/6
9
255
4J TJ•i-4 rHO o0)•rH Xi <r CM 00 00 in6 4-> 0) *3- CM VO CO CM -ao CO CO ® 1-4 p% o o 00 in avo id 3 N . . . • • m • •G r-4Hh O •rH o 1—4 o o H o o oHH W o 33 co i 1 1 1 i i i
x
00 VOVO VOON ONrH r-4X
00 vOVO voav ONrH rH
X oH £ « c C£* CD g o v4J W o w CG 3 O In M rO O 6 ® ® >h
Z S H CM flu
CO m CO n. CM CO ONCM in •o rH p» rH VOCO o © O © © © o. . • • • . . ♦ .o © o © © © © o1 1 1 1 1 1
<0 ON vO VO r* VO in COCO 'O’ m o r-4 00 CM p*© o o © © © o. . • • • • • •© © © o O © ©
1©
vo p- nr in •o ON 00 HTo rs p- <r CO co •a rH• . • . • • .ON CM PN- rH vo CM CO •arH CM CM CO CO -O in
oCOo01
invo
p*vOor>.
to0000
vococo
T3r—4
* 9 rt A & ® ■U (0c s o o
® G vO ONs O vO CMo 40 ON .o u U 1—4 COc 0) 0) >« rHt«H Ph PH
•orHCO oG •G 00o a vOCO CO ONtH® u® 3O > r1—4.
Ph PH X CM
■GrH(0 0C X voO ® vO(0 (0 ON 1—4u u 3 rH •® ® o X COPH PH Xav ® x vo 6 0 h © n g •co ^ mi o nvo ® 6 o osO' > o C VrH < 3E3 M
vO 00 rH CDs r t £ 6 •vo M .M O (0vo (U G O 05ON > O G wrH •< X H
Pvt
CM
O ON <■ p*
p*.CM
vOCM
co co in o vo oo
VO VO vo m p* ON CO 00 00 •O’CM r>. o i n © vo CM CM CO• . . • . . . . . .rH i n ON Hf © r>. ON CO - a avCO CO CO • a m VO p . ©CM rHCM av
CO
00“CM
o p- inc m c o <tr-4 • O CO<r ao cm
inm
inin
voavCM1
CMON
,H 'O- CO r-l VO 00 O in• • • • • • • | .vo vo oo oo r-c p^
cm av • •
vO VO
Or>»CMCM
ONVO
VOp-©p-CM
Htin
1-4 avcm vo CM CM
p«» p* • •p* oo
rH O i-4 in • •av oo co co <o
CMo o • •co av •a co co <r
ON vO p* O ©. • . . •00 o in 00 1—4
1—4 i—4
CM 00 © oCM 00 o o• • • 1 .
O CO ON CMvO CO rH mm 00 CO CO
i-4 CM
© in P*» CM COrH © vO CM CO. . . . .r>» <r 00 HT COON in 1—4 avm 00 rH P^ CO
rH rH <0
® >* o00 rH jG 0) 40Cd XI ® e o . •M 4-> CO o 3 CO® G 3 O O 05> o O c M VH< z a H O
omcoco®»-}
O0*-41Qin
0 mrH1O©
o0CM1om
0 inCM1OoCM
OOCOIoin
0 © «o1o©CM CO
o0 m1oo<rioom All
Groups
198.36
189.87
5.6
5.4
35.42
35.1
6
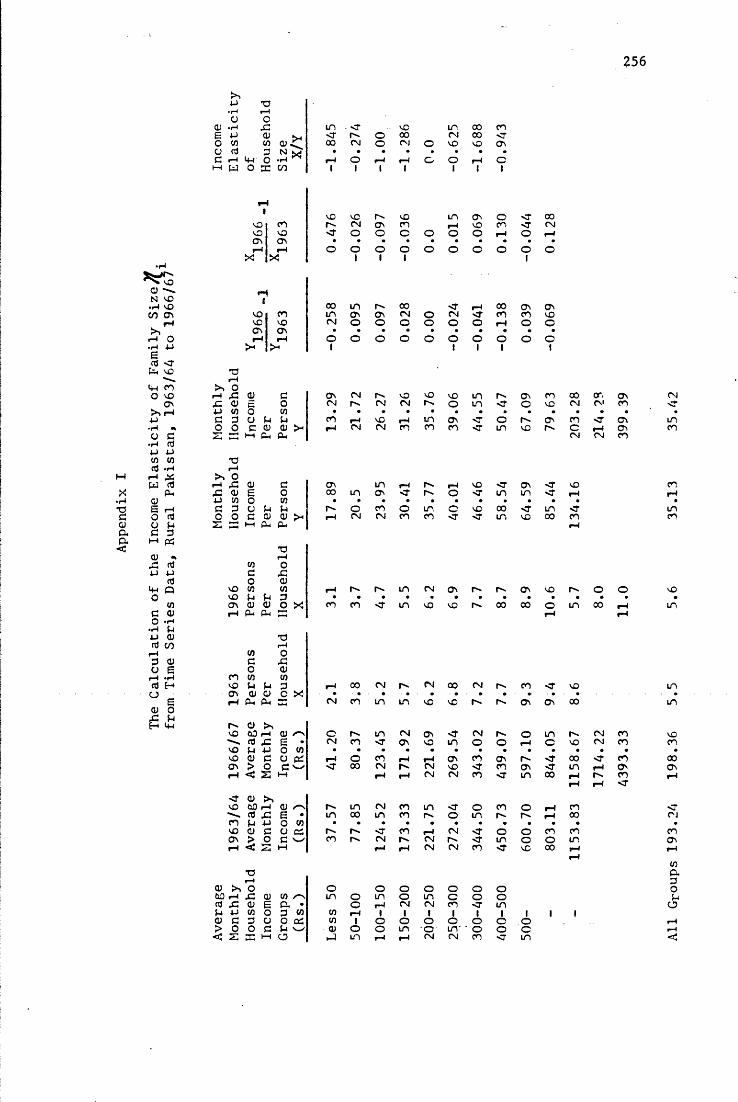
256
o —N vO •P VO CO ONI—IX
r—I O • H 0>Eoj <rCii vO ip COO voON X r -1■p
• H *o c• H nJ P P CO CO
CTj - H M rP Xw c j X eu •h o-o E r-t
P- H pS
P PO COC 0) O -H •P £h P (UnJ co
r-l *Pcd EH<U O
!!ilI
Xp rs•H ?po oCU •P 43 in
E P a; a> <rO CO CO 00o rt
. 2 *•
c i—i P o r-lM W o 33 CO i
r-1 VOVO CO xvO vO <rON On •i—I tP oX X
rH1 00VO CO inVO VO CMO n ON •f p Ip oX X 1
T3iPX Or-t 43 a ; £3 ON
43 <u s o CMP CO 0 CO •c a a H U COo o C 0) cu x « p2 33 Ph Ph
rsX O
r—1 43 cu £3 CTn43 CU E O 00P CO O CO •3 3 o u U X0 O c at CU X iP23 33 IP PH PhrsfpCO o
C 43o CUVO CO CO iPVO IH P 3 «ON a <U o X COrP PH Ph 33TJiPCO O£3 43O (UCO CO COvO u P 3 iPON a* CU O X •|P Ph Ph 33 CM
x cu Xvo to CUn O—— cs 43 E * CMVO p P o CO •vo cu £3 o 03 rPON > O £3 np -CTiP < s ip
<r cu XvO 00 CU/“V XnJ 43 E • inCO P P o CO •vo a £3 o C3 xON > O £3 v_> COiP < 22 IP
T3X o Or-l43 CU CO/-v in43 (U E cx •P CO O 3 CO CO£3 3 o O 03 COO o £3 P cuA 33 IP a
<r VC in CO COx o 00 CM 00 <rCM o CM o VO VO ON• • • . . • •o1 r—i rP1 o 01 r-li c1
VC x vO in ON o <rCM ON CO fp vO CO <TO o o o o o fp O• • • • • • • 901 01 01 o o o o 01
in x 00 <T fp 00 ONON ON CM o CM <r CO COo o O o O o fp o• • • • • • • •o o o o O1 01 01 o
CM X VO VO VO m X ONx CM CM X o in <r o• » • * • • • .|p VO rH in CTN <r o XCM CM CO CO CO <r in VO
in fp X fp VO <T ONin ON <T X o <r in in. . . . • • . .o CO O in c vC 00 <rCM CM CO CO <r <r in vO
x x in CM ON X X ON• • • . • • . •CO <T in vO VO X 00 00
00 CM X CM 00 CM X CO' . . ■. * ' « » ■ .CO in in vO vO X X ON
x in CM ON CM X oCO <T ON vO in o o fp• . • • • • . •o co fP »P ON co ON X00 CM X CM vO CO CTNfp rH CM CM CO in
in CM CO in <r o co O00 in CO X o in X X. • • • • « • .x <r CO fp CM o ox CM X CM X <r in ofp fp CM CM CO <r vC
O o O O o oo in o in c o oo fp CM CM CO -CT infp 1 1 1 1 1 i 11 o o o O O o _oo o in o in ' o o oin fp fp CM CM CO <r in
ooCMO
onvOoo»
CO 00 or, ONvO CM CM CO« • • .ON CO <T ONX c f p ONCM CM CO
< r vo
in <roo co
vo X o o• • • .Ofp m 00 fpfp
VO> . «'ON 00
in X CM COC VO CM CO• • • •00 <r CO<r in fp ON00 r-i X COip fp <rfp COfp 00. •CO COo m.00 ip
i i
All
Groups 193.24
198.36
5.5
5.6
35.13
35.4
2
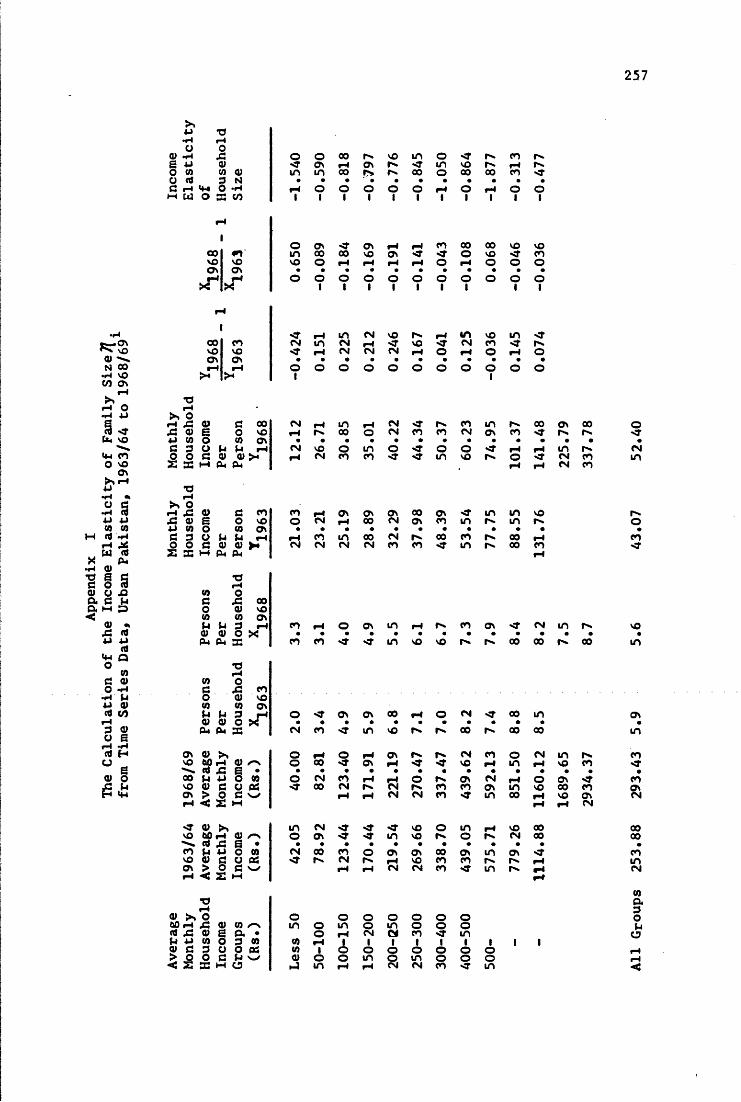
257
X4-> •d•H rMo 0«rl A o o 00 r>» vO m o •O CO r«.P 0) -o ON rM ON X mt in vo X rM r>.(0 (0 0) m in 00 r* 00 o 00 00 CO *3-Ctf 0 N • • • • • • • • • • •rM O •H H o O o o o rM o rM o Ow o x CO i i 1 1 1 1 1 1 1 1 1
i o ON Mf ON rM rM CO 00 00 vo vo00 *v m 00 00 vo ON < -o o vo sr CONO vo vo o rM rM rM r-l o rM O o OON ON • • • • • • • • • • •|M rM o o o O O O o © O o oX X 1 1 1 1 1 1 1 1 1
on C*x vO <0 ***. N 00 •H VO CO ON
00 COVO VOON ONrM rM
•O' r-i tn < N v o r - » i - i u " > v o i n < rf v J t n C M r - l ' O v O ' O C M O O O ’ rs • t f r M C M C M C M r M O r M O r M O • • • • • • • • • • •0 0 0 0 0 0 0 0 0 0 01 IX •o1—1 o rM ••«M p X oS rM A 0) G 00COPm <r A 0> e O VOvo P CO o CO ONG P o U M rMMm CO o o G 0) 0) X0 vOON X X M PM PmX rMP •ofM HO G X o•<M CO rM A 0) G COP p A 0) 6 O VOCO CO P <0 o CO ON(0•rl G p o u u rMrM X O o G 0) 0) XW (0 X X M Pm Pm
•H 0)'HIS 0) 0.0 G. G UA H p
(U « A <4 p p rt«W Q O toG o> O *H •H U P 0) <0 CO
flj H° e o u<+40)&
oA c0) VCO c u a « 0) o xpu 0+ x
CO og .fl coO 0) VOCO CO ONM *M P rM0) 0) O X 04 PM S
on a> xvO (OH 0)^^ «« a a •oo u p o tovo o) e o oso\ > O C vi-m < x w
CMCv| vo rM CM
CO i-M • •co tn
oCM
OOO
co
ooCM00
inoooco
r-l COCM CM inCM
ON
coCM
inco
CO r-4 ON ONo CM rM CO
CM <T CM CO • • o -o<T
r-cooin
co inCM ON CO 00 On 00x
ON 00 ONCM ON CO00CM CMCO I"*CO 00
ovo
Mfincoin
rMC* O in x cm coCM CO
mr-»
min vo00 rM00 CO
O ON • •<0*inm vo
o co on• • •vo r-
cm in • • • •CO OO N »
O N O O r M O CM •? 0O inm vo r* oo oo oo
O rM ON•J ON H <JCMCM
or-*CM
r*r-N.COCO
CMvo•ONCOCOCMONm
oinmoo
CMovO
mvo•ON00VO
rvco•MfcoONCM
oCMm
oCO
VOm
ONmco•o•COONCM
0) X m CM sr -O' M*vO 00 rM co rv o ON Mf mCOA 6 • • • • • •
CO U P o co CM oo CO O ONvO 0) G O OS Mf X CM X rMON > O C N-/ rM rM CMrM■< X M
•orM
CDX o o O O O00 rM X a) CO in o m O m<0A 0) g o. • o rM CM CMU P COo p CO CO rM 1 1 10) G p o O 06 CO 1 © o O> O o c (M s_/ a> o o m o< X X M o A m rM rM CM
VO o m rM vo oo 00VO o n* CM 00 00• • • • • • •ON 00 ON in ON MT COVO CO CO r>. r- rM inCM CO -o in r\ rM CMr-l
COaHO o o Joo o o uCO Mf in a1 1 i I l 1o o o o rMin o © o rMCM CO •O’ in <
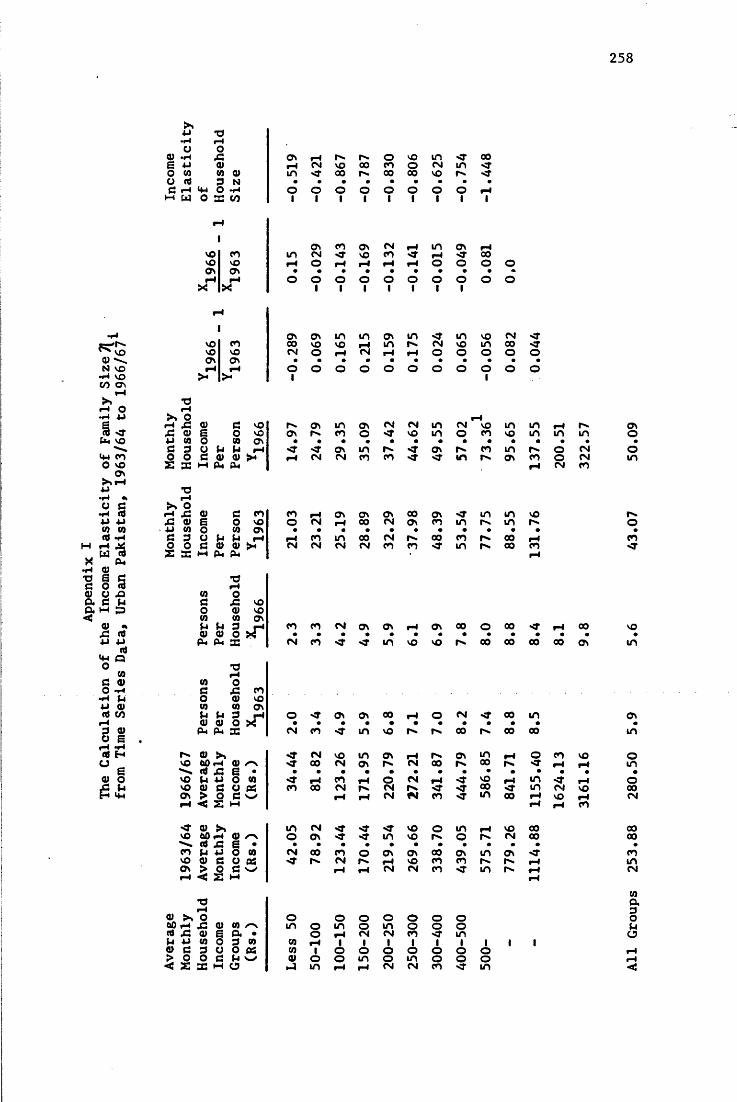
Appendix
IThe
Calculation
of the
Income Elasticity
of Family
Size7l
from
Time
Series Da
ta, Urb
an Pakistan,
1963/64
to 1966/67
258
xU T3•H i—<o oQ) *H jCg 4J 0)O w WO)o rt p Nd H O -Hh w o as co
Ov rH Is-* r>* o vo in 'O 00rH CM VO 00 co o CM in *oLD *0 00 n* 00 00 VO n* <r• • • . a • • • •o O o o © o o o H1 1 1 1 1 1 1 i i
OV CO OV CM rH i n OV rHVO CO i n CM *0 vO co Mf rH • o 00vo vO rH O rH rH rH rH O o O oOV Ov a • . • . a . • • *rH rH O o © O © O o o o oX X 1 1 1 1 1 1 1
OV OV in in Ov in in vo CM -O'vO CO 00 vO vO rH in !>» CM vO in 00vo VO CM o rH CM rH rH O o o O oOV OV . • . a • . . • • • •rH rH o o O O O O o o o © o>« >< 1 1
x orH £43 <u4J (0C P o o
x orH SZ 43 0) 4J (0G P O O
c VO r>. OV in OV CM CM m CM vo in in rH r>.o vO OV Is-* CO o VO m O CO vo in in mCO Ov • . • . • • • • • • a a au rH *o Ov in Is* *cr Ov r>. co in o CMcu <u rH CM CM CO co *0 in r** ov CO o CMPH Ph rH CM CO
d CO CO rH OV ov Ov 00 OV in m vOo VO O CM rH 00 CM Ov CO in r*s mCO ov . a . • a . • • . • au rH rH CO m 00 CM r>. 00 CO r*. oo rHd) CU >H CM CM CM CM CO CO HJ- m r*. 00 copH Ph rH
01 oG 43 vOO d) vo(0 CO ovP 3 rH<U <U O XpH put XCO CO CM OV OV rH OV 00 o 00 •o- rH 00a a a a a a a a a a a a aCM co *o •o m VO vO 1^ OO OO 00 00 OV
CO oC 4 3 COO d) voCO CO ONP P 3 rH<U <U O XPh Ph 33
r>* d> x vO D O r l 0)v e •VO (H U o covo CU G O OSOV > O C v-rrH < s W
n r d> xvO d O H ( 1 ^ ^ rt 43 g •CO p 4J o COvo d) C OOv > O G wH < S H
o -O ov OV 00 rH O CM Sf 00 ma • a a a a a a a a aCM CO in VO r>» Is* 00 r>. 00 00
CM vO in OV rH OV in rH o CO VO'O 00 CM ov I-** CM 00 r>. 00 r>* Mf rH rHa a a a a a a a a a • a a*0 rH CO rH o CM rH <r VO rH m -o rHCO oo CM Is* CM -O 00 m CM VOrH rH CM CO in 00 rH vO rHrH rH CO
m CM -O *0 vo o in rH VO 00o Ov •o •o in vO l>» o r. CM 00a a a a a a a • a • aCM 00 CO o ov OV 00 ov in OV Hf'O l>* CM 1-*. rH VO CO CO Is* rHrH rH CM CM CO *0 in r>» rHrH
<U
CU (3 > O
o O o O O O o o43 d) 01<r\ in o in o in O o o0) 6 Ot a o rH CM CM CO Hf in(0 o p 0) co rH 1 1 1 1 1 i 1p u o 03 co 1 O O O o o o oo G M W <u O o m o in o o oX M o h4 m rH rH CM CM CO -o m All
Groups
253.88
280.50
5.9
5.6
43.07
50.09
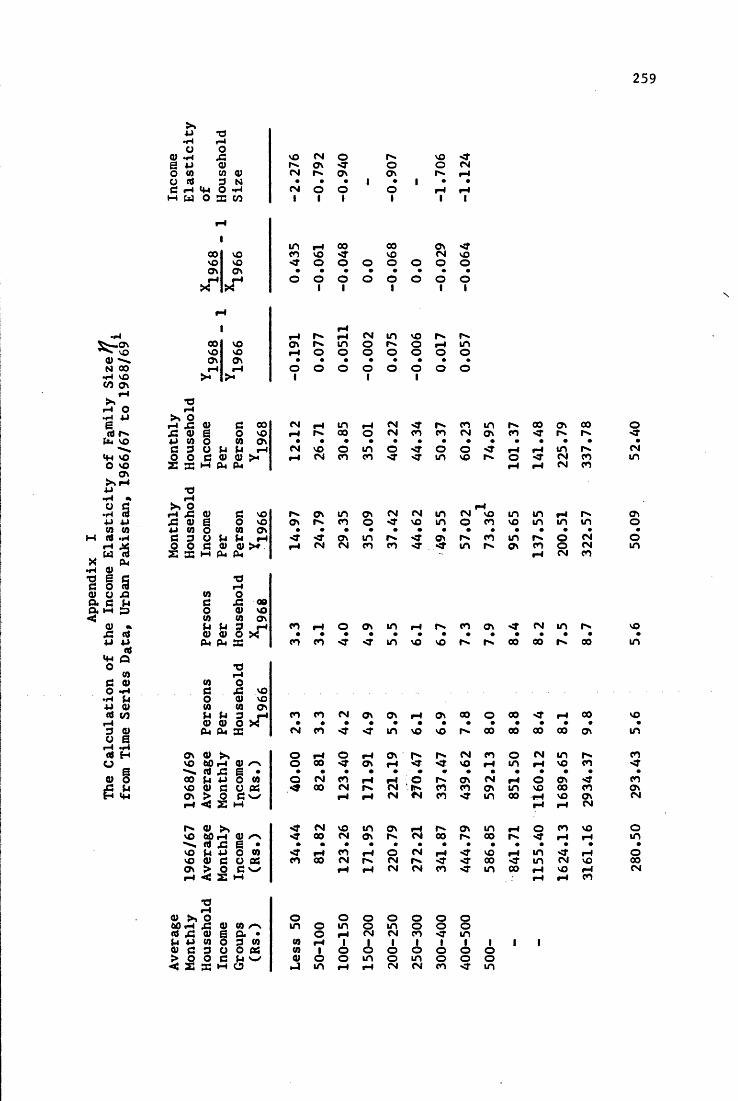
Appendix
IThe
Calculation
of the
Income Elasticity
of Family
Size)f
from
Time
Series Data*
Urban
Pakistan*
1966/67
to 1968/69
259
o o0) •H X vo CM © rs vO 'OE 4-> to rs OV o O CMo to (0 0) CM rs OV Ov rs rHo (4 3 N • • • 1 • 1 • •3 i—4 t+-t O •H <N © o o rH rH1-4 w o X CO 1 1 1 1 1 1
H
in fi X 00 Ov <•00 VO CO VO <T vo CM vOVO vo •o © o © o © O ©ov OV • • • • • • • •rH rH o © © O © © o ©
X! X 1 1 1 1 1
rH1 i—4rH rs i—4 CM m VO rs is
00 VO OV rs m © is o ft inVO VO rH © © © © © © ©OV OV • • • • • • • •r-t rH o o © © o © © ©
>4 1 1 1
T3r-tAr\rH ox a 3 00 CM rH m rH CM <r rs CO in IS CO Ov CO ©X to £ O vo i—4 rs CO © CM CO CO CM ov CO <■ rs rs4J w O to ov • • • • • • • • • • • • • •s 3 o -1 M 1-4 CM vO © m © Mt o o rH rH m rs CMo o 3 to 0) >4 rH CM co co 'O' <r in vO IS © <r CM CO ins X M 04 04 rH rH CM CO
•of-t>* o rH*H X a) 3 vo rs. OV m ov CM CM m CM vO m m rH rs ovX 0) £ O vO Ov rs CO © Mf VO in O CO vo in in m ©+J (0 O to ON • • • • • • • . • • • • • • •3 3 o -4 P t-t •O OV m rs <t ov rs CO in rs o CM ©o o a to a) >♦. r-4 CM CM CO co <r m IS ov CO o CM inx X M 04 04 rH CM CO
•3rH(0 O3 X 00o to VO(0 w OvM ■4 3 ft CO rH O ov in rH IS CO OV Hf CM m rs voto to O X • • • • • • • • • • • • • •X 04 X CO CO Hf m vO vO rs rs 00 00 rs CO in
•or—tw os X VOo a) vOw to OV-1 3 ft CO CO CM Ov ov 1-4 OV CO © 00 Mf rH CO voto a) O X • • • • • • • • • • • • • •X 04 X CM CO Mf Mf m VO VO rs CO 00 00 X ov mo\ a> i © rH © rH Ov rs rs CM CO © CM in rs COVO 60 r-l (0 /-V o 00 Hf OV rH <t Mt vO rH m rH vo CO •sts^ ra X £ • • • • • • • m • • • • • • •00 M 4J O to o CM CO rH f4 ■; o rs OV CM rH O OV •o COvo a) 3 a X 00 CM rs CM .rs CO CO OV m vO 00 CO ovOV > 0 3 >«✓ rH rH CM CM CO •O’ m 00 ft VO OV CMrH < X M rH rH CM
is a Mf CM VO m OV ft rs OV in rH O CO VO ©VO 60 i—4 a) /-N -o 00 CM ov rs CM 00 rs CO is Hf ft rH inCO X E • • • • • • • • • • • • • • •vo u 4 O to rH CO H o CM rH -O’ vo rH in Ht rH ovO <u o X CO oo CM rs CM rs. Hf HT CO HT m CM vo XOV > 5 3 rH rH CM CM CO •O m CO rH VO rH CMrH x M rH rH CO
T3Hto X O © © O © © © O60 H X a) to m © in O in © o ©«9 X a) 6 P. • © rH CM CM co «4t int-4 m 3 3 to m rH 1 1 1 1 1 I i 1 10) 3 3 y O X m 1 O © © © © © ©> o O s (-4 v_y a> O © in o m o © ©«< X X w a X m rH rH CM CM CO 'O m