footprints: demographic effects of out-migration
TRANSCRIPT
1
1 ___________________________________________________
Footprints: Demographic Effects of Out-Migration1
Lawrence C. Hamilton
Introduction Reports of gold discoveries along the Yukon’s Klondike River reached San Francisco in the summer of 1897, setting off a migration stampede that quickly inflated the remote northern area’s population from a handful to perhaps 40,000. ‘Klondike’ has since become a generic term for rapid and sometimes heedless resource-driven growth. The Circumpolar North has seen more than its share of Klondikes, from gold rush days to modern fishing and energy booms. World War II, the Soviet era and the Cold War brought other flows of in-migrants, as have postwar economic and public sector expansions. The arriving newcomers challenge and transform life for longtime northern residents and their traditional settlements.
The highly visible movement of southerners to the North tends to overshadow an opposite flow that also shapes these places: northern-born people moving south. Unlike southerners moving north, the northerners moving south have not written a broad literature about their experiences, or so visibly changed their destination communities. Often, these reverse flows are not easily counted or tracked. Departures do, however, leave footprints in the altered profiles of the places left behind. This chapter brings together some results from a series of studies that, incidentally at first, followed the demographic footprints of out-migration from the North. We use the terms ‘North’ and ‘South’ somewhat loosely; social gravity pulls toward larger, more diverse communities, which are often but not necessarily in lower latitudes.
1 The research described here was supported by grants from the Arctic Social Sciences and Arctic System Science programs at the U.S. National Science Foundation (OPP-0638413, OPP-0531354, OPP-9912004, OPP-9515380, OPP-9319921 and DPP-9111675). Many colleagues contributed, including Carole Seyfrit, Rasmus Ole Rasmussen, Oddmund Otterstad, Richard Haedrich, Helga Ögmundardóttir, Cliff Brown, Cynthia M. Duncan, Igor Belkin, Chris Colocousis and Melissa Butler.
Hamilton, L.C. 2010. "Footprints: Demographic effects of out-migration,"pp.1-14 in L. Huskey & C. Southcott (eds.) Migration in the Circumpolar North:Issues and Contexts. Edmonton, Alberta: Canadian Circumpolar Institute.
Migration in the Circumpolar North
2
As with any migration flow, out-migration from northern communities is not random. Migration decisions vary both with individual characteristics (e.g., Seyfrit and Hamilton 1992; Hamilton and Seyfrit 1994a; Seyfrit et al. 1998) and with socioeconomic conditions (e.g., Hamilton 2007; Hamilton et al. 1999, 2000, 2003, 2004a–c). More energetic and mobile individuals, including those with portable skills, are more likely than others to move, and especially to do so when their opportunities seem better elsewhere. To whatever extent movers differ from those who stay behind, out-migration reshapes the source community. Effects of out-migration can be particularly strong in northern communities, where populations are not large relative to migration flows (e.g., Hamilton and Mitiguy 2009).
Although everyone in a small place knows people who have left, or talk of leaving, broader patterns sometimes go unrecognized until we take a step-back, statistical view. Patterns of out-migration from small places change the population structure of source communities. For example, many small northern communities have experienced a gradual, disproportionate out-migration by women in recent decades. In times of economic difficulty in particular, young adults of both sexes often leave. These two patterns of out-migration leave demographic footprints in their source communities that might not be apparent on the street, but stand out in statistical analysis and have broad consequences for community life. Outmigration Effects on Sex Ratios During the course of survey research on the aspirations of high school students in two predominantly Native regions of rural Alaska, Carole Seyfrit and I noticed a pattern. Girls, more often than boys, told us that they expected to live most of the rest of their lives elsewhere. High proportions among students of both genders expected to leave, but the gender gap proved robust across 15 communities and follow-up interviews with high school graduates (Hamilton and Seyfrit 1993, 1994b). A replication survey several years later confirmed this pattern, adding several new communities and showing also that the gender gap was widest among Alaska Native students (Seyfrit et al. 1998).
The students themselves suggested a number of push and pull factors, even before learning about the gender gap in our survey. We heard repeatedly that “school is a girl kind of thing,” an attitude they extended toward post-secondary education, and hence to jobs requiring some higher education as well. High school girls voiced an interest in ‘careers,’ not just ‘jobs’ or ‘work.’ Their choices for careers looked better in cities than in their present small villages or towns. Women’s roles in a village seemed more narrowly constrained, and careers almost non-existent. In describing positive aspects of village life, students spoke enthusiastically about
Chapter 1: Footprints: Demographic Effects of Out-Migration
3
hunting, fishing, snowmobiling and basketball—activities that appealed more strongly to boys than to girls. Among the negative aspects were social problems (often related to alcohol) that created pressures on women and girls. Marriage between local women and outsider men opens another common path for outmigration (Hamilton and Seyfrit 1994c).
Were women really voting with their feet, then, and disproportionately moving away? We reasoned that gender-biased migration from such small communities should leave clear footprints in the Census. Specifically, the high-school survey findings led us to hypothesize that there should be fewer young-adult women than men among the villages’ Native populations (Iñupiat or Yupik, and mostly local-born). A look at 1990 Census data generally supported this hypothesis, revealing a characteristics scatterplot pattern. Among young-adult age groups, small communities (migration sources) generally had more men than women. In larger communities (migration destinations), there were often more women. We confined our analysis, initially, to Alaska Native populations to reduce the impact of newcomers (typically more men than women) moving in to these small northern places.
2030
4050
6020
3040
5060
100 1,000 10,000 100 1,000 10,000
Bethel Nome
N Slope NW Arctic
% f
emal
e a
mon
g N
ativ
es a
ge 2
0-39
Community population
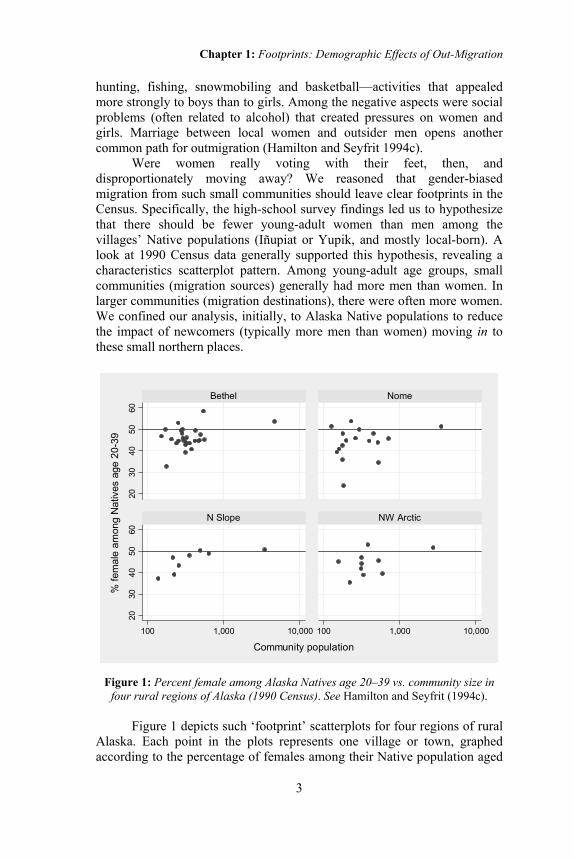
Figure 1: Percent female among Alaska Natives age 20–39 vs. community size in
four rural regions of Alaska (1990 Census). See Hamilton and Seyfrit (1994c). Figure 1 depicts such ‘footprint’ scatterplots for four regions of rural
Alaska. Each point in the plots represents one village or town, graphed according to the percentage of females among their Native population aged
Migration in the Circumpolar North
4
20–39, and the total community size (note logarithmic scaling). Within each of the four regions, we see a scattering of small villages at lower left, which have total populations below 1,000 and fewer than 50% women. Also within each region its hub town (Bethel, Nome, Barrow or Kotzebue) appears toward the upper right, with more than 1,000 people and slightly more than 50% women. Offering a wider range of job and educational choices, hub towns provide an attractive destination for many Natives leaving small villages.
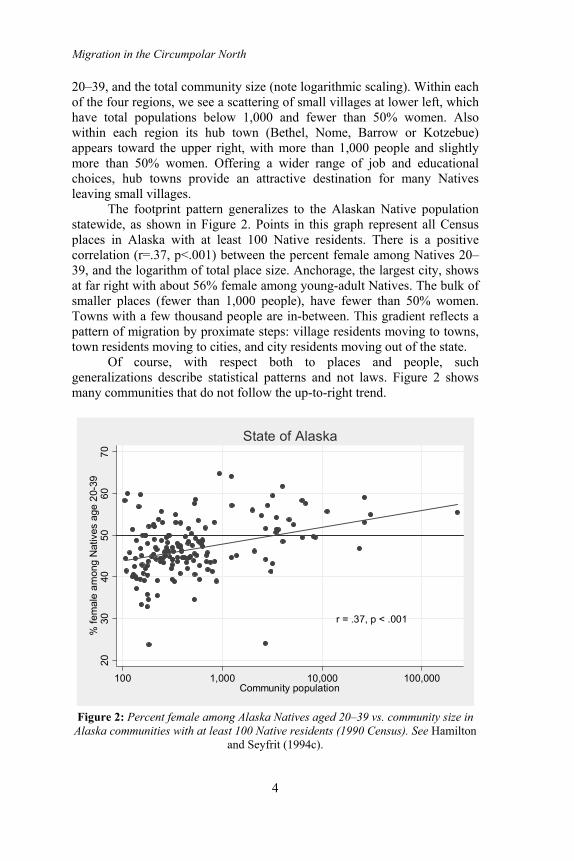
The footprint pattern generalizes to the Alaskan Native population statewide, as shown in Figure 2. Points in this graph represent all Census places in Alaska with at least 100 Native residents. There is a positive correlation (r=.37, p<.001) between the percent female among Natives 20–39, and the logarithm of total place size. Anchorage, the largest city, shows at far right with about 56% female among young-adult Natives. The bulk of smaller places (fewer than 1,000 people), have fewer than 50% women. Towns with a few thousand people are in-between. This gradient reflects a pattern of migration by proximate steps: village residents moving to towns, town residents moving to cities, and city residents moving out of the state.
Of course, with respect both to places and people, such generalizations describe statistical patterns and not laws. Figure 2 shows many communities that do not follow the up-to-right trend.
r = .37, p < .001
2030
4050
6070
% f
emal
e a
mon
g N
ativ
es a
ge 2
0-39
100 1,000 10,000 100,000Community population
State of Alaska
Figure 2: Percent female among Alaska Natives aged 20–39 vs. community size in
Alaska communities with at least 100 Native residents (1990 Census). See Hamilton and Seyfrit (1994c).
Chapter 1: Footprints: Demographic Effects of Out-Migration
5
The deficit of Native females in many places becomes more striking
if we take differential mortality into account. Males suffer higher death rates, and this factor alone should lead to a growing excess of females after about age 25. Migration more than offsets the substantial mortality differences, resulting in an excess of males (Hamilton and Seyfrit 1994c).
After seeing these sex-ratio patterns for Alaska in the 1990s, we began to wonder when the imbalance began historically, and where else it might occur. An exploration of limited historical data found no evidence of an earlier ‘stable state’ with approximately equal males and females. Sex ratios among Natives have fluctuated substantially in the past, responding to various environmental, health and social forces—of which differential migration is only the most recent (Hamilton et al. 1997). Earlier gender-roles-linked differences in mortality (such as the dangers to males hunting on ice, or to females exposed to tuberculosis and other illness) had contributed to widely off-center sex ratios in various historical periods.
r = .15, n.s.
4648
5052
54P
erce
nt G
ree
nlan
d-b
orn
fem
ales
age
20-
39
0 3,000 6,000 9,000 12,000Total population
Greenland
r = .20, n.s.
3035
4045
5055
Per
cent
fem
ale
age
20
-39
100 1,000 10,000Total population
Faroe Islands
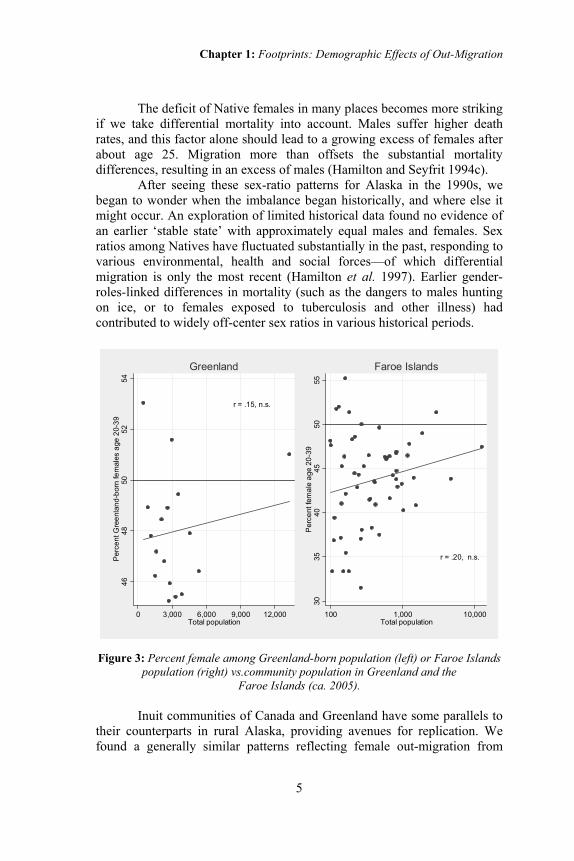
Figure 3: Percent female among Greenland-born population (left) or Faroe Islands
population (right) vs.community population in Greenland and the Faroe Islands (ca. 2005).
Inuit communities of Canada and Greenland have some parallels to
their counterparts in rural Alaska, providing avenues for replication. We found a generally similar patterns reflecting female out-migration from
Migration in the Circumpolar North
6
Greenland (left scatterplot in Fig. 3). Population registry statistics confirmed this flow directly, and also showed a gender bias in out-migration by Greenlanders to more urban destinations in Denmark (Hamilton et al. 1996; Hamilton and Rasmussen 2010). Another former Danish colony, the Faroe Islands, exhibits a similar pattern of excess males in the smallest municipalities (right plot in Fig. 3). Unlike the Inuit Greenlanders, however, the Faroese are culturally Nordic. Their movements to and from Denmark tend therefore to be simpler, and an excess of men in small Faroese places could reflect in- as well as out-migration.
r = .45, p < .001
4244
4648
5052
Per
cent
fem
ale
age
s 20
-39
100 1,000 10,000 100,000Total population
Norway
r = .15, p < .05
3040
5060
70P
erce
nt fe
ma
le a
ges
20-3
9
100 1,000 10,000 100,000Total population
Iceland
r = .19, p < .001
3040
5060
70P
erce
nt fe
ma
le a
ges
20-3
9
100 1,000 10,000 100,000Total population
Newfoundland
r = .07, n.s.
2040
6080
Per
cent
fem
ale
age
s 20
-39
100 1,000 10,000 100,000Total population
Maine
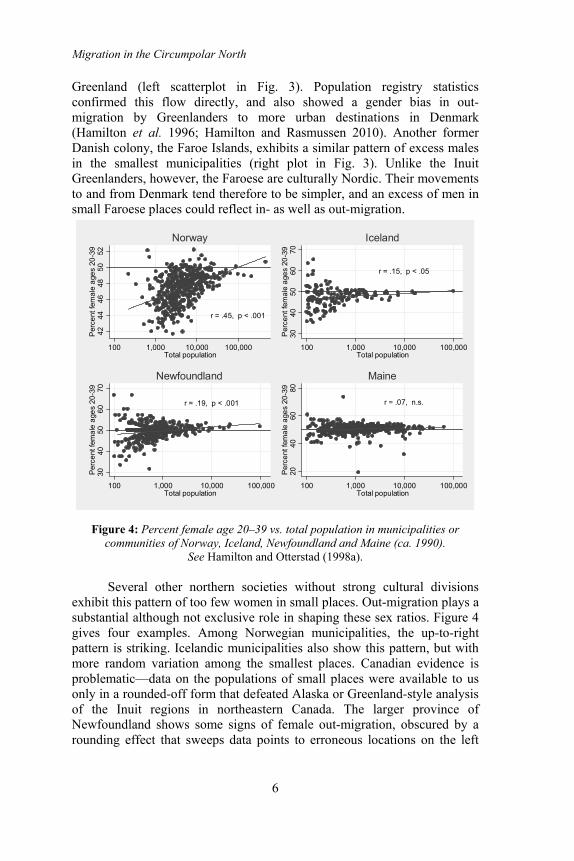
Figure 4: Percent female age 20–39 vs. total population in municipalities or communities of Norway, Iceland, Newfoundland and Maine (ca. 1990).
See Hamilton and Otterstad (1998a).
Several other northern societies without strong cultural divisions exhibit this pattern of too few women in small places. Out-migration plays a substantial although not exclusive role in shaping these sex ratios. Figure 4 gives four examples. Among Norwegian municipalities, the up-to-right pattern is striking. Icelandic municipalities also show this pattern, but with more random variation among the smallest places. Canadian evidence is problematic—data on the populations of small places were available to us only in a rounded-off form that defeated Alaska or Greenland-style analysis of the Inuit regions in northeastern Canada. The larger province of Newfoundland shows some signs of female out-migration, obscured by a rounding effect that sweeps data points to erroneous locations on the left
Chapter 1: Footprints: Demographic Effects of Out-Migration
7
third of the graph. The U.S. state of Maine, in contrast, exhibits no significant correlation between percent female and community population.
What are the consequences, if more women than men leave? One obvious result for source communities is that men have reduced prospects to find long-term partners and form families—the key transition to adulthood for many. Some Alaska informants described increased pressures on teenage girls, creating problems for them and further incentives to leave. In migration–destination communities there could be gender mismatches within culture/age-cohort groups too, although the total population tends to be larger and more diverse.
In summary, the motivations for female out-migration apply to many small northern communities. Aggregate data appear widely, although not universally, consistent with the hypothesis that disproportionate net outmigration does occur, and has shaped the populations left behind—perhaps with complex social consequences. Disproportionate in-migration by outsider males certainly can shift sex ratios too, but in many places this is not the main force. Case studies and individual-level research on who comes and goes, and what happens to those who leave, invite further study. Out-migration Effects on Age Structure Disproportionate female out-migration from small northern places reflects broad social conditions such as gender roles, attitudes toward education and careers, marriage patterns, and the availability of amenities and jobs. In some of these same places we also saw another out-migration pattern, not so gender biased, that responded more immediately to economic development. Sharp declines in jobs tend to drive out-migration by the most mobile age groups—young adults and families. Age-biased migration causes a rapid ‘aging’ of the population left behind.
Fisheries-dependent communities of the North Atlantic, beset by resource crises during the 1980s and 90s, experienced out-migration of this type. Looking at demographic changes in Norway, Hamilton and Otterstad (1998b) noted a median population loss of 10% among fisheries-dependent municipalities from 1980 to 1990. During the same period, other municipalities experienced a median gain of 1.2%. Median age went up by more than 3 years in the fisheries-dependent municipalities, but less than 2 years elsewhere. Population loss and aging resulted not simply from net out-migration, but also from social changes that brought rural birth rates down from their formerly high levels (which historically somewhat offset out-migration) to low levels closer to the rest of the nation—hence, no longer able to offset out-migration. Similar demographic changes occurred in the most fisheries-dependent regions of Newfoundland, in connection with 1980–90s fisheries troubles (Hamilton and Butler 2001; Hamilton et al. 2004b).
Migration in the Circumpolar North
8
510
1520
Bir
ths
or d
eat
hs p
er 1
,000
3040
50P
opu
latio
n in
thou
san
ds
1970 1980 1990 2000
PopulationBirth rateDeath rate
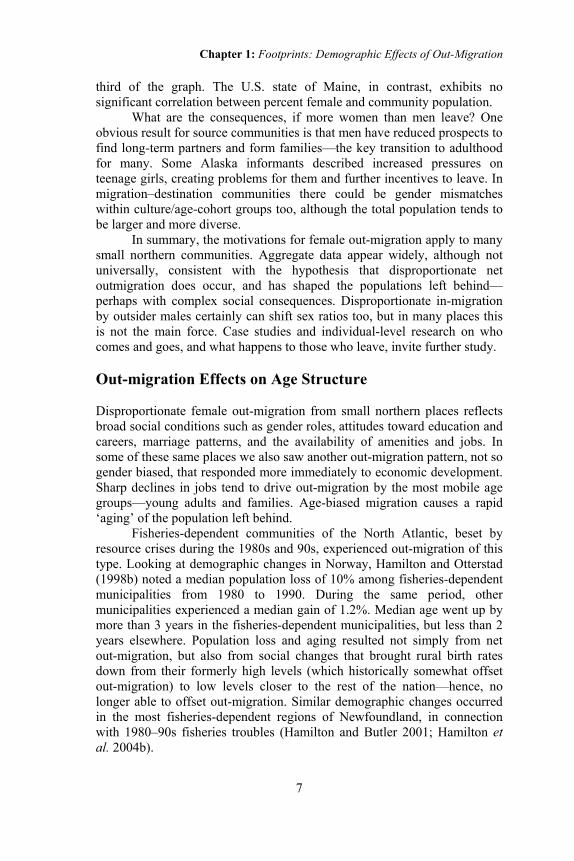
Figure 5: Faroe Islands total population, birth and death rates 1970–2005.
The Faroe Islands, among the most fisheries-dependent societies in
the world, provide a striking example of resource-driven out-migration. Catches of cod and other groundfish species declined steeply during the late 1980s and early 1990s, setting off an economic crisis that caused many Faroese to leave the islands. Net migration shadowed the falling and rising fortunes of the cod fishery, with a lag of 0–2 years. The Faroe Islands population had grown by 23% between 1970 and 1988, mainly due to natural increase while net migration hovered around zero. Lower in-migration, combined with rising out-migration (strongest in 1993–95), eroded half of the 19-year gain in just 6 years, from 1989 to 1995. After 1995 the flow reverses—in-migration, mostly returning Faroese, increased while out-migration declined. Rising catches of other species in the late 1990s partially offset the decline in cod landings. Moreover, the Faroese economy as a whole, having gone through bankruptcies and a painful restructuring, emerged more efficient and less fragile after the crisis (Hamilton et al. 2004a). Figure 5 graphs the down-and-up path of total population, together with shifting birth and death rates.
Faroese outmigration both shrank and ‘aged’ the population left behind as it had in fishing communities of Norway and Newfoundland. The late-1980s crisis marked a clear discontinuity, where the proportion of young adults began falling steeply, and the proportion of children (leaving with their parents, or simply not born in the Faroes because adults of family-starting age had moved elsewhere) also declined. The proportion of
Chapter 1: Footprints: Demographic Effects of Out-Migration
9
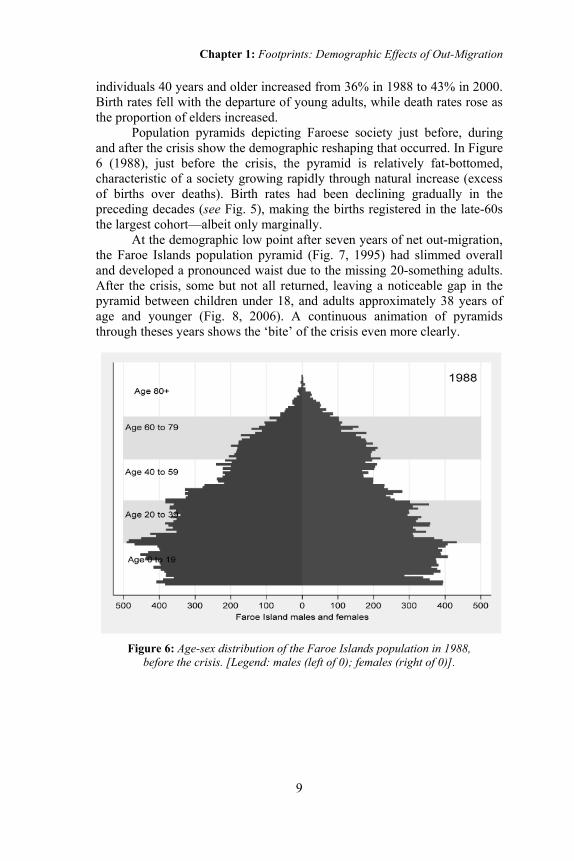
individuals 40 years and older increased from 36% in 1988 to 43% in 2000. Birth rates fell with the departure of young adults, while death rates rose as the proportion of elders increased.
Population pyramids depicting Faroese society just before, during and after the crisis show the demographic reshaping that occurred. In Figure 6 (1988), just before the crisis, the pyramid is relatively fat-bottomed, characteristic of a society growing rapidly through natural increase (excess of births over deaths). Birth rates had been declining gradually in the preceding decades (see Fig. 5), making the births registered in the late-60s the largest cohort—albeit only marginally.
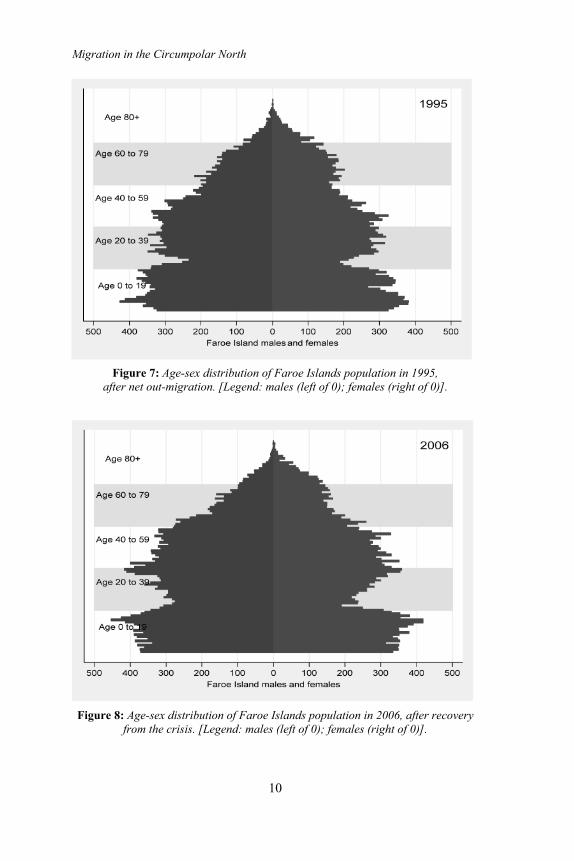
At the demographic low point after seven years of net out-migration, the Faroe Islands population pyramid (Fig. 7, 1995) had slimmed overall and developed a pronounced waist due to the missing 20-something adults. After the crisis, some but not all returned, leaving a noticeable gap in the pyramid between children under 18, and adults approximately 38 years of age and younger (Fig. 8, 2006). A continuous animation of pyramids through theses years shows the ‘bite’ of the crisis even more clearly.
Figure 6: Age-sex distribution of the Faroe Islands population in 1988, before the crisis. [Legend: males (left of 0); females (right of 0)].
1988
Age 0 to 19
Age 20 to 39
Age 40 to 59
Age 60 to 79
Age 80+
500 400 300 200 100 0 100 200 300 400 500
Faroe Island males (blue) and females (red)
Migration in the Circumpolar North
10
Figure 7: Age-sex distribution of Faroe Islands population in 1995, after net out-migration. [Legend: males (left of 0); females (right of 0)].
Figure 8: Age-sex distribution of Faroe Islands population in 2006, after recovery from the crisis. [Legend: males (left of 0); females (right of 0)].
2006
Age 0 to 19
Age 20 to 39
Age 40 to 59
Age 60 to 79
Age 80+
500 400 300 200 100 0 100 200 300 400 500
Faroe Island males (blue) and females (red)
1995
Age 0 to 19
Age 20 to 39
Age 40 to 59
Age 60 to 79
Age 80+
500 400 300 200 100 0 100 200 300 400 500
Faroe Island males (blue) and females (red)
Chapter 1: Footprints: Demographic Effects of Out-Migration
11
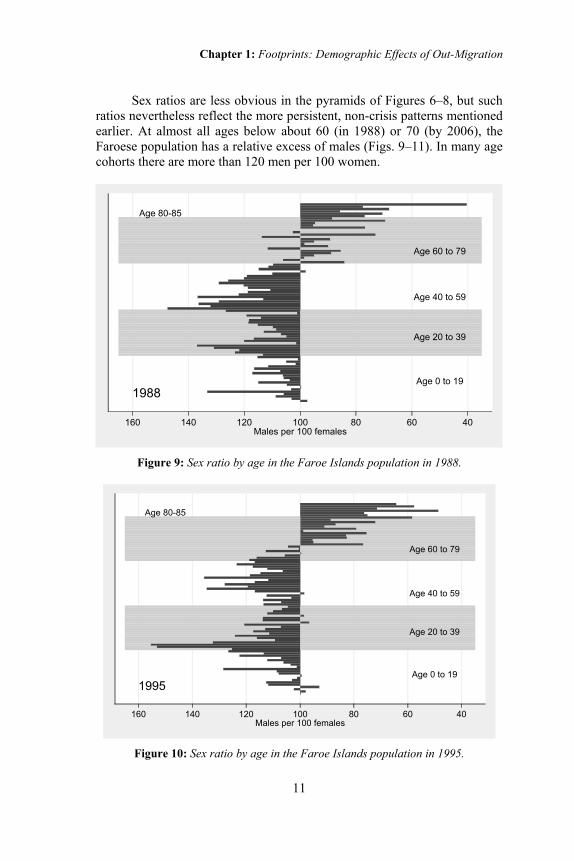
Sex ratios are less obvious in the pyramids of Figures 6–8, but such
ratios nevertheless reflect the more persistent, non-crisis patterns mentioned earlier. At almost all ages below about 60 (in 1988) or 70 (by 2006), the Faroese population has a relative excess of males (Figs. 9–11). In many age cohorts there are more than 120 men per 100 women.
Figure 9: Sex ratio by age in the Faroe Islands population in 1988.
Age 0 to 19
Age 20 to 39
Age 40 to 59
Age 60 to 79
Age 80-85
1995
160 140 120 100 80 60 40Males per 100 females
Figure 10: Sex ratio by age in the Faroe Islands population in 1995.
Age 0 to 19
Age 20 to 39
Age 40 to 59
Age 60 to 79
Age 80-85
1988
160 140 120 100 80 60 40Males per 100 females

Migration in the Circumpolar North
12
Figure 11: Sex ratio by age in the Faroe Islands population in 2006.
Conclusion Individual migration decisions are non-random along dimensions more personal than the simple demographic patterns displayed here. Such decisions select for energy and ambition, or people who believe they could do better somewhere else. Departures related to these less tangible qualities might not leave such clear footprints in demographic statistics, but their consequences will be no less real.
Understanding this, northern residents often look for ways to make their communities more attractive, specifically to retain local youth. Government investments to create jobs or expand educational choices have been effective in some places, particularly those functioning as regional government, transportation, and educational centers. At the high end, universities seem to be a new growth engine. Stimulating private enterprise, even with subsidies, has had mixed success in remote area where labor and other market conditions were not competitive to begin with. More persuasively, the need for jobs to retain youth has provided arguments for encouraging industrial development of natural resources. Future studies could more systematically examine how migration and demographic indicators respond to policy initiatives.
The challenges of reducing out-migration from small places are by no means unique to the Circumpolar North. A recent survey of 7,800 residents in selected rural counties of 9 U.S. states (not including Alaska; see Hamilton et al. 2008) asked the following question:
Age 0 to 19
Age 20 to 39
Age 40 to 59
Age 60 to 79
Age 80-85
2006
160 140 120 100 80 60 40Males per 100 females
Chapter 1: Footprints: Demographic Effects of Out-Migration
13
If your own teenage child, or the child of a close friend, asked you for advice, would you recommend that they should plan to stay in this town as an adult, or move away for opportunities somewhere else? Recommend they stay here? Recommend they move away?
More than two-thirds of the survey’s respondents said that they
would advise their teenager to move away. Looking at the other side of this conversation, the high school student surveys described earlier (Seyfrit and Hamilton 1992; Hamilton and Seyfrit 1993, 1994a,b; Seyfrit et al. 1998) found that many northern teenagers, often the majority, shared (realistically or not) a similar hope of moving away. Out-migration is an area where individual and community self-interest can pull in opposite directions. Policies might influence their choices, with outcomes revealed by how people vote with their feet. References Hamilton, L.C. and C.L. Seyfrit (1993). Town–village contrasts in Alaskan youth
aspirations. Arctic 46(3): 255–263. Hamilton, L.C. and C.L. Seyfrit (1994a). Resources and hopes in Newfoundland.
Society and Natural Resources 7(6): 561–578. Hamilton, L.C. and C.L. Seyfrit (1994b). Female flight? Gender balance and
outmigration by Native Alaskan villagers. Arctic Medical Research 53(Supplement 2): 189–193.
Hamilton, L.C. and C.L. Seyfrit (1994c). Coming out of the country: Community size and gender balance among Alaskan Natives. Arctic Anthropology 31(1): 16–25.
Hamilton, L.C., RO. Rasmussen, N.E. Flanders, and C.L. Seyfrit (1996). Outmigration and gender balance in Greenland. Arctic Anthropology 33(1): 89–97.
Hamilton, L.C., C.L. Seyfrit, and C. Bellinger (1997). Environment and sex ratios among Alaska Natives: An historical perspective. Population and Environment 18(3): 283–299.
Hamilton, L.C. and O. Otterstad (1998a). Sex ratio and community size: Notes from the northern Atlantic. Population and Environment 20(1): 11–22.
Hamilton, L.C. and O. Otterstad (1998b). Demographic change and fisheries dependence in the northern Atlantic. Human Ecology Review 5(1): 16–22.
Hamilton, L.C. and R.L. Haedrich (1999). Ecological and population changes in fishing communities of the North Atlantic Arc. Polar Research 18(2): 383–388.
Hamilton, L.C. and C.M. Duncan (2000). Fisheries dependence and social change in the northern Atlantic, pp. 95–105 in Symes, D. (ed.), Fisheries Dependent Regions. Oxford: Fishing News Books.
Migration in the Circumpolar North
14
Hamilton, L.C. and M.J. Butler (2001). Outport adaptations: Social indicators through Newfoundland’s cod crisis. Human Ecology Review 8(2): 1–11.
Hamilton, L.C., B.C. Brown, and R.O. Rasmussen (2003). West Greenland’s cod-to-shrimp transition: Local dimensions of climatic change. Arctic 56(3): 271–282.
Hamilton, L.C., C.R. Colocousis, and S.T.F. Johansen (2004a). Migration from resource depletion: The case of the Faroe Islands. Society and Natural Resources 17(5): 443–453.
Hamilton, L.C., R.L. Haedrich, and C.M. Duncan (2004b). Above and below the water: Social/ecological transformation in northwest Newfoundland. Population and Environment 25(3): 195–215.
Hamilton, L.C., S. Jónsson, H. Ögmundardóttir, and I.M. Belkin (2004c). Sea changes ashore: The ocean and Iceland’s herring capital. Arctic 57(4): 325–335.
Hamilton, L.C. (2007). Climate, fishery and society interactions: Observations from the North Atlantic. Deep Sea Research II 54: 2958–2969.
Hamilton, L.C., L.R. Hamilton, C.M. Duncan, and C.R. Colocousis (2008). Place Matters: Challenges and Opportunities in Four Rural Americas. Durham, NH: Carsey Institute, University of New Hampshire.
Hamilton, L.C. and A.M. Mitiguy (2009). Visualizing population dynamics of Alaska’s Arctic communities. Arctic 62(4): 393–398.
Hamilton, L.C. and R.O. Rasmussen (2010). Population, sex ratios and development in Greenland. Arctic 63(1): 43–52.
Seyfrit, C.L. and L.C. Hamilton (1992). Who will leave? Oil, migration, and Scottish island youth. Society and Natural Resources 5(3): 263–276.
Seyfrit, C.L. and L.C. Hamilton (1997). Alaska Native youth and their attitudes towards education. Arctic Anthropology 34(1): 135–148.
Seyfrit, C.L., L.C. Hamilton, C.M. Duncan, and J. Grimes (1998). Ethnic identity and aspirations among rural Alaska youth. Sociological Perspectives 41(2): 343–365.