an adaptative mathematical model for pattern classification in microarray data analysis
TRANSCRIPT

Proceedings of the International Conference on Computational and Mathematical Methods in Science and Engineering, CMMSE2009 Gijón, Spain, June 30, July 1-3 2009
An Adaptative Mathematical Model for Pattern Classification in Microarray Data Analysis
Juan F. De Paz, Sara Rodríguez, Javier Bajo and Juan M. Corchado
Departamento de Informática y Automática, Universidad de Salamanca
Plaza de la Merced s/n, 37008, Salamanca, España
emails: {fcofds;srg;jbajope;corchado}@usal.es
Abstract
With the most recent advances in bioinformatics, the amount of information available for analyzing certain diseases has increased considerably. Specifically, the use of micro-arrays makes it possible to obtain information on genetic patterns. The analysis of this information requires the use of new mathematical models and the modification of existing models so that it becomes possible to work with such an elevated amount of data. This study will demonstrate the integration of an expression analysis in a case based reasoning system that can apply data mining techniques to classify and obtain patterns which have been stored in a case database for leukemia patients. Key words: Case-based Reasoning, HG U133, ESOINN, leukemia classification, decision tree
1. Introduction
The last few years have seen great advances in the fields of bioinformatics and biomedicine. The incorporation of data mining and artificial intelligence into biomedical data has led to significant progress in the prevention and detection of diseases. Genomics is an area of bioinformatics that is in the height of its development and in which the application of techniques is essential to facilitate both the automated treatment of data and extraction of knowledge. Genomics deals with the study of genes, their mapping, structure and interaction. There are different fields of study within genomics. One of them is transcriptomics, which involves the study of ribonucleic acid (RNA) using techniques such as expression analysis. Expression analysis consists of hybridizing a sample from a case study, from which different levels of luminescence are obtained that can be analyzed and

AN ADAPTATIVE MATHEMATICAL MODEL FOR PATTERN CLASSIFICATION
represented as a data array. The purpose of this study is to study and extract information from biomedical databases that characterizes different individuals based on the luminescence level of micro arrays DNA microarray technology makes it possible to substantially increase investigations in molecular biology [22] [24]. The study of expression analysis is a very important field of scientific investigations because changes or disease in certain organisms can be a reflection of changes in expression patterns. Expression arrays [24] are a type of microarray that can be used in different approximations for identifying genes that characterize specific diseases [22] [24]. An expression analysis basically consists of three phases: standardization and filtering, clustering and classification, and knowledge extraction. These steps are carried out starting with the data from the luminescence values, which are obtained from the probes found within the microarrays. The amount of information that is provided amounts to several million bits of data for each sample. The current problem deals specifically with the Affymetrix HG U133 Plus 2.0 Array [23], which includes 1,300,000 values for each test. These values correspond to a series of oligonucleotides that are grouped in probes. Each of the chips contains approximately 54,000 waves. This research will present a mathematical model that integrates the different phases of expression analysis using a Case-Based Reasoning (CBR) system [7]. Subsequent iterations will be based on the previous predictions, thus incorporating a final learning mechanism. CBR solves problems by using a reasoning cycle comprised of four sequential phases: retrieve, re-use, revise and retain. Specific algorithms are introduced within each of these phases as needed to finalize the expression analysis. During each of the phases, various statistical techniques are integrated for reducing the dimensionality of the data. Clustering and classification techniques are integrated for associating individuals with different classes, and knowledge extraction techniques are used for explaining the final groupings.
The paper is structured as follows: the next section briefly introduces the problem that motivates this research, presents the proposed CBR-based model, and describes the novel strategies incorporated in the stages of the CBR cycle. Section 3 describes a case study specifically developed to evaluate the CBR system presented within this work, consisting of a classification of leukemia patients. Finally, Section 4 presents the results and conclusions obtained after testing the model.
2. CBR System for Classifying Microarray Data
The CBR developed system receives data from the analysis of chips and is responsible for classifying individuals based on evidence and existing data. The purpose of CBR is to solve new problems by adapting solutions that have been used to solve similar problems in the past [7]. The primary concept when working with CBRs is the concept of case. A case can be defined as a past experience, and is composed of three elements: a problem description which describes the initial

AN ADAPTATIVE MATHEMATICAL MODEL FOR PATTERN CLASSIFICATION
problem, a solution which provides the sequence of actions carried out in order to solve the problem, and the final state which describes the state achieved once the solution was applied. A CBR manages cases (past experiences) to solve new problems. The way cases are managed is known as the CBR cycle, and consists of four sequential steps which are recalled every time a problem needs to be solved: retrieve, reuse, revise and retain. Each of the steps of the CBR life cycle requires a model or method in order to perform its mission.
},...,{ ''
1
'
tddD
nsRd s
i ,'
RMA
Control Erroneous
Variability
Uniform
Correlation
},...,{ 1 tddD n
i Rd
Cluster
Classification
Reuse
Retrieve
Revise
srggG r } ,...,{ 1
Dgi
}{ '
1
'
tii dgg
'
1tdit gd
'
1
),...,( 1 si ffg
)},)...(,{( 11 lli vzvzf
CART
Retain new case
da
ta
Expert
Decision
tree
Me
mo
ry
Ca
se
s
Fig 1. CBR system
Figure 1 shows a diagram of the techniques applied in the different stages of the CBR cycle. As can be seen in Figure 1, the important probes that allow the classification of patients are recovered in the Retrieve phase. The Retrieve phase is divided into 6 sub-phases: pre-processing through Robust Multi-array Average (RMA), removal of control probes, erroneous probes, low variability, uniform distribution, and correlated variables. In the Reuse phase the patients are grouped by means of an ESOINN neural network. Then, the patients without prior classification are assigned to a group. In the Revise phase the Classification and Regression Tree (CART) technique is applied for extracting knowledge about the most important probes for the classification. Finally, in the Retain phase, the knowledge is updated.
Next, the structure of the CBR system proposed within this paper is explained in detail, and the innovative techniques modelled in each of the stages of the CBR are presented.
2.1 Retrieve
Traditionally, only the cases similar to the current problem are recovered, often because of their performance, and then adapted. With expression arrays, the number of cases is not a critical factor, rather the number of variables. For this

AN ADAPTATIVE MATHEMATICAL MODEL FOR PATTERN CLASSIFICATION
reason, we have incorporated an innovative strategy where variables are retrieved at this stage and then, depending on the identified variables, the rest of the stages of the CBR are carried out. First, a pre-processing of the data is conducted using RMA. Then, the 5 filtering sub-phases are executed: removal of control probes, removal of erroneous probes, removal of low variability probes, removal of probes with a uniform distribution, and removal of correlated probes. These five sub-phases are outlined in the following paragraphs.
2.1.1 RMA
This phase begins once the laboratory experiment with microarrays has been completed. The researcher obtains various files that contain gross intensity values. Prior to analyzing the data, it is important to complete the pre-processing phase, which eliminates defective samples and standardizes the data. This phase is normally divided into 3 sub-phases: background correction, standardization, and summarization. There is currently a limited group of algorithms that investigators use for performing these steps. The most common are Affymetrix Microarray Suite 5.0 (MAS5.0) [2], Probe Logarithmic Intensity Error (PLIER) [1], and RMA [15]. The RMA [15] algorithm is frequently used for pre-processing Affymetrix microarray data and consists of three steps: Background Correction, Quantile Normalization, Expression Calculation.
2.1.2 Control and erroneous
During this phase, all probes used for testing hybridization are eliminated. These probes have no relevance at the time that individuals are classified, as there are no more than a few control points that should contain the same values for all individuals. If they have different values, the case should be discarded. Therefore, the probes control will not be useful in grouping individuals. On occasion, some of the measurements made during hybridization may be erroneous; not so with the control variables. In this case, the erroneous probes that were marked during the implementation of the RMA must be eliminated.
2.1.3 Variability
Once both the control and the erroneous probes have been eliminated, the filtering begins. The first stage is to remove the probes that have low variability. This work is carried out according to the following steps: 1. Calculate the standard deviation for each of the probes j
N
j
ijjj xN 1
2
··
1 (1)
where N is the total number of cases, j· is the average population for the
variable j, and ijx is the value of the probe j for the individual i.
2. Standardize the above values
AN ADAPTATIVE MATHEMATICAL MODEL FOR PATTERN CLASSIFICATION
j
iz·
(2)
where
N
j
jN 1
·
1
and
N
j
ijjj xN 1
2
··
1
where )1,0(Nzi
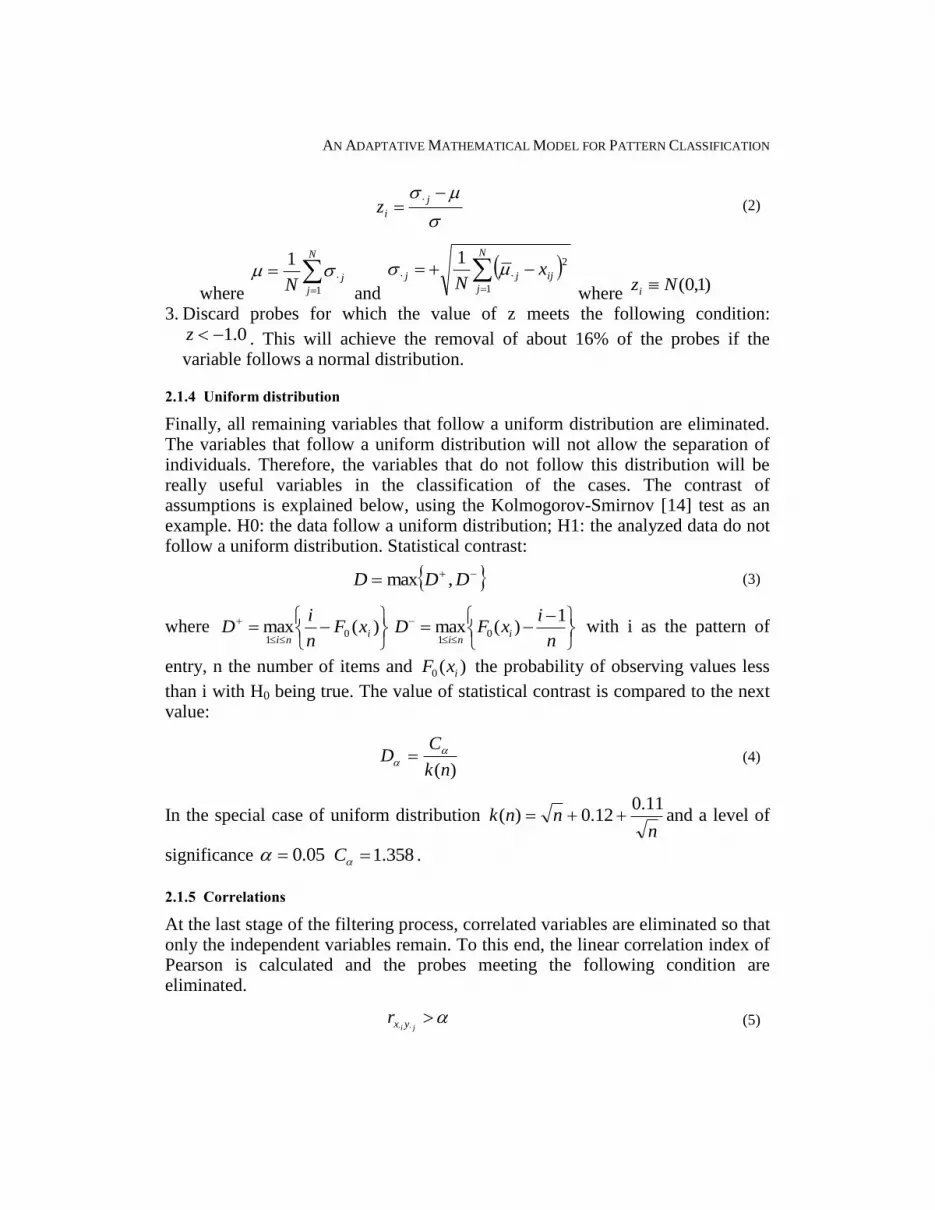
3. Discard probes for which the value of z meets the following condition: 0.1z . This will achieve the removal of about 16% of the probes if the
variable follows a normal distribution.
2.1.4 Uniform distribution
Finally, all remaining variables that follow a uniform distribution are eliminated. The variables that follow a uniform distribution will not allow the separation of individuals. Therefore, the variables that do not follow this distribution will be really useful variables in the classification of the cases. The contrast of assumptions is explained below, using the Kolmogorov-Smirnov [14] test as an example. H0: the data follow a uniform distribution; H1: the analyzed data do not follow a uniform distribution. Statistical contrast:
DDD ,max (3)
where
)(max 01
ini
xFn
iD
n
ixFD i
ni
1)(max 0
1 with i as the pattern of
entry, n the number of items and )(0 ixF the probability of observing values less
than i with H0 being true. The value of statistical contrast is compared to the next value:
)(nk
CD
(4)
In the special case of uniform distribution n
nnk11.0
12.0)( and a level of
significance 05.0 358.1C .
2.1.5 Correlations
At the last stage of the filtering process, correlated variables are eliminated so that only the independent variables remain. To this end, the linear correlation index of Pearson is calculated and the probes meeting the following condition are eliminated.
ji yxr ··
(5)

AN ADAPTATIVE MATHEMATICAL MODEL FOR PATTERN CLASSIFICATION
given: 95.0
ji
ji
ji
xx
xx
yxr
··
.·
··
,
N
s
sjjsiijxx xuxNi
1
..
1··
where ji xx .·
is
the covariance between probes i and j.
2.2 Reuse
Once the probes are filtered and standardized, they produce a set of values with i = 1 ... t, j = 1 ... s where N is the total number of cases, s the number of end probes. The next step is to perform the clustering of individuals based on their proximity according to their probes. Given that it is not possible to establish a fixed number of groups in the initial stages, and taking into account the need of the system to initiate the clustering without a previous classification, a technique for unsupervised classification was used. There is a wide range of possibilities for these techniques. Some are artificial neural networks such as SOM [18] (Self-Organizing Map), GNG [3] (Growing Neural Gas) which is the union of the CHL [17] (Competitive Hebbian Learning) and NG [19] (Neural Gas) techniques, GCS [17] (Growing Cell Structure), Growing Grid or the SOINN [6] (Self-Organizing Incremental Neuronal Network). Other methods, such as self-organized Kohonen maps, set the number of clusters in the initial phase of training when using the k-means learning method algorithm. For this reason these methods cannot be used for the problem at hand, since in this case the number of clusters is unknown. However, the number of groups could be adjusted and the degree of waste compaction checked so that according to this value, the final number of groups could be set. The self-organized maps have other variants of learning methods that base their behaviour on methods similar to the NG. They create a mesh that is adjusted automatically to a specific area. The greatest disadvantage, however, is that both the number of neurons that are distributed over the surface and the degree of proximity are set beforehand, resulting in the number remaining constant throughout the entire training process, thus complicating, to a certain extent, the adaptation of the mesh. Growing Grid or GCS do not set the number of neurons, or the degree of connectivity, but they do establish the dimensionality of each mesh. This complicates the separation phase between groups once it is distributed evenly across the surface.
After analyzing different techniques and the problems each one might present as applied to the situation at hand, we have decided to use a variation of neural network SOINN [6], called ESOINN [16]. Unlike the SOINN, ESOINN consists of a single layer, so it is not necessary to determine the manner in which the training of the first layer changes to the second. With a single layer, ESOINN is able to incorporate both the distribution process along the surface and the separation between low density groups. The operation and training of the network presents many similarities with those used in GCS networks as far as distribution over the surface is concerned, but not as far as the dimensionality of the meshes. Nevertheless, it more closely resembles a merger between a CHL and a NG: it has characteristics of a network CHL in the initial phases of the algorithm, by which it

AN ADAPTATIVE MATHEMATICAL MODEL FOR PATTERN CLASSIFICATION
could be understood as a phase of competition, while in a second phase, the network of nodes begins to expand just as with a NG network. Only the changes in training phase are detailed below:
1. Update the weights of neurons by following a process similar to the SOINN, but introducing a new definition for the learning rate in order to provide greater stability for the model. This learning rate has produced good results in other networks such as SOM [9].
))((111 1 aaa WMnW
))((12 ii aaa WMnW with
1ai Na
(6)
Given x
xn1
)(1 , 2
2
2
1)(
xxn
Aai is the neuron i, and
1aN is set of
neighbours ia .
2. Delete the connections with higher age. The ages are standardized and those whose values are in the region of rejection with k>0 are removed. The
assigned value of is 0.05, therefore
i
i
ez , )1,0(Nz then
22
1)(
2zExpzf
(7)
where 2/)( kzP 975.0)( kzP 975.0)( z k=1.96 Therefore all z values that are greater than 1.96 are deleted
3. If all input patterns have been passed then a KS-Test [14] is carried out in order to determine if the density distribution for the neurons in each group follows a normal distribution. If so then the learning procedure is finished;
otherwise the next pattern is processed. The value of chosen is 0.05. Once the meshes have been generated, previously unclassified individuals are
classified by selecting the nearest mesh. Once the mesh has been selected, the case is assigned to the group with a high quantity of recovered elements. The allocation process is based on priorities. The individuals with the highest proportion are high priority level.
2.3 Revise and Retain
As shown in Figure 1, the revision is carried out by an expert who determines the correction with the group assigned by the system. If the assignation is considered correct, then the retrieve and reuse phases are carried out again so that the system can be ready for the next classification. If a classification is considered as incorrect or presents certain doubts, the case is not included into the memory of cases until the medical diagnosis is certain. For this reason, the CBR system proposed in this work incorporates a knowledge extraction method in the Revise phase. This method analyses the steps followed in the retrieve and reuse stages, and extracts knowledge which is formalized in the set of rules. In this way, the

AN ADAPTATIVE MATHEMATICAL MODEL FOR PATTERN CLASSIFICATION
human expert can easily evaluate the classification and extract conclusions on the efficiency of the classification process.
In the Revise stage, the data are initially discretized in five levels [0, 0.25, 0.5, 0.75, 1], and then the extraction of knowledge using the CART [10] algorithm is carried out. Finally the expert assigns the individual to the final group. The CART algorithm is a non parametric test that allows extracting rules that explain the classification carried out in the previous steps. There are other techniques to generate the decision trees, such as the methods based on Induction Decision Trees (ID3) [8], although currently CART is the most commonly used.
Nevertheless, the system provides an automatic temporal revision for considering the retrieved cases. In the Retain stage, the system calculates the percentage of cases that have already been accurately classified among those retrieved for the current problem. If the percentage of a class is greater than the threshold, the system determines that the case has been successfully classified, and both the case and the knowledge obtained are stored in the memory of cases. This decision has to be confirmed by the human expert.
2. Case Study: Classification of Leukemia Patients
The Cancer Institute in the city of Salamanca was interested in novel tools for decision support in the process of leukemia patient classification. The Institute provided us with patient data and asked for a tool to automate certain tedious tasks in the expression array analysis process and incorporate innovative techniques to reduce the dimensionality of the data and identify the variables with a higher influence in the patient’s classification. In the case study presented within this research, 212 samples were made available from analyses performed on patients either through punctures in the marrow or from blood samples. The samples corresponded to patients affected by five different types of leukemia: ALL (Acute Lymphocytic Leukemia), AML (Acute Myeloid Leukemia), CLL (Chronic Lymphocytic Leukemia), CML (Chronis Myeloid Leukemia) and MDS (Myelodysplastic Syndromes). The aim of the tests performed was to determine whether the system is able to classify new patients based on the cases previously analyzed and stored.
Figure 1 represents the bio-inspired model intended to resolve the problem of leukemia patient classification. The proposed model follows the procedures that are performed in medical centres. As can be seen in Figure 1, there is a previous phase which is external to the model. This phase consists of a set of tests which have been carried out by laboratory personnel and allow us to obtain data from the chips. When a new sample is received, it is introduced into the chip. The chips are hybridized and explored by a scanner, allowing us to obtain information on the marking of several genes based on luminescence values. At that point, the CBR-based model starts to process the data obtained from the microarrays.
Figure 1 illustrates the phases of the CBR cycle, as well as the inputs and the
outputs of each of the phases. The Retrieve phase uses a matrix D containing the

AN ADAPTATIVE MATHEMATICAL MODEL FOR PATTERN CLASSIFICATION
data id of the individuals from the memory of cases and the new case. This phase
recovers the relevant probes for patient classification. The total number of probes selected after pre-processing the data is represented as n. The system applies filtering techniques to remove control variables, erroneous variables, low variability variables, uniform distribution and correlated variables. The final number of probes remaining after the filtering process is represented as s, and D’ represents the new reduced data matrix containing the luminescence intensities
corresponding to individuals for the probes '
id .
As can be seen in Figure 1, the results obtained in the Retrieve phase are used as inputs for the Reuse phase. In this phase, patient classification is made by selecting the individuals that are most similar to the new individual, and by selecting the nearest cluster. The ESOINN neural network [16] uses these data to obtain clusters. The results of the Reuse phase consist of a set of meshes for the
individuals representing the groups ig , so that an unclassified user '
1td is
assigned to the most numerous group in the closest mesh ig .
Finally, during the Revise and Retain phases, the system uses the CART algorithm to obtain the decision rules used in the classification process, thus
providing a set of rules if indicating the membership to each of the groups ig .
Each one of the rules contains a decision value iv and the probe iz . The human
expert determines if the classification process has provided successful results and indicates the way to proceed in the Retain phase.
4. Results and Conclusions
The CBR system presented in this work focused on identifying the important variables for each of the variants of blood cancer so that patients can be classified according to these variables. The model combines techniques for reducing the dimensionality of the original data set and a novel clustering method for classifying patients. The system works in a way similar to how human specialists operate in the laboratory, but is able to work with great amounts of data and make decisions automatically, thus significantly reducing both the time required to make a prediction, and the rate of human error due to confusion.
When conducting a study of leukemia based on data from microarrays, the process of filtering data takes on special importance. In the experiments reported in this paper, we worked with a database of bone marrow cases from 212 adult patients with five types of leukemia. The retrieve stage of the proposed CBR system presents a novel technique to reduce the dimensionality of the data. The initial number of probes in the experiment was 54.000, and the configuration obtained after the filtering process reduced this number to 785 probes, considered as really meaningful for the classification process. The error rates have remained fairly low especially for cases where the number of patients was high.

AN ADAPTATIVE MATHEMATICAL MODEL FOR PATTERN CLASSIFICATION
Table 1 shows the total number of patients from each group and the number of misclassifications. As can be seen, groups with fewer patients are those with a greater error rate. The results shown in Table 1 are those obtained for the classification provided by the ESOINN neural network. The network learnt from all the patient data, after which each of the misclassified individuals was selected and classified to a group according to the classification of the other individuals. As CBR systems need initial knowledge to work in an efficient manner, 30 previously classified individuals were initially included in the memory of cases. A systematic sampling was applied in the selection of the 30 individuals from the 212 existing ones. No statistical technique was applied for the selection of the initial size of the sample since all the individuals are ultimately introduced into the system. The rest of the individuals were classified using the automated system proposed within this work.
Table 1. Classification errors numerical
Total Error
ALL 10 3 AML 49 11 CLL 89 4 CML 22 7 MDS 42 5
Fig 2. knowledge extraction with CART
Once it can be verified that the retrieved probes allow classifying the patients in
a way similar to the original classification, we can conclude that the retrieve phase works satisfactorily. The knowledge extraction is then carried out taking the selected probes into consideration. The algorithm used was CART [19], and the results obtained are shown in Figure 2a. Figure 2a shows the probe and the condition, the total number of elements, the number of misclassified elements, and finally, the probability of assigning each of elements from the node to each of the groups, sorted as (ALL, AML, CLL, CML, MDS). The leaf nodes are identified by an asterisk *. Figure 2b illustrates the information from the first 3

AN ADAPTATIVE MATHEMATICAL MODEL FOR PATTERN CLASSIFICATION
probes shown by CART. Is shown, the CLL and ALL patients can be separated from the others.
As demonstrated, the proposed system reduces the dimensionality by filtering genes with little variability and those that do not allow a separation of individuals due to the distribution of data. It also presents a clustering technique based in neuronal networks. The results obtained from empirical studies provide a tool that allows both the detection of genes and the most important variables for detecting pathology, and the facilitation of a classification and reliable diagnosis, as shown by the results presented in this paper.
References
[1] AFFYMETRIX. GUIDE TO PROBE LOGARITHMIC INTENSITY ERROR (PLIER)
ESTIMATION
HTTP://WWW.AFFYMETRIX.COM/SUPPORT/TECHNICAL/TECHNOTES/PLIER_TE
CHNOTE.PDF [2] AFFYMETRIX. STATISTICAL ALGORITHMS DESCRIPTION DOCUMENT,
HTTP://WWW.AFFYMETRIX.COM/SUPPORT/TECHNICAL/WHITEPAPERS/SADD_WHITEPAPER.PDF
[3] B. FRITZKE, A GROWING NEURAL GAS NETWORK LEARNS TOPOLOGIES, ADVANCES IN NEURAL INFORMATION PROCESSING SYSTEMS 7, (1995) 625-632.
[4] C. LENG, SPARSE OPTIMAL SCORING FOR MULTICLASS CANCER DIAGNOSIS
AND BIOMARKER DETECTION USING MICROARRAY DATA, COMPUTATIONAL
BIOLOGY AND CHEMISTRY, IN PRESS. [5] D. VOGIATZIS AND N. TSAPATSOULIS, ACTIVE LEARNING FOR
MICROARRAY DATA, INTERNATIONAL JOURNAL OF APPROXIMATE
REASONING, 47 (1) (2008) 85-96. [6] F. SHEN, AN ALGORITHM FOR INCREMENTAL UNSUPERVISED LEARNING AND
TOPOLOGY REPRESENTATION, TOKYO: PH.D. THESIS. TOKYO INSTITUTE OF
TECHNOLOGY, 2006 [7] J. KOLODNER, CASE-BASED REASONING, MORGAN KAUFMANN 1993. [8] J. QUINLAN, DISCOVERING RULES BY INDUCTION FROM LARGE
COLLECTIONS OF EXAMPLES, EXPERT SYSTEMS IN THE MICRO ELECTRONIC
AGE, (1979) 168-201. [9] J.M. CORCHADO, J. BAJO, Y. DE PAZ, J.F. DE PAZ INTEGRATING CASE
PLANNING AND RPTW NEURONAL NETWORKS TO CONSTRUCT AN
INTELLIGENT ENVIRONMENT FOR HEALTH CARE, EXPERT SYSTEMS WITH
APPLICATIONS, 36 (2009) 5844–5858. [10] L. BREIMAN, J. FRIEDMAN, A. OLSHEN AND C. STONE, CLASSIFICATION
AND REGRESSION TREES, WADSWORTH INTERNATIONAL GROUP, 1984. [11] L. KAUFMAN AND P.J. ROUSSEEUW, FINDING GROUPS IN DATA: AN
INTRODUCTION TO CLUSTER ANALYSIS, WILEY, NEW YORK, 1990. [12] N. SAITOU, M. NIE, THE NEIGHBOR-JOINING METHOD: A NEW METHOD FOR
RECONSTRUCTING PHYLOGENETIC TREES, MOL. BIOL, 4 (1987) 406-425.

AN ADAPTATIVE MATHEMATICAL MODEL FOR PATTERN CLASSIFICATION
[13] R. AVOGADRI AND G. VALENTINI, THE CORRESPONDING AUTHOR AND
GIORGIO VALENTINI FUZZY ENSEMBLE CLUSTERING BASED ON RANDOM
PROJECTIONS FOR DNA MICROARRAY DATA ANALYSIS, ARTIFICIAL
INTELLIGENCE IN MEDICINE, IN PRESS [14] R. BRUNELLI, HISTOGRAM ANALYSIS FOR IMAGE RETRIEVAL. PATTERN
RECOGNITION, 34, (2001) 1625-1637. [15] R.A. IRIZARRY, B. HOBBS, F. COLLIN, Y.D. BEAZER-BARCLAY, K.J.
ANTONELLIS, U. SCHERF AND T.P. SPEED, EXPLORATION, NORMALIZATION, AND SUMMARIES OF HIGH DENSITY OLIGONUCLEOTIDE
ARRAY PROBE LEVEL DATA, BIOSTATISTICS, 4 (2003) 249-264. [16] S. FURAO, T. OGURA AND O. HASEGAWA, AN ENHANCED SELF-
ORGANIZING INCREMENTAL NEURAL NETWORK FOR ONLINE UNSUPERVISED
LEARNING, NEURAL NETWORKS, 20 (2007) 893-903. [17] T. MARTINETZ, COMPETITIVE HEBBIAN LEARNING RULE FORMS PERFECTLY
TOPOLOGY PRESERVING MAPS, ICANN'93: INTERNATIONAL CONFERENCE
ON ARTIFICIAL NEURAL NETWORKS, (1993) 427-434. [18] T. KOHONEN, SELF-ORGANIZED FORMATION OF TOPOLOGICALLY CORRECT
FEATURE MAPS, BIOLOGICAL CYBERNETICS, (1982) 59-69. [19] T. MARTINETZ AND K. SCHULTEN, A NEURAL-GAS NETWORK LEARNS
TOPOLOGIES, ARTIFICIAL NEURAL NETWORKS, (1991) 397-402. [20] T.Y. YANG. EFFICIENT MULTI-CLASS CANCER DIAGNOSIS ALGORITHM,
USING A GLOBAL SIMILARITY PATTERN, COMPUTATIONAL STATISTICS &
DATA ANALYSIS. IN PRESS. [21] W. KRUSKAL AND W. WALLIS, USE OF RANKS IN ONE-CRITERION
VARIANCE ANALYSIS, JOURNAL OF AMERICAN STATISTICS ASSOCIATION
(1952). [22] N.L.W. VAN HAL, O. VORST. A.M.M.L. VAN HOUWELINGEN, E.J. KOK, A.
PEIJNENBURG, A. AHARONI, A.J. VAN TUNEN, AND J. KEIJER: THE
APPLICATION OF DNA MICROARRAYS IN GENE EXPRESSION ANALYSIS. JOURNAL OF BIOTECHNOLOGY. 78 (3) (2000) 271-280.
[23] AFFYMETRIX. GENECHIP® HUMAN GENOME U133 ARRAYS
HTTP://WWW.AFFYMETRIX.COM/SUPPORT/TECHNICAL/DATASHEETS/HGU133ARRAYS_DATASHEET.PDF
[24] C.K. YOO, I.B. LEE, P.A. VANROLLEGHEM: INTERPRETING PATTERNS AND
ANALYSIS OF ACUTE LEUKEMIA GENE EXPRESSION DATA BY MULTIVARIATE
FUZZY STATISTICAL ANALYSIS. COMPUTERS & CHEMICAL ENGINEERING. 29
(6) (2005) 1345-1356.