mathematical processes
TRANSCRIPT
Vocabulary
natural numberprime numberperfect squarevertexpentominorational numberconjecturemeancounter-example
Mathematical Processes
The mathematical process has many components. These components help you to organize your thoughts, solve problems effectively, and communicate your understanding.
CHAPTER
1Mathematical Processes� Problem Solving
� Reasoning and Proving
� Refl ecting
� Selecting Tools and Computational Strategies
� Connecting
� Representing
� Communicating
Number Sense and Algebra� Simplify numerical expressions
involving integers and rational numbers.
� Solve problems requiring the manipulation of expressions arising from applications of percent, ratio, rate, and proportion.
2
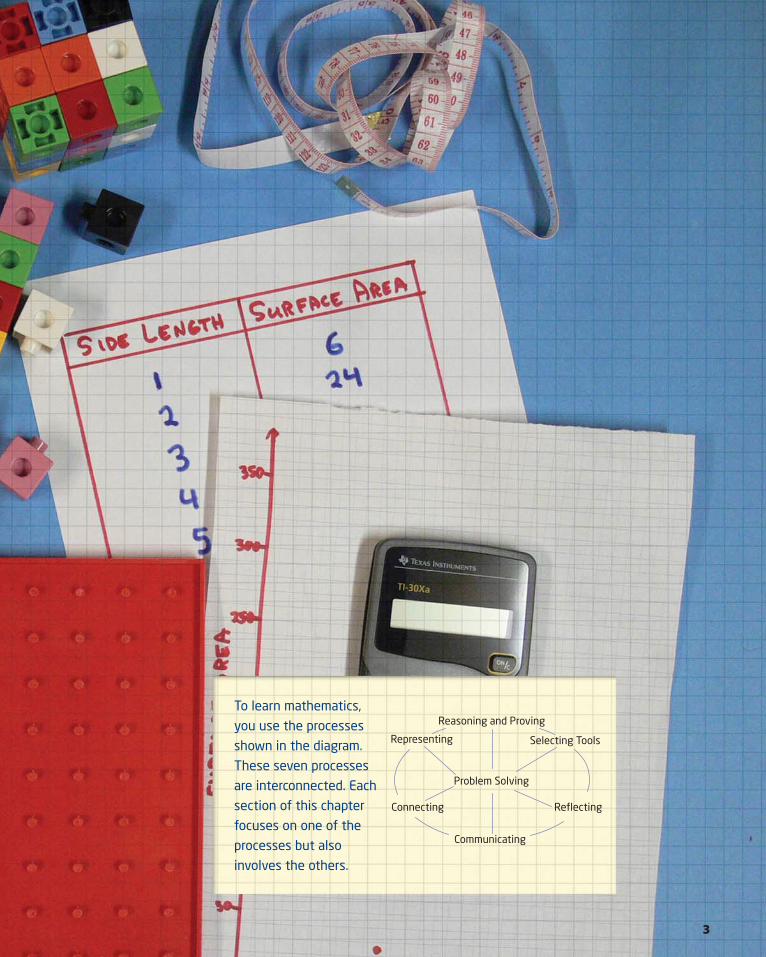
To learn mathematics,
you use the processes
shown in the diagram.
These seven processes
are interconnected. Each
section of this chapter
focuses on one of the
processes but also
involves the others.
Selecting ToolsRepresenting
Reasoning and Proving
Communicating
Connecting Reflecting
Problem Solving
3
1. Find each sum or difference. Express youranswers in lowest terms.
a) b)
c) d)
2. Find each product or quotient. Express youranswers in lowest terms.
a) b)
c) d)
3. Five friends shared two pizzas. Fran ate
of a pizza, Abdul ate of a pizza, Hannah
ate of a pizza, and Siva ate of a pizza.
What fraction of the pizza remains for Brad?
12
14
38
13
29
� 227
278
� 612
a34
�23b5
12�
310
179
�25
56
�25
38
�14
310
�910
4 MHR • Chapter 1
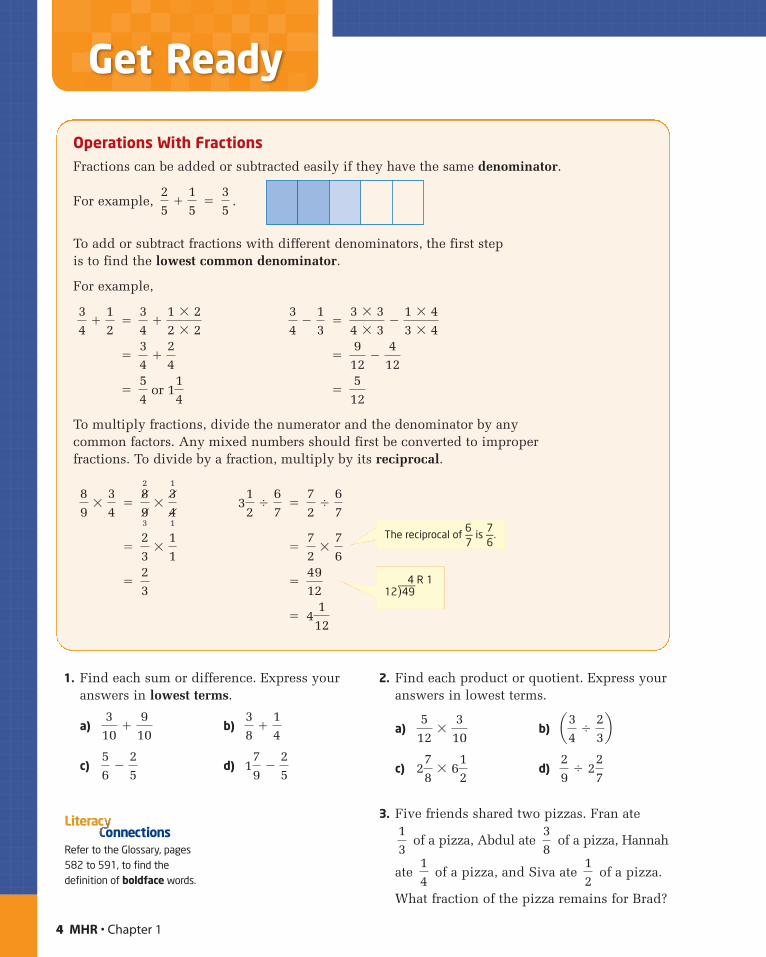
Operations With FractionsFractions can be added or subtracted easily if they have the same denominator.
For example, � .
To add or subtract fractions with different denominators, the first step is to find the lowest common denominator.
For example,
� �
� �
� �
To multiply fractions, divide the numerator and the denominator by anycommon factors. Any mixed numbers should first be converted to improperfractions. To divide by a fraction, multiply by its reciprocal.
� �
� �
� �
� 4112
4912
23
72
�76
23
�11
72
�67
312
�67
82
93
�31
41
89
�34
512
54
or 114
912
�4
1234
�24
3 � 34 � 3
�1 � 43 � 4
34
�13
34
�1 � 22 � 2
34
�12
35
25
�15
Refer to the Glossary, pages582 to 591, to find thedefinition of boldface words.
onnectionsLiterac
The reciprocal of 6—7
is7—6
.
4 R 112)−−−
49
4. Perform each integer operation.
a) 13 � (�5) b) �7 � 2
c) �8 � (�15) d) 7 � 11
e) 2 � 16 f) 8 � (�7)
g) �5 � (�9) h) 100 � (�4)
i) �7 � 7 j) �3 � (�14)
k) 42 � (�6) l) �28 � 7
5. Evaluate.
a) �16 � 6 � (�2) b) �3 � 5 � (�1)
c) �15 � (�12) � 4 � (�8)
6. A small business lost $6200 in its first year,lost $2150 in its second year, and earned$4780 in its third year. Overall, in the 3-yearperiod, how much did the business earnor lose?
Get Ready • MHR 5
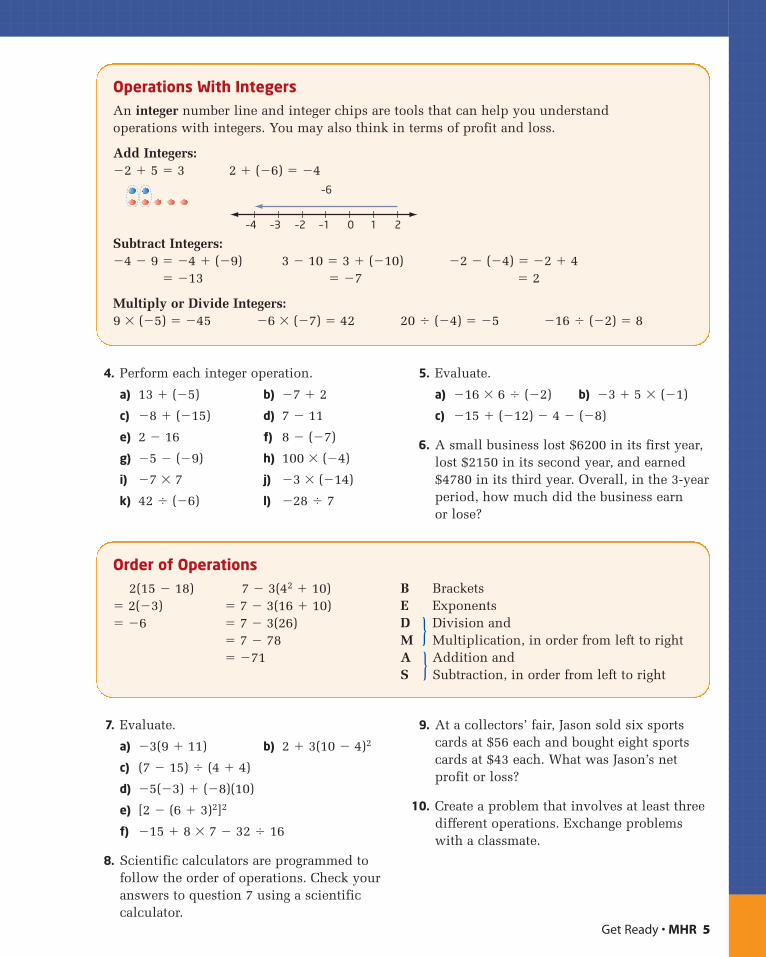
Operations With IntegersAn integer number line and integer chips are tools that can help you understand operations with integers. You may also think in terms of profit and loss.
Add Integers:�2 � 5 � 3 2 � (�6) � �4
Subtract Integers:�4 � 9 � �4 � (�9) 3 � 10 � 3 � (�10) �2 � (�4) � �2 � 4
� �13 � �7 � 2
Multiply or Divide Integers:9 � (�5) � �45 �6 � (�7) � 42 20 � (�4) � �5 �16 � (�2) � 8
7. Evaluate.
a) �3(9 � 11) b) 2 � 3(10 � 4)2
c) (7 � 15) � (4 � 4)
d) �5(�3) � (�8)(10)
e) [2 � (6 � 3)2]2
f) �15 � 8 � 7 � 32 � 16
8. Scientific calculators are programmed tofollow the order of operations. Check youranswers to question 7 using a scientificcalculator.
9. At a collectors’ fair, Jason sold six sportscards at $56 each and bought eight sportscards at $43 each. What was Jason’s netprofit or loss?
10. Create a problem that involves at least threedifferent operations. Exchange problemswith a classmate.
Order of Operations2(15 � 18) 7 � 3(42 � 10)
� 2(�3) � 7 � 3(16 � 10)� �6 � 7 � 3(26)
� 7 � 78� �71
–4
–6
–3 –2 –1 0 1 2
B BracketsE ExponentsD } Division andM Multiplication, in order from left to rightA } Addition andS Subtraction, in order from left to right
6 MHR • Chapter 1
Focus on Problem Solving
When you solve problems in mathematics, or in other subjects, a specificprocess helps you to organize your thoughts. This way, you can clearlyunderstand the problem, devise a strategy, carry out the strategy, andreflect on the results.
Consider the following strategies when you are developing mathematicalsolutions to problems. You may use other strategies too.
• Make an Organized List• Look for a Pattern• Work Backward• Draw a Diagram• Select a Tool• Use Systematic Trial• Use Logic or Reasoning
Investigate
How can a pattern help you solve a problem?
Part A: Make an organized list or table
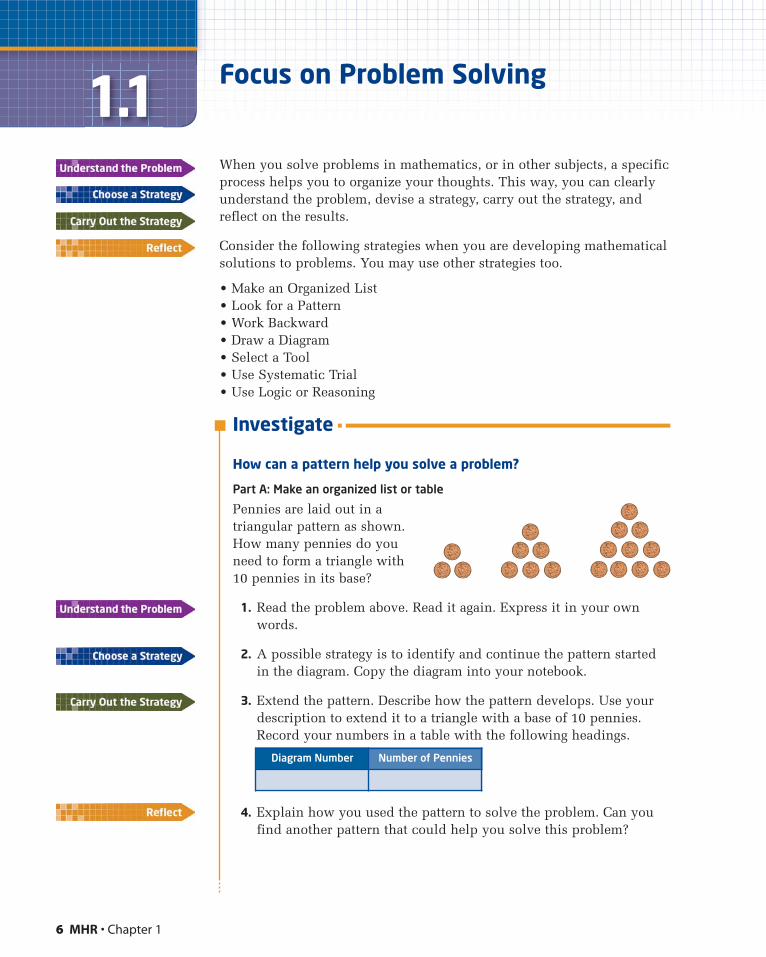
Pennies are laid out in atriangular pattern as shown.How many pennies do youneed to form a triangle with10 pennies in its base?
1. Read the problem above. Read it again. Express it in your ownwords.
2. A possible strategy is to identify and continue the pattern startedin the diagram. Copy the diagram into your notebook.
3. Extend the pattern. Describe how the pattern develops. Use yourdescription to extend it to a triangle with a base of 10 pennies.Record your numbers in a table with the following headings.
4. Explain how you used the pattern to solve the problem. Can youfind another pattern that could help you solve this problem?
Diagram Number Number of Pennies
Part B: Use Logic or Reasoning
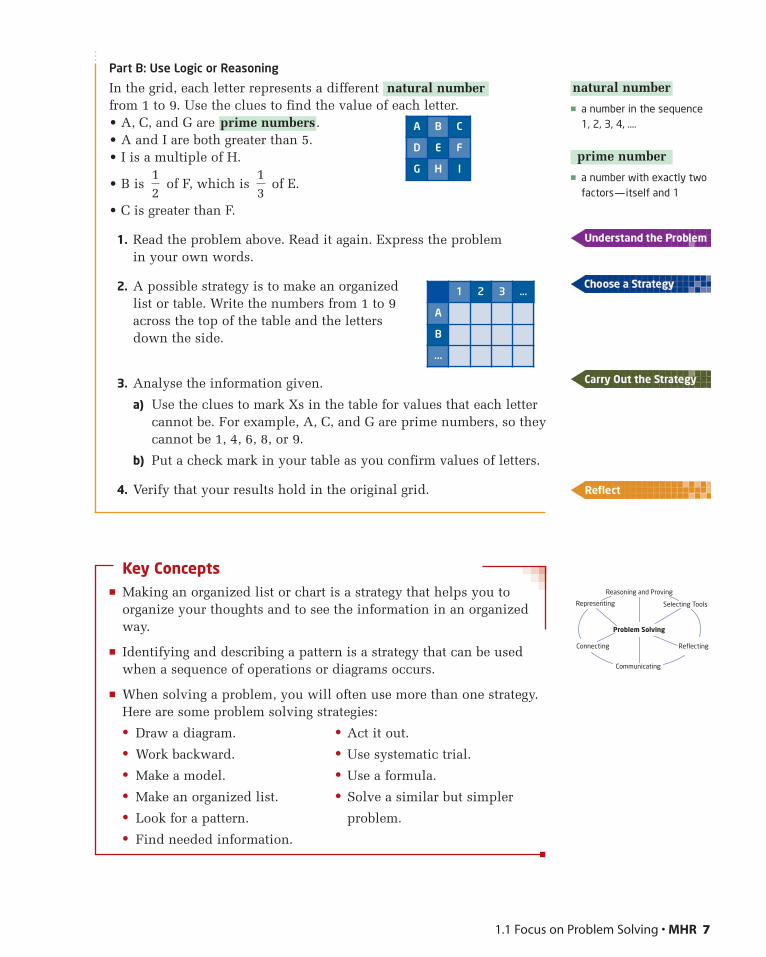
In the grid, each letter represents a different from 1 to 9. Use the clues to find the value of each letter.• A, C, and G are .• A and I are both greater than 5.• I is a multiple of H.
• B is of F, which is of E.
• C is greater than F.
1. Read the problem above. Read it again. Express the problem in your own words.
2. A possible strategy is to make an organizedlist or table. Write the numbers from 1 to 9across the top of the table and the lettersdown the side.
3. Analyse the information given.
a) Use the clues to mark Xs in the table for values that each lettercannot be. For example, A, C, and G are prime numbers, so theycannot be 1, 4, 6, 8, or 9.
b) Put a check mark in your table as you confirm values of letters.
4. Verify that your results hold in the original grid.
Key Concepts� Making an organized list or chart is a strategy that helps you to
organize your thoughts and to see the information in an organizedway.
� Identifying and describing a pattern is a strategy that can be usedwhen a sequence of operations or diagrams occurs.
� When solving a problem, you will often use more than one strategy.Here are some problem solving strategies:
• Draw a diagram. • Act it out.
• Work backward. • Use systematic trial.
• Make a model. • Use a formula.
• Make an organized list. • Solve a similar but simpler
• Look for a pattern. problem.
• Find needed information.
13
12
prime numbers
natural number
1 2 3 …
A
B
...
A B C
D E F
G H I
1.1 Focus on Problem Solving • MHR 7
� a number in the sequence1, 2, 3, 4, ….
natural number
� a number with exactly twofactors—itself and 1
prime number
Selecting ToolsRepresenting
Reasoning and Proving
Communicating
Connecting Reflecting
Problem Solving
Communicate Your UnderstandingIn the Investigate, Part A, the strategy recommended was to use an organized list.
a) Which other strategies did you use?
b) How could you answer the problem using a different strategy?
In the Investigate, Part B, the strategy recommended was to makean organized list or chart. Which other strategies did you use?
Practise1. Continue each pattern for three more terms. Describe how to find
successive terms.
a) 1, 3, 5, 7, 9 b) 4, 17, 30, 43
c) 2, 4, 8, 16 d) 1, 1, 2, 3, 5, 8
2. You have two quarters, a dime, and a nickel. How many differentsums of money can you make?
3. a) Copy and complete these products.1 � 1 � ?11 � 11 � ?111 � 111 � ?1111 � 1111 � ?
b) Describe the pattern in the answers.
c) Use the pattern to predict the product 111 111 111 � 111 111 111.
4. a) Evaluate each product.11 � 37 � ?22 � 37 � ?33 � 37 � ?
b) Continue and identify a pattern in the results.
c) Use the pattern to evaluate 99 � 37.
Connect and ApplyIn each problem, write one or two sentences to describe your strategy.Then, carry out your strategy.
5. a) Express the fractions , , , and so on as decimals.
Describe the pattern.
b) How does the pattern change if the denominator is 99?
c) What if the denominator is 99 999?
39
29
19
C2C2
C1C1
8 MHR • Chapter 1
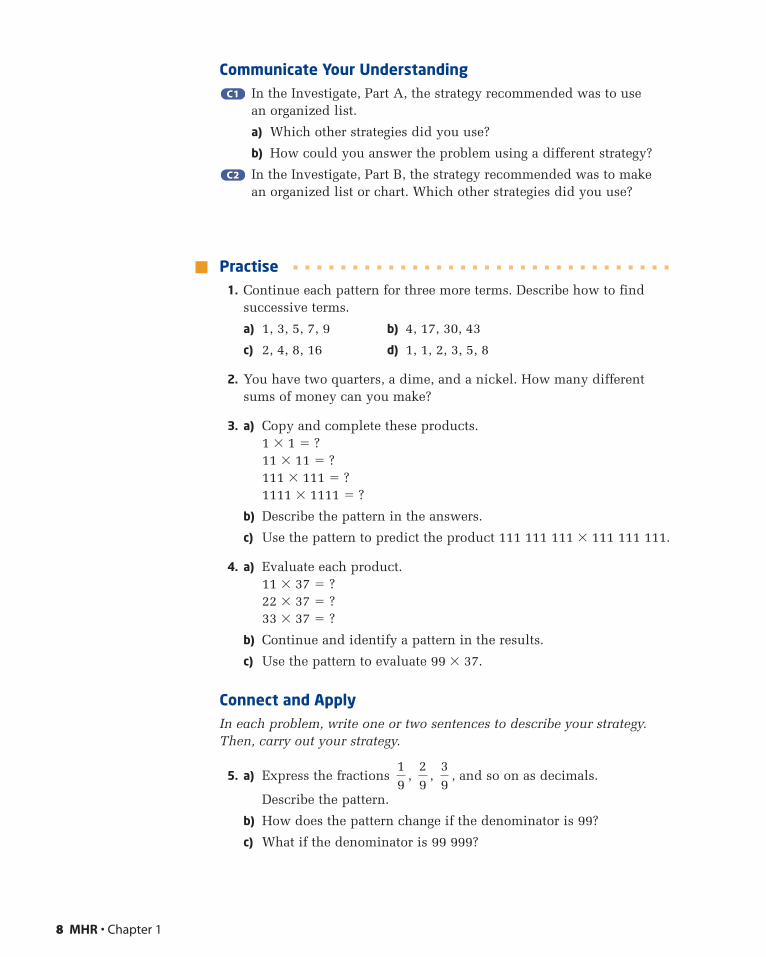
6. A Sudoku is a Japanese number puzzle that follows a simpleset of rules. Each three by three square, each row, and eachcolumn must contain each of the numerals 1 through 9 onlyonce. Here is a Sudoku that is almost completed. What mustthe missing digits be?
7. Gina was born on September 15, 1997. Sam was born on January 23, 1994.
a) How many years, months, and days old is each of them on January 1, 2020?
b) Describe a method of determining anyone’s age in years, months, and days.
8. In the opening round of a chess tournament, players must play eachother only once. How many matches are necessary in the openinground for a tournament that is set up for
a) 2 players? b) 3 players?
c) 4 players? d) 10 players?
9. How many divide evenly into 8820?
Extend10. In the following sum, each letter represents a different digit.
F is half of C and R � 7. Find the value of each letter.
EAT�FREE
CAKE
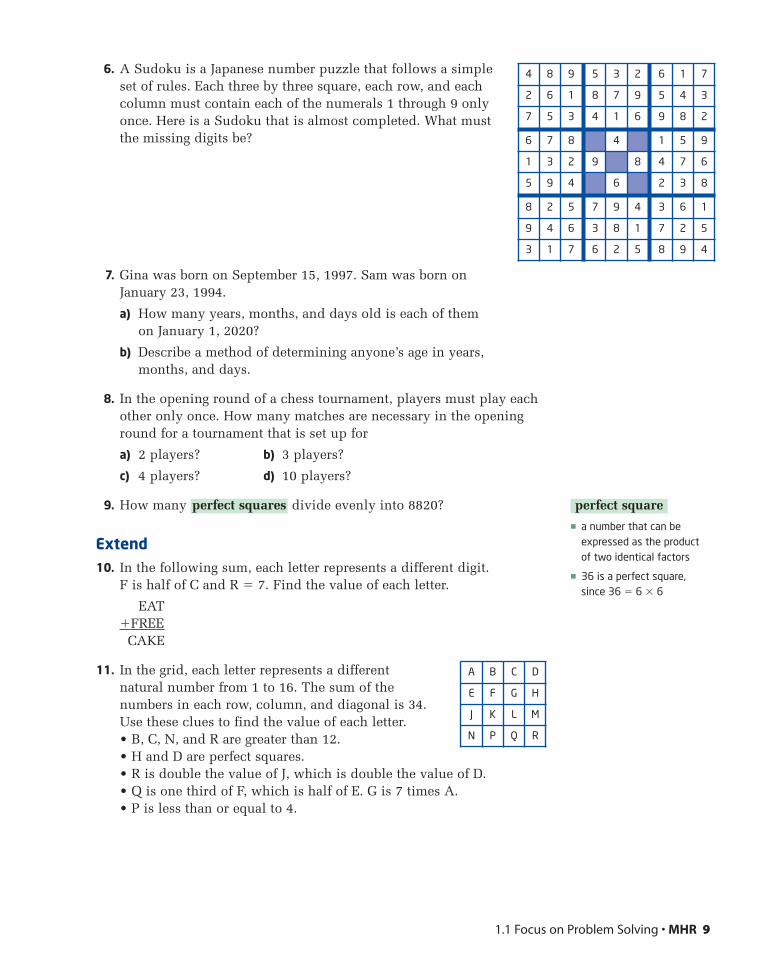
11. In the grid, each letter represents a different natural number from 1 to 16. The sum of thenumbers in each row, column, and diagonal is 34.Use these clues to find the value of each letter.• B, C, N, and R are greater than 12.• H and D are perfect squares.• R is double the value of J, which is double the value of D.• Q is one third of F, which is half of E. G is 7 times A.• P is less than or equal to 4.
perfect squares
A B C D
E F G H
J K L M
N P Q R
4 8 9 5 3 2 6 1 7
2 6 1 8 7 9 5 4 3
7 5 3 4 1 6 9 8 2
6 7 8 4 1 5 9
1 3 2 9 8 4 7 6
5 9 4 6 2 3 8
8 2 5 7 9 4 3 6 1
9 4 6 3 8 1 7 2 5
3 1 7 6 2 5 8 9 4
1.1 Focus on Problem Solving • MHR 9
� a number that can beexpressed as the productof two identical factors
� 36 is a perfect square,since 36 � 6 � 6
perfect square
10 MHR • Chapter 1
Focus on Communicating
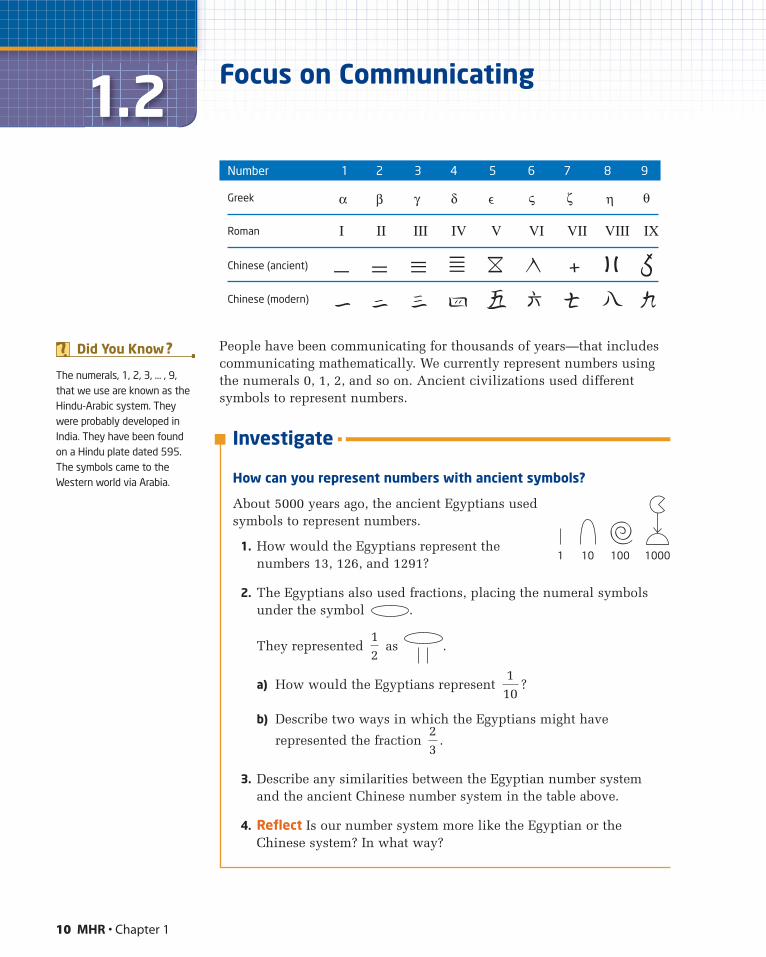
People have been communicating for thousands of years—that includescommunicating mathematically. We currently represent numbers usingthe numerals 0, 1, 2, and so on. Ancient civilizations used differentsymbols to represent numbers.
Investigate
How can you represent numbers with ancient symbols?
About 5000 years ago, the ancient Egyptians usedsymbols to represent numbers.
1. How would the Egyptians represent thenumbers 13, 126, and 1291?
2. The Egyptians also used fractions, placing the numeral symbolsunder the symbol .
They represented as .
a) How would the Egyptians represent ?
b) Describe two ways in which the Egyptians might have
represented the fraction .
3. Describe any similarities between the Egyptian number system and the ancient Chinese number system in the table above.
4. Reflect Is our number system more like the Egyptian or theChinese system? In what way?
23
110
12
Greek
Roman
Chinese (ancient)
Chinese (modern)
I II III IV V VI VII VIII IX
∋γ β α δ ζ η θ
Number 1 2 3 4 5 6 7 8 9
1 10 100 1000
The numerals, 1, 2, 3, … , 9,that we use are known as theHindu-Arabic system. Theywere probably developed inIndia. They have been foundon a Hindu plate dated 595.The symbols came to theWestern world via Arabia.
Did You Know ?
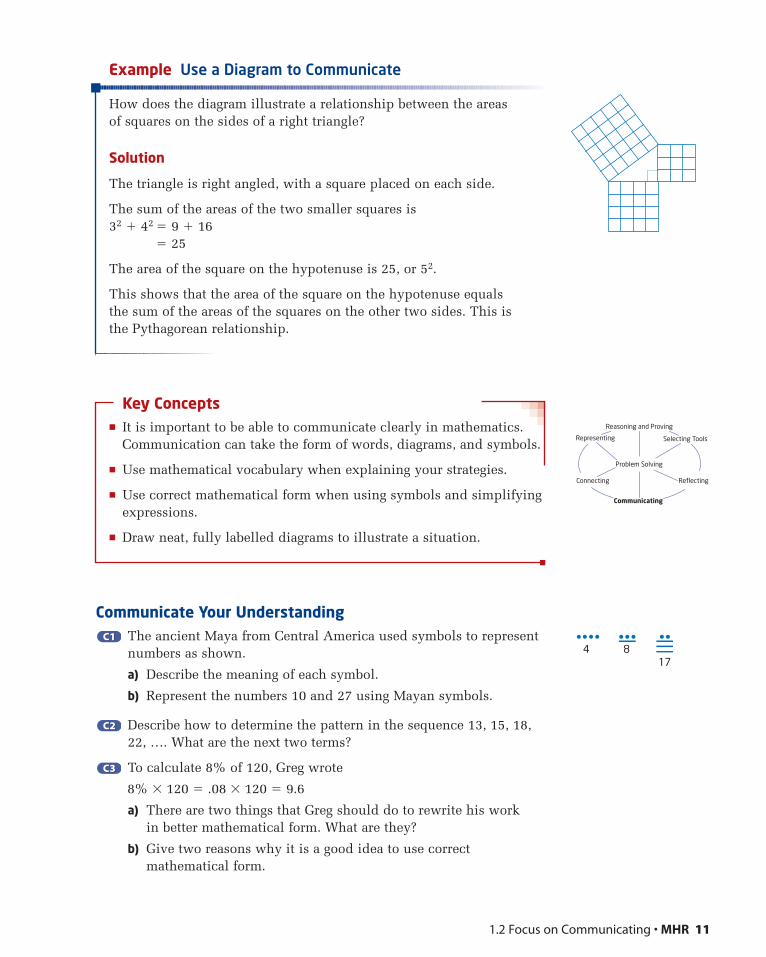
Example Use a Diagram to Communicate
How does the diagram illustrate a relationship between the areas of squares on the sides of a right triangle?
Solution
The triangle is right angled, with a square placed on each side.
The sum of the areas of the two smaller squares is32 � 42 � 9 � 16
� 25
The area of the square on the hypotenuse is 25, or 52.
This shows that the area of the square on the hypotenuse equals the sum of the areas of the squares on the other two sides. This is the Pythagorean relationship.
Key Concepts� It is important to be able to communicate clearly in mathematics.
Communication can take the form of words, diagrams, and symbols.
� Use mathematical vocabulary when explaining your strategies.
� Use correct mathematical form when using symbols and simplifyingexpressions.
� Draw neat, fully labelled diagrams to illustrate a situation.
Communicate Your UnderstandingThe ancient Maya from Central America used symbols to representnumbers as shown.
a) Describe the meaning of each symbol.
b) Represent the numbers 10 and 27 using Mayan symbols.
Describe how to determine the pattern in the sequence 13, 15, 18,22, …. What are the next two terms?
To calculate 8% of 120, Greg wrote
8% � 120 � .08 � 120 � 9.6
a) There are two things that Greg should do to rewrite his work in better mathematical form. What are they?
b) Give two reasons why it is a good idea to use correctmathematical form.
C3C3
C2C2
C1C1
1.2 Focus on Communicating • MHR 11
4 817
Selecting ToolsRepresenting
Reasoning and Proving
Communicating
Connecting Reflecting
Problem Solving
Practise1. Describe the pattern in each sequence. Give the next two terms.
a) 15, 10, 5 b) �6, �10, �14
c) , , d) , 2,
e) 3, �6, 12, �24 f) �96, �48, �24
g) 100, 80, 65, 55 h) 3, 3, 6, 18, 72
i) j)
2. a) Build a sequence of numbers.
b) Describe the process you used to build the sequence.
c) Trade your sequence with a classmate. Find the pattern.
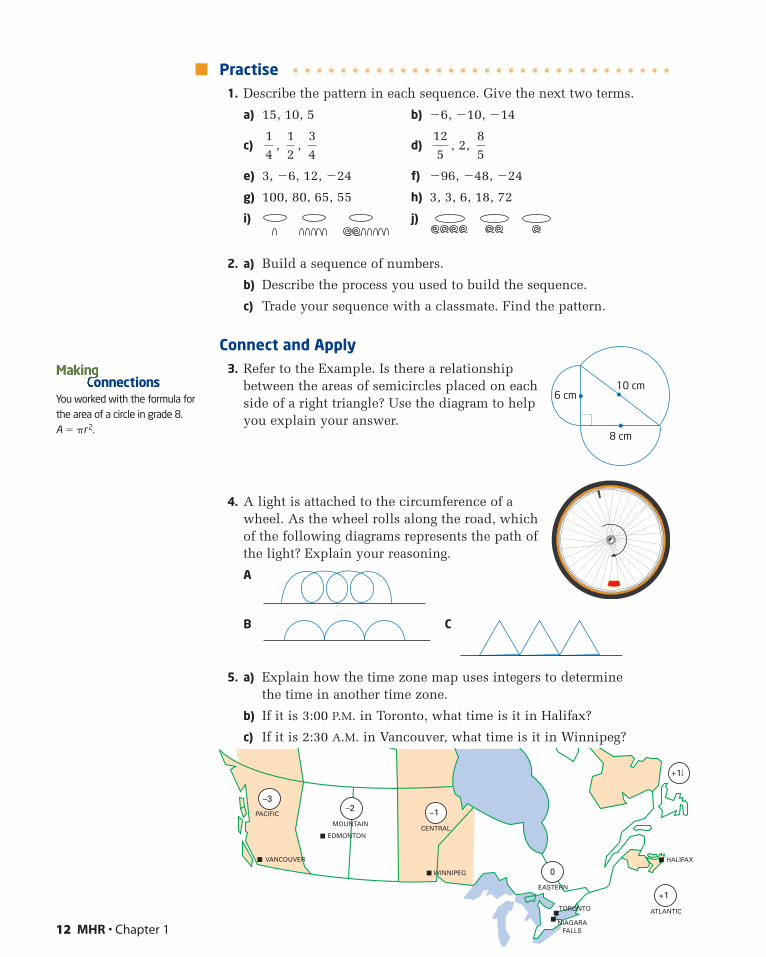
Connect and Apply3. Refer to the Example. Is there a relationship
between the areas of semicircles placed on eachside of a right triangle? Use the diagram to helpyou explain your answer.
4. A light is attached to the circumference of awheel. As the wheel rolls along the road, whichof the following diagrams represents the path ofthe light? Explain your reasoning.
A
B C
5. a) Explain how the time zone map uses integers to determine the time in another time zone.
b) If it is 3:00 P.M. in Toronto, what time is it in Halifax?
c) If it is 2:30 A.M. in Vancouver, what time is it in Winnipeg?
85
125
34
12
14
12 MHR • Chapter 1
10 cm6 cm
8 cm
You worked with the formula forthe area of a circle in grade 8.A � �r2.
Makinonnections
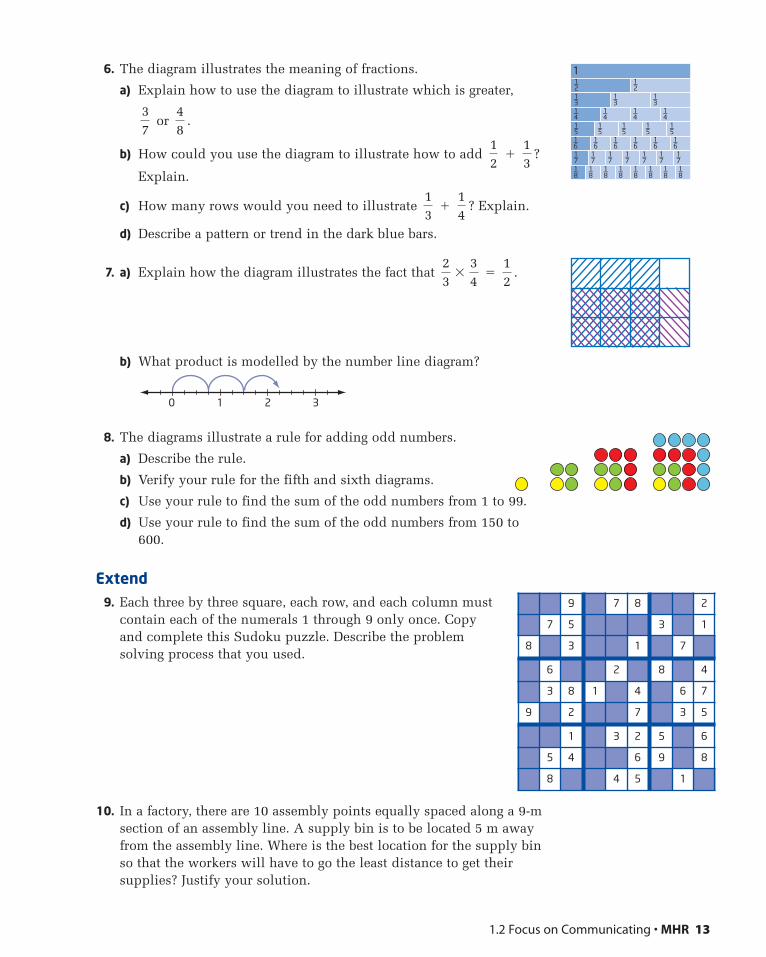
6. The diagram illustrates the meaning of fractions.
a) Explain how to use the diagram to illustrate which is greater,
or .
b) How could you use the diagram to illustrate how to add � ?
Explain.
c) How many rows would you need to illustrate � ? Explain.
d) Describe a pattern or trend in the dark blue bars.
7. a) Explain how the diagram illustrates the fact that � .
b) What product is modelled by the number line diagram?
8. The diagrams illustrate a rule for adding odd numbers.
a) Describe the rule.
b) Verify your rule for the fifth and sixth diagrams.
c) Use your rule to find the sum of the odd numbers from 1 to 99.
d) Use your rule to find the sum of the odd numbers from 150 to600.
Extend9. Each three by three square, each row, and each column must
contain each of the numerals 1 through 9 only once. Copyand complete this Sudoku puzzle. Describe the problemsolving process that you used.
10. In a factory, there are 10 assembly points equally spaced along a 9-msection of an assembly line. A supply bin is to be located 5 m awayfrom the assembly line. Where is the best location for the supply binso that the workers will have to go the least distance to get theirsupplies? Justify your solution.
0 1 2 3
12
23
�34
14
13
13
12
48
37
9 7 8 2
7 5 3 1
8 3 1 7
6 2 8 4
3 8 1 4 6 7
9 2 7 3 5
1 3 2 5 6
5 4 6 9 8
8 4 5 1
1.2 Focus on Communicating • MHR 13
11––21––31––41––5
1––5
1––5
1––5
1––5
1––6
1––6
1––6
1––6
1––6
1––6
1––7
1––7
1––7
1––7
1––7
1––7
1––7
1––8
1––8
1––8
1––8
1––8
1––8
1––8
1––8
1––4
1––4
1––4
1––3
1––3
1––2
14 MHR • Chapter 1
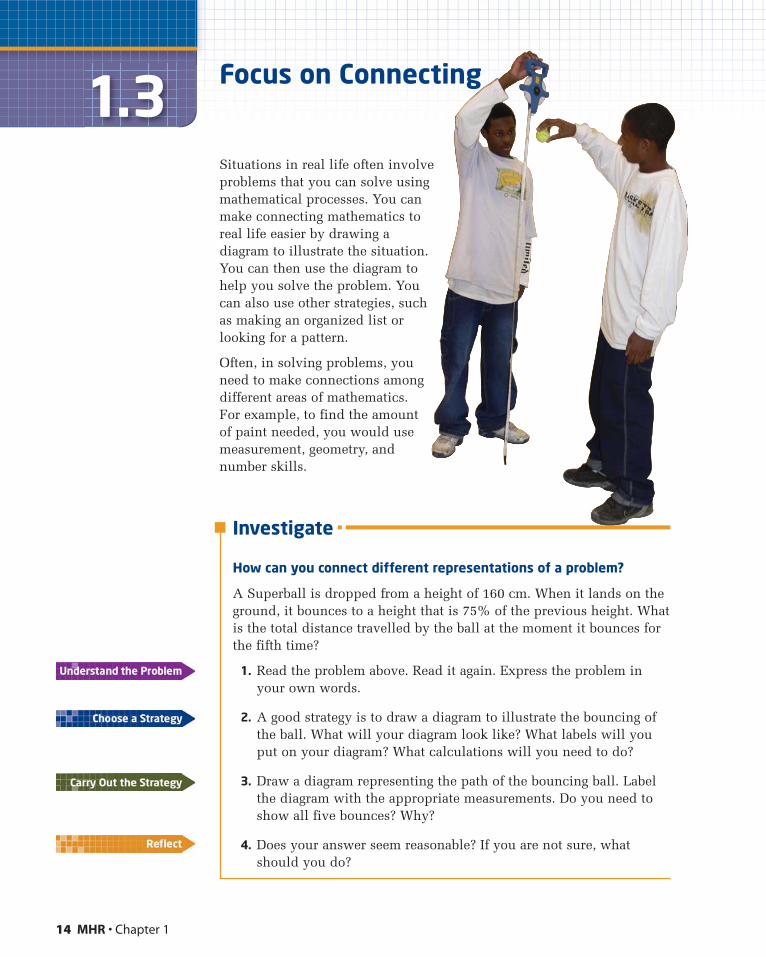
Situations in real life often involveproblems that you can solve usingmathematical processes. You canmake connecting mathematics toreal life easier by drawing adiagram to illustrate the situation.You can then use the diagram tohelp you solve the problem. Youcan also use other strategies, suchas making an organized list orlooking for a pattern.
Often, in solving problems, youneed to make connections amongdifferent areas of mathematics.For example, to find the amountof paint needed, you would usemeasurement, geometry, andnumber skills.
Investigate
How can you connect different representations of a problem?
A Superball is dropped from a height of 160 cm. When it lands on theground, it bounces to a height that is 75% of the previous height. Whatis the total distance travelled by the ball at the moment it bounces forthe fifth time?
1. Read the problem above. Read it again. Express the problem inyour own words.
2. A good strategy is to draw a diagram to illustrate the bouncing ofthe ball. What will your diagram look like? What labels will youput on your diagram? What calculations will you need to do?
3. Draw a diagram representing the path of the bouncing ball. Labelthe diagram with the appropriate measurements. Do you need toshow all five bounces? Why?
4. Does your answer seem reasonable? If you are not sure, whatshould you do?
Focus on Connecting
Example 1 Number of Point Totals
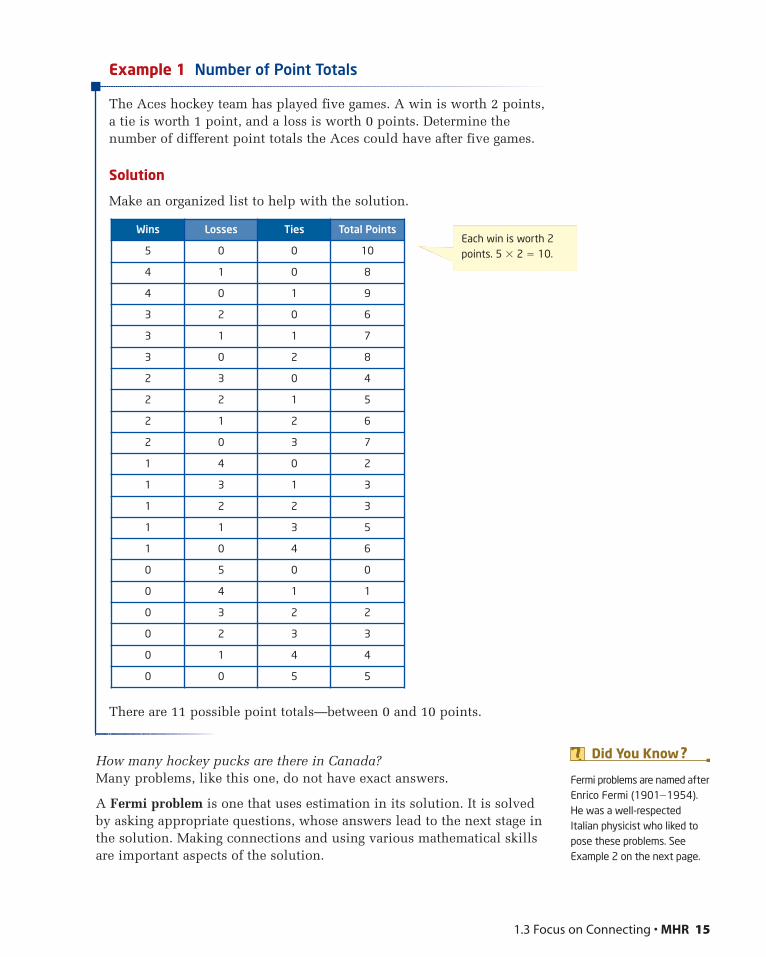
The Aces hockey team has played five games. A win is worth 2 points,a tie is worth 1 point, and a loss is worth 0 points. Determine thenumber of different point totals the Aces could have after five games.
Solution
Make an organized list to help with the solution.
There are 11 possible point totals—between 0 and 10 points.
How many hockey pucks are there in Canada?Many problems, like this one, do not have exact answers.
A Fermi problem is one that uses estimation in its solution. It is solvedby asking appropriate questions, whose answers lead to the next stage inthe solution. Making connections and using various mathematical skillsare important aspects of the solution.
Wins Losses Ties Total Points
5 0 0 10
4 1 0 8
4 0 1 9
3 2 0 6
3 1 1 7
3 0 2 8
2 3 0 4
2 2 1 5
2 1 2 6
2 0 3 7
1 4 0 2
1 3 1 3
1 2 2 3
1 1 3 5
1 0 4 6
0 5 0 0
0 4 1 1
0 3 2 2
0 2 3 3
0 1 4 4
0 0 5 5
1.3 Focus on Connecting • MHR 15
Each win is worth 2points. 5 � 2 � 10.
Fermi problems are named afterEnrico Fermi (1901�1954).He was a well-respectedItalian physicist who liked topose these problems. SeeExample 2 on the next page.
Did You Know ?
Example 2 Jelly Beans in a Jar
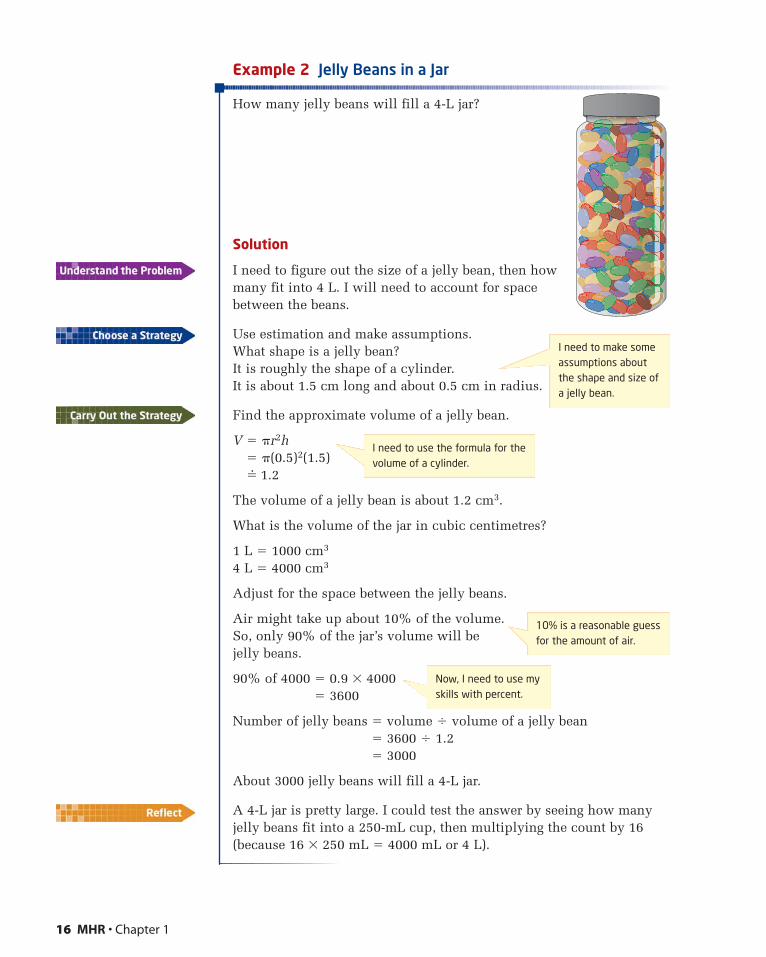
How many jelly beans will fill a 4-L jar?
Solution
I need to figure out the size of a jelly bean, then howmany fit into 4 L. I will need to account for spacebetween the beans.
Use estimation and make assumptions.What shape is a jelly bean?It is roughly the shape of a cylinder.It is about 1.5 cm long and about 0.5 cm in radius.
Find the approximate volume of a jelly bean.
V � �r2h� �(0.5)2(1.5)�� 1.2
The volume of a jelly bean is about 1.2 cm3.
What is the volume of the jar in cubic centimetres?
1 L � 1000 cm3
4 L � 4000 cm3
Adjust for the space between the jelly beans.
Air might take up about 10% of the volume. So, only 90% of the jar’s volume will be jelly beans.
90% of 4000 � 0.9 � 4000� 3600
Number of jelly beans � volume � volume of a jelly bean� 3600 � 1.2� 3000
About 3000 jelly beans will fill a 4-L jar.
A 4-L jar is pretty large. I could test the answer by seeing how manyjelly beans fit into a 250-mL cup, then multiplying the count by 16(because 16 � 250 mL � 4000 mL or 4 L).
16 MHR • Chapter 1
I need to use the formula for thevolume of a cylinder.
10% is a reasonable guessfor the amount of air.
Now, I need to use myskills with percent.
I need to make someassumptions aboutthe shape and size ofa jelly bean.
Key Concepts� You can make connections that relate math to other areas of study
and of daily life.
� You can also make connections between areas of mathematics, such as geometry and number sense.
Communicate Your UnderstandingUsing the Investigate as a reference, explain how drawing a diagramis different from drawing a picture.
How many people are sitting down in your school at this moment?What information will you need to find or estimate to solve thisFermi problem?
PractiseFor help with question 1, see the Investigate.
1. A bird flew 800 m in one direction. It turned around and flew half as far back. Then, it turned around and again flew half as far back.The bird continued this pattern for a total of six flights.
a) Draw a diagram illustrating this situation.
b) What was the total distance the bird flew?
c) How far from its starting point did the bird end up?
For help with question 2, see Example 1.
2. Raoul has four Canadian coins in his pocket. The coins are quarters,dimes, or nickels. What are the possible total values of the coins?
For help with questions 3 and 4, see Example 2.
3. How many hockey pucks would fit inside your classroom? Explainyour reasoning.
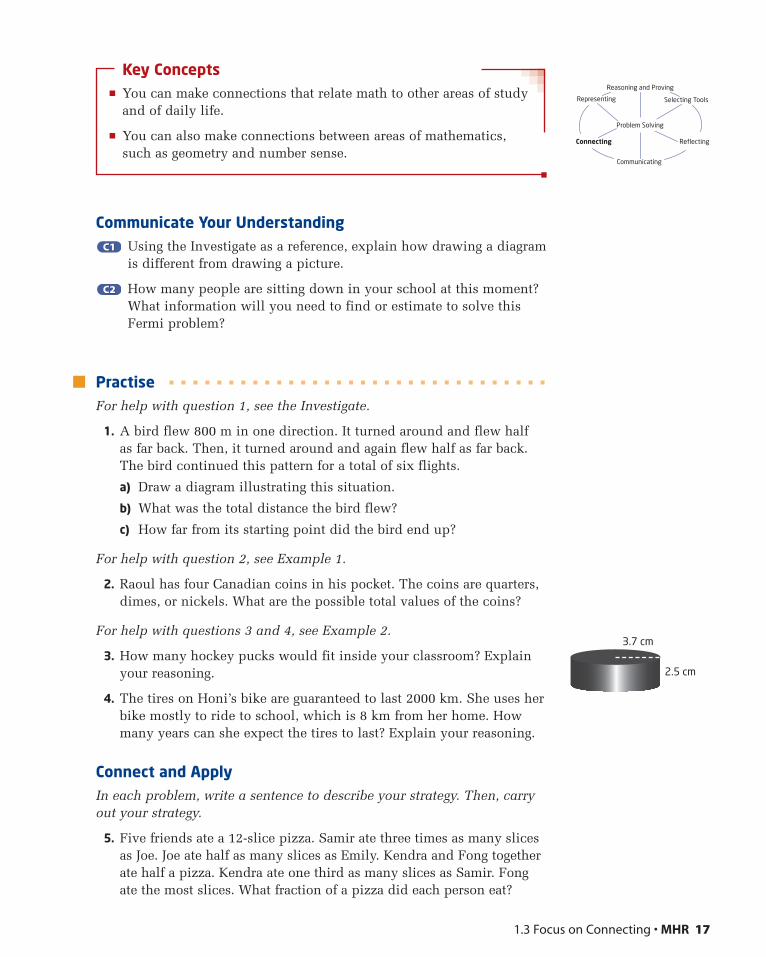
4. The tires on Honi’s bike are guaranteed to last 2000 km. She uses herbike mostly to ride to school, which is 8 km from her home. Howmany years can she expect the tires to last? Explain your reasoning.
Connect and ApplyIn each problem, write a sentence to describe your strategy. Then, carryout your strategy.
5. Five friends ate a 12-slice pizza. Samir ate three times as many slicesas Joe. Joe ate half as many slices as Emily. Kendra and Fong togetherate half a pizza. Kendra ate one third as many slices as Samir. Fongate the most slices. What fraction of a pizza did each person eat?
C2C2
C1C1
1.3 Focus on Connecting • MHR 17
3.7 cm
2.5 cm
Selecting ToolsRepresenting
Reasoning and Proving
Communicating
Connecting Reflecting
Problem Solving
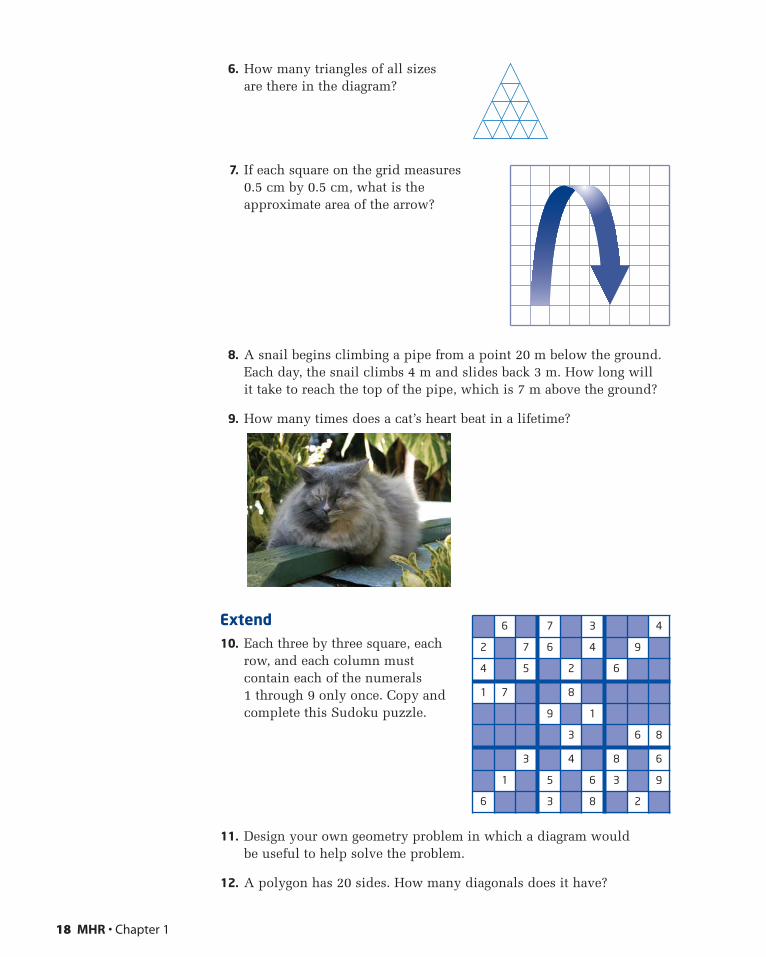
6. How many triangles of all sizes are there in the diagram?
7. If each square on the grid measures 0.5 cm by 0.5 cm, what is the approximate area of the arrow?
8. A snail begins climbing a pipe from a point 20 m below the ground.Each day, the snail climbs 4 m and slides back 3 m. How long will it take to reach the top of the pipe, which is 7 m above the ground?
9. How many times does a cat’s heart beat in a lifetime?
Extend10. Each three by three square, each
row, and each column mustcontain each of the numerals 1 through 9 only once. Copy andcomplete this Sudoku puzzle.
11. Design your own geometry problem in which a diagram would be useful to help solve the problem.
12. A polygon has 20 sides. How many diagonals does it have?
18 MHR • Chapter 1
6 7 3 4
2 7 6 4 9
4 5 2 6
1 7 8
9 1
3 6 8
3 4 8 6
1 5 6 3 9
6 3 8 2
1.4 Focus on Representing • MHR 19
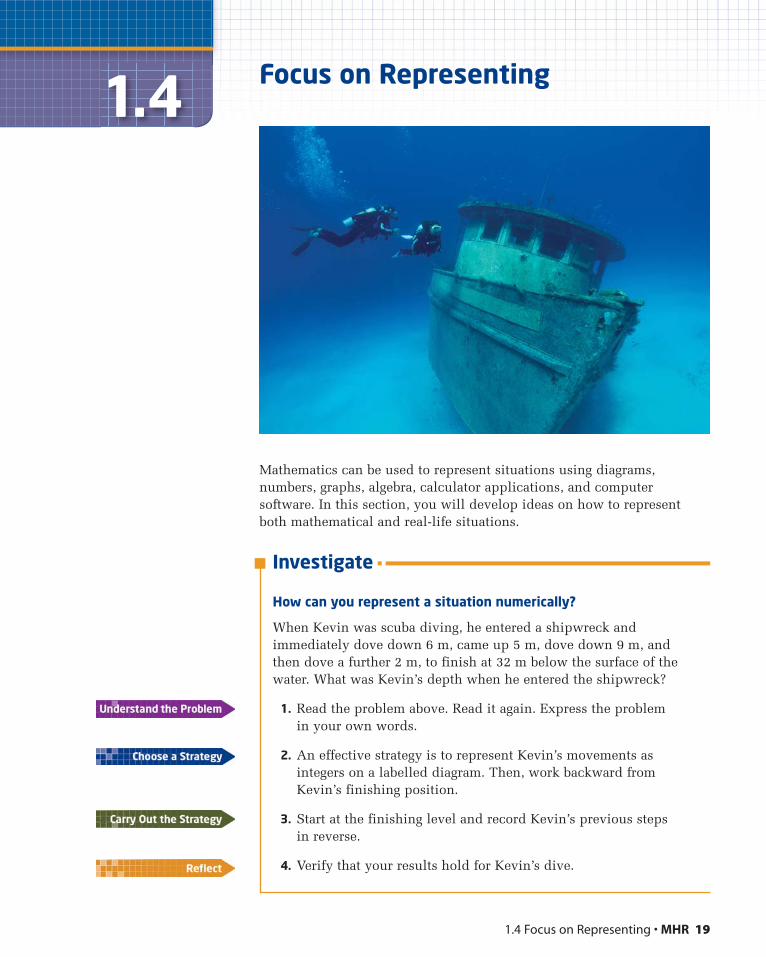
Focus on Representing
Mathematics can be used to represent situations using diagrams,numbers, graphs, algebra, calculator applications, and computersoftware. In this section, you will develop ideas on how to representboth mathematical and real-life situations.
Investigate
How can you represent a situation numerically?
When Kevin was scuba diving, he entered a shipwreck andimmediately dove down 6 m, came up 5 m, dove down 9 m, and then dove a further 2 m, to finish at 32 m below the surface of thewater. What was Kevin’s depth when he entered the shipwreck?
1. Read the problem above. Read it again. Express the problem in your own words.
2. An effective strategy is to represent Kevin’s movements as integers on a labelled diagram. Then, work backward from Kevin’s finishing position.
3. Start at the finishing level and record Kevin’s previous steps in reverse.
4. Verify that your results hold for Kevin’s dive.
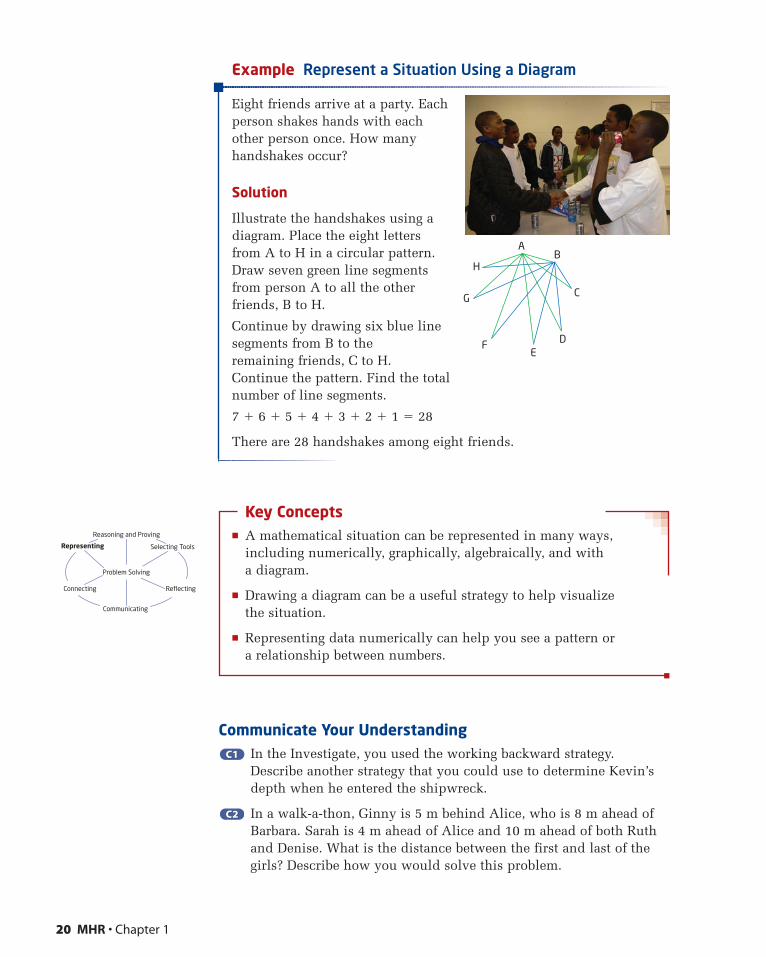
Example Represent a Situation Using a Diagram
Eight friends arrive at a party. Eachperson shakes hands with eachother person once. How manyhandshakes occur?
Solution
Illustrate the handshakes using adiagram. Place the eight lettersfrom A to H in a circular pattern.Draw seven green line segmentsfrom person A to all the otherfriends, B to H.
Continue by drawing six blue linesegments from B to the remaining friends, C to H.Continue the pattern. Find the total number of line segments.
7 � 6 � 5 � 4 � 3 � 2 � 1 � 28
There are 28 handshakes among eight friends.
Key Concepts� A mathematical situation can be represented in many ways,
including numerically, graphically, algebraically, and with a diagram.
� Drawing a diagram can be a useful strategy to help visualize the situation.
� Representing data numerically can help you see a pattern or a relationship between numbers.
Communicate Your UnderstandingIn the Investigate, you used the working backward strategy.Describe another strategy that you could use to determine Kevin’sdepth when he entered the shipwreck.
In a walk-a-thon, Ginny is 5 m behind Alice, who is 8 m ahead ofBarbara. Sarah is 4 m ahead of Alice and 10 m ahead of both Ruthand Denise. What is the distance between the first and last of thegirls? Describe how you would solve this problem.
C2C2
C1C1
20 MHR • Chapter 1
BA
H
G
FE
D
C
Selecting ToolsRepresenting
Reasoning and Proving
Communicating
Connecting Reflecting
Problem Solving
1.4 Focus on Representing • MHR 21
PractiseFor help with question 1, see the Investigate.
1. On a treasure hunt, players are instructed to go 2 km north, then 5 km east, then 4 km south, then 3 km west, and finally 2 km north.Where is the treasure relative to the starting point?
For help with questions 2 to 4, see the Example.
2. The top floor of an apartment building has eight apartments. Each
of the other floors below it has times as many apartments as
the floor above. Use a diagram and a numeric representation to helpdetermine the maximum number of floors that this building can have.
3. Seven friends have initials O, P, Q, R, S, T, and U. Each must have a telephone conversation with friends whose initials are within twoletters of their own. Use a diagram and a numeric representation todetermine how many telephone conversations will occur.
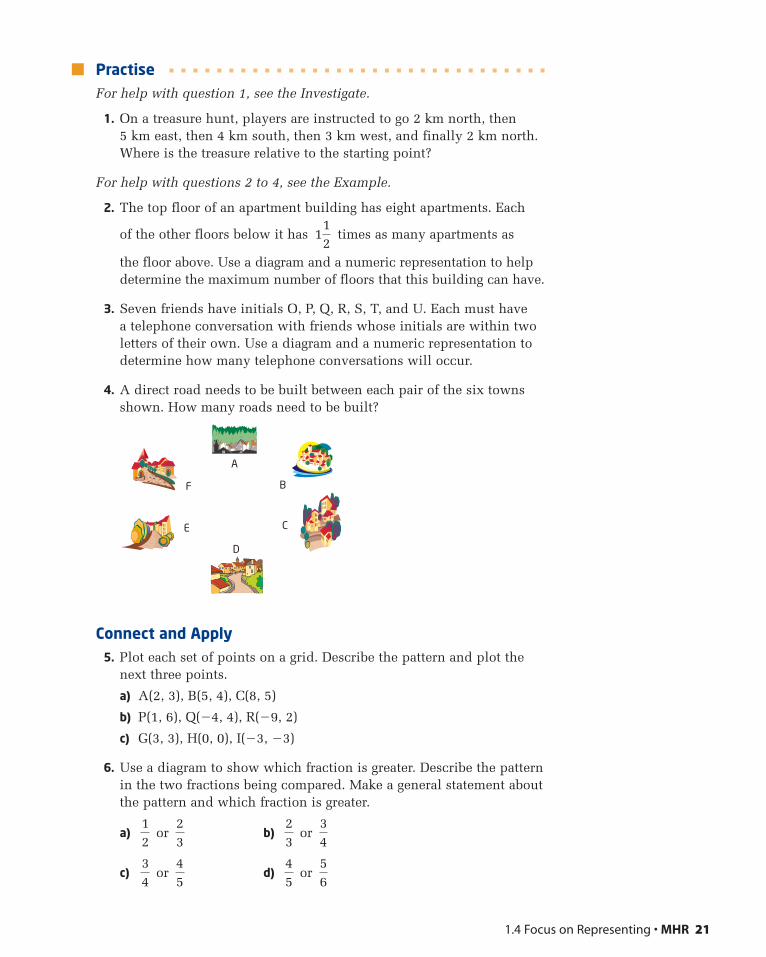
4. A direct road needs to be built between each pair of the six townsshown. How many roads need to be built?
Connect and Apply5. Plot each set of points on a grid. Describe the pattern and plot the
next three points.
a) A(2, 3), B(5, 4), C(8, 5)
b) P(1, 6), Q(�4, 4), R(�9, 2)
c) G(3, 3), H(0, 0), I(�3, �3)
6. Use a diagram to show which fraction is greater. Describe the patternin the two fractions being compared. Make a general statement aboutthe pattern and which fraction is greater.
a) or b) or
c) or d) or 56
45
45
34
34
23
23
12
A
B
C
D
E
F
112
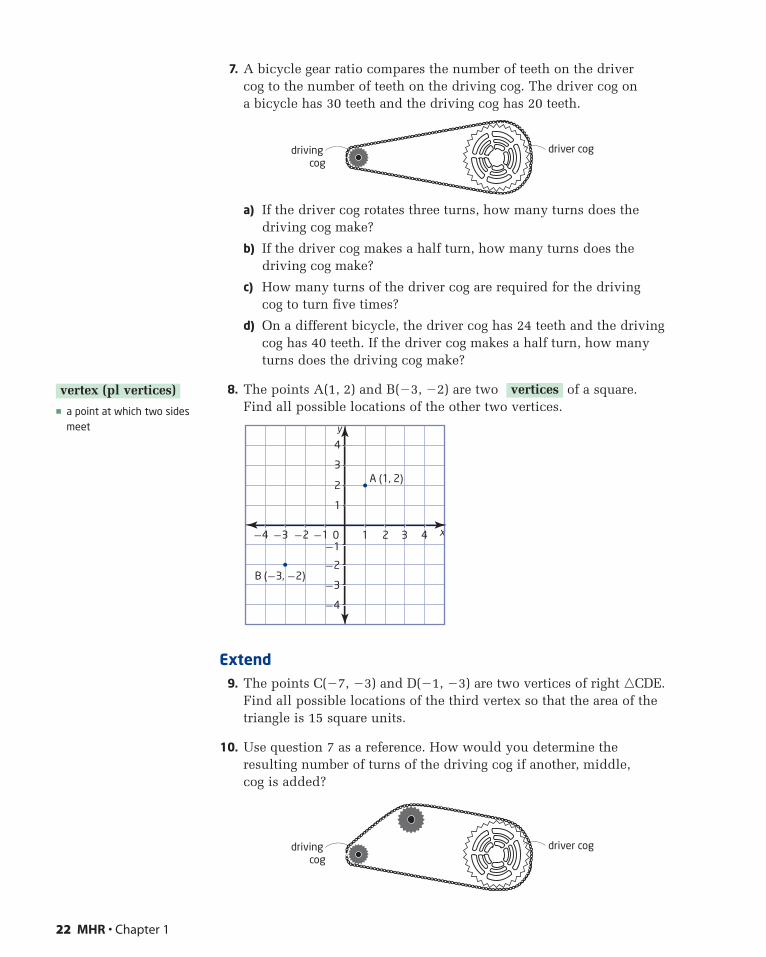
7. A bicycle gear ratio compares the number of teeth on the driver cog to the number of teeth on the driving cog. The driver cog on a bicycle has 30 teeth and the driving cog has 20 teeth.
a) If the driver cog rotates three turns, how many turns does thedriving cog make?
b) If the driver cog makes a half turn, how many turns does thedriving cog make?
c) How many turns of the driver cog are required for the driving cog to turn five times?
d) On a different bicycle, the driver cog has 24 teeth and the drivingcog has 40 teeth. If the driver cog makes a half turn, how manyturns does the driving cog make?
8. The points A(1, 2) and B(�3, �2) are two of a square. Find all possible locations of the other two vertices.
Extend9. The points C(�7, �3) and D(�1, �3) are two vertices of right �CDE.
Find all possible locations of the third vertex so that the area of thetriangle is 15 square units.
10. Use question 7 as a reference. How would you determine theresulting number of turns of the driving cog if another, middle, cog is added?
driver cogdriving cog
y
x10
1
2
3
4
-1-1
-2
-3
-4
-2-3-4 2 3 4
A (1, 2)
B (-3, -2)
vertices
driver cogdriving cog
22 MHR • Chapter 1
� a point at which two sidesmeet
vertex (pl vertices)
1.5 Focus on Selecting Tools and Computational Strategies • MHR 23
Focus on Selecting Tools andComputational Strategies
When solving problems, it is important to select appropriate tools. Youmay be able to solve some problems using pencil and paper, while forothers you may need a calculator. Sometimes it helps to usemanipulatives such as linking cubes or integer chips, while othersituations are best tackled using a graph. Quite often, you may find youneed several tools. In other situations, you might start with one tool,then find you need another tool to help find the answer.
Investigate
Which tool(s) can you use to solve a problem?
A: Create shapes with square tiles
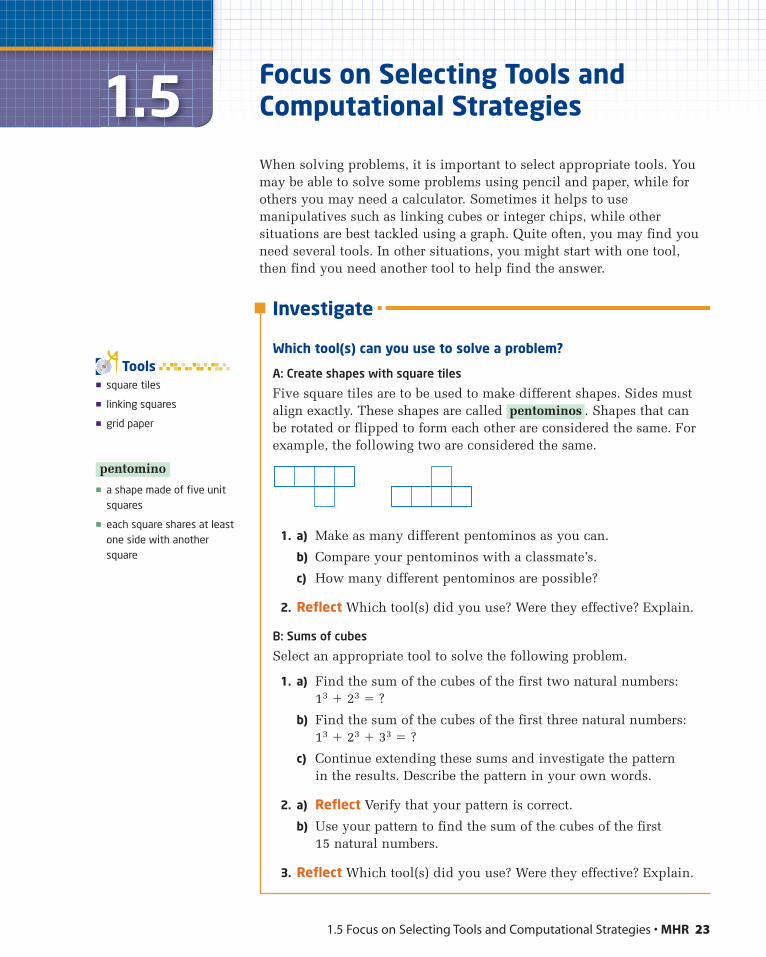
Five square tiles are to be used to make different shapes. Sides mustalign exactly. These shapes are called . Shapes that can be rotated or flipped to form each other are considered the same. Forexample, the following two are considered the same.
1. a) Make as many different pentominos as you can.
b) Compare your pentominos with a classmate’s.
c) How many different pentominos are possible?
2. Reflect Which tool(s) did you use? Were they effective? Explain.
B: Sums of cubes
Select an appropriate tool to solve the following problem.
1. a) Find the sum of the cubes of the first two natural numbers: 13 � 23 � ?
b) Find the sum of the cubes of the first three natural numbers: 13 � 23 � 33 � ?
c) Continue extending these sums and investigate the pattern in the results. Describe the pattern in your own words.
2. a) Reflect Verify that your pattern is correct.
b) Use your pattern to find the sum of the cubes of the first 15 natural numbers.
3. Reflect Which tool(s) did you use? Were they effective? Explain.
pentominos
� square tiles
� linking squares
� grid paper
Tools
� a shape made of five unitsquares
� each square shares at leastone side with anothersquare
pentomino
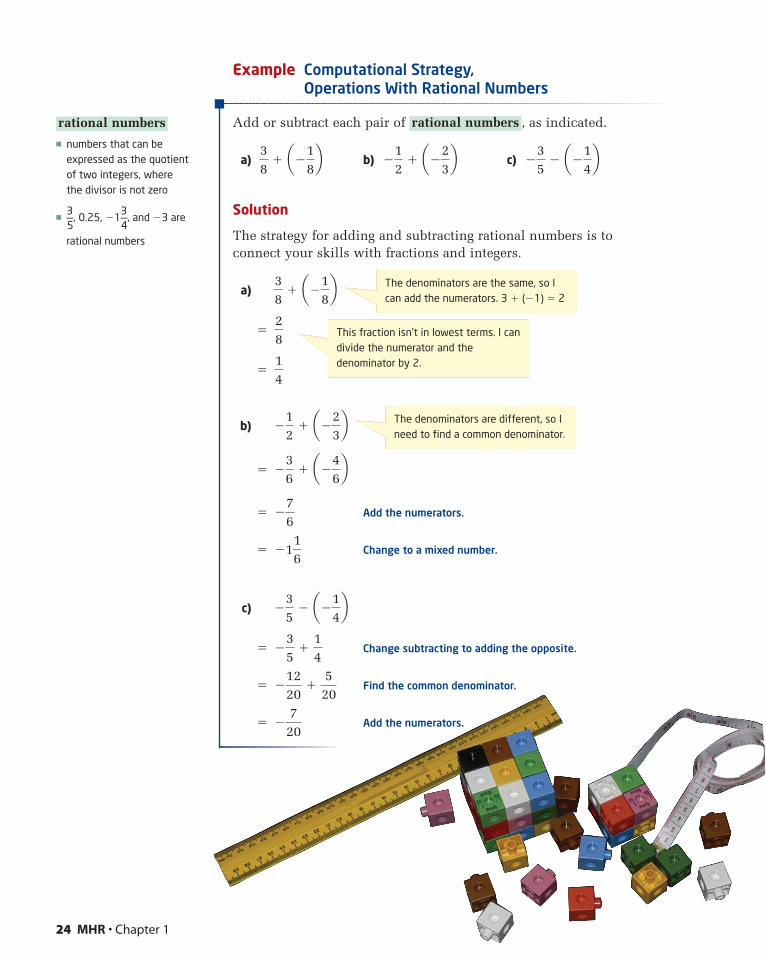
Example Computational Strategy, Operations With Rational Numbers
Add or subtract each pair of , as indicated.
a) b) c)
Solution
The strategy for adding and subtracting rational numbers is to connect your skills with fractions and integers.
a)
�
�
b)
�
� Add the numerators.
� Change to a mixed number.
c)
� Change subtracting to adding the opposite.
� Find the common denominator.
� Add the numerators.�720
�1220
�520
�35
�14
�35
� a�14b
�116
�76
�12
� a�23b
14
28
38
� a�18b
�35
� a�14b�
12
� a�23b3
8� a�1
8b
rational numbers
24 MHR • Chapter 1
� numbers that can beexpressed as the quotientof two integers, where the divisor is not zero
�3—5
, 0.25, �13—4
, and �3 are
rational numbers
rational numbers
The denominators are the same, so Ican add the numerators. 3 � (�1) � 2
The denominators are different, so Ineed to find a common denominator.
This fraction isn’t in lowest terms. I candivide the numerator and thedenominator by 2.
�36
� a�46b
1.5 Focus on Selecting Tools and Computational Strategies • MHR 25
Key Concepts� Tools such as calculators, physical models, graph paper, and
computers can help you solve problems.
� Choosing the best tool for a given situation can make you a moreefficient problem solver. For example,
• adding 10 and 20 on a scientific calculator would take longer than finding the sum mentally
• using a 30-cm ruler to measure the length of a soccer field would take longer than using a trundle wheel
� A variety of computational strategies need to be considered when investigating mathematical ideas and solving problems.
Communicate Your UnderstandingA Fermi problem asks how many times a truck wheel turns indriving along the 401 highway from Windsor to London. What tools would you use to solve this problem?
Ted used a calculator to evaluate the expression in the
following way:
� 0.6 � 0.7 � 0.1
� 1.2
Explain what Ted’s error was and how he could have used hiscalculator more appropriately.
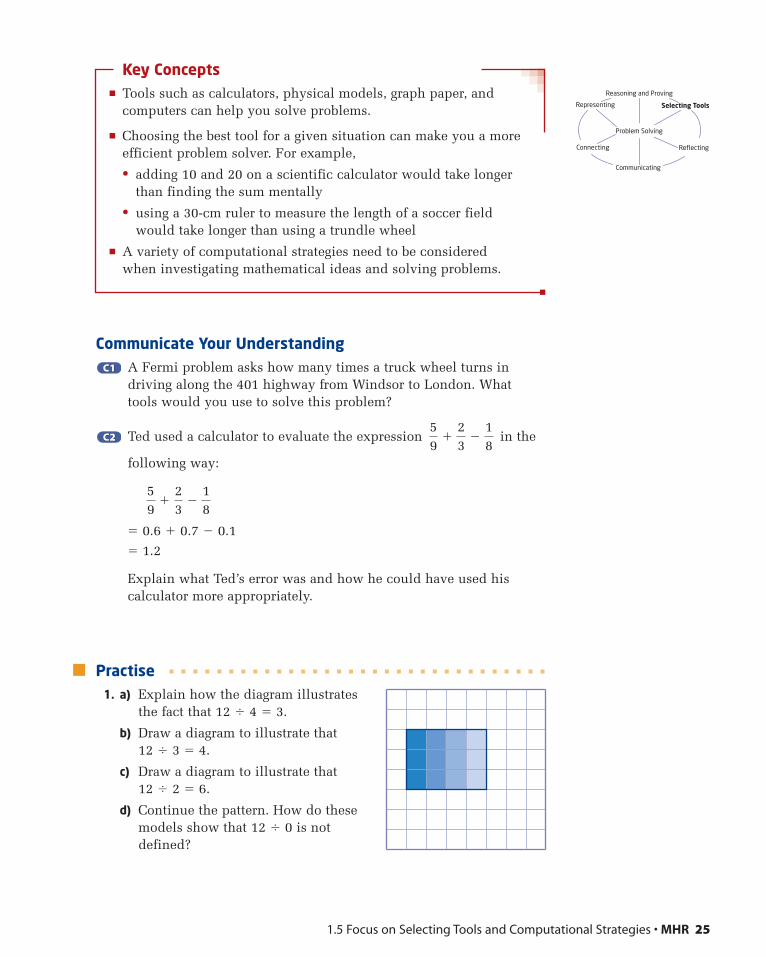
Practise1. a) Explain how the diagram illustrates
the fact that 12 � 4 � 3.
b) Draw a diagram to illustrate that12 � 3 � 4.
c) Draw a diagram to illustrate that12 � 2 � 6.
d) Continue the pattern. How do thesemodels show that 12 � 0 is notdefined?
59
�23
�18
59
�23
�18
C2C2
C1C1
Selecting ToolsRepresenting
Reasoning and Proving
Communicating
Connecting Reflecting
Problem Solving
2. a) Explain how the diagram illustrates the fact that
b) Use a visual tool to model .
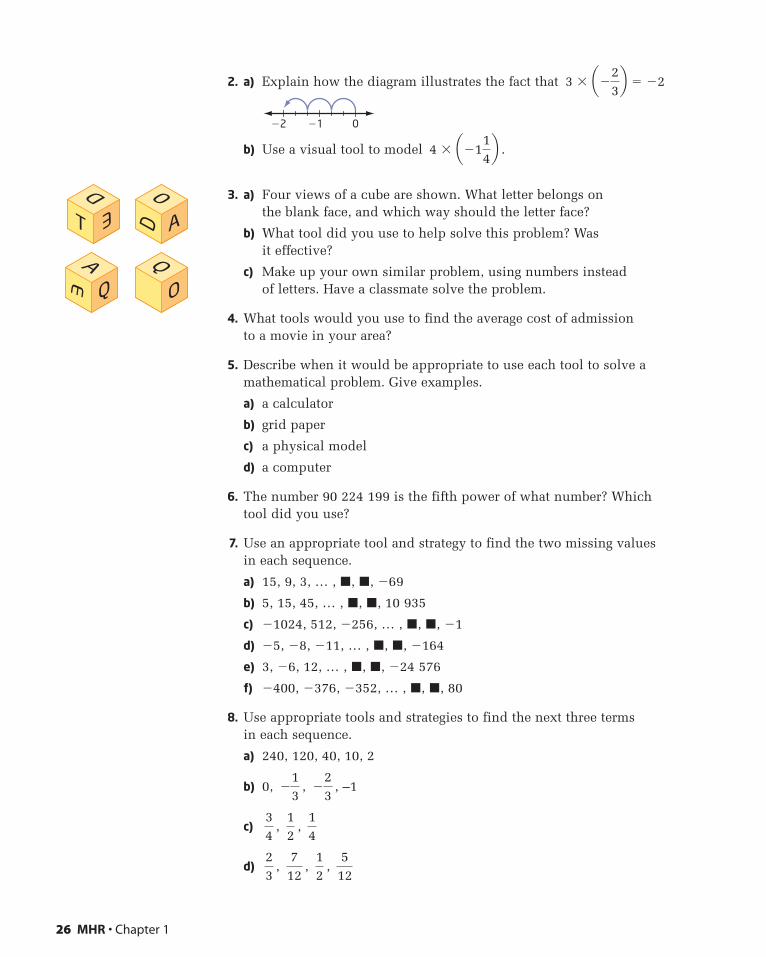
3. a) Four views of a cube are shown. What letter belongs on the blank face, and which way should the letter face?
b) What tool did you use to help solve this problem? Was it effective?
c) Make up your own similar problem, using numbers instead of letters. Have a classmate solve the problem.
4. What tools would you use to find the average cost of admission to a movie in your area?
5. Describe when it would be appropriate to use each tool to solve amathematical problem. Give examples.
a) a calculator
b) grid paper
c) a physical model
d) a computer
6. The number 90 224 199 is the fifth power of what number? Whichtool did you use?
7. Use an appropriate tool and strategy to find the two missing valuesin each sequence.
a) 15, 9, 3, … , �, �, �69
b) 5, 15, 45, … , �, �, 10 935
c) �1024, 512, �256, … , �, �, �1
d) �5, �8, �11, … , �, �, �164
e) 3, �6, 12, … , �, �, �24 576
f) �400, �376, �352, … , �, �, 80
8. Use appropriate tools and strategies to find the next three terms in each sequence.
a) 240, 120, 40, 10, 2
b) 0, , , –1
c) , ,
d) , , , 512
12
712
23
14
12
34
�23
�13
4 � a�114b
0�1�2
3 � a�23b � �2
26 MHR • Chapter 1
T
E
A
0D
E
Q O
QA
1.5 Focus on Selecting Tools and Computational Strategies • MHR 27
9. Find each sum.
a) b)
c) d)
10. Find each difference.
a) b)
c) d)
Connect and Apply11. The Example demonstrated how to add and subtract rational
numbers. Describe how to multiply and divide rational numbers.Provide examples.
12. Evaluate.
a) b)
c) d)
e) f)
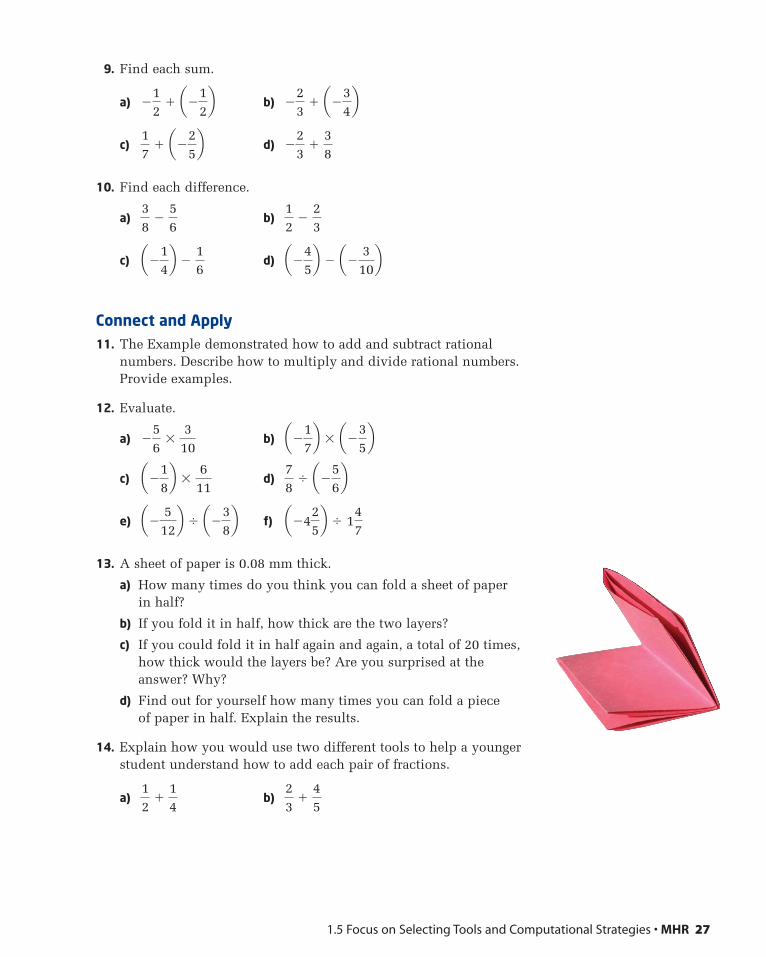
13. A sheet of paper is 0.08 mm thick.
a) How many times do you think you can fold a sheet of paper in half?
b) If you fold it in half, how thick are the two layers?
c) If you could fold it in half again and again, a total of 20 times,how thick would the layers be? Are you surprised at the answer? Why?
d) Find out for yourself how many times you can fold a piece of paper in half. Explain the results.
14. Explain how you would use two different tools to help a youngerstudent understand how to add each pair of fractions.
a) b)23
�45
12
�14
a�425b � 1
47
a� 512b � a�3
8b
78
� a�56ba�1
8b �
611
a�17b � a�3
5b�
56
�310
a�45b � a� 3
10ba�1
4b �
16
12
�23
38
�56
�23
�38
17
� a�25b
�23
� a�34b�
12
� a�12b
15. Use a geoboard or centimetre dot paper to find how many differentrectangles with a perimeter of 20 cm and whole-number side lengthscan be made. Find the area of each rectangle. Record your results ina table.
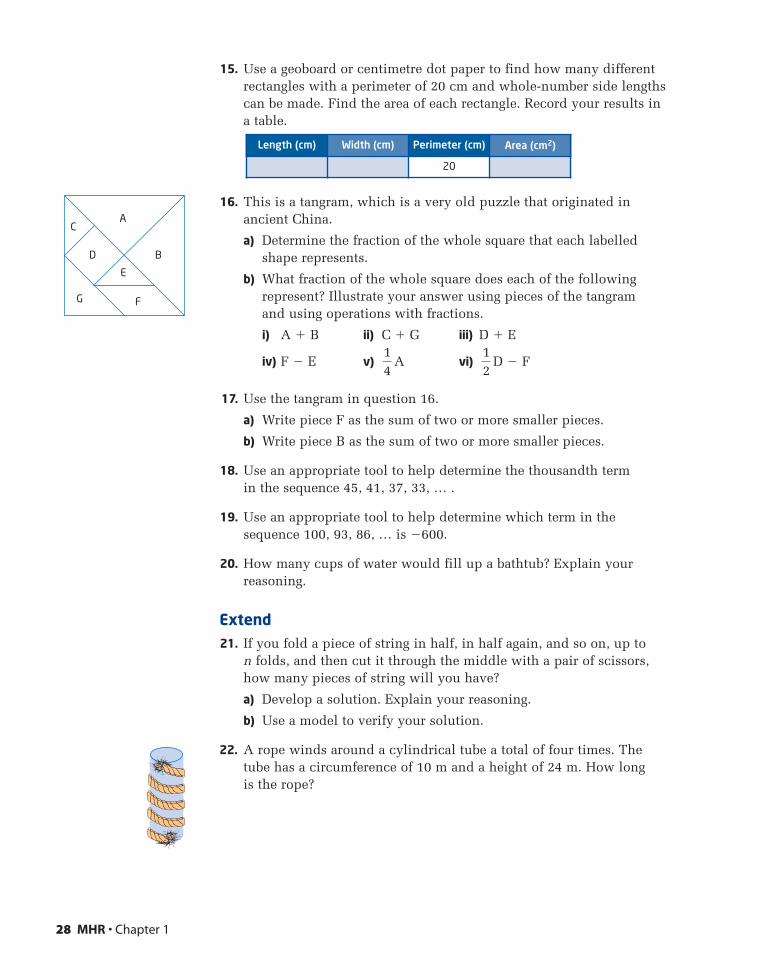
16. This is a tangram, which is a very old puzzle that originated inancient China.
a) Determine the fraction of the whole square that each labelledshape represents.
b) What fraction of the whole square does each of the followingrepresent? Illustrate your answer using pieces of the tangram and using operations with fractions.
i) A � B ii) C � G iii) D � E
iv) F � E v) A vi) D � F
17. Use the tangram in question 16.
a) Write piece F as the sum of two or more smaller pieces.
b) Write piece B as the sum of two or more smaller pieces.
18. Use an appropriate tool to help determine the thousandth term in the sequence 45, 41, 37, 33, … .
19. Use an appropriate tool to help determine which term in thesequence 100, 93, 86, … is �600.
20. How many cups of water would fill up a bathtub? Explain yourreasoning.
Extend21. If you fold a piece of string in half, in half again, and so on, up to
n folds, and then cut it through the middle with a pair of scissors,how many pieces of string will you have?
a) Develop a solution. Explain your reasoning.
b) Use a model to verify your solution.
22. A rope winds around a cylindrical tube a total of four times. Thetube has a circumference of 10 m and a height of 24 m. How long is the rope?
12
14
Length (cm) Width (cm) Perimeter (cm) Area (cm2)
20
28 MHR • Chapter 1
A
D
E
F
B
C
G
1.6 Focus on Reasoning and Proving • MHR 29
Focus on Reasoning and Proving
Investigate
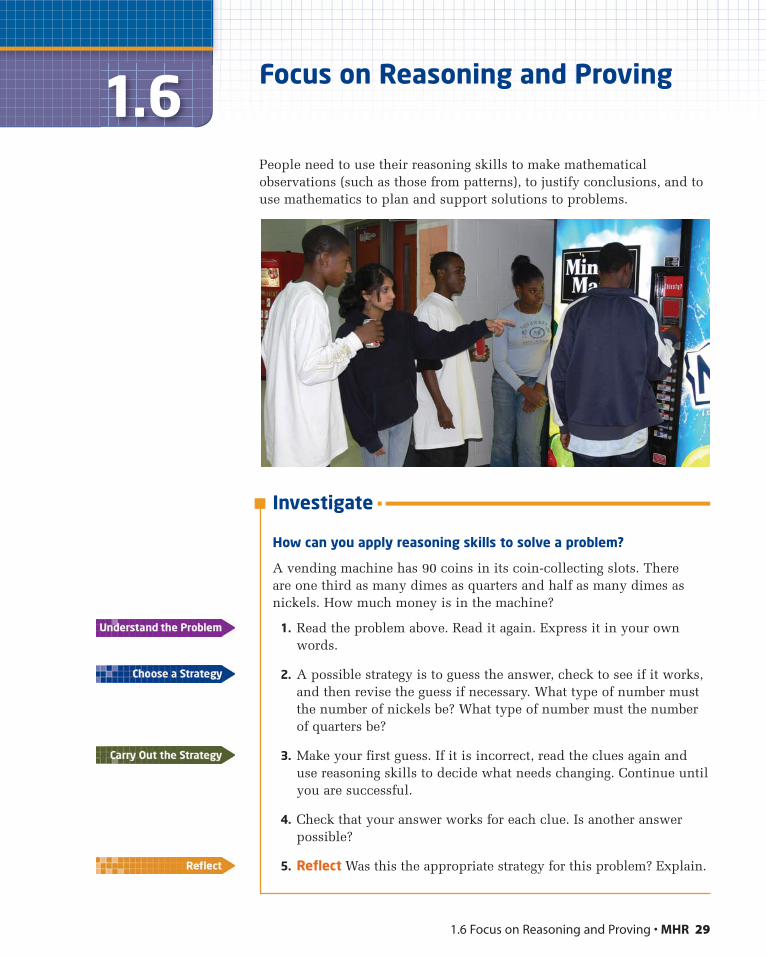
How can you apply reasoning skills to solve a problem?
A vending machine has 90 coins in its coin-collecting slots. There are one third as many dimes as quarters and half as many dimes asnickels. How much money is in the machine?
1. Read the problem above. Read it again. Express it in your ownwords.
2. A possible strategy is to guess the answer, check to see if it works,and then revise the guess if necessary. What type of number mustthe number of nickels be? What type of number must the numberof quarters be?
3. Make your first guess. If it is incorrect, read the clues again anduse reasoning skills to decide what needs changing. Continue untilyou are successful.
4. Check that your answer works for each clue. Is another answerpossible?
5. Reflect Was this the appropriate strategy for this problem? Explain.
People need to use their reasoning skills to make mathematicalobservations (such as those from patterns), to justify conclusions, and touse mathematics to plan and support solutions to problems.
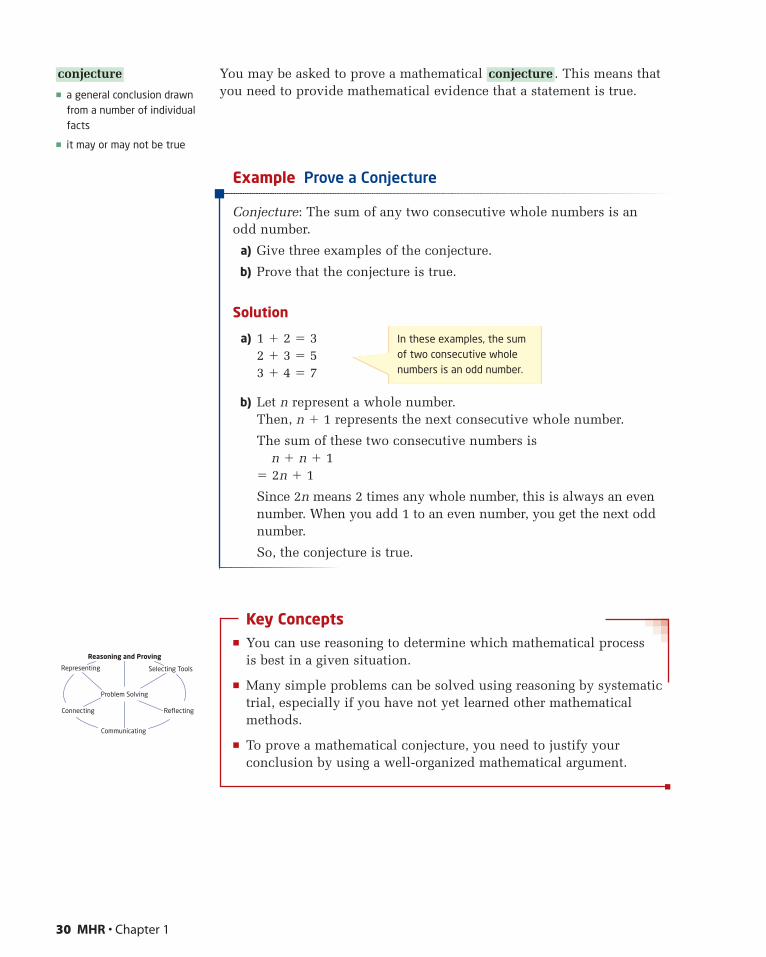
You may be asked to prove a mathematical . This means thatyou need to provide mathematical evidence that a statement is true.
Example Prove a Conjecture
Conjecture: The sum of any two consecutive whole numbers is an odd number.
a) Give three examples of the conjecture.
b) Prove that the conjecture is true.
Solution
a) 1 � 2 � 32 � 3 � 53 � 4 � 7
b) Let n represent a whole number.Then, n � 1 represents the next consecutive whole number.
The sum of these two consecutive numbers isn � n � 1
� 2n � 1
Since 2n means 2 times any whole number, this is always an evennumber. When you add 1 to an even number, you get the next oddnumber.
So, the conjecture is true.
Key Concepts� You can use reasoning to determine which mathematical process
is best in a given situation.
� Many simple problems can be solved using reasoning by systematictrial, especially if you have not yet learned other mathematicalmethods.
� To prove a mathematical conjecture, you need to justify yourconclusion by using a well-organized mathematical argument.
conjecture
30 MHR • Chapter 1
� a general conclusion drawnfrom a number of individualfacts
� it may or may not be true
conjecture
In these examples, the sumof two consecutive wholenumbers is an odd number.
Selecting ToolsRepresenting
Reasoning and Proving
Communicating
Connecting Reflecting
Problem Solving
1.6 Focus on Reasoning and Proving • MHR 31
Communicate Your UnderstandingJay’s method for solving the problem “Which power of �2 is closestto �300?” is shown.
(�2)5 � �32(�2)6 � 64(�2)7 � �128 ⇒ �300 � (�512) � 212(�2)8 � 256 ⇒ �300 � (�128) � �172(�2)9 � �512
The power of �2 that is closest to �300 is (�2)7.
a) Describe Jay’s strategy.
b) Do you think this was the most efficient strategy? Explain.
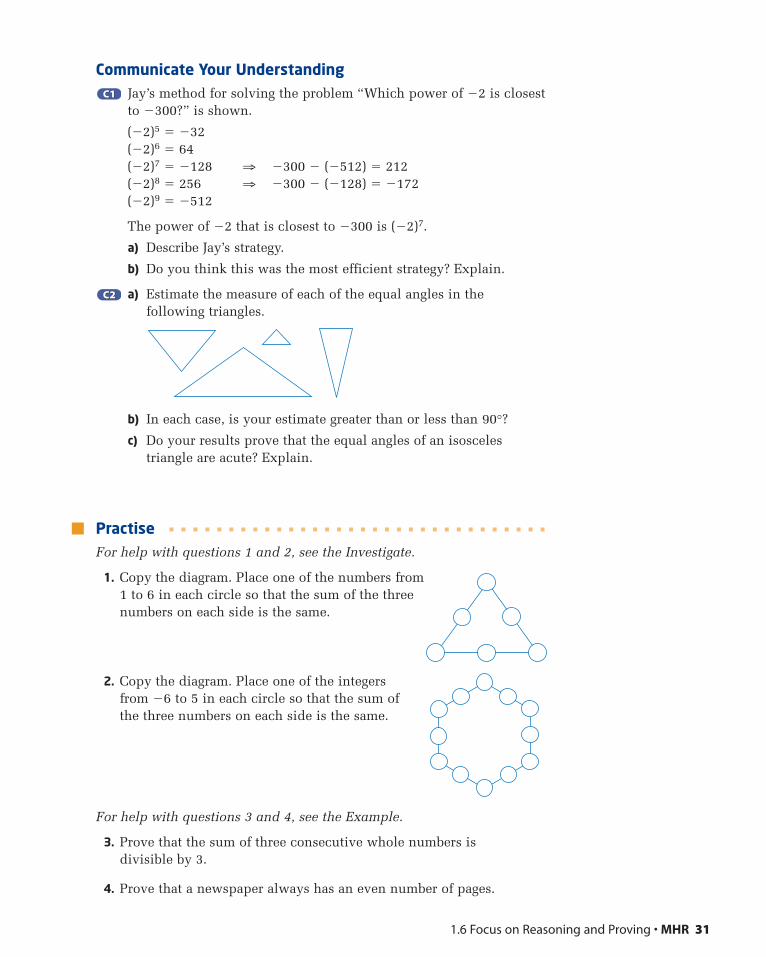
a) Estimate the measure of each of the equal angles in the following triangles.
b) In each case, is your estimate greater than or less than 90°?
c) Do your results prove that the equal angles of an isoscelestriangle are acute? Explain.
PractiseFor help with questions 1 and 2, see the Investigate.
1. Copy the diagram. Place one of the numbers from1 to 6 in each circle so that the sum of the threenumbers on each side is the same.
2. Copy the diagram. Place one of the integersfrom �6 to 5 in each circle so that the sum ofthe three numbers on each side is the same.
For help with questions 3 and 4, see the Example.
3. Prove that the sum of three consecutive whole numbers is divisible by 3.
4. Prove that a newspaper always has an even number of pages.
C2C2
C1C1
Connect and ApplyIn each problem, write one or two sentences to describe your strategy.Then, carry out your strategy and justify your solution. Reflect anddecide if your strategy was an appropriate one.
5. Paul claims that you only need seven coins to be able to make anyamount of money up to 50¢. Show that Paul is correct.
6. Copy the numbers in the order shown. Replace each � with some of the symbols �, �, �, �, ( ), and � to make true statements.
a) 5 � 2 � 8 � 3 � 15 b) 25 � 5 � 11 � 25 � 9
c) � � � d) � �
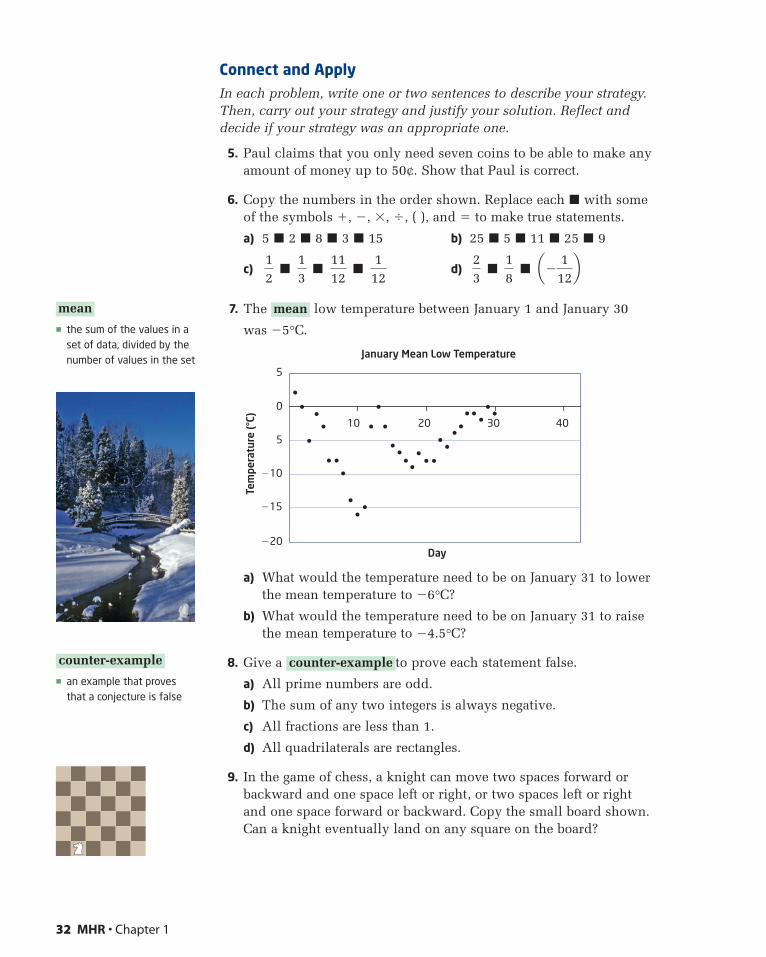
7. The low temperature between January 1 and January 30
was �5°C.
a) What would the temperature need to be on January 31 to lowerthe mean temperature to �6°C?
b) What would the temperature need to be on January 31 to raise the mean temperature to �4.5°C?
8. Give a to prove each statement false.
a) All prime numbers are odd.
b) The sum of any two integers is always negative.
c) All fractions are less than 1.
d) All quadrilaterals are rectangles.
9. In the game of chess, a knight can move two spaces forward orbackward and one space left or right, or two spaces left or right and one space forward or backward. Copy the small board shown.Can a knight eventually land on any square on the board?
counter-example
Day
January Mean Low Temperature
�20
�15
�10
5
10 20 30 40
0
5
Tem
pera
ture
(°C)
mean
a� 112b1
823
112
1112
13
12
32 MHR • Chapter 1
� the sum of the values in aset of data, divided by thenumber of values in the set
mean
� an example that provesthat a conjecture is false
counter-example
1.6 Focus on Reasoning and Proving • MHR 33
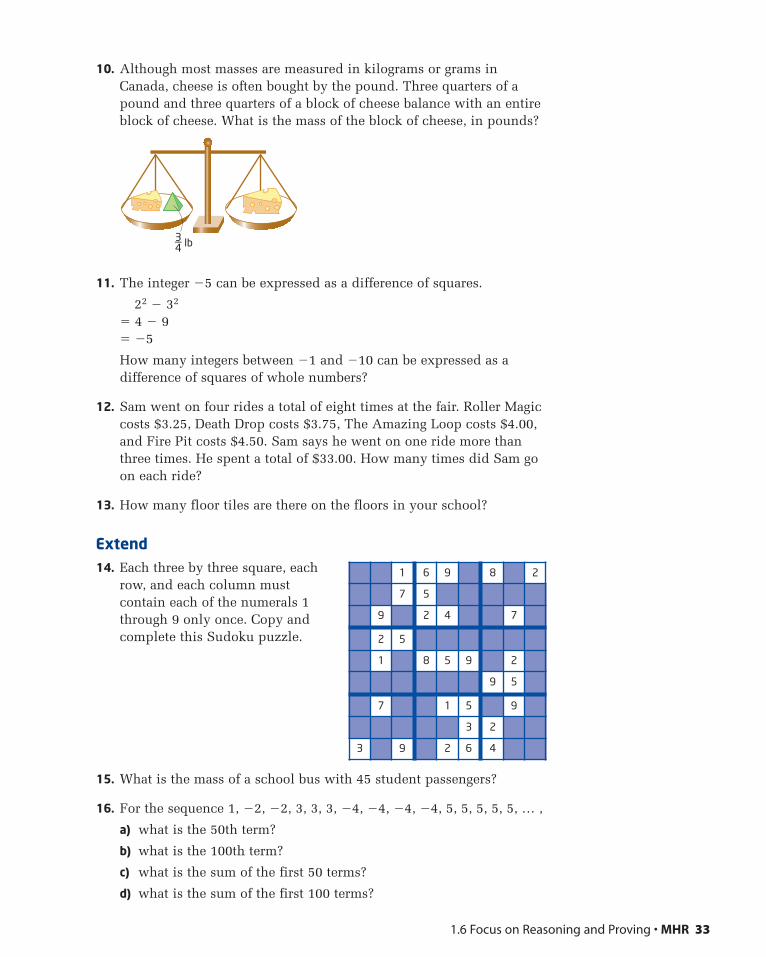
10. Although most masses are measured in kilograms or grams inCanada, cheese is often bought by the pound. Three quarters of apound and three quarters of a block of cheese balance with an entireblock of cheese. What is the mass of the block of cheese, in pounds?
11. The integer �5 can be expressed as a difference of squares.
22 � 32
� 4 � 9� �5
How many integers between �1 and �10 can be expressed as adifference of squares of whole numbers?
12. Sam went on four rides a total of eight times at the fair. Roller Magiccosts $3.25, Death Drop costs $3.75, The Amazing Loop costs $4.00,and Fire Pit costs $4.50. Sam says he went on one ride more thanthree times. He spent a total of $33.00. How many times did Sam goon each ride?
13. How many floor tiles are there on the floors in your school?
Extend14. Each three by three square, each
row, and each column mustcontain each of the numerals 1through 9 only once. Copy andcomplete this Sudoku puzzle.
15. What is the mass of a school bus with 45 student passengers?
16. For the sequence 1, �2, �2, 3, 3, 3, �4, �4, �4, �4, 5, 5, 5, 5, 5, … ,
a) what is the 50th term?
b) what is the 100th term?
c) what is the sum of the first 50 terms?
d) what is the sum of the first 100 terms?
3––4 lb
1 6 9 8 2
7 5
9 2 4 7
2 5
1 8 5 9 2
9 5
7 1 5 9
3 2
3 9 2 6 4

34 MHR • Chapter 1
Focus on Reflecting
When you solve a problem, you need to regularly check and re-checkyour thought processes.
• Is your strategy the best one?• Are you checking to make sure you are not making any errors?• Have you considered alternative strategies or the use of different tools?• Does your answer make sense?• Can you verify that your solution is correct?
Reflecting on your processes will make you a better problem solver.
Investigate
How can the process of reflecting help you solve problems?
A: Möbius strip
How can a sheet of paper have only one side?
1. Cut a strip of paper about 4 cm wideand 28 cm long. Twist it a half turnand tape the ends together. This iscalled a Möbius strip.
2. Draw a line along one face of thepaper without lifting your pencil.Describe what happened.
3. Predict what would happen if you cutall the way along this line.
4. Test your hypothesis. What happened? Explain.
5. Make another Möbius strip. This time, draw two lines, each one-third of the distance from each edge. Then, cut along the two lines.
6. Reflect What happened? Can you explain why the result wasdifferent?
B: Strategies
How many numbers between 1 and 100 are divisible by 7?
1. Devise two strategies that would be efficient in solving thisproblem.
2. Solve the problem in two ways, using both strategies.
3. Reflect Explain which strategy was more effective.
� paper strips
� tape
� pencil
Tools
Key Concepts� As you solve a problem, indicate, in words or symbols, what
your strategy is, so you can evaluate it later on.
� Reflect back to evaluate the effectiveness of your strategies and to verify that your solution is correct.
� If you determine that the solution was incorrect, check to see if your steps were done correctly, or try a different strategy.
Communicate Your UnderstandingTo answer the problem, “Find five odd numbers that add up to 55,”Ben used the strategy of systematic trial.
a) Ben’s first trial was 3 � 5 � 7 � 9 � 11 � 35. What might hisnext trial be? Why?
b) Do you think that systematic trial is a good strategy for thisproblem? Explain.
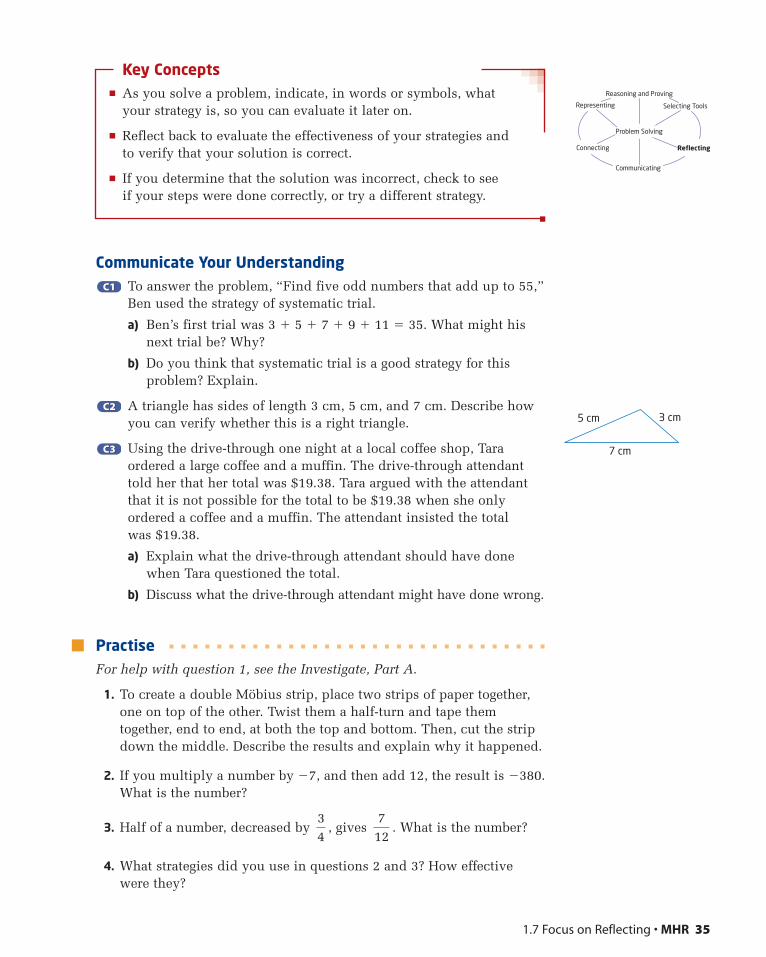
A triangle has sides of length 3 cm, 5 cm, and 7 cm. Describe howyou can verify whether this is a right triangle.
Using the drive-through one night at a local coffee shop, Taraordered a large coffee and a muffin. The drive-through attendanttold her that her total was $19.38. Tara argued with the attendantthat it is not possible for the total to be $19.38 when she onlyordered a coffee and a muffin. The attendant insisted the total was $19.38.
a) Explain what the drive-through attendant should have donewhen Tara questioned the total.
b) Discuss what the drive-through attendant might have done wrong.
PractiseFor help with question 1, see the Investigate, Part A.
1. To create a double Möbius strip, place two strips of paper together,one on top of the other. Twist them a half-turn and tape themtogether, end to end, at both the top and bottom. Then, cut the stripdown the middle. Describe the results and explain why it happened.
2. If you multiply a number by �7, and then add 12, the result is �380.What is the number?
3. Half of a number, decreased by , gives . What is the number?
4. What strategies did you use in questions 2 and 3? How effectivewere they?
712
34
C3C3
C2C2
C1C1
1.7 Focus on Reflecting • MHR 35
5 cm 3 cm
7 cm
Selecting ToolsRepresenting
Reasoning and Proving
Communicating
Connecting Reflecting
Problem Solving
5. What is the least number divisible by all of the integers 1 through 9?Explain your strategy and whether it was effective.
Connect and Apply6. a) Using only the integers �3, �2, �1, 0, 1, 2, and 3, find all
solutions to X � Y � Z � �5. You may repeat numbers.
b) What strategy did you use? Was it effective? Explain.
7. a) Multiply 1 � 2 � 3 � 4. b) Calculate 52 � 1.
c) Multiply 2 � 3 � 4 � 5. d) Calculate 112 � 1.
e) Multiply 4 � 5 � 6 � 7. f) Calculate 292 � 1.
g) Describe a rule that this pattern seems to illustrate.
h) Verify your rule by trying it with two more examples.
i) Did your examples work? If not, try to develop a different ruleand verify it.
8. In a video game, a character has been programmed to start at 60 pixelsto the left of centre. The character moves 90 pixels to the right, then75 pixels to the left, then 60 pixels to the right, and so on.
a) The character disappears when it lands on zero, the centre. Afterhow many moves will this occur?
b) Verify that your answer is correct.
9. How many numbers between 1 and 100 are divisible by either 2 or3? Explain your strategy and verify that it works.
10. A recipe calls for 1 kg of flour, 500 mL of milk, 2 eggs, and 125 g ofsugar. To triple the recipe, Karen calculated that she needed 3 kg offlour, 15 L of milk, 6 eggs, and 3.75 kg of sugar.
a) Without calculating the correct amounts, find Karen’s errors, anddescribe the clues to her errors.
b) Verify that your discoveries are correct.
Extend11. How many square metres of pizza are ordered in Ontario in a year?
12. In a magic square, the rows, columns, and diagonals each add to thesame sum.
a) Construct a magic square using these numbers:
i) 1, 2, 3, 4, 5, 6, 7, 8, 9
ii) �4, �3, �2, �1, 0, 1, 2, 3, 4
b) Describe the strategies that you used.
36 MHR • Chapter 1
A pixel is a single grid point ona computer or TV screen. Manyscreens are 640 pixels acrossand 480 pixels high.
onnectionsLiterac
diagonalscolumns
rows
Chapter 1 Review • MHR 37
Chapter 1 Review
For each question, try to use the mostappropriate tools, computational methods, and problem solving strategies. Providecomplete justification for each solution.
1. Continue each pattern for three more terms.Describe how to find successive terms.
a) 12, 9, 6, 3 b) 7, 14, 28
c) 5, 6, 8, 11 d) 3, �1, �6, �12
2. A fence will be built to enclose a 100-m by 70-m field. It will need a post at eachcorner and one every 5 m. How many posts are needed?
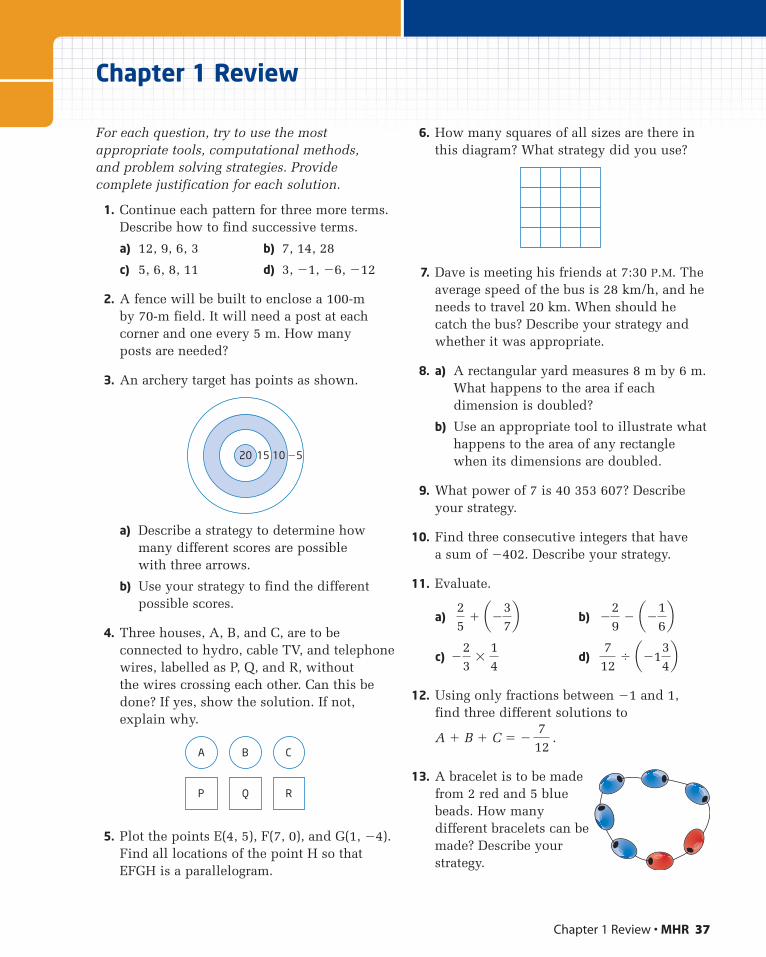
3. An archery target has points as shown.
a) Describe a strategy to determine howmany different scores are possible with three arrows.
b) Use your strategy to find the differentpossible scores.
4. Three houses, A, B, and C, are to beconnected to hydro, cable TV, and telephonewires, labelled as P, Q, and R, without the wires crossing each other. Can this bedone? If yes, show the solution. If not,explain why.
5. Plot the points E(4, 5), F(7, 0), and G(1, �4).Find all locations of the point H so thatEFGH is a parallelogram.
6. How many squares of all sizes are there inthis diagram? What strategy did you use?
7. Dave is meeting his friends at 7:30 P.M. Theaverage speed of the bus is 28 km/h, and heneeds to travel 20 km. When should hecatch the bus? Describe your strategy andwhether it was appropriate.
8. a) A rectangular yard measures 8 m by 6 m.What happens to the area if eachdimension is doubled?
b) Use an appropriate tool to illustrate whathappens to the area of any rectanglewhen its dimensions are doubled.
9. What power of 7 is 40 353 607? Describeyour strategy.
10. Find three consecutive integers that have a sum of �402. Describe your strategy.
11. Evaluate.
a) b)
c) d)
12. Using only fractions between �1 and 1, find three different solutions to
A � B � C � � .
13. A bracelet is to be madefrom 2 red and 5 bluebeads. How manydifferent bracelets can bemade? Describe yourstrategy.
712
712
� a�134b�
23
�14
�29
� a�16b2
5� a�3
7b
A B C
P Q R
20 15 10 �5
Vocabulary
hypothesisstatisticsprimary datasecondary datasamplepopulationcensusrandom sample
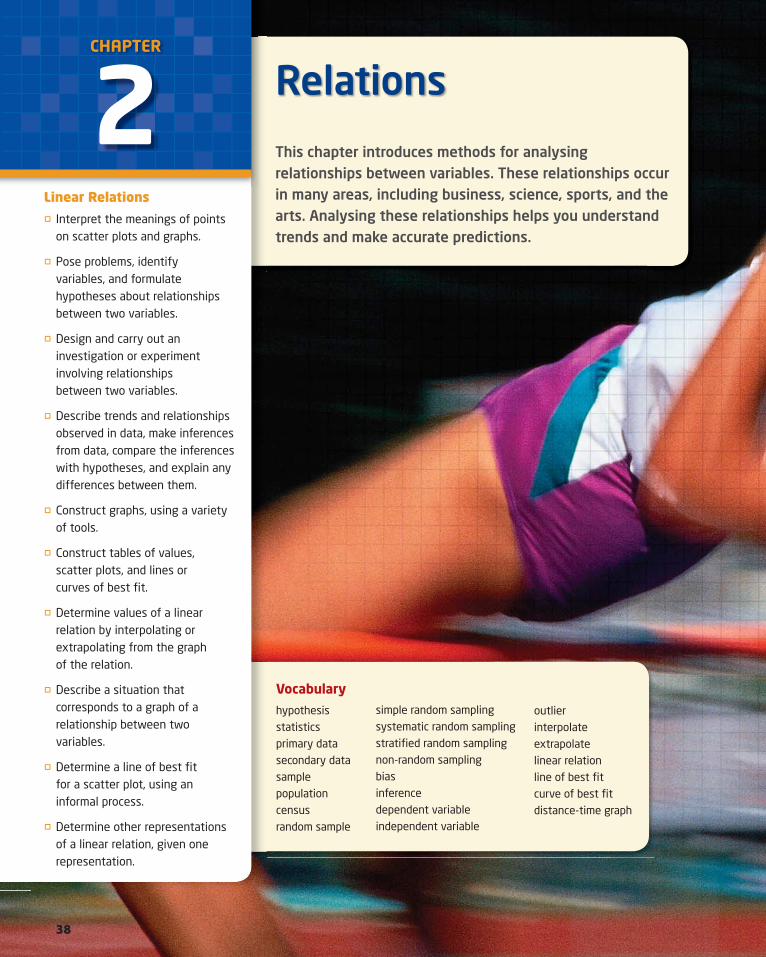
Relations
This chapter introduces methods for analysing relationships between variables. These relationships occur in many areas, including business, science, sports, and the arts. Analysing these relationships helps you understand trends and make accurate predictions.
CHAPTER
2Linear Relations� Interpret the meanings of points
on scatter plots and graphs.
� Pose problems, identify variables, and formulate hypotheses about relationships between two variables.
� Design and carry out an investigation or experiment involving relationships between two variables.
� Describe trends and relationships observed in data, make inferences from data, compare the inferences with hypotheses, and explain any differences between them.
� Construct graphs, using a variety of tools.
� Construct tables of values, scatter plots, and lines or curves of best fi t.
� Determine values of a linear relation by interpolating or extrapolating from the graph of the relation.
� Describe a situation that corresponds to a graph of a relationship between two variables.
� Determine a line of best fi t for a scatter plot, using an informal process.
� Determine other representations of a linear relation, given one representation.
simple random samplingsystematic random samplingstratifi ed random samplingnon-random samplingbiasinferencedependent variableindependent variable
outlierinterpolateextrapolatelinear relationline of best fi tcurve of best fi tdistance-time graph
38
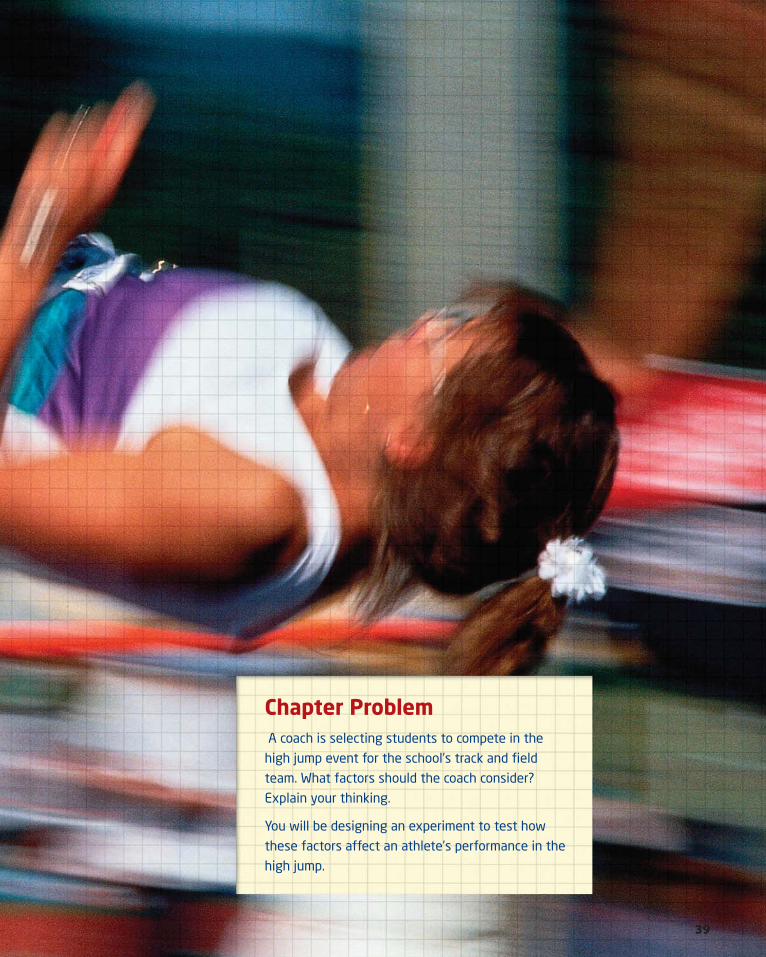
Chapter Problem A coach is selecting students to compete in the
high jump event for the school’s track and fi eld
team. What factors should the coach consider?
Explain your thinking.
You will be designing an experiment to test how
these factors affect an athlete’s performance in the
high jump.
39

1. This graph shows data from a survey taken by Statistics Canada.
a) What do the heights of the bars represent?
b) Which province has the greatestunemployment rate?
c) In what region did people havethe best chance of finding work in2003? Why?Adapted from Statistics Canada, CANSIMdatabase, Table 109-5204, accessed viahttp://estat.statcan.ca, February 2006.
2. This graph shows exchange ratesbetween the U.S. dollar and theCanadian dollar in 2005.
a) What is the lowest value of the U.S. dollar shown on the graph?
b) When was the value of the U.S.dollar the greatest compared tothe Canadian dollar?
c) Describe any pattern you see in the graph.
40 MHR • Chapter 2
Bar GraphsThis bar graph shows the number of tickets soldduring one week at the Main Street Cinema.
The graph shows that the cinema sold the fewesttickets on Monday and the most on Saturday.The attendance increases from Monday toSaturday but drops on Sunday.
1400
1600
1200
1000
800
600
400
200
0
MonTuesWedThursFri Sat Sun
Cinema Ticket Sales
Tick
et S
ales
0
British
ColumbiaAlberta
Saska
tchewan
Manito
ba
Ontario
Québec
Nova S
cotia
New Bru
nswick
Prince
Edward
Islan
d
Newfoundlan
d
and La
brador
Unemployment in 2003
Rat
e (%
)
5
10
15
20
1.25
1.26
U.S. Dollar Exchange Rates in 2005
Valu
e in
Can
adia
n D
olla
rs 1.24
1.23
1.22
1.21
1.20
1.19
1.18
1.17
1.160
JanFeb
MarApr
May Jun JulAug
OctSept
NovDec
3. Every hour for 7 h, a biology studentcounted the number of larvae that hatchedfrom a batch of fruit fly eggs. Here are the student’s data.
a) Make a scatter plot of the data. Put timeon the x-axis and the number of larvaeon the y-axis. Label the axes, and includea title for the scatter plot.
b) Estimate the number of larvae hatchedafter 4.5 h.
4. This table shows the mean air pressure at various altitudes.
a) Make a scatter plot of the data. Putaltitude on the x-axis and air pressure on the y-axis. Label the axes, and includea title for the scatter plot.
b) Estimate the air pressure at an altitude of 18 km.
Altitude(km)
0 5 10 15 20 25 30
Air Pressure(kPa)
101.3 54.0 26.0 12.0 5.5 2.5 1.2Time (h) 0 1 2 3 4 5 6
Number ofLarvae
5 10 21 43 82 168 320
Get Ready • MHR 41
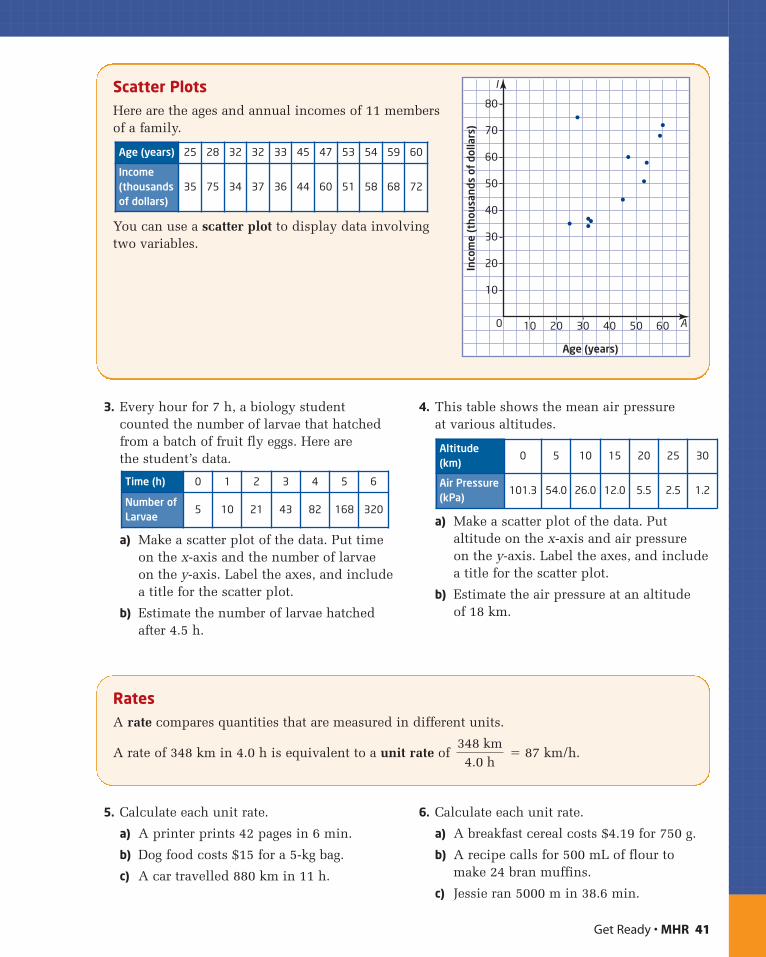
Scatter PlotsHere are the ages and annual incomes of 11 membersof a family.
You can use a scatter plot to display data involvingtwo variables.
I
A0
10
20
30
40
50
60
70
80
10 20 30 40 50 60
Age (years)
Inco
me
(tho
usan
ds o
f do
llars
)
5. Calculate each unit rate.
a) A printer prints 42 pages in 6 min.
b) Dog food costs $15 for a 5-kg bag.
c) A car travelled 880 km in 11 h.
6. Calculate each unit rate.
a) A breakfast cereal costs $4.19 for 750 g.
b) A recipe calls for 500 mL of flour tomake 24 bran muffins.
c) Jessie ran 5000 m in 38.6 min.
RatesA rate compares quantities that are measured in different units.
A rate of 348 km in 4.0 h is equivalent to a unit rate of � 87 km/h.348 km
4.0 h
Age (years) 25 28 32 32 33 45 47 53 54 59 60
Income(thousandsof dollars)
35 75 34 37 36 44 60 51 58 68 72
42 MHR • Chapter 2
2.1 Hypotheses and Sources of Data
Some people think that driversof red cars are more likely thanother drivers to have anaccident. How can you tell ifthis opinion is valid? First,write a that clearlystates what you want to proveor disprove. You can use
to test whether thehypothesis is likely to be true.
For example, you could startwith the hypothesis that theaccident rate for red cars ishigher than that for other cars. You could then use data from accidentreports or insurance claims to see if your hypothesis is correct. Often, itis not practical to collect enough data to determine for certain whether ahypothesis is true.
statistics
hypothesis
Investigate
How do you state a hypothesis?
1. Write a hypothesis for each question.
a) What percent of students in your school will get a driver’s licence this year?
b) Is television advertising more effective than newspaperadvertising?
c) Do people consider price or brand more important when buying toothpaste?
d) Do boys and girls have different study habits?
e) How often do people use the phonebook?
f) Which sport do teenagers like the most?
2. Do all hypotheses have to include numbers? How could you classify different types of hypotheses?
3. Reflect What information would you need to test each hypothesis in step 1?
All hypotheses are either true or false. If a hypothesis is false, then its opposite must be true.
� a theory or statement thatis either true or false
� numerical data, or thecollection, organization,and analysis of numericaldata
statistics
hypothesis
Example 1 State a Hypothesis and Its Opposite
Write a hypothesis about a relationship between the variables in each pair. Then, give the opposite hypothesis.
a) a driver’s age and the risk of having an accident
b) attendance at school and marks
c) the heights of boys and the heights of girls
Solution
There are many possible hypotheses. Here is one example for eachpair of variables.
a) Hypothesis: As drivers age, their risk of having an accidentincreases.Opposite: As drivers age, their risk of having an accident does notincrease. You can state the opposite another way: As drivers age,their risk of having an accident either decreases or stays the same.
b) Hypothesis: Students’ marks decrease as they miss more classes.Opposite: Students’ marks do not decrease as they miss more classes.
c) Hypothesis: On average, boys and girls of the same age are thesame height.Opposite: On average, boys and girls of the same age are not thesame height.
Data Sources
Often, you need data to test a hypothesis. Researchers must decidewhether to collect new data or use data that other people have alreadycollected. come from experiments and surveys done by the
researchers. Researchers can find in sources such aspublications, the Internet, and surveys done by Statistics Canada.
Example 2 Identify Primary and Secondary Data
Explain whether each set of data is primary or secondary. What are theadvantages and any disadvantages of each person’s choice of data source?
a) Daniel telephoned 100 families in his town to ask them how manypets they have.
b) Cathy used data from Statistics Canada to determine theproportion of households in Canada that have at least one car.
c) Anja found a Web site with the results from a survey on thespending habits of teenagers across Canada.
d) Tomas checked the Web sites of 24 stores for the price of the latestHarry Potter DVD.
secondary data
Primary data
2.1 Hypotheses and Sources of Data • MHR 43
� original data that aresearcher gathersspecifically for a particularexperiment or survey
� data that someone elsehas already gathered forsome other purpose
secondary data
primary data
Solution
a) The telephone interviews produce primary data because Danielperformed the survey himself. The telephone survey is easy to do,but time-consuming. Data on pets in his town are unlikely to beavailable from a secondary source.
b) Cathy is using a secondary source since Statistics Canada gatheredthe survey data. Statistics Canada is an excellent source because itcollects data from a huge number of families all across Canada.Cathy could never gather that much data by herself.
c) The Web site is a secondary source since Anja did not collect thesurvey data herself. The Web site is a convenient way to get surveyresults. It might take Anja a lot of time and expense to gathersimilar data herself. However, data on Web sites are not alwaysreliable. Anja should check who did the survey and whether theresults are complete and accurate. When a business or organizationdoes a survey, they sometimes publish only data that arefavourable to them.
d) Tomas used the Web sites as a way to survey the prices that thevideo stores charged for the DVD. So, Tomas collected primarydata from the Internet. This method was probably faster andcheaper than phoning all the video stores.
Key Concepts� A hypothesis is a statement that can be tested to determine if
it is likely to be true.
� Primary data are new information collected by a researcher.
� Secondary data are existing data that were gathered for some other purpose.
Communicate Your Understandinga) Give an example of a hypothesis that involves numbers.
b) Give an example of a hypothesis that does not involve numbers.
c) Describe how you could test each hypothesis.
Is it always better to use primary data when testing a hypothesis?Explain why or why not.
C2C2
C1C1
44 MHR • Chapter 2
Your school can get free accessto data from Statistics Canadathrough its educational Webresource, Σ -STAT.
Did You Know ?
PractiseFor help with questions 1 and 2, see Example 1.
1. State the opposite of each hypothesis.
a) Most people’s favourite number is 7.
b) Adults spend more time listening to classical music than to rap.
c) In Ontario, more teenagers join soccer teams than hockey teams.
d) Chocolate is not the most popular flavour of ice cream.
2. State a hypothesis about a relationship between each pair ofvariables. Then, state the opposite of each hypothesis.
a) a student’s age and time spent doing homework
b) a mother’s height and the height of her children
c) temperature and crime rates
d) the cost of gasoline and the number of people using public transit
For help with questions 3 and 4, see Example 2.
3. Which of the following data are primary and which are secondary?Explain.
a) An office manager hands out a questionnaire to see if employeeswant to work earlier hours during the summer.
b) A student finds data on Internet use in a report published byStatistics Canada.
c) A researcher collects information about how far people travel onpublic transit by talking to passengers on the buses.
d) A researcher downloads data about the length of rides taken onpublic transit from a transit authority’s Web site.
4. Identify each data source as primary or secondary. State oneadvantage of each source of data.
a) A researcher interviewed 100 students about their study habits.
b) A sporting goods company searched on the Internet for data onhow Canadians spend their leisure time.
c) A manufacturer surveyed 1000 recent customers about possiblechanges to a product.
d) A student found advertisements in out-of-town newspapers at a library to check admission prices at theatresacross the country.
Connect and Apply5. a) Make a hypothesis about whether the students in
your class prefer cats or dogs as pets.
b) Describe how you could test your hypothesis.Explain whether you would use primary orsecondary data.
2.1 Hypotheses and Sources of Data • MHR 45
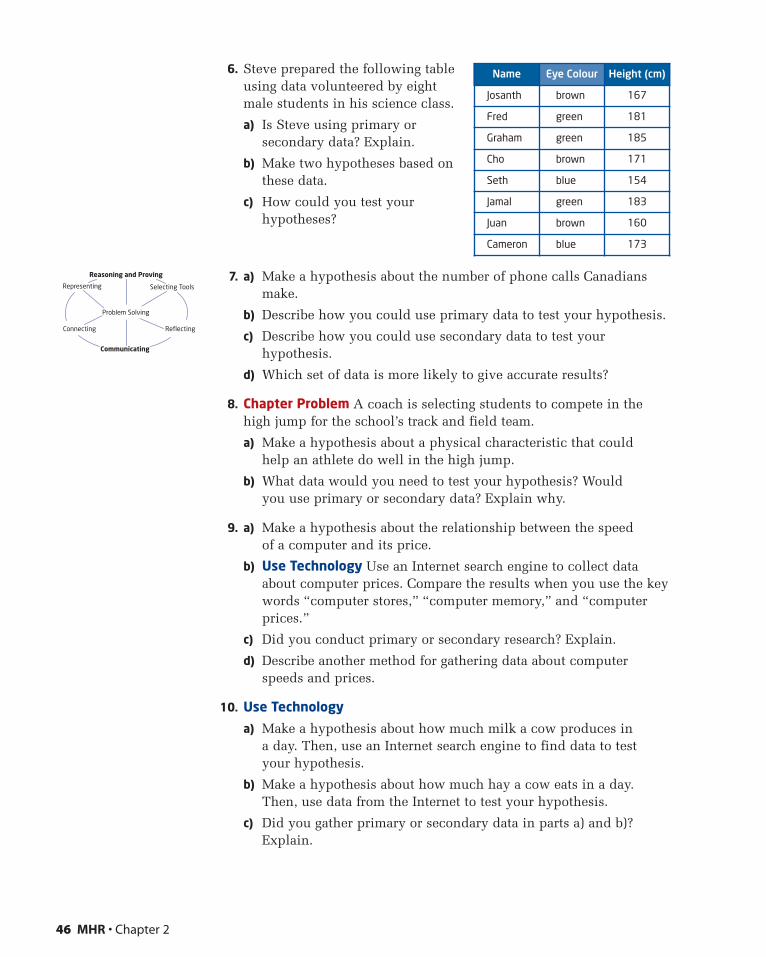
6. Steve prepared the following tableusing data volunteered by eightmale students in his science class.
a) Is Steve using primary orsecondary data? Explain.
b) Make two hypotheses based onthese data.
c) How could you test yourhypotheses?
7. a) Make a hypothesis about the number of phone calls Canadiansmake.
b) Describe how you could use primary data to test your hypothesis.
c) Describe how you could use secondary data to test yourhypothesis.
d) Which set of data is more likely to give accurate results?
8. Chapter Problem A coach is selecting students to compete in thehigh jump for the school’s track and field team.
a) Make a hypothesis about a physical characteristic that could help an athlete do well in the high jump.
b) What data would you need to test your hypothesis? Would you use primary or secondary data? Explain why.
9. a) Make a hypothesis about the relationship between the speed of a computer and its price.
b) Use Technology Use an Internet search engine to collect dataabout computer prices. Compare the results when you use the keywords “computer stores,” “computer memory,” and “computerprices.”
c) Did you conduct primary or secondary research? Explain.
d) Describe another method for gathering data about computerspeeds and prices.
10. Use Technology
a) Make a hypothesis about how much milk a cow produces in a day. Then, use an Internet search engine to find data to test your hypothesis.
b) Make a hypothesis about how much hay a cow eats in a day.Then, use data from the Internet to test your hypothesis.
c) Did you gather primary or secondary data in parts a) and b)?Explain.
Name Eye Colour Height (cm)
Josanth brown 167
Fred green 181
Graham green 185
Cho brown 171
Seth blue 154
Jamal green 183
Juan brown 160
Cameron blue 173
46 MHR • Chapter 2
Selecting ToolsRepresenting
Reasoning and Proving
Communicating
Connecting Reflecting
Problem Solving
Achievement Check
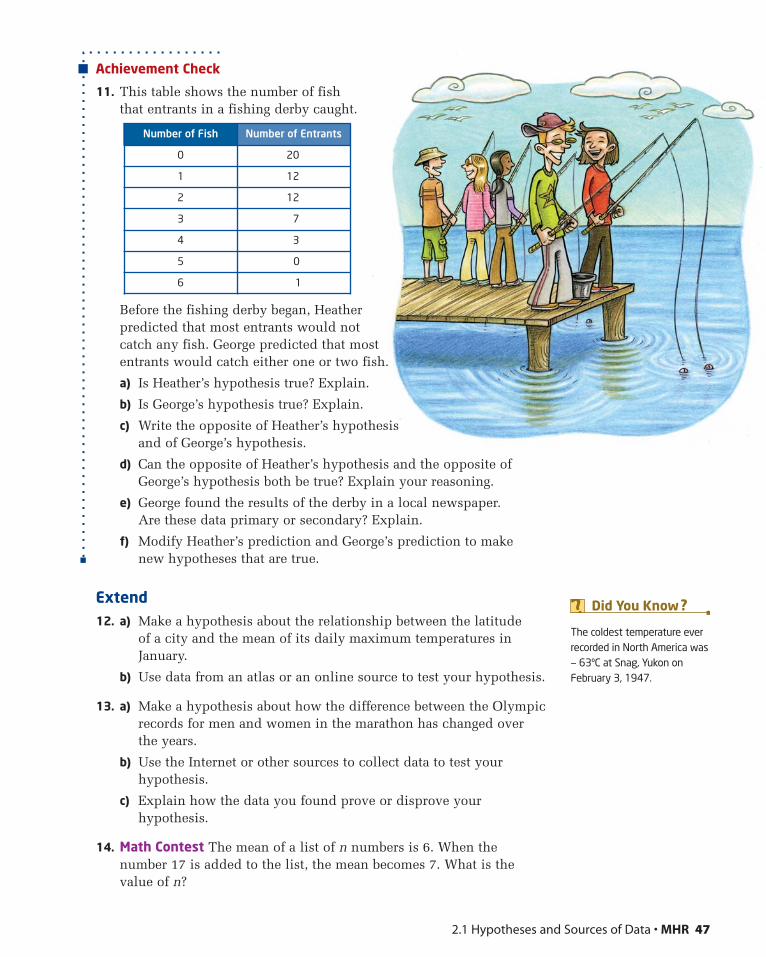
11. This table shows the number of fish that entrants in a fishing derby caught.
Before the fishing derby began, Heather predicted that most entrants would not catch any fish. George predicted that most entrants would catch either one or two fish.
a) Is Heather’s hypothesis true? Explain.
b) Is George’s hypothesis true? Explain.
c) Write the opposite of Heather’s hypothesis and of George’s hypothesis.
d) Can the opposite of Heather’s hypothesis and the opposite ofGeorge’s hypothesis both be true? Explain your reasoning.
e) George found the results of the derby in a local newspaper. Are these data primary or secondary? Explain.
f) Modify Heather’s prediction and George’s prediction to make new hypotheses that are true.
Extend12. a) Make a hypothesis about the relationship between the latitude
of a city and the mean of its daily maximum temperatures inJanuary.
b) Use data from an atlas or an online source to test your hypothesis.
13. a) Make a hypothesis about how the difference between the Olympicrecords for men and women in the marathon has changed overthe years.
b) Use the Internet or other sources to collect data to test yourhypothesis.
c) Explain how the data you found prove or disprove yourhypothesis.
14. Math Contest The mean of a list of n numbers is 6. When thenumber 17 is added to the list, the mean becomes 7. What is thevalue of n?
Number of Fish Number of Entrants
0 20
1 12
2 12
3 7
4 3
5 0
6 1
2.1 Hypotheses and Sources of Data • MHR 47
The coldest temperature everrecorded in North America was— 63ºC at Snag, Yukon onFebruary 3, 1947.
Did You Know ?
48 MHR • Chapter 2
2.2 Sampling Principles
Do radio call-in showsaccurately reflect theopinions of all theirlisteners? Are theselisteners likely to havethe same opinions aspeople who do notlisten to the program?How can you reduce thechances of inaccurateresults from a survey?
Investigate
How can you choose participants for a survey?
A sportswear manufacturer is thinking of hiring a world-championspeed skater to help promote its products. Since the company wantssomeone who will appeal to teenagers, it surveyed 200 teenagers fortheir opinions about the speed skater.
1. Which of these is likely to accurately reflect the opinions of teenagers in the whole country? Explain.
a) 200 students at a school near the company’s office
b) 200 teenagers selected from across Canada
c) the first 200 teenagers willing to answer a questionnaire at a shopping mall
d) 10 teenagers from each of 20 schools chosen from acrossCanada
2. Reflect How could you select a sample so that it properlyrepresents the whole ?
The population depends on what you are trying to measure or study. If you are studying the music preferences of teenagers in your school, the population is all the teenagers in the school. It is often not practicalto survey all members of a large population. So, instead of doing a
, you survey a sample of the population.census
population
samples
� any group of people oritems selected from apopulation
sample
� the whole group of peopleor items being studied
� a survey of all members ofa population
census
population
Example 1 Identify the Population
Identify the population in each situation. Then, indicate whether eachresearcher should survey a sample of the population or do a census.Explain your reasoning.
a) A teacher wishes to know how early his students wake up in themorning.
b) The principal of a school with 2100 students wants to find outhow much homework her students have each day.
c) A clothing store needs to find out whether its customers are happywith its service.
d) A newspaper wants to know the public’s opinion of a federalpolitical party.
e) A polling firm wants to know how people will vote in the nextfederal election.
Solution
a) The population is the students in the teacher’s class. He should do a census since the population is small and easy to survey.
b) The population is the students in the school. The principal shoulduse a sample, since the school population is quite large and allstudents in any particular class may have the same amount ofhomework for that subject.
c) The population is the store’s customers. A random sample isprobably best because it could be difficult and time-consuming to reach all of the store’s customers.
d) The population is everyone in Canada. The newspaper will haveto use a sample since it is next to impossible to get the opinion ofevery person in Canada.
e) The population is every person who can vote in the next federalelection. Again, a census is not practical. It will take far less timeand expense to interview a sample of voters from across thecountry.
You can never be completely certain that a sample is representative ofthe population. However, a usually gives reasonablyaccurate results. You can use several different methods to select arandom sample.
random sample
2.2 Sampling Principles • MHR 49
� a sample in which allmembers of a populationhave an equal chance ofbeing chosen
random sample
Example 2 Choose a Random Sample
A principal of a school with1600 students wants to knowwhether they favourintroducing school uniforms.Describe three methods hecould use to select a randomsample of 200 students.
Solution
1. The principal takes an alphabetical list of all the students at theschool and numbers the names in sequence. He then uses agraphing calculator or a spreadsheet to generate 200 randomnumbers between 1 and 1600. He selects the names on the list thatcorrespond to these numbers. This method is an example of
.
2. The principal finds a starting point on the list of students bypicking a single random number between 1 and 1600. To get a random sample with 200 students, he then selects every eighthname before and after the starting point. This method is anexample of .
3. The principal uses lists of the students in each grade. He thenrandomly selects the same fraction of students from the list foreach grade. Since he wants a sample of 200 students out of a total
of 1600, he needs to choose � of the students in each
grade. Thus, if there are 480 students in grade 9, he would
randomly select of these grade 9 students to be
part of the sample. This method is an example of.
Sometimes people use samples that are not randomly chosen.can be cheaper or more convenient than random
sampling, but the results are less likely to be accurate. Samples that arenot random may tend to choose a certain type of member from thepopulation. As a result of this , the sample does not properlyrepresent the whole population.
bias
Non-random sampling
stratified random sampling
18
� 480 � 60
18
2001600
systematic random sampling
simple random sampling
50 MHR • Chapter 2
� choosing a specific numberof members randomly fromthe entire population
� choosing members of apopulation at fixedintervals from a randomlyselected member
systematic randomsampling
simple randomsampling
� dividing a population intodistinct groups and thenchoosing the same fractionof members from eachgroup
� using a method that is notrandom to choose a samplefrom a population
� error resulting fromchoosing a sample thatdoes not represent thewhole population
bias
non-randomsampling
stratified randomsampling
Example 3 Identify Sampling Techniques
Identify the type of sampling in each situation. Explain any bias thatthe samples could have.
a) The personnel department sends questionnaires to 75 employeesrandomly selected from a list of everyone working for the company.
b) A computer randomly chooses one name from an alphabetical listof a store’s customers and then also selects every 25th personlisted before and after that name.
c) The president of a restaurant chain interviews employees atone branch.
d) The student council of a school randomly selects a number of students from each class. This number is proportional to the size of the class.
Solution
a) simple random sampling
b) systematic random sampling
c) non-random sampling: This sample could be biased since theemployees of one branch may not be representative of theemployees of the whole chain.
d) stratified random sampling
Key Concepts� A population is the entire group of people or items that is being
studied.
� A sample is any part of the population.
� A random sampling technique ensures that all members of apopulation are equally likely to be selected. As a result, a randomsample is likely to be representative of the whole population.
� Sampling methods include simple random, systematic random,stratified random, and non-random sampling.
� Bias can make the results of a survey inaccurate.
2.2 Sampling Principles • MHR 51
Communicate Your UnderstandingThe city council is considering building a new library. Yourcouncillor surveys 75 people in your neighbourhood to see if theyapprove of this expense. Is this survey a good method for judginghow the citizens of the city feel about the project? Use the words“population” and “sample” in your explanation.
a) Describe two ways you could select a random sample to estimatehow many of the students in your school have access to theInternet at home.
b) Describe a survey method that is unlikely to give an accurateestimate.
PractiseFor help with questions 1 and 2, see Example 1.
1. Identify the population in each situation.
a) Generally, girls learn to walk before boys do.
b) The mean mark on yesterday’s test was 72%.
c) As cars age, their repair costs increase.
d) Most food stores charge more for cream than for milk.
2. Describe the data required to answer each question. Explain whetheryou would use a census or a sample to collect each set of data.
a) Do girls learn to walk before boys do?
b) Is the mean mark on a test greater than 75%?
c) Is the mean annual salary of employees in Canada less than$50 000?
d) How are a person’s height and age related?
e) What is the most common make of car in your school’s parkinglot?
f) What is the most common colour among the cars that drive by your school?
For help with question 3, see Example 2.
3. Describe how you could choose a random sample to determine each of the following.
a) the type of coffee preferred by customers of a local cafe
b) Ontario teenagers’ favourite magazines
c) political parties supported by bilingual Canadians
d) countries of origin for immigrants to Canada
C2C2
C1C1
52 MHR • Chapter 2
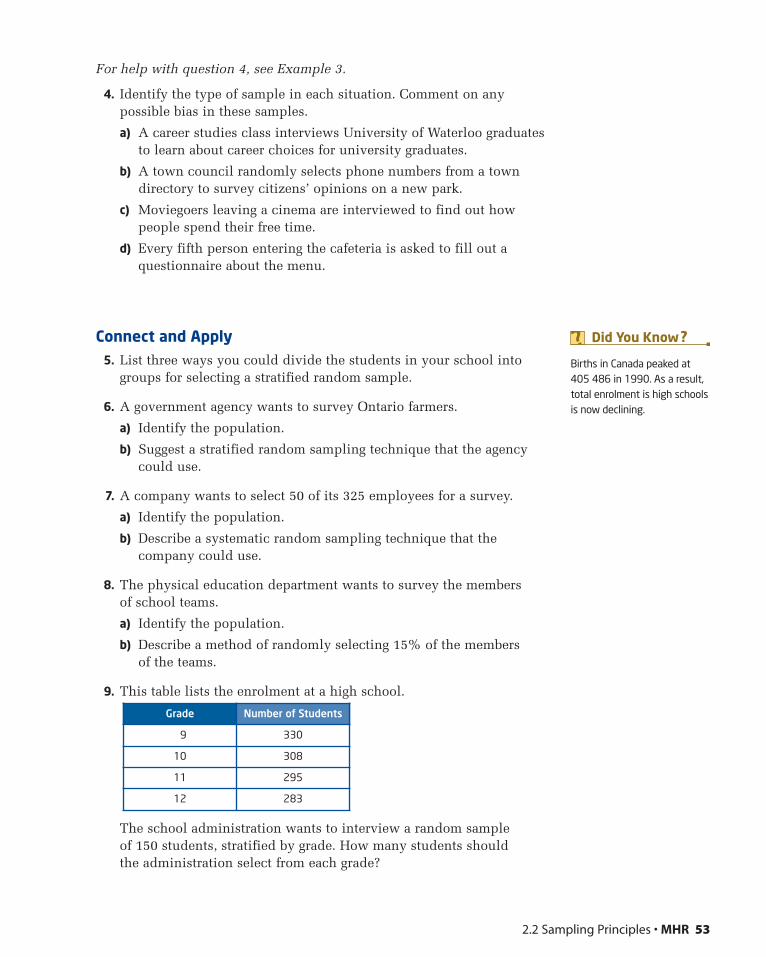
For help with question 4, see Example 3.
4. Identify the type of sample in each situation. Comment on anypossible bias in these samples.
a) A career studies class interviews University of Waterloo graduatesto learn about career choices for university graduates.
b) A town council randomly selects phone numbers from a towndirectory to survey citizens’ opinions on a new park.
c) Moviegoers leaving a cinema are interviewed to find out howpeople spend their free time.
d) Every fifth person entering the cafeteria is asked to fill out aquestionnaire about the menu.
Connect and Apply5. List three ways you could divide the students in your school into
groups for selecting a stratified random sample.
6. A government agency wants to survey Ontario farmers.
a) Identify the population.
b) Suggest a stratified random sampling technique that the agencycould use.
7. A company wants to select 50 of its 325 employees for a survey.
a) Identify the population.
b) Describe a systematic random sampling technique that thecompany could use.
8. The physical education department wants to survey the members of school teams.
a) Identify the population.
b) Describe a method of randomly selecting 15% of the members of the teams.
9. This table lists the enrolment at a high school.
The school administration wants to interview a random sample of 150 students, stratified by grade. How many students should the administration select from each grade?
2.2 Sampling Principles • MHR 53
Grade Number of Students
9 330
10 308
11 295
12 283
Births in Canada peaked at405 486 in 1990. As a result,total enrolment is high schoolsis now declining.
Did You Know ?

10. Use Technology Use this method to generate random integers with a TI-83 Plus or TI-84 graphing calculator.
• Press k. Cursor over to display the PRB menu.• Move the cursor down to 5:randInt(, and press e.• Press 1 , 10 , 20 ) e.
The calculator will display 20 randomly selected integers between 1 and 10, inclusive.
a) What command would you enter to produce a list of 25 randomintegers between 12 and 36?
b) How could you use a graphing calculator to randomly select40 house numbers between 1 and 500?
c) What command would you enter to randomly select 75 housenumbers between 100 and 1000?
11. A survey selects five students from each grade at 100 high schoolsacross Ontario.
a) Explain why this sample is not completely random.
b) How does this sampling method bias the results of the survey?
12. Identify the population for each of the following. Then, describe how you could select an appropriate sample of each population.
a) the popularity of various kinds of music in your school
b) the popularity of various kinds of music in your community
c) the effectiveness of a national campaign to convince peoplebetween the ages of 18 and 30 not to smoke
d) the spending habits of senior citizens in Ontario
e) the quality of printing from various computer printers on sale in Canada
f) the mean cost of gasoline in your community
13. In a voluntary sample, people choose to answer the survey, ratherthan being selected by the person doing the survey. For example, a Web site could ask people browsing the site to fill out an onlinesurvey form. Discuss whether this voluntary sample accuratelyrepresents a population.
14. Even in the 1920s, polling companies conducted surveys by callingpeople randomly selected from telephone directories.
a) Explain why using this sampling method in the 1920s would notproduce a representative sample of the opinions of everyone inthe country.
b) Describe two ways in which a telephone survey today could bebiased.
54 MHR • Chapter 2
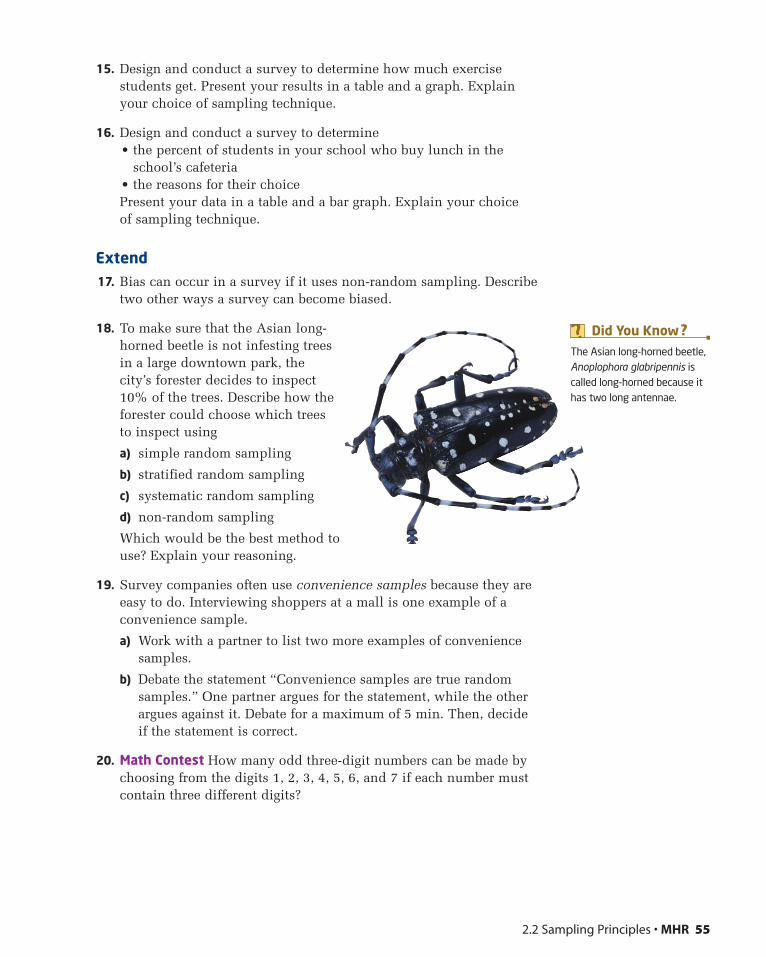
15. Design and conduct a survey to determine how much exercisestudents get. Present your results in a table and a graph. Explainyour choice of sampling technique.
16. Design and conduct a survey to determine• the percent of students in your school who buy lunch in the
school’s cafeteria• the reasons for their choicePresent your data in a table and a bar graph. Explain your choice of sampling technique.
Extend17. Bias can occur in a survey if it uses non-random sampling. Describe
two other ways a survey can become biased.
18. To make sure that the Asian long-horned beetle is not infesting treesin a large downtown park, thecity’s forester decides to inspect10% of the trees. Describe how theforester could choose which treesto inspect using
a) simple random sampling
b) stratified random sampling
c) systematic random sampling
d) non-random sampling
Which would be the best method touse? Explain your reasoning.
19. Survey companies often use convenience samples because they areeasy to do. Interviewing shoppers at a mall is one example of aconvenience sample.
a) Work with a partner to list two more examples of conveniencesamples.
b) Debate the statement “Convenience samples are true randomsamples.” One partner argues for the statement, while the otherargues against it. Debate for a maximum of 5 min. Then, decide if the statement is correct.
20. Math Contest How many odd three-digit numbers can be made bychoosing from the digits 1, 2, 3, 4, 5, 6, and 7 if each number mustcontain three different digits?
2.2 Sampling Principles • MHR 55
The Asian long-horned beetle,Anoplophora glabripennis iscalled long-horned because ithas two long antennae.
Did You Know ?
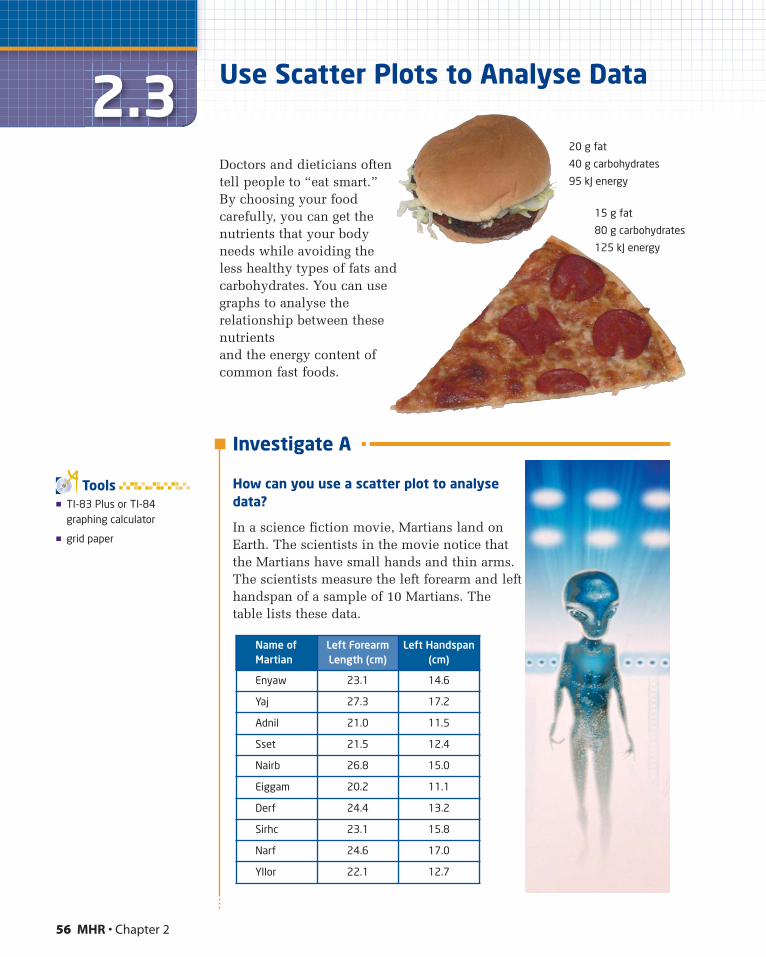
56 MHR • Chapter 2
2.3Doctors and dieticians oftentell people to “eat smart.”By choosing your foodcarefully, you can get thenutrients that your bodyneeds while avoiding theless healthy types of fats andcarbohydrates. You can usegraphs to analyse therelationship between thesenutrientsand the energy content ofcommon fast foods.
Investigate A
How can you use a scatter plot to analysedata?
In a science fiction movie, Martians land onEarth. The scientists in the movie notice thatthe Martians have small hands and thin arms.The scientists measure the left forearm and lefthandspan of a sample of 10 Martians. Thetable lists these data.
Name ofMartian
Left ForearmLength (cm)
Left Handspan(cm)
Enyaw 23.1 14.6
Yaj 27.3 17.2
Adnil 21.0 11.5
Sset 21.5 12.4
Nairb 26.8 15.0
Eiggam 20.2 11.1
Derf 24.4 13.2
Sirhc 23.1 15.8
Narf 24.6 17.0
Yllor 22.1 12.7
Use Scatter Plots to Analyse Data
� TI-83 Plus or TI-84graphing calculator
� grid paper
Tools
20 g fat
40 g carbohydrates
95 kJ energy
15 g fat
80 g carbohydrates
125 kJ energy
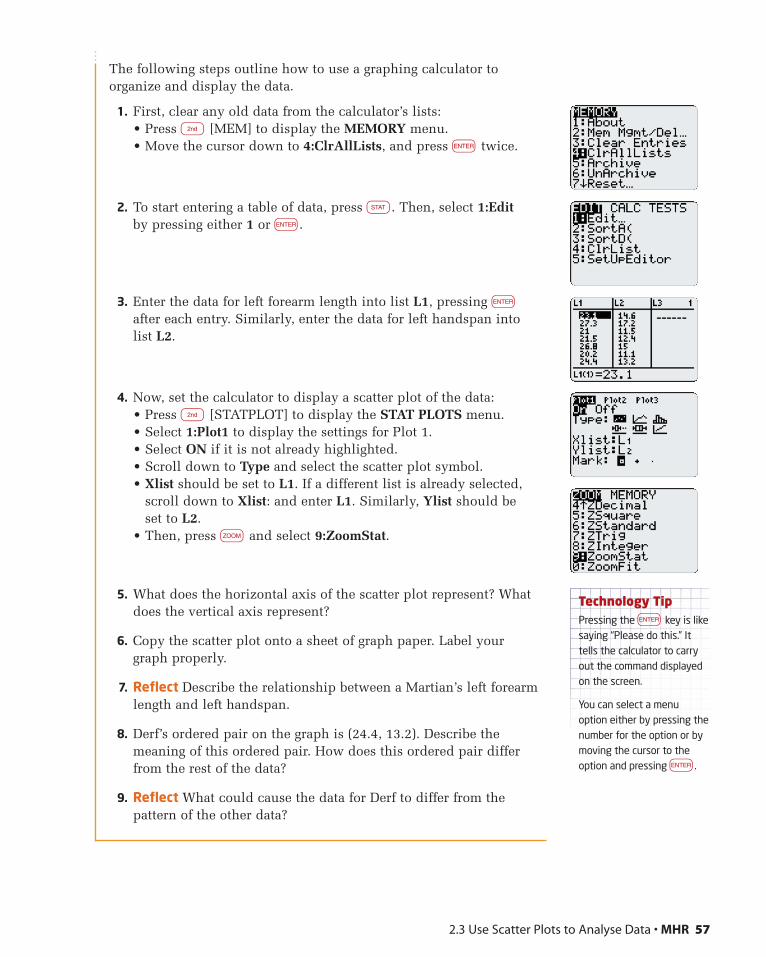
The following steps outline how to use a graphing calculator toorganize and display the data.
1. First, clear any old data from the calculator’s lists:• Press n [MEM] to display the MEMORY menu.• Move the cursor down to 4:ClrAllLists, and press e twice.
2. To start entering a table of data, press q. Then, select 1:Editby pressing either 1 or e.
3. Enter the data for left forearm length into list L1, pressing e
after each entry. Similarly, enter the data for left handspan intolist L2.
4. Now, set the calculator to display a scatter plot of the data:• Press n [STATPLOT] to display the STAT PLOTS menu.• Select 1:Plot1 to display the settings for Plot 1.• Select ON if it is not already highlighted.• Scroll down to Type and select the scatter plot symbol.• Xlist should be set to L1. If a different list is already selected,
scroll down to Xlist: and enter L1. Similarly, Ylist should be set to L2.
• Then, press z and select 9:ZoomStat.
5. What does the horizontal axis of the scatter plot represent? Whatdoes the vertical axis represent?
6. Copy the scatter plot onto a sheet of graph paper. Label your graph properly.
7. Reflect Describe the relationship between a Martian’s left forearmlength and left handspan.
8. Derf’s ordered pair on the graph is (24.4, 13.2). Describe themeaning of this ordered pair. How does this ordered pair differfrom the rest of the data?
9. Reflect What could cause the data for Derf to differ from thepattern of the other data?
2.3 Use Scatter Plots to Analyse Data • MHR 57
Technology TipPressing the e key is likesaying “Please do this.” Ittells the calculator to carryout the command displayedon the screen.
You can select a menuoption either by pressing thenumber for the option or bymoving the cursor to theoption and pressing e.
Investigate B
How do you conduct an experiment?
Is there a relationship between a human’s forearm length andhandspan? To answer this question, you need to collect and analysedata.
1. Objective: Outline the purpose of your experiment.
2. Hypothesis: Make a hypothesis based on the objective. Do youthink a person’s forearm length and handspan are related? If so,what pattern do you expect the data to have?
3. Procedure: Measure your own forearm length and handspan.Then, gather more data from nine classmates. Record these data in a table similar to the one for the Martian data.
4. Observations: Make a scatter plot of your data. Describe anypattern you see in the data.
5. Conclusion: Make an based on your observations. Does this inference support your hypothesis? Explain.
6. Evaluation: Did the experiment meet its objective? How could you improve the experiment?
7. Reflect How could you compare the relationship between a Martian’s forearm length and handspan that you found inInvestigate A to the relationship between a human’s forearm length and handspan?
If you have a set of measurements of one variable, you can calculatestatistics for that variable, such as the mean and the median. When you have data for two variables, you can look for a relationship between the two variables. Often, you use the data to determine whether the value of the changes when the
value of the changes.independent variable
dependent variable
inference
58 MHR • Chapter 2
Your forearm is the part ofyour arm from your elbow toyour wrist.
Your handspan is the distancefrom the tip of your thumb tothe tip of your little fingerwhen your fingers are spreadout.
onnectionsLiterac
� conclusion based onreasoning and data
inference
� a variable that is affectedby some other variable
� a variable that affects thevalue of another variable
independentvariable
dependent variable

Example 1 Identify Related Variables
Identify the independent and dependent variable in each situation.
a) Does the outdoor temperature affect the amount of fuel needed to heat a house?
b) Is there a relationship between people’s ages and their heights?
c) Does the amount of rain in a region depend on its latitude?
Solution
a) Since you want to know whether the outdoor temperature affects the amount of fuel required for heating, the independent variableis the outdoor temperature and the dependent variable is theamount of fuel required.
b) The independent variable is age and the dependent variableis height.
c) The dependent variable is the amount of rain and the independentvariable is the latitude. Note that the latitude might not actuallyaffect the amount of rain. However, to analyse the data, you treatlatitude as the independent variable and the amount of rain as thedependent variable.
Often, a scatter plot can help you see if there is a relationshipbetween two variables. On such graphs, the horizontal axisusually represents the independent variable, while the verticalaxis represents the dependent variable. A measurement of theindependent variable and the corresponding measurement ofthe dependent variable make up an ordered pair, (x, y), whichappears as a point on the scatter plot.
An is a point separated from the main body of data on agraph. Sometimes, an outlier results from a measurement error or fromsome factor that affects only a few of the observed values for a variable.If you can show that an outlier is inaccurate or unrepresentative, you canleave it out of your calculations. Otherwise, you should include theoutlier in the data set.
outlier
2.3 Use Scatter Plots to Analyse Data • MHR 59
h
aAge independent
variable
outlier
dependent variable
Hei
ght
� measurement that differssignificantly from the restof the data
outlier
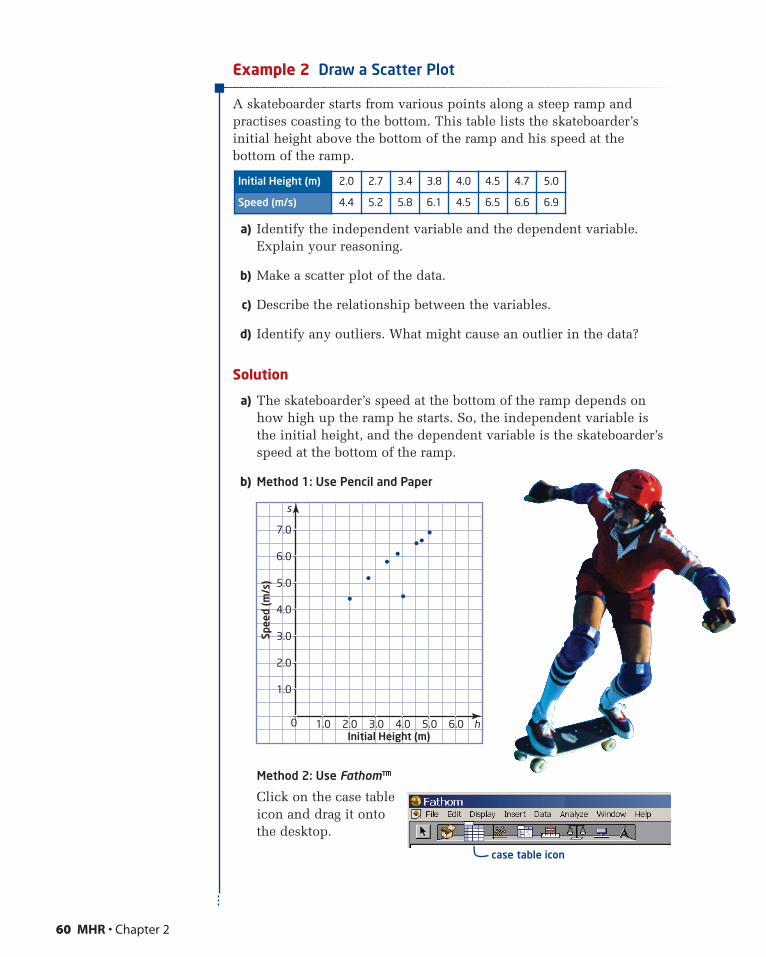
Example 2 Draw a Scatter Plot
A skateboarder starts from various points along a steep ramp andpractises coasting to the bottom. This table lists the skateboarder’sinitial height above the bottom of the ramp and his speed at thebottom of the ramp.
a) Identify the independent variable and the dependent variable.Explain your reasoning.
b) Make a scatter plot of the data.
c) Describe the relationship between the variables.
d) Identify any outliers. What might cause an outlier in the data?
Solution
a) The skateboarder’s speed at the bottom of the ramp depends onhow high up the ramp he starts. So, the independent variable isthe initial height, and the dependent variable is the skateboarder’sspeed at the bottom of the ramp.
b) Method 1: Use Pencil and Paper
Method 2: Use Fathom™
Click on the case tableicon and drag it ontothe desktop.
60 MHR • Chapter 2
s
h0
1.0
2.0
3.0
4.0
5.0
6.0
7.0
1.0 2.0 3.0 4.0 5.0 6.0Initial Height (m)
Spee
d (m
/s)
case table icon
Initial Height (m) 2.0 2.7 3.4 3.8 4.0 4.5 4.7 5.0
Speed (m/s) 4.4 5.2 5.8 6.1 4.5 6.5 6.6 6.9

Click on <new> in thefirst column, and enter “InitialHeight.” Click on<new> in the secondcolumn, and enter“Speed.”
Enter the data in the case table.
Click on the graph iconand drag it onto thedesktop.
Drag the “InitialHeight” heading to the horizontal axis.
Drag the “Speed” heading to the vertical axis. Fathom™ thengenerates the scatter plot automatically.
2.3 Use Scatter Plots to Analyse Data • MHR 61
Technology TipYou can use Ctrl-Z to undoan action. This shortcutworks in many programs.
graph icon
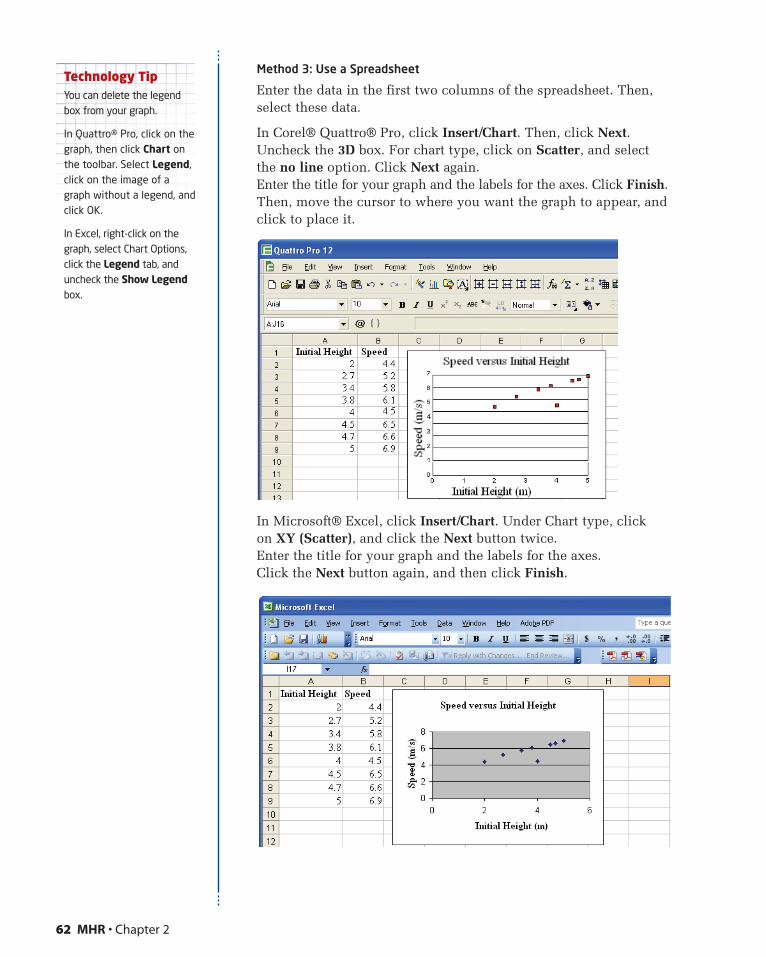
Method 3: Use a Spreadsheet
Enter the data in the first two columns of the spreadsheet. Then,select these data.
In Corel® Quattro® Pro, click Insert/Chart. Then, click Next.Uncheck the 3D box. For chart type, click on Scatter, and selectthe no line option. Click Next again.Enter the title for your graph and the labels for the axes. Click Finish.Then, move the cursor to where you want the graph to appear, andclick to place it.
In Microsoft® Excel, click Insert/Chart. Under Chart type, click on XY (Scatter), and click the Next button twice.Enter the title for your graph and the labels for the axes.Click the Next button again, and then click Finish.
62 MHR • Chapter 2
Technology TipYou can delete the legendbox from your graph.
In Quattro® Pro, click on thegraph, then click Chart onthe toolbar. Select Legend,click on the image of agraph without a legend, andclick OK.
In Excel, right-click on thegraph, select Chart Options,click the Legend tab, anduncheck the Show Legendbox.
You can make your graph easier to read by enlarging it. Click onthe graph, then drag a side or corner.
You can also adjust the scale of the axes.• In Quattro® Pro, click on the axis to select it, then right-click.
Select Axis Properties, click on the Scale tab, and enter thesettings you want.
• In Excel, right-click on the axis and select Format Axis. Then,click on the Scale tab and enter the settings you want.
c) As the initial height increases, the skateboarder’s speed at thebottom of the ramp increases. The pattern of the data points is a curve rather than a straight line.
d) The ordered pair (4.0, 4.5) is an outlier because it is separatedfrom the rest of the data. The speed is less than you would expectfrom looking at the rest of the data. The skateboarder could havedragged his foot or started at an angle that slowed him down.
Key Concepts� Scatter plots can help you see relationships between variables.
� Graphing calculators, spreadsheets, and statistics software can plot graphs of data.
� When the value of the independent variable changes, the value of the dependent variable may also change.
� An outlier is separate from the main body of data. You can discardan outlier only if you know that it not representative of therelationship between the variables.
Communicate Your UnderstandingExplain how a scatter plot can show that two variables are related.
Which statement is true? Why?
A You should discard all outliers since they do not follow thepattern of the rest of the data.
B You should not discard an outlier unless you can show that it does not accurately represent the relationship between thevariables.
C2C2
C1C1
2.3 Use Scatter Plots to Analyse Data • MHR 63
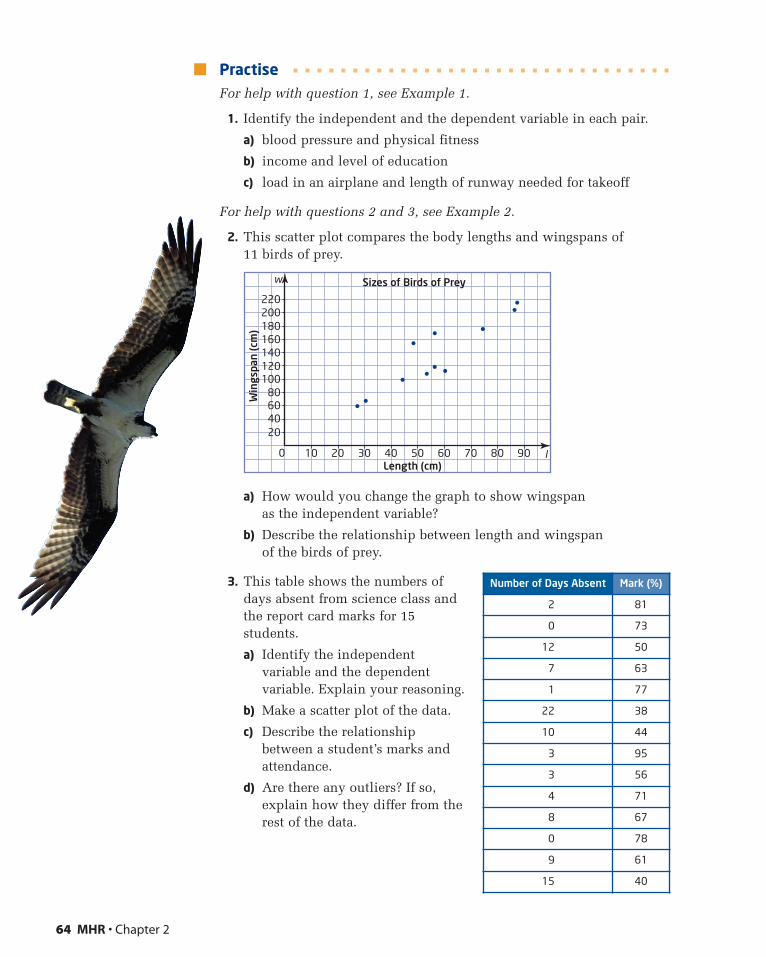
PractiseFor help with question 1, see Example 1.
1. Identify the independent and the dependent variable in each pair.
a) blood pressure and physical fitness
b) income and level of education
c) load in an airplane and length of runway needed for takeoff
For help with questions 2 and 3, see Example 2.
2. This scatter plot compares the body lengths and wingspans of11 birds of prey.
a) How would you change the graph to show wingspan as the independent variable?
b) Describe the relationship between length and wingspan of the birds of prey.
3. This table shows the numbers ofdays absent from science class andthe report card marks for 15students.
a) Identify the independentvariable and the dependentvariable. Explain your reasoning.
b) Make a scatter plot of the data.
c) Describe the relationshipbetween a student’s marks andattendance.
d) Are there any outliers? If so,explain how they differ from therest of the data.
Number of Days Absent Mark (%)
2 81
0 73
12 50
7 63
1 77
22 38
10 44
3 95
3 56
4 71
8 67
0 78
9 61
15 40
64 MHR • Chapter 2
w
l0
20406080
100120140160180200220
10 20 30 40 50 60 70 80 90Length (cm)
Sizes of Birds of Prey
Win
gspa
n (c
m)
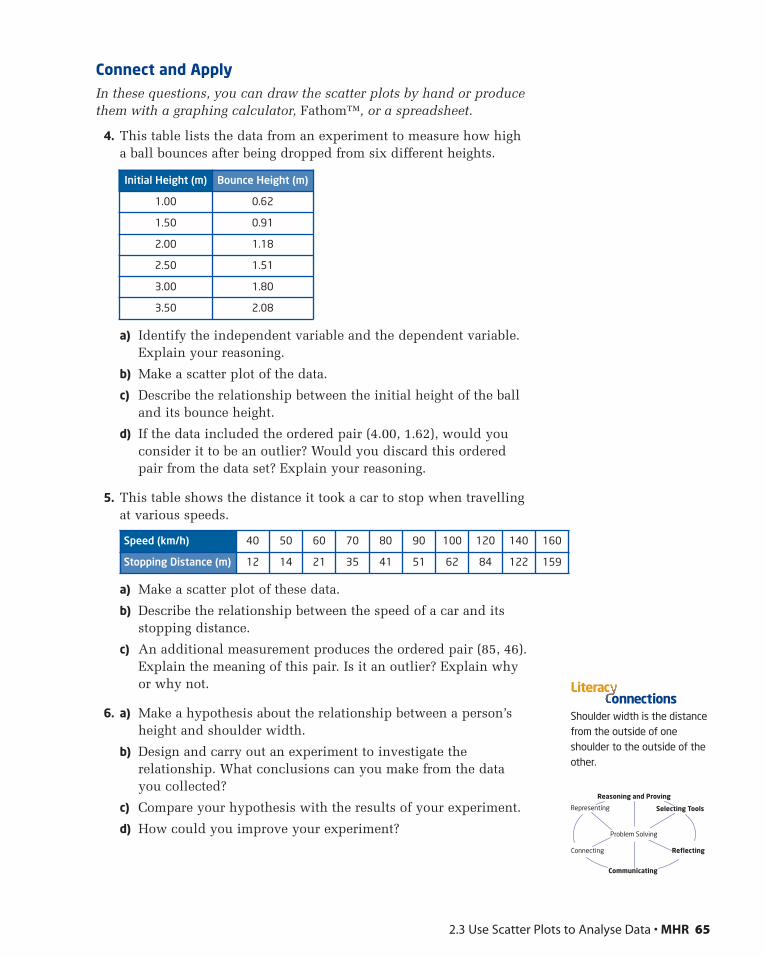
Connect and ApplyIn these questions, you can draw the scatter plots by hand or producethem with a graphing calculator, Fathom™, or a spreadsheet.
4. This table lists the data from an experiment to measure how high a ball bounces after being dropped from six different heights.
a) Identify the independent variable and the dependent variable.Explain your reasoning.
b) Make a scatter plot of the data.
c) Describe the relationship between the initial height of the balland its bounce height.
d) If the data included the ordered pair (4.00, 1.62), would youconsider it to be an outlier? Would you discard this ordered pair from the data set? Explain your reasoning.
5. This table shows the distance it took a car to stop when travelling at various speeds.
a) Make a scatter plot of these data.
b) Describe the relationship between the speed of a car and itsstopping distance.
c) An additional measurement produces the ordered pair (85, 46).Explain the meaning of this pair. Is it an outlier? Explain why or why not.
6. a) Make a hypothesis about the relationship between a person’sheight and shoulder width.
b) Design and carry out an experiment to investigate therelationship. What conclusions can you make from the data you collected?
c) Compare your hypothesis with the results of your experiment.
d) How could you improve your experiment?
Speed (km/h) 40 50 60 70 80 90 100 120 140 160
Stopping Distance (m) 12 14 21 35 41 51 62 84 122 159
2.3 Use Scatter Plots to Analyse Data • MHR 65
Initial Height (m) Bounce Height (m)
1.00 0.62
1.50 0.91
2.00 1.18
2.50 1.51
3.00 1.80
3.50 2.08
Selecting ToolsRepresenting
Reasoning and Proving
Communicating
Connecting Reflecting
Problem Solving
Shoulder width is the distancefrom the outside of oneshoulder to the outside of theother.
onnectionsLiterac
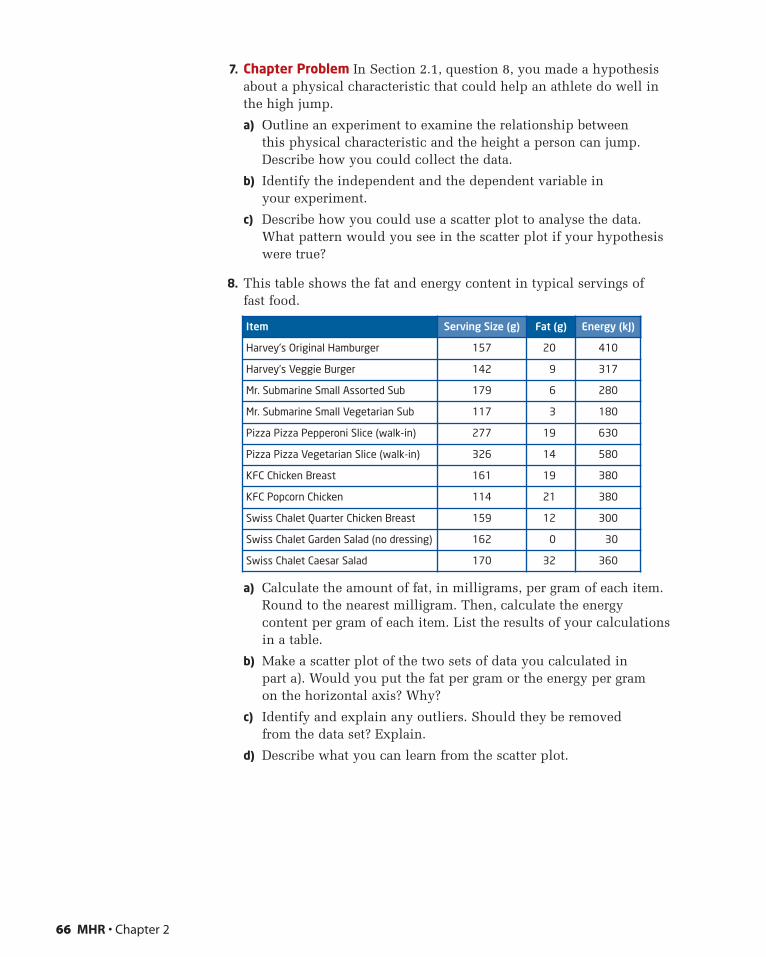
7. Chapter Problem In Section 2.1, question 8, you made a hypothesisabout a physical characteristic that could help an athlete do well inthe high jump.
a) Outline an experiment to examine the relationship between this physical characteristic and the height a person can jump.Describe how you could collect the data.
b) Identify the independent and the dependent variable in your experiment.
c) Describe how you could use a scatter plot to analyse the data.What pattern would you see in the scatter plot if your hypothesiswere true?
8. This table shows the fat and energy content in typical servings offast food.
a) Calculate the amount of fat, in milligrams, per gram of each item.Round to the nearest milligram. Then, calculate the energycontent per gram of each item. List the results of your calculationsin a table.
b) Make a scatter plot of the two sets of data you calculated in part a). Would you put the fat per gram or the energy per gram on the horizontal axis? Why?
c) Identify and explain any outliers. Should they be removed from the data set? Explain.
d) Describe what you can learn from the scatter plot.
66 MHR • Chapter 2
Item Serving Size (g) Fat (g) Energy (kJ)
Harvey’s Original Hamburger 157 20 410
Harvey’s Veggie Burger 142 9 317
Mr. Submarine Small Assorted Sub 179 6 280
Mr. Submarine Small Vegetarian Sub 117 3 180
Pizza Pizza Pepperoni Slice (walk-in) 277 19 630
Pizza Pizza Vegetarian Slice (walk-in) 326 14 580
KFC Chicken Breast 161 19 380
KFC Popcorn Chicken 114 21 380
Swiss Chalet Quarter Chicken Breast 159 12 300
Swiss Chalet Garden Salad (no dressing) 162 0 30
Swiss Chalet Caesar Salad 170 32 360
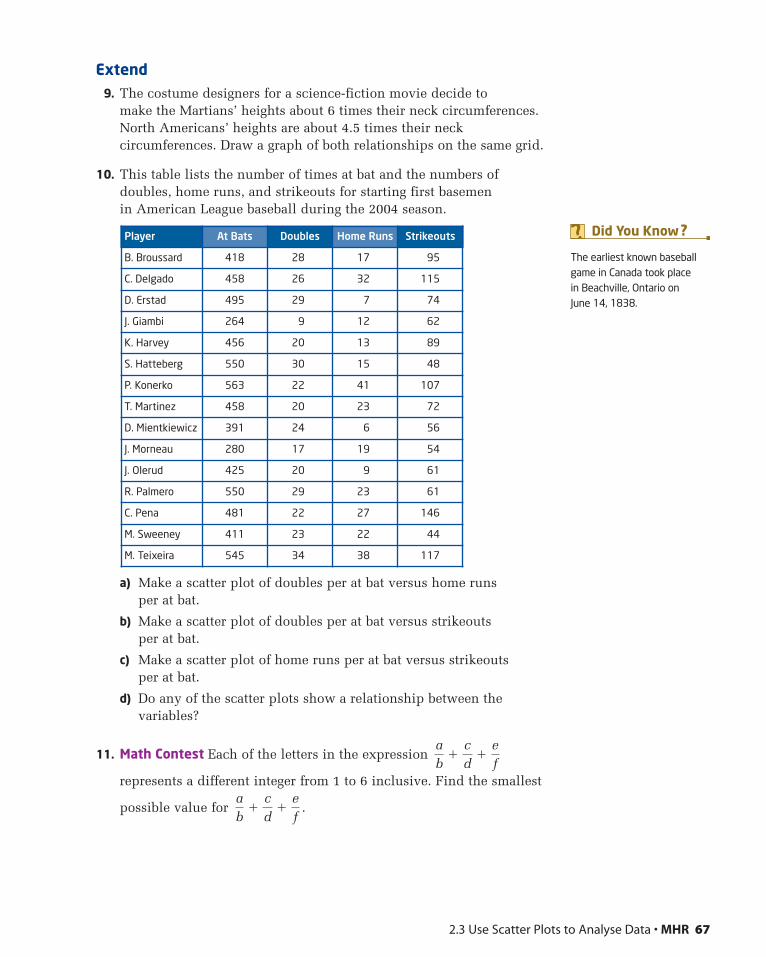
Extend9. The costume designers for a science-fiction movie decide to
make the Martians’ heights about 6 times their neck circumferences.North Americans’ heights are about 4.5 times their neckcircumferences. Draw a graph of both relationships on the same grid.
10. This table lists the number of times at bat and the numbers ofdoubles, home runs, and strikeouts for starting first basemen in American League baseball during the 2004 season.
a) Make a scatter plot of doubles per at bat versus home runs per at bat.
b) Make a scatter plot of doubles per at bat versus strikeouts per at bat.
c) Make a scatter plot of home runs per at bat versus strikeouts per at bat.
d) Do any of the scatter plots show a relationship between thevariables?
11. Math Contest Each of the letters in the expression
represents a different integer from 1 to 6 inclusive. Find the smallest
possible value for .ab
�cd
�ef
ab
�cd
�ef
Player At Bats Doubles Home Runs Strikeouts
B. Broussard 418 28 17 95
C. Delgado 458 26 32 115
D. Erstad 495 29 7 74
J. Giambi 264 9 12 62
K. Harvey 456 20 13 89
S. Hatteberg 550 30 15 48
P. Konerko 563 22 41 107
T. Martinez 458 20 23 72
D. Mientkiewicz 391 24 6 56
J. Morneau 280 17 19 54
J. Olerud 425 20 9 61
R. Palmero 550 29 23 61
C. Pena 481 22 27 146
M. Sweeney 411 23 22 44
M. Teixeira 545 34 38 117
2.3 Use Scatter Plots to Analyse Data • MHR 67
The earliest known baseballgame in Canada took place in Beachville, Ontario on June 14, 1838.
Did You Know ?
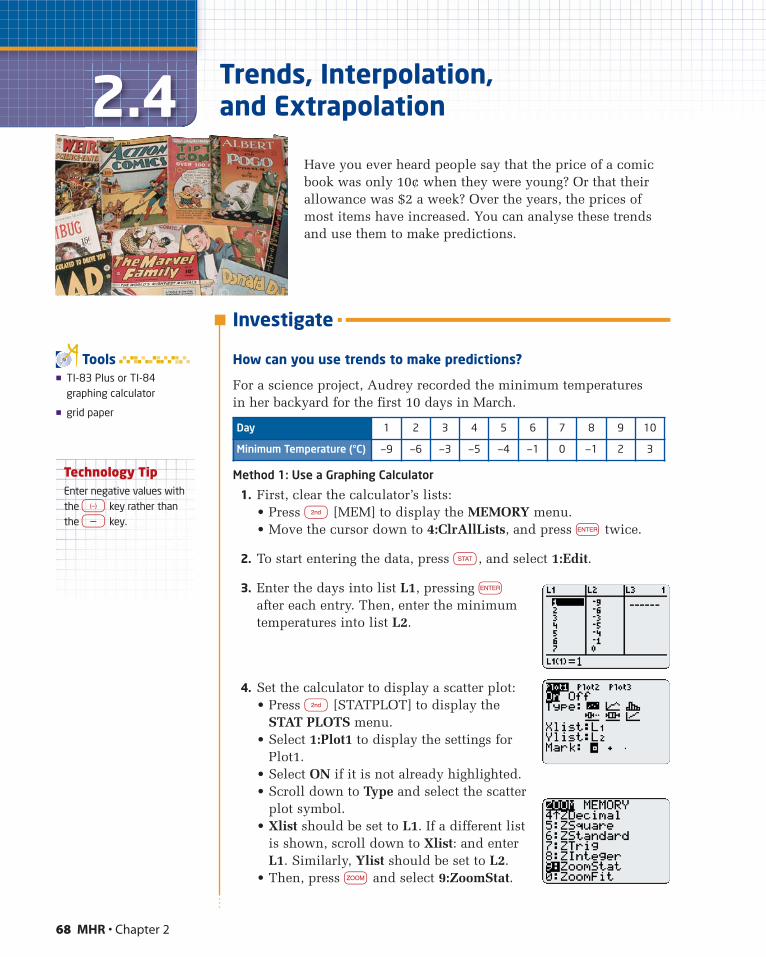
68 MHR • Chapter 2
2.4 Trends, Interpolation, and Extrapolation
Have you ever heard people say that the price of a comicbook was only 10¢ when they were young? Or that theirallowance was $2 a week? Over the years, the prices ofmost items have increased. You can analyse these trendsand use them to make predictions.
� TI-83 Plus or TI-84graphing calculator
� grid paper
Tools
Technology TipEnter negative values withthe – key rather thanthe - key.
Investigate
How can you use trends to make predictions?
For a science project, Audrey recorded the minimum temperatures in her backyard for the first 10 days in March.
Method 1: Use a Graphing Calculator
1. First, clear the calculator’s lists:• Press n [MEM] to display the MEMORY menu.• Move the cursor down to 4:ClrAllLists, and press e twice.
2. To start entering the data, press q, and select 1:Edit.
3. Enter the days into list L1, pressing e
after each entry. Then, enter the minimumtemperatures into list L2.
4. Set the calculator to display a scatter plot:• Press n [STATPLOT] to display the
STAT PLOTS menu.• Select 1:Plot1 to display the settings for
Plot1.• Select ON if it is not already highlighted.• Scroll down to Type and select the scatter
plot symbol.• Xlist should be set to L1. If a different list
is shown, scroll down to Xlist: and enterL1. Similarly, Ylist should be set to L2.
• Then, press z and select 9:ZoomStat.
Day 1 2 3 4 5 6 7 8 9 10
Minimum Temperature (°C) —9 —6 —3 —5 —4 —1 0 —1 2 3
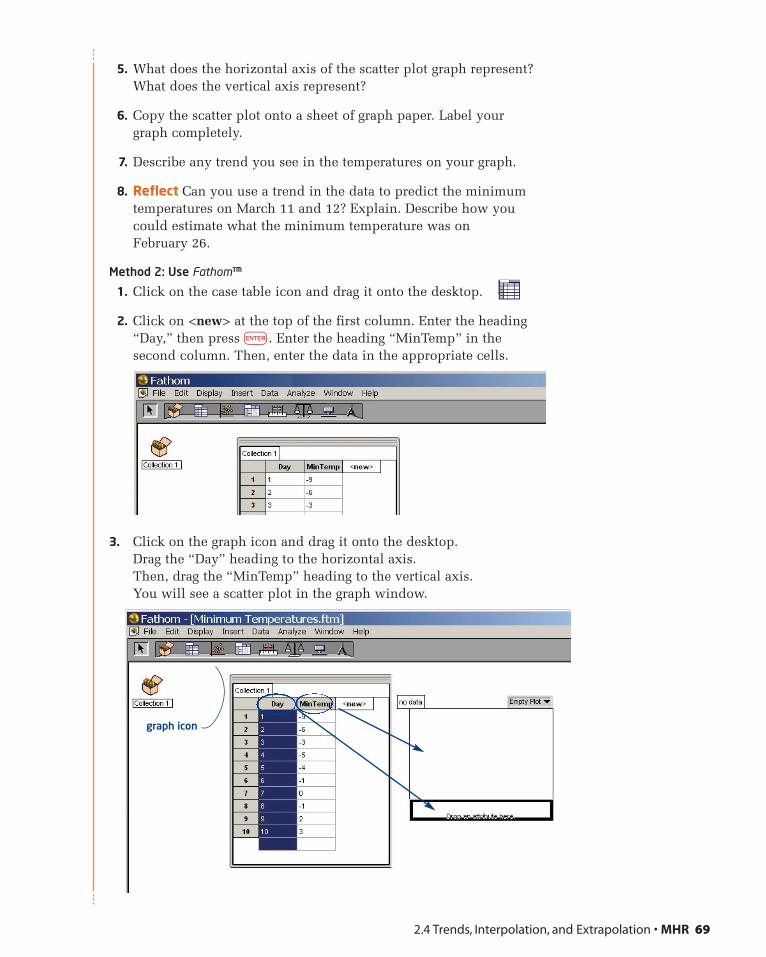
5. What does the horizontal axis of the scatter plot graph represent?What does the vertical axis represent?
6. Copy the scatter plot onto a sheet of graph paper. Label your graph completely.
7. Describe any trend you see in the temperatures on your graph.
8. Reflect Can you use a trend in the data to predict the minimumtemperatures on March 11 and 12? Explain. Describe how youcould estimate what the minimum temperature was onFebruary 26.
Method 2: Use Fathom™
1. Click on the case table icon and drag it onto the desktop.
2. Click on <new> at the top of the first column. Enter the heading“Day,” then press e. Enter the heading “MinTemp” in thesecond column. Then, enter the data in the appropriate cells.
3. Click on the graph icon and drag it onto the desktop.Drag the “Day” heading to the horizontal axis.Then, drag the “MinTemp” heading to the vertical axis.You will see a scatter plot in the graph window.
2.4 Trends, Interpolation, and Extrapolation • MHR 69
graph icon
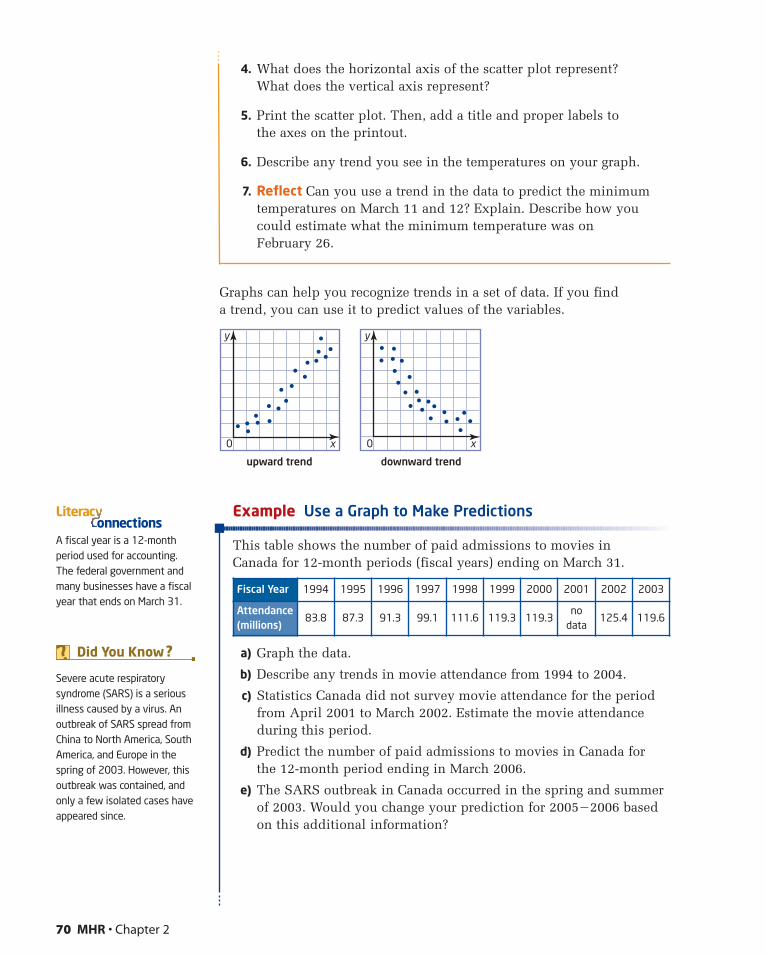
4. What does the horizontal axis of the scatter plot represent? What does the vertical axis represent?
5. Print the scatter plot. Then, add a title and proper labels to the axes on the printout.
6. Describe any trend you see in the temperatures on your graph.
7. Reflect Can you use a trend in the data to predict the minimumtemperatures on March 11 and 12? Explain. Describe how youcould estimate what the minimum temperature was onFebruary 26.
Graphs can help you recognize trends in a set of data. If you find a trend, you can use it to predict values of the variables.
70 MHR • Chapter 2
Severe acute respiratorysyndrome (SARS) is a seriousillness caused by a virus. Anoutbreak of SARS spread fromChina to North America, SouthAmerica, and Europe in thespring of 2003. However, thisoutbreak was contained, andonly a few isolated cases haveappeared since.
Did You Know ?
Example Use a Graph to Make Predictions
This table shows the number of paid admissions to movies in Canada for 12-month periods (fiscal years) ending on March 31.
a) Graph the data.
b) Describe any trends in movie attendance from 1994 to 2004.
c) Statistics Canada did not survey movie attendance for the periodfrom April 2001 to March 2002. Estimate the movie attendanceduring this period.
d) Predict the number of paid admissions to movies in Canada for the 12-month period ending in March 2006.
e) The SARS outbreak in Canada occurred in the spring and summerof 2003. Would you change your prediction for 2005�2006 basedon this additional information?
Fiscal Year 1994 1995 1996 1997 1998 1999 2000 2001 2002 2003
Attendance(millions)
83.8 87.3 91.3 99.1 111.6 119.3 119.3no
data125.4 119.6
A fiscal year is a 12-monthperiod used for accounting.The federal government andmany businesses have a fiscalyear that ends on March 31.
onnectionsLiterac
y
x0
y
x0
upward trend downward trend
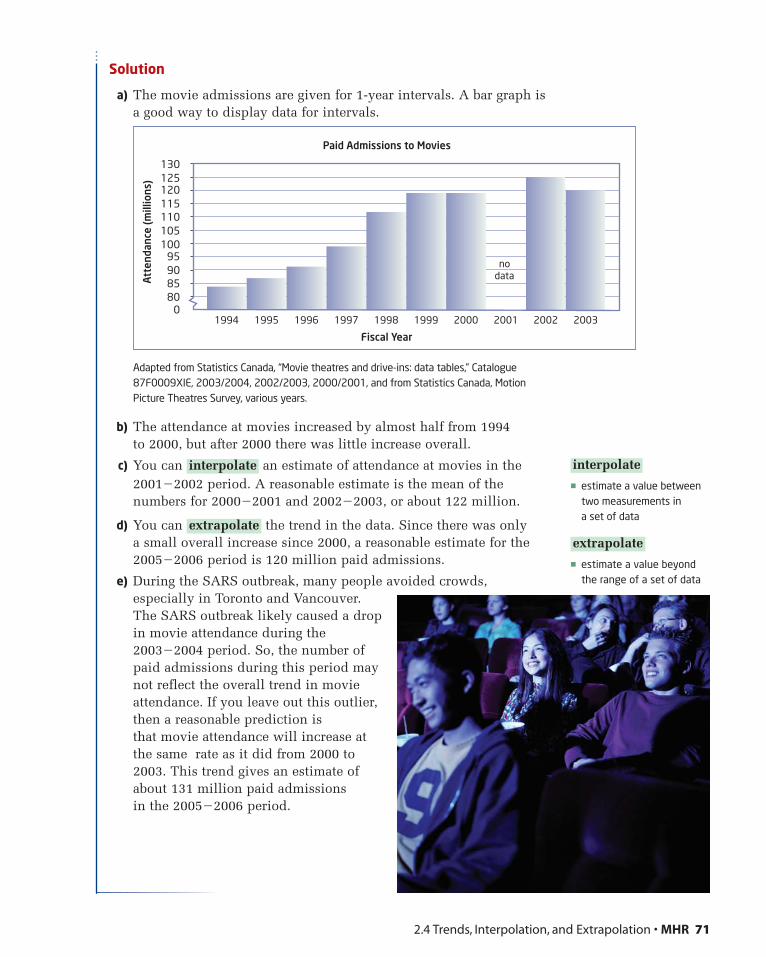
Solution
a) The movie admissions are given for 1-year intervals. A bar graph isa good way to display data for intervals.
Adapted from Statistics Canada, “Movie theatres and drive-ins: data tables,” Catalogue87F0009XIE, 2003/2004, 2002/2003, 2000/2001, and from Statistics Canada, MotionPicture Theatres Survey, various years.
b) The attendance at movies increased by almost half from 1994 to 2000, but after 2000 there was little increase overall.
c) You can an estimate of attendance at movies in the 2001�2002 period. A reasonable estimate is the mean of thenumbers for 2000�2001 and 2002�2003, or about 122 million.
d) You can the trend in the data. Since there was only a small overall increase since 2000, a reasonable estimate for the2005�2006 period is 120 million paid admissions.
e) During the SARS outbreak, many people avoided crowds,especially in Toronto and Vancouver.The SARS outbreak likely caused a dropin movie attendance during the2003�2004 period. So, the number ofpaid admissions during this period maynot reflect the overall trend in movieattendance. If you leave out this outlier,then a reasonable prediction is that movie attendance will increase atthe same rate as it did from 2000 to2003. This trend gives an estimate ofabout 131 million paid admissions in the 2005�2006 period.
extrapolate
interpolate
2.4 Trends, Interpolation, and Extrapolation • MHR 71
� estimate a value betweentwo measurements in a set of data
� estimate a value beyondthe range of a set of data
extrapolate
interpolate
800
859095
100105110115120125130
1994 1995 1996 1997 1998 1999 2000 2001
nodata
2002 2003
Fiscal Year
Paid Admissions to MoviesAt
tend
ance
(mill
ions
)
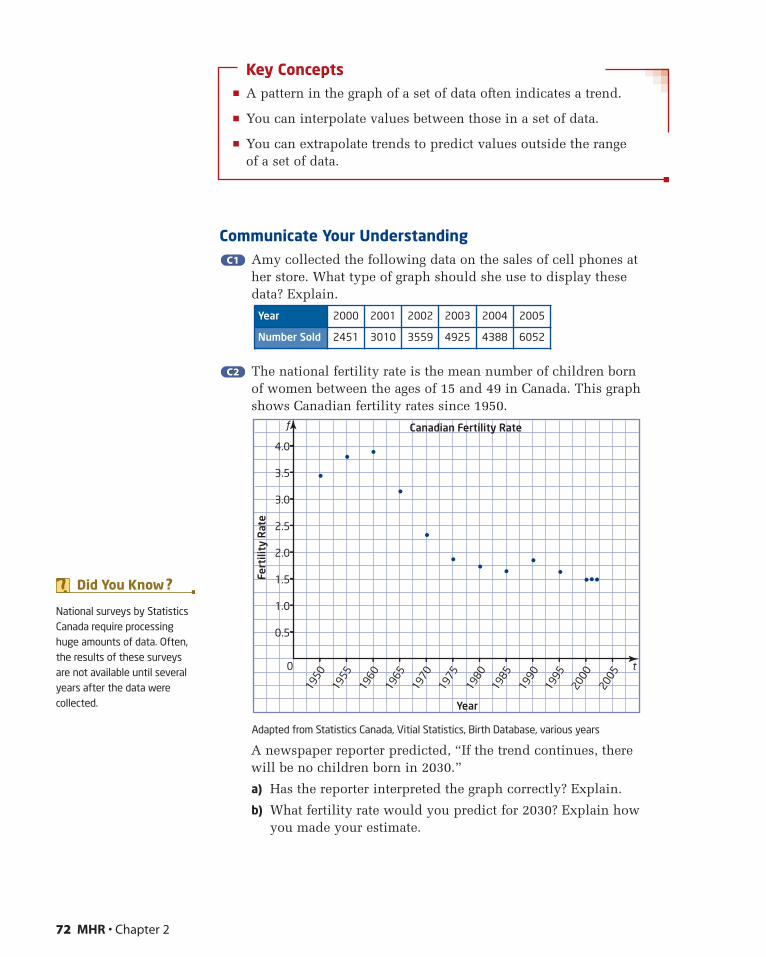
Key Concepts� A pattern in the graph of a set of data often indicates a trend.
� You can interpolate values between those in a set of data.
� You can extrapolate trends to predict values outside the range of a set of data.
Communicate Your UnderstandingAmy collected the following data on the sales of cell phones at her store. What type of graph should she use to display these data? Explain.
The national fertility rate is the mean number of children born of women between the ages of 15 and 49 in Canada. This graphshows Canadian fertility rates since 1950.
Adapted from Statistics Canada, Vitial Statistics, Birth Database, various years
A newspaper reporter predicted, “If the trend continues, there will be no children born in 2030.”
a) Has the reporter interpreted the graph correctly? Explain.
b) What fertility rate would you predict for 2030? Explain how you made your estimate.
f
t0
0.5
1.0
1.5
2.0
2.5
3.0
3.5
4.0
1950
1955
1960
1965
1970
1975
1980
1985
1990
1995
2000
2005
Year
Fert
ility
Rat
e
Canadian Fertility Rate
C2C2
C1C1
Year 2000 2001 2002 2003 2004 2005
Number Sold 2451 3010 3559 4925 4388 6052
72 MHR • Chapter 2
National surveys by StatisticsCanada require processinghuge amounts of data. Often,the results of these surveysare not available until severalyears after the data werecollected.
Did You Know ?
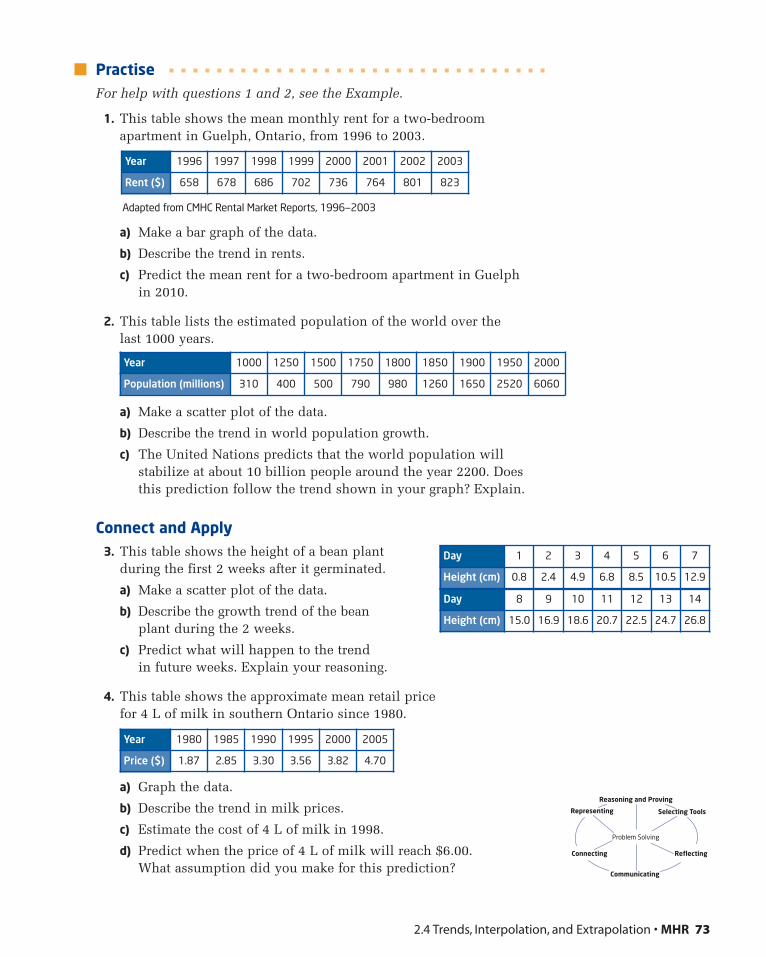
PractiseFor help with questions 1 and 2, see the Example.
1. This table shows the mean monthly rent for a two-bedroomapartment in Guelph, Ontario, from 1996 to 2003.
Adapted from CMHC Rental Market Reports, 1996—2003
a) Make a bar graph of the data.
b) Describe the trend in rents.
c) Predict the mean rent for a two-bedroom apartment in Guelph in 2010.
2. This table lists the estimated population of the world over the last 1000 years.
a) Make a scatter plot of the data.
b) Describe the trend in world population growth.
c) The United Nations predicts that the world population willstabilize at about 10 billion people around the year 2200. Doesthis prediction follow the trend shown in your graph? Explain.
Connect and Apply3. This table shows the height of a bean plant
during the first 2 weeks after it germinated.
a) Make a scatter plot of the data.
b) Describe the growth trend of the bean plant during the 2 weeks.
c) Predict what will happen to the trend in future weeks. Explain your reasoning.
4. This table shows the approximate mean retail price for 4 L of milk in southern Ontario since 1980.
a) Graph the data.
b) Describe the trend in milk prices.
c) Estimate the cost of 4 L of milk in 1998.
d) Predict when the price of 4 L of milk will reach $6.00. What assumption did you make for this prediction?
Year 1980 1985 1990 1995 2000 2005
Price ($) 1.87 2.85 3.30 3.56 3.82 4.70
Year 1000 1250 1500 1750 1800 1850 1900 1950 2000
Population (millions) 310 400 500 790 980 1260 1650 2520 6060
Year 1996 1997 1998 1999 2000 2001 2002 2003
Rent ($) 658 678 686 702 736 764 801 823
2.4 Trends, Interpolation, and Extrapolation • MHR 73
Day 8 9 10 11 12 13 14
Height (cm) 15.0 16.9 18.6 20.7 22.5 24.7 26.8
Day 1 2 3 4 5 6 7
Height (cm) 0.8 2.4 4.9 6.8 8.5 10.5 12.9
Selecting ToolsRepresenting
Reasoning and Proving
Communicating
Connecting Reflecting
Problem Solving
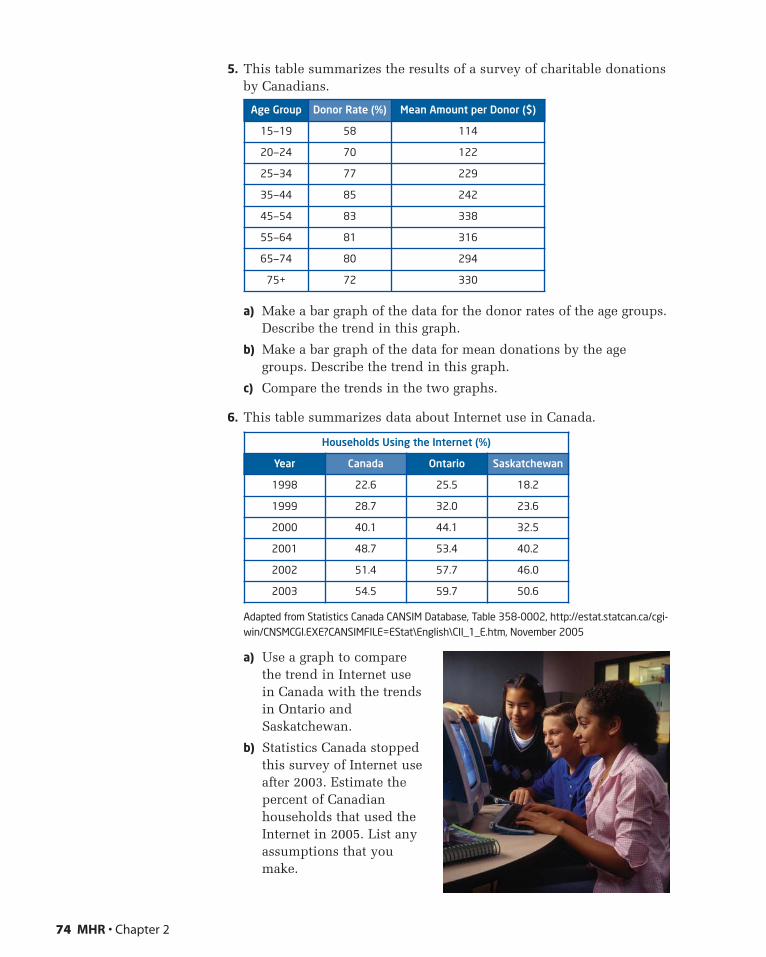
5. This table summarizes the results of a survey of charitable donationsby Canadians.
a) Make a bar graph of the data for the donor rates of the age groups.Describe the trend in this graph.
b) Make a bar graph of the data for mean donations by the agegroups. Describe the trend in this graph.
c) Compare the trends in the two graphs.
6. This table summarizes data about Internet use in Canada.
Adapted from Statistics Canada CANSIM Database, Table 358-0002, http://estat.statcan.ca/cgi-win/CNSMCGI.EXE?CANSIMFILE=EStat\English\CII_1_E.htm, November 2005
Households Using the Internet (%)
Year Canada Ontario Saskatchewan
1998 22.6 25.5 18.2
1999 28.7 32.0 23.6
2000 40.1 44.1 32.5
2001 48.7 53.4 40.2
2002 51.4 57.7 46.0
2003 54.5 59.7 50.6
Age Group Donor Rate (%) Mean Amount per Donor ($)
15—19 58 114
20—24 70 122
25—34 77 229
35—44 85 242
45—54 83 338
55—64 81 316
65—74 80 294
75+ 72 330
74 MHR • Chapter 2
a) Use a graph to comparethe trend in Internet usein Canada with the trendsin Ontario andSaskatchewan.
b) Statistics Canada stoppedthis survey of Internet useafter 2003. Estimate thepercent of Canadianhouseholds that used theInternet in 2005. List anyassumptions that youmake.

7. The table shows the number of music singles, cassettes, and CDssold in Canada between 1998 and 2004.
a) Use graphs to help you describe the trends in the sales of each type of recording.
b) Predict the sales of each type of recording in 2005.
c) Use data from the Internet to check if your predictions were correct. Did any of the trends change in 2005?
Achievement Check
8. This table shows the time it takes a skateboarder to reach the bottomof a ramp when starting from various points along the ramp.
a) Identify the independent variable and the dependent variable.Explain your reasoning.
b) Make a scatter plot of the data.
c) Describe the relationship between the variables.
d) Identify any outliers. Explain whether you would include any of these outliers in the data set.
e) Estimate the time it would take the skateboarder to reach the bottom of the ramp from a starting height of 3.6 m. Explainhow you made your estimate.
Sales of Recorded Music in Canada (millions of units)
Year Singles Cassettes CDs
1998 0.9 8.4 57.7
1999 0.8 5.7 58.4
2000 0.5 2.8 57.3
2001 0.5 1.4 54.0
2002 0.6 1.0 50.9
2003 0.8 0.3 49.0
2004 0.5 < 0.1 51.3
2.4 Trends, Interpolation, and Extrapolation • MHR 75
Initial Height (m) Descent Time (s)
2.0 1.4
2.7 1.9
3.4 2.5
3.8 2.7
4.0 2.8
4.5 2.2
4.7 3.0
5.0 3.1
Go towww.mcgrawhill.ca/
links/principles9 and followthe links to learn more aboutthe sales of recordings inCanada.
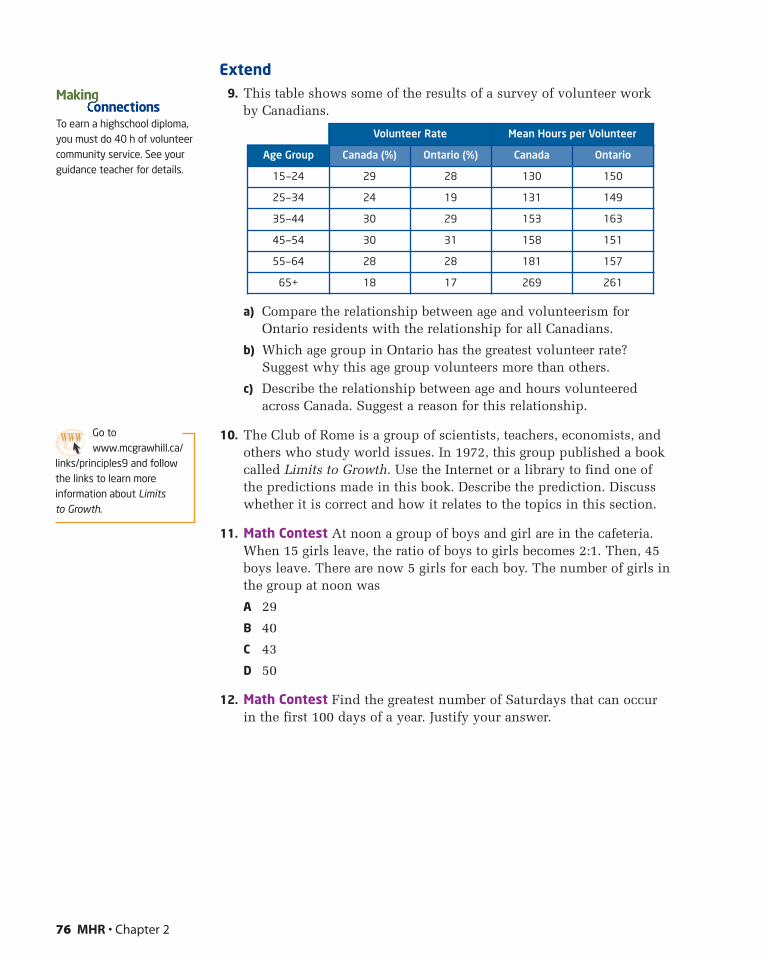
Extend9. This table shows some of the results of a survey of volunteer work
by Canadians.
a) Compare the relationship between age and volunteerism forOntario residents with the relationship for all Canadians.
b) Which age group in Ontario has the greatest volunteer rate?Suggest why this age group volunteers more than others.
c) Describe the relationship between age and hours volunteeredacross Canada. Suggest a reason for this relationship.
10. The Club of Rome is a group of scientists, teachers, economists, andothers who study world issues. In 1972, this group published a bookcalled Limits to Growth. Use the Internet or a library to find one ofthe predictions made in this book. Describe the prediction. Discusswhether it is correct and how it relates to the topics in this section.
11. Math Contest At noon a group of boys and girl are in the cafeteria.When 15 girls leave, the ratio of boys to girls becomes 2:1. Then, 45boys leave. There are now 5 girls for each boy. The number of girls inthe group at noon was
A 29
B 40
C 43
D 50
12. Math Contest Find the greatest number of Saturdays that can occurin the first 100 days of a year. Justify your answer.
76 MHR • Chapter 2
Volunteer Rate Mean Hours per Volunteer
Age Group Canada (%) Ontario (%) Canada Ontario
15—24 29 28 130 150
25—34 24 19 131 149
35—44 30 29 153 163
45—54 30 31 158 151
55—64 28 28 181 157
65+ 18 17 269 261
To earn a highschool diploma,you must do 40 h of volunteercommunity service. See yourguidance teacher for details.
Makinonnections
Go towww.mcgrawhill.ca/
links/principles9 and followthe links to learn moreinformation about Limitsto Growth.
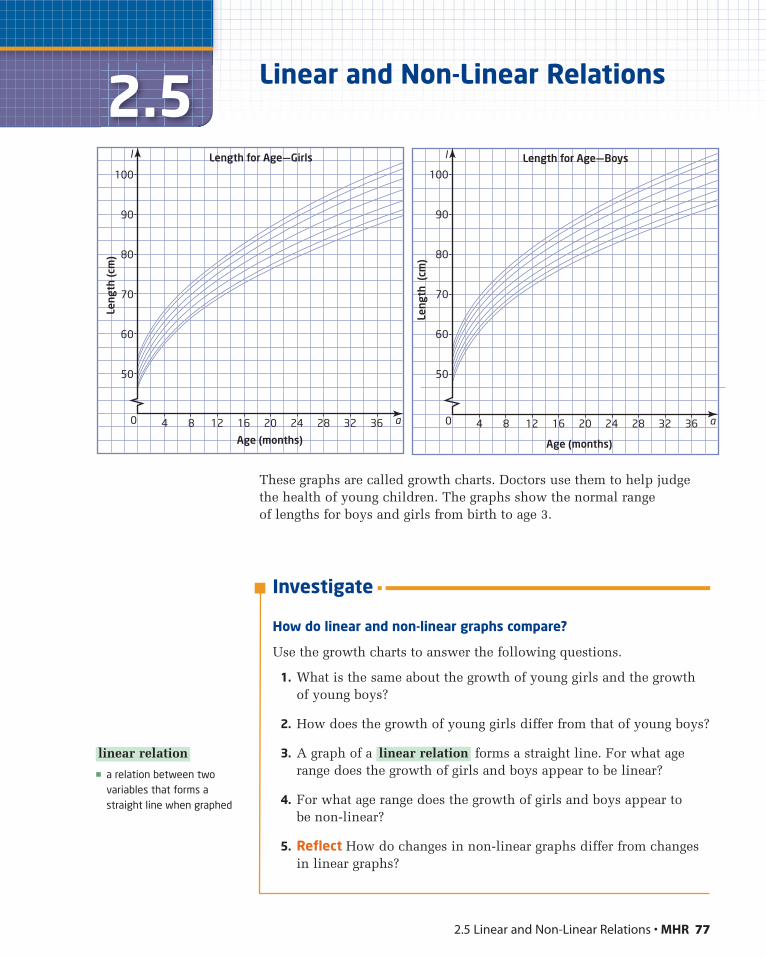
2.5 Linear and Non-Linear Relations • MHR 77
2.5 Linear and Non-Linear Relations
These graphs are called growth charts. Doctors use them to help judgethe health of young children. The graphs show the normal range of lengths for boys and girls from birth to age 3.
Investigate
How do linear and non-linear graphs compare?
Use the growth charts to answer the following questions.
1. What is the same about the growth of young girls and the growthof young boys?
2. How does the growth of young girls differ from that of young boys?
3. A graph of a forms a straight line. For what agerange does the growth of girls and boys appear to be linear?
4. For what age range does the growth of girls and boys appear tobe non-linear?
5. Reflect How do changes in non-linear graphs differ from changesin linear graphs?
linear relation� a relation between two
variables that forms astraight line when graphed
linear relation
l
a0 4 8 12 16 20 24 28 32 36
50
60
70
80
90
100
Age (months)
Length for Age—Girls
Leng
th (c
m)
l
a0 4 8 12 16 20 24 28 32 36
50
60
70
80
90
100
Age (months)
Length for Age—Boys
Leng
th (
cm)
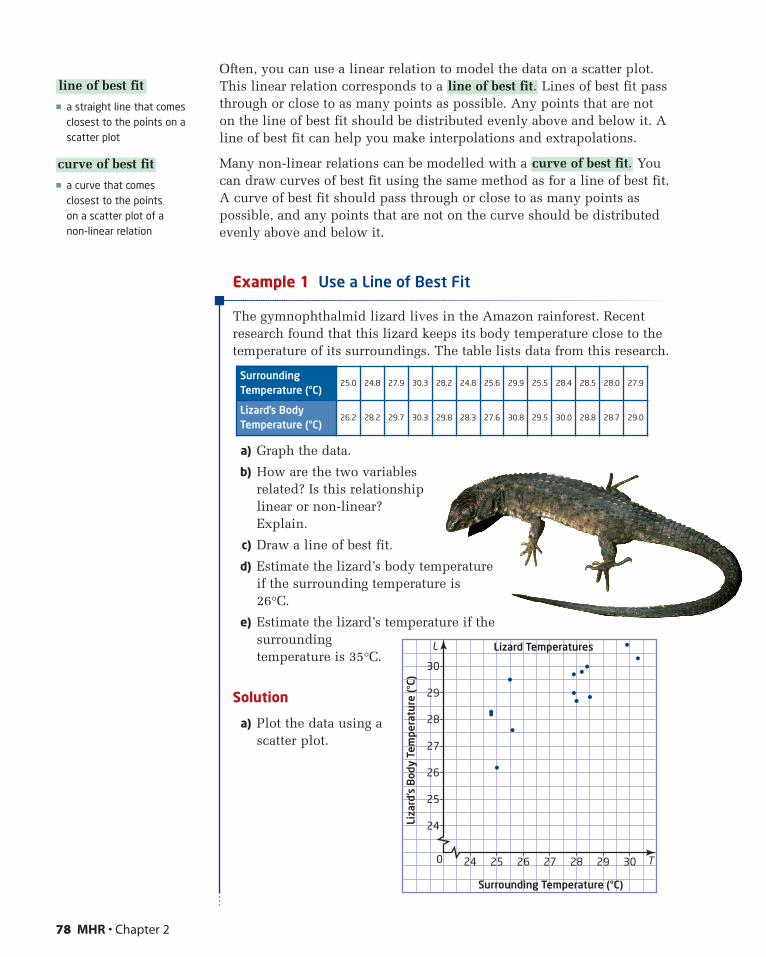
Often, you can use a linear relation to model the data on a scatter plot.This linear relation corresponds to a Lines of best fit passthrough or close to as many points as possible. Any points that are noton the line of best fit should be distributed evenly above and below it. Aline of best fit can help you make interpolations and extrapolations.
Many non-linear relations can be modelled with a Youcan draw curves of best fit using the same method as for a line of best fit.A curve of best fit should pass through or close to as many points aspossible, and any points that are not on the curve should be distributedevenly above and below it.
Example 1 Use a Line of Best Fit
The gymnophthalmid lizard lives in the Amazon rainforest. Recentresearch found that this lizard keeps its body temperature close to thetemperature of its surroundings. The table lists data from this research.
a) Graph the data.
b) How are the two variablesrelated? Is this relationshiplinear or non-linear?Explain.
c) Draw a line of best fit.
d) Estimate the lizard’s body temperature if the surrounding temperature is26°C.
e) Estimate the lizard’s temperature if thesurroundingtemperature is 35°C.
Solution
a) Plot the data using ascatter plot.
curve of best fit.
line of best fit.
SurroundingTemperature (°C)
25.0 24.8 27.9 30.3 28.2 24.8 25.6 29.9 25.5 28.4 28.5 28.0 27.9
Lizard’s BodyTemperature (°C)
26.2 28.2 29.7 30.3 29.8 28.3 27.6 30.8 29.5 30.0 28.8 28.7 29.0
78 MHR • Chapter 2
� a straight line that comesclosest to the points on ascatter plot
� a curve that comesclosest to the points on a scatter plot of anon-linear relation
curve of best fit
line of best fit
L
T0
24
25
26
27
28
29
30
24 25 26 27 28 29 30
Surrounding Temperature (°C)
Lizard Temperatures
Liza
rd’s
Bod
y Te
mpe
ratu
re (°
C)
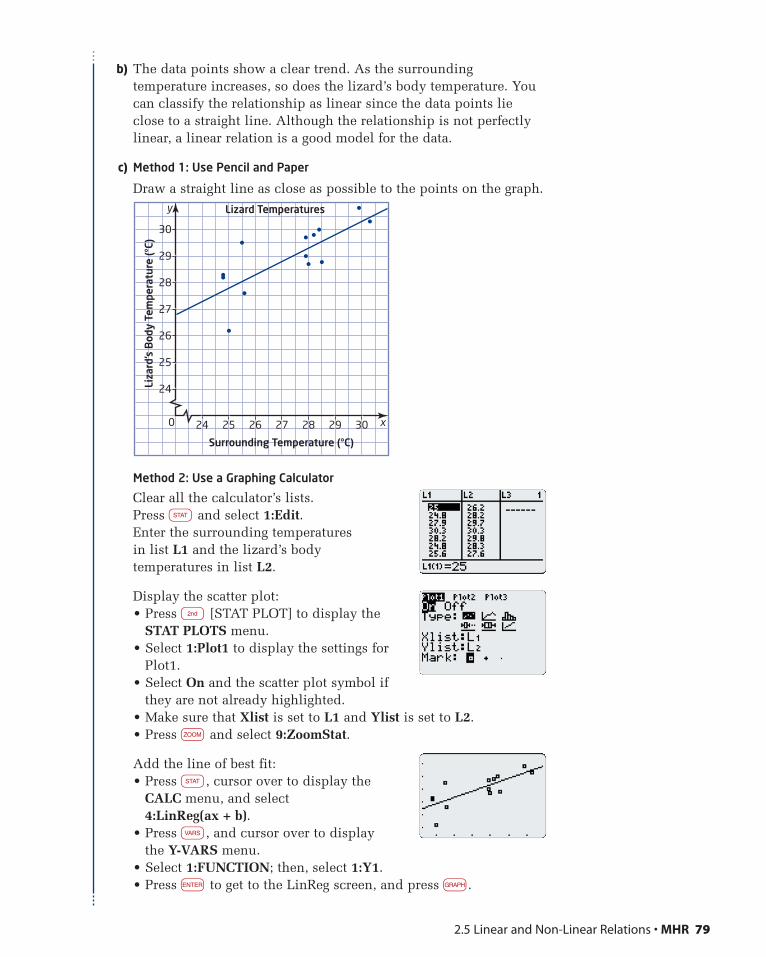
2.5 Linear and Non-Linear Relations • MHR 79
b) The data points show a clear trend. As the surroundingtemperature increases, so does the lizard’s body temperature. Youcan classify the relationship as linear since the data points lieclose to a straight line. Although the relationship is not perfectlylinear, a linear relation is a good model for the data.
c) Method 1: Use Pencil and Paper
Draw a straight line as close as possible to the points on the graph.
Method 2: Use a Graphing Calculator
Clear all the calculator’s lists.Press q and select 1:Edit.Enter the surrounding temperaturesin list L1 and the lizard’s bodytemperatures in list L2.
Display the scatter plot:• Press n [STAT PLOT] to display the
STAT PLOTS menu.• Select 1:Plot1 to display the settings for
Plot1.• Select On and the scatter plot symbol if
they are not already highlighted.• Make sure that Xlist is set to L1 and Ylist is set to L2.• Press z and select 9:ZoomStat.
Add the line of best fit:• Press q, cursor over to display the
CALC menu, and select 4:LinReg(ax + b).
• Press v, and cursor over to display the Y-VARS menu.
• Select 1:FUNCTION; then, select 1:Y1.• Press e to get to the LinReg screen, and press g.
y
x0
24
25
26
27
28
29
30
24 25 26 27 28 29 30
Surrounding Temperature (°C)
Liza
rd’s
Bod
y Te
mpe
ratu
re (°
C)
Lizard Temperatures
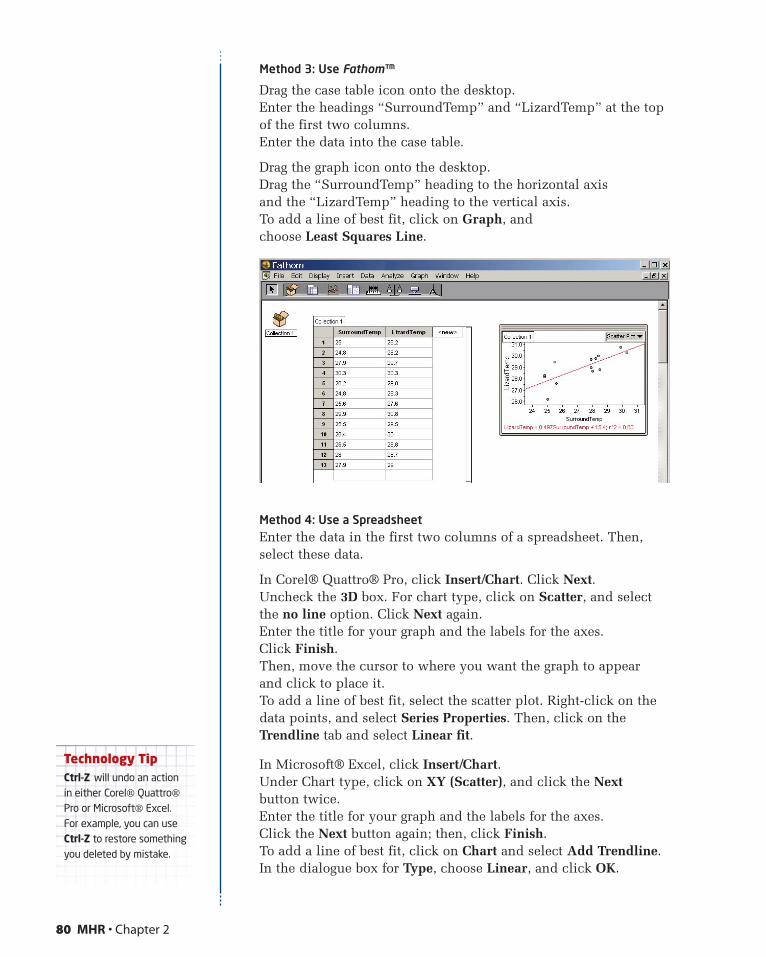
Method 3: Use Fathom™
Drag the case table icon onto the desktop.Enter the headings “SurroundTemp” and “LizardTemp” at the topof the first two columns.Enter the data into the case table.
Drag the graph icon onto the desktop.Drag the “SurroundTemp” heading to the horizontal axisand the “LizardTemp” heading to the vertical axis.To add a line of best fit, click on Graph, and choose Least Squares Line.
Method 4: Use a SpreadsheetEnter the data in the first two columns of a spreadsheet. Then,select these data.
In Corel® Quattro® Pro, click Insert/Chart. Click Next.Uncheck the 3D box. For chart type, click on Scatter, and selectthe no line option. Click Next again.Enter the title for your graph and the labels for the axes.Click Finish.Then, move the cursor to where you want the graph to appear and click to place it.To add a line of best fit, select the scatter plot. Right-click on thedata points, and select Series Properties. Then, click on theTrendline tab and select Linear fit.
In Microsoft® Excel, click Insert/Chart.Under Chart type, click on XY (Scatter), and click the Nextbutton twice.Enter the title for your graph and the labels for the axes.Click the Next button again; then, click Finish.To add a line of best fit, click on Chart and select Add Trendline.In the dialogue box for Type, choose Linear, and click OK.
80 MHR • Chapter 2
Technology TipCtrl-Z will undo an actionin either Corel® Quattro®
Pro or Microsoft® Excel.For example, you can useCtrl-Z to restore somethingyou deleted by mistake.
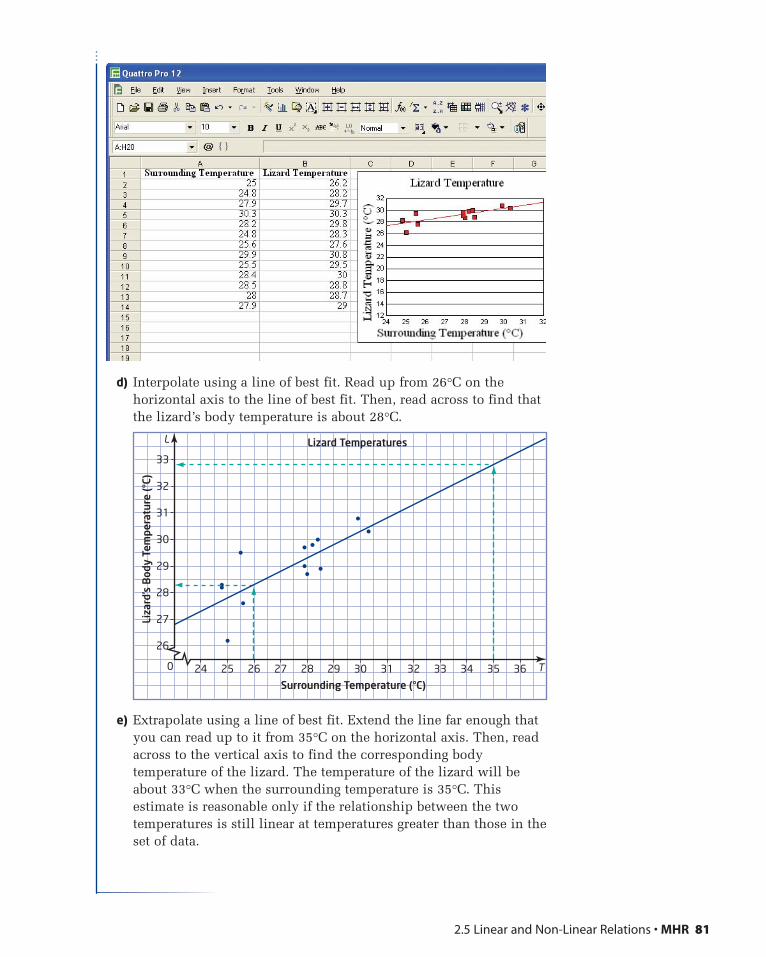
2.5 Linear and Non-Linear Relations • MHR 81
d) Interpolate using a line of best fit. Read up from 26°C on thehorizontal axis to the line of best fit. Then, read across to find thatthe lizard’s body temperature is about 28°C.
e) Extrapolate using a line of best fit. Extend the line far enough thatyou can read up to it from 35°C on the horizontal axis. Then, readacross to the vertical axis to find the corresponding bodytemperature of the lizard. The temperature of the lizard will beabout 33°C when the surrounding temperature is 35°C. Thisestimate is reasonable only if the relationship between the twotemperatures is still linear at temperatures greater than those in theset of data.
L
T0
26
27
28
29
30
31
32
33
24 25 26 27 28 29 30 31 32 33 34 35 36
Surrounding Temperature (°C)
Lizard Temperatures
Liza
rd’s
Bod
y Te
mpe
ratu
re (°
C)
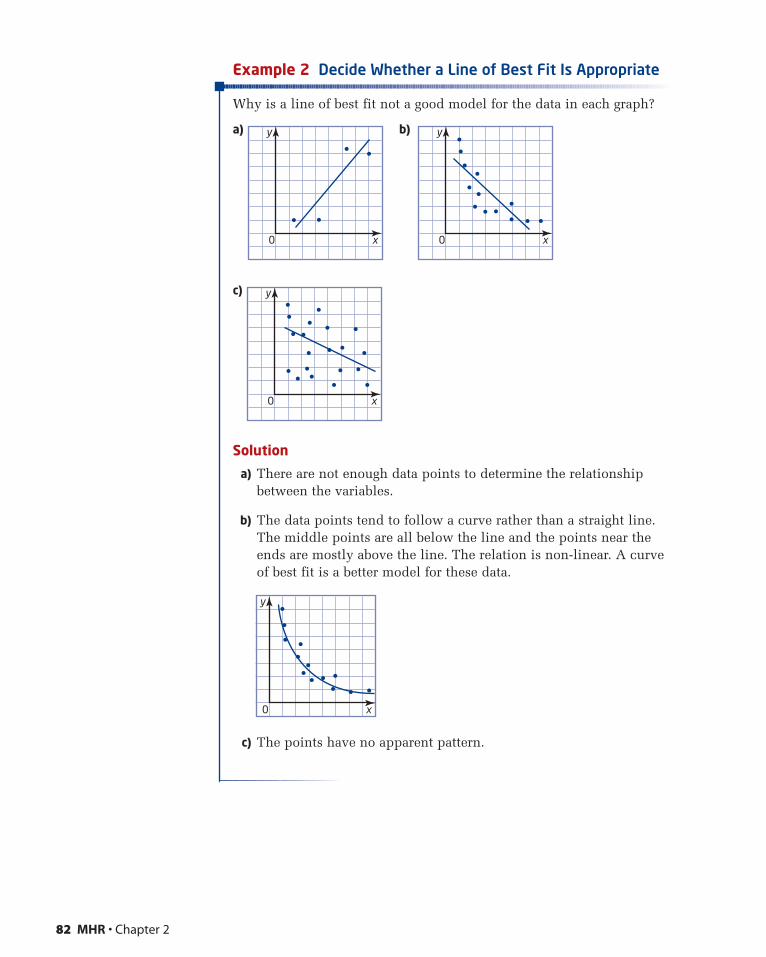
Example 2 Decide Whether a Line of Best Fit Is Appropriate
Why is a line of best fit not a good model for the data in each graph?
a) b)
c)
Solution
a) There are not enough data points to determine the relationshipbetween the variables.
b) The data points tend to follow a curve rather than a straight line.The middle points are all below the line and the points near theends are mostly above the line. The relation is non-linear. A curveof best fit is a better model for these data.
c) The points have no apparent pattern.
y
x0
y
x0
y
x0
82 MHR • Chapter 2
y
x0
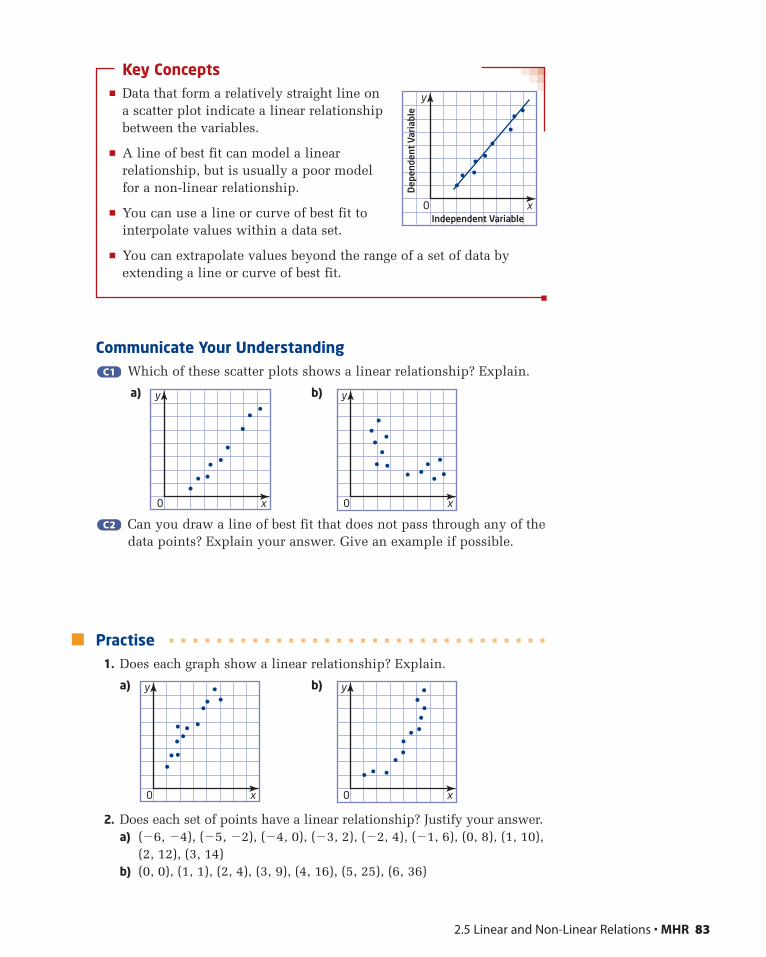
2.5 Linear and Non-Linear Relations • MHR 83
Key Concepts� Data that form a relatively straight line on
a scatter plot indicate a linear relationshipbetween the variables.
� A line of best fit can model a linearrelationship, but is usually a poor modelfor a non-linear relationship.
� You can use a line or curve of best fit tointerpolate values within a data set.
� You can extrapolate values beyond the range of a set of data byextending a line or curve of best fit.
Communicate Your UnderstandingWhich of these scatter plots shows a linear relationship? Explain.
a) b)
Can you draw a line of best fit that does not pass through any of thedata points? Explain your answer. Give an example if possible.
Practise1. Does each graph show a linear relationship? Explain.
a) b)
2. Does each set of points have a linear relationship? Justify your answer.a) (�6, �4), (�5, �2), (�4, 0), (�3, 2), (�2, 4), (�1, 6), (0, 8), (1, 10),
(2, 12), (3, 14)b) (0, 0), (1, 1), (2, 4), (3, 9), (4, 16), (5, 25), (6, 36)
y
x0
y
x0
C2C2
y
x0
y
x0
C1C1
y
x0
Dep
ende
nt V
aria
ble
Independent Variable
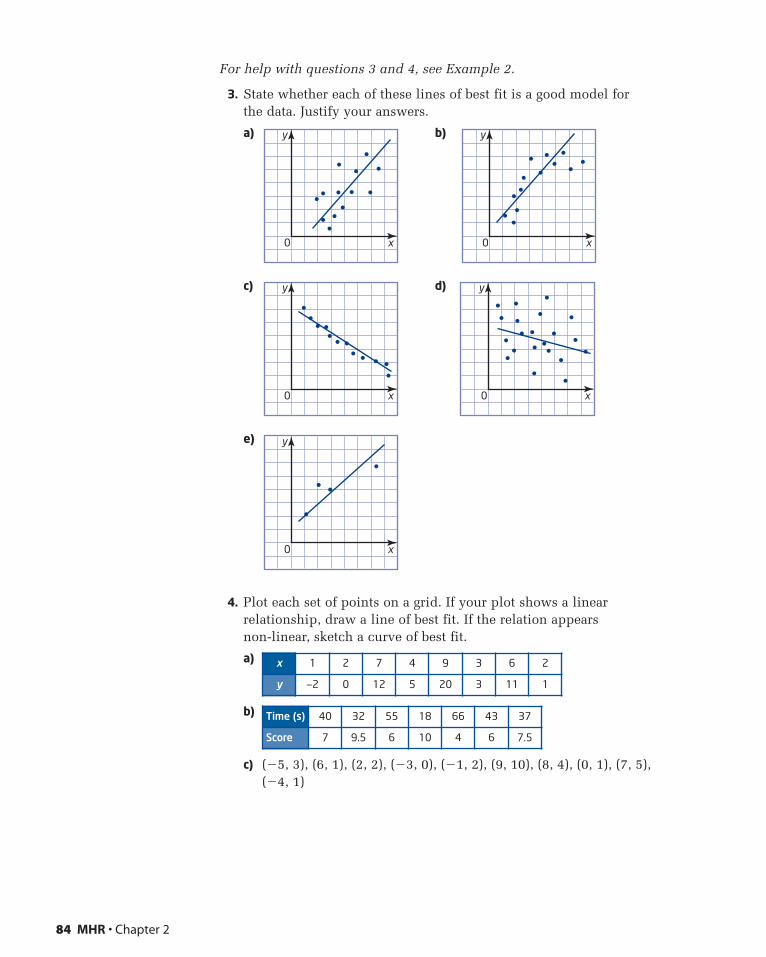
For help with questions 3 and 4, see Example 2.
3. State whether each of these lines of best fit is a good model forthe data. Justify your answers.
a) b)
c) d)
e)
4. Plot each set of points on a grid. If your plot shows a linearrelationship, draw a line of best fit. If the relation appears non-linear, sketch a curve of best fit.
a)
b)
c) (�5, 3), (6, 1), (2, 2), (�3, 0), (�1, 2), (9, 10), (8, 4), (0, 1), (7, 5),(�4, 1)
Time (s) 40 32 55 18 66 43 37
Score 7 9.5 6 10 4 6 7.5
x 1 2 7 4 9 3 6 2
y —2 0 12 5 20 3 11 1
y
x0
y
x0
y
x0
y
x0
y
x0
84 MHR • Chapter 2
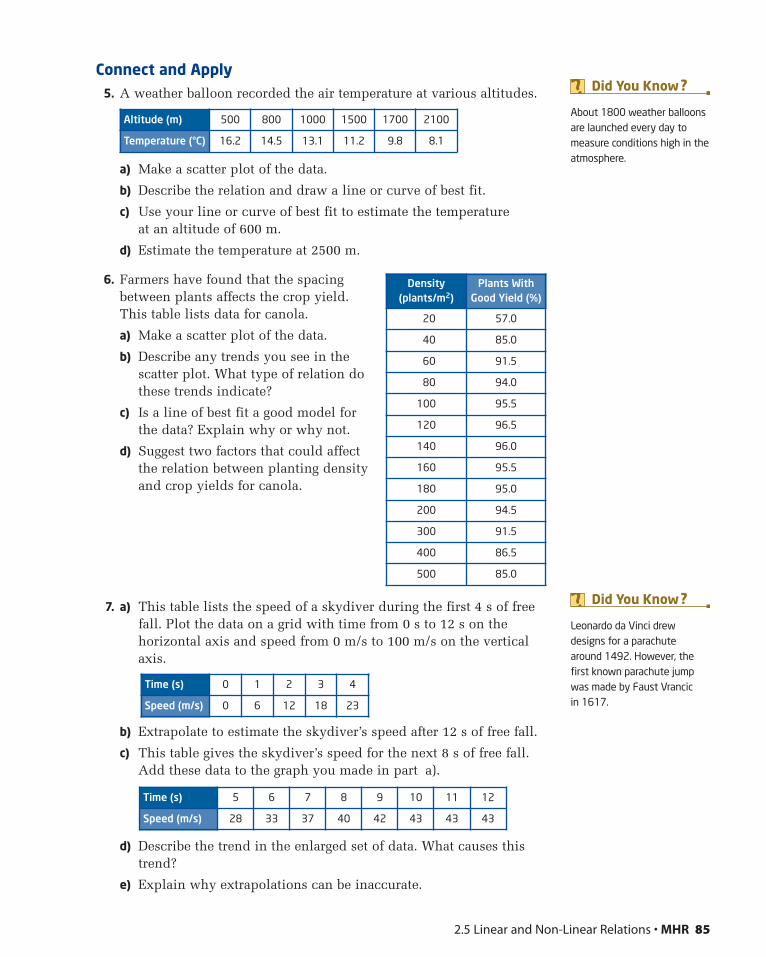
2.5 Linear and Non-Linear Relations • MHR 85
Connect and Apply5. A weather balloon recorded the air temperature at various altitudes.
a) Make a scatter plot of the data.
b) Describe the relation and draw a line or curve of best fit.
c) Use your line or curve of best fit to estimate the temperature at an altitude of 600 m.
d) Estimate the temperature at 2500 m.
6. Farmers have found that the spacingbetween plants affects the crop yield.This table lists data for canola.
a) Make a scatter plot of the data.
b) Describe any trends you see in thescatter plot. What type of relation dothese trends indicate?
c) Is a line of best fit a good model forthe data? Explain why or why not.
d) Suggest two factors that could affectthe relation between planting densityand crop yields for canola.
7. a) This table lists the speed of a skydiver during the first 4 s of freefall. Plot the data on a grid with time from 0 s to 12 s on thehorizontal axis and speed from 0 m/s to 100 m/s on the verticalaxis.
b) Extrapolate to estimate the skydiver’s speed after 12 s of free fall.
c) This table gives the skydiver’s speed for the next 8 s of free fall.Add these data to the graph you made in part a).
d) Describe the trend in the enlarged set of data. What causes thistrend?
e) Explain why extrapolations can be inaccurate.
Altitude (m) 500 800 1000 1500 1700 2100
Temperature (°C) 16.2 14.5 13.1 11.2 9.8 8.1
Density(plants/m2)
Plants WithGood Yield (%)
20 57.0
40 85.0
60 91.5
80 94.0
100 95.5
120 96.5
140 96.0
160 95.5
180 95.0
200 94.5
300 91.5
400 86.5
500 85.0
About 1800 weather balloonsare launched every day tomeasure conditions high in theatmosphere.
Did You Know ?
Leonardo da Vinci drewdesigns for a parachutearound 1492. However, thefirst known parachute jumpwas made by Faust Vrancic in 1617.
Did You Know ?
Time (s) 0 1 2 3 4
Speed (m/s) 0 6 12 18 23
Time (s) 5 6 7 8 9 10 11 12
Speed (m/s) 28 33 37 40 42 43 43 43
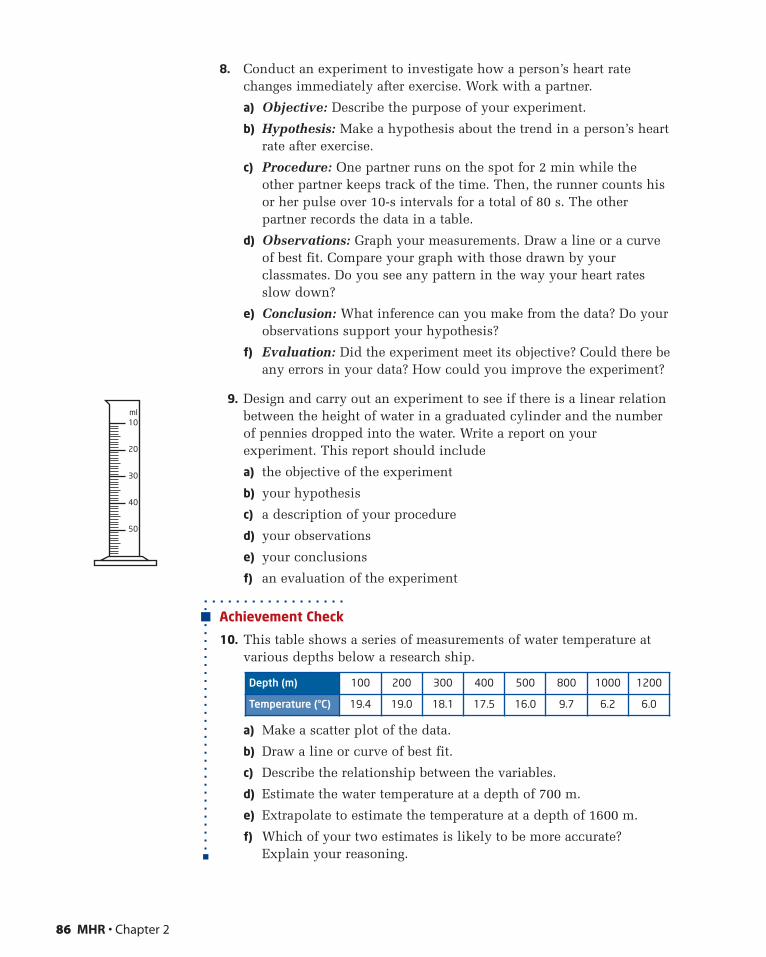
8. Conduct an experiment to investigate how a person’s heart ratechanges immediately after exercise. Work with a partner.
a) Objective: Describe the purpose of your experiment.
b) Hypothesis: Make a hypothesis about the trend in a person’s heartrate after exercise.
c) Procedure: One partner runs on the spot for 2 min while theother partner keeps track of the time. Then, the runner counts hisor her pulse over 10-s intervals for a total of 80 s. The otherpartner records the data in a table.
d) Observations: Graph your measurements. Draw a line or a curveof best fit. Compare your graph with those drawn by yourclassmates. Do you see any pattern in the way your heart ratesslow down?
e) Conclusion: What inference can you make from the data? Do yourobservations support your hypothesis?
f) Evaluation: Did the experiment meet its objective? Could there beany errors in your data? How could you improve the experiment?
9. Design and carry out an experiment to see if there is a linear relationbetween the height of water in a graduated cylinder and the numberof pennies dropped into the water. Write a report on yourexperiment. This report should include
a) the objective of the experiment
b) your hypothesis
c) a description of your procedure
d) your observations
e) your conclusions
f) an evaluation of the experiment
Achievement Check
10. This table shows a series of measurements of water temperature atvarious depths below a research ship.
a) Make a scatter plot of the data.
b) Draw a line or curve of best fit.
c) Describe the relationship between the variables.
d) Estimate the water temperature at a depth of 700 m.
e) Extrapolate to estimate the temperature at a depth of 1600 m.
f) Which of your two estimates is likely to be more accurate?Explain your reasoning.
86 MHR • Chapter 2
Depth (m) 100 200 300 400 500 800 1000 1200
Temperature (°C) 19.4 19.0 18.1 17.5 16.0 9.7 6.2 6.0
ml10
20
30
40
50
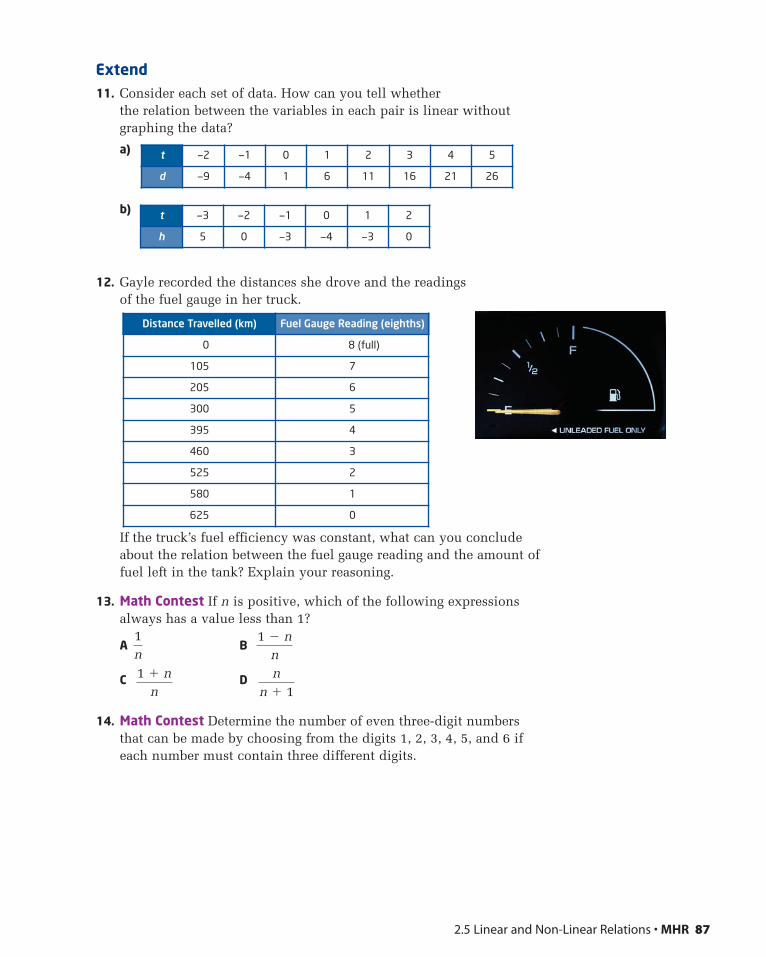
2.5 Linear and Non-Linear Relations • MHR 87
t —3 —2 —1 0 1 2
h 5 0 —3 —4 —3 0
t —2 —1 0 1 2 3 4 5
d —9 —4 1 6 11 16 21 26
Extend11. Consider each set of data. How can you tell whether
the relation between the variables in each pair is linear withoutgraphing the data?
a)
b)
12. Gayle recorded the distances she drove and the readings of the fuel gauge in her truck.
If the truck’s fuel efficiency was constant, what can you concludeabout the relation between the fuel gauge reading and the amount offuel left in the tank? Explain your reasoning.
13. Math Contest If n is positive, which of the following expressionsalways has a value less than 1?
A B
C D
14. Math Contest Determine the number of even three-digit numbersthat can be made by choosing from the digits 1, 2, 3, 4, 5, and 6 ifeach number must contain three different digits.
1n
Distance Travelled (km) Fuel Gauge Reading (eighths)
0 8 (full)
105 7
205 6
300 5
395 4
460 3
525 2
580 1
625 0
1 � nn
1 � nn
nn � 1
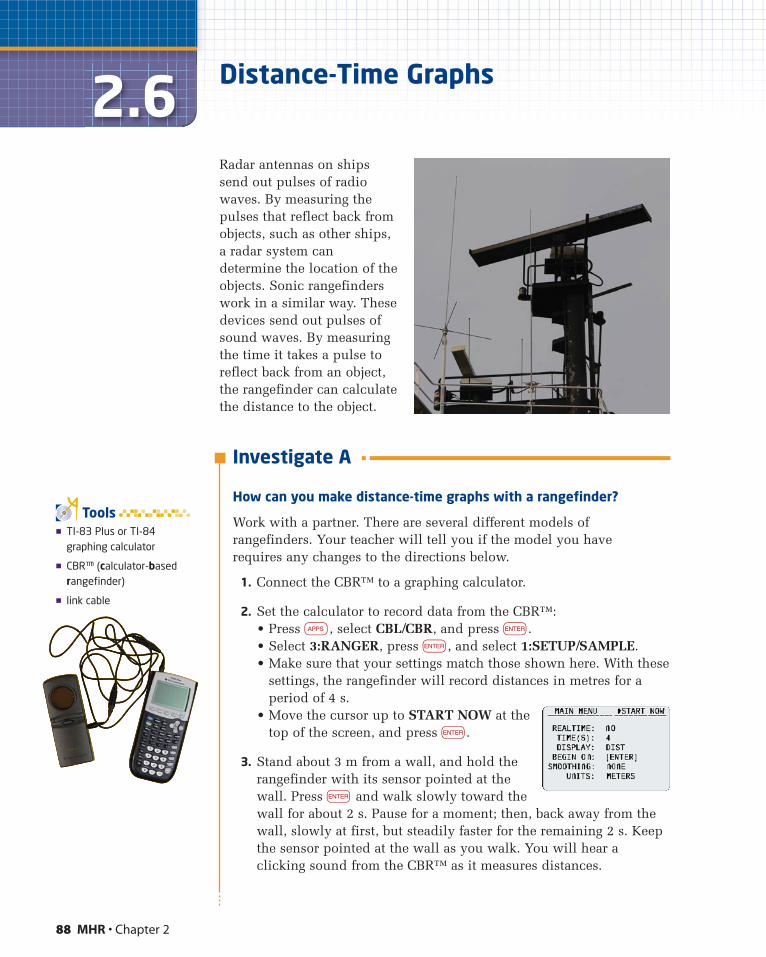
88 MHR • Chapter 2
2.6 Distance-Time Graphs
Radar antennas on shipssend out pulses of radiowaves. By measuring thepulses that reflect back fromobjects, such as other ships,a radar system candetermine the location of theobjects. Sonic rangefinderswork in a similar way. Thesedevices send out pulses ofsound waves. By measuringthe time it takes a pulse toreflect back from an object,the rangefinder can calculatethe distance to the object.
Investigate A
How can you make distance-time graphs with a rangefinder?
Work with a partner. There are several different models ofrangefinders. Your teacher will tell you if the model you have requires any changes to the directions below.
1. Connect the CBR™ to a graphing calculator.
2. Set the calculator to record data from the CBR™:• Press ∂, select CBL/CBR, and press e.• Select 3:RANGER, press e, and select 1:SETUP/SAMPLE.• Make sure that your settings match those shown here. With these
settings, the rangefinder will record distances in metres for aperiod of 4 s.
• Move the cursor up to START NOW at thetop of the screen, and press e.
3. Stand about 3 m from a wall, and hold therangefinder with its sensor pointed at thewall. Press e and walk slowly toward thewall for about 2 s. Pause for a moment; then, back away from thewall, slowly at first, but steadily faster for the remaining 2 s. Keepthe sensor pointed at the wall as you walk. You will hear aclicking sound from the CBR™ as it measures distances.
� TI-83 Plus or TI-84graphing calculator
� CBR™ (calculator-basedrangefinder)
� link cable
Tools
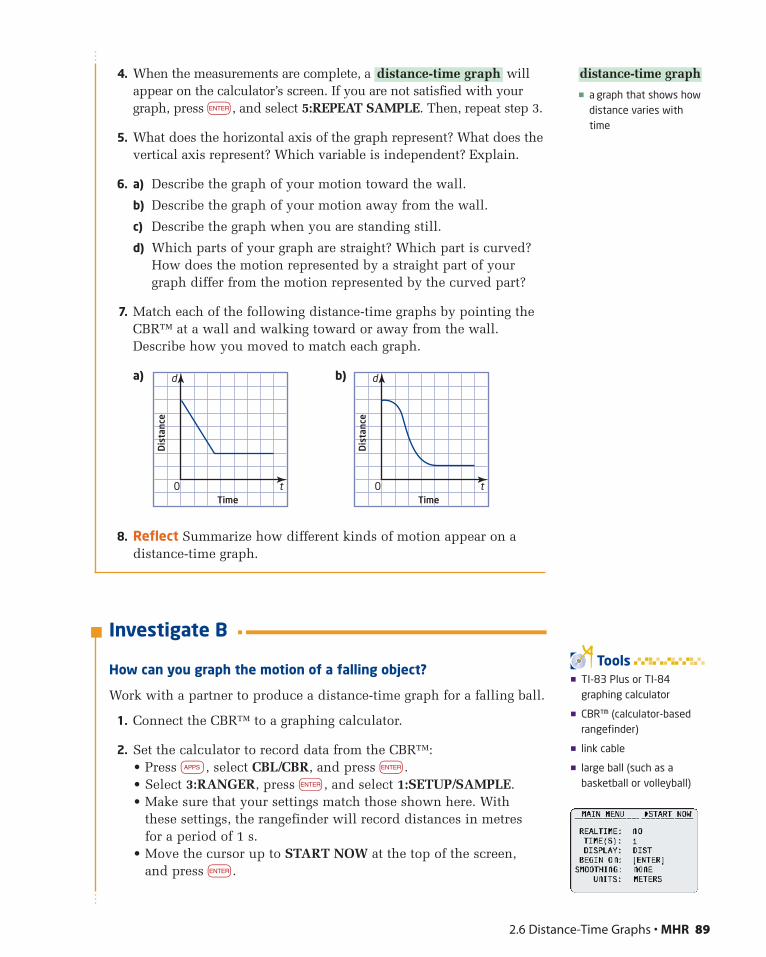
4. When the measurements are complete, a willappear on the calculator’s screen. If you are not satisfied with yourgraph, press e, and select 5:REPEAT SAMPLE. Then, repeat step 3.
5. What does the horizontal axis of the graph represent? What does thevertical axis represent? Which variable is independent? Explain.
6. a) Describe the graph of your motion toward the wall.
b) Describe the graph of your motion away from the wall.
c) Describe the graph when you are standing still.
d) Which parts of your graph are straight? Which part is curved?How does the motion represented by a straight part of yourgraph differ from the motion represented by the curved part?
7. Match each of the following distance-time graphs by pointing theCBR™ at a wall and walking toward or away from the wall.Describe how you moved to match each graph.
a) b)
8. Reflect Summarize how different kinds of motion appear on adistance-time graph.
Investigate B
How can you graph the motion of a falling object?
Work with a partner to produce a distance-time graph for a falling ball.
1. Connect the CBR™ to a graphing calculator.
2. Set the calculator to record data from the CBR™:• Press ∂, select CBL/CBR, and press e.• Select 3:RANGER, press e, and select 1:SETUP/SAMPLE.• Make sure that your settings match those shown here. With
these settings, the rangefinder will record distances in metres for a period of 1 s.
• Move the cursor up to START NOW at the top of the screen, and press e.
d
t0Time
Dis
tanc
e
d
t0Time
Dis
tanc
e
distance-time graph
2.6 Distance-Time Graphs • MHR 89
� TI-83 Plus or TI-84graphing calculator
� CBR™ (calculator-basedrangefinder)
� link cable
� large ball (such as abasketball or volleyball)
Tools
� a graph that shows howdistance varies with time
distance-time graph
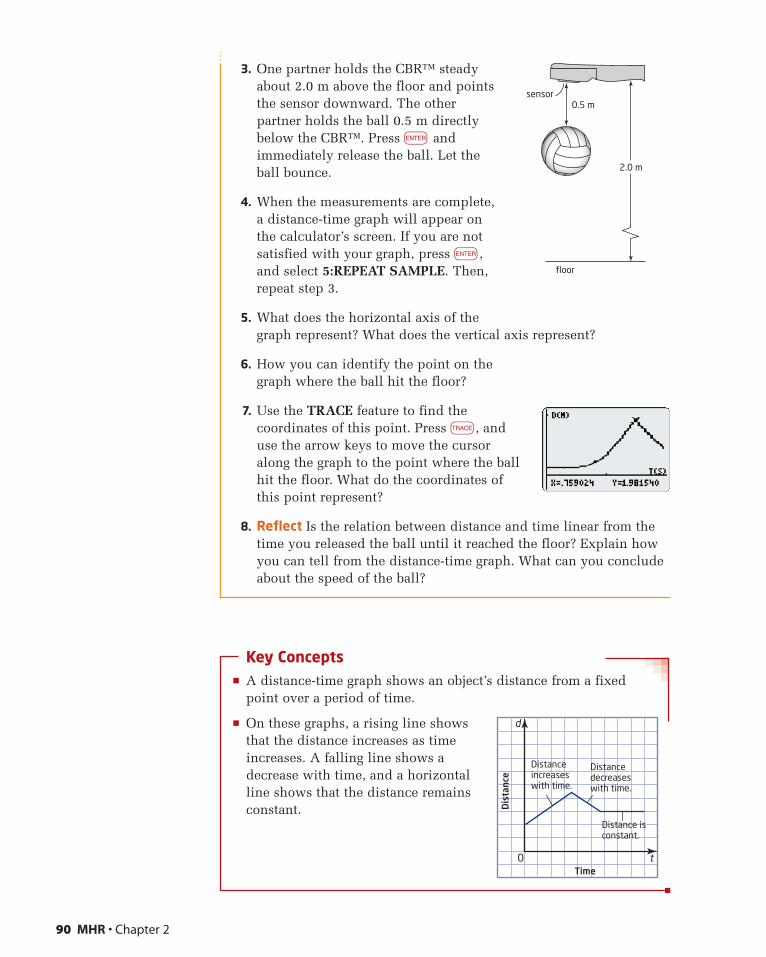
3. One partner holds the CBR™ steadyabout 2.0 m above the floor and pointsthe sensor downward. The otherpartner holds the ball 0.5 m directlybelow the CBR™. Press e andimmediately release the ball. Let theball bounce.
4. When the measurements are complete,a distance-time graph will appear onthe calculator’s screen. If you are notsatisfied with your graph, press e,and select 5:REPEAT SAMPLE. Then,repeat step 3.
5. What does the horizontal axis of thegraph represent? What does the vertical axis represent?
6. How you can identify the point on the graph where the ball hit the floor?
7. Use the TRACE feature to find thecoordinates of this point. Press u, anduse the arrow keys to move the cursoralong the graph to the point where the ballhit the floor. What do the coordinates ofthis point represent?
8. Reflect Is the relation between distance and time linear from thetime you released the ball until it reached the floor? Explain howyou can tell from the distance-time graph. What can you concludeabout the speed of the ball?
Key Concepts� A distance-time graph shows an object’s distance from a fixed
point over a period of time.
� On these graphs, a rising line showsthat the distance increases as timeincreases. A falling line shows adecrease with time, and a horizontalline shows that the distance remainsconstant.
90 MHR • Chapter 2
sensor
floor
0.5 m
2.0 m
d
t0Time
Dis
tanc
e
Distanceincreaseswith time.
Distancedecreaseswith time.
Distance isconstant.
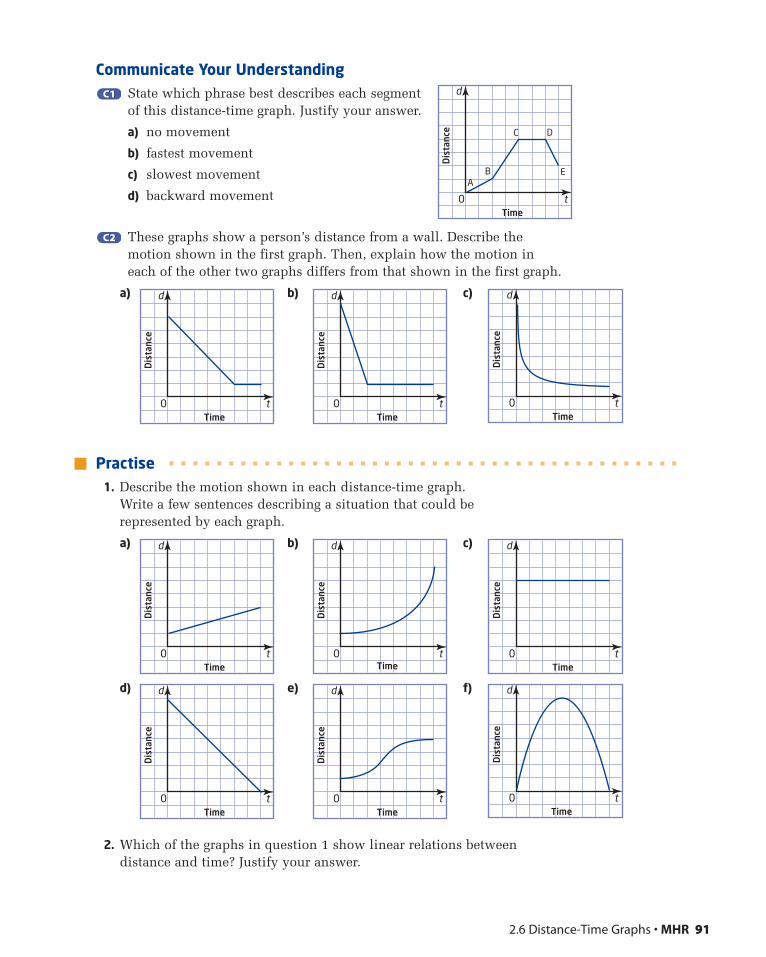
Communicate Your UnderstandingState which phrase best describes each segmentof this distance-time graph. Justify your answer.
a) no movement
b) fastest movement
c) slowest movement
d) backward movement
These graphs show a person’s distance from a wall. Describe the motion shown in the first graph. Then, explain how the motion in each of the other two graphs differs from that shown in the first graph.
a) b) c) d
t0Time
Dis
tanc
e
d
t0Time
Dis
tanc
e
d
t0Time
Dis
tanc
e
C2C2
C1C1
2.6 Distance-Time Graphs • MHR 91
d
t0Time
Dis
tanc
e
AB
C D
E
Practise1. Describe the motion shown in each distance-time graph.
Write a few sentences describing a situation that could be represented by each graph.
a) b) c)
d) e) f)
2. Which of the graphs in question 1 show linear relations between distance and time? Justify your answer.
d
t0Time
Dis
tanc
e
d
t0Time
Dis
tanc
e
d
t0Time
Dis
tanc
e
d
t0Time
Dis
tanc
e
d
t0Time
Dis
tanc
e
d
t0Time
Dis
tanc
e
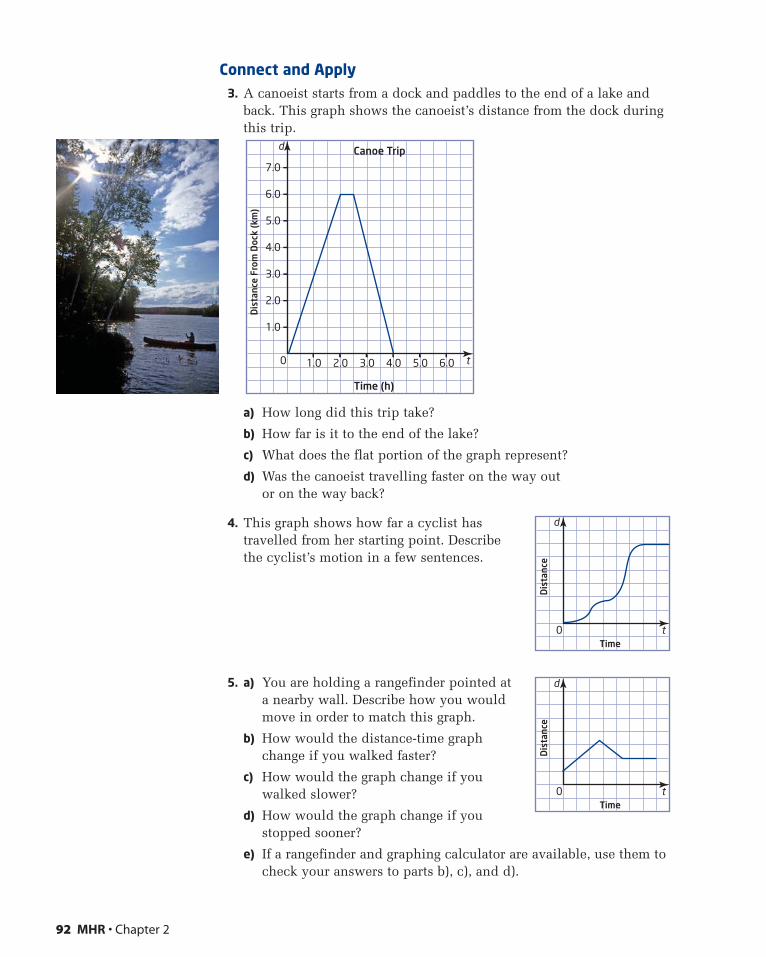
Connect and Apply3. A canoeist starts from a dock and paddles to the end of a lake and
back. This graph shows the canoeist’s distance from the dock duringthis trip.
a) How long did this trip take?
b) How far is it to the end of the lake?
c) What does the flat portion of the graph represent?
d) Was the canoeist travelling faster on the way out or on the way back?
4. This graph shows how far a cyclist hastravelled from her starting point. Describethe cyclist’s motion in a few sentences.
5. a) You are holding a rangefinder pointed ata nearby wall. Describe how you wouldmove in order to match this graph.
b) How would the distance-time graphchange if you walked faster?
c) How would the graph change if youwalked slower?
d) How would the graph change if youstopped sooner?
e) If a rangefinder and graphing calculator are available, use them tocheck your answers to parts b), c), and d).
92 MHR • Chapter 2
d
t0
1.0
2.0
3.0
4.0
5.0
6.0
7.0
1.0 2.0 3.0 4.0 5.0 6.0
Time (h)
Canoe Trip
Dis
tanc
e Fr
om D
ock
(km
)
d
t0Time
Dis
tanc
e
d
t0Time
Dis
tanc
e
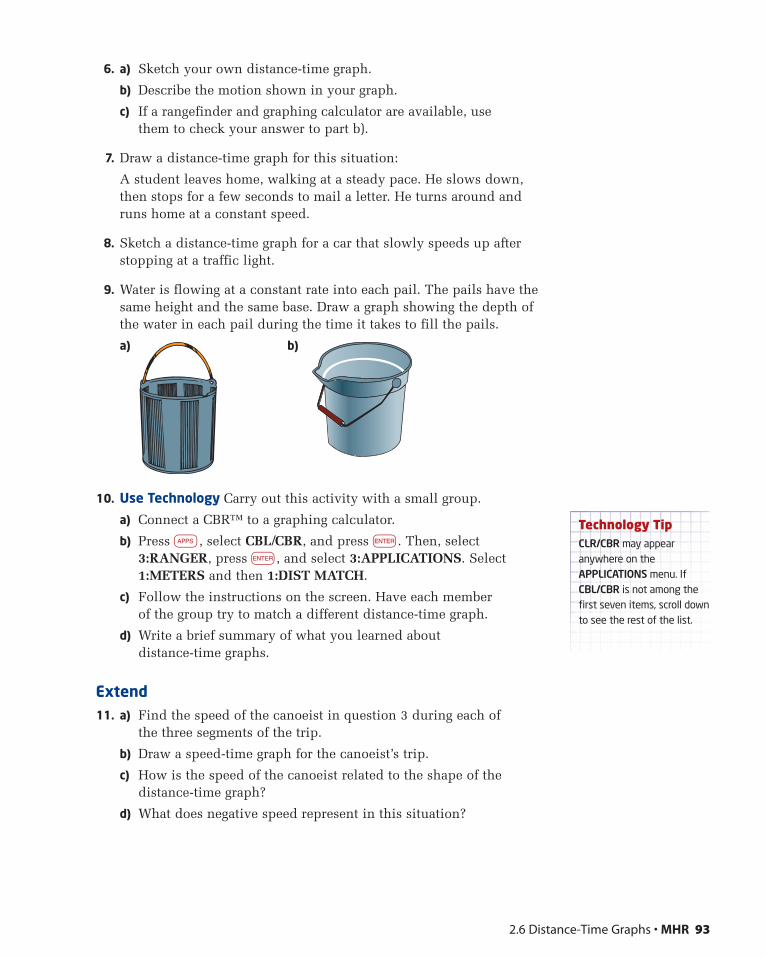
6. a) Sketch your own distance-time graph.
b) Describe the motion shown in your graph.
c) If a rangefinder and graphing calculator are available, use them to check your answer to part b).
7. Draw a distance-time graph for this situation:
A student leaves home, walking at a steady pace. He slows down,then stops for a few seconds to mail a letter. He turns around andruns home at a constant speed.
8. Sketch a distance-time graph for a car that slowly speeds up afterstopping at a traffic light.
9. Water is flowing at a constant rate into each pail. The pails have thesame height and the same base. Draw a graph showing the depth ofthe water in each pail during the time it takes to fill the pails.
a) b)
10. Use Technology Carry out this activity with a small group.
a) Connect a CBR™ to a graphing calculator.
b) Press ∂, select CBL/CBR, and press e. Then, select3:RANGER, press e, and select 3:APPLICATIONS. Select1:METERS and then 1:DIST MATCH.
c) Follow the instructions on the screen. Have each member of the group try to match a different distance-time graph.
d) Write a brief summary of what you learned about distance-time graphs.
Extend11. a) Find the speed of the canoeist in question 3 during each of
the three segments of the trip.
b) Draw a speed-time graph for the canoeist’s trip.
c) How is the speed of the canoeist related to the shape of thedistance-time graph?
d) What does negative speed represent in this situation?
2.6 Distance-Time Graphs • MHR 93
Technology TipCLR/CBR may appearanywhere on theAPPLICATIONS menu. IfCBL/CBR is not among thefirst seven items, scroll downto see the rest of the list.
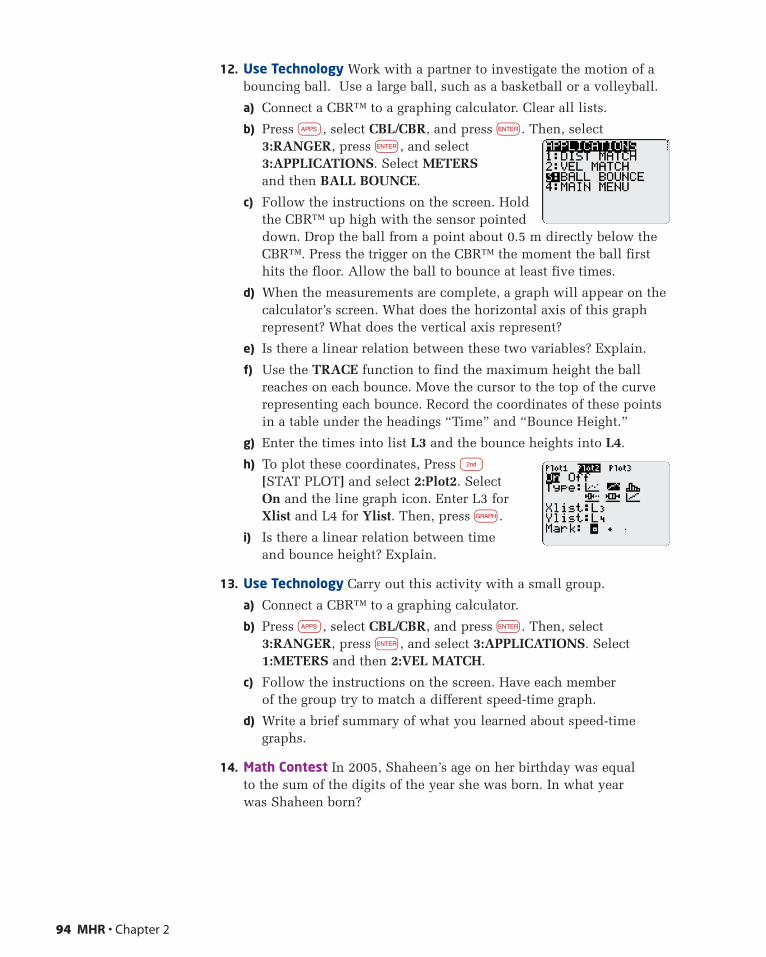
12. Use Technology Work with a partner to investigate the motion of abouncing ball. Use a large ball, such as a basketball or a volleyball.
a) Connect a CBR™ to a graphing calculator. Clear all lists.
b) Press ∂, select CBL/CBR, and press e. Then, select3:RANGER, press e, and select3:APPLICATIONS. Select METERSand then BALL BOUNCE.
c) Follow the instructions on the screen. Holdthe CBR™ up high with the sensor pointeddown. Drop the ball from a point about 0.5 m directly below theCBR™. Press the trigger on the CBR™ the moment the ball firsthits the floor. Allow the ball to bounce at least five times.
d) When the measurements are complete, a graph will appear on thecalculator’s screen. What does the horizontal axis of this graphrepresent? What does the vertical axis represent?
e) Is there a linear relation between these two variables? Explain.
f) Use the TRACE function to find the maximum height the ballreaches on each bounce. Move the cursor to the top of the curverepresenting each bounce. Record the coordinates of these pointsin a table under the headings “Time” and “Bounce Height.”
g) Enter the times into list L3 and the bounce heights into L4.
h) To plot these coordinates, Press n
[STAT PLOT] and select 2:Plot2. Select On and the line graph icon. Enter L3 forXlist and L4 for Ylist. Then, press g.
i) Is there a linear relation between time and bounce height? Explain.
13. Use Technology Carry out this activity with a small group.
a) Connect a CBR™ to a graphing calculator.
b) Press ∂, select CBL/CBR, and press e. Then, select3:RANGER, press e, and select 3:APPLICATIONS. Select1:METERS and then 2:VEL MATCH.
c) Follow the instructions on the screen. Have each member of the group try to match a different speed-time graph.
d) Write a brief summary of what you learned about speed-timegraphs.
14. Math Contest In 2005, Shaheen’s age on her birthday was equal to the sum of the digits of the year she was born. In what year was Shaheen born?
94 MHR • Chapter 2
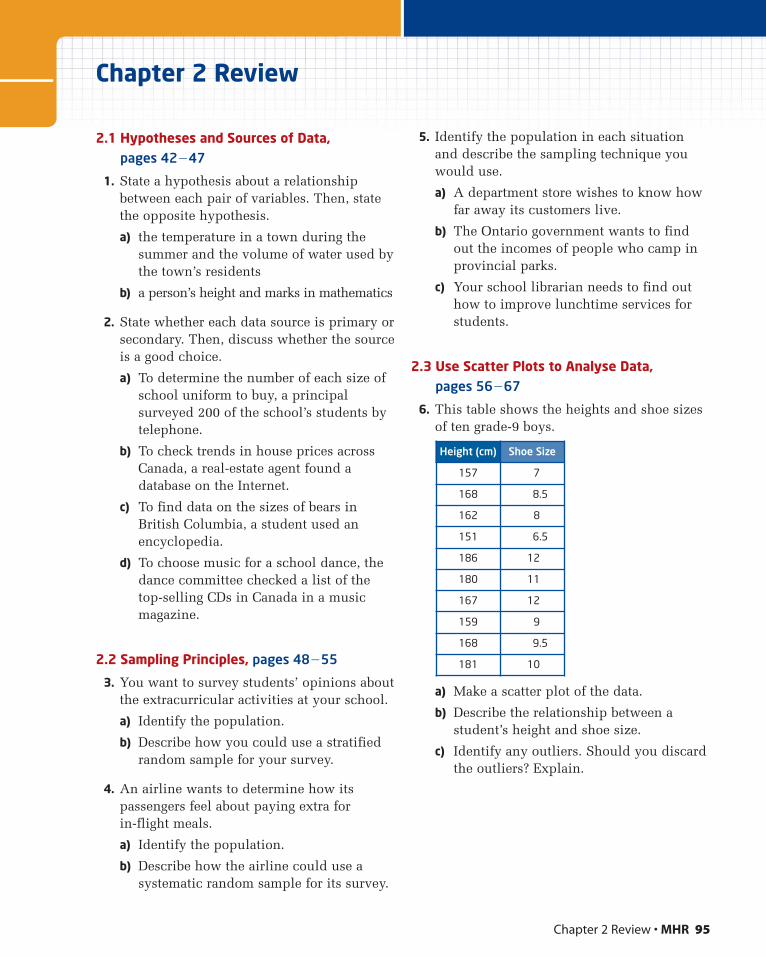
Chapter 2 Review • MHR 95
Chapter 2 Review
2.1 Hypotheses and Sources of Data, pages 42�47
1. State a hypothesis about a relationshipbetween each pair of variables. Then, statethe opposite hypothesis.
a) the temperature in a town during thesummer and the volume of water used bythe town’s residents
b) a person’s height and marks in mathematics
2. State whether each data source is primary orsecondary. Then, discuss whether the sourceis a good choice.
a) To determine the number of each size ofschool uniform to buy, a principalsurveyed 200 of the school’s students bytelephone.
b) To check trends in house prices acrossCanada, a real-estate agent found adatabase on the Internet.
c) To find data on the sizes of bears inBritish Columbia, a student used anencyclopedia.
d) To choose music for a school dance, thedance committee checked a list of thetop-selling CDs in Canada in a musicmagazine.
2.2 Sampling Principles, pages 48�55
3. You want to survey students’ opinions aboutthe extracurricular activities at your school.
a) Identify the population.
b) Describe how you could use a stratifiedrandom sample for your survey.
4. An airline wants to determine how itspassengers feel about paying extra forin-flight meals.
a) Identify the population.
b) Describe how the airline could use asystematic random sample for its survey.
5. Identify the population in each situationand describe the sampling technique youwould use.
a) A department store wishes to know howfar away its customers live.
b) The Ontario government wants to findout the incomes of people who camp inprovincial parks.
c) Your school librarian needs to find outhow to improve lunchtime services forstudents.
2.3 Use Scatter Plots to Analyse Data, pages 56�67
6. This table shows the heights and shoe sizesof ten grade-9 boys.
a) Make a scatter plot of the data.
b) Describe the relationship between astudent’s height and shoe size.
c) Identify any outliers. Should you discardthe outliers? Explain.
Height (cm) Shoe Size
157 7
168 8.5
162 8
151 6.5
186 12
180 11
167 12
159 9
168 9.5
181 10
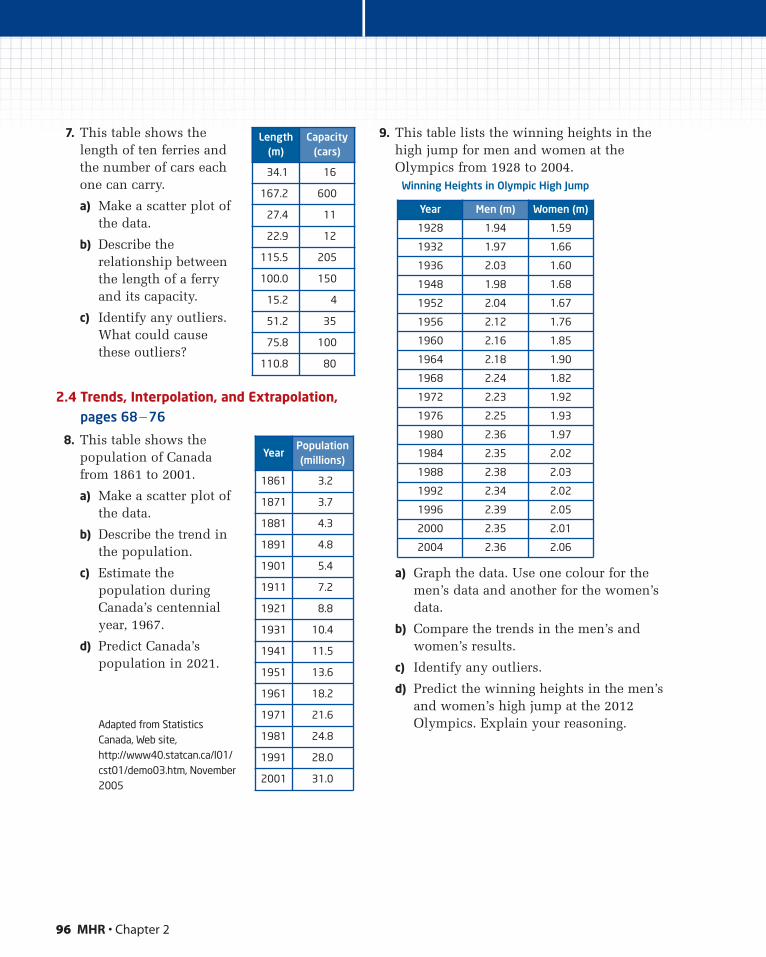
96 MHR • Chapter 2
7. This table shows thelength of ten ferries andthe number of cars eachone can carry.
a) Make a scatter plot ofthe data.
b) Describe therelationship betweenthe length of a ferryand its capacity.
c) Identify any outliers.What could causethese outliers?
2.4 Trends, Interpolation, and Extrapolation, pages 68�76
8. This table shows thepopulation of Canadafrom 1861 to 2001.
a) Make a scatter plot ofthe data.
b) Describe the trend inthe population.
c) Estimate thepopulation duringCanada’s centennialyear, 1967.
d) Predict Canada’spopulation in 2021.
Adapted from StatisticsCanada, Web site,http://www40.statcan.ca/l01/cst01/demo03.htm, November2005
9. This table lists the winning heights in thehigh jump for men and women at theOlympics from 1928 to 2004.
a) Graph the data. Use one colour for themen’s data and another for the women’sdata.
b) Compare the trends in the men’s andwomen’s results.
c) Identify any outliers.
d) Predict the winning heights in the men’sand women’s high jump at the 2012Olympics. Explain your reasoning.
Year Men (m) Women (m)
1928 1.94 1.59
1932 1.97 1.66
1936 2.03 1.60
1948 1.98 1.68
1952 2.04 1.67
1956 2.12 1.76
1960 2.16 1.85
1964 2.18 1.90
1968 2.24 1.82
1972 2.23 1.92
1976 2.25 1.93
1980 2.36 1.97
1984 2.35 2.02
1988 2.38 2.03
1992 2.34 2.02
1996 2.39 2.05
2000 2.35 2.01
2004 2.36 2.06
Winning Heights in Olympic High Jump
Length(m)
Capacity(cars)
34.1 16
167.2 600
27.4 11
22.9 12
115.5 205
100.0 150
15.2 4
51.2 35
75.8 100
110.8 80
YearPopulation(millions)
1861 3.2
1871 3.7
1881 4.3
1891 4.8
1901 5.4
1911 7.2
1921 8.8
1931 10.4
1941 11.5
1951 13.6
1961 18.2
1971 21.6
1981 24.8
1991 28.0
2001 31.0
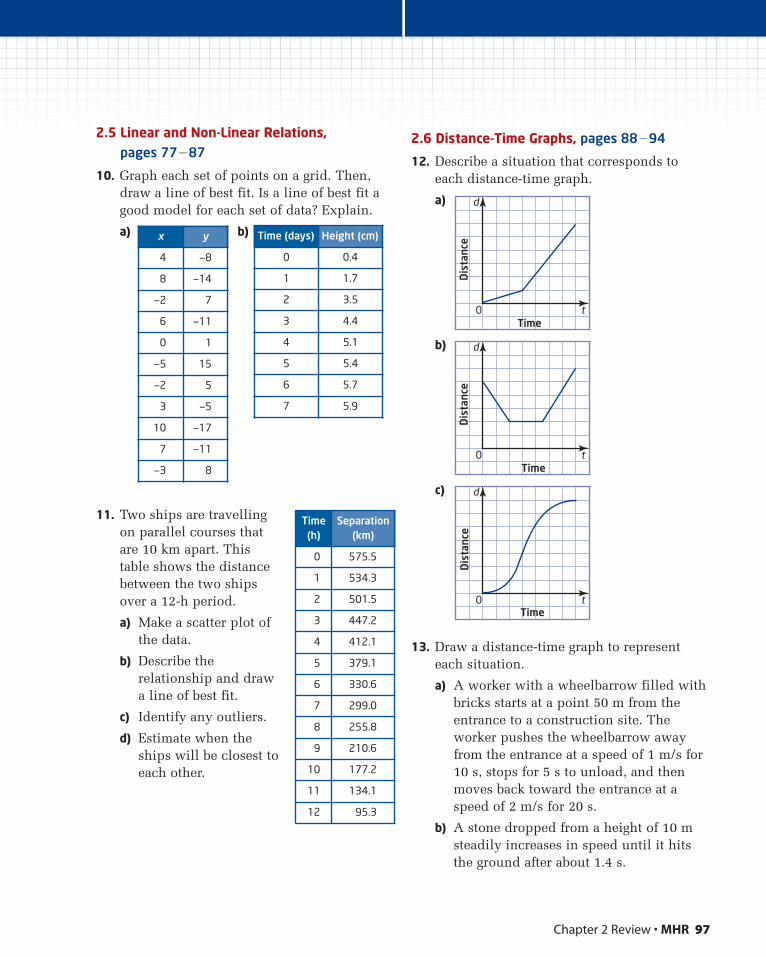
Time (days) Height (cm)
0 0.4
1 1.7
2 3.5
3 4.4
4 5.1
5 5.4
6 5.7
7 5.9
x y
4 —8
8 —14
—2 7
6 —11
0 1
—5 15
—2 5
3 —5
10 —17
7 —11
—3 8
Chapter 2 Review • MHR 97
2.5 Linear and Non-Linear Relations,pages 77�87
10. Graph each set of points on a grid. Then,draw a line of best fit. Is a line of best fit agood model for each set of data? Explain.
a) b)
11. Two ships are travellingon parallel courses thatare 10 km apart. Thistable shows the distancebetween the two shipsover a 12-h period.
a) Make a scatter plot ofthe data.
b) Describe therelationship and drawa line of best fit.
c) Identify any outliers.
d) Estimate when theships will be closest toeach other.
2.6 Distance-Time Graphs, pages 88�94
12. Describe a situation that corresponds toeach distance-time graph.
a)
b)
c)
13. Draw a distance-time graph to representeach situation.
a) A worker with a wheelbarrow filled withbricks starts at a point 50 m from theentrance to a construction site. Theworker pushes the wheelbarrow awayfrom the entrance at a speed of 1 m/s for10 s, stops for 5 s to unload, and thenmoves back toward the entrance at aspeed of 2 m/s for 20 s.
b) A stone dropped from a height of 10 msteadily increases in speed until it hitsthe ground after about 1.4 s.
d
t0Time
Dis
tanc
e
d
t0Time
Dis
tanc
e
d
t0Time
Dis
tanc
e
Time(h)
Separation(km)
0 575.5
1 534.3
2 501.5
3 447.2
4 412.1
5 379.1
6 330.6
7 299.0
8 255.8
9 210.6
10 177.2
11 134.1
12 95.3
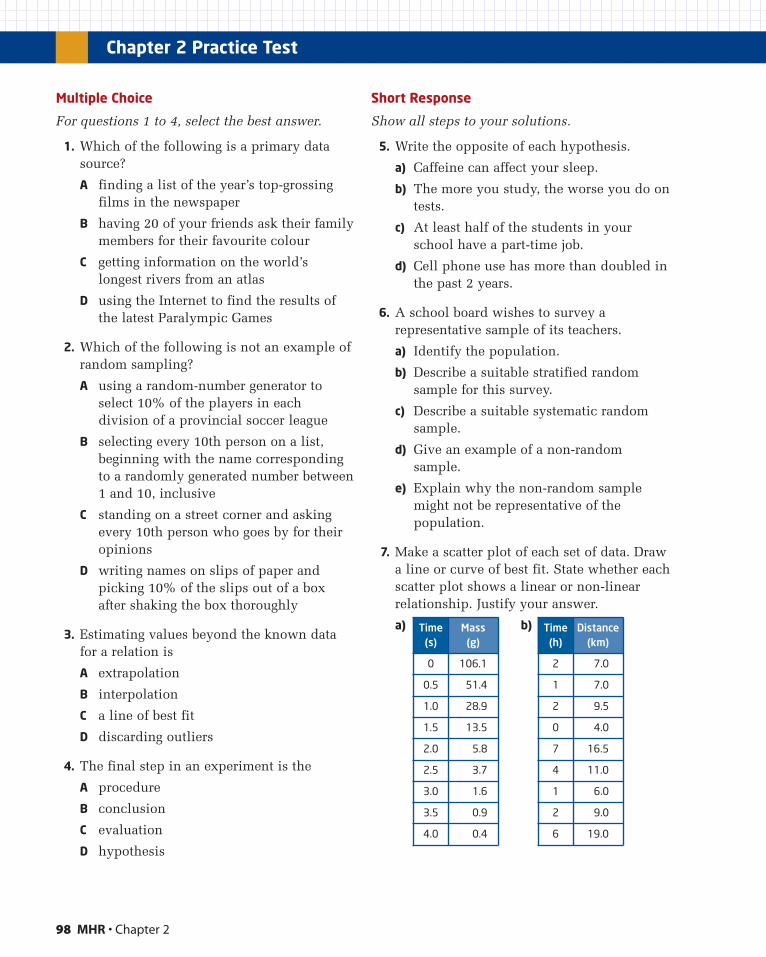
Time(s)
Mass(g)
0 106.1
0.5 51.4
1.0 28.9
1.5 13.5
2.0 5.8
2.5 3.7
3.0 1.6
3.5 0.9
4.0 0.4
Time(h)
Distance(km)
2 7.0
1 7.0
2 9.5
0 4.0
7 16.5
4 11.0
1 6.0
2 9.0
6 19.0
98 MHR • Chapter 2
Multiple Choice
For questions 1 to 4, select the best answer.
1. Which of the following is a primary datasource?
A finding a list of the year’s top-grossingfilms in the newspaper
B having 20 of your friends ask their familymembers for their favourite colour
C getting information on the world’slongest rivers from an atlas
D using the Internet to find the results ofthe latest Paralympic Games
2. Which of the following is not an example ofrandom sampling?
A using a random-number generator toselect 10% of the players in eachdivision of a provincial soccer league
B selecting every 10th person on a list,beginning with the name correspondingto a randomly generated number between1 and 10, inclusive
C standing on a street corner and askingevery 10th person who goes by for theiropinions
D writing names on slips of paper andpicking 10% of the slips out of a boxafter shaking the box thoroughly
3. Estimating values beyond the known datafor a relation is
A extrapolation
B interpolation
C a line of best fit
D discarding outliers
4. The final step in an experiment is the
A procedure
B conclusion
C evaluation
D hypothesis
Short Response
Show all steps to your solutions.
5. Write the opposite of each hypothesis.
a) Caffeine can affect your sleep.
b) The more you study, the worse you do ontests.
c) At least half of the students in yourschool have a part-time job.
d) Cell phone use has more than doubled inthe past 2 years.
6. A school board wishes to survey arepresentative sample of its teachers.
a) Identify the population.
b) Describe a suitable stratified randomsample for this survey.
c) Describe a suitable systematic randomsample.
d) Give an example of a non-randomsample.
e) Explain why the non-random samplemight not be representative of thepopulation.
7. Make a scatter plot of each set of data. Drawa line or curve of best fit. State whether eachscatter plot shows a linear or non-linearrelationship. Justify your answer.
a) b)
Chapter 2 Practice Test
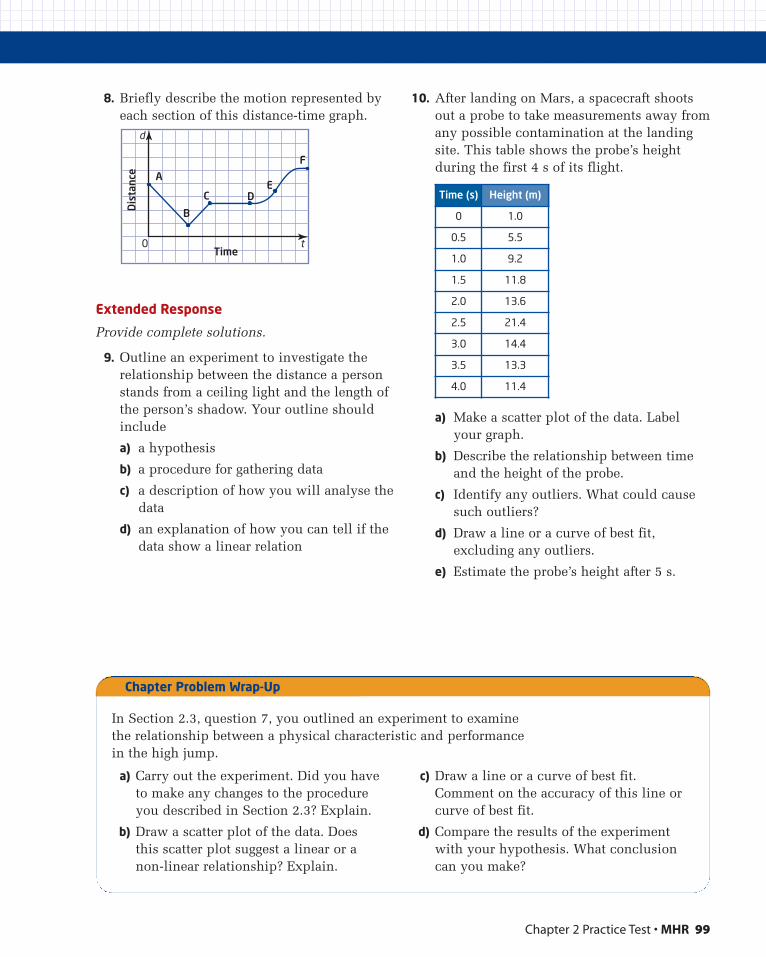
Chapter 2 Practice Test • MHR 99
8. Briefly describe the motion represented byeach section of this distance-time graph.
Extended Response
Provide complete solutions.
9. Outline an experiment to investigate therelationship between the distance a personstands from a ceiling light and the length ofthe person’s shadow. Your outline shouldinclude
a) a hypothesis
b) a procedure for gathering data
c) a description of how you will analyse thedata
d) an explanation of how you can tell if thedata show a linear relation
10. After landing on Mars, a spacecraft shootsout a probe to take measurements away fromany possible contamination at the landingsite. This table shows the probe’s heightduring the first 4 s of its flight.
a) Make a scatter plot of the data. Labelyour graph.
b) Describe the relationship between timeand the height of the probe.
c) Identify any outliers. What could causesuch outliers?
d) Draw a line or a curve of best fit,excluding any outliers.
e) Estimate the probe’s height after 5 s.
d
t0Time
Dis
tanc
e A
B
C DE
F
In Section 2.3, question 7, you outlined an experiment to examinethe relationship between a physical characteristic and performancein the high jump.
a) Carry out the experiment. Did you haveto make any changes to the procedureyou described in Section 2.3? Explain.
b) Draw a scatter plot of the data. Does this scatter plot suggest a linear or anon-linear relationship? Explain.
c) Draw a line or a curve of best fit.Comment on the accuracy of this line orcurve of best fit.
d) Compare the results of the experimentwith your hypothesis. What conclusioncan you make?
Chapter Problem Wrap-Up
Time (s) Height (m)
0 1.0
0.5 5.5
1.0 9.2
1.5 11.8
2.0 13.6
2.5 21.4
3.0 14.4
3.5 13.3
4.0 11.4

Vocabulary
variablealgebraic expressiontermpolynomial
Polynomials
As science becomes more complex, it becomes more important to communicate mathematical ideas clearly. Imagine if Einstein always had to write out his famous equation E = mc2 as “energy equals mass times the square of the speed of light.” Using letters or symbols to represent unknown amounts is called algebra. Algebra is a basic building block of advanced mathematical and scientifi c thinking. How can you use algebra to communicate your mathematical ideas?
CHAPTER
3Number Sense and Algebra� Substitute into and evaluate
algebraic expressions involving exponents.
� Describe the relationship between the algebraic and geometric representations of a single-variable term up to degree three.
� Derive, through the investigation and examination of patterns, the exponent rules for multiplying and dividing monomials, and apply these rules in expressions involving one and two variables with positive exponents.
� Relate understanding of inverse operations to squaring and taking the square root.
� Extend the multiplication rule to derive and understand the power of a power rule, and apply it to simplify expressions involving one and two variables with positive exponents.
� Add and subtract polynomials with up to two variables.
� Multiply a polynomial by a monomial involving the same variable.
� Expand and simplify polynomial expressions involving one variable.
degree of a termdegree of a polynomiallike termsdistributive property
100
Chapter Problem Alysia has selected the letter E to design
the logo for her school team, the Eagles.
The design will be used to make different-
sized crests for clothing such as jackets,
sweaters, and baseball caps. How can Alysia
make sure that, when the crest is made
larger or smaller, the proportions do not change?
101
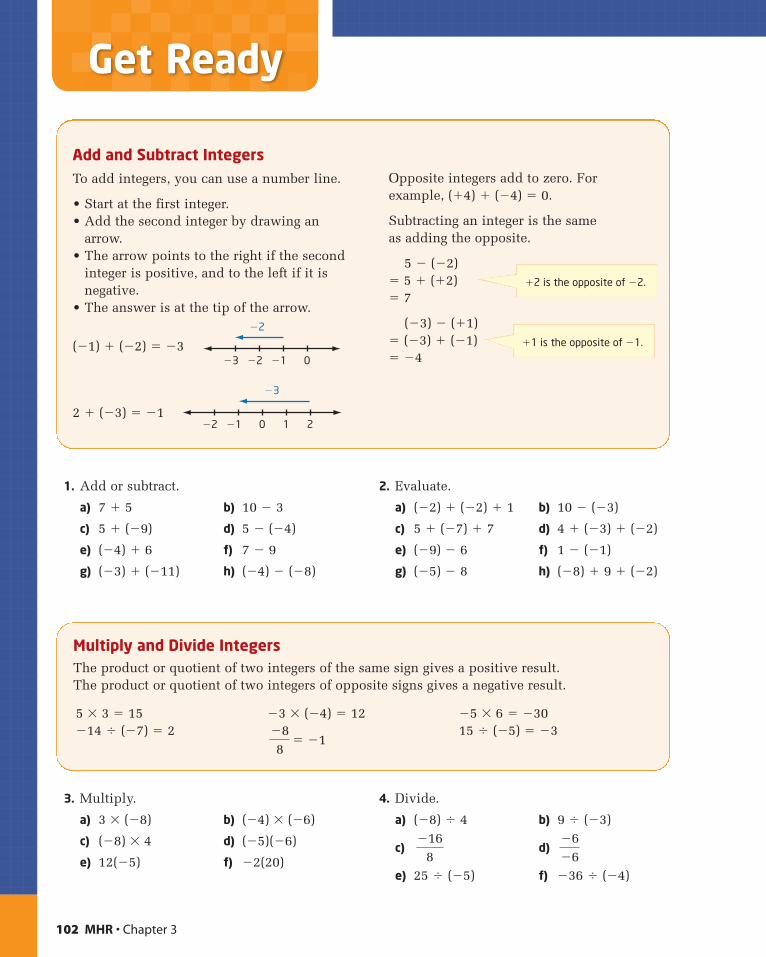
1. Add or subtract.
a) 7 � 5 b) 10 � 3
c) 5 � (�9) d) 5 � (�4)
e) (�4) � 6 f) 7 � 9
g) (�3) � (�11) h) (�4) � (�8)
2. Evaluate.
a) (�2) � (�2) � 1 b) 10 � (�3)
c) 5 � (�7) � 7 d) 4 � (�3) � (�2)
e) (�9) � 6 f) 1 � (�1)
g) (�5) � 8 h) (�8) � 9 � (�2)
102 MHR • Chapter 3
3. Multiply.
a) 3 � (�8) b) (�4) � (�6)
c) (�8) � 4 d) (�5)(�6)
e) 12(�5) f) �2(20)
4. Divide.
a) (�8) � 4 b) 9 � (�3)
c) d)
e) 25 � (�5) f) �36 � (�4)
�6�6
�168
Multiply and Divide IntegersThe product or quotient of two integers of the same sign gives a positive result. The product or quotient of two integers of opposite signs gives a negative result.
5 � 3 � 15�14 � (�7) � 2
�3 � (�4) � 12
� �1�88
�5 � 6 � �3015 � (�5) � �3
�2 is the opposite of �2.
�1 is the opposite of �1.
Add and Subtract IntegersTo add integers, you can use a number line.
• Start at the first integer.• Add the second integer by drawing an
arrow.• The arrow points to the right if the second
integer is positive, and to the left if it isnegative.
• The answer is at the tip of the arrow.
(�1) � (�2) � �3
2 � (�3) � �1�2
�3
�1 0 1 2
�2�3
�2
�1 0
Opposite integers add to zero. Forexample, (�4) � (�4) � 0.
Subtracting an integer is the sameas adding the opposite.
5 � (�2)� 5 � (�2)� 7
(�3) � (�1)� (�3) � (�1)� �4
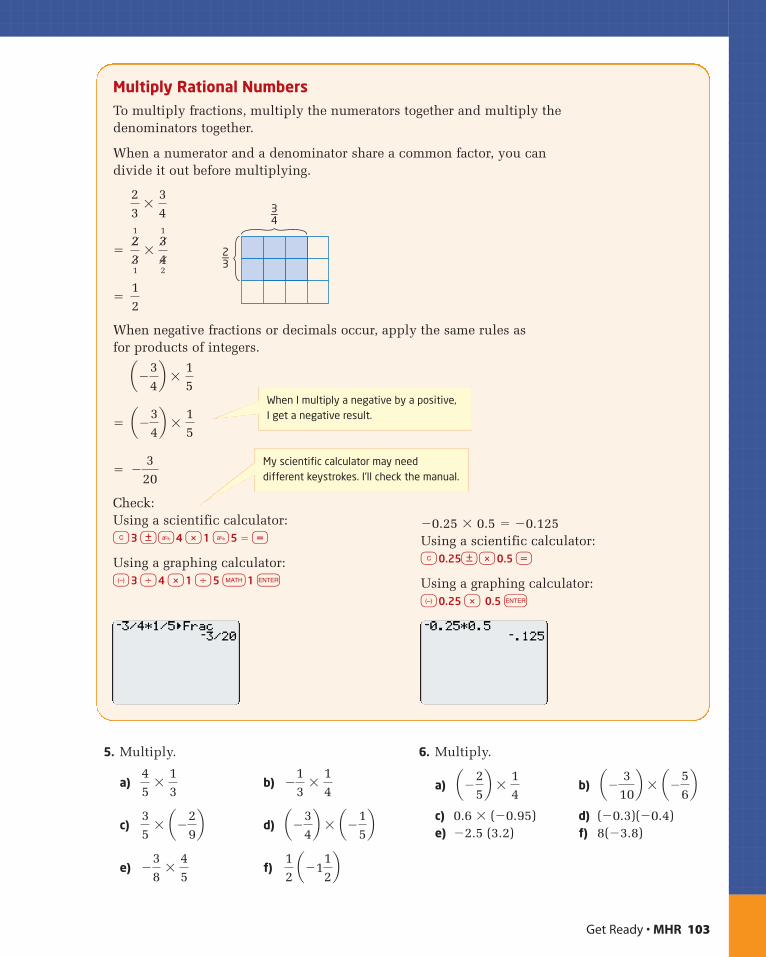
Get Ready • MHR 103
Multiply Rational NumbersTo multiply fractions, multiply the numerators together and multiply thedenominators together.
When a numerator and a denominator share a common factor, you candivide it out before multiplying.
�
�
When negative fractions or decimals occur, apply the same rules as for products of integers.
�
�
Check:
�0.25 � 0.5 � �0.125Using a scientific calculator: ç0.25\*0.5 =
Using a graphing calculator: –0.25 * 0.5 e
Using a scientific calculator: ç3 \∫4 *1 ∫5 � =
Using a graphing calculator: –3 ÷4 *1 ÷5 k1 e
�3
20
a�34b �
15
a�34b �
15
12
21
31
�31
42
23
�34 3––
4
2––3
5. Multiply.
a) b)
c) d)
e) f)
6. Multiply.
a) b)
c) 0.6 � (�0.95) d) (�0.3)(�0.4)e) �2.5 (3.2) f) 8(�3.8)
a� 310b � a�5
6ba�2
5b �
14
12
a�112b�
38
�45
a�34b � a�1
5b3
5� a�2
9b
�13
�14
45
�13
My scientific calculator may needdifferent keystrokes. I’ll check the manual.
When I multiply a negative by a positive, I get a negative result.
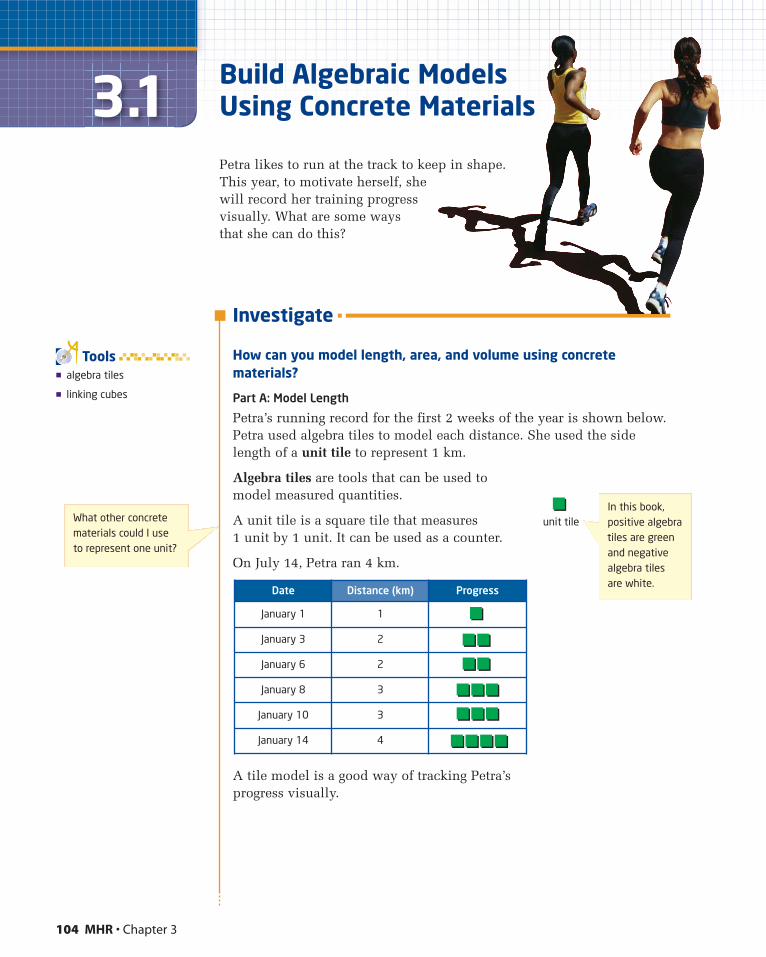
3.1Petra likes to run at the track to keep in shape.This year, to motivate herself, shewill record her training progressvisually. What are some waysthat she can do this?
Investigate
How can you model length, area, and volume using concretematerials?
Part A: Model Length
Petra’s running record for the first 2 weeks of the year is shown below.Petra used algebra tiles to model each distance. She used the sidelength of a unit tile to represent 1 km.
Algebra tiles are tools that can be used to model measured quantities.
A unit tile is a square tile that measures 1 unit by 1 unit. It can be used as a counter.
On July 14, Petra ran 4 km.
A tile model is a good way of tracking Petra’s progress visually.
� algebra tiles
� linking cubes
Tools
unit tile
Build Algebraic ModelsUsing Concrete Materials
Date Distance (km) Progress
January 1 1
January 3 2
January 6 2
January 8 3
January 10 3
January 14 4
104 MHR • Chapter 3
What other concretematerials could I useto represent one unit?
In this book,positive algebratiles are greenand negativealgebra tiles are white.
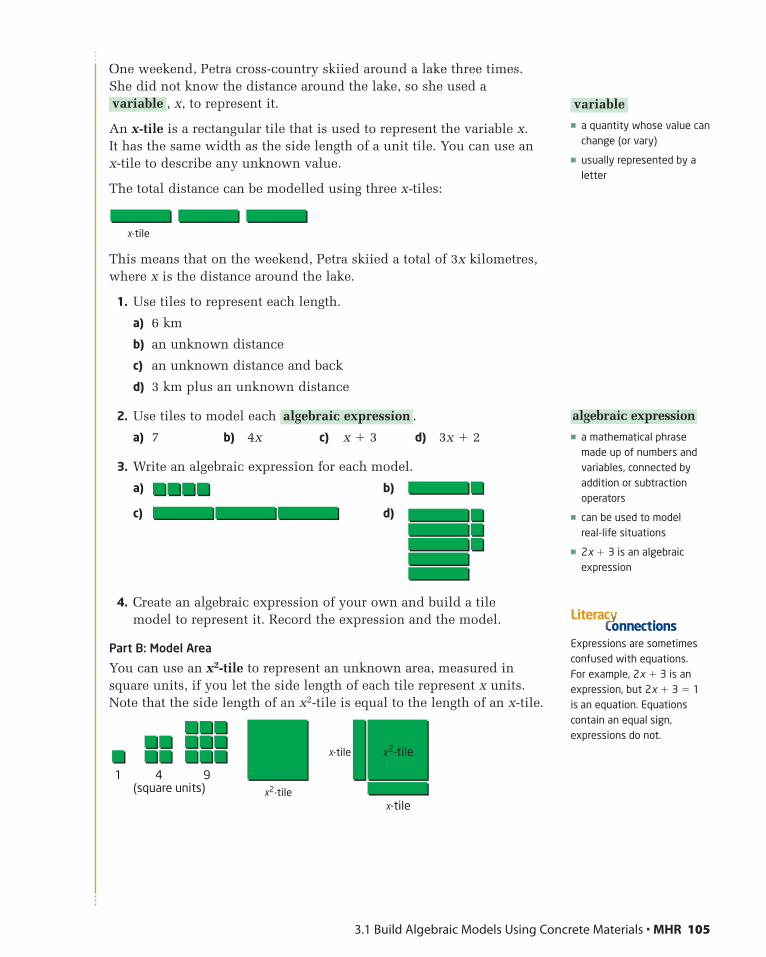
One weekend, Petra cross-country skiied around a lake three times.She did not know the distance around the lake, so she used a
, x, to represent it.
An x-tile is a rectangular tile that is used to represent the variable x. It has the same width as the side length of a unit tile. You can use anx-tile to describe any unknown value.
The total distance can be modelled using three x-tiles:
This means that on the weekend, Petra skiied a total of 3x kilometres, where x is the distance around the lake.
1. Use tiles to represent each length.
a) 6 km
b) an unknown distance
c) an unknown distance and back
d) 3 km plus an unknown distance
2. Use tiles to model each .
a) 7 b) 4x c) x � 3 d) 3x � 2
3. Write an algebraic expression for each model.
a) b)
c) d)
4. Create an algebraic expression of your own and build a tile model to represent it. Record the expression and the model.
Part B: Model Area
You can use an x2-tile to represent an unknown area, measured insquare units, if you let the side length of each tile represent x units.Note that the side length of an x2-tile is equal to the length of an x-tile.
algebraic expression
x-tile
variable
3.1 Build Algebraic Models Using Concrete Materials • MHR 105
� a quantity whose value canchange (or vary)
� usually represented by aletter
variable
� a mathematical phrasemade up of numbers andvariables, connected byaddition or subtractionoperators
� can be used to model real-life situations
� 2x � 3 is an algebraicexpression
algebraic expression
Expressions are sometimesconfused with equations.For example, 2x � 3 is anexpression, but 2x � 3 � 1is an equation. Equationscontain an equal sign,expressions do not.
onnectionsLiterac
1 4 9(square units) x2-tile
x2-tile
x-tile
x-tile
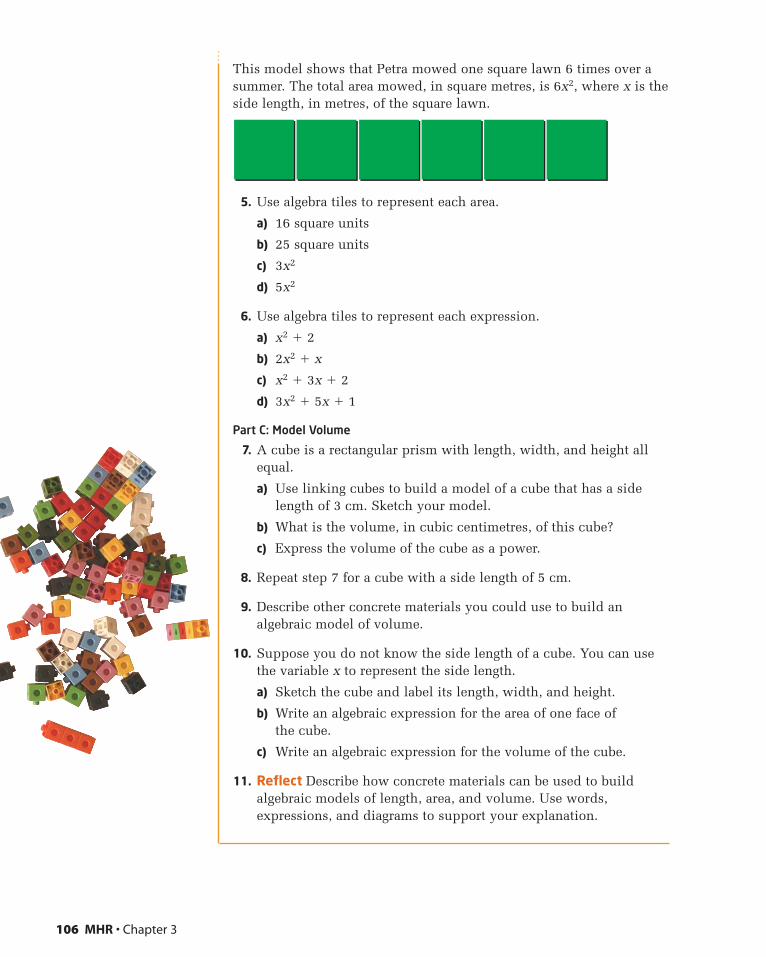
This model shows that Petra mowed one square lawn 6 times over asummer. The total area mowed, in square metres, is 6x2, where x is theside length, in metres, of the square lawn.
5. Use algebra tiles to represent each area.
a) 16 square units
b) 25 square units
c) 3x2
d) 5x2
6. Use algebra tiles to represent each expression.
a) x2 � 2
b) 2x2 � x
c) x2 � 3x � 2
d) 3x2 � 5x � 1
Part C: Model Volume
7. A cube is a rectangular prism with length, width, and height allequal.
a) Use linking cubes to build a model of a cube that has a sidelength of 3 cm. Sketch your model.
b) What is the volume, in cubic centimetres, of this cube?
c) Express the volume of the cube as a power.
8. Repeat step 7 for a cube with a side length of 5 cm.
9. Describe other concrete materials you could use to build analgebraic model of volume.
10. Suppose you do not know the side length of a cube. You can usethe variable x to represent the side length.
a) Sketch the cube and label its length, width, and height.
b) Write an algebraic expression for the area of one face of the cube.
c) Write an algebraic expression for the volume of the cube.
11. Reflect Describe how concrete materials can be used to buildalgebraic models of length, area, and volume. Use words,expressions, and diagrams to support your explanation.
106 MHR • Chapter 3

Key Concepts� Concrete materials, such as algebra
tiles and linking cubes, can be usedto build algebraic models.
� You can build length models withalgebra tiles.
� You can build area models withalgebra tiles.
� You can build volume models withlinking cubes.
Communicate Your UnderstandingState the length and width of each.
a) a unit tile
b) an x-tile
c) an x2-tile
a) How are the length and width of a unit tile and an x-tile related?
b) How are the length and width of an x-tile and an x2-tile related?
a) Suggest two other objects that could be used to model length.
b) Suggest two other objects that could be used to model area.
c) For your answers to parts a) and b), identify any advantages ordisadvantages of each object.
Explain how concrete materials can be used to model each type of measurement. Include a diagram to support each explanation.
a) length b) area c) volume
Practise1. Which expression is represented by the algebra
tile model?
A 4x2 � 2x � 5 B �4x2 � 2x � 5
C 4x2 � 2x � 5 D 4x2 � 2x � 5
C4C4
C3C3
C2C2
C1C1
3.1 Build Algebraic Models Using Concrete Materials • MHR 107
x-tile �x-tile
x2-tile �x2-tile
unit tile
�1 �1
negativeunit tile
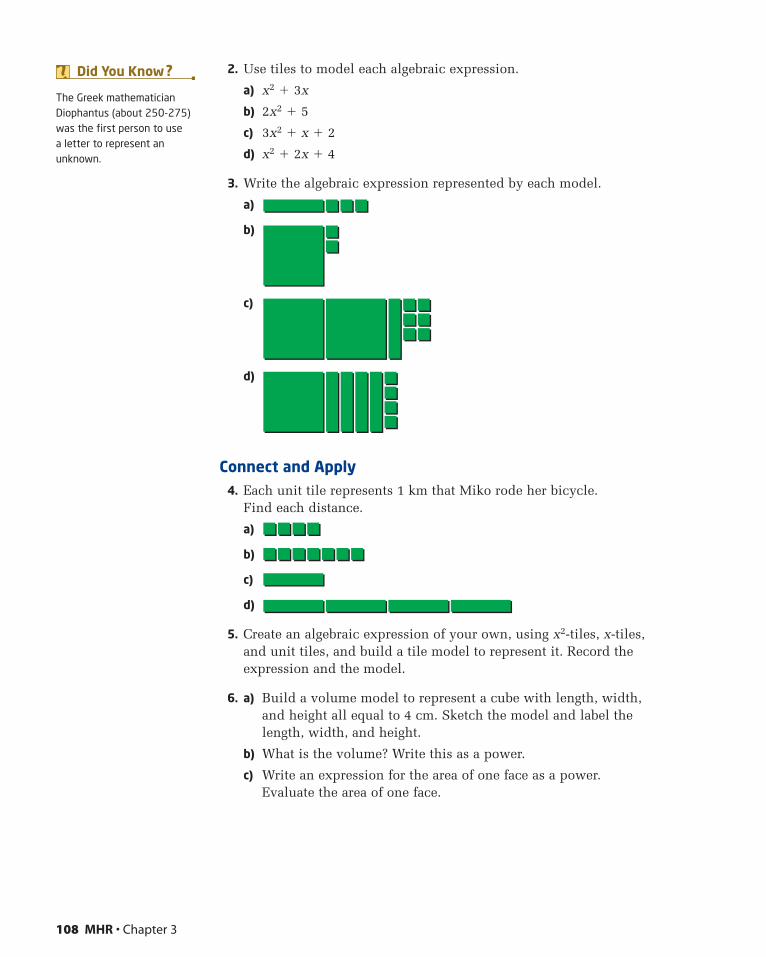
2. Use tiles to model each algebraic expression.
a) x2 � 3x
b) 2x2 � 5
c) 3x2 � x � 2
d) x2 � 2x � 4
3. Write the algebraic expression represented by each model.
a)
b)
c)
d)
Connect and Apply4. Each unit tile represents 1 km that Miko rode her bicycle.
Find each distance.
a)
b)
c)
d)
5. Create an algebraic expression of your own, using x2-tiles, x-tiles,and unit tiles, and build a tile model to represent it. Record theexpression and the model.
6. a) Build a volume model to represent a cube with length, width, and height all equal to 4 cm. Sketch the model and label thelength, width, and height.
b) What is the volume? Write this as a power.
c) Write an expression for the area of one face as a power. Evaluate the area of one face.
108 MHR • Chapter 3
The Greek mathematicianDiophantus (about 250-275)was the first person to use a letter to represent anunknown.
Did You Know ?
7. A cube has a volume of 216 cm3.
a) What side length of the cube would give this volume?
b) Determine the area of one face of the cube.
8. The area of one face of a cube is 49 m2.
a) What side length of the cube would give this area?
b) Determine the volume of the cube.
Extend9. Build an area model using tiles that have length and
width as indicated.
a) length � x � 3, width � x
b) length � x � 4, width � x � 1
10. A cube has a volume of 8 cm3. Find the total surface area of all six faces.
11. Math Contest Mersenne numbers are numbers of the form 2n � 1.Father Marin Mersenne (1588�1648) was especially interested in prime numbers of this form. One conjecture about Mersennenumbers is that numbers of the form 2p � 1 are prime if p is prime.Investigate this conjecture and write a brief report of your findings.
12. Math Contest Find the smallest possible value of ab � cd � e f if a, b,c, d, e, and f are all different and are chosen from the values 1, 2, 3,4, 5, and 6.
13. Math Contest When 3040 � 4030 is written in expanded form, thenumber of zeros at the end of the number is
A 30
B 40
C 70
D 120
E 1200
14. Math Contest Fermat numbers are numbers of the form 22n� 1.
Pierre de Fermat (1601�1665) conjectured that all numbers of thisform are primes. Investigate this conjecture. Write a brief report ofyour findings.
3.1 Build Algebraic Models Using Concrete Materials • MHR 109
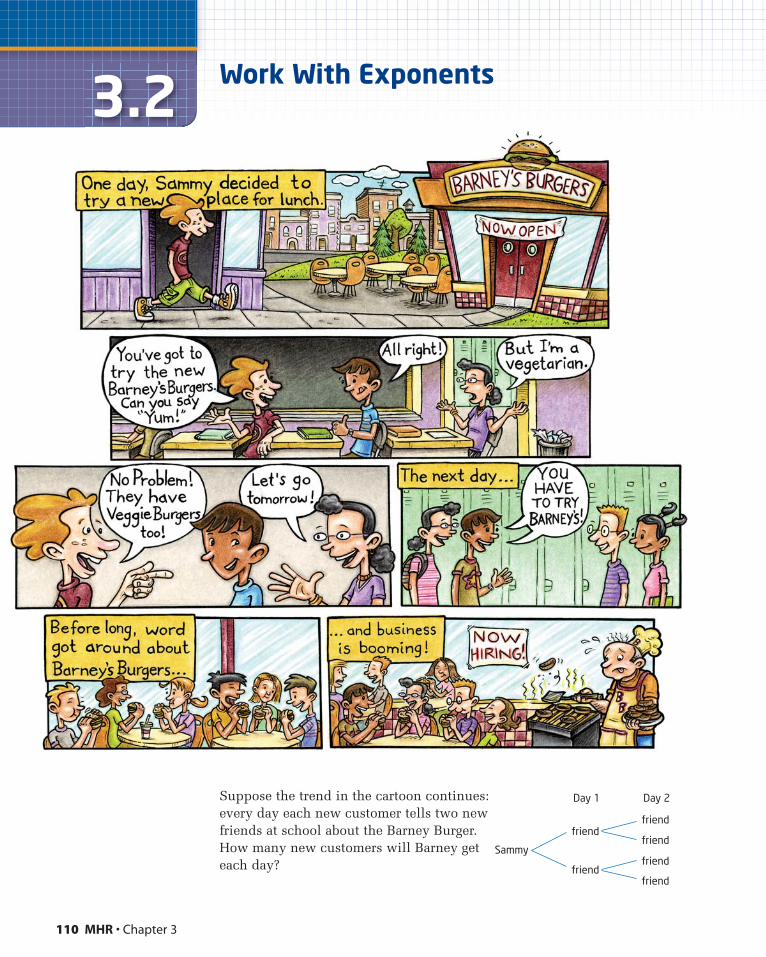
110 MHR • Chapter 3
3.2 Work With Exponents
Suppose the trend in the cartoon continues:every day each new customer tells two newfriends at school about the Barney Burger.How many new customers will Barney geteach day?
Sammy
friend
Day 1 Day 2
friend
friend
friend
friend
friend
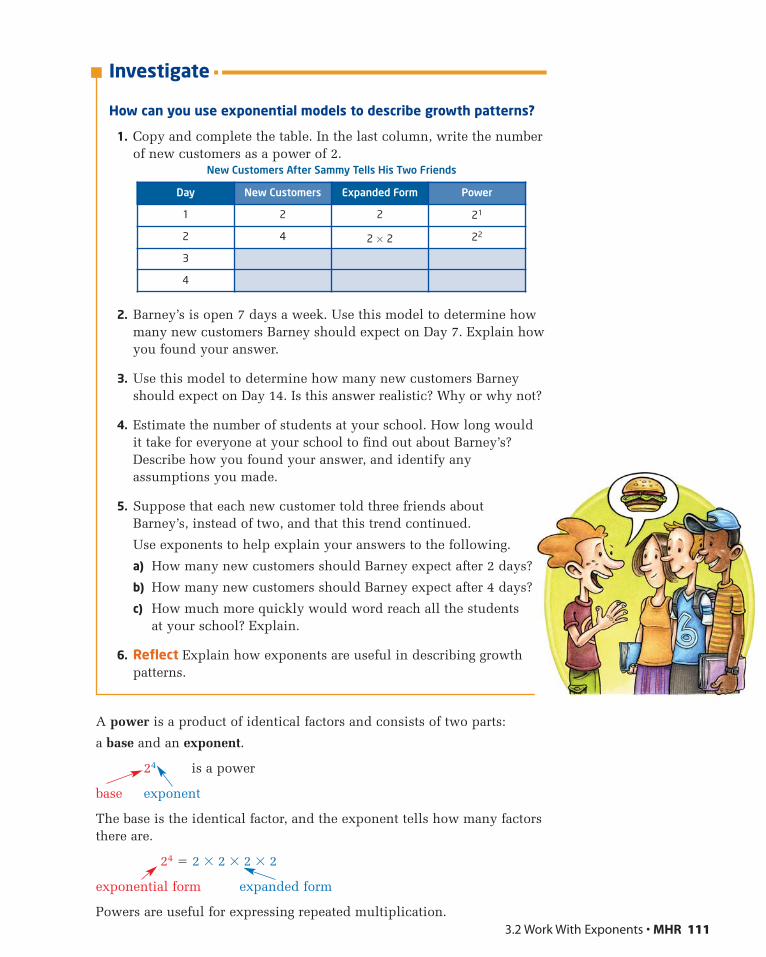
Investigate
How can you use exponential models to describe growth patterns?
1. Copy and complete the table. In the last column, write the numberof new customers as a power of 2.
2. Barney’s is open 7 days a week. Use this model to determine howmany new customers Barney should expect on Day 7. Explain howyou found your answer.
3. Use this model to determine how many new customers Barneyshould expect on Day 14. Is this answer realistic? Why or why not?
4. Estimate the number of students at your school. How long would it take for everyone at your school to find out about Barney’s?Describe how you found your answer, and identify anyassumptions you made.
5. Suppose that each new customer told three friends aboutBarney’s, instead of two, and that this trend continued.
Use exponents to help explain your answers to the following.
a) How many new customers should Barney expect after 2 days?
b) How many new customers should Barney expect after 4 days?
c) How much more quickly would word reach all the studentsat your school? Explain.
6. Reflect Explain how exponents are useful in describing growthpatterns.
A power is a product of identical factors and consists of two parts:
a base and an exponent.
24 is a power
base exponent
The base is the identical factor, and the exponent tells how many factorsthere are.
24 � 2 � 2 � 2 � 2
exponential form expanded form
Powers are useful for expressing repeated multiplication.
Day New Customers Expanded Form Power
1 2 2 21
2 4 2 � 2 22
3
4
3.2 Work With Exponents • MHR 111
New Customers After Sammy Tells His Two Friends

Example 1 Evaluate Powers
Write in expanded form, and then evaluate.
a) 25 b) (�3)3 c) (�3)4
d) �34 e) 3.53 f)
Solution
a) 25 � 2 � 2 � 2 � 2 � 2� 32
b) (�3)3 � (�3) � (�3) � (�3)� �27
c) (�3)4 � (�3) � (�3) � (�3) � (�3)� 81
d) �34 � �(3 � 3 � 3 � 3)� �81
e) 3.53 � 3.5 � 3.5 � 3.5� 42.875 ç3.5 Y3 =
f) �
�
�
Example 2 Apply Exponents to Solve Problems
Mega-Box Jumbo Drum
Which container holds more popcorn? How much more? Assume thateach container is filled just to the top. Round your answer to thenearest cubic centimetre.
827
2 � 2 � 23 � 3 � 3
a23ba2
3ba2
3ba2
3b3
a23b3
112 MHR • Chapter 3
There is an odd number ofnegative factors. Theanswer is negative.
There is an even numberof negative factors. Theanswer is positive.
The base of this power is 3, not�3. The negative sign in frontmakes the result negative.
To multiply fractions, I multiplynumerators together andmultiply denominators together.
9.2 cm
9.2 cm
Popcorn
9.2 cm
9.0 cm
10.4 cm
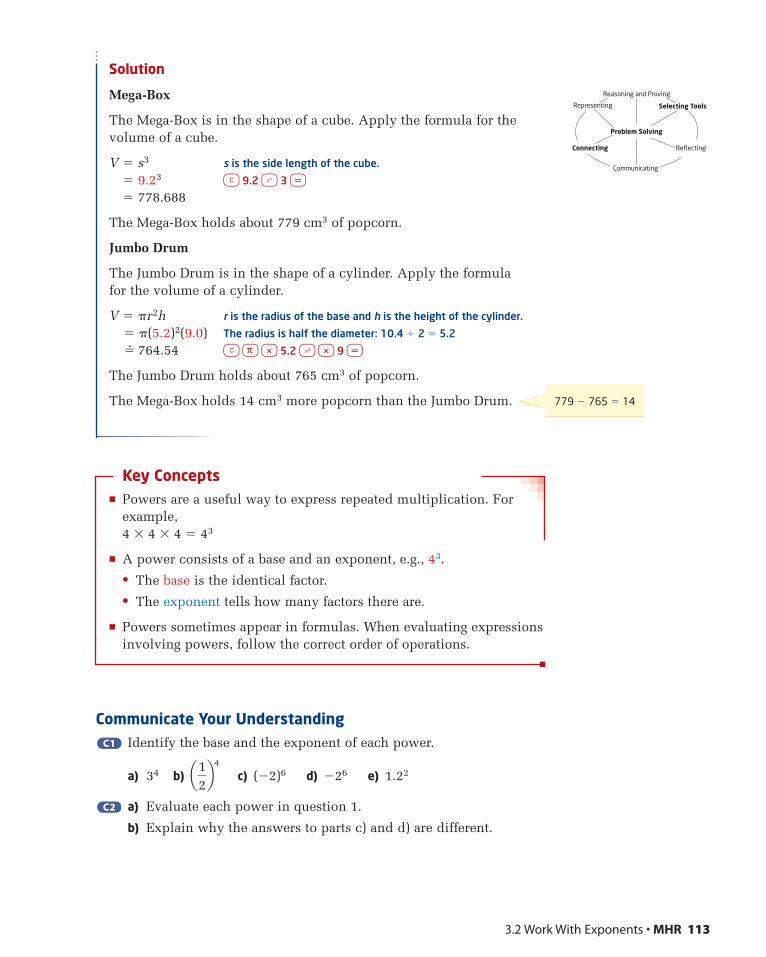
Solution
Mega-Box
The Mega-Box is in the shape of a cube. Apply the formula for thevolume of a cube.
V � s3 s is the side length of the cube.
� 9.23 ç 9.2 Y 3 =
� 778.688
The Mega-Box holds about 779 cm3 of popcorn.
Jumbo Drum
The Jumbo Drum is in the shape of a cylinder. Apply the formula for the volume of a cylinder.
V � �r2h r is the radius of the base and h is the height of the cylinder.
� �(5.2)2(9.0) The radius is half the diameter: 10.4 � 2 � 5.2
�� 764.54 ç π * 5.2 x * 9 =
The Jumbo Drum holds about 765 cm3 of popcorn.
The Mega-Box holds 14 cm3 more popcorn than the Jumbo Drum.
Key Concepts� Powers are a useful way to express repeated multiplication. For
example, 4 � 4 � 4 � 43
� A power consists of a base and an exponent, e.g., 43.
• The base is the identical factor.
• The exponent tells how many factors there are.
� Powers sometimes appear in formulas. When evaluating expressionsinvolving powers, follow the correct order of operations.
Communicate Your UnderstandingIdentify the base and the exponent of each power.
a) 34 b) c) (�2)6 d) �26 e) 1.22
a) Evaluate each power in question 1.
b) Explain why the answers to parts c) and d) are different.
C2C2
a12b4
C1C1
3.2 Work With Exponents • MHR 113
779 � 765 � 14
Selecting ToolsRepresenting
Reasoning and Proving
Communicating
Connecting Reflecting
Problem Solving
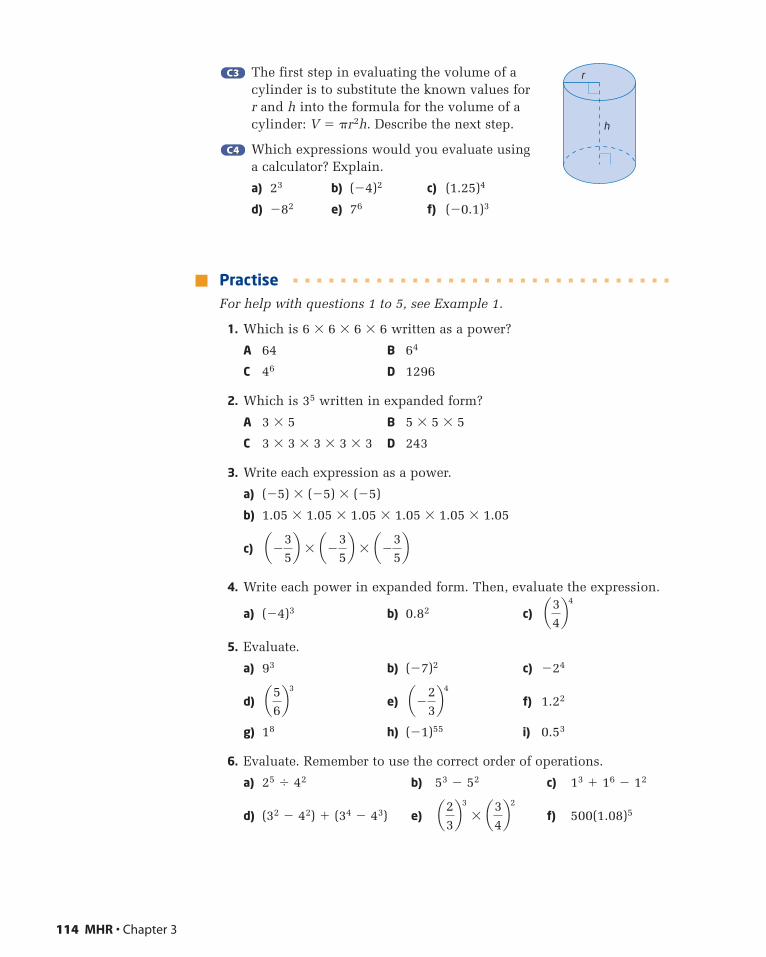
The first step in evaluating the volume of acylinder is to substitute the known values forr and h into the formula for the volume of acylinder: V � �r2h. Describe the next step.
Which expressions would you evaluate usinga calculator? Explain.
a) 23 b) (�4)2 c) (1.25)4
d) �82 e) 76 f) (�0.1)3
PractiseFor help with questions 1 to 5, see Example 1.
1. Which is 6 � 6 � 6 � 6 written as a power?
A 64 B 64
C 46 D 1296
2. Which is 35 written in expanded form?
A 3 � 5 B 5 � 5 � 5
C 3 � 3 � 3 � 3 � 3 D 243
3. Write each expression as a power.
a) (�5) � (�5) � (�5)
b) 1.05 � 1.05 � 1.05 � 1.05 � 1.05 � 1.05
c)
4. Write each power in expanded form. Then, evaluate the expression.
a) (�4)3 b) 0.82 c)
5. Evaluate.
a) 93 b) (�7)2 c) �24
d) e) f) 1.22
g) 18 h) (�1)55 i) 0.53
6. Evaluate. Remember to use the correct order of operations.
a) 25 � 42 b) 53 � 52 c) 13 � 16 � 12
d) (32 � 42) � (34 � 43) e) f) 500(1.08)5a23b3
� a34b2
a�23b4a5
6b3
a34b4
a�35b � a�3
5b � a�3
5b
C4C4
C3C3
114 MHR • Chapter 3
r
h
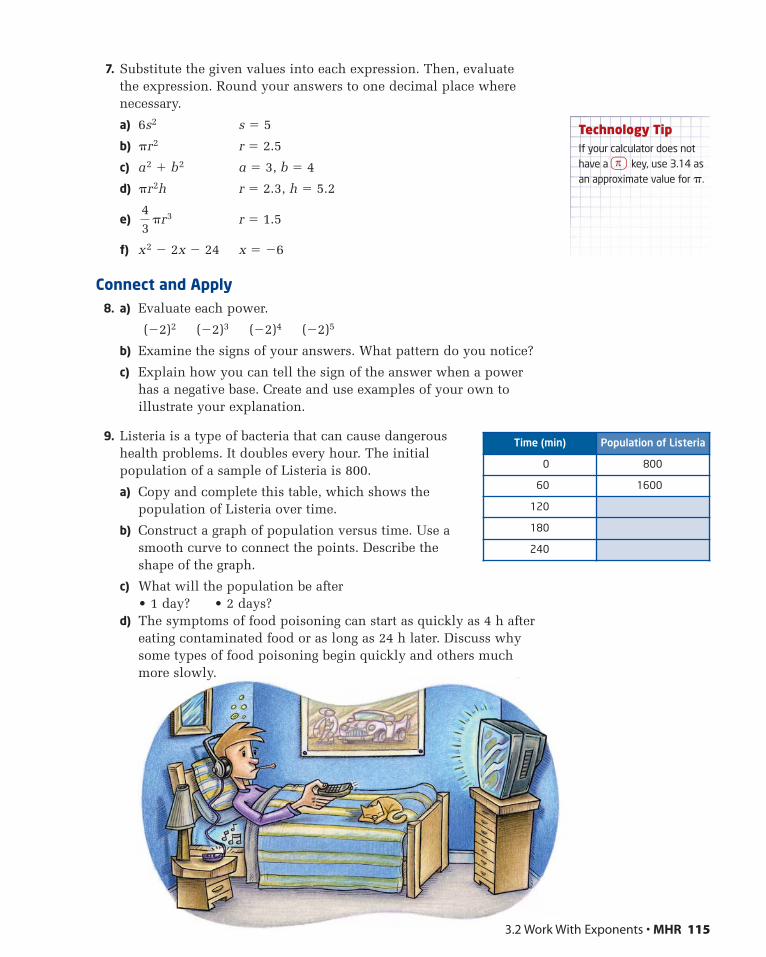
7. Substitute the given values into each expression. Then, evaluatethe expression. Round your answers to one decimal place wherenecessary.
a) 6s2 s � 5
b) �r2 r � 2.5
c) a2 � b2 a � 3, b � 4
d) �r2h r � 2.3, h � 5.2
e) �r3 r � 1.5
f) x2 � 2x � 24 x � �6
Connect and Apply8. a) Evaluate each power.
(�2)2 (�2)3 (�2)4 (�2)5
b) Examine the signs of your answers. What pattern do you notice?
c) Explain how you can tell the sign of the answer when a powerhas a negative base. Create and use examples of your own toillustrate your explanation.
9. Listeria is a type of bacteria that can cause dangeroushealth problems. It doubles every hour. The initialpopulation of a sample of Listeria is 800.
a) Copy and complete this table, which shows thepopulation of Listeria over time.
b) Construct a graph of population versus time. Use asmooth curve to connect the points. Describe theshape of the graph.
c) What will the population be after• 1 day? • 2 days?
d) The symptoms of food poisoning can start as quickly as 4 h aftereating contaminated food or as long as 24 h later. Discuss why some types of food poisoning begin quickly and others muchmore slowly.
43
3.2 Work With Exponents • MHR 115
Time (min) Population of Listeria
0 800
60 1600
120
180
240
Technology TipIf your calculator does nothave a π key, use 3.14 asan approximate value for �.
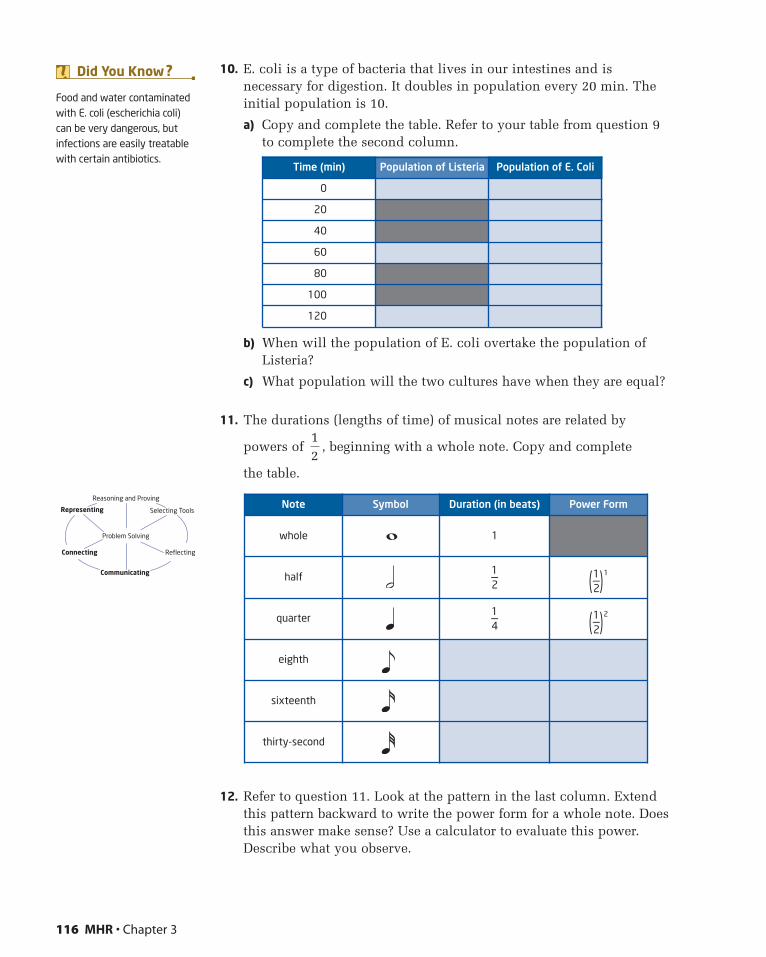
10. E. coli is a type of bacteria that lives in our intestines and isnecessary for digestion. It doubles in population every 20 min. Theinitial population is 10.
a) Copy and complete the table. Refer to your table from question 9to complete the second column.
b) When will the population of E. coli overtake the population ofListeria?
c) What population will the two cultures have when they are equal?
11. The durations (lengths of time) of musical notes are related by
powers of , beginning with a whole note. Copy and complete
the table.
12. Refer to question 11. Look at the pattern in the last column. Extendthis pattern backward to write the power form for a whole note. Doesthis answer make sense? Use a calculator to evaluate this power.Describe what you observe.
12
116 MHR • Chapter 3
Food and water contaminatedwith E. coli (escherichia coli)can be very dangerous, butinfections are easily treatablewith certain antibiotics.
Did You Know ?
Time (min) Population of Listeria Population of E. Coli
0
20
40
60
80
100
120
Note Symbol Duration (in beats) Power Form
whole 1
half1—2 (1—2)1
quarter1—4 (1—2)2
eighth
sixteenth
thirty-second
Selecting ToolsRepresenting
Reasoning and Proving
Communicating
Connecting Reflecting
Problem Solving

13. Chapter Problem Alysia has selected the letter E to design the logofor her school team, the Eagles.
The design will be used to make different-sized crests for clothingsuch as jackets, sweaters, and baseball caps. The height of the crest istwice the width. How can Alysia make sure that, when the crest is made larger or smaller, the proportions will not change?
a) Find an expression for the area of the crest in terms of the width.
b) Determine the area of a crest with a width of 8 cm.
c) Determine the height of a crest with an area of 72 cm2.
14. Uranium is a radioactive material that emits energy when it changesinto another substance. Uranium comes in different forms, calledisotopes. One isotope, U-235, has a half-life of 23 min, which meansthat it takes 23 min for a sample to decay to half its original amount.
a) Suppose you started with a 100-mg sample of U-235. Copy andcomplete the table.
b) Construct a graph of the amount, in milligrams,of U-235 remaining versus time, in minutes.Describe the shape of the graph.
c) Approximately how much U-235 will remainafter 2 h?
d) How long will it take until only 1 mg of U-235remains?
e) Use the pattern in the table to write an
expression, using powers of , for the
original amount of U-235. Does this makesense?
12
3.2 Work With Exponents • MHR 117
Number of Half-Life Periods
Time (min)Amount of U-235Remaining (mg)
Expression
0 0 100
1 23 50 100(1—2)1
2 46 100(1—2)2
3
4
Uranium is used as a fuelsource in nuclear fissionreactors, which provide 48% of Ontario’s electrical power.
CANDU (Canada DeuteriumUranium) reactors are amongthe safest nuclear powergenerators in the world.
Did You Know ?
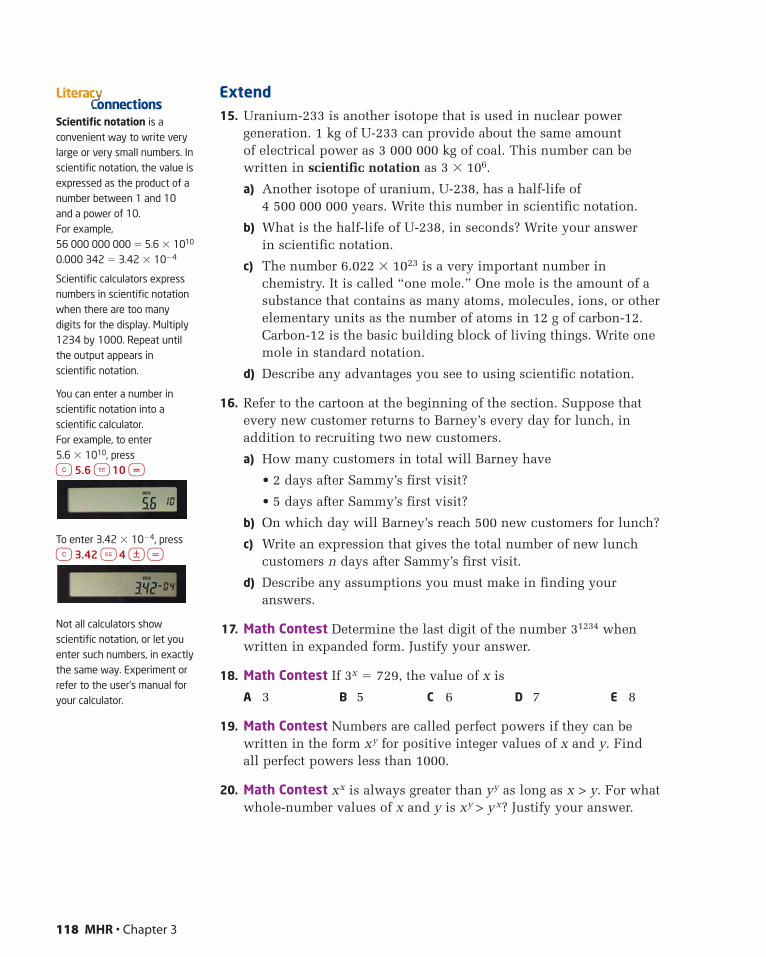
Extend15. Uranium-233 is another isotope that is used in nuclear power
generation. 1 kg of U-233 can provide about the same amount of electrical power as 3 000 000 kg of coal. This number can bewritten in scientific notation as 3 � 106.
a) Another isotope of uranium, U-238, has a half-life of 4 500 000 000 years. Write this number in scientific notation.
b) What is the half-life of U-238, in seconds? Write your answer in scientific notation.
c) The number 6.022 � 1023 is a very important number inchemistry. It is called “one mole.” One mole is the amount of asubstance that contains as many atoms, molecules, ions, or otherelementary units as the number of atoms in 12 g of carbon-12.Carbon-12 is the basic building block of living things. Write onemole in standard notation.
d) Describe any advantages you see to using scientific notation.
16. Refer to the cartoon at the beginning of the section. Suppose thatevery new customer returns to Barney’s every day for lunch, inaddition to recruiting two new customers.
a) How many customers in total will Barney have
• 2 days after Sammy’s first visit?
• 5 days after Sammy’s first visit?
b) On which day will Barney’s reach 500 new customers for lunch?
c) Write an expression that gives the total number of new lunchcustomers n days after Sammy’s first visit.
d) Describe any assumptions you must make in finding your answers.
17. Math Contest Determine the last digit of the number 31234 whenwritten in expanded form. Justify your answer.
18. Math Contest If 3x � 729, the value of x is
A 3 B 5 C 6 D 7 E 8
19. Math Contest Numbers are called perfect powers if they can bewritten in the form xy for positive integer values of x and y. Find all perfect powers less than 1000.
20. Math Contest xx is always greater than yy as long as x > y. For whatwhole-number values of x and y is xy > yx? Justify your answer.
118 MHR • Chapter 3
Scientific notation is aconvenient way to write verylarge or very small numbers. Inscientific notation, the value isexpressed as the product of anumber between 1 and 10and a power of 10. For example,56 000 000 000 � 5.6 � 1010
0.000 342 � 3.42 � 10�4
Scientific calculators expressnumbers in scientific notationwhen there are too manydigits for the display. Multiply1234 by 1000. Repeat untilthe output appears inscientific notation.
You can enter a number inscientific notation into ascientific calculator. For example, to enter 5.6 � 1010, pressç 5.6 ÍEE 10 =
To enter 3.42 � 10�4, pressç 3.42 ÍEE 4 \ =
Not all calculators showscientific notation, or let youenter such numbers, in exactlythe same way. Experiment orrefer to the user’s manual foryour calculator.
onnectionsLiterac
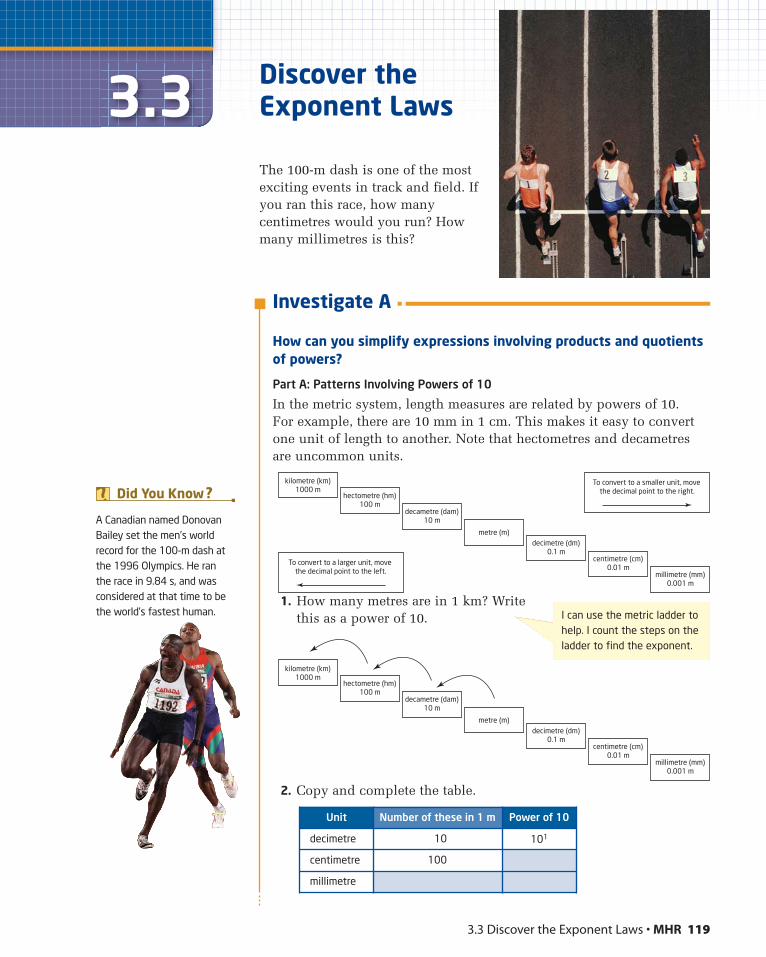
3.3 Discover the Exponent Laws • MHR 119
3.3The 100-m dash is one of the mostexciting events in track and field. Ifyou ran this race, how manycentimetres would you run? Howmany millimetres is this?
Investigate A
How can you simplify expressions involving products and quotientsof powers?
Part A: Patterns Involving Powers of 10
In the metric system, length measures are related by powers of 10. For example, there are 10 mm in 1 cm. This makes it easy to convertone unit of length to another. Note that hectometres and decametresare uncommon units.
1. How many metres are in 1 km? Writethis as a power of 10.
2. Copy and complete the table.
Unit Number of these in 1 m Power of 10
decimetre 10 101
centimetre 100
millimetre
Discover theExponent Laws
A Canadian named DonovanBailey set the men’s worldrecord for the 100-m dash atthe 1996 Olympics. He ran the race in 9.84 s, and wasconsidered at that time to bethe world’s fastest human.
Did You Know ?kilometre (km)
1000 mhectometre (hm)
100 mdecametre (dam)
10 m
decimetre (dm)0.1 m
centimetre (cm)0.01 m
millimetre (mm)0.001 m
metre (m)
To convert to a smaller unit, movethe decimal point to the right.
To convert to a larger unit, movethe decimal point to the left.
kilometre (km)1000 m
hectometre (hm)100 m
decametre (dam)10 m
decimetre (dm)0.1 m
centimetre (cm)0.01 m
millimetre (mm)0.001 m
metre (m)
I can use the metric ladder tohelp. I count the steps on theladder to find the exponent.
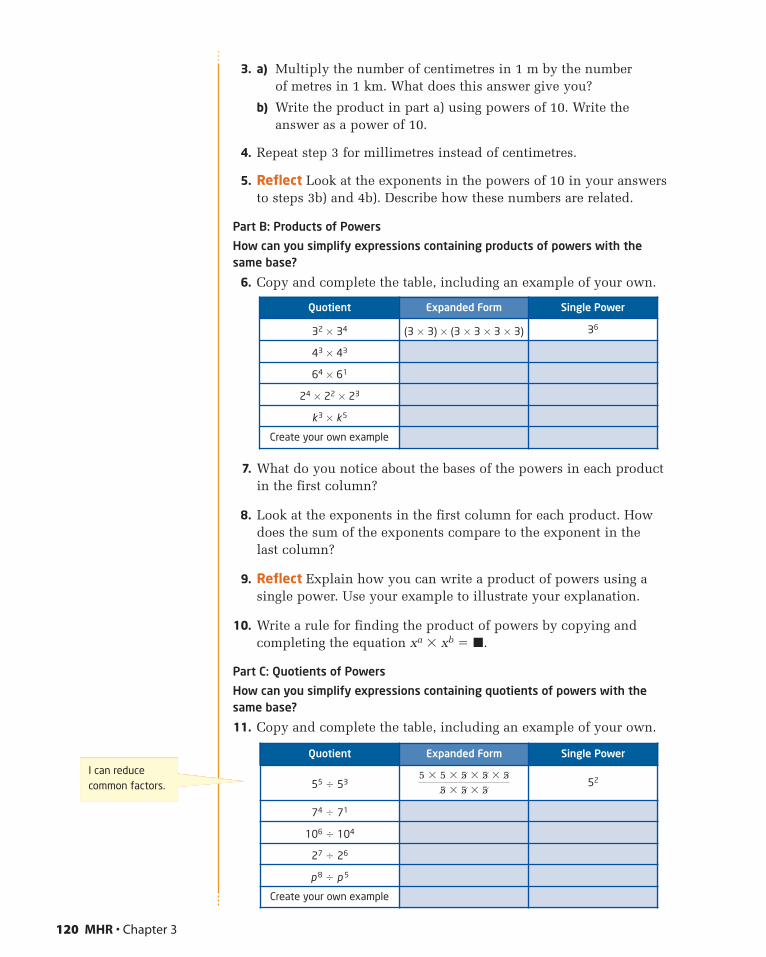
3. a) Multiply the number of centimetres in 1 m by the number of metres in 1 km. What does this answer give you?
b) Write the product in part a) using powers of 10. Write theanswer as a power of 10.
4. Repeat step 3 for millimetres instead of centimetres.
5. Reflect Look at the exponents in the powers of 10 in your answersto steps 3b) and 4b). Describe how these numbers are related.
Part B: Products of Powers
How can you simplify expressions containing products of powers with thesame base?
6. Copy and complete the table, including an example of your own.
7. What do you notice about the bases of the powers in each productin the first column?
8. Look at the exponents in the first column for each product. Howdoes the sum of the exponents compare to the exponent in the last column?
9. Reflect Explain how you can write a product of powers using asingle power. Use your example to illustrate your explanation.
10. Write a rule for finding the product of powers by copying andcompleting the equation xa � xb � �.
Part C: Quotients of Powers
How can you simplify expressions containing quotients of powers with thesame base?
11. Copy and complete the table, including an example of your own.
Quotient Expanded Form Single Power
55 � 535 � 5 � 5 � 5 � 5
5 � 5 � 552
74 � 71
106 � 104
27 � 26
p 8 � p 5
Create your own example
120 MHR • Chapter 3
I can reducecommon factors.
Quotient Expanded Form Single Power
32 � 34 (3 � 3) � (3 � 3 � 3 � 3) 36
43 � 43
64 � 61
24 � 22 � 23
k3 � k5
Create your own example
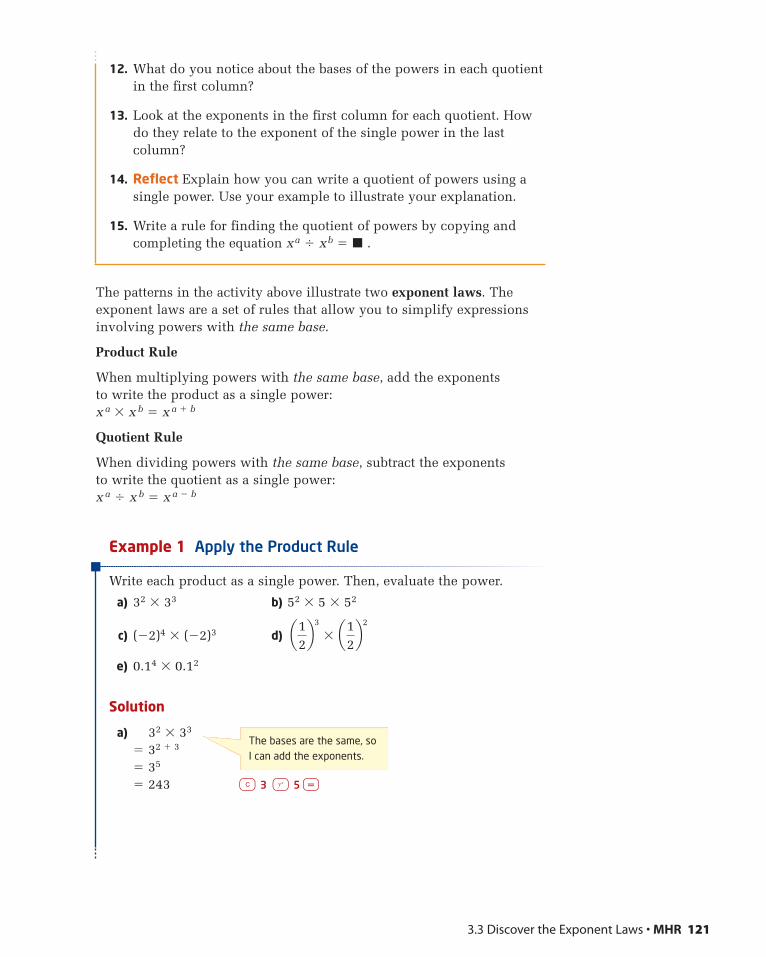
3.3 Discover the Exponent Laws • MHR 121
12. What do you notice about the bases of the powers in each quotientin the first column?
13. Look at the exponents in the first column for each quotient. Howdo they relate to the exponent of the single power in the lastcolumn?
14. Reflect Explain how you can write a quotient of powers using asingle power. Use your example to illustrate your explanation.
15. Write a rule for finding the quotient of powers by copying andcompleting the equation xa � xb � � .
The patterns in the activity above illustrate two exponent laws. Theexponent laws are a set of rules that allow you to simplify expressionsinvolving powers with the same base.
Product Rule
When multiplying powers with the same base, add the exponents to write the product as a single power:x a � x b � x a � b
Quotient Rule
When dividing powers with the same base, subtract the exponents to write the quotient as a single power:x a � x b � x a � b
Example 1 Apply the Product Rule
Write each product as a single power. Then, evaluate the power.
a) 32 � 33 b) 52 � 5 � 52
c) (�2)4 � (�2)3 d)
e) 0.14 � 0.12
Solution
a) 32 � 33
� 32 � 3
� 35
� 243 ç 3 Y 5 =
a12b3
� a12b2
The bases are the same, soI can add the exponents.
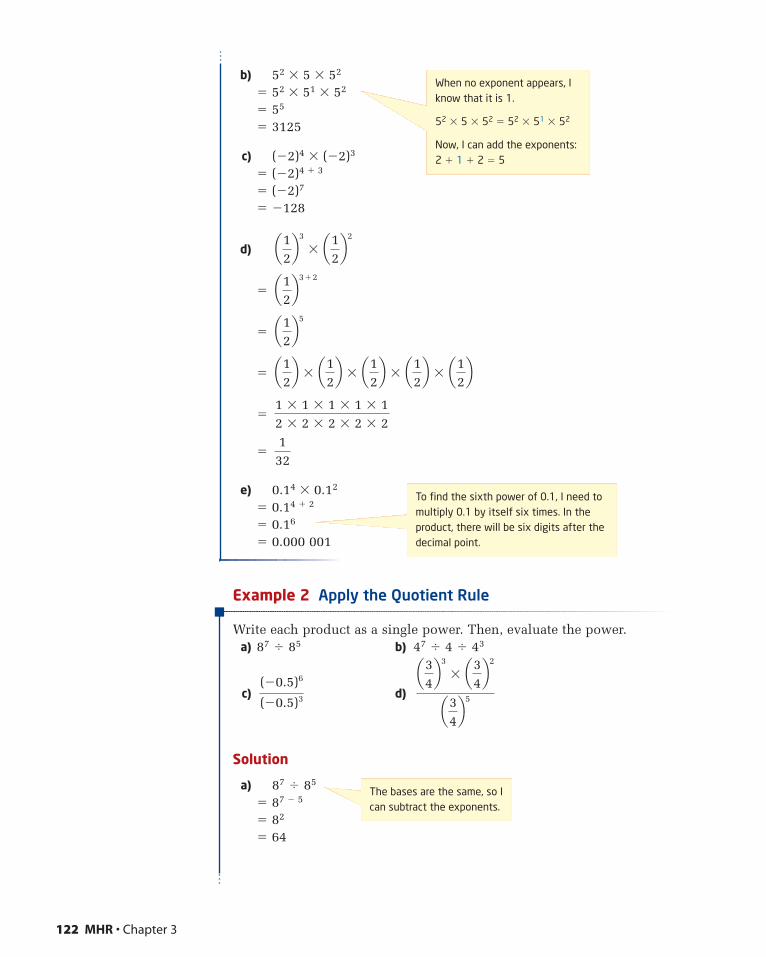
b) 52 � 5 � 52
� 52 � 51 � 52
� 55
� 3125
c) (�2)4 � (�2)3
� (�2)4 � 3
� (�2)7
� �128
d)
�
�
�
�
�
e) 0.14 � 0.12
� 0.14 � 2
� 0.16
� 0.000 001
Example 2 Apply the Quotient Rule
Write each product as a single power. Then, evaluate the power.a) 87 � 85 b) 47 � 4 � 43
c) d)
Solution
a) 87 � 85
� 87 � 5
� 82
� 64
a34b3
� a34b2
a34b5
(�0.5)6
(�0.5)3
132
1 � 1 � 1 � 1 � 12 � 2 � 2 � 2 � 2
a12b � a1
2b � a1
2b � a1
2b � a1
2b
a12b5
a12b3�2
a12b3
� a12b2
122 MHR • Chapter 3
When no exponent appears, Iknow that it is 1.
52 � 5 � 52 � 52 � 51 � 52
Now, I can add the exponents:2 � 1 � 2 � 5
To find the sixth power of 0.1, I need tomultiply 0.1 by itself six times. In theproduct, there will be six digits after thedecimal point.
The bases are the same, so Ican subtract the exponents.
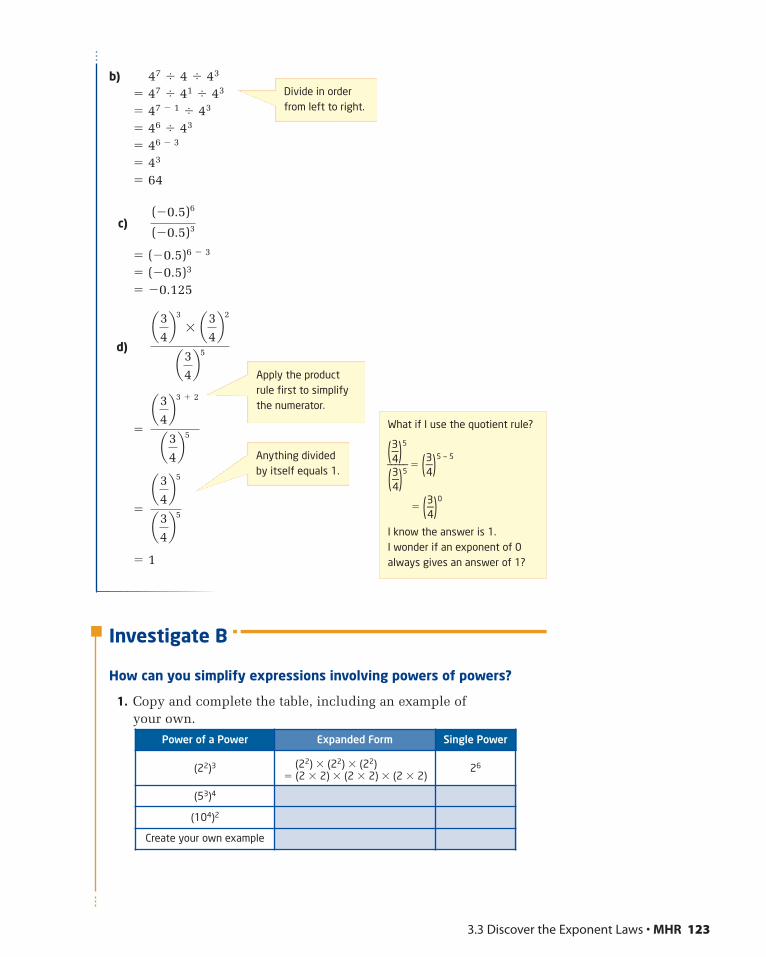
3.3 Discover the Exponent Laws • MHR 123
b) 47 � 4 � 43
� 47 � 41 � 43
� 47 � 1 � 43
� 46 � 43
� 46 � 3
� 43
� 64
c)
� (�0.5)6 � 3
� (�0.5)3
� �0.125
d)
�
�
� 1
Investigate B
How can you simplify expressions involving powers of powers?
1. Copy and complete the table, including an example of your own.
a34b5
a34b5
a34b3 � 2
a34b5
a34b3
� a34b2
a34b5
(�0.5)6
(�0.5)3
Divide in orderfrom left to right.
Apply the productrule first to simplifythe numerator.
Anything dividedby itself equals 1.
What if I use the quotient rule?
(3—4)5
—————
(3—4)5� (3—4)5 — 5
� (3—4)0
I know the answer is 1. I wonder if an exponent of 0always gives an answer of 1?
Power of a Power Expanded Form Single Power
(22)3 (22) � (22) � (22) � (2 � 2) � (2 � 2) � (2 � 2)
26
(53)4
(104)2
Create your own example
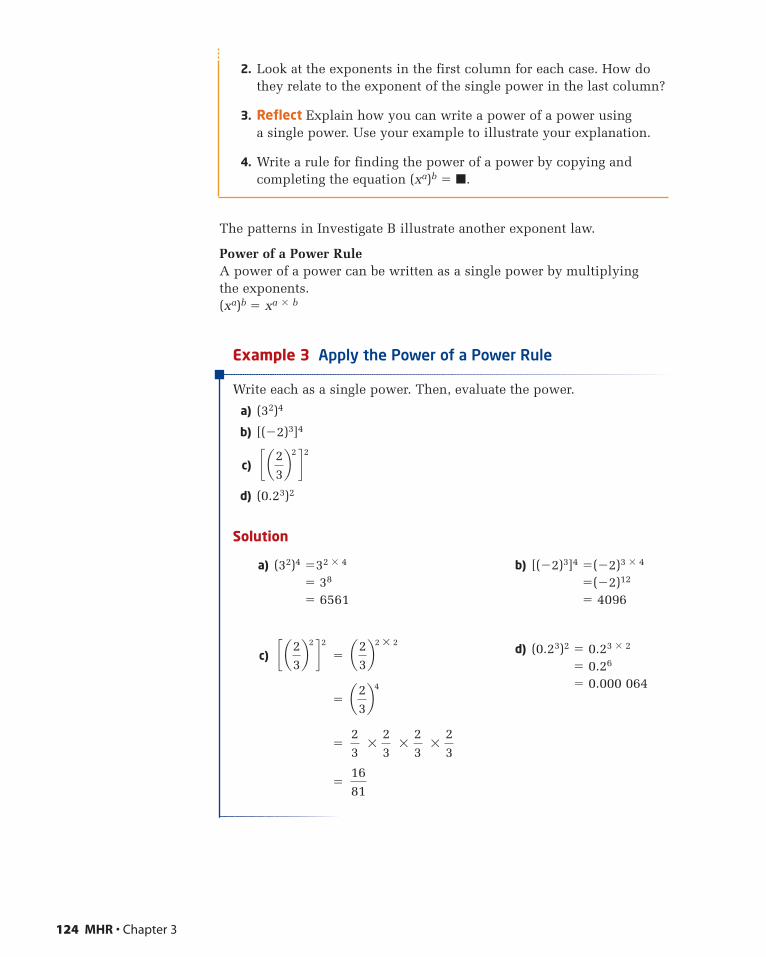
2. Look at the exponents in the first column for each case. How dothey relate to the exponent of the single power in the last column?
3. Reflect Explain how you can write a power of a power using a single power. Use your example to illustrate your explanation.
4. Write a rule for finding the power of a power by copying andcompleting the equation (xa)b � �.
The patterns in Investigate B illustrate another exponent law.
Power of a Power RuleA power of a power can be written as a single power by multiplyingthe exponents.(xa)b � xa � b
Example 3 Apply the Power of a Power Rule
Write each as a single power. Then, evaluate the power.
a) (32)4
b) [(�2)3]4
c)
d) (0.23)2
Solution
c a23b2 d 2
124 MHR • Chapter 3
a) (32)4 �32 � 4
� 38
� 6561
c) �
�
�
�
b) [(�2)3]4 �(�2)3 � 4
�(�2)12
� 4096
d) (0.23)2 � 0.23 � 2
� 0.26
� 0.000 064
1681
23
�23
�23
�23
a23b4
a23b2 : 2c a2
3b2 d 2
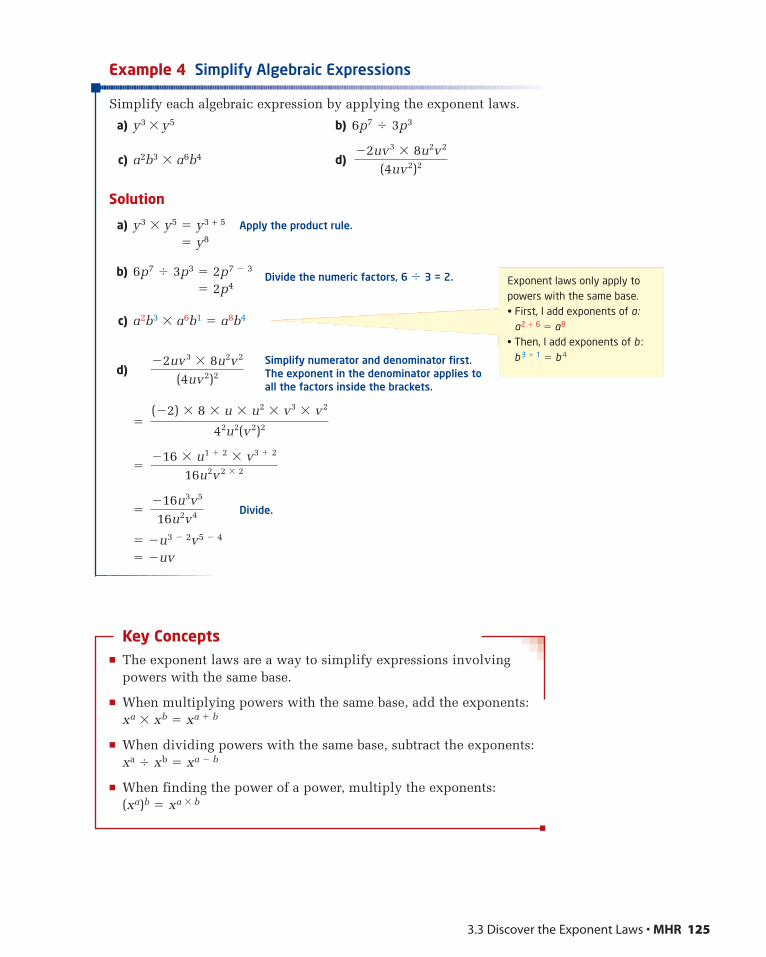
3.3 Discover the Exponent Laws • MHR 125
Example 4 Simplify Algebraic Expressions
Simplify each algebraic expression by applying the exponent laws.
a) y3 � y5 b) 6p7 � 3p3
c) a2b3 � a6b4 d)
Solution
a) y3 � y5 � y3 + 5 Apply the product rule.
� y8
b) 6p7 � 3p3 � 2p7 � 3
� 2p4
c) a2b3 � a6b1 � a8b4
d)
�
�
� Divide.
� �u3 � 2v5 � 4
� �uv
Key Concepts� The exponent laws are a way to simplify expressions involving
powers with the same base.
� When multiplying powers with the same base, add the exponents: xa � xb � xa � b
� When dividing powers with the same base, subtract the exponents:xa � xb � xa � b
� When finding the power of a power, multiply the exponents: (xa)b � xa � b
�16u3v˛˛
5
16u2v˛˛
4
�16 � u1 � 2 � v˛˛
3 � 2
16u2v˛˛˛˛
2 � 2
(�2) � 8 � u � u2 � v˛˛
3 � v˛˛˛
2
42u2(v˛˛˛
2)2
�2uv˛˛˛
3 � 8u2v˛˛˛
2
(4uv˛˛˛
2)2
�2uv˛˛˛
3 � 8u2v˛˛˛
2
(4uv˛˛˛
2)2
Exponent laws only apply topowers with the same base.• First, I add exponents of a:
a2 � 6 � a8
• Then, I add exponents of b :b 3 � 1 � b 4
Divide the numeric factors, 6 � 3 = 2.
Simplify numerator and denominator first. The exponent in the denominator applies to all the factors inside the brackets.
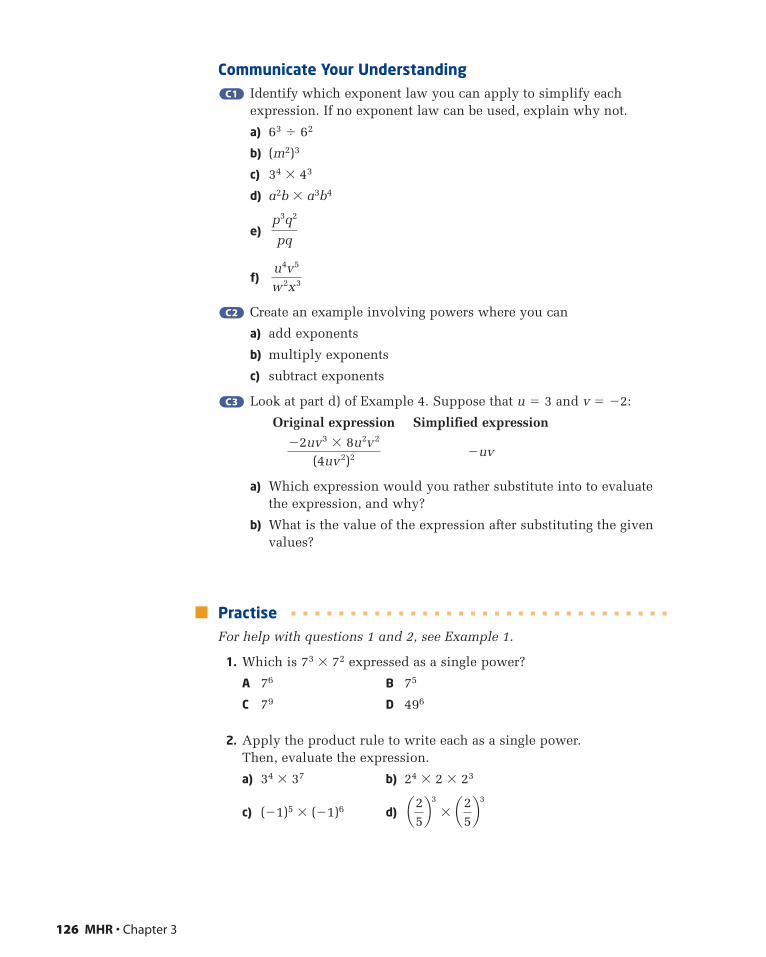
Communicate Your UnderstandingIdentify which exponent law you can apply to simplify eachexpression. If no exponent law can be used, explain why not.
a) 63 � 62
b) (m2)3
c) 34 � 43
d) a2b � a3b4
e)
f)
Create an example involving powers where you can
a) add exponents
b) multiply exponents
c) subtract exponents
Look at part d) of Example 4. Suppose that u � 3 and v � �2:
Original expression Simplified expression
�uv
a) Which expression would you rather substitute into to evaluatethe expression, and why?
b) What is the value of the expression after substituting the givenvalues?
PractiseFor help with questions 1 and 2, see Example 1.
1. Which is 73 � 72 expressed as a single power?
A 76 B 75
C 79 D 496
2. Apply the product rule to write each as a single power. Then, evaluate the expression.
a) 34 � 37 b) 24 � 2 � 23
c) (�1)5 � (�1)6 d) a25b3
� a25b3
�2uv˛˛
3 � 8u2v˛˛˛
2
(4uv˛˛˛
2)2
C3C3
C2C2
u4v˛˛
5
w˛˛˛
2x˛˛
3
p3q2
pq
C1C1
126 MHR • Chapter 3
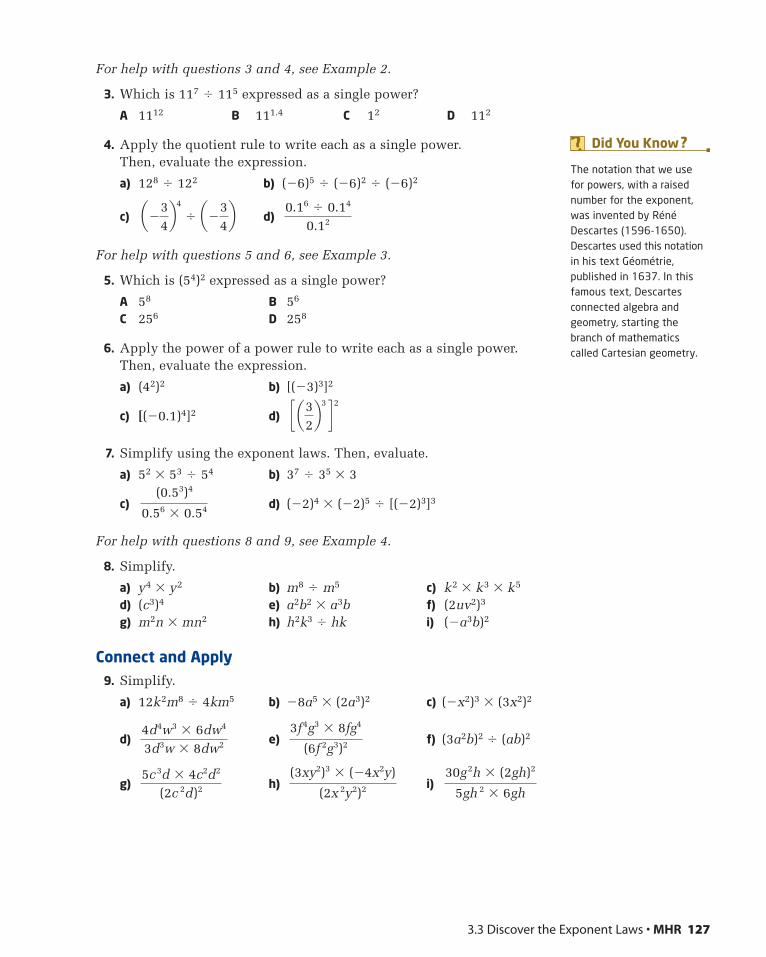
3.3 Discover the Exponent Laws • MHR 127
For help with questions 3 and 4, see Example 2.
3. Which is 117 � 115 expressed as a single power?
A 1112 B 111.4 C 12 D 112
4. Apply the quotient rule to write each as a single power. Then, evaluate the expression.
a) 128 � 122 b) (�6)5 � (�6)2 � (�6)2
c) d)
For help with questions 5 and 6, see Example 3.
5. Which is (54)2 expressed as a single power?
A 58 B 56
C 256 D 258
6. Apply the power of a power rule to write each as a single power. Then, evaluate the expression.
a) (42)2 b) [(�3)3]2
c) [(�0.1)4]2 d)
7. Simplify using the exponent laws. Then, evaluate.
a) 52 � 53 � 54 b) 37 � 35 � 3
c) d) (�2)4 � (�2)5 � [(�2)3]3
For help with questions 8 and 9, see Example 4.
8. Simplify.
a) y4 � y2 b) m8 � m5 c) k2 � k3 � k5
d) (c3)4 e) a2b2 � a3b f) (2uv2)3
g) m2n � mn2 h) h2k3 � hk i) (�a3b)2
Connect and Apply9. Simplify.
a) 12k2m8 � 4km5 b) �8a5 � (2a3)2 c) (�x2)3 � (3x2)2
d) e) f) (3a2b)2 � (ab)2
g) h) i)30g˛˛˛
2h � (2gh)2
5gh˛˛˛˛˛
2 � 6gh
(3xy2)3 � (�4x2y)
(2x˛˛˛˛˛
2y˛
2)2
5c˛˛˛
3d � 4c2d2
(2c˛˛˛˛˛
2d˛)2
3f˛˛˛
4g3 � 8fg4
(6f˛˛˛˛˛
2g˛
3)2
4d4w3 � 6dw4
3d3w � 8dw2
(0.53)4
0.56 � 0.54
c a32b3 d 2
0.16 � 0.14
0.12a�34b4
� a�34b
The notation that we use for powers, with a raisednumber for the exponent,was invented by RénéDescartes (1596-1650).Descartes used this notationin his text Géométrie,published in 1637. In thisfamous text, Descartesconnected algebra andgeometry, starting thebranch of mathematicscalled Cartesian geometry.
Did You Know ?
10. Consider the expression .
a) Substitute x � 3 and y � �1 into the expression. Then, evaluatethe expression.
b) Simplify the original expression using the exponent laws. Then, substitute the given values and evaluate the expression.
c) Describe the advantages and disadvantages of each method.
11. A crawlspace in a space station has the shape of a rectangular prism.It is about 100 cm high, 10 m wide, and 1 km long. What is thevolume enclosed by the crawlspace?
12. The probability of tossing heads with a standard coin is , because
it is one of two possible outcomes. The probability of tossing three
heads in a row is or .
a) What is the probability of tossing• six heads in a row?• 12 heads in a row?
b) Write each answer in part a) as a power of a power.
13. a) What is the probability of rolling a 6 with a standardnumber cube?
b) What is the probability of rolling four 6s in a row?
c) What is the probability of rolling a perfect square with anumber cube?
d) What is the probability of rolling eight perfect squares in a row?
e) Write each answer in parts b) and d) as a power of a power.
Achievement Check
14. Consider the expression .
a) Substitute m � 4 and n � �3 into the expression and evaluate it.
b) Simplify the original expression using the exponent laws.
c) Substitute m � 4 and n � �3 into the simplified expression andevaluate it.
d) What did you notice? What are the advantages and disadvantagesof the two methods?
e) Josie made two errors in copying the above expression. She wrote
, but she still got the correct answer.
Explain how this is possible.
�3m2n � 4mn2
(2mn)2 � 3mn
�3m2n � 4m3n2
(2m2n)2 � 3mn
18
a12b3
12
5xy˛˛˛
2 � 2x˛˛
2y
(2xy)2
128 MHR • Chapter 3
3 6
2
Rectangular prism is themathematical name for a box.
onnectionsLiterac
3.3 Discover the Exponent Laws • MHR 129
Extend15. You can multiply and divide numbers in scientific notation by
applying the exponent laws. For example,
(3 � 105) � (2 � 104) (9 � 108) � (3 � 105)
� 3 � 2 � 105 � 104 �
� 6 � 109
�
� 3 � 103
Evaluate each of the following. Express each answer in scientificnotation and then in standard notation.
a) 4 � 102 � 2 � 103 b) 1.5 � 104 � 6 � 106
c) (8 � 107) � (2 � 105) d) (3.9 � 1012) � (3 � 108)
16. a) Predict the screen output of your scientific or graphing calculatorwhen you enter the following calculation: (3 � 105) � (2 � 106).
b) Is the answer what you predicted? Explain the answer that thecalculator has provided.
17. a) Predict the screen output of your scientific or graphing calculatorwhen you enter the following calculation: (3 � 1018) � (6 � 102).
b) Is the answer what you predicted? Explain the answer that thecalculator has provided.
18. a) Evaluate (2 � 105)3. Express your answer in both scientific andstandard notation.
b) Explain how you can evaluate a power of a number expressed inscientific notation. Create an example of your own to helpillustrate your explanation.
19. Math Contest Copy and complete the table to make the square amultiplicative magic square (the product of every row, column, and diagonal is equal).
20. Math Contest If x � , place the following values in order from
least to greatest:
x, x2, x3, , 1x
2x
19
a19b16 a15b12
a9b6 a13b10
a21b18 a7b4
93
� 108
31
� 105
9 � 108
3 � 105

130 MHR • Chapter 3
3.4 Communicate With Algebra
You have seen how algebra tiles can be used to model algebraicexpressions.
The model below shows that Petra mowed a square lawn of unknownarea once a week for 4 weeks.
The algebraic representation is 4x2. Look at each part of this expression.What does the 4 represent? What does the x2 represent?
The expression 4x2 is called a . A term consists of two parts:
4 x2
coefficient variable
When you represent an algebraic expression using algebratiles, the variable in the expression tells you which type oftile to use. To represent x2, use an x2-tile.
The number of tiles corresponds to the coefficient. Since the expressionis 4x2, there are four x2-tiles.
term� an expression formed by
the product of numbersand/or variables
term
x2-tile
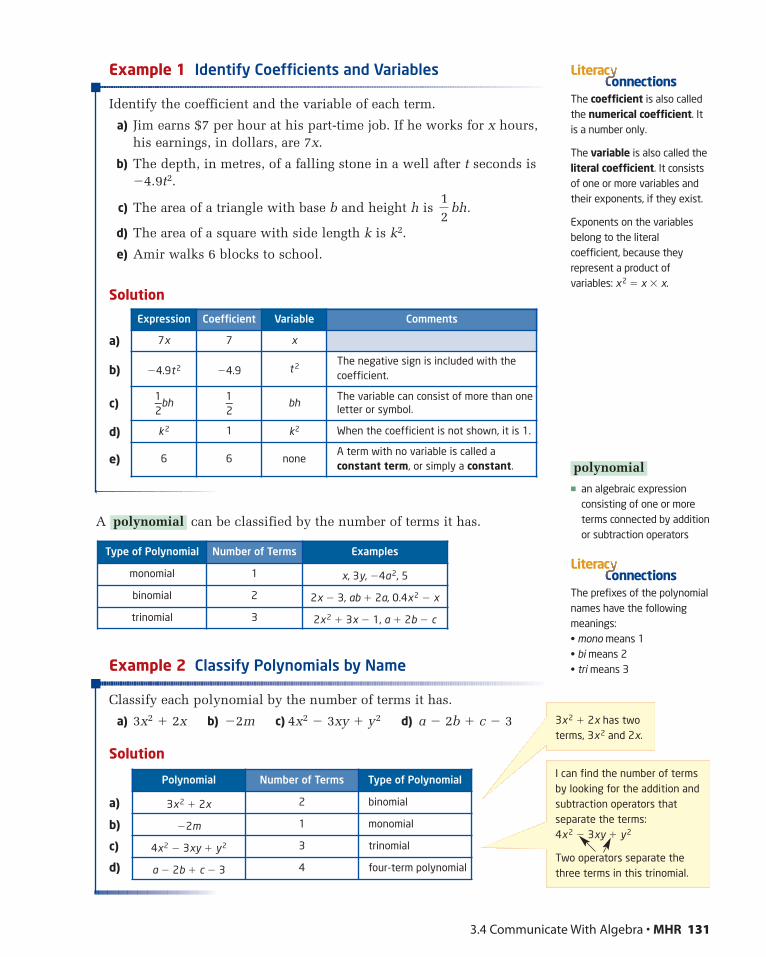
Polynomial Number of Terms Type of Polynomial
3x2 � 2x 2 binomial
�2m 1 monomial
4x2 � 3xy � y2 3 trinomial
a � 2b � c � 3 4 four-term polynomial
Expression Coefficient Variable Comments
7x 7 x
�4.9t 2 �4.9 t 2 The negative sign is included with thecoefficient.
1—2
bh1—2
bhThe variable can consist of more than oneletter or symbol.
k2 1 k2 When the coefficient is not shown, it is 1.
6 6 noneA term with no variable is called aconstant term, or simply a constant.
3.4 Communicate With Algebra • MHR 131
The coefficient is also calledthe numerical coefficient. Itis a number only.
The variable is also called theliteral coefficient. It consistsof one or more variables andtheir exponents, if they exist.
Exponents on the variablesbelong to the literalcoefficient, because theyrepresent a product ofvariables: x2 � x � x.
onnectionsLiterac
� an algebraic expressionconsisting of one or moreterms connected by additionor subtraction operators
polynomial
The prefixes of the polynomialnames have the followingmeanings:• mono means 1• bi means 2• tri means 3
onnectionsLiterac
Example 1 Identify Coefficients and Variables
Identify the coefficient and the variable of each term.
a) Jim earns $7 per hour at his part-time job. If he works for x hours,his earnings, in dollars, are 7x.
b) The depth, in metres, of a falling stone in a well after t seconds is�4.9t2.
c) The area of a triangle with base b and height h is bh.
d) The area of a square with side length k is k2.
e) Amir walks 6 blocks to school.
Solution
a)
b)
c)
d)
e)
A can be classified by the number of terms it has.
Example 2 Classify Polynomials by Name
Classify each polynomial by the number of terms it has.
a) 3x2 � 2x b) �2m c) 4x2 � 3xy � y2 d) a � 2b � c � 3
Solution
a)
b)
c)
d)
Type of Polynomial Number of Terms Examples
monomial 1 x, 3y, �4a2, 5
binomial 2 2x � 3, ab � 2a, 0.4x2 � x
trinomial 3 2x2 � 3x � 1, a � 2b � c
polynomial
12
3x2 � 2x has twoterms, 3x2 and 2x.
I can find the number of termsby looking for the addition andsubtraction operators thatseparate the terms: 4x2 � 3xy � y2
Two operators separate thethree terms in this trinomial.
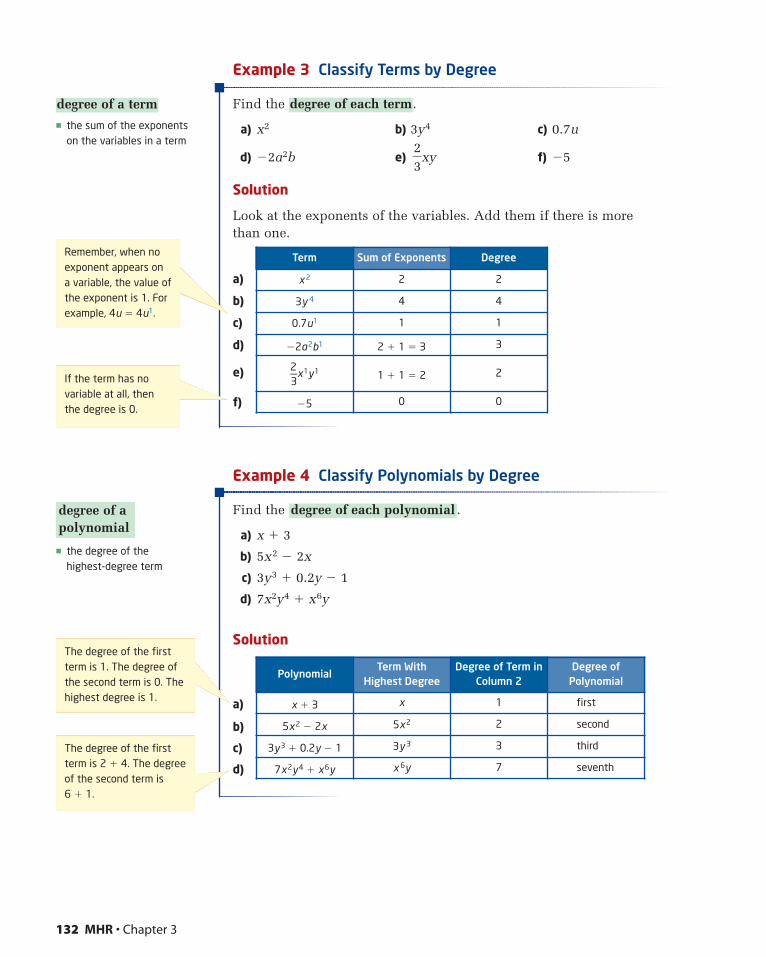
PolynomialTerm With
Highest DegreeDegree of Term in
Column 2Degree of
Polynomial
x � 3 x 1 first
5x2 � 2x 5x2 2 second
3y3 � 0.2y � 1 3y 3 3 third
7x2y4 � x6y x 6y 7 seventh
Term Sum of Exponents Degree
x 2 2 2
3y 4 4 4
0.7u1 1 1
�2a2b1 2 � 1 � 3 3
2—3
x1y1 1 � 1 � 2 2
�5 0 0
132 MHR • Chapter 3
� the degree of the highest-degree term
degree of a polynomial
The degree of the firstterm is 1. The degree ofthe second term is 0. Thehighest degree is 1.
The degree of the firstterm is 2 � 4. The degreeof the second term is 6 � 1.
� the sum of the exponentson the variables in a term
degree of a term
Example 3 Classify Terms by Degree
Find the .
a) x2 b) 3y4 c) 0.7u
d) �2a2b e) f) �5
Solution
Look at the exponents of the variables. Add them if there is morethan one.
a)
b)
c)
d)
e)
f)
Example 4 Classify Polynomials by Degree
Find the .
a) x � 3
b) 5x2 � 2x
c) 3y3 � 0.2y � 1
d) 7x2y4 � x6y
Solution
a)
b)
c)
d)
degree of each polynomial
23
xy
degree of each term
Remember, when noexponent appears ona variable, the value ofthe exponent is 1. Forexample, 4u � 4u1.
If the term has novariable at all, thenthe degree is 0.
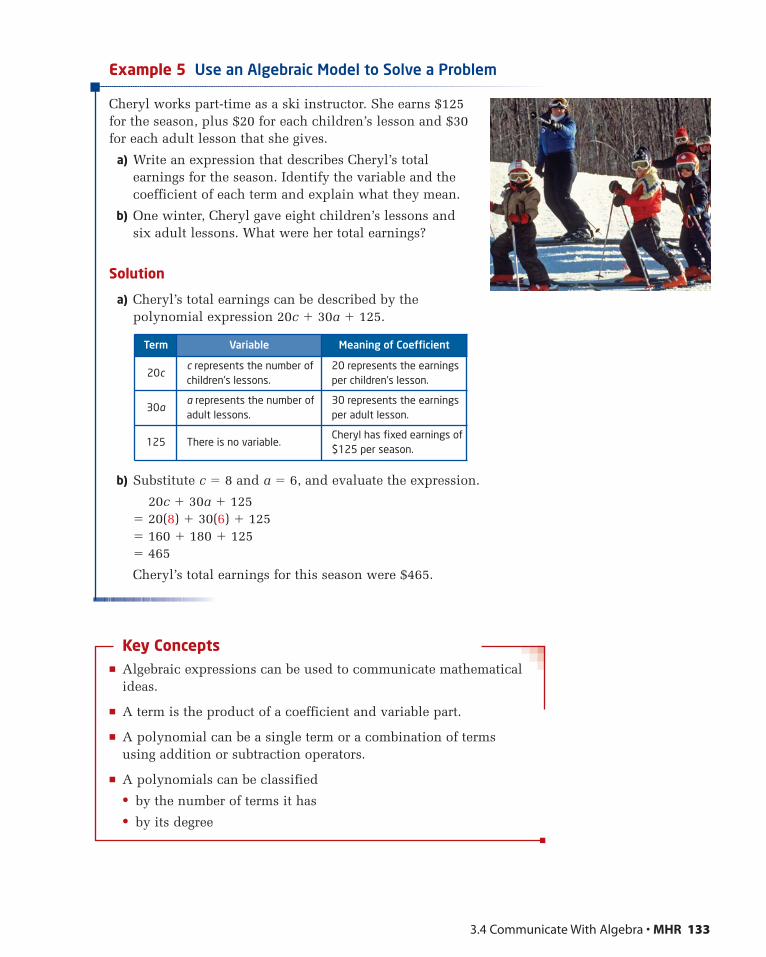
Example 5 Use an Algebraic Model to Solve a Problem
Cheryl works part-time as a ski instructor. She earns $125for the season, plus $20 for each children’s lesson and $30for each adult lesson that she gives.
a) Write an expression that describes Cheryl’s totalearnings for the season. Identify the variable and thecoefficient of each term and explain what they mean.
b) One winter, Cheryl gave eight children’s lessons andsix adult lessons. What were her total earnings?
Solution
a) Cheryl’s total earnings can be described by the polynomial expression 20c � 30a � 125.
b) Substitute c � 8 and a � 6, and evaluate the expression.
20c � 30a � 125� 20(8) � 30(6) � 125� 160 � 180 � 125� 465
Cheryl’s total earnings for this season were $465.
Key Concepts� Algebraic expressions can be used to communicate mathematical
ideas.
� A term is the product of a coefficient and variable part.
� A polynomial can be a single term or a combination of terms using addition or subtraction operators.
� A polynomials can be classified
• by the number of terms it has
• by its degree
Term Variable Meaning of Coefficient
20cc represents the number ofchildren’s lessons.
20 represents the earningsper children’s lesson.
30aa represents the number ofadult lessons.
30 represents the earningsper adult lesson.
125 There is no variable.Cheryl has fixed earnings of$125 per season.
3.4 Communicate With Algebra • MHR 133
Communicate Your UnderstandingCreate two examples of each.
a) monomial b) binomial
c) trinomial d) four-term polynomial
Julio says that the term x2 has a coefficient of 2 and a variable x. Is Julio correct? Explain.
a) Are these expressions equivalent? Explain.2w � 1t 2w � t
b) Are these expressions equivalent? Explain.3x � 1 3x
c) Explain when you must write the number 1, and when you do not need to.
PractiseFor help with question 1, see Example 1.
1. Identify the coefficient and the variable part of each term.
a) 2y b) �3x c) mn
d) x2 e) �w2 f) �0.4gh3
For help with questions 2 and 3, see Example 2.
2. 7x2 � 3xy � 4y2 is a
A monomial B binomial
C trinomial D term
3. Classify each polynomial by the number of terms.
a) �2x b) 6y2 � 2y � 1
c) a � b d) 3u2 � uv � 2v2
e) 3k2 � k f) m � 0.2n � 0.3 � mn
For help with questions 4 and 5, see Example 3.
4. The degree of 4u � 5u2 � 9 is
A 1 B 2 C 3 D 0
5. State the degree of each term.
a) 5x2 b) �6y c) �3
d) u2v4 e) x2y3 f) 0.2a2b13
12
12
12
C3C3
C2C2
C1C1
134 MHR • Chapter 3
For help with question 6, see Example 4.
6. State the degree of each polynomial.
a) 3x � 4 b) y2 � 3y � 1 c) m � 2m3
d) a3b2 � 8a2b5 e) 2x2y4 � xy3
For help with questions 7 and 8, see Example 4.
7. In a TV trivia show, a contestant receives 500 points for a correctanswer and loses 200 points for an incorrect answer. Let crepresent the number of correct answers and i represent thenumber of incorrect answers. Which expression describes acontestant’s total points?
A 500c � 200i B 500c � 200i
C 500i � 200c D 500i � 200c
8. A hockey team earns 2 points for a win and 1 point for a tie. Let w represent the number of wins and t represent the number of ties.
a) Which expression can be used to describe the total points?
A 2w � 1 B w � t C 2w � 1t D 2w � t
b) Is there more than one correct answer? Justify your answer.
9. Substitute the given values and evaluate each expression.
a) 3x � 5 x � 2
b) 4y � 4 y � �2
c) a2 � 2b � 7 a � 4, b � 1
d) 2m2 � 3n � 8 m � �2, n � 5
Connect and Apply10. The students at Prince Albert Public School sell magazine
subscriptions to raise money. The school receives 37% of the money paid for the subscriptions.
a) Choose a variable to represent the money paid for thesubscriptions.
b) Using your variable from part a), write an expression for theamount of money the school will receive.
c) Tyler sold one magazine subscription to his aunt for $25.99.Calculate the amount the school receives on this sale.
d) The sum of all the subscription orders was $4257.49. Use yourformula to calculate how much the school will receive for thisfundraiser.
25
3.4 Communicate With Algebra • MHR 135
11. Meredith has a summer job at a fitness club. She earns a $5 bonusfor each student membership and a $7 bonus for each adultmembership she sells.
a) Write a polynomial expression that describes Meredith’s totalbonus.
b) Identify the variable and the coefficient of each term and explainwhat they mean.
c) How much will Meredith’s bonus be if she sells 12 studentmemberships and 10 adult memberships?
12. An arena charges $25 for gold seats, $18 for red seats, and $15 forblue seats.
a) Write an expression that describes the total earnings from seatsales.
b) Identify the variable and the coefficient of each term and explainwhat they mean.
c) How much will the arena earn if it sells 100 gold seats, 200 blueseats, and 250 red seats?
13. On a multiple-choice test, you earn 2 points for each correct answer and lose 1 point for each incorrect answer.
a) Write an expression for a student’s total score.
b) Maria answered 15 questions correctly and 3 incorrectly. Find Maria’s total score.
14. a) Describe a situation that can be modelled by an algebraicexpression.
b) Select variables and write the expression.
c) Illustrate your expression using algebra tiles or a diagram.
15. Write a response to this e-mail from a classmate.
136 MHR • Chapter 3
FROM: ManuelSTO: JillPSUBJECT: changing a decimal to a percent
Hi Jill,
Too bad I missed today’s class. I copied yournotes and I get most of it, I guess. I’m just alittle confused about the difference betweena term and a polynomial. Can you pleasehelp me out?
Thanks,Manuel
16. Chapter Problem Alysia is designing a logo for her school team, theEagles. The design will be used to make different-sized crests for clothingsuch as jackets, sweaters, and baseball caps. How can Alysia make surethat, when the crest is made larger or smaller, the shape will not change?
The height will always be double the width.
a) If w represents the width, what expression represents the height?
b) How high will a crest that is 5 cm wide be?
c) How wide will a crest that is 25 cm high be?
Achievement Check
17. In a soccer league, teams receive 3 points for a win, 2 points for aloss, and 1 point for a tie.
a) Write an algebraic expression to represent a team’s total points.
b) What variables did you choose? Identify what each variablerepresents.
c) The Falcons’ record for the season was 5 wins, 2 losses, and 3 ties. Use your expression to find the Falcons’ total points.
d) The 10-game season ended with the Falcons tied for second placewith the same number of points as the Eagles. The Eagles had adifferent record than the Falcons. How is this possible?
Extend18. Alberto is training for a triathlon, where athletes swim, cycle, and
run. During his training program, he has found that he can swim at 1.2 km/h, cycle at 25 km/h, and run at 10 km/h. To estimate histime for an upcoming race, Alberto rearranges the formula
distance � speed � time to find that: time � .
a) Choose a variable to represent the distance travelled for each part of the race. For example, choose s for the swim.
b) Copy and complete the table. The first row is done for you.
c) Write a trinomial to model Alberto’s total time.
d) A triathlon is advertised in Kingston. Participants have to swim1.5 km, cycle 40 km, and run 10 km. Using your expression frompart c), calculate how long it will take Alberto to finish the race.
e) Is your answer a reasonable estimate of Alberto’s triathlon time?Explain.
Part of the Race Speed (km/h) Distance (km) Time (h)
swim 1.2 ss
———1.2
cycle
run
distancespeed
3.4 Communicate With Algebra • MHR 137
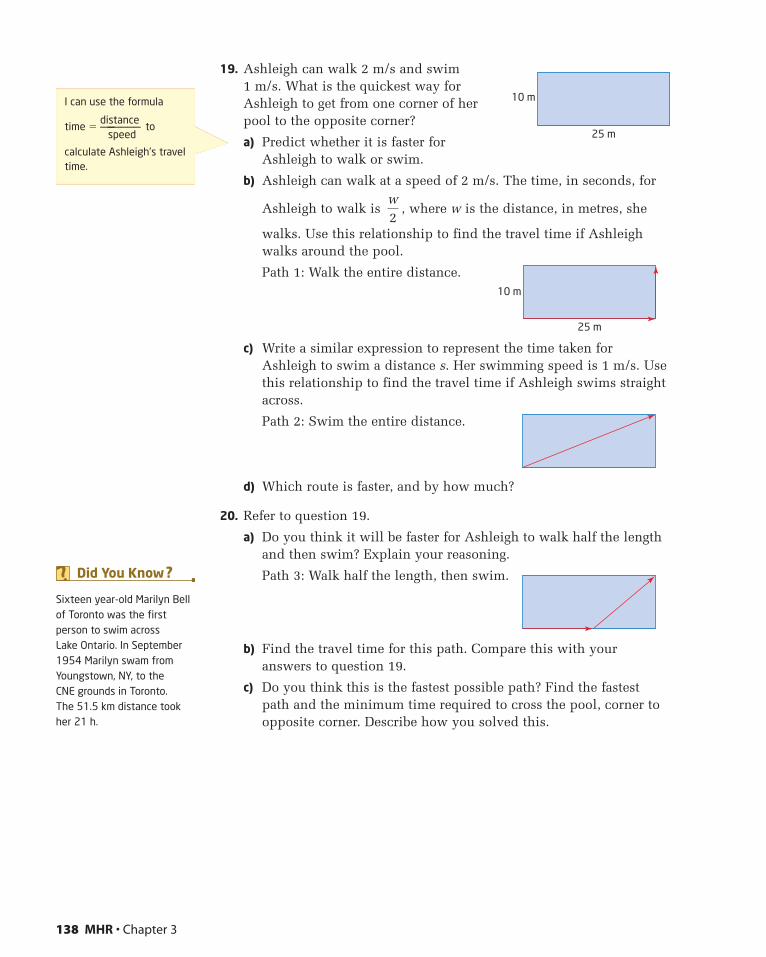
19. Ashleigh can walk 2 m/s and swim1 m/s. What is the quickest way forAshleigh to get from one corner of herpool to the opposite corner?
a) Predict whether it is faster forAshleigh to walk or swim.
b) Ashleigh can walk at a speed of 2 m/s. The time, in seconds, for
Ashleigh to walk is , where w is the distance, in metres, she
walks. Use this relationship to find the travel time if Ashleighwalks around the pool.
Path 1: Walk the entire distance.
c) Write a similar expression to represent the time taken forAshleigh to swim a distance s. Her swimming speed is 1 m/s. Usethis relationship to find the travel time if Ashleigh swims straightacross.
Path 2: Swim the entire distance.
d) Which route is faster, and by how much?
20. Refer to question 19.
a) Do you think it will be faster for Ashleigh to walk half the lengthand then swim? Explain your reasoning.
Path 3: Walk half the length, then swim.
b) Find the travel time for this path. Compare this with youranswers to question 19.
c) Do you think this is the fastest possible path? Find the fastestpath and the minimum time required to cross the pool, corner toopposite corner. Describe how you solved this.
w2
138 MHR • Chapter 3
10 m
25 m
10 m
25 m
I can use the formula
time �dis——
tance—————speed
to
calculate Ashleigh’s traveltime.
Sixteen year-old Marilyn Bellof Toronto was the firstperson to swim across Lake Ontario. In September1954 Marilyn swam fromYoungstown, NY, to the CNE grounds in Toronto. The 51.5 km distance tookher 21 h.
Did You Know ?
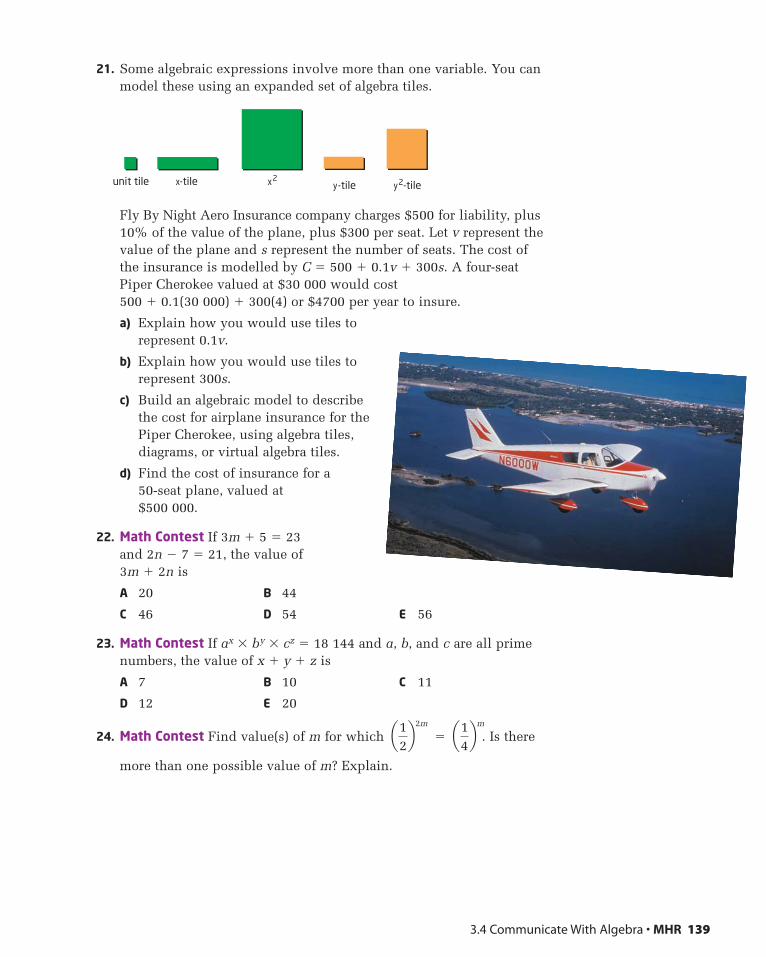
21. Some algebraic expressions involve more than one variable. You canmodel these using an expanded set of algebra tiles.
Fly By Night Aero Insurance company charges $500 for liability, plus10% of the value of the plane, plus $300 per seat. Let v represent thevalue of the plane and s represent the number of seats. The cost ofthe insurance is modelled by C � 500 � 0.1v � 300s. A four-seatPiper Cherokee valued at $30 000 would cost 500 � 0.1(30 000) � 300(4) or $4700 per year to insure.
a) Explain how you would use tiles to represent 0.1v.
b) Explain how you would use tiles torepresent 300s.
c) Build an algebraic model to describethe cost for airplane insurance for thePiper Cherokee, using algebra tiles, diagrams, or virtual algebra tiles.
d) Find the cost of insurance for a 50-seat plane, valued at $500 000.
22. Math Contest If 3m � 5 � 23 and 2n � 7 � 21, the value of 3m � 2n is
A 20 B 44
C 46 D 54 E 56
23. Math Contest If ax � by � cz � 18 144 and a, b, and c are all primenumbers, the value of x � y � z is
A 7 B 10 C 11
D 12 E 20
24. Math Contest Find value(s) of m for which � . Is there
more than one possible value of m? Explain.
a14bma1
2b2m
x-tile y2-tiley -tileunit tile x2
3.4 Communicate With Algebra • MHR 139
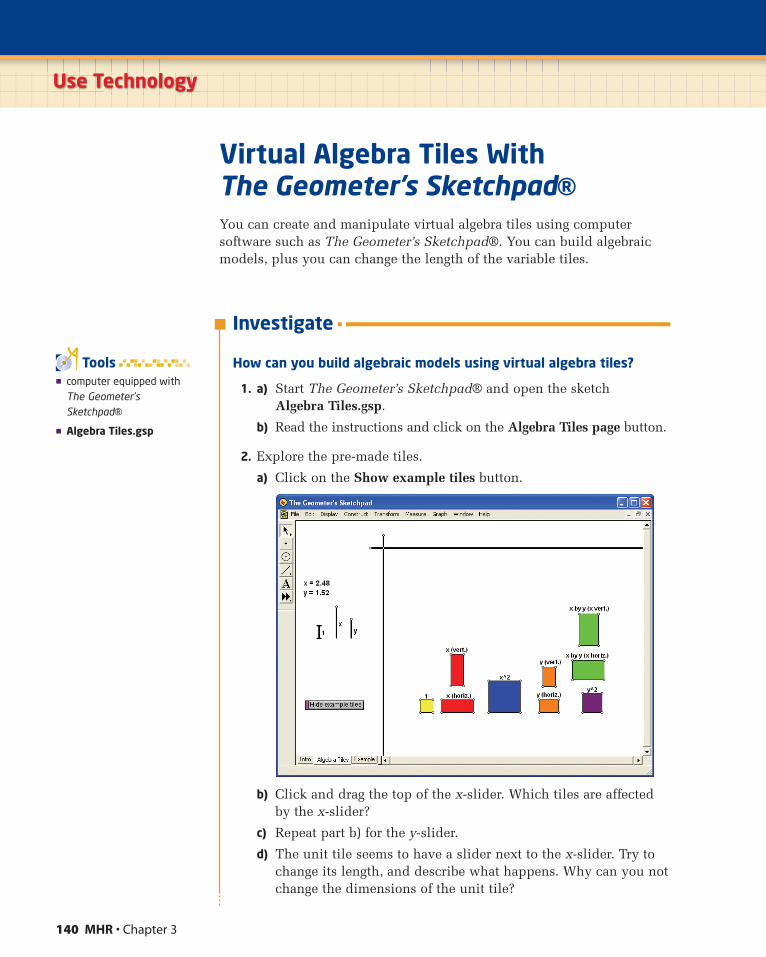
140 MHR • Chapter 3
Virtual Algebra Tiles With The Geometer’s Sketchpad®You can create and manipulate virtual algebra tiles using computersoftware such as The Geometer’s Sketchpad®. You can build algebraicmodels, plus you can change the length of the variable tiles.
Investigate
How can you build algebraic models using virtual algebra tiles?
1. a) Start The Geometer’s Sketchpad® and open the sketch Algebra Tiles.gsp.
b) Read the instructions and click on the Algebra Tiles page button.
2. Explore the pre-made tiles.
a) Click on the Show example tiles button.
b) Click and drag the top of the x-slider. Which tiles are affectedby the x-slider?
c) Repeat part b) for the y-slider.
d) The unit tile seems to have a slider next to the x-slider. Try tochange its length, and describe what happens. Why can you notchange the dimensions of the unit tile?
Use Technology
� computer equipped withThe Geometer’sSketchpad®
� Algebra Tiles.gsp
Tools
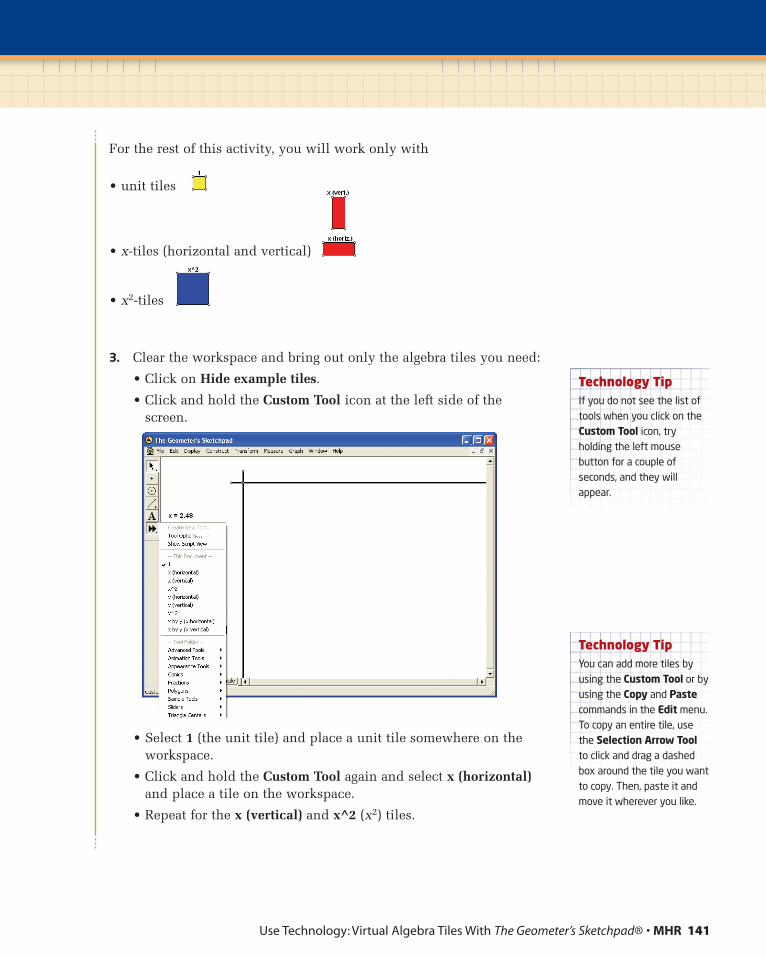
Use Technology: Virtual Algebra Tiles With The Geometer’s Sketchpad® • MHR 141
For the rest of this activity, you will work only with
• unit tiles
• x-tiles (horizontal and vertical)
• x2-tiles
3. Clear the workspace and bring out only the algebra tiles you need:
• Click on Hide example tiles.
• Click and hold the Custom Tool icon at the left side of thescreen.
• Select 1 (the unit tile) and place a unit tile somewhere on theworkspace.
• Click and hold the Custom Tool again and select x (horizontal)and place a tile on the workspace.
• Repeat for the x (vertical) and x^2 (x2) tiles.
Technology TipIf you do not see the list oftools when you click on theCustom Tool icon, tryholding the left mousebutton for a couple ofseconds, and they willappear.
Technology TipYou can add more tiles byusing the Custom Tool or byusing the Copy and Pastecommands in the Edit menu.To copy an entire tile, usethe Selection Arrow Toolto click and drag a dashedbox around the tile you wantto copy. Then, paste it andmove it wherever you like.
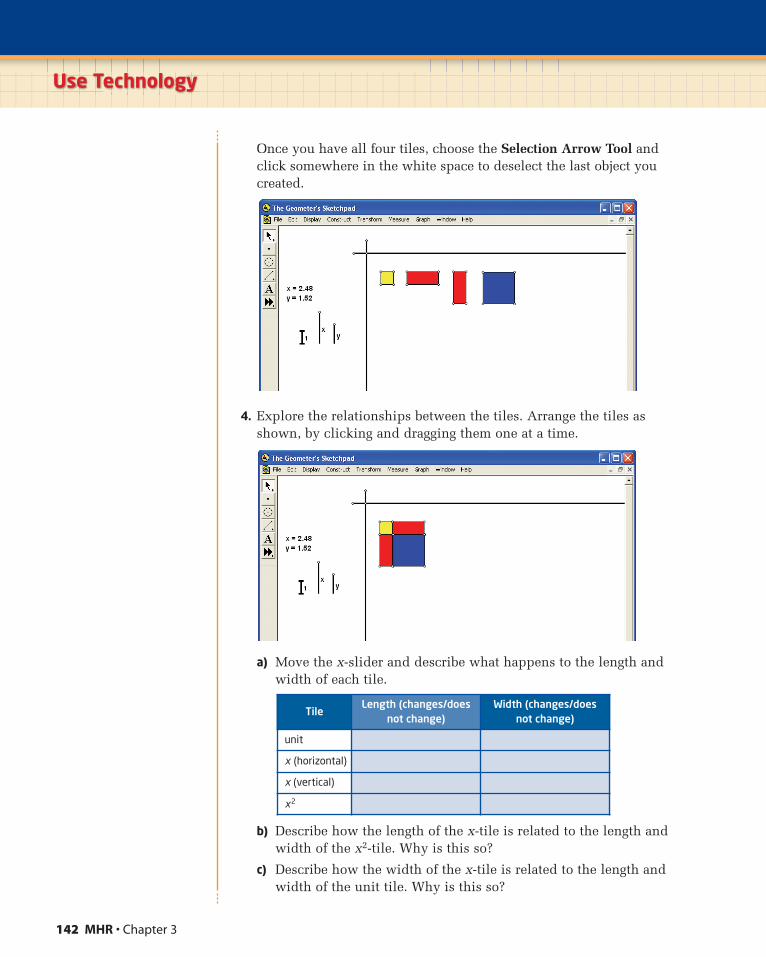
142 MHR • Chapter 3
Once you have all four tiles, choose the Selection Arrow Tool andclick somewhere in the white space to deselect the last object youcreated.
4. Explore the relationships between the tiles. Arrange the tiles asshown, by clicking and dragging them one at a time.
a) Move the x-slider and describe what happens to the length andwidth of each tile.
b) Describe how the length of the x-tile is related to the length andwidth of the x2-tile. Why is this so?
c) Describe how the width of the x-tile is related to the length andwidth of the unit tile. Why is this so?
TileLength (changes/does
not change)Width (changes/does
not change)
unit
x (horizontal)
x (vertical)
x2
Use Technology
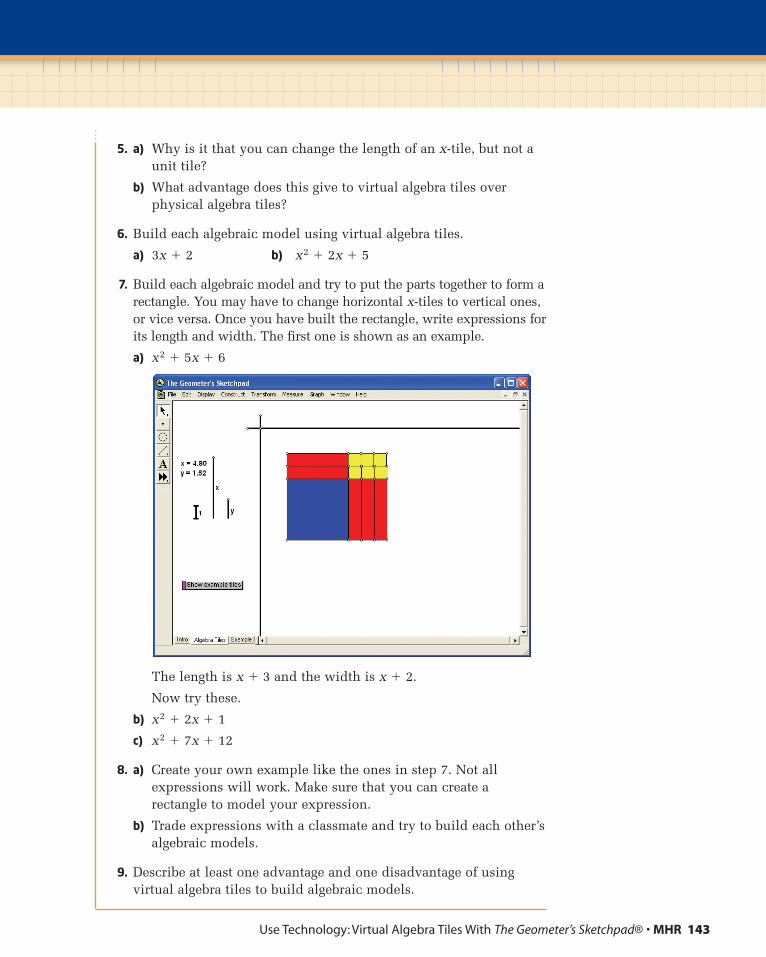
Use Technology: Virtual Algebra Tiles With The Geometer’s Sketchpad® • MHR 143
5. a) Why is it that you can change the length of an x-tile, but not aunit tile?
b) What advantage does this give to virtual algebra tiles overphysical algebra tiles?
6. Build each algebraic model using virtual algebra tiles.
a) 3x � 2 b) x2 � 2x � 5
7. Build each algebraic model and try to put the parts together to form arectangle. You may have to change horizontal x-tiles to vertical ones,or vice versa. Once you have built the rectangle, write expressions forits length and width. The first one is shown as an example.
a) x2 � 5x � 6
The length is x � 3 and the width is x � 2.
Now try these.
b) x2 � 2x � 1
c) x2 � 7x � 12
8. a) Create your own example like the ones in step 7. Not allexpressions will work. Make sure that you can create arectangle to model your expression.
b) Trade expressions with a classmate and try to build each other’salgebraic models.
9. Describe at least one advantage and one disadvantage of usingvirtual algebra tiles to build algebraic models.
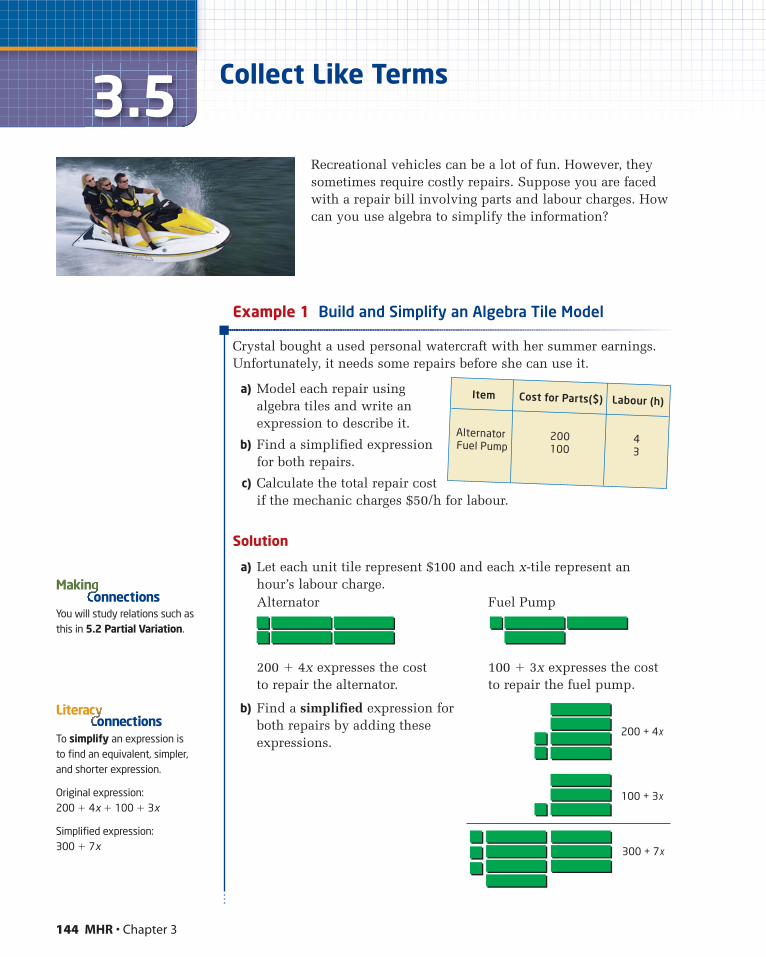
Fuel Pump
100 � 3x expresses the costto repair the fuel pump.
Example 1 Build and Simplify an Algebra Tile Model
Crystal bought a used personal watercraft with her summer earnings.Unfortunately, it needs some repairs before she can use it.
a) Model each repair usingalgebra tiles and write anexpression to describe it.
b) Find a simplified expressionfor both repairs.
c) Calculate the total repair costif the mechanic charges $50/h for labour.
Solution
a) Let each unit tile represent $100 and each x-tile represent anhour’s labour charge.
144 MHR • Chapter 3
3.5 Collect Like Terms
Recreational vehicles can be a lot of fun. However, theysometimes require costly repairs. Suppose you are facedwith a repair bill involving parts and labour charges. Howcan you use algebra to simplify the information?
Alternator
200 � 4x expresses the costto repair the alternator.
You will study relations such asthis in 5.2 Partial Variation.
Makinonnections
b) Find a simplified expression forboth repairs by adding theseexpressions.To simplify an expression is
to find an equivalent, simpler,and shorter expression.
Original expression:200 � 4x � 100 � 3x
Simplified expression:300 � 7x
onnectionsLiterac
200 + 4x
300 + 7x
100 + 3x
Item
Alternator Fuel Pump
Cost for Parts($)
200100
Labour (h)
43
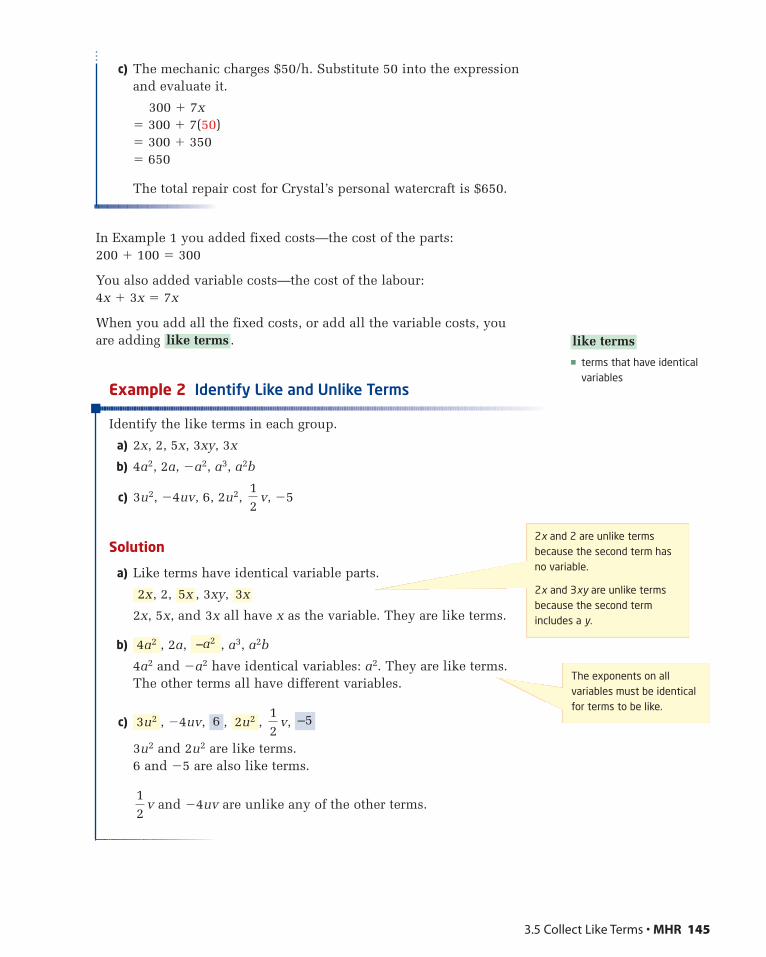
c) The mechanic charges $50/h. Substitute 50 into the expression and evaluate it.
300 � 7x� 300 � 7(50)� 300 � 350� 650
The total repair cost for Crystal’s personal watercraft is $650.
In Example 1 you added fixed costs—the cost of the parts:200 � 100 � 300
You also added variable costs—the cost of the labour:4x � 3x � 7x
When you add all the fixed costs, or add all the variable costs, you are adding .
Example 2 Identify Like and Unlike Terms
Identify the like terms in each group.
a) 2x, 2, 5x, 3xy, 3x
b) 4a2, 2a, �a2, a3, a2b
c) 3u2, �4uv, 6, 2u2, v, �5
Solution
a) Like terms have identical variable parts.
, 2, , 3xy,
2x, 5x, and 3x all have x as the variable. They are like terms.
b) , 2a, , a3, a2b
4a2 and �a2 have identical variables: a2. They are like terms. The other terms all have different variables.
c) , �4uv, , , v,
3u2 and 2u2 are like terms.6 and �5 are also like terms.
v and �4uv are unlike any of the other terms.12
–512
2u263u2
–a24a2
3x5x2x
12
like terms
3.5 Collect Like Terms • MHR 145
� terms that have identicalvariables
like terms
2x and 2 are unlike termsbecause the second term hasno variable.
2x and 3xy are unlike termsbecause the second termincludes a y.
The exponents on allvariables must be identicalfor terms to be like.
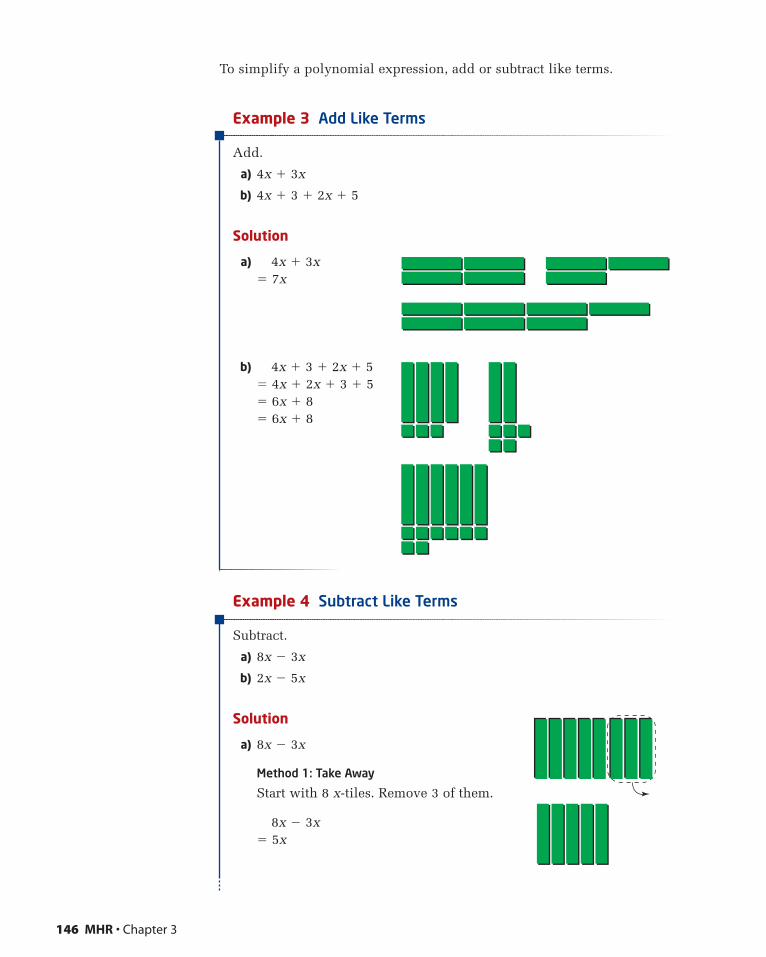
To simplify a polynomial expression, add or subtract like terms.
Example 3 Add Like Terms
Add.
a) 4x � 3x
b) 4x � 3 � 2x � 5
Solution
a) 4x � 3x� 7x
b) 4x � 3 � 2x � 5� 4x � 2x � 3 � 5� 6x � 8� 6x � 8
Example 4 Subtract Like Terms
Subtract.
a) 8x � 3x
b) 2x � 5x
Solution
a) 8x � 3x
Method 1: Take Away
Start with 8 x-tiles. Remove 3 of them.
8x � 3x � 5x
146 MHR • Chapter 3
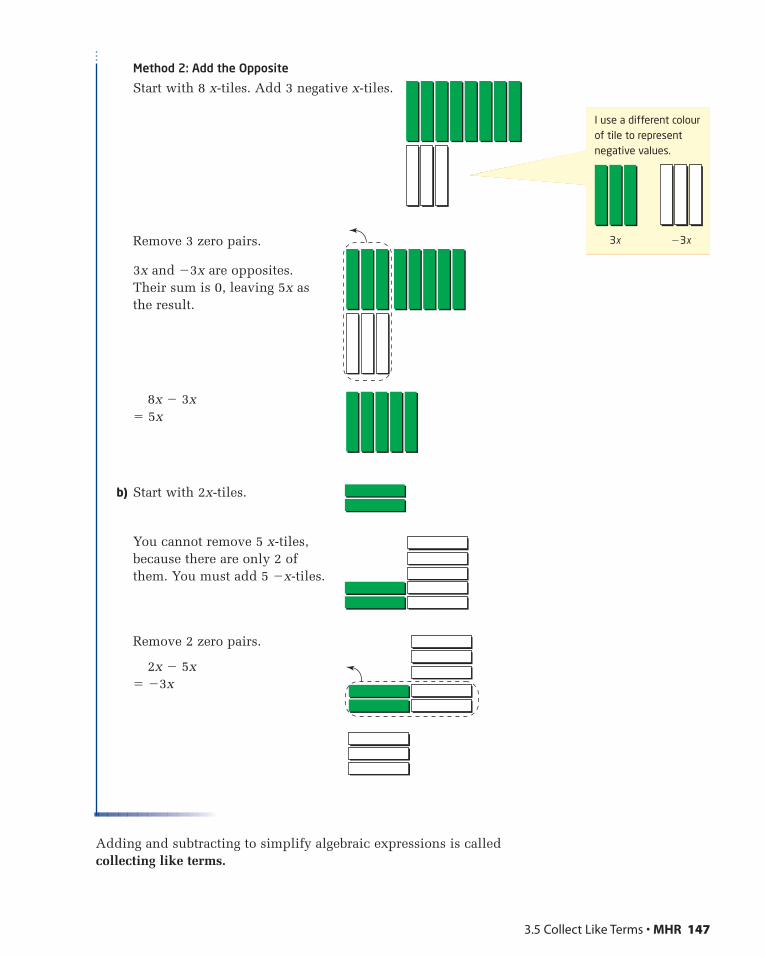
Method 2: Add the Opposite
Start with 8 x-tiles. Add 3 negative x-tiles.
Remove 3 zero pairs.
3x and �3x are opposites.Their sum is 0, leaving 5x asthe result.
8x � 3x � 5x
b) Start with 2x-tiles.
You cannot remove 5 x-tiles,because there are only 2 ofthem. You must add 5 �x-tiles.
Remove 2 zero pairs.
2x � 5x� �3x
Adding and subtracting to simplify algebraic expressions is calledcollecting like terms.
3.5 Collect Like Terms • MHR 147
I use a different colourof tile to representnegative values.
3x �3x
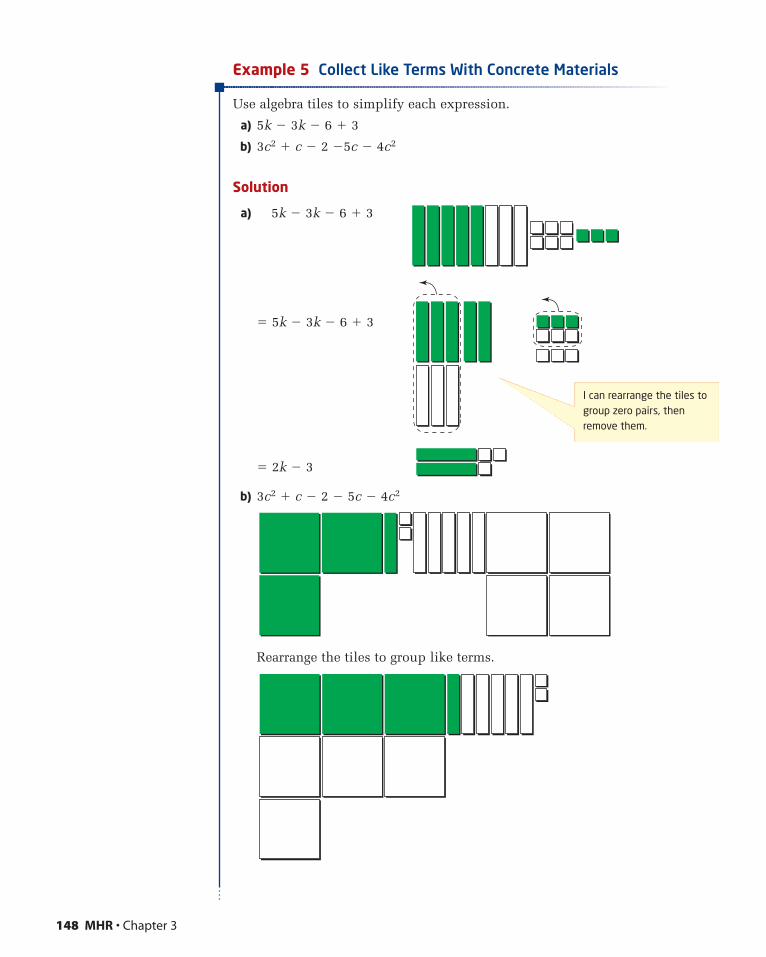
Example 5 Collect Like Terms With Concrete Materials
Use algebra tiles to simplify each expression.
a) 5k � 3k � 6 � 3
b) 3c2 � c � 2 �5c � 4c2
Solution
a) 5k � 3k � 6 � 3
� 5k � 3k � 6 � 3
� 2k � 3
b) 3c2 � c � 2 � 5c � 4c2
Rearrange the tiles to group like terms.
148 MHR • Chapter 3
I can rearrange the tiles togroup zero pairs, thenremove them.

Remove zero pairs.
� 3c2 � 4c2 � c � 5c � 2
� �c2 � 4c � 2
Example 6: Collect Like Terms Without Concrete Materials
Simplify.
a) 6x � 4 � 8x � 3
b) 2b � b � 7 � 8
c) 3r2 � 2 � 6r � 9r � 3r2
d) 0.5m � 4.5n � 0.7m � 4.5n � 1.5
Solution
When collecting like terms,• group or identify like terms• add or subtract like terms only• apply integer rules to the coefficients of like terms• do not change the variable parts
a) 6x � 4 � 8x � 3
3.5 Collect Like Terms • MHR 149
When the coefficient is 1 or �1, you can omit the 1. Butyou must keep the minus sign.
3c2 � 4c2 � �1c2
� �c2Algebraic expressions are usuallywritten in order of degree, withthe greatest-degree term first andthe least-degree term last.
Method 1: Align Like Terms Vertically
6x � 4� 8x � 314x � 7
Method 2: Collect Like Terms
6x � 4 � 8x � 3� 6x � 8x � 4 � 3 Once you have had some practice,
you may be able to skip this step.
� 14x � 7
Identify like terms first. 6x and 8x are like terms. 4 and 3 are also like terms.
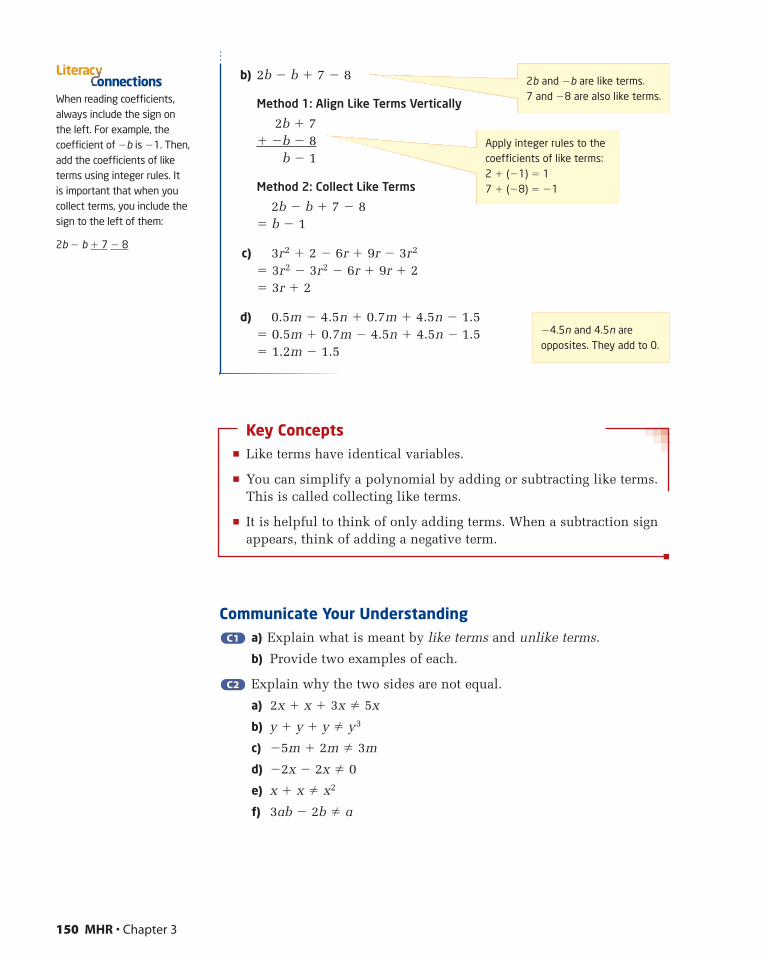
b) 2b � b � 7 � 8
Method 1: Align Like Terms Vertically
2b � 7� �b � 8
b � 1
Method 2: Collect Like Terms
2b � b � 7 � 8� b � 1
c) 3r2 � 2 � 6r � 9r � 3r2
� 3r2 � 3r2 � 6r � 9r � 2� 3r � 2
d) 0.5m � 4.5n � 0.7m � 4.5n � 1.5� 0.5m � 0.7m � 4.5n � 4.5n � 1.5� 1.2m � 1.5
Key Concepts� Like terms have identical variables.
� You can simplify a polynomial by adding or subtracting like terms.This is called collecting like terms.
� It is helpful to think of only adding terms. When a subtraction signappears, think of adding a negative term.
Communicate Your Understandinga) Explain what is meant by like terms and unlike terms.
b) Provide two examples of each.
Explain why the two sides are not equal.
a) 2x � x � 3x � 5x
b) y � y � y � y3
c) �5m � 2m � 3m
d) �2x � 2x � 0
e) x � x � x2
f) 3ab � 2b � a
C2C2
C1C1
150 MHR • Chapter 3
Apply integer rules to thecoefficients of like terms:2 � (�1) � 17 � (�8) � �1
When reading coefficients,always include the sign on the left. For example, thecoefficient of �b is �1. Then,add the coefficients of liketerms using integer rules. It is important that when youcollect terms, you include thesign to the left of them:
2b � b � 7 � 8
onnectionsLiterac
�4.5n and 4.5n areopposites. They add to 0.
2b and �b are like terms. 7 and �8 are also like terms.
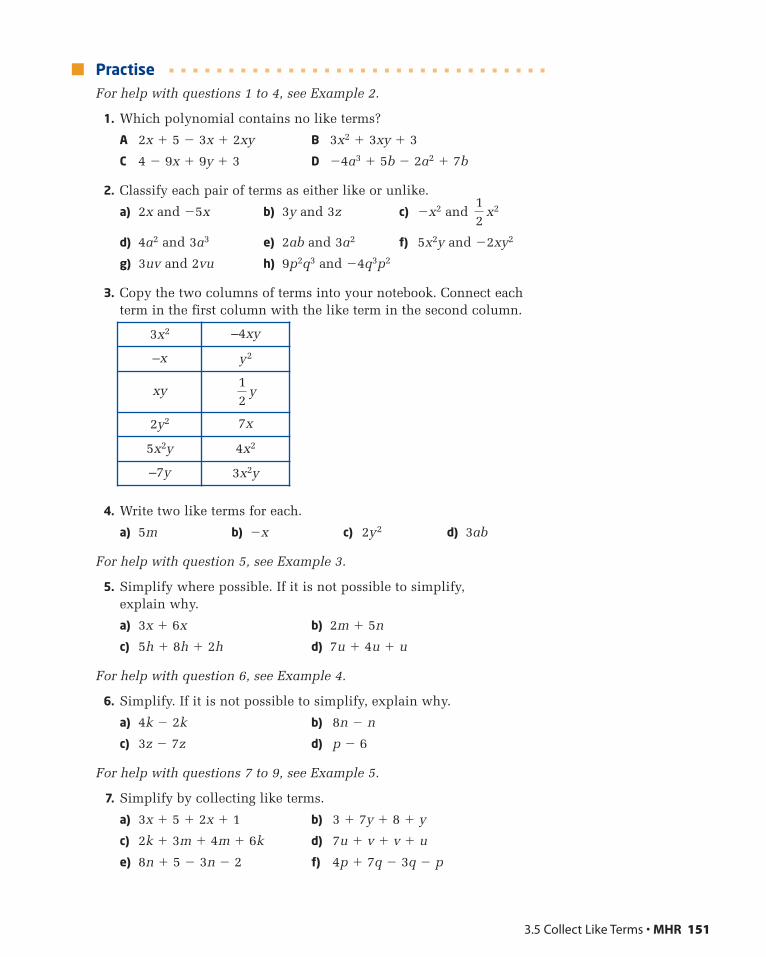
PractiseFor help with questions 1 to 4, see Example 2.
1. Which polynomial contains no like terms?
A 2x � 5 � 3x � 2xy B 3x2 � 3xy � 3
C 4 � 9x � 9y � 3 D �4a3 � 5b � 2a2 � 7b
2. Classify each pair of terms as either like or unlike.
a) 2x and �5x b) 3y and 3z c) �x2 and x2
d) 4a2 and 3a3 e) 2ab and 3a2 f) 5x2y and �2xy2
g) 3uv and 2vu h) 9p2q3 and �4q3p2
3. Copy the two columns of terms into your notebook. Connect each term in the first column with the like term in the second column.
4. Write two like terms for each.
a) 5m b) �x c) 2y2 d) 3ab
For help with question 5, see Example 3.
5. Simplify where possible. If it is not possible to simplify, explain why.
a) 3x � 6x b) 2m � 5n
c) 5h � 8h � 2h d) 7u � 4u � u
For help with question 6, see Example 4.
6. Simplify. If it is not possible to simplify, explain why.
a) 4k � 2k b) 8n � n
c) 3z � 7z d) p � 6
For help with questions 7 to 9, see Example 5.
7. Simplify by collecting like terms.
a) 3x � 5 � 2x � 1 b) 3 � 7y � 8 � y
c) 2k � 3m � 4m � 6k d) 7u � v � v � u
e) 8n � 5 � 3n � 2 f) 4p � 7q � 3q � p
12
3.5 Collect Like Terms • MHR 151
3x2 –4xy
–x y2
xy y12
2y2 7x
5x2y 4x2
–7y 3x2y
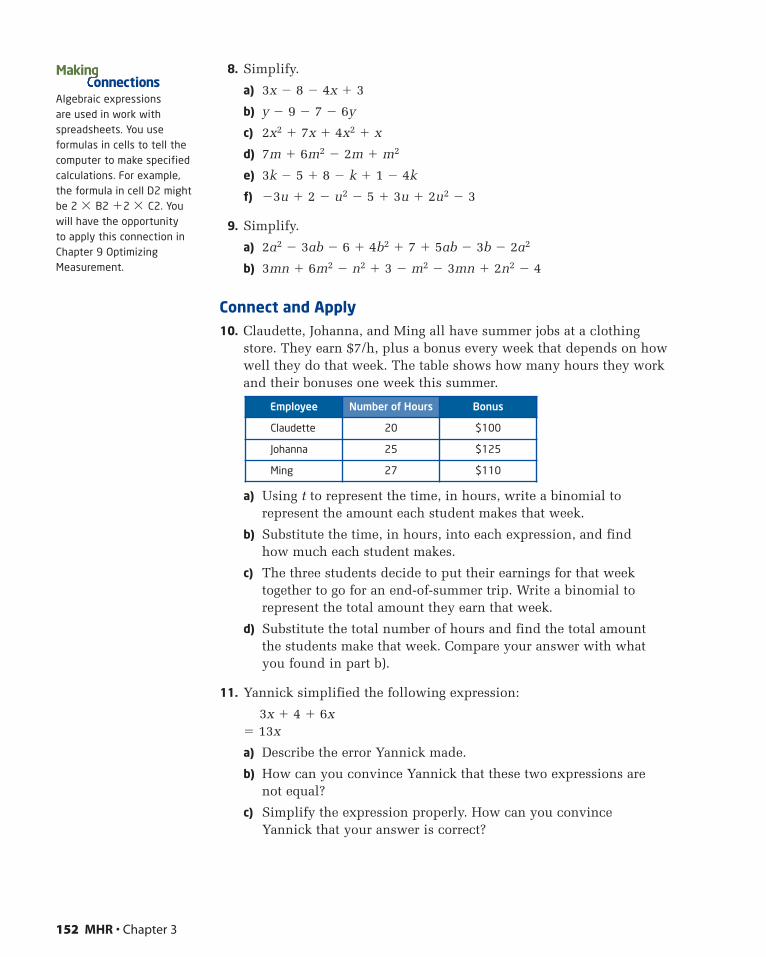
8. Simplify.
a) 3x � 8 � 4x � 3
b) y � 9 � 7 � 6y
c) 2x2 � 7x � 4x2 � x
d) 7m � 6m2 � 2m � m2
e) 3k � 5 � 8 � k � 1 � 4k
f) �3u � 2 � u2 � 5 � 3u � 2u2 � 3
9. Simplify.
a) 2a2 � 3ab � 6 � 4b2 � 7 � 5ab � 3b � 2a2
b) 3mn � 6m2 � n2 � 3 � m2 � 3mn � 2n2 � 4
Connect and Apply10. Claudette, Johanna, and Ming all have summer jobs at a clothing
store. They earn $7/h, plus a bonus every week that depends on howwell they do that week. The table shows how many hours they workand their bonuses one week this summer.
a) Using t to represent the time, in hours, write a binomial torepresent the amount each student makes that week.
b) Substitute the time, in hours, into each expression, and find how much each student makes.
c) The three students decide to put their earnings for that weektogether to go for an end-of-summer trip. Write a binomial torepresent the total amount they earn that week.
d) Substitute the total number of hours and find the total amount the students make that week. Compare your answer with whatyou found in part b).
11. Yannick simplified the following expression:
3x � 4 � 6x� 13x
a) Describe the error Yannick made.
b) How can you convince Yannick that these two expressions are not equal?
c) Simplify the expression properly. How can you convince Yannick that your answer is correct?
Employee Number of Hours Bonus
Claudette 20 $100
Johanna 25 $125
Ming 27 $110
152 MHR • Chapter 3
Algebraic expressions are used in work withspreadsheets. You useformulas in cells to tell thecomputer to make specifiedcalculations. For example,the formula in cell D2 mightbe 2 � B2 �2 � C2. Youwill have the opportunity to apply this connection inChapter 9 OptimizingMeasurement.
Makinonnections
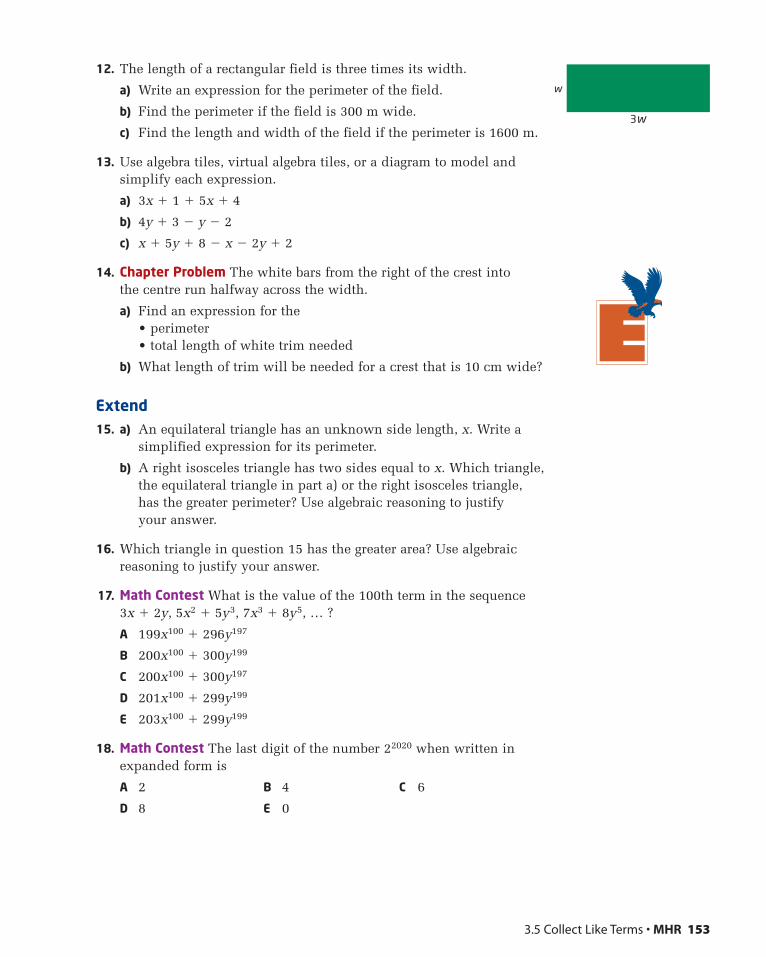
12. The length of a rectangular field is three times its width.
a) Write an expression for the perimeter of the field.
b) Find the perimeter if the field is 300 m wide.
c) Find the length and width of the field if the perimeter is 1600 m.
13. Use algebra tiles, virtual algebra tiles, or a diagram to model andsimplify each expression.
a) 3x � 1 � 5x � 4
b) 4y � 3 � y � 2
c) x � 5y � 8 � x � 2y � 2
14. Chapter Problem The white bars from the right of the crest into the centre run halfway across the width.
a) Find an expression for the• perimeter• total length of white trim needed
b) What length of trim will be needed for a crest that is 10 cm wide?
Extend15. a) An equilateral triangle has an unknown side length, x. Write a
simplified expression for its perimeter.
b) A right isosceles triangle has two sides equal to x. Which triangle,the equilateral triangle in part a) or the right isosceles triangle,has the greater perimeter? Use algebraic reasoning to justify your answer.
16. Which triangle in question 15 has the greater area? Use algebraicreasoning to justify your answer.
17. Math Contest What is the value of the 100th term in the sequence 3x � 2y, 5x2 � 5y3, 7x3 � 8y5, … ?
A 199x100 � 296y197
B 200x100 � 300y199
C 200x100 � 300y197
D 201x100 � 299y199
E 203x100 � 299y199
18. Math Contest The last digit of the number 22020 when written inexpanded form is
A 2 B 4 C 6
D 8 E 0
3.5 Collect Like Terms • MHR 153
w
3w
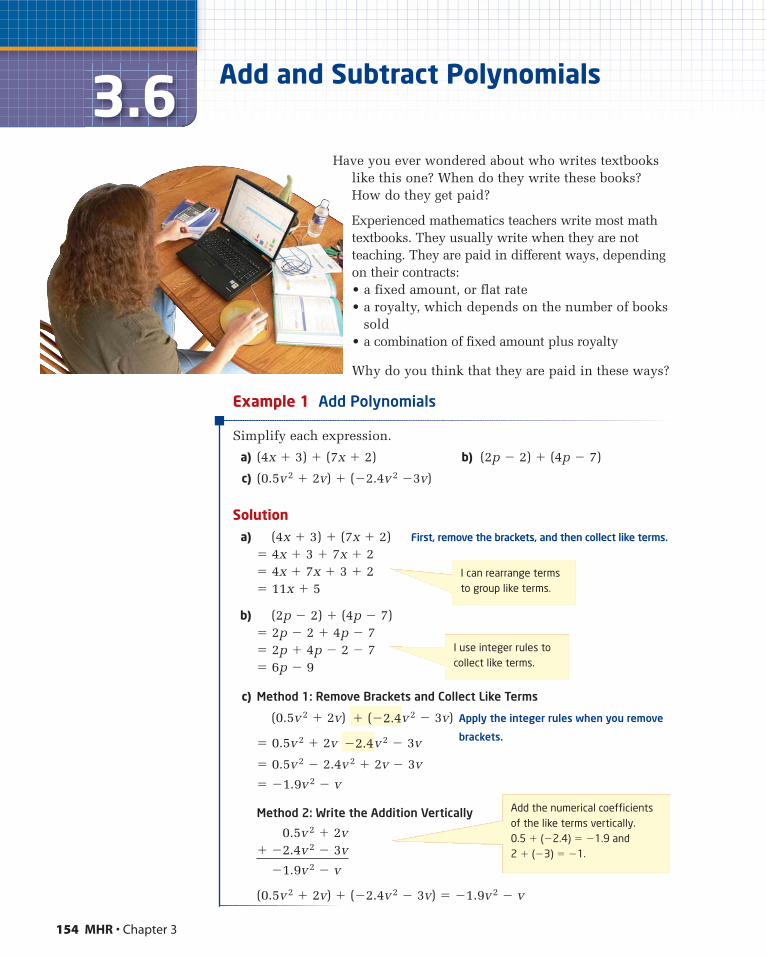
154 MHR • Chapter 3
3.6 Add and Subtract Polynomials
Have you ever wondered about who writes textbookslike this one? When do they write these books?How do they get paid?
Experienced mathematics teachers write most mathtextbooks. They usually write when they are notteaching. They are paid in different ways, dependingon their contracts:• a fixed amount, or flat rate• a royalty, which depends on the number of books
sold• a combination of fixed amount plus royalty
Why do you think that they are paid in these ways?
Example 1 Add Polynomials
Simplify each expression.
a) (4x � 3) � (7x � 2) b) (2p � 2) � (4p � 7)
c) (0.5v2 � 2v) � (�2.4v2 �3v)
Solutiona) (4x � 3) � (7x � 2) First, remove the brackets, and then collect like terms.
� 4x � 3 � 7x � 2� 4x � 7x � 3 � 2� 11x � 5
b) (2p � 2) � (4p � 7)� 2p � 2 � 4p � 7� 2p � 4p � 2 � 7� 6p � 9
c) Method 1: Remove Brackets and Collect Like Terms
(0.5v2 � 2v) v2 � 3v) Apply the integer rules when you remove
� 0.5v2 � 2v v2 � 3v brackets.
� 0.5v2 � 2.4v2 � 2v � 3v
� �1.9v2 � v
Method 2: Write the Addition Vertically
0.5v2 � 2v� �2.4v2 � 3v
�1.9v2 � v
(0.5v2 � 2v) � (�2.4v2 � 3v) � �1.9v2 � v
�2.4
� (�2.4
I can rearrange termsto group like terms.
I use integer rules tocollect like terms.
Add the numerical coefficientsof the like terms vertically.0.5 � (�2.4) � �1.9 and 2 � (�3) � �1.
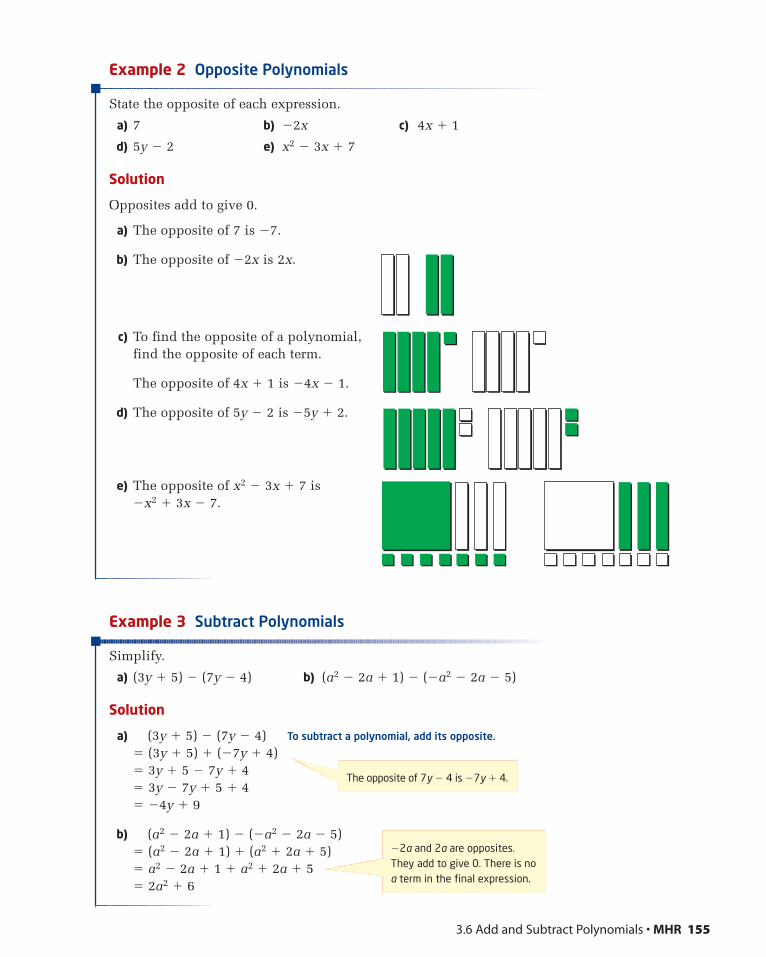
Example 2 Opposite Polynomials
State the opposite of each expression.
a) 7 b) �2x c) 4x � 1
d) 5y � 2 e) x2 � 3x � 7
Solution
Opposites add to give 0.
a) The opposite of 7 is �7.
b) The opposite of �2x is 2x.
c) To find the opposite of a polynomial,find the opposite of each term.
The opposite of 4x � 1 is �4x � 1.
d) The opposite of 5y � 2 is �5y � 2.
e) The opposite of x2 � 3x � 7 is �x2 � 3x � 7.
Example 3 Subtract Polynomials
Simplify.
a) (3y � 5) � (7y � 4) b) (a2 � 2a � 1) � (�a2 � 2a � 5)
Solution
a) (3y � 5) � (7y � 4) To subtract a polynomial, add its opposite.
� (3y � 5) � (�7y � 4)� 3y � 5 � 7y � 4� 3y � 7y � 5 � 4� �4y � 9
b) (a2 � 2a � 1) � (�a2 � 2a � 5)� (a2 � 2a � 1) � (a2 � 2a � 5)� a2 � 2a � 1 � a2 � 2a � 5� 2a2 � 6
3.6 Add and Subtract Polynomials • MHR 155
The opposite of 7y � 4 is �7y � 4.
�2a and 2a are opposites.They add to give 0. There is noa term in the final expression.

Example 4 Apply an Algebraic Model to Solve a Problem
Four authors team up to write a textbook. The publisher negotiates thefollowing contracts with them.
a) Write a simplified expression for the total payout to the authors.
b) Determine the total amount paid to the authors for 1200 books sold.
Solution
a) Write an expression for the total amount paid to each author.Then, add these expressions.
Lita: 2000Jamal: 1000 � 2nVera: 1500 � nFleming: 3n
Total payout:2000 � (1000 � 2n) � (1500 � n) � 3n
� 2000 � 1000 � 2n � 1500 � n � 3n� 4500 � 6n
The publisher will pay 4500 � 6n to the authors, where nis the number of books sold.
b) Substitute n � 1200 and evaluate the expression.
4500 � 6n� 4500 � 6(1200)� 4500 � 7200� 11 700
If 1200 books are sold, the publisher will pay $11 700 to theauthors.
Key Concepts� To add polynomials, remove brackets and collect like terms.
� To subtract a polynomial, add the opposite polynomial.
Author Fixed Rate ($) Royalty ($ per n books sold)
Lita 2000 —
Jamal 1000 2n
Vera 1500 n
Fleming — 3n
156 MHR • Chapter 3
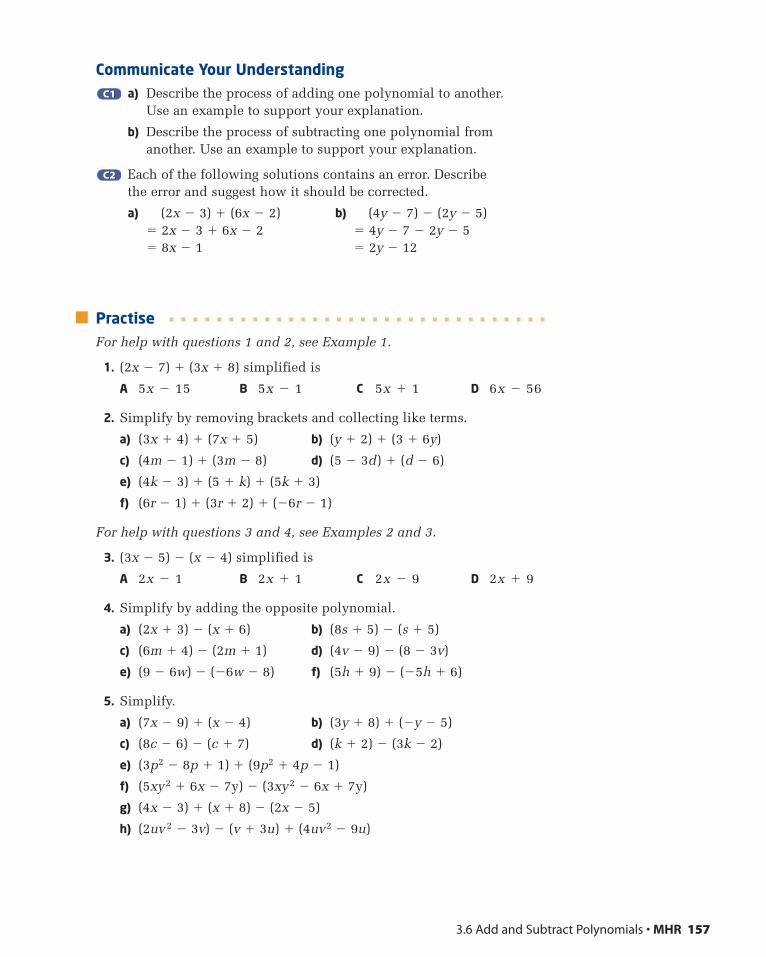
Communicate Your Understandinga) Describe the process of adding one polynomial to another.
Use an example to support your explanation.
b) Describe the process of subtracting one polynomial fromanother. Use an example to support your explanation.
Each of the following solutions contains an error. Describe the error and suggest how it should be corrected.
a) (2x � 3) � (6x � 2) b) (4y � 7) � (2y � 5)� 2x � 3 � 6x � 2 � 4y � 7 � 2y � 5� 8x � 1 � 2y � 12
PractiseFor help with questions 1 and 2, see Example 1.
1. (2x � 7) � (3x � 8) simplified is
A 5x � 15 B 5x � 1 C 5x � 1 D 6x � 56
2. Simplify by removing brackets and collecting like terms.
a) (3x � 4) � (7x � 5) b) (y � 2) � (3 � 6y)
c) (4m � 1) � (3m � 8) d) (5 � 3d) � (d � 6)
e) (4k � 3) � (5 � k) � (5k � 3)
f) (6r � 1) � (3r � 2) � (�6r � 1)
For help with questions 3 and 4, see Examples 2 and 3.
3. (3x � 5) � (x � 4) simplified is
A 2x � 1 B 2x � 1 C 2x � 9 D 2x � 9
4. Simplify by adding the opposite polynomial.
a) (2x � 3) � (x � 6) b) (8s � 5) � (s � 5)
c) (6m � 4) � (2m � 1) d) (4v � 9) � (8 � 3v)
e) (9 � 6w) � (�6w � 8) f) (5h � 9) � (�5h � 6)
5. Simplify.
a) (7x � 9) � (x � 4) b) (3y � 8) � (�y � 5)
c) (8c � 6) � (c � 7) d) (k � 2) � (3k � 2)
e) (3p2 � 8p � 1) � (9p2 � 4p � 1)
f) (5xy2 � 6x � 7y) � (3xy2 � 6x � 7y)
g) (4x � 3) � (x � 8) � (2x � 5)
h) (2uv2 � 3v) � (v � 3u) � (4uv2 � 9u)
C2C2
C1C1
3.6 Add and Subtract Polynomials • MHR 157
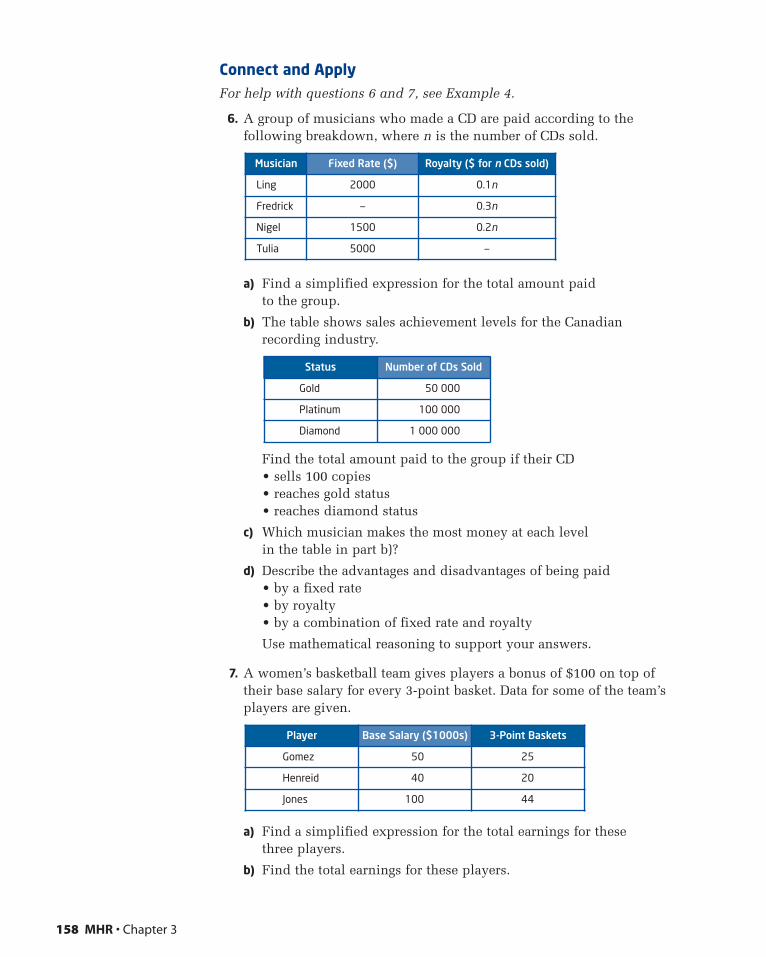
Connect and ApplyFor help with questions 6 and 7, see Example 4.
6. A group of musicians who made a CD are paid according to thefollowing breakdown, where n is the number of CDs sold.
a) Find a simplified expression for the total amount paid to the group.
b) The table shows sales achievement levels for the Canadianrecording industry.
Find the total amount paid to the group if their CD• sells 100 copies• reaches gold status• reaches diamond status
c) Which musician makes the most money at each level in the table in part b)?
d) Describe the advantages and disadvantages of being paid• by a fixed rate• by royalty• by a combination of fixed rate and royalty
Use mathematical reasoning to support your answers.
7. A women’s basketball team gives players a bonus of $100 on top oftheir base salary for every 3-point basket. Data for some of the team’splayers are given.
a) Find a simplified expression for the total earnings for these three players.
b) Find the total earnings for these players.
Player Base Salary ($1000s) 3-Point Baskets
Gomez 50 25
Henreid 40 20
Jones 100 44
Status Number of CDs Sold
Gold 50 000
Platinum 100 000
Diamond 1 000 000
Musician Fixed Rate ($) Royalty ($ for n CDs sold)
Ling 2000 0.1n
Fredrick — 0.3n
Nigel 1500 0.2n
Tulia 5000 —
158 MHR • Chapter 3
8. Use algebra tiles, virtual algebra tiles, or a diagram to model andsimplify each expression.
a) (2x � 5) � (3x � 2)
b) (y2 � 3y � 1) � (y2 � 2y � 2)
c) (2x2 � 3x � 4y2) � (2x2 � x � 2y2)
9. A swimming pool manufacturer installs rectangular pools whoselength is twice the width, plus 5 m.
a) Draw a diagram of the pool and label the width and length with algebraic expressions.
b) The entire outer edge of the pool must be fitted with coping,which is a cap used to join the wall of the pool and the deck.Find a simplified algebraic expression that describes the totallength of coping needed.
c) How much coping is required if the width of the pool is 6 m?
10. Refer to question 9.
a) Predict how the amount of coping will change if you double the width of the pool.
b) Calculate the new amount required and compare this with your prediction. Explain the results.
Extend11. Refer to question 9. If you use the same expressions for the length
and width of the pool as in question 9, do the proportions of thepool change when you change the width? Describe the relationshipsbetween width, length, and perimeter as you change the width. Usediagrams, words, and algebraic expressions to support yourexplanations.
12. Math Contest
a) Copy and complete the addition cascade.
b) Build your own addition cascade. Have another student completeit, and then verify each other’s work.
�8k � 4p
�4p � 3k
k � 2p
5k � 7p�3k � 11p
3.6 Add and Subtract Polynomials • MHR 159
Selecting ToolsRepresenting
Reasoning and Proving
Communicating
Connecting Reflecting
Problem Solving
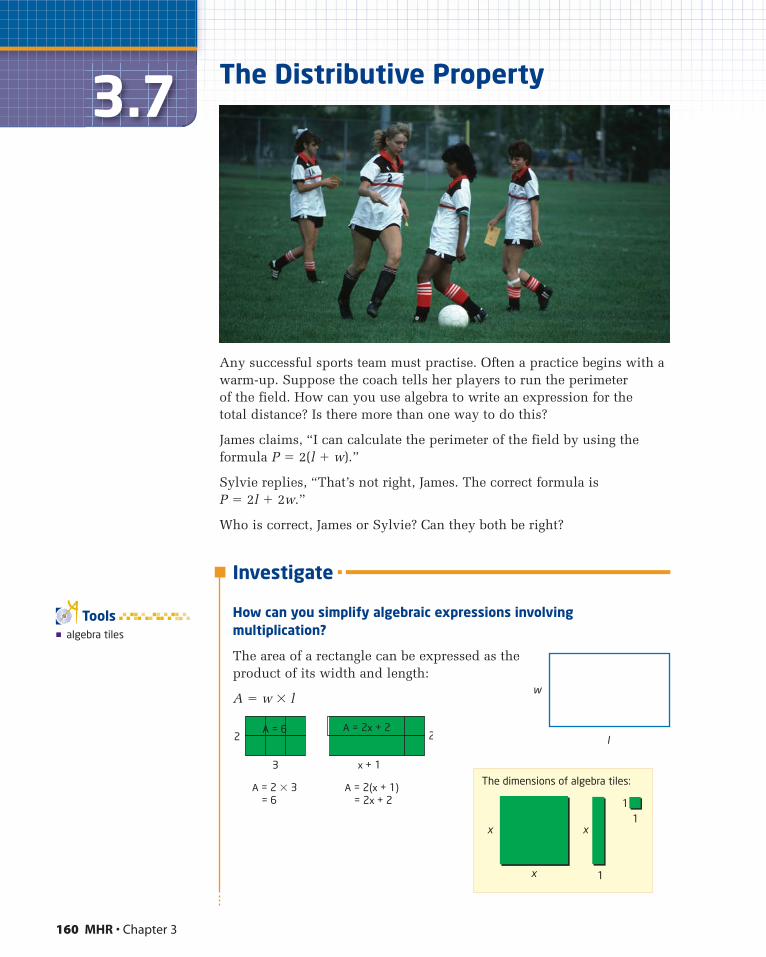
Investigate
How can you simplify algebraic expressions involvingmultiplication?
The area of a rectangle can be expressed as theproduct of its width and length:
A � w � l
160 MHR • Chapter 3
3.7 The Distributive Property
Any successful sports team must practise. Often a practice begins with awarm-up. Suppose the coach tells her players to run the perimeter of the field. How can you use algebra to write an expression for the total distance? Is there more than one way to do this?
James claims, “I can calculate the perimeter of the field by using theformula P � 2(l � w).”
Sylvie replies, “That’s not right, James. The correct formula is P � 2l � 2w.”
Who is correct, James or Sylvie? Can they both be right?
� algebra tiles
Tools
w
l2
A = 2 � 3 = 6
3
A = 62
A = 2(x + 1) = 2x + 2
A = 2x + 2
x + 1
The dimensions of algebra tiles:
x
x
x
1
11
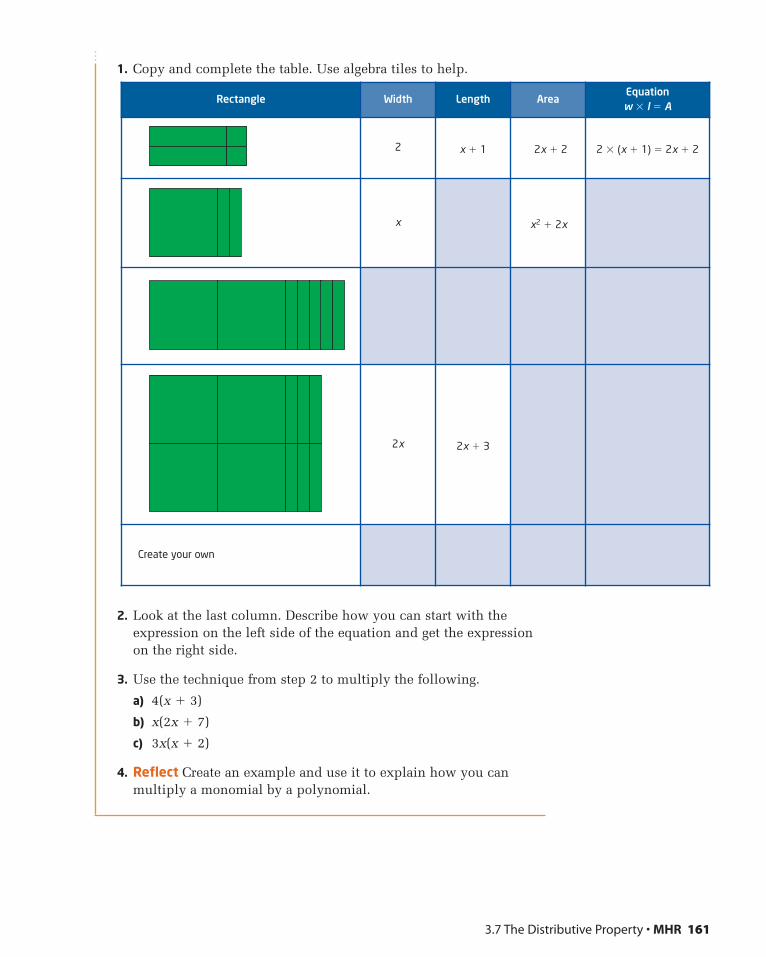
1. Copy and complete the table. Use algebra tiles to help.
2. Look at the last column. Describe how you can start with theexpression on the left side of the equation and get the expressionon the right side.
3. Use the technique from step 2 to multiply the following.
a) 4(x � 3)
b) x(2x � 7)
c) 3x(x � 2)
4. Reflect Create an example and use it to explain how you canmultiply a monomial by a polynomial.
3.7 The Distributive Property • MHR 161
Rectangle Width Length AreaEquationw � l � A
2 x � 1 2x � 2 2 � (x � 1) � 2x � 2
x x2 � 2x
2x 2x � 3
Create your own

Suppose that you have three dimes and three nickels.
The total amount can be expressed different ways:
3(10) � 3(5)� 30 � 15� 45
3(10 � 5)� 3(15)� 45
Whether you use 3(10) � 3(5) or 3(10 � 5), the result is 45¢. What does this tell you about these two numeric expressions?
Some algebraic expressions cannot be simplified using the secondmethod. Reflect on the situations when you cannot simplify anexpression. Suppose you add two nickels to a pile of nickels. The value of the nickels can be modelled by 5(x � 2), where x is the numberof nickels in the original pile.
5(x � 2)
You cannot add x � 2 because they are not like terms. However, you can multiply the 5 by both terms in the binomial:
5(x � 2)� 5(x) � 5(2)� 5x � 10
This is called the .
Example 1 Apply the Distributive Property
Expand.
a) 3(x � 2) b) �5(4m � 3)
c) (2y � 5)(�4) d) 2(5a2 � 7a � 2)
Solution
a) 3(x � 2)� 3(x) � 3(2)� 3x � 6
distributive property
162 MHR • Chapter 3
• a (x � y ) � ax � ay
distributive property
When you apply thedistributive property, you areexpanding an expression.
onnectionsLiterac
To apply the distributiveproperty, I need to multiply bothterms in the brackets by 3.
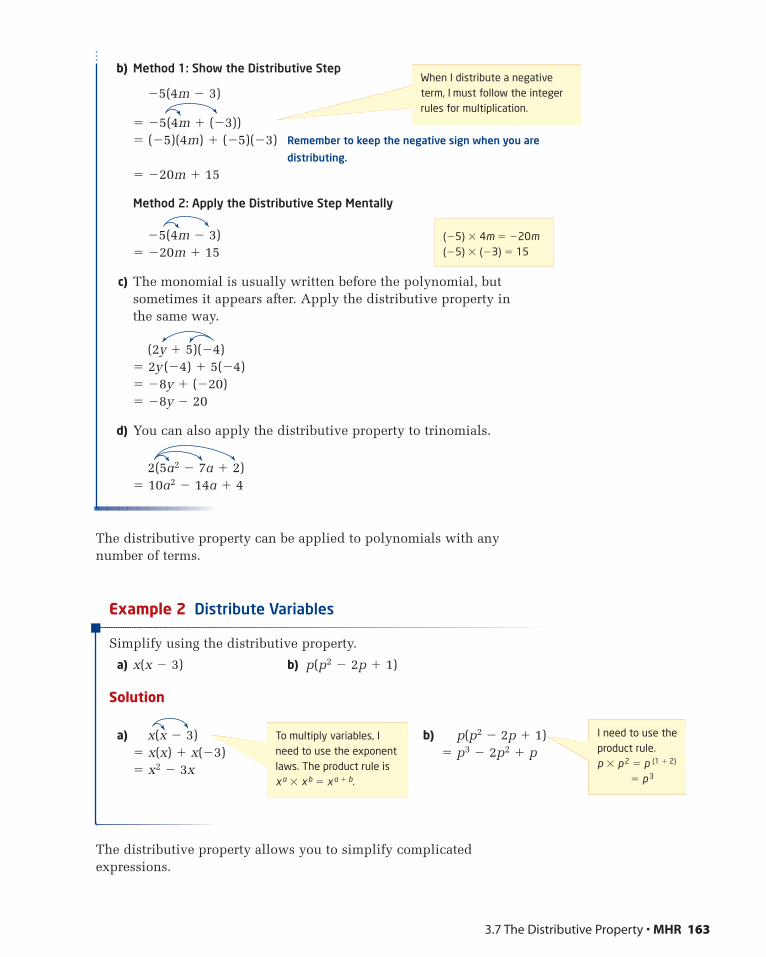
b) Method 1: Show the Distributive Step
�5(4m � 3)
� �5(4m � (�3))� (�5)(4m) � (�5)(�3) Remember to keep the negative sign when you are
distributing.
� �20m � 15
Method 2: Apply the Distributive Step Mentally
�5(4m � 3)� �20m � 15
c) The monomial is usually written before the polynomial, butsometimes it appears after. Apply the distributive property in the same way.
(2y � 5)(�4)� 2y (�4) � 5(�4)� �8y � (�20)� �8y � 20
d) You can also apply the distributive property to trinomials.
2(5a2 � 7a � 2)� 10a2 � 14a � 4
The distributive property can be applied to polynomials with anynumber of terms.
Example 2 Distribute Variables
Simplify using the distributive property.
a) x(x � 3) b) p(p2 � 2p � 1)
Solution
a) x(x � 3) b) p(p2 � 2p � 1)� x(x) � x(�3) � p3 � 2p2 � p� x2 � 3x
The distributive property allows you to simplify complicatedexpressions.
3.7 The Distributive Property • MHR 163
(�5) � 4m � �20m(�5) � (�3) � 15
To multiply variables, Ineed to use the exponentlaws. The product rule isx a � x b � x a � b.
When I distribute a negativeterm, I must follow the integerrules for multiplication.
I need to use theproduct rule. p � p 2 � p (1 � 2)
� p 3
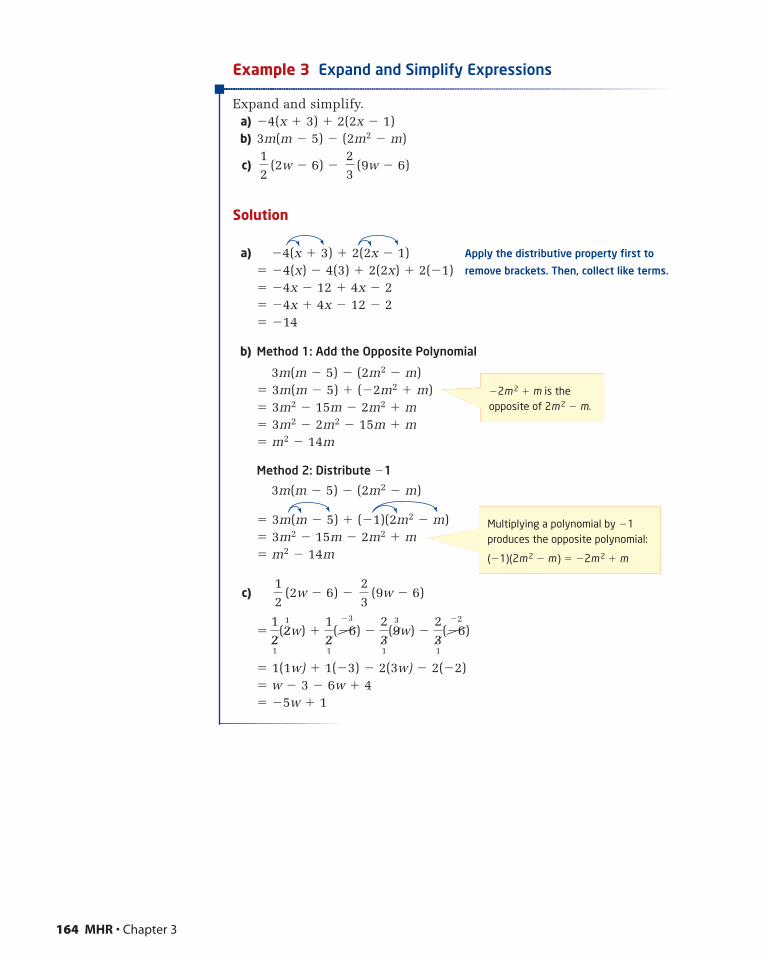
Example 3 Expand and Simplify Expressions
Expand and simplify.a) �4(x � 3) � 2(2x � 1)b) 3m(m � 5) � (2m2 � m)
c) (2w � 6) � (9w � 6)
Solution
a) �4(x � 3) � 2(2x � 1) Apply the distributive property first to
� �4(x) � 4(3) � 2(2x) � 2(�1) remove brackets. Then, collect like terms.
� �4x � 12 � 4x � 2� �4x � 4x � 12 � 2� �14
b) Method 1: Add the Opposite Polynomial
3m(m � 5) � (2m2 � m)� 3m(m � 5) � (�2m2 � m)� 3m2 � 15m � 2m2 � m� 3m2 � 2m2 � 15m � m� m2 � 14m
Method 2: Distribute �1
3m(m � 5) � (2m2 � m)
� 3m(m � 5) � (�1)(2m2 � m)� 3m2 � 15m � 2m2 � m� m2 � 14m
c) (2w � 6) � (9w � 6)
�
� 1(1w) � 1(�3) � 2(3w) � 2(�2)� w � 3 � 6w � 4� �5w � 1
121
(21w) �
121
(�6�3
) �231
(93w) �
231
(�6�2
)
23
12
23
12
164 MHR • Chapter 3
�2m 2 � m is theopposite of 2m 2 � m.
Multiplying a polynomial by �1produces the opposite polynomial:
(�1)(2m 2 � m ) � �2m 2 � m
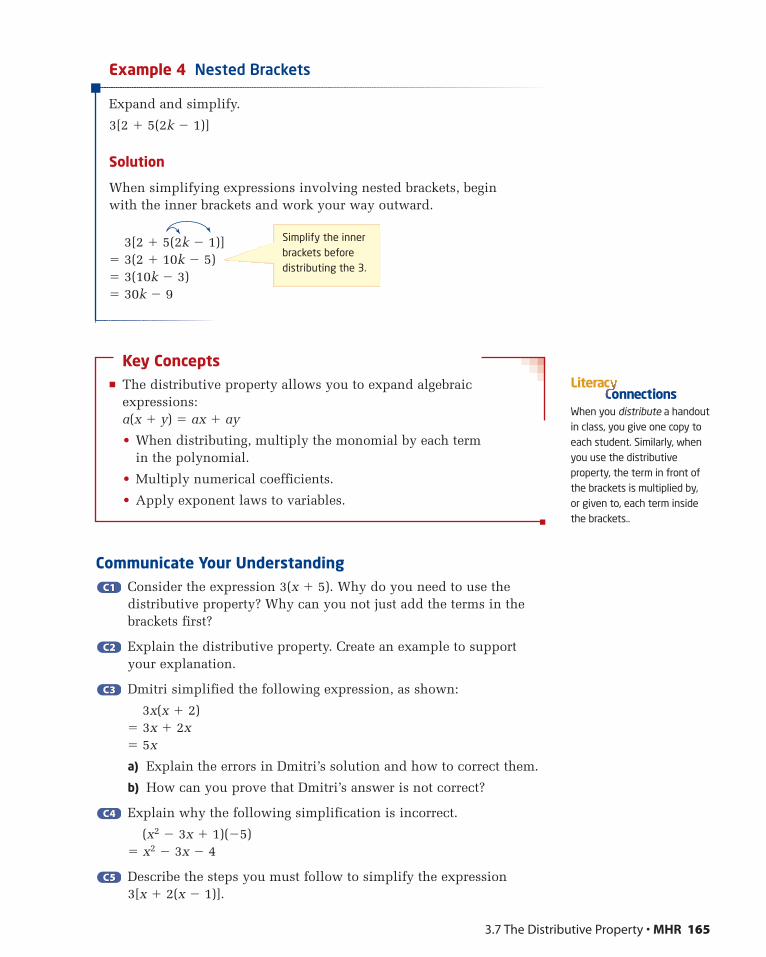
Example 4 Nested Brackets
Expand and simplify.
3[2 � 5(2k � 1)]
Solution
When simplifying expressions involving nested brackets, begin with the inner brackets and work your way outward.
3[2 � 5(2k � 1)]� 3(2 � 10k � 5)� 3(10k � 3)� 30k � 9
Key Concepts� The distributive property allows you to expand algebraic
expressions:a(x � y) � ax � ay
• When distributing, multiply the monomial by each term in the polynomial.
• Multiply numerical coefficients.
• Apply exponent laws to variables.
Communicate Your UnderstandingConsider the expression 3(x � 5). Why do you need to use thedistributive property? Why can you not just add the terms in thebrackets first?
Explain the distributive property. Create an example to supportyour explanation.
Dmitri simplified the following expression, as shown:
3x(x � 2)� 3x � 2x� 5x
a) Explain the errors in Dmitri’s solution and how to correct them.
b) How can you prove that Dmitri’s answer is not correct?
Explain why the following simplification is incorrect.
(x2 � 3x � 1)(�5) � x2 � 3x � 4
Describe the steps you must follow to simplify the expression 3[x � 2(x � 1)].
C5C5
C4C4
C3C3
C2C2
C1C1
3.7 The Distributive Property • MHR 165
Simplify the innerbrackets beforedistributing the 3.
When you distribute a handoutin class, you give one copy toeach student. Similarly, whenyou use the distributiveproperty, the term in front ofthe brackets is multiplied by, or given to, each term insidethe brackets..
onnectionsLiterac
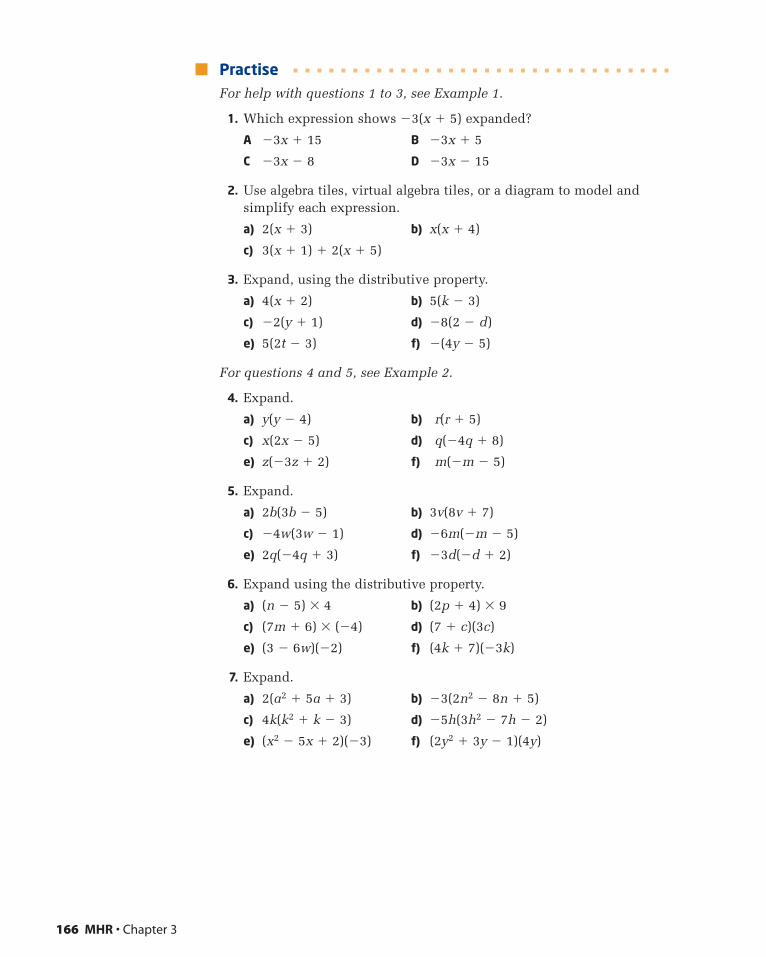
PractiseFor help with questions 1 to 3, see Example 1.
1. Which expression shows �3(x � 5) expanded?
A �3x � 15 B �3x � 5
C �3x � 8 D �3x � 15
2. Use algebra tiles, virtual algebra tiles, or a diagram to model andsimplify each expression.
a) 2(x � 3) b) x(x � 4)
c) 3(x � 1) � 2(x � 5)
3. Expand, using the distributive property.
a) 4(x � 2) b) 5(k � 3)
c) �2(y � 1) d) �8(2 � d)
e) 5(2t � 3) f) �(4y � 5)
For questions 4 and 5, see Example 2.
4. Expand.
a) y(y � 4) b) r(r � 5)
c) x(2x � 5) d) q(�4q � 8)
e) z(�3z � 2) f) m(�m � 5)
5. Expand.
a) 2b(3b � 5) b) 3v(8v � 7)
c) �4w(3w � 1) d) �6m(�m � 5)
e) 2q(�4q � 3) f) �3d(�d � 2)
6. Expand using the distributive property.
a) (n � 5) � 4 b) (2p � 4) � 9
c) (7m � 6) � (�4) d) (7 � c)(3c)
e) (3 � 6w)(�2) f) (4k � 7)(�3k)
7. Expand.
a) 2(a2 � 5a � 3) b) �3(2n2 � 8n � 5)
c) 4k(k2 � k � 3) d) �5h(3h2 � 7h � 2)
e) (x2 � 5x � 2)(�3) f) (2y2 � 3y � 1)(4y)
166 MHR • Chapter 3
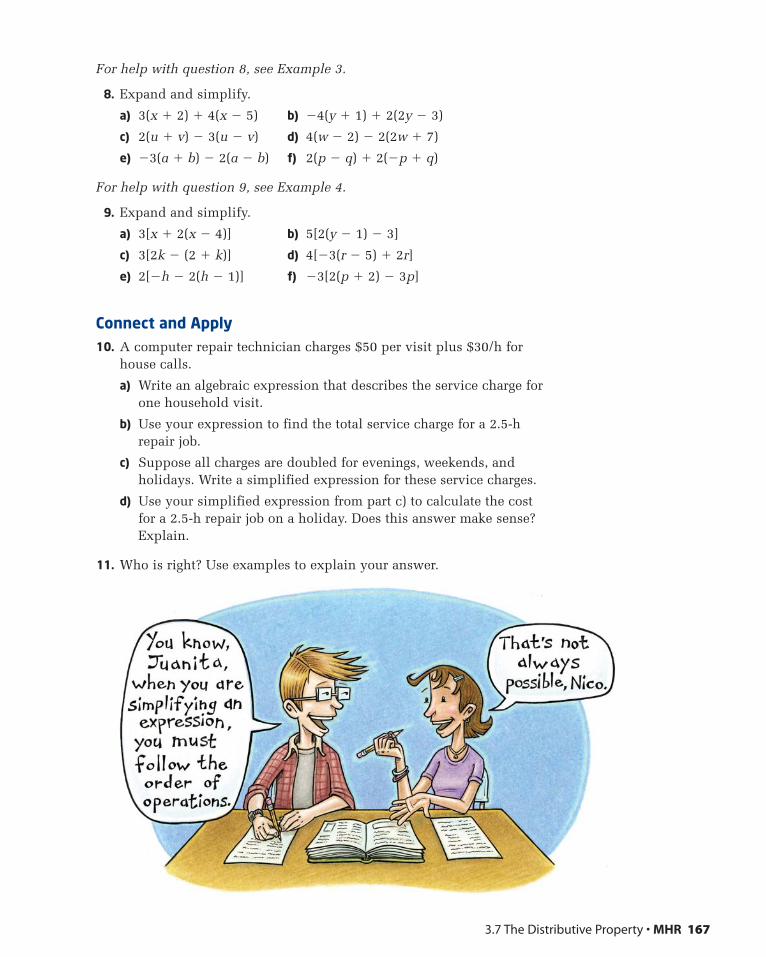
For help with question 8, see Example 3.
8. Expand and simplify.
a) 3(x � 2) � 4(x � 5) b) �4(y � 1) � 2(2y � 3)
c) 2(u � v) � 3(u � v) d) 4(w � 2) � 2(2w � 7)
e) �3(a � b) � 2(a � b) f) 2(p � q) � 2(�p � q)
For help with question 9, see Example 4.
9. Expand and simplify.
a) 3[x � 2(x � 4)] b) 5[2(y � 1) � 3]
c) 3[2k � (2 � k)] d) 4[�3(r � 5) � 2r]
e) 2[�h � 2(h � 1)] f) �3[2(p � 2) � 3p]
Connect and Apply10. A computer repair technician charges $50 per visit plus $30/h for
house calls.
a) Write an algebraic expression that describes the service charge forone household visit.
b) Use your expression to find the total service charge for a 2.5-hrepair job.
c) Suppose all charges are doubled for evenings, weekends, andholidays. Write a simplified expression for these service charges.
d) Use your simplified expression from part c) to calculate the costfor a 2.5-h repair job on a holiday. Does this answer make sense?Explain.
11. Who is right? Use examples to explain your answer.
3.7 The Distributive Property • MHR 167
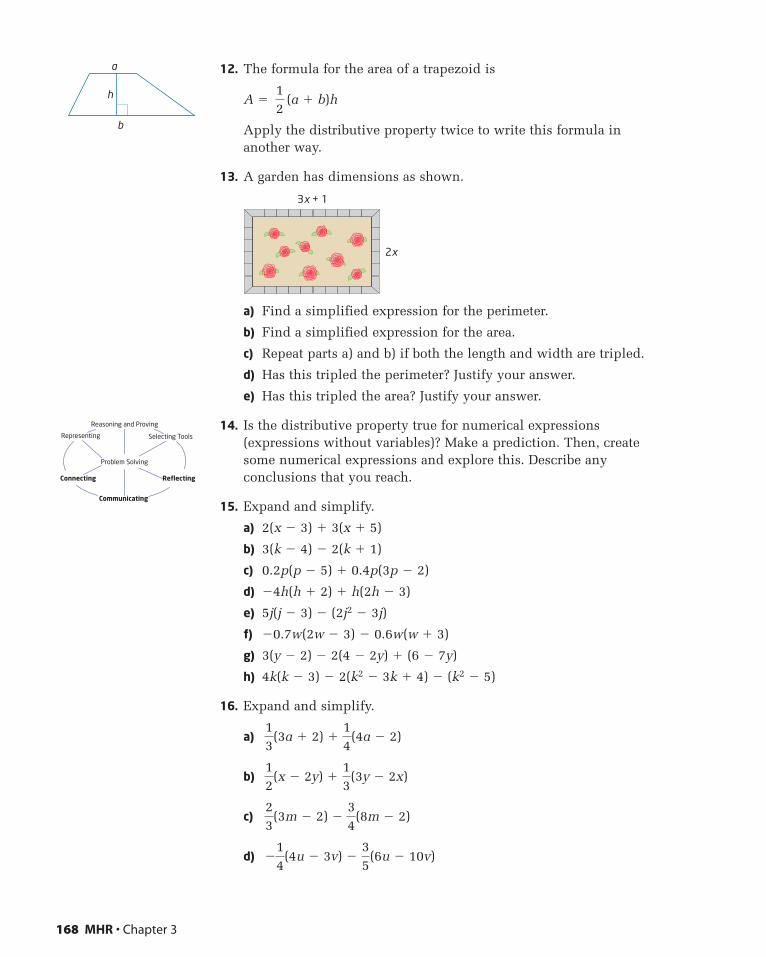
12. The formula for the area of a trapezoid is
A � (a � b)h
Apply the distributive property twice to write this formula inanother way.
13. A garden has dimensions as shown.
a) Find a simplified expression for the perimeter.
b) Find a simplified expression for the area.
c) Repeat parts a) and b) if both the length and width are tripled.
d) Has this tripled the perimeter? Justify your answer.
e) Has this tripled the area? Justify your answer.
14. Is the distributive property true for numerical expressions(expressions without variables)? Make a prediction. Then, createsome numerical expressions and explore this. Describe anyconclusions that you reach.
15. Expand and simplify.
a) 2(x � 3) � 3(x � 5)
b) 3(k � 4) � 2(k � 1)
c) 0.2p(p � 5) � 0.4p(3p � 2)
d) �4h(h � 2) � h(2h � 3)
e) 5j(j � 3) � (2j2 � 3j)
f) �0.7w(2w � 3) � 0.6w(w � 3)
g) 3(y � 2) � 2(4 � 2y) � (6 � 7y)
h) 4k(k � 3) � 2(k2 � 3k � 4) � (k2 � 5)
16. Expand and simplify.
a)
b)
c)
d) �14
(4u � 3v) �35
(6u � 10v)
23
(3m � 2) �34
(8m � 2)
12
(x � 2y) �13
(3y � 2x)
13
(3a � 2) �14
(4a � 2)
3x + 1
2x
12
168 MHR • Chapter 3
h
a
b
Selecting ToolsRepresenting
Reasoning and Proving
Communicating
Connecting Reflecting
Problem Solving

Achievement Check
17. a) Find a simplified expression for the perimeter of each figure. Use algebra tiles if you wish.
b) A rectangle has length 2x � 1 and width 8 � 2x. What is unusualabout the perimeter?
c) For what value of x is the rectangle in part b) also a square?
Extend18. Expand and simplify.
a) 2m[m � 3(m � 2)]
b) �3p[2p(p � 4) � p2]
c) 2[3 � 2(x � 6)] � 3[�2(x � 5) � 8]
d) �3[2 � (y � 5)] � 4[3(y � 1) � (6 � y)(�2)]
19. How do you distribute a binomial? Consider the following product of two binomials:
(x � 3)(2x � 2)
Distribute the (x � 3) to each term in the second binomial to form an expression consisting of two products:
(x � 3)(2x) � (x � 3)(�2)
a) Simplify this expression. Check to see that your result appears tobe equivalent to the original expression, by substituting valuesinto both expressions.
b) Make up your own question similar to this and simplify it.
c) Can you see an easier way to expand the product of twobinomials? Find and explain an easier method.
20. Expand and simplify. Check to see if your result is correct. If you need a hint, look at the method from question 19.
(k � 1)(k2 � 2k � 1)
21. Math Contest If � 0.015 625, determine the value of x.a12bx
3.7 The Distributive Property • MHR 169
x 2x �1
2x + 32x + 1
x3x + 12x � 1
2x + 120 � 4x
3w � 2
2w +3
You will multiply binomials ingrade 10 and beyond as amethod of simplifyingpolynomial expressions.
Makinonnections
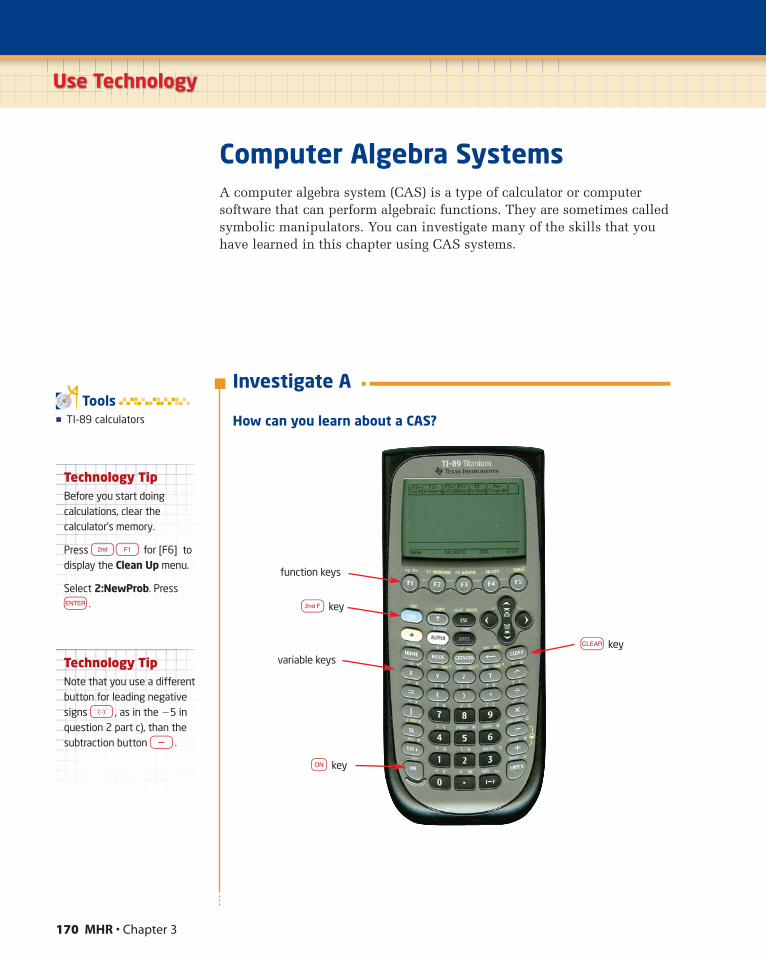
170 MHR • Chapter 3
Computer Algebra SystemsA computer algebra system (CAS) is a type of calculator or computersoftware that can perform algebraic functions. They are sometimes calledsymbolic manipulators. You can investigate many of the skills that youhave learned in this chapter using CAS systems.
Investigate A
How can you learn about a CAS?
Use Technology
� TI-89 calculators
Tools
Technology TipBefore you start doingcalculations, clear thecalculator’s memory.
Press n¡ for [F6] todisplay the Clean Up menu.
Select 2:NewProb. Presse.
Technology TipNote that you use a differentbutton for leading negativesigns –, as in the �5 inquestion 2 part c), than thesubtraction button -.
o key
N key
b key
function keys
variable keys

Use Technology: Computer Algebra Systems • MHR 171
1. Press the o key to turnthe calculator on. If youdo not see the Homescreen, as shown, pressthe ÍHOME key.
2. Perform some basic calculations to get familiar with thekeyboard and display. Follow the keystrokes shown.
a) 3(6 � 4)5
3 *(6 - 4 )^5 e
b) � (2.5)2
n^*2.5 ^2 e
c) �5 �
–5 -n*9 )e
3. Explore the Function keys at the top of the keypad.
a) Press ¡ to see the TI-89 Tools menu. Identify atleast three commands that you recognize fromworking on a computer. Use the up and down cursorkeys to see more commands.
b) Press ™ to see the algebra functions that the TI-89can perform. Identify two commands that yourecognize from this chapter and two that you do notrecognize.
c) You can also use the left and right cursor keys to see thedifferent function menus. Scroll over to see the menus of F3and F4. You will learn about these functions in futuremathematics courses.
d) Clean up the home screen:• Press n [F6] to display the Clean Up menu.• Select 2:NewProb.• Press e.
29
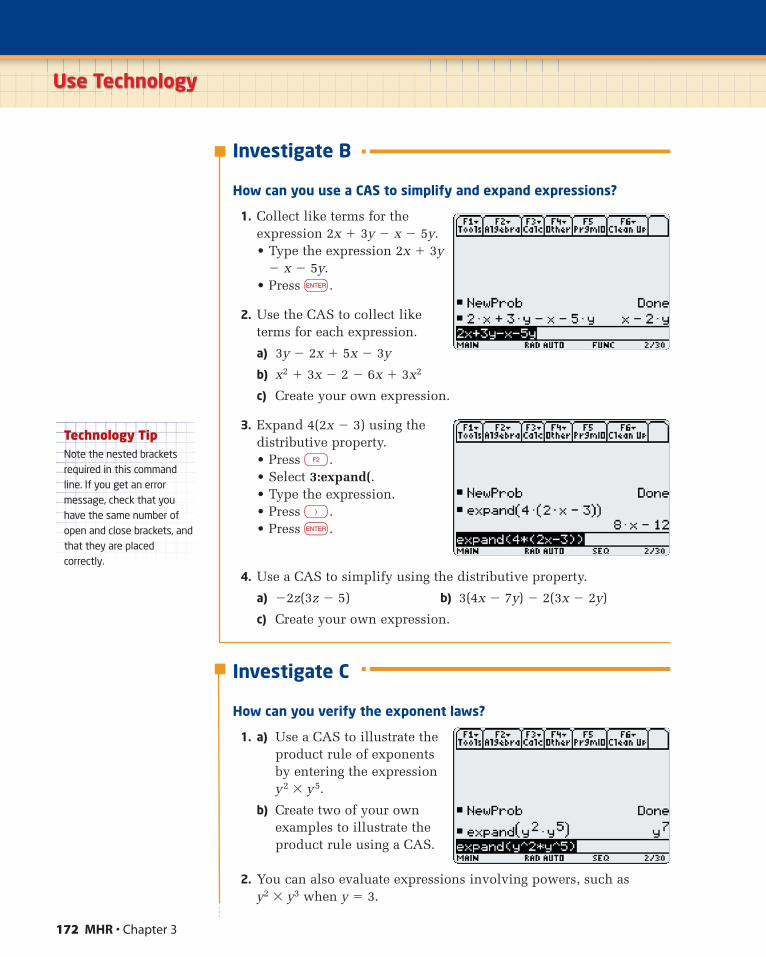
172 MHR • Chapter 3
Investigate B
How can you use a CAS to simplify and expand expressions?
1. Collect like terms for theexpression 2x � 3y � x � 5y.• Type the expression 2x � 3y
� x � 5y.• Press e.
2. Use the CAS to collect liketerms for each expression.
a) 3y � 2x � 5x � 3y
b) x2 � 3x � 2 � 6x � 3x2
c) Create your own expression.
3. Expand 4(2x � 3) using thedistributive property.• Press ™.• Select 3:expand(.• Type the expression.• Press ).• Press e.
4. Use a CAS to simplify using the distributive property.
a) �2z(3z � 5) b) 3(4x � 7y) � 2(3x � 2y)
c) Create your own expression.
Investigate C
How can you verify the exponent laws?
1. a) Use a CAS to illustrate theproduct rule of exponentsby entering the expressiony2 � y5.
b) Create two of your ownexamples to illustrate theproduct rule using a CAS.
2. You can also evaluate expressions involving powers, such as y2 � y3 when y � 3.
Use Technology
Technology TipNote the nested bracketsrequired in this commandline. If you get an errormessage, check that youhave the same number ofopen and close brackets, andthat they are placedcorrectly.

Use Technology: Computer Algebra Systems • MHR 173
Press ÍY ^ 2 * ÍY ^ 3 Í| ÍY = 3.
Use this feature to evaluate
a) y3 � y4 when y � 4 b) when z � �5
c) when x �
3. Design your own method for verifying either the quotient rule orthe power of a power rule for exponents. Describe your steps,keystrokes, and screen outputs.
Investigate D
How can you explore an unknown function?
Many of the functions of the CAS will be unknown to you at this level.Several of them you will learn about in future mathematics courses,but in this section you will have the opportunity to experiment andlearn a little about some of these “mystery” functions.
1. a) Clear the home screen. Press n¡ for [F6] to display theClean Up menu. Select 2:NewProb and press e.
b) Use the Expand command to simplify the expression 3(x � 4).
c) Factor the result:• Press ™.• Select 2:Factor(.• Type 3x � 12.• Press ).• Press e.
d) Write down the result. What do you notice?
2. Repeat step 1 for each expression.a) y(2y � 3) b) 5z(2z � 1)
3. Explain what the Factor command seems to do. How does it seemto be related to the Expand command?
4. a) Repeat step 1 for the expression 2(2x � 6).
b) Is the factored result what you expected? Explain.
c) Create a few examples of your own. Describe what you discover.
5. Explore some of the unknown features of the TI-89. Try to figureout what one of them does. Write a brief report of your findings.
23
x4 � x7
x5
z8
z5
What does the Factorfunction do?
You will learn about factoringin grade 10.
Makinonnections
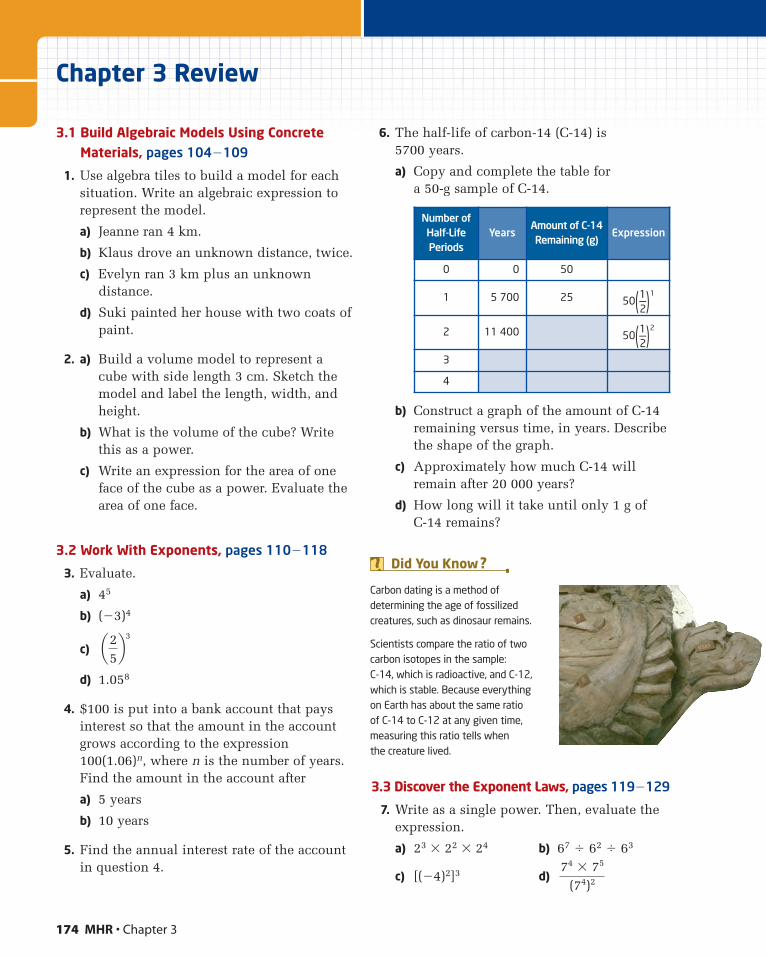
174 MHR • Chapter 3
Chapter 3 Review
3.1 Build Algebraic Models Using ConcreteMaterials, pages 104�109
1. Use algebra tiles to build a model for eachsituation. Write an algebraic expression torepresent the model.
a) Jeanne ran 4 km.
b) Klaus drove an unknown distance, twice.
c) Evelyn ran 3 km plus an unknowndistance.
d) Suki painted her house with two coats ofpaint.
2. a) Build a volume model to represent acube with side length 3 cm. Sketch themodel and label the length, width, andheight.
b) What is the volume of the cube? Writethis as a power.
c) Write an expression for the area of oneface of the cube as a power. Evaluate thearea of one face.
3.2 Work With Exponents, pages 110�118
3. Evaluate.
a) 45
b) (�3)4
c)
d) 1.058
4. $100 is put into a bank account that paysinterest so that the amount in the accountgrows according to the expression100(1.06)n, where n is the number of years.Find the amount in the account after
a) 5 years
b) 10 years
5. Find the annual interest rate of the accountin question 4.
6. The half-life of carbon-14 (C-14) is 5700 years.
a) Copy and complete the table for a 50-g sample of C-14.
b) Construct a graph of the amount of C-14remaining versus time, in years. Describethe shape of the graph.
c) Approximately how much C-14 willremain after 20 000 years?
d) How long will it take until only 1 g of C-14 remains?
3.3 Discover the Exponent Laws, pages 119�129
7. Write as a single power. Then, evaluate theexpression.
a) 23 � 22 � 24 b) 67 � 62 � 63
c) [(�4)2]3 d)74 � 75
(74)2
a25b3
Number of Half-Life Periods
YearsAmount of C-14Remaining (g)
Expression
0 0 50
1 5 700 25 50(1—2)1
2 11 400 50(1—2)2
3
4
Carbon dating is a method ofdetermining the age of fossilizedcreatures, such as dinosaur remains.
Scientists compare the ratio of twocarbon isotopes in the sample: C-14, which is radioactive, and C-12,which is stable. Because everythingon Earth has about the same ratio of C-14 to C-12 at any given time,measuring this ratio tells when the creature lived.
Did You Know ?
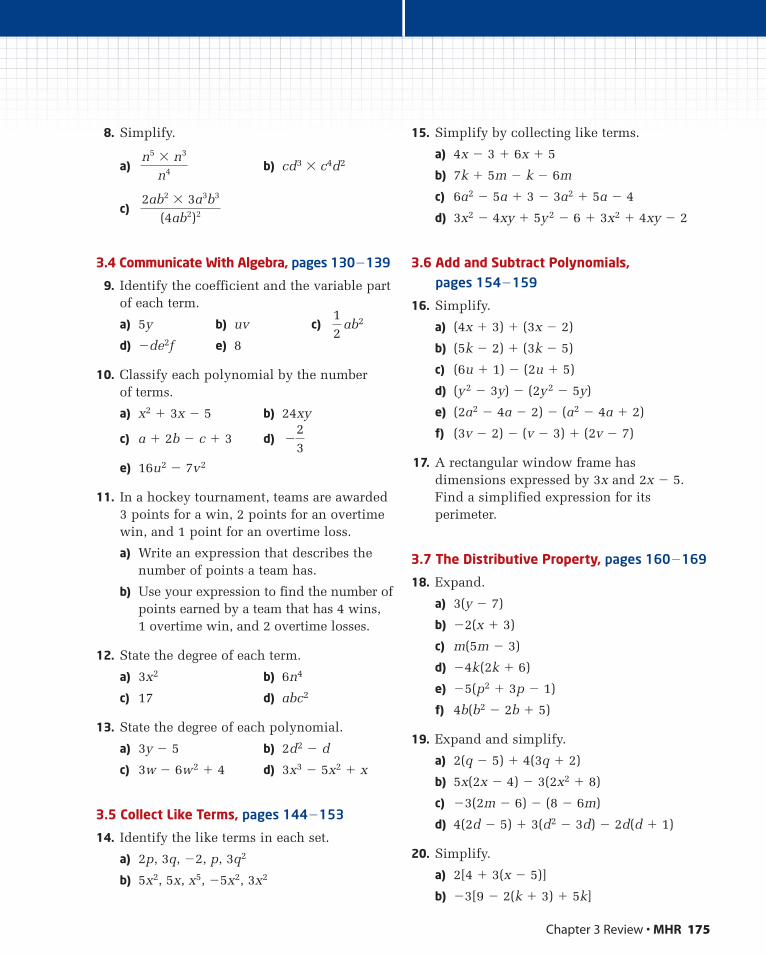
Chapter 3 Review • MHR 175
8. Simplify.
a) b) cd3 � c4d2
c)
3.4 Communicate With Algebra, pages 130�139
9. Identify the coefficient and the variable partof each term.
a) 5y b) uv c) ab2
d) �de2f e) 8
10. Classify each polynomial by the number of terms.
a) x2 � 3x � 5 b) 24xy
c) a � 2b � c � 3 d)
e) 16u2 � 7v2
11. In a hockey tournament, teams are awarded3 points for a win, 2 points for an overtimewin, and 1 point for an overtime loss.
a) Write an expression that describes thenumber of points a team has.
b) Use your expression to find the number ofpoints earned by a team that has 4 wins, 1 overtime win, and 2 overtime losses.
12. State the degree of each term.
a) 3x2 b) 6n4
c) 17 d) abc2
13. State the degree of each polynomial.
a) 3y � 5 b) 2d2 � d
c) 3w � 6w2 � 4 d) 3x3 � 5x2 � x
3.5 Collect Like Terms, pages 144�153
14. Identify the like terms in each set.
a) 2p, 3q, �2, p, 3q2
b) 5x2, 5x, x5, �5x2, 3x2
15. Simplify by collecting like terms.
a) 4x � 3 � 6x � 5
b) 7k � 5m � k � 6m
c) 6a2 � 5a � 3 � 3a2 � 5a � 4
d) 3x2 � 4xy � 5y2 � 6 � 3x2 � 4xy � 2
3.6 Add and Subtract Polynomials, pages 154�159
16. Simplify.
a) (4x � 3) � (3x � 2)
b) (5k � 2) � (3k � 5)
c) (6u � 1) � (2u � 5)
d) (y2 � 3y) � (2y2 � 5y)
e) (2a2 � 4a � 2) � (a2 � 4a � 2)
f) (3v � 2) � (v � 3) � (2v � 7)
17. A rectangular window frame hasdimensions expressed by 3x and 2x � 5.Find a simplified expression for itsperimeter.
3.7 The Distributive Property, pages 160�169
18. Expand.
a) 3(y � 7)
b) �2(x � 3)
c) m(5m � 3)
d) �4k(2k � 6)
e) �5(p2 � 3p � 1)
f) 4b(b2 � 2b � 5)
19. Expand and simplify.
a) 2(q � 5) � 4(3q � 2)
b) 5x(2x � 4) � 3(2x2 � 8)
c) �3(2m � 6) � (8 � 6m)
d) 4(2d � 5) � 3(d2 � 3d) � 2d(d � 1)
20. Simplify.
a) 2[4 � 3(x � 5)]
b) �3[9 � 2(k � 3) � 5k]
�23
12
2ab2 � 3a3b3
(4ab2)2
n5 � n3
n4
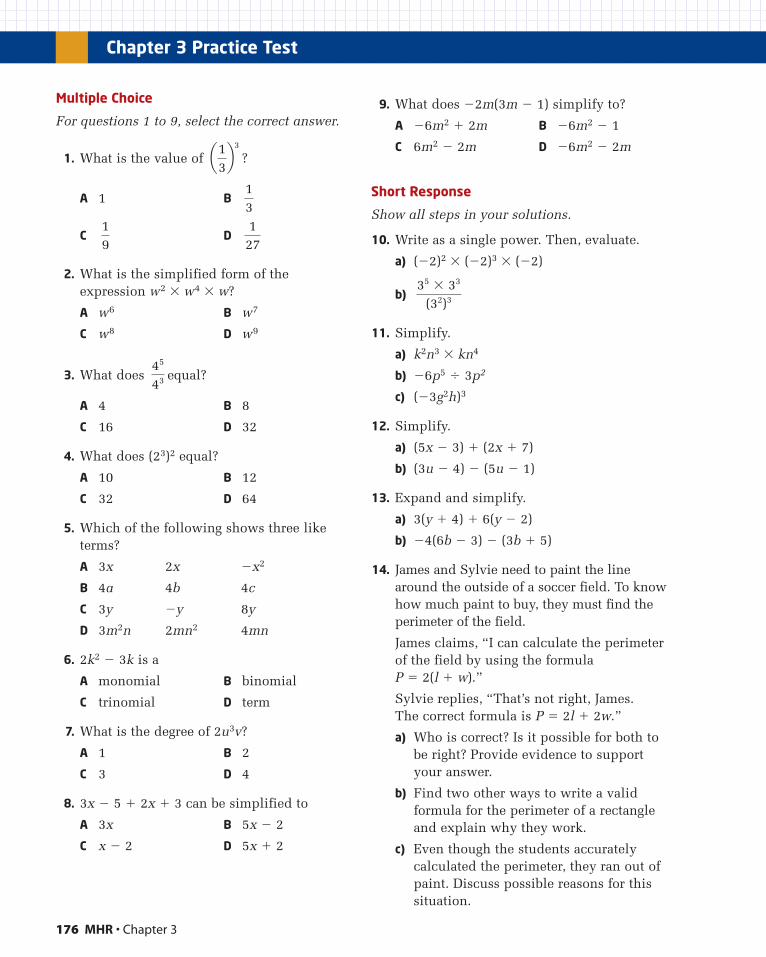
176 MHR • Chapter 3
Multiple Choice
For questions 1 to 9, select the correct answer.
1. What is the value of ?
A 1 B
C D
2. What is the simplified form of theexpression w2 � w4 � w?
A w6 B w7
C w8 D w9
3. What does equal?
A 4 B 8
C 16 D 32
4. What does (23)2 equal?
A 10 B 12
C 32 D 64
5. Which of the following shows three liketerms?
A 3x 2x �x2
B 4a 4b 4c
C 3y �y 8y
D 3m2n 2mn2 4mn
6. 2k2 � 3k is a
A monomial B binomial
C trinomial D term
7. What is the degree of 2u3v?
A 1 B 2
C 3 D 4
8. 3x � 5 � 2x � 3 can be simplified to
A 3x B 5x � 2
C x � 2 D 5x � 2
9. What does �2m(3m � 1) simplify to?
A �6m2 � 2m B �6m2 � 1
C 6m2 � 2m D �6m2 � 2m
Short Response
Show all steps in your solutions.
10. Write as a single power. Then, evaluate.
a) (�2)2 � (�2)3 � (�2)
b)
11. Simplify.
a) k2n3 � kn4
b) �6p5 � 3p2
c) (�3g2h)3
12. Simplify.
a) (5x � 3) � (2x � 7)
b) (3u � 4) � (5u � 1)
13. Expand and simplify.
a) 3(y � 4) � 6(y � 2)
b) �4(6b � 3) � (3b � 5)
14. James and Sylvie need to paint the linearound the outside of a soccer field. To knowhow much paint to buy, they must find theperimeter of the field.
James claims, “I can calculate the perimeterof the field by using the formula P � 2(l � w).”
Sylvie replies, “That’s not right, James. The correct formula is P � 2l � 2w.”
a) Who is correct? Is it possible for both tobe right? Provide evidence to supportyour answer.
b) Find two other ways to write a validformula for the perimeter of a rectangleand explain why they work.
c) Even though the students accuratelycalculated the perimeter, they ran out ofpaint. Discuss possible reasons for thissituation.
35 � 33
(32)3
45
43
127
19
13
a13b3
Chapter 3 Practice Test
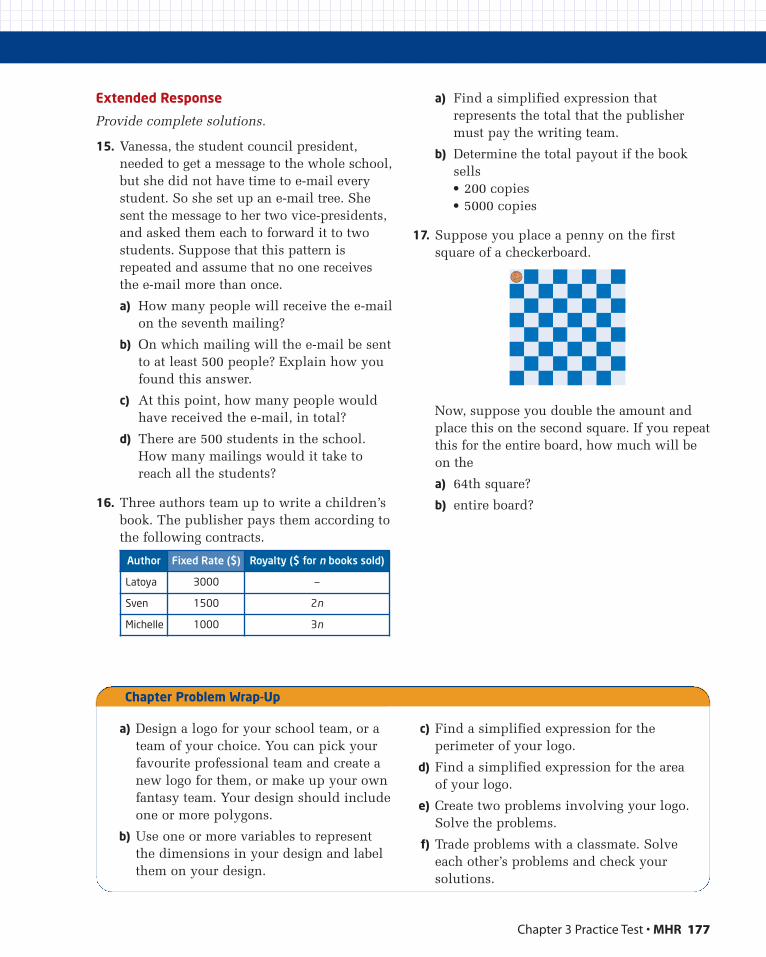
Chapter 3 Practice Test • MHR 177
Extended Response
Provide complete solutions.
15. Vanessa, the student council president,needed to get a message to the whole school,but she did not have time to e-mail everystudent. So she set up an e-mail tree. Shesent the message to her two vice-presidents,and asked them each to forward it to twostudents. Suppose that this pattern isrepeated and assume that no one receivesthe e-mail more than once.
a) How many people will receive the e-mailon the seventh mailing?
b) On which mailing will the e-mail be sentto at least 500 people? Explain how youfound this answer.
c) At this point, how many people wouldhave received the e-mail, in total?
d) There are 500 students in the school.How many mailings would it take toreach all the students?
16. Three authors team up to write a children’sbook. The publisher pays them according tothe following contracts.
a) Find a simplified expression thatrepresents the total that the publishermust pay the writing team.
b) Determine the total payout if the booksells• 200 copies• 5000 copies
17. Suppose you place a penny on the firstsquare of a checkerboard.
Now, suppose you double the amount andplace this on the second square. If you repeatthis for the entire board, how much will beon the
a) 64th square?
b) entire board?
Author Fixed Rate ($) Royalty ($ for n books sold)
Latoya 3000 —
Sven 1500 2n
Michelle 1000 3n
a) Design a logo for your school team, or ateam of your choice. You can pick yourfavourite professional team and create anew logo for them, or make up your ownfantasy team. Your design should includeone or more polygons.
b) Use one or more variables to representthe dimensions in your design and labelthem on your design.
c) Find a simplified expression for theperimeter of your logo.
d) Find a simplified expression for the areaof your logo.
e) Create two problems involving your logo.Solve the problems.
f) Trade problems with a classmate. Solveeach other’s problems and check yoursolutions.
Chapter Problem Wrap-Up
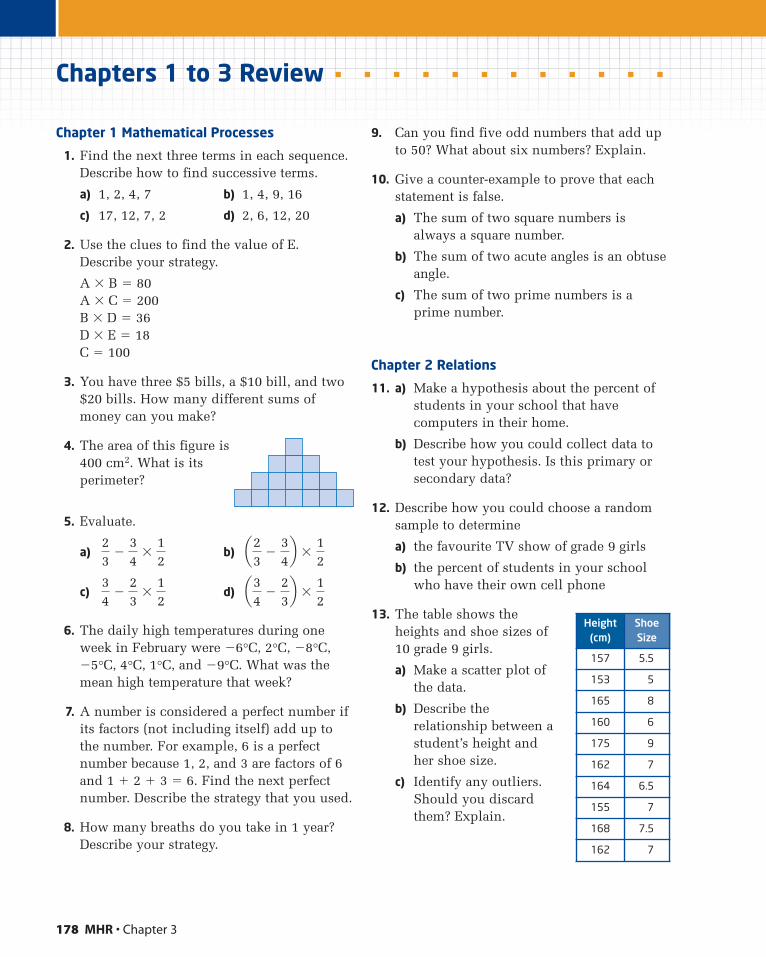
178 MHR • Chapter 3
Chapters 1 to 3 Review
Chapter 1 Mathematical Processes
1. Find the next three terms in each sequence.Describe how to find successive terms.
a) 1, 2, 4, 7 b) 1, 4, 9, 16
c) 17, 12, 7, 2 d) 2, 6, 12, 20
2. Use the clues to find the value of E.Describe your strategy.
A � B � 80A � C � 200B � D � 36D � E � 18C � 100
3. You have three $5 bills, a $10 bill, and two$20 bills. How many different sums ofmoney can you make?
4. The area of this figure is400 cm2. What is itsperimeter?
5. Evaluate.
a) b)
c) d)
6. The daily high temperatures during oneweek in February were �6°C, 2°C, �8°C,�5°C, 4°C, 1°C, and �9°C. What was themean high temperature that week?
7. A number is considered a perfect number ifits factors (not including itself) add up tothe number. For example, 6 is a perfectnumber because 1, 2, and 3 are factors of 6and 1 � 2 � 3 � 6. Find the next perfectnumber. Describe the strategy that you used.
8. How many breaths do you take in 1 year?Describe your strategy.
9. Can you find five odd numbers that add upto 50? What about six numbers? Explain.
10. Give a counter-example to prove that eachstatement is false.
a) The sum of two square numbers isalways a square number.
b) The sum of two acute angles is an obtuseangle.
c) The sum of two prime numbers is aprime number.
Chapter 2 Relations
11. a) Make a hypothesis about the percent ofstudents in your school that havecomputers in their home.
b) Describe how you could collect data totest your hypothesis. Is this primary orsecondary data?
12. Describe how you could choose a randomsample to determine
a) the favourite TV show of grade 9 girls
b) the percent of students in your schoolwho have their own cell phone
13. The table shows theheights and shoe sizes of10 grade 9 girls.
a) Make a scatter plot ofthe data.
b) Describe therelationship between astudent’s height andher shoe size.
c) Identify any outliers.Should you discardthem? Explain.
a34
�23b �
12
34
�23
�12
a23
�34b �
12
23
�34
�12
Height(cm)
ShoeSize
157 5.5
153 5
165 8
160 6
175 9
162 7
164 6.5
155 7
168 7.5
162 7
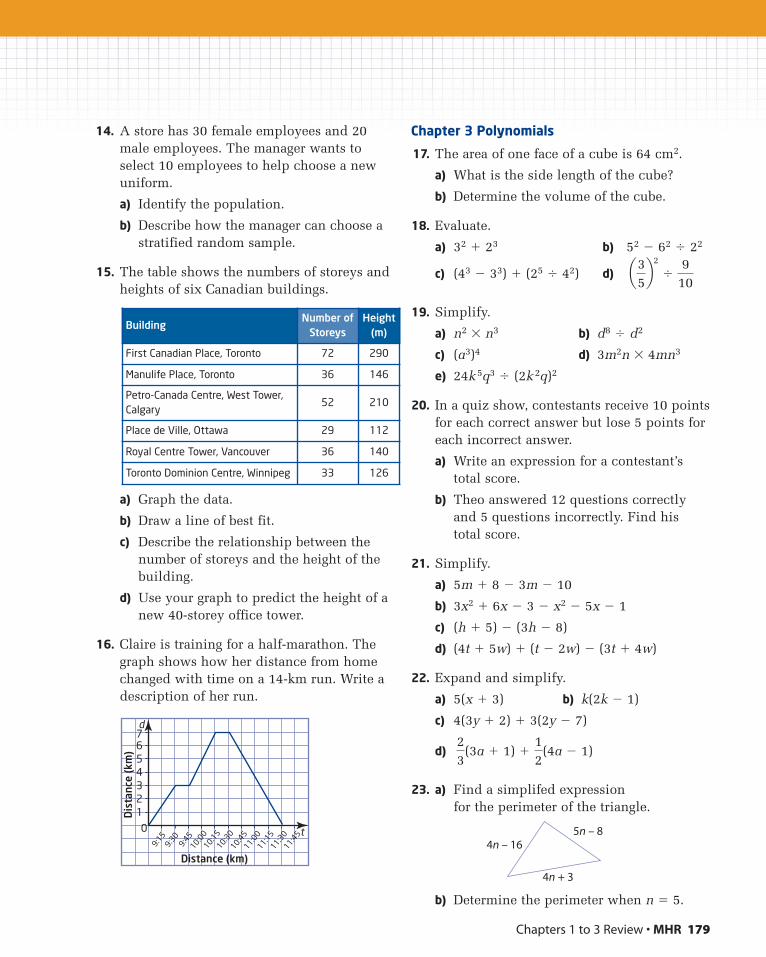
Chapters 1 to 3 Review • MHR 179
14. A store has 30 female employees and 20male employees. The manager wants toselect 10 employees to help choose a newuniform.
a) Identify the population.
b) Describe how the manager can choose astratified random sample.
15. The table shows the numbers of storeys andheights of six Canadian buildings.
a) Graph the data.
b) Draw a line of best fit.
c) Describe the relationship between thenumber of storeys and the height of thebuilding.
d) Use your graph to predict the height of anew 40-storey office tower.
16. Claire is training for a half-marathon. Thegraph shows how her distance from homechanged with time on a 14-km run. Write adescription of her run.
Chapter 3 Polynomials
17. The area of one face of a cube is 64 cm2.
a) What is the side length of the cube?
b) Determine the volume of the cube.
18. Evaluate.
a) 32 � 23 b) 52 � 62 � 22
c) (43 � 33) � (25 � 42) d)
19. Simplify.
a) n2 � n3 b) d8 � d2
c) (a3)4 d) 3m2n � 4mn3
e) 24k5q3 � (2k2q)2
20. In a quiz show, contestants receive 10 pointsfor each correct answer but lose 5 points foreach incorrect answer.
a) Write an expression for a contestant’stotal score.
b) Theo answered 12 questions correctlyand 5 questions incorrectly. Find histotal score.
21. Simplify.
a) 5m � 8 � 3m � 10
b) 3x2 � 6x � 3 � x2 � 5x � 1
c) (h � 5) � (3h � 8)
d) (4t � 5w) � (t � 2w) � (3t � 4w)
22. Expand and simplify.
a) 5(x � 3) b) k(2k � 1)
c) 4(3y � 2) � 3(2y � 7)
d)
23. a) Find a simplifed expression for the perimeter of the triangle.
b) Determine the perimeter when n � 5.
4n – 165n – 8
4n + 3
23
(3a � 1) �12
(4a � 1)
a35b2
�9
10
7
54321
0
9:15
9:30
9:45
10:00
10:15
10:30
10:45
11:00
11:15
11:30
11:45
6
Dis
tanc
e (k
m)
Distance (km)
d
t
BuildingNumber of
StoreysHeight
(m)
First Canadian Place, Toronto 72 290
Manulife Place, Toronto 36 146
Petro-Canada Centre, West Tower,Calgary
52 210
Place de Ville, Ottawa 29 112
Royal Centre Tower, Vancouver 36 140
Toronto Dominion Centre, Winnipeg 33 126
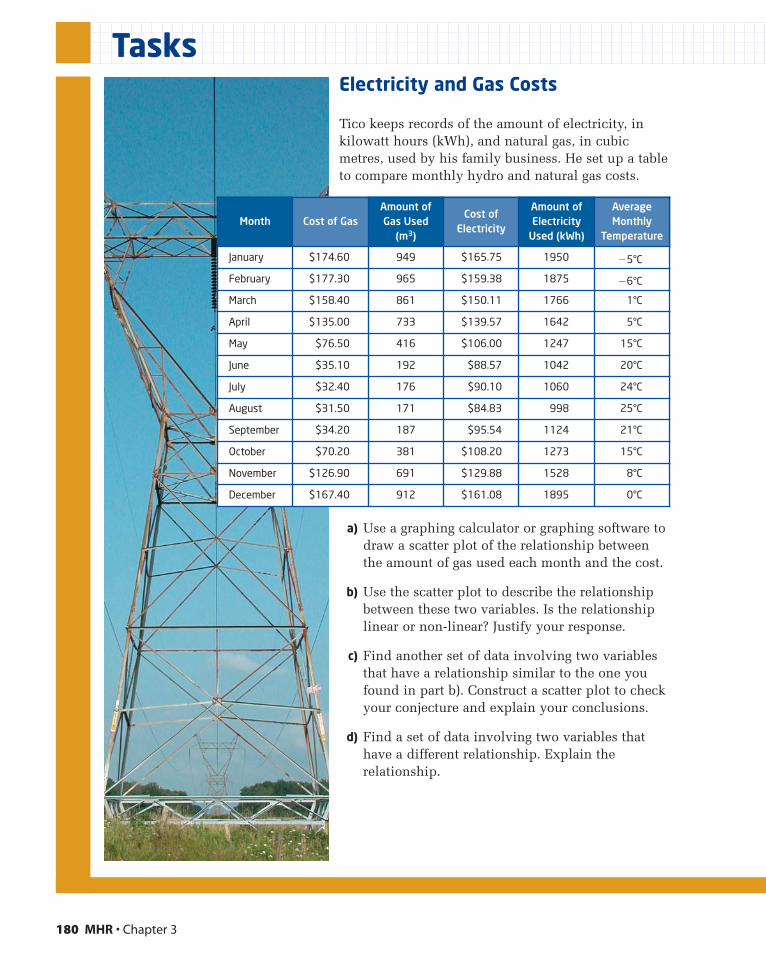
180 MHR • Chapter 3
TaskTasksElectricity and Gas Costs
Tico keeps records of the amount of electricity, inkilowatt hours (kWh), and natural gas, in cubicmetres, used by his family business. He set up a tableto compare monthly hydro and natural gas costs.
a) Use a graphing calculator or graphing software todraw a scatter plot of the relationship betweenthe amount of gas used each month and the cost.
b) Use the scatter plot to describe the relationshipbetween these two variables. Is the relationshiplinear or non-linear? Justify your response.
c) Find another set of data involving two variablesthat have a relationship similar to the one youfound in part b). Construct a scatter plot to checkyour conjecture and explain your conclusions.
d) Find a set of data involving two variables thathave a different relationship. Explain therelationship.
Month Cost of GasAmount ofGas Used
(m3)
Cost ofElectricity
Amount ofElectricity
Used (kWh)
AverageMonthly
Temperature
January $174.60 949 $165.75 1950 �5°C
February $177.30 965 $159.38 1875 �6°C
March $158.40 861 $150.11 1766 1°C
April $135.00 733 $139.57 1642 5°C
May $76.50 416 $106.00 1247 15°C
June $35.10 192 $88.57 1042 20°C
July $32.40 176 $90.10 1060 24°C
August $31.50 171 $84.83 998 25°C
September $34.20 187 $95.54 1124 21°C
October $70.20 381 $108.20 1273 15°C
November $126.90 691 $129.88 1528 8°C
December $167.40 912 $161.08 1895 0°C
Chapter 3 Tasks • MHR 181
Perimeters and Areas
a) Write an expression, in simplified form, for the perimeter of this rectangle.
b) Write an expression for the area of the rectangle.
c) Suppose 16 of these rectangles are put together to form a largerrectangle. Show all the possible ways of combining them. Write an expression for the perimeter in each case.
d) For each of the values x � 1, x � 2, and x � 3, which combination ofsmall rectangles from part c) has the least perimeter? Is this morethan one combination? Justify your answer.
e) Find the area of each combined rectangle in part c).
Mind Reader
Part 1
Aidan’s cousin Heather found thisMind Reader challenge in a gamesmagazine. She asked Aidan toexplain how it works.
• Think of a number.• Add 20.• Multiply the answer by 5.• Double the result.• Subtract 200.• Divide by the number you picked.
The answer will always be the same.What is it?
a) Heather thought of the number 5.Show how the steps work for thisnumber.
b) Explain how this challengeworks, using words, numbers,and/or symbols.
Part 2
Aidan found another Mind Reader in themagazine. It involves a person’s birth date. In this challenge, 15 April 1993 is writtennumerically as 150493.
• Write down the day of the month that youwere born.
• Multiply the number by 5.• Add 4.• Multiply by 20.• Add the number of the month you were
born.• Multiply by 100.• Add the last two digits of the year you
were born.• Subtract 8000.
a) What is the result? What does it mean?
b) Explain, using symbols, how this MindReader works.
x
x + 2

Vocabulary
equationsolutionrootconstant termformula
Equations
Organizing an event, such as a party for a few friends or a dance for the entire school, can involve algebra. You might use algebraic expressions and equations to determine how much money you can spend on food, decorations, and entertainment. If the event involves ticket sales, your knowledge of algebra can help you determine what the price of a ticket should be.
In this chapter, you will solve a variety of equations, rearrange formulas, and solve problems using algebraic modelling.
CHAPTER
4Number Sense and Algebra� Solve fi rst-degree equations using
a variety of tools and strategies.
� Rearrange formulas involving variables in the fi rst degree.
� Solve problems that can be modelled with fi rst-degree equations, and compare algebraic methods to other solution methods.
� Relate understanding of inverse operations to squaring and taking the square root, and apply inverse operations to simplify expressions and solve equations.
182
Chapter Problem Suppose that you are the producer of a new reality show called
Canadian Superstar. In each episode, talented Canadian teens
compete in various singing and dancing events. First prize is a
recording contract and a national concert tour. As the show’s
producer, you are required to plan a number of important details,
such as theatre rentals, hotel accommodations, meals, and travel.
Your sponsors give you a budget. How can you use mathematics
to make smart decisions? In this chapter, you will learn to build
equation models that will allow you to solve some of these
problems.
183
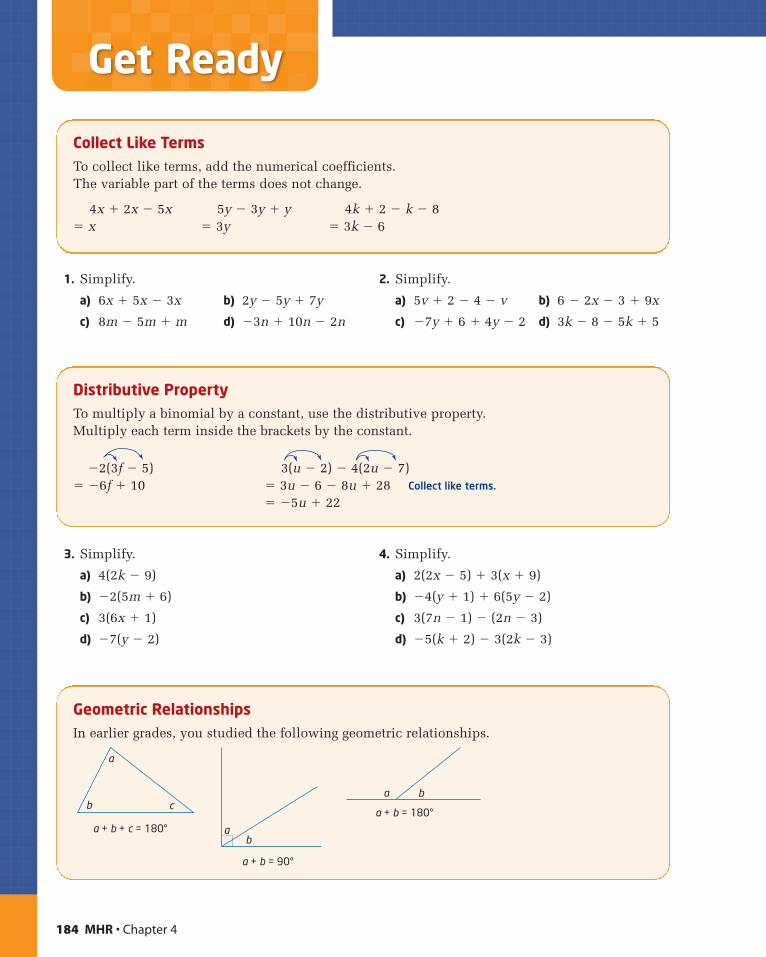
1. Simplify.
a) 6x � 5x � 3x b) 2y � 5y � 7y
c) 8m � 5m � m d) �3n � 10n � 2n
2. Simplify.
a) 5v � 2 � 4 � v b) 6 � 2x � 3 � 9x
c) �7y � 6 � 4y � 2 d) 3k � 8 � 5k � 5
184 MHR • Chapter 4
Collect Like TermsTo collect like terms, add the numerical coefficients. The variable part of the terms does not change.
4x � 2x � 5x 5y � 3y � y 4k � 2 � k � 8� x � 3y � 3k � 6
3. Simplify.
a) 4(2k � 9)
b) �2(5m � 6)
c) 3(6x � 1)
d) �7(y � 2)
4. Simplify.
a) 2(2x � 5) � 3(x � 9)
b) �4(y � 1) � 6(5y � 2)
c) 3(7n � 1) � (2n � 3)
d) �5(k � 2) � 3(2k � 3)
Distributive PropertyTo multiply a binomial by a constant, use the distributive property. Multiply each term inside the brackets by the constant.
�2(3f � 5) 3(u � 2) � 4(2u � 7)� �6f � 10 � 3u � 6 � 8u � 28 Collect like terms.
� �5u � 22
Geometric RelationshipsIn earlier grades, you studied the following geometric relationships.
a
b
a + b + c = 180°
c
ab
a + b = 90°
a b
a + b = 180°
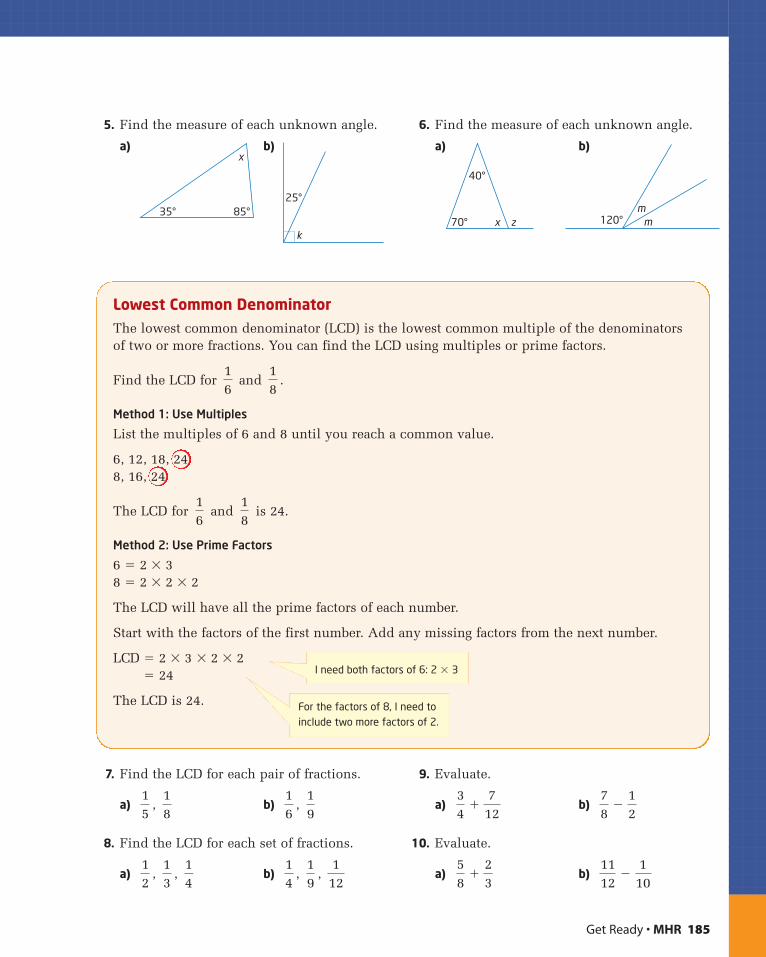
5. Find the measure of each unknown angle.
a) b)
6. Find the measure of each unknown angle.
a) b)
25°
k
35° 85°
x
Get Ready • MHR 185
7. Find the LCD for each pair of fractions.
a) , b) ,
8. Find the LCD for each set of fractions.
a) , , b) , ,
9. Evaluate.
a) b)
10. Evaluate.
a) b)1112
�110
58
�23
78
�12
34
�712
112
19
14
14
13
12
19
16
18
15
Lowest Common DenominatorThe lowest common denominator (LCD) is the lowest common multiple of the denominatorsof two or more fractions. You can find the LCD using multiples or prime factors.
Find the LCD for and .
Method 1: Use Multiples
List the multiples of 6 and 8 until you reach a common value.
6, 12, 18, 248, 16, 24
The LCD for and is 24.
Method 2: Use Prime Factors
6 � 2 � 38 � 2 � 2 � 2
The LCD will have all the prime factors of each number.
Start with the factors of the first number. Add any missing factors from the next number.
LCD � 2 � 3 � 2 � 2� 24
The LCD is 24.
18
16
18
16
70°
40°
x z 120°m
m
I need both factors of 6: 2 � 3
For the factors of 8, I need toinclude two more factors of 2.
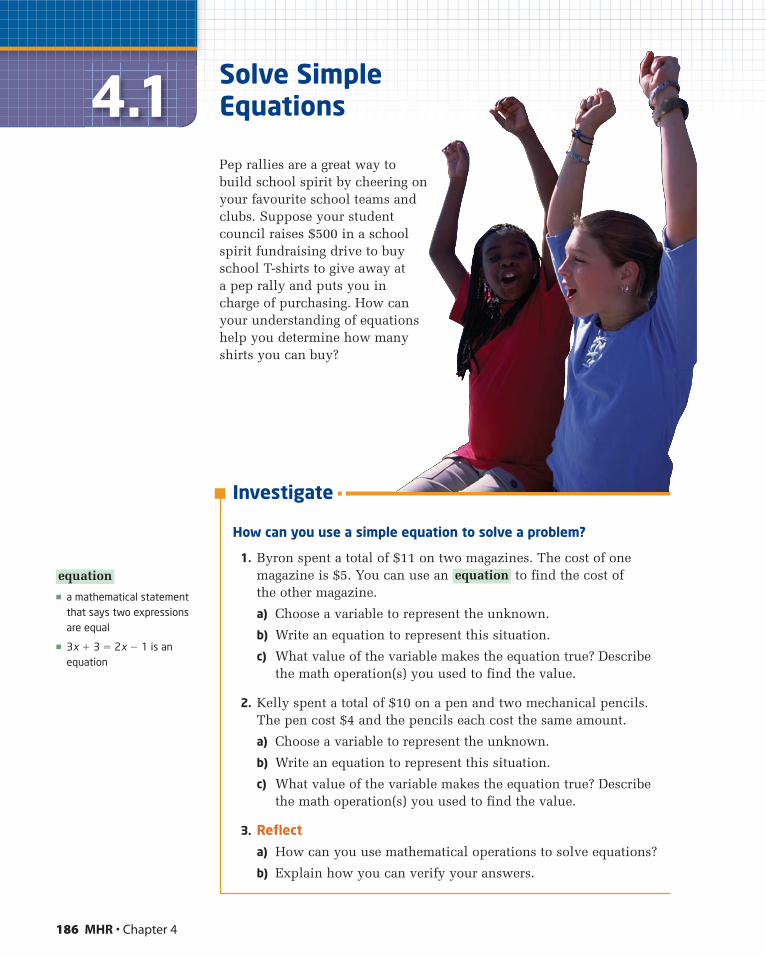
186 MHR • Chapter 4
4.1 Solve SimpleEquations
Pep rallies are a great way tobuild school spirit by cheering onyour favourite school teams andclubs. Suppose your studentcouncil raises $500 in a schoolspirit fundraising drive to buyschool T-shirts to give away ata pep rally and puts you incharge of purchasing. How canyour understanding of equationshelp you determine how manyshirts you can buy?
Investigate
How can you use a simple equation to solve a problem?
1. Byron spent a total of $11 on two magazines. The cost of onemagazine is $5. You can use an to find the cost of the other magazine.
a) Choose a variable to represent the unknown.
b) Write an equation to represent this situation.
c) What value of the variable makes the equation true? Describethe math operation(s) you used to find the value.
2. Kelly spent a total of $10 on a pen and two mechanical pencils.The pen cost $4 and the pencils each cost the same amount.
a) Choose a variable to represent the unknown.
b) Write an equation to represent this situation.
c) What value of the variable makes the equation true? Describethe math operation(s) you used to find the value.
3. Reflect
a) How can you use mathematical operations to solve equations?
b) Explain how you can verify your answers.
equation
� a mathematical statementthat says two expressionsare equal
� 3x � 3 � 2x � 1 is anequation
equation
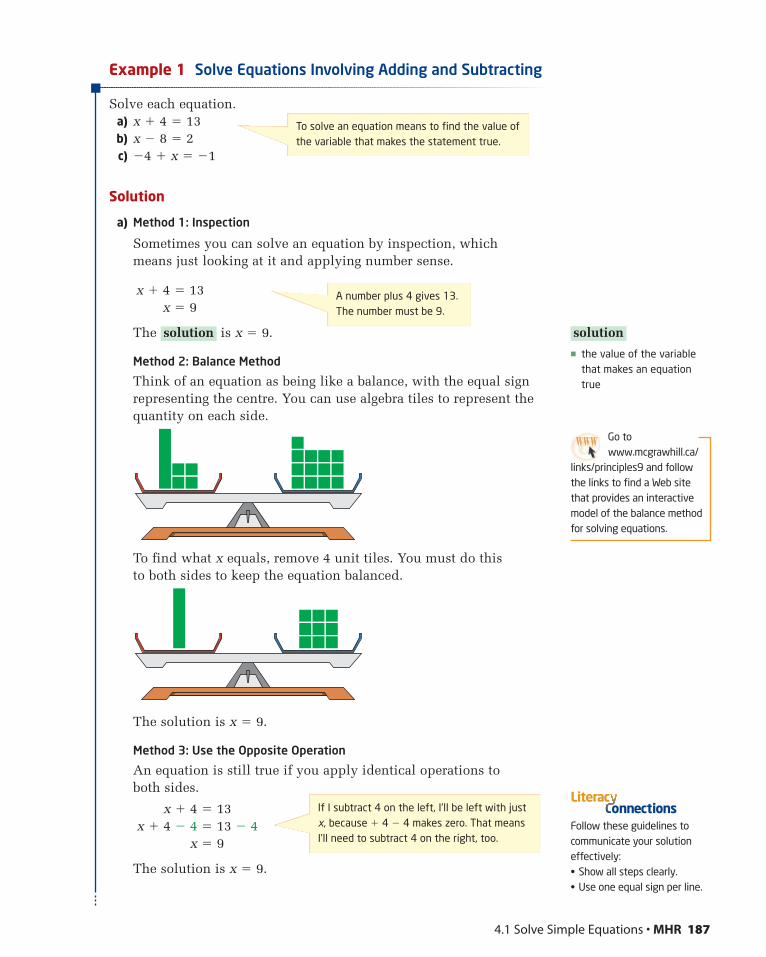
Example 1 Solve Equations Involving Adding and Subtracting
Solve each equation.a) x � 4 � 13b) x � 8 � 2c) �4 � x � �1
Solution
a) Method 1: Inspection
Sometimes you can solve an equation by inspection, which means just looking at it and applying number sense.
x � 4 � 13x � 9
The is x � 9.
Method 2: Balance Method
Think of an equation as being like a balance, with the equal signrepresenting the centre. You can use algebra tiles to represent thequantity on each side.
To find what x equals, remove 4 unit tiles. You must do this to both sides to keep the equation balanced.
The solution is x � 9.
Method 3: Use the Opposite Operation
An equation is still true if you apply identical operations to both sides.
x � 4 � 13x � 4 � 4 � 13 � 4
x � 9
The solution is x � 9.
solution
4.1 Solve Simple Equations • MHR 187
� the value of the variablethat makes an equationtrue
solution
A number plus 4 gives 13.The number must be 9.
To solve an equation means to find the value ofthe variable that makes the statement true.
Go towww.mcgrawhill.ca/
links/principles9 and followthe links to find a Web sitethat provides an interactivemodel of the balance methodfor solving equations.
If I subtract 4 on the left, I’ll be left with justx, because � 4 � 4 makes zero. That meansI’ll need to subtract 4 on the right, too.
Follow these guidelines tocommunicate your solutioneffectively:• Show all steps clearly.• Use one equal sign per line.
onnectionsLiterac
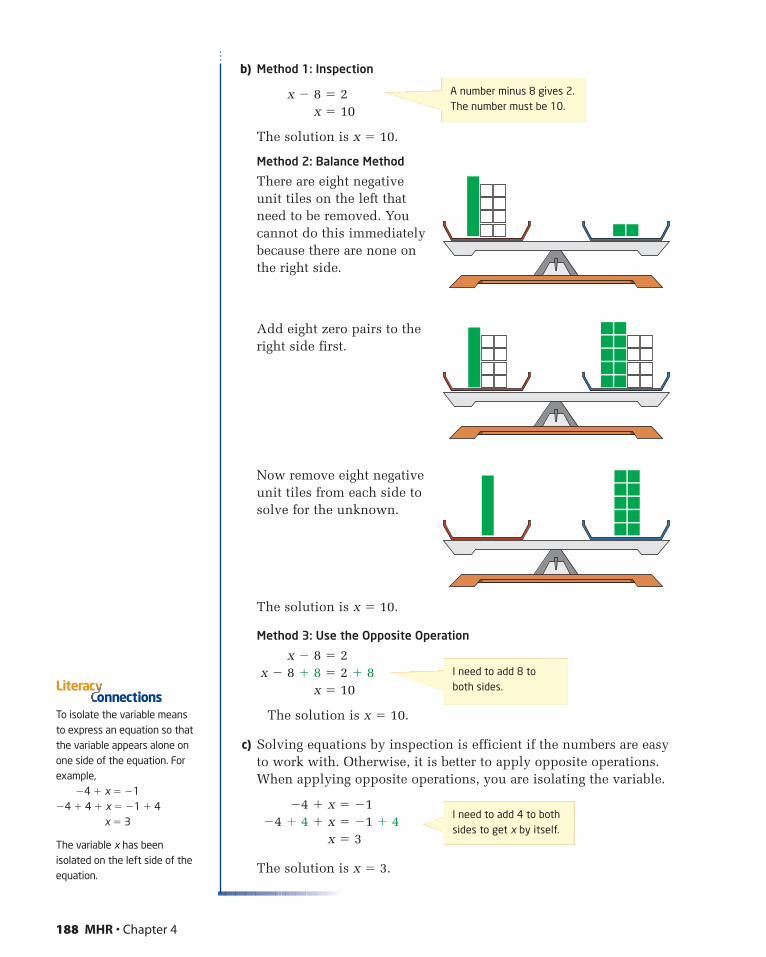
b) Method 1: Inspection
x � 8 � 2x � 10
The solution is x � 10.
Method 2: Balance Method
There are eight negativeunit tiles on the left thatneed to be removed. Youcannot do this immediatelybecause there are none onthe right side.
Add eight zero pairs to theright side first.
Now remove eight negativeunit tiles from each side tosolve for the unknown.
The solution is x � 10.
Method 3: Use the Opposite Operation
x � 8 � 2x � 8 � 8 � 2 � 8
x � 10
The solution is x � 10.
c) Solving equations by inspection is efficient if the numbers are easyto work with. Otherwise, it is better to apply opposite operations.When applying opposite operations, you are isolating the variable.
�4 � x � �1�4 � 4 � x � �1 � 4
x � 3
The solution is x � 3.
188 MHR • Chapter 4
A number minus 8 gives 2.The number must be 10.
I need to add 8 toboth sides.
I need to add 4 to bothsides to get x by itself.
To isolate the variable meansto express an equation so thatthe variable appears alone onone side of the equation. Forexample,
�4 � x � �1�4 � 4 � x � �1 � 4
x � 3
The variable x has beenisolated on the left side of theequation.
onnectionsLiterac
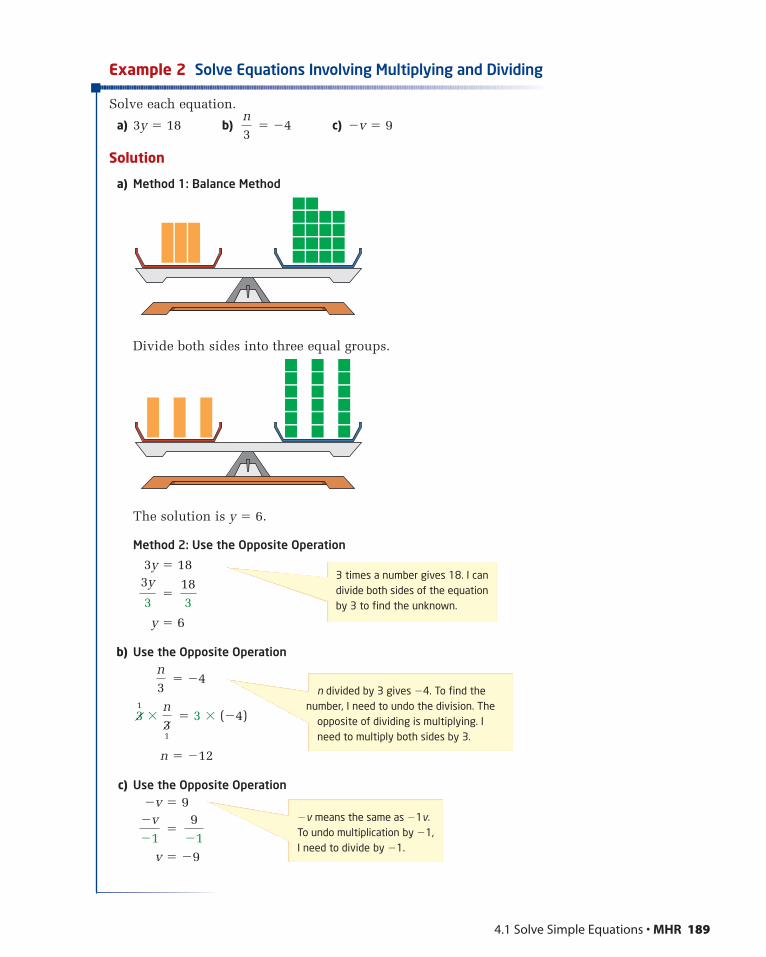
Example 2 Solve Equations Involving Multiplying and Dividing
Solve each equation.
a) 3y � 18 b) � �4 c) �v � 9
Solution
a) Method 1: Balance Method
Divide both sides into three equal groups.
The solution is y � 6.
Method 2: Use the Opposite Operation
3y � 18
�
y � 6
b) Use the Opposite Operation
� �4
� 3 � (�4)
n � �12
c) Use the Opposite Operation�v � 9
�
v � �9
9�1
�v�1
31
�n31
n3
183
3y
3
n3
4.1 Solve Simple Equations • MHR 189
3 times a number gives 18. I candivide both sides of the equationby 3 to find the unknown.
n divided by 3 gives �4. To find thenumber, I need to undo the division. The
opposite of dividing is multiplying. Ineed to multiply both sides by 3.
�v means the same as �1v.To undo multiplication by �1,I need to divide by �1.
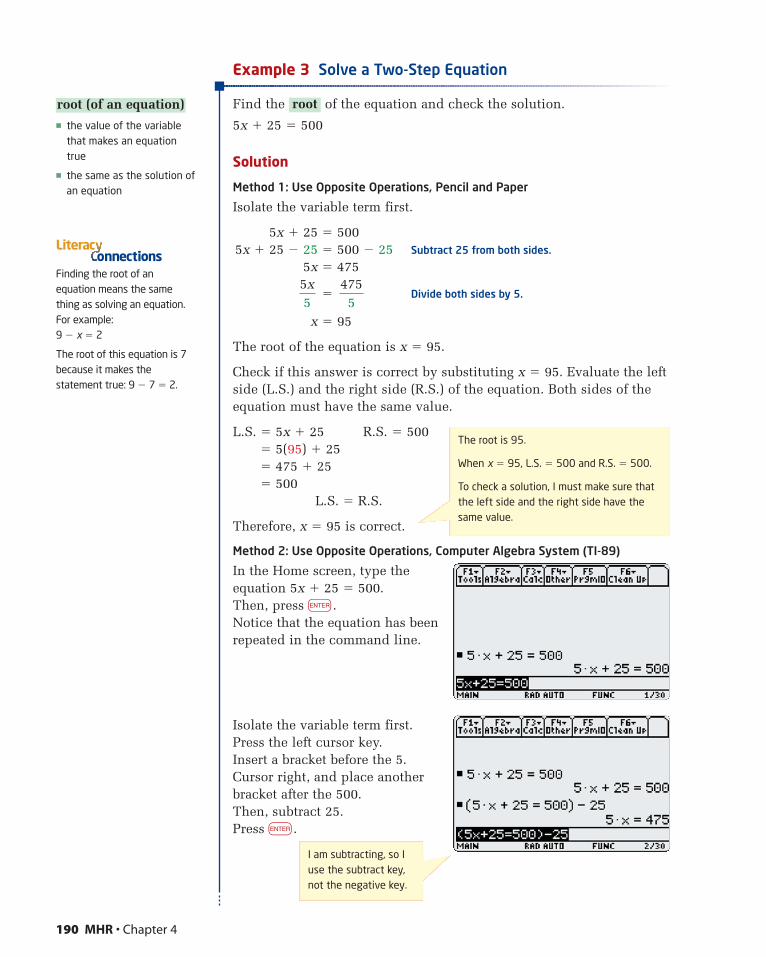
Example 3 Solve a Two-Step Equation
Find the of the equation and check the solution.
5x � 25 � 500
Solution
Method 1: Use Opposite Operations, Pencil and Paper
Isolate the variable term first.
5x � 25 � 5005x � 25 � 25 � 500 � 25 Subtract 25 from both sides.
5x � 475
� Divide both sides by 5.
x � 95
The root of the equation is x � 95.
Check if this answer is correct by substituting x � 95. Evaluate the leftside (L.S.) and the right side (R.S.) of the equation. Both sides of theequation must have the same value.
L.S. � 5x � 25 R.S. � 500� 5(95) � 25� 475 � 25� 500
L.S. � R.S.
Therefore, x � 95 is correct.
Method 2: Use Opposite Operations, Computer Algebra System (TI-89)
In the Home screen, type theequation 5x � 25 � 500.Then, press e.Notice that the equation has been repeated in the command line.
Isolate the variable term first.Press the left cursor key.Insert a bracket before the 5.Cursor right, and place anotherbracket after the 500.Then, subtract 25.Press e.
4755
5x5
root
190 MHR • Chapter 4
� the value of the variablethat makes an equationtrue
� the same as the solution ofan equation
root (of an equation)
Finding the root of anequation means the samething as solving an equation.For example:9 � x � 2
The root of this equation is 7because it makes thestatement true: 9 � 7 � 2.
onnectionsLiterac
The root is 95.
When x � 95, L.S. � 500 and R.S. � 500.
To check a solution, I must make sure thatthe left side and the right side have thesame value.
I am subtracting, so Iuse the subtract key,not the negative key.
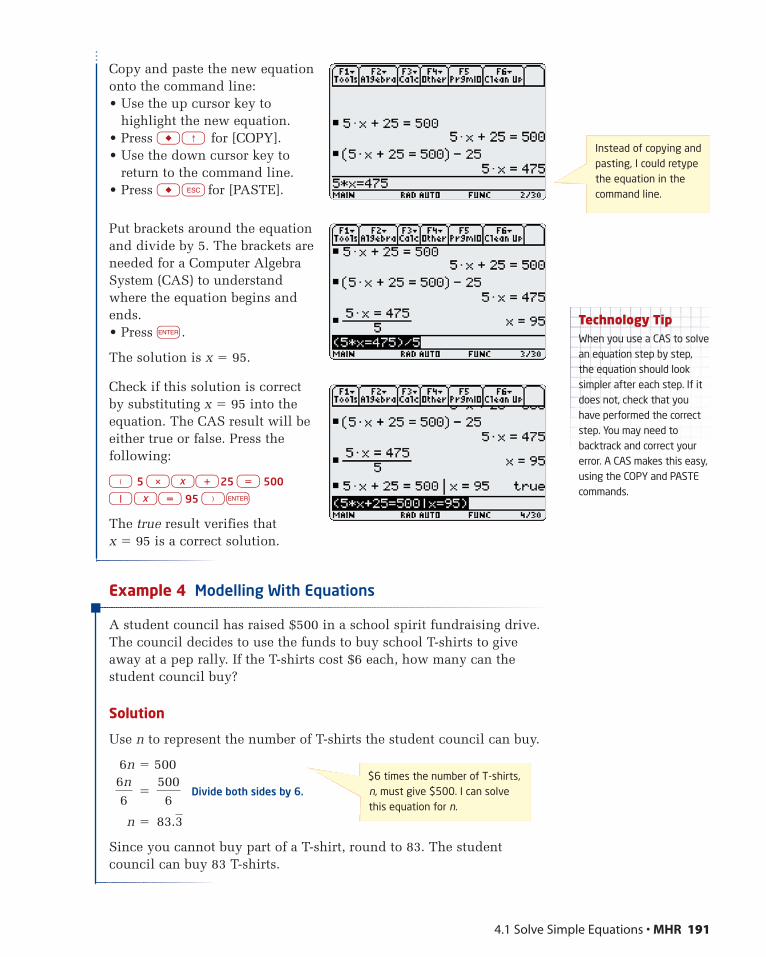
Copy and paste the new equationonto the command line:• Use the up cursor key to
highlight the new equation.• Press Í� Í↑ for [COPY].• Use the down cursor key to
return to the command line.• Press Í� ÍESC for [PASTE].
Put brackets around the equationand divide by 5. The brackets areneeded for a Computer AlgebraSystem (CAS) to understandwhere the equation begins andends.• Press e.
The solution is x � 95.
Check if this solution is correctby substituting x � 95 into theequation. The CAS result will beeither true or false. Press thefollowing:
( 5 *Íx +25 = 500
Í| Íx = 95 )e
The true result verifies that x � 95 is a correct solution.
Example 4 Modelling With Equations
A student council has raised $500 in a school spirit fundraising drive.The council decides to use the funds to buy school T-shirts to giveaway at a pep rally. If the T-shirts cost $6 each, how many can thestudent council buy?
Solution
Use n to represent the number of T-shirts the student council can buy.
6n � 500
� Divide both sides by 6.
n �
Since you cannot buy part of a T-shirt, round to 83. The studentcouncil can buy 83 T-shirts.
83.3
5006
6n6
4.1 Solve Simple Equations • MHR 191
Instead of copying andpasting, I could retypethe equation in thecommand line.
Technology TipWhen you use a CAS to solvean equation step by step,the equation should looksimpler after each step. If itdoes not, check that youhave performed the correctstep. You may need tobacktrack and correct yourerror. A CAS makes this easy,using the COPY and PASTEcommands.
$6 times the number of T-shirts,n, must give $500. I can solvethis equation for n.
Key Concepts� To solve an equation means to find the value of the variable that
makes the statement true. This is also called finding the root of theequation.
� To solve a one-step equation, isolate the variable by performing theopposite operation.
� In a two-step equation, there is more than one term on one side, soisolate the variable term first by adding or subtracting. Then, divideby the coefficient of the variable term.
For example:2x � 7 � 9
2x � 7 � 7 � 9 � 7 Add or subtract to isolate the variable term. BEDMAS
2x � 16
� Multiply or divide to solve for the variable. BEDMAS
x � 8
� Check a solution to an equation by substituting the root into the leftside and the right side of the equation. Both sides must be equal.
For the example above:Substitute x � 8.
L.S. � 2(8) � 7 R.S. � 9� 16 � 7� 9
L.S. � R.S.
Communicate Your UnderstandingDescribe the first step you would take to solve each equation.
a) k � 5 � �11 b) 3m � 18
c) � �4 d) 5n � 75 � 225
Which is the correct solution to 2x � 5 � 21? Explain how you cantell without solving the equation.
A x � 7 B x � 8 C x � 9
A high school football team has raised $1000 to spend on teamjackets. The cost is $50 per jacket. Which equation can be used tosolve for the number of jackets the team can buy? Explain.
A 50 � 1000n B 50n � 1000 C 1000n � 50n
C3C3
C2C2
x5
C1C1
162
2x2
192 MHR • Chapter 4
This is like applyingBEDMAS in reverse.
PractiseFor help with questions 1 to 3, see Example 1.
1. Solve by inspection.
a) x � 5 � 4 b) m � 8 � 11
c) y � 3 � 0 d) h � 2 � 6
2. Solve using the balance method.
a) x � 5 � 12 b) x � 6 � 7
c) y � 3 � 10 d) y � 4 � 2
3. Solve using opposite operations.
a) x � 7 � 12 b) n � 8 � 11
c) �5 � y � �2 d) �9 � h � �6
For help with questions 4 and 5, see Example 2.
4. Solve using the balance method.
a) 3x � 12 b) 5y � 20
c) � 8 d) �2k � 16
5. Solve using opposite operations.
a) 4z � �24 b) � �6
c) �6c � �42 d) �9u � 45
For help with questions 6 and 7, see Example 3.
6. Find the root of each equation using paper and pencil. Applyopposite operations. Check each root.
a) 7x � 4 � 10 b) 7k � 2 � 16
c) �p � 7 � 0 d) �12g � 33 � 0
7. Use a CAS to solve. Apply opposite operations. Check each solution.
a) k � 4 � �9 b) 6x � �30
c) � 2 d) 2y � 7 � 9
e) �3w � 1 � 14 f) 2q � 9 � �13
8. Solve using the method of your choice. Check your answers.
a) p � 9 � �2 b) �5x � 35
c) � �8 d) 6r � 3 � 33
e) 10c � 6 � �16 f) �3v � 6 � �9
For help with questions 9 and 10, see Example 4.
9. At a bake sale, pies cost $7 each. One customer buys $84 worth of pies.
a) Write an equation to model the number of pies the customer bought.
b) Solve the equation.
u4
q
7
h�5
n3
4.1 Solve Simple Equations • MHR 193
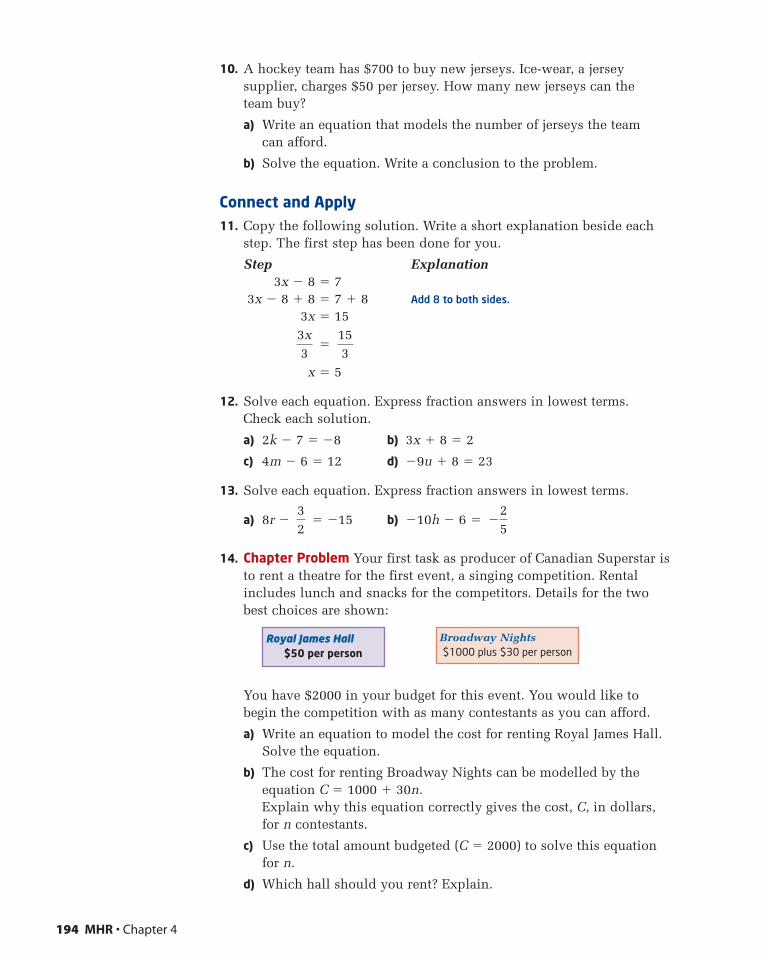
10. A hockey team has $700 to buy new jerseys. Ice-wear, a jerseysupplier, charges $50 per jersey. How many new jerseys can the team buy?
a) Write an equation that models the number of jerseys the team can afford.
b) Solve the equation. Write a conclusion to the problem.
Connect and Apply11. Copy the following solution. Write a short explanation beside each
step. The first step has been done for you.
Step Explanation3x � 8 � 7
3x � 8 � 8 � 7 � 8 Add 8 to both sides.
3x � 15
�
x � 5
12. Solve each equation. Express fraction answers in lowest terms.Check each solution.
a) 2k � 7 � �8 b) 3x � 8 � 2
c) 4m � 6 � 12 d) �9u � 8 � 23
13. Solve each equation. Express fraction answers in lowest terms.
a) 8r � � �15 b) �10h � 6 �
14. Chapter Problem Your first task as producer of Canadian Superstar isto rent a theatre for the first event, a singing competition. Rentalincludes lunch and snacks for the competitors. Details for the twobest choices are shown:
You have $2000 in your budget for this event. You would like tobegin the competition with as many contestants as you can afford.
a) Write an equation to model the cost for renting Royal James Hall.Solve the equation.
b) The cost for renting Broadway Nights can be modelled by theequation C � 1000 � 30n.Explain why this equation correctly gives the cost, C, in dollars,for n contestants.
c) Use the total amount budgeted (C � 2000) to solve this equationfor n.
d) Which hall should you rent? Explain.
�25
32
153
3x3
194 MHR • Chapter 4
Royal James Hall$50 per person
Broadway Nights$1000 plus $30 per person
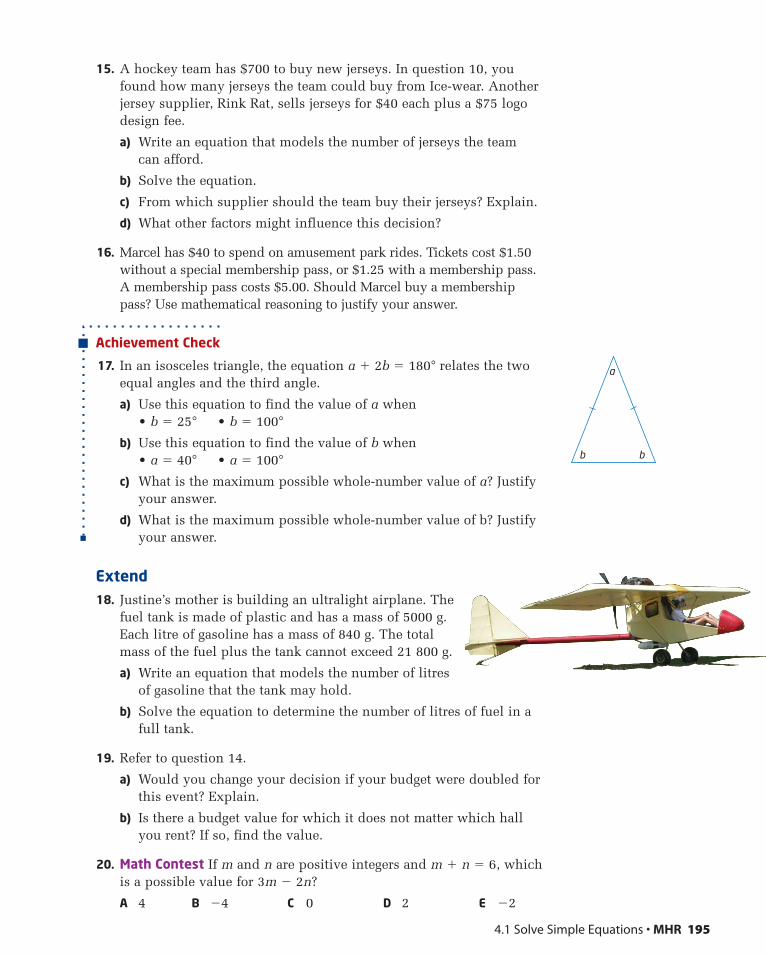
15. A hockey team has $700 to buy new jerseys. In question 10, youfound how many jerseys the team could buy from Ice-wear. Anotherjersey supplier, Rink Rat, sells jerseys for $40 each plus a $75 logodesign fee.
a) Write an equation that models the number of jerseys the team can afford.
b) Solve the equation.
c) From which supplier should the team buy their jerseys? Explain.
d) What other factors might influence this decision?
16. Marcel has $40 to spend on amusement park rides. Tickets cost $1.50without a special membership pass, or $1.25 with a membership pass.A membership pass costs $5.00. Should Marcel buy a membershippass? Use mathematical reasoning to justify your answer.
Achievement Check
17. In an isosceles triangle, the equation a � 2b � 180° relates the twoequal angles and the third angle.
a) Use this equation to find the value of a when• b � 25° • b � 100°
b) Use this equation to find the value of b when• a � 40° • a � 100°
c) What is the maximum possible whole-number value of a? Justifyyour answer.
d) What is the maximum possible whole-number value of b? Justifyyour answer.
Extend18. Justine’s mother is building an ultralight airplane. The
fuel tank is made of plastic and has a mass of 5000 g.Each litre of gasoline has a mass of 840 g. The totalmass of the fuel plus the tank cannot exceed 21 800 g.
a) Write an equation that models the number of litresof gasoline that the tank may hold.
b) Solve the equation to determine the number of litres of fuel in afull tank.
19. Refer to question 14.
a) Would you change your decision if your budget were doubled forthis event? Explain.
b) Is there a budget value for which it does not matter which hallyou rent? If so, find the value.
20. Math Contest If m and n are positive integers and m � n � 6, whichis a possible value for 3m � 2n?
A 4 B �4 C 0 D 2 E �2
4.1 Solve Simple Equations • MHR 195
a
b b
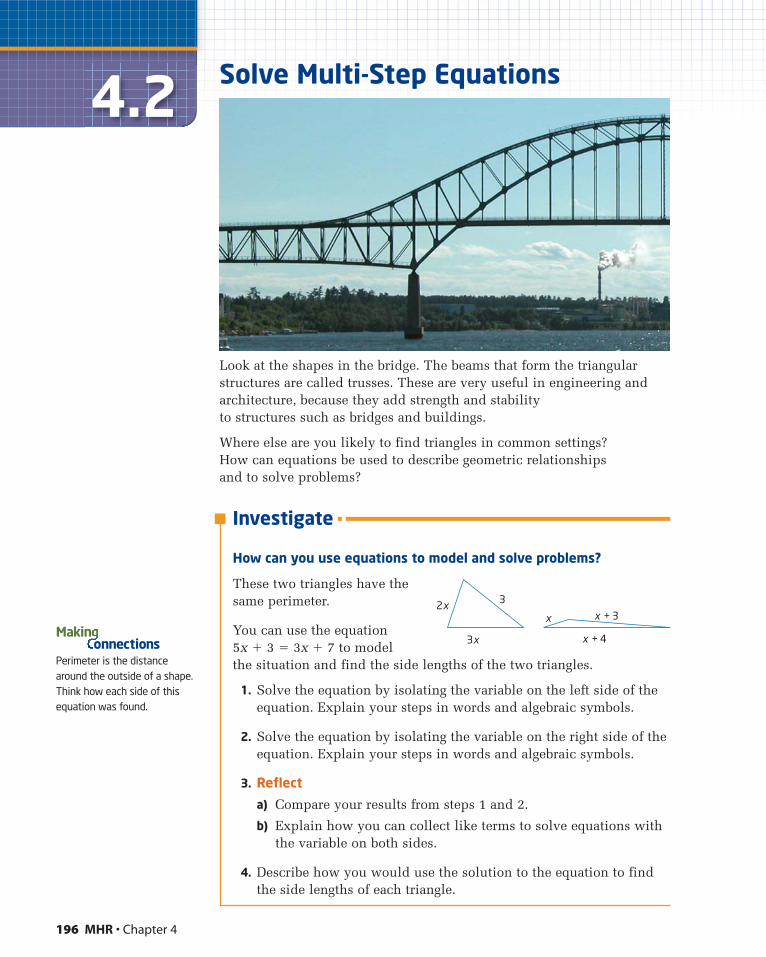
196 MHR • Chapter 4
4.2 Solve Multi-Step Equations
Look at the shapes in the bridge. The beams that form the triangularstructures are called trusses. These are very useful in engineering andarchitecture, because they add strength and stability to structures such as bridges and buildings.
Where else are you likely to find triangles in common settings? How can equations be used to describe geometric relationships and to solve problems?
Investigate
How can you use equations to model and solve problems?
These two triangles have thesame perimeter.
You can use the equation 5x � 3 � 3x � 7 to model the situation and find the side lengths of the two triangles.
1. Solve the equation by isolating the variable on the left side of theequation. Explain your steps in words and algebraic symbols.
2. Solve the equation by isolating the variable on the right side of theequation. Explain your steps in words and algebraic symbols.
3. Reflect
a) Compare your results from steps 1 and 2.
b) Explain how you can collect like terms to solve equations withthe variable on both sides.
4. Describe how you would use the solution to the equation to findthe side lengths of each triangle.
2x 3
3x x + 4
x x + 3
Perimeter is the distancearound the outside of a shape.Think how each side of thisequation was found.
Makinonnections
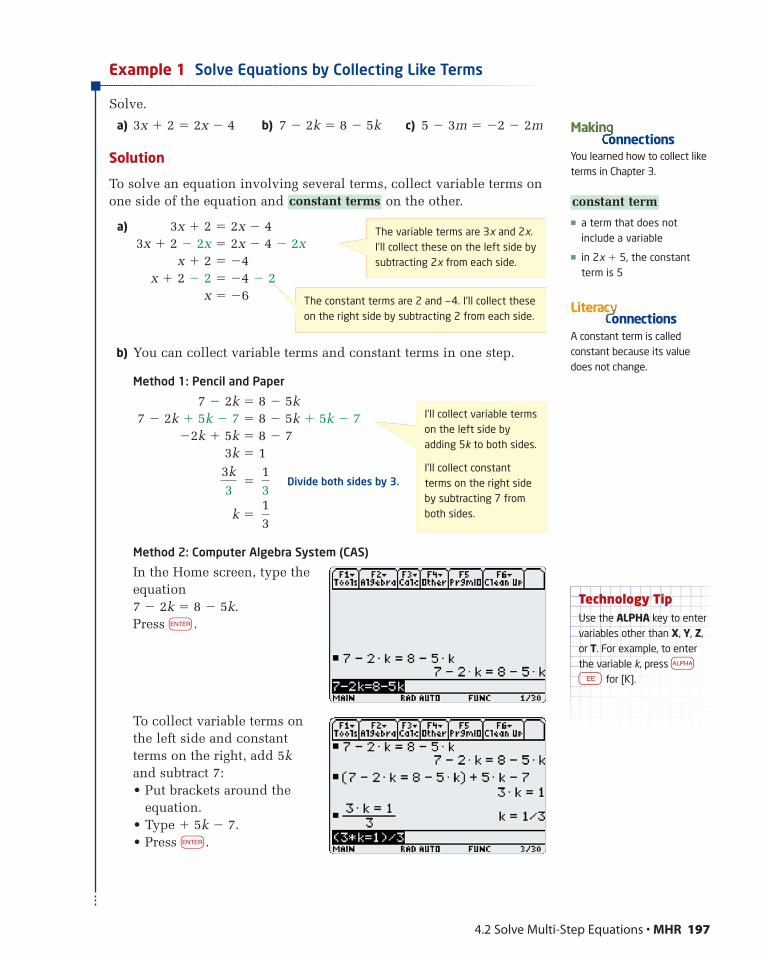
Example 1 Solve Equations by Collecting Like Terms
Solve.
a) 3x � 2 � 2x � 4 b) 7 � 2k � 8 � 5k c) 5 � 3m � �2 � 2m
Solution
To solve an equation involving several terms, collect variable terms onone side of the equation and on the other.
a) 3x � 2 � 2x � 43x � 2 � 2x � 2x � 4 � 2x
x � 2 � �4x � 2 � 2 � �4 � 2
x � �6
b) You can collect variable terms and constant terms in one step.
Method 1: Pencil and Paper
7 � 2k � 8 � 5k7 � 2k � 5k � 7 � 8 � 5k � 5k � 7
�2k � 5k � 8 � 73k � 1
� Divide both sides by 3.
k �
Method 2: Computer Algebra System (CAS)
In the Home screen, type theequation 7 � 2k � 8 � 5k.Press e.
To collect variable terms onthe left side and constantterms on the right, add 5kand subtract 7:• Put brackets around the
equation.• Type � 5k � 7.• Press e.
13
13
3k3
constant terms
4.2 Solve Multi-Step Equations • MHR 197
� a term that does notinclude a variable
� in 2x � 5, the constantterm is 5
constant term
You learned how to collect liketerms in Chapter 3.
Makinonnections
The variable terms are 3x and 2x.I’ll collect these on the left side bysubtracting 2x from each side.
The constant terms are 2 and —4. I’ll collect theseon the right side by subtracting 2 from each side.
A constant term is calledconstant because its valuedoes not change.
onnectionsLiterac
I’ll collect variable termson the left side byadding 5k to both sides.
I’ll collect constantterms on the right sideby subtracting 7 fromboth sides.
Technology TipUse the ALPHA key to entervariables other than X, Y, Z,or T. For example, to enterthe variable k, press aÍEE for [K].
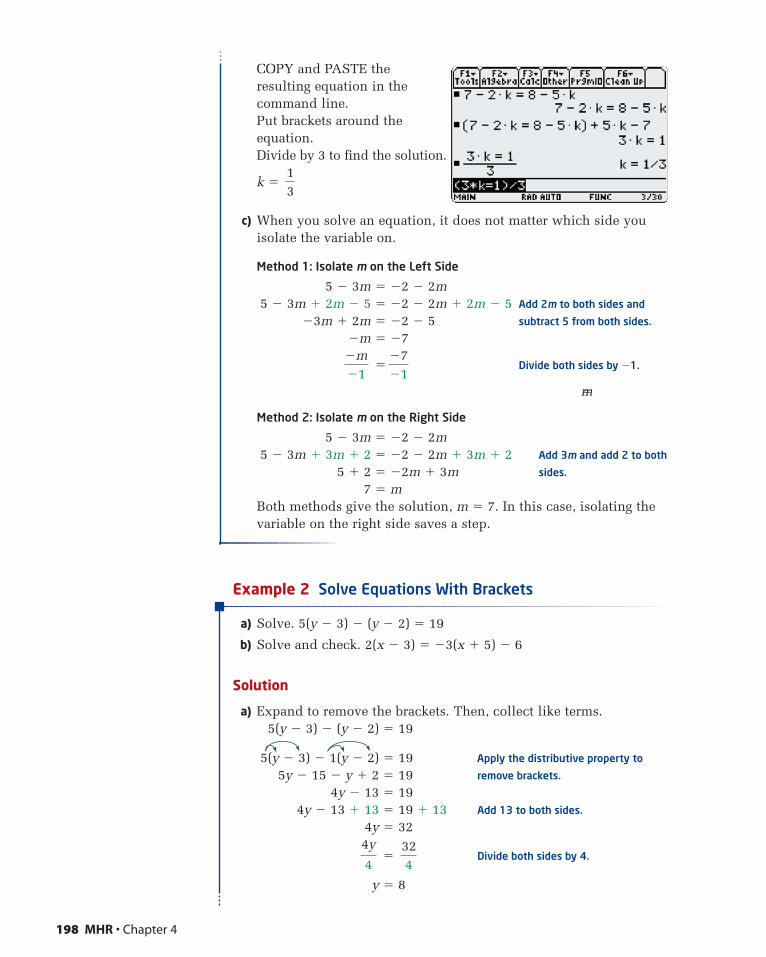
COPY and PASTE theresulting equation in thecommand line.Put brackets around theequation.Divide by 3 to find the solution.
k �
c) When you solve an equation, it does not matter which side youisolate the variable on.
Method 1: Isolate m on the Left Side
5 � 3m � �2 � 2m5 � 3m � 2m � 5 � �2 � 2m � 2m � 5 Add 2m to both sides and
�3m � 2m � �2 � 5 subtract 5 from both sides.
�m � �7
� Divide both sides by �1.
m�
Method 2: Isolate m on the Right Side
5 � 3m � �2 � 2m5 � 3m � 3m � 2 � �2 � 2m � 3m � 2 Add 3m and add 2 to both
5 � 2 � �2m � 3m sides.
7 � mBoth methods give the solution, m � 7. In this case, isolating thevariable on the right side saves a step.
Example 2 Solve Equations With Brackets
a) Solve. 5(y � 3) � (y � 2) � 19
b) Solve and check. 2(x � 3) � �3(x � 5) � 6
Solution
a) Expand to remove the brackets. Then, collect like terms.5(y � 3) � (y � 2) � 19
5(y � 3) � 1(y � 2) � 19 Apply the distributive property to
5y � 15 � y � 2 � 19 remove brackets.
4y � 13 � 194y � 13 � 13 � 19 � 13 Add 13 to both sides.
4y � 32
� Divide both sides by 4.
y � 8
324
4y
4
�7�1
�m�1
13
198 MHR • Chapter 4
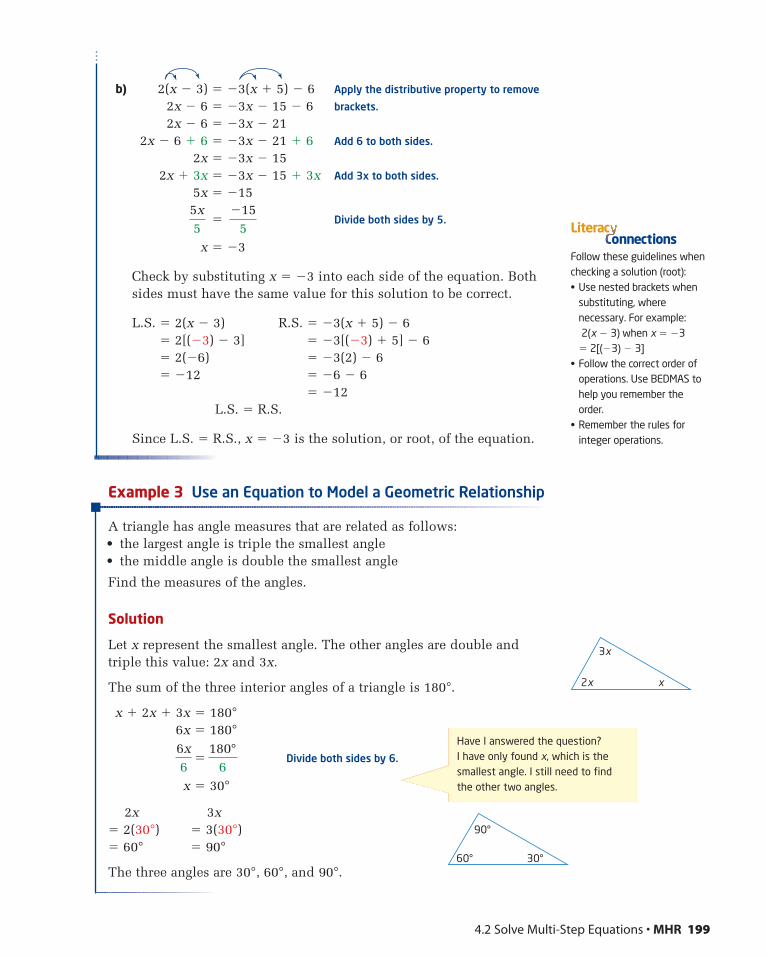
b) 2(x � 3) � �3(x � 5) � 6 Apply the distributive property to remove
2x � 6 � �3x � 15 � 6 brackets.
2x � 6 � �3x � 212x � 6 � 6 � �3x � 21 � 6 Add 6 to both sides.
2x � �3x � 152x � 3x � �3x � 15 � 3x Add 3x to both sides.
5x � �15
� Divide both sides by 5.
x � �3
Check by substituting x � �3 into each side of the equation. Bothsides must have the same value for this solution to be correct.
L.S. � 2(x � 3) R.S. � �3(x � 5) � 6� 2[(�3) � 3] � �3[(�3) � 5] � 6� 2(�6) � �3(2) � 6� �12 � �6 � 6
� �12L.S. � R.S.
Since L.S. � R.S., x � �3 is the solution, or root, of the equation.
Example 3 Use an Equation to Model a Geometric Relationship
A triangle has angle measures that are related as follows:• the largest angle is triple the smallest angle• the middle angle is double the smallest angle
Find the measures of the angles.
Solution
Let x represent the smallest angle. The other angles are double andtriple this value: 2x and 3x.
The sum of the three interior angles of a triangle is 180°.
x � 2x � 3x � 180°6x � 180°
� Divide both sides by 6.
x � 30°
2x 3x� 2(30°) � 3(30°)� 60° � 90°
The three angles are 30°, 60°, and 90°.
180°
66x6
�155
5x5
4.2 Solve Multi-Step Equations • MHR 199
Follow these guidelines whenchecking a solution (root):• Use nested brackets when
substituting, wherenecessary. For example:2(x � 3) when x � �3
� 2[(�3) � 3]• Follow the correct order of
operations. Use BEDMAS tohelp you remember theorder.
• Remember the rules forinteger operations.
onnectionsLiterac
2x x
3x
Have I answered the question? I have only found x, which is thesmallest angle. I still need to findthe other two angles.
90°
60° 30°
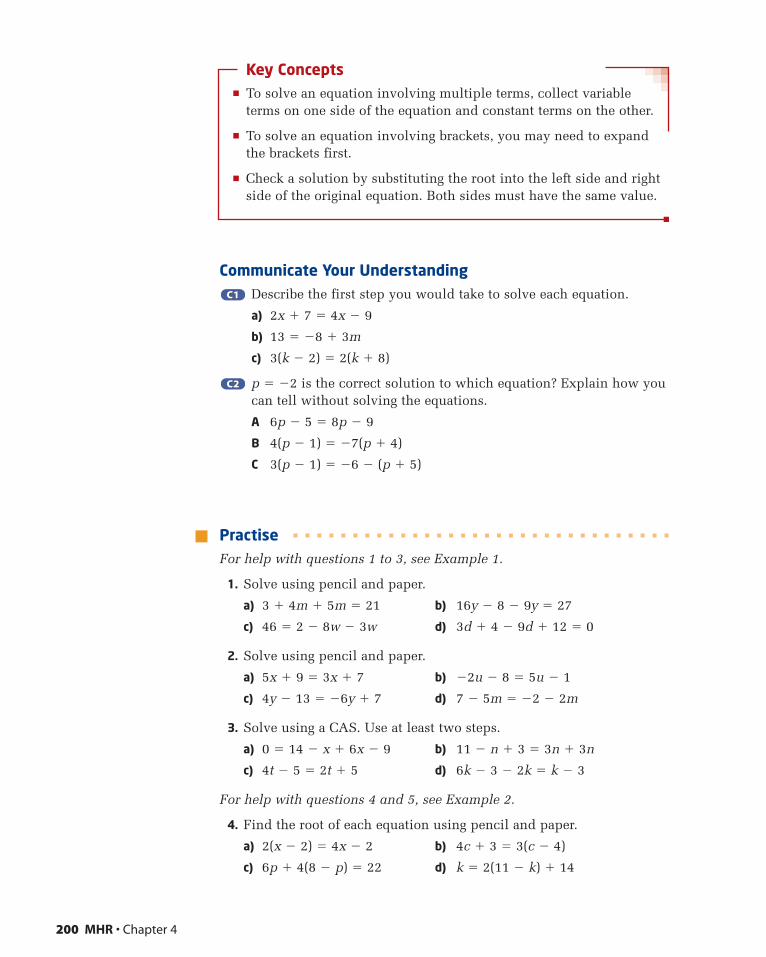
Key Concepts� To solve an equation involving multiple terms, collect variable
terms on one side of the equation and constant terms on the other.
� To solve an equation involving brackets, you may need to expandthe brackets first.
� Check a solution by substituting the root into the left side and rightside of the original equation. Both sides must have the same value.
Communicate Your UnderstandingDescribe the first step you would take to solve each equation.
a) 2x � 7 � 4x � 9
b) 13 � �8 � 3m
c) 3(k � 2) � 2(k � 8)
p � �2 is the correct solution to which equation? Explain how youcan tell without solving the equations.
A 6p � 5 � 8p � 9
B 4(p � 1) � �7(p � 4)
C 3(p � 1) � �6 � (p � 5)
PractiseFor help with questions 1 to 3, see Example 1.
1. Solve using pencil and paper.
a) 3 � 4m � 5m � 21 b) 16y � 8 � 9y � 27
c) 46 � 2 � 8w � 3w d) 3d � 4 � 9d � 12 � 0
2. Solve using pencil and paper.
a) 5x � 9 � 3x � 7 b) �2u � 8 � 5u � 1
c) 4y � 13 � �6y � 7 d) 7 � 5m � �2 � 2m
3. Solve using a CAS. Use at least two steps.
a) 0 � 14 � x � 6x � 9 b) 11 � n � 3 � 3n � 3n
c) 4t � 5 � 2t � 5 d) 6k � 3 � 2k � k � 3
For help with questions 4 and 5, see Example 2.
4. Find the root of each equation using pencil and paper.
a) 2(x � 2) � 4x � 2 b) 4c � 3 � 3(c � 4)
c) 6p � 4(8 � p) � 22 d) k � 2(11 � k) � 14
C2C2
C1C1
200 MHR • Chapter 4
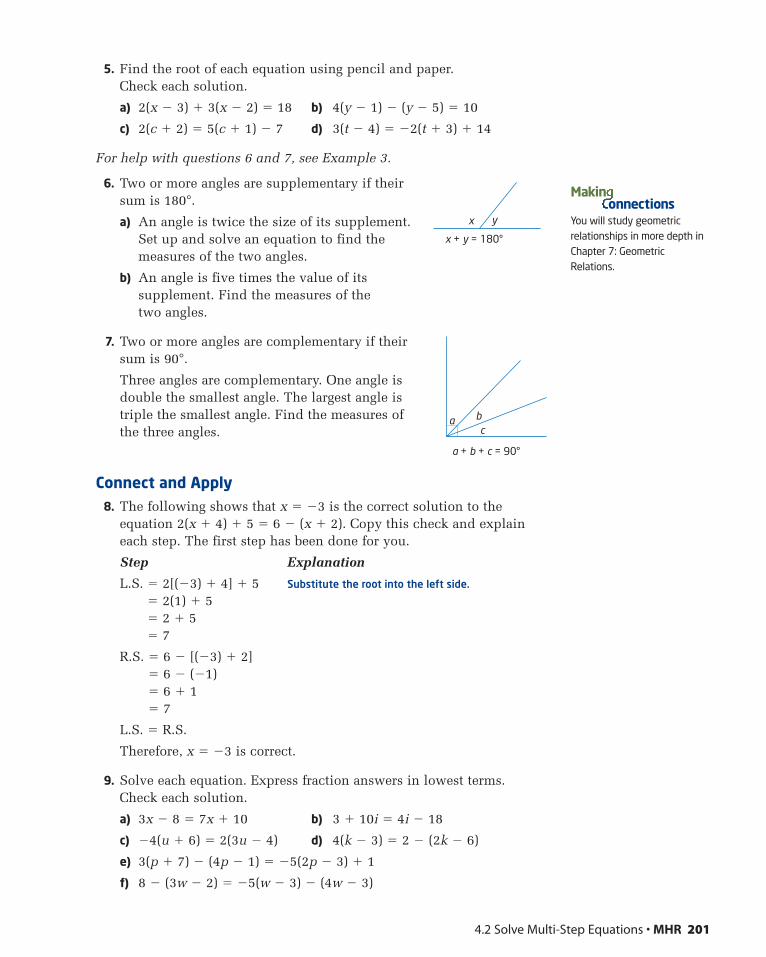
5. Find the root of each equation using pencil and paper. Check each solution.
a) 2(x � 3) � 3(x � 2) � 18 b) 4(y � 1) � (y � 5) � 10
c) 2(c � 2) � 5(c � 1) � 7 d) 3(t � 4) � �2(t � 3) � 14
For help with questions 6 and 7, see Example 3.
6. Two or more angles are supplementary if theirsum is 180°.
a) An angle is twice the size of its supplement.Set up and solve an equation to find themeasures of the two angles.
b) An angle is five times the value of itssupplement. Find the measures of the two angles.
7. Two or more angles are complementary if theirsum is 90°.
Three angles are complementary. One angle isdouble the smallest angle. The largest angle istriple the smallest angle. Find the measures of the three angles.
Connect and Apply8. The following shows that x � �3 is the correct solution to the
equation 2(x � 4) � 5 � 6 � (x � 2). Copy this check and explaineach step. The first step has been done for you.
Step Explanation
L.S. � 2[(�3) � 4] � 5 Substitute the root into the left side.
� 2(1) � 5� 2 � 5� 7
R.S. � 6 � [(�3) � 2]� 6 � (�1)� 6 � 1� 7
L.S. � R.S.
Therefore, x � �3 is correct.
9. Solve each equation. Express fraction answers in lowest terms.Check each solution.
a) 3x � 8 � 7x � 10 b) 3 � 10i � 4i � 18
c) �4(u � 6) � 2(3u � 4) d) 4(k � 3) � 2 � (2k � 6)
e) 3(p � 7) � (4p � 1) � �5(2p � 3) � 1
f) 8 � (3w � 2) � �5(w � 3) � (4w � 3)
4.2 Solve Multi-Step Equations • MHR 201
x y
x + y = 180°
a bc
a + b + c = 90°
You will study geometricrelationships in more depth inChapter 7: GeometricRelations.
Makinonnections

10. Find the root, to one decimal place. Check each answer.
a) 3.2x � 7.4 � 2.1x � 1.5
b) 3(2.5d � 1.1) � 2(5.2 � 3.3d)
11. How does a Computer Algebra System handle complicatedequations? Refer to Example 2, part a):
5(y � 3) � (y � 2) � 19
a) Enter this equation into the Home screen and press e.
b) Write down the screen output.
c) Explain what the CAS did to the equation.
d) Use the CAS to finish solving the equation.
12. Use a CAS to find the root of each equation.
a) (5q � 2) � (3 � 4q) � 4
b) 17 � (6u � 7) � (3u � 10)
13. One type of truss design commonly used to build bridges is knownas the Warren truss pattern. This features a series of equilateral orisosceles triangles.
An isosceles triangle and an equilateral triangle have the sameperimeter. Find the side lengths of each triangle.
14. A family of isosceles triangles has the property that the two equalangles are each half the value of the third angle. Find the measuresof the angles.
62x + 1
3x + 2
202 MHR • Chapter 4
An isosceles triangle has twoequal sides and two equalangles.
onnectionsLiterac
Selecting ToolsRepresenting
Reasoning and Proving
Communicating
Connecting Reflecting
Problem Solving
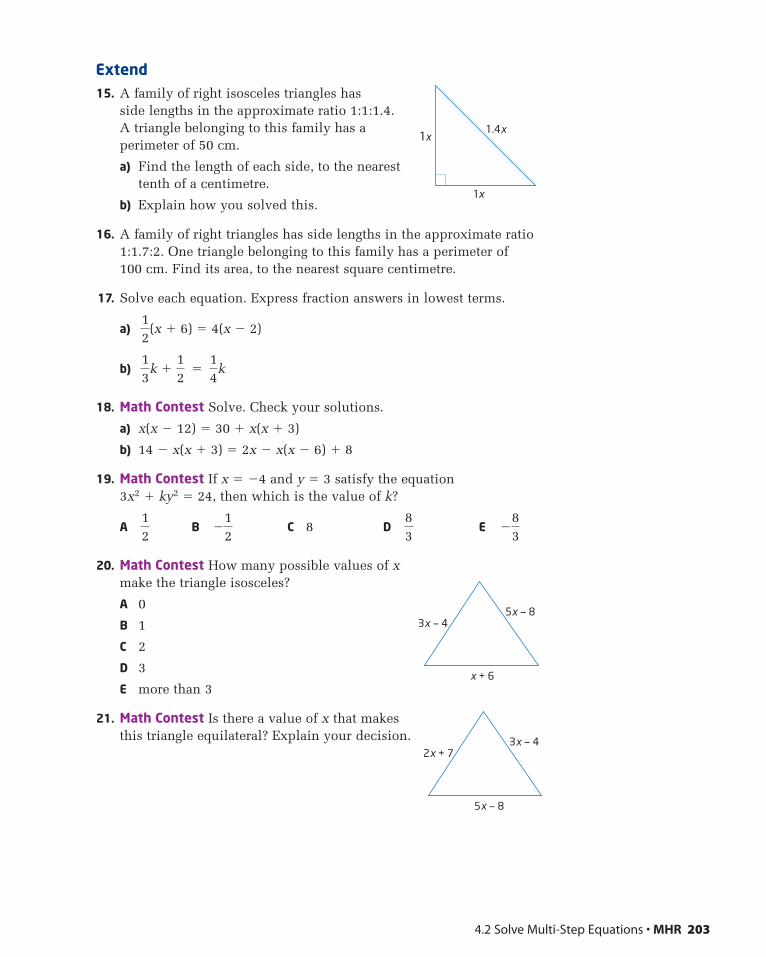
Extend15. A family of right isosceles triangles has
side lengths in the approximate ratio 1:1:1.4.A triangle belonging to this family has aperimeter of 50 cm.
a) Find the length of each side, to the nearesttenth of a centimetre.
b) Explain how you solved this.
16. A family of right triangles has side lengths in the approximate ratio1:1.7:2. One triangle belonging to this family has a perimeter of 100 cm. Find its area, to the nearest square centimetre.
17. Solve each equation. Express fraction answers in lowest terms.
a)
b) �
18. Math Contest Solve. Check your solutions.
a) x(x � 12) � 30 � x(x � 3)
b) 14 � x(x � 3) � 2x � x(x � 6) � 8
19. Math Contest If x � �4 and y � 3 satisfy the equation 3x2 � ky2 � 24, then which is the value of k?
A B C 8 D E
20. Math Contest How many possible values of xmake the triangle isosceles?
A 0
B 1
C 2
D 3
E more than 3
21. Math Contest Is there a value of x that makesthis triangle equilateral? Explain your decision.
�83
83
�12
12
14
k13
k �12
12
(x � 6) � 4(x � 2)
4.2 Solve Multi-Step Equations • MHR 203
1x
1x
1.4x
3x — 45x — 8
x + 6
2x + 73x — 4
5x — 8
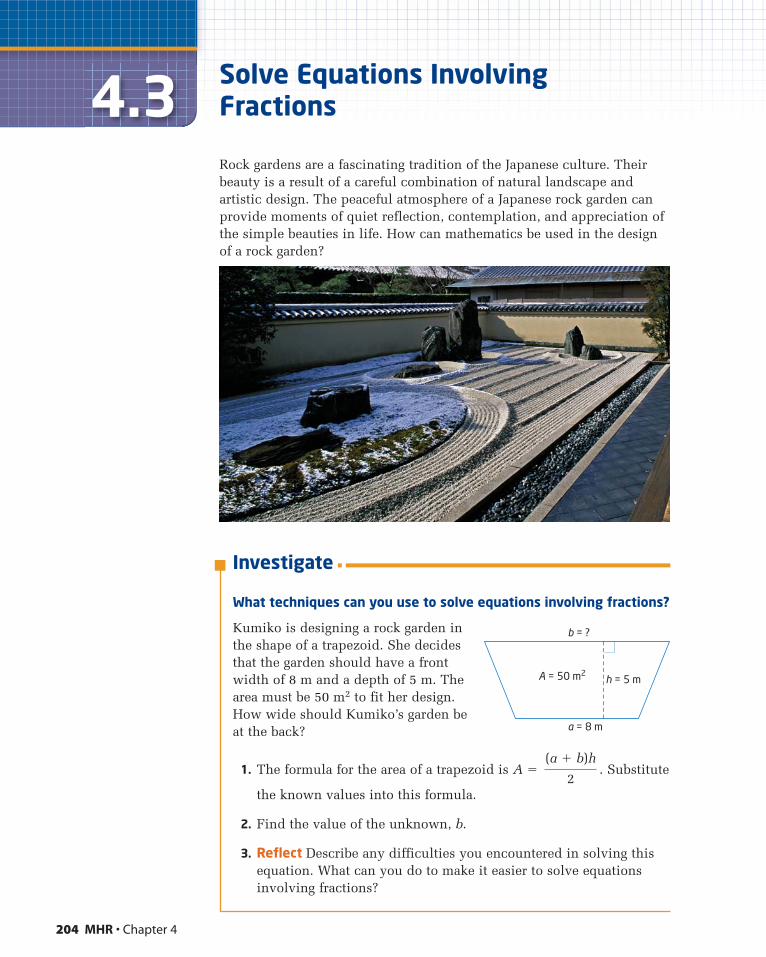
204 MHR • Chapter 4
4.3Rock gardens are a fascinating tradition of the Japanese culture. Theirbeauty is a result of a careful combination of natural landscape andartistic design. The peaceful atmosphere of a Japanese rock garden canprovide moments of quiet reflection, contemplation, and appreciation ofthe simple beauties in life. How can mathematics be used in the designof a rock garden?
Solve Equations InvolvingFractions
Investigate
What techniques can you use to solve equations involving fractions?
Kumiko is designing a rock garden inthe shape of a trapezoid. She decidesthat the garden should have a frontwidth of 8 m and a depth of 5 m. Thearea must be 50 m2 to fit her design.How wide should Kumiko’s garden beat the back?
1. The formula for the area of a trapezoid is A � . Substitute
the known values into this formula.
2. Find the value of the unknown, b.
3. Reflect Describe any difficulties you encountered in solving thisequation. What can you do to make it easier to solve equationsinvolving fractions?
(a � b)h
2
A = 50 m2
b = ?
a = 8 m
h = 5 m
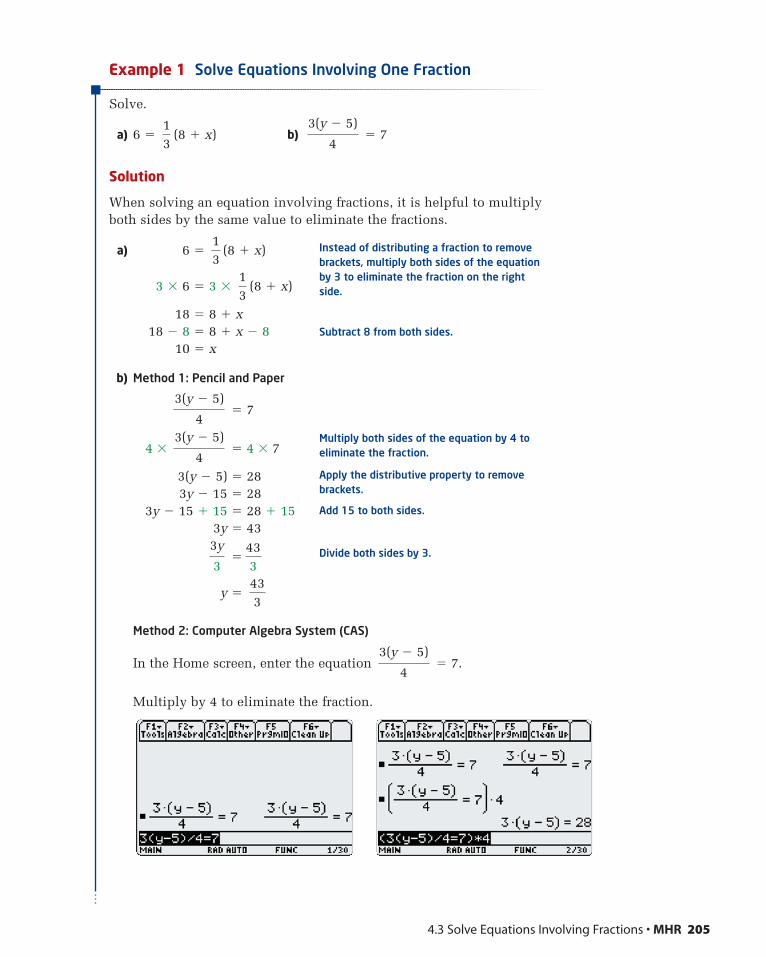
Example 1 Solve Equations Involving One Fraction
Solve.
a) 6 � (8 � x) b) � 7
Solution
When solving an equation involving fractions, it is helpful to multiplyboth sides by the same value to eliminate the fractions.
a) 6 � (8 � x)
3 � 6 � 3 � (8 � x)
18 � 8 � x18 � 8 � 8 � x � 8 Subtract 8 from both sides.
10 � x
b) Method 1: Pencil and Paper
� 7
4 � � 4 � 7
3(y � 5) � 283y � 15 � 28
3y � 15 � 15 � 28 � 153y � 43
�
y �
Method 2: Computer Algebra System (CAS)
In the Home screen, enter the equation � 7.
Multiply by 4 to eliminate the fraction.
3(y � 5)
4
433
433
3y
3
3(y � 5)
4
3(y � 5)
4
13
13
3(y � 5)
413
4.3 Solve Equations Involving Fractions • MHR 205
Instead of distributing a fraction to removebrackets, multiply both sides of the equationby 3 to eliminate the fraction on the rightside.
Multiply both sides of the equation by 4 toeliminate the fraction.
Apply the distributive property to removebrackets.
Add 15 to both sides.
Divide both sides by 3.

You can distribute the 3, oryou can simply divide bothsides by 3 to remove thebrackets.
This produces an unpleasantfraction on the right side.However, a CAS has nodifficulty working withfractions. Finish the solutionby adding 5 to both sides.
The solution is y � .
Example 2 Solve Equations With More Than One Fraction
a) Solve � .
b) Solve and check (2x � 5) � (x � 2).
Solution
a) �
�
5(k � 2) � 3(k � 4)5k � 10 � 3k � 12
5k � 10 � 3k � 10 � 3k � 12 � 3k � 102k � �22
�
k � �11
�222
2k2
153
�k � 4
51
155
�k � 2
31
k � 45
k � 23
34
13
k � 45
k � 23
433
206 MHR • Chapter 4
To find the LCD for 1—3
and 1—5
,
I’ll count by 3s and 5s.
3 6 9 12 155 10 15The LCD is 15.
Multiply both sides by thelowest common denominatorto eliminate both fractions.
Apply the distributiveproperty to remove brackets.
Subtract 3k and 10 fromboth sides.
Divide both sides by 2.
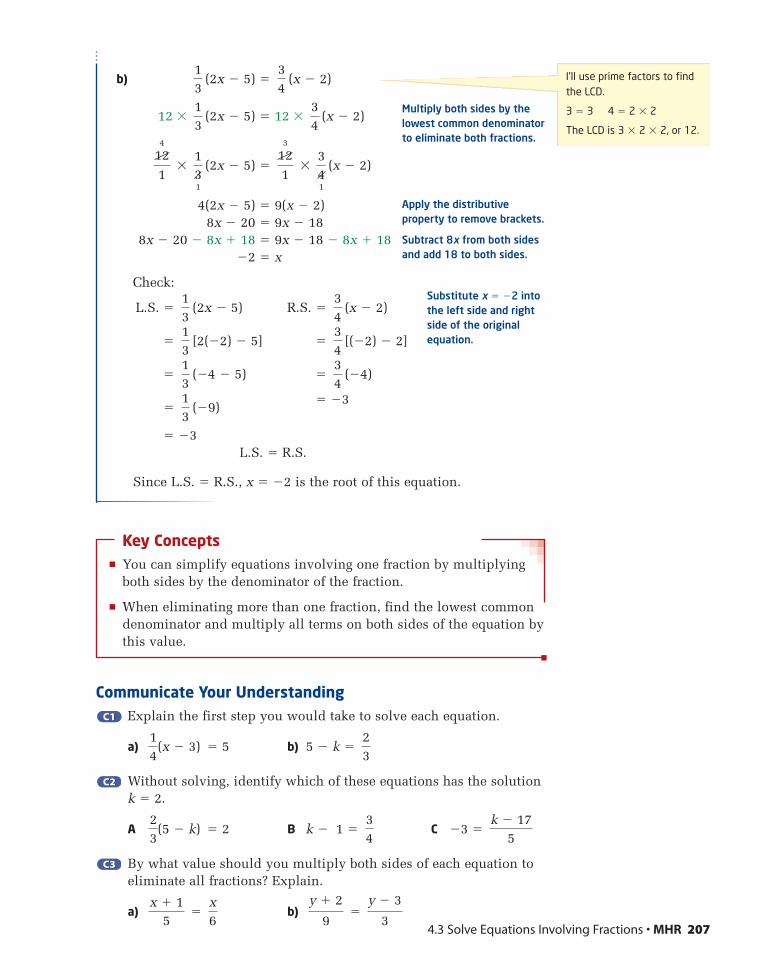
b) (2x � 5) � (x � 2)
12 � (2x � 5) � 12 � (x � 2)
� (2x � 5) � � (x � 2)
4(2x � 5) � 9(x � 2)8x � 20 � 9x � 18
8x � 20 � 8x � 18 � 9x � 18 � 8x � 18�2 � x
Check:
L.S. � (2x � 5) R.S. � (x � 2)
� [2(�2) � 5] � [(�2) � 2]
� (�4 � 5) � (�4)
� (�9)� �3
� �3L.S. � R.S.
Since L.S. � R.S., x � �2 is the root of this equation.
Key Concepts� You can simplify equations involving one fraction by multiplying
both sides by the denominator of the fraction.
� When eliminating more than one fraction, find the lowest commondenominator and multiply all terms on both sides of the equation bythis value.
Communicate Your UnderstandingExplain the first step you would take to solve each equation.
a) � 5 b) 5 � k �
Without solving, identify which of these equations has the solutionk � 2.
A � 2 B k � 1 � C �3 �
By what value should you multiply both sides of each equation toeliminate all fractions? Explain.
a) � b) �y � 3
3
y � 2
9x6
x � 15
C3C3
k � 175
34
23
(5 � k)
C2C2
23
14
(x � 3)
C1C1
13
34
13
34
13
34
13
341
123
1131
124
1
34
13
34
13
4.3 Solve Equations Involving Fractions • MHR 207
I’ll use prime factors to findthe LCD.
3 � 3 4 � 2 � 2
The LCD is 3 � 2 � 2, or 12.
Multiply both sides by thelowest common denominator to eliminate both fractions.
Apply the distributiveproperty to remove brackets.
Subtract 8x from both sidesand add 18 to both sides.
Substitute x � �2 intothe left side and rightside of the originalequation.
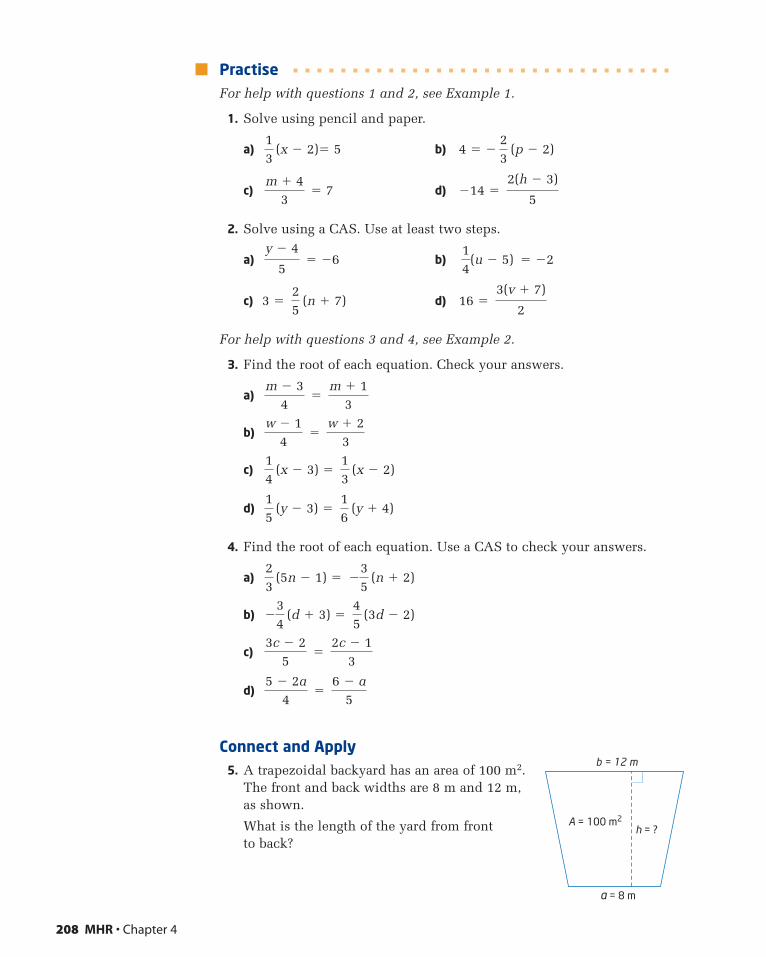
PractiseFor help with questions 1 and 2, see Example 1.
1. Solve using pencil and paper.
a) (x � 2)� 5 b) 4 � � (p � 2)
c) � 7 d) �14 �
2. Solve using a CAS. Use at least two steps.
a) � �6 b) � �2
c) 3 � (n � 7) d) 16 �
For help with questions 3 and 4, see Example 2.
3. Find the root of each equation. Check your answers.
a) �
b) �
c) (x � 3) � (x � 2)
d) (y � 3) � (y � 4)
4. Find the root of each equation. Use a CAS to check your answers.
a) (5n � 1) � (n � 2)
b) (d � 3) � (3d � 2)
c) �
d) �
Connect and Apply5. A trapezoidal backyard has an area of 100 m2.
The front and back widths are 8 m and 12 m,as shown.
What is the length of the yard from frontto back?
6 � a5
5 � 2a4
2c � 13
3c � 25
45
�34
�35
23
16
15
13
14
w � 23
w � 14
m � 13
m � 34
3(v � 7)
225
14
(u � 5)y � 4
5
2(h � 3)
5m � 4
3
23
13
208 MHR • Chapter 4
A = 100 m2
b = 12 m
a = 8 m
h = ?
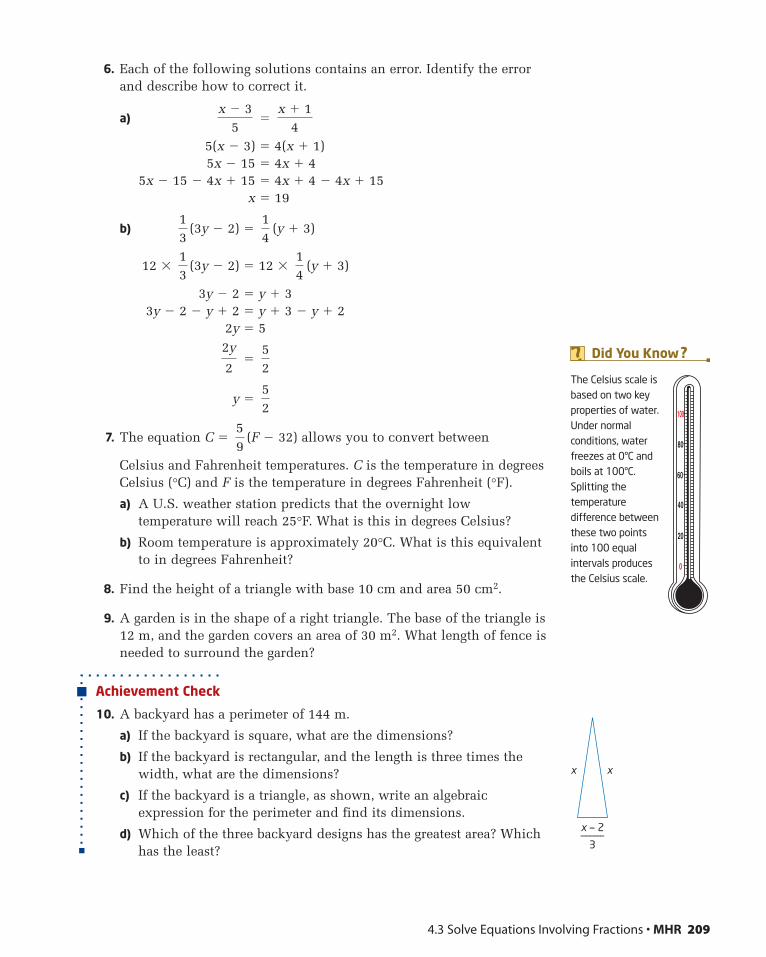
6. Each of the following solutions contains an error. Identify the errorand describe how to correct it.
a) �
5(x � 3) � 4(x � 1)5x � 15 � 4x � 4
5x � 15 � 4x � 15 � 4x � 4 � 4x � 15x � 19
b) (3y � 2) � (y � 3)
12 � (3y � 2) � 12 � (y � 3)
3y � 2 � y � 33y � 2 � y � 2 � y � 3 � y � 2
2y � 5
�
y �
7. The equation C � (F � 32) allows you to convert between
Celsius and Fahrenheit temperatures. C is the temperature in degreesCelsius (°C) and F is the temperature in degrees Fahrenheit (°F).
a) A U.S. weather station predicts that the overnight lowtemperature will reach 25°F. What is this in degrees Celsius?
b) Room temperature is approximately 20°C. What is this equivalentto in degrees Fahrenheit?
8. Find the height of a triangle with base 10 cm and area 50 cm2.
9. A garden is in the shape of a right triangle. The base of the triangle is12 m, and the garden covers an area of 30 m2. What length of fence isneeded to surround the garden?
Achievement Check
10. A backyard has a perimeter of 144 m.
a) If the backyard is square, what are the dimensions?
b) If the backyard is rectangular, and the length is three times thewidth, what are the dimensions?
c) If the backyard is a triangle, as shown, write an algebraicexpression for the perimeter and find its dimensions.
d) Which of the three backyard designs has the greatest area? Whichhas the least?
59
52
52
2y
2
14
13
14
13
x � 14
x � 35
4.3 Solve Equations Involving Fractions • MHR 209
The Celsius scale isbased on two keyproperties of water.Under normalconditions, waterfreezes at 0°C andboils at 100°C.Splitting thetemperaturedifference betweenthese two pointsinto 100 equalintervals producesthe Celsius scale.
Did You Know ?
x x
x — 2———–––
3
210 MHR • Chapter 4
Extend11. Solve.
a) � b) �
12. Fahad called Sara over. “I’m stuck on this question about equations,”he said.
“Where did you get it from?” asked Sara.
“From my older brother’s book,” Fahad told her. “It asks you to findthe roots of x(x � 5) � 0. I know how to solve equations, but thisone is different.”
Sara said “I know! The answer is x � 0! If I substitute 0, it works!”
“Great!” said Fahad. “But the book says there are two roots.”
“Well,” said Sara, “if a � b � 0, then either a � 0 or b � 0.”
“I’ve got it!” said Fahad.“The other solution is x � 5, because it makesthe value of the secondbracket zero.”
“Excellent!” said Sara.
Solve these questionsfrom Fahad’s brother’sbook.
a) (x � 3)(x � 7) � 0(2 roots)
b) x(x � 4)(x � 2) � 0(3 roots)
13. Math Contest Diophantus of Alexandria was born around the year200. He is known as the Father of Arithmetic. A puzzle aboutDiophantus is as follows:
“His boyhood lasted one sixth of his life. He married after oneseventh more. His beard grew after one twelfth more and his son wasborn 5 years later. The son lived to half his father’s final age, and thefather died 4 years after the son.”
How old was Diophantus when he died?
3u2
�2u � 1
5u � 3
4� 2
12
3p
4�
p � 5
3

4.4 Modelling With Formulas • MHR 211
Investigate
How can you use formulas to solve problems?
Have you ever seen a ship disappear over the horizon? This happens because of the curvature of Earth. The higher you are above the surface of Earth, the farther away the horizon appears. The relationshipbetween how high you are and how far you can see is given by the
where h is your height, in metres, above groundand d is the distance, in kilometres, to the horizon.Use this relationship to answer the following.
1. How far can you see from each? Round youranswers to the nearest kilometre.
a) the 360 Restaurant
b) the Sky Pod observation deck
2. a) How high would you have to go for thehorizon to appear to be 100 km away?Round your answer to the nearest metre.
b) Explain how you found your answer.
3. Reflect Explain how you can use formulas indifferent ways to solve problems. Think ofother formulas that you have used before. Useone of them to illustrate your explanation.
d � 223.2h
formula
4.4The CN Tower, in downtown Toronto, is theworld’s tallest freestanding structure. It wasbuilt in the 1970s as a giant radio antenna.Every year, thousands of tourists enjoy athrilling ride to the top and a breathtakingview. Have you ever been up the CN Tower?How far can you see?
� describes an algebraicrelationship between twoor more variables
formula
Modelling With Formulas
Sky Pod
360Restaurant
447 m351 m
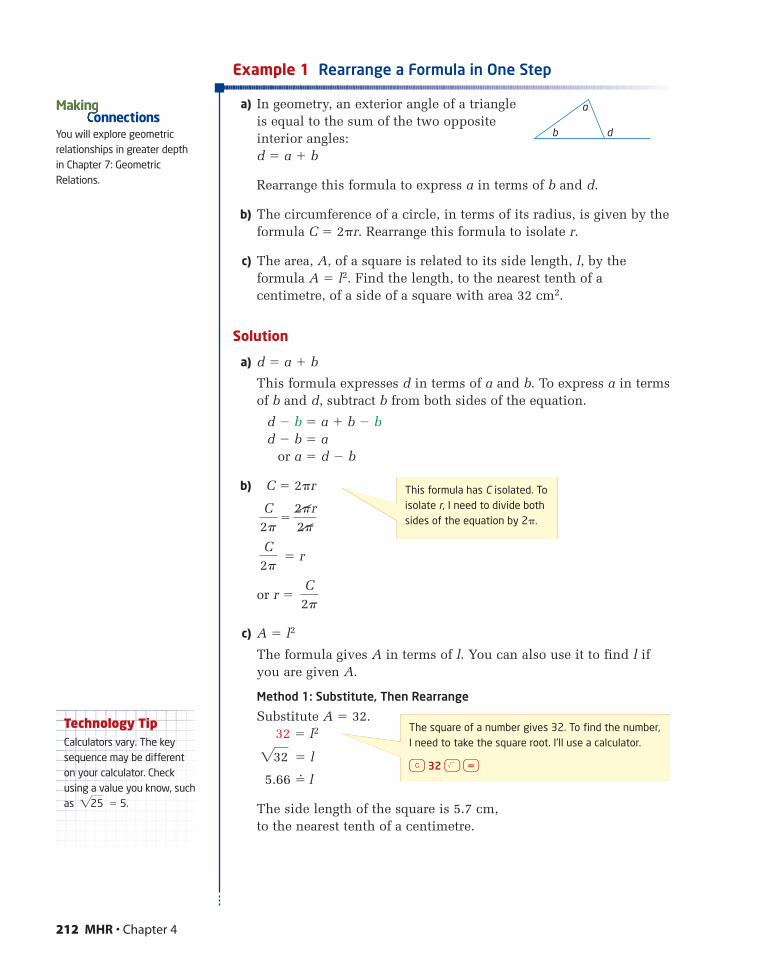
Example 1 Rearrange a Formula in One Step
a) In geometry, an exterior angle of a triangle is equal to the sum of the two oppositeinterior angles:d � a � b
Rearrange this formula to express a in terms of b and d.
b) The circumference of a circle, in terms of its radius, is given by theformula C � 2�r. Rearrange this formula to isolate r.
c) The area, A, of a square is related to its side length, l, by theformula A � l2. Find the length, to the nearest tenth of acentimetre, of a side of a square with area 32 cm2.
Solution
a) d � a � b
This formula expresses d in terms of a and b. To express a in termsof b and d, subtract b from both sides of the equation.
d � b � a � b � bd � b � a
or a � d � b
b) C � 2�r
�
� r
or r �
c) A � l2
The formula gives A in terms of l. You can also use it to find l ifyou are given A.
Method 1: Substitute, Then Rearrange
Substitute A � 32.32 � l2
� l
5.66 �� l
The side length of the square is 5.7 cm, to the nearest tenth of a centimetre.
232
C2p
C2p
2pr2p
C2p
212 MHR • Chapter 4
a
b dYou will explore geometricrelationships in greater depthin Chapter 7: GeometricRelations.
Makinonnections
The square of a number gives 32. To find the number,I need to take the square root. I’ll use a calculator.
ç 32 ◊ =
Technology TipCalculators vary. The keysequence may be differenton your calculator. Checkusing a value you know, suchas � 5.225
This formula has C isolated. Toisolate r, I need to divide bothsides of the equation by 2�.
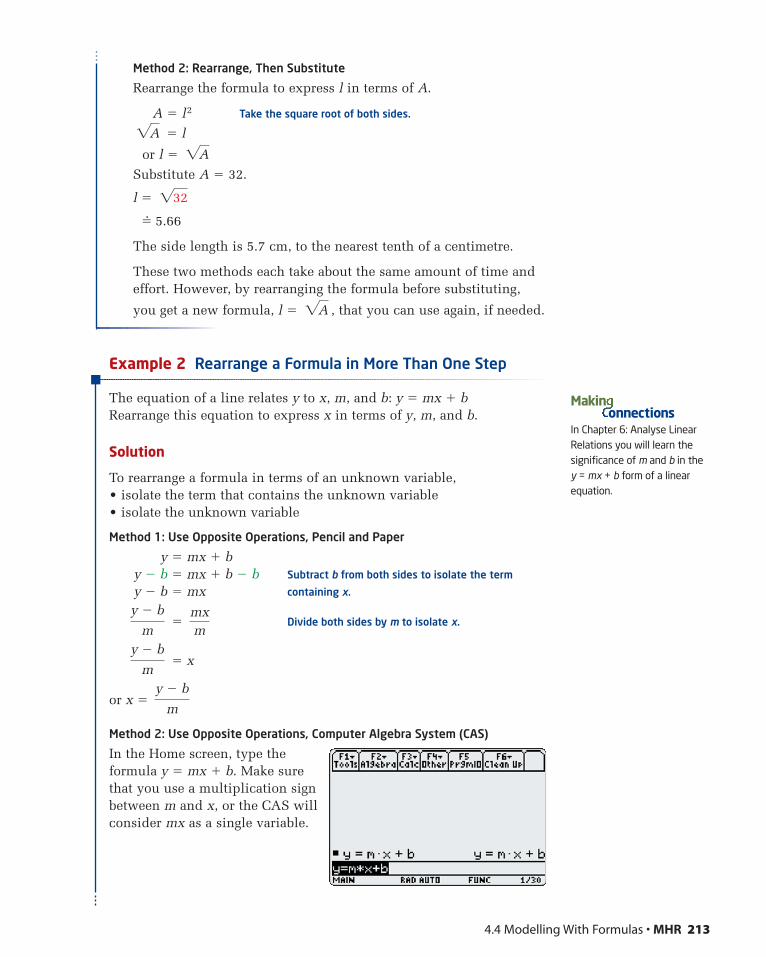
4.4 Modelling With Formulas • MHR 213
Method 2: Rearrange, Then Substitute
Rearrange the formula to express l in terms of A.
A � l2 Take the square root of both sides.
� l
or l �
Substitute A � 32.
l �
�� 5.66
The side length is 5.7 cm, to the nearest tenth of a centimetre.
These two methods each take about the same amount of time andeffort. However, by rearranging the formula before substituting,
you get a new formula, l � , that you can use again, if needed.
Example 2 Rearrange a Formula in More Than One Step
The equation of a line relates y to x, m, and b: y � mx � bRearrange this equation to express x in terms of y, m, and b.
Solution
To rearrange a formula in terms of an unknown variable,• isolate the term that contains the unknown variable• isolate the unknown variable
Method 1: Use Opposite Operations, Pencil and Paper
y � mx � by � b � mx � b � b Subtract b from both sides to isolate the term
y � b � mx containing x.
� Divide both sides by m to isolate x.
� x
or x �
Method 2: Use Opposite Operations, Computer Algebra System (CAS)
In the Home screen, type theformula y � mx � b. Make surethat you use a multiplication signbetween m and x, or the CAS willconsider mx as a single variable.
y � b
m
y � b
m
mxm
y � b
m
2A
232
2A
2A
In Chapter 6: Analyse LinearRelations you will learn thesignificance of m and b in they = mx + b form of a linearequation.
Makinonnections
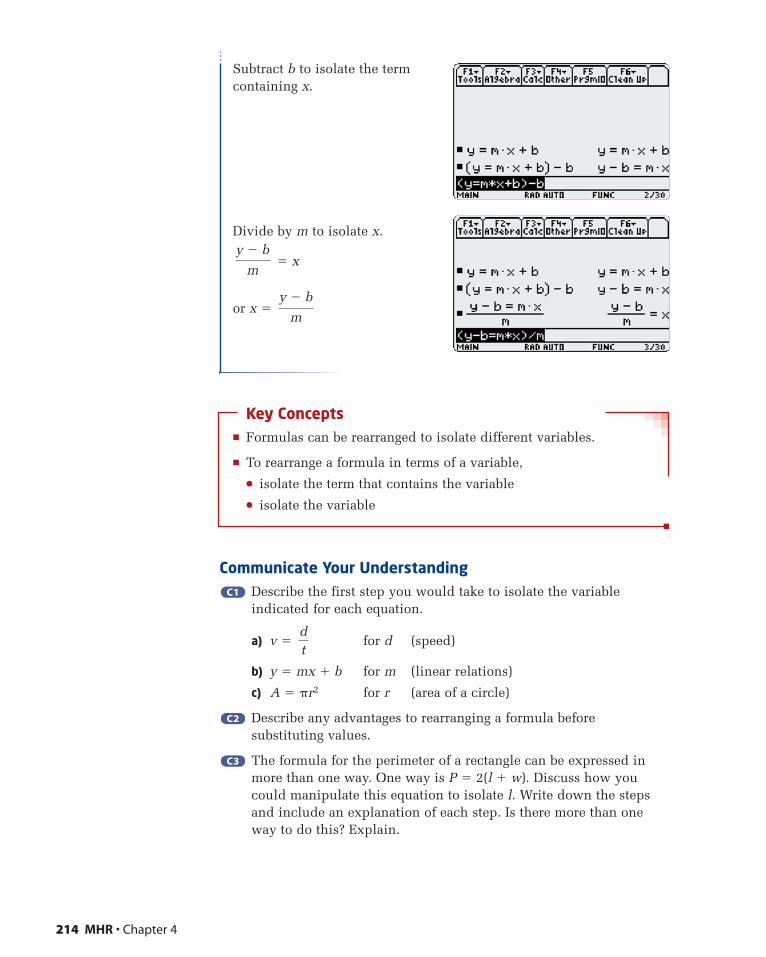
Subtract b to isolate the termcontaining x.
Divide by m to isolate x.
� x
or x �
Key Concepts� Formulas can be rearranged to isolate different variables.
� To rearrange a formula in terms of a variable,
� isolate the term that contains the variable
� isolate the variable
Communicate Your UnderstandingDescribe the first step you would take to isolate the variableindicated for each equation.
a) v � for d (speed)
b) y � mx � b for m (linear relations)
c) A � �r2 for r (area of a circle)
Describe any advantages to rearranging a formula beforesubstituting values.
The formula for the perimeter of a rectangle can be expressed inmore than one way. One way is P � 2(l � w). Discuss how youcould manipulate this equation to isolate l. Write down the stepsand include an explanation of each step. Is there more than oneway to do this? Explain.
C3C3
C2C2
dt
C1C1
y � b
m
y � b
m
214 MHR • Chapter 4
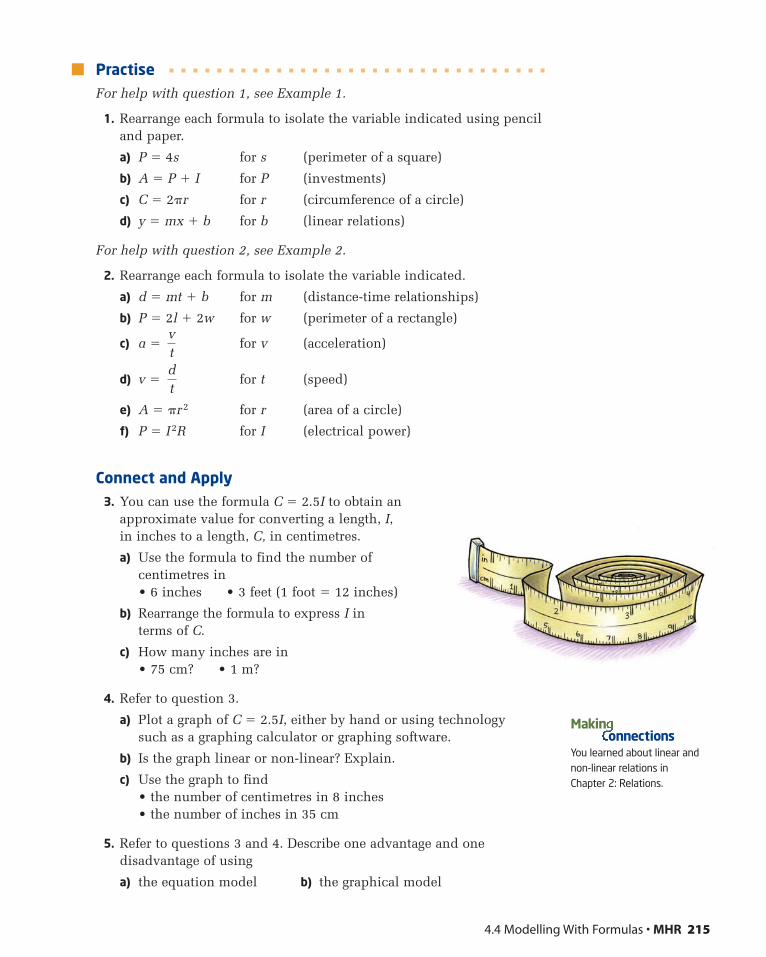
4.4 Modelling With Formulas • MHR 215
PractiseFor help with question 1, see Example 1.
1. Rearrange each formula to isolate the variable indicated using penciland paper.
a) P � 4s for s (perimeter of a square)
b) A � P � I for P (investments)
c) C � 2�r for r (circumference of a circle)
d) y � mx � b for b (linear relations)
For help with question 2, see Example 2.
2. Rearrange each formula to isolate the variable indicated.
a) d � mt � b for m (distance-time relationships)
b) P � 2l � 2w for w (perimeter of a rectangle)
c) a � for v (acceleration)
d) v � for t (speed)
e) A � �r2 for r (area of a circle)
f) P � I2R for I (electrical power)
Connect and Apply3. You can use the formula C � 2.5I to obtain an
approximate value for converting a length, I, in inches to a length, C, in centimetres.
a) Use the formula to find the number of centimetres in• 6 inches • 3 feet (1 foot � 12 inches)
b) Rearrange the formula to express I in terms of C.
c) How many inches are in• 75 cm? • 1 m?
4. Refer to question 3.
a) Plot a graph of C � 2.5I, either by hand or using technology such as a graphing calculator or graphing software.
b) Is the graph linear or non-linear? Explain.
c) Use the graph to find• the number of centimetres in 8 inches• the number of inches in 35 cm
5. Refer to questions 3 and 4. Describe one advantage and onedisadvantage of using
a) the equation model b) the graphical model
dt
vt
You learned about linear andnon-linear relations in Chapter 2: Relations.
Makinonnections
6. Kwok is a hotel manager. His responsibilities include renting roomsfor conferences. The hotel charges $250 per day plus $15 per personfor the grand ballroom.
a) Create a formula that relates the cost, C, in dollars, of renting theballroom to the number of people, n.
b) How much should Kwok charge to rent the hall for• 50 people?• 100 people?
c) Rearrange your formula to express n in terms of C.
d) How many people could attend a wedding reception if thewedding planners have a budget of• $4000?• $2000?
e) In part d), is it better to substitute into the original equation or therearranged equation? Explain.
f) Is the relationship between cost and number of guests linear ornon-linear? Explain how you can tell.
7. Chapter Problem As Canadian Superstar nears its finale, the judgeshave narrowed the competition down to two finalists, Jodie andQuentin. They have one final performance, and the judges willaward a score out of 10 for each of the following criteria:• vocal performance, v• movement, m• stage presence, p
The formula S � 7v � 5m � 3p will be used to determine eachcompetitor’s overall score, S.
a) After Jodie’s performance, the judges awarded her scores of 9 forvocal performance, 7 for movement, and 7 for stage presence.What is Jodie’s overall score?
b) It is Quentin’s turn. Quentin thinks he can match Jodie on vocalperformance, but will likely score only a 6 on movement. CanQuentin win the competition? If so, what is the minimum scorehe must obtain for stage presence?
8. The area, A, of a square is related to its perimeter, P, by the formula
A �
a) Rearrange this formula to express P in terms of A.
b) Find the perimeter of a square with area• 25 cm2 • 50 cm2
P˛
2
16
216 MHR • Chapter 4
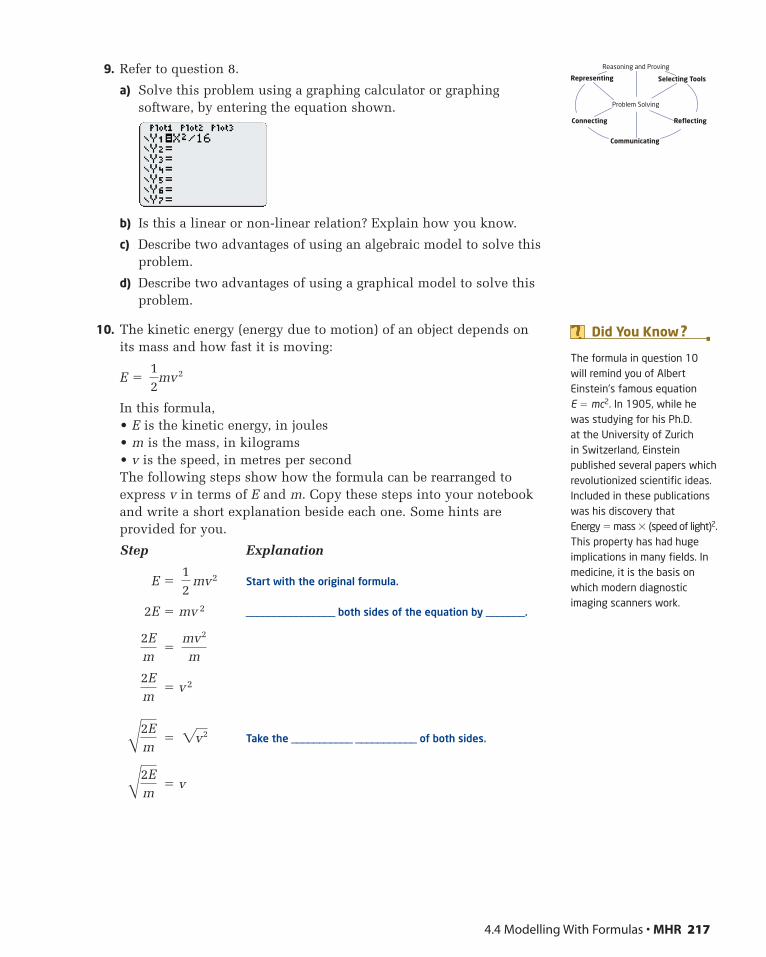
4.4 Modelling With Formulas • MHR 217
9. Refer to question 8.
a) Solve this problem using a graphing calculator or graphingsoftware, by entering the equation shown.
b) Is this a linear or non-linear relation? Explain how you know.
c) Describe two advantages of using an algebraic model to solve thisproblem.
d) Describe two advantages of using a graphical model to solve thisproblem.
10. The kinetic energy (energy due to motion) of an object depends onits mass and how fast it is moving:
E �
In this formula,• E is the kinetic energy, in joules• m is the mass, in kilograms• v is the speed, in metres per secondThe following steps show how the formula can be rearranged toexpress v in terms of E and m. Copy these steps into your notebookand write a short explanation beside each one. Some hints areprovided for you.
Step Explanation
E � mv2 Start with the original formula.
2E � mv 2 ________________ both sides of the equation by _______.
�
� v2
� Take the ___________ ___________ of both sides.
� vB2Em
2v˛˛
2B2Em
2Em
mv˛˛
2
m2Em
12
12
mv˛˛˛
2
Selecting ToolsRepresenting
Reasoning and Proving
Communicating
Connecting Reflecting
Problem Solving
The formula in question 10 will remind you of AlbertEinstein’s famous equation E � mc2. In 1905, while he was studying for his Ph.D. at the University of Zurich in Switzerland, Einsteinpublished several papers whichrevolutionized scientific ideas.Included in these publicationswas his discovery that Energy � mass � (speed of light)2.This property has had hugeimplications in many fields. Inmedicine, it is the basis onwhich modern diagnosticimaging scanners work.
Did You Know ?

11. Use the formula in question 10 to solve this problem.
Two koala bears, Rocco and Biff, are wrestling in a meadow, whensuddenly they notice a nice clump of eucalyptus fall to the ground.Both bears bolt for the tasty treat at the same time. Rocco’s mass is5 kg and he has 4.2 J of kinetic energy. Biff is half a kilogram heavierthan Rocco, but has 1 J more of kinetic energy.
a) Who will reach the eucalyptus first? Explain how you know.
b) How much more kinetic energy would the slower bear have toexert for the two bears to reach the eucalyptus at the same time?
12. Sometimes the same formula can have many different forms. PV � nRT is a useful formula in chemistry. It relates thecharacteristics of a gas:
a) Rearrange this formula to isolate each variable. The first one isdone for you as an example:
PV � nRT
�
P � The formula is rearranged to isolate pressure, P.
b) Explain when these forms may be more useful than the form PV � nRT.
Extend13. The area, A, of a square is related to its side length, l, by the formula
A � l 2.
a) Express l in terms of A.
b) Graph both formulas using a graphing calculator or graphingsoftware.
c) How are the graphs similar?
d) How are they different?
14. The volume, V, of a cube is related to its side length, l, by theformula V � l 3.
a) Rearrange the formula to express l in terms of V.
b) Graph both formulas and comment on any similarities ordifferences you see.
nRTV
nRTV
PVV
218 MHR • Chapter 4
You will explore measurementrelationships in greater depthin Chapter 8: Measurementand Chapter 9: Optimization.
Makinonnections
Variable Characteristic
P pressure
V volume
R universal gas constant
n number of moles, or how much gas there is
T temperature
4.4 Modelling With Formulas • MHR 219
15. The distance an accelerating object travels is related to its initialspeed, v, its rate of acceleration, a, and time, t:
d � vt �
a) Rearrange this formula to isolate v.
b) An object travels 30 m while accelerating at a rate of 6 m/s2
for 3 s. What was its initial speed?
16. Refer to the formula in question 15.
a) Rearrange the formula to isolate a.
b) What acceleration would be required for the object in question 15part b) to have travelled twice the distance in the same time interval?
17. Math Contest The formula for keyboarding speed (s) is s � ,
where e is the number of errors, w is the number of words typed, andt is the time, in minutes. Solve the formula for e and find the numberof errors made by Saher, who typed 400 words in 5 min, and had akeyboarding speed of 70 words per minute.
18. Math Contest The period (time for one complete swing back andforth) p, in seconds, of a pendulum is related to its length, L, in
metres, by the formula p � 2� , where g � 9.8 m/s2 is a constant.
Solve this formula for L, and find the length needed for thependulum to have a period of 1 s.
19. Math Contest The escape velocity (speed needed to escape a planet’s
gravitational field), in metres per second, is given by v � .
M � 5.98 � 1024 kg is the mass of the Earth, G � 0.000 000 000 066 73 (a constant), and r is the radius of the orbit. The average radius of Earth is 6.38 � 106 m.
a) Find the escape velocity for an Earth satellite in kilometresper second.
b) Solve the formula for M.
c) Find the mass of the planet Mars. Mars has a diameter of 6794 km. A Martian satellite requires an escape velocity of 5 km/s.
B2GM
r
BLg
w � 10et
12
at2
220 MHR • Chapter 4
4.5 Modelling WithAlgebra
Algebra is an efficient way to expressmathematical ideas. Algebraic modelling isone of many ways to solve a problem. Thebest method often depends on the type ofproblem and the preference of the problemsolver.
Investigate
How can you use algebraic modelling to solve problems?
1. Work with a partner or in a small group. One person will be themagician, and the others will be the audience. Have all studentsclose their textbooks except the magician.
Magician’s Instructions to the Audience
2. Tell the audience to pick a number from 1 to 10 and write it downso everyone but the magician can see it. Instruct the audience tocarry out the following arithmetic steps, out of view of themagician.
a) Take the number and double it.
b) Add 50.
c) Triple the result.
d) Subtract 100.
e) Divide this value in half.
f) Write down the final result and show it to the magician. Showonly the final result.
Magician’s Secret Steps to Find the Number
3. Look at the result. Announce the following: “I will now use themagic of algebra to determine your number!” Add a magic word orphrase if you like. Try not to let the audience know that you aredoing the following calculations mentally.
a) Subtract 25 from the number you see.
b) Divide by 3. The result is the number the audience picked.
c) Announce the number to the amazement of your audience. Takea bow!
4. Repeat the magic trick with a different number.
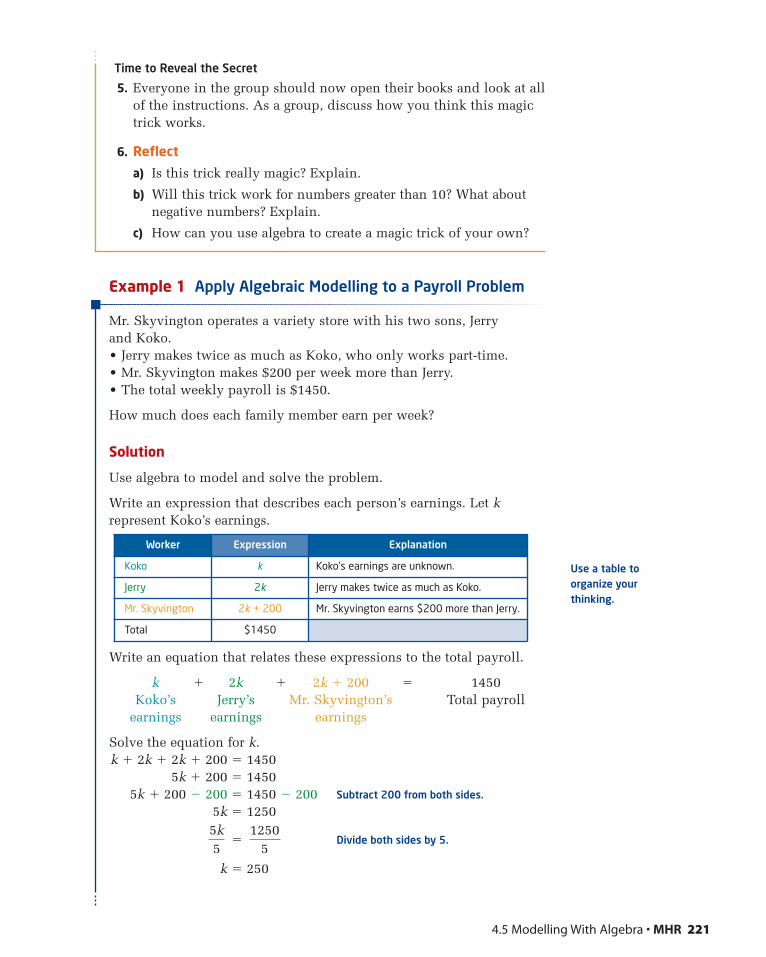
Time to Reveal the Secret
5. Everyone in the group should now open their books and look at allof the instructions. As a group, discuss how you think this magictrick works.
6. Reflect
a) Is this trick really magic? Explain.
b) Will this trick work for numbers greater than 10? What aboutnegative numbers? Explain.
c) How can you use algebra to create a magic trick of your own?
Example 1 Apply Algebraic Modelling to a Payroll Problem
Mr. Skyvington operates a variety store with his two sons, Jerry and Koko.• Jerry makes twice as much as Koko, who only works part-time.• Mr. Skyvington makes $200 per week more than Jerry.• The total weekly payroll is $1450.
How much does each family member earn per week?
Solution
Use algebra to model and solve the problem.
Write an expression that describes each person’s earnings. Let krepresent Koko’s earnings.
Write an equation that relates these expressions to the total payroll.
k � 2k � 2k � 200 � 1450Koko’s Jerry’s Mr. Skyvington’s Total payroll
earnings earnings earnings
Solve the equation for k.k � 2k � 2k � 200 � 1450
5k � 200 � 14505k � 200 � 200 � 1450 � 200 Subtract 200 from both sides.
5k � 1250
� Divide both sides by 5.
k � 250
12505
5k5
Worker Expression Explanation
Koko k Koko’s earnings are unknown.
Jerry 2k Jerry makes twice as much as Koko.
Mr. Skyvington 2k + 200 Mr. Skyvington earns $200 more than Jerry.
Total $1450
4.5 Modelling With Algebra • MHR 221
Use a table toorganize yourthinking.
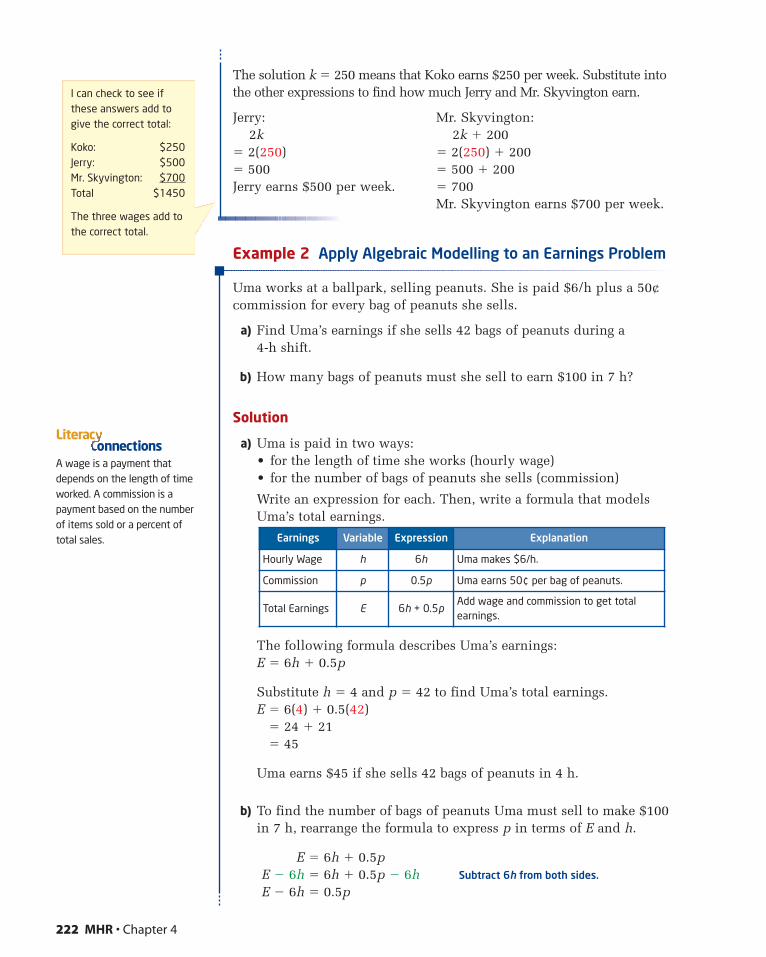
b) To find the number of bags of peanuts Uma must sell to make $100in 7 h, rearrange the formula to express p in terms of E and h.
E � 6h � 0.5pE � 6h � 6h � 0.5p � 6h Subtract 6h from both sides.
E � 6h � 0.5p
The solution k � 250 means that Koko earns $250 per week. Substitute intothe other expressions to find how much Jerry and Mr. Skyvington earn.
Jerry: Mr. Skyvington:2k 2k � 200
� 2(250) � 2(250) � 200� 500 � 500 � 200Jerry earns $500 per week. � 700
Mr. Skyvington earns $700 per week.
Example 2 Apply Algebraic Modelling to an Earnings Problem
Uma works at a ballpark, selling peanuts. She is paid $6/h plus a 50¢commission for every bag of peanuts she sells.
a) Find Uma’s earnings if she sells 42 bags of peanuts during a 4-h shift.
b) How many bags of peanuts must she sell to earn $100 in 7 h?
Solution
a) Uma is paid in two ways:• for the length of time she works (hourly wage)• for the number of bags of peanuts she sells (commission)
Write an expression for each. Then, write a formula that modelsUma’s total earnings.
The following formula describes Uma’s earnings:E � 6h � 0.5p
Substitute h � 4 and p � 42 to find Uma’s total earnings.E � 6(4) � 0.5(42)
� 24 � 21� 45
Uma earns $45 if she sells 42 bags of peanuts in 4 h.
Earnings Variable Expression Explanation
Hourly Wage h 6h Uma makes $6/h.
Commission p 0.5p Uma earns 50¢ per bag of peanuts.
Total Earnings E 6h + 0.5pAdd wage and commission to get totalearnings.
222 MHR • Chapter 4
I can check to see ifthese answers add togive the correct total:
Koko: $250Jerry: $500Mr. Skyvington: $700Total $1450
The three wages add tothe correct total.
A wage is a payment thatdepends on the length of timeworked. A commission is apayment based on the numberof items sold or a percent oftotal sales.
onnectionsLiterac
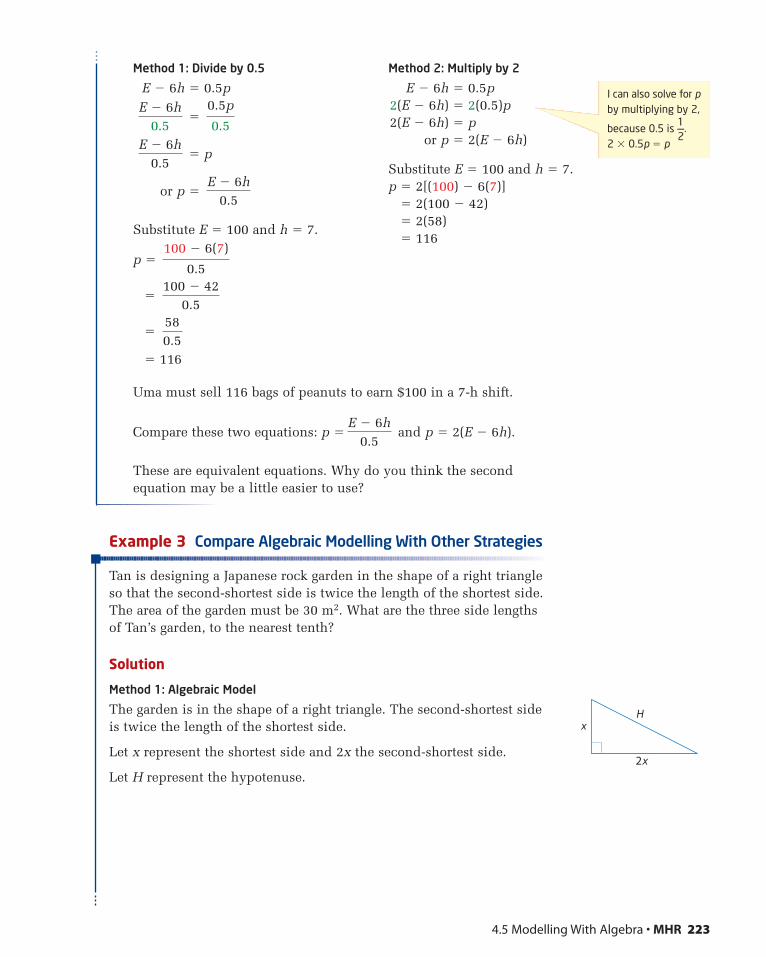
4.5 Modelling With Algebra • MHR 223
Method 1: Divide by 0.5
E � 6h � 0.5p
�
� p
or p �
Substitute E � 100 and h � 7.
p �
�
�
� 116
580.5
100 � 420.5
100 � 6(7)
0.5
E � 6h0.5
E � 6h0.5
0.5p
0.5E � 6h
0.5
Method 2: Multiply by 2
E � 6h � 0.5p2(E � 6h) � 2(0.5)p2(E � 6h) � p
or p � 2(E � 6h)
Substitute E � 100 and h � 7.p � 2[(100) � 6(7)]
� 2(100 � 42)� 2(58)� 116
Uma must sell 116 bags of peanuts to earn $100 in a 7-h shift.
Compare these two equations: p � and p � 2(E � 6h).
These are equivalent equations. Why do you think the secondequation may be a little easier to use?
Example 3 Compare Algebraic Modelling With Other Strategies
Tan is designing a Japanese rock garden in the shape of a right triangleso that the second-shortest side is twice the length of the shortest side.The area of the garden must be 30 m2. What are the three side lengthsof Tan’s garden, to the nearest tenth?
Solution
Method 1: Algebraic Model
The garden is in the shape of a right triangle. The second-shortest sideis twice the length of the shortest side.
Let x represent the shortest side and 2x the second-shortest side.
Let H represent the hypotenuse.
E � 6h0.5
I can also solve for pby multiplying by 2,
because 0.5 is 1—2
.2 � 0.5p � p
x
2x
H
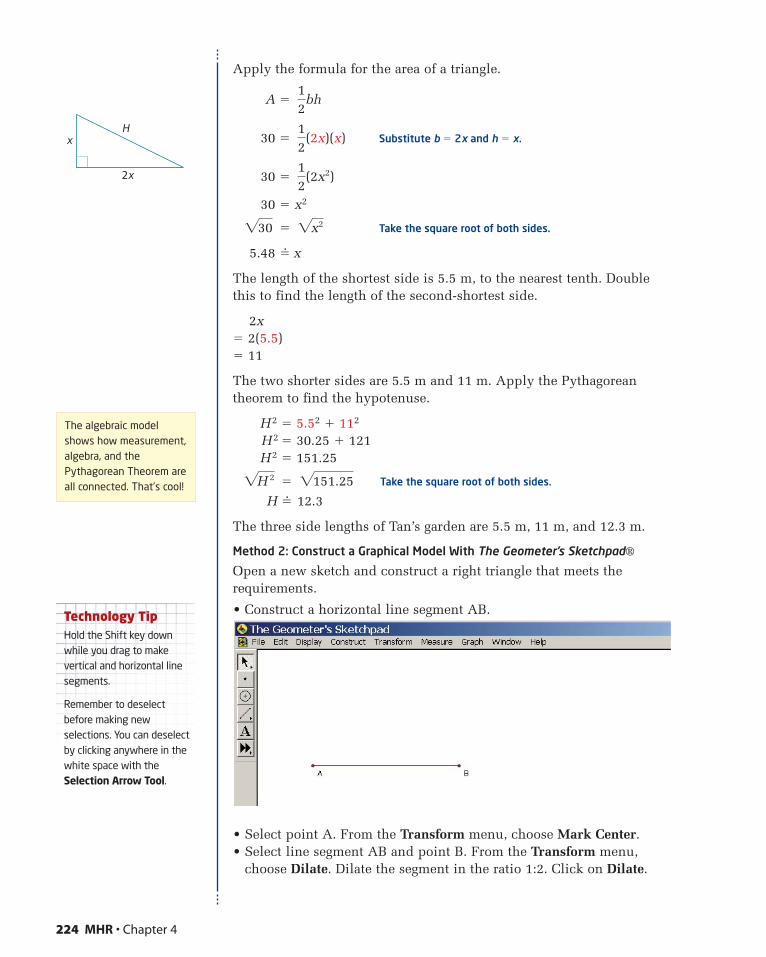
Apply the formula for the area of a triangle.
A �
30 � Substitute b � 2x and h � x.
30 �
30 � x2
� Take the square root of both sides.
5.48 �� x
The length of the shortest side is 5.5 m, to the nearest tenth. Doublethis to find the length of the second-shortest side.
2x� 2(5.5)� 11
The two shorter sides are 5.5 m and 11 m. Apply the Pythagoreantheorem to find the hypotenuse.
H2 � 5.52 � 112
H2 � 30.25 � 121H2 � 151.25
� Take the square root of both sides.
H �� 12.3
The three side lengths of Tan’s garden are 5.5 m, 11 m, and 12.3 m.
Method 2: Construct a Graphical Model With The Geometer’s Sketchpad®
Open a new sketch and construct a right triangle that meets therequirements.
• Construct a horizontal line segment AB.
• Select point A. From the Transform menu, choose Mark Center.• Select line segment AB and point B. From the Transform menu,
choose Dilate. Dilate the segment in the ratio 1:2. Click on Dilate.
2151.252H˛˛˛˛˛˛
2
2x2230
12
(2x2)
12
(2x)(x)
12
bh
224 MHR • Chapter 4
Technology TipHold the Shift key downwhile you drag to makevertical and horizontal linesegments.
Remember to deselectbefore making newselections. You can deselectby clicking anywhere in thewhite space with theSelection Arrow Tool.
The algebraic modelshows how measurement,algebra, and thePythagorean Theorem areall connected. That’s cool!
x
2x
H
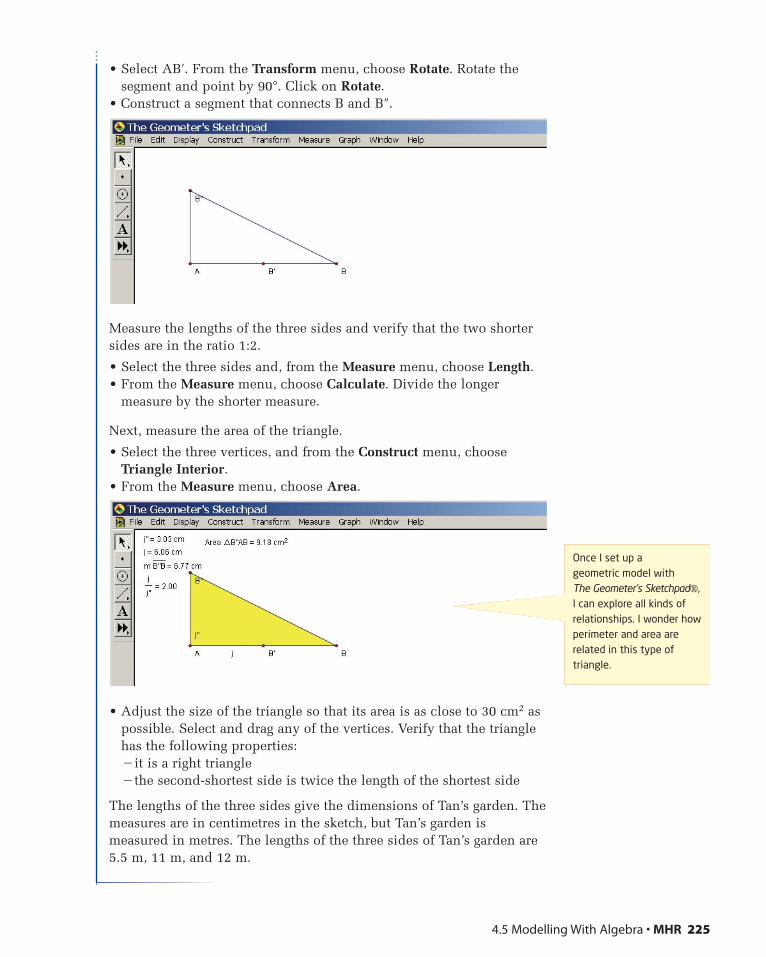
• Select AB′. From the Transform menu, choose Rotate. Rotate thesegment and point by 90°. Click on Rotate.
• Construct a segment that connects B and B″.
Measure the lengths of the three sides and verify that the two shortersides are in the ratio 1:2.
• Select the three sides and, from the Measure menu, choose Length.• From the Measure menu, choose Calculate. Divide the longer
measure by the shorter measure.
Next, measure the area of the triangle.
• Select the three vertices, and from the Construct menu, chooseTriangle Interior.
• From the Measure menu, choose Area.
• Adjust the size of the triangle so that its area is as close to 30 cm2 aspossible. Select and drag any of the vertices. Verify that the trianglehas the following properties:�it is a right triangle�the second-shortest side is twice the length of the shortest side
The lengths of the three sides give the dimensions of Tan’s garden. Themeasures are in centimetres in the sketch, but Tan’s garden ismeasured in metres. The lengths of the three sides of Tan’s garden are5.5 m, 11 m, and 12 m.
4.5 Modelling With Algebra • MHR 225
Once I set up a geometric model with The Geometer’s Sketchpad®, I can explore all kinds ofrelationships. I wonder howperimeter and area arerelated in this type oftriangle.
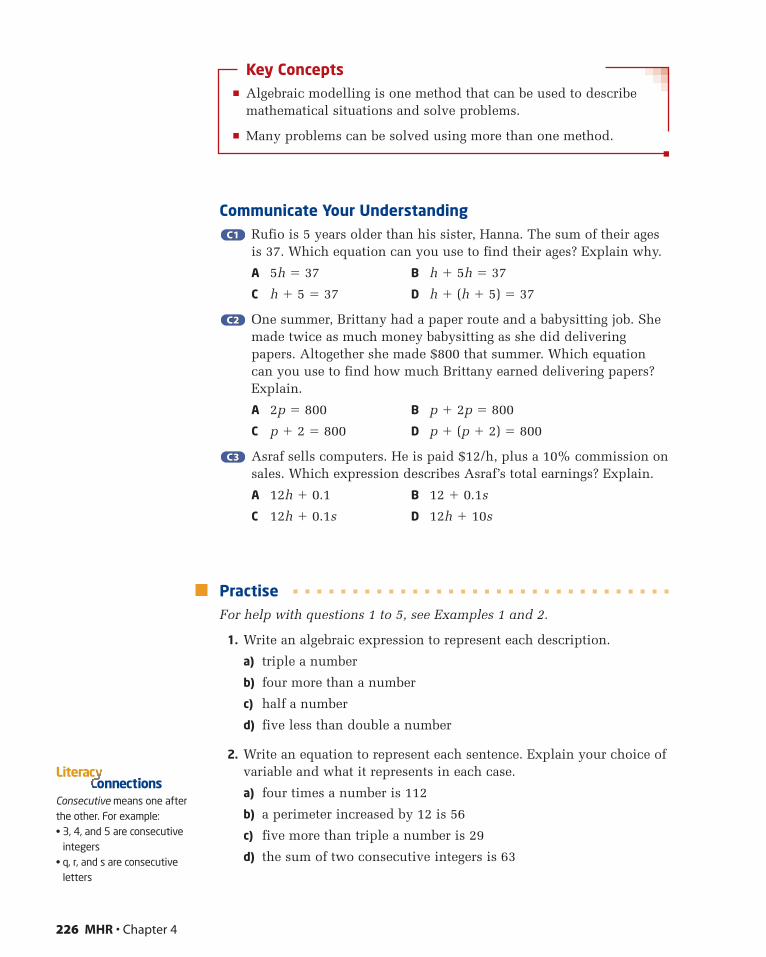
Key Concepts� Algebraic modelling is one method that can be used to describe
mathematical situations and solve problems.
� Many problems can be solved using more than one method.
Communicate Your UnderstandingRufio is 5 years older than his sister, Hanna. The sum of their agesis 37. Which equation can you use to find their ages? Explain why.
A 5h � 37 B h � 5h � 37
C h � 5 � 37 D h � (h � 5) � 37
One summer, Brittany had a paper route and a babysitting job. Shemade twice as much money babysitting as she did deliveringpapers. Altogether she made $800 that summer. Which equationcan you use to find how much Brittany earned delivering papers?Explain.
A 2p � 800 B p � 2p � 800
C p � 2 � 800 D p � (p � 2) � 800
Asraf sells computers. He is paid $12/h, plus a 10% commission onsales. Which expression describes Asraf’s total earnings? Explain.
A 12h � 0.1 B 12 � 0.1s
C 12h � 0.1s D 12h � 10s
PractiseFor help with questions 1 to 5, see Examples 1 and 2.
1. Write an algebraic expression to represent each description.
a) triple a number
b) four more than a number
c) half a number
d) five less than double a number
2. Write an equation to represent each sentence. Explain your choice ofvariable and what it represents in each case.
a) four times a number is 112
b) a perimeter increased by 12 is 56
c) five more than triple a number is 29
d) the sum of two consecutive integers is 63
C3C3
C2C2
C1C1
226 MHR • Chapter 4
Consecutive means one afterthe other. For example:• 3, 4, and 5 are consecutive
integers• q, r, and s are consecutive
letters
onnectionsLiterac
3. Solve each equation in question 2, and explain what the answermeans.
4. Estaban is 6 years older than his brother Raoul. The sum of their agesis 38. How old are the brothers?
5. Two friends enter a trivia challenge as a team. Fayth scored 200 morepoints than Jamal. As a team, they collected a total of 2250 points.How many points did each friend earn?
Connect and Apply6. Natalie, Chantal, and Samara play together as a forward line on a
hockey team. At the end of the season, Chantal had scored eightmore goals than Natalie, while Samara had scored twice as manygoals as Natalie. The three girls scored a total of 52 goals. How manygoals did each girl score?
7. Kyle sells used cars. He is paid $14/hour plus an 8% commission onsales. What dollar amount of car sales must Kyle make to earn $1200in a 38-h work week?
8. Chapter Problem At the season finale, you present the winner ofCanadian Superstar with a recording-and-tour contract. The contractstates that the winner will be paid $5000 per month while on tourplus $2 per CD sold.
a) Write an equation that relates total earnings in terms of thenumber of months, m, on tour and the number, n, of CDs sold.
b) How much will the winner earn after the first month if 500 CDsare sold?
c) Suppose after the third month on tour the new recording artisthas earned a total of $74 000. How many CDs were sold?
d) In Canada, a record album or CD achieves gold status once it sells50 000 units. How much will the artist make if the CD goes goldafter 6 months of touring?
9. The sum of three consecutive integers is 54. Find the numbers.
10. The sum of two consecutive even integers is �134. Find the numbers.
11. A circular garden has a diameter of 12 m. By how much should thediameter be increased to triple the area of the garden?
12. Refer to question 11.
a) Solve the problem using a different method.
b) Compare the two methods. Identify at least one advantage andone disadvantage of each approach.
4.5 Modelling With Algebra • MHR 227
In March 2003, Dark Side ofthe Moon, by Pink Floyd,achieved double diamondstatus in Canada for sellingover 2 000 000 units.
Did You Know ?
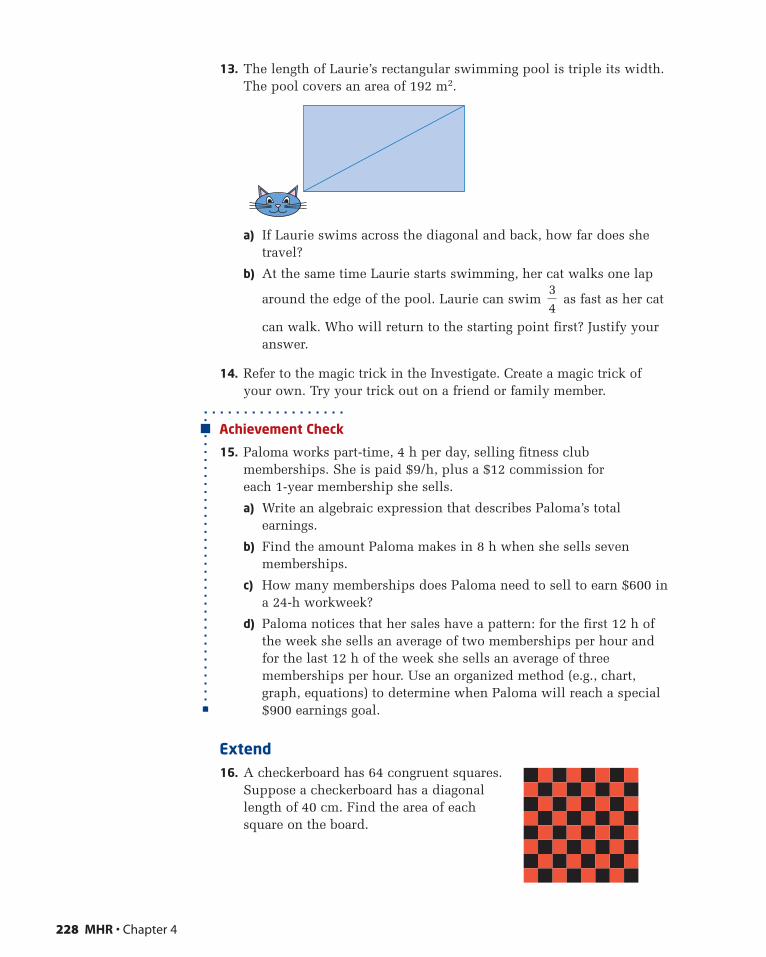
13. The length of Laurie’s rectangular swimming pool is triple its width.The pool covers an area of 192 m2.
a) If Laurie swims across the diagonal and back, how far does shetravel?
b) At the same time Laurie starts swimming, her cat walks one lap
around the edge of the pool. Laurie can swim as fast as her cat
can walk. Who will return to the starting point first? Justify youranswer.
14. Refer to the magic trick in the Investigate. Create a magic trick ofyour own. Try your trick out on a friend or family member.
Achievement Check
15. Paloma works part-time, 4 h per day, selling fitness clubmemberships. She is paid $9/h, plus a $12 commission for each 1-year membership she sells.
a) Write an algebraic expression that describes Paloma’s totalearnings.
b) Find the amount Paloma makes in 8 h when she sells sevenmemberships.
c) How many memberships does Paloma need to sell to earn $600 ina 24-h workweek?
d) Paloma notices that her sales have a pattern: for the first 12 h ofthe week she sells an average of two memberships per hour andfor the last 12 h of the week she sells an average of threememberships per hour. Use an organized method (e.g., chart,graph, equations) to determine when Paloma will reach a special$900 earnings goal.
Extend16. A checkerboard has 64 congruent squares.
Suppose a checkerboard has a diagonallength of 40 cm. Find the area of eachsquare on the board.
34
228 MHR • Chapter 4
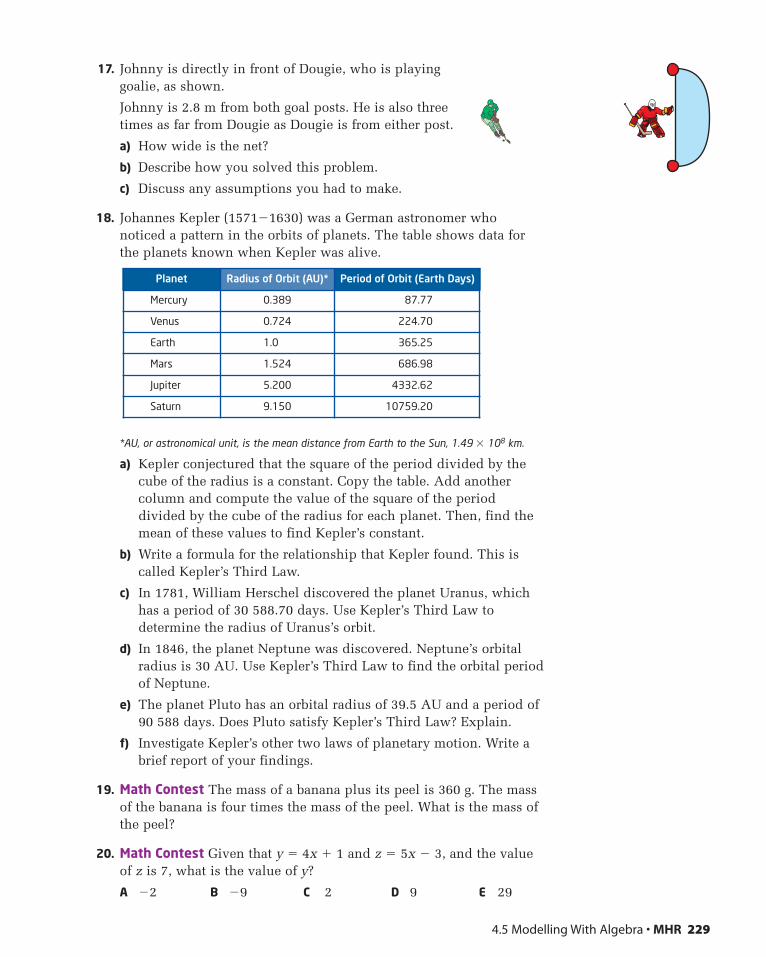
17. Johnny is directly in front of Dougie, who is playinggoalie, as shown.
Johnny is 2.8 m from both goal posts. He is also threetimes as far from Dougie as Dougie is from either post.
a) How wide is the net?
b) Describe how you solved this problem.
c) Discuss any assumptions you had to make.
18. Johannes Kepler (1571�1630) was a German astronomer whonoticed a pattern in the orbits of planets. The table shows data forthe planets known when Kepler was alive.
*AU, or astronomical unit, is the mean distance from Earth to the Sun, 1.49 � 108 km.
a) Kepler conjectured that the square of the period divided by thecube of the radius is a constant. Copy the table. Add anothercolumn and compute the value of the square of the perioddivided by the cube of the radius for each planet. Then, find themean of these values to find Kepler’s constant.
b) Write a formula for the relationship that Kepler found. This iscalled Kepler’s Third Law.
c) In 1781, William Herschel discovered the planet Uranus, whichhas a period of 30 588.70 days. Use Kepler’s Third Law todetermine the radius of Uranus’s orbit.
d) In 1846, the planet Neptune was discovered. Neptune’s orbitalradius is 30 AU. Use Kepler’s Third Law to find the orbital periodof Neptune.
e) The planet Pluto has an orbital radius of 39.5 AU and a period of90 588 days. Does Pluto satisfy Kepler’s Third Law? Explain.
f) Investigate Kepler’s other two laws of planetary motion. Write abrief report of your findings.
19. Math Contest The mass of a banana plus its peel is 360 g. The massof the banana is four times the mass of the peel. What is the mass ofthe peel?
20. Math Contest Given that y � 4x � 1 and z � 5x � 3, and the valueof z is 7, what is the value of y?
A �2 B �9 C 2 D 9 E 29
Planet Radius of Orbit (AU)* Period of Orbit (Earth Days)
Mercury 0.389 87.77
Venus 0.724 224.70
Earth 1.0 365.25
Mars 1.524 686.98
Jupiter 5.200 4332.62
Saturn 9.150 10759.20
4.5 Modelling With Algebra • MHR 229
230 MHR • Chapter 4
Chapter 4 Review
4.1 Solve Simple Equations, pages 186�195
1. Solve using pencil and paper.
a) 8 � m � �2
b) k � 7 � �11
c) 3x � 18
d) � �4
2. Find the root of each equation using penciland paper. Check each answer.
a) 2y � 7 � 13
b) 4 � 5v � �21
c) 9 � 2x � �1
d) �3s � 6 � 9
3. Find the root of each equation using aComputer Algebra System. Check eachanswer.
a) 3n � 8 � 20
b) 9 � 4r � �27
c) 5x � 2 � 18
d) �7y � 6 � �20
4. Cindy has $2.50 to spend on milk andcandy. The milk costs $0.70. Her favouritecandies cost $0.12 each.
a) Write an equation that models thenumber of candies that Cindy can afford.
b) Solve the equation.
4.2 Solve Multi-Step Equations, pages 196�203
5. Solve using pencil and paper.
a) 3 � 2m � 6m � 19
b) 7w � 4 � w � 12 � 0
c) 3x � 7 � 2x � 3
d) 5w � 6 � �4w � 3
6. Solve using a Computer Algebra System.
a) 5 � 4y � 2y � 9
b) 7 � 3k � 2 � 4k
c) 2w � 9 � 5w � 2 � 0
d) �5 � 7n � 9n � 11
7. Find the root of each equation using penciland paper. Check each solution.
a) 4 � (3p � 2) � p � 10
b) 3 � (h � 2) � 5 � 3h
c) 2(n � 8) � �4(2n � 1)
d) 3(2k � 5) � k � 4 � (3k � 7)
8. A triangle has angle measures that arerelated as follows:• the largest angle is eight times the smallest
angle• the middle angle is triple the smallest
angle
Find the measures of the angles.
4.3 Solve Equations Involving Fractions, pages 204�210
9. Find the root of each equation using penciland paper. Check each solution.
a) (x � 1)� 4
b) � �5
c) 3 � (p � 1)
d) �3 �5x � 4
7
34
b � 43
13
3x
8x x
h5
Chapter 4 Review • MHR 231
10. Find the root of each equation using aComputer Algebra System. Check each root.
a) 7 �
b) (u � 5) � 2u � 5
11. Find the solution to each equation.
a) �
b) (w � 5) � (w � 2)
c) �
d) (x � 3) � (x � 5)
4.4 Modelling With Formulas, pages 211�219
12. Rearrange each formula to isolate thevariable indicated.
a) P � a � b � c for a (perimeter of atriangle)
b) C � �d for d (circumference ofa circle)
c) a � for F (force)
d) d � mt � b for t (distance-timerelationships)
13. The power, P, in an electric circuit is relatedto the current, I, and resistance, R, by theformula P � I 2R.
a) Find the power, in watts (W), when thecurrent is 0.5 A (amperes) and theresistance is 600 � (ohms).
b) What is the resistance of a circuit that uses500 W of power with a current of 2 A?
c) The resistance in a circuit is 4 �. Thesame circuit uses 100 W of power. Findthe current in the circuit.
4.5 Modelling With Algebra, pages 220�229
14. The total of three sisters’ ages is 39. Dina ishalf as old as Michelle and 3 years youngerthan Juliette. How old are the sisters?
15. Sven sells hamburgers at a ballpark. Heearns $7.50/h, plus $0.40 for eachhamburger he sells.
a) How much will Sven earn in a 3-h shift if he sells 24 hamburgers?
b) How many hamburgers must Sven sell to earn $100 in a 6.5-h shift?
16. Hitori’s rock garden is in the shape of atrapezoid. The garden has an area of 60 m2
and a depth of 8 m. The front width isdouble the back width.
Without changing the front or back widths,by how much must Hitori increase thedepth of his garden to double its area?
17. Refer to question 16.
a) Solve this problem using a differentmethod.
b) Compare the methods. Describe at leastone advantage and one disadvantage ofeach approach.
A = 60 m2
h = 8 m
Fm
12
25
c � 56
c � 34
34
23
y � 4
2
y � 8
3
12
6q � 8
4
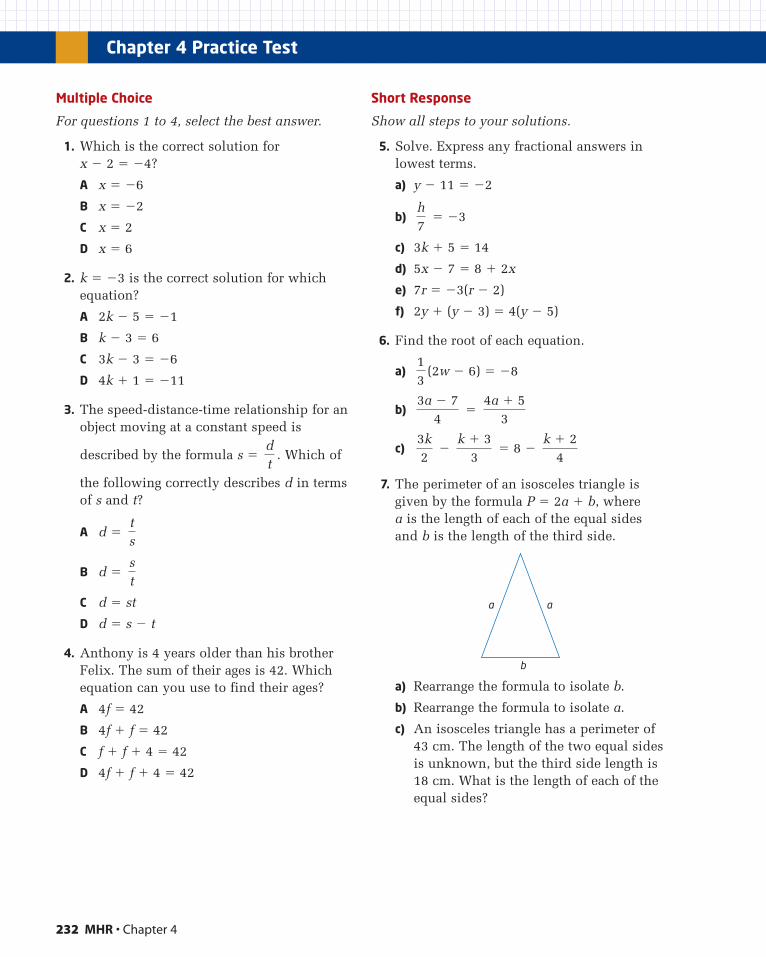
232 MHR • Chapter 4
Multiple Choice
For questions 1 to 4, select the best answer.
1. Which is the correct solution for x � 2 � �4?
A x � �6
B x � �2
C x � 2
D x � 6
2. k � �3 is the correct solution for whichequation?
A 2k � 5 � �1
B k � 3 � 6
C 3k � 3 � �6
D 4k � 1 � �11
3. The speed-distance-time relationship for anobject moving at a constant speed is
described by the formula s � . Which of
the following correctly describes d in termsof s and t?
A d �
B d �
C d � st
D d � s � t
4. Anthony is 4 years older than his brotherFelix. The sum of their ages is 42. Whichequation can you use to find their ages?
A 4f � 42
B 4f � f � 42
C f � f � 4 � 42
D 4f � f � 4 � 42
Short Response
Show all steps to your solutions.
5. Solve. Express any fractional answers inlowest terms.
a) y � 11 � �2
b) � �3
c) 3k � 5 � 14
d) 5x � 7 � 8 � 2x
e) 7r � �3(r � 2)
f) 2y � (y � 3) � 4(y � 5)
6. Find the root of each equation.
a) (2w � 6) � �8
b) �
c) � � 8 �
7. The perimeter of an isosceles triangle isgiven by the formula P � 2a � b, where a is the length of each of the equal sides and b is the length of the third side.
a) Rearrange the formula to isolate b.
b) Rearrange the formula to isolate a.
c) An isosceles triangle has a perimeter of43 cm. The length of the two equal sidesis unknown, but the third side length is18 cm. What is the length of each of theequal sides?
aa
b
k � 24
k � 33
3k2
4a � 53
3a � 74
13
h7
st
ts
dt
Chapter 4 Practice Test
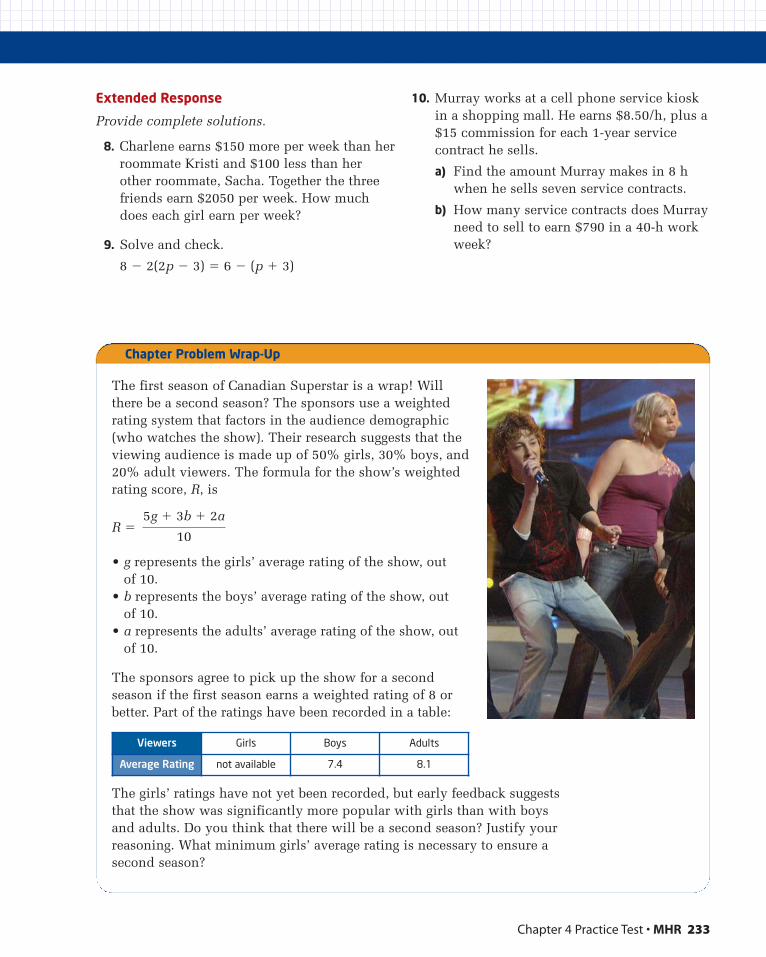
Chapter 4 Practice Test • MHR 233
Extended Response
Provide complete solutions.
8. Charlene earns $150 more per week than herroommate Kristi and $100 less than herother roommate, Sacha. Together the threefriends earn $2050 per week. How muchdoes each girl earn per week?
9. Solve and check.
8 � 2(2p � 3) � 6 � (p � 3)
10. Murray works at a cell phone service kioskin a shopping mall. He earns $8.50/h, plus a$15 commission for each 1-year servicecontract he sells.
a) Find the amount Murray makes in 8 hwhen he sells seven service contracts.
b) How many service contracts does Murrayneed to sell to earn $790 in a 40-h workweek?
The first season of Canadian Superstar is a wrap! Willthere be a second season? The sponsors use a weightedrating system that factors in the audience demographic(who watches the show). Their research suggests that theviewing audience is made up of 50% girls, 30% boys, and20% adult viewers. The formula for the show’s weightedrating score, R, is
R �
• g represents the girls’ average rating of the show, outof 10.
• b represents the boys’ average rating of the show, outof 10.
• a represents the adults’ average rating of the show, outof 10.
The sponsors agree to pick up the show for a secondseason if the first season earns a weighted rating of 8 orbetter. Part of the ratings have been recorded in a table:
The girls’ ratings have not yet been recorded, but early feedback suggeststhat the show was significantly more popular with girls than with boysand adults. Do you think that there will be a second season? Justify yourreasoning. What minimum girls’ average rating is necessary to ensure asecond season?
5g � 3b � 2a
10
Viewers Girls Boys Adults
Average Rating not available 7.4 8.1
Chapter Problem Wrap-Up
Vocabulary
direct variationconstant of variationpartial variationsloperiserunrate of changefi rst differences
Modelling With Graphs
There are many types of puzzles—logic puzzles, word puzzles, number puzzles, mechanical puzzles, and puzzles based on diagrams. Puzzles may be solved by methods such as guessing, trial and error, and analysing data. The solution to a puzzle may rely on patterns and relations. Being able to represent data in a variety of ways is a useful skill in puzzle solving. In this chapter, you will investigate graphs and data and develop equations that represent relations between two variables. You will also analyse and interpret data so that you can make conclusions and extensions.
CHAPTER
5Linear Relations� Construct tables of values, graphs,
and equations.
� Identify, through investigation, some properties of linear relations, and apply these properties to determine whether a relation is linear or non-linear.
� Compare the properties of direct variation and partial variation in applications, and identify the initial value.
� Determine values of a linear relation by using a table of values and by using the equation of the relation.
� Determine other representations of a linear relation, given one representation.
� Describe the effects on a linear graph and make the corresponding changes to the linear equation when the conditions of the situation they represent are varied.
Analytic Geometry� Determine, through investigation,
various formulas for the slope of a line segment or a line, and use the formulas to determine the slope of a line segment or a line.
� Determine, through investigation, connections among the representations of a constant rate of change of a linear relation.
234

Chapter Problem Toothpick patterns are popular puzzles. How
does each pattern relate to the number of
toothpicks? In this chapter, you will develop
equations to represent relationships like these.
235
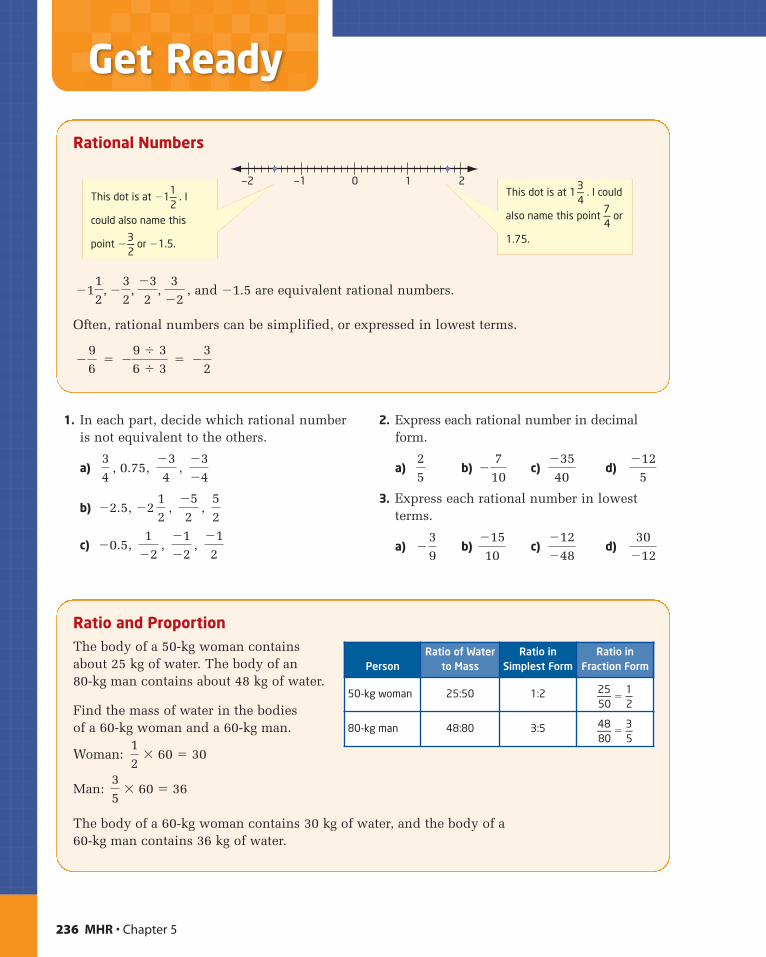
1. In each part, decide which rational numberis not equivalent to the others.
a) , 0.75, ,
b) �2.5, �2 , ,
c) �0.5, , ,
2. Express each rational number in decimalform.
a) b) c) d)
3. Express each rational number in lowestterms.
a) b) c) d)30
�12�12�48
�1510
�˛˛
39
�125
�3540
�˛˛
710
25
�12
�1�2
1�2
52
�52
12
�3�4
�34
34
236 MHR • Chapter 5
Rational Numbers
, and �1.5 are equivalent rational numbers.
Often, rational numbers can be simplified, or expressed in lowest terms.
� � �32
�9 � 36 � 3
�˛˛
96
�112
, �˛˛
32
, �32
, 3
�2
—2 —1 0 1 2This dot is at �1
1—2
. I
could also name this
point �3—2
or �1.5.
This dot is at 13—4
. I could
also name this point 7—4
or
1.75.
Ratio and ProportionThe body of a 50-kg woman containsabout 25 kg of water. The body of an 80-kg man contains about 48 kg of water.
Find the mass of water in the bodies of a 60-kg woman and a 60-kg man.
Woman:
Man:
The body of a 60-kg woman contains 30 kg of water, and the body of a 60-kg man contains 36 kg of water.
35
� 60 � 36
12
� 60 � 30
PersonRatio of Water
to MassRatio in
Simplest FormRatio in
Fraction Form
50-kg woman 25:50 1:2 25—50
�1—2
80-kg man 48:80 3:5 48—80
�3—5
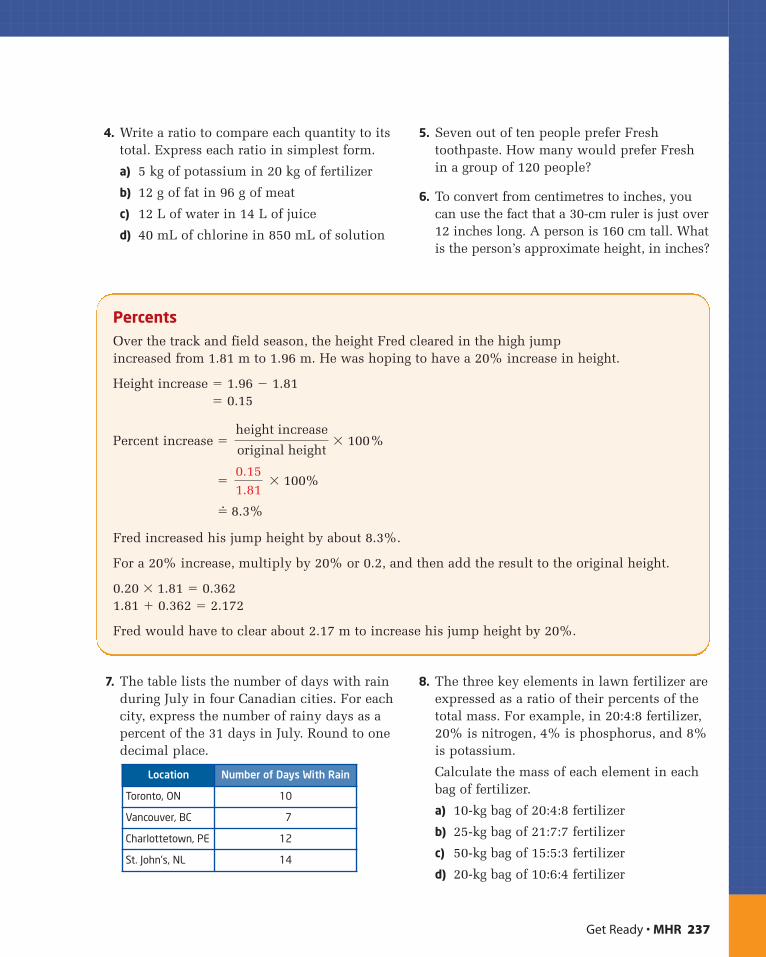
4. Write a ratio to compare each quantity to itstotal. Express each ratio in simplest form.
a) 5 kg of potassium in 20 kg of fertilizer
b) 12 g of fat in 96 g of meat
c) 12 L of water in 14 L of juice
d) 40 mL of chlorine in 850 mL of solution
5. Seven out of ten people prefer Freshtoothpaste. How many would prefer Freshin a group of 120 people?
6. To convert from centimetres to inches, youcan use the fact that a 30-cm ruler is just over12 inches long. A person is 160 cm tall. Whatis the person’s approximate height, in inches?
Get Ready • MHR 237
7. The table lists the number of days with rainduring July in four Canadian cities. For eachcity, express the number of rainy days as apercent of the 31 days in July. Round to onedecimal place.
8. The three key elements in lawn fertilizer areexpressed as a ratio of their percents of thetotal mass. For example, in 20:4:8 fertilizer,20% is nitrogen, 4% is phosphorus, and 8%is potassium.
Calculate the mass of each element in eachbag of fertilizer.
a) 10-kg bag of 20:4:8 fertilizer
b) 25-kg bag of 21:7:7 fertilizer
c) 50-kg bag of 15:5:3 fertilizer
d) 20-kg bag of 10:6:4 fertilizer
Location Number of Days With Rain
Toronto, ON 10
Vancouver, BC 7
Charlottetown, PE 12
St. John’s, NL 14
PercentsOver the track and field season, the height Fred cleared in the high jump increased from 1.81 m to 1.96 m. He was hoping to have a 20% increase in height.
Height increase � 1.96 � 1.81� 0.15
Percent increase �
� � 100%
�� 8.3%
Fred increased his jump height by about 8.3%.
For a 20% increase, multiply by 20% or 0.2, and then add the result to the original height.
0.20 � 1.81 � 0.3621.81 � 0.362 � 2.172
Fred would have to clear about 2.17 m to increase his jump height by 20%.
0.151.81
height increase
original height� 100%
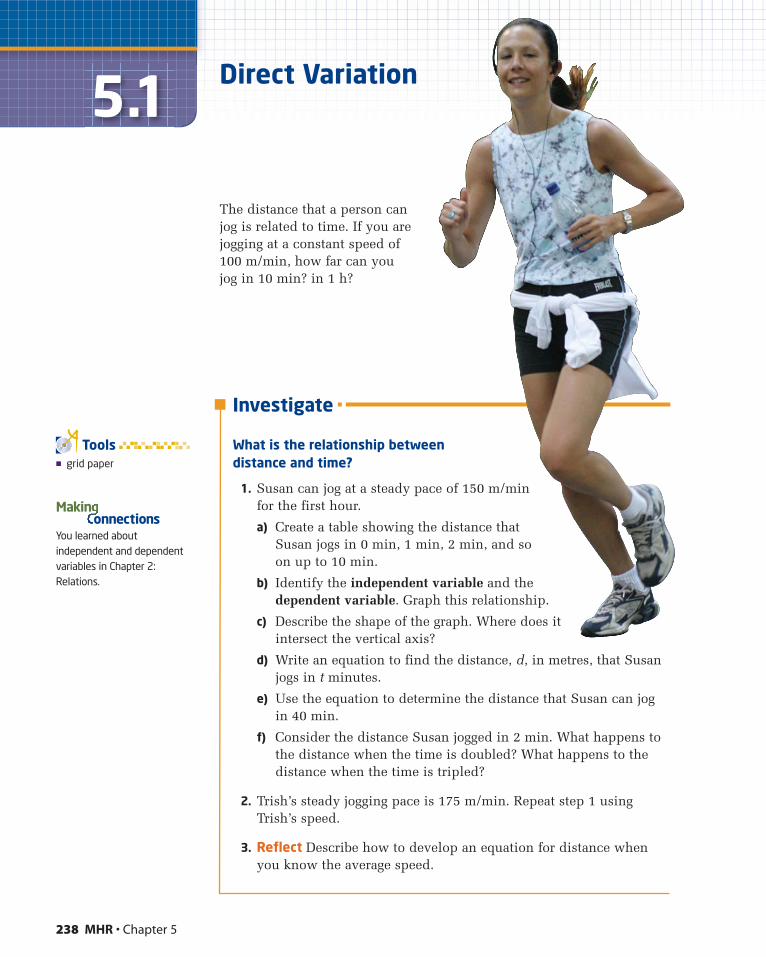
238 MHR • Chapter 5
5.1 Direct Variation
The distance that a person canjog is related to time. If you arejogging at a constant speed of100 m/min, how far can youjog in 10 min? in 1 h?
Investigate
What is the relationship between distance and time?
1. Susan can jog at a steady pace of 150 m/minfor the first hour.
a) Create a table showing the distance that Susan jogs in 0 min, 1 min, 2 min, and so on up to 10 min.
b) Identify the independent variable and the dependent variable. Graph this relationship.
c) Describe the shape of the graph. Where does itintersect the vertical axis?
d) Write an equation to find the distance, d, in metres, that Susanjogs in t minutes.
e) Use the equation to determine the distance that Susan can jogin 40 min.
f) Consider the distance Susan jogged in 2 min. What happens tothe distance when the time is doubled? What happens to thedistance when the time is tripled?
2. Trish’s steady jogging pace is 175 m/min. Repeat step 1 usingTrish’s speed.
3. Reflect Describe how to develop an equation for distance whenyou know the average speed.
� grid paper
Tools
You learned aboutindependent and dependentvariables in Chapter 2:Relations.
Makinonnections

The relationship between distance and time isan example of a . For example,the table shows distances travelled in varioustime periods at a constant speed of 10 m/s.
When time is multiplied by a specific number,distance is also multiplied by the same number.Another way to describe this direct variation isto say that distance varies directly with time.
In a direct variation, the ratio of corresponding values of the variables
does not change. So, if d is distance and t is time, then � k, where k
is called the . Multiplying both sides of the
equation by t gives d � kt.
For the data in the table, � 10, or d � 10t. The constant of variation
is 10.
Example 1 Algebraic Direct Variation
The Fredrick family travels 250 km to a relative’s home. The distance,d, in kilometres, varies directly with the time, t, in hours.
a) Find the equation relating d and t if d � 43 when t � 0.5. What does the constant of variation represent?
b) Use the equation to determine how long it will take the Fredricks to reach their destination.
Solution
a) Since d varies directly with t, the equation has the form d � kt.
To find k, substitute the given values into k � .
k �
� 86
The constant of variation represents the constant average speed, 86 km/h. The equation relating d to t is d � 86t.
b) Substitute d � 250.250 � 86t
� t Divide both sides by 86.
2.9 �� t
It will take the Fredricks about 2.9 h to reach their destination.
25086
430.5
dt
dt
constant of variation
dt
direct variationTime (s) Distance (m)
1 10
2 20
3 30
4 40
5 50
5.1 Direct Variation • MHR 239
� a relationship between twovariables in which onevariable is a constantmultiple of the other
direct variation
� in a direct variation, theratio of correspondingvalues of the variables,often represented by k, orthe constant multiple bywhich one variable ismultiplied
� if d varies directly as t,then the constant ofvariation, k, is given by
k �d—t
or d � kt
constant of variation
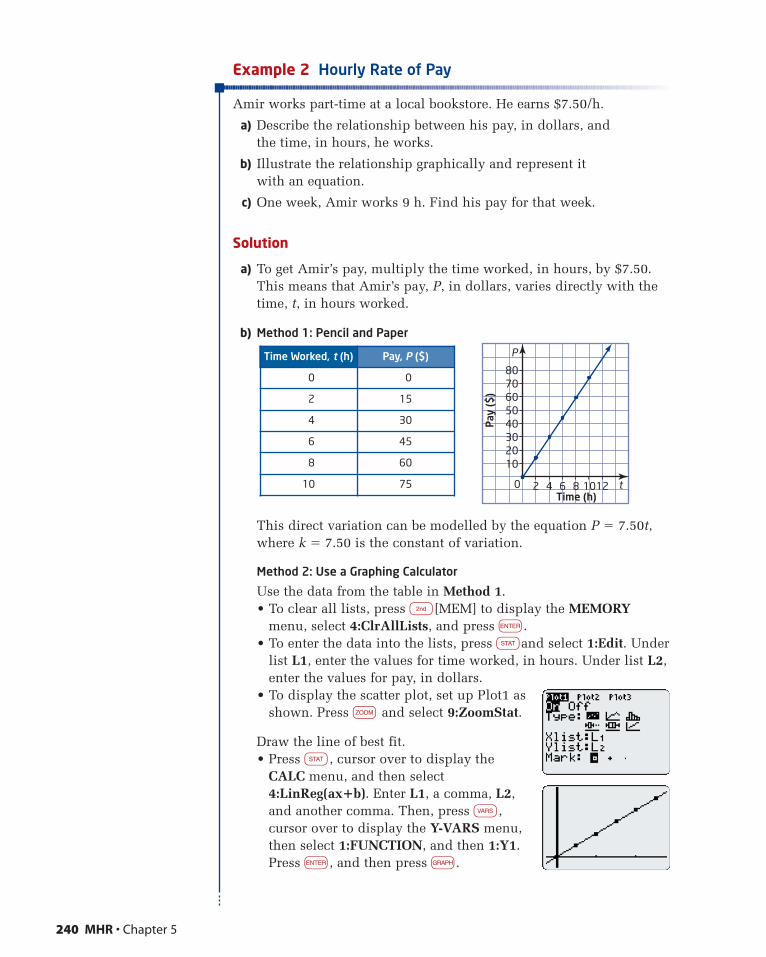
Example 2 Hourly Rate of Pay
Amir works part-time at a local bookstore. He earns $7.50/h.
a) Describe the relationship between his pay, in dollars, and the time, in hours, he works.
b) Illustrate the relationship graphically and represent it with an equation.
c) One week, Amir works 9 h. Find his pay for that week.
Solution
a) To get Amir’s pay, multiply the time worked, in hours, by $7.50.This means that Amir’s pay, P, in dollars, varies directly with thetime, t, in hours worked.
b) Method 1: Pencil and Paper
This direct variation can be modelled by the equation P � 7.50t,where k � 7.50 is the constant of variation.
Method 2: Use a Graphing Calculator
Use the data from the table in Method 1.• To clear all lists, press n[MEM] to display the MEMORY
menu, select 4:ClrAllLists, and press e.• To enter the data into the lists, press qand select 1:Edit. Under
list L1, enter the values for time worked, in hours. Under list L2,enter the values for pay, in dollars.
• To display the scatter plot, set up Plot1 asshown. Press z and select 9:ZoomStat.
Draw the line of best fit.• Press q, cursor over to display the
CALC menu, and then select4:LinReg(ax�b). Enter L1, a comma, L2,and another comma. Then, press v,cursor over to display the Y-VARS menu,then select 1:FUNCTION, and then 1:Y1.Press e, and then press g.
240 MHR • Chapter 5
Time Worked, t (h) Pay, P ($)
0 0
2 15
4 30
6 45
8 60
10 75
70605040302010
0 2 4 6Time (h)
Pay
($)
8 1012
80
t
P
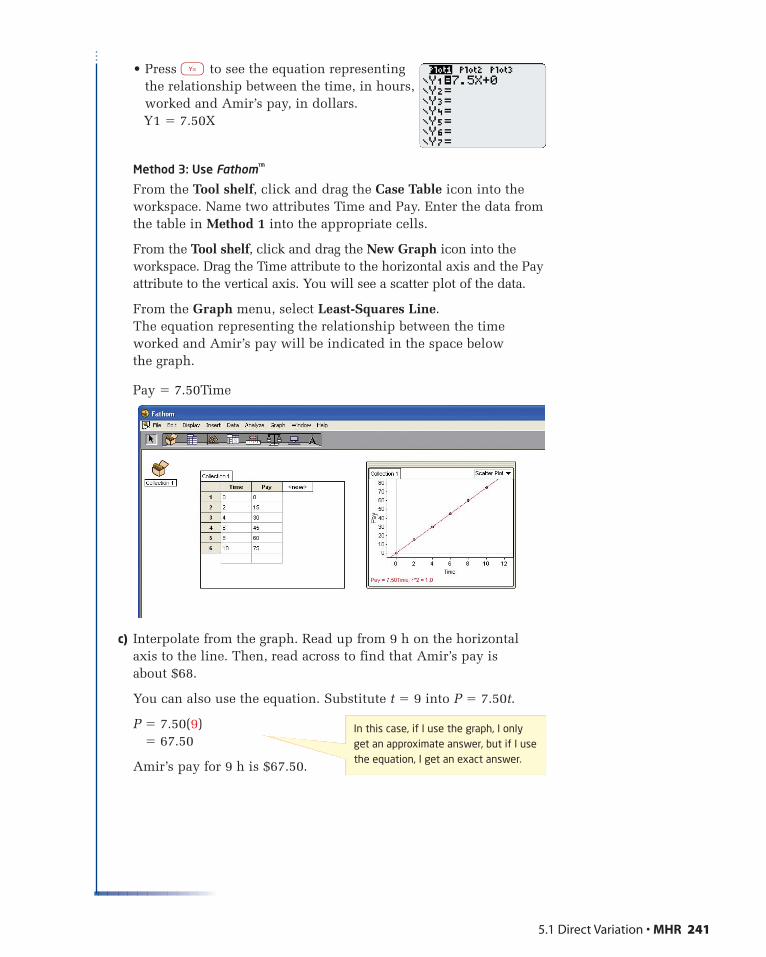
• Press y to see the equation representingthe relationship between the time, in hours,worked and Amir’s pay, in dollars.Y1 � 7.50X
Method 3: Use Fathom™
From the Tool shelf, click and drag the Case Table icon into theworkspace. Name two attributes Time and Pay. Enter the data fromthe table in Method 1 into the appropriate cells.
From the Tool shelf, click and drag the New Graph icon into theworkspace. Drag the Time attribute to the horizontal axis and the Payattribute to the vertical axis. You will see a scatter plot of the data.
From the Graph menu, select Least-Squares Line.The equation representing the relationship between the timeworked and Amir’s pay will be indicated in the space below the graph.
Pay � 7.50Time
c) Interpolate from the graph. Read up from 9 h on the horizontalaxis to the line. Then, read across to find that Amir’s pay is about $68.
You can also use the equation. Substitute t � 9 into P � 7.50t.
P � 7.50(9)� 67.50
Amir’s pay for 9 h is $67.50.
5.1 Direct Variation • MHR 241
In this case, if I use the graph, I onlyget an approximate answer, but if I usethe equation, I get an exact answer.
Key Concepts� Direct variation occurs when the dependent variable varies
by the same factor as the independent variable.
� Direct variation can be defined algebraically as � k or y � kx,
where k is the constant of variation.
� The graph of a direct variation is a straight line that passes throughthe origin.
Communicate Your UnderstandingConsider the two equations A � 2C � 5 and A � 2C. Which is an example of a direct variation? Explain.
Consider the graphs of d � 2t and d � 3t.
a) Describe the similarities.
b) Describe the differences. Explain why these differences occur.
PractiseFor help with questions 1 and 2, see Example 1.
1. Determine the constant of variation for each direct variation.
a) The distance travelled by a bus varies directly with time. The bus travels 240 km in 3 h.
b) The total cost varies directly with the number of books bought. Five books cost $35.
c) The volume of water varies directly with time. A swimming pool contains 500 L of water after 5 min.
C2C2
C1C1
y
x
242 MHR • Chapter 5
y = kx
0 x
y
1210
8642
0 1 2 3 4
d
t
d = 2t
1210
8642
0 1 2 3 4
d
t
d = 3t
2. The cost, C, in dollars, of building aconcrete sidewalk varies directly with itslength, s, in metres.
a) Find an equation relating C and s if a200-m sidewalk costs $4500.
b) What does the constant of variationrepresent?
c) Use the equation to determine the cost of a 700-m sidewalk.
For help with questions 3 to 5, see Example 2.
3. Passent’s pay varies directly with the time, in hours,she works. She earns $8/h.
a) Choose appropriate letters for variables. Make a table of valuesshowing Passent’s pay for 0 h, 1 h, 2 h, and 3 h.
b) Graph the relationship.
c) Write an equation in the form y � kx.
4. The total cost of apples varies directly with the mass, in kilograms,bought. Apples cost $1.50/kg.
a) Choose appropriate letters for variables. Make a table of valuesshowing the cost of 0 kg, 1 kg, 2 kg, and 3 kg of apples.
b) Graph the relationship.
c) Write an equation in the form y � kx.
5. A parking garage charges $2.75/h for parking.
a) Describe the relationship between the cost of parking and thetime, in hours, parked.
b) Illustrate the relationship graphically and represent it with anequation.
c) Use your graph to estimate the cost for 7 h of parking.
d) Use your equation to determine the exact cost for 7 h of parking.
Connect and Apply6. The cost of oranges varies directly with the total mass bought.
2 kg of oranges costs $4.50.
a) Describe the relationship in words.
b) Write an equation relating the cost and the mass of the oranges.What does the constant of variation represent?
c) What is the cost of 30 kg of oranges?
5.1 Direct Variation • MHR 243
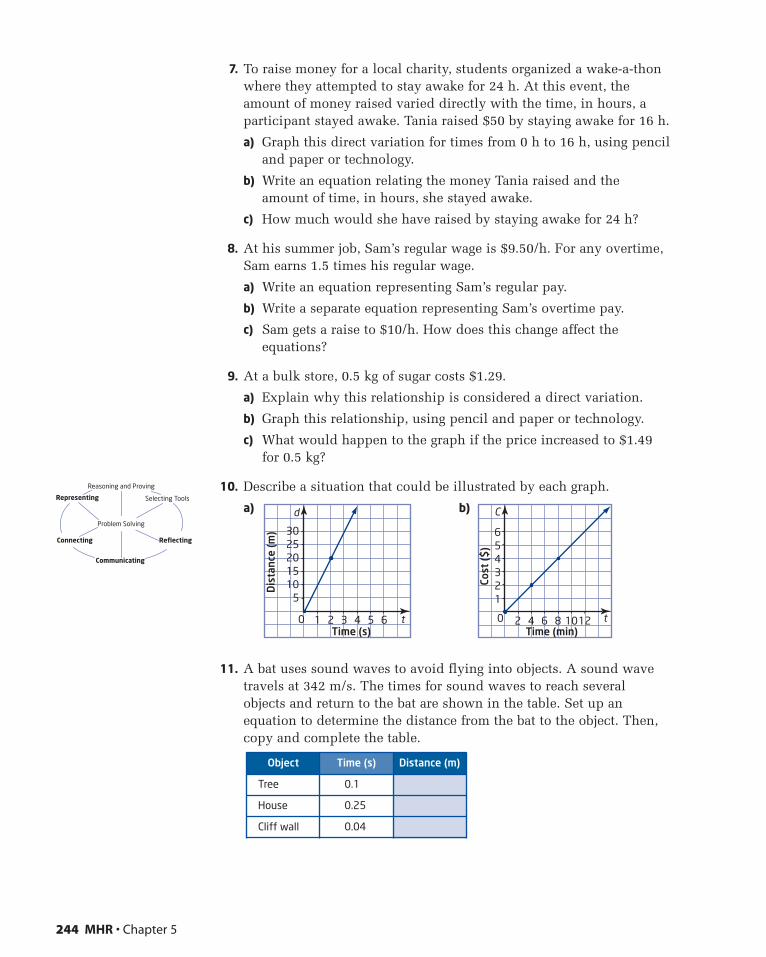
7. To raise money for a local charity, students organized a wake-a-thonwhere they attempted to stay awake for 24 h. At this event, theamount of money raised varied directly with the time, in hours, aparticipant stayed awake. Tania raised $50 by staying awake for 16 h.
a) Graph this direct variation for times from 0 h to 16 h, using penciland paper or technology.
b) Write an equation relating the money Tania raised and theamount of time, in hours, she stayed awake.
c) How much would she have raised by staying awake for 24 h?
8. At his summer job, Sam’s regular wage is $9.50/h. For any overtime,Sam earns 1.5 times his regular wage.
a) Write an equation representing Sam’s regular pay.
b) Write a separate equation representing Sam’s overtime pay.
c) Sam gets a raise to $10/h. How does this change affect theequations?
9. At a bulk store, 0.5 kg of sugar costs $1.29.
a) Explain why this relationship is considered a direct variation.
b) Graph this relationship, using pencil and paper or technology.
c) What would happen to the graph if the price increased to $1.49for 0.5 kg?
10. Describe a situation that could be illustrated by each graph.
a) b)
11. A bat uses sound waves to avoid flying into objects. A sound wavetravels at 342 m/s. The times for sound waves to reach severalobjects and return to the bat are shown in the table. Set up anequation to determine the distance from the bat to the object. Then,copy and complete the table.
654321
0 2 4 6Time (min)
Cost
($)
8 1012
C
t
3025201510
5
0 1 2 3Time (s)
Dis
tanc
e (m
)
4 5 6
d
t
Object Time (s) Distance (m)
Tree 0.1
House 0.25
Cliff wall 0.04
244 MHR • Chapter 5
Selecting ToolsRepresenting
Reasoning and Proving
Communicating
Connecting Reflecting
Problem Solving
12. The volume of water in a swimming pool varies directly with time.500 L of water is in the pool after 4 min.
a) Write an equation relating the volume of water and time. What does the constant of variation represent?
b) Graph this relationship using pencil and paper or technology.
c) What volume of water is in the swimming pool after 20 min?
d) How long will it take to fill a swimming pool that holds 115 000 L of water?
e) Describe the changes to the equation and graph if only 400 L ofwater is in the pool after 4 min.
13. The freezing point of water variesdirectly with the salt content ofthe water. Fresh water (no saltcontent) freezes at a temperatureof 0°C. Ocean water has a saltcontent of 3.5% and freezes at�2°C.
a) Which is the independentvariable? Why?
b) Write an equation relating thefreezing point of water and thesalt content.
c) At what temperature will waterwith a salt content of 1%freeze?
d) What is the salt content ofwater that freezes at �3°C?
Extend14. To convert from kilometres to miles, multiply by 0.62.
Write an equation to convert miles to kilometres.
15. Determine the set of ordered pairs that lists the diameter andcircumference of four different coins: a penny, a nickel, a dime, and a quarter. Does the circumference vary directly with thediameter? Explain.
16. Math Contest From a bag of disks numbered 1 through 100, onedisk is chosen. What is the probability that the number on the disk contains a 3? Justify your answer.
17. Math Contest The digits 2, 3, 4, 5, and 6 are used to create five-digitodd numbers, with no digit being repeated in any number. Determinethe difference between the greatest and least of these numbers.
5.1 Direct Variation • MHR 245
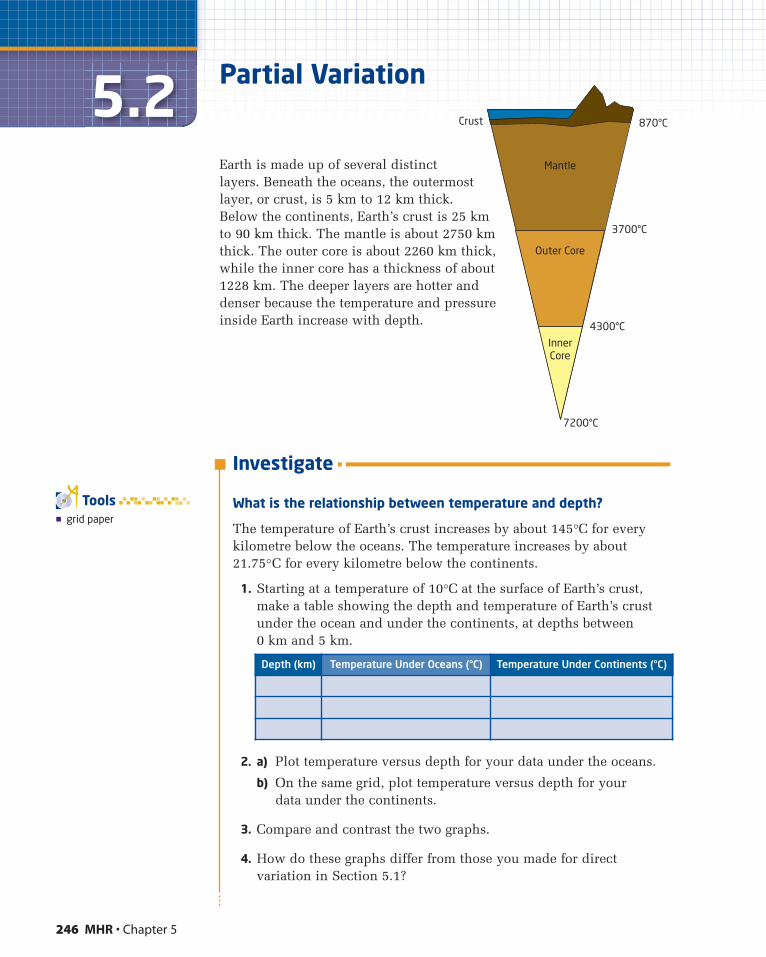
246 MHR • Chapter 5
5.2 Partial Variation
Earth is made up of several distinctlayers. Beneath the oceans, the outermostlayer, or crust, is 5 km to 12 km thick.Below the continents, Earth’s crust is 25 kmto 90 km thick. The mantle is about 2750 kmthick. The outer core is about 2260 km thick,while the inner core has a thickness of about1228 km. The deeper layers are hotter anddenser because the temperature and pressureinside Earth increase with depth.
Depth (km) Temperature Under Oceans (°C) Temperature Under Continents (°C)
InnerCore
Outer Core
Crust 870°C
3700°C
4300°C
7200°C
Mantle
� grid paper
Tools
Investigate
What is the relationship between temperature and depth?
The temperature of Earth’s crust increases by about 145°C for everykilometre below the oceans. The temperature increases by about21.75°C for every kilometre below the continents.
1. Starting at a temperature of 10°C at the surface of Earth’s crust,make a table showing the depth and temperature of Earth’s crustunder the ocean and under the continents, at depths between 0 km and 5 km.
2. a) Plot temperature versus depth for your data under the oceans.
b) On the same grid, plot temperature versus depth for your data under the continents.
3. Compare and contrast the two graphs.
4. How do these graphs differ from those you made for directvariation in Section 5.1?
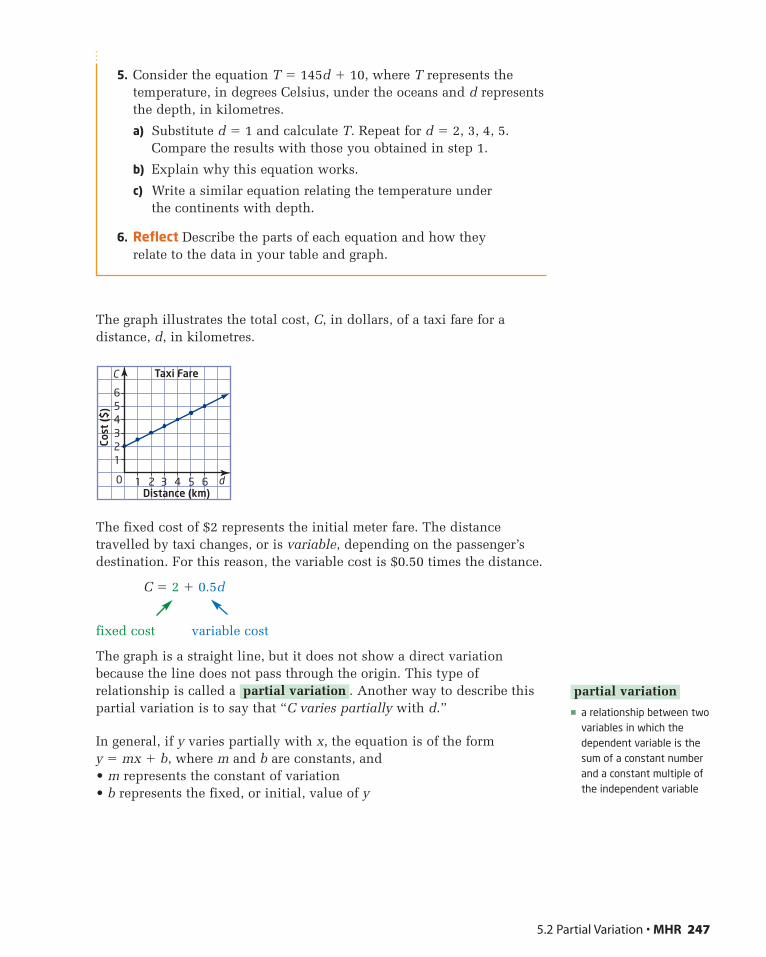
5. Consider the equation T � 145d � 10, where T represents thetemperature, in degrees Celsius, under the oceans and d representsthe depth, in kilometres.
a) Substitute d � 1 and calculate T. Repeat for d � 2, 3, 4, 5.Compare the results with those you obtained in step 1.
b) Explain why this equation works.
c) Write a similar equation relating the temperature under the continents with depth.
6. Reflect Describe the parts of each equation and how they relate to the data in your table and graph.
The graph illustrates the total cost, C, in dollars, of a taxi fare for adistance, d, in kilometres.
The fixed cost of $2 represents the initial meter fare. The distancetravelled by taxi changes, or is variable, depending on the passenger’sdestination. For this reason, the variable cost is $0.50 times the distance.
C � 2 � 0.5d
fixed cost variable cost
The graph is a straight line, but it does not show a direct variationbecause the line does not pass through the origin. This type ofrelationship is called a . Another way to describe thispartial variation is to say that “C varies partially with d.”
In general, if y varies partially with x, the equation is of the form y � mx � b, where m and b are constants, and• m represents the constant of variation• b represents the fixed, or initial, value of y
partial variation
56
4321
0 1 2 3Distance (km)
Taxi Fare
Cost
($)
4 5 6
C
d
5.2 Partial Variation • MHR 247
� a relationship between twovariables in which thedependent variable is thesum of a constant numberand a constant multiple ofthe independent variable
partial variation
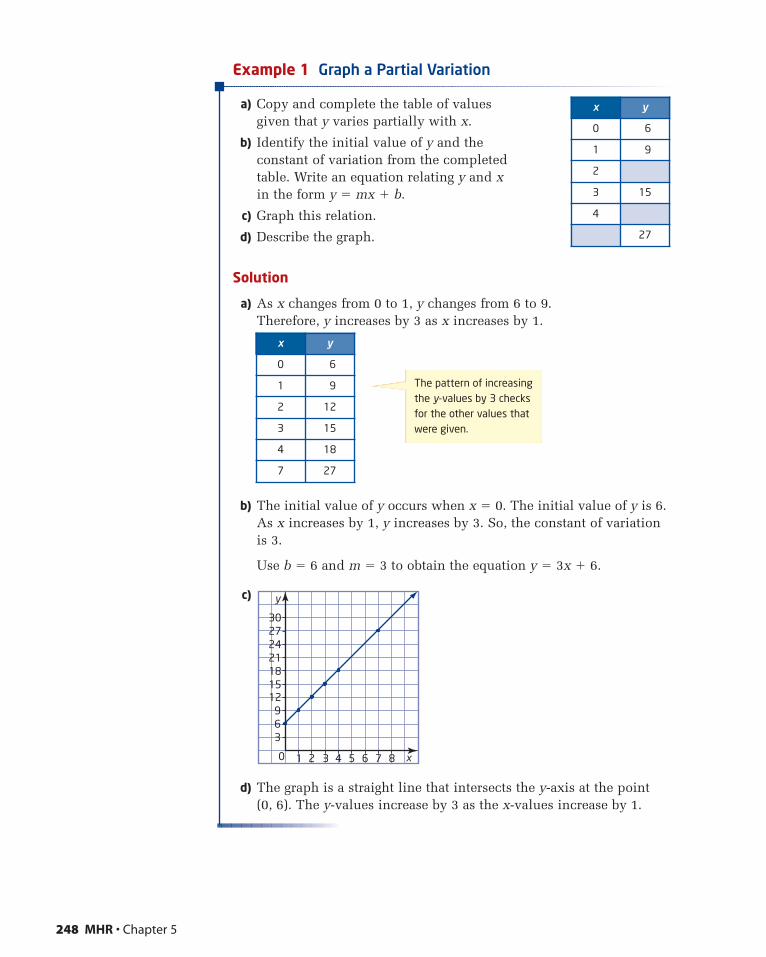
Example 1 Graph a Partial Variation
a) Copy and complete the table of values given that y varies partially with x.
b) Identify the initial value of y and the constant of variation from the completed table. Write an equation relating y and xin the form y � mx � b.
c) Graph this relation.
d) Describe the graph.
Solution
a) As x changes from 0 to 1, y changes from 6 to 9. Therefore, y increases by 3 as x increases by 1.
b) The initial value of y occurs when x � 0. The initial value of y is 6.As x increases by 1, y increases by 3. So, the constant of variationis 3.
Use b � 6 and m � 3 to obtain the equation y � 3x � 6.
c)
d) The graph is a straight line that intersects the y-axis at the point (0, 6). The y-values increase by 3 as the x-values increase by 1.
y
151821242730
12963
0 1 2 3 4 5 6 7 8 x
x y
0 6
1 9
2 12
3 15
4 18
7 27
248 MHR • Chapter 5
x y
0 6
1 9
2
3 15
4
27
The pattern of increasingthe y-values by 3 checksfor the other values thatwere given.
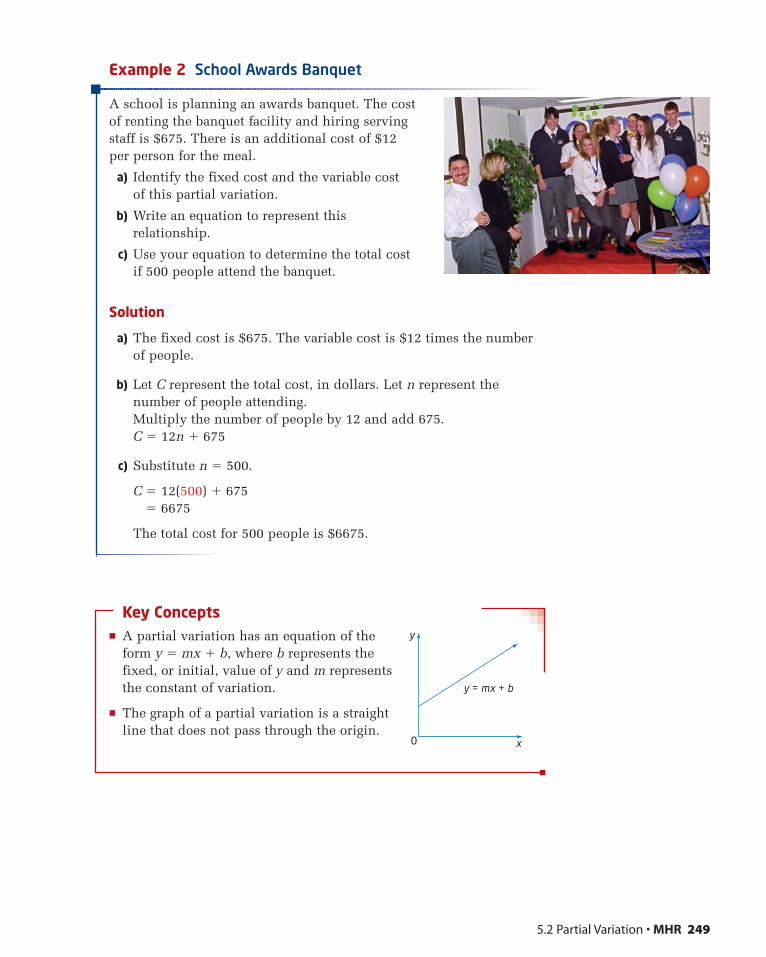
Example 2 School Awards Banquet
A school is planning an awards banquet. The costof renting the banquet facility and hiring servingstaff is $675. There is an additional cost of $12per person for the meal.
a) Identify the fixed cost and the variable cost of this partial variation.
b) Write an equation to represent thisrelationship.
c) Use your equation to determine the total costif 500 people attend the banquet.
Solution
a) The fixed cost is $675. The variable cost is $12 times the numberof people.
b) Let C represent the total cost, in dollars. Let n represent thenumber of people attending.Multiply the number of people by 12 and add 675.C � 12n � 675
c) Substitute n � 500.
C � 12(500) � 675� 6675
The total cost for 500 people is $6675.
Key Concepts� A partial variation has an equation of the
form y � mx � b, where b represents thefixed, or initial, value of y and m representsthe constant of variation.
� The graph of a partial variation is a straightline that does not pass through the origin.
5.2 Partial Variation • MHR 249
y = mx + b
0
y
x
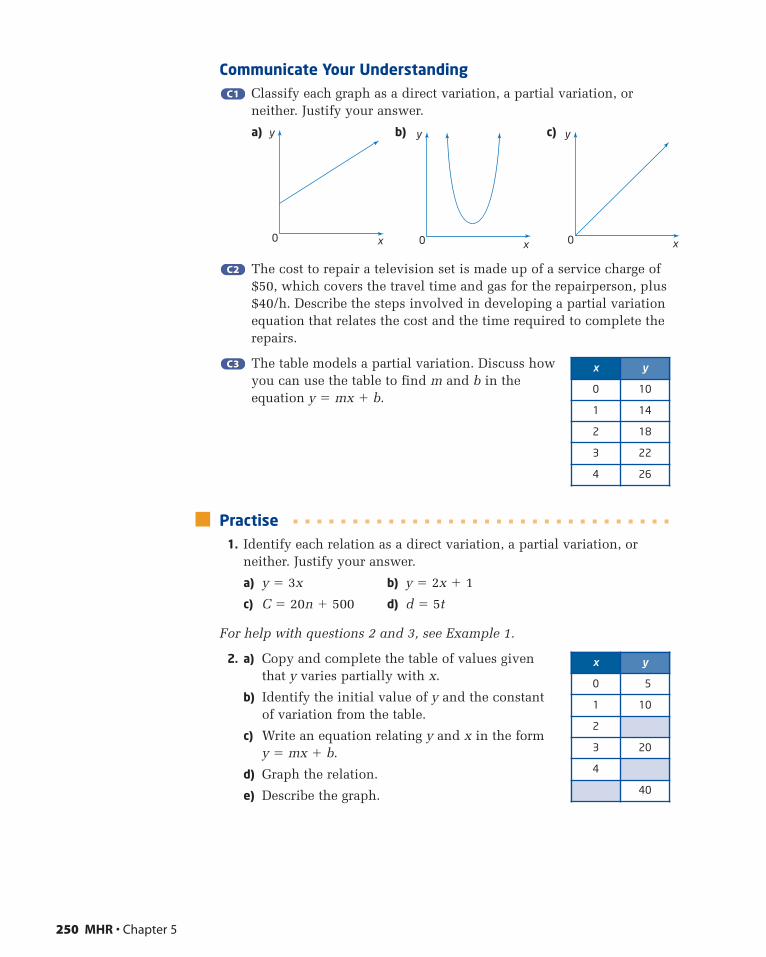
Communicate Your UnderstandingClassify each graph as a direct variation, a partial variation, orneither. Justify your answer.
a) b) c)
The cost to repair a television set is made up of a service charge of$50, which covers the travel time and gas for the repairperson, plus$40/h. Describe the steps involved in developing a partial variationequation that relates the cost and the time required to complete therepairs.
The table models a partial variation. Discuss howyou can use the table to find m and b in theequation y � mx � b.
Practise1. Identify each relation as a direct variation, a partial variation, or
neither. Justify your answer.
a) y � 3x b) y � 2x � 1
c) C � 20n � 500 d) d � 5t
For help with questions 2 and 3, see Example 1.
2. a) Copy and complete the table of values giventhat y varies partially with x.
b) Identify the initial value of y and the constantof variation from the table.
c) Write an equation relating y and x in the formy � mx � b.
d) Graph the relation.
e) Describe the graph.
C3C3
C2C2
C1C1
x y
0 5
1 10
2
3 20
4
40
250 MHR • Chapter 5
x y
0 10
1 14
2 18
3 22
4 26
0
y
x 0
y
x 0
y
x
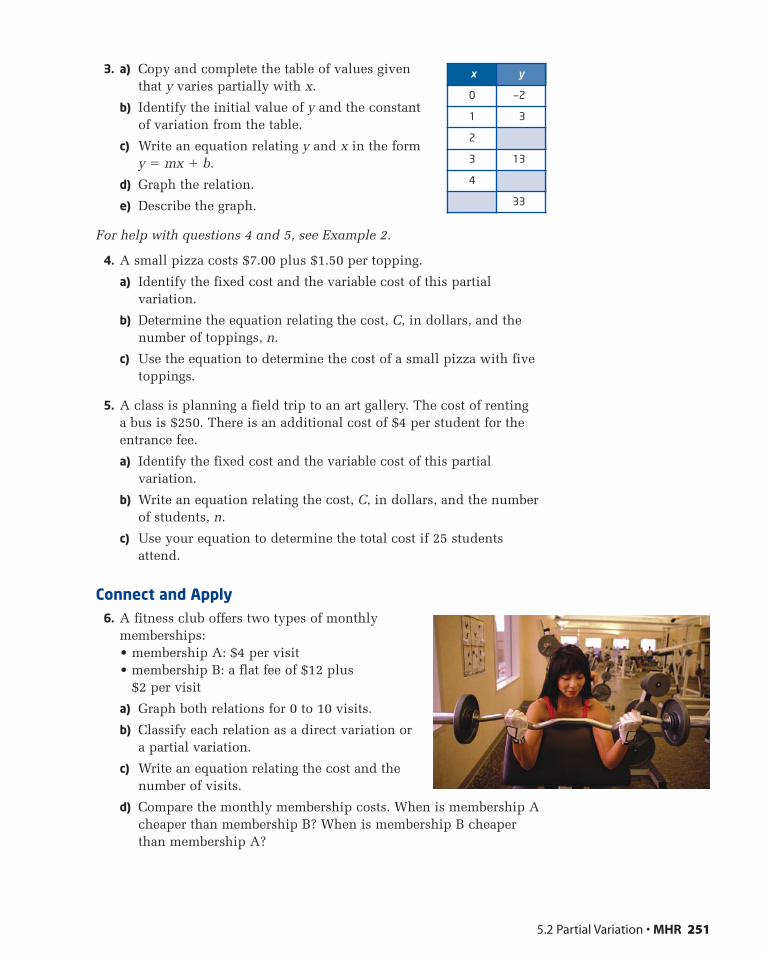
3. a) Copy and complete the table of values giventhat y varies partially with x.
b) Identify the initial value of y and the constantof variation from the table.
c) Write an equation relating y and x in the formy � mx � b.
d) Graph the relation.
e) Describe the graph.
For help with questions 4 and 5, see Example 2.
4. A small pizza costs $7.00 plus $1.50 per topping.
a) Identify the fixed cost and the variable cost of this partialvariation.
b) Determine the equation relating the cost, C, in dollars, and thenumber of toppings, n.
c) Use the equation to determine the cost of a small pizza with fivetoppings.
5. A class is planning a field trip to an art gallery. The cost of renting a bus is $250. There is an additional cost of $4 per student for theentrance fee.
a) Identify the fixed cost and the variable cost of this partialvariation.
b) Write an equation relating the cost, C, in dollars, and the numberof students, n.
c) Use your equation to determine the total cost if 25 studentsattend.
Connect and Apply6. A fitness club offers two types of monthly
memberships:• membership A: $4 per visit• membership B: a flat fee of $12 plus
$2 per visit
a) Graph both relations for 0 to 10 visits.
b) Classify each relation as a direct variation ora partial variation.
c) Write an equation relating the cost and thenumber of visits.
d) Compare the monthly membership costs. When is membership Acheaper than membership B? When is membership B cheaperthan membership A?
5.2 Partial Variation • MHR 251
x y
0 —2
1 3
2
3 13
4
33
7. The table shows the amount a printing company charges foradvertising flyers.
a) Identify the fixed cost this company charges for producing theflyers. What do you think this amount might represent?
b) Determine the variable cost for producing one flyer. Explain how you found this.
c) Write an equation representing the price for the flyers.
d) What is the cost to produce 1000 flyers?
e) How many flyers can be produced for $280?
8. Chapter Problem Toothpick patterns are popular puzzles. Here is an example of a toothpick pattern.
a) Write an equation relating the diagram number and the number of toothpicks. Is this a partial variation? Explain.
b) Use your equation to determine the number of toothpicks inDiagram 20.
9. At the surface of a lake, a scuba diver experiences 102.4 kPa(kilopascal) of pressure. As the diver descends, the pressureincreases by 101.3 kPa for every 10 m.
a) Write an equation that relates the pressure experienced by a diverand the depth that the diver has descended.
b) Divers must be aware of nitrogen narcosis, which occurs whentoo much nitrogen dissolves in the blood. Narcosis becomespossible when the diver is exposed to a pressure of about400 kPa. At what depth does the danger from narcosis begin?
10. Describe a situation that might lead tothis graph.
Diagram 1 Diagram 2 Diagram 3
252 MHR • Chapter 5
70
C
605040302010
0 1 2 3Time (h)
Cost
($)
4 5 6 t
Number of Flyers, n Cost, C ($)
0 100
100 120
200 140
300 160
Scuba divers will ascendslowly to the surface to avoiddecompression sickness, orthe bends. After deep or longdives, a scuba diver needs toundergo decompression byreturning to the surfaceslowly and in stages.
Did You Know ?
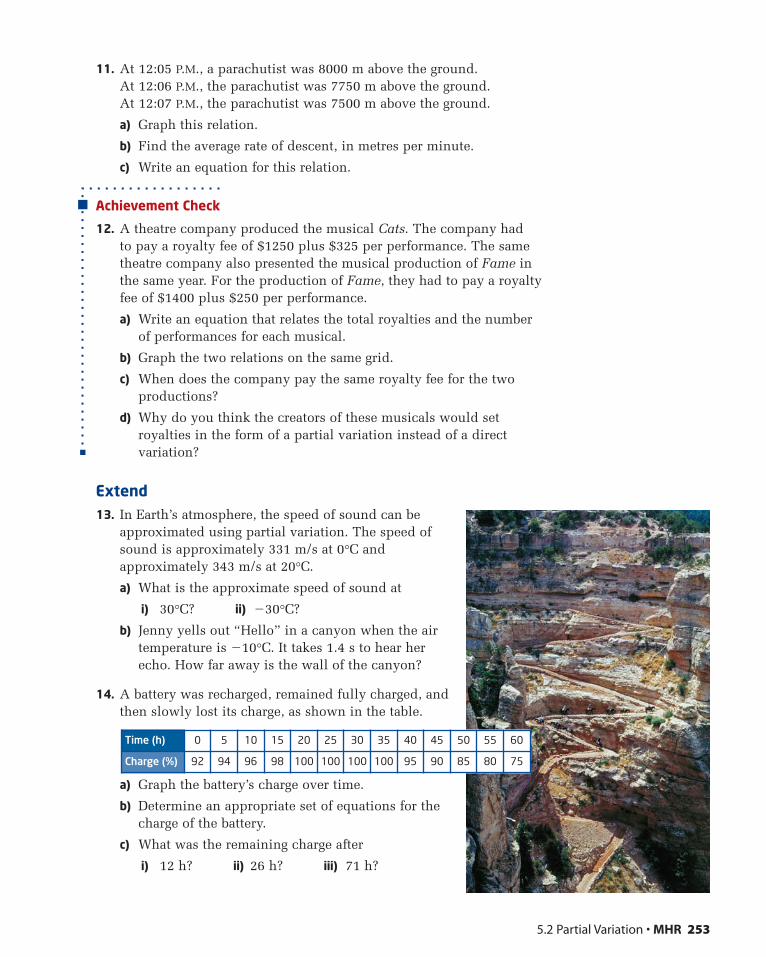
11. At 12:05 P.M., a parachutist was 8000 m above the ground. At 12:06 P.M., the parachutist was 7750 m above the ground. At 12:07 P.M., the parachutist was 7500 m above the ground.
a) Graph this relation.
b) Find the average rate of descent, in metres per minute.
c) Write an equation for this relation.
Achievement Check
12. A theatre company produced the musical Cats. The company had to pay a royalty fee of $1250 plus $325 per performance. The sametheatre company also presented the musical production of Fame inthe same year. For the production of Fame, they had to pay a royaltyfee of $1400 plus $250 per performance.
a) Write an equation that relates the total royalties and the numberof performances for each musical.
b) Graph the two relations on the same grid.
c) When does the company pay the same royalty fee for the twoproductions?
d) Why do you think the creators of these musicals would setroyalties in the form of a partial variation instead of a directvariation?
Extend13. In Earth’s atmosphere, the speed of sound can be
approximated using partial variation. The speed ofsound is approximately 331 m/s at 0°C andapproximately 343 m/s at 20°C.
a) What is the approximate speed of sound at
i) 30°C? ii) �30°C?
b) Jenny yells out “Hello” in a canyon when the airtemperature is �10°C. It takes 1.4 s to hear herecho. How far away is the wall of the canyon?
14. A battery was recharged, remained fully charged, andthen slowly lost its charge, as shown in the table.
a) Graph the battery’s charge over time.
b) Determine an appropriate set of equations for thecharge of the battery.
c) What was the remaining charge after
i) 12 h? ii) 26 h? iii) 71 h?
5.2 Partial Variation • MHR 253
Time (h) 0 5 10 15 20 25 30 35 40 45 50 55 60
Charge (%) 92 94 96 98 100 100 100 100 95 90 85 80 75
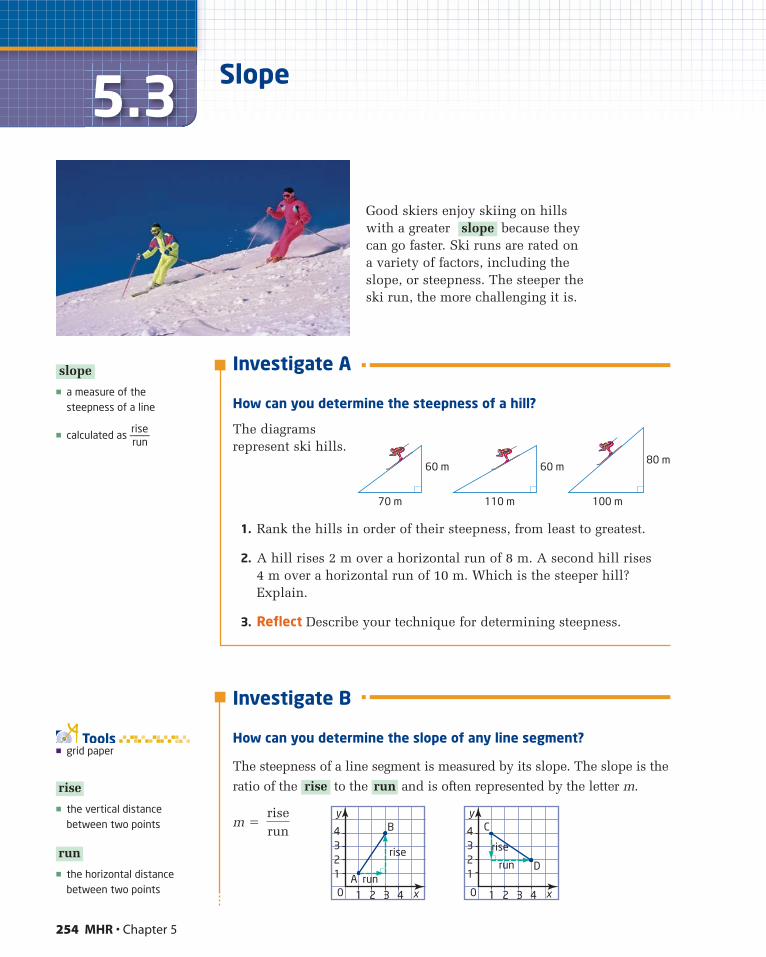
254 MHR • Chapter 5
5.3
Good skiers enjoy skiing on hillswith a greater because they can go faster. Ski runs are rated on a variety of factors, including theslope, or steepness. The steeper theski run, the more challenging it is.
slope
Slope
� the vertical distancebetween two points
� the horizontal distancebetween two points
run
rise
� grid paperTools
Investigate A
How can you determine the steepness of a hill?
The diagramsrepresent ski hills.
1. Rank the hills in order of their steepness, from least to greatest.
2. A hill rises 2 m over a horizontal run of 8 m. A second hill rises 4 m over a horizontal run of 10 m. Which is the steeper hill?Explain.
3. Reflect Describe your technique for determining steepness.
Investigate B
How can you determine the slope of any line segment?
The steepness of a line segment is measured by its slope. The slope is the
ratio of the to the and is often represented by the letter m.
m �riserun
runrise
60 m60 m
70 m 110 m 100 m
80 m
4
A
B
rise
run
y
x
321
0 1 2 3 4
4rise
C
Drun
y
x
321
0 1 2 3 4
� a measure of thesteepness of a line
� calculated as ———runrise
slope
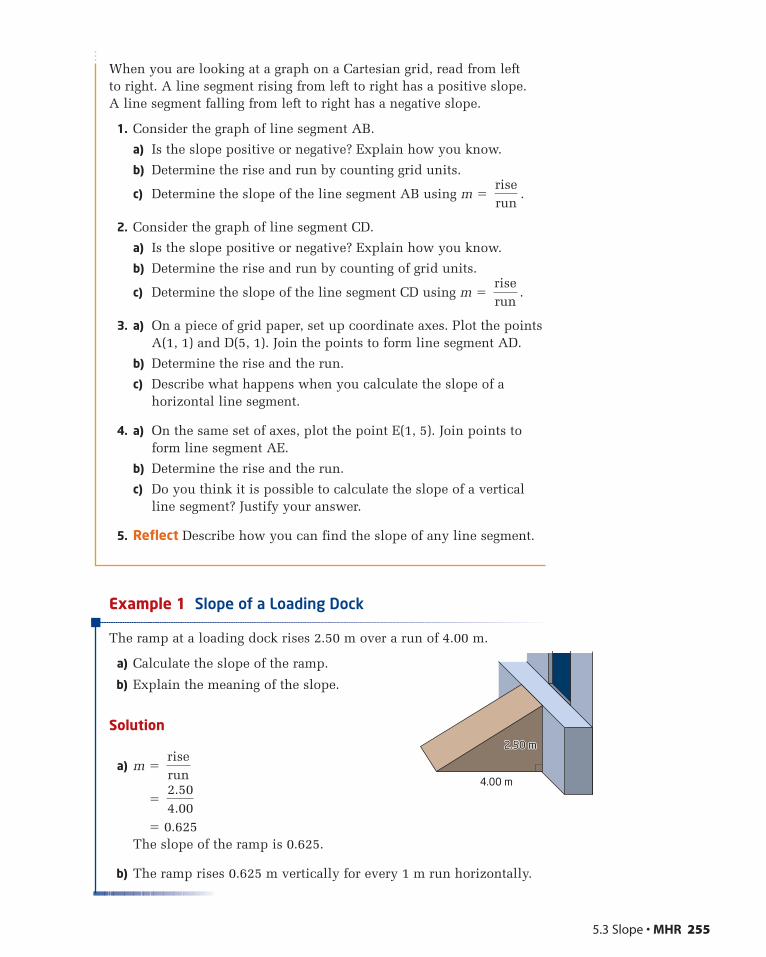
When you are looking at a graph on a Cartesian grid, read from left to right. A line segment rising from left to right has a positive slope. A line segment falling from left to right has a negative slope.
1. Consider the graph of line segment AB.
a) Is the slope positive or negative? Explain how you know.
b) Determine the rise and run by counting grid units.
c) Determine the slope of the line segment AB using m � .
2. Consider the graph of line segment CD.
a) Is the slope positive or negative? Explain how you know.
b) Determine the rise and run by counting of grid units.
c) Determine the slope of the line segment CD using m � .
3. a) On a piece of grid paper, set up coordinate axes. Plot the pointsA(1, 1) and D(5, 1). Join the points to form line segment AD.
b) Determine the rise and the run.
c) Describe what happens when you calculate the slope of ahorizontal line segment.
4. a) On the same set of axes, plot the point E(1, 5). Join points toform line segment AE.
b) Determine the rise and the run.
c) Do you think it is possible to calculate the slope of a verticalline segment? Justify your answer.
5. Reflect Describe how you can find the slope of any line segment.
Example 1 Slope of a Loading Dock
The ramp at a loading dock rises 2.50 m over a run of 4.00 m.
a) Calculate the slope of the ramp.
b) Explain the meaning of the slope.
Solution
a) m �
�
� 0.625The slope of the ramp is 0.625.
b) The ramp rises 0.625 m vertically for every 1 m run horizontally.
2.504.00
riserun
riserun
riserun
5.3 Slope • MHR 255
4.00 m
2.50 m2.50 m2.50 m
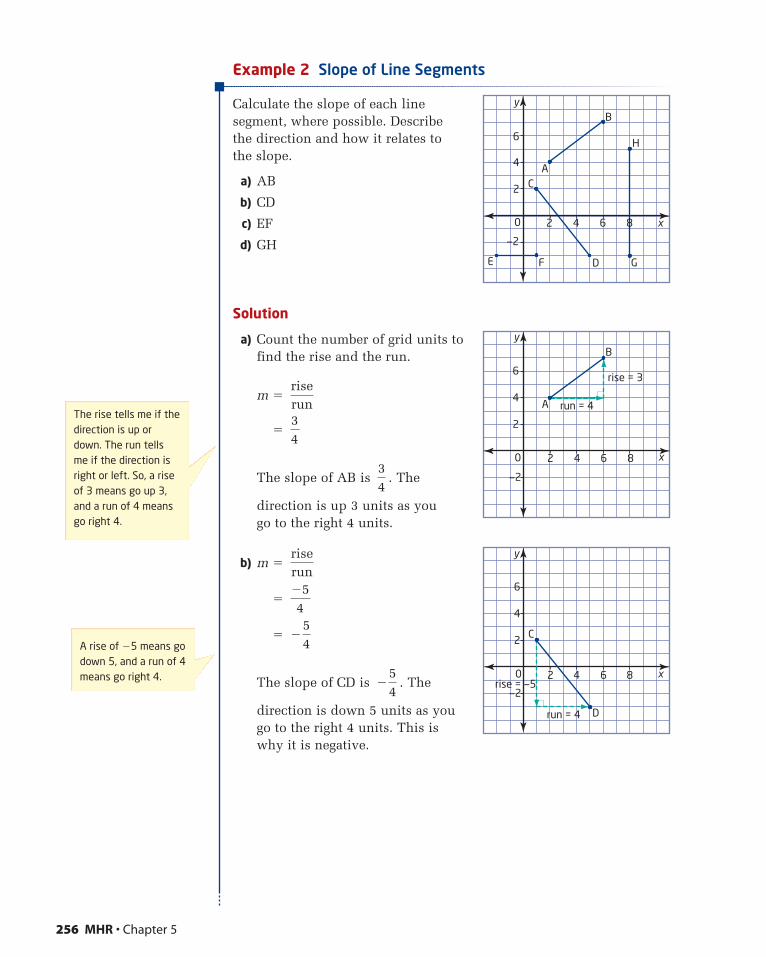
Example 2 Slope of Line Segments
Calculate the slope of each linesegment, where possible. Describe the direction and how it relates to the slope.
a) AB
b) CD
c) EF
d) GH
Solution
a) Count the number of grid units tofind the rise and the run.
m �
�
The slope of AB is . The
direction is up 3 units as you go to the right 4 units.
b) m �
�
�
The slope of CD is . The
direction is down 5 units as yougo to the right 4 units. This iswhy it is negative.
�˛˛
54
�˛˛
54
�54
riserun
34
34
riserun
256 MHR • Chapter 5
A
B
H
GD
C
FE
6
4
2
—2
2 4 6
y
x0 8
A
B
6
4
2
—2
2 4 6 8
y
x0
run = 4
rise = 3
The rise tells me if thedirection is up ordown. The run tellsme if the direction isright or left. So, a riseof 3 means go up 3,and a run of 4 meansgo right 4.
C
D
6
4
2
—2
2 4 6 8
y
x0
run = 4
rise = —5
A rise of �5 means godown 5, and a run of 4means go right 4.
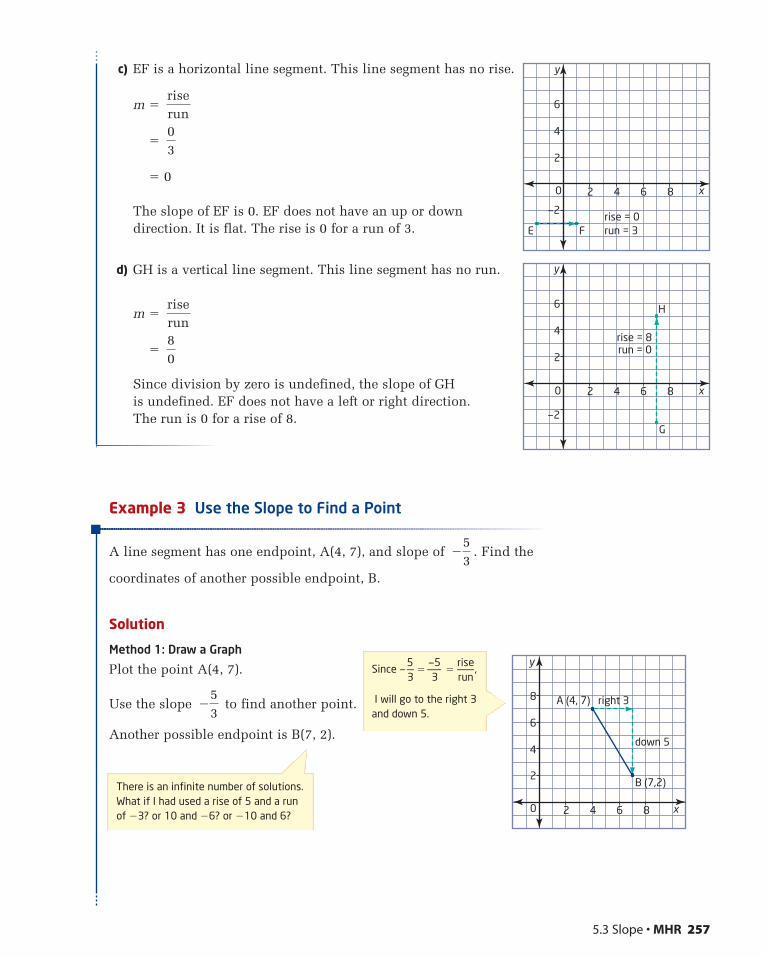
c) EF is a horizontal line segment. This line segment has no rise.
m �
�
� 0
The slope of EF is 0. EF does not have an up or downdirection. It is flat. The rise is 0 for a run of 3.
d) GH is a vertical line segment. This line segment has no run.
m �
�
Since division by zero is undefined, the slope of GHis undefined. EF does not have a left or right direction.The run is 0 for a rise of 8.
Example 3 Use the Slope to Find a Point
A line segment has one endpoint, A(4, 7), and slope of . Find the
coordinates of another possible endpoint, B.
Solution
Method 1: Draw a Graph
Plot the point A(4, 7).
Use the slope to find another point.
Another possible endpoint is B(7, 2).
�53
�53
80
riserun
03
riserun
5.3 Slope • MHR 257
6
4
2
—2
2 4 6 8
y
x0
run = 3rise = 0
E F
6
4
2
—2
2 4 6 8
y
x0
run = 0rise = 8
H
G
Since —5—3
�—5—
3�
rise—run
,
I will go to the right 3and down 5.
There is an infinite number of solutions.What if I had used a rise of 5 and a runof �3? or 10 and �6? or �10 and 6?
A (4, 7)
B (7,2)
6
4
2
2 4 6 8
8
y
x0
right 3
down 5
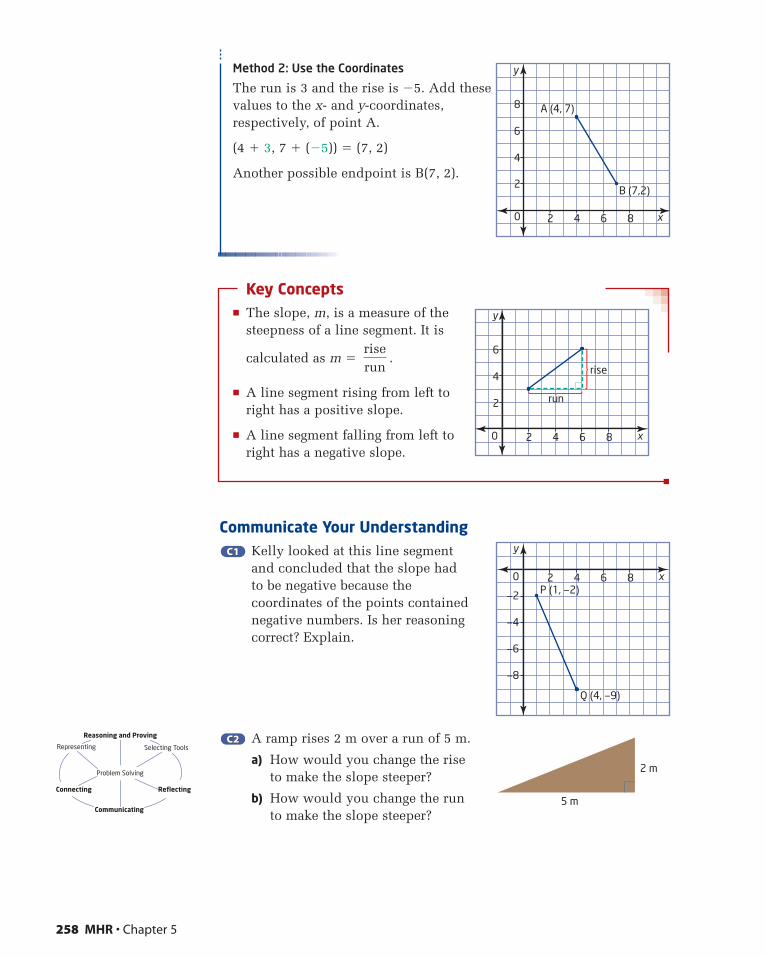
Method 2: Use the Coordinates
The run is 3 and the rise is �5. Add thesevalues to the x- and y-coordinates,respectively, of point A.
(4 � 3, 7 � (�5)) � (7, 2)
Another possible endpoint is B(7, 2).
Key Concepts� The slope, m, is a measure of the
steepness of a line segment. It is
calculated as m � .
� A line segment rising from left to right has a positive slope.
� A line segment falling from left to right has a negative slope.
Communicate Your UnderstandingKelly looked at this line segmentand concluded that the slope hadto be negative because thecoordinates of the points containednegative numbers. Is her reasoningcorrect? Explain.
A ramp rises 2 m over a run of 5 m.
a) How would you change the riseto make the slope steeper?
b) How would you change the runto make the slope steeper?
C2C2
C1C1
riserun
258 MHR • Chapter 5
6
4
2
2 4 6 8
y
x0
rise
run
P (1, —2)
Q (4, —9)
—4
—6
—8
2 4 6 8
—2
y
x0
2 m
5 m
Selecting ToolsRepresenting
Reasoning and Proving
Communicating
Connecting Reflecting
Problem Solving
A (4, 7)
B (7,2)
6
4
2
2 4 6 8
8
y
x0
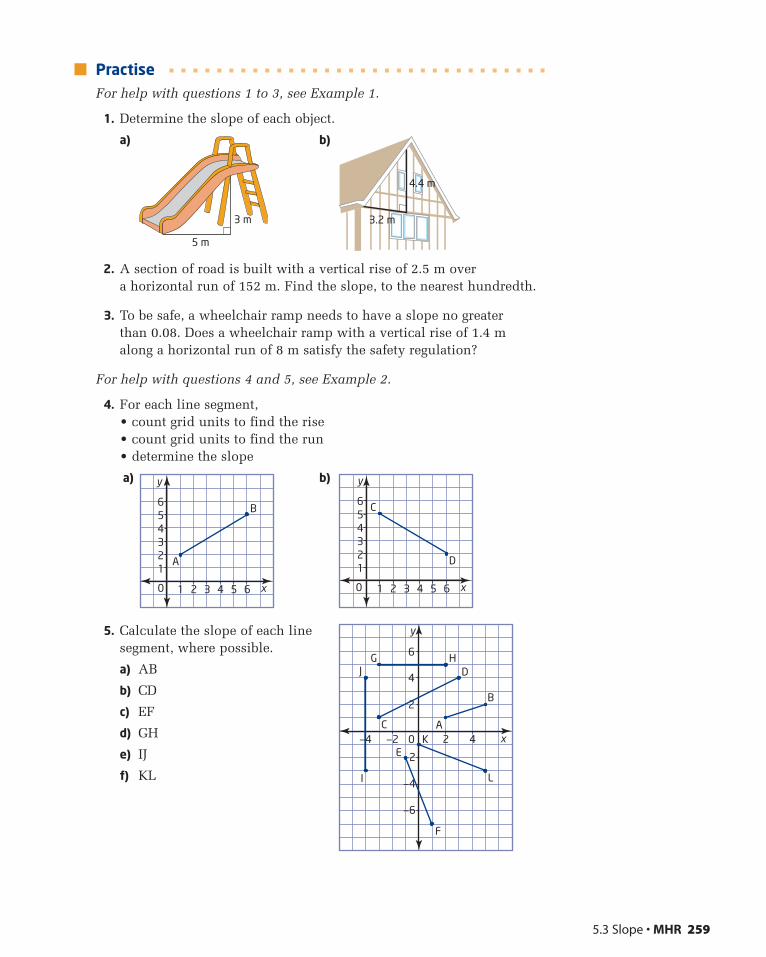
PractiseFor help with questions 1 to 3, see Example 1.
1. Determine the slope of each object.
a) b)
2. A section of road is built with a vertical rise of 2.5 m overa horizontal run of 152 m. Find the slope, to the nearest hundredth.
3. To be safe, a wheelchair ramp needs to have a slope no greaterthan 0.08. Does a wheelchair ramp with a vertical rise of 1.4 malong a horizontal run of 8 m satisfy the safety regulation?
For help with questions 4 and 5, see Example 2.
4. For each line segment,• count grid units to find the rise• count grid units to find the run• determine the slope
a) b)
5. Calculate the slope of each linesegment, where possible.
a) AB
b) CD
c) EF
d) GH
e) IJ
f) KL
C
D
654321
1 2 3 4 5 6
y
x0
A
B654321
1 2 3 4 5 6
y
x0
4.4 m
3.2 m3 m
5 m
5.3 Slope • MHR 259
6
4
2
—2
—4
—6
2 4
y
x0—2—4
JG H
C
I
E
F
K
L
A
B
D
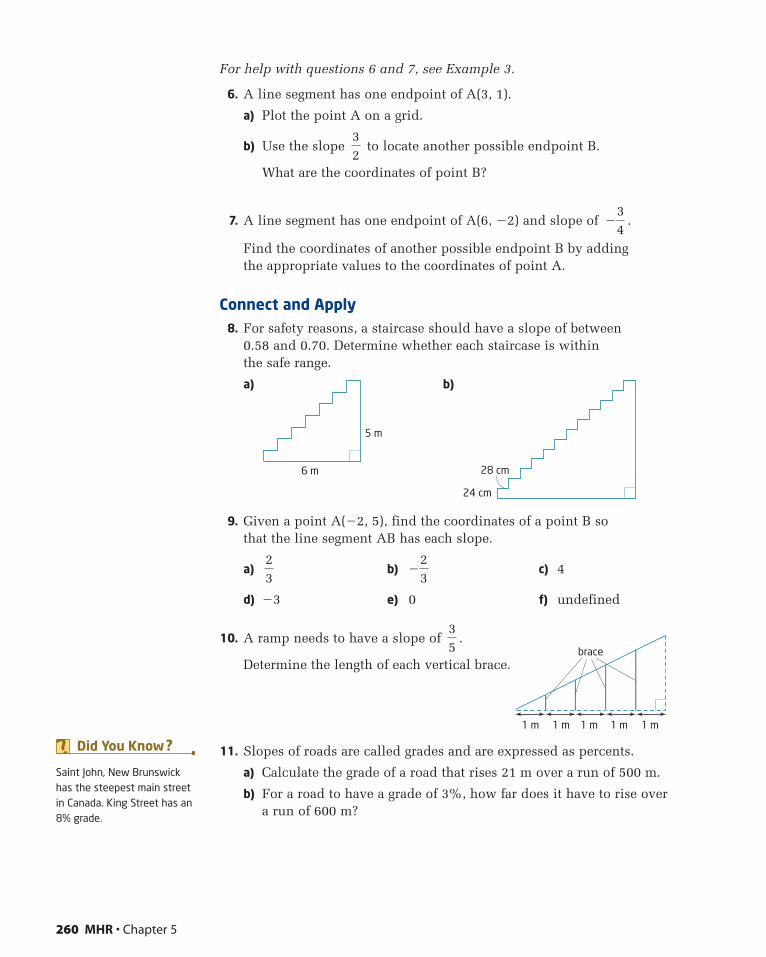
For help with questions 6 and 7, see Example 3.
6. A line segment has one endpoint of A(3, 1).
a) Plot the point A on a grid.
b) Use the slope to locate another possible endpoint B.
What are the coordinates of point B?
7. A line segment has one endpoint of A(6, �2) and slope of .
Find the coordinates of another possible endpoint B by adding the appropriate values to the coordinates of point A.
Connect and Apply8. For safety reasons, a staircase should have a slope of between
0.58 and 0.70. Determine whether each staircase is within the safe range.
a) b)
9. Given a point A(�2, 5), find the coordinates of a point B so that the line segment AB has each slope.
a) b) c) 4
d) �3 e) 0 f) undefined
10. A ramp needs to have a slope of .
Determine the length of each vertical brace.
11. Slopes of roads are called grades and are expressed as percents.
a) Calculate the grade of a road that rises 21 m over a run of 500 m.
b) For a road to have a grade of 3%, how far does it have to rise overa run of 600 m?
35
�23
23
24 cm
28 cm
5 m
6 m
�34
32
260 MHR • Chapter 5
1 m 1 m 1 m 1 m
brace
1 m
Saint John, New Brunswickhas the steepest main streetin Canada. King Street has an8% grade.
Did You Know ?
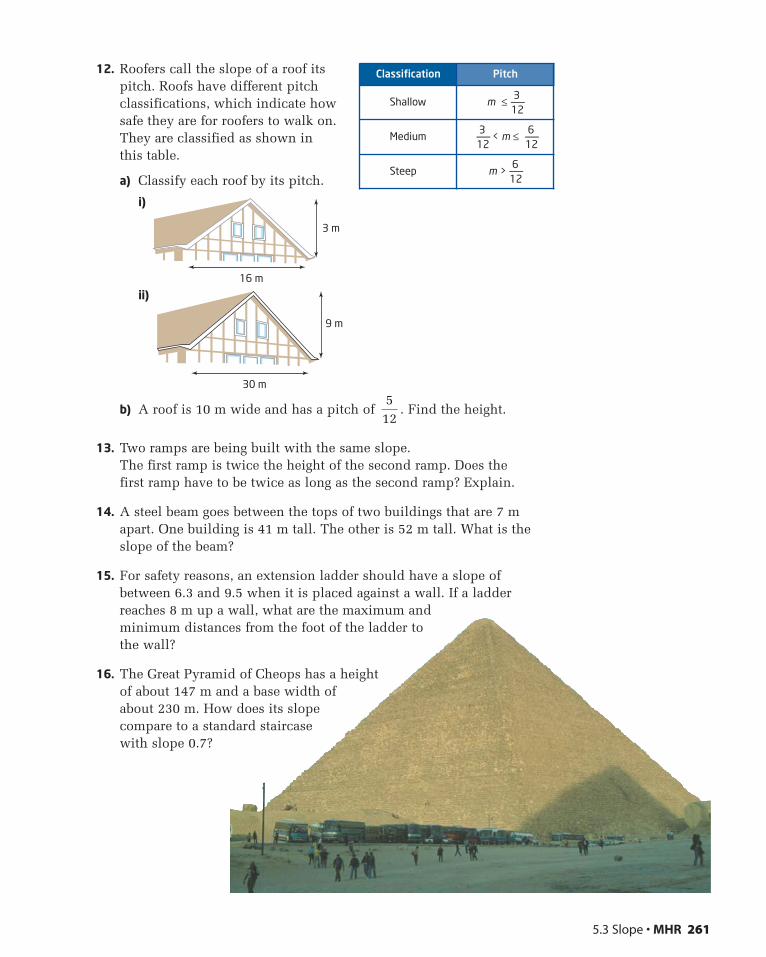
12. Roofers call the slope of a roof itspitch. Roofs have different pitchclassifications, which indicate howsafe they are for roofers to walk on.They are classified as shown inthis table.
a) Classify each roof by its pitch.
i)
ii)
b) A roof is 10 m wide and has a pitch of . Find the height.
13. Two ramps are being built with the same slope. The first ramp is twice the height of the second ramp. Does the first ramp have to be twice as long as the second ramp? Explain.
14. A steel beam goes between the tops of two buildings that are 7 mapart. One building is 41 m tall. The other is 52 m tall. What is theslope of the beam?
15. For safety reasons, an extension ladder should have a slope ofbetween 6.3 and 9.5 when it is placed against a wall. If a ladderreaches 8 m up a wall, what are the maximum andminimum distances from the foot of the ladder tothe wall?
16. The Great Pyramid of Cheops has a heightof about 147 m and a base width ofabout 230 m. How does its slopecompare to a standard staircasewith slope 0.7?
512
9 m
30 m
3 m
16 m
Classification Pitch
Shallow m ≤3—12
Medium3—12
< m ≤6—12
Steep m > 6—12
5.3 Slope • MHR 261
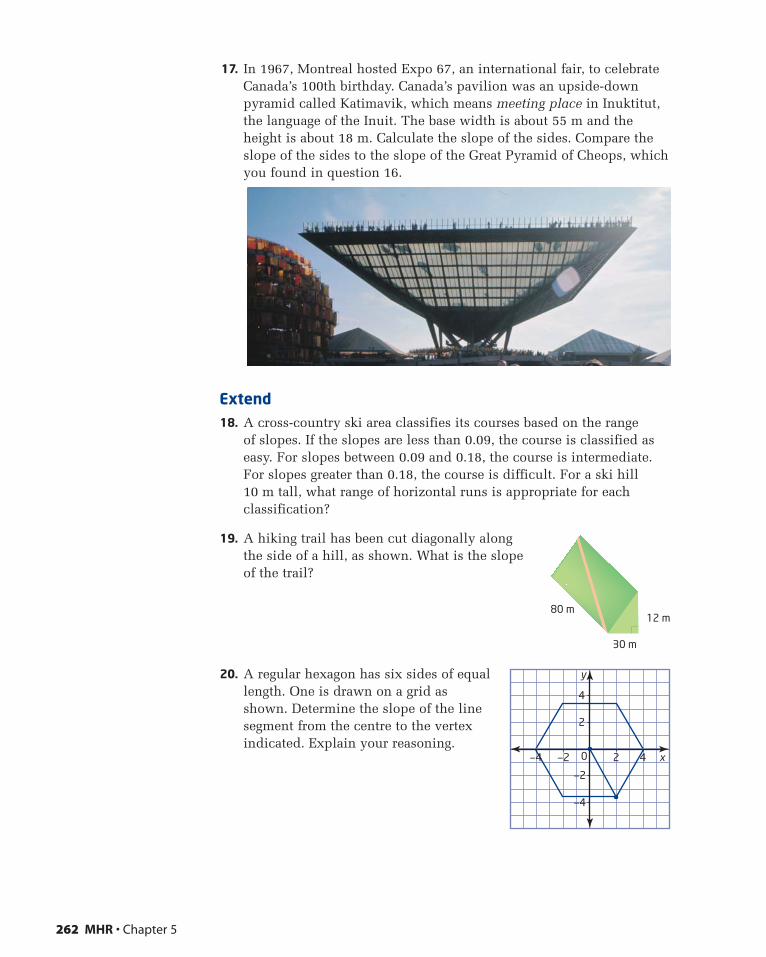
17. In 1967, Montreal hosted Expo 67, an international fair, to celebrateCanada’s 100th birthday. Canada’s pavilion was an upside-downpyramid called Katimavik, which means meeting place in Inuktitut,the language of the Inuit. The base width is about 55 m and theheight is about 18 m. Calculate the slope of the sides. Compare theslope of the sides to the slope of the Great Pyramid of Cheops, whichyou found in question 16.
Extend18. A cross-country ski area classifies its courses based on the range
of slopes. If the slopes are less than 0.09, the course is classified aseasy. For slopes between 0.09 and 0.18, the course is intermediate.For slopes greater than 0.18, the course is difficult. For a ski hill10 m tall, what range of horizontal runs is appropriate for eachclassification?
19. A hiking trail has been cut diagonally along the side of a hill, as shown. What is the slope of the trail?
20. A regular hexagon has six sides of equallength. One is drawn on a grid asshown. Determine the slope of the linesegment from the centre to the vertexindicated. Explain your reasoning.
262 MHR • Chapter 5
12 m
30 m
80 m
4
2
—2
—4
2 4 x
y
0—2—4
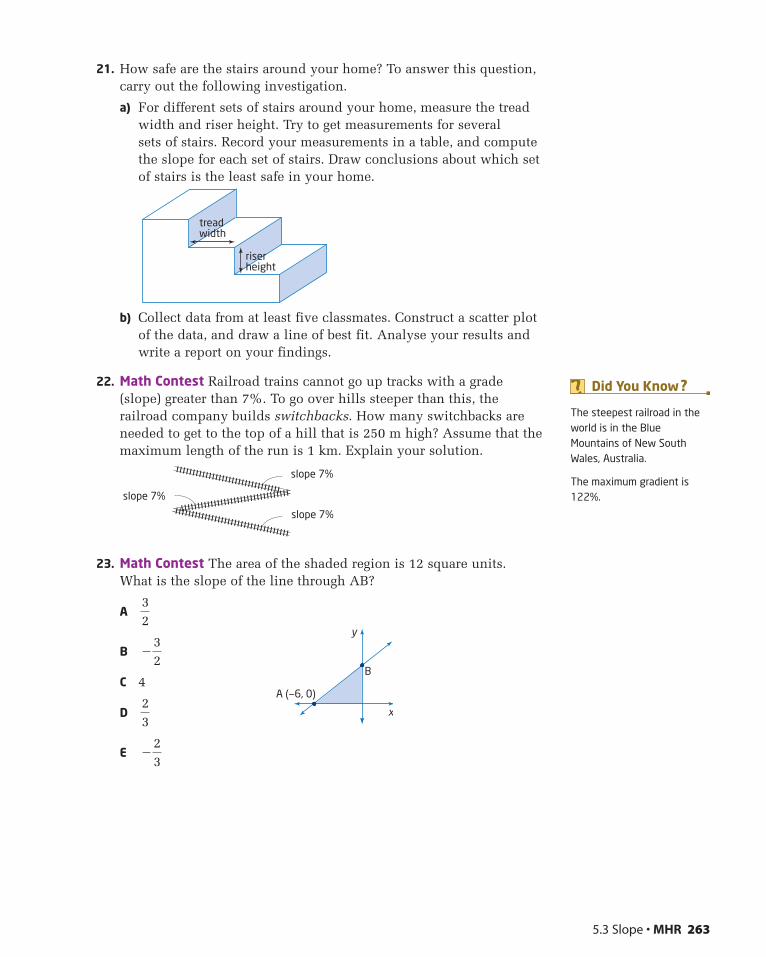
21. How safe are the stairs around your home? To answer this question,carry out the following investigation.
a) For different sets of stairs around your home, measure the treadwidth and riser height. Try to get measurements for several sets of stairs. Record your measurements in a table, and compute the slope for each set of stairs. Draw conclusions about which set of stairs is the least safe in your home.
b) Collect data from at least five classmates. Construct a scatter plotof the data, and draw a line of best fit. Analyse your results andwrite a report on your findings.
22. Math Contest Railroad trains cannot go up tracks with a grade(slope) greater than 7%. To go over hills steeper than this, therailroad company builds switchbacks. How many switchbacks areneeded to get to the top of a hill that is 250 m high? Assume that themaximum length of the run is 1 km. Explain your solution.
23. Math Contest The area of the shaded region is 12 square units. What is the slope of the line through AB?
A
B
C 4
D
E �˛˛
23
23
�˛˛
32
32
5.3 Slope • MHR 263
slope 7%
slope 7%
slope 7%
A (—6, 0)
B
y
x
riserheight
treadwidth
The steepest railroad in theworld is in the BlueMountains of New SouthWales, Australia.
The maximum gradient is122%.
Did You Know ?
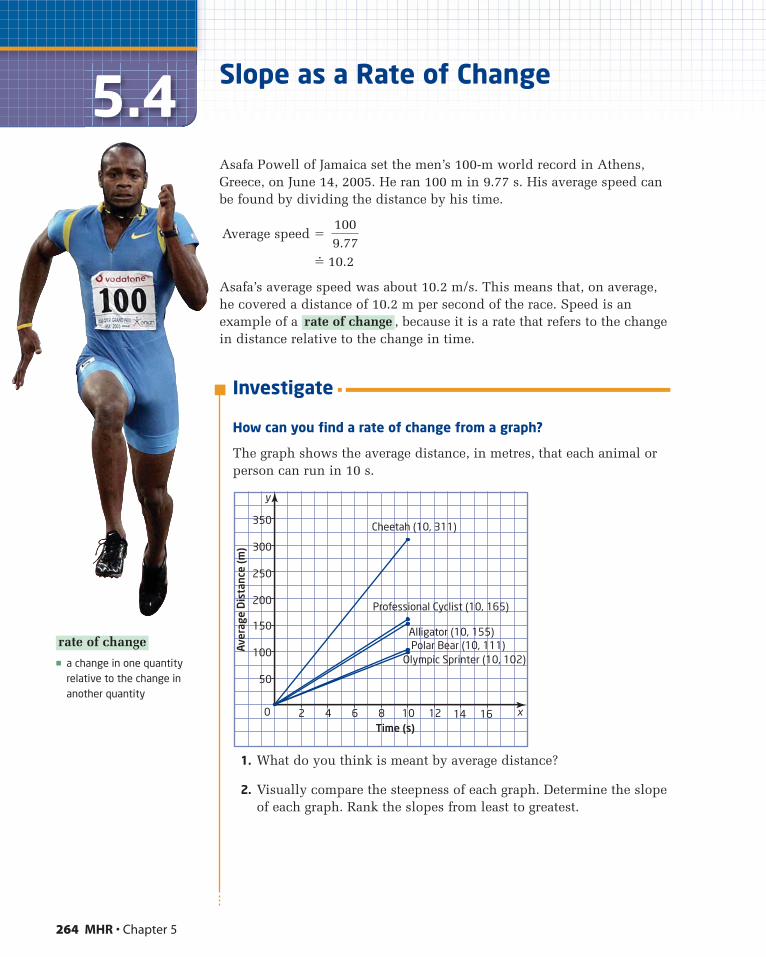
Investigate
How can you find a rate of change from a graph?
The graph shows the average distance, in metres, that each animal orperson can run in 10 s.
1. What do you think is meant by average distance?
2. Visually compare the steepness of each graph. Determine the slopeof each graph. Rank the slopes from least to greatest.
Time (s)
Aver
age
Dis
tanc
e (m
)
150
100
50
300
350
250
200
2 4 6 8 10 12 14 16
y
x0
Cheetah (10, 311)
Professional Cyclist (10, 165)
Alligator (10, 155) Polar Bear (10, 111)
Olympic Sprinter (10, 102)
264 MHR • Chapter 5
5.4 Slope as a Rate of Change
Asafa Powell of Jamaica set the men’s 100-m world record in Athens,Greece, on June 14, 2005. He ran 100 m in 9.77 s. His average speed can be found by dividing the distance by his time.
Average speed �
�� 10.2
Asafa’s average speed was about 10.2 m/s. This means that, on average,he covered a distance of 10.2 m per second of the race. Speed is anexample of a , because it is a rate that refers to the changein distance relative to the change in time.
rate of change
1009.77
� a change in one quantityrelative to the change inanother quantity
rate of change
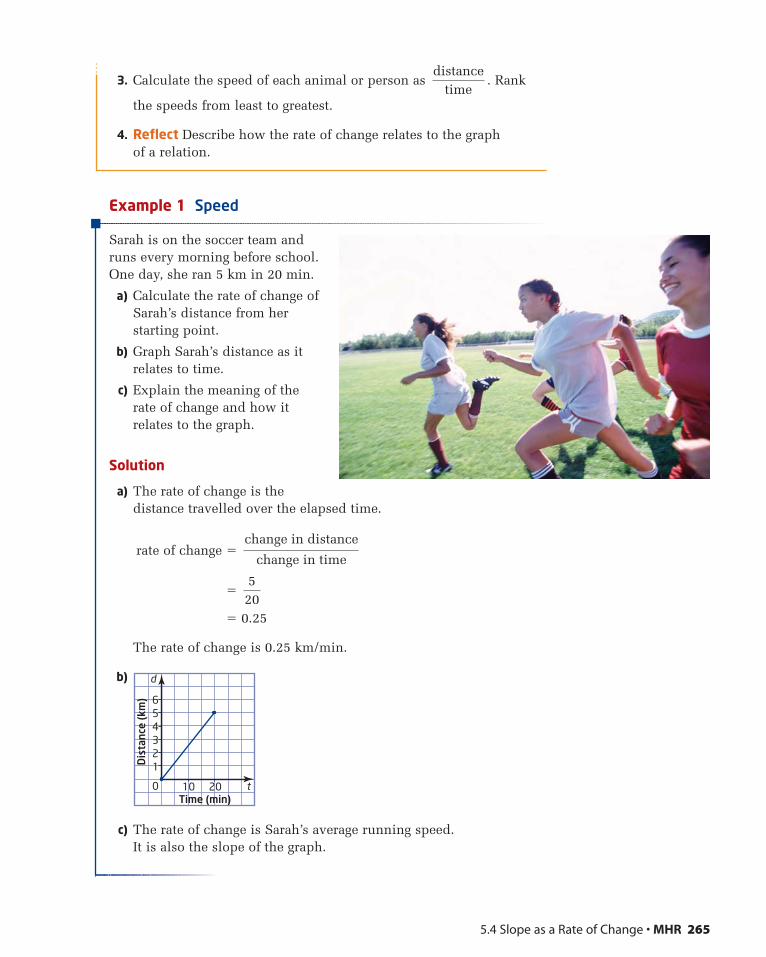
3. Calculate the speed of each animal or person as . Rank
the speeds from least to greatest.
4. Reflect Describe how the rate of change relates to the graph of a relation.
Example 1 Speed
Sarah is on the soccer team andruns every morning before school. One day, she ran 5 km in 20 min.
a) Calculate the rate of change ofSarah’s distance from herstarting point.
b) Graph Sarah’s distance as itrelates to time.
c) Explain the meaning of therate of change and how itrelates to the graph.
Solution
a) The rate of change is thedistance travelled over the elapsed time.
rate of change �
�
� 0.25
The rate of change is 0.25 km/min.
b)
c) The rate of change is Sarah’s average running speed. It is also the slope of the graph.
654321
10 20
d
t0
Dis
tanc
e (k
m)
Time (min)
520
change in distance
change in time
distancetime
5.4 Slope as a Rate of Change • MHR 265
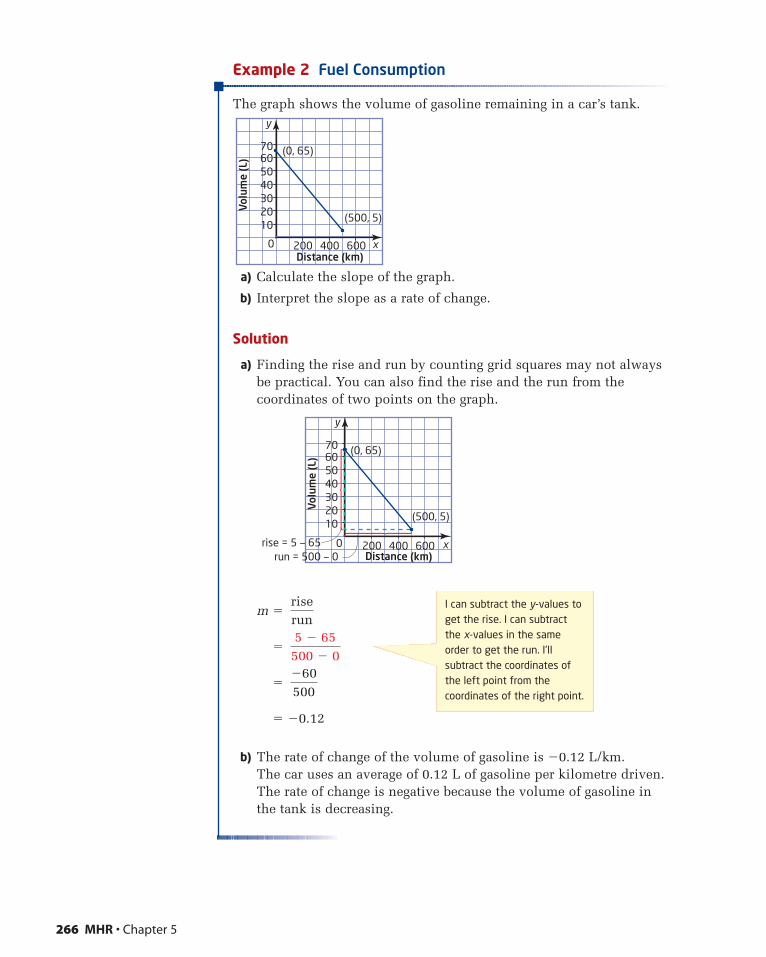
Example 2 Fuel Consumption
The graph shows the volume of gasoline remaining in a car’s tank.
a) Calculate the slope of the graph.
b) Interpret the slope as a rate of change.
Solution
a) Finding the rise and run by counting grid squares may not alwaysbe practical. You can also find the rise and the run from thecoordinates of two points on the graph.
m �
�
�
� �0.12
b) The rate of change of the volume of gasoline is �0.12 L/km. The car uses an average of 0.12 L of gasoline per kilometre driven.The rate of change is negative because the volume of gasoline inthe tank is decreasing.
�60500
5 � 65500 � 0
riserun
266 MHR • Chapter 5
6070
5040302010
200 400 600
y
x0
(0, 65)
(500, 5)
Distance (km)run = 500 — 0rise = 5 — 65
Volu
me
(L)
I can subtract the y-values toget the rise. I can subtractthe x-values in the sameorder to get the run. I’llsubtract the coordinates ofthe left point from thecoordinates of the right point.
6070
5040302010
200 400 600
y
x0
(0, 65)
(500, 5)
Distance (km)Vo
lum
e (L
)
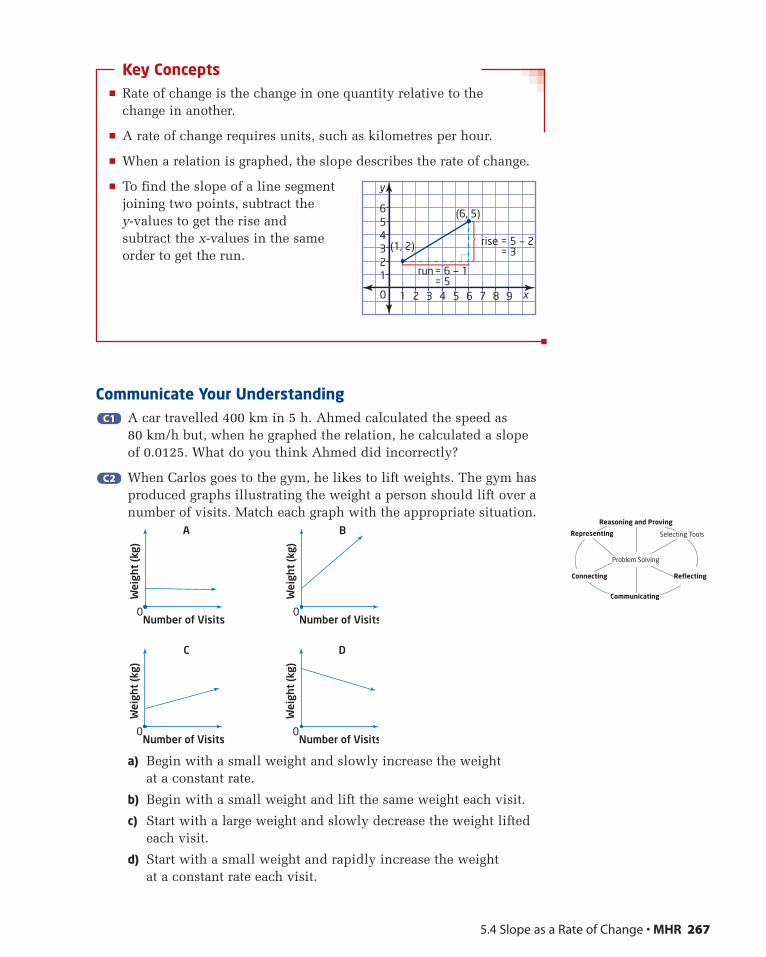
Key Concepts� Rate of change is the change in one quantity relative to the
change in another.
� A rate of change requires units, such as kilometres per hour.
� When a relation is graphed, the slope describes the rate of change.
� To find the slope of a line segmentjoining two points, subtract the y-values to get the rise andsubtract the x-values in the sameorder to get the run.
Communicate Your UnderstandingA car travelled 400 km in 5 h. Ahmed calculated the speed as80 km/h but, when he graphed the relation, he calculated a slopeof 0.0125. What do you think Ahmed did incorrectly?
When Carlos goes to the gym, he likes to lift weights. The gym hasproduced graphs illustrating the weight a person should lift over anumber of visits. Match each graph with the appropriate situation.
a) Begin with a small weight and slowly increase the weight at a constant rate.
b) Begin with a small weight and lift the same weight each visit.
c) Start with a large weight and slowly decrease the weight liftedeach visit.
d) Start with a small weight and rapidly increase the weight at a constant rate each visit.
C2C2
C1C1
5.4 Slope as a Rate of Change • MHR 267
654321
1 2 3 4 5 6 7 8 9
y
x0
= 6 — 1= 5
run
= 5 — 2= 3
rise
(6, 5)
(1, 2)
0Number of Visits
Wei
ght
(kg)
A
0Number of Visits
Wei
ght
(kg)
B
0Number of Visits
Wei
ght
(kg)
C
0Number of Visits
Wei
ght
(kg)
D
Selecting ToolsRepresenting
Reasoning and Proving
Communicating
Connecting Reflecting
Problem Solving
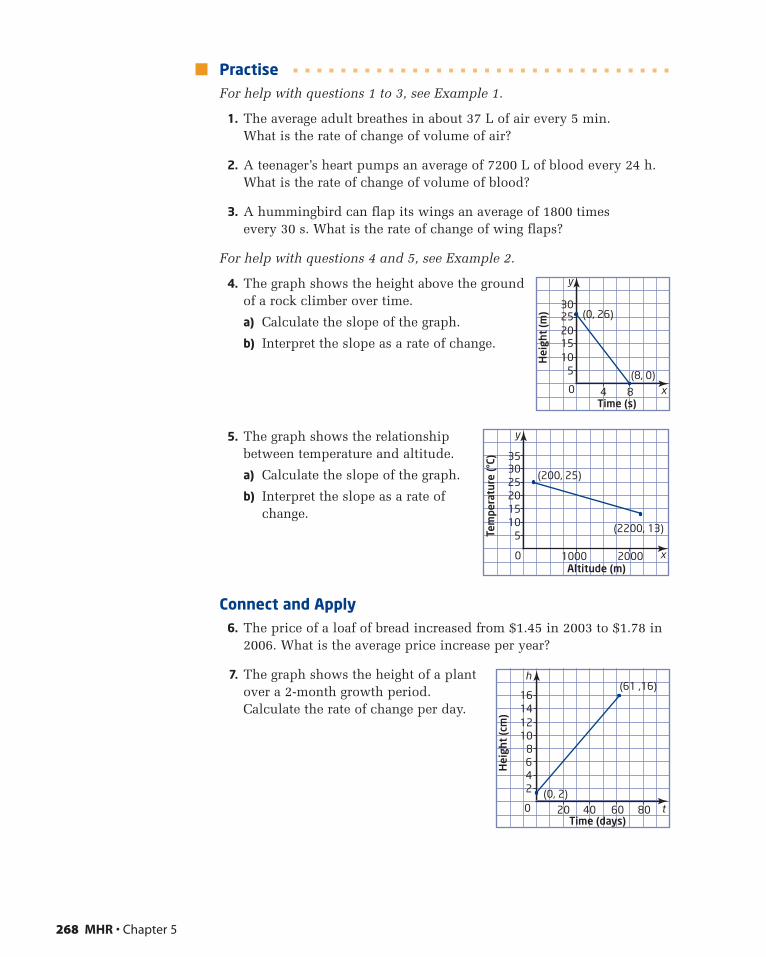
PractiseFor help with questions 1 to 3, see Example 1.
1. The average adult breathes in about 37 L of air every 5 min. What is the rate of change of volume of air?
2. A teenager’s heart pumps an average of 7200 L of blood every 24 h.What is the rate of change of volume of blood?
3. A hummingbird can flap its wings an average of 1800 times every 30 s. What is the rate of change of wing flaps?
For help with questions 4 and 5, see Example 2.
4. The graph shows the height above the groundof a rock climber over time.
a) Calculate the slope of the graph.
b) Interpret the slope as a rate of change.
5. The graph shows the relationshipbetween temperature and altitude.
a) Calculate the slope of the graph.
b) Interpret the slope as a rate ofchange.
Connect and Apply6. The price of a loaf of bread increased from $1.45 in 2003 to $1.78 in
2006. What is the average price increase per year?
7. The graph shows the height of a plantover a 2-month growth period.Calculate the rate of change per day.
268 MHR • Chapter 5
3035
25201510
5
200010000
(200, 25)
(2200, 13)Tem
pera
ture
(°C)
Altitude (m)
y
x
1214
108642
20 40 60 800
(61 ,16)
(0, 2)
Hei
ght
(cm
)
Time (days)
16
h
t
3025201510
5
4 80
(0, 26)
(8, 0)
Time (s)
Hei
ght
(m)
y
x
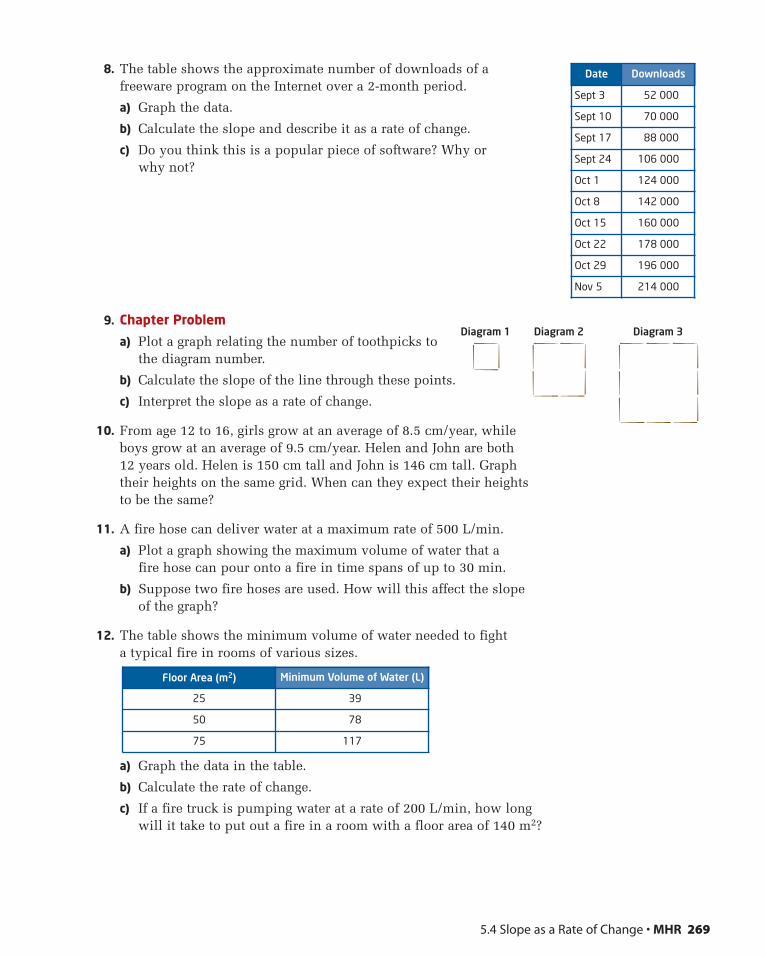
8. The table shows the approximate number of downloads of a freeware program on the Internet over a 2-month period.
a) Graph the data.
b) Calculate the slope and describe it as a rate of change.
c) Do you think this is a popular piece of software? Why orwhy not?
9. Chapter Problem
a) Plot a graph relating the number of toothpicks tothe diagram number.
b) Calculate the slope of the line through these points.
c) Interpret the slope as a rate of change.
10. From age 12 to 16, girls grow at an average of 8.5 cm/year, whileboys grow at an average of 9.5 cm/year. Helen and John are both12 years old. Helen is 150 cm tall and John is 146 cm tall. Graphtheir heights on the same grid. When can they expect their heightsto be the same?
11. A fire hose can deliver water at a maximum rate of 500 L/min.
a) Plot a graph showing the maximum volume of water that afire hose can pour onto a fire in time spans of up to 30 min.
b) Suppose two fire hoses are used. How will this affect the slopeof the graph?
12. The table shows the minimum volume of water needed to fight a typical fire in rooms of various sizes.
a) Graph the data in the table.
b) Calculate the rate of change.
c) If a fire truck is pumping water at a rate of 200 L/min, how longwill it take to put out a fire in a room with a floor area of 140 m2?
5.4 Slope as a Rate of Change • MHR 269
Floor Area (m2) Minimum Volume of Water (L)
25 39
50 78
75 117
Date Downloads
Sept 3 52 000
Sept 10 70 000
Sept 17 88 000
Sept 24 106 000
Oct 1 124 000
Oct 8 142 000
Oct 15 160 000
Oct 22 178 000
Oct 29 196 000
Nov 5 214 000
Diagram 1 Diagram 2 Diagram 3
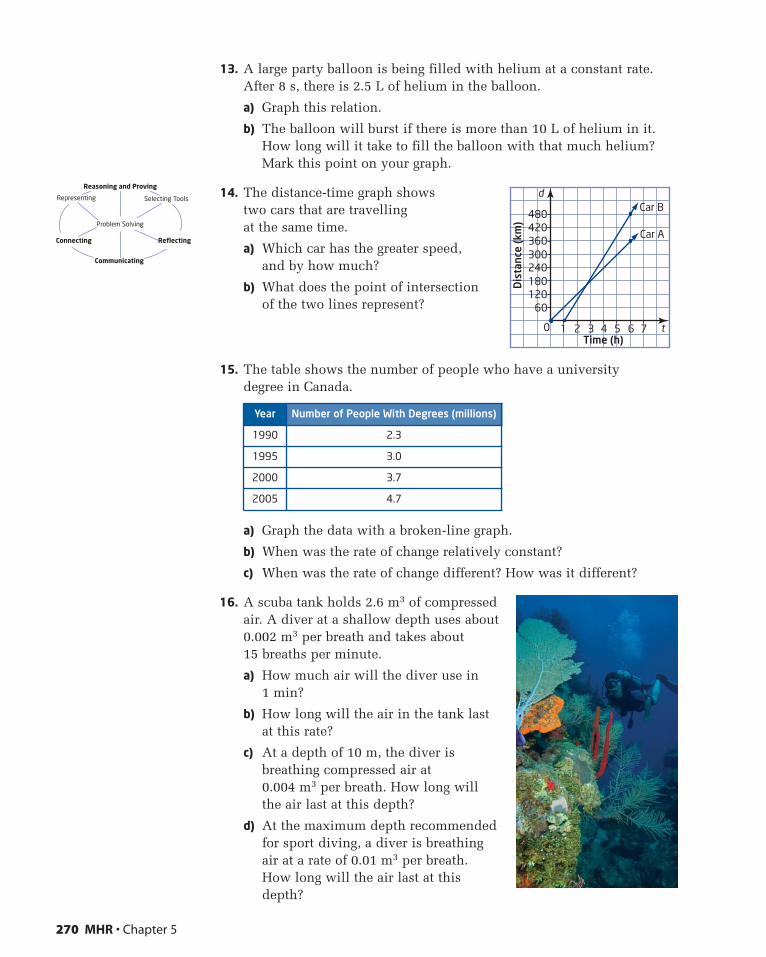
13. A large party balloon is being filled with helium at a constant rate.After 8 s, there is 2.5 L of helium in the balloon.
a) Graph this relation.
b) The balloon will burst if there is more than 10 L of helium in it.How long will it take to fill the balloon with that much helium?Mark this point on your graph.
14. The distance-time graph showstwo cars that are travelling at the same time.
a) Which car has the greater speed, and by how much?
b) What does the point of intersection of the two lines represent?
15. The table shows the number of people who have a university degree in Canada.
a) Graph the data with a broken-line graph.
b) When was the rate of change relatively constant?
c) When was the rate of change different? How was it different?
16. A scuba tank holds 2.6 m3 of compressedair. A diver at a shallow depth uses about0.002 m3 per breath and takes about15 breaths per minute.
a) How much air will the diver use in1 min?
b) How long will the air in the tank lastat this rate?
c) At a depth of 10 m, the diver isbreathing compressed air at 0.004 m3 per breath. How long willthe air last at this depth?
d) At the maximum depth recommendedfor sport diving, a diver is breathingair at a rate of 0.01 m3 per breath.How long will the air last at thisdepth?
270 MHR • Chapter 5
Year Number of People With Degrees (millions)
1990 2.3
1995 3.0
2000 3.7
2005 4.7
360420480
300240180120
60
0 21Time (h)
d
t
Dis
tanc
e (k
m)
4 5 6 73
Car A
Car BSelecting ToolsRepresenting
Reasoning and Proving
Communicating
Connecting Reflecting
Problem Solving
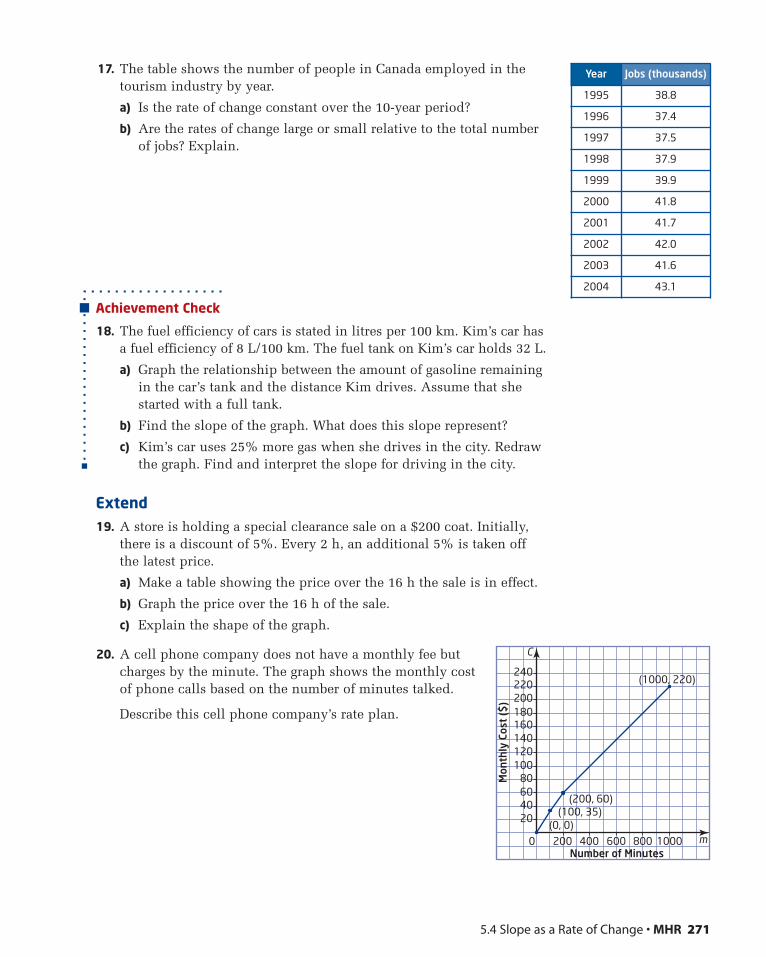
17. The table shows the number of people in Canada employed in thetourism industry by year.
a) Is the rate of change constant over the 10-year period?
b) Are the rates of change large or small relative to the total numberof jobs? Explain.
Achievement Check
18. The fuel efficiency of cars is stated in litres per 100 km. Kim’s car hasa fuel efficiency of 8 L/100 km. The fuel tank on Kim’s car holds 32 L.
a) Graph the relationship between the amount of gasoline remainingin the car’s tank and the distance Kim drives. Assume that shestarted with a full tank.
b) Find the slope of the graph. What does this slope represent?
c) Kim’s car uses 25% more gas when she drives in the city. Redrawthe graph. Find and interpret the slope for driving in the city.
Extend19. A store is holding a special clearance sale on a $200 coat. Initially,
there is a discount of 5%. Every 2 h, an additional 5% is taken offthe latest price.
a) Make a table showing the price over the 16 h the sale is in effect.
b) Graph the price over the 16 h of the sale.
c) Explain the shape of the graph.
20. A cell phone company does not have a monthly fee butcharges by the minute. The graph shows the monthly costof phone calls based on the number of minutes talked.
Describe this cell phone company’s rate plan.
5.4 Slope as a Rate of Change • MHR 271
Year Jobs (thousands)
1995 38.8
1996 37.4
1997 37.5
1998 37.9
1999 39.9
2000 41.8
2001 41.7
2002 42.0
2003 41.6
2004 43.1
120140160180200220240
10080604020
0 200Number of Minutes
Mon
thly
Cos
t ($
)
400 600 800 1000
(1000, 220)
(200, 60)(100, 35)
(0, 0)
C
m
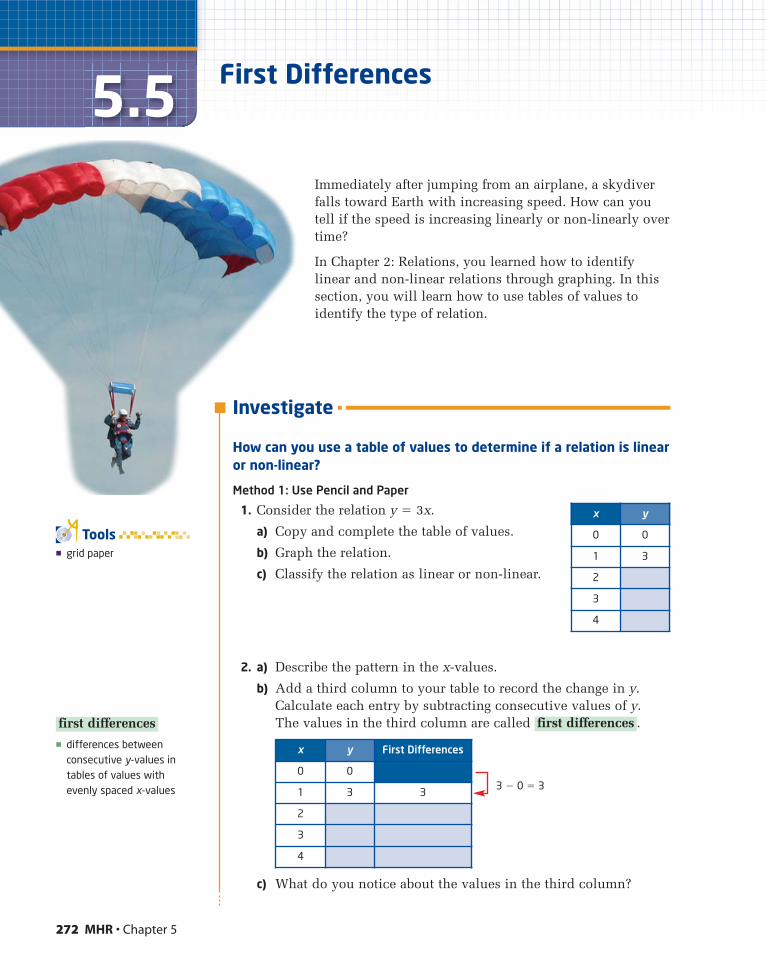
Investigate
How can you use a table of values to determine if a relation is linearor non-linear?
Method 1: Use Pencil and Paper
1. Consider the relation y � 3x.
a) Copy and complete the table of values.
b) Graph the relation.
c) Classify the relation as linear or non-linear.
2. a) Describe the pattern in the x-values.
b) Add a third column to your table to record the change in y.Calculate each entry by subtracting consecutive values of y. The values in the third column are called .
c) What do you notice about the values in the third column?
first differences
272 MHR • Chapter 5
5.5 First Differences
Immediately after jumping from an airplane, a skydiverfalls toward Earth with increasing speed. How can youtell if the speed is increasing linearly or non-linearly overtime?
In Chapter 2: Relations, you learned how to identifylinear and non-linear relations through graphing. In thissection, you will learn how to use tables of values toidentify the type of relation.
x y First Differences
0 0
1 3 3
2
3
4
x y
0 0
1 3
2
3
4
� grid paper
Tools
� differences betweenconsecutive y-values intables of values withevenly spaced x-values
first differences
3 � 0 � 3
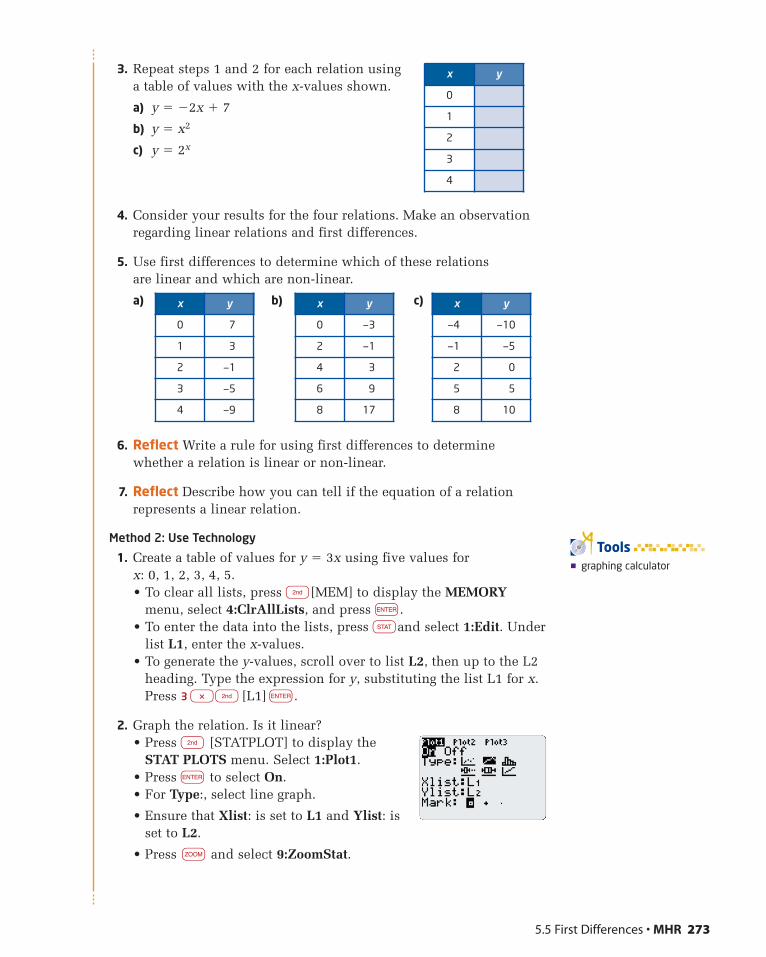
x y
—4 —10
—1 —5
2 0
5 5
8 10
x y
0 —3
2 —1
4 3
6 9
8 17
x y
0 7
1 3
2 —1
3 —5
4 —9
3. Repeat steps 1 and 2 for each relation usinga table of values with the x-values shown.
a) y � �2x � 7
b) y � x2
c) y � 2x
4. Consider your results for the four relations. Make an observationregarding linear relations and first differences.
5. Use first differences to determine which of these relations are linear and which are non-linear.
a) b) c)
6. Reflect Write a rule for using first differences to determinewhether a relation is linear or non-linear.
7. Reflect Describe how you can tell if the equation of a relationrepresents a linear relation.
Method 2: Use Technology
1. Create a table of values for y � 3x using five values for x: 0, 1, 2, 3, 4, 5.• To clear all lists, press n[MEM] to display the MEMORY
menu, select 4:ClrAllLists, and press e.• To enter the data into the lists, press qand select 1:Edit. Under
list L1, enter the x-values.• To generate the y-values, scroll over to list L2, then up to the L2
heading. Type the expression for y, substituting the list L1 for x.Press 3 *n [L1] e.
2. Graph the relation. Is it linear?• Press n [STATPLOT] to display the
STAT PLOTS menu. Select 1:Plot1.• Press e to select On.• For Type:, select line graph.
• Ensure that Xlist: is set to L1 and Ylist: isset to L2.
• Press z and select 9:ZoomStat.
x y
0
1
2
3
4
5.5 First Differences • MHR 273
� graphing calculator
Tools
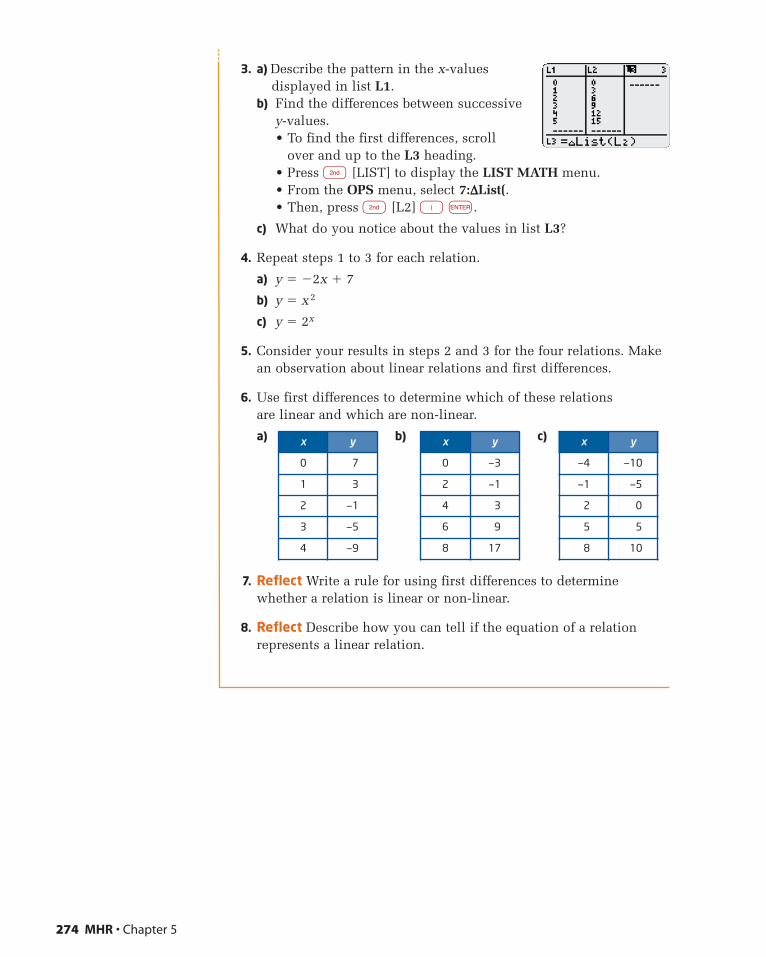
x y
—4 —10
—1 —5
2 0
5 5
8 10
x y
0 —3
2 —1
4 3
6 9
8 17
x y
0 7
1 3
2 —1
3 —5
4 —9
3. a) Describe the pattern in the x-valuesdisplayed in list L1.
b) Find the differences between successivey-values.• To find the first differences, scroll
over and up to the L3 heading.• Press n [LIST] to display the LIST MATH menu.• From the OPS menu, select 7:∆List(.• Then, press n [L2] ) e.
c) What do you notice about the values in list L3?
4. Repeat steps 1 to 3 for each relation.
a) y � �2x � 7
b) y � x2
c) y � 2x
5. Consider your results in steps 2 and 3 for the four relations. Makean observation about linear relations and first differences.
6. Use first differences to determine which of these relations are linear and which are non-linear.
a) b) c)
7. Reflect Write a rule for using first differences to determinewhether a relation is linear or non-linear.
8. Reflect Describe how you can tell if the equation of a relationrepresents a linear relation.
274 MHR • Chapter 5
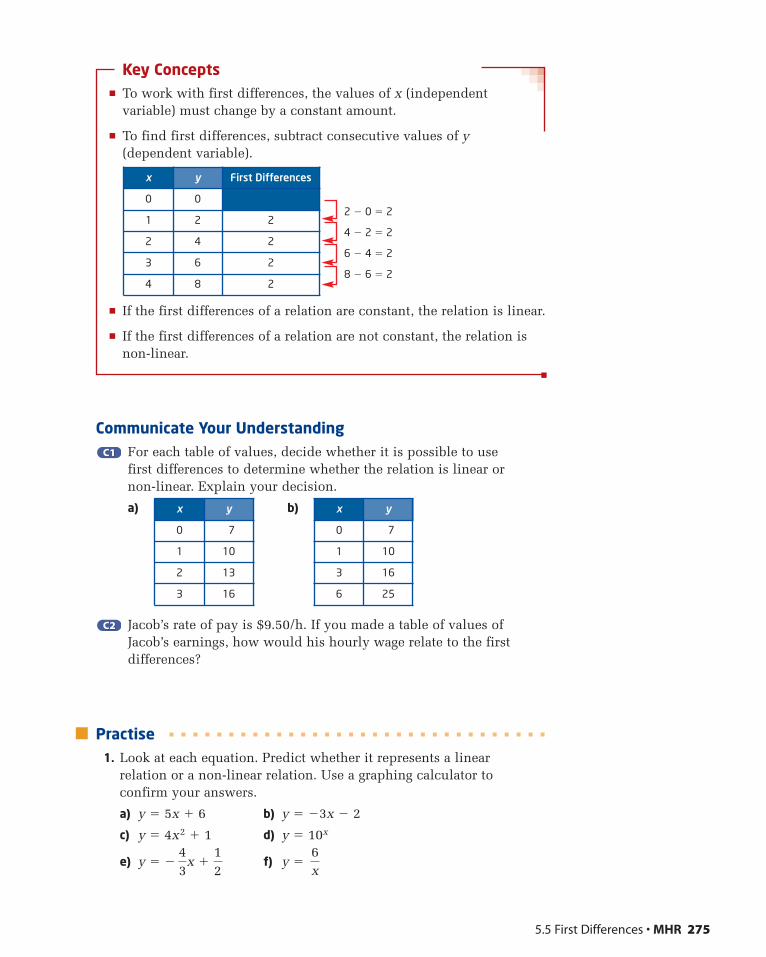
x y
0 7
1 10
3 16
6 25
x y
0 7
1 10
2 13
3 16
Key Concepts� To work with first differences, the values of x (independent
variable) must change by a constant amount.
� To find first differences, subtract consecutive values of y(dependent variable).
2 � 0 � 2
4 � 2 � 2
6 � 4 � 2
8 � 6 � 2
� If the first differences of a relation are constant, the relation is linear.
� If the first differences of a relation are not constant, the relation isnon-linear.
Communicate Your UnderstandingFor each table of values, decide whether it is possible to use first differences to determine whether the relation is linear or non-linear. Explain your decision.
a) b)
Jacob’s rate of pay is $9.50/h. If you made a table of values ofJacob’s earnings, how would his hourly wage relate to the firstdifferences?
Practise1. Look at each equation. Predict whether it represents a linear
relation or a non-linear relation. Use a graphing calculator to confirm your answers.
a) y � 5x � 6 b) y � �3x � 2
c) y � 4x2 � 1 d) y � 10x
e) y � � f) y �6x
43
x �12
C2C2
C1C1
x y First Differences
0 0
1 2 2
2 4 2
3 6 2
4 8 2
5.5 First Differences • MHR 275
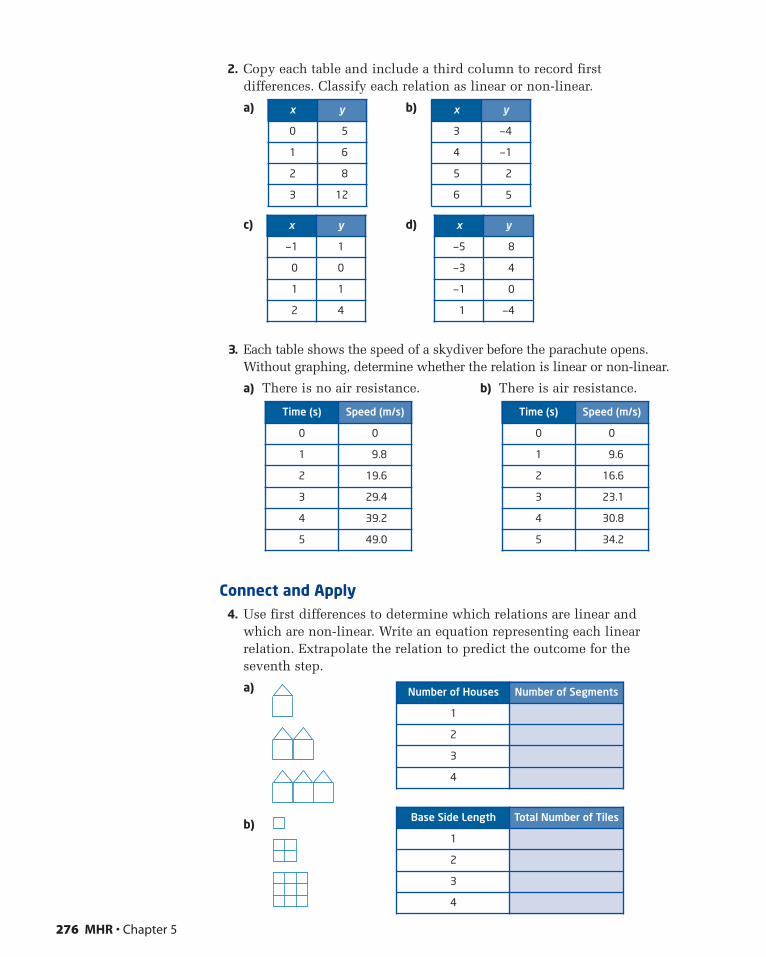
x y
—5 8
—3 4
—1 0
1 —4
x y
—1 1
0 0
1 1
2 4
x y
3 —4
4 —1
5 2
6 5
x y
0 5
1 6
2 8
3 12
2. Copy each table and include a third column to record firstdifferences. Classify each relation as linear or non-linear.
a) b)
c) d)
3. Each table shows the speed of a skydiver before the parachute opens.Without graphing, determine whether the relation is linear or non-linear.
a) There is no air resistance. b) There is air resistance.
Connect and Apply4. Use first differences to determine which relations are linear and
which are non-linear. Write an equation representing each linearrelation. Extrapolate the relation to predict the outcome for theseventh step.
a)
b)
276 MHR • Chapter 5
Time (s) Speed (m/s)
0 0
1 9.6
2 16.6
3 23.1
4 30.8
5 34.2
Time (s) Speed (m/s)
0 0
1 9.8
2 19.6
3 29.4
4 39.2
5 49.0
Number of Houses Number of Segments
1
2
3
4
Base Side Length Total Number of Tiles
1
2
3
4
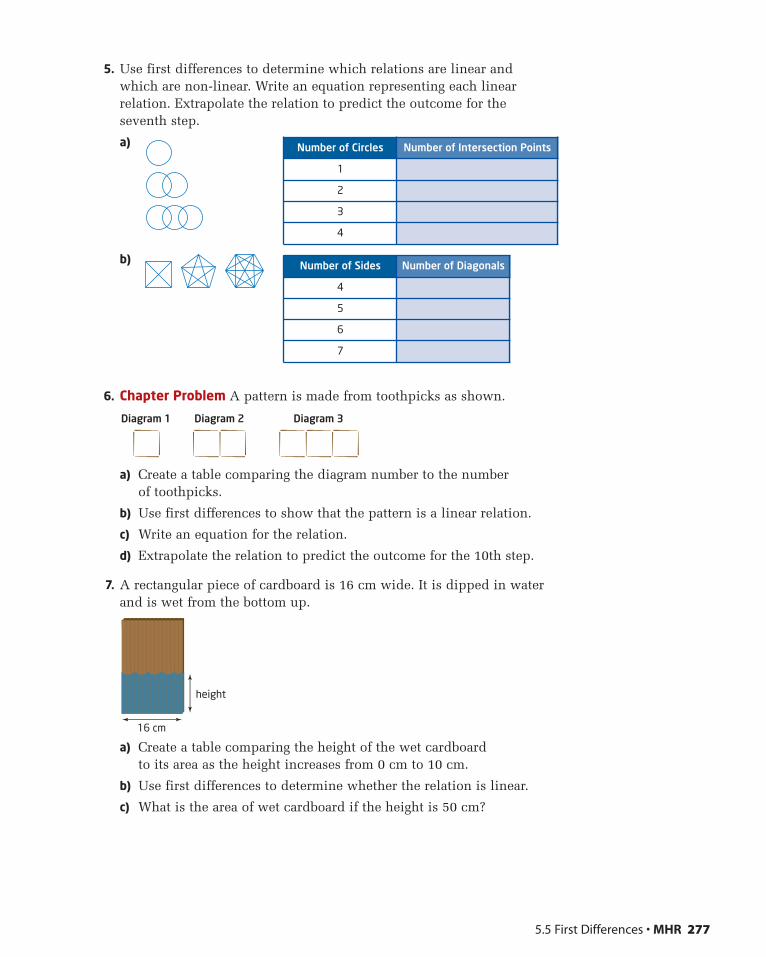
5. Use first differences to determine which relations are linear andwhich are non-linear. Write an equation representing each linearrelation. Extrapolate the relation to predict the outcome for theseventh step.
a)
b)
6. Chapter Problem A pattern is made from toothpicks as shown.
a) Create a table comparing the diagram number to the number of toothpicks.
b) Use first differences to show that the pattern is a linear relation.
c) Write an equation for the relation.
d) Extrapolate the relation to predict the outcome for the 10th step.
7. A rectangular piece of cardboard is 16 cm wide. It is dipped in waterand is wet from the bottom up.
a) Create a table comparing the height of the wet cardboard to its area as the height increases from 0 cm to 10 cm.
b) Use first differences to determine whether the relation is linear.
c) What is the area of wet cardboard if the height is 50 cm?
Diagram 1 Diagram 2 Diagram 3
5.5 First Differences • MHR 277
height
16 cm
Number of Sides Number of Diagonals
4
5
6
7
Number of Circles Number of Intersection Points
1
2
3
4
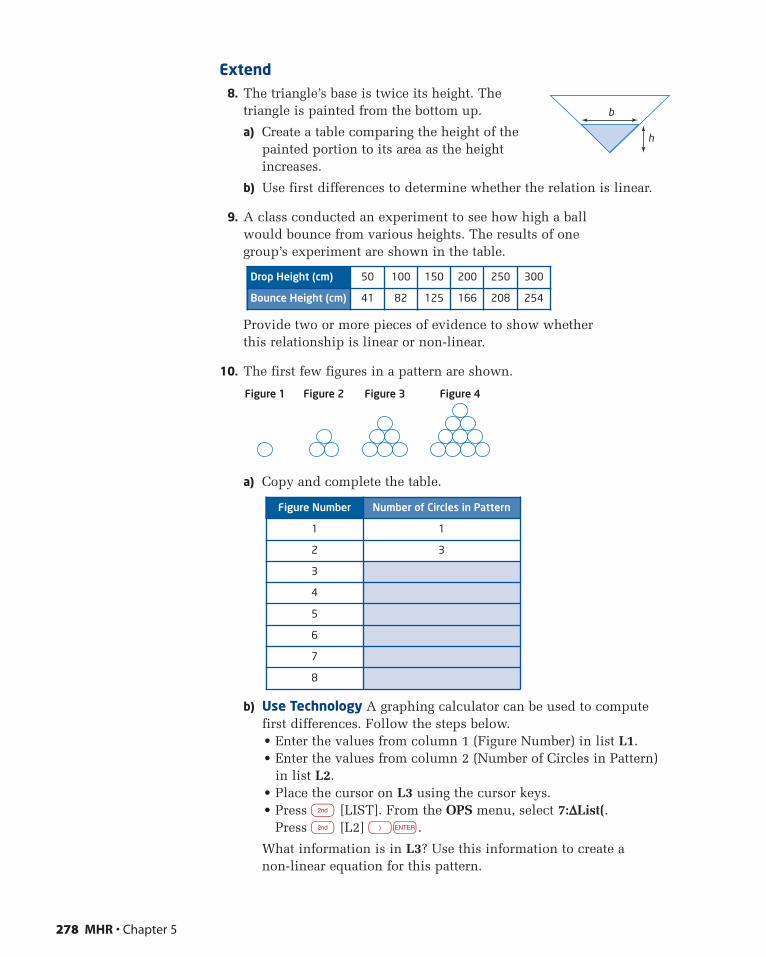
Extend8. The triangle’s base is twice its height. The
triangle is painted from the bottom up.
a) Create a table comparing the height of thepainted portion to its area as the heightincreases.
b) Use first differences to determine whether the relation is linear.
9. A class conducted an experiment to see how high a ball would bounce from various heights. The results of one group’s experiment are shown in the table.
Provide two or more pieces of evidence to show whether this relationship is linear or non-linear.
10. The first few figures in a pattern are shown.
a) Copy and complete the table.
b) Use Technology A graphing calculator can be used to computefirst differences. Follow the steps below.• Enter the values from column 1 (Figure Number) in list L1.• Enter the values from column 2 (Number of Circles in Pattern)
in list L2.• Place the cursor on L3 using the cursor keys.• Press n [LIST]. From the OPS menu, select 7:∆List(.
Press n [L2] )e.
What information is in L3? Use this information to create a non-linear equation for this pattern.
Figure 1 Figure 2 Figure 3 Figure 4
278 MHR • Chapter 5
Figure Number Number of Circles in Pattern
1 1
2 3
3
4
5
6
7
8
Drop Height (cm) 50 100 150 200 250 300
Bounce Height (cm) 41 82 125 166 208 254
b
h

5.6 Connecting Variation, Slope, and First Differences • MHR 279
5.6 Connecting Variation, Slope, andFirst Differences
You have learned to identify a linear relation from its graph, equation, and table of values. For example, from the graph of a linear relation, you can tell if it is a directvariation or a partial variation and calculate its slope. In addition, you can identify a linear relation from its table of values by calculating first differences.
Consider the distance travelled by a snail over time. Is the graph of this relationship linear? How could you find the slope?
In this section, you will learn how variation, slope, and first differences are connected.
Time, t (min) Height, h (m)
0 —3
3 1
6 5
9 9
12 13
Investigate
How are variation, slope, and first differences connected?
The table shows the height, compared to the ground, of a snail as it crawls up a pipe.
1. Graph the relation. Is this a direct variation or a partial variation?
2. Describe the pattern in the t-values. Use first differences to confirm that the relation is linear.
3. Calculate the slope.
4. How does the slope relate to the first differences and the pattern in the t-values?
5. What is the initial value of the height?
6. Write an equation of the line.
7. Reflect Describe how first differences, slope, and partial variation are related.
� grid paper
Tools
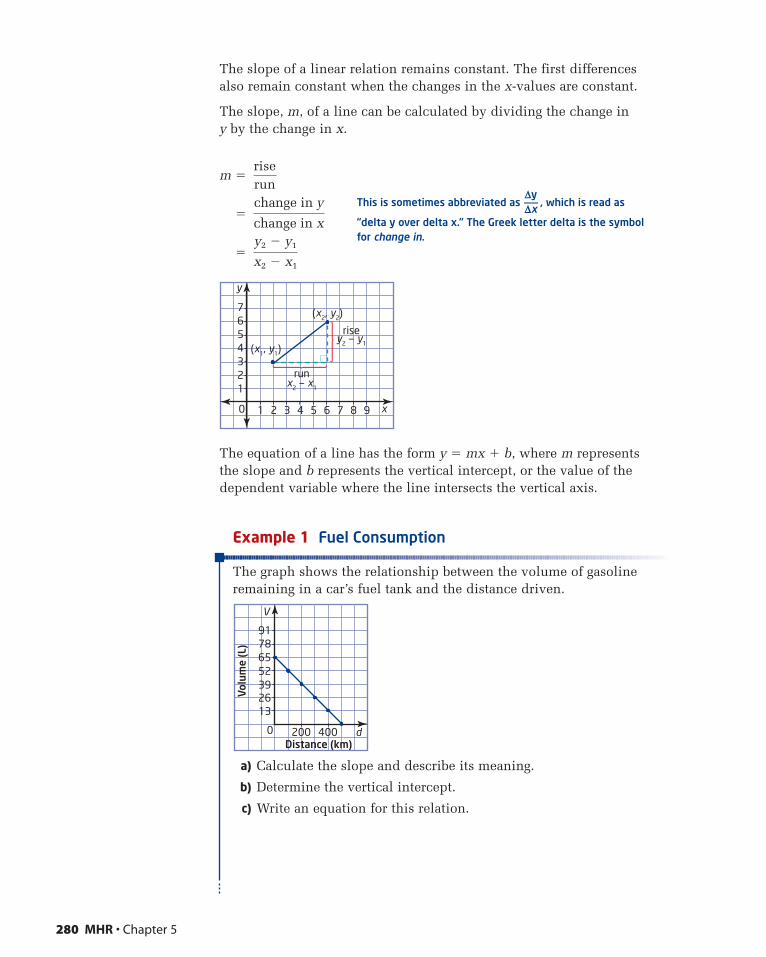
The slope of a linear relation remains constant. The first differences also remain constant when the changes in the x-values are constant.
The slope, m, of a line can be calculated by dividing the change in y by the change in x.
m �
�
�
The equation of a line has the form y � mx � b, where m represents the slope and b represents the vertical intercept, or the value of thedependent variable where the line intersects the vertical axis.
Example 1 Fuel Consumption
The graph shows the relationship between the volume of gasolineremaining in a car’s fuel tank and the distance driven.
a) Calculate the slope and describe its meaning.
b) Determine the vertical intercept.
c) Write an equation for this relation.
y2 � y1
x2 � x1
change in y
change in x
riserun
280 MHR • Chapter 5
This is sometimes abbreviated as∆y—∆x
, which is read as
“delta y over delta x.” The Greek letter delta is the symbolfor change in.
67
54321
0 21 3 4 5 6 7 8 9
(x2, y2)
(x1, y1)
runx2 — x1
risey2 — y1
y
x
7891
6552392613
0 200 400 d
V
Distance (km)
Volu
me
(L)
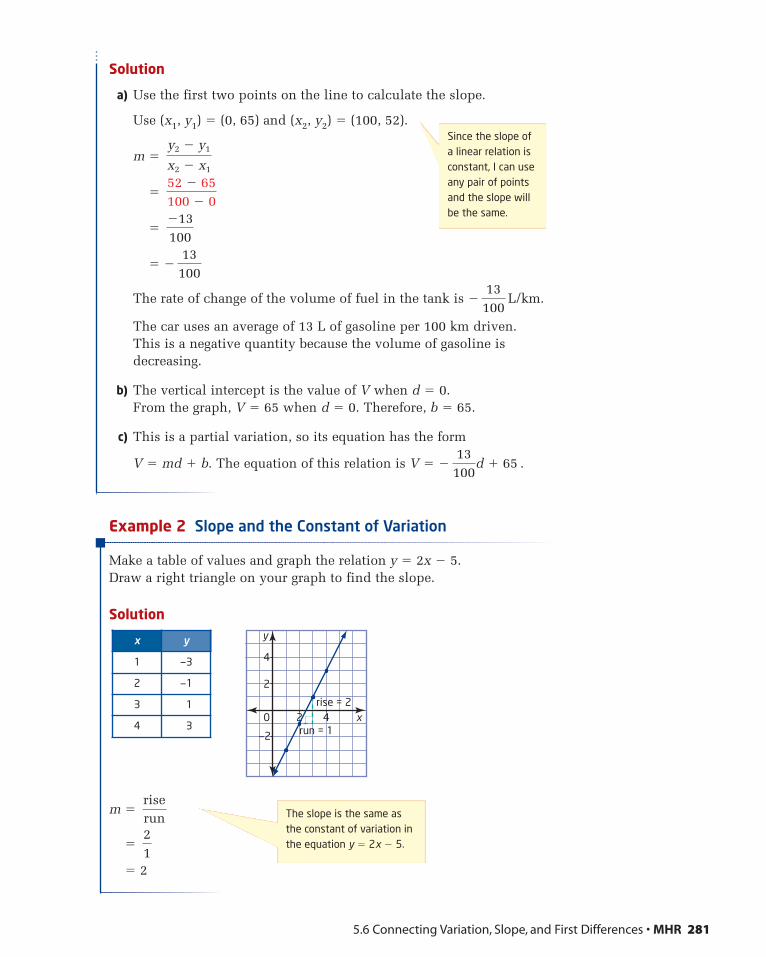
5.6 Connecting Variation, Slope, and First Differences • MHR 281
Solution
a) Use the first two points on the line to calculate the slope.
Use (x1, y1) � (0, 65) and (x2, y2) � (100, 52).
m �
�
�
� �
The rate of change of the volume of fuel in the tank is � L/km.
The car uses an average of 13 L of gasoline per 100 km driven.This is a negative quantity because the volume of gasoline isdecreasing.
b) The vertical intercept is the value of V when d � 0. From the graph, V � 65 when d � 0. Therefore, b � 65.
c) This is a partial variation, so its equation has the form
V � md � b. The equation of this relation is V � � .
Example 2 Slope and the Constant of Variation
Make a table of values and graph the relation y � 2x � 5. Draw a right triangle on your graph to find the slope.
Solution
m �
�
� 2
21
riserun
13100
d � 65
13100
13100
�13100
52 � 65100 � 0
y2 � y1
x2 � x1
Since the slope ofa linear relation isconstant, I can useany pair of pointsand the slope willbe the same.
x y
1 —3
2 —1
3 1
4 3
4
2
—2
0 2 4run = 1
rise = 2x
y
The slope is the same asthe constant of variation inthe equation y � 2x � 5.

The Rule of FourA relation can be represented in a variety of ways so that it can be looked at from different points of view. A mathematical relation can be described in four ways:• using words• using a diagram or a graph• using numbers• using an equation
Example 3 Slope and the Equation of a Relation
Jacques earns $25 per day plus $9 per 100 flyers for deliveringadvertising flyers. This is an example of using words to describe a relation. Use the rule of four to describe this relation in three other ways.
Solution
Using numbers: Create a table showing Jacques’s earnings for various numbers of flyers.
Using a graph: Graph this relation.
Between any pair of points, there is a rise of 9 for a run of 100. The graph intersects the vertical axis at E � 25.
30
40
50
20
10
0 100Number of Flyers Delivered
Earn
ings
($)
200 300 F
E
run=100
rise=9
282 MHR • Chapter 5
The graph is a straightline that does not passthrough (0, 0). This isa partial variation.
Number of Flyers, F Earnings, E ($)
0 25
100 34
200 43
300 52
Selecting ToolsRepresenting
Reasoning and Proving
Communicating
Connecting Reflecting
Problem Solving
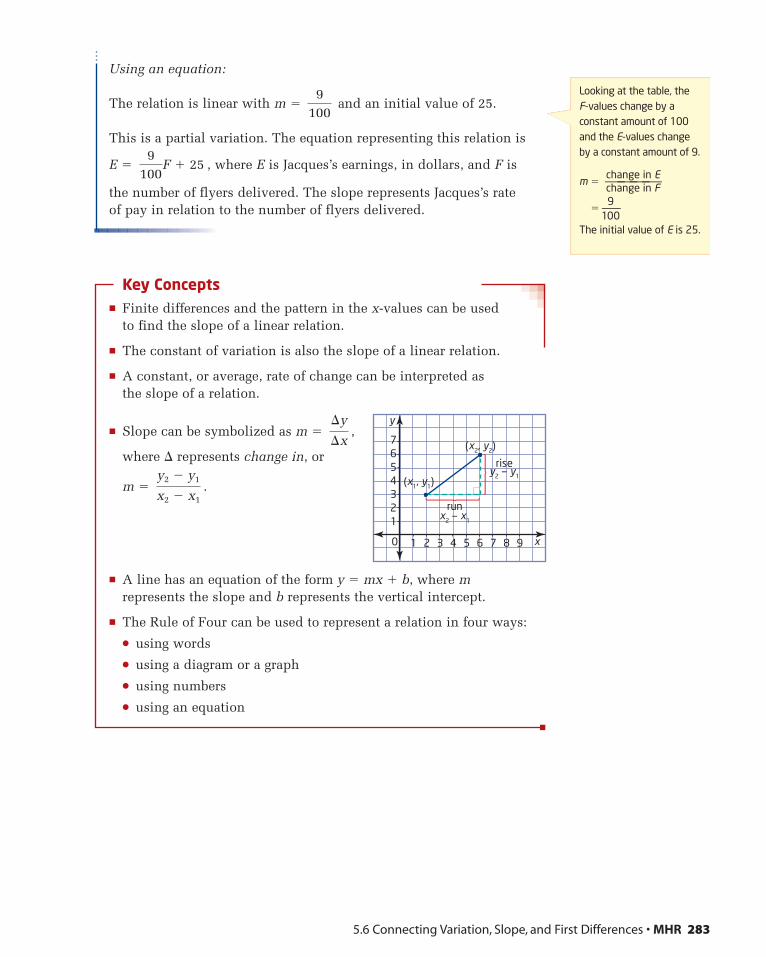
5.6 Connecting Variation, Slope, and First Differences • MHR 283
Looking at the table, the F-values change by aconstant amount of 100and the E-values changeby a constant amount of 9.
change in Em � ————
change in F
�9—100
The initial value of E is 25.
Using an equation:
The relation is linear with m � and an initial value of 25.
This is a partial variation. The equation representing this relation is
E � , where E is Jacques’s earnings, in dollars, and F is
the number of flyers delivered. The slope represents Jacques’s rate of pay in relation to the number of flyers delivered.
Key Concepts� Finite differences and the pattern in the x-values can be used
to find the slope of a linear relation.
� The constant of variation is also the slope of a linear relation.
� A constant, or average, rate of change can be interpreted as the slope of a relation.
� Slope can be symbolized as m � ,
where � represents change in, or
m � .
� A line has an equation of the form y � mx � b, where mrepresents the slope and b represents the vertical intercept.
� The Rule of Four can be used to represent a relation in four ways:
� using words
� using a diagram or a graph
� using numbers
� using an equation
y2 � y1
x2 � x1
¢y
¢x
9100
F � 25
9100
67
54321
0 21 3 4 5 6 7 8 9
(x2, y2)
(x1, y1)
runx2 — x1
risey2 — y1
y
x
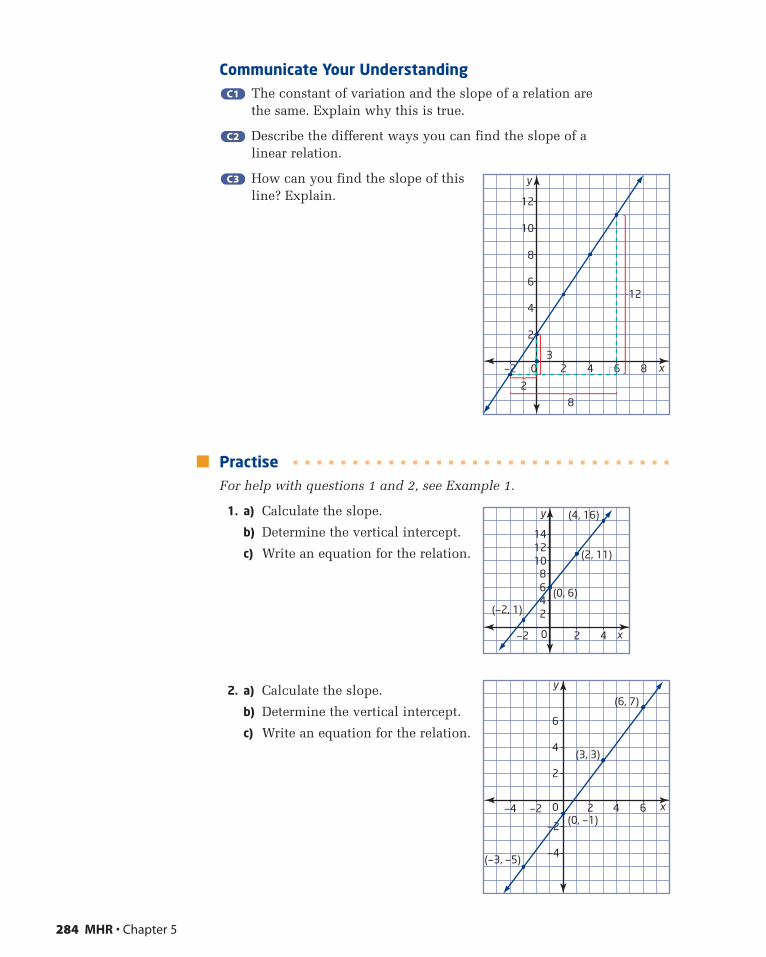
Communicate Your UnderstandingThe constant of variation and the slope of a relation are the same. Explain why this is true.
Describe the different ways you can find the slope of a linear relation.
How can you find the slope of thisline? Explain.
PractiseFor help with questions 1 and 2, see Example 1.
1. a) Calculate the slope.
b) Determine the vertical intercept.
c) Write an equation for the relation.
2. a) Calculate the slope.
b) Determine the vertical intercept.
c) Write an equation for the relation.
C3C3
C2C2
C1C1
284 MHR • Chapter 5
8101214
64
(—2, 1)
(0, 6)
(2, 11)
(4, 16)
2
0 2—2 4 x
y
4
6
2
(—3, —5)
(0, —1)
(3, 3)
(6, 7)
—2
—4
0 2—2—4 4 6
y
x
0
4
6
8
10
12
2
2
2—2 4 6
12
38
8
x
y
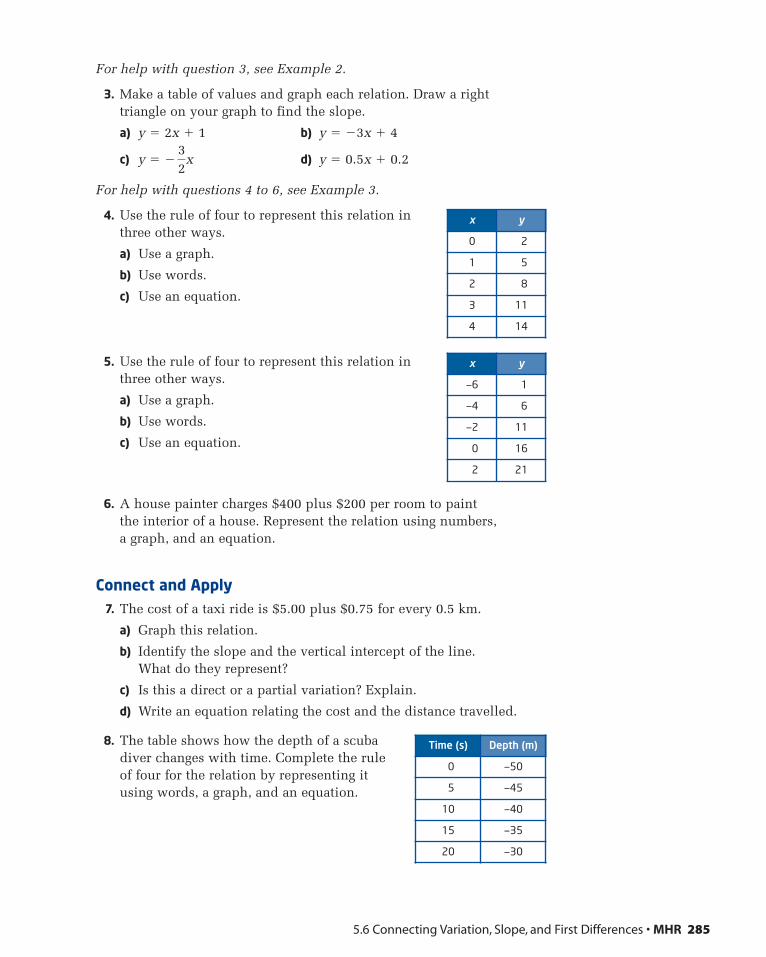
5.6 Connecting Variation, Slope, and First Differences • MHR 285
For help with question 3, see Example 2.
3. Make a table of values and graph each relation. Draw a right triangle on your graph to find the slope.
a) y � 2x � 1 b) y � �3x � 4
c) y � � d) y � 0.5x � 0.2
For help with questions 4 to 6, see Example 3.
4. Use the rule of four to represent this relation inthree other ways.
a) Use a graph.
b) Use words.
c) Use an equation.
5. Use the rule of four to represent this relation inthree other ways.
a) Use a graph.
b) Use words.
c) Use an equation.
6. A house painter charges $400 plus $200 per room to paint the interior of a house. Represent the relation using numbers, a graph, and an equation.
Connect and Apply7. The cost of a taxi ride is $5.00 plus $0.75 for every 0.5 km.
a) Graph this relation.
b) Identify the slope and the vertical intercept of the line. What do they represent?
c) Is this a direct or a partial variation? Explain.
d) Write an equation relating the cost and the distance travelled.
8. The table shows how the depth of a scubadiver changes with time. Complete the ruleof four for the relation by representing itusing words, a graph, and an equation.
32
x
Time (s) Depth (m)
0 —50
5 —45
10 —40
15 —35
20 —30
x y
—6 1
—4 6
—2 11
0 16
2 21
x y
0 2
1 5
2 8
3 11
4 14
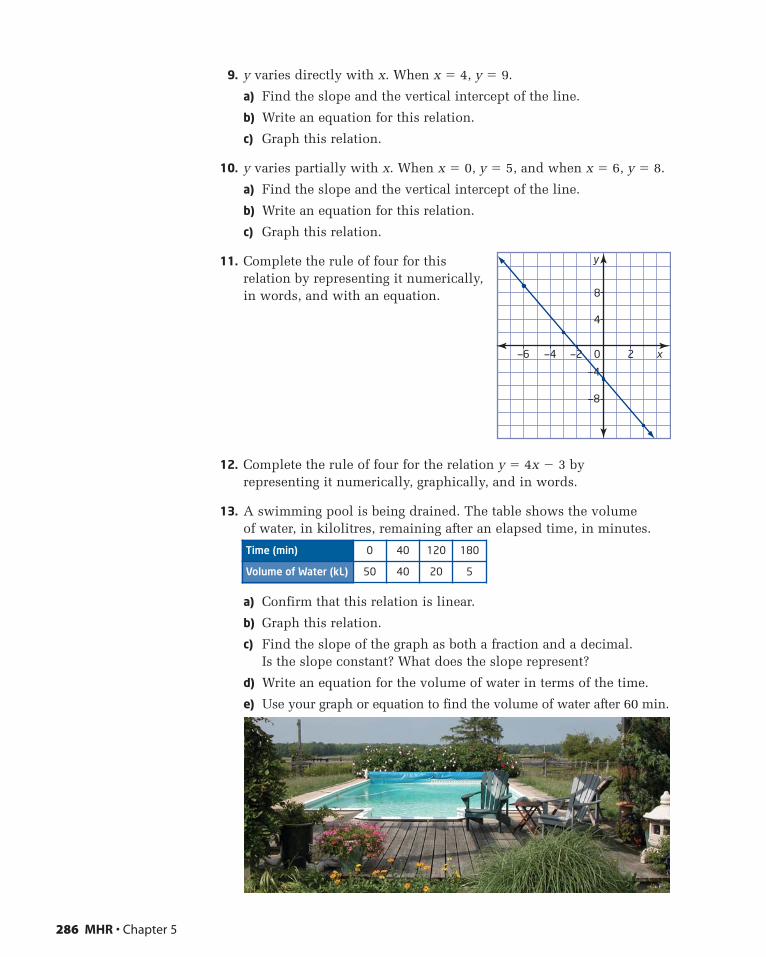
286 MHR • Chapter 5
9. y varies directly with x. When x � 4, y � 9.
a) Find the slope and the vertical intercept of the line.
b) Write an equation for this relation.
c) Graph this relation.
10. y varies partially with x. When x � 0, y � 5, and when x � 6, y � 8.
a) Find the slope and the vertical intercept of the line.
b) Write an equation for this relation.
c) Graph this relation.
11. Complete the rule of four for thisrelation by representing it numerically,in words, and with an equation.
12. Complete the rule of four for the relation y � 4x � 3 by representing it numerically, graphically, and in words.
13. A swimming pool is being drained. The table shows the volume of water, in kilolitres, remaining after an elapsed time, in minutes.
a) Confirm that this relation is linear.
b) Graph this relation.
c) Find the slope of the graph as both a fraction and a decimal. Is the slope constant? What does the slope represent?
d) Write an equation for the volume of water in terms of the time.
e) Use your graph or equation to find the volume of water after 60 min.
Time (min) 0 40 120 180
Volume of Water (kL) 50 40 20 5
8
4
—4
—8
0 2—2—4—6 x
y
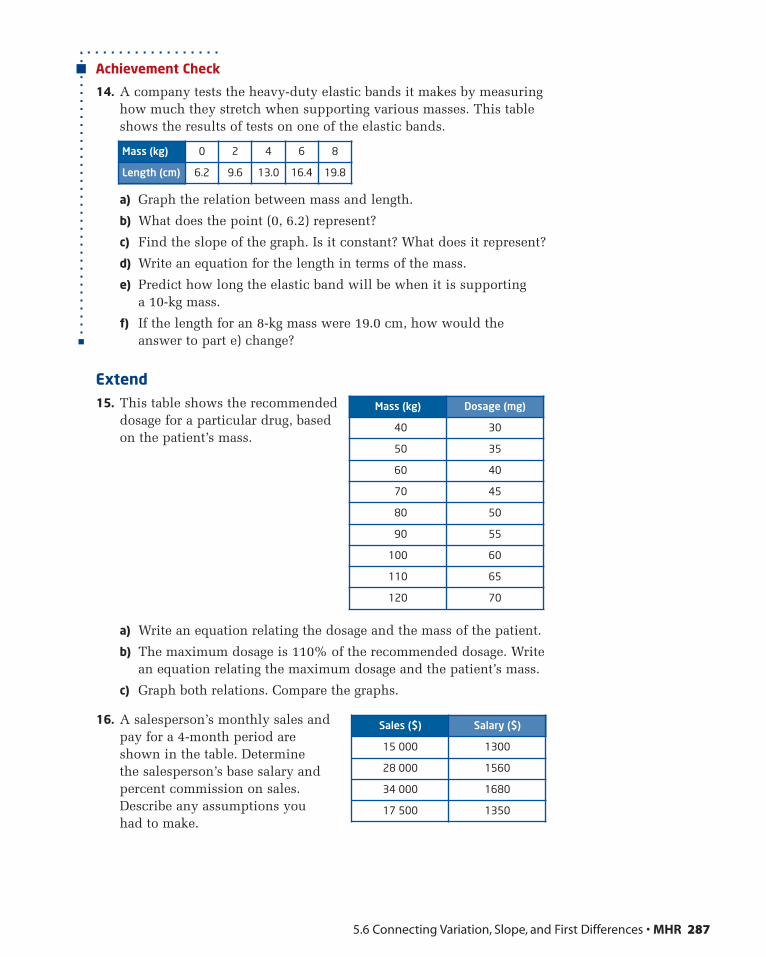
5.6 Connecting Variation, Slope, and First Differences • MHR 287
Mass (kg) 0 2 4 6 8
Length (cm) 6.2 9.6 13.0 16.4 19.8
Achievement Check
14. A company tests the heavy-duty elastic bands it makes by measuringhow much they stretch when supporting various masses. This tableshows the results of tests on one of the elastic bands.
a) Graph the relation between mass and length.
b) What does the point (0, 6.2) represent?
c) Find the slope of the graph. Is it constant? What does it represent?
d) Write an equation for the length in terms of the mass.
e) Predict how long the elastic band will be when it is supporting a 10-kg mass.
f) If the length for an 8-kg mass were 19.0 cm, how would theanswer to part e) change?
Extend15. This table shows the recommended
dosage for a particular drug, basedon the patient’s mass.
a) Write an equation relating the dosage and the mass of the patient.
b) The maximum dosage is 110% of the recommended dosage. Writean equation relating the maximum dosage and the patient’s mass.
c) Graph both relations. Compare the graphs.
16. A salesperson’s monthly sales andpay for a 4-month period areshown in the table. Determine the salesperson’s base salary andpercent commission on sales.Describe any assumptions youhad to make.
Mass (kg) Dosage (mg)
40 30
50 35
60 40
70 45
80 50
90 55
100 60
110 65
120 70
Sales ($) Salary ($)
15 000 1300
28 000 1560
34 000 1680
17 500 1350
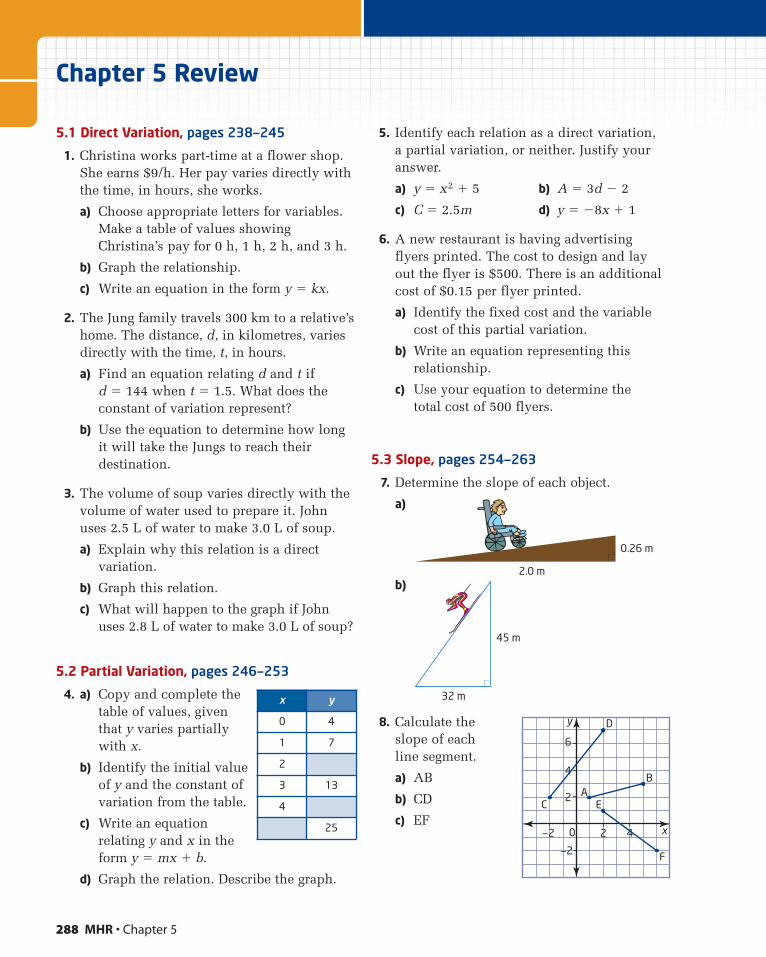
288 MHR • Chapter 5
Chapter 5 Review
5.1 Direct Variation, pages 238—245
1. Christina works part-time at a flower shop.She earns $9/h. Her pay varies directly withthe time, in hours, she works.
a) Choose appropriate letters for variables.Make a table of values showingChristina’s pay for 0 h, 1 h, 2 h, and 3 h.
b) Graph the relationship.
c) Write an equation in the form y � kx.
2. The Jung family travels 300 km to a relative’shome. The distance, d, in kilometres, variesdirectly with the time, t, in hours.
a) Find an equation relating d and t if d � 144 when t � 1.5. What does theconstant of variation represent?
b) Use the equation to determine how longit will take the Jungs to reach theirdestination.
3. The volume of soup varies directly with thevolume of water used to prepare it. Johnuses 2.5 L of water to make 3.0 L of soup.
a) Explain why this relation is a directvariation.
b) Graph this relation.
c) What will happen to the graph if Johnuses 2.8 L of water to make 3.0 L of soup?
5.2 Partial Variation, pages 246—253
4. a) Copy and complete thetable of values, giventhat y varies partiallywith x.
b) Identify the initial valueof y and the constant ofvariation from the table.
c) Write an equationrelating y and x in theform y � mx � b.
d) Graph the relation. Describe the graph.
5. Identify each relation as a direct variation, a partial variation, or neither. Justify youranswer.
a) y � x2 � 5 b) A � 3d � 2
c) C � 2.5m d) y � �8x � 1
6. A new restaurant is having advertisingflyers printed. The cost to design and layout the flyer is $500. There is an additionalcost of $0.15 per flyer printed.
a) Identify the fixed cost and the variablecost of this partial variation.
b) Write an equation representing thisrelationship.
c) Use your equation to determine the total cost of 500 flyers.
5.3 Slope, pages 254—263
7. Determine the slope of each object.
a)
b)
8. Calculate theslope of eachline segment.
a) AB
b) CD
c) EF
45 m
32 m
0.26 m
2.0 m
x y
0 4
1 7
2
3 13
4
25
4
2 AB
EC
D
F—2
0 2—2 4
6
y
x
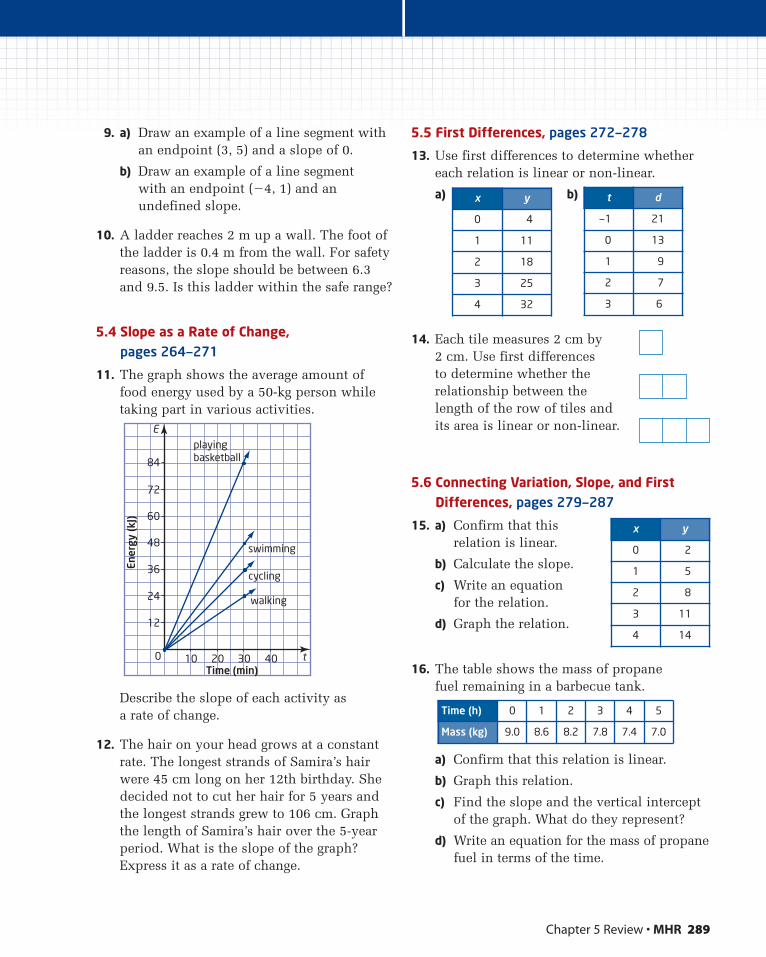
t d
—1 21
0 13
1 9
2 7
3 6
x y
0 4
1 11
2 18
3 25
4 32
Chapter 5 Review • MHR 289
9. a) Draw an example of a line segment withan endpoint (3, 5) and a slope of 0.
b) Draw an example of a line segment with an endpoint (�4, 1) and anundefined slope.
10. A ladder reaches 2 m up a wall. The foot ofthe ladder is 0.4 m from the wall. For safetyreasons, the slope should be between 6.3and 9.5. Is this ladder within the safe range?
5.4 Slope as a Rate of Change, pages 264—271
11. The graph shows the average amount offood energy used by a 50-kg person whiletaking part in various activities.
Describe the slope of each activity as a rate of change.
12. The hair on your head grows at a constantrate. The longest strands of Samira’s hairwere 45 cm long on her 12th birthday. Shedecided not to cut her hair for 5 years andthe longest strands grew to 106 cm. Graphthe length of Samira’s hair over the 5-yearperiod. What is the slope of the graph?Express it as a rate of change.
5.5 First Differences, pages 272—278
13. Use first differences to determine whethereach relation is linear or non-linear.
a) b)
14. Each tile measures 2 cm by2 cm. Use first differencesto determine whether therelationship between thelength of the row of tiles andits area is linear or non-linear.
5.6 Connecting Variation, Slope, and FirstDifferences, pages 279—287
15. a) Confirm that thisrelation is linear.
b) Calculate the slope.
c) Write an equation for the relation.
d) Graph the relation.
16. The table shows the mass of propane fuel remaining in a barbecue tank.
a) Confirm that this relation is linear.
b) Graph this relation.
c) Find the slope and the vertical interceptof the graph. What do they represent?
d) Write an equation for the mass of propanefuel in terms of the time.
36
48
60
72
84
24
12
0 10Time (min)
Ener
gy (k
J)
20 30 40
walking
swimming
playingbasketball
cycling
E
t
Time (h) 0 1 2 3 4 5
Mass (kg) 9.0 8.6 8.2 7.8 7.4 7.0
x y
0 2
1 5
2 8
3 11
4 14

290 MHR • Chapter 5
Multiple Choice
For questions 1 to 5, select the best answer.
1. Which of the following is an example of a partial variation?
A M � 9N
B p � 3q
C k � 9h � 7
D y � 4x2
2. The distance travelled by a car in a giventime varies directly with its speed. A cartravelled 150 km in 1.5 h. What is theconstant of variation?
A 100
B 0.01
C 15
D 375
3. What is the slope of this roof?
A 3
B 12
C 0.75
D 0.5
4. Which statement is false?
A The slope of a linear relation alsorepresents a constant rate of change.
B Slope can be calculated as .
C Non-linear relations have constant firstdifferences.
D In the equation y � mx � b, the slope is represented by m.
5. The cost of gasoline varies directly with thevolume purchased. 50 L of gasoline costs$43.50. Which of the following relates thecost, C, and the volume of gasoline, G?
A C = 0.87G + 43.50
B C = 1.15G
C C = 1.15G + 50
D C = 0.87G
Short Response
Show all steps to your solutions
6. a) Calculate theslope.
b) Determine theverticalintercept.
c) Write anequation forthe relation.
7. The time between seeing a lightning flashand hearing the thunder it creates variesdirectly with how far away the lightning is.The thunder from a lightning flash 685 maway was heard after 2.0 s.
a) Determine an equation relating the time before hearing the thunder and the distance from the lightning flash.
b) Graph this relationship.
8. When water freezes, its volume increases, as shown in the table.
Without graphing, determine whether the relation is linear or non-linear. Justifyyour answer.
9. The price charged to repair a computer is $60, plus $50/h.
a) Write an equation representing thisrelationship.
b) What is the total cost of a repair thattakes 3.5 h?
c) How would the equation change if the hourly cost changed to $45?
riserun
Liquid Volume ofWater (L)
Frozen Volume ofWater (L)
5 5.45
10 10.90
15 16.35
20 21.80
Chapter 5 Practice Test
3 m
4 m
4
2
—2
0—2—4
6
x
y
2
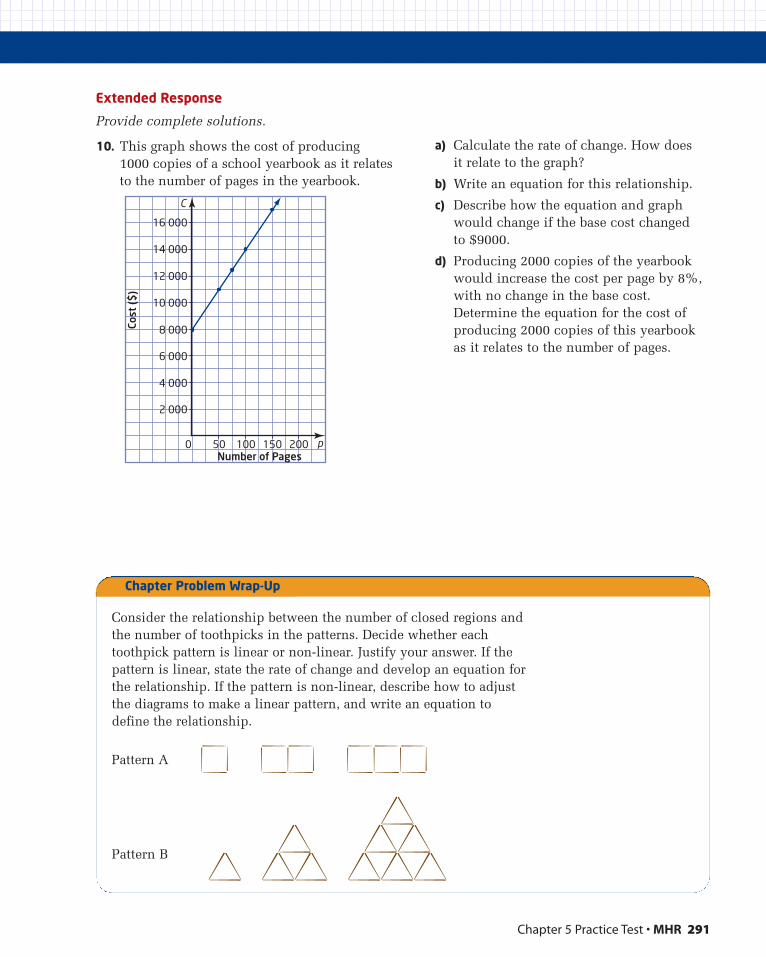
Chapter 5 Practice Test • MHR 291
Extended Response
Provide complete solutions.
10. This graph shows the cost of producing 1000 copies of a school yearbook as it relatesto the number of pages in the yearbook.
a) Calculate the rate of change. How does it relate to the graph?
b) Write an equation for this relationship.
c) Describe how the equation and graphwould change if the base cost changed to $9000.
d) Producing 2000 copies of the yearbookwould increase the cost per page by 8%,with no change in the base cost.Determine the equation for the cost ofproducing 2000 copies of this yearbookas it relates to the number of pages.
Consider the relationship between the number of closed regions andthe number of toothpicks in the patterns. Decide whether eachtoothpick pattern is linear or non-linear. Justify your answer. If thepattern is linear, state the rate of change and develop an equation forthe relationship. If the pattern is non-linear, describe how to adjustthe diagrams to make a linear pattern, and write an equation todefine the relationship.
Pattern A
Pattern B
Chapter Problem Wrap-Up
p
C
6 000
8 000
10 000
12 000
14 000
16 000
4 000
2 000
0 50 100 150 200
Cost
($)
Number of Pages
Vocabulary
x-interceptparallel linesperpendicular linesnegative reciprocalslinear systempoint of intersection
Analyse Linear Relations
In this chapter, you will look more closely at the equation for a linear relation. You will learn how to connect the equation to the graph and how to build the equation given a few facts about the line.
CHAPTER
6Analytic Geometry� Determine, through investigation,
the characteristics that distinguish the equation of a straight line from the equations of non-linear relations.
� Identify, through investigation, the equation of a line in any of the forms y � mx � b, Ax � By � C � 0, x � a, y � b.
� Express the equation of a line in the form y � mx � b, given the form Ax � By � C � 0.
� Identify, through investigation with technology, the geometric signifi cance of m and b in the equation y � mx � b.
� Identify, through investigation, properties of the slopes of lines and line segments, using graphing technology to facilitate investigations, where appropriate.
� Graph lines by hand, using a variety of techniques.
� Determine the equation of a line from information about the line.
� Describe the meaning of the slope and y-intercept for a linear relation arising from a realistic situation and describe a situation that could be modelled by a given linear equation.
� Identify and explain any restrictions on the variables in a linear relation arising from a realistic situation.
� Determine graphically the point of intersection of two linear relations, and interpret the intersection point in the context of an application.
292
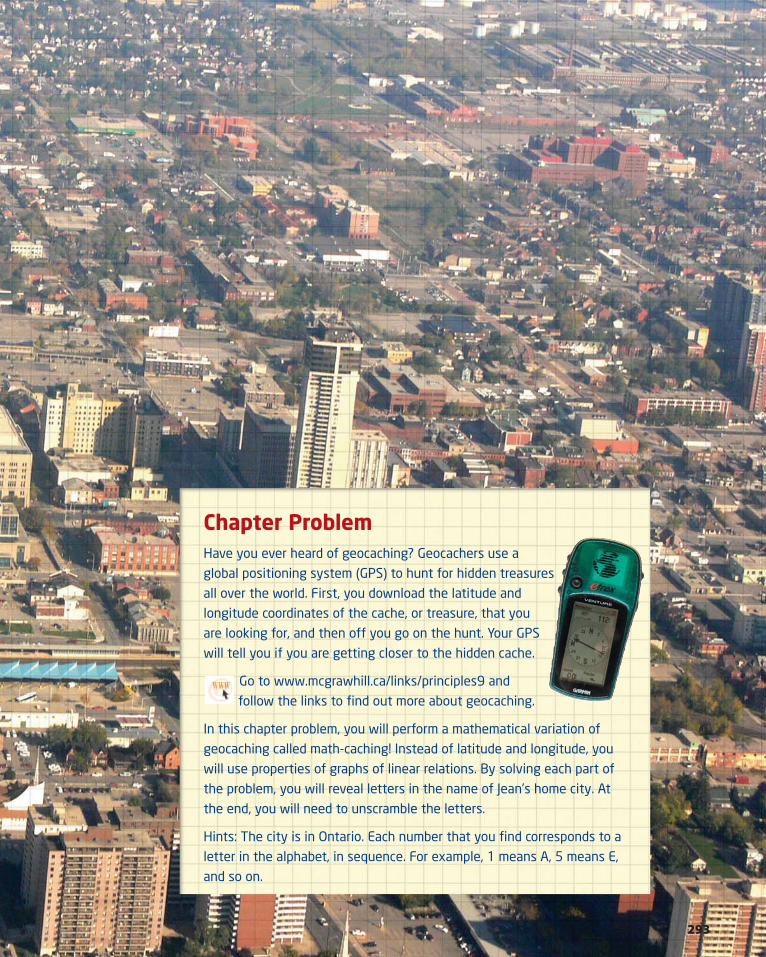
Chapter Problem Have you ever heard of geocaching? Geocachers use a
global positioning system (GPS) to hunt for hidden treasures
all over the world. First, you download the latitude and
longitude coordinates of the cache, or treasure, that you
are looking for, and then off you go on the hunt. Your GPS
will tell you if you are getting closer to the hidden cache.
Go to www.mcgrawhill.ca/links/principles9 and
follow the links to fi nd out more about geocaching.
In this chapter problem, you will perform a mathematical variation of
geocaching called math-caching! Instead of latitude and longitude, you
will use properties of graphs of linear relations. By solving each part of
the problem, you will reveal letters in the name of Jean’s home city. At
the end, you will need to unscramble the letters.
Hints: The city is in Ontario. Each number that you fi nd corresponds to a
letter in the alphabet, in sequence. For example, 1 means A, 5 means E,
and so on.
293
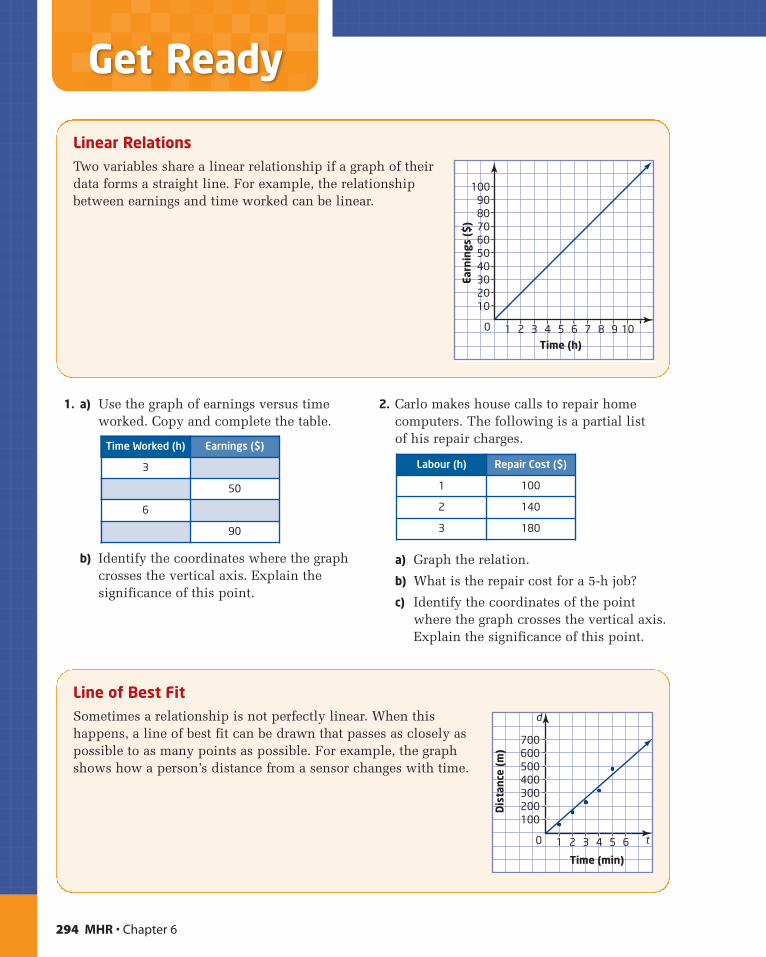
1. a) Use the graph of earnings versus timeworked. Copy and complete the table.
b) Identify the coordinates where the graphcrosses the vertical axis. Explain thesignificance of this point.
2. Carlo makes house calls to repair homecomputers. The following is a partial list of his repair charges.
a) Graph the relation.
b) What is the repair cost for a 5-h job?
c) Identify the coordinates of the pointwhere the graph crosses the vertical axis.Explain the significance of this point.
294 MHR • Chapter 6
Linear RelationsTwo variables share a linear relationship if a graph of theirdata forms a straight line. For example, the relationshipbetween earnings and time worked can be linear.
Labour (h) Repair Cost ($)
1 100
2 140
3 180
Time Worked (h) Earnings ($)
3
50
6
90
Line of Best FitSometimes a relationship is not perfectly linear. When thishappens, a line of best fit can be drawn that passes as closely aspossible to as many points as possible. For example, the graphshows how a person’s distance from a sensor changes with time.
0 1Time (h)
Earn
ings
($
)
2 3 4 5 6 7 8 9 10
102030405060708090
100
d
t0 1
Time (min)
Dis
tanc
e (m
)
2 3 4 5 6
100200300400500600700
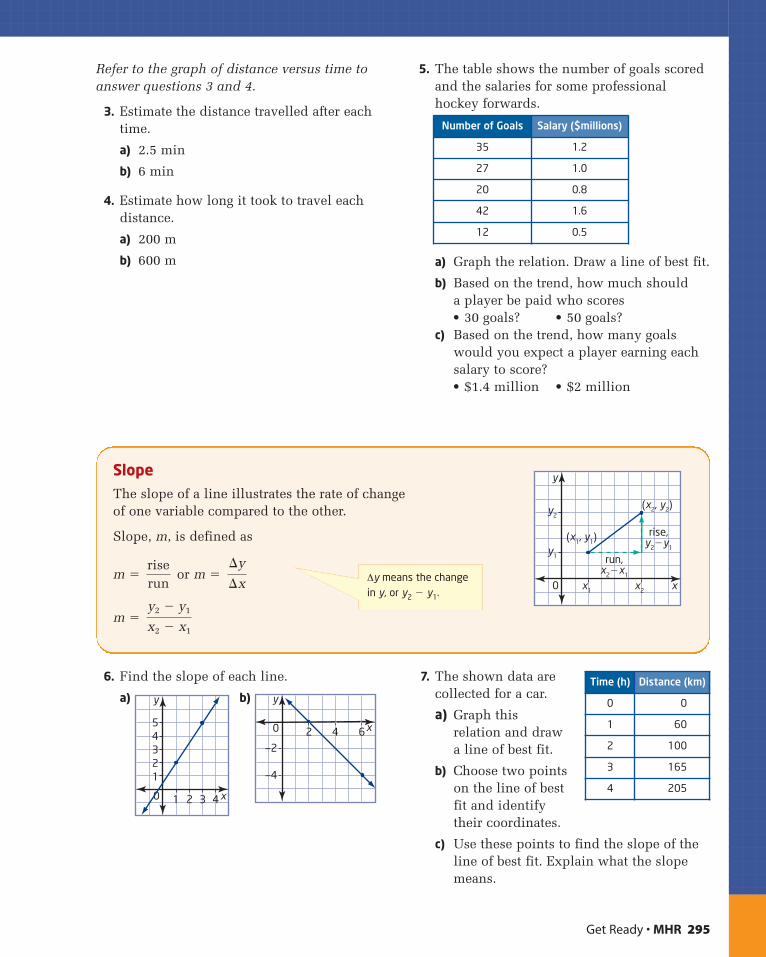
Refer to the graph of distance versus time toanswer questions 3 and 4.
3. Estimate the distance travelled after eachtime.
a) 2.5 min
b) 6 min
4. Estimate how long it took to travel eachdistance.
a) 200 m
b) 600 m
5. The table shows the number of goals scoredand the salaries for some professionalhockey forwards.
a) Graph the relation. Draw a line of best fit.
b) Based on the trend, how much should a player be paid who scores• 30 goals? • 50 goals?
c) Based on the trend, how many goalswould you expect a player earning eachsalary to score?• $1.4 million • $2 million
Get Ready • MHR 295
SlopeThe slope of a line illustrates the rate of changeof one variable compared to the other.
Slope, m, is defined as
m � or m �
m �y2 � y1
x2 � x1
¢y
¢xriserun ∆y means the change
in y, or y2 � y1.
y2
(x1, y1)
(x2, y2)
y1
xx1 x20
y
rise,y2�y1
run,x2�x1
6. Find the slope of each line.
a) b)
7. The shown data arecollected for a car.
a) Graph thisrelation and drawa line of best fit.
b) Choose two pointson the line of best fit and identifytheir coordinates.
c) Use these points to find the slope of theline of best fit. Explain what the slopemeans.
x0
—4
—2
2 4 6
y
x
1
0
2345
1 2 3 4
y
Time (h) Distance (km)
0 0
1 60
2 100
3 165
4 205
Number of Goals Salary ($millions)
35 1.2
27 1.0
20 0.8
42 1.6
12 0.5
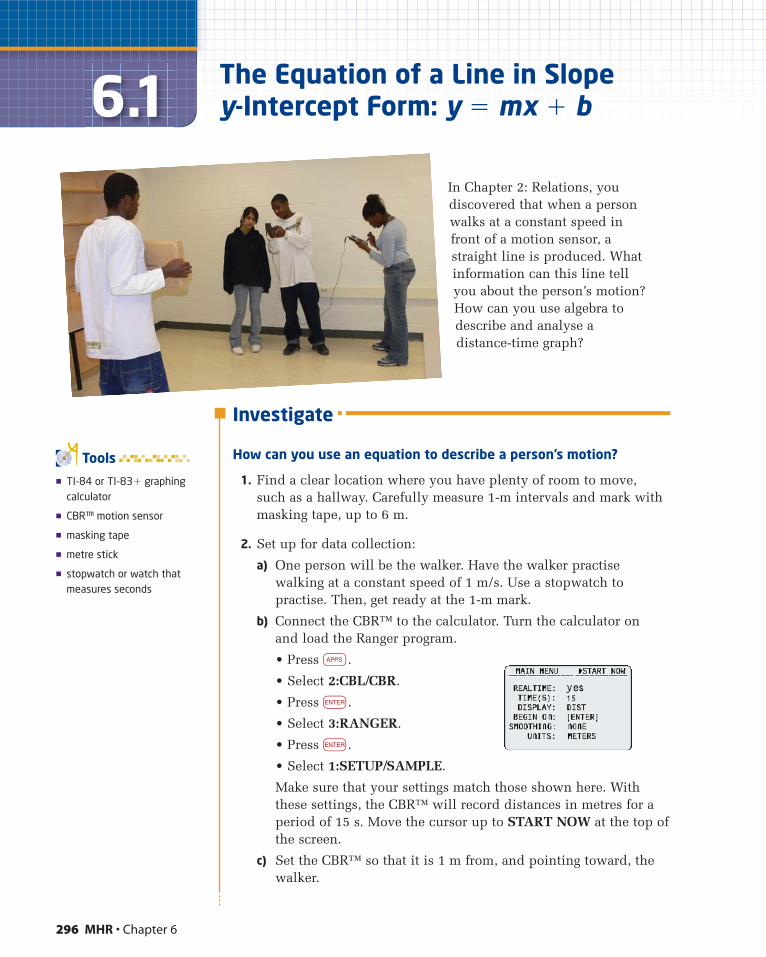
Investigate
How can you use an equation to describe a person’s motion?
1. Find a clear location where you have plenty of room to move, such as a hallway. Carefully measure 1-m intervals and mark withmasking tape, up to 6 m.
2. Set up for data collection:
a) One person will be the walker. Have the walker practisewalking at a constant speed of 1 m/s. Use a stopwatch topractise. Then, get ready at the 1-m mark.
b) Connect the CBR™ to the calculator. Turn the calculator on and load the Ranger program.
• Press ∂.
• Select 2:CBL/CBR.
• Press e.
• Select 3:RANGER.
• Press e.
• Select 1:SETUP/SAMPLE.
Make sure that your settings match those shown here. Withthese settings, the CBR™ will record distances in metres for aperiod of 15 s. Move the cursor up to START NOW at the top ofthe screen.
c) Set the CBR™ so that it is 1 m from, and pointing toward, thewalker.
296 MHR • Chapter 6
6.1 The Equation of a Line in Slope y-Intercept Form: y � mx � b
In Chapter 2: Relations, youdiscovered that when a personwalks at a constant speed infront of a motion sensor, astraight line is produced. Whatinformation can this line tellyou about the person’s motion?How can you use algebra todescribe and analyse adistance-time graph?
� TI-84 or TI-83� graphingcalculator
� CBR™ motion sensor
� masking tape
� metre stick
� stopwatch or watch thatmeasures seconds
Tools
3. Press e.You should hear a ticking sound from the CBR™. Havethe walker start walking away from the CBR™ at a slow steadypace of 1 m/s. A graph will begin to form on the calculator screen.
4. a) Use the blue cursor keys to trace along the graph. You will seethe coordinates of each data point appear at the bottom of thescreen.
b) The left-most point is the y-intercept, usually labelled with theletter b. Write down the coordinates of this point. What do younotice about this point? Why might this value not be exactlywhat you expect?
c) Pick any two points along the linear part of the graph (try to usetwo points that are not close together) and write down theircoordinates. Use these points to calculate the slope of the line
using the slope formula m � . Compare the slope to the
speed of the walker and describe what you notice.
5. a) Substitute the values of b and m that you found in step 4 intothe equation y � mx � b.
b) This equation describes where the walker is, y, at any time, x.Trace along the graph and pick any point to test the equation.• Substitute the value of the x-coordinate into the equation you
found in part a).• Calculate the value of y.• Compare this to the actual y-coordinate of that point.• Explain why these points may not be exactly the same.
c) Repeat part b) for another point on the graph.
6. a) Now, collect a new set of motion data.• Press e and select 3:REPEAT SAMPLE.• Have your partner pick a different starting point and walking
speed (take note of these values).• Press e and have your partner begin walking.
b) Repeat steps 4 and 5 for your new graph.
7. Reflect Describe how an equation of the form y � mx � b can beused to describe a person’s motion. What do the values of m and bdescribe in this case?
y2 � y1
x2 � x1
6.1 The Equation of a Line in Slope y-Intercept Form: y = mx + b • MHR 297
Technology TipYou may need a few practiceattempts to get a feel forthe correct speed. Try to geta graph that is fairly linear. Ifyou are unsatisfied withyour graph, you can collect anew set of data after theCBR™ has stopped ticking:• Press e.Select 3:REPEAT SAMPLE.
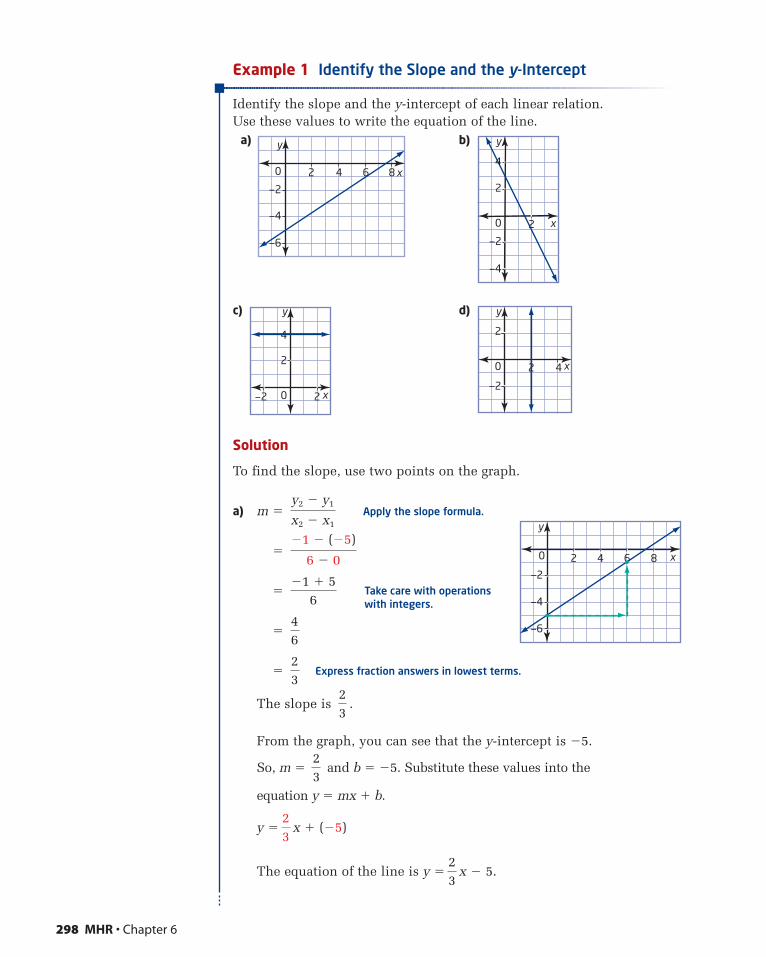
Example 1 Identify the Slope and the y-Intercept
Identify the slope and the y-intercept of each linear relation. Use these values to write the equation of the line.
a) b)
c) d)
Solution
To find the slope, use two points on the graph.
a) m � Apply the slope formula.
�
�
�
� Express fraction answers in lowest terms.
The slope is .
From the graph, you can see that the y-intercept is �5.
So, m � and b � �5. Substitute these values into the
equation y � mx � b.
y � x � (�5)
The equation of the line is y � x � 5.23
23
23
23
23
46
Take care with operationswith integers.
�1 � 56
�1 � (�5)
6 � 0
y2 � y1
x2 � x1
x
—2
2
y
0 2 4
x
y
2
4
0 2—2
x
y
—4
—2
2
4
0 2
x
y
—6
—4
—2
0 2 4 6 8
298 MHR • Chapter 6
x0 2 4 6 8
y
—2
—4
—6
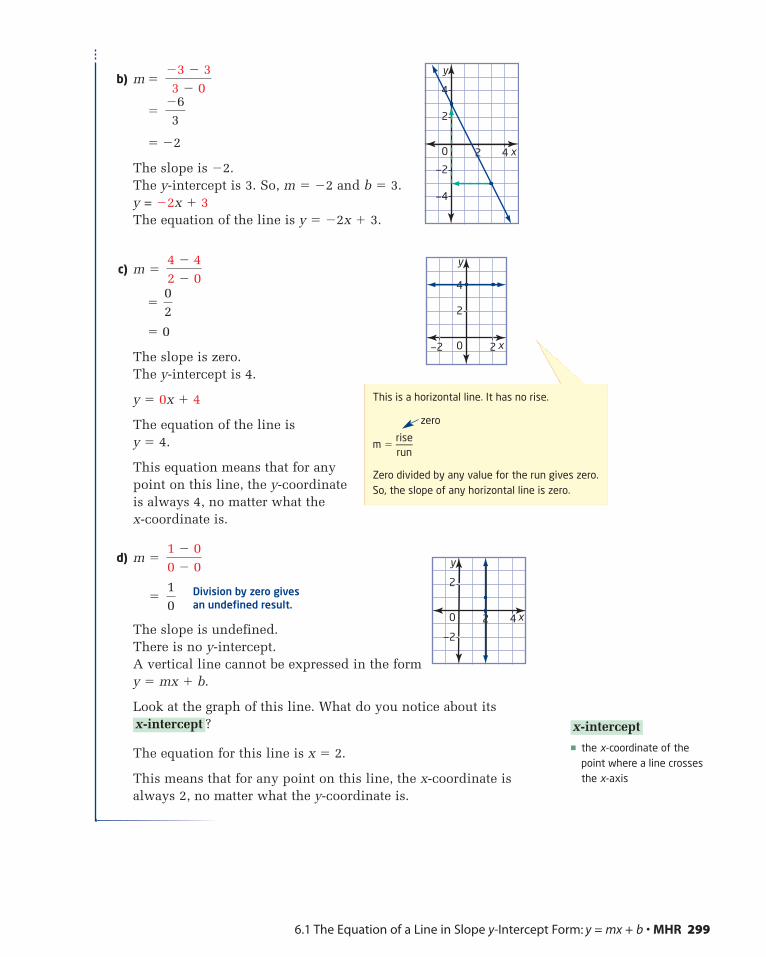
b) m �
�
� �2
The slope is �2.The y-intercept is 3. So, m � �2 and b � 3.y = �2x � 3The equation of the line is y � �2x � 3.
c) m �
�
� 0
The slope is zero. The y-intercept is 4.
y � 0x � 4
The equation of the line is y � 4.
This equation means that for anypoint on this line, the y-coordinateis always 4, no matter what the x-coordinate is.
d) m �
�
The slope is undefined.There is no y-intercept.A vertical line cannot be expressed in the formy � mx � b.
Look at the graph of this line. What do you notice about its?
The equation for this line is x � 2.
This means that for any point on this line, the x-coordinate isalways 2, no matter what the y-coordinate is.
x-intercept
Division by zero givesan undefined result.
10
1 � 00 � 0
02
4 � 42 � 0
�63
�3 � 33 � 0
6.1 The Equation of a Line in Slope y-Intercept Form: y = mx + b • MHR 299
x
—2
—4
2
4
y
0 2 4
x
y
2
4
0 2—2
x
—2
2
y
0 2 4
� the x-coordinate of thepoint where a line crossesthe x-axis
x-intercept
This is a horizontal line. It has no rise.
zero
m �rise—run
Zero divided by any value for the run gives zero.So, the slope of any horizontal line is zero.
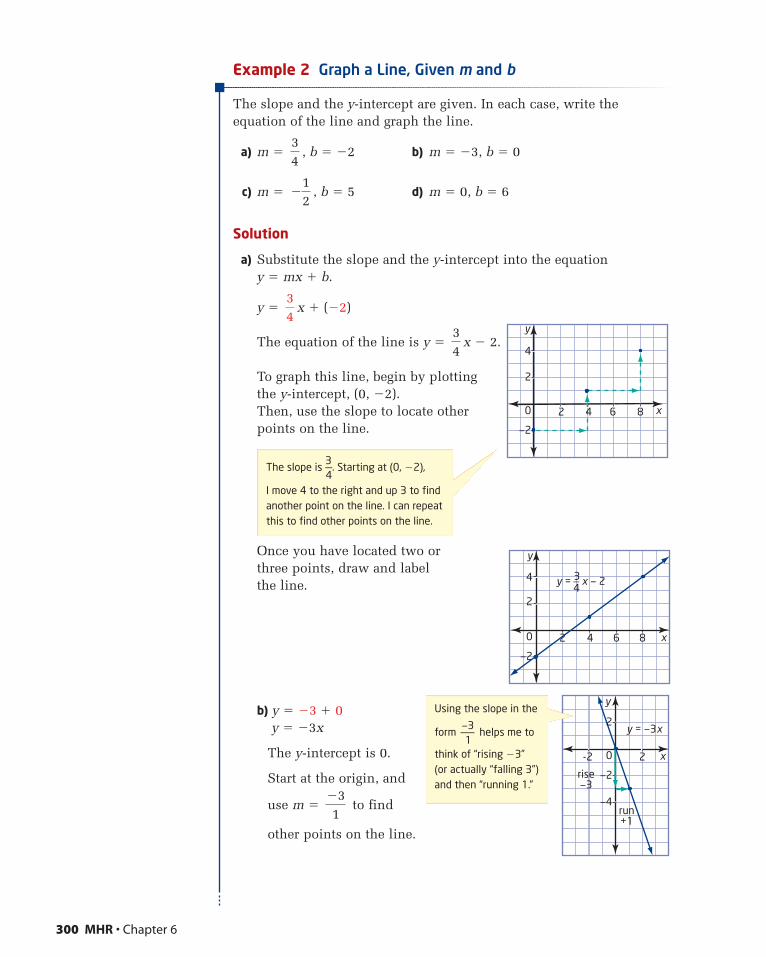
Example 2 Graph a Line, Given m and b
The slope and the y-intercept are given. In each case, write theequation of the line and graph the line.
a) m � , b � �2 b) m � �3, b � 0
c) m � , b � 5 d) m � 0, b � 6
Solution
a) Substitute the slope and the y-intercept into the equation y � mx � b.
y � x � (�2)
The equation of the line is y � x � 2.
To graph this line, begin by plottingthe y-intercept, (0, �2).Then, use the slope to locate otherpoints on the line.
Once you have located two orthree points, draw and labelthe line.
b) y � �3 � 0y � �3x
The y-intercept is 0.
Start at the origin, and
use m � to find
other points on the line.
�31
34
34
�12
34
300 MHR • Chapter 6
The slope is 3—4
. Starting at (0, �2),
I move 4 to the right and up 3 to findanother point on the line. I can repeatthis to find other points on the line.
x
3_4
y = x — 2
—2
2
4
y
0 2 4 6 8
x
y
—2
2
4
0 2 6 84
x
y
rise—3
run+1
y = —3x
—2
—4
2
0 2-2
Using the slope in the
form—3—
1helps me to
think of “rising �3”(or actually “falling 3”)and then “running 1.”
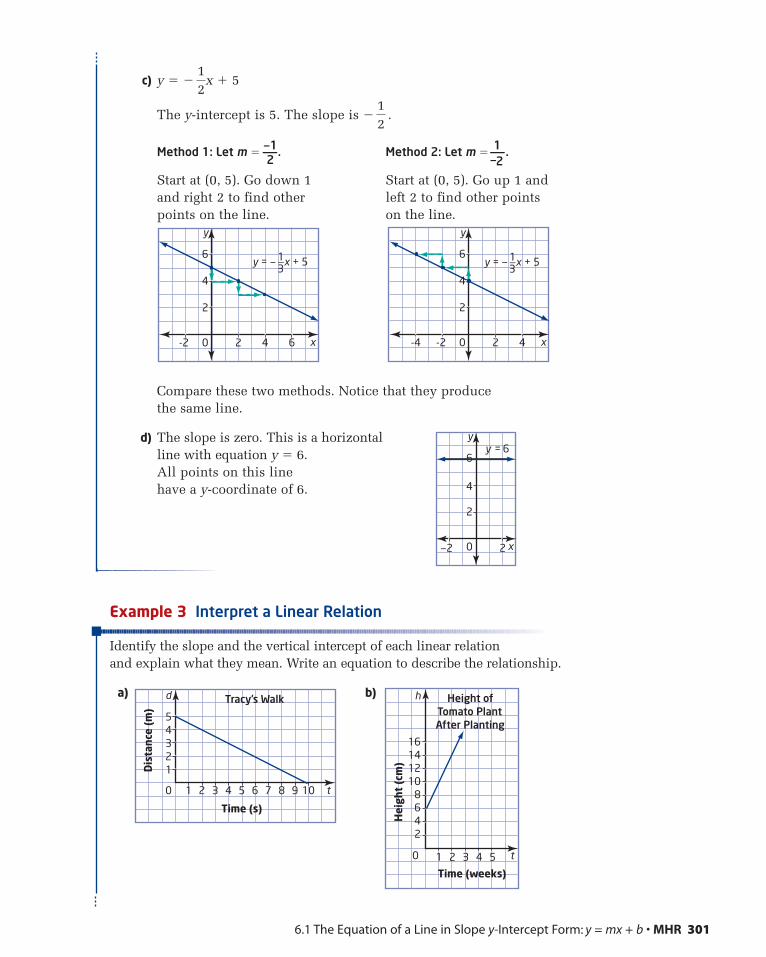
6.1 The Equation of a Line in Slope y-Intercept Form: y = mx + b • MHR 301
Example 3 Interpret a Linear Relation
Identify the slope and the vertical intercept of each linear relation and explain what they mean. Write an equation to describe the relationship.
a) b)
t0 1
Time (weeks)
2 3 4 5
Hei
ght
(cm
)
Height ofTomato PlantAfter Planting
2468
10121416
hd
t0 1
Time (s)
2 3 4 5 6 7 8 9 10
12345
Dis
tanc
e (m
)
Tracy’s Walk
c) y � �
The y-intercept is 5. The slope is � .12
12
x � 5
Method 1: Let m �—1—2
.
Start at (0, 5). Go down 1 and right 2 to find otherpoints on the line.
Method 2: Let m �1—
—2.
Start at (0, 5). Go up 1 andleft 2 to find other points on the line.
Compare these two methods. Notice that they produce the same line.
d) The slope is zero. This is a horizontalline with equation y � 6.All points on this linehave a y-coordinate of 6.
x
1_3
y = — x + 5
2
4
6
y
0 2 4 6-2
x
y
2
4
6
0 2—2
y = 6
x
1_3
y = — x + 5
2
4
6
y
0 2 4-2-4
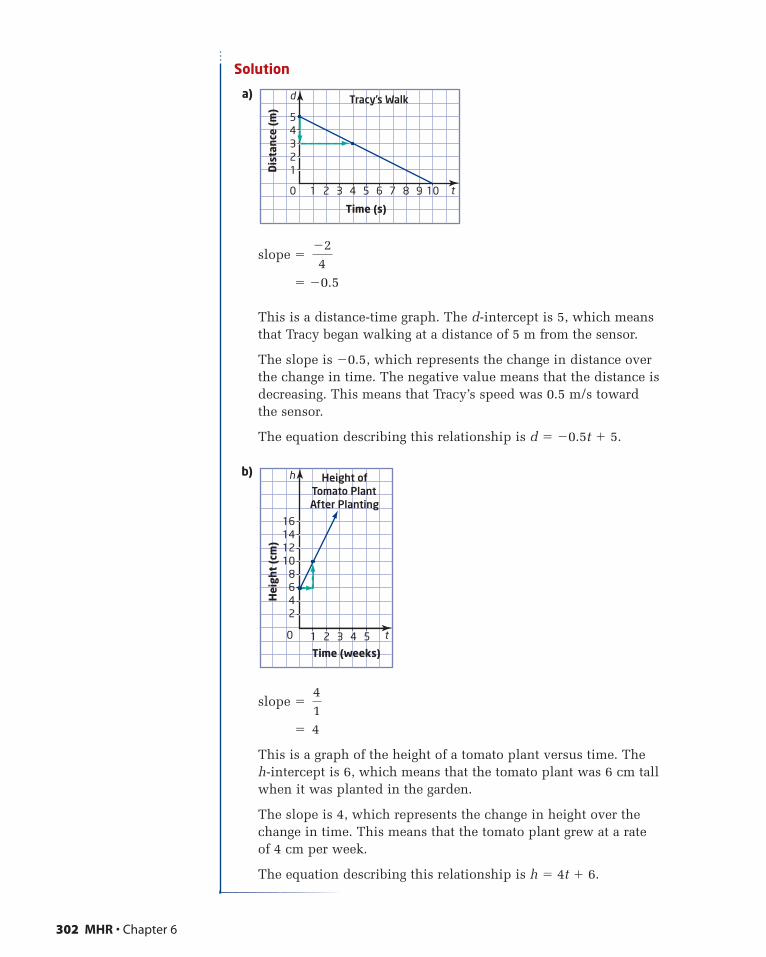
302 MHR • Chapter 6
Solution
a)
slope �
� �0.5
This is a distance-time graph. The d-intercept is 5, which meansthat Tracy began walking at a distance of 5 m from the sensor.
The slope is �0.5, which represents the change in distance overthe change in time. The negative value means that the distance isdecreasing. This means that Tracy’s speed was 0.5 m/s towardthe sensor.
The equation describing this relationship is d � �0.5t � 5.
b)
slope �
� 4
This is a graph of the height of a tomato plant versus time. The h-intercept is 6, which means that the tomato plant was 6 cm tallwhen it was planted in the garden.
The slope is 4, which represents the change in height over thechange in time. This means that the tomato plant grew at a rate of 4 cm per week.
The equation describing this relationship is h � 4t � 6.
41
t0 1
Time (weeks)
2 3 4 5
Hei
ght
(cm
)
Height ofTomato PlantAfter Planting
2468
10121416
h
�24
d
t0 1
Time (s)
2 3 4 5 6 7 8 9 10
12345
Dis
tanc
e (m
)
Tracy’s Walk
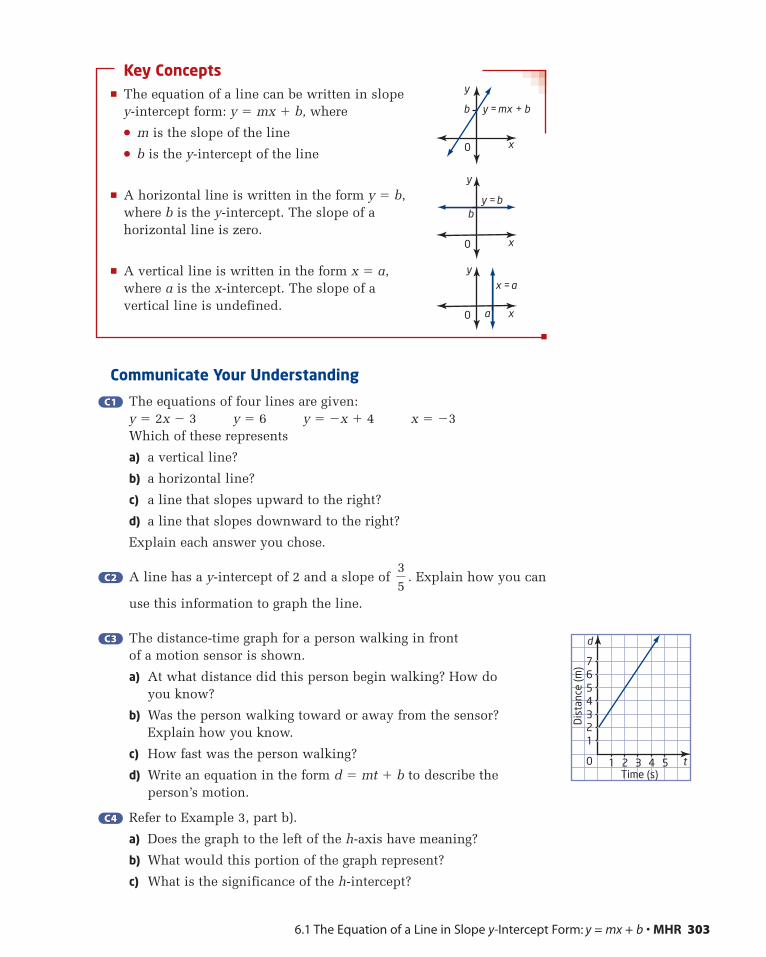
6.1 The Equation of a Line in Slope y-Intercept Form: y = mx + b • MHR 303
Key Concepts� The equation of a line can be written in slope
y-intercept form: y � mx � b, where
� m is the slope of the line
� b is the y-intercept of the line
� A horizontal line is written in the form y � b,where b is the y-intercept. The slope of a horizontal line is zero.
� A vertical line is written in the form x � a, where a is the x-intercept. The slope of avertical line is undefined.
Communicate Your Understanding
The equations of four lines are given:y � 2x � 3 y � 6 y � �x � 4 x � �3Which of these represents
a) a vertical line?
b) a horizontal line?
c) a line that slopes upward to the right?
d) a line that slopes downward to the right?
Explain each answer you chose.
A line has a y-intercept of 2 and a slope of . Explain how you can
use this information to graph the line.
The distance-time graph for a person walking in front of a motion sensor is shown.
a) At what distance did this person begin walking? How do you know?
b) Was the person walking toward or away from the sensor?Explain how you know.
c) How fast was the person walking?
d) Write an equation in the form d � mt � b to describe theperson’s motion.
Refer to Example 3, part b).
a) Does the graph to the left of the h-axis have meaning?
b) What would this portion of the graph represent?
c) What is the significance of the h-intercept?
C4C4
C3C3
35
C2C2
C1C1
x
y
b y = mx + b
0
x
y
by = b
0
x
y
a
x = a
0
t1Time (s)2 3 4 5
Dis
tanc
e (m
)
1
0
234567
d

304 MHR • Chapter 6
PractiseFor help with questions 1 to 4, see Example 1.
1. Identify the slope and the y-intercept of each line. Organize your answers in a table like the one shown.
a) y � 4x � 1 b) y �
c) y � x � 2 d) y � � x
e) y � 3 f) y � �x �
2. Find the slope and the y-intercept of each line.
a) b)
c) d)
3. Write the equation of each line in question 2.
4. Write the equation of each line. State its slope and y-intercept, if they exist.
a) b)
c) d)
5. The line in question 4, part d), has a special name. What is it?
x
y
2
—2
0 2—2x
y
2
—2
0 2 4—2
x
y
2
0 2—2—4x
y
2
0 2—2
x
—2
2
y
0—2 2—4x
—2
2
y
0—2 2 4 6—4
x
y
—2
2
4
0 2—2x
y
—2
2
4
0 2—2
12
23
23
x � 3
Equation Slope y-intercept
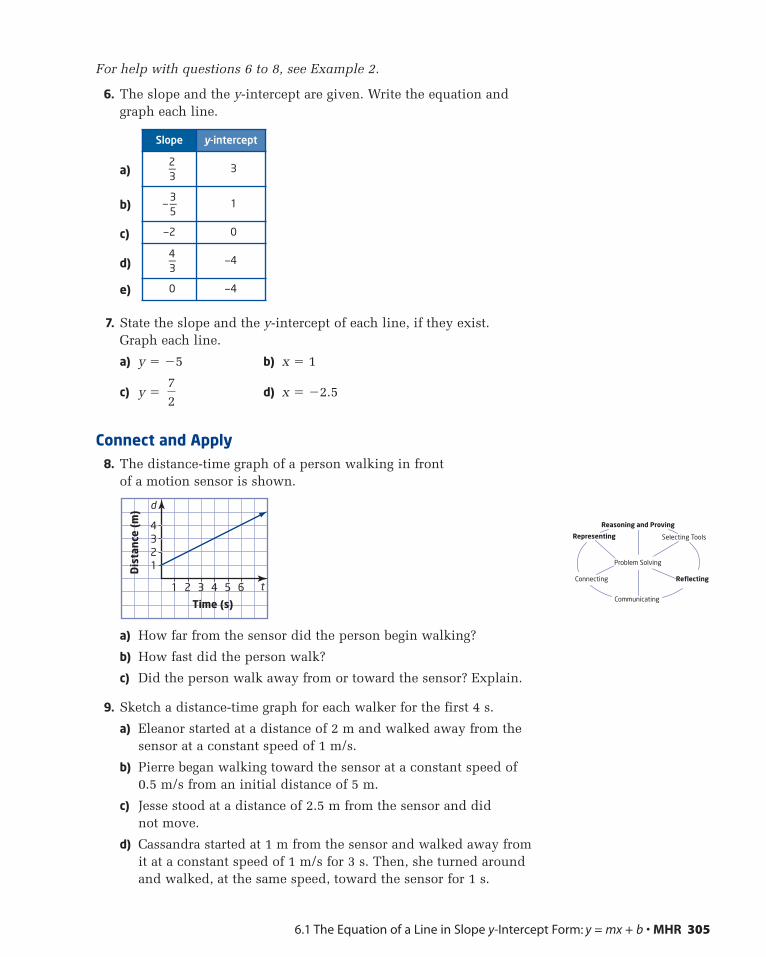
Slope y-intercept
2—3
3
—3—5
1
—2 0
4—3
—4
0 —4
6.1 The Equation of a Line in Slope y-Intercept Form: y = mx + b • MHR 305
Selecting ToolsRepresenting
Reasoning and Proving
Communicating
Connecting Reflecting
Problem Solving
For help with questions 6 to 8, see Example 2.
6. The slope and the y-intercept are given. Write the equation andgraph each line.
a)
b)
c)
d)
e)
7. State the slope and the y-intercept of each line, if they exist. Graph each line.
a) y � �5 b) x � 1
c) y � d) x � �2.5
Connect and Apply8. The distance-time graph of a person walking in front
of a motion sensor is shown.
a) How far from the sensor did the person begin walking?
b) How fast did the person walk?
c) Did the person walk away from or toward the sensor? Explain.
9. Sketch a distance-time graph for each walker for the first 4 s.
a) Eleanor started at a distance of 2 m and walked away from thesensor at a constant speed of 1 m/s.
b) Pierre began walking toward the sensor at a constant speed of 0.5 m/s from an initial distance of 5 m.
c) Jesse stood at a distance of 2.5 m from the sensor and didnot move.
d) Cassandra started at 1 m from the sensor and walked away from it at a constant speed of 1 m/s for 3 s. Then, she turned aroundand walked, at the same speed, toward the sensor for 1 s.
d
t1
Time (s)
Dis
tanc
e (m
)
2 3 4 5 6
1234
72
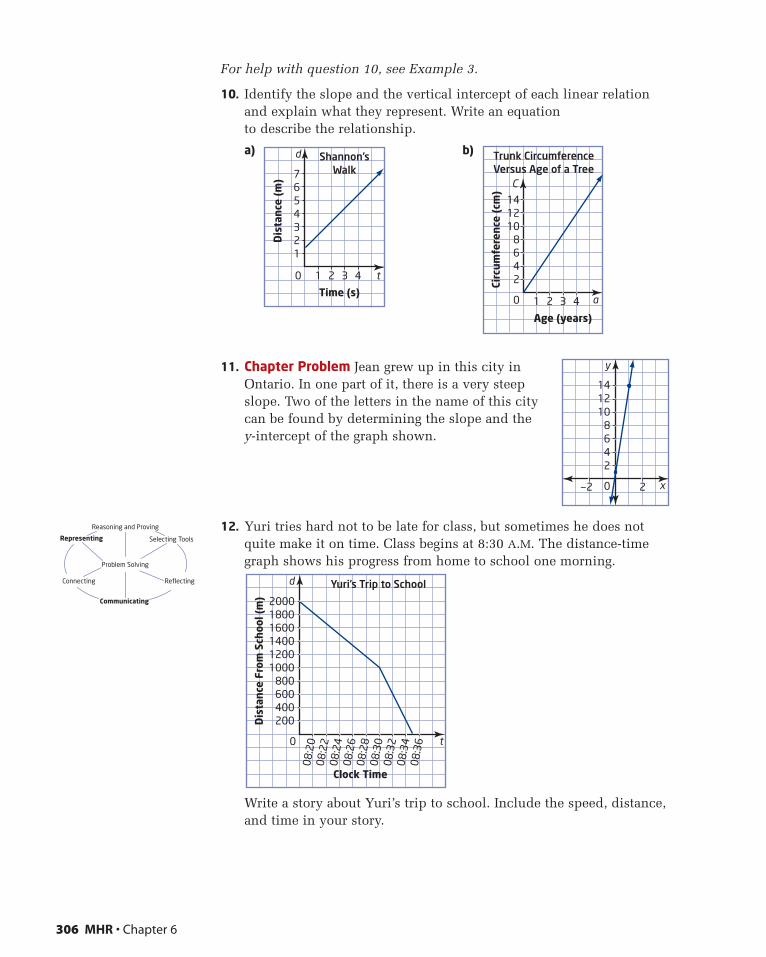
306 MHR • Chapter 6
For help with question 10, see Example 3.
10. Identify the slope and the vertical intercept of each linear relationand explain what they represent. Write an equation to describe the relationship.
a) b)
11. Chapter Problem Jean grew up in this city inOntario. In one part of it, there is a very steepslope. Two of the letters in the name of this citycan be found by determining the slope and the y-intercept of the graph shown.
12. Yuri tries hard not to be late for class, but sometimes he does notquite make it on time. Class begins at 8:30 A.M. The distance-timegraph shows his progress from home to school one morning.
Write a story about Yuri’s trip to school. Include the speed, distance,and time in your story.
d
t0
08:2
008
:22
08:2
408
:26
08:2
808
:30
08:3
208
:34
08:3
6
Clock Time
Dis
tanc
e Fr
om S
choo
l (m
)
200400600800
100012001400160018002000
Yuri’s Trip to School
C
a0 1
Age (years)
2 3 4
2468
101214
Circ
umfe
renc
e (c
m)
Trunk CircumferenceVersus Age of a Tree
d
t0 1
Time (s)
2 3 4
1234567
Dis
tanc
e (m
)
Shannon’sWalk
x
2
0—2 2
468
101214
y
Selecting ToolsRepresenting
Reasoning and Proving
Communicating
Connecting Reflecting
Problem Solving
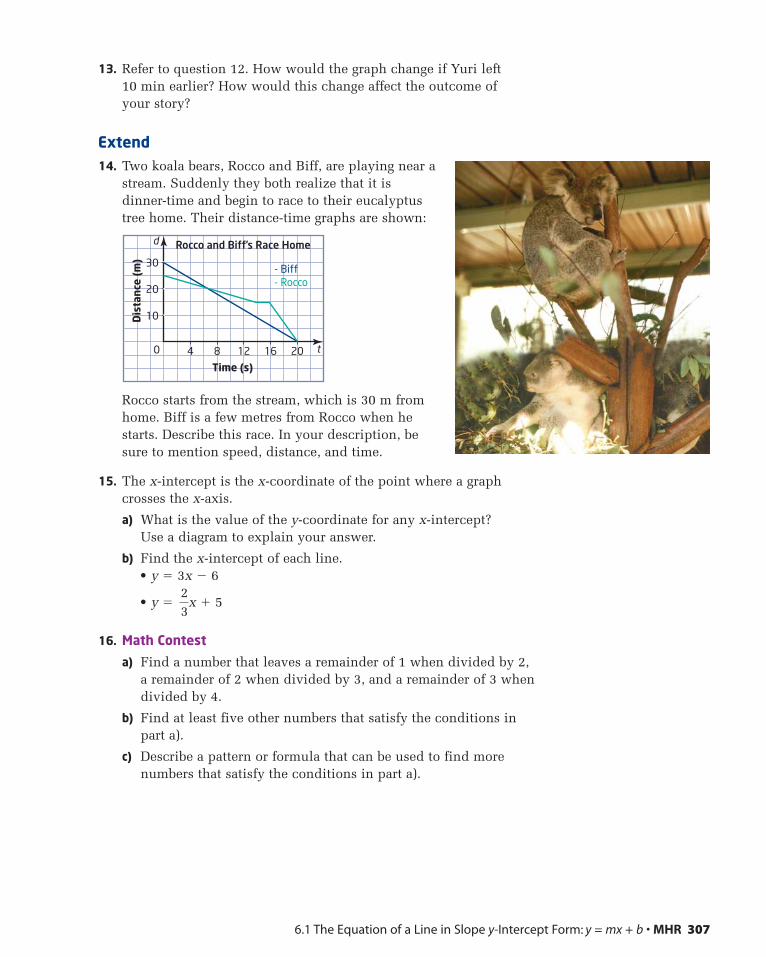
6.1 The Equation of a Line in Slope y-Intercept Form: y = mx + b • MHR 307
13. Refer to question 12. How would the graph change if Yuri left 10 min earlier? How would this change affect the outcome of your story?
Extend14. Two koala bears, Rocco and Biff, are playing near a
stream. Suddenly they both realize that it isdinner-time and begin to race to their eucalyptustree home. Their distance-time graphs are shown:
Rocco starts from the stream, which is 30 m fromhome. Biff is a few metres from Rocco when hestarts. Describe this race. In your description, besure to mention speed, distance, and time.
15. The x-intercept is the x-coordinate of the point where a graphcrosses the x-axis.
a) What is the value of the y-coordinate for any x-intercept? Use a diagram to explain your answer.
b) Find the x-intercept of each line.• y � 3x � 6
• y �
16. Math Contest
a) Find a number that leaves a remainder of 1 when divided by 2, a remainder of 2 when divided by 3, and a remainder of 3 whendivided by 4.
b) Find at least five other numbers that satisfy the conditions in part a).
c) Describe a pattern or formula that can be used to find morenumbers that satisfy the conditions in part a).
23
x � 5
0 4 8 12 16 20
Time (s)
Dis
tanc
e (m
)
10
20
30
Rocco and Biff’s Race Home
- Biff- Rocco
d
t
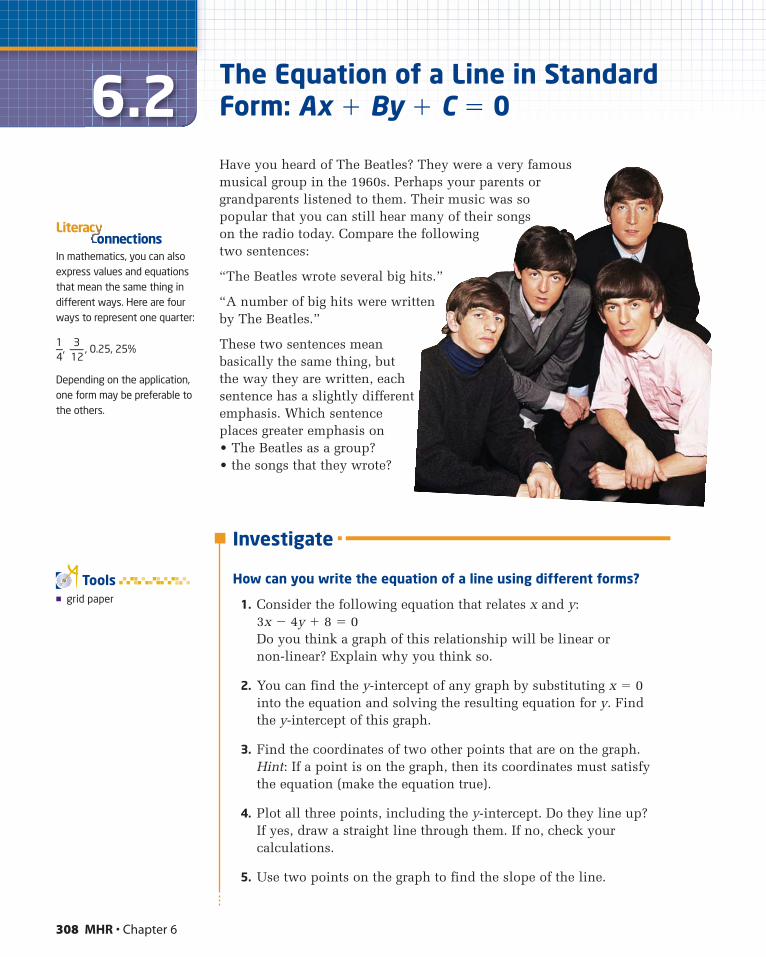
308 MHR • Chapter 6
6.2 The Equation of a Line in StandardForm: Ax � By � C � 0
Have you heard of The Beatles? They were a very famousmusical group in the 1960s. Perhaps your parents orgrandparents listened to them. Their music was so popular that you can still hear many of their songs on the radio today. Compare the following two sentences:
“The Beatles wrote several big hits.”
“A number of big hits were writtenby The Beatles.”
These two sentences meanbasically the same thing, butthe way they are written, eachsentence has a slightly differentemphasis. Which sentenceplaces greater emphasis on• The Beatles as a group?• the songs that they wrote?
In mathematics, you can alsoexpress values and equationsthat mean the same thing indifferent ways. Here are fourways to represent one quarter:
1—4
,3—12
, 0.25, 25%
Depending on the application,one form may be preferable tothe others.
onnectionsLiterac
� grid paper
Tools
Investigate
How can you write the equation of a line using different forms?
1. Consider the following equation that relates x and y:3x � 4y � 8 � 0Do you think a graph of this relationship will be linear or non-linear? Explain why you think so.
2. You can find the y-intercept of any graph by substituting x � 0into the equation and solving the resulting equation for y. Find the y-intercept of this graph.
3. Find the coordinates of two other points that are on the graph.Hint: If a point is on the graph, then its coordinates must satisfythe equation (make the equation true).
4. Plot all three points, including the y-intercept. Do they line up? If yes, draw a straight line through them. If no, check yourcalculations.
5. Use two points on the graph to find the slope of the line.
6. Use the slope and the y-intercept to write the equation of this linein the form y � mx � b.
7. Reflect Compare the equation you wrote in step 6 to the originalequation in step 1. What can you tell about how these equationsare related?
The standard form of the equation of a line is Ax � By � C � 0, whereA, B, and C are integers and A and B are not both zero. You can convertan equation from standard form to slope y-intercept form by performingsome algebraic manipulation.
In standard form, the coefficient of the x-term is always positive. If thecoefficient of the x-term is negative, you can multiply both sides by �1to express the equation in standard form. For example,�3x � 4y � 7 � 0 is not in standard form.(�1)(�3x � 4y � 7) � (�1)(0)gives 3x � 4y � 7 � 0, which is in standard form.
Example 1 Change From Standard Form to Slope y-InterceptForm
Express each equation in the form y � mx � b and identify its slope and y-intercept.
a) x � y � 3 � 0 b) x � 2y � 4 � 0 c) 6x � 3y � 15 � 0
Solution
a) Isolate the y-term on one side of the equation.
x � y � 3 � 0 Subtract x from both sides and add 3 to both sides.
y � �x � 3
The slope is �1 and the y-intercept is 3.
b) Begin by isolating the term containing y. Then, divide by thecoefficient of the y-term.
x � 2y � 4 � 0 Subtract x from both sides and add 4 to both sides.
2y � �x � 4
� Divide both sides by 2.
y � Divide each term on the right side by 2.
y � x � 2
The slope is and the y-intercept is 2.�12
�12
�1x2
�42
�x � 42
21y
21
6.2 The Equation of a Line in Standard Form: Ax + By + C = 0 • MHR 309
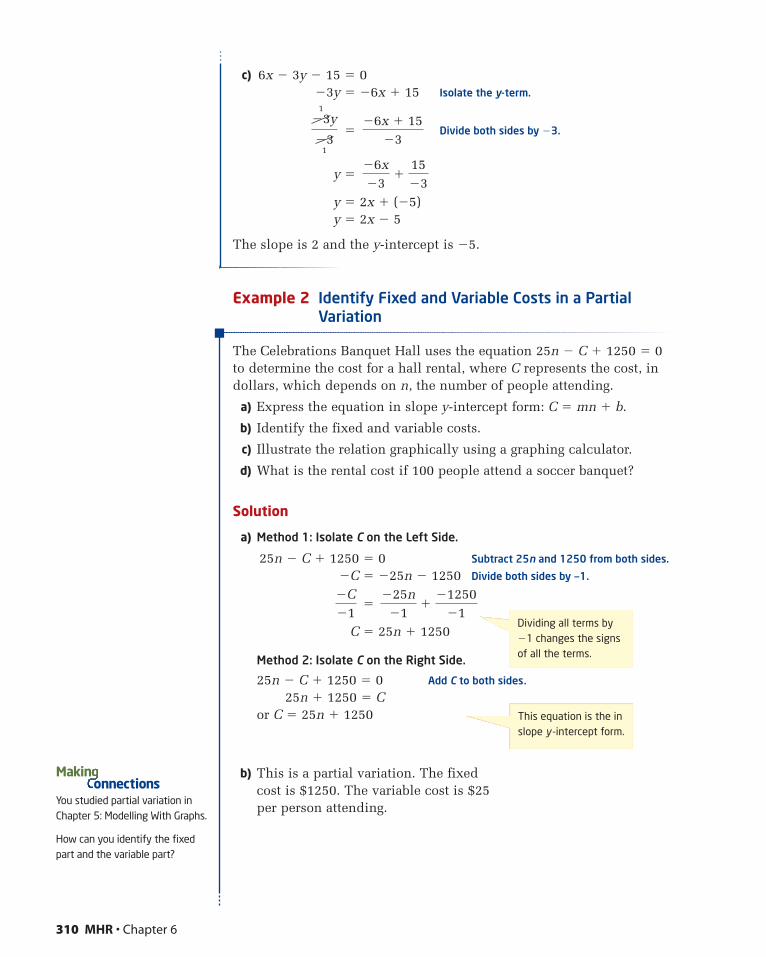
c) 6x � 3y � 15 � 0�3y � �6x � 15 Isolate the y-term.
� Divide both sides by �3.
y �
y � 2x � (�5)y � 2x � 5
The slope is 2 and the y-intercept is �5.
Example 2 Identify Fixed and Variable Costs in a PartialVariation
The Celebrations Banquet Hall uses the equation 25n � C � 1250 � 0to determine the cost for a hall rental, where C represents the cost, indollars, which depends on n, the number of people attending.
a) Express the equation in slope y-intercept form: C � mn � b.
b) Identify the fixed and variable costs.
c) Illustrate the relation graphically using a graphing calculator.
d) What is the rental cost if 100 people attend a soccer banquet?
Solution
a) Method 1: Isolate C on the Left Side.
25n � C � 1250 � 0 Subtract 25n and 1250 from both sides.
�C � �25n � 1250 Divide both sides by —1.
�
C � 25n � 1250
Method 2: Isolate C on the Right Side.
25n � C � 1250 � 0 Add C to both sides.25n � 1250 � C
or C � 25n � 1250
b) This is a partial variation. The fixedcost is $1250. The variable cost is $25per person attending.
�25n�1
��1250
�1�C�1
�6x�3
�15�3
�6x � 15�3
�31
y
�31
310 MHR • Chapter 6
Dividing all terms by�1 changes the signsof all the terms.
You studied partial variation inChapter 5: Modelling With Graphs.
How can you identify the fixedpart and the variable part?
Makinonnections
This equation is the inslope y-intercept form.
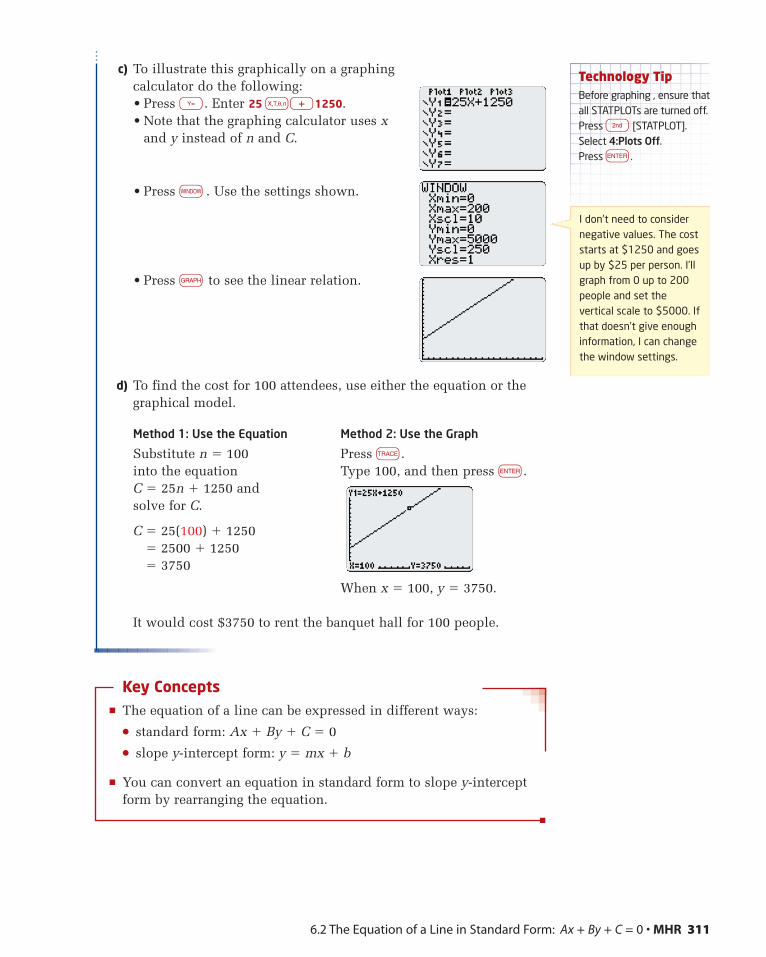
c) To illustrate this graphically on a graphingcalculator do the following:• Press y. Enter 25 x+1250.• Note that the graphing calculator uses x
and y instead of n and C.
• Press w . Use the settings shown.
• Press g to see the linear relation.
d) To find the cost for 100 attendees, use either the equation or thegraphical model.
6.2 The Equation of a Line in Standard Form: Ax + By + C = 0 • MHR 311
Technology TipBefore graphing , ensure thatall STATPLOTs are turned off.Press n [STATPLOT].Select 4:Plots Off.Press e.
I don’t need to considernegative values. The coststarts at $1250 and goesup by $25 per person. I’llgraph from 0 up to 200people and set thevertical scale to $5000. Ifthat doesn’t give enoughinformation, I can changethe window settings.
Method 1: Use the Equation
Substitute n � 100 into the equation C � 25n � 1250 andsolve for C.
C � 25(100) � 1250� 2500 � 1250� 3750
Method 2: Use the Graph
Press u.Type 100, and then press e.
When x � 100, y � 3750.
Key Concepts� The equation of a line can be expressed in different ways:
� standard form: Ax � By � C � 0
� slope y-intercept form: y � mx � b
� You can convert an equation in standard form to slope y-interceptform by rearranging the equation.
It would cost $3750 to rent the banquet hall for 100 people.
Communicate Your UnderstandingThe following equations are expressed in standard form. Identifythe coefficients A, B, and C in each.
a) 2x � 3y � 6 � 0
b) 5x � 2y � 1 � 0
c) x � y � 0
The steps show how to convert an equation in standard form toslope y-intercept form. Explain each step.
Step Explanation
5x � 4y � 20 � 0 Start with the equation in standard form.
�4y � �5x � 20
�
y �
PractiseFor help with questions 1 to 3, see Example 1.
1. Express each equation in the form y � mx � b.
a) x � y � 3 � 0 b) 2x � 3y � 6 � 0
c) x � 4y � 12 � 0 d) 3x � 2y � 5 � 0
2. For each linear relation in question 1,
• identify the slope and the y-intercept
• use this information to graph the line
3. Identify the slope and the y-intercept of each line.
a) x � 3y � 3 � 0 b) 2x � 5y � 8 � 0
Connect and Apply4. Refer to Example 2. The Easy Event banquet hall charges according
to the equation 40n � C � 250 � 0.
a) Express the equation in slope y-intercept form: C � mn � b.
b) Identify the fixed and variable costs.
c) Illustrate the relation graphically.
d) What is the rental cost if 100 people attend a soccer banquet?
e) Is this a better deal than Celebrations? Explain.
5. How does your answer to question 4, part e), change if only 50 people attend? Explain.
54
x � 5
�5x � 20�4
�4y
�4
C2C2
C1C1
312 MHR • Chapter 6
6. Chapter Problem There are a lot of factories in the Jean’s home city.The equation n � E � 15 � 0 describes how much a worker mightearn, E, in dollars per hour, according to the number of yearsexperience, n.
Find the hourly earnings of a beginning factory worker, and of aworker with 5 years of experience, and you will have two moreletters in the name of this city.
7. The equation 9C � 5F � 160 � 0 describes the relationship betweentemperature, C, in degrees Celsius, and temperature, F, in degreesFahrenheit.
a) Express this equation in the form C � mF � b.
b) Graph this relation.
c) Identify the slope and the C-intercept and explain what they mean.
8. Refer to question 7.
a) Express the equation in the form F � mC � b.
b) Graph this relation.
c) Identify the slope and the F-intercept and explain what theymean.
9. Compare the two relations from questions 7 and 8.
a) Describe how their graphs are• similar• different
b) How are the slopes of the two graphs related?
Achievement Check
10. The Knights Banquet Hall uses the equation 25n � C � 1250 � 0 todetermine the cost for a hall rental.
The Legions Banquet Hall uses the equation 30n � 995 � C � 0 todetermine the cost for their hall rental.
In each case, C represents the cost, in dollars, which depends on n,the number of people attending.
a) Express each equation in slope y-intercept form: C � mn � b.
b) Identify the fixed and variable costs for each hall.
c) What is the cost at each hall for a graduation banquet for45 people?
d) Which hall offers the better price? Comment on whether yourconclusion changes if a few more people wish to attend.
6.2 The Equation of a Line in Standard Form: Ax + By + C = 0 • MHR 313
C F
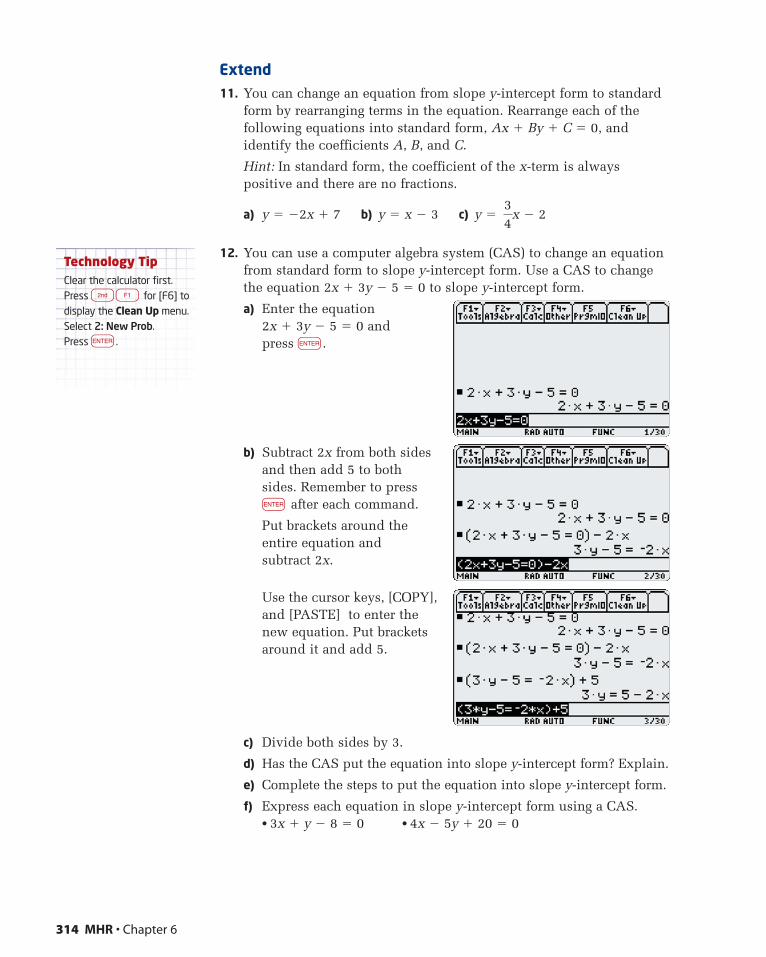
Extend11. You can change an equation from slope y-intercept form to standard
form by rearranging terms in the equation. Rearrange each of thefollowing equations into standard form, Ax � By � C � 0, andidentify the coefficients A, B, and C.
Hint: In standard form, the coefficient of the x-term is alwayspositive and there are no fractions.
a) y � �2x � 7 b) y � x � 3 c) y �
12. You can use a computer algebra system (CAS) to change an equationfrom standard form to slope y-intercept form. Use a CAS to changethe equation 2x � 3y � 5 � 0 to slope y-intercept form.
a) Enter the equation 2x � 3y � 5 � 0 and press e.
b) Subtract 2x from both sidesand then add 5 to bothsides. Remember to presse after each command.
Put brackets around theentire equation and subtract 2x.
Use the cursor keys, [COPY],and [PASTE] to enter thenew equation. Put bracketsaround it and add 5.
c) Divide both sides by 3.
d) Has the CAS put the equation into slope y-intercept form? Explain.
e) Complete the steps to put the equation into slope y-intercept form.
f) Express each equation in slope y-intercept form using a CAS.• 3x � y � 8 � 0 • 4x � 5y � 20 � 0
34
x � 2
314 MHR • Chapter 6
Technology TipClear the calculator first.Press n¡ for [F6] todisplay the Clean Up menu.Select 2: New Prob.Press e.
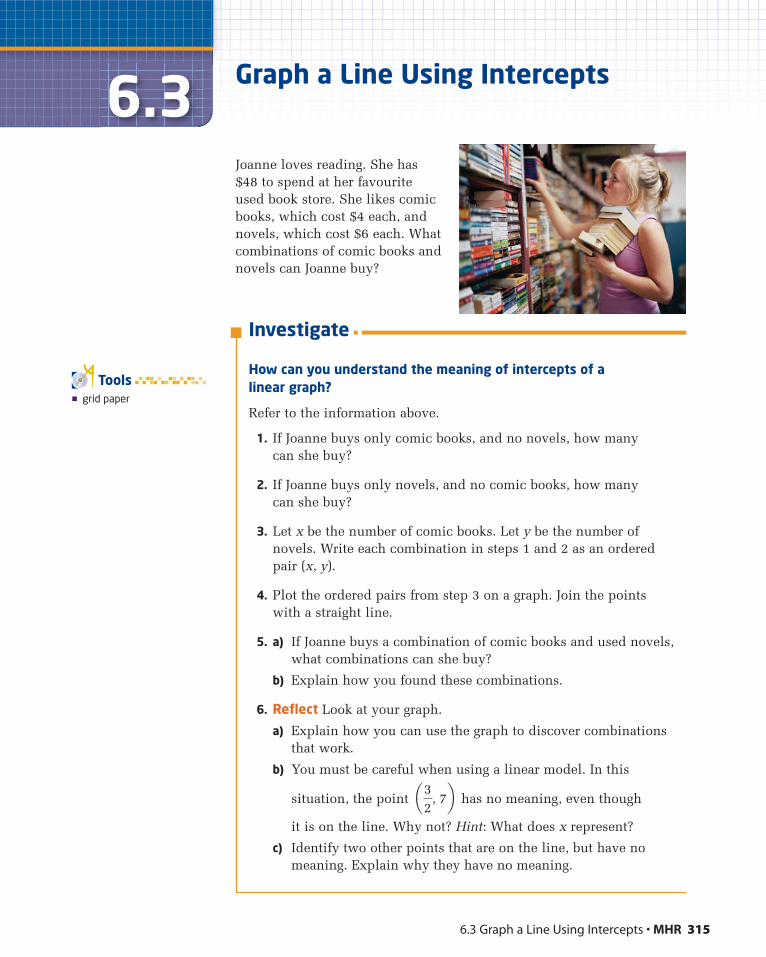
6.3 Graph a Line Using Intercepts • MHR 315
6.3Joanne loves reading. She has$48 to spend at her favouriteused book store. She likes comicbooks, which cost $4 each, andnovels, which cost $6 each. Whatcombinations of comic books andnovels can Joanne buy?
Graph a Line Using Intercepts
� grid paper
Tools
Investigate
How can you understand the meaning of intercepts of a linear graph?
Refer to the information above.
1. If Joanne buys only comic books, and no novels, how many can she buy?
2. If Joanne buys only novels, and no comic books, how many can she buy?
3. Let x be the number of comic books. Let y be the number ofnovels. Write each combination in steps 1 and 2 as an orderedpair (x, y).
4. Plot the ordered pairs from step 3 on a graph. Join the points with a straight line.
5. a) If Joanne buys a combination of comic books and used novels,what combinations can she buy?
b) Explain how you found these combinations.
6. Reflect Look at your graph.
a) Explain how you can use the graph to discover combinationsthat work.
b) You must be careful when using a linear model. In this
situation, the point has no meaning, even though
it is on the line. Why not? Hint: What does x represent?
c) Identify two other points that are on the line, but have nomeaning. Explain why they have no meaning.
a32
, 7b
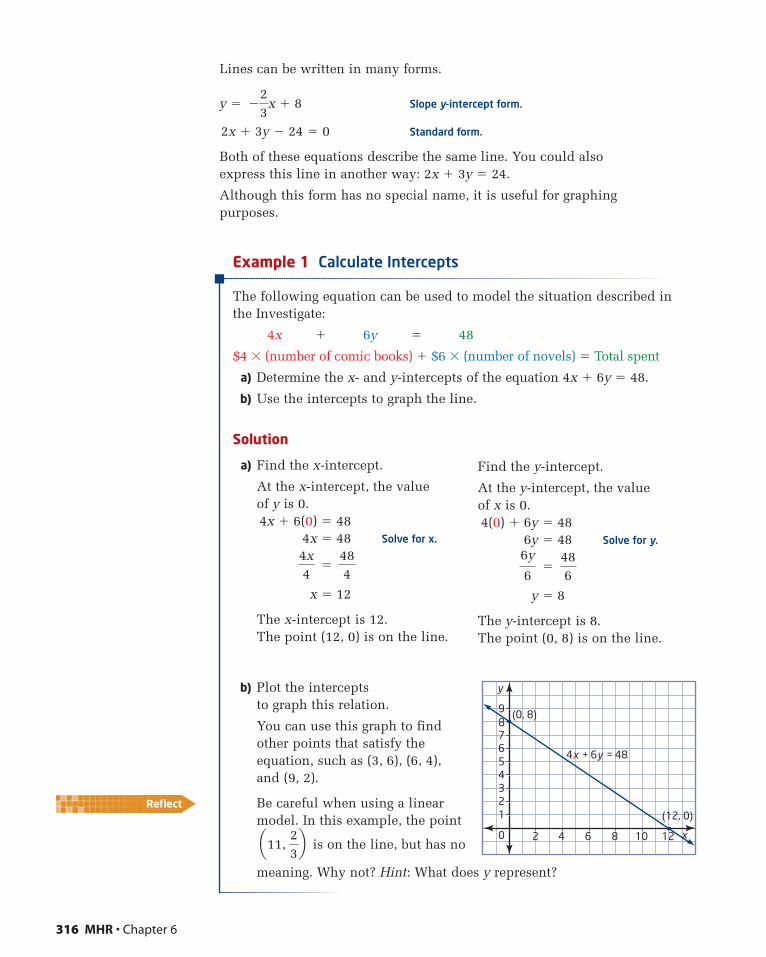
Lines can be written in many forms.
y � Slope y-intercept form.
2x � 3y � 24 � 0 Standard form.
Both of these equations describe the same line. You could also express this line in another way: 2x � 3y � 24.
Although this form has no special name, it is useful for graphingpurposes.
Example 1 Calculate Intercepts
The following equation can be used to model the situation described inthe Investigate:
4x � 6y � 48
$4 � (number of comic books) � $6 � (number of novels) � Total spent
a) Determine the x- and y-intercepts of the equation 4x � 6y � 48.
b) Use the intercepts to graph the line.
Solution
a) Find the x-intercept.
At the x-intercept, the value of y is 0.4x � 6(0) � 48
4x � 48 Solve for x.
�
x � 12
The x-intercept is 12.The point (12, 0) is on the line.
484
4x4
�23
x � 8
316 MHR • Chapter 6
Find the y-intercept.
At the y-intercept, the value of x is 0.4(0) � 6y � 48
6y � 48 Solve for y.
�
y � 8
The y-intercept is 8.The point (0, 8) is on the line.
486
6y
6
b) Plot the interceptsto graph this relation.
You can use this graph to findother points that satisfy theequation, such as (3, 6), (6, 4),and (9, 2).
Be careful when using a linearmodel. In this example, the point
is on the line, but has no
meaning. Why not? Hint: What does y represent?
a11, 23b
y
4x + 6y = 48
(0, 8)
(12, 0)
x0 2 4 6 8 10 12
123456789

6.3 Graph a Line Using Intercepts • MHR 317
Example 2 Use Intercepts to Graph a Line
For each linear relation, determine the x- and y-intercepts and graph the line.
a) 2x � y � 7 b) 3x � 5y � 15 � 0
Solution
a) Find the x-intercept.Substitute y � 0.
2x � 0 � 72x � 7 Solve for x.
�
x �
The x-intercept is or 3.5.
The point (3.5, 0) is on the line.
Plot the intercepts.Draw a line through the intercepts.Label the line with the equation.
b) 3x � 5y � 15 � 0
Find the x-intercept.Substitute y � 0.3x � 5(0) � 15 � 0
3x � 15 � 03x � �15x � �5
The x-intercept is �5.The point (�5, 0) is on the line.
72
72
72
2x2
x2 4
y(3.5, 0)
(0, 7)
2x — y = 7
—2
0
—4
—6
—8
Find the y-intercept.Substitute x � 0.3(0) � 5y � 15 � 0
�5y � 15 � 0�5y � �15
y � 3The y-intercept is 3.The point (0, 3) is on the line.
Plot the intercepts.Draw a line through the intercepts.Label the line with the equation.
y
2
4
0—2—4—6
y
(0, 3)
(—5, 0)
3x — 5y + 15 = 0
Find the y-intercept.Substitute x � 0.
2(0) � y � 7�y � 7 Solve for y.
�
y � �7The y-intercept is �7.The point (0, �7) is on theline.
7�1
�y
�1
I could do this mentally.I just cover up the x-term and solve �y � 7 in my head.
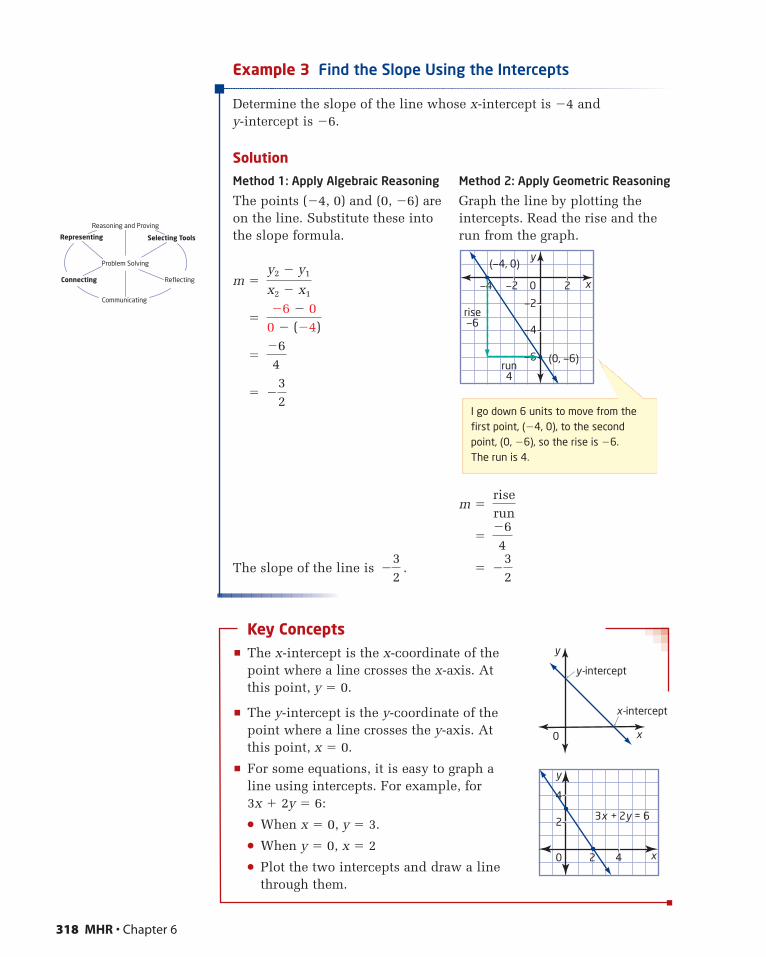
Example 3 Find the Slope Using the Intercepts
Determine the slope of the line whose x-intercept is �4 andy-intercept is �6.
Solution
318 MHR • Chapter 6
Method 1: Apply Algebraic Reasoning
The points (�4, 0) and (0, �6) areon the line. Substitute these intothe slope formula.
m �
�
�
�
The slope of the line is .�32
�32
�64
�6 � 00 � (�4)
y2 � y1
x2 � x1
Method 2: Apply Geometric Reasoning
Graph the line by plotting theintercepts. Read the rise and therun from the graph.
m �
�
� �32
�64
riserun
x
—2
—4
0—2—4 2
y(—4, 0)
rise—6
run4
(0, —6)—6
Key Concepts� The x-intercept is the x-coordinate of the
point where a line crosses the x-axis. At this point, y � 0.
� The y-intercept is the y-coordinate of thepoint where a line crosses the y-axis. At this point, x � 0.
� For some equations, it is easy to graph a line using intercepts. For example, for 3x � 2y � 6:
� When x � 0, y � 3.
� When y � 0, x � 2
� Plot the two intercepts and draw a linethrough them.
x
y
y-intercept
x-intercept
0
x
2
4
0 2
y
3x + 2y = 6
4
Selecting ToolsRepresenting
Reasoning and Proving
Communicating
Connecting Reflecting
Problem Solving
I go down 6 units to move from thefirst point, (�4, 0), to the secondpoint, (0, �6), so the rise is �6. The run is 4.
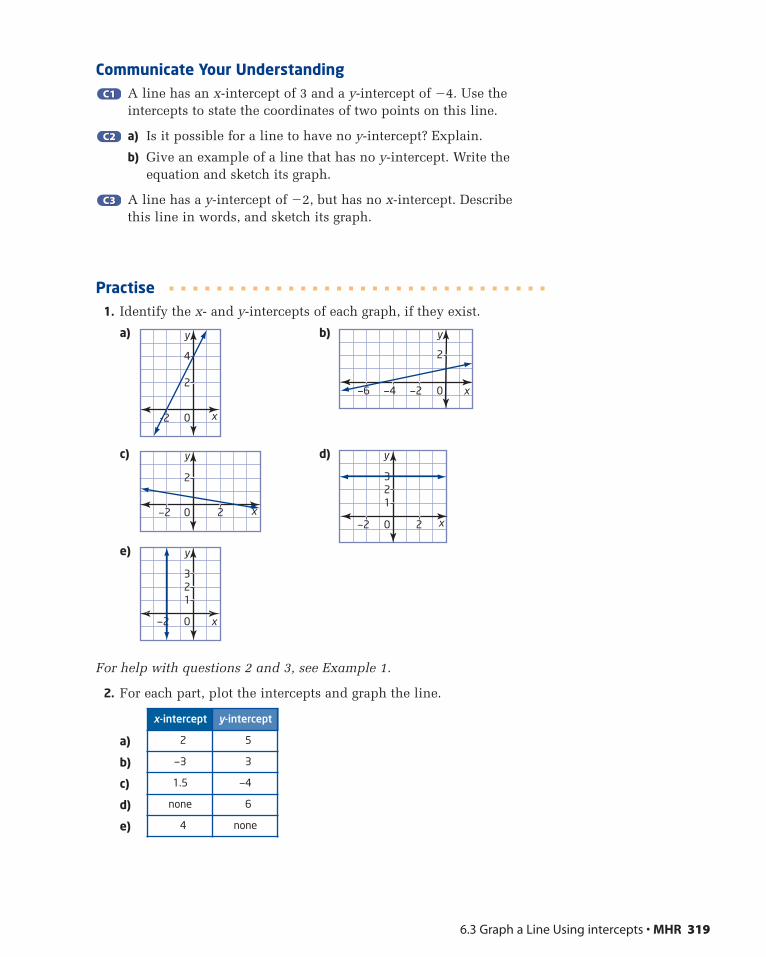
x-intercept y-intercept
2 5
—3 3
1.5 —4
none 6
4 none
6.3 Graph a Line Using intercepts • MHR 319
Communicate Your UnderstandingA line has an x-intercept of 3 and a y-intercept of �4. Use theintercepts to state the coordinates of two points on this line.
a) Is it possible for a line to have no y-intercept? Explain.
b) Give an example of a line that has no y-intercept. Write theequation and sketch its graph.
A line has a y-intercept of �2, but has no x-intercept. Describe this line in words, and sketch its graph.
Practise1. Identify the x- and y-intercepts of each graph, if they exist.
a) b)
c) d)
e)
For help with questions 2 and 3, see Example 1.
2. For each part, plot the intercepts and graph the line.
a)
b)
c)
d)
e)
x
123
0—2
y
x
123
0—2 2
y
x
2
0—2 2
y
x
2
0—2—4—6
y
x
2
4
0-2
y
C3C3
C2C2
C1C1
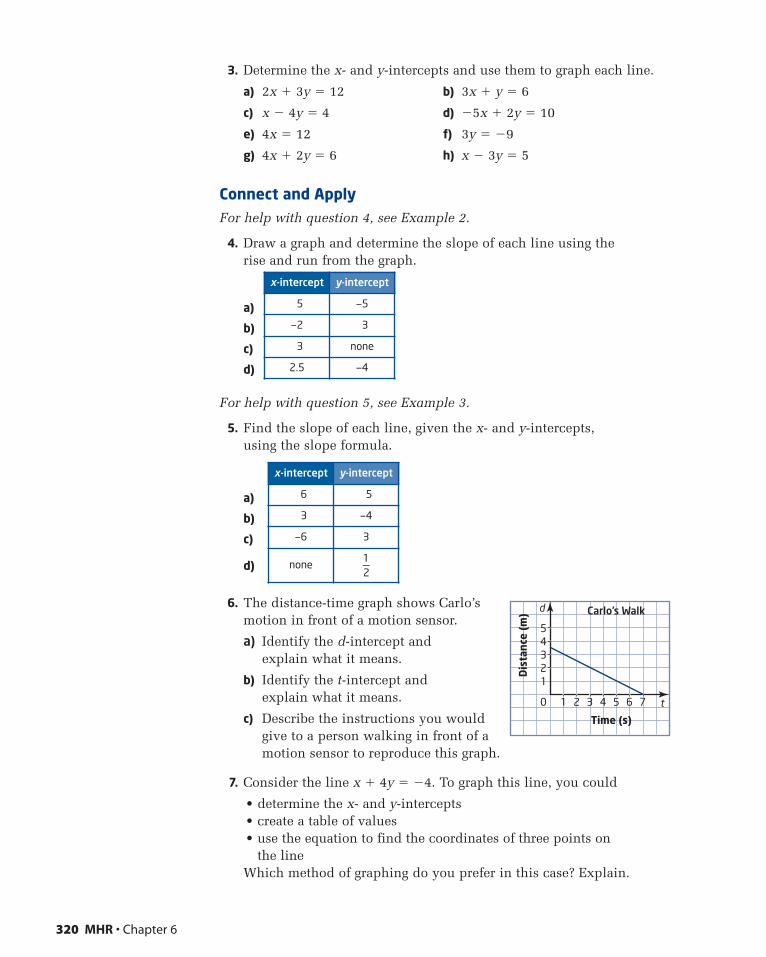
x-intercept y-intercept
6 5
3 —4
—6 3
none1—2
x-intercept y-intercept
5 —5
—2 3
3 none
2.5 —4
3. Determine the x- and y-intercepts and use them to graph each line.
a) 2x � 3y � 12 b) 3x � y � 6
c) x � 4y � 4 d) �5x � 2y � 10
e) 4x � 12 f) 3y � �9
g) 4x � 2y � 6 h) x � 3y � 5
Connect and ApplyFor help with question 4, see Example 2.
4. Draw a graph and determine the slope of each line using the rise and run from the graph.
a)
b)
c)
d)
For help with question 5, see Example 3.
5. Find the slope of each line, given the x- and y-intercepts, using the slope formula.
a)
b)
c)
d)
6. The distance-time graph shows Carlo’smotion in front of a motion sensor.
a) Identify the d-intercept andexplain what it means.
b) Identify the t-intercept andexplain what it means.
c) Describe the instructions you wouldgive to a person walking in front of amotion sensor to reproduce this graph.
7. Consider the line x � 4y � �4. To graph this line, you could
• determine the x- and y-intercepts• create a table of values• use the equation to find the coordinates of three points on
the lineWhich method of graphing do you prefer in this case? Explain.
320 MHR • Chapter 6
d
t0 1
Time (s)
2 3 4 5 6 7
12345
Dis
tanc
e (m
) Carlo’s Walk
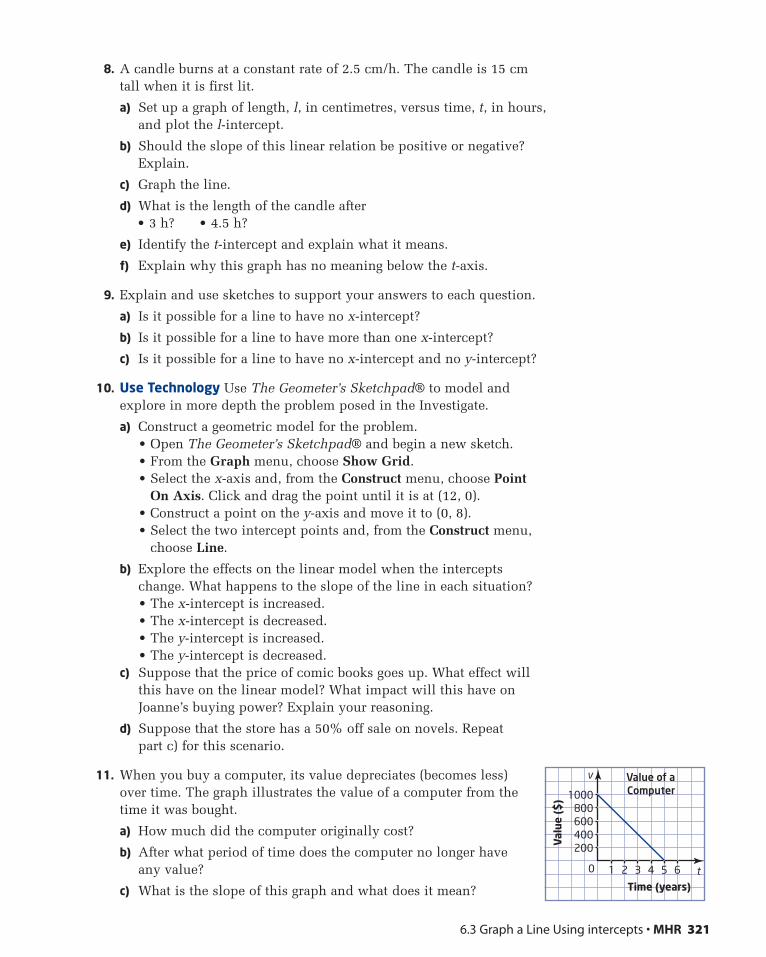
8. A candle burns at a constant rate of 2.5 cm/h. The candle is 15 cmtall when it is first lit.
a) Set up a graph of length, l, in centimetres, versus time, t, in hours,and plot the l-intercept.
b) Should the slope of this linear relation be positive or negative?Explain.
c) Graph the line.
d) What is the length of the candle after• 3 h? • 4.5 h?
e) Identify the t-intercept and explain what it means.
f) Explain why this graph has no meaning below the t-axis.
9. Explain and use sketches to support your answers to each question.
a) Is it possible for a line to have no x-intercept?
b) Is it possible for a line to have more than one x-intercept?
c) Is it possible for a line to have no x-intercept and no y-intercept?
10. Use Technology Use The Geometer’s Sketchpad® to model andexplore in more depth the problem posed in the Investigate.
a) Construct a geometric model for the problem.• Open The Geometer’s Sketchpad® and begin a new sketch.• From the Graph menu, choose Show Grid.• Select the x-axis and, from the Construct menu, choose Point
On Axis. Click and drag the point until it is at (12, 0).• Construct a point on the y-axis and move it to (0, 8).• Select the two intercept points and, from the Construct menu,
choose Line.
b) Explore the effects on the linear model when the interceptschange. What happens to the slope of the line in each situation?• The x-intercept is increased.• The x-intercept is decreased.• The y-intercept is increased.• The y-intercept is decreased.
c) Suppose that the price of comic books goes up. What effect willthis have on the linear model? What impact will this have onJoanne’s buying power? Explain your reasoning.
d) Suppose that the store has a 50% off sale on novels. Repeat part c) for this scenario.
11. When you buy a computer, its value depreciates (becomes less)over time. The graph illustrates the value of a computer from thetime it was bought.
a) How much did the computer originally cost?
b) After what period of time does the computer no longer haveany value?
c) What is the slope of this graph and what does it mean?
6.3 Graph a Line Using intercepts • MHR 321
v
t0 1
Time (years)
2 3 4 5 6
200400600800
1000
Val
ue (
$)
Value of aComputer
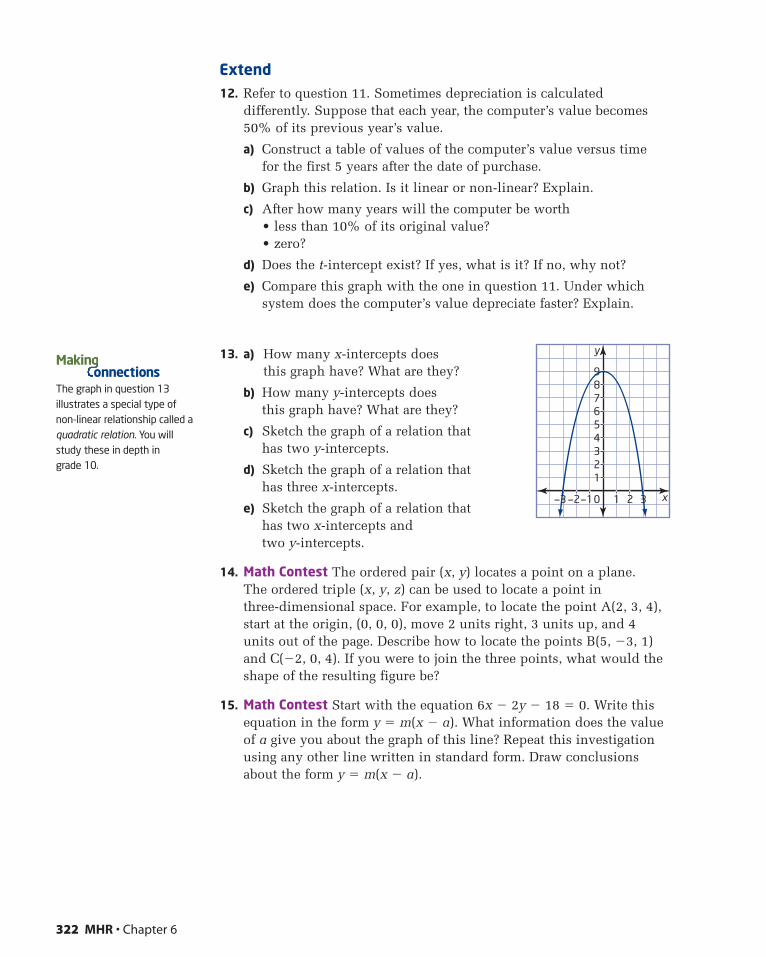
Extend12. Refer to question 11. Sometimes depreciation is calculated
differently. Suppose that each year, the computer’s value becomes50% of its previous year’s value.
a) Construct a table of values of the computer’s value versus time for the first 5 years after the date of purchase.
b) Graph this relation. Is it linear or non-linear? Explain.
c) After how many years will the computer be worth• less than 10% of its original value?• zero?
d) Does the t-intercept exist? If yes, what is it? If no, why not?
e) Compare this graph with the one in question 11. Under whichsystem does the computer’s value depreciate faster? Explain.
13. a) How many x-intercepts doesthis graph have? What are they?
b) How many y-intercepts doesthis graph have? What are they?
c) Sketch the graph of a relation that has two y-intercepts.
d) Sketch the graph of a relation that has three x-intercepts.
e) Sketch the graph of a relation that has two x-intercepts and two y-intercepts.
14. Math Contest The ordered pair (x, y) locates a point on a plane. The ordered triple (x, y, z) can be used to locate a point inthree-dimensional space. For example, to locate the point A(2, 3, 4),start at the origin, (0, 0, 0), move 2 units right, 3 units up, and 4units out of the page. Describe how to locate the points B(5, �3, 1)and C(�2, 0, 4). If you were to join the three points, what would theshape of the resulting figure be?
15. Math Contest Start with the equation 6x � 2y � 18 � 0. Write thisequation in the form y � m(x � a). What information does the valueof a give you about the graph of this line? Repeat this investigationusing any other line written in standard form. Draw conclusionsabout the form y � m(x � a).
322 MHR • Chapter 6
The graph in question 13illustrates a special type ofnon-linear relationship called aquadratic relation. You willstudy these in depth ingrade 10.
Makinonnections
x
123456789
0—1—2—3 1 2 3
y
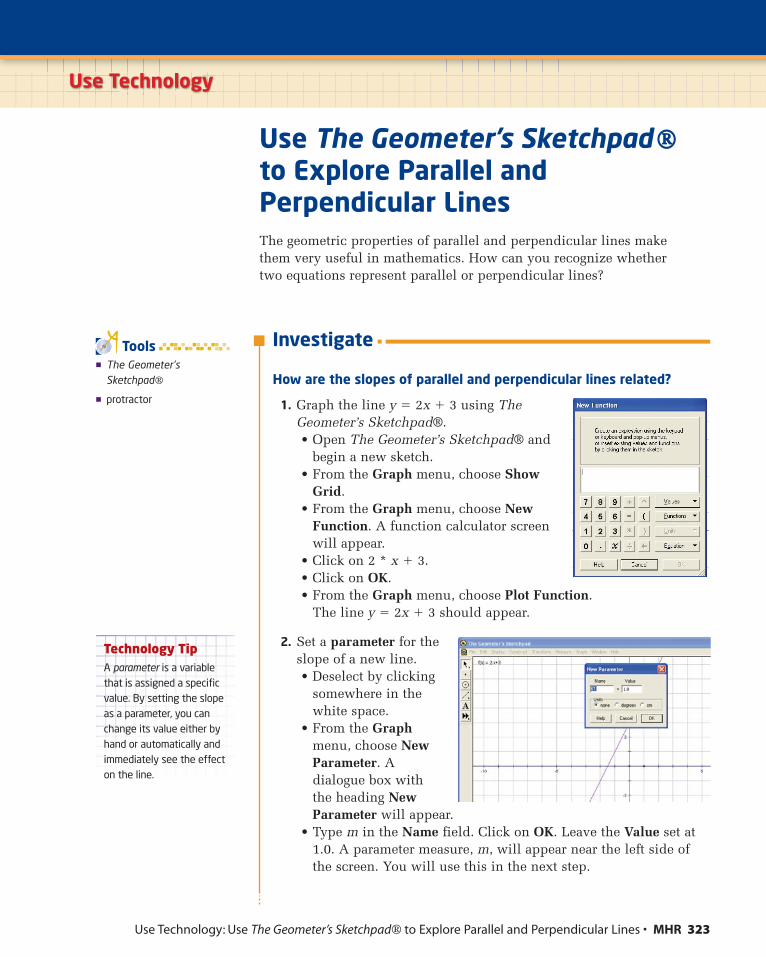
Use Technology: Use The Geometer’s Sketchpad® to Explore Parallel and Perpendicular Lines • MHR 323
Use The Geometer’s Sketchpad ®to Explore Parallel andPerpendicular LinesThe geometric properties of parallel and perpendicular lines make them very useful in mathematics. How can you recognize whether two equations represent parallel or perpendicular lines?
Investigate
How are the slopes of parallel and perpendicular lines related?
1. Graph the line y � 2x � 3 using TheGeometer’s Sketchpad®.• Open The Geometer’s Sketchpad® and
begin a new sketch.• From the Graph menu, choose Show
Grid.• From the Graph menu, choose New
Function. A function calculator screenwill appear.
• Click on 2 * x � 3.• Click on OK.• From the Graph menu, choose Plot Function.
The line y � 2x � 3 should appear.
2. Set a parameter for theslope of a new line.• Deselect by clicking
somewhere in thewhite space.
• From the Graphmenu, choose NewParameter. Adialogue box withthe heading NewParameter will appear.
• Type m in the Name field. Click on OK. Leave the Value set at1.0. A parameter measure, m, will appear near the left side ofthe screen. You will use this in the next step.
Use Technology
� The Geometer’sSketchpad®
� protractor
Tools
Technology TipA parameter is a variablethat is assigned a specificvalue. By setting the slopeas a parameter, you canchange its value either byhand or automatically andimmediately see the effecton the line.
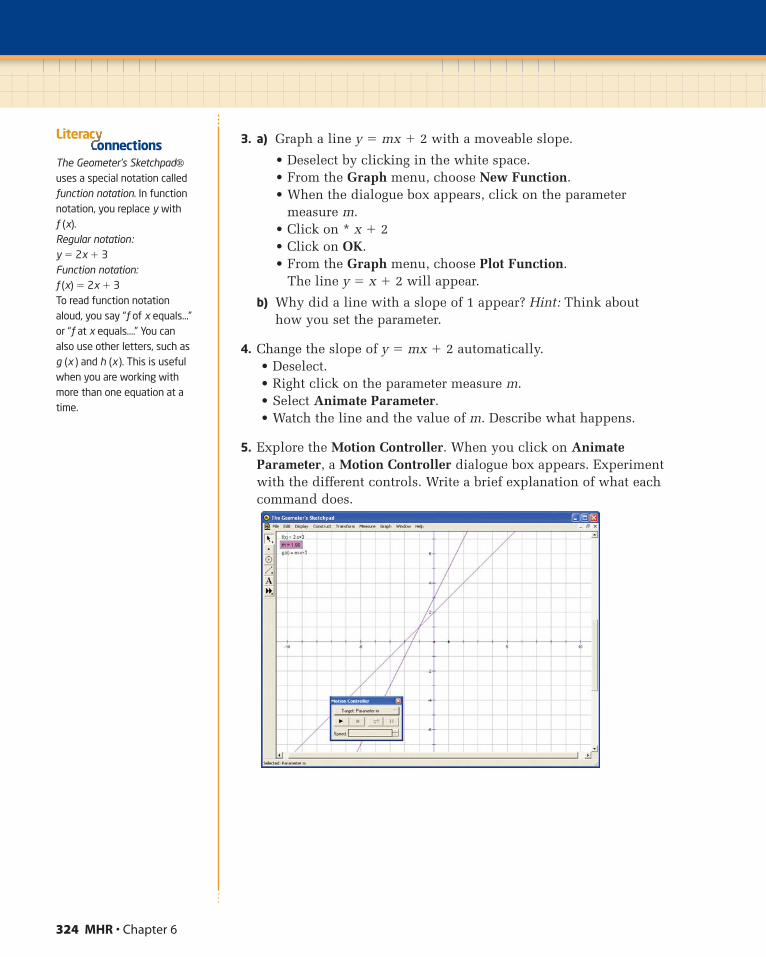
324 MHR • Chapter 6
3. a) Graph a line y � mx � 2 with a moveable slope.
• Deselect by clicking in the white space.• From the Graph menu, choose New Function.• When the dialogue box appears, click on the parameter
measure m.• Click on * x � 2• Click on OK.• From the Graph menu, choose Plot Function.
The line y � x � 2 will appear.
b) Why did a line with a slope of 1 appear? Hint: Think about how you set the parameter.
4. Change the slope of y � mx � 2 automatically.• Deselect.• Right click on the parameter measure m.• Select Animate Parameter.• Watch the line and the value of m. Describe what happens.
5. Explore the Motion Controller. When you click on AnimateParameter, a Motion Controller dialogue box appears. Experimentwith the different controls. Write a brief explanation of what eachcommand does.
The Geometer’s Sketchpad®
uses a special notation calledfunction notation. In functionnotation, you replace y withf (x).Regular notation:y � 2x � 3Function notation:f (x) � 2x � 3To read function notationaloud, you say “f of x equals…”or “f at x equals….” You canalso use other letters, such asg (x ) and h (x ). This is usefulwhen you are working withmore than one equation at atime.
onnectionsLiterac
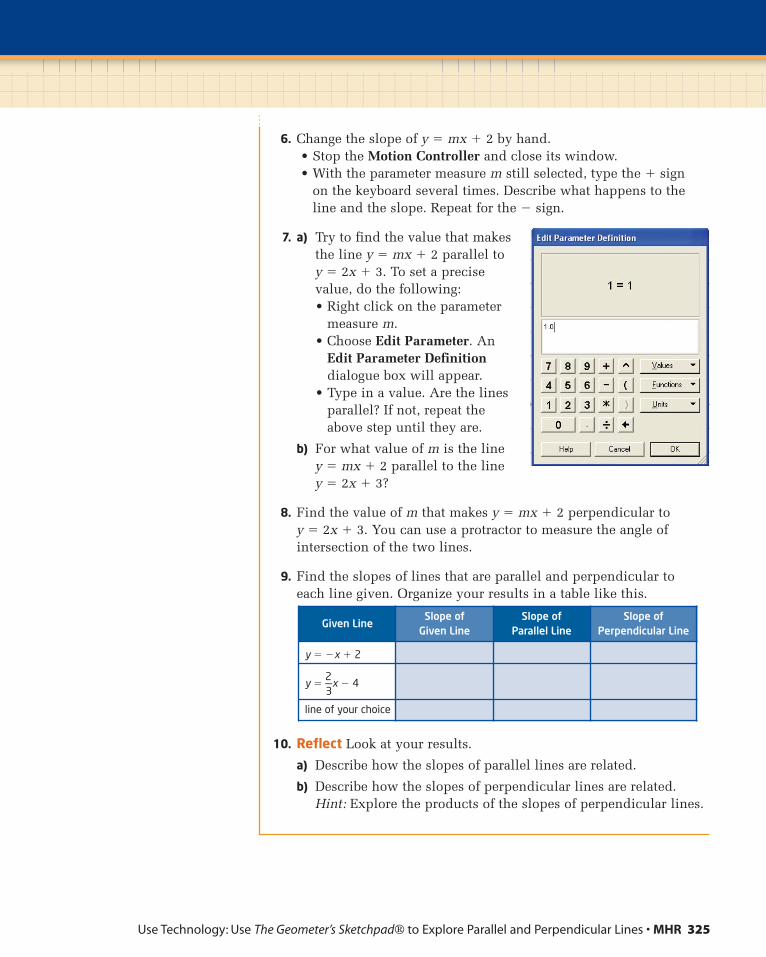
Use Technology: Use The Geometer’s Sketchpad® to Explore Parallel and Perpendicular Lines • MHR 325
6. Change the slope of y � mx � 2 by hand.• Stop the Motion Controller and close its window.• With the parameter measure m still selected, type the � sign
on the keyboard several times. Describe what happens to the line and the slope. Repeat for the � sign.
7. a) Try to find the value that makes the line y � mx � 2 parallel to y � 2x � 3. To set a precise value, do the following:• Right click on the parameter
measure m.• Choose Edit Parameter. An
Edit Parameter Definitiondialogue box will appear.
• Type in a value. Are the linesparallel? If not, repeat theabove step until they are.
b) For what value of m is the line y � mx � 2 parallel to the line y � 2x � 3?
8. Find the value of m that makes y � mx � 2 perpendicular to y � 2x � 3. You can use a protractor to measure the angle ofintersection of the two lines.
9. Find the slopes of lines that are parallel and perpendicular to each line given. Organize your results in a table like this.
10. Reflect Look at your results.
a) Describe how the slopes of parallel lines are related.
b) Describe how the slopes of perpendicular lines are related.Hint: Explore the products of the slopes of perpendicular lines.
Given LineSlope of
Given LineSlope of
Parallel LineSlope of
Perpendicular Line
y � �x � 2
y �2—3
x � 4
line of your choice
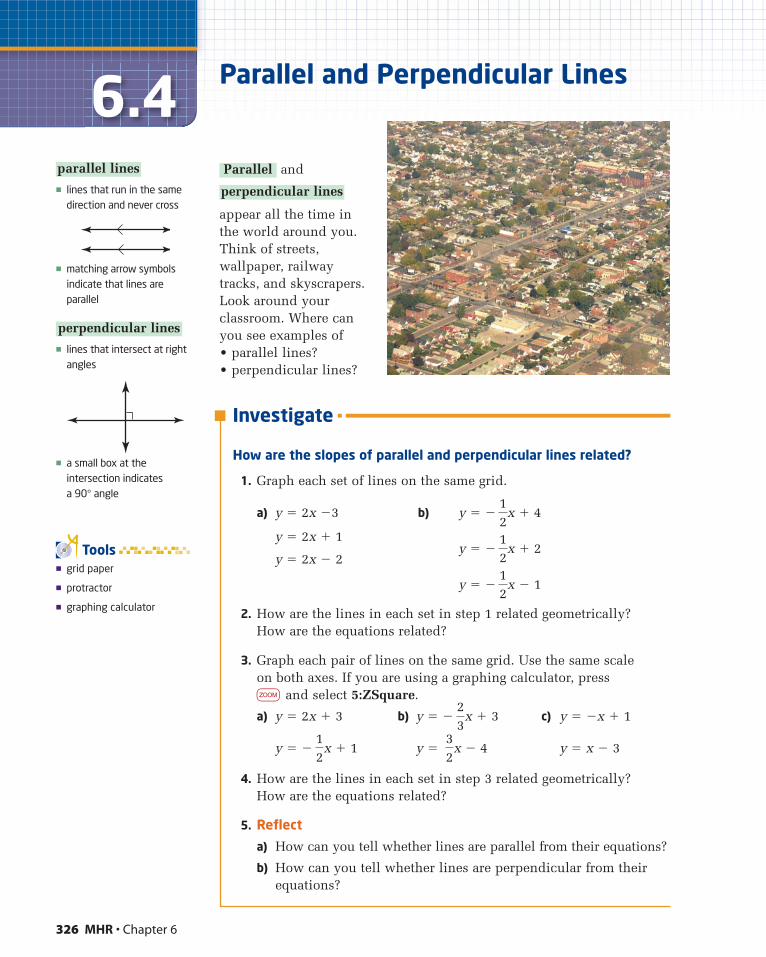
326 MHR • Chapter 6
6.4 Parallel and Perpendicular Lines
and
perpendicular lines
Parallel� lines that run in the same
direction and never cross
� matching arrow symbolsindicate that lines areparallel
� lines that intersect at rightangles
� a small box at theintersection indicates a 90° angle
perpendicular lines
parallel lines
� grid paper
� protractor
� graphing calculator
Tools
Investigate
How are the slopes of parallel and perpendicular lines related?
1. Graph each set of lines on the same grid.
a) y � 2x �3 b) y � �
y � 2x � 1y � �
y � 2x � 2
y � �
2. How are the lines in each set in step 1 related geometrically? How are the equations related?
3. Graph each pair of lines on the same grid. Use the same scale on both axes. If you are using a graphing calculator, press z and select 5:ZSquare.
a) y � 2x � 3 b) y � � c) y � �x � 1
y � � y � y � x � 3
4. How are the lines in each set in step 3 related geometrically? How are the equations related?
5. Reflect
a) How can you tell whether lines are parallel from their equations?
b) How can you tell whether lines are perpendicular from theirequations?
32
x � 412
x � 1
23
x � 3
12
x � 1
12
x � 2
12
x � 4
appear all the time inthe world around you.Think of streets,wallpaper, railwaytracks, and skyscrapers.Look around yourclassroom. Where canyou see examples of• parallel lines?• perpendicular lines?
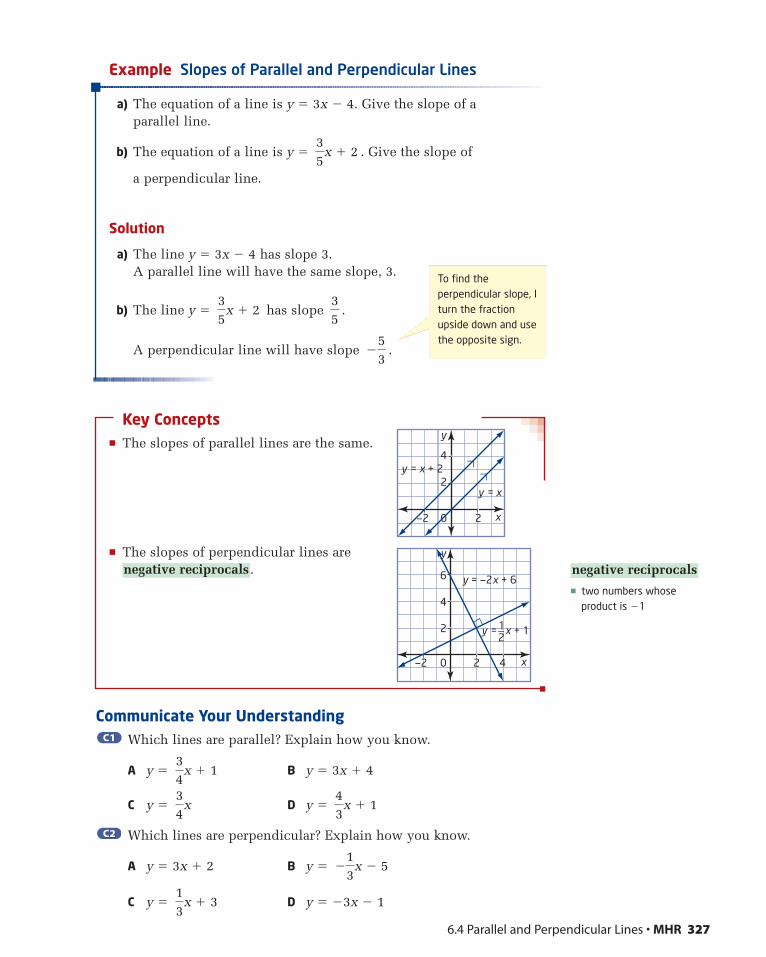
Example Slopes of Parallel and Perpendicular Lines
a) The equation of a line is y � 3x � 4. Give the slope of aparallel line.
b) The equation of a line is y � . Give the slope of
a perpendicular line.
Solution
a) The line y � 3x � 4 has slope 3.A parallel line will have the same slope, 3.
b) The line y � has slope .
A perpendicular line will have slope .
Key Concepts� The slopes of parallel lines are the same.
� The slopes of perpendicular lines are.
Communicate Your UnderstandingWhich lines are parallel? Explain how you know.
A y � B y � 3x � 4
C y � D y �
Which lines are perpendicular? Explain how you know.
A y � 3x � 2 B y �
C y � D y � �3x � 113
x � 3
�13
x � 5
C2C2
43
x � 134
x
34
x � 1
C1C1
negative reciprocals
�53
35
35
x � 2
35
x � 2
6.4 Parallel and Perpendicular Lines • MHR 327
To find theperpendicular slope, Iturn the fractionupside down and usethe opposite sign.
x
y = x
y = x + 22
4
0—2 2
y
� two numbers whoseproduct is �1
negative reciprocals
x
y = —2x + 6
2
4
6
0—2 2 4
y
y = x + 11_2

Practise1. Graph each pair of lines on the same coordinate grid. Find their slopes
and conclude whether the lines are parallel, perpendicular, or neither.
a) y � y �
b) y � 2x � 5 4x � 2y � 6 � 0
c) x � y � 4 y � x � 3
d) y � x � 2y � 1 � 0
2. Graph each pair of lines on the same coordinate grid. Find their slopesand conclude whether the lines are parallel, perpendicular, or neither.
a) y � 3 x � �2 b) y � �4 y � x
c) x � 5 x � 0 d) y � x � 1 y � �x
Connect and Apply3. The slopes of two lines are given. Conclude whether the lines are
parallel, perpendicular, or neither. Justify your answers.
a) m � , m � b) m � , m �
c) m � 2, m � �2 d) m � 1, m � �1
e) m � , m � 0.2 f) m � , m �
For help with questions 4 and 5, see the Example.
4. What is the slope of a line that is parallel to each line?
a) y � b) y � �x � 7
c) 2x � y � 3 � 0 d) 4x � 3y � 12
e) y � 2 f) x � �5
5. For each line in question 4, give the slope of a perpendicular line.
6. Write the equations of two lines that are parallel to the line 3x � 6y � 5 � 0.
7. Write the equations of two lines that are perpendicular to the line 4x � y � 2 � 0.
8. A triangle has vertices A(1, 2), B(3, 8), and C(6, 7).
a) Plot these points and draw the triangle.
b) Does this appear to be a right triangle? Explain.
c) Find the slopes of the line segments that form this triangle.
d) Explain how the slopes can be used to conclude whether or not this is a right triangle. Is it?
35
x � 2
�49
214
15
�43
34
46
23
12
x � 4
14
x � 314
x � 2
328 MHR • Chapter 6
9. Determine whether or not the following sets of points form righttriangles. Justify your answers with mathematical reasoning.
a) A(1, 1), B(�2, 5), C(3, �2)
b) P(2, 4), Q(�2, 2), R(5, �2)
10. �KLM has vertices K(�2, 3) and L(�6, �2).
a) Find the coordinates of M such that �KLM is a right triangle.
b) Is there more than one solution? Explain.
Achievement Check
11. a) Using intercepts, graph the three lines 4x � y � 8 � 0, 2x � y � 4 � 0, and x � 2y � 16 � 0 on the same coordinate grid.
b) The three lines form a triangle. Does this triangle appear to be aright triangle?
c) Using slopes, explain how you can be sure of your conclusion inpart b).
d) Give the equations for three different lines that do form a righttriangle.
Extend12. a) Graph this pair of lines and identify their x- and y-intercepts.
2x � 5y � 10 2x � 5y � �10
b) Repeat part a) for this pair of lines.
3x � 4y � 12 3x � 4y � �12
c) Describe how you can use intercepts to quickly find a line that is parallel to a given line. Create an example of your own tosupport your explanation.
13. a) Graph this pair of lines and identify their x- and y-intercepts.
3x � 5y � 15 5x � 3y � �15
b) Repeat part a) for this pair of lines.
2x � 7y � 14 7x � 2y � �14
c) Describe how you can use intercepts to quickly find a line that is perpendicular to a given line. Create an example of your own to support your explanation.
14. Math Contest A and k are one-digit numbers. Given two lines, Ax � 3y � 15 � 0 and y � kx � 7, determine the number of pairs of values for A and k for which the two lines are
a) parallel
b) perpendicular
c) coincident (the same line)
6.4 Parallel and Perpendicular Lines • MHR 329
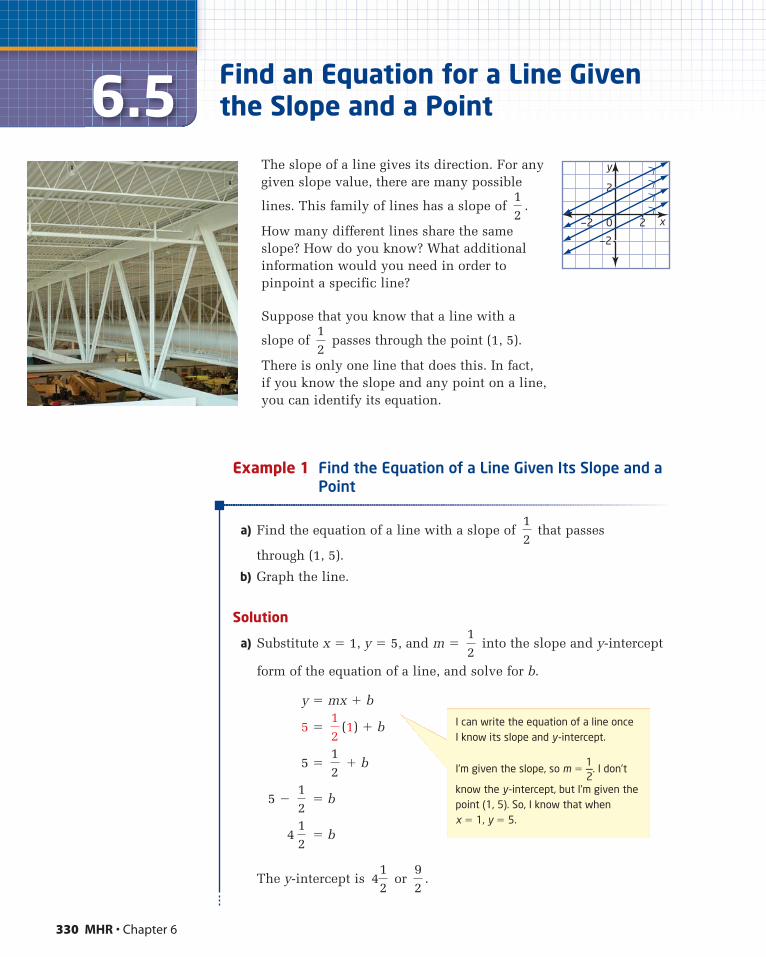
Example 1 Find the Equation of a Line Given Its Slope and aPoint
a) Find the equation of a line with a slope of that passes
through (1, 5).
b) Graph the line.
Solution
a) Substitute x � 1, y � 5, and m � into the slope and y-intercept
form of the equation of a line, and solve for b.
y � mx � b
5 � (1) � b
5 � � b
5 � � b
4 � b
The y-intercept is or .92
412
12
12
12
12
12
12
330 MHR • Chapter 6
6.5 Find an Equation for a Line Giventhe Slope and a Point
The slope of a line gives its direction. For anygiven slope value, there are many possible
lines. This family of lines has a slope of .
How many different lines share the sameslope? How do you know? What additionalinformation would you need in order topinpoint a specific line?
Suppose that you know that a line with a
slope of passes through the point (1, 5).
There is only one line that does this. In fact, if you know the slope and any point on a line,you can identify its equation.
12
12
y
x
2
—2
0—2 2
I can write the equation of a line once I know its slope and y-intercept.
I’m given the slope, so m �1—2
. I don’t
know the y-intercept, but I’m given thepoint (1, 5). So, I know that when x � 1, y � 5.
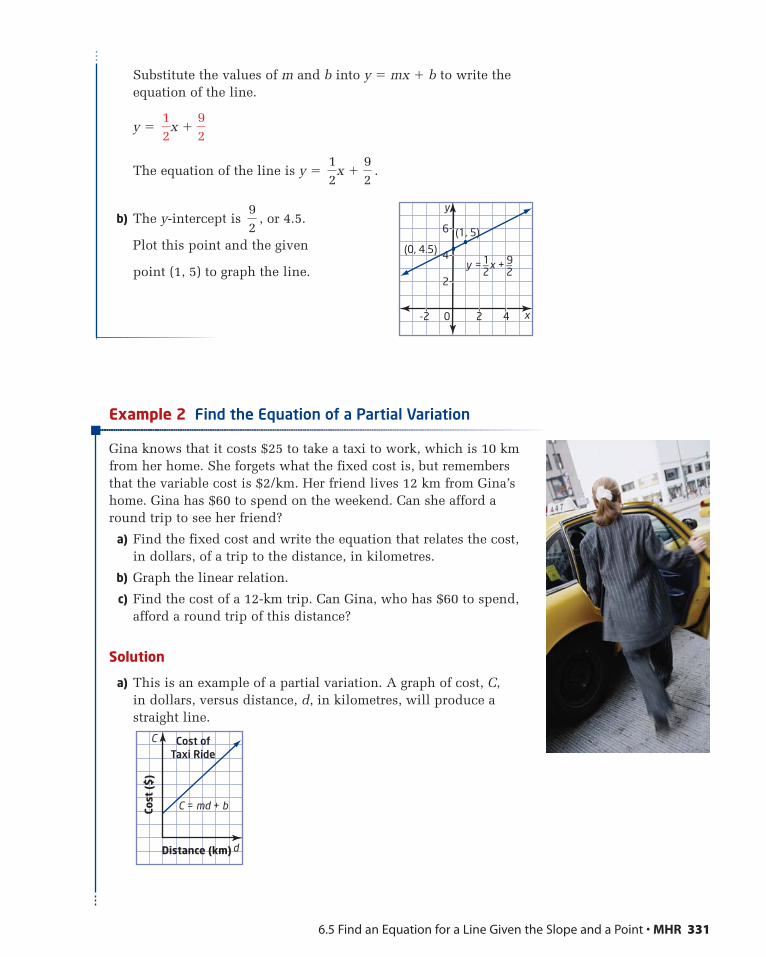
Substitute the values of m and b into y � mx � b to write theequation of the line.
y �
The equation of the line is y � .
b) The y-intercept is , or 4.5.
Plot this point and the given
point (1, 5) to graph the line.
Example 2 Find the Equation of a Partial Variation
Gina knows that it costs $25 to take a taxi to work, which is 10 kmfrom her home. She forgets what the fixed cost is, but remembersthat the variable cost is $2/km. Her friend lives 12 km from Gina’shome. Gina has $60 to spend on the weekend. Can she afford around trip to see her friend?
a) Find the fixed cost and write the equation that relates the cost,in dollars, of a trip to the distance, in kilometres.
b) Graph the linear relation.
c) Find the cost of a 12-km trip. Can Gina, who has $60 to spend,afford a round trip of this distance?
Solution
a) This is an example of a partial variation. A graph of cost, C, in dollars, versus distance, d, in kilometres, will produce astraight line.
92
12
x �92
12
x �92
6.5 Find an Equation for a Line Given the Slope and a Point • MHR 331
C
C = md + b
dDistance (km)
Cost
($
)
Cost ofTaxi Ride
x
(0, 4.5)
(1, 5)
2
4
6
0-2 2 4
y
y = x +1_2
9_2
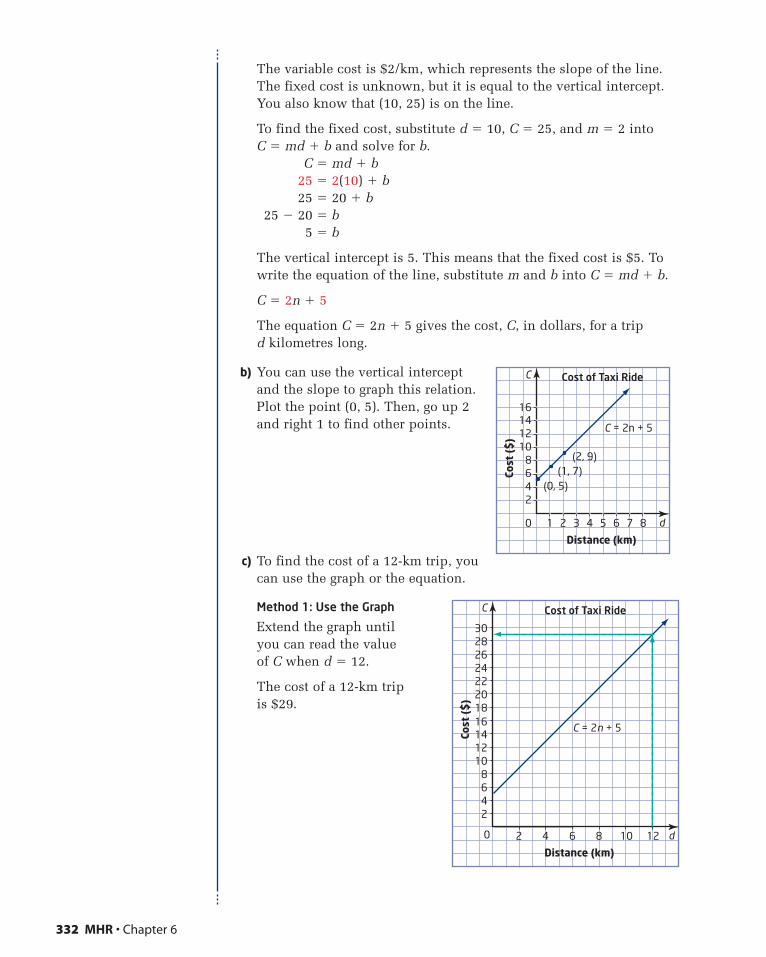
The variable cost is $2/km, which represents the slope of the line.The fixed cost is unknown, but it is equal to the vertical intercept.You also know that (10, 25) is on the line.
To find the fixed cost, substitute d � 10, C � 25, and m � 2 into C � md � b and solve for b.
C � md � b25 � 2(10) � b25 � 20 � b
25 � 20 � b5 � b
The vertical intercept is 5. This means that the fixed cost is $5. Towrite the equation of the line, substitute m and b into C � md � b.
C � 2n � 5
The equation C � 2n � 5 gives the cost, C, in dollars, for a trip d kilometres long.
b) You can use the vertical interceptand the slope to graph this relation.Plot the point (0, 5). Then, go up 2and right 1 to find other points.
c) To find the cost of a 12-km trip, you can use the graph or the equation.
Method 1: Use the Graph
Extend the graph until you can read the value of C when d � 12.
The cost of a 12-km trip is $29.
332 MHR • Chapter 6
C
d0 1
Distance (km)
2 3 4 5 6 7 8
2468
10121416
Cost
($
)
(0, 5)(1, 7)
(2, 9)
C = 2n + 5
Cost of Taxi Ride
C
d0
Distance (km)
2 4 6 8 10 12
2468
1012141618202224262830
Cost
($
)
Cost of Taxi Ride
C = 2n + 5
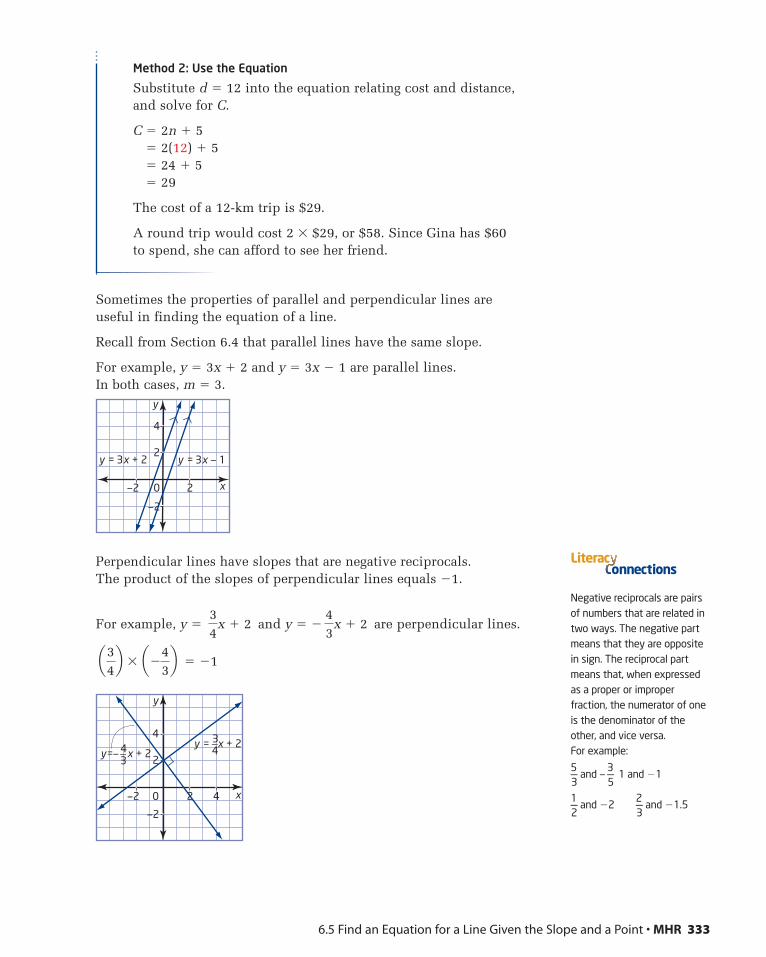
Method 2: Use the Equation
Substitute d � 12 into the equation relating cost and distance, and solve for C.
C � 2n � 5� 2(12) � 5� 24 � 5� 29
The cost of a 12-km trip is $29.
A round trip would cost 2 � $29, or $58. Since Gina has $60 to spend, she can afford to see her friend.
Sometimes the properties of parallel and perpendicular lines are useful in finding the equation of a line.
Recall from Section 6.4 that parallel lines have the same slope.
For example, y � 3x � 2 and y � 3x � 1 are parallel lines. In both cases, m � 3.
Perpendicular lines have slopes that are negative reciprocals. The product of the slopes of perpendicular lines equals �1.
For example, y � and y � � are perpendicular lines.
� �1a34b � a�4
3b
43
x � 234
x � 2
6.5 Find an Equation for a Line Given the Slope and a Point • MHR 333
x
2
4
—2
0—2 2
y
y = 3x + 2 y = 3x — 1
x
2
4
—2
0—2 2 4
y
y = x + 23_4y=— x + 24_
3
Negative reciprocals are pairsof numbers that are related intwo ways. The negative partmeans that they are oppositein sign. The reciprocal partmeans that, when expressedas a proper or improperfraction, the numerator of oneis the denominator of theother, and vice versa.For example:
5—3
and —3—5
1 and �1
1—2
and �22—3
and �1.5
onnectionsLiterac
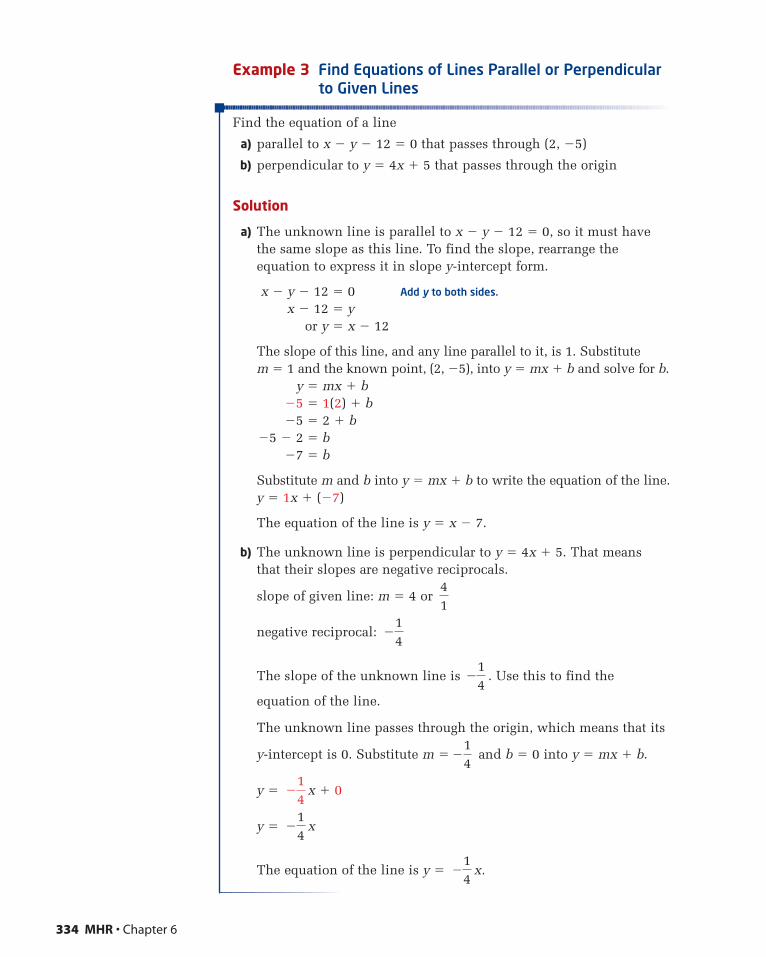
Example 3 Find Equations of Lines Parallel or Perpendicularto Given Lines
Find the equation of a line
a) parallel to x � y � 12 � 0 that passes through (2, �5)
b) perpendicular to y � 4x � 5 that passes through the origin
Solution
a) The unknown line is parallel to x � y � 12 � 0, so it must havethe same slope as this line. To find the slope, rearrange theequation to express it in slope y-intercept form.
x � y � 12 � 0 Add y to both sides.
x � 12 � yor y � x � 12
The slope of this line, and any line parallel to it, is 1. Substitute m � 1 and the known point, (2, �5), into y � mx � b and solve for b.
y � mx � b�5 � 1(2) � b�5 � 2 � b
�5 � 2 � b�7 � b
Substitute m and b into y � mx � b to write the equation of the line.y � 1x � (�7)
The equation of the line is y � x � 7.
b) The unknown line is perpendicular to y � 4x � 5. That means that their slopes are negative reciprocals.
slope of given line: m � 4 or
negative reciprocal:
The slope of the unknown line is . Use this to find the
equation of the line.
The unknown line passes through the origin, which means that its
y-intercept is 0. Substitute m � and b � 0 into y � mx � b.
y � x � 0
y � x
The equation of the line is y � x.�14
�14
�14
�14
�14
�14
41
334 MHR • Chapter 6
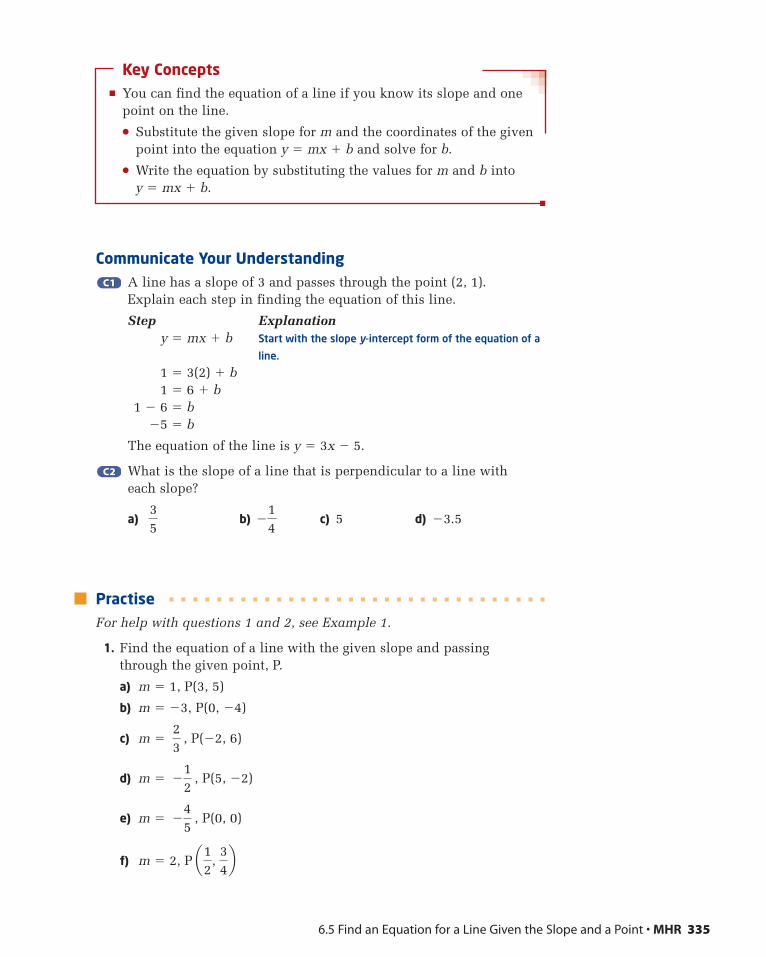
Key Concepts� You can find the equation of a line if you know its slope and one
point on the line.
� Substitute the given slope for m and the coordinates of the givenpoint into the equation y � mx � b and solve for b.
� Write the equation by substituting the values for m and b into y � mx � b.
Communicate Your UnderstandingA line has a slope of 3 and passes through the point (2, 1). Explain each step in finding the equation of this line.
Step Explanationy � mx � b Start with the slope y-intercept form of the equation of a
line.
1 � 3(2) � b1 � 6 � b
1 � 6 � b�5 � b
The equation of the line is y � 3x � 5.
What is the slope of a line that is perpendicular to a line with each slope?
a) b) c) 5 d) �3.5
PractiseFor help with questions 1 and 2, see Example 1.
1. Find the equation of a line with the given slope and passing through the given point, P.
a) m � 1, P(3, 5)
b) m � �3, P(0, �4)
c) m � , P(�2, 6)
d) m � , P(5, �2)
e) m � , P(0, 0)
f) m � 2, P a12
, 34b
�45
�12
23
�14
35
C2C2
C1C1
6.5 Find an Equation for a Line Given the Slope and a Point • MHR 335
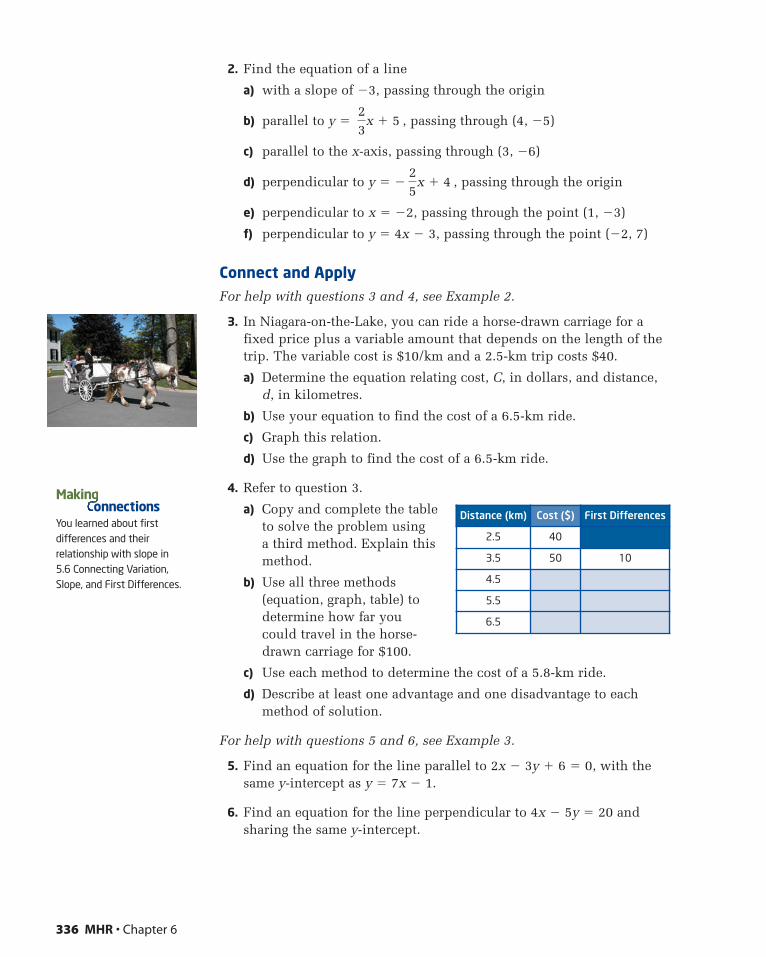
2. Find the equation of a line
a) with a slope of �3, passing through the origin
b) parallel to y � , passing through (4, �5)
c) parallel to the x-axis, passing through (3, �6)
d) perpendicular to y � � , passing through the origin
e) perpendicular to x � �2, passing through the point (1, �3)
f) perpendicular to y � 4x � 3, passing through the point (�2, 7)
Connect and ApplyFor help with questions 3 and 4, see Example 2.
3. In Niagara-on-the-Lake, you can ride a horse-drawn carriage for afixed price plus a variable amount that depends on the length of thetrip. The variable cost is $10/km and a 2.5-km trip costs $40.
a) Determine the equation relating cost, C, in dollars, and distance,d, in kilometres.
b) Use your equation to find the cost of a 6.5-km ride.
c) Graph this relation.
d) Use the graph to find the cost of a 6.5-km ride.
4. Refer to question 3.
a) Copy and complete the tableto solve the problem using a third method. Explain thismethod.
b) Use all three methods(equation, graph, table) todetermine how far youcould travel in the horse-drawn carriage for $100.
c) Use each method to determine the cost of a 5.8-km ride.
d) Describe at least one advantage and one disadvantage to eachmethod of solution.
For help with questions 5 and 6, see Example 3.
5. Find an equation for the line parallel to 2x � 3y � 6 � 0, with thesame y-intercept as y � 7x � 1.
6. Find an equation for the line perpendicular to 4x � 5y � 20 andsharing the same y-intercept.
25
x � 4
23
x � 5
Distance (km) Cost ($) First Differences
2.5 40
3.5 50 10
4.5
5.5
6.5
336 MHR • Chapter 6
You learned about firstdifferences and theirrelationship with slope in 5.6 Connecting Variation,Slope, and First Differences.
Makinonnections
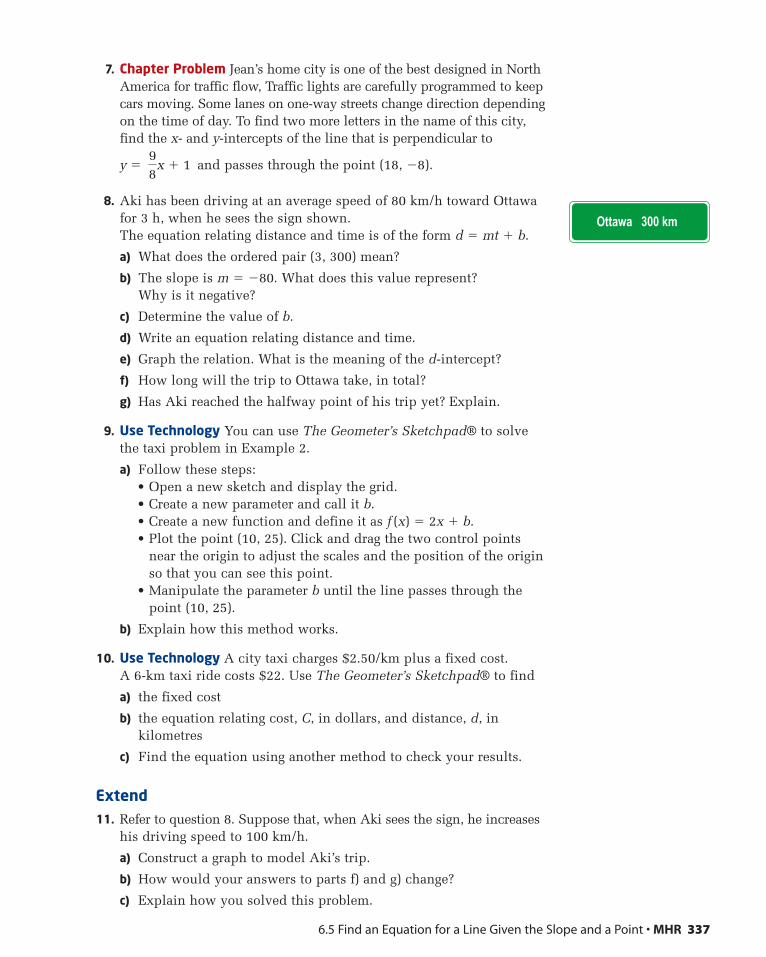
7. Chapter Problem Jean’s home city is one of the best designed in NorthAmerica for traffic flow, Traffic lights are carefully programmed to keepcars moving. Some lanes on one-way streets change direction dependingon the time of day. To find two more letters in the name of this city,find the x- and y-intercepts of the line that is perpendicular to
y � and passes through the point (18, �8).
8. Aki has been driving at an average speed of 80 km/h toward Ottawafor 3 h, when he sees the sign shown.The equation relating distance and time is of the form d � mt � b.
a) What does the ordered pair (3, 300) mean?
b) The slope is m � �80. What does this value represent? Why is it negative?
c) Determine the value of b.
d) Write an equation relating distance and time.
e) Graph the relation. What is the meaning of the d-intercept?
f) How long will the trip to Ottawa take, in total?
g) Has Aki reached the halfway point of his trip yet? Explain.
9. Use Technology You can use The Geometer’s Sketchpad® to solvethe taxi problem in Example 2.
a) Follow these steps:• Open a new sketch and display the grid.• Create a new parameter and call it b.• Create a new function and define it as f (x) � 2x � b.• Plot the point (10, 25). Click and drag the two control points
near the origin to adjust the scales and the position of the originso that you can see this point.
• Manipulate the parameter b until the line passes through thepoint (10, 25).
b) Explain how this method works.
10. Use Technology A city taxi charges $2.50/km plus a fixed cost. A 6-km taxi ride costs $22. Use The Geometer’s Sketchpad® to find
a) the fixed cost
b) the equation relating cost, C, in dollars, and distance, d, inkilometres
c) Find the equation using another method to check your results.
Extend11. Refer to question 8. Suppose that, when Aki sees the sign, he increases
his driving speed to 100 km/h.
a) Construct a graph to model Aki’s trip.
b) How would your answers to parts f) and g) change?
c) Explain how you solved this problem.
98
x � 1
6.5 Find an Equation for a Line Given the Slope and a Point • MHR 337
Ottawa 300 km
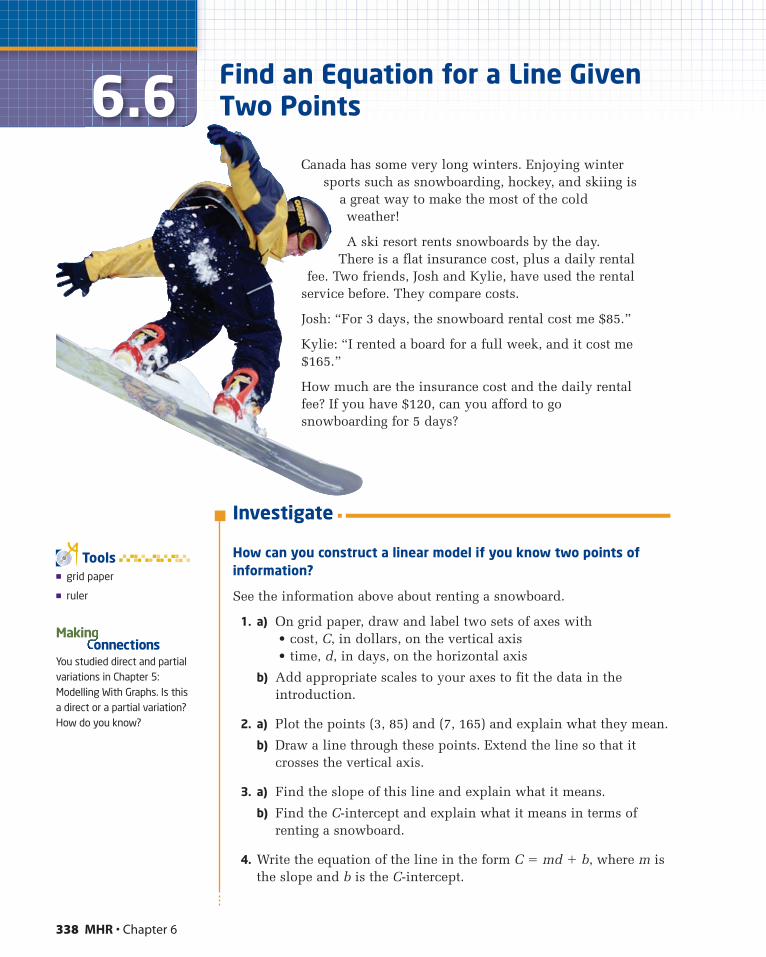
338 MHR • Chapter 6
6.6Canada has some very long winters. Enjoying winter
sports such as snowboarding, hockey, and skiing isa great way to make the most of the coldweather!
A ski resort rents snowboards by the day.There is a flat insurance cost, plus a daily rental
fee. Two friends, Josh and Kylie, have used the rentalservice before. They compare costs.
Josh: “For 3 days, the snowboard rental cost me $85.”
Kylie: “I rented a board for a full week, and it cost me$165.”
How much are the insurance cost and the daily rentalfee? If you have $120, can you afford to gosnowboarding for 5 days?
You studied direct and partialvariations in Chapter 5:Modelling With Graphs. Is thisa direct or a partial variation?How do you know?
Makinonnections
� grid paper
� ruler
Tools
Investigate
How can you construct a linear model if you know two points ofinformation?
See the information above about renting a snowboard.
1. a) On grid paper, draw and label two sets of axes with• cost, C, in dollars, on the vertical axis• time, d, in days, on the horizontal axis
b) Add appropriate scales to your axes to fit the data in theintroduction.
2. a) Plot the points (3, 85) and (7, 165) and explain what they mean.
b) Draw a line through these points. Extend the line so that itcrosses the vertical axis.
3. a) Find the slope of this line and explain what it means.
b) Find the C-intercept and explain what it means in terms ofrenting a snowboard.
4. Write the equation of the line in the form C � md � b, where m isthe slope and b is the C-intercept.
Find an Equation for a Line GivenTwo Points
5. a) Use the graph to find the cost of renting a snowboard for 5 days.
b) Use your equation from step 4 to find the cost of renting asnowboard for 5 days.
c) Are these answers the same? Explain.
6. Reflect Is it possible to find an equation for this line withoutgraphing it? Explain.
Linear models can be useful for making predictions in many situationsinvolving direct and partial variation. If you know two points ofinformation, you can find an equation for the line.
Step 1. Find the slope. Substitute the two known points into the slope
formula: m � .
Step 2. Find the y-intercept. Substitute the slope and one of the twopoints into y � mx � b. Solve for b.
Step 3. Write the equation. Substitute the slope and y-intercept into y � mx � b.
Example Find an Equation for a Line, Given Two Points
a) A line passes through (1, 2) and (5, 10). Find an equation forthe line.
b) A line passes through (�3, �2) and (6, �8). Find an equation for the line.
Solution
a) Step 1. Find the slope.
Substitute (1, 2) and (5, 10) into the slope formula: m � .
m �
� or 2
The slope is 2.
Step 2. Find the y-intercept.
Substitute m � 2 and one of the points, say (1, 2), into y � mx � b.2 � 2(1) � b2 � 2 � b0 � b
The y-intercept is 0.
84
10 � 25 � 1
y2 � y1
x2 � x1
y2 � y1
x2 � x1
6.6 Find an Equation for a Line Given Two Points • MHR 339
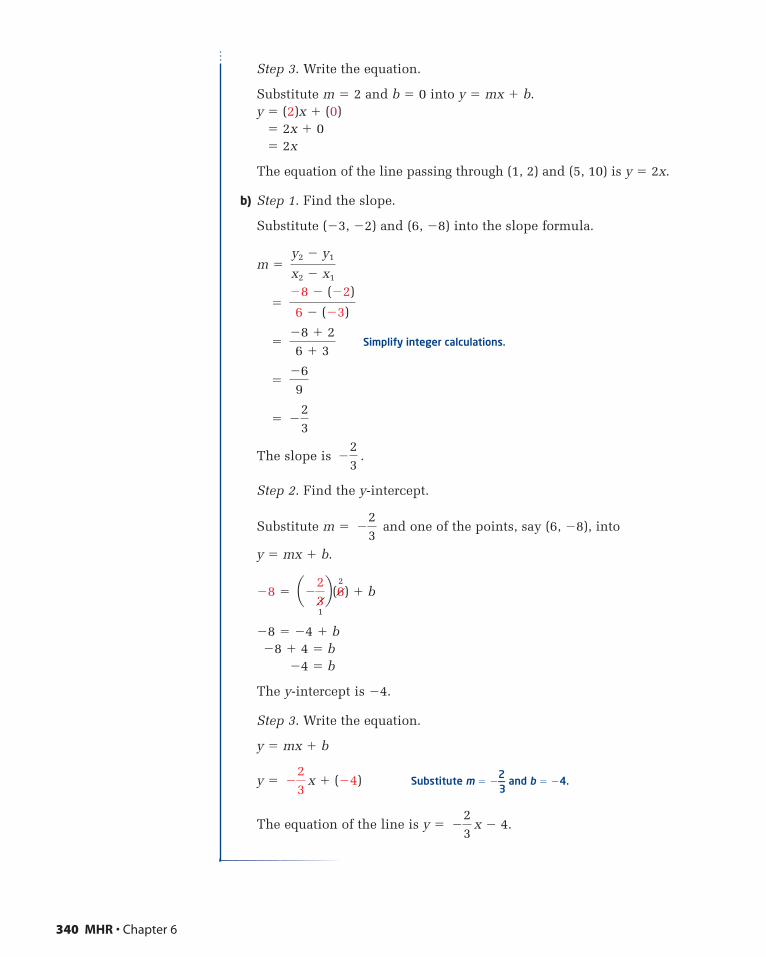
Step 3. Write the equation.
Substitute m � 2 and b � 0 into y � mx � b.y � (2)x � (0)
� 2x � 0� 2x
The equation of the line passing through (1, 2) and (5, 10) is y � 2x.
b) Step 1. Find the slope.
Substitute (�3, �2) and (6, �8) into the slope formula.
m �
�
� Simplify integer calculations.
�
�
The slope is .
Step 2. Find the y-intercept.
Substitute m � and one of the points, say (6, �8), into
y � mx � b.
�8 �
�8 � �4 � b�8 � 4 � b
�4 � b
The y-intercept is �4.
Step 3. Write the equation.
y � mx � b
y � x � (�4) Substitute m � �2—3
and b � �4.
The equation of the line is y � x � 4.�23
�23
a�231
b(62) � b
�23
�23
�23
�69
�8 � 26 � 3
�8 � (�2)
6 � (�3)
y2 � y1
x2 � x1
340 MHR • Chapter 6
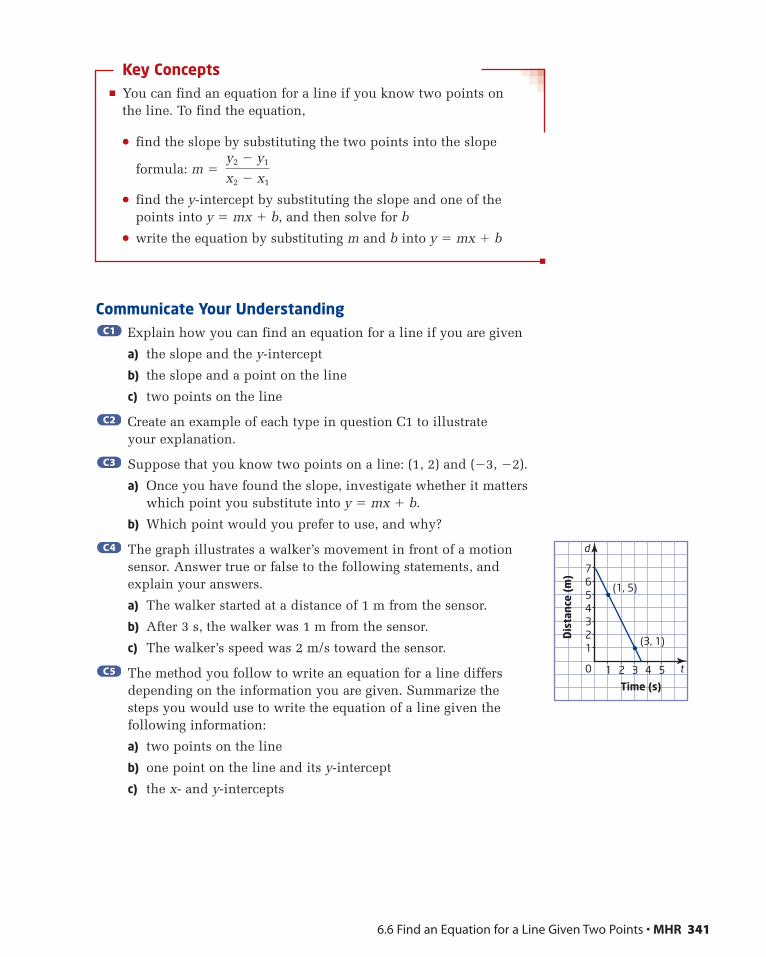
Key Concepts� You can find an equation for a line if you know two points on
the line. To find the equation,
� find the slope by substituting the two points into the slope
formula: m �
� find the y-intercept by substituting the slope and one of the points into y � mx � b, and then solve for b
� write the equation by substituting m and b into y � mx � b
Communicate Your UnderstandingExplain how you can find an equation for a line if you are given
a) the slope and the y-intercept
b) the slope and a point on the line
c) two points on the line
Create an example of each type in question C1 to illustrate your explanation.
Suppose that you know two points on a line: (1, 2) and (�3, �2).
a) Once you have found the slope, investigate whether it matterswhich point you substitute into y � mx � b.
b) Which point would you prefer to use, and why?
The graph illustrates a walker’s movement in front of a motionsensor. Answer true or false to the following statements, andexplain your answers.
a) The walker started at a distance of 1 m from the sensor.
b) After 3 s, the walker was 1 m from the sensor.
c) The walker’s speed was 2 m/s toward the sensor.
The method you follow to write an equation for a line differsdepending on the information you are given. Summarize the steps you would use to write the equation of a line given thefollowing information:
a) two points on the line
b) one point on the line and its y-intercept
c) the x- and y-intercepts
C5C5
C4C4
C3C3
C2C2
C1C1
y2 � y1
x2 � x1
6.6 Find an Equation for a Line Given Two Points • MHR 341
d
t0 1
Time (s)
2 3 4 5
1234567
Dis
tanc
e (m
)
(1, 5)
(3, 1)
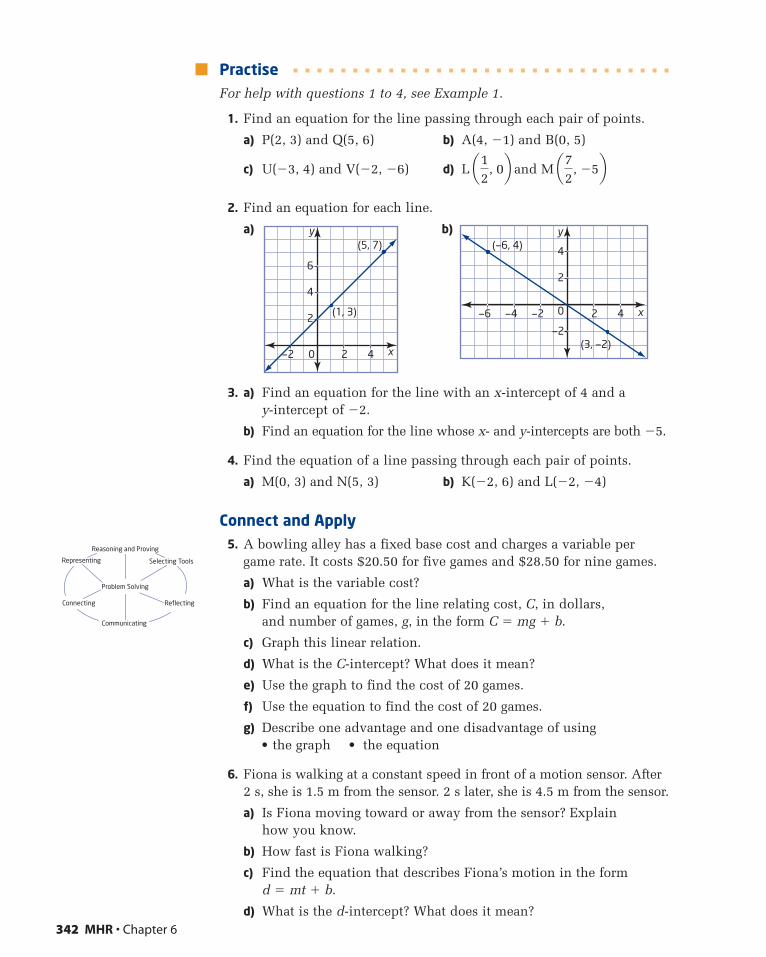
PractiseFor help with questions 1 to 4, see Example 1.
1. Find an equation for the line passing through each pair of points.
a) P(2, 3) and Q(5, 6) b) A(4, �1) and B(0, 5)
c) U(�3, 4) and V(�2, �6) d) L and M
2. Find an equation for each line.
a) b)
3. a) Find an equation for the line with an x-intercept of 4 and a y-intercept of �2.
b) Find an equation for the line whose x- and y-intercepts are both �5.
4. Find the equation of a line passing through each pair of points.
a) M(0, 3) and N(5, 3) b) K(�2, 6) and L(�2, �4)
Connect and Apply5. A bowling alley has a fixed base cost and charges a variable per
game rate. It costs $20.50 for five games and $28.50 for nine games.
a) What is the variable cost?
b) Find an equation for the line relating cost, C, in dollars, and number of games, g, in the form C � mg � b.
c) Graph this linear relation.
d) What is the C-intercept? What does it mean?
e) Use the graph to find the cost of 20 games.
f) Use the equation to find the cost of 20 games.
g) Describe one advantage and one disadvantage of using• the graph • the equation
6. Fiona is walking at a constant speed in front of a motion sensor. After2 s, she is 1.5 m from the sensor. 2 s later, she is 4.5 m from the sensor.
a) Is Fiona moving toward or away from the sensor? Explain how you know.
b) How fast is Fiona walking?
c) Find the equation that describes Fiona’s motion in the form d � mt � b.
d) What is the d-intercept? What does it mean?
x
2
4
—2
0—2—4—6 2 4
y
(3, —2)
(—6, 4)
x
2
4
6
0—2 2 4
y
(1, 3)
(5, 7)
a72
, �5ba12
, 0b
342 MHR • Chapter 6
Selecting ToolsRepresenting
Reasoning and Proving
Communicating
Connecting Reflecting
Problem Solving
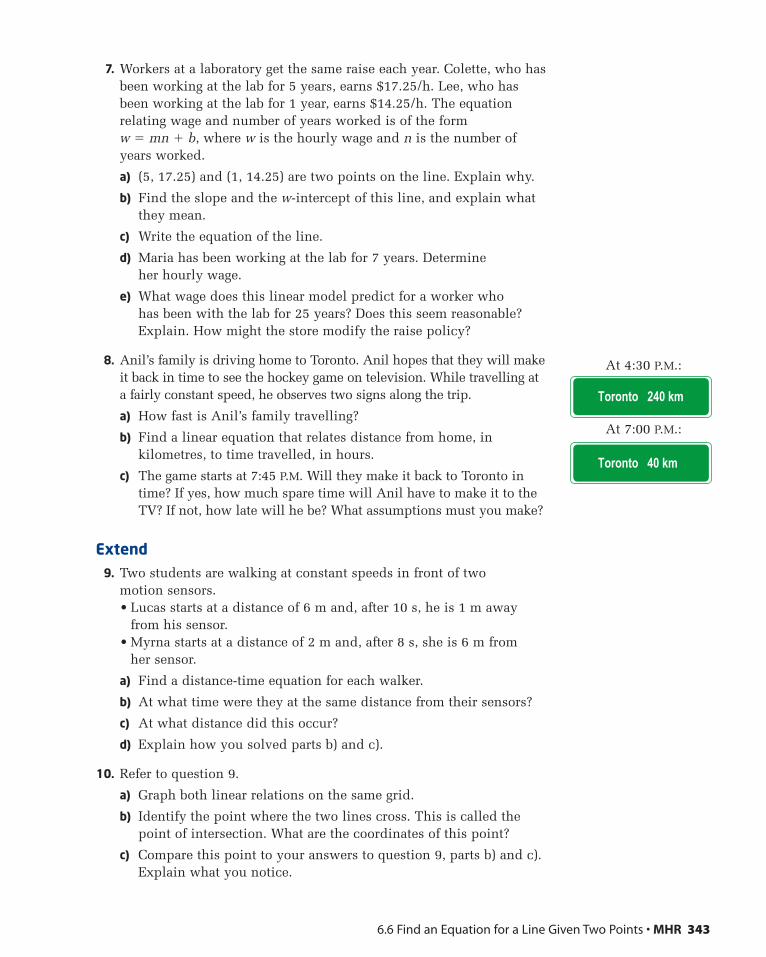
At 4:30 P.M.:
At 7:00 P.M.:
7. Workers at a laboratory get the same raise each year. Colette, who hasbeen working at the lab for 5 years, earns $17.25/h. Lee, who hasbeen working at the lab for 1 year, earns $14.25/h. The equationrelating wage and number of years worked is of the form w � mn � b, where w is the hourly wage and n is the number ofyears worked.
a) (5, 17.25) and (1, 14.25) are two points on the line. Explain why.
b) Find the slope and the w-intercept of this line, and explain whatthey mean.
c) Write the equation of the line.
d) Maria has been working at the lab for 7 years. Determine her hourly wage.
e) What wage does this linear model predict for a worker who has been with the lab for 25 years? Does this seem reasonable?Explain. How might the store modify the raise policy?
8. Anil’s family is driving home to Toronto. Anil hopes that they will makeit back in time to see the hockey game on television. While travelling ata fairly constant speed, he observes two signs along the trip.
a) How fast is Anil’s family travelling?
b) Find a linear equation that relates distance from home, inkilometres, to time travelled, in hours.
c) The game starts at 7:45 P.M. Will they make it back to Toronto intime? If yes, how much spare time will Anil have to make it to theTV? If not, how late will he be? What assumptions must you make?
Extend9. Two students are walking at constant speeds in front of two
motion sensors.• Lucas starts at a distance of 6 m and, after 10 s, he is 1 m away
from his sensor.• Myrna starts at a distance of 2 m and, after 8 s, she is 6 m from
her sensor.
a) Find a distance-time equation for each walker.
b) At what time were they at the same distance from their sensors?
c) At what distance did this occur?
d) Explain how you solved parts b) and c).
10. Refer to question 9.
a) Graph both linear relations on the same grid.
b) Identify the point where the two lines cross. This is called thepoint of intersection. What are the coordinates of this point?
c) Compare this point to your answers to question 9, parts b) and c).Explain what you notice.
6.6 Find an Equation for a Line Given Two Points • MHR 343
Toronto 240 km
Toronto 40 km
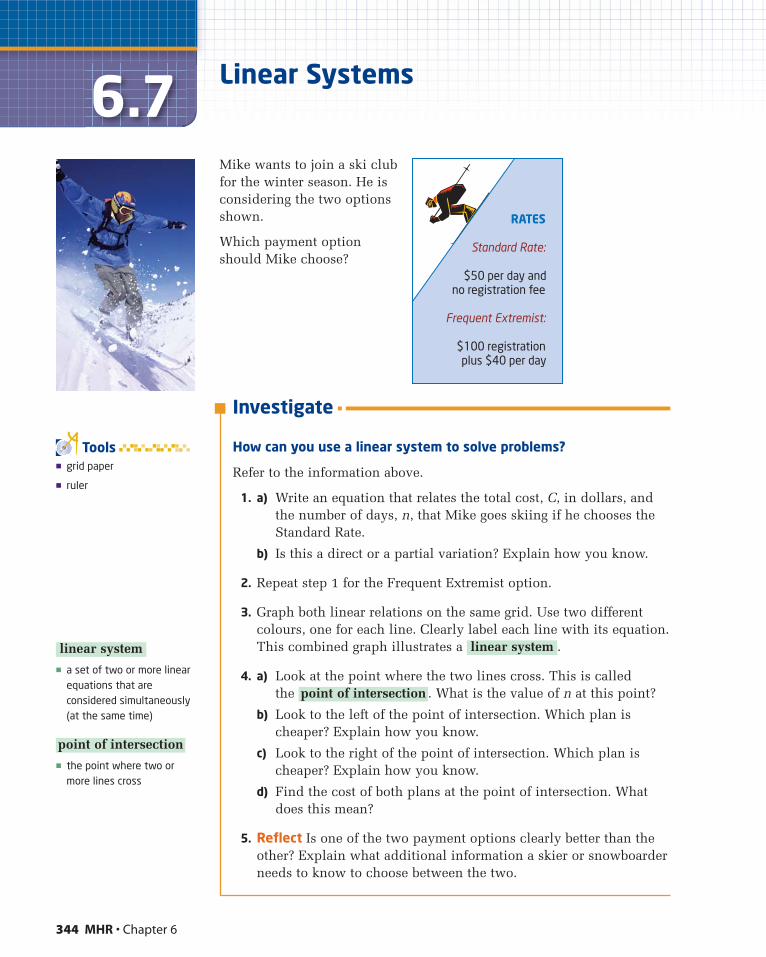
344 MHR • Chapter 6
6.7 Linear Systems
Mike wants to join a ski clubfor the winter season. He isconsidering the two optionsshown.
Which payment optionshould Mike choose?
� a set of two or more linearequations that areconsidered simultaneously(at the same time)
� the point where two ormore lines cross
point of intersection
linear system
� grid paper
� ruler
Tools
Investigate
How can you use a linear system to solve problems?
Refer to the information above.
1. a) Write an equation that relates the total cost, C, in dollars, andthe number of days, n, that Mike goes skiing if he chooses theStandard Rate.
b) Is this a direct or a partial variation? Explain how you know.
2. Repeat step 1 for the Frequent Extremist option.
3. Graph both linear relations on the same grid. Use two differentcolours, one for each line. Clearly label each line with its equation.This combined graph illustrates a .
4. a) Look at the point where the two lines cross. This is called the . What is the value of n at this point?
b) Look to the left of the point of intersection. Which plan ischeaper? Explain how you know.
c) Look to the right of the point of intersection. Which plan ischeaper? Explain how you know.
d) Find the cost of both plans at the point of intersection. Whatdoes this mean?
5. Reflect Is one of the two payment options clearly better than theother? Explain what additional information a skier or snowboarderneeds to know to choose between the two.
point of intersection
linear system
RATES
Standard Rate:
$50 per day andno registration fee
Frequent Extremist:
$100 registrationplus $40 per day
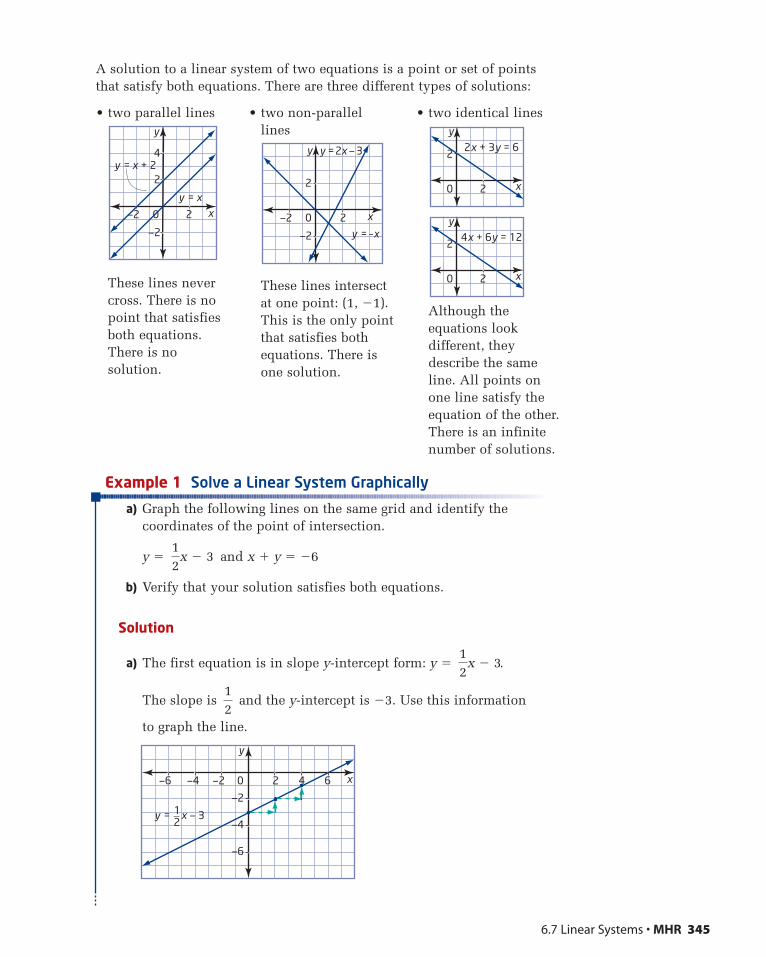
A solution to a linear system of two equations is a point or set of pointsthat satisfy both equations. There are three different types of solutions:
6.7 Linear Systems • MHR 345
• two parallel lines
These lines nevercross. There is nopoint that satisfiesboth equations. There is nosolution.
xy = x
y = x + 22
4
—2
0—2 2
y
• two non-parallellines
These lines intersect at one point: (1, �1).This is the only pointthat satisfies bothequations. There is one solution.
x
y = –x
2
—2
0—2 2
y y = 2x — 3
• two identical lines
Although theequations lookdifferent, theydescribe the sameline. All points onone line satisfy theequation of the other.There is an infinitenumber of solutions.
x
4x + 6y = 122
0 2
y
x
2x + 3y = 62
0 2
y
Example 1 Solve a Linear System Graphically
a) Graph the following lines on the same grid and identify thecoordinates of the point of intersection.
y � and x � y � �6
b) Verify that your solution satisfies both equations.
Solution
a) The first equation is in slope y-intercept form: y � .
The slope is and the y-intercept is �3. Use this information
to graph the line.
12
12
x � 3
12
x � 3
x
—2
—4
—6
0—2—4—6 2 4 6
y
y = x — 31_2
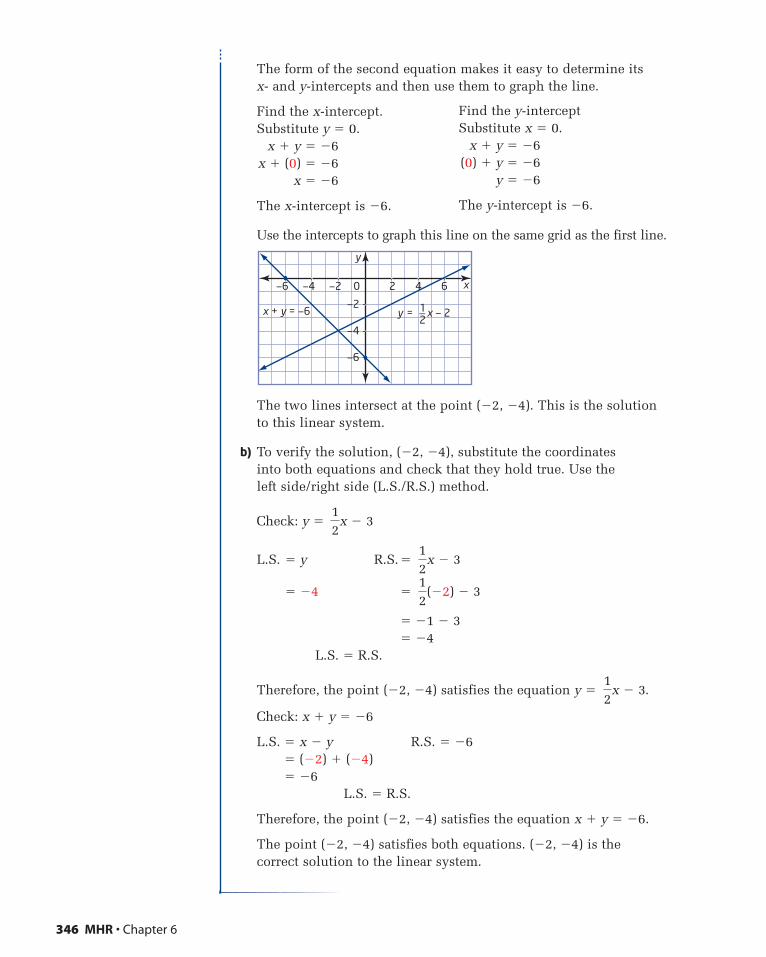
The form of the second equation makes it easy to determine its x- and y-intercepts and then use them to graph the line.
Find the x-intercept.Substitute y � 0.
x � y � �6x � (0) � �6
x � �6
The x-intercept is �6.
Use the intercepts to graph this line on the same grid as the first line.
The two lines intersect at the point (�2, �4). This is the solutionto this linear system.
b) To verify the solution, (�2, �4), substitute the coordinates into both equations and check that they hold true. Use the left side/right side (L.S./R.S.) method.
Check: y �
L.S. � y R.S. �
� �4 �
� �1 � 3� �4
L.S. � R.S.
Therefore, the point (�2, �4) satisfies the equation y � .
Check: x � y � �6
L.S. � x � y R.S. � �6� (�2) � (�4)� �6
L.S. � R.S.
Therefore, the point (�2, �4) satisfies the equation x � y � �6.
The point (�2, �4) satisfies both equations. (�2, �4) is the correct solution to the linear system.
12
x � 3
12
(�2) � 3
12
x � 3
12
x � 3
x
—2
—4
—6
0—2—4—6 2 4 6
y
x + y = —6 y = x — 21_2
346 MHR • Chapter 6
Find the y-interceptSubstitute x � 0.
x � y � �6(0) � y � �6
y � �6
The y-intercept is �6.
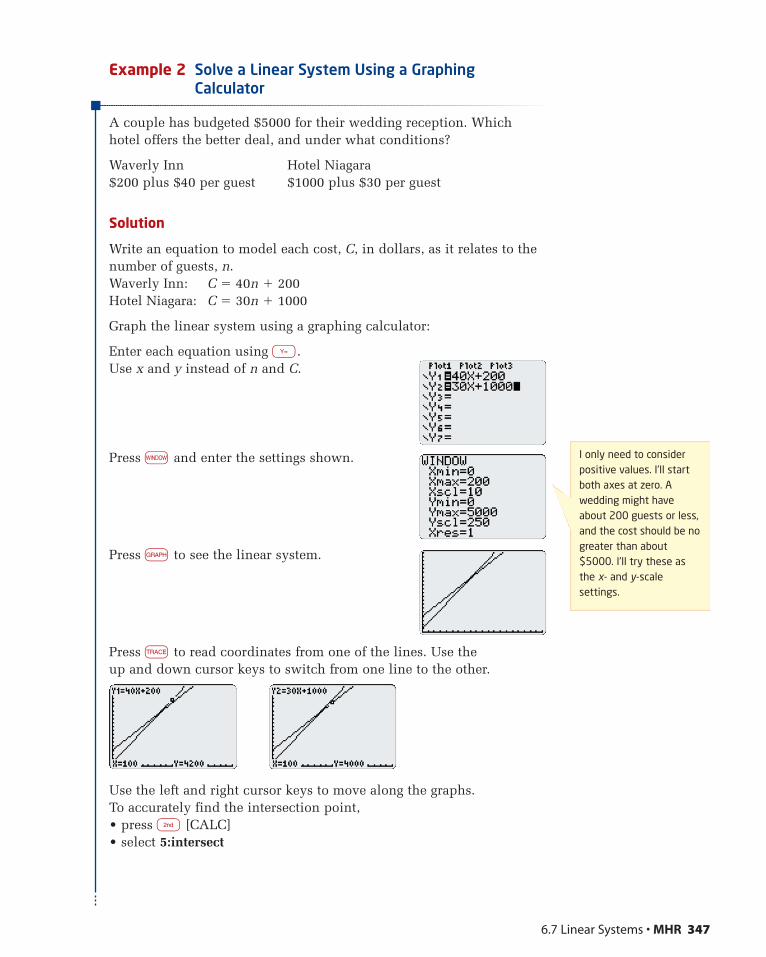
Example 2 Solve a Linear System Using a GraphingCalculator
A couple has budgeted $5000 for their wedding reception. Whichhotel offers the better deal, and under what conditions?
Waverly Inn Hotel Niagara$200 plus $40 per guest $1000 plus $30 per guest
Solution
Write an equation to model each cost, C, in dollars, as it relates to thenumber of guests, n.Waverly Inn: C � 40n � 200Hotel Niagara: C � 30n � 1000
Graph the linear system using a graphing calculator:
Enter each equation using y. Use x and y instead of n and C.
Press w and enter the settings shown.
Press g to see the linear system.
Press u to read coordinates from one of the lines. Use the up and down cursor keys to switch from one line to the other.
Use the left and right cursor keys to move along the graphs. To accurately find the intersection point,• press n [CALC]• select 5:intersect
6.7 Linear Systems • MHR 347
I only need to considerpositive values. I’ll startboth axes at zero. Awedding might haveabout 200 guests or less,and the cost should be nogreater than about$5000. I’ll try these asthe x- and y-scalesettings.
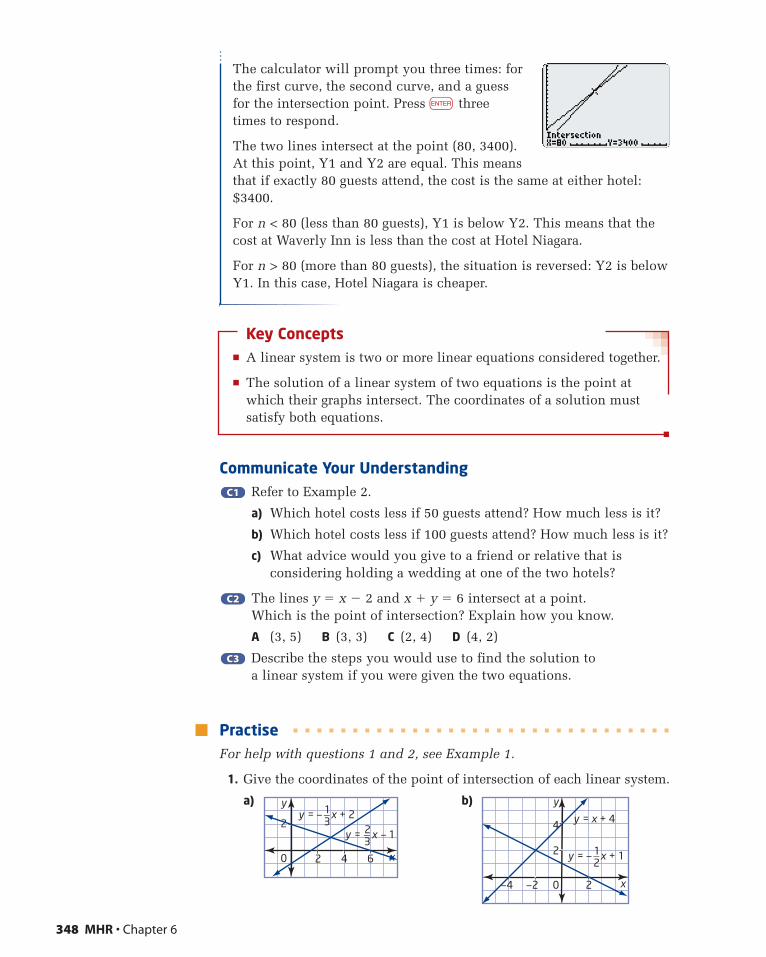
The calculator will prompt you three times: forthe first curve, the second curve, and a guessfor the intersection point. Press e threetimes to respond.
The two lines intersect at the point (80, 3400).At this point, Y1 and Y2 are equal. This meansthat if exactly 80 guests attend, the cost is the same at either hotel:$3400.
For n < 80 (less than 80 guests), Y1 is below Y2. This means that thecost at Waverly Inn is less than the cost at Hotel Niagara.
For n > 80 (more than 80 guests), the situation is reversed: Y2 is belowY1. In this case, Hotel Niagara is cheaper.
Key Concepts� A linear system is two or more linear equations considered together.
� The solution of a linear system of two equations is the point atwhich their graphs intersect. The coordinates of a solution mustsatisfy both equations.
Communicate Your UnderstandingRefer to Example 2.
a) Which hotel costs less if 50 guests attend? How much less is it?
b) Which hotel costs less if 100 guests attend? How much less is it?
c) What advice would you give to a friend or relative that isconsidering holding a wedding at one of the two hotels?
The lines y � x � 2 and x � y � 6 intersect at a point. Which is the point of intersection? Explain how you know.
A (3, 5) B (3, 3) C (2, 4) D (4, 2)
Describe the steps you would use to find the solution to a linear system if you were given the two equations.
PractiseFor help with questions 1 and 2, see Example 1.
1. Give the coordinates of the point of intersection of each linear system.
a) b)
x
2
4
0—2—4 2
y
y = — x + 11_2
y = x + 4
x
2
0 2 4 6
yy = — x + 21_
3y = x — 12_
3
C3C3
C2C2
C1C1
348 MHR • Chapter 6
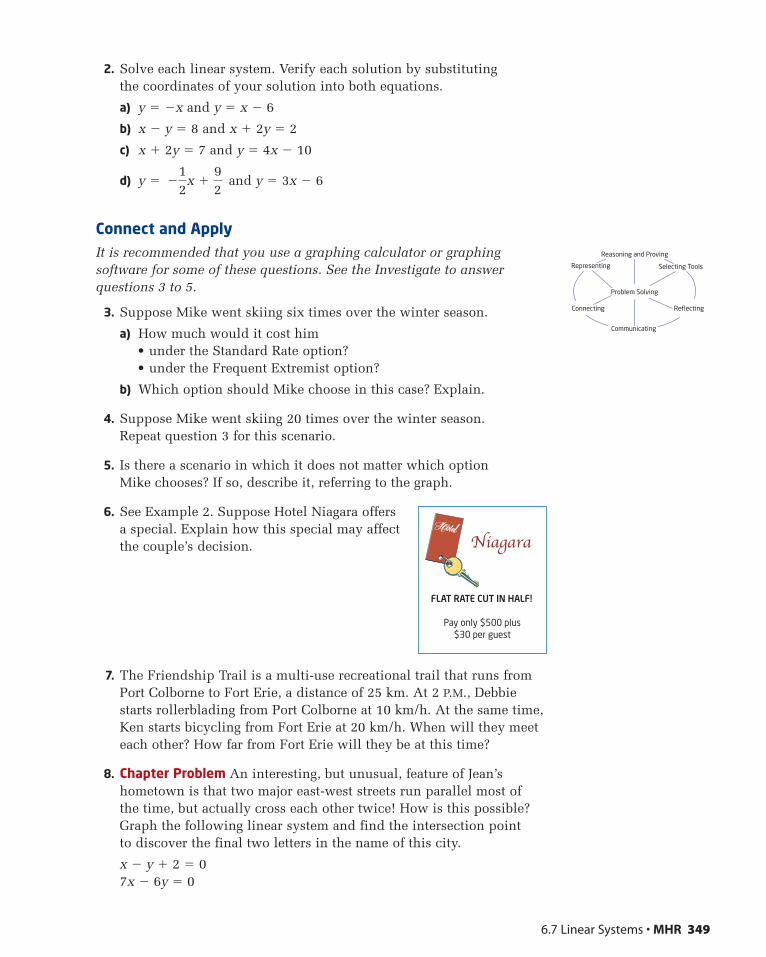
2. Solve each linear system. Verify each solution by substituting the coordinates of your solution into both equations.
a) y � �x and y � x � 6
b) x � y � 8 and x � 2y � 2
c) x � 2y � 7 and y � 4x � 10
d) y � and y � 3x � 6
Connect and ApplyIt is recommended that you use a graphing calculator or graphingsoftware for some of these questions. See the Investigate to answerquestions 3 to 5.
3. Suppose Mike went skiing six times over the winter season.
a) How much would it cost him• under the Standard Rate option?• under the Frequent Extremist option?
b) Which option should Mike choose in this case? Explain.
4. Suppose Mike went skiing 20 times over the winter season. Repeat question 3 for this scenario.
5. Is there a scenario in which it does not matter which option Mike chooses? If so, describe it, referring to the graph.
6. See Example 2. Suppose Hotel Niagara offersa special. Explain how this special may affectthe couple’s decision.
7. The Friendship Trail is a multi-use recreational trail that runs fromPort Colborne to Fort Erie, a distance of 25 km. At 2 P.M., Debbiestarts rollerblading from Port Colborne at 10 km/h. At the same time,Ken starts bicycling from Fort Erie at 20 km/h. When will they meeteach other? How far from Fort Erie will they be at this time?
8. Chapter Problem An interesting, but unusual, feature of Jean’shometown is that two major east-west streets run parallel most of the time, but actually cross each other twice! How is this possible?Graph the following linear system and find the intersection point to discover the final two letters in the name of this city.
x � y � 2 � 07x � 6y � 0
�12
x �92
6.7 Linear Systems • MHR 349
Selecting ToolsRepresenting
Reasoning and Proving
Communicating
Connecting Reflecting
Problem Solving
FLAT RATE CUT IN HALF!
Pay only $500 plus$30 per guest
Niagara
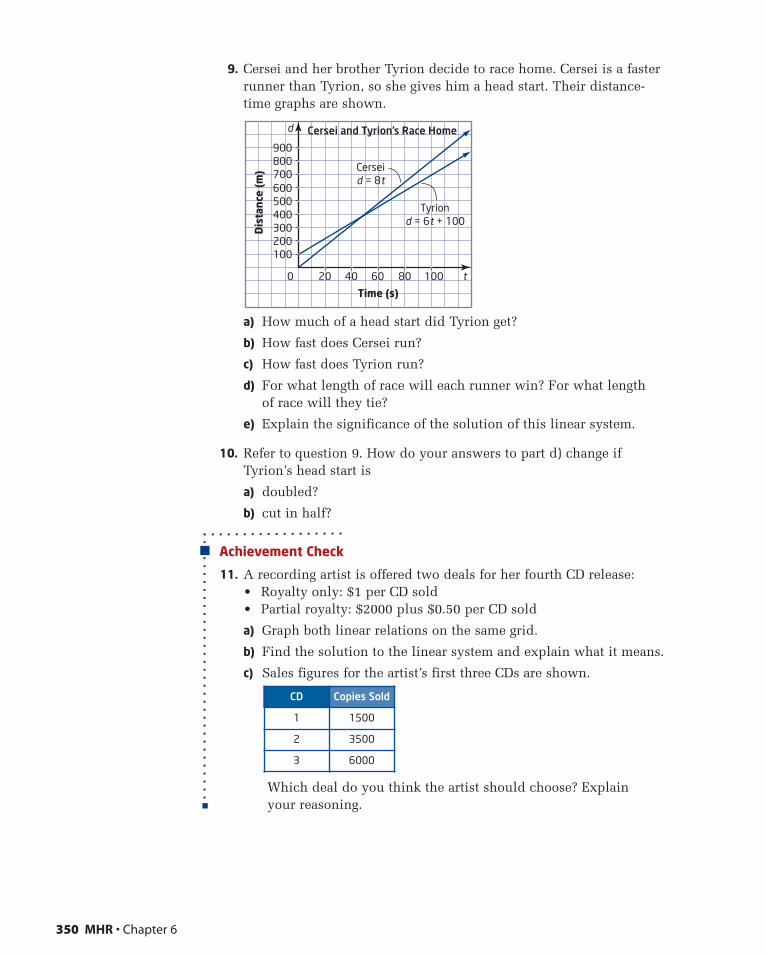
9. Cersei and her brother Tyrion decide to race home. Cersei is a fasterrunner than Tyrion, so she gives him a head start. Their distance-time graphs are shown.
a) How much of a head start did Tyrion get?
b) How fast does Cersei run?
c) How fast does Tyrion run?
d) For what length of race will each runner win? For what length of race will they tie?
e) Explain the significance of the solution of this linear system.
10. Refer to question 9. How do your answers to part d) change ifTyrion’s head start is
a) doubled?
b) cut in half?
Achievement Check
11. A recording artist is offered two deals for her fourth CD release:• Royalty only: $1 per CD sold• Partial royalty: $2000 plus $0.50 per CD sold
a) Graph both linear relations on the same grid.
b) Find the solution to the linear system and explain what it means.
c) Sales figures for the artist’s first three CDs are shown.
Which deal do you think the artist should choose? Explain your reasoning.
CD Copies Sold
1 1500
2 3500
3 6000
d
t0
Time (s)
20 40 60 80 100
100200300400500600700800900
Dis
tanc
e (m
) Cerseid = 8t
Tyriond = 6t + 100
Cersei and Tyrion’s Race Home
350 MHR • Chapter 6
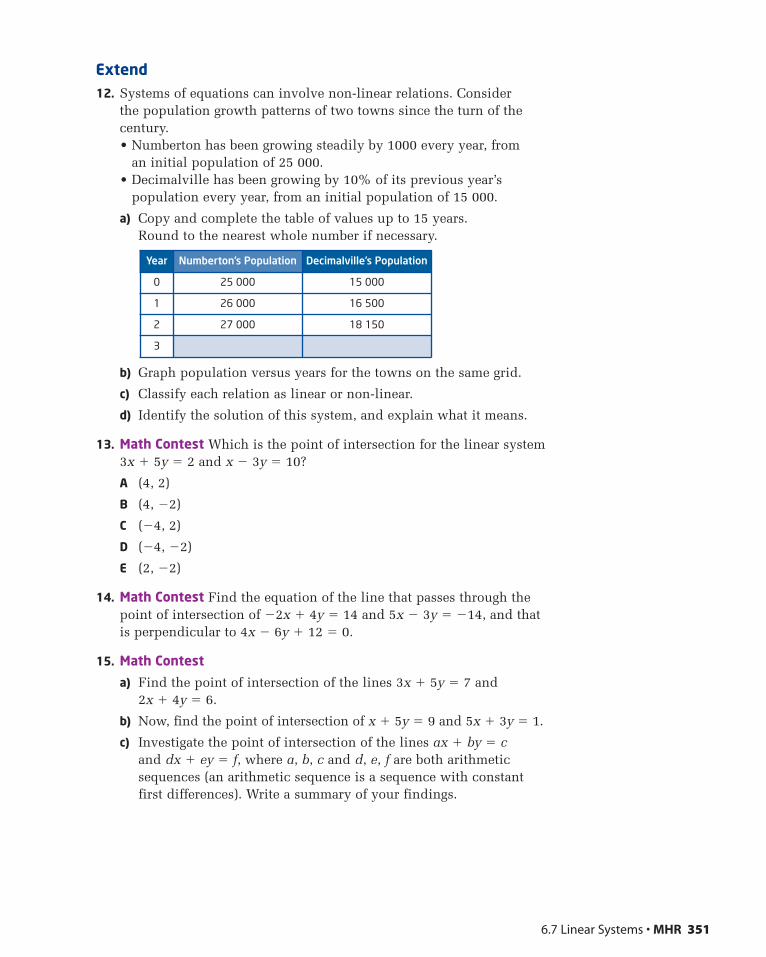
Extend12. Systems of equations can involve non-linear relations. Consider
the population growth patterns of two towns since the turn of thecentury.• Numberton has been growing steadily by 1000 every year, from
an initial population of 25 000.• Decimalville has been growing by 10% of its previous year’s
population every year, from an initial population of 15 000.
a) Copy and complete the table of values up to 15 years. Round to the nearest whole number if necessary.
b) Graph population versus years for the towns on the same grid.
c) Classify each relation as linear or non-linear.
d) Identify the solution of this system, and explain what it means.
13. Math Contest Which is the point of intersection for the linear system3x � 5y � 2 and x � 3y � 10?
A (4, 2)
B (4, �2)
C (�4, 2)
D (�4, �2)
E (2, �2)
14. Math Contest Find the equation of the line that passes through thepoint of intersection of �2x � 4y � 14 and 5x � 3y � �14, and thatis perpendicular to 4x � 6y � 12 � 0.
15. Math Contest
a) Find the point of intersection of the lines 3x � 5y � 7 and 2x � 4y � 6.
b) Now, find the point of intersection of x � 5y � 9 and 5x � 3y � 1.
c) Investigate the point of intersection of the lines ax � by � cand dx � ey � f, where a, b, c and d, e, f are both arithmeticsequences (an arithmetic sequence is a sequence with constantfirst differences). Write a summary of your findings.
Year Numberton’s Population Decimalville’s Population
0 25 000 15 000
1 26 000 16 500
2 27 000 18 150
3
6.7 Linear Systems • MHR 351

352 MHR • Chapter 6
Chapter 6 Review
6.1 The Equation of a Line in Slope y-InterceptForm: y � mx � b, pages 296—307
1. Identify the slope and the y-intercept ofeach line.
a)
b)
2. Identify the slope and the y-intercept ofeach line.
a) y � �3x � 2 b) y �
3. Write the equation of a line with the givenslope and y-intercept. Then, graph the line.
a) m � �2, b � 3
b) m � , b � �4
c) m � 0, b � 2
4. The distance-time graphillustrates a person’smovements in front ofa motion sensor.
a) Identify the slope andthe d-intercept.Explain what theymean.
b) Write an equation inthe form d � mt � bthat describes thewalker’s motion.
6.2 The Equation of a Line in Standard Form:Ax � By � C � 0, pages 308—314
5. Rewrite each equation in the form y � mx � b.
a) 2x � y � 6 � 0
b) 3x � 5y � 15 � 0
6. A plumber charges according to theequation 60n � C � 90 � 0, where C is the total charge, in dollars, for a house call, and n is the time, in hours, the jobtakes.
a) Rearrange the equation to express it in the form C � mn � b.
b) Identify the slope and the C-interceptand explain what they mean.
c) Graph the relation.
d) What would a 3-h house call cost?
6.3 Graph a Line Using Intercepts, pages 315—322
7. Determine the x- and y-intercepts of each line. Then, graph the line.
a) 3x � 4y � 12
b) 6x � y � 9
8. Cindy is at a baseball game with heryounger brother, Mike. She has $18 to spendon hamburgers and pop. Hamburgers cost $3each and pop cost $2 each.
a) If Cindy buys only hamburgers, howmany can she buy?
b) If she buys only pop, how many can she buy?
c) The equation 2x � 3y � 18 can be used to model this problem. Graph this line. What other combinations can Cindy buy?
23
35
x � 1
x
2
—2
0—2 2
y
x
2
4
—2
0—2 2
y
d
t0 1Time (s)2 3 4
1234567
Dis
tanc
e (m
)
Chapter 6 Review • MHR 353
6.4 Parallel and Perpendicular Lines, pages 326—329
9. Explain how the slopes of parallel lines are related. Create an example to supportyour explanation.
10. Explain how the slopes of perpendicularlines are related. Create an example tosupport your explanation.
6.5 Find an Equation for a Line Given theSlope and a Point, pages 330—337
11. Find an equation for a line with a slope
of , passing through (1, �4).
12. Find an equation for a line parallel to 3x � 4y � 12, with an x-intercept of 6.
13. Find an equation for a line perpendicular to y � 2x � 3, passing through the origin.
14. An airplane must always carry a minimumamount of fuel, above what is needed for theflight. Seth’s plane burns fuel at a constantrate of 32 L/h. For a 2-h flight, Seth has tocarry 88 L of fuel.
a) What is the minimum amount of extrafuel that Seth must carry in his plane at all times?
b) Write an equation that relates the amountof fuel, in litres, required versus the triplength, in hours.
c) The fuel tank in Seth’s plane has acapacity of 160 L. How long can he fly before having to refuel?
d) If Seth tunes up his plane, the fuel burnrate reduces to 24 L/h. How does thischange your answers to parts b) and c)?
6.6 Find the Equation of a Line Given TwoPoints, pages 338—343
15. Find an equation for a line passing through(�2, 5) and (3, �5).
16. Claudia is walking at a constant speed infront of a motion sensor. After 1 s, she is 2.5 m from the sensor. 2 s later, she is 4.0 mfrom the sensor.
a) Find the equation in the form d � mt � bthat describes her motion.
b) Determine the slope and the d-interceptand explain what they mean.
c) How far will Claudia be from the sensor5 s after she begins walking?
6.7 Linear Systems, pages 344—351
17. a) Solve the following linear system:
y �
y � �x � 6
b) Check that the solution is correct bysubstituting into both equations.
18. Two tutors charge according to the followingequations, relating the tutoring charge, C, indollars, to the time, t, in hours:• Mr. Wellington: C � 40t• Ms. Tenshu: C � 35t � 20
a) Solve the linear system and explain what the solution means.
b) Under what conditions should a student hire either tutor? Explain any assumptions you must make.
13
x � 2
23
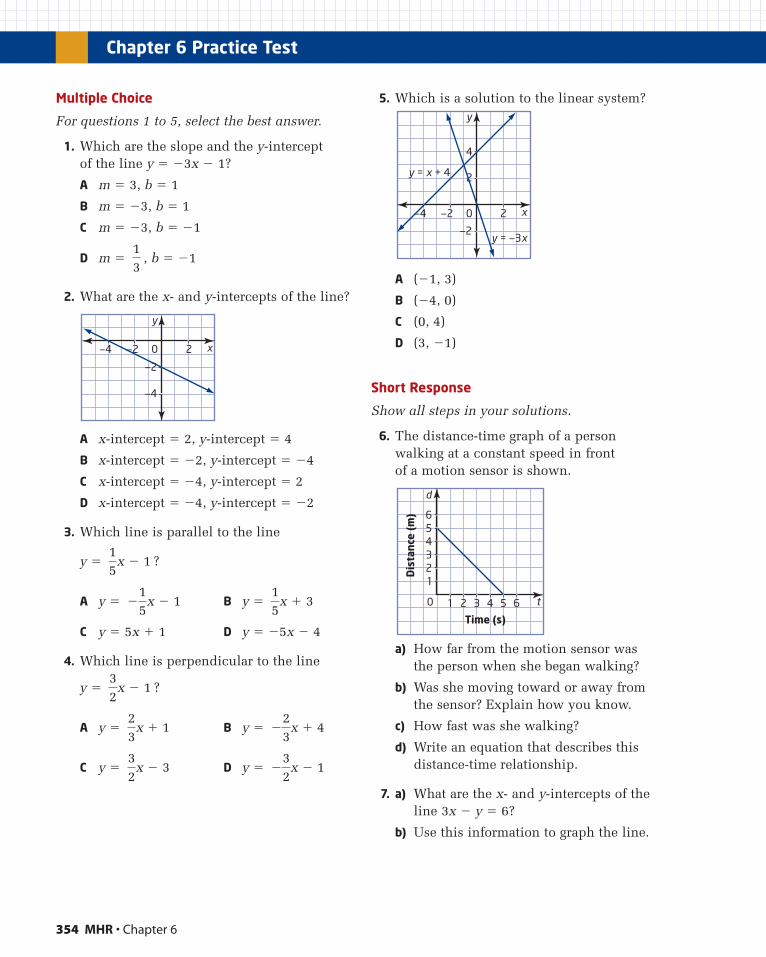
354 MHR • Chapter 6
Multiple Choice
For questions 1 to 5, select the best answer.
1. Which are the slope and the y-intercept of the line y � �3x � 1?
A m � 3, b � 1
B m � �3, b � 1
C m � �3, b � �1
D m � , b � �1
2. What are the x- and y-intercepts of the line?
A x-intercept � 2, y-intercept � 4
B x-intercept � �2, y-intercept � �4
C x-intercept � �4, y-intercept � 2
D x-intercept � �4, y-intercept � �2
3. Which line is parallel to the line
y � ?
A y � B y �
C y � 5x � 1 D y � �5x � 4
4. Which line is perpendicular to the line
y � ?
A y � B y �
C y � D y �
5. Which is a solution to the linear system?
A (�1, 3)
B (�4, 0)
C (0, 4)
D (3, �1)
Short Response
Show all steps in your solutions.
6. The distance-time graph of a person walking at a constant speed in front of a motion sensor is shown.
a) How far from the motion sensor was the person when she began walking?
b) Was she moving toward or away from the sensor? Explain how you know.
c) How fast was she walking?
d) Write an equation that describes thisdistance-time relationship.
7. a) What are the x- and y-intercepts of theline 3x � y � 6?
b) Use this information to graph the line.
d
t0 1
Time (s)
2 3 4 5 6
123456
Dis
tanc
e (m
)
x
2
4
—2
0—2—4 2
y
y = x + 4
y = —3x
�32
x � 132
x � 3
�23
x � 423
x � 1
32
x � 1
15
x � 3�15
x � 1
15
x � 1
x
—2
0—2—4 2
y
—4
13
Chapter 6 Practice Test
Chapter 6 Practice Test • MHR 355
8. An electrician charges according to theequation 75n � C � 60 � 0, where C is the total charge, in dollars, for a house call,and n is the time, in hours, the job takes.
a) Rearrange this equation to express it in the form C � mn � b.
b) Identify the slope and the C-interceptand explain what they mean.
c) Graph the relation.
d) What would a 2-h house call cost?
9. Find an equation for a line with a slope
of that passes through the point (4, �1).
10. Find an equation for a line passing throughthe points (�3, �4) and (6, 8).
11. You can use the formula L = 3.8G to obtainan approximate value for converting avolume in U.S. gallons, G, to a volume inlitres, L.
a) Use the formula to find the number oflitres in• 0.5 gallons • 1 pint (1 pint = 0.125 gallons)
b) Rearrange the formula to express G interms of L.
c) How many gallons are in•4 L?•250 mL?
Extended Response
Provide complete solutions.
12. Find an equation for a line that isperpendicular to 2x � 3y � 6 � 0 and hasthe same x-intercept as 3x � 7y � 9 � 0.
13. A video rental company has two monthlyplans:• Plan A: $40 for unlimited rentals• Plan B: $10 plus $3 per video
a) Graph this linear system and find thesolution.
b) Explain the conditions under which each plan is better.
14. Tess is flying an airplane from Wainfleet toher cottage at a constant speed. She takesoff at noon and passes St. Catharines at12:15. Tess knows that St. Catharines is40 km from Wainfleet.
a) How fast is Tess’s airplane flying, inkilometres per hour?
b) Write an equation relating distancetravelled to flight time.
c) Assuming Tess continues on a straightpath, at what time will she arrive at hercottage, which is 360 km due north of St. Catharines?
23
By now you should have all eight letters in the name of Jean’s homecity. All you need to do is unscramble them.
Create a problem like this one based on the name of your city ortown. Or, if you prefer, pick a city or town of a friend or relative.Then, trade problems with a classmate and try to discover eachother’s mystery location. Happy math-caching!
Chapter Problem Wrap-Up
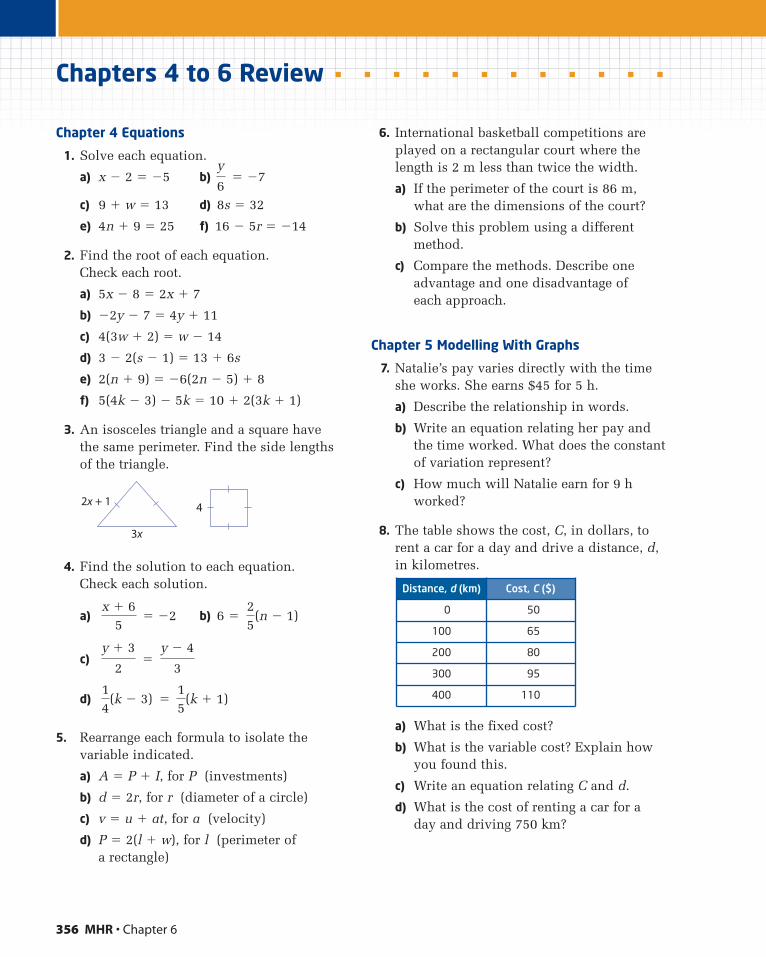
356 MHR • Chapter 6
Chapters 4 to 6 Review
Chapter 4 Equations
1. Solve each equation.
a) x � 2 � �5 b) � �7
c) 9 � w � 13 d) 8s � 32
e) 4n � 9 � 25 f) 16 � 5r � �14
2. Find the root of each equation. Check each root.
a) 5x � 8 � 2x � 7
b) �2y � 7 � 4y � 11
c) 4(3w � 2) � w � 14
d) 3 � 2(s � 1) � 13 � 6s
e) 2(n � 9) � �6(2n � 5) � 8
f) 5(4k � 3) � 5k � 10 � 2(3k � 1)
3. An isosceles triangle and a square have the same perimeter. Find the side lengths of the triangle.
4. Find the solution to each equation. Check each solution.
a) � �2 b) 6 �
c) �
d) �
5. Rearrange each formula to isolate thevariable indicated.
a) A � P � I, for P (investments)
b) d � 2r, for r (diameter of a circle)
c) v � u � at, for a (velocity)
d) P � 2(l � w), for l (perimeter of a rectangle)
6. International basketball competitions areplayed on a rectangular court where thelength is 2 m less than twice the width.
a) If the perimeter of the court is 86 m,what are the dimensions of the court?
b) Solve this problem using a differentmethod.
c) Compare the methods. Describe oneadvantage and one disadvantage of each approach.
Chapter 5 Modelling With Graphs
7. Natalie’s pay varies directly with the timeshe works. She earns $45 for 5 h.
a) Describe the relationship in words.
b) Write an equation relating her pay andthe time worked. What does the constantof variation represent?
c) How much will Natalie earn for 9 hworked?
8. The table shows the cost, C, in dollars, torent a car for a day and drive a distance, d,in kilometres.
a) What is the fixed cost?
b) What is the variable cost? Explain howyou found this.
c) Write an equation relating C and d.
d) What is the cost of renting a car for a day and driving 750 km?
15
(k � 1)14
(k � 3)
y � 4
3
y � 3
2
25
(n � 1)x � 6
5
3x
42x + 1
y
6
Distance, d (km) Cost, C ($)
0 50
100 65
200 80
300 95
400 110
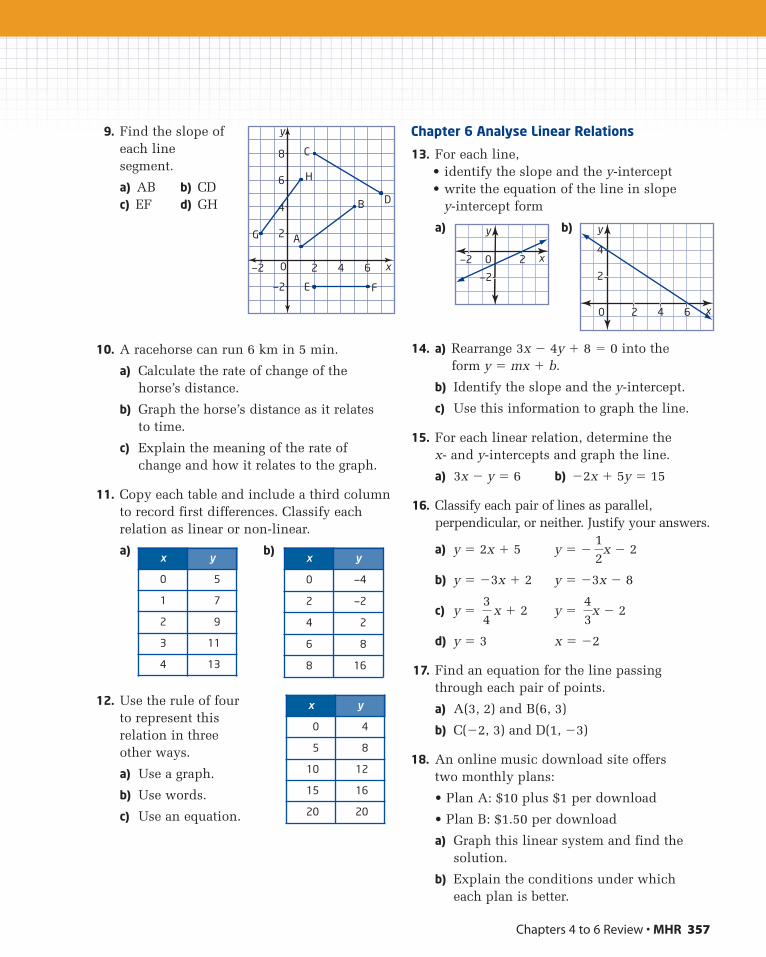
x y
0 —4
2 —2
4 2
6 8
8 16
x y
0 5
1 7
2 9
3 11
4 13
Chapters 4 to 6 Review • MHR 357
x y
0 4
5 8
10 12
15 16
20 20
9. Find the slope ofeach linesegment.
a) AB b) CD c) EF d) GH
10. A racehorse can run 6 km in 5 min.
a) Calculate the rate of change of the horse’s distance.
b) Graph the horse’s distance as it relates to time.
c) Explain the meaning of the rate of change and how it relates to the graph.
11. Copy each table and include a third columnto record first differences. Classify eachrelation as linear or non-linear.
a) b)
12. Use the rule of fourto represent this relation in threeother ways.
a) Use a graph.
b) Use words.
c) Use an equation.
Chapter 6 Analyse Linear Relations
13. For each line,• identify the slope and the y-intercept• write the equation of the line in slope
y-intercept form
a) b)
14. a) Rearrange 3x � 4y � 8 � 0 into the form y � mx � b.
b) Identify the slope and the y-intercept.
c) Use this information to graph the line.
15. For each linear relation, determine the x- and y-intercepts and graph the line.
a) 3x � y � 6 b) �2x � 5y � 15
16. Classify each pair of lines as parallel,perpendicular, or neither. Justify your answers.
a) y � 2x � 5 y � �
b) y � �3x � 2 y � �3x � 8
c) y � x � 2 y �
d) y � 3 x � �2
17. Find an equation for the line passingthrough each pair of points.
a) A(3, 2) and B(6, 3)
b) C(�2, 3) and D(1, �3)
18. An online music download site offers two monthly plans:
• Plan A: $10 plus $1 per download
• Plan B: $1.50 per download
a) Graph this linear system and find thesolution.
b) Explain the conditions under which each plan is better.
43
x � 234
12
x � 2
x
—2
0—2 2
y
4
2 A
B
E
G
H
C
D
F—2
0 2—2 4 6
6
8
y
x
x
2
4
0 2 4 6
y
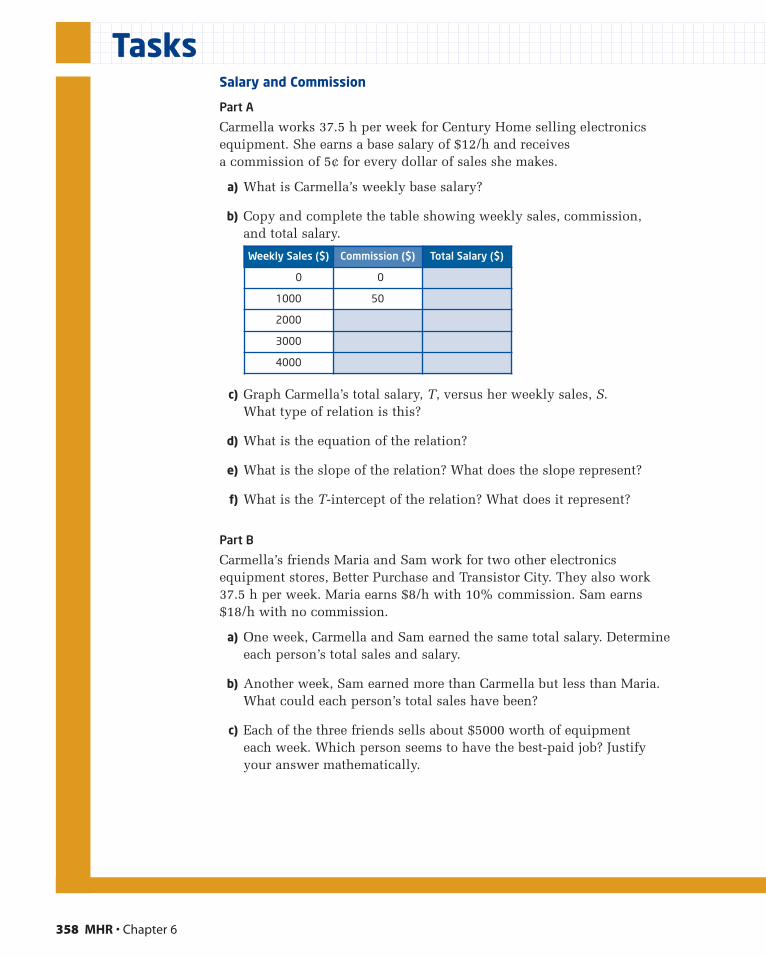
358 MHR • Chapter 6
Salary and Commission
Part A
Carmella works 37.5 h per week for Century Home selling electronicsequipment. She earns a base salary of $12/h and receives a commission of 5¢ for every dollar of sales she makes.
a) What is Carmella’s weekly base salary?
b) Copy and complete the table showing weekly sales, commission, and total salary.
c) Graph Carmella’s total salary, T, versus her weekly sales, S. What type of relation is this?
d) What is the equation of the relation?
e) What is the slope of the relation? What does the slope represent?
f) What is the T-intercept of the relation? What does it represent?
Part B
Carmella’s friends Maria and Sam work for two other electronicsequipment stores, Better Purchase and Transistor City. They also work37.5 h per week. Maria earns $8/h with 10% commission. Sam earns$18/h with no commission.
a) One week, Carmella and Sam earned the same total salary. Determineeach person’s total sales and salary.
b) Another week, Sam earned more than Carmella but less than Maria.What could each person’s total sales have been?
c) Each of the three friends sells about $5000 worth of equipment each week. Which person seems to have the best-paid job? Justifyyour answer mathematically.
TaskTasks
Weekly Sales ($) Commission ($) Total Salary ($)
0 0
1000 50
2000
3000
4000
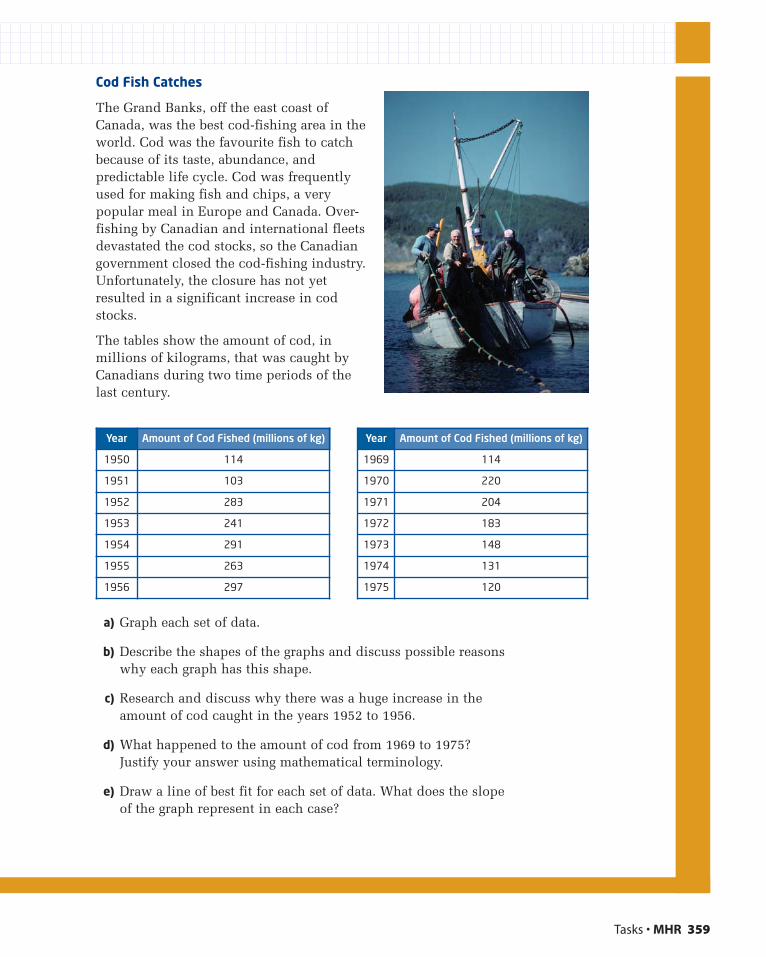
Tasks • MHR 359
Cod Fish Catches
The Grand Banks, off the east coast ofCanada, was the best cod-fishing area in theworld. Cod was the favourite fish to catchbecause of its taste, abundance, andpredictable life cycle. Cod was frequentlyused for making fish and chips, a verypopular meal in Europe and Canada. Over-fishing by Canadian and international fleetsdevastated the cod stocks, so the Canadiangovernment closed the cod-fishing industry.Unfortunately, the closure has not yetresulted in a significant increase in codstocks.
The tables show the amount of cod, inmillions of kilograms, that was caught byCanadians during two time periods of thelast century.
a) Graph each set of data.
b) Describe the shapes of the graphs and discuss possible reasons why each graph has this shape.
c) Research and discuss why there was a huge increase in the amount of cod caught in the years 1952 to 1956.
d) What happened to the amount of cod from 1969 to 1975? Justify your answer using mathematical terminology.
e) Draw a line of best fit for each set of data. What does the slope of the graph represent in each case?
Year Amount of Cod Fished (millions of kg)
1969 114
1970 220
1971 204
1972 183
1973 148
1974 131
1975 120
Year Amount of Cod Fished (millions of kg)
1950 114
1951 103
1952 283
1953 241
1954 291
1955 263
1956 297
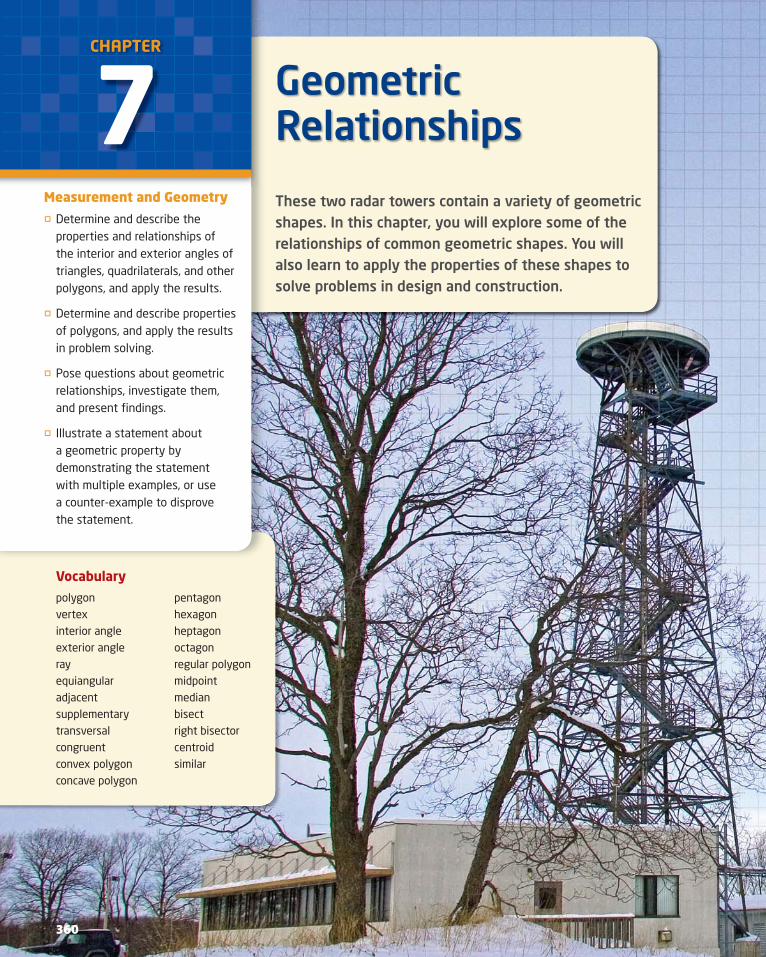
Vocabulary
polygonvertexinterior angleexterior anglerayequiangularadjacentsupplementarytransversalcongruentconvex polygonconcave polygon
pentagonhexagonheptagonoctagonregular polygonmidpointmedianbisectright bisectorcentroidsimilar
Geometric Relationships
These two radar towers contain a variety of geometric shapes. In this chapter, you will explore some of the relationships of common geometric shapes. You will also learn to apply the properties of these shapes to solve problems in design and construction.
CHAPTER
7 Measurement and Geometry� Determine and describe the
properties and relationships of the interior and exterior angles of triangles, quadrilaterals, and other polygons, and apply the results.
� Determine and describe properties of polygons, and apply the results in problem solving.
� Pose questions about geometric relationships, investigate them, and present fi ndings.
� Illustrate a statement about a geometric property by demonstrating the statement with multiple examples, or use a counter-example to disprove the statement.
360
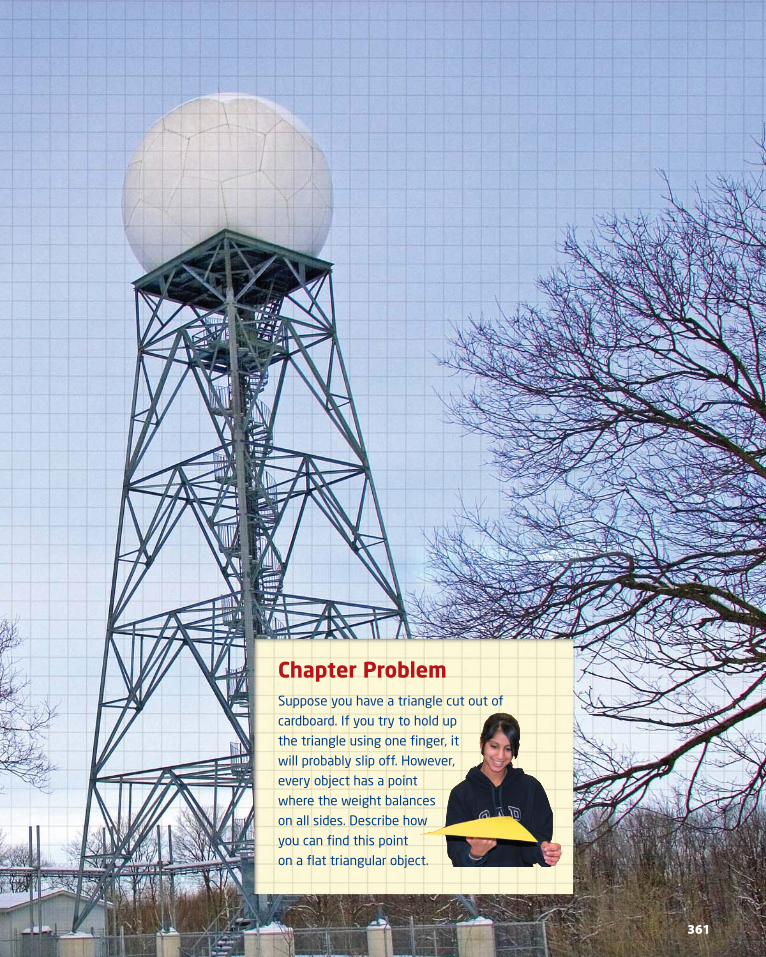
Chapter Problem Suppose you have a triangle cut out of
cardboard. If you try to hold up
the triangle using one fi nger, it
will probably slip off. However,
every object has a point
where the weight balances
on all sides. Describe how
you can fi nd this point
on a fl at triangular object.
361
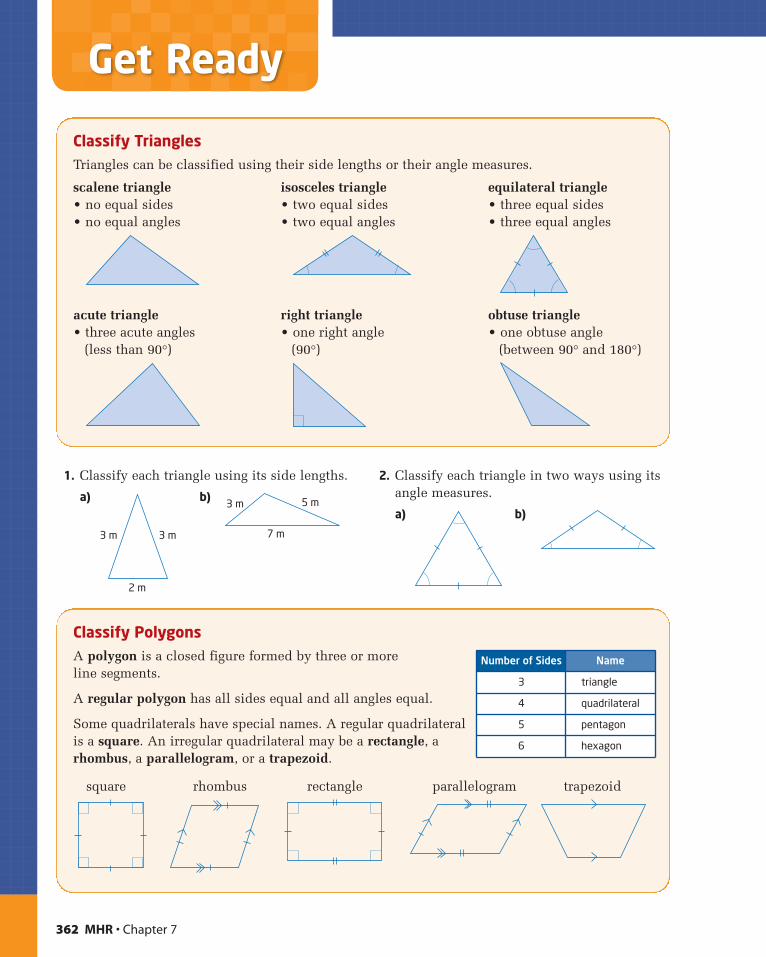
1. Classify each triangle using its side lengths.
a) b)
2. Classify each triangle in two ways using itsangle measures.
a) b)
7 m
5 m3 m
2 m
3 m3 m
362 MHR • Chapter 7
Classify TrianglesTriangles can be classified using their side lengths or their angle measures.
scalene triangle isosceles triangle equilateral triangle• no equal sides • two equal sides • three equal sides• no equal angles • two equal angles • three equal angles
acute triangle right triangle obtuse triangle• three acute angles • one right angle • one obtuse angle
(less than 90°) (90°) (between 90° and 180°)
Classify PolygonsA polygon is a closed figure formed by three or more line segments.
A regular polygon has all sides equal and all angles equal.
Some quadrilaterals have special names. A regular quadrilateralis a square. An irregular quadrilateral may be a rectangle, arhombus, a parallelogram, or a trapezoid.
square rhombus rectangle parallelogram trapezoid
Number of Sides Name
3 triangle
4 quadrilateral
5 pentagon
6 hexagon
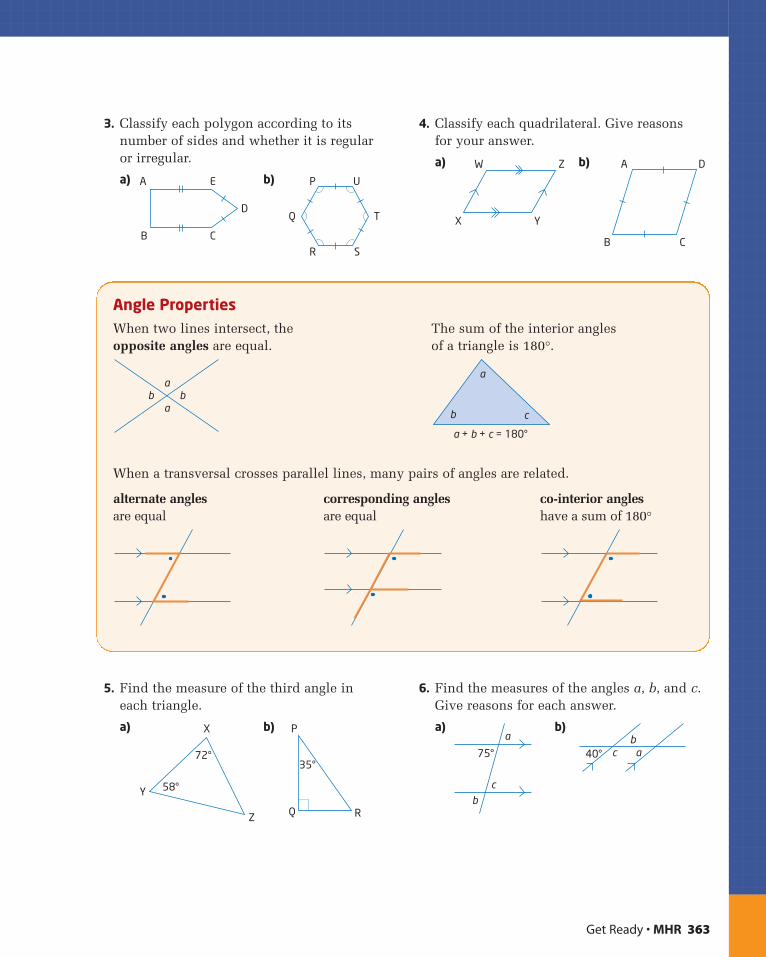
Get Ready • MHR 363
3. Classify each polygon according to itsnumber of sides and whether it is regular or irregular.
a) b)
4. Classify each quadrilateral. Give reasons for your answer.
a) b) A D
CB
ZW
YX
P
Q
R S
T
UA
B C
E
D
5. Find the measure of the third angle in each triangle.
a) b)
6. Find the measures of the angles a, b, and c.Give reasons for each answer.
a) b)
40° acb
75°
a
cb
P
Q R
35°
58°
72°
X
Y
Z
Angle PropertiesWhen two lines intersect, the The sum of the interior angles opposite angles are equal. of a triangle is 180°.
When a transversal crosses parallel lines, many pairs of angles are related.
alternate angles corresponding angles co-interior anglesare equal are equal have a sum of 180°
b c
a
a + b + c = 180°
ab
ab
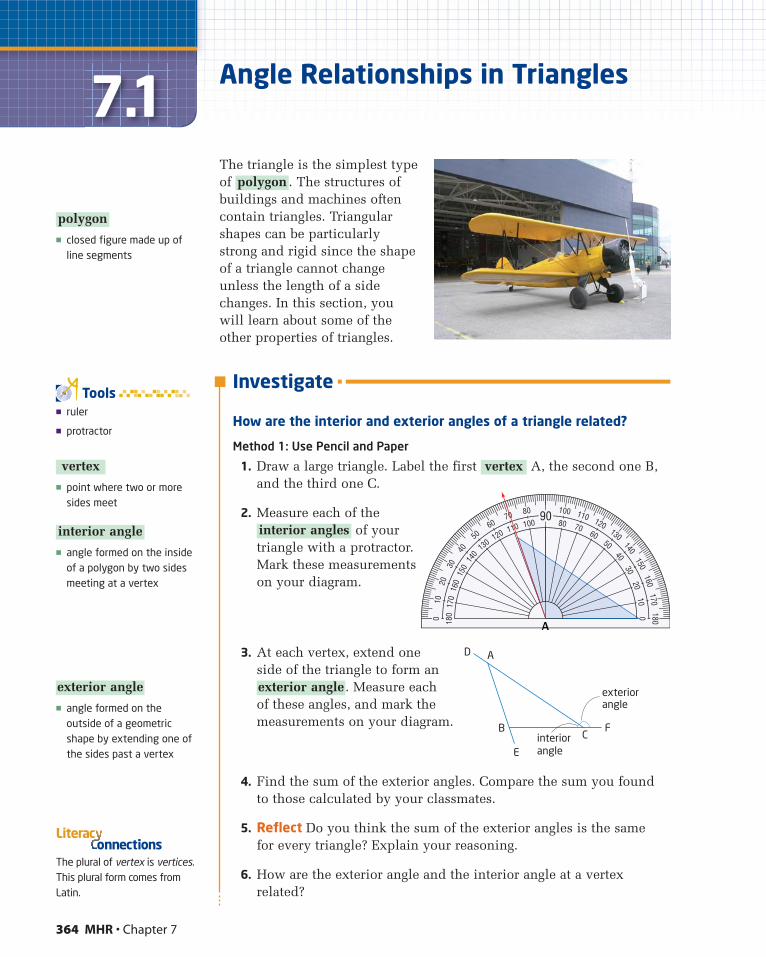
Investigate
How are the interior and exterior angles of a triangle related?
Method 1: Use Pencil and Paper
1. Draw a large triangle. Label the first A, the second one B,and the third one C.
2. Measure each of theof your
triangle with a protractor.Mark these measurementson your diagram.
3. At each vertex, extend one side of the triangle to form an
. Measure each of these angles, and mark themeasurements on your diagram.
4. Find the sum of the exterior angles. Compare the sum you foundto those calculated by your classmates.
5. Reflect Do you think the sum of the exterior angles is the same for every triangle? Explain your reasoning.
6. How are the exterior angle and the interior angle at a vertexrelated?
exterior angle
interior angles
vertex
364 MHR • Chapter 7
7.1 Angle Relationships in Triangles
The triangle is the simplest typeof . The structures ofbuildings and machines oftencontain triangles. Triangularshapes can be particularlystrong and rigid since the shapeof a triangle cannot changeunless the length of a sidechanges. In this section, youwill learn about some of theother properties of triangles.
polygon
� closed figure made up ofline segments
polygon
� point where two or moresides meet
� angle formed on the insideof a polygon by two sidesmeeting at a vertex
� angle formed on theoutside of a geometricshape by extending one ofthe sides past a vertex
exterior angle
interior angle
vertex
� ruler
� protractor
Tools
The plural of vertex is vertices.This plural form comes fromLatin.
onnectionsLiterac
A
AD
B
E
CF
exterior angle
interior angle

7. Reflecta) Describe the relationship between the exterior angle at a vertex of
a triangle and the interior angles at the other two vertices.
b) Will this relationship apply to the exterior angles of alltriangles? Explain.
Method 2: Use The Geometer’s Sketchpad®1. Turn on automatic labelling
of points. From the Editmenu, choose Preferences.Click on the Text tab, checkFor All New Points, andclick on OK.
2. Use the Point Tool to create three points on the screen.
3. Select point A and point B.From the Construct menu,choose Ray. Use the samemethod to construct from B to C and from C to A.
4. Select the three rays. Fromthe Construct menu, choosePoints on Rays. If necessary,drag each point to a locationoutside the triangle.
5. To measure �FAB,select points F, A,and B in that order.From the Measuremenu, chooseAngle. Measure�DBC and �ECAthe same way.
rays
7.1 Angle Relationships in Triangles • MHR 365
� a part of a line with oneendpoint
ray
� computer with TheGeometer’s Sketchpad®
Tools
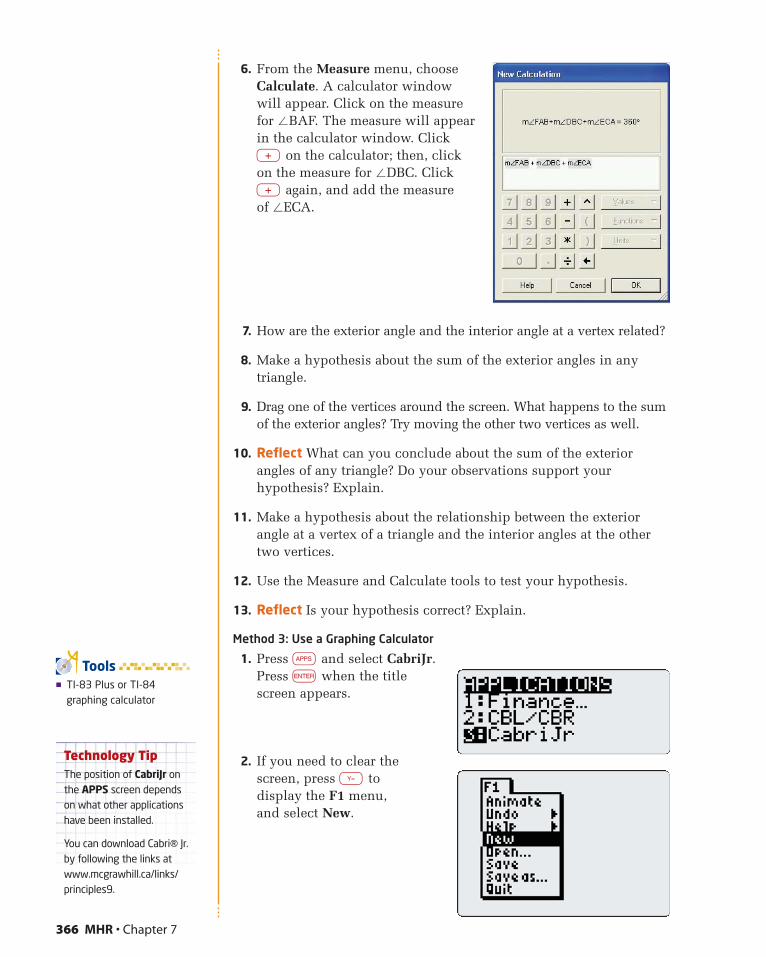
� TI-83 Plus or TI-84graphing calculator
Tools
Technology TipThe position of CabriJr onthe APPS screen dependson what other applicationshave been installed.
You can download Cabri® Jr.by following the links atwww.mcgrawhill.ca/links/principles9.
6. From the Measure menu, chooseCalculate. A calculator windowwill appear. Click on the measurefor �BAF. The measure will appearin the calculator window. Click + on the calculator; then, clickon the measure for �DBC. Click+ again, and add the measure of �ECA.
7. How are the exterior angle and the interior angle at a vertex related?
8. Make a hypothesis about the sum of the exterior angles in anytriangle.
9. Drag one of the vertices around the screen. What happens to the sumof the exterior angles? Try moving the other two vertices as well.
10. Reflect What can you conclude about the sum of the exteriorangles of any triangle? Do your observations support yourhypothesis? Explain.
11. Make a hypothesis about the relationship between the exteriorangle at a vertex of a triangle and the interior angles at the othertwo vertices.
12. Use the Measure and Calculate tools to test your hypothesis.
13. Reflect Is your hypothesis correct? Explain.
Method 3: Use a Graphing Calculator
1. Press ∂ and select CabriJr.Press e when the titlescreen appears.
2. If you need to clear thescreen, press y to display the F1 menu, and select New.
366 MHR • Chapter 7
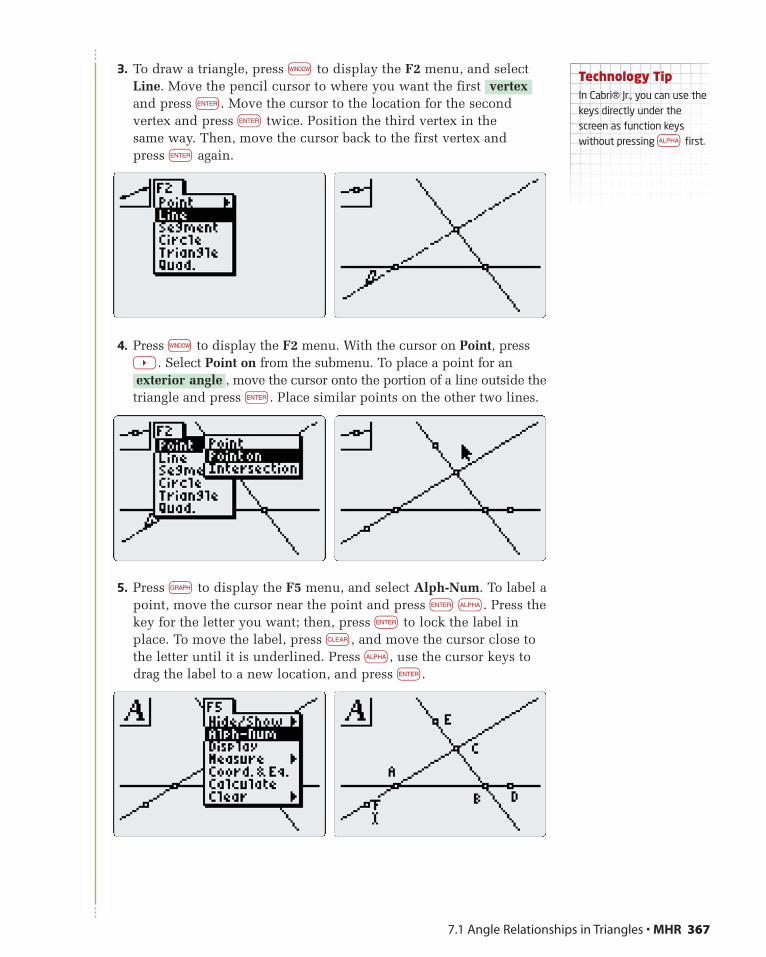
3. To draw a triangle, press w to display the F2 menu, and selectLine. Move the pencil cursor to where you want the first and press e. Move the cursor to the location for the secondvertex and press e twice. Position the third vertex in the same way. Then, move the cursor back to the first vertex and press e again.
4. Press w to display the F2 menu. With the cursor on Point, press]. Select Point on from the submenu. To place a point for an
, move the cursor onto the portion of a line outside thetriangle and press e. Place similar points on the other two lines.
5. Press g to display the F5 menu, and select Alph-Num. To label apoint, move the cursor near the point and press e a. Press thekey for the letter you want; then, press e to lock the label inplace. To move the label, press b, and move the cursor close tothe letter until it is underlined. Press a, use the cursor keys todrag the label to a new location, and press e.
exterior angle
vertex
7.1 Angle Relationships in Triangles • MHR 367
Technology TipIn Cabri® Jr., you can use thekeys directly under thescreen as function keyswithout pressing a first.
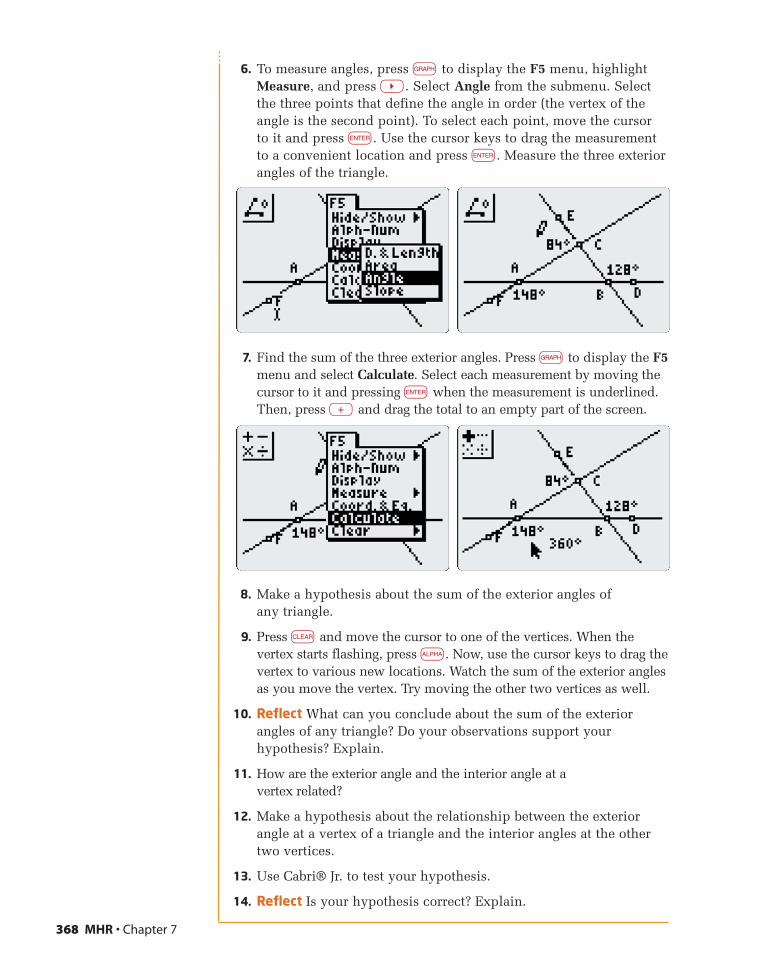
6. To measure angles, press g to display the F5 menu, highlightMeasure, and press ]. Select Angle from the submenu. Selectthe three points that define the angle in order (the vertex of theangle is the second point). To select each point, move the cursor to it and press e. Use the cursor keys to drag the measurement to a convenient location and press e. Measure the three exteriorangles of the triangle.
7. Find the sum of the three exterior angles. Press g to display the F5menu and select Calculate. Select each measurement by moving thecursor to it and pressing e when the measurement is underlined.Then, press + and drag the total to an empty part of the screen.
8. Make a hypothesis about the sum of the exterior angles of any triangle.
9. Press b and move the cursor to one of the vertices. When thevertex starts flashing, press a. Now, use the cursor keys to drag thevertex to various new locations. Watch the sum of the exterior anglesas you move the vertex. Try moving the other two vertices as well.
10. Reflect What can you conclude about the sum of the exteriorangles of any triangle? Do your observations support yourhypothesis? Explain.
11. How are the exterior angle and the interior angle at a vertex related?
12. Make a hypothesis about the relationship between the exteriorangle at a vertex of a triangle and the interior angles at the othertwo vertices.
13. Use Cabri® Jr. to test your hypothesis.
14. Reflect Is your hypothesis correct? Explain.
368 MHR • Chapter 7
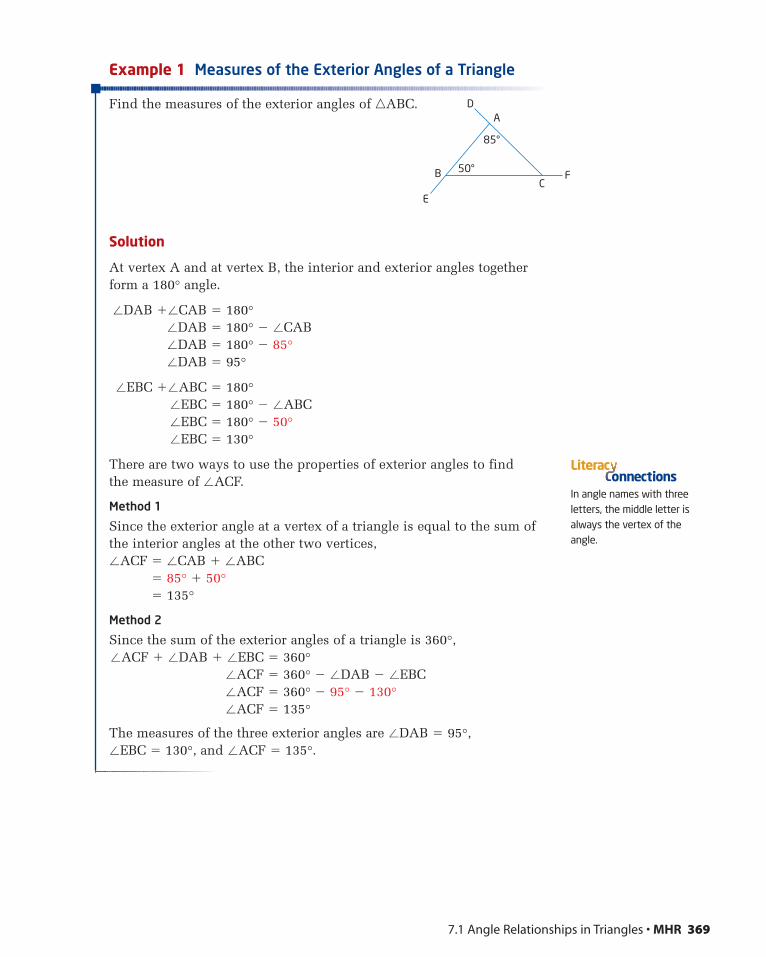
Example 1 Measures of the Exterior Angles of a Triangle
Find the measures of the exterior angles of �ABC.
Solution
At vertex A and at vertex B, the interior and exterior angles togetherform a 180° angle.
�DAB ��CAB � 180°�DAB � 180° � �CAB�DAB � 180° � 85°�DAB � 95°
�EBC ��ABC � 180°�EBC � 180° � �ABC�EBC � 180° � 50°�EBC � 130°
There are two ways to use the properties of exterior angles to find the measure of �ACF.
Method 1
Since the exterior angle at a vertex of a triangle is equal to the sum ofthe interior angles at the other two vertices,�ACF � �CAB � �ABC
� 85° � 50°� 135°
Method 2
Since the sum of the exterior angles of a triangle is 360°,�ACF � �DAB � �EBC � 360°
�ACF � 360° � �DAB � �EBC�ACF � 360° � 95° � 130°�ACF � 135°
The measures of the three exterior angles are �DAB � 95°, �EBC � 130°, and �ACF � 135°.
7.1 Angle Relationships in Triangles • MHR 369
A
85°
50°
D
B
EC
F
In angle names with threeletters, the middle letter isalways the vertex of theangle.
onnectionsLiterac
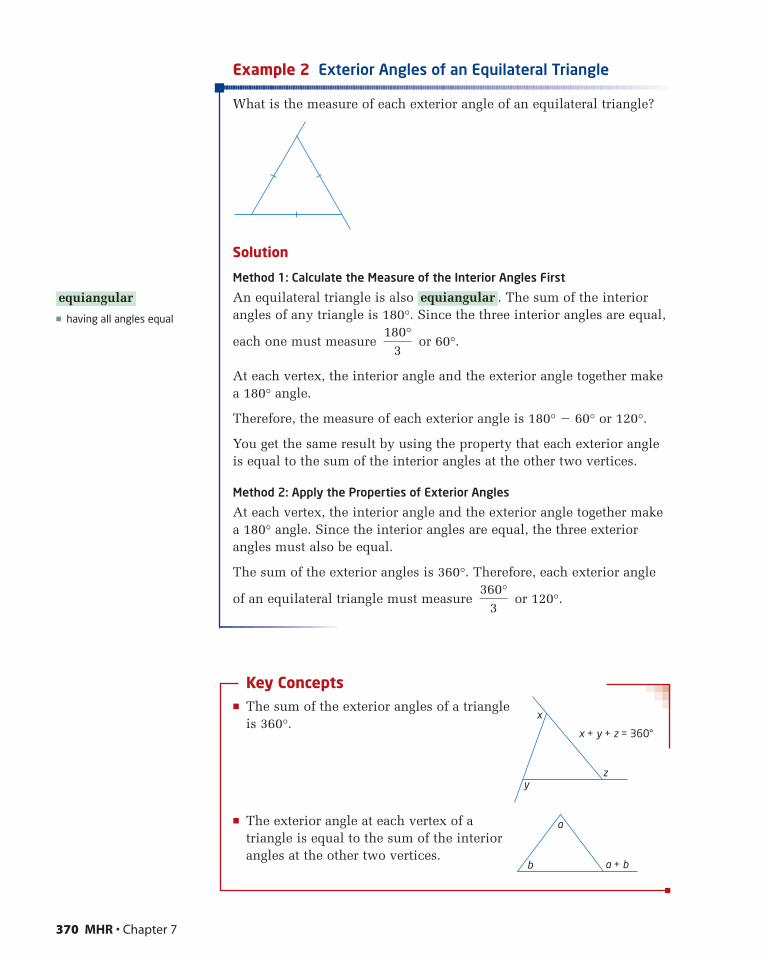
Example 2 Exterior Angles of an Equilateral Triangle
What is the measure of each exterior angle of an equilateral triangle?
Solution
Method 1: Calculate the Measure of the Interior Angles First
An equilateral triangle is also . The sum of the interiorangles of any triangle is 180°. Since the three interior angles are equal,
each one must measure or 60°.
At each vertex, the interior angle and the exterior angle together makea 180° angle.
Therefore, the measure of each exterior angle is 180° � 60° or 120°.
You get the same result by using the property that each exterior angleis equal to the sum of the interior angles at the other two vertices.
Method 2: Apply the Properties of Exterior Angles
At each vertex, the interior angle and the exterior angle together makea 180° angle. Since the interior angles are equal, the three exteriorangles must also be equal.
The sum of the exterior angles is 360°. Therefore, each exterior angle
of an equilateral triangle must measure or 120°.
Key Concepts� The sum of the exterior angles of a triangle
is 360°.
� The exterior angle at each vertex of atriangle is equal to the sum of the interiorangles at the other two vertices.
360°3
180°3
equiangular
370 MHR • Chapter 7
� having all angles equal
equiangular
x
y
x + y + z = 360°
z
a
b a + b
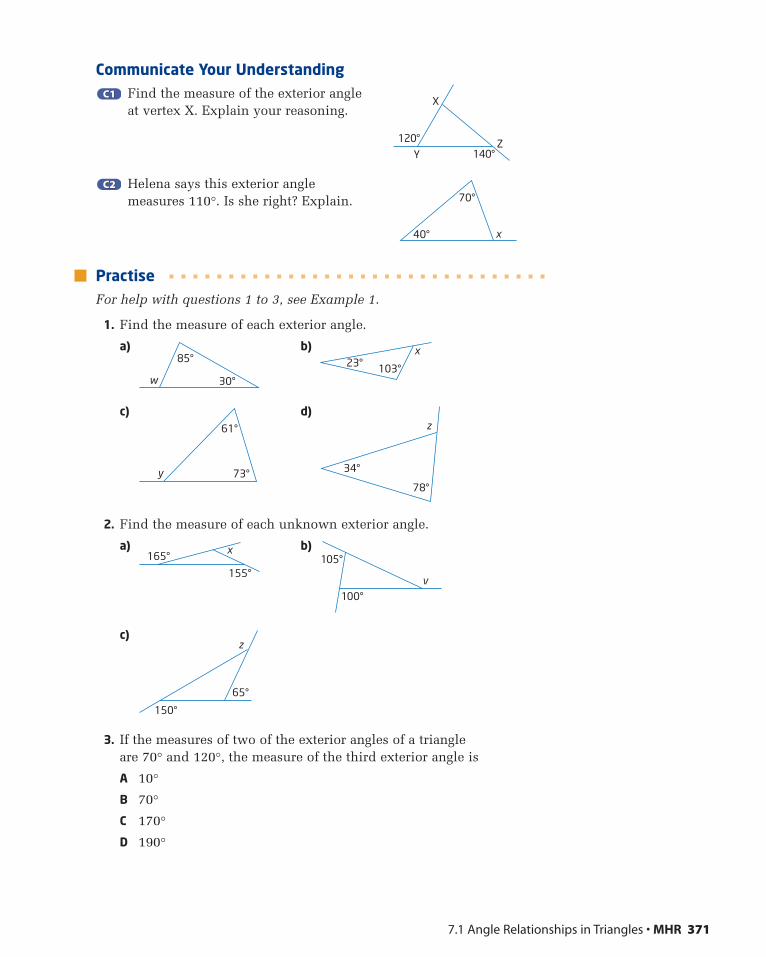
Communicate Your UnderstandingFind the measure of the exterior angle at vertex X. Explain your reasoning.
Helena says this exterior angle measures 110°. Is she right? Explain.
PractiseFor help with questions 1 to 3, see Example 1.
1. Find the measure of each exterior angle.
a) b)
c) d)
2. Find the measure of each unknown exterior angle.
a) b)
c)
3. If the measures of two of the exterior angles of a triangle are 70° and 120°, the measure of the third exterior angle is
A 10°
B 70°
C 170°
D 190°
150°
65°
z
100°
105°
v
165°
155°
x
34°
78°
z
73°
61°
y
23° 103°
x
w
85°
30°
C2C2
C1C1
7.1 Angle Relationships in Triangles • MHR 371
X
YZ120°
140°
x40°
70°
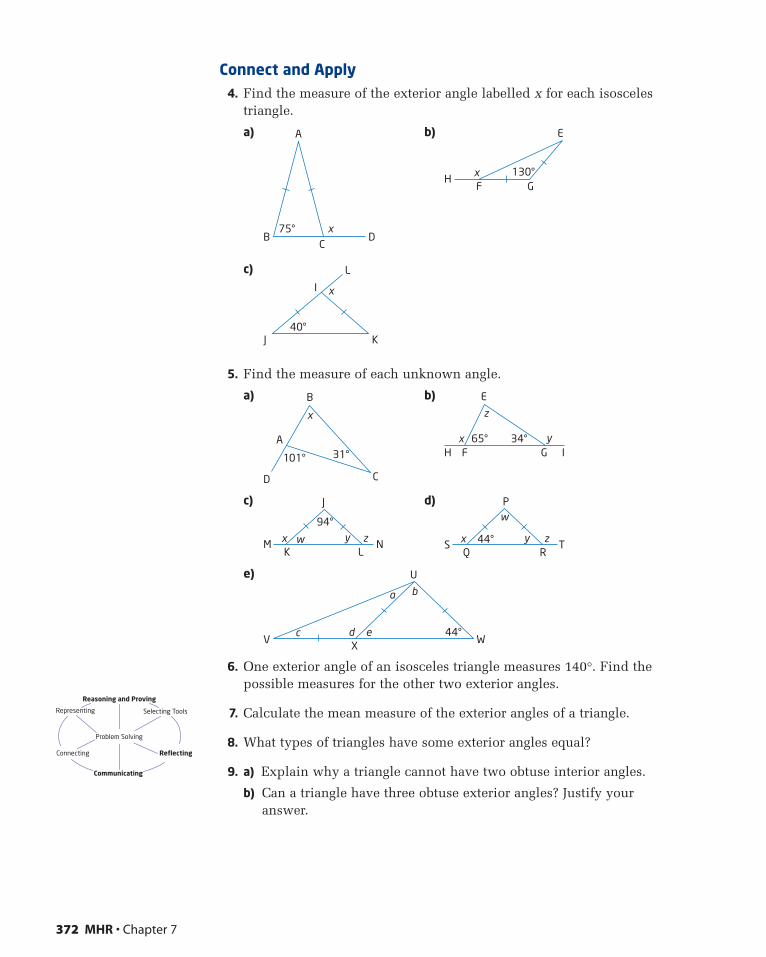
Connect and Apply4. Find the measure of the exterior angle labelled x for each isosceles
triangle.
a) b)
c)
5. Find the measure of each unknown angle.
a) b)
c) d)
e)
6. One exterior angle of an isosceles triangle measures 140°. Find thepossible measures for the other two exterior angles.
7. Calculate the mean measure of the exterior angles of a triangle.
8. What types of triangles have some exterior angles equal?
9. a) Explain why a triangle cannot have two obtuse interior angles.
b) Can a triangle have three obtuse exterior angles? Justify youranswer.
edc
ba
V WX
U
44°
y zx
w
S TQ R
P
44°y zx wM NK L
J
94°
y
z
xH IF G
E
65° 34°
101° 31°
x
B
A
D C
40°
x
J K
I
L
130°xHG
E
F
75° xB
CD
A
372 MHR • Chapter 7
Selecting ToolsRepresenting
Reasoning and Proving
Communicating
Connecting Reflecting
Problem Solving
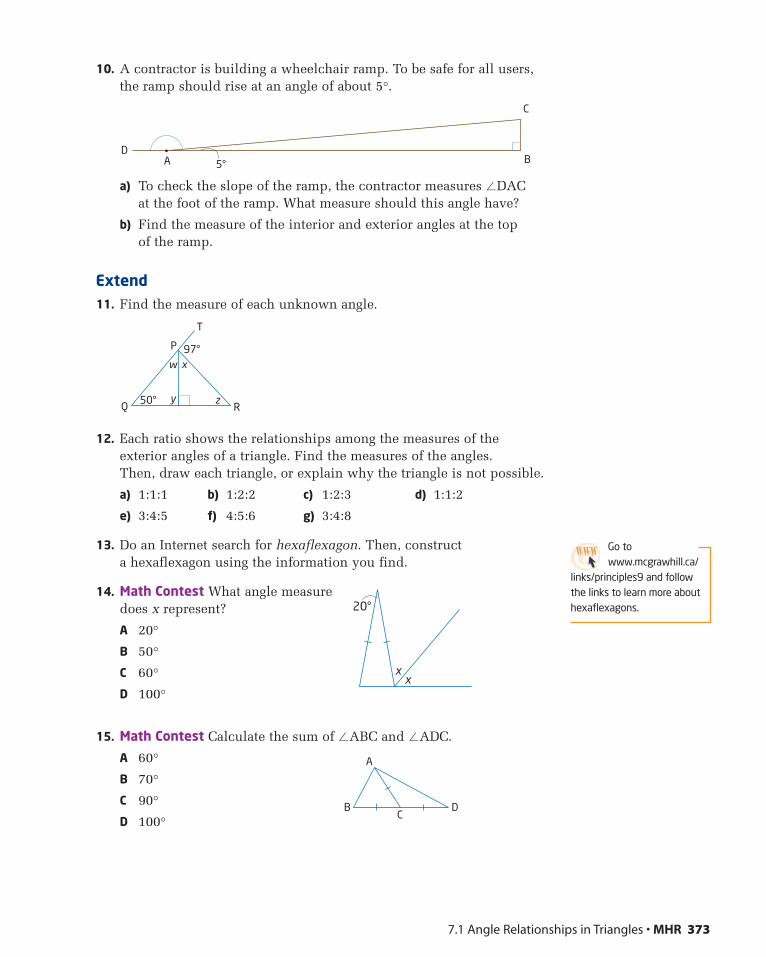
10. A contractor is building a wheelchair ramp. To be safe for all users,the ramp should rise at an angle of about 5°.
a) To check the slope of the ramp, the contractor measures �DAC at the foot of the ramp. What measure should this angle have?
b) Find the measure of the interior and exterior angles at the top of the ramp.
Extend11. Find the measure of each unknown angle.
12. Each ratio shows the relationships among the measures of theexterior angles of a triangle. Find the measures of the angles. Then, draw each triangle, or explain why the triangle is not possible.
a) 1:1:1 b) 1:2:2 c) 1:2:3 d) 1:1:2
e) 3:4:5 f) 4:5:6 g) 3:4:8
13. Do an Internet search for hexaflexagon. Then, construct a hexaflexagon using the information you find.
14. Math Contest What angle measure does x represent?
A 20°
B 50°
C 60°
D 100°
15. Math Contest Calculate the sum of �ABC and �ADC.
A 60°
B 70°
C 90°
D 100°
w x
zyQ
P
R
T
50°
97°
DB
C
A 5°
7.1 Angle Relationships in Triangles • MHR 373
xx
20°
DBC
A
Go towww.mcgrawhill.ca/
links/principles9 and followthe links to learn more abouthexaflexagons.
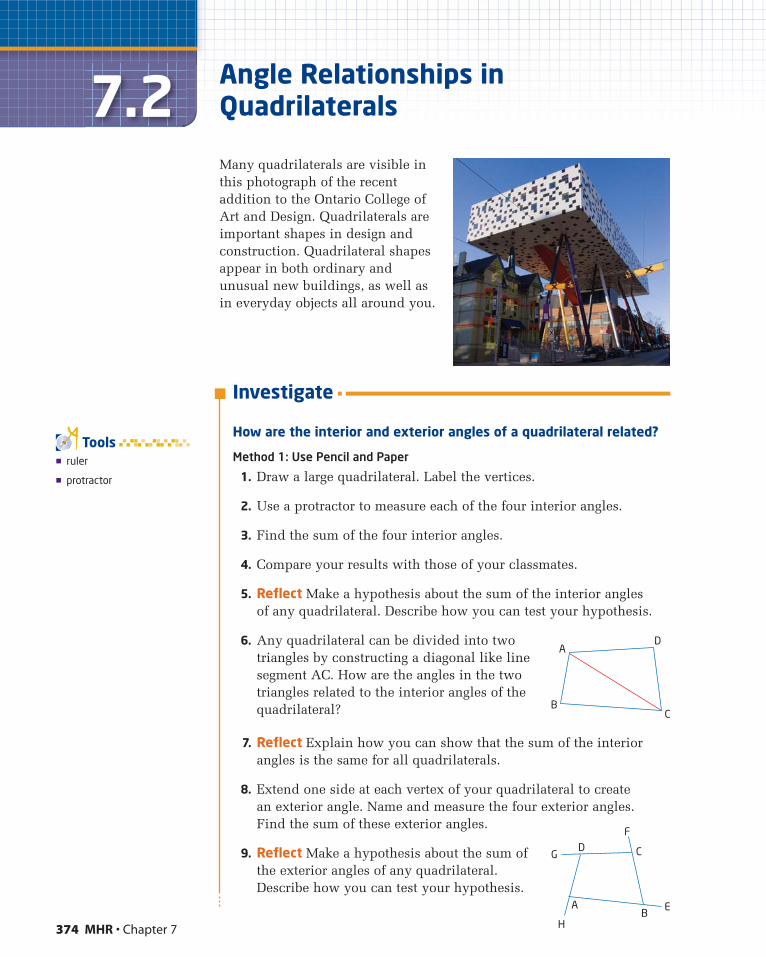
374 MHR • Chapter 7
7.2 Angle Relationships inQuadrilaterals
Many quadrilaterals are visible in this photograph of the recentaddition to the Ontario College ofArt and Design. Quadrilaterals areimportant shapes in design andconstruction. Quadrilateral shapesappear in both ordinary andunusual new buildings, as well asin everyday objects all around you.
� ruler
� protractor
Tools
Investigate
How are the interior and exterior angles of a quadrilateral related?
Method 1: Use Pencil and Paper
1. Draw a large quadrilateral. Label the vertices.
2. Use a protractor to measure each of the four interior angles.
3. Find the sum of the four interior angles.
4. Compare your results with those of your classmates.
5. Reflect Make a hypothesis about the sum of the interior angles of any quadrilateral. Describe how you can test your hypothesis.
6. Any quadrilateral can be divided into twotriangles by constructing a diagonal like linesegment AC. How are the angles in the twotriangles related to the interior angles of thequadrilateral?
7. Reflect Explain how you can show that the sum of the interiorangles is the same for all quadrilaterals.
8. Extend one side at each vertex of your quadrilateral to create an exterior angle. Name and measure the four exterior angles. Find the sum of these exterior angles.
9. Reflect Make a hypothesis about the sum ofthe exterior angles of any quadrilateral.Describe how you can test your hypothesis.
CB
AD
C
A
HB
E
DG
F
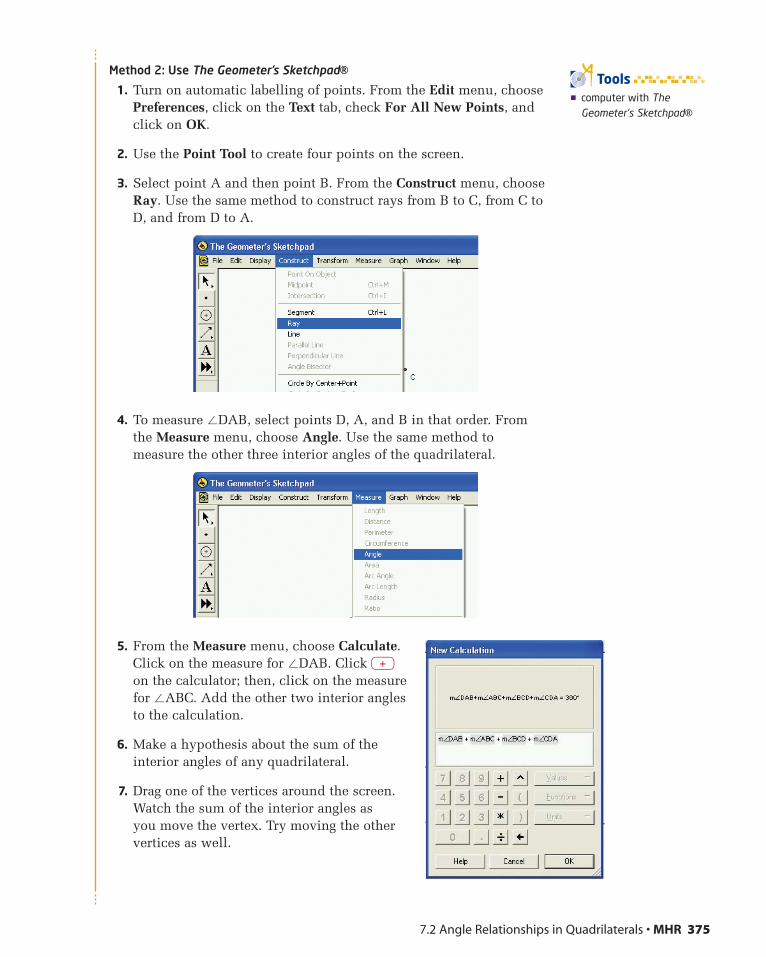
Method 2: Use The Geometer’s Sketchpad®1. Turn on automatic labelling of points. From the Edit menu, choose
Preferences, click on the Text tab, check For All New Points, andclick on OK.
2. Use the Point Tool to create four points on the screen.
3. Select point A and then point B. From the Construct menu, chooseRay. Use the same method to construct rays from B to C, from C toD, and from D to A.
4. To measure �DAB, select points D, A, and B in that order. Fromthe Measure menu, choose Angle. Use the same method tomeasure the other three interior angles of the quadrilateral.
5. From the Measure menu, choose Calculate.Click on the measure for �DAB. Click +
on the calculator; then, click on the measurefor �ABC. Add the other two interior angles to the calculation.
6. Make a hypothesis about the sum of theinterior angles of any quadrilateral.
7. Drag one of the vertices around the screen.Watch the sum of the interior angles as you move the vertex. Try moving the other vertices as well.
7.2 Angle Relationships in Quadrilaterals • MHR 375
� computer with TheGeometer’s Sketchpad®
Tools
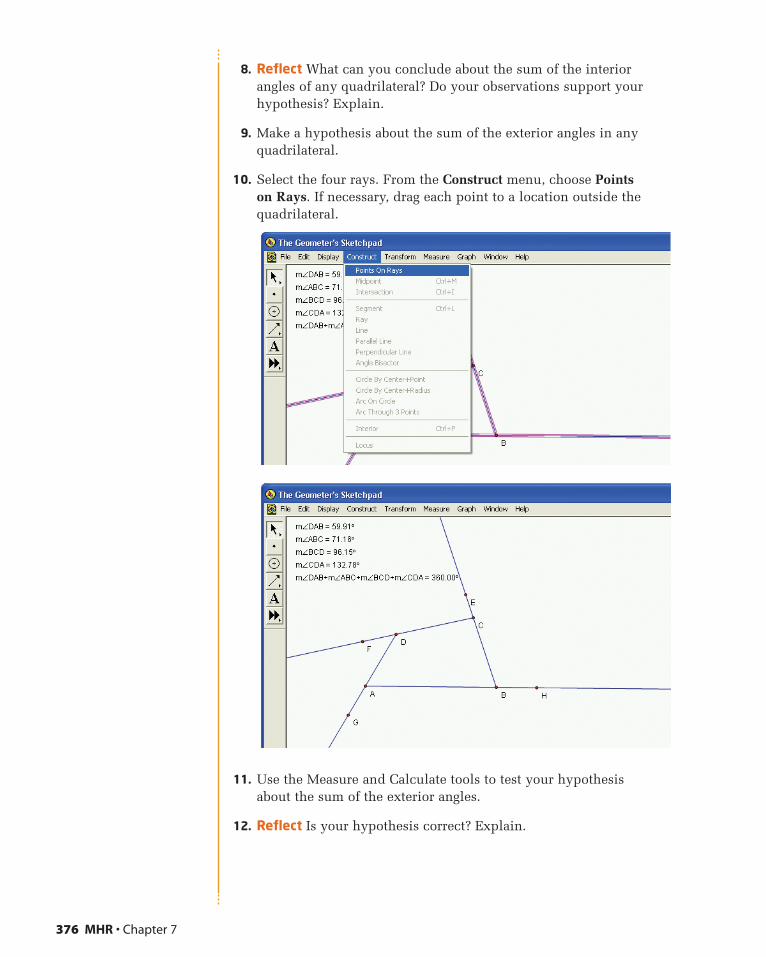
8. Reflect What can you conclude about the sum of the interiorangles of any quadrilateral? Do your observations support yourhypothesis? Explain.
9. Make a hypothesis about the sum of the exterior angles in anyquadrilateral.
10. Select the four rays. From the Construct menu, choose Points on Rays. If necessary, drag each point to a location outside thequadrilateral.
11. Use the Measure and Calculate tools to test your hypothesis about the sum of the exterior angles.
12. Reflect Is your hypothesis correct? Explain.
376 MHR • Chapter 7

Method 3: Use a Graphing Calculator
1. Press ∂ and select CabriJr. Press e when the title screenappears. If you need to clear a previous drawing from the screen,press y to display the F1 menu, and select New.
2. Press w to display the F2menu. Select Quad.. Use thecursor keys to move thepencil cursor around thescreen. Press e to placeeach vertex of thequadrilateral.
3. To measure angles, press g to display the F5 menu, highlightMeasure, and press ]. Select Angle from the submenu. For eachangle, select three points that define the angle by pressing e ateach point. Always select the vertex as the second of the threepoints. Use the cursor keys to drag the measurement so that itlabels the angle clearly; then, press e. Measure the four interiorangles of the quadrilateral.
4. Press g to display the F5 menu, and select Calculate. Selectthree of the angle measures by moving the cursor to each one andpressing e when the measurement is underlined. Press +
and drag the subtotal to an empty part of the screen. Select thissubtotal and the fourth angle measure. Now, press + to displaythe sum of all four angles. To avoid confusion, hide the subtotal by dragging the total sum to the same location.
� TI-83 Plus or TI-84graphing calculator
Tools
Technology TipVersion 2.00 of Cabri® Jr. canadd only three angles at atime. Later versions may letyou add all four angles ofthe quadrilateral in a singleoperation.
7.2 Angle Relationships in Quadrilaterals • MHR 377
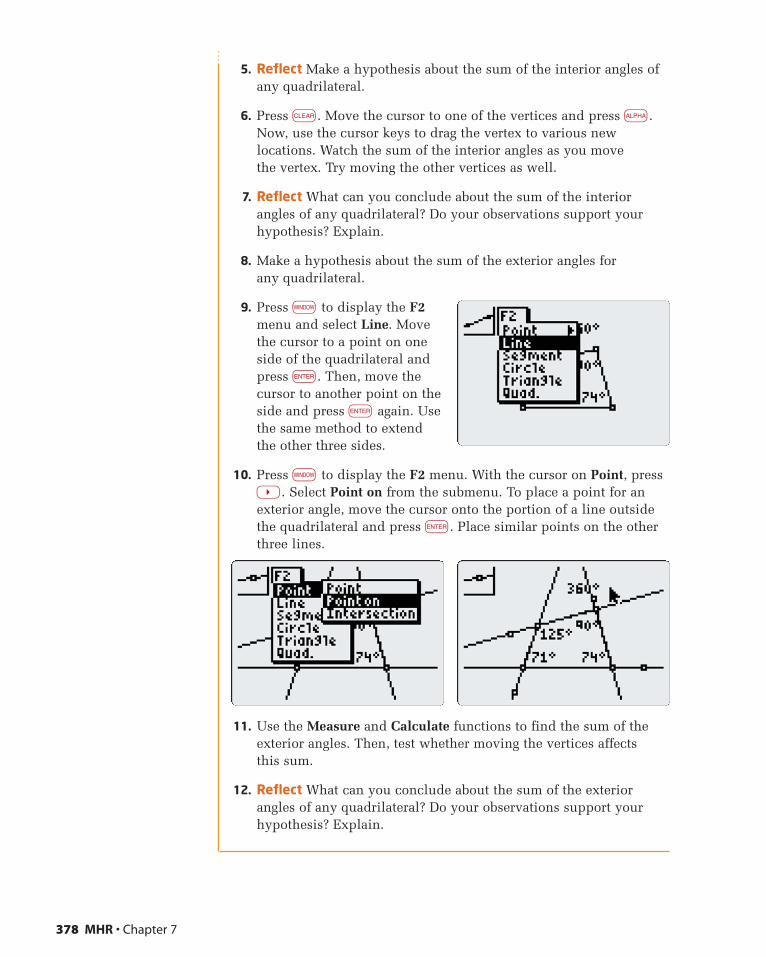
5. Reflect Make a hypothesis about the sum of the interior angles ofany quadrilateral.
6. Press b. Move the cursor to one of the vertices and press a.Now, use the cursor keys to drag the vertex to various newlocations. Watch the sum of the interior angles as you move the vertex. Try moving the other vertices as well.
7. Reflect What can you conclude about the sum of the interiorangles of any quadrilateral? Do your observations support yourhypothesis? Explain.
8. Make a hypothesis about the sum of the exterior angles for any quadrilateral.
9. Press w to display the F2menu and select Line. Movethe cursor to a point on oneside of the quadrilateral andpress e. Then, move thecursor to another point on theside and press e again. Usethe same method to extendthe other three sides.
10. Press w to display the F2 menu. With the cursor on Point, press]. Select Point on from the submenu. To place a point for anexterior angle, move the cursor onto the portion of a line outsidethe quadrilateral and press e. Place similar points on the otherthree lines.
11. Use the Measure and Calculate functions to find the sum of theexterior angles. Then, test whether moving the vertices affects this sum.
12. Reflect What can you conclude about the sum of the exteriorangles of any quadrilateral? Do your observations support yourhypothesis? Explain.
378 MHR • Chapter 7
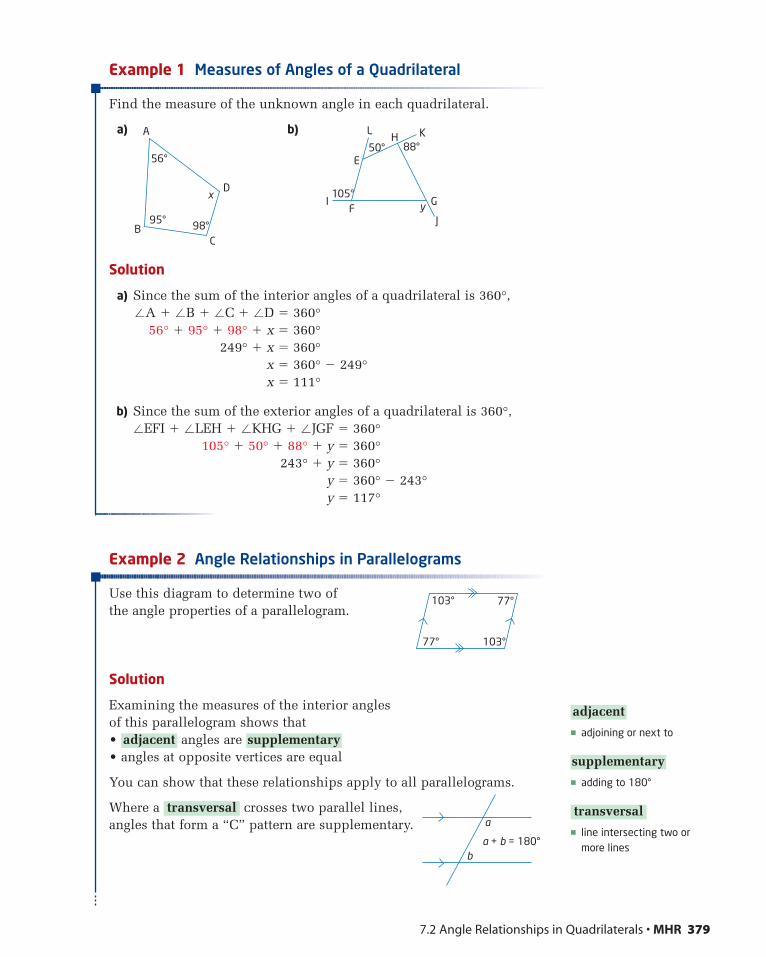
Example 1 Measures of Angles of a Quadrilateral
Find the measure of the unknown angle in each quadrilateral.
a) b)
Solution
a) Since the sum of the interior angles of a quadrilateral is 360°,�A � �B � �C � �D � 360°
56° � 95° � 98° � x � 360°249° � x � 360°
x � 360° � 249°x � 111°
b) Since the sum of the exterior angles of a quadrilateral is 360°,�EFI � �LEH � �KHG � �JGF � 360°
105° � 50° � 88° � y � 360°243° � y � 360°
y � 360° � 243°y � 117°
Example 2 Angle Relationships in Parallelograms
Use this diagram to determine two of the angle properties of a parallelogram.
Solution
Examining the measures of the interior angles of this parallelogram shows that• angles are • angles at opposite vertices are equal
You can show that these relationships apply to all parallelograms.
Where a crosses two parallel lines,angles that form a “C” pattern are supplementary.
transversal
supplementaryadjacent
105°
50° 88°
L
E
IF
J
G
H K
y
CB
95°
56°
98°
A
Dx
7.2 Angle Relationships in Quadrilaterals • MHR 379
� adjoining or next to
� adding to 180°
� line intersecting two ormore lines
transversal
supplementary
adjacent
77°
77°
103°
103°
a
a + b = 180°b
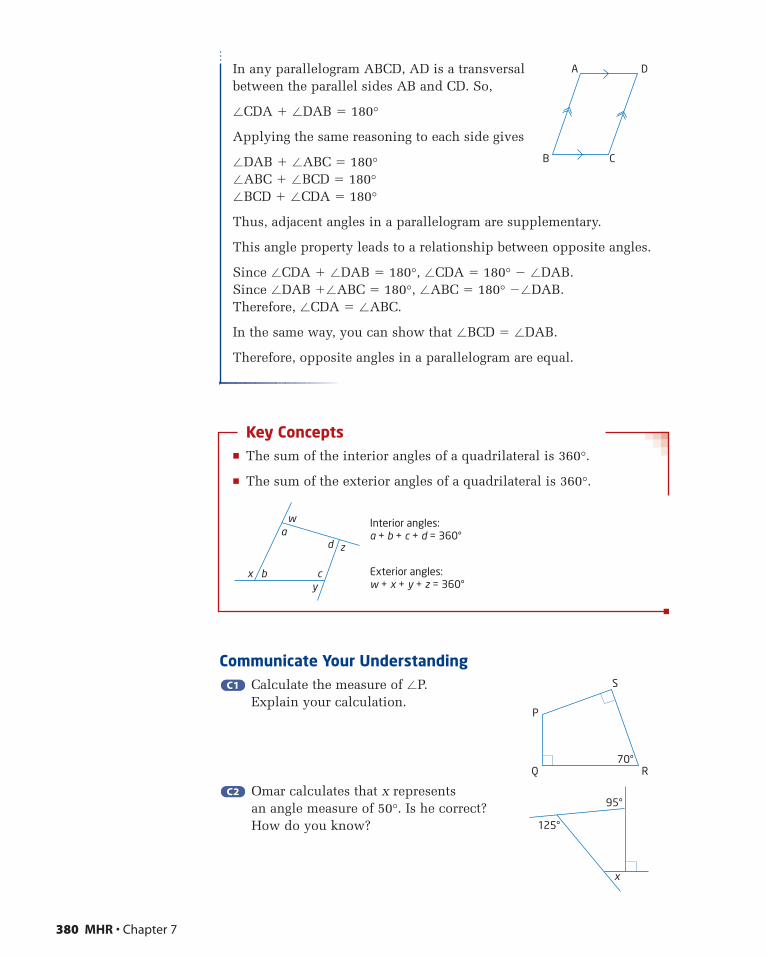
In any parallelogram ABCD, AD is a transversal between the parallel sides AB and CD. So,
�CDA � �DAB � 180°
Applying the same reasoning to each side gives
�DAB � �ABC � 180°�ABC � �BCD � 180°�BCD � �CDA � 180°
Thus, adjacent angles in a parallelogram are supplementary.
This angle property leads to a relationship between opposite angles.
Since �CDA � �DAB � 180°, �CDA � 180° � �DAB.Since �DAB ��ABC � 180°, �ABC � 180° ��DAB.Therefore, �CDA � �ABC.
In the same way, you can show that �BCD � �DAB.
Therefore, opposite angles in a parallelogram are equal.
Key Concepts� The sum of the interior angles of a quadrilateral is 360°.
� The sum of the exterior angles of a quadrilateral is 360°.
Communicate Your UnderstandingCalculate the measure of �P. Explain your calculation.
Omar calculates that x represents an angle measure of 50°. Is he correct? How do you know?
C2C2
C1C1
wa
b c
d
Interior angles:a + b + c + d = 360°
Exterior angles:w + x + y + z = 360°
z
yx
380 MHR • Chapter 7
Q R
S
P
70°
x
125°
95°
A D
CB
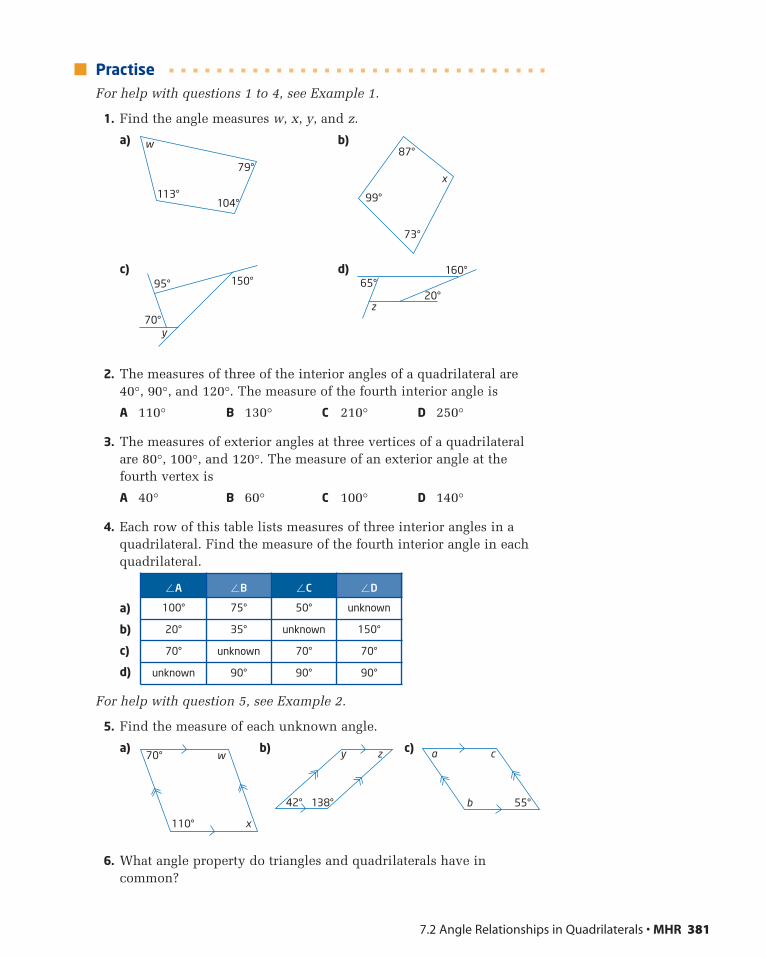
�A �B �C �D
100° 75° 50° unknown
20° 35° unknown 150°
70° unknown 70° 70°
unknown 90° 90° 90°
PractiseFor help with questions 1 to 4, see Example 1.
1. Find the angle measures w, x, y, and z.
a) b)
c) d)
2. The measures of three of the interior angles of a quadrilateral are 40°, 90°, and 120°. The measure of the fourth interior angle is
A 110° B 130° C 210° D 250°
3. The measures of exterior angles at three vertices of a quadrilateralare 80°, 100°, and 120°. The measure of an exterior angle at thefourth vertex is
A 40° B 60° C 100° D 140°
4. Each row of this table lists measures of three interior angles in aquadrilateral. Find the measure of the fourth interior angle in eachquadrilateral.
a)
b)
c)
d)
For help with question 5, see Example 2.
5. Find the measure of each unknown angle.
a) b) c)
6. What angle property do triangles and quadrilaterals have incommon?
55°
a c
b42° 138°
y z70°
110° x
w
65°20°
z
160°
70°
95° 150°
y
87°
99°
73°
x
104°
79°
113°
w
7.2 Angle Relationships in Quadrilaterals • MHR 381
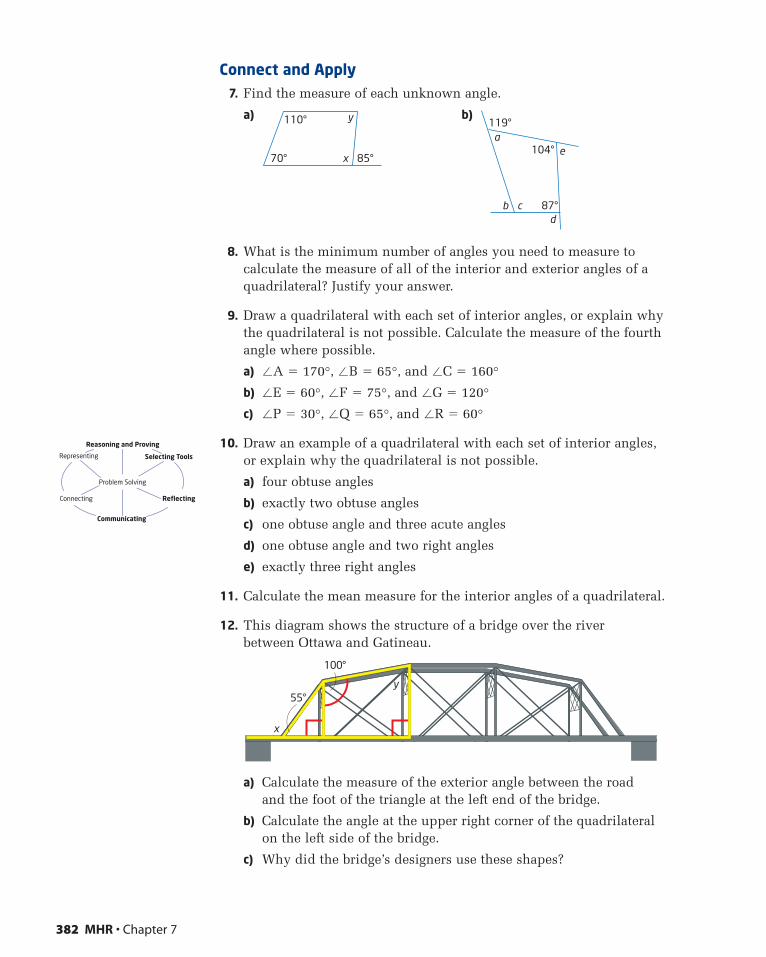
Connect and Apply7. Find the measure of each unknown angle.
a) b)
8. What is the minimum number of angles you need to measure tocalculate the measure of all of the interior and exterior angles of aquadrilateral? Justify your answer.
9. Draw a quadrilateral with each set of interior angles, or explain whythe quadrilateral is not possible. Calculate the measure of the fourthangle where possible.
a) �A � 170°, �B � 65°, and �C � 160°
b) �E � 60°, �F � 75°, and �G � 120°
c) �P � 30°, �Q � 65°, and �R � 60°
10. Draw an example of a quadrilateral with each set of interior angles,or explain why the quadrilateral is not possible.
a) four obtuse angles
b) exactly two obtuse angles
c) one obtuse angle and three acute angles
d) one obtuse angle and two right angles
e) exactly three right angles
11. Calculate the mean measure for the interior angles of a quadrilateral.
12. This diagram shows the structure of a bridge over the river between Ottawa and Gatineau.
a) Calculate the measure of the exterior angle between the road and the foot of the triangle at the left end of the bridge.
b) Calculate the angle at the upper right corner of the quadrilateralon the left side of the bridge.
c) Why did the bridge’s designers use these shapes?
y
100°
x
55°
104°
119°
87°cd
ae
b
85°70°
110°
x
y
382 MHR • Chapter 7
Selecting ToolsRepresenting
Reasoning and Proving
Communicating
Connecting Reflecting
Problem Solving
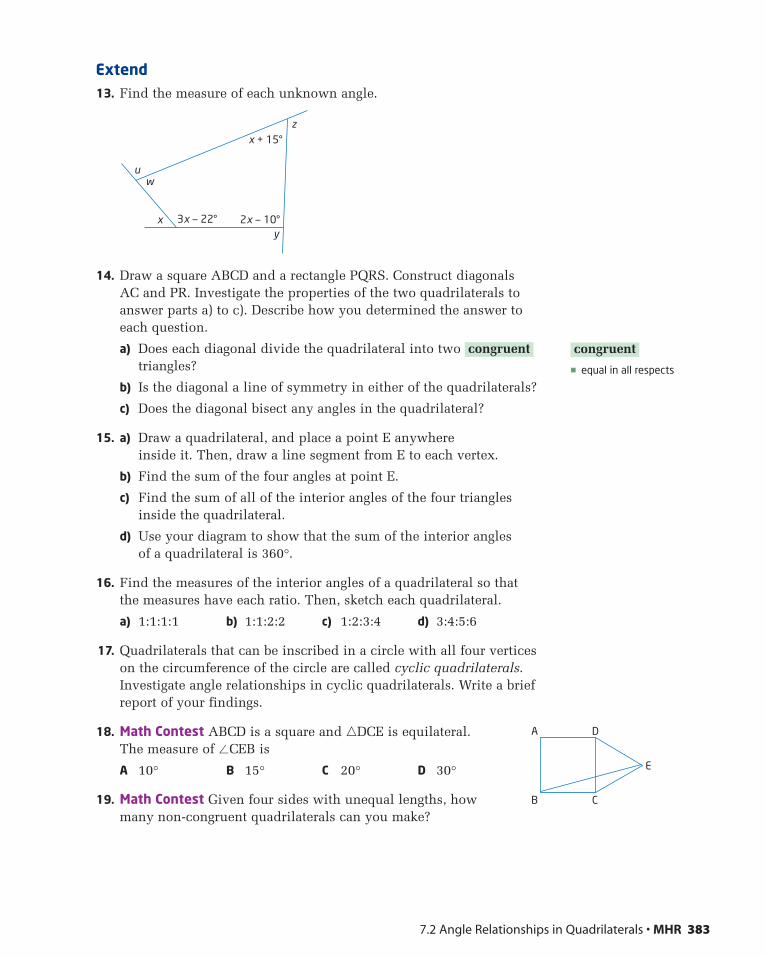
Extend13. Find the measure of each unknown angle.
14. Draw a square ABCD and a rectangle PQRS. Construct diagonals AC and PR. Investigate the properties of the two quadrilaterals toanswer parts a) to c). Describe how you determined the answer toeach question.
a) Does each diagonal divide the quadrilateral into two triangles?
b) Is the diagonal a line of symmetry in either of the quadrilaterals?
c) Does the diagonal bisect any angles in the quadrilateral?
15. a) Draw a quadrilateral, and place a point E anywhere inside it. Then, draw a line segment from E to each vertex.
b) Find the sum of the four angles at point E.
c) Find the sum of all of the interior angles of the four trianglesinside the quadrilateral.
d) Use your diagram to show that the sum of the interior angles of a quadrilateral is 360°.
16. Find the measures of the interior angles of a quadrilateral so that the measures have each ratio. Then, sketch each quadrilateral.
a) 1:1:1:1 b) 1:1:2:2 c) 1:2:3:4 d) 3:4:5:6
17. Quadrilaterals that can be inscribed in a circle with all four verticeson the circumference of the circle are called cyclic quadrilaterals.Investigate angle relationships in cyclic quadrilaterals. Write a briefreport of your findings.
18. Math Contest ABCD is a square and �DCE is equilateral. The measure of �CEB is
A 10° B 15° C 20° D 30°
19. Math Contest Given four sides with unequal lengths, how many non-congruent quadrilaterals can you make?
congruent
wu
x
z
y3x — 22° 2x — 10°
x + 15°
7.2 Angle Relationships in Quadrilaterals • MHR 383
� equal in all respects
congruent
B
A D
C
E
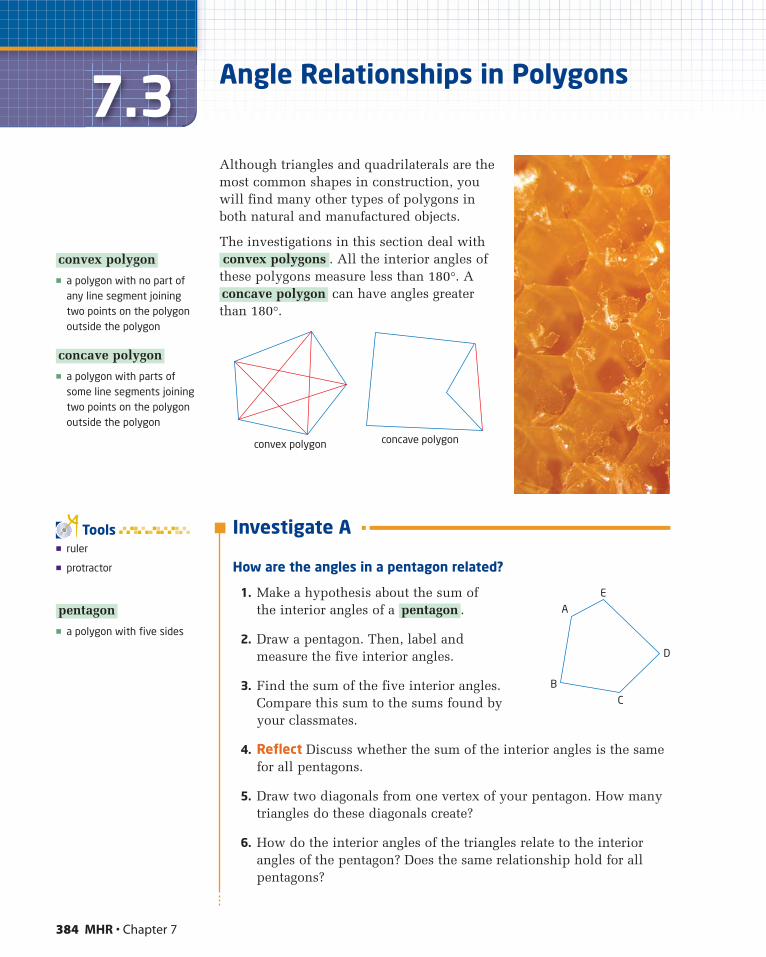
384 MHR • Chapter 7
7.3Although triangles and quadrilaterals are themost common shapes in construction, youwill find many other types of polygons inboth natural and manufactured objects.
The investigations in this section deal with. All the interior angles of
these polygons measure less than 180°. Acan have angles greater
than 180°.concave polygon
convex polygons
Angle Relationships in Polygons
� a polygon with no part ofany line segment joiningtwo points on the polygonoutside the polygon
� a polygon with parts ofsome line segments joiningtwo points on the polygonoutside the polygon
concave polygon
convex polygon
� ruler
� protractor
Tools
� a polygon with five sides
pentagon
convex polygon concave polygon
Investigate A
How are the angles in a pentagon related?
1. Make a hypothesis about the sum of the interior angles of a .
2. Draw a pentagon. Then, label and measure the five interior angles.
3. Find the sum of the five interior angles.Compare this sum to the sums found by your classmates.
4. Reflect Discuss whether the sum of the interior angles is the samefor all pentagons.
5. Draw two diagonals from one vertex of your pentagon. How manytriangles do these diagonals create?
6. How do the interior angles of the triangles relate to the interiorangles of the pentagon? Does the same relationship hold for allpentagons?
pentagon A
E
D
C
B
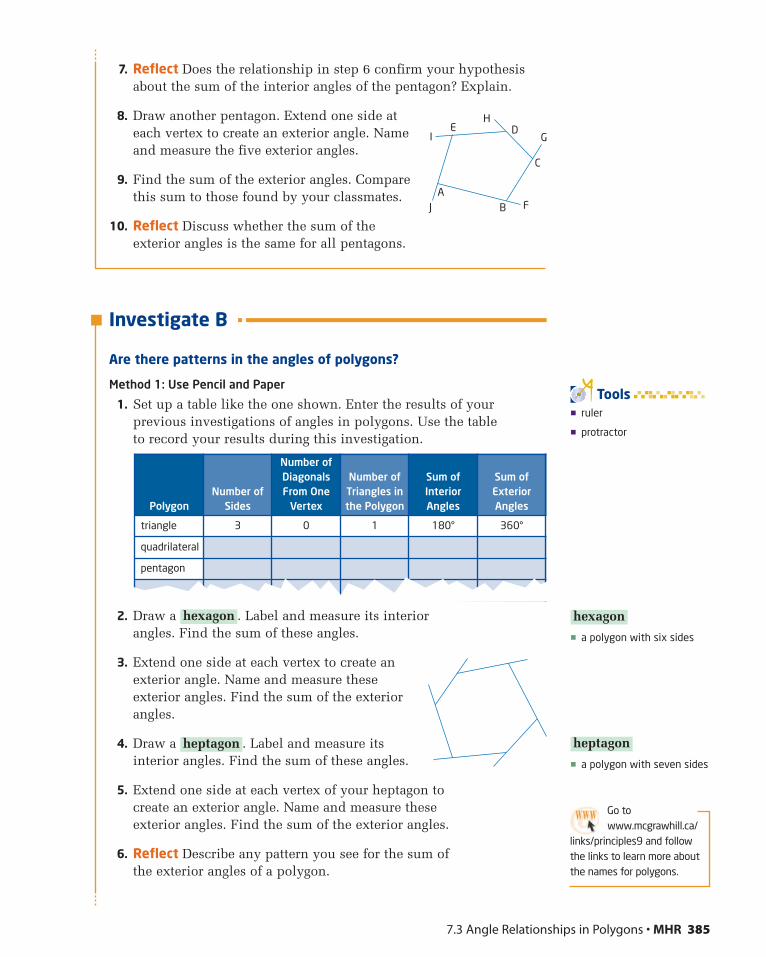
7. Reflect Does the relationship in step 6 confirm your hypothesisabout the sum of the interior angles of the pentagon? Explain.
8. Draw another pentagon. Extend one side ateach vertex to create an exterior angle. Nameand measure the five exterior angles.
9. Find the sum of the exterior angles. Comparethis sum to those found by your classmates.
10. Reflect Discuss whether the sum of the exterior angles is the same for all pentagons.
Investigate B
Are there patterns in the angles of polygons?
Method 1: Use Pencil and Paper
1. Set up a table like the one shown. Enter the results of yourprevious investigations of angles in polygons. Use the table to record your results during this investigation.
2. Draw a . Label and measure its interior angles. Find the sum of these angles.
3. Extend one side at each vertex to create anexterior angle. Name and measure theseexterior angles. Find the sum of the exteriorangles.
4. Draw a . Label and measure itsinterior angles. Find the sum of these angles.
5. Extend one side at each vertex of your heptagon to create an exterior angle. Name and measure these exterior angles. Find the sum of the exterior angles.
6. Reflect Describe any pattern you see for the sum ofthe exterior angles of a polygon.
heptagon
hexagon
PolygonNumber of
Sides
Number ofDiagonalsFrom One
Vertex
Number ofTriangles inthe Polygon
Sum ofInteriorAngles
Sum ofExteriorAngles
triangle 3 0 1 180° 360°
quadrilateral
pentagon
7.3 Angle Relationships in Polygons • MHR 385
� a polygon with six sides
hexagon
� a polygon with seven sides
heptagon
A
EI
J F
G
HD
C
B
� ruler
� protractor
Tools
Go towww.mcgrawhill.ca/
links/principles9 and followthe links to learn more aboutthe names for polygons.
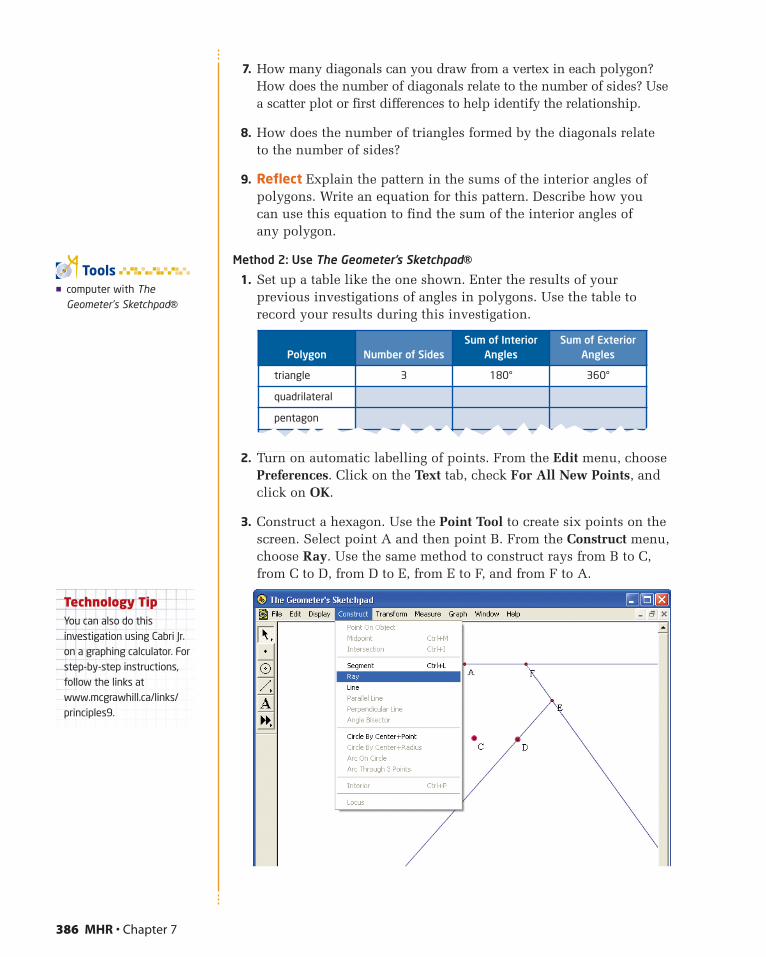
Polygon Number of SidesSum of Interior
AnglesSum of Exterior
Angles
triangle 3 180° 360°
quadrilateral
pentagon
7. How many diagonals can you draw from a vertex in each polygon?How does the number of diagonals relate to the number of sides? Usea scatter plot or first differences to help identify the relationship.
8. How does the number of triangles formed by the diagonals relateto the number of sides?
9. Reflect Explain the pattern in the sums of the interior angles ofpolygons. Write an equation for this pattern. Describe how you can use this equation to find the sum of the interior angles of any polygon.
Method 2: Use The Geometer’s Sketchpad®1. Set up a table like the one shown. Enter the results of your
previous investigations of angles in polygons. Use the table torecord your results during this investigation.
2. Turn on automatic labelling of points. From the Edit menu, choosePreferences. Click on the Text tab, check For All New Points, andclick on OK.
3. Construct a hexagon. Use the Point Tool to create six points on thescreen. Select point A and then point B. From the Construct menu,choose Ray. Use the same method to construct rays from B to C,from C to D, from D to E, from E to F, and from F to A.
386 MHR • Chapter 7
� computer with TheGeometer’s Sketchpad®
Tools
Technology TipYou can also do thisinvestigation using Cabri Jr.on a graphing calculator. Forstep-by-step instructions,follow the links at www.mcgrawhill.ca/links/principles9.
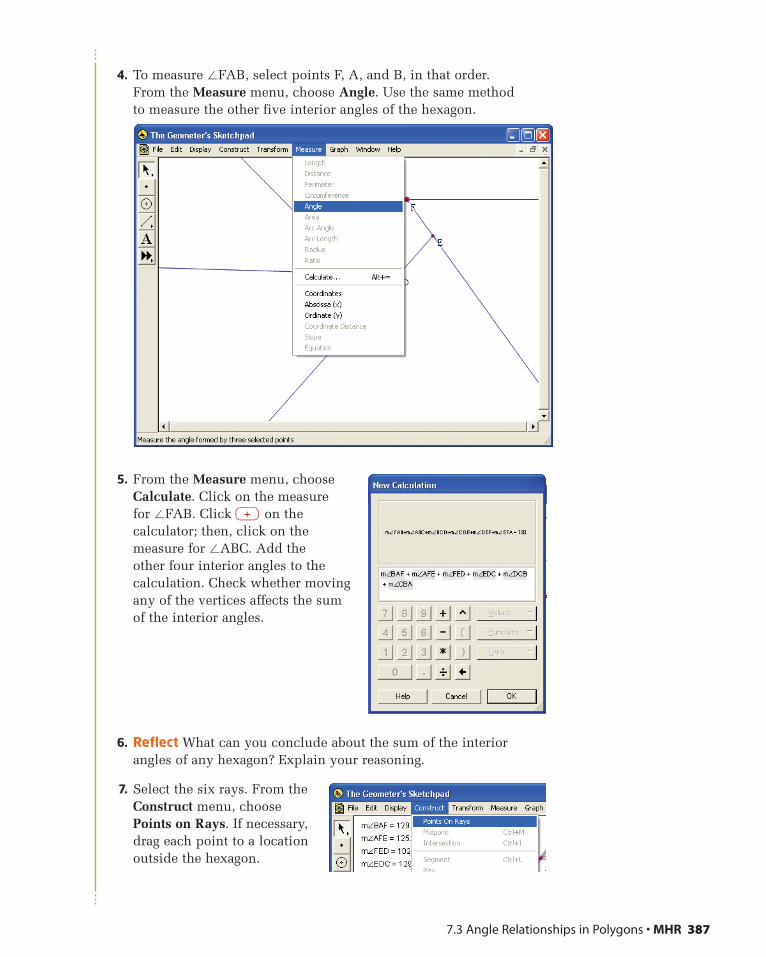
4. To measure �FAB, select points F, A, and B, in that order. From the Measure menu, choose Angle. Use the same method to measure the other five interior angles of the hexagon.
5. From the Measure menu, chooseCalculate. Click on the measure for �FAB. Click + on thecalculator; then, click on themeasure for �ABC. Add the other four interior angles to thecalculation. Check whether movingany of the vertices affects the sumof the interior angles.
6. Reflect What can you conclude about the sum of the interiorangles of any hexagon? Explain your reasoning.
7. Select the six rays. From theConstruct menu, choosePoints on Rays. If necessary,drag each point to a locationoutside the hexagon.
7.3 Angle Relationships in Polygons • MHR 387
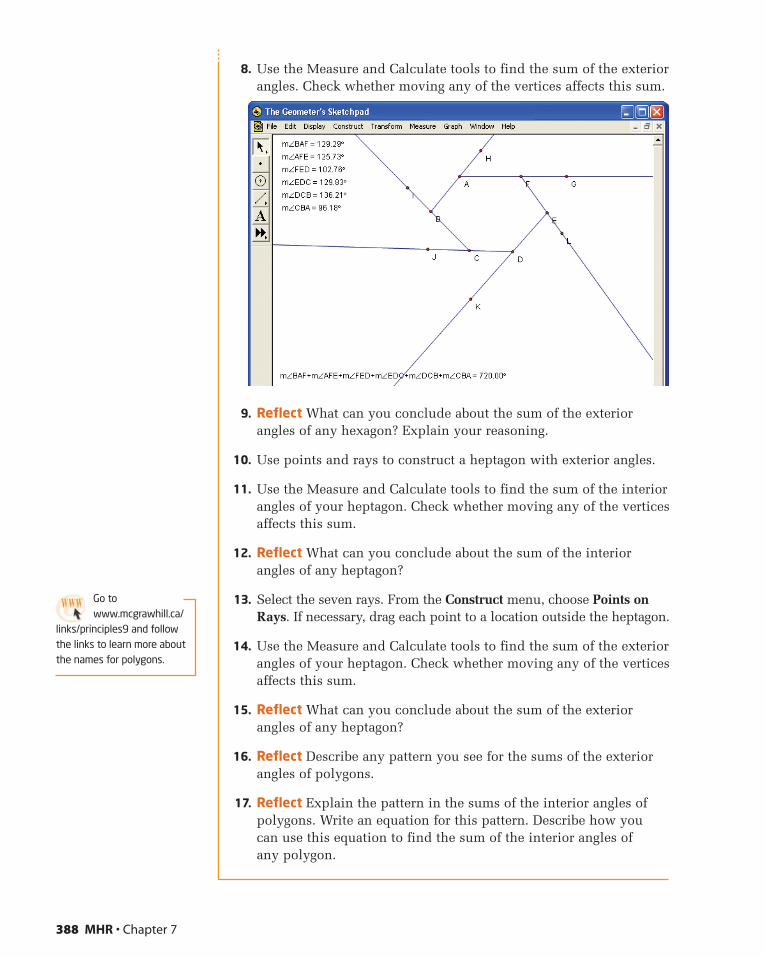
8. Use the Measure and Calculate tools to find the sum of the exteriorangles. Check whether moving any of the vertices affects this sum.
9. Reflect What can you conclude about the sum of the exteriorangles of any hexagon? Explain your reasoning.
10. Use points and rays to construct a heptagon with exterior angles.
11. Use the Measure and Calculate tools to find the sum of the interiorangles of your heptagon. Check whether moving any of the verticesaffects this sum.
12. Reflect What can you conclude about the sum of the interiorangles of any heptagon?
13. Select the seven rays. From the Construct menu, choose Points onRays. If necessary, drag each point to a location outside the heptagon.
14. Use the Measure and Calculate tools to find the sum of the exteriorangles of your heptagon. Check whether moving any of the verticesaffects this sum.
15. Reflect What can you conclude about the sum of the exteriorangles of any heptagon?
16. Reflect Describe any pattern you see for the sums of the exteriorangles of polygons.
17. Reflect Explain the pattern in the sums of the interior angles ofpolygons. Write an equation for this pattern. Describe how you can use this equation to find the sum of the interior angles of any polygon.
388 MHR • Chapter 7
Go to www.mcgrawhill.ca/
links/principles9 and followthe links to learn more aboutthe names for polygons.
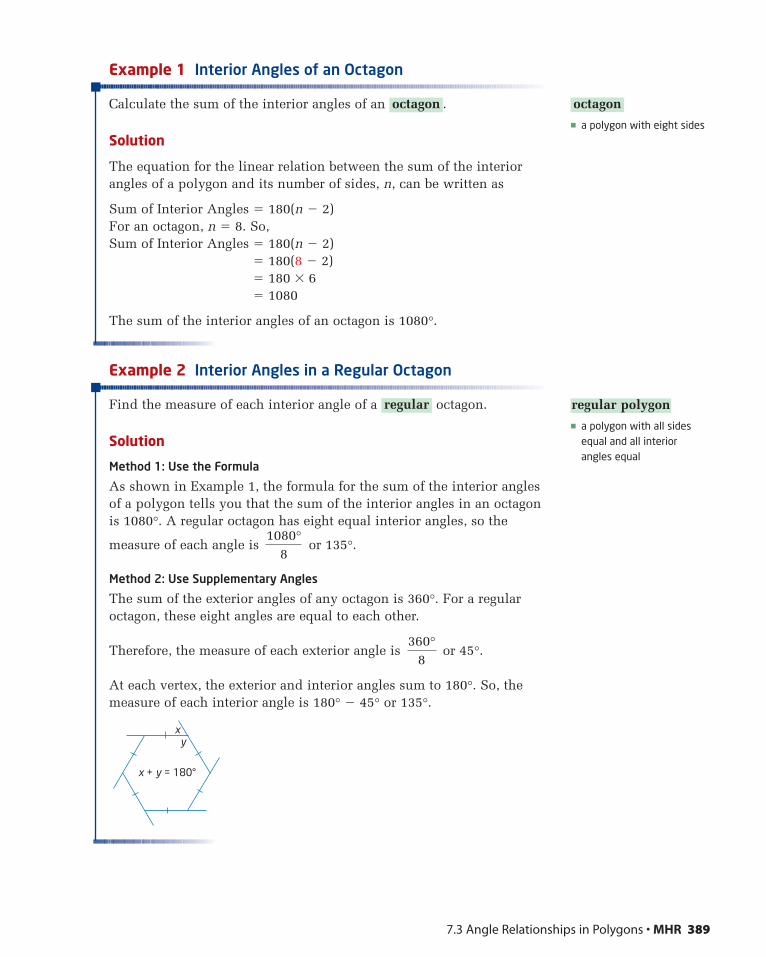
Example 1 Interior Angles of an Octagon
Calculate the sum of the interior angles of an .
Solution
The equation for the linear relation between the sum of the interiorangles of a polygon and its number of sides, n, can be written as
Sum of Interior Angles � 180(n � 2)For an octagon, n � 8. So,Sum of Interior Angles � 180(n � 2)
� 180(8 � 2)� 180 � 6� 1080
The sum of the interior angles of an octagon is 1080°.
Example 2 Interior Angles in a Regular Octagon
Find the measure of each interior angle of a octagon.
Solution
Method 1: Use the Formula
As shown in Example 1, the formula for the sum of the interior anglesof a polygon tells you that the sum of the interior angles in an octagonis 1080°. A regular octagon has eight equal interior angles, so the
measure of each angle is or 135°.
Method 2: Use Supplementary Angles
The sum of the exterior angles of any octagon is 360°. For a regularoctagon, these eight angles are equal to each other.
Therefore, the measure of each exterior angle is or 45°.
At each vertex, the exterior and interior angles sum to 180°. So, themeasure of each interior angle is 180° � 45° or 135°.
360°8
1080°8
regular
octagon
7.3 Angle Relationships in Polygons • MHR 389
� a polygon with eight sides
octagon
� a polygon with all sidesequal and all interiorangles equal
regular polygon
x + y = 180°
xy
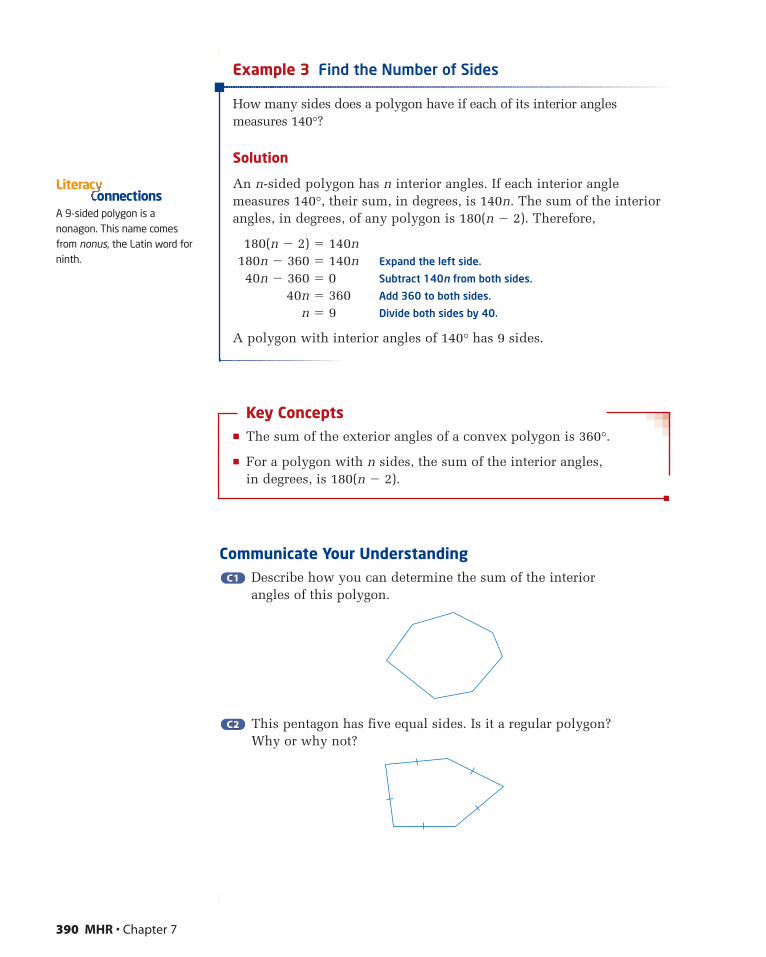
Example 3 Find the Number of Sides
How many sides does a polygon have if each of its interior anglesmeasures 140°?
Solution
An n-sided polygon has n interior angles. If each interior anglemeasures 140°, their sum, in degrees, is 140n. The sum of the interiorangles, in degrees, of any polygon is 180(n � 2). Therefore,
180(n � 2) � 140n180n � 360 � 140n Expand the left side.
40n � 360 � 0 Subtract 140n from both sides.
40n � 360 Add 360 to both sides.
n � 9 Divide both sides by 40.
A polygon with interior angles of 140° has 9 sides.
Key Concepts� The sum of the exterior angles of a convex polygon is 360°.
� For a polygon with n sides, the sum of the interior angles, in degrees, is 180(n � 2).
Communicate Your UnderstandingDescribe how you can determine the sum of the interior angles of this polygon.
This pentagon has five equal sides. Is it a regular polygon? Why or why not?
C2C2
C1C1
390 MHR • Chapter 7
A 9-sided polygon is anonagon. This name comesfrom nonus, the Latin word forninth.
onnectionsLiterac
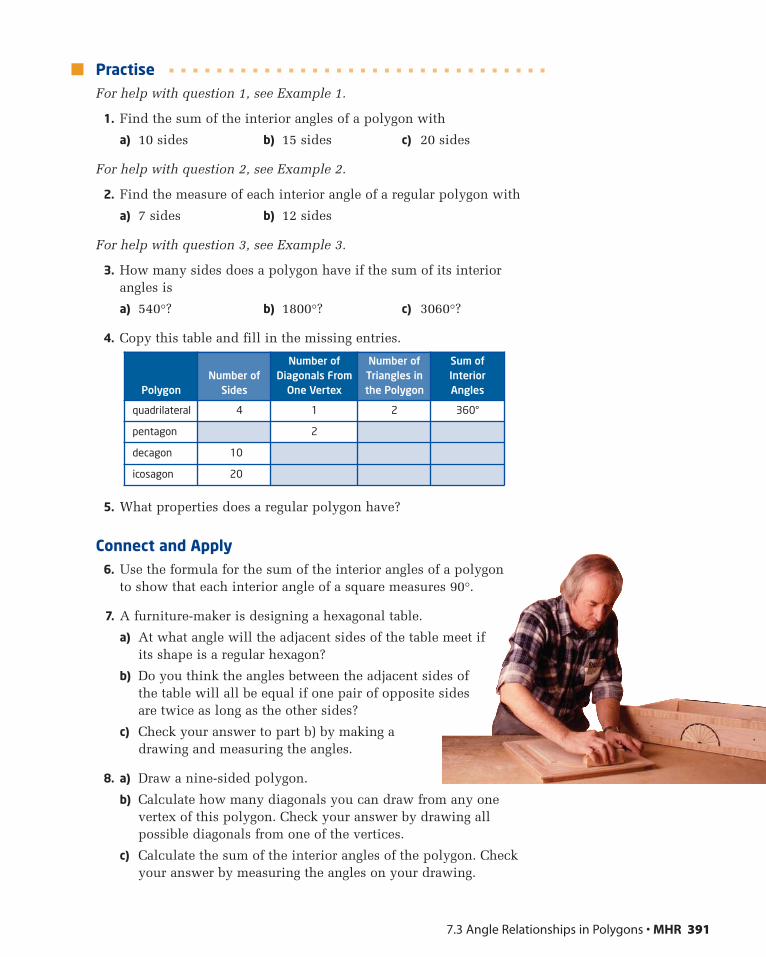
PractiseFor help with question 1, see Example 1.
1. Find the sum of the interior angles of a polygon with
a) 10 sides b) 15 sides c) 20 sides
For help with question 2, see Example 2.
2. Find the measure of each interior angle of a regular polygon with
a) 7 sides b) 12 sides
For help with question 3, see Example 3.
3. How many sides does a polygon have if the sum of its interiorangles is
a) 540°? b) 1800°? c) 3060°?
4. Copy this table and fill in the missing entries.
5. What properties does a regular polygon have?
Connect and Apply6. Use the formula for the sum of the interior angles of a polygon
to show that each interior angle of a square measures 90°.
7. A furniture-maker is designing a hexagonal table.
a) At what angle will the adjacent sides of the table meet if its shape is a regular hexagon?
b) Do you think the angles between the adjacent sides ofthe table will all be equal if one pair of opposite sidesare twice as long as the other sides?
c) Check your answer to part b) by making adrawing and measuring the angles.
8. a) Draw a nine-sided polygon.
b) Calculate how many diagonals you can draw from any one vertex of this polygon. Check your answer by drawing all possible diagonals from one of the vertices.
c) Calculate the sum of the interior angles of the polygon. Checkyour answer by measuring the angles on your drawing.
7.3 Angle Relationships in Polygons • MHR 391
PolygonNumber of
Sides
Number ofDiagonals From
One Vertex
Number ofTriangles inthe Polygon
Sum ofInteriorAngles
quadrilateral 4 1 2 360°
pentagon 2
decagon 10
icosagon 20
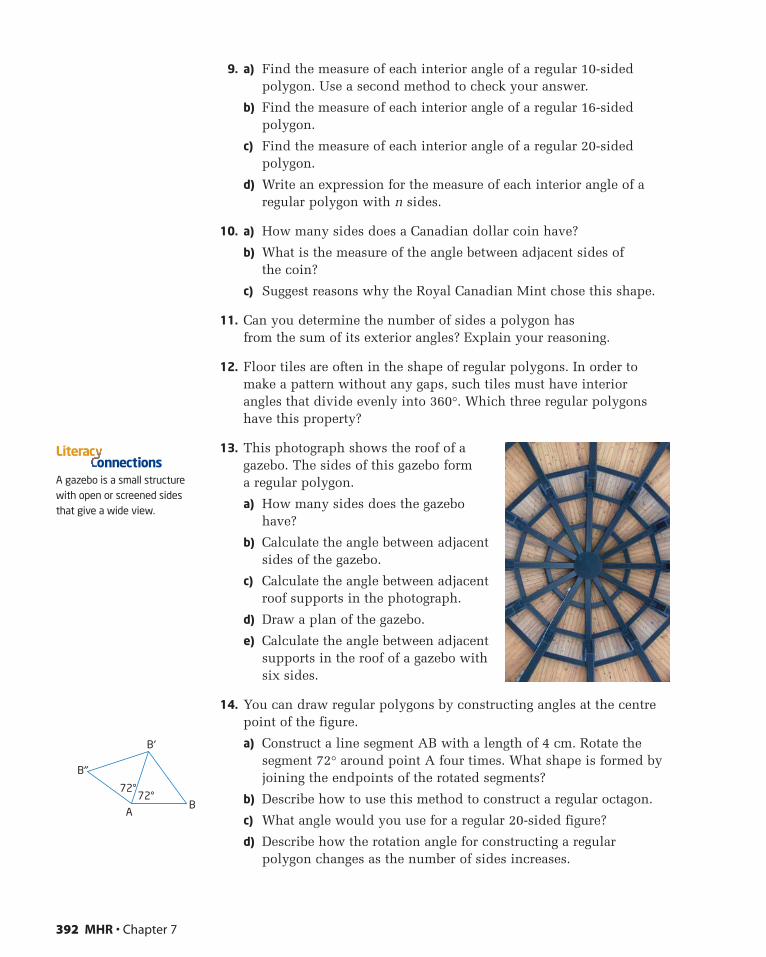
9. a) Find the measure of each interior angle of a regular 10-sidedpolygon. Use a second method to check your answer.
b) Find the measure of each interior angle of a regular 16-sidedpolygon.
c) Find the measure of each interior angle of a regular 20-sidedpolygon.
d) Write an expression for the measure of each interior angle of aregular polygon with n sides.
10. a) How many sides does a Canadian dollar coin have?
b) What is the measure of the angle between adjacent sides of the coin?
c) Suggest reasons why the Royal Canadian Mint chose this shape.
11. Can you determine the number of sides a polygon has from the sum of its exterior angles? Explain your reasoning.
12. Floor tiles are often in the shape of regular polygons. In order tomake a pattern without any gaps, such tiles must have interior angles that divide evenly into 360°. Which three regular polygonshave this property?
13. This photograph shows the roof of agazebo. The sides of this gazebo form a regular polygon.
a) How many sides does the gazebohave?
b) Calculate the angle between adjacentsides of the gazebo.
c) Calculate the angle between adjacentroof supports in the photograph.
d) Draw a plan of the gazebo.
e) Calculate the angle between adjacentsupports in the roof of a gazebo withsix sides.
14. You can draw regular polygons by constructing angles at the centrepoint of the figure.
a) Construct a line segment AB with a length of 4 cm. Rotate thesegment 72° around point A four times. What shape is formed byjoining the endpoints of the rotated segments?
b) Describe how to use this method to construct a regular octagon.
c) What angle would you use for a regular 20-sided figure?
d) Describe how the rotation angle for constructing a regular polygon changes as the number of sides increases.
392 MHR • Chapter 7
A gazebo is a small structurewith open or screened sidesthat give a wide view.
onnectionsLiterac
72°72°
BA
B′
B″
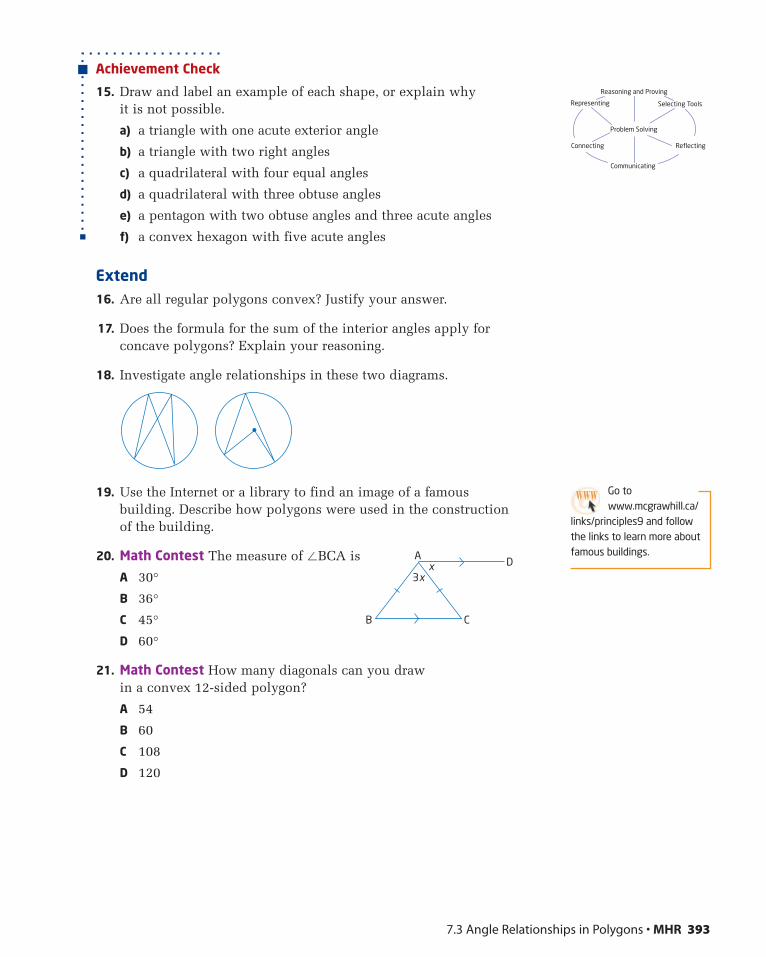
Achievement Check
15. Draw and label an example of each shape, or explain why it is not possible.
a) a triangle with one acute exterior angle
b) a triangle with two right angles
c) a quadrilateral with four equal angles
d) a quadrilateral with three obtuse angles
e) a pentagon with two obtuse angles and three acute angles
f) a convex hexagon with five acute angles
Extend16. Are all regular polygons convex? Justify your answer.
17. Does the formula for the sum of the interior angles apply for concave polygons? Explain your reasoning.
18. Investigate angle relationships in these two diagrams.
19. Use the Internet or a library to find an image of a famous building. Describe how polygons were used in the construction of the building.
20. Math Contest The measure of �BCA is
A 30°
B 36°
C 45°
D 60°
21. Math Contest How many diagonals can you draw in a convex 12-sided polygon?
A 54
B 60
C 108
D 120
7.3 Angle Relationships in Polygons • MHR 393
B C
3xx
A D
Selecting ToolsRepresenting
Reasoning and Proving
Communicating
Connecting Reflecting
Problem Solving
Go towww.mcgrawhill.ca/
links/principles9 and followthe links to learn more aboutfamous buildings.
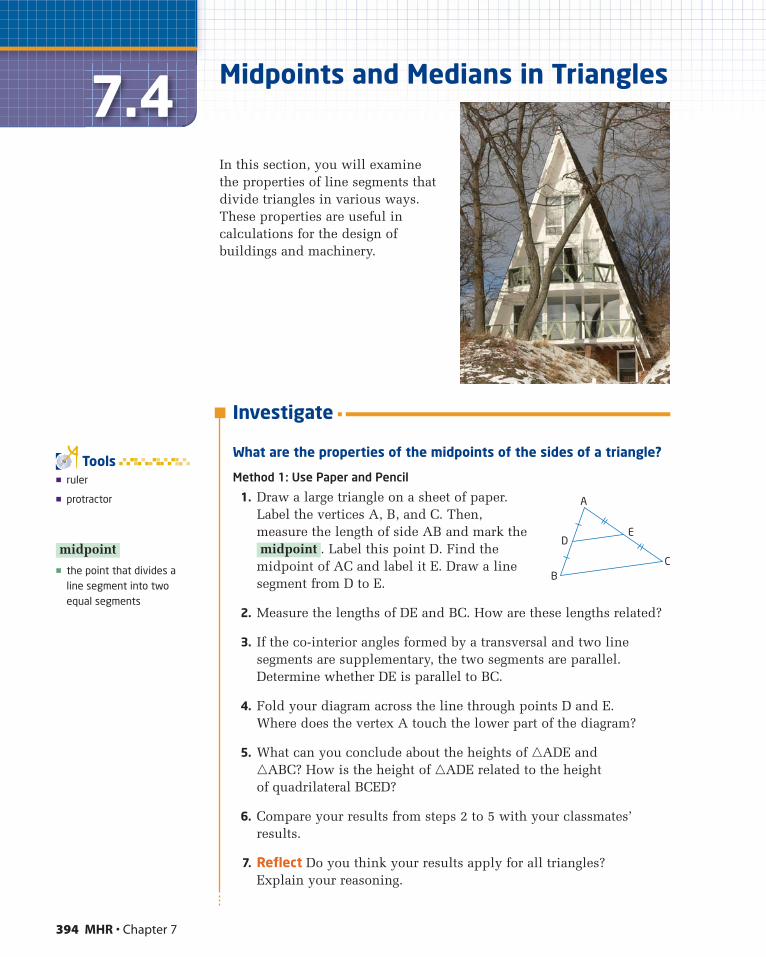
Investigate
What are the properties of the midpoints of the sides of a triangle?
Method 1: Use Paper and Pencil
1. Draw a large triangle on a sheet of paper.Label the vertices A, B, and C. Then,measure the length of side AB and mark the
. Label this point D. Find themidpoint of AC and label it E. Draw a linesegment from D to E.
2. Measure the lengths of DE and BC. How are these lengths related?
3. If the co-interior angles formed by a transversal and two linesegments are supplementary, the two segments are parallel.Determine whether DE is parallel to BC.
4. Fold your diagram across the line through points D and E. Where does the vertex A touch the lower part of the diagram?
5. What can you conclude about the heights of �ADE and �ABC? How is the height of �ADE related to the height of quadrilateral BCED?
6. Compare your results from steps 2 to 5 with your classmates’results.
7. Reflect Do you think your results apply for all triangles? Explain your reasoning.
midpoint
394 MHR • Chapter 7
7.4 Midpoints and Medians in Triangles
In this section, you will examinethe properties of line segments thatdivide triangles in various ways.These properties are useful incalculations for the design ofbuildings and machinery.
� ruler
� protractor
Tools
� the point that divides aline segment into twoequal segments
midpoint
B
DE
C
A
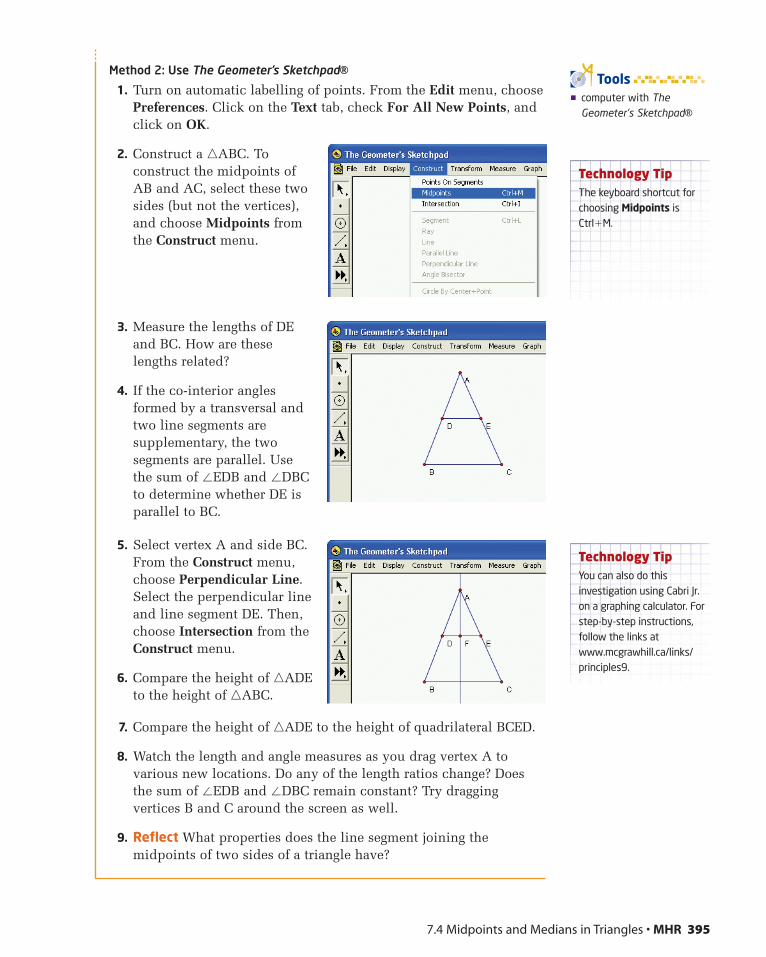
Method 2: Use The Geometer’s Sketchpad®1. Turn on automatic labelling of points. From the Edit menu, choose
Preferences. Click on the Text tab, check For All New Points, andclick on OK.
2. Construct a �ABC. Toconstruct the midpoints ofAB and AC, select these twosides (but not the vertices),and choose Midpoints fromthe Construct menu.
3. Measure the lengths of DEand BC. How are theselengths related?
4. If the co-interior anglesformed by a transversal andtwo line segments aresupplementary, the twosegments are parallel. Usethe sum of �EDB and �DBCto determine whether DE isparallel to BC.
5. Select vertex A and side BC.From the Construct menu,choose Perpendicular Line.Select the perpendicular lineand line segment DE. Then,choose Intersection from theConstruct menu.
6. Compare the height of �ADEto the height of �ABC.
7. Compare the height of �ADE to the height of quadrilateral BCED.
8. Watch the length and angle measures as you drag vertex A tovarious new locations. Do any of the length ratios change? Doesthe sum of �EDB and �DBC remain constant? Try draggingvertices B and C around the screen as well.
9. Reflect What properties does the line segment joining themidpoints of two sides of a triangle have?
7.4 Midpoints and Medians in Triangles • MHR 395
Technology TipThe keyboard shortcut forchoosing Midpoints isCtrl�M.
� computer with TheGeometer’s Sketchpad®
Tools
Technology TipYou can also do thisinvestigation using Cabri Jr.on a graphing calculator. Forstep-by-step instructions,follow the links at www.mcgrawhill.ca/links/principles9.
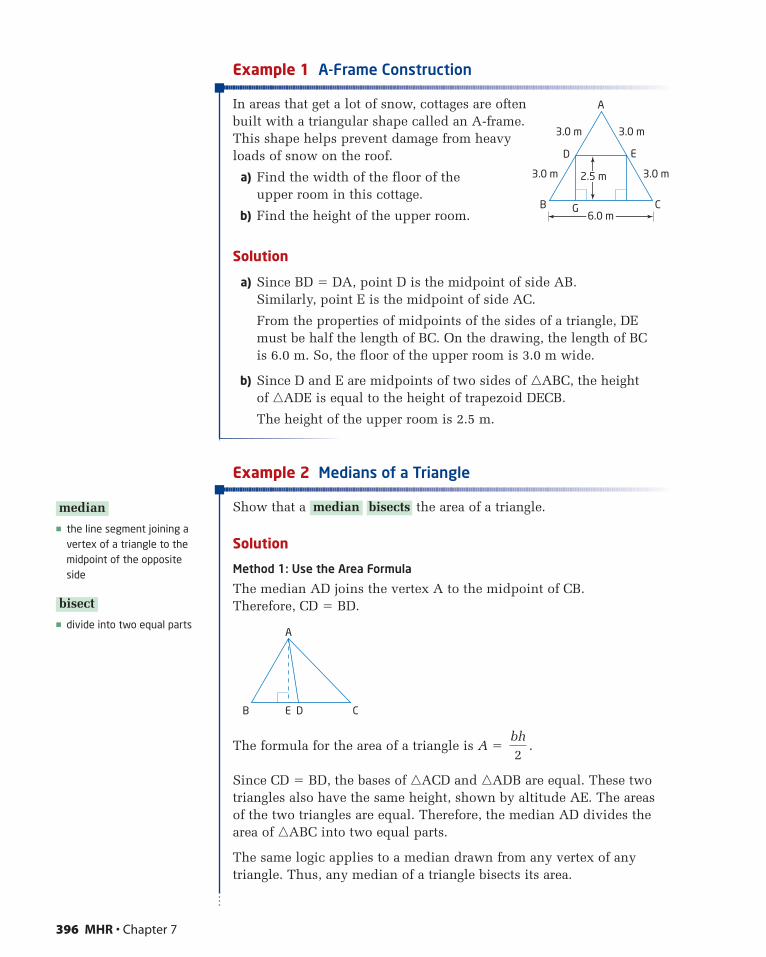
Example 1 A-Frame Construction
In areas that get a lot of snow, cottages are oftenbuilt with a triangular shape called an A-frame.This shape helps prevent damage from heavyloads of snow on the roof.
a) Find the width of the floor of the upper room in this cottage.
b) Find the height of the upper room.
Solution
a) Since BD � DA, point D is the midpoint of side AB. Similarly, point E is the midpoint of side AC.
From the properties of midpoints of the sides of a triangle, DEmust be half the length of BC. On the drawing, the length of BC is 6.0 m. So, the floor of the upper room is 3.0 m wide.
b) Since D and E are midpoints of two sides of �ABC, the height of �ADE is equal to the height of trapezoid DECB.
The height of the upper room is 2.5 m.
Example 2 Medians of a Triangle
Show that a the area of a triangle.
Solution
Method 1: Use the Area Formula
The median AD joins the vertex A to the midpoint of CB. Therefore, CD � BD.
The formula for the area of a triangle is A � .
Since CD � BD, the bases of �ACD and �ADB are equal. These twotriangles also have the same height, shown by altitude AE. The areasof the two triangles are equal. Therefore, the median AD divides thearea of �ABC into two equal parts.
The same logic applies to a median drawn from any vertex of anytriangle. Thus, any median of a triangle bisects its area.
bh2
bisectsmedian
396 MHR • Chapter 7
6.0 mB CG
ED
A
3.0 m 3.0 m
3.0 m 3.0 m
2.5 m
� the line segment joining avertex of a triangle to themidpoint of the oppositeside
� divide into two equal parts
bisect
median
B CE D
A

Method 2: Use The Geometer’s Sketchpad®Construct any �ABC. Construct the midpoint of side BC by selecting theside and choosing Midpoints from the Construct menu. Construct a linesegment from this midpoint to vertex A. This line segment is a median.
Select points A, B, and D; then, choose Triangle Interior from theConstruct menu. Select points A, D, and C; then, choose TriangleInterior from the Construct menu again.
Select the interior of �ABD, and choose Area from the Measure menu.Measure the area of �ACD in the same way. These measures show thatthe two areas are equal.
Drag any of the vertices A, B, and C around the screen. The softwareautomatically moves point D so that it stays at the midpoint of BC and AD is still a median. The areas of �ACD and �ABD remain equalfor all shapes of �ABC.
This relationship shows that a median bisects the area of any triangle.
Example 3 Use a Counter-Example
Shivany measured this right triangle and noticedthat a median bisects the right angle. Sheconjectures that a median will bisect the right angle in all right triangles. Is this conjecture correct?
Solution
In this right triangle, �ABD and �DBC are clearly not equal. Thus, the median does not bisect the right angle.
This counter-example shows that Shivany’s conjecture is incorrect.
Key Concepts� A line segment joining the midpoints of two sides of a triangle is
parallel to the third side and half as long.
� The height of a triangle formed by joining themidpoints of two sides of a triangle is half theheight of the original triangle.
� The medians of a triangle bisect its area.
� A counter-example can disprove a conjecture or hypothesis.
7.4 Midpoints and Medians in Triangles • MHR 397
A conjecture is an educatedguess.
onnectionsLiterac
45°45°
A
B
D
C
l
2l
� computer with TheGeometer’s Sketchpad®
Tools
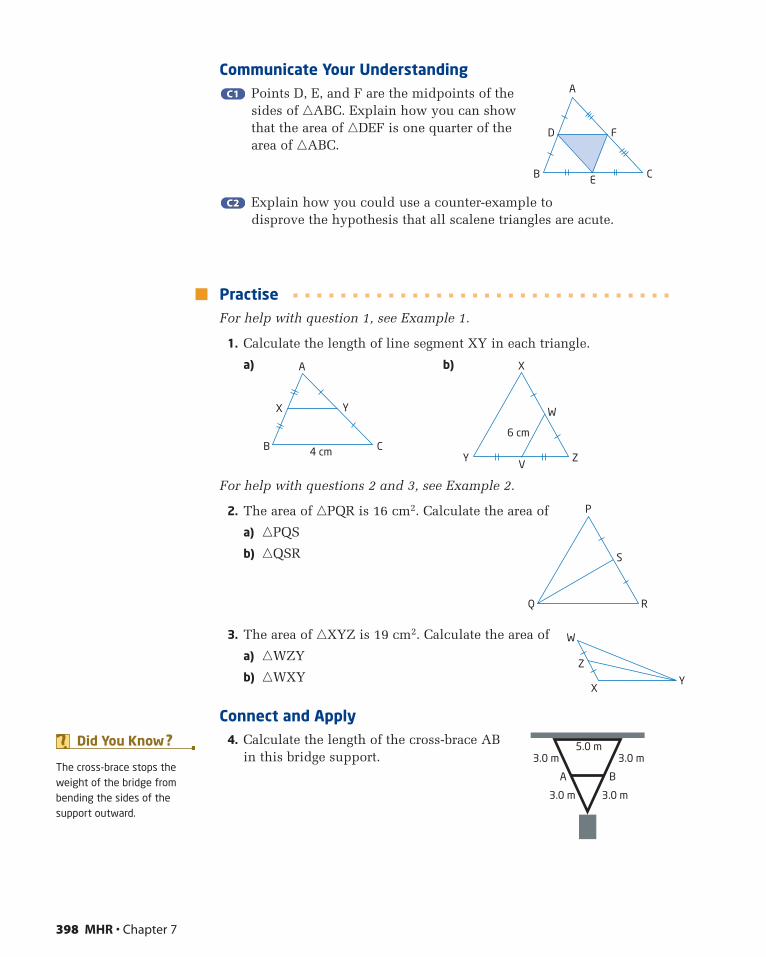
P
Q R
S
Communicate Your UnderstandingPoints D, E, and F are the midpoints of the sides of �ABC. Explain how you can show that the area of �DEF is one quarter of the area of �ABC.
Explain how you could use a counter-example to disprove the hypothesis that all scalene triangles are acute.
PractiseFor help with question 1, see Example 1.
1. Calculate the length of line segment XY in each triangle.
a) b)
For help with questions 2 and 3, see Example 2.
2. The area of �PQR is 16 cm2. Calculate the area of
a) �PQS
b) �QSR
3. The area of �XYZ is 19 cm2. Calculate the area of
a) �WZY
b) �WXY
Connect and Apply4. Calculate the length of the cross-brace AB
in this bridge support.
X
YV
W
6 cm
Z
A
B
X
4 cm
Y
C
C2C2
C1C1
398 MHR • Chapter 7
A
B
D
E
F
C
W
X
Z
Y
5.0 m
3.0 m 3.0 m
3.0 m 3.0 m
A BThe cross-brace stops theweight of the bridge frombending the sides of thesupport outward.
Did You Know ?
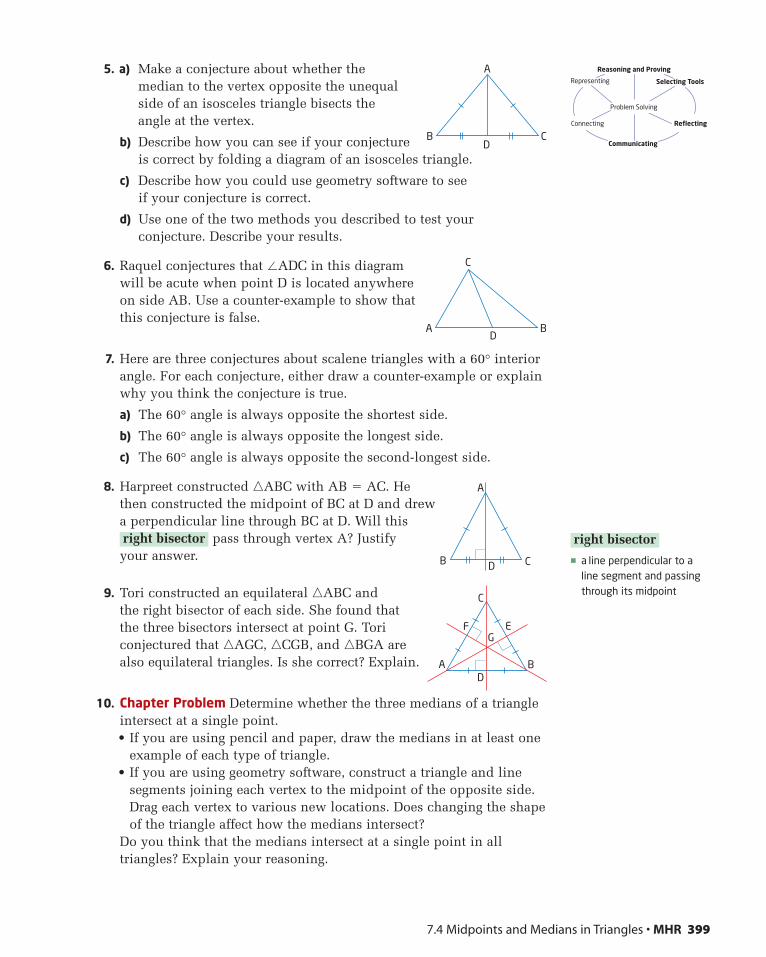
5. a) Make a conjecture about whether themedian to the vertex opposite the unequalside of an isosceles triangle bisects theangle at the vertex.
b) Describe how you can see if your conjectureis correct by folding a diagram of an isosceles triangle.
c) Describe how you could use geometry software to see if your conjecture is correct.
d) Use one of the two methods you described to test your conjecture. Describe your results.
6. Raquel conjectures that �ADC in this diagramwill be acute when point D is located anywhereon side AB. Use a counter-example to show thatthis conjecture is false.
7. Here are three conjectures about scalene triangles with a 60° interiorangle. For each conjecture, either draw a counter-example or explainwhy you think the conjecture is true.
a) The 60° angle is always opposite the shortest side.
b) The 60° angle is always opposite the longest side.
c) The 60° angle is always opposite the second-longest side.
8. Harpreet constructed �ABC with AB � AC. Hethen constructed the midpoint of BC at D and drewa perpendicular line through BC at D. Will this
pass through vertex A? Justify your answer.
9. Tori constructed an equilateral �ABC and the right bisector of each side. She found that the three bisectors intersect at point G. Toriconjectured that �AGC, �CGB, and �BGA arealso equilateral triangles. Is she correct? Explain.
10. Chapter Problem Determine whether the three medians of a triangleintersect at a single point.• If you are using pencil and paper, draw the medians in at least one
example of each type of triangle.• If you are using geometry software, construct a triangle and line
segments joining each vertex to the midpoint of the opposite side.Drag each vertex to various new locations. Does changing the shapeof the triangle affect how the medians intersect?
Do you think that the medians intersect at a single point in alltriangles? Explain your reasoning.
right bisector
7.4 Midpoints and Medians in Triangles • MHR 399
BD
C
A
AD
B
C
B D C
A
BAD
E
C
FG
� a line perpendicular to aline segment and passingthrough its midpoint
right bisector
Selecting ToolsRepresenting
Reasoning and Proving
Communicating
Connecting Reflecting
Problem Solving
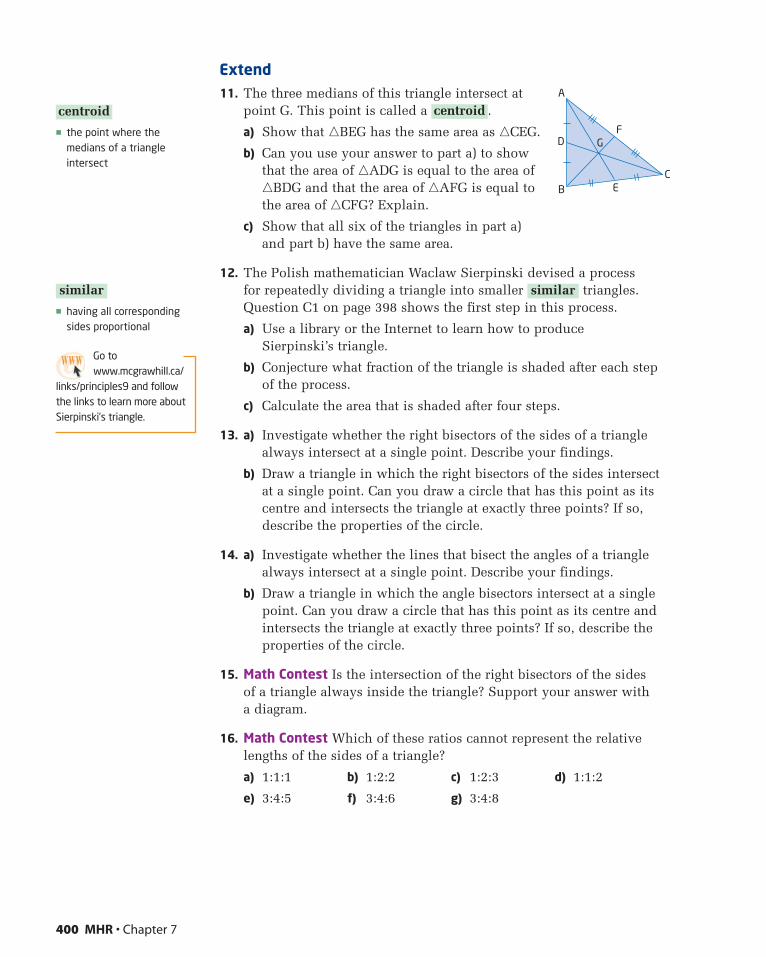
Extend11. The three medians of this triangle intersect at
point G. This point is called a .
a) Show that �BEG has the same area as �CEG.
b) Can you use your answer to part a) to showthat the area of �ADG is equal to the area of�BDG and that the area of �AFG is equal tothe area of �CFG? Explain.
c) Show that all six of the triangles in part a) and part b) have the same area.
12. The Polish mathematician Waclaw Sierpinski devised a process for repeatedly dividing a triangle into smaller triangles.Question C1 on page 398 shows the first step in this process.
a) Use a library or the Internet to learn how to produce Sierpinski’s triangle.
b) Conjecture what fraction of the triangle is shaded after each stepof the process.
c) Calculate the area that is shaded after four steps.
13. a) Investigate whether the right bisectors of the sides of a trianglealways intersect at a single point. Describe your findings.
b) Draw a triangle in which the right bisectors of the sides intersectat a single point. Can you draw a circle that has this point as itscentre and intersects the triangle at exactly three points? If so,describe the properties of the circle.
14. a) Investigate whether the lines that bisect the angles of a trianglealways intersect at a single point. Describe your findings.
b) Draw a triangle in which the angle bisectors intersect at a singlepoint. Can you draw a circle that has this point as its centre andintersects the triangle at exactly three points? If so, describe theproperties of the circle.
15. Math Contest Is the intersection of the right bisectors of the sides of a triangle always inside the triangle? Support your answer with a diagram.
16. Math Contest Which of these ratios cannot represent the relativelengths of the sides of a triangle?
a) 1:1:1 b) 1:2:2 c) 1:2:3 d) 1:1:2
e) 3:4:5 f) 3:4:6 g) 3:4:8
similar
centroid
400 MHR • Chapter 7
A
D
B EC
FG
� the point where themedians of a triangleintersect
centroid
� having all correspondingsides proportional
similar
Go towww.mcgrawhill.ca/
links/principles9 and followthe links to learn more aboutSierpinski’s triangle.
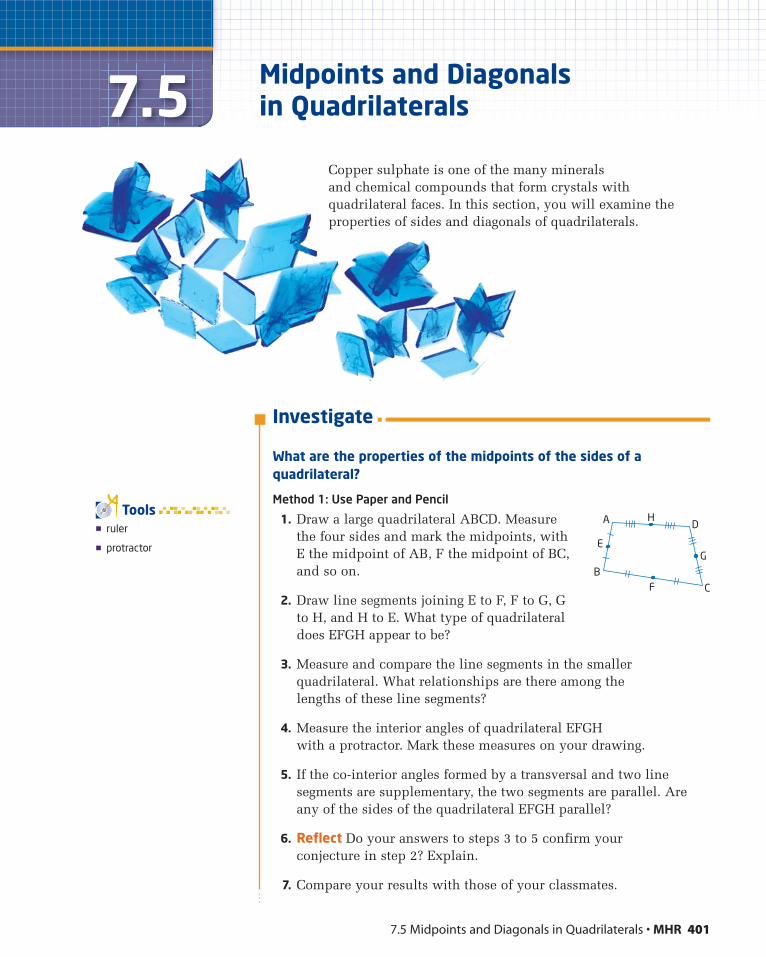
7.5 Midpoints and Diagonals in Quadrilaterals • MHR 401
7.5 Midpoints and Diagonals in Quadrilaterals
Copper sulphate is one of the many minerals and chemical compounds that form crystals withquadrilateral faces. In this section, you will examine theproperties of sides and diagonals of quadrilaterals.
� ruler
� protractor
Tools
Investigate
What are the properties of the midpoints of the sides of aquadrilateral?
Method 1: Use Paper and Pencil
1. Draw a large quadrilateral ABCD. Measurethe four sides and mark the midpoints, withE the midpoint of AB, F the midpoint of BC,and so on.
2. Draw line segments joining E to F, F to G, Gto H, and H to E. What type of quadrilateraldoes EFGH appear to be?
3. Measure and compare the line segments in the smallerquadrilateral. What relationships are there among the lengths of these line segments?
4. Measure the interior angles of quadrilateral EFGH with a protractor. Mark these measures on your drawing.
5. If the co-interior angles formed by a transversal and two linesegments are supplementary, the two segments are parallel. Areany of the sides of the quadrilateral EFGH parallel?
6. Reflect Do your answers to steps 3 to 5 confirm your conjecture in step 2? Explain.
7. Compare your results with those of your classmates.
A
E
BF C
D
G
H
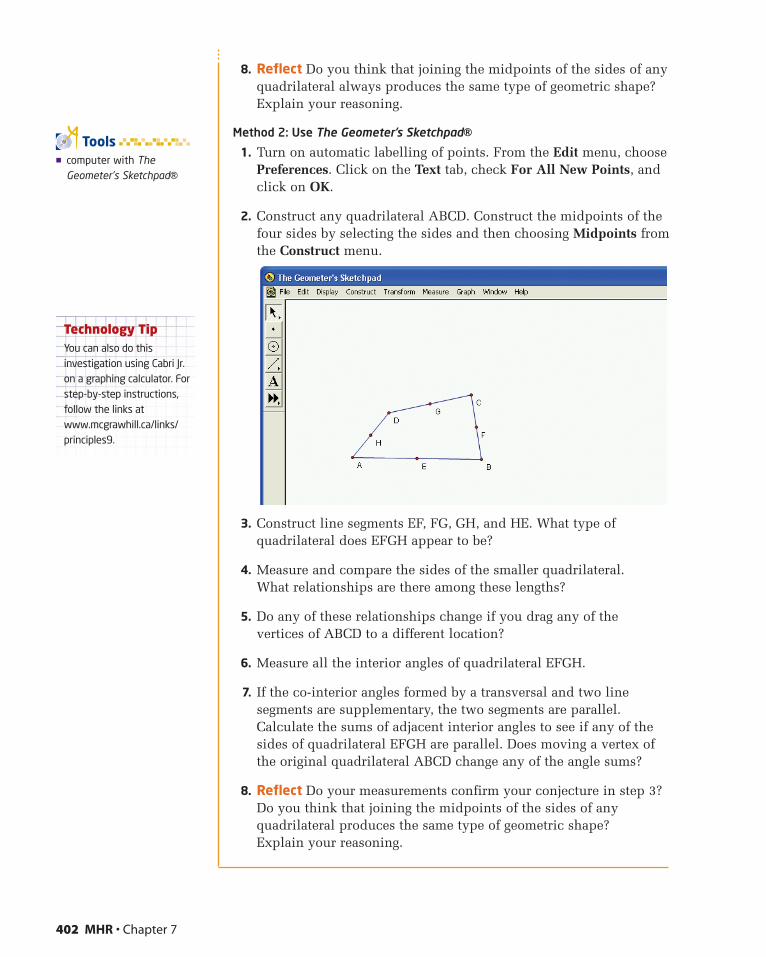
8. Reflect Do you think that joining the midpoints of the sides of anyquadrilateral always produces the same type of geometric shape?Explain your reasoning.
Method 2: Use The Geometer’s Sketchpad®1. Turn on automatic labelling of points. From the Edit menu, choose
Preferences. Click on the Text tab, check For All New Points, andclick on OK.
2. Construct any quadrilateral ABCD. Construct the midpoints of thefour sides by selecting the sides and then choosing Midpoints fromthe Construct menu.
3. Construct line segments EF, FG, GH, and HE. What type ofquadrilateral does EFGH appear to be?
4. Measure and compare the sides of the smaller quadrilateral. What relationships are there among these lengths?
5. Do any of these relationships change if you drag any of the vertices of ABCD to a different location?
6. Measure all the interior angles of quadrilateral EFGH.
7. If the co-interior angles formed by a transversal and two linesegments are supplementary, the two segments are parallel.Calculate the sums of adjacent interior angles to see if any of thesides of quadrilateral EFGH are parallel. Does moving a vertex ofthe original quadrilateral ABCD change any of the angle sums?
8. Reflect Do your measurements confirm your conjecture in step 3?Do you think that joining the midpoints of the sides of anyquadrilateral produces the same type of geometric shape? Explain your reasoning.
402 MHR • Chapter 7
� computer with TheGeometer’s Sketchpad®
Tools
Technology TipYou can also do thisinvestigation using Cabri Jr.on a graphing calculator. Forstep-by-step instructions,follow the links at www.mcgrawhill.ca/links/principles9.
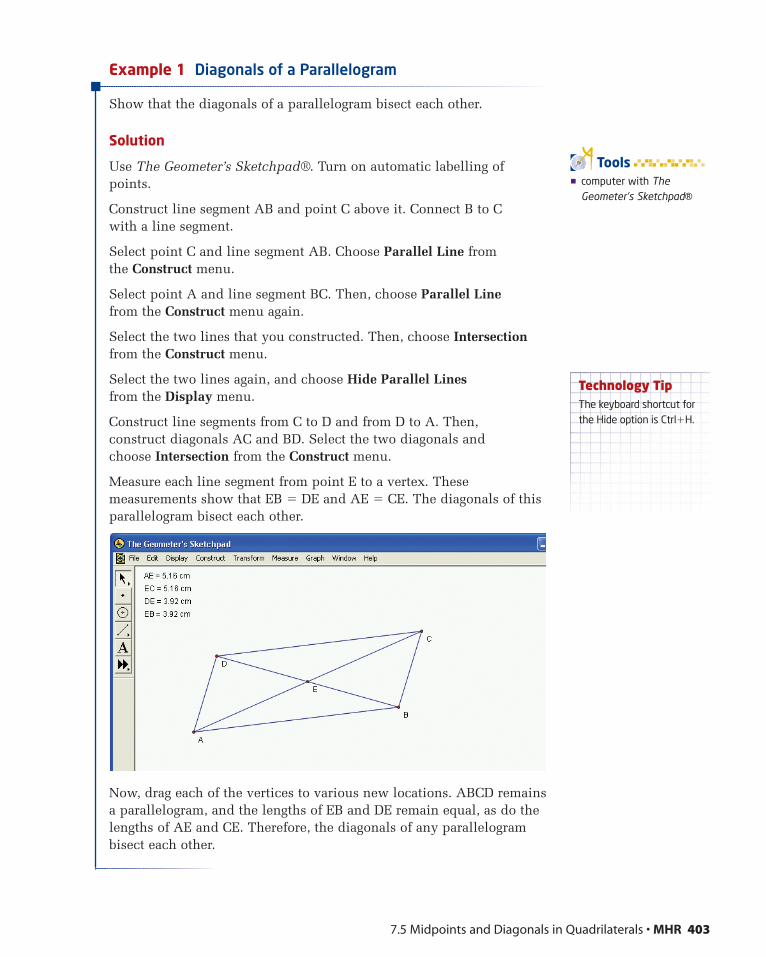
7.5 Midpoints and Diagonals in Quadrilaterals • MHR 403
Example 1 Diagonals of a Parallelogram
Show that the diagonals of a parallelogram bisect each other.
Solution
Use The Geometer’s Sketchpad®. Turn on automatic labelling ofpoints.
Construct line segment AB and point C above it. Connect B to C with a line segment.
Select point C and line segment AB. Choose Parallel Line from the Construct menu.
Select point A and line segment BC. Then, choose Parallel Linefrom the Construct menu again.
Select the two lines that you constructed. Then, choose Intersectionfrom the Construct menu.
Select the two lines again, and choose Hide Parallel Linesfrom the Display menu.
Construct line segments from C to D and from D to A. Then, construct diagonals AC and BD. Select the two diagonals and choose Intersection from the Construct menu.
Measure each line segment from point E to a vertex. Thesemeasurements show that EB � DE and AE � CE. The diagonals of thisparallelogram bisect each other.
Now, drag each of the vertices to various new locations. ABCD remainsa parallelogram, and the lengths of EB and DE remain equal, as do thelengths of AE and CE. Therefore, the diagonals of any parallelogrambisect each other.
Technology TipThe keyboard shortcut forthe Hide option is Ctrl�H.
� computer with TheGeometer’s Sketchpad®
Tools
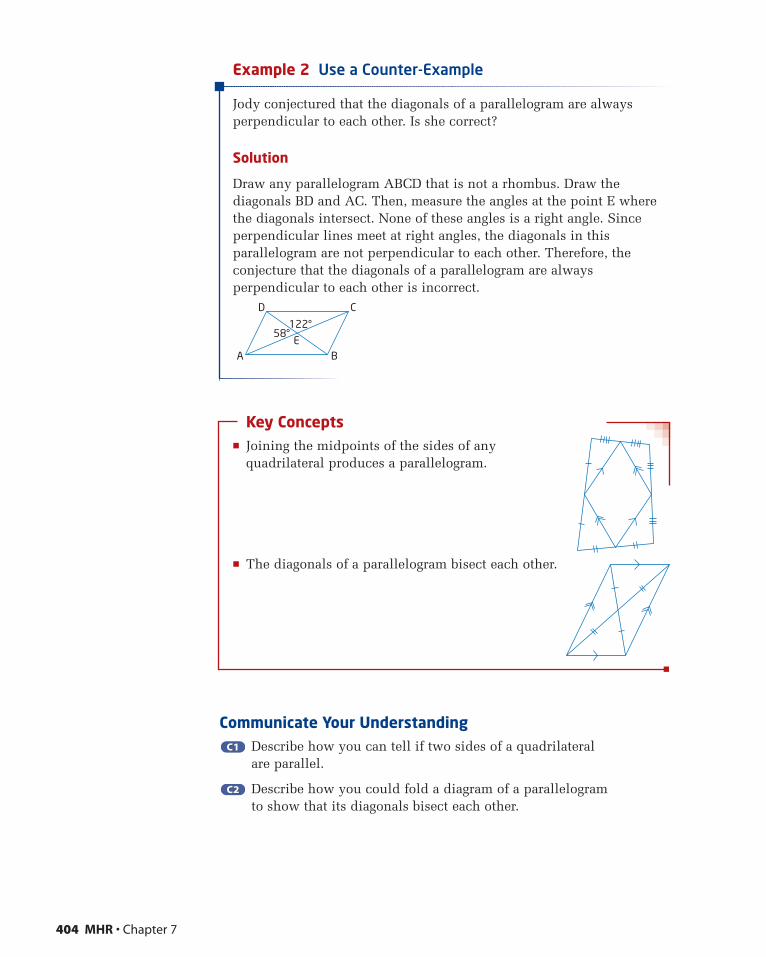
Example 2 Use a Counter-Example
Jody conjectured that the diagonals of a parallelogram are alwaysperpendicular to each other. Is she correct?
Solution
Draw any parallelogram ABCD that is not a rhombus. Draw thediagonals BD and AC. Then, measure the angles at the point E wherethe diagonals intersect. None of these angles is a right angle. Sinceperpendicular lines meet at right angles, the diagonals in thisparallelogram are not perpendicular to each other. Therefore, theconjecture that the diagonals of a parallelogram are alwaysperpendicular to each other is incorrect.
Key Concepts� Joining the midpoints of the sides of any
quadrilateral produces a parallelogram.
� The diagonals of a parallelogram bisect each other.
Communicate Your UnderstandingDescribe how you can tell if two sides of a quadrilateral are parallel.
Describe how you could fold a diagram of a parallelogram to show that its diagonals bisect each other.
C2C2
C1C1
404 MHR • Chapter 7
D
A B
C
E58°
122°
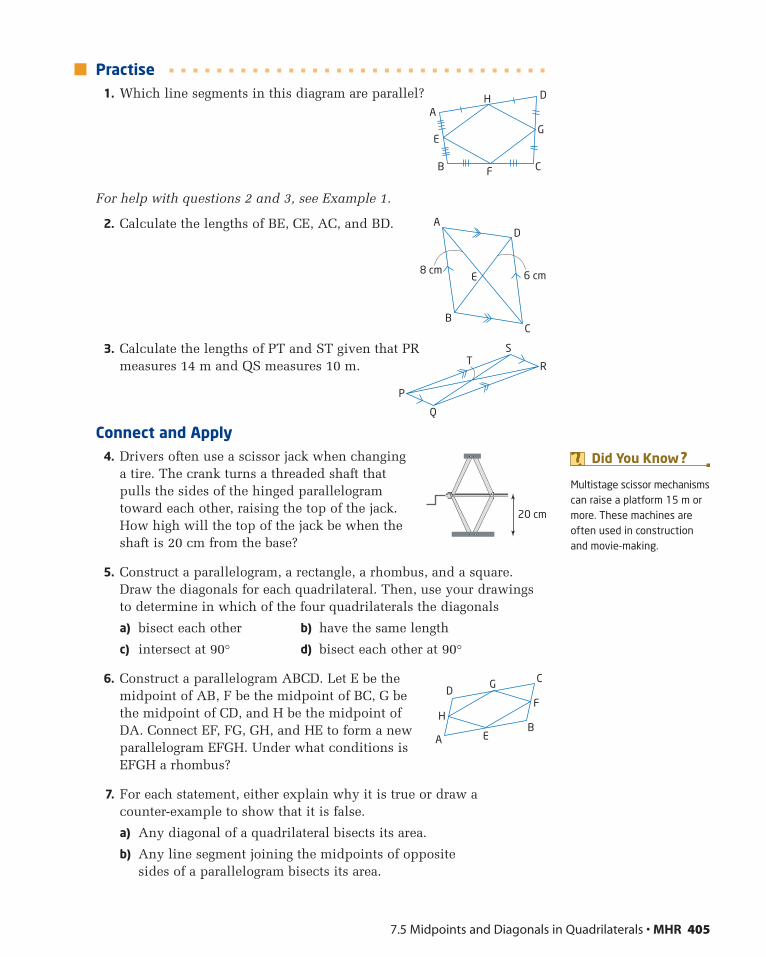
7.5 Midpoints and Diagonals in Quadrilaterals • MHR 405
Practise1. Which line segments in this diagram are parallel?
For help with questions 2 and 3, see Example 1.
2. Calculate the lengths of BE, CE, AC, and BD.
3. Calculate the lengths of PT and ST given that PRmeasures 14 m and QS measures 10 m.
Connect and Apply4. Drivers often use a scissor jack when changing
a tire. The crank turns a threaded shaft thatpulls the sides of the hinged parallelogramtoward each other, raising the top of the jack.How high will the top of the jack be when theshaft is 20 cm from the base?
5. Construct a parallelogram, a rectangle, a rhombus, and a square.Draw the diagonals for each quadrilateral. Then, use your drawingsto determine in which of the four quadrilaterals the diagonals
a) bisect each other b) have the same length
c) intersect at 90° d) bisect each other at 90°
6. Construct a parallelogram ABCD. Let E be themidpoint of AB, F be the midpoint of BC, G bethe midpoint of CD, and H be the midpoint ofDA. Connect EF, FG, GH, and HE to form a newparallelogram EFGH. Under what conditions isEFGH a rhombus?
7. For each statement, either explain why it is true or draw a counter-example to show that it is false.
a) Any diagonal of a quadrilateral bisects its area.
b) Any line segment joining the midpoints of opposite sides of a parallelogram bisects its area.
A
B F C
E
H D
G
A
E8 cm 6 cm
BC
D
P
Q
R
ST
20 cm
D
A E
HB
F
CG
Multistage scissor mechanismscan raise a platform 15 m ormore. These machines areoften used in constructionand movie-making.
Did You Know ?
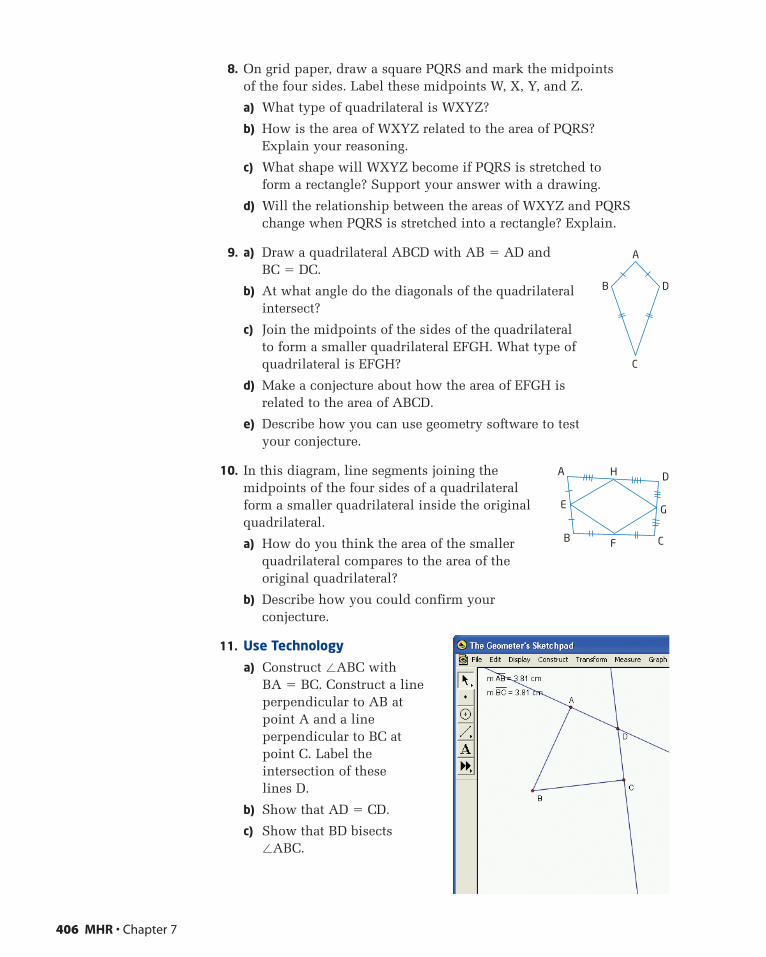
8. On grid paper, draw a square PQRS and mark the midpoints of the four sides. Label these midpoints W, X, Y, and Z.
a) What type of quadrilateral is WXYZ?
b) How is the area of WXYZ related to the area of PQRS? Explain your reasoning.
c) What shape will WXYZ become if PQRS is stretched to form a rectangle? Support your answer with a drawing.
d) Will the relationship between the areas of WXYZ and PQRSchange when PQRS is stretched into a rectangle? Explain.
9. a) Draw a quadrilateral ABCD with AB � AD and BC � DC.
b) At what angle do the diagonals of the quadrilateralintersect?
c) Join the midpoints of the sides of the quadrilateralto form a smaller quadrilateral EFGH. What type ofquadrilateral is EFGH?
d) Make a conjecture about how the area of EFGH isrelated to the area of ABCD.
e) Describe how you can use geometry software to testyour conjecture.
10. In this diagram, line segments joining themidpoints of the four sides of a quadrilateralform a smaller quadrilateral inside the originalquadrilateral.
a) How do you think the area of the smallerquadrilateral compares to the area of theoriginal quadrilateral?
b) Describe how you could confirm yourconjecture.
11. Use Technology
a) Construct �ABC with BA � BC. Construct a lineperpendicular to AB atpoint A and a lineperpendicular to BC atpoint C. Label theintersection of theselines D.
b) Show that AD � CD.
c) Show that BD bisects�ABC.
406 MHR • Chapter 7
A
B D
C
A
B F C
E
H D
G
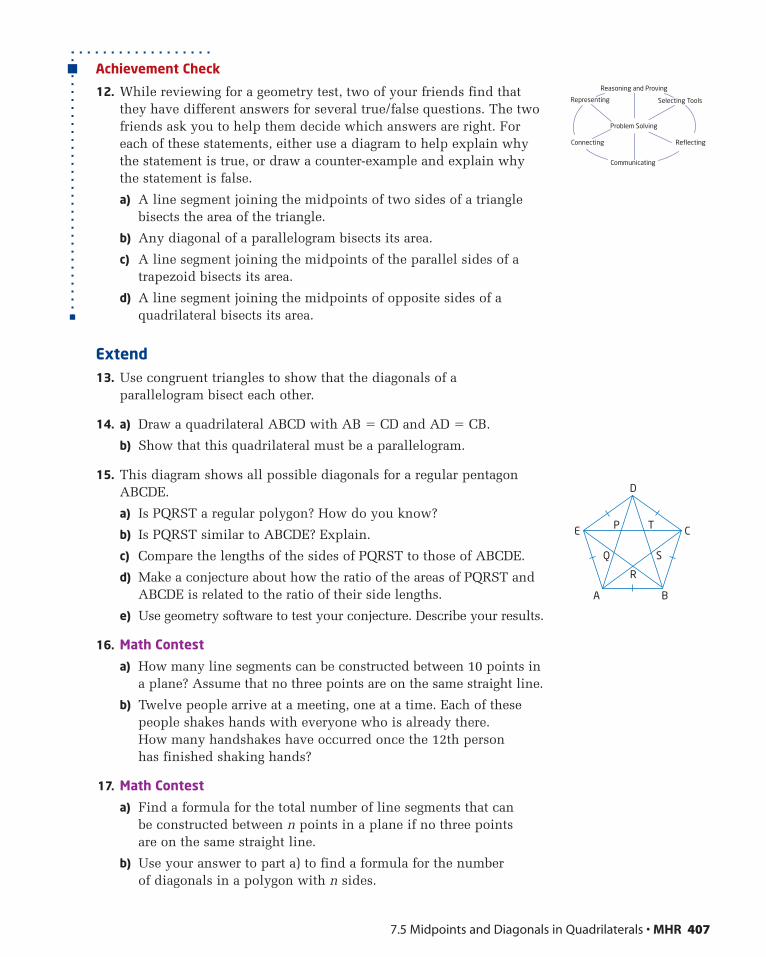
7.5 Midpoints and Diagonals in Quadrilaterals • MHR 407
Achievement Check
12. While reviewing for a geometry test, two of your friends find thatthey have different answers for several true/false questions. The twofriends ask you to help them decide which answers are right. Foreach of these statements, either use a diagram to help explain whythe statement is true, or draw a counter-example and explain whythe statement is false.
a) A line segment joining the midpoints of two sides of a trianglebisects the area of the triangle.
b) Any diagonal of a parallelogram bisects its area.
c) A line segment joining the midpoints of the parallel sides of atrapezoid bisects its area.
d) A line segment joining the midpoints of opposite sides of aquadrilateral bisects its area.
Extend13. Use congruent triangles to show that the diagonals of a
parallelogram bisect each other.
14. a) Draw a quadrilateral ABCD with AB � CD and AD � CB.
b) Show that this quadrilateral must be a parallelogram.
15. This diagram shows all possible diagonals for a regular pentagonABCDE.
a) Is PQRST a regular polygon? How do you know?
b) Is PQRST similar to ABCDE? Explain.
c) Compare the lengths of the sides of PQRST to those of ABCDE.
d) Make a conjecture about how the ratio of the areas of PQRST andABCDE is related to the ratio of their side lengths.
e) Use geometry software to test your conjecture. Describe your results.
16. Math Contest
a) How many line segments can be constructed between 10 points ina plane? Assume that no three points are on the same straight line.
b) Twelve people arrive at a meeting, one at a time. Each of thesepeople shakes hands with everyone who is already there. How many handshakes have occurred once the 12th person has finished shaking hands?
17. Math Contest
a) Find a formula for the total number of line segments that can be constructed between n points in a plane if no three points are on the same straight line.
b) Use your answer to part a) to find a formula for the number of diagonals in a polygon with n sides.
A B
C
D
P
Q
R
S
TE
Selecting ToolsRepresenting
Reasoning and Proving
Communicating
Connecting Reflecting
Problem Solving
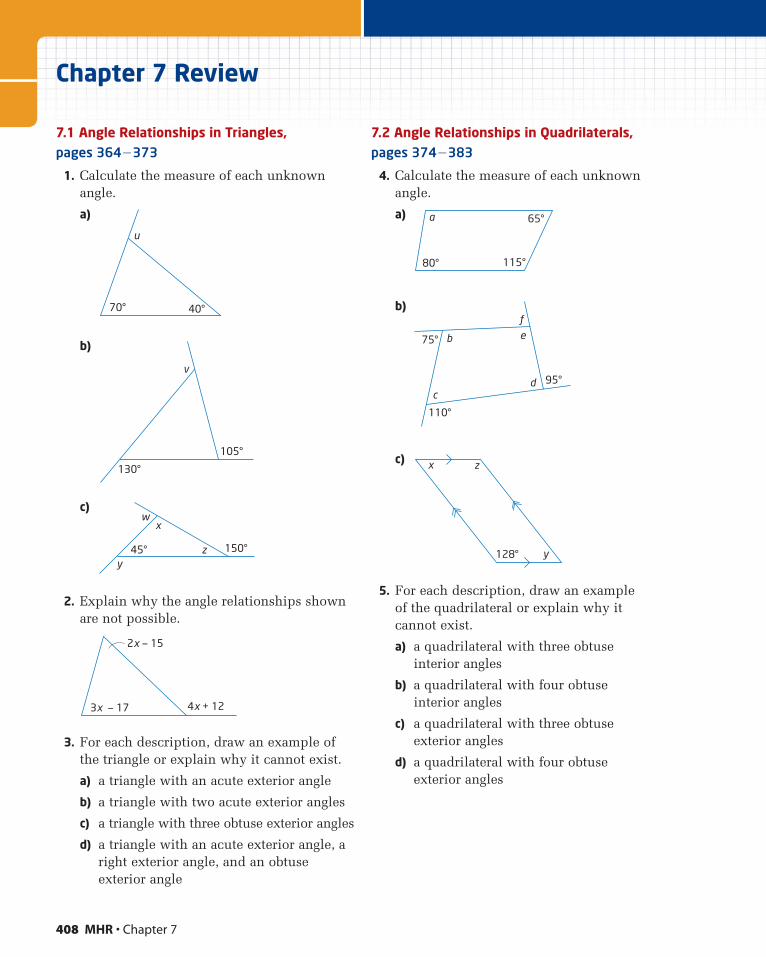
408 MHR • Chapter 7
Chapter 7 Review
7.1 Angle Relationships in Triangles, pages 364�373
1. Calculate the measure of each unknownangle.
a)
b)
c)
2. Explain why the angle relationships shownare not possible.
3. For each description, draw an example ofthe triangle or explain why it cannot exist.
a) a triangle with an acute exterior angle
b) a triangle with two acute exterior angles
c) a triangle with three obtuse exterior angles
d) a triangle with an acute exterior angle, aright exterior angle, and an obtuseexterior angle
7.2 Angle Relationships in Quadrilaterals,pages 374�383
4. Calculate the measure of each unknownangle.
a)
b)
c)
5. For each description, draw an example of the quadrilateral or explain why it cannot exist.
a) a quadrilateral with three obtuse interior angles
b) a quadrilateral with four obtuse interior angles
c) a quadrilateral with three obtuse exterior angles
d) a quadrilateral with four obtuse exterior angles
x z
y128°
c
b e
d
f
110°
75°
95°
a
115°
65°
80°
4x + 12
2x — 15
3x — 17
wx
yz 150°45°
v
130°
105°
u
40°70°
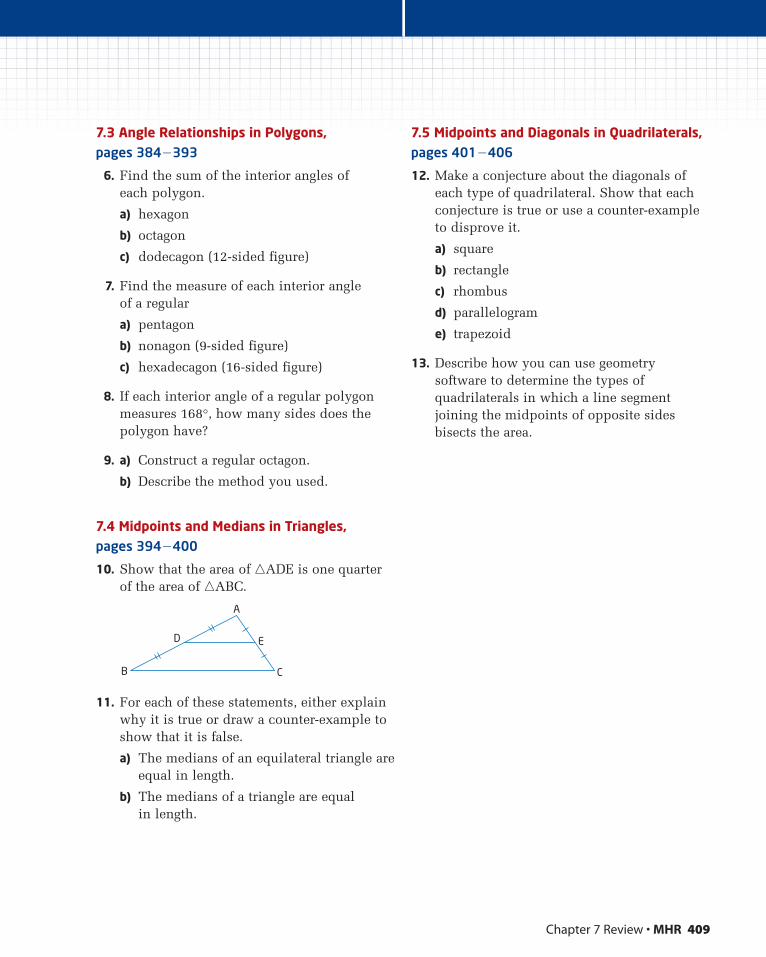
Chapter 7 Review • MHR 409
7.3 Angle Relationships in Polygons, pages 384�393
6. Find the sum of the interior angles of each polygon.
a) hexagon
b) octagon
c) dodecagon (12-sided figure)
7. Find the measure of each interior angle of a regular
a) pentagon
b) nonagon (9-sided figure)
c) hexadecagon (16-sided figure)
8. If each interior angle of a regular polygonmeasures 168°, how many sides does thepolygon have?
9. a) Construct a regular octagon.
b) Describe the method you used.
7.4 Midpoints and Medians in Triangles, pages 394�400
10. Show that the area of �ADE is one quarterof the area of �ABC.
11. For each of these statements, either explainwhy it is true or draw a counter-example toshow that it is false.
a) The medians of an equilateral triangle areequal in length.
b) The medians of a triangle are equal in length.
7.5 Midpoints and Diagonals in Quadrilaterals,pages 401�406
12. Make a conjecture about the diagonals ofeach type of quadrilateral. Show that eachconjecture is true or use a counter-exampleto disprove it.
a) square
b) rectangle
c) rhombus
d) parallelogram
e) trapezoid
13. Describe how you can use geometrysoftware to determine the types ofquadrilaterals in which a line segmentjoining the midpoints of opposite sidesbisects the area.
B C
A
D E
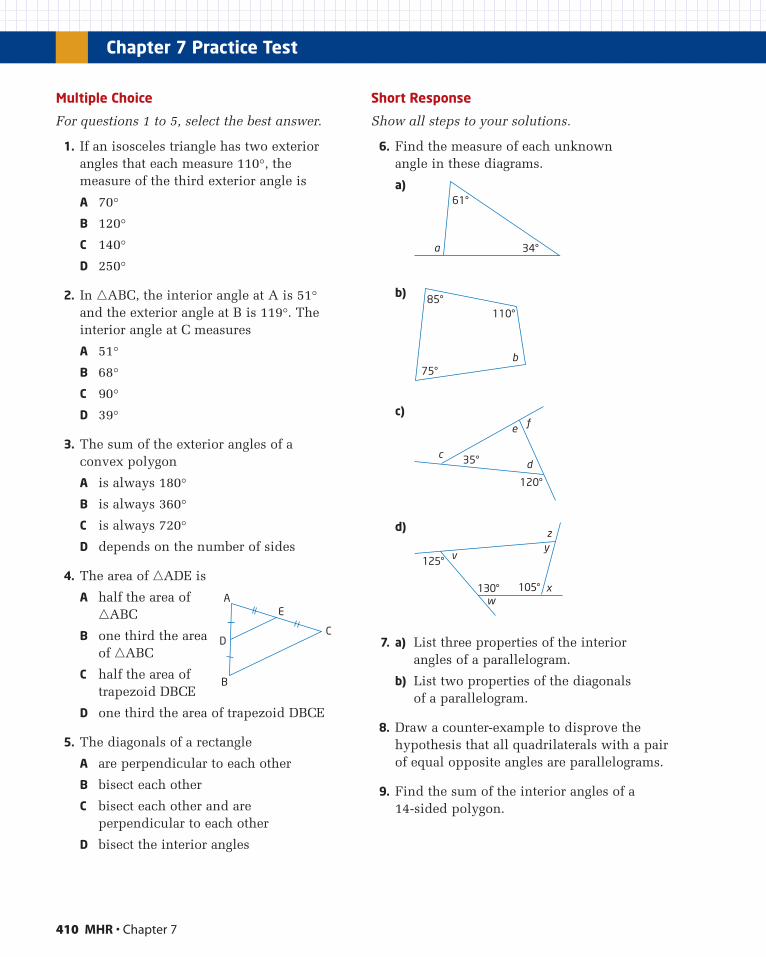
410 MHR • Chapter 7
Multiple Choice
For questions 1 to 5, select the best answer.
1. If an isosceles triangle has two exteriorangles that each measure 110°, the measure of the third exterior angle is
A 70°
B 120°
C 140°
D 250°
2. In �ABC, the interior angle at A is 51°and the exterior angle at B is 119°. Theinterior angle at C measures
A 51°
B 68°
C 90°
D 39°
3. The sum of the exterior angles of a convex polygon
A is always 180°
B is always 360°
C is always 720°
D depends on the number of sides
4. The area of �ADE is
A half the area of�ABC
B one third the areaof �ABC
C half the area oftrapezoid DBCE
D one third the area of trapezoid DBCE
5. The diagonals of a rectangle
A are perpendicular to each other
B bisect each other
C bisect each other and are perpendicular to each other
D bisect the interior angles
Short Response
Show all steps to your solutions.
6. Find the measure of each unknown angle in these diagrams.
a)
b)
c)
d)
7. a) List three properties of the interior angles of a parallelogram.
b) List two properties of the diagonals of a parallelogram.
8. Draw a counter-example to disprove thehypothesis that all quadrilaterals with a pairof equal opposite angles are parallelograms.
9. Find the sum of the interior angles of a 14-sided polygon.
zy
x
v
w
125°
130° 105°
c
e
d
f
120°
35°
b
85°
75°
110°
a 34°
61°
Chapter 7 Practice Test
B
D
E
C
A
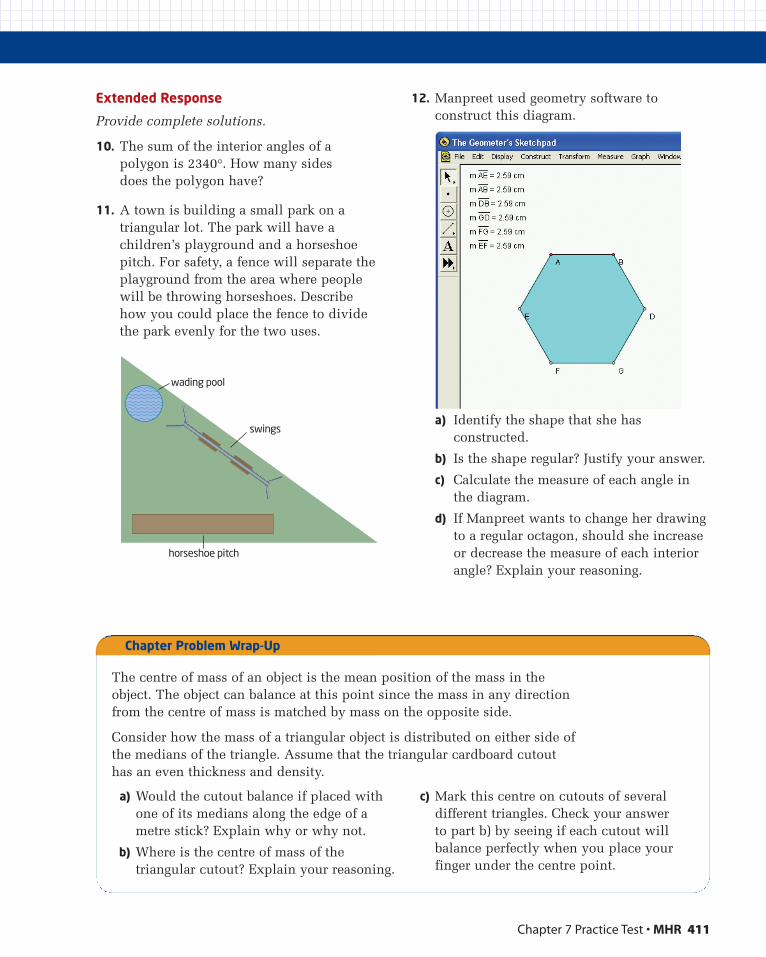
Chapter 7 Practice Test • MHR 411
Extended Response
Provide complete solutions.
10. The sum of the interior angles of a polygon is 2340°. How many sides does the polygon have?
11. A town is building a small park on atriangular lot. The park will have achildren’s playground and a horseshoepitch. For safety, a fence will separate theplayground from the area where people will be throwing horseshoes. Describe how you could place the fence to divide the park evenly for the two uses.
12. Manpreet used geometry software toconstruct this diagram.
a) Identify the shape that she hasconstructed.
b) Is the shape regular? Justify your answer.
c) Calculate the measure of each angle inthe diagram.
d) If Manpreet wants to change her drawingto a regular octagon, should she increaseor decrease the measure of each interiorangle? Explain your reasoning.
wading pool
swings
horseshoe pitch
The centre of mass of an object is the mean position of the mass in theobject. The object can balance at this point since the mass in any directionfrom the centre of mass is matched by mass on the opposite side.
Consider how the mass of a triangular object is distributed on either side ofthe medians of the triangle. Assume that the triangular cardboard cutouthas an even thickness and density.
a) Would the cutout balance if placed withone of its medians along the edge of ametre stick? Explain why or why not.
b) Where is the centre of mass of thetriangular cutout? Explain your reasoning.
c) Mark this centre on cutouts of severaldifferent triangles. Check your answer to part b) by seeing if each cutout willbalance perfectly when you place yourfinger under the centre point.
Chapter Problem Wrap-Up
Vocabulary
hypotenusePythagorean theoremsurface areavolumepyramidlateral facesconesphere
Measurement Relationships
Landscape architects design, plan, and manage land. Their work can be seen in the attractiveness and usefulness of parks, highways, neighbourhoods, gardens, and zoos. Concepts of measurement in two-dimensional and three-dimensional geometry are important in landscape design and construction.
In this chapter, you will solve problems involving two-dimensional and three-dimensional fi gures. You will also extend your skills with three-dimensional geometry to include pyramids, cones, and spheres.
CHAPTER
8 Measurement and Geometry� Relate the geometric
representation and the algebraic representation, a2 � b2 � c2, of the Pythagorean theorem.
� Solve problems using the Pythagorean theorem.
� Solve problems involving the areas and perimeters of composite shapes.
� Determine, through investigation, the formula for the surface area of a pyramid.
� Develop, through investigation, the formulas for the volume of a pyramid, a cone, and a sphere.
� Solve problems involving the surface areas and volumes of prisms, pyramids, cylinders, cones, and spheres.
412
Chapter Problem For her summer job, Emily will help her brother with
his landscaping business. The company designs and
installs patios and gardens and puts the fi nishing
touches around swimming pools. Throughout this
chapter, you will apply your skills to help Emily
complete her projects.
413
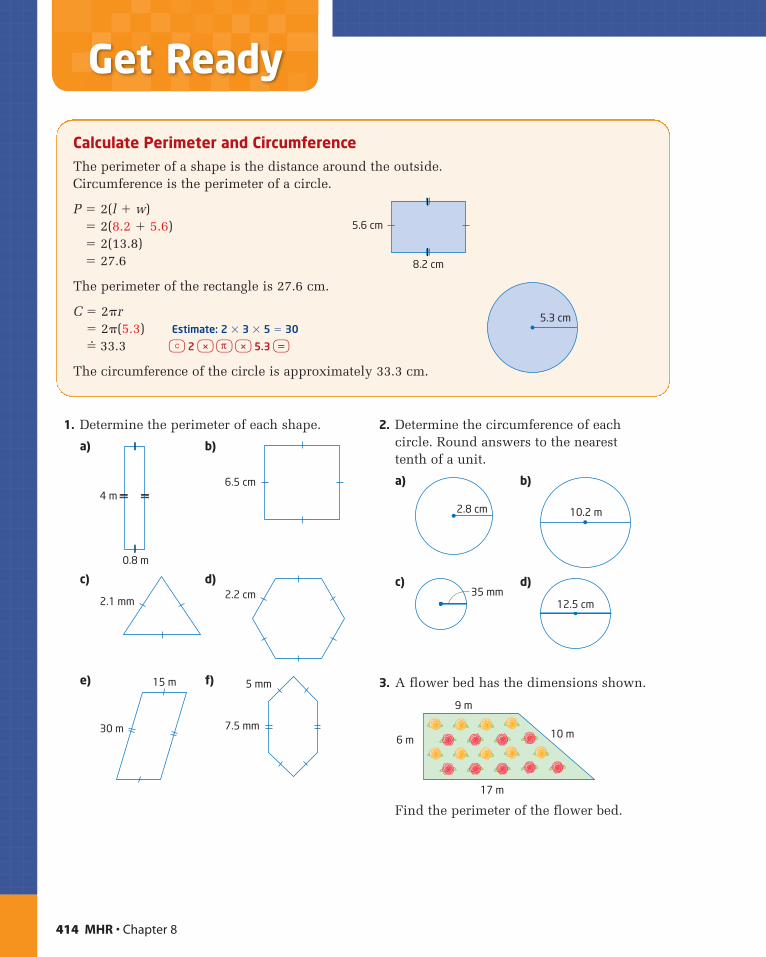
1. Determine the perimeter of each shape.
a) b)
c) d)
e) f)
2. Determine the circumference of each circle. Round answers to the nearest tenth of a unit.
a) b)
c) d)
3. A flower bed has the dimensions shown.
Find the perimeter of the flower bed.
9 m
6 m
17 m
10 m
12.5 cm35 mm
10.2 m2.8 cm
5 mm
7.5 mm
15 m
30 m
2.2 cm2.1 mm
6.5 cm4 m
0.8 m
414 MHR • Chapter 8
Calculate Perimeter and CircumferenceThe perimeter of a shape is the distance around the outside. Circumference is the perimeter of a circle.
P � 2(l � w)� 2(8.2 � 5.6)� 2(13.8)� 27.6
The perimeter of the rectangle is 27.6 cm.
C � 2�r� 2�(5.3) Estimate: 2 � 3 � 5 � 30
�� 33.3 ç 2 * π * 5.3 =
The circumference of the circle is approximately 33.3 cm.
8.2 cm
5.6 cm
5.3 cm
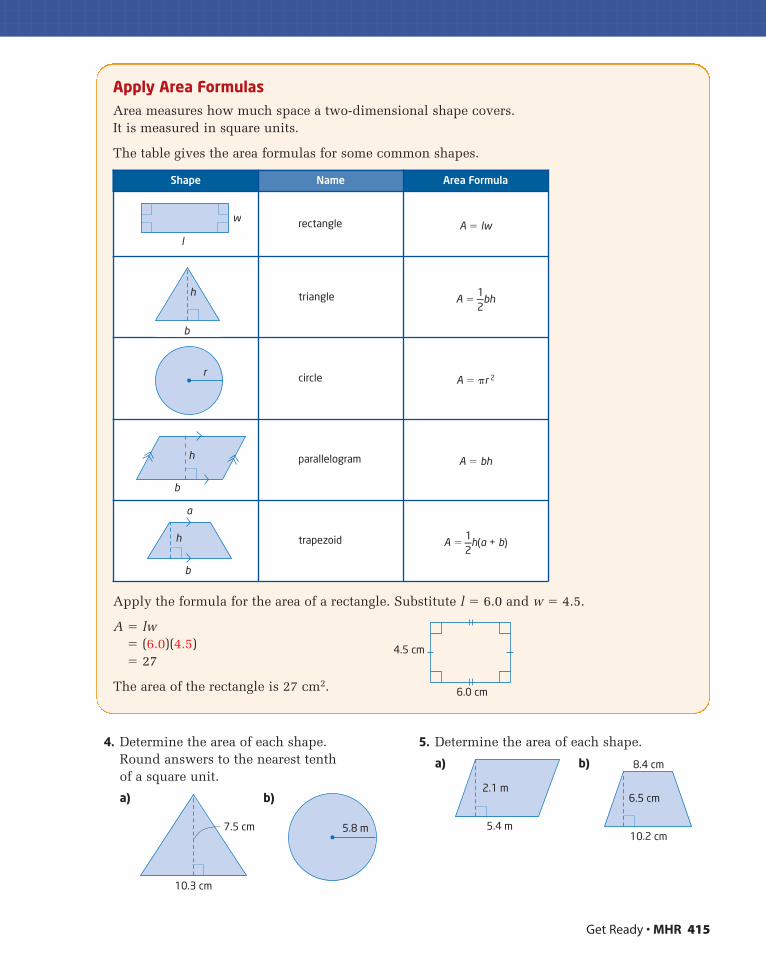
4. Determine the area of each shape. Round answers to the nearest tenth of a square unit.
a) b)
5. Determine the area of each shape.
a) b)
6.5 cm
8.4 cm
10.2 cm
2.1 m
5.4 m5.8 m
10.3 cm
7.5 cm
Get Ready • MHR 415
Apply Area FormulasArea measures how much space a two-dimensional shape covers. It is measured in square units.
The table gives the area formulas for some common shapes.
Apply the formula for the area of a rectangle. Substitute l � 6.0 and w � 4.5.
A � lw� (6.0)(4.5)� 27
The area of the rectangle is 27 cm2.
Shape Name Area Formula
rectangle A � lw
triangle A �1—2
bh
circle A � �r 2
parallelogram A � bh
trapezoid A �1—2
h(a + b)
l
w
b
h
r
h
b
h
b
a
6.0 cm
4.5 cm
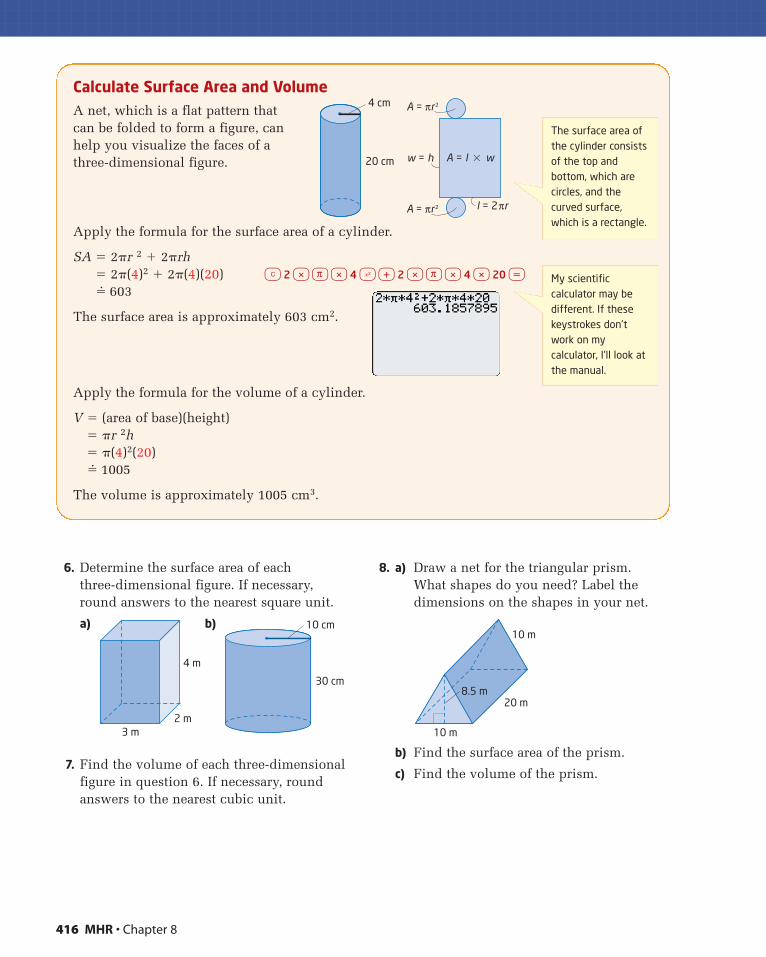
416 MHR • Chapter 8
Calculate Surface Area and VolumeA net, which is a flat pattern that can be folded to form a figure, can help you visualize the faces of a three-dimensional figure.
Apply the formula for the surface area of a cylinder.
SA � 2�r 2 � 2�rh� 2�(4)2 � 2�(4)(20) ç 2 * π * 4 x + 2 * π * 4 * 20 =
�� 603
The surface area is approximately 603 cm2.
Apply the formula for the volume of a cylinder.
V � (area of base)(height)� �r 2h� �(4)2(20)�� 1005
The volume is approximately 1005 cm3.
6. Determine the surface area of each three-dimensional figure. If necessary, round answers to the nearest square unit.
a) b)
7. Find the volume of each three-dimensionalfigure in question 6. If necessary, roundanswers to the nearest cubic unit.
8. a) Draw a net for the triangular prism. What shapes do you need? Label thedimensions on the shapes in your net.
b) Find the surface area of the prism.
c) Find the volume of the prism.
8.5 m
10 m
20 m
10 m
10 cm
30 cm
3 m2 m
4 m
4 cm
20 cm
A = πr2
A = l � ww = h
l = 2πr A = πr2
The surface area ofthe cylinder consistsof the top andbottom, which arecircles, and thecurved surface,which is a rectangle.
My scientificcalculator may bedifferent. If thesekeystrokes don’twork on mycalculator, I’ll look atthe manual.
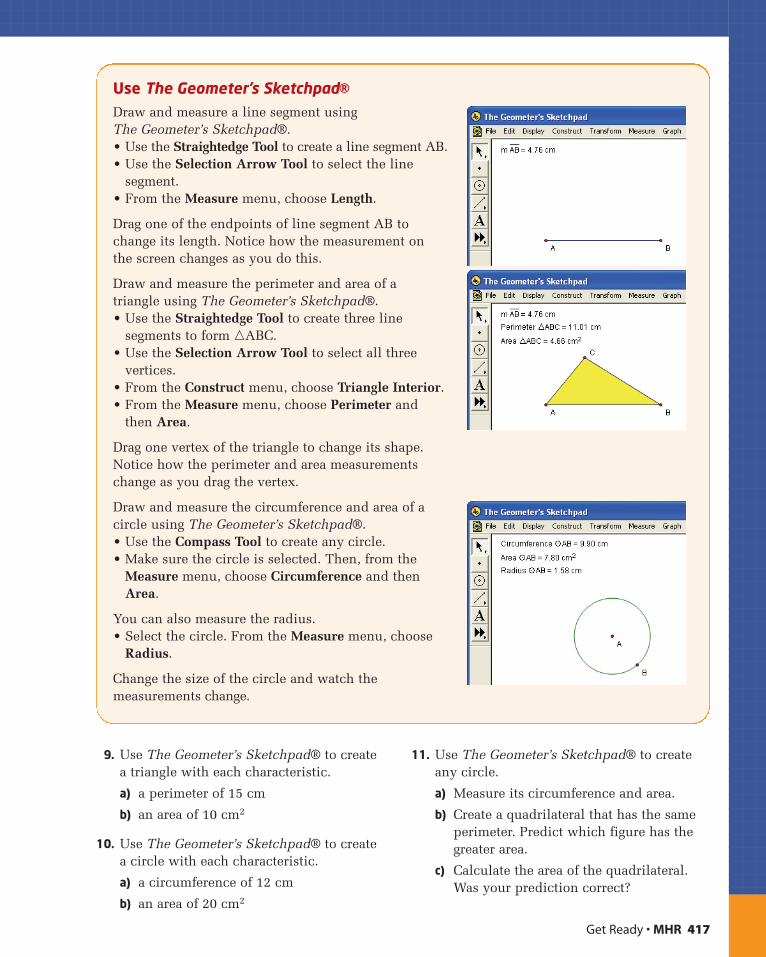
Get Ready • MHR 417
9. Use The Geometer’s Sketchpad® to create a triangle with each characteristic.
a) a perimeter of 15 cm
b) an area of 10 cm2
10. Use The Geometer’s Sketchpad® to create a circle with each characteristic.
a) a circumference of 12 cm
b) an area of 20 cm2
11. Use The Geometer’s Sketchpad® to createany circle.
a) Measure its circumference and area.
b) Create a quadrilateral that has the sameperimeter. Predict which figure has thegreater area.
c) Calculate the area of the quadrilateral.Was your prediction correct?
Use The Geometer’s Sketchpad®Draw and measure a line segment using The Geometer’s Sketchpad®.• Use the Straightedge Tool to create a line segment AB.• Use the Selection Arrow Tool to select the line
segment.• From the Measure menu, choose Length.
Drag one of the endpoints of line segment AB tochange its length. Notice how the measurement on the screen changes as you do this.
Draw and measure the perimeter and area of a triangle using The Geometer’s Sketchpad®.• Use the Straightedge Tool to create three line
segments to form �ABC.• Use the Selection Arrow Tool to select all three
vertices.• From the Construct menu, choose Triangle Interior.• From the Measure menu, choose Perimeter and
then Area.
Drag one vertex of the triangle to change its shape. Notice how the perimeter and area measurements change as you drag the vertex.
Draw and measure the circumference and area of acircle using The Geometer’s Sketchpad®.• Use the Compass Tool to create any circle.• Make sure the circle is selected. Then, from the
Measure menu, choose Circumference and thenArea.
You can also measure the radius.• Select the circle. From the Measure menu, choose
Radius.
Change the size of the circle and watch themeasurements change.
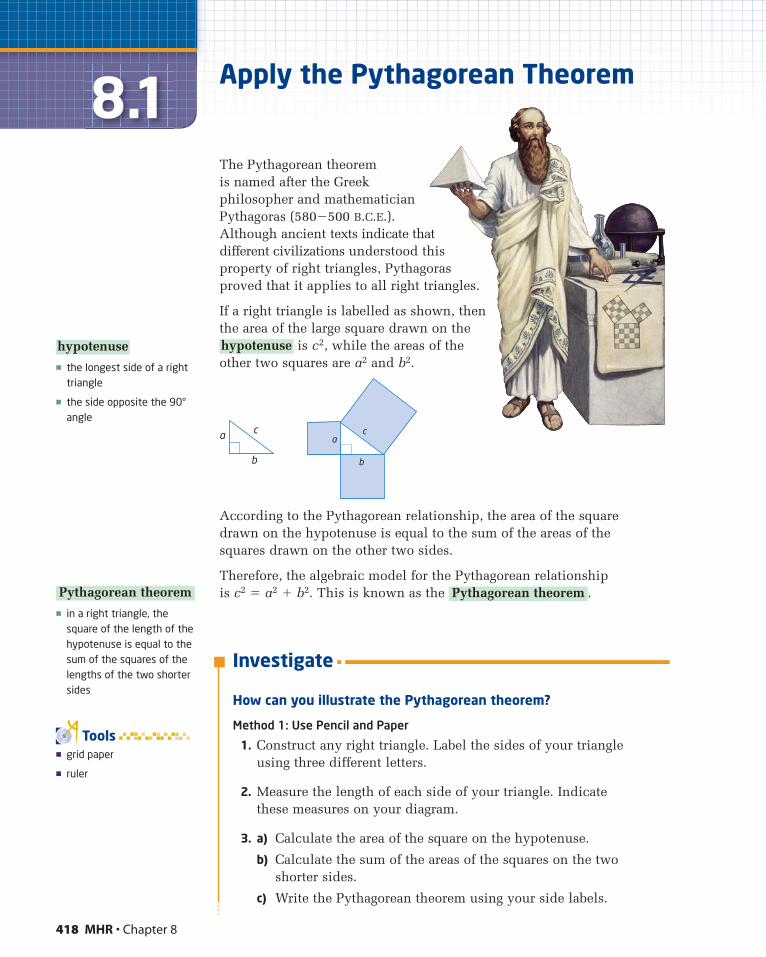
418 MHR • Chapter 8
8.1Apply the Pythagorean Theorem
The Pythagorean theorem is named after the Greekphilosopher and mathematicianPythagoras (580�500 B.C.E.).Although ancient texts indicate thatdifferent civilizations understood thisproperty of right triangles, Pythagorasproved that it applies to all right triangles.
If a right triangle is labelled as shown, thenthe area of the large square drawn on the
is c2, while the areas of theother two squares are a2 and b2.
According to the Pythagorean relationship, the area of the square drawn on the hypotenuse is equal to the sum of the areas of the squares drawn on the other two sides.
Therefore, the algebraic model for the Pythagorean relationship is c2 � a2 � b2. This is known as the .Pythagorean theorem
hypotenuse
a
b
ca
c
b
� the longest side of a righttriangle
� the side opposite the 90°angle
hypotenuse
� in a right triangle, thesquare of the length of thehypotenuse is equal to thesum of the squares of thelengths of the two shortersides
Pythagorean theorem
� grid paper
� ruler
Tools
Investigate
How can you illustrate the Pythagorean theorem?
Method 1: Use Pencil and Paper
1. Construct any right triangle. Label the sides of your triangle using three different letters.
2. Measure the length of each side of your triangle. Indicate these measures on your diagram.
3. a) Calculate the area of the square on the hypotenuse.
b) Calculate the sum of the areas of the squares on the two shorter sides.
c) Write the Pythagorean theorem using your side labels.
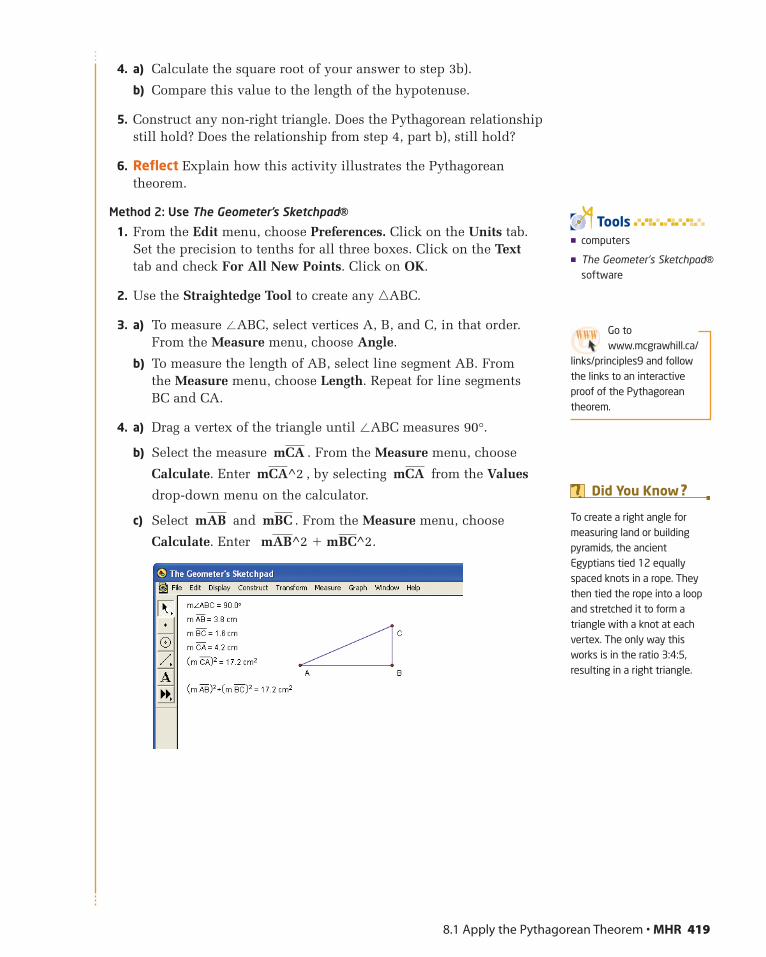
4. a) Calculate the square root of your answer to step 3b).
b) Compare this value to the length of the hypotenuse.
5. Construct any non-right triangle. Does the Pythagorean relationshipstill hold? Does the relationship from step 4, part b), still hold?
6. Reflect Explain how this activity illustrates the Pythagoreantheorem.
Method 2: Use The Geometer’s Sketchpad®1. From the Edit menu, choose Preferences. Click on the Units tab.
Set the precision to tenths for all three boxes. Click on the Texttab and check For All New Points. Click on OK.
2. Use the Straightedge Tool to create any �ABC.
3. a) To measure �ABC, select vertices A, B, and C, in that order.From the Measure menu, choose Angle.
b) To measure the length of AB, select line segment AB. From the Measure menu, choose Length. Repeat for line segments BC and CA.
4. a) Drag a vertex of the triangle until �ABC measures 90°.
b) Select the measure . From the Measure menu, choose
Calculate. Enter , by selecting from the Values
drop-down menu on the calculator.
c) Select and . From the Measure menu, choose
Calculate. Enter .mAB^2 � mBC^2
mBCmAB
mCAmCA^2
mCA
8.1 Apply the Pythagorean Theorem • MHR 419
� computers
� The Geometer’s Sketchpad®software
Tools
To create a right angle formeasuring land or buildingpyramids, the ancientEgyptians tied 12 equallyspaced knots in a rope. Theythen tied the rope into a loopand stretched it to form atriangle with a knot at eachvertex. The only way thisworks is in the ratio 3:4:5,resulting in a right triangle.
Did You Know ?
Go towww.mcgrawhill.ca/
links/principles9 and followthe links to an interactiveproof of the Pythagoreantheorem.
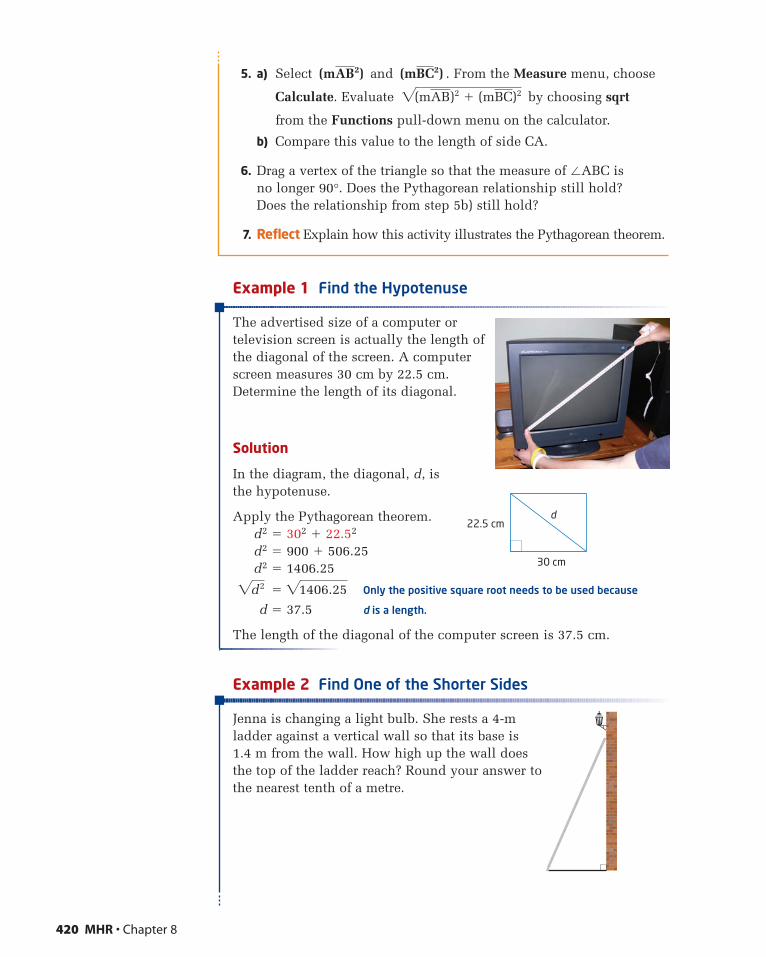
5. a) Select and . From the Measure menu, choose
Calculate. Evaluate by choosing sqrt
from the Functions pull-down menu on the calculator.
b) Compare this value to the length of side CA.
6. Drag a vertex of the triangle so that the measure of �ABC is no longer 90°. Does the Pythagorean relationship still hold? Does the relationship from step 5b) still hold?
7. Reflect Explain how this activity illustrates the Pythagorean theorem.
Example 1 Find the Hypotenuse
The advertised size of a computer ortelevision screen is actually the length ofthe diagonal of the screen. A computerscreen measures 30 cm by 22.5 cm.Determine the length of its diagonal.
Solution
In the diagram, the diagonal, d, is the hypotenuse.
Apply the Pythagorean theorem.d2 � 302 � 22.52
d2 � 900 � 506.25d2 � 1406.25
� Only the positive square root needs to be used because
d � 37.5 d is a length.
The length of the diagonal of the computer screen is 37.5 cm.
Example 2 Find One of the Shorter Sides
Jenna is changing a light bulb. She rests a 4-mladder against a vertical wall so that its base is 1.4 m from the wall. How high up the wall doesthe top of the ladder reach? Round your answer tothe nearest tenth of a metre.
21406.252d˛˛
2
2(mAB)2 � (mBC)2
(mBC2)(mAB2)
420 MHR • Chapter 8
d22.5 cm
30 cm
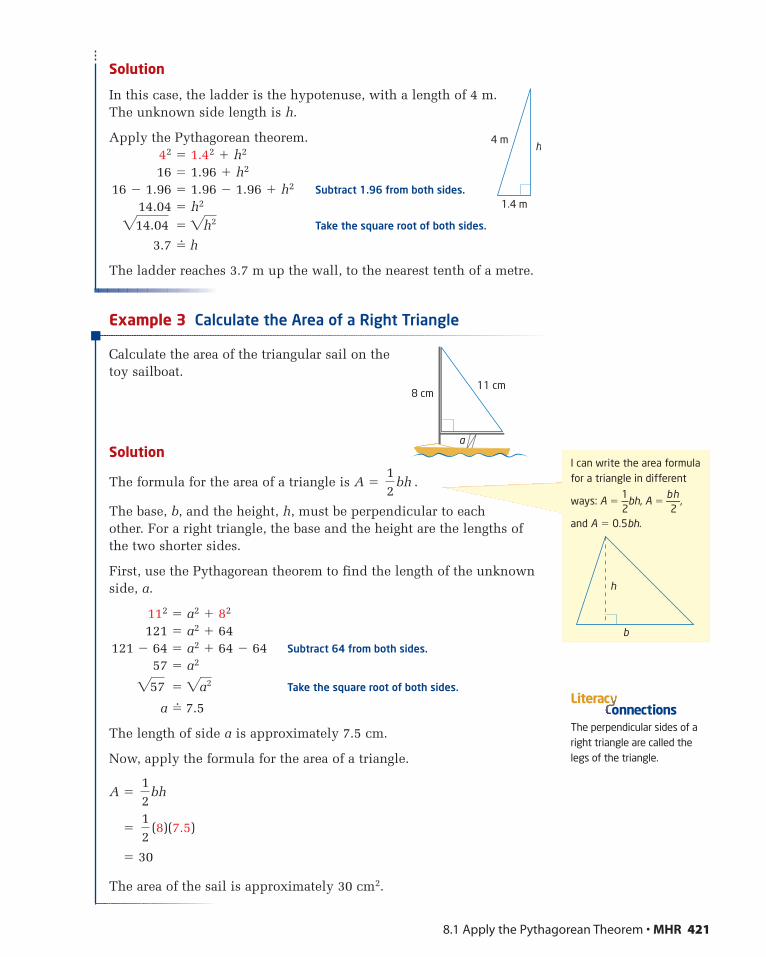
Solution
In this case, the ladder is the hypotenuse, with a length of 4 m.The unknown side length is h.
Apply the Pythagorean theorem.42 � 1.42 � h2
16 � 1.96 � h2
16 � 1.96 � 1.96 � 1.96 � h2 Subtract 1.96 from both sides.
14.04 � h2
� Take the square root of both sides.
3.7 �� h
The ladder reaches 3.7 m up the wall, to the nearest tenth of a metre.
Example 3 Calculate the Area of a Right Triangle
Calculate the area of the triangular sail on thetoy sailboat.
Solution
The formula for the area of a triangle is A � .
The base, b, and the height, h, must be perpendicular to eachother. For a right triangle, the base and the height are the lengths of the two shorter sides.
First, use the Pythagorean theorem to find the length of the unknownside, a.
112 � a2 � 82
121 � a2 � 64121 � 64 � a2 � 64 � 64 Subtract 64 from both sides.
57 � a2
� Take the square root of both sides.
a �� 7.5
The length of side a is approximately 7.5 cm.
Now, apply the formula for the area of a triangle.
A �
� (8)(7.5)
� 30
The area of the sail is approximately 30 cm2.
12
˛˛˛˛
12
˛˛˛bh
2a2257
12
˛˛˛˛bh
2h2214.04
8.1 Apply the Pythagorean Theorem • MHR 421
4 m
1.4 m
h
11 cm8 cm
a
I can write the area formulafor a triangle in different
ways: A �1—2
bh, A �bh—
2,
and A � 0.5bh.
h
b
The perpendicular sides of aright triangle are called thelegs of the triangle.
onnectionsLiterac
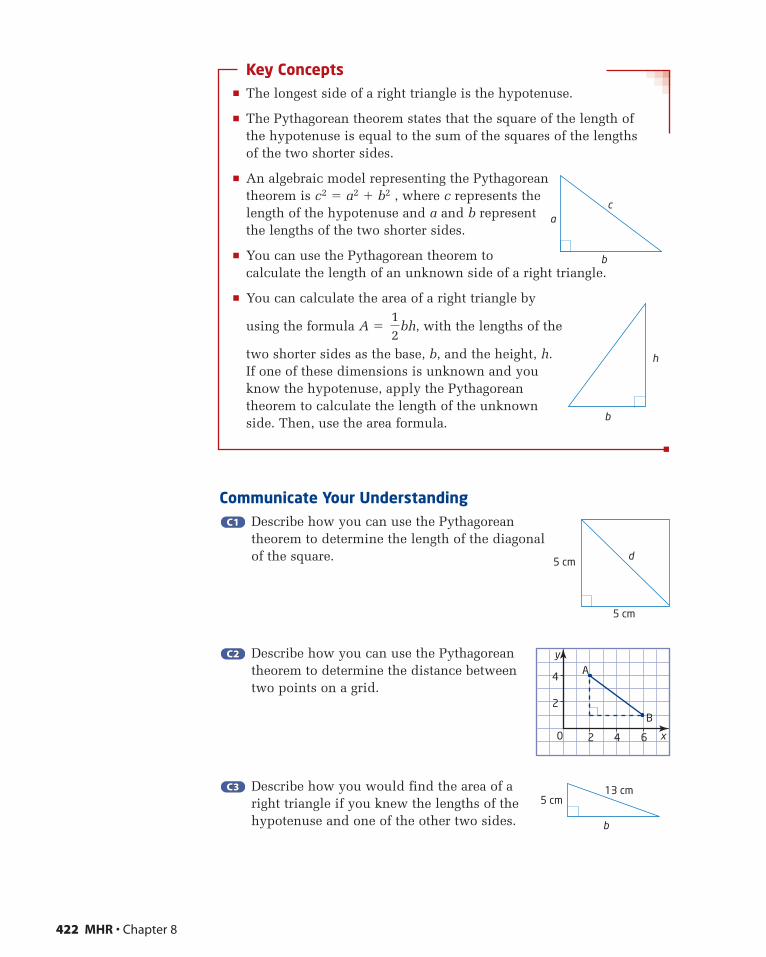
Key Concepts� The longest side of a right triangle is the hypotenuse.
� The Pythagorean theorem states that the square of the length of the hypotenuse is equal to the sum of the squares of the lengths of the two shorter sides.
� An algebraic model representing the Pythagoreantheorem is c2 � a2 � b2 , where c represents thelength of the hypotenuse and a and b representthe lengths of the two shorter sides.
� You can use the Pythagorean theorem tocalculate the length of an unknown side of a right triangle.
� You can calculate the area of a right triangle by
using the formula A � , with the lengths of the
two shorter sides as the base, b, and the height, h. If one of these dimensions is unknown and youknow the hypotenuse, apply the Pythagoreantheorem to calculate the length of the unknownside. Then, use the area formula.
Communicate Your UnderstandingDescribe how you can use the Pythagoreantheorem to determine the length of the diagonalof the square.
Describe how you can use the Pythagoreantheorem to determine the distance betweentwo points on a grid.
Describe how you would find the area of aright triangle if you knew the lengths of thehypotenuse and one of the other two sides.
C3C3
C2C2
C1C1
12
˛˛˛bh
422 MHR • Chapter 8
a
b
c
h
b
d
5 cm
5 cm
y
x0
A
B
2 4 6
2
4
b
13 cm5 cm
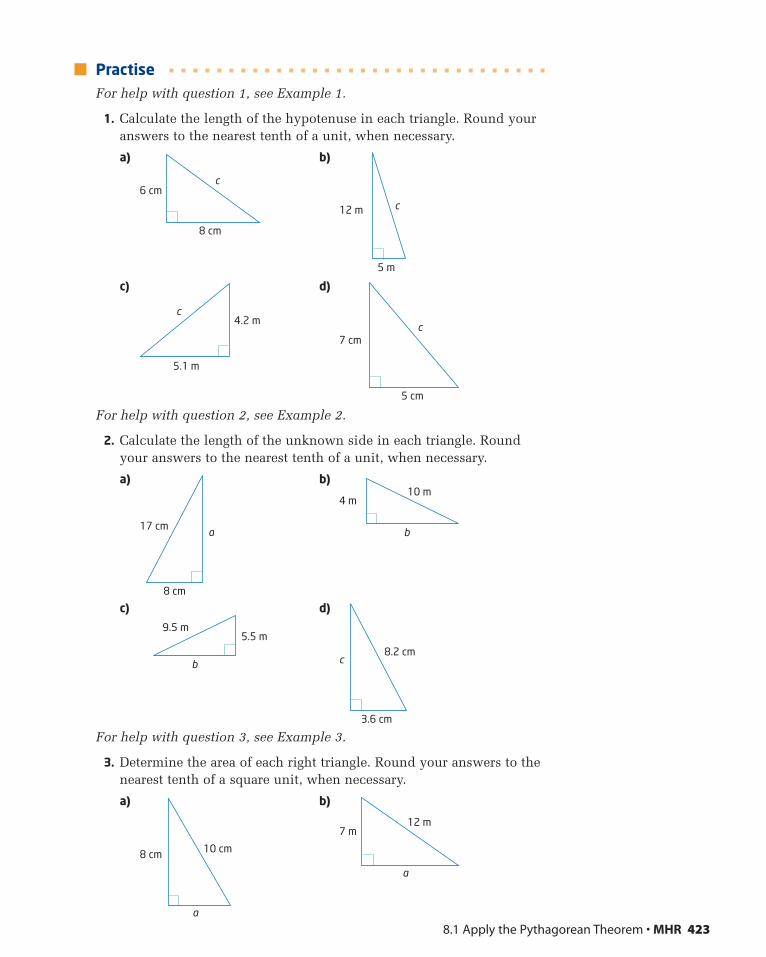
PractiseFor help with question 1, see Example 1.
1. Calculate the length of the hypotenuse in each triangle. Round youranswers to the nearest tenth of a unit, when necessary.
a) b)
c) d)
For help with question 2, see Example 2.
2. Calculate the length of the unknown side in each triangle. Roundyour answers to the nearest tenth of a unit, when necessary.
a) b)
c) d)
For help with question 3, see Example 3.
3. Determine the area of each right triangle. Round your answers to thenearest tenth of a square unit, when necessary.
a) b)
7 m12 m
a
8 cm 10 cm
a
8.2 cm
3.6 cm
cb
9.5 m5.5 m
b
10 m4 m
17 cm
8 cm
a
7 cm
5 cm
c4.2 m
5.1 m
c
12 m
5 m
c
c
8 cm
6 cm
8.1 Apply the Pythagorean Theorem • MHR 423
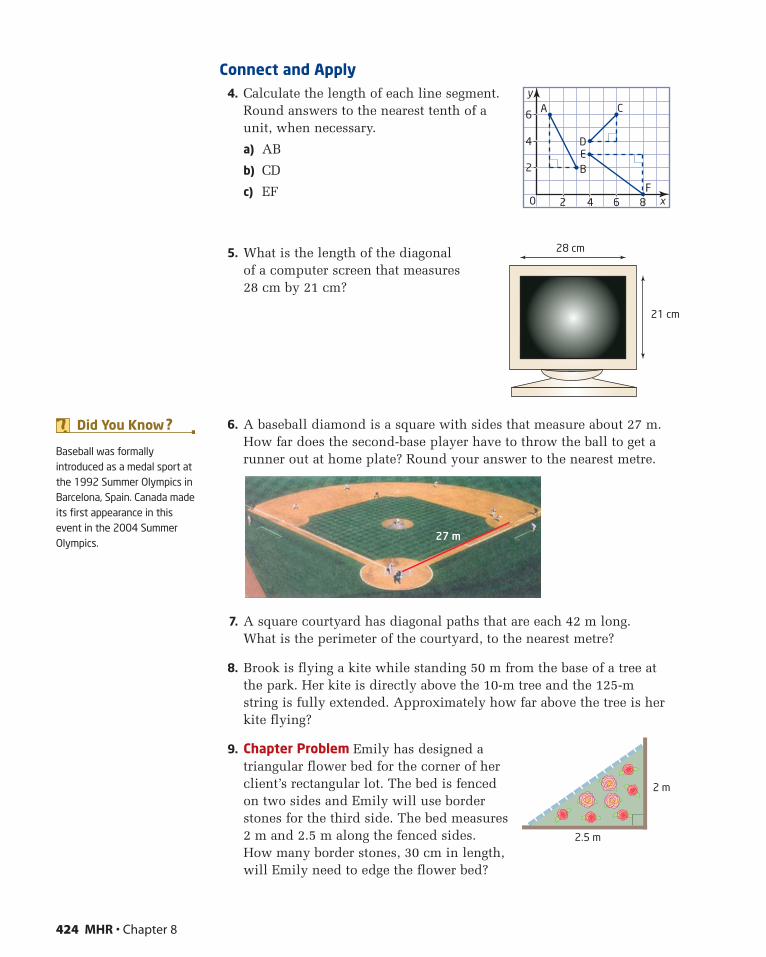
Connect and Apply4. Calculate the length of each line segment.
Round answers to the nearest tenth of aunit, when necessary.
a) AB
b) CD
c) EF
5. What is the length of the diagonal of a computer screen that measures 28 cm by 21 cm?
6. A baseball diamond is a square with sides that measure about 27 m.How far does the second-base player have to throw the ball to get arunner out at home plate? Round your answer to the nearest metre.
7. A square courtyard has diagonal paths that are each 42 m long. What is the perimeter of the courtyard, to the nearest metre?
8. Brook is flying a kite while standing 50 m from the base of a tree atthe park. Her kite is directly above the 10-m tree and the 125-mstring is fully extended. Approximately how far above the tree is herkite flying?
9. Chapter Problem Emily has designed atriangular flower bed for the corner of herclient’s rectangular lot. The bed is fencedon two sides and Emily will use borderstones for the third side. The bed measures2 m and 2.5 m along the fenced sides.How many border stones, 30 cm in length,will Emily need to edge the flower bed?
27 m
424 MHR • Chapter 8
y
x0
DE
A C
B
F2
2
4
6
4 6 8
28 cm
21 cm
2.5 m
2 m
Baseball was formallyintroduced as a medal sport atthe 1992 Summer Olympics inBarcelona, Spain. Canada madeits first appearance in thisevent in the 2004 SummerOlympics.
Did You Know ?
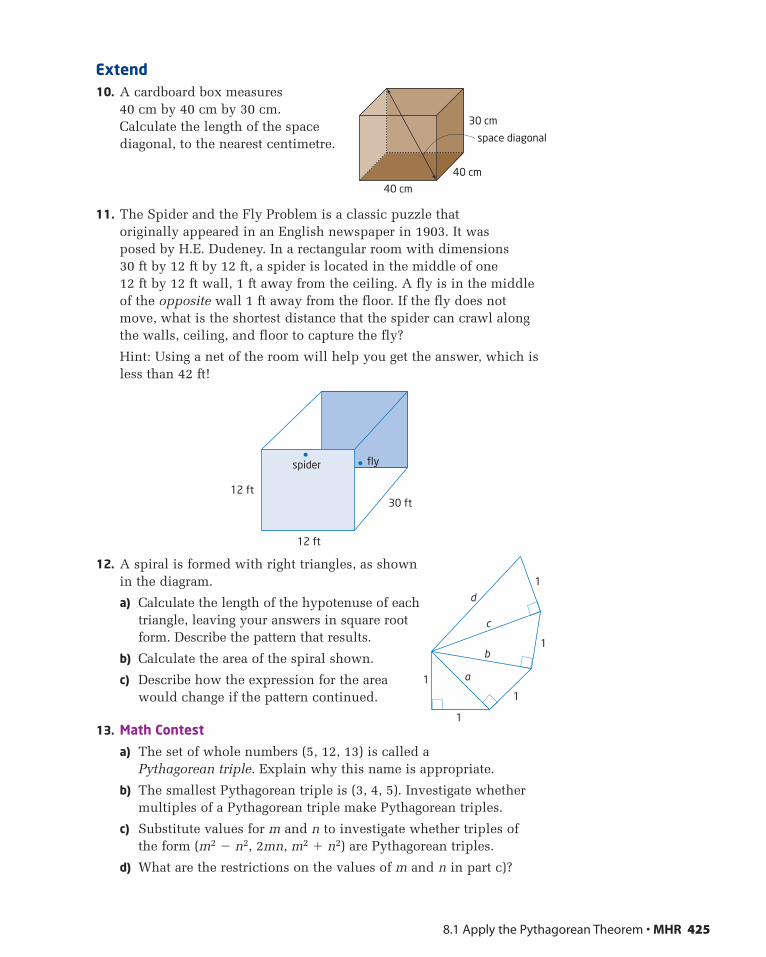
Extend10. A cardboard box measures
40 cm by 40 cm by 30 cm. Calculate the length of the spacediagonal, to the nearest centimetre.
11. The Spider and the Fly Problem is a classic puzzle that originally appeared in an English newspaper in 1903. It was posed by H.E. Dudeney. In a rectangular room with dimensions 30 ft by 12 ft by 12 ft, a spider is located in the middle of one 12 ft by 12 ft wall, 1 ft away from the ceiling. A fly is in the middleof the opposite wall 1 ft away from the floor. If the fly does notmove, what is the shortest distance that the spider can crawl alongthe walls, ceiling, and floor to capture the fly?
Hint: Using a net of the room will help you get the answer, which isless than 42 ft!
12. A spiral is formed with right triangles, as shownin the diagram.
a) Calculate the length of the hypotenuse of eachtriangle, leaving your answers in square rootform. Describe the pattern that results.
b) Calculate the area of the spiral shown.
c) Describe how the expression for the areawould change if the pattern continued.
13. Math Contest
a) The set of whole numbers (5, 12, 13) is called a Pythagorean triple. Explain why this name is appropriate.
b) The smallest Pythagorean triple is (3, 4, 5). Investigate whethermultiples of a Pythagorean triple make Pythagorean triples.
c) Substitute values for m and n to investigate whether triples of the form (m2 � n2, 2mn, m2 � n2) are Pythagorean triples.
d) What are the restrictions on the values of m and n in part c)?
12 ft
30 ft
fly
12 ft
spider
8.1 Apply the Pythagorean Theorem • MHR 425
space diagonal
40 cm
40 cm
30 cm
1
1
1
1
1
a
b
c
d
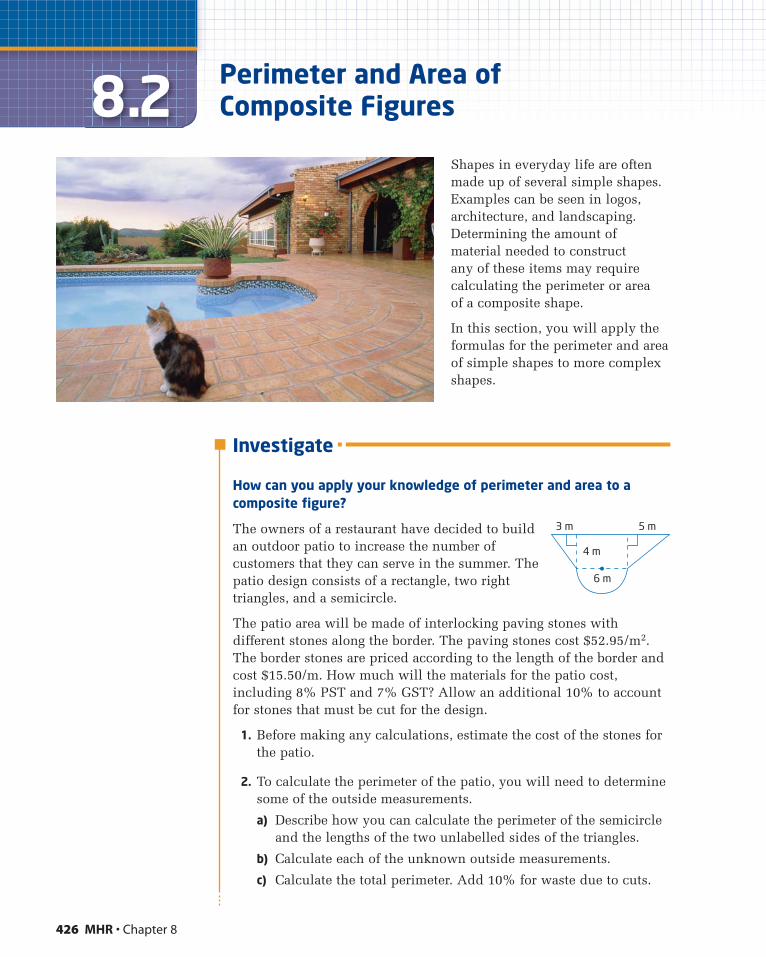
Investigate
How can you apply your knowledge of perimeter and area to acomposite figure?
The owners of a restaurant have decided to buildan outdoor patio to increase the number ofcustomers that they can serve in the summer. Thepatio design consists of a rectangle, two righttriangles, and a semicircle.
The patio area will be made of interlocking paving stones withdifferent stones along the border. The paving stones cost $52.95/m2.The border stones are priced according to the length of the border andcost $15.50/m. How much will the materials for the patio cost,including 8% PST and 7% GST? Allow an additional 10% to accountfor stones that must be cut for the design.
1. Before making any calculations, estimate the cost of the stones forthe patio.
2. To calculate the perimeter of the patio, you will need to determinesome of the outside measurements.
a) Describe how you can calculate the perimeter of the semicircleand the lengths of the two unlabelled sides of the triangles.
b) Calculate each of the unknown outside measurements.
c) Calculate the total perimeter. Add 10% for waste due to cuts.
426 MHR • Chapter 8
8.2 Perimeter and Area of Composite Figures
Shapes in everyday life are oftenmade up of several simple shapes.Examples can be seen in logos,architecture, and landscaping.Determining the amount ofmaterial needed to construct any of these items may requirecalculating the perimeter or area of a composite shape.
In this section, you will apply theformulas for the perimeter and areaof simple shapes to more complexshapes.
4 m
3 m 5 m
6 m
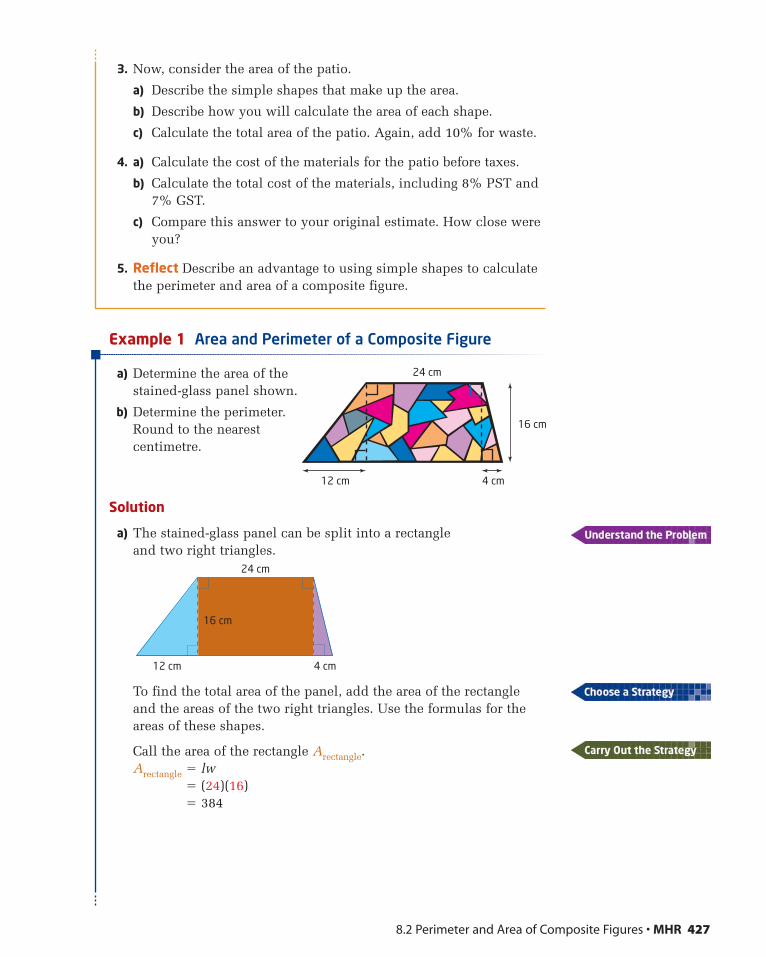
3. Now, consider the area of the patio.
a) Describe the simple shapes that make up the area.
b) Describe how you will calculate the area of each shape.
c) Calculate the total area of the patio. Again, add 10% for waste.
4. a) Calculate the cost of the materials for the patio before taxes.
b) Calculate the total cost of the materials, including 8% PST and7% GST.
c) Compare this answer to your original estimate. How close wereyou?
5. Reflect Describe an advantage to using simple shapes to calculatethe perimeter and area of a composite figure.
Example 1 Area and Perimeter of a Composite Figure
a) Determine the area of thestained-glass panel shown.
b) Determine the perimeter.Round to the nearestcentimetre.
Solution
a) The stained-glass panel can be split into a rectangle and two right triangles.
To find the total area of the panel, add the area of the rectangleand the areas of the two right triangles. Use the formulas for theareas of these shapes.
Call the area of the rectangle Arectangle.Arectangle � lw
� (24)(16)� 384
8.2 Perimeter and Area of Composite Figures • MHR 427
24 cm
16 cm
12 cm 4 cm
24 cm
16 cm
12 cm 4 cm
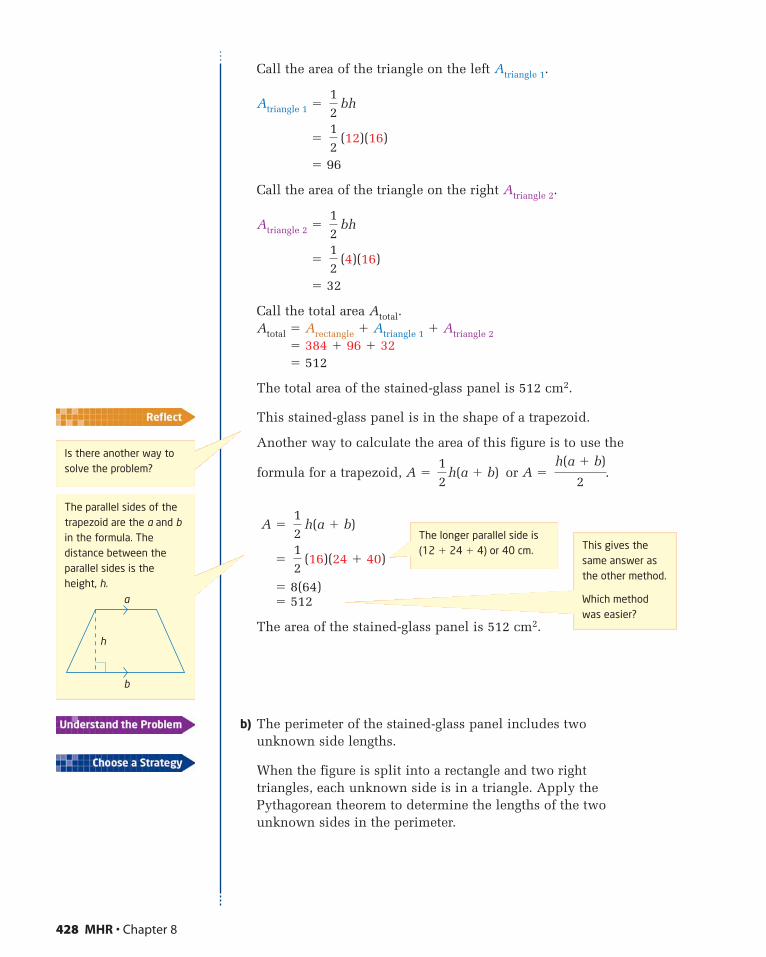
Call the area of the triangle on the left Atriangle 1.
Atriangle 1 � bh
� (12)(16)
� 96
Call the area of the triangle on the right Atriangle 2.
Atriangle 2 � bh
� (4)(16)
� 32
Call the total area Atotal.Atotal � Arectangle � Atriangle 1 � Atriangle 2
� 384 � 96 � 32� 512
The total area of the stained-glass panel is 512 cm2.
This stained-glass panel is in the shape of a trapezoid.
Another way to calculate the area of this figure is to use the
formula for a trapezoid, A � or A � .
A � h(a � b)
� (16)(24 � 40)
� 8(64)� 512
The area of the stained-glass panel is 512 cm2.
b) The perimeter of the stained-glass panel includes two unknown side lengths.
When the figure is split into a rectangle and two right triangles, each unknown side is in a triangle. Apply thePythagorean theorem to determine the lengths of the two unknown sides in the perimeter.
12
12
h(a � b)
212
˛˛˛˛h(a � b)
12
12
12
12
428 MHR • Chapter 8
The longer parallel side is(12 � 24 � 4) or 40 cm. This gives the
same answer asthe other method.
Which methodwas easier?
Is there another way tosolve the problem?
The parallel sides of thetrapezoid are the a and bin the formula. Thedistance between theparallel sides is theheight, h.
a
b
h

First, find the length of the unknown side on the left. Call it c.c2 � 122 � 162
c2 � 144 � 256c2 � 400
c �
c � 20
Next, find the length of the unknown side on the right. Call it d.d2 � 42 � 162
d2 � 16 � 256d2 � 272
d �
d �� 16
Now, find the perimeter by adding the outside measurements.P � 24 � 16 � 40 � 20
� 100
The perimeter of the stained-glass panel is approximately 100 cm.
The two unknown sides of the trapezoid must each be longer than16 cm. This means that the total perimeter must be longer than (24 � 16 � 40 � 16) or 96 cm. A perimeter of 100 cm seemsreasonable for this stained-glass panel.
Example 2 Area of a Composite Figure, by Subtraction, andPerimeter
A hotel is remodelling its outdoor entrance area. The new design includes a tile walkway leading to a semicircular fountain.
a) Describe the steps you would use to find the area of the walkway.
b) Calculate the area of the walkway. Round to the nearest tenth of a square metre.
c) The walkway will have a border in a differentcolour of tile. Calculate the perimeter of thewalkway. Round to the nearest tenth of a metre.
2272
2400
8.2 Perimeter and Area of Composite Figures • MHR 429
24 cm
16 cm
12 cm 4 cm
In both triangles, theunknown side is thehypotenuse.
2.1 m
5.2 m
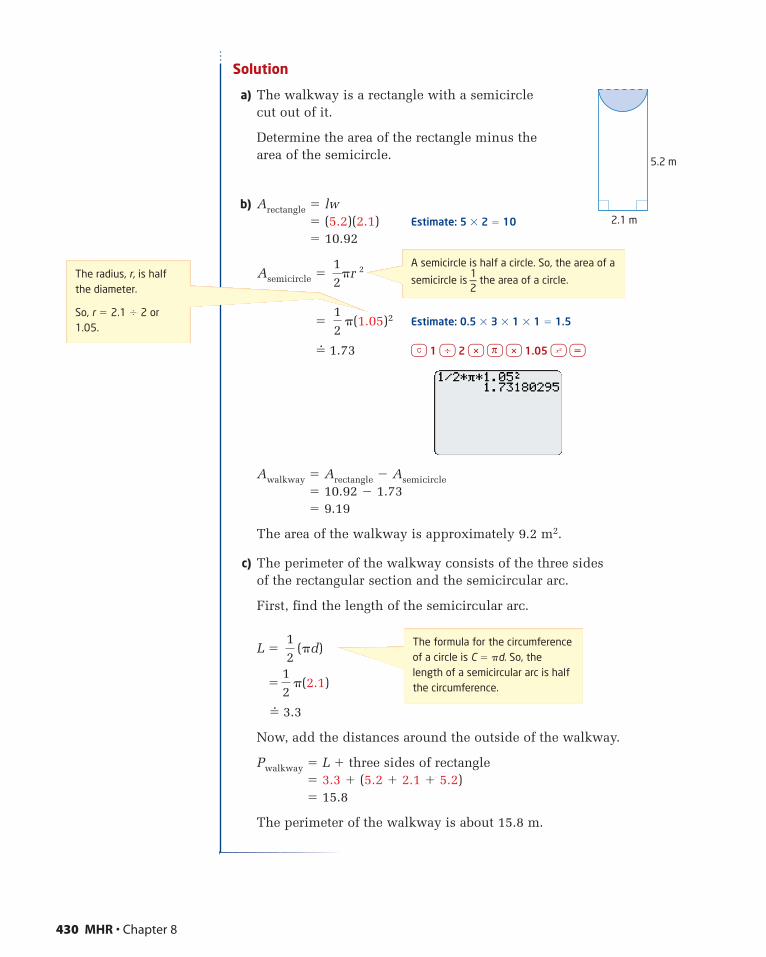
Solution
a) The walkway is a rectangle with a semicircle cut out of it.
Determine the area of the rectangle minus the area of the semicircle.
b) Arectangle � lw� (5.2)(2.1) Estimate: 5 � 2 � 10
� 10.92
Asemicircle �
� �(1.05)2 Estimate: 0.5 � 3 � 1 � 1 � 1.5
�� 1.73 ç 1 ÷ 2 * π * 1.05 x =
Awalkway � Arectangle � Asemicircle� 10.92 � 1.73� 9.19
The area of the walkway is approximately 9.2 m2.
c) The perimeter of the walkway consists of the three sides of the rectangular section and the semicircular arc.
First, find the length of the semicircular arc.
L � (�d)
� �(2.1)
�� 3.3
Now, add the distances around the outside of the walkway.
Pwalkway � L � three sides of rectangle� 3.3 � (5.2 � 2.1 � 5.2)� 15.8
The perimeter of the walkway is about 15.8 m.
12
12
12
12
�r 2
430 MHR • Chapter 8
2.1 m
5.2 m
A semicircle is half a circle. So, the area of a
semicircle is 1—2
the area of a circle.
The formula for the circumferenceof a circle is C � �d. So, thelength of a semicircular arc is halfthe circumference.
The radius, r, is halfthe diameter.
So, r � 2.1 � 2 or1.05.

Key Concepts� A composite figure is made up of more than one simple shape.
� To determine the total area of a composite figure, add and/orsubtract areas.
� To determine the perimeter of a composite figure, add the distances around the outside of the figure.
Communicate Your UnderstandingRefer to the Investigate on pages 426 and 427. The patio wasdivided into four simple shapes: a rectangle, two triangles, and asemicircle. Describe how to determine the area of the patio byadding the areas of two shapes.
Consider the yard shown.
a) Describe how you can determinethe unknown lengths.
b) Describe how you can determinethe area of the yard by adding theareas of simpler shapes.
c) Describe how you can determinethe area by subtracting areas.
a) Suppose you need to calculate the perimeter of the yard inquestion C2. Explain why you cannot simply add the perimetersof the rectangles that make up the composite figure.
b) Without calculating, describe how the perimeter of this yardcompares to the perimeter of a rectangular yard that measures 10 m by 7 m.
a) How does the perimeter of theyard in question C2 compare tothe perimeter of the yard shown,which has been increased by thesmaller rectangular section ratherthan being decreased in size?
b) Describe how you woulddetermine the area of this yard.
c) How does its area compare to thearea of the yard in question C2?
C4C4
C3C3
C2C2
C1C1
8.2 Perimeter and Area of Composite Figures • MHR 431
2 m 2 m
7 m
3 m
10 m
2 m 2 m
7 m3 m
10 m
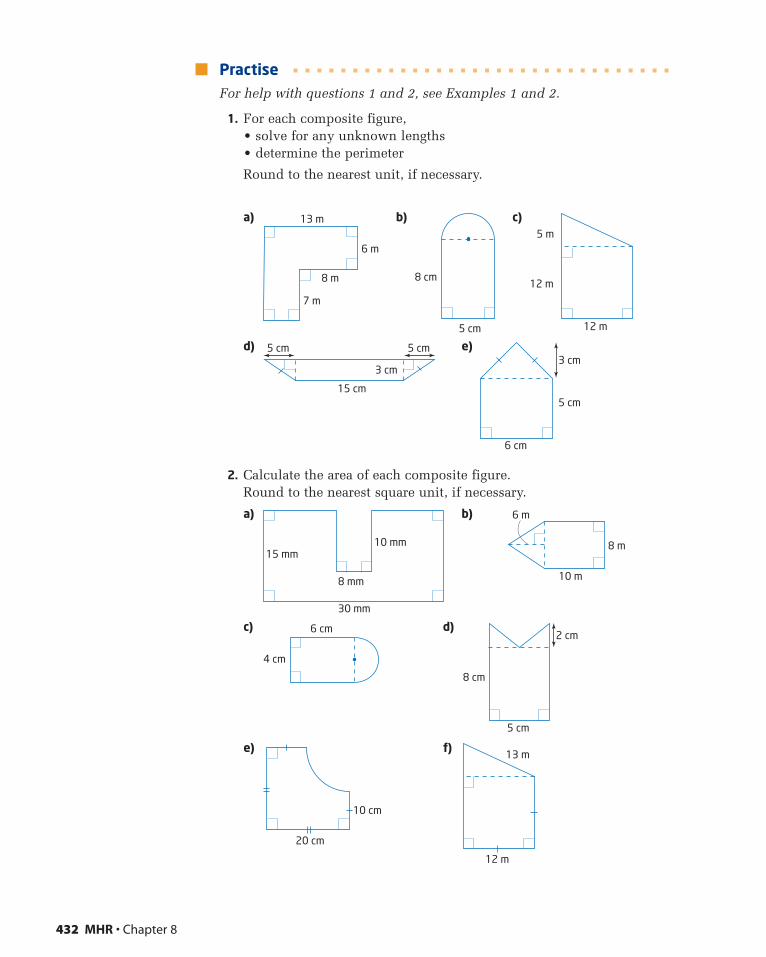
PractiseFor help with questions 1 and 2, see Examples 1 and 2.
1. For each composite figure,• solve for any unknown lengths• determine the perimeter
Round to the nearest unit, if necessary.
a) b) c)
d) e)
2. Calculate the area of each composite figure. Round to the nearest square unit, if necessary.
a) b)
c) d)
e) f) 13 m
12 m
10 cm
20 cm
8 cm
2 cm
5 cm
6 cm
4 cm
10 m
6 m
8 m
30 mm
8 mm
10 mm15 mm
6 cm
5 cm
3 cm5 cm5 cm
15 cm
3 cm
12 m
5 m
12 m
8 cm
5 cm
6 m
13 m
8 m
7 m
432 MHR • Chapter 8
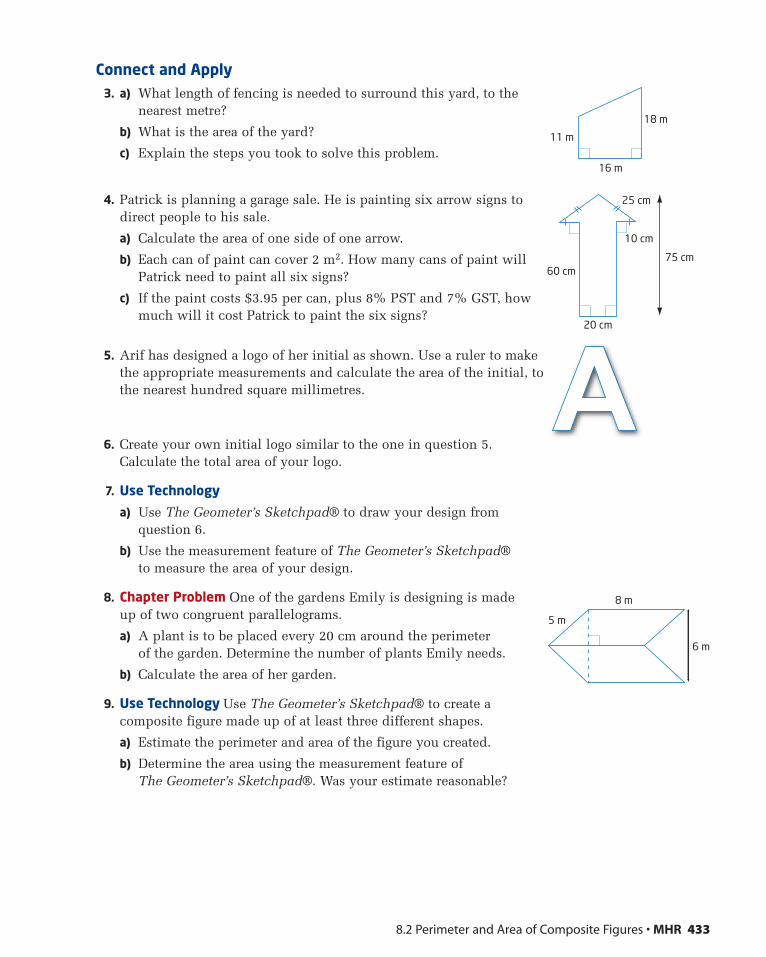
Connect and Apply3. a) What length of fencing is needed to surround this yard, to the
nearest metre?
b) What is the area of the yard?
c) Explain the steps you took to solve this problem.
4. Patrick is planning a garage sale. He is painting six arrow signs todirect people to his sale.
a) Calculate the area of one side of one arrow.
b) Each can of paint can cover 2 m2. How many cans of paint willPatrick need to paint all six signs?
c) If the paint costs $3.95 per can, plus 8% PST and 7% GST, howmuch will it cost Patrick to paint the six signs?
5. Arif has designed a logo of her initial as shown. Use a ruler to makethe appropriate measurements and calculate the area of the initial, tothe nearest hundred square millimetres.
6. Create your own initial logo similar to the one in question 5.Calculate the total area of your logo.
7. Use Technology
a) Use The Geometer’s Sketchpad® to draw your design fromquestion 6.
b) Use the measurement feature of The Geometer’s Sketchpad® to measure the area of your design.
8. Chapter Problem One of the gardens Emily is designing is made up of two congruent parallelograms.
a) A plant is to be placed every 20 cm around the perimeter of the garden. Determine the number of plants Emily needs.
b) Calculate the area of her garden.
9. Use Technology Use The Geometer’s Sketchpad® to create acomposite figure made up of at least three different shapes.
a) Estimate the perimeter and area of the figure you created.
b) Determine the area using the measurement feature of The Geometer’s Sketchpad®. Was your estimate reasonable?
8.2 Perimeter and Area of Composite Figures • MHR 433
11 m
16 m
18 m
60 cm
10 cm
75 cm
25 cm
20 cm
8 m
5 m
6 m
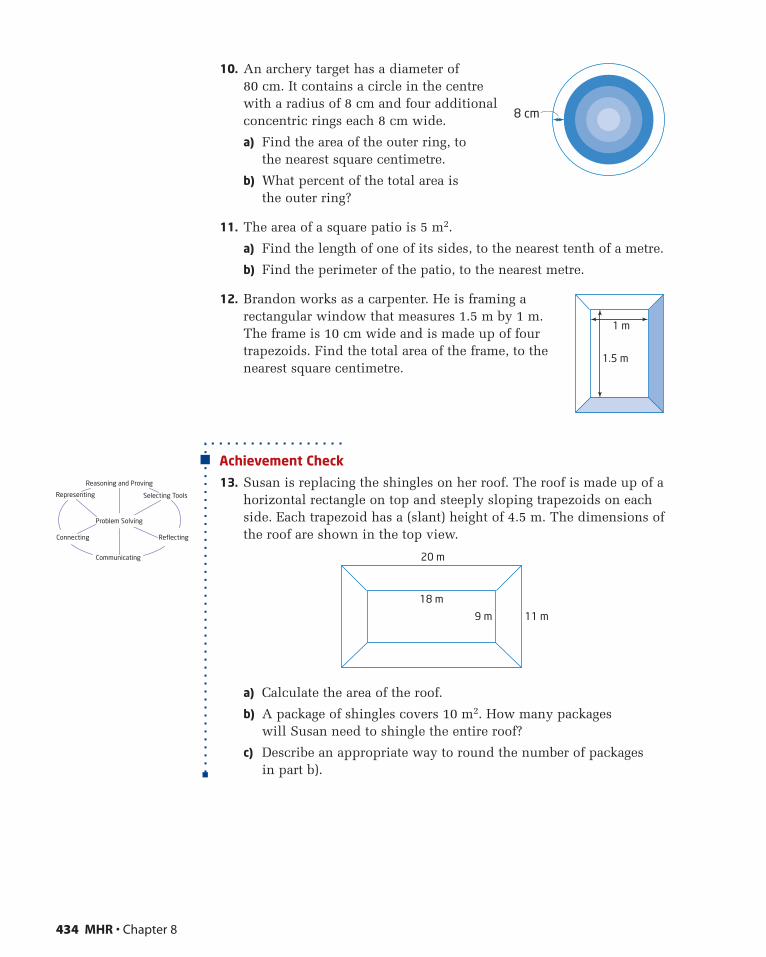
10. An archery target has a diameter of80 cm. It contains a circle in the centrewith a radius of 8 cm and four additionalconcentric rings each 8 cm wide.
a) Find the area of the outer ring, to the nearest square centimetre.
b) What percent of the total area is the outer ring?
11. The area of a square patio is 5 m2.
a) Find the length of one of its sides, to the nearest tenth of a metre.
b) Find the perimeter of the patio, to the nearest metre.
12. Brandon works as a carpenter. He is framing arectangular window that measures 1.5 m by 1 m. The frame is 10 cm wide and is made up of fourtrapezoids. Find the total area of the frame, to thenearest square centimetre.
Achievement Check
13. Susan is replacing the shingles on her roof. The roof is made up of ahorizontal rectangle on top and steeply sloping trapezoids on eachside. Each trapezoid has a (slant) height of 4.5 m. The dimensions ofthe roof are shown in the top view.
a) Calculate the area of the roof.
b) A package of shingles covers 10 m2. How many packages will Susan need to shingle the entire roof?
c) Describe an appropriate way to round the number of packages in part b).
11 m9 m
18 m
20 m
434 MHR • Chapter 8
8 cm
1 m
1.5 m
Selecting ToolsRepresenting
Reasoning and Proving
Communicating
Connecting Reflecting
Problem Solving
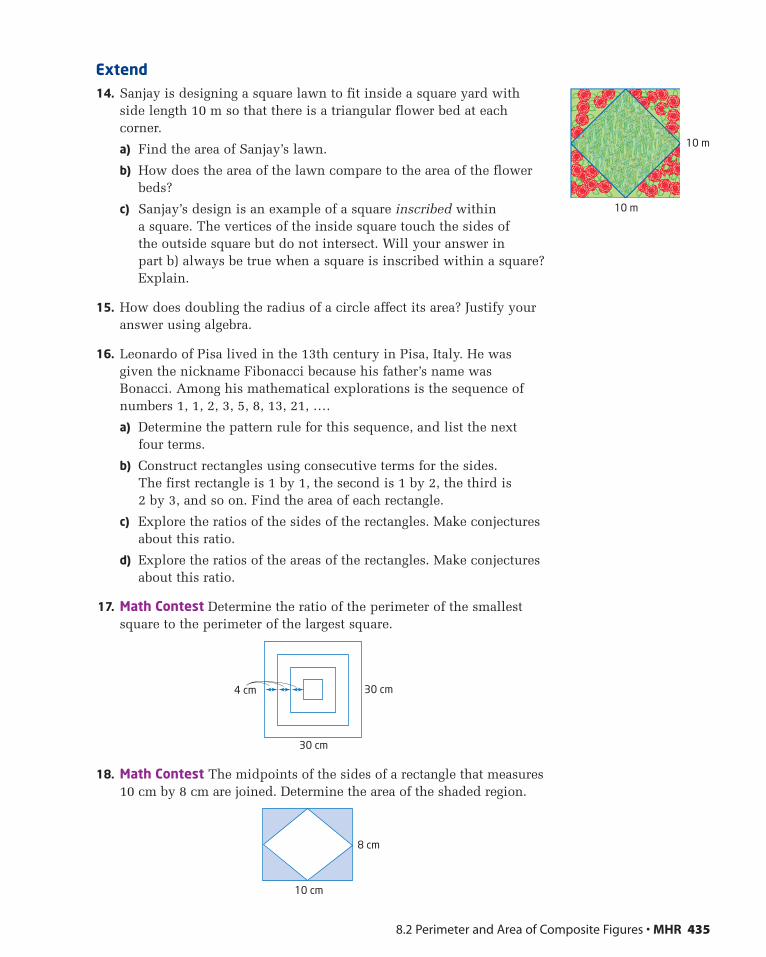
Extend14. Sanjay is designing a square lawn to fit inside a square yard with
side length 10 m so that there is a triangular flower bed at eachcorner.
a) Find the area of Sanjay’s lawn.
b) How does the area of the lawn compare to the area of the flowerbeds?
c) Sanjay’s design is an example of a square inscribed within a square. The vertices of the inside square touch the sides ofthe outside square but do not intersect. Will your answer inpart b) always be true when a square is inscribed within a square?Explain.
15. How does doubling the radius of a circle affect its area? Justify youranswer using algebra.
16. Leonardo of Pisa lived in the 13th century in Pisa, Italy. He wasgiven the nickname Fibonacci because his father’s name wasBonacci. Among his mathematical explorations is the sequence ofnumbers 1, 1, 2, 3, 5, 8, 13, 21, ….
a) Determine the pattern rule for this sequence, and list the next four terms.
b) Construct rectangles using consecutive terms for the sides. The first rectangle is 1 by 1, the second is 1 by 2, the third is 2 by 3, and so on. Find the area of each rectangle.
c) Explore the ratios of the sides of the rectangles. Make conjecturesabout this ratio.
d) Explore the ratios of the areas of the rectangles. Make conjecturesabout this ratio.
17. Math Contest Determine the ratio of the perimeter of the smallestsquare to the perimeter of the largest square.
18. Math Contest The midpoints of the sides of a rectangle that measures10 cm by 8 cm are joined. Determine the area of the shaded region.
8 cm
10 cm
30 cm
4 cm 30 cm
8.2 Perimeter and Area of Composite Figures • MHR 435
10 m
10 m

Investigate
How can you model the surface area and volume of a pyramid?
A: Surface Area
1. A square-based and itsnet are shown.
a) What is the shape of the base?Write a formula for its area.
b) What is the shape of each? Write a formula for
the area of one lateral face.
c) Write an expression for the surface area of the pyramid.Simplify the expression to give a formula for the surface area of a pyramid.
2. Reflect How would the results in step 1 change if you weredeveloping a formula for the surface area of a hexagon-basedpyramid? an octagon-based pyramid? Describe how to find thesurface area of any pyramid.
lateral face
pyramid
436 MHR • Chapter 8
8.3
� the number of square unitsneeded to cover the surfaceof a three-dimensionalobject
� the amount of space that an object occupies,measured in cubic units
volume
surface area
� a polyhedron whose baseis a polygon and whosefaces are triangles thatmeet at a common vertex
� the faces of a prism orpyramid that are not bases
lateral faces
pyramid
lateralface
base
Surface Area and Volume of Prismsand Pyramids
To package their products economically, manufacturers need to know the amount of material required for the package. To do this, they need toknow the of the package.
The amount of space a package occupies is the . Products suchas cereal, laundry detergent, and dog food are often sold by mass ratherthan volume. Why do you think these products are sold by mass?
volume
surface area
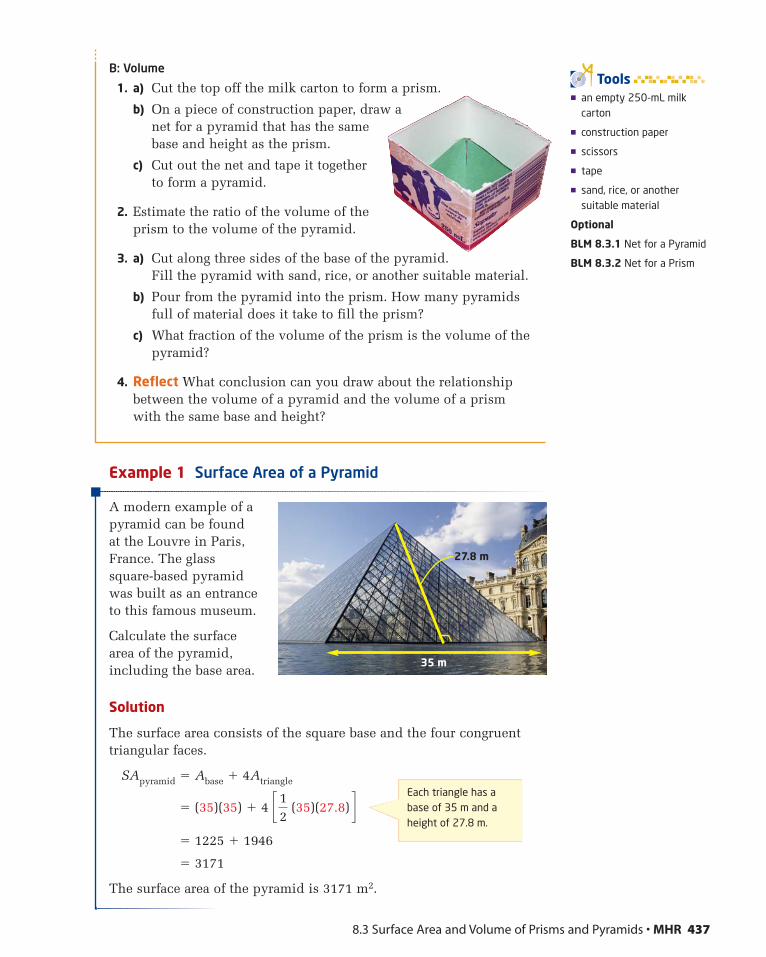
Example 1 Surface Area of a Pyramid
A modern example of apyramid can be found at the Louvre in Paris,France. The glasssquare-based pyramidwas built as an entranceto this famous museum.
Calculate the surfacearea of the pyramid,including the base area.
Solution
The surface area consists of the square base and the four congruenttriangular faces.
SApyramid � Abase � 4Atriangle
� (35)(35) � 4
� 1225 � 1946
� 3171
The surface area of the pyramid is 3171 m2.
c 12
(35)(27.8) d
B: Volume
1. a) Cut the top off the milk carton to form a prism.
b) On a piece of construction paper, draw anet for a pyramid that has the samebase and height as the prism.
c) Cut out the net and tape it togetherto form a pyramid.
2. Estimate the ratio of the volume of theprism to the volume of the pyramid.
3. a) Cut along three sides of the base of the pyramid.Fill the pyramid with sand, rice, or another suitable material.
b) Pour from the pyramid into the prism. How many pyramids full of material does it take to fill the prism?
c) What fraction of the volume of the prism is the volume of thepyramid?
4. Reflect What conclusion can you draw about the relationshipbetween the volume of a pyramid and the volume of a prism with the same base and height?
8.3 Surface Area and Volume of Prisms and Pyramids • MHR 437
� an empty 250-mL milkcarton
� construction paper
� scissors
� tape
� sand, rice, or anothersuitable material
Optional
BLM 8.3.1 Net for a Pyramid
BLM 8.3.2 Net for a Prism
Tools
Each triangle has abase of 35 m and aheight of 27.8 m.
35 m
27.8 m
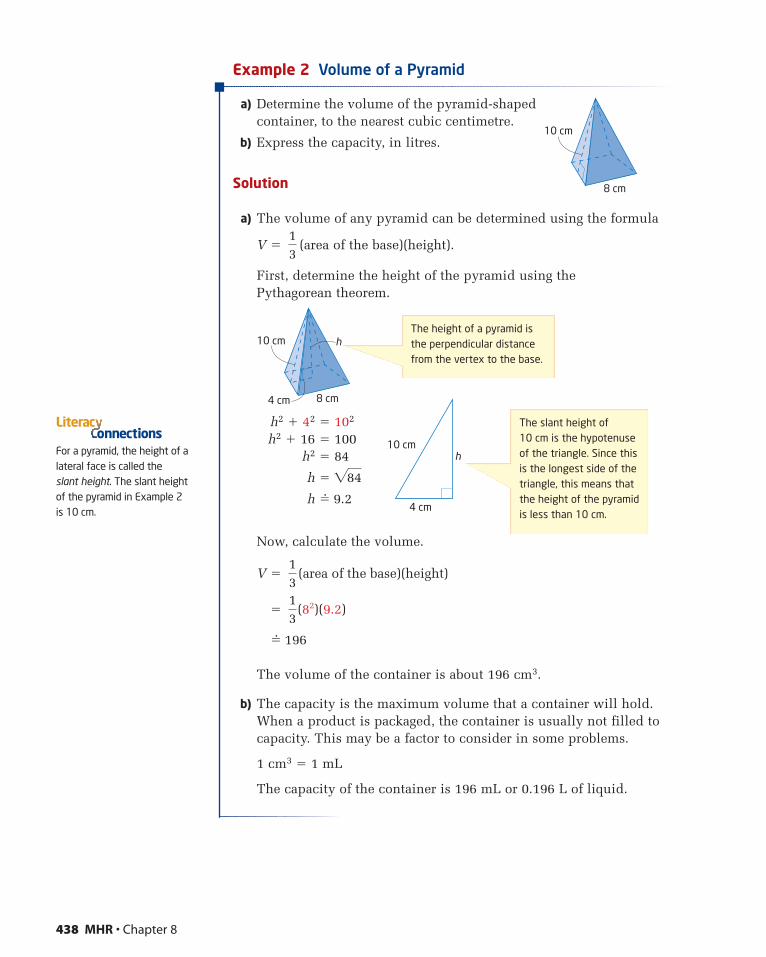
Example 2 Volume of a Pyramid
a) Determine the volume of the pyramid-shapedcontainer, to the nearest cubic centimetre.
b) Express the capacity, in litres.
Solution
a) The volume of any pyramid can be determined using the formula
V � (area of the base)(height).
First, determine the height of the pyramid using the Pythagorean theorem.
h2 � 42 � 102
h2 � 16 � 100h2 � 84
h �
h �� 9.2
Now, calculate the volume.
V �
�
�� 196
The volume of the container is about 196 cm3.
b) The capacity is the maximum volume that a container will hold.When a product is packaged, the container is usually not filled tocapacity. This may be a factor to consider in some problems.
1 cm3 � 1 mL
The capacity of the container is 196 mL or 0.196 L of liquid.
13
˛˛(82)(9.2)
13
˛˛˛˛(area of the base)(height)
284
13
438 MHR • Chapter 8
8 cm
10 cm
8 cm
10 cm h
4 cm
The height of a pyramid isthe perpendicular distancefrom the vertex to the base.
For a pyramid, the height of alateral face is called theslant height. The slant heightof the pyramid in Example 2is 10 cm.
onnectionsLiterac
10 cmh
4 cm
The slant height of 10 cm is the hypotenuseof the triangle. Since thisis the longest side of thetriangle, this means thatthe height of the pyramidis less than 10 cm.
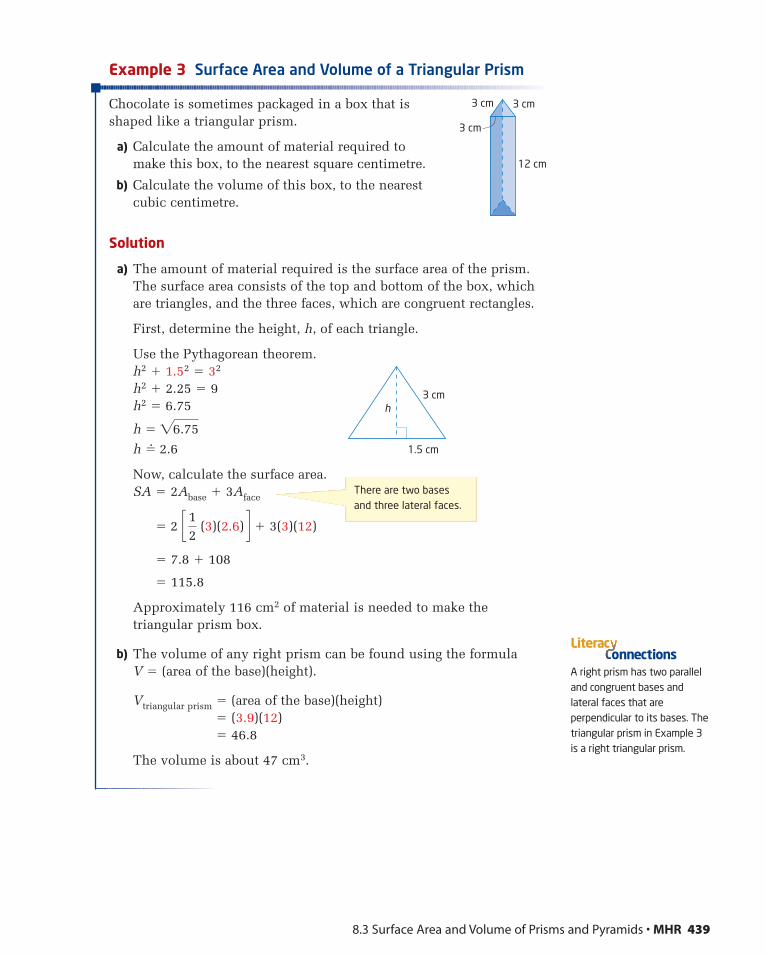
Example 3 Surface Area and Volume of a Triangular Prism
Chocolate is sometimes packaged in a box that isshaped like a triangular prism.
a) Calculate the amount of material required to make this box, to the nearest square centimetre.
b) Calculate the volume of this box, to the nearestcubic centimetre.
Solution
a) The amount of material required is the surface area of the prism.The surface area consists of the top and bottom of the box, whichare triangles, and the three faces, which are congruent rectangles.
First, determine the height, h, of each triangle.
Use the Pythagorean theorem.h2 � 1.52 � 32
h2 � 2.25 � 9h2 � 6.75
h �
h �� 2.6
Now, calculate the surface area.SA � 2Abase � 3Aface
� 2 � 3(3)(12)
� 7.8 � 108
� 115.8
Approximately 116 cm2 of material is needed to make thetriangular prism box.
b) The volume of any right prism can be found using the formula V � (area of the base)(height).
Vtriangular prism � (area of the base)(height)� (3.9)(12)� 46.8
The volume is about 47 cm3.
c 12
(3)(2.6) d
26.75
8.3 Surface Area and Volume of Prisms and Pyramids • MHR 439
There are two basesand three lateral faces.
A right prism has two paralleland congruent bases andlateral faces that areperpendicular to its bases. Thetriangular prism in Example 3is a right triangular prism.
onnectionsLiterac
12 cm
3 cm3 cm
3 cm
3 cmh
1.5 cm
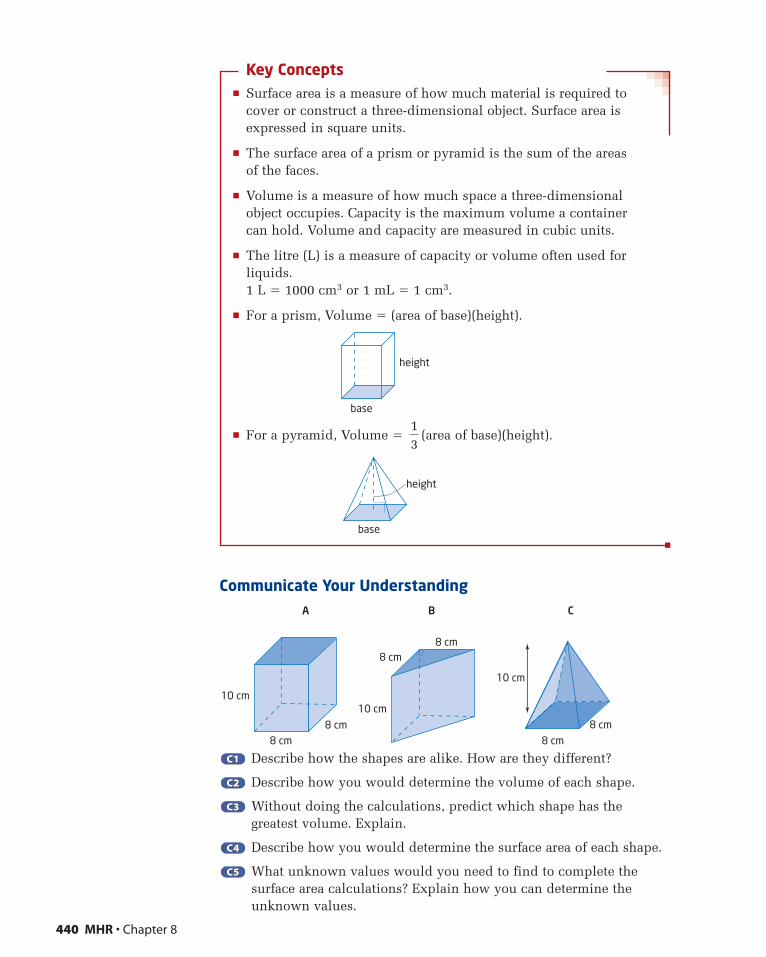
Key Concepts� Surface area is a measure of how much material is required to
cover or construct a three-dimensional object. Surface area isexpressed in square units.
� The surface area of a prism or pyramid is the sum of the areas of the faces.
� Volume is a measure of how much space a three-dimensional object occupies. Capacity is the maximum volume a container can hold. Volume and capacity are measured in cubic units.
� The litre (L) is a measure of capacity or volume often used forliquids.1 L � 1000 cm3 or 1 mL � 1 cm3.
� For a prism, Volume � (area of base)(height).
� For a pyramid, Volume � (area of base)(height).
Communicate Your Understanding
Describe how the shapes are alike. How are they different?
Describe how you would determine the volume of each shape.
Without doing the calculations, predict which shape has thegreatest volume. Explain.
Describe how you would determine the surface area of each shape.
What unknown values would you need to find to complete thesurface area calculations? Explain how you can determine theunknown values.
C5C5
C4C4
C3C3
C2C2
C1C1
10 cm
8 cm8 cm
A B C
10 cm
8 cm
8 cm10 cm
8 cm8 cm
13
440 MHR • Chapter 8
base
height
base
height
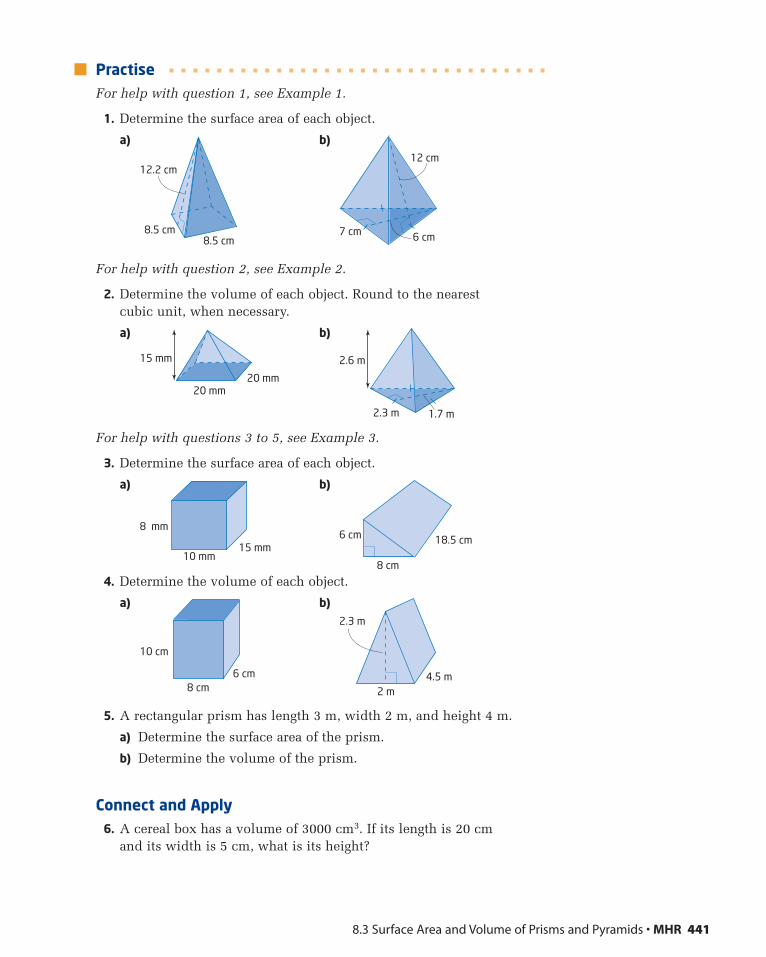
PractiseFor help with question 1, see Example 1.
1. Determine the surface area of each object.
a) b)
For help with question 2, see Example 2.
2. Determine the volume of each object. Round to the nearest cubic unit, when necessary.
a) b)
For help with questions 3 to 5, see Example 3.
3. Determine the surface area of each object.
a) b)
4. Determine the volume of each object.
a) b)
5. A rectangular prism has length 3 m, width 2 m, and height 4 m.
a) Determine the surface area of the prism.
b) Determine the volume of the prism.
Connect and Apply6. A cereal box has a volume of 3000 cm3. If its length is 20 cm
and its width is 5 cm, what is its height?
2.3 m
2 m4.5 m
10 cm
8 cm6 cm
6 cm
8 cm
18.5 cm8 mm
10 mm15 mm
2.6 m
2.3 m 1.7 m
15 mm
20 mm20 mm
6 cm
12 cm
7 cm8.5 cm
8.5 cm
12.2 cm
8.3 Surface Area and Volume of Prisms and Pyramids • MHR 441
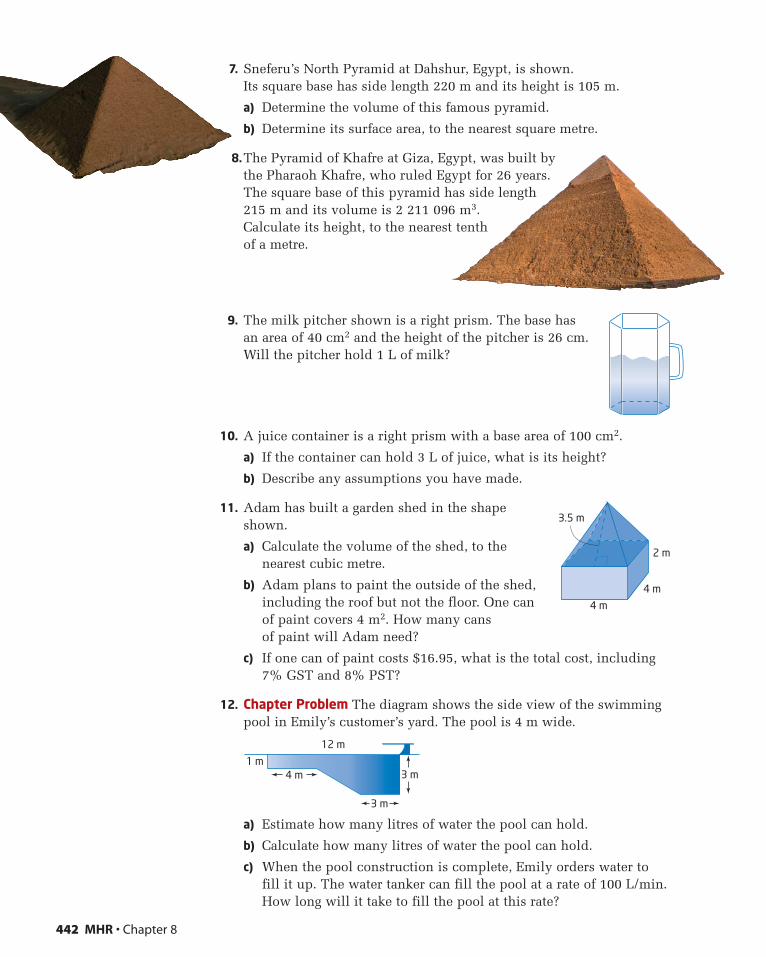
7. Sneferu’s North Pyramid at Dahshur, Egypt, is shown. Its square base has side length 220 m and its height is 105 m.
a) Determine the volume of this famous pyramid.
b) Determine its surface area, to the nearest square metre.
8.The Pyramid of Khafre at Giza, Egypt, was built bythe Pharaoh Khafre, who ruled Egypt for 26 years.The square base of this pyramid has side length215 m and its volume is 2 211 096 m3.Calculate its height, to the nearest tenthof a metre.
9. The milk pitcher shown is a right prism. The base hasan area of 40 cm2 and the height of the pitcher is 26 cm.Will the pitcher hold 1 L of milk?
10. A juice container is a right prism with a base area of 100 cm2.
a) If the container can hold 3 L of juice, what is its height?
b) Describe any assumptions you have made.
11. Adam has built a garden shed in the shapeshown.
a) Calculate the volume of the shed, to thenearest cubic metre.
b) Adam plans to paint the outside of the shed,including the roof but not the floor. One canof paint covers 4 m2. How many cans of paint will Adam need?
c) If one can of paint costs $16.95, what is the total cost, including7% GST and 8% PST?
12. Chapter Problem The diagram shows the side view of the swimmingpool in Emily’s customer’s yard. The pool is 4 m wide.
a) Estimate how many litres of water the pool can hold.
b) Calculate how many litres of water the pool can hold.
c) When the pool construction is complete, Emily orders water tofill it up. The water tanker can fill the pool at a rate of 100 L/min.How long will it take to fill the pool at this rate?
12 m
1 m3 m4 m
3 m
442 MHR • Chapter 8
3.5 m
4 m
4 m
2 m
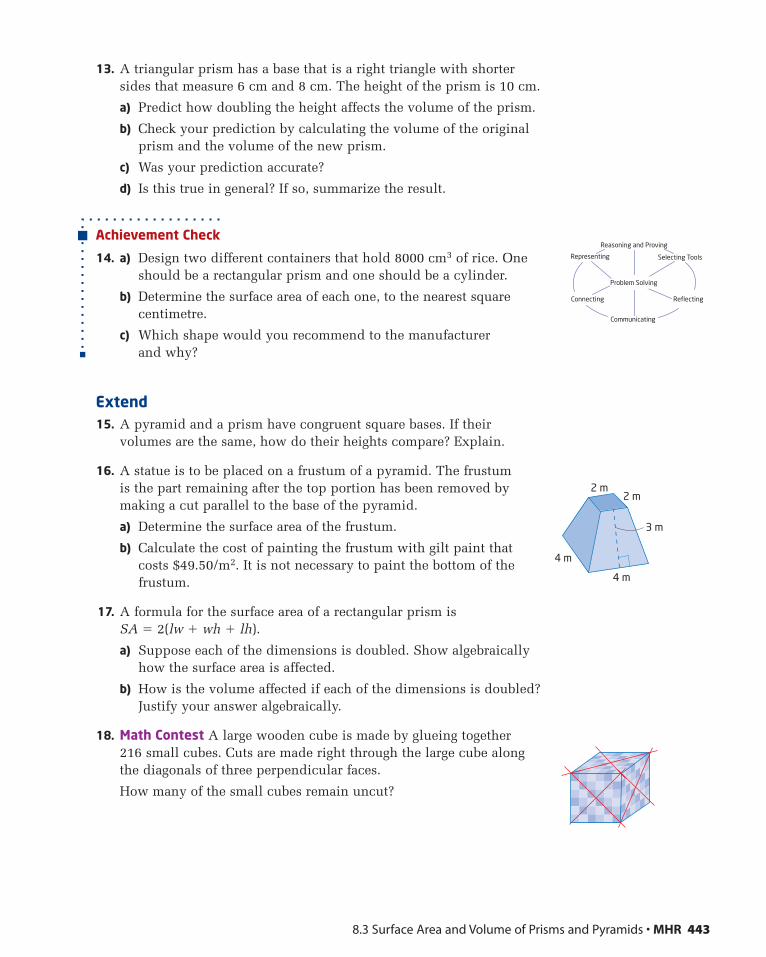
13. A triangular prism has a base that is a right triangle with shortersides that measure 6 cm and 8 cm. The height of the prism is 10 cm.
a) Predict how doubling the height affects the volume of the prism.
b) Check your prediction by calculating the volume of the originalprism and the volume of the new prism.
c) Was your prediction accurate?
d) Is this true in general? If so, summarize the result.
Achievement Check
14. a) Design two different containers that hold 8000 cm3 of rice. Oneshould be a rectangular prism and one should be a cylinder.
b) Determine the surface area of each one, to the nearest squarecentimetre.
c) Which shape would you recommend to the manufacturer and why?
Extend15. A pyramid and a prism have congruent square bases. If their
volumes are the same, how do their heights compare? Explain.
16. A statue is to be placed on a frustum of a pyramid. The frustum is the part remaining after the top portion has been removed bymaking a cut parallel to the base of the pyramid.
a) Determine the surface area of the frustum.
b) Calculate the cost of painting the frustum with gilt paint thatcosts $49.50/m2. It is not necessary to paint the bottom of thefrustum.
17. A formula for the surface area of a rectangular prism is SA � 2(lw � wh � lh).
a) Suppose each of the dimensions is doubled. Show algebraicallyhow the surface area is affected.
b) How is the volume affected if each of the dimensions is doubled?Justify your answer algebraically.
18. Math Contest A large wooden cube is made by glueing together216 small cubes. Cuts are made right through the large cube alongthe diagonals of three perpendicular faces.
How many of the small cubes remain uncut?
8.3 Surface Area and Volume of Prisms and Pyramids • MHR 443
2 m2 m
3 m
4 m
4 m
Selecting ToolsRepresenting
Reasoning and Proving
Communicating
Connecting Reflecting
Problem Solving
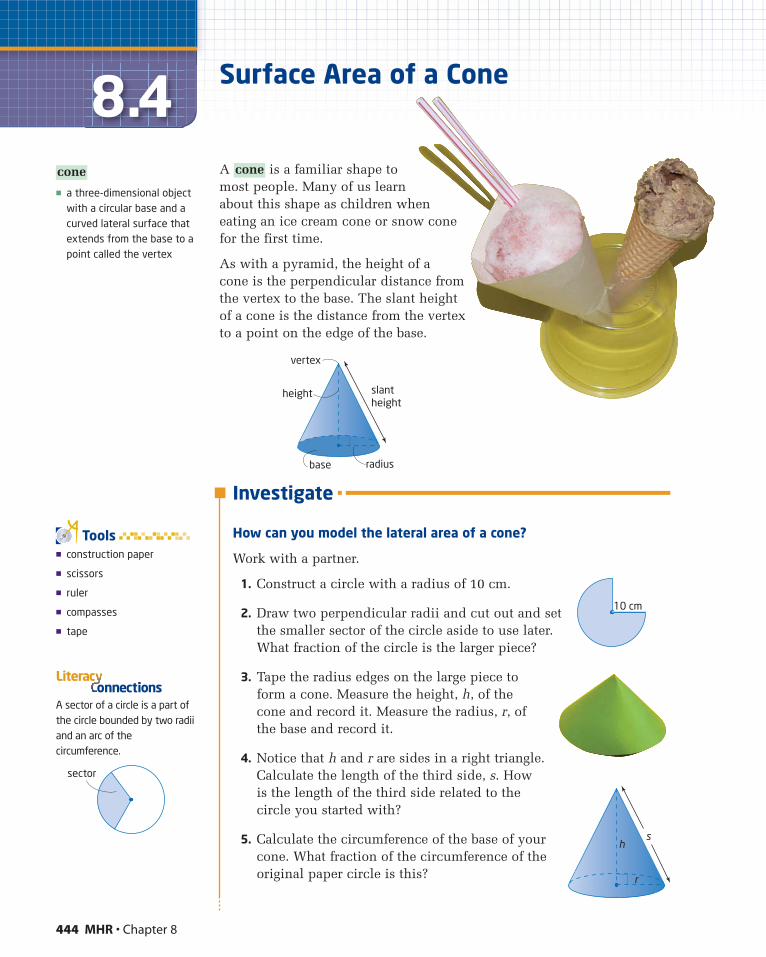
Investigate
How can you model the lateral area of a cone?
Work with a partner.
1. Construct a circle with a radius of 10 cm.
2. Draw two perpendicular radii and cut out and setthe smaller sector of the circle aside to use later.What fraction of the circle is the larger piece?
3. Tape the radius edges on the large piece to form a cone. Measure the height, h, of the cone and record it. Measure the radius, r, ofthe base and record it.
4. Notice that h and r are sides in a right triangle.Calculate the length of the third side, s. Howis the length of the third side related to thecircle you started with?
5. Calculate the circumference of the base of yourcone. What fraction of the circumference of theoriginal paper circle is this?
444 MHR • Chapter 8
8.4A is a familiar shape tomost people. Many of us learnabout this shape as children wheneating an ice cream cone or snow conefor the first time.
As with a pyramid, the height of acone is the perpendicular distance fromthe vertex to the base. The slant heightof a cone is the distance from the vertexto a point on the edge of the base.
cone
vertex
slant height
radiusbase
height
sector
10 cm
sh
r
� a three-dimensional objectwith a circular base and acurved lateral surface thatextends from the base to apoint called the vertex
cone
� construction paper
� scissors
� ruler
� compasses
� tape
Tools
A sector of a circle is a part ofthe circle bounded by two radiiand an arc of thecircumference.
onnectionsLiterac
Surface Area of a Cone
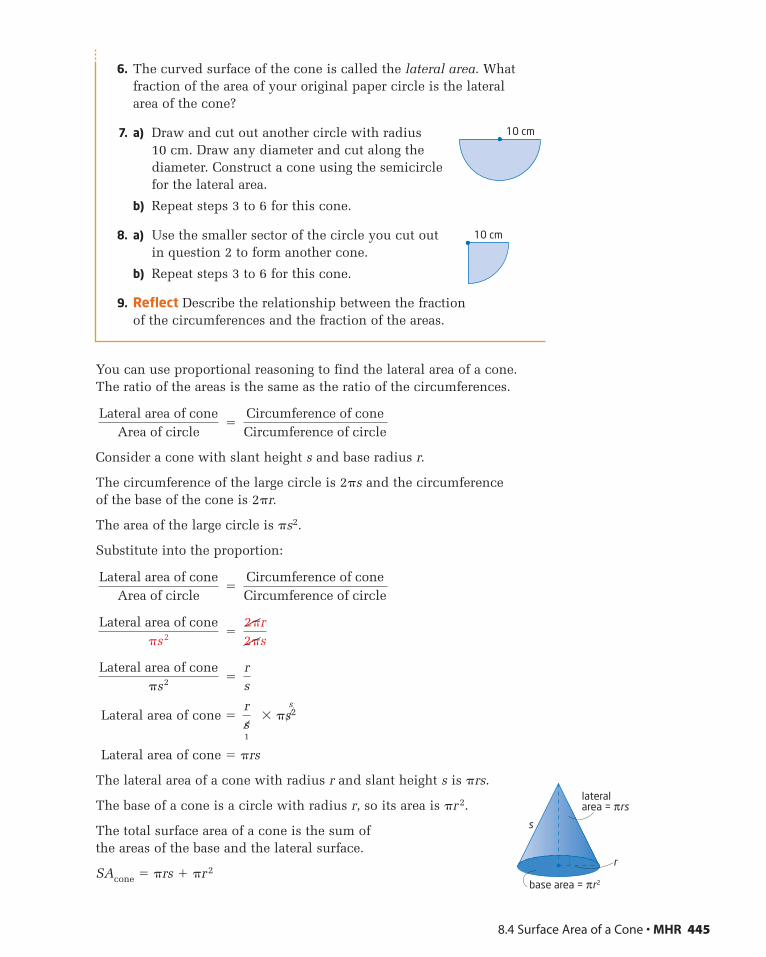
6. The curved surface of the cone is called the lateral area. Whatfraction of the area of your original paper circle is the lateral area of the cone?
7. a) Draw and cut out another circle with radius 10 cm. Draw any diameter and cut along thediameter. Construct a cone using the semicirclefor the lateral area.
b) Repeat steps 3 to 6 for this cone.
8. a) Use the smaller sector of the circle you cut out in question 2 to form another cone.
b) Repeat steps 3 to 6 for this cone.
9. Reflect Describe the relationship between the fraction of the circumferences and the fraction of the areas.
You can use proportional reasoning to find the lateral area of a cone. The ratio of the areas is the same as the ratio of the circumferences.
�
Consider a cone with slant height s and base radius r.
The circumference of the large circle is 2�s and the circumference of the base of the cone is 2�r.
The area of the large circle is �s2.
Substitute into the proportion:
�
�
�
Lateral area of cone � � �s2s�
Lateral area of cone � �rs
The lateral area of a cone with radius r and slant height s is �rs.
The base of a cone is a circle with radius r, so its area is �r2.
The total surface area of a cone is the sum of the areas of the base and the lateral surface.
SAcone � �rs � �r2
rs1
rs
Lateral area of cone�s˛˛
2
2�r2�s
Lateral area of cone�s˛˛˛
2
Circumference of coneCircumference of circle
Lateral area of coneArea of circle
Circumference of coneCircumference of circle
Lateral area of coneArea of circle
8.4 Surface Area of a Cone • MHR 445
10 cm
10 cm
base area = πr2
lateralarea = πrs
s
r
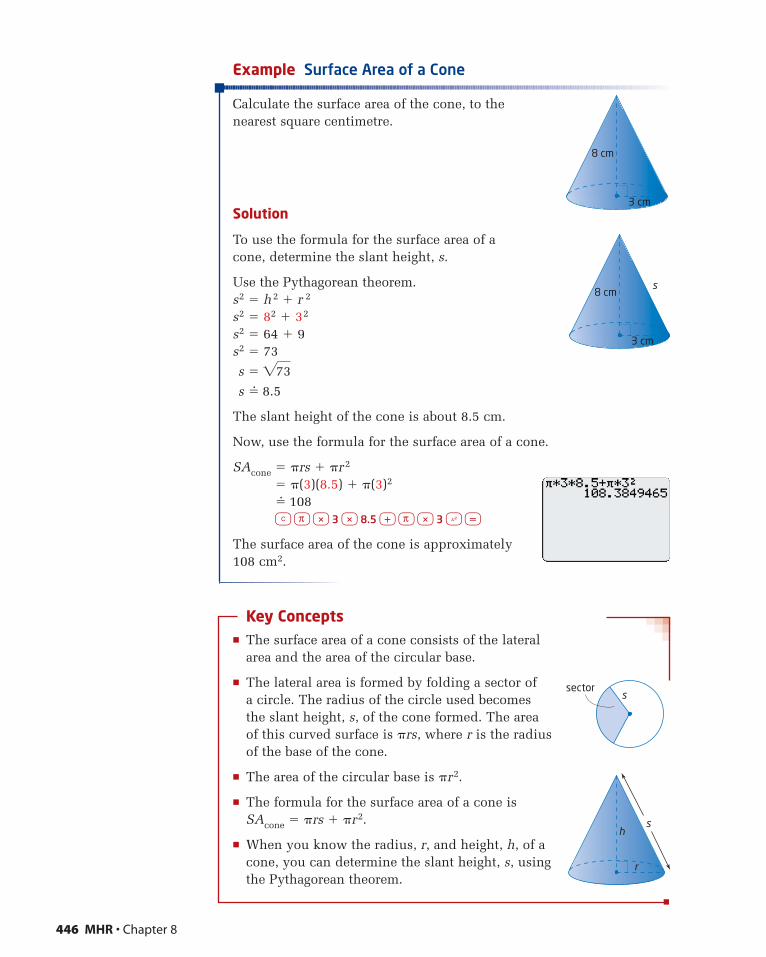
Example Surface Area of a Cone
Calculate the surface area of the cone, to the nearest square centimetre.
Solution
To use the formula for the surface area of a cone, determine the slant height, s.
Use the Pythagorean theorem.s2 � h2 � r 2
s2 � 82 � 32
s2 � 64 � 9s2 � 73
s �
s �� 8.5
The slant height of the cone is about 8.5 cm.
Now, use the formula for the surface area of a cone.
SAcone � �rs � �r2
� �(3)(8.5) � �(3)2
�� 108ç π * 3 * 8.5 + π * 3 x =
The surface area of the cone is approximately108 cm2.
Key Concepts� The surface area of a cone consists of the lateral
area and the area of the circular base.
� The lateral area is formed by folding a sector of a circle. The radius of the circle used becomes the slant height, s, of the cone formed. The area of this curved surface is �rs, where r is the radiusof the base of the cone.
� The area of the circular base is �r2.
� The formula for the surface area of a cone is SAcone � �rs � �r2.
� When you know the radius, r, and height, h, of acone, you can determine the slant height, s, usingthe Pythagorean theorem.
273
446 MHR • Chapter 8
8 cm
3 cm
8 cm
3 cm
s
sectors
sh
r
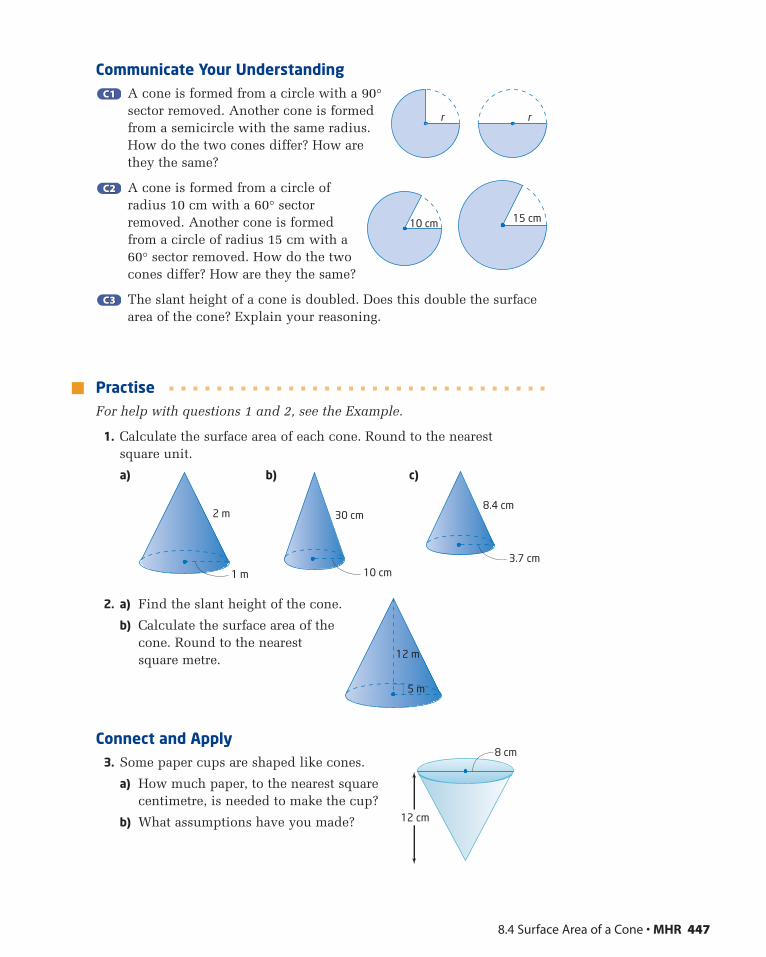
Communicate Your UnderstandingA cone is formed from a circle with a 90°sector removed. Another cone is formedfrom a semicircle with the same radius.How do the two cones differ? How arethey the same?
A cone is formed from a circle ofradius 10 cm with a 60° sectorremoved. Another cone is formedfrom a circle of radius 15 cm with a60° sector removed. How do the twocones differ? How are they the same?
The slant height of a cone is doubled. Does this double the surfacearea of the cone? Explain your reasoning.
PractiseFor help with questions 1 and 2, see the Example.
1. Calculate the surface area of each cone. Round to the nearestsquare unit.
a) b) c)
2. a) Find the slant height of the cone.
b) Calculate the surface area of thecone. Round to the nearest square metre.
Connect and Apply3. Some paper cups are shaped like cones.
a) How much paper, to the nearest squarecentimetre, is needed to make the cup?
b) What assumptions have you made?
8.4 cm
3.7 cm
30 cm
10 cm
2 m
1 m
C3C3
C2C2
C1C1
8.4 Surface Area of a Cone • MHR 447
r r
15 cm10 cm
12 m
5 m
12 cm
8 cm
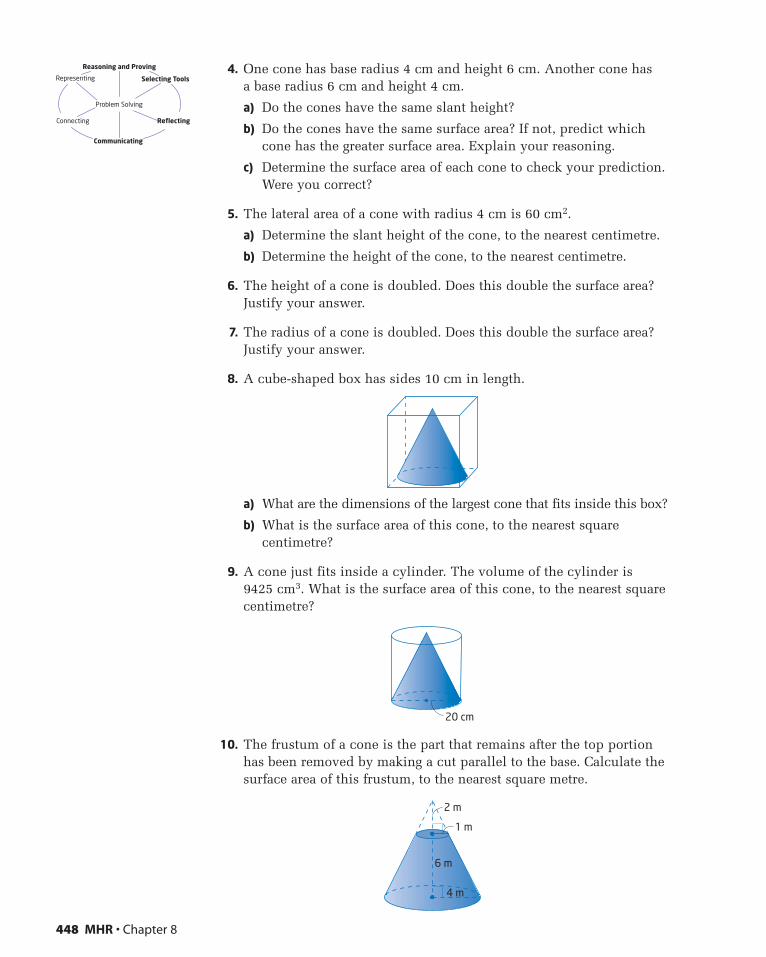
4. One cone has base radius 4 cm and height 6 cm. Another cone has a base radius 6 cm and height 4 cm.
a) Do the cones have the same slant height?
b) Do the cones have the same surface area? If not, predict whichcone has the greater surface area. Explain your reasoning.
c) Determine the surface area of each cone to check your prediction.Were you correct?
5. The lateral area of a cone with radius 4 cm is 60 cm2.
a) Determine the slant height of the cone, to the nearest centimetre.
b) Determine the height of the cone, to the nearest centimetre.
6. The height of a cone is doubled. Does this double the surface area?Justify your answer.
7. The radius of a cone is doubled. Does this double the surface area?Justify your answer.
8. A cube-shaped box has sides 10 cm in length.
a) What are the dimensions of the largest cone that fits inside this box?
b) What is the surface area of this cone, to the nearest squarecentimetre?
9. A cone just fits inside a cylinder. The volume of the cylinder is 9425 cm3. What is the surface area of this cone, to the nearest squarecentimetre?
10. The frustum of a cone is the part that remains after the top portionhas been removed by making a cut parallel to the base. Calculate thesurface area of this frustum, to the nearest square metre.
6 m
2 m
1 m
4 m
20 cm
448 MHR • Chapter 8
Selecting ToolsRepresenting
Reasoning and Proving
Communicating
Connecting Reflecting
Problem Solving
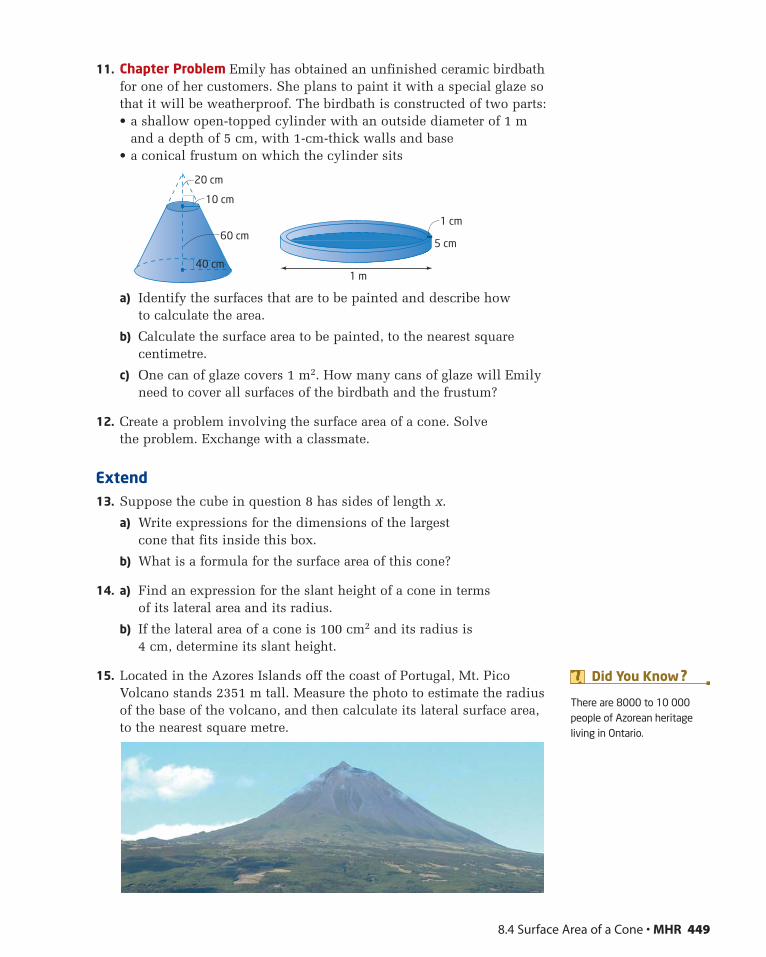
11. Chapter Problem Emily has obtained an unfinished ceramic birdbathfor one of her customers. She plans to paint it with a special glaze sothat it will be weatherproof. The birdbath is constructed of two parts:• a shallow open-topped cylinder with an outside diameter of 1 m
and a depth of 5 cm, with 1-cm-thick walls and base• a conical frustum on which the cylinder sits
a) Identify the surfaces that are to be painted and describe how to calculate the area.
b) Calculate the surface area to be painted, to the nearest squarecentimetre.
c) One can of glaze covers 1 m2. How many cans of glaze will Emilyneed to cover all surfaces of the birdbath and the frustum?
12. Create a problem involving the surface area of a cone. Solve the problem. Exchange with a classmate.
Extend13. Suppose the cube in question 8 has sides of length x.
a) Write expressions for the dimensions of the largest cone that fits inside this box.
b) What is a formula for the surface area of this cone?
14. a) Find an expression for the slant height of a cone in terms of its lateral area and its radius.
b) If the lateral area of a cone is 100 cm2 and its radius is 4 cm, determine its slant height.
15. Located in the Azores Islands off the coast of Portugal, Mt. PicoVolcano stands 2351 m tall. Measure the photo to estimate the radiusof the base of the volcano, and then calculate its lateral surface area,to the nearest square metre.
60 cm
20 cm
10 cm
40 cm1 m
1 cm
5 cm
8.4 Surface Area of a Cone • MHR 449
There are 8000 to 10 000people of Azorean heritageliving in Ontario.
Did You Know ?
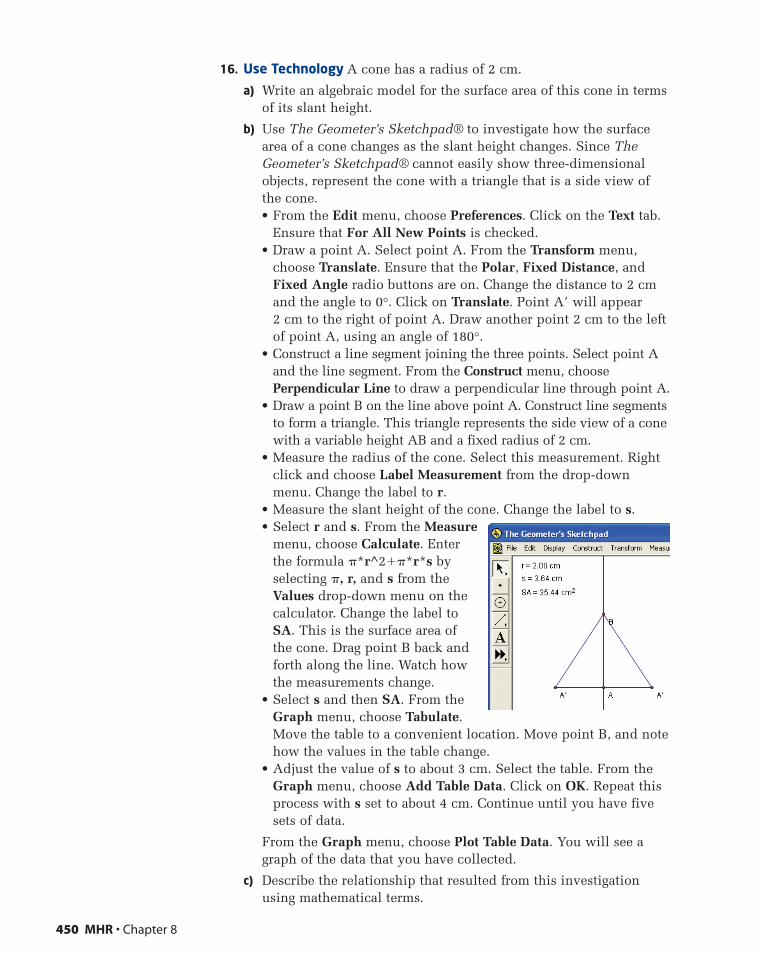
16. Use Technology A cone has a radius of 2 cm.
a) Write an algebraic model for the surface area of this cone in termsof its slant height.
b) Use The Geometer’s Sketchpad® to investigate how the surfacearea of a cone changes as the slant height changes. Since TheGeometer’s Sketchpad® cannot easily show three-dimensionalobjects, represent the cone with a triangle that is a side view ofthe cone.• From the Edit menu, choose Preferences. Click on the Text tab.
Ensure that For All New Points is checked.• Draw a point A. Select point A. From the Transform menu,
choose Translate. Ensure that the Polar, Fixed Distance, andFixed Angle radio buttons are on. Change the distance to 2 cmand the angle to 0°. Click on Translate. Point A� will appear2 cm to the right of point A. Draw another point 2 cm to the left of point A, using an angle of 180°.
• Construct a line segment joining the three points. Select point Aand the line segment. From the Construct menu, choosePerpendicular Line to draw a perpendicular line through point A.
• Draw a point B on the line above point A. Construct line segmentsto form a triangle. This triangle represents the side view of a conewith a variable height AB and a fixed radius of 2 cm.
• Measure the radius of the cone. Select this measurement. Rightclick and choose Label Measurement from the drop-downmenu. Change the label to r.
• Measure the slant height of the cone. Change the label to s.• Select r and s. From the Measure
menu, choose Calculate. Enterthe formula �*r^2��*r*s byselecting �, r, and s from theValues drop-down menu on thecalculator. Change the label toSA. This is the surface area ofthe cone. Drag point B back andforth along the line. Watch howthe measurements change.
• Select s and then SA. From theGraph menu, choose Tabulate.Move the table to a convenient location. Move point B, and notehow the values in the table change.
• Adjust the value of s to about 3 cm. Select the table. From theGraph menu, choose Add Table Data. Click on OK. Repeat thisprocess with s set to about 4 cm. Continue until you have fivesets of data.
From the Graph menu, choose Plot Table Data. You will see agraph of the data that you have collected.
c) Describe the relationship that resulted from this investigationusing mathematical terms.
450 MHR • Chapter 8

8.5 Volume of a Cone • MHR 451
8.5Cone-shaped containers are used ina variety of professions, such asenvironmental studies, agriculture,and culinary arts.
In this section, you will develop aformula for the volume of any cone.
� empty cylindrical can
� construction paper
� scissors
� tape
� sand, rice, or anothersuitable material
Tools
Investigate
How can you model the volume of a cone?
Work with a partner.
1. Measure the radius and height of the can.
2. Construct a cone with the same baseradius and height as the can.
a) Use the radius and height tocalculate the slant height ofthe cone.
b) Construct a circle with a radius equal to the slant height youdetermined. Make a cut along a radius so that the circle can be formed into a cone.
c) The cone’s circumference should fit the circumference of the can. Tape the seam to form a cone.
3. Fill the cone with sand, rice, or another suitable material. Emptythe rice into the can. Repeat until the can is full. How many conesof material does it take to fill the can?
4. a) Reflect What conclusion can you draw about the relationshipbetween the volume of a cone and the volume of a cylinderwith the same height and radius?
b) You know the formula for the volume of a cylinder. Use yourconclusion from part a) to write a formula for the volume, V, ofa cone in terms of the radius, r, of the base and the height, h.
Volume of a Cone
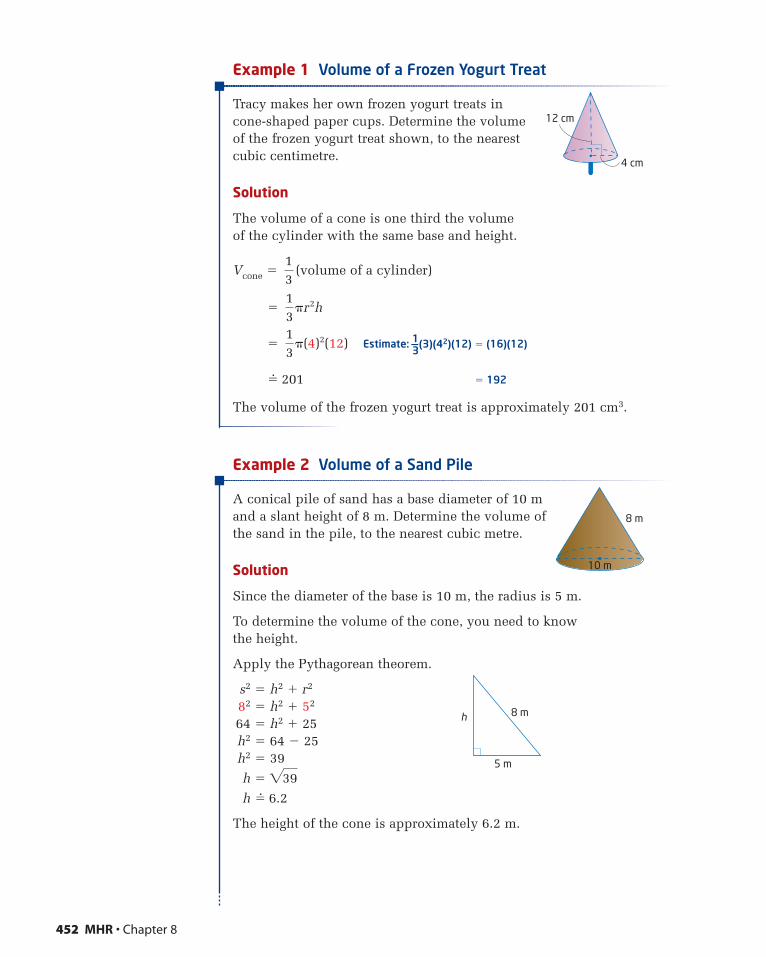
Example 1 Volume of a Frozen Yogurt Treat
Tracy makes her own frozen yogurt treats in cone-shaped paper cups. Determine the volume of the frozen yogurt treat shown, to the nearestcubic centimetre.
Solution
The volume of a cone is one third the volume of the cylinder with the same base and height.
Vcone � (volume of a cylinder)
�
� Estimate: 1—3
(3)(42)(12) � (16)(12)
�� 201 � 192
The volume of the frozen yogurt treat is approximately 201 cm3.
Example 2 Volume of a Sand Pile
A conical pile of sand has a base diameter of 10 mand a slant height of 8 m. Determine the volume ofthe sand in the pile, to the nearest cubic metre.
Solution
Since the diameter of the base is 10 m, the radius is 5 m.
To determine the volume of the cone, you need to know the height.
Apply the Pythagorean theorem.
s2 � h2 � r2
82 � h2 � 52
64 � h2 � 25h2 � 64 � 25h2 � 39
h �
h �� 6.2
The height of the cone is approximately 6.2 m.
239
13
˛˛�(4)2(12)
13
˛˛�r˛˛˛
2h
13
452 MHR • Chapter 8
12 cm
4 cm
8 m
10 m
5 m
8 mh
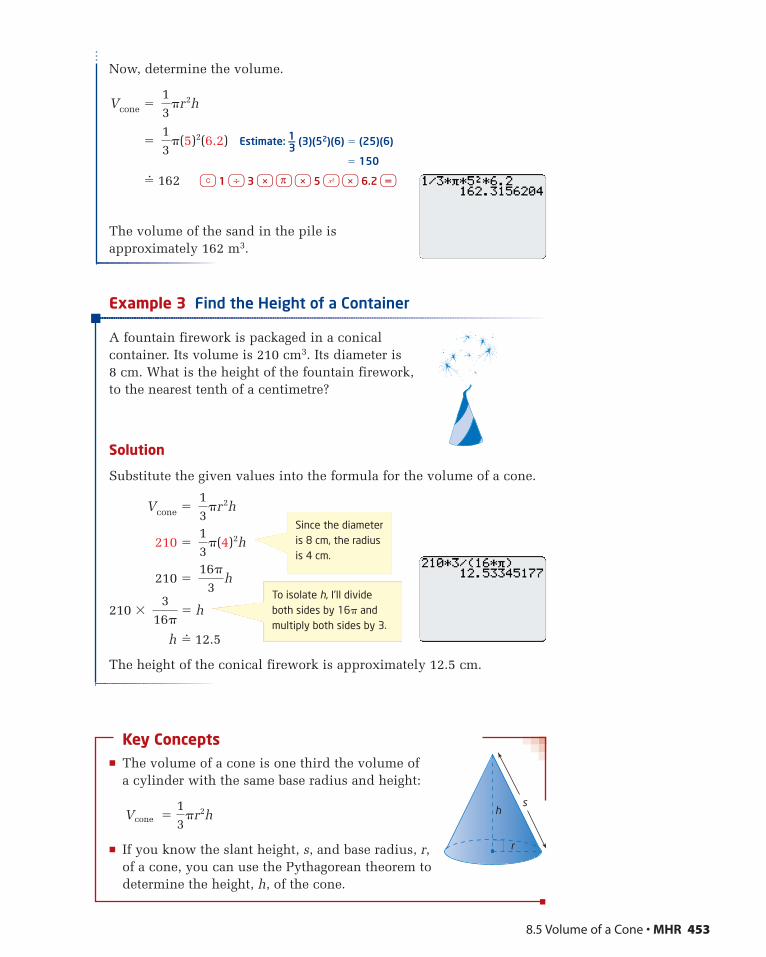
8.5 Volume of a Cone • MHR 453
Now, determine the volume.
Vcone �
� Estimate: 1—3
(3)(52)(6) � (25)(6)
� 150
�� 162 ç 1 ÷ 3 * π * 5 x * 6.2 =
The volume of the sand in the pile isapproximately 162 m3.
Example 3 Find the Height of a Container
A fountain firework is packaged in a conicalcontainer. Its volume is 210 cm3. Its diameter is8 cm. What is the height of the fountain firework, to the nearest tenth of a centimetre?
Solution
Substitute the given values into the formula for the volume of a cone.
Vcone �
210 �
210 �
210 � � h
h �� 12.5
The height of the conical firework is approximately 12.5 cm.
Key Concepts� The volume of a cone is one third the volume of
a cylinder with the same base radius and height:
� If you know the slant height, s, and base radius, r, of a cone, you can use the Pythagorean theorem todetermine the height, h, of the cone.
Vcone �13
˛�r˛˛
2h
316�
˛˛
16�
3˛˛h
13
˛˛�(4)2h
13
˛˛�r˛˛˛
2h
13
˛˛�(5)2(6.2)
13
˛˛�r˛˛˛
2h
sh
r
Since the diameteris 8 cm, the radiusis 4 cm.
To isolate h, I’ll divideboth sides by 16� andmultiply both sides by 3.

Communicate Your UnderstandingA cylindrical container and a conical container have the sameradius and height. How are their volumes related? How could you illustrate this relationship for a friend?
Suppose the height of a cone is doubled. How will this affect the volume?
Suppose the radius of a cone is doubled. How will this affect the volume?
PractiseFor help with question 1, see Example 1.
1. Determine the volume of each cone. Round to the nearest cubic unit.
a) b)
c) d)
For help with questions 2 and 3, see Example 2.
2. Determine the volume of each cone. Round to the nearest cubic unit.
a) b)
3. Wesley uses a cone-shaped funnel to put oil in a car engine. The funnel has a radius of 5.4 cmand a slant height of 10.2 cm. How much oil canthe funnel hold, to the nearest tenth of a cubiccentimetre?
30 cm
10 cm
2 m
1 m
60 cm
40 cm
12 mm
30 mm
6.4 m
5.3 m
6 cm
2 cm
C3C3
C2C2
C1C1
454 MHR • Chapter 8
5.4 cm
10.2 cm
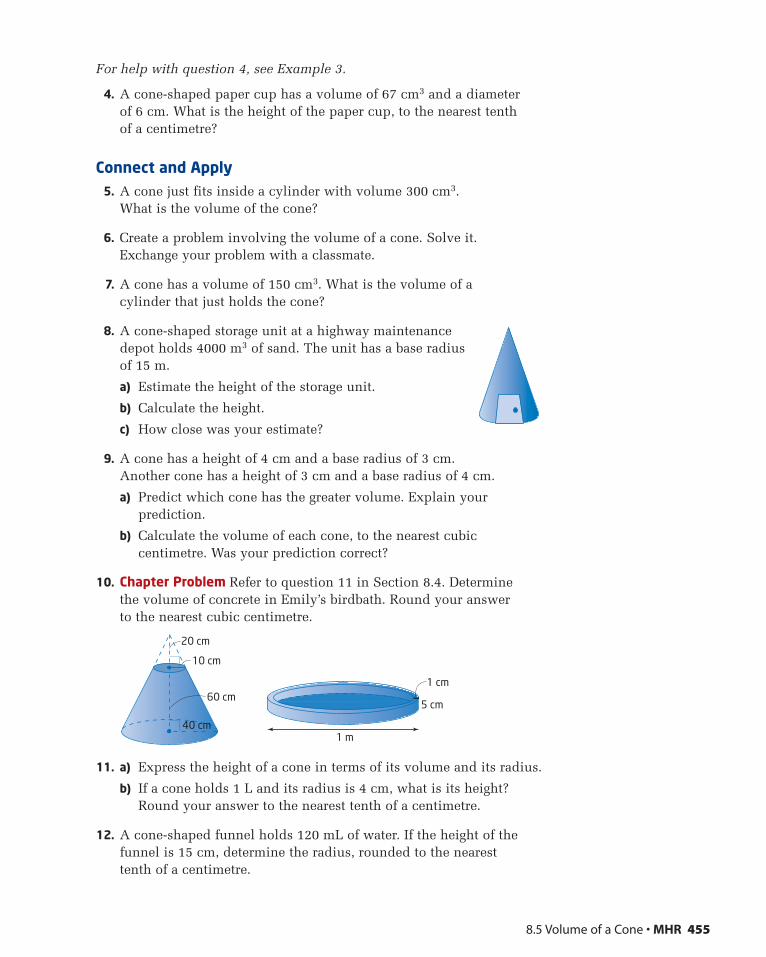
8.5 Volume of a Cone • MHR 455
For help with question 4, see Example 3.
4. A cone-shaped paper cup has a volume of 67 cm3 and a diameter of 6 cm. What is the height of the paper cup, to the nearest tenth of a centimetre?
Connect and Apply5. A cone just fits inside a cylinder with volume 300 cm3.
What is the volume of the cone?
6. Create a problem involving the volume of a cone. Solve it. Exchange your problem with a classmate.
7. A cone has a volume of 150 cm3. What is the volume of a cylinder that just holds the cone?
8. A cone-shaped storage unit at a highway maintenancedepot holds 4000 m3 of sand. The unit has a base radiusof 15 m.
a) Estimate the height of the storage unit.
b) Calculate the height.
c) How close was your estimate?
9. A cone has a height of 4 cm and a base radius of 3 cm. Another cone has a height of 3 cm and a base radius of 4 cm.
a) Predict which cone has the greater volume. Explain yourprediction.
b) Calculate the volume of each cone, to the nearest cubiccentimetre. Was your prediction correct?
10. Chapter Problem Refer to question 11 in Section 8.4. Determine the volume of concrete in Emily’s birdbath. Round your answer to the nearest cubic centimetre.
11. a) Express the height of a cone in terms of its volume and its radius.
b) If a cone holds 1 L and its radius is 4 cm, what is its height?Round your answer to the nearest tenth of a centimetre.
12. A cone-shaped funnel holds 120 mL of water. If the height of thefunnel is 15 cm, determine the radius, rounded to the nearest tenth of a centimetre.
60 cm
20 cm
10 cm
40 cm1 m
1 cm
5 cm
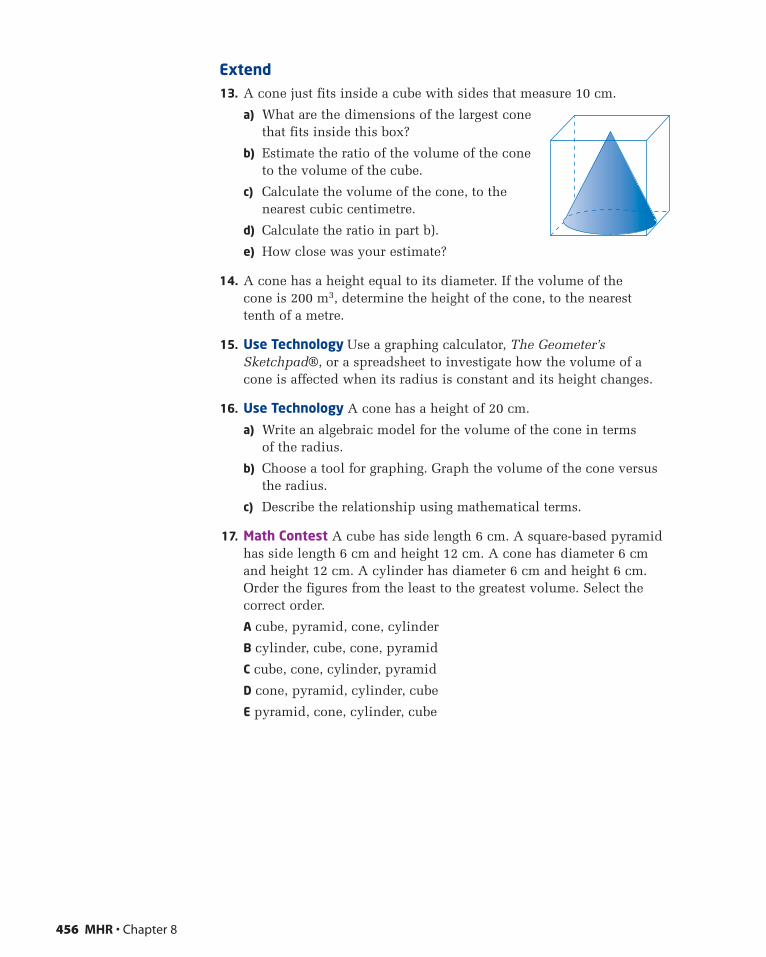
Extend13. A cone just fits inside a cube with sides that measure 10 cm.
a) What are the dimensions of the largest conethat fits inside this box?
b) Estimate the ratio of the volume of the coneto the volume of the cube.
c) Calculate the volume of the cone, to thenearest cubic centimetre.
d) Calculate the ratio in part b).
e) How close was your estimate?
14. A cone has a height equal to its diameter. If the volume of the cone is 200 m3, determine the height of the cone, to the nearest tenth of a metre.
15. Use Technology Use a graphing calculator, The Geometer’sSketchpad®, or a spreadsheet to investigate how the volume of acone is affected when its radius is constant and its height changes.
16. Use Technology A cone has a height of 20 cm.
a) Write an algebraic model for the volume of the cone in terms of the radius.
b) Choose a tool for graphing. Graph the volume of the cone versusthe radius.
c) Describe the relationship using mathematical terms.
17. Math Contest A cube has side length 6 cm. A square-based pyramidhas side length 6 cm and height 12 cm. A cone has diameter 6 cmand height 12 cm. A cylinder has diameter 6 cm and height 6 cm.Order the figures from the least to the greatest volume. Select thecorrect order.
A cube, pyramid, cone, cylinder
B cylinder, cube, cone, pyramid
C cube, cone, cylinder, pyramid
D cone, pyramid, cylinder, cube
E pyramid, cone, cylinder, cube
456 MHR • Chapter 8
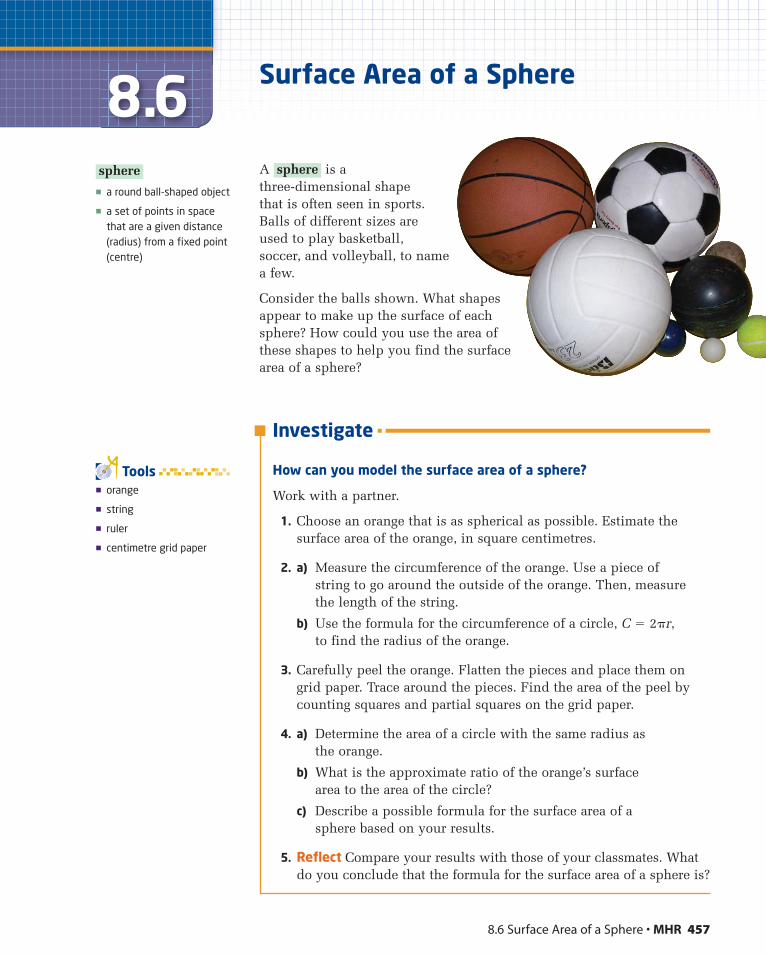
8.6 Surface Area of a Sphere • MHR 457
8.6A is athree-dimensional shapethat is often seen in sports.Balls of different sizes areused to play basketball,soccer, and volleyball, to namea few.
Consider the balls shown. What shapesappear to make up the surface of eachsphere? How could you use the area ofthese shapes to help you find the surfacearea of a sphere?
sphere
� a round ball-shaped object
� a set of points in spacethat are a given distance(radius) from a fixed point(centre)
sphere
� orange
� string
� ruler
� centimetre grid paper
Tools
Investigate
How can you model the surface area of a sphere?
Work with a partner.
1. Choose an orange that is as spherical as possible. Estimate thesurface area of the orange, in square centimetres.
2. a) Measure the circumference of the orange. Use a piece of string to go around the outside of the orange. Then, measure the length of the string.
b) Use the formula for the circumference of a circle, C � 2�r,to find the radius of the orange.
3. Carefully peel the orange. Flatten the pieces and place them on grid paper. Trace around the pieces. Find the area of the peel bycounting squares and partial squares on the grid paper.
4. a) Determine the area of a circle with the same radius asthe orange.
b) What is the approximate ratio of the orange’s surface area to the area of the circle?
c) Describe a possible formula for the surface area of a sphere based on your results.
5. Reflect Compare your results with those of your classmates. Whatdo you conclude that the formula for the surface area of a sphere is?
Surface Area of a Sphere
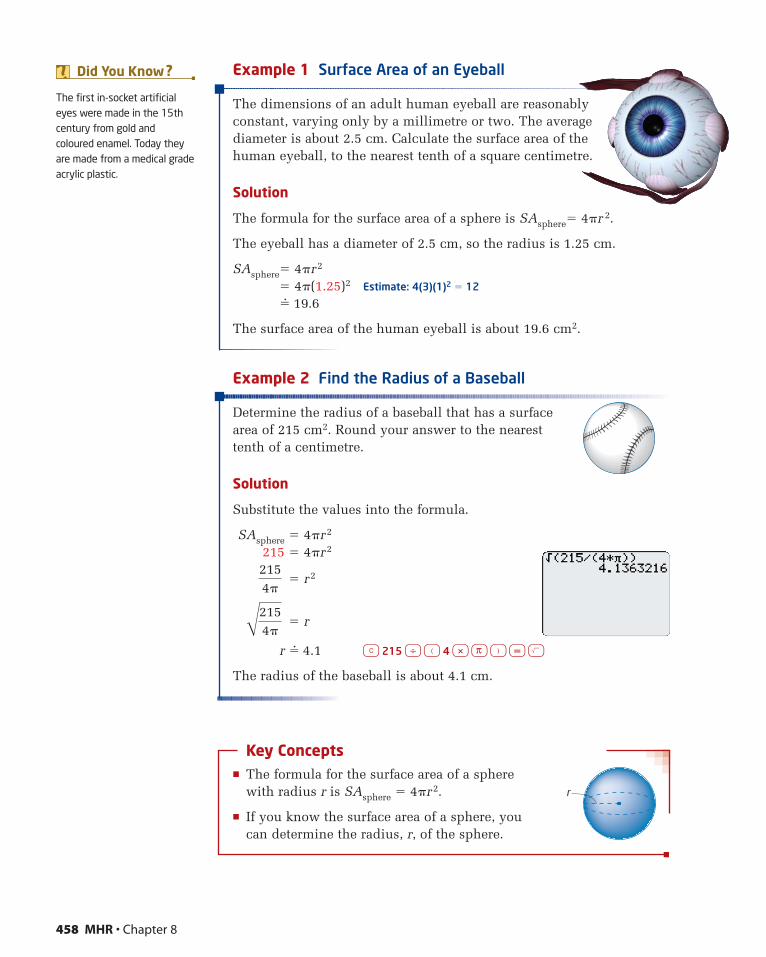
Example 1 Surface Area of an Eyeball
The dimensions of an adult human eyeball are reasonablyconstant, varying only by a millimetre or two. The averagediameter is about 2.5 cm. Calculate the surface area of thehuman eyeball, to the nearest tenth of a square centimetre.
Solution
The formula for the surface area of a sphere is SAsphere� 4�r 2.
The eyeball has a diameter of 2.5 cm, so the radius is 1.25 cm.
SAsphere� 4�r2
� 4�(1.25)2 Estimate: 4(3)(1)2 � 12
�� 19.6
The surface area of the human eyeball is about 19.6 cm2.
Example 2 Find the Radius of a Baseball
Determine the radius of a baseball that has a surfacearea of 215 cm2. Round your answer to the nearesttenth of a centimetre.
Solution
Substitute the values into the formula.
SAsphere � 4�r2
215 � 4�r2
� r2
� r
r �� 4.1 ç 215 ÷ ( 4 * π ) = ◊
The radius of the baseball is about 4.1 cm.
Key Concepts� The formula for the surface area of a sphere
with radius r is SAsphere � 4�r2.
� If you know the surface area of a sphere, you can determine the radius, r, of the sphere.
B2154�
2154�
458 MHR • Chapter 8
r
The first in-socket artificialeyes were made in the 15thcentury from gold andcoloured enamel. Today theyare made from a medical gradeacrylic plastic.
Did You Know ?
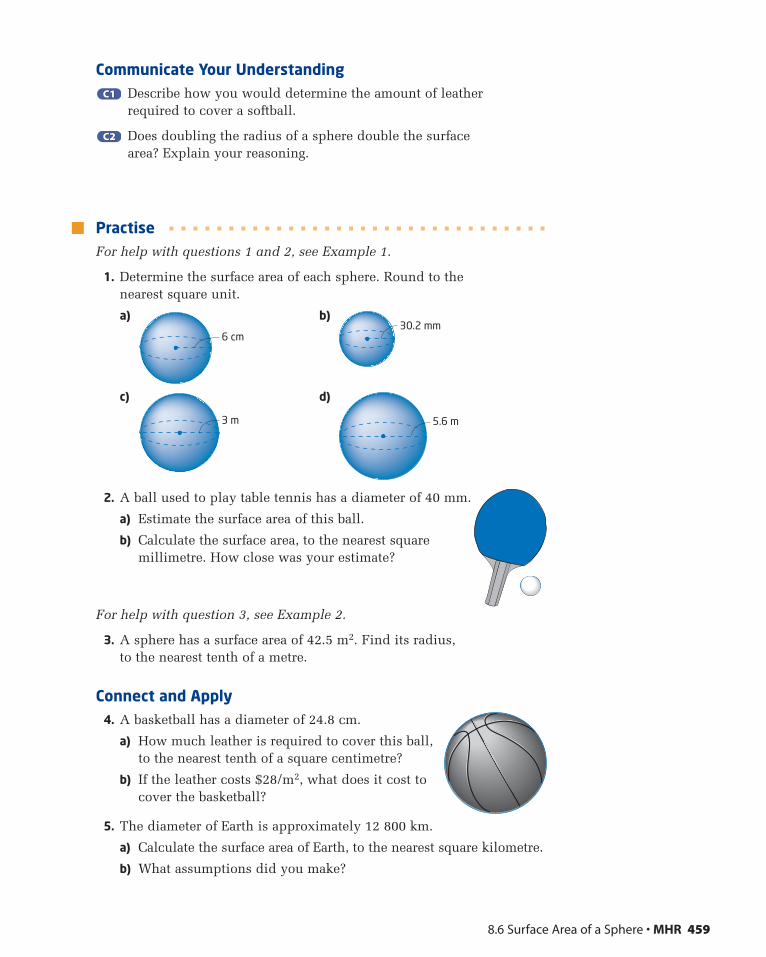
8.6 Surface Area of a Sphere • MHR 459
Communicate Your UnderstandingDescribe how you would determine the amount of leather required to cover a softball.
Does doubling the radius of a sphere double the surface area? Explain your reasoning.
PractiseFor help with questions 1 and 2, see Example 1.
1. Determine the surface area of each sphere. Round to the nearest square unit.
a) b)
c) d)
2. A ball used to play table tennis has a diameter of 40 mm.
a) Estimate the surface area of this ball.
b) Calculate the surface area, to the nearest squaremillimetre. How close was your estimate?
For help with question 3, see Example 2.
3. A sphere has a surface area of 42.5 m2. Find its radius, to the nearest tenth of a metre.
Connect and Apply4. A basketball has a diameter of 24.8 cm.
a) How much leather is required to cover this ball,to the nearest tenth of a square centimetre?
b) If the leather costs $28/m2, what does it cost tocover the basketball?
5. The diameter of Earth is approximately 12 800 km.
a) Calculate the surface area of Earth, to the nearest square kilometre.
b) What assumptions did you make?
5.6 m3 m
30.2 mm6 cm
C2C2
C1C1
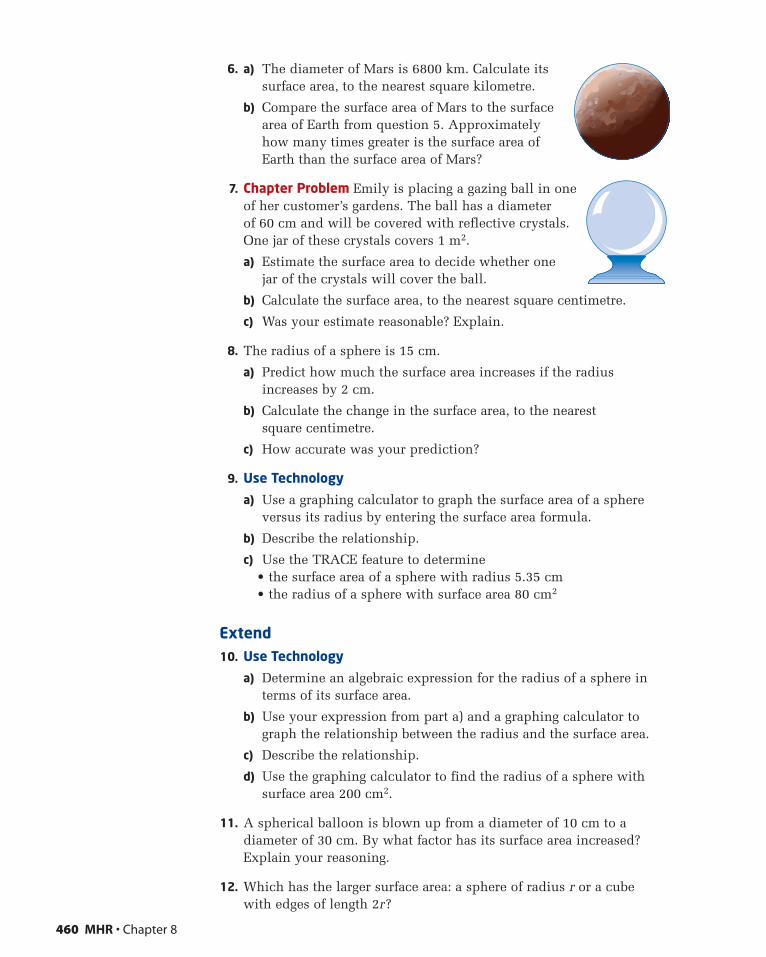
6. a) The diameter of Mars is 6800 km. Calculate itssurface area, to the nearest square kilometre.
b) Compare the surface area of Mars to the surfacearea of Earth from question 5. Approximately how many times greater is the surface area ofEarth than the surface area of Mars?
7. Chapter Problem Emily is placing a gazing ball in oneof her customer’s gardens. The ball has a diameter of 60 cm and will be covered with reflective crystals. One jar of these crystals covers 1 m2.
a) Estimate the surface area to decide whether one jar of the crystals will cover the ball.
b) Calculate the surface area, to the nearest square centimetre.
c) Was your estimate reasonable? Explain.
8. The radius of a sphere is 15 cm.
a) Predict how much the surface area increases if the radiusincreases by 2 cm.
b) Calculate the change in the surface area, to the nearest square centimetre.
c) How accurate was your prediction?
9. Use Technology
a) Use a graphing calculator to graph the surface area of a sphereversus its radius by entering the surface area formula.
b) Describe the relationship.
c) Use the TRACE feature to determine• the surface area of a sphere with radius 5.35 cm• the radius of a sphere with surface area 80 cm2
Extend10. Use Technology
a) Determine an algebraic expression for the radius of a sphere in terms of its surface area.
b) Use your expression from part a) and a graphing calculator tograph the relationship between the radius and the surface area.
c) Describe the relationship.
d) Use the graphing calculator to find the radius of a sphere withsurface area 200 cm2.
11. A spherical balloon is blown up from a diameter of 10 cm to adiameter of 30 cm. By what factor has its surface area increased?Explain your reasoning.
12. Which has the larger surface area: a sphere of radius r or a cube with edges of length 2r?
460 MHR • Chapter 8
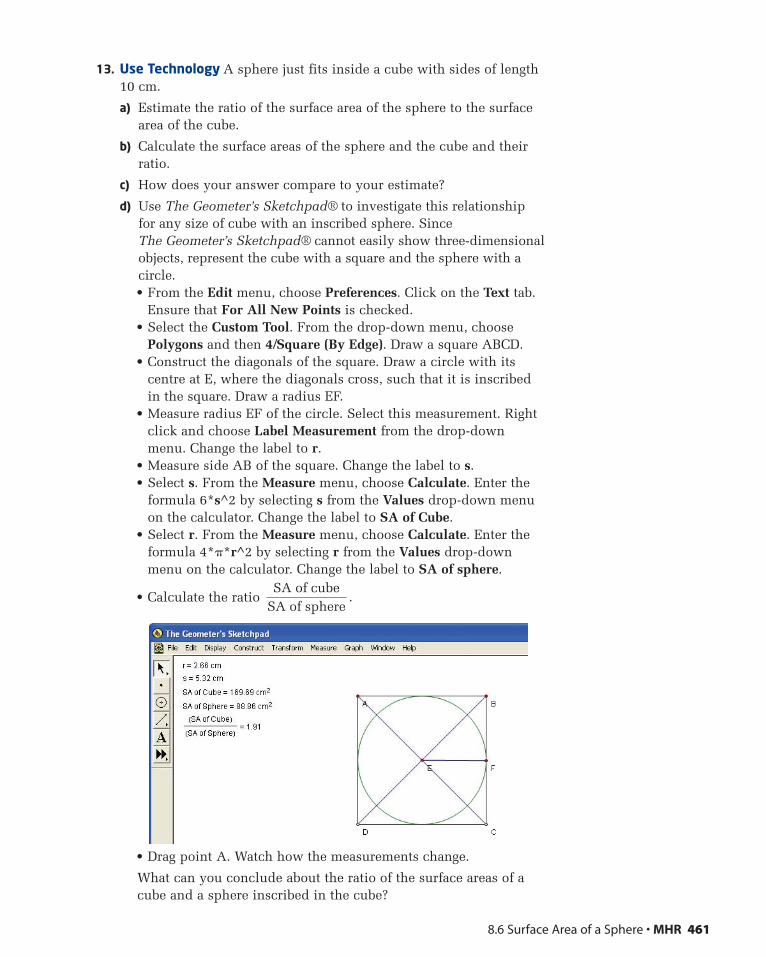
8.6 Surface Area of a Sphere • MHR 461
13. Use Technology A sphere just fits inside a cube with sides of length10 cm.
a) Estimate the ratio of the surface area of the sphere to the surfacearea of the cube.
b) Calculate the surface areas of the sphere and the cube and theirratio.
c) How does your answer compare to your estimate?
d) Use The Geometer’s Sketchpad® to investigate this relationship for any size of cube with an inscribed sphere. Since The Geometer’s Sketchpad® cannot easily show three-dimensionalobjects, represent the cube with a square and the sphere with acircle.• From the Edit menu, choose Preferences. Click on the Text tab.
Ensure that For All New Points is checked.• Select the Custom Tool. From the drop-down menu, choose
Polygons and then 4/Square (By Edge). Draw a square ABCD.• Construct the diagonals of the square. Draw a circle with its
centre at E, where the diagonals cross, such that it is inscribedin the square. Draw a radius EF.
• Measure radius EF of the circle. Select this measurement. Rightclick and choose Label Measurement from the drop-downmenu. Change the label to r.
• Measure side AB of the square. Change the label to s.• Select s. From the Measure menu, choose Calculate. Enter the
formula 6*s^2 by selecting s from the Values drop-down menuon the calculator. Change the label to SA of Cube.
• Select r. From the Measure menu, choose Calculate. Enter theformula 4*�*r^2 by selecting r from the Values drop-downmenu on the calculator. Change the label to SA of sphere.
• Calculate the ratio .
• Drag point A. Watch how the measurements change.
What can you conclude about the ratio of the surface areas of acube and a sphere inscribed in the cube?
SA of cubeSA of sphere
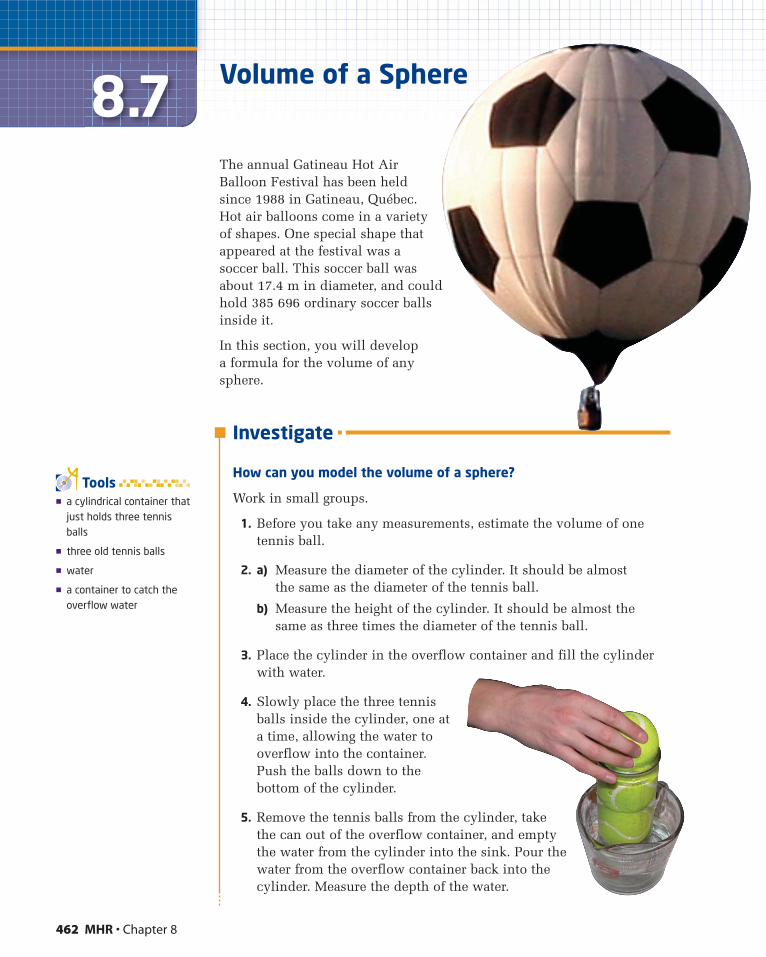
462 MHR • Chapter 8
8.7The annual Gatineau Hot AirBalloon Festival has been heldsince 1988 in Gatineau, Québec.Hot air balloons come in a varietyof shapes. One special shape thatappeared at the festival was asoccer ball. This soccer ball wasabout 17.4 m in diameter, and couldhold 385 696 ordinary soccer ballsinside it.
In this section, you will develop a formula for the volume of anysphere.
� a cylindrical container thatjust holds three tennisballs
� three old tennis balls
� water
� a container to catch theoverflow water
Tools
Investigate
How can you model the volume of a sphere?
Work in small groups.
1. Before you take any measurements, estimate the volume of onetennis ball.
2. a) Measure the diameter of the cylinder. It should be almost the same as the diameter of the tennis ball.
b) Measure the height of the cylinder. It should be almost the same as three times the diameter of the tennis ball.
3. Place the cylinder in the overflow container and fill the cylinderwith water.
4. Slowly place the three tennisballs inside the cylinder, one at a time, allowing the water tooverflow into the container. Push the balls down to the bottom of the cylinder.
5. Remove the tennis balls from the cylinder, takethe can out of the overflow container, and emptythe water from the cylinder into the sink. Pour thewater from the overflow container back into thecylinder. Measure the depth of the water.
Volume of a Sphere
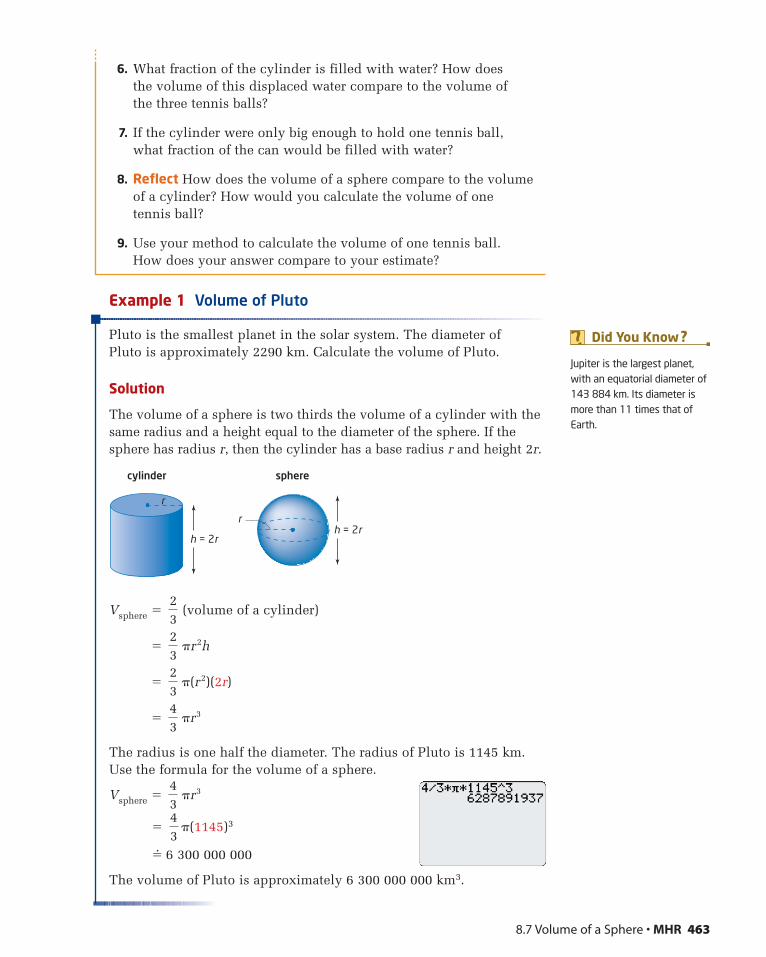
Example 1 Volume of Pluto
Pluto is the smallest planet in the solar system. The diameter of Pluto is approximately 2290 km. Calculate the volume of Pluto.
Solution
The volume of a sphere is two thirds the volume of a cylinder with thesame radius and a height equal to the diameter of the sphere. If thesphere has radius r, then the cylinder has a base radius r and height 2r.
Vsphere � (volume of a cylinder)
�
�
�
The radius is one half the diameter. The radius of Pluto is 1145 km.Use the formula for the volume of a sphere.
Vsphere �
� �(1145)3
�� 6 300 000 000
The volume of Pluto is approximately 6 300 000 000 km3.
43
43
�r˛˛
3
43
�r˛˛
3
23
�(r˛˛˛
2)(2r)
23
˛ �r˛˛˛
2h
23
rh = 2r
h = 2r
r
cylinder sphere
6. What fraction of the cylinder is filled with water? How does the volume of this displaced water compare to the volume of the three tennis balls?
7. If the cylinder were only big enough to hold one tennis ball, what fraction of the can would be filled with water?
8. Reflect How does the volume of a sphere compare to the volumeof a cylinder? How would you calculate the volume of onetennis ball?
9. Use your method to calculate the volume of one tennis ball. How does your answer compare to your estimate?
8.7 Volume of a Sphere • MHR 463
Jupiter is the largest planet,with an equatorial diameter of143 884 km. Its diameter ismore than 11 times that ofEarth.
Did You Know ?

Example 2 Package a Gemstone
A spherical gemstone just fits inside a plastic cube with edges 10 cm.
a) Calculate the volume of the gemstone, to the nearest cubiccentimetre.
b) How much empty space is there?
Solution
a) The diameter of the gemstone is about 10 cm, so its radius is 5 cm.
Vsphere �
� Estimate: 4—3
(3)53 � 4(125)
�� 524
The volume of the gemstone is about 524 cm3.
b) Determine the volume of the cube.
Vcube � s3
� 103
� 1000
The empty space is the difference in the volumes of the cube and the gemstone.
Vempty space � Vcube � Vsphere� 1000 � 524� 476
There is about 476 cm3 of empty space in the box.
Key Concepts
� The volume of a sphere with radius r is given by
the formula Vsphere � .
� You can calculate the empty space in a containerby subtracting the volume of the object from thevolume of the container in which it is packaged.
43
�r˛˛
3
43
�(5)3
43
�r˛˛
3
464 MHR • Chapter 8
r
� 500
Since medieval times quartzcrystal balls have been used inattempts to divine the future.Gemstone spheres are thoughtto have healing powers, witheach gemstone having adifferent therapeutic energy.
Did You Know ?
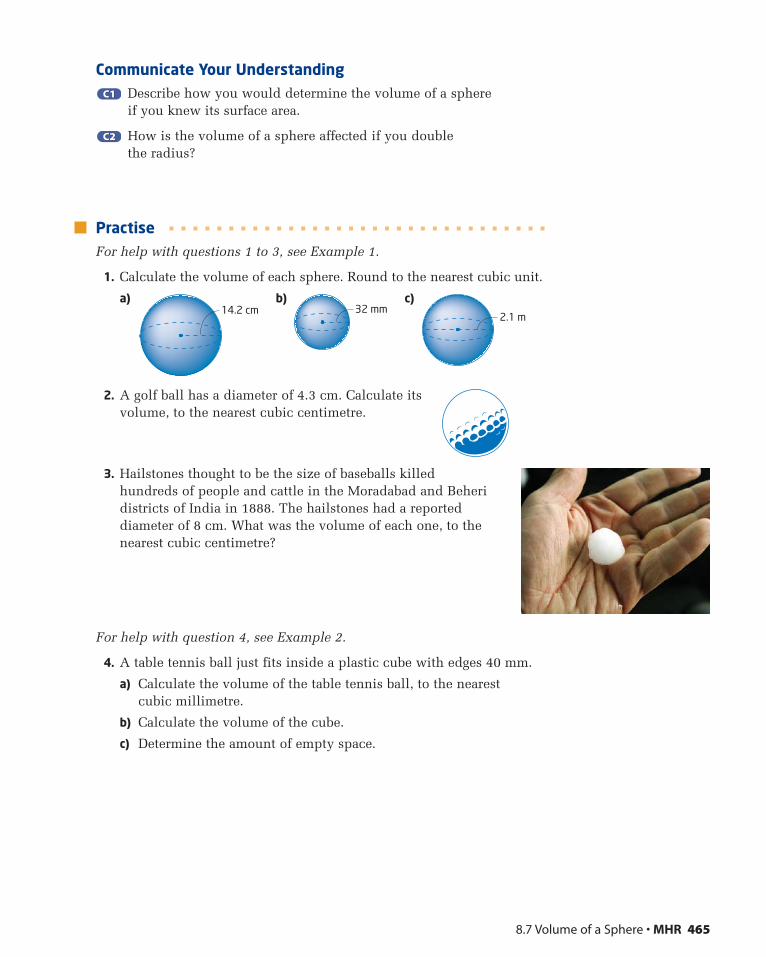
Communicate Your UnderstandingDescribe how you would determine the volume of a sphere if you knew its surface area.
How is the volume of a sphere affected if you double the radius?
PractiseFor help with questions 1 to 3, see Example 1.
1. Calculate the volume of each sphere. Round to the nearest cubic unit.
a) b) c)
2. A golf ball has a diameter of 4.3 cm. Calculate its volume, to the nearest cubic centimetre.
3. Hailstones thought to be the size of baseballs killedhundreds of people and cattle in the Moradabad and Beheridistricts of India in 1888. The hailstones had a reporteddiameter of 8 cm. What was the volume of each one, to thenearest cubic centimetre?
For help with question 4, see Example 2.
4. A table tennis ball just fits inside a plastic cube with edges 40 mm.
a) Calculate the volume of the table tennis ball, to the nearest cubic millimetre.
b) Calculate the volume of the cube.
c) Determine the amount of empty space.
2.1 m32 mm14.2 cm
C2C2
C1C1
8.7 Volume of a Sphere • MHR 465
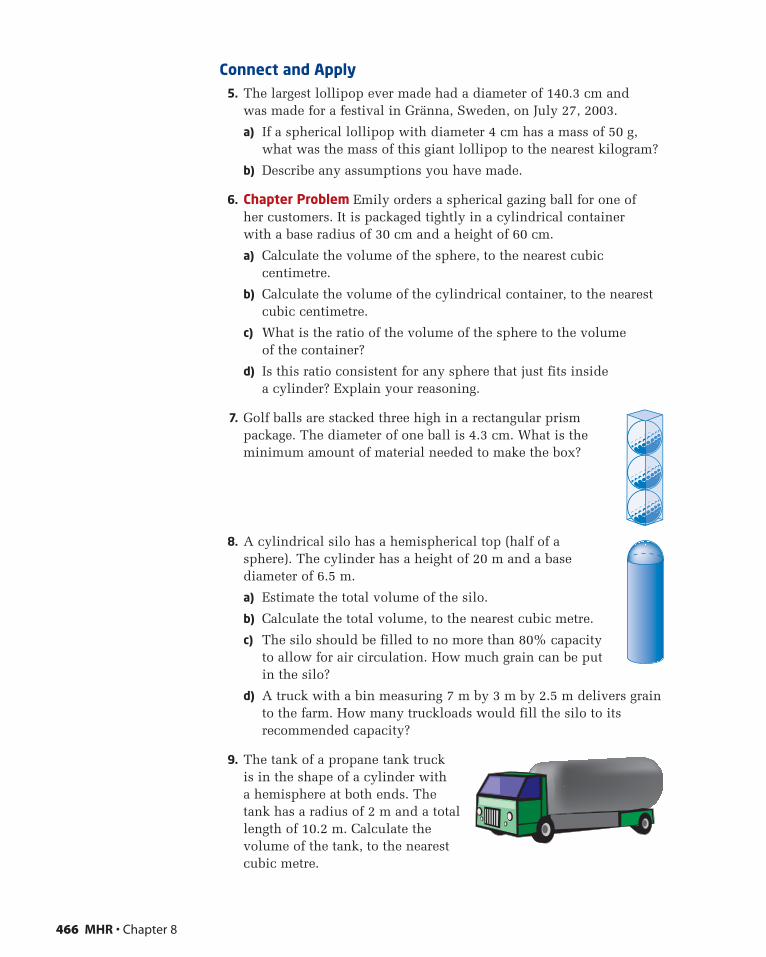
Connect and Apply5. The largest lollipop ever made had a diameter of 140.3 cm and
was made for a festival in Gränna, Sweden, on July 27, 2003.
a) If a spherical lollipop with diameter 4 cm has a mass of 50 g, what was the mass of this giant lollipop to the nearest kilogram?
b) Describe any assumptions you have made.
6. Chapter Problem Emily orders a spherical gazing ball for one of her customers. It is packaged tightly in a cylindrical container with a base radius of 30 cm and a height of 60 cm.
a) Calculate the volume of the sphere, to the nearest cubiccentimetre.
b) Calculate the volume of the cylindrical container, to the nearestcubic centimetre.
c) What is the ratio of the volume of the sphere to the volume of the container?
d) Is this ratio consistent for any sphere that just fits inside a cylinder? Explain your reasoning.
7. Golf balls are stacked three high in a rectangular prismpackage. The diameter of one ball is 4.3 cm. What is theminimum amount of material needed to make the box?
8. A cylindrical silo has a hemispherical top (half of asphere). The cylinder has a height of 20 m and a basediameter of 6.5 m.
a) Estimate the total volume of the silo.
b) Calculate the total volume, to the nearest cubic metre.
c) The silo should be filled to no more than 80% capacityto allow for air circulation. How much grain can be putin the silo?
d) A truck with a bin measuring 7 m by 3 m by 2.5 m delivers grainto the farm. How many truckloads would fill the silo to itsrecommended capacity?
9. The tank of a propane tank truckis in the shape of a cylinder with a hemisphere at both ends. Thetank has a radius of 2 m and a totallength of 10.2 m. Calculate thevolume of the tank, to the nearestcubic metre.
466 MHR • Chapter 8
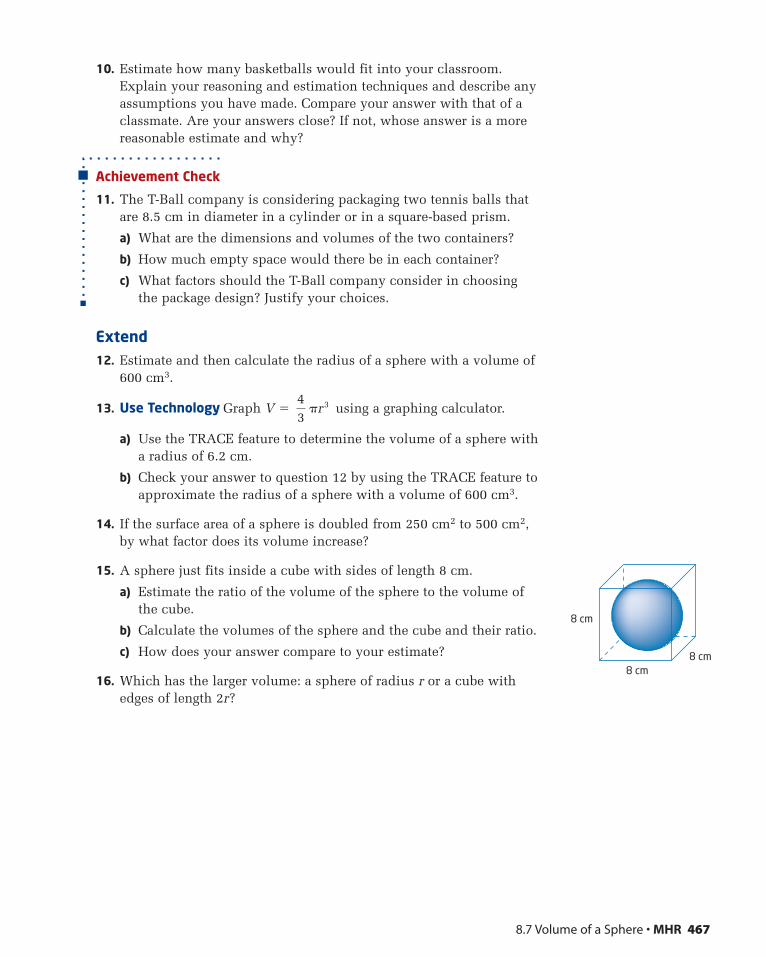
10. Estimate how many basketballs would fit into your classroom.Explain your reasoning and estimation techniques and describe anyassumptions you have made. Compare your answer with that of aclassmate. Are your answers close? If not, whose answer is a morereasonable estimate and why?
Achievement Check
11. The T-Ball company is considering packaging two tennis balls thatare 8.5 cm in diameter in a cylinder or in a square-based prism.
a) What are the dimensions and volumes of the two containers?
b) How much empty space would there be in each container?
c) What factors should the T-Ball company consider in choosing the package design? Justify your choices.
Extend12. Estimate and then calculate the radius of a sphere with a volume of
600 cm3.
13. Use Technology Graph V � using a graphing calculator.
a) Use the TRACE feature to determine the volume of a sphere with a radius of 6.2 cm.
b) Check your answer to question 12 by using the TRACE feature toapproximate the radius of a sphere with a volume of 600 cm3.
14. If the surface area of a sphere is doubled from 250 cm2 to 500 cm2,by what factor does its volume increase?
15. A sphere just fits inside a cube with sides of length 8 cm.
a) Estimate the ratio of the volume of the sphere to the volume ofthe cube.
b) Calculate the volumes of the sphere and the cube and their ratio.
c) How does your answer compare to your estimate?
16. Which has the larger volume: a sphere of radius r or a cube withedges of length 2r?
43
�r˛˛˛
3
8.7 Volume of a Sphere • MHR 467
8 cm
8 cm8 cm
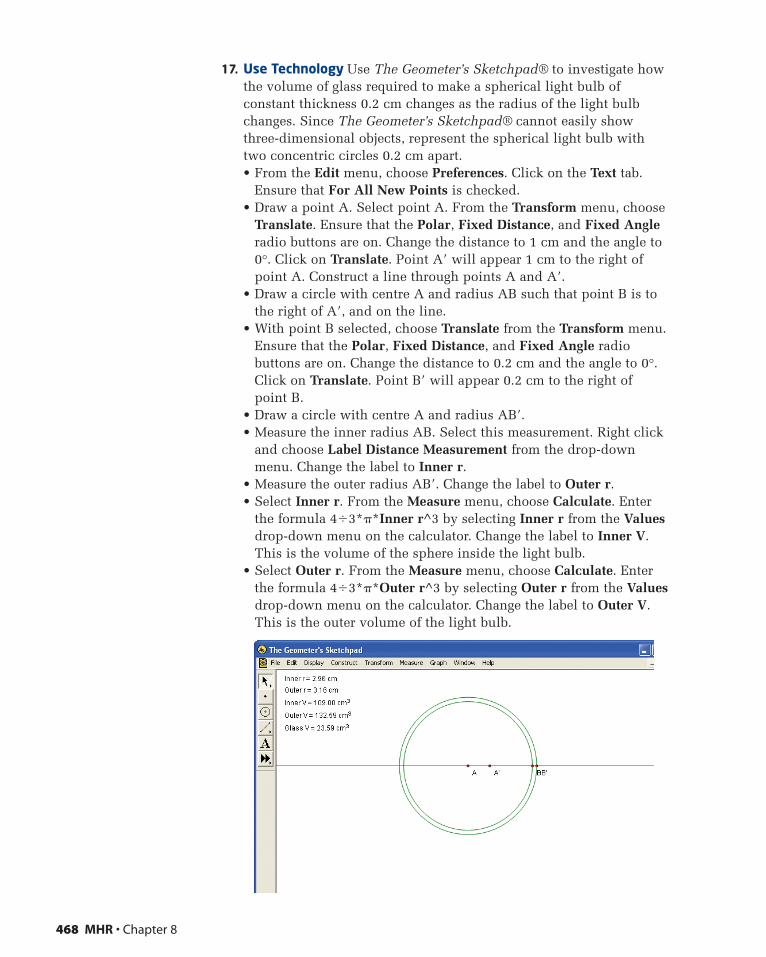
17. Use Technology Use The Geometer’s Sketchpad® to investigate howthe volume of glass required to make a spherical light bulb ofconstant thickness 0.2 cm changes as the radius of the light bulbchanges. Since The Geometer’s Sketchpad® cannot easily showthree-dimensional objects, represent the spherical light bulb withtwo concentric circles 0.2 cm apart.• From the Edit menu, choose Preferences. Click on the Text tab.
Ensure that For All New Points is checked.• Draw a point A. Select point A. From the Transform menu, choose
Translate. Ensure that the Polar, Fixed Distance, and Fixed Angleradio buttons are on. Change the distance to 1 cm and the angle to0°. Click on Translate. Point A� will appear 1 cm to the right ofpoint A. Construct a line through points A and A�.
• Draw a circle with centre A and radius AB such that point B is tothe right of A�, and on the line.
• With point B selected, choose Translate from the Transform menu.Ensure that the Polar, Fixed Distance, and Fixed Angle radiobuttons are on. Change the distance to 0.2 cm and the angle to 0°.Click on Translate. Point B� will appear 0.2 cm to the right ofpoint B.
• Draw a circle with centre A and radius AB�.• Measure the inner radius AB. Select this measurement. Right click
and choose Label Distance Measurement from the drop-downmenu. Change the label to Inner r.
• Measure the outer radius AB�. Change the label to Outer r.• Select Inner r. From the Measure menu, choose Calculate. Enter
the formula 4�3*�*Inner r^3 by selecting Inner r from the Valuesdrop-down menu on the calculator. Change the label to Inner V.This is the volume of the sphere inside the light bulb.
• Select Outer r. From the Measure menu, choose Calculate. Enterthe formula 4�3*�*Outer r^3 by selecting Outer r from the Valuesdrop-down menu on the calculator. Change the label to Outer V.This is the outer volume of the light bulb.
468 MHR • Chapter 8
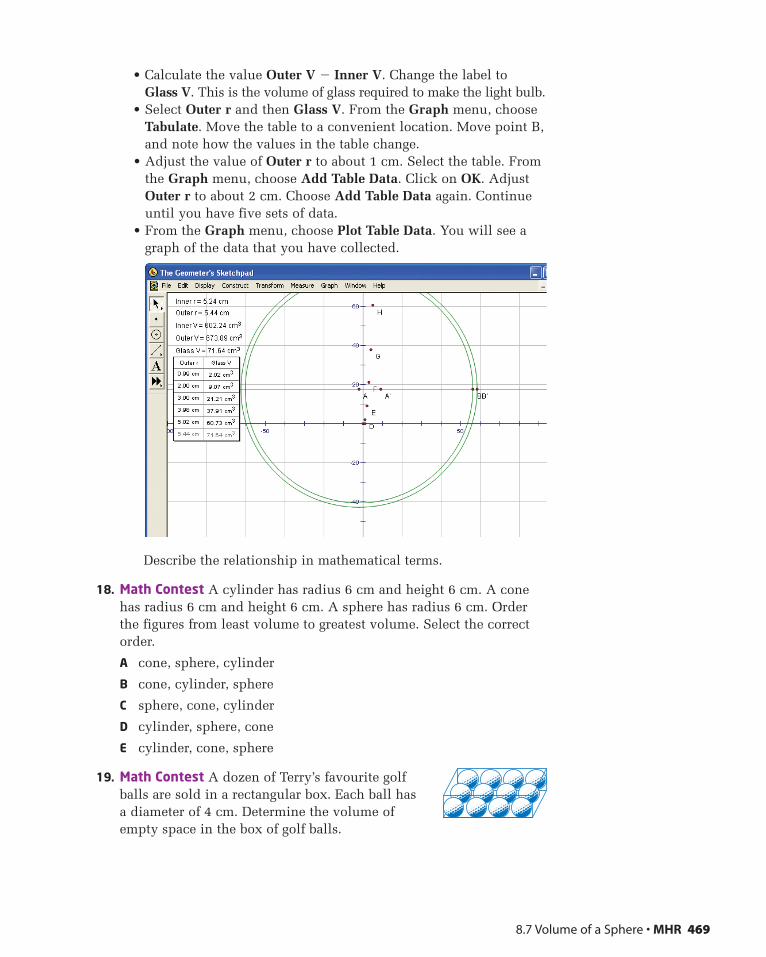
• Calculate the value Outer V � Inner V. Change the label to Glass V. This is the volume of glass required to make the light bulb.
• Select Outer r and then Glass V. From the Graph menu, chooseTabulate. Move the table to a convenient location. Move point B,and note how the values in the table change.
• Adjust the value of Outer r to about 1 cm. Select the table. Fromthe Graph menu, choose Add Table Data. Click on OK. AdjustOuter r to about 2 cm. Choose Add Table Data again. Continueuntil you have five sets of data.
• From the Graph menu, choose Plot Table Data. You will see agraph of the data that you have collected.
Describe the relationship in mathematical terms.
18. Math Contest A cylinder has radius 6 cm and height 6 cm. A conehas radius 6 cm and height 6 cm. A sphere has radius 6 cm. Orderthe figures from least volume to greatest volume. Select the correctorder.
A cone, sphere, cylinder
B cone, cylinder, sphere
C sphere, cone, cylinder
D cylinder, sphere, cone
E cylinder, cone, sphere
19. Math Contest A dozen of Terry’s favourite golf balls are sold in a rectangular box. Each ball hasa diameter of 4 cm. Determine the volume ofempty space in the box of golf balls.
8.7 Volume of a Sphere • MHR 469
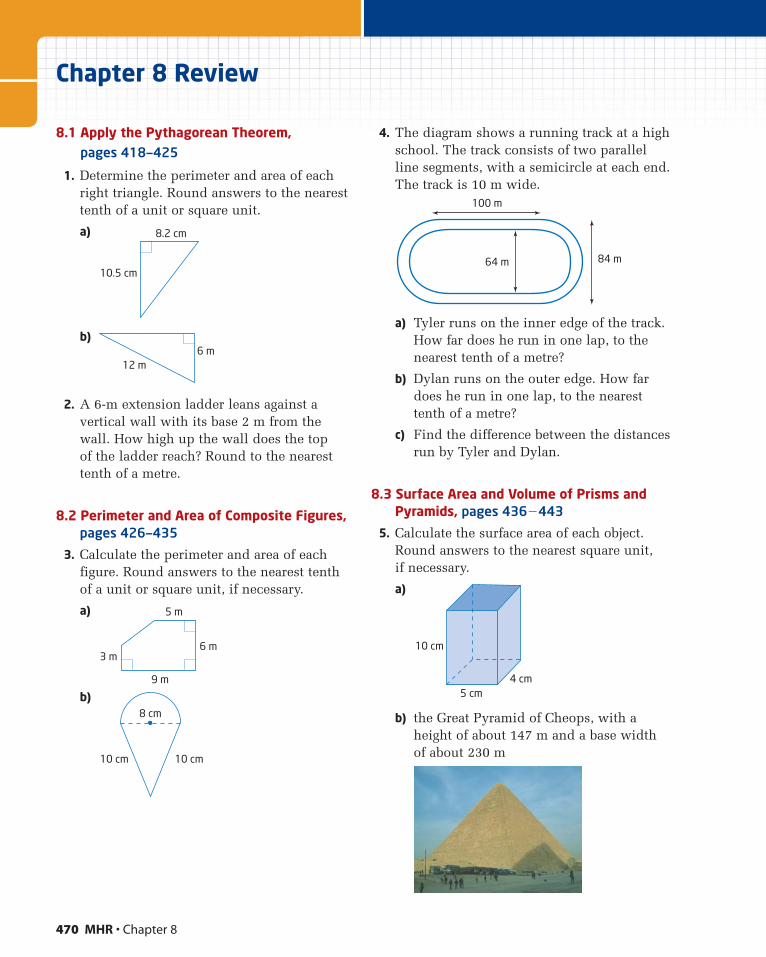
470 MHR • Chapter 8
Chapter 8 Review
8.1 Apply the Pythagorean Theorem, pages 418—425
1. Determine the perimeter and area of eachright triangle. Round answers to the nearesttenth of a unit or square unit.
a)
b)
2. A 6-m extension ladder leans against avertical wall with its base 2 m from thewall. How high up the wall does the top of the ladder reach? Round to the nearesttenth of a metre.
8.2 Perimeter and Area of Composite Figures,pages 426—435
3. Calculate the perimeter and area of eachfigure. Round answers to the nearest tenthof a unit or square unit, if necessary.
a)
b)
4. The diagram shows a running track at a highschool. The track consists of two parallelline segments, with a semicircle at each end.The track is 10 m wide.
a) Tyler runs on the inner edge of the track.How far does he run in one lap, to thenearest tenth of a metre?
b) Dylan runs on the outer edge. How fardoes he run in one lap, to the nearesttenth of a metre?
c) Find the difference between the distancesrun by Tyler and Dylan.
8.3 Surface Area and Volume of Prisms andPyramids, pages 436�443
5. Calculate the surface area of each object.Round answers to the nearest square unit, if necessary.
a)
b) the Great Pyramid of Cheops, with aheight of about 147 m and a base widthof about 230 m
10 cm
5 cm4 cm
100 m
64 m 84 m
8 cm
10 cm 10 cm
5 m
6 m
9 m
3 m
12 m6 m
10.5 cm
8.2 cm
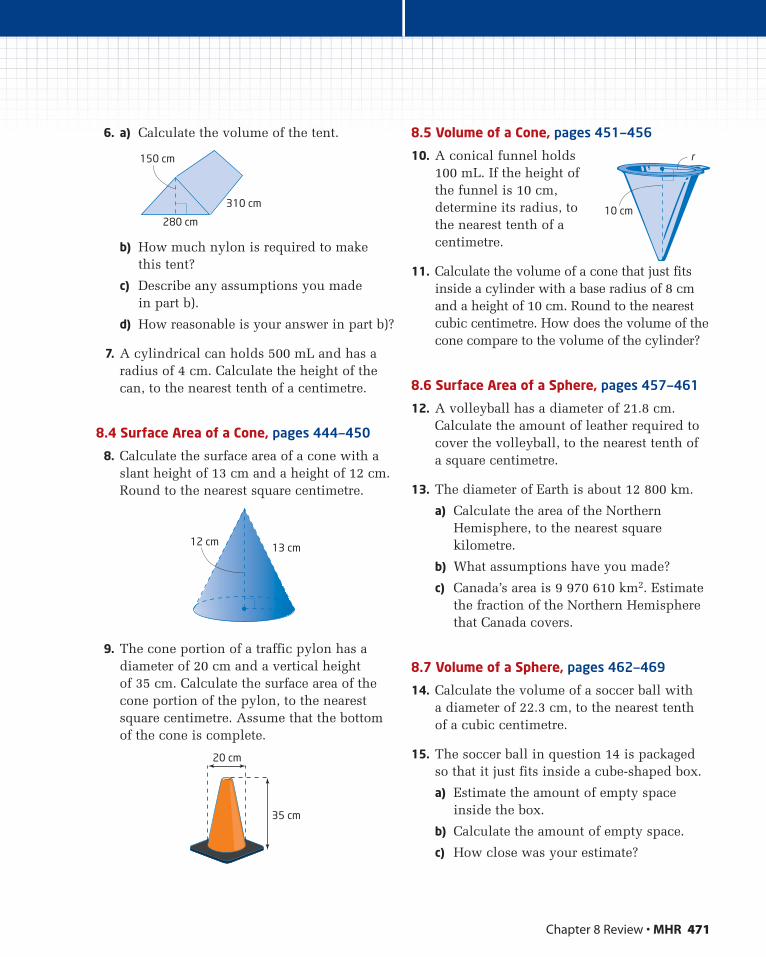
Chapter 8 Review • MHR 471
6. a) Calculate the volume of the tent.
b) How much nylon is required to makethis tent?
c) Describe any assumptions you made in part b).
d) How reasonable is your answer in part b)?
7. A cylindrical can holds 500 mL and has aradius of 4 cm. Calculate the height of thecan, to the nearest tenth of a centimetre.
8.4 Surface Area of a Cone, pages 444—450
8. Calculate the surface area of a cone with aslant height of 13 cm and a height of 12 cm.Round to the nearest square centimetre.
9. The cone portion of a traffic pylon has adiameter of 20 cm and a vertical height of 35 cm. Calculate the surface area of thecone portion of the pylon, to the nearestsquare centimetre. Assume that the bottomof the cone is complete.
8.5 Volume of a Cone, pages 451—456
10. A conical funnel holds100 mL. If the height ofthe funnel is 10 cm,determine its radius, tothe nearest tenth of acentimetre.
11. Calculate the volume of a cone that just fitsinside a cylinder with a base radius of 8 cmand a height of 10 cm. Round to the nearestcubic centimetre. How does the volume of thecone compare to the volume of the cylinder?
8.6 Surface Area of a Sphere, pages 457—461
12. A volleyball has a diameter of 21.8 cm.Calculate the amount of leather required tocover the volleyball, to the nearest tenth of a square centimetre.
13. The diameter of Earth is about 12 800 km.
a) Calculate the area of the NorthernHemisphere, to the nearest squarekilometre.
b) What assumptions have you made?
c) Canada’s area is 9 970 610 km2. Estimatethe fraction of the Northern Hemispherethat Canada covers.
8.7 Volume of a Sphere, pages 462—469
14. Calculate the volume of a soccer ball with a diameter of 22.3 cm, to the nearest tenth of a cubic centimetre.
15. The soccer ball in question 14 is packagedso that it just fits inside a cube-shaped box.
a) Estimate the amount of empty spaceinside the box.
b) Calculate the amount of empty space.
c) How close was your estimate?
20 cm
35 cm
13 cm12 cm
150 cm
280 cm
310 cm
r
10 cm
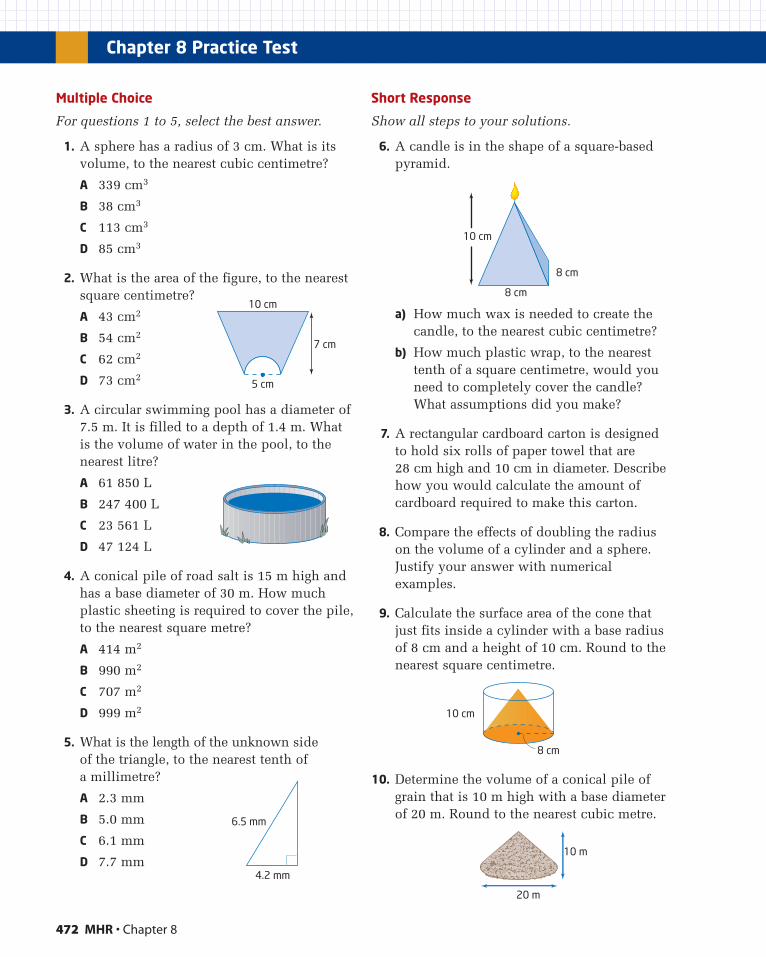
472 MHR • Chapter 8
Multiple Choice
For questions 1 to 5, select the best answer.
1. A sphere has a radius of 3 cm. What is itsvolume, to the nearest cubic centimetre?
A 339 cm3
B 38 cm3
C 113 cm3
D 85 cm3
2. What is the area of the figure, to the nearestsquare centimetre?
A 43 cm2
B 54 cm2
C 62 cm2
D 73 cm2
3. A circular swimming pool has a diameter of7.5 m. It is filled to a depth of 1.4 m. Whatis the volume of water in the pool, to thenearest litre?
A 61 850 L
B 247 400 L
C 23 561 L
D 47 124 L
4. A conical pile of road salt is 15 m high andhas a base diameter of 30 m. How muchplastic sheeting is required to cover the pile,to the nearest square metre?
A 414 m2
B 990 m2
C 707 m2
D 999 m2
5. What is the length of the unknown side of the triangle, to the nearest tenth of a millimetre?
A 2.3 mm
B 5.0 mm
C 6.1 mm
D 7.7 mm
Short Response
Show all steps to your solutions.
6. A candle is in the shape of a square-basedpyramid.
a) How much wax is needed to create thecandle, to the nearest cubic centimetre?
b) How much plastic wrap, to the nearesttenth of a square centimetre, would youneed to completely cover the candle?What assumptions did you make?
7. A rectangular cardboard carton is designedto hold six rolls of paper towel that are 28 cm high and 10 cm in diameter. Describehow you would calculate the amount ofcardboard required to make this carton.
8. Compare the effects of doubling the radiuson the volume of a cylinder and a sphere.Justify your answer with numericalexamples.
9. Calculate the surface area of the cone thatjust fits inside a cylinder with a base radiusof 8 cm and a height of 10 cm. Round to thenearest square centimetre.
10. Determine the volume of a conical pile ofgrain that is 10 m high with a base diameterof 20 m. Round to the nearest cubic metre.
20 m
10 m
10 cm
8 cm
10 cm
8 cm
8 cm
Chapter 8 Practice Test
7 cm
10 cm
5 cm
6.5 mm
4.2 mm
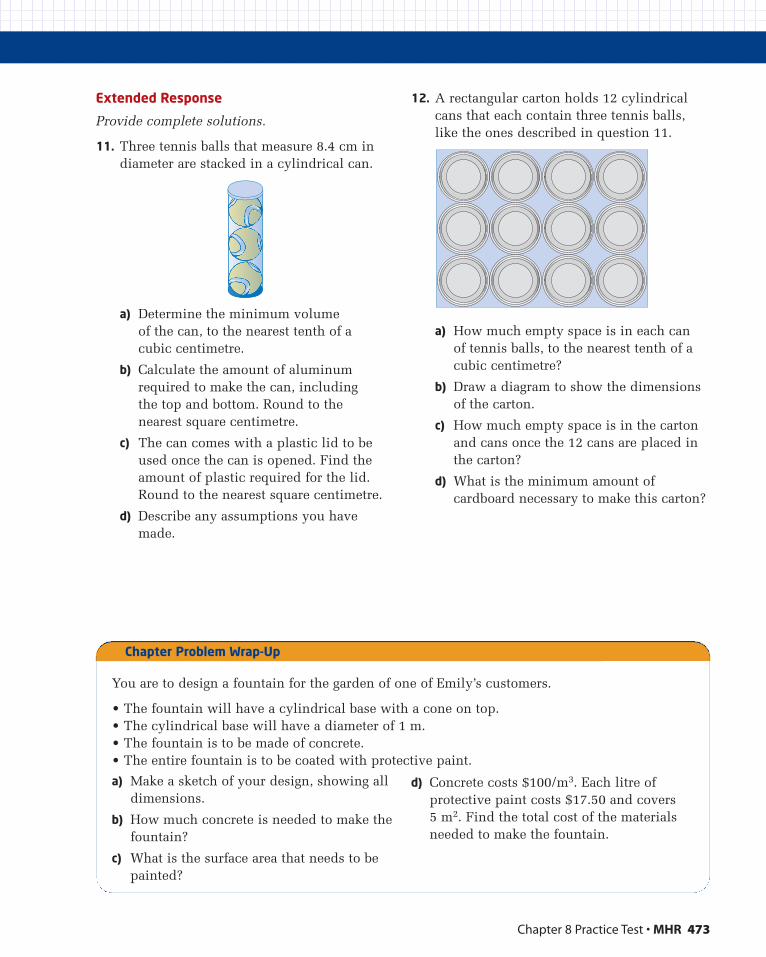
Chapter 8 Practice Test • MHR 473
Extended Response
Provide complete solutions.
11. Three tennis balls that measure 8.4 cm indiameter are stacked in a cylindrical can.
a) Determine the minimum volume of the can, to the nearest tenth of a cubic centimetre.
b) Calculate the amount of aluminumrequired to make the can, including the top and bottom. Round to the nearest square centimetre.
c) The can comes with a plastic lid to beused once the can is opened. Find theamount of plastic required for the lid.Round to the nearest square centimetre.
d) Describe any assumptions you havemade.
12. A rectangular carton holds 12 cylindricalcans that each contain three tennis balls, like the ones described in question 11.
a) How much empty space is in each can of tennis balls, to the nearest tenth of acubic centimetre?
b) Draw a diagram to show the dimensionsof the carton.
c) How much empty space is in the cartonand cans once the 12 cans are placed inthe carton?
d) What is the minimum amount ofcardboard necessary to make this carton?
You are to design a fountain for the garden of one of Emily’s customers.
• The fountain will have a cylindrical base with a cone on top.• The cylindrical base will have a diameter of 1 m.• The fountain is to be made of concrete.• The entire fountain is to be coated with protective paint.
a) Make a sketch of your design, showing alldimensions.
b) How much concrete is needed to make thefountain?
c) What is the surface area that needs to bepainted?
d) Concrete costs $100/m3. Each litre ofprotective paint costs $17.50 and covers 5 m2. Find the total cost of the materialsneeded to make the fountain.
Chapter Problem Wrap-Up