the impact of darfur conflict on agro- pastoralists in ... · abdul mahmoud. ii acknowledgements: i...
TRANSCRIPT

بسم اهللا الرحمن الرحيم
The Impact of Darfur Conflict on Agro- Pastoralists in Displacement Camps
By: Abdel Mahamoud Adam Mohammed Mahmaden B.Sc. (Honour) Department of Animal Production
Faculty of Agriculture University of Zalingei
April (2002) A dissertation submitted in partial fulfillment for the requirement of the Degree of M.Sc. in Nutritional Sciences
Supervisor Prof. Amir Mohammed Salih Department of Animal Nutrition Faculty of Animal production University of Khartoum
October 2007

1
بسم اهللا الرحمن الرحيم
: قال تعالى
لعبرة نسقيكم مما في بطونها ولكم فيها األنعاموان لكم في (
وعليها وعلى الفلك تحملون ) 21 (تأكلونمنافع كثيرة ومنها
)22((
صدق اهللا العظيم سورة المؤمنون

2
i
Dedication
To my
Parents Brothers Sisters
Colleagues Special friend Abdul Halim
I dedicate this work with my love Abdul Mahmoud

ii
Acknowledgements:
I want to acknowledge my thanks to the almighty "Allah" who
offered me the health, patience and ability to undertake this work.
I wish to express my deep sense of gratitude to my supervisor
professor Amir Mohammed Salih, for help, guidance, patience,
encouragement and interest. This made the work possible. Also I would like
to thank Dr. Mohammed Khair Abdalla who chose for me a suitable design
computer analysis for the experimental data. My sincere thanks are due to
staff of Animal Production in University of Khartoum their help by form
and other hand.
I gratefully acknowledge to my uncle Dr. Abdelrhman Mohammed
Tahir Ministry of Sciences and Technology, agriculture researches, Nayala
Station for his best guidance to look forward, Assistance and prompt me to
obtain this Degree, and for my friends, Ibrahim Hemida and Mohammed
Osman Abaker all help me on processing of data and analysis. Also thanks
for my friend's works on (NGOs) help me and give me information about
this research specially Doctor Mohammed Abdul Hamide and Alhadi
Ibrahim,
My thanks are extended to my family in south Darfur specially my
brother Mousa and mother sisters Mhasen and thanks for all who help me or
wish to help me during the data collection.
Lastly my thanks goes to Dr. Khadiga Abbas, Coerces Coordinate of Msc
Nutrition Sciences for assistance during my study.
With my Best wishes to all.
iii
List of Contents Page
Dedication ………………………………………………………. i Acknowledgement ………………………………………………… ii List of Contents…………………………………………………… iii List of Tables ……………………………………………………… iv List of Figures …………………………………………………… v Abstract …………………………………………………………… vi Arabic Abstract …………………………………………………… vii Chapter one: Introduction ……………………………………… 1 Chapter tow: Literature Review …………………………………. 3 2.1 Background ……………………………………………... 3 2.2 Farming system …………………………………………. 3 2.3 Conflicts between the farmers and pastoralists …………. 5 2.4 Conflicts between pastoralists …………………………... 6 2.5 The impact of conflicts on the farmers ………………….. 6 2.6 Livestock ownership ……………………………………. 7 2.7 Pastoral nomadism ……………………………………… 7 2.7.1 The study is concerned three types of pastoral …………. 7 2.8 Social function for animal ………………………………. 9 2.9 The impact of conflicts on the livestock ownership …….. 10 2.10 The situation of displaced people ……………………….. 12 2.11 Camps nutritional status ………………………………… 13 2.12 Healthily status ………………………………………….. 14 2.13. Educational status ……………………………………….. 15 Chapter three: Materials and Methods …………………………. 16 3.1 Topography of study area ……………………………….. 16 3.2 Method of data collection ……………………………….. 17 3.2. Statistical analysis ………………………………………. 19 Chapter Four: Results and Discussion …………………………... 21 Gender status ……………………………………………. Type of occupation of Internal Displacement Peoples ….. 23 Relationship between educational level and type of
occupation ………………………………………………. 23
Type of animals …………………………………………. 24 The relationship between the type of animal and the
percentage of losses ……………………………………... 26
Access land ownership ………………………………….. 27 The component of diet …………………………………... 29 The main source of food ………………………………… 30 The main disease facing IDPs in camps ………………… 32 The main source of income ……………………………... 33 The difference between life before and after displacemed 34 Conclusion and Recommendation 36 References 37 Appendix 42

iv
List of Tables
Table Page
1 Gender status 21
2 Marital status 21
3 Educational level 22
4 Type of occupation of IDPS 23
5 The relationship between educational level and the main occupation 23
6 The type of animal 24
7 Animal losses in four camps 25
8 The total of animal belonging at present by IDPs 26
9 Relationship between the kind of animal and the percentage of losses 26
10 The system of land tenure before and after displacement 27
11 Reasons for stoppage of cultivate 28
12 The food component before displacement 29
13 The food component after displacement 29
14 The main source of household food 30
15 The period of food shortage frequency 31
16 The trade and sale of distributed food 31
17 The main diseases facing IDPs in camps 32
18 The main sources of household income 33
19 The relationship between educational level and the main sources of income 34
20 The difference between life before and after displacement
35
v
List of Figures
Figure Page
1 The map of the study area 18
2 Food distribution 20
vi
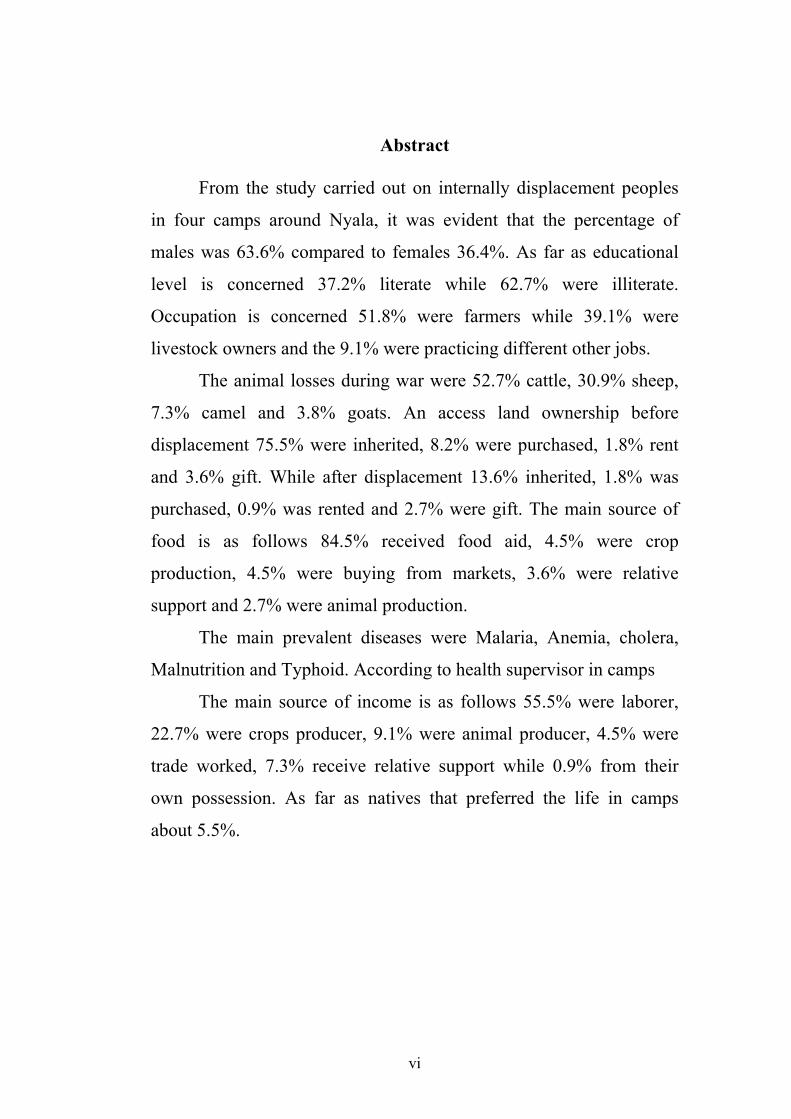
Abstract
From the study carried out on internally displacement peoples
in four camps around Nyala, it was evident that the percentage of
males was 63.6% compared to females 36.4%. As far as educational
level is concerned 37.2% literate while 62.7% were illiterate.
Occupation is concerned 51.8% were farmers while 39.1% were
livestock owners and the 9.1% were practicing different other jobs.
The animal losses during war were 52.7% cattle, 30.9% sheep,
7.3% camel and 3.8% goats. An access land ownership before
displacement 75.5% were inherited, 8.2% were purchased, 1.8% rent
and 3.6% gift. While after displacement 13.6% inherited, 1.8% was
purchased, 0.9% was rented and 2.7% were gift. The main source of
food is as follows 84.5% received food aid, 4.5% were crop
production, 4.5% were buying from markets, 3.6% were relative
support and 2.7% were animal production.
The main prevalent diseases were Malaria, Anemia, cholera,
Malnutrition and Typhoid. According to health supervisor in camps
The main source of income is as follows 55.5% were laborer,
22.7% were crops producer, 9.1% were animal producer, 4.5% were
trade worked, 7.3% receive relative support while 0.9% from their
own possession. As far as natives that preferred the life in camps
about 5.5%.

vii
الخالصة
من الدراسة التي أجريت في النازحين في أربع معسكرات حول مدينة نياال اتضح
بينما المستوى التعليمـي يمثـل % 36.4 اإلناثبمقارنة إلي % 63.6 الذكورأن معدالت
% 39.1مزارعين و % 51.8 إما ما يتعلق بالمهنة أميين% 62.7 بينما المتعلمين% 37.2
سون أعمال أخرى فيما يتعلق بفقد الحيوانات فـي الحـرب يمار% 9.1مربي حيوانات و
%.3.6وماعز % 7.3، جمال %30.9، ضان %52.7أبقار
، %8.2، بالـشراء %75.5فيما يتعلق بملكية األراضي قبل النـزوح بالوراثـة
، %1.8، بالـشراء %13.6مقارنة بما بعد النزوح بالوراثة % 3.6 هبةو% 1.8باإليجار
%.2.7 ةبوه% 0.9بااليجار
، إنتـاج محاصـيل %84.5فيما يتعلق بمصدر الغذاء الرئيسي العون الغـذائي
هؤالء يـشتكون %. 2.7واإلنتاج الحيواني % 3.6، دعم األقارب %4.5، السوق 4.5%
سـؤالتغذية ، % 59.1معظم األمراض الشائعة عندهم المال ريـا % 88.2من االسهاالت
%.4.5 كوليرالوا% 4.5، أنيميا %10.9 التيفود، 20.9%
، منتجـي %22.7منتجي المحاصيل ،% 55.5فيما يتعلق بمصادر الدخل الرئيسي العمالة
% 0.9بينمـا % 7.3 من األقارب والمدعومون% 4.5، األعمال التجارية %9.1الحيوان
.أصحاب وظائف
يفضلون حيـاة فقط %5.5لحياة في المعسكر ل المواطنين إما فيما يتعلق بتفضيل
.المعسكر
1
CHAPTER ONE
INTRODUCTIN
Sudan is the largest country in Africa with an area of about one
million square miles and a population of approximately 36 million as
estimated in (2006) by Central Bureau of Statistics. The population is
increasing at about 2.5% annually. Sudan is composed of various
distinct ethnic groups
Each group has its own customs and traditions which has affected
own and way of living. Sudan has a wide range of food sources due to
the prevalence of a wide range of climate and rainfall and the
heterogeneity of its human population.
Greater Darfur comprises three states: North. West and South
Darfur states. It is located between latitudes 10 and 20 N and
longitudes 22 and 27.30 E. Its surface area is about 500.000 Km i.e.
one fifth of Sudan. Southern Darfur state lies between latitudes 9 30
and 13 00N and longitudes 27 15 and 27 45 E It has an area of
13780km with 2.1million inhabitants and animal resources of 12
million. The semi-arid climate prevails in the north and low rainfall
savanna in the middle and the high rainfall woodland savanna in the
south. The rainfall ranges between 300 mm in the north to 800mm in
the south and it may reach up to 1200 mm in Jebel Marra Mountain
(Adam, 1999). The rainy season extends from May to October with a
peak in August. Rainfall is highly variable and uncertain in the north
and middle parts of the state. The climate is characterized by high
temperature high evaporation rate and low relative humidity. The
major activities of population in this state are agriculture and livestock
2
production. It is estimated that more than 80% of the population is
engaged in agriculture including livestock activities.
The national comprehensive strategic program has concentrated
on the expansion of cultivating of rainfall agricultural crops. This help
in the achievement of food security and export. The state is considered
as one of the main potential livestock production areas in the country
as well as rangeland. The livestock systems are nomadic, semi-
nomadic and sedentary.
On the last four years tribal disputes lead to the well known
Darfur conflict large numbers of farmers and livestock producers have
been displaced. Many of them now live in camps and receive
assistance.
Objectives
1. To study the current situation of agro- pastoralists living in
camps in southern Darfur.
2. To study the effect of Darfur conflicts on agro- pastoralists
activities.
3
CHAPTER TWO
LITERATURE REVIEW
2.1 Background:
The population of Darfur is about (6) million inhabitatants.
Most of them live in the rural areas. Rural inhabitatants can broadly be
categorized into sedentary farmers and nomadic herdsmen. Darfur has
resources of various kinds: manpower, animal wealth (about (20)
million heads of livestock tourism and recreation, arable land forestry,
minerals, petroleum oil. How-ever it has very poor infrastructure and
development schemes. It is also constrained by weak security. Health
and education services and shortages of food and drinking water.
Agriculture and animal breeding represent 90% of economic activity
followed by trade and handcrafts. Thus agriculture and animal
breeding play essential role in economy.( Abu-Suwar, 2007)
The people of that village depend mainly on irrigated and rain
fed agriculture and livestock.
2.2 Farming system:
1. Irrigated farming system.
2. Rained farming system.
2.2.1 Irrigated farming system:
This activity started in 1950 with cultivation of onion .hot
pepper and the ownership removed the date palm suckers in the early
stage because they afraid from the tenant farms and taxes. They are
producing vegetable and fruits. The average area per family is 1-5
feddan irrigated with-dello and diesel and benzene water pumps and
water fall they planted crops according to the season as following:

4
1. Winter crops.
2. Summer crops.
3. Autumn crops.
In addition to vegetable production they have fruit trees like
date, lemon, guava, mango, Grapefruit and orange.
2.2.2 Rain farming system:
All farmers cultivating millet as main crop during rainy season
in addition to watermelon, cucumber sesame, Okra, Karkadi and lubia.
The average of millet field is (4) feddan per family. They practice
traditional rain water harvesting technique-using tree branches.
The Sudanese agricultural sector with its noted potential was
expected to satisfy domestic food needs and to generate surplus for
export (Afaf, 1994).
Studies of the 1984/85 famine showed that famine is a
consequence of long process. The main contributing components are
drought and desertification (Ibrahim 1984; ILO, 1985). Lack of
misguided government and agricultural polices (Abdel atti, 1988). It is
conceivable that Darfur region is one of the worst – hit areas by
drought where food balance deteriorated rapidly between (1971-72
and 1981-82) the growth of cereal supply amounted to 23 percent of
the need. As a result some 50 percent of the population of north
Darfur migrated to south Darfur in 1983/84. During the same year
70% of the populations were estimated to have suffered from
malnutrition (ILO, 1985).
The outcome of this vicious interaction between drought
unsound agricultural strategies in addition to the civil war and rising
5
population leads an acute food security problem which was associated
with food aid and other forms of external assistance.
2.3 Conflicts between the farmers and livestock breeders:
It is believed that there were some causes that contributed to
develop the friction between herdsmen and farmers in the region are
follows:
1. Weak native administration and their did no provide severity
movement nomads from north to south and their return
especially at the beginning of rainy season.
2. The increase in numbers and concentration of livestock of
pastoral Arab tribes in the region as a result of drought and
desertification that hit north Darfur pushing these tribes
southwards.
3. Lack of periodic review of traditional routes which were never
increased up to meet the growth in livestock.
4. The spread of weapons especially among citizens complicated
the normal problems between the farmers and herdsmen.
From this situation it is inevitable that competition over land
would take place not only between the farmers and nomads but
between the farmers themselves due to lack of grazing lands for their
animals.
2.4 Conflicts between pastoralists:
Inter group conflict between pastoralist has often been
interpreted as competition for pasture. However chronic insecurity
from livestock raiding has the effect in some areas of deterring herders
from exploiting pasture that are not easily defensible. The purpose of
raiding is less economic and more to do with the maintenance of
6
group solidarity and the prestige mechanisms. The result however is
often palely overgrazing as pastoralist are completed to stay within a
region too small to support their herds. Expansion of crop production
at the expense of grazing land has also resulted in some losses of the
wet and dry season pasture land in many regions.
2.5 The impact of conflicts on the farmers:
The effects on production are more pronounced in farming
areas. Because farming as a production strategy requires that the
farmer is present to tend the crops, when farmers are displaced by
violence and insecurity. Production is severely curtailed (Adan and
Pkalya, 2005).
When farmers are unable to tend their farms it is inevitable that
food production in that season will be decreased. As illustrated in the
following case studies conflict results in significant reduction of land
under crops in growing season affected by conflict. This conflict
forced many farmers to abandan their farms. A comparison of
agricultural production between the conflict prone years and the rest
illustrate the effect of conflict on food production (Adan and Pkalya,
2005).
Concerning IDPs population data showed surprisingly that only
a small proportion of household have access to their own land (7%),
More than (77%) have access to only rented land. Vast majority of
people without access to land are IDPs Action Contre Lafaim,
Cooperative Housing Foundation and Samaritan Purse (2007) The UN
University of Peace Conference (Environ-mental Degradation) as
access of conflict in Darfur (Khartoum December, 2007) describes the
following process and taking place in whole Darfur.
7
Out of 402, 49 interviewed household were unable to cultivate.
Insecurity conflict appear in first position of the answers given,
followed by lack of animal power, shortage of agricultural inputs and
displacement. However displacement not living in normal place
comes up as the main limit for most of the area. The second and third
hindering factors are insecurity coupled with problem of land
availability. Wadiland has been very low cultivated this year because
wadi land is usually at a certain distance from the village and
consequently considered as less secure for farmers (Action Contre
Lafaim, Cooperative Housing Foundation and Samaritan Purse, 2007).
2.6 Livestock ownership:
They are classified as a major sub sector and make together
with pastoral resources the backbone of the rural economic (Badria et
al., 1987).
Official estimates of animal production in head (2006) in Sudan
put cattle as 40994 head, sheep 50390 head, goats 42756 head, camels
4078 head (Ministry of Animal Resources, 2006).
The estimation of livestock in Darfur (2002) 6884218 heads 1.6%
cattle, 7.22% sheep , 6.65% goats and 12.48% camel which about
75% or total animal in Darfur region (Ministry of Animal Resources,
2002).
2.7 Pastoral Nomadism:
2.7.1 The study is Concerned three types of pastoral nomadism:
2.7.1.1 Mainly Nomadism:
Where people are always on the move with their animals
wandering throughout the year fetching water and pasture. Herding

8
and watering are the major activities. They usually inhabit drier areas
and raise camel as the main animal and live in tent in temporary
location and camps called (farigs). The tents are made cloths plastic
material straw or cartons. Group of extended families of the same kin
usually move together to secure themselves against raiding. Their
going to long distance about 500-600 Km between region to region
search for pasture and water point. An example of such a group is the
northern Rizaigat Iraygat, Zaghawa Bideyate.Midoub and Zayyadiyya
of Northern Darfur State.
2.7.1.2 Semi Nomadism:
Where people stay in village during the rainy season and engage
in small scale subsistence cultivation and maintain their herds around
the area. During the dry season they migrate to seek water and pasture
following definite and well-recognized routes. They live in self-
contained clusters of huts separated from each other by stretches of
land for cultivation and herding of cattle, sheep, and goats. Camels are
usually herded far away from the village by members of the family or
by paid labour who usually receive payment in kind e.g. small animal
every year. The herd owner visits the pastoral area from time to time
for supervision and delivery of basic consumer items (sorghum, sugar,
cooking oil and salt). The labourer is responsible for husbandry and
health care of the animal. He decides where the animal graze an how
long they remain there and how often they are watered. He can
slaughter an animal in case of emergency e.g. disease, fracture or
accident injury but should inform the owner in all cases. The main
tribes practice such activities are (Benihalba, Habbaniyya, Rizaygat,
Baggara, Taaisha, Birged and Bertie).
9
2.7.1.3 Sedentary:
Where pastoralists are permanently settled and engaged in
agriculture as the major economic activity. Animals are maintained
around their village and movements outside the settlement domain are
very limited. The Tongour tribe of north Darfur state provide an
example UNDP Sep (2002).
Their traditional agriculture system and some irrigated areas
and this system is an important supply for urban areas. Intensive
integrated livestock/crop production system using fodder and
concentrates located in urban areas are more oriented to dairy
production. Mainly poultry and goats milk production based on
household waste and on screening mainly for home consumption.
Output 80% of milk and 70% of red meat come from pastoralist
system of production Mohammed (2002). The main tribes practice
these activities such as (Fur. Masalit, Tama, Qimr, Mima, Tunjur and
Daju).
2.8 Social function for animal:
In addition to the monetary value and provision of food,
livestock has social roles for the pastoralists in the area. They are kept
as sign of wealth, social prestige, and self-identification and often
herded to build a system of human bonds aiming at increasing
security. Livestock reinforces social relationship and fulfills obligation
in cases of marriage ceremonies, gifts are often offered to government
officials as sign of respect and hospitality (UNDP, 2002).
In the area livestock represents the weight center to which the
individual as well as the group life is strongly linked – through
surpluses livestock play a socio-culture role that minimizes or
10
antagonizes the efficiency of the economic role (Al Areefi, 1997).
However in many occasions the animals is used as legal tender and
form of exchange (Abbas, 1997). For instance, as a dowry in marriage
transactions and as blood money (Diyya) in cases of homicide and in
settlement as tribal conflicts. Such customs initiate the need of
keeping too many animals not only that but livestock herding among
herders in the region brings social prestige, reputation and generates
the feeling of security (Abdalla, 1974). The common system of herd
management is traditional pastoralist. The animals are raised under
traditional grazing and are subjected to extensive seasonal movement
in search of feed and water. Milking herd is generally excluded from
the migratory movements and is kept in village and in camps (Fariegs)
around towns and cities for the supply of milk to the dwellers.
The herds are taken during the daylight to natural grazing in the
vicinity of the camps and in the evening they are returned to the
camps and kept in cattle enclosures. The enclosures are usually in the
form of thorn bush fences, and separate enclosures are usually
provided for different classes of cattle. The cows are generally hand
milked twice a day in the morning before they leave their enclosures,
and in the early evening after their return from grazing Mohammed
(2000). Goats are easily sold to provide an income for immediate
subsistence needs. In addition to provision of milk the family, goats
are also sources of meat for the family.
2.9 The impact of conflicts on the livestock ownership:
In times of insecurity animals tend to concentrate in safe areas
where it is easier for their owners to defend them. In times of conflict
and congregation of animals there is also a higher probability that
11
alien; animals raided from others belligerents will be introduced to the
home herd with disastrous effects if the incoming animals are
diseased. Compounding this situation is the disruption of veterinary
and extension in times of insecurity.
The indicators may include; Reduction of herd size owned by
individuals and communities deterioration of livestock health status
and increasing susceptibility to disease: increased death rates.
Lowering of animal productivity (milk, meat) substitution of livestock
species and decrease of number of species reared. Disruption of the
traditional nomadic movement (derivation in from demarcated and
traditional route) prolongation of stay period at the richer areas in the
southern parts of the region (Abu-Suwar, 2007). Starving animals
have also greatly reduced production of dairy products, according to
respondents apprize milk cow that could give 5 liters of milk may
shrivel up to a mere half liter when denied sufficient pasture. In
addition to disease and starvation the disruption to range management
by conflict also contribute to the decimation of livestock in time of
conflict. Conflicts also increase the cost of livestock production. In
many instances livestock keepers are forced to invest in arms that are
expensive in order to protect their livestock. Finally the effects of
thefts on livestock production are too huge to be overlooked. Loss of
livestock in this manner often leads to the consumption of breading
stock, just to make sure families have food to survive. The closure of
markets also has the effect of making it impossible to sell animals at
their prime thereby depleting their market value. This assessment
result of lost well over 459.905 livestock (a combination of cattle,
camel, donkey, goats and sheep) between 1994 – 2004. It has also
been estimated that up to 13% of food production capacity is lost
12
every year in Eastern Africa to conflict related losses (Adan and
Pkalya, 2005). Generally speaking the de-capitalization of the
livestock base has led to important loss of income to the households
and in addition reduced contribution of animal product to the
household dietary intake. Household had faced several constraints that
impact on animal razing. 37% of household mentioned lack of pasture,
26% reported insecurity (access to pastures to migration routes, theft/
looting) 15% of households mentioned lack of water for livestock
while 15% of household mentioned lack of veterinary services
livestock diseases Action Contre Lafaim, Cooperative Housing
Foundation and Samaritan Purse report (2007). There conflicts
resulted in complete damage of natural resource in addition to the
death of hundred of human beings, burring of villages, and theft of
livestock, infrastructure and social services damage (Mohammed,
2002).
2.10 The situation of displaced people:
Displacement of people leaving their native home to secured
areas within the state and/or central Sudan. From changing of the
model of life, the impact of the displacement population on the
environment is clearer in and around the urban centers. Poor internal
displacement populations who lost their means of living due to natural
or political disasters and came to live in the outskirts of towns have
influenced the urban environment in several ways.
1. Coming directly from their home areas with their cultures and
traditional values and practices the IDPs constituted a process
of ruralization of the urban centers.
2. Increasing pressure on social services, especially education and
health service.

13
3. The steady increase in the number of vagrant children's
particularly during the 1990 the most observed new
phenomenon is the increase in the number of street girls and
street families.
4. The rate of crime associated with some social problems is on
the increase, especially crimes of theft, burglaries and child
delinquency.
5. The increase in the number of female – head household (Abdel
Atti, 2001).
Conflict related displacement also have an impact on water and
sanitation. Lack of water sanitation in turn increases susceptibility to
diarrhea diseases.
Besides being displaced from their homes and cut off from their
livelihood options, these IDPs have been exposed to an array of health
related hazards including susceptibility contracting HIV/AIDS (Adan
and Pkalya, 2005).
They may include: migration flows recurring famines
increasing dependence upon food aid and upon markets for securing
subsistence requirement due to low productivity of land increased
communal and tribal insecurity and conflict: absence of development
programs, absence of alternative job opportunities other than
traditional occupations.
2.11 Camps nutritional status:
Yohanes (1990) revealed that 53-56% of the total house-hold
budget in western Sudan is spent on food; expenditure on millet
14
dominates the expenditure in all provinces except southern Kordofan
where the share from sorghum is higher.
Many displaced people demonstrate greatest concern and anger
over food shortages and the attacked destruction of their food stock.
Food aid does not cover all the needs to fill this gap. The displaced
and host population had to wait nine months after their arrival until the
first food aid was distributed. The food distributions to date have not
completely addressed the high level of mortality among starving
children, but have for now prevented a looming famine. However the
distribution still only cover half of the assessed needs of the displaced
population. If refugees don’t get firewood or soap they have to sell
their generals food rations to buy it said WFP deputy country director
(Marain Read, 2007). Mass displacement and food shortage have a
serious impact on the health status of the population. The every
precarious living condition of the displaced has favored the
development and spread of preventable disease.
2.12 Healthily status:
There are also additional health penalties imposed by conflict
on health the most visible being the closure of health facilities. This
drastically increases the distance to the nearest health facility for
residents. This has a huge impact on the ability to reach a facility in
time, a critical factor in the survival of victims of diseases such as
malaria and diarrhea, prevalent in these areas (Adan and Pkalya,
2005). The movement of population to safe areas may also place
excessive demand on health services in those areas. Another health
penalty already alluded to is the increase in the rates of malnutrition,

15
which in turn increases the susceptibility of individuals to other
diseases.
Malnutrition is reported to be the second cause of death, after
diarrhea disease Different nutrition surveys highlight that malnutrition
is the direct result of lack of food and not due to environment factors.
The main reported causes of death are diarrhea disease, respiratory
infections and malaria. Almost 45% of MSF consultations are for
diarrhea disease and acute respiratory infections while malaria case
(Medicines Sans Frontiers MSF, 2004).
2.13 Educational status:
Education level in ASAL areas of Eastern Africa are way below
those in other parts of the region. It is therefore tragic that education is
one of primary casualties of conflicts. Needles to say, such school
have no facilities or qualified staff. Also many of the conflict occur
during the exam period displacing, disruption candidates. Conversely
the North rift region there is a lot of pressure on boys to leave school
and participate in herding and raiding (Adan and Pkalya, 2005).
Children do not go to school because they are on the move all the time
and they are needed to look after the animals
(Http//www/unu.edu/unupress/ unupbooks).
16
CHAPTER THREE
MATERIALS AND METHODS
3.1 Topography of the study area:
3.1.1 Location:
The study area is located in Darfur region. It lies between the
parallel 8: 15 and 20.00 North and latitude 22.00and 27:30 East. The
place of study is around town of Nyala. It consisted of four camps for
internally displaced people (IDPs) (see the attached map). (Fig 3.1).
3.1.2 Climate:
The region mainly consists of four main climatic zones. First
the rich savanna in the south with range of rainfall between 400mm to
800mm per year the rainy season extends between 4 to 5 months.
Then: the poor savanna in the middle of the region, with in average
annual rainfall that ranging between 200 to 400mm and a rainy season
range between 3 to 4 month. Thirdly: the arid zone which occupies the
middle of northern part of region. The rainfall in this zone is limited,
with high fluctuations and range from 100 to 300mm. The fourth zone
is the desert zone and it is characterized by lack of rainfall and high
temperatures during the summer.
3.1.3 Topography:
Darfur is sandy and qoz soils occupying the major parts and
form about sixty-five percent of the north parts of the region and 10 to
15% of the southern parts.
3.1.4 Places of study:
Four camps around Nyala town were selected to conduct the
study, because it's very difficult to reach or cover all camps in the
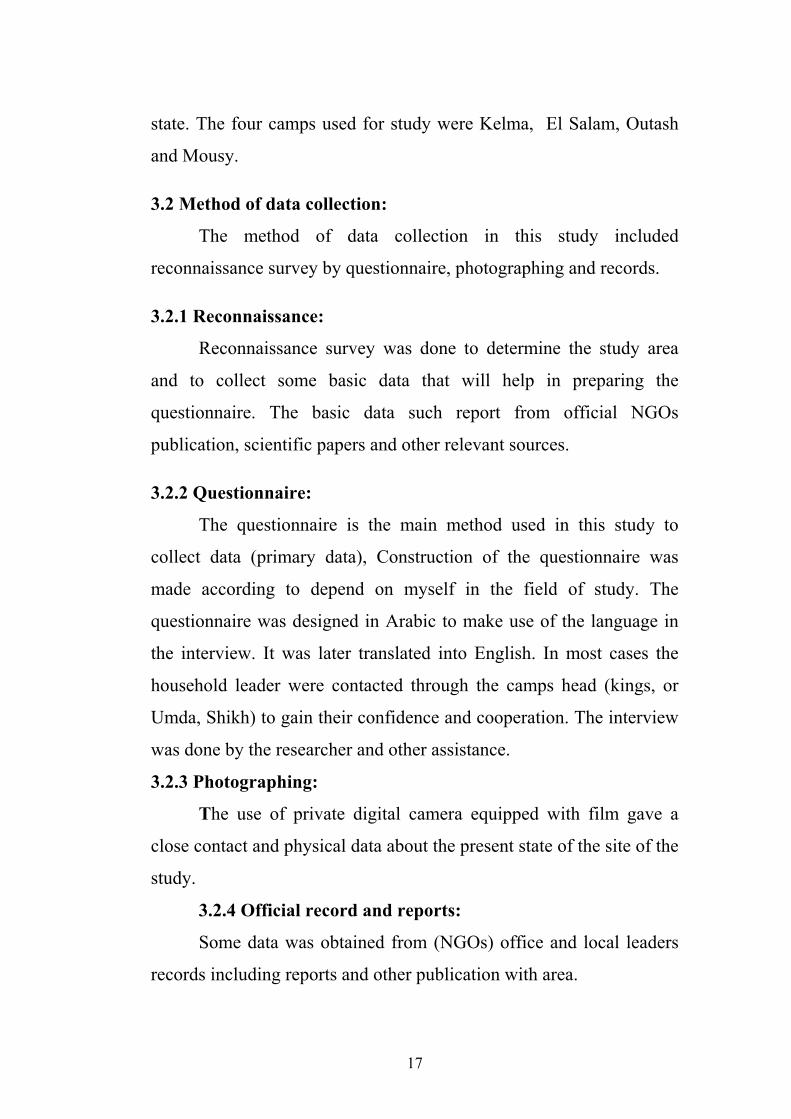
17
state. The four camps used for study were Kelma, El Salam, Outash
and Mousy.
3.2 Method of data collection:
The method of data collection in this study included
reconnaissance survey by questionnaire, photographing and records.
3.2.1 Reconnaissance:
Reconnaissance survey was done to determine the study area
and to collect some basic data that will help in preparing the
questionnaire. The basic data such report from official NGOs
publication, scientific papers and other relevant sources.
3.2.2 Questionnaire:
The questionnaire is the main method used in this study to
collect data (primary data), Construction of the questionnaire was
made according to depend on myself in the field of study. The
questionnaire was designed in Arabic to make use of the language in
the interview. It was later translated into English. In most cases the
household leader were contacted through the camps head (kings, or
Umda, Shikh) to gain their confidence and cooperation. The interview
was done by the researcher and other assistance.
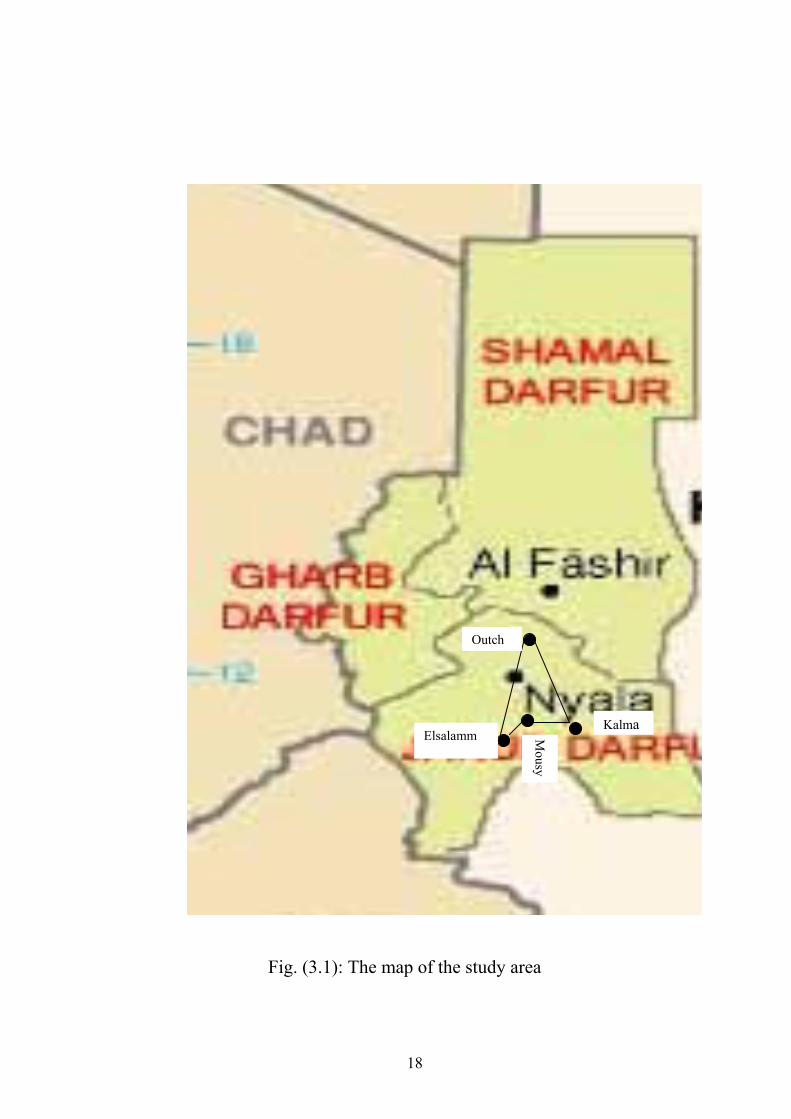
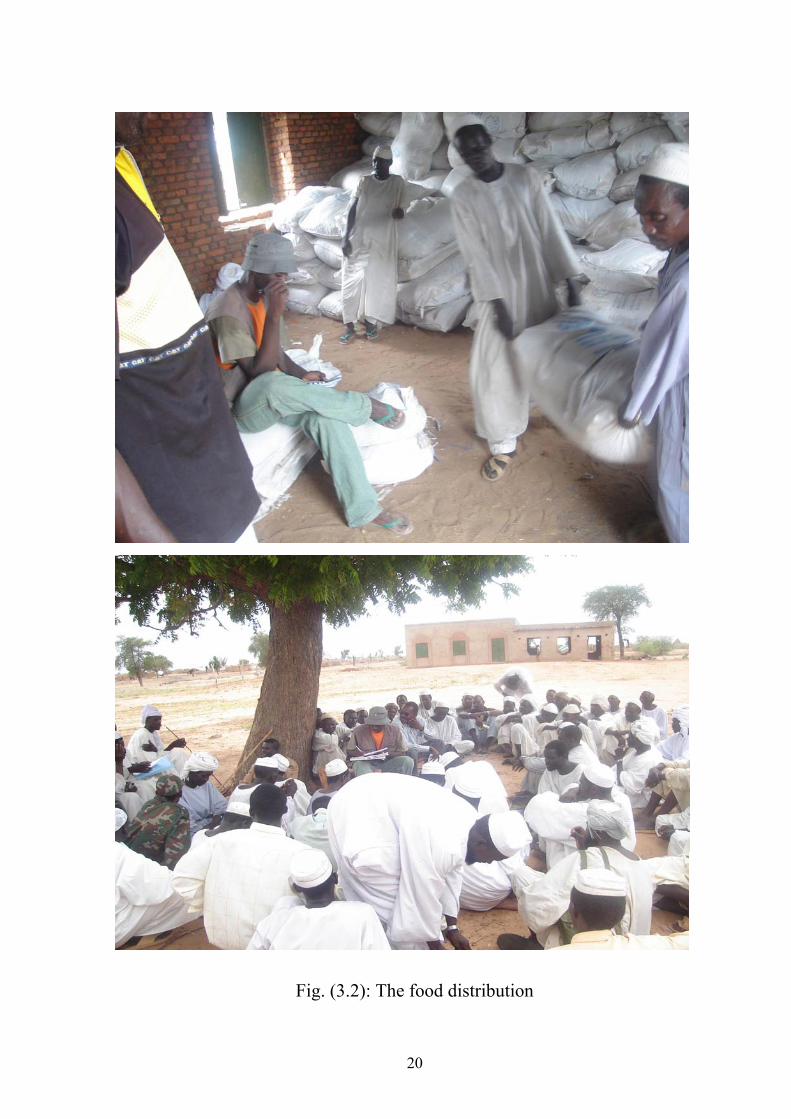
3.2.3 Photographing:
The use of private digital camera equipped with film gave a
close contact and physical data about the present state of the site of the
study.
3.2.4 Official record and reports:
Some data was obtained from (NGOs) office and local leaders
records including reports and other publication with area.
18
Fig. (3.1): The map of the study area
Kalma
Outch
Elsalamm Mousy
19
3.2.5 The total number of questionnaire: In all camps total families interviewed were 110.
3.2.6 Statistical analysis:
The statistical analysis was done through exploratory
manipulations of the data obtained from the study area .this process
was accomplished by critically examining the data through the use of
as statistical package for social sciences (SPSS).
All families interviewed were very co-operative. Before the
study of the filling of the questionnaire several visits were conducted
with IDPs in each camp to explain to them the objective of the study.
20
Fig. (3.2): The food distribution
21
CHAPTER FOUR
RESULTS AND DISCUSSION
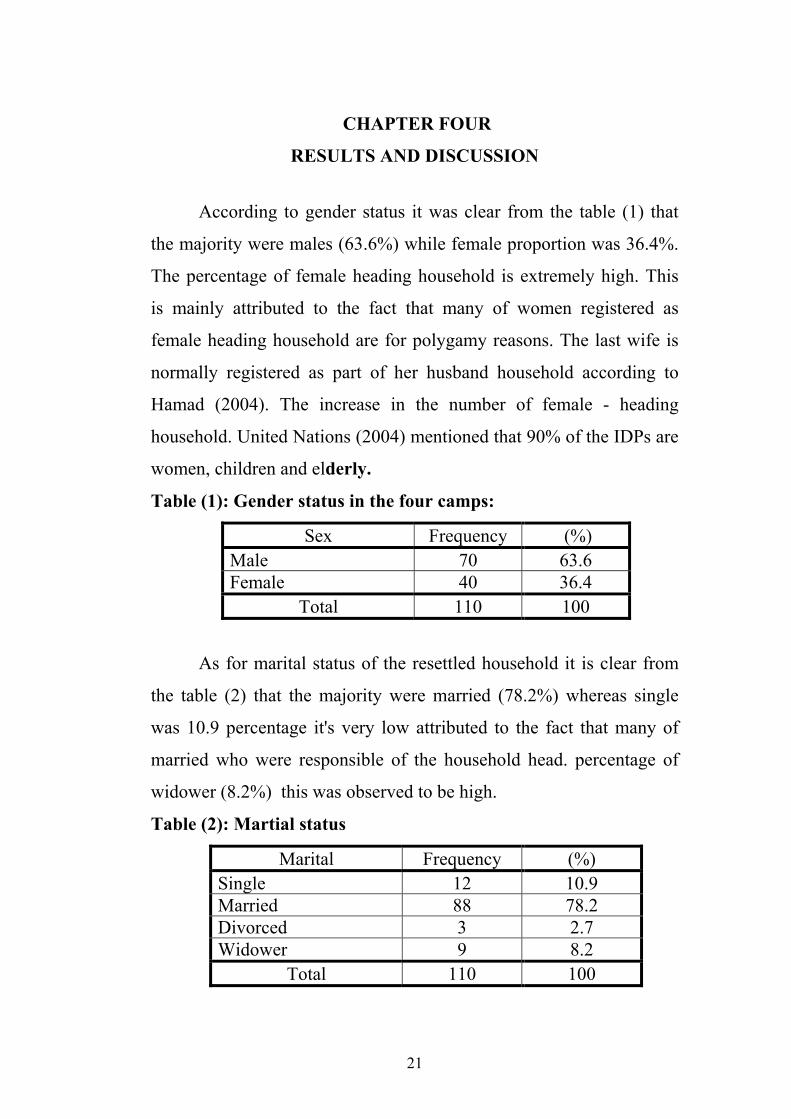
According to gender status it was clear from the table (1) that
the majority were males (63.6%) while female proportion was 36.4%.
The percentage of female heading household is extremely high. This
is mainly attributed to the fact that many of women registered as
female heading household are for polygamy reasons. The last wife is
normally registered as part of her husband household according to
Hamad (2004). The increase in the number of female - heading
household. United Nations (2004) mentioned that 90% of the IDPs are
women, children and elderly.
Table (1): Gender status in the four camps:
Sex Frequency (%) Male 70 63.6 Female 40 36.4
Total 110 100
As for marital status of the resettled household it is clear from
the table (2) that the majority were married (78.2%) whereas single
was 10.9 percentage it's very low attributed to the fact that many of
married who were responsible of the household head. percentage of
widower (8.2%) this was observed to be high.
Table (2): Martial status
Marital Frequency (%) Single 12 10.9 Married 88 78.2 Divorced 3 2.7 Widower 9 8.2
Total 110 100
22
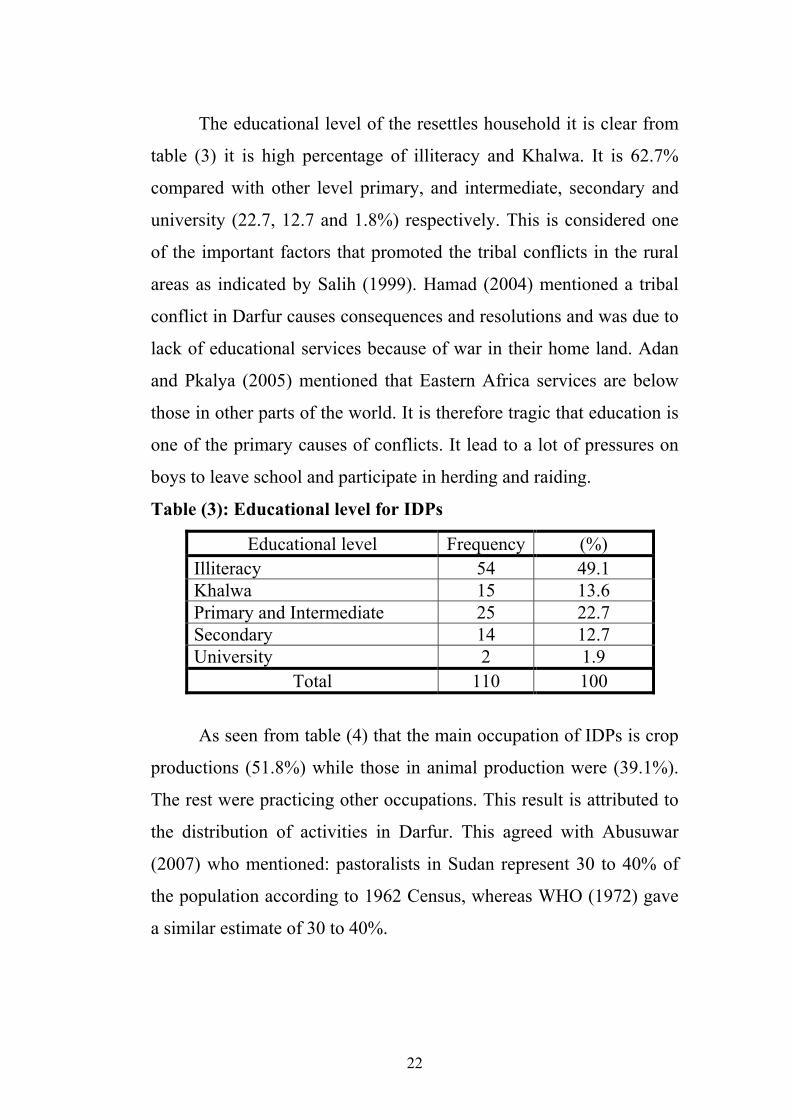
The educational level of the resettles household it is clear from
table (3) it is high percentage of illiteracy and Khalwa. It is 62.7%
compared with other level primary, and intermediate, secondary and
university (22.7, 12.7 and 1.8%) respectively. This is considered one
of the important factors that promoted the tribal conflicts in the rural
areas as indicated by Salih (1999). Hamad (2004) mentioned a tribal
conflict in Darfur causes consequences and resolutions and was due to
lack of educational services because of war in their home land. Adan
and Pkalya (2005) mentioned that Eastern Africa services are below
those in other parts of the world. It is therefore tragic that education is
one of the primary causes of conflicts. It lead to a lot of pressures on
boys to leave school and participate in herding and raiding.
Table (3): Educational level for IDPs
Educational level Frequency (%) Illiteracy 54 49.1 Khalwa 15 13.6 Primary and Intermediate 25 22.7 Secondary 14 12.7 University 2 1.9
Total 110 100
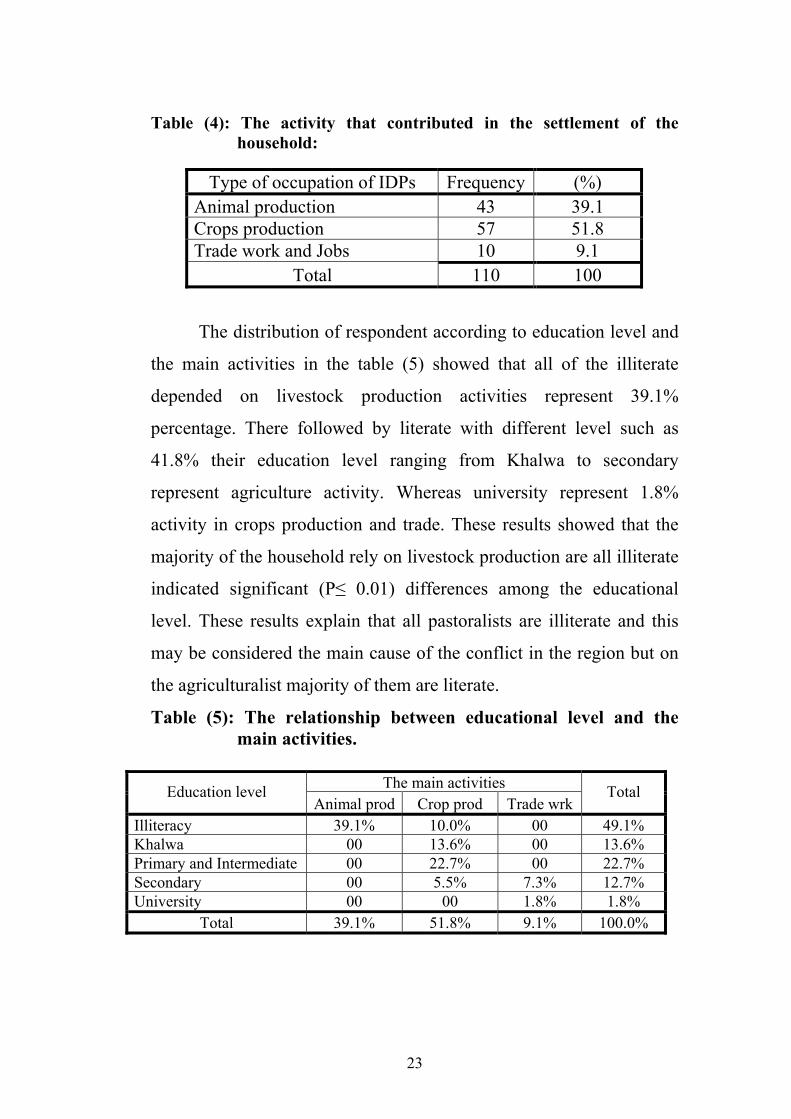
As seen from table (4) that the main occupation of IDPs is crop
productions (51.8%) while those in animal production were (39.1%).
The rest were practicing other occupations. This result is attributed to
the distribution of activities in Darfur. This agreed with Abusuwar
(2007) who mentioned: pastoralists in Sudan represent 30 to 40% of
the population according to 1962 Census, whereas WHO (1972) gave
a similar estimate of 30 to 40%.
23
Table (4): The activity that contributed in the settlement of the household:
Type of occupation of IDPs Frequency (%) Animal production 43 39.1 Crops production 57 51.8 Trade work and Jobs 10 9.1
Total 110 100
The distribution of respondent according to education level and
the main activities in the table (5) showed that all of the illiterate
depended on livestock production activities represent 39.1%
percentage. There followed by literate with different level such as
41.8% their education level ranging from Khalwa to secondary
represent agriculture activity. Whereas university represent 1.8%
activity in crops production and trade. These results showed that the
majority of the household rely on livestock production are all illiterate
indicated significant (P≤ 0.01) differences among the educational
level. These results explain that all pastoralists are illiterate and this
may be considered the main cause of the conflict in the region but on
the agriculturalist majority of them are literate.
Table (5): The relationship between educational level and the main activities.
The main activities Education level
Animal prod Crop prod Trade wrk Total
Illiteracy 39.1% 10.0% 00 49.1% Khalwa 00 13.6% 00 13.6% Primary and Intermediate 00 22.7% 00 22.7% Secondary 00 5.5% 7.3% 12.7% University 00 00 1.8% 1.8%
Total 39.1% 51.8% 9.1% 100.0%
24
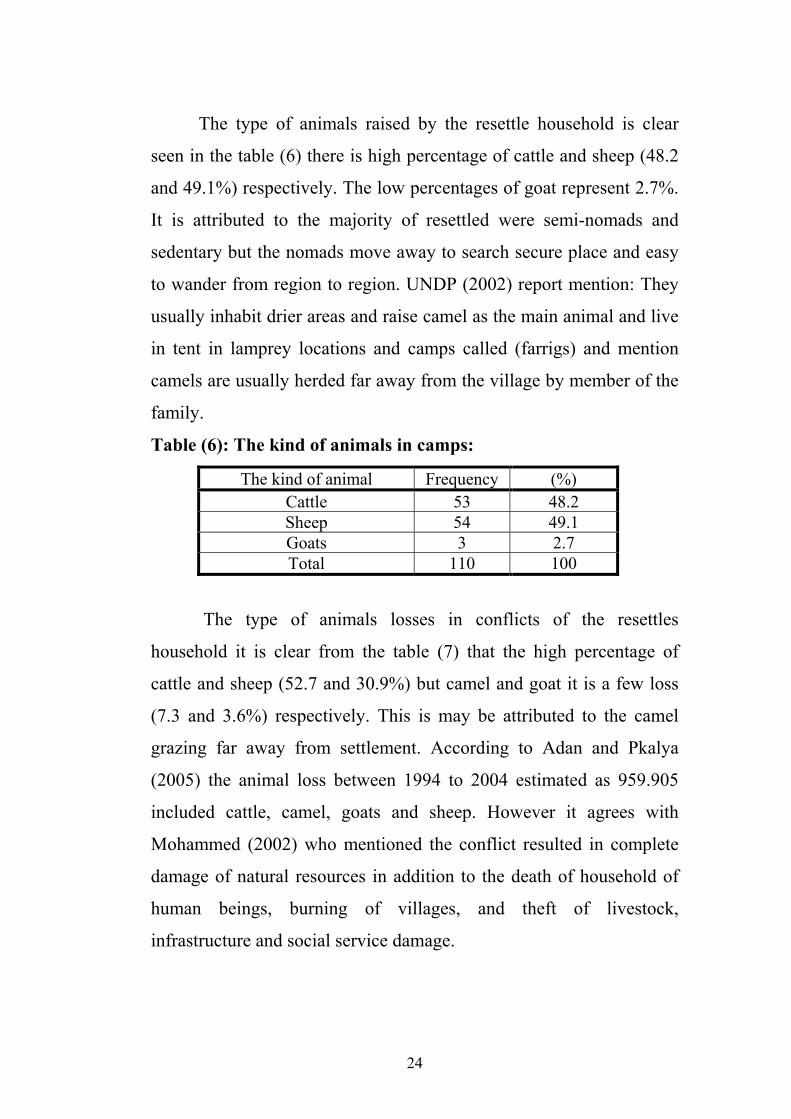
The type of animals raised by the resettle household is clear
seen in the table (6) there is high percentage of cattle and sheep (48.2
and 49.1%) respectively. The low percentages of goat represent 2.7%.
It is attributed to the majority of resettled were semi-nomads and
sedentary but the nomads move away to search secure place and easy
to wander from region to region. UNDP (2002) report mention: They
usually inhabit drier areas and raise camel as the main animal and live
in tent in lamprey locations and camps called (farrigs) and mention
camels are usually herded far away from the village by member of the
family.
Table (6): The kind of animals in camps:
The kind of animal Frequency (%) Cattle 53 48.2 Sheep 54 49.1 Goats 3 2.7 Total 110 100
The type of animals losses in conflicts of the resettles
household it is clear from the table (7) that the high percentage of
cattle and sheep (52.7 and 30.9%) but camel and goat it is a few loss
(7.3 and 3.6%) respectively. This is may be attributed to the camel
grazing far away from settlement. According to Adan and Pkalya
(2005) the animal loss between 1994 to 2004 estimated as 959.905
included cattle, camel, goats and sheep. However it agrees with
Mohammed (2002) who mentioned the conflict resulted in complete
damage of natural resources in addition to the death of household of
human beings, burning of villages, and theft of livestock,
infrastructure and social service damage.

25
Table (7): The animals' losses in the four camps:
Losses of animals Frequency (%) Cattle 58 52.7% Sheep 34 30.9
Camels 8 7.3% Goats 4 3.6 Hors 6 5.5 Total 110 100
As for type of animal's surplus of the resettles household it is
clearly that all was very low percentage 4.5 and 18.2% locality and
other place respectively and null is very high percentage (77.3). This
showed most of displaced people are quite poor and changing
lifestyles. Pastoral communities shown in this table (8) represent
18.2%. They keep in safe places but with a high risk. According to
Adan and Pkalya (2005) at time of insecurity animals tend to
concentrate in safe areas where the spread of any livestock disease is
also high probability that "alian" animal raid from other belligerent.
This situation disrupted veterinary and extension services at times of
insecurity. It also resulted in over grazing and damage of grass and
shrubbery. It also affects wildlife and raise tensions over water and
pasture among herdsmen seeking asylum there. They have no money
to pay for livestock medicine, hence increasing disease outbreaks.
Mohammed (2002) mentioned that the increase in numbers and
concentration of livestock of pastoral Arab tribes in the region as a
result of drought and desertification hit north Darfur pushing these
tribes southward.
26
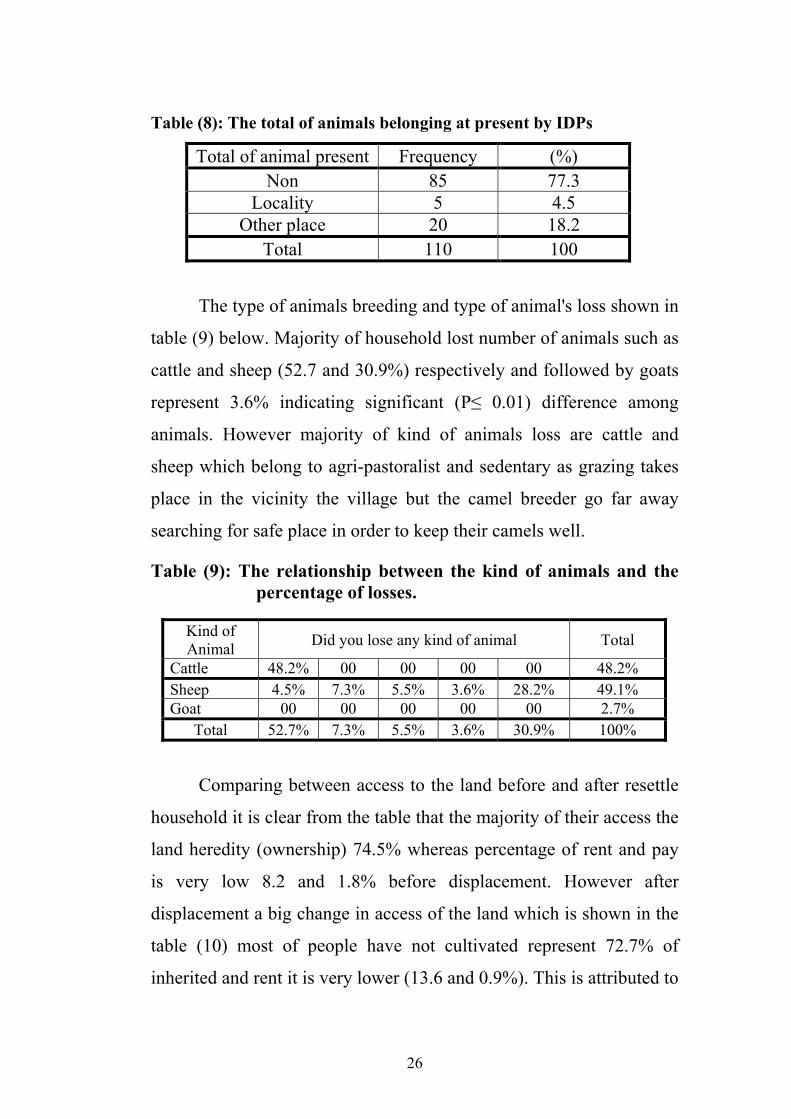
Table (8): The total of animals belonging at present by IDPs
Total of animal present Frequency (%) Non 85 77.3
Locality 5 4.5 Other place 20 18.2
Total 110 100
The type of animals breeding and type of animal's loss shown in
table (9) below. Majority of household lost number of animals such as
cattle and sheep (52.7 and 30.9%) respectively and followed by goats
represent 3.6% indicating significant (P≤ 0.01) difference among
animals. However majority of kind of animals loss are cattle and
sheep which belong to agri-pastoralist and sedentary as grazing takes
place in the vicinity the village but the camel breeder go far away
searching for safe place in order to keep their camels well.
Table (9): The relationship between the kind of animals and the percentage of losses.
Kind of Animal Did you lose any kind of animal Total
Cattle 48.2% 00 00 00 00 48.2% Sheep 4.5% 7.3% 5.5% 3.6% 28.2% 49.1% Goat 00 00 00 00 00 2.7%
Total 52.7% 7.3% 5.5% 3.6% 30.9% 100%
Comparing between access to the land before and after resettle
household it is clear from the table that the majority of their access the
land heredity (ownership) 74.5% whereas percentage of rent and pay
is very low 8.2 and 1.8% before displacement. However after
displacement a big change in access of the land which is shown in the
table (10) most of people have not cultivated represent 72.7% of
inherited and rent it is very lower (13.6 and 0.9%). This is attributed to

27
insecurity and animal power agrees with Action contre lafaim,
Cooperative Housing Foundation and Samaritan Purse (2007) report
mentioned: Vast majority of people without access to land are
internally displaced persons. So as Adan and Pkalya (2005) mentioned
that effects on production are more pronounced in farming areas
because farming as production strategy requires that the farmer be
present to attend the crops.
Action Centre Lafaim, Cooperative Housing Foundation and
Samaritan Purse (2007) mention concerning IDPs population data
show not surprising that only a small proportion of household have
access to their own land (7 %).
Table (10): The system of land tenure before and after displacement in four IDPs camps.
Before After Access land ownership Frequency (%) Frequency (%)
inherited 83 74.5 15 13.6 Buy 9 8.2 2 1.8 Rent 2 1.8 1 .9 Gift 4 3.6 3 2.7 Non 13 11.8 89 80.9
Total 110 100 110 100
The result from the table showed that the majority of people
mention insecurity, not available land and no natural place
respectively (45.5, 30.9 and 12.7%). The insecurity was the main
cause to preventing farmers to cultivate even after displacement. This
is because of the attacks that were reported on village within a 4-5 Km
radius from town. This investigation may agree with United Nation
Report (2004) mentioned they claimed their male relative couldn’t go
with them as it is dangerous for men to walk outside Nyala town. And
28
mention Action Contre Lafaim, Cooperative Housing Foundation and
Samaritan Purse (2007) Insecurity conflicts appear in first position of
the answers given followed by lack of animal power, shortage of
agricultural inputs and displacement. However displaced people not
living in normal place come up as the main limit for most of the area.
The second and third hindering factors are insecurity coupled with
problem of land availability. This Agrees with Adan and Pkalya
(2005) who mentioned that these conflicts forced many farmers to flee
their farms.
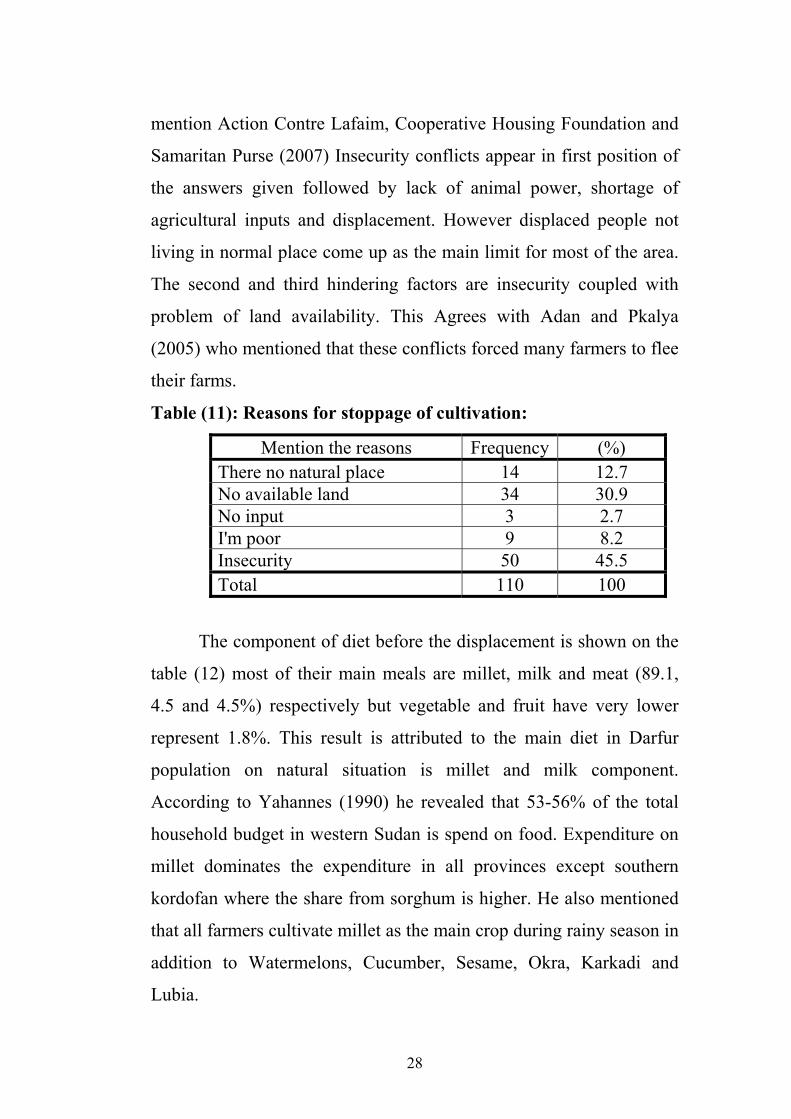
Table (11): Reasons for stoppage of cultivation:
Mention the reasons Frequency (%) There no natural place 14 12.7 No available land 34 30.9 No input 3 2.7 I'm poor 9 8.2 Insecurity 50 45.5 Total 110 100
The component of diet before the displacement is shown on the
table (12) most of their main meals are millet, milk and meat (89.1,
4.5 and 4.5%) respectively but vegetable and fruit have very lower
represent 1.8%. This result is attributed to the main diet in Darfur
population on natural situation is millet and milk component.
According to Yahannes (1990) he revealed that 53-56% of the total
household budget in western Sudan is spend on food. Expenditure on
millet dominates the expenditure in all provinces except southern
kordofan where the share from sorghum is higher. He also mentioned
that all farmers cultivate millet as the main crop during rainy season in
addition to Watermelons, Cucumber, Sesame, Okra, Karkadi and
Lubia.
29
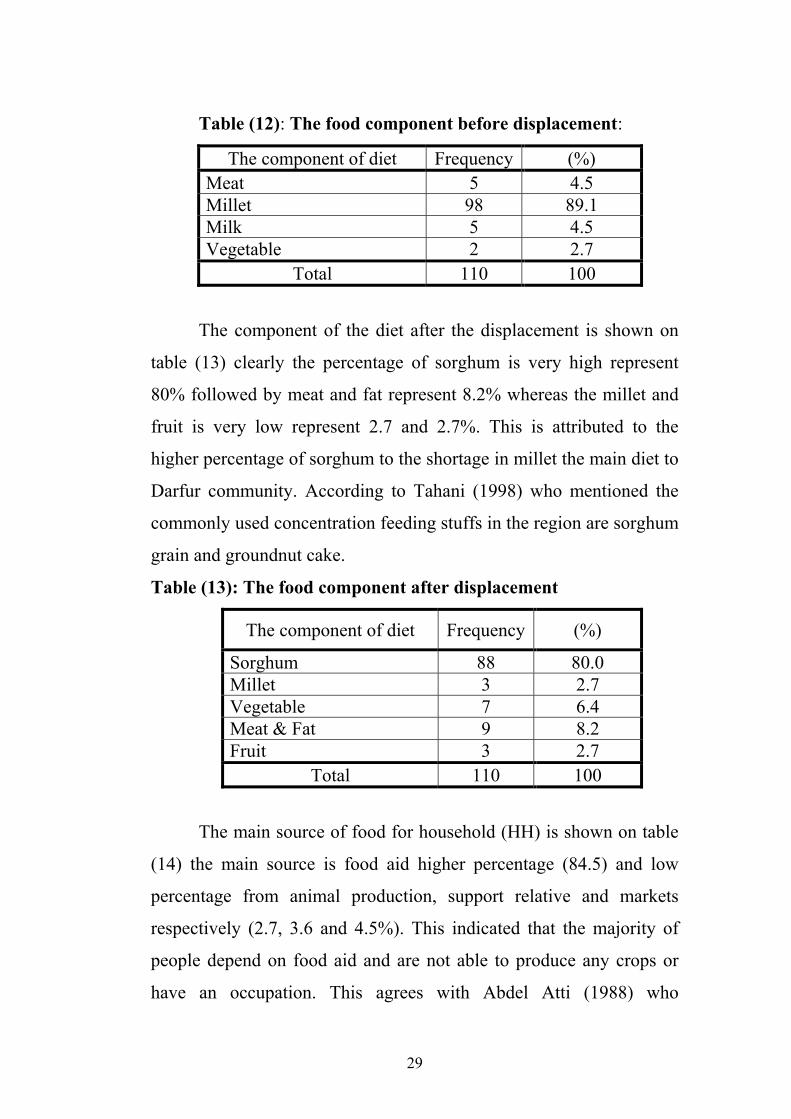
Table (12): The food component before displacement:
The component of diet Frequency (%) Meat 5 4.5 Millet 98 89.1 Milk 5 4.5 Vegetable 2 2.7
Total 110 100
The component of the diet after the displacement is shown on
table (13) clearly the percentage of sorghum is very high represent
80% followed by meat and fat represent 8.2% whereas the millet and
fruit is very low represent 2.7 and 2.7%. This is attributed to the
higher percentage of sorghum to the shortage in millet the main diet to
Darfur community. According to Tahani (1998) who mentioned the
commonly used concentration feeding stuffs in the region are sorghum
grain and groundnut cake.
Table (13): The food component after displacement
The component of diet Frequency (%)
Sorghum 88 80.0 Millet 3 2.7 Vegetable 7 6.4 Meat & Fat 9 8.2 Fruit 3 2.7
Total 110 100
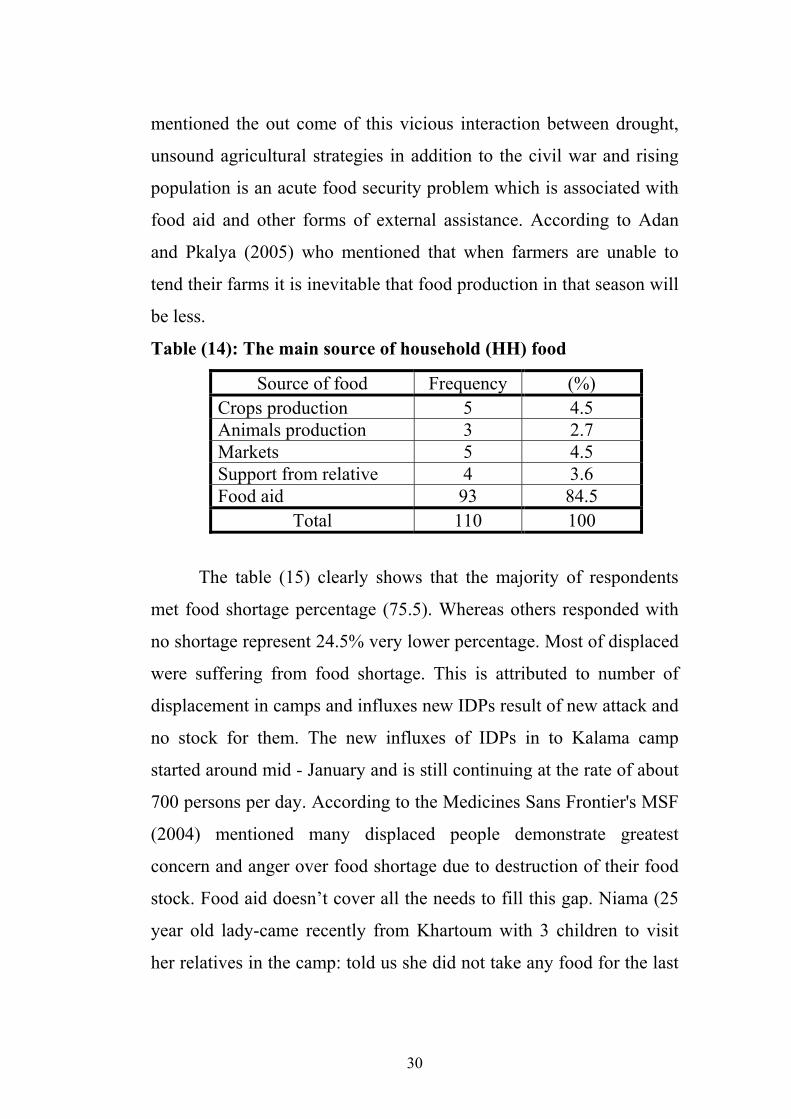
The main source of food for household (HH) is shown on table
(14) the main source is food aid higher percentage (84.5) and low
percentage from animal production, support relative and markets
respectively (2.7, 3.6 and 4.5%). This indicated that the majority of
people depend on food aid and are not able to produce any crops or
have an occupation. This agrees with Abdel Atti (1988) who
30
mentioned the out come of this vicious interaction between drought,
unsound agricultural strategies in addition to the civil war and rising
population is an acute food security problem which is associated with
food aid and other forms of external assistance. According to Adan
and Pkalya (2005) who mentioned that when farmers are unable to
tend their farms it is inevitable that food production in that season will
be less.
Table (14): The main source of household (HH) food
Source of food Frequency (%) Crops production 5 4.5 Animals production 3 2.7 Markets 5 4.5 Support from relative 4 3.6 Food aid 93 84.5
Total 110 100
The table (15) clearly shows that the majority of respondents
met food shortage percentage (75.5). Whereas others responded with
no shortage represent 24.5% very lower percentage. Most of displaced
were suffering from food shortage. This is attributed to number of
displacement in camps and influxes new IDPs result of new attack and
no stock for them. The new influxes of IDPs in to Kalama camp
started around mid - January and is still continuing at the rate of about
700 persons per day. According to the Medicines Sans Frontier's MSF
(2004) mentioned many displaced people demonstrate greatest
concern and anger over food shortage due to destruction of their food
stock. Food aid doesn’t cover all the needs to fill this gap. Niama (25
year old lady-came recently from Khartoum with 3 children to visit
her relatives in the camp: told us she did not take any food for the last
31
13 days. This explains that they do not have any food for themselves
and cannot maintain themselves inside Nyala.
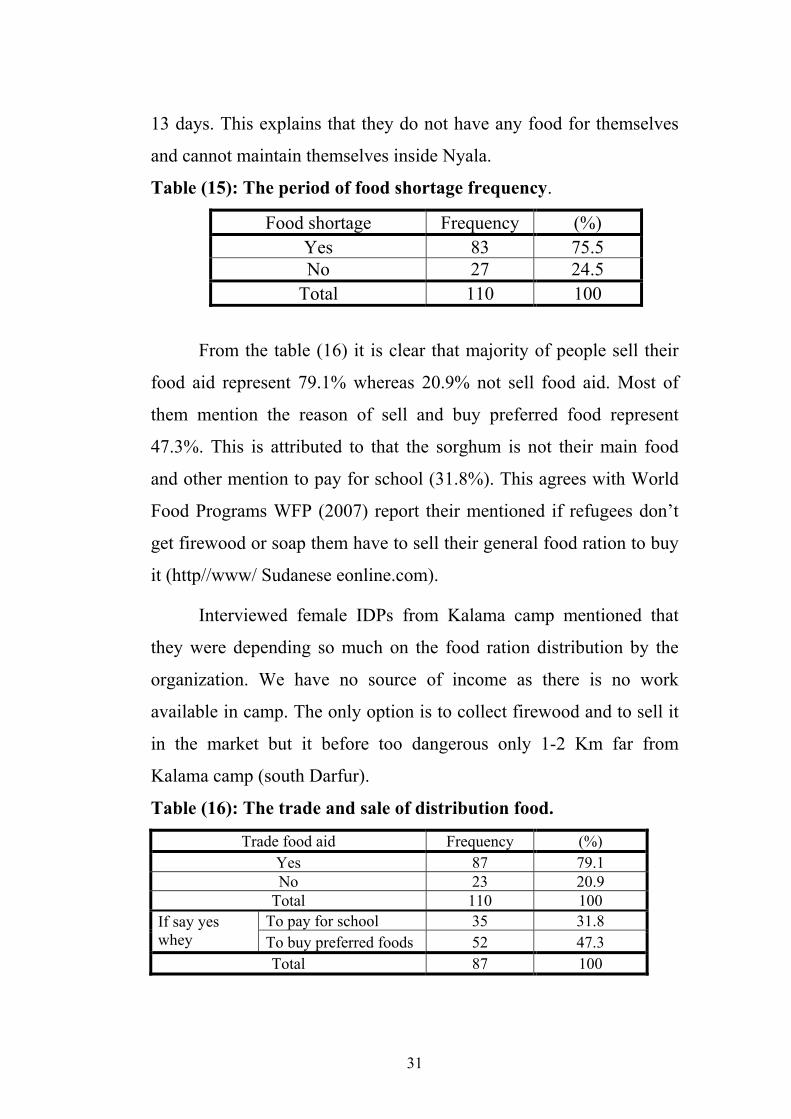
Table (15): The period of food shortage frequency.
Food shortage Frequency (%) Yes 83 75.5 No 27 24.5
Total 110 100
From the table (16) it is clear that majority of people sell their
food aid represent 79.1% whereas 20.9% not sell food aid. Most of
them mention the reason of sell and buy preferred food represent
47.3%. This is attributed to that the sorghum is not their main food
and other mention to pay for school (31.8%). This agrees with World
Food Programs WFP (2007) report their mentioned if refugees don’t
get firewood or soap them have to sell their general food ration to buy
it (http//www/ Sudanese eonline.com).
Interviewed female IDPs from Kalama camp mentioned that
they were depending so much on the food ration distribution by the
organization. We have no source of income as there is no work
available in camp. The only option is to collect firewood and to sell it
in the market but it before too dangerous only 1-2 Km far from
Kalama camp (south Darfur).
Table (16): The trade and sale of distribution food.
Trade food aid Frequency (%) Yes 87 79.1 No 23 20.9
Total 110 100 To pay for school 35 31.8 If say yes
whey To buy preferred foods 52 47.3 Total 87 100
32
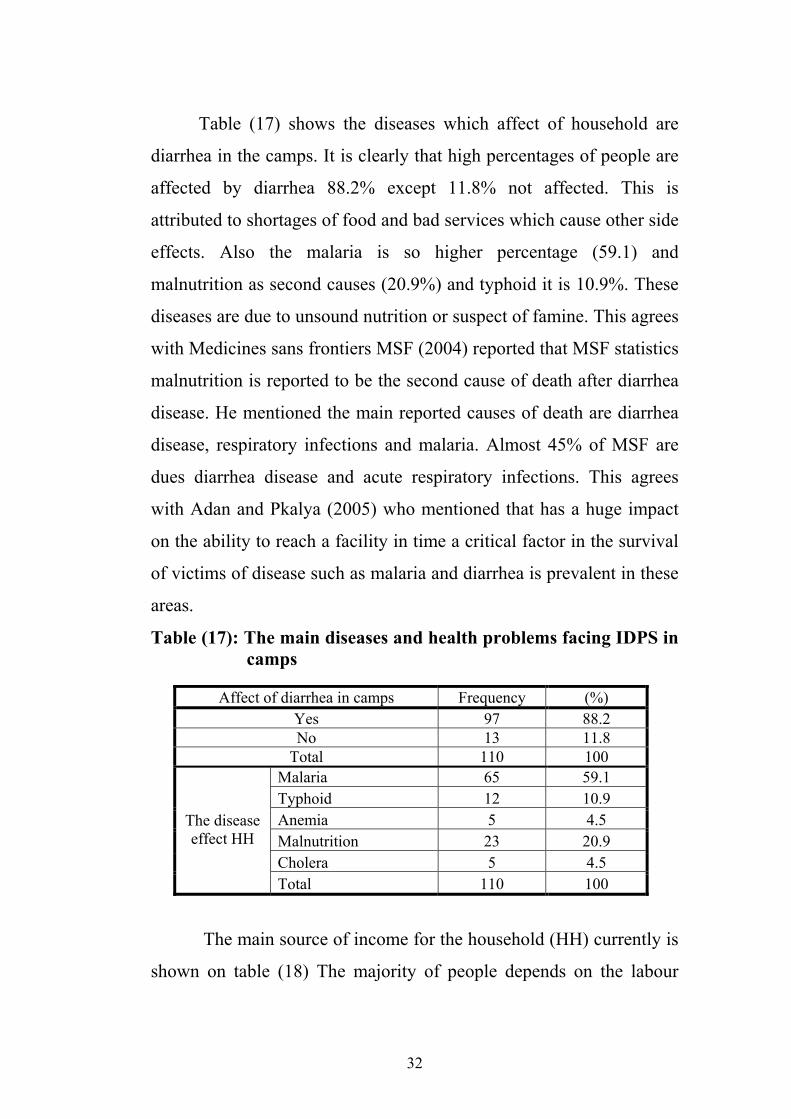
Table (17) shows the diseases which affect of household are
diarrhea in the camps. It is clearly that high percentages of people are
affected by diarrhea 88.2% except 11.8% not affected. This is
attributed to shortages of food and bad services which cause other side
effects. Also the malaria is so higher percentage (59.1) and
malnutrition as second causes (20.9%) and typhoid it is 10.9%. These
diseases are due to unsound nutrition or suspect of famine. This agrees
with Medicines sans frontiers MSF (2004) reported that MSF statistics
malnutrition is reported to be the second cause of death after diarrhea
disease. He mentioned the main reported causes of death are diarrhea
disease, respiratory infections and malaria. Almost 45% of MSF are
dues diarrhea disease and acute respiratory infections. This agrees
with Adan and Pkalya (2005) who mentioned that has a huge impact
on the ability to reach a facility in time a critical factor in the survival
of victims of disease such as malaria and diarrhea is prevalent in these
areas.
Table (17): The main diseases and health problems facing IDPS in camps
Affect of diarrhea in camps Frequency (%) Yes 97 88.2 No 13 11.8
Total 110 100 Malaria 65 59.1 Typhoid 12 10.9 Anemia 5 4.5 Malnutrition 23 20.9 Cholera 5 4.5
The disease effect HH
Total 110 100
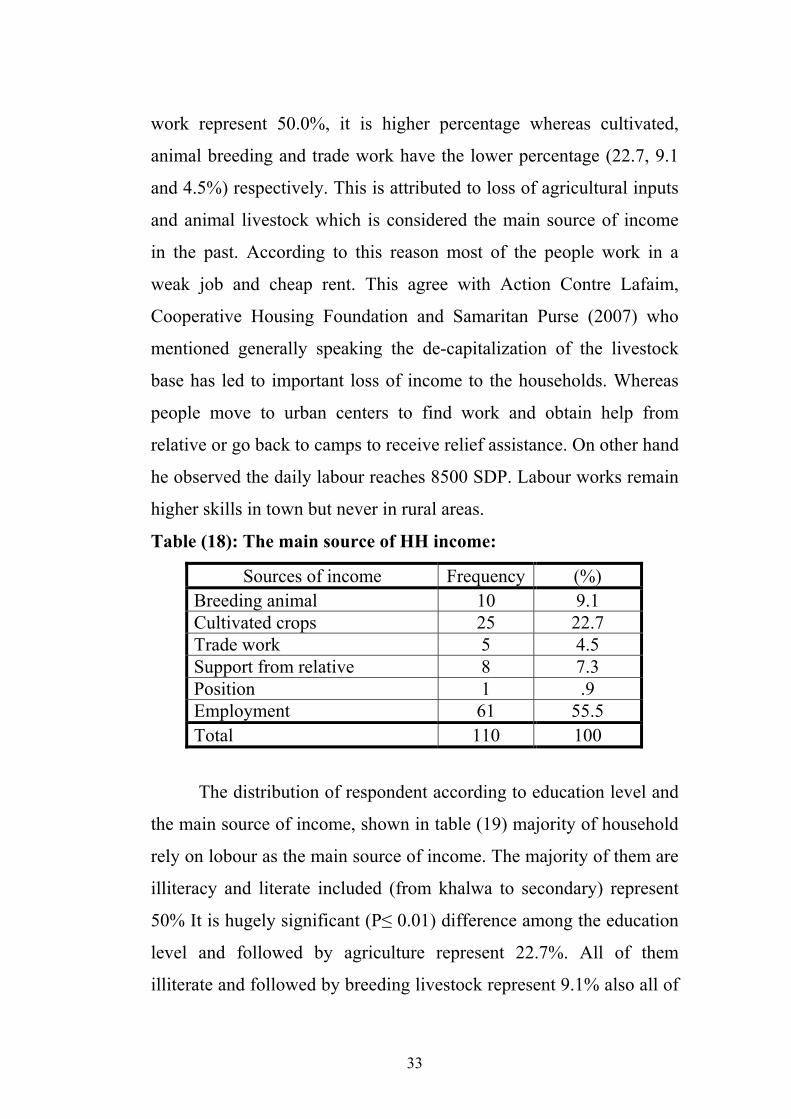
The main source of income for the household (HH) currently is
shown on table (18) The majority of people depends on the labour
33
work represent 50.0%, it is higher percentage whereas cultivated,
animal breeding and trade work have the lower percentage (22.7, 9.1
and 4.5%) respectively. This is attributed to loss of agricultural inputs
and animal livestock which is considered the main source of income
in the past. According to this reason most of the people work in a
weak job and cheap rent. This agree with Action Contre Lafaim,
Cooperative Housing Foundation and Samaritan Purse (2007) who
mentioned generally speaking the de-capitalization of the livestock
base has led to important loss of income to the households. Whereas
people move to urban centers to find work and obtain help from
relative or go back to camps to receive relief assistance. On other hand
he observed the daily labour reaches 8500 SDP. Labour works remain
higher skills in town but never in rural areas.
Table (18): The main source of HH income:
Sources of income Frequency (%) Breeding animal 10 9.1 Cultivated crops 25 22.7 Trade work 5 4.5 Support from relative 8 7.3 Position 1 .9 Employment 61 55.5 Total 110 100
The distribution of respondent according to education level and
the main source of income, shown in table (19) majority of household
rely on lobour as the main source of income. The majority of them are
illiteracy and literate included (from khalwa to secondary) represent
50% It is hugely significant (P≤ 0.01) difference among the education
level and followed by agriculture represent 22.7%. All of them
illiterate and followed by breeding livestock represent 9.1% also all of

34
them illiterate. It is Obvious from this result that the people with little
education level compete in cheaper work return rent, agricultural and
breeding animals. This is attributed to lack of opportunities in other
job and absence of development efforts especially those dealing with
human developments that are considered one of the main causes of
tribal conflicts in the areas.
Table (19): The relationship between educational level and the main source of income
the main source of income Education Level
Br-Live Cu-Cr Tr-W Su- Re Po La Other
Total
Illiteracy 9.1% 22.% 4.5% 7.3% .9% 4.5% 00 49.1% Khalwa 00 00 00 00 00 13.6% 00 13.6% Primary& In 00 00 00 00 00 22.7% 00 22.7% Secondary 00 00 00 00 00 9.1% 3.6% 12.7% University 00 00 00 00 00 00 1.8% 1.8% Total 9.1% 22.% 4.5% 7.3% .9% 50.0% 5.5% 10%
Br-Live=breeding livestock, Cu-Cr=cultivated crops, Tr-w=trade
work, Su-Re=support from relative, Po=position, La=labour
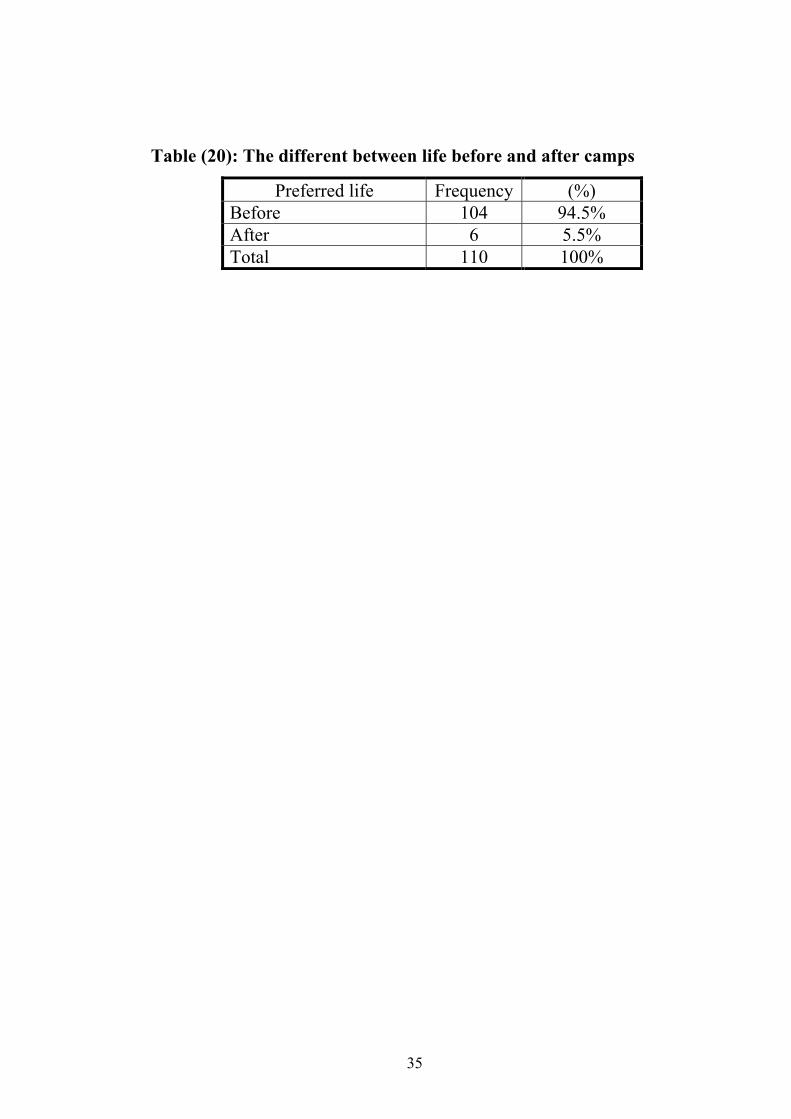
The life preferred in the camp or before, shown table (20) there
is higher percentage of people favorably that life before the camps
represent 94.5 and low percentage of people preferred life of camps
represent 5.5%. Majority of them mentioned that the camps it was a
good life. They are free to practice any activities such as grazing
animals and farms. The people whom hate the camps found a lot of
things very bad such as competition in service. According to Hamad
(2004) who mentioned the rate of crime associated with same social
problem is on the increase, especially crimes of theft, burglaries and
child delinquency. This agrees with Hassan A, Abdel Ati (2001) who
mentioned the increase in the number of female – headed household.
35
Table (20): The different between life before and after camps
Preferred life Frequency (%) Before 104 94.5% After 6 5.5% Total 110 100%

36
Conclusions and Recommendations
From the study of agro- pastoralist in the four camps, it was
clear that IDPs had been affected adversely in health, education, land
ownership, cattle owning and several other factors.
IDPs live in distress under camp condition. Hence to give
following suggestion should:
1. All peoples of Darfur should unite to stop the war in Darfur.
2. Short term programs cared to improve current situation.
3. Long term program rehabilitation of all infrastructures
destroyed as well and development programs to improve the
current situation.
4. To look for social work between herdsmen and farmers in order
to gain from their land and ensure common interest among
them.
5. The necessity of removing war aspects from pastoralists and
farmers and enhancing of field and movement of herdsmen.
6. The development of an environmental education system with
special focus on children.
7. Improved farming system and technologies are crucial for the
rehabilitation of deserted filed and the increase of their
agricultural productivity.
8. Investment in rural infrastructure: power and drinking water is
a top priority.
9. The truth is we hoped these people would be back rebuilding
their homes by now.
37
References
Abbas, B. (1997). The New Natural Resource Management Paradigm and a future Outlook for Sudanese Pastoralists'' a Paper Presented to a workshop on the Camel Applied Research and Development Network (CARDN), The Arab Center for The Studies of Arid Zone and Dry lands (ACSAD), Khartoum. PP. 1-3.
Abdalla, Z.M. (1974). Marketing of Livestock in the Sudan'' Research Bulletin Dept. of Rural Economy, Faculty of Agriculture, University of Khartoum 1974 PP.6-40.
Abdel Ati, H (2002) Sustainable Development in Sudan, ten years after Rio Summit Environmentalist Society EDGE for Consultancy and Research, Heinrich Boll foundation Regional Office Horn of Africa.
Abdel atti, H. (1988). The Process of Famine Causes and Consequences in Sudan. Development and change Vol. 19. April
Abu-suwar, A.O.M (2007). Range Management.
Action Contre Lafaim, Cooperative Housing Foundation and Samaritan Purse (ACF, CHF and SP) Report (2007) Food Security Department: JONIT POST HARVEST MONITORING. South Nyala Area, South Darfur.
Adan, M and Pkalya, R. (2005). Closed to Progress: An assessment of the socio- economic impact of conflicts on pastoral and semi- pastoral economies in Kenya and Uganda.
Afaf, H. A (1994). Evaluation of the rural of Non- Governmental Organization (NGOs) in food – security case study of Kabkabiya small Holders project.
Central Bureau of Statistics (2006) Estimated Population for the Annual Report (2006).
Hamad, M.E. (2004). Improvement of Displaced Persons through Coordination of Governmental and Non- Governmental Programs.
38
http:// www. Msf-org/msfinternational linvoke. Cfm? Objected =099E6BOA-6785-47E9-A76710 15610057F48Component=1001kit.
http:// www/ sudaneseonline-com/enz/publish,News-1.
http://www-unu-edu/unvpb- ooks- Nomads and their Sedentarization in the Sudan.
Ibrahim, F. N. (1984). Ecological Imbalance in the Republic of the Sudan. With Reference to Desertification in Darfur. Dept. of Economics, Khartoum University DSBC.
ILO, (1985). After the famine. Aprogramme of Action to Strengthen the Survival Strategies of Affected Populations ILO, Geneva.
Medecins Sans Frontieres (MSF), Report (2004). Nutritional Status of the Population.
Mohammed, A.E. (2002). The Socio-Economic Aspects of Tribal Conflicts and Their Impacts on Rural Development Process.
Mohammed, A.O. (2000). The Effect of Food Supplementation on the Performance of Nomadic Dairy Herds.
Proceeding of the Khartoum workshop and arid lands management – The University of Khartoum the United Nation University 22-26 October 1978.
Produced for UNDP Project Reduction of Natural Resource – Based Conflict Among Pastoralists and Farmers SUD/01/013.
Salih, T. (1999). Tribal Conflicts In Darfur Causes Consequences and Resolutions. Sudan Company Press, Khartoum.
United Nation Development Programme (UNDP) (2002). Research on Roots of Conflicts and Traditional Conflicts Transformation Mechanisms: Transhumance Routes in North Darfur.
United Nation, (UN) Report (2004). Office of UN Resident and Humanitarian Co- ordinator for the Sudan: Report on Inter-agency Mission to Kutum Town (North Darfur).
Yohannes, Y. (1990) Food Consumption Patterns Western Sudan 1978-80 Discussion Paper 1. Washington, D.C, USA, P. 2.
39
:المراجع العربية
ليمان آدم حسين اخ الزراعي)1999( س ري . ز المن اه وال د إدارة المي رة معه ة الجزي . جامع
.84ص .دار األصالة للصحافة والنشر واإلنتاج اإلعالمي
سويق الماشية واللحوم ). 1987(سليمان بدري وآخرون ة لت ة أداء المؤسسة العام تقرير لجن
.2-1ص . الخرطوم–ة الحيوانية المكلفة من السيد وزير الثرو
ي د اهللا ألعريف ان ). 1997(صالح عب ة بكردف ات الرعوي ة المجتمع ام لتنمي ار ع ؤتمر -إط م
. السودان– آادقلي –آادقلي لتنمية إقليم آردفان

40
Appendix بسم اهللا الرحمن الرحيم
آلية الدراسات العليا-جامعة الخرطوم
علوم التغذية
استبيان
البيانات األساسية/ 1
: العمر: االسم
: مدة تواجدك بالمعسكر: المعسكر
أنثى / ذآر ب/ ا: النوع
أرمل/ مطلق د/ جمتزوج / عاذب ب/ ا -:الحالة االجتماعية/ 2
جامعي/ ثانوي ه/ ابتدائي ومتوسط د/ خلوة ج/ أمي ب/ ا-:المستوى التعليمي/ 3
:قرار أسرتك خالل السنين الماضية اذآر احد األنشطة التي ساهمت في است-4
التجارة وأعمال أخرى/ اإلنتاج الزراعي ج/ اإلنتاج الحيواني ب/ ا
أخرى/ جمال ج/ ماعز د/ أغنام ج/ أبقار ب/ ا -:نوع الحيوانات التي تربيها -5
لم يتأثر/ نقصان ج/ زيادة ب/ ا-: أثرها دخلك-6
مكان أخر/محليا ب/ ا -:اذآر ما تملك من الحيوانات - 7
-: أي من الحيوانات اآلتية بعتها خالل السنة الماضية-8
الشي/ جمال ل/ ضان و/ ماعز ه/أبقار د/ دواجن ج/ حمير ب/ ا
ماعز/ بقرة ب/ ا: إذا آان لديك بقرة أو ماعز آمية اللبن منها-9
نضا/ ماعز ه/ ين دحص/ جمال ج/ أبقار ب/ ا -:هل فقدت حيوانات في الحرب-10
وآالة / مشارآة د/ إيجار ج/ ملك ب/ ا -: الحيازة قبل النزوح-11
-: آيف اآتسبت األرض التي تعيش فيها وتستغلها-12
هدية/ باإليجار د/بالشراء ج/ بالوراثة ب/ ا: قبل المعسكر / 1
ةهدي/ باإليجار د/ بالشراء ج/ بالوراثة ب/ ا: بعد المعسكر / 2
-: هل فقدت من المحاصيل التي زرعتها إذا آانت اإلجابة بنعم اذآر األسباب-13
سرقات/ انعدام األمن د/ جفاف ج/ آفات ب/ ا
-: إذا فقدت من المحاصيل قدر بالنسبة المئوية-14
%100 -% 76/ د% 75 -% 51/ ج% 50 -26/ %ب% 25/ ا
-: لم تزرع أي محصول في هذه السنة ولماذا إذا-15
يوجد أدوات زراعية ال/ االراضى غير متاحة ج/ هذا ليس المكان الطبيعي للزراعة ب/ ا
يوجد امن ال/ ألني فقير ه/ د
41
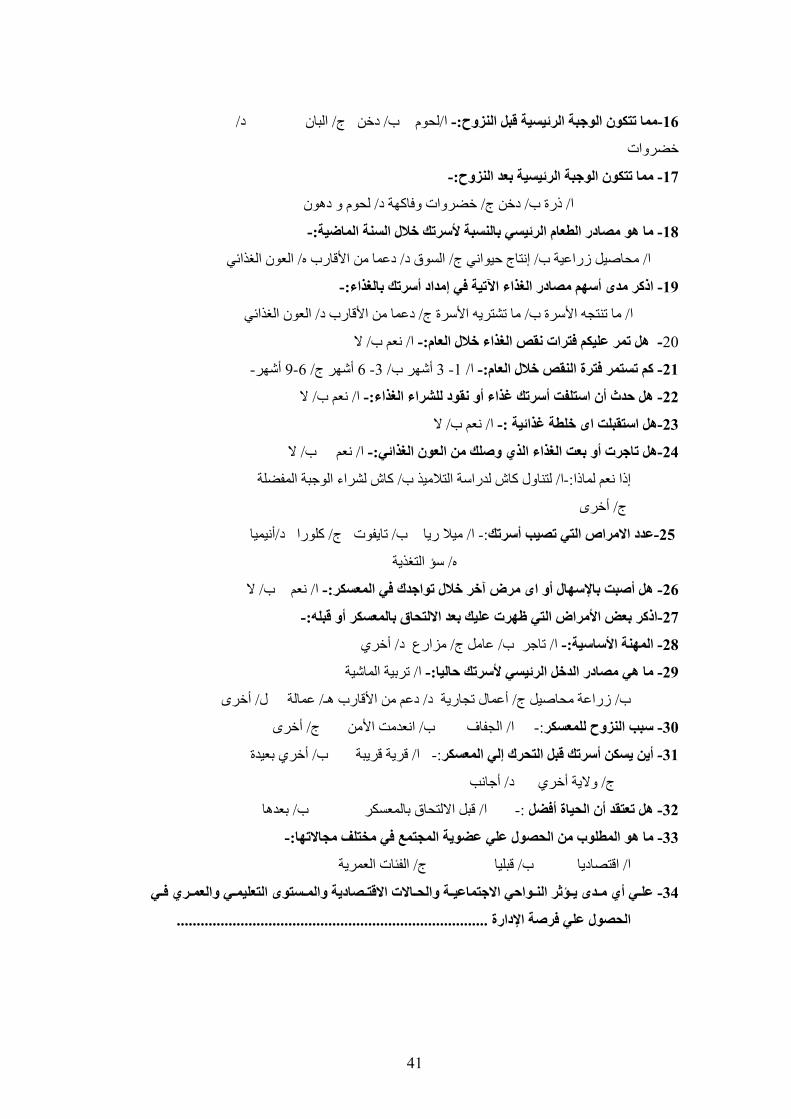
/ دالبان / دخن ج/ لحوم ب/ا -:مما تتكون الوجبة الرئيسية قبل النزوح-16
خضروات
-: مما تتكون الوجبة الرئيسية بعد النزوح-17
لحوم و دهون/ خضروات وفاآهة د/ دخن ج/ ذرة ب/ ا
18 -: ما هو مصادر الطعام الرئيسي بالنسبة ألسرتك خالل السنة الماضية-
ائيالعون الغذ/ دعما من األقارب ه/ السوق د/ إنتاج حيواني ج/ محاصيل زراعية ب/ ا
-:اذآر مدى أسهم مصادر الغذاء اآلتية في إمداد أسرتك بالغذاء -19
العون الغذائي/ دعما من األقارب د/ ما تشتريه األسرة ج/ ما تنتجه األسرة ب/ ا
ال/ نعم ب/ ا -: هل تمر عليكم فترات نقص الغذاء خالل العام- 20
- أشهر9-6/ أشهر ج6 -3/ أشهر ب3 -1/ ا -: آم تستمر فترة النقص خالل العام-21
ال/ نعم ب/ ا -:هل حدث أن استلفت أسرتك غذاء أو نقود للشراء الغذاء -22
ال/ نعم ب/ ا-:هل استقبلت اى خلطة غذائية -23
ال/ نعم ب/ ا-:هل تاجرت أو بعت الغذاء الذي وصلك من العون الغذائي-24
آاش لشراء الوجبة المفضلة/ لتناول آاش لدراسة التالميذ ب/ ا-:إذا نعم لماذا
أخرى/ ج
أنيميا /آلورا د/ تايفوت ج/ ميال ريا ب/ ا-:عدد االمراص التي تصيب أسرتك-25
سؤ التغذية / ه
ال / نعم ب/ ا -:هل أصبت باإلسهال أو اى مرض آخر خالل تواجدك في المعسكر -26
-:االلتحاق بالمعسكر أو قبلهاذآر بعض األمراض التي ظهرت عليك بعد -27
أخري/ مزارع د/ عامل ج/ تاجر ب/ ا -:المهنة األساسية -28
تربية الماشية / ا -:ما هي مصادر الدخل الرئيسي ألسرتك حاليا -29
أخرى / عمالة ل/ ـدعم من األقارب ه/ أعمال تجارية د/ زراعة محاصيل ج/ ب
أخرى/ انعدمت األمن ج/ الجفاف ب/ ا -: سبب النزوح للمعسكر-30
أخري بعيدة / قرية قريبة ب/ ا-:أين يسكن أسرتك قبل التحرك إلي المعسكر -31
أجانب / والية أخري د/ ج
بعدها/ قبل االلتحاق بالمعسكر ب/ ا-:هل تعتقد أن الحياة أفضل -32
-:ما هو المطلوب من الحصول علي عضوية المجتمع في مختلف مجاالتها -33
الفئات العمرية/ قبليا ج/ اقتصاديا ب/ ا
ي -34 ري ف ي والعم ستوى التعليم صادية والم االت االقت ة والح واحي االجتماعي ؤثر الن دى ي ي أي م عل
..............................................................................علي فرصة اإلدارةالحصول