south asia
DESCRIPTION
A Political StudyTRANSCRIPT


RISING TO THE CHALLENGE OF GLOBALIZATION
SOUTH ASIA

This page intentionally left blankThis page intentionally left blankThis page intentionally left blankThis page intentionally left blank

N E W J E R S E Y • L O N D O N • S I N G A P O R E • BE IJ ING • S H A N G H A I • H O N G K O N G • TA I P E I • C H E N N A I
World Scientific
RISING TO THE CHALLENGE OF GLOBALIZATION
SOUTH ASIA
Pradumna B Rana Nanyang Technological University, Singapore
John Malcolm Dowling University of Hawaii, USA

British Library Cataloguing-in-Publication DataA catalogue record for this book is available from the British Library.
For photocopying of material in this volume, please pay a copying fee through the CopyrightClearance Center, Inc., 222 Rosewood Drive, Danvers, MA 01923, USA. In this case permission tophotocopy is not required from the publisher.
ISBN-13 978-981-281-421-0ISBN-10 981-281-421-3
Typeset by Stallion PressEmail: [email protected]
All rights reserved. This book, or parts thereof, may not be reproduced in any form or by any means,electronic or mechanical, including photocopying, recording or any information storage and retrievalsystem now known or to be invented, without written permission from the Publisher.
Copyright © 2009 by World Scientific Publishing Co. Pte. Ltd.
Published by
World Scientific Publishing Co. Pte. Ltd.
5 Toh Tuck Link, Singapore 596224
USA office: 27 Warren Street, Suite 401-402, Hackensack, NJ 07601
UK office: 57 Shelton Street, Covent Garden, London WC2H 9HE
Printed in Singapore.
SOUTH ASIARising to the Challenge of Globalization
Sandhya - South Asia.pmd 4/9/2009, 11:06 AM1

v
“Rana and Dowling have been keen observers of the South Asian scene forover two decades. This experience and scholarship is amply demonstrated intheir new book. The book has two special features that should make it anecessary reading for all those interested in Asia’s evolving economic geo-graphy. The first is its comparison of the development experience in Chinaand South Asia. The second is the discussion of pan-Asian cooperation andthe prospects of strengthening of economic cooperation between South Asiaand East Asia, an idea whose time is now well within the planning horizon.Their prescription is right on the mark. The book is a welcome addition tothe growing literature on pan-Asian cooperation and will strengthen theimportant cause of regional cooperation in South Asia.”
Rajiv KumarDirector and Chief ExecutiveIndian Council for Research on International Economic Relations
“The basic premise of Rana and Dowling’s remarkable book is that sustain-ing high growth in South Asia is essential for integrating Asia, and forenhancing its role in global affairs. They make many policy suggestions forpursuing inclusive high growth by South Asian countries, so the sub-regioncan be a growth node for the rest of Asia. The book is a welcome additionto growing literature on Asian integration in general, and to managing glob-alization in South Asia in particular.”
Mukul G Asher Professor of Public PolicyLee Kuan Yew School of Public Policy National University of Singapore
“This book provides a thorough assessment about the developments inSouth Asia — a region that has risen significantly on the global stage inrecent decades. As the long time observers of the Asian economies, theauthors are well-positioned for tackling various challenging policy issues fac-ing the region. Policy-makers and students alike should benefit enormouslyfrom the careful analyses and invaluable knowledge that the authors haveoffered in this timely book.”
Wei Ge, Ph.D.Department of EconomicsBucknell University
b670_FM.qxd 12/10/2008 7:38 AM Page v

“There has been a proliferation of books on East Asia’s dynamism and it’sintegration intraregionally as well as with the global economy. In contrast,much less has been written on South Asia which has, until recently, been arelative laggard in economic growth. There are also encouraging signsregarding the gradual integration of India and — to a lesser extent — therest of South Asia with China and the rest of East Asia, leading some to talkabout “Pan-Asian” integration. The revitalization of South Asia has alsogiven impetus for enhanced intra-South Asian economic integration ….There has, however, been little careful and thoughtful analysis of theseimportant trends and ongoings. The book by Rana and Dowling very ablyfills this gap. The authors, both of whom have extensive policy experience inAsia, should be commended for writing a book that offers a thorough anddetailed analysis of the data and provides highly useful and insightful policyrecommendations.”
Ramkishen S. RajanGeorge Mason University, USAand University of Adelaide, Australia
“Rana and Dowling have come up with an interesting analysis of South Asia,a region that has begun to emerge as one of the most dynamic by exploitingopportunities provided by globalization. They also focus on the challenges thatthey face in responding to globalization and regional economic integration.I hope that the book will be widely read.”
Nagesh KumarDirector-GeneralResearch and Information System for Developing Countries
b670_FM.qxd 12/10/2008 7:38 AM Page vi

vii
Contents
Tables ix
Figures xiii
Abbreviations xv
Foreword xvii
Acknowledgments xix
About the Authors xxi
Chapter 1: Introduction and Summary 1
Chapter 2: South Asia’s Global Integration 19
Introduction 19Globalization of South Asia 21Impact of Globalization on South Asia 31South Asia’s Globalization Initiatives 35Future Agenda for Globalization in South Asia 45References 55
Chapter 3: A Comparative Analysis of Economic 57Performance and Policy Reformsin South Asia and the PRC
Introduction 57Comparative Economic Performance 58Raising Living Standards in the PRC and South Asia 75
b670_FM.qxd 12/10/2008 7:38 AM Page vii

Impact of Policy Reforms 98The Unfinished Agenda 110Future Prospects: A Comparison of India and the PRC 116Appendix 3.1: Chronology of Policy Reforms in South Asia 125Appendix 3.2: Governance Indicators 156Appendix 3.3: Unfinished Agenda of Reforms 162
in South Asian CountriesReferences 173
Chapter 4: Economic Integration Between South Asia 175and East Asia: The Second Phaseof Pan-Asian Integration?
Introduction 175Quantitative Measures of Integration 178Economic Complementarities 187Ongoing Policy Efforts 201Conclusions and Policy Recommendations 203Appendix 4.1: Total Trade of South Asia with East Asia: 213
Levels and Growth RatesAppendix 4.2: Pan-Asian Intra-regional and 214
Interregional TradeAppendix 4.3: Revealed Comparative Advantage Indices 216
in South Asia and East Asia, by CountryAppendix 4.4: Annotated List of Free Trade Agreements 224
(FTAs) between South Asia and East AsiaReferences 227
Chapter 5: Economic Integration in South Asia 228
Introduction 228Economic Integration in South Asia 230Lessons from East Asia and Recommendations 238References 242
Author Index 244
Subject Index 246
viii South Asia: Rising to the Challenge of Globalization
b670_FM.qxd 12/10/2008 7:38 AM Page viii

ix
Tables
2.1 Average Per Capita Income Growth for Low- 20and High-Globalization Countries (percentage)
2.2 South Asia’s Total Trade, 1980, 1985, 1990, 221995, 2000, and 2005 ($ million)
2.3 Foreign Direct Investment Inflows, 1980, 1985, 241990, 1995, 2000, and 2005 ($ million)
2.4 Direct Investment and Portfolio Investment in 25India and Pakistan, 1991, 1995, 2000, 2005,and 2007 ($ million)
2.5a Globalization Index Rankings, 2006 262.5b Globalization Index Rankings, 2001 and 2006 262.6 Globalization Indices, 1975, 1990, and 2000 27
(Rankings for Selected Asian Countries Only)2.7 Openness Factor and Indigenous Factor Indicators 28
(1998–2002 Average)2.8 Globalization Rankings 302.9 Regressions of Per Capita GDP on Trade 35
and Foreign Direct Investment2.10 South Asian Free Trade Agreements with Non-Asian 37
Countries2.11 Mean Tariff Rates in East Asia and South Asia, 1985, 39
1990, 1995, 2000, and 2004 (percentage)2.12a World Competitiveness Indicators, 1995 and 2006 41
(rankings)2.12b World Competitiveness Factors, 2000 41
and 2006 (rankings)
b670_FM.qxd 12/10/2008 7:38 AM Page ix

x South Asia: Rising to the Challenge of Globalization
2.13 Workers’ Remittances and Receipts (Balance 44of Payments), 1980, 1985, 1990, 1995, 2000,and 2004 ($ million)
2.14 Effective Rate of Duty on Imports into 46the US, 2005 (percentage)
2.15 Intra-regional Export Shares, 1990 and 2001 48(percentage)
2.16 Interregional and Intra-regional Portfolio 52Investments, 2003 ($ billion)
2.17 Corporate Governance Ratings, 2000 and 2004 533.1 GDP Per Capita, 1980, 1985, 1990, 1995, 2000, 59
and 2006 (constant 2000 $)3.2 Poverty Head-Count Ratio at $1-a-Day, in PPP 61
(percentage of population)3.3 Exports of Goods and Services, 1978, 1991, 2004, 62
and 2005 (percentage of GDP).3.4 Taxes on International Trade, 1990 and 2005 63
(percentage of revenue)3.5 Foreign Direct Investment Inflows and Outflows, 64
1980, 1985, 1990, 1995, 2000, and 2005($ million)
3.6 Cash Surplus/Deficit, 1990, 1995, 2000, 2004, 65and 2005 (percentage of GDP)
3.7 Current Account Balance, 1980, 1985, 1990, 661995, 2000, and 2004 (percentage of GDP)
3.8 Money and Quasi Money (M2), 1978, 1991, 67and 2005 (percentage of GDP)
3.9 Sectoral Share of Employment (percentage 68of total employment)
3.10 Total Reserves minus Gold, 1980, 1985, 1990, 691995, 2000, and 2006 ($ million)
3.11 Total Life Expectancy at Birth, 1980 and 2004 (years) 703.12 Infant Mortality Rate, 1980 and 2004 71
(per 1,000 live births)3.13 Total Adult Literacy Rate, 1990 and 2004 72
(percentage of people 15 and above)
b670_FM.qxd 12/10/2008 7:38 AM Page x

Tables xi
3.14 Share of World GDP (in PPP), 1980, 1990, 2000, 73and 2005 (percentage)
3.15 Gross Capital Formation, 1980, 1985, 1990, 1995, 772000, and 2005 (percentage of GDP)
3.16 Economically Active Population, Age 15 78and above 1980, 1985, 1990, 1995, 2000,and 2005 (percentage)
3.17 Sectoral Output Growth in the PRC (percentage) 813.18 Industrial Output Share, by Form of Ownership, 85
1980, 1984, 1988, 1992, 1996, and 2002(percentage)
3.19 Rigidity of Labor Market Indices, 2005 963.20 Average Growth in GDP and Per Capita GDP 99
(percentage)3.21 Selected Doing Business Indicators, 2005 1013.22 Sectoral Share of Value Added, 1980 and 2005 102
(percentage)3.23 Average Share of Trade in GDP (percentage) 1053.24 Growth in Labor Force and Income and Total 110
Factor Productivity3.25 Composition of Manufactured Output in the PRC, 117
1970, 1980, 1990, and 1997 (percentage of totaloutput of manufactured goods)
3.26 Export Share of Selected Two-Digit Manufacturing 117Industries in the PRC (percentage)
3.27 Export Share of Selected Two-Digit Manufacturing 118Industries in India (percentage)
3.28 Poverty Levels in India and the PRC (percentage 123of people in poverty)
4.1 World Foreign Direct Investment Inflows 183into South Asia and East Asia, 1990, 1995,2000, and 2005 ($ million)
4.2 Top 10 Exports of South Asia to East Asia, 1990 187and 2004
4.3 Top 10 Exports of East Asia to South Asia, 1990 188and 2004
b670_FM.qxd 12/10/2008 7:38 AM Page xi

xii South Asia: Rising to the Challenge of Globalization
4.4 Revealed Comparative Advantage Indices for 190South Asia, 1993 and 2004
4.5 Commodities in Which Various South Asian 191Countries Have Comparative Advantage, 2004
4.6 Revealed Comparative Advantage Indices for 192East Asia, 1993 and 2004
4.7 Commodities in Which Various East Asian 193Countries Have Comparative Advantage, 2004
4.8 Spearman Rank Correlation Coefficients for 195Revealed Comparative Advantage Indices,1993 and 2004
4.9 Trade Complementarity Indices between South Asia 197and East Asia, 1993 and 2004
4.10 Exports of Commercial Services, 1990, 1995, 1982000, and 2005 ($ million)
4.11 Commercial Service Exports for India 199and the PRC by Sector, 1990, 1995, 2000,2003, and 2004 ($ million)
4.12 Revealed Comparative Advantage in Services, 2004 2004.13 Trade Restrictiveness Indices (percentage) 2044.14 Ease of Doing Business Index: Rankings for Asian 206
Countries, 20055.1 Share of South Asian Intra-regional Trade 229
in World Trade, 1980, 1985, 1990, 1995,2000, and 2006 (percentage)
b670_FM.qxd 12/10/2008 7:38 AM Page xii

Figures
2.1 Total Trade and GDP Growth 322.2 Foreign Direct Investment and GDP Growth 332.3 Poverty Head-Count Ratio and Level of Per Capita 34
Income3.1 Per Capita GDP, 1980–2006 (constant 2000 $) 603.2 Share of Value Added in GDP, 1980 (percentage) 793.3 Average Firm Size in India and Comparator 120
Countries, 1990 (value added in $ millionper establishment)
4.1 Total Trade between South Asia and East Asia, 1781990–2006 ($ billion)
4.2 Pan-Asian Intra-regional and Inter-regional Trade, 1802006
4.3 Inter-regional Trade between South Asia 180and East Asia (as a percentage of South Asia’sTotal Trade with the World), 1990–2006
4.4 Inter-regional Trade between South Asia and East Asia 181(as a percentage of East Asia’s Total Trade with theWorld), 1990–2006
4.5 Total Trade Intensity Index between South Asia 182and East Asia, 1990–2006
4.6a Foreign Direct Investment Flows from Selected 184East Asian Countries to India, 2002/03–2006/07($ million)
4.6b Foreign Direct Investment Flows from Selected 184East Asian Countries to Pakistan 1999/00–2005/06($ million)
xiii
b670_FM.qxd 12/10/2008 7:38 AM Page xiii

4.7a Foreign Direct Investment Flows from Selected 185South Asian Countries to ASEAN, 1995–2006($ million)
4.7b Foreign Direct Investment Flows from Selected 185South Asian Countries to the PRC, 1994–2006($ million)
4.8a Infrastructure: Southern Corridor: Shipping 2094.8b Infrastructure: Central Corridor: Air Freight Hubs 2104.8c Infrastructure: Northern Corridor: Asian Highway 2104.8d Infrastructure: Northern Corridor: Trans-Asian 211
Railways5.1 Total World and Intra-regional Exports of East Asia, 239
1980–2006 ($ billion)
xiv South Asia: Rising to the Challenge of Globalization
b670_FM.qxd 12/10/2008 7:38 AM Page xiv

xv
Abbreviations
ASEAN Association of Southeast Asian NationsASEAN + 3 ASEAN plus the People’s Republic of China, Japan,
and the Republic of KoreaBIMSTEC Bay of Bengal Institute for Multi-Sectoral Technical
and Economic CooperationCMI Chiang Mai InitiativeFDI foreign direct investmentFTA free trade agreementGATT General Agreement on Tariffs and TradeGDP gross domestic productICT information and communication technologyILO International Labour OrganizationIMF International Monetary FundIT information technologyMFN most favored nationNAFTA North American Free Trade AgreementNGO nongovernment organizationNPLs nonperforming loansNTBs nontariff barriersOECD Organisation for Economic Co-operation and
DevelopmentPPP purchasing power parityPRC People’s Republic of ChinaPTAs preferential trading arrangementsQRs quantitative restrictionsRCA revealed comparative advantageSAARC South Asian Association for Regional Cooperation
b670_FM.qxd 12/10/2008 7:38 AM Page xv

SAFMs South Asian finance ministersSAFTA South Asia Free Trade AgreementSAGQ South Asian Growth QuadrangleSAPTA SAARC Preferential Trading ArrangementSASEC South Asia Subregional Economic CooperationSEZ special economic zoneSITC Standard International Trade ClassificationSOE state-owned enterpriseTFP total factor productivityTVEs township and village enterprisesUNDP United Nations Development ProgrammeVAT value-added taxWTO World Trade Organization
xvi South Asia: Rising to the Challenge of Globalization
b670_FM.qxd 12/10/2008 7:38 AM Page xvi

xvii
Foreword
After adopting rigid import substitution policies for four decades,beginning in the 1980s and the 1990s the South Asian countries startedto opt for greater economic openness and began the long process ofaligning their economies with those of the rest of the world. This impor-tant book, authored by two acknowledged experts on Asia with manyyears of experience working at the Asian Development Bank (ADB),is devoted to analyzing the recent economic dynamism of South Asiaand the challenges that the region faces in a globalizing world.
The book examines the South Asian experience of globalizationthrough several different lenses. The book compares South Asia’sglobalization efforts with those of East Asia and the rest of the world,giving the reader a broad overview of globalization progress, impact,and potential in South Asia. This comparison demonstrates how,despite recent successes, India and the rest of South Asia are laggingbehind the People’s Republic of China (PRC) in various areas.
The book then presents a penetrating comparative analysis of eco-nomic performance and policy reforms in the PRC and South Asia.The major premise is that policy does matter. Good policies can helplift income growth rates and lower poverty, while poor policies retardgrowth and stall poverty reduction. Both the PRC and South Asiahave been growing rapidly in the past few years, faster than mostother developing countries in Asia and the rest of the developingworld, raising living standards for more than two billion people. Thisis a major accomplishment and to be applauded and it owes much ofits success to policy reforms.
The book moves on to examine the evolving trade relationshipbetween South Asia and East Asia, including the trade relationship
b670_FM.qxd 12/10/2008 7:38 AM Page xvii

xviii South Asia: Rising to the Challenge of Globalization
between the PRC and India. This relationship has important implica-tions for other countries in the region and the global economy.
The final chapter of the book turns to a discussion of mechanismsand modalities for increasing intra-regional trade and fostering regionalcooperation in South Asia. Among these are developing cross-borderinfrastructure, fostering international trade and investment, andincreasing regional financial sector cooperation.
Among the important questions answered in the book are:
• How globalized is South Asia? Has global integration been beneficial?• Economic reforms in South Asia have borne fruit. What does each
country still have to do?• The PRC began the reform process with a lower per capita GDP
than South Asia, but by 2005 its per capita income was more thantwice that of South Asia. Why?
• India has the potential to grow as fast as the PRC over the next twodecades. What policy actions are needed to realize this potential?
• After falling dramatically after 1947, trade integration among theSouth Asian countries is now starting to increase. Can South Asiabe as well integrated in the future as it was before 1947?
• South Asia’s economic relations with East Asia are starting tosurge. Could this eventually lead to an integrated Pan-Asia, similarto what has been achieved in Europe?
This book is timely and helps enhance the understanding of recentSouth Asian economic development and how the surge in SouthAsia’s trade and investment relations with East Asia could pave theway for an integrated Asia. The book will be of value to a wide spec-trum of readers — academics, policy makers, development institu-tions, students of economics, and the general public.
Professor Lim Chong YahAlbert Winsemius Chair Professor of Economics
Director of Economic Growth CentreNanyang Technological University
SingaporeNovember 2008
b670_FM.qxd 12/10/2008 7:38 AM Page xviii
xix
Acknowledgments
If Rip van Winkle had gone to sleep in the 1980s and awakened twoand a half decades later, he would have been surprised by the changesthat have occurred in the South Asian economies and their linkageswith the rest of the world. The changes have been most significant inIndia, but other South Asian countries have also shown economicdynamism. This book seeks to systematically document these changes.
The idea for the book arose when both of the authors wereinvolved in the ADB’s Study on Economic Cooperation between EastAsia and South Asia. We would therefore like to thank the ADB forthis opportunity. In addition, Dr. Rana would also like to thank theNanyang Technological University, where he completed work on thebook, and Neeru, Abhi, and Ayush for their inspiration. Dr. Dowlingwould like to thank the University of Hawaii, where he completedwork on the book, and Maribeth Boritzer for her helpful commentsand suggestions.
Our colleagues and collaborators have also given us much encour-agement throughout the project, especially Professor Lim Chong Yah,and Professor Euston Quah.
Benjamin Endriga provided excellent research assistance. WilheminaPaz provided administrative support. Pauline Chan and Sandhya ofWorld Scientific provided editorial support. We are grateful to them.
b670_FM.qxd 12/10/2008 7:38 AM Page xix

b670_FM.qxd 12/10/2008 7:38 AM Page xx
This page intentionally left blankThis page intentionally left blank

xxi
About the Authors
Pradumna B. RanaDr. Pradumna B. Rana is currently a Senior Fellow at the NanyangTechnological University in Singapore. He was the Senior Director ofthe Asian Development Bank’s (ADB’s) Office of Regional EconomicIntegration which spearheaded the ADB’s support for regional coop-eration and integration in Asia. He joined the ADB in the early 1980sand held senior positions at the research and various operationaldepartments. Earlier he was a Lecturer at the National University ofSingapore and the Tribhuvan University (Nepal), a researcher at theInstitute of Southeast Asian Studies in Singapore, and a consultant tothe World Bank in Washington D.C. He obtained his PhD fromVanderbilt University where he was a Fulbright Scholar and a Mastersin Economics from Michigan State University and Tribhuvan Universitywhere he was a gold medalist. He has published widely in the areas ofAsian economic development and integration, Asian financial crisis,business cycle co-movements, early warning systems of financial crisis,and policy reforms in transition economies. These include half adozen books and numerous articles in international scholarly journalsincluding Review of Economics and Statistics, Journal of InternationalEconomics, Journal of Development Economics, Journal of AsianEconomics, World Development, Developing Economies, and SingaporeEconomic Review. Currently, in addition to this book, he is co-editingbooks on Pan-Asian Integration: Linking East and South Asia (forth-coming Palgrave Macmillan) and National Strategies for RegionalIntegration (forthcoming ADB, Manila).
b670_FM.qxd 12/10/2008 7:38 AM Page xxi

John Malcolm DowlingProfessor Dowling received his Ph. D in Economics from the Universityof Pittsburg and taught at the University of Colorado for 15 yearswhere he became a full professor in 1976. He moved to the AsianDevelopment Bank in the early 1980s where he served as AssistantChief Economist for many years. After retiring from the AsianDevelopment in 1996 he taught at the University of Melbourne inAustralia, Singapore Management University in Singapore and, mostrecently, the University of Hawaii at Manoa. Professor Dowlinghas been the recipient of two Fulbright Fellowships (Iran andThailand) and a Rockefeller Foundation fellowship. He is the authorof numerous articles in professional journals and several books onAsian development topics.
xxii South Asia: Rising to the Challenge of Globalization
b670_FM.qxd 12/10/2008 7:38 AM Page xxii

1
Chapter 1
Introduction and Summary
India and the People’s Republic of China (PRC) were by far therichest countries in the world 2,000 years ago. Even in the early19th century their share of global gross domestic product (GDP) wasnearly 50%. However, by 1950 this share had fallen to a mere 8% asthe industrialized countries in Europe, North America, andAustralasia developed further. This balance persisted until the 1970s(Maddison, 2001). As India, after the mid-1980s and early 1990s,and the PRC, after 1978, began to open up and liberalize, their shareof world income began to rise again. By 1998 it had risen to 16% andby 2005 to 21%. As the PRC and India continue to grow and inte-grate further into the global economy, their economic prospects willdepend more and more on how they manage globalization. The much-quoted 2003 Goldman Sachs study (Wilson and Purushothaman,2003) forecasts that by 2050 three of the four largest economies inthe world will be in Asia and in this order: the PRC, the UnitedStates, India, and Japan. The 2007 Goldman Sachs report (Poddarand Yi, 2007) forecasts that India will overtake the United Statesfaster than expected and be the second largest economy in the worldby 2050 after the PRC. During the 1980s and 1990s, other SouthAsian countries also started to opt for greater openness and began thelong process of realigning their economies with those of the rest ofthe world.1
1 South Asia in this book refers to the seven members of the South Asia Associationfor Regional Cooperation (SAARC), which are Bangladesh, Bhutan, India, Maldives,Nepal, Pakistan, and Sri Lanka. Afghanistan, which became the eighth member of theSAARC in 2007, is not included here.
b670_Chapter-01.qxd 12/10/2008 7:43 AM Page 1

The benefits of globalization are many and varied. By opening upto international trade and investment, countries can acquire technol-ogy and some essential inputs that help to raise productivity andincrease economic efficiency. Greater access to a wider market throughglobalization helps to reduce the risk of fluctuations in externaldemand and provides greater scope for exporting a broader range ofexports. Greater openness also helps countries to attract foreign directinvestment (FDI), which brings with it new technology and innova-tion and greater access to industrial country markets. In addition,globalization increases export demand, generates employment, andraises living standards. More open financial markets result in increasedcompetition, lower costs of financial intermediation, better resourceallocation, and deepening of financial markets. More open labor mar-kets bring new flexibility, skills, and expertise. Skilled labor migrationoffers benefits to the economy as returning migrants bring improvedskills and knowledge and a deeper understanding of science, engi-neering, technology, and business, which can make the local economymore productive and open new lines of international communication.But globalization also has associated costs. Maximizing the benefitsand minimizing the potential costs of globalization requires imple-menting appropriate policies at the national, regional and global level.These require good governance, transparency, and a consistent policyenvironment.
An appropriate response to globalization requires a three-pronged approach. First, countries need to integrate with the worldeconomy through the multilateral initiatives for trade and finance.De-linking is not an option, as multilateral initiatives provide frame-works that are fair and equitable for all countries and convey immensebenefits. Domestic policies must be adjusted to take full advantage ofthe benefits of multilateral liberalization. This brings us to the sec-ond point. National policy reforms — in trade and finance, theexchange rate, industrial and financial sectors, and labor policies —have to be developed and implemented within the broad context ofglobalization. These will improve international competitiveness, pro-ductivity, and economic efficiency and resilience. Third, regionalpolicies have to be considered, not only to increase the connectivity
2 South Asia: Rising to the Challenge of Globalization
b670_Chapter-01.qxd 12/10/2008 7:43 AM Page 2

of countries to regional groupings but also to bring smaller and per-haps isolated economies under the umbrella of a larger regionalgrouping. The greater economies of production and export diversifi-cation these smaller economies can thus achieve may not be possibleotherwise, even within the broader framework of global integra-tion. Such regional agreements can also be stepping-stones to widerglobalization.
Hence, to respond to globalization, national, regional (interre-gional), and global policies and actions must be implemented. At thenational level, a number of macroeconomic issues, such as exchangerates, monetary stabilization, and fiscal policies, need to be consid-ered. Financial markets must also be developed, and the possible con-tagion effects of actions in other countries, contained. Capital accountliberalization needs to be sequenced properly. Other structuralreforms have to be addressed as well. Regional actions offer anothereffective way to address and manage globalization. These havebecome an important component of the development strategy in EastAsia since the financial crisis of 1997 and 1998.2 The Association ofSoutheast Asian Nations (ASEAN) and ASEAN+3 (ASEAN plus thePRC, Japan, and the Republic of Korea) have become more active,and several new initiatives have been started to stimulate trade andfinancial integration. There has also been a proliferation of bilateraland subregional free trade agreements (FTAs), both within the Asianregion and between Asian economies and other regions. In the areaof monetary and financial cooperation, regional policy dialogues havebegun through various forums comprising ASEAN and ASEAN+3finance ministers and their deputies. A regional resource-poolingscheme, the Chiang Mai Initiative, has been established and effortsare being made to develop multilateral swaps as well as bond marketsdenominated in local currencies. Bridges are also starting to be builtacross the Asian subregions especially between South Asia and EastAsia. East Asia’s momentum of integration with the global economy,including its role in various international forums, is also beingstrengthened.
Introduction and Summary 3
2 See Chapter 5.
b670_Chapter-01.qxd 12/10/2008 7:43 AM Page 3

After independence from the British in 1947, both India andPakistan (with what is now Bangladesh) had adopted import-substituting policies and erected high walls of protection on all sec-tors of the economy. This had meant not only high tariffs but alsovarious forms of licensing to control entry into industries. The result-ing “license raj” in both countries had created inefficiencies, pro-moted public sector corruption, and constrained the rate of economicgrowth. The smaller South Asian countries — Bhutan, Maldives, andNepal — had also adopted a similar development strategy. It was basi-cally only in the 1980s and the 1990s — the 1980s in the case ofSri Lanka, the mid 1980s in the case of India and Bangladesh, andthe 1990s in the case of Pakistan and Nepal — that the South Asiancountries started the reform process (Devarajan and Nabi, 2006). Inmany cases reforms have been proceeding in spurts because vestedinterests have applied pressures to slow the reform process.
Since its independence 60 years ago, India has consolidated avibrant and competitive form of democracy, banished famine, morethan halved its absolute poverty rate and dramatically improved liter-acy and health conditions. It has also achieved global competitivenessin information technology (IT), outsourcing, telecommunications,and pharmaceuticals; acquired de facto membership in the club ofnuclear powers; created more billionaires than any other country inAsia and became one of the most dynamic and fastest-growing coun-tries, ranked the world’s fourth-largest in purchasing power parity. Ithas also acquired a new geo-strategic importance.
On the economic side, however, India’s success is relativelyrecent. Some changes occurred slowly and the growth rate of theeconomy rose to 5% a year in the 1980s, much higher than during theearlier decades of independence (when the growth rate was 3% peryear). But the decisive change occurred after the reforms of the early1990s. During the period 1991–2005, the growth rate averaged 6%,compared to 4.9% in 1976–1990. The reforms of the 1980s in SriLanka and in the 1990s in other South Asian countries have alsoborne fruit, and other South Asian countries have also shown eco-nomic dynamism. The Bangladeshi economy grew by an averageof 5% in 1991–2005, compared to 3.9% in 1976–1990, and the
4 South Asia: Rising to the Challenge of Globalization
b670_Chapter-01.qxd 12/10/2008 7:43 AM Page 4

Sri Lankan economy, by 4.8% and 4.6%, respectively. The economy ofNepal, which has been ravaged by political problems, grew by an aver-age of 4.3% in 1991–2005. The Pakistani economy has, howeverslowed, from an average of 6.3% in 1976–1990 to 4.3% in 1991–2005.This economic dynamism of the South Asian countries is expected tocontinue in the future, and South Asia’s share of global income isexpected to increase further. For example, the Planning Commissionprojects that the Indian economy will grow by 10% per year in2007–2012. However, as the East Asian crisis has shown, a financialcrisis can be a major setback to an economy, entailing huge economicand social costs but without derailing it. The recovery of the crisis-affected countries in East Asia was swift, but the investment rates havenot recovered yet and the post-crisis growth rates are significantlylower than the pre-crisis ones.
South Asia was spared from the contagion of the 1997 EastAsian financial crisis mainly because it had not deregulated its cap-ital account. However, in the future, as South Asia continues itseconomic reforms and deregulates its capital account and enhancesits integration with the world, a financial crisis cannot be ruled out.Capital account deregulation is necessary in order to attract foreigncapital into local stock and bond markets. Financial sectors inSouth Asia continue to be weak and the system of corporate gov-ernance is less than fully transparent. Like those in East Asia, bankscontinue to bear the brunt of the required financing, and capitalmarkets are less developed. This could create the so-called “doublemismatch” problem, which led to the Asian financial crisis. Theregion can also be buffeted by other types of real and financialshocks. A major lesson for South Asia from the post-crisis experi-ence of East Asia is that globalization can convey large amounts ofbenefits but also presents some challenges, which have to beaddressed effectively.
This book reviews how South Asia is rising to the challenge ofglobalization. How are South Asian countries maximizing the ben-efits of globalization while minimizing its costs? What actions havethey taken at the national, regional (inter-regional), and globallevel? What lessons have the South Asian countries learned from the
Introduction and Summary 5
b670_Chapter-01.qxd 12/10/2008 7:43 AM Page 5

East Asian financial crisis and how are they preparing for financialglobalization?
This book comprises five chapters. This chapter contains theintroduction and summary. In Chapter 2, the current status of theregion is compared to that of countries in East Asia and the rest ofthe world, against a variety of globalization indicators. The chaptergives the reader a broad overview of progress, impact, and potentialfor globalization in South Asia. Since globalization has generally beena positive force for greater economic growth throughout the world,the chapter analyzes the globalization experience of South Asia usingthe various indices developed, among others, by Kearney (2006)and the Carnegie Endowment for International Peace (2006) andDreher (2005). South Asia has opened up its economy to foreigninvestment and provided stimulus for growth in international tradesince the 1980s and the 1990s and has become more globalized.There has been a shift in emphasis from an inward-looking importsubstitution strategy to more outward-looking international policieswith a role for the private sector. A variety of indicators of economicgrowth and international trade and finance and others reflect this newlook. Among these are the share of FDI in total investment andincome, the share of trade in GDP, the growth in trade, and the inflowof portfolio capital into the stock market. Although the globalizationscores for South Asia are increasing, they are lower than those for EastAsia and the PRC mainly because of poor health and education, qual-ity of labor force, and institutional strength indicators. By looking athow these indicators are related to economic growth, the chapterdraws a clearer profile of the impact of globalization on economicgrowth and poverty reduction. Globalization initiatives in South Asia,such as lowered barriers to trade, FTAs signed and under negotiation,international migration, and FDI and capital flows, are examined.
The chapter ends with a discussion of an agenda for enhancingglobalization — trade policy, improved competitiveness, policies toencourage inflows of FDI, increased financial integration, and anappropriate international migration policy. Integrating further intothe global economy would benefit South Asia. Initiatives taken sincethe 1980s and 1990s have borne fruit, both in accelerating economic
6 South Asia: Rising to the Challenge of Globalization
b670_Chapter-01.qxd 12/10/2008 7:43 AM Page 6

growth and reducing poverty. South Asia must build on this founda-tion to become even more competitive internationally and to acceler-ate economic growth. South Asia can integrate further into the globalcommunity in several ways. Many of these initiatives relate to inter-national trade in goods and services and in the flow of capital, such asreducing trade barriers, improving international competitiveness,attracting FDI, developing new trade agreements, and increasing cap-ital account convertibility. The flow of labor and issues of financialintegration must also be addressed. Recent data on FDI inflows intoIndia are encouraging. According to the United Nations Conferenceon Trade and Development (UNCTAD), India ranked second only tothe PRC as the most preferred destination for global FDI, receiving$17 billion of FDI in 2006, an amount equivalent to the combinedflows for the previous three years.
On the trade front, the chapter recommends further reductions intariffs and nontariff barriers (NTBs). The overall assessment of vari-ous competitiveness indicators for South Asia is positive but there isscope for further improvement, through reforms in business and gov-ernment efficiency by reducing bureaucratic procedures and increas-ing competition. In increasing competitiveness, infrastructureimprovements are critical. Despite recent improvements, includingefforts to involve the private sector, the lack of a modern and efficientinfrastructure foundation continues to inhibit the growth of industryand the private sector in South Asia. The removal of road transporta-tion bottlenecks can be extremely effective in increasing efficiency, byreducing costs and time to market as well as facilitating the movementof temporary labor throughout the country. Cross-border linksshould also be improved as part of the Asian highway network and thetrans-Asian railway system.
Additional measures should be adopted to attract FDI. Amongthese are various institutional and procedural improvements that candemonstrate the attractiveness of South Asia as an FDI destination.First, measures can be taken to harmonize FDI regulations and incen-tives to stop a “race to the bottom,” develop regulations to stop dou-ble taxation, pool experience among South Asian countries todetermine a strategy for attracting FDI into different sectors, and
Introduction and Summary 7
b670_Chapter-01.qxd 12/10/2008 7:43 AM Page 7

establish a regional research center devoted to studying the patternand effectiveness of FDI in the region and elsewhere and disseminat-ing the results. Second, a series of procedures can be developed tosimplify entry and exit procedures, set up a fast track for approvals ofFDI investment, allow repatriation of profits, and encourage free flowof FDI within the region. Harmonization of financial regulations isanother key area of need in South Asia. This should be combined withdeepening of the financial infrastructure and financial markets, per-haps using the Asian Bond Market Initiative proposed for East Asiaas a model. Capital account convertibility should not be eschewed;liberalization should, however, be sequenced properly.
Many impediments to increasing migration from South Asia restwith recipient countries in Europe, North America, and Australia.Bilateral negotiations to enhance personal safety and improve work-ing conditions for short-term guest workers should be intensified.Given the increasing importance of remittances in South Asian coun-tries, facilitation of these flows can also be improved. Further integra-tion into the global information and telecommunications labormarket can be encouraged and promoted in a number of ways. Givingsupport to the private sector by upgrading physical infrastructure inservice sectors specializing in IT and communications should be amajor priority as the demand for outsourcing and migration of skilledprofessionals in the IT industry continues to grow. Better coordina-tion between shifting job openings in industrial countries and skilldevelopment in South Asian countries can be developed by encour-aging private sector involvement in IT and communications trainingin South Asia as well as facilitating migration programs that allowskilled and professional workers to migrate for a year or two and thenreturn to use their expertise at home.
Chapter 3 presents a comparative analysis of economic perform-ance and policy reforms in the PRC and South Asia. There are severalreasons for this. First, nearly half of the world’s population has a stakein the ability of both to sustain high rates of growth and raise livingstandards. Second, the PRC and South Asia can benefit from eachother’s experiences. Their unique features make mutual dialogue anddiscussions important. The two are at similar stages of economic
8 South Asia: Rising to the Challenge of Globalization
b670_Chapter-01.qxd 12/10/2008 7:43 AM Page 8

development with diverse policy challenges. They both have hugeland masses, diverse climates and geography, similar demands on theenvironment, and, of course, large populations. The major premise ofthis chapter is that policies are important. Good policies can help liftincome growth rates and lower poverty, while poor policies retardgrowth and stall poverty reduction. The chain of events leading frompolicy reforms to growth is not the same for all economies. Specialcircumstances in each economy have to be analyzed as well. History,government, and institutions are also important because they serve asthe background for policy adjustments.
In both India (and its neighbors in South Asia) and the PRCgrowth has been rapid in the past few years, faster than in most otherdeveloping countries in Asia and the rest of the developing world.The fact that living standards have swiftly improved for the more than2 billion people in these countries is a major accomplishment to belauded. While the PRC has grown rapidly for more than threedecades, growth in India and the rest of South Asia has acceleratedonly recently. To provide a better grasp of the details of recent eco-nomic development, the chapter begins with a short review of eco-nomic performance indicators for South Asia and the PRC: thepattern of growth in per capita income; modifications in sector sharesin agriculture, industry, and services; inflation, FDI, and currentaccount balances, along with international reserves; and humanresource indicators such as the incidence of poverty.
This review is followed by a discussion of why living standardshave been rising faster in the PRC than in South Asia. PRC began thereform period with a lower per capita GDP than all the countries inSouth Asia with the exception of Nepal. But by 2005 per capitaincome was more than twice as high in the PRC than in all of SouthAsia with the exception of Sri Lanka. Furthermore, poverty reductionhas been more dramatic and human development indicators haveimproved more rapidly. The differences in initial conditions as well asthe design and sequencing of reforms explain this outcome. Reformsin agriculture and industry took center stage at the start of the reformprocess in the PRC. This facilitated the development of relatively effi-cient commodity markets and the encouragement of quick supply
Introduction and Summary 9
b670_Chapter-01.qxd 12/10/2008 7:43 AM Page 9

responses early in the reform process. Macroeconomic reforms (e.g.,fiscal, financial, trade and investment, and exchange rate reforms) andother microeconomic reforms (e.g., industrial policy and public enter-prise, public administration, labor market, and infrastructure reforms)were undertaken later, sometimes in response to distortions and bot-tlenecks that resulted from reforms in the productive sector. SouthAsia, on the other hand, generally put macroeconomic reforms aheadof microeconomic reforms mainly because reforms were undertakenin response to adverse macroeconomic situation and required belt-tightening measures with high social costs.
Although South Asia put macroeconomic reforms ahead ofmicroeconomic ones, more remains to be done at this level. Tariffshave been lowered, yet they are still higher than rates in SoutheastAsia and East Asia. In India, export processing zones are relativelyrecent and small compared with those in the PRC, and they lack effi-cient and cheap connectivity with major ports. Regulations are stillcumbersome and are a disincentive to foreign investors. In othercountries in South Asia, similar reforms are needed in trade, foreigninvestment, and the financial sector, although the details differ fromcountry to country. Additional reforms at the microeconomic level orthe so-called second-generation reforms are needed to make marketswork better. These comprise continued reforms of the agriculture andindustrial sectors; reform of public institutions for improved gover-ence (civil service, bureaucracy, and public administration); reform ofinstitutions that create or maintain human capital (education andhealth); and, improving the environment affecting the private sector(regulatory environment, flexibility in labor markets, legal and physi-cal infrastructure, and clearly-defined property rights). Unlike macro-economic reforms, however, successful implementation of second-generation reforms requires a wider consences in the countries. Thischapter also provides a discussion of the unfinished agenda for SouthAsian countries at a country level and concludes with an analysis offuture growth prospects for the region, which are fairly encouragingprovided reforms remain on track. The unfinished agenda includes,among others, restructuring private enterprises in most countries,improving tax administration in Nepal and Pakistan, implementing
10 South Asia: Rising to the Challenge of Globalization
b670_Chapter-01.qxd 12/10/2008 7:43 AM Page 10
various standards and codes and best practices for the financial sector,improving labor market flexibility, and upgrading governance andinfrastructure throughout the region (see Chapter 3, Appendix 3, forfurther details).
A review of the pattern of economic growth and sectoral changesin the PRC and India brings out several aspects that are important inassessing the future prospects for these two giant economies. First isthe overwhelming importance of industrial growth in the PRC.Industry in 2005 accounted for 40% of the country’s GDP, up froma negligible amount only 30 years ago. This growth has not only beenspectacular but has been concentrated for the most part in a fewsectors, primarily Standard International Trade Classification (SITC)categories 5–8 (office machinery, electrical machinery and appliances,telecommunications equipment, and miscellaneous manufacturedgoods).
Second, although it is starting to improve, the performance of theindustrial sector in India has been anemic. The sector has not grownas fast as the rest of the economy and has therefore provided littleimpetus for economic expansion. The sector share is only 26% ofGDP, versus 40% in the PRC. Even accounting for some estimationerrors, this is still a very big difference. The acceleration in growth ofthe Indian economy since the mid-1990s has been led by the servicessector, with a small contribution from agriculture. Since the middle ofthis decade, there has also been some turnaround in manufacturingproductivity, mainly because of private sector activities and responsesto reforms. FDI is only one-tenth the level of the PRC’s and exportgrowth has been slow. Merchandise exports are only about 10% ofGDP and are not nearly as well focused on labor-intensive industriesas they are in the PRC.
The PRC can easily continue to grow rapidly and increase itsexport domination in manufactured goods categories 75–77, and per-haps expand into 78 (road vehicles). By 2001–2004 this subsector’sshare of total manufactured output was already 34%, up from a neg-ligible amount in the 1990s. Whether this continued growth in indus-try is in the best interest of the country is another matter, however.A more appropriate strategy would be to put less emphasis on industry
Introduction and Summary 11
b670_Chapter-01.qxd 12/10/2008 7:43 AM Page 11

and more on services and the rural development of the backward inte-rior provinces.
Much of the current emphasis in India is to leapfrog over theindustrialization phase of development and focus on a wide variety ofboth high- and low-technology services, primarily in IT and commu-nications. To sustain rapid growth, there has to be an added push todevelop labor-intensive industry as in East Asia and the PRC. Such astrategy would also benefit rural areas as growth would trickle downto the poor. India has the potential to develop a vibrant, efficient, andinternationally competitive industrial sector, but this requires betterinfrastructure as well as labor and industrial policies that are flexibleand allow large-scale industry to operate in labor-intensive industries.
The recent Goldman Sachs report (Poddar and Yi, 2007) arguesthat growth acceleration in India since 2003 represents a structuralincrease rather than simply a cyclical upturn. India could grow by 8%yearly until 2020 (from the 5.7% forecast for 2003), the report adds.But to do this, India needs to address supply-side constraints on busi-ness, infrastructure development (health and education, among oth-ers), and the labor market.
There are encouraging signs that such a takeoff is near in India;however, FDI growth in manufacturing is still slow, labor markets arestill constrained, and business investment in new plant and equipmentis weak. For the outlook for the next decade to change, theGovernment will have to remove all of these bottlenecks. Then it willdefinitely be possible for the industrial sector to exhibit the dynamismthat the IT and related service sectors have been showing in the lastfew years. If this materializes, India could well grow as fast as PRC inthe next two decades, particularly if it is able to raise investment ratesso that they are closer to the rates achieved by the PRC.
Chapter 4 looks at the evolving economic relationship betweenSouth Asia and East Asia. Recently, there has been growing interestin the economic relationships between these two regions. There are,at least, three reasons for this interest. First, two of the most dynamiccountries in the world, namely, the PRC and India, are in theseregions and the evolution of these giant economies, together with grow-ing economic interrelations between the two, could have important
12 South Asia: Rising to the Challenge of Globalization
b670_Chapter-01.qxd 12/10/2008 7:43 AM Page 12

implications for other countries in the regions and the global economy.Second, with the surge in regionalism in post-crisis East Asia, a questionthat is frequently being asked is: will growing economic relationsbetween South Asia and East Asia be the second phase and eventuallylead to an integrated Pan-Asia similar to the integration achieved inEurope sometime in the future? Third, during the pre-colonial period,Asia not only dominated the global economy but was one of the mostintegrated regions in the world, will this happen once again? The chap-ter highlights the recent surge and the potential for increased integrationin the future between the two regions. It also recommends a set of poli-cies to further enhance integration between South Asia and East Asia.
The chapter begins by reviewing trends in economic integra-tion between South Asia and East Asia. South Asia’s merchandisetrade with East Asia has grown significantly in absolute terms. Thistrade is the second-largest component of Pan-Asian trade, suggest-ing that South Asia–East Asia economic relations could be labeledas the “second phase of Pan-Asian integration.” The chapter alsoreviews quantitative measures of economic integration betweenSouth Asia and East Asia, and assesses economic complementaritiesbetween the two regions by looking at the pattern of exports andcomparative advantage. A large part of the increase in SouthAsia–East Asia trade is accounted for by the bilateral trade betweenthe two giant economies of India and the PRC; trade betweenthem has also increased rapidly in recent years. The trends show aswell that East Asia is a more important trading partner for SouthAsia than vice versa.
Trade shares are not sufficient to assess the extent to which coun-tries prefer to trade with each other than with other trading partners.Trade intensity indices are a better way of measuring whether tradebetween two regions is greater relative to their importance in worldtrade. The trade intensity indices between South Asia and East Asiadeclined in the 1990s but have increased since then. This increasereflects mainly the increasing trade intensity between South Asia andASEAN and the PRC. Despite overlaps, exports between the tworegions have some complementarities. South Asia exports mainlyagricultural, primary, and labor-intensive manufactured goods to
Introduction and Summary 13
b670_Chapter-01.qxd 12/10/2008 7:43 AM Page 13

East Asia. East Asia’s exports to South Asia, on the other hand, com-prise mainly of capital- and knowledge-intensive products such astelecommunications and sound recording equipment, electricalmachinery, road vehicles, and industrial machines.
Policies in South Asia, particularly in India, have recently soughtto establish trade and investment links with ASEAN and East Asiancountries. India’s engagement with ASEAN began in 1992, and since2005 India has also participated in various East Asia Summits as wellas other meetings with European finance ministers. South Asia andEast Asia have signed a number of FTAs as well.
Which policy actions would increase South Asia–East Asia inte-gration? First, while tariffs and NTBs are already low in many EastAsian countries and while South Asia has made encouraging progressin the same direction, further reductions can be made (especially inNTBs in East Asia, where tariffs are already low). Second, trade liber-alization efforts need to be embedded in a wider program of eco-nomic reforms. South Asian countries and several East Asian countriesneed to make progress in implementing reforms at the microeconomiclevel and the so-called second-generation reforms to enhance trans-parency, good governance, and human captial. Among these reformsare reform of the civil service and of the delivery of public goods, tostrengthen competition, regulations, and property rights and thuscreate an environment conducive to private sector opportunities. Thereform of institutions that create human capital, in health and educa-tion among others, is also required. Third, South and East Asiancountries need to consolidate their FTAs into an Asia-wide FTA. Tomake the proliferation of FTAs between South Asia and East Asiastepping-stones rather than stumbling blocks to multilateralism andto reduce economic inefficiencies due to overlapping rules of originand others, policy makers in the region may wish to adopt the conceptof “open regionalism” and broaden FTAs by creating as large andwide a market as possible. Deepening FTAs by extending their cover-age beyond trade in goods into services, investment, technology, etc.,may reduce the problem of trade diversion. Quantitative estimatessuggest that a broad regional approach will, for the most part, forestalllargely adverse effects on individual Asian countries that may follow
14 South Asia: Rising to the Challenge of Globalization
b670_Chapter-01.qxd 12/10/2008 7:43 AM Page 14

when countries and subregions are otherwise left out (Francois, Rana,Wignaraja, forthcoming). The fourth measure that could significantlyaffect trade between South Asia and East Asia is reduction of tradingcosts. This could be brought about by investment in trade-relatedinfrastructure and the streamlining of cross-border procedures (suchas customs procedures and logistic costs) to minimize delays incustoms inspection, cargo handling and transfer, and processing ofdocuments. Finally, trade promotion through skillful economic diplo-macy, regular exchange of business delegations, and civil society partic-ipation could be given much more encouragement. People-to-peoplecontacts can go a long way toward enhancing trade and investmentbetween countries.
Chapter 5 considers the broad topic of regional integrationwithin South Asia and draws lessons from the experience of EastAsia. South Asia was a well-integrated region of the British Empirein the 19th and early 20th century before World War II. In 1947,when Pakistan and India became independent, more than half ofPakistan’s imports came from India and nearly two-thirds of itsexports went to India. Then, after Pakistan was partitioned, tensionsbetween the two countries grew as they bickered over water rights,territory, and currency valuation. These, together with the adoptionof international trade policies that emphasized import substitution,led to a dramatic reduction of trade among South Asian countries.Whatever limited international trade that took place was with indus-trial countries, particularly the United States. Consequently, afterindependence from British rule, trade among the South Asian coun-tries fell from around 20% of total trade to about 4% by the end ofthe 1950s, and to 2% by 1967 (World Bank, 2004). The share ofintra-regional trade in total trade began to increase only after thecountries abandoned import substitution polices in the 1980s andthe 1990s. It now stands at about 4% of total trade.
This chapter explores how the previous strong pattern of tradecan be revitalized. There are several mechanisms and modalitiesfor increasing intra-regional trade and fostering regional coopera-tion, such as developing cross-border infrastructure, fostering inter-national trade and investment (including services), and increasing
Introduction and Summary 15
b670_Chapter-01.qxd 12/10/2008 7:43 AM Page 15

cooperation in the financial sector. In infrastructure, under theSouth Asia Subregional Economic Cooperation (SASEC), six prioritysectors have been identified: transport; energy and power; tourism;environment; trade, investment, and private sector cooperation; andinformation and communication technology. Progress is still in theearly stages, although projects are being identified and preliminarywork is being done.
The South Asian Association for Regional Cooperation (SAARC)with its trade initiatives — the SAARC Preferential TradingArrangement (SAPTA) and the South Asia Free Trade Agreement(SAFTA) — is the major institutional entity charged with promotingfree trade in South Asia. SAFTA aims to reduce tariffs among mem-bers to 0%–5% by 2016 and establish a free trade area. However,progress has also been slow. Each country has a list of products thatare not part of the agenda for tariff reduction and these products arehard to eliminate. The hope is that all countries are more committedto free trade than they have been in the past and will be willing tomake mutual concessions to make trade agreements work. Withregard to free trade agreements, two current bilateral agreementsinvolve South Asian countries — those between Sri Lanka and Indiaand between Nepal and India. Although the World Bank (2004)argues that even with free trade the amount of trade within SouthAsia would be relatively small (although certainly bigger than the cur-rent flows), opportunities for more trade within South Asia are con-firmed by a number of studies that consider comparative advantageand geographic proximity. The level of intra-regional trade is expectedto increase in the future but not to the pre-partition level as patternsof comparative advantage have changed. Integration with East Asia(discussed in Chapter 4) will provide additional opportunities forboth South Asia and other regions of Asia to reap the benefits of glob-alization. As Chandra and Kumar (2008) note, South Asia can bene-fit from a twin-track approach: integration within itself and betterintegration with the rest of the world. Integration within South Asiais more likely to succeed if undertaken as part of broader Pan-Asiancooperation. Increased integration in South Asia could also help buildbridges between Central Asia and East Asia.
16 South Asia: Rising to the Challenge of Globalization
b670_Chapter-01.qxd 12/10/2008 7:43 AM Page 16

Regarding financial integration, several institutional develop-ments in the past decade were designed to promote greater mone-tary and financial integration in South Asia. Among these is therecent formation of a network of central bank governors and financesecretaries of the SAARC region and a forum of SAARC finance min-isters. These groups discuss and exchange views on macroeconomicissues, and possibilities for harmonizing strategies for the environ-ment and natural disaster relief. A South Asian Development Fund(SADF) has been set up to identify regional projects in industry,energy, agriculture, and services, as well as infrastructure and socialdevelopment projects. The SADF has also financed feasibility studies.For financial and monetary integration within South Asia to progressbeyond these steps, more work must be done to assess whetherenough macroeconomic convergence and political will has beendeveloped before the idea of a common market can be entertained.This work is ongoing.
An important lesson for South Asia from East Asia’s experi-ence is that regionalism can help maximize the benefits of global-ization while minimizing its costs. South Asia should strengthenits efforts to enhance cooperation within the region and with EastAsia. The recent observer status given to the PRC and Japan inSAARC should have a catalytic impact on South Asian integration.Second, expeditious implementation of SAFTA is necessary.Nontariff barriers to trade should be removed. SAFTA should alsobe deepened to cover the service trade and the movement of labor.Third, efforts should be made to strengthen monetary and finan-cial cooperation in South Asia. The region could join ongoingefforts in East Asia (such as the Chiang Mai Initiative and localcurrency bond markets).1 Fourth, in infrastructure cooperation,the SASEC initiative could benefit from interaction with theGreater Mekong Subregion program.
Introduction and Summary 17
1 Recently a $3 billion bilateral swap agreement was signed between India andJapan.
b670_Chapter-01.qxd 12/10/2008 7:43 AM Page 17

ReferencesChandra, R and R Kumar (2008). South Asian Integration Prospects and Lessons from
East Asia. Indian Council for International Economic Relations.Devarajan, S and I Nabi (2001). Economic Growth in South Asia, Promising,
Unequalizing, Sustainable? Economic and Political Weekly, August 19.Dreher, A (2005). Does Globalization Affect Growth? Evidence from a New Index
of Globalization. Thurgauer Wirtschaftsinstitut Research Paper Series No. 6.April.
Francois, J, PB Rana and G Wignaraja (eds.) (forthcoming). Pan-Asian Integration:Linking East and South Asia, Chapter 1, Palgrave Macmillan.
Kearney, A. T. Inc. and the Carnegie Endowment for International Peace (2006).The Globalization Index. Foreign Policy (November/December), 74–81.
Maddison, A (2001). The World Economy: A Millennial Perspective. OECD.Poddar, T and E Yi (2007). India’s Rising Growth Potential. Global Economics,
Paper 152. Goldman Sachs.United Nations Conference on Trade and Development (UNCTAD) (2007). World
Investment Report 2007.Wilson, D and R Purushothaman (2003). Dreaming with the BRICS: The Path to
2050. Global Economic Paper No. 99. Goldman Sachs.World Bank (2004). Trade Policies in South Asia: An Overview. Report No. 29929,
Washington, DC.
18 South Asia: Rising to the Challenge of Globalization
b670_Chapter-01.qxd 12/10/2008 7:43 AM Page 18

19
Chapter 2
South Asia’s Global Integration
IntroductionGlobalization is a contentious word that means different things todifferent people. While the general public has grown skeptical of glob-alization, fearing foreign competition and loss of jobs, most econo-mists are optimistic about the longer-term prospects for the worldeconomy and for countries that are joining the global community. Forthem the net effect of globalization is definitely positive. For others,where local producers are threatened by lower-cost imports, the netimpact is negative.
Empirical studies on globalization have measured its impact oneconomic growth and development. Many of these have used inter-national trade flows, direct foreign investment, and other capital flowas measures of globalization. Dollar (1992) and Frankel and Romer(1996) find that trade and openness to trade have both had a positiveand significant impact on economic growth for many countries. Theimpact of capital account liberalization on growth is more debatable.Rodrik (1998) and Alesina, Grilli, and Milesi-Ferretti (1994) do notfind a significant relationship between capital account openness andeconomic growth, and Chandra (2001) finds that there are moredeveloping countries that have suffered than those that have gainedfrom globalization. However, Dollar and Kray (2001) find a positiverelationship between FDI flows and growth.
Several other studies have expanded the definition of globalizationbeyond FDI, openness to trade, and trade flows. These studies (reviewedin the next section of this chapter) look at a much wider range ofindicators to assess the degree of globalization in different economies.
b670_Chapter-02.qxd 11/12/2008 11:02 AM Page 19

The results of these studies generally find that globalization is positivelyrelated to growth in per capita income, using panel data for a variety ofindustrial and developing countries. Dreher (2005) finds that countrieswith high rates of globalization grew faster than countries with lowrates of globalization (see Table 2.1). His regression results imply thatthe PRC’s growth rate was 2.33 percentage points higher in 2000 thanin 1975 as a result of greater integration with the rest of the world. Li,Pang, and Ng (2006) find that openness and local domestic factors likegovernance, human resources, and the quality of the labor force bothcontribute to more rapid economic growth.
Since globalization has generally been a positive force for greatergrowth throughout the world, we can turn to an analysis of the glob-alization experience of South Asia. South Asia has opened up its econ-omy to foreign investment and provided stimulus for the growth ininternational trade essentially sometime in the 1980s and the 1990s.This shift emphasizes the move from an inward-looking import sub-stitution strategy to more outward-looking international policies andthe role of the private sector. A variety of indicators of economicgrowth and international trade and finance reflect this new look.Among these are the share of trade in GDP, the growth in trade, theshare of FDI in total investment and income, and the inflow of port-folio capital into the stock market. By looking at how these indicatorsare related to economic growth we can draw a better profile of theimpact of globalization on economic growth and poverty reduction.
20 South Asia: Rising to the Challenge of Globalization
Table 2.1 Average Per Capita Income Growth for Low- and High-GlobalizationCountries (percentage).
Degree of 1970– 1976– 1981– 1986– 1991– 1996–Globalization 1975 1980 1985 1990 1995 2000
Low globalization 2.62 2.08 0.35 0.68 0.14 1.16(68) (71) (80) (83) (64) (40)
High globalization 2.99 3.02 0.79 2.64 1.24 2.04(38) (38) (36) (36) (59) (82)
Note: Figures in parentheses refer to sample size.Source: Dreher (2005).
b670_Chapter-02.qxd 11/12/2008 11:02 AM Page 20

It is also useful to analyze the changing placement of South Asiaon various indices of globalization. The most popular index is theKearney’s Index (2006), which has four separate categories of global-ization: economic integration, personal contact, technological con-nectivity, and political engagement.3 Each of these dimensions isreflected in a number of different variables. A slightly different seriesof three categories is reported by Dreher (2005). These categories areeconomic integration, social globalization, and political engagement.A paper by Heshmati (2003) uses principal component analysis toderive an index of globalization with the four Kearney variables.Another approach adopted by Li, Pang, and Ng (2006) adds a set ofindigenous factors including health and education, quality of thelabor force, and effectiveness of government and amount of corrup-tion. These indigenous factors enable countries to take advantage ofthe opportunities that globalization offers.
In the next section we review the trends in South Asia’s externaleconomic relations and relative country rankings with respect to var-ious globalization indicators. Simple assessments of the economicimpact of globalization on South Asian economic performance arealso provided. After that we explore possible policy initiatives forincreasing the integration of South Asia into the global economy.
Globalization of South AsiaWe begin this section by reviewing trends in South Asia’s globalizationusing the more traditional measures. From 1980 to 1990, South Asia’sshare of world trade remained at 1%, even though the value of tradegrew strongly from 1985 to 1995 (see Table 2.2). Trade in other
South Asia’s Global Integration 21
3 The economic variable includes trade and FDI. The personal contact variableincludes factors such as international travel and tourism, international telephone traf-fic, and workers’ remittances. The technological connectivity variable includes thenumber of Internet users, Internet hosts, and secure servers. The political engage-ment variable includes membership in international organizations, contributions toUnited Nations peacekeeping missions, international treaties ratified, and govern-ment transfers.
b670_Chapter-02.qxd 11/12/2008 11:02 AM Page 21

22South A
sia: Rising to the C
hallenge of Globalization
Table 2.2 South Asia’s Total Trade, 1980, 1985, 1990, 1995, 2000, and 2005 ($ million).
Country 1980 1985 1990 1995 2000 2005
Bangladesh 3,400.7 3,525.1 5,326.6 9,625.2 14,590.4 22,345.3India 23,263.0 24,594.4 41,804.4 65,024.5 92,961.9 238,590.6Maldives 0.0 93.2 190.0 406.5 465.2 948.2Nepal 0.0 430.0 797.9 1,090.9 1,734.1 2,551.7Pakistan 7,969.1 8,627.0 12,970.4 19,452.3 19,598.4 40,561.4Sri Lanka 3,067.8 3,096.7 4,531.7 8,282.0 12,146.8 16,474.7South Asia 37,700.7 40,366.2 65,621.0 103,881.4 141,496.7 321,471.9
South Asia’s Share of 1.0% 1.0% 1.0% 1.0% 1.1% 1.5%World Trade
Average 5-Year – 1.4% 12.5% 11.7% 7.2% 25.4%Growth Rate
Source: International Monetary Fund, Direction of Trade Statistics CD-ROM, July 2006.
b670_Chapter-02.qxd 11/12/2008 11:02 AM Page 22

parts of the world also increased during this period. However, asreforms began to take hold after 1990 and tariff barriers were low-ered, South Asia’s participation in international trade accelerated evenfaster, and by 2005 its share of world trade had increased by 50%, to1.5%. More importantly, the average rate of growth of world trade peryear also rose rapidly, more than doubling from 2000 to 2005 aftergrowing by nearly 40% from 1995 to 2000. India was responsible forthe bulk of the increase. Its total trade (exports plus imports)increased by 2.5 times from 2000 to 2005. Trade in other economiesalso accelerated after 2000. Pakistan’s total trade more than doubledand that of other countries increased by healthy amounts. From 2000to 2005, South Asia’s total trade grew by an average of more than25% yearly, one of the highest rates in the world.
FDI is another important index of globalization. It reflects theinterest of industrial countries in developing countries and is a keyingredient of technological transfer and innovation. Before reformswere introduced in the 1980s and the 1990s, FDI in South Asia wasonly a trickle and its pace was slow, actually falling between 1980 and1985. South Asia’s share of world FDI flows was less than one-half of1% (see Table 2.3). As reforms began in India and Pakistan, FDI flowsaccelerated somewhat, although they remained small relative to totalworld inflows. From 2000 to 2004, South Asia’s share of world FDIflows increased from 0.22% to 1.04%, still a small amount but morethan a fourfold increase in 6 years. India and Pakistan were the bigrecipients. It is notable that from 2000 to 2005 the total global flowof FDI fell by about 48% as global flows from the US declined.However, inflows into South Asia more than doubled. This pattern ofacceleration in the flow of FDI is a strong sign that South Asia isbecoming further integrated into the global economy.
Portfolio investment and other capital flows are yet another indi-cation of the pace of globalization of capital markets in South Asia.According to data from the Institute of International Finance, equityinvestment in India has increased quite dramatically since liberaliza-tion began in the late 1980s and early 1990s (see Table 2.4). In India,direct investment went from $129 million in 1991 to just over $6 bil-lion in 2006 and was forecast to reach $8 billion in 2007. Portfolio
South Asia’s Global Integration 23
b670_Chapter-02.qxd 11/12/2008 11:02 AM Page 23

24South A
sia: Rising to the C
hallenge of Globalization
Table 2.3 Foreign Direct Investment Inflows, 1980, 1985, 1990, 1995, 2000, and 2005 ($ million).
Country 1980 1985 1990 1995 2000 2005
Bangladesh 8.5 −6.7 3.2 1.9 280.4 692.0Bhutan n.a. n.a. 1.6 0.1 −0.1 9.0India 79.2 106.1 236.7 2,151.0 2,319.0 6,676.0Maldives −0.1 1.2 5.6 7.2 13.0 9.5Nepal 0.3 0.7 5.9 8.0 −0.5 2.4Pakistan 63.6 47.4 250.0 719.0 308.0 2,201.0Sri Lanka 42.9 24.4 43.4 65.0 173.0 272.0South Asia 194.4 173.1 546.4 2,952.2 3,092.8 9,861.9World 55,108.1 57,644.9 207,878.4 341,085.9 1,396,538.6 945,795.0
South Asia’s Share 0.35% 0.30% 0.26% 0.87% 0.22% 1.04%of World FDI
n.a. = not available.Source: UNCTAD FDI database online.
b670_Chapter-02.qxd 11/12/2008 11:02 AM Page 24

flows started more slowly, beginning only in 1993 after some liberal-ization of inflows. There was a big spurt in 1993 and 1994, followedby fluctuations over the next decade including negative flows in 1998(not shown in the table). Since 2000, portfolio inflows have acceler-ated further, but with some fluctuation, reaching over $12 billion in2005 before receding somewhat since then. Since 1991, foreignexchange reserves have also increased in every year except 1995.
In Pakistan, direct equity investment has fluctuated since the late1980s with a slight upward trend, peaking in 1998 at $1.5 billion andthen falling back to around $700 million in the last few years.Portfolio investment has been anemic, and there has been a small out-flow in most years since 2001. International reserves have alsoincreased, but not at the same rate as in India. Much of the accelera-tion in FDI has been the result of policy changes that have made iteasier for foreign investors to develop partnerships with South Asianfirms and also to make portfolio investments in South Asian stock andbond markets.
The Kearney’s Index (2006) has been compiled for the past sev-eral years. Its components are listed in Table 2.5a along with the rank-ings of selected countries (from a total of 62 countries) for 2001 and
South Asia’s Global Integration 25
Table 2.4 Direct Investment and Portfolio Investment in India and Pakistan,1991, 1995, 2000, 2005, and 2007 ($ million).
2007Country 1991 1995 2000 2005 (forecast)
India
Direct investment 129 1,954 3,066 6,093 8,000Portfolio investment 4 2,784 2,590 12,489 6,000Increase in reserves 3,385 −2,936 5,842 15,052 12,000
Pakistan
Direct investment 0 439 471 750 n.a.Portfolio investment 323 1,098 73 −30 n.a.Increase in reserves −112 333 1,254 1,150 n.a.
n.a. = not available.Source: Institute of International Finance website.
b670_Chapter-02.qxd 11/12/2008 11:02 AM Page 25

2006 (Table 2.5b). Except for Sri Lanka, the South Asian economiesranked near the very bottom of the overall ranking in 2006. The PRCalso ranks low on the list. India ranks very low in three categories. Itranks higher in personal contact because of the size of remittances.
26 South Asia: Rising to the Challenge of Globalization
Table 2.5a Globalization Index Rankings, 2006.
Country Economic Personal Technological Political
Bangladesh 61 37 62 49India 59 51 57 60Pakistan 60 34 59 55Sri Lanka 38 27 58 58PRC 28 55 50 47Indonesia 52 59 51 50Korea, Republic of 32 39 19 33Malaysia 3 19 28 48Singapore 1 3 12 29Taiwan 12 33 18 62Thailand 16 49 41 57
Source: Kearney (2006).
Table 2.5b Globalization Index Rankings, 2001 and 2006.
Country 2001 2006
Bangladesh 48* 58India 49* 61Pakistan 56* 56Sri Lanka 32* 46PRC 48* 51Indonesia 38* 60Korea, Republic of 31* 29Malaysia 20* 19Singapore 1 1Taiwan 32* 35Thailand 30* 45
*2002 figures.Source: Kearney (2006).
b670_Chapter-02.qxd 11/12/2008 11:02 AM Page 26
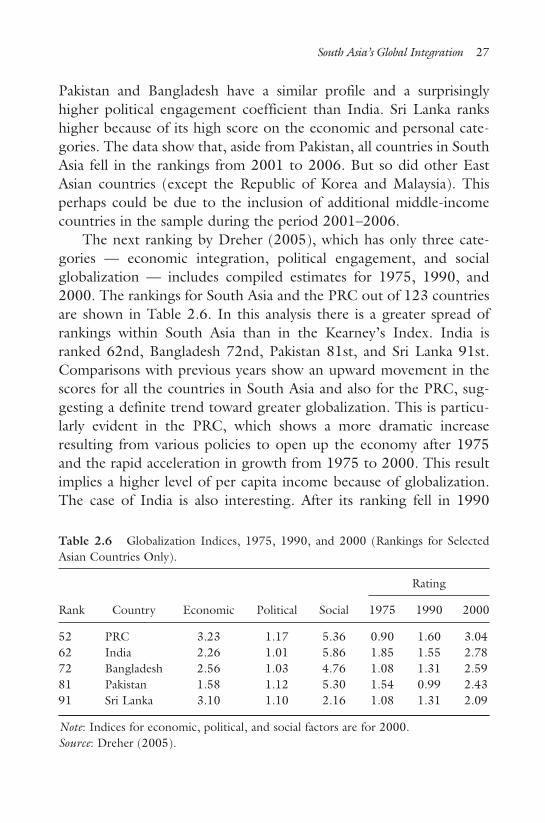
Pakistan and Bangladesh have a similar profile and a surprisinglyhigher political engagement coefficient than India. Sri Lanka rankshigher because of its high score on the economic and personal cate-gories. The data show that, aside from Pakistan, all countries in SouthAsia fell in the rankings from 2001 to 2006. But so did other EastAsian countries (except the Republic of Korea and Malaysia). Thisperhaps could be due to the inclusion of additional middle-incomecountries in the sample during the period 2001–2006.
The next ranking by Dreher (2005), which has only three cate-gories — economic integration, political engagement, and socialglobalization — includes compiled estimates for 1975, 1990, and2000. The rankings for South Asia and the PRC out of 123 countriesare shown in Table 2.6. In this analysis there is a greater spread ofrankings within South Asia than in the Kearney’s Index. India isranked 62nd, Bangladesh 72nd, Pakistan 81st, and Sri Lanka 91st.Comparisons with previous years show an upward movement in thescores for all the countries in South Asia and also for the PRC, sug-gesting a definite trend toward greater globalization. This is particu-larly evident in the PRC, which shows a more dramatic increaseresulting from various policies to open up the economy after 1975and the rapid acceleration in growth from 1975 to 2000. This resultimplies a higher level of per capita income because of globalization.The case of India is also interesting. After its ranking fell in 1990
South Asia’s Global Integration 27
Table 2.6 Globalization Indices, 1975, 1990, and 2000 (Rankings for SelectedAsian Countries Only).
Rating
Rank Country Economic Political Social 1975 1990 2000
52 PRC 3.23 1.17 5.36 0.90 1.60 3.0462 India 2.26 1.01 5.86 1.85 1.55 2.7872 Bangladesh 2.56 1.03 4.76 1.08 1.31 2.5981 Pakistan 1.58 1.12 5.30 1.54 0.99 2.4391 Sri Lanka 3.10 1.10 2.16 1.08 1.31 2.09
Note: Indices for economic, political, and social factors are for 2000.Source: Dreher (2005).
b670_Chapter-02.qxd 11/12/2008 11:02 AM Page 27

relative to 1975, reflecting a tendency to become more insular, Indiaaccelerated its rate of globalization almost as dramatically as the PRC,raising its rating from 1.55 in 1990 to 2.78 in 2000, compared witha movement from 1.60 to 3.04 for the PRC over the same period.There was also substantial progress in globalization in the other coun-tries in South Asia, particularly in Bangladesh and Pakistan.
Rankings on both openness and indigenous factors are compiledby Li, Pang, and Ng (2006) and are shown in Table 2.7 for selectedcountries from a total of 62 countries. The indigenous factors are
28 South Asia: Rising to the Challenge of Globalization
Table 2.7 Openness Factor and Indigenous Factor Indicators (1998–2002Average).
Openness Factor Indicators Indigenous Factor Indicators
Economies Ranking Economies Ranking
PRC 40 Iran 61Turkey 41 Bangladesh 62Romania 42 Sri Lanka 44South Africa 43 Turkey 45Indonesia 44 Peru 46Ukraine 45 Mexico 47Botswana 46 Venezuela 48India 47 Colombia 49Tunisia 48 Russia 50Colombia 49 Philippines 51Peru 50 India 52Senegal 51 Iran 53Venezuela 52 PRC 54Nigeria 53 Indonesia 55Egypt 54 Ukraine 56Kenya 55 Senegal 57Morocco 56 Kenya 58Pakistan 57 Pakistan 59Sri Lanka 58 Uganda 60Uganda 59 Bangladesh 61Saudi Arabia 60 Nigeria 61
Source: Li et al. (2006).
b670_Chapter-02.qxd 11/12/2008 11:02 AM Page 28

domestic characteristics that provide an enabling environment forglobalization to take hold and thrive. These include 17 factors thatare classified under the three broad categories of institutional estab-lishment, education and health, and quality of the labor force.4 Theopenness rankings are for the same group of countries compiled byKearney. While all of the South Asian countries are ranked toward thebottom of the scale, there are differences in the intra-regional rank-ings between Kearney and Li, Pang, and Ng. Bangladesh is rankedlow in both but the other countries shift around. Sri Lanka is a rela-tively high 43rd in the Kearney ranking and 58th in Li, Pang, and Ng,while India is 47th in the Li, Pang, and Ng rankings and 61st inKearney. As a comparator country, the PRC also ranks lower in Li,Pang, and Ng. Clearly the rankings are sensitive to the survey yearand the different variable definitions. Therefore, the exact placementin the rankings should not be given too much weight. The moreimportant point is the relatively low placement of South Asia in therankings.
A paper by Heshmati (2003) uses principal components toderive a weighted index of globalization for the same 62 countriesas those used by Kearney. These rankings for Asia are found inTable 2.8. The rankings are closer to those of Li, Pang, and Ngthan to those of Kearney. Sri Lanka is rated toward the bottom ofthe list; India is ranked 46th (47th in Li, Pang, and Ng) and thePRC is ranked 42nd (40th in Li, Pang, and Ng). Drawing conclusionsfrom the overall analysis, Heshmati finds that low rank is oftenassociated with lower personal and political factors and that tech-nology factors are important in raising globalization connectivity.
South Asia’s Global Integration 29
4 The institutional factors are patent applications, corruption perception index, voiceand accountability, political stability, government effectiveness, regulatory quality,rule of law, control of corruption, property rights protection, and regulatory scores.The education and health category consists of primary school enrollment, publicspending on education, primary school pupil-teacher ratios, total health expenditure,and number of physicians per thousand households. The quality of the labor forceincludes youth employment and size of the child labor force.
b670_Chapter-02.qxd 11/12/2008 11:02 AM Page 29

An interesting result is that his index also shows that Indonesia,Taiwan, and Thailand are not much more globalized thanSri Lanka and Bangladesh and less so than India, Pakistan, andSri Lanka. However, Singapore still gets high marks. Heshmati’sfindings are significantly different from those of the other global-ization studies and the conventional wisdom regarding globaliza-tion, showing a smaller gap between South Asia and East Asia.Indonesia, the Philippines, and Thailand, however, also rank low inthe Dreher and Li, Pang and Ng studies but not in the Kearneystudy.
From this review of globalization studies, it is evident thatricher countries have higher globalization coefficients and thatglobalization and high incomes move together. However, it ishard to establish causality. The analysis has also shown that SouthAsia has only lately begun to globalize rapidly. Of the four indicesconstructed to reflect the economic, personal, technological,and political aspects of globalization, it is in the personal aspectthat South Asia scores most heavily, primarily because of strongremittances.
South Asia also scores poorly on the indigenous factor indi-cators, which include health and education, quality of the labor
30 South Asia: Rising to the Challenge of Globalization
Table 2.8 Globalization Rankings.
Country Rank
Bangladesh 52India 46Pakistan 41Sri Lanka 56PRC 42Indonesia 47Malaysia 21Singapore 2Taiwan 55Thailand 51
Source: Heshmati (2003).
b670_Chapter-02.qxd 11/12/2008 11:02 AM Page 30

force, and institutional strength. The last-named variable includesindices of corruption, the effectiveness of the regulatory apparatus,voice in government and accountability, and government effec-tiveness and adherence to the rule of law. These indigenousfactors change only slowly in response to a variety of social devel-opments including openness and more rapid economic growth,which makes available resources for raising health and educationalperformance and for developing a more transparent and efficientgovernment.
Comparisons between South and East Asia including the PRCshow that average scores in the PRC and East Asia reflect a higherlevel of globalization than in South Asia. Occasionally one of the EastAsian economies registers a poor globalization score that could putit in the same globalization camp as South Asia, e.g., Indonesia inthe Kearney rankings, Thailand in the Dreher, and Taiwan in theHeshmati rankings. Nevertheless, all four ranking schemes show that,on average, South Asia ranks below the PRC and East Asia in theextent of globalization.
Impact of Globalization on South AsiaThe relationship between economic growth and openness, andbetween economic growth and FDI inflows, was analyzed; the resultsare shown in Figs. 2.1 and 2.2. In addition, we explored the relation-ship between income growth and poverty reduction. Openness, asmeasured by the level of total trade, is positively related to economicgrowth. India dominates this relationship. For the other countries,openness and GDP growth are not as closely related. FDI and GDPgrowth are also positively related, and again the relationship is domi-nated by India.
The level of GDP per capita is also positively related to reduc-tions in the head-count ratio of poverty (Fig. 2.3). The evidence islimited and should be viewed with some caution since it is based ona small sample of poverty observations in South Asia over the pasttwo decades. The extreme examples of Sri Lanka, India, andPakistan demonstrate this relationship. Sri Lanka has historically had
South Asia’s Global Integration 31
b670_Chapter-02.qxd 11/12/2008 11:02 AM Page 31

a higher level of per capita income and also lower poverty ratios,while India and Pakistan have lower levels of per capita incomeand higher poverty ratios. More comprehensive studies of thegrowth-poverty nexus point to more robust results. Hasan andQuibria (2004), for instance, find evidence that growth reducespoverty in East Asia, Latin America, South Asia, and sub-SaharanAfrica. Their estimates show that for South Asia, a 1% increase in percapita income would reduce the incidence of absolute poverty by0.8%. Ravallion and Datt (1996) also note similar poverty-reducingeffects of growth for India.
We also carried out a more formal analysis by applying the modeldeveloped by Dollar and Kraay (2001) to South Asia. Followingthem, we computed similar (but simpler because of data limitations)
32 South Asia: Rising to the Challenge of Globalization
-4
-2
0
2
4
6
8
10
12
0 50 100 150 200 250 300
Total trade (billion USD)
GD
P g
row
th (
%)
Bangladesh India Nepal Pakistan Sri Lanka linear trend
Fig. 2.1 Total Trade and GDP Growth.
Note: Authors’ calculation based on data for 1980–2005. Bangladesh, India,Pakistan, and Sri Lanka cover data for 1980–2005; Nepal, for 1981–2005.Source: World Bank, World Development Indicators Online.
b670_Chapter-02.qxd 11/12/2008 11:02 AM Page 32

growth regressions using lagged per capita GDP, trade, and FDI asexplanatory variables. The following equations were used to estimatethe coefficients:
yct = β0 + β1 • yc, t−k + β2 • Tct + β3 • Ict + vct (2.1)
yct − yc,t−k = β1 • (yc, t−k − yc, t−2k) + β2 • (Tct − Tc,t−k) (2.2)+ β2 • (Ict − Ic,t−k) + (vct − vc,t−k)
where yct is log-level of per capita GDP in country c at time t, yc, t−k isits lag in k years, Tct is the ratio of total trade to GDP, and Ict is thelog of FDI. The variables Tc,t−k and Ic,t−k are the lagged values of trade
South Asia’s Global Integration 33
-6
-4
-2
0
2
4
6
8
10
12
-0.2 0 0.2 0.4 0.6 0.8 1 1.2 1.4
FDI (% of GDP)
GD
P g
row
th (
%)
Bangladesh India Nepal Pakistan Sri Lanka linear trend
Fig. 2.2 Foreign Direct Investment and GDP Growth.
Note: Data for Bangladesh, India, Pakistan, and Sri Lanka are based on figures from1975, 1980, 1985, 1990, and 2000–2004. Data for Nepal are from 1980, 1990,1995, and 2000–2004.Source: UNCTAD FDI statistics online; and World Bank, World DevelopmentIndicators Online.
b670_Chapter-02.qxd 11/12/2008 11:02 AM Page 33

and FDI, respectively. We used a lag of k = 5 years rather than 10because we had fewer observations than Dollar and Kraay (2001).
Equation 2.1 is the standard cross-country growth regression.Equation 2.2 is an alternative specification in difference form to cor-rect for problems of measurement error, omitted variables, and possi-ble endogeneity. Equation 2.2 is a regression of growth on laggedgrowth and on changes in trade and FDI. Table 2.9 shows that theindependent variables are positive and statistically significant inexplaining growth. The lagged per capita GDP variable indicates thatthere is convergence of growth rates since the coefficient is less than 1.The positive relationship between growth and trade and FDI is con-sistent with other findings (Dollar and Kraay, 2001, for example) that
34 South Asia: Rising to the Challenge of Globalization
0
500
1000
1500
2000
2500
3000
3500
4000
0 10 20 30 40 50 60
Poverty Head-count Ratio
GD
P p
er
cap
ita (
cu
rren
t $ P
PP
)
Bangladesh India Nepal Pakistan Sri Lanka trend line
Fig. 2.3 Poverty Head-Count Ratio and Level of Per Capita Income.
PPP = Purchasing Power Parity.Source: Poverty head-count ratios at $1 per day (PPP) from World DevelopmentIndicators database for 1984–2004. Bangladesh 1984, 1989, 1992, 1996, 2000;India 1987, 1993, 2000; Nepal 1985, 1996, 2004; Pakistan 1987, 1991, 1993,1999, 2002; Sri Lanka 1985, 1990, 1996, 2002. GDP per capita from World Bank,World Development Indicators Online.
b670_Chapter-02.qxd 11/12/2008 11:02 AM Page 34

policies, encouraging greater trade openness and investment integra-tion help promote growth.5
South Asia’s Globalization InitiativesSouth Asian countries have taken a number of initiatives to open uptheir economies to international trade in goods and services. There havealso been initiatives to increase participation in international organiza-tions and encourage international migration of labor. Each of theseinitiatives is described in the rest of this section. We begin with inter-national trade initiatives to lower tariff barriers and then move on to
South Asia’s Global Integration 35
5 We also estimated Equation 2.2 by including government-consumption-to-GDPratio, M2, and inflation as controlling variables. The results for trade and FDI were sim-ilar to those reported in Table 2.9, although the FDI coefficient turned out to beinsignificant in one of the difference equations that included government consumptionand inflation. The coefficients for the controlling variables were mostly insignificant.
Table 2.9 Regressions of Per Capita GDP on Trade and Foreign Direct Investment.
Item Equation 2.1 Equation 2.2
Lagged per capita GDP 0.939 0.437(57.84)*** (5.41)***
Trade-to-GDP ratio 0.001 0.001(5.03)*** (2.24)**
FDI 0.017 0.008(6.85)*** (1.82)*
Constant 0.359 0.068(4.49)*** (5.67)***
No. of Observations 118 92
F-statistic 4,053.25 14.20
Adjusted R2 0.991 0.30
Note: Figures in parentheses are t-ratios. Results shown include Bangladesh, India,Nepal, Pakistan, and Sri Lanka.*** Significant at 1%, ** at 5%, * at 10%.Source: Computed from World Development Indicators Online and UNCTAD FDIDatabase online using Stata Package 9.0.
b670_Chapter-02.qxd 11/12/2008 11:02 AM Page 35

a discussion of regional trade agreements. We then examine the effortsmade to participate in international organizations. We also look at theinternational competitiveness of South Asian economies and the role offinancial integration and capital account liberalization in promotingglobalization. Finally, we discuss labor migration policies and initiatives.
Free Trade Agreements
There are three possible ways to focus efforts on lowering barriers tointernational trade in goods and services. First is by granting tradepreferences to all countries unilaterally — the so-called most-favored-nation (MFN) approach. Unilateral lowering of trade barriers is a gen-erous approach to increasing international trade since it does notrequire reciprocity from other countries. A second approach is to enterinto negotiated FTAs with individual countries bilaterally. A thirdapproach is to negotiate preferences as part of an association of nationsthat then negotiates tariff reductions among the member countriesand with other countries or associations. This is the plurilateral FTAapproach. We explore trade agreements between South Asia and EastAsia in Chapter 4, and between countries in South Asia — such as ini-tiatives by the SAARC and the Bay of Bengal Institute forMulti-Sectoral Technical and Economic Cooperation (BIMSTEC)6
countries — in Chapter 5. In this section we focus on FTAs that havebeen negotiated between South Asian and non-Asian countries.
South Asia has signed or is negotiating free trade or preferential tradeagreements with a number of countries outside Asia (see Table 2.10).India and Pakistan have either signed or are negotiating the mostagreements (14 for India and 11 for Pakistan). Only a few had beensigned as of June 2007. Most of these FTAs are with developing coun-tries with large Islamic populations, although Pakistan and Sri Lankaare negotiating pacts with the US. To date, Bangladesh has signed anagreement with the Group of Eight Developing Countries, of which itis also a member. India has signed agreements with Chile and Mercosur
36 South Asia: Rising to the Challenge of Globalization
6 BIMSTEC comprises Bangladesh, Bhutan, India, Myanmar, Nepal, Sri Lanka, andThailand.
b670_Chapter-02.qxd 11/12/2008 11:02 AM Page 36

South Asia’s Global Integration 37
Table 2.10 South Asian Free Trade Agreements with Non-Asian Countries.
Bangladesh • Preferential-Tariff Arrangement — Group of Eight DevelopingCountries (signed)
• Preferential Trade System of the Organization of the IslamicConference (FA/signed/FTA under negotiation)
India • India–Australia Free Trade Agreement (proposed/underconsultation and study)
• India–Chile Preferential Trading Agreement (signed)• India–Colombia Preferential Trading Arrangement
(proposed/under consultation and study)• India–Egypt Preferential Trade Agreement (under negotiation)• India–European Union Free Trade Agreement (proposed/under
consultation and study)• India–Gulf Cooperation Council Free Trade Area (FA signed/
FTA under negotiation)• India–Israel Preferential Trade Agreement (proposed/under
consultation and study)• India–Mauritius Comprehensive Economic Cooperation and
Partnership Agreement (under negotiation)• India–Mercosur Preferential Trade Agreement (signed)• India–Southern African Customs Union Preferential Trade
Agreement (FA signed/FTA under negotiation)• India–Uruguay Preferential Trading Arrangement (proposed/
under consultation and study)• India–Venezuela Preferential Trading Arrangement (proposed/
under consultation and study)• New Zealand–India Free Trade Agreement (proposed/under
consultation and study)• India–Russian Federation Comprehensive Economic Cooperation
Agreement (proposed/under consultation and study)Pakistan • Economic Cooperation Organization Trade Agreement (signed)
• Pakistan–Gulf Cooperation Council Free Trade Agreement(FA signed/FTA under negotiation)
• Pakistan–Iran Preferential Trade Agreement (signed)• Pakistan–Jordan Free Trade Agreement (proposed/under
consultation and study)• Pakistan–Mauritius Preferential Trade Agreement (under
negotiation)• Pakistan–Mercosur Preferential Trade Agreement (FA signed/
FTA under negotiation)
(Continued)
b670_Chapter-02.qxd 11/12/2008 11:02 AM Page 37

(the Southern Common Market). Pakistan has signed agreements withthe Economic Cooperation Organization, the Group of Eight, andIran. Sri Lanka has signed a pact with Iran. The rest are under negoti-ation. Only India is negotiating with a large number of countries thatare not Islamic and outside West Asia. Since most of these FTAs orpreferential trading arrangements (PTAs) are still under negotiation, itwill take some time before their impact on the pattern of South Asiantrade and economic development can be assessed.
International Trade Liberalization
Tariff reduction is the primary way to liberalize international trade,and tariff and nontariff barriers in South Asia have been loweredrather dramatically over the past two decades. Mean tariff rates aresubstantially lower than they were in 1985 — from around 80% ormore in Bangladesh, India, and Pakistan to under 20% in all countriesexcept India (Table 2.11).
38 South Asia: Rising to the Challenge of Globalization
Table 2.10 (Continued)
• Pakistan–Morocco Preferential Trade Agreement (undernegotiation)
• Pakistan–Turkey Preferential Trade Agreement (FA signed/FTAunder negotiation)
• Preferential Tariff Arrangement — Group of Eight DevelopingCountries (signed)
• Preferential Trade System of the Organization of the IslamicConference (FA signed/FTA under negotiation)
• United States–Pakistan Free Trade Agreement (proposed/underconsultation and study)
Sri Lanka • Sri Lanka–Iran Preferential Trade Agreement (signed)• United States–Sri Lanka Free Trade Agreement (proposed/under
consultation and study)
FA = Framework Agreement, FTA = Free Trade Agreement.Note: Bangladesh, Egypt, Indonesia, Iran, Malaysia, Nigeria, Pakistan, and Turkey arein the Group of Eight. The Economic Cooperation Organization comprises Afghanistan,Iran, Pakistan, Tajikistan, and Turkey. The organization of the Islamic Conferencehas 56 Islamic member states.Source: ADB, Asian Regional Integration website: http://www.aric.adb.org.
b670_Chapter-02.qxd 11/12/2008 11:02 AM Page 38

It is hard to assess the amount of protection afforded by NTBssuch as cumbersome procedures, import restrictions, trading monop-olies, quota restrictions, as well as import taxes and restrictive licens-ing of imports. Some of these NTBs have been outlawed by the WorldTrade Organization (WTO), but others are still in effect. Someempirical work by Littellvin (1994) and Deardorff and Stern (1997)suggest that the negative impact of NTBs on international trade isgreater than that of import tariffs. Many other observers think thatNTBs offer more protection than tariffs and that greater effortsshould be made to reduce these barriers further.
Role in Global Organizations
India and South Asia play a major role in global organizations. India isone of the largest developing countries and a member of the Group ofTwenty (G20) and other groups representing developing countries. TheG20 is an informal meeting of the finance ministers and central bankgovernors of 19 countries: Argentina, Australia, Brazil, Canada, thePRC, France, Germany, India, Indonesia, Italy, Japan, Republic ofKorea, Mexico, Russia, Saudi Arabia, South Africa, Turkey, the UnitedKingdom, and the United States, plus the European Union Councilpresidency and the European Central Bank. The managing director of
South Asia’s Global Integration 39
Table 2.11 Mean Tariff Rates in East Asia and South Asia, 1985, 1990, 1995,2000, and 2004 (percentage).
Country 1985 1990 1995 2000 2004
Bangladesh 86.0 102.2 81.2 21.6 16.4India 98.8 79.2 55.2 32.5 28.1Nepal 22.6 22.6 16.1 14.7 14.8Pakistan 78.0 58.8 61.1 46.6 16.1Sri Lanka 29.0 26.9 26.1 9.9 9.8Korea, Rep. of 23.0 13.3 11.5 8.7 9.3Indonesia 18.1 20.3 17.0 8.4 6.4Malaysia 13.5 13.0 12.8 9.2 7.4Philippines 27.6 24.3 27.6 7.6 4.4Thailand 31.2 40.8 36.0 17.0 13.3
Source: Economic Freedom of the World 2006 Annual Report, Chapter 3.
b670_Chapter-02.qxd 11/12/2008 11:02 AM Page 39
the International Monetary Fund (IMF) and the president of the WorldBank, plus the chairs of the International Monetary and FinancialCommittee and Development Committee of the IMF and World Bank,also participate in G20 meetings as ex officio members. The G20 is aninterface between the G7 and the broader global economic community.India’s share in the IMF is second only to that of the PRC among devel-oping countries. However, its share declined slightly to 1.91% in 2006from 1.95%. Shares are adjusted under a new formula to show a coun-try’s relative position in the world economy, as reflected in the opennessof its economy and the size of GDP. Following this formula, it is rec-ommended that India’s share be revised upward in the future. In theUnited Nations, India was an elected member of the UN SecurityCouncil in 1991 and 1992. Other countries in South Asia have alsoserved on the Security Council. Bangladesh was an elected member in2000 and 2001, while Pakistan was an elected member in 2003. In July2005, Brazil, Germany, India, and Japan — known as the Group of Four(G4) — submitted a resolution to the Security Council proposing thatthe council be expanded to include six new permanent non-veto-hold-ing seats and four rotating seats. Debate on this proposal continues inthe UN. India was a founding member of the General Agreement onTariffs and Trade (GATT) and of the WTO. India has also been activelyengaged in different formats within the WTO (G4, G20, G33, CoreGroup on Services, group on processing standards, the “five interestedparties” [FIPS] working to break the deadlock in agriculture) and willcontinue to play a constructive role in pursuing its national interests. Infact, India, along with Brazil, is a representative of the G20 in the FIPS.
International Competitiveness
Increasing international competitiveness is important in enhancingtrade performance and raising incomes. Increased competitivenessmeans that policies to promote exports, lower trade barriers, andopen up the economy are helping to increase the ability of South Asiato compete in international markets. The World CompetitivenessYearbook provides assessments of competitiveness in the global econ-omy over the past decade (Tables 2.12a and 2.12b). Several indicators
40 South Asia: Rising to the Challenge of Globalization
b670_Chapter-02.qxd 11/12/2008 11:02 AM Page 40
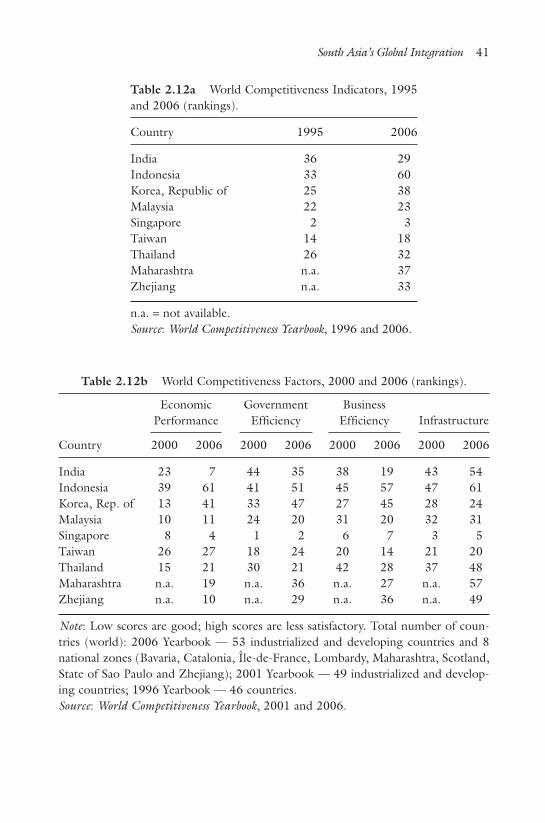
South Asia’s Global Integration 41
Table 2.12a World Competitiveness Indicators, 1995and 2006 (rankings).
Country 1995 2006
India 36 29Indonesia 33 60Korea, Republic of 25 38Malaysia 22 23Singapore 2 3Taiwan 14 18Thailand 26 32Maharashtra n.a. 37Zhejiang n.a. 33
n.a. = not available.Source: World Competitiveness Yearbook, 1996 and 2006.
Table 2.12b World Competitiveness Factors, 2000 and 2006 (rankings).
Country 2000 2006 2000 2006 2000 2006 2000 2006
India 23 7 44 35 38 19 43 54Indonesia 39 61 41 51 45 57 47 61Korea, Rep. of 13 41 33 47 27 45 28 24Malaysia 10 11 24 20 31 20 32 31Singapore 8 4 1 2 6 7 3 5Taiwan 26 27 18 24 20 14 21 20Thailand 15 21 30 21 42 28 37 48Maharashtra n.a. 19 n.a. 36 n.a. 27 n.a. 57Zhejiang n.a. 10 n.a. 29 n.a. 36 n.a. 49
Note: Low scores are good; high scores are less satisfactory. Total number of coun-tries (world): 2006 Yearbook — 53 industrialized and developing countries and 8national zones (Bavaria, Catalonia, Île-de-France, Lombardy, Maharashtra, Scotland,State of Sao Paulo and Zhejiang); 2001 Yearbook — 49 industrialized and develop-ing countries; 1996 Yearbook — 46 countries.Source: World Competitiveness Yearbook, 2001 and 2006.
EconomicPerformance
GovernmentEfficiency
BusinessEfficiency Infrastructure
b670_Chapter-02.qxd 11/12/2008 11:02 AM Page 41

are used to compile an overall index of competitiveness. These includethe four categories of economic performance, government efficiency,business efficiency, and quality of infrastructure. An analysis of thesescores for South Asia in comparison with other Asian economies cangive some guidance for future policy reform. India, which was theonly South Asian economy included, moved up in the rankings byseven places from 1995 to 2006, a strong improvement. In contrast,other Southeast and East Asian economies lost competitiveness andfell in the rankings. The loss of competitiveness in East Asia corre-sponds closely with the intensity of the impact of the financial crisis inSoutheast and East Asia. Indonesia was the worst hit, followed closelyby the Republic of Korea and Thailand. There was less impact onMalaysia, Singapore, and Taiwan.
In 2006, India ranked higher in competitiveness than three EastAsian and Southeast Asian economies: Indonesia, Republic of Korea,and Thailand. This was a dramatic improvement from the rankings in1995, when India placed last among Asian economies. In 2006, theWorld Competitiveness Index also developed rankings for differentnational zones that specialize in the production of industrial exports.There were two zones in Asia, Maharashtra (where Mumbai is located)in India and Zhejiang in southern PRC. Maharashtra compares favor-ably with Zhejiang, slightly lower in the rankings but higher thanIndia as a whole.
In a comparison of the countries in the four areas of economicperformance, government efficiency, business efficiency, and infra-structure, India showed the biggest gains in economic performance,jumping to 7th place in 2006 from 23rd in 2000. Its efficiencyrankings (government and business) also improved, while infrastruc-ture deteriorated. In business efficiency, India now ranks behindSingapore and Taiwan, but ahead of Thailand, Republic of Korea,Malaysia, and Indonesia in East Asia. In 2000, India ranked last ingovernment efficiency. By 2006, it had moved up several notchesahead of Indonesia and Republic of Korea. Maharashtra laggedbehind Zhejiang in the three categories of economic performance,government efficiency, and infrastructure but came out ahead inbusiness efficiency.
42 South Asia: Rising to the Challenge of Globalization
b670_Chapter-02.qxd 11/12/2008 11:02 AM Page 42

The overall results of this global competitiveness survey are encour-aging. The business efficiency ratings reflect a sharp improvement in theinternational competitiveness of Indian businesses. They indicate thatIndia has been partially successful in streamlining business proceduresand can improve even more by undertaking further reforms — reducingbureaucratic procedures and increasing competition — to improve busi-ness and government efficiency. There is scope for improving perform-ance in the other areas, particularly infrastructure. However, once theregulatory environment in India improves and infrastructure bottlenecksare removed, overall efficiency will certainly improve and India will beable to compete effectively in a wide array of goods and service exportmarkets. Compared to the PRC, for example, India has a much longermercantilist and business history and it can exploit this advantage. Othercountries in South Asia also have good business experience and acumenand can use this to develop their export capabilities. On the other hand,the PRC can benefit from India’s experience to improve the efficiency ofits business operations.
International Migration and the Pattern of Remittances
International flows of labor and remittance income are an area wherethere has been limited policy dialogue. Along with rates of overseasmigration, remittance flows are a useful index of labor market inte-gration and are easier to track. The two variables also tend to movetogether. Furthermore, the indices of globalization reported in theprevious section incorporate the level of remittance as a measure oflabor market integration. Labor migrants tend to make up two dis-tinct groups: professionals who migrate for an extended period oreven permanently, and manual and other unskilled and semi-skilledworkers who work overseas for short periods on a contract basis, oftenin the Middle East. The potential contribution of professionals toglobalization is higher since they can bring back skills and educationfrom their overseas experience and even networks that enable them toestablish start-up businesses in their home countries. Returning SouthAsian migrants from the USA and Europe, for example, and the com-munications links developed between them have provided stimulus
South Asia’s Global Integration 43
b670_Chapter-02.qxd 11/12/2008 11:02 AM Page 43

for recent developments in IT, particularly in India and Bangladesh.Aside from the remittance flows that contribute to family income andhelp reduce poverty in the home country, unskilled and semi-skilledworkers may bring back additional work experience that will con-tribute to their labor productivity when they return home.Remittances in South Asia, although relatively flat during the 1980s,are now increasing rapidly (see Table 2.13). The slowdown in eco-nomic growth in the Middle East after the second oil shock in the late1970s and early 1980s lessened the demand for overseas workers. Inthe 1990s, the flow of remittances accelerated dramatically, and by2000 the overall flow had more than tripled in value since 1990.During this decade there was solid growth in income in industrialcountries and some recovery in the Middle East. The demand foroverseas workers thus continued to accelerate in industrial countries.The demand for scientists, doctors, and other health professionalspicked up as the domestic supply of new entrants into these profes-sions in industrial countries failed to keep pace with demand. Thedemand for unskilled and semi-skilled workers also increased as theconstruction industries in the Middle East grew and domestic resi-dents in industrial countries kept away from jobs in these occupations.With the onset of the global slowdown in 2001 and 2002, workers’remittances weakened from lack of growth in demand in industrialcountries and the Middle East.
44 South Asia: Rising to the Challenge of Globalization
Table 2.13 Workers’ Remittances and Receipts (Balance of Payments), 1980, 1985,1990, 1995, 2000, and 2004 ($ million).
Country 1980 1985 1990 1995 2000 2004
Bangladesh 338.7 502.5 778.9 1,201.7 1,958.1 3,572.2India 2,755.7 2,466.9 2,351.9 6,139.0 12,744.9 21,595.1*Nepal 0.0 0.0 0.0 56.8 111.5 792.6Pakistan 2,047.6 2,537.1 2,006.3 1,712.2 1,075.0 3,943.0Sri Lanka 151.7 291.7 400.8 789.8 1,142.3 1,563.9South Asia 5,293.7 5,798.1 5,537.8 9,899.5 17,031.8 9,871.7
*2003 figure.Source: World Bank, World Development Indicators Online.
b670_Chapter-02.qxd 11/12/2008 11:02 AM Page 44

Countries in South Asia have implemented policies for monitor-ing, regulating, and encouraging the flow of workers in both cate-gories of skill. In India efforts are being made to encourage skilledworkers to return home, and measures are also being taken to stream-line the inflow of remittances. One approach to dealing with theseissues is to encourage temporary, instead of permanent, migration.Several industrial countries have developed visas that encourage thismigration route (see Khadria, 2006). Migration policies range fromunregulated regimes (where the migration decisions and flows are leftto the market) to more regulated and state-managed policies. In thecase of regulation, the state establishes a legal framework to controland license the recruitment agencies that hire workers for overseaspositions. These recruitment agencies coordinate with firms andagencies in receiving countries, and the markets do the rest. This isthe typical system in most Asian countries including Bangladesh,India, and Pakistan, where most placements are made by private agen-cies. In some countries, state-managed firms are set up to recruitworkers and subsidies can be given to encourage particular kinds ofmigration. In South Asia, only Pakistan follows this model, whichallows for some private sector participation. In the PRC, the statecontrols the entire migration process (see Waddington, 2003, fordetails).
Future Agenda for Globalization in South AsiaIt will be beneficial for South Asia to further integrate into the globaleconomy. As our analysis has shown, initiatives taken since the 1980sand the 1990s have borne fruit, both in accelerating economicgrowth and reducing poverty. South Asia needs to build on this foun-dation to improve its international competitiveness further and toaccelerate economic growth. There are several ways in which SouthAsia can integrate further into the global community. Many of theseinitiatives relate to international trade in goods and services as well asthe flow of capital. These aspects are covered in the rest of this sec-tion, which deals with reducing trade barriers (including the role ofSAARC), improving international competitiveness, attracting FDI,
South Asia’s Global Integration 45
b670_Chapter-02.qxd 11/12/2008 11:02 AM Page 45

developing new trade agreements, and increasing capital account con-vertibility. There is also a need to address the flow of labor and issuesof financial integration, which are discussed in the second part of thissection.
Further Reduction in Trade Barriers
While tariffs have been reduced in South Asia, they need to be loweredfurther if the region is to stay competitive with East Asia and SoutheastAsia in export markets. The average tariff rates in South Asia are higherthan those in East and Southeast Asia. Furthermore, the USA and otherindustrial countries impose higher tariffs on products from South Asiathan on goods exported from East and Southeast Asia. The effective rateof import duty to the USA (measured as a percentage of customs valueof shipments to the USA) is shown in Table 2.14 for selected countriesin East Asia and South Asia. With the exception of Viet Nam, tariff rateson South Asian products are significantly higher than for other coun-tries. Furthermore, countries that have a free trade agreement with theUSA, including members of the North American Free Trade Agreement(NAFTA), Australia, and Singapore, have duties of less than 1%.
Deeper integration within the South Asian community can be animportant force for globalization as well as further cooperation within
46 South Asia: Rising to the Challenge of Globalization
Table 2.14 Effective Rate of Duty on Importsinto the USA, 2005 (percentage).
Country Effective Duty Rate
Bangladesh 14.7Nepal 8.8Pakistan 10.1Sri Lanka 13.3Indonesia 5.5Philippines 4.0Viet Nam 9.0
Source: Asian Development Bank (2006) and USInternational Trade Commission.
b670_Chapter-02.qxd 11/12/2008 11:02 AM Page 46

South Asia. One way to achieve these objectives is to pursue a global-ization agenda through SAARC. This could complement individualcountry initiatives and would enhance globalization and increase eco-nomic efficiency by reducing high trading costs. There are several areaswhere this is possible. Trade facilitation with the SAFTA treaty can beachieved through harmonized standards, as well as customs proceduresand evaluation methods, and increased efficiency in transporting goodsacross borders and within individual countries. Cost reductions can bedramatic and can even dwarf the gains from tariff reduction. Trade inservices, including the movement of labor, should be part of anexpanded agenda for SAFTA. Illegal migration and human rights viola-tions could be covered, as could a review of migration laws and restric-tions. The removal of constraints on investment flows across borderscan also be addressed, as well as the promotion of investment fromcountries in other regions. One proposal that makes sense is to create acommon investment area that would develop a harmonized investmentpolicy setting out common guidelines for foreign investors. This movewould be in step with the removal of restrictions on investment in stockmarkets, perhaps leading to the setting up of a common stock exchangeunder the auspices of SAARC. Trade negotiations with other regionalgroupings outside Asia should be pursued as well. These groups are alsolooking for closer relationships outside their regions as they grapplewith some of the same problems that face SAARC. Table 2.15 showsthat intra-regional trade has also increased within these groups even asthey try to increase total trade. Generally, with the exception of theCommon Market of Eastern and Southern Africa (COMESA), thesegroups have been able to raise intra-regional trade more than SAARCin the 1990s.
Enhanced International Competitiveness
The overall results of competitiveness surveys reported in Table 2.12aare encouraging. India is becoming more efficient and competitive,particularly in business efficiency. Compared to the PRC, for exam-ple, India has a much longer mercantilist and business history and itcan exploit this advantage in the future. There is scope for more
South Asia’s Global Integration 47
b670_Chapter-02.qxd 11/12/2008 11:02 AM Page 47

improvement, through further reforms in business and governmentefficiency by reducing bureaucratic procedures and increasing compe-tition. On the other hand, the PRC can benefit from India’s experi-ence to improve the efficiency of its business operations. Othercountries in South Asia also have good business know-how and acu-men and can use this to develop their export capabilities.
In increasing competitiveness, infrastructure improvements are crit-ical. The lack of a modern and efficient infrastructure foundation isinhibiting the growth of industry and the private sector in South Asia.The removal of road transportation bottlenecks can be extremely effec-tive in increasing efficiency by reducing costs and time-to-market as wellas facilitating the movement of temporary labor throughout the coun-try. Cross-border links should also be improved through the Asian high-way network and the trans-Asian railway system. These are componentsof the Asian land transportation infrastructure system, which includescapital-to-capital links and connections between industrial centers,
48 South Asia: Rising to the Challenge of Globalization
Table 2.15 Intra-regional Export Shares, 1990 and 2001 (percentage).
Group 1990 2001
Andean group 4.2 11.2Mercosur 8.9 20.8COMESA 6.3 5.2SADC 3.1 10.9UEMOA 12.1 13.5ASEAN/AFTA 19.0 22.4SAARC 3.2 4.9
AFTA = ASEAN Free Trade Area, ASEAN = Association of Southeast AsianNations, COMESA = Common Market of Eastern and Southern Africa,SAARC = South Asian Association for Regional Cooperation, SADC =South African Development Community, UEMOA = West AfricanEconomic and Monetary Union.Note: The Andean group is a South American trade organization withBolivia, Colombia, Ecuador, and Venezuela as members. It created a freetrade area, the Andean Pact, in 1992. Mercosur, the Southern CommonMarket, was created by Argentina, Brazil, Paraguay, and Uruguay in 1991.Source: Mehta and Kumar (2004).
b670_Chapter-02.qxd 11/12/2008 11:02 AM Page 48

agricultural centers, and growth zones, besides connections to major seaand river ports and inland terminals. Some important components ofthis network are the Jamuna bridge in Bangladesh; the removal of tran-sit restrictions between India, Bhutan, Nepal, and Bangladesh; and therehabilitation of the Arakan road linking Myanmar and Bangladesh. Thepower network in India is overloaded and subject to periodic interrup-tions of service, with severe adverse effects on industrial productivity.India’s higher power costs than those of countries in East Asia put itimmediately at a competitive disadvantage. Water supply and sewerage isalso a constraint, as is irrigation water in agriculture. More effective waterpricing in rural areas is a key to more efficient water use in agriculture.In urban areas, access to clean water and proper sewerage is critical.Many lives are lost to dysentery, cholera, and other water-borne diseases.
The implications regarding globalization that flow from the analy-sis of the competitiveness index are somewhat at odds with the glob-alization indices presented earlier, which had South Asia near thebottom in most categories. The most plausible explanation is that thetwo indices measure different aspects of globalization and develop-ment. For the most part, globalization figures capture the macroeco-nomic aspects of development achievements, although there arebroader political and social performance indicators reported. On theother hand, the competitiveness index focuses on a number of eco-nomic characteristics that have to do with economic performance. Thisis the area where India has been doing a better job in recent years. Ifthis pattern continues, the competitiveness index will improve as well.It should be noted, however, that the competitiveness survey resultsapply only to India, though it is likely that other countries in the SouthAsian region have also improved their competitiveness.
Increased Foreign Direct Investment
Additional measures can be adopted to attract FDI. These include avariety of institutional and procedural improvements that candemonstrate the attractiveness of South Asia as an FDI destination.First, measures can be taken to harmonize FDI regulations andincentives to stop a “race to the bottom,” develop regulations to
South Asia’s Global Integration 49
b670_Chapter-02.qxd 11/12/2008 11:02 AM Page 49

stop double taxation, pool experience among South Asian countriesto determine a strategy for attracting FDI into different sectors, andestablish a regional research center devoted to studying the patternand effectiveness of FDI in the region and elsewhere and dissemi-nating the results. Second, a series of procedures can be developedto simplify entry and exit procedures, fast-track approvals of FDIinvestment, allow repatriation of profits, and encourage free flow ofintra-regional FDI.
New Free Trade Agreements
Free trade agreements between South Asia and other countries caninvolve other regional groups and large countries in addition to indi-vidual countries and groups of countries. Among these new initiativescould be agreements with the European Union, NAFTA or the USA,and Mercosur. India has signed agreements with Chile and Mercosurand has several FTAs under consideration with several Latin Americancountries. Sri Lanka and Pakistan are in negotiation with the USA,and India is holding talks with the European Union. Further stepscould be taken to accelerate these negotiations and to begin newnegotiations, perhaps between SAARC and ASEAN or betweenSAARC and the European Union. Bilateral negotiations betweenindividual South Asian countries and these larger groupings are alsopossible. Also, South Asian countries will definitely continue to par-ticipate in ongoing global negotiations of the WTO.
Properly Sequenced Capital Account Convertibility
Capital account liberalization has come under serious scrutiny amongdeveloping countries since the Asian financial crisis. The conventionalwisdom is that capital account convertibility should follow currentaccount convertibility once the preconditions for liberalization are inplace. These conditions would include a flexible exchange rate andappropriate exchange rate policies, acceptable fiscal deficits, restruc-turing and recapitalization of domestic banks, greater domestic com-petition to encourage efficient operation of the financial sector, and
50 South Asia: Rising to the Challenge of Globalization
b670_Chapter-02.qxd 11/12/2008 11:02 AM Page 50

satisfactory macroeconomic and external indicators like inflation, debtservice, and foreign exchange reserve position. There would also haveto be progress in secondary or microeconomic reforms such as bettergovernance, greater transparency and accountability, enhanced com-petition in the productive sectors, and labor reforms.
Despite this wisdom, many East Asian countries deregulated theircapital account early in their reform program (Indonesia did so in theearly 1970s), and the resulting vulnerability eventually precipitatedthe Asian financial crisis. An important lesson for South Asia is, there-fore, to properly sequence capital account liberalization. A pragmaticapproach is necessary. Jadhav (2003) provides an excellent summaryof the current state of capital account liberalization in India. The pri-mary aim of capital account liberalization after the 1991 financial cri-sis was first to gradually liberalize foreign investment and portfolioinvestment inflows. Capital outflows were still controlled. The liber-alization of inflows was considered possible only after some of thepreconditions discussed above were met, namely, low inflation, dereg-ulation of interest rates, and better risk management, auditing, anddisclosure. Fiscal consolidation and reduction of non-performingloans have lagged behind, however.
On the inflow side, FDI is still on a two-track system, where thesecond track has to be approved case by case. Portfolio investmentsare still restricted to certain institutional investors and non-residentIndians (NRIs). Other inflows such as overseas borrowing are con-fined to businesses and development finance institutions; banks areexcluded. There are also ceilings on long-term external borrowing.Short-term external debt is heavily regulated and limited to tradefinance. Short-term debt as a proportion of foreign currency assets isnow less than 10%.
The Government has liberalized capital outflows gradually by lift-ing controls on the convertibility of domestic assets by residents aswell as dollarization of domestic assets. Corporations have the fewestregulations relating to outflows, followed by financial intermediariesand then individuals. Convertibility of assets by individuals is likely tobe low on the list of priorities, however, since there is a fear that ananticipated currency depreciation of the rupee would result in capital
South Asia’s Global Integration 51
b670_Chapter-02.qxd 11/12/2008 11:02 AM Page 51

flight and further rupee depreciation. Since the current rupee moneysupply is four times the level of foreign exchange reserves, rupee assetsare still unlikely to be made fully convertible anytime soon. Residentsare prohibited from dollarizing rupee accounts for the same reason.
Deeper Financial Integration
Harmonization of financial regulations is a primary goal of furtherfinancial integration in South Asia. This should be combined withdeepening of the financial infrastructure and financial markets, per-haps using the ASEAN + 3 Asian Bond Market Initiative of East Asiaas a model. Currently the flow of inter- and intra-regional portfolioinvestments in South Asia is still quite small (see Table 2.16).Investments from NAFTA are the largest single component, at $20billion. Other flows are smaller. Total flows to the region are an
52 South Asia: Rising to the Challenge of Globalization
Table 2.16 Interregional and Intra-regional Portfolio Investments, 2003 ($ billion).
Investment From
East South Rest ofInvestment in NAFTA EU15 Asia Asia the World Total
NAFTA 548 1,784 751 0 1,620 4,703EU15 1,617 6,132 801 0.006 1,452 10,001East Asia 419 376 95 0 159 1,049South Asia 20 12 2 0.008 16 49
(India,Pakistan,Sri Lanka)
Rest of the 858 1,316 585 0.054 487 3,241World
Total Global 3,462 9,620 2,233 0.068 3,246 19,044
NAFTA = North American Free Trade Agreement.Note: EU15 = Austria, Belgium, Denmark, Finland, France, Germany, Greece,Ireland, Italy, Luxembourg, Netherlands, Portugal, Sweden, Spain, and UnitedKingdom. East Asia = People’s Republic of China; Hong Kong; Indonesia; Japan;Republic of Korea; Malaysia; Philippines; Singapore; Thailand; and Viet Nam.Source: International Monetary Fund, Coordinated Portfolio Investments Survey.
b670_Chapter-02.qxd 11/12/2008 11:02 AM Page 52

order of magnitude smaller than flows to East Asia ($49 billion,compared just over $1 trillion to East Asia and $19 trillion in globalflows in 2003). Flows out of South Asia are also close to zero.Outflows of portfolio investment from India are prohibited, and theinvestments of the other countries are very limited — less than a fewmillion dollars.
Integrating further into global money markets requires theregion to explore new financial instruments with a regional as wellas local flavor, including insurance and other financial instrumentsthat would help to reduce the region’s focus on bank lending. Itwould also include developing a region-wide rating agency, a clear-ing and payments system for South Asia, and pension systems, whichare woefully lacking in the region, and strengthening corporategovernance.
As an aside, corporate governance, to the extent that it is relatedto the financial sector, is also essential for financial market develop-ment. India is already well placed compared with other countries inthe Asian region (see Table 2.17) and can build on this foundation asit develops deeper reforms to protect minority shareholders, increasethe transparency of closely held companies, and develop legal channelsfor legal redress for shareholders.
South Asia’s Global Integration 53
Table 2.17 Corporate Governance Ratings, 2000 and 2004.
Country 2000 2004
People’s Republic of China 3.6 4.8Hong Kong, China 7.1 6.7India 5.6 6.2Indonesia 2.9 4.0Korea, Republic of 5.2 5.8Malaysia 3.2 6.0Philippines 2.9 5.0Singapore 7.5 7.5Thailand 2.8 5.3
Note: High scores reflect better corporate governance.Source: Cowen et al. (2006).
b670_Chapter-02.qxd 11/12/2008 11:02 AM Page 53

Migration and Remittance Facilitation
Some migration patterns and remittance flows are amenable to policyreform only after extensive consultation with recipient governments.Many impediments to further migration rest with recipient countriesin Europe, North America, and Australia. Negotiations to enhancepersonal safety and improve working conditions for short-term guestworkers should be intensified on a bilateral basis. Facilitation of remit-tance flows can also be improved. Further integration into the globalinformation and telecommunications labor market can be encouragedand promoted in a number of ways. Giving support to the private sec-tor by upgrading physical infrastructure in service sectors specializingin IT and communications should be a major priority area as thedemand for outsourcing and migration of skilled professionals in theIT industry continues to grow. Better coordination between shiftingjob openings in industrial countries and skill development in SouthAsian countries can be developed by encouraging private sectorinvolvement in IT and communications training in South Asia as wellas facilitating migration programs that allow skilled and professionalworkers to migrate for a year or two and then return to use theirexpertise at home. The key to a successful migration policy is flexibil-ity, allowing competition to flourish while at the same time ensuringprotection of the rights and well-being of migrants. Important com-ponents of the latter are predeparture training and provision of infor-mation, including the person or office to contact to report contractviolations, physical abuse, or other problems or issues. These policiescan be the subject of bilateral and multilateral talks between sourceand host countries in the region and in other regions. Experience insuch negotiations is not extensive. Abella and Lonnroth (1995)report that there are virtually no agreements regarding labor migra-tion between source countries and host countries. Furthermore,internationally agreed standards under the UN InternationalCovenant on Economic, Social, and Cultural Rights have been diffi-cult to enforce for migrants. Host countries are often not interested,and sending country governments have little leverage. To bridge thisgap, the UN adopted a special treaty in 2003 to protect migrants’
54 South Asia: Rising to the Challenge of Globalization
b670_Chapter-02.qxd 11/12/2008 11:02 AM Page 54

rights and privileges. These rights need to be followed up with recip-ient countries, particularly in the Middle East.
ReferencesAbella, M and K Lonnroth (1995). Orderly International Migration of Workers and
Incentives to Stay: Options for Migration to the Arab World — Experience ofReturning Migrants. Japan: United Nations University Press.
Alesina, A, V Grilli and GM Milesi-Ferretti (1994). The Political Economy of CapitalControls. In Capital Mobility: The Impact on Consumption, Investmentand Growth, Leonardo Leiderman and Assaf Razin. Cambridge University Press.pp. 289–321.
Asian Development Bank (2006). Asian Development Outlook 2006.Chandra, A (2001). The Influence of Capital Controls on Long Run Growth: Where
and How Much? North Carolina State University. Mimeo.Cowen, D, R Salgado, H Shaw, L Teo and A Zanello (2006). Financial Integration
in Asia: Recent Developments and Next Steps. Part II. IMF Working PaperWP/06/196.
Deardorff, AV and RM Stern (1997). Measurement of Non-Tariff Barriers.Economics Department Working Paper 179. OECD, Paris.
Dollar, D (1992). Outward-Oriented Developing Economies Really Do Grow MoreRapidly: Evidence from 95 LDCs, 1976–85. Economic Development and CulturalChange, pp. 523–544.
Dollar, D and A Kraay (2001). Trade, Growth, and Poverty. World Bank DiscussionPaper. Washington, DC.
Dreher, A (2005). Does Globalization Affect Growth? Evidence from a New Indexof Globalization. Thurgauer Wirtschaftsinstitut Research Paper Series No. 6.April.
Frankel, JA and D Romer (1996). Trade and Growth: An Empirical Investigation.NBER Working Paper 5476.
Hasan, R and MG Quibria (2004). Industry Matters for Poverty: A Critique ofAgricultural Fundamentalism. Kyklos 57, pp. 253–264.
Heshmati, A (2003). Measurement of a Multidimensional Index of Globalization andIts Impact on Income Inequality. United Nations University Wider Institute ofDevelopment Economics Research Discussion Paper No. 2003/69.
IMD. (1996). The World Competitiveness Yearbook 1996.———. (2001). The World Competitiveness Yearbook 2001.———. (2006). The World Competitiveness Yearbook 2006.Institute of International Finance website. www.iif.comInternational Monetary Fund (2006). Direction of Trade Statistics. CD-ROM.
July.
South Asia’s Global Integration 55
b670_Chapter-02.qxd 11/12/2008 11:02 AM Page 55

Jadhav, N (2003). Capital Account Liberalisation: The Indian Experience. Paper pre-sented at the conference A Tale of Two Giants: India’s and China’s Experiencewith Reform and Growth, New Delhi.
Kearney Inc. (2006). Foreign Policy Magazine Globalization Index 2006. http://www.atkearney.com/.
Khadria, B (2006). Uncharted Contours of a Changing Paradigm: Skilled Migrationand Brain Drain in India. Harvard International Review. http://hir.harvard.edu/articles/print.php?article=1445.
Li, KW, IAJ Pang and MCM Ng (2006). The Impact of Openness and IndigenousFactors on Economic Growth and Globalization among World Economies. APECStudy Center Consortium Conference, Ho Chi Minh City, Viet Nam, 23–24 May.
Littellvin, E (1994). Intra-industry Trade in Asia. International Economic Journal,8(4), Winter.
Mehta, PS and P Kumar (2004). RTAs and South Asia: Options in the Wake of theCancun Fiasco. Australian South Asia Research Center Working Paper 11.
Ravallion M and G Datt (1996). How Important to India’s Poor is the SectoralComposition of Growth? The World Bank Economic Review, 10(1): 1–25.
Rodrik, D (1998). Who Needs Capital Account Convertibility? In Should the IMFPursue Capital Account Convertibility? Essays in International Finance 207, editedby Stanley Fischer, Department of Economics, Princeton University, Princeton,NJ. pp. 55–65.
Waddington, C (2003). International Migration Policies in Asia. Paper presented atthe Regional Conference on Migration, Development and Pro-poor Policy Choicesin Asia, Department for International Development, UK. www.livelihoods.org.
56 South Asia: Rising to the Challenge of Globalization
b670_Chapter-02.qxd 11/12/2008 11:02 AM Page 56

57
Chapter 3
A Comparative Analysis of EconomicPerformance and Policy Reforms
in South Asia and the PRC
IntroductionBoth India, along with its neighbors in South Asia, and the PRC havebeen growing rapidly in the past few years, faster than most otherdeveloping countries in Asia and the rest of the developing world.The fact that these countries have been rapidly raising living standardsfor more than 2 billion people is a major accomplishment to beapplauded. While the PRC has been growing rapidly for more thanthree decades, growth in India and the rest of South Asia has acceler-ated only recently.
It is important to compare the performance and policies of thesetwo mega-economies for several reasons. First, nearly half of theworld’s population has a stake in the ability of both countries to sus-tain high growth rates and raise living standards. Second, each coun-try can benefit from the experience of the other. Both have featuresthat are unique, making mutual dialogue and discussions important.They are both dynamic and at similar stages of economic develop-ment with diverse policy challenges. They both have huge landmasses, diverse climates and geography, similar demands on the envi-ronment, and, of course, large populations.
This chapter explores the importance of policy reforms in thePRC and South Asia. The major premise is that policy does matter.Good policies can help lift rates of income growth and lower poverty.
b670_Chapter-03.qxd 12/12/2008 10:11 AM Page 57

Poor policies retard growth and stall poverty reduction.7 The chain ofevents leading from policy reforms to growth are not the same for alleconomies. Special circumstances that are particular to each economyhave to be analyzed as well. History, government, and institutionsare also important because they serve as the background for policyadjustments.
To get a better grasp of the details of recent economic devel-opment, we begin the chapter with a short review of economic per-formance indicators for South Asia and the PRC. This is followedby a discussion of the reasons why living standards have been risingmuch faster in the PRC than in South Asia. The role of initial con-ditions and the timing and sequencing of policy reforms are high-lighted. The impact of policy reforms on economic performanceand the remaining agenda for policy reforms are discussed in thetwo succeeding sections. The chapter concludes with an analysis offuture growth prospects for South Asia and the PRC.
Comparative Economic PerformancePer Capita Income
The PRC and the economies of South Asia were at comparable levelsof income per capita in 1980 (see Table 3.1). Sri Lanka had the high-est GDP per capita (in constant 2000 US dollars) at $442, followedby Pakistan ($327), Bhutan ($257), Bangladesh ($240), India($224), the PRC ($186), and Nepal ($140). The difference betweenthe South Asian average of $237 and the PRC’s was $51, or about20%. By 2005, the PRC’s per capita GDP was $1,445 and the SouthAsian average was $570. The PRC’s GDP per capita had grown to2.5 times the South Asian average. In a little more than a decade ithad passed all the South Asian economies except Sri Lanka, which itovertook in 1997.
58 South Asia: Rising to the Challenge of Globalization
7 Early on, DeLong (2003) had argued that reforms in India could not be creditedwith higher growth. But now there is ample evidence to refute this view.
b670_Chapter-03.qxd 12/12/2008 10:11 AM Page 58

Growth in Per Capita Income
Per capita income in the PRC and South Asia was between $200 (thePRC, India, and Nepal) and $400 (Sri Lanka) in 1980. By 2006, thePRC’s per capita income was much higher (Fig. 3.1). Growth in percapita income was also substantially higher in the PRC (an average of8.6% per year from 1980 to 2006) than in India (4% for the sameperiod). Growth rates for the other South Asian economies wereslightly lower.
Poverty Head-Count Ratios
The World Bank has collected two measures of poverty — $1 per dayand $2 per day — systematically but intermittently. Pakistan and Nepalhad the best record in reducing poverty in terms of percentage pointreductions. In Pakistan, $1-a-day poverty fell from just below 50% in1987 to 17% in 2000 — a whopping 33 percentage point decline. Suchfigures, however, must be viewed with some caution. There have beenwide divergences in poverty estimates for Pakistan: in the 1990s its$1-per-day poverty ratios declined while its national estimates showedan increase (see ADB, 2004). In Nepal, poverty levels dropped nearly
A Comparative Analysis of Economic Performance and Policy Reforms 59
Table 3.1 GDP Per Capita, 1980, 1985, 1990, 1995, 2000, and 2006 (constant2000 $).
Country 1980 1985 1990 1995 2000 2006
Bangladesh 240.1 255.1 273.3 302.7 352.5 453.6Bhutan 257.0 322.0 463.8 477.7 555.2 1,069.0PRC 186.4 289.7 391.7 658.0 949.2 1,594.9India 223.9 261.1 318.1 373.6 454.1 633.7Maldives n.a. n.a. n.a. 1,661.3 2,151.3 2,811.0Nepal 139.9 158.5 175.7 200.0 224.7 233.8Pakistan 327.4 396.6 461.4 510.4 531.0 622.8Sri Lanka 441.9 523.7 577.2 704.4 843.6 1,075.9
n.a. = not available.Source: World Bank, World Development Indicators Online.
b670_Chapter-03.qxd 12/12/2008 10:11 AM Page 59

16 percentage points over a slightly longer period, from 39.7% in 1985to 24% in 2004. The PRC had the next-best record in reducingpoverty, although starting from a much lower level. The $1-per-dayhead-count poverty ratio in the PRC declined steadily from 28.5% in1987 to 16.6% in 2001 — a decline of nearly 12 percentage points in15 years. India did nearly as well but from a much higher initial level:$1-per-day poverty dropped by 10 percentage points, from 46.3% in1987 to 36% in 2000. In Bangladesh, the ratio hovered around 36%for the decade of the 1990s, increasing from 26.2% in 1984, while inSri Lanka poverty levels were below 10% in 1985 and declined some-what over the next 15 years. Details are given in Table 3.2.
Inflation
The PRC had two bouts of inflation in the late 1980s and mid-1990sas GDP growth shot into double digits, creating strong excess
60 South Asia: Rising to the Challenge of Globalization
0
200
400
600
800
1000
1200
1400
1600
1800
1980
1981
1982
1983
1984
1985
1986
1987
1988
1989
1990
1991
1992
1993
1994
1995
1996
1997
1998
1999
2000
2001
2002
2003
2004
2005
2006
PRC Bangladesh Bhutan India Nepal Pakistan Sri Lanka South Asia
Fig. 3.1 Per Capita GDP, 1980–2006 (constant 2000 $).
Source: World Bank, World Development Indicators Online.
b670_Chapter-03.qxd 12/12/2008 10:11 AM Page 60

demand pressures. Prices fell in 1998, 1999, and 2002, and inflationhas been held in check in recent years. Inflation in India has been rel-atively stable at around 4% for the last 7 years. Previous bouts of infla-tion were experienced after the second oil shock in the early 1980sand in the early and mid-1990s. Pakistan and Sri Lanka also had infla-tionary episodes lasting nearly a decade in the 1990s. Inflation mod-erated for several years in both countries but has increased in the lastcouple of years. Bangladesh has had more stable prices than otherSouth Asian economies except in 1987 and 1995, when inflationsurged to double-digit rates. Nepal’s inflation rate tends to trackprices in India, since there is so much border trade with its southernneighbor.
Exports and International Trade
In a truly amazing reflection of the opening up of the economy in thelast 30 years, the exports of the PRC as a share of GDP increased from6.6% in 1978 to 34% in 2004 (Table 3.3). The increase is all the moreinteresting because large developed open economies such as the USAand Japan have smaller export shares in GDP. In South Asia, Sri Lankahas had the most open economy. This is reflected in its export shareof GDP, which has fluctuated between 25% and 39% for the past30 years. Since 1995, exports have averaged over 35% of GDP. India, acountry comparable in land size, population, and geographic diversity
A Comparative Analysis of Economic Performance and Policy Reforms 61
Table 3.2 Poverty Head-Count Ratio at $1 a Day, in PPP (percentage of population).
Country From (Year) To (Year)
Bangladesh 26.2 (1984) 36.0 (2000)PRC 28.5 (1987) 16.6 (2001)India 46.3 (1987) 36.0 (2000)Nepal 39.7 (1985) 24.1 (2004)Pakistan 49.6 (1987) 17.0 (2002)Sri Lanka 9.4 (1984) 5.8 (2002)
PPP = Purchasing Power Parity.Source: World Bank, World Development Indicators Online.
b670_Chapter-03.qxd 12/12/2008 10:11 AM Page 61

to the PRC, had a much smaller export share, which remained stuckat around 6%–7% of GDP from 1975 to 1990, even dipping to 5.3%in 1986. But since 1992, India’s export share of GDP has nearly dou-bled, from around 10% of GDP to 19% in 2004. Bangladesh followeda similar pattern of export performance as did Pakistan, althoughPakistan’s export share started at a higher 9%–10%, increasing to15%–16% in the later years of the sample period. The sum of exportsand imports exhibits a similar pattern to that of exports (not shownin the table). By 2004 and 2005, trade was nearly 80% of GDP in SriLanka, 35% in Pakistan and Bangladesh, 40% in India, and 46% inNepal, compared to 11% for Bangladesh, 13% for India, 33% forPakistan, and 62% for Sri Lanka in 1975. India and Bangladesh showthe largest increase in openness in South Asia. For the PRC, the rele-vant comparison is 9.2% in 1975 and 65% in 2004, a more than six-fold increase.
Taxes on International Trade
Mean tariff revenues have declined during the reform period alongwith mean tariff rates. Table 3.4 shows that taxes as a percentageof revenue fell from 28% or 29% to 13% in India and Pakistan from
62 South Asia: Rising to the Challenge of Globalization
Table 3.3 Exports of Goods and Services, 1978, 1991, 2004, and 2005 (percent-age of GDP).
Country 1978 1991 2004 2005
Bangladesh 5.6 6.7 15.5 16.1Bhutan n.a. 32.1 28.2 n.a.PRC 6.6 21.0 34.0 n.a.India 6.2 8.6 19.0 n.a.Maldives n.a. n.a. 89.3 n.a.Nepal 10.6 11.5 17.6 16.1Pakistan 9.2 17.0 16.0 15.3Sri Lanka 34.8 28.2 36.4 34.0
n.a. = not available.Source: World Bank, World Development Indicators Online.
b670_Chapter-03.qxd 12/12/2008 10:11 AM Page 62

1990 to 2005, and from 26% to 12% in Sri Lanka. In Nepal the reduc-tions were smaller, while data for Bangladesh cover too short a periodto allow any conclusions to be drawn. Mean tariff rates also fell dra-matically, from close to 50% in the PRC to below 20% in 1999, andfrom over 70% in India and Pakistan to around 30% in 1999. Furtherreductions to the 15% range took place in India between 1999 and2004 (Ahluwalia, 2002). However, customs duties are still higher inSouth Asia than in the PRC and Southeast Asia.
Foreign Direct Investment
FDI inflows into South Asia and the PRC have fluctuated over thepast 30 years in most countries. However, the trend has been stronglyupward. The PRC and India started with comparable levels of FDI in1980 ($57 million and $79 million, respectively). By 2005, FDI flowsto the PRC had exceeded $70 billion, while India had attracted$6.6 billion (Table 3.5). Other countries in South Asia received muchlower inflows, although the inflows have accelerated in the past fewyears. By 2005, Sri Lanka had attracted $272 million, Bangladesh
A Comparative Analysis of Economic Performance and Policy Reforms 63
Table 3.4 Taxes on International Trade, 1990and 2005 (percentage of revenue).
Country 1990 2005*
Bangladesh n.a. 32.6Bhutan 0.2 1.5PRC 9.8 −8.4India 28.6 13.8Maldives 32.7 28.6Nepal 25.6 19.8Pakistan 29.6 13.6Sri Lanka 26.0 11.9
n.a. = not available.* 2004 figures for Bangladesh, Bhutan, and India;2003 for the PRC; 2002 for Sri Lanka.Source: World Bank, World Development IndicatorsOnline.
b670_Chapter-03.qxd 12/12/2008 10:11 AM Page 63

nearly $0.7 billion, and Pakistan over $2 billion. Both the PRC andIndia have also been investing abroad. FDI outflows from the PRChave been quite volatile, ranging from nearly $7 billion in 2001 to$2.8 billion in 2003, and reaching more than $12 billion in 2005.In India, FDI outflows have been rising more steadily, reaching$2.5 billion in 2005.
Fiscal Balance
The World Bank has reported overall budget balances on its WorldDevelopment Indicators Database since 1990 under the heading“cash surplus/deficit.” The difference between the earlier budget bal-ance and this new cash surplus/deficit is lending minus repayments,
64 South Asia: Rising to the Challenge of Globalization
Table 3.5 Foreign Direct Investment Inflows and Outflows, 1980, 1985, 1990,1995, 2000, and 2005 ($ million).
Country 1980 1985 1990 1995 2000 2005
FDI inflowsBangladesh 8.5 −6.7 3.2 1.9 280.4 692.0Bhutan n.a. n.a. 1.6 0.1 −0.1 9.0PRC 57.0 1,956.0 3,487.1 37,520.5 40,714.8 72,406.0India 79.2 106.1 236.7 2,151.0 2,319.0 6,676.0Maldives −0.1 1.2 5.6 7.2 13.0 9.5Nepal 0.3 0.7 5.9 8.0 −0.5 2.4Pakistan 63.6 47.4 250.0 719.0 308.0 2,201.0Sri Lanka 42.9 24.4 43.4 65.0 173.0 272.0
FDI outflowsBangladesh n.a. n.a. 0.5 1.7 2.0 1.9Bhutan n.a. n.a. n.a. n.a. n.a. n.a.PRC — 629.0 830.0 2,000.0 915.8 12,261.2India 4.0 3.0 6.0 119.0 509.0 2,495.0Maldives n.a. n.a. n.a. n.a. n.a. n.a.Nepal n.a. n.a. n.a. n.a. n.a. n.a.Pakistan −4.8 24.8 2.0 0.0 11.0 44.0Sri Lanka n.a. 1.4 0.8 5.6 2.0 38.0
n.a. = not available.Source: UNCTAD FDI Database Online.
b670_Chapter-03.qxd 12/12/2008 10:11 AM Page 64

which appears in another ledger. All the countries in South Asia andthe PRC have been running cash deficits (Table 3.6). As a percentageof GDP these deficits have been in the range of 2%–4% of GDP inIndia; 2.5% in the PRC; 5.5%–6.5% in Pakistan in the 1990s, fallingto 2%–3% after 2001; less than 1% in Bangladesh; and 5%–7% inSri Lanka but increasing to 8% or 9% from 2000 to 2002. The deficitsin Sri Lanka are the most worrisome. They are large and increasing,partly because of defense spending to deal with the Tamil separatistmovement.
Current Account Balance
The PRC’s current account balance has been strongly positive withthe exception of the two periods in the late 1980s and the mid-1990swhen inflation accelerated along with economic growth. Since 1997the balance has fluctuated between 1.3% and 3.6% of GDP. India hasbeen running a current account deficit — up to 2.2% of GDP in 1990and 1.6% in 1995 (Table 3.7). In the 1990s the deficits were inthe range of 1%–1.5% of GDP, lower than in the late 1980s, whenthey were over 2% of GDP in the run-up to the fiscal crisis of 1991.The current account balance in Bangladesh improved in the 1990sand after 2000 with some years of surplus and some small deficits.
A Comparative Analysis of Economic Performance and Policy Reforms 65
Table 3.6 Cash Surplus/Deficit, 1990, 1995, 2000, 2004, and 2005 (percentageof GDP).
Country 1990 1995 2000 2004 2005
Bangladesh n.a. n.a. n.a. −0.7 n.a.Bhutan −5.8 −0.1 −2.4 1.9 n.a.PRC n.a. n.a. n.a. −2.5 n.a.India −3.4 −2.2 −3.9 −3.6 n.a.Maldives −7.5 −6.6 −5.0 −3.5 −5.1Pakistan −2.5 −5.3 −4.1 −2.0 −3.2Sri Lanka −5.2 −7.6 −8.4 −7.6 (2002) n.a.
n.a. = not available.Source: World Bank, World Development Indicators Online.
b670_Chapter-03.qxd 12/12/2008 10:11 AM Page 65

This contrasts with the 1970s and 1980s, when deficits were in excessof 2% in most years and as high as 5% in 1981. Sri Lanka’s deficit hasbeen smaller in the past few years, ranging between 2% and 3% ofGDP. In the 1980s and 1990s, deficits were much higher.
Financial Liberalization
There are several indices of financial liberalization including interestrate deregulation, reduction in the allocation of targeted lending bycommercial banks, and the degree of competition within the bankingsystem. The monetization of the banking system as reflected in theratio of the money supply to GDP is another broad overall measureof economic progress in financial liberalization (see Table 3.8). InSouth Asia, financial liberalization has been slow, despite somechanges in interest rate regulations, directed lending, and increasedbank competition. Money-to-GDP ratios are small and have not beenincreasing very rapidly — in the range of 25%–30% from 1991 to2005 in Nepal, Pakistan, and Sri Lanka. By 2005, the money-to-GDPratio was only 35%–40%. Liberalization has been a bit more success-ful in Bangladesh and India, with larger increases in the money-to-GDP ratio and also higher levels in 2005 of 41.4% in Bangladesh and62.8% in India. In the PRC the increase in the money-to-GDP ratio
66 South Asia: Rising to the Challenge of Globalization
Table 3.7 Current Account Balance, 1980, 1985, 1990, 1995, 2000, and 2004(percentage of GDP).
Country 1980 1985 1990 1995 2000 2004
Bangladesh −3.9 −2.1 −1.3 −2.2 −0.7 −0.5PRC n.a. −3.7 3.4 0.2 1.7 3.6India −1.0 −1.8 −2.2 −1.6 −1.0 1.1Maldives −52.3 −4.3 4.6 −4.6 −8.2 −16.7Nepal −2.0 −4.6 −8.0 −8.1 −2.4 2.9Pakistan −3.7 −3.4 −4.2 −5.5 −0.1 −0.9Sri Lanka −16.3 −7.0 −3.7 −5.9 −6.4 −3.2
n.a. = not available.* 2003 for India.Source: World Bank, World Development Indicators Online.
b670_Chapter-03.qxd 12/12/2008 10:11 AM Page 66

in 2005 was 60% and the ratio of money to GDP was 122.9%, sub-stantially higher than the ratio in South Asia.
Sectoral Share of Employment
The sector shares of employment are not up to date for South Asia,the most recent figures being those for 1990 to 1995 in India andNepal and 2000 or 2002 in the remaining countries. There havebeen shifts out of agriculture and into the service sector in all coun-tries in the region and less of a shift into industry, as Table 3.9shows. Agricultural employment fell most dramatically in Sri Lanka,from 48.7% of the workforce to 34.3%. Declines were less than5 percentage points in Nepal and India and 9 percentage points inPakistan. Employment in industry went down in Bangladesh, India,Pakistan, and Sri Lanka and went up only slightly in Nepal fromvery low levels. The remainder of the shift out of agriculture wasabsorbed by the service sector. In the PRC the story is much thesame. From 1981 to 2002 there was a 6.6% decline in agriculturalemployment and a 0.5% decline in industrial employment, which wasoffset by an 8.6% increase in service sector employment. It is a myth thatindustrial sector growth in the PRC and India was labor-absorbing
A Comparative Analysis of Economic Performance and Policy Reforms 67
Table 3.8 Money and Quasi Money (M2), 1978, 1991, and 2005 (percentageof GDP).
Country 1978 1991 2005
Bangladesh 12.2 22.7 41.4Bhutan n.a. 21.8 46.9PRC 24.1 77.0 122.9India 30.8 40.6 62.8Maldives n.a. 24.0 60.6Nepal 18.9 30.0 38.2Pakistan 36.7 36.1 45.2Sri Lanka 23.9 27.1 35.0
n.a. = not available.Source: World Bank, World Development Indicators Online.
b670_Chapter-03.qxd 12/12/2008 10:11 AM Page 67

68South A
sia: Rising to the C
hallenge of Globalization
Table 3.9 Sectoral Share of Employment (percentage of total employment).
Agriculture Industry Services
Country From (Yr) To (Yr) From (Yr) To (Yr) From (Yr) To (Yr)
Bangladesh 64.9 (1989) 62.1 (2000) 15.4 (1989) 10.3 (2000) 14.8 (1989) 23.5 (2000)PRC 68.7 (1980) 44.1 (2002) 18.2 (1980) 17.7 (2002) 11.7 (1980) 16.1 (2002)India 69.1 (1990) 66.7 (1995) 13.6 (1990) 12.9 (1995) 17.3 (1990) 20.3 (1995)Maldives 25.2 (1990) 13.7 (2000) 22.4 (1990) 19.0 (2000) 48.5 (1990) 50.2 (2000)Nepal 83.3 (1990) 78.5 (1995) 2.3 (1990) 5.5 (1995) 13.7 (1990) 21.0 (1995)Pakistan 52.7 (1980) 42.1 (2002) 20.3 (1980) 20.8 (2002) 26.8 (1980) 37.1 (2002)Sri Lanka 45.9 (1981) 34.3 (2003) 18.6 (1981) 23.4 (2003) 29.3 (1981) 38.7 (2003)
Source: World Bank, World Development Indicators Online.
b670_Chapter-03.qxd 12/12/2008 10:11 AM Page 68

and consistent with the relatively slow change in value added in theindustrial sector.
International Reserves
The PRC has been rapidly building up its foreign exchange reservesin recent years (see Table 3.10). In 30 years, reserves increased morethan 40-fold (Dowling, 2008). By the end of 2006, reserves exceeded$1 trillion. In 1977, at the start of the reform period, foreign reserveswere just $2.3 billion. The buildup of reserves in India has not beenas rapid. From modest levels at the start of reform in the mid-1980s,reserves had grown to more than $170 billion by 2006. Foreignexchange reserves have been growing for some of the other countriesin South Asia as well. Several countries hold reserves that are sub-stantially larger than required as a precaution against a fall in exportsor to maintain liquidity. The PRC’s reserves in 2006 were equal to15 months of imports (Economist, 2006), compared to an internationalbenchmark of 3 months. Reserves were also six times the level ofshort-term debt. In South Asia, India’s reserves in terms of monthsof imports are also quite high. They were equivalent to 12 months of
A Comparative Analysis of Economic Performance and Policy Reforms 69
Table 3.10 Total Reserves minus Gold, 1980, 1985, 1990, 1995, 2000, and2006 ($ million).
Country 1980 1985 1990 1995 2000 2006
Bangladesh 299.7 336.5 628.7 2,339.7 1,486.0 3,805.6Bhutan n.a. 53.3 88.8 130.5 317.6 545.3PRC 2,545.2 12,728.1 29,586.2 75,376.7 168,278.0 1,068,493.0India 6,943.9 6,420.4 1,521.0 17,921.8 37,902.2 170,738.0Maldives 1.0 4.6 24.4 48.0 122.8 231.4Nepal 182.8 56.0 295.3 586.4 945.4 1,499.0*Pakistan 495.8 807.5 295.9 1,732.8 1,513.4 11,543.1Sri Lanka 245.5 451.2 422.9 2,087.7 1,039.0 2,836.7
n.a. = not available.* 2005 for Nepal.Source: World Bank, World Development Indicators Online.
b670_Chapter-03.qxd 12/12/2008 10:11 AM Page 69

imports in 2003 and are even higher now. Reserves in Pakistan andNepal are equivalent to 5 months and 8 months of imports, respec-tively. Other countries have the equivalent of less than 3 months ofimports in reserves.
Labor Force Participation Rates
One aspect of differences in cultural and religious preferences isreflected on large differences in labor force participation, particularlyamong women. Labor force participation rates are lower in SouthAsia than in the PRC. The International Labour Organization (ILO)estimates overall labor force participation rates in South Asia to bearound 60%. Only a small number of women are in the labor force,although the figures are rising.
Education and Health
Life expectancy has increased at different rates in South Asia and thePRC (see Table 3.11). In South Asia, Nepal and Bangladesh had thelowest life expectancy in 1980 of around 48 years, followed by Indiaand Pakistan at around 55 years. Sri Lanka had a much higher lifeexpectancy of 67.6 years, somewhat higher than the PRC’s 66.8.
70 South Asia: Rising to the Challenge of Globalization
Table 3.11 Total Life Expectancy at Birth, 1980 and2004 (years).
Country 1980 2004
Bangladesh 48.8 63.5Bhutan 44.8 63.5PRC 66.8 71.4India 54.2 63.5Maldives 56.1 67.2Nepal 48.4 62.2Pakistan 55.1 64.9Sri Lanka 67.6 74.4
Source: World Bank, World Development Indicators Online.
b670_Chapter-03.qxd 12/12/2008 10:11 AM Page 70

Twenty-five years later, life expectancy had increased by about14 years in Nepal and Bangladesh and 9–10 years in India and Pakistan.Starting from a higher level, gains in Sri Lanka and PRC were lower.Still, life expectancy in these two countries was not much lowerthan the levels in Organisation for Economic Cooperation andDevelopment (OECD) countries — 77 in the USA and 78 in theUnited Kingdom. Sri Lanka ranked 78th in the world in 2006, aheadof all the Southeast Asian countries. Infant mortality (see Table 3.12)was high in 1980 and remained high in South Asia relative to theindustrialized countries in 2004 and 2005. However, declines weresubstantial in Bangladesh and Nepal, while there were smaller gains inPakistan and Sri Lanka. The result for Pakistan is a bit disturbing. Itstarted at about the same level as India but made significantly lessprogress in the 25 years after the start of reforms. Sri Lanka and thePRC made smaller absolute gains in reducing infant mortality fromalready relatively low rates. Sri Lanka ranks 84th out of 225 countrieslisted on the Central Intelligence Agency website, lower than Russiaand most other developing countries in Asia. Literacy rates increasedfrom already high levels in Sri Lanka and the PRC, while progressfrom lower levels was made in other countries (see Table 3.13). ThePRC and Sri Lanka achieved more than 90% literacy by 2004, from67% and 85%, respectively, in 1990. Less than 50% of the population
A Comparative Analysis of Economic Performance and Policy Reforms 71
Table 3.12 Infant Mortality Rate, 1980 and 2004 (per1,000 live births).
Country 1980 2004
Bangladesh 129 56.4Bhutan 135 67.4PRC 49 26.0India 113 61.6Maldives 115 35.4Nepal 133 58.6Pakistan 110 80.2Sri Lanka 36 12.0
Source: World Bank, World Development Indicators Online.
b670_Chapter-03.qxd 12/12/2008 10:11 AM Page 71

is literate in the remaining countries in South Asia except India, wherethe literacy rate is now 61%. While this is a distinct improvement fromthe 20%–30% in 1980, these countries still have a long way to gobefore they have a highly literate population and labor force.Bangladesh ranks 165th and Nepal 159th out of 175 countries sur-veyed by the United Nations Development Program (UNDP) for its2006 Human Development Report.
World Share of GDP
From just under 7% of world GDP in 1980, by 2005 the PRC andSouth Asia had increased their share to 21.4% (using purchasingpower parity [PPP] weights). The PRC’s share of world GDPincreased to 15.4%, and India’s to 6.0%. The PRC and India startedoff on an equal footing in the late 1970s and 1980s. At the beginningof the reform period, the PRC and India had about the same share ofworld GDP — 3.5% and 3.3%, respectively (Table 3.14).
Governance
Good governance can be broadly defined as a strong commitment to therule of law, effective government and regulation, control of corruption,
72 South Asia: Rising to the Challenge of Globalization
Table 3.13 Total Adult Literacy Rate, 1990 and 2004(percentage of people 15 and above).
Country 1990 2004
Bangladesh 34.2 n.a.PRC 78.3 90.9India 49.3 61.0Maldives 94.8 96.3Nepal 30.4 48.6Pakistan 35.4 49.9Sri Lanka 88.7 90.7
n.a. = not available.Source: World Bank, World Development Indicators Online.
b670_Chapter-03.qxd 12/12/2008 10:11 AM Page 72

and an attractive investment climate. It can also include political sta-bility and the absence of violence, and the extent to which citizens areable to participate in selecting their government, as well as freedomof expression and a free media. Many of these indicators have beendeveloped in the past decade by the World Bank. Summary statisticsare given in Appendix 3.2. South Asia scores relatively low on politi-cal stability and violence. Domestic unrest in Sri Lanka and tensionsin Pakistan with Afghanistan and India over Kashmir, along with theMao rebels in Nepal, keep scores in the region far below the worldaverage and also well below scores for East Asia. Voice and accounta-bility scores are higher. India has the highest score, although it is stillonly a bit above the mean, followed by Sri Lanka and Bangladesh.Less democratic systems in Pakistan and Nepal result in lower scores.There are no strong trends in either of these variables within theregion over the past decade. Government effectiveness is high inBhutan and the Maldives. It has been improving in India, althoughthe country still scores low relative to East Asia and just above theworld average of 50. Aside from Sri Lanka, where effectiveness hasdeteriorated somewhat in the past few years (to a ranking of 40), theother countries in the region received low marks ranging from 15 forNepal to 21 for Bangladesh (where effectiveness has deteriorated) andPakistan (which ranked 34th in 2005). The ability of the government
A Comparative Analysis of Economic Performance and Policy Reforms 73
Table 3.14 Share of World GDP (in PPP), 1980, 1990, 2000, and 2005 (percentage).
Country 1980 1990 2000 2005
Bangladesh 0.38 0.40 0.47 0.50Bhutan 0.00 0.00 0.00 0.01PRC 3.45 6.07 11.83 15.41India 3.34 4.26 5.35 5.95Maldives 0.00 0.00 0.00 0.00Nepal 0.05 0.06 0.07 0.06Pakistan 0.45 0.58 0.62 0.66Sri Lanka 0.11 0.12 0.14 0.14
PPP = Purchasing Power Parity.Source: International Monetary Fund, World Economic Outlook Database Online.
b670_Chapter-03.qxd 12/12/2008 10:11 AM Page 73

to formulate sound policies is highest in Sri Lanka, where the indexhas been trending upward somewhat, followed by Maldives and India.The other countries have lower ratings. There has been substantialimprovement in Bangladesh, some progress in Nepal, and littleprogress in Pakistan. The rule-of-law variable, which reflects theextent to which people have confidence in and abide by the rulesof society, including the quality of the policy and the judicial system,has been trending downward in Bangladesh, Nepal, Pakistan, andSri Lanka. It has remained relatively stable in India. For the regionas a whole, the variable is below the world average. The control-of-corruption variable, which means control over the extent to whichpublic power is exercised for private gain and includes both pettyand extensive corruption, is highest, for Bhutan, the Maldives, andSri Lanka followed by India, meaning that corruption is lowest inthose countries. The other countries have lower scores. Bangladeshrecorded a dramatic drop in 2003, suggesting an increase in cor-ruption, and has remained at a very low level (less than 10) forthe past 2 years. The variable has also declined in Nepal and Pakistan.The region’s scores are below the world average and lower thanEast Asia’s.
In summary, for all indicators of governance, South Asia scoreslower than other regions and, with some exceptions, has notimproved significantly in the past decade. In the PRC, voice andaccountability are in the lowest decile while the political stability vari-able averaged around 40 over the 10-year sample period. This ishigher than the average for South Asia but still below the world aver-age and East Asia’s average. The rating of government effectivenesshas fallen over the decade from over 60 to 52, while regulatory qual-ity has fluctuated around 40, in the same range as India’s. The rule-of-law variable is lower than in India and fell from 47 in 2002 to 40in 2005. Finally, corruption has increased quite dramatically. Theindex has fallen continuously, from 60 in 1996 to 30.5 in 2005.Corruption is also high in East Asia with the exception of HongKong, China; Singapore; and Taiwan. Even if these countries andJapan were included, the index for East Asia would still be lower thanthe world average.
74 South Asia: Rising to the Challenge of Globalization
b670_Chapter-03.qxd 12/12/2008 10:11 AM Page 74

Raising Living Standards in the PRCand South AsiaIt is generally agreed that the PRC has been more successful thanSouth Asia in raising living standards. Looking at the level of GDP percapita, we noted in the previous section that the PRC began thereform period with a lower per capita income than all the countries inSouth Asia with the exception of Nepal. By 2005 its per capita incomewas more than twice as high as that of all of South Asia, with theexception of Sri Lanka. Furthermore, poverty reduction has beenmore dramatic and human development indicators have improvedmore rapidly.
There are two general reasons why the PRC has been doing betterat raising living standards. The first is the set of initial conditions thatprevailed in the PRC and South Asia at the start of the reform process.The second is the policy environment and policy changes that wereadopted and implemented during the reform process. In particular, thedesign of policies and their sequencing are critical to understanding thenature and dynamics of the growth trajectory that followed. We beginthis section with a discussion of initial conditions. For the PRC, reformsbegan in 1978 following the landmark speech by Deng Xiaoping inDecember, when he announced a new open-door policy. In India, ini-tial reforms began in the mid-1980s and intensified in the early 1990s.In the other South Asia countries, reform process in South Asia alsodates to the 1980s and the 1990s. We begin our discussion of initialconditions with these benchmark dates in mind.
Initial Conditions
There were a number of similarities and differences in the initial con-ditions in South Asia and the PRC at the beginning of the reformperiod. These geographic regions — among the world’s largest as wellas its most populous — have diverse climates and topography. Withintheir boundaries live the bulk of the world’s poor, with low per capitaincomes particularly at the start of the period. But these two were alsodifferent in many ways.
A Comparative Analysis of Economic Performance and Policy Reforms 75
b670_Chapter-03.qxd 12/12/2008 10:11 AM Page 75

Form of Government
The PRC is a communist state. There is no private property, there areno popular elections for public officials, and the Government is con-trolled by the Communist party. In contrast, the major countries inSouth Asia are democracies with duly elected government officials.These differences in political systems are reflected in the ability todevelop and implement policies and, hence, have a direct impact oneconomic growth and development.
Size of the State Sector
The size of the state sector differs from country to country, depend-ing on the form of government and historical precedents for the rela-tionship between the private and public sectors. In the PRC, theState’s share of industrial activity was 57% in 1992, more than adecade after reforms began. Before that the state sector’s share wasprobably close to 100%. The agricultural sector was fully controlledby the state before reforms began and collectivization ended in 1978.The state sector’s share in agriculture was minimal by the late 1980s.Data on the service sector have been collected only recently, since thissector did not exist under the Soviet accounting scheme, which wasformerly used by the PRC. Overall, we would guess that the state sec-tor in 1978 was close to 100% of total output. In India in 2002, aftera decade of reforms, the state sector’s share of output was 35%. At thestart of reforms, it was undoubtedly much higher, probably as muchas 50%. In other countries in South Asia, the size of the state sectorwas also significant, although firm estimates of the proportion ofGDP at the start of the reform era could not be found.
World Share of GDP
As noted earlier, at the start of the reform period the PRC and Indiahad about the same share of world GDP — 3.5% and 3.3%, respec-tively, using PPP weights (Table 3.14). This share increases about apercentage point to 4.3% of global GDP when the rest of South Asiais added.
76 South Asia: Rising to the Challenge of Globalization
b670_Chapter-03.qxd 12/12/2008 10:11 AM Page 76

Investment Rates
The PRC had gross capital formation rates of more than 35% of GDPin 18 of the 27 years since reforms began in 1978, and more than 30%in the remaining 9 years. Investment rates have been substantiallylower in South Asia, averaging around 24% in India and Sri Lankasince 1985 and somewhat lower for Pakistan and Bangladesh. Thisamounts to a sustained investment rate that is at least a third higherin the PRC than in South Asia. Table 3.15 shows capital formation asa share of output in these countries.
Literacy and Health
Sri Lanka aside, literacy, life expectancy, and infant mortalityrates were low at the start of the reform period in South Asia(Tables 3.11–3.13). Life expectancy at birth in 1980 was 48 inNepal, 49 in Bangladesh, 54 in India, and 55 in Pakistan. The PRCand Sri Lanka had substantially higher rates, at 67 and 68, respec-tively. Infant mortality tells a similar story. Infant mortality wasmore than 100 per 1,000 live births in all of South Asia exceptSri Lanka, where it was 35. The PRC had a slightly higher levelof 49. Adult literacy in 1980 was less than 30% in Bangladesh,
A Comparative Analysis of Economic Performance and Policy Reforms 77
Table 3.15 Gross Capital Formation, 1980, 1985, 1990, 1995, 2000, and 2005(percentage of GDP).
Country 1980 1985 1990 1995 2000 2005
Bangladesh 14.4 16.3 17.1 19.1 23.9 24.4Bhutan 31.0 42.8 32.5 45.7 47.4 61.0*PRC 35.2 37.8 34.7 39.3 32.8 38.7*India 18.7 23.7 24.1 26.5 24.2 30.1*Maldives n.a. n.a. n.a. 31.3 26.3 34.0*Nepal 18.3 22.6 18.1 25.2 24.3 25.7Pakistan 18.5 18.3 18.9 18.5 17.4 16.8Sri Lanka 33.7 22.2 22.6 25.7 28.0 26.2
*2004 figures.Source: World Bank, World Development Indicators Online.
b670_Chapter-03.qxd 12/12/2008 10:11 AM Page 77

Nepal, and Pakistan and 41% in India. In the PRC, it was 67%, andin Sri Lanka, 85%.
Labor Force Participation Rates
Cultural and religious differences manifest themselves in large differencesin labor force participation, especially by women. Hence, labor force par-ticipation is lower in South Asia than in the PRC. The ILO estimates thatoverall labor force participation rates in South Asia are around 60%.Women in the labor force constitute a small number, although the figuresare rising. As a proxy for labor force participation, the ILO compiles aseries for the economically active population. These figures are consistentwith the 60% figure in 1980 (61.9% in India, 66% in Nepal, 58% inPakistan, and 61% in Sri Lanka) (Table 3.16). Participation rates arehigher in Bangladesh, despite its Islamic population, perhaps becausewomen in poor families have to work. In the PRC, on the other hand,women have higher participation in the labor force, raising the rate of theeconomically active population to around 80% in 1980.
Composition of GDP
Before reforms were introduced in the 1980s and the 1990s, thepoorer countries of Asia were still dominated by agriculture, although
78 South Asia: Rising to the Challenge of Globalization
Table 3.16 Economically Active Population, Age 15 and above, 1980, 1985,1990, 1995, 2000, and 2005 (percentage).
Country 1980 1985 1990 1995 2000 2005
Bangladesh 77.3 77.9 76.3 72.9 71.1 69.8Bhutan 60.7 60.5 60.0 59.3 60.3 63.4PRC 79.5 79.0 79.2 79.0 77.8 75.7India 61.9 61.6 61.2 60.5 59.2 58.5Maldives 51.0 52.4 49.9 51.8 55.4 60.1Nepal 66.0 65.2 64.1 63.4 63.6 63.6Pakistan 58.0 58.7 57.9 57.1 57.6 58.8Sri Lanka 61.2 60.1 62.9 56.4 57.1 56.4
Source: World Bank, World Development Indicators Online.
b670_Chapter-03.qxd 12/12/2008 10:11 AM Page 78

not to the same extent as they were in the early years after World War II.In 1980, the poorest countries, particularly Nepal, had the largestagricultural sectors (61.8%). Bangladesh, India, and the PRC weregrouped fairly closely, with agricultural shares of GDP in the 30%range (see Fig. 3.2). Pakistan and Sri Lanka had slightly lower shares.This is because both countries had developed an outward-lookingtrade policy and shifted toward labor-intensive industries earlier thanthe rest of South Asia. In the industrial sector (see Fig. 3.2) the SouthAsian countries had GDP shares of between 20% (Bangladesh) and30% (Sri Lanka). Pakistan and India had nearly identical shares of24%–25%. The PRC was the outlier, with an industrial share of closeto 50%. However, this may be an overstatement resulting from meas-urement error, since services associated with industrial developmentwere probably underreported. Nevertheless, even in this early periodit is likely that the PRC still had a larger industrial sector than thecountries of South Asia.
A Comparative Analysis of Economic Performance and Policy Reforms 79
Fig. 3.2 Share of Value Added in GDP, 1980 (percentage).
Source: World Bank, World Development Indicators Online.
b670_Chapter-03.qxd 12/12/2008 10:11 AM Page 79

Policies
The PRC and South Asia had to undergo economic reform to takefull advantage of their resource endowments in the developmentprocess and to improve standards of living. Both the PRC and SouthAsia realized that the policy environment in the countries of East Asiawas much more conducive to rapid growth than their own economicregimes. In the PRC, central planning had not led to efficient use ofresources or sustainable development and less poverty. The moveaway from the central planning model began with agriculture andgradually continued in other sectors of the economy, grafting market-oriented reforms and policies onto a system that still contained a largestate sector.
India had been following a Soviet-style system with capitalistcomponents featuring a large state sector, and inward-looking tradeand industrial policies within a socialist market framework. As reformswere put in place, there was a spirit of liberalization and private sec-tor initiatives, although the basic philosophy of balancing the privateand public sectors remained on center stage. On balance, the reformsin the PRC were more comprehensive and wider-ranging than thosein India. In this section we look first at the design and sequencing ofpolicy reforms in the PRC and South Asia and then draw some com-parisons. In the next section we discuss how effective the reformswere, and in the section after that, we go into the impact of policyreforms on the indicators of economic development discussed above.
PRC
Reforms in agriculture and industry took center stage at the startof the reform process in the PRC. This facilitated the development ofrelatively efficient commodity markets and the encouragement ofquick supply responses by helping to establish market-oriented enter-prises capable of responding to market incentives. Macroeconomicreforms and other microeconomic reforms were undertaken later,sometimes in response to distortions and bottlenecks that resultedfrom reforms in the productive sectors. Therefore, we consider real
80 South Asia: Rising to the Challenge of Globalization
b670_Chapter-03.qxd 12/12/2008 10:11 AM Page 80

sector reforms first, followed by a discussion of other microeconomicand macroeconomic reforms.
Agriculture
In 1978 the PRC began to reform the agriculture sector with the twinobjectives of increasing the supply of agricultural products and reducingpoverty. Historically, agricultural collectives had output quotas that weresold at predetermined prices. There were few incentives for increasingproductivity, innovating, or increasing output. Output growth in agri-culture stagnated and rural poverty was high. To reform the sector, thePRC began replacing these large agricultural collectives with smallerunits and introducing a mixed system where farmers sold a set amountto the state at controlled prices. Anything above this quota could be soldin the market to other buyers at prices responsive to market forces. Landtenure rights under the new system could be transferred from one farmerto another. These reforms led to a surge in agricultural output growth,from 2.7% per year from 1970 to 1978 (Table 3.17) to more than 7%from 1979 to 1984, before slowing to 3%–4% from 1985 to 2005.
Industry
In the early 1980s, the focus of reforms shifted to rural light industry,which began to absorb labor released by productivity improvements
A Comparative Analysis of Economic Performance and Policy Reforms 81
Table 3.17 Sectoral Output Growth in the PRC (percentage).
Item 1970–1978 1979–1984 1985–1995 1996–2000 2001–2005
GDP growth 4.9 8.5 9.7 8.2 9.5Agriculture 2.7 7.1 4.0 3.4 3.9Industry 6.8 8.2 12.8 9.6 10.7Non-farm rural n.a. 12.3 24.1 14.0 n.a.
enterprises(TVEs)
n.a. = not available, TVEs = township and village enterprises.Source: Anderson (2003) and Asian Development Bank (2006).
b670_Chapter-03.qxd 12/12/2008 10:11 AM Page 81

in agriculture. These industries were small and medium scale and wereowned by local communities. These non-farm rural enterprises arecommonly known as township and village enterprises (TVEs). Theoutput of TVEs increased by 12.3% from 1979 to 1984, and grewmore rapidly, by more than 24%, from 1985 to 1995, before slowingto 14% from 1996 to 2000 (see Table 3.17). TVEs operate outsidethe web of price and output controls that circumscribe the activitiesof state enterprises. They contribute more than 50% of industrial out-put, 30% of GDP, and more than 50% of exports. There are 22 millionTVEs across the PRC, generally employing fewer than 100 workers.The importance of TVEs began to wane as more private enterprisesand greater emphasis on foreign trade developed with the formationof special economic zones (SEZs).
Industrial reform in the PRC reflected the continued retention ofa large and mostly inefficient state sector operating side by side witha more efficient private sector. The latter comprised TVEs and lateron jointly-owned companies with extensive foreign participation. Thestate-owned enterprises (SOEs) were still heavily subsidized, while thenewly competitive (both internationally and domestically) private sec-tor was not. This was a pragmatic and cautious approach to marketliberalization, particularly when contrasted with the approach takenby counterpart socialist transition economies in Eastern Europe. Thiscautious approach was evident in foreign and commercial policy aswell. In addition to the SEZs, export promotion policies includeddecentralization of foreign trade companies, export retention, andforeign exchange contracting schemes.
Trade
The main concern of international trade reform was the developmentof SEZs and the relaxation of export and import tariffs in these zonesto facilitate international trade and to attract FDI. The Governmentestablished SEZs in several southern provinces in 1980 includingShenzhen, Zhuhai, and Shantou in Guangdong Province, andXiamen in Fujian Province. It also designated the entire province ofHainan as an SEZ. In 1984, the PRC further opened 14 coastal cities
82 South Asia: Rising to the Challenge of Globalization
b670_Chapter-03.qxd 12/12/2008 10:11 AM Page 82

to overseas investment, and in 1985 it extended the open economiczones of the Yangtze River Delta, Pearl River Delta, the Xiamen-Zhangzhou-Quanzhou Triangle in south Fujian Province, theShandong Peninsula and the Liaodong Peninsula, Hebei, andGuanzxi into an open coastal belt. In 1990 the PRC further openedthe Pudong New Zone in Shanghai to overseas investment includingmore cities in the Yangtze River valley. In 1992 this area was furtherexpanded to include all the capital cities of inland provinces andautonomous regions. In addition, 15 free trade zones and 32 state-level economic and development zones were opened, as well as53 industrial development zones. These SEZs had different rules andregulations for tariffs on imports and exports and as such constitutedextensive reforms of the international trade regime. Basically, exportand import taxes were eliminated for goods produced in SEZs toincrease their export competitiveness. In the rest of the country tar-iffs were lowered. Taxes on trade as a share of exports and imports fellto a low of 1% by the end of the 1990s although the mean tariff rateremained a relatively high 17.5% in 1999. The capital account remainsclosed and foreign exchange transactions are regulated.
The development of inland cities has been a further step in SEZdevelopment designed to link the coastal areas with inland areas viariver transport. The Government has invested significant resources indeveloping and improving the infrastructure within and in support ofthe SEZs. Businesses that locate in the SEZs are afforded tax breaksand waiver of import and export taxes and other restrictions. TheSEZs have been a spectacular success in achieving their stated pur-pose, namely, to attract FDI and to develop export platforms for avariety of industries. They have also attracted new technology andmanagerial expertise as foreign firms have brought these into theSEZs. In the case of the Pudong New Zone, the State also permitsthe zone to open financial institutions and run tertiary industries. ThePudong area has also spearheaded capital and skill-intensive industriesin automobiles, microelectronics, household electrical appliances,biomedicine, and optical, mechanical, and electrical products.
The development of SEZs and the foreign investment they haveattracted have sustained rapid growth in production and exports for
A Comparative Analysis of Economic Performance and Policy Reforms 83
b670_Chapter-03.qxd 12/12/2008 10:11 AM Page 83

the past 25 years. About half of the country’s exports are from for-eign-funded enterprises, primarily in the SEZs in the southernprovinces. FDI has grown, from almost nothing in 1980 to more than$50 billion annually in 2003. The stock of FDI is about 35% of GDP.The upturn in FDI began in earnest in the early 1990s and continuedat an unrelenting pace until the Asian financial crisis, when it dippeda bit, only to resume its upward trend in 2000.
Exchange Rate
For most of the reform period, the PRC followed a fixed exchangerate policy with the renminbi tied to the US dollar. After pressurefrom the USA and other OECD countries, the PRC revalued its cur-rency by 2% in July 2005 and moved to a managed float based onmarket supply and demand with reference to a basket of currencies.Since then the renminbi has not been tied to the US dollar and hasbeen appreciating gradually. While exchange rates in South Asia aremarket-determined, there are elements of a managed float arrange-ment as currency values are still not permitted to fluctuate freely.
Public Enterprise
The state sector dominated the PRC economy at the start of thereform period. Since then, there have been consistent efforts to boostthe role of the private sector while downsizing the state sector.Progress has been slow, however, primarily because labor shedding,which accompanies the streamlining of public sector enterprises, cre-ates an additional pool of unemployed. This creates potential socialtension and also requires an increase in state support. The alternativestrategy that has been followed by and large is to slowly privatizeviable SOEs while not expanding the remaining SOEs and lettingemployment shrink with retirement. The output share of SOEs hasfallen and so has employment in SOEs relative to the private sector(Table 3.18). In the future, further reform of small and medium-sizedSOEs would involve further privatization and restructuring. TheWorld Bank notes that small and medium SOEs should be culled from
84 South Asia: Rising to the Challenge of Globalization
b670_Chapter-03.qxd 12/12/2008 10:11 AM Page 84

the SOE portfolio. Half of these (about 150,000) could be sold asviable businesses and the rest could be liquidated or their assets sold.
Labor Markets
Wage rates are either administered by the Government, in the case ofSOEs, or freely determined by markets in the private sector and inSEZs. There are no trade unions and labor is free to move within thelocal labor market. However, migration between provinces is still con-trolled, although these movements have been somewhat relaxed aslabor shortages have arisen in the rapidly growing coastal provinces.There is no shortage of workers willing to move from the interior tothe more rapidly-growing industrial centers around Shanghai,Shenzhen, and other cities where labor-intensive manufactured goodsare being produced and exported and where wages are substantiallyhigher. Migration from rural to urban areas is a prominent feature ofmost models of economic development and figures prominently inthe experience of East and Southeast Asia. Lewis (1954) and Fei andRanis (1961) feature the movement of low-productivity labor fromthe rural sector to more productive employment in the urban sector.Such movement raises the productivity of both the rural sector, aspopulation movements raise the productivity of the remaining work-ers, and the urban sector, where the new migrants earn more moneythan they did previously working on the farm. Such rural-to-urbanmigration tends to bring wages in the two sectors into equilibrium,although a disparity remains because urban workers typically havemore capital to work with and are more highly skilled and educated.
A Comparative Analysis of Economic Performance and Policy Reforms 85
Table 3.18 Industrial Output Share, by Form of Ownership, 1980, 1984, 1988,1992, 1996, and 2002 (percentage).
Form of Ownership 1980 1984 1988 1992 1996 2002
State-owned 80.2 75.8 68.2 61.6 43.2 30.0Collective 19.8 24.2 28.9 29.2 31.3 29.0Foreign — — 1.0 7.1 18.5 34.0
Source: Central Bureau of Statistics, PRC.
b670_Chapter-03.qxd 12/12/2008 10:11 AM Page 85

In both industrialized and developing countries the gap between ruraland urban standards of living measured by per capita income differ-entials would be a factor of 1.5–2 times. In the PRC these differen-tials are substantially higher, as much as 6 times (Whalley and Zhang,1997).
In the PRC, a set of historical circumstances has created a situa-tion where this natural flow of labor, which contributes to overall eco-nomic efficiency, has been interrupted. The household registrationsystem, hukou, which was installed as a regulation in 1958, requiresthat all changes of residence have to be registered with and approvedby both origin and destination governments.
This policy effectively restricted rural-to-urban migration to thosewho were willing to risk breaking the law. As the pressure to migrateincreased, particularly after the growth in agricultural output between1978 and 1983, peasants no longer had to report for their daily workschedules to the collectives since these had been dismantled. With therise of TVEs, rural workers were allowed to move to small towns towork. In fact, during the mid-1980s rural enterprises provided anaverage of 10.8 million jobs per year (Whalley and Zhang, 1997).
Nevertheless, over the next two decades, from 1985 to 2005, therate of rural-to-urban migration did not increase beyond 0.25% yearly.Failure to obtain hukou certificates prevented rural migrants fromacquiring any of the perquisites available to legitimate urban resi-dents, including children’s education, housing, and other social ben-efits. They were often employed in the construction industry andwere provided temporary housing by their employer. Because theirstatus was so tenuous, most migrants never established permanentresidence and many came to be known as the “floating” population,moving backward and forward between rural and urban locationsdepending on the availability of work and other personal factors.
In view of all of the hardships and uncertainties they face, manypotential migrants simply elect not to migrate, despite the higher wagesthey could earn in the city. The barriers to migration have imposed asubstantial deadweight loss on the economy and created a social situ-ation where urban residents have higher incomes and more benefitsthan those living in rural areas, including more social spending for
86 South Asia: Rising to the Challenge of Globalization
b670_Chapter-03.qxd 12/12/2008 10:11 AM Page 86

health and education. The disparity in living standards and incomecreates further divisions in the social fabric of the communist system.Social tension, crime, and protests by farmers and other rural resi-dents have increased. Yet, despite these problems, the hukou systemremains intact.
Fiscal Reform
The shift to more private enterprise entailed adjustments in govern-ment budgets. The PRC’s revenue share in GDP fell sharply fromnearly 35% in 1978 to 18.5% in 1991 and a large fiscal deficit devel-oped. However, inflation remained low. Savings rates also increased asfarmers became self-sufficient. Furthermore, the TVEs were discour-aged from borrowing from the State and encouraged to finance theirinvestment projects themselves. Real interest rates were positive asinflation rates were generally held in check aside from two bouts ofinflation in the late 1980s and mid-1990s. To cushion the movementtoward more market orientation in the non-state sector, theGovernment was able to maintain support of traditional SOEs, whichwere less efficient yet still necessary components of the industrial sec-tor makeup, supplying a variety of heavy manufactures and energy aswell as providing employment to millions of workers.
Financial Sector Reforms
The PRC’s financial system is dominated by four state-owned com-mercial banks, which account for the vast majority of financial activityand bank lending. These banks were created in the 1980s as part ofthe economic reform program when the central bank function wasseparated from commercial banking. Besides the four commercialbanks, the financial system consists of the central bank (People’s Bankof China), three policy banks that provide funds to the centralGovernment and also finance grain procurement, and several smallregional banks and rural credit cooperatives. The four commercialbanks are wholly owned by the State, while the other banks are ownedby state entities such as SOEs or local governments. Until 1998, the
A Comparative Analysis of Economic Performance and Policy Reforms 87
b670_Chapter-03.qxd 12/12/2008 10:11 AM Page 87

four commercial banks served as the financial arm of the SOEs.Lending to non-state firms has accounted for a small proportion ofthe loan portfolio of these banks. Credit plans were issued by the cen-tral bank to the commercial banks and their regional offices in coop-eration with enterprises and the government planning agencies.Because most private firms were not part of the planning apparatus,they did not submit investment plans and many non-state firms weretherefore excluded from access to credit from the four state banks.Interest rates were also managed to favor SOEs. Working capital loansto non-state firms carried 20% higher interest than similar loans toSOEs. In recent years, interest rates have become more flexible,although SOEs still have an advantage over private firms. This systemof control and credit allocation to SOEs has created a credit crunchfor domestic private firms including TVEs. The squeeze on lendingtightened in the late 1980s and early 1990s. According to Park andSehrt (2001), loans to collectives, TVEs, and private firms accountedfor 18% of new loans by the four state banks and only 5% in 1995.Private firms have received little support from the rapidly growingequity market. Even in the late 1990s, after the supposed liberaliza-tion of the Shanghai and Shenzhen stock exchanges, only about 1%were non-state firms. Because of these systematic distortions in lend-ing to favor SOEs, it is not surprising that savings from labor com-pensation and loans from friends and relatives were the mostimportant source of funds, according to surveys of private firms.There was also probably substantial borrowing from the informalcurb market, which charged much higher rates than the formal sector.
Interest rates for large foreign currency loans have been decon-trolled to some extent, and deposits and the interest rate structurehave been simplified. However, other interest rates, including thosefor checking and savings accounts, have not yet begun to be liberal-ized (US Department of Commerce, Commercial Service website). Itis not surprising that many loans were non-performing. The officialestimate of non-performing loans (NPLs) in the four state banks for1998 was 25%, of which about 20% was considered non-recoverable.Outside estimates put the figure even higher. Besides the fact thatmany loans to SOEs were not commercially viable, the size of the
88 South Asia: Rising to the Challenge of Globalization
b670_Chapter-03.qxd 12/12/2008 10:11 AM Page 88

NPLs also reflects the social obligations that the SOEs were expectedto fulfill, including education, housing, and health expenditures.
Despite the continued strong hand of the central Government,there are signs that banks are beginning to respond to market signals.Some banks in the provinces, where the private sector is strong, aremore willing to lend to larger private firms. There has been somegrowth as well in the financing of home mortgages. Asset manage-ment companies are also beginning to repackage NPLs and sell themto investors.
As noted, the financial system is highly controlled and politicizedand the stock market has been used to support SOEs. In addition, theGovernment has not been able to provide a transparent regulatoryapparatus that deals with potential agency problems between borrow-ers and lenders. A key feature of this transformation of the financialsystem is the recognition of the legitimacy of private firms and theiraccess to bank loans, as well as the ability of the banking system toevaluate lending options against market criteria. There is a clear con-sensus among most economists that financial sector reforms have seri-ously lagged behind reforms in the real sector. This is primarilybecause of the refusal of the State to relinquish control and ownershipof the banking system.
The reform of the financial sector goes beyond bank ownershipand the relaxation of regulations that have created financial repressionand resource misallocation. The PRC’s weak fiscal capacity is also aresult of the inability of the Government to find a viable solution tothe provision of social services formerly supplied by SOEs. By relin-quishing lending to unviable SOEs and by developing an alternativesystem for financing these expenditures, the Government could beginto effectively deal with pressing social sector issues.
South Asia
Rethinking of economic policy in India began in the mid-1980s as itbecame clear that the policy regime was not working. This regime wasbased on a Soviet-type model characterized by import substitutionand a dominant public sector, which placed many restrictions on the
A Comparative Analysis of Economic Performance and Policy Reforms 89
b670_Chapter-03.qxd 12/12/2008 10:11 AM Page 89

private sector. Policy reforms introduced in 1991 recognized a needto change the model by reducing government controls, providingincentives to invigorate the private sector, and lowering barriers totrade to promote integration with the global economy. The reformswere gradual, as required by a pluralistic democracy — perhaps moregradual than many reformers would have liked but necessary to gaina political consensus for the policy changes. The details of the reformsare discussed in the following sections and described in more detail inthe attached comprehensive table (Appendix 3.1). Reforms pro-ceeded broadly on several fronts. First, controls on the private sectorwere relaxed or removed. Industrial licensing controls were abolishedand areas previously reserved for the public sector were opened up.Less progress was made in eliminating restrictions on entry into areasreserved for small-scale industry. This policy was originally designedto protect small producers. It now keeps large, labor-intensive firmsout of sectors where they have international comparative advantage.The second step was to open the economy to foreign trade by dis-mantling quantitative restrictions (QRs) in the form of importlicenses, reducing tariffs and customs duties, and introducing a flexi-ble exchange rate regime that made the local industry more compet-itive in global markets. Tariffs were brought down, but not as muchas in other competitors in the PRC and Southeast Asia. Third, foreigninvestment was expedited through simplified approval procedures andencouragement for the actual implementation of projects approved.Fourth, portfolio investment was encouraged by allowing the partic-ipation of foreign institutional investors in Indian equities. Fifth, pricecontrols were abolished in several key industries and revised to moreapproximate market rates in others. Sixth, labor market controls werereviewed but not changed significantly. The present laws discourageentrepreneurs from investing in labor-intensive, export-orientedindustries because it introduces unnecessary rigidities in hiring prac-tices. Seventh, financial sector reforms were introduced to deregulateinterest rates, increase prudential control and capital adequacy, andencourage greater competition by allowing more private and foreignbanks to operate. Eighth, some progress has been made in raising theefficiency and profitability of SOEs, although public sector reforms
90 South Asia: Rising to the Challenge of Globalization
b670_Chapter-03.qxd 12/12/2008 10:11 AM Page 90

have been minimal as loss-making public enterprises have not beenrestructured.
We discuss individual sectors more closely and incorporate reformsundertaken by other South Asian countries the 1980s and the 1990sbelow (Appendix 3.1).
Fiscal Reforms and Public Resources Management
Value-added taxes (VAT) were introduced in several countries andexcise taxes were revamped to resemble VAT in others as part of thereform agenda in the 1990s. In Pakistan, the only country without aVAT-type system, the coverage of sales taxes was expanded. However,it was not until 2004 when a general sales tax similar to VAT wasintroduced. In India, VAT was introduced in 2005. Marginal tax rateson personal income were lowered in several countries from 1990 to1997. This also included expanding the coverage of income and salestaxes and simplifying tax codes. Octroi taxes on goods sold in otherstates, which amount to double taxation and create distortions inresource allocation, have slowly been eliminated in India and Nepal,where they were more widely used than in other parts of South Asia.Improvements in tax administration, including computerization, wereintroduced in several countries. In some instances (in Bangladesh andSri Lanka), subsidies for power and fuels were reduced, and utility andenergy prices raised. However, subsidies were granted to the powersector in India and to petroleum products in Sri Lanka.
Financial Sector
The financial sector in India consists of the Reserve Bank of India,274 commercial banks (223 of which are publicly owned), and24 foreign banks. Foreign banks account for only 7% of total commer-cial bank assets but 40% of foreign exchange transactions and 25% ofthe government securities market. The Reserve Bank exercises a gooddeal of control over commercial banks including interest rate controlsand directed lending to key sectors. Foreign banks are not allowed tohave local customers, and their ownership of local banks is restricted
A Comparative Analysis of Economic Performance and Policy Reforms 91
b670_Chapter-03.qxd 12/12/2008 10:11 AM Page 91

to 5%. Forty percent of loans by commercial banks (both private andpublicly owned) are earmarked for priority sectors including agricul-ture, small businesses, and exporters. Foreign banks are also subjectto earmarking, but only up to 32% of loans. Caps on rural lending anddeposit rates have made the banking business unattractive in ruralareas because of the high transaction costs and collateral require-ments. There are also ceilings on earnings from deposits, as well ascontrols on interest rates charged to borrowers and non-residentIndian accounts. The reserve requirement is now close to the statu-tory minimum of 3%, having fallen from more than 10% a decade ago.Lowering the reserve requirement reduces the implicit tax on thebanking system and promotes economic efficiency.
Restrictions imposed by the Reserve Bank of India, such as thestatutory liquidity ratio (SLR), cash reserve ratio (CCR), interest ratecontrols, and directed credit, have contributed to the financial repres-sion of the banking system. This was an important means of financingpublic expenditures in India. There has been some liberalization sincethe early 1990s. The Government and the Reserve Bank have carriedout reforms that have improved prudential regulation, efficiency ofbank operations, and scrutiny of loan applications. The CCR and theSLR have been lowered, reducing the implicit tax on the banking sys-tem and improving bank efficiency. The rates of interest on governmentdebt have therefore also been lowered — an indirect incentive to accu-mulate public debt. Nevertheless, commercial banks still hold a largeproportion of government debt and these holdings preempt lending tothe private sector. Repressive policies in the financial sector also allowthe Government to finance public sector deficits at lower rates of infla-tion than would be possible in a financially integrated economy.
The banking system does not have a large amount of bad debt.The level of net non-performing loans is estimated at less than 3% ofoutstanding net loans in 2004/2005 (International Monetary Fund2005, Table 1.1) and about double that for gross loans. Nevertheless,the banking system in India is still highly risk-averse, and lending tothe industrial sector has been weak. Currently, nearly 40% of the assetsof the banking system are held in government bonds, far above thestatutory requirement of 25%. The corporate sector also holds a large
92 South Asia: Rising to the Challenge of Globalization
b670_Chapter-03.qxd 12/12/2008 10:11 AM Page 92

volume of government bonds and, together with bank holdings, thiscontinues to restrict borrowing investment in the industrial sector.
Financial repression of a similar nature also exists in the othercountries of South Asia. There are capital controls in all other coun-tries, and while the nature and extent of financial controls differs fromcountry to country, the financial systems in Bangladesh, Nepal,Pakistan, and Sri Lanka have many features in common with those inIndia.
Against this background we can summarize recent financial sectorpolicy developments in South Asia. From 1990 to 1997 there was ageneral liberalization of the financial sector in the region. Thisincluded interest rate deregulation, increased competition throughthe entry of more private and foreign banks, reduction in requiredcredit to priority sectors, and introduction of open-market operationsby the central bank. Stock markets were established in some countriesor opened to foreign investors, and regulations were strengthened inothers. Interest rate deregulation took place in Bangladesh and Indiaand open-market operations were introduced in Nepal and Pakistanin the early 1990s. Private banking rules were relaxed and private andforeign banks were allowed to establish and expand operations inBangladesh, India, Nepal, Pakistan, and Sri Lanka. There was reducedlending to priority sectors in Bangladesh and India. The stockexchange in Sri Lanka was opened to foreign investors and a creditinformation bureau was established in the country. The securityexchange board in India was strengthened.
Since 1998, measures have been taken to strengthen financial sys-tems and prudential standards, reduce insider lending, increase capi-tal adequacy ratios, and adopt international best-practice standards forthe banking system. Interest rates have also been further deregulatedand targeted lending has been reduced. Measures to increase trans-parency and reduce NPLs were adopted in Bangladesh and India.Plans were made to implement Basel II standards in Bangladesh andIndia, and to generally raise regulatory standards in Pakistan and SriLanka. Central banks in Bangladesh and Nepal were strengthened andgiven greater autonomy. Administered interest rates were abolished inIndia.
A Comparative Analysis of Economic Performance and Policy Reforms 93
b670_Chapter-03.qxd 12/12/2008 10:11 AM Page 93

Trade
Before liberalization, the trade regimes in South Asia were inward-oriented. Taxes on trade were high and QRs to protect domesticindustries were widespread. After liberalization in the early 1990s, thefollowing steps were taken. From 1990 to 1997, QRs and tariffs werereduced. QRs on most products were removed in Bangladesh. Tariffrates were reduced in all countries in South Asia and import licensingwas liberalized in Nepal, Pakistan, and Sri Lanka through the removalof negative lists or abolished for some products. In addition, exportincentive systems were strengthened in Nepal and Pakistan. From1998 to 2005, tariffs were further reduced in Bangladesh, India,Pakistan, and Sri Lanka, and QRs on all products were removed inIndia.
Exchange Rate
Exchange rates in all South Asian economies are quasi-market-determined, although Nepal maintains a peg to the Indian rupee. Allcountries still have current account convertibility except Pakistan,which has a few restrictions. Managed float was replaced by a market-based exchange rate in Pakistan and Sri Lanka in 2001 and inBangladesh in 2003. India retains a managed float, which is respon-sive to market conditions. None of the South Asian countries havefree capital account convertibility.
Agriculture
Some success has been achieved in reducing or eliminating subsidiesin Bangladesh and Nepal, but large subsidies still exist in India andPakistan and to a lesser extent in Sri Lanka. Land reform has pro-ceeded slowly in general. In Bangladesh there was some land reformin the 1980s. Little progress has been made in India, Nepal, andSri Lanka. Poor infrastructure is generally still a problem in theregion. More public investment is needed in irrigation and extension,as well as rural roads and watershed management. There has been
94 South Asia: Rising to the Challenge of Globalization
b670_Chapter-03.qxd 12/12/2008 10:11 AM Page 94

some initiative to increase crop diversification in Pakistan. In Indiaimplicit subsidies to agriculture are draining resources from the stategovernments. More rational pricing of water and electricity wouldreduce these subsidies, and the resources thus freed up could be investedin agriculture and rural infrastructure. Adjustments in exchange ratesalso make agricultural exports more competitive and stimulate thegrowth of agro-processing industries. Restrictions on domestic tradein agricultural products have also been removed, and those on agri-cultural exports have been reduced.
Industry
Generally, the reform in industrial policies has been quicker in someareas than in others. Industrial licenses were abolished in most sectorsin Bangladesh, India, and Nepal in the early years of the reform, from1990 to 1997. They had been eliminated earlier in Sri Lanka. Foreigninvestment regulations were liberalized in all countries in South Asia —in the 1990s in some countries, and since 2000 in others. Foreigninvestment ownership was liberalized further in India in 2004.Privatization of state-owned enterprises has proceeded slowly inBangladesh, India, and Nepal and more quickly in Sri Lanka. InPakistan a privatization policy was approved in 1994 and the govern-ment privatized its interest in the petroleum industry in 2002. Powerand telecoms were later deregulated and partially privatized in 2003.Independent regulatory agencies in oil and gas were also established.Some banks, electric utilities, and telecom companies were privatizedrecently. In Sri Lanka, the petroleum sector was liberalized in 2003.Economic zones were established in India in 2004 to promoteexports.
Public Administration
Generally, the reform of government departments and public agen-cies has been slow throughout South Asia. In India there has beensome retrenchment and restructuring in the public sector to improveefficiency. In Nepal, the number of ministries has been reduced
A Comparative Analysis of Economic Performance and Policy Reforms 95
b670_Chapter-03.qxd 12/12/2008 10:11 AM Page 95

and some civil servants have been retrenched. The devolution ofpublic sector responsibilities to the provinces continues in Pakistanand progress has been made in separating accounting and auditfunctions. Sri Lanka imposed a freeze on public sector hiring in2003. However, the new government created many new positionsa year later. Computerization has proceeded slowly, and bureaucra-cies are still overstaffed. In India there has been some progress injudicial reform and the decentralization of the health and educa-tion sectors.
Labor Markets
More flexible labor laws are needed throughout South Asia, butlittle progress has been made in streamlining regulations and pro-viding a framework for hiring and firing. While several countriesare considering ordinances and new regulations, they have not yetpassed any concrete legislation. The World Bank index of employ-ment rigidity compiled in 2005 shows that South Asia still hasrelatively rigid employment markets. India’s is the most rigid (seeTable 3.19), followed by the employment markets in Nepal, Pakistan,and Sri Lanka. Bangladesh has the least rigid labor market. Among
96 South Asia: Rising to the Challenge of Globalization
Table 3.19 Rigidity of Labor Markets Indices, 2005.
Difficulty-of- Rigidity-of- Difficulty-of- Rigidity-of-Country Hiring Index Hours Index Firing Index Employment Index
Bangladesh 11 40 20 24Bhutan 78 60 0 46PRC 11 40 40 30India 56 40 90 62Maldives 0 20 0 7Nepal 22 20 90 44Pakistan 67 40 30 46Sri Lanka 0 40 80 40
0 = least rigid, to 100 = most rigid.Source: World Bank and IFC (2006).
b670_Chapter-03.qxd 12/12/2008 10:11 AM Page 96

the major economies, India has the most rigid labor market when itcomes to firing, while Pakistan’s labor market is the most rigid whenit comes to hiring. The PRC’s labor market is less rigid than SouthAsia’s except for the Bangladesh labor market. India, Nepal, and SriLanka also have extremely high indices of difficulty in firing employ-ees. These indices are much higher than those in Bangladesh,Pakistan, and the PRC. Labor market rigidities are also present inthe hiring index, where India and Pakistan rank highest, followed byNepal, Bangladesh, the PRC, and Sri Lanka. Data for earlier yearsare not available, so it is difficult to judge whether progress has beenmade in reducing these rigidities, although the lack of new legislationsuggests that these problems are deep-seated. An updated DoingBusiness study by the World Bank in 2007 focusing on South Asiaechoes the need for more flexible labor market regulations. Greaterflexibility can be achieved by simplifying procedures and cutting themandated period for redundancy dismissal, as well as removing timelimits on term contracts.
Private Investment in Infrastructure
There are pressing infrastructure needs throughout South Asia. Poorinfrastructure inhibits the ability to attract FDI and build exportpotential. Although there have been implementation problems, Indiahas experimented with private sector involvement in the power andtelecom sectors. Ahluwalia (n.d.) argues for the need for a better pol-icy framework before private sector investments in these and othersectors can be effectively used. Recent initiatives to use excess inter-national reserves to fund infrastructure development have been sug-gested by the Prime Minister but are still in the early stages ofimplementation. There has been significant infrastructure spendingfor specific projects by rich industrialists including Mukesh and AnilAmbani (reportedly the second- and third-richest people in India)and Tusi Tanti (the eighth-richest). There has also been some inflowof borrowed funds from Japan through ICICI, the biggest Indianbank. ADB has generally argued for greater infrastructure spending inSouth Asia.
A Comparative Analysis of Economic Performance and Policy Reforms 97
b670_Chapter-03.qxd 12/12/2008 10:11 AM Page 97

Impact of Policy ReformsTo evaluate the success of policy reforms, we consider the changes insome of the performance variables reviewed at the start of this chap-ter over the reform period.
Per Capita Income and Growth in Per Capita Income
How much of the acceleration in growth in per capita income can beattributed to the shift in policies that occurred in India and the PRCduring the reform periods 1990–2005 (for India) and 1978–2005(for the PRC)? While we do not know this for a fact, it is plausiblethat most of the acceleration came as a result of policy changes thatimproved economic efficiency and moved resources from less to moreproductive uses.
One way to look at this question is to compare growth rates betweencomparable periods before the reforms (see Table 3.20). In the PRCthe growth rate of income in the 15 years before reforms from 1963to 1978 averaged 7.7%, compared with 9.7% from 1978 to 2005 —an average gain of 2% per year. In India, comparisons between the1976–1990 and 1991–2005 periods show a gain of 1.1% per year,from 4.9% to 6%. Hence, growth rates in both countries acceleratedafter reforms. In India, growth was more rapid in the first 5 years afterreform than in the next 5 years, and growth has accelerated furthersince 2000.
It is difficult to say how much of this growth was the result ofreforms and the increases in efficiency that resulted from the reforms.Certainly some of the growth was the result of higher saving andinvestment rates, FDI, and perhaps increases in total factor produc-tivity, which arose from the shift of resources to export industries andaway from less productive agriculture. However, these improvementswere, in turn, primarily due to a more conducive and open policyenvironment in both the PRC and India. In the rest of South Asia,gains in GDP growth during the reform period were less impressive.Growth rates accelerated slightly in Nepal and Sri Lanka, and fell by2% in Pakistan.
98 South Asia: Rising to the Challenge of Globalization
b670_Chapter-03.qxd 12/12/2008 10:11 AM Page 98

Governance
The indicators of governance compiled by the World Bank over thepast decade show limited improvement in governance in South Asiaand the PRC (see Appendix 3.2). Despite a shift toward marketliberalization, South Asia is still over-regulated. Permits and licens-ing fees hamper business start-ups and increase costs. The tax sys-tems remain complex, and the collection process can cost more thanthe taxes collected. Export and import clearances are long andcostly, particularly for perishables; time-bound delivery schedulesare not met. NTBs still restrict trade and import tariffs are stillhigher than in East Asia. Government effectiveness is inhibited bythe still highly bureaucratic nature of governments in South Asia.Ministries and government agencies are sometimes charged withsimilar and overlapping responsibilities. There are also shortages of
A Comparative Analysis of Economic Performance and Policy Reforms 99
Table 3.20 Average Growth in GDP and Per Capita GDP (percentage).
Country 1963–1977 1978–2005 1976–1990 1991–2005
GDP growthBangladesh — — 3.9 5.0PRC 7.7 9.7 — —India — — 4.9 6.0Maldives — — — 6.5Nepal — — 4.0 4.3Pakistan — — 6.3 4.3Sri Lanka — — 4.6 4.8
Per capita GDP growthBangladesh — — 1.5 2.8PRC 5.2 8.5 — —India — — 2.7 4.2Maldives — — n.a. 3.7Nepal — — 1.6 1.9Pakistan — — 3.3 1.7Sri Lanka — — 3.0 3.8
n.a. = not available.Source: World Bank, World Development Indicators Online.
b670_Chapter-03.qxd 12/12/2008 10:11 AM Page 99

properly trained and competent technical staff to design and imple-ment effective policies.
In the PRC, the effectiveness of reform in governance has beenlimited. As noted at the start of this chapter, voice and accountabilityis low and not improving. Government control of the media is stillpervasive and has extended to the Internet. Government effectivenesshas fallen for several reasons, including the lack of devolution of powerto the provinces and the inability to control the actions of local gov-ernments, along with the continued inefficiency of SOEs. The rule oflaw needs improvement, although some progress is being made inreducing the arbitrariness of the legal process. Perhaps people arebecoming more aware of the shortcomings of the judicial process, andthis awareness has biased responses to these questions. Corruptionindices, including those of Transparency International as well as theWorld Bank, have increased over time. Policy pronouncements havebeen strongly against corruption. There have also been highly publi-cized convictions of wrongdoers. All these measures, however, do notseem to have had the desired effect.
Cost of Doing Business
South Asia and the PRC do not differ dramatically in the cost ofdoing business and trading (see Table 3.21). More proceduresare required to start a business in the PRC than anywhere in SouthAsia, but the elapsed time is shorter in the PRC than in India andSri Lanka. Licensing is also arduous, and more so in the PRC thanin South Asia, requiring more procedures and long delays. Inter-national trade is more efficient in the PRC: only a few days, andfewer documents, are required to export and import. Contracts arealso quite cumbersome to enforce, although slightly less so in thePRC than in South Asia. Neither the PRC nor any of the South Asianeconomies is as efficient as Singapore, which can be referred to as thebest-practice economy. One argument to justify the flow of FDI intothe PRC (and possibly also to India) despite the proliferation ofbureaucratic regulations is the vast size of the economy. If a foreigninvestor is finally able to clear all the hurdles and set up shop there is
100 South Asia: Rising to the Challenge of Globalization
b670_Chapter-03.qxd 12/12/2008 10:11 AM Page 100

A C
omparative A
nalysis of Economic Perform
ance and Policy Reform
s101
Table 3.21 Selected Doing Business Indicators, 2005.
Dealing with EnforcingStarting a Business Licenses Trading Across Borders Contracts
Time TimeExport for Import for
Procedures Time Procedures Time Documents Export Documents Import Procedures TimeCountry (number) (days) (number) (days) (number) (days) (number) (days) (number) (days)
Bangladesh 8 35 13 185 7 35 16 57 29 365India 11 71 20 270 10 36 15 43 40 425Nepal 7 21 12 147 7 44 10 38 28 350Pakistan 11 24 12 218 8 33 12 39 46 395Sri Lanka 8 50 18 167 8 25 13 27 17 440
Average 9 40 15 197 8 35 13 41 32 395
PRC 13 48 30 363 6 20 11 24 25 241Singapore 6 6 11 129 5 6 6 8 23 69
Source: World Bank and IFC (2006).
b670_Chapter-03.qxd 12/12/2008 10:11 AM Page 101

a vast and rapidly growing domestic market that is hungry for goodproducts.
Shift in Employment and Value Added
There have been policy reforms in the PRC and South Asia designedto shift resources away from agriculture to more productive industrialand manufacturing activities. In sector value added and sector employ-ment trends these efforts have not been successful. Employment andoutput have shifted mostly from agriculture to services in both SouthAsia and the PRC, although the available data on employment cover ashorter period than the data on value added (see Tables 3.9 and 3.22).Why this lack of response in employment and value added when otherindicators show more dramatic gains in industrial output, particularlyin exports of manufactured goods? There are two possible reasons.The first is that labor productivity gains in industry have increased rap-idly as a result of more investment. Second, some of the gains in serv-ice employment and value added, such as in telecoms, insurance, andother related services, are associated with growth in the industrial sec-tor. If these factors are taken into account, the rapid gain in exports inthe PRC and to a lesser extent in South Asia can be reconciled withmore modest shifts in employment and value added.
102 South Asia: Rising to the Challenge of Globalization
Table 3.22 Sectoral Share of Value Added, 1980 and 2005 (percentage).
Agriculture Industry Services
Country 1980 2005 1980 2005 1980 2005
Bangladesh 31.6 20.5 20.6 28.0 47.8 51.5Bhutan 47.2 25.8* 15.6 37.9* 37.2 36.3*PRC 30.1 13.1* 48.5 46.2* 21.4 40.7*India 38.9 18.6 24.5 27.6 36.6 53.8Nepal 61.8 40.2 11.9 21.4 26.3 38.4Pakistan 29.5 21.6 24.9 25.1 45.6 53.3Sri Lanka 27.6 16.8 29.6 26.1 42.8 57.1
* 2004 figures.Source: World Bank, World Development Indicators Online.
b670_Chapter-03.qxd 12/12/2008 10:11 AM Page 102

Poverty Head-Count Ratios
How much of the substantial decline in poverty in the PRC andSouth Asia is due to new policy initiatives? Since we have little infor-mation about poverty levels in the 1960s and 1970s, it is difficult tocompare the reform and non-reform periods. We do know fromother research on several developing countries that growth in incomeis generally associated with a decrease in poverty (Dollar and Kraay,2000; Ravallion and Chen, 2004; Bourguignon and Morrison,2002). Financial columnists like the highly respected Martin Wolf(2004) also hold this view. We know that economic growth acceler-ated in the reform period both in South Asia and in the PRC. Weknow as well that openness can also be associated with a reduction inpoverty. However, a number of other factors must be consideredhere. Certainly in agriculture, if the poor get greater market accessand can effectively sell more than they did before liberalization, theirincomes and consumption will rise, including the incomes of thosein their communities who supply the goods they purchase (seeTimmer, 1997, and Mellor and Gavian, 1999, for an analysis of theseeffects). The impact on the rural poor is likely to be large, particu-larly if the elasticity of labor supply is not infinite. Restrictions onmarket access and monopoly elements that restrict the pass-througheffects on the poor will have more modest or even negative impacton the poor. There have been reforms to liberalize trade in both thePRC and South Asia, and so it is likely that poverty reduction hasbeen aided by these changes, although the details would have to beworked out more systematically country by country. Other aspects ofthe reform agenda could also contribute to reductions in poverty,including reforms in labor markets that open up job opportunities tothe poor, educational opportunities and higher literacy rates fromincreased expenditure on education, and more open financial mar-kets, which have increased credit access for the poor. This possiblepolicy impact remains for future analysis. A recent study on India byHasan, Mitra, and Ural (forthcoming) shows evidence of thepoverty-reducing effects of economic reforms, including trade liber-alization, industrial de-licensing, and more flexible labor markets.Those states that saw greater trade liberalization also saw a faster
A Comparative Analysis of Economic Performance and Policy Reforms 103
b670_Chapter-03.qxd 12/12/2008 10:11 AM Page 103

reduction in poverty rates. Superficially, in South Asia none of thesefactors seems to have made a significant difference in the pace ofpoverty reduction. Financial markets have been reformed somewhatand educational indicators have improved, but progress has beenslow. Labor market reforms, on the other hand, have been minimal.Finally, the dramatic reduction in poverty in Pakistan may be theresult of several factors including poor agricultural harvests, whichraised poverty in some periods. Poverty was also lower in the 1980sbecause of substantial remittances from the Middle East.Nevertheless, the dramatic reduction in poverty in the 1990s andsince 2000 can be questioned, simply because growth in income,along with trade liberalization and other reform variables, has notbeen as significant for such remarkable progress in reducing povertyto be anticipated.
Inflation
Reforms in macroeconomic policy, the financial sector, and interna-tional trade have had significant impact on inflation in recent years.There has been greater price stability in the past decade across SouthAsia and in the PRC since the financial crisis of 1997 despite politicalvolatility in Sri Lanka, Pakistan, and India. Governments haveadjusted public finance and fiscal policy by increasing VAT or retain-ing sales taxes as custom duties have decreased after internationaltrade liberalization. Greater fiscal discipline and stability has also beenpossible as export earnings have increased and the balance of pay-ments has improved. Governments have likewise shown greaterawareness of the need for a stable price environment in encouraginginflows of capital for investment.
International Trade
Reforms in international trade have had a dramatic effect on growthin exports and trade in general. The PRC has had the most dramaticexperience. From 1963 and 1977, trade was 7.9% of GDP. After thereforms began, trade accelerated dramatically, averaging nearly 36% of
104 South Asia: Rising to the Challenge of Globalization
b670_Chapter-03.qxd 12/12/2008 10:11 AM Page 104
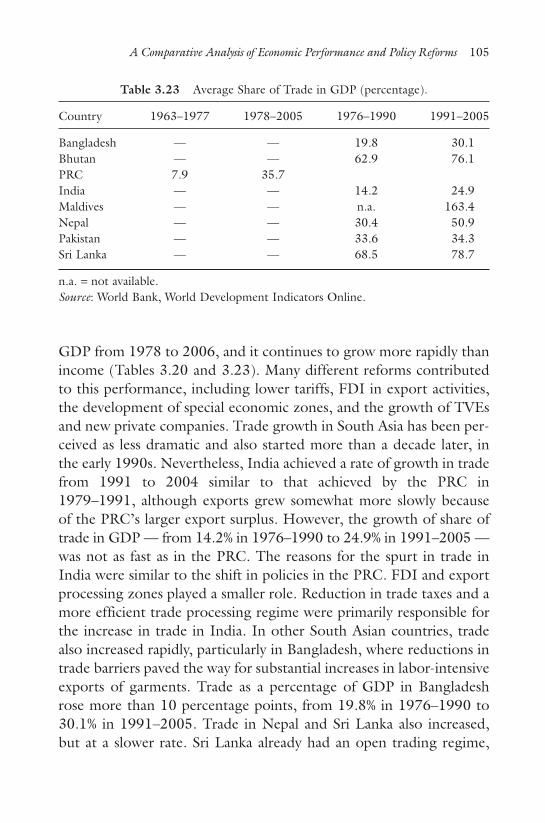
GDP from 1978 to 2006, and it continues to grow more rapidly thanincome (Tables 3.20 and 3.23). Many different reforms contributedto this performance, including lower tariffs, FDI in export activities,the development of special economic zones, and the growth of TVEsand new private companies. Trade growth in South Asia has been per-ceived as less dramatic and also started more than a decade later, inthe early 1990s. Nevertheless, India achieved a rate of growth in tradefrom 1991 to 2004 similar to that achieved by the PRC in1979–1991, although exports grew somewhat more slowly becauseof the PRC’s larger export surplus. However, the growth of share oftrade in GDP — from 14.2% in 1976–1990 to 24.9% in 1991–2005 —was not as fast as in the PRC. The reasons for the spurt in trade inIndia were similar to the shift in policies in the PRC. FDI and exportprocessing zones played a smaller role. Reduction in trade taxes and amore efficient trade processing regime were primarily responsible forthe increase in trade in India. In other South Asian countries, tradealso increased rapidly, particularly in Bangladesh, where reductions intrade barriers paved the way for substantial increases in labor-intensiveexports of garments. Trade as a percentage of GDP in Bangladeshrose more than 10 percentage points, from 19.8% in 1976–1990 to30.1% in 1991–2005. Trade in Nepal and Sri Lanka also increased,but at a slower rate. Sri Lanka already had an open trading regime,
A Comparative Analysis of Economic Performance and Policy Reforms 105
Table 3.23 Average Share of Trade in GDP (percentage).
Country 1963–1977 1978–2005 1976–1990 1991–2005
Bangladesh — — 19.8 30.1Bhutan — — 62.9 76.1PRC 7.9 35.7India — — 14.2 24.9Maldives — — n.a. 163.4Nepal — — 30.4 50.9Pakistan — — 33.6 34.3Sri Lanka — — 68.5 78.7
n.a. = not available.Source: World Bank, World Development Indicators Online.
b670_Chapter-03.qxd 12/12/2008 10:11 AM Page 105

although additional reforms contributed to a further increase in tradeto nearly 80% of GDP by 2005. Being landlocked, Nepal has had todepend primarily on trade with India, which has also flourished asIndia has become more open. Pakistan is the odd one out. Total tradehas stagnated primarily because the country has relied almost exclu-sively on cotton and cotton products as its primary export. It has notdiversified despite a more attractive trading regime resulting fromtrade reforms.
Foreign Direct Investment
As noted above, FDI inflows into South Asia and the PRC haveincreased from low levels in the early 1980s, although much moredramatically in the PRC than in India (Table 3.5). From minimallevels in the early 1980s, by 2004 FDI flows to the PRC hadexceeded $60 billion while India had attracted a little more than$5 billion. Inflows into the rest of South Asia have increased but arestill less than a $1 billion per year. There is no simple answer toexplain the disparity in the ability to attract FDI. Clearly, the policyenvironment in PRC was more attractive. The large number ofSEZs close to Shanghai and Hong Kong, China provided excellentinfrastructure including transport and communications. The regula-tory environment was smooth and efficient. Local authorities weregeared to cater to foreign enterprises, and there were many conces-sions, good infrastructure, and minimal taxes on trade. SEZs inIndia developed more slowly, were smaller in land area, and hadmore problems in infrastructure and logistics, being farther awayfrom ports and subject to power, communications, and water con-straints. SEZs in India were also subject to more regulations includ-ing restrictions on hiring and firing. All of these factors raised costsand increased risks. These impediments to growth in FDI were pres-ent to a greater or lesser extent in the rest of South Asia, althoughthere were exceptions in the IT sector, where Bangalore has becomea center for a number of related service industries. IT was notencumbered by the web of regulations that have held back manu-facturing industries because it did not exist when these regulations
106 South Asia: Rising to the Challenge of Globalization
b670_Chapter-03.qxd 12/12/2008 10:11 AM Page 106

were being developed. Also, since it deals in services it does not relyas much on physical infrastructure outside communications as theindustrial sector.
Current Account Balance
As noted above, the PRC and South Asia have been running currentaccount surpluses for the past few years. In South Asia this is a turn-around from chronic balance-of-payments deficits, one of which ledto the financial crisis in India in 1991. In the 1970s and 1980s deficitswere often in excess of 2% in several countries. Much of this turn-around in the balance of payments is a result of stronger exportgrowth, helped by a more favorable policy regime, which has reducedtaxes on exports and provided incentives to exporters. Clearly, if thesereforms had not been adopted, South Asia would have continued tobe challenged by current account deficits and the need to find waysto finance these deficits, including destabilizing inflationary finance.More buoyant exports have not only addressed these chronic prob-lems but have stabilized financial risk and contributed to a more sta-ble macroeconomic environment. They have also provided scope foraddressing some of the longer-term infrastructure problems facingthese countries.
Fiscal Balance
Fiscal deficits have been persistent throughout South Asia (Table 3.6)and the PRC for the duration of the reform period. There seems tobe no trend toward deficit reduction as a result of macroeconomicreforms.
International Reserves
What part do changes in the policy environment play in the rapidbuildup in foreign reserves in South Asia? Certainly the Asian cri-sis changed the perceptions of governments regarding the level ofprecautionary reserves they should hold. Countries in the Asian
A Comparative Analysis of Economic Performance and Policy Reforms 107
b670_Chapter-03.qxd 12/12/2008 10:11 AM Page 107
region have been accumulating reserves. However, as we notedearlier, this reserve buildup seems excessive when related to importcover or the level of external debt. Reserves have also increased asa natural consequence of more buoyancy in export markets. Thisbuoyancy is a result of reforms in the trade regime and also inindustry and the financial sectors. The reserve buildup is due inpart to the reluctance of the PRC to let market forces work in for-eign exchange markets to raise the value of the yuan. In South Asia,similar forces may be at play, since the countries in this region con-tinue to intervene in foreign exchange markets, ostensibly to main-tain smooth conditions.
Education and Health
The reform agenda in the PRC and South Asia has not considerededucation and health explicitly. However, the reforms themselveshave had an indirect impact on these social indicators. In the PRCthe responsibility for education and health programs for workers inthe industrial sector was traditionally the responsibility of theemployer — either the SOE or the agricultural commune. As the sizeof the state sector has shrunk (and private markets have grown),so has the ability of these traditional providers to provide healthand educational services. It has become the general responsibilityof the State to provide the services, and mechanisms are beingput in place to fill the gaps. Some people have no health coverage,and the educational system is still being reorganized. In South Asiathe reforms have helped to reduce the financial strains that werepresent during periods of slower economic growth. However, it isnot clear that more resources are being devoted to primary educa-tion to improve the skills of the poor as well as the richer groupsin society in equal measure, or that health expenditures haveincreased as a direct result of having more financial resources.There have been evident gains in reducing infant mortality, raisingliteracy rates, and increasing life expectancy. But the link withreforms in the productive sectors and in macroeconomic policy isless obvious.
108 South Asia: Rising to the Challenge of Globalization
b670_Chapter-03.qxd 12/12/2008 10:11 AM Page 108

Total Factor Productivity
The pace of economic growth has increased during the reform period.The Solow model defines growth as follows:
y = α h + (1 − α) k + a (3.1)
where y is the rate of change in income, h is the rate of change ineducation-adjusted labor input, k is the rate of growth in capital, α islabor’s share in income, 1 − α is capital’s share in income, and a istotal factor productivity (TFP). If we assume that the capital-to-outputratio is fixed in the short run, then we can substitute y for k on theright-hand side of equation 3.1 and rearrange the equation so that
y = h + a/α (3.2)
Clearly, growth in income depends on the rate of growth in theeducation-adjusted labor force and TFP divided by labor’s share inincome. For the sake of argument, assume that α equals 0.65, asmany growth theorists working with this model have assumed. Thenthe impact of changes in TFP will be very important. Being a resid-ual, TFP can have a number of components that reflect changes inoutput beyond changes in the education-adjusted labor and the cap-ital stock. These changes can be innovations, new products thatimprove efficiency, or better management techniques such as inven-tory management and other logistical improvements resulting fromIT applications. TFP can also reflect the movement of resourcesfrom low- to higher-productivity areas, e.g., from agriculture toindustry and high-tech services, or from low-productivity sectorswithin industry.
How have the reforms in South Asia and the PRC affected TFP?There are several estimates of TFP for the PRC but fewer estimatesfor South Asia. If we start from what we know and work backward,perhaps we can find an estimate and see if there have been anychanges in TFP over the reform period and in contrast with the pre-vious decade or so before reforms in South Asia. We assume that
A Comparative Analysis of Economic Performance and Policy Reforms 109
b670_Chapter-03.qxd 12/12/2008 10:11 AM Page 109

labor’s share is 0.65. The education-adjusted rate of growth of thelabor force is 3% for Bangladesh, India, and Sri Lanka, and 3.5% forPakistan and Nepal. This is based on labor force growth figures from1990 to 2003 compiled from the World Development Indicators, aswell as educational adjustments of about 1% in Bangladesh, India, andSri Lanka and slightly less in Pakistan and Nepal. If we know the aver-age rate of income growth for 1990 to 2005, then we can solve forα in equation 3.2. These calculations are shown in Table 3.24.
The implication from this analysis is that the PRC had a muchhigher rate of TFP than the other countries, followed by India. It maynot be unreasonable to observe TFP contributing about half of theincrease in output every year, since there were shifts in workers withinindustry to more productive jobs in the foreign-assisted industries inthe SEZs, combined with the movement from the interior provincesto the more highly productive coastal provinces. Because these pro-ductivity gains were much less dramatic in South Asia, productivityimprovements were smaller.
The Unfinished AgendaIn South Asia many reforms already in place have dealt with the macro-economic environment including fiscal, financial, trade and investment,and exchange rate reforms. Yet more remains to be done at this level.
110 South Asia: Rising to the Challenge of Globalization
Table 3.24 Growth in Labor Force and Income and Total Factor Productivity.
Rate of Growth of Labor’s Income Growth, Total FactorEducation-Adjusted Share in (y): 1990–2005 Productivity,
Country Labor Force (h) Income (α) Average a = (y − h) x (α)
Bangladesh 3.0 0.65 5.0 1.3PRC 2.1 0.65 9.7 4.9India 3.0 0.65 6.0 2.0Nepal 3.5 0.65 4.3 0.3Pakistan 3.5 0.65 4.3 0.5Sri Lanka 3.0 0.65 4.8 1.2
Source: World Bank, World Development Indicators Online; and authors’ calculations.
b670_Chapter-03.qxd 12/12/2008 10:11 AM Page 110

Tariffs have been lowered, yet they are still higher than rates in SoutheastAsia and East Asia. In India, export processing zones are relatively newand small compared with those in the PRC, and they lack efficient andcheap connectivity with major ports. Regulations are still cumbersomeand are a disincentive to foreign investors. In other countries in SouthAsia, similar reforms in trade, foreign investment, and the financial sec-tor are needed, although the details differ from country to country(see Appendix 3.3). Additional reforms at the microeconomic level orthe so-called second-generation reforms are needed to make marketswork better. These comprise continued reforms of the agriculture andindustrial sectors; reform of public institutions for improved governance(civil service, bureaucracy, and public administration); reform of institu-tions that create or maintain human capital (education and health); and,improving the environment affecting the private sector (regulatory envi-ronment, flexibility in labor markets, legal and physical infrastructure,and clearly-defined property rights). Unlike macroeconomic reforms,however, successful implementation of second-generation reformsrequires a wider consensus in the countries.
Industrial Sector
In India, the industrial sector is handicapped by continued overregu-lation of the economy. Instead of being excluded from sectors reservedfor small-scale industries, large-scale industries should be encouragedto go into labor-intensive manufacturing. This would provide furtherimpetus for the development of labor-intensive exports and encourageFDI in those industries. As it is, the cumbersome procedures and pro-hibitions against entry into the industrial sector discourage domesticfirms as well as foreign investors, who value flexibility in determiningthe mix of output between different production platforms. Light reg-ulations are preferable, and best-practice regulations in Singapore andHong Kong, China could serve as a guide. The further privatization ofthe remaining public sector enterprises should also proceed, along withthe development of bankruptcy laws. The public sector is still ineffi-cient and subsidized. Privatization would free resources for other uses,add revenue to the government coffers, and increase the capacity of
A Comparative Analysis of Economic Performance and Policy Reforms 111
b670_Chapter-03.qxd 12/12/2008 10:11 AM Page 111

the private sector. Industrial sector development in Pakistan is alsohampered by the heavy presence of the public sector. Furthermore,production and exports are highly specialized in cotton and relatedproducts. Diversification is critical if the industrial sector is to remaindynamic. In Bangladesh, the growth of industrial output has beenaided by the development of nongovernment organizations (NGOs).Their role has increased dramatically and this has contributed to thedynamism of the private sector and helped to promote the growth ofsmall-scale industry. Grameen Bank has been joined by other NGOsincluding BRAC, which is reportedly the biggest NGO in the world.These efforts of NGOs should be encouraged and supported by gov-ernment policy wherever possible. The blueprint for NGO develop-ment in Bangladesh can also be shared with other countries in theregion. Nepal’s industrial sector has been heavily dependent on devel-opments in India. By joining other countries in regional developmentagreements such as SASEC, the South Asian Growth Quadrangle(SAGQ), and the Bay of Bengal Initiative for Multi-Sectoral Technicaland Economic Cooperation (BIMSTEC), Nepal can widen its contactswithin South Asia and with the rest of the world.
Labor Markets
In India, labor markets, particularly hiring and firing, are heavily con-trolled by government. Companies with more than 100 employeeshave to ask state governments for permission to fire or retrench work-ers, and this permission is seldom given. To get around this regula-tion, firms resort to hiring contract workers and keep the number ofemployees below 100. This is not beneficial for firms hoping to takeadvantage of economies of scale. Recently, the rule has been waivedfor the establishment of some export processing zones, but these arefew in number. Meanwhile, these labor market restrictions continueto constrain the business community. There are also proposals thatthe labor limit be raised to 1,000 employees. There are fewer laborrestrictions in the other countries in the region, although even inthose countries labor standards including the use of child labor, workhours, and safety standards need to be improved.
112 South Asia: Rising to the Challenge of Globalization
b670_Chapter-03.qxd 12/12/2008 10:11 AM Page 112

Human Capital Development
With the exception of Sri Lanka, all countries in South Asia rank lowin human development. The UNDP Human Development Index,which blends measures of material prosperity, longevity, and school-ing, ranks India 126th, Pakistan 134th, Bangladesh 137th, andNepal 138th out of 177 countries worldwide. Only African coun-tries score lower. In Pakistan there is a particular need to raise thelevel of human capital, particularly women’s education and health.More resources need to be devoted to raising educational levels andto supplying social infrastructure to poor provinces that have fallenbehind and that have low life expectancy and literacy rates.
Private Sector Development
Many of the initiatives to stimulate the private sector also relate to theimplementation of industrial policies discussed above. Private sectorgrowth likewise depends on the ability to compete domestically andinternationally. This capacity can be enhanced by the development ofa more efficient and supportive regulatory environment. Doing busi-ness in South Asia is not easy. The regulatory apparatus still has astranglehold on the private sector when it comes to starting and clos-ing a business, obtaining licenses, hiring and firing workers, protect-ing investors, enforcing contracts, and engaging in internationaltrade. Moving to best practices will require streamlining the regula-tory apparatus and introducing more computerized procedures.
Infrastructure
The lack of a modern and efficient infrastructure foundation is inhibit-ing the growth of industry and the private sector in South Asia. Thereare transportation bottlenecks in the shortage of all-weather farm-to-market roads, feeder roads, as well as wide highways connecting majorcities. Developments in India suggest that such a highway system canbe extremely effective in increasing efficiency, reducing costs andtime-to-market, and also facilitating the movement of temporarylabor throughout the country. Recently, the Government announced
A Comparative Analysis of Economic Performance and Policy Reforms 113
b670_Chapter-03.qxd 12/12/2008 10:11 AM Page 113

that over the next five years the country would spend $500 billion onimproving cities, ports, roads, and airports. From about 5% of GDP,infrastructure spending would almost double to 9%. The power net-work throughout South Asia is overloaded and subject to periodicinterruptions of service. The impact on industrial productivity issevere. To supplement the national power grid, many businesses havebought generators, which are much more costly than the nationalgrid. Because of this, South Asia has the highest power costs of anyregion in Asia. Water supply and sewerage is also a constraintthroughout the region, and so is irrigation water in agriculture. Lackof water in the dry season restricts agricultural productivity on rain-fed fields, and the reliance on deep wells creates a demand on theunderground aquifers that will eventually lead to even greater watershortages in the future. More effective water pricing in rural areas isa key to more efficient water use in agriculture. In urban areas, accessto clean water and proper sewerage is critical. The lack of clean waterincreases the incidence of disease, and this is one reason why humandevelopment indicators are low. Many lives are lost to dysentery,cholera, and other water-borne diseases.
Governance and Public Administration
There is growing evidence that local governments are more effectiveboth in gauging the needs of local communities and in deliveringservices to these communities. The experience of Bangladesh with vil-lage NGOs, both in providing financial services and assistance and inworking with small-scale industries to improve production, market-ing, and distribution, is a good example of how quasi-public sectorentities can aid the private sector. The devolution of control to localgovernments has also been instrumental in the development of ruralindustry and infrastructure in the PRC through the TVEs. Economicsuccess in raising incomes and living standards far above the nationalaverage in the state of Kerala in India has much to do with the effec-tiveness of the state government as well as local governments.Experiments with this shift in power and responsibility should bepromoted and encouraged in the rest of South Asia.
114 South Asia: Rising to the Challenge of Globalization
b670_Chapter-03.qxd 12/12/2008 10:11 AM Page 114
Long-Term Capital Market Development
The financial systems of all the countries in South Asia depend heavilyon the banking system for financial intermediation, and governmentstill has a central role both in the provision of banking services and inthe control of commercial banks. Medium- and longer-term capitalmarkets are weak. To reduce the reliance on the banking system and toincrease competitiveness within the financial sector, South Asia mustdevelop longer-term capital markets, including markets for equities andbonds, insurance, and more sophisticated instruments like derivatives.Such developments will increase financial stability and reduce systemicrisk and vulnerability. They will also facilitate government debt man-agement and the conduct of monetary policy, and provide more oppor-tunities for privatizing banks and other financial intermediaries. Thereare many policy aspects to these developments that require continuedfinancial sector liberalization as well as opening of the capital account.Bond markets have developed recently, including issues by financialinstitutions as well as by government. As a result, yield curves are morerealistic than when the market was completely dominated by govern-ment issues. Equity and derivatives markets have also grown. However,the financial system still works to serve the government’s objectives ofproviding finance for its own projects and priorities. Reforms have to gobeyond rules and regulations for ratios and portfolio risk. What isneeded is further privatization of the banking system to force the gov-ernment to relinquish control. It must go beyond the reduction inownership, which is coupled with control of the boards of directors andrestrictions on the voting rights of non-government members. Withoutsuch deep regulatory changes, the banking system will continue toinvest in government securities that provide a good return but will notventure into the kinds of lending that energize the private sector andfurther accelerate the growth of forward-looking and innovative indus-trial establishments (Bhattacharya and Patel, 2003; Rodrik, 2002).
Other Issues
In Sri Lanka and Nepal the fight against insurgencies has continuedto create budgetary difficulties and drain budgetary resources. It has
A Comparative Analysis of Economic Performance and Policy Reforms 115
b670_Chapter-03.qxd 12/12/2008 10:11 AM Page 115

had an adverse impact on tourism and FDI, and diverts resourcesaway from development projects. A peaceful solution is critical if thesecountries are to raise living standards and achieve more rapid growthin the future.
Future Prospects: A Comparison of Indiaand the PRC8
Economic Growth and Structural Change
In a review of the pattern of economic growth and sectoral changes inthe PRC and India, several things stand out. These are important inassessing the future prospects for these two giant economies.
First is the overwhelming importance of industrial growth in thePRC. This growth has not only been spectacular; it has been concen-trated for the most part in a few sectors, primarily Standard Inter-national Trade Classification (SITC) categories 5–8 (office machinery,electrical machinery and appliances, telecommunications equipment,and miscellaneous manufactured goods). Textiles and apparel werealso important but have declined in relative importance in recentyears. Much of the focus in manufactured goods began with steelproduction, which served as the basic input for most of the otherproducts. Subsequently, the composition of manufactured produc-tion has shifted considerably (Table 3.25). Notice the shift awayfrom metals to process goods, particularly machinery and electricalmachinery. The focus of exports is even more dramatic. From1984–1990 to 2001–2004, the focus on a few two-digit categoriesshowed a dramatic increase. SITC codes 75, 76, and 77 (office anddata processing machines, telecommunications, sound recording andreproducing equipment, and electrical machinery) went from 4.5% ofexports in the earlier period to nearly 33.4% in the latter period —a remarkable increase in 15 years — even as exports increased rapidlyat double-digit rates. These three closely related product categoriessurpassed the three traditional export leaders — textiles, apparel, and
116 South Asia: Rising to the Challenge of Globalization
8 This section draws on Dowling (2008).
b670_Chapter-03.qxd 12/12/2008 10:11 AM Page 116

miscellaneous exports (SITC 65, 84, 89) — by the turn of the century(see Table 3.26). The shift in export focus in such a short timedemonstrates the commitment of the PRC to developing a strongexport performance in semi-skilled and labor-intensive manufacturedproducts using steel as the basic input. Much of this output was fundedby FDI; by 2003 the total stock of FDI was 35% of GDP. Foreign-funded enterprises contribute about half of total exports and haveownership in more than a third of industrial enterprises. The foreignsector has been the main growth driver of the economy in the past fewyears, contributing about two-thirds of the total annual growth ofaround 9%.
A Comparative Analysis of Economic Performance and Policy Reforms 117
Table 3.25 Composition of Manufactured Output in the PRC, 1970, 1980, 1990,and 1997 (percentage of total output of manufactured goods).
Category 1970 1980 1990 1997
Metals 16.8 15.6 12.8 7.6Machinery and vehicles 14.2 12.8 13.7 17.5Electrical machinery 4.7 5.3 8.3 13.2Other manufactured goods 3.0 5.2 6.3 4.5
Source: Nararaj (2005).
Table 3.26 Export Share of Selected Two-Digit Manufacturing Industries in thePRC (percentage).
Category 1984–1990 2001–2004
SITC 75: Office machinery and 0.4 12.9data processing machines
SITC 76: Telecommunications 2.9 10.4and sound equipment
SITC 77: Electrical machinery 1.2 10.1SITC 65 and 84: Apparel and 28.1 17.9
textile yarn, etc.SITC 89: Miscellaneous 4.9 7.3
manufactured goods
SITC = Standard International Trade Classification.Source: Panagariya (2006).
b670_Chapter-03.qxd 12/12/2008 10:11 AM Page 117
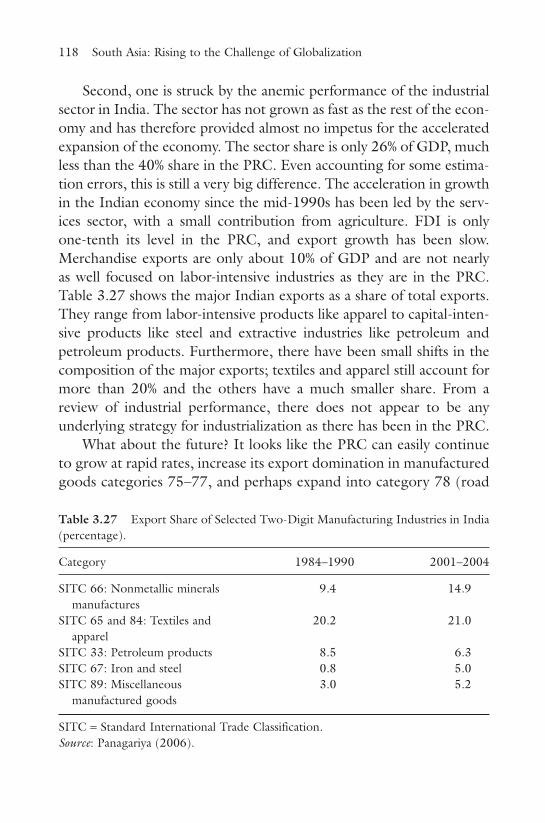
Second, one is struck by the anemic performance of the industrialsector in India. The sector has not grown as fast as the rest of the econ-omy and has therefore provided almost no impetus for the acceleratedexpansion of the economy. The sector share is only 26% of GDP, muchless than the 40% share in the PRC. Even accounting for some estima-tion errors, this is still a very big difference. The acceleration in growthin the Indian economy since the mid-1990s has been led by the serv-ices sector, with a small contribution from agriculture. FDI is onlyone-tenth its level in the PRC, and export growth has been slow.Merchandise exports are only about 10% of GDP and are not nearlyas well focused on labor-intensive industries as they are in the PRC.Table 3.27 shows the major Indian exports as a share of total exports.They range from labor-intensive products like apparel to capital-inten-sive products like steel and extractive industries like petroleum andpetroleum products. Furthermore, there have been small shifts in thecomposition of the major exports; textiles and apparel still account formore than 20% and the others have a much smaller share. From areview of industrial performance, there does not appear to be anyunderlying strategy for industrialization as there has been in the PRC.
What about the future? It looks like the PRC can easily continueto grow at rapid rates, increase its export domination in manufacturedgoods categories 75–77, and perhaps expand into category 78 (road
118 South Asia: Rising to the Challenge of Globalization
Table 3.27 Export Share of Selected Two-Digit Manufacturing Industries in India(percentage).
Category 1984–1990 2001–2004
SITC 66: Nonmetallic minerals 9.4 14.9manufactures
SITC 65 and 84: Textiles and 20.2 21.0apparel
SITC 33: Petroleum products 8.5 6.3SITC 67: Iron and steel 0.8 5.0SITC 89: Miscellaneous 3.0 5.2
manufactured goods
SITC = Standard International Trade Classification.Source: Panagariya (2006).
b670_Chapter-03.qxd 12/12/2008 10:11 AM Page 118

vehicles). By 2001–2004 this sub-sector’s share of total output wasalready 26%, up from a negligible amount in the 1990s. Whether thiscontinued growth in industry is in the best interest of the country,however, is another matter. A more appropriate strategy would be toput less emphasis on industry and more on services and rural devel-opment of the backward interior provinces.
India has the potential to develop a vibrant, efficient, and inter-nationally competitive industrial sector. It has the manpower andexpertise. It has the organizational and management abilities. But sofar it has been constrained by a policy environment that has throttledinitiative, opposed the opening up of important sectors of the econ-omy to large-scale industries, and refused to allow competitive forcesto determine wage rates and employment. Much of the currentemphasis in India is to leapfrog over the industrialization phaseof development and focus on a wide variety of both high- and low-technology services, primarily in the IT and communications sectors.
To sustain rapid growth, there has to be an additional push todevelop labor-intensive industry as in East Asia and the PRC. Such astrategy would also benefit rural areas as growth would trickle downto the poor. This requires better infrastructure and more flexible laborand industrial policies, which allow large-scale industry to operate inlabor-intensive industries. Compared with other countries, India hasquite small value added per establishment. Firms are too small to takeadvantage of economies of scale to produce large quantities for export(Fig. 3.3). As noted above, under the Industrial Disputes Act of 1947,companies with more than 100 employees need to ask state govern-ments for permission to fire or retrench workers. This permission is sel-dom granted. Firms try to get around this regulation by hiring contractworkers to keep the number of employees below 100. However, firmsremain small and find it difficult to take advantage of economies of scale.While the rule has been waived for the establishment of some exportprocessing zones, these are few in number. Also under the small-scaleindustries reservation policy, all labor-intensive exports in the 1980s and1990s were reserved for exclusive manufacturing by small-scale units.
The development of SEZs is a component of this industrializationstrategy that can facilitate and accelerate development by focusing
A Comparative Analysis of Economic Performance and Policy Reforms 119
b670_Chapter-03.qxd 12/12/2008 10:11 AM Page 119

export industries and associated infrastructure on these locations.India is already beginning to address some of the infrastructure bot-tlenecks along with private sector participation.
In response, industry is beginning to mount a successful drive toproduce a wide array of labor-intensive products for export and togenerate income and employment to qualify as a takeoff to sustainedindustrial growth. SEZs could be a critical component of such a take-off. While SEZs in India are numerous, they are still small and exportsfrom these zones are still limited although growing rapidly. One hun-dred seventy-two SEZs in 17 provinces were established after thepassage of the SEZ act of 2005, following the formation of 19 SEZsbefore the act was passed. Most of the SEZs are less than 100 hectares.Only six are larger — 1,000–6,000 hectares. In comparison, the largestSEZs in the PRC are 32,000 hectares or more. Nevertheless, forecasts
120 South Asia: Rising to the Challenge of Globalization
10.00
9.00
8.00
7.00
6.00
5.00
4.00
3.00
2.00
1.00
0.00
Textiles Iron and steel Transportequipment
Food productsexcept electric
Machinery Machinery, electric
Industrial chemicals
Other chemicals
Other non-metallicmineral products
All industries
Fig. 3.3 Average Firm Size in India and Comparator Countries, 1990 (value addedin $ million per establishment).
Note: Histograms in gray refer to India; those in black refer to comparator countries.Source: Kochhar et al. (2006).
b670_Chapter-03.qxd 12/12/2008 10:11 AM Page 120

suggest that exports from SEZs could compose as much as 10% oftotal exports by 2008.
While a takeoff to more rapid industrial is becoming more likely,FDI growth in manufacturing is still slow, labor markets are still con-strained, and business investment in new plant and equipment is weak.For the outlook for the next decade to change, the Government willhave to remove all of these bottlenecks. Then it will definitely be pos-sible for the industrial sector to exhibit the dynamism that the IT andrelated service sectors have been showing in the last few years. If thismaterializes, India could well grow as fast as the PRC in the next twodecades, particularly if it is able to raise investment rates so that theyare closer to the rates achieved by the PRC.
Labor productivity, labor force participation rate, and share of theworking population in the total population are all higher in the PRCand give it an advantage. However, this will change rapidly over thenext couple of decades as the PRC’s slow population growth rate (fol-lowing the one-child policy) begins to have a greater effect on thegrowth of the labor force.
International Trade
The PRC now has an overwhelming advantage in international trade.It exports more as a percentage of GDP (44%, compared to 20% forIndia) and has a larger share of world merchandise exports (4%, ver-sus India’s 0.7%). Tariff rates are lower and India depends less ontrade taxes for government revenue. Are India and the PRC likely tocome into greater competition with each other in the future? If Indiais able to liberalize its regulatory environment, it could begin toattract more FDI into labor- and skill-intensive manufacturing indus-tries. Over the last decade, FDI in India was mostly in power andtelecommunications, very little in manufacturing, and almost none inlabor-intensive manufacturing such as textile and apparel (Henley,2003). In contrast, the bulk of FDI in the PRC was in manufactur-ing. If India can attract more FDI into manufacturing, it would pres-ent a challenge for producers in the PRC, particularly in view of the
A Comparative Analysis of Economic Performance and Policy Reforms 121
b670_Chapter-03.qxd 12/12/2008 10:11 AM Page 121

growing competitiveness of domestic Indian firms. However, thePRC has already developed a wide array of manufactured exports andwill continue to develop into new areas. It has such a big advantageover India that it can easily relinquish some of its markets in low-skilled, labor-intensive products in which it may be starting to losecomparative advantage as wages rise in the southern provinces andSEZs. India could thus easily become competitive in labor-intensiveindustries where it, along with other countries in South Asia, alreadyhas a comparative advantage: in textiles, apparel, and footwear andleather products. India, on the other hand, has a big lead in IT andother skill-intensive software. However, it will have to develop moreeffective SEZs and reduce the regulatory burden that has reducedefficiency and served as a disincentive to foreign investors. The PRCis only beginning to enter the services sector. It will be hamperedby the lack of fluent English speakers and the market penetrationalready established by India, the Philippines, Sri Lanka, and otherEnglish-speaking countries. Therefore, it is likely that South Asiaand India will continue to maintain an advantage in this sector in thenear future.
Poverty and Income Distribution
Comparing the relative success in reducing poverty since 1990, Indiaand the PRC have had different patterns of success (see Table 3.28).Between 1990 and 2000 poverty fell by 51 percent using $1-a-daycut off, 47 percent using a $2-per-day cut off and 63 percent usingthe national poverty line cut off. In India the comparable percentagesare 25 percent, 9 percent and 33 percent, less than half the progressmade in the PRC over the decade in reducing poverty.
The PRC has managed to reduce poverty dramatically, primarilybecause of the rapid growth of income in urban areas. In recent yearsthe thrust to reduce poverty has sputtered somewhat as the coastalprovinces have continued to outpace the interior and resources havefailed to flow to redress the imbalances created by these dramaticgrowth differentials. For poverty levels to be reduced further a strong
122 South Asia: Rising to the Challenge of Globalization
b670_Chapter-03.qxd 12/12/2008 10:11 AM Page 122

commitment to the development of the interior is required, includingrural industry, better education and health, infrastructure and removalof migration restrictions that prohibit more out migration from ruralareas to the cities. The PRC has sufficient resources to address theseproblems if it can muster the political will to do it. Restlessness hasbeen increasing as more demonstrations have been taking place in ruralprovinces and the distribution of income continues to deteriorate.
As noted above India has had more modest success in reducingpoverty and it is doubtful whether it will be able to achieve the mil-lennium development goal of reducing poverty to half the 2000 levelby 2015 (see Table 3.28). Without a dynamic and rapidly growingindustrial sector to absorb new entrants into the labor force and a lackof resources to boost education and health expenditures in the poorer
A Comparative Analysis of Economic Performance and Policy Reforms 123
Table 3.28 Poverty Levels in India and thePRC (percentage of people in poverty).
Year and Poverty Line India PRC
$1-per-day cut off1990 46.6 31.51993 51.1 29.01996 46.2 16.41998 44.2 16.12000 34.7 15.42002 — 12.7
$2-per-day cut off1990 88.2 69.91995 82.9 51.62000 79.9 44.82002 — 37.3
National poverty line1990 38.9 9.41995 36.0 7.12000 26.1 3.42002 — 3.0
Source: Dowling 2008, Chapter 7.
b670_Chapter-03.qxd 12/12/2008 10:11 AM Page 123

states, India has been unable to generate employment and raiseincomes enough to make a significant acceleration in poverty reduc-tion. If policies are adjusted to bring about more rapid growth inincome by raising industrial sector growth poverty reduction couldaccelerate over the next ten to fifteen years. Otherwise, progress willcontinue to be slow. Poverty reduction has also been hampered by thelow elasticity of poverty reduction to growth. This is consistent withthe low elasticity of employment generation with respect to incomegrowth. Much of growth in India has been the result of capital or skillintensive growth rather than unskilled and semi-skilled labor growth.As a result employment generation and poverty reduction have beenlimited. India also has to put an end to widespread discrimination byclass and gender.
This contrasts with the Chinese experience where much of thegrowth in manufacturing has been in labor-intensive manufacturing.As manufacturing value added accelerates, it should bring with it amore rapid reduction in poverty and further growth in income. Taxrevenues will also increase, enabling the Government to devote moreresources to infrastructure and human resource development, creat-ing a virtuous cycle of growth.
Both India and the PRC have been experiencing deterioration inincome distribution. From a regional perspective certain states andprovinces have experienced acceleration in growth while others havelanguished. In the PRC these regional developments are consistentwith a pattern of urban and industrial growth that has favored thecoastal provinces. In India certain states with limited resourceendowments and large minority populations have fallen behind andneed to be restored to more rapid growth by a consistent set of poli-cies that increase education and health indicators and create moreemployment.
124 South Asia: Rising to the Challenge of Globalization
b670_Chapter-03.qxd 12/12/2008 10:11 AM Page 124
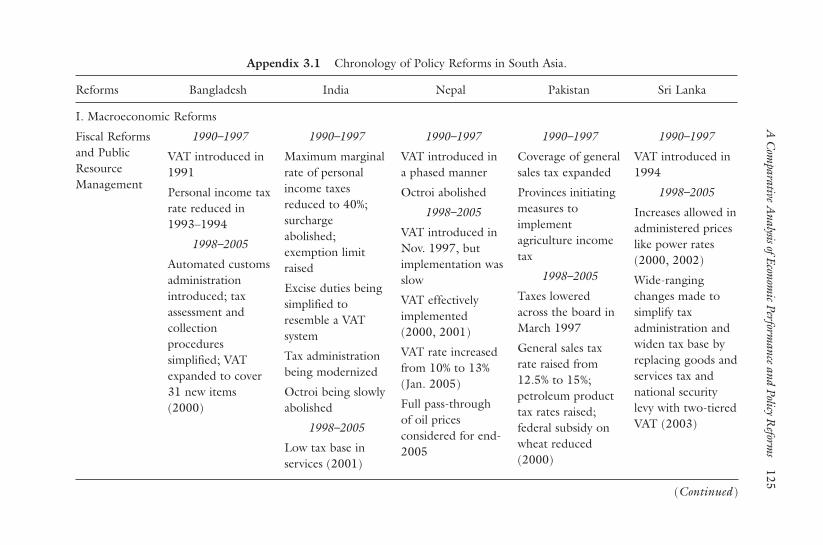
A C
omparative A
nalysis of Economic Perform
ance and Policy Reform
s125
Appendix 3.1 Chronology of Policy Reforms in South Asia.
Reforms Bangladesh India Nepal Pakistan Sri Lanka
I. Macroeconomic Reforms
Fiscal Reformsand PublicResourceManagement
1990–1997
VAT introduced in1991
Personal income taxrate reduced in1993–1994
1998–2005
Automated customsadministrationintroduced; taxassessment andcollectionproceduressimplified; VATexpanded to cover31 new items(2000)
1990–1997
Maximum marginalrate of personalincome taxesreduced to 40%;surchargeabolished;exemption limitraised
Excise duties beingsimplified toresemble a VATsystem
Tax administrationbeing modernized
Octroi being slowlyabolished
1998–2005
Low tax base inservices (2001)
1990–1997
VAT introduced ina phased manner
Octroi abolished
1998–2005
VAT introduced inNov. 1997, butimplementation wasslow
VAT effectivelyimplemented(2000, 2001)
VAT rate increasedfrom 10% to 13%(Jan. 2005)
Full pass-throughof oil pricesconsidered for end-2005
1990–1997
Coverage of generalsales tax expanded
Provinces initiatingmeasures toimplementagriculture incometax
1998–2005
Taxes loweredacross the board inMarch 1997
General sales taxrate raised from12.5% to 15%;petroleum producttax rates raised;federal subsidy onwheat reduced(2000)
1990–1997
VAT introduced in1994
1998–2005
Increases allowed inadministered priceslike power rates(2000, 2002)
Wide-rangingchanges made tosimplify taxadministration andwiden tax base byreplacing goods andservices tax andnational securitylevy with two-tieredVAT (2003)
(Continued)
b670_Chapter-03.qxd 12/12/2008 10:11 AM Page 125

126South A
sia: Rising to the C
hallenge of Globalization
Appendix 3.1 (Continued)
Reforms Bangladesh India Nepal Pakistan Sri Lanka
Fiscal Reformsand PublicResourceManagement(cont’d)
Utility tariffs andenergy pricesadjusted upward(1999, 2000, 2001,2004)
VAT and incometax coverageexpanded (2005)
Huge subsidiesgranted to publicsector undertakings(PSUs), e.g.,power, main sourceof fiscal deficits(2002)
Securitization,reconstruction offinancial assets, andenforcement ofSecurity InterestAct 2002; actprovidescomprehensiveframework forforeclosure of assets
Introduction ofVAT planned forApril 2002 butslipped to 2003
Plans made toallow privateparticipation inpetroleum sector toleave Nepal OilCorp. as wholesaler
Steps taken tostrengthen taxadministration:operations of LargeTaxpayers Officeimproved, customsadministrationstrengthened, exciseleakages plugged
Performance-basedincentives beingplanned in LargeTaxpayers Office
Coverage for salesand income taxesexpanded (agricul-ture and services);tax amnesty and taxsurvey implemented;implicit fuel subsidyreduced in 2000
Comprehensivedebt reductionstrategy initiated in2001 for fiscaladjustment and topay off liabilities
Central Board ofRevenue reforms:Large Taxpayers Unitset up, Sales TaxAutomated RefundRepository facilityinitiated (2003)
VAT on wholesaleand retail tradeintroduced but notimplemented in2003
High levels ofsubsidies on fuel,wheat, fertilizer addto expenditurepressures; weak taxadministration andleakages; persistentweak performanceof collectionagencies (2005);planned toeliminate mostsubsidies on fueland wheat in 2005
(Continued)
b670_Chapter-03.qxd 12/12/2008 10:11 AM Page 126

A C
omparative A
nalysis of Economic Perform
ance and Policy Reform
s127
Appendix 3.1 (Continued)
Reforms Bangladesh India Nepal Pakistan Sri Lanka
Fiscal Reformsand PublicResourceManagement(cont’d)
Institutionalreforms under wayto strengthenNational Board ofRevenue, includingthe setting up of aLarge TaxpayersUnit (LTU) forincome tax andvalue-added tax,and a CentralIntelligence Cell,but revenuecollection ishampered byinadequateresources in VATLTU. Audit andcollectionenforcement isweak
Large subsidies onpower (2004,2005)
Tax base expandedin services;significantexemptionsabolished (2005)
Personal incometaxes furtherreduced to 30%;corporate taxes onIndian companiesunified and loweredto 35%
IT enhancementsmade to boost taxadministration
Fiscal Responsibilityand DebtLimitation Billsubmitted in 2003to NationalAssembly forapproval. Bill bindsgov’t to eliminaterevenue deficit (i.e.,no borrowing tofinance currentexpenditures) byJune 2007 andreduce debt to 60%of GDP by 2012
Medium TaxpayersUnit set up indifferent cities;income taxes filedunder self-assessment systemin 2004
Tax basebroadened: broad-based business tax(called EconomicService Charge)introduced; civilservice incomebrought into taxnet; excise tax basebroadened toinclude severalhouseholdappliances
Unified VAT rate of15% introduced(2004),supplemented with5% rate on essentialfood items and 18%on luxury goods(2005)
(Continued)
b670_Chapter-03.qxd 12/12/2008 10:11 AM Page 127

128South A
sia: Rising to the C
hallenge of Globalization
Appendix 3.1 (Continued)
Reforms Bangladesh India Nepal Pakistan Sri Lanka
Fiscal Reformsand PublicResourceManagement(cont’d)
VAT introduced inmost states; servicestax base widened bytrimmingexemptions(~2005)
States generallysucceed in reducingtheir deficitsthrough tighterconstraints andconditionalities
New simplifiedgeneral sales taxsystem introducedin July 2004; GSTrate structuresimplified to onestandard rate of 15%from multiple ratesof 15%–23% in 2004
Tax rates for banksand private limitedcompanies reduced(~2004) in linewith plan to haveone corporate taxrate by 2007
Tax base broadenedby removing 20more exemptionsfrom income tax in2004
Revenue Boardcreated; secondLarge TaxpayersUnit established
Prices of petroleumproducts andelectricitysubsidized; largefiscal costs fromoperations ofCeylon PetroleumCorp. and CeylonElectricity Board(1% of GDP in2004); slowadjustment ofelectricity tariffs
(Continued)
b670_Chapter-03.qxd 12/12/2008 10:11 AM Page 128

A C
omparative A
nalysis of Economic Perform
ance and Policy Reform
s129
Appendix 3.1 (Continued)
Reforms Bangladesh India Nepal Pakistan Sri Lanka
Fiscal Reformsand PublicResourceManagement(cont’d)
One LTU and 5more MediumTaxpayers Units setup; plans made toorganize entireCentral Board ofRevenue alongfunctional lines(collection, audit,assessment,enforcement) (2005)
Coverage of salesand income taxesexpanded
(Continued)
b670_Chapter-03.qxd 12/12/2008 10:11 AM Page 129

130South A
sia: Rising to the C
hallenge of Globalization
Appendix 3.1 (Continued)
Reforms Bangladesh India Nepal Pakistan Sri Lanka
FinancialSector
1990–1997
Interest ratessignificantlyderegulated
Role of directedcredit reduced andNCBs given morefreedom; NCBs alsorecapitalized
Rupali Bank to beprivatized
Several new privateand foreign banksallowed
1998–2005
Bankruptcy Law1997 passed tofacilitate recovery ofbad loans
1990–1997
Interest ratesgraduallyderegulated andcredit allocated topriority sectorsreduced
Prudentialaccounting andcapital adequacynorms introduced
Private banksallowed to expandand new onesestablished
Securities ExchangeBoard of India(with regulatoryand prosecutingpowers) established
1990–1997
Open-marketoperationsintroduced
Several new non-bankfinancial institutionsestablished
Nepal StockExchangeestablished
1998–2005
2 gov’t banksrecapitalized (NepalBank Ltd. andRastriya BanijyaBank)
Slow reform offinancial sector,dominated by gov’tfinancial institutions(2001)
1990–1997
Open-marketoperationsintroduced
Two of 5 state-owned banksprivatized
1998–2005
Capital marketdevelopmentprogram in placewith ADB and WBsupport (1999)
Insurance sectorderegulated (2002)
1990–1997
Several financialinstitutionsprivatized
Since 1991, foreignbanks allowed to setup branches outsideColombo
Credit InformationBureau established
Stock exchangeopened to foreigninvestors beginningin 1990
1998–2005
Need for financialsector reform(1999); role ofdomestic capitalmarket modest(2000)
(Continued)
b670_Chapter-03.qxd 12/12/2008 10:11 AM Page 130

A C
omparative A
nalysis of Economic Perform
ance and Policy Reform
s131
Appendix 3.1 (Continued)
Reforms Bangladesh India Nepal Pakistan Sri Lanka
FinancialSector (cont’d)
Financial LoanCourt Act amendedto empower loancourts to enforcedebt recovery(1998)
SEC strengthened;automation of stockexchange achieved(1998)
Bangladesh Bankgranted greaterautonomy andexpanded authorityto conductmonetary andexchange ratepolicy and superviseall banks (2004)
Slow NCB reformcontinued (2004)
Regulatoryframework forinsuranceliberalization beingfinalized
National StockExchangeestablished
1998–2005
Prudential normsnot stringentenough; bankingsector characterizedby inefficiencies andhigh intermediationcosts (1999)
New insurance billopened up marketto private sector(2000)
Nepal Rastra BankAct 2002 passed,giving bank moreautonomy andstrengtheningregulatory,supervisoryfunctions
Nepal Rastra Bankdownsized; moreefforts under wayto enhance capacityof staff
NRB Act 2002:NRB made moretransparent;monetary policystance announcedat start of fiscal year
Directives issued onappointments ofbank boardmembers andCEOs; minimumpaid-up capitalrequirements ofbanks raised fromPRs500 to PRs1billion in 2002
An NCB, UnitedBank Ltd.,privatized inSeptember 2002;gov’t divests 20%share in NationalBank of Pakistan
Fiscal ResponsibilityAct passed in 2002committing gov’tto reduce deficit to5% of GDP andpublic debt from100% to 85% ofGDP in 2006
Privatization ofstate-owned banks(whose financialperformance hasimprovedsignificantly)abandoned, butrestructuringcontinues under thesupervision of theStrategic EnterpriseManagementAgency
(Continued)
b670_Chapter-03.qxd 12/12/2008 10:11 AM Page 131

132South A
sia: Rising to the C
hallenge of Globalization
Appendix 3.1 (Continued)
Reforms Bangladesh India Nepal Pakistan Sri Lanka
FinancialSector (cont’d)
Commitmentssecured by gov’tfrom NCBs torestrict newlending, reduceNPLs, rationalizebranch networks(2005)
Measures adoptedto furtherstrengthen financialsystem: raisedcapitalrequirements, tooksteps to reduceinsider lending,improvedprudentialsupervision (2006)
Reforms in 2001:bank and non-bankprudential standardsraised, i.e., capitaladequacy, incomerecognition,provisioning fornon-performingassets, disclosureand transparency inaccounting; gov’tsecurities marketimproved
Measures initiatedto enhancetransparency anddisclosure, capitaladequacy, risk(2004)
Administeredinterest ratesabolished
Ordinances issued:SecuredTransactions,Company,Securities, andInsolvencyordinances
Authoritiesconsideringamendments toBanking andFinancialInstitutionsOrdinance, possiblyraising capitalrequirements, rulesfor mergers in viewof increasedcompetitionexpected in 2010under WTOcommitments
About 75% ofbanking sectorprivately owned;government still hasmajority share ofcountry’s largestbank, NationalBank of Pakistan
Regulatorystandards improved;good compliancewith internationalsupervisorystandards
Prudential normstightened and banksupervisionimproved
(Continued)
b670_Chapter-03.qxd 12/12/2008 10:11 AM Page 132

A C
omparative A
nalysis of Economic Perform
ance and Policy Reform
s133
Appendix 3.1 (Continued)
Reforms Bangladesh India Nepal Pakistan Sri Lanka
FinancialSector (cont’d)
National SteeringCommittee formed,led by BangladeshBank to proceedwith implementa-tion of Basel IIstandards (2006)
Financial position ofNCBs weakened byfuel subsidies (2006)
Rupali Banksuccessfullydivested; preferredbidder announcedin August; sales andpurchase agreementexpected to befinalized later in theyear; plans made touse Rupali Bank asa model fordivestment of otherbanks (2006)
Licensing ofdomestic andforeign privatesector banksliberalized
Insurance sectorliberalized
Pension reforminitiated; passage ofPension Bill wouldhelp provide asecure source ofretirement incomeand aid indevelopment ofcapital markets
Regulatorystandards improved;plan to implementBasel II in 2007
Legal framework forloan recoveryimproved: blacklist-ing directives, DebtRecovery Tribunal,Appellate Tribunalestablished; progressin restructuring ofcommercial anddevelopment banks:mgmt teams forNepal Bank Ltd andRastriya BanijyaBank (2 largestbanks, whichaccount for 50% ofdeposits) eliminatedlosses; profits madein 03/04 and04/05 throughretirement schemes,reduction in depositrates
(Continued)
b670_Chapter-03.qxd 12/12/2008 10:11 AM Page 133
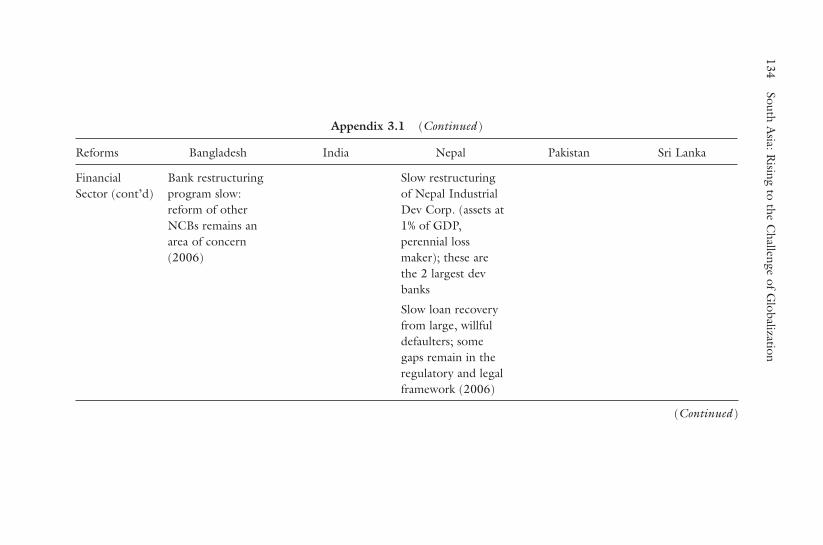
134South A
sia: Rising to the C
hallenge of Globalization
Appendix 3.1 (Continued)
Reforms Bangladesh India Nepal Pakistan Sri Lanka
FinancialSector (cont’d)
Bank restructuringprogram slow:reform of otherNCBs remains anarea of concern(2006)
Slow restructuringof Nepal IndustrialDev Corp. (assets at1% of GDP,perennial lossmaker); these arethe 2 largest devbanks
Slow loan recoveryfrom large, willfuldefaulters; somegaps remain in theregulatory and legalframework (2006)
(Continued)
b670_Chapter-03.qxd 12/12/2008 10:11 AM Page 134

A C
omparative A
nalysis of Economic Perform
ance and Policy Reform
s135
Appendix 3.1 (Continued)
Reforms Bangladesh India Nepal Pakistan Sri Lanka
Trade 1990–1997
QRs on importsliberalized from192 to 112 items in1993 and about 30in 1997
Level and structureof tariff ratesimproved: onlycigarettes andalcohol have tariffsabove 100%;maximum rate onothers 60%
Export incentivesdeepened byintroducing bondedwarehouses, dutydrawback schemes,and back-to-backletters of credit
1990–1997
QRs replaced bytariffs
Maximum tariffsreduced from 400%in 1990/91 to 65%in 1994, 50% in1995; average dutyfrom 50% to 27%during the sameperiod
1998–2005
Maximum tariff ratereduced from 355%in 1990 to 45% in1997, 40% in 1999,35% in 2000(38.5% with 10%surcharge)
1990–1997
Tariffs reduced instages: ranges from5% to 100% and8 subrates
Import licensingsystem abolishedfor most rawmaterials andimported inputs
Export incentivesbeing developed
75% of forexearnings can besold at market rate
1990–1997
Tariffs reducedfrom 225% in 1988to 70% in 1994
Import licensing lib-eralized by removalof negative list
Export incentivesstrengthened:concessional tarifftreatment ofimported inputsand freight subsidy
1998–2005
Tariff rates loweredacross the board inMarch 1997
Maximum tariffreduced from 35%to 30% (2001) to25% in 2002
1990–1997
1991–1997 tariffstructure reducedto 4 bands andrates reduced
Export taxesremoved
Import surchargeabolished in 1991
Import licensingsystem liberalized:only 11 itemsrequire license
1998–2005
1998 budgetincluded dutyexemptions forimports of advancedtechnologymachinery andequipment
(Continued)
b670_Chapter-03.qxd 12/12/2008 10:11 AM Page 135
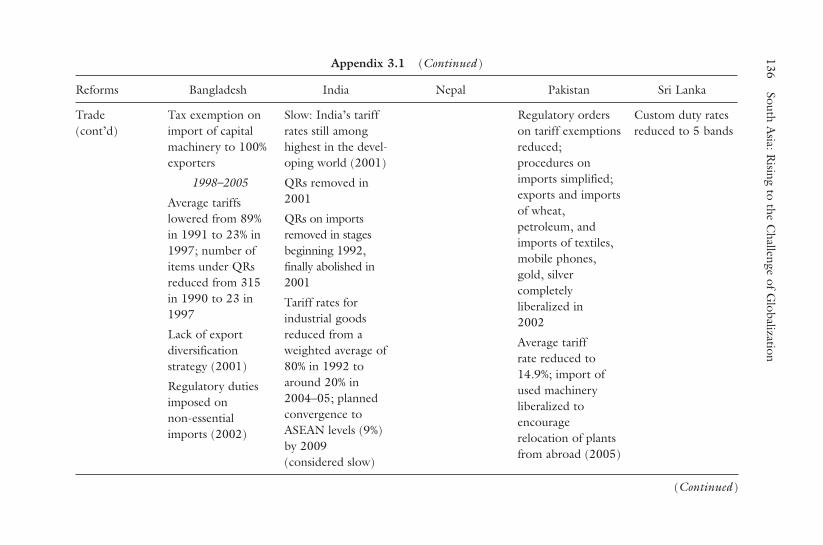
136South A
sia: Rising to the C
hallenge of Globalization
Appendix 3.1 (Continued)
Reforms Bangladesh India Nepal Pakistan Sri Lanka
Trade(cont’d)
Tax exemption onimport of capitalmachinery to 100%exporters
1998–2005
Average tariffslowered from 89%in 1991 to 23% in1997; number ofitems under QRsreduced from 315in 1990 to 23 in1997
Lack of exportdiversificationstrategy (2001)
Regulatory dutiesimposed onnon-essentialimports (2002)
Slow: India’s tariffrates still amonghighest in the devel-oping world (2001)
QRs removed in2001
QRs on importsremoved in stagesbeginning 1992,finally abolished in2001
Tariff rates forindustrial goodsreduced from aweighted average of80% in 1992 toaround 20% in2004–05; plannedconvergence toASEAN levels (9%)by 2009(considered slow)
Regulatory orderson tariff exemptionsreduced;procedures onimports simplified;exports and importsof wheat,petroleum, andimports of textiles,mobile phones,gold, silvercompletelyliberalized in2002
Average tariffrate reduced to14.9%; import ofused machineryliberalized toencouragerelocation of plantsfrom abroad (2005)
Custom duty ratesreduced to 5 bands
(Continued)
b670_Chapter-03.qxd 12/12/2008 10:11 AM Page 136

A C
omparative A
nalysis of Economic Perform
ance and Policy Reform
s137
Appendix 3.1 (Continued)
Reforms Bangladesh India Nepal Pakistan Sri Lanka
Trade(cont’d)
Remaining quantita-tive restrictions onimports removed,except those ongrounds of religion,health, security, andenvironment; admin-istrative procedureson imports andexports simplified
Weak governance,corruption, hindertrade performance
Levels and dispersionof duty rates reduced;3-tier duty structureintroduced; top dutyrate lowered from30% to 25%
Restrictions on FDIin the garmentsector outside theEPZs abolished
Reduced number oftariff categories tofour (5%, 10%, 20%,25%)
(Continued)
b670_Chapter-03.qxd 12/12/2008 10:11 AM Page 137

138South A
sia: Rising to the C
hallenge of Globalization
Appendix 3.1 (Continued)
Reforms Bangladesh India Nepal Pakistan Sri Lanka
Exchange Rate 1990–1997
Dual exchange ratesystem abolished in1992; taka freelyconvertible forcurrent accounttransactions
1998–2005
Taka floated May2003 by removingofficial band withdollar (fixed in Jan.2002)
Bangladesh Bankgiven greaterautonomy toconduct monetaryand exchange ratepolicy (2004)
1990–1997
Market-determinedexchange rate; pegwith Indian rupeestill maintained;current accountconvertibility
1998–2005
Foreign exchangemarket liberalized(2003)
Managed floatresponsive tomarket conditions
1990–1997
Market-determinedexchange rate;current accountconvertibility
1998–2005
Exchange ratepegged to Indianrupee
1990–1997
Market-determinedexchange rate;current accountconvertibility (since1994)
1998–2005
Exchange rateliberalized in July2000, replacedmanaged float withmarket-basedsystem in 2001
Full autonomy ofSBP in conduct ofmonetary, credit,and exchange ratepolicy granted inSept. 2002
1990–1997
Market-determinedexchange rate;current accountconvertibility
1998–2005
Sri Lanka rupeefloated in Jan. 2001
(Continued)
b670_Chapter-03.qxd 12/12/2008 10:11 AM Page 138

A C
omparative A
nalysis of Economic Perform
ance and Policy Reform
s139
Appendix 3.1 (Continued)
Reforms Bangladesh India Nepal Pakistan Sri Lanka
Exchange Rate(cont’d)
Market-determinedexchange rate;interventionsconfined tocounteringdisorderly conditions
SBP ended practiceof purchasingforeign exchangefrom the curbmarket in July2002; governmentallowed foreignexchangecompanies in 2002
Some currentaccount restrictions:advance paymentfor certain importslimited to 50%
(Continued)
b670_Chapter-03.qxd 12/12/2008 10:11 AM Page 139

140South A
sia: Rising to the C
hallenge of Globalization
Appendix 3.1 (Continued)
Bangladesh India Nepal Pakistan Sri Lanka
II. Microeconomic or Second-Generation Reforms
AgricultureSector andLand Issues
1990–1997
Significantderegulation ofinputs
Subsidies eliminated
Some steps towardland reform in the1980s
1990–1997
Slow: massivesubsidies for water,electricity, fertilizer
1998–2005
Slow: publicinvestments inirrigation (2004)
Archaic land laws(2004)
Slow: reversedecline in publicinvestment andinstitute reforms inrural infrastructureincluding irrigation,rural roads, andwatershedmanagement
1990–1997
Distribution ofagricultural inputsliberalized
1998–2005
Under AgriculturalPerspective Plan:monopoly of state-owned AgriculturalInputs Corporation(in import anddistribution offertilizer)eliminated (2000)
Removal offertilizer subsidiescompleted mid-2000
1990–1997
Slow: AwamiTractor Schemeintroduced
Farm developmentpackage introducedto encourage cropdiversification
1998–2005
Investments madein irrigationinfrastructure inpast few years(2004); surge inpublic expendituresin ruraldevelopment in last3 years (2004)
1990–1997
Management of teaplantationsprivatized
1998–2005
Slow: policysupport, promotionof research andextension services,development ofactive land marketfor intensive landuse and improvedproductivity (1999)
Slow: addressingland issues,restrictive landregulations (2002,2004, 2005)
(Continued)
b670_Chapter-03.qxd 12/12/2008 10:11 AM Page 140

A C
omparative A
nalysis of Economic Perform
ance and Policy Reform
s141
Appendix 3.1 (Continued)
Bangladesh India Nepal Pakistan Sri Lanka
AgricultureSector andLand Issues(cont’d)
Lack ofimprovements indelivery of ruralcredit and cropinsurance
Slow: strategytowarddiversification ofagriculture fromfood grains tohigher-valuehorticulturalcrops — impliesdevelopment ofpost-harvesttechnology, coldchains, refrigeratedtransport, grading,and modernmarketing
Land reform across5 decades withmixed results:some progress inreducing inequality,but lack ofcomplementaryinputs
AgriculturalPerspective Plan(1995) sets out20-year agenda inagriculture,includingaddressingcomplementaryinputs
Subsidies given toagriculture mainlyfertilizer
Weak performanceof agriculture: lackof agriculturalresearch, weakdevelopment andextension services,inconsistent tariffpolicy, land-userestrictions, lack ofinfrastructure,fragmentation oflandholdings
(Continued)
b670_Chapter-03.qxd 12/12/2008 10:11 AM Page 141

142South A
sia: Rising to the C
hallenge of Globalization
Appendix 3.1 (Continued)
Bangladesh India Nepal Pakistan Sri Lanka
IndustrialPolicy andPublicEnterprise
1990–1997
Industrial licensesabolished
Foreign investmentregulationssignificantlyliberalized
Incentive schemeupgraded
Slow restructuring,privatization,institutional reforms
1998–2005
Slow reform of non-financial SOEscontinues (2001,2002, 2004); SOEscontinue to besubsidized
1990–1997
Industrial licensesabolished except for14 industries in theareas of defense,health, safety,environment; liberalstance even in these14 industries
Restrictions onexpansion of largebusiness housesabolished
Significantlyliberalized foreigninvestmentregulations:automatic approvalsfor up to 51%foreign equityparticipation (Jan.1993)
1990–1997
Industrial licensesabolished except indefense, health,environment
Significantlyliberalized foreigninvestmentregulations: 100%ownershippermitted inmedium and large-scale industries, and“one window”licensing established
Privatization Act inplace and severalindustries includingairlines privatized
Slow: restructuringpolicies
1990–1997
Board of Investmentestablished toreduce number ofinstitutions involvedin investmentdecisions
Significantlyliberalized foreigninvestment forpower generation
New privatizationpolicy approved in1994
Slow: restructuringpolicies
1998–2005
New powergeneration policy inOctober 2002, toencourage privatesector investments
1990–1997
New liberalguidelines forforeign investmentannounced in 1991
3rd investmentpromotion zoneapproved in 1991
Over 30 SOEsprivatized
1998–2005
Sri Lanka Telecomand NationalDevelopment Bankprivatized in 1997
(Continued)
b670_Chapter-03.qxd 12/12/2008 10:11 AM Page 142

A C
omparative A
nalysis of Economic Perform
ance and Policy Reform
s143
Appendix 3.1 (Continued)
Bangladesh India Nepal Pakistan Sri Lanka
IndustrialPolicy andPublicEnterprise(cont’d)
Slow reform ofSOEs in the energysector — largequasi-fiscal lossesfrom oil subsidies(0.8% of GDP in2005)
5-year tax holidayfor private investorsin powergeneration, port,airlines, telecom,infrastructure
Slow institutionalreforms,privatization,restructuring ofpublic enterprises
1998–2005
Slow: privatization,divestment (1999,2000, 2001, 2002)
All items placedunder automaticapproval routeexcept for a smallnegative list in Feb.2000
1998–2005
Slow SOE reform(2003)
Butwal Power Co.privatized;privatization of 9other SOEsinitiated (2004);Bhaktapur BrickFactory privatizedin 2004
Slow: reform orliquidation ofpublic enterprises; 3privatized orliquidated, 5earmarked for early2005
Lumbini SugarFactory privatized(~2005)
Gov’t privatized itsworking interests in9 petroleumconcessions(~2002)
Oil and GasRegulatoryAuthority set up in2002 to encouragecompetition andgrowth in thesector
5% of shares of Oiland GasDevelopment Corp.sold in 2003; saleof 51% of equity inHabib Bank Ltd.finalized in Dec.2003
Slow: diversificationof industrialproduction (2000);promotion of morecommercialorientation inremaining SOEs(2002)
Sri Lanka InsuranceCorp. privatized in2003
Petroleum sectorliberalized in 2003
Slow: progress inprivatization(2004); new gov’truled outprivatization, prefersrestructuring(2005)
(Continued)
b670_Chapter-03.qxd 12/12/2008 10:11 AM Page 143

144South A
sia: Rising to the C
hallenge of Globalization
Appendix 3.1 (Continued)
Bangladesh India Nepal Pakistan Sri Lanka
IndustrialPolicy andPublicEnterprise(cont’d)
Slow removal ofsmall-scale industryreservations (2002)
Slow: reform ofstate electricityboards, roadtransportcorporations, otherpublic enterprises(2003)
Electricity Act 2003enacted, providesliberalized captivepower policy, openaccess totransmission anddistribution,transparency insubsidymanagement, etc.
Review of NepalOil Corp inprogress to assessits financial positionand operatingefficiency
Telecomderegulation policyannounced in 2003,followed by cellularphone policy in2004; PakistanTelecommunicationAuthority issued 12licenses to local andforeign firms and73 fixed-line localloop licenses in 14regions of thecountry
20% of shares ofKot Addu PowerCo. divestedthrough stockmarket in 2005
Slow: reform ofpower sector;started in 1996with goal tounbundle CeylonElectricity Boardbut has not beenseen through(2005)
Slow: tariffadjustments andrestructuring ofCeylon PetroleumCorp. and CeylonElectricity Board;slow reform of CEB(deadlines forreform postponedrepeatedly)
(Continued)
b670_Chapter-03.qxd 12/12/2008 10:11 AM Page 144

A C
omparative A
nalysis of Economic Perform
ance and Policy Reform
s145
Appendix 3.1 (Continued)
Bangladesh India Nepal Pakistan Sri Lanka
IndustrialPolicy andPublicEnterprise(cont’d)
Electricity tariffreform andprivatization ofpower generation.Electricity Act2003: establishesState ElectricityRegulatoryCommission to fixtariffs, phase outcross-subsidies,unbundlegeneration,transmission, anddistribution, andallow access to bulkconsumers
Some progress inprivatization: HabibBank Ltd., PakistanTelecommunicationCompany, KarachiElectric SupplyCompanyprivatized. Sale ofother companiesunder wayincluding PakistanSteel and PakistanPetroleum (2006)
Independentregulatory agenciesestablished forelectricity and oiland gas sector
(Continued)
b670_Chapter-03.qxd 12/12/2008 10:11 AM Page 145

146South A
sia: Rising to the C
hallenge of Globalization
Appendix 3.1 (Continued)
Bangladesh India Nepal Pakistan Sri Lanka
IndustrialPolicy andPublicEnterprise(cont’d)
Substantiallyliberalized FDIownership limita-tions, extended tohydrocarbon andbanks; but regula-tory procedurescumbersome andnontransparent(2004)
Large number ofeconomic zonesestablished (2004)
Slow: disinvestmentin public enterprises(2005)
Public sector reserva-tions reduced from18 major industriesto 3 (defense,atomic energy, railtransport)
Water Resourcesand PowerDevelopmentAuthorityunbundled;regional tariff andsubsidy policyestablished
(Continued)
b670_Chapter-03.qxd 12/12/2008 10:11 AM Page 146
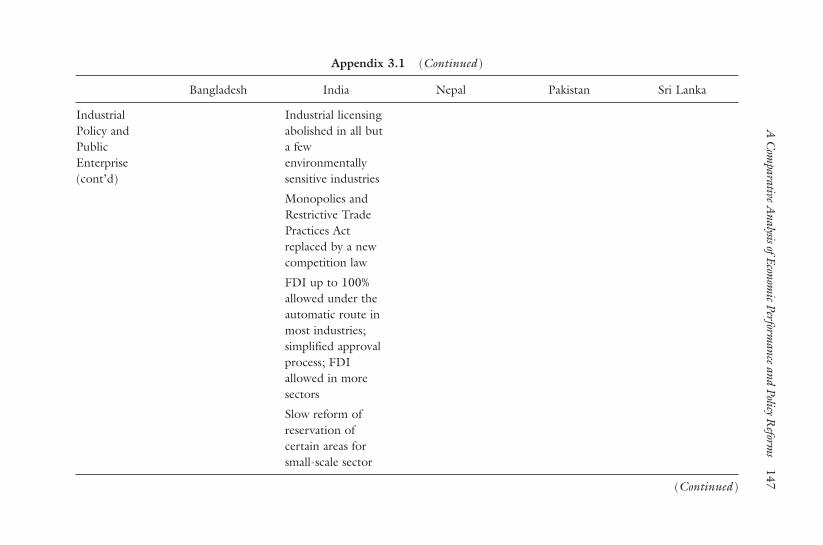
A C
omparative A
nalysis of Economic Perform
ance and Policy Reform
s147
Appendix 3.1 (Continued)
Bangladesh India Nepal Pakistan Sri Lanka
IndustrialPolicy andPublicEnterprise(cont’d)
Industrial licensingabolished in all buta fewenvironmentallysensitive industries
Monopolies andRestrictive TradePractices Actreplaced by a newcompetition law
FDI up to 100%allowed under theautomatic route inmost industries;simplified approvalprocess; FDIallowed in moresectors
Slow reform ofreservation ofcertain areas forsmall-scale sector
(Continued)
b670_Chapter-03.qxd 12/12/2008 10:11 AM Page 147
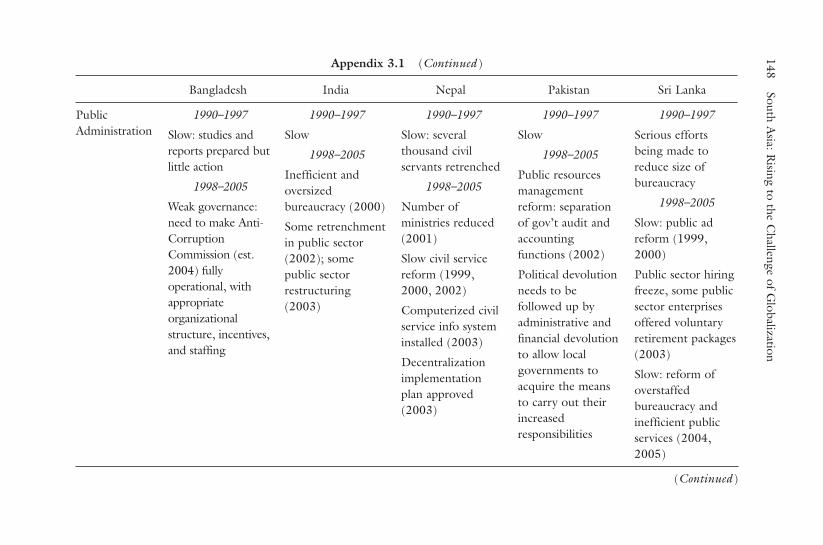
148South A
sia: Rising to the C
hallenge of Globalization
Appendix 3.1 (Continued)
Bangladesh India Nepal Pakistan Sri Lanka
PublicAdministration
1990–1997
Slow: studies andreports prepared butlittle action
1998–2005
Weak governance:need to make Anti-CorruptionCommission (est.2004) fullyoperational, withappropriateorganizationalstructure, incentives,and staffing
1990–1997
Slow
1998–2005
Inefficient andoversizedbureaucracy (2000)
Some retrenchmentin public sector(2002); somepublic sectorrestructuring(2003)
1990–1997
Slow: severalthousand civilservants retrenched
1998–2005
Number ofministries reduced(2001)
Slow civil servicereform (1999,2000, 2002)
Computerized civilservice info systeminstalled (2003)
Decentralizationimplementationplan approved(2003)
1990–1997
Slow
1998–2005
Public resourcesmanagementreform: separationof gov’t audit andaccountingfunctions (2002)
Political devolutionneeds to befollowed up byadministrative andfinancial devolutionto allow localgovernments toacquire the meansto carry out theirincreasedresponsibilities
1990–1997
Serious effortsbeing made toreduce size ofbureaucracy
1998–2005
Slow: public adreform (1999,2000)
Public sector hiringfreeze, some publicsector enterprisesoffered voluntaryretirement packages(2003)
Slow: reform ofoverstaffedbureaucracy andinefficient publicservices (2004,2005)
(Continued)
b670_Chapter-03.qxd 12/12/2008 10:11 AM Page 148

A C
omparative A
nalysis of Economic Perform
ance and Policy Reform
s149
Appendix 3.1 (Continued)
Bangladesh India Nepal Pakistan Sri Lanka
PublicAdministration(cont’d)
Approvedreservation of 45%of vacant civilservice posts fordisadvantagedgroups (women,dalits, janjatis)
Civil ServiceOrdinance promul-gated (July 2005)
Promulgation ofGovernance Ordi-nance under way(clarifies responsibili-ties between execu-tive and civil service)
Decentralizationprogressing inhealth andeducation sectors
Progress in judicialreforms slower
New gov’t createdabout 70,000 newpositions in2004–05
(Continued)
b670_Chapter-03.qxd 12/12/2008 10:11 AM Page 149

150South A
sia: Rising to the C
hallenge of Globalization
Appendix 3.1 (Continued)
Bangladesh India Nepal Pakistan Sri Lanka
Labor Market 1990–1997
Slow
1990–1997
Slow: IndustrialDisputes Act andCompanies Actbeing revised
National RenewalFund for trainingand redeployingworkers established
1998–2005
Archaic labor lawshinder producersfrom retrenchingworkers and restruc-turing their businesses (2002, 2004, 2005)
Need to expandcontract employ-ment, streamlinelabor regulations, andcreate greater flexibil-ity to accommodaterapidly expandinglabor force
1990–1997
Slow
1998–2005
4 ordinancespromulgated in2005 to improveregulatoryenvironment:SecuredTransactions,Company,Securities, andInsolvency.CompetitionOrdinance beingdrafted for moreflexible contractualhiring
1990–1997
Slow
1998–2005
New labor policyapproved inSeptember 2002:reconcile nationallaws on industrialrelations withinternational laws,consolidating 30existing laws into 6
Restrictive laborlaws; need torationalizeindustrial andcommercial laborlaws
1990–1997
Slow
1998–2005
Slow labor marketreform (2002,2004, 2005)
Need for moreflexible labor laws
(Continued)
b670_Chapter-03.qxd 12/12/2008 10:11 AM Page 150

A C
omparative A
nalysis of Economic Perform
ance and Policy Reform
s151
Appendix 3.1 (Continued)
Bangladesh India Nepal Pakistan Sri Lanka
Infrastructure Power shortages;public spending onphysicalinfrastructureincluding energy,transport, andcommunications, islow and spread toothinly (1994)
Private sectorinvolvement ininfrastructuredevelopmentallowed (1995)
Some progress inopening upinfrastructure andenergy sectors toprivate investment;serious infrastructureweaknesses in portand power facilitiesremain (1999)
Industry sectorreforms in 1994included reductionof entry restrictionsfor both domesticand foreign firms intelecoms, powerprojects, and otherinfrastructure (1995)
Serious infrastructuredeficiencies (1998,1999); commercial-ization of infrastruc-ture faces severalconstraints includingabsence of an appro-priate long-termframework andpolicy incentivemechanism forprivate investment;long-term debt mar-kets not well devel-oped (1998, 1999)
In 1997 Parliamentratified MahakaliIntegratedDevelopmentTreaty betweenNepal and India, ajoint hydroelectric,irrigation, and floodcontrol project
Butwal PowerCompany privatized(2004)
Weak infrastructure,transport andtransaction delays,high power costs,and anunpredictableregulatoryframework burdeneconomicperformance(2006)
Social ActionProgram (SAP)launched in 1993to improve socialservices includingrural water supplyand sanitation
Telecomderegulation policyannounced in July2003 followed bythe cellular phonepolicy in January2004
Weak infrastructure,especially in thewake of the 2005earthquake (2006)
Substantial publicsector investmentsin irrigation in thelast few years(2006)
Underdevelopedand outdatedinfrastructure inagriculture (1993)
Governmenteliminated loadshedding of powerin 2002;groundwork laid forutilities to beregulated byindependentcommission; plansto unbundlevertically integratedstate-ownedelectricity companyto encouragecompetition andefficiency (2003)
(Continued)
b670_Chapter-03.qxd 12/12/2008 10:11 AM Page 151

152South A
sia: Rising to the C
hallenge of Globalization
Appendix 3.1 (Continued)
Bangladesh India Nepal Pakistan Sri Lanka
Infrastructure(cont’d)
Large publicinvestments ininfrastructureneeded, but arelimited by very lowgovernmentrevenue base, weakprojectimplementationcapacity, andsignificant fiscalobligations such asrecapitalization ofNCBs (2004)
Power sector suffersfrom high systemlosses, poor qualityof supply, weakfinancialmanagement, andsignificant paymentarrears (2006)
Investments inpower, road, andtransport sectorshave failed to keeppace with develop-ments in the overalleconomy (1999)
Infrastructureoverstrained andsuffers from under-investment in post-reform period (2000)
Infrastructurebottlenecks inirrigation and ruralelectrification(2002, 2004)
2003 Electricity Actenacted to promotecompetition,efficiency, andfinancial viability
High energy costsand weak infra-structure seriouslyimpede competitive-ness; some progressin unbundling powersector; insufficientsupply of hydro-power (2004)
Continuing lossesof CeylonElectricity Board,including paymentarrears (2006)
No large infrastruc-ture improvementsin the last 20 years,resulting in bottle-necks in economicperformance(2006)
(Continued)
b670_Chapter-03.qxd 12/12/2008 10:11 AM Page 152
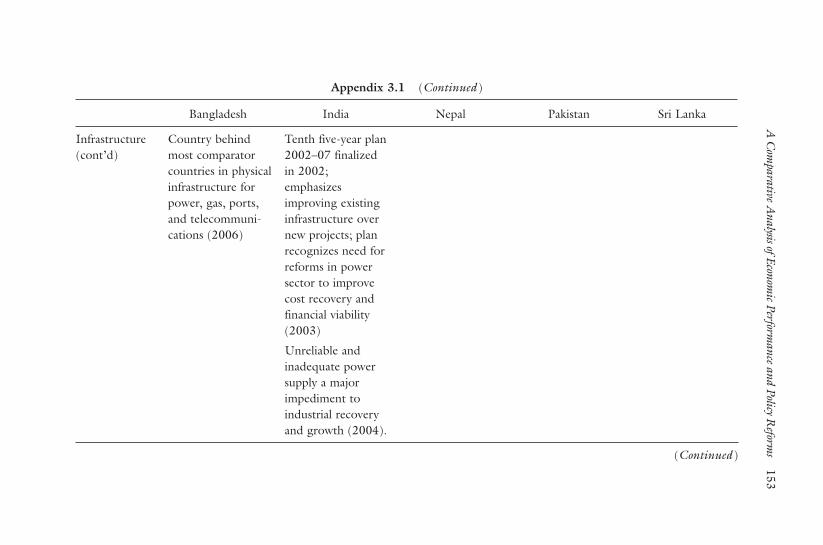
A C
omparative A
nalysis of Economic Perform
ance and Policy Reform
s153
Appendix 3.1 (Continued)
Bangladesh India Nepal Pakistan Sri Lanka
Infrastructure(cont’d)
Country behindmost comparatorcountries in physicalinfrastructure forpower, gas, ports,and telecommuni-cations (2006)
Tenth five-year plan2002–07 finalizedin 2002;emphasizesimproving existinginfrastructure overnew projects; planrecognizes need forreforms in powersector to improvecost recovery andfinancial viability(2003)
Unreliable andinadequate powersupply a majorimpediment toindustrial recoveryand growth (2004).
(Continued)
b670_Chapter-03.qxd 12/12/2008 10:11 AM Page 153

154South A
sia: Rising to the C
hallenge of Globalization
Appendix 3.1 (Continued)
Bangladesh India Nepal Pakistan Sri Lanka
Infrastructure(cont’d)
Infrastructureinvestment of 3.5%of GDP in FY2005way below target of8.0% of GDPmainly because oflarge consolidateddeficit position offederal and stategovernments(2005)
Phasedliberalization ofcommunicationssector
Poor agriculturalperformance linkedpartly to problemswith irrigation andsurface watermanagement(2006)
(Continued)
b670_Chapter-03.qxd 12/12/2008 10:11 AM Page 154

A C
omparative A
nalysis of Economic Perform
ance and Policy Reform
s155
Appendix 3.1 (Continued)
Bangladesh India Nepal Pakistan Sri Lanka
Infrastructure(cont’d)
Continuingshortage of powergeneration capacityand financialproblems at manystate electricityboards (2006)
India InfrastructureFinance CompanyLtd. established inJanuary 2006 tohelp financeprojects withinsufficient long-term debt
Note: Year in parentheses refers to the publication date of source; this usually refers to reforms of the previous year.Sources: ADB, Asian Development Outlook, various years; IMF, Article IV Consultation reports.
b670_Chapter-03.qxd 12/12/2008 10:11 AM Page 155

156 South Asia: Rising to the Challenge of Globalization
Appendix 3.2 Governance Indicators.
Voice and Accountability (percentile rank, 0–100)
Country 1996 1998 2000 2002 2003 2004 2005
South AsiaBangladesh 38.5 41.5 35.3 30.0 32.4 29.5 31.4Bhutan 7.2 7.2 4.8 13.5 13.5 14.5 21.7India 56.7 52.7 57.0 58.0 52.7 55.6 55.6Maldives 19.7 15.0 18.4 25.6 20.8 19.3 20.3Nepal 52.9 46.9 43.5 30.9 27.5 21.7 14.5Pakistan 20.2 30.4 6.8 17.4 14.0 11.6 12.6Sri Lanka 40.9 37.2 35.7 45.9 42.5 41.1 39.6
Average 33.7 33.0 28.8 31.6 29.1 27.6 28.0
East AsiaBrunei 20.7 13.5 15.9 22.2 19.8 17.9 22.2Cambodia 25.5 22.7 33.3 29.5 26.1 24.2 23.7PRC 11.1 4.3 6.3 9.7 7.7 8.2 6.3Hong Kong, 63.5 38.6 30.9 54.1 58.5 52.2 52.2
ChinaIndonesia 14.9 10.6 30.4 32.4 35.7 36.2 40.6Japan 79.8 79.2 72.5 79.2 79.7 78.3 74.9Korea, Rep. of 67.3 66.7 67.6 68.6 66.2 70.0 68.1Laos 15.9 12.1 8.7 3.4 2.4 7.2 8.2Malaysia 48.1 42.0 38.2 42.0 36.7 39.1 34.3Myanmar 1.4 1.0 0.0 1.4 0.5 0.0 0.0Philippines 53.8 58.9 54.6 52.2 50.2 48.3 47.8Singapore 59.1 42.5 41.5 63.8 43.0 44.4 38.2Taiwan 63.9 68.1 70.0 75.4 70.0 76.8 69.1Thailand 49.5 49.8 53.6 53.6 53.1 53.1 49.3Viet Nam 10.6 3.4 5.8 10.6 8.2 8.7 7.7
Average 39.0 34.2 35.3 39.9 37.2 37.6 36.2
Latin America 50.3 52.7 54.5 52.3 53.2 53.7 52.3
World Average 50.0 50.0 50.0 50.0 50.0 50.0 50.0
Note: Voice and accountability refer to the extent to which a country’s citizens areable to participate in selecting their government, as well as freedom of expression,freedom of association, and free media.Source: Kaufmann, Kraay, and Mastruzzi (2006).
b670_Chapter-03.qxd 12/12/2008 10:11 AM Page 156

A Comparative Analysis of Economic Performance and Policy Reforms 157
Appendix 3.2 (Continued)
Political Stability (percentile rank, 0–100)
Country 1996 1998 2000 2002 2003 2004 2005
South AsiaBangladesh 18.4 26.9 23.1 25 20.3 15.1 6.6Bhutan 74.1 62.7 62.7 69.3 68.9 79.2 83India 15.1 20.8 27.8 19.3 14.6 15.6 22.2Maldives 48.6 n.a. n.a. 90.1 84.9 62.7 70.8Nepal 28.8 19.8 10.4 5.7 4.7 3.8 1.9Pakistan 9 11.8 19.3 11.3 8 5.7 5.7Sri Lanka 5.2 6.1 3.8 17.5 18.9 14.2 10.8
Average 28.5 24.7 24.5 34.0 31.5 28.0 28.7
East AsiaBrunei 91.5 91.0 87.7 82.1 87.3 90.6 87.7Cambodia 10.4 9.9 18.4 31.1 30.2 35.4 31.1PRC 40.1 40.6 43.9 40.6 39.6 41.0 39.2Hong Kong, 46.7 68.4 83.5 80.2 82.1 89.6 89.6
ChinaIndonesia 23.1 7.5 2.8 9.4 4.2 7.1 9.0Japan 76.4 83.0 85.4 87.3 91.0 79.7 80.2Korea, Rep. of 40.6 43.4 51.9 54.7 51.9 61.8 60.8Laos 82.1 58.0 41.5 35.4 24.1 24.1 37.3Malaysia 73.1 51.9 50.0 51.9 56.1 56.1 62.3Myanmar 11.8 10.4 7.1 12.7 13.7 17.9 19.8Philippines 34.0 39.2 29.2 24.1 14.2 12.3 17.5Singapore 93.9 85.8 94.3 89.2 76.9 88.7 84.0Taiwan 75.5 77.4 60.4 67.9 67.5 62.3 64.2Thailand 42.0 50.9 45.8 54.2 48.1 33.0 29.2Viet Nam 49.5 56.1 53.3 55.7 56.6 55.2 59.0
Average 52.7 51.6 50.3 51.8 49.6 50.3 51.4
Latin America 33.0 38.1 41.5 39.1 39.0 37.0 35.8
World Average 50.0 50.0 50.0 50.0 50.0 50.0 50.0
Note: Political stability and absence of violence refer to perceptions of the likelihoodthat the government will be destabilized or overthrown by unconstitutional or vio-lent means, including political violence and terrorism.Source: Kaufmann, Kraay, and Mastruzzi (2006).
b670_Chapter-03.qxd 12/12/2008 10:11 AM Page 157

158 South Asia: Rising to the Challenge of Globalization
Appendix 3.2 (Continued)
Government Effectiveness (percentile rank, 0–100)
Country 1996 1998 2000 2002 2003 2004 2005
South AsiaBangladesh 21 38.3 36.4 28.7 31.1 28.7 21.1Bhutan 67.6 63.6 73.7 74.2 70.3 61.2 64.6India 38.1 52.2 55 55.5 57.9 56.9 51.7Maldives 60 71.3 60.3 74.6 67 63.6 59.8Nepal 40.5 11 29.2 38.3 30.6 20.1 15.3Pakistan 40 22 33.5 33 34.9 37.3 34Sri Lanka 47.1 39.7 43.5 59.8 54.5 44 40.7
Average 44.9 42.6 47.4 52.0 49.5 44.5 41.0
East AsiaBrunei 84.3 59.3 74.6 76.6 73.2 60.3 70.3Cambodia 27.1 7.2 35.4 31.6 34.4 18.2 18.7PRC 64.3 61.7 63.6 62.2 59.8 57.9 52.2Hong Kong, 92.4 89.0 84.7 89.5 90.0 91.9 92.8
ChinaIndonesia 61.9 30.1 39.2 34.0 34.0 39.7 37.3Japan 88.1 83.3 85.6 85.2 85.2 87.1 84.7Korea, Rep. of 77.6 70.8 76.1 81.3 79.9 78.5 78.9Laos 57.1 42.1 22.0 29.7 14.8 12.9 12.0Malaysia 79.5 78.0 73.2 80.9 78.9 79.4 80.4Myanmar 6.2 2.9 6.2 6.7 5.3 2.4 2.4Philippines 66.7 63.2 61.2 56.0 53.6 50.2 55.5Singapore 97.6 100.0 100.0 100.0 100.0 98.6 99.5Taiwan 86.7 90.0 87.6 84.7 84.2 88.0 83.7Thailand 75.2 60.8 61.7 64.6 64.6 66.5 66.0Viet Nam 51.0 48.8 41.1 46.9 46.4 42.6 45.0
Average 67.7 59.1 60.8 62.0 60.3 58.3 58.6
Latin America 44.9 50.2 46.4 41.7 42.7 43.8 43.4
World Average 50.0 50.0 50.0 50.0 50.0 50.0 50.0
Note: Government effectiveness refers to the quality of public services, the quality ofthe civil service and the degree of its independence from political pressures, the qual-ity of policy formulation and implementation, and the credibility of the government’scommitment to such policies.Source: Kaufmann, Kraay, and Mastruzzi (2006).
b670_Chapter-03.qxd 12/12/2008 10:11 AM Page 158

A Comparative Analysis of Economic Performance and Policy Reforms 159
Appendix 3.2 (Continued)
Regulatory Quality (percentile rank, 0–100)
Country 1996 1998 2000 2002 2003 2004 2005
South AsiaBangladesh 14.9 11.3 16.7 14.3 37.4 39.4 28.9Bhutan 50.5 22.2 55.7 39.9 51.7 35.5 50India 41.1 35.5 36.9 41.9 34.5 38.9 41.7Maldives 66.3 57.6 67 71.9 48.3 49.3 56.9Nepal 28.7 26.6 35.5 32.5 28.6 32 34.3Pakistan 27.7 18.7 20.7 21.2 18.7 37.4 25.5Sri Lanka 50 56.7 56.7 59.6 56.2 69.5 64.7
Average 39.9 32.7 41.3 40.2 39.3 43.1 43.1
East AsiaBrunei 100.0 40.9 52.2 80.8 78.3 84.2 76.7Cambodia 32.4 35.0 40.4 36.0 36.0 30.0 27.2PRC 40.7 41.4 46.8 36.5 40.4 39.4 44.6Hong Kong, 99.0 98.0 98.5 89.7 98.0 99.0 100.0
ChinaIndonesia 57.4 44.3 31.5 23.6 23.6 36.9 36.6Japan 77.5 64.0 78.8 78.8 79.3 82.8 85.6Korea, Rep. of 72.1 53.7 67.5 74.9 70.9 73.4 71.8Laos 10.3 11.3 9.9 8.9 6.9 10.3 10.9Malaysia 80.4 65.0 59.1 67.5 69.0 69.5 66.8Myanmar 11.8 9.9 6.9 2.5 2.0 0.5 1.5Philippines 64.2 68.5 58.6 53.7 53.2 47.3 52.0Singapore 99.5 99.5 100.0 99.0 99.0 99.5 99.5Taiwan 85.3 84.2 84.2 79.8 80.3 81.8 79.7Thailand 65.2 51.7 74.9 62.1 63.5 58.6 63.9Viet Nam 27.9 23.6 21.2 24.1 33.0 27.1 25.7
Average 61.6 52.7 55.4 54.5 55.6 56.0 56.2
Latin America 64.4 68.7 62.2 51.3 50.7 50.5 47.3
World Average 50.0 50.0 50.0 50.0 50.0 50.0 50.0
Note: Regulatory quality refers to the ability of the government to formulate andimplement sound policies and regulations that permit and promote private sectordevelopment.Source: Kaufmann, Kraay, and Mastruzzi (2006).
b670_Chapter-03.qxd 12/12/2008 10:11 AM Page 159
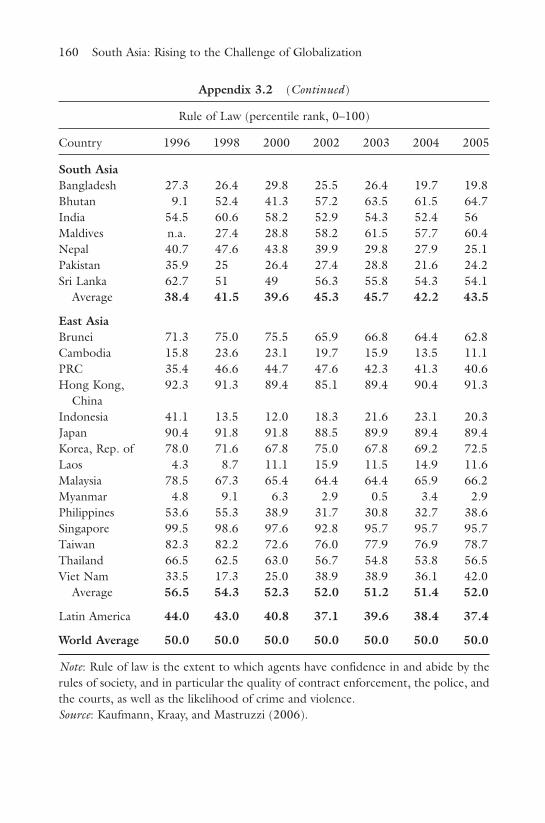
160 South Asia: Rising to the Challenge of Globalization
Appendix 3.2 (Continued)
Rule of Law (percentile rank, 0–100)
Country 1996 1998 2000 2002 2003 2004 2005
South AsiaBangladesh 27.3 26.4 29.8 25.5 26.4 19.7 19.8Bhutan 9.1 52.4 41.3 57.2 63.5 61.5 64.7India 54.5 60.6 58.2 52.9 54.3 52.4 56Maldives n.a. 27.4 28.8 58.2 61.5 57.7 60.4Nepal 40.7 47.6 43.8 39.9 29.8 27.9 25.1Pakistan 35.9 25 26.4 27.4 28.8 21.6 24.2Sri Lanka 62.7 51 49 56.3 55.8 54.3 54.1
Average 38.4 41.5 39.6 45.3 45.7 42.2 43.5
East AsiaBrunei 71.3 75.0 75.5 65.9 66.8 64.4 62.8Cambodia 15.8 23.6 23.1 19.7 15.9 13.5 11.1PRC 35.4 46.6 44.7 47.6 42.3 41.3 40.6Hong Kong, 92.3 91.3 89.4 85.1 89.4 90.4 91.3
ChinaIndonesia 41.1 13.5 12.0 18.3 21.6 23.1 20.3Japan 90.4 91.8 91.8 88.5 89.9 89.4 89.4Korea, Rep. of 78.0 71.6 67.8 75.0 67.8 69.2 72.5Laos 4.3 8.7 11.1 15.9 11.5 14.9 11.6Malaysia 78.5 67.3 65.4 64.4 64.4 65.9 66.2Myanmar 4.8 9.1 6.3 2.9 0.5 3.4 2.9Philippines 53.6 55.3 38.9 31.7 30.8 32.7 38.6Singapore 99.5 98.6 97.6 92.8 95.7 95.7 95.7Taiwan 82.3 82.2 72.6 76.0 77.9 76.9 78.7Thailand 66.5 62.5 63.0 56.7 54.8 53.8 56.5Viet Nam 33.5 17.3 25.0 38.9 38.9 36.1 42.0
Average 56.5 54.3 52.3 52.0 51.2 51.4 52.0
Latin America 44.0 43.0 40.8 37.1 39.6 38.4 37.4
World Average 50.0 50.0 50.0 50.0 50.0 50.0 50.0
Note: Rule of law is the extent to which agents have confidence in and abide by therules of society, and in particular the quality of contract enforcement, the police, andthe courts, as well as the likelihood of crime and violence.Source: Kaufmann, Kraay, and Mastruzzi (2006).
b670_Chapter-03.qxd 12/12/2008 10:11 AM Page 160

A Comparative Analysis of Economic Performance and Policy Reforms 161
Appendix 3.2 (Continued)
Control of Corruption (percentile rank, 0–100)
Country 1996 1998 2000 2002 2003 2004 2005
South AsiaBangladesh 35.1 40.2 31.4 13.7 7.4 5.9 7.9Bhutan n.a. 70.6 69.6 71.6 80.9 77 78.8India 44.9 54.4 46.6 41.7 46.1 44.6 46.8Maldives n.a. 31.4 37.3 52.9 55.9 52 48.8Nepal 48.8 28.4 33.8 40.2 39.2 30.4 29.1Pakistan 12.2 18.6 16.2 23.5 27.5 11.3 15.8Sri Lanka 50.2 52.5 53.4 51.5 52.9 51.5 47.3
Average 38.2 42.3 41.2 42.2 44.3 39.0 39.2
East AsiaBrunei 67.8 62.3 52.5 65.7 62.7 68.6 63.1Cambodia 14.6 2.9 24.5 18.6 18.1 14.2 8.9PRC 60.0 56.4 44.1 42.6 38.7 33.3 30.5Hong Kong, 91.2 91.2 90.7 90.7 91.2 92.2 92.1
ChinaIndonesia 34.1 9.3 10.8 6.9 13.2 15.2 21.2Japan 88.8 84.3 85.8 85.8 84.8 86.8 85.2Korea, Rep. of 76.6 64.2 67.2 67.2 64.2 59.3 69.0Laos 14.6 22.5 19.6 18.1 12.7 12.3 9.4Malaysia 75.6 77.0 64.2 66.7 68.1 64.7 64.5Myanmar 4.9 2.5 3.4 1.5 2.0 1.0 1.5Philippines 36.6 50.5 36.8 34.8 42.2 34.8 37.4Singapore 98.0 97.1 99.5 99.5 99.0 99.5 99.0Taiwan 80.5 80.4 74.0 75.0 73.5 74.0 70.9Thailand 44.4 52.0 45.1 46.6 47.1 48.0 51.2Viet Nam 26.8 27.0 25.0 31.4 31.4 23.0 26.6
Average 54.3 52.0 49.5 50.1 49.9 48.5 48.7
Latin America 42.7 41.7 42.7 40.9 44.0 43.5 41.2
World Average 50.0 50.0 50.0 50.0 50.0 50.0 50.0
Note: Corruption is the extent to which public power is exercised for private gain,including both petty and grand forms of corruption, as well as “capture” of the stateby elites and private interests.Source: Kaufmann, Kraay, and Mastruzzi (2006).
b670_Chapter-03.qxd 12/12/2008 10:11 AM Page 161

162South A
sia: Rising to the C
hallenge of Globalization
Appendix 3.3 Unfinished Agenda of Reforms in South Asian Countries.
Bangladesh India Nepal Pakistan Sri Lanka
I. Macroeconomic Reforms
Fiscal Reformsand PublicResourceManagement
Energy sector SOEsa source of fiscalrisk, need to allowfull pass-through ofhigher oil prices
Need to implement2004 subsidyreform forimproved targetingof subsidies
Need to allow fullpass-through ofhigher oil prices tolimit quasi-fiscallosses
Considerable scopefor improvementsin taxadministration,especially customs,excises, and LTOoperations to raisecollections. Lowlevels of devspending dampengrowth. Need toraise externalassistance and devspending
Need to furtherbroaden tax base byexpanding taxationmore intoagricultural andservice sectors andreducing remainingexemptions
Need to allow fullpass-through ofhigher oil prices,lessen subsidies
Prices of petroleumproducts andelectricitysubsidized; largefiscal costs fromoperations ofCeylon PetroleumCorp and CeylonElectricity Board(1% of GDP in2004); need toallow full pass-through of higheroil prices; slowadjustment ofelectricity tariffs
Need to ensureimplementation ofFiscal ResponsibilityAct 2002
(Continued)
b670_Chapter-03.qxd 12/12/2008 10:11 AM Page 162

A C
omparative A
nalysis of Economic Perform
ance and Policy Reform
s163
Appendix 3.3 (Continued)
Bangladesh India Nepal Pakistan Sri Lanka
Fiscal Reformsand PublicResourceManagement(cont’d)
Need to ensureimplementation ofFiscal Responsibilityand DebtLimitation Bill toeliminate revenuedeficit (i.e., noborrowing tofinance currentexpenditures) byJune 2007 andreduce debt to 60%of GDP by 2012
Need to ensureimplementation ofplan to have onecorporate tax rateby 2007
(Continued)
b670_Chapter-03.qxd 12/12/2008 10:11 AM Page 163

164South A
sia: Rising to the C
hallenge of Globalization
Appendix 3.3 (Continued)
Bangladesh India Nepal Pakistan Sri Lanka
FinancialSector
Need to ensureproperimplementation ofBasel II standards
Bank restructuringprogram slow; needto speed updivestment ofRupali Bank;reform of otherNCBs
Need to developcapital markets;high reliance onbanks
Need to ensureproperimplementation ofBasel II in 2007
Need to improveloan recovery, staffperformance, raiseaudit andaccountingstandards
Need to strengthenlegal and regulatoryframework; NRBneeds to strengthenits supervisorycapacity; NPLs oftwo state bankscontinue to beproblematic
Need to strengthenpension andinsurance systems;divest remainingpublic ownership ofcommercial banks;broaden access tofinance tounderservedsegment ofpopulation
Privatization ofstate-owned banks(whose financialperformance hasimprovedsignificantly)abandoned, butrestructuringcontinues under thesupervision of theStrategic EnterpriseManagementAgency
(Continued)
b670_Chapter-03.qxd 12/12/2008 10:11 AM Page 164

A C
omparative A
nalysis of Economic Perform
ance and Policy Reform
s165
Appendix 3.3 (Continued)
Bangladesh India Nepal Pakistan Sri Lanka
Trade
Exchange Rate
Weak governance,corruption hindertrade performance
Tariff rates forindustrial goodsreduced from aweighted average of80% in 1992 toaround 20% in2004–2005; plannedconvergence toASEAN levels (9%)by 2009 (consideredslow)
ER level broadlyappropriate, butneeds to bemonitored in viewof uncertaintiesfacing Pakistan
Need to liftexchange restrictionon payments forcurrent internationaltransactions
Need to improvereliability of powersupply and roadtransport in MFApost-quota era
(Continued)
b670_Chapter-03.qxd 12/12/2008 10:11 AM Page 165

166South A
sia: Rising to the C
hallenge of Globalization
Appendix 3.3 (Continued)
Bangladesh India Nepal Pakistan Sri Lanka
II. Microeconomic or Second-Generation Reforms
AgricultureSector andLand Issues
Need to reversedecline in publicinvestment andinstitute reforms inrural infrastructureincluding irrigation,rural roads, andwatershedmanagement
Need forimprovements indelivery of ruralcredit and cropinsurance
Problems in landreform: inability ofland recipients toassert rights (lack ofknowledge orilliteracy), lowquality of landredistributed, lackof complementaryinputs
Need forcomplementaryinputs: rural financefor irrigation, farmmachinery,fertilizers, ruralinfrastructure
Need for effectiveimplementation ofAgriculturalPerspective Plan
Need to developinfrastructureespecially irrigationsystems
Weak performanceof agriculture: lackof agriculturalresearch, weakdevelopment andextension services,inconsistent tariffpolicy, land-userestrictions, lack ofinfrastructure,fragmentation oflandholdings
(Continued)
b670_Chapter-03.qxd 12/12/2008 10:11 AM Page 166

A C
omparative A
nalysis of Economic Perform
ance and Policy Reform
s167
Appendix 3.3 (Continued)
Bangladesh India Nepal Pakistan Sri Lanka
AgricultureSector andLand Issues(cont’d)
Need for strategytowarddiversification ofagriculture fromfood grains tohigher-valuehorticulturalcrops — impliesdevelopment ofpost-harvesttechnology, coldchains, refrigeratedtransport, grading,and modernmarketing
(Continued)
b670_Chapter-03.qxd 12/12/2008 10:11 AM Page 167

168South A
sia: Rising to the C
hallenge of Globalization
Appendix 3.3 (Continued)
Bangladesh India Nepal Pakistan Sri Lanka
IndustrialPolicy andPublicEnterprise
Need to expediteindustrialrestructuring,privatization,institutionalreforms
Slow reform ofSOEs in the energysector — largequasi-fiscal lossesfrom oil subsidies(0.8% of GDP in2005)
Need to expediteinstitutionalreforms,privatization,restructuring ofpublic enterprises
Need for exitpolicies, bankruptcylaw
Need for structuralreform orliquidation of loss-making publicenterprises
Need to expediterestructuring policies
Some progress inprivatization: HabibBank Ltd., PakistanTelecommunicationCompany, KarachiElectric SupplyCompanyprivatized. Sale ofother companiesunder way includingPakistan Steel andPakistan Petroleum
Need to strengthengovernance andaccountabilityincludingprivatization (settingeconomically soundtariffs and reducingcosts) in powersector
Need for tariffadjustments andrestructuring ofCeylon PetroleumCorp. and CeylonElectricity Board;slow reform of CEB(deadlines forreform postponedrepeatedly)
(Continued)
b670_Chapter-03.qxd 12/12/2008 10:11 AM Page 168

A C
omparative A
nalysis of Economic Perform
ance and Policy Reform
s169
Appendix 3.3 (Continued)
Bangladesh India Nepal Pakistan Sri Lanka
PublicAdministration
Labor Market
Weak governancehinders investmentclimate: need tomake Anti-CorruptionCommission (est.2004) fullyoperational, withappropriateorganizationalstructure, incentives,and staffing
Slow
Need to expandcontractemployment,streamline laborregulations, andcreate greaterflexibility toaccommodaterapidly expandinglabor force
Need forgovernance reforms
Need for moreflexible labormarkets; need toaccommodate laborconcerns aboutunemploymentinsurance and due-process provisionsin draft ofCompetitionOrdinance
Slow
Political devolutionneeds to befollowed byadministrative andfinancial devolutionto allow localgovernments toacquire the meansto carry out theirincreasedresponsibilities
Restrictive laborlaws; need torationalizeindustrial andcommercial laborlaws
Need for moreflexible labor laws
(Continued)
b670_Chapter-03.qxd 12/12/2008 10:11 AM Page 169
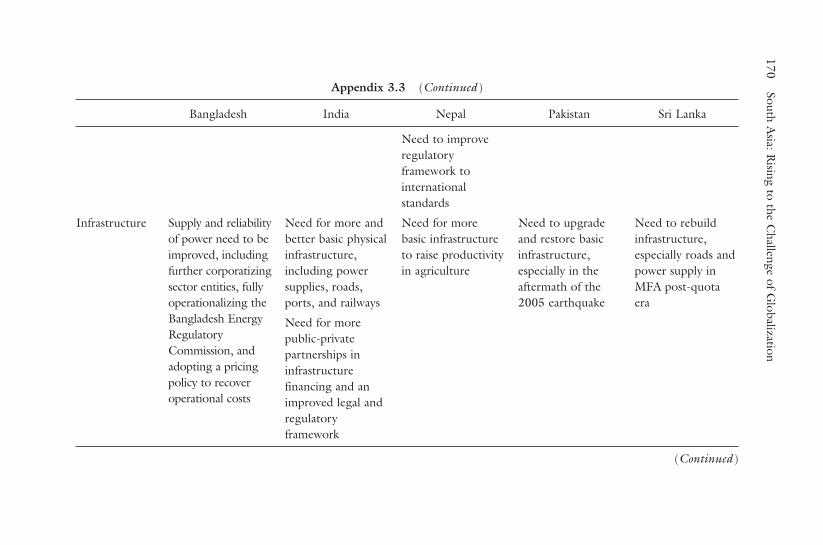
170South A
sia: Rising to the C
hallenge of Globalization
Appendix 3.3 (Continued)
Bangladesh India Nepal Pakistan Sri Lanka
Infrastructure Supply and reliabilityof power need to beimproved, includingfurther corporatizingsector entities, fullyoperationalizing theBangladesh EnergyRegulatoryCommission, andadopting a pricingpolicy to recoveroperational costs
Need for more andbetter basic physicalinfrastructure,including powersupplies, roads,ports, and railways
Need for morepublic-privatepartnerships ininfrastructurefinancing and animproved legal andregulatoryframework
Need to improveregulatoryframework tointernationalstandards
Need for morebasic infrastructureto raise productivityin agriculture
Need to upgradeand restore basicinfrastructure,especially in theaftermath of the2005 earthquake
Need to rebuildinfrastructure,especially roads andpower supply inMFA post-quotaera
(Continued)
b670_Chapter-03.qxd 12/12/2008 10:11 AM Page 170

A C
omparative A
nalysis of Economic Perform
ance and Policy Reform
s171
Appendix 3.3 (Continued)
Bangladesh India Nepal Pakistan Sri Lanka
Infrastructure(cont’d)
Gas sector needs tobe reorganized tode-link regulationfrom operation,create a conduciveenvironment toencourage privatesector involvementin transmission anddistribution, and linkdomestic prices tointernational levels
More reformsneeded inChittagong port toimprove vesselturnaround time andcontainer idle time
(Continued)
b670_Chapter-03.qxd 12/12/2008 10:11 AM Page 171

172South A
sia: Rising to the C
hallenge of Globalization
Appendix 3.3 (Continued)
Bangladesh India Nepal Pakistan Sri Lanka
Infrastructure(cont’d)
More reforminitiatives in roadsneeded to improvegovernance, createan autonomoususer-financed roadmaintenance fund,and approve amultimodaltransport policy
Bangladesh Railwaymust adopt a morecommercial focus totake advantage ofincreased domesticand cross-borderdemand for railwayservices
Sources: ADB (2006) and 2006 update; IMF, Article IV Consultation reports.
b670_Chapter-03.qxd 12/12/2008 10:11 AM Page 172

ReferencesAhluwalia, MS (2002). Economic Reforms in India since 1991: Has Gradualism
Worked? Journal of Economic Perspectives, 16(3): 67–88.———. n.d. India’s Economic Reforms and Appraisal. Speech, Planning
Commission, Government of India. Anderson, K (2003). Agriculture and Agricultural Incentives in China and India
Post-Uruguay Round. Paper presented at the conference Agricultural PolicyReforms and the WTO: Where Are We Heading?, Capri, Italy.
Asian Development Bank (2006). Asian Development Outlook 2006.Bhattacharya, S and UR Patel (2003). Reform Strategies in the Indian Financial
Sector. Paper presented at the conference A Tale of Two Giants: India’s andChina’s Experience with Reform and Growth, New Delhi, India.
Bourguignon, F and C Morrison (2002). Inequality among World Citizens:1820–1992. American Economic Review, 92(4): 727–744.
DeLong, B (2003). India since Independence: An Analytic Growth Narrative. InSearch of Prosperity: Analytic Narratives on Economic Growth, edited by DaniRodrik, Princeton University Press.
Dollar, D and A Kraay (2000). Growth Is Good for the Poor. World BankDevelopment Research Group. Mimeo.
Dowling, JM (2008). Future Perspectives on the Economic Development of Asia,Advanced Research in Asian Economic Studies, Volume 5 . World Scientific,New Jersey and Singapore.
Economist (2006). Who Wants To Be a Trillionaire? The Economist, 28 October, 91. Eslake, S (2005). China and India in the world economy and Implications for
Australia ABERU Discussion Paper No. 20. Monash University, Melbourne,Australia.
Fei, JCH and G Ranis (1961). A Theory of Economic Development. AmericanEconomic Review, 51(4): 533–565.
Hasan, R, D Mitra, and B Ural (forthcoming). Trade Liberalization, Labor MarketInstitutions and Poverty Reduction: Evidence from Indian States. India PolicyForum.
Henley, JS (2003). Chasing the Dragon: Accounting for the Under-Performance ofIndia by Comparison with China in Attracting Foreign Direct Investment. Paperpresented at the Annual Conference 2003: Globalisation and Development,Development Studies Association.
International Monetary Fund (2005). Bhutan: Joint Staff Advisory Note of thePoverty Reduction Strategy Paper, Country Report 05/85.
———. (2006). World Economic Outlook Database Online.Kochhar, K, U Kumar, RG Rajan, A Subramanian and I Trokatlidis (2006). India’s
Pattern of Development: What Happened, What Follows? IMF Working Paper 22.
A Comparative Analysis of Economic Performance and Policy Reforms 173
b670_Chapter-03.qxd 12/12/2008 10:11 AM Page 173
Lewis, WA (1954). Economic Development with Unlimited Supplies of Labour. TheManchester School, 22(2): 139–191.
Mellor, JW and Sarah Gavian (1999). The Determinants of Employment Growth inEgypt: The Dominant Role of Agriculture and the Rural Small Scale Sector.Impact Assessment Report No. 7. Abt Associates, Inc.
Nararaj, R (2005). Industrial Growth in China and India: A Preliminary Comparison.Economic and Political Weekly, 2163–2171.
Panagariya, A (2006). India and China: Trade and Foreign Investment. Paper pre-sented at Pan Asia Conference, Stanford University.
Park, A and K Sehrt (2001). Tests of Financial Intermediation and Banking Reformin China. Journal of Comparative Economics, 29(4): 608–644.
Ravallion, M and S Chen (2004). How Have the World’s Poorest Fared since theEarly 1980s? World Bank Policy Research Working Paper 3341.
Rodrik, D (2002). After Neo-liberalism What? Harvard University. Mimeo.Timmer, PC (1997). How Well Do the Poor Connect to the Growth Process? CAER
Discussion Paper 17, Harvard Institute of International Development.UNCTAD FDI Database.United States Department of Commerce, Commercial Service website http://www.
buyusa.gov/china/en/bank.htmlWhalley, J and S Zhang (2004). Inequality Change in China and (Hukou) Labour
Mobility Restrictions. NBER Working Paper Series No. 10683.Wolf, M (2004). There’s A Proven Way to Rid the World of Poverty. Straits Times
Singapore, 6 May.World Bank. World Development Indicators Online.World Bank and International Bank for Reconstruction and Development (IBRD)
(2007). Doing Business in South Asia 2007.World Bank and International Finance Corporation (IFC) (2006). Doing Business in
2006: Creating Jobs.
174 South Asia: Rising to the Challenge of Globalization
b670_Chapter-03.qxd 12/12/2008 10:11 AM Page 174

175
9 For a more comprehensive discussion, see Vineeta Shankar (2004).
Chapter 4
Economic Integration Between SouthAsia and East Asia: The Second Phase
of Pan-Asian Integration?
IntroductionRecently, there has been growing interest in the evolving economicrelationships between South Asia and East Asia. There are at leastthree reasons for this. First, two of the most dynamic countries in theworld, namely, China and India, are in the region and the evolutionof these giant economies together with growing economic interrela-tions between the two could have important implications for othercountries in the region and the global economy. Second, with thesurge in regionalism in post-crisis East Asia, a question that is fre-quently being asked is, will growing economic relations betweenSouth Asia and East Asia be the second phase and eventually lead toan integrated Pan-Asia similar to the integration achieved in Europe,sometime in the future? Third, during the pre-colonial period, Asianot only dominated the global economy but was one of the mostintegrated regions of the world — will this happen once again?
South Asia has a long history of economic ties and cultural andreligious exchange with East Asia which date back to the pre-Christianera. The first millennium of the Christian era was a period of rapidgrowth for India and China. Trade ties between these two countriesalso increased and the expansion of trade links between these coun-tries widened localized networks into regional ones.9 Exports from
b670_Chapter-04.qxd 12/10/2008 7:48 AM Page 175

India comprised mainly rice, sugar and textiles, while imports weremore varied and included Indonesian spices, various kinds of woods,Chinese silk, gold and non-precious metals such as tin, copper andvermillion. India and China were in contact with each other througha network of land and sea routes. Land routes started off as localizednetworks and were gradually linked into long distant trading channelknown as the Silk Road. There were two major maritime ports in theeast coast of India, namely, the port of Coromandel (near present-dayChennai) and Bengal. There is evidence of extensive trade withBurma and Thailand. The opening of the Straits of Malacca in thefifth century enabled direct contact with the northwestern edge of theJava Sea region where intra-regional trade was strong and which ledto the establishment of the Srivijaya Empire (present-day Indonesia).This, together with the emergence of the Chola Empire in SouthIndia and the Sung Dynasty in China in the tenth and the eleventhcenturies as large, unified, and prosperous regional powers, providedan additional fillip to regional economic trade and exchange.Strategically located on the route of the great maritime route con-necting China and the West, Southeast Asia also provided a stagingground for merchants from the East and the West. Various strategicalliances were also made. Rajendra I of the Chola dynasty conducteda naval expedition to Srivijaya to protect trade with China.Rajendrachola Deva I named the island of Singapore (Singapura) inthe 10th century AD. Hence, during the pre-colonial period, in addi-tion to being the dominant region of the world, Asia was one of themost integrated regions of the world. The latter fact is relatively lessknown.
Together with land and sea-borne commerce, trader, missionaries,priests, adventurers, and fortune seekers moved from South Asia toSoutheast Asia. The Sanskrit language, Hinduism, and Buddhismwere like old wine lacing East Asia’s culture. Names from the Sanskritlanguage and various Hindu-Buddhist cults were adopted in EastAsia. The common people too were influenced by the stories of theRamayana, and various deities became popular.
During the colonial period (the 19th and early 20th centuries),Europeans (the Portuguese, the Spanish, the Dutch, the British, and
176 South Asia: Rising to the Challenge of Globalization
b670_Chapter-04.qxd 12/10/2008 7:48 AM Page 176

the French) and the Americans were able to take control of the inter-national trade of Asia, thereby diverting the profits from this trade toEurope. This distorted center-periphery relations made Europestronger while the Asian empires and kingdoms became weaker.Economic links between South Asia and East Asia also weakened asSouth Asian soldiers were used to quash rebellions in other parts ofAsia such as China (the Opium War) and Malaya. It is only after theend of the colonial period that South Asia has once again started tore-engage with East Asia. This will be discussed later.
While there is growing interest on South Asia–East Asia economicrelations, most studies on regionalism in Asia focus on either SouthAsia or East Asia separately. Studies on the implications of economiccooperation between the two regions are few — the only exceptionsare a number of studies on BIMSTEC (e.g., ADB, 2005) — and thesefocus mainly on India’s economic relations with the PRC, ASEAN, orASEAN+3 (Asher and Sen, 2005; Kumar, Sen, and Asher, 2006).An exception in Chandra and Kumar (2008). It is true, no doubt, thatIndia accounts for about 80% of South Asia’s gross national product(GNP) and has been the most active in pursuing enhanced economicrelations with East Asia under its so-called “Look East” policy.However, other countries in South Asia such as Pakistan and SriLanka are also now initiating FTA discussions with various East Asiancountries, and Bangladesh, Bhutan, Nepal and Sri Lanka are membersof BIMSTEC.
The objectives of this chapter are threefold: to review trends ineconomic integration between South Asia and East Asia, highlight thepotential for increased integration in the future, and recommendpolicies to further enhance integration between the two regions.
After this introductory section, the next section provides variousquantitative measures of economic integration between South Asiaand East Asia. It is followed by a section that assesses the economiccomplementarities between the two regions by analyzing the com-position of the top 10 exports of the two regions to each other, bycalculating revealed comparative advantage indices, and by calculat-ing the trade complementarity index. This section also attempts toexplain why the level of integration between the two regions was low
Economic Integration Between South Asia and East Asia 177
b670_Chapter-04.qxd 12/10/2008 7:48 AM Page 177

until 2000 and why it has started to surge since then. The sectionafter that reviews ongoing policy efforts to promote integrationbetween the two regions including the proliferation of FTAsbetween them. The final section recommends a set of policies thatcould be considered for enhancing integration between South Asiaand East Asia.
Quantitative Measures of IntegrationTrade Integration
South Asia’s total merchandise trade with East Asia (ASEAN+3) hasgrown significantly in absolute terms. It increased nearly eightfold in1990–2006, from $12.4 billion to $96.8 billion, for an averageannual growth rate of 14.6% (Fig. 4.1). The annual growth ratewas relatively moderate until 2000, but it surged after that and aver-aged 26.2% in 2001–2006, with the largest increase being in 2006
178 South Asia: Rising to the Challenge of Globalization
Fig. 4.1 Total Trade between South Asia and East Asia, 1990–2006 ($ billion).
Source: IMF (2007).
b670_Chapter-04.qxd 12/10/2008 7:48 AM Page 178

(48.6%).10 Trade with the PRC on average in 1990–2006 increasedthe fastest (at 28.7%), albeit from a low base, followed by trade withASEAN (at 15.5%). Total trade with Japan grew at a relatively slowerpace of 5.2% in the same period (Appendix 4.1).11
A large part of the increase in South Asia–East Asia trade isaccounted for by the bilateral trade between the two giant economiesof India and the PRC, which has also increased rapidly in recent years.From $48.8 million in 1990, total trade between the two countriesgrew to $25.6 billion in 2006 (or about 26% of total trade betweenSouth Asia and East Asia). In 2001–2006, total trade between thetwo countries posted an average growth of about 51%, with growthreaching 57.1% in 2005–2006.
Although in 2006 South Asia–East Asia trade was higher than thevolume of intra-South Asia trade ($16.2 billion), intra-Central Asiatrade ($4.3 billion), and South Asia–Central Asia trade ($2.3 billion),it was much lower than the level of intra-East Asia trade, which stoodat $2 trillion (Fig. 4.2). In spite of this, South Asia–East Asia trade isthe second-largest component of Pan-Asian trade.
Also relative to the volume of total trade, South Asia’s trade withEast Asia has not changed very much (Fig. 4.3). East Asia accountedfor 18.9% of South Asia’s trade in 1990 and about 21% in 1994,before it fell back to about 18% in 2000. Since then, however, EastAsia’s share has been increasing, reaching about 24% in 2006.South Asia’s trade with the ASEAN countries increased steadily fromabout 7% in 1990 to about 10% in 2006. The same trend holds in thecase of South Asia’s trade with the PRC, which has had more pro-nounced increases since 2000. In fact, in 2006, South Asia’s totaltrade with the PRC stood at about 9%, only slightly lower than itstrade with ASEAN. On the other hand, South Asia’s total trade withJapan declined sharply in 1990–2006, while South Asia’s trade with
Economic Integration Between South Asia and East Asia 179
10 Except in 2002, when South Asia’s exports to the Republic of Korea and Japansoftened somewhat. Trade with other partners, however, surged.11 If East Asia were defined to also include Taiwan and Hong Kong, China, then thelevel of trade would increase from $14.8 billion in 1990 to $110.6 billion in 2006.
b670_Chapter-04.qxd 12/10/2008 7:48 AM Page 179

180 South Asia: Rising to the Challenge of Globalization
CentralAsia
$4.3 billion(4.5%)
South Asia $16.2billion (4.0%)
$18.1 billion (18.9%/0.7%)
$2.3 billion (2.4%/0.9%)
$96.8 billion
(23.8%a
/1.9%b)
East Asia$2,003.1 billion
(39.1%)
Fig. 4.2 Pan-Asian Intra-regional and Inter-regional Trade, 2006.a As a share of South Asia’s trade. b As a share of East Asia’s trade.Note: For inter-regional trade, the percentage figure on the left side refers to inter-regional trade as a share of the left-side region’s total trade; the figure on the rightrefers to inter-regional trade as a share of the right-side region’s total trade.Source: Appendix 4.2.
Fig. 4.3 Inter-regional Trade between South Asia and East Asia (as a percentage ofSouth Asia’s Total Trade with the World), 1990–2006.
Source: IMF (2007).
b670_Chapter-04.qxd 12/10/2008 7:48 AM Page 180

the Republic of Korea, after a sluggish trend until 2001, started todecline slightly.
South Asia accounted for a mere 1.3% of East Asia’s trade in 1990and a slightly higher 1.9% in 2006 (Fig. 4.4). Hence, East Asia is amore important trading partner for South Asia than vice versa.
Trade Intensity Index
Trade shares are not sufficient to assess the extent to which countriesprefer to trade with each other than with their other trading partnersin the rest of the world. Therefore, we also computed trade intensityindices to measure whether trade between two regions is greater rel-ative to their importance in world trade.12
Economic Integration Between South Asia and East Asia 181
Fig. 4.4 Inter-regional Trade between South Asia and East Asia (as a percentage ofEast Asia’s Total Trade with the World), 1990–2006.
Source: IMF (2007).
12 The total Trade Intensity Index (TII) was computed as TIIij = (tij/Tit)/(twj/Twt),where tij and twj are the values of country (or region) i ’s total trade and of world tradewith country (or region) j, and Tit and Twt are country i ’s total trade and total worldtrade, respectively.
b670_Chapter-04.qxd 12/10/2008 7:48 AM Page 181
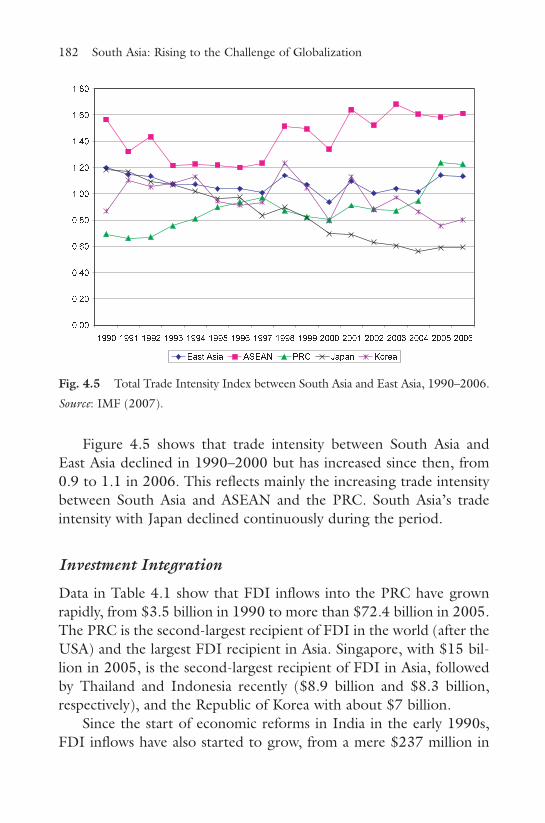
Figure 4.5 shows that trade intensity between South Asia andEast Asia declined in 1990–2000 but has increased since then, from0.9 to 1.1 in 2006. This reflects mainly the increasing trade intensitybetween South Asia and ASEAN and the PRC. South Asia’s tradeintensity with Japan declined continuously during the period.
Investment Integration
Data in Table 4.1 show that FDI inflows into the PRC have grownrapidly, from $3.5 billion in 1990 to more than $72.4 billion in 2005.The PRC is the second-largest recipient of FDI in the world (after theUSA) and the largest FDI recipient in Asia. Singapore, with $15 bil-lion in 2005, is the second-largest recipient of FDI in Asia, followedby Thailand and Indonesia recently ($8.9 billion and $8.3 billion,respectively), and the Republic of Korea with about $7 billion.
Since the start of economic reforms in India in the early 1990s,FDI inflows have also started to grow, from a mere $237 million in
182 South Asia: Rising to the Challenge of Globalization
Fig. 4.5 Total Trade Intensity Index between South Asia and East Asia, 1990–2006.
Source: IMF (2007).
b670_Chapter-04.qxd 12/10/2008 7:48 AM Page 182

1990 to $6.7 billion in 2005. However, even now the level of FDIinflows into India is less than one-tenth of that in the PRC. This gapis expected to lessen further in the future as it is now well accepted inIndia that FDI inflows have a critical role to play in today’s globaleconomy by providing resources and by facilitating technology trans-fer and improvements in managerial systems. Policies to attract FDIhave been put in place as a result.
The absence of comparable data on FDI, by source, limits ananalysis of investment relationships between South Asia and East Asia.
Economic Integration Between South Asia and East Asia 183
Table 4.1 World Foreign Direct Investment Inflows into South Asia and East Asia,1990, 1995, 2000, and 2005 ($ million).
Country 1990 1995 2000 2005
South Asia 546.4 2,952.2 3,092.8 9,861.9Bangladesh 3.2 1.9 280.4 692.0 Bhutan 1.6 0.1 (0.1) 9.0 India 236.7 2,151.0 2,319.0 6,676.0 Maldives 5.6 7.2 13.0 9.5 Nepal 5.9 8.0 (0.5) 2.4 Pakistan 250.0 719.0 308.0 2,201.0 Sri Lanka 43.4 65.0 173.0 272.0
East Asia 18,820.0 67,013.2 80,274.3 123,298.6 Japan 1,753.0 41.5 8,322.7 2,775.4 Brunei Darussalam 7.0 582.8 549.2 288.5 Cambodia 150.7 148.5 381.2 Indonesia 1,092.0 4,346.0 (4,550.0) 8,337.0 Korea, Republic of 759.0 1,250.0 8,591.0 7,049.5 Lao PDR 6.0 88.4 34.0 27.7Malaysia 2,611.0 5,815.0 3,787.6 3,964.8 Myanmar 225.1 317.6 208.0 235.8 Philippines 550.0 1,459.0 1,345.0 1,854.0 PRC 3,487.1 37,520.5 40,714.8 72,406.0 Singapore 5,574.7 11,591.3 16,484.5 15,003.7 Thailand 2,575.0 2,070.0 3,350.0 8,954.0 Viet Nam 180.0 1,780.4 1,289.0 2,021.0
Source: UNCTAD, FDI Indicators Online.
b670_Chapter-04.qxd 12/10/2008 7:48 AM Page 183

The data that are available from national sources and the ASEANSecretariat show that investment relationships between the tworegions, although starting to increase in recent years, is still limited.
184 South Asia: Rising to the Challenge of Globalization
0
100
200
300
400
500
600
700
2002-03 2003-04 2004-05 2005-06 2006-07
Japan Singapore Korea
0
5
10
15
20
25
30
35
40
45
50
1999-00 2000-01 2001-02 2002-03 2003-04 2004-05 2005-06
Japan Hong Kong, China
Singapore PRC
Korea
Figure 4.6b Foreign Direct Investment Flows from Selected East Asian Countriesto Pakistan, 1999/00–2005/06 ($ million).
Source: State Bank of Pakistan.
Figure 4.6a Foreign Direct Investment Flows from Selected East Asian Countriesto India, 2002/03–2006/07 ($ million).
Source: Ministry of Commerce and Industry of India.
b670_Chapter-04.qxd 12/10/2008 7:48 AM Page 184

Economic Integration Between South Asia and East Asia 185
0
10
20
30
40
50
60
1994
1995
1996
1997
1998
1999
2000
2001
2002
2003
2004
2005
2006
India Nepal
Figure 4.7b Foreign Direct Investment Flows from Selected SouthAsian Countries to the PRC, 1994–2006 ($ million).
Source: Chinese Statistical Yearbook, various years.
-500
-400
-300
-200
-100
0
100
200
300
400
1995
1996
1997
1998
1999
2000
2001
2002
2003
2004
2005
2006
India Pakistan
Figure 4.7a Foreign Direct Investment Flows from Selected SouthAsian Countries to ASEAN, 1995–2006 ($ million).
Source: ASEAN Secretariat FDI Database 2005.
b670_Chapter-04.qxd 12/10/2008 7:48 AM Page 185

Figure 4.6a shows an increasing trend for FDI inflows into Indiafrom Japan, the Republic of Korea, and Singapore. An interesting find-ing is that since fiscal year 2004/2005, Singapore has overtaken Japanas the largest Asian source of FDI in India. This reflects the invest-ments made in India by Singapore-based multi-national corporationsand Singapore’s government-linked companies such as SingaporeTelecom, Port of Singapore Authority, and Singapore Technologies.Singapore private sector companies have also made small-scale invest-ments in health care, real estate, large townships, and tourism in India.
Figure 4.6b shows FDI inflows into Pakistan to be rising from Japan,Singapore, and Hong Kong, China but small (relative to total FDI inPakistan) Similarly, data from the PRC’s Ministry of Commerce showthat the PRC’s outward FDI to South Asia has been increasing in recentyears, although the levels are still low. Non-finance outward FDI of thePRC was $11.4 million in 2003 and rose to $17.1 million in 2005(albeit from a decline to $4.5 million in 2004). It is interesting to notethat, of these total figures, $0.14 million went to India in 2003, $0.35million in 2004, and $11.2 million in 2005 (65% of the PRC’s FDIflows to South Asia that year). These figures, however, represent a tinyportion of inward FDI to South Asia as well as outward FDI of the PRC.
Figure 4.7a and 4.7b present data on FDI outflows from selectedSouth Asian countries to East Asia. These show some diversion ofIndia’s FDI away from ASEAN to the PRC. In other words, whileIndia’s investments in the ASEAN countries have softened somewhat,they have increased in the case of the PRC.13 Once again, in relativeterms the magnitude of this shift is not very large.
According to the data provider Dealogic, in the first 9 months of2006 Indian companies announced a record 112 foreign acquisitionswith a combined deal value of $7.2 billion. Deals in 2005 totaled$4.5 billion, which itself was thrice the figure for 2004. A noticeablefeature of India’s overseas expansion is that it focuses on Europe andthe USA and less on East Asia. That feature of its expansion is expectedto continue into the future. An important constraint is that, although
186 South Asia: Rising to the Challenge of Globalization
13 The largest recipient of Indian FDI in ASEAN is Singapore (about $80 million in2003), but the trend is not encouraging.
b670_Chapter-04.qxd 12/10/2008 7:48 AM Page 186

the Government has relaxed limits on the use of foreign exchange byIndian companies for overseas acquisitions, companies are still notpermitted to undertake overseas acquisitions equivalent to more thantwo times their net worth.
Economic ComplementaritiesCommodity Composition of Merchandise Trade
Tables 4.2 and 4.3 show the top 10 exports of South Asia and EastAsia to each other at the two-digit SITC (Revision 3) level in 1990
Economic Integration Between South Asia and East Asia 187
Table 4.2 Top 10 Exports of South Asia to East Asia, 1990 and 2004.
AmountRank SITC Code Commodity ($ million)
19901 S3–66 Non-metallic mineral manufactures 769.02 S3–65 Textile yarn, fabric, etc. 755.03 S3–28 Metalliferous ore, scrap 514.04 S3–03 Fish, crustaceans, molluscs 376.05 S3–26 Textile fibers 327.06 S3–84 Clothing and accessories 117.07 S3–61 Leather, leather goods 113.08 S3–33 Petroleum, petroleum products 92.49 S3–93 Special transactions not classified elsewhere 83.3
10 S3–27 Crude fertilizer, minerals 80.9
20041 S3–28 Metalliferous ore, scrap 3,470.02 S3–33 Petroleum, petroleum products 2,400.03 S3–66 Non-metallic mineral manufactures 1,420.04 S3–67 Iron and steel 1,270.05 S3–65 Textile yarn, fabric, etc. 1,220.06 S3–51 Organic chemicals 1,050.07 S3–03 Fish, crustaceans, molluscs 667.08 S3–57 Plastics in primary form 562.09 S3–68 Non-ferrous metals 510.0
10 S3–08 Animal feedstuff 481.0
SITC = Standard International Trade Classification.Source: Computed from UN COMTRADE Online using Stata Package 9.0.
b670_Chapter-04.qxd 12/10/2008 7:48 AM Page 187

and 2004. The data suggest that, in the case of South Asia, severalunskilled labor-intensive goods dropped out of the top-10 list in 2004as compared with 1990 (such as textile fibers, and clothing and acces-sories), while several capital-intensive goods (such as iron and steel,organic chemicals, and non-ferrous metals) were added to the list. Inthe case of East Asia, power-generating machines and iron and steeldropped out of the top-10 list, while several capital- and knowledge-intensive goods (such as office machines and inorganic chemicals)were added to the list.
188 South Asia: Rising to the Challenge of Globalization
Table 4.3 Top 10 Exports of East Asia to South Asia, 1990 and 2004.
AmountRank SITC Code Commodity ($ million)
19901 S3–33 Petroleum, petroleum products 753.02 S3–78 Road vehicles 621.03 S3–65 Textile yarn, fabric, etc. 604.04 S3–67 Iron and steel 578.05 S3–77 Electrical machinery, apparatus, parts, NES 462.06 S3–72 Specialized industrial machinery 453.07 S3–74 General industrial machineries 431.08 S3–42 Fixed vegetable fats and oils 363.09 S3–71 Power-generating machines 266.0
10 S3–76 Telecommunications, sound equipment, etc. 216.0
20041 S3–65 Textile yarn, fabric, etc. 3,600.02 S3–76 Telecommunications, sound equipment, etc. 3,120.03 S3–42 Fixed vegetable fats and oils 2,490.04 S3–77 Electrical machinery, apparatus, parts, NES 2,370.05 S3–75 Office machines, ADP machines 2,090.06 S3–78 Road vehicles 2,080.07 S3–72 Specialized industrial machinery 1,800.08 S3–51 Organic chemicals 1,790.09 S3–33 Petroleum, petroleum products 1,720.0
10 S3–74 General industrial machineries 1,660.0
ADP = automatic data-processing; NES = not elsewhere specified; SITC = StandardInternational Trade Classification.Source: Computed from UN COMTRADE Online using Stata Package 9.0.
b670_Chapter-04.qxd 12/10/2008 7:48 AM Page 188

The data in the tables suggest that in 2004 there was a certainamount of complementarity between the two regions. South Asia’sexports to East Asia comprise mainly agricultural, primary, and labor-intensive manufactured goods. A limited amount of petroleum prod-ucts (such as kerosene, aviation turbine fuel, high-speed diesel oil, andlight diesel oil) is also exported from India to East Asian countriessuch as Singapore. East Asia’s exports to South Asia, on the otherhand, comprise mainly items in the SITC 7 product group, which aremore capital- and knowledge-intensive, such as telecommunicationsand sound recording equipment, electrical machinery, road vehicles,and industrial machines.
Revealed Comparative Advantage Indicesfor Merchandise Trade
Table 4.4 presents the revealed comparative advantage (RCA) indicesfor South Asia, calculated at the two-digit SITC level.14 The data pre-sented are only for those commodities whose indices are equal to orabove unity in 2004, signifying comparative advantage; these indices arecompared with their corresponding values in 1993. The table showsthat the products for which South Asia had comparative advantage in2004 were mainly primary goods and labor-intensive manufactures.15
Textiles, yarn and fabrics, and clothing and accessories showed thehighest RCA indices in 2004 (and in 1993), and this may have been the
Economic Integration Between South Asia and East Asia 189
14 RCA indices can be used to assess a country’s (or region’s) export potential. It ismeasured by a product’s share in the country’s exports in relation to its share in worldtrade. The RCA index of country i for product j is computed as: RCAij = (xij/Xit)/(xwj /Xwt), where xij and xwj are the values of country (region) i’s exports of productj and world exports of product j, and where Xit and Xwt refer to the country’s(region’s) total exports and world total exports, respectively. An index that exceedsunity means the country (region) has a revealed comparative advantage in the prod-uct; a value less than unity implies a comparative disadvantage. Countries (regions)with similar RCA profiles are unlikely to have high bilateral trade intensities unlessintra-industry trade is involved. Data limitations exclude Bhutan, Maldives, and Nepalfrom the computations.15 India also has comparative advantage in iron and steel, which is capital-intensive.
b670_Chapter-04.qxd 12/10/2008 7:48 AM Page 189

result of the Multi-Fiber Agreement, which granted privileged access togarment exporters. Table 4.5 shows the merchandise goods in whichindividual South Asian countries had comparative advantage in 2004.
The RCA indices for East Asia, on the other hand, show that thisregion has comparative advantage across a much wider range of goods
190 South Asia: Rising to the Challenge of Globalization
Table 4.4 Revealed Comparative Advantage Indices for South Asia, 1993 and2004.
RCA Indices Rank
SITC Code Description 1993 2004 1993 2004
S3–65 Textile yarn, fabric, etc. 6.6 6.0 1 1S3–84 Clothing and accessories 6.5 5.8 2 2S3–66 Non-metallic mineral manufactures 5.7 5.7 5 3S3–61 Leather, leather goods 6.2 4.5 4 4S3–07 Coffee, tea, cocoa, spices 6.4 3.9 3 5S3–28 Metalliferous ore, scrap 2.1 3.4 10 6S3–04 Cereals, cereal preparations 1.6 3.2 14 7S3–27 Crude fertilizer, mineral 2.0 2.8 11 8S3–03 Fish, crustaceans, molluscs 3.7 2.6 7 9S3–83 Travel goods, handbags, etc. 3.1 2.3 9 10S3–08 Animal feedstuff 4.1 1.9 6 11S3–43 Animal, vegetable fats, oils, NES 0.4 1.8 31 12S3–26 Textile fibers 3.6 1.8 8 13S3–29 Crude animal, vegetable materials 2.0 1.7 12 14S3–89 Misc. manufactured goods, NES 0.8 1.6 25 15S3–85 Footwear 1.8 1.5 13 16S3–67 Iron and steel 0.8 1.5 24 17S3–12 Tobacco, tobacco manufactures 1.1 1.3 18 18S3–51 Organic chemicals 0.5 1.2 30 19S3–22 Oilseed, oleaginous fruit 1.0 1.2 20 20S3–05 Vegetables and fruit 1.3 1.1 16 21S3–33 Petroleum, petroleum products 0.3 1.1 37 22S3–53 Dyes, coloring materials 1.4 1.1 15 23S3–69 Metal manufactures, NES 0.7 1.0 26 24S3–62 Rubber manufactures, NES 1.0 1.0 19 25
NES = not elsewhere specified; RCA = revealed comparative advantage; SITC =Standard International Trade Classification.Source: Computed from UN COMTRADE Online using Stata Package 9.0.
b670_Chapter-04.qxd 12/10/2008 7:48 AM Page 190

(Table 4.6). These include primary goods such as crude rubber andfish; labor-intensive manufactured goods such as textiles, travelgoods, and footwear; and more capital- and knowledge-intensiveitems such as office machines and telecommunications equipment.Table 4.7 shows commodities in which individual East Asian coun-tries have comparative advantage.
Economic Integration Between South Asia and East Asia 191
Table 4.5 Commodities in Which Various South Asian Countries Have ComparativeAdvantage, 2004.*
Country Commodity
Bangladesh Clothing and accessories, leather and leather goods, fish, textilefibers, textile yarn, fabric, tobacco and tobacco manufacturing(increase in RCA of clothing and accessories, tobacco and tobaccomanufacturing; decline in RCA of leather and leather goods,textile fibers, textile yarn and fabrics)
India Non-metal mineral manufacturing, textile yarn, fabric, cereals, coffee,tea, animal feedstuff, iron and steel, footwear, organic chemicals,dyes, petroleum products, oilseed, tobacco and tobaccomanufacturing, vegetables and fruits, animal and vegetable fats andoils, plastics in primary form, rubber manufactures(some decline in RCA of level 0 and 6 products except cereals, and iron and steel, which increased; increase in RCA of petroleum and petroleum products)
Pakistan Textile yarn, fabric, leather and leather goods, clothing andaccessories, cereals, animal and vegetable fats and oils, sugar, fish,furniture, beddings, footwear, other transport equipment,vegetables and fruits(some increase in RCA of level 8 products)
Sri Lanka Coffee, tea, clothing and accessories, textile fibers, yarn, fabric, cruderubber, rubber manufactures, tobacco and tobacco manufacturing,animal and vegetable fats and oils, fish, travel goods, handbags,vegetables and fruits, non-ferrous metals, crude animal or vegetablematerial, other transport equipment(increase in RCA of coffee, tea and spices, clothing and accessories,rubber manufacturing, non-ferrous metals, other transportequipment; relatively no change for other products)
RCA = revealed comparative advantage.*Changes since 1993 are in parentheses.Source: Appendix 4.3.
b670_Chapter-04.qxd 12/10/2008 7:48 AM Page 191

Tables 4.4 and 4.6 suggest that RCAs for South Asian and EastAsian countries changed somewhat in 1993 and 2004. A more for-mal test for this is to calculate the Spearman rank correlation coef-ficients between the 1993 and 2004 values (Table 4.8). The data inTable 4.8 show that in East Asia, the PRC has the lowest coeffi-cient (0.667), and this suggests that the country has experiencedthe largest change in its comparative advantage compared withother countries in the East Asian region. Appendix 4.3 shows thatthe PRC’s RCA indices for most primary goods have been declin-ing; this is the case for crude fertilizer, fish, and inorganic chemi-cals. Although not shown, our RCA calculations for the PRC alsorevealed that many primary goods, including live animals, fruits
192 South Asia: Rising to the Challenge of Globalization
Table 4.6 Revealed Comparative Advantage Indices for East Asia, 1993 and 2004.
RCA Indices Rank
SITC Code Description 1993 2004 1993 2004
S3–23 Crude rubber 2.5 2.4 1 1S3–75 Office machines, ADP machines 1.8 2.1 4 2S3–76 Telecom, sound equipment, etc. 2.3 2.0 2 3S3–83 Travel goods, handbags, etc. 2.1 1.8 3 4S3–77 Elect. mach., apparatus, parts, NES 1.6 1.8 8 5S3–43 Animal, vegetable fats, oils, NES 1.6 1.6 7 6S3–88 Photog. apparatus, NES; clocks 1.7 1.6 6 7S3–42 Fixed vegetable fats and oils 1.6 1.6 10 8S3–85 Footwear 1.6 1.5 9 9S3–84 Clothing and accessories 1.5 1.5 11 10S3–65 Textile yarn, fabric, etc. 1.4 1.4 12 11S3–73 Metalworking machinery 1.1 1.2 15 12S3–32 Coal, coke, briquettes 0.5 1.2 44 13S3–03 Fish, crustaceans, molluscs 1.3 1.1 13 14S3–89 Misc. manufactured goods, NES 1.0 1.0 18 15S3–62 Rubber manufactures, NES 1.1 1.0 16 16S3–87 Scientific equipment, NES 0.8 1.0 26 17
ADP = automatic data-processing; NES = not elsewhere specified; RCA = revealedcomparative advantage; SITC = Standard International Trade Classification.Source: Computed from UN COMTRADE Online using Stata Package 9.0.
b670_Chapter-04.qxd 12/10/2008 7:48 AM Page 192

Economic Integration Between South Asia and East Asia 193
Table 4.7 Commodities in Which Various East Asian Countries Have ComparativeAdvantage, 2004.*
PRC Travel goods, handbags, footwear, clothing and accessories, officemachines, coal, coke, textile yarn, fabric, telecom and soundequipment, prefabricated buildings and fittings, furniture, bedding,metals manufacturing, fish, inorganic chemicals, leather and leathergoods, cork, wood manufacturing, electrical machinery andapparatus, crude fertilizer, photographic apparatus(increase in RCA of level 7 products; decline in RCA of most level 8 products and several level 0 products)
Indonesia Fixed vegetable fats and oils, crude rubber, coal, coke, cork and woodmanufactures, coffee, tea, metalliferous ore, scrap, fish, pulp andwastepaper, footwear, natural and manufactured gas, furniture,bedding, clothing and accessories, paper and paperboard, textileyarn, fabric, textile fibers, petroleum products, tobacco and tobaccomanufacturing, non-ferrous metals, cork and wood, rubbermanufacturing(increase in RCA of level 2, 4 products; decrease in RCA of petroleum and petroleum products)
Japan Photo apparatus, metalworking machinery, special industrialmachinery, road vehicles, electrical machinery and apparatus,rubber manufacturing, power-generating machines, generalindustrial machineries, iron and steel, telecom and soundequipment, plastic in non-primary form, chemical materials,organic chemicals, other transport equipment(increase in RCA of level 5 products and some level 7 products; decline in RCA of telecom and sound equipment)
Korea, Gold, telecom, sound equipment, other transport equipment, plasticsRepublic in primary form, textile yarn, fabric, textile fibers, office machines,of electrical machinery and apparatus, iron and steel, leather and
leather goods, organic chemicals, road vehicles, crude rubber,rubber manufacturing(increase in RCA of level 5 and 7 products; decline in RCA of level 6 products)
Malaysia Animal and vegetable fats and oils, coffee, tea, furniture, bedding,crude rubber, natural and manufactured gas, petroleum products,office machines, telecom and sound equipment, furniture, bedding(increase in RCA of animal and vegetable fats/oils, and officemachines; decline in RCA of fixed vegetable fats/oils, cruderubber, cork and wood manufactures, telecom and sound equipment)
(Continued)
b670_Chapter-04.qxd 12/10/2008 7:48 AM Page 193

and vegetables, and cereals, changed from comparative advantageto disadvantage from 1993 and 2004. On the other hand, there hasbeen an increase in the PRC’s RCA indices for most manufacturedgoods, such as telecommunications and sound equipment, metalmanufactures, prefabricated fittings, electrical machinery parts, andoffice machines.
In South Asia, Bangladesh has the lowest coefficient (0.552),suggesting a relatively higher change in RCA compared withthe other South Asian countries. Bangladesh’s RCA in clothing
194 South Asia: Rising to the Challenge of Globalization
Table 4.7 (Continued)
Philippines Fixed vegetable fats and oils, electrical machinery and apparatus,vegetables and fruits, fish, sugar and sugar preparations, tobacco and tobacco manufacturing, clothing and accessories, special transactions not classified elsewhere(increase in RCA of level 7 products; decline in RCA of level0 products)
Singapore Electrical machinery, office machines, petroleum products, organicchemicals, photographic apparatus, plastics in primary form,telecom and sound equipment, special transactions not classifiedelsewhere(increase in RCA of electrical machinery and apparatus, plastics in primary form, and organic chemicals; decline in RCA of office machines, petroleum products, telecom and sound equipment)
Thailand Crude rubber, sugar and sugar preparations, cereals, plastics inprimary form, rubber manufacturing, office machines, electricalmachinery and apparatus, textile fibers, vegetables and fruits,leather and leather goods, footwear, furniture, crude fertilizer,clothing and accessories, textile yarn, fabric, photographicapparatus, animal feedstuff, animal and vegetable fats and oils,furniture, bedding, footwear, telecom and sound equipment(increase in RCA of crude rubber, plastics in primary form, textilefibers, photographic apparatus and clocks, and animal andvegetable fats/oils; decline in RCA of several level 0 and level 8products)
RCA = revealed comparative advantage.*Changes since 1993 are in parentheses.Source: Appendix 4.3.
b670_Chapter-04.qxd 12/10/2008 7:48 AM Page 194

and textiles decreased, while that in leather and leather goodsincreased. For all the countries in both regions, however, thecorrelation coefficients are quite high (close to unity) and statisti-cally significant at the 1% level, indicating no significant changein RCA.
Trade Complementarity Indices
One possible explanation for the increasing integration betweenSouth Asia and East Asia is that the regions’ export and importdemand profiles have become more “complementary” over time.That is, goods exported by South Asia are becoming increasinglysimilar to the goods imported by East Asia, and vice versa. We cal-culated the so-called “trade complementarity index” for pairs ofSouth and East Asian countries using SITC two-digit data in 1993
Economic Integration Between South Asia and East Asia 195
Table 4.8 Spearman Rank Correlation Coefficients for Revealed ComparativeAdvantage Indices, 1993 and 2004.
Country Spearman’s Rho No. of Observations
South Asia 0.859* 65Bangladesh 0.552* 51India 0.869* 65Pakistan 0.736* 58Sri Lanka 0.709* 61
East Asia 0.860* 66Indonesia 0.849* 64Japan 0.948* 65Korea, Republic of 0.803* 63Malaysia 0.775* 65Philippines 0.714* 63PRC 0.667* 64Singapore 0.797* 65Thailand 0.825* 65
Note: South Asia and East Asia here consist of only those countries listed above.*Significant at 1%.Source: Computed from UN COMTRADE Online using Stata Package 9.0.
b670_Chapter-04.qxd 12/10/2008 7:48 AM Page 195

and 2004. The results are presented in Table 4.9.16 The first set ofdata refers to the similarity of South Asia’s exports with East Asia’simports, and the second to the similarity of East Asia’s exports withSouth Asia’s imports. The data show that while the complementarityof India’s and Pakistan’s trade with various East Asian countries hasincreased, the results are more mixed in the case of Sri Lanka. Thecomplementarity of Bangladesh’s trade with East Asia has, however,declined. The overall index for South Asia as a group suggests thatSouth Asia has been increasingly exporting the commodities thatEast Asia is importing (the complementarity index increased from 40to 48), while the complementarity of East Asia’s exports with SouthAsia’s imports has not changed very much (the index has remainedat around 49).
Trade in Commercial Services
With the rapid changes in technology and globalization, trade incommercial services is becoming increasingly more important in boththe South and East Asian countries. However, unlike in merchandisetrade, bilateral data on the trade in services are unavailable. Hence,analysis is restricted to service exports from those countries and theirbreakdown into various sectors that are available in the IMF’s bal-ance-of-payments statistics.
Table 4.10 shows that the service exports of both South Asiaand East Asia quadrupled in 1990–2004 to about $30 billionin South Asia and about $344 billion in East Asia. India is thelargest exporter of services in South Asia, while the PRC, theRepublic of Korea, and Singapore are the largest exporters in EastAsia aside from Japan. Data in Table 4.11 show that information
196 South Asia: Rising to the Challenge of Globalization
16 The Trade Complementarity Index (TCI) between countries (or regions) k and jwere computed as: TCI = 100 − sum(|mik − xij |/2), where xij is the share of good i inglobal exports of country j, and mik is the share of good i in total imports of countryk. The index shows how well the structures of a country’s (or region’s) imports andexports match. The index is 0 when no goods are exported by one country orimported by the other, and 100 when the export and import shares exactly match.
b670_Chapter-04.qxd 12/10/2008 7:48 AM Page 196

Economic Integration Between South Asia and East Asia 197
Table 4.9 Trade Complementarity Indices between South Asia and East Asia,1993 and 2004.
Similarity of SimilaritySouth Asia’s of South Asia’s
Exports to East Imports to EastAsia’s Imports Asia’s Exports
Trading Partners 1993 2004 1993 2004
South Asia East Asia 39.5 47.9 49.1 48.3
Bangladesh Indonesia 16.8 9.6 38.1 46.0Japan 26.1 17.7 39.2 37.6Korea, Rep. of 17.9 12.1 47.6 43.8Malaysia 12.6 7.2 38.4 37.2Philippines 13.5 7.9 26.8 24.1PRC 20.0 9.5 47.9 38.0Singapore 12.3 6.4 43.4 34.0Thailand 14.5 10.1 37.6 44.4
India Indonesia 37.9 51.5 40.4 49.6Japan 49.0 54.6 36.1 39.4Korea, Rep. of 36.2 49.3 37.6 43.7Malaysia 34.8 41.2 32.4 42.2Philippines 38.2 41.5 31.0 24.9PRC 37.9 47.7 33.4 37.0Singapore 33.5 38.5 43.2 43.0Thailand 37.4 52.5 28.5 38.9
Pakistan Indonesia 18.6 21.2 40.2 46.9Japan 27.5 26.6 46.4 45.4Korea, Rep. of 19.5 20.8 41.1 48.6Malaysia 14.8 18.8 38.0 38.7Philippines 15.7 17.0 24.9 23.9PRC 20.4 18.8 33.7 34.9Singapore 15.7 18.8 44.3 42.9Thailand 15.1 19.9 29.0 43.1
Sri Lanka Indonesia 15.0 18.7 38.8 50.1Japan 30.1 28.3 43.1 40.5Korea, Rep. of 18.4 21.1 52.8 49.0Malaysia 18.5 20.2 38.0 39.1Philippines 17.5 16.5 28.5 27.1PRC 16.6 19.5 50.9 42.7Singapore 20.8 18.2 43.6 39.9Thailand 20.1 22.6 42.2 52.2
Source: Computed from UN COMTRADE Online using Stata Package 9.0.
b670_Chapter-04.qxd 12/10/2008 7:48 AM Page 197

and communication technology (ICT) (which comprises commu-nication services and computer and information services) accountsfor the bulk of the increase in the service exports of India. In 2003,ICT accounted for about 53% of India’s service exports. In the caseof the PRC, however, travel (business and tourism) is the most sig-nificant portion of service exports, accounting for about 40% of thetotal in 2004.
India has become the leading destination for the outsourcing ofICT services, call-center support, and other back-end business opera-tions (like data entry and handling, payroll management, accountingand bookkeeping, and ticketing). However, in spite of rapid growth,India’s share of the global software market is still small. Also, while
198 South Asia: Rising to the Challenge of Globalization
Table 4.10 Exports of Commercial Services, 1990, 1995, 2000, and 2005 ($ million).
Country 1990 1995 2000 2005*
South Asia 7,190.8 11,061.2 20,671.9 30,556.7Bangladesh 391.6 698.2 815.1 1,245.4India 4,624.9 6,774.7 16,683.7 23,396.6Maldives 101.1 232.8 348.5 317.2Nepal 204.4 679.0 505.9 380.4Pakistan 1,429.3 1,857.3 1,380.0 3,677.0Sri Lanka 439.6 819.2 938.7 1,540.1
East Asia 44,472.2 111,694.1 131,382.0 344,610.4Cambodia n.a. 114.0 428.4 1,106.5Indonesia 2,488.0 5,469.0 5,214.1 12,925.5Japan 41.4 65.3 69.2 110,210.0Korea, Republic of 9,636.9 22,827.3 30,533.6 45,374.6Lao PDR 23.7 96.8 175.7 166.1Malaysia 3,859.0 11,601.6 13,940.5 19,575.7Myanmar 94.4 364.6 477.9 254.7Philippines 3,244.0 9,348.0 3,972.0 4,462.0PRC 5,855.0 19,130.3 30,430.5 74,404.1Singapore 12,810.8 27,832.1 29,569.9 51,307.9Thailand 6,419.0 14,845.2 13,868.2 20,647.3Viet Nam n.a. n.a. 2,702.0 4,176.0
* Latest figures are 2001 for Lao PDR, 2003 for India, and 2004 for Myanmar.Source: IMF (2007a).
b670_Chapter-04.qxd 12/10/2008 7:48 AM Page 198

Economic Integration Between South Asia and East Asia 199
Table 4.11 Commercial Service Exports for India and the PRC by Sector, 1990,1995, 2000, 2003, and 2004 ($ million).
Country/Service Sector 1990 1995 2000 2003 2004
IndiaTransportation 959.4 1,890.4 1,978.7 3,061.6Travel 1,558.4 2,581.5 3,459.9 3,887.1Communication services n.a. n.a. 598.8 1,065.9Construction services n.a. n.a. 501.9 284.1Insurance services 123.3 170.2 257.0 408.9Financial services n.a. n.a. 276.0 392.1Computer and information n.a. n.a. 4,727.4 11,365.7
services Royalties and license fees 1.3 1.4 82.6 25.2Other business services 1,967.1 2,119.7 4,147.8 2,601.0Government services 15.4 11.5 653.7 305.1Total Services 4,624.9 6,774.7 16,683.7 23,396.6
PRCTransportation 2,706.0 3,352.1 3,671.0 7,906.4 12,067.5Travel 1,738.0 8,730.0 16,231.0 17,406.0 25,739.0Communication services 159.0 755.7 1,345.5 638.4 440.5Construction services n.a. n.a. 602.3 1,289.7 1,467.5Insurance services 227.0 1,852.1 107.8 312.8 380.8Financial services n.a. n.a. 77.8 152.0 94.0Computer and information n.a. n.a. 356.0 1,102.2 1,637.2
servicesRoyalties and license fees n.a. n.a. 80.4 107.0 236.4Other business services 918.0 3,740.0 7,663.0 17,427.0 19,951.9Personal, cultural, and n.a. n.a. 11.3 33.4 41.0
recreational servicesGovernment services 107.0 700.3 284.5 358.8 378.5Total Services 5,855.0 19,130.3 30,430.5 46,733.6 62,434.1
n.a. = not available.Source: IMF (2007a).
the software industry in India is diversifying into new areas withstrong growth potential, the hardware industry is only now beginningto receive the requisite attention of policy makers and industry.Cooperation with East Asian countries that have developed such
b670_Chapter-04.qxd 12/10/2008 7:48 AM Page 199

capabilities could create synergies for mutual benefits in this area(Sen, Asher, and Rajan, 2004).
RCA indices for various commercial service trade sectors in200417 presented in Table 4.12 suggest a certain degree of comple-mentarity between South Asia and East Asia. South Asia has comple-mentarity in ICT, defined as communication and computer andinformation services (India and Sri Lanka), and travel (business andtourism) (Maldives, Nepal, and Sri Lanka), and East Asia in royaltieson licenses for the authorized use of proprietary rights (Japan andRepublic of Korea), financial services and insurance (Singapore), con-struction services (PRC, Indonesia, Japan, Malaysia, and the Philippines),and travel (business and tourism) (Cambodia, PRC, Malaysia, thePhilippines, and Thailand).
200 South Asia: Rising to the Challenge of Globalization
Table 4.12 Revealed Comparative Advantage in Services, 2004.
Country Service Sector
South AsiaBangladesh CommunicationsIndia Computer and information, communicationsMaldives TravelNepal Communications, travelPakistan Communications, transportationSri Lanka Transportation, insurance communications, computer and
information, construction, travel
East AsiaCambodia Travel, communicationsIndonesia Communications, business, constructionJapan Royalties and licenses, construction, transportationKorea, Rep. of Business, royalties, and licensesMalaysia Personal, cultural, and recreational; travel; constructionPhilippines Communications, travel, transportation, constructionPRC Travel, constructionSingapore Business, transportation, financial, insuranceThailand Travel
Source: Computed from IMF (2006), using Stata Package 9.0.
17 2003 for India and Malaysia.
b670_Chapter-04.qxd 12/10/2008 7:48 AM Page 200

Reasons for Low Integration
It is well known that levels of South-South trade and investmenttend to be low because of the relative absence of complementarities.However, South Asia–East Asia trade and investment has some ele-ment of North-South trade because of the inclusion of Japan andseveral middle-income countries including Singapore and theRepublic of Korea, which are members of the OECD. Despite that,the level of trade and investment integration has been low and hasstarted to surge only recently (since 2001). Why is that? First,because of its cultural and colonial past, until recently South Asialooked toward Europe and the USA for markets. East Asia alsolooked toward its traditional markets in the USA and, to someextent, Europe. It is only recently that South Asia has started to lookeast for economic opportunities and East Asia to look west (see nextsection). Second, ever since its rout by the PRC in a brief but bloodywar in 1962, India has viewed its relationship with the PRC with asense of injustice, humiliation, and suspicion. Although labeled a“border dispute,” it is more than that. India claims an area of thePRC-controlled territory in Ladakh, Kashmir. Similarly, the PRCclaims some part of what is now the Indian state of ArunachalPradesh. Since 1988, working groups have been meeting to discussthe dispute. A settlement seems remote, but it is no longer incon-ceivable. Among others, India and the PRC have started to cooper-ate to secure strategic natural resources. For example, Indiaannounced in January 2006 that it had acquired a 20% share in thedevelopment of Iran’s biggest onshore oilfield, which is operated and50% owned by Sinopec, the PRC’s state-owned oil company.
Ongoing Policy Efforts It is only after the end of the colonial era that South Asia once againstarted to re-engage with East Asia. The Asian Relations Conferenceheld in New Delhi in 1947 under the leadership of Jawaharlal Nehruserved as one of the earliest attempts to form a Pan-Asian identity.Forming a common cause with other Asian leaders on decolonization,
Economic Integration Between South Asia and East Asia 201
b670_Chapter-04.qxd 12/10/2008 7:48 AM Page 201

Western imperialism, equality and developing-world solidarity, Nehruhelped to forge the “Bandung Spirit” of 1955 which led to the non-aligned movement. This phase of India’s engagement with East Asia,however, ended with India’s border war with China in 1962, and pre-occupation with Pakistan. India turned inward and adopted the Sovietmodel of development.
India started to enhance its links with East Asia only in 1992when it launched its “Look East” policy in the aftermath of the ColdWar and the start of its economic liberalization policies. Under theCongress Government of Manmohan Singh, the “Look East” policyhas been re-energized with renewed focus on India’s place in theglobal economy. Other South Asian countries have also followed suit.“Look East” policies in South Asia have sought to establish trade andinvestment links with the dynamic ASEAN and now the East Asiancountries. India’s engagement with ASEAN began as a sectoral dia-logue partnership in 1992, which was upgraded into a full dialoguepartnership in 1995 and membership in the ASEAN Regional Forumin 1996. The first summit-level interaction began in November 2002.A Long-Term Vision 2020 paper for the ASEAN-India partnershiphas been prepared and is under implementation. Since 1995, Indiahas also participated in various East Asia Summit that brings togetherthe heads of states and governments of ASEAN +3 plus Australia,New Zealand, and India. At the Summit in Singapore last year, it wasdecided to revive the 3000-year old Nalanda University in India as aPan-Asian center of excellence. The recent observer status given tothe PRC and Japan in the SAARC also portends well for SouthAsia–East Asia economic relations. Observer status to Korea andASEAN is also being considered. At the 2006 Asia-Europe FinanceMinisters’ meeting, a decision was made to expand membership toinclude India, Pakistan, Mongolia, and the ASEAN Secretariat fromthe Asian side, and Romania and Bulgaria from the European side.
More recently, as in other parts of the world, there has been a pro-liferation of FTAs between South Asia and East Asia. The most sig-nificant of these so far is the signing of the India-SingaporeComprehensive Economic Cooperation Agreement (CECA) on June2005. The CECA, which took effect in August 2005, covers trade not
202 South Asia: Rising to the Challenge of Globalization
b670_Chapter-04.qxd 12/10/2008 7:48 AM Page 202

only in goods but also in services, investments, and cooperation intechnology, education, air services, and human resources. VariousSouth Asian countries are also members of the Asia-Pacific TradeAgreement under the UN Economic and Social Commission for Asiaand the Pacific (ESCAP). In addition, eight FTA framework agree-ments have been signed between South and East Asian countries(Appendix 4.4). These are the ASEAN-India, India-Thailand, BIM-STEC, PRC-Pakistan, India–Republic of Korea, Malaysia-Pakistan,Pakistan-Singapore, and Pakistan-Indonesia FTAs. Another six FTAshave been proposed — between the PRC and India, Japan and India,Malaysia and India, Pakistan and the Philippines, Pakistan andThailand, and Singapore and Sri Lanka.
Several infrastructure projects also serve to tie South Asia closerto East Asia. South Asian countries are participating in UN ESCAP’sAsian Highway Network (Figure 4.8c) and the Trans-Asian RailwayNetwork (Figure 4.8d). Discussions are also proceeding on re-openingthe World War II era Stillwell Road linking the Assam state withChina’s Yunnan Province through Myanmar. This follows the re-opening of a direct overland trade route along the Nathu La pass onthe border between Sikkim and Tibet in July 2006 after 44 years.
As the economic dynamism of the South Asian and East Asianregions continues, economic relations between South Asia and EastAsia are bound to increase further. What distinguishes the presentengagement with East Asia from the previous one during the pre-colonial period is that it is operating on multiple fronts: South Asia’shistorical, cultural, and idealogical links are being complemented bygrowing economic interdependence including movement of capitaland human resources and a growing number of free trade agreementsand security relationships.
Conclusions and Policy Recommendations The major findings of this chapter are:
• The level of economic integration between South Asia and EastAsia, although increasing since 1990, started to surge after 2000,
Economic Integration Between South Asia and East Asia 203
b670_Chapter-04.qxd 12/10/2008 7:48 AM Page 203

albeit from a low base, mainly because of growing interdepend-ence between India and the PRC.
• Despite the acceleration, the level of integration between the tworegions is low in relative terms.
• Given the complementarities between the two regions and ongo-ing policy efforts, economic integration is bound to increase muchmore in the future.
Which policy actions could be taken to increase the level of SouthAsia–East Asia integration? First, although tariffs and NTBs arealready low in many East Asian countries and South Asia has madeencouraging progress in the same direction since the 1990s, thereappears to be room for further reductions in tariffs and NTBs in bothregions (especially NTBs in East Asia). Table 4.13, which is based onthe recently released Trade Restrictiveness Index of the World Bank,suggests that the average ad valorem tariff is 25.9% in the South Asianregion and 18.2% in East Asia. In South Asia, the ad valorem tariff is
204 South Asia: Rising to the Challenge of Globalization
Table 4.13 Trade Restrictiveness Indices (percentage).
Country Tariffs Only Tariffs and NTBs % Change due to NTBs
South Asia 25.9 32.7 26.2Bangladesh 23.6 30.7 30.1Bhutan 20.5 28.2 37.6India 33.6 50.8 51.2Nepal 38.9 39.0 0.3Pakistan 22.9 31.3 36.7Sri Lanka 15.8 16.0 1.3
East Asia 18.2 36.7 102.2PRC 19.4 31.4 61.9Indonesia 10.6 23.4 120.8Malaysia 26.2 47.6 81.7Philippines 7.3 41.0 461.6Thailand 19.5 25.9 32.8Viet Nam 25.9 50.9 96.5
NTBs = non-tariff barriers.Source: Hiau, Nicita, and Olarreaga (2006).
b670_Chapter-04.qxd 12/10/2008 7:48 AM Page 204

38.9% in Nepal; 33.6% in India; about 20%–23% in Bangladesh,Bhutan, and Pakistan; and 16% in Sri Lanka. NTBs are importantinstruments of protection in four of the six South Asian countries(except Sri Lanka and Pakistan). In East Asia, ad valorem tariff levels arehighest in Malaysia and Viet Nam (about 26%), followed by the PRCand Thailand (about 19%). But NTBs are high in all the countries, espe-cially in Indonesia, the Philippines, and Viet Nam. South Asian coun-tries need to reduce tariffs and NTBs further so that they can participatemore effectively in the global production networks centered in EastAsia while developing regional production networks of their own.
Second, besides reducing tariffs and NTBs, South Asian coun-tries and several East Asian countries also need to make progress inimplementing reforms at the microeconomic level or the so-calledsecond-generation reforms to increase transparency, good governance,and human capital. These reforms include, among others, reform ofthe civil service and the delivery of public goods, creation of an envi-ronment that is conducive to private sector opportunities (greatercompetition, better regulations, and stronger property rights), andreform of institutions that create human capital (e.g., health and edu-cation). India is on the cusp of something big. Economic growthsince the early 1990s (6% and 8% in the last 4 years) is expected notonly to continue but to accelerate further because, among otherthings, one-half of the population is below the age of 25 and a demo-graphic dividend can be expected. But this growth will happen only ifIndia makes progress with the second-generation reforms, particularlyin education and health. Recently, public debt has been too high andthis discourages investment in much-needed infrastructure develop-ment. The banking and insurance sectors have also not been openedup to encourage long-term financing for infrastructure development.The public sector is large and inefficient with much red tape. Severelabor laws cover only 10% of workers, but, once hired, laborers can-not be fired. By and large, this argument holds for other South Asiancountries as well.
The World Bank’s comprehensive index measuring ease of doingbusiness (World Bank, 2006), which ranks 155 countries on 10 topics(starting a business, dealing with licenses, hiring and firing workers,
Economic Integration Between South Asia and East Asia 205
b670_Chapter-04.qxd 12/10/2008 7:48 AM Page 205

registering property, getting credit, protecting investors, paying taxes,trading across borders, enforcing contracts, and closing a business),finds that most East Asian countries and four South Asian countries(Bangladesh, Nepal, Pakistan, and Sri Lanka) rank above average.However, Cambodia, the PRC, Indonesia, the Philippines, and VietNam in East Asia, and Afghanistan, Bhutan, and India in South Asiarank below average. Table 4.14 shows the rankings for various Asiancountries.
Third, South and East Asian countries need to consolidate theirFTAs. There are positive and negative economic aspects to the spreadof FTAs in Asia. On the positive side, against a backdrop of slowprogress in global trade talks, FTAs can promote continuing liberal-ization, induce structural reforms in the countries concerned, and widen
206 South Asia: Rising to the Challenge of Globalization
Table 4.14 Ease of Doing Business Index:Rankings for Asian Countries, 2005.
Country Ranking
Singapore 2Hong Kong, China 7Japan 10Thailand 20Malaysia 21Korea, Republic of 27Taiwan 35Nepal 55Pakistan 60Bangladesh 65Sri Lanka 75PRC 91Viet Nam 99Bhutan 104Philippines 113Indonesia 115India 116Afghanistan 122Cambodia 133
Source: World Bank and IFC (2006).
b670_Chapter-04.qxd 12/10/2008 7:48 AM Page 206

market access across the region. Trade arrangements with dynamic,internationally competitive partners can also encourage the spread ofefficient production practices.
On the negative side, however, the formation of a large number ofbilateral FTAs can lead to the “spaghetti bowl effect.”18 FTAs can leadto trade diversion, with bilateral FTAs being the most trade-diverting.There can be harmful effects caused by multiple rules of origin (e.g.,value-added rules or changes in customs classification) arising fromoverlapping agreements among members of different FTAs. Complexrules increase administrative and business costs, particularly for smalland medium enterprises, which have limited capacity to deal with them.Such rules can also deter FDI and trade. Furthermore, the demands ofnegotiating multiple trade agreements place increasing strains on thescarce trade negotiation resources of many Asian countries, particularlythe least-developed countries, which have limited trade policy capacity.
To make the proliferation of FTAs between South Asia and EastAsia stepping-stones rather than stumbling blocks to multilateralism,policy makers in the region may wish to adopt the concept of “openregionalism” and broaden (create as large and as wide a market as pos-sible) and deepen FTAs (extend coverage beyond trade in goods intoservices, investment, technology, etc.), to reduce the spaghetti-bowleffects mentioned above. Quantitative estimates using the com-putable general equilibrium (CGE) model and the Global TradeAnalysis Project (GTAP) database suggest that a broader regionalapproach will have large beneficial impact. The estimated impact onnational income of an ASEAN+3 and South Asia FTA is much higherthan that of an ASEAN+3 and India FTA, which in turn is higher thanthat of an ASEAN FTA. While India benefits from an ASEAN+3 andIndia FTA, other South Asian countries lose. However, a broaderASEAN+3 and South Asian FTA is a win-win for all. This suggeststhat other South Asian countries should also join India in its “LookEast” policy (Francois, Rana, Wignaraja, forthcoming).
The fourth measure that could significantly affect the level oftrade between South Asia and East Asia is the reduction of trading
Economic Integration Between South Asia and East Asia 207
18 For a concise restatement, see Bhagwati (2002).
b670_Chapter-04.qxd 12/10/2008 7:48 AM Page 207

costs. This could be brought about through investment in trade-related infrastructure and streamlining of cross-border procedures(including customs procedures and logistic costs). In the case of man-ufactured goods, trading costs could be the single highest cost oftrading in developing countries — even higher than the costs of tar-iffs imposed by importers on their imports. A detailed analysis of theseissues is beyond the scope of this chapter, but several observations canbe made.
• First, most cargo between South Asia and East Asia moves by waterand air, as no land transport services are operating at present. Theinternational shipping lines serving the South Asia–East Asia regionoperate on the equatorial route connecting East Asia and thePersian Gulf and Mediterranean. They call at the major trans-ship-ment hubs of Singapore and Colombo and use feeder vessels to col-lect cargo from, or distribute it to, the other ports in the region.Some ships call at the secondary hubs, e.g., Port Kelang, NhavaSheva, but these are relatively few. There are also regional shippingservices, but most use the same hubs to construct back-to-backfeeder services, one serving the Bay of Bengal and the other theGulf of Thailand (Fig. 4.8a). There is a need to develop regionalshipping lines so that ships call at various regional ports.
• Second, unlike the other corridors, the air corridor does not havefixed routes but is made up of a series of point-to-point connec-tions. However, the airlines have generally adopted a hub-and-spoke arrangement for both passenger and freight operations. Theinternational freight hubs are used for trans-shipment of cargoesmoving between Europe, the Middle East, Southeast Asia, andEast Asia. From there, there are routes connecting the hubs to themajor airports and then to the local airports. Most of the trans-shipment hubs have developed because of the strength of thenational carriers as well as demands of the local market. Thus Parisacts as a hub because of Air France’s freight operation, Frankfurtbecause of Lufthansa’s operations, Dubai because of Emirates,Singapore because of Singapore Airlines, and Seoul for Korean
208 South Asia: Rising to the Challenge of Globalization
b670_Chapter-04.qxd 12/10/2008 7:48 AM Page 208

Airlines. The major exception is Bangkok, which has developeddespite the fact that Thai Airways does not have a freighter oper-ation. South Asia has yet to develop a regional trans-shipmenthub, in part because of the lack of a national carrier with a strongfreight operation and in part because of the lack of suitable airportfacilities (Fig. 4.8b).
• Third, land transit through the Northeast Indian states andMyanmar is not yet possible and movements through Bangladeshare difficult because of restrictions on cross-border movements aswell as the condition of the road network (Fig. 4.8c). This will,however, eventually change as the volume of South Asia–East Asiatrade increases. Additional corridors will have to be developedbetween India and the PRC through Bhutan and Nepal. Recently,the Nathu La pass between the PRC and India, which had beenclosed since 1962, was opened. This pass is 460 kilometers fromLhasa in Tibet and 550 kilometers from Calcutta, India’s second-largest city. Land access to ports is also important in the case oflandlocked countries.
Economic Integration Between South Asia and East Asia 209
Figure 4.8a Infrastructure: Southern Corridor: Shipping.
b670_Chapter-04.qxd 12/10/2008 7:48 AM Page 209

210 South Asia: Rising to the Challenge of Globalization
Figure 4.8b Infrastructure: Central Corridor: Air Freight Hubs.
Figure 4.8c Infrastructure: Northern Corridor: Asian Highway.
b670_Chapter-04.qxd 12/10/2008 7:48 AM Page 210

• Fourth, the Trans-Asian Railways, although being built, is lessdeveloped than the Asian highway (Fig. 4.8d). The Qinghai–Tibet railway has been completed. There are plans to extend thisline to Shigaste and to Yadong, a border town near India. A rail-way from Shigaste to Nilamu, a land port entry to Nepal is also tobe built. Unlike roads, which are built to different standards butcan all accommodate the same trucks, the railroad requires a com-mon gauge. By 2015, it should be possible to travel by rail fromSingapore to Kunming in the PRC. However, between East Asiaand South Asia, not only are there missing sections connectingIndia/Bangladesh with Myanmar and then through to Thailand,but there are also different rail gauges. While India is standardiz-ing its broad-gauge system, Southeast Asia remains meter-gaugeand the PRC, standard-gauge.
• Fifth, in the area of trade facilitation, countries should also makeefforts to streamline cross-border procedures. These includedelays in customs inspection, cargo handling and logistics, and the
Economic Integration Between South Asia and East Asia 211
Figure 4.8d Infrastructure: Northern Corridor: Trans-Asian Railways.
b670_Chapter-04.qxd 12/10/2008 7:48 AM Page 211

processing of documents. Customs procedures could be modern-ized by aligning the customs code to international standards, sim-plifying and harmonizing procedures, making tariff structuresconsistent with the international harmonized tariff classification,and adopting and implementing the WTO Customs ValuationAgreement. The World Bank and the International FinanceCorporation (IFC) (2006) estimate that the time now needed tocomplete the processing of import documents at the pre-shipmentand arrival stage averages 47 days in South Asia and 28 days in EastAsia. In the OECD, it is only 14 days. As Singapore’s experienceshows, electronic document filing could reduce logistic costsgreatly. Within 2 years of the introduction of Singapore’sTradeNet system, the time for cargo clearance was cut from 4 daysto 30 minutes.
• Finally, trade promotion efforts through skillful economic diplo-macy, regular exchange of business delegations, and civil societycould be encouraged much more. People-to-people contacts cango a long way toward enhancing the level of trade and investmentacross countries.
212 South Asia: Rising to the Challenge of Globalization
b670_Chapter-04.qxd 12/10/2008 7:48 AM Page 212

Economic Integration Betw
een South Asia and East A
sia213
Appendix 4.1 Total Trade of South Asia with East Asia: Levels and Growth Rates.
Total Trade of South Asia with East Asia ($ million)
Region/Country 1990 1991 1992 1993 1994 1995 1996 1997 1998 1999 2000 2001 2002 2003 2004 2005 2006
East Asia 12,400.6 12,151.8 13,824.9 14,737.1 16,930.6 21,249.4 22,226.9 22,638.0 22,518.0 24,088.6 25,106.5 30,049.4 29,427.6 38,055.3 48,872.1 65,165.8 96,825.2ASEAN 4,578.6 4,119.7 5,284.5 5,258.0 6,408.0 8,517.3 8,991.2 9,631.9 9,974.4 10,996.2 11,600.4 14,287.5 13,852.7 17,796.4 21,858.3 27,111.8 40,218.8Japan 5,885.5 5,722.1 5,888.9 6,254.5 6,504.4 7,621.0 7,688.8 6,766.8 6,478.8 6,684.3 6,493.0 6,212.5 5,693.2 6,479.2 7,448.2 8,851.9 12,045.6Korea, 1,169.6 1,511.3 1,593.1 1,797.1 2,190.4 2,549.3 2,726.7 2,873.8 3,010.0 3,084.9 2,873.6 3,964.0 3,308.2 4,523.0 5,364.7 7,336.7 8,599.8
Rep.of
PRC 766.9 798.8 1,058.4 1,427.6 1,827.8 2,561.8 2,820.1 3,365.5 3,054.8 3,323.3 4,139.6 5,585.5 6,573.6 9,256.7 14,200.9 21,865.4 35,961.0
Source: IMF (2007b).
Total Trade of South Asia with East Asia, Growth Rates (percentage).
Region/Country 1990 1991 1992 1993 1994 1995 1996 1997 1998 1999 2000 2001 2002 2003 2004 2005 2006
East Asia −2.0 13.8 6.6 14.9 25.5 4.6 1.8 −0.5 7.0 4.2 19.7 −2.1 29.3 28.4 33.3 48.6ASEAN −10.0 28.3 −0.5 21.9 32.9 5.6 7.1 3.6 10.2 5.5 23.2 −3.0 28.5 22.8 24.0 48.3Japan −2.8 2.9 6.2 4.0 17.2 0.9 −12.0 −4.3 3.2 −2.9 −4.3 −8.4 13.8 15.0 18.8 36.1Korea, 29.2 5.4 12.8 21.9 16.4 7.0 5.4 4.7 2.5 −6.8 37.9 −16.5 36.7 18.6 36.8 17.2
Rep.of
PRC 4.2 32.5 34.9 28.0 40.2 10.1 19.3 −9.2 8.8 24.6 34.9 17.7 40.8 53.4 54.0 64.5
Source: IMF (2007b).
b670_Chapter-04.qxd 12/10/2008 7:48 AM Page 213

214South A
sia: Rising to the C
hallenge of Globalization
Appendix 4.2 Pan-Asian Intra-regional and Interregional Trade.
Intra-regional and Interregional Trade ($ million)
Region 1980 1985 1990 1995 2000 2006
Intra-regional TradeEast Asia 140,453.7 168,535.8 311,702.9 746,324.4 920,914.9 2,003,110.5South Asia 1,106.4 1,114.5 1,618.7 4,265.4 5,311.0 16,193.8Central Asia n.a. n.a. n.a. 2,700.6 2,034.0 4,330.8
Interregional TradeSouth Asia– 6,182.1 7,527.6 12,400.6 21,249.4 25,106.5 96,825.2
East AsiaCentral Asia–South Asia 142.3 68.3 89.9 152.6 397.1 2,279.6Central Asia–East Asia 107.3 242.0 365.8 1,741.6 2,629.6 18,103.5
Memo ItemsNAFTA 215,029.1 302,657.3 457,519.0 790,475.0 1,362,714.0 1,771,058.7EU 948,499.0 862,502.0 2,010,134.0 2,679,330.0 3,141,640.0 6,021,300.0
EU = European Union, n.a. = not available, NAFTA = North American Free Trade Agreement.
Notes:1. For interregional trade, the reporting regions are mentioned first.2. Regions are defined as consisting of the following countries: East Asia: ASEAN+3; South Asia: Bangladesh, Bhutan, India,
Maldives, Nepal, Pakistan, and Sri Lanka; Central Asia: Afghanistan, Azerbaijan, Kazakhstan, Kyrgyz Republic, Mongolia,Tajikistan, and Uzbekistan.
Source: IMF (2007b).
b670_Chapter-04.qxd 12/10/2008 7:48 AM Page 214

Economic Integration Betw
een South Asia and East A
sia215
Appendix 4.2 (Continued)
Intra-regional and Interregional Trade (as a percentage of the region’s total trade)
Region 1980 1985 1990 1995 2000 2006
Intra-regional TradeEast Asia 29.0 29.2 28.6 37.0 37.4 39.1South Asia 2.9 2.8 2.5 4.1 3.8 4.0Central Asia n.a. n.a. n.a. 13.6 7.7 4.5
Interregional TradeSouth Asia–East Asia 16.4a/1.4b 18.6/1.6 18.9/1.3 20.5/1.3 17.7/1.3 23.8/1.9Central Asia–South Asia 12.2/0.3 8.9/0.2 10.6/0.1 0.8/0.2 1.5/0.3 2.4/0.5Central Asia–East Asia 9.2/0.03 31.7/0.03 43.3/0.02 8.8/0.10 9.9/0.13 18.9/0.3
Memo ItemsNAFTA 33.2 38.3 37.2 42.0 46.8 42.1EU 57.3 58.4 65.4 65.1 64.6 65.4
EU = European Union, n.a. = not available, NAFTA = North American Free Trade Agreement.a Total interregional trade as a percentage of South Asia’s total trade. b As a percentage of East Asia’s total trade.Source: IMF (2007b).
b670_Chapter-04.qxd 12/10/2008 7:48 AM Page 215

Appendix 4.3 Revealed Comparative Advantage Indices in South Asia and EastAsia, by Country.
A. South Asia
Bangladesh
RCA Indices Rank
SITC Code Commodity 1993 2004 1993 2004
S3–84 Clothing and accessories 15.568 25.437 2 1S3–61 Leather, leather goods 17.321 12.711 1 2S3–03 Fish, crustaceans, molluscs 9.623 9.476 4 3S3–26 Textile fibers 6.969 5.873 5 4S3–65 Textile yarn, fabric, etc. 4.581 2.920 6 5S3–12 Tobacco, tobacco manufacturing 0.133 1.610 15 6
India
RCA Indices Rank
SITC Code Commodity 1993 2004 1993 2004
S3–66 Non-metallic mineral 8.290 7.300 1 1manufactures
S3–28 Metalliferous ore, scrap 3.245 4.564 8 2S3–65 Textile yarn, fabric, etc. 4.057 3.830 5 3S3–27 Crude fertilizer, mineral 2.939 3.589 10 4S3–04 Cereals, cereal preparations 1.550 3.156 16 5S3–61 Leather, leather goods 4.194 3.028 4 6S3–84 Clothing and accessories 3.583 2.757 7 7S3–07 Coffee, tea, cocoa, spices 5.721 2.699 3 8S3–08 Animal feedstuff 6.559 2.498 2 9S3–03 Fish, crustaceans, molluscs 3.724 2.418 6 10S3–83 Travel goods, handbags, etc. 2.967 2.291 9 11S3–29 Crude animal, vegetable 2.325 2.013 11 12
materialsS3–67 Iron and steel 1.255 2.009 21 13S3–89 Misc. manufactured goods NES 0.767 1.734 26 14S3–85 Footwear 2.129 1.584 14 15S3–51 Organic chemicals 0.791 1.533 25 16
(Continued)
216 South Asia: Rising to the Challenge of Globalization
b670_Chapter-04.qxd 12/10/2008 7:48 AM Page 216

Appendix 4.3 (Continued)
India (Continued)
RCA Indices Rank
SITC Code Commodity 1993 2004 1993 2004
S3–53 Dyes, coloring materials 2.164 1.423 13 17S3–33 Petroleum, petroleum products 0.331 1.418 37 18S3–22 Oilseed, oleaginous fruit 1.360 1.364 19 19S3–69 Metal manufactures, NES 1.058 1.289 23 20S3–12 Tobacco, tobacco manufacturing 1.201 1.277 22 21S3–05 Vegetables and fruit 1.689 1.240 15 22S3–43 Animal, vegetable fats,oils, NES 0.657 1.172 29 23S3–57 Plastics in primary form 0.052 1.050 55 24S3–42 Fixed vegetable fats and oils 1.323 1.041 20 25S3–62 Rubber manufactures, NES 1.371 1.017 18 26
Pakistan
RCA Indices Rank
SITC Code Commodity 1993 2004 1993 2004
S3–65 Textile yarn, fabric, etc. 15.771 19.970 1 1S3–61 Leather, leather goods 9.779 7.945 2 2S3–84 Clothing and accessories 6.079 7.507 4 3S3–04 Cereals, cereal preparations 3.202 6.729 5 4S3–43 Animal, vegetable fats, oils, NES 6.305 60+ 5S3–26 Textile fibers 8.062 4.832 3 6S3–06 Sugar, sugar preparations, honey 3.160 3.467 6 7S3–03 Fish, crustaceans, molluscs 3.011 1.503 7 8S3–82 Furniture, bedding, etc. 0.011 1.309 41 9S3–29 Crude animal, vegetable 1.799 1.254 8 10
materialsS3–85 Footwear 0.523 1.173 12 11S3–79 Other transport equipment 0.024 1.121 36 12S3–05 Vegetables and fruit 0.618 1.008 11 13
(Continued)
Economic Integration Between South Asia and East Asia 217
b670_Chapter-04.qxd 12/10/2008 7:48 AM Page 217

Appendix 4.3 (Continued)
Sri Lanka
RCA Indices Rank
SITC Code Commodity 1993 2004 1993 2004
S3–07 Coffee, tea, cocoa, spices 31.233 36.478 1 1S3–84 Clothing and accessories 12.669 16.799 2 2S3–23 Crude rubber 10.156 4.679 3 3S3–62 Rubber manufactures, NES 1.776 4.640 7 4S3–12 Tobacco, tobacco manufactures 2.563 3.791 5 5S3–43 Animal, vegetable fats, oils, NES 0.014 2.993 50 6S3–66 Non-metallic mineral 4.056 2.614 4 7
manufacturesS3–03 Fish, crustaceans, molluscs 1.581 2.452 9 8S3–26 Textile fibers 1.234 2.369 11 9S3–83 Travel goods, handbags, etc. 1.886 1.508 6 10S3–05 Vegetables and fruit 1.617 1.467 8 11S3–68 Non-ferrous metals 0.008 1.292 54 12S3–65 Textile yarn, fabric, etc. 1.121 1.187 12 13S3–29 Crude animal, vegetable materials 1.354 1.068 10 14S3–79 Other transport equipment 0.020 1.001 46 15
NES = not elsewhere specified; RCA = revealed comparative advantage; SITC =Standard International Trade Classification.Source: Computed from UN COMTRADE Online using Stata Package 9.0.
B. East Asia
People’s Republic of China
RCA Indices Rank
SITC Code Commodity 1993 2004 1993 2004
S3–83 Travel goods, handbags, etc. 6.251 4.279 1 1S3–85 Footwear 5.473 3.813 2 2S3–84 Clothing and accessories 5.393 3.460 3 3S3–75 Office machines, ADP machines 0.396 2.896 43 4
(Continued)
218 South Asia: Rising to the Challenge of Globalization
b670_Chapter-04.qxd 12/10/2008 7:48 AM Page 218

Appendix 4.3 (Continued)
People’s Republic of China (Continued)
RCA Indices Rank
SITC Code Commodity 1993 2004 1993 2004
S3–32 Coal, coke, briquettes 2.085 2.786 8 5S3–65 Textile yarn, fabric, etc. 2.933 2.458 4 6S3–76 Telecom, sound equipment, etc. 1.320 2.379 20 7S3–81 Prefab buildings, fittings, etc. 1.690 2.164 15 8S3–82 Furniture, bedding, etc. 1.313 2.018 21 9S3–89 Misc. manufactured goods, NES 2.226 1.742 6 10S3–69 Metal manufactures, NES 1.373 1.625 19 11S3–03 Fish, crustaceans, molluscs 1.724 1.581 13 12S3–52 Inorganic chemicals 1.936 1.469 12 13S3–61 Leather, leather goods 0.718 1.341 27 14S3–63 Cork, wood manufactures 0.967 1.254 25 15S3–77 Elect. mach., appar., parts, NES 0.588 1.146 33 16S3–27 Crude fertilizer, minerals 2.197 1.052 7 17S3–88 Photog. apparatus, NES; clocks 1.644 0.991 16 18
Indonesia
RCA Indices Rank
SITC Code Commodity 1993 2004 1993 2004
S3–42 Fixed vegetable fats and oils 6.301 19.886 4 1S3–23 Crude rubber 12.070 17.143 3 2S3–32 Coal, coke, briquettes 3.832 9.092 9 3S3–63 Cork, wood manufactures 22.308 7.373 1 4S3–43 Animal, vegetable fats, oils, NES 4.841 6.476 5 5S3–07 Coffee, tea, cocoa, spices 4.531 4.342 6 6S3–28 Metalliferous ore, scrap 3.025 4.037 10 7S3–03 Fish, crustaceans, molluscs 3.946 3.732 8 8S3–25 Pulp and wastepaper 0.341 3.116 35 9S3–85 Footwear 4.291 3.047 7 10S3–34 Gas, natural, manufactured 14.071 2.661 2 11S3–82 Furniture, bedding, etc. 2.047 2.456 14 12
(Continued)
Economic Integration Between South Asia and East Asia 219
b670_Chapter-04.qxd 12/10/2008 7:48 AM Page 219

Appendix 4.3 (Continued)
Indonesia (Continued)
RCA Indices Rank
SITC Code Commodity 1993 2004 1993 2004
S3–84 Clothing and accessories 2.552 2.293 12 13S3–64 Paper, paperboard, etc. 0.760 2.239 20 14S3–65 Textile yarn, fabric, etc. 2.215 2.132 13 15S3–33 Petroleum, petroleum products 2.853 1.683 11 16S3–12 Tobacco, tobacco manufacturing 0.871 1.483 19 17S3–68 Non-ferrous metals 0.491 1.431 27 18S3–24 Cork and wood 1.328 1.379 16 19S3–62 Rubber manufactures, NES 0.362 1.339 33 20S3–09 Misc. edible products, etc. 0.246 1.133 38 21S3–26 Textile fibers 0.221 1.039 41 22
Japan
RCA Indices Rank
SITC Code Commodity 1993 2004 1993 2004
S3–88 Photog. apparatus, NES; clocks 2.086 3.011 3 1S3–73 Metalworking machinery 1.931 2.943 5 2S3–72 Specialized industrial machinery 1.460 2.151 9 3S3–78 Road vehicles 2.298 2.085 1 4S3–77 Elect. mach., appar., parts, NES 1.775 1.643 6 5S3–87 Scientific equipment, NES 1.229 1.634 12 6S3–93 Special transactions not classified 0.697 1.593 20 7
elsewhereS3–62 Rubber manufactures, NES 1.394 1.510 11 8S3–71 Power-generating machines 1.514 1.410 7 9S3–74 General industrial machines 1.485 1.409 8 10S3–67 Iron and steel 1.454 1.383 10 11S3–76 Telecom, sound equipment, etc. 2.190 1.308 2 12S3–58 Plastic, non-primary form 0.764 1.205 15 13S3–59 Chemical materials, NES 0.630 1.183 21 14S3–51 Organic chemicals 0.909 1.095 14 15S3–79 Other transport equipment 1.009 1.095 13 16
(Continued)
220 South Asia: Rising to the Challenge of Globalization
b670_Chapter-04.qxd 12/10/2008 7:48 AM Page 220

Appendix 4.3 (Continued)
Republic of Korea
RCA Indices Rank
SITC Code Commodity 1993 2004 1993 2004
S3–97 Gold, non-monetary, excluding 0.633 3.010 22 1ores
S3–76 Telecom, sound equipment, 2.311 2.972 5 2etc.
S3–79 Other transport equipment 1.759 2.744 10 3S3–57 Plastics in primary form 1.570 2.097 13 4S3–65 Textile yarn, fabric, etc. 3.368 1.863 2 5S3–75 Office machines, ADP 0.932 1.674 17 6
machinesS3–77 Elect. mach., apparatus, parts, 2.038 1.651 7 7
NESS3–67 Iron and steel 2.170 1.538 6 8S3–61 Leather, leather goods 3.464 1.391 1 9S3–26 Textile fibers 1.520 1.384 14 10S3–51 Organic chemicals 0.859 1.322 20 11S3–78 Road vehicles 0.722 1.280 21 12S3–23 Crude rubber 0.580 1.208 24 13S3–62 Rubber manufactures, NES 1.955 1.194 9 14
Malaysia
RCA Indices Rank
SITC Code Commodity 1993 2004 1993 2004
S3–43 Animal, vegetable fats, oils, NES 15.127 19.568 2 1S3–42 Fixed vegetable fats and oils 15.770 12.871 1 2S3–23 Crude rubber 8.026 5.555 4 3S3–34 Gas, natural, manufactured 3.186 3.237 7 4S3–75 Office machines, ADP machines 1.552 3.148 10 5S3–63 Cork, wood manufactures 5.303 3.048 5 6S3–77 Elect. mach., appar., parts, NES 2.669 2.791 8 7S3–24 Cork and wood 8.197 2.228 3 8
(Continued)
Economic Integration Between South Asia and East Asia 221
b670_Chapter-04.qxd 12/10/2008 7:48 AM Page 221

Appendix 4.3 (Continued)
Malaysia (Continued)
RCA Indices Rank
SITC Code Commodity 1993 2004 1993 2004
S3–76 Telecom, sound equipment, etc. 4.044 2.034 6 9S3–82 Furniture, bedding, etc. 1.335 1.427 12 10S3–33 Petroleum, petroleum products 1.438 1.230 11 11S3–07 Coffee, tea, cocoa, spices 1.235 1.114 13 12S3–09 Misc. edible products, etc. 0.849 1.076 15 13
Philippines
RCA Indices Rank
SITC Code Commodity 1993 2004 1993 2004
S3–93 Special transactions not classified 14.604 13.446 1 1elsewhere
S3–42 Fixed vegetable fats and oils 10.332 4.456 2 2S3–75 Office machines, ADP machines 0.417 3.165 29 3S3–77 Elect. mach., appar., parts, NES 1.491 2.283 14 4S3–05 Vegetables and fruit 3.633 1.731 4 5S3–03 Fish, crustaceans, molluscs 4.298 1.465 3 6S3–12 Tobacco, tobacco manufacturing 0.556 1.126 25 7S3–43 Animal, vegetable fats, oils, NES 1.210 1.111 15 8S3–84 Clothing and accessories 1.968 1.096 10 9S3–06 Sugar, sugar preparations, honey 3.469 1.082 5 10
Singapore
RCA Indices Rank
SITC Code Commodity 1993 2004 1993 2004
S3–77 Elect. mach., appar., parts, NES 1.927 3.589 7 1S3–75 Office machines, ADP machines 4.921 3.063 1 2S3–51 Organic chemicals 0.961 2.433 13 3S3–33 Petroleum, petroleum products 2.228 1.582 6 4
(Continued)
222 South Asia: Rising to the Challenge of Globalization
b670_Chapter-04.qxd 12/10/2008 7:48 AM Page 222

Appendix 4.3 (Continued)
Singapore (Continued)
RCA Indices Rank
SITC Code Commodity 1993 2004 1993 2004
S3–57 Plastics in primary form 0.928 1.365 14 5S3–76 Telecom, sound equipment, etc. 3.223 1.345 3 6S3–93 Special transactions not classified 0.657 1.241 23 7
elsewhereS3–88 Photog. apparatus, NES; clocks 1.091 1.186 9 8
Thailand
RCA Indices Rank
SITC Code Commodity 1993 2004 1993 2004
S3–23 Crude rubber 14.083 18.516 1 1S3–03 Fish, crustaceans, molluscs 9.392 5.906 2 2S3–06 Sugar, sugar preparations, 4.382 4.362 3 3
honeyS3–04 Cereals, cereal preparations 3.187 3.902 4 4S3–57 Plastics in primary form 0.288 1.972 37 5S3–62 Rubber manufactures, NES 1.019 1.883 21 6S3–75 Office machines, ADP machines 1.675 1.866 13 7S3–09 Misc. edible products, etc. 1.291 1.762 16 8S3–77 Elect. mach., appar., parts, NES 1.314 1.688 15 9S3–26 Textile fibers 0.729 1.600 26 10S3–05 Vegetables and fruit 2.907 1.600 7 11S3–61 Leather, leather goods 2.117 1.488 9 12S3–27 Crude fertilizer, minerals 1.063 1.400 20 13S3–84 Clothing and accessories 3.017 1.374 6 14S3–88 Photog. apparatus, NES; clocks 0.906 1.342 23 15S3–08 Animal feedstuff 1.064 1.280 19 16S3–76 Telecom, sound equipment, 1.433 1.239 14 17
etc.S3–43 Animal, vegetable fats, oils, 0.142 1.214 50 18
NES
(Continued)
Economic Integration Between South Asia and East Asia 223
b670_Chapter-04.qxd 12/10/2008 7:48 AM Page 223

Appendix 4.3 (Continued)
Thailand (Continued)
RCA Indices Rank
SITC Code Commodity 1993 2004 1993 2004
S3–82 Furniture, bedding, etc. 1.779 1.187 12 19S3–85 Footwear 2.824 1.175 8 20S3–65 Textile yarn, fabric, etc. 1.140 1.162 17 21S3–66 Non-metallic mineral 1.822 1.137 11 22
manufacturesS3–89 Misc. manufactured goods, NES 1.842 1.057 10 23
ADP = automatic data-processing processing; NES = not elsewhere specified; RCA =revealed comparative advantage; SITC = Standard International Trade Classification.Source: Computed from UN COMTRADE Online using Stata Package 9.0.
Appendix 4.4 Annotated List of Free Trade Agreements (FTAs) between SouthAsia and East Asia.
FTA Signed and Under Implementation
• India–Singapore Comprehensive Economic Cooperation Agreement (CECA)
� Under CECA (signed June 2005 and effective August 2005), India will removeduties on 506 products from Singapore immediately, on 2,202 items by April2009, and cut duties on another 2,407 products to 50% by the same date
� Singapore will scrap tariffs on goods made in India starting 1 August 2005� The pact also covers services, investments, and cooperation in technology,
education, air services, and human resources
• Asia-Pacific Trade Agreement (APTA, formerly Bangkok Agreement)
� FTA under implementation since 1976
Framework Agreement Signed and FTA Under Negotiation
• ASEAN–India Regional Trade and Investment Area
� Agreement signed October 2003 and became effective July 2004� Reduction or elimination of tariffs will start January 2006� India and ASEAN-6, excluding the Philippines, have until 2011 to reduce or
eliminate tariffs
(Continued)
224 South Asia: Rising to the Challenge of Globalization
b670_Chapter-04.qxd 12/10/2008 7:48 AM Page 224

Appendix 4.4 (Continued)
� Between India and the Philippines, the schedule runs to 2016� For India and new ASEAN members, India will reduce or eliminate tariffs
before January 2011, while new ASEAN members will reduce or eliminatetariffs before 2016
� Criteria for rules of origin remain to be resolved
• India–Thailand Free Trade Area
� The Framework Agreement for the India–Thailand FTA (signed October2003 and effective September 2004) reduces tariffs on 82 “early harvest”items by 50% in the first year, by 75% in the second year, and 100% thereafter
� The second phase hopes to have a comprehensive FTA covering all items by2010
� Agreement provides for emergency measures to protect domestic producersin case of sudden surges in imports
• BIMSTEC Free Trade Area
� The Framework Agreement on the BIMSTEC FTA (signed in February2004 and effective June 2004) involves a reduction and elimination of tariffsstarting July 2006 up to 2010 for India, Sri Lanka, and Thailand and up to2017 for Bhutan, Myanmar, and Nepal
� Negotiations began in September 2004� FTA will have two phases (for fast-track and normal-track products)� Members were scheduled to provide their sensitive lists to the trade
negotiating committee meeting in June 2005
• PRC–Pakistan Free Trade Agreement
� In December 2004, a Joint Study Group was formed to study the feasibilityof the Pakistan–PRC FTA
� A Memorandum of Understanding on FTA and Other Trade Issues wassigned in April 2005 announcing the conclusion of the Joint Feasibility Studyon Pakistan–PRC FTA and launching of negotiations on the FTA
� The Agreement on Early Harvest Program (EHP) was also signed� EHP includes a common list of items whose tariffs will be removed and a
separate list for each country whose duties will also be scrapped
• India–Republic of Korea Comprehensive Economic Partnership Agreement (CEPA)
� A Joint Study Group was set up on 6 October 2004 and its concluding reportwas signed on January 2006. It recommended that a comprehensive economicpartnership agreement (CEPA) exploit the existing bilateral economic relationsbetween the two countries and provide significant benefits for both
(Continued)
Economic Integration Between South Asia and East Asia 225
b670_Chapter-04.qxd 12/10/2008 7:48 AM Page 225

Appendix 4.4 (Continued)
� Following the recommendations of the Joint Study Group, a Joint TaskForce composed of government officials of both countries was constituted forthe development of the CEPA
� FTA negotiation launched in March 2006
• Malaysia–Pakistan Free Trade Agreement
� FTA negotiation launched February 2005� Early Harvest Program (EHP) signed October 2005 for implementation
January 2006
• Pakistan–Singapore Free Trade Agreement
� FTA negotiation launched August 2005
• Pakistan–Indonesia Free Trade Agreement
� On November 2005, Pakistan and Indonesia signed the FrameworkAgreement on Comprehensive Economic Partnership and expressedwillingness to conclude an FTA
� Both parties decided to negotiate a preferential trade agreement and movetoward the goal of an FTA.
FTAs Proposed
• PRC–India Regional Trading Arrangement
� In June 2003, India and the PRC agreed to set up a Joint Study Group(JSG). The JSG was tasked to present a report and recommendation oncomprehensive trade and economic cooperation
� In March 2005, the report of the JSG was finalized. It recommended aPRC–India Regional Trading Arrangement, which shall cover trade in goodsand services, and investments
• Japan–India Economic Partnership Agreement
� On 29 November 2004, Japan and India agreed to establish a Japan–IndiaJoint Study Group (JSG) for a Comprehensive Study to serve as a frameworkfor reviewing their economic relationship
� On 29 April 2005, both parties directed the JSG to submit a report within ayear, focusing on requirements for a comprehensive expansion of trade in goodsand services, investment flows, and other areas of economic cooperation
� FTA proposed August 2005
• Malaysia–India Comprehensive Economic Cooperation Agreement
� FTA proposed January 2005
(Continued)
226 South Asia: Rising to the Challenge of Globalization
b670_Chapter-04.qxd 12/10/2008 7:48 AM Page 226

Appendix 4.4 (Continued)
• Pakistan–Philippines Free Trade Agreement
� FTA proposed 2004
• Pakistan–Thailand Free Trade Agreement
� FTA proposed April 2004
• Singapore–Sri Lanka Comprehensive Economic Partnership Agreement
� FTA proposed October 2003
Sources: Asia Regional Integration Center website, http://www.aric.adb.org.
ReferencesAsher, MG and R Sen (2005). India-East Asia Integration: A Win-Win for Asia.
Research and Information System for the Non-Aligned and Other DevelopingCountries (RIS), Discussion Paper No. 91/2005.
Asian Development Bank (2005). A Study on Economic Cooperation between EastAsia and South Asia. Technical Assistance Project No. 39592.
Bhagwati J (2002). Free Trade Today. Princeton University Press.Chandra, R and R Kumar (2008). South Asian Integration Prospects and Lessons
from East Asia. Indian Council for Research in International Economic Relations.Francois, J, PB Rana and G Wignaraja (eds.) (forthcoming). Pan-Asian Integration:
Linking East and South Asia, Chapter 1. Palgrave Macmillan.Hiau LK, A Nicita and M Olarreaga (2006). Estimating Trade Restrictiveness
Indices. World Bank Working Paper No. 3840. Washington, DC.International Monetary Fund (IMF) (2006). Balance of Payments Statistics. CD-
ROM, April.——— (2007). Balance of Payments Statistics. CD-ROM, July.——— (2007). Direction of Trade Statistics. CD-ROM, June.Kumar, N, R Sen and MG Asher (eds.) (2006). India-ASEAN Economic Relations:
Meeting the Challenges of Globalization. ISEAS and RIS.Shankar V (2004). “Towards an Asian Economic Community: Exploring the Past”
in Nagesh Kumar (ed), Towards and Asian Economic Community: Vision of aNew Asia, RIS and ISEAS, 2004.
Sen R, M Asher and R Rajan (2004). ASEAN-India Economic Relations: CurrentStatus and Future Prospects. RIS, Discussion Paper No. 73/2004.
World Bank and International Finance Corporation (IFC) (2006). Doing Business in2006: Creating Jobs. World Bank and IFC.
Economic Integration Between South Asia and East Asia 227
b670_Chapter-04.qxd 12/10/2008 7:48 AM Page 227

228
19 This chapter draws on Rana and Dowling (forthcoming).
Chapter 5
Economic Integration in South Asia19
IntroductionBefore World War II, South Asia was a relatively well integratedregion of the British Empire. Then, in 1947, Pakistan and Indiabecame independent. At that time more than half of Pakistan’simports and nearly two-thirds of its exports were with India. Totaltrade volumes among the countries of the region before the partitionwere estimated at around 20% of total trade (World Bank, 2004).They fell to about 4% by the end of the 1950s and 2% by 1967.The share of intra-regional trade began to increase only in the 1990s,after the countries in the region abandoned import-substitution poli-cies and began to adopt trade liberalization measures. It has reachedthe 1950 level of around 4% of total trade — still quite small com-pared with trade in other developing regions in Asia and the rest ofthe world.
There were many reasons for the dramatic fall in trade withinSouth Asia. The most obvious was the hostility between India andPakistan that emerged after the British partitioned colonial India in1947. The hostility arose from a series of disagreements resultingfrom the partition. The first was the apportionment of water from theIndus River. There were also conflicts over Kashmir, which still per-sist. Trade was stopped after partition as differences between the twocountries were exacerbated by disagreements over exchange rates.Trade between Pakistan and India never returned to pre-partitionlevels, despite the previous successful trade relationships and the
b670_Chapter-05.qxd 11/12/2008 11:03 AM Page 228

Economic Integration in South Asia 229
extensive infrastructure built by the British to connect these two partsof colonial India.
In addition to the political and economic differences betweenIndia and Pakistan, South Asia generally embarked on a developmentmodel that drew widely on the Soviet experience, stressing importsubstitution and self-sufficiency rather than export promotion andopenness. Soviet-style heavy industry development was also stressedalong with the importation of capital goods from the Soviet Union.
In the 1980s and 1990s, the region began to undergo funda-mental change. First Sri Lanka (in the 1980s) and then the othercountries began to open their economies to international trade anddismantle industrial regulations. International trade volumes began toincrease, particularly following the Indian financial crisis of 1991 andthe set of reforms that followed. Trade as a share of GDP generallyrose in the 1990s and into the 21st century especially for the largereconomies. Intra-regional trade (exports plus imports) of South Asiahas increased more moderately, from 2.9% of total trade in 1980 to4% in 2006 (Table 5.1). The shares have increased the most for thesmaller countries. A simple gravity model suggests that trade shouldbe much greater. Contiguous countries in the rest of the world haveconsiderable trade with each other. Canada and Mexico, for instance,are the biggest trading partners of the USA. All countries in Europe
Table 5.1 Share of South Asian Intra-regional Trade in World Trade, 1980, 1985,1990, 1995, 2000, and 2006 (percentage).
Country 1980 1985 1990 1995 2000 2006
Bangladesh 4.8 4.7 6.0 12.8 7.9 8.5India 1.9 1.6 1.4 2.7 2.4 2.4Maldives n.a. 12.5 12.7 14.3 22.2 15.7Nepal n.a. 34.3 11.9 14.8 22.3 50.9Pakistan 3.6 2.8 2.7 2.2 2.7 3.3Sri Lanka 6.7 5.5 5.6 7.8 7.4 16.3South Asia 2.9 2.8 2.5 4.1 3.8 4.0
n.a. = not available.Source: IMF (2007b).
b670_Chapter-05.qxd 11/12/2008 11:03 AM Page 229

trade with each other, and 65% of European Union trade is intra-regional. In South Asia the share of intra-regional trade in world tradehas not increased much since the start of reforms in 1991. It is not anunderstatement to say that there is wide scope for greater regionalcooperation within South Asia. Trade within South Asia is also lop-sided and dominated by Indian exports to the rest of the region. TheWorld Bank estimates that 85% of exports to the region are fromIndia.
In the next section we review the various efforts made by SouthAsian countries to promote integration among themselves and theimpact that these efforts have had. In the last section we derivelessons for South Asia from East Asia.
Economic Integration in South AsiaThere is scope for greater economic integration in three general areas.These are cross-border infrastructure, international trade and invest-ment (including services), and financial sector cooperation. Potentialalso exists for cooperation in various sectors such as water and energyresources.
Cross-Border Infrastructure
Major cross-border initiatives are being undertaken through theSASEC program. This program was initiated by the four members ofthe SAARC (Bangladesh, Bhutan, India, and Nepal) that formed theSouth Asian Growth Quadrangle (SAGQ) in 1996. The SASEC pro-gram was launched in 2001 with support from the Asian DevelopmentBank and its aim was to accelerate economic cooperation within thefour countries. Six priority sectors were identified: transport; energyand power; tourism; environment; trade, investment, and private sec-tor cooperation; and ICT. Working groups were set up in each of thesectors. There has been some progress in identifying projects in eachsector. In transport a framework involving several corridors was devel-oped for regional connectivity. Six of these corridors are beingexplored. In trade and investment the focus was on removing NTBs
230 South Asia: Rising to the Challenge of Globalization
b670_Chapter-05.qxd 11/12/2008 11:03 AM Page 230

and promoting private sector cooperation. Business facilitation hasbeen promoted through the recently established South Asia BusinessForum and commissioned studies on private sector cooperation tolower trade barriers, boost human resources, and increase connectivityin ICT.
In tourism the plan is to focus on eco-tourism and visits toBuddhist sites in the region. Cooperation with the transport group isrecommended to close the gap between tourist sites and main roadswhere necessary. ICT initiatives have been identified in enhancinghigh-bandwidth connectivity, establishing community informationcenters, strengthening ICT regulations, developing common softwaretools and information sharing, and developing human resources.Projects for the rural electrification of Assam based on the Bangladeshimodel and the distribution of natural gas in Bangladesh with Indianassistance were started but little progress has been reported. In theenvironment, problems of overlapping jurisdictions, lack of interest,and the complexity of cross-border environmental issues have ham-pered project formulation and implementation. Of the many projectsproposed, only regional air quality management was implemented.The implementation of SASEC initiatives has been modest.
Trade and Investment
SAARC and Its Trade Initiatives
SAARC, with its trade initiatives SAPTA and SAFTA, is the majorinstitutional entity charged with promoting free trade in South Asia.
SAARC is an association of eight countries of South Asia:Afghanistan, Bangladesh, Bhutan, India, Maldives, Nepal, Pakistan, andSri Lanka. SAARC encourages cooperation in agriculture, rural develop-ment, science and technology, culture, health, population control, nar-cotics control, and anti-terrorism. In 1993, SAARC-countries signed anagreement to generally lower tariffs within the region through SAPTA.Three rounds of preferential tariff reductions were introduced for indi-vidual products. In 2004, the SAARC countries framed the SAFTA,which sought to establish a free trade zone in South Asia. SAFTA set out
Economic Integration in South Asia 231
b670_Chapter-05.qxd 11/12/2008 11:03 AM Page 231

a series of objectives in discussions that started in 1995 and continuedinto the next decade. The objectives were the following: eliminate all tar-iffs and import restrictions; harmonize customs procedures; facilitateintra-regional banking, and port and land transport facilities; develop aprogram to facilitate trade-related services; establish a review and moni-toring mechanism; ensure equitable benefits to all member countries;and remove structural impediments to regional trade. Representativesfrom the members of SAARC meet yearly to discuss progress and ensurethat the benefits from trade expansion resulting from the implementa-tion of the agreement are distributed equitably.
An effective and vibrant SAFTA and SAARC will likewise enhancethe region’s ability to bargain in multilateral negotiations if and whenthey resume. Moreover, the implementation of this trade agreementwill open the door for negotiations in trade facilitation dealing withso-called behind-the-border bottlenecks that go beyond harmonizingcustoms procedures.
Some weaknesses in the agreement could, however, undermine itseffectiveness unless they are remedied in further negotiations. Onlycustoms duties are addressed. A number of other protective arrange-ments (NTBs) serve to reduce trade and increase costs. While NTBsthat are not compatible with the GATT are to be removed, there isno effective mechanism in the agreement for removing other NTBs.Any reduction in agricultural tariffs is likely to be contentious. Thesuccessful implementation of the agreement faces other bottlenecks,such as the escape clause of sensitive lists, negotiation of rules of ori-gin, and possible suspension of concessions for members with bal-ance-of-payments difficulties. Given the mixed experience of SAPTAin achieving much in the past, these potential bottlenecks could wellscuttle the agreement. The hope is that all countries will be morecommitted to free trade than they have been in the past and will bewilling to make mutual concessions to make the agreement work. Ifthe agreement is implemented, all countries in the region could ben-efit from scale economies and greater competition; this would alsopave the way for greater trade with the rest of the world.
How successful have SAARC and its related trade initiatives beenin raising the share of intra-regional trade in total trade? Since we do
232 South Asia: Rising to the Challenge of Globalization
b670_Chapter-05.qxd 11/12/2008 11:03 AM Page 232

not know what would have happened without them, a definitiveanswer is difficult. Gravity models have been used to estimate howmuch SAARC and its trade initiatives have contributed to the growthin trade. The gravity model suggests that trade between two countrieswill depend on the geographic distance between them and the rela-tive size of their economies. Research using such a model suggeststhat SAPTA has had a positive effect on intra-bloc trade.
Bandara and Yu (2003) use the Global Trade Analysis Project(GTAP) computable equilibrium model to analyze the impact ofSAFTA on the countries in South Asia. They find that India gains morethan the other countries but that the rest of the region also benefits.Increased intra-regional trade possibilities will be created but will besmall relative to gains from unilateral liberalization by all SAFTA coun-tries. Hirantha (2004) shows strong evidence of trade creation in theregion under SAPTA and Srinivasan (1994) uses a gravity model toshow that complete removal of tariffs would result in a 3% increase inIndia’s GNP. Using an expanded gravity model, Batra (2004) findspositive trade potential in SAARC, mainly from increased tradebetween India and Pakistan. The estimates of Frankel, Stein, and Wei(1995) indicate that trade between India and Pakistan is 70% lowerthan that between two other economies that are otherwise identical.
Bilateral and Plurilateral FTAs
Two bilateral FTAs involve South Asian countries: those between SriLanka and India and between Nepal and India. The Sri Lanka–IndiaFTA took effect in March 2000. The agreement provides for duty-free status as well as duty-preference access for goods manufacturedin the two countries. Both countries have prepared a list of productsthat will be duty-free and have agreed to phase out tariffs on a num-ber of other items.
India and Nepal have had a trade treaty for many years. The cur-rent treaty was renegotiated in 2002 from a treaty signed in 1996. Thetreaty has a number of components. The major features are an empha-sis on trade facilitation and the reciprocal grant of unconditionalMFN status. A unique feature not found in other trade agreements is
Economic Integration in South Asia 233
b670_Chapter-05.qxd 11/12/2008 11:03 AM Page 233

a provision for refunds to Nepal for excise and other duties collectedby India on goods produced in India and exported to Nepal. Nepaleseprimary products have full access to the Indian market, free of dutiesand quantitative restrictions. Indian exports to Nepal are similarlyunencumbered. There is a clause where India agrees to promote indus-trial development in Nepal through the favorable treatment of indus-trial goods produced in Nepal. Nath (2004) has analyzed the treatyand argues that it is not consistent with WTO rules.
BIMSTEC started as BISTEC in June 1997 at a meeting of thetrade ministers of Bangladesh, India, Sri Lanka, and Thailand. InDecember 1997 Myanmar was added as a fifth member. Each mem-ber country has been assigned a lead role in different sectors — tradeand investment, technology transfer, transportation and communica-tion, energy, tourism, and fisheries. Ministerial meetings are held peri-odically, and, at a meeting in November 2003, additional subsectorsfor cooperation were identified: textiles and clothing, drugs and phar-maceuticals, gems and jewelry, horticulture, processed foods, auto-motive parts, coconuts, spices, rubber, and tea and coffee. Thailandwas the most active member and had the idea of using BIMSTEC toestablish a foothold in South Asia. The emphasis on gems and jewelryand automotive parts reflects the commercial interests of Thailand(Bhattacharya and Bhattacharyay, 2006; Inoue, Murayama, andRahmatullah, 2004).
An FTA between India and the other members of BIMSTEC isbeing discussed. A framework agreement FTA was signed inFebruary 2004; it stipulates preferential treatment and a time framefor tariff reductions. Subsequent meetings focused on ironing outdetails on rules of origin, sensitive lists, and NTBs so that an agree-ment could be concluded before the BIMSTEC summit in February2007. Originally the agreement was to be concluded in July 2006.The India–BIMSTEC FTA differs from SAFTA in that it has provi-sions for agreement in services and investment. These were not partof the package to be discussed at the BIMSTEC summit but will benegotiated later on. Talks between India and BIMSTEC are mired indisagreement over the number of products on the sensitive lists andrules of origin. India wants a short preferential list of items, but its
234 South Asia: Rising to the Challenge of Globalization
b670_Chapter-05.qxd 11/12/2008 11:03 AM Page 234

BIMSTEC partners want to accommodate a large number of items.Other areas of discussion include the negative list of items to beexcluded from tariff reduction commitments under the FTA and theremoval of NTBs.
To summarize, remember that trade before partition was about20% of total trade in the region. Since then, trade barriers haveresulted in changes in comparative advantage, particularly in Pakistan,where the most obvious result is the development of an industrial baseto counter the cessation of trade with India. How much trade wouldoccur if all trade barriers were removed is thus debatable. The WorldBank (2004) argues that even with free trade the amount of tradewithin South Asia would be relatively small (although certainly biggerthan current flows) because of limited complementarities. All coun-tries in the region have comparative advantage in labor-intensive man-ufactured products, and the benefits of trading these products amongthe countries themselves are limited.
RCA analysis based on more disaggregated data on internationaltrade in goods and services, however, suggests that there may bescope for a greater volume of trade within South Asia (see Table 4.5).India has comparative advantage in capital-intensive products like ironand steel, organic chemicals, and petroleum products, as well as someagricultural products. Bangladesh, Pakistan, and Sri Lanka have com-parative advantage in clothing and accessories, leather goods, and tex-tile yarn and fabric, along with rubber in the case of Sri Lanka. In theservices sector (see Table 4.12) all the countries in the region havecomparative advantage in communications services, so the scope fortrade may be limited.
Intra-South Asian trade is, therefore, expected to increase in thefuture, especially if the political will to implement the various agree-ments can be sustained, but perhaps not to the pre-partition level.Therefore, while seeking to enhance regional trade, it is also impor-tant for South Asia to find economies of scale in the rest of the world.Chandra and Kumar (2008) recommend a twin track policy for SouthAsia — integration within itself and better integration with the rest ofthe world. As they argue, integration within South Asia is more likelyto succeed if undertaken as part of a broader Pan-Asian cooperation.
Economic Integration in South Asia 235
b670_Chapter-05.qxd 11/12/2008 11:03 AM Page 235

The region’s “Look East” policies seem to reflect added emphasis onincreasing trade with Southeast Asia and East Asia. BIMSTEC reflectsthis look-east orientation. South Asia can pursue such a strategy bylowering tariffs and other forms of protection on an MFN basis andby pursuing FTAs with East Asia. This would open their economiesfurther and allow them to release comparative advantage. South Asiacould also enhance links with Central Asia.
Money and Finance
Several institutional developments in the past decade were designedto promote greater monetary and financial integration in South Asia.In 1998, SAARC heads of state agreed in principle to establish a net-work of central bank governors and finance secretaries of the SAARCregion. Dubbed SAARCFINANCE, the network has the basic objec-tive of discussing macroeconomic policy issues and establishing closerlinks among the members. This is achieved through semi-annual meet-ings of central bank governors and finance secretaries, staff visits andregular exchange of information, and harmonization of banking leg-islations and practices. In addition, the network seeks to forge closercooperation on macroeconomic policies, promote research on eco-nomic and financial issues, and train staff of the central banks, min-istries of finance, and other financial institutions of SAARC members.The secretariat of the network rotates among the member countriesand its chair moves with the SAARC chair. Each central bank hasestablished a cell in its research department to coordinate the activi-ties of SAARCFINANCE (Dasgupta and Maskay, 2003).
In addition to SAARCFINANCE, at the Dhaka summit ofNovember 2005, it was formally decided to initiate regular meetingsof the South Asian finance ministers (SAFMs) within the first quar-ter after the annual SAARC summits. The Dhaka summit alsorequired the SAFMs to meet on the sidelines of ADB and WorldBank annual meetings to take stock of the macroeconomic develop-ments and outlook for South Asia; the achievement of SAARC devel-opment goals as correlated with the Millennium Development Goals;and the investment climate, foreign capital flows, financial sector
236 South Asia: Rising to the Challenge of Globalization
b670_Chapter-05.qxd 11/12/2008 11:03 AM Page 236

reforms, and other areas of cooperation. While this effort is very usefulin initiating regional policy dialogue in South Asia, a system of multi-tiered meetings based on the East Asian experience could also beconsidered. The meetings of SAFMs could be preceded by meetingsof finance secretaries and central bank deputy governors, and byworking-level meetings of mid-level officials. Issues could thus bereviewed and discussed at various levels before they are broughtbefore the SAFMs for decision.
At the Dhaka summit, it was also decided to establish a SAARCdevelopment fund to be an umbrella funding mechanism for allSAARC projects. Accordingly, in 1996 the South Asia DevelopmentFund was set up under the SAARC to identify regional projects inindustry, energy, agriculture, and services, as well as projects in infra-structure and social development.
For further financial and monetary integration beyond these stepsto take place within South Asia, additional work has to be done toassess whether a common currency is feasible and whether there isenough macroeconomic convergence and political will to entertainthe idea of a common market.
With this in mind, financial integration within South Asia can bestudied from several points of view. Concerning the background con-ditions required for a monetary union similar to the European Union,there are good prima facie reasons for moving forward with plans topursue a monetary union. The region has begun to exhibit greaterconvergence for a number of macroeconomic indicators like the infla-tion rate, interest rates and exchange rates, public debt, and fiscaldeficits (Saxena and Baig, 2003; Jayasuriya et al., 2003). The patternsof shocks experienced tend to be similar. Agricultural volatilities tendto be correlated since the monsoon patterns are similar across theregion. The countries also have a similar production mix, and a similarvariety of agricultural products (including sugar, wheat, and rice) andlabor-intensive manufacturing (including textiles, cotton fabrics, andgarments). India is the exception. Its economy is more diverse and itproduces a variety of manufactured goods. Because of its small shareof international trade, the region has not been subject to strong exter-nal shocks like Southeast Asia and East Asia. Exchange rates have
Economic Integration in South Asia 237
b670_Chapter-05.qxd 11/12/2008 11:03 AM Page 237

238 South Asia: Rising to the Challenge of Globalization
tended to move together and the major currencies are closely alignedwith the US dollar in a managed float while the small countries are tiedto the Indian rupee. Pursuing a basis for a common currency couldstrengthen fiscal and monetary policy coordination and create moreincentives for greater intra-regional trade and the establishment of asingle market. Labor mobility would be encouraged and fiscal transferscould provide insurance by diversifying risk among several countries.
Two further points can be considered. First, while a currencyunion may not have a strong basis at the start, its establishment wouldincrease harmony. Second, a currency union is definitely good for theeconomies that join. Rose and Engel (2002) find that members of acurrency union trade more and have less volatile exchange rates.Frankel and Rose (2000) show that trade triples for each member ofa currency union. They also find that every 1% increase in trade rela-tive to GDP raises income per capita by 0.33% over a 20-year period.Furthermore, Glick and Rose (2001) show that bilateral trade dou-bles when a pair of countries forms a currency union.
The stumbling blocks to further monetary cooperation lie with thelack of political will, which is manifested in hostility between Pakistanand India, and the continued low level of internal trade in the region.Ironically, Saxena (2002) and Maskay (2003) both find, on the basisof the above criteria, that India and Pakistan are the most suitable can-didates for a single currency. Until more trade occurs, either sponta-neously or through regional agreements like SAARC, BIMSTEC,SAPTA, and SAFTA, a monetary union is unlikely. However, mutualcooperation toward more realistic opportunities such as currency swaparrangements and the use of surplus foreign exchange reserves to fundinfrastructure development in the region can be effectively considered.
Lessons from East Asia and RecommendationsEast Asia20 has grown dramatically in the past four decades and in the1990s was known as the Asian economic miracle. Much of this
20 East Asia is defined as ASEAN + 3.
b670_Chapter-05.qxd 11/12/2008 11:03 AM Page 238

Economic Integration in South Asia 239
dynamism has been the result of openness to international trade andthe pursuit of multilateralism within the GATT/WTO framework.Intra-regional trade also grew in tandem with global trade with therest of the world (Fig. 5.1).
Since the Asian financial crisis of 1997, there has been are-orientation of development thinking in East Asia regarding the role ofregionalism. The contagion effects of the Asian financial crisis werestrong and unexpected and some of the initial policies under the IMFpackage were not fully appropriate, requiring a re-assessment of the roleof regional factors in growth and international trade. Slow progress inthe Doha round of multilateral trade negotiations was also partly respon-sible for renewed interest in regional trade arrangements.
What can South Asia learn from the experiences of East Asia? Themost significant lesson is that regionalism can help maximize the ben-efits of globalization while minimizing its costs. South Asia shouldstrengthen its efforts to enhance cooperation within the region and
0
500
1,000
1,500
2,000
2,500
3,000
3,500
1980
1982
1984
1986
1988
1990
1992
1994
1996
1998
2000
2002
2004
2006
total world exports
intra-regional exports
Fig. 5.1 Total World and Intra-regional Exports of East Asia, 1980–2006 ($ billion).
Source: IMF (2007b).
b670_Chapter-05.qxd 11/12/2008 11:03 AM Page 239

240 South Asia: Rising to the Challenge of Globalization
with East Asia — the latter subject is discussed in Chapter 4). At theNovember 2005 SAARC summit, the leaders approved, among oth-ers, observer status for Japan and the PRC. Observer status for theRepublic of Korea and ASEAN is also being considered. The presenceof ASEAN, the PRC, Japan, and the Republic of Korea, which have arich experience in promoting regional cooperation in East Asia,should provide a catalyst for SAARC integration. The level of inte-gration within ASEAN+3, which includes these three countries, hasbeen increasing rapidly. Granting observer status to the East Asiancountries should also have a positive impact on economic integrationbetween South Asia and East Asia for Asia-wide integration.
Trade and Investment
As mentioned above, although SAFTA has put more teeth into thetrade agreement than previously agreed on as part of SAARC, the sen-sitive-list loophole still exists. Speedy implementation of SAFTAwould certainly help. NTBs should be reduced. Trade in services andmovement of labor could also be included in SAFTA. As noted inChapter 4, following the global trend, FTAs between South Asia andEast Asia have recently proliferated. While there is a risk that the pro-liferation of FTAs could raise administrative costs and divert trade,there seems to be no stopping the spread of these agreements, partic-ularly after the stalling of the Doha round of multilateral trade nego-tiations in the middle of 2006. Deepening the scope of FTAs beyondtariffs to include services and other facets of international exchange,as well as broadening membership, is one way of increasing the effi-ciency of these kinds of trade arrangements.
Money and Finance
As mentioned above, the recently established regular meetings of theSouth Asian finance ministers at the apex level could be supplementedby meetings of deputies comprising finance secretaries and centralbank deputy governors to set the agenda for the ministerial meetings.
b670_Chapter-05.qxd 11/12/2008 11:03 AM Page 240

Economic Integration in South Asia 241
Efforts could be made to develop consensus on topics of regionalinterest and to monitor short-term capital flows as part of an “earlywarning system” to detect potential currency and banking crises. EastAsia has made good progress in establishing regional financingarrangements under the Chiang Mai Initiative. To date, 16 bilateralswaps amounting to $83 billion have been signed. Encouragingprogress is being made to “multilateralize” these bilateral swaps andto form a centralized reserve pool. South Asian countries may con-sider participating in these efforts for liquidity support in emergen-cies, in addition to funds from the IMF.
East Asia has also come up with initiatives to develop regionalbond markets. These include the ASEAN+3 Asian Bond MarketInitiative and the Asian Bond Funds I and II of the Executives’Meeting of East Asia-Pacific Central Banks (EMEAP). These effortscan serve as a template for local currency bond markets in South Asia.South Asia could also participate in the on-going East Asian efforts.The recent signing of a bilateral swap agreement between India andJapan is a step in the right direction.
Infrastructure
The SASEC initiative in South Asia can benefit from interaction withthe Greater Mekong Sub-region Initiative begun in 1992 and involv-ing Cambodia, the Lao People’s Democratic Republic, Myanmar,Thailand, Viet Nam, and two southern provinces in the PRC. Thisprogram is well established and has overcome many of the handicapsthat SASEC may encounter as it begins its programs of regional coop-eration in infrastructure. Chapter 4 highlighted the significant con-straints posed by high transport and logistic costs on increased traderelations between South Asia and East Asia. Land transit throughMyanmar is not possible at present, but this situation will eventuallychange over time. Additional corridors between India and the PRCthrough Bhutan and Nepal will have to be developed. Logistic con-straints will also have to be addressed to facilitate the movement ofgoods between the two regions.
b670_Chapter-05.qxd 11/12/2008 11:03 AM Page 241

242 South Asia: Rising to the Challenge of Globalization
Capital Account Liberalization and InternationalFinancial Integration
One of the characteristics of the Asian financial crisis that most sur-prised economists and government officials was the power of capitalmovements to disrupt activity and cause large movements in exchangerates. There were many reasons for the large amount of speculation atthat time, including the size of international liquidity and the largeamounts of short-term external debt held by Thailand and othercountries whose currencies were under attack. Premature capitalaccount convertibility certainly played a critical role as well. Wherecapital accounts were closed in South Asia and in the PRC, specula-tors could not mount an attack. This does not mean that the coun-tries of South Asia should eschew capital account convertibility. Tofully integrate into the global economy and to attract foreigninvestors into local stock and bond markets, capital account convert-ibility is a must. However, South Asia should study the crisis carefully,particularly the bank and financial practices that sowed the seeds ofthe crisis. Capital account liberalization should be sequenced prop-erly. When South Asia feels it is ready and its financial sectors arestrong, viable, and sufficiently well regulated, it can begin to loosenthe controls on capital movement, but not earlier.
ReferencesBandara, JS and W Yu (2003). How Desirable Is the South Asian Free Trade Area?
A Quantitative Economic Assessment. World Economy, 26(9): 1293–1323.Batra, A (2004). India’s Global Trade Potential: The Gravity Model Approach.
Indian Council for Research on International Economic Relations. Working PaperNo. 151.
Bhattacharya, SK and BN Bhattacharyay (2006). Prospects and Challenges ofCooperation and Integration in Trade, Investment and Finance in Asia: An EmpiricalAnalysis on BIMSTEC Countries and Japan. CESifo Working Paper No. 1725.
Chandra, R and R Kumar (2008). South Asian Integration Prospects and Lessonsfrom East Asia. Indian Council for International Economic Relations.
Dasgupta, A and NM Maskay (2003). Financial Policy Cooperation in SAARC: AFirst Step toward Greater Monetary Integration in South Asia. South AsianEconomic Journal, 4(1): 133–143.
b670_Chapter-05.qxd 11/12/2008 11:03 AM Page 242

Frankel, JA, and AK Rose (2000). Estimating the Effects of Currency Unions onTrade and Output. NBER Working Paper No. 7857.
Frankel, JA, E Stein and S Wei (1995). Trading Blocs and the Americas: The Natural,the Unnatural and the Super Natural. Journal of Development Economics, 47(1):61–95.
Glick, R and AK Rose (2001). Does a Currency Union Affect Trade? The Time SeriesEvidence. NBER Working Paper No. 8396.
Hirantha, SW (2004). From SAPTA to SAFTA: Gravity Analysis of South Asia FreeTrade. Department of Commerce, Faculty of Management Studies andCommerce, University of Jayewardenpura, Sri Lanka. Mimeo.
Inoue, K, M Murayama and M Rahmatullah (2004). Sub-regional Relations in theEastern South Asia: With Special Focus on Bangladesh and Bhutan. IDE-JETROJoint Research Program Series No. 132, Institute of Developing Economies,Japan.
International Monetary Fund (IMF) (2007). Balance of Payments Statistics. CD-ROM. July.
——— (2007). Direction of Trade Statistics. CD-ROM. June.Jayasuriya, S, N Maskay, D Weerakoon, YR Khatiwada and S Kurukulasuriya (2003).
Monetary Cooperation in South Asia. South Asia Network of Economic ResearchInstitutes SANEI, Kathmandu, Nepal. Working draft.
Nath, V (2004). Nepal-India Trade Treaty and WTO Compatibility. In Implicationsof the WTO Membership on Nepalese Agriculture, edited by RP Sharma, MK Karkeeand LK Gautam. Food and Agriculture Organization, United Nations DevelopmentProgramme, and Ministry of Agriculture and Cooperatives, Nepal.
Rana, PB and JM Dowling. Forthcoming. Economic Integration in South Asia andLessons from East Asia. In Pan-Asian Integration: Linking East and South Asia,edited by J Francois, PB Rana and G Wignaraja. Palgrave Macmillan.
Rose, AK and C Engel (2002). Currency Unions and International Integration.Journal of Money, Credit and Banking, 34(4): 1067–1089.
Saxena, SC (2002). Is the Euro Area a Role Model for Asia? University of Pittsburgh.Mimeo.
Saxena, SC and MA Baig (2003). Monetary Cooperation in South Asia: Potential andProspects, RIS (New Delhi)/SACEPS (Dhaka) Workshop on Monetary Cooperationin South Asia: Potential and Prospects, 23 December 2003, RIS, New Delhi.
World Bank (2004). Trade Policies in South Asia: An Overview. Report No. 29929,Washington, DC.
———. World Development Indicators Online.
Economic Integration in South Asia 243
b670_Chapter-05.qxd 11/12/2008 11:03 AM Page 243

244
Author Index
Abella, M 54, 55Ahluwalia, MS 63, 173Alesina, A 19, 55Anderson, K 173Asher, MG 177, 200, 227
Baig, MA 237, 243Bandara, JS 233, 242Batra, A 233, 242Bhagwati J 227Bhattacharya, SK 115, 173, 234Bhattacharyay, BN 234, 242Bourguignon, F 103, 173
Chandra, A 19, 55Chandra, R 16, 18, 177, 227, 242Chen, S 103, 174Cowen, D 55
Dasgupta, A 236, 242Datt, G 32Deardorff, AV 39, 55DeLong, B 58, 173Deng Xiaoping, 75Devarajan, S 4, 18Dollar, D 19, 32, 55, 103, 173Dowling, JM 69, 173, 243Dreher, A 6, 18, 20, 21, 55
Engel, C 238, 243Eslake, S 173
Fei, JCH 173Francois, J 15, 18, 227Frankel, JA 55, 233, 238, 243
Gavian 103Glick, R 238, 243Grilli, V 19, 55
Hasan, R 32, 55, 103, 173Henley, JS 173Heshmati, A 21, 29, 55Hiau, LK 227Hirantha, SW 233, 243
Inoue, K 234, 243
Jadhav, N 51, 56Jayasuriya, S 237, 243
Kearney, Inc. 29Khadria, B 45Khatiwada, YR 243Kochhar, K 173Kraay, A 32, 55, 103, 173Kumar, N 16, 177, 227Kumar, R 18, 227, 242Kumar, U 173Kurukulasuriya, S 243
Lewis, WA 174Li, 20, 21
b670_Author Index.qxd 12/10/2008 1:29 PM Page 244

Littellvin, E 39Lonnroth, K 54, 55
Maddison, A 18Martin, W 103Maskay, NM 238, 242, 243Mellor, JW 103, 174Milesi-Ferretti, GM 19, 55Mitra, D 103, 173Morrison, C 103, 173Murayama, M 234, 243
Nabi, I 4, 18Nararaj, R 174Nath, V 243Ng, MCM 20, 21Nicita, A 227
Olarreaga, M 27
Panagariya, A 174Pang, IAJ 20, 21Park, A 88, 174Patel, UR 115, 173Poddar, T 1, 18Purushothaman, R 18
Quibria, MG 32, 55
Rahmatullah, M 234, 243Rajan, RG 173Rajan, R 200, 227Rana, PB 15, 18, 227, 243Ranis, G 173
Ravallion, M 32, 103,174
Rodrik, D 19, 115, 174Romer, D 55Rose, AK 238, 243
Salgado, R 55Sarah, G 174Saxena, SC 237, 238, 243Sehrt, K 88, 174Sen, R 177, 200, 227Shankar, V 175, 227Shaw, H 55Srinivasan, T 233Stein, E 233, 243Stern, RM 39, 55
Teo, L 55Timmer, PC 103, 174
Ural, B 103, 173
Weerakoon, D 45, 243Wei, S 233, 243Whalley, J 86, 174Wignaraja, G 15, 18, 227Wilson, D 18Wolf, M 174
Yi, E 1, 18Yu, W 233, 242
Zanello, A 55Zhang, S 86, 174
Author Index 245
b670_Author Index.qxd 12/10/2008 1:29 PM Page 245

246
Subject Index
ad valorem tariff 204, 205administered interest rates 93, 132Afghanistan 1, 38, 73, 206, 214, 231agricultural collectives 81air corridor 208Anil Ambani 97Arakan road 49ASEAN 3, 13, 14, 48, 50, 52, 136,
165, 177–179, 182, 185, 186, 202,203, 207, 213, 214, 224, 225, 238,240, 241
ASEAN+3 3, 52, 177, 178, 202,207, 214, 238, 240, 241
ASEAN+3 and India FTA 207ASEAN+3 and South Asia FTA 207ASEAN+3 Asian Bond Market
Initiative 241ASEAN+3 finance ministers 3ASEAN FTA 207ASEAN Regional Forum 202ASEAN Secretariat 184, 185, 202Asia 1, 3–10, 12–17, 20–24, 27–32,
36, 38–40, 42–54, 57–59, 61–63,65–67, 69–80, 84, 85, 89–91,93–100, 102–115, 122, 125,156–161, 175–183, 185–190, 192,194–198, 200–209, 211–216, 218,224, 227–231, 233–242
Asia-Europe Finance Ministers’ meet-ing 202
Asian Bond Funds I and II 241
Asian Development Bank 46, 81,230
Asian economic miracle 238Asian financial crisis 5, 6, 50, 51, 84,
239, 242Asian highway network 7, 48, 203Asian Relations Conference 201Asia-Pacific Trade Agreement 203,
224Asia-wide FTA 14Asset management companies 89Australia 8, 37, 39, 46, 54, 202automotive parts 234
back-to-back feeder services 208Bandung Spirit 202Bangalore 106Bangladesh 1, 4, 22, 24, 26–30,
32–40, 44–46, 49, 58–74, 77–79,91, 93–97, 99, 101, 102, 105, 110,112–114, 125–172, 177, 183, 191,194–198, 200, 204–206, 209, 211,214, 216, 229–231, 234, 235
Basel II standards 93, 133, 164Bay of Bengal 36, 112, 208Bay of Bengal Initiative for Multi-
Sectoral Technical and EconomicCooperation (BIMSTEC) 36,112, 177, 203, 225, 234–236,238
Bengal 36, 112, 176, 208
b670_Subject Index.qxd 11/12/2008 11:04 AM Page 246

Bhutan 1, 4, 24, 36, 49, 58, 59,62–65, 67, 69–71, 73, 74, 77, 78,96, 102, 105, 156–161, 177, 183,189, 204–206, 209, 214, 225, 230,231, 241
Bilateral and Plurilateral FTAs 233BIMSTEC summit 234BISTEC 234border dispute 201British 4, 15, 176, 228, 229British Empire 15, 228broad-gauge system 211Buddhism 176Buddhist sites 231Burma 176
Calcutta 209capital account convertibility 7, 8,
46, 50, 94, 242capital account deregulation 5capital account liberalization 3, 19,
36, 50, 51, 242capital- and knowledge-intensive items
191capital flow 6, 19, 23, 236, 241capital market development 115, 130capital outflows 51cargo handling and logistics 211cargo handling and transfer 15Central Asia 16, 179, 214, 215, 236central bank 17, 39, 87, 88, 93, 236,
237, 240, 241Central Intelligence Agency 71central planning 80Chennai 176Chiang Mai Initiative 3, 17, 241China 1, 52, 53, 74, 87, 106, 111,
156–161, 175–177, 179, 186, 202,203, 206, 218, 219
China’s Yunnan Province 203Chinese silk 176Chola dynasty 176
Chola empire 176clearing and payments system 53Cold War 202Colombo 130, 208colonial era 201colonial period 176, 177commercial banks 66, 87, 88, 91, 92,
115, 164Common Market of Eastern and
Southern Africa 47, 48comparative advantage 13, 16, 90,
122, 177, 189–195, 200, 216, 218,224, 235, 236
Comparison of India and the PRC116
competitiveness 2, 4, 6, 7, 36,40–43, 45, 47–49, 83, 115, 122,152
competitiveness index 42, 49competitiveness indicators 7, 41complementarities 13, 177, 187,
201, 204, 235connectivity 2, 10, 21, 29, 111, 230,
231construction services 199, 200contagion 3, 5, 239contagion effects 3, 239control of corruption 29, 72, 161cooperation in agriculture 231Coromandel 176corporate governance 5, 53Corporate Governance Ratings 53corruption 4, 21, 29, 31, 72,
74, 100, 137, 148, 161, 165,169
corruption perception index 29cost of doing business 100credit plans 88crop diversification 95, 140cross-border infrastructure 15, 230cross-border procedures 15, 208,
211
Subject Index 247
b670_Subject Index.qxd 11/12/2008 11:04 AM Page 247

customs inspection 15, 211customs procedures 15, 47, 208,
212, 232
Dealogic 186debt service 51decolonization 201deepening of financial markets 2demographic dividend 205design and sequencing of reforms 9development strategy 3, 4direct foreign investment 19doing business study 97double mismatch 5double taxation 7, 50, 91drugs and pharmaceuticals 234Dutch 176
Ease of Doing Business Index 206East Asia 3, 5, 6, 8, 10, 12–17,
30–32, 36, 39, 42, 46, 49, 52, 53,73, 74, 80, 99, 111, 156–161,175–183, 185–190, 192, 195–198,200–209, 211–216, 218, 224, 230,236–241
East Asia Summit 14, 202economic complementarities 13, 177,
187Economic Cooperation Organization
37, 38economic efficiency 2, 47, 86, 92, 98economic growth 4, 6, 11, 19, 20,
31, 44, 45, 65, 76, 103, 108, 109,116, 205
economic integration 13, 21, 27,175, 177, 203, 204, 228, 230,240
economic reforms 5, 10, 14, 51, 80,81, 103, 107, 111, 125, 162, 182
education and health 10, 29, 70,108, 111, 113, 123, 124, 205
effectiveness of government 21
effectiveness of the regulatoryapparatus 31
energy and power 16, 230environment 2, 9, 10, 14, 16, 17,
29, 43, 57, 75, 80, 98, 104, 106,107, 110, 111, 113, 119, 121,137, 142, 147, 150, 171, 205,230, 231
Europe 1, 8, 13, 43, 54, 82, 175,177, 186, 201, 202, 208, 229
European Central Bank 39European finance ministers 14European Union 37, 39, 50, 214,
215, 230, 237European Union Council 39exchange rate policies 50excise taxes 91Executives’ Meeting of East Asia-
Pacific Central Banks (EMEAP)241
export diversification 3, 136export processing zones 10, 105,
111, 112, 119
feeder vessels 208financial crisis of 1997 and 1998 3financial infrastructure 8, 52financial integration 3, 6, 7, 17, 36,
46, 52, 236, 237, 242financial intermediation 2, 115financial liberalization 66financial markets 2, 3, 8, 52, 103,
104financial repression 89, 92, 93financial sector reforms 87, 89,
90financial services and insurance 200fiscal balance 64, 107fiscal consolidation 51fisheries 234five interested parties [FIPS] 40flexible labor markets 103, 169
248 South Asia: Rising to the Challenge of Globalization
b670_Subject Index.qxd 11/12/2008 11:04 AM Page 248

foreign direct investment (FDI) 2,6–9, 11, 12, 19–21, 23–25, 31,33–35, 45, 49–51, 63, 64, 82–84,97, 98, 100, 105, 106, 111,116–118, 121, 137, 146, 147,182–186, 207
foreign exchange reserve 25, 51, 52,69, 238
foreign investment regulations 95,142
fostering regional cooperation 15free trade agreements (FTAs) 3, 6,
14, 16, 36–38, 50, 178, 202,203, 206, 207, 224, 226, 233,236, 240
free trade area 16, 37, 48, 225FTA framework agreements 203
G20 39, 40gems and jewelry 234General Agreement on Tariffs and
Trade (GATT) 40, 232, 239giant economies 11–13, 116, 175,
179global competitiveness 4, 43global competitiveness survey 43global economy 1, 3, 6, 12, 13, 21,
23, 40, 45, 90, 175, 183, 202, 242global integration 3, 19Global Trade Analysis Project (GTAP)
207, 233globalization 1–3, 5, 6, 16, 17,
19–21, 23, 26–31, 35, 36, 43,45–47, 49, 196, 239
globalization indicators 6, 21globalization indices 27, 49Goldman Sachs 1, 12good governance 2, 10, 14, 72, 205governance 2, 5, 11, 14, 20, 51,
53, 72, 74, 99, 100, 111, 114,137, 148, 149, 156, 165, 168,169, 172, 205
government effectiveness 29, 31, 73,74, 99, 100, 158
Grameen Bank 112gravity model 229, 233Greater Mekong Sub-region Initiative
241Greater Mekong Subregion program
17gross national product (GNP) 177,
233Group of Eight 36–38Group of Eight Developing Countries
36–38Group of Four (G4) 40growth in per capita income 9, 20,
59, 98Gulf of Thailand 208
harmonization of financial regulations8, 52
harmonize customs procedures 232health and education 6, 12, 14, 21,
30, 31, 87, 96, 108, 149, 205high-bandwidth connectivity 231Hinduism 176horticulture 234household registration system 86hub-and-spoke arrangement 208hukou certificates 86human development indicators 9, 75,
114human development report 72human resource indicators 9
ICT services 198IMF and World Bank 40IMF’s balance-of-payments statistics
196impact of policy reforms 58, 80, 98import-substituting policies 4incidence of poverty 9index of labor market integration 43
Subject Index 249
b670_Subject Index.qxd 11/12/2008 11:04 AM Page 249

India 1, 4, 7, 9–17, 22–45, 47–53,57–80, 89, 91–107, 110–114, 116,118–172, 175–177, 179, 182–184,186, 189, 191, 195–207, 209, 211,214, 216, 217, 224–226, 228–231,233–235, 237, 238, 241
India’s border war with China 202India–BIMSTEC FTA 234India-Singapore Comprehensive
Economic Cooperation Agreement(CECA) 202, 224
indicators of governance 74, 99indices of corruption 31indices of globalization 21, 43indigenous factors 21, 28, 31Indonesia 26, 28, 30, 31, 38, 39, 41,
42, 46, 51–53, 156–161, 176, 182,183, 193, 195, 197, 198, 200,203–206, 219, 220, 226
Indonesian spices 176Indus River 228industrial de-licensing 103Industrial Disputes Act of 1947 119industrial licenses 95, 142industrial licensing 90, 147industrial policy 10, 142–147, 168industry 7–9, 11, 12, 17, 48, 54, 67,
68, 80, 81, 86, 90, 95, 102,108–110, 112–114, 119, 120, 123,144, 151, 184, 189, 199, 229, 237
infant mortality 71, 77, 108inflation 9, 35, 51, 60, 61, 65, 87,
92, 104, 107, 237information and communication
technology (ICT) 16, 198, 200,230, 231
information technology (IT) 4, 8,12, 44, 54, 106, 109, 119, 121,122, 127
infrastructure 7, 8, 10–12, 15–17,41–43, 48, 52, 54, 83, 94, 95, 97,106, 107, 111, 113, 114, 119, 120,
123, 124, 140, 141, 143, 151–155,166, 170–172, 203, 205, 208–211,229, 230, 237, 238, 241
infrastructure bottlenecks 43, 120,152
infrastructure reforms 10initial conditions 9, 58, 75innovation 2, 23, 109insider lending 93, 132Institute of International Finance 23,
25institutions 9, 10, 14, 51, 58, 83,
111, 115, 130, 132, 142, 205, 236International Bank for Reconstruction
and Development (IBRD) 174international best-practice standards for
the banking system 93international competitiveness 2, 7,
36, 40, 43, 45, 47International Finance Corporation
(IFC) 96, 101, 206, 212international flows of labor 43international freight hubs 208international harmonized tariff classifi-
cation 212International Labour Organization
(ILO) 70, 78international migration policy 6International Monetary and Financial
Committee 40International Monetary Fund 22, 40,
52, 73, 92international reserves 9, 25, 69, 97,
107international shipping lines 208international trade 2, 6, 7, 11, 15,
19, 20, 23, 35, 36, 38, 39, 45, 46,61–63, 82, 83, 100, 104, 113,116–118, 121, 177, 187, 188, 190,192, 218, 224, 229, 230, 235, 237,239
Internet 21, 100
250 South Asia: Rising to the Challenge of Globalization
b670_Subject Index.qxd 11/12/2008 11:04 AM Page 250

intra-regional trade 15, 16, 47, 176,214, 215, 228–230, 232, 233, 238,239
Intra-South Asian trade 235investment 2, 5, 6, 8, 10, 12, 14–16,
19, 20, 23–25, 33, 35, 47, 49–53,63, 64, 73, 77, 83, 87, 88, 90,93–95, 97, 98, 102, 104, 106, 110,111, 121, 140, 142, 146, 151, 152,154, 166, 169, 182–186, 201–203,205, 207, 208, 212, 224, 226, 230,231, 234, 236, 240
investment in trade-related infrastruc-ture 15, 208
investment integration 35, 182, 201IT 4, 8, 12, 44, 54, 106, 109, 119,
121, 122, 127
Jamuna bridge in Bangladesh 49Japan 1, 3, 17, 39, 40, 52, 61, 74,
97, 156–161, 179, 182, 183, 186,193, 195–198, 200–203, 206, 213,220, 226, 240, 241
Java Sea 176Jawaharlal Nehru 201
Kashmir 73, 201, 228Kearney Inc 56Kearney, A. T. Inc. and the Carnegie
Endowment for International Peace18
Kearney’s Index 21, 25, 27Kunming 211
labor force participation 70, 78, 121labor market 2, 8, 10–12, 43, 54, 85,
90, 96, 97, 103, 104, 111, 112,121, 150, 169
labor market integration 43labor market reforms 104labor market restrictions 112labor migrants 43
labor reforms 51labor-intensive industry 11, 12, 79,
119labor-intensive manufactured goods
13, 85, 191Ladakh, Kashmir 201Latin America 32, 156–161leapfrog 12, 119Lhasa 209license raj 4licensing 4, 39, 90, 94, 99, 100,
133, 135, 142, 147life expectancy 70, 71, 77, 108,
113living standards 2, 8, 9, 57, 58, 75,
87, 114, 116local currency bond markets 17, 241local governments 87, 100, 114,
148, 169logistic costs 15, 208, 212, 241Long-Term Vision 2020 paper 202Look East policy 177, 202, 207
macroeconomic convergence 17, 237macroeconomic reforms 10, 80, 81,
107, 111, 125, 162Maharashtra 41, 42Malaysia 26, 27, 30, 38, 39, 41, 42,
52, 53, 156–161, 183, 193, 195,197, 198, 200, 203–206, 221, 222,226
Maldives 1, 4, 22, 24, 59, 62–74,77, 78, 96, 99, 105, 156–161, 183,189, 198, 200, 214, 229, 231
Manmohan Singh 202Mao rebels in Nepal 73market flexibility 11Mediterranean 208Mercosur 36, 37, 48, 50meter-gauge 211microeconomic reforms 10, 51, 80Middle East 43, 44, 55, 104, 208
Subject Index 251
b670_Subject Index.qxd 11/12/2008 11:04 AM Page 251

migration 2, 6, 8, 35, 36, 43, 45, 47,54, 85, 86, 123
migration from rural to urban areas85
migration policies 36, 45millennium development goal 123,
236monetary stabilization 3most-favored-nation (MFN) approach
36Multi-Fiber Agreement 190multilateral negotiations 232multilateralism 14, 207, 239Myanmar 36, 49, 156–161, 183,
198, 203, 209, 211, 225, 234,241
Nalanda University 202Nathu La pass 203, 209natural disaster relief 17natural gas in Bangladesh 231Nepal 1, 4, 5, 9, 10, 16, 22, 24,
32–36, 39, 44, 46, 49, 58, 59,61–64, 66–75, 77–79, 91, 93–99,101, 102, 105, 106, 110, 112,113, 115, 125–172, 177, 183,189, 198, 200, 204, 205, 206,209, 211, 214, 225, 229–231,233, 234, 241
Nhava Sheva 208Nilamu 211non-farm rural enterprises 82non-performing loans (NPLs) 51,
88, 89, 92, 93, 132, 164non-resident Indians (NRIs) 51nontariff barriers 7, 17, 38North America 1, 8, 46, 52, 54, 214,
215North American Free Trade Agreement
(NAFTA) 46, 50, 52, 214, 215Northeast Indian states 209Northern Corridor 210, 211
North-South trade 201number of physicians per thousand
households 29
Octroi taxes 91open regionalism 14, 207openness 1, 2, 19, 20, 28, 29, 31,
35, 40, 62, 103, 229, 239Openness Factor Indicators 28openness to trade 19Opium War 177Organisation for Economic
Cooperation and Development(OECD) 71, 84, 201, 212
outsourcing 4, 8, 54, 198
Pakistan 1, 4, 10, 15, 22–28, 30–40,44–46, 50, 52, 58, 59, 61–74,77–79, 91, 93–99, 101, 102,104–106, 110, 112, 113, 125–172,177, 183, 184, 186, 191, 195–198,200, 202–206, 214, 217, 225–229,231, 233, 235, 238
Pan-Asia 13, 175Pan-Asian center of excellence 202Pan-Asian cooperation 16, 235Pan-Asian identity 201Pan-Asian Integration 13, 175partition 228, 235Pearl River Delta 83People’s Republic of China (PRC) 1,
3, 6–13, 17, 20, 26–31, 39, 40, 42,43, 45, 47, 48, 52, 53, 57–87, 89,90, 96–111, 114, 116–118,120–124, 156–161, 177, 179,182, 183, 185, 186, 192–206,209, 211, 213, 218, 219, 225, 226,240–242
per capita GDP 9, 33–35, 58, 60, 99Persian Gulf 208personal contact 21, 26pharmaceuticals 4, 234
252 South Asia: Rising to the Challenge of Globalization
b670_Subject Index.qxd 11/12/2008 11:04 AM Page 252

Philippines 28, 30, 39, 46, 52, 53,122, 156–161, 183, 194, 195, 197,198, 200, 203–206, 222, 224, 225,227
plurilateral FTA approach 36policy reforms 2, 8, 9, 57, 58, 80,
90, 98, 102, 125Policy Reforms in South Asia 57,
125political engagement 21, 27political stability 29, 73, 74, 157political stability and violence 73Port Kelang 208Port of Singapore Authority 186portfolio investment 23, 25, 51–53,
90Portuguese 176Poverty Head-Count Ratio 34, 59,
61, 103poverty ratios 32, 59poverty reduction 6, 9, 20, 31, 58,
75, 103, 104, 124pre-Christian era 175pre-colonial period 13, 175, 176preferential tariff reductions 231preferential trade agreements 36premature capital account convertibility
242pre-partition 16, 228, 235primary school enrollment 29primary school pupil-teacher ratios
29principal component analysis 21principal components 29private investment in infrastructure
97private sector cooperation 16, 230,
231private sector development 113, 159privatization policy 95, 142processed foods 234processing of documents 15, 212
productivity 2, 11, 44, 49, 81, 85,98, 102, 109, 110, 114,.121, 140,170
proliferation of FTAs 14, 178, 202,207, 240
property rights 10, 14, 29, 111, 205property rights protection 29public administration 10, 95, 111,
114, 148, 149, 169public enterprise 10, 84, 91,
142–147, 168public spending on education 29Pudong New Zone in Shanghai 83Purchasing Power Parity 4, 34, 61,
72, 73
Qinghai–Tibet railway 211quality of the labor force 20, 21, 29quantitative restrictions (QRs) 90,
94, 135, 136, 234
race to the bottom 7, 49Rajendra I 176Rajendrachola Deva I 176Ramayana 176rating agency 53reduction of trading costs 15, 207reform of institutions 10, 14, 111,
205reforms in agriculture and industry 9,
80reforms in labor markets 103regional connectivity 230regional integration 15, 38, 227regional policy dialogues 3regional shipping lines 208regional trade agreements 36regional trans-shipment hub 209regulatory quality 29, 74, 159regulatory scores 29remittance flows 43, 44, 54remittance income 43
Subject Index 253
b670_Subject Index.qxd 11/12/2008 11:04 AM Page 253

remittances 8, 21, 26, 30, 43, 44,45, 104
renminbi 84repatriation of profits 8, 50Republic of Korea 3, 27, 39, 42, 52,
179, 181, 182, 186, 196, 200, 201,203, 221, 225, 240
Reserve Bank of India 91, 92resource allocation 2, 91revealed comparative advantage indices
177, 189, 190, 192, 195, 216rule of law 29, 31, 72, 74, 100, 160rules of origin 14, 207, 225, 232,
234rural credit cooperatives 87rural electrification 152, 231rural-to-urban migration 85, 86
SAARC 1, 16, 17, 36, 45, 47, 48,50, 202, 230–233, 236–238, 240
SAARC development goals 236SAARC finance ministers 17SAARC Preferential Trading
Arrangement (SAPTA) 16,231–233, 238
SAARC summits 236SAARCFINANCE 236SAFTA 16, 17, 47, 231–234, 238,
240Sanskrit language 176SAPTA 16, 231–233, 238SASEC program 230second phase of Pan-Asian integration
13, 175second-generation reforms 10, 14,
111, 140, 166, 205semi-skilled and labor-intensive manu-
factured products 117services 7, 9, 11, 12, 14, 15, 17, 35,
36, 40, 45, 47, 62, 68, 79, 89, 102,107–109, 114, 115, 118, 119, 122,125–128, 140, 141, 148, 151, 158,
166, 172, 196, 198–200, 203, 207,208, 224, 226, 230, 232, 234, 235,237, 240
Shigaste 211short-term external debt 51, 242Sikkim 203Silk Road 176Singapore 26, 30, 41, 42, 46, 52,
53, 74, 100, 101, 111, 156–161,176, 182, 183, 186, 189, 194–198,200–203, 206, 208, 211, 212,222–224, 226, 227
Singapore Technologies 186Singapore Telecom 186Singapore’s TradeNet system 212Sinopec 201size of the state sector 76, 108software industry in India 199South Asia 1, 3, 5–10, 12–17,
20–24, 27–32, 36, 38–40, 42–54,57–59, 61–63, 65–67, 69–80, 84,89, 91, 93, 94–100, 102–115, 122,125, 156–161, 175–183, 186–190,194–198, 200–204, 206–209,211–216, 224, 228–231, 233–237,239–242
South Asia and East Asia 3, 12–15,30, 36, 175, 177–183, 187,195–197, 199, 200, 202, 203, 207,208, 216, 224, 240, 241
South Asia Association for RegionalCooperation (SAARC) 1, 16, 17,36, 45, 47, 48, 50, 202, 230–233,236, 237, 238, 240
South Asia Business Forum 231South Asia Development Fund 237South Asia Free Trade Agreement
(SAFTA) 16, 17, 47, 231–234,238, 240
South Asia Subregional EconomicCooperation (SASEC) 16, 17,112, 230, 231, 241
254 South Asia: Rising to the Challenge of Globalization
b670_Subject Index.qxd 11/12/2008 11:04 AM Page 254

South Asia’s external economicrelations 21
South Asia–East Asia economicrelations 13, 179, 202
South Asia–East Asia trade 13, 179,201, 209
South Asian Development Fund(SADF) 17
South Asian economic performance21
South Asian finance ministers (SAFMs)236, 237, 240
South Asian Growth Quadrangle(SAGQ) 112, 230
South India 176Southeast Asia 10, 46, 63, 85, 90,
111, 176, 208, 211, 236, 237Southern Corridor 209South-South trade 201Soviet-style heavy industry
development 229Soviet-style system 80spaghetti bowl effect 207Spanish 176Spearman rank correlation coefficients
192, 195special economic zones (SEZs)
82–85, 105, 106, 110, 119–122Sri Lanka 1, 4, 9, 16, 22, 24, 26–36,
38, 39, 44, 46, 50, 52, 58–75,77–79, 91, 93–102, 104, 105, 110,113, 115, 122, 125–172, 177, 183,191, 195–198, 200, 203–206, 214,218, 225, 227, 229, 231, 233–235
Srivijaya 176Srivijaya Empire 176Standard International Trade
Classification (SITC) 11,116–118, 187–190, 192, 195,216–224
standard-gauge 211state-owned commercial banks 87
state-owned enterprises (SOEs) 82,84, 85, 87–90, 95, 100, 142, 143,162, 168
Stillwell Road 203stock market 6, 20, 47, 89, 93, 144Straits of Malacca 176streamlining of cross-border
procedures 15, 208, 211structural reforms 3, 206sub-Saharan Africa 32Sung Dynasty 176supply responses 9, 80supply-side constraints 12sustainable development 80
Taiwan 26, 30, 31, 41, 42, 74,156–161, 179, 206
tariff and nontariff barriers in SouthAsia 38
tariff reduction 16, 36, 38, 47, 231,234, 235
tariffs 4, 7, 10, 14, 16, 39, 40, 46,82, 83, 90, 94, 99, 105, 111, 126,128, 135, 136, 145, 162, 168, 204,205, 208, 224, 225, 231–233, 236,240
tax administration 10, 91, 125–127,162
taxes on international trade 62, 63technological connectivity 21technology 2, 4, 12, 14, 16, 29, 83,
119, 135, 141, 167, 183, 196, 198,203, 207, 224, 231, 234
technology transfer 183, 234telecommunications 4, 8, 11, 14, 54,
116, 117, 121, 153, 188, 189, 191,194
textiles and apparel 116, 118Thai Airways 209Thailand 26, 30, 31, 36, 39, 41, 42,
52, 53, 156–161, 176, 182, 183,194, 195, 197, 198, 200, 203–206,
Subject Index 255
b670_Subject Index.qxd 11/12/2008 11:04 AM Page 255

208, 211, 223–225, 227, 234, 241,242
Tibet 203, 209, 211timing and sequencing of policy
reforms 58total factor productivity (TFP) 98,
109, 110total health expenditure 29tourism 16, 21, 116, 186, 198, 200,
230, 231, 234township and village enterprises
(TVEs) 81, 82, 86–88, 105,114
trade complementarity index 177,195, 196
trade creation 233trade facilitation 47, 211, 232, 233trade in commercial services 196trade intensity indices 13, 181trade liberalization efforts 14trade liberalization measures 228trade promotion 15, 212Trade Restrictiveness Index 204trade treaty 233trade-related infrastructure 15Trans-Asian Railway Network 203trans-Asian railway system 7, 48Trans-Asian Railways 211transparency 2, 14, 51, 53, 93, 100,
132, 144, 205Transport 16, 83, 106, 141, 144,
146, 151, 152, 165, 167, 172,191, 193, 208, 217, 218, 220, 221,230–232, 241
transportation and communication234
trans-shipment hubs 208travel 21, 190–193, 198–200, 211,
216, 218twin track policy for South Asia
235twin-track approach 16
UN COMTRADE Online 187, 188,190, 192, 195, 197, 218, 224
UN Economic and Social Commissionfor Asia and the Pacific (ESCAP)203
UN ESCAP’s Asian Highway Network203
UN International Covenant onEconomic, Social, and CulturalRights 54
UN Security Council 40UNCTAD FDI Database 24, 35, 64UNDP Human Development Index
113unfinished agenda 10, 110, 162United Kingdom 39, 52, 71United Nations 7, 21, 40, 72United Nations Conference on Trade
and Development (UNCTAD) 7,24, 33, 35, 64, 183
United Nations Development Program(UNDP) 72, 113
United States 1, 15, 38, 39
Value-added taxes (VAT) 91, 104,125–128
vested interests 4Viet Nam 46, 52, 156–161, 183,
198, 204–206, 241voice and accountability 29, 73, 74,
100, 156voice and accountability scores 73
Western imperialism 202Workers’ Remittances 21, 44World Bank 15, 16, 32–34, 40, 44,
59–73, 77–79, 84, 96, 97, 99–102,105, 110, 204–206, 212, 228, 230,235, 236
World Bank index of employmentrigidity 96
World Competitiveness Index 42
256 South Asia: Rising to the Challenge of Globalization
b670_Subject Index.qxd 11/12/2008 11:04 AM Page 256

World Competitiveness Yearbook 40,41
World Development IndicatorsDatabase 34, 64
World Development Indicators Online32–35, 44, 59–63, 65–72, 77–79,99, 102, 105, 110
World Trade Organization 39
World War II 15, 79, 203, 228WTO Customs Valuation Agreement
212
Yadong 211Yangtze River Delta 83
Zhejiang 41, 42
Subject Index 257
b670_Subject Index.qxd 11/12/2008 11:04 AM Page 257