log correlation engine 3.4 statistics daemon guidestatic.tenable.com/prod_docs/lce_3.4_stats.pdf ·...
TRANSCRIPT
Log Correlation Engine 3.4
Statistics Daemon Guide
July 29, 2010
(Revision 3)
The newest version of this document is available at the following URL:
http://cgi.tenablesecurity.com/LCE_3.4_stats.pdf
Copyright 2004-2010, Tenable Network Security, Inc. 2
Table of Contents
TABLE OF CONTENTS ........................................................................................................................................ 2
INTRODUCTION ................................................................................................................................................... 3
BASIC OPERATION ............................................................................................................................................. 3
CONFIGURING THE STATISTICS DAEMON ........................................................................................... 7
REQUIRED INITIAL POST-INSTALLATION CHANGES .................................................................... 9
OPERATING THE STATISTICS DAEMON ............................................................................................... 10
STATISTICS DAEMON NETWORK MODEL ............................................................................................ 11
STATISTICS THEORY ....................................................................................................................................... 12
TUNING THE STATISTICS DAEMON ........................................................................................................ 15
FOR MORE INFORMATION ........................................................................................................................... 16
ABOUT TENABLE NETWORK SECURITY ................................................................................................ 17
Copyright 2004-2010, Tenable Network Security, Inc. 3
Introduction
This document outlines the basic concepts of the Log Correlation Engine 3.4 statistics
daemon, configuration and offers a basic review of statistics. Please share your comments
and suggestions with us by emailing them to [email protected].
The goal of the Log Correlation Engine statistics daemon is to automatically determine a
baseline of network activity and then create alerts for anomalous behavior.
This document is intended to be used with LCE installations for version 3.4 and
higher.
Standards and Conventions
Throughout the documentation, filenames, daemons and executables are indicated with a courier bold font such as gunzip, httpd and /etc/passwd.
Command line options and keywords will also be printed with the courier bold font.
Command line options may or may not include the command line prompt and output text
from the results of the command. Often, the command being run will be boldfaced to indicate what the user typed. Below is an example running of the Unix pwd command.
# pwd
/opt/lce
#
Important notes and considerations are highlighted with this symbol and grey text
boxes.
Basic Operation
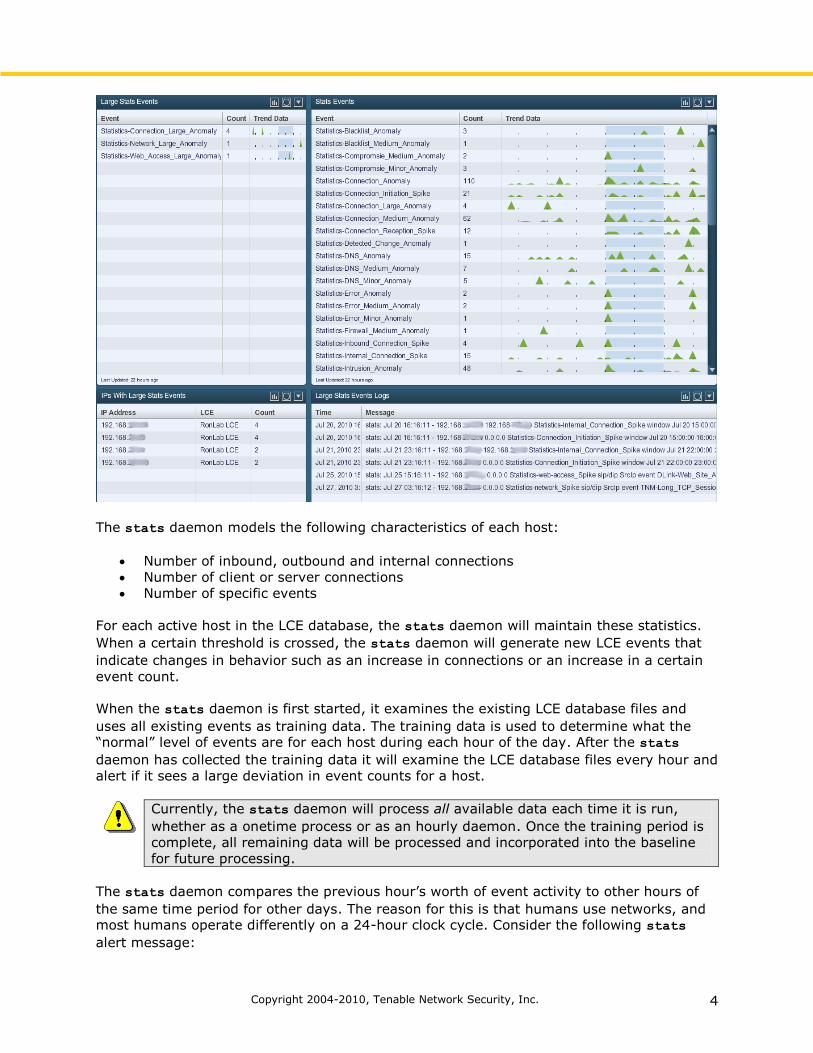
The Log Correlation Engine (LCE) statistics daemon, “stats”, is designed to monitor LCE
database files in real-time and generate new events when there are large changes in the
behavior of events for a particular host. The sole purpose of the daemon is to generate an
alert when a large statistical increase in any type of activity has been observed.
Graphs demonstrating statistical anomalies can be easily added to the SecurityCenter 4
dashboard to give the user a feel for breaking events based on various activity types.
Copyright 2004-2010, Tenable Network Security, Inc. 4
The stats daemon models the following characteristics of each host:
Number of inbound, outbound and internal connections
Number of client or server connections
Number of specific events
For each active host in the LCE database, the stats daemon will maintain these statistics.
When a certain threshold is crossed, the stats daemon will generate new LCE events that
indicate changes in behavior such as an increase in connections or an increase in a certain
event count.
When the stats daemon is first started, it examines the existing LCE database files and
uses all existing events as training data. The training data is used to determine what the “normal” level of events are for each host during each hour of the day. After the stats
daemon has collected the training data it will examine the LCE database files every hour and
alert if it sees a large deviation in event counts for a host.
Currently, the stats daemon will process all available data each time it is run,
whether as a onetime process or as an hourly daemon. Once the training period is
complete, all remaining data will be processed and incorporated into the baseline
for future processing.
The stats daemon compares the previous hour’s worth of event activity to other hours of
the same time period for other days. The reason for this is that humans use networks, and most humans operate differently on a 24-hour clock cycle. Consider the following stats
alert message:

Copyright 2004-2010, Tenable Network Security, Inc. 5
stats: Jul 14 03:01:49 – 192.168.1.1 0.0.0.0 Statistics-network_Spike
sip/dip SrcIp event TNM-TCP_Session_Started window Jul 14 02:00:00
03:00:00 average 2.50 stddev 3.77 nhits 95 stddev_units 24.50 freq 0.00
This says that IP address 192.168.1.1 had a spike in “network” events. The “network”
comes from the unique “types” of LCE events such as “intrusion”, “firewall”, etc. In this
case, we can read on further and see that the event in question was “TNM-
TCP_Session_Started”. This anomaly occurred on July 14th between 2:00 am and 3:00 am.
Normally the number of events was 2.5 with a standard deviation grouping of 3.77.
However, during this time period, we saw 95 of these events with a standard deviation
grouping of 24.5.
All events from the stats daemon are normalized as a “stats” type. Within an event
summary of all LCE events, all logs generated by the stats daemon will be on their own
event line such as shown below:
In this case, there have been 2679 statistical anomalies in the last 24-hours. A
SecurityCenter user who clicks on the event count would be presented with the following
display:
Copyright 2004-2010, Tenable Network Security, Inc. 6
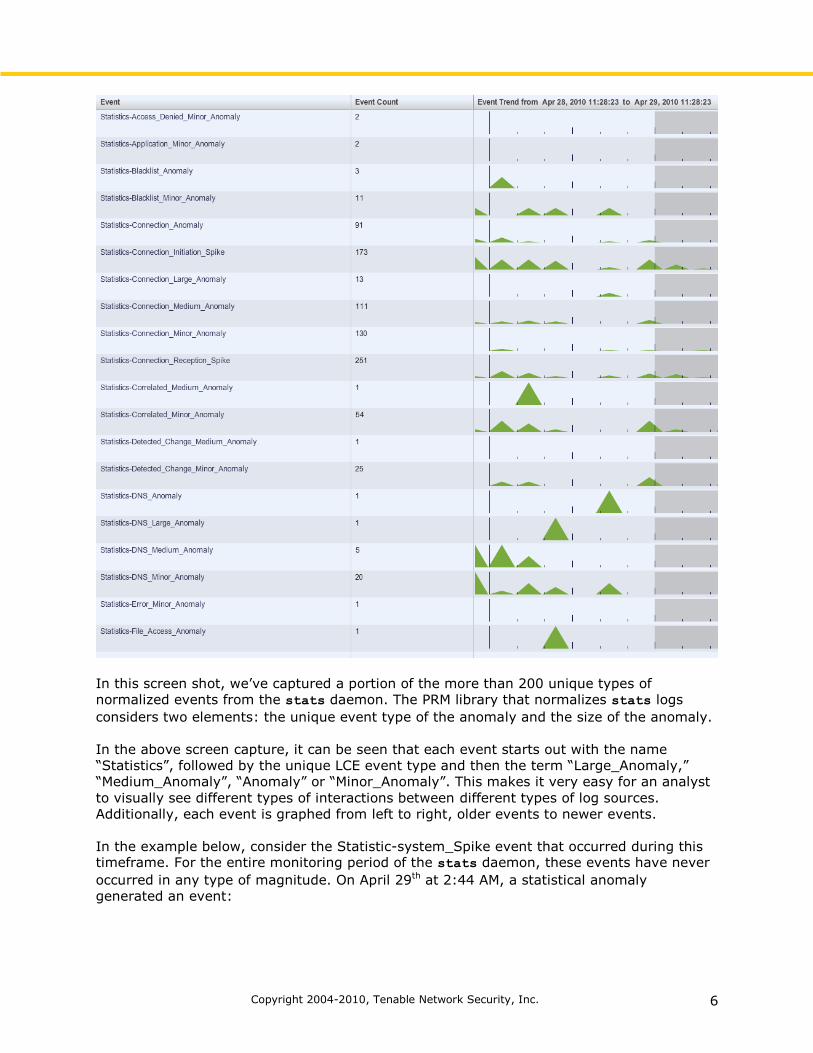
In this screen shot, we’ve captured a portion of the more than 200 unique types of
normalized events from the stats daemon. The PRM library that normalizes stats logs
considers two elements: the unique event type of the anomaly and the size of the anomaly.
In the above screen capture, it can be seen that each event starts out with the name
“Statistics”, followed by the unique LCE event type and then the term “Large_Anomaly,”
“Medium_Anomaly”, “Anomaly” or “Minor_Anomaly”. This makes it very easy for an analyst
to visually see different types of interactions between different types of log sources.
Additionally, each event is graphed from left to right, older events to newer events.
In the example below, consider the Statistic-system_Spike event that occurred during this timeframe. For the entire monitoring period of the stats daemon, these events have never
occurred in any type of magnitude. On April 29th at 2:44 AM, a statistical anomaly
generated an event:

Copyright 2004-2010, Tenable Network Security, Inc. 7
In this case, the normalized event “Windows-Privileged_Service_Called” has had a spike.
The monitored IP address had more than 254 events occur between 2:00 AM and 3:00 AM
whereas before on average had been tracking less than one.
Configuring the Statistics Daemon
File Locations
The stats daemon is located in the /opt/lce/daemons directory. Configuration options
used to modify how the stats daemon operates are located in the lce.conf file within the
stat_options section.
Example stats_options Section
stats_options {
event-directory /opt/lce/db
log-directory /opt/lce/admin/log/stats/
syslog-alert 192.168.20.6
stddev-threshold 1.0
stddev-unit-threshold 5.0
iteration-threshold 0
nhits-frequency-threshold 10.0
}
include-networks {
192.168.20.0/24;
66.0.0.0/8;
}
Keyword Explanations
Keyword Description
event-directory Directory containing the LCE events.txt file.
log-directory Log files are named according to the date and stored in the
specified directory.
syslog-alert The stats daemon will generate SYSLOG messages to one or
more recipients. By default, a local address of 127.0.0.1 is
used to send messages to the lced services. However, more
than one SYSLOG server can be configured on separate lines
in the following format:
syslog-alert 127.0.0.1
syslog-alert 192.168.10.10

Copyright 2004-2010, Tenable Network Security, Inc. 8
stddev-threshold This keyword specifies the minimum standard deviation that
must occur for an event before an alert will be generated for
it. The higher this number, the more statistically significant a
sequence of events needs to be before an alert is raised.
stddev-unit-threshold If an event occurs more or less than 5.0 standard deviation
units, an alert will be generated. Setting this value higher will
cut down on any sequence of events that occur close to the
standard deviation.
iteration-threshold This keyword specifies the number of iterations (days) per-
event that are required before alerts will be generated. If a
large amount of LCE data is already present, set this number to a low value or even to zero. The stats daemon can be
started to read in all or just part of the existing LCE data. If
you have NO LCE data, leave this value around seven so the stats daemon will not alert on anything until it has seven
days of event data.
nhits-frequency-
threshold If an event occurs less than 10% of the time then an alert
will be generated. Even if an event may be statistically
significant, that sequence of events may also occur
periodically. For example, 50% of the time you are within a
standard deviation, however, occasionally (the other 50%)
you have outliers two and three standard deviations away.
Those outliers may be the cause of 90% of the alerts
generated in this case. Setting this value to 10, 20 or other
values would only alert for hours that were both out of the
allotted standard deviation, and also are event counts that
have not occurred before.
include-networks Specifies a list of network ranges for which host statistics will
be maintained.
exclude-networks Specifies a list of network ranges for which host statistics will
not be maintained.
Explanation of example stats_options Section
In the stats_options section above, the first parameter, event-directory, specifies the
/opt/lce/db directory.
All log messages about operation, data analysis and discovered statistical behavior
anomalies are logged to a date-based log file. By default, this is located in the
/opt/lce/admin/log/stats directory but can be pointed to other places using the log-
directory keyword, if required.
The syslog-alert setting is used to configure a destination to send SYSLOG messages
directly from the stats daemon. There is no need to configure a local SYSLOG service. The
stats daemon will generate the SYSLOG message and send it to the receiving IP address.
This is how events are sent to the LCE daemon. The local IP address of the lced SYSLOG
Copyright 2004-2010, Tenable Network Security, Inc. 9
listener must be specified. In most cases, 127.0.0.1 will work. If this is not desirable, a LCE client can be used to monitor the stats log file directory in /opt/lce/admin/logs/stats.
The stats daemon applies statistical analysis to several indicators. Each hour, the stats
daemon will consider each host, and compute the amount of server/client counts,
internal/external/inbound counts and event counts for each unique event type. It will then
generate a statistical value for each of these types and alert accordingly if the values have exceeded the stddev-unit-threshold and stddev-threshold.
In the example stats_options section, the stddev-threshold keyword is set to a standard
deviation of one (1). This will cause the stats daemon to generate an alert for any set of
events that occur with a standard deviation greater than one (1). The example stats_options section also had a value of five for the stddev-unit-threshold value and a
value of 10% for the nhits-frequency-threshold setting. Please refer to the “Statistics
Theory” section to learn more about these values.
The example stats_options section also had an iteration-threshold setting of zero
days. This tells the stats daemon to begin alerting right away and base all statistics on
existing LCE data. This is ideal if enough existing LCE data exists. If not, it may make sense to let the stats demon run for several days or even a week before generating alerts.
The last section specifies the networks of interest. The stats daemon needs to know which
networks it is keeping statistics for. The include-networks keyword specifies a list of
networks in CIDR notation. This list can be further refined by also making use of the exclude-networks keyword.
Required Initial Post-Installation Changes
The LCE installs with a default lce.conf file that requires manual modification of
the stats_options section for the stats daemon to become operational.
IP Address of the Log Correlation Engine
Enter the desired IP address of the LCE for SYSLOG messages. By default, a value of 127.0.0.1 may be used. However, if the lced process is bound to a specific IP address, this
is specified in the stats_options section.
Local Network Ranges
The stats daemon does not know what networks are of interest to you. This is configured
similar to the customer managed IP ranges of the SecurityCenter that are associated with
this LCE server.
Iteration Days
By default, a value of seven is used. If a large amount of LCE data is already present, set this number to a lower value or even to zero. The stats daemon can be started to read in
all or just part of the existing LCE data. If you have no LCE data, leave this value around seven so the stats daemon will not alert on anything until it has seven days of event data.
Copyright 2004-2010, Tenable Network Security, Inc. 10
Operating the Statistics Daemon
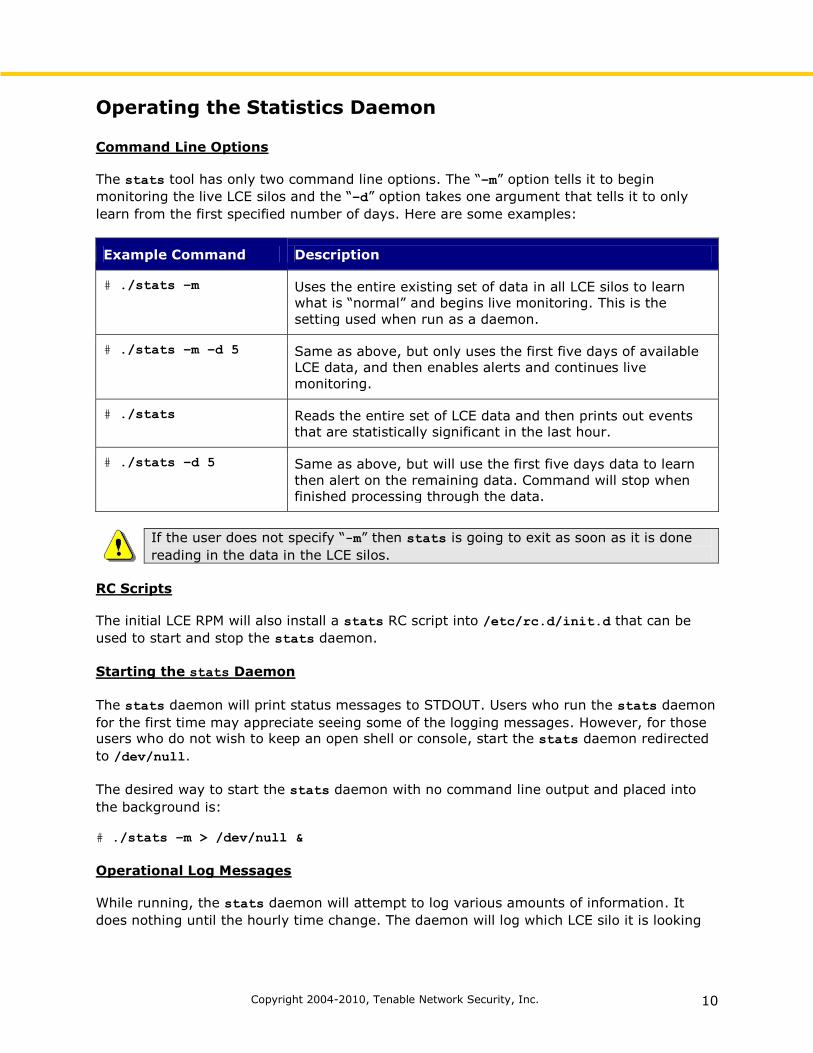
Command Line Options
The stats tool has only two command line options. The “–m” option tells it to begin
monitoring the live LCE silos and the “–d” option takes one argument that tells it to only
learn from the first specified number of days. Here are some examples:
Example Command Description
# ./stats –m Uses the entire existing set of data in all LCE silos to learn
what is “normal” and begins live monitoring. This is the
setting used when run as a daemon.
# ./stats –m –d 5 Same as above, but only uses the first five days of available
LCE data, and then enables alerts and continues live
monitoring.
# ./stats Reads the entire set of LCE data and then prints out events
that are statistically significant in the last hour.
# ./stats –d 5 Same as above, but will use the first five days data to learn
then alert on the remaining data. Command will stop when
finished processing through the data.
If the user does not specify “-m” then stats is going to exit as soon as it is done
reading in the data in the LCE silos.
RC Scripts
The initial LCE RPM will also install a stats RC script into /etc/rc.d/init.d that can be
used to start and stop the stats daemon.
Starting the stats Daemon
The stats daemon will print status messages to STDOUT. Users who run the stats daemon
for the first time may appreciate seeing some of the logging messages. However, for those users who do not wish to keep an open shell or console, start the stats daemon redirected
to /dev/null.
The desired way to start the stats daemon with no command line output and placed into
the background is:
# ./stats –m > /dev/null &
Operational Log Messages
While running, the stats daemon will attempt to log various amounts of information. It
does nothing until the hourly time change. The daemon will log which LCE silo it is looking

Copyright 2004-2010, Tenable Network Security, Inc. 11
at, how many events of interest it is analyzing and will also log when statistically significant
event groupings have occurred.
Stopping the stats Daemon
To manually halt the stats daemon, simply use the kill command in order to cause it to
exit. Otherwise, the provided RC script will also stop the stats daemon.
Keeping State
The stats daemon will quickly parse the entire set of data in the LCE database. Starting it
with the –m option will not cause undue delay or system load and it will efficiently re-learn
what is normal for all events.
System Load
There will be no excess system CPU, I/O or memory load while the stats daemon is waiting
to start its “on the hour” analysis. During the analysis, CPU impact may be noticeable, but it
is extremely short in duration.
Statistics Daemon Network Model
The stats daemon builds up three different types of models when it reads the LCE database
files:
Model of counts for specific events (e.g., “Dragon - Port Scan”).
Model of counts for the total number of inbound, outbound and internal events (not
specific to any one event).
Model of counts for the total number of events where a host is the source or
destination address (not specific to any one event).
Model of Event Counts for Specific Events
This model is intended to help identify changes in numbers of events for specific host/event
pairs. For example, if typically a host has 20 “Dragon - Port Scan” events generated for it
per-day and this suddenly spikes up to 120 events per-day, the stats daemon would
generate an alert if configured to do so.
Note that this model differentiates between a host appearing as a source or destination
address in an event. In other words, host 10.0.0.1 may, on average, appear 20 times a day
as the source address in a SnortICMP_Event event and 30 times a day as the destination
address in a SnortICMP_Event event. These are two different model counts as far as the stats daemon is concerned and a jump in either might generate an event.
Inbound, Outbound and Internal Event Count Model
This model is intended to track how often a host’s traffic is inbound, outbound and internal.
For example, if an internal company file server starts initiating outbound traffic all of a sudden causing the outbound traffic event counts to increase, the stats daemon would
generate an alert. This model is not based on specific host/event pairs. Only the addresses are used in this model. The stats daemon uses the configured included networks when

Copyright 2004-2010, Tenable Network Security, Inc. 12
deciding what constitutes internal, outbound or inbound traffic. Anything not in the included
list of network is considered outside the external to the “home” network.
Model of Client or Server Behavior
This model tracks whether a host is generally acting as a client or a server. It is designed to
detect the case where a host that generally acts as a client suddenly starts behaving like a
server. For instance, a typical user’s Windows machine will generally act like a client in that
most of the traffic from the host will be initiated by the host. If the user’s machine is broken
into and a backdoor shell is installed, the machine would start appearing more as a server
as hackers connected to the shell.
Statistics Theory The LCE stats daemon uses relatively simple statistics to build a model of “normal” traffic
patterns in a network and detect when traffic deviates from that model. This section is intended to provide a brief description of the underlying mathematics used by the stats
daemon.
Frequency Distribution
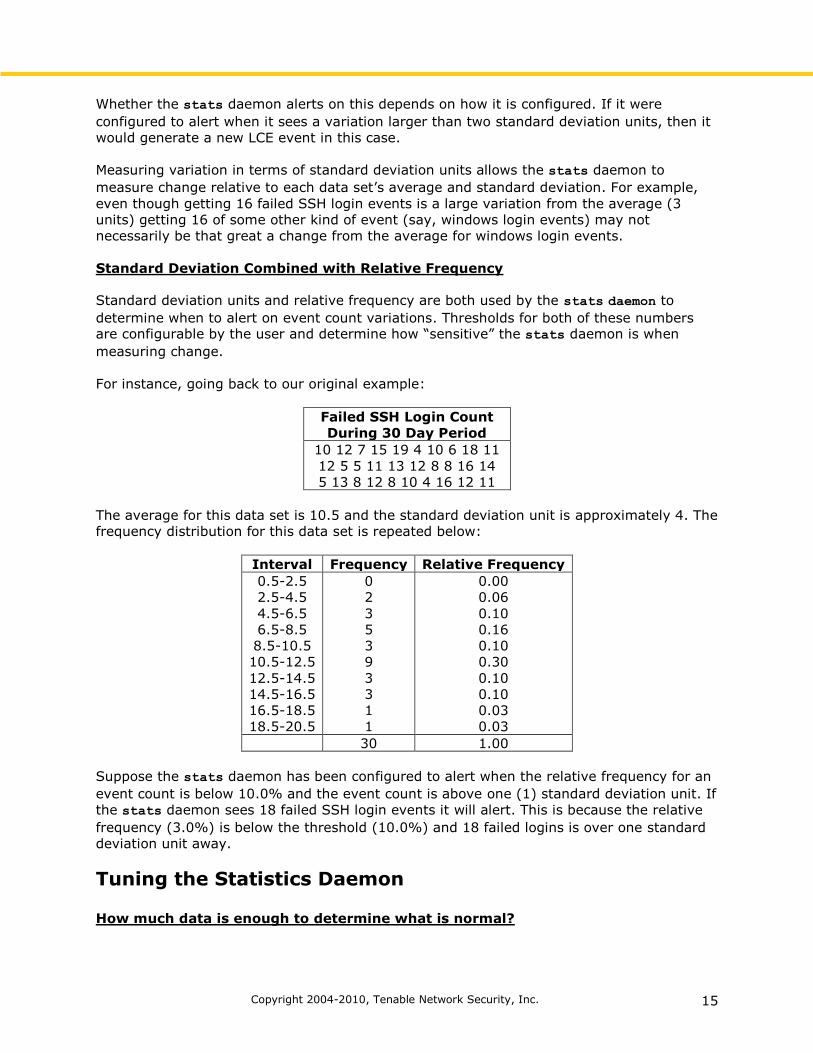
Suppose that during the course of a 30-day period the following number of failed SSH logins
are observed at a large university. A count for the number of failed SSH logins for each day
is entered in the table:
Failed SSH Login Count
During 30 Day Period
10 12 7 15 19 4 10 6 18 11
12 5 5 11 13 12 8 8 16 14
5 13 8 12 8 10 4 16 12 11
Viewed this way, the data does not elicit much useful information. However, if we organize
this data into groups we can get a quantitative measure of how often we get a certain
number of failed SSH login events each day.
Interval Frequency Relative Frequency
0.5-2.5
2.5-4.5
4.5-6.5
6.5-8.5
8.5-10.5
10.5-12.5
12.5-14.5
14.5-16.5
16.5-18.5
18.5-20.5
0
2
3
5
3
9
3
3
1
1
0.00
0.06
0.10
0.16
0.10
0.30
0.10
0.10
0.03
0.03
30 1.00
The previous table is a frequency distribution table. The relative frequencies in the table
represent the probabilities of seeing a certain number of failed SSH login events per-day
given our current sample set of 30 days.

Copyright 2004-2010, Tenable Network Security, Inc. 13
Examining the table we see that during the 30-day interval there were no days where we
saw only one or two failed SSH login events. If we were to use this table to predict the
chances of getting one or two events per-day in the future, we would say that likelihood of
this is 0.0%. Similarly, the likelihood of seeing 11 or 12 failed login events on a given day is
30.0% according to this table.
Calculating the relative frequency of events is one way the LCE stats daemon determines
deviations from normal traffic patterns. The relative frequency allows the stats daemon to
determine how likely or unlikely it is to see a certain number of events for a given host.
Measures of Central Tendency
In order to determine the “normal” traffic patterns for a host, the stats daemon also
calculates the average number of events received per-host during each hour of the day. By calculating the average, the stats daemon can approximate the center of the range of
event counts for a host. This center point is then used as the baseline for what constitutes
“normal” traffic event counts for this host.
Given a set of n elements x1, x2, ... xn, we can determine the average of the data set using
the following formula:
This average is also known as the arithmetic mean.
Standard Deviation
While the average of the event counts can show where the approximate center of the data
distribution lies, it does not show us how widely dispersed the data is around the center
point.
For example, suppose we are given the following set of numbers:
0, 20, 0, 20
The average of these numbers is:
Now suppose we are also given a second set of numbers:
9, 11, 9, 11
The average of this data set is also 10:

Copyright 2004-2010, Tenable Network Security, Inc. 14
The average of the two data sets is the same. However, the second data set contains
numbers that are much closer to the average than those in the first set. In other words, the
numbers in the first data set deviate a lot from the average while the numbers in the
second data deviate from the average by only a small amount.
Deviation from Average for Data Set 1
Number (Number - Average)
0
20
0
20
-10
10
-10
10
Deviation from Average for Data Set 2
Number (Number - Average)
9
11
9
11
-1
1
-1
1
The set of deviations for each element in the data sets may be combined to calculate a
single number known as the standard deviation. The standard deviation is a single measure
of variation that can be used to describe how widely dispersed the elements in a data set
are from the data set’s average.
The formula for standard deviation of a set of n measurements x1, x2, ... xn with an
average x0 is given by:
Standard Deviation Units
Given the average and the standard deviation of the number of events per host, the stats
daemon now has a model of what constitutes “normal” traffic for a host. For example, if a
host averages 10 failed SSH login events per-day with a standard deviation of 2, then the stats daemon will expect to generally see around 8 to 12 failed SSH login events for that
host.
Now, suppose the stats daemon observes 16 failed SSH logins for this same host. How far
away from “normal” these 16 failed logins are can be measured as follows:
Using the standard deviation (2) as a unit of measurement, the result, 3, tells us that
getting 16 failed logins in one day is three (3) standard deviation units away from the
average.
Copyright 2004-2010, Tenable Network Security, Inc. 15
Whether the stats daemon alerts on this depends on how it is configured. If it were
configured to alert when it sees a variation larger than two standard deviation units, then it
would generate a new LCE event in this case.
Measuring variation in terms of standard deviation units allows the stats daemon to
measure change relative to each data set’s average and standard deviation. For example,
even though getting 16 failed SSH login events is a large variation from the average (3
units) getting 16 of some other kind of event (say, windows login events) may not
necessarily be that great a change from the average for windows login events.
Standard Deviation Combined with Relative Frequency
Standard deviation units and relative frequency are both used by the stats daemon to
determine when to alert on event count variations. Thresholds for both of these numbers are configurable by the user and determine how “sensitive” the stats daemon is when
measuring change.
For instance, going back to our original example:
Failed SSH Login Count
During 30 Day Period
10 12 7 15 19 4 10 6 18 11
12 5 5 11 13 12 8 8 16 14
5 13 8 12 8 10 4 16 12 11
The average for this data set is 10.5 and the standard deviation unit is approximately 4. The
frequency distribution for this data set is repeated below:
Interval Frequency Relative Frequency
0.5-2.5
2.5-4.5
4.5-6.5
6.5-8.5
8.5-10.5
10.5-12.5
12.5-14.5
14.5-16.5
16.5-18.5
18.5-20.5
0
2
3
5
3
9
3
3
1
1
0.00
0.06
0.10
0.16
0.10
0.30
0.10
0.10
0.03
0.03
30 1.00
Suppose the stats daemon has been configured to alert when the relative frequency for an
event count is below 10.0% and the event count is above one (1) standard deviation unit. If
the stats daemon sees 18 failed SSH login events it will alert. This is because the relative
frequency (3.0%) is below the threshold (10.0%) and 18 failed logins is over one standard
deviation unit away.
Tuning the Statistics Daemon
How much data is enough to determine what is normal?
Copyright 2004-2010, Tenable Network Security, Inc. 16
There is no direct answer to this question. In practice, Tenable tells customers to have at
least one week’s worth of LCE data. However, if certain events occur on a monthly basis,
expect some statistical events to be generated at that time.
Frequently, customers have told Tenable that the stats daemon has highlighted “normal”
events for which there was no prior understanding of in the first place. For example, one
customer found that there were a large number of file transfer events each night.
One very useful thing about the stats daemon is that if there is not enough data, the
amount of alerts starts to drop as more data comes in. For example, consider the above
customer that was receiving large numbers of file transfer events each night. After several nights of this activity, the stats daemon began to recognize this traffic as “normal” and
stopped alerting on it.
What about adding in new events?
If new event types are added to the LCE (such as adding a new type of firewall log source or adding web logs when none existed before) the stats daemon will immediately generate
new events. However, as several days of data of these new events accumulate they will be
recognized as “normal” events.
Manually Testing Existing Data
By running the stats daemon using the “-d <#days>” option without “-m”, users can use
the existing set of LCE data to see what would have alerted. This is also an excellent way to
tune the stats_options section of the lce.conf file until only very significant event
groupings are highlighted.
For More Information
Tenable has produced a variety of other documents detailing the LCE’s deployment,
configuration, user operation and overall testing. These are listed here:
Log Correlation Engine Administration and User Guide – additional information
for installing, configuring and operating the LCE
Log Correlation Engine Client Guide – how to configure, operate and manage the
various Unix, Windows, netflow, OPSEC, Splunk and other clients
Log Correlation Engine Log Normalization Guide – explanation of the LCE’s log
parsing syntax with extensive examples of log parsing and manipulating the LCE’s .prm libraries
TASL Reference Guide – explanation of the Tenable Application Scripting Language
with extensive examples of a variety of correlation rules
Documentation is also available for Nessus, the Passive Vulnerability Scanner and
SecurityCenter. Please feel free to contact us at [email protected], [email protected]
or visit our web site at http://www.tenable.com/.
Copyright 2004-2010, Tenable Network Security, Inc. 17
About Tenable Network Security
Tenable, headquartered in Columbia, Md., USA, is the world leader in Unified Security
Monitoring. Tenable provides agent-less solutions for continuous monitoring of
vulnerabilities, configurations, data leakage, log analysis and compromise detection. For
more information, please visit us at http://www.tenable.com/.
TENABLE Network Security, Inc.
7063 Columbia Gateway Drive
Suite 100
Columbia, MD 21046
TEL: 410-872-0555
http://www.tenable.com/