visuo-spatial consciousness and parieto-occipital areas: a high-resolution eeg study
TRANSCRIPT

Visuo-spatial Consciousness andParieto-occipital Areas: A High-resolutionEEG Study
Claudio Babiloni1,2,3, Fabrizio Vecchio1,3, Maurizio Miriello1,
Gian Luca Romani4,5 and Paolo Maria Rossini2,3,6
1Dip. Fisiologia Umana e Farmacologia, Universita ‘La
Sapienza’, Rome, Italy, 2IRCCS ‘S. Giovanni di Dio-FBF’, AFaR,
Brescia, Italy, 3AFaR Dip Neuroscienze, Osp. FBF, Isola
Tiberina, Italy, 4Dipartimento di Scienze Cliniche e
Bioimmagini, Universita G. D’Annunzio, Chieti, Italy, 5ITAB,
Fondazione ‘Universita G D’Annunzio’, Chieti, Italy and6Clinica Neurologica, Campus Biomedico, Universita di Roma,
Rome, Italy
Conscious and unconscious visuo-spatial processes are mainlyrelated to parieto-occipital cortical activation. In this study, theworking hypothesis was that a specific pattern of parieto-occipitalactivation is induced by conscious, as opposed to unconscious,visuo-spatial processes. Electroencephalographic data (128 chan-nels) were recorded in 12 normal adults during a visuo-spatial task.A cue stimulus appeared on the right or the left (equal probability)monitor side for a ‘threshold time’ inducing ~50% of correctrecognitions. It was followed (after 2 s) by visual go stimuli atspatially congruent or incongruent positions with reference to thecue location. The left (right) mouse button was clicked if the gostimulus appeared on the left (right) monitor side. Subjects wererequired to say ‘seen’ if they had detected the cue stimulus or ‘notseen’ if they missed it (self-report). ‘Seen’ and ‘not seen’electroencephalographic trials were averaged separately to formvisual evoked potentials. Sources of these potentials wereestimated by LORETA software. Reaction time to go stimuli wasshorter during spatially congruent than incongruent ‘seen’ trials,possibly due to covert attention on cue for self-report. It was alsoshorter during spatially congruent than incongruent ‘not seen’ trials,as an objective sign of unconscious processes. Cue stimulusevoked parieto-occipital potentials which has the same peaklatencies in the ‘seen’ and ‘not seen’ cases. Sources of thesepotentials were located in occipital area 19 and parietal area 7.Source strength was significantly stronger in ‘seen’ than ‘not seen’cases at ~1300 ms post-stimulus. These results may unveilfeatures of parieto-occipital activation accompanying visuo-spatialconsciousness.
Keywords: awareness, human cortex, LORETA, subliminal stimuli, visualevoked potentials (VEPs)
Introduction
A variety of visual stimuli is perceived and processed without
any reportable consciousness (Merikle, 1982; Purcell et al.,
1983; Holender, 1986; Reingold and Merikle, 1988; Kihlstrom
et al., 1992). Neural correlates of conscious and unconscious
visual processes have been fruitfully studied in patients with
unilateral brain injuries, particularly at right posterior parietal
cortex (Vallar et al., 1988; Driver et al., 1997; Driver and
Vuilleumier, 2001). These patients can detect unilateral visual
stimuli on either hemifields, thanks to intact visual fields and
posterior occipital cortex. Instead, they typically miss contrale-
sional stimuli at the left visual hemifield during bilateral
stimulations. Such a ‘visual extinction’ is probably due to
a pathological bias in spatial attention (Posner et al., 1984;
Vallar et al., 1988; Desimone and Duncan, 1995; Driver et al.,
1997; Cocchini et al., 1999).
In the above-mentioned patients, extinguished visual stimuli
may be unconsciously processed. In fact, the reaction time to
‘go’ (target) stimuli on the ipsilesional visual hemifield is
affected by concurrent undetected stimuli on the contralesional
visual hemifield (Marzi et al., 1996; Vuilleumier and Rafal, 2000).
Furthermore, ‘visual extinction’ is affected by the semantic
relationship between concurrent ipsilesional (‘seen’) and con-
tralesional (‘extinguished’ or ‘not seen’) stimuli (Baylis et al.,
1993; Mattingley et al., 1997; Vuilleumier and Rafal, 2000).
Extinguished visual stimuli can be unconsciously processed
by parieto-occipital areas, typically spared in the above-
mentioned patients (Driver, 1996; Driver et al., 1997; Heilman
et al., 1997; Driver and Mattingley, 1998; Robertson et al., 1997).
Functional magnetic resonance imaging (fMRI) has been em-
ployed to test this hypothesis in a patient with left ‘visual
extinction’ due to right parietal lesion (Rees et al., 2000;
Vuilleumier et al., 2001). During bilateral stimulation, the
patient consciously perceived only the stimuli delivered to
the right hemifield. In the bilateral stimulation trials, right
occipital striate and extra-striate visual areas including parietal
cortex were activated despite the extinction of left visual
stimuli. Furthermore, other converging evidence would suggest
that these areas may represent the neural substrate for the
unconscious residual processing of extinguished visual stimuli
(Audet et al., 1991; Berti and Rizzolatti, 1992; Baylis et al., 1993;
McGlinchey-Berroth et al., 1993; Cohen et al., 1995). However,
an open issue remains: why are parieto-occipital responses to
extinguished stimuli not able to produce visual consciousness?
In order to address this issue, parieto-occipital responses
were evaluated in patients showing ‘visual extinction’ of left
visual stimulus only in some bilateral stimulation trials, namely
the ‘not seen’ trials (Marzi et al., 2000; Driver et al., 2001;
Vuilleumier et al., 2001). In the remaining cases (‘seen’ trials),
they consciously perceived both left and right visual stimuli.
This allowed the comparison of fMRI activation in ‘seen’ versus
‘not seen’ trials. As a result, right occipital striate, right cuneus,
bilateral fusiform gyrus and left parietal areas were more active
in ‘seen’ than ‘not seen’ trials (Driver and Vuilleumier et al.
2001). Furthermore, coupling of occipital and frontal areas was
stronger in magnitude in ‘seen’ than ‘not seen’ trials (Buchel and
Friston, 1997). These results emphasized the strength of
parieto-occipital activation for conscious visual processes.
To complement the high spatial resolution of fMRI, visual
event-related potentials (ERPs) have been recoded to evaluate
fine timing of cortical responses in ‘extinction’ patients
(Lhermitte et al., 1985; Vallar et al., 1991; Spinelli et al., 1994;
Verleger et al., 1996; Marzi et al., 2000; Driver and
Vuilleumier et al., 2001). Of particular interest was a ‘visual
extinction’ patient with a lesion of the right parietal cortex
� The Author 2005. Published by Oxford University Press. All rights reserved.
For permissions, please e-mail: [email protected]
Cerebral Cortex
doi:10.1093/cercor/bhi082
Cerebral Cortex Advance Access published March 30, 2005 by guest on June 9, 2013
http://cercor.oxfordjournals.org/D
ownloaded from

(Marzi et al., 2000). In this patient, bilateral visual stimulation
evoked visual ERPs in both ‘seen’ and ‘not seen’ trials. However,
early posterior ERPs of the right (damaged) hemisphere were
higher in amplitude in ‘seen’ than in ‘not seen’ trials. As regards
another patient with ‘visual extinction’, bilateral visual stimula-
tion evoked early occipital ERPs only in ‘seen’ trials (Vuilleumier
et al., 2001). Instead, later ERPs were observed in both ‘seen’
and ‘not seen’ trials.
Overall, these results emphasized spatio-temporal features of
cerebral responses related to conscious and unconscious visual
processes. However, uncontrolled effects of brain lesions
motivated investigations in normal subjects (Shevrin and
Fritzler, 1968; Kostandov and Arzumanov, 1977; Naatanen and
Gaillard, 1983; Brandeis and Lehmann, 1986; Shevrin, 1992;
Wong et al., 1994). In the most employed paradigm, subjects
had to respond (i.e. movement or counting) after rare, but not
frequent stimuli of a sequence, namely the ‘P300 paradigm’. As is
well known, rare stimuli evoke a well-shaped late positive ERP
(P300), which is supposed to reflect cognitive closure of the
recognition processing and memory updating (Smith et al.,
1970; Hillyard et al., 1971; Hillyard and Picton, 1987; Iragui et al.,
1993). It has been shown that parietal P300 was higher in
amplitude after ‘seen’ (conscious perception) than ‘not seen’
(subliminal perception) rare stimuli (Shevrin, 1976; Kostandov
and Arzumanov, 1977; Brandeis and Lehmann, 1986; Shefrin
et al., 1988; Brazdil et al., 1998, 2001, 2002). However, it might
be argued that sensorimotor interaction impinged only upon
P300 of ‘seen’ trials (i.e. rare supraliminal stimuli), which
required movement or counting. To overcome this issue, the
present high-resolution ERP study did not use a P300 paradigm.
Instead, an experimental paradigm was employed requiring the
same post-stimulus motor demand in both ‘seen’ (conscious
perception) and ‘not seen’ (unconscious perception) trials. The
working hypothesis was a specific spatio-temporal pattern of
parieto-occipital activation in ‘seen’ when compared to ‘not
seen’ trials.
Materials and Methods
SubjectsExperiments were performed on 12 healthy adult volunteers (age
29.3 ± 0.8 years, mean ± SE). They were right-handed, as revealed by
the Edinburgh Inventory (81.2 ± 4.6%), and had no previous psychiatric
or neurological history. Their sight was normal or corrected-to-normal.
All experiments were undertaken with the understanding and written
consent of each participant, according to Code of Ethics of the World
Medical Association (1997) and the standards established by the
Author’s Institutional Review Board. The study was approved by local
ethical commitee.
Experimental TaskThe subjects were seated in a comfortable reclining armchair, placed in
a dimly lit, sound-damped, and electrically shielded room. They kept
their forearms resting on the armchairs, with the right index finger
resting between two buttons of a mouse, which was connected to
a computer monitor. The monitor of the computer was placed in front
of them at a distance of ~100 cm.
For each subject, a preliminary procedure ascertained the individual
threshold time (ms) of the cue stimulus. The cue stimulus was a white
circle (diameter ~0.5� of visual angle) appearing at 6� to the right or left
of the background central white cross (diameter 0.5�). The cue stimulus
was preceded and followed by a masking visual stimulus formed by two
‘Xs’ (~0.8�), located at 6� to the right and left of the central white cross.
The subjects had to say ‘seen’ any time they perceived the position of
the cue stimulus. In detail, the procedure was as follows. The duration of
the cue stimulus varied randomly trial-by-trial within the following
values: 20, 40, 60, 80, 100, 120, 140, 160 ms for 80 trials (10 for each
duration value). The procedure was repeated seven times. The
threshold time to be used during the EEG recordings was defined as
the duration of the cue stimulus determining ~50% of correct stimulus
detections within a series of 10 trials, in the majority of the seven
repetitions of the procedure. Just before the EEG recording, this
threshold time was systematically varied up and down (10 ms) for
some preliminary trials, to verify the stability of that time based on
subject’s self-report. There was always a confirmation before the EEG
recording of the threshold time of cue presentation as indicated by the
above preliminary procedure. Subject-by-subject, the mean (± SE)
threshold time of the cue stimulus was 101 ± 8.8 ms. It is worth noting
that the global correctness of the procedure for the determination of
that threshold time was supported by the post hoc verification and that
the recognition of the cue stimuli during the EEG recordings was 48%
(±2 SE) on across-subjects average.
Figure 1 illustrates a ‘standard’ trial. The sequence of the visual stimuli
was as follows: (i) the masking stimulus ‘Xs’ lasting 5.5 s; (ii) the cue
stimulus ‘small circle’ appearing on the right or left (50%) monitor side
for the threshold time; (iii) the masking stimulus ‘Xs’ lasting ~2 s (i.e. 2 s
Figure 1. Sequence of events during a ‘standard’ trial: (i) masking stimulus lasting5.5 s; (ii) cue stimulus appearing on the right or left monitor side for the ‘thresholdtime’ giving ~50% of stimulus recognition; (iii) masking stimulus lasting ~2 s (i.e. 2 sminus the threshold time); (iv) go stimulus lasting ~0.5 s. The go stimulus was a greencircle with a diameter of ~0.5�, which appeared on the right or the left monitor side.Subjects had to click the left mouse button if the go stimulus appeared on the leftmonitor side, whereas they had to click the right mouse button if the go stimulusappeared on the right monitor side (self-report). The computer receiving mouse inputsregistered the corresponding reaction time and the side of the mouse button clicked.After hand motor response, subjects had to say ‘seen’ if they had detected the cuestimulus (‘seen’ trial) or ‘not seen’ if they had missed the cue stimulus (‘not seen’ trial).
Page 2 of 10 Visuo-spatial Consciousness and ERPs d Babiloni et al.
by guest on June 9, 2013http://cercor.oxfordjournals.org/
Dow
nloaded from

minus the threshold time); (iv) a go (target) stimulus lasting ~0.5 s. The
go stimulus was a small green circle with a diameter of ~0.5�, which
appeared 6� to the right or left (50% of probability) of the central white
cross. The subjects had to press the left mouse button if the go stimulus
appeared on the left monitor side, whereas they had to press the right
mouse button if the go stimulus appeared on the right monitor side. The
computer receiving the mouse inputs registered the corresponding
reaction time and the side of the button pressed. Immediately after the
hand motor response, the subjects had to say ‘seen’ if they had detected
the cue stimulus (‘seen trial’) or ‘not seen’ if they had missed the cue
stimulus (‘not seen trial’). It is noteworthy that subjects denied the use
of mental verbal codes for the cue or go stimuli after the experiment.
Verbal self-report was registered by a microphone connected to the
computer, and was also noted manually by an experimenter. The
experimenter controlled that subjects watched the computer monitor
during the task. Note that the same presentation time and physical
features (shape, position, luminance, etc.) characterized the cue stimuli
consciously perceived (‘seen trials’) and those not consciously per-
ceived (‘not seen trials’). Therefore, these features cannot explain the
reason why some cue stimuli were ‘seen’ and others were consciously
‘not seen’.
In some cases, the ‘standard’ trials were replaced by ‘baseline’ trials,
which were characterized by the following stimulus sequence: (i) the
masking stimulus ‘Xs’ lasting 5.5 s; (ii) a black screen lasting the
threshold time, instead of the cue stimulus. The rest of the sequence
was the same as that of the ‘standard’ trials. The ‘baseline’ trials were
delivered to evaluate the subjective self-reports’ reliability on the
detection of cue stimuli. Such reliability was indexed by the percentage
of false recognitions of the cue stimuli during the ‘baseline’ trials, i.e.
when the subjects said ‘seen’ even if the baseline trials had no cue
stimulus.
Electroencephalographic RecordingsDuring the experimental task, electroencephalographic (EEG) data
were recorded (bandpass 0.1--100 Hz; sampling rate 256 Hz) from 128
electrodes placed according to an augmented 10--20 system. Linked ear
lobes served as an electrical reference and electrode impedance was
kept <5 kX. Vertical and horizontal electrooculographic activity was
also recorded with the same features of the EEG data, to monitor eye
movements and blinking. In parallel, involuntary and voluntary (follow-
ing the go stimulus) hand motor responses were assessed by collecting
electromyographic activity from extensor digitorum muscle of both
arms. This allowed the monitoring of the voluntary right motor
responses and of possible involuntary left mirror movements. Acquisi-
tion time for all data was set from –1 s to +5.5 s after the onset of the cue
stimulation.
In all subjects, the EEG data were recorded in the aforementioned
experimental task. On average, there were 270 ‘standard’ trials (66.6%)
and 135 ‘baseline’ trials (33.3%) pseudo-randomly intermingled.
In addition, a control condition was added in seven subjects. In this
condition, there were only ‘standard’ trials (i.e. no ‘baseline’ trial), so that
‘not seen’ and ‘seen’ trials occurred with a percentage of ~50% each. As
a consequence, ERPs due to the trials in which the subjects recognized
the cue stimuli (‘seen’ trials) were as frequent as the trials in which the
subjects did not recognize the cue stimuli (‘not seen’ trials). This
allowed pairing the variable ‘frequency’ of the ‘seen’ compared to the
‘not seen’ trials, theoretically able to enhance positive ERPs around +300ms post-stimulus — the so called ‘P300 effect’. In total, the control
condition consisted of 160 ‘standard’ trials given without the occur-
rence of ‘baseline trials’.
Behavioral Data AnalysisBehavioral data analysis was mainly aimed at verifying the occurrence of
unconscious visual processes in the ‘standard not seen’ trials. The
‘standard’ trials were classified as follows: (i) ‘congruent seen’ trials, in
which the cue stimulus was detected and the go stimulus appeared on
the cued location; (ii) ‘incongruent seen’ trials, in which the cue
stimulus was detected and the go stimulus appeared on the uncued
location; (iii) ‘congruent not seen’ trials, in which the cue stimulus was
not detected and the go stimulus appeared on the cued location; and
(iv) ‘incongruent not seen’ trials, in which the cue stimulus was not
detected and the go stimulus appeared on the uncued location. There
were equal numbers of ‘congruent’ and the ‘incongruent’ trials (50%).
The ‘baseline’ trials (i.e. those having no cue stimulus) were grouped
into a unique, separate class.
The reaction time for each trial class was defined as the period
between the onset of the go stimulus and the mouse button click. The
trials showing a reaction time longer than 1.2 s were considered as
affected by ‘partial distraction’, and thus were not considered any
further.
Statistical Analysis of the Behavioral DataA run test was performed to evaluate if both the ‘seen’ and ‘not seen’
trials were randomly intermingled, according to the hypothesis that ‘not
seen’ trials were not purely determined by fatigue or boredom at the end
of the session. This test is based on the number of ‘runs’ defined as the
changes from ‘seen’ to ‘not seen’ in the trial sequence. The null
hypothesis (H0) was the randomness in the sequence of ‘seen’ and
‘not seen’ trials, which reflected the fluctuation of attention/awareness
towards the cue stimuli. If N1 is the number of the subliminal trials, N2
the number of the supraliminal ones, and U the number of ‘runs’ in the
whole sequence, then the distribution ofU for large samples approaches
normality with a mean of
lU =2N1N2
N+1
and a standard deviation of
rU =
ffiffiffiffiffiffiffiffiffiffiffiffiffiffiffiffiffiffiffiffiffiffiffiffiffiffiffiffiffiffiffiffiffiffiffiffiffi2N1N1ð2N1N2 –N Þ
N2ðN – 1Þ
s;
where N = N1 + N2. The probability values can be computed by
Zc =jU –lU j – 0:5
rU
:
The 0.5 in the numerator of ZC is a correction for continuity. By ZC, we
can obtain the probability value for the H0 hypothesis (P > 0.05).
In order to corroborate the run test’s results, we used an ANOVA. The
working hypothesis was that the percentage of the ‘seen’ trials was not
higher at the beginning than at the end of the experimental session. The
one-way ANOVA design included the percentage of the ‘seen’ trials
(dependent variable) during three periods of the experimental session,
i.e. ‘beginning’, ‘medium’ and ‘final’. Each period lasted a third of that
session. Duncan’s test was used for post hoc comparisons (P < 0.05).
ANOVA for repeated measures served to evaluate the following
hypothesis. In line with well-known previous evidence (McCormick,
1997; Ivanoff and Klein, 2003; C. Babiloni, F. Vecchio, M. Miriello, G.L.
Romani and P.M. Rossini, submitted), it was predicted that the reaction
time to go stimuli (dependent variable) should be shorter in the
‘congruent seen’ trials than in the ‘incongruent seen’ ones, due to the
effect of the covert attention on cued location for the self-report.
Similarly, the working hypothesis stated that the reaction time to go
stimuli should be shorter in the ‘congruent not seen’ than in the
‘incongruent not seen’ trials, as a sign of unconscious visuo-spatial
processes. The confirmation of these hypotheses was a crucial pre-
requisite for the subsequent comparison of the ERPs related to ‘seen’
trials (related to conscious perception) versus ‘not seen’ trials (sup-
posed to be related to unconscious perception). The ANOVA design
included the factor Condition (‘baseline’, ‘congruent seen’, ‘incongruent
seen’, ‘congruent not seen’, ‘incongruent not seen’). Mauchley’s test, to
evaluate the sphericity assumption and correct for the degrees of
freedom, was made by the Greenhouse--Geisser procedure. Duncan’s
test was used for post hoc comparisons (P < 0.05).
Preliminary EEG Data AnalysisEEG single trials contaminated by blinking, eye movements and in-
voluntary motor acts during the cue stimulation were rejected off-line.
For the EEG data analysis, the artifact-free trials were classified only in
the three following classes: ‘baseline’, ‘seen’ and ‘not seen’. Indeed, the
conscious and unconscious processes accompanying the cue stimula-
tion preceded the go stimulus, so that they could not be affected by
Cerebral Cortex Page 3 of 10
by guest on June 9, 2013http://cercor.oxfordjournals.org/
Dow
nloaded from
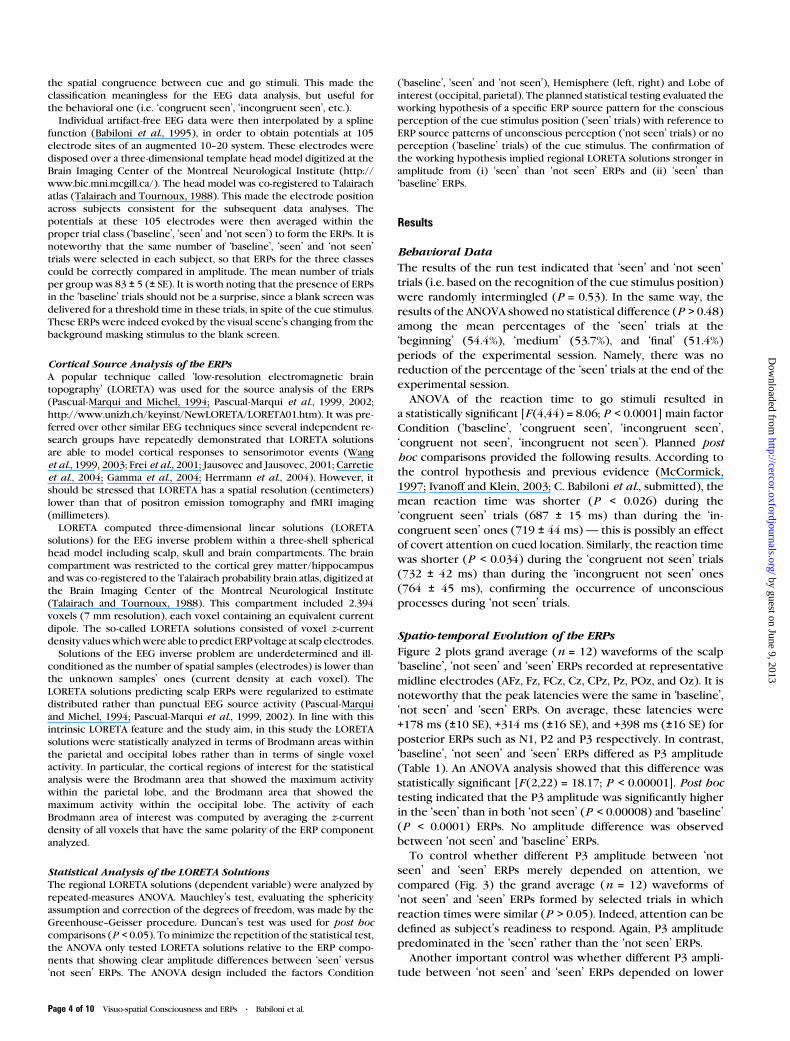
the spatial congruence between cue and go stimuli. This made the
classification meaningless for the EEG data analysis, but useful for
the behavioral one (i.e. ‘congruent seen’, ‘incongruent seen’, etc.).
Individual artifact-free EEG data were then interpolated by a spline
function (Babiloni et al., 1995), in order to obtain potentials at 105
electrode sites of an augmented 10--20 system. These electrodes were
disposed over a three-dimensional template head model digitized at the
Brain Imaging Center of the Montreal Neurological Institute (http://
www.bic.mni.mcgill.ca/). The head model was co-registered to Talairach
atlas (Talairach and Tournoux, 1988). This made the electrode position
across subjects consistent for the subsequent data analyses. The
potentials at these 105 electrodes were then averaged within the
proper trial class (‘baseline’, ‘seen’ and ‘not seen’) to form the ERPs. It is
noteworthy that the same number of ‘baseline’, ‘seen’ and ‘not seen’
trials were selected in each subject, so that ERPs for the three classes
could be correctly compared in amplitude. The mean number of trials
per group was 83 ± 5 (± SE). It is worth noting that the presence of ERPs
in the ‘baseline’ trials should not be a surprise, since a blank screen was
delivered for a threshold time in these trials, in spite of the cue stimulus.
These ERPs were indeed evoked by the visual scene’s changing from the
background masking stimulus to the blank screen.
Cortical Source Analysis of the ERPsA popular technique called ‘low-resolution electromagnetic brain
topography’ (LORETA) was used for the source analysis of the ERPs
(Pascual-Marqui and Michel, 1994; Pascual-Marqui et al., 1999, 2002;
http://www.unizh.ch/keyinst/NewLORETA/LORETA01.htm). It was pre-
ferred over other similar EEG techniques since several independent re-
search groups have repeatedly demonstrated that LORETA solutions
are able to model cortical responses to sensorimotor events (Wang
et al., 1999, 2003; Frei et al., 2001; Jausovec and Jausovec, 2001; Carretie
et al., 2004; Gamma et al., 2004; Herrmann et al., 2004). However, it
should be stressed that LORETA has a spatial resolution (centimeters)
lower than that of positron emission tomography and fMRI imaging
(millimeters).
LORETA computed three-dimensional linear solutions (LORETA
solutions) for the EEG inverse problem within a three-shell spherical
head model including scalp, skull and brain compartments. The brain
compartment was restricted to the cortical grey matter/hippocampus
and was co-registered to the Talairach probability brain atlas, digitized at
the Brain Imaging Center of the Montreal Neurological Institute
(Talairach and Tournoux, 1988). This compartment included 2.394
voxels (7 mm resolution), each voxel containing an equivalent current
dipole. The so-called LORETA solutions consisted of voxel z-current
density valueswhichwere able to predict ERP voltage at scalp electrodes.
Solutions of the EEG inverse problem are underdetermined and ill-
conditioned as the number of spatial samples (electrodes) is lower than
the unknown samples’ ones (current density at each voxel). The
LORETA solutions predicting scalp ERPs were regularized to estimate
distributed rather than punctual EEG source activity (Pascual-Marqui
and Michel, 1994; Pascual-Marqui et al., 1999, 2002). In line with this
intrinsic LORETA feature and the study aim, in this study the LORETA
solutions were statistically analyzed in terms of Brodmann areas within
the parietal and occipital lobes rather than in terms of single voxel
activity. In particular, the cortical regions of interest for the statistical
analysis were the Brodmann area that showed the maximum activity
within the parietal lobe, and the Brodmann area that showed the
maximum activity within the occipital lobe. The activity of each
Brodmann area of interest was computed by averaging the z-current
density of all voxels that have the same polarity of the ERP component
analyzed.
Statistical Analysis of the LORETA SolutionsThe regional LORETA solutions (dependent variable) were analyzed by
repeated-measures ANOVA. Mauchley’s test, evaluating the sphericity
assumption and correction of the degrees of freedom, was made by the
Greenhouse--Geisser procedure. Duncan’s test was used for post hoc
comparisons (P < 0.05). To minimize the repetition of the statistical test,
the ANOVA only tested LORETA solutions relative to the ERP compo-
nents that showing clear amplitude differences between ‘seen’ versus
‘not seen’ ERPs. The ANOVA design included the factors Condition
(‘baseline’, ‘seen’ and ‘not seen’), Hemisphere (left, right) and Lobe of
interest (occipital, parietal). The planned statistical testing evaluated the
working hypothesis of a specific ERP source pattern for the conscious
perception of the cue stimulus position (‘seen’ trials) with reference to
ERP source patterns of unconscious perception (‘not seen’ trials) or no
perception (‘baseline’ trials) of the cue stimulus. The confirmation of
the working hypothesis implied regional LORETA solutions stronger in
amplitude from (i) ‘seen’ than ‘not seen’ ERPs and (ii) ‘seen’ than
‘baseline’ ERPs.
Results
Behavioral Data
The results of the run test indicated that ‘seen’ and ‘not seen’
trials (i.e. based on the recognition of the cue stimulus position)
were randomly intermingled (P = 0.53). In the same way, the
results of the ANOVA showed no statistical difference (P > 0.48)among the mean percentages of the ‘seen’ trials at the
‘beginning’ (54.4%), ‘medium’ (53.7%), and ‘final’ (51.4%)
periods of the experimental session. Namely, there was no
reduction of the percentage of the ‘seen’ trials at the end of the
experimental session.
ANOVA of the reaction time to go stimuli resulted in
a statistically significant [F (4,44) = 8.06; P < 0.0001] main factor
Condition (‘baseline’, ‘congruent seen’, ‘incongruent seen’,
‘congruent not seen’, ‘incongruent not seen’). Planned post
hoc comparisons provided the following results. According to
the control hypothesis and previous evidence (McCormick,
1997; Ivanoff and Klein, 2003; C. Babiloni et al., submitted), the
mean reaction time was shorter (P < 0.026) during the
‘congruent seen’ trials (687 ± 15 ms) than during the ‘in-
congruent seen’ ones (719 ± 44 ms) — this is possibly an effect
of covert attention on cued location. Similarly, the reaction time
was shorter (P < 0.034) during the ‘congruent not seen’ trials
(732 ± 42 ms) than during the ‘incongruent not seen’ ones
(764 ± 45 ms), confirming the occurrence of unconscious
processes during ‘not seen’ trials.
Spatio-temporal Evolution of the ERPs
Figure 2 plots grand average (n = 12) waveforms of the scalp
‘baseline’, ‘not seen’ and ‘seen’ ERPs recorded at representative
midline electrodes (AFz, Fz, FCz, Cz, CPz, Pz, POz, and Oz). It is
noteworthy that the peak latencies were the same in ‘baseline’,
‘not seen’ and ‘seen’ ERPs. On average, these latencies were
+178 ms (±10 SE), +314 ms (±16 SE), and +398 ms (±16 SE) for
posterior ERPs such as N1, P2 and P3 respectively. In contrast,
‘baseline’, ‘not seen’ and ‘seen’ ERPs differed as P3 amplitude
(Table 1). An ANOVA analysis showed that this difference was
statistically significant [F (2,22) = 18.17; P < 0.00001]. Post hoc
testing indicated that the P3 amplitude was significantly higher
in the ‘seen’ than in both ‘not seen’ (P < 0.00008) and ‘baseline’
(P < 0.0001) ERPs. No amplitude difference was observed
between ‘not seen’ and ‘baseline’ ERPs.
To control whether different P3 amplitude between ‘not
seen’ and ‘seen’ ERPs merely depended on attention, we
compared (Fig. 3) the grand average (n = 12) waveforms of
‘not seen’ and ‘seen’ ERPs formed by selected trials in which
reaction times were similar (P > 0.05). Indeed, attention can be
defined as subject’s readiness to respond. Again, P3 amplitude
predominated in the ‘seen’ rather than the ‘not seen’ ERPs.
Another important control was whether different P3 ampli-
tude between ‘not seen’ and ‘seen’ ERPs depended on lower
Page 4 of 10 Visuo-spatial Consciousness and ERPs d Babiloni et al.
by guest on June 9, 2013http://cercor.oxfordjournals.org/
Dow
nloaded from

frequency of ‘seen’ trials than on trials in which cue stimulus
was missed (‘baseline’ and ‘not seen’ trials). In other words, we
wondered if P3 amplitude was modulated by a sort of ‘P300’
effect. For this reason, we compared the grand average (n = 7)
ERP waveforms relative to control blocks in which no ‘baseline’
trial was delivered. In these blocks, there were only ‘seen’ and
‘not seen’ trials (50% each). P3 amplitude still prevailed in ‘seen’
rather than ‘not seen’ ERPs. Keeping in mind these results, P3
was employed as an input for LORETA source analysis.
P3 Sources Computed by LORETA
Figure 5 maps the grand average (n = 12) of LORETA solutions
(i.e. z-current density at cortical voxels) modeling the distrib-
uted ERP sources of ‘baseline’, ‘not seen’ and ‘seen’ P3. Main P3
sources were estimated in occipital (Brodmann areas [BA] 19)
and parietal (BA 7) regions. At BA 7, Talairach coordinates of
maximal LORETA values were 39,–74, 50 for ‘seen’ P3; 32,–74, 50
for ‘not seen’ P3; and 25,–74, 50 for ‘baseline’ P3. At BA 19, they
were 39,–74, 43 for ‘seen’ P3; 32,–74, 43 for ‘not seen’ P3; and
Figure 2. Grand average (n 5 12) waveforms of event-related potentials (ERPs)recorded at representative midline electrodes (AFz, Fz, FCz, Cz, CPz, Pz, POz and Ozsites of 10--20 system). These potentials were obtained averaging separately‘baseline’, ‘not seen’ and ‘seen’ trials. See Materials and Methods for the definitionof these trial classes.
Figure 3. Grand average (n 5 12) waveforms of ERPs formed by selected trials inwhich reaction time was comparable in ‘not seen’ and ‘seen’ trials (P[ 0.05). Thesewaveforms were illustrated to control whether differences in amplitude of ERPsbetween ‘not seen’ and ‘seen’ trials were dependent on attention defined as ‘subject’sreadiness to respond’ (i.e. reaction time).
Table 1P3 amplitude (lV) and latency values (ms) for ‘baseline’, ‘not-seen’ and ‘seen’ trials and for all
subjects
Subject Channel BaselineAmplitude
Not-seenAmplitude
SeenAmplitude
Latency(ms)
1 CZ 8.68 7.14 17.81 þ3652 CZ 2.41 3.35 14.68 þ4873 FZ 5.88 4.81 11.73 þ3604 FCZ 11.55 9.14 10.51 þ4795 CZ 5.93 9.74 8.24 þ3766 CPZ 0.57 2.01 7.02 þ4947 CZ 5.76 3.11 15.12 þ3888 CZ 8.87 7.72 10.45 þ3439 CPZ 4.21 2.27 8.05 þ41110 FCZ 2.35 3.11 9.02 þ36711 CPZ 8.42 2.96 8.64 þ37612 CPZ 1.43 2.07 4.96 þ332
Mean 5.50 4.78 10.52 1398
SEM 0.9 0.8 1.0 16
Cerebral Cortex Page 5 of 10
by guest on June 9, 2013http://cercor.oxfordjournals.org/
Dow
nloaded from

32,–74, 43 for ‘baseline’ P3. These sources appeared to be
greater in magnitude in ‘seen’ than ‘baseline’ and ‘not seen’ P3.
ANOVA analysis of P3 LORETA solutions showed statistically
significant main effects for all factors such as Condition
(‘baseline’, ‘not seen’, ‘seen’), Hemisphere (left, right) and
Lobe of interest (parietal BA 7, occipital BA 19). In contrast,
there was no statistically significant interaction among the
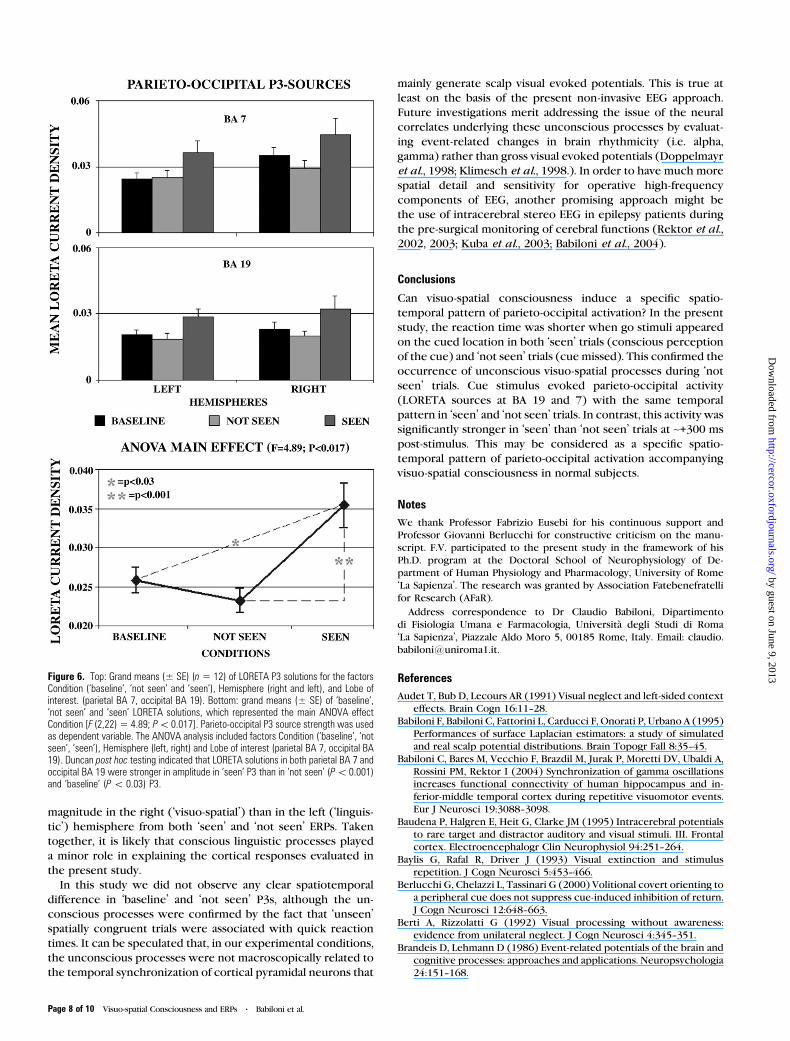
factors. Figure 6 (top) plots grand means (n = 12) of P3 LORETA
solutions for each factor (Condition, Hemisphere, Lobe of
interest). There was a main effect Condition [F (2,22) = 4.89;
P < 0.017]. Figure 6 (bottom) also plots results of post hoc
testing, which showed that LORETA solutions in both parietal
BA 7 and occipital BA 19 were stronger in amplitude in ‘seen’ P3
than in ‘not seen’ (P < 0.001) and ‘baseline’ (P < 0.03) P3.
Furthermore, there were two other main factors. The main
factor Hemisphere [F (1,11) = 5.76; P < 0.035] indicated
a stronger amplitude of the P3 LORETA solutions in the right
hemisphere than in the left one, whereas the main factor Lobe
of interest [F (1,11) = 17.95; P < 0.002] indicated a stronger
amplitude of the P3 LORETA solutions in the parietal BA 7 than
occipital BA 19.
Discussion
Behavioral Results Disclose UnconsciousVisuo-spatial Processes
The low rate of false recognition (~3% of ‘baseline’ trials)
confirmed the reliability of the subjects’ self-reports and
validated the present approach for the study of conscious and
unconscious visuo-spatial processes (Schacter, 1999). This
agrees with several lines of evidence showing reliability of
self-report and reaction time for similar purposes (Schacter,
1999).
In the present study, reaction time was shorter when the go
stimuli appeared on the cued location in both ‘seen’ and ‘not
seen’ trials. This confirmed the occurrence of unconscious
visuo-spatial processes during ‘not seen’ trials, in line with
previous evidence (McCormick, 1997; Ivanoff and Klein, 2003;
C. Babiloni et al., submitted). In contrast, the present results are
apparently at odds with previous findings on ‘inhibition of
return’ mechanism (Posner and Cohen, 1984; Posner et al.,
1985). According to ‘inhibition of return’, the reaction time to
the (extrafoveal) go stimuli should be lengthened by non-
informative cue stimuli at the same location or hemifield
(Tassinari and Berlucchi, 1993; Berlucchi et al., 2000). This
paradox is just apparent. In contrast to the paradigms inducing
‘inhibition of return’, the present paradigm forced subjects to
attract attentional and memory resources on the cue stimulus
for the final self-report (i.e. to say ‘seen’ or ‘not seen’). It is
reasonable that covert attention on cue position speeded the
reaction time at cued location. This explanation agrees with the
previous results showing that subliminal visuo-spatial cue
stimuli cancel ‘inhibition of return’ effects when associated
with self-report (McCormick, 1997; Ivanoff and Klein, 2003). In
that sense, self-report would produce effects similar to those
reported when the cue is spatially informative on the sub-
sequent go stimuli (Posner et al., 1980, 1994; Posner, 1987;
Merikle and Daneman, 1999; Berlucchi et al., 2000).
ERPs Disclose Spatio-temporal Cortical Pattern ofConscious Visuo-spatial Processes
Here cue stimulation evoked three major ERP components such
as posterior N1, P2 and P3, which had the same peak latencies in
‘baseline’, ‘not seen’ and ‘seen’ potentials. These results hint that
conscious and unconscious visuo-spatial processes are related
to quite similar temporal evolution of parieto-occipital activity.
In contrast, P3 amplitude was higher in ‘seen’ than ‘not seen’ and
‘baseline’ ERPs (Table 1). Mere effects of attention did not
provoke this result, since it was still found when attention
(indexed by reaction time) was paired in ‘seen’ and ‘not seen’
ERPs. Furthermore, P3 modulation was not due to relative
frequency of the ‘seen’ and ‘not seen’ trials (the so-called P300
effect). In fact, it was still recognized in control blocks in which
‘seen trials’ were as frequent as ‘not seen’ trials (50%) and there
were no ‘baseline’ trials.
LORETA analysis of P3 sources showed a strong activity of the
extrastriate occipital (BA 19) and posterior parietal (BA 7) areas
in both ‘seen’ and ‘not seen’ ERPs, indicating that conscious and
unconscious visuo-spatial processes basically impinge upon the
Figure 4. Grand average (n 5 7) waveforms of ERPs formed by the trials of thecontrol blocks in which no ‘baseline’ trial was delivered. In these blocks, the subjectsrecognized the cue stimuli (‘seen’ trials) as frequently as they did not recognize the cuestimuli (‘not seen’ trials). Of note, this control was mandatory, since a lower frequencyof the ‘seen’ then other trials may have enhanced the P3 amplitude merely for well-known ‘P300’ effect.
Page 6 of 10 Visuo-spatial Consciousness and ERPs d Babiloni et al.
by guest on June 9, 2013http://cercor.oxfordjournals.org/
Dow
nloaded from

same cortical ‘dorsal’ stream. However, there was an important
statistical difference. Parieto-occipital P3 sources were greater
in magnitude in ‘seen’ than ‘not seen’ LORETA solutions. This
supports the hypothesis of specific spatial (occipital BA 19 and
parietal BA 7) and temporal (~+300 ms post-stimulus) features
of cortical responses to visuo-spatial consciousness.
The present results showed that amplitude of parieto-
occipital activation is important for visual consciousness not
only in patients with ‘visual extinction’ (Driver 1996; Driver
et al., 1997; Heilman et al., 1997; Robertson et al., 1997; Driver
and Mattingley, 1998) but also in normal subjects. In patients
with ‘visual extinction’, ERPs were modulated by visual con-
sciousness (‘seen trials’) at early latencies spanning 100--200 ms
post-stimulus (Lhermitte et al., 1985; Vallar et al., 1991; Spinelli
et al., 1994; Verleger et al., 1996; Marzi et al., 2000; Driver and
Vuilleumier et al., 2001). In the present normal subjects, visual
consciousness modulated parieto-occipital sources of late ERPs,
namely at ~+300 ms post-stimulus (P3). That latency difference
is compatible with side effects of brain lesions on the flow of
conscious visuo-spatial processes and motivates further com-
parative investigations on these processes in normal subjects
and patients.
The present results complement those of previous studies
using P300 paradigms. These studies have shown that, in normal
subjects, the amplitude of frontal and parietal P300 was higher
after ‘seen’ (conscious perception) than ‘not seen’ (subliminal
perception) rare stimuli (Shevrin, 1976; Kostandov and Arzu-
manov, 1977; Brandeis and Lehmann, 1986; Shefrin et al., 1988;
Brazdil et al., 1998, 2001, 2002). Without the typical sensori-
motor demands of the P300 paradigm, the present results
indicate that conscious visuo-spatial processes modulate late
ERPs at the latency of P300, but they have a parieto-occipital
rather than frontal representation. Reasonably this topograph-
ical difference depended on more demanding executive func-
tions elicited by P300 paradigms than by the present
experimental condition.
In the present study the visuo-spatial consciousness modu-
lated late parieto-occipital activation in both hemispheres. This
is compatible with the notion that both the hemispheres are
involved in visual consciousness, probably with peculiar aspects.
Previous studies have emphasized the role of the left hemi-
sphere for consciousness, whereas others have favored the right
hemisphere (Galin, 1974; Kostandov and Arzumanov, 1977;
Brandeis and Lehmann, 1986; Shevrin et al., 1992; Gazzaniga,
1993; Henke et al., 1993). In this framework, the left hemi-
sphere may subserve sequential organization of percepts and
linguistic elaboration, whereas the right one may subserve
global visuo-spatial search and somatic perceptive processes,
as revealed by well-known neurological syndromes such as
neglect, visual extinction, prosopagnosia, etc. (Berti and Rizzo-
latti, 1992; Wallace, 1994; Baudena et al., 1995; Farah and
Feinberg, 1997; De Renzi, 2000). In this regard, the specific
demand of the present experiments was mainly visuo-spatial.
Indeed, subjects had to click the mouse button as a function of
the position of the go stimulus. They were not asked to say the
position of the cue during self-report and they denied the use of
mental verbal codes after the experiment. Moreover, the cue
stimulation evoked potentials whose sources had greater
Figure 5. Grand average of LORETA solutions (i.e. z-current density at cortical voxels) modeling the distributed sources for P3 component of the ERPs. These solutions refer to theERPs formed by ‘baseline’, ‘not seen’, and ‘seen’ trials (n 5 12).
Cerebral Cortex Page 7 of 10
by guest on June 9, 2013http://cercor.oxfordjournals.org/
Dow
nloaded from
magnitude in the right (‘visuo-spatial’) than in the left (‘linguis-
tic’) hemisphere from both ‘seen’ and ‘not seen’ ERPs. Taken
together, it is likely that conscious linguistic processes played
a minor role in explaining the cortical responses evaluated in
the present study.
In this study we did not observe any clear spatiotemporal
difference in ‘baseline’ and ‘not seen’ P3s, although the un-
conscious processes were confirmed by the fact that ‘unseen’
spatially congruent trials were associated with quick reaction
times. It can be speculated that, in our experimental conditions,
the unconscious processes were not macroscopically related to
the temporal synchronization of cortical pyramidal neurons that
mainly generate scalp visual evoked potentials. This is true at
least on the basis of the present non-invasive EEG approach.
Future investigations merit addressing the issue of the neural
correlates underlying these unconscious processes by evaluat-
ing event-related changes in brain rhythmicity (i.e. alpha,
gamma) rather than gross visual evoked potentials (Doppelmayr
et al., 1998; Klimesch et al., 1998.). In order to have much more
spatial detail and sensitivity for operative high-frequency
components of EEG, another promising approach might be
the use of intracerebral stereo EEG in epilepsy patients during
the pre-surgical monitoring of cerebral functions (Rektor et al.,
2002, 2003; Kuba et al., 2003; Babiloni et al., 2004).
Conclusions
Can visuo-spatial consciousness induce a specific spatio-
temporal pattern of parieto-occipital activation? In the present
study, the reaction time was shorter when go stimuli appeared
on the cued location in both ‘seen’ trials (conscious perception
of the cue) and ‘not seen’ trials (cue missed). This confirmed the
occurrence of unconscious visuo-spatial processes during ‘not
seen’ trials. Cue stimulus evoked parieto-occipital activity
(LORETA sources at BA 19 and 7) with the same temporal
pattern in ‘seen’ and ‘not seen’ trials. In contrast, this activity was
significantly stronger in ‘seen’ than ‘not seen’ trials at ~+300 ms
post-stimulus. This may be considered as a specific spatio-
temporal pattern of parieto-occipital activation accompanying
visuo-spatial consciousness in normal subjects.
Notes
We thank Professor Fabrizio Eusebi for his continuous support and
Professor Giovanni Berlucchi for constructive criticism on the manu-
script. F.V. participated to the present study in the framework of his
Ph.D. program at the Doctoral School of Neurophysiology of De-
partment of Human Physiology and Pharmacology, University of Rome
‘La Sapienza’. The research was granted by Association Fatebenefratelli
for Research (AFaR).
Address correspondence to Dr Claudio Babiloni, Dipartimento
di Fisiologia Umana e Farmacologia, Universita degli Studi di Roma
‘La Sapienza’, Piazzale Aldo Moro 5, 00185 Rome, Italy. Email: claudio.
References
Audet T, Bub D, Lecours AR (1991) Visual neglect and left-sided context
effects. Brain Cogn 16:11--28.
Babiloni F, Babiloni C, Fattorini L, Carducci F, Onorati P, Urbano A (1995)
Performances of surface Laplacian estimators: a study of simulated
and real scalp potential distributions. Brain Topogr Fall 8:35--45.
Babiloni C, Bares M, Vecchio F, Brazdil M, Jurak P, Moretti DV, Ubaldi A,
Rossini PM, Rektor I (2004) Synchronization of gamma oscillations
increases functional connectivity of human hippocampus and in-
ferior-middle temporal cortex during repetitive visuomotor events.
Eur J Neurosci 19:3088--3098.
Baudena P, Halgren E, Heit G, Clarke JM (1995) Intracerebral potentials
to rare target and distractor auditory and visual stimuli. III. Frontal
cortex. Electroencephalogr Clin Neurophysiol 94:251--264.
Baylis G, Rafal R, Driver J (1993) Visual extinction and stimulus
repetition. J Cogn Neurosci 5:453--466.
Berlucchi G, Chelazzi L, Tassinari G (2000) Volitional covert orienting to
a peripheral cue does not suppress cue-induced inhibition of return.
J Cogn Neurosci 12:648--663.
Berti A, Rizzolatti G (1992) Visual processing without awareness:
evidence from unilateral neglect. J Cogn Neurosci 4:345--351.
Brandeis D, Lehmann D (1986) Event-related potentials of the brain and
cognitive processes: approaches and applications. Neuropsychologia
24:151--168.
Figure 6. Top: Grand means (± SE) (n5 12) of LORETA P3 solutions for the factorsCondition (‘baseline’, ‘not seen’ and ‘seen’), Hemisphere (right and left), and Lobe ofinterest. (parietal BA 7, occipital BA 19). Bottom: grand means (± SE) of ‘baseline’,‘not seen’ and ‘seen’ LORETA solutions, which represented the main ANOVA effectCondition [F (2,22) 5 4.89; P\0.017]. Parieto-occipital P3 source strength was usedas dependent variable. The ANOVA analysis included factors Condition (‘baseline’, ‘notseen’, ‘seen’), Hemisphere (left, right) and Lobe of interest (parietal BA 7, occipital BA19). Duncan post hoc testing indicated that LORETA solutions in both parietal BA 7 andoccipital BA 19 were stronger in amplitude in ‘seen’ P3 than in ‘not seen’ (P\ 0.001)and ‘baseline’ (P\ 0.03) P3.
Page 8 of 10 Visuo-spatial Consciousness and ERPs d Babiloni et al.
by guest on June 9, 2013http://cercor.oxfordjournals.org/
Dow
nloaded from

Brazdil M, Rektor I, Dufek M, Jurak P, Daniel P (1998) Effect of
subthreshold target stimuli on event-related potentials. Electro-
encephalogr Clin Neurophysiol 107:64--68.
Brazdil M, Rektor I, Daniel P, Dufek M, Jurak P (2001) Intracerebral
event-related potentials to subthreshold target stimuli. Clin Neuro-
physiol 112:650--661.
Brazdil M, Kuba R, Daniel P, Sochurkova D, Dobsik M, Rektor I (2002)
Covert vision sign. Eur J Neurol 9:316--319.
Buchel C, Friston KJ. (1997) Modulation of connectivity in visual
pathways by attention: cortical interactions evaluated with struc-
tural equation modelling and fMRI. Cereb Cortex 7:768--778.
Carretie L, Hinojosa JA, Martin-Loeches M, Mercado F, Tapia M (2004)
Automatic attention to emotional stimuli: neural correlates. Hum
Brain Mapp 22:290--299.
Cocchini G, Cubelli R, Della Sala S, Beschin N (1999) Neglect without
extinction. Cortex 35:285--313.
Cohen A, Ivry R, Rafal R, Kohn C (1995) Response code activation by
stimuli in the neglected visual field. Neuropsychology 9:165--173.
De Renzi E (2000) Disorders of visual recognition. Semin Neurol
20:479--485.
Desimone R, Duncan J (1995) Neural mechanisms of selective visual
attention. Annu Rev Neurosci 18:193--222.
Doppelmayr MM, Klimesch W, Pachinger T, Ripper B (1998). The
functional significance of absolute power with respect to event-
related desynchronization. Brain Topogr 11:133--140.
Driver J (1996) What can visual neglect and extinction reveal about the
extent of ‘preattentive’ processing? In: Convergent operations in the
study of visual selective attention (Kramer AF, Cole MGH, Logan GD,
eds), pp. 193--224. Washington, DC: APA Press.
Driver J, Mattingley JB (1998) Parietal neglect and visual awareness. Nat
Neurosci 1:17--22.
Driver J, Vuilleumier P (2001) Perceptual awareness and its loss in
unilateral neglect and extinction. Cognition 79:39--88.
Driver J, Mattingley JB, Rorden C, Davis G (1997) Extinction as
a paradigm measure of attentional bias and restricted capacity
following brain injury. In: Parietal lobe contributions to orientation
in 3D space (Karnath H-O, Thier P, eds), pp. 401--429. Berlin:
Springer Verlag.
Farah MJ, Feinberg TE (1997) Consciousness of perception after brain
damage. Semin Neurol 17:145--152.
Frei E, Gamma A, Pascual-Marqui R, Lehmann D, Hell D, Vollenweider FX
(2001) Localization of MDMA-induced brain activity in healthy
volunteers using low resolution brain electromagnetic tomography
(LORETA). Hum Brain Mapp 14:152--65.
Galin D (1974) Implications for psychiatry of left and right cerebral
specialization: a neurophysiological content for unconscious pro-
cesses. Arch Gen Psychiatry 31:572--583.
Gamma A, Lehmann D, Frei E, Iwata K, Pascual-Marqui RD, Vollenweider
FX (2004). Comparison of simultaneously recorded [H2(15)O]-PET
and LORETA during cognitive and pharmacological activation. Hum
Brain Mapp 22:83--96.
Gazzaniga MS (1993) Brain mechanisms and conscious experience.
Experimental and theoretical studies of consciousness. CIBA Foun-
dation Symposium 174, pp. 247--262. Chichester: Wiley.
Heilman KM, Watson RT, Valenstein E (1997) Neglect: clinical and
anatomic aspects. In: Behavioral neurology and neuropsychology
(Feinberg TE, Farah MJ, eds), pp. 309--317. New York: McGraw-Hill.
Henke K, Landis T, Markowitsch HJ (1993) Subliminal perception of
pictures in the right hemisphere. Conscious Cogn 2:225--236.
Herrmann MJ, Rommler J, Ehlis AC, Heidrich A, Fallgatter AJ (2004).
Source localization (LORETA) of the error-related-negativity
(ERN/Ne) and positivity (Pe). Brain Res Cogn Brain Res 20:294--299.
Hillyard SA, Squires KC, Bauer JW, Lindsay PH (1971) Evoked potential
correlates of auditory signal detection. Science 172:1357--1360.
Hillyard SA, Picton TW (1987) Electrophysiology of cognition. In: Higher
functions of the brain, Part 2, Handbook of physiology, Section 1, The
nervous system, 5 (Plum F, ed.), pp. 591--684. Washington, DC:
American Physiological Society.
Holender D (1986) Semantic activation without conscious identification
in dichotic listening, parafoveal vision, and visual masking: a survey
and appraisal. Behav Brain Sci 9:1--66.
Iragui VJ, Kutas M, Mitchiner MR, Hillyard SA (1993) Effect of aging on
eventrelated brain potentials and reaction times in an auditory
oddball task. Psychophysiology 30:10--22.
Ivanoff J, Klein RM (2003) Orienting of attention without awareness is
affected by measurement-induced attentional control settings. J Vis
3:32--40.
Jausovec N, Jausovec K (2001) Differences in EEG current density
related to intelligence. Brain Res Cogn Brain Res 12:55--60.
Kihlstrom JF, Barnhardt TM, Tataryn DJ (1992) Implicit perception. In:
Perception without awareness: cognitive, clinical, and social perspec-
tives (Bornstein RF, Pittman TS, eds), pp. 17--54. New York: Guilford.
KlimeschW, Russegger H, Doppelmayr M, Pachinger T (1998) A method
for the calculation of induced band power: implications for the
significance of brain oscillations. Electroencephalogr Clin Neuro-
physiol 108:123--130.
Kostandov E, Arzumanov Y (1977) Averaged cortical evoked potentials
to recognized and non-recognized verbal stimuli. Acta Neurobiol
Exp 37:311--324.
Kuba R, Rektor I, Brazdil M (2003) Ictal limb dystonia in temporal lobe
epilepsy. an invasive video-EEG finding. Eur J Neurol 10:641--649.
Lhermitte F, Turell E, LeBrigand D, Chain F (1985) Unilateral visual
neglect and wave P 300. A study of nine cases with unilateral lesions
of the parietal lobes. Arch Neurol 42:567--573.
Marzi CA, Smania N, Martini MC, Gambina G, Tomelleri G, Palamara A,
Alessandrini F, Prior M (1996) Implicit redundant-targets effect in
visual extinction. Neuropsychologia 34:9--22.
Marzi CA, Girelli M, Miniussi C, Smania N, Maravita A (2000) Electro-
physiological correlates of conscious vision: evidence from unilateral
extinction. J Cogn Neurosci 12:869--877.
Mattingley JB, Driver J, Beschin N, Robertson IH (1997) Attentional
competition between modalities: extinction between touch and
vision after right hemisphere damage. Neuropsychologia 35:867--880.
McCormick PA (1997) Orienting attention without awareness. J Exp
Psychol Hum Percept Perform 23:168--180.
McGlinchey-Berroth R, Milberg WP, Verfaellie M, Alexander M, Kilduff PT
(1993) Semantic processing in the neglected visual field: evidence
from a lexical decision task. Cognit Neuropsychol 10:79--108.
Merikle PM (1982) Unconscious perception revisited. Percept Psycho-
phys 31:298--301.
Merikle PM, Daneman M (1999) Conscious vs. unconscious perception.
In: The new cognitive neurosciences (Gazzaniga MS, ed.), pp. 1295--
1304. Cambridge, MA: MIT Press.
Naatanen R, Gaillard AWK (1983) The N2 deflection of ERP and the
orienting reflex. In: EEG correlates of information processing:
theoretical issues (Gaillard AWK, Ritter W, eds), pp. 119--141.
Amsterdam: North Holland.
Pascual-Marqui RD, Michel CM (1994) LORETA (low resolution brain
electromagnetic tomography): new authentic 3D functional images
of the brain. ISBET Newsletter ISNN 5:4--8.
Pascual-Marqui RD, Lehmann D, Koenig T, Kochi K, Merlo MC, Hell D,
Koukkou M (1999) Low resolution brain electromagnetic tomogra-
phy (LORETA) functional imaging in acute, neurolepticnaive, first-
episode, productive schizophrenia. Psychiatry Res 90:169--179.
Pascual-Marqui RD, Esslen M, Kochi K, Lehmann D (2002) Functional
imaging with low resolution brain electromagnetic tomography
(LORETA): a review. Methods Findings Exp Clin Pharmacol 24:91--95.
Posner MI (1987) Cognitive neuropsychology and the problem of
selective attention. Electroencephalogr Clin Neurophysiol 39
(Suppl) :313--316.
Posner MI, Cohen Y (1984) Components of visual orienting. In:
Attention and performance, Vol. X (Bumpy H, Bouwhuis TU, eds).
Hillsdale, NJ: Erlsbaum.
Posner MI, Snyder CR, Davidson BJ (1980) Attention and the detection
of signals. J Exp Psychol 109:160--174.
Posner MI, Walker JA, Friedrich FJ, Rafal RD (1984) Effects of parietal
injury on covert orienting of attention. J Neurosci 4:1863--1874.
Posner MI, Rafal RD, Choate LS, Vaughan J (1985) Inhibition of return:
neural basis and function. Cognit Neuropsychol 2:211--228.
Purcell DG, Stewart AL, Stanovich KE (1983) Another look at semantic
priming without awareness. Percept Psychophys 34:65--71.
Cerebral Cortex Page 9 of 10
by guest on June 9, 2013http://cercor.oxfordjournals.org/
Dow
nloaded from

Rees G, Wojciulik E, Clarke K, Husain M, Frith C, Driver J (2000)
Unconscious activation of visual cortex in the damaged right hemi-
sphere of a parietal patient with extinction. Brain 123:1624--1633.
Reingold EM, Merikle PM (1988) Using direct and indirect measures
to study perception without awareness. Percept Psychophys 44:
563--575.
Rektor I, Kuba R, Brazdil M (2002) Interictal and ictal EEG activity in the
basal ganglia: an SEEG study in patients with temporal lobe epilepsy.
Epilepsia 43:253--262.
Rektor I, Kaiiovsky P, Bares M, Brazdil M, Streitova H, Klajblova H,
Kuba R, Daniel P (2003) A SEEG study of ERP in motor and premotor
cortices and in the basal ganglia. Clin Neurophysiol 114:463--471.
Robertson L, Treisman A, Friedman-Hill S, Grabowecky M (1997) The
interaction of spatial and object pathways: evidence from Balint’s
syndrome. J Cogn Neurosci 9:295--317.
Schacter DL (1999) Consciousness. In: The new cognitive neurosciences
(Gazzaniga MS, ed.), pp. 1273--1276. Cambridge, MA: MIT Press.
Shefrin SL, Goodin DS, Aminoff MJ (1988) Visual evoked response in the
investigation of ‘blindsight’. Neurology 38:104--109.
Shevrin H (1976) Brain wave correlates of subliminal stimulation,
unconscious attention, primary- and secondary-process thinking,
and repressiveness. Psychol Issues 8:56--87.
Shevrin H (1992) Subliminal perception, memory, and consciousness:
cognitive and dynamic perspectives. In: Perception without aware-
ness: cognitive, clinical, and social perspectives, (Bornstein RF,
Pittman TS, eds), pp. 123--142. New York: Guilford.
Shevrin H, Fritzler DE (1968) Visual evoked response correlates of
unconscious mental processes. Science 161:295--298.
Smith DBD, Donchin E, Cohen L, Starr A (1970) Auditory evoked
potentials in man during selective binaural listening. Electroence-
phalogr Clin Neurophysiol 28:146--152.
Spinelli D, Burr DC, Morrone MC (1994) Spatial neglect is associated
with increased latencies of visual evoked potentials. Vis Neurosci
11:909--918.
Talairach J, Tournoux P (1988) Co-planar stereotaxic atlas of the human
brain. Stuttgart: Thieme Verlag.
Tassinari G, Berlucchi G (1993) Sensory and attentional components of
slowing of manual reaction time to non-fixated visual targets by
ipsilateral primes. Vision Res 33:1525--1534.
Vallar G, Bisiach E, Cerizza M, Rusconi ML (1988) The role of the left
hemisphere in decision-making. Cortex 24:605.
Vallar G, Sandroni P, Rusconi ML, Barbieri S (1991) Hemianopia,
hemianesthesia, and hemispatial neglect: a study with evoked
potentials. Neurology 41:1918--1922.
Verleger R, Heide W, Butt C, Wascher E, Kompf D (1996) On-line brain
potential correlates of right parietal patients’ attentional deficit.
Electroencephalogr Clin Neurophysiol 99:444--457.
Vuilleumier PO, Rafal RD (2000) A systematic study of visual extinction.
Between- andwithin-field deficits of attention in hemispatial neglect.
Brain 123:1263--1279.
Vuilleumier P, Schwartz S, Husain M, Clarke K, Driver J (2001) Implicit
processing and learning of visual stimuli in parietal extinction and
neglect. Cortex 37:741--744.
Wang J, Jin Y, Xiao F, Fan S, Chen L (1999) Attention-sensitive visual
event-related potentials elicited by kinetic forms. Clin Neurophysiol.
110(2):329--41.
Wang J, Hiramatsu K, Hokama H, Miyazato H, Ogura C (2003)
Abnormalities of auditory P300 cortical current density in patients
with schizophrenia using high density recording. Int J Psychophysiol
47:243--253.
Wallace MA (1994) Unconscious perception in neglect and extinction.
In: The neuropsychology of high-level vision: collected tutorial essays
(Farah MJ, Ratcliff G, eds), pp. 107--125. Hillsdale, NJ: Lawrence
Erlbaum.
Wong PS, Shevrin H, Williams WJ (1994) Conscious and nonconscious
processes: an ERP index of an anticipatory response in a condition-
ing paradigm using visual masked stimuli. Psychophysiology 31:
87--101.
Page 10 of 10 Visuo-spatial Consciousness and ERPs d Babiloni et al.
by guest on June 9, 2013http://cercor.oxfordjournals.org/
Dow
nloaded from